As filed with the Securities and Exchange Commission on 23 March 2023
UNITED STATES
SECURITIES AND EXCHANGE COMMISSION
Washington, D.C. 20549
FORM 20-F
☐ REGISTRATION STATEMENT PURSUANT TO SECTION 12(b) OR (g) OF THE SECURITIES EXCHANGE ACT OF 1934
OR
☒ ANNUAL REPORT PURSUANT TO SECTION 13 OR 15(d) OF THE SECURITIES EXCHANGE ACT OF 1934
For the fiscal year ended 31 December 2022
OR
☐ TRANSITION REPORT PURSUANT TO SECTION 13 OR 15(d) OF THE SECURITIES EXCHANGE ACT OF 1934
OR
☐ SHELL COMPANY REPORT PURSUANT TO SECTION 13 OR 15(d) OF THE SECURITIES EXCHANGE ACT OF 1934
Commission File Number: 1-15040
PRUDENTIAL PUBLIC LIMITED COMPANY
Exact Name of Registrant as Specified in its Charter)
England and Wales
(Jurisdiction of Incorporation)
13th Floor, One International Financial Centre, 1 Harbour View Street, Central, Hong Kong
(Address of Principal Executive Offices)
Rebecca Wyatt, Chief of Financial & Capital Reporting
+44 20 7220 7588, rebecca.wyatt@prudentialplc.com
1 Angel Court, London EC2R 7AG, England
(Name, telephone, e-mail and/or facsimile number and address of company contact person)
Securities registered or to be registered pursuant to Section 12(b) of the Act:
| | |||
Title of Each Class |
| Trading Symbol |
| Name of Each Exchange on Which Registered |
| | | ||
American Depositary Shares, each representing 2 Ordinary Shares, 5 pence par value each | PUK | New York Stock Exchange | ||
| | | ||
Ordinary Shares, 5 pence par value each | PUK/D | New York Stock Exchange* | ||
| | | ||
3.125% Senior Notes due 2030 issued by Prudential Funding (Asia) plc | PUK30 | New York Stock Exchange | ||
| | | ||
3.625% Senior Notes due 2032 issued by Prudential Funding (Asia) plc | PUK32 | New York Stock Exchange | ||
Securities registered or to be registered pursuant to Section 12(g) of the Act:
None
Securities for which there is a reporting obligation pursuant to Section 15(d) of the Act:
None
The number of outstanding shares of each of the issuer’s classes of capital or common stock as of 31 December 2022 was
2,749,669,380 Ordinary Shares, 5 pence par value each
Indicate by check mark if the registrant is a well-known seasoned issuer, as defined in Rule 405 of the Securities Act.
☒ Yes ☐ No
If this report is an annual or transition report, indicate by check mark if the registrant is not required to file reports pursuant to Section 13 or 15(d) of the Securities Exchange Act of 1934.
☐ Yes ☒ No
Indicate by check mark whether the registrant: (1) has filed all reports required to be filed by Section 13 or 15(d) of the Securities Exchange Act of 1934 during the preceding 12 months (or for such shorter period that the registrant was required to file such reports), and (2) has been subject to such filing requirements for the past 90 days.
☒ Yes ☐ No
Indicate by check mark whether the registrant has submitted electronically every Interactive Data File required to be submitted pursuant to Rule 405 of Regulation S-T (§ 232.405 of this chapter) during the preceding 12 months (or for such shorter period that the registrant was required to submit and post such files).
☒ Yes ☐ No
Indicate by check mark whether the registrant is a large accelerated filer, an accelerated filer, or a non-accelerated filer, or an emerging growth company. See definition of “large accelerated filer," "accelerated filer," and "emerging growth company” in Rule 12b-2 of the Exchange Act.
Large accelerated filer ☒ Accelerated filer ☐ Non-accelerated filer ☐ Emerging growth company ☐
If an emerging growth company that prepares its financial statements in accordance with U.S. GAAP, indicate by check mark if the registrant has elected to not use the extended transition period for complying with any new or revised financial accounting standards† provided pursuant to Section 13(a) of the Exchange Act.
☐
Indicate by check mark whether the registrant has filed a report on and attestation to its management's assessment of the effectiveness of its internal control over financial reporting under Section 404(b) of the Sarbanes-Oxley Act (15 U.S.C. 7262(b)) by the registered public accounting firm that prepared or issued its audit report.
☒
If securities are registered pursuant to Section 12(b) of the Act, indicate by check mark whether the financial statements of the registrant included in the filing reflect the correction of an error to previously issued financial statements.
☐
Indicate by check mark whether any of those error corrections are restatements that required a recovery analysis of incentive-based compensation received by any of the registrant’s executive officers during the relevant recovery period pursuant to § 240.10D-1(b).
☐
Indicate by check mark which basis of accounting the registrant has used to prepare the financial statements included in this filing:
U.S. GAAP or International Financial Reporting Standards as issued by the International Accounting Standards Board ☒ Other ☐
If “Other” has been checked in response to the previous question, indicate by check mark which financial statement item the registrant has elected to follow:
☐ Item 17 ☐ Item 18
If this is an annual report, indicate by check mark whether the registrant is a shell company (as defined in Rule 12b-2 of the Exchange Act).
☐ Yes ☒ No
* | Not for trading, but only in connection with the registration of American Depositary Shares. |
† | The term "new or revised financial accounting standard" refers to any update issued by the Financial Accounting Standards Board to its Accounting Standards Codification after April 5, 2012. |
TABLE OF CONTENTS
1 | |
5 | |
5 | |
6 | |
EEV Basis, New Business Profit, Free Surplus Generation and Group Adjusted Operating Profit | 6 |
7 | |
7 | |
8 | |
9 | |
13 | |
26 | |
26 | |
Summary Consolidated Results and Basis of Preparation Analysis | 27 |
28 | |
34 | |
36 | |
48 | |
48 | |
50 | |
50 | |
52 | |
55 | |
67 | |
67 | |
68 | |
70 | |
75 | |
76 | |
76 | |
77 | |
87 | |
92 | |
96 | |
113 | |
113 | |
115 | |
119 | |
120 | |
120 | |
Summary of proposed changes to the Directors' remuneration Policy | 121 |
124 | |
167 | |
169 | |
170 | |
171 | |
171 | |
188 | |
189 | |
189 | |
190 | |
190 | |
190 | |
191 | |
195 | |
195 | |
196 | |
196 | |
Purchases of Equity Securities by Prudential plc and Affiliated Purchasers | 196 |
197 | |
197 | |
Limitations on Enforcement of US Laws Against Prudential, Its Directors, Management and Others | 197 |
| |
198 | |
198 | |
283 | |
292 | |
304 |
ii
CROSS REFERENCES TO FORM 20-F REQUIREMENTS
Item | 20-F Form Requirements | Section in this Annual Report on Form 20-F | Page |
|---|---|---|---|
Item 1 | Identity of Directors, Senior Management and Advisers | n/a | |
Item 2 | Offer Statistics and Expected Timetable | n/a | |
Item 3 | Key Information | | |
| Capitalisation and indebtedness | n/a | |
| Reasons for the offer and use of proceeds | n/a | |
| Risk Factors | Risk Factors | 171 |
Item 4 | Information on the Company | | |
History and development of the company | ·Our Business at A Glance | 1 | |
·Company Address and Agent | 5 | ||
Business overview | ·Our Strategy | 2 | |
·Our Business Model | 3 | ||
| | ●Recent achievements | 4 |
| | ●Strategic and Operating Review | 8 |
| | ●Competition | 7 |
·Sources | 7 | ||
·Supervision and Regulation of Prudential | 67 | ||
·Investments | 48 | ||
· EEV Basis, New Business Profit, Free Surplus Generation and Group Adjusted Operating Profit | 6 | ||
Organisational structure | ·Our business model | 3 | |
·Significant Subsidiaries | 188 | ||
Property, plants and equipment | Note C11 to the Consolidated Financial Statements | 266 | |
Item 4A | Unresolved Staff Comments | n/a | |
Item 5 | Operating and Financial Review and Prospects | | |
Operating results | · Strategic and Operating Review | 8 | |
| · Note A3 to the Consolidated Financial Statements | 209 | |
· Summary Consolidated Results and Basis of Preparation of Analysis | 27 | ||
· Explanation of Movements in Revenue and Charges | 28 | ||
· Determining Adjusted Operating Profit of Operating Segments | 34 | ||
· Explanation of Performance and Other Financial Measures | 36 | ||
Liquidity and capital resources | · Explanation of Performance and Other Financial Measures | 36 | |
· Additional Information on Liquidity and Capital Resources | 48 | ||
· Note D5 to the Consolidated Financial Statements | 270 | ||
Research and development, patents and licenses, etc | n/a | | |
Trend information | · Strategic and Operating Review | 8 | |
· Explanation of Performance and Other Financial Measures | 36 | ||
Item 6 | Directors, Senior Management and Employees | | |
| Directors and senior management | Board of Directors | 77 |
| Compensation | Compensation and employees: | |
| | · Our Executive Directors’ remuneration at a glance | 120 |
| | · Annual report on remuneration | 124 |
| | · Summary of current Directors’ remuneration policy | 121 |
| | · Additional remuneration disclosure | 167 |
| Board Practices | · How we operate | 87 |
| | · Committee Reports | 96 |
| Employees | Employees | 170 |
| Share ownership | Share ownership | 169 |
Item 7 | Major Shareholders and Related Party Transactions | | |
| Major shareholders | Major Shareholders | 189 |
| Related party transactions | Note D4 to the Consolidated Financial Statements | 269 |
| Interests of Experts and Counsel | n/a | |
iii
Item | 20-F Form Requirements | Section in this Annual Report on Form 20-F | Page |
Item 8 | Financial Information | | |
| Consolidated statements and other financial | · Financial Statements | 198 |
information | · Intellectual Property | 189 | |
| · Legal Proceedings | 190 | |
| Significant changes | n/a | |
Item 9 | The Offer and Listing | Listing Information | 196 |
Item 10 | Additional Information | | |
| Share capital | Memorandum and Articles of Association | 115 |
| Memorandum and Articles of Association | Memorandum and Articles of Association | 115 |
| Material contracts | Material contracts | 190 |
| Exchange controls | Exchange controls | 190 |
| Taxation | Taxation | 191 |
| Dividends and paying agents | n/a | |
| Statement by experts | n/a | |
| Documents on display | Documents on Display | 195 |
| Subsidiary information | n/a | |
| Annual report to security holders | Submitted separately | n/a |
Item 11 | Quantitative and Qualitative Disclosures about Market Risk | · Risk Review | 50 |
· Note C6 to the Consolidated Financial Statements | 257 | ||
Item 12 | Description of Securities Other than Equity Securities | Description of Securities Other than Equity Securities | 196 |
Item 13 | Defaults, Dividend Arrearages and Delinquencies | n/a | |
Item 14 | Material Modifications to the Rights of Security Holders and Use of Proceeds | n/a | |
Item 15 | Controls and Procedures | Controls and Procedures | 195 |
Item 16A | Audit Committee Financial Expert | Audit Committee Financial Expert | 113 |
Item 16B | Code of Ethics | Code of Ethics | 119 |
Item 16C | Principal Accountant Fees and Services | Principal Accountant Fees and Services | 197 |
Item 16D | Exemptions from the Listing Standards for Audit Committees | n/a | |
Item 16E | Purchases of Equity Securities by Prudential plc and Affiliated Purchasers | Purchases of Equity Securities by Prudential plc and Affiliated Purchasers | 196 |
Item 16F | Change in Registrant’s Certifying Accountant | Change in Registrant’s Certifying Accountant | 197 |
Item 16G | Corporate Governance | Differences between Prudential’s Governance Practice and the NYSE Corporate Governance Rules | 113 |
Item 16H | Mine Safety Disclosure | n/a | |
Item 16I | Disclosure Regarding Foreign Jurisdictions that Prevent Inspections | n/a | |
Item 17 | Financial Statements | n/a | |
Item 18 | Financial Statements | Financial Statements | 198 |
Item 19 | Exhibits | Exhibits | 304 |
As used in this document, unless the context otherwise requires, the terms ‘Prudential’, ‘Prudential Group’, the ‘Group’, ‘we’, ‘us’ and ‘our’ each refer to Prudential plc together with its subsidiaries, while the terms ‘Prudential plc’, the ‘Company’ and the ‘parent company’ each refer to ‘Prudential plc’.
This 2022 Annual Report may include references to our website. Information on our website or any other website referenced in the Prudential 2022 Annual Report is not incorporated into this Form 20-F and should not be considered to be part of the Form 20-F. We have included any website as an inactive textual reference only.
v
FORWARD-LOOKING STATEMENTS
This document contains ‘forward-looking statements’ with respect to certain of Prudential’s (and its wholly and jointly owned businesses’) plans and its goals and expectations relating to future financial condition, performance, results, strategy and objectives. Statements that are not historical facts, including statements about Prudential’s (and its wholly and jointly owned businesses’) beliefs and expectations and including, without limitation, commitments, ambitions and targets, including those related to ESG, and statements containing the words ‘may’, ‘will’, ‘should’, ‘continue’, ‘aims’, ‘estimates’, ‘projects’, ‘believes’, ‘intends’, ‘expects’, ‘plans’, ‘seeks’ and ‘anticipates’, and words of similar meaning, are forward-looking statements. These statements are based on plans, estimates and projections as at the time they are made, and therefore undue reliance should not be placed on them. By their nature, all forward-looking statements involve risk and uncertainty.
A number of important factors could cause actual future financial condition or performance or other indicated results to differ materially from those indicated in any forward-looking statement. Such factors include, but are not limited to:
| ● | current and future market conditions, including fluctuations in interest rates and exchange rates, inflation (including resulting interest rate rises), sustained high or low interest rate environments, the performance of financial and credit markets generally and the impact of economic uncertainty, slowdown or contraction (including as a result of the Russia-Ukraine conflict and related or other geopolitical tensions and conflicts), which may also impact policyholder behaviour and reduce product affordability; |
| ● | asset valuation impacts from the transition to a lower carbon economy; |
| ● | derivative instruments not effectively mitigating any exposures; |
| ● | global political uncertainties, including the potential for increased friction in cross-border trade and the exercise of laws, regulations and executive powers to restrict trade, financial transactions, capital movements and/or investment; |
| ● | the longer-term impacts of Covid-19, including macro-economic impacts on financial market volatility and global economic activity and impacts on sales, claims, assumptions and increased product lapses; |
| ● | the policies and actions of regulatory authorities, including, in particular, the policies and actions of the Hong Kong Insurance Authority, as Prudential's Group-wide supervisor, as well as the degree and pace of regulatory changes and new government initiatives generally; |
| ● | given Prudential’s designation as an Internationally Active Insurance Group, the impact on Prudential of systemic risk and other group supervision policy standards adopted by the International Association of Insurance Supervisors; |
| ● | the physical, social, morbidity/health and financial impacts of climate change and global health crises, which may impact Prudential's business, investments, operations and its duties owed to customers; |
| ● | legal, policy and regulatory developments in response to climate change and broader sustainability-related issues, including the development of regulations and standards and interpretations such as those relating to ESG reporting, disclosures and product labelling and their interpretations (which may conflict and create misrepresentation risks); |
| ● | the collective ability of governments, policymakers, the Group, industry and other stakeholders to implement and adhere to commitments on mitigation of climate change and broader sustainability-related issues effectively (including not appropriately considering the interests of all Prudential’s stakeholders or failing to maintain high standards of corporate governance and responsible business practices); |
| ● | the impact of competition and fast-paced technological change; |
| ● | the effect on Prudential's business and results from, in particular, mortality and morbidity trends, lapse rates and policy renewal rates; |
| ● | the timing, impact and other uncertainties of future acquisitions or combinations within relevant industries; |
| ● | the impact of internal transformation projects and other strategic actions failing to meet their objectives or adversely impacting the Group’s employees; |
| ● | the availability and effectiveness of reinsurance for Prudential’s businesses; |
| ● | the risk that Prudential's operational resilience (or that of its suppliers and partners) may prove to be inadequate, including in relation to operational disruption due to external events; |
| ● | disruption to the availability, confidentiality or integrity of Prudential's information technology, digital systems and data (or those of its suppliers and partners) including the Pulse platform; |
| ● | the increased non-financial and financial risks and uncertainties associated with operating joint ventures with independent partners, particularly where joint ventures are not controlled by Prudential; |
| ● | the impact of changes in capital, solvency standards, accounting standards or relevant regulatory frameworks, and tax and other legislation and regulations in the jurisdictions in which Prudential and its affiliates operate; and |
| ● | the impact of legal and regulatory actions, investigations and disputes. |
These factors are not exhaustive. Prudential operates in a continually changing business environment with new risks emerging from time to time that it may be unable to predict or that it currently does not expect to have a material adverse effect on its business. In addition, these and other important factors may, for example, result in changes to assumptions used for determining results of operations or re-estimations of reserves for future policy benefits. Further discussion of these and other important factors that could cause actual future financial condition or performance to differ, possibly materially, from those anticipated in Prudential's forward-looking statements can be found under the 'Risk Factors' heading of this Annual Report filed with the US Securities and Exchange Commission on Form 20-F.
vi
Any forward-looking statements contained in this document speak only as of the date on which they are made. Prudential expressly disclaims any obligation to update any of the forward-looking statements contained in this document or any other forward-looking statements it may make, whether as a result of future events, new information or otherwise except as required pursuant to the UK Prospectus Rules, the UK Listing Rules, the UK Disclosure Guidance and Transparency Rules, the Hong Kong Listing Rules, the SGX-ST Listing Rules or other applicable laws and regulations.
Prudential may also make or disclose written and/or oral forward-looking statements in reports filed with or furnished to the SEC, the UK Financial Conduct Authority, the Hong Kong Stock Exchange and other regulatory authorities, as well as in its annual report and accounts to shareholders, periodic financial reports to shareholders, proxy statements, offering circulars, registration statements, prospectuses, prospectus supplements, press releases and other written materials and in oral statements made by directors, officers or employees of Prudential to third parties, including financial analysts. All such forward-looking statements are qualified in their entirety by reference to the factors discussed under the ‘Risk Factors’ heading of this Annual Report filed with the US Securities and Exchange Commission on Form 20-F.
CAUTIONARY STATEMENTS
This document does not constitute or form part of any offer or invitation to purchase, acquire, subscribe for, sell, dispose of or issue, or any solicitation of any offer to purchase, acquire, subscribe for, sell or dispose of, any securities in any jurisdiction nor shall it (or any part of it) or the fact of its distribution, form the basis of, or be relied on in connection with, any contract therefor.
vii

Company Address and Agent
Prudential plc is a public limited company incorporated on 1 November 1978 and registered in England and Wales. Refer to the ‘Memorandum and Articles of Association’ sub-section of the ‘Governance’ section of this report for further information on the constitution of the Company.
Prudential’s registered office is 1 Angel Court, London EC2R 7AG, England (telephone: +44 20 7220 7588). Prudential’s principal address in Hong Kong is 13th Floor, One International Financial Centre, 1 Harbour View Street, Central, Hong Kong. Prudential’s agent in the US for the purposes of this annual report on Form 20-F is Cogency Global Inc, located at 18th Floor, 122 East 42nd Street, New York, NY 10168, United States of America.
Selected Historical Financial Information
The following table sets forth Prudential’s selected consolidated financial data for the years indicated, which is derived from Prudential’s audited consolidated financial statements. This table provides a five year summary overview of the Group and demonstrates trends in the Group’s financial results over the period. This table is only a summary and should be read in conjunction with Prudential’s consolidated financial statements and the related notes included elsewhere in this document.
In the table below, continuing operations reflect the Group’s insurance and asset management businesses in Asia and Africa and central operations. Discontinued operations represent the Group’s US business (Jackson) demerged in September 2021 and the Group’s UK and Europe business (M&G) demerged in November 2019.
IFRS financial results
| | | | | | | | | | | |
Income statement |
| 2022 $m |
| 2021 $m |
| 2020 $m |
| 2019 $m |
| 2018 $m |
|
Continuing operations: |
|
|
|
|
|
|
|
|
|
| |
Gross premiums earned |
| 23,344 |
| 24,217 |
| 23,495 |
| 23,855 |
| 22,039 | |
Outward reinsurance premiums |
| (1,943) |
| (1,844) |
| (1,625) |
| (1,116) |
| (771) | |
Earned premiums, net of reinsurance |
| 21,401 |
| 22,373 |
| 21,870 |
| 22,739 |
| 21,268 | |
Investment return |
| (30,159) |
| 3,486 |
| 13,762 |
| 14,961 |
| (2,723) | |
Other income |
| 539 |
| 641 |
| 615 |
| 639 |
| 465 | |
Total revenue, net of reinsurance |
| (8,219) |
| 26,500 |
| 36,247 |
| 38,339 |
| 19,010 | |
Benefits and claims and movement in unallocated surplus of with-profits funds, net of reinsurance |
| 13,697 |
| (18,911) |
| (28,588) |
| (29,171) |
| (11,690) | |
Acquisition costs and other expenditure |
| (3,880) |
| (4,560) |
| (4,651) |
| (5,908) |
| (5,793) | |
Finance costs: interest on core structural borrowings of shareholder-financed businesses |
| (200) |
| (328) |
| (316) |
| (496) |
| (525) | |
Gain (loss) attaching to corporate transactions |
| 55 |
| (35) |
| (30) |
| (142) |
| (57) | |
Total charges, net of reinsurance |
| 9,672 |
| (23,834) |
| (33,585) |
| (35,717) |
| (18,065) | |
Share of profits from joint ventures and associates net of related tax |
| 29 |
| 352 |
| 517 |
| 397 |
| 319 | |
Profit before tax (being tax attributable to shareholders’ and policyholders’ returns)note (i) |
| 1,482 |
| 3,018 |
| 3,179 |
| 3,019 |
| 1,264 | |
Tax charges attributable to policyholders’ returns |
| (21) |
| (342) |
| (271) |
| (365) |
| (107) | |
Profit before tax attributable to shareholders' returns |
| 1,461 |
| 2,676 |
| 2,908 |
| 2,654 |
| 1,157 | |
Tax charges attributable to shareholders’ returns |
| (454) |
| (462) |
| (440) |
| (316) |
| (235) | |
Profit from continuing operations |
| 1,007 |
| 2,214 |
| 2,468 |
| 2,338 |
| 922 | |
(Loss) profit from discontinued US operations |
| — |
| (5,027) |
| (283) |
| (385) |
| 1,959 | |
(Loss) profit from discontinued UK and Europe operations |
| — |
| — |
| — |
| (1,161) |
| 1,142 | |
Profit (loss) for the year |
| 1,007 |
| (2,813) |
| 2,185 |
| 792 |
| 4,023 | |
| | | | | | | | | | | |
Basic earnings per share (in cents) |
| 2022 |
| 2021 |
| 2020 |
| 2019 |
| 2018 | |
Based on profit (loss) for the year attributable to the equity holders of the Company: |
|
|
|
|
|
|
|
|
|
| |
Continuing operations |
| 36.5 | ¢ | 83.4 | ¢ | 94.6 | ¢ | 90.0 | ¢ | 35.6 | ¢ |
Discontinued US operations |
| — | ¢ | (161.1) | ¢ | (13.0) | ¢ | (14.9) | ¢ | 76.1 | ¢ |
Discontinued UK and Europe operations |
| — | ¢ | — | ¢ | — | ¢ | (44.8) | ¢ | 44.3 | ¢ |
Total |
| 36.5 | ¢ | (77.7) | ¢ | 81.6 | ¢ | 30.3 | ¢ | 156.0 | ¢ |
| | | | | | | | | | | |
Dividend per share (in cents) excluding demerger | | | | | | | | | | |
|
dividend |
| 2022 |
| 2021 |
| 2020 |
| 2019 |
| 2018 | |
Dividends paid in reporting period | | 17.60 | ¢ | 16.10 | ¢ | 31.34 | ¢ | 63.18 | ¢ | 64.34 | ¢ |
| | | | | | | | | | |
Statement of financial position at 31 Dec |
| 2022 $m |
| 2021 $m |
| 2020 $m |
| 2019 $m |
| 2018 $m |
Total assets |
| 165,942 |
| 199,102 |
| 516,097 |
| 454,214 |
| 647,810 |
Total policyholder liabilities and unallocated surplus of with-profits funds |
| 125,758 |
| 157,299 |
| 446,463 |
| 390,428 |
| 541,466 |
Core structural borrowings of shareholder-financed businesses |
| 4,261 |
| 6,127 |
| 6,633 |
| 5,594 |
| 9,761 |
Total liabilities |
| 148,815 |
| 181,838 |
| 493,978 |
| 434,545 |
| 625,819 |
Total equity |
| 17,127 |
| 17,264 |
| 22,119 |
| 19,669 |
| 21,991 |
5
Other financial information
| | | | | | | | | | |
At 31 Dec |
| 2022 $bn |
| 2021 $bn |
| 2020 $bn |
| 2019 $bn |
| 2018 $bn |
Eastspring funds under management or advicenote (ii) |
| 221.4 |
| 258.5 |
| 247.8 |
| 241.1 |
| 192.7 |
Group shareholder GWS capital surplus (over GPCR)note (iii) |
| 15.6 |
| 17.5 |
| n/a |
| n/a |
| n/a |
Notes
(i) | This measure is the formal profit (loss) before tax measure under IFRS. It is not the result attributable to shareholders. |
(ii) | Eastspring total funds under management or advice comprise funds from external parties, including funds managed on behalf of M&G plc, as well as funds managed or advised for the Group’s insurance operations. |
(iii) | The Group shareholder GWS capital surplus (over GPCR) reflects the Insurance (Group Capital) Rules as set out in the GWS Framework which became effective for Prudential in May 2021.The 2021 comparative information has been re-presented to reflect the impact of HK RBC and C-ROSS II regimes which became effective in the first half of 2022 and after allowing for the impact of the $1.7 billion debt redemption in January 2022 to show total Group GWS capital surplus (over GPCR) on a more comparable basis. Prior to 2021, the Group adopted LCSM basis. Further details of these regulatory updates are provided in the ‘Explanation of Performance and Other Financial Measures’ section. |
Dividend Data
Under UK company law, Prudential plc may pay dividends only if sufficient distributable reserves of the Company are available for that purpose and if the amount of its net assets is greater than the aggregate of its called-up share capital and non-distributable reserves (such as the share premium account) and the payment of the dividend does not reduce the amount of its net assets to less than that aggregate. ‘Distributable reserves’ are accumulated, realised profits not previously distributed or capitalised less accumulated, realised losses not previously written off, on the applicable GAAP basis. For further information about the Company, please refer to the section headed Condensed Financial Information of Registrant (Schedule II).
The retained profit of the Company is principally generated from dividend and interest income received from subsidiaries. Many of its insurance subsidiaries are subject to regulations that restrict the amount of dividends that they can pay to the Company. These restrictions are discussed in more detail in notes C10 and D6.2 to Prudential’s consolidated financial statements. Further information on the Group’s 2022 dividends is provided in note B5 to Prudential’s consolidated financial statements.
Subject to the restrictions referred to above, Prudential plc’s directors have the discretion to determine whether to pay an interim dividend and the amount of any such interim dividend but must take into account the Company’s financial position. The directors also have the discretion to recommend payment of a final dividend, such recommendation to be approved by ordinary resolution of the shareholders. The approved amount may not exceed the amount recommended by the directors.
The following table shows certain information regarding the dividends per share of Prudential plc relating to the years indicated. Prior to the second interim dividend in 2019, the dividends were declared in pence sterling and converted into USD at the noon buying rate in effect on each payment date. First interim dividends for a specific year generally have a record date in August and a payment date in September of that year, and second interim dividends generally have a record date in the following March/April and a payment date in the following May.
| | | | | | | | | | |
US cents per share |
| 2022 |
| 2021 |
| 2020 |
| 2019 |
| 2018 |
First Interim Dividend |
| 5.74 |
| 5.37 |
| 5.37 |
| 20.29 |
| 20.55 |
Second interim Dividend |
| 13.04 |
| 11.86 |
| 10.73 |
| 25.97 |
| 42.89 |
Reflecting the Group’s capital allocation priorities, a portion of capital generation will be retained for reinvestment in the business, and dividends will be determined primarily based on the Group’s operating capital generation after allowing for the capital strain of writing new business and recurring central costs. Dividends are expected to grow broadly in line with the growth in the Group’s operating free surplus generation net of right-sized central costs, and will be set taking into account financial prospects, investment opportunities and market conditions.
The Board has approved a 2022 second interim cash dividend of 13.04 cents per share (2021: 11.86 cents per share). Combined with the first interim cash dividend of 5.74 cents per share (2021: 5.37 cents per share), the Group’s total 2022 cash dividend is 18.78 cents per share (2021: 17.23 cents per share), an increase of 9 per cent.
EEV Basis, New Business Profit, Free Surplus Generation and Group Adjusted Operating Profit
In addition to IFRS basis results, Prudential’s filings with the Financial Conduct Authority, the Stock Exchange of Hong Kong and the Singapore Stock Exchange include reporting by Key Performance Indicators (‘KPIs’). These include results prepared in accordance with the European Embedded Value (‘EEV’) Principles and Guidance issued by the European Insurance CFO Forum in 2016, as well as new business profit and operating free surplus generation measures, which are alternative performance measures.
The EEV basis is a value-based method of reporting in that it reflects the change in the value of in-force long-term business over the accounting period. This value is called the shareholders’ funds on the EEV basis which, at a given point in time, is the value of future cash flows expected to arise from the current book of long-term insurance business plus the net worth (being the net assets on the local regulatory basis with adjustments) of Prudential’s life insurance operations. Prudential publishes its EEV results semi-annually in the UK, Hong Kong and Singapore markets.
6
New business sales are provided as an indicative volume measure of transactions undertaken in the reporting period that have the potential to generate profits for shareholders. New business profitability is a key metric for the Group’s management of the development of the business. New business profit reflects the value of future profit streams which are not fully captured in the year of sale under IFRS reporting. New business margin is shown by reference to annual premium equivalent (APE) which is calculated as the aggregate of regular new business amounts and one-tenth of single new business amounts. The amounts are not, and are not intended to be, reflective of premium income recorded in the IFRS income statement. EEV basis new business profit and margins are also published semi-annually.
Operating free surplus generation is the financial metric we use to measure the internal cash generation of our business operations and for our life operations is generally based (with adjustments) on the capital regimes that apply locally in the various jurisdictions in which the Group operates. It represents amounts emerging from the in-force business during the period, net of amounts reinvested in writing new business. For asset management and other non-insurance operations (including the Group’s central operations), free surplus is taken to be IFRS basis shareholders’ equity, net of goodwill attributable to shareholders, with central Group debt recorded as free surplus to the extent that it is classified as capital resources under the Group’s capital regime.
Prudential’s filings with the Financial Conduct Authority, the Stock Exchange of Hong Kong and the Singapore Stock Exchange also include discussion of the Group adjusted IFRS operating profit based on longer-term investment returns (adjusted operating profit), which is the aggregation of the segment adjusted operating profit and the central expenditure (including restructuring and IFRS 17 implementation costs) discussed in this document.
Competition
There are other significant participants in each of the financial services markets in which Prudential operates. Our competitors include both mutual and stock financial companies. In addition, regulatory and other developments in many of Prudential’s markets have blurred traditional financial service industry lines and opened the market to new competitors and increased competition. In some of Prudential’s markets, other companies may have greater financial resources, allowing them to benefit from economies of scale, and may have stronger brands than Prudential does in that market.
The principal competitive factors affecting the sale of Prudential’s products in its chosen markets are:
– | Price and yields offered; |
– | Financial strength and ratings; |
– | Commission levels, charges and other expenses; |
– | Range of product lines and product quality; |
– | Brand strength, including reputation, quality of service and use of technological advances; |
– | Distribution channels; |
– | Investment management performance; and |
– | Historical bonus/contract enhancement and bonus interest levels. |
Prudential offers different products in its different markets in Asia and Africa and, accordingly, faces different competitors and different types of competition in each market. In all of the markets in which Prudential operates, its products are not unique and, accordingly, it faces competition from market participants who manufacture a varying range of similar and identical products.
The competitive landscape across Asia and Africa differs widely by geographical market, reflecting differing levels of market maturity and regulation. Prudential’s competitors include both the subsidiaries of global life insurers and local domestic (including state-owned) entities. The majority of local domestic life insurers in Asia and Africa remain focused on their core home markets. The developed and liberalised markets of Hong Kong and Singapore are dominated by subsidiaries and branches of global life insurance groups. The developing markets in South-east Asia such as Indonesia, Vietnam and the Philippines also see a high level of participation by global life insurance groups. The large and relatively mature markets, such as Taiwan, are dominated by local domestic insurers. In certain countries, the life insurance markets are dominated by local domestic insurers or by joint venture entities between global insurance groups and local companies.
Prudential’s principal competitors in Asia and Africa include global life insurers together with regional insurers and multinational asset managers. In most markets, there are also local companies that have a material market presence.
Sources
Throughout this annual report, Prudential describes the position and ranking of its overall business and individual business units in various industry and geographic markets. Such data comes from a variety of conventional sources generally accepted as relevant business indicators by members of the financial services industry and which we believe to be reliable. These sources include information available from China Banking and Insurance Regulatory Commission, Insurance Commission of Philippines, the Asia Asset Management Magazine, Indonesian Life Insurance Association, Vietnam Actuarial Network, Fitch, Hong Kong Federation of Insurers, Hong Kong Insurance Authority, HSBC Global Research, Insurance Regulatory and Development Authority of India, Insurance Services Malaysia Berhad, Life Insurance Association of Malaysia, Life Insurance Association of Singapore, Taiwan Insurance Institute, Morningstar, Moody’s, Standard & Poor’s, Thai Life Assurance Association, The Asset Benchmark Research and UBS.
7
STRATEGIC AND OPERATING REVIEW
The following discussion and analysis should be read in conjunction with Prudential’s consolidated financial statements and the related notes for the year ended 31 December 2022 included in this document.
A summary of the critical accounting policies which have been applied in preparing Prudential’s financial statements is set forth in note A3 to the consolidated financial statements.
The results discussed below are not necessarily indicative of the results to be expected in any future periods. This discussion contains forward-looking statements based on current expectations, which involve risks and uncertainties. Actual results and the timing of certain events may differ significantly from those projected in these forward-looking statements due to a number of factors, including those set forth in the ‘Risk Factors’ section and elsewhere in this document
Operating segments and performance measure
The Group's operating and reported segments for financial reporting purposes are defined and presented in accordance with IFRS 8 ‘Operating Segments’ on the basis of the management reporting structure and its financial management information. Under the Group's management and reporting structure, its chief operating decision maker is the Group Executive Committee (GEC), chaired by the Chief Executive Officer.
Adjusted operating profit is management’s primary measure of profitability for each segment and provides an underlying operating result based on longer-term investment returns and excludes non-operating items. Further explanation on the determination of adjusted operating profit is provided in the ‘Determining Adjusted Operating Profit of Operating Segments’ section.
Joint ventures and associates
Under IFRS, the Group accounts for its investments in joint ventures and associates by using the equity method of accounting. The Group’s share of profit or loss of its joint ventures and associates is presented in a single line in the income statement and its share of movements in other comprehensive income is recognised in other comprehensive income, on a net of related tax basis.
For the purpose of segmental reporting on the Group’s other performance metrics such as APE new business sales and adjusted operating profit, the Group’s proportionate share of the results of the joint ventures and associates are included within total Group results and on a pre-tax basis for the segmental analysis of adjusted operating profit, with related tax charges included separately within the Growth markets and other segment.
Currency volatility
Our approach to evaluating the financial performance of the Group is to present percentage growth rates before the impact of the fluctuations in the value of the US dollar against local currencies in our operating markets. In a period of currency volatility this approach allows a more meaningful assessment of underlying performance trends. This is because our businesses receive premiums and pay claims in local currencies and are therefore not exposed to any cross-currency trading effects. To maintain comparability in the discussion below the same basis has been applied. Growth rates based on actual exchange rates (AER) are also shown in the financial tables presented for IFRS measures in this report. Consistent with previous reporting periods, the assets and liabilities of our businesses are translated at year-end exchange rates so the effect of currency movements has been fully incorporated within reported shareholders’ equity.
New business sales
The Group reports APE as a measure of new policies sold in the year, which is a key metric for the Group’s management of the development of the business. APE is calculated as the aggregate of regular premiums and one-tenth of single premiums on new business written during the year for all insurance products, including premiums for contracts designated as investment contracts under IFRS 4. The use of the one-tenth of single premiums is to normalise policy premiums into the equivalent of regular annual payments. This measure is commonly used in the insurance industry to allow comparisons of the amount of new business written in a period by life insurance companies, particularly when the sales contain both single premium and regular premium business. This differs from the IFRS measure of gross premiums earned as shown in the table below:
8
Reconciliation from Gross premiums earned to APE
| | | | | | |
|
| AER | ||||
|
| 2022 $m |
| 2021 $m |
| 2020 $m |
Gross premiums earned |
| 23,344 |
| 24,217 |
| 23,495 |
Less: premiums from in-force renewal business |
| (16,413) |
| (17,593) |
| (18,253) |
Less: 90% of single premiums on new business sold in the period |
| (3,839) |
| (3,602) |
| (2,147) |
Add: APE sales from joint ventures and associates on equity accounting method |
| 1,182 |
| 1,104 |
| 820 |
Other adjustments |
| 119 |
| 68 |
| (107) |
Annual premium equivalent (APE) |
| 4,393 |
| 4,194 |
| 3,808 |
Further explanation of the differences is provided in note II(viii) of the section headed ‘Additional unaudited financial information’. A discussion of the year-on-year movement of gross premiums earned is provided in the ‘Explanation of Movements in Revenue and Charges’ section.
In the remainder of this section, every time we comment on the performance of our businesses, we focus on their performance measured in local currency (presented here by reference to percentage growth expressed on a constant exchange rate (CER) basis) unless otherwise stated. In each such case, the performance of our businesses on an AER basis is explained by the same factors discussed in the comments below, together with the impact of currency movements.
Overview
Following the completion of the Group’s restructuring in 2021, our operations are fully dedicated to the life insurance and asset management opportunities in Asia and Africa. Our headquarters and management of the Group are now based in Hong Kong.
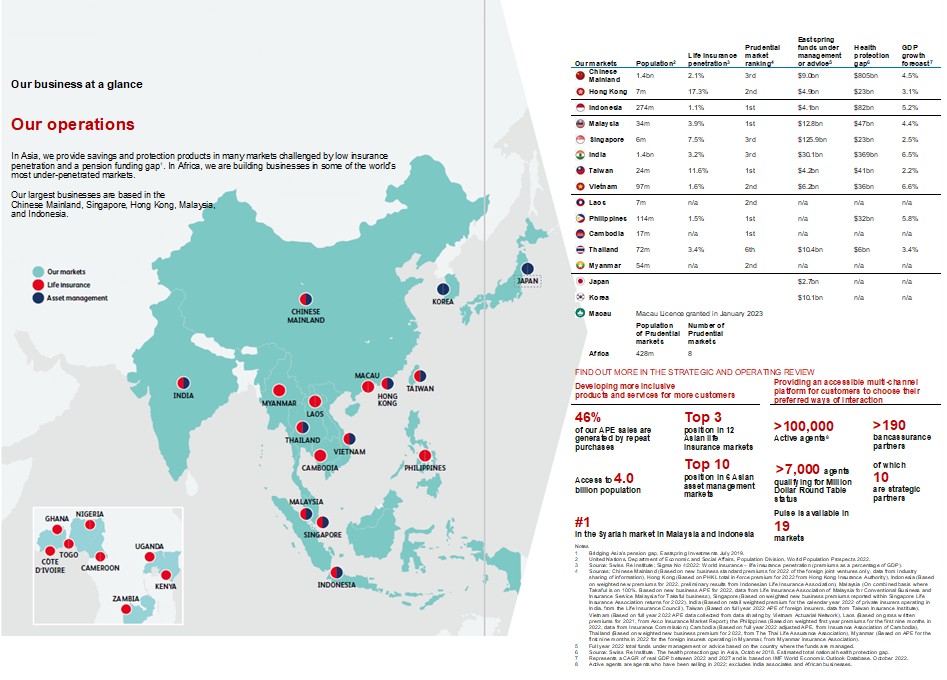
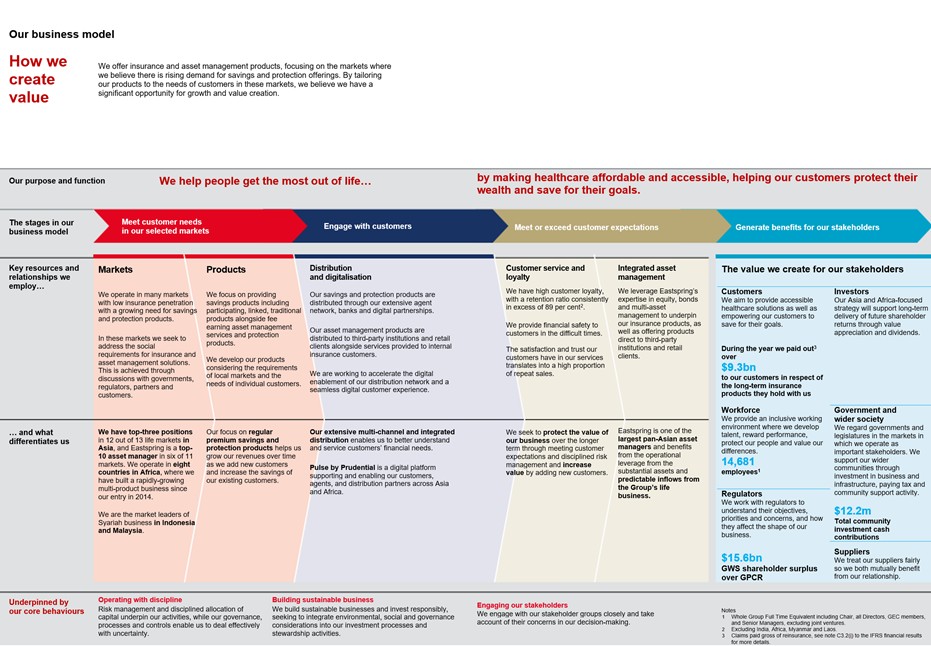
Our strategy is aligned with the long-term structural opportunities in Asia and Africa. Across Asia, the middle class is growing and is forecast to increase by 1.5 billion1 by 2030. Prosperity is also rising across the region2. This, combined with a low level of insurance penetration3 and a high level of out-of-pocket health and protection spending4 is driving an estimated $1.8 trillion health protection gap5. In Africa, the population is expected to double to more than two billion6 people by 2050. These long-term trends underpin increasing demand for savings and protection and create significant opportunities for growth and value creation.
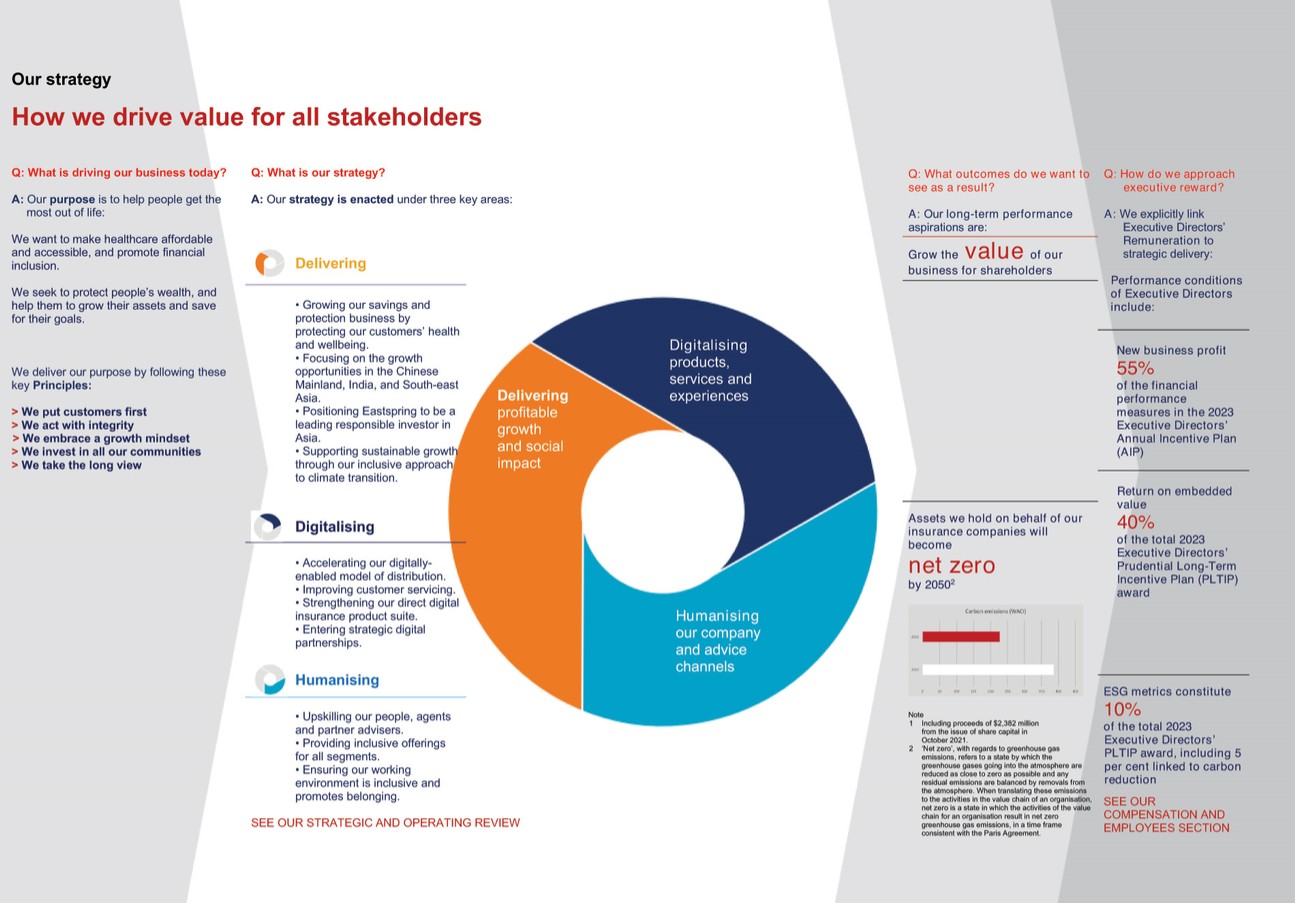
We have set out that our purpose is to help people get the most out of life and we put our customers at the heart of everything we do. We strive to meet the needs of our customers and continue to support the development of the capital markets in which we operate. We believe that it is important to the long-term success of our Group that we play a wider role in the societies in which we operate. In Asia and Africa, we seek to promote financial inclusion and a just and inclusive transition to a low-carbon economy. We will use our investments in both corporate and government sectors to promote long-term sustainable development that is equitable for our markets in the context of their historic carbon emissions. We also aim to fulfil our purpose for our employees, one of our greatest assets. As an employer, we have promised to make Prudential a place where our people can connect, grow and succeed.
To further our purpose, we continue to focus on developing our range of products and investing in our distribution channels as well as enhancing and embedding our digital capabilities. In this way, we expand our capacity to help protect our customers from threats to their health and wellbeing, as well as support them to achieve their savings goals. We also remain focused on investing in our people and systems to ensure we have the resources to deliver on our long-term growth strategy and to enhance our operating model to keep pace with our opportunities.
We have strong franchises and operational expertise in both the more developed markets and developing markets in Asia and Africa. We continue to build on our success in the Chinese Mainland where we see substantial opportunity to deepen our presence across a nationwide footprint. With the newly set up Macau branch of the Hong Kong business, we are strengthening our operations to capture the opportunities in the Greater Bay Area and to fully prepare ourselves for the increase in opportunities following the reopening of the border between Hong Kong and the Chinese Mainland. We also see large growth opportunities in South-east Asia, particularly in Indonesia and Thailand, and also in India. Our focus on selected markets in East and West Africa has provided us with exposure to a growing and fast-changing continent since we re-entered Africa in 2014.
We will allocate capital to those markets that we consider to have attractive size and demographic characteristics, and where we believe we have the ability to build and retain competitive advantage. Through leveraging our scale and expertise in those markets we believe we can achieve attractive returns. We have significant investment appetite and capacity to support organic growth through funding the writing of new business and through adding to our existing capabilities, including distribution. We also remain ready to consider strategic inorganic opportunities.
We seek geographic diversification of our Asia operations among Greater China7, our businesses in South-east Asia8 and India.
9
The first part of 2022 saw Covid-19-related disruption in many of our markets as the Omicron variant increased infection levels and associated social restrictions. Subsequently, most markets have returned to more stable operating conditions, albeit the border between the Chinese Mainland and Hong Kong remained closed throughout 2022. Against this backdrop, APE sales9 increased 9 per cent10 to $4,393 million on a CER basis reflecting growth in the second half of 2022 from both agency and bancassurance channels. Additional commentary on the performance by segment is included in the Operational performance by market section below.
IFRS profit after tax was $1,007 million in 2022 (2021: $2,143 million on a CER basis, $2,214 million on an AER basis). Increases in the underlying life and asset management and segment profitability and lower interest costs following redemption of debt in late 2021 and early 2022 were more than offset by the negative effect of higher interest rates and lower equity markets on the valuation of investments and insurance liabilities. The losses from market volatility were offset in part by the benefit from refinements to the reserving basis following adoption of the Hong Kong Risk-Based Capital regime (HK RBC) as discussed in note C3 of the consolidated financial statements. The Group’s financial performance for the year is further discussed in the Financial Review later in this report.
Customers
Customers are at the heart of everything we do. Our customer-centric strategy has three key pillars:
| 1. | ‘WE Listen to Understand’ the needs of our customers across different segments and build lifelong relationships when we onboard them. For example, our customer segmentation has identified a clear opportunity in further expanding our offering in the family segment leading to the launch of the innovative ‘WE DO Family’ proposition in 2022. Through the application of a data-driven approach, this proposition helps us identify the needs of our customers based on their life events and individual circumstances, helping us to tailor our offerings and build lifelong relationships. More than 30 per cent of our new customers are from the affluent and advanced affluent segments and over 50 per cent of policies issued are health and protection plans to cover for critical illness, to provide medical reimbursement to cover hospital bills and to give protection against loss of income from acute illness or permanent disability. These products and solutions are offered through our multi-channel and integrated distribution and are key to driving long-term business growth. |
| 2. | ‘WE Care’ for our customers to deliver value across all the engagements they have with us. At Prudential, we have well-established core expertise in utilising data and insights to improve customer interactions and make operational improvements to provide a differentiated and personalised experience to our customers. At the point of purchasing, smart underwriting using reflexive methods (an approach to inquiries that generates follow up questions based on the initial answer) enables instant underwriting decisions with confirmation of terms. In 2022, 79 per cent of new policies were auto-underwritten and 41 per cent of policies were issued with no human intervention. At the point of claims, 64 per cent of claims are submitted electronically and 31 per cent of all claims are auto-adjudicated for instantaneous approval. These actions supported 46 per cent11 of total APE sales being generated by customers making a repeat purchase in 2022. |
| 3. | ‘WE Build’ customer advocacy by listening to the voice of customers to understand and address their feedback. We have adopted a systematic approach to understanding customer feedback and then applying the insights gained to continually improve our offerings with the aim of delivering best-in-class customer experiences through each touchpoint and interaction. Customer retention remains high at 89 per cent11. |
We seek to expand and innovate the coverage of our health and financial security products in an inclusive manner. This entails delivering solutions that recognise the evolution and needs of non-nuclear families, women, religious minorities, small and medium-sized enterprises, and lower-income groups. During 2022, we launched strategic propositions that celebrate ‘families of every shape and size’. Across 11 markets, we rolled out a range of new and extended products that are ‘Made For Every Family’ with progressive term definitions (such as ‘Beneficiary’) to offer more tailored protection for extended family members.
Our total life customer base increased to 18.3 million12 (2021: 17.7 million12). New policies13 included 2.4 million14 health and protection cases, an increase of 9 per cent when compared with 2021, reflecting our customers’ increased focus on this area in light of the pandemic. While these policies were generally smaller in size than in previous years14, we believe that the conversion of these customer interactions into sales by our diverse distribution channels is evidence of the power and quality of the Group’s franchise and brand.
Our strategy is to be a customer-centric organisation, driven by customer needs. Customers are active in conducting their own research, for example through search engines and social media; however, when it comes to purchasing decisions on life insurance, given the complexity and emotions, their preferred route is to seek advice. Our multi-channel and integrated distribution strategy enables us to adapt flexibly to changing local market conditions in order to deliver products and services to targeted consumer segments and support our growth ambitions. This distribution network encompasses agency and bancassurance partnerships with a digital platform. Asian and African insurance market distribution dynamics have been significantly affected by Covid-19-related restrictions. Over the last three years, our bancassurance sales have been relatively resilient and agency sales have been limited by mobility.
10
Agency
Agency continues to be an integral part of Prudential’s brand and customer service platform. Across our markets, we have launched and connected a series of agency growth programmes to build capabilities and expand capacity for our agency platform. Prudential’s Futuready Agency programmes aim to give our agency force a defensible competitive advantage by leveraging technology, behavioural science, and analytics to improve their skill sets, capabilities, and external positioning for long-term sustainable growth.
Our Futuready Agency programmes have four areas of emphasis:
| ● | Attracting talent from target segments. PruVenture is Prudential’s signature recruitment programme to attract talent and build a purpose-driven agency force. This has been deployed in seven core agency markets15 and onboarded over 9,800 associates over three years with productivity16 four times higher than standard new recruits. Our profiling assessment, PruDNA, selects individuals with high propensity to succeed. Thirty thousand successful agents went through PruDNA assessment in 2022, prior to joining Prudential. |
| ● | Leading and coaching leaders. PruVerge is Prudential’s signature learning programme for the next generation of leaders to help them attract, recruit, coach and build high-performing teams. This has enrolled over 6,000 Verge leaders over two years, where they learn the science of coaching and development utilising a data-driven decision model. We saw an increase in agent recruitment per leader of 50 per cent for the Verge leaders while overall recruitment was up 9 per cent and agent productivity measured by cases per agent increased 6 per cent in the year. |
| ● | Building a premium career path for purpose-driven agents and offering robust professional development. We had over 7,000 agents with production levels that qualified for the Million Dollar Round Table (MDRT) contributing to 42 per cent17 of APE sales in the relevant markets in 2022. |
| ● | Nurturing prospects by reimagining every aspect of prospecting, engaging, and advising to fit the digital business environment. Agents using PRULeads, our activity and leads management engine, were 30 per cent more productive16 with 32 per cent of agency sales generated using PRULeads18 (2021: circa 30 per cent) from 7.3 million leads19 (2021: 10.2 million) channelled via PRULeads. |
Agency sales were adversely affected by Covid-19-related restrictions in the first half of 2022. Sales through our agency business represent 61 per cent of our total health and protection APE sales. As the impact of Covid-19 subsides and agency activity resumes, we expect the agency contribution to increase while maintaining the diversified distribution mix in line with our strategy.
Bancassurance
Bancassurance plays a key role in our diversified multi-channel platform. We operate the largest independent bancassurance franchise in Asia with access to over 190 bancassurance partners of which 10 are strategic partners. We continue to invest and integrate our insurance solutions into the bank partners’ platforms and ecosystems to enable a seamless customer journey, supporting online to offline, virtual face-to-face and self-directed sales. We also leverage our expertise in selling through bank partners to deepen our customer relationships with an emphasis on health and protection solutions.
Bancassurance was our largest channel in 2022, generating $2,225 million in APE sales. Our strategic partnerships, both regionally and locally, contribute 74 per cent of our overall bancassurance APE sales in 2022.
New health and protection policies sold through the bancassurance channel increased 39 per cent in the year.
Digital
Prudential’s digital platform, Pulse, continues to support and enable our agents, customers and distribution partners across Asia and Africa in 19 of our majority owned markets of operation. We are constantly evolving the Pulse proposition as market conditions and the distribution landscape changes. The agility and flexibility of the platform allows us to provide products and services that meet the changing needs of multiple customer segments locally, while also providing up-to-date customer insights and leads to our distribution network. Pulse also supports a wide variety of modules to assist our agency force such as an integrated training and recruitment solution, ‘real-time’ management information tools and AI-powered analytics. From a technology standpoint, the Pulse platform utilises a one platform approach, allowing Prudential to consolidate and reduce IT investment over the long term as well as accelerate application development and deployment across our many markets. We remain committed to the strategic pillars which have driven our digital transformation and underpin our digital strategy. These are outlined below:
| ● | Accelerating our digitally-enabled model of distribution via PRUForce; |
| ● | Improving servicing of existing and new customers via PRUServices; |
| ● | Strengthening our direct digital insurance suite of products and services; and |
| ● | Nurturing new business verticals and partnerships to drive future customer acquisition opportunities. |
11
PRUForce, our agency tool on the Pulse platform, has allowed our agents to be more efficient, reaching and managing multiple customers at a time, whilst still maintaining a personalised approach. We continue to improve and refine this approach, with PRUForce central to the evolution of our agency network. PRUForce is live in six markets and offers our agents the competitive advantage by allowing them to stay connected with customers, building trust and providing personalised advice.
Accelerating the digital enablement of our distribution network remains critical for Prudential. We provide a full set of digital capabilities enabling agents to interact with customers via a multi-channel approach. The use of data and analytics helps accelerate our aspiration to support and increase sales productivity from those within our organisation, to those of our distribution partners. From a data security perspective, we have developed a common bancassurance gateway which can manage all transactions securely between any bank and Prudential’s businesses, ensuring data security and privacy is always top of mind.
PRUServices is our digital customer servicing platform, allowing customers and agents to access their policy claims, payments, and benefits. Customers and agents can manage policies, from tracking the status of a policy proposal to reinstating a lapsed policy, via self-service features on the platform. PRUServices is live in nine markets. We aim to deliver a seamless digital experience for customers through an effective end-to-end journey. We believe this will strengthen customer affinity toward Prudential, reduce attrition of the in-force policy values and support the value represented by our installed customer base.
Furthermore, the ability to embed insurance products in our ecosystem and in core offerings from our partners is critical. To offer these products dynamically and seamlessly to the broadest possible market is only achievable via a digital platform. We have strengthened our direct product suite, including the launch of endowment products in several markets both via Pulse and through partners’ mobile apps. This has enabled us to capture a larger pool of insurance customers from a wider range of socio-economic segments. Our life insurance joint venture in the Chinese Mainland and our associate in India maintain their own high-quality offerings via digital platforms with further details provided in the relevant sections that follow.
Finally, we have expanded our collaboration with new partners. For example, in October 2022, we entered a strategic partnership with Google Cloud to make healthcare and financial security more accessible across Asia and Africa. This strategic partnership supports our broader digital strategy to leverage AI and advanced analytics to transform the customer and agent experience and lower barriers to accessing financial services.
Asset and wealth management
Eastspring Investments (‘Eastspring’) is the pan-Asia asset management arm of Prudential with a presence in 11 Asian markets20 as well as distribution offices in North America and Europe. Eastspring is a top-10 asset manager in six of these markets21 managing or advising on $221.4 billion in assets22. Eastspring is well placed to address the saving and investment needs of customers across the region through a team of 300 investment professionals with local market expertise. Eastspring also benefits from reliable and stable fund inflows from the Group’s insurance businesses which, together with its broad regional footprint, it can leverage to meet the long-term opportunity to grow mutual fund penetration from the market’s current low base. Eastspring is also playing an important role as an active asset manager and is engaging with investee companies and governments in supporting our commitment to carbon reduction in our insurance company asset portfolio23, allowing us to deliver profitable growth alongside a positive social impact.
During the year, Eastspring’s average funds under management or advice decreased by (5) per cent10 to $229.4 billion (2021: $240.9 billion10), reflecting adverse market movements during the year, partially offset by net inflows, including from the Group’s insurance business.
As a Group, we see opportunities to deepen our share of the wealth market by providing holistic wealth solutions to our high-net-worth and affluent customers. Our large and diverse customer base, well-positioned agency networks, strong intermediary relationships and leading brand name position us well to better serve this segment and deepen our relationship with our existing customers. Fund solutions occupy a central role in the product proposition, and we are focused on offering customer choice and access to top fund managers and innovative portfolio options. Our aim is to distinguish ourselves in this market through our service to customers and additional value-added services, such as consultation with independent panels providing legal and estate planning advice.
People
The Group employs over 14,000 members of staff24. As an employer, we have made a promise to make Prudential a place where our people can Connect, Grow and Succeed. A significant part of that pledge to employees is preparing them for the future of work, so that they can participate in and contribute confidently to our business transformation. We believe in creating a workforce and a workplace that is innovative, inclusive, and customer-centric. During 2022, we focused on equipping our employees with these future-ready skills through a series of webinars and developing our innovation and design thinking capabilities within the organisation.
12
Our goal is to empower our people and deepen belonging at Prudential by respecting and appreciating differences. We maintain a culture where diversity is celebrated, and inclusion assured for our people, customers and partners. Building on the launch of PRUCommunities in 2021, our employee-led networks continued to enhance connections and are key to deepening belonging at Prudential. In 2022, we saw the global launch of various communities including PRU Women Empowered, PRU Young Professionals, Women in Tech, Mental Health First Aiders and the intersectional We DO Wellness, joining the well-established PRUPride. We have been included in the Bloomberg Gender Equality Index 2023, being listed on the index for the third successive year.
Leadership developments
2022 saw a number of leadership changes to support the ongoing evolution of the Group. The internal promotions during the year of James Turner to Group Chief Financial Officer and Avnish Kalra to Group Chief Risk and Compliance Officer, demonstrate Prudential’s bench-strength and ability to focus on operational delivery by leveraging continuity in executive leadership. In addition, the Group continues to benefit from broad based and experienced local leadership teams who are deeply rooted in their markets.
During 2022 Seck Wai-Kwong, CEO, Eastspring; Dennis Tan, CEO, Prudential Singapore; Lilian Ng, CEO, Insurance; and Solmaz Altin, Group Chief Strategy and Transformation Officer, were all promoted to the Group Executive Committee (GEC). Mr Tan, Ms Ng and Mr Altin were promoted to Managing Directors of the Strategic Business Groups, which consist of selected markets. Mr Seck remains responsible for the growth of Eastspring’s business and the delivery of its investment performance. Prudential’s leadership team was further enhanced with the appointment of Lawrence Lam as the new CEO of the Hong Kong insurance business and Bundit Jiamanukoonkit (Kenny) as the new CEO of the Thailand insurance business.
Outlook
We continue to believe that the Group’s multi-channel, digitally enabled distribution model positions us well to capture the opportunities open to us, and this competitive advantage, alongside our distinctive geographical footprint and customer-centric product range enables us to deliver a resilient performance.
There are signs that Covid-19-related impacts in many of our markets have stabilised, albeit operating conditions may continue to be challenging given the volatile macroeconomic environment and increasing risks of inflation. We enter 2023 with a resilient balance sheet and strong capital position, which we believe will enable us to manage these uncertainties and capture the resulting opportunities that arise.
We are encouraged by the year-on-year sales growth we have seen in the first two months of 2023. Our actions to maintain and build agent capacity and our continued innovation to broaden our product proposition mean we stand ready to serve our customers across all our markets. In particular, we are well positioned in Hong Kong and the Chinese Mainland to take advantage of the opportunities that we expect to arise as Covid-19-related restrictions are eased. We have seen a gradual increase in cross-border traffic with sales in the first two months of 2023 driven predominately by savings products.
We remain confident that we have the financial resilience, capital strength and capability to meet the growing protection and savings needs of our customers in Asia and Africa. By doing so, we believe we will deliver on our purpose to help people get the most out of life and also build value for our shareholders over the long term.
Operational performance by market
The following commentary provides an update on the operational capabilities and performance for each of the Group’s segments. Discussion of the financial performance of the Group and its segments, including adjusted operating profit, is contained separately in the Financial review section of this report. Unless otherwise stated, the APE discussion in the following commentary is provided on a CER basis. For the 2021 comparatives to 2022, the CER results were calculated using the 2022 average exchange rates. For the 2020 comparatives to 2021, the CER results were calculated using the 2021 average exchange rates.
Chinese Mainland – CITIC Prudential Life (CPL)
The Chinese Mainland continues to present significant growth opportunities for the Group, with a population of circa 1.4 billion25, with low levels of insurance penetration and an estimated health and protection gap of $805 billion5. Furthermore, a number of factors also support further growth both in health and protection as well as retirement planning products and services. These include regulatory proposals which are conducive to the long-term development of insurance markets as well as favourable demographics such as an ageing population, emerging middle class and rapid urbanisation. The recent announcement made by the China Banking and Insurance Regulatory Commission (CBIRC) to reform private pension schemes offers a significant opportunity for foreign insurers with strong financial capability and deep expertise in retirement planning products.
13
Prudential’s life business in the Chinese Mainland, CPL, is a 50/50 joint venture with CITIC, a leading Chinese state-owned conglomerate. CPL benefits from the strong brands of both shareholders and a balanced distribution network with strength in agency and bancassurance and a well-diversified product range. CPL is a powerful franchise with an extensive footprint across 23 branches. CPL is focused on the affluent and upper affluent segments of the market where there is more stability of income and employment. CPL’s diverse footprint supported its resilient performance with its Greater Bay Area cluster and Beijing performing well, offsetting some softness in Shanghai and surrounding cities which were most affected by Covid-19 surges during the first half of the year. CPL continues to outperform the market. The total Chinese Mainland industry-wide measure of gross written premium increased by 3 per cent in the year, while CPL, on the same basis, saw an increase of 16 per cent26 in 2022. CPL believes that these operational outcomes are due to CPL seeking to put customers first and to enrich their health and wealth journeys. As Covid-19-related controls are progressively removed, CPL will continue to use its multi-distribution platform to serve the insurance needs of customers in terms of health, protection, long-term savings and retirement planning and expects to see a more balanced mix of sales from agency and bancassurance going forward.
New business performance
2022 compared with 2021
Despite isolated lockdowns, CPL achieved APE sales growth of 19 per cent10 to $884 million. This resilient growth has been underpinned by a diversified distribution strategy with a high-quality agency force and strong partnerships with banks delivering customer-centric protection and savings solutions.
The 19 per cent10 growth in APE sales was driven by stronger growth in the bancassurance channel (an increase of 32 per cent10), with the agency business being consolidated with the aim of driving quality throughout 2022 resulting in an overall decrease of (7) per cent10 in the year. In the first half of 2021 agency sales benefited from the effect of regulatory changes in the definition of critical illness coverage, which did not recur in the current year, lowering APE sales by (11) per cent10 in the first half of 2022. Agency APE sales in the second half of 2022 were 6 per cent10 higher than the equivalent period in the prior year.
2021 (AER) compared with 2020 (CER)
CPL’s APE sales grew by 25 per cent to $776 million. Its solid and resilient growth was underpinned by its diversified distribution strategy, with both agency and bancassurance channels delivering double-digit APE sales growth at 25 per cent and 28 per cent respectively in 2021. CPL continued to outgrow the overall sector. In 2021, CPL increased its overall market share to 0.86 per cent, from 0.74 per cent in 2020.
Delivering customer-led solutions
CPL seeks to address customers’ financial security and wellbeing at different life stages, with built-in related services enriching the overall customer propositions. Solutions and services are combined in an ecosystem that provides an integrated experience, which seeks to identify and meet the customers’ needs and so strengthens relationships with them for the long term.
During 2022 CPL continued to develop customised protection solutions. One specialised critical illness product that was specifically developed to meet the needs of customers in the Greater Bay Area of the Chinese Mainland contributed 21 per cent of CPL’s relevant APE sales in that area. Beyond protection, CPL expanded its concierge service network to not only cover healthcare needs, including specialist consultation on treatment options, priority hospital access and mental health rehabilitation services, but also through development of its retirement and planning concierge service. This expansion includes extension of CPL’s retirement village network to cover 17 institutions in seven cities.
CPL is enhancing the digital experience to its customers and distributors, including through its mobile first Xin Yi Tong app. CPL’s ‘Virtual Lounge’ leverages technology to humanise the connection between the agent and the customer. The technology’s ease of use by customers has been recognised by digital media.
Multi-channel distribution
CPL continues to focus on building a professional, high-quality agency force, with a strong understanding of its health, protection and retirement planning products. CPL has over 15,200 agents that serve customers across the country. While CPL’s agency channel continues to go through a period of rationalisation along with the overall industry, CPL’s agency force shows signs of stabilising in numbers as well as improvements in quality, with APE sales per active agent rising 9 per cent. CPL had over 1,000 agents with production levels that qualified for the Million Dollar Round Table (MDRT) in 2022. CPL is providing agents with advanced tools and techniques that help them engage with customers in order to provide solutions tailored to their needs and manage the conversion of leads to completed sales. Over time, as CPL’s agency force continues to mature and build experience, CPL expects this to result in further enhancement in productivity, providing additional support to the growth trajectory in CPL.
14
Meanwhile, CPL also continues to build out its bancassurance distribution network, adding 11 partners. China Merchant Bank has become a significant partner in the Greater Bay Area and beyond. CPL has a network of 59 bancassurance partners with access to over 6,600 branches across the Chinese Mainland. Importantly, these relationships are strengthened and enhanced by 3,200 local insurance specialists catering to customers of the banks. This has resulted in higher levels of new business from the bank channel and supported an improvement in product mix.
Consistent with the ongoing regulatory developments in terms of capital management and customer conduct in the industry, we expect that refinements in the product features may, in the short-term, impact volumes but CPL continues to evolve its product set so that focus remains on meeting customer demands.
Hong Kong
Prudential has a strong and reputable brand in Hong Kong and serves over 1.3 million customers. The fifth wave of the Covid-19 epidemic significantly decreased the amount of economic activity in Hong Kong, especially during the first half of the year with the impact compounded by restrictions on cross-border travel.
Demand for insurance products and solutions centres around retirement, legacy planning and health protection. Retirement savings needs are driven by a de minimis social security net, very limited employer contribution schemes and increasing longevity and rising dependency ratios. As a result, the average member of the Hong Kong population has no option but to voluntarily purchase savings and insurance products. In addition, an awareness of the need for health and protection products is generally high: an ageing population, relatively low benefit growth schemes offered by employers, the government’s desire to manage down medical expenditure from the public purse and the rising cost of medical attention shape the market for these sorts of products. These needs and concerns from Hong Kong consumers are also relevant to Chinese Mainland Visitors. 86 per cent of those surveyed said they are likely to purchase insurance in Hong Kong for legacy planning and health protection.
Chinese Mainland customers remain an important customer segment for the Hong Kong business and represented around 50 per cent of Hong Kong’s policies sold in 2019, prior to the Covid-19 pandemic. We believe that Chinese Mainland customers continue to provide a significant long-term opportunity for the Hong Kong insurance industry, an opportunity Prudential Hong Kong remains focused upon, despite the fact that sales momentum has been severely impacted by the restriction on cross-border travel since late January 2020. The fundamental reasons for Chinese Mainland customers buying insurance products in Hong Kong remain the same, including diversification in terms of currency and asset class, access to professional financial advice with a broad product spectrum and access to high-quality medical care available in Hong Kong, amongst other factors. As a result, we expect to see the gradual return of this important source of new business as cross-border travel normalises for family and business visits with the resumption of quarantine free travelling. We are well prepared in all aspects, including distribution channels and customer servicing, platforms and systems, to serve Chinese Mainland customers.
We obtained a licence to open our Macau branch in January 2023, strengthening our operations to capture the opportunities in the Greater Bay Area. We are building distribution capabilities having established a strong and experienced leadership team in Macau. We expect that the Macau branch will take some time to establish itself before contributing meaningfully to the Hong Kong business.
New business performance
2022 compared with 2021
Overall APE sales declined by (4) per cent10 in the year to $522 million, with sales through our agency channel adversely affected by the fifth wave of the Covid-19 pandemic in the first half of the year. However we saw a recovery in the second half with APE sales growing by 30 per cent10 compared with the first half, with growth across all channels, demonstrating our capacity to grow once the economy is fully reopened. In fact, based on the latest statistics available from the regulator for the full year, our sales outperformed the market, aided by the timely launch of our signature multi-currency product, our market share26 of APE sales increased by 2.0 percentage points to 7.4 per cent for 2022 compared with 2021. In the discrete fourth quarter of 2022, we outperformed the market and increased our market share to 12.5 per cent44 , an increase of more than 5 percentage points compared with the discrete fourth quarter of 2021. This expanded market share was underpinned by the strong performance and maintenance of sales quality in both agency and bancassurance channels.
2021 (AER) compared with 2020 (CER)
Overall APE sales declined by (27) per cent in the year as border closure continued to prevent Chinese Mainland visitors from buying insurance products in Hong Kong. In the domestic segment, we further strengthened our focus on regular-premium health and protection products and also shifted towards higher margin savings solutions. This strategy helped improve the protection mix by 7 percentage points and grow protection APE sales by 12 per cent, although the resultant lower case size led to a 15 per cent fall in overall APE sales for the domestic segment.
15
Delivering customer-led solutions
Our continued pivot to domestic customers has resulted in an overall increase of market share to 7.4 per cent27, based on the latest statistics available from the regulator for 2022, despite fierce competition in the domestic market. Our customer base is stable with a retention rate of over 97 per cent.
The business continues to refresh and upgrade its customer offerings with comprehensive protection and wealth accumulation propositions for affluent customers, for example through the launch of our new multi-currency saving product with a special feature for wealth distribution across generations.
We continue to enhance our health and protection product suite for our customers and potential customers as well as being a leading player and offering a full range of VHIS products to serve our domestic customers. We have fully embraced the government’s ‘Qualified Deferred Annuity Plan’ (QDAP) for retirement and continue to offer a competitive product, making us one of the leading players in the market.
Our investment proposition provides access to international equities and bonds. Our with-profits product offering pools the investments of policyholders and allocates returns based on long-term investment performance. This is a distinct, capital-efficient structure benefiting from significant scale, enabling Prudential to provide differentiated products while generating attractive margins.
Multi-channel distribution
We operate a digitally-enabled multi-distribution platform and provide customers with a choice on how they prefer to be served.
Our agency force accounted for more than 58 per cent of our APE sales in the year. Despite a challenging operating backdrop in the first half of the year, agent activity rebounded in the second half, assisted by our drive to increase activity through customer-centric solutions, enhancing digital capabilities and training and development programmes. The second half of 2022 saw positive momentum with an increase in APE sales for agency channel by 57 per cent, compared with the first half of the year. The average agent case size was up 17 per cent year-on-year on the back of a broadened savings product suite. Agent recruitment has also rebounded 45 per cent in the second half of the year compared with the first half of the year.
On the bancassurance side, we have a long-standing strategic alliance with Standard Chartered Bank which has gone from strength to strength for more than 20 years. We were the leading major non-bank owned insurer in the bancassurance channel and increased our market share, measured by share of APE sales in the latest available public data for 202227, driven by timely launch of new products and robust training and sales motivation.
Indonesia
Indonesia remains a critical market for Prudential. It is expected to contribute more than a third of ASEAN's economic growth28 between now and 2026, hence long-term growth prospects remain extremely favourable. We see strong growth prospects specifically in the Syariah segment given low insurance penetration rates, a substantial protection gap and a sizeable Muslim population29.
We regained our leadership position in the Indonesian life market with 11 per cent market share26 by weighted new business premium in 2022. We are also the market leader in the agency segment with 28 per cent of market share26, and a market leader in the fast-growing Syariah segment, with 32 per cent market share26.
In 2022, we became the first multi-national insurer to set up a dedicated Syariah life insurance entity in Indonesia as part of our strategy to meet the growing demands for Syariah solutions and support the growth of the Syariah community and economy. Our innovative product capabilities, coupled with a multi-channel distribution network, puts us in a strong position to grow our business and expand our customer reach.
Having completed a comprehensive refresh of our product offering, we recently initiated a transformation programme for the operations of the Indonesian business, looking to refresh the existing agency model, rejuvenate the sales capability, improve productivity per agent, and drive higher performance through operational efficiency. This aims to consolidate our position in what is a large and vastly under-insured market, recovering from a challenging economic backdrop and operating environment.
16
New business performance
2022 compared with 2021
Overall APE sales increased by 2 per cent10 in the year to $247 million, despite Covid-19-related restrictions hampering sales activity in the first half of the year, limiting face-to-face interactions, and resulting in reduced footfall within bank branches. Mitigation efforts included leveraging our digital infrastructure to drive sales which, combined with restrictions easing in the second half of 2022, contributed to a 30 per cent10 increase in APE sales for the second half of 2022 compared with the first half of the year, and an overall increase in APE sales of 7 per cent in the second half of the year compared with the second half of 2021.
2021 (AER) compared with 2020 (CER)
Overall APE sales fell by (7) per cent with Covid-19-related social movement restrictions disrupting sales activity throughout much of the year. Despite the fall in absolute APE sales amounts year-on-year, we saw a growth of over 37 per cent in the number of standalone protection policies sold over the period, which contributed to over 70 per cent of total policies sold and 43 per cent of total APE sales in 2021 (2020: 29 per cent of APE sales). Our strength in the Syariah segment also added resilience to the business with a 19 per cent increase in new Syariah policies. We did however experience a worsening of persistency exacerbated by the financial hardships of our policyholders.
Delivering customer-led solutions
We continue to focus on maintaining our market leadership by broadening our propositions, delivering sound advice and solutions, providing a superior customer experience, enhancing operational effectiveness, and exploring new avenues for customer acquisition.
In terms of product propositions, we leveraged our dedicated Syariah life insurance entity in Indonesia by launching several new products in 2022. This included a first-in-market with yearly renewable term standalone Syariah critical illness product (PRUSolusi Kondisi Kritis Syariah) to meet consumer demand for simple, affordable cover. We also launched an enhanced version of the first-in-market Syariah education savings product, first launched in 2021 (PRUCerah Plus), which supports customers with their children’s university education costs. These innovative products further strengthened our competitive position of being the only insurer to offer Syariah traditional insurance solutions across multiple channels.
The business also launched new medical products (PRUSolusi Sehat Plus Pro and PRUSolusi Sehat Plus Pro Syariah) to address the health protection needs of a family, midlife, and younger segments. We also continued to serve the insurance needs of the mass market segments by launching eight bite-sized digital protection offerings in Pulse and on the platforms of three digital partners, enabling us to acquire more than 91,000 new customers.
Multi-channel distribution
Driving the quality and productivity of our agency channel has remained one of our most important priorities. With 980 agents qualifying for the MDRT award in 2022, we are the leader in the agency channel. The shift to full time agents led to a reduction in the overall agency force by (7) per cent to 183,000. This contributed to an improvement in agency productivity16 of 8 per cent compared with 2021. Management actions include a drive to create a long-term career path for agents and a focus on urban areas where there is more scope for operational leverage. Resumption of full face-to-face agency activities followed a relaxation of Covid-19-related restrictions, enabling us to further penetrate the advice-based affluent segment. This contributed to a 26 per cent10 growth in average APE per new policy compared with 2021.
In the bancassurance channel, our long-standing strategic partnerships with SCB and UOB continued in 2022. These strategic partnerships have enabled us to provide solutions to a wide spectrum of customer segments, with SCB focusing on the premier face-to-face segment and UOB serving its customers through multiple distribution models. In addition to SCB and UOB, we have partnerships with other banks on distribution and direct marketing. We are seeking to enhance our bank partnerships particularly in the Syariah space.
Malaysia
Significant growth prospects remain in the Malaysian insurance market, given the large protection gap and low level of retirement and healthcare provision in both the public and private sectors. Insurance penetration is still low, especially in the mass market which is a largely Muslim population29. The population of the country is 34 million25, of which over 60 per cent is Muslim29. The Central Bank of Malaysia is actively supporting an increase in access to insurance products for this group through the sponsoring of Takaful market growth30. It has a public target of doubling the number of Malaysians insured under Takaful policy certificates by 2026 through providing financial incentives for the purchasing of private insurance policies30.
17
In Malaysia, we are the leading life insurer with 18.9 per cent market share26, and we have one of the largest agency forces in the industry. We are the largest Takaful operator in the market with 22.3 per cent market share26 and our Takaful new business sales are 1.4 times greater versus our nearest competitor in this market31.
New business performance
2022 compared with 2021
APE sales declined (17) per cent10 due to both the combined impact of Covid-19-related restrictions in the first half of 2022 and the effect of product repricing in 2021. Excluding the effect of repricing in 2021, APE sales were marginally lower by 2 per cent10. However, as restrictions started to ease, sales improved with the second half of 2022 delivering APE sales that were 15 per cent10 higher than the first half of the year. Our business profile remains resilient with over 97 per cent of our products being regular premium in nature.
2021 (AER) compared with 2020 (CER)
APE sales increased by 31 per cent, driven by growth of 45 per cent in agency production despite the tightening of Covid-19-related movement restrictions at several points throughout the year. The Takaful business achieved APE sales growth of 61 per cent fuelled by an increase in active agents. APE sales also benefitted from the effect of repricing actions in the year.
Delivering customer-led solutions
Our number of customers was 3.0 million in 2022 with 1.5 million from the conventional business and 1.5 million from the Takaful business, stable year-on-year. We continue to develop new and innovative propositions to address the evolving needs of our customers.
For example, we strengthened our health and protection offering by enhancing our core medical investment-linked proposition, which caters for both new and existing customers. We believe that its benefits offering is unique and supports customers’ needs by providing medical protection that automatically increases in value every year, unlimited room and board and ICU stay, and longer pre and post-hospitalisation care. It also rewards customers for staying healthy. The benefits are designed to reinforce the importance of early intervention and consistent annual preventive care. We also provided a one-time offer to all our existing customers to opt-in for pandemic coverage if their existing policy excluded this benefit.
We continued to expand our customer base and drive financial inclusion in the market. Through our partnership with BSN, we have issued over 396,000 BSN Takaful Sakinah health and protection certificates. We have also entered a digital partnership with EPF i-Lindung to offer under-insured Malaysians further protection coverage that can be funded from their Provident Fund accounts. The i-Lindung initiative is aimed at promoting the importance of financial protection amongst the lower income community without the burden of upfront cash outlay.
Multi-channel distribution
Against a challenging operating backdrop, our agency force continued to grow with the workforce increasing 8 per cent over the period to over 24,300. We continued to attract high-quality agents, with a retention ratio that is above market levels. In 2022, we recruited over 7,400 new agents. We upgraded our channel capabilities with digital tools and leads for effective customer prospecting. We will continue to utilise digitalisation as a key enabler for customer and business excellence.
In the bancassurance segment, our product innovation drove APE sales growth of 17 per cent10. Growth prospects remain strong as we continue to build on our strength in the affluent segment and capture opportunities to penetrate the mass market segment across existing bank partners, including SCB, UOB and BSN. The merger of UOB and Citibank’s operations in Malaysia will provide potential access to an incremental 500,000 customers.
Singapore
As Singaporeans live longer, demand for healthcare will continue to increase - in fact, the overall health protection gap is estimated at $23 billion5, being the measure of the shortfall in finances to fund health expenditure. With increasing prosperity, Singapore is set to have Asia’s highest number of millionaires by 203032, demand for wealth management services is high, with life insurance a key part of the suite of products being used for legacy planning and asset diversification.
In Singapore, we are one of the market leaders in protection, savings and investment-linked plans26. We have been serving the financial needs of Singapore residents for more than 90 years, delivering a suite of product offerings and professional advice through our network of more than 5,000 financial consultants and our bank partners.
18
In 2022, we continued to drive our segment-led customer strategy by further penetrating the high-net-worth segment. In the affluent segment, we intend to strengthen our leadership position with comprehensive health and retirement solutions. We leverage our Pulse app and market-leading Shield offerings to expand our presence in the mass segment. For the younger generation, we are reinvigorating our investment-linked propositions for both the affluent and mass market segments. Finally, we further penetrate the SME segment through our Business@Pulse platform for the employee benefit business.
New business performance
2022 compared with 2021
Overall APE sales increased by 6 per cent10 to $770 million, despite the negative impact of Covid-19-related social movement restrictions on agency sales in the first half of the year. Reflecting these restrictions, agency APE sales declined by (11) per cent10 in the first half of the year compared with the first half of 2021. The easing of these restrictions in the second half contributed to agency APE sales growth of 15 per cent in the second half of the year, compared with the equivalent prior year period, resulting in an overall increase in agency APE sales of 3 per cent10 in the year. Demonstrating the benefit of our balanced channel and diversified product mix, APE sales in our bancassurance channel grew by 11 per cent10 in 2022.
2021 (AER) compared with 2020 (CER)
Our new business momentum in Singapore continued despite the tightening of Covid-19-related movement restrictions at several points throughout the year. APE sales were 19 per cent higher, supported by 10 per cent growth across our agency channel and 30 per cent growth across our bancassurance channel.
Delivering customer-led solutions
We saw diversified growth across our wide product offerings in 2022 to meet the health and wealth needs of our customers in Singapore. APE sales to the high-net-worth segment grew 30 per cent10 driven by new channels and services, as well as our effort to deliver superior customer experience. Our enterprise benefit business also delivered good growth with APE sales increasing by 17 per cent10, covering over 3,000 small-to-medium enterprises and over 200,000 employees.
To meet the specific retirement and investment needs of our customers, we have launched PruVantage Wealth, an investment-linked product offering low fees, simplified charges and a wide range of professionally managed fund choices including dividend paying funds and hassle-free model portfolio funds. We are offering innovative plans that integrate both protection and wealth accumulation for younger customers with affordable premiums of 90 SGD per month for 200,000 SGD life and critical illness cover.
Our claims-based pricing model for the PruShield medical reimbursement product enables us to manage our health book sustainably and continue to offer best value for our customers without compromising their medical outcomes.
We continue to improve our customer experience, leveraging digital and technology in our day-to-day operations. Three out of four policies went through instant underwriting engines, which improve productivity and turnaround time. An AI TalkBot with localised dialect was rolled out in 2022 to address customer queries instantly. In addition, the PRUaccess platform is interfaced with SGFindex which enables customers to have a single consolidated view of financial investments within Singapore so that our customers can better plan their financial future. The quality of our customer service is reflected in the form of a high customer retention ratio of 96 per cent.
Multi-channel distribution
The quality and productivity of our agency force continues to improve significantly. The total agency force stood at over 5,000, stable when compared with 2021. Top-tier agents grew at pace as demonstrated by the more than 23 per cent increase in the number of MDRT qualifiers to over 1,200 in 2022. We are the first and only agency force in Singapore, where all agents are subject to the Institute of Banking and Finance (IBF) level 1 qualification. Regular premium APE sales in our agency channel remained strong, and productivity, as measured by APE sales per active agent, rose 2 per cent10, despite the industry headwinds.
In the bancassurance space, with two strategic partners, UOB and SCB, we are gaining access to more than 1.6 million33 active mobile banking customers and 130,000 small and medium enterprises and commercial banking customers33. We continue to work with the banks in serving their customers and focusing on distinct segments such as the affluent and high-net-worth. We have also offered digital wealth solutions on UOB mobile and SCB internet banking platforms. This enabled us to connect directly with customers online or get a lead for customers who prefer face-to-face engagements.
Growth markets and other
The Group’s growth markets and other segment incorporates its businesses in India, Thailand, Vietnam, the Philippines, Taiwan, Cambodia, Laos, Myanmar, and its businesses in Africa. The Group sees the opportunity for rapid growth through the rollout of its efficient and scalable business model, and multi-channel distribution networks, including its digital Pulse platform.
19
India represents a very large opportunity for the Group’s further growth, having a population of 1.4 billion25, low insurance penetration and expectation of fast rising GDP per capita. We are a Promoter under Indian Listing rules of ICICI Prudential Life Insurance Company, being one of the founding shareholders. We currently have one board seat and own 22 per cent of its voting rights. ICICI Prudential Life Insurance Company is amongst the top-three private life insurance companies26 in India and is listed on the National Stock Exchange (NSE) and Bombay Stock Exchange (BSE) in India. It intends to grow its business by deepening penetration of under-served customer segments, enhancing its distribution footprint and tailoring solutions to the different customer needs across savings, protection, and retirement, including developing new propositions for the mass market.
Thailand is the second-largest economy in ASEAN with a population of over 70 million25 and a well-developed financial services industry. Our strategy in Thailand is to focus on bancassurance and supported by alternative distributions including digital, agency, direct marketing and brokerage, together with retail asset management offering. We have completed the integration of our bancassurance capabilities with the expanded TMB Thanachart Bank (TTB), including the training of their staff in our products and propositions. We continue to focus on delivering the benefits from our bank partnerships with both TTB and UOB. As a result, we delivered higher-than-industry-average APE sales growth, both in the bancassurance channel and for the industry as a whole in 2022. We have double-digit APE sales growth for three consecutive years from 2020 to 2022, and now have an overall market share of 7 per cent26, being sixth in the market26. We are also offering relevant digital propositions served via the digital apps of our bank partners to bring new health and protection solutions to the underserved mass segment. In addition, we have been working closely with our bank partners to unlock SME opportunities through our Business@Pulse platform for the employee benefit business. Finally, as part of our integrated model for customers, we have been working in collaboration with our Thai retail fund management business to design propositions in the health, wealth, and retirement space, particularly for the high-net-worth and affluent segment.
Vietnam has the third-largest population in ASEAN with a population size of just under 100 million25, a median age of 32 years and a significant health and protection gap estimated at $36 billion5. The market has undergone rapid urbanisation with less than 20 per cent34 of the population living in urban areas in 1986, increasing to 37 per cent34 at the end of 2021 and forecast to increase to 45 per cent by 202535. We are expanding our geographical footprint in the urban areas through digitally-enabled agency and bancassurance channels. We are second in the market with 15 per cent26 market share, up 2 percentage points from 2021.
The Philippines provides us with an opportunity to serve customers, given the large protection gap and low level of insurance penetration across the country. We are the market leader with 17 per cent26 market share, based on the latest available market data to 30 September 2022, by weighted new business premium. Our core strengths in the affluent and mass market segments together with our digital capability helped drive a 17 per cent growth in our customer base to 0.9 million customers.
Taiwan is the fifth largest life insurance market in the world36, with a population of 24 million25. Our business has an overall APE market share of 4.4 per cent26, 1.5 percentage points higher than in 2021. Prudential is a leading insurance brand in the market amongst the foreign players26.
Africa presents a significant opportunity, with its population expected to double6 by 2050. Since we entered Ghana in 2014, the business has delivered double-digit APE sales growth in every year of operation. We are in top-five positions in five of our eight countries in Africa, including the number one position in Uganda and Zambia26. Our business provided health, wealth and protection solutions to 990,000 customers across eight countries. Prudential was a sponsor of the 2022 Africa Cup of Nations, the largest football tournament in Africa. The matches were viewed by over one billion individuals, improving Prudential’s brand awareness throughout the continent.
New business performance
2022 compared with 2021
In India, APE sales grew 4 per cent10 driven by strong growth in the protection and annuity business. ICICI Prudential’s focus areas of annuity and protection, which represent underserved needs of the country, performed well. Over the 9 month period to December 202243 annuity APE sales grew 56 per cent10 and protection APE sales growing 23 per cent10, compared with the equivalent period in 2021. This sales performance enabled ICICI Prudential to maintain its top three position in the private market with a market share of 6.3 per cent26.
In Thailand, APE sales rose 18 per cent10 through the expansion of bancassurance sales in 2022 and the progressive easing of Covid-19-related restrictions. During the year, there was strong appetite for bundled protection products through the bancassurance channel.
In the Philippines, while the effects of Covid-19-related disruptions hampered sales in the first half of 2022, momentum in the second half was strong, as economic activity began to normalise. Overall APE sales were up 14 per cent10 to $182 million.
20
Vietnam’s economy showed its resilience during the Covid-19 pandemic, being one of the few countries in the world to record two consecutive years of growth. Our Vietnam business continued to outperform the market in 2022, delivering a strong APE growth of 26 per cent10 compared with 2021, stronger than the industry APE growth of 8 per cent26, underpinned by double-digit growth rates in both bank and agency channels.
In Taiwan, APE sales grew 35 per cent10 during 2022 driven by strong growth in both bancassurance and brokerage channels, outperforming the market which reported a contraction of (11) per cent during 2022 compared with 2021.
In Africa, despite headwinds from inflation and Covid-19, APE sales grew by 19 per cent10 year-on-year, with a broad-based performance across all channels.
2021 (AER) compared with 2020 (CER)
The businesses comprising our Growth markets and other segment saw APE sales up 12 per cent compared with 2020. Cambodia, India, Myanmar, the Philippines, Thailand and Africa all had double-digit growth despite the difficulties associated with Covid-19.
In India, APE sales grew 29 per cent supported by diverse growth across all distribution channels, with both agency and bancassurance channels achieving APE sales growth in 2021, as well as an increased focus on annuity products. In Thailand, APE sales rose 22 per cent helped by the expansion of bancassurance sales in 2021.
In Vietnam, sales volume slightly increased despite nationwide Covid-19 lockdowns impacting the agency market. The bancassurance channel performed well despite Covid-19, with APE sales up 17 per cent, as banks were allowed to remain open as essential services during the lockdown. Prudential also benefited from the expansion of bancassurance agreements and remained the leader in the bancassurance channel with 19.4 per cent market share.
In the Philippines, 2021 APE sales were up 26 per cent, primarily from the agency channel, and Prudential remains the largest player in the market.
In Africa, APE sales grew by 24 per cent year-on-year, with growth in all eight countries. The East and Central Africa business (comprising Kenya, Uganda and Zambia) performed particularly well with an APE sales growth of 43 per cent.
Delivering customer-led solutions
In India, ICICI Prudential continues to offer products designed to match customers’ need and life stage. A shift in customer preferences and continued investment in product development have culminated in award-winning product propositions across the protection, long-term savings and annuity segments. This has given ICICI Prudential a well-balanced product mix thereby insulating it from volatility. ICICI Prudential introduced a number of significant new products in the year, such as a regular premium annuity plan to provide flexibility to customers in building retirement savings pools over the long term. ICICI Prudential also launched a new long-term participating savings product that enables customers to receive tax-free guaranteed income or a lump sum maturity. This includes a savings wallet option to accumulate the income and withdraw the accumulated fund value at any point during the policy term.
ICICI Prudential continues to innovate by leveraging new-age digital technologies to better address customer requirements during the policy life cycle – from onboarding, to servicing, to claims processing. With an exponential rise in digital adoption, its technology initiatives have ensured that it is well positioned. ICICI Prudential will continue to deploy best-in-class technology solutions to increase efficiencies and empower customers. An example of the benefits of its updated technology infrastructure and capability is that over 91 per cent of service transactions are now done through self-help or the digital mode.
In Thailand, we continued to refresh our product suite to address the evolving needs of the Thai population’s health and wealth aspirations. From a low base, we tripled our health reimbursement sales and our whole-of-life sales through extensive training for the bank staff, as well as widening health and protection products to both individual and group customers. We also promoted protection through plans like Easy Care Plus, which offers simplified underwriting to our customers. As a result, our health and protection APE sales mix increased from 16 per cent in 2019 to 24 per cent in 2022. In addition, we relaunched our flagship 888 savings product, which is a long-term saving product that also offers protection, and other Legacy Builder products and introduced innovative Index Link Participating solutions. Our product initiatives have resulted in 17 per cent10 growth in total bancassurance APE sales including 19 per cent10 growth in protection sales through TTB. Our focus on customer needs was also reflected in our market-leading net promoter score position in the market26 and our 11 per cent increase in the number of new customers37 acquired, bringing total customer numbers to 1.7 million.
21
In Vietnam, we continued to provide customer segment-led propositions by offering affordable protection solutions to the mass market segment alongside providing savings, education and health and protection plans to the middle-income segment, and serving the investment needs of affluent customers. To address the market’s need for affordable protection solutions, we have launched System and Organ Function Insurance (SOFI), which provides simple to understand health coverage based on the severity of symptoms and organ function of customers. We also have launched PRU-Easy365 offering comprehensive protection benefits against accidental risk and three common critical illnesses for customers. More than 2,100 and 31,100 SOFI and PRU-Easy365 policies respectively have been sold since launch, increasing our penetration into the younger segment of the population.
In the Philippines, we continue to drive product innovation and financial inclusion with the launch of PRUHealth FamLove. This is a first-of-its-kind critical illness protection plan for different types of Filipino families and can cover up to four family members in one policy. The product’s innovative design provides medical cover based on severity of illness, rather than specific diseases.
In Taiwan, we provide solutions for long-term savings and protection to our target market segments. We are focusing on addressing the diverse needs of the Sandwich Generation with unique end-to-end propositions. Through our H.E.A.R. campaign, we are innovating and expanding our solution offerings for health and protection products. We recognised the growing demand for eye-related treatments as people spend more time using electronic devices, particularly as working from home became more prevalent during the Covid-19 pandemic. In 2022, we launch the first-in-the-market eye care insurance to strengthen the coverage for a broad range of eye-related treatments from simple eye care to complicated eye surgery. The product was well received and the continued emphasis on health and protection led to a 94 per cent increase in sales of such products in 2022.
In Africa, we continue to pursue customer-led insurance initiatives, with the launch of 12 new products across the region in 2022. We have also introduced end-to-end digital products in three countries.
Multi-channel distribution
In India, ICICI Prudential Life has continued to drive its growth ambitions by enhancing its multi-channel distribution capability supported by a diversified product mix. In the agency channel, we recruited over 34,700 new agents during the year, bringing the total number of agents to over 204,000. Outside agency, we have over 850 partnerships including 34 banks. Distribution partners are enabled with digital tools to onboard and serve customers with ease. The onboarding journey is simplified by using collaboration platforms, pre-approved sum assured offers, pre-population of application forms from uploaded Know-Your-Customer documents, customised offers to customers, and tele and video verification triggers. We have built a state-of-the-art platform enabling ease of integration with ecosystems and partners’ systems. Additionally, we support our partners to build customer onboarding journeys on their platform powered by micro services.
In Thailand, the relaxation of Covid-19-related restrictions during the second quarter of the year resulted in the reopening of many of the bank outlets of our main distribution partners, TTB and UOB. TTB is one of the largest banks in Thailand with around 600 branches, and UOB has around 150 branches. We continue to engage actively with our partners at TTB to improve productivity and customer experience, as well as to extend our reach to the wealth and enterprise benefit segments. The acquisition of Citibank’s Thailand operations by UOB provides an opportunity to further grow our bancassurance presence and expand our customer base. Operational integration of the Citi outlets started in late 2022 and will continue over the next year. For Group EB, rapid realisation of strategy had made this business grow 49 per cent compared with 2021. Our digital channel also achieved a robust result where we attained second position38 in the digital market share, with APE sales tripling10 during 2022 compared with 2021.
In Vietnam, we continued to focus on quality recruitment and training in the agency channel and supporting our agents with access to comprehensive product propositions and digital tools such as PRUForce and PRULeads. As a result, we have grown our number of MDRT qualifiers by 60 per cent in 2022 to almost 2,000. The bancassurance channel continued to record strong growth of 26 per cent10, underpinned by our partnerships with seven banks with strong operations in urban areas, which combined have over 600 branches in Vietnam.
In the Philippines, our agency channel continued its strong growth with a 89 per cent growth in recruits. In addition to agency, we continued to grow our customer base and promote financial inclusion by offering bite-sized products on Pulse and by partnering with banks and other digital outlets. Our partners include CIMB, a digital bank with more than 6.5 million39 customers, GCash, the top mobile wallet provider in the Philippines, and Shopee, the leading online shopping platform.
In Taiwan, our 35 per cent10 APE sales growth in 2022 was supported by strong bancassurance performance. Through strategic and non-strategic bancassurance partners and brokers, we continue to broaden and diversify our distribution network. Today, we reach customers through partnerships with more than 20 banks and top brokers in Taiwan, and we continue to digitalise our processes to provide seamless services to customers and distributors.
22
In Africa, Prudential has a 16,000-strong agency force and is the first African company to achieve the over 200 MDRT members milestone in 2022. In addition, Prudential Africa has access to over 1,000 bank branches, digital, telecommunication and intermediary partnerships. Our ongoing investment in digital innovation and robust systems to digitise processes will allow us to grow at scale and provide seamless experience to better service our customer needs.
Eastspring
Eastspring is the asset management arm of the Group. Its funds under management or advice (referred collectively as funds under management below) of $221.4 billion includes $30.1 billion that represents our 49 per cent share in funds managed by ICICI Prudential Asset Management Company (IPAMC) in India and $9.0 billion that represents our 49 per cent share in funds managed by CITIC-Prudential Fund Management Company Limited (CPFMC) in China. Eastspring has $130.2 billion of funds under management on behalf of the Prudential Group.
2022 was a challenging year for the asset management industry. Global bond and equity markets declined sharply, weighed down by concerns around the outlook for growth and fears of recession as inflation spiked and central banks ratcheted up interest rates. This was further compounded by the continuing conflict in eastern Europe and, in 2022, an uncertain economic outlook in the Chinese Mainland.
Eastspring’s ambition is to be a leading provider of investment solutions to protect and grow clients’ wealth. Its purpose ‘Experts in Asia. Invested in Your Future’ guides the business and reflects its commitment to help its stakeholders build a better and more sustainable future.
Eastspring sees three key enablers in driving its future success:
| ● | Driving improved investment performance by leveraging an integrated investment platform regionally, and through a rigorous investment framework; |
| ● | Expanding its investment capabilities and product range to offer competitive solutions for institutional and retail clients globally; and |
| ● | Achieving greater operating efficiency through best-in-class infrastructure and systems. |
Financial performance
Eastspring saw a (14) per cent40 decline in its funds under management to $221.4 billion in 2022, predominantly due to market depreciation and foreign exchange translation losses, which collectively totalled $42.1 billion. During 2022, there was a small shift in overall asset mix from bond to equity funds with an asset mix as at 31 December 2022 being 47 per cent in bonds, 46 per cent equity, 1 per cent in alternatives and 6 per cent in money market funds. The firm’s overall assets remain well diversified across both clients and asset classes.
The decline in funds under management was cushioned by stable and reliable inflows of $7.8 billion from Prudential’s life insurance businesses but offset by net outflows of $(3.2) billion from third-party business41. These net outflows were driven primarily by bond funds following interest rate hikes throughout the year, as well as redemption of equity funds managed on behalf of M&G plc.
Fee margins reduced by 1 basis point40 as a result of mark-to-market losses of $7.8 million on seed investments made to fund new products. This reflects the volatile and adverse market conditions of 2022. The firm’s cost/income ratio declined by 1 percentage point40. Excluding these realised and mark-to-market investment losses, Eastspring’s cost/income ratio improved by 2 percentage points against 2021.
Investment performance
Despite the challenging market environment, Eastspring recorded solid performance results with 59 per cent of assets under management outperforming their benchmarks42 over the past year (2021: 61 per cent) and 39 per cent of assets under management outperforming their benchmarks42 over the past three years (2021: 42 per cent). The Singapore-based Value Equity teams posted substantial outperformance over the past year on a funds under management weighted basis and the Active Quantitative strategies also firmly supported aggregate returns. Although Fixed Income and Growth Equity strategies were under pressure over the year, broadly underperforming benchmarks, sentiment started to turn in the final quarter of 2022 following the unexpected easing of Covid-19-related restrictions in the Chinese Mainland, the Chinese government’s support for China’s stressed property market and signs that global inflation pressures were beginning to ease.
To compete in an increasingly dynamic environment and to bring its deep expertise of Asian markets to clients, Eastspring integrated the investment capabilities of its wholly-owned businesses onto a single platform. This enabled the firm to capitalise on its global execution capabilities and resources more efficiently, providing more cohesive and robust data and investment analysis.
23
Eastspring is proud to be recognised for its achievements, winning numerous industry awards in 2022. Notably, Eastspring Investments was named the Best Emerging Markets Equity Manager by the Citywire Asia Asset Management Awards. At a country level, Eastspring Singapore was named Top Investment House by The Asset Benchmark Research Awards, while Eastspring Vietnam was named Best Fund House in Vietnam by Asia Asset Management.
2021 compared with 2020
In what was largely a volatile market in 2021, existing and new clients turned to Eastspring for advice. Eastspring grew its assets under management by 4 per cent in 2021, reflecting favourable investment returns and net inflows from the Group’s insurance businesses and from third-party clients. Third-party business saw net in-flows from retail clients, driven by a strong demand for equity products, partially offset by institutional net outflows. The outflows across the businesses were predominantly due to profit taking and asset rebalancing amid generally strong equity market conditions. The redemptions of funds managed on behalf of M&G plc in 2021, net of inflows, totalled $(4.0) billion. The overall asset mix remained stable and well diversified across both clients and asset classes.
Eastspring continued to perform well for clients, with 61 per cent of assets under management outperforming benchmarks42 over one year in 2021. Significant ‘alphas’ were generated by the value-style equity teams, in addition to positive relative and absolute performance by teams focusing on quantitative strategies and multi-asset solutions.
Client excellence
During a year when market headwinds resulted in challenging outcomes for both the asset management industry and its clients, Eastspring maintained its client-centric approach and frequently engaged internal and external clients to better understand their challenges and investment needs. In doing so, it could best meet client expectations and provide tailored solutions.
Eastspring continued to strengthen its relationship with the Prudential Group’s life insurance and corporate asset owners, including launching customised strategies for local markets.
Across its institutional business, Eastspring continued winning mandates, and top-ups, from some of the largest pension and sovereign wealth funds. Notably, the firm has seen good success in its international markets of the Americas, Europe, and Taiwan and Malaysia’s Islamic business.
Enhancing distribution capabilities
While deepening and broadening its relationships with distributors, Eastspring has also increased its efforts to improve its distribution capabilities by developing new digital investment and servicing platforms, particularly in Malaysia and Thailand. In Japan, Eastspring launched online-exclusive funds to capture flows from the younger generation. Eastspring also expanded its partnerships with online mutual funds and wealth management platforms, for example with a co-branded fund on iFast’s Fundsupermart.
In July 2022, Eastspring further strengthened its franchise and footprint through the successful incorporation of Eastspring Thailand, merging TMBAM Eastspring and Thanachart Fund Eastspring. With this merger, Eastspring is now the sixth-largest fund management company in Thailand and is well positioned to offer compelling investment solutions to local investors and to grow its business in South-east Asia’s second-largest economy.
Accelerating responsible investing
Eastspring’s commitment to responsible investing is embedded across its business.
The firm is focused on driving sustainable solutions on three fronts. First, Eastspring strengthened its engagement on climate change and decarbonisation with investee companies, including with the top emitters contributing to 65 per cent of absolute carbon emissions in Prudential’s asset book. Second, the firm enhanced its ESG data capabilities to support investment and engagement activities. Third, the firm harmonised all Responsible Investment-related policies across its markets into a single Eastspring Investments Group Responsible Investment Policy.
Eastspring provided strong support to the wider Group’s successful efforts in meeting its sustainability milestones. At the same time, Eastspring expanded its range of sustainability-focused funds, for instance, launching a Japan Sustainable Value Fund. In Indonesia, the business launched the award-winning Reksa Dana Indeks ESG IDX Leaders Plus, the first mutual fund that utilises the Indonesian Stock Exchange’s ESG Leaders Index.
Joint venture growth initiatives
IPAMC continued to enhance its digital strengths and broadened its product suite across equity and fixed income strategies. As a result, over 50 per cent of new customers were onboarded directly and through partnerships with fintech companies and neobanks, resulting in an existing customer base of circa eight million.
24
CPFMC has deep cooperative relationships with over 40 local research institutes and provides Qualified Foreign Institutional Investors (QFII) with professional investment advisory services. Since 2021, it has been building out its pension target funds, which attracted steady net subscriptions from retail investors.
Notes
| 1 | Source: The Unprecedented Expansion of the Global Middle Class, Global Economy and Development program at the Brookings Institution, February 2017. Forecast growth of Asia Pacific middle class 2020 to 2030. |
| 2 | Source: IMF World Economic Outlook Database, April 2022, compound annual growth rates of GDP per capita, 2022-2026. |
| 3 | Source: Swiss Re Institute; Sigma No 3/2021: World insurance – life insurance penetration (premiums as a percentage of GDP in 2020). |
| 4 | Source: World Health Organisation: Global Health Observatory data (2019). South-east Asia, Out-of-pocket expenditure as percentage of current health expenditure (CHE). |
| 5 | Source: Swiss Re Institute: The health protection gap in Asia, October 2018. |
| 6 | Source: The Economist, Special report, 28 March 2020 edition. |
| 7 | Greater China comprises of our businesses in the Chinese Mainland, Hong Kong and Taiwan. |
| 8 | South-east Asia comprises of our businesses in Asia excluding the Chinese Mainland, Hong Kong, Taiwan and India. |
| 9 | APE sales is a measure of new business activity that comprises the aggregate of annualised regular premiums and one-tenth of single premiums on new business written during the year for all insurance products, including premiums for contracts designated as investment contracts under IFRS 4. It is not representative of premium income recorded in the IFRS financial results. See note II of the Additional unaudited financial information for further explanation. |
| 10 | On a constant exchange rate basis. |
| 11 | Excluding India, Laos, Myanmar and Africa. |
| 12 | A life customer is defined as an individual or entity who holds one or more policies with a Prudential life insurance entity, including 100 per cent of customers of the Group’s joint ventures and associate. Group business is considered to be a single customer for the purpose of this definition. The customer numbers for 2021 have been restated to ensure consistent and comparable application of this definition across all Group entities. |
| 13 | New policies are presented on a 100 per cent basis. |
| 14 | Excluding Africa. |
| 15 | Core markets consist of the Chinese Mainland, Hong Kong, Indonesia, Singapore, Malaysia, Vietnam and the Philippines. |
| 16 | Productivity measured by APE sales per average active agent. |
| 17 | Percentage of APE sales in Asia markets, including CPL, India and Malaysia Takaful on a 100 per cent basis. |
| 18 | APE sales completed by agents on leads recorded and managed on our PruLeads System as a percentage of total APE new business sales through the agency channel. |
| 19 | Leads from all sources recorded and managed on our PruLeads System. |
| 20 | The Chinese Mainland, Hong Kong, India, Indonesia, Japan, Malaysia, Singapore, South Korea, Taiwan, Thailand and Vietnam. |
| 21 | Sources: Chinese Mainland: based on new business single premiums from the CBIRC for foreign joint ventures only; Hong Kong: based on total in-force premiums; Indonesia: based on weighted new business premiums from the PLAI; Malaysia combined: based on APE sales from the Life Insurance Association of Malaysia; Singapore: based on weighted new business premium for regular premium from the Life Insurance Association of Singapore; India: based on retail weighted premium income among foreign players from the Insurance Regulatory and Development Authority of India; Vietnam: based on APE sales from the Vietnam Actuarial Network data sharing; Taiwan: based on APE sales from the Taiwan Life Insurance Association for foreign insurers; Thailand: based on weighted new business premiums from the Thailand Life Assurance Association for the first 11 months of 2022; Philippines: based on weighted full-year premiums from the Insurance Commission for the first 9 months of 2022; Cambodia: based on APE sales. |
| 22 | Full year 2022 total funds under management or advice, including external funds under management, money market funds, funds managed on behalf of M&G plc and internal funds under management or advice, reported based on the country where the funds are managed, including joint ventures. |
| 23 | Our investment portfolio includes both listed equities and corporate bonds, while excluding assets held by joint venture businesses and assets in unit-linked funds as we do not have full authority to change the investment strategies of these. |
| 24 | Whole Group Full Time Equivalent including Chair, all Directors, GEC members, and Senior Managers, excluding joint ventures. |
| 25 | United Nations, Department of Economic and Social Affairs, Population Division, World Population Prospects 2022. |
| 26 | Sources: Mainland China (Based on new business standard premiums for 2022 of the foreign joint ventures only, data from industry sharing of information), Hong Kong (Based on PHKL APE for 2022 from Hong Kong Insurance Authority), Indonesia (Based on weighted new premiums for 2022, preliminary results from Indonesian Life Insurance Association), Malaysia (On combined basis where Takaful is on 100%. Based on new business APE for 2022, data from Life Insurance Association of Malaysia for Conventional Business and Insurance Service Malaysia for Takaful business), Singapore (Based on weighted new business premiums reported within Singapore Life Insurance Association returns for 2022), India (Based on retail weighted premium for the calendar year 2022 of private insurers operating in India, from the Life Insurance Council), Taiwan (Based on full year 2022 APE of foreign insurers, data from Taiwan Insurance Institute), Vietnam (Based on full year 2022 APE data collected from data sharing by Vietnam Actuarial Network), Laos (Based on gross written premiums for 2021, from Axco Insurance Market Report), the Philippines (Based on weighted first year premiums for the first nine months in 2022, data from Insurance Commission), Cambodia (Based on full year 2022 adjusted APE, from Insurance Association of Cambodia), Thailand (Based on weighted new business premium for 2022, from The Thai Life Assurance Association), Myanmar (Based on APE for the first nine months in 2022 for the foreign insurers operating in Myanmar, from Myanmar Insurance Association). |
| 27 | Source: based on APE sales from Hong Kong Insurance Authority 2022. |
| 28 | Source: based on GDP data sourced from the World Bank and www.bayarea.gov.hk websites. |
| 29 | Source: World Population Review – Country Rankings – Muslim population by country. |
| 30 | Source: Bank Negara Malaysia, Financial Sector Blueprint 2022-2026. |
| 31 | Source: Based on APE sales from the Insurance services Malaysia (ISM) for the Takaful business at 100 per cent. |
| 32 | Source: UNU-WIDER, World Income Inequality Database (WIID), World Bank, IMF, United Nations Population Division, HSBC forecasts. |
| 33 | The number of customers is based on Prudential Singapore’s internal estimates. |
| 34 | Source: Based on data from the World Bank organisation: Urban population (% of total population). |
| 35 | Source: Central Committee Vietnamese Communist Party, Resolution Number 06-NQ/TW on planning, construction, management, and sustainable development of urban areas in Vietnam until 2030, with a vision toward 2045, 24 January 2022. |
| 36 | Source: Global data report, Taiwan (Province of China) Life Insurance Market Size, Trends by Line of Business (General Annuity and Personal, Accident and Health), Distribution Channel, Competitive Landscape and Forecast, 2021-2026, November 2022. |
| 37 | New customers defined as the sum newly joined customers and newly joined who were lost but reinstated. |
| 38 | Source: The Thai Life Assurance Association’s Life Insurance Business Report, data as of November 2022 year-to-date. |
| 39 | CIMB Philippines number of customers as at 31 December 2022 based on the full year 2022 results. |
| 40 | On an actual exchange rate basis. |
| 41 | Including money market funds and funds managed on behalf of M&G plc. |
| 42 | The value of assets under management at 31 December 2022 in funds which outperform their performance benchmark as a percentage of total assets under management at 31 December 2022, excluding assets in funds with no performance benchmark. |
| 43 | ICICI Prudential financial year runs from 1 April to 31 March each year. |
| 44 | Based on Prudential Hong Kong Limited’s APE for the discrete fourth quarter of 2022 from Hong Kong Insurance Authority. |
25
FINANCIAL REVIEW
Overview
The Group delivered a resilient financial performance for the year against a backdrop of Covid-19-related disruption during the first half of 2022 in many of our markets and the broader macroeconomic and geopolitical volatility, discussed further below. The diversity of our business in terms of its geography, its multi-channel distribution and its customer-centric product suite positions us well to take advantage of the long-term opportunities as our markets recover from the effects of Covid-19.
The Group’s 2022 financial performance saw us deliver growth with APE sales1 higher than the prior year2. IFRS profit for the year was negatively impacted by the increases in interest rates and decreases in equity market values in the year, as further discussed below and in the section headed Corporate transactions and other items principally driven by short-term market fluctuations.
2022 saw considerable macroeconomic volatility, characterised in many markets by lower equity index levels, material increases in government bond yields and widening corporate bond spreads. The MSCI Asia excluding Japan equity index fell (24) per cent, the Hang Seng index fell by (15) per cent and the CSI 300 index fell by (22) per cent while the S&P 500 index fell by (19) per cent. Government bond yields in many of our markets ended the year higher with the US 10-year yield increasing by 236 basis points to 3.9 per cent. As well as their impact on IFRS profit for the year, lower associated asset values and consequent impact on fee-generating account balances.
The year also saw the US dollar increase in value relative to many currencies globally, resulting in a translation headwind. As in previous years, we comment on our performance in local currency terms (expressed on a CER basis) to show the underlying business trends in periods of currency movement, unless otherwise noted.
In 2022, the Group reported a 9 per cent2 increase in APE sales to $4,393 million. This encouraging APE sales performance, despite Covid-19-related disruption during the first half of the year, reflects the benefit of diversification across geography, channel and products. APE sales were broadly balanced between Greater China3 and South-east4 Asia across the four main product groups, with an emphasis on health and protection, and across distribution channels with bancassurance channel providing notable resilience in periods of disruption for the agency salesforce. Agency distribution and health and protection products remain the most important value drivers.
The Group’s total IFRS profit after tax from continuing operations was $1,007 million (2021: profit of $2,143 million on a CER basis and $2,214 million on an AER basis). Increases in the underlying life and asset management segment profitability and lower interest costs following redemption of debt in late 2021 and early 2022 were more than offset by the negative effect of higher interest rates and lower equity markets during the year. The losses from market volatility were offset in part by the benefit from refinements to the reserving basis following the adoption of the Hong Kong Risk-Based Capital regime (HK RBC) for which we received approval from the regulator in April 2022, effective from 1 January 2022 as discussed in note C3 of the consolidated financial statements. The IFRS reserving basis for Hong Kong was refined to reflect the measurement techniques applied within HK RBC, leading to a reduction in policyholder liabilities (net of reinsurance) and an increase in profit before tax of $945 million5. The Group has completed its programme to deliver a targeted reduction in central operating expenses of $70 million6 a year from the start of 2023 which, combined with previously completed savings, represents delivery of central cost reduction programmes since 2018 that in total have saved $250 million7 a year.
Our Group’s regulatory capital position, free surplus and central liquidity positions remain robust. The Group’s leverage remains near the bottom of our target range at 20 per cent, estimated on a Moody’s basis, after allowing for the redemption of a £300 million senior bond in January 2023. As a result, supported by a clear and disciplined capital allocation policy, the Group is well positioned, with considerable financial flexibility including leverage capacity, to take advantage of the growth opportunities ahead.
The Group aligns its capital adequacy requirements with the established EEV and free surplus framework by comparing the total eligible Group capital resources with the Group’s Prescribed Capital Requirement (GPCR) and this is explained further in the capital management section below. At 31 December 2022, the estimated shareholder surplus above the GPCR was $15.6 billion8 (31 December 2021: $17.5 billion5) and cover ratio 307 per cent9 (31 December 2021: 320 per cent5). The surplus reduced due to adverse market movements in the year, reducing available capital more than the reduction in capital requirements.
During the year, the Group adopted both HK RBC for the Hong Kong business and the China Risk Oriented Solvency System Phase II (C-ROSS II) requirements in the Chinese Mainland with an improvement to the shareholder GWS capital surplus of total eligible group capital resources over the Group Minimum Capital Requirement (GMCR) at 1 January 2022 by $9.3 billion10, increasing the coverage ratio11 from 408 per cent to 545 per cent (after allowing for the debt redemption in January 2022). The GWS coverage ratio at 1 January 2022 measured on GPCR basis after the regulatory changes was 320 per cent.
With effect from 1 January 2023, IFRS 17, the new accounting standard for insurance contracts that replaces IFRS 4, becomes effective and the Group’s IFRS reporting will be prepared on this basis from half year 2023. While this is an important step for the Group and the wider insurance industry, this new accounting framework has no impact on the Group’s capital generation or management, business strategy or dividend policy. Similarly, the new IFRS 17 framework has no impact on the total level of profit generated over the life of the policy, but it does change the timing of profit recognition. Upon transition from our IFRS 4 grandfathered local GAAP measures to IFRS 17, we expect an increase in opening shareholders’ equity of between $1.8 billion and $2.7 billion from the $17.1 billion dollars recorded under IFRS 4 at 31 December 2021. This reflects the release of prudent margins from our legacy accounting basis, particularly in Hong Kong, recognition of the shareholders’ share of the inherited estate within the with-profit funds and the net impact of timing differences in the pattern of profit recognition. We have yet to complete the production of our half-year and full-year 2022 comparatives using the IFRS 17 accounting standard. The remaining uncertainty in the estimated impact will be addressed once full-year IFRS 17 results have been completed on the end state systems. Further disclosure of the impact on 2022 results will be provided in June 2023.
26
We provide a discussion of our operating results and financial review in this section, which is organised as follows:
| ● | Summary Consolidated Results and Basis of Preparation of Analysis |
| ● | Explanation of Movements in Revenue and Charges |
| ● | Determining Adjusted Operating Profit of Operating Segments |
| ● | Explanation of performance and other financial measures |
| ● | Group overview |
| ● | Segment discussion |
| ● | Other financial commentary based on management’s view |
- | Analysis of profit drivers |
Corporate transactions and other items principally driven by short-term market fluctuations
- | Effective tax rates, total tax contribution, change of tax residence and tax strategy |
- | Shareholders’ equity |
- | New business performance |
- | Dividends |
- | Group capital position |
- | Financing and liquidity and cash remittances |
| ● | Investments |
| ● | Additional Information on Liquidity and Capital Resources |
Summary Consolidated Results and Basis of Preparation Analysis
The following table shows Prudential’s consolidated total revenue and consolidated total charges on an AER basis for the years presented:
| | | | | | |
|
| 2022 $m |
| 2021* $m |
| 2020* $m |
Continuing operations: |
|
|
|
|
|
|
Gross premiums earned |
| 23,344 |
| 24,217 |
| 23,495 |
Outward reinsurance premiums |
| (1,943) |
| (1,844) |
| (1,625) |
Earned premiums, net of reinsurance |
| 21,401 |
| 22,373 |
| 21,870 |
Investment return |
| (30,159) |
| 3,486 |
| 13,762 |
Other income |
| 539 |
| 641 |
| 615 |
Total revenue, net of reinsurance |
| (8,219) |
| 26,500 |
| 36,247 |
Benefits and claims |
| 17,997 |
| (17,738) |
| (34,463) |
Reinsurers’ share of benefits and claims |
| (6,168) |
| (971) |
| 6,313 |
Movement in unallocated surplus of with-profits funds |
| 1,868 |
| (202) |
| (438) |
Benefits and claims and movement in unallocated surplus of with-profits funds, net of reinsurance |
| 13,697 |
| (18,911) |
| (28,588) |
Acquisition costs and other expenditure |
| (3,880) |
| (4,560) |
| (4,651) |
Finance costs: interest on core structural borrowings of shareholder-financed businesses |
| (200) |
| (328) |
| (316) |
Gain (loss) attaching to corporate transactions |
| 55 |
| (35) |
| (30) |
Total charges net of reinsurance |
| 9,672 |
| (23,834) |
| (33,585) |
Share of profit from joint ventures and associates, net of related tax |
| 29 |
| 352 |
| 517 |
Profit before tax (being tax attributable to shareholders’ and policyholders’ returns) |
| 1,482 |
| 3,018 |
| 3,179 |
Tax charge attributable to policyholders' returns |
| (21) |
| (342) |
| (271) |
Profit before tax attributable to shareholders' returns |
| 1,461 |
| 2,676 |
| 2,908 |
Total tax charge attributable to shareholders' and policyholders' returns |
| (475) |
| (804) |
| (711) |
Remove tax charge attributable to policyholders' returns |
| 21 |
| 342 |
| 271 |
Tax charge attributable to shareholders' returns |
| (454) |
| (462) |
| (440) |
Profit after tax from continuing operations |
| 1,007 |
| 2,214 |
| 2,468 |
Loss after tax from discontinued US operations |
| — |
| (5,027) |
| (283) |
Profit (loss) for the year |
| 1,007 |
| (2,813) |
| 2,185 |
* | Discontinued operations for 2021 and 2020 related to the US operations (Jackson) that were demerged from the Group in September 2021. |
Under IFRS, the pre-tax GAAP measure of profit is profit before policyholder and shareholder taxes. This measure is not the result attributable to shareholders principally because total corporate tax of the Group includes those taxes on the income of consolidated with-profits and unit-linked funds that, through adjustments to benefits, are borne by policyholders. These amounts are required to be included in the tax charge of the Company under IAS 12. Consequently, the IFRS profit before tax measure is not representative of pre-tax profit attributable to shareholders as it is determined after deducting the cost of policyholder benefits and movements in the liability for unallocated surplus of with-profits funds after adjusting for tax borne by policyholders.
Accordingly, Prudential has chosen to explain its consolidated results principally by reference to profits for the year, reflecting profit after tax. In explaining movements in profit for the year, reference is made to trends in profit before shareholder tax and the shareholder tax charge. The explanations of movement in profit before shareholder tax are shown below by reference to the profit analysis applied for segmental disclosure as shown in note B1 to the consolidated financial statements. This basis is used by management and reported externally to the holders of shares listed on the London, Hong Kong and Singapore exchanges and to those financial markets. Separately analysis of movements in profits before shareholder tax is provided by nature of revenue and charges in the ‘Explanation of Movements in Revenue and Charges’ section.
27
Explanation of Movements in Revenue and Charges
CPL, Prudential’s life business in the Chinese Mainland, which forms one of the Group’s operating segments, is a joint venture accounted for using the equity method under IFRS. The Group’s share of its results, net of related tax, is presented in a single line within the Group’s profit before tax and therefore not included in the explanation of movements in revenue and charges line items below.
(a) | Gross premiums earned |
| | | | | | |
|
| AER | ||||
|
| 2022 $m |
| 2021 $m |
| 2020 $m |
Hong Kong |
| 8,792 |
| 10,032 |
| 11,091 |
Indonesia |
| 1,590 |
| 1,724 |
| 1,738 |
Malaysia |
| 1,843 |
| 1,900 |
| 1,783 |
Singapore |
| 6,540 |
| 6,246 |
| 5,035 |
Growth markets and other |
| 4,579 |
| 4,315 |
| 3,848 |
Total gross premiums earned |
| 23,344 |
| 24,217 |
| 23,495 |
Gross premiums earned reflect the aggregate of single and regular premiums of new business sold in the year and renewal premiums on business sold in previous years.
2022 compared with 2021
Gross premiums earned decreased by $873 million or 4 per cent from $24,217 million in 2021 to $23,344 million in 2022. Excluding the impact of currency translation of $794 million, gross premiums earned decreased by $79 million, mainly driven by lower premiums in Hong Kong and Indonesia, partially offset by higher premiums in Singapore and Growth Markets and other.
In Hong Kong, gross premiums earned decreased by $1,240 million or 12 per cent from 2021 to 2022. Excluding the negative impact of currency translation of $74 million, gross premiums earned decreased by $1,166 million, primarily driven by a fall in renewal premiums in the with-profits funds as some policies reached the end of their premium paying term. We continued to earn profits on these policies in-line with bonus declarations. Renewal premiums from shareholder-backed business increased by 2 per cent when compared to 2021 on an AER basis.
In Indonesia, gross premiums earned were $134 million or 8 per cent lower than 2021. Excluding the negative impact of currency translation of $64 million, gross premiums earned were $70 million or 4 per cent lower, driven by lower renewal premiums reflecting lower sales volumes in recent years, partially offset by an improvement in new business premiums driven by Covid-19-related restrictions easing in the second half of 2022.
In Malaysia, gross premiums earned in 2022 were $57 million or 3 per cent lower than 2021. Excluding the negative impact of currency translation of $111 million, gross premiums earned increased by $54 million or 3 per cent, mainly driven by increases in shareholder-backed renewal premiums, with a greater proportion of new business in 2021 being from regular premium business.
In Singapore, gross premiums earned increased by $294 million or 5 per cent from 2021 to 2022. Excluding the negative impact of currency translation of $159 million, gross premiums earned increased by $453 million or 7 per cent, with increases in both new business and renewal premiums. There were increases in new business from both the agency and bancassurance channels, demonstrating the benefit of our diversified distribution model.
In the Growth markets and other segment, gross premiums earned increased by $264 million or 6 per cent from 2021 to 2022. Excluding the negative impact of currency translation of $233 million, gross premiums earned increased by $497 million or 12 per cent driven mainly by increases in regular premiums new business from Taiwan, Thailand and Vietnam and increases in renewal premiums across a number of markets. Further information on new business movements is discussed in the “Strategic and Operating Review” section above.
2021 compared with 2020
Gross premiums earned, totalling $24,217 million in 2021, saw an increase from $23,495 million in 2020. The increase of $722 million was mainly driven by higher earned premiums in most business segments partially offset by a reduction in Hong Kong and Indonesia.
In Hong Kong, the decrease in gross premiums earned of $(1,059) million or (10) per cent from 2020 to 2021 was primarily driven by a fall in renewal premiums in the with-profits fund as some policies reached the end of the premium-paying term in the year. We continued to earn profits on these policies in-line with bonus declarations. Renewal premiums from shareholder-backed business increased by 3 per cent when compared to 2020 on an AER basis.
In Indonesia, gross premiums earned were marginally lower than 2020, with falls in both new business and renewal premiums being offset by positive foreign exchange effects. Overall, new business on an APE basis were down by 6 per cent on an AER basis.
In Malaysia, gross premiums earned grew by $117 million or 7 per cent from 2020 to 2021, primarily due to growth in renewal premiums reflecting the recent growth of its in-force protection business. The contribution to the gross premiums earned from new business also increased in the year with a higher proportion of new business being regular premium business.
28
In Singapore, gross premiums earned increased by $1,211 million or 24 per cent from 2020 to 2021 due to an increase in new business and renewal premiums. Both regular and single new business premiums increased leading to an increase in APE sales on AER basis of 22 per cent. This increase in sales benefitted from a re-pricing of with-profits products and saw a favourable shift in product mix towards newly launched, higher margin investment-linked products.
In the Growth markets and other segment, gross premiums earned increased by $467 million or 12 per cent from 2020 to 2021 primarily due to an increase in regular premiums from new business across the markets despite the difficulties associated with Covid-19 and increase in renewal premiums across Taiwan, Thailand, Vietnam and the Philippines reflective of in-force growth. In Thailand and Vietnam, sales growth was supported by the expansion of bancassurance sales in 2021.
(b) | Investment return |
| | | | | | |
|
| AER | ||||
|
| 2022 $m |
| 2021 $m |
| 2020 $m |
Hong Kong |
| (22,019) |
| 1,670 |
| 8,785 |
Indonesia |
| 90 |
| 195 |
| (11) |
Malaysia |
| 35 |
| 80 |
| 678 |
Singapore |
| (6,178) |
| 1,184 |
| 2,856 |
Growth markets and other |
| (2,141) |
| 343 |
| 1,400 |
Eastspring |
| (16) |
| 11 |
| 31 |
Total segment |
| (30,229) |
| 3,483 |
| 13,739 |
Unallocated to a segment and intra-segment elimination |
| 70 |
| 3 |
| 23 |
Total investment return |
| (30,159) |
| 3,486 |
| 13,762 |
Investment return principally comprises interest income, dividends, investment appreciation and depreciation (realised and unrealised gains and losses) on investments designated as fair value through profit and loss and realised gains and losses on the Group’s retained interest in Jackson post its demerger in 2021, which has been accounted for on an IAS 39 available-for-sale basis.
Allocation of investment return between policyholders and shareholders
Investment return is attributable to policyholders and shareholders. A key feature of the accounting policies under IFRS is that the investment return included in the income statement relates to all investment assets of the Group, irrespective of whether the return is attributable to shareholders, policyholders or the unallocated surplus of with-profits funds, the latter two of which have no direct impact on shareholders’ profit. The table below provides a breakdown of the investment return attributable to each type of business.
| | | | | | |
|
| AER | ||||
| | 2022 $m |
| 2021 $m |
| 2020 $m |
Policyholder returns |
|
|
|
|
|
|
Assets backing unit-linked liabilities |
| (2,574) |
| 516 |
| 1,549 |
With-profits business |
| (21,287) |
| 2,700 |
| 8,384 |
|
| (23,861) |
| 3,216 |
| 9,933 |
Shareholder returns |
| (6,298) |
| 270 |
| 3,829 |
Total investment return |
| (30,159) |
| 3,486 |
| 13,762 |
Further explanation of the features of policyholder returns and shareholder returns is provided in note B1.2 of the consolidated financial statements.
Reasons for year-on-year changes in investment returns
All investments of the Group are carried at fair value in the statement of financial position with fair value movements, which are volatile from year to year, recorded in the income statement, except for loans and receivables, which are generally carried at amortised cost (unless designated at fair value through profit or loss) and the Group’s retained interest in Jackson for which the changes in unrealised fair value are booked in other comprehensive income.
Subject to the effect of the exceptions, the year-on-year changes in investment returns primarily reflect the generality of overall market movements for equities and debt securities. In addition, foreign exchange rates affect the US dollar value of the translated income. Consistent with the treatment applied for other items of income and expenditure, investment returns for operations not using US dollars as functional currency are translated at average exchange rates.
29
Total segment investment return
The table below provides an analysis of investment return attributable to the Group’s operating segments for the years presented:
| | | | | | | | | | | | | | |
| | 2022 $m | ||||||||||||
| | | | | | | | | | Growth | | | | |
| | Hong | | | | | | | | markets | | | | Total |
|
| Kong |
| Indonesia |
| Malaysia |
| Singapore |
| and other |
| Eastspring |
| segments |
Interest/dividend and other investment income | | 1,685 | | 160 | | 400 | | 1,320 | | 735 | | 5 | | 4,305 |
Investment depreciation* | | (23,704) | | (70) | | (365) | | (7,498) | | (2,876) | | (21) | | (34,534) |
Total investment return |
| (22,019) |
| 90 |
| 35 |
| (6,178) |
| (2,141) |
| (16) |
| (30,229) |
| | | | | | | | | | | | | | |
|
| 2021 AER $m | ||||||||||||
| | | | | | | | | | Growth | | | | |
| | Hong | | | | | | | | markets | | | | Total |
|
| Kong |
| Indonesia |
| Malaysia |
| Singapore |
| and other |
| Eastspring |
| segments |
Interest/dividend and other investment income |
| 1,613 |
| 161 |
| 380 |
| 1,213 |
| 704 |
| 3 |
| 4,074 |
Investment appreciation (depreciation)* |
| 57 |
| 34 |
| (300) |
| (29) |
| (361) |
| 8 |
| (591) |
Total investment return |
| 1,670 |
| 195 |
| 80 |
| 1,184 |
| 343 |
| 11 |
| 3,483 |
| | | | | | | | | | | | | | |
|
| 2020 AER $m | ||||||||||||
| | | | | | | | | | Growth | | | | |
| | Hong | | | | | | | | markets | | | | Total |
|
| Kong |
| Indonesia |
| Malaysia |
| Singapore |
| and other |
| Eastspring |
| segments |
Interest/dividend and other investment income |
| 1,292 |
| 190 |
| 309 |
| 811 |
| 635 |
| 10 |
| 3,247 |
Investment appreciation (depreciation)* |
| 7,493 |
| (201) |
| 369 |
| 2,045 |
| 765 |
| 21 |
| 10,492 |
Total investment return |
| 8,785 |
| (11) |
| 678 |
| 2,856 |
| 1,400 |
| 31 |
| 13,739 |
* Investment appreciation (depreciation) comprises net realised and unrealised gains and losses on the investments and foreign exchange gains and losses.
At 31 December, directly held debt securities account for 54 per cent of the total segment investment portfolio in 2022 (2021: 59 per cent; 2020: 58 per cent), of which 70 per cent (2021: 70 per cent; 2020: 69 per cent) were held by the with-profits and unit-linked funds. Equity securities and holdings in collective investment schemes account for 40 per cent (2021: 37 per cent; 2020: 38 per cent) of the total investment portfolio, of which 88 per cent (2021: 90 per cent; 2020: 91 per cent) were held by the with-profits and unit-linked funds. The remaining assets in the investment portfolio primarily comprise of investment properties, loans and deposits with credit institutions.
The year-on-year movements in investment return mainly reflected the cumulative impact from the changes in interest rates and credit spreads on bond asset values and the performance of equity markets. 2022 saw considerable macroeconomic volatility, characterised in many markets by lower equity index levels, material increases in government bond yields and widening corporate bond spreads. The Hang Seng index fell by (15) per cent (2021: down (14) per cent; 2020: down (3) per cent) and the S&P 500 index fell by (19) per cent (2021: up 27 per cent: 2020: up 16 per cent). Government bond yields in many of our markets ended the year higher with the US 10-year yield increasing by 236 basis points to 3.9 per cent (2021: up 59 basis points to 1.5 per cent; 2020: down 99 basis points to 0.9 per cent). The increase in interest rates and decrease in equity market returns have negatively impacted the total investment return.
2022 compared with 2021
Overall, the total investment return decreased by $33,712 million from a positive return of $3,483 million in 2021 to a negative return of $(30,229) million in 2022 mainly reflecting significantly higher investment depreciation, particularly in Hong Kong, Singapore and Growth markets and other.
In Hong Kong, the decrease in investment return from $1,670 million in 2021 to $(22,019) million in 2022 arose primarily from realised and unrealised losses in debt securities as a result of material increases in interest rates and widening credit spreads, as well as realised and unrealised losses in equity securities following unfavourable equity market performance both locally and in the US (as a large proportion of the Hong Kong business is denominated in USD). The movements in investment return generated during the year arose primarily within the with-profits and unit-linked funds whose investment return does not directly impact profit in the year. In 2021, bond losses from higher interest rates (at a smaller scale) were largely offset by gains in equity securities. Investment income remained largely consistent with prior year.
In Indonesia, investment return decreased from $195 million in 2021 to $90 million in 2022 mainly due to equity losses arising during the year compared with equity gains in 2021 principally within the unit-linked funds, as well as higher losses on debt securities given the effect of rising bond yields.
In Malaysia, the decrease in investment return from $80 million in 2021 to $35 million in 2022 is primarily due to higher level of losses from equities as a result of unfavourable equity market performance. The movements in investment return generated during the year arose primarily within the with-profits and unit-linked funds whose investment return does not directly impact profit in the year.
In Singapore, the decrease in investment return from $1,184 million in 2021 to $(6,178) million in 2022 primarily reflects realised and unrealised losses in both bonds and equities primarily within the with-profits and unit-linked funds. This has been driven by a higher level of increases in interest rates and unfavourable equity market movements during the year both locally and in the US, compared with a rising equity market in the US in 2021.
In Growth markets and other, the decrease in investment returns from $343 million in 2021 to $(2,141) million in 2022 was mainly driven by realised and unrealised losses on debt securities and equity securities from higher level of increases in bond yields in 2022 compared with 2021 and unfavourable equity market performances in most of these markets.
30
2021 compared with 2020
Overall, the total investment return decreased from $13,739 million in 2020 to $3,483 million in 2021 mainly reflecting decreases in Hong Kong, Singapore and Growth markets and other.
In Hong Kong, the decrease in investment returns from $8,785 million in 2020 to $1,670 million in 2021 arose primarily from lower investment appreciation in the year as gains from US equity securities were largely offset by bond losses from higher interest rates compared with equity securities and bond gains in 2020.
In Indonesia, investment returns improved from $(11) million in 2020 to $195 million in 2021 mainly due to equity market gains arising during the year compared with large equity market losses in 2020. Equity movements were largely borne by the policyholders as they arose principally within the unit-linked funds.
In Malaysia, the decrease in investment return from $678 million in 2020 to $80 million in 2021 was primarily due to unrealised bond losses and lower returns from equity securities principally within its with-profits and unit-linked funds as a result of higher interest rates and less favourable equity market movements in 2021 compared with bond gains due to lower interest rates and stronger equity market performance in 2020.
In Singapore, the decrease in investment return from $2,856 million in 2020 to $1,184 million in 2021 primarily reflected favourable equity returns being offset by unrealised bond losses driven by higher interest rates compared with equity and bond gains in 2020. The vast majority of the equity return and a large proportion of the bond losses generated in the year arose within the with-profits and unit-linked funds and so, as described above, do not directly impact profit in the year. The shareholder exposure was largely due to bond losses in the period.
In Growth markets and other, the decrease in investment returns from $1,400 million in 2020 to $343 million in 2021 was mainly driven by investment depreciation in the year due to bond losses in Taiwan, Thailand and the Philippines from rising interest rates, compared with bond gains in 2020 from falling interest rates.
(c) | Benefits and claims and movement in unallocated surplus of with-profits funds, net of reinsurance |
| | | | | | |
|
| AER | ||||
| | 2022 $m |
| 2021 $m |
| 2020 $m |
Hong Kong |
| 15,425 |
| (8,025) |
| (16,241) |
Indonesia |
| (958) |
| (1,017) |
| (682) |
Malaysia |
| (1,152) |
| (1,227) |
| (1,740) |
Singapore |
| 471 |
| (5,893) |
| (6,618) |
Growth markets and other |
| (89) |
| (2,749) |
| (3,307) |
Total benefits and claims and movement in unallocated surplus of with-profits funds, net of reinsurance |
| 13,697 |
| (18,911) |
| (28,588) |
Benefits and claims represent payments, including final bonuses, to policyholders in respect of maturities, surrenders, deaths and other claim events, plus changes in technical provisions (which primarily represent the movement in amounts owed to policyholders) net of any associated reinsurance recoveries. The movement in unallocated surplus of with-profits funds represents the transfer to (from) the unallocated surplus each year through a charge (credit) to the income statement of the annual excess (shortfall) of income over expenditure of the with-profits funds, after declaration and attribution of the cost of bonuses to policyholders and shareholders.
The underlying reasons for the year-on-year changes in benefits and claims and movement in unallocated surplus in each of Prudential’s insurance operations are changes in the incidence of claims incurred, movements in policyholders’ liabilities and movements in unallocated surplus of with-profits funds, net of reinsurance.
Additionally, the movements in policyholder liabilities and unallocated surplus of with-profits funds represent the amount recognised in the income statement and therefore exclude the effect of foreign exchange translation differences on the policyholder liabilities of subsidiaries not using US dollar as a functional currency and the movement in liabilities arising on acquisitions and disposals of businesses in the year, together with other items that do not pass through the income statement as described in note C3.1 to the consolidated financial statements.
The movement in policyholder liabilities recognised in the income statement includes reserving for inflows from premiums net of upfront charges, release of liabilities for claims paid on surrenders, withdrawals, maturities, deaths and other claim events, change due to investment return to the extent of the amounts allocated to policyholders or reflected in the measurement of the policyholder liabilities and other changes in the liability measurement.
The principal driver for the year-on-year variations in the movements in policyholder liabilities is the investment return element due to the inherent nature of market fluctuations. These variations are driven by changes to investment return reflected in the statement of financial position measurement of liabilities for Prudential’s with-profits and unit-linked policies. In addition, for those liabilities under IFRS where the measurement involves discounting future cash flows at current interest rates, the year-on-year changes in interest rates also contribute significantly to variations in the measurement of policyholder liabilities. The principal driver for variations in the change in unallocated surplus of with-profits funds is the value movements on the investment assets of the with-profits funds to the extent not reflected in policyholder liabilities.
31
An analysis of the statement of financial position movements in policyholder liabilities and unallocated surplus of with-profits funds is provided in note C3.1 to the consolidated financial statements. The policyholder liabilities shown in the analysis in note C3.1 are gross of reinsurance and include the full movement in the year of investment contracts without discretionary participating features (as defined in IFRS 4). Further, the analysis in note C3.1 has been prepared to include the Group’s share of the policyholder liabilities of the joint ventures and associate that are accounted for on an equity method basis in the Group’s financial statements. A reconciliation of the change in policyholder liabilities recognised in the income statement to the total movement of liabilities is provided in note C3.2 to the consolidated financial statements.
The principal variations in the movements in policyholder liabilities and movements in unallocated surplus of with-profits funds for each of the Group’s insurance operations are discussed below.
| | | | | | | | | | | | |
|
| 2022 $m | ||||||||||
| | | | | | | | | | Growth | | |
| | Hong | | | | | | | | markets | | Total |
|
| Kong |
| Indonesia |
| Malaysia |
| Singapore |
| and other |
| segments |
Claims incurred, net of reinsurance | | (2,033) | | (1,228) | | (1,070) | | (2,718) | | (1,768) | | (8,817) |
(Increase) decrease in policyholder liabilities, net of reinsurance | | 15,643 | | 270 | | (135) | | 3,189 | | 1,679 | | 20,646 |
Movement in unallocated surplus of with-profits funds |
| 1,815 |
| — |
| 53 |
| — |
| — |
| 1,868 |
Benefits and claims and movement in unallocated surplus, net of reinsurance |
| 15,425 |
| (958) |
| (1,152) |
| 471 |
| (89) |
| 13,697 |
| | | | | | | | | | | | |
|
| 2021 AER $m | ||||||||||
| | | | | | | | | | Growth | | |
| | Hong | | | | | | | | markets | | Total |
|
| Kong |
| Indonesia |
| Malaysia |
| Singapore |
| and other |
| segments |
Claims incurred, net of reinsurance |
| (1,687) |
| (1,184) |
| (1,015) |
| (3,037) |
| (1,590) |
| (8,513) |
(Increase) decrease in policyholder liabilities, net of reinsurance |
| (6,088) |
| 167 |
| (260) |
| (2,856) |
| (1,159) |
| (10,196) |
Movement in unallocated surplus of with-profits funds |
| (250) |
| — |
| 48 |
| — |
| — |
| (202) |
Benefits and claims and movement in unallocated surplus, net of reinsurance |
| (8,025) |
| (1,017) |
| (1,227) |
| (5,893) |
| (2,749) |
| (18,911) |
| | | | | | | | | | | | |
|
| 2020 AER $m | ||||||||||
| | | | | | | | | | Growth | | |
| | Hong | | | | | | | | markets | | Total |
|
| Kong |
| Indonesia |
| Malaysia |
| Singapore |
| and other |
| segments |
Claims incurred, net of reinsurance |
| (1,735) |
| (942) |
| (867) |
| (2,334) |
| (1,199) |
| (7,077) |
(Increase) decrease in policyholder liabilities, net of reinsurance |
| (14,168) |
| 260 |
| (773) |
| (4,284) |
| (2,108) |
| (21,073) |
Movement in unallocated surplus of with-profits funds |
| (338) |
| — |
| (100) |
| — |
| — |
| (438) |
Benefits and claims and movement in unallocated surplus, net of reinsurance |
| (16,241) |
| (682) |
| (1,740) |
| (6,618) |
| (3,307) |
| (28,588) |
In general, the movement in policyholder liabilities over the years reflects the combined growth of new business and the in-force books of the Group’s insurance business operations. The variations in the movements in policyholder liabilities in individual years are, however, primarily due to movements in interest rates and investment returns as discussed above.
2022 compared with 2021
Overall, total benefits and claims changed by $32,608 million from $(18,911) million in 2021 to $13,697 million in 2022 largely reflecting decreases in policyholder liabilities, net of reinsurance, across most of the Group’s segments.
In Hong Kong, total benefits and claims changed from $(8,025) million in 2021 to $15,425 million in 2022 primarily reflecting decreases in policyholder liabilities and unallocated surplus in with-profits funds in 2022 compared with 2021. Movements in 2022 were driven by a decrease in the asset shares attributable to with profit and other policyholders as a result of net losses on bonds and equities following market movements in the period, together with the effect of higher discount rates used to measure policyholder liabilities. Claims incurred was higher in 2022 compared with 2021 following higher claims within the with-profits fund.
In Indonesia, total benefits and claims decreased from $(1,017) million in 2021 to $(958) million in 2022, reflecting a larger decrease in policyholder liabilities in 2022 primarily driven by depreciation in investments as described above in the ‘Investment returns’ section, partially offset by an increase in claims incurred during the year from higher medical claims levels, particularly in the second half of 2022.
In Malaysia, total benefits and claims decreased from $(1,227) million in 2021 to $(1,152) million in 2022 primarily due to a smaller increase in policyholder liabilities. The increase in policyholder liabilities was reduced by a higher level of investment deflation in 2022, largely reflecting a fall in the value of investments held in with-profits and unit-linked funds, as described above in the ‘Investment return’ section.
In Singapore, total benefits and claims changed from $(5,893) million in 2021 to $471 million in 2022 reflecting a decrease in policyholder liabilities in 2022, as compared with an increase in 2021. The movement in policyholder liabilities primarily reflects the effect of higher discount rates used to measure policyholder liabilities as a result of increases in interest rates and the depreciation of investments held in the with-profits and unit-linked funds, as described above.
32
In Growth markets and other, total benefits and claims decreased from $(2,749) million in 2021 to $(89) million in 2022 primarily as a result of a decrease in policyholder liabilities in 2022 compared with an increase in 2021. The fall in policyholder liabilities is largely as a result of a fall in the value of bonds and equities that are attributable to policyholders in many markets, as well as higher discount rates following increases in interest rates.
2021 compared with 2020
Overall, total benefits and claims decreased by $9,677 million from $(28,588) million in 2020 to $(18,911) million in 2021 reflecting decreases across all segments except Indonesia.
In Hong Kong, total benefits and claims decreased from $(16,241) million in 2020 to $(8,025) million in 2021 primarily reflecting a lower increase in policyholder liabilities over 2021 as a result of lower investment returns attributable to policyholders, as compared with 2020. Furthermore, the movement in 2021 was impacted by an increase in discount rates used to measure policyholder liabilities following rises in interest rates as opposed to the negative effects seen in 2020 when interest rates fell.
In Indonesia, total benefits and claims increased from $(682) million in 2020 to $(1,017) million in 2021 reflecting, in part, an increase in claims incurred during 2021 due to the high numbers of Covid-19 cases seen in Indonesia in the second half of 2021.
In Malaysia, total benefits and claims decreased from $(1,740) million in 2020 to $(1,227) million in 2021 primarily due to a smaller increase in policyholder liabilities than was seen in 2020 reflecting the depreciation of investments primarily held within the with-profits and unit-linked funds as discussed above partially offset by higher claims incurred during 2021.
In Singapore, total benefits and claims decreased from $(6,618) million in 2020 to $(5,893) million in 2021 reflecting a smaller increase in policyholder liabilities as compared with 2020 partially offset by higher claims incurred during 2021. The movement in policyholder liabilities was driven by the effect of higher discount rates used to measure policyholder liabilities following rising interest rates in 2021, together with reduced investment returns attributable to policyholders as discussed above. The increase in claims incurred was mainly due to higher maturities on with-profits savings products.
In Growth markets and other, total benefits and claims decreased from $(3,307) million in 2020 to $(2,749) million in 2021 primarily as a result of the increase in policyholder liabilities in 2021 being smaller than that in 2020 as higher interest rates both increase the discount rates used to measure policyholder liabilities and reduce the value of bonds that are attributable to policyholders.
(d) | Acquisition costs and other expenditure |
| | | | | | |
|
| AER | ||||
| | 2022 $m |
| 2021 $m |
| 2020 $m |
Hong Kong |
| (872) |
| (994) |
| (710) |
Indonesia |
| (385) |
| (439) |
| (454) |
Malaysia |
| (351) |
| (396) |
| (376) |
Singapore |
| (109) |
| (700) |
| (965) |
Growth markets and other |
| (1,382) |
| (1,260) |
| (1,279) |
Eastspring |
| (398) |
| (498) |
| (446) |
Unallocated to a segment (central operations) and intra-segment elimination |
| (383) |
| (273) |
| (421) |
Total acquisition costs and other expenditure |
| (3,880) |
| (4,560) |
| (4,651) |
In general, acquisition costs and other expenditure comprise acquisition costs incurred for insurance policies, changes in deferred acquisition costs (DAC), operating expenses and movements in amounts attributable to external unit holders of consolidated investment funds. Movements in amounts attributable to external unit holders reflect the change in the overall returns in these funds in the year that are attributable to third parties, which is treated as a liability under IFRS, and will vary from year to year as the underlying investments change value. This change in value is included within “other expenditure”. The above table excludes interest on core structural borrowings which are presented separately in the income statement.
2022 compared with 2021
Total acquisition costs and other expenditure decreased by $680 million from $(4,560) million in 2021 to $(3,880) million in 2022, reflecting decreases primarily in Singapore, Hong Kong and Eastspring, partially offset by increases in Growth markets and other and central operations. The overall year-on-year decrease was mainly driven by the movements in amounts attributable to external unit holders of consolidated investment funds, which decreased by $866 million reflecting the proportion of the fall in the value of these funds in the year that is attributable to third parties.
In Hong Kong, the decrease of $122 million was mainly due to a decrease of $85 million in the amount classified as ‘movement in amounts attributable to external unit holders of consolidated investments funds’, representing a fall in value of the underlying funds that have been consolidated. In addition, acquisition costs and other operating expenses fell by $37 million.
In Indonesia, acquisition costs and other expenditure have fallen from $(439) million in 2021 to $(385) million in 2022 primarily as a result of lower renewal commissions reflecting lower renewal premium sales in recent years.
In Malaysia, acquisition costs and other expenditure have fallen from $(396) million in 2021 to $(351) million in 2022 primarily driven by a decrease of $23 million in the movement in the amounts attributable external unit holders of consolidated investment funds and lower acquisition costs (net of amounts deferred) following lower new business sales in the year.
33
In Singapore, the decrease of $591 million was primarily due to a decrease of $666 million from the movement in amounts attributable to external unit holders of consolidated investment funds, reflecting investment losses in the underlying funds being consolidated, partially offset by an increase of $75 million in other costs and expenses.
In Growth markets and other, acquisition costs and other expenditure increased by $122 million, mainly due to increased expenses and deferred acquisition cost amortisation as the business grows and we continue to invest.
The decrease of $100 million in Eastspring’s costs is due in part to lower commissions paid, which fell by $62 million, following lower inflows and the adverse impact of market movements on the value of funds under management.
The net expenditure that was unallocated to a segment included head office expenditure and elimination of intra-segment items. The increase of $110 million mainly reflected higher restructuring costs associated with the Group’s one-off costs associated with cost saving, regulatory and other initiatives in our business.
2021 compared with 2020
Total acquisition costs and other expenditure decreased by $91 million from $(4,651) million in 2020 to $(4,560) million in 2021, reflecting a decrease primarily in Singapore and central operations, partially offset by increases mainly in Hong Kong and Eastspring. The acquisition costs and other expenditure in other segments were broadly in line with the prior year.
In Hong Kong, the increase of $284 million was primarily due to the non-recurrence of $770 million ceding commission received in in 2020 due to a reinsurance transaction. Offsetting this increase in costs were lower acquisition costs net of deferral in 2021 as a result of lower new business sales and lower renewal commissions.
In Singapore, the decrease of $265 million in 2021 compared with 2020 was mainly due to a decrease of $508 million in the movements in amounts attributable to external unit holders of consolidated investment funds. This represents the third party interest in our consolidated investment funds. Excluding this movement, underlying expenses increased by $(243) million mainly as a result of an increase in acquisition costs incurred following higher sales.
The increase of $52 million in Eastspring’s costs reflected an increase in operating expenses driven by both higher staff costs and investments made in strengthening the capabilities of the business across dimensions including footprint, distribution, investment strategies and customer experience.
The net expenditure that was unallocated to a segment included head office expenditure and elimination of intra-segment items. The decrease of $148 million reflected the benefit of the delivery of activity to right-size head office costs, partially offset by higher restructuring and IFRS 17 implementation costs and the costs incurred by Prudential plc in connection with the demerger of Jackson.
Determining Adjusted Operating Profit of Operating Segments
Performance measure
The performance measure of operating segments utilised by the Group is IFRS operating profit based on longer-term investment returns (adjusted operating profit) as described below. This measurement basis distinguishes adjusted operating profit from other constituents of total profit or loss for the year as follows:
– | Short-term fluctuations in investment returns on shareholder-backed business; |
– | Amortisation of acquisition accounting adjustments arising on the purchase of business; and |
– | Gain or loss on corporate transactions. |
Determination of adjusted operating profit for investment and liability movements
With-profits business
For with-profits business in Hong Kong, Singapore and Malaysia, the adjusted operating profit reflects the shareholders’ share in the bonuses declared to policyholders. Value movements in the underlying assets of the with-profits funds only affect the shareholder results through indirect effects of investment performance on declared policyholder bonuses and therefore, do not affect directly the determination of adjusted operating profit.
Assets and liabilities held within unit-linked funds
The policyholder unit liabilities are directly reflective of the underlying asset value movements. Accordingly, the adjusted operating profit reflects the current year value movements in both the unit liabilities and the backing assets, which offset one another.
Other shareholder-backed long-term insurance business
In the case of other shareholder-financed business, the measurement of adjusted operating profit reflects that, for the long-term insurance business, assets and liabilities are held for the longer term. For this business the Group believes trends in underlying performance are better understood if the effects of short-term fluctuations in market conditions, such as changes in interest rates or equity markets, are excluded. In determining the profit on this basis, the following key elements are applied to the results of the Group’s shareholder-financed businesses.
(a) Policyholder liabilities that are sensitive to market conditions
Under IFRS, the degree to which the carrying values of liabilities to policyholders are sensitive to current market conditions varies between business units depending upon the nature of the ‘grandfathered’ measurement basis. Taiwan and India apply US GAAP, whose policyholder liabilities are not sensitive to market movements as they are locked in at policy inception.
34
Movements in liabilities for some types of business do require bifurcation between the elements that relate to longer-term market condition and short-term effects to ensure that at the net level (ie after allocated investment return and charge for policyholder benefits) the adjusted operating profit reflects longer-term market returns.
For certain non-participating business, for example in Hong Kong, the economic features are more akin to asset management products with policyholder liabilities reflecting asset shares over the contract term. Consequently, for these products, the charge for policyholder benefits in the adjusted operating profit reflects the asset share feature that is calculated assuming a longer-term return assumption rather than volatile movements that would otherwise be reflected if the IFRS balance sheet reserving basis was applied.
For other types of non-participating business, expected longer-term investment returns and interest rates are used to determine the movement in policyholder liabilities for determining adjusted operating profit. This ensures assets and liabilities are reflected on a consistent basis.
(b) Assets backing other shareholder-backed long-term insurance business
Except in the case of assets backing liabilities which are directly matched (such as unit-linked business) adjusted operating profit for assets backing shareholder-financed business is determined on the basis of expected longer-term investment returns. Longer-term investment returns comprise actual income receivable for the year (interest/dividend income) and longer-term capital returns, determined for debt and equity-type securities on the basis described below. The difference between the actual investment returns in the reporting period and the longer-term investment returns is recognised within short-term fluctuations in investment returns.
Debt securities and loans
As a general principle, for debt securities and loans, the longer-term investment returns comprise the interest receivable for the year and the amortisation of interest-related realised gains and losses to the date when sold securities would have otherwise matured (or a suitable proxy for this period). All unrealised gains and losses are treated as a component of short-term investment fluctuations. Consideration is given to the need to recognise an expected longer-term level of defaults for the securities within the longer-term investment returns, based on past performance and having regard to the credit quality of the portfolio, with any difference with actual credit-related realised losses arising in the year being included in short-term fluctuations. If, under this analysis, realised gains and losses are principally considered to be interest related with no significant credit-related losses based on past performance, then all realised gains and losses to date for these operations are treated as interest related and amortised to adjusted operating profit over the period to the date those securities would otherwise have matured and no separate charge to longer-term investment returns for credit defaults is made.
For Group debt securities at 31 December 2022, the level of interest-related realised gains and losses on previously sold bonds that had yet to be amortised to adjusted operating profit from short-term investment fluctuations was a net loss of $(98) million (2021: net gain of $515 million; 2020: net gain of $525 million).
Equity-type securities
For equity-type securities that comprise both the Group’s investments in direct equities and all of its collective investment scheme holdings, the longer-term rates of return are estimates of the long-term trend investment returns for income and capital having regard to past performance, current trends and future expectations. Different rates apply to different categories of the securities within this category.
For insurance operations, investments in equity-type securities held for non-linked shareholder-backed business amounted to $7,089 million as at 31 December 2022 (31 December 2021: $6,073 million). For Group’s investments in direct equities, the longer-term rates of return applied in 2022 ranged from 8.7 per cent to 16.9 per cent (2021: 7.3 per cent to 16.9 per cent; 2020: 5.8 per cent to 16.9 per cent). For Group’s collective investment scheme holdings, the longer-term rates of return applied ranged from 3.5 per cent to 10.7 per cent (2021: 3.6 per cent to 11.0 per cent; 2020: 3.7 per cent to 11.3 per cent) representing the range across business units of the weighted average expected longer-term return rates determined by reference to the underlying asset mix of the funds for each business unit. These rates are broadly stable from year to year but may be different between regions, reflecting, for example, differing expectations of inflation in each business unit.
The assumptions are for the returns expected to apply in equilibrium conditions. The assumed rates of return do not reflect any cyclical variability in economic performance and are not set by reference to prevailing asset valuations. The longer-term investment returns for the insurance joint ventures and associates accounted for using the equity method are determined on a similar basis as the other insurance operations described above.
Derivative value movements
Generally, derivative value movements are excluded from adjusted operating profit. The exception is where the derivative value movements broadly offset changes in the accounting value of other assets and liabilities included in adjusted operating profit.
Other non-insurance businesses
For these businesses, the determination of adjusted operating profit reflects the underlying economic substance of the arrangements. Generally, realised gains and losses are included in adjusted operating profit with temporary unrealised gains and losses being included in short-term fluctuations. In some instances, realised gains and losses on derivatives and other financial instruments are amortised to adjusted operating profit over a time period that reflects the underlying economic substance of the arrangements.
35
Explanation of Performance and Other Financial Measures
| | | | | | | | | | | | | | |
IFRS profit |
| | | | | | | | | | | | | |
| | | | AER | | CER* | | AER |
| CER† | ||||
|
| 2022 $m |
| 2021 $m |
| Change | % | 2021 $m |
| Change | % | 2020 $m |
| 2020 $m |
Profit before tax attributable to shareholders |
| 1,461 |
| 2,676 |
| (45) | | 2,586 |
| (44) | | 2,908 |
| 2,964 |
Tax charge attributable to shareholders' returns |
| (454) |
| (462) |
| 2 | | (443) |
| (2) | | (440) |
| (450) |
Profit from continuing operations for the year |
| 1,007 |
| 2,214 |
| (55) | | 2,143 |
| (53) | | 2,468 |
| 2,514 |
Loss from discontinued operations for the year, net of related tax |
| — |
| (5,027) |
| n/a |
| (5,027) |
| n/a | | (283) |
| (283) |
Profit (loss) for the year |
| 1,007 |
| (2,813) |
| n/a |
| (2,884) |
| n/a |
| 2,185 |
| 2,231 |
| | | | | | | | | | | | | | |
IFRS earnings per share |
|
|
|
|
|
|
|
|
|
|
|
|
|
|
| | | | AER | | CER | | AER | | CER† | ||||
|
| 2022 cents |
| 2021 cents |
| Change % | | 2021 cents |
| Change % | | 2020 cents |
| 2020 cents |
Basic earnings per share based on: |
| | | | | | | | | | | | | |
Total profit after tax from continuing operations |
| 36.5 | | 83.4 | | (56) | | 80.6 | | (55) | | 94.6 | | 96.4 |
Total loss after tax from discontinued operations |
| — |
| (161.1) |
| n/a |
| (161.2) |
| n/a |
| (13.0) | | (13.1) |
* For 2021, the CER results were calculated using the 2022 average exchange rates.
† For 2020, the CER results were calculated using the 2021 average exchange rates.
All discussions below address continuing operations only, unless otherwise stated.
(a)Group overview
2022 compared with 2021
Total IFRS profit after tax for 2022 was $1,007 million compared with a profit of $2,214 million in 2021. The decrease of $1,207 million primarily reflected a decrease in the profit before shareholder tax of $1,215 million from $2,676 million to $1,461 million, partially offset by a $8 million decrease in shareholder tax charge from $(462) million to $(454) million.
The effective tax rate on total IFRS profit in 2022 was 31 per cent (2021: 17 per cent), due to a higher proportion of losses on investments in FY22 compared to FY21, arising in jurisdictions where such losses are not subject to tax.
2021 compared with 2020
The decrease of $(254) million in profit after tax from continuing operations from $2,468 million in 2020 to $2,214 million in 2021 primarily reflected a decrease in the profit before shareholder tax of $(232) million from $2,908 million to $2,676 million, together with a $(22) million increase in shareholder tax charge from $(440) million to $(462) million.
The effective tax rate on total IFRS profit in 2021 was 17 per cent (2020: 15 per cent), primarily reflecting the adverse impact of investment losses on which no tax credit was recognised.
Further analysis of the results by each segment is provided below.
(b)Segment discussion
The Group’s operating segments for financial reporting purposes are defined and presented in accordance with IFRS 8, ‘Operating Segments’ on the basis of the management reporting structure and its financial management information. Further details on the Group’s determination of operating segments are provided in the ‘‘Determining Adjusted Operating Profit of Operating Segments’ section.
36
The following table shows Prudential’s IFRS consolidated total profit after tax and adjusted operating profit for the years indicated presented by business segment.
| | | | | | | | | | | | | | | | | | |
|
| | | | | | | | | AER | | CER* | ||||||
| | 2022 $m |
| 2021 $m |
| 2021 $m | ||||||||||||
| | | | Profit | | | | | | | | Profit | | | | | | |
| | Adjusted | | before | | | | | | Adjusted | | before | | | | | | Adjusted |
| | operating | | shareholder | | Shareholder | | Profit after | | operating | | shareholder | | Shareholder | | Profit after | | operating |
|
| profit |
| tax |
| tax charge |
| tax |
| profit |
| tax |
| tax charge |
| tax |
| profit |
CPL | | 368 | | (144) | | — | | (144) | | 343 | | 278 | | — | | 278 | | 329 |
Hong Kong | | 1,036 | | (159) | | (52) | | (211) | | 975 | | 1,108 | | (40) | | 1,068 | | 969 |
Indonesia | | 343 | | 303 | | (60) | | 243 | | 446 | | 436 | | (74) | | 362 | | 429 |
Malaysia |
| 364 |
| 342 |
| (90) |
| 252 |
| 350 |
| 336 |
| (71) |
| 265 |
| 330 |
Singapore |
| 678 |
| 484 |
| (78) |
| 406 |
| 663 |
| 461 |
| (67) |
| 394 |
| 646 |
Growth markets and other |
| 1,057 |
| 1,025 |
| (144) |
| 881 |
| 932 |
| 593 |
| (159) |
| 434 |
| 880 |
Eastspring |
| 260 |
| 260 |
| (26) |
| 234 |
| 314 |
| 314 |
| (30) |
| 284 |
| 299 |
Unallocated to a segment |
| (731) |
| (650) |
| (4) |
| (654) |
| (790) |
| (850) |
| (21) |
| (871) |
| (765) |
Total |
| |
| 1,461 |
| (454) |
| 1,007 |
| |
| 2,676 |
| (462) |
| 2,214 |
| |
| | | | | | | | | | | | | | | | | | |
| | | | | | | | | | AER | | CER* | ||||||
| | | | | | | | | | 2020 $m |
| 2020 $m | ||||||
| | | | | | | | | | | | Profit | | | | | | |
| | | | | | | | | | Adjusted | | before | | | | | | Adjusted |
| | | | | | | | | | operating | | shareholder | | Shareholder | | Profit after | | operating |
|
| |
| |
| |
| |
| profit |
| tax |
| tax charge |
| tax |
| profit |
CPL | | | | | | | | | | 251 | | 394 | | — | | 394 | | 269 |
Hong Kong | | | | | | | | | | 891 | | 1,009 | | (15) | | 994 | | 889 |
Indonesia | | | | | | | | | | 519 | | 534 | | (125) | | 409 | | 529 |
Malaysia | | | | | | | | | | 309 |
| 314 |
| (58) |
| 256 |
| 313 |
Singapore | | | | | | | | | | 574 |
| 608 |
| (87) |
| 521 |
| 589 |
Growth markets and other | | | | | | | | | | 835 |
| 673 |
| (125) |
| 548 |
| 841 |
Eastspring | | | | | | | | | | 283 |
| 283 |
| (30) |
| 253 |
| 286 |
Unallocated to a segment | | | | | | | | | | (905) |
| (907) |
| – |
| (907) |
| (926) |
Total | | | | | | | | | | |
| 2,908 |
| (440) |
| 2,468 |
| |
* Comparatives presented in this table on an AER basis except for Adjusted operating profit, for which the CER basis is also presented. For 2021, the CER results were calculated using the 2022 average exchange rates. For 2020, the CER results were calculated using the 2021 average exchange rates. CER amounts for profit after tax are set out above in the table at the start of this ‘Explanation of Performance and Other Financial Measures’ section.
CPL
Given that CPL, Prudential’s joint venture business in the Chinese Mainland, is accounted for on the equity method, there is no amount related to CPL in the Group’s tax charge in the income statement. Management’s focus is on analysing the profit before shareholder tax (to be consistent with its review of other segments) and hence, on the segmental analysis basis, the tax related to life joint ventures and associate including that of CPL is allocated to the ‘Growth markets and other’ segment.
2022 compared with 2021
The decrease of $422 million from a profit before shareholder tax of $278 million in 2021 to a loss of $(144) million in 2022 was primarily due to adverse equity market movements and the impact of the change in the discount rate used to calculate policyholder liabilities in the period in the year. Excluding this effect, adjusted operating profit, the Group’s segmental measure which excludes these short-term market effects, grew by 12 per cent on a CER basis (7 per cent on an AER basis) to $368 million reflecting growth in the underlying in-force portfolio from higher sales volumes in recent years and improved experience during the year.
2021 compared with 2020
The decrease in the profit before shareholder tax of $116 million from $394 million in 2020 to $278 million in 2021 was due to lower investment returns in 2021 following declining bond yields resulting in lower discount rates to measure policyholder liabilities partially offset by unrealised gains on bond assets. Excluding this effect, profit before shareholder tax grew in 2021. This was driven by a 28 per cent increase on a CER basis (37 per cent on an AER basis) in adjusted operating profit to $343 million, primarily driven by growth in our in-force portfolio, evident by a 19 per cent growth (26 per cent on an AER basis) in recurring premiums in 2021.
Hong Kong
2022 compared with 2021
The decrease of $1,279 million from profit after tax of $1,068 million in 2021 to loss after tax of $(211) million in 2022 was due to a decrease in profit before shareholder tax of $1,267 million and an increase in shareholder tax charge of $12 million.
The decrease in profit before shareholder tax was driven by bond losses from material increases in bond yields and widening credit spreads, coupled with equity losses, not being fully offset by the consequential benefit of a higher discount rate being used to calculate policyholder liabilities. These market effects are excluded from the segmental measure of Adjusted operating profit, which grew by 7 per cent on a CER basis (6 per cent on an AER basis) to $1,036 million. This reflects the benefit of the accumulating nature of the asset shares underpinning our flagship critical illness product, higher levels of profits from our with-profits business given the ageing of certain cohorts, and the impact from changes to underlying product profit profiles as a result of the adoption of the risk-based capital regime.
37
The effective shareholder tax rate on profits was negative 33 per cent in 2022 compared with 4 per cent in 2021. The 2022 effective tax rate reflects the mathematical combination of a normal tax charge on adjusted operating profit and significant non-operating losses on which no tax credit is recognised given the tax charge in Hong Kong is based on net insurance premiums.
2021 compared with 2020
The increase of $74 million in the profit after tax from $994 million in 2020 to $1,068 million in 2021 was due to an increase in profit before shareholder tax of $99 million partially offset by an increase in shareholder tax charge of $25 million.
The increase in profit before shareholder tax was driven by the continued growth of in-force shareholder-backed business. Adjusted operating profit was up 10 per cent on a CER basis (9 per cent on an AER basis) to $975 million and was driven by our long-term focus on regular premium business and strong retention of both our domestic and Chinese Mainland customers. It also reflected the on-going growth of our health and protection business and, for our flagship critical illness products, the compounding benefit to adjusted operating profit given the accumulating nature of asset shares. Earnings outperformed growth in renewal premiums, as some policies within the with-profits funds reached the end of their premium paying term, albeit they continued to contribute to annual adjusted operating profit through the with-profits bonus mechanism.
Outside of adjusted operating profit, the impact of more favourable movements in short-term fluctuations in investment returns, was offset by the non-repeat of the benefit from the reinsurance transaction undertaken in 2020.
The effective shareholder tax rate on profits was 4 per cent in 2021 compared with 1 per cent in 2020.
Indonesia
2022 compared with 2021
The decrease of $119 million in the profit after tax from $362 million in 2021 to $243 million in 2022 reflected a decrease in profit before shareholder tax of $133 million, partially offset by a decrease in shareholder tax charge of $14 million.
The decrease in profit before shareholder tax was driven by a decrease of 20 per cent on a CER basis (23 per cent on an AER basis) in adjusted operating profit reflecting lower new business sales in recent years, lower fee income from unit-linked business due to adverse market movements and higher medical claims levels, specifically in the second half of the year, as the country emerged from the restrictions of the pandemic and policyholders felt more comfortable in undertaking usual medical activity. 2022 also saw an increase in investment losses when compared to 2021.
The effective shareholder tax rate was 20 per cent in 2022 compared with 17 per cent in 2021. The higher effective tax rate was principally due to unrealised investment losses in 2022 which receive a tax credit at a reduced rate.
2021 compared with 2020
The decrease of $47 million in the profit after tax from $409 million in 2020 to $362 million in 2021 reflected a decrease in profit before shareholder tax of $98 million, partially offset by a decrease in shareholder tax charge of $51 million.
The decrease in profit before shareholder tax was primarily due to lower new business sales over recent years and adverse Covid-19-related claims experience, with adjusted operating profit reduced by (16) per cent on a CER basis ((14) per cent on an AER basis).
The effective shareholder tax rate was 17 per cent in 2021 compared with 23 per cent in 2020. The lower effective tax rate was principally due to realised investment gains in 2021 which were subject to a lower rate of taxation.
Malaysia
2022 compared with 2021
The decrease of $13 million in the profit after tax from $265 million in 2021 to $252 million in 2022 reflected an increase in profit before shareholder tax of $6 million being more than offset by an increase in shareholder tax charge of $19 million.
The increase in profit before shareholder tax of $6 million was driven by adjusted operating profit growth of 10 per cent on a CER basis (4 per cent on an AER basis), which was supported by the growth of our in-force business, with shareholder-backed renewal premiums increasing by 8 per cent on a CER basis (1 per cent on an AER basis). The increase in adjusted operating profit was partially offset by an increased level of negative movements in short-term fluctuations in investment returns.
The effective shareholder tax rate on profits was 26 per cent in 2022 compared with 21 per cent in 2021. The higher rate primarily reflects a combination of a higher proportion of non-tax deductible expenses, the impact of a temporary tax rate increase, from 24 per cent to 33 per cent on taxable profits in 2022 exceeding 100 million Malaysian Ringgit, and the impact from prior year adjustments.
2021 compared with 2020
Profit after tax in 2021 was broadly in line with 2020 due to increase in profit before shareholder tax being mostly offset by increase in the shareholder tax charge.
The increase in profit before shareholder tax of $22 million was driven by adjusted operating profit growth of 12 per cent on a CER basis (13 per cent on an AER basis) which was supported by the growth of our in-force health and protection business, with increased shareholder-backed renewal premiums, and higher fee income as a result of increased funds held within unit-linked funds.
38
The increase in adjusted operating profit was partially offset by negative movements in short-term fluctuations in investment returns with losses on bonds, from an increase in interest rates, more than offsetting the impact of higher discount rates on policyholder liabilities.
The effective shareholder tax rate on profits was 21 per cent in 2021 compared with 18 per cent in 2020.
Singapore
2022 compared with 2021
The increase of $12 million in the profit after tax from $394 million in 2021 to $406 million in 2022 primarily reflected an increase in profit before shareholder tax of $23 million partially offset by an increase in shareholder tax charge of $11 million.
The increase in profit before shareholder tax was mainly driven by the increase in adjusted operating profit by 5 per cent on a CER basis (2 per cent on an AER basis) reflecting the continued growth of our in-force business evidenced by 9 per cent on a CER basis (5 per cent on an AER basis) growth in shareholder-backed renewal premiums alongside higher profits from our with-profits business, offset in part by the impact on revenue from adverse market movements.
The effective shareholder tax rate on profits was 16 per cent in 2022, similar to 15 per cent in 2021.
2021 compared with 2020
The decrease of $127 million in the profit after tax from $521 million in 2020 to $394 million in 2021 primarily reflected a decrease in profit before shareholder tax of $147 million partially offset by a decrease in shareholder tax charge of $20 million.
The decrease in profit before shareholder tax primarily reflected negative short-term fluctuations in investment returns from bond losses in 2021, compared with bond gains in 2020, driven by the increase in interest rates, which more than offset the impact of higher discount rates on policyholder liabilities.
The fall described above was offset by an increase in adjusted operating profit of 13 per cent on a CER basis (16 per cent on an AER basis) reflecting the continued growth of our in-force business, including in protection and savings products where we believe demand will continue as the population ages and seeks to meet its health and retirement needs.
The effective shareholder tax rate on profits was 15 per cent in 2021, in line with 2020.
Growth markets and other
2022 compared with 2021
The increase of $447 million in the profit after tax from $434 million in 2021 to $881 million in 2022 reflected an increase in profit before shareholder tax of $432 million and a decrease in shareholder tax charge of $15 million.
The increase in profit before shareholder tax was driven by the combined impact of higher adjusted operating profit and the benefit from refinements to the reserving basis following adoption of HK RBC (as discussed in note C3.2 to the Consolidated Financial Statements) that is part of other items included within Growth markets and other under the definition of the Group’s segments. This was partly offset by losses on equities and bonds, from higher interest rates in many growth markets, exceeding the movement in policyholder liabilities from a higher discount rate, particularly in Taiwan where policyholder liabilities are less sensitive to interest rate movements. In addition, Thailand had higher losses in the year due to the non-recurrence of a benefit in 2021 from a change to allow for illiquidity premium in the calculation of the valuation interest rate used to value long-term liabilities.
Growth markets and other segment generated adjusted operating profit of $1,057 million, up 20 per cent on a CER basis (13 per cent on an AER basis). This includes other items of $211 million (2021: $217 million on an AER basis and $208 million on a CER basis) which in 2022 comprised largely the impact of the adoption of the HK RBC (as discussed further in note C3.2 of the IFRS financial results). The adjusted operating profit for the Growth markets (excluding other items) increased by 26 per cent on a CER basis (18 per cent on an AER basis) to $846 million, driven by Thailand and India. Thailand achieved 24 per cent growth on a CER basis (13 per cent on an AER basis) in adjusted operating profit following growth in new business over recent years as we upscaled the business through our bank partnerships with TMB Thanachart Bank (TTB) and United Overseas Bank (UOB), while India saw improved claims experience in the period, following the spike in Covid-19 cases seen in 202112.
The effective tax rate on total IFRS profit in 2022 was 14 per cent (2021: 27 per cent), reflecting a greater proportion of non-operating losses attracting a tax credit in 2022 than in 2021.
2021 compared with 2020
The decrease of $114 million in the profit after tax from $548 million in 2020 to $434 million in 2021 reflected a decrease in profit before shareholder tax of $80 million and an increase in shareholder tax charge of $34 million.
39
The decrease in the profit before shareholder tax was mainly reflective of a higher loss in short-term fluctuations in investment returns in 2021 compared with 2020 due to losses on bond asset values from higher interest rates in many growth markets exceeding the movement in policyholder liabilities from a higher discount, particularly in Taiwan where policyholder liabilities are less sensitive to interest rate movements. This was partially offset by the benefit from a change to allow for illiquidity premium in the calculation of the valuation interest rate used to value long-term insurance liabilities in Thailand, as discussed in note C3.2 to the consolidated financial statements. The reduction in profit discussed above was offset by an increase in adjusted operating profit of 11 per cent on a CER basis (12 per cent on an AER basis), reflective of in-force growth which is supported by APE sales in recent years. Vietnam, the Philippines and Thailand all reported double-digit growth. In Thailand double-digit growth in adjusted operating profit was achieved through APE sales growth from the expansion of the strategic partnerships and resilient in-force growth. In India, the result for the period reflected higher Covid-19-related claims following the large spike in cases seen in the first half of the year.
The effective shareholder tax rate on profits was 27 per cent in 2021 compared with 19 per cent in 2020. The higher effective tax rate was primarily due to investment losses in Taiwan which were not tax deductible in 2021 compared to non-taxable investment gains in 2020.
Asset management – Eastspring
| | | | | | | | | | | | | | | | | |
| | | | | AER | | CER | | AER | | |||||||
|
| | 2022 $m |
| 2021 $m |
| Change % |
| 2021 $m |
| Change % |
| 2020 $m |
| |||
| | | | | | | | | | | | | | | | | |
External funds under management* ($bn) |
| | 81.9 |
| | 94.0 |
| (13) |
| | 87.5 | | (6) | | | 93.9 | |
Funds managed on behalf of M&G plc ($bn) |
| | 9.3 |
| | 11.5 |
| (19) |
| | 11.6 | | (20) | | | 15.7 | |
External funds under management ($bn) |
| | 91.2 |
| | 105.5 |
| (14) |
| | 99.1 | | (8) | | | 109.6 | |
| | | | | | | | | | | | | | | | | |
Total internal funds under management or advice ($bn) | | | 130.2 | | | 153.0 | | (15) | | | 152.5 | | (15) | | | 138.2 | |
| | | | | | | | | | | | | | | | | |
Total funds under management or advice ($bn) | | | 221.4 | | | 258.5 | | (14) | | | 251.6 | | (12) | | | 247.8 | |
| | | | | | | | | | | | | | | | | |
Total external net flows*,14 | | | (1,586) | | | 613 | | n/a | | | 765 | | n/a | | | (9,972) | |
| | | | | | | | | | | | | | | | | |
Analysis of adjusted operating profit |
| |
|
| |
|
|
|
| | | | | | |
| |
Retail operating income |
| | 392 |
| | 449 |
| (13) |
| | 424 | | (8) | | | 390 | |
Institutional operating income |
| | 268 |
| | 298 |
| (10) |
| | 289 | | (7) | | | 256 | |
Operating income before performance-related fees |
| | 660 |
| | 747 |
| (12) |
| | 713 | | (7) | | | 646 | |
Performance-related fees |
| | 1 |
| | 15 |
| (93) |
| | 15 | | (93) | | | 7 | |
Operating income (net of commission) |
| | 661 |
| | 762 |
| (13) |
| | 728 | | (9) | | | 653 | |
Operating expense |
| | (360) |
| | (403) |
| 11 |
| | (387) | | 7 | | | (336) | |
Group's share of tax on joint ventures' adjusted operating profit |
| | (41) |
| | (45) |
| 9 |
| | (42) | | 2 | | | (34) | |
Adjusted operating profit |
| | 260 |
| | 314 |
| (17) |
| | 299 | | (13) | | | 283 | |
Adjusted operating profit after tax |
| | 234 |
| | 284 |
| (18) |
| | 271 | | (14) | | | 253 | |
| | | | | | | | | | | | | | | | | |
Average funds under management or advice by Eastspring |
| $ | 229.4bn |
| $ | 251.7bn |
| (9)% | | $ | 240.9bn | | (5)% | | $ | 227.1bn | |
Fee margin based on operating income |
| | 29bps |
| | 30bps |
| (1)bp |
| | 30bps | | (1)bp | | | 28bps | |
Cost/income ratio15 |
| | 55 | % | | 54 | % | +1ppt |
| | 54 | % | +1ppt | | | 52 | % |
* | Excluding funds managed on behalf of M&G plc. |
Eastspring, the Group’s asset management business, had total funds under management or advice16 of $221.4 billion at 31 December 2022 (31 December 2021: $251.6 billion on a CER basis). Compared with 2021, Eastspring’s average funds under management or advice decreased by (5) per cent on a CER basis ((9) per cent on an AER basis) to $229.4 billion (2021: $240.9 billion on a CER basis; $251.7 billion on an AER basis), reflecting adverse market movements during the year, partially offset by net inflows.
We saw total net inflows of $4.5 billion over 2022 (2021: $5.8 billion on an AER and CER basis) which included internal net inflows from our insurance businesses totalling $7.8 billion (2021: $10.4 billion on a CER basis; $10.7 billion on an AER basis). These flows were partially offset by third-party outflows (excluding money market funds and funds managed on behalf of M&G plc) of $(1.6) billion (2021: net inflows of $0.8 billion on a CER basis; net inflows of $0.6 billion on an AER basis), primarily from our bond funds in the retail business following increases in interest rates throughout the year, and $(0.8) billion (2021: $(3.9) billion on a CER basis; $(4.0) billion on an AER basis) of net outflows from funds managed on behalf of M&G plc.
Eastspring’s profit before shareholder tax decreased from $314 million in 2021 to $260 million in 2022.
Eastspring’s adjusted operating profit of $260 million was down (13) per cent on a CER basis ((17) per cent on an AER basis) compared with the prior year, reflecting a decline in the average funds under management or advice and losses on shareholder investments including seed capital in its retail funds, compared with gains in 2021. Operating income before gains and losses on shareholder investments and performance-related fees was (4) per cent lower on a CER basis ((8) per cent lower on an AER basis), reflecting a (5) per cent decline on a CER basis ((9) per cent on an AER basis) in average funds under management or advice. Despite a 7 per cent reduction in operating costs on a CER basis (11 per cent on an AER basis), the cost/income ratio increased marginally to 55 per cent (2021: 54 per cent on an AER and CER basis) due to the effect of mark-to-market movements on shareholders’ investments.
The effective shareholder tax rate on Eastspring was 10 per cent in 2022, in line with 2021.
40
2021 compared with 2020
Eastspring’s total funds under management or advice were $258.5 billion at 31 December 2021 (31 December 2020: $247.8 billion), reflecting favourable internal net flows and higher equity markets. Compared with 2020, Eastspring’s average funds under management or advice increased by 11 per cent on an AER basis (9 per cent on a CER basis).
Eastspring saw total net inflows of $5.8 billion over 2021 (2020: $(11.5) billion) which included internal net inflows from our life businesses of $10.7 billion (2020: $8.5 billion) and from third-parties (excluding money market funds) of $0.6 billion (2020: $(10.0) billion of outflows). Offsetting these amounts were $(4.0) billion of net outflows for funds managed on behalf of M&G plc with further net outflows of about $(0.9) billion expected in 2022. Third-party net flows were driven by $1.1 billion of retail net inflows, partly offset by net institutional outflows. Overall there were external net inflows into equity funds and external net outflows from fixed income funds, which contributed to an increase in the retail fee margin.
The profit before shareholder tax of Eastspring was $314 million in 2021. The increase of $31 million from $283 million in 2020 was primarily driven by higher average funds under management or advice and a 2 basis points increase in fee margin reflecting an improved asset mix.
Eastspring’s adjusted operating profit of $314 million was up 10 per cent compared with 2020 on a CER basis (up 11 per cent on an AER basis). Operating income before performance related fees was 16 per cent higher, driven by higher average funds under management or advice and a 2 basis points increase in fee margin reflecting an improved asset mix. The cost/income ratio increased to 54 per cent (2020: 52 per cent) reflecting both higher staff costs and investments made in strengthening the capabilities of the business across dimensions including footprint, distribution, investment strategies and customer experience.
Central costs unallocated to a segment
| | | | | | |
|
| 2022 $m |
| 2021 $m |
| 2020 $m |
Investment return and other income |
| 39 |
| 21 |
| (15) |
Interest payable on core structural borrowings |
| (200) |
| (328) |
| (316) |
Corporate expenditure |
| (276) |
| (298) |
| (412) |
|
| (437) |
| (605) |
| (743) |
Restructuring and IFRS 17 implementation costs |
| (294) |
| (185) |
| (162) |
Central costs unallocated to a segment |
| (731) |
| (790) |
| (905) |
Other income and expenditure
Central costs (before restructuring and IFRS 17 implementation costs) comprising investment return and other income, interest payable on core structural borrowings and corporate expenditures were 26 per cent on a CER basis (28 per cent on an AER basis) lower than the prior period, reflecting the benefit of the debt reduction programme completed in January 2022. Interest payable on core structural borrowings reduced by $128 million compared with 2021. Total head office expenditure was $(276) million (2021: $(280) million on a CER basis; $(298) million on an AER basis) and the Group has completed its programme to deliver a targeted reduction in central operating expenses of around $70 million6 of cost savings from 2023. Net investment income and other items for the year was $39 million (2021: $21 million on an AER and CER basis).
Restructuring costs of $(294) million (2021: $(178) million on a CER basis; $(185) million on an AER basis) reflect the Group’s substantial and ongoing IFRS 17 project, and one-off costs associated with cost saving, regulatory and other initiatives in our business. IFRS 17 costs are expected to remain elevated until the standard is fully implemented in 2023.
The effective shareholder tax rate on losses unallocated to a segment was negative 1 per cent in 2022, similar to the 2021 effective tax rate of negative 2 per cent. Losses unallocated to a segment tend to have a low effective tax rate due to the absence of taxable profits against which interest expense, head office and other costs can be offset.
2021 compared with 2020
Central costs comprising investment return and other income, interest payable on core structural borrowings and corporate expenditures were 30 per cent on a CER basis (28 per cent on an AER basis) lower than 2020 reflecting the delivery of the $180 million of right-sizing of our head office costs alongside the evolving footprint of the business.
Interest costs on core structural borrowings of $(328) million (2020: $(316) million on an AER and CER basis) included interest costs of $(126) million related to the four tranches of debt that were redeemed in December 2021 and January 2022 using the proceeds from the share offer during the year, which are not expected to recur going forward.
Restructuring costs of $(185) million (2020: $(162) million) reflect the Group’s substantial and ongoing IFRS 17 project, and one-off costs associated with cost saving, regulatory and other initiatives in our business. IFRS 17 costs are expected to remain elevated until the standard is fully implemented.
The effective shareholder tax rate on losses unallocated to a segment was negative 2 per cent in 2021 compared with nil per cent in 2020, principally due to irrecoverable withholding tax suffered on remittances received from certain jurisdictions and on certain investment income.
41
(c) Other financial commentary based on management’s view
Analysis of profit drivers13
| | | | | | | | | | | | | |
|
| 2022 | | 2021 AER | | 2021* CER |
| ||||||
|
| |
| Margin |
| |
| Margin |
| |
| Margin | |
| | $m | | bps | | $m | | bps | | $m | | bps | |
Profit margin analysis of long-term insurance continuing operations13 | | | | | | | | | | | | | |
Spread income | | 307 |
| 72 | | 312 |
| 66 | | 299 |
| 65 | |
Fee income | | 331 |
| 102 | | 345 |
| 103 | | 329 |
| 103 | |
With-profits | | 160 |
| 20 | | 135 |
| 16 | | 133 |
| 16 | |
Insurance margin | | 3,219 |
| | | 2,897 |
|
| | 2,795 |
|
| |
Other income | | 3,429 |
| | | 3,239 |
|
| | 3,105 |
|
| |
Total life insurance income | | 7,446 |
| | | 6,928 |
|
| | 6,661 |
|
| |
Expenses: | | |
|
| | |
|
| | |
|
| |
Acquisition costs | | (2,346) |
| (53) | % | (2,085) |
| (50) | % | (2,000) |
| (50) | % |
Administration expenses | | (1,732) |
| (230) | | (1,656) |
| (205) | | (1,581) |
| (201) | |
DAC adjustments | | 554 |
| | | 566 |
|
| | 545 |
|
| |
Share of related tax charges from joint ventures and associates | | (76) | | | | (44) | | | | (42) | | | |
Eastspring adjusted operating profit (see section above) | | 260 | | | | 314 | | | | 299 | | | |
Central costs unallocated to a segment (see section above) | | (731) | | | | (790) | | | | (765) | | | |
Corporate transactions (see section below) | | 11 | | | | (94) | | | | (91) | | | |
Other items principally driven by short-term market fluctuations (see section below) | | (1,925) |
| | | (463) |
|
| | (440) |
|
| |
Profit before tax attributable to shareholders | | 1,461 |
| | | 2,676 |
|
| | 2,586 |
|
| |
| | | | | | | | | |
|
| 2020 AER | | 2020† CER |
| ||||
| | | | Margin | | | | Margin |
|
|
| $m |
| bps |
| $m |
| bps |
|
Profit margin analysis of long-term insurance continuing operations13 | | | | | | | | | |
Spread income |
| 296 |
| 74 |
| 304 |
| 76 | |
Fee income |
| 282 |
| 101 |
| 287 |
| 101 | |
With-profits |
| 117 |
| 16 |
| 118 |
| 16 | |
Insurance margin |
| 2,648 |
| |
| 2,689 |
|
| |
Other income |
| 3,219 |
| |
| 3,262 |
|
| |
Total life income |
| 6,562 |
| |
| 6,660 |
|
| |
Expenses: | | | | | | | | | |
Acquisition costs | | (1,928) | | (51) | % | (1,964) | | (50) | % |
Administration expenses | | (1,591) | | (234) |
| (1,609) | | (234) | |
DAC adjustments | | 382 | | | | 392 | | | |
Share of related tax charges from joint ventures and associates |
| (46) |
|
|
| (49) |
|
| |
Eastspring adjusted operating profit (see section above) |
| 283 |
| | | 286 |
| | |
Central costs unallocated to a segment (see section above) |
| (905) |
| | | (926) |
| | |
Corporate transactions (see section below) |
| 735 |
| |
| 733 |
|
| |
Other items principally driven by short-term market fluctuations (see section below) |
| (584) |
| |
| (559) |
|
| |
Profit before tax attributable to shareholders |
| 2,908 |
| |
| 2,964 |
|
| |
* For 2021, the CER results were calculated using the 2022 average exchange rates
† For 2020, the CER results were calculated using the 2022 average exchange rates
Profit margin analysis of long-term insurance operations
Insurance margin-related revenues grew by 15 per cent on a CER basis (11 per cent on an AER basis). This increase arises both from the growth of our business in the current and recent years, supported by our focus on recurring premium health and protection products, and from the adoption of HK RBC in the year. While medical claims have begun to normalise (and increase) as people return to usual claim patterns post the pandemic, this has been balanced by a fall in mortality claims in the year.
Fee income increased by 1 per cent on a CER basis (decreased by 4 per cent on an AER basis), reflecting premium contributions largely offset by unfavourable market movements, while spread income increased by 3 per cent on a CER basis (decreased by 2 per cent on an AER basis), reflecting in-force business growth with the improvement in margin primarily driven by the impact of rising interest rates.
With-profits earnings relate to the shareholders’ share in bonuses declared to policyholders. As these bonuses are typically weighted towards the end of a contract, under IFRS, with-profit earnings consequently emerge only gradually over time. The 20 per cent on a CER basis (19 per cent on an AER basis) growth in with-profits earnings reflects the ongoing growth and aging of certain cohorts within these portfolios.
42
Other income primarily represents amounts deducted from premiums to cover acquisition costs and administration expenses. As such, the growth of 10 per cent on a CER basis (6 per cent on an AER basis) from 2021 largely reflects premium growth in the year for our shareholder-backed business. Acquisition costs increased in the year, driven by higher APE sales as compared with the prior year. Administration expenses, including renewal commissions, increased by 10 per cent on a CER basis (5 per cent increase on an AER basis), reflecting in-force business growth and sales and premium tax-related provisions. Both acquisition costs and administration expenses reflect our continued investment in the business to enhance and maintain our capabilities for future growth.
2021 compared with 2020
The profitability of the Group’s long-term insurance operations continued to be based on high-quality drivers. Insurance margin-related revenues grew by 8 per cent growth on a CER basis (9 per cent on an AER basis) reflecting our ongoing focus on recurring premium health and protection products and the associated continued growth of our in-force business, partially offset by a more normalised claims experience following the lower level of claims seen in 2020 and higher Covid-19 claims in Indonesia and India in 2021.
Fee income increased by 20 per cent on a CER basis (22 per cent on an AER basis), reflecting the beneficial impact of stronger equity markets and premium contributions while spread income increased by 3 per cent on a CER basis (5 per cent on an AER basis), with a fall in margin due to country mix.
With-profits earnings relate principally to the shareholders’ share in bonuses declared to policyholders. As these bonuses are typically weighted to the end of a contract, under IFRS, with-profit earnings consequently emerge only gradually over time. The 14 per cent growth on a CER basis (15 per cent on an AER basis) in with-profits earnings reflected the ongoing growth in these portfolios.
Other income primarily represents amounts deducted from premiums to cover acquisition costs and administration expenses. As such, the 1 per cent decline in other income on a CER basis (1 per cent increase on an AER basis) from 2020 reflected changes in product mix partially offset by higher premiums on shareholder-backed business. Acquisition costs increased in the year, largely due to higher APE sales as compared with the prior year. This increase in acquisition costs led to an increase in the costs deferred and therefore higher DAC adjustments in the year. Administration expenses, including renewal commissions, increased by 3 per cent on a CER basis (4 per cent increase on an AER basis) reflecting in-force business growth.
Corporate transactions and other items principally driven by short-term market fluctuations
Other items principally driven by short-term fluctuations in investment returns on shareholder-backed business were negative $(1,915) million (2021: negative $(435) million on a CER basis; negative $(458) million on an AER basis) and a gain of $11 million from corporate transactions (2021: loss of $(91) million on a CER basis; loss of $(94) million on an AER basis).
The increase in the level of short-term fluctuations reflects the significant increase in interest rates during the year compared with 2021 and the fall in equity markets during the year, compared with equity market gains in 2021. Decreases in bond values from rising interest rates are not fully offset by reductions in policyholder liabilities as assets held will exceed liabilities, given the need to hold capital in line with local regulations, while some regimes have policyholder liabilities that do not directly reflect changes in interest rates or reprice more slowly than assets. This loss was offset in part from the benefit arising from the early adoption of the HK RBC.
Corporate transactions include a $62 million realised gain from the sale of 8.7 million shares in Jackson Financial Inc. during 2022. At 31 December 2022, we held 9.2 per cent of the shares17 in Jackson Financial Inc. which had a fair value of $266 million. Further information on corporate transactions is presented in note D1.1 to the IFRS financial results.
2021 compared with 2020
Other items principally driven by short-term fluctuations in investment returns on shareholder- backed business were negative $(458) million, (2020: negative $(554) million on a CER basis; $(579) million on an AER basis).
Short-term fluctuations reflected the net impact from an increase in interest rates in most Asia markets on bond asset values and on the valuation interest rates (VIRs) used to determine policyholder liabilities.
Costs associated with corporate transactions of $(94) million (2020: gain of $733 million on a CER basis; $735 million on an AER basis) include the cost incurred by Prudential plc in connection with the separation of Jackson including key management changes.
IFRS effective tax rates for continuing operations
2022
The effective tax rate on total IFRS profit in 2022 was 31 per cent (2021: 17 per cent), reflecting the adverse impact of investment losses on which no tax credit is recognised.
2021
The effective tax rate on total IFRS profit in 2021 was 17 per cent (2020: 15 per cent). The increase in the 2021 effective tax rate reflects the adverse impact of investment losses on which no tax credit is recognised.
43
From 2024 onwards, the effective tax rate is likely to be impacted by a combination of the Organisation for Economic Co-operation and Development (OECD) proposals to implement a global minimum tax rate of 15 per cent and some jurisdictions where Prudential operates implementing a domestic minimum tax based on the OECD proposals. Through 2021, 2022 and early 2023, the OECD has issued model rules, guidance and a number of supplementary documents. Further OECD documents are expected during the course of 2023. A number of jurisdictions where Prudential has operations either have already issued or intend to issue draft legislation to implement the OECD rules into domestic tax law. Detailed analysis and consideration of all of these documents is ongoing.
Total tax contributions from continuing operations
The Group continues to make significant tax contributions in the jurisdictions in which it operates, with $1,009 million remitted to tax authorities in 2022. This was similar to the equivalent amount of $1,071 million5 remitted in 2021 after allowing for movements in exchange rates.
Change of tax residence of Prudential plc
In 2022 the Prudential Board decided, in the context of having demerged M&G plc in 2019 and Jackson Financial Inc. in 2021 and its now exclusive focus on the growth markets of Asia and Africa, that the roles of the Chief Executive Officer and Group Chief Financial Officer would be based in Asia where Prudential’s largest businesses, the Group’s regulator and the rest of the senior management team are located. As a result of these actions, the tax residence of Prudential plc has changed to Hong Kong with effect from 3 March 2023. This is an immediate consequence of a Board meeting of that date in Hong Kong, where the Board now regularly meets, and also the commencement of the new Chief Executive Officer’s employment in Hong Kong on 25 February 2023. The change of tax residence to Hong Kong is not expected to impact materially the Group’s total corporate income tax payment amounts or the location of those payments. Of the $1,009 million total taxes remitted in 2022, over $950 million related to our Asian and African insurance and asset management businesses who pay and collect taxes where they do business and where they make investments. None of these tax remittances will be affected by Prudential plc changing tax residence. This change does not impact Prudential plc’s legal structure or place of incorporation which remains in the UK. Further detail, including tax guidance for relevant shareholders, can be found at www.prudentialplc.com.
Tax strategy
The Group publishes its tax strategy annually which, in addition to complying with the mandatory UK (Finance Act 2016) requirements, also includes a number of additional disclosures, including a country-by-country disclosure of revenues, profits, average employee numbers and taxes for all jurisdictions where more than $5 million tax was paid. This disclosure is included as a way of demonstrating that our tax footprint (ie where we pay taxes) is consistent with our business footprint. An updated version of the tax strategy, including 2022 data, will be available on the Group’s website before 31 May 2023.
Shareholders’ equity
Group IFRS shareholders' equity
| | | | | |
|
| 2022 $m |
| 2021 $m | |
Profit from continuing operations for the year |
| 1,007 |
| 2,214 | |
Less non-controlling interest from continuing operations |
| (9) |
| (22) | |
Profit after tax for the year attributable to shareholders from continuing operations |
| 998 |
| 2,192 | |
Net decrease in shareholders’ equity from discontinued operations (see note D1.2 in the IFRS financial results) |
| — |
| (6,283) | |
Demerger dividend in-specie of Jackson |
| — |
| (1,735) | |
Exchange movements, net of related tax |
| (531) |
| (165) | |
Other external dividends |
| (474) |
| (421) | |
Issue of equity shares |
| (4) |
| 2,382 | |
Other (including revaluation of Jackson residual interest since demerger) |
| (117) |
| 240 | |
Decrease in shareholders’ equity |
| (128) |
| (3,790) | |
Shareholders’ equity at beginning of the year |
| 17,088 |
| 20,878 | |
Shareholders’ equity at end of the year |
| 16,960 |
| 17,088 | |
Shareholders' value per share15 |
| 617 | ¢ | 622 | ¢ |
Group IFRS shareholders’ equity decreased marginally to $17.0 billion at 31 December 2022, reflecting profit generated during the year, offset by dividend payments of $(0.5) billion, adverse exchange movements of $(0.5) billion and movements including the revaluation of the residual interest in Jackson Financial Inc.
44
New business performance
The Group reports APE as a measure of new business sales, which is a key metric for the Group’s management of the development and growth of the business. Therefore, the Group sees this as a measure that is relevant for both its insurance subsidiaries and its insurance joint ventures and associate. APE is calculated as the aggregate of regular premiums and one-tenth of single premiums on new business written during the year for all insurance products, including premiums for contracts designated as investment contracts under IFRS 4. APE differs from the IFRS measure of gross premiums earned. A reconciliation of APE new business sales to IFRS gross premiums earned is provided in note II(viii) of the section headed Additional Unaudited Financial Information.
| | | | | | | | | | | | | | |
|
| AER | | CER | | AER |
| CER | ||||||
| | 2022 $m |
| 2021 $m |
| Change % | | 2021 $m |
| Change % | | 2020 $m |
| 2020 $m |
CPL |
| 884 |
| 776 |
| 14 |
| 743 |
| 19 |
| 582 |
| 623 |
Hong Kong |
| 522 |
| 550 |
| (5) |
| 546 |
| (4) |
| 758 |
| 757 |
Indonesia |
| 247 |
| 252 |
| (2) |
| 243 |
| 2 |
| 267 |
| 271 |
Malaysia |
| 359 |
| 461 |
| (22) |
| 434 |
| (17) |
| 346 |
| 351 |
Singapore |
| 770 |
| 743 |
| 4 |
| 724 |
| 6 |
| 610 |
| 626 |
Growth markets and other |
| 1,611 |
| 1,412 |
| 14 |
| 1,323 |
| 22 |
| 1,245 |
| 1,262 |
Total |
| 4,393 |
| 4,194 |
| 5 |
| 4,013 |
| 9 |
| 3,808 |
| 3,890 |
APE sales increased by 9 per cent2 to $4,393 million. Detailed discussion of new business performance by segment is presented in the Strategic and operating review.
Dividend
Reflecting the Group’s capital allocation priorities, a portion of capital generation will be retained for reinvestment in the business, and dividends will be determined primarily based on the Group’s operating capital generation after allowing for the capital strain of writing new business and recurring central costs. Dividends are expected to grow broadly in line with the growth in the Group’s operating free surplus generation net of right-sized central costs, and will be set taking into account financial prospects, investment opportunities and market conditions.
The Board has approved a 2022 second interim cash dividend of 13.04 cents per share (2021: 11.86 cents per share5). Combined with the first interim cash dividend of 5.74 cents per share (2021: 5.37 cents per share5), the Group’s total 2022 cash dividend is 18.78 cents per share (2021: 17.23 cents per share5), an increase of 9 per cent5.
Group capital position
Prudential applies the Insurance (Group Capital) Rules set out in the GWS Framework issued by the Hong Kong Insurance Authority to determine Group regulatory capital requirements (both minimum and prescribed levels). The GWS Group capital adequacy requirements require that total eligible Group capital resources are not less than the GPCR and that GWS Tier 1 group capital resources are not less than the GMCR. In line with the changes at half year 2022 and the updated GWS disclosure guidelines issued by the Hong Kong Insurance Authority in December 2022, the GWS capital disclosures present the Group capital position by comparing the total eligible group capital resources to the GPCR, aligned with the basis of our EEV capital requirements. In addition, the total regulatory Tier 1 capital resources relative to the GMCR is also disclosed. More information is set out in note I(i) of the Additional unaudited financial information.
The Group holds material participating business in Hong Kong, Singapore and Malaysia. Alongside the regulatory GWS capital basis, a shareholder GWS capital basis is also presented which excludes the contribution to the Group GWS eligible group capital resources, the GMCR and the GPCR from these participating funds.
During the year, Group adopted C-ROSS Phase II requirements in the Chinese Mainland and the HK RBC for the Hong Kong business following the receipt of approval from the Hong Kong Insurance Authority to early-adopt the new Risk-Based Capital regime effective from 1 January 2022. These changes are estimated to have increased the GWS shareholder surplus over the GMCR by $9.3 billion10 and to have increased the corresponding coverage ratio from 408 per cent to 545 per cent11 as at 31 December 2021, after allowing for the $1.7 billion debt redemption in January 2022. As at 31 December 2021 the corresponding GWS shareholder capital surplus over the GPCR is estimated to have been $17.5 billion8 with a corresponding GWS coverage ratio of 320 per cent9. When including the contribution from ring-fenced policyholder funds, the total surplus over the GPCR is estimated to have been $21.4 billion8, with a corresponding GWS coverage ratio of 204 per cent9.
As at 31 December 2022, the estimated shareholder GWS capital surplus over the GPCR is $15.6 billion8 (31 December 2021: $17.5 billion5), representing a coverage ratio of 307 per cent9 (31 December 2021: 320 per cent5) and the estimated total GWS capital surplus over the GPCR is $18.1 billion8 (31 December 2021: $21.4 billion5) representing a coverage ratio of 202 per cent9 (31 December 2021: 204 per cent5). The estimated Group Tier 1 capital resources are $17.4 billion19 with estimated GWS Tier 1 surplus over the GMCR of $12.1 billion10 (31 December 2021: $14.9 billion5), representing a coverage ratio of 328 per cent11 (31 December 2021: 328 per cent5).
The Group shareholder GWS capital surplus over the GPCR reduced by $(1.9) billion5 to $15.6 billion at 31 December 2022. Operating capital generation in the period was $1.4 billion after allowing for central costs and investment in new business. The impact of non-operating and other items, including market movements, were negative overall and reduced surplus by $(2.8) billion. Dividends of $0.5 billion were paid to shareholders in respect of the 2022 first interim dividend.
45
The Group’s GWS position is resilient to external macroeconomic movements as demonstrated by the sensitivity disclosure contained in note I(i) of the Additional unaudited financial information, alongside further information on the GWS measure.
| | | | | | | | | | | | | |
| | 31 Dec 2022 | | 31 Dec 202118 |
| ||||||||
| | (post regulatory updates) | | (post regulatory updates) | | ||||||||
|
| Shareholder |
| Policyholder* |
| Total** |
| Shareholder |
| Policyholder* |
| Total** | |
Group capital resources ($bn) |
| 23.2 |
| 12.6 | | 35.8 |
| 25.5 | | 16.5 |
| 42.0 | |
of which: Tier 1 capital resources19 ($bn) |
| 15.9 |
| 1.5 | | 17.4 |
| 17.9 | | 3.5 |
| 21.4 | |
| | | | | | | | | | | | | |
Group Minimum Capital Requirement ($bn) | | 4.4 | | 0.9 | | 5.3 | | 4.7 | | 1.8 | | 6.5 | |
Group Prescribed Capital Requirement ($bn) | | 7.6 | | 10.1 | | 17.7 | | 8.0 | | 12.6 | | 20.6 | |
| | | | | | | | | | | | | |
GWS capital surplus over GPCR ($bn) | | 15.6 | | 2.5 | | 18.1 | | 17.5 | | 3.9 | | 21.4 | |
GWS coverage ratio over GPCR (%) | | 307 | % | | | 202 | % | 320 | % | | | 204 | % |
| | | | | | | | | | | | | |
GWS coverage ratio (over GMCR) (%) |
| | | | | 12.1 | | | | | | 14.9 | |
GWS Tier 1 coverage ratio over GMCR (%) |
| | | | | 328 | % | | | | | 328 | % |
* This allows for any associated diversification impacts between the shareholder and policyholder positions reflected in the total company results where relevant.
** The total company GWS coverage ratio over GPCR presented above represents the eligible group capital resources coverage ratio as set out in the GWS framework while the total company GWS tier 1 coverage ratio over GMCR represents the tier 1 group capital coverage ratio.
The 31 December 2022 GWS capital results do not reflect the impact of the redemption of $0.4 billion of senior debt in January 2023. Allowing for this redemption reduces the shareholder GWS capital surplus over GPCR to $15.2 billion with a coverage ratio of 302 per cent and reduces the total GWS capital surplus over GPCR to $17.7 billion with a coverage ratio of 200 per cent. The total GWS Tier 1 over GMCR capital position is unaffected by this redemption.
GWS risk appetite and capital management
The Group’s capital management framework focuses on achieving sustainable, profitable growth and retaining a resilient balance sheet.
The Group monitors regulatory capital, economic capital and rating agency capital metrics and manages the business within its risk appetite by remaining within its economic and regulatory capital limits. In respect of regulatory capital limits, a capital buffer above the GPCR is held to ensure the Group can withstand volatility in markets and operational experience, with capital resources remaining sufficient to cover the GPCR even after significant stresses. The calibration of the capital buffer reflects the Group’s risk profile and the external economic environment, and is set and reviewed regularly by the Board.
Typically, this requires a Group shareholder coverage ratio of above 150 per cent of the shareholder GPCR to be maintained and de-risking management actions will be taken as necessary to maintain this buffer. No maximum limit on the GWS coverage ratio has been set.
The uses of capital, for both organic and inorganic opportunities, are assessed by reference to expected shareholder returns and payback periods, relative to risk-adjusted hurdle rates which are set centrally.
Reflecting the Group’s capital allocation priorities, a portion of the free surplus generated in each period will be retained for reinvestment in the business, and dividends will be determined primarily based on the Group’s operating free surplus generation after allowing for the capital strain of writing new business and recurring central costs (on a right-sized basis). To the extent that free surplus arises which is not required to support organic and inorganic growth opportunities, consideration will be given to returning capital to shareholders.
Separate from the capital management framework applied for shareholder-owned capital, the capital held in ring-fenced with-profits funds supports policyholder investment freedom, which increases expected returns for our with-profits funds’ customers. GWS policyholder capital surplus is not available for distribution out of the ring-fenced funds other than as a defined proportion distributable to shareholders when policyholder bonuses are declared. Policyholder fund capital surplus is deployed over time to increase investment risk in the with-profits funds in order to target higher customer returns, or distributed as higher customer bonuses, in line with the specific with-profits bonus policies which apply to each ring-fenced fund. The result of applying these policies is that the aggregate policyholder fund GPCR coverage ratio is typically lower than the GPCR shareholder coverage ratio.
The total GWS coverage ratio, which is an aggregate of the policyholder and shareholder capital positions, is therefore usually lower than the shareholder coverage ratio, but also less sensitive in stress scenarios, as is shown in the GWS sensitivity analysis section above as at 31 December 2022. The total GWS coverage ratio is the Group’s regulatory solvency metric to which Group supervision applies, and this total regulatory coverage ratio is managed to ensure it remains above the GPCR by applying separate shareholder and policyholder risk appetite limits, as described above.
Financing and liquidity
At 31 December 2022, the Group’s net gearing ratio as defined in the table below was 7 per cent, after reflecting the refined definition of holding company cash and short-term investments as discussed below, but excluding the impact of the redemption on 20 January 2023 of the £300 million senior bond, with a carrying value of $361 million at 31 December 2022. The Group manages its leverage on a Moody’s total leverage basis, which differs from the above by taking into account gross debt, including commercial paper, and also allows for a proportion of the surplus within the Group’s with-profits funds. We estimate the Moody’s total leverage at 31 December 2022 to be 21 per cent (31 December 2021: 26 per cent5). After allowing for the redemption in January 2023 of the £300 million senior bond we estimate that Moody’s total leverage would be 20 per cent.
46
Prudential is targeting a Moody’s total leverage ratio of around 20 to 25 per cent over the medium term. Prudential may operate outside this range temporarily to take advantage of growth opportunities with attractive risk-adjusted returns as they arise, while still preserving its strong credit ratings.
Prudential seeks to maintain its financial strength rating with applicable credit rating agencies, which derives, in part, from its high level of financial flexibility to issue debt and equity instruments, which is intended to be maintained in the future.
Net core structural borrowings of shareholder-financed businesses
| | | | | |
|
| 31 Dec 2022 $m |
| 31 Dec 2021 $m |
|
Borrowings of shareholder-financed businesses |
| 4,261 |
| 6,127 | |
Less: holding company cash and short-term investments20 |
| (3,057) |
| (3,572) | |
Net core structural borrowings of shareholder-financed businesses |
| 1,204 |
| 2,555 | |
Net gearing ratio* |
| 7 | % | 13 | % |
* | Net core structural borrowings from continuing operations as proportion of IFRS shareholders’ equity from continuing operations plus net core structural borrowings from continuing operations, as set out in note II of the Additional unaudited financial information. |
The total borrowings of the shareholder-financed businesses from continuing operations were $4.3 billion at 31 December 2022 and the Group had central cash resources of $3.1 billion20 at the same date resulting in net core structural borrowings of the shareholder-financed businesses of $1.2 billion. We have complied with all of the covenants and undertakings of our core structural borrowings and have not modified any of their terms during 2022.
The Group has two securities that reach maturity in 2023; the £300 million senior bonds that were redeemed on 20 January 2023 and a €20 million medium-term note that falls due in July 2023. In addition, the Group has a $750 million perpetual note that reached its first call date in January 2023 at which time the Group’s management elected not to call it. We retain the right to call this security at par on a quarterly basis hereafter. The Group’s remaining securities have contractual maturities that fall between 2029 and 2033. Further analysis of the maturity profile of borrowings is presented in note C2.3 to the IFRS financial results.
In addition to its net core structural borrowings of shareholder-financed businesses set out above, the Group is able to access funding via the medium-term note programme, the US shelf programme (the platform for issuance of SEC registered bonds in the US market), a commercial paper programme and committed revolving credit facilities. All of these are available for general corporate purposes. Proceeds from the Group’s commercial paper programme are not included in the holding company cash and short-term investment balance.
Prudential plc has maintained a consistent presence as an issuer in the commercial paper market for the past decade and had $501 million in issue at 31 December 2022 (31 December 2021: $500 million5).
As at 31 December 2022, the Group had a total of $2.6 billion of undrawn committed facilities, expiring in 2026. Apart from small drawdowns to test the process, these facilities have never been drawn, and there were no amounts outstanding at 31 December 2022.
Cash remittances
Holding company cash flow
| | | | | | |
| | | | AER | ||
|
| 2022 $m |
| 2021 $m |
| Change % |
Net cash remitted by business units21 |
| 1,304 |
| 1,451 |
| (10) |
Net interest paid |
| (204) |
| (314) |
| 35 |
Corporate expenditure22 |
| (232) |
| (322) |
| 28 |
Centrally funded recurring bancassurance fees |
| (220) |
| (176) |
| (25) |
Total central outflows |
| (656) |
| (812) |
| 19 |
Holding company cash flow before dividends and other movements |
| 648 |
| 639 |
|
|
Dividends paid |
| (474) |
| (421) |
|
|
Operating holding company cash flow after dividends but before other movements |
| 174 |
| 218 |
|
|
Issuance and redemption of debt |
| (1,729) |
| (255) |
|
|
Hong Kong public offer and international placing |
| — |
| 2,374 |
|
|
Other corporate activities |
| 248 |
| (199) |
|
|
US demerger costs |
| — |
| (30) |
|
|
Total other movements |
| (1,481) |
| 1,890 |
|
|
Total holding company cash flow |
| (1,307) |
| 2,108 |
|
|
Cash and short-term investments at the beginning of the year |
| 3,572 |
| 1,463 |
|
|
Foreign exchange and other movements |
| (113) |
| 1 |
|
|
Inclusion of amounts at 31 Dec from additional centrally managed entities |
| 905 |
| — |
|
|
Cash and short-term investments at the end of the year |
| 3,057 |
| 3,572 |
|
|
Remittances from our businesses were $1,304 million (2021: $1,451 million5). Remittances were used to meet central outflows of $(656) million (2021: $(812) million5) and to pay dividends of $(474) million. Central outflows include net interest paid of $(204) million (2021: $(314) million5), corporate expenditure of $(232) million (2021: $(322) million5) and centrally funded recurring bancassurance fees of $(220) million (2021: $(176) million5).
47
Other cash flow movements included net receipts from other corporate activities of $248 million (2021: $(199) million5 net payments) comprising proceeds of $315 million received from the sales of shares in Jackson Financial Inc. together with dividends from Jackson Financial Inc., partially offset by cash provided for investment by the businesses mainly in digital infrastructure. Our debt redemption and refinancing programme was completed in January 2022 at a cost of $1,725 million. We also settled a bank loan in the year funded by the issue of new senior debt at a net outflow of $4 million.
The definition of holding company cash and short-term investments has been updated, with effect from 31 December 2022, following the combination of the Group’s London office and Asia regional office into a single Group Head Office in 2022. This updated definition includes all cash and short-term investments held by central holding and service companies, including amounts previously managed on a regional basis. These balances are now being centrally managed by the Group’s Treasury function. This refinement increased holding company cash and short-term investment balances by $0.9 billion at 31 December 2022. After reflecting this refinement, cash and short-term investments totalled $3.1 billion at 31 December 2022 (31 December 2021: $3.6 billion5). The redemption of debt in January 2023 reduced this balance by $371 million.
The Group will continue to seek to manage its financial condition such that it has sufficient resources available to provide a buffer to support the retained businesses in stress scenarios and to provide liquidity to service central outflows.
Investments
The overall financial strength of Prudential and the results, both current and future, of the insurance business are in part dependent upon the quality and performance of the various investment portfolios.
Prudential’s total investments
Prudential’s total investments, net of derivative liabilities, at 31 December 2022 were $143,084 million (31 December 2021: $168,255 million), of which $26,009 million (31 December 2021: $22,463 million) were held to cover linked liabilities related to unit-linked products and assets to cover external unit holders in relation to the consolidated investment funds.
Further analysis on financial investments and fair value measurement is included in notes C1 and C2 to Prudential’s consolidated financial statements, in accordance with IFRS 7 ‘Financial Instruments: Disclosures’.
Prudential’s insurance investment strategy and objectives
Prudential’s insurance investments support a range of businesses operating in many geographic areas. Each of the operations formulates a strategy based on the nature of its underlying liabilities, its level of capital and its local regulatory requirements.
Internal funds under management
Prudential manages a significant portion of its group funds principally through its fund management business, Eastspring Investments.
In each of the operations, local management analyses the liabilities and determines asset allocation, benchmarks and permitted deviations from these benchmarks appropriate for its operation. These benchmarks and permitted deviations are agreed with internal fund managers, who are responsible for implementing the specific investment strategy through their local fund management operations.
Investments strategy and objectives
Prudential’s insurance business’s investments, excluding assets to cover linked liabilities and those attributable to external unit holders of consolidated investment funds, are largely held by Prudential’s Singapore and Hong Kong operations.
Our exposure to interest rate risk arises from the guarantees of some non-unit-linked investment savings products, including the Hong Kong and Singapore with-profits and non-profit business. This exposure exists because of the potential for an asset and liability mismatch where long-dated liabilities and guarantees are backed by short-dated assets, which cannot be eliminated but is monitored and managed through local risk and asset liability management committees against risk appetite aligned with the Group’s limit framework. A large proportion of the Hong Kong liabilities are denominated in USD and Prudential holds USD assets to back these liabilities.
Additional Information on Liquidity and Capital Resources
After making sufficient enquiries the directors of Prudential have a reasonable expectation that the Company and the Group have adequate resources to continue their operations for a period of at least 12 months from the date that the financial statements are approved. Further information is provided in note A1 to the Consolidated Financial Statements.
The liquidity requirements of Prudential’s life insurance businesses are regularly monitored to match anticipated cash inflows with cash requirements. Cash needs are forecast and projected sources and uses of funds, as well as the asset, liability, investment and cash flow assumptions underlying these projections, are reviewed periodically. Adjustments are made periodically to the investment policies with respect to, among other things, the maturity and risk characteristics of the investment assets to reflect changes in the business cash needs and the changing competitive and economic environment.
The liquidity sources for Prudential’s life insurance businesses comprise premiums, deposits and charges on policies, proceeds from the sale and maturity of investments, borrowings and capital contributions from the parent company. The liquidity requirements comprise benefits and claims, operating expenses, interest on debt and purchases of investments.
48
The nature of insurance means that the life businesses, in a normal economic cycle, have access to sufficient liquidity to meet their obligations when due. Prudential plc therefore focuses the Group’s liquidity considerations on the liquidity by its central companies and its ability to fund growth, meet the capital needs of the operating business and meeting its own financing and expense costs. This liquidity comprises the cash and short-term investments held by the specified companies as well as bank facilities available to it which are not recorded on the balance sheet. Further information on the parent’s financing and liquidity is outlined in “Explanation of Performance and Other Financial Measures” above.
The parent company, including the central finance subsidiaries, held cash and short-term investments $3,057 million as at 31 December 2022. As discussed above, the definition of holding company cash and short-term investments has been updated, with effect from 31 December 2022, following the combination of the Group’s London office and Asia regional office into a single Group Head Office in 2022. This refinement increased holding company cash and short-term investment balances by $0.9 billion at 31 December 2022.
The sources of cash included dividends, loans and cash remittances received by Prudential from its principal operating subsidiaries, joint ventures and associates as well as debt and equity issuances. Amounts are distributed to the parent company after considering capital requirements. Further information on local statutory capital requirements, capital requirements and sources are located in note C10 to the consolidated financial statements.
The amount of dividends paid by Prudential’s main operations is determined after considering the development, growth and investment requirements of the operating businesses and subject to the applicable legal and regulatory restrictions. Further information on cash remittances to the Group and other sources of funding accessible to the Group is detailed in the ‘Explanation of Performance and Other Financial Measures’ section.
The contractual maturities of the financial liabilities of the Group recognised on the consolidated balance sheet as at 31 December 2022, including lease liabilities, are provided in note C2.3 to the consolidated financial statements.
Information on the Group’s purchase obligations, which comprise the unfunded commitments relating to investment funds and not recognised on the consolidated balance sheet, is provided in note D5 to the consolidated financial statements.
Notes
| 1 | APE sales is a measure of new business activity that comprises the aggregate of annualised regular premiums and one-tenth of single premiums on new business written during the year for all insurance products, including premiums for contracts designated as investment contracts under IFRS 4. It is not representative of premium income recorded in the IFRS financial results. See note II of the Additional unaudited financial information for further explanation. |
| 2 | On a constant exchange rate basis. |
| 3 | Greater China comprises of our businesses in the Chinese Mainland, Hong Kong and Taiwan. |
| 4 | South-east Asia comprises of our businesses in Asia excluding the Chinese Mainland, Hong Kong, Taiwan and India. |
| 5 | On an actual exchange rate basis. |
| 6 | As compared with full year 2021 actual expenditure of $298 million and assuming no significant change in current exchange rates. |
| 7 | Represents previously referred to $70 million costs savings from the start of 2023, compared with full year 2021 actual expenditure, together with $180 million of cost savings delivered from the start of 2021 compared with full year 2018 actual expenditure. |
| 8 | Estimated GWS capital resources in excess of the GPCR attributable to the shareholder business, before allowing for the 2022 second cash interim dividend. Prescribed capital requirements are set at the level at which the local regulator of a given entity can impose penalties, sanctions or intervention measures. The estimated GWS group capital adequacy requirements require that total eligible Group capital resources are not less than the GPCR. |
| 9 | Estimated GWS coverage ratio of capital resources over GPCR attributable to the shareholder business, before allowing for the 2022 second cash interim dividend. |
| 10 | Estimated GWS capital resources in excess of the GMCR attributable to the shareholder business, before allowing for the 2022 second cash interim dividend. Under the GWS Framework, all debt instruments (senior and subordinated) issued by Prudential plc at 30 June 2022 are included as GWS eligible group capital resources. |
| 11 | Estimated GWS coverage ratio of capital resources over GMCR attributable to shareholder business, before allowing for the 2022 second cash interim dividend. |
| 12 | Our World in Data, India confirmed Covid-19 cases. |
| 13 | For discussion on the basis of preparation of the sources of earnings in the table see note I(ii) of the Additional unaudited financial information. |
| 14 | Excludes Money Market Funds. |
| 15 | See note II of the Additional unaudited financial information for definition and reconciliation to IFRS balances. |
| 16 | Full-year 2022 total funds under management or advice including external funds under management, money market funds, funds managed on behalf of M&G plc and internal funds under management or advice. |
| 17 | Jackson Financial Inc. shares held by Prudential as a percentage of Jackson Financial Inc. Shares disclosed as outstanding as at 31 December 2022. |
| 18 | 31 December 2021 comparative amounts include the effect of the adoption of HK RBC, C-ROSS Phase II and the redemption of $1,725 million of sub-ordinated debt completed in January 2022. |
| 19 | The classification of tiering of capital under the GWS framework reflects the different local regulatory regimes along with guidance issued by the Hong Kong IA. |
| 20 | The definition of holding company cash and short-term investments has been updated, with effect from 31 December 2022, following the combination of the Group’s London office and Asia regional office into a single Group Head Office in 2022. This updated definition includes all cash and short-term investments held by central holding and service companies, including amounts previously managed on a regional basis. These balances are now being centrally managed by the Group’s Treasury function. |
| 21 | Net cash amounts remitted by businesses are included in the holding company cash flow. This comprises dividends and other transfers from businesses that are reflective of earnings and capital generation. |
| 22 | Including IFRS 17 implementation and restructuring costs paid in the year. |
49
RISK REVIEW
Enabling effective risk-based decision-making in a complex world
In the face of significant market volatility and uncertainty, Prudential’s Group Risk Framework, risk appetite, and robust governance have allowed the business to manage and control its risk exposure dynamically and effectively throughout 2022, in order to achieve the Group’s strategy of delivering value for our shareholders and all our stakeholders. This section explains the main risks inherent in the business and how Prudential manages those risks, with the aim of ensuring an appropriate risk profile is maintained.
1 | Introduction |
The Group
Following key actions taken in 2021 to reshape Prudential into an Asia and Africa-focused business, the Group has transformed its leadership structure and its strategic and operating models as it continues to enhance its focus on its customers, as well as adapting a multi-channel distribution model to reflect evolving markets and external operating conditions. The Group Risk, Compliance and Security (RCS) function continues to provide risk opinions, guidance, assurance and engagement with Prudential’s Group-wide supervisor, the Hong Kong Insurance Authority (IA), on these critical activities, while overseeing the risks and implications to the ongoing business in order to ensure the Group remains within approved risk appetite, at all times, in the backdrop of increased complexity of the macroeconomic, geopolitical and regulatory environments. During 2022, the Group achieved notable milestones with the completion of all agreed transitional arrangements to fully implement the Hong Kong IA GWS Framework, the implementation of the C-ROSS II at CPL, its Chinese Mainland joint venture and early adoption of RBC at its Hong Kong businesses.
2022 was characterised by high inflation, high interest rates and economic uncertainties, set against reconfigured national alliances and competition for energy and natural resources. The impacts to the Group are multifaceted and may be pronounced. These include increased strategic and business risks, as well as increasing insurance, product and customer conduct risks. For the Group’s customers, these wider geopolitical and macroeconomic circumstances may increase uncertainty over livelihoods, elevate costs of living, and cause challenges in affordability for essential needs and services, including insurance products and perhaps at times when they may be most needed. The complexity of meeting regulatory expectations on these issues, as governments increasingly focus on them, is expected to increase. Prudential will need to meet these challenges for its business and those of its customers in a fair and equitable way. At the same time, the Group will be expected to navigate the volatile financial environment in its markets to ensure it remains robustly capitalised to sustainably deliver for the additional needs of its customers and the societies in which it operates. These are the key themes underpinning this report, with details included below.
Against this backdrop, the Group continues to effectively leverage its risk management, compliance and security experience in more mature markets, applying it to its growth markets as appropriate to their respective risks and the extent of their challenges in this changed world, and reflective of opportunities, customer issues and needs and local customs. Prudential will continue to apply the holistic and coordinated approach in managing the increasingly dynamic, multifaceted and often interconnected risks facing its businesses.
Macroeconomic and market environment
The Russia-Ukraine conflict may continue to lead to economic and market stresses being particularly intense in Europe given its dependence on Russian energy and commodities. The uncertainty on the longer-term evolution of these tensions has contributed to keeping energy and commodity prices high and volatile leading to high inflationary pressures. In early 2023, for certain markets which the Group operates, inflation appears to have peaked after having reached decades-high levels in 2022. However, there are structural risks to inflation persistence, constraining real incomes and growth to an extent capable of triggering a global recession.
Central banks, including many in Asia, in large part but at varying pace and levels, have responded to inflationary pressures with monetary policy tightening and base interest rate increases, while factoring in the impact of US Federal Reserve monetary policy on the strength of the US dollar and implications in emerging markets. This challenging inflationary environment led to wide-spread weakness across asset classes in 2022, in both fixed income and equities which posted significant losses. Sentiment was also impacted by weak demand in the property sector, and volatility in the economic outlook in the Chinese Mainland as Covid-19 restrictions continued through most of the year. The Chinese Mainland and Japan were the regional exceptions in retaining a relatively accommodative monetary policy. Global activity data was generally weaker in 2022, but showed some resilience given the record pace of tightening of financial conditions. Consumer confidence in both developed and emerging markets in Asia fell sharply and into depressed territory for much of the year, although actual spending remained at fairly stable levels, given high levels of excess savings, reopening flows and higher-than-expected fiscal stimulus.
50
With the rapid reopening of the Chinese Mainland market, the headwinds appear to have reached a turning point at the end of the year with policymakers announcing a relaxation of pandemic-related restrictions and the reopening of borders as well as a more convincing package of measures to stabilise the property market. However, the growth path with recovery in consumer spending, especially services, is likely to be volatile based on the experience in other countries, when restrictions were quickly released, the temporary escalation in Covid-19 cases led to an economic pause before a more sustained rebound. Furthermore, supply chains have also taken time to recover to previous levels of efficiency and capacity.
The continued strength in the US dollar against the majority of other currencies further contributed to tighter financial conditions and weaker exchange rates of a number of emerging markets in which the Group operates, adversely impacting Prudential’s consolidated financial statements upon the translation of results into US dollar, the Group’s reporting currency. With interest rates rising, sub-Saharan Africa has seen an increase in external debt servicing costs. The rising debt servicing burden could lead to a trade-off for governments in the region between paying down debt obligations or funding longer-term social projects.
The macroeconomic landscape and financial markets are expected to remain challenging and highly uncertain. The capital position of the Group and its local businesses has been monitored with high cadence and has remained robust throughout 2022. The full impact of the economic turbulence in 2022 is yet to fully materialise and will continue to be closely monitored by the Group.
Geopolitical landscape
The Russia-Ukraine conflict has led to a range of geopolitical implications, which remain uncertain and complex. The direct implications were regularly monitored throughout 2022 and were considered in the Group’s broader scenario analysis and planning. The diplomatic consequences of the conflict have driven an adjustment (and some reinforcement) in regional security and trading blocs, with an increasing conflation of economic issues with considerations of national interest and security, and with implications for international strategic competition. The Russia-Ukraine conflict may have implications for, or result in a short-term slowing of, progress in meeting global and corporate decarbonisation targets, as markets prioritise access to sufficient primary energy sources, increasing the use of coal. In the medium term, a reduction in the reliance on external gas and oil supplies may drive an acceleration in the adoption of zero-carbon energy sources. However, challenges to supply chains, technologies and access to raw materials and energy will remain where national security concerns are heightened. Over the longer term, the conflict, and the diplomatic and economic reactions to it, could contribute to an acceleration towards ‘decoupling’ or the divergence of markets into more distinct trading blocs, limiting the scope for flows of people, capital and data between blocs, increasing the potential operational and reputational risks for companies continuing to trade and operate between these blocs.
The US-China relationship has been a key focus of geopolitical tension in 2022, impacted in part by the Russia-Ukraine conflict. In turn, this has exerted pressure on policymakers in other geographies, including the Asian markets in which the Group operates. Following the US mid-term Congressional elections and 20th Party Congress of the Communist Party of China in the second half of 2022, political pressures continued to indicate an increasingly divergent set of positions and strained rhetoric on matters of mutual interest, including Taiwan. The relationship remains inherently dynamic and continues to be monitored, against a backdrop of increasing strategic competition as illustrated by the US CHIPS Act and sustained bilateral criticism. While the pace of domestic regulatory reform in the Chinese Mainland abated in 2022 relative to 2021, the effects of reforms and their implementation, including those relating to technology, data usage and capital market operations, may create geopolitical implications which will require assessment, as will US legislation, which may in turn be mirrored or affect other markets’ regulations related to China. Legislative or regulatory changes that adversely impact Hong Kong’s economy or its international trading and economic relationships, as a key market which hosts Group head office functions, could have an adverse impact on sales and distribution and the operations of the Group.
Societal developments
Global economic uncertainties and the rise in inflation are increasingly putting pressure on household affordability and may exacerbate existing structural inequalities within societies. Government and supervisory attention is being increasingly focused on the cost of living crisis taking shape across many of the Group’s markets and the contribution of the corporate sector to government tax revenues. These developments have implications for Prudential in terms of how it engages with its customers, who will, in some markets, experience real challenges in affording or maintaining insurance products at their current level of coverage. This may happen at times when that protection is needed most, and when such customers increasingly represent the vulnerable in society. In Asia, there is an increasing expectation from governments for private companies to help with affordability issues, for example, by introducing moratoria on price increases, and to extend the regulatory definitions of ‘vulnerable’ customers to explicitly include those in need due to the current economic pressures. Prudential will continue to carefully balance affordability and the impact on its customers with the need, and ability, to reprice products where necessary.
A high inflation environment, combined with recessionary concerns, and societal and regulatory expectations of support, may also heighten existing challenges in persistency for insurers. As has always been the case, Prudential will continue to engage with governments, regulators and supervisors on these issues. As a matter of course, the Group regularly assesses the suitability and affordability of its products, and aims to reduce their perceived complexity whilst increasing the transparency of their costs and benefits. These aims, as well as the Group’s increasing focus on the sustainable digital distribution of its health and protection products via its digital platform, help to expand the financial inclusion of Prudential’s products and improve customer outcomes.
51
Most markets have moved, at different paces, to an endemic approach in managing Covid-19. The Group looks to retain the positive changes that the pandemic accelerated, including those related to changes in traditional working practices and the use of digital services, technologies and distribution methods to customers, while monitoring and mitigating the potential increase in technology, data security or misuse and regulatory risks that these may bring. Prudential is exploring new ways of working and, as a responsible employer, is reflecting thematic trends through a coordinated suite of activities related to the upskilling of its workforce, and increasing flexibility, inclusivity and psychological safety in the workplace. The Group continues to monitor emerging social trends, including those linked to environmental change and the impacts to developing market societies associated with the transition to a lower-carbon global economy. A just and inclusive transition is central to the Group’s strategy and Prudential recognises the interests from a wide range of stakeholders in the way it manages ESG and climate-related risks. The Group continues to recognise the importance of financial inclusion and the ways in which the Group’s products and services meet the changing needs of affected societies. Its risk management framework continues to evolve to manage the changing nature of these wide-ranging risks, including activities to promote a transparent culture, and active encouragement of open discussion and learnings from mistakes.
Regulations
Prudential operates in highly regulated markets, and as the nature and focus of regulations and laws evolve, the complexity of regulatory compliance (including with respect to economic sanctions, anti-money laundering and anti-corruption) continues to increase and represents a challenge for international businesses. Geopolitical tensions including the Russia-Ukraine conflict have increased uncertainties and the long-term complexity of legal and regulatory compliance for Prudential’s businesses operating across multiple jurisdictions. Whilst the complexity of sanctions driven by the geopolitical conflicts is elevated, the Group is experienced in managing this and has in place risk tolerance frameworks to deal with complex and conflicting risk trade-offs to guide executive decisions.
The rapid pace and high volume of regulatory changes and interventions, and swiftness of their application including those driven by the financial services industry, have the potential to increase strategic and regulatory risks for the Group’s businesses. There has been an increased regulatory focus by Prudential’s Group-wide supervisor, the Hong Kong IA, in particular on customer experience, investment management, governance and sustainability and climate-related topics. In the Chinese Mainland, various policy and regulatory developments relevant to the provision of financial services are in progress, as is the implementation of the market’s data governance pillars. Regulatory focus on the financial services industry remains broad and often concurrent, and includes areas such as customer conduct and protection, information security and data privacy and residency, third-party management, systemic risk regulation, corporate governance and senior management accountability. Climate and sustainability-related regulatory developments continue to develop at pace, both globally and in Asia. Developments in domestic and international capital standards continue to move forward, for example, the International Insurance Capital Standard (ICS) is being developed by the International Association of Insurance Supervisors (IAIS) due for adoption post 2024; C-ROSS II and Hong Kong RBC which were implemented in the Group’s Chinese Mainland joint venture and Hong Kong businesses respectively. Changes in regulations related to capital have the potential to change the extent of capital sensitivity to risk factors. The new accounting standards IFRS 17 also became effective from 1 January 2023 which is mandatory for the Group given its UK domicile and its dual primary listings. Other examples of material regulatory changes include the sale and management of investment-linked products in Indonesia. Prudential’s portfolio of transformation and regulatory change programmes have the potential to introduce new, or increase existing, regulatory risks and supervisory interest while increasing the complexity of ensuring concurrent regulatory compliance across markets driven by potential for increased intra-Group connectivity and dependencies.
The Hong Kong IA’s GWS Framework became effective for Prudential following designation by the Hong Kong IA on 14 May 2021. Prudential will continue to engage constructively with the Hong Kong IA as its Group-wide supervisor as it ensures ongoing sustainable compliance. In jurisdictions where Prudential operates with ongoing policy initiatives and regulatory developments which impact the way Prudential is supervised, these developments continue to be monitored by the Group at a market and global level and these considerations form part of the Group Risk Framework and ongoing engagement with government policymakers, industry groups and regulators.
2 Risk governance
aSystem of governance
Prudential has in place a system of governance that embeds a clear ownership of risk, together with risk policies and standards to enable risks to be identified, measured and assessed, managed and controlled, monitored and reported. The Group Risk Framework, owned by the Board, details Prudential’s risk governance, risk management processes and risk appetite. The Group’s risk governance arrangements are based on the ‘three lines’ model. The ‘first line’ is responsible for taking and managing risk, while the ‘second line’ provides additional challenge, expertise, oversight and scrutiny. The role of the ‘third line’, assumed by the independent Group-wide Internal Audit function, is to provide objective assurance on the design, effectiveness and implementation of the overall system of internal control. The Group-wide RCS function reviews, assesses, oversees and reports on the Group’s aggregate risk exposure and solvency position from an economic, regulatory and credit ratings perspective.
52
In 2022, a review of committees across the Group’s head office was undertaken to ensure continued appropriateness of the level of Group governance that promotes individual accountability in decision-making and supports the overall corporate governance framework to provide sound and prudent management and oversight of the Group’s business. The Group constituted a new Group Investment Committee, chaired by the Group Chief Financial Officer, which was accompanied by the approval of a revised Group Investment Policy, for the oversight of all investment activities and in line with GWS Framework requirements. During 2022, oversight responsibilities for the Group’s reporting against the recommendations of the Task Force on Climate-Related Financial Disclosures (TCFD) and the ongoing implementation of the Group’s climate-focused commitments, as part of the Group’s ESG strategic framework, were transferred from the Board-established Responsibility and Sustainability Working Group (RSWG) to the Group Risk Committee with the RSWG retaining its focus on overseeing the culture, customer and digital aspects of the framework. Building on enhancements implemented in 2021, Prudential has continued to embed ESG and climate change considerations within the Group Risk Framework, such as explicitly defining time horizons for the purposes of climate risk and requiring the consideration of risks in the context of the time horizon of expected benefits/paybacks of decisions within core strategic processes where ‘risk-based decision-making’ must be incorporated, and the embedding of its Group-wide customer conduct risk (including the implementation of enhanced monitoring metrics), third-party and outsourcing and data management frameworks and policies.
b Group Risk Framework
i.Risk governance and culture
Prudential’s risk governance comprises the Board organisational structures, reporting relationships, delegation of authority, roles and responsibilities, and risk policies that have been established to make decisions and control activities on risk-related matters. The risk governance structure is led by the Group Risk Committee, supported by independent Non-executive Directors on the risk committees of the Group’s major businesses. The Group Risk Committee approves changes to the Group Risk Framework and the core risk policies that support it. The Committee has direct lines of communication, reporting and oversight of the risk committees of the Group’s major businesses. In the second half of 2022, the chief risk and compliance officers of the Group’s major businesses and the managing directors of the Group’s Strategic Business Groups have formally become members of the Group Executive Risk Committee, the advisory committee to the Group Chief Risk and Compliance Officer. The chief risk and compliance officers of the Group’s major businesses also attend Group Risk Committee meetings on a rotational participating basis.
Risk culture is a strategic priority of the Board, which recognises its importance in the way that the Group conducts business. A Group-wide culture framework is in place, unifying the Group towards its overarching purpose of helping our customers get the most out of life. The RSWG supports its responsibilities in relation to implementation of the culture framework, as well as embedding the culture aspects of the Group’s ESG strategic framework and overseeing progress on diversity and inclusion initiatives. The culture framework provides principles and values that are embedded in the ways of working across the Group’s functions and locations and defines how Prudential expects business to be conducted to achieve its strategic objectives, informs expectations of leadership and supports the resilience and sustainability of the Group. The components of the culture framework support sound risk management practices by requiring a focus on customers, longer-term goals and sustainability, the avoidance of excessive risk-taking, and highlighting acceptable and unacceptable behaviours. This is supported through the inclusion of risk and sustainability considerations in performance management for key executives; the building of appropriate skills and capabilities in risk management; and by ensuring that employees understand and care about their role in managing risk through open discussions, collaboration and engagement. The Group Risk Committee has a key role in providing advice to the Remuneration Committee on risk management considerations to be applied in respect of executive remuneration.
Prudential’s Group Code of Business Conduct and Group Governance Manual, supported by the Group’s risk-related policies, include guiding principles on the day-to-day conduct of all its people and any organisations acting on its behalf. Supporting policies include those related to financial crime, covering anti-money laundering, sanctions, anti-bribery and corruption and conduct. The Group’s third-party and outsourcing policy requires that human rights and modern slavery considerations are embedded across all of its supplier and supply chain arrangements. Procedures to allow individuals to speak out safely and anonymously against unethical behaviour and conduct are also in place.
The Group publishes an ESG report that sets out in more detail our ESG activities during the year, including our progress towards ESG targets. The ESG report is available on the Group’s website.
ii.The risk management cycle
Risk identification
The Group’s emerging risk identification process recognises the dynamic materiality of emerging risk themes. This has been shown by recent events such as the Covid-19 pandemic and the Russia-Ukraine conflict, and this concept is also considered relevant in the context of the Group’s monitoring of emerging themes relevant to ESG and climate-related risks, including reputation risk.
53
The Group Own Risk and Solvency Assessment (ORSA) is the ongoing process of identifying, measuring and assessing, managing and controlling, monitoring and reporting the risks to which the business is exposed. It includes an assessment of capital adequacy to ensure that the Group’s solvency needs are met at all times, as well as stress and scenario testing, which includes climate scenarios and reverse stress testing. The latter requires the Group to ascertain the point of business model failure and is another tool that helps to identify the key risks and scenarios that may have a material impact on the Group. The risk profile assessment is a key output from the risk identification and risk measurement processes and is used as a basis for setting Group-wide limits, management information, assessment of solvency needs, and determining appropriate stress and scenario testing. The Group’s principal risks, which are reported and managed by the Group with enhanced focus, are reviewed and updated on a regular basis.
Risk measurement and assessment
All identified risks are assessed based on an appropriate methodology for that risk. Quantifiable risks, which are material and mitigated by holding capital, are modelled in the Group’s internal model, which is used to determine the Group Internal Economic Capital Assessment (GIECA) and is subject to independent validation and processes and controls around model changes and limitations.
Risk management and control
The Group’s control procedures and systems focus on aligning the levels of risk-taking with the Group’s strategy and can only provide reasonable, and not absolute, assurance against material misstatement or loss. The Group’s risk policies define the Group’s appetite to material risks and set out the risk management and control requirements to limit exposure to these risks. These policies also set out the processes to enable the measurement and management of these risks in a consistent and coherent way, including the flows of management information required. The methods and risk management tools employed to mitigate each of the Group’s principal risks are detailed in section 3 below.
Risk monitoring and reporting
The Group’s principal risks are highlighted in the management information received by the Group Risk Committee and the Board, which also includes key exposures against appetite and developments in the Group’s principal and emerging risks.
iii.Risk appetite, limits and triggers
The Group is cognisant of the interests of the broad spectrum of its stakeholders (including customers, investors, employees, communities and key business partners) and that a managed acceptance of risk lies at the heart of its business. The Group seeks to generate stakeholder value by selectively taking exposure to risks, mitigated to the extent it is cost-effective to do so, and where these are an outcome of its chosen business activities and strategy. Those risks for which the Group has no tolerance are actively avoided. The Group’s systems, procedures and controls are designed to manage risk appropriately, and its approach to resilience and recovery aims to maintain the Group’s ability and flexibility to respond in times of stress.
Qualitative and quantitative expressions of risk appetite are defined and operationalised through risk limits, triggers and indicators. The RCS function reviews the appropriateness of these measures at least annually. The Board approves changes to the Group’s aggregate risk appetite and the Group Risk Committee has delegated authority to approve changes to the system of limits, triggers and indicators.
Group risk appetite is defined and monitored in aggregate by the setting of objectives for its capital requirements, liquidity, and non-financial risk exposure, covering risks to stakeholders, including those from participating and third-party businesses. Group limits operate within these expressions of risk appetite to constrain material risks, while triggers and indicators provide additional defined points for escalation. The Group Risk Committee, supported by the RCS function, is responsible for reviewing the risks inherent in the Group’s business plan and for providing the Board with a view on the risk/reward trade-offs and the resulting impact to the Group’s aggregated position relative to Group risk appetite and limits, including non-financial risk considerations.
a. | Capital requirements. Limits on capital requirements aim to ensure that in both business as usual and stressed conditions, the Group maintains adequate capital in excess of internal economic capital requirements, achieves its desired target credit rating to meet its business objectives, and supervisory intervention is avoided. The two measures in use at the Group level are the GWS group capital requirements and internal economic capital requirements, determined by the Group Internal Economic Capital Assessment (GIECA). |
b. | Liquidity. The objective of the Group’s liquidity risk appetite is to ensure that appropriate cash resources are available to meet financial obligations as they fall due in both business as usual and stressed scenarios. This is measured using a liquidity coverage ratio which considers the sources of liquidity against liquidity requirements under stress scenarios. |
54
Non-financial risks. In 2022, the Group implemented the revised Non-Financial Risk Appetite Framework, aiming to adopt an approach framed around the perspectives of its varied stakeholders and taking into account current and expected changes in the external environment, and rolled out a simplification of the limit and trigger appetite thresholds for non-financial risk categories across the Group’s locations. The Group accepts a degree of non-financial risk exposure as an outcome of its chosen business activities and strategy. It aims to manage these risks effectively to maintain its operational resilience and its commitments to customers and all stakeholders and avoid material adverse financial loss or impact to its reputation.
3 The Group’s principal risks
The delivery of the Group’s strategy in building long-term value for its shareholders and other stakeholders, focusing on high-growth business in Asia and Africa, exposes Prudential to risks. The materialisation of these risks within the Group or in its joint ventures, associates or key third-party partners may have a financial impact and may affect the performance of products or services or the fulfilment of commitments to customers and other stakeholders, with an adverse impact on Prudential’s brand and reputation. This report is focused mainly on risks to the shareholder but includes those which arise indirectly through policyholder exposures and third-party business. The Group’s principal risks, which are not exhaustive, are detailed below. The Group’s risk management cycle (detailed above) includes within its scope the processes for prioritising and determining the relative significance of ESG and climate-related risks, as well as those associated with implementing the Group’s externally communicated commitments. The Group’s 2022 ESG Report includes further detail on the ESG and climate-related risks which contribute to the materiality of the Group’s principal risks detailed below, including those related to the Group’s operational and financial resilience, data privacy requirements and expectations, the regulatory landscape and the implementation of the Group’s strategy. The Group’s Risk Factor disclosures can be found at the end of this document.
Risks to the Group’s financial situation (including those from the external macroeconomic and geopolitical environment) The global economic and geopolitical environment may impact on the Group directly by affecting trends in financial markets and asset values, as well as driving short-term volatility.
Risks in this category include the market risks to our investments and the credit quality of our investment portfolio as well as liquidity risk.
Global economic and geopolitical conditions
With geopolitical tensions high as national alliances and blocs evolve, the jostling of the current world order and the increasing prioritisation of national security widely defined has become a key determinant of macroeconomic policy, with geopolitical and macroeconomic uncertainties being intertwined. Geopolitical developments and tensions, macroeconomic conditions, and broad policy-driven regulatory developments (see below), at times interconnected in the speed and manner in which they evolve, drive the operating environment and risk landscape for the Group and the level of its exposure to the principal risks outlined below.
Macroeconomic and geopolitical developments are considered material to the Group and can potentially increase operational and business disruption, regulatory and financial market risks, and have the potential to directly impact Prudential’s sales and distribution networks, as well as its reputation. The potential impacts to the Group are included in the disclosures on Risk Factors.
Market risks to our investments
(Audited)
The value of Prudential’s investments is impacted by fluctuations in equity prices, interest rates, credit spreads, foreign exchange rates and property prices. Although inflation remains at decades-level highs, the Group’s direct exposure to inflation remains modest. Exposure mainly arises through an increase in medical claims obligations, driven by rising medical import prices. This exposure can be effectively managed by the business’ well-established practice and ability to reprice products. Challenges for insurers linked to affordability and existing challenges in persistency are detailed in the Insurance Risks section below.
55
The Group has appetite for market risk where it arises from profit-generating insurance activities to the extent that it remains part of a balanced portfolio of sources of income for shareholders and is compatible with a robust solvency position. The Group’s market risks are managed and mitigated by the following:
- | The Group market risk policy; |
- | Risk appetite statements, limits and triggers; |
- | The Group’s capital and asset liability management committees; |
- | Asset and liability management activities, which include management actions such as changes in asset allocation, bonus revisions, repricing and the use of reinsurance where appropriate; |
- | The Group Investment Committee and Group Investment Policy; |
- | Hedging using derivatives, including currency forwards, interest rate futures and swaps, and equity futures; |
- | The monitoring and oversight of market risks through the regular reporting of management information; |
- | Regular deep dive assessments; and |
- | The Group Critical Incident Procedure (GCIP), which defines specific governance to be invoked in the event of a critical incident, such as a significant market, liquidity or credit-related event. This includes, where necessary, the convening of a Critical Incident Group (CIG) to oversee, coordinate, and where appropriate, direct activities during a critical incident. |
| ● | Interest rate risk, including asset liability management (ALM). Interest rate risk is driven by the impact of the valuation of Prudential’s assets (particularly government and corporate bonds) and liabilities, which are dependent on market interest rates. Prudential’s appetite for interest rate risk requires that assets and liabilities should be tightly matched for exposures where assets or derivatives exist that can cover these exposures. Interest rate risk is accepted where this cannot be hedged, provided that this arises from profitable products and to the extent that such interest rate risk exposure remains part of a balanced exposure to risks and is compatible with a robust solvency position. |
Sustained inflationary pressures have driven interest rates higher, these have the potential to increase further in the near-to-medium term, and may impact the valuation of fixed income investments and reduce fee income. The Group’s risk exposure to rising interest rates also arises from the potential impact to the present value of future fees for unit-linked based businesses, such as in Indonesia and Malaysia, as well as the impact to the present value of the future profits for accident and health products, such as in Hong Kong. Exposure to higher interest rates also arises from the potential impact to the value of fixed income assets in the shareholder funds.
The Group’s risk exposure to lower/decreased interest rates arises from the guarantees of some non-unit-linked products with a savings component, including the Hong Kong and Singapore with-profits and non-profit businesses. This exposure results from the potential for an asset and liability mismatch, where long-dated liabilities and guarantees are backed by short-dated assets. When this duration mismatch is not eliminated, it is monitored and managed through local risk and asset liability management committees and Group risk limits consistent with the Group’s appetite for interest rate risk.
The Group-level Capital and ALM Committee is a management committee supporting the identification, assessment and management of key financial risks to the achievement of the Group’s business objectives. The Committee also oversees ALM, solvency and liquidity risks of the local businesses as well as the declaration and management of non-guaranteed benefits for participating and universal life lines of business. Local business units are responsible for the management of their own asset and liability positions, with appropriate governance in place.
The objective of the local business unit ALM process is to meet policyholder liabilities with the returns generated from the investment assets held, while maintaining the financial strength of capital and solvency positions. The ALM strategy adopted by the local business units considers the liability profile and related assumptions of in-force business and new products to appropriately manage investment risk within ALM risk appetite, under different scenarios in accordance with policyholders’ reasonable expectations, and economic and local regulatory requirements. Factors such as the availability of matching assets, diversification, currency and duration are considered as appropriate. The assumptions and methodology used in the measurement of assets and liabilities for ALM purposes conform with local solvency regulations. Assessments are carried out on an economic basis which conforms to the Group’s internal economic capital methodology.
| ● | Equity and property investment risk. The shareholder exposure to equity price movements arises from various sources, including from unit-linked products where fee income is linked to the market value of funds under management. Exposure also arises from with-profits businesses through potential fluctuations in the value of future shareholders’ profits and where bonuses declared are based broadly on historical and current rates of return from the business’s investment portfolios, which include equities. The Group has limited acceptance for exposures to equity risk, but accepts the equity exposure that arises on future fees (including shareholder transfers from the with-profits business). |
56
The material exposures to equity risk in the Group’s businesses include CPL’s exposure to equity risk through investments in equity assets for most of its products, including participating and non-participating savings products and protection and investment-linked products. The Hong Kong business and, to a lesser extent, the Singapore business contribute to the Group’s equity risk exposure due to the equity assets backing participating products. The Indonesia and Malaysia businesses are exposed to equity risk through their unit-linked products, and in the case of Malaysia exposure also arises from participating and investment-linked business.
| ● | Foreign exchange risk. The geographical diversity of Prudential’s businesses means that it has some exposure to the risk of foreign exchange rate fluctuations. Some entities within the Group write policies, invest in assets or enter into other transactions in local currencies or currencies not linked to the Group’s reporting/functional currency, the US dollar. Although this limits the effect of exchange rate movements on local operating results, it can lead to fluctuations in the Group’s US dollar-reported financial statements. This risk is accepted within the Group’s appetite for foreign exchange risk. In cases where a non-US dollar denominated surplus arises in an operation which is to be used to support Group capital or shareholders’ interest (ie remittances), this currency exposure may be hedged where considered economically favourable. Further, the Group generally does not have appetite for significant direct shareholder exposure to foreign exchange risks in currencies outside the markets in which it operates, but it does have some appetite for this on fee income and on equity investments within the with-profits funds. Where foreign exchange risk arises outside appetite, currency swaps and other derivatives are used to manage the exposure. |
Liquidity risk
(Audited)
Prudential’s liquidity risk arises from the need to have sufficient liquid assets to meet policyholder and third-party payments as they fall due, considered under both business-as-usual and stressed conditions. It includes the risk arising from funds composed of illiquid assets and results from a mismatch between the liquidity profile of assets and liabilities. Liquidity risk may impact on market conditions and valuation of assets in a more uncertain way than for other risks like interest rate or credit risk. It may arise, for example, where external capital is unavailable at sustainable cost, where derivatives transactions require a sudden significant need of liquid assets or cash to post as collateral to meet derivatives margin requirements, or where redemption requests are made against funds managed for external clients (both retail and institutional). Liquidity risk is considered material at the level of the Group. Prudential has no appetite for any business to have insufficient resources to cover its outgoing cash flows, or for the Group as a whole to not meet cash flow requirements from its debt obligations under any plausible scenario. The Group has significant internal sources of liquidity sufficient to meet its expected cash requirements for at least 12 months from the date the financial statements are approved, without having to resort to external sources of funding. The Group has a total of $2.6 billion of undrawn committed facilities that can be made use of, expiring in 2026. Access to further liquidity is available through the debt capital markets and the Group’s extensive commercial paper programme. Prudential has maintained a consistent presence as an issuer in the market for the past decade.
A number of risk management tools are used to manage and mitigate liquidity risk, including the following:
- | The Group’s liquidity risk policy; |
- | Risk appetite statements, limits and triggers; |
- | Regular assessment and reporting by the Group and business units of Liquidity Coverage Ratios which are calculated under both base case and stressed scenarios; |
- | The Group’s Liquidity Risk Management Plan, which includes details of the Group Liquidity Risk Framework as well as analysis of Group and business units liquidity risks and the adequacy of available liquidity resources under business-as-usual and stressed conditions; |
- | The Group’s Collateral Management Framework, which sets out the approach to ensuring business units using derivatives have sufficient liquid assets or ability to raise liquidity to meet derivatives margins; |
- | The Group’s contingency plans and identified sources of liquidity; |
- | The Group’s ability to access the money and debt capital markets; and |
- | The Group’s access to external committed credit facilities. |
Credit risk
(Audited)
Credit risk is the potential for loss resulting from a borrower’s failure to meet its contractual debt obligation(s). Counterparty risk, a type of credit risk, is the probability that a counterparty to a transaction defaults on its contractual obligation(s) causing the other counterparty to suffer a loss. These risks arise from the Group’s investments in bonds, reinsurance arrangements, derivative contracts with third parties, and its cash deposits with banks. Credit spread risk, another type of credit risk, arises when the interest rate/return on a loan or bond is disproportionately low compared with another investment with a lower risk of default. Invested credit and counterparty risks are considered a material risk for the Group’s business units.
57
The Group’s holdings across its life portfolios are mostly in local currency and with a largely domestic investor base, which provides support to these positions. These portfolios are generally positioned towards high-quality names, including those with either government or considerable parent company balance sheet support. Areas which the Group is actively monitoring include the developments in the Chinese Mainland property development sector and the impacts of rising inflation and the tightening of monetary policy in the Group’s key markets, as well as high indebtedness in sub-Saharan African countries. The impacts of these trends, which are being closely monitored, include potential for deterioration in the credit quality of the Group’s invested credit exposures, particularly due to rising funding costs and overall credit risks, and the extent of downward pressure on the fair value of the Group’s portfolios. The Group’s portfolio is generally well diversified in relation to individual counterparties, although counterparty concentration is monitored in particular in local markets where depth (and therefore the liquidity of such investments) may be low. Prudential actively reviews its investment portfolio to improve the robustness and resilience of the solvency position. The Group has appetite to take credit risk to the extent that it remains part of a balanced portfolio of sources of income for shareholders and is compatible with a robust solvency position. Further detail on the Group’s debt portfolio is provided below.
A number of risk management tools are used to manage and mitigate credit and counterparty credit risk, including the following:
- | A credit risk policy and dealing and controls policy; |
- | Risk appetite statements and portfolio-level limits that have been defined on issuers, and counterparties; |
- | Collateral arrangements for derivative, secured lending reverse repurchase and reinsurance transactions which aim to provide a high level of credit protection; |
- | The Group Executive Risk Committee and Group Investment Committee’s oversight of credit and counterparty credit risk and sector and/or name-specific reviews; |
- | Regular assessments, including of individual and sector exposures subject to elevated credit risks; and |
- | Close monitoring or restrictions on investments that may be of concern. |
The total debt securities at 31 December 2022 for the Group’s continuing operations were $77.0 billion (31 December 2021: $99.1 billion). The majority (70 per cent) of the portfolio is in unit-linked and with-profits funds. The remaining 30 per cent of the debt portfolio is held to back the shareholder business.
| ● | Group sovereign debt. Prudential invests in bonds issued by national governments. This sovereign debt holding of the Group’s operations represented 46 per cent or $10.5 billion1 of the shareholder debt portfolio of the Group’s operations as at 31 December 2022 (31 December 2021: 47 per cent or $14.2 billion of the shareholder debt portfolio for the Group’s continuing operations). The particular risks associated with holding sovereign debt are detailed further in the disclosures on Risk Factors. |
The exposures held by the shareholder-backed business and with-profits funds in sovereign debt securities at 31 December 2022 are given in note C1 of the Group’s IFRS financial statements.
| ● | Corporate debt portfolio. In the shareholder-backed business, corporate debt exposures totalled $11.5 billion of which $10.2 billion or 89 per cent were investment grade rated. |
| ● | Bank debt exposure and counterparty credit risk. The banking sector represents a material concentration in the Group’s corporate debt portfolio which largely reflects the composition of the fixed income markets across the regions in which Prudential is invested. As such, exposure to banks is a key part of its core investments, as well as being important for the hedging and other activities undertaken to manage its various financial risks. Exposure to the sector is considered a material risk for the Group. Derivative and reinsurance counterparty credit risk exposure is managed using an array of risk management tools, including a comprehensive system of limits. Prudential manages the level of its counterparty credit risk by reducing its exposure, buying credit protection or using additional collateral arrangements where appropriate. |
At 31 December 2022:
- | 89 per cent of the Group’s shareholder portfolio (excluding all government and government-related debt) is investment grade rated2. In particular, 55 per cent of the portfolio is rated2 A- and above (or equivalent); and |
- | The Group’s shareholder portfolio is well diversified: no individual sector3 makes up more than 13 per cent of the total portfolio (excluding the financial and sovereign sectors). |
|
The Group’s sustainability and ESG-related risks These include sustainability risks associated with environmental considerations such as climate change (including physical and transition risks), social risks arising from diverse stakeholder commitments and expectations and governance-related risks. |
58
Material risks associated with key ESG themes may undermine the sustainability of a business by adversely impacting its reputation and brand, ability to attract and retain customers, employees and distribution and other business partners, and increasing litigation risks, and therefore the results of its operations and delivery of its strategy and long-erm financial success. Prudential seeks to manage sustainability risks and their potential impact on its business and stakeholders through a focus on the Group’s purpose to ‘help people get the most out of life’, and transparent and consistent implementation of its strategy in its markets and across operational, underwriting and investment activities. The Group’s strategy includes a focus on supporting a just and inclusive transition to a lower-carbon global economy that places the societies of developing markets at the forefront of considerations, as well as providing greater and more inclusive access to good health and financial security that meets the changing needs of societies, promotes responsible stewardship in managing the human impact of climate change and building human and social capital with its broad range of stakeholders. It is enabled by strong internal governance, sound business practices and a responsible investment approach, with ESG considerations integrated into investment processes and decisions and the performance of fiduciary and stewardship duties, including voting and active engagement decisions with respect to investee companies, as both an asset owner and an asset manager. With the update to the Board committee oversight responsibilities noted in section 1 above, climate risk, the Group’s reporting against the recommendations of the TCFD and progress on the Group’s external climate-related commitments will be a priority focus for the Group Risk Committee for 2023.
Regulatory interest and developments continue to increase globally and in Asia, and ESG and sustainability-related risks are high on the agenda of both local regulators and international supervisory bodies such as the International Association of Insurance Supervisors (IAIS) and the International Sustainability Standards Board (ISSB), which is progressing on ESG and sustainability-related disclosure requirements. The Group continues to actively engage with, and respond to, discussions, consultations and supervisory information-gathering exercises. Details of the Group’s sustainability and ESG-related risks are included in the disclosure on Risk Factors.
As local regulatory requirements on climate risk management and disclosures develop, the Group continues to leverage and share its Group-wide experience and knowledge with its local businesses on their ESG policies and approaches, both to provide support and to help drive consistency in their continuing embedment across Prudential’s businesses. The Group Risk Framework continues to be critically evaluated and updated where required to ensure both ESG and sustainability-related considerations and risks to the Group, and the external impact from the Group’s activities, are appropriately captured.
Risk management and mitigation of ESG sustainability risks at Prudential include the following:
- | A focus on enhancing access to good health and financial security, and in connection with our stakeholders, ensuring responsible stewardship of climate and ESG related issues; clear governance arrangements, both in the definition of the roles and responsibilities of the Board and management committees for aspects of ESG and sustainability risks and through the Group Governance Manual, which include ESG and responsible business practice-linked policies, and the Group Code of Business Conduct; |
- | The continued embedding of ESG and sustainability risk within the Group Risk Framework and risk processes, including: |
| o | Consideration of the potential for dynamically-changing materiality in emerging environmental, social and governance themes and risks through emerging risk identification and evaluation processes; |
| o | Definition of appropriate (and longer) time horizons with respect to climate risk management and the requirement to consider time horizons where required in risk-based decision-making; |
| o | Reflection in the risk taxonomy that the Group can be both impacted by ESG/sustainability issues as well as having an impact on these in the external world (‘double materiality’); |
| o | The applicability of the Group’s Model Risk and UDA Risk Policy to the tools used for the aggregation of the Group’s carbon intensity metrics across its investment portfolios; and |
| o | Deep dives into ESG themes, including climate-related risks, and Board-level training sessions. |
- | Integrating ESG considerations into investment processes and responsible supply chain management; and |
- | Participation in networks and industry forums and working groups such as the Net Zero Asset Owner Alliance (NZAOA), Principles for Responsible Investment (PRI) and CRO Forum to further develop understanding and support collaborative action in relation to ESG sustainability risks such as climate change and promoting a just and inclusive transition. |
|
Risks from the nature of our business and our industry These include the Group’s non-financial risks (including operational and transformation risks from significant change activity), the customer conduct risks and insurance risks assumed by the Group in providing its products, and risks related to regulatory compliance. |
59
Non-financial risks
The complexity of Prudential, its activities and the extent of transformation in progress creates a challenging operating environment and exposure to a variety of non-financial risks. These risks are considered to be material at a Group level.
| ● | Operational risk. This is the risk of loss (or unintended gain or profit) arising from inadequate or failed internal processes, personnel or systems and external events, and may arise from employee error, model error, system failures, fraud or other events which disrupt business processes or which have a detrimental impact to customers. Prudential accepts a degree of non-financial risk exposure as an outcome of its chosen business activities and strategy. It aims to manage these risks effectively to maintain its operational resilience and its commitments to customers and all stakeholders and avoid material adverse financial loss or impact on its reputation. |
| ● | Transformation risk. Transformation risk remains a material risk for Prudential, with a number of significant change programmes under way which, if not delivered and executed effectively to defined timelines, scope and cost, may negatively impact its operational capability, control environment, reputation, and ability to deliver its strategy and maintain market competitiveness. Prudential’s current portfolio of transformation and significant change programmes include (i) the implementation of large scale regulatory changes; (ii) the expansion of the Group’s digital capabilities and use of technology, platforms and analytics; and (iii) improvement of business efficiencies through operating model changes, including those relating to the Group’s central, asset management and investment oversight functions. Programmes related to regulatory/industry change, such as those required to effect the discontinuation of inter-bank offered rates (IBORs) in their current form and the implementation of IFRS 17, are also ongoing. Further detail on the risks to the Group associated with large-scale transformation and complex strategic initiatives is included in the disclosures on Risk Factors. |
The Group therefore aims to ensure that, for both transformation and strategic initiatives, strong programme governance is in place with embedded risk expertise to achieve ongoing and nimble risk oversight, with regular risk monitoring and reporting to risk committees. Transformation risk oversight operates alongside the Group’s existing risk policies and frameworks to ensure appropriate governance and controls are in place to mitigate these risks.
| ● | Outsourcing and third-party risks. The Group’s outsourcing and third-party relationships require distinct oversight and risk management processes. The Group has a number of important third-party relationships, both with market counterparties and outsourcing partners, including distribution, technology and ecosystem providers. In Asia, the Group maintains material strategic partnerships and bancassurance arrangements. These arrangements support the delivery of high level and cost-effective services to customers, but also create a reliance on the operational resilience and performance of outsourcing and business partners. The Group’s requirements for the management of material outsourcing arrangements have been incorporated in its Group third-party supply and outsourcing policy, aligned to the requirements of the Hong Kong IA’s GWS Framework, and which outlines the governance in place in respect of material outsourcing and third-party arrangements and the Group’s monitoring and risk assessment framework. This ensures that appropriate contract performance and risk mitigation measures are in place over these arrangements. Third-party management is also included and embedded in the Group-wide operational risk framework (see below). |
(b) | Information security and data privacy risk. Risks related to malicious attacks on Prudential systems, service disruption, exfiltration of data, loss of data integrity and the impact on the privacy of our customer data continue to be prevalent, particularly as the accessibility of attacking tools available to potential adversaries increases. The frequency and sophistication of attacks, particularly in relation to ransomware, continues to grow globally. With a rapidly transforming technological landscape, continued expansion of Cloud services, including the adoption of a hybrid multi-cloud strategy partnering with third-party service providers, and the increased scrutiny from regulators against a backdrop of tightening data privacy regulations across Asia, security and privacy risks are material at the Group level. To mitigate the risk, the Group has adopted a holistic risk management approach, not only to prevent and disrupt potential attacks against Prudential systems but to also manage the recovery process should an attack take place successfully. It is also well understood that some attacks will still be successful despite the layered security control defence-in-depth methodology that Prudential and other mature organisations assume, and so it is essential that the Group’s security strategy encompasses a cyber resilience theme focusing on its ability to respond and recover from an attack in order to maintain its reputation and customer trust. |
60
Globally, ransomware and distributed denial of services (DDoS) attacks have increased markedly in 2022, in part driven by the Russia-Ukraine conflict. The Group has responded swiftly by leveraging threat intelligence information to configure security systems to mitigate any potential attacks, whether targeted or collateral, from these events. Prudential also has a number of defences in place to protect its systems from these types of attacks, including but not limited to: (i) DDoS protection for the Group’s websites via web application firewall services; (ii) AI-based endpoint security software; (iii) continuous security monitoring; (iv) network-based intrusion detection; and (v) employee training and awareness campaigns to raise understanding of attacks utilising email phishing techniques. Cyber insurance coverage is in place to provide some protection against potential financial losses and the Group conducts simulation exercises for ransomware attacks to assess and develop the effectiveness of incident responses across its businesses. Cyber-attack simulation exercises have been carried out during the year to enhance preparedness.
The Group has not, to date, experienced or been affected by any cyber or data breaches which have had a material impact on its operations. However, as the Group continues to develop and expand digital services and emerging products, its reliance on third-party service providers and business partners who specialise in niche capabilities is also increasing. A number of supply chain attacks took place in 2022 with notable breaches of service disruption and infringements to data security, integrity or privacy on Prudential’s service providers, which as a result directly impacted the Group’s ability to service customers, maintain its reputation and comply with regulation and privacy requirements. As part of the remedial actions, the Group has continued to enhance its third-party management process including the enhanced security due diligence process when onboarding new business partners and the ongoing monitoring of key business partners.
The key material risks can be summarised into three threat areas: (i) ransomware attacks, (ii) supply chain compromise and (iii) service disruption caused by cyber threats. In order for the Group to manage these risks effectively, the security strategy encompasses the ongoing maturity and development of protective and detective controls, while further expanding and uplifting its ability to react to and recover from successful attacks on both the Group’s system as well as third-party partner systems.
The Group’s Information Security and Privacy strategy is structured with three key pillars:
- | Defending the nation – To expand coverage and maturity of protective and detective security controls in response to both the changing technology landscape, such as the adoption of new Cloud services, as well as the heightened threat actor risks. Within this pillar, continued focus on Africa business units remains in order to ensure the same maturity level as Asia-based business units is achieved. |
- | Cyber resilience – To build on a number of existing security processes and formalise the development of an integrated cross-functional incident management framework that is regularly tried and tested. This includes further aligning Group incident management plans, business unit incident management plans and cyber security incident management plans along with executing a number of drills and tabletop exercises. The drills and exercises will be conducted at all levels including executive committee members and within the business units while bringing in critical key business partners such as cyber insurance providers and forensic investigation partners. |
- | Enabling the digital journey – To focus on introducing and building out key security controls within the digital ecosystem to ensure continued enablement of the organisation’s digital strategy while improving customer experience and data security within the digital ecosystem. |
The centralised Technology Risk Management team leverages skills, tools and resources across different technology domains to provide advisory, assurance and operations support for holistic technology risk management including information security and privacy. The Group Technology Risk Committee provides Group-wide oversight of technology risks, including information security and privacy. Technology risk management is also performed locally within business units, with inputs from business information security officers and with oversight from local risk committees. The Board is briefed at least twice annually on cyber security and privacy by the Group Chief Information Security Officer (CISO) and is being engaged more closely on cyber resilience with executive-level cyber tabletop exercises and risk workshops conducted in 2022 and continuing in 2023 to ensure that members have the means to enable appropriate oversight and understand the latest threats and regulatory expectations. The Group Information Security, Privacy and Data policies were developed to ensure compliance with all applicable laws and regulations, and the ethical use of customer data. In addition, these policies consider the requirements of a range of supervisory guidelines including the international standards on information security (ISO 27001/27002) and the US National Institute of Standards and Technology’s Cyber Security Framework. Localised regulations or legal requirements are addressed by local policies or standards.
61
| ● | Model and user developed application (UDA) risk. Erroneous or misinterpreted tools used in core business activities, decision-making and reporting may have adverse consequences for Prudential. The Group utilises various tools to perform a range of operational functions including the calculation of regulatory or internal capital requirements, the valuation of assets and liabilities, determining hedging requirements, and acquiring new business via digital platforms. Many of these tools are an integral part of the information and decision-making frameworks used at Prudential and errors or limitations in these tools, or inappropriate usage, may lead to regulatory breaches, inappropriate decision-making, financial loss, customer detriment, inaccurate external reporting or reputational damage. |
The Group has no appetite for model and UDA risk arising from failures to develop, implement and monitor appropriate risk mitigation measures. Prudential’s model and UDA risk framework and policy applies a risk-based approach from the point of view of a broad range of stakeholders, including policyholders, in order to ensure appropriate and proportionate risk management is applied to all models and UDAs used across the business (including those under development).
Prudential’s model and UDA risk is managed and mitigated using the following:
- | The Group’s Model and UDA Risk Policy and relevant guidelines; |
- | Annual risk assessment (including model limitations, known errors and approximations) of all tools used for core business activities, decision-making and reporting; |
- | Maintenance of appropriate documentation for tools used; |
- | Implementation of controls to ensure tools are accurate and appropriately used; |
- | Tools are subject to rigorous and independent model validation; and |
- | Regular reporting to the RCS function and relevant risk and Board committees to support the measurement and management of the risk. |
Technological developments, in particular in the field of artificial intelligence (AI), pose new questions on risk oversight provided under the Group Risk Framework. An oversight forum for the use of AI and key ethical principles apply to the use of AI by the Group.
| ● | Business disruption and operational resilience risk. The Group continually seeks to increase business resilience through adaptation, planning, preparation and testing of contingency plans and its ability to respond effectively to and operate through disruptive incidents. Business resilience is at the core of the Group’s embedded Business Continuity Management (BCM) programme and framework that help to protect the Group’s systems and its key stakeholders. The BCM programme and framework covers business impact analyses, risk assessments, and the maintenance and exercising of business continuity, incident management and disaster recovery plans. Business disruption risks are monitored by the Group Security function, with key operational effectiveness metrics and updates on specific activities reported to the Group Risk Committee. |
| ● | Financial crime risk. As with all financial services firms, Prudential is exposed to risks relating to money laundering (the risk that the products or services of the Group are used by customers or other third parties to transfer or conceal the proceeds of crime); fraud (the risk that fraudulent insurance claims, transactions, or procurement of services, are made against or through the business); sanctions compliance breaches (the risk that the Group undertakes business with individuals and entities on the lists of the main sanctions regimes); and bribery and corruption (the risk that employees or associated persons seek to influence the behaviour of others to obtain an unfair advantage or receive benefits from others for the same purpose). |
Prudential operates in some high-risk markets where, for example, the acceptance of cash premiums from customers may be common practice, large-scale agency networks may be in operation where sales are incentivised by commission and fees, and concentration of exposure to politically-exposed persons may give rise to higher geopolitical risk exposure.
The Group-wide policies in place on anti-money laundering, fraud, sanctions and anti-bribery and corruption risks reflect the values, behaviours and standards that are expected across the business. Screening and transaction monitoring systems are in place with ongoing improvements and upgrades being implemented where required, and a programme of compliance control monitoring reviews is in place across the Group. The Group has continued to strengthen and enhance its financial crime risk management capability through investment in advanced analytics and AI tools. Proactive detective capabilities are being implemented across the Group and delivered through a centralised monitoring hub, to further strengthen oversight of financial crime risks in the areas of procurement and third-party management. Risk assessments are performed annually at higher-risk locations. Due diligence reviews and assessments against Prudential’s financial crime policies are performed as part of the Group’s business acquisition process. The Group continues to undertake strategic activity to monitor and evaluate the evolving fraud risk landscape, mitigate the likelihood of fraud occurring and increase the rate of detection.
The Group has in place a mature confidential reporting system through which employees and other stakeholders can report concerns relating to potential misconduct. The process and results of this system are overseen by the Group Audit Committee.
62
Group-wide framework and risk management for non-financial risks
The risks outlined above form key elements of the Group’s non-financial risk profile. A Group-wide operational risk framework is in place to identify, measure and assess, manage and control, monitor and report effectively on all material operational risks across the business. Outputs from these processes and activities performed by individual business units are monitored by the RCS function, which provides an aggregated view of the risk profile across the business to the Group Risk Committee and the Board.
The key components of the framework are listed below:
- | Application of a risk and control self-assessment (RCSA) process, where risk exposures are identified and assessed as part of a periodical cycle; |
- | An internal incident management process, which identifies, quantifies and monitors remediation conducted through root cause analysis and application of action plans for risk events; |
- | An annual scenario analysis process for the quantification of extreme, yet plausible manifestations of key operational risks across the business on a forward-looking basis; and |
- | A risk appetite framework for non-financial risks that articulates the level of risk exposure the business is willing to tolerate and defines escalation processes for breaches of appetite. |
These core framework components are embedded across Prudential via the Group Operational Risk Policy and accompanying standards, which set out the key principles and minimum standards for the management of operational risk within the Group’s risk appetite. These sit alongside other risk policies and standards that individually engage with specific operational risks, including outsourcing and third-party supply, business continuity, financial crime, technology and data, operations processes and extent of transformation. These policies and standards include subject matter expert-led processes that are designed to identify, assess, manage and control operational risks, detailed below. These activities are fundamental in maintaining an effective system of internal control, and ensure that operational risk considerations are embedded in key business decision-making, including material business approvals and in setting and challenging the Group’s strategy. These activities include:
- | Reviews of key operational risks and challenges within Group and business unit business plans during the annual planning cycle, to support business decisions; |
- | Corporate insurance programmes to limit the financial impact of operational risks; |
- | Oversight of risk management during the transformation life cycle, project prioritisation and the risks, interdependencies and possible conflicts arising from a large portfolio of transformation activities; |
- | Screening and transaction monitoring systems for financial crime and a programme of compliance control monitoring reviews and regular risk assessments; |
- | Internal and external review of cyber security capability and defences; and |
- | Regular updating and risk-based testing of disaster recovery plans and the Critical Incident Procedure process. |
Risks associated with the Group’s joint ventures and associates
Prudential operates, and in certain markets is required by local regulation to operate, through joint ventures and other joint ownership or third-party arrangements (including associates). A material proportion of the Group’s business comes from its joint venture and associate in the Chinese Mainland and India respectively. For such operations, the level of control exercisable by the Group depends on the terms of the contractual agreements between participants. As such, the level of oversight, control and access to management information the Group is able to exercise over the extent of the exposure to material risks at these operations may be lower compared with the Group’s wholly owned businesses. Further information on the risks to the Group associated with its joint ventures and other shareholders and third parties are included in the disclosures on Risk Factors.
Insurance risks
(Audited)
Insurance risks make up a significant proportion of Prudential’s overall risk exposure. The profitability of the Group’s businesses depends on a mix of factors, including levels of, and trends in, mortality (policyholders dying), morbidity (policyholders becoming ill or suffering an accident) and policyholder behaviour (variability in how customers interact with their policies, including utilisation of withdrawals, take-up of options and guarantees and persistency, ie lapsing/surrendering of policies), and increases in the costs of claims over time (claim inflation). The risks associated with adverse experience relative to assumptions associated with product performance and customer behaviour are detailed in the disclosures on Risk Factors. The Group has appetite for retaining insurance risks in the areas where it believes it has expertise and operational controls to manage the risk and where it judges it to be more value creating to do so rather than transferring the risk, and only to the extent that these risks remain part of a balanced portfolio of sources of income for shareholders and are compatible with a robust solvency position.
63
Whilst most markets have moved, at difference paces, to an endemic approach in managing Covid-19, the impact of policyholders having deferred medical treatment during the pandemic (latent morbidity impacts) continues to be experienced in a number of markets. The implications from other factors such as long-term post-Covid-19 symptoms (although there is currently no consensus on the longer-term impact on morbidity) is being monitored. Inflationary pressures driving higher interest rates may lead to increased lapses for some guaranteed savings products where higher levels of guarantees are offered by products of the Group’s competitors, reflecting consumer demand for returns at the level of, or exceeding, inflation. A high inflation environment, and the broader economic effects of recessionary concerns, may also increase lapses, surrenders and fraud, as well as heighten premium affordability challenges.
The principal drivers of the Group’s insurance risk vary across its business units. In Hong Kong, Singapore, Indonesia and Malaysia, a significant volume of health and protection business is written and the most significant insurance risks are persistency risk, morbidity risk, and medical claims inflation risk.
| ● | Medical claims inflation risk: A key assumption in these markets is the rate of medical claims inflation, which is often in excess of general price inflation. Where the cost of medical treatment increases more than expected, resulting in higher than anticipated medical claims cost passed on to Prudential, is a key risk. This risk is best mitigated by retaining the right to reprice products and appropriate overall claims limits within policies, either per type of medical treatment or in total across a policy, annually and/or over the policy lifetime. Medical reimbursement downgrade experience (where the policyholder reduces the level of the coverage/protection in order to reduce premium payments) following any repricing is also a factor to be monitored by the Group’s businesses. The risks to the Group’s ability to reprice are included in the disclosures on Risk Factors. |
| ● | Morbidity risk: Prudential’s morbidity risk is managed through prudent product design, underwriting and claims management, and for certain products, the right to reprice where appropriate. Prudential’s morbidity assumptions reflect its recent experience and expectation of future trends for each relevant line of business. |
| ● | Persistency risk: The Group’s persistency assumptions reflect recent experience and expert judgement, especially where a lack of experience data exists, as well as any expected change in future persistency. Persistency risk is managed by appropriate controls across the product life cycle. This includes review and revisions to product design and incentive structures where required, ensuring appropriate training and sales processes, including those ensuring active customer engagement and high service quality, appropriate customer disclosures and product collaterals, use of customer retention initiatives and post-sale management through regular experience monitoring. Strong risk management and mitigation of conduct risk and the identification of common characteristics of business with high lapse rates is also crucial. Where appropriate, allowance is made for the relationship (either assumed or observed historically) between persistency and investment returns. Modelling this dynamic policyholder behaviour is particularly important when assessing the likely take-up rate of options embedded within certain products. |
Prudential’s insurance risks are managed and mitigated using the following:
- | The Group’s insurance policy, which sets out the Group’s insurance risk appetite and required standards for effective insurance risk management by head office and local businesses, including processes to enable the measurement of the Group’s insurance risk profile, management information flows and escalation mechanisms; |
- | The Group’s product and underwriting risk policy, which sets out the required standards for effective product and underwriting risk management and approvals for new, or changes to existing, products (including the role of the Group), and the processes to enable the measurement of underwriting risk. The policy also describes how the Group’s Customer Conduct Risk Policy is met in relation to new product approvals and current and legacy products; |
- | The Group’s counter fraud policy, which sets out the required standards to enhance fraud detection, prevention and investigation activities. The policy also sets out the framework to tackle fraud that safeguards customers, protects local businesses and the Group’s reputation and provides assurance that fraud risk is managed within appetite, and to protect resources to support sustainable business growth; |
- | In product design and appropriate processes related to the management of policyholders’ reasonable expectations; |
- | The risk appetite statements, limits and triggers; |
- | Using persistency, morbidity and longevity assumptions that reflect recent experience and expectation of future trends, and the use of industry data and expert judgement where appropriate; |
- | Using reinsurance to mitigate mortality and morbidity risks; |
- | Ensuring appropriate medical underwriting when policies are issued and appropriate claims management practices when claims are received in order to mitigate morbidity risk; |
- | Maintaining the quality of sales processes, training and using initiatives to increase customer retention in order to mitigate persistency risk; |
- | The use of mystery shopping to identify opportunities for improvement in sales processes and training; |
- | Using product repricing and other claims management initiatives in order to mitigate morbidity and medical expense inflation risk; and |
- | Regular deep dive assessments. |
64
Customer conduct risk
Prudential’s conduct of business, especially in the design and distribution of its products and the servicing of customers, is crucial in ensuring that the Group’s commitment to meeting its customers’ needs and expectations are met. The Group’s customer conduct risk framework, owned by the Chief Executive Officer, reflects management’s focus on customer outcomes.
Factors that may increase conduct risks can be found throughout the product life cycle, from the complexity of the Group’s products and services to its diverse distribution channels, which include its agency workforce, virtual face-to-face sales and sales via online digital platforms. Prudential has developed a Group Customer Conduct Risk Policy which sets out five customer conduct standards that the business is expected to meet, being:
1 | Treat customers fairly, honestly and with integrity; |
2 | Provide and promote products and services that meet customer needs, are clearly explained and that deliver real value; |
3 | Manage customer information appropriately, and maintain the confidentiality of customer information; |
4 | Provide and promote high standards of customer service; and |
5 | Act fairly and timely to address customer complaints and any errors found. |
Prudential manages conduct risk via a range of controls that are assessed through the Group’s conduct risk assessment framework, reviewed within its monitoring programmes, and overseen within reporting to its boards and committees.
As the pandemic-related initiatives and campaigns rolled out across markets to support customers expire (including customer cash benefits, goodwill payments, and extended grace periods for premium payments), the Group is monitoring the impact to customers to ensure they are treated fairly and with due care aligned with the Group’s customer conduct risk framework. The virtual face-to-face sales processes and digital product offerings, rolled out in most markets during the pandemic, continue to be monitored for customer conduct, operational, regulatory compliance and commercial risks.
Management of Prudential’s conduct risk is key to the Group’s strategy. Prudential’s conduct risks are managed and mitigated using the following:
| ● | The Group’s code of business conduct and conduct standards, product underwriting and other related risk policies, and supporting controls including the Group’s fraud risk control programme; |
| ● | A culture that supports the fair treatment of the customer, incentivises the right behaviour through proper remuneration structures, and provides a safe environment to report conduct risk-related issues via the Group’s internal processes and the Speak Out programme; |
| ● | Distribution controls, including monitoring programmes relevant to the type of business (insurance or asset management), distribution channel (agency, bancassurance, or digital) and ecosystem, to ensure sales are conducted in a manner that considers the fair treatment of customers within digital environments; |
| ● | Quality of sales processes and training, and using other initiatives such as special requirements for vulnerable customers, to improve customer outcomes; |
| ● | Appropriate claims management and complaint handling practices; and |
| ● | Regular deep dive assessments on, and monitoring of, conduct risks and periodic conduct risk assessments. |
Risks related to regulatory and legal compliance
Prudential operates in highly regulated markets and under the ever-evolving requirements and expectations of diverse and dynamic regulatory, legal and tax regimes which may impact its business or the way it is conducted. The complexity of legal and regulatory (including sanctions) compliance continues to evolve and increase, representing a challenge for international businesses. Compliance with the Group’s legal or regulatory obligations (including in respect of international sanctions) in one jurisdiction may conflict with the law or policy objectives of another jurisdiction, or may be seen as supporting the law or policy objectives of one jurisdiction over another, creating additional legal, regulatory compliance and reputational risks. These risks may be increased where the scope of regulatory requirements and obligations are uncertain, and where specific cases applicable to the Group are complex. Regulatory risks cover a broad range of risks including changes in government policy and legislation, capital control measures, and new regulations at either a national or international level. The breadth of local and Group-wide regulatory arrangements presents the risk that requirements are not fully met, resulting in specific regulator interventions or actions including retrospective interpretation of standards by regulators. As the industry’s use of emerging technological tools and digital services increases, this is likely to lead to new and unforeseen regulatory issues and the Group is monitoring emerging regulatory developments and standards on the governance and ethical use of technology and data. In certain jurisdictions in which Prudential operates there are a number of ongoing policy initiatives and regulatory developments which will impact the way Prudential is supervised. These developments continue to be monitored by the Group at a national and global level and these considerations form part of the Group’s ongoing engagement with government policy teams, industry groups and regulators. Further information on specific areas of regulatory and supervisory focus and changes are included in the disclosures on Risk Factors.
65
Risk management and mitigation of regulatory risk at Prudential includes:
- | Proactively adapting and complying with the latest regulatory developments; |
- | Group and business unit-level compliance oversight and risk-based testing in respect of adherence with regulations; |
- | Close monitoring and assessment of our business and regulatory environment and strategic risks; |
- | The explicit consideration of risk themes in strategic decisions; |
- | Ongoing engagement with national regulators, government policy teams and international standard setters; and |
- | Compliance oversight to ensure adherence with in-force regulations and management of new regulatory developments. |
Notes
1 | Excluding assets held to cover linked liabilities and those of the consolidated investment funds. |
2 | Based on middle rating from Standard & Poor’s, Moody’s and Fitch. If unavailable, NAIC and other external ratings and then internal ratings have been used. |
3 | Source of segmentation: Bloomberg Sector, Bloomberg Group and Merrill Lynch. Anything that cannot be identified from the three sources noted is classified as other. |
66
SUPERVISION AND REGULATION OF PRUDENTIAL
Prudential has insurance and investment operations in Asia and Africa, and is subject to applicable material insurance and other financial services regulations discussed below.
Prudential’s individual insurance and asset management businesses are supervised at a local entity level and local statutory capital requirements apply. For more detailed information on the framework of local capital requirements, see note C10 of the consolidated financial statements. The Hong Kong Insurance Authority (Hong Kong IA) is the Group-wide supervisor for Prudential. The Hong Kong IA’s GWS Framework applies a principles-based and outcome-focused approach and allows the Hong Kong IA to exercise direct regulatory powers over the designated holding companies of multinational insurance groups as authorised by the Insurance Ordinance (Cap.41) of the Hong Kong Special Administrative Region of the People's Republic of China with details specified under GL32: Guideline on Group Supervision issued by the Hong Kong Insurance Authority. Prudential also applies the Insurance (Group Capital) Rules issued by the Hong Kong IA to determine group regulatory capital requirements (both minimum and prescribed levels). Further information is provided in the ‘Explanation of Performance and Other Financial Measures’ section and in note I(i) of Additional unaudited financial information.
Global regulatory developments and trends
Prudential operates in highly regulated markets, and as the nature and focus of regulations and laws evolve, the complexity of regulatory compliance continues to increase and represents a challenge for international businesses.
Regulatory focus on the financial services industry remains broad and often concurrent, and includes areas such as customer conduct and protection, information security and data privacy and residency, third-party management, systemic risk regulation, capital and corporate governance. There has also been an increased supervisory focus by the Hong Kong IA in particular on customer conduct, capital and investment management, third-party management (including oversight of technology-related vendors and controls), GWS compliance and sustainability-related topics.
In conduct regulation, there is a continuing priority focus at the international level and across jurisdictions on market policies, customer outcomes, fairness, sustainable investment, culture and behaviour. Regulators are also putting growing emphasis on the economic consequences that poor value products and services have on consumers. In Asia, distribution and product suitability linked to innovation continues to set the pace of conduct regulatory change. Prudential falls under scope of these conduct regulations and remains committed to meeting customer needs and expectations and ensuring regulatory changes are appropriately implemented.
Developments in domestic and international capital standards continue to evolve, for example C-ROSS II in the Chinese Mainland and RBC in Hong Kong which were recently implemented in the Group’s Chinese Mainland joint venture and Hong Kong businesses respectively. Changes in regulations related to capital have the potential to change the extent of capital sensitivity to market factors.
The pace and volume of regulatory changes and interventions, and the swiftness of their application including those driven by the financial services industry, have been noticed in recent years in many of the Group’s markets. Prudential’s portfolio of transformation and regulatory change programmes have the potential to introduce new, or increase existing, regulatory risks and supervisory interest while increasing the complexity of ensuring concurrent regulatory compliance across markets driven by potential for increased intra-Group connectivity and dependencies. In jurisdictions where Prudential operates with ongoing policy initiatives and regulatory developments which will impact the way Prudential is supervised, these developments continue to be monitored by the Group at a market and global level and these considerations form part of the Group’s risk framework and ongoing engagement with government policy makers, industry groups and regulators. Other regulatory risk management control measures at Prudential include risk assessment of the Business Plan which includes consideration of the Group’s current strategies; monitoring and assessment of our business environment and strategic risks; the explicit consideration of risk themes in strategic decisions; and Compliance oversight to ensure adherence with in-force regulations and management of new regulatory developments.
The Hong Kong IA’s GWS Framework became effective for Prudential following designation by the Hong Kong IA on 14 May 2021. Prudential completed all agreed transitional arrangements in the first half of 2022. Prudential will continue to engage constructively with the Hong Kong IA as its Group-wide supervisor as it ensures ongoing sustainable compliance.
In addition, global geopolitical tensions including the Russia-Ukraine conflict have also increased uncertainties and the long-term complexity of legal and regulatory compliance for Prudential’s businesses operating across multiple jurisdictions. The complexity in sanctions driven by geopolitical conflicts have also elevated, although the Group is experienced and has in place appropriate frameworks designed to continuously monitor and deal with complex and conflicting compliance obligations to guide executive decisions.
67
Climate Change and Sustainability
Climate and sustainability-related regulatory developments continue to develop at pace, both globally and in Asia, with recent examples of government and regulatory enforcement and civil actions against companies for misleading investors on ESG disclosures highlighting the disclosure and reputational risks in this area for the financial services industry. ESG and sustainability-related risks are high on the agenda of various regulators and the IAIS. The Group continues to actively engage with, and respond to, discussions, consultations and supervisory information-gathering exercises. International regulatory and supervisory bodies, such as the ISSB, are progressing on ESG and sustainability-related disclosure requirements. Details of the Group’s Sustainability and ESG-related risks are included in the disclosure on Risk Factors. The Group continues to leverage and share its Group-wide experience and knowledge with its local businesses on their ESG policies and approaches, both to provide support as well as to help drive consistency across Prudential’s businesses. The Group Risk Framework continues to be critically evaluated to ensure both ESG and sustainability-related risks to the Group, and the external impact from the Group’s activities, are appropriately captured.
Financial crime
In each of the markets in which it operates, Prudential is subject to regulatory requirements and obligations with respect to financial crime including anti-money laundering (AML), anti-bribery and corruption, and sanctions compliance, which may either impose obligations on the Group to act in a certain manner or restrict the way that it can act in respect of specified individuals, organisations, businesses and/or governments. The Group has appropriate systems and controls to mitigate financial crime risks, including sanctions and anti-bribery and corruption, and it examines these on an ongoing basis as part of its proactive supervision agenda.
Data privacy and information security
The Group’s Information Security and Data Privacy strategy has four key objectives: business enablement; continuous improvement of cyber defences; automation and optimisation; and governance and assurance to ascertain ongoing robustness of cyber security and privacy measures.
The key focus for Prudential in 2022 was to continue ensuring and optimising consistent global coverage of security controls in the management of data privacy activities in order to embed high standards across the Group. This was achieved through operationalisation of a global privacy management and data security platform, with a Group hybrid team that leverages skills, tools and resources across different technology domains to provide advisory, assurance and operations support for holistic technology risk management, including information security and privacy management. In addition, the Group Technology Risk Committee provides group-wide oversight of information security and privacy compliance. Data privacy and information security management are also performed locally within business units, with input from business information security officers and with oversight from local risk committees. The Group Board is briefed regularly to ensure that members have the means to enable appropriate oversight and understand the latest data privacy and information security issues.
The Group-wide information security policy was developed to support a pragmatic approach to the evolving regulatory environment globally and ensure compliance with all applicable privacy laws and regulations and the appropriate and ethical use of customer data. The security measures that the Group takes to protect its data and systems are commensurate with local regulatory requirements and risk appetite. In practice, this means that the Group’s businesses must identify and classify data and operate a risk-based information security approach which leverages people, processes, and technology solutions. This is in the context of a Group-wide Information Security Policy and operating standards.
Disclosure obligations under Section 219 of the Iran Threat Reduction and Syria Human Rights Act of 2012
Under Section 219 of the Iran Threat Reduction and Syria Human Rights Act of 2012, which added Section 13(r) of the Securities Exchange Act of 1934, Prudential is required to disclose certain activities and those of its affiliates related to Iran and to persons sanctioned by the US under programs relating to terrorism, proliferation of weapons of mass destruction and trading with North Korea that have occurred in the twelve-month period covered by this report.
During the twelve-month period ended 31 December 2022, Prudential’s non-US affiliates had contractual relationships with nine persons sanctioned by the Office of Foreign Assets Control (OFAC) of the US Department of Treasury in relation to Iran, terrorism, proliferation of weapons of mass destruction and trading with North Korea. These contracts were entered into in compliance with laws and regulations applicable to the relevant affiliates. Two of the nine sanctioned persons were identified in 2022 and one was identified in January 2023. The remaining six persons were identified in prior years and duly reported in our prior Annual Reports on Form 20-F. None of the Prudential non-US affiliates is a US person. No US nexus was detected in any of the transactions, except for one transaction which was denominated in US dollars, as detailed below.
The first individual, designated pursuant to US Executive Order 13224, took out a takaful certificate (a Syariah compliant life policy) with Prudential’s Malaysian insurance joint venture in October 2011 and was identified in March 2012 through periodic customer screening. The policy is denominated in Malaysian Ringgit and the annual premium is RM 8,196 (US$1,921). The matter was reported to the Malaysian government regulatory authority, the Bank Negara Malaysia Financial Intelligence Unit. Currently, the policy is frozen with no top-up, withdrawal or claims permitted, although regular premium payment is still allowed in Malaysian Ringgit. The policy is in force, with no claims submitted or any outward payments made to date.
68
The second individual, also designated pursuant to US Executive Order 13224, is a beneficiary of three life insurance policies in his wife’s name, the first taken out in December 2010 and two others taken out in November 2011 with Prudential’s Indonesian insurance subsidiary. The annual premiums of the three life insurance policies are IDR 6,000,000 (US$400), IDR 12,000,000 (US$800) and IDR 12,000,000 (US$800) respectively. The matter was identified on 8 August 2012 and reported to the Indonesian governmental sanctions authority, the Pusat Pelaporan Dan Analisis Transaksi Keuangan. All three policies have been frozen with no transactions allowed. Two of the policies have lapsed. The remaining policy, which is being funded by the policy’s cash value, will lapse once the remaining cash value is insufficient to cover the cost of insurance. There were no premiums received and no claims or other outward payments made in 2022.
The third individual, designated on 30 August 2019 pursuant to US Executive Order 13810, took out four medical and critical illness policies denominated in New Taiwan Dollar between November 2012 and February 2015 with Prudential’s Taiwan insurance subsidiary. The matter was identified during periodic customer screening in September 2019 and reported to the Financial Intelligence Unit, Taiwan. One of the policies expired in November 2019 and no further premium will be received. The annual premiums of the other three policies in force received in 2022 were NT$20,856 (US$689), NT$12,048 (US$398) and NT$19,512 (US$644) respectively. There were no outward payments made in 2022.
The fourth individual, designated on 16 December 2020 pursuant to US Executive Order 13846 and subsequently removed from the Specially Designated Nationals and Blocked Persons List (SDN) in June 2022, took out one endowment policy in March 2014 and is the life assured of another investment-linked policy taken out by his wife in November 2018 with Prudential’s Vietnam insurance subsidiary. The matter was identified during periodic customer screening in December 2020. Both policies are denominated in Vietnamese Dong and the annual premiums are VND25,800,000 (US$1,101) and VND 129,890,000 (US$5,535) respectively. The matter was reported to the Vietnam government regulatory authority, the State Bank of Vietnam. Both policies remain in force, with no claims submitted or any outward payments made to date.
The fifth individual, designated on 10 March 2021 pursuant to US Executive Order 14014, took out two endowment policies with Prudential’s Singapore insurance subsidiary between 2016 and 2018 with a total annual premium of SGD 78,024 (US$57,804). The matter was identified on 4 April 2021 and both policies were terminated on 31 May 2021. The customer account has been frozen and segregated in the general ledger. Prior consent from the local law enforcement authority will be required prior to any payout of the policies’ cash value.
The sixth individual, designated on 17 September 2021 pursuant to US Executive Order 13224, took out one endowment policy denominated in Hong Kong Dollar in June 2017 with Prudential’s Hong Kong insurance subsidiary and the annual premium is HKD60,813 (US$7,747). The policy is fully paid up since June 2021. The matter was identified during periodic customer screening in October 2021 and reported to the Hong Kong government law enforcement agency. There has been no claim or any outward payment made to date and Prudential will seek prior clearance from local authority for any future transaction with the individual.
The seventh individual, designated on 31 January 2022 pursuant to US Executive Order 14014, took out one USD denominated term life policy with Prudential’s Singapore insurance subsidiary in August 2019 with an annual premium of USD 5,141.67 and was identified in February 2022 through periodic customer screening. The matter was reported to the Singapore authorities and the policy was terminated in August 2022. The policy had no surrender value and no transaction had been made in 2022.
The eighth individual, designated on 25 March 2022 pursuant to US Executive Order 14014, took out one endowment policy with Prudential’s Singapore insurance subsidiary in March 2018 with an annual premium of SGD 80,041.50 (USD 60,011) and was identified in April 2022 through periodic customer screening. The matter was reported to the Singapore authorities and the policy was terminated in April 2022 with funds frozen in a suspense account. No transaction had been made in 2022.
The ninth individual, designated on 8 November 2022 pursuant to US Executive Order 14014, took out one endowment policy with Prudential’s Singapore insurance subsidiary in May 2022 with an annual premium of SGD 30,000 (USD 22,494) and was identified in January 2023 through periodic customer screening. The policy was terminated in February 2023 and the matter was reported to the Singapore authorities. The policy had no surrender value and no outgoing transaction had been made in 2022.
As the provisioning of insurance liabilities is undertaken on a portfolio basis, it is not practical to estimate the net profits on the contracts referred to above. Prudential does not intend to engage in further new business dealings with these sanctioned individuals.
69
Prudential in Asia
Regulators, laws and major regulations of insurance business
Prudential operates in highly-regulated markets and under the ever-evolving requirements and expectations of diverse regulatory, legal and tax regimes which may impact its business or the way it is conducted. The businesses in Asia are subject to all relevant local regulatory and supervisory schemes. These laws and regulations vary from jurisdiction to jurisdiction, but it is the local regulators that typically grant (or revoke) licences and therefore control the ability to operate a business.
The complexity of legal and regulatory (including sanctions) compliance continues to evolve and increase in Asia, where economies in the region are in various phases of maturity, also representing a challenge for international businesses. In general (although there are exceptions), regulators in developing economies continue to build the regulatory framework relevant to their level of economic development. Increasing regulatory developments in the region will continue to affect Prudential’s Asia businesses. At the same time, the global geopolitical tensions including the Russia-Ukraine conflict have also increased uncertainties and the complexity regulatory compliance for Prudential’s businesses in some of the jurisdictions. The Group has in place appropriate frameworks designed to continuously monitor and deal with the various regulatory concerns.
Other central issues for all regulators in 2022 continued to be efforts to ensure the financial and operational resilience of the insurance industry (including to address the rising interest rates) and the protection of consumers and policyholders of insurance products amid the Covid-19 pandemic. Efforts were made and new regulations and guidelines were continuously issued in a number of markets to assist and require the industry to (i) assess, monitor and manage insurance and financial risks, including capital and solvency, (ii) introduce new coverages and services applicable for the risks specific to the crisis, (iii) launch/enhance new/existing sales and servicing platform with corresponding controls, while maintaining capability of meeting all regulatory requirements including ongoing filings. Business conduct and consumer protection continue to be a key priority for regulators in Asia. The focus continues to be on product design, commission structure, marketing literature, sales and various business processes including specifically for investment-linked products.
The increasing use of emerging technological tools and digital services across industry is likely to lead to new and unforeseen regulatory requirements and issues, including renewed expectations on the governance and ethical use of technology and data. Distribution and product suitability linked to innovation continue to set the pace of conduct regulatory change in Asia. Prudential falls under the scope of these conduct regulations and will continue to ensure regulatory expectations are appropriately met.
Significant additional details of the regulatory regimes, to which Prudential’s Asia insurance operations are subject, are discussed below:
Hong Kong
Prudential currently operates two subsidiaries in Hong Kong for life (Prudential Hong Kong Limited (PHKL)) and general (Prudential General Insurance Hong Kong Limited (PGHK)) insurance businesses, with both entities now fully under the regulatory regime of the Hong Kong IA. The sale of mandatory pensions by agents is regulated by the Mandatory Provident Fund (MPF) Schemes Authority which supervises the MPF intermediaries. Investment-linked insurance and voluntary health insurance schemes manufactured by local insurers are also required to obtain approvals respectively from the Securities and Futures Commission and the Food and Health Bureau, before launching of such businesses or new products.
The Hong Kong IA has in place comprehensive regulations covering all aspects of the insurance product lifecycle. The regulator continued to place focus of its supervision on PHKL and PGHK’s culture and conduct aspects throughout 2022.
The Hong Kong IA has sought to align the territory’s insurance regime with international standards and has been developing a risk-based capital framework that comprises of quantitative and qualitative requirements and requires public disclosures and transparency of information. In April 2022 PHKL received approval from the Hong Kong IA to early-adopt the new risk-based capital regime with effect from 1 January 2022.
In late 2022, the regulator shared the ongoing industry priorities for 2023 including Insurtech, ESG, and cybersecurity, which are essential in enabling Hong Kong insurers’ developments in the Greater Bay Area. Further regulatory developments are anticipated. The Hong Kong Government also proposed to establish a Policyholder Protection Scheme in December 2022 as a safety net for policyholders in the event of an insurer’s insolvency. A public consultation is underway till the end of March 2023, to be followed by industry level consultation within the same year.
Singapore
Prudential Assurance Company Singapore (Pte.) Limited is registered by the Monetary Authority of Singapore (the MAS) to design and sell both life and accident and health insurance products pursuant to the Insurance Act and Financial Advisers Act.
70
Under the Insurance Act, the MAS is responsible for insurance regulation and supervision of insurance companies. The MAS has detailed regulatory frameworks to govern insurance companies and the distribution of insurance products in Singapore. MAS regulations cover, inter alia, product development, pricing and management of insurance products, market conduct standards, investments undertaken, public disclosure requirements, reinsurance management, maximum representatives tier structure, loans and advances and product disclosure. The MAS also issues directions and regulations for the prevention of money laundering and to counter financing terrorism. This is in addition to the general AML law under which suspicious transactions must also be notified to the Commercial Affairs Department, an enforcement agency of the Singapore Police Force.
The Financial Adviser Act gives the MAS the authority to regulate and supervise all financial advisory activities conducted by insurance companies. The MAS regulation covers, among other things, the appointment and training of representatives, disciplinary action, mandatory disclosure to clients, sales and recommendations process on investment products, replacement (switching) of investment products and fair dealings with customers. Mandatory disclosure to clients covers both product information and basic data about the representatives and the firm.
On 4 November 2022, MAS proposed new amendments to the Insurance Act and the intermediaries’ regulations, which would introduce new measures for anti-commingling for insurers and brokers, oversight of outsourcing arrangements, supervision of policyholder funds, protecting auditors from liability of disclosure to MAS, maximum term of executive appointments and removal of not fit/proper persons, and widening scope of circumstances for false or misleading information provided to MAS. Further developments are expected.
Indonesia
PT. Prudential Life Assurance is authorised to carry out long-term insurance business in Indonesia. Prudential’s operations in Indonesia are authorised to distribute life insurance products based on either conventional or Syariah principles, through agency, bancassurance (including direct marketing) and other alternate distribution channels.
The financial regulatory regime in Indonesia operates on a ‘twin peaks’ model with the Financial Services Authority of Indonesia, the Otoritas Jasa Keuangan (OJK) responsible for microprudential supervision and Bank Indonesia retaining its macroprudential responsibilities. The implementation of AML controls in the insurance industry is monitored by the Indonesian Financial Transaction Reports and Analysis Center, or Pusat Pelaporan dan Analisis Transaksi Keuangan in Indonesian.
The OJK has revised investment linked products regulations with the aim of increasing insurance penetration and better protecting customer interests and improving market conduct. The final regulations were enacted in Q1 2022 and have implications for the product strategies and insurance and compliance risks for insurers. Industry discussion with respect to the implementation of some of the requirements under the new regulations is ongoing. General supervisory focus on insurer governance has increased, in particular on the autonomy of decision-making of local insurers. The OJK has also focused on consumer protection regulations more broadly, issuing updated regulations in April 2022, and has recently enhanced regulatory requirements on IT risk management.
The new Personal Data Protection Law came into effect in October 2022. The law requires actions to enhance data protection governance and procedures including privacy assessments and designated data protection personnel within a two-year transition period. Moreover, a new financial sector law was passed in early 2023. A notable change includes a new insurance policy guarantee mechanism for the insurance sector, which will be established by the Indonesia Deposit Insurance Corporation.
Malaysia
Prudential Assurance Malaysia Berhad (PAMB) carries out life insurance business in Malaysia.
The Bank Negara Malaysia (BNM) is the central bank of Malaysia and is the regulatory body responsible for supervising and regulating the financial services sector, including the conduct of insurance and Takaful business (insurance that is compliant with Islamic principles). BNM places considerable emphasis on fair market conduct by the insurance industry and protection of consumers’ interests and is also responsible for administering legislation in relation to AML matters. BNM has the power to enforce sanctions on financial institutions.
In addition, PAMB is a member of the Life Insurance Association of Malaysia (LIAM), a self-regulatory body. Resolutions and circulars issued by the LIAM are binding on the member insurance companies.
Market liberalisation measures were introduced by BNM in April 2009, which increased the limit from 49 per cent to 70 per cent on foreign equity ownership for insurance companies and Takaful operators in Malaysia. A higher foreign equity limit beyond 70 per cent for insurance companies will be considered by BNM on a case-by-case basis, for example, for companies who support expansion of insurance provision to the most vulnerable in Malaysian society.
Prudential BSN Takaful Berhad (a Prudential joint venture with Bank Simpanan Nasional) was one of the first overseas insurers to be granted a domestic Takaful License in Malaysia.
71
The Takaful business in Malaysia is also regulated by BNM. In addition, Prudential Takaful is also a member of the Malaysian Takaful Association, an association for Takaful operators that seeks to improve industry self-regulation through uniformity in market practice and to promote a higher level of co-operation.
The BNM has initiated a multi-phase review of its current RBC frameworks for insurers and takaful operators which has been conducted since 2018. The review aims to ensure that the frameworks remain effective under changing market conditions, facilitate consistent and comparable capital adequacy measurement across the insurance and takaful industry, where appropriate, and achieve greater alignment with key elements of the global capital standards such as ICS, where appropriate. The roll out of the RBC framework is planned in phases, which include quantitative impact studies in 2022, the issuance of exposure drafts and parallel run planned in 2023, prior to potential full implementation in 2024 at the earliest.
Chinese Mainland
CITIC-Prudential Life Insurance Company Limited, Prudential’s joint venture with CITIC in which Prudential has a 50 per cent share, is authorised to conduct life insurance business in China.
The body responsible for regulation of the insurance sector is the China Banking and Insurance Regulatory Commission (CBIRC). CBIRC reports directly to the State Council. CBIRC is authorised to conduct the administration, supervision and regulation of the Chinese insurance market and to ensure that the insurance industry operates in a stable manner in compliance with the law.
The People’s Bank of China oversees all AML activities in China and has actively been developing rules and guidance, requiring insurance companies to abide by the main AML law and regulations in connection with capital investment, transfers and set-up of new branches, as well as specifying senior management’s responsibilities on AML.
It was announced by the National People Congress on 7 March 2023 that the Chinese government plans to set up a new national regulatory body as part of its regulatory reform. The proposal would consolidate oversight of the financial industry directly under the State Council and aiming to streamline the current approach of multiple regulatory bodies. Under the new set-up, an enlarged national financial regulator will be established, absorbing CBIRC with enhanced powers and amending some functionalities of PBOC and China Securities Regulatory Commission (CSRC). Upon completion of the regulatory reform, PBOC will become more focused on monetary policy, and the CSRC will remain independent yet will also be elevated as a government agency under the State Council.
The Covid-19 epidemic and regulatory tightening across a number of industries in 2022 including the financial sector, have driven market volatility, heightened credit risk, and adversely impacted business sentiment, with the potential for broader financial contagion. In addition, recent regulatory developments in the Chinese Mainland which may potentially increase compliance risk to the Group, include the CBIRC upgrade to C-ROSS II to enhance solvency reporting, which became effective in the first quarter of 2022, subject to transitional arrangements.
The Personal Information Protection Law enacted in late 2021, is aimed at regulating data and cyber security and continuing to challenge businesses in use and processing of data virtually. In Q3 2022, the Cyberspace Administration of China (CAC) issued the Measures on Security Assessment of Outbound Data Transfers, which, although provide more information on cross-border data transfers, imposed new requirements including a mandatory security assessment on outbound data transfers. Businesses that collect and process the personal information of Chinese Mainland citizens are anticipating further requirements to be introduced.
CBIRC also issued updated rules in 2022 for consumer rights protection and information disclosures. Insurers are required to establish mechanisms throughout the business strategy and product lifecycle with proper governance and customer protection. Sufficient product information and risk disclosures should be also provided for different life insurance products. These regulatory developments are intended to promote industry professionalisation, customer satisfaction and sustainability in the long run.
Thailand
Prudential Life Assurance (Thailand) Public Company Limited carries out life insurance business in Thailand. The Office of Insurance Commission, under the supervision of the Ministry of Finance regulates insurers, brokers and agents. The sale of unit linked products are regulated by the Securities and Exchange Commission (SEC).
The main regulation regarding AML in Thailand is the Anti-Money Laundering Act of 1999 (AMLA) which has been effective since August 1999. The Anti-Money Laundering Office was also established upon the enactment of the AMLA as a state agency in charge of enforcing the AMLA and anti-terrorism funding regulations, as well as reviewing the regulatory standards thereof. In this regard, the AMLA has undergone several amendments over the years.
The Personal Data Protection Commission was established in January 2022 under Thailand’s Personal Data Protection Act which became effective in June 2022.
Vietnam
Prudential Vietnam Assurance Private Limited is licensed and regulated by the Ministry of Finance (MoF) as a life insurance company. An insurance company is not permitted to operate both life and non-life insurance at the same time, except in the case of a life insurance company that offers personal health and protection care insurance as a supplement to life insurance.
72
The Insurance Supervision Authority of the MoF Vietnam specifically undertakes the supervision of insurance companies. The fundamental principles of the operation of insurance companies are set out in the Insurance Business Law. The amended Law took effect on 1 January 2023, which also contains provisions on RBC, with a five-year grace period.
AML controls in the insurance industry are monitored by the Anti-Money Laundering Department under the Banking Inspectorate and Supervision Department of the State Bank of Vietnam.
Other markets
Market | Operation | Key regulator | AML Reporting Agency |
|---|---|---|---|
Cambodia | Prudential (Cambodia) Life Assurance PLC (PCLA) | Insurance Regulator of Cambodia (under the Non-Banking Financial Service Authority) | Cambodian Financial Intelligence Unit |
India | ICICI Prudential Life Insurance Company Limited | Insurance Regulatory and Development Authority of India (IRDAI) | Financial Intelligence Unit - India (under the Ministry of Finance) |
Laos | Prudential Life Assurance (Lao) Company Limited (PLAL) | Ministry of Finance and its regulatory unit, Department of Government Investment Enterprise and Insurance Management Authority (DSI) | Anti-Money Laundering Intelligence Office (AMLIO) |
Myanmar | Prudential Myanmar Life Insurance Company Limited (PMLI) | Financial Regulatory Department (under the Ministry of Planning and Finance (MoPF)) | Myanmar Financial Intelligence Unit |
The Philippines | Pru Life Insurance Corporation of UK (PLUK) | Insurance Commission (IC) | Anti-Money Laundering Council (AMLC) |
Taiwan | PCA Life Assurance Company Limited (PCALT) | Financial Supervisory Commission (FSC) | Financial Intelligence Unit, Taiwan |
Regulation of investment and fund management businesses and other regulated operations
Prudential conducts investment and fund management businesses through subsidiaries or JVs in Asia in Hong Kong, Japan, Korea, Taiwan,Chinese Mainland, India, Singapore, Malaysia, Vietnam and Indonesia. Eastspring Investments also has a presence in Luxembourg, the US and the UK. All operations are authorised and licensed by the relevant authorities. Depending on the licensing regime in the respective jurisdiction, Eastspring entities are generally authorised to conduct fund/investment management and investment advisory activities for both retail and institutional funds. In addition, two of the JV companies are licensed to provide Trust services to funds.
Significant additional details of the regulatory regimes, to which Prudential’s Asia asset management operations are subject, are discussed below:
Singapore
Eastspring Singapore is regulated by the MAS. The Company holds a Capital Markets Services Licence under the Securities and Futures Act, Cap 286 to conduct the following regulated activities: (a) fund management and (b) dealing in securities.
Eastspring Singapore is also an exempt financial adviser under the Financial Advisers Act, Cap 110. In addition, Eastspring Singapore holds other registrations outside of Singapore, including the Registered Investment Adviser with the US SEC and the Renminbi Qualified Foreign Institutional Investors with the CSRC in China. As such, the US SEC and CSRC regulations relevant to these registrations apply to Eastspring Singapore. Furthermore, Eastspring Singapore is the appointed fund manager and global distributor of the Eastspring Investments Luxembourg SICAV funds. Accordingly, the UCITS regulations issued by the Commission de Surveillance du Secteur Financier (CSSF) and certain requirements by the European Union (EU) and European Securities and Markets Authority (ESMA) are relevant to Eastspring Singapore.
In view of the increasingly digitalised financial industry, the MAS remains vigilant on technology and cyber risk management, data governance, use of artificial intelligence as well as outsourcing and third-party vendor management. In addition, MAS is expected to continue its focus on regulatory themes such as accountability requirements and ESG. On accountability, MAS plans to propose amendments to the Guidelines on Fair Dealing which will widen the scope of application to include all products and services offered by financial institutions to their customers and incorporate key principles and guidance on the fair treatment of customers at various stages of the customer journey. On ESG, MAS issued the Disclosure and Reporting Guidelines for Retail ESG Funds in 2022 to mitigate the risk of greenwashing and facilitate greater comparability in the disclosures made by retail ESG funds. Similarly, the ESMA and CSSF continue to address greenwashing and the technical standards under the Sustainable Finance Disclosure Regulation (SFDR) are officially in place since 1st January 2023. Further, CSSF has initiated a SFDR data collection exercise for investment fund managers to assess compliance with the existing SFDR requirements.
73
India
ICICI Prudential Asset Management Company and ICICI Prudential Trust are Prudential’s two asset management related JVs with ICICI Bank Limited. These two entities are registered with the Securities and Exchange Board of India (SEBI) to perform asset management activities and to act as trustees to funds registered with SEBI respectively.
SEBI is primarily set up to protect the interests of investors in the securities market. It promotes the development of the securities market and regulates the business. It regulates the operations of depositories, participants, custodians of securities, foreign portfolio investors, and credit rating agencies and acts to prohibit fraudulent and unfair trade practices related to the securities market. It ensures that investors are educated on the securities markets and undertakes research and development to ensure the securities market is efficient at all times.
Malaysia
Eastspring Investments Berhad (EIMY) and Eastspring Al-Wara’ Investments Berhad are primarily regulated by the Securities Commission Malaysia. EIMY is also a ‘reporting institution’ under the Anti-Money Laundering, Anti-Terrorism Financing and Proceeds of Unlawful Activities Act 2001 and is bound by BNM requirements. In addition, EIMY is a member of the Federation of Investment Managers Malaysia (FIMM), a Self-Regulatory Organisation for the unit trust industry. FIMM regulates its members while ensuring that investors are protected and public interests are upheld.
Thailand
TMBAM Eastspring and TFund Eastspring, Prudential’s majority owned subsidiaries are both investment management companies regulated by the Securities and Exchange Commission of Thailand. They are licensed to conduct fund management and investment advisory services.
The core obligation of the SEC as prescribed by the Securities and Exchange Act is to carry out supervision. The SEC has the responsibility to issue rules and regulations, ensure compliance and pursue enforcement in case of violations. In order to create an effective supervisory mechanism and sustainable capital market, the SEC has moved towards more principles-based regulations and self-discipline among practitioners by issuing preventive regulations, conducting monitoring activities, imposing enforcement actions and providing supportive measures to improve regulatory standards and practices within the financial industry.
Chinese Mainland
Eastspring Overseas Investment Fund Management (Shanghai) Company Limited and Eastspring Investment Fund Management (Shanghai) Company Limited, both Eastspring subsidiaries, as well as CITIC-Prudential Fund Management, Prudential’s asset management joint venture with CITIC Trust, and its subsidiary, CITIC CP Asset Management Company, are governed by the CSRC. The duties of CSRC include the formulation and development of policies, rules and regulations for the securities and futures markets as well as to perform regulatory supervision over the management and the managerial officials of the relevant companies.
In addition, these entities need to abide by the self-regulatory rules established by the Asset Management Association of China, covering private investment fund management institutions, fund products, qualified investors, fund custody, fund sales, fund investment, information disclosure, accounting, fund valuation and outsourcing of services.
Other key regulators for investment and fund management businesses are as follows:
Market | Operation | Key regulator |
|---|---|---|
Hong Kong | Eastspring Investments (Hong Kong) Limited | Securities and Futures Commission (SFC) |
Indonesia | PT Eastspring Investments Indonesia | Otoritas Jasa Keuangan (OJK) |
Japan | Eastspring Investments Limited | Japan Financial Services Agency (JFSA) |
Luxembourg | Eastspring Investments (Luxembourg) S.A. | Commission de Surveillance du Secteur Financier (CSSF) |
The Philippines | Pru Life UK Asset Management and Trust Corporation | Bangko Sentral ng Pilipinas (BSP) |
South Korea | Eastspring Asset Management Korea Co. Ltd. | Financial Services Commission (FSC) |
Taiwan | Eastspring Securities Investment Trust Co. Ltd. | Financial Supervisory Commission Republic of China (Taiwan) (FSC) Securities Investment Trust & Consulting Association (SITCA) |
United States | Eastspring Investments Inc. | Securities Exchange Commission (SEC) Financial Industry Regulatory Authority (FINRA) |
Vietnam | Eastspring Investments Fund Management Company | State Securities Commission of Vietnam (SSC) |
74
Prudential in Africa
Prudential has operations in Ghana, Kenya, Uganda, Zambia, Nigeria, Cameroon, Côte d’Ivoire and Togo. The regulatory landscape in these jurisdictions continues to evolve and regulators are introducing new laws and regulations to strengthen the business licensing and market conduct requirements, and to develop a safe and stable insurance industry and deepen insurance penetration.
75
GOVERNANCE
Introduction
2022 was a year when we completed a period of significant corporate transactions and restructuring that has transformed Prudential.
The appointment of our new Chief Executive Officer, Anil Wadhwani, completed the shift of Prudential’s management to Asia, reflecting our transformation to focus on the growth markets there and in Africa. Given the importance of the decision to the future success of the company, all Non-executive Directors were involved in the decision-making process that resulted in Anil’s appointment. Building on previous work by the Nomination & Governance Committee, the Board conducted a thorough and robust search process, considering the best internal and external talent with the support of the external search firm, Egon Zehnder. Candidates were interviewed by all Non-executive Directors and subject to full independent assessments and extensive referencing. Our key criteria were deep understanding of, and operating experience in, insurance across our key Asian markets and the skills to lead and develop a customer-centric, performance-driven culture. Following an extensive and rigorous search, the Non-executive Board members unanimously identified Anil as the best candidate. He has more than 30 years’ experience, predominantly in Asia, including in insurance and as a customer-centric people leader with a strong track record of creating and driving a culture of success, significant and proven digital experience, and the leadership skills required to take the company through the next phase of its journey, building on the strong platform that we have created.
Alongside this key management change, we recognised some time ago that the changes to our organisational focus and footprint meant changing the composition, focus and culture of the Board and its committees. These continuing changes are set out in the Nomination & Governance Committee report. As the Board composition has changed to reflect the Group’s transformation, we have worked to ensure we do not lose the experience and insights gained from our long-standing commitment to strong governance as a core pillar of our resilience.
In transforming the business and the Board, the Board benefited hugely from the greater ability to travel through the course of the year, with the return of in-person engagement and interaction, building and re-building personal connections as a Board and with our management teams across the Group. This enabled us to better understand the different perspectives and expectations of a range of stakeholders who are important to our success as a business.
As well as its composition, the Board’s agenda and ways of working have also changed to reflect the transformed company’s needs. Through 2022, we continued to conduct deep dives into each market presented by local leadership on a rotating basis to enable a clearer understanding of the performance, strategy, opportunities and risks facing each of the businesses, as well as increasing dialogue between Group and subsidiary boards to share understanding and experience. We received regular updates on cross-cutting issues so the Board could support management as they enhanced the operational focus, synergies and risk management across the Group to realise the promise of our re-focused strategy, which was energetically led by Mark FitzPatrick through the year.
These subjects have included agency productivity, bank distribution, our technology strategy, digital adoption opportunities and challenges, trends in persistency and its implications, and people issues such as how we are managing stress, well-being and attrition, and the impact of the pandemic and cost of living crisis on our customers. We ensured appropriate time and consideration was given to understanding the impact of regulatory changes affecting the Group, particularly IFRS 17, and risks such as those relating to cyber security.
As reported last year, we created the Board Responsibility & Sustainability Working Group (RSWG) in 2021 with particular focus in its first phase on how we created, embedded and reported on Prudential’s role in, and targets for, a just and inclusive transition on climate change, and on people issues.
In 2022, our attention to climate change continued unabated. With our climate change policies more mature, we were able to move the oversight of environmental and climate-related issues, including the Group’s external commitments and their embedding into the business, into the regular agenda of the Risk Committee, with its terms of reference updated to ensure a holistic approach to this area.
Following detailed discussions at the Board of our approach to climate change, and the progress towards the Group’s externally communicated climate-related commitments set out in our 2022 ESG Report, recognising the evolving expectations of stakeholders, the Board agreed the need for clear communication around Prudential’s role in emerging markets. As a significant investor and asset owner with long-term investment horizons and liabilities, we believe we are in a position to support a just and inclusive transition for and within emerging markets. We articulated this in 2022 through the development of a white paper which defined the case for a just and inclusive transition, and its place in meeting the Paris Agreement. The paper explored case studies and further actions required, both from ourselves, the wider market and a range of stakeholders.
76
With climate now under the terms of reference of the Risk Committee, we have changed the RSWG to include focus on Customers and Digital, in addition to its existing role with respect to People, Culture and Communities. These are deeply inter-linked issues at the heart of our future success: for example, how we ensure truly embedded customer-centricity as the critical underpinning of our business and conduct; how we use technology to support our people and agents to deliver for our customers better; and how our culture, talent and capabilities need to develop in order to deliver these objectives and be nurtured through the pressures and stretch of change.
With Alice Schroeder’s departure, George Sartorel now chairs the RSWG. Arijit Basu and Claudia Suessmuth Dyckerhoff were appointed to the RSWG on joining the Board, with Jeremy Anderson stepping down from it on 31 March 2023 after the publication of the ESG Report, in light of his appointment as Senior Independent Director from the AGM in May 2023.
Focus in 2023
With Anil’s arrival, we want to ensure that our governance is an enabler of, and support to, his and the senior management team’s success in leading the company to deliver for our customers, invest in our capabilities, technology and people, and realise the promise of our growth strategy to create long term value for our shareholders and to serve all our stakeholders.
We will continue to work on developing a performance-driven culture, aligned to our values and necessary to support our transformation. This underpins the ways we work, ensuring we have the diversity of experience and perspectives, with our people truly included and supported in their ambitions, able to contribute fully to the company and, critically, to serve our customers.
We are focused on the careful management of key risks which are set out further in the Risk Committee report, as well as adapting to changes in regulatory and reporting requirements such as IFRS 17, which is discussed further in the Audit Committee report.
Board of Directors
CHANGES TO THE BOARD
Chief Executive Officer and Chief Financial Officer
Mike Wells retired from his role as Group Chief Executive and stepped down from the Board on 31 March 2022. Mark FitzPatrick, previously Group Chief Financial Officer and Chief Operating Officer, took up the role of Group Chief Executive on an interim basis until 24 February 2023 when he stepped down from the Board. On 25 February 2023, Anil Wadhwani joined the Board and assumed the role of Chief Executive Officer.
James Turner, who performed the role of Group Chief Risk and Compliance Officer since 2018, became Group Chief Financial Officer on 1 April 2022 when Mark took up the role of Group Chief Executive on an interim basis. On 16 November 2022, Prudential announced a change to the structure of the Board composition and the role of Group Chief Financial Officer is no longer a Board role, effective from 1 January 2023. James continues as a member of the Group Executive Committee.
Non-executive Directors
As part of the regular refresh of Board membership, a number of Non-executive Directors reached the end of their tenure and were succeeded by new Directors with skills required to execute the Group strategy going forward. Each Director’s relevant skills and experience is set out in their biography and more information on succession planning can be found below.
| ● | Alice Schroeder and Anthony Nightingale retired from the Board at the conclusion of the last Annual General Meeting (AGM) on 26 May 2022. |
| ● | Philip Remnant and Tom Watjen will retire from the Board following the conclusion of the next AGM on 25 May 2023. Jeremy Anderson will succeed Philip as Senior Independent Director at the conclusion of the 2023 AGM. |
| ● | On 14 January 2022, George Sartorel joined the Board. |
| ● | On 1 September 2022, Arijit Basu joined the Board. |
| ● | On 1 January 2023, Claudia Suessmuth Dyckerhoff joined the Board. |
The composition of the Prudential Corporation Asia Limited board of directors mirrors the Prudential plc Board.
CHANGES TO BOARD COMMITTEE AND WORKING GROUP MEMBERSHIP:
Audit Committee
| ● | On 1 May 2022, Chua Sock Koong stepped down from the Audit Committee. |
| ● | On 1 September 2022, Arijit Basu joined the Audit Committee. |
77
Nomination & Governance Committee
| ● | On 1 May 2022, George Sartorel and Chua Sock Koong joined the Nomination & Governance Committee and Tom Watjen stepped down from the Committee. |
| ● | On 16 November 2022, Jeremy Anderson joined the Nomination & Governance Committee. |
Remuneration Committee
| ● | On 1 May 2022, Ming Lu joined the Remuneration Committee. |
| ● | On 26 May 2022, Chua Sock Koong succeeded Anthony Nightingale as Chair of the Remuneration Committee. Sock Koong served on the Remuneration Committee as a member since May 2021. |
Risk Committee
| ● | On 1 May 2022, George Sartorel joined the Risk Committee and Ming Lu stepped down from the Committee. |
| ● | On 1 January 2023, Claudia Suessmuth Dyckerhoff joined the Risk Committee. |
Responsibility & Sustainability Working Group
| ● | On 1 May 2022, George Sartorel joined the RSWG and succeeded Alice Schroeder as Chair of the RSWG on 26 May 2022, following her retirement at the conclusion of the AGM. |
| ● | On 1 September 2022, Arijit Basu joined the RSWG. |
| ● | On 1 January 2023, Claudia Suessmuth Dyckerhoff joined the RSWG. |
| ● | On 31 March 2023, Jeremy Anderson will step down from the RSWG. |
Chair and Chief Executive Officer
Shriti Vadera
Chair
Age: 60
| ● | Appointed to the Board: May 2020 |
| ● | Appointed Chair of the Board: January 2021 |
| ● | Appointed Chair of the Nomination & Governance Committee: January 2021 (member since May 2020) |
Shriti is a standing attendee at meetings of the Audit, Remuneration and Risk Committees and the RSWG.
Relevant skills and experience
Shriti brings senior boardroom experience and leadership skills at complex organisations, including extensive experience in the financial services sector, with international operations and at the highest level of international negotiations between governments and in multilateral organisations. She contributes her wide-ranging and global experience in economics, public policy and strategy, as well as her deep understanding and insight into global and emerging markets and the macro-political and economic environment.
Shriti was chair of Santander UK Group Holdings, Senior Independent Director at BHP and a Non-executive Director of Astra Zeneca. Between 2009 and 2014, she undertook a wide range of assignments, such as advising the South Korean Chair of the G20, two European countries on the Eurozone and banking crisis, the African Development Bank on infrastructure financing and a number of global investors and sovereign wealth funds on strategy and economic and market developments. From 2007 to 2009, Shriti was a Minister in the UK government, serving in the Cabinet Office, Business Department and International Development Department. She led on the UK government’s response to the global financial crisis and its Presidency of the G20. From 1999 to 2007 she was a member of HM Treasury’s Council of Economic Advisers.
Shriti’s career began with 15 years in investment banking with SG Warburg/UBS, where she had a strong focus on emerging markets. Shriti holds a Bachelor’s Degree in Philosophy, Politics and Economics from Oxford University.
Current key external appointments
| ● | Chair, The Royal Shakespeare Company |
| ● | Institute of International Finance, Board Member |
Anil Wadhwani
Chief Executive Officer
Age: 54
| ● | Appointed to the Board: February 2023 |
| ● | Appointed Chief Executive Officer: February 2023 |
78
Anil is a standing attendee at meetings of the Audit, Nomination & Governance, Remuneration and Risk Committees and the RSWG.
Relevant skills and experience
Anil is a global financial services leader with more than 30 years' experience, predominantly in Asia, combining strategic vision and execution in some of the world's biggest companies. Most recently, as CEO of Manulife's Asia region, he successfully grew and transformed its diversified and multi-channel business with significant market share gains in many key markets and made it the company's largest source of core earnings. Anil also has significant and proven digital experience, having driven the modernisation of technology platforms across 13 markets in Asia in his previous role.
Prior to this he spent 25 years with Citi in Asia Pacific, EMEA and the US, in a number of consumer financial services roles. Anil holds a Master’s Degree in Management Studies from the Somaiya Institute of Management Studies and a Bachelor’s Degree in Commerce from the Narsee Monjee College of Commerce and Economics.
Non-executive Directors
Lord Remnant (Philip) CBE FCA
Senior Independent Director
Age: 68
Philip is due to retire from the Board at the conclusion of the AGM on 25 May 2023.
Relevant skills and experience
Philip is a chartered accountant and brings substantial advisory, regulatory and listed company experience to the Board, having worked in senior roles across the financial services sector, including asset management, in the UK and Europe.
Philip was formerly a senior adviser at Credit Suisse and a Vice Chairman of Credit Suisse First Boston Europe and Head of its UK Investment Banking Department. He was twice seconded to the role of Director General of the Takeover Panel and in May 2022 he retired from the Takeover Panel after serving as Deputy Chair for ten years.
Philip also held the office of Chair of The City of London Investment Trust plc and of M&G Group Limited and served on the board of Severn Trent plc.
In 2008, Philip was Chair of the Shareholder Executive of the UK government. He served on the board of Northern Rock plc as one of two government appointed directors and on the board of UK Financial Investments Limited.
Philip was awarded a CBE in 2011 for services to the financial services industry and to the public sector. He is a fellow of the Institute of Chartered Accountants in England and Wales and holds a Master’s Degree in Law from Oxford University.
Current key external appointments
| ● | Chair, Coutts & Co |
| ● | Member of the House of Lords |
Jeremy Anderson CBE
Independent Non-executive Director
Age: 64
Jeremy will succeed Philip Remnant as Senior Independent Director with effect from the conclusion of the AGM on 25 May 2023, subject to re-election by shareholders.
79
Relevant skills and experience
Jeremy brings to the Board substantial leadership experience in the financial services sector across Asia. He has extensive technical audit and risk management skills and experience, particularly with regard to multinational companies.
Jeremy was formerly the Chairman of Global Financial Services at KPMG International having previously been in charge of its UK Financial Services Practice and held roles including Head of Financial Services KPMG Europe, Head of Clients and Markets KPMG Europe and CEO of KPMG’s UK consulting business. Jeremy served as a member of the Group Management Board of Atos Origin and as Head of its UK operations. Jeremy also served on the board of the UK Commission for Employment and Skills.
Jeremy was awarded a CBE in 2005 for his services to employment. He holds a Bachelor’s Degree in Science (Economics) from University College London.
External listed company directorships
●Senior Independent Director, UBS Group AG (including its subsidiary, UBS AG)
Other current key external appointments
● | The Kingham Hill Trust (trustee) |
● | The Productivity Group (non-executive director) |
Arijit Basu
Independent Non-executive Director
Age: 62
●Appointed to the Board: September 2022
●Member of the Audit Committee (since September 2022)
●Member of the Responsibility & Sustainability Working Group (since September 2022)
Relevant skills and experience
Arijit has extensive experience in the banking and insurance industries in India following a career at State Bank of India (SBI) spanning nearly 40 years.
Arijit retired as the managing director of SBI in September 2020 having joined in 1983. During his career, he held a number of senior positions at the bank, across retail, corporate and international banking, business process re-engineering, IT and risk management. He was managing director and chief executive officer of SBI Life Insurance Company (a subsidiary of SBI), one of India’s leading life insurers, from 2014 until 2018 and took it public in 2017.
Since his retirement from SBI, Arijit has acted as a consultant, including advising the Life Insurance Corporation of India on its 2022 IPO.
Arijit is a Certified Associate of the Indian Institute of Bankers. He holds a Master’s Degree in History and a Bachelor’s Degree in Economics from the University of Delhi.
Current key external appointments
●Chair, HDB Financial Services Ltd
●Academic Advisory Council of the Reserve Bank of India (member)
●Peerless Hospitex Hospital and Research Center Ltd (non-executive director)
Chua Sock Koong
Independent Non-executive Director
Age: 65
●Appointed to the Board: May 2021
●Appointed Chair of the Remuneration Committee: May 2022 (member since May 2021)
●Member of the Nomination & Governance Committee (since May 2022)
Sock Koong served as a member of the Audit Committee from May 2021 until May 2022.
Relevant skills and experience
Sock Koong has more than 30 years’ experience in business leadership, operations, information technology and digitalisation throughout Asia.
From 2007 to 2020, Sock Koong was Chief Executive Officer of Singapore Telecommunications Limited (Singtel), Asia’s leading communications technology group, having previously held a number of senior roles at the firm, including Treasurer, Chief Executive Officer International and Group Chief Financial Officer, where she was responsible for Singtel’s financial functions, including treasury, tax, insurance, risk management and capital management.
80
Sock Koong is a Fellow Member of the Institute of Singapore Chartered Accountants and a Chartered Financial Analyst. She holds a Bachelor’s Degree in Accountancy from the University of Singapore.
External listed company directorships
●Bharti Airtel Limited (including its parent Bharti Telecom Limited)
●Royal Philips NV
●Ayala Corporation
Other current key external appointments
●Cap Vista Pte Ltd (non-executive director)
●Defence Science and Technology Agency (non-executive director)
●Deputy Chair, The Singapore Public Service Commission
●The Singapore Council of Presidential Advisers (member)
David Law ACA
Independent Non-executive Director
Age: 62
●Appointed to the Board: September 2015
●Appointed Chair of the Audit Committee: May 2017 (member since September 2015)
●Member of the Risk Committee (since May 2017)
●Member of the Remuneration Committee (since February 2021)
David served on the Nomination & Governance Committee from May 2017 until February 2021.
Relevant skills and experience
David has extensive technical knowledge and skills in audit, accounting and financial reporting matters and experience across the Group’s key markets, and across a number of industry sectors, particularly insurance.
David is a chartered accountant and spent almost 33 years working with Price Waterhouse and PricewaterhouseCoopers (PwC). During that time he was, amongst other things, the global leader of PwC’s insurance practice, a partner in the UK firm, and worked as the lead audit partner for multinational insurance companies. He also led PwC’s insurance and investment management assurance practice in London and the firm’s Scottish assurance division. After his retirement from PwC, David became a director and Chief Executive Officer of L&F Holdings Limited and its subsidiaries, which is a professional indemnity captive insurance group which serves the PwC network and its member firms. David retired from this role in June 2019.
David is an Associate of the Institute of Chartered Accountants in England and Wales and holds a Master’s Degree in Economics from the University of Edinburgh.
Ming Lu
Independent Non-executive Director
Age: 64
●Appointed to the Board: May 2021
●Member of the Nomination & Governance Committee (since May 2021)
●Member of the Remuneration Committee (since May 2022)
Ming Lu served on the Risk Committee from May 2021 until May 2022.
Relevant skills and experience
Ming has over 30 years’ experience of investing and developing businesses throughout the Asia Pacific region. He is the Head of Asia Pacific at KKR Asia Limited and is a Partner of Kohlberg Kravis Roberts & Co. L.P. He also serves as a member of the KKR Asian Private Equity Investment Committee, KKR Asian Portfolio Management Committee and KKR Operating Committee. Since 2018 he has played an important role in KKR’s Asia growth and expansion and has served as a member of the Asia Infrastructure Investment Committee and Asia Real Estate Investment Committee.
Ming previously worked for CITIC, the largest direct investment firm in China, before moving to Kraft Foods International Inc. He was president of Asia Pacific at Lucas Varity, and a partner at CCMP Capital Asia (formerly J.P. Morgan Partners Asia), where he was responsible for investment in the automotive, consumer and industrial sectors across a number of countries throughout Asia. Ming has also held directorships at Ma San Consumer Corporation, Mandala Energy Management Pte Ltd, Weststar Aviation Service Sdn Bhd and MMI Technologies Pte Ltd. He was a non-executive director of Jones Lang LaSalle Inc from 2009-2021.
81
Ming holds a Master’s Degree in Business Administration from the University of Leuven and a Bachelor’s Degree in Arts (Economics) from the Wuhan University of Hydroelectrical Engineering.
Current key external appointments
●KKR Asia Ltd (executive director)
●Goodpack Pte Ltd (KKR portfolio company)
George Sartorel
Independent Non-executive Director
Age: 65
●Appointed to the Board: January 2022
●Appointed Chair of the Responsibility & Sustainability Working Group: May 2022
●Member of the Nomination & Governance Committee (since May 2022)
●Member of the Risk Committee (since May 2022)
Relevant skills and experience
George has considerable operational expertise in insurance, following a career spanning 40 years in the sector, mainly across the Asia Pacific region.
From 2014 to 2019 he was the regional Chief Executive Officer of Allianz’s Asia Pacific business, having previously held a range of senior roles for Allianz, including chief executive of Allianz Italy, chief executive of Allianz Turkey, Global head of change programmes for the Allianz Group, general manager of Allianz Malaysia, Allianz Australia and New Zealand. He also previously sat on the Financial Advisory Panel of the Monetary Authority of Singapore from 2015 to 2019.
George began his career at Manufacturers Mutual Insurance in Australia. He holds a Master’s Degree in International Business Studies from the Heriot-Watt University.
External listed company directorships
● | Insurance Australia Group Limited |
Claudia Suessmuth Dyckerhoff
Independent Non-executive Director
Age: 56
●Appointed to the Board: January 2023
●Member of the Risk Committee (since January 2023)
●Member of the Responsibility & Sustainability Working Group (since January 2023)
Relevant skills and experience
Claudia has considerable experience in the healthcare services and technology sectors across China and the broader Asia-Pacific region.
Claudia joined the global consultancy firm McKinsey & Partners in 1995 and worked in a number of senior roles. She was responsible for helping to build the firm’s healthcare Services and Systems sector in Asia Pacific, including working with the Chinese Ministry of Health to help develop their views on China’s national healthcare systems. Much of the client work during this period involved transformation through technology, digital and data and her board experience in recent years has helped her develop valuable insights around the implementation of this in healthcare services. She has experience across various Asian markets, in particular in China, having been based in Shanghai for nearly 15 years and in Hong Kong for a further two years. Claudia holds a PhD in Business Administration from the University of St. Gallen and a Master’s Degree in Business Administration from CEMS/ESADE.
External listed company directorships
● | Ramsay Health Care Ltd |
● | Clariant AG |
● | Roche Holding AG |
Other current key external appointments
● | Huma Therapeutics Ltd (non-executive director) |
● | QuEST Global Services Private Ltd (non-executive director) |
82
Thomas Watjen
Independent Non-executive Director
Age: 68
●Appointed to the Board: July 2017
●Member of the Remuneration Committee (since July 2017)
●Member of the Risk Committee (since November 2018)
Tom is due to retire from the Board at the conclusion of the AGM on 25 May 2023.
Relevant skills and experience
Tom has experience across the insurance, asset management and financial services industries, as well as experience with listed companies.
Tom was formerly a director of Sun Trust Bank, an executive vice president and the chief financial officer of Provident Companies Inc., a director of LocatorX Inc. and, following Provident’s merger with Unum, president and chief executive officer of the renamed Unum Group. Tom started his career at Aetna Life and Casualty before joining Conning & Company, an investment and asset management provider, where he became a partner in the consulting and private capital areas. He joined Morgan Stanley in 1987, and became a managing director in its insurance practice. Tom holds a Master’s Degree in Business Administration from the University of Virginia and a Bachelor’s Degree in Economics from the Virginia Military Institute.
External listed company directorships
●Arch Capital Group Limited
Other current key external appointments
●Vice-Chair, Virginia Military Institute Board of Visitors
Jeanette Wong
Independent Non-executive Director
Age: 63
●Appointed to the Board: May 2021
●Member of the Audit Committee (since May 2021)
●Member of the Risk Committee (since May 2021)
●Member of the Responsibility & Sustainability Working Group (since November 2021)
Relevant skills and experience
Jeanette brings to the Board operational skills and experience in the financial services sector, following a career spanning more than 35 years across the South-East Asia Pacific region.
From 2008 to 2019, she led DBS Group’s institutional banking business, where she was responsible for corporate banking, global transaction services, strategic advisory, and mergers and acquisitions. Prior to this, Jeanette was the DBS Group’s chief financial officer from 2003 to 2008, having previously been chief administrative officer. As part of her role at DBS Group, Jeanette held non-executive director positions with ASEAN Finance Corporation, TMB Bank and the Bank of the Philippine Islands. Jeanette began her career in Singapore at Banque Paribas before moving to Citibank and then J.P. Morgan in Singapore, where she held senior pan-Asian roles. She has previously served as a non-executive director of Fullerton Fund Management Ltd and Neptune Orient Lines Limited.
Jeanette holds a Master’s Degree in Business Administration from the University of Chicago and a Bachelor’s Degree in Business Administration from the National University of Singapore.
External listed company directorships
●UBS Group AG (including its subsidiary, UBS AG)
●Singapore Airlines Limited
Other current key external appointments
●Council of CareShield Life (Chair)
●GIC Pte Ltd (member of risk committee)
●PSA International Pte Ltd (non-executive director)
●Singapore Securities Industry Council (member)
83
Amy Yip
Independent Non-executive Director
Age: 71
●Appointed to the Board: September 2019
●Member of the Audit Committee (since March 2021)
Amy served on the Remuneration Committee from September 2019 until March 2021.
Relevant skills and experience
Amy has extensive skills and experience in asset management, banking, insurance, and regulation following a career spanning more than 40 years in China and South-east Asia. Amy was formerly a non-executive director of Deutsche Börse AG, Temenos Group AG, Fidelity Funds, Vita Green, Hong Kong and an Executive Director of Reserves Management at the Hong Kong Monetary Authority.
From 2006 to 2010, Amy was chief executive officer of DBS Bank (Hong Kong) Limited, where she was concurrently head of its wealth management group and previously chair of DBS asset management. Amy began her career at the Morgan Guaranty Trust Company of New York, going on to hold senior appointments at Rothschild Asset Management and Citibank Private Bank. From 1996 to 2006, Amy held various senior positions at the Hong Kong Monetary Authority.
Amy holds a Master’s Degree in Business Administration from Harvard Business School and a Bachelor’s Degree in Arts (History) from Brown University.
External listed company directorships
●EFG International AG (including its subsidiary, EFG Bank AG)
Other current key external appointments
●AIG Insurance Hong Kong Limited (non-executive director)
Company Secretary
Tom Clarkson
Company Secretary
Age: 47
Appointments
●Appointed as Company Secretary: August 2019
Relevant skills and experience
As the Company Secretary, Tom is a trusted adviser to the Board and plays a pivotal role in the governance and administration of Prudential. Prior to his appointment as Company Secretary, Tom held a number of senior roles at Prudential, including Head of Compliance, Business Partners and prior to that, Group Litigation & Regulatory Counsel.
Tom is a qualified solicitor, admitted to practice in England and Wales. Prior to joining Prudential, he practised law at Herbert Smith LLP, London from 2002 to 2012, which included secondments to Lloyds Banking Group and Royal Bank of Scotland.
Group Executive Committee
The Group Executive Committee is a management committee constituted to support the Chief Executive Officer, who chairs the Committee. Members comprise the Chief Executive Officer, the Group Chief Financial Officer, the Group Human Resources Director, the Group Chief Risk and Compliance Officer, the Managing Directors of the Strategic Business Groups and the Chief Executive Officer of Eastspring Investments Group.
For the purposes of the Hong Kong Listing Rules, Senior Management is defined as the members of the Group Executive Committee.
84
Solmaz Altin
Managing Director, Strategic Business Group
Age: 49
Appointments
●Appointed to the Group Executive Committee: July 2022
Relevant skills and experience
Solmaz is Managing Director of the Strategic Business Group covering India, Indonesia, Malaysia, the Philippines, Laos, Myanmar, Cambodia and Africa.
He is also accountable for our Digital and Technology functions and is driving the business transformation, accelerating our customer delivery through multi-channel models and strengthening our customer engagement platforms, including Pulse.
Solmaz joined Prudential as Group Strategic Transformation Officer in May 2022, bringing with him 25 years’ experience of leading business change and growth in the financial services industry. His most recent role before joining Prudential was as regional CEO, Asia-Pacific at Allianz.
Solmaz holds a Diplom-Ökonom, Banking and Economics from the University of Duisburg-Essen and a Bachelor’s Degree in Business Administration and Management from the University of Technology Sydney.
Jolene Chen
Group Human Resources Director
Age: 63
Appointments
●Appointed to the Group Executive Committee: June 2019
Jolene is also a standing attendee at meetings of the Remuneration and Nomination & Governance Committees. Jolene is due to retire from her role on the Group Executive Committee at the end of March and will be succeeded by Catherine Chia.
Relevant skills and experience
Jolene is the Group Human Resources Director for Prudential. She is also a Councillor of Prudence Foundation, the community investment arm of Prudential in Asia.
Jolene has more than 30 years’ experience, including eight as Chief Human Resources Officer for Prudential Corporation Asia. Prior to joining Prudential she spent over 21 years with multinational companies in a variety of resourcing, organisational design, talent management, learning and development and human resources roles.
Jolene is a graduate of the INSEAD International Directors Program and holds a Bachelor’s Degree in Pharmacy from the National University of Singapore.
Avnish Kalra CA
Group Chief Risk and Compliance Officer
Age: 55
Appointments
●Appointed to the Group Executive Committee: April 2022
Avnish is a standing attendee at meetings of the Board and of the Audit and Risk Committees.
Relevant skills and experience
Avnish was appointed Group Chief Risk and Compliance Officer in April 2022. He previously held the position of Chief Risk Officer of Prudential Corporation Asia since July 2018 and was responsible for regulatory compliance, risk management and corporate governance across all of the Group’s insurance and asset management businesses in Asia and Africa. He joined Prudential in August 2014.
Prior to joining Prudential, Avnish was the Asia Chief Risk Officer for Aviva for six years and has also worked at Bank of America for 14 years in various capital markets trading and risk roles across Asia. Avnish is a Chartered Accountant by training, having worked with PwC in India and Ernst & Young in Dubai.
85
Lilian Ng
Managing Director, Strategic Business Group
Age: 57
Appointments
Relevant skills and experience
Lilian is Managing Director of the Strategic Business Group, responsible for the insurance operations covering Chinese Mainland, Hong Kong and Taiwan; and the Group-wide customer, distribution and marketing strategy across the network of insurance businesses. Lilian spearheads the Group-wide customer strategy and the corresponding strategic framework for customer segmentation and proposition, distribution, marketing and customer care to deliver customer success and drive customer advocacy.
Lilian is the Chair of the Board of Prudential Hong Kong Limited. She is also a Director of CITIC Prudential Life Insurance Company Limited, Prudential BSN Takaful Berhad and Pulse Ecosystems Pte. Ltd.
Lilian has been part of the Prudential family for over 20 years and has held a range of leadership roles, including Chief Financial Officer of Prudential Hong Kong, Chief Operating Officer, Insurance and Chief Executive, Insurance of Prudential Corporation Asia.
She is a Fellow of the Institute of Actuaries of Australia and holds a Bachelor’s Degree in Economics from Macquarie University.
Seck Wai-Kwong
Chief Executive Officer, Eastspring
Age: 67
Appointments
Relevant skills and experience
Wai-Kwong is Chief Executive Officer of Eastspring Investments Group, responsible for growing the business, deepening investment capabilities and expanding Eastspring’s client base. Prior to joining Eastspring in April 2019, Wai-Kwong was CEO AsiaPacific for State Street Bank & Trust since 2011. He joined State Street from the Singapore Exchange, where he was chief financial officer for eight years. He held senior-level positions in the Monetary Authority of Singapore, the Government of Singapore Investment Corporation (GIC), Lehman Brothers and DBS Bank.
Wai-Kwong is a board member of GIC and serves on the Board Risk and Audit Committees. He is also chair of the Investment Committee and a trustee of the Singapore Police Force’s pension fund. He chairs the Future Leaders Council at the Wealth Management Institute and is a member of the Hong Kong University of Science and Technology’s Business School Advisory Council.
Wai-Kwong holds a Master’s Degree in Business Administration from the Wharton School of the University of Pennsylvania and a Bachelor’s Degree in Economics, Econometrics and Operations Research from Monash University.
Dennis Tan
Managing Director, Strategic Business Group, and CEO, Prudential Assurance Company, Singapore
Age: 54
Appointments
| ● | Appointed to the Group Executive Committee: July 2022 |
Relevant skills and experience
Dennis is Managing Director of the Strategic Business Group covering Singapore, Thailand and Vietnam.
A veteran banker, Dennis has 26 years of experience in consumer banking spanning product development, segment management, marketing and sales and distribution.
Prior to joining Prudential, he was with OCBC Bank for 10 years, of which seven were spent as head, consumer financial services. Dennis also spearheaded the growth of OCBC’s Premier Banking business in Singapore, Malaysia, Indonesia and China as head of branch and group premier banking. He was also a member of OCBC Bank’s management committee.
Dennis has been CEO of Prudential Singapore since March 2020. He is also Deputy President in the Life Insurance Association’s Management Committee, Council Member at IBF Singapore, Multilateral Healthcare Insurance Committee Member at Ministry of Health Singapore, Board Director at the Council for Third Age, and Board Member at the European Chamber of Commerce in Singapore.
86
Dennis has completed the Asian Financial Leaders Programme from Temasek Management Services & Singapore Management University, the Investing in Alternative Investments Program at Yale School of Management and the Stanford Executive Program at the Stanford University Graduate School of Business. He holds a Bachelor’s Degree in Finance from Indiana University.
James Turner FSA FCSI FRM
Group Chief Financial Officer
Age: 53
Appointments
James is a standing attendee at meetings of the Board and of the Audit and Risk Committees. He also attends Remuneration Committee meetings for specific matters.
Relevant skills and experience
James was appointed Group Chief Financial Officer in April 2022, having previously been the Group Chief Risk and Compliance Officer since March 2018. For the period March 2018 to January 2023, James served as a Director on the Prudential plc Board. Having held senior positions at Prudential for over a decade, James has a wide-ranging understanding of the business and draws on previous experience across internal audit, finance, risk and compliance, as well as technical knowledge and skills relevant to his role.
James joined Prudential as the Director of Group-wide Internal Audit and was appointed Director of Group Finance in September 2015. He is a Director of Pulse Ecosystems Pte. Ltd. and Eastspring Investments Group Pte. Ltd, which are wholly-owned Prudential subsidiaries.
James is a Fellow of the Institute of Chartered Accountants in England and Wales, and a Financial Risk Manager (Global Association of Risk Professionals). He holds a Diploma from the Chartered Institute for Securities & Investment and a Bachelor’s Degree in Accounting and Finance from the Manchester Metropolitan University.
How we operate
Board and Committee Structure
Shareholders | ||||
Board of Directors The Board is collectively responsible for establishing the purpose, values and strategy of the Group and for promoting the long-term success of Prudential for the benefit of our members and other stakeholders | ||||
Audit Committee | Risk Committee | Remuneration Committee Assists with the implementation and operation of the Remuneration Policy, including the remuneration of the Chair and the Chief Executive Officer, as well as overseeing the remuneration arrangements of other staff within its purview. | Nomination & Governance Assists with the recruitment of candidates for the Board and the maintenance of an effective framework for succession planning. Provides support and advice on corporate governance arrangements. | Responsibility & Enables the Board to bring additional focus to the embedding of the Group’s ESG strategic framework and oversight of people initiatives, customers and digital. |
Chief Executive Officer Responsible for the day-to-day management of the business | ||||
Group Executive Committee The Group Executive Committee is our leadership team responsible for executing the strategy and supporting the Chief Executive Officer in the discharge of his responsibilities | ||||
87
Led by the Chair, the Board is collectively responsible for the overall leadership of the Group, its long-term sustainable success and for fostering and overseeing the embedding of culture. It does this by setting the strategy and strategic objectives, approving capital allocations, annual budgets and business plans for the Group, overseeing the operations and monitoring financial performance and reporting. The Board establishes the Group’s purpose, values and Environmental, Social and Governance (ESG) policies, satisfying itself that these and the Group’s culture are aligned with strategy. Further, the Board is responsible for ensuring that an effective system of internal control and risk management is in place, approving the Group’s overall risk appetite and tolerance and endorsing the Directors’ Remuneration Policy for approval by shareholders.
To assist the Board in carrying out its functions, a substantial part of the Board’s responsibilities is delegated to the Board’s principal Committees, which comprise Non-executive Directors only. The Board’s principal Committees are the Audit Committee, Risk Committee, Remuneration Committee and the Nomination & Governance Committee. In addition, the Responsibility & Sustainability Working Group (RSWG) assists the Board with matters concerning the Group’s overall ESG Strategic Framework, including engagement with the workforce. The Board receives regular updates on Committee and RSWG activities. In 2022, responsibility for oversight of matters relating to the impact of climate change and responsible investment was transferred from the RSWG to the Risk Committee. The Board requested that the RSWG increase its focus on customer, culture and digital strategy. The terms of reference for the Board and each of the Board’s Committees are available to view on our website www.prudentialplc.com/en/investors/governance-and-policies/board-and-committees-governance
In addition to the principal Committees and the RSWG, the Board has established a Standing Committee which can meet as required to assist with any business of the Board. It is typically used for ad hoc urgent matters, which cannot be delayed until the next scheduled Board meeting. All Directors are members of the Standing Committee and have the right to attend meetings and receive papers. Before taking decisions on any matter, the Standing Committee must first determine that the business it intends to consider is appropriate for a Committee of the Board and does not need to be considered by the whole Board. The Standing Committee allows for nimble decision-making where necessary, while ensuring that the full Board has oversight of and receives feedback on all matters under the Committee’s consideration and all Directors can contribute. During 2022, the Standing Committee met three times.
Delegation to management
Responsibility for the day-to-day management of the business and implementation of strategy has been delegated to the Chief Executive Officer, within certain limits, for execution or further delegation by him in respect of matters which are necessary for the effective day-to-day running and management of the business. The Chief Executive Officer delegates authority to certain senior executives through management reporting lines (principally to other members of the Group Executive Committee).
To support the ongoing evolution of the Group, Prudential appointed Solmaz Altin, Lilian Ng and Dennis Tan, the Managing Directors of the Strategic Business Groups, and Seck Wai-Kwong, the CEO of Eastspring to the membership of the Group Executive Committee. They joined existing members: the Chief Executive Officer; the Group Chief Financial Officer; the Group Chief Risk and Compliance Officer; and the Group Human Resources Director. The Group Executive Committee meets on a weekly basis, supporting the Chief Executive Officer in the day-to-day management of the business and the implementation of strategy.
Strategic Business Groups bring together our mature and growth market businesses to drive and enable business performance, operational excellence and the sharing of best practices. The Managing Directors of the Strategic Business Groups are each accountable for the business and operational results of the markets in their Strategic Business Group and also for the Group-wide delivery of enabling functions. The CEO, Eastspring is responsible for the growth of Eastspring’s business and the delivery of its investment performance.
Board size and roles
The Board’s size allows for decision-making to reflect a broad range of views and perspectives while allowing all Directors to participate effectively in meetings. At the date of publication, the Board comprised 12 Non-executive Directors, which will reduce to 10 after the AGM, and one Executive Director, the Chief Executive Officer.
On 16 November, Prudential announced a change to the structure of the Board composition and the role of Group Chief Financial Officer is no longer a Board role, effective from 1 January 2023. The role of Group Chief Financial Officer, along with that of Group Chief Risk and Compliance Officer, continues to be part of the Group Executive Committee. The Board satisfied itself that in making this change, which is in line with many boards of Asia listed companies, the role and status of the Group Chief Financial Officer within the Prudential boardroom is well safeguarded and the Company’s governance processes and protections for shareholders remain robust. In particular, both the Group Chief Financial Officer and the Group Chief Risk and Compliance Officer have a standing invitation to Board meetings (except for private meetings of the Non-executive Directors) as well as to Audit and Risk Committee meetings. Appointments to both roles continue to be a matter for the Board to determine and both are “key persons in control functions” under the Hong Kong Insurance Authority’s Group-wide Supervision framework. Performance reviews for those roles include input from the Chairs of the Audit and Risk Committees respectively, and their remuneration as members of the Group Executive Committee is reviewed and approved by the Remuneration Committee. The Group Chief Financial Officer’s responsibility within the Group’s financial reporting processes is unchanged.
88
At each scheduled meeting of the Board, the Non-executive Directors have a session without the Executive Director present.
The roles of Chair and Chief Executive Officer are clearly segregated. The Chair leads the board and is responsible for its overall effectiveness in directing the company, whilst the Chief Executive Officer is responsible for the day-to-day management of the company. The Senior Independent Director acts as a sounding board for the Chair, and provides support in the delivery of her objectives. The Chair, Chief Executive Officer and Senior Independent Director all have written terms of reference which are approved by the Board and kept under regular review. A summary is available to view on our website.
| | |
| | Read more |
Chair | The Chair has overall responsibility for the leadership of the Board and is responsible for its effectiveness in directing the company and for succession planning. She sets the Board’s agenda, including on strategy, performance and value creation, and ensures effective communication with shareholders and, together with the Chief Executive Officer, represents the Group externally. | Governance Report |
Chief Executive Officer | The Chief Executive Officer is accountable to, and reports to the Board. He is responsible for the day-to-day management of the Group, recommending an overall strategic plan to the Board and executing the approved strategy. | Strategic and Operating Review |
Senior Independent Director | The Senior Independent Director acts as a sounding board for the Chair, and provides support in the delivery of her objectives. The Senior Independent Director also acts as an intermediary for other Directors and shareholders when necessary and leads the annual performance evaluation of the Chair. | Nomination & Governance Committee report |
Committee Chairs | Committee Chairs are responsible for the leadership and governance of their respective Committees. They set the agenda for Committee meetings and report to the Board on Committee activities. | Nomination & Governance Committee report Audit Committee report Risk Committee Report |
Non-executive Directors | Non-executive Directors offer constructive challenge to management, holding them to account against agreed performance objectives for individual and business performance. They also provide strategic guidance, offer specialist advice and serve on at least one of the Board’s principal Committees. |
|
Company Secretary | The Company Secretary is responsible for advising the Board and management on governance related matters, and supports the Chair in ensuring the effective functioning of the Board and its committees. The Secretary is available to all Directors to provide advice and support and facilitates Directors’ induction and ongoing professional development. |
|
Group Chief Financial Officer | The Group Chief Financial Officer is responsible for managing the finance function, including all aspects of financial reporting and planning, and investor engagement. The Group Chief Financial Officer is a standing attendee at, and receives all papers for, meetings of the Board and the Audit and Risk Committees (except private meetings of Non-executive Directors). Their appointment and removal are matters reserved for the Board. Their remuneration is determined by the Remuneration Committee. | Financial Review Compensation and Employees |
Group Chief Risk and Compliance Officer | The Group Chief Risk and Compliance Officer is responsible for risk management and compliance activities of the Group. The Group Chief Risk and Compliance Officer is a standing attendee at, and receives all papers for, meetings of the Board and the Risk and Audit Committees (except private meetings of Non-executive Directors). Their appointment and removal are matters reserved for the Board. Their remuneration is determined by the Remuneration Committee. | Risk Review Compensation and Employees |
89
Our governance framework
The Group Governance Manual (GGM) defines Prudential’s Group-wide approach to Governance, Risk Management and Internal Control. The principles by which Prudential conducts its business activities are set out in the Group Code of Business Conduct (Code), which sits at the heart of the GGM, incorporating standards of business conduct which set expectations over employee behaviour by presenting all individual obligations referenced throughout the GGM policies in a single code.
The Code is reviewed annually by the RSWG to ensure that it remains appropriate for the global business and is approved by the Board. Each individual employee confirms their compliance with the Code on an annual basis. The GGM itself sets out the Group’s Governance Framework, Group-wide policies and standards, including the Group Risk Framework, delegated authorities and lines of responsibility, and is supported by a programme of regular learning for all Prudential colleagues.
The Nomination & Governance Committee conducts regular reviews of the Group’s Governance Framework, monitoring the Group’s significant governance policies, including governance arrangements of the Group’s main subsidiaries, and makes recommendations to the Board as appropriate. The Risk Committee approves the Group Risk Framework, an integral part of the GGM, and the Audit Committee monitors Group-wide compliance with the GGM throughout the year. Businesses manage and report compliance with the Group-wide mandatory requirements set out in the GGM through annual attestations. This includes compliance with our Risk Management Framework, a summary of which is set out in the Risk Review section.
The content of the GGM is reviewed regularly, reflecting the developing nature of both the Group and the markets in which it operates, with significant changes on key policies reported to the relevant Board Committee or the RSWG. The GGM helps the Board embed the Group’s system of risk management and internal control into the day-to-day operations of the business.
Subsidiary governance
Prudential’s material subsidiaries, comprising the insurance subsidiaries in Hong Kong, Indonesia, Malaysia and Singapore and the Eastspring holding company (the Material Subsidiaries) and a number of its other subsidiaries have appointed independent non-executive directors to their boards and have established an audit and a risk committee with standard terms of reference. All audit and risk committees of the Material Subsidiaries, as well as a number of other subsidiaries’ committees, are chaired by an independent board member. To ensure an effective information flow, the Chairs of the Group Audit and Risk Committees maintain regular dialogue with their counterparts in each of the Material Subsidiaries. Material Subsidiaries and other life insurance businesses that operate local audit and risk committees report to the Group-level Committees through written updates and the chairs of the local committees can escalate matters to the Group Committee Chairs or management as required.
In 2022, the Chairs of the Audit and Risk Committees hosted a subsidiary governance forum in Singapore, where they met with non-executive directors from each of the Material Subsidiaries to discuss matters of mutual importance, including the Group’s digital strategy, conduct framework, ESG and areas of focus in audit and risk.
The Nomination & Governance Committee is responsible for oversight of governance arrangements for the Material Subsidiaries.
Directors’ inductions, training and development
The induction programme for new Non-executive Directors features a series of core topics, including an overview of the Group, its key businesses and the control environment, as well as content tailored to reflect the new Board member’s role and any particular needs identified during the recruitment process. The induction includes written materials, presentations and meetings with the Chair, the Chief Executive Officer, the Group Chief Financial Officer, the Group Chief Risk and Compliance Officer and the Chairs of the Board’s principal Committees and the RSWG (as appropriate). Further meetings with members of senior management at Group and local level are also scheduled as required to develop the Directors’ knowledge of the business. Each new Board member is also assigned a longer-tenured Non-executive Director to support them in their new role and provide advice and feedback.
Training
Throughout the year the Board and its Committees received regular business updates and participated in deep dive sessions, developing the Board’s more granular knowledge of individual businesses, current and emerging issues relevant to the Group and its operations and on particular products and business opportunities. In 2022, these sessions included deep dives into the Group’s operations in a number of its markets and into its principal distribution channels.
In addition, the Board received training on the new Group Internal Economic Capital Assessment (GIECA) model including key areas of methodology and assumptions underpinning the model and how it is being used across the Group. It had a deep dive session on climate, which included an overview of the evolving expectations of stakeholders and of climate-related opportunities for the Group. Ahead of the Group's adoption of the new financial reporting standard, IFRS 17, the Group Audit Committee received training on the new standard and how it may impact the Group's financial reporting, and other Board members were provided with the core elements of this training.
All Directors have the opportunity to discuss their individual development needs as part of their Director evaluations and are encouraged to request specific updates during the year. At the start of the year, suggested topics are shared with the Board for feedback. Directors are asked to provide information on any external training or development on an annual basis. All Directors have the right to obtain professional advice at Prudential’s expense.
90
Stakeholder engagement
Information on the Board’s engagement with, and discussion of, stakeholder views as part of the Board decision-making process can be found below.
Regulatory environment
Prudential is a designated insurance holding company under the Hong Kong IA Insurance Ordinance, and is subject to the Hong Kong IA’s GWS Framework. The GWS Framework includes requirements for Hong Kong insurance groups to have in place appropriate corporate governance arrangements and to maintain appropriate internal controls for the oversight of their business.
Individual regulated entities within the Group continue to be subject to entity-level regulatory requirements in the relevant jurisdictions in which they carry out business.
Interactions with regulators form a key part of the Group’s governance framework and the Chair, Chief Executive Officer and the Group Chief Risk and Compliance Officer play a leading role in representing the Group to regulators and ensuring our dialogue with them is constructive.
Employee voice
Prudential’s programme for workforce engagement is led by the RSWG, and all Board members participate in engagement activities.
Shareholder communication policy and engagement
Prudential has dual primary listings on the Hong Kong Stock Exchange and the London Stock Exchange, as well as a secondary listing on the Singapore Stock Exchange and a listing on the New York Stock Exchange in the form of American Depositary Receipts. These listings are subject to rules that form the basis of Prudential’s shareholder communications policy which, in summary, seeks to ensure that shareholders and the investment community at large are provided with timely access to balanced and understandable information about the Company, its financial performance, strategic goals, plans and material developments. This enables all shareholders, including prospective shareholders, to exercise their rights in an informed manner.
Information released by the Company to the stock exchanges where it is listed is also posted on the Company’s website (www.prudentialplc.com). Prudential’s corporate communications are available in English and Chinese where required.
To better understand the views of shareholders, the Chair holds an annual programme of engagement with major shareholders in respect of governance and strategic matters. The Remuneration Committee Chair engages with major shareholders annually to hear their feedback on remuneration decisions and policy proposals. Other Non-executive Directors, in particular the Senior Independent Director, who acts as an intermediary for shareholders, and Committee Chairs, are available to meet with major shareholders on request. In addition, shareholders can communicate their views on matters affecting the Company through various channels including investor events held throughout the year. Retail shareholders have dedicated services in place at the Company’s Registrar, EQ. Key information is available in the Shareholder Information section of the Annual Report and on the Company’s website, including contact details for Group Secretariat.
The Board conducts an annual review of its shareholder communications policy. For the year ended 31 December 2022, the Board concluded that the shareholder communications policy continues to be effective.
During 2022, 371 meetings were held with 319 individual institutional investors in Asia, the US, UK and Europe. Of these 371 meetings, 141 were attended by either the Group Chief Executive Officer or the Group Chief Financial Officer. These meetings took the form of one-on-one, group sessions and participation in panels and walking tours organised in some cases by brokers. A summary of the Board’s engagement with other stakeholders is set out below. The perspectives gained from investor meetings and broader shareholder engagement exercises are considered by the Board when making key strategic decisions.
In keeping with the intent to communicate with shareholders on an open basis and to use technology to facilitate this, the Group continued its programme of visual and online interaction with shareholders and the research community in 2022. During 2022, it hosted four one-hour detailed briefings on individual business units - Vietnam, Indonesia, the Philippines and Singapore. The briefings were recorded in video format and published on the Group website along with the transcripts. The Group hosted presentations for its Half Year Results for 2022 in Hong Kong for the first time and used this recorded session to introduce the Managing Directors of the Group’s Strategic Business Groups.
The Group’s AGM in 2022 was a hybrid meeting with shareholders able to attend in-person or online. The Group intends to continue to use both in person and online communication techniques in the coming year to communicate with investors.
Induction of Arijit Basu
In September 2022, Arijit Basu joined the Board as an Independent Non-executive Director and member of the Audit Committee and the Responsibility & Sustainability Working Group (RSWG).
91
As part of his induction, Arijit had the benefit of attending Board meetings in April and July 2022 as an observer. He also attended a site visit in Singapore and the head offices in London and Hong Kong. During these meetings Arijit met with various members of the Board and Group as well as local business unit management teams and gained insight into the Group’s business, strategy, operations, risk profile, and culture framework.
He also received briefings on his duties as a Director under relevant UK and Hong Kong corporate governance frameworks and the Group’s regulatory environment. Arijit also participated in Board deep dive sessions and one-to-one meetings with senior management which helped him gain an understanding of the various Strategic Business Groups, the Eastspring asset management business, the Pulse platform and the digital ecosystem.
Specifically for his role, Arijit met with the Chairs of the Audit Committee and RSWG. In respect of his role as member of the Audit Committee, Arijit met with, among others, the Chief of Internal Audit who provided an overview of Group-wide Internal Audit and recent activities. Arijit also met with the external auditor KPMG, to hear their views on Prudential’s financial reporting and business issues, with the Director of Group Financial Accounting & Reporting who provided a briefing on the Group’s key performance indicators and balance sheet and with the Group Chief Risk and Compliance Officer, who provided an overview of the Group’s risk profile, risk framework and key risks in each market.
For RSWG matters, Arijit met with the Director of ESG and received a briefing on the Group’s ESG Strategic Framework. The Group HR Director briefed Arijit on the Group’s culture framework and workforce strategies and initiatives, including diversity & inclusion and employee wellbeing priorities.
These meetings were tailored to Arijit’s role at Prudential and provided him with a detailed view of current issues and emerging themes, as well as an understanding of the interests of the Group’s key stakeholders.
Tom Watjen was chosen as the long-standing Non-executive Director to support Arijit during his first year on the Board. Following the conclusion of his formal induction programme, Arijit provided the Company Secretary with feedback on the induction programme.
Key areas of focus – how the Board spent its time in 2022
In 2022, the Board held six scheduled meetings and an additional three ad hoc meetings. Board meetings focussed on the key areas set out below.
Strategy, Business Plan and Capital Business and strategy deep dives ● Reviewed and scrutinised the strategic and operational performance of the business in key markets and across distribution channels. This included deep dives into the following areas: o the Group’s life businesses in Africa, Hong Kong, Indonesia, Malaysia, the Philippines and Vietnam as well as in the Eastspring asset management business o the Group’s agency and bancassurance distribution channels, as well as its digital strategy, including Pulse ● Received updates on business performance in the Group’s China and India joint venture businesses Business plan and budget ● Approved the 2023-2025 business plan and budget ● Approved the 2023 Strategic Priorities ● Considered and approved any spend over $30 million and oversaw other management approvals Capital ● Oversaw an increase in the allocation of capital invested in organic new business and investments in capabilities/distribution, following the restructuring of the Group into a pure-play Asia and Africa growth business | Performance, business and operations Reports from CEO, CFO, CRCO ● Received reports at every meeting from the Group Chief Executive Officer, Group Chief Financial Officer and the Group Chief Risk and Compliance Officer ● Received reports from regional business heads Financial results ● Reviewed and approved the half year and full year results and the Form 20F ● Considered fair, balanced and understandable requirements in the half and full year financial reports, following a review by the Audit Committee ● Reviewed and approved the Going Concern and the Viability Statements that appeared in the 2022 Annual Report ● Approved the 2021 second interim dividend and first interim dividend for 2022 ● Held a discussion of the macroeconomic and geopolitical trends affecting the Group’s key markets, supported by an external economist Customers ● Customers are considered as a core part of the Board’s discussions on business performance and operations ● Discussed customer proposition, products, and customer service as part of deep dives and business updates ● Discussed the evolution of Prudential’s digital strategy, including how Pulse is supporting distribution and customer experience ● Considered the impact of the pandemic and global macroeconomic trends on customers and initiatives to mitigate the impact on them |
92
Stakeholders Investors ● Received regular reports from the Chief of Investor Relations on shareholder-related matters, feedback from the Chair’s annual shareholder engagement exercise and additional meetings offered in connection with the Chief Executive Officer succession process, and regular feedback from management on their ongoing shareholder engagement activities ● Received an investor perception survey report from Rothschild & Co, discussed the findings with the review team and management’s response ● Kept appraised of investor and Hong Kong and UK governance themes Workforce ● Regularly discussed people issues as part of the Chief Executive Officer report, including particular areas of higher attrition and steps being taken by management to address them ● As part of business reviews, discussed with local management teams particular challenges faced in their markets and how they are developing a diverse pipeline of talent ● Received updates from the RSWG and directly from the Group Human Resources Director on various people, culture and talent initiatives and feedback from employee engagement activities Regulators ● Received regular reports on the Group’s engagement with its key regulators ● Received feedback from the regulatory Supervisory College and discussed the Hong Kong IA’s annual management letter and the Group’s response to it ● Received reports from the Head of Group Government Relations on key government and political developments and regulatory policy updates Government and wider society ● Considered the impact of the pandemic on the communities in which we operate and efforts by the business to support affected communities ● Received detailed briefing on the work of the Prudence Foundation ● Received training materials on climate-related issues, including Chapter Zero background materials ● Deep dive on the Group’s approach to climate change, including an update on progress towards the Group’s externally communicated climate-related commitments, understanding the evolving expectations of stakeholders, identifying climate-related opportunities, and considering next steps on the Group’s climate journey ● Received regular reports on ESG policy developments | Governance, approvals and Board succession Approvals ● Considered various routine and administrative proposals put to the Board for approval not covered above ● Reviewed the Delegation of Authority and noted key matters approved by management Board Committees ● Received reports from the Chairs of the Audit, Risk, Remuneration and Nomination & Governance Committees, and the RSWG ● Considered updates to the Group risk appetite ● Approved the Own Risk and Solvency Assessment for submission to the Hong Kong IA Shareholder meetings ● Approved key items for, and attended, the AGM (either in person, or online) Board evaluation and succession planning ● Process to appoint a new Chief Executive Officer, as well as appoint an interim Chief Executive Officer, a new Group Chief Financial Officer and a new Group Chief Risk and Compliance Officer (the Executive Directors did not attend meetings where appropriate) ● Approved other Board appointments and committee changes on recommendation from the Nomination & Governance Committee ● Received the findings of the internal Board evaluation exercise, discussed and agreed the action plan and monitored progress |
Board visit to Singapore
In April, the Board visited Prudential Singapore and spent time with management teams from the Singapore, Indonesia and Malaysia life businesses and from Eastspring.
In addition to presentations on those businesses, the visit involved an extensive programme of interactive sessions with employees, agents and customers. Topics included:
Employees – how Prudential Singapore is bringing to life the Group’s employee value proposition – Connect, Grow, Succeed – in order to prepare colleagues to better serve its customers, and how the Group is helping talent in Prudential Singapore and Eastspring to develop.
Product innovation and development – seeing how products and processes are being designed to meet evolving customer preferences, and how inclusive products are being developed to cater to customers who have been underserved by traditional financial services.
93
Digitisation - seeing how Prudential Singapore is digitising sales and services to make insurance simpler and more accessible for its customers and distributors, and getting hands-on experience of how Pulse is supporting agents and enhancing customer journeys.
Communities – meeting with leaders from the Prudence Foundation and local partners from Taiwan, the Philippines and Zambia to hear about the impact the Foundation is having in improving financial literacy through its flagship Cha-Ching programme.
The Board also hosted a dinner with agency leaders, as well as a dinner that was the culmination of a Group-wide Future of Work innovation challenge at which the successful employee teams from across the Group pitched their projects to the Board and senior management.
Board meeting attendance throughout 2022
Individual Directors’ attendance at Board meetings throughout the year is set out in the table below. Board and Committee papers are usually provided one week in advance of a meeting. Where a director is unable to attend a meeting, their views are canvassed in advance by the Chair of that meeting where possible.
| | Scheduled Board meetings | Ad hoc Board meetings | General Meetings |
Chair | Shriti Vadera | 6/6 | 3/3 | 1/1 |
Executive Directors | Mike Wells1 | 1/1 | 1/1 | - |
Mark FitzPatrick2 | 6/6 | 1/1 | 1/1 | |
James Turner2 | 6/6 | 1/1 | 1/1 | |
Non-executive | Philip Remnant | 6/6 | 3/3 | 1/1 |
Jeremy Anderson | 6/6 | 3/3 | 1/1 | |
| Arijit Basu3 | 2/2 | - | 0/0 |
Chua Sock Koong | 6/6 | 3/3 | 1/1 | |
David Law | 6/6 | 3/3 | 1/1 | |
Ming Lu | 6/6 | 2/3 | 1/1 | |
Anthony Nightingale4 | 3/3 | 3/3 | 1/1 | |
George Sartorel | 6/6 | 2/3 | 1/1 | |
Alice Schroeder4 | 3/3 | 3/3 | 1/1 | |
Tom Watjen | 6/6 | 3/3 | 1/1 | |
Jeanette Wong | 6/6 | 3/3 | 1/1 | |
Amy Yip | 6/6 | 2/3 | 1/1 |
Notes
1Mike Wells stepped down from the Board on 31 March 2022.
2Mark FitzPatrick and James Turner did not attend two meetings of the Board in 2022 that were held to consider CEO succession.
3Arijit Basu joined the Board on 1 September 2022. Prior to joining, he attended two meetings as an observer.
4 | Anthony Nightingale and Alice Schroeder stepped down from the Board on 26 May 2022. |
94
Board effectiveness
Actions during 2022 arising from the 2021 review
The last Annual Report set out the key actions we planned to take in 2022 to enhance the performance of the Board in light of the findings of the Board and Committee effectiveness evaluation conducted internally at the end of 2021. Set out below is an update on progress to address the 2022 actions:
Theme | Summary of Actions | Progress in 2022 |
|---|---|---|
Board composition, succession planning and meeting process | - Continue to develop the skills map to support the work on Board succession planning and review processes for oversight of the development of the pipeline for executive positions with the critical skills and diversity required for the Group’s future strategy. - Create more opportunities for Board interaction within the Board, with management and with employees, where possible in person. | - The skills matrix has been updated and discussed by the Board, refining key areas of focus for Non-executive Director succession planning. - In addition to regular updates to the Responsibility & Sustainability Working Group (RSWG) on talent development programmes, the Nomination & Governance Committee and RSWG held a joint session in October to discuss the refreshed talent development framework being created and implemented by management which focuses on a core group of roles identified as critical for the Group’s growth strategy. This will be discussed further in 2023. - Whilst certain restrictions remained in place for much of the year, Board meetings held in person in London, Hong Kong and Singapore were attended by most Board members and enabled greater interaction amongst the Board, with the Group Executive Committee and other senior leaders. - The Board visit to Singapore, and individual visits by Directors to local businesses, enabled the Board to engage with wider groups of employees. |
Board oversight, stakeholders and decision making | - Focus more Board meeting agenda time on customers and employees and review and update KPIs for consistent reporting and analysis. - Consider new ways to ensure learnings from past decisions are highlighted to the Board where appropriate, to fully support decision-making. | - In May, the Board amended the terms of reference of the RSWG to create a focus on customers and digital, in addition to its existing remit on people, culture and communities, while oversight of climate (on a holistic basis) transitioned to the Risk Committee. The RSWG has looked at the ways in which customer experience is being measured and how data-insights are being used to enhance processes. It will oversee the development of refreshed KPIs for Board reporting. - The April Board visit to Singapore included sessions with customers and agents to provide Board members with direct insight into their perspectives. - The RSWG recommended further development of People KPIs which will be included in the regular management dashboard. - People, culture and customers have been regular topics at Board and Committee meetings throughout the year and further work to develop the framework for these areas is ongoing. - The Board agreed a revised approach for conducting Post Transaction Reviews and enhancements to make the process more dynamic and forward-looking. This will be further embedded in 2023. |
Risk management and internal control | - Enhance risk reporting to the Board to further support the prioritisation of key risks. | - The Chief Risk Officer report and Risk MI Dashboard presented to the Risk Committee and Board was updated to support the prioritisation on key risks. |
2022 review and actions for 2023
The performance evaluation of the Board and its principal Committees for 2022 was conducted internally at the end of 2022, led by the Company Secretary, through a questionnaire which covered: Board composition; dynamics; meeting management and support; the Board’s oversight of different areas; risk management and internal control; succession planning; and the work of the Committees.
The findings were presented to the Nomination & Governance Committee and the Board in March 2023 and collective Committee and Board discussions to exchange ideas and agree priorities arising from the evaluation took place. The review confirmed that the Board and its principal Committees continued to operate effectively during the year and that no major improvements were required, however a number of suggested areas for improvement were discussed. Given that the new Chief Executive Officer started shortly before the March meetings, it was agreed that the Chair, Chief Executive Officer and Company Secretary would further discuss the priorities and prepare an action plan for later approval by the Board.
95
Theme | Areas of focus |
Board dynamics | ● Continue to build Board and senior management relationships and ways of working, recognising the relative newness of the senior management team and many Board members and the ability to have in-person meetings. |
Meeting management and support | · Drive greater consistency across all management papers/presentations in order to focus the Board on key matters and support good discussion. · Continue to create opportunities for a wider group of management to present at Board meetings and for Board members to interact with future leaders within the organisation. · Review suite of Non-financial KPIs. |
Succession planning and talent development | · Following senior leadership changes in 2022, the Nomination & Governance Committee will oversee the refresh of CEO succession and development, and the GEC succession development plans by the Chief Executive Officer. · Continuing to oversee, through the RSWG, the development of a systematic approach to talent development across the Group. |
Director evaluation
Individual performance evaluation of Non-executive Directors was undertaken by the Chair, who gathered feedback from each Board member and Group Executive Committee member. The Nomination & Governance Committee discussed the performance of Directors at its meeting in March 2023 as part of the overall Board evaluation. The Chair relayed feedback.
Feedback on the performance of the Chair was separately gathered by the Senior Independent Director, who held a meeting of the Non-executive Directors, without the Chair present. The Senior Independent Director then discussed the feedback with the Chair. The Chair assesses the performance of Executive Directors in respect of their role as Board Directors.
The outcome of these evaluation processes informs the Nomination & Governance Committee’s recommendation for Directors to be put forward for re-election by shareholders.
The performance of Executive Directors, in their capacity as Executives, is subject to regular review, as part of our overall employee performance evaluation. The outcome of this assessment is reported to the Remuneration Committee, with input from Audit and Risk Committee Chairs in respect of the Group Chief Financial Officer and the Group Chief Risk and Compliance Officer respectively.
Committee reports
Nomination & Governance Committee report
Committee’s purpose
The purpose of the Committee is to assist the Board in retaining an appropriate balance of skills to support the strategic objectives of the Group, to develop a formal, rigorous and transparent approach to the appointment of Directors and maintain an effective framework for succession planning. Further, the Committee provides support and advice to the Board on governance arrangements.
More information on the role and responsibilities of the Nomination & Governance Committee can be found in its terms of reference, which are available at www.prudentialplc.com/investors/governance-and-policies/board-and-committees-governance
Membership and 2022 meeting attendance
Committee members | 2022 meetings1 |
Shriti Vadera, Chair | 4/4 |
Jeremy Anderson2 | - |
Chua Sock Koong3 | 3/3 |
Ming Lu | 4/4 |
Anthony Nightingale4 | 1/1 |
Philip Remnant | 4/4 |
George Sartorel3 | 3/3 |
Tom Watjen5 | 1/1 |
Regular attendees | |
Chief Executive Officer Group Human Resources Director Company Secretary | |
Notes 1 The Committee held one meeting jointly with the Responsibility and Sustainability Working Group (RSWG). Attendance included the members of the RSWG, who at that time comprised Mr Anderson (Chair), Mr Basu, Mr Sartorel and Ms Wong. 2 Jeremy Anderson joined the Committee on 16 November 2022. Prior to joining, he attended one meeting as an observer, in addition to the meeting he attended as a member of the RSWG. 3 Chua Sock Koong and George Sartorel joined the Committee on 1 May 2022. Prior to his joining, Mr Sartorel attended one meeting as an observer. 4 Anthony Nightingale stepped down from the Committee on 26 May 2022. 5 Tom Watjen stepped down from the Committee on 1 May 2022. He attended one additional meeting after stepping down. | |
96
Succession planning for both the Board and the executive management team was a key focus in 2022. The process that led to the appointment of Anil Wadhwani as our new Chief Executive Officer which, given the importance of the decision, involved all Non-executive Directors and is set out in the introduction to the Governance report.
Building on the extensive succession planning activities of the Committee in 2021, the Board was able to appoint Mark FitzPatrick as interim Group Chief Executive whilst the process for appointing a permanent successor was ongoing, and to promote James Turner to the role of Group Chief Financial Officer and Avnish Kalra to the role of Group Chief Risk and Compliance Officer. This provided leadership continuity and ensured that the Group could complete its restructuring and continue to deliver on its strategy. The Committee supported Mark in his capacity as interim Group Chief Executive in restructuring the Group Executive Committee. A key area of focus for the Committee over the next 18 months will be to oversee the development of updated succession plans for the new Chief Executive Officer and other Group Executive Committee roles. The Committee will also work closely with the RSWG to oversee the development of the framework which ensures that there is a strong and diverse pipeline of talent for the Group’s future leadership needs.
Alongside management changes, we also continued to develop the Board’s composition. In our recruitment, we have set requirements for deep Asian experience and strong digital understanding, alongside ensuring a balance of specific market and sectoral experience, focusing in 2022 on insurance and healthcare. We have paid careful regard to ensuring the diversity of both experience and perspectives, and the ability to contribute views within the Board, to ensure strong governance, support and challenge for the Group’s transformation and operational delivery.
In August 2022, we announced the appointment of Arijit Basu and Dr. Claudia Suessmuth Dyckerhoff to the Board. Arijit, who joined the Board in September 2022, brings extensive operating and insurance industry experience following a nearly 40 year career at State Bank of India (SBI), including four years as CEO of SBI Life Insurance Company Ltd. Claudia, who joined the Board in January 2023, brings a deep and broad knowledge of the healthcare services sector and health technology across China and the Asia-Pacific region. She spent much of her career based in Shanghai and, more recently, in Hong Kong and has worked with healthcare providers, governments, insurers, pharmaceuticals and medical device companies. As with all new Non-executive Directors, the Committee oversees their induction to the business to quickly ensure that they are able to contribute and the Board is able to benefit from their experience and expertise.
The Committee continues to review the composition of the Board and the skills and experience needed in order for it to lead and oversee the Group.
As announced in November, the role of Group Chief Financial Officer is no longer an Executive Director role. The Committee and the Board satisfied itself that in making this change, which is in line with many boards of Asia listed companies, the role and status of the Group Chief Financial Officer as well as the Group Chief Risk and Compliance Officer within the Prudential boardroom is well safeguarded and the Company’s governance processes and protections for shareholders remain robust. In particular, with further details set out in the Governance Report, the Group Chief Financial Officer and the Group Chief Risk and Compliance Officer are standing attendees at the Board, their appointment is a matter reserved to the Board, and the Chairs of the Audit and Risk Committee have a key role in their performance assessment.
Looking ahead, the Committee has identified specific focus areas for succession planning, including insurance-specific financial assurance skills in anticipation of David Law reaching the end of his tenure in 2024.
The rest of this report sets out in more detail the activities of the Committee in 2022.
Board composition, skills and succession
The Committee keeps under review the leadership needs of the Group, both for Executive and Non-executive Directors. Board succession plans are supported and informed by the results of the annual Board evaluation, individual Director evaluations and any skills gaps identified. Ongoing succession planning helps to ensure that the Board maintains a balance in the mix of skills and experience of its members.
The Committee regularly reviews the size, structure and composition of the Board, its principal committees and the RSWG, including an appropriate combination of Non-executive to Executive Directors on the Board, the overall number of Directors and their respective skills and experience. The Chair also seeks views on the needs of the Board and its principal committees as part of the annual Board evaluation and the Committee discusses desired skills as part of succession planning.
To support its assessment of skills and support succession planning, the Committee maintains a skills matrix for Non-executive Directors to help it map existing and desired skills on the Board and identify any gaps. The skills matrix includes the key skills and experience gained from positions external to Prudential that the Committee considers as particularly valuable for the Board to enable it to effectively oversee the Group and the execution of our strategy.
97
Looking ahead, in light of Non-executive Directors who are due to step down at the 2023 AGM and who will reach the end of their tenure at the 2024 AGM, the Committee has identified the need for a Board member with insurance-specific financial assurance expertise as David Law reaches the end of his tenure in 2024.
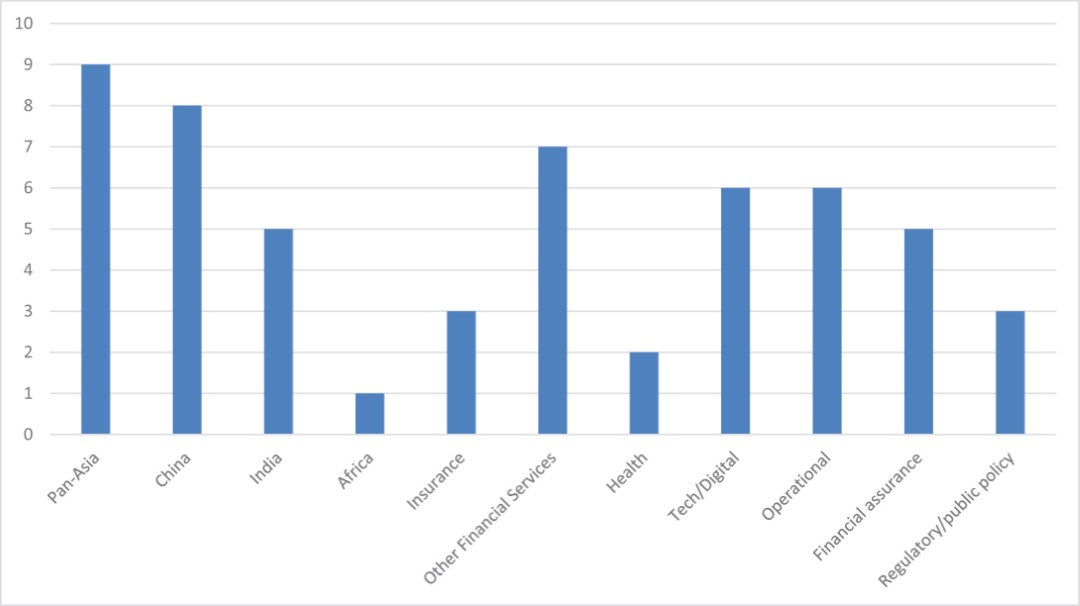
Non-executive Directors
The existing Non-executive Board members contribute a range of industry operating experience, sector expertise and personal strengths to the Board. In 2022, the Committee focused on the Board’s need to increase its expertise and experience in the areas of insurance and healthcare, which led to the appointments of Arijit Basu and Dr Claudia Suessmuth Dyckerhoff. Mr Basu has an in-depth understanding of the banking and insurance industries in India whilst Dr Suessmuth Dyckerhoff has broad experience in the healthcare sector in Asia, including specifically in China. These appointments are part of an ongoing process to refresh the Board to ensure that it has the right skills and experience to support the Group’s strategic objectives in Asia and Africa, both now and in the future.
The regular and ongoing review of candidates by the Committee ensures a controlled approach to the onboarding of new Non-executive Directors and allows a sufficient transition period with those Directors who are reaching the end of their tenure.
The Committee also makes recommendations to the Board in relation to skills to ensure the Audit Committee has the skills required by the Codes and US legislation. The Audit Committee financial expert, as defined in the Sarbanes-Oxley Act, is David Law.
Executive roles
Given the importance of Chief Executive Officer succession and the Board’s collective responsibility, the succession process that led to the appointment of Mr Wadhwani involved all of the Non-executive members of the Board and is described above.
Based on the extensive work by the Committee in 2021 on succession planning for Group Executive roles, including considering full assessments and development plans for internal candidates and external benchmarking, the Committee had identified Mr Turner as the preferred successor for the role of Group Chief Financial Officer, and Avnish Kalra as the preferred successor for the role of Group Chief Risk and Compliance Officer. The Board approved these appointments in February 2022. The Board was also able to approve the appointment of Mark FitzPatrick as interim Group Chief Executive whilst the process for appointing a new Chief Executive Officer was completed. These appointments ensured continuous and effective leadership of the Group.
The Committee also has oversight of a diverse pipeline of leadership talent extending below the level of the Group Executive Committee in order to attract, retain and develop the next generation of emerging leaders. Responsibility for overseeing talent
98
development across the Group more broadly, including diversity, inclusion, and employee wellbeing sits with the RSWG. The Committee and RSWG hold joint meetings where appropriate.
The Committee is supported by the Group HR Director and during the year engaged Egon Zehnder and Spencer Stuart to support the searches for certain Non-executive and Executive hires. Spencer Stuart is also engaged by the Group for senior management recruitment and Egon Zehnder for senior management recruitment and leadership assessment and development.
Process for appointing new Directors
The Committee assists the Board in ensuring that there is a formal, rigorous and transparent approach to the appointment of new Directors.
The Committee is involved from the start in identifying a vacancy or a gap in the Board’s skills. A role description is prepared, listing the desired skills and experience and reflecting feedback from the Committee and the objectives of the Board’s Diversity Policy. Once agreed, specialist talent agencies are typically engaged to create a long-list of candidates, which is reviewed by the Committee and other Board members to create a short-list. Interviews with short-listed individuals then take place with the Committee and additional selected Board members and feedback is provided to the Committee. In this manner, a preferred candidate is selected and the Committee then recommends the individual to the Board for appointment. The Senior Independent Director leads the Committee in the process of appointing a new Chair and the Chair leads the process for the appointment of a new Chief Executive Officer, involving all Non-executive Directors in the process.
Contemporaneous with this process, due diligence checks are undertaken on the candidate and Prudential liaises with the relevant regulatory authorities. The Committee is kept updated on this process as appropriate. Following appointment, the Committee oversees the induction of new Non-executive Directors.
Director evaluation
The Committee has concluded that each of the Directors in office for the year under review continued to perform effectively and each was able to devote appropriate time to fulfil their duties, and that the Board and its Committees had an appropriate combination of skills, experience and knowledge.
In reaching this conclusion, the Committee determined that the Non-executive Directors continued to demonstrate the desired attributes, contributing effectively to decision-making and exercising sound independent judgement in holding management to account. Accordingly, the Committee recommended to the Board those Directors standing for election at the 2023 Annual General Meeting.
During 2022, the Committee also reviewed the membership of the Board’s principal Committees and the RSWG, recommending changes to the Board. When making recommendations, the Committee takes account of the current composition of each of the principal Committees and the RSWG, the skills and experience of the members and the strategic objectives of the Group. Assigning new Directors to the Audit or Risk Committees has also helped them to build up their knowledge of the business.
Senior Independent Director succession
The role of Senior Independent Director derives from the UK Corporate Governance Code. The Senior Independent Director acts as a sounding board for the Chair and supports her in the delivery of her objectives. He also acts as an intermediary for other Directors and shareholders when necessary. The Senior Independent Director also leads the annual performance evaluation of the Chair as well as leading on the search of any new Chair.
During 2022, the Chair consulted with members of the Committee and other Board members on the best candidate to succeed Philip Remnant, who has held the role of Senior Independent Director since joining the Board in January 2013. Mr Anderson was considered the ideal candidate. He is familiar with the UK investor and governance landscape, has long experience of engaging with stakeholders, including through successfully carrying out a similar role at UBS, and possesses the personal skills necessary to fulfil the different functions of the role.
In anticipation of his appointment, Mr Anderson became a member of the Committee on 16 November 2022 and will step down from the RSWG on 31 March 2023, following the publication of the 2022 ESG Report.
Board diversity policy
Given the location of the Group’s operations, its business strategy and long-term focus in Asia and Africa, the Committee seeks candidates with backgrounds, experience and skills that broaden the Board’s capability, and who possess a balance of sector-specific knowledge, operational experience and commercial acumen, ensuring it has representation from individuals with insights into the markets in which the Group operates. Talent search agencies are briefed on the Group’s requirements and candidate selection is based on merit, against objective criteria and with due regard for the benefits of diversity, including diversity of thought and perspective, gender, ethnicity, age, geographical provenance and social, educational and professional backgrounds.
99
The Board’s target for female representation on the Board is 40 per cent by the end of 2025, as recommended by the FTSE Women Leaders Review. At 31 December 2022, the role of Chair was held by a woman and the overall representation of women on our Board was 31 per cent. On 1 January 2023 female representation increased to 38 per cent. As previously announced, Philip Remnant and Tom Watjen will not stand for re-election at the forthcoming AGM, which will further increase the proportion of women on our Board to 45 per cent.
The Parker Review recommends that we appoint at least one director from what is regarded in the UK as an ethnic minority background. We have exceeded this recommendation, with six of our 13 Directors meeting those criteria as at 31 December 2022 (seven out of 11 following the 2023 AGM or 63%) reflecting our Asian and African focus and operations. We are one of only three FTSE 100 companies with a non-white Chair.
The Group’s Diversity and Inclusion Policy applies at all levels of the business, including to the Board and its Committees. The Committee is responsible for overseeing a diverse pipeline of talent for the Board and other senior executive roles, driving a Group-wide culture where our people feel valued, and are treated fairly and respected: enabling them to fully contribute their thoughts and perspectives and to be their authentic selves.
The Committee considers that the pipeline for diverse talent to serve on the Group Executive Committee remains reasonable with continued effort needed. Female representation of those who are regarded as senior management and part of the leadership teams is 35%. The RSWG has overseen the development of a people dashboard, which includes measures for tracking local representation, gender, age, tenure and experience. Inclusive leadership practices are implemented starting with the Board and Committee and throughout the organisation.
Terms of appointment
Non-executive Directors are appointed for an initial term of three years, and subject to review by the Committee and re-election by shareholders, it is expected that Non-executive Directors serve a second term of three years. After six years, Non-executive Directors may be appointed for a further year, up to a maximum of three years, or more in certain limited circumstances. Reappointment is subject to rigorous review as well as re-election by shareholders.
The notice of AGM includes details on the skills and experience of each director seeking re-election and specific reasons why their contribution is, and continues to be, important to the Company’s long-term sustainable success.
Non-executive Director tenure
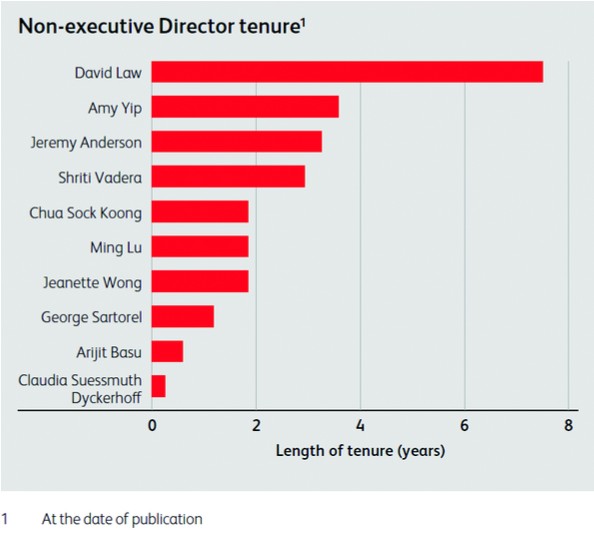
The Compensation and Employees section sets out the terms of Non-executive Directors’ letters of appointment, in addition to the terms applicable to Executive Directors’ service contracts.
100
Independence
All Directors have a statutory duty to exercise independent judgement. For Non-executive Directors, the application of independent judgement is critical to their role in providing constructive challenge and holding management to account, while providing strategic guidance and offering specialist advice. The independence of Non-executive Directors is assessed as part of the appointment process, and annually thereafter, in line with requirements. To support that assessment, each Non-executive Director (except the Chair) provides an annual independence confirmation as required under the Hong Kong Listing Rules. Members of the Audit Committee are also assessed against independence criteria in the Sarbanes-Oxley Act.
During 2022 all Non-executive Directors were considered to be independent by the Committee. The Chair, who was independent on appointment, is no longer counted as independent in accordance with the UK Corporate Governance Code.
Philip Remnant, the Senior Independent Director, joined the Board in January 2013 and was re-elected at the AGM in May 2022 to serve for a further one year term, with 96.65% of votes cast in favour. While the UK Code provides that the independence of a director who has served for more than nine years is likely to have been impaired, or could appear to have been impaired, the Committee and the Board were satisfied, having assessed his independence throughout 2022, that Lord Remnant remained independent in judgement and character. As previously announced, Lord Remnant will not stand for re-election at the forthcoming AGM in May 2023. He will be succeeded as Senior Independent Director by Jeremy Anderson.
When considering the independence of Jeremy Anderson and Jeanette Wong, the Committee and the Board took into account that both Mr Anderson and Ms Wong serve as Non-executive Directors of UBS Group AG. The Committee and the Board have determined that this cross-directorship does not affect their independence. Based on their contributions to Board discussions to date, the Board is confident that both can be expected to continue to demonstrate objectivity and independence of judgement.
Time commitment
Non-executive Directors are expected to devote such time as is necessary for the proper performance of their duties. The expected time commitment for directors to effectively discharge their duties is agreed and set out in writing in the Letter of Appointment, at which point the existing external demands on an individual’s time are assessed to confirm their capacity to take on the role. The assessment takes into account the time required to prepare for and attend Board and Committee meetings, the AGM, general projects, Board training, dinners and other activities. Further external appointments which could impair the ability of Directors to meet these time commitments must first be discussed with the Chair (or, for the Chair, with the Senior Independent Director) and, where appropriate, approved by the Committee or the Board. Should the Executive Director wish to take on any external appointments, this would also be subject to Board consent. In line with UK Code recommendations, the Executive Director is not permitted to hold more than one non-executive directorship with a FTSE 100 company or other significant appointments.
During 2022, the Committee considered the time commitment required of the Non-executive Directors. Taking into account the varying demands of the business, it was concluded that the time commitment required of Directors needed to be refreshed The current time expectations for Board and Committee membership are set out in the following table. The time expectations of Directors performing Chair roles is considerably more.
Number of regular scheduled meetings
| | | | |
|
| |
| Approximate time commitment |
Board |
| 6 | | 33 days |
Audit |
| 5 | | 15 days |
Risk |
| 5 | | 8.5 days |
Remuneration |
| 4 | | 6 days |
Nomination & Governance |
| 3 | | 5 days |
Responsibility & Sustainability Working Group | | 4 | | 5.5 days |
Conflicts of interest
Directors have a statutory duty to avoid conflicts of interest. In addition, the Company has in place procedures to identify and, where necessary, mitigate potential conflicts of interest. These processes help to ensure decisions are made in the best interests of the Company. The Board has delegated authority to the Committee to identify and, where necessary, authorise any actual or potential conflicts of interest.
When recommending a candidate for appointment or re-election to the Board, the Committee considers the external appointments of the proposed candidate and recommends authorisation of any conflicts to the Board as appropriate, attaching conditions to the authorisation where necessary. If a Director makes a request to take on a new external position during the year, the Chair (or the Senior Independent Director in respect of the Chair) considers the proposed external appointment and escalates to the Committee for authorisation where a conflict or potential conflict could arise.
The Board considers that the procedures for dealing with conflicts of interest operate effectively.
101
Board effectiveness
The Committee oversees the process by which the Board, its Committees and individual Directors’ effectiveness is assessed. The 2022 Board evaluation was conducted internally using a questionnaire. The findings were presented to the Committee and the Board in March 2023 and suggested actions to address areas of focus identified by the evaluation were discussed. The themes, summary of actions and progress are set out above.
Governance
The Committee reviews the Group’s governance framework regularly, monitoring the Group’s significant governance policies, (including governance arrangements of the Group’s main subsidiaries), recommending changes to the Board as appropriate.
Audit Committee report
Committee’s purpose
The Committee’s purpose is to assist the Board in meeting its responsibilities for the integrity of the Group’s financial reporting, including the effectiveness of the internal control and risk management system and for monitoring the effectiveness and objectivity of internal and external auditors.
More information about the Audit Committee can be found in its terms of reference, which are available at
www.prudentialplc.com/investors/governance-and-policies/board-and-committees-governance
Membership and 2022 meeting attendance
Committee members | 2022 meetings1 |
David Law, Chair | 8/8 |
Jeremy Anderson | 8/8 |
Arijit Basu2 | 2/2 |
Chua Sock Koong3 | 3/3 |
Philip Remnant | 7/8 |
Alice Schroeder4 | 4/4 |
Jeanette Wong | 8/8 |
Amy Yip | 8/8 |
Regular attendees | |
Chair of the Board Chief Executive Officer Group Chief Financial Officer Group Chief Risk and Compliance Officer Senior members of the Finance function Company Secretary Group Chief Internal Auditor External Audit Partner Chief Security Officer | |
Notes 1 The Committee held four joint meetings with the Risk Committee, in addition to the eight Audit Committee meetings. All members attended the joint meetings. 2 Arijit Basu joined the Audit Committee on 1 September 2022. Prior to joining, he attended one Audit Committee meeting and one joint Audit and Risk Committee meeting as an observer. 3 Chua Sock Koong stepped down from the Audit Committee on 1 May 2022. After stepping down, Chua Sock Koong attended one additional joint Audit and Risk Committee meeting. 4. Alice Schroeder stepped down from the Audit Committee on 26 May 2022. | |
2022 has been another busy year for the Audit Committee as the Group became a purely Asia and Africa focused business.
At the start of the year, the Committee considered that the following should be the key areas of focus in addition to its regular ongoing responsibilities.
1. | Monitoring the Group’s preparedness for reporting under IFRS 17 and understanding the implications of the transition; |
2. | Deepening the Committee’s understanding of the accounting judgements and issues in the Group’s major subsidiary businesses; |
3. | Overseeing transitional activities relating to the change of external auditor in 2023; and |
4.Ensuring the Group’s financial controls remain robust during a period of transition for the business.
At the end of the year, the review of the Committee’s effectiveness concluded that the Committee delivered against these objectives.
102
IFRS 17 became effective on 1 January 2023, alongside the adoption of IFRS 9. This is a significant undertaking for the Group’s finance teams and the Committee has been kept informed of progress on a regular basis. During the year, systems implementation was completed and the transition balance sheet on 1 January 2022 produced. In addition to time spent in meetings overseeing implementation and discussing areas of judgment, the Committee has spent time getting to understand the new regime and how it is expected to impact the Group. There will be significant challenges ahead in bedding down this complex project and also helping stakeholders understand its impact across the industry. More information on the project and expected impact on our transition is contained in note A3.2 of the consolidated financial statements. Completion of the audited comparatives will be a significant focus for the Committee in the first half of 2023.
In order to increase its focus on the Group’s Asia entities, the Committee set out to strengthen its relationships in 2022 with the finance teams and audit committees in our most material subsidiaries. To that end, in addition to the usual written updates on the activities of the local audit committees, David Law meets regularly with the chairs of our Material Subsidiary audit committee chairs and provide an update to the Committee on important points raised at local level. In addition to its ongoing consideration of matters regarding the Material Subsidiaries, the Committee has also received presentations from local audit committee chairs and finance teams from the Material Subsidiaries. This helped to deepen the Committee’s understanding and facilitate discussion of key accounting assumptions and judgements, control matters, key products and the drivers of profitability in those businesses. In order to continue to foster closer working relationships with the audit and risk committees, in September Jeremy Anderson and David Law chaired a conference attended by the non-executive directors of the Group’s Material Subsidiaries.
We have continued to pay particular attention to our whistleblowing procedures and monitored these for any indicators of issues. David Law has met privately with the Group Chief Risk and Compliance Officer and/or Chief Security Officer to discuss significant cases and how they are investigated and resolved. These are also discussed in private sessions with the Committee, the Board or the relevant local audit committee as appropriate.
Committee membership and compliance with regulatory and governance requirements
In September, Arijit Basu joined the Committee. Arijit has extensive executive experience in the banking and insurance industries in India. His full biography and experiences are set out above. In May, the Committee said goodbye to Alice Schroeder who stepped down from the Committee and from the Board, while Chua Sock Koong also stepped down from the Committee as part of a refresh in the membership of several of the Board Committees as announced on 26 April.
At the conclusion of the 2023 AGM, the Committee will also bid farewell to Philip Remnant who will step down from the Committee and the Board. He has served on both since January 2013. Philip has seen through many significant events in these years and we will miss his wise counsel. I am extremely grateful for his support and contribution throughout my period as Chair.
Further, for the purposes of the UK and Hong Kong Corporate Governance Codes, each member of the Committee has recent and relevant financial experience. Detailed information on the experience, qualifications and skillsets of all Committee members can be found above.
The effectiveness of the Committee was reviewed as part of the annual Board evaluation, which confirmed that the Committee continued to operate effectively during the year, with actions agreed where appropriate. Further details on the Board evaluation are set out above.
External auditor
An important part of the Committee’s work consists of overseeing the relationship with the Group’s external auditor, including safeguarding independence and approving non-audit fees. The Committee continued its practice of meeting privately with KPMG and David Law has held a number of meetings with the lead partner throughout the year.
The audit of the 2022 year-end results will be the final one by the Group’s current auditor, KPMG LLP (KPMG).
As reported in the 2020 Annual Report, following a rigorous tendering process the Board resolved that it intends to recommend EY for appointment as the Group’s auditor for the financial year ending 31 December 2023 onwards, subject to shareholder approval at the AGM in 2023. The Committee is therefore also overseeing the Group’s relationship with EY, their independence from Prudential and the transition plan. EY have been undertaking assurance work on the Group’s IFRS 17 comparatives in advance of the publication of its first IFRS 17 results at Half Year 2023. We have also met regularly with them to discuss progress. Their work has assisted with the transition and I also met with their lead partners regularly.
Internal audit
The Committee receives regular updates from the Group Chief Internal Auditor and key members of his team and David Law meets regularly with him and the Group-wide Quality Assurance Director to discuss internal audit work and matters arising. Having a strong function with appropriate resource focused on our key risks has been a priority of the Committee throughout the year.
103
Principal activities and significant issues considered by the Audit Committee during 2022 | |
|---|---|
Accounting judgements and estimates supporting the Group’s results | One of the Committee’s key responsibilities is to monitor the integrity of the financial statements and any other periodic financial reporting. This includes, the half-year financial statements, the Annual Report (including compliance with the GWS public reporting requirements), associated results announcements and Form 20-F disclosures, as well as the annual update of the Group’s published Tax Strategy. In reviewing these and other items, the Committee received reports from management and, as appropriate, reports from internal and external assurance providers. When considering financial reporting matters, the Committee assesses compliance with relevant accounting standards, regulations and governance codes focusing on key areas of judgement and complexity. No material changes to accounting policies were made during 2022. The Committee continued to receive updates on the Group’s implementation of IFRS 9 ‘Financial Instruments’ and IFRS 17 ‘Insurance Contracts’, which became effective on 1 January 2023. The approach to and the impact of adopting these standards is further discussed in note A3.2 of the consolidated financial statements. The Committee reviewed the key assumptions and judgements supporting the Group’s IFRS results, including those made in valuing the Group's investments, insurance liabilities and intangible assets under IFRS, together with reports on the operation of internal controls to derive these amounts. The Committee also reviewed the assumptions underpinning the Group's European Embedded Value (EEV) metrics. Assumptions setting The measurement of insurance liabilities is based on estimates of future cash flows, including those to and from policyholders, over a long period of time. These estimates can, depending on the type of business, be highly judgemental. The Committee considered changes to assumptions and other estimates used to derive IFRS insurance liabilities and for EEV reporting. The key assumptions reviewed were: - Within the insurance businesses, persistency, mortality, morbidity (including expectations of future medical costs inflation and related premium rises) and expense assumptions (including consideration of future expense levels anticipated in the business plan). When assessing assumptions the Committee considered recent experience, including the impact of any short-term Covid-related disruption. - Economic assumptions, including investment return and associated risk discount rates, which generally increased as interest rates rose in the year, leading to adverse impacts on the Group’s EEV. The Committee was satisfied that the assumptions adopted by management were appropriate. In addition to the above the Committee received and considered information on the impact on the Group’s metrics of the adoption of the Risk-Based Capital regime in Hong Kong. This included in particular the refinements needed to the methodology used to calculate Hong Kong’s IFRS policyholder liabilities and the impact of that change as further described in note C3.2 in the consolidated financial statements. Valuation of investments The Committee received information on the carrying value of investments in the Group’s balance sheet acknowledging that the vast majority of the Group’s investments are based on quoted prices in an active market (circa 80 per cent being included in level 1 as at 31 December 2022). Further information on the valuation of assets is contained in note C2 of the consolidated financial statements. The Committee satisfied itself that overall investments were valued appropriately. Intangible assets The Committee received information to enable it to review the more material intangible asset balances, for example, whether there had been any indication of impairment of the Group’s distribution rights asset or goodwill in light of the current macroeconomic environment. The Committee was satisfied that there was no impairment of these intangible assets at 31 December 2022. Further information is contained in note C4 of the consolidated financial statements. |
Other financial reporting matters | Going concern and viability statements The Committee considered various analyses from management regarding the capital and liquidity positions at Group and parent company level, taking into account the Group’s principal risks. This included an assessment of the impact that different stress scenarios may have on the Group’s plan and its resilience to those threats. Following this review, the Committee recommended to the Board that it could conclude that the financial statements should continue to be prepared on a going concern basis and that the disclosures in the 2022 Annual Report on the Group’s longer-term viability were both reasonable and appropriate. Fair, balanced and understandable requirement The Committee carried out a formal review of whether the 2022 Annual Report were ‘fair, balanced and understandable’ as required by the UK Corporate Governance Code. In particular, it considered whether the report gave a full picture of the Group’s business model, strategy, financial position and performance in the year, with important messages appropriately highlighted. It also considered the level of consistency between financial statements and narrative sections, whether performance measures were clearly explained and the prominence of alternative performance measures. After completion of its detailed review, the Committee was satisfied that, taken as a whole, the Group’s Annual Report is fair, balanced and understandable. Taxation |
104
Principal activities and significant issues considered by the Audit Committee during 2022 | |
|---|---|
The Committee regularly received updates on the Group’s tax matters and provisions for certain open tax items, including tax matters in litigation. The Committee was satisfied that the level of provisioning adopted by management was appropriate. See notes B3 and C7 of the consolidated financial statements. In 2022, the Committee was also updated on the OECD proposals to reform international tax including the introduction of a global minimum tax rate of 15 per cent likely to be effective from 2024. The Committee received updates in November 2022 and February 2023 about the anticipated change in tax residency of Prudential plc from the UK to Hong Kong, which became effective from 3 March 2023, as a consequence of the strategic shift to being an Asia and Africa focused business. Parent company financial statements The Committee reviewed the parent company profit and loss account and balance sheet, which included the recoverability of the parent company’s investment in subsidiaries by assessing and confirming that the net assets of the relevant subsidiaries (being an approximation of their minimum recoverable amount) were in excess of their carrying value at the balance sheet date. FRC’s thematic reviews on TCFD and climate disclosures The FRC’s Corporate Reporting Review (CRR) team carried out a limited scope review of the Group’s TCFD disclosures and disclosures of climate in the 2021 Annual Report. The review is based solely on the Annual Report and does not benefit from detailed knowledge of Prudential’s business or an understanding of the underlying transactions entered into. Following completion of the review, the Committee was provided with a letter from the FRC’s CRR team and was pleased to note that no questions or queries were raised by the FRC. In preparing its 2022 Annual Report, the Group has taken account of a number of improvements applicable to all companies following the thematic review alongside suggestions made to the Group by the FRC following its review. | |
External audit | External audit effectiveness The Group's current external auditor is KPMG and oversight of the relationship with KPMG is one of the Committee's key responsibilities. Matters considered by the Committee in the year included: - The detailed audit strategy for the year, approach to risk assessment and coverage of the audit response to highlighted significant risks; - Their approach to Group materiality setting and their proposal on how that is applied to the individual business units; - Insight around the key accounting judgements and the way KPMG applied constructive challenge and professional scepticism in dealing with management; and - The outcome of management’s internal evaluation of the auditor, which was based on a questionnaire survey circulated to the Committee members, independent members of the audit committees of Material Subsidiaries, the Group Chief Financial Officer and the Group’s senior financial leadership for completion. The survey covered audit quality and execution, team performance, process and communication in relation to the 2021 audit. In addition, the Committee discussed the results of the latest FRC review with KPMG, including any implications for the Prudential audit and any actions being taken by KPMG to address these. The Committee maintains an open dialogue on emerging risks and issues with the Group Lead Partner via a regular schedule of meetings aligned to key reporting milestones. In 2022 the Committee formally met with the Group Lead Partner without management present on two separate occasions. The 2022 audit is expected to be the last one completed by KPMG. Following a tender process undertaken in 2020, the Board will recommend to shareholders that it appoints EY as the Group’s new auditors in 2023. This is discussed further below. Auditor independence and objectivity The Committee has responsibility for monitoring auditor independence and objectivity and is supported in doing so by the Group’s Auditor Independence Policy (the Policy). The Policy is approved annually by the Committee. It sets out the circumstances in which the external auditor may be permitted to undertake non-audit services and is based on four key principles which specify that the auditor should not: - Have a mutual or conflicting interest with the Group; - Audit its own firm’s work; - Act as management or employees for the Group; or - Be put in a position of being an advocate for the Group. |
105
Principal activities and significant issues considered by the Audit Committee during 2022 | |
|---|---|
The Policy has two permissible service types: those that require specific approval by the Committee on an engagement basis and those that are pre-approved by the Committee with an annual monetary limit capped at no more than five per cent of the Group audit fee in the proposed year and capped at $65,000 individually. The Policy also provides that the total fees payable to KPMG for non-audit services, other than those required by law or regulation, shall be limited to no more than 70 per cent of the average audit fees paid in the past three consecutive financial years. In accordance with the Policy, the Committee approved these permissible services, classified as either audit or non-audit services, and monitored the usage of the annual limits on a quarterly basis. Non-audit services undertaken by KPMG were agreed prior to the commencement of work, except as noted below, and were confirmed as permissible for the external auditor to undertake in accordance with the Policy which complies with the rules and regulations of the FRC’s Revised Ethical Standard (2019), the US Securities and Exchange Commission (SEC) and the standards of the Public Company Accounting Oversight Board (PCAOB). The Committee monitored the nature and extent of non-audit services on a regular basis to ensure the provision of non-audit services complied with the Group’s Policy and did not impair the auditor’s objectivity or independence. The Committee noted that KPMG typically only performed non-audit services where they complemented its role as external auditor, for example the review of half year and EEV financial statements or additional assurance to support capital market requirements. In keeping with professional ethical standards, KPMG confirmed its independence to the Committee and set out the supporting evidence for its conclusion in a report that was considered by the Committee prior to publication of the financial results. Included in this review, KPMG advised the Committee that two KPMG member firms have provided services in connection with the preparation of local statutory accounts and their translation into a different language. These services were provided to three of the Group’s subsidiaries for either no or a nominal additional fee. The entities concerned were not individually significant to the Group’s audit, the services did not involve management decisions and were provided after the Group audit opinion was signed in the years concerned. The Committee agreed with KPMG’s assessment that this has not impaired their integrity or objectivity. The Committee asked management to ensure suitable reminders were shared with local teams and that they engaged with the incoming auditor to ensure procedures were sufficiently robust to identify such services before they took place. In line with the FRC’s Ethical Standard, the rules and regulations of the SEC and the standards of the PCAOB, a new KPMG Group Lead Partner, Stuart Crisp, was appointed for the 2022 audit following completion of a five year term by the prior lead partner at the end of the 2021 reporting cycle. The Committee will continue to monitor developments to ensure the Group’s policies and processes around audit effectiveness and independence evolve in line with market practice. During 2022 it also approved fees payable to EY under the same policy, where applicable, to ensure the firm is independent prior to being recommended for appointment as the Group’s auditor at the 2023 AGM. Fees paid to the external auditor The fees paid to KPMG for the year ended 31 December 2022 amounted to $10.9 million (2021: $15.5 million) of which $3.3 million (2021: $6.5 million) was total amounts payable in respect of non-audit services, except those required by law and regulation, as defined by the FRC’s Revised Ethical Standard (2019). A breakdown of the fees payable to KPMG can be found in note B2.4 of the consolidated financial statements. The ratio of non-audit fees for the Group in 2022 over the average of audit fees for the past three years is 31 per cent (2021: 51 per cent) for the Group, 39 per cent (2021: 19 per cent) below the 70 per cent cap set by the FRC. Total non-audit service fees that are subject to non-audit fee cap in 2022 were $3.3 million (2021: $4.4 million excluding one-off amounts related to the demerger of Jackson and the public offering of equity shares in Hong Kong). The 2022 services associated with this amount included the review of the Group’s half year financial statements and EEV disclosures and assurance work performed by KPMG in connection with Prudential’s debt programme and other internal assurance work. In all these cases, the audit firm was considered the most appropriate to carry out the work, given its knowledge of the Group and the synergies that arise from running these engagements alongside its main audit. All non-audit services were pre-approved by the Committee and were in line with the Policy discussed above. Appointment of the external auditor KPMG was appointed in 1999 and since 2005, the Committee has annually considered the need to retender the external audit service. Following the competitive tender process in 2020, the Board resolved that it intends to recommend EY for appointment for the year ending 31 December 2023 onwards, subject to shareholders’ approval at the 2023 AGM. Full details of the tender process were included in the 2020 Annual Report, including the two firms recommended by the Committee and how the firms were evaluated. Transition to the new auditor has commenced. EY has been providing assurance work in connection with the Group’s IFRS 17 project and through this work regularly attends Committee meetings and meets with senior members of the financial leadership. EY has confirmed its independence to the Committee and the Committee has reaffirmed its view that the Board should recommend EY be appointed as the Group Auditor at the 2023 AGM. Throughout the 2022 financial year, the Company has complied with the provisions of the Statutory Audit Services for Large Companies Market Investigation (Mandatory Use of Competitive Tender Processes and Audit Committee Responsibilities) Order 2014 issued by the UK Competition and Markets Authority. | |
106
Principal activities and significant issues considered by the Audit Committee during 2022 | |
|---|---|
Whistle blowing | Speak Out The Group continues to operate a Group-wide whistleblowing programme (‘Speak Out’), hosted by an independent third party (Navex). The Speak Out programme received ad hoc reports from a wide variety of channels, including a web portal, hotline, email and letters. Reports are captured, confidentially recorded by Navex, and triaged by Group Security Investigations prior to investigation by the appropriate teams. The Committee is responsible for oversight of the effectiveness of the Group’s whistleblowing arrangements. The Committee received regular reports on the most serious cases and other significant matters raised through the programme and the actions taken to address them. The Committee was also briefed on emerging Speak Out trends and themes, causal factors and post-investigation remediation. The Committee may, and has, requested further reviews of particular areas of interest. Through an Annual Speak Out Report and quarterly updates, the Committee reviews the Group’s Speak Out programme, satisfying itself that it continues to comply with legal, regulatory and governance requirements. The Committee also considered the consistency of approach adopted across subsidiary audit committees, where locally recorded Speak Out events, themes and trends are also briefed and considered. The Speak Out programme has been further strengthened during the year by the management level committees. Where relevant, the Committee requested information on the sharing of lessons learned. The Committee Chair and Committee spend time privately, with the Group Chief Risk and Compliance Officer and Group Chief Security Officer, to ensure that investigations were adequately resourced and appropriately managed, that there had been no retaliation against anyone making a report and that investigations were not improperly influenced and to understand outcomes of investigations. An annual assessment of Speak Out arrangements is undertaken by an independent UK based Whistleblowing Charity (‘Protect’) and benchmarked against peers. The assessment confirmed that the Group’s programme continued to perform well and in accordance with best practice. |
Internal audit | Regular reporting The Committee received regular updates from Group-wide Internal Audit (GwIA) on audits conducted and management’s progress in addressing audit findings within agreed timelines. Any delays in implementing remediation actions were escalated to the Committee and given particular scrutiny. The independent assurance provided by GwIA formed a key part of the Committee’s deliberations on the Group’s overall control environment. During 2022, the areas reviewed included: transformation and change management; financial controls; outsourcing and third-party supply; customer outcomes; cyber security and IT risk; compliance and regulatory; and the second line. The Group Chief Internal Auditor reports functionally to the Committee Chair and has direct access to the Chair of the Board and to the Chief Executive Officer. For administrative purposes (excluding strictly all audit related matters), the Group Chief Internal Auditor has a reporting line to the Group Chief Risk and Compliance Officer. In addition to formal Committee meetings, the Committee meets with the Group Chief Internal Auditor in private to discuss matters relating to, for example, the effectiveness of the internal audit function, significant audit findings and the risk and control culture of the organisation. The Committee Chair also meets with GwIA’s Quality Assurance Director to discuss the outcome of the quality reviews of GwIA’s work and actions arising. Annual internal audit plan and focus for 2023 GwIA operates a rolling six-month approach to audit planning. The Committee approved the plan for the second half (H2) of 2022. It also considered and approved the Internal Audit Plan, resource and budget for the first half (H1) of 2023. The H1 2023 Internal Audit Plan was formulated based on a bottom-up risk assessment of audit needs mapped against various metrics combined with top-down challenge. The plan was then mapped against a series of risk and control parameters, including the top risks identified by the Risk Committee, to verify that it is appropriately balanced between financial, business change, regulatory and operational risk drivers and provides appropriate coverage of key risk areas and audit themes within a risk-based cycle of coverage. Key areas of focus for H1 2023 include: strategic change initiatives; customer outcomes; cyber security; financial risk and financial controls; culture; outsourcing and regulatory compliance. Effectiveness of internal audit The Committee is responsible for approval of the GwIA charter, audit plan, resources, and for monitoring the effectiveness of the function. The Committee also assesses the effectiveness of GwIA through a combination of External Quality Assessment (EQA) reviews, required every five years, and an annual internal effectiveness review. In Q4 2021, Deloitte performed an EQA of GwIA, which assessed GwIA as a mature function that ‘Generally Conforms’ (the highest rating under the framework) with the Institute of Internal Audit International Professional Practices Framework and Internal Audit Financial Services Code of Practice (the Standards), and with the approach to meeting the requirements and expectations of the Hong Kong IA including the GWS framework. The assessment also considered GwIA’s purpose, position, processes and reporting in the context of the Group’s wider systems of governance. |
107
Principal activities and significant issues considered by the Audit Committee during 2022 | |
|---|---|
Having considered the findings of the EQA, which was reported to the Committee in February 2022, and the 2022 Internal Effectiveness review, performed by the GwIA Quality Assurance Director, the Committee concluded that GwIA had continued to operate independently of management and in compliance with the requirements of GwIA delegated authorities, procedures and practice standards in all material respects and had remained aligned to mandated objectives during 2022. | |
Internal control and risk management | Internal control and risk management systems The Committee is responsible for reporting and making recommendations to the Board on the effectiveness of the Group’s system of risk management and internal control. The Committee considered the outcome of the annual review of the system of risk management and internal control. The review identified specific areas for improvement and the necessary actions that have been, or are being, taken. Group Governance Manual The Group Governance Manual (the Manual) sets out the general principles by which we conduct our business and ourselves and defines our Group-wide approach to Governance, Risk Management and Internal Control. Incorporating our Group Code of Business Conduct, the Manual sets out the general principles by which we conduct our business and ourselves. Each business attests annually to compliance with: -Mandatory requirements set out in Group-wide policies, including the Group Code of Business Conduct; and -Matters requiring prior approval from those parties with delegated authority. The Committee reviewed the results of the annual content review of the Manual and the results of the year-end compliance attestation for the year ended 31 December 2022. |
108
Risk Committee Report
Committee’s Purpose
The Committee’s purpose is to assist the Board in providing leadership, direction and oversight of the Group’s overall risk appetite, tolerance and strategy. It oversees and advises the Board on the current and potential risks to the Group, reviews and approves the Group’s risk management framework, and monitors its effectiveness and adherence to the various risk policies.
More information on the Risk Committee can be found in its terms of reference, which are available at www.prudentialplc.com/investors/governance-and-policies/board-and-committees-governance
Membership and 2022 meeting attendance
Committee Members | 2022 Meetings1,5 |
Jeremy Anderson, Chair | 7/7 |
David Law | 7/7 |
Ming Lu2 | 7/7 |
George Sartorel3 | 5/5 |
Alice Schroeder4 | 3/3 |
Tom Watjen | 7/7 |
Jeanette Wong | 6/7 |
Regular Attendees | |
- Chair of the Board - Chief Executive Officer - Group Chief Risk and Compliance Officer - Group Chief Financial Officer - Company Secretary - Group Chief Internal Auditor Members of the Group Risk Leadership Team are invited to attend each meeting as appropriate. | |
1 The Committee held four joint meetings with the Risk Committee, in addition to the seven Risk Committee meetings. All members attended the joint meetings. 2 Ming Lu stepped down from the Risk Committee on 1 May 2022. 3 George Sartorel joined the Risk Committee on 1 May 2022. 4 Alice Schroeder stepped down from the Board following the conclusion of the AGM held on 26 May 2022. 5 Arijit Basu attended one of the meetings as an observer, as part of his induction programme. | |
The Committee considered the challenges presented by the confluence of macroeconomic volatility, geopolitical tensions and Covid-19, with specific focus on the management of non-financial risks that may impact operational resilience and lead to reputational risk, such as those associated with third parties and outsourcing, customer conduct and technology risk. Moreover, the Committee has made people a first-order focus, in recognition of the many demands on resources across the Group.
The key risks and matters considered by the Committee are summarised in this report, with further information included in the table below. In areas where risks are strategic or have broader impact, the Risk Committee escalates to the Board for a wider discussion.
Committee operation and governance
As part of its duties detailed above, the Committee reviews the Group Risk Framework (GRF) to ensure that it remains effective in identifying and managing the risks faced by the Group and recommends changes for approval by the Board. We considered and approved the Risk, Compliance and Security (RCS) function’s planned activities for 2022 and received regular reports from the Group Chief Risk and Compliance Officer (CRCO), who is advised by the Group Executive Risk Committee (GERC). We also received regular reports from the GwIA function and updates from other areas of the business as needed.
The Committee works closely with the Audit Committee to ensure both committees are updated and aligned on matters of common interest, and Jeremy Anderson reports to the Board on the main matters discussed. Commencing in the second half of 2022, the CRCOs of the Group’s Material Subsidiaries have been invited to present to the Committee on a rotational basis, to help deepen the Committee’s understanding of risks relevant to the local businesses. Regular direct communication and close cooperation with each of the Material Subsidiary risk committee chairs remains a key component of our governance framework, and at each meeting Jeremy Anderson updates the Committee on important points raised at local level. In order to continue to foster a close working relationship with the local audit and risk committees and deepen understanding of Group-wide risk topics, David Law and Jeremy Anderson chaired a conference attended by the non-executive directors of the Group’s Material Subsidiaries.
The effectiveness of the Committee was reviewed as part of the annual Board evaluation, which confirmed that the Committee continued to operate effectively during the year, with actions agreed where necessary to improve its effectiveness.
109
Risk appetite and principal risks
a.Risk governance, capital and liquidity
The Committee performed its regular review of the Group’s risk policies and proposed changes to the Group risk appetite statements and associated limits. We regularly reviewed the strength of our capital and liquidity positions, including the results of stress and scenario analyses.
b.The Group’s principal risks
The Committee considered the principal risks to the Group’s financial viability, operational resilience and sustainability. These included the long-term macroeconomic impacts of Covid-19, geopolitical tensions, inflationary pressure, rising interest rates and slowing economic growth. Risks associated with the Group’s digital transformation and sustainability agenda were also considered. The Committee reviewed the Group’s annual Own Risk and Solvency Assessment (ORSA) report in May 2022 and in-depth reviews were performed on existing and emerging high-risk areas. A fuller explanation of the principal risks facing the Group and the way in which these are managed is set out in the Risk Review section above.
Sustainability, including climate change risk
In July 2022, oversight responsibilities for environmental and climate-related issues, including the ongoing implementation of the Group’s external commitments to the decarbonisation of its operations and investment portfolio and other climate-focused external responsible investment commitments were transferred to the Committee. The Committee’s terms of reference were changed to reflect its holistic role in overseeing these areas. Building on changes implemented in 2021, the embedding of ESG considerations into the GRF continued during the year, such as explicitly including consideration of risks in the context of the time horizon of expected benefits/paybacks of decisions within core strategic processes where ‘risk-based decision-making’ must be incorporated. Time horizons for the purposes of climate disclosures have been defined and included in the GRF.
Digital and technology risks
The Committee received regular updates on the key risks associated with technology across the Group, including notable incidents, regulatory developments, governance and strategy, as well as developments in the global cybersecurity threat landscape such as the rise in prominence of ransomware, and the progress of cyber-attack simulation exercises with senior executives and readiness training across the Group.
Joint sessions of the Risk Committee and Audit Committee were held in May and July 2022 covering updates on the Group Data Policy and data governance process, as well as the cybersecurity and privacy posture across businesses, respectively.
In the backdrop of heightened risks involving IT service areas managed by third parties, a deep dive was performed and the Committee received regular updates on the improvement plans.
Customer conduct risk
Treating customers fairly, honestly and with integrity remains a key focus area of the Group and the Committee. In addition to receiving regular updates, a joint session of the Risk and Audit Committees in September 2022 was dedicated to customer conduct risk, where the Committee considered the implementation and actions relevant to the continuous developments in the Group’s conduct risk framework. Going forward, the Committee will work with the Audit Committee and the Responsibility & Sustainability Working Group (RSWG) on matters relating to customer conduct risk.
Model risk
Following the review in 2021 on the oversight and governance arrangements of the Group’s critical models, a number of enhancement actions have been taken throughout the year at Group and business unit level. In February 2022, the Committee updated its terms of reference to expand the model risk oversight expectations and responsibilities and similar changes were implemented in the Group’s Material Subsidiaries. Relevant model risk training has been presented to the Committee and executive members of these subsidiaries to facilitate effective oversight. The Committee also received updates on model risk developments across the Group, including areas of risk, controls in place and validation activity.
The Committee received regular updates on the Group internal economic capital assessment (GIECA) model results in 2022, prior to submission to the Hong Kong Insurance Authority (HKIA). The updates considered key assumptions, the governance framework and validation activity for the GIECA model. The Committee focused on the use of the GIECA model which provides a consistent risk and return lens for capital allocation and decision making across various business processes including business planning, product pricing, strategic business decision and remuneration management. We also considered the approach and the application of the Risk-Based Capital (RBC) regime for our Hong Kong business and received regulatory approval for early adoption in April 2022.
110
Principal activities and significant issues considered by the Risk Committee during 2022 | |
|---|---|
Risk management | Group principal risks, including Group Chief Risk and Compliance Officer (CRCO) reporting The Committee evaluated the Group’s principal risks, considering recommendations for promoting additional risks and changes in the scope of existing risks. The Committee also received regular reporting on the Group’s exposure to, and management of, its principal risks, emerging risk themes and external developments within the Group CRCO’s regular report to the Committee. Further information on how the Group identifies emerging and principal risks can be found in the Risk Review. The Group CRCO’s reports also provided the Committee with regulatory updates, including the implications of the developing global capital standards, systemic risk regulation, engagement with the regulators (including the Supervisory College) and the Group’s ongoing compliance with the Group-wide Supervision Framework (GWS Framework). Covid-19 related risks While most markets have moved to an endemic approach in managing Covid-19, the developments and risks have been continuously monitored by the Committee including the ongoing resilience, and the level of mortality claims and policy lapses or surrenders in certain markets. Deep dives As part of its risk oversight responsibilities, the Committee considered the results of ‘deep dive’ risk reviews performed over the year. In 2022, these focused on the risks related to the Group’s Artificial Intelligence (AI) ethics and governance framework; agency sales practices and risk management in Indonesia; the Group’s data privacy governance framework; IT service management areas managed by third parties; the Group’s debt investment portfolio covering exposures to China property development sector and sub-investment grade debt; and the Group’s interest rate risk exposures and asset liability management. The Committee also considered the progress made in managing and addressing money laundering, fraud, bribery and corruption risks. Transformation oversight and people risk The Committee monitored the progress of the Group’s key strategic projects during the year which, in addition to those outlined in the report above, included activities focused on IFRS 17 implementation and IBOR cessation. The Committee received regular updates on elevated people risk and mitigating actions. The Group is undergoing significant transformation and we noted the importance of management balancing the need to look after people whilst maintaining focus on desired outcomes. The Committee was updated on several people initiatives, including fostering better flexibility, inclusivity and psychological safety in the workplace to deepen belonging. Outsourcing management and third-party oversight The Committee received regular updates on the Group’s supplier and third-party oversight and Joint Ventures (JVs). In May 2022, the Committee considered third parties, JVs and outsourcing management as part of the ORSA report, and approved the list of the Group’s material outsourcing arrangements prior to submission to the HKIA. Technology risk During 2022, updates were provided to the Committee on key external developments relevant to information security and data privacy, including changes in regulations and the external threat landscape. The Committee received regular progress updates on the operationalisation of the Group-wide governance model and strategy for the management of information security and data privacy risks, as well as material incidents and improvement plans. Two joint sessions of the Risk Committee and Audit Committee in May and July 2022 were dedicated to cybersecurity and data/privacy, where the Committees considered the matters detailed in the report above. Sustainability, including climate change, risk Updates to the oversight responsibilities of the Committee and the continued embedding of climate risk considerations into the GRF have been detailed in the report above. The Committee received regular updates on key climate-related regulatory and legislative developments, including those in respect of disclosure requirements, progress against the Group’s responsible investment commitments, its ESG ratings by external assessors and agencies, as well as the Group’s participation in industry fora, such as the Net Zero Asset Owner Alliance, and consultations, including that of the International Sustainability Standards Board on its proposed standards for general sustainability and climate-related disclosure requirements. In November 2022, a joint update by RCS and the ESG team to the Committee covered development plans for the Group’s reporting against TCFD recommendations and the results of an exercise to map out the material climate and climate-commitment-related activities to support the Committee’s plan with respect to its updated responsibilities within the broader ESG Strategic Framework and the ongoing implementation of the Group’s external climate-focused commitments. Remuneration The Committee has a formal role in the provision of advice to the Remuneration Committee on risk management considerations in respect of executive remuneration. It considered risk management assessments of proposed executive remuneration structures and outcomes during the year, making related recommendations to the Remuneration Committee for its consideration. In September 2022, the Committee recommended to the Remuneration Committee to approve the use of GIECA in setting remuneration targets. |
111
Principal activities and significant issues considered by the Risk Committee during 2022 | |
|---|---|
Stress and scenario testing The Committee is responsible for reviewing the outcome and results of stress and scenario testing, which is a key risk identification and measurement tool for the Group. Stress and scenario testing is a key component of the Group’s ORSA process and the Risk Assessment of the Business Plan, as described below, as well as its Recovery Planning and Reverse Stress Testing (RST). The Group’s Recovery Plan, considered by the Committee in July 2022, included an assessment of the viability and operational resilience of the Group under severe financial and non-financial shock scenarios, and actions available to the Group to restore its financial strength in such circumstances. The Plan concluded that the Group is expected to remain in a resilient financial and operational condition when under severe stress, with only a very extreme scenario breaching the Group’s recovery activation measures, and that established governance frameworks and procedures are in place for senior management to respond to actual and potential threats. Risk assessment of the Business Plan As part of its role in overseeing and advising the Board on future risk exposures and strategic risks, the Committee reviewed the Risk Assessment of the Business Plan, which highlighted key financial and non-financial risks. The analysis reviewed included sensitivity assessments of the impact of various plausible scenarios. Model risk management The Committee received regular updates on the enhancement of the oversight and governance arrangements which operate for the Group’s critical models, see details in the report above. Recommendations were made in 2021 relating to 1) the central role of management in overseeing models; 2) the oversight expectations and responsibilities for the Audit and Risk Committees at Group and business unit level; and 3) the development of guidance and training to support committees in their roles in an appropriately consistent manner. These recommendations were acted on in 2022 and changes and improvements have been made in all three areas. | |
Regulatory and compliance matters | GWS Framework In May 2022, the Committee received confirmation of the completion of all agreed GWS transitional arrangements. The Committee received regular updates on the ongoing assurance processes in compliance with the GWS Framework with its wider responsibilities for compliance oversight. Compliance and regulatory change The Committee received regular reporting on key regulatory compliance risks and mitigation activities across the Group’s businesses throughout the year, covering regulatory changes, reviews and interventions, including those relating to money laundering, sanctions and geopolitical risks. In addition to those outlined in the report above, we also received regular updates on the Group’s customer conduct risk metrics. Group-wide Internal Audit The Committee received updates from GwIA throughout the year relating to matters which fall within the scope of its responsibilities. |
Risk and compliance framework | Annual review of risk policies, risk framework compliance and Committee effectiveness The GRF and risk policies were subject to their annual review, with amendments made to ensure the policies remained fit for purpose and reflect developments within the Group. The Board approved the changes recommended by the Committee. The Committee reviewed the results of the annual Group Governance Manual year-end compliance attestation performed by the business units against the GRF and associated policies. In February 2022, the Committee considered the findings of the annual evaluation of Committee effectiveness, agreeing actions where necessary to improve Committee effectiveness. In November 2022, the Committee reviewed the actions taken in respect of how the Committee focuses its time and considered that the key areas of focus for 2022 had been adequately covered. In March 2023, it also considered the effectiveness of the RCS function in overseeing the key risks to the Group. Group Risk Appetite and Limits The Committee is responsible for recommending changes in the Group’s overall risk appetite and tolerance to the Board for approval. In July 2022, the Committee recommended for approval by the Board proposed recalibration of the Group Risk Appetite capital targets to ensure their continued appropriateness. In November 2022, as part of the annual review of Group Risk Limits, we approved a recalibration of Limits and Triggers on duration mismatches to reflect more recent market conditions. We also approved a decrease in the Group’s capital counter-cyclical buffer reflective of the assessed cycle position back to a more neutral position compared to the mid-to-late economic cycle assessed in Q4 2021. The Committee received regular reporting throughout the year on any appetite breach of the Group’s non-financial risk appetite. |
112
Principal activities and significant issues considered by the Risk Committee during 2022 | |
|---|---|
External and regulatory reporting | ORSA The ORSA is a key ongoing process for identifying, assessing, controlling, monitoring and reporting the risks to which the Group is exposed and assessing capital adequacy over the business planning horizon. In May 2022, the Committee considered the Group’s ORSA report, based on the Business Plan, prior to its approval by the Board and submission to the HKIA. Systemic Risk Management In July 2022, the Committee considered the Group’s Recovery Plan and Liquidity Risk Management Plan and recommended them for approval by the Board. Group Internal Economic Capital Assessment (GIECA) The Committee received the regular bi-annual updates on the GIECA results in May and November 2022, prior to submission to the HKIA. The updates also covered the governance framework and validation activity for the GIECA model. In November 2022, we approved the proposed changes to the GIECA risk modelling assumptions for FY 2022 reporting. The Committee received updates on the use of the GIECA model for business decision making in May and July 2022. Hong Kong Risk-based Capital Regime (RBC) In February 2022, the Committee considered the planned application for early adoption of the Hong Kong RBC framework by the Group’s Hong Kong business which received HKIA approval in April 2022. |
Audit Committee Financial Expert
The Board has determined that David Law, Chair of the Audit Committee, qualifies as audit committee financial expert within the meaning of Item 16A of Form 20-F, and that David Law is independent within the meaning of Rule 10A-3 under the Exchange Act.
Governance – Differences between Prudential’s Governance Practice and the NYSE Corporate Governance Rules
The application of the New York Stock Exchange (‘NYSE’) corporate governance rules for foreign companies, recognises that they have to comply with domestic requirements. As a foreign private issuer, Prudential must comply with the following NYSE rules:
1 | The Company must satisfy the audit committee requirements of the SEC; |
2 | The Chief Executive Officer must promptly notify the NYSE in writing after any executive officer of the Company becomes aware of any non-compliance with any applicable provisions of Section 303(A) of the NYSE’s Listed Company Manual; |
3 | The Company must submit an executed written affirmation annually to the NYSE affirming the Company’s compliance with applicable NYSE Corporate Governance Standards and submit an interim written affirmation notifying it of specified changes to its audit committee or a change to the Company’s status as a foreign private issuer; and |
4 | The Company must provide a brief description of any significant difference between its corporate governance practices and those followed by US companies under the NYSE listing standards. |
As a company listed on the London Stock Exchange, Prudential is required to comply with the UK Listing Rules, the Disclosure Guidance and Transparency Rules and the Prospectus Rules issued by the FCA. Prudential is also required, pursuant to the UK Listing Rules, to report on its compliance with the UK Corporate Governance Code (the ‘UK Code’) which is issued by the Financial Reporting Council. Throughout 2022, the UK Code applicable to Prudential consisted of a number of main principles, and a series of more detailed provisions. The UK Listing Rules stipulate that Prudential must set out to shareholders how it has applied the main principles of the UK Code and a statement as to whether it has complied with all relevant provisions. Where it has not complied with all the applicable provisions of the UK Code, it must set out reasons for such deviation (the ‘comply or explain’ regime).
As a result of its listing on the Hong Kong Stock Exchange, Prudential is also required to comply with the continuing obligations set forth in the Rules Governing the Listing of Securities on The Stock Exchange of Hong Kong Limited (the ‘HK Listing Rules’) and is expected to comply with or explain any deviation from the provisions of the Corporate Governance Code contained in Appendix 14 to the HK Listing Rules (the ‘HK Code’).
The material differences between Prudential’s corporate governance practices and the NYSE rules on corporate governance (‘NYSE Rules’) are set out below. Unless specifically indicated otherwise, references to compliance with the UK Code below also includes compliance with the HK Code.
113
Independence of directors
The NYSE Rules require that the majority of the board be independent and sets out specific tests for determining director independence. The UK Code requires that at least half of the board, excluding the chair, should be non-executive directors whom the board considers to be independent. Where there are circumstances which are likely to impair, or could appear to impair, a non-executive director’s independence, and the board nonetheless considers that the non-executive director is independent, a clear explanation is provided in the annual report. The UK Code also requires that the board should include an appropriate combination of executive and non-executive (and, in particular, independent non-executive) directors, such that no individual or small group of individuals can dominate the board’s decision making.
Every non-executive director must satisfy the Hong Kong Stock Exchange that they have the character, integrity, independence and experience to effectively fulfil their role. The HK Listing Rules set out a number of factors which may impact independence. Each independent Non-executive Director is asked, on an annual basis, to confirm whether any of the factors are relevant to their personal circumstances (without treating any such factor as necessarily conclusive).
The Independence of Directors is outlined in the ‘Board of Directors’ section above.
Separation of duties
The NYSE Rules do not specify a requirement for roles of the Chief Executive Officer and the Chair to be separate.
The UK Code requires that these roles be fulfilled by different individuals. As at 23 March 2023, the roles of the Chief Executive Officer and Chair of the Board are fulfilled by Anil Wadhwani and Shriti Vadera, respectively.
Committees of the board
The Prudential Board has established a number of Board Committees which are similar in both composition and purpose to those required under the NYSE Rules. The membership of these committees is entirely made up of non-executive directors whom the Board has deemed to be independent, with the exception of the Chair who was independent on appointment and is longer qualifies as independent in accordance with the UK Code. The Chair of the Nomination & Governance Committee is the Chair of the Board, as permissible under the UK and HK Codes. The Chair is not a member of the Remuneration, Risk or Audit Committee.
In accordance with Rule 10A-3 of the Exchange Act, Prudential is required to have an Audit Committee which complies with the requirements of that rule. The Audit Committee of Prudential complies with these requirements except that it is responsible for considering the appointment, re-appointment or removal of the auditor and to make recommendations to the Board, to be put to shareholders for consideration at the annual general meeting. Shareholders are asked at the annual general meeting to authorise the Audit Committee to set the remuneration of the auditor. Prudential’s Audit Committee reviews the Company’s internal financial controls and, unless expressly addressed by the Board itself, reviews the Company’s internal control and risk management systems in relation to financial reporting. The Risk Committee has responsibility for the oversight of risk management.
The role of the compensation committee under NYSE rules is fulfilled at Prudential by the Remuneration Committee, which consists entirely of independent Non-executive Directors, in line with the UK Code.
Prudential has established a Nomination & Governance Committee whose membership consists of independent Non-executive Directors and the Chair. The Committee is not responsible for developing and recommending a set of corporate governance guidelines to apply to the Company as would be applicable for a US domestic company.
Non-executive Director meetings
To empower non-management directors to serve as a more effective check on management, the NYSE Rules require that the non-management directors of each listed company must meet at regularly scheduled executive sessions without management.
Prudential complies with the equivalent provisions set out in the UK Code.
Code of ethics
Under the NYSE Rules, US companies must adopt and disclose a code of business conduct and ethics for directors, officers and employees, and promptly disclose any waiver of the code for directors or executive officers.
Prudential’s Code of Business Conduct is available on Prudential’s website. Although not required by the Sarbanes-Oxley Act, Prudential has extended the applicability of its Code of Business Conduct to all employees and agents.
114
Approval of equity compensation plans
The NYSE Rules for US companies require that shareholders must be given the opportunity to vote on all equity-compensation plans and material revisions thereto, except for employment inducement awards, certain grants, plans and amendments in the context of mergers and acquisitions, and certain specific types of plans. Prudential complies with corresponding domestic requirements in the UK Listing Rules issued by the UK Listing Authority where appropriate, which mandate that the Company must seek shareholder approval for certain employee share plans, however, the Board does not explicitly take account of the NYSE definition of ‘material revisions’. The HK Listing Rules also provide that shareholder approval is required when making certain amendments to equity compensation plans.
Memorandum and Articles of Association
Prudential plc is incorporated and registered in England and Wales, under registered number 1397169. Its objects are unrestricted, in line with the default position under the Companies Act 2006.
The following is a summary of both the rights of Prudential shareholders including certain provisions of Prudential’s Articles of Association (the Articles). Rights of Prudential shareholders are set out in the Articles or are provided for by English law. This document is a summary and, therefore, does not contain full details of the Articles. A complete copy of the Articles was filed as an exhibit to Form 20-F on 22 March 2019. In addition, the Articles may be viewed on Prudential’s website.
Issued share capital
The issued share capital as at 31 December 2022 consisted of 2,749,669,380 (31 December 2021: 2,746,412,265; 31 December 2020: 2,609,489,702) ordinary shares of 5 pence each, all fully paid up and listed on the London Stock Exchange and the Hong Kong Stock Exchange. As at 31 December 2022, there were 38,453 (31 December 2021: 41,532; 31 December 2020: 45,176) accounts on the register. Further information can be found in note C8 to the consolidated financial statements.
As at 21 March 2023, the issued share capital of Prudential consisted of 2,749,674,740 ordinary shares of 5 pence each, all fully paid up and listed on the London Stock Exchange and the Hong Kong Exchange. No shares were held in treasury.
Prudential also maintains secondary listings on the New York Stock Exchange (in the form of American Depositary Receipts which are referenced to ordinary shares on the main UK register) and the Singapore Stock Exchange. Prudential has maintained a sufficiency of public float throughout the reporting period as required by the Hong Kong Listing Rules.
Rights and obligations
The issued share capital of Prudential is not currently divided into different classes of shares. The Companies Act 2006 abolished the requirement for a company to have an authorised share capital.
The rights and obligations attaching to the Company’s shares are set out in full in the Articles. There are currently no voting restrictions on the Ordinary Shares, all of which are fully paid, and each share carries one vote on a poll. If votes are cast on a show of hands, each shareholder present in person or by proxy, or in the case of a corporation, by its duly authorised corporate representatives, has one vote. The same individual may be appointed as proxy or as a corporate representative by more than one member.
Holders of Ordinary Shares have the right to participate in a distribution of profits, by way of dividend and have the right to participate in the surplus assets of the Company available for distribution in the event of a winding up or liquidation, voluntary or otherwise in proportion to the amounts paid up or credited as paid up on such Ordinary Shares.
Where, under an employee share scheme, participants are the beneficial owners of the shares but not the registered owners, the voting rights are normally exercisable by the trustee on behalf of the registered owner in accordance with the relevant plan rules. The trustees would not usually vote any unallocated shares held in trust but they may do so at their discretion provided it would be considered to be in the best interests of the beneficiaries of the trust and permitted under the relevant trust deed.
As at 21 March 2023, Trustees held 0.44 per cent of the issued share capital under the various plans in operation.
Rights to dividends under the various plans are set out in the ‘Compensation and Employees’ section of this report.
Transfer of shares
In accordance with English company law, shares may be transferred by an instrument of transfer or through an electronic system (currently CREST) and no transfer is restricted except that the Directors may, in certain circumstances, refuse to register transfers of shares. If the Directors make use of that power, they must send the transferee notice of the refusal within two months.
Certain restrictions may be imposed from time to time by applicable laws and regulations (for example, insider trading laws) and pursuant to the listing rules of both the Financial Conduct Authority and the Hong Kong Stock Exchange, as well as under the rules of some of the Group’s employee share plans.
115
Changes in share capital and authority to issue shares
Under English law, directors require authority from shareholders, other than under certain types of employee share schemes, whenever shares are issued. Newly issued shares must first be offered to existing shareholders pro rata to their holdings (pre-emption rights) subject to certain exemptions, for example, where shares are issued for non-cash consideration or in respect of certain types of employee share schemes.
Prudential seeks authority from its shareholders on an annual basis to issue shares up to a maximum amount of which a defined number may be issued without pre-emption rights applying. Dis-application of statutory pre-emption procedures is also available for rights issues. The existing authorities to issue shares and dis-apply pre-emption rights are due to expire at the end of the 2023 annual general meeting of the Company when shareholder approval will be sought to renew and enhance those authorities.
Shares may not be consolidated or sub-divided without approval by an ordinary resolution of the shareholders.
Reductions in Prudential’s issued share capital and share premium account must be approved by a special resolution of the shareholders and must be confirmed by an order of the court.
Subject to the Articles, if the share capital is divided into different classes of shares, the rights of any class of shares may be changed or deemed varied, only if such measure is approved by a special resolution passed at a separate meeting of the members of that class, or with the written consent of members holding at least three quarters of the shares of that class. At least two persons holding or representing by proxy at least one-third in nominal amount of the issued shares of the class must be present at such a meeting in person or by proxy to constitute a quorum.
The Board may not authorise, create or increase the amount of, any shares of any class or any security convertible into shares of any class or any security which is convertible into shares of any class ranking, as regards rights to participate in the profits or assets in the company, in priority to a series or class of preference shares without the consent in writing of at least three-quarters in nominal value of, or the sanction of a special resolution of, the holders of such series or class of preference shares.
In accordance with the terms of a waiver granted by the Hong Kong Stock Exchange, Prudential confirms that it complies with the applicable law and regulation in the UK in relation to the holding of shares in treasury and with the conditions of the waiver in connection with the purchase of own shares and any treasury shares it may hold.
Shares authorised but not issued
Preference shares
The Directors have authority to allot Sterling preference shares up to a maximum nominal amount of £20 million, Dollar preference shares up to a maximum nominal amount of US$20 million, and Euro preference shares up to a maximum nominal value of €20 million, the terms of which will be determined by the Board on allotment. This authority, originally granted in 2004 for five years, was renewed most recently by shareholders at the 2019 annual general meeting and is due to expire in May 2024 (or at the 2024 annual general meeting, if earlier) unless renewed by shareholders. It is anticipated that shareholder approval will be sought to renew the authority at the 2024 annual general meeting of the Company.
Prior to the date of allotment, the Board shall determine whether the preference shares are to be redeemable and the terms of any redemption, their dividend rights, their rights to a return of capital or to share in the assets of the Company on a winding up or liquidation and their rights to attend and vote at general meetings of the Company prior to the date on which the preference shares are allotted.
The Board may only capitalise any amounts available for distribution in respect of any series or class of preference shares if to do so would mean that the aggregate of the amounts so capitalised would be less than the multiple, if any, determined by the Board of the aggregate amount of the dividends payable in the 12 month period following the capitalisation on the series or class of preference shares and on any other preference shares in issue which rank pari passu in relation to participation in profits. This restriction may be overturned with either: (i) the written consent of the holders of at least three-quarters in nominal value; or (ii) a special resolution passed at a general meeting of the holders of the class or series of preference shares.
116
Dividends
Under English law, Prudential may pay dividends only if distributable profits are available for that purpose. Distributable profits are accumulated, realised profits not previously distributed or capitalised, less accumulated, realised losses not previously written off in a reduction or reorganisation of capital. Even if distributable profits are available, Prudential may only pay dividends if the amount of its net assets is not less than the aggregate of its called-up share capital and undistributable reserves (including, for example, the share premium account) and the payment of the dividend does not reduce the amount of the net assets to less than that aggregate. Subject to these restrictions, Prudential’s Directors may recommend to ordinary shareholders that a final dividend be declared and recommend the amount of any such dividend or determine whether to pay a distribution by way of an interim dividend, and the amount of any such interim dividend, but must take into account Prudential’s financial position. Final dividends become a legal liability of a company upon the later of the date they are declared and the date the shareholder approval expresses them to be payable. Interim dividends only become a legal liability of a company at the point they are paid.
The Company or its Directors determine the date on which Prudential pays dividends. Prudential pays dividends to the shareholders on its share registers on the record date in proportion to the number of Ordinary Shares held by each shareholder. There are no fixed dates on which entitlements to dividends arise. Interest is not payable on dividends or on other amounts payable in respect of Ordinary Shares.
If a shareholder does not claim a dividend within 12 years of such dividend becoming due for payment, such shareholder forfeits their right to receive it. Such unclaimed amounts may be invested or otherwise used for Prudential’s benefit.
The Company periodically undertakes share forfeiture programmes. If a shareholder is recorded as untraced for more than 12 years, the shares are deemed as forfeited and sold by the Company. The proceeds from the sale of the forfeited shares are held for a period of six years by the Company, as required under the Articles.
A number of dividend waivers are in place and these relate to Ordinary Shares issued but not allocated under the Group’s employee share plans. These shares are primarily held by the Trustees and will, in due course, be used to satisfy requirements under the Group’s employee share plans.
Shareholder meetings
English law provides for shareholders to exercise their power to decide on corporate matters at general meetings. In accordance with English law, the Company is required to call and hold annual general meetings. General meetings to consider specific matters may be held at the discretion of Prudential’s Directors or must be convened, in accordance with English law, following the written request of shareholders representing at least five per cent of the voting rights of the issued and paid-up share capital. The quorum required under the Articles for a general meeting is two shareholders present in person or by proxy and entitled to vote on the business to be transacted.
Under English law, notice periods for all general meetings must be at least 21 clear days unless certain requirements are met. Prudential seeks an authority annually at its annual general meeting to hold general meetings which are not an annual general meeting on 14 clear days’ notice.
Save for where a holder has failed to pay any monies payable in respect of their Ordinary Shares following a call by the Company, holders of partly paid Ordinary Shares may attend, be counted in the quorum at meetings and vote. If more than one joint shareholder votes, only the vote of the shareholder whose name appears first in the register is counted. A shareholder whose shareholding is registered in the name of a nominee may only attend and vote at a general meeting if appointed by their nominee as a proxy or a corporate representative. Any shareholder who is entitled to attend and vote at a general meeting may appoint one or more proxies to attend and vote at the meeting on their behalf.
Shareholders resident abroad
There are no limitations on non-resident or foreign shareholders’ rights to own Prudential securities or exercise voting rights where such rights are given under English company law.
Board of Directors
Subject to the Articles and to any directions given by special resolution by shareholders, the business of the Company is managed by the Board, which may exercise all the powers of the Company. However, the Company’s shareholders must approve certain matters, such as changes to the share capital and the election and re-election of Directors. Directors are appointed subject to the Articles. The Board may appoint Directors to fill vacancies and appoint additional Directors who hold office until the next general meeting. The Articles require that each Director must have beneficial ownership of a given number of Ordinary Shares. The number of Ordinary Shares is determined by ordinary resolution at a general meeting and is currently 2,500.
117
Shareholders may appoint and remove Directors by ordinary resolution at a general meeting of the Company. The UK Corporate Governance Code contains a provision that all directors should stand for annual re-election. In line with these provisions, all Directors, except those who are retiring or being elected for the first time, are expected to stand for re-election at the 2023 annual general meeting.
There is no age restriction applicable to Directors in the Articles.
Borrowing powers
The Directors may exercise all the powers of the Company to borrow money and to mortgage or charge any of its assets provided that the total aggregate amount borrowed (excluding, amongst other things, intra-group borrowings and amounts secured by policies, guarantees, bonds or contracts issued or given by the Company or its subsidiaries in the course of its business) by the Company and its subsidiaries does not, exceed the aggregate of the share capital and consolidated reserves and of one-tenth of the insurance funds of Prudential and each of its subsidiaries as shown in the most recent audited consolidated balance sheet of the Group prepared in accordance with English law.
Disclosure of interests
There are no provisions in the Articles that require persons acquiring, holding or disposing of a certain percentage of Ordinary Shares to make disclosure of their ownership percentage. Shareholders are required to disclose certain interests in accordance with Rule 5 of the UK’s Disclosure Guidance and Transparency Rules by notifying Prudential of the percentage of the voting rights they directly or indirectly hold or control if the percentage of the voting rights:
· | reaches, exceeds or falls below 3 per cent and/or any subsequent whole percentage figure as a result of an acquisition or disposal of Ordinary Shares or financial instruments; or |
· | reaches, exceeds or falls below any such threshold as a result of any change in the number of voting rights attached to the Ordinary Shares. |
The UK Disclosure Guidance and Transparency Rules set out in detail the circumstances in which an obligation to disclose will arise, as well as certain exemptions from those obligations.
The City Code on Takeovers and Mergers also imposes strict disclosure requirements with regard to dealings in the securities of an offeror or offeree company on all parties to a takeover and also on their respective associates during the course of an offer period.
Directors’ interests in contracts
A Director may hold positions with, or be interested in, other companies (subject to Board authorisation where such position or interest can reasonably be regarded as giving rise to a conflict of interest) and, subject to applicable legislation, contract with the Company or any other company in which Prudential has an interest, provided they have declared their interest to the Board.
In accordance with English company law, the Articles allow the Board to authorise any matter which would otherwise involve a Director breaching his duty under the Companies Act 2006 to avoid conflicts of interest or potential conflicts of interest and the relevant Director is obliged to conduct themselves in accordance with any terms imposed by the Board in relation to such authorisation.
A Director may not vote or be counted in the quorum in relation to any resolution of the Board in respect of any contract in which they have an interest. This prohibition does not, however, apply to any resolution where that interest cannot reasonably be regarded as likely to give rise to a conflict of interest or where that interest arises only from certain matters specified in the Articles, including the following:
· | certain matters that benefit the Group (such as a guarantee, indemnity or security in respect of money lent or obligations undertaken by the Director at the request of or for the benefit of the Company or one of its subsidiaries); |
· | certain matters that are available to all other Directors and/or employees (such as the provision to the Director of an indemnity where all other Directors are being offered indemnities on substantially the same terms or in respect of any contract for the benefit of Group employees under which the Director benefits in a similar manner to the employees); and |
· | certain matters that arise solely from the Director’s interest in shares or debentures of the Company (such as where Prudential or one of its subsidiaries is offering securities in which offer the Director is entitled to participate as a holder of securities or in respect of any contract in which a Director is interested by virtue of their interest in securities in the Company). |
The Company may by ordinary resolution suspend or relax these provisions to any extent or ratify any contract not properly authorised by reason of a contravention of these provisions contained in its Articles.
118
Directors’ power to vote on own terms of appointment
A Director shall not vote on or be counted in the quorum in relation to any resolution of the Board concerning their own appointment, or the settlement or variation of the terms or the termination of their own appointment, as the holder of any office or place of profit with the Company or any other company in which the Company is interested.
Directors’ remuneration
The remuneration of the Executive Director and the Chair is determined by the Remuneration Committee, which consists solely of Non-executive Directors. The remuneration of the Non-executive Directors is determined by the Board. For further information, including information on payments to Directors for loss of office, see, ‘Compensation and employees’.
Change of control
There is no specific provision in the Articles that would have an effect of delaying, deferring or preventing a change in control of Prudential and that would operate only with respect to a merger, acquisition or corporate restructuring involving Prudential, or any of its subsidiaries.
Exclusive jurisdiction
Under the Articles, any proceeding, suit or action between a shareholder and Prudential and/or its Directors arising out of or in connection with the Articles or otherwise, between Prudential and any of its Directors (to the fullest extent permitted by law), between a shareholder and Prudential’s professional service providers and/or between Prudential and Prudential’s professional service providers (to the extent such proceeding, suit or action arises in connection with a proceeding, suit or action between a shareholder, Prudential and/or its Directors and/or such professional service provider) may only be brought in the courts of England and Wales.
Code of Ethics
Prudential has a code of ethics, as defined in Item 16B of Form 20-F under the Exchange Act, (which Prudential calls its Group Code of Business Conduct) which applies to the Chief Executive Officer, Group Chief Financial Officer, the Group Chief Risk and Compliance Officer and persons performing similar functions as well as to all other employees. Prudential’s Group Code of Business Conduct (the “Code”) is available on its website at www.prudentialplc.com.
The Code sits at the heart of the Group Governance Manual (“GGM”), incorporating Standards of Business Conduct which clarify expectations over employee behaviour by presenting all individual obligations referenced throughout the GGM in a single, accessible format:
·Customer Conduct
·Financial Crime (ABC/AML/Fraud/Preventing Tax Evasion);
·Conflicts of Interest;
·Information & Dealing (Inside Info/Info Barriers/Securities Dealing/Info Security/Privacy);
·Communication (Internal/External/Media/Social Media/Anti-Competitive Behaviour);
·People (Diversity & Inclusion/Respect/Discrimination and Harassment); and
·Confidential Reporting.
A review of the Code is undertaken each year to ensure it remains appropriate for the global business, taking into consideration both internal and external factors.
119
COMPENSATION AND EMPLOYEES
Our Executive Directors’ remuneration at a glance
Our Executive Directors’ remuneration at a glance
What performance means for Executive Directors’ pay in 2022
At Prudential, remuneration packages are designed to ensure strong alignment between pay and performance. In 2022 the Group’s performance was appropriately reflected in the incentive outcomes, as set out in the Annual report on remuneration.
The value of the performance-related elements of remuneration is added to the fixed packages provided to Executive Directors to calculate the 2022 ‘single figure’ of total remuneration. For 2022, the ‘single figure’ outcomes for Executive Directors’ were higher than in the previous year. This chiefly reflects the higher proportion of long-term incentive awards vesting this year. The values for the Executive Directors who served during 2022 are outlined in the summary table below:
| | | | | | | | | | | | | | |
| | |
| Fixed pay | | Variable pay | | | | | ||||
|
| |
| |
| 2022 |
| |
| |
| |
| |
| | | | | | pension | | | | 2022 | | 2022 | | 2021 |
| | | | 2022 | | and | | 2022 | | PLTIP | | single | | single |
| | | | salary | | benefits | | bonus | | vesting | | figure | | figure |
Executive Director |
| Role |
| ($000) |
| ($000) |
| ($000) |
| ($000) |
| ($000) |
| ($000) |
Mark FitzPatrick |
| Group Chief Financial Officer and Chief Operating Officer/ Interim Group Chief Executive |
| 1,352 |
| 490 |
| 2,591 |
| 1,026 |
| 5,459 |
| 3,796 |
James Turner |
| Group Chief Risk and Compliance Officer/ Group Chief Financial Officer |
| 1,051 |
| 1,053 |
| 1,767 |
| 1,040 |
| 4,911 |
| 3,900 |
Mike Wells |
| Group Chief Executive |
| 366 |
| 297 |
| 693 |
| 1,723 |
| 3,079 |
| 6,358 |
Aligning pay with the Group’s forward-looking strategy
During 2022, the Committee reviewed the Policy, taking into account the Group’s strategy, which is now entirely focused on the long-term opportunities identified across the Asian and African growth markets, as well as the views of our shareholders and other stakeholders and the broader regulatory and competitive environment. In this context, the Committee has made several changes to the remuneration framework. These include:
· | Making any deferred payments under the AIP in respect of 2023 and subsequent performance years in the form of cash, rather than shares, where an Executive Director has already achieved their share ownership guideline; |
· | Adjusting the weightings of the financial AIP measures for 2023, by further increasing the focus on new business profit; |
· | Reweighting of the PLTIP measures for 2023 and introducing GIECA into the business integrity scorecard; |
· | Revising our TSR peer group ahead of 2023 awards being made under the PLTIP in order to better reflect the Asia footprint of the Group; and |
· | Updating pay benchmarking peer groups to increase focus on the 2023 TSR peer group. |
Remuneration arrangements for 2023
Remuneration packages for 2023, effective 1 January 2023, are set out in detail in the Annual report on remuneration and are summarised below:
| | | | | | | | | | | | | | |
| | |
| |
| | |
| Annual Incentive Plan |
|
| | ||
| | | | | | | |
| (AIP) | | | | ||
| | |
| |
| | |
| Maximum |
| Bonus |
| PLTIP | |
| | |
| 2023 salary |
| 2023 salary |
| bonus |
| deferred |
| award | | |
Executive Director |
| Role | | (local currency) | | (USD)1 |
| (% of salary) |
| (% of bonus) |
| (% of salary)2 | | |
Mark FitzPatrick |
| Interim Group Chief Executive |
| £1,209,000 | | $ | 1,495,000 |
| 200 | % | 40 | % | N/A | |
Anil Wadhwani |
| Chief Executive Officer |
| HK$12,281,000 | | $ | 1,568,000 |
| 200 | % | 40 | % | 400 | % |
Notes
1 | Mr Wadhwani’s salary was set on his appointment on 25 February 2023. Mark FitzPatrick received a salary increase of 3 per cent per cent with effect from 1 January 2023. In addition to base salary, the interim Group Chief Executive received a monthly pensionable cash supplement of £30,167; he stepped down from his role as Interim Group Chief Executive on 24 February 2023. For further details see section ’Statement of implementation of remuneration policy in 2023’. |
2 | The exchange rate used to convert pay to USD is the reporting rate during 2022 of 0.8088 for GBP and 7.8305 for HKD. All salaries are rounded to the nearest $1,000/£1,000 or HKD 10,000. |
120
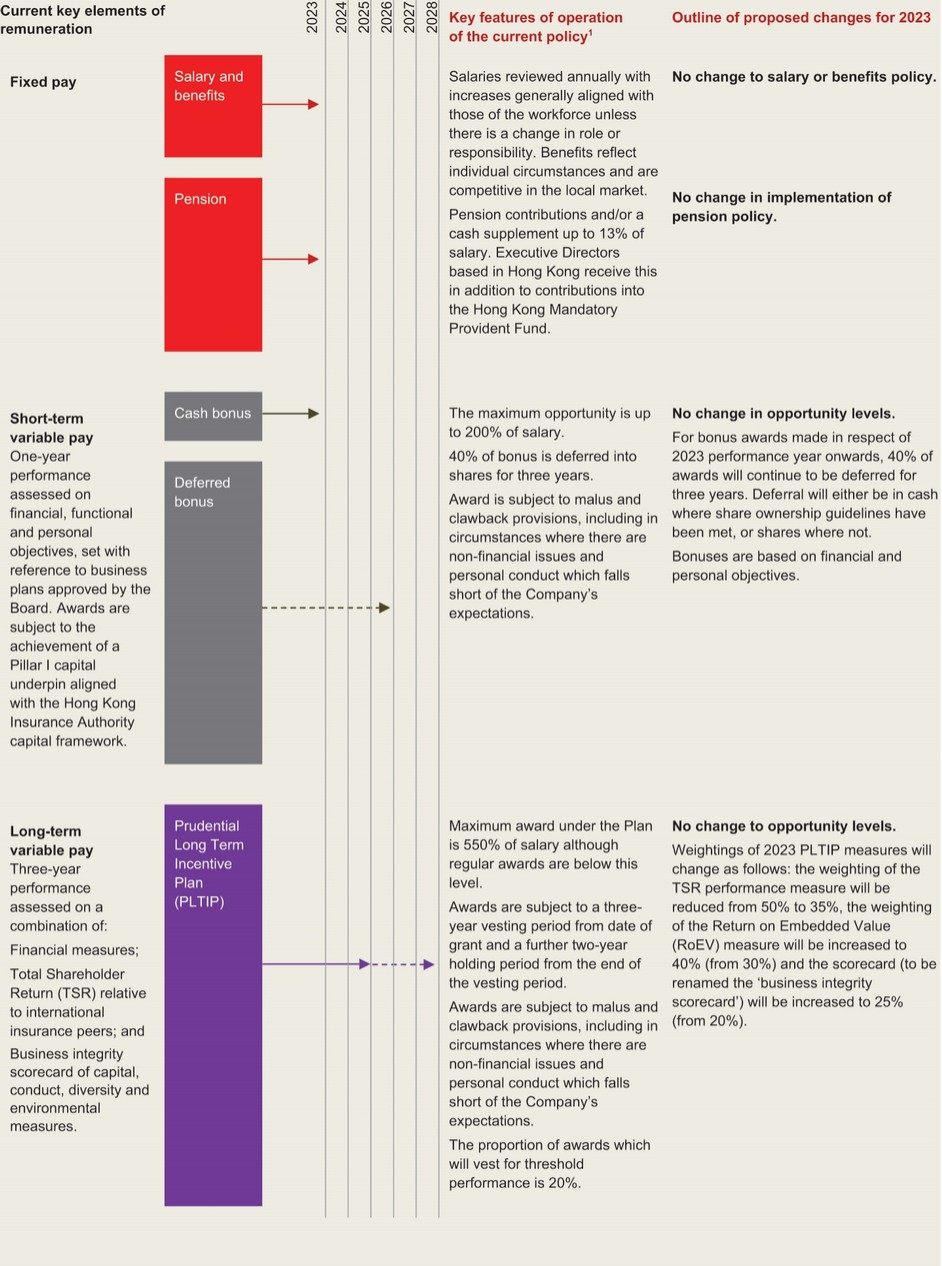
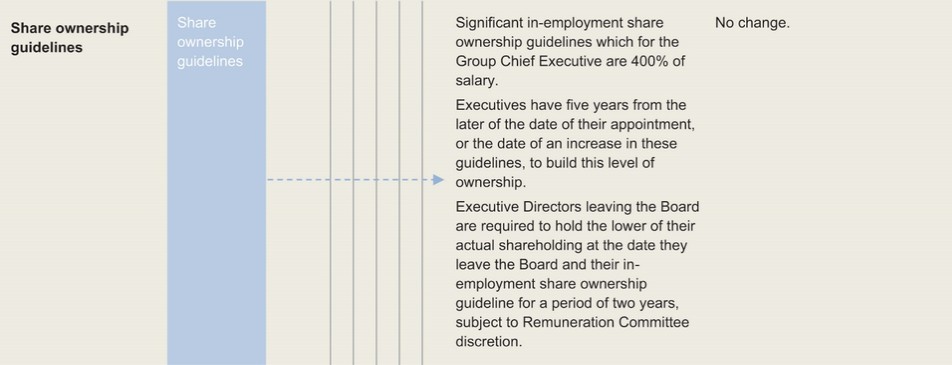
Note
1 | ‘Policy’ refers to the 2020 Directors’ remuneration policy which can be found at www.prudentialplc.com/~/media/Files/P/Prudential-V13/policies-and-statements/directors-remuneration-policy-2020-1.pdf |
122
Principles underlying the policy
When reviewing the 2023 Directors’ remuneration policy, the Committee had regard to a number of key principles as illustrated below:
Key elements of remuneration | How we reviewed the policy in 2022 |
Simplicity | The Committee is comfortable that the current remuneration structure is simple as it consists of fixed remuneration, annual and long-term incentives only. This structure is largely unchanged from our previous policy. Stakeholders are familiar with the operation of reward arrangements and there is a demonstrable link between performance and reward outcome. |
Risk | The Group Risk Committee formally provides advice to the Committee on risk management considerations to inform decisions over bonus payments and long-term incentive vesting levels. The policy provides the Committee with substantial flexibility to adjust incentive outcomes, to reduce or cancel unvested awards and to reclaim both bonus and long-term incentive payments. The time horizon for our long-term incentives extends for five years, including the holding period on awards. There are currently significant in-employment share ownership guidelines for all Executive Directors providing a material connection to the sustained success of the Company. Executive Directors have five years from the later of the date of their appointment, or the date of an increase in these guidelines, to build this level of ownership. A post-employment shareholding requirement for Executive Directors provides continued alignment with the success of the Company and stakeholder interests even after leaving the Board. This obligation will be implemented by requiring Executive Directors leaving the Board to obtain clearance to deal in the Company’s shares during the two years following their retirement. |
Alignment to culture | Executive Directors are offered pension benefits of 13 per cent of salary, aligned with the employer pension contribution available to the wider workforce. The conduct measure in the PLTIP rewards for appropriate management action and ensures that there are no significant conduct/culture/governance issues that result in significant capital add-ons or material fines. The vesting period attached to the long-term incentive reflects the time horizon of the business plan. The additional post-vesting holding period and share ownership guidelines strengthen the community of interests between Executive Directors and other stakeholders. |
Clarity | The Committee has consulted with the Company’s largest shareholders and their advisers on the 2023 Directors’ remuneration policy and executive pay decisions before they are implemented. Details on Executive Director pay are clearly set out in the Annual report on remuneration. |
Proportionality | There are no incentive awards for below threshold performance. Financial targets are set against the Board-approved plan. Under the PLTIP, 20 per cent of each portion of the award will vest for achieving threshold performance. The Committee approves the termination arrangements of Executive Directors to ensure that there is no reward for failure. The PLTIP leaver rules are another safeguard to ensure that there is no reward for failure under this plan. |
Predictability | The levels of awards under incentive arrangements to Executive Directors at threshold, on-target and maximum performance points are clearly defined and presented in relevant sections of this report. |
123
Annual report on remuneration
Membership and 2022 meeting attendance
| ||
Committee members | Scheduled meetings | Ad hoc meetings |
Anthony Nightingale CMG SBS JP1 (Chair) | 4/4 | 8/8 |
Chua Sock Koong2 (Chair) | 6/6 | 8/9 |
David Law ACA | 6/6 | 9/9 |
Ming Lu3 | 4/4 | 2/3 |
Philip Remnant CBE FCA | 5/6 | 8/9 |
Thomas Watjen | 6/6 | 8/9 |
| | |
Regular attendees | | |
Chair Chief Executive Officer Company Secretary Group Human Resources Director Director, Group Reward and Employee Relations and CHRO, UK Remuneration Committee Adviser | | |
1Anthony Nightingale stepped down as Chair of the Remuneration Committee at the 2022 AGM.
2Chua Sock Koong became Chair of the Remuneration Committee at the 2022 AGM.
3Ming Lu joined the Remuneration Committee in May 2022.
Individual Directors’ attendance at meetings throughout 2022 is also set out in the ‘Governance’ section.
Role and responsibilities
The role and responsibilities of the Committee are set out in its terms of reference, which are reviewed by the Committee and approved by the Board on a periodic basis, and which can be found on the Company’s website at www.prudentialplc.com/~/media/Files/P/Prudential-V13/content-pdf/gremco-tor-at-30-11-2022.pdf. The Committee’s role is to assist the Board in meeting its responsibilities regarding the determination, implementation and operation of the overall remuneration policy for the Group, including the remuneration of the Chair of the Board, Executive Directors, Group Executive Committee members and the Company Secretary, as well as overseeing the remuneration arrangements of other staff within its purview. In 2022, the Committee met 15 times and also dealt with a number of matters by email circulation.
The principal responsibilities of the Committee set out in their terms of reference and discharged during 2022 were:
– | Approving the operation of performance-related pay schemes operated for the Executive Directors, other members of the Group Executive Committee and the Company Secretary, and determining the targets and individual payouts under such schemes; |
– | Reviewing the operation and awards made under all share plans requiring approval by the Board and/or the Company’s shareholders; |
– | Monitoring compliance of the Chair and Executive Directors and other members of the Group Executive Committee with share ownership guidelines; |
– | Reviewing and approving individual packages for the Executive Directors and other members of the Group Executive Committee including for any new hires and departures, |
– | Reviewing workforce remuneration practices and related policies across the Group when setting the remuneration policy for Executive Directors, as well as the alignment of incentives and awards with culture; |
– | Monitoring the remuneration and risk management implications of remuneration of senior executives across the Group and other selected roles; and |
– | Overseeing the implementation of the Group remuneration policy for those roles within scope of the specific arrangements referred to in the Hong Kong IA GWS Framework. |
The Chair and the Chief Executive Officer attend meetings by invitation. The Committee also had the benefit of advice from:
– | Group Chief Risk and Compliance Officer; |
– | Group Chief Financial Officer; |
– | Group Human Resources Director; and |
– | Director, Group Reward and Employee Relations and CHRO, UK. |
Individuals are not present when their own remuneration is discussed and the Committee is always careful to manage potential conflicts of interest when receiving views from Executive Directors or senior management about executive remuneration proposals.
124
In addition, during 2022, the Committee spent time reviewing the Directors’ remuneration policy and its implementation ahead of its renewal at the 2023 AGM. As part of this, the Remuneration Committee Chair engaged extensively with shareholders. As part of our broader programme of shareholder engagement, the Chair of the Committee held meetings with shareholders and the principle advisory bodies to discuss decisions taken in respect of the Executive Directors’ remuneration arrangements for 2023 and the Directors’ remuneration policy. We have had the benefit of substantive feedback from 44 per cent of our shareholder register and are pleased that the majority of shareholders and advisory bodies who provided input were supportive of our proposals and commended the manner in which we conducted the consultation process.
During 2022, Deloitte LLP was the independent remuneration adviser to the Committee. Deloitte was re-appointed by the Committee following a competitive tender process during 2021. Deloitte is a member of the Remuneration Consultants’ Group and voluntarily operates under their code of conduct when providing advice on executive remuneration in the UK. Deloitte regularly meets with the Chair of the Committee without management present. The Committee is comfortable that the Deloitte engagement partner and team providing remuneration advice to the Committee do not have connections with Prudential that may impair their independence and objectivity. The total fees paid to Deloitte for the provision of independent advice to the Committee in 2022 were £137,700 charged on a fixed fee as well as time and materials basis. During 2022, Deloitte provided Prudential management advice on remuneration, digital and technology, taxation, internal audit, global mobility, risk and regulatory matters. Remuneration advice is provided by an entirely separate team within Deloitte. Management also received external advice and data from a number of other providers. This included market data and legal counsel. This advice, and these services, are not material.
In 2022, the Board conducted an evaluation of its effectiveness, which included an assessment of the Remuneration Committee. The evaluation confirmed that the Committee continued to operate effectively during the year.
Table of 2022 Executive Director total remuneration (the ‘single figure’)
| | | | | | | | | | | | | | | | | | |
|
| |
| |
| |
| |
| |
| |
| |
| |
| Total 2022 |
| | | | | | | | | | | | | | | | Total 2022 | | remuneration |
| | | | 2022 | | 2022 | | 2022 | | 2022 | | Total 2022 | | Total 2022 | | remuneration | | the ‘single |
| | 2022 | | taxable | | total | | PLTIP | | pension | | fixed | | variable | | the ‘single | | figure’ in |
$000s | | salary | | benefits* | | bonus† | | releases‡ | | benefits§ | | remuneration~ | | remuneration~ | | figure’˄ | | GBP (£000)# |
Mark FitzPatrick1 | | 1,352 | | 314 | | 2,591 | | 1,026 | | 176 | | 1,842 | | 3,617 | | 5,459 | | 4,415 |
James Turner2 |
| 1,051 |
| 914 |
| 1,767 |
| 1,040 |
| 139 |
| 2,104 |
| 2,807 |
| 4,911 |
| 3,972 |
Mike Wells3 |
| 366 |
| 249 |
| 693 |
| 1,723 |
| 48 |
| 663 |
| 2,416 |
| 3,079 |
| 2,490 |
Total |
| 2,769 |
| 1,477 |
| 5,051 |
| 3,789 |
| 363 |
| 4,609 |
| 8,840 |
| 13,449 |
| 10,877 |
* | Benefits include (where provided) the cost of providing the use of a car and driver, medical insurance, security arrangements, relocation/expatriate benefits. Benefits of significant value include home leave/personal flights for Mr Wells, and housing and associated costs for Mr Turner. |
† | The total value of the bonus, comprising both the 60 per cent delivered in cash and 40 per cent bonus deferred into Prudential plc shares for three years. The deferred part of the bonus is subject to malus and clawback in accordance with the malus and clawback policies, but no further performance conditions. |
‡ | The estimated value of the 2022 PLTIP awards vesting for all Executive Directors has been calculated based on the average share price over the last three months of 2022 (£9.62/US$11.89) and includes the accumulated dividends delivered in the form of shares. The Committee’s approach to determining the level of vesting for this award is set out in the ‘Remuneration in respect of performance periods ending in 2022’ section. The number of Prudential plc shares under award has been adjusted to take account of the Jackson demerger in line with the approach set out in the section on ‘Remuneration decisions taken in relation to the demerger’ in last year’s remuneration report. The actual value of vesting PLTIP awards, based on the share price on the date awards vest, will be shown in the 2023 report. Due to share price depreciation over the vesting period, the estimated value per share of the 2020 LTIP awards is 11.3 per cent lower than the value per share at grant. |
§ | 2022 pension benefits include cash supplements for pension purposes and contributions into defined contribution schemes as outlined in the ‘pension benefit entitlement’ section. |
~ | Total fixed remuneration includes salary, taxable benefits and pension benefits. Total variable remuneration includes total bonus and PLTIP awards vesting. |
˄ | Each remuneration element is rounded to the nearest $1,000 and totals are the sum of these rounded figures. Total 2022 remuneration has been converted to US dollars using the exchange rate of 0.8088 for GBP and 7.8305 for HKD. Exchange rate fluctuations will therefore impact the reported value. |
# | Total 2022 remuneration has been converted to GBP using the exchange rate of 0.8088 USD to 1 GBP. |
Note
1 | Mr FitzPatrick received a monthly pensionable cash supplement of £30,167, which is included in the annualised salary number from 1 April 2022. |
2 | Mr Turner is paid in HK dollars, while Messrs Wells and FitzPatrick are paid in sterling. |
3 | Mr Wells stepped down from his role as Group Chief Executive on 1 April 2022 and subsequently retired from the business on 14 July 2022. |
125
Table of 2021 Executive Director total remuneration (the ‘single figure’)
| | | | | | | | | | | | | | | | | | |
|
| |
| |
| |
| |
| |
| |
| |
| |
| Total 2021 |
| | | | | | | | | | | | | | | | Total 2021 | | remuneration |
| | | | 2021 | | 2021 | | 2021 | | 2021 | | Total 2021 | | Total 2021 | | remuneration | | the ‘single |
| | 2021 | | taxable | | total | | PLTIP | | pension | | fixed | | variable | | the ‘single | | figure’ in |
$000s | | salary | | benefits* | | bonus† | | releases‡ | | benefits§ | | remuneration~ | | remuneration~ | | figure’˄ | | GBP (£000)# |
Mark FitzPatrick | | 1,085 | | 275 | | 1,860 | | 435 | | 141 | | 1,501 | | 2,295 | | 3,796 | | 2,759 |
James Turner1 | | 943 | | 838 | | 1,629 | | 365 | | 125 | | 1,906 | | 1,994 | | 3,900 | | 2,835 |
Mike Wells | | 1,581 | | 463 | | 3,057 | | 1,052 | | 205 | | 2,249 | | 4,109 | | 6,358 | | 4,622 |
Total | | 3,609 | | 1,576 | | 6,546 | | 1,852 | | 471 | | 5,656 | | 8,398 | | 14,054 | | 10,216 |
* | Benefits include (where provided) the cost of providing the use of a car and driver, medical insurance, security arrangements, relocation/expatriate benefits. Benefits of significant value include housing and associated costs for Mr Turner and taxes paid by the Company on behalf of Mr Wells. The benefit total also includes a tax payment of USD 191,296 paid by the Company in respect of Mr Turner’s attendance at the London office which triggered a UK tax liability due to the Company’s corporate structure. This was omitted in error in the 2021 single figure. |
† | The total value of the bonus, comprising both the 60 per cent delivered in cash and 40 per cent bonus deferred into Prudential plc shares for three years. The deferred part of the bonus is subject to malus and clawback in accordance with the malus and clawback policies, but no further performance conditions. |
‡ | In line with the regulations, the value of the 2021 PLTIP releases for all Executive Directors has been calculated using the share price at vesting of £11.2741 and includes the accumulated dividends delivered. The number of Prudential plc shares under award has been adjusted to take account of the Jackson demerger in line with the approach set out in the section on ‘Remuneration decisions taken in relation to the demerger’ in last year’s remuneration report. As set out in the 2019 Annual Report, these awards have previously been adjusted on the demerger of M&G. Due to the share price depreciation over the vesting period, the value per share of the 2019 PLTIP awards is 37 per cent lower than the value per share at grant. As a result, no value is attributable to share price appreciation. No adjustment to vesting levels has been proposed as a result of the share price depreciation. |
§ | 2021 pension benefits include cash supplements for pension purposes and contributions into defined contribution schemes as outlined in the ‘pension benefit entitlement’ section. |
~ | Total fixed remuneration includes salary, taxable benefits and pension benefits. Total variable remuneration includes total bonus and PLTIP releases. |
˄ | Each remuneration element is rounded to the nearest $1,000 and totals are the sum of these rounded figures. Total 2021 remuneration has been converted to US dollars using the exchange rate of 0.7269 for GBP and 7.7728 for HKD. Exchange rate fluctuations will therefore impact the reported value. |
# | Total 2021 remuneration has been converted to GBP using the exchange rate of 0.7269 USD to 1 GBP. |
Note
1 | Mr Turner is paid in HK dollars, while Messrs Wells and FitzPatrick are paid in sterling. |
Remuneration in respect of performance in 2022
Base salary
Salary increases of 3 per cent were awarded to Executive Directors with effect from January 2022. The 2022 salary increase budgets for other employees across the Group’s businesses were between 4.5 per cent and 5 per cent.
On 1 April 2022, Mike Wells stepped down from his role as Group Chief Executive and Mark FitzPatrick was appointed as interim Group Chief Executive. To reflect the additional responsibilities, Mark FitzPatrick received a monthly pensionable cash supplement of £30,167 in addition to his base salary. This is included in his annualised salary from 1 April 2022. On the same date, James Turner was appointed as Group Chief Financial Officer and his salary was increased to reflect this.
As a result, Executive Directors received the following salaries in 2022:
| | | | | | | | | | | | |
|
| | |
| | |
| 2022 salary |
| | ||
| | 2022 salary | | 2022 salary | | (local | | | ||||
| | (local currency) | | (USD)1 from | | currency) | | 2022 salary | ||||
| | from 1 January | | 1 January | | from 1 April | | (USD)1 from | ||||
Executive Director | | 2022 | | 2022 | | 2022 | | 1 April 2022 | ||||
Mark FitzPatrick, Group Chief Financial Officer and Chief Operating Officer/Interim Group Chief Executive |
| £ | 822,000 | | $ | 1,016,000 |
| £ | 1,184,000 | | $ | 1,464,000 |
James Turner, Group Chief Risk and Compliance Officer/Group Chief Financial Officer |
| HK$ | 7,550,000 | | $ | 964,000 | | HK$ | 8,460,000 | | $ | 1,080,000 |
Mike Wells, Group Chief Executive |
| £ | 1,184,000 | | $ | 1,464,000 | | | | | | |
Note
1 | 2022 salaries were converted to US dollars using an exchange rate of 0.8088 for GBP and 7.8305 for HKD. All salaries are rounded to the nearest $1,000/£1,000 or HKD 10,000. |
126
Pension benefit entitlements
Pension benefit arrangements for 2022 are set out in the table below. The employer pension contribution available to the wider workforce is 13 per cent of salary.
Executive Director | 2022 pension benefit | Life assurance provision |
|---|---|---|
James Turner | Pension supplement in lieu of pension of 13 per cent of salary and a HKD18,000 employer payment to the Hong Kong Mandatory Provident Fund. | Eight times salary. |
Mark FitzPatrick and Mike Wells | Pension supplement in lieu of pension of 13 per cent of salary. | Four times salary plus an additional four times salary dependants’ pension. |
Annual bonus outcomes for 2022
Target setting
For 2022, financial AIP metrics comprised 80 per cent of the bonus opportunity for the Group Chief Executive role, 40 per cent for the Group Chief Risk and Compliance Officer role, and 50 per cent for the Group Chief Financial Officer role. The financial element of Executive Directors’ 2022 bonuses was determined by the achievement of four Group measures, namely adjusted operating profit, operating free surplus generation, EEV new business profit and cash flow, which are aligned to the Group’s growth and cash generation focus. The performance ranges were based on the annual business plans approved by the Board and reflected the ambitions of the Group, in the context of anticipated market conditions.
Personal objectives comprised 20 per cent of the bonus opportunity for all Executive Directors. These objectives were established at the start of the year and reflect the Group’s Strategic Priorities as set by the Board. For 2022, Executive Directors had the shared strategic objectives which are detailed below.
Functional objectives accounted for the remaining 40 per cent of the Group Chief Risk and Compliance Officer role’s bonus opportunity. These were based on the Group Risk Plan and were developed with input from the Chair of the Group Risk Committee. Functional objectives accounted for 30 per cent of the Group Chief Financial Officer role’s bonus. These were developed with input from the Chair of the Group Audit Committee.
AIP payments are subject to meeting minimum capital thresholds which are aligned to the Group risk framework and appetites (as adjusted for any Group Risk Committee approved counter-cyclical buffers), as described in the Group Chief Risk and Compliance Officer’s report section of this report.
The Committee seeks advice from the Group Risk Committee on risk management considerations to inform decisions about remuneration architecture and performance measures to ensure that risk management, culture and conduct are appropriately reflected in the design and operation of Executive Directors’ remuneration.
Performance assessment
The Committee determines the overall value of the bonus, taking account of the inputs described above and any other factors which it considers relevant.
The Committee considered a report from the Group Chief Risk and Compliance Officer which was approved by the Group Risk Committee. This report confirmed that the 2022 results were achieved within the Group’s and businesses’ risk framework and appetite. The Group Chief Risk and Compliance Officer also considered the effectiveness of risk management and internal controls, and specific actions taken to mitigate risks, particularly where these may be at the expense of profits or sales. The report also confirmed that the Group met minimum capital thresholds which were aligned to the Group risk framework and appetites. The Committee took into account this advice when determining AIP outcomes for Executive Directors.
127
The table below illustrates the weighting of performance measures for 2022 and the level of achievement under the AIP:
| | | | | | | | | | | | | | | |
| | | | | | | | Achievement against performance | | | | ||||
| | Weighting of measures | | measures | | | | ||||||||
| | (% of total bonus opportunity) | | (% of maximum for each component) | | | | ||||||||
|
| Group |
| |
| |
| Group |
| |
| |
| 2022 AIP outcome1 |
|
| | financial | | Functional | | Personal | | financial | | Functional | | Personal | | (% of total bonus |
|
Executive Director | | measures | | objectives | | objectives | | measures | | objectives | | objectives | | opportunity) |
|
Mark FitzPatrick | | | | | | | | | | | | | | | |
Group Chief Financial Officer and Chief Operating Officer (up to 31 March 2022) | | 50 | % | 30 | % | 20 | % | 100 | % | 96.7 | % | 95 | % | 98 | % |
Interim Group Chief Executive (for the remainder of 2022) | | 80 | % | — | | 20 | % | 100 | % | — | | 90 | % | 98 | % |
James Turner | | | | | | | | | | | | | | | |
Group Chief Risk and Compliance Officer (up to 31 March 2022) | | 40 | % | 40 | % | 20 | % | 100 | % | 93.8 | % | 92.5 | % | 96 | % |
Group Chief Financial Officer (for the remainder of 2022) | | 50 | % | 30 | % | 20 | % | 100 | % | 90 | % | 95 | % | 96 | % |
Mike Wells |
| | | | | | | | | | | | | | |
Group Chief Executive (up to 31 March 2022) |
| 80 | % | — |
| 20 | % | 100 | % | — |
| 80 | % | 96 | % |
Note
1 | All bonus awards are subject to 40 per cent deferral for three years and the deferred bonus will be paid in Prudential plc shares. |
Financial performance
The Committee reviewed performance at its meeting in March 2023. For all the financial metrics, namely Group EEV new business profit, Group adjusted operating profit, Group free surplus generation and Group cash flow, the adjusted stretch targets established by the Board were met or exceeded.
The level of performance required for threshold, plan and maximum payment against the Group’s 2022 AIP financial measures and the results achieved are set out below:
| | | | | | | | | | |
|
| |
| |
| |
| Stretch |
| |
| | | | Threshold | | Target | | target | | Achievement |
2022 AIP measure | | Weighting |
| ($m) |
| ($m) |
| ($m) |
| ($m) |
Group adjusted operating profit |
| 25 | % | 2,902 |
| 3,055 |
| 3,208 |
| 3,375 |
Group operating free surplus generated |
| 20 | % | 1,244 |
| 1,309 |
| 1,375 |
| 1,374 |
Group cash flow |
| 10 | % | 91 |
| 191 |
| 291 |
| 394 |
Group EEV new business profit |
| 45 | % | 1,947 |
| 2,105 |
| 2,157 |
| 2,184 |
In line with our long established practice, the targets have been adjusted to reflect prevailing interest rate and foreign exchange rate assumptions applicable for the full year reporting of new business profit and other metrics. Adjustments to targets in any given year may be upwards or downwards and are designed to ensure that outcomes reflect management’s performance in the year by neutralizing the effect of interest rates and foreign exchange movements during that year.
Personal performance
A proportion of the annual bonus for each Executive Director is based on the achievement of personal objectives including:
· | The executive meeting their individual conduct and customer measures; |
· | The executive’s contribution to Group strategy as a member of the Board; and |
· | Specific goals related to the function for which they are responsible and progress on major projects. |
At the end of the year, the Committee considered the performance of all executives against objectives established at the start of the year. At its meeting in March 2023, it concluded that 2022 had seen the execution of significant strategic objectives, as described in the ‘Strategic and Operating Review’ section of the Annual Report. These achievements reflect Executive Directors’ high level of performance against their 2022 personal objectives. All executives met their individual conduct measures and each Executive Director made a significant contribution to the achievement of Group strategy during 2022.
The below summarises performance against the personal objectives and strategic priorities for the Executive Directors. Assessments were undertaken by each Executive Director’s manager. Additionally, the Chair of the Group Risk Committee reviewed the performance of the Group Chief Risk and Compliance Officer while the Chair of the Group Audit Committee considered the contribution of the Group Chief Financial Officer.
128
Shared strategic objectives
2022 key strategic objectives | Achievement | Performance relative to target |
|---|---|---|
ESG - climate & diversity Drive the climate and responsible investment focus across the organisation, both as an asset owner and an asset manager, through embedding the external ESG commitments made in May 2021 SOCIETY, PEOPLE | The Executive Directors made significant progress towards all of our external targets. By the end of 2022, Prudential had: - reduced the WACI of our investment portfolio by 43 per cent ahead of our 25 per cent target; - substantively completed our divestment from coal bonds with one holding remaining as a result of market conditions; - completed first year of Climate Change & Decarbonisation engagement under the Central Engagement programme; - achieved an intensity ratio of 1.21 tCO2e/FTE for 2022, keeping us ahead of the emissions reduction trajectory required to meet our 2030 target of 1.65 tCO2e/FTE; and - 35 per cent representation of women in senior management, in line with our 2023 target. Prudential signed the 2022 Global Investor Statement to Governments on the Climate Crisis and in October 2022 we published a white paper to outline the case for the financial and social burden of the transition to be just and inclusive, and its place in meeting the Paris Agreement. Launch of Eastspring’s Group Responsible Investment Policy, harmonising the approach to responsible investment across the Eastspring Group and launched a number of products to support our ESG strategy. Strengthening of senior management team with a number of significant hires in Asia to support our ESG strategy including Director of Group ESG to deliver our ESG strategy and commitments and a new Group Chief Investment Officer. The Director of Group ESG aims to maintain constructive dialogue with key stakeholders, and further embed our ESG strategy for sustainable long-term value. The Group Chief Investment Officer will establish the new GCIO function to drive investment strategy for Prudential as an asset owner and to support the local businesses drive better investment performance for policyholders. In 2022, we embarked on a two-year research partnership with the Nanyang Technological University (NTU) in Singapore to examine the intersection of climate change and health. The Prudential EOS (Earth Observatory of Singapore) Climate Impacts Initiative will focus on 10 key markets across Asia and Africa. Via the Prudence Foundation we are also funding research by the International Federation of the Red Cross’s Climate Centre to examine the compound health risks of heat, humidity, and air pollution, and what effective early actions can be taken to reduce this risk. | Between target and above stretch target level |
Increase the Asia shareholder base and Hong Kong retail shareholder awareness of Prudential, with a view to increasing Hong Kong liquidity to drive valuation re-rating INVESTORS | Material increase in the number of Asia-based sell side analyst coverage to 11 (plus one joint EU/Asia coverage) by the end of 2022 (from 2 at the end of 2021). In September 2022, we achieved inclusion of Prudential shares in the Hang Seng Composite Index (HSCI) and the Shenzhen-Hong Kong Stock Connect mechanism, a significant milestone to further expand our investor base (not only to qualified investors in the Chinese Mainland but also to institutional investors) and increase the trading liquidity. The volume of trading on the Hong Kong Stock Exchange has become more active since these inclusions. Throughout 2022 we hosted a number of ‘meet the business’ events which gave investors and sell side analysts the chance to engage with Strategic Business Group Managing Directors and country CEOs across Asia, including Singapore, Indonesia, Vietnam and the Philippines. | Above stretch target level |
129
Mark FitzPatrick in the role of Group Chief Financial Officer and Chief Operating Officer from 1 January to 31 March 2022
Personal and strategic objectives
2022 key strategic objectives | Achievement | Performance relative to target |
|---|---|---|
Increased focus on improving diversity, inclusion and belonging in the organisation, as measured by inclusion questions in the employee engagement survey, with a view to developing appropriate targets for Group and local businesses PEOPLE, SOCIETY | Mark championed our diversity and inclusion efforts across the organisation through his role as Co-Chair of the Prudential Diversity & Inclusion Council. During 2022, Prudential adopted the United Nations Women’s Empowerment Principles and was included in the Bloomberg Gender Equality Index for the third successive year. At 31 December 2022, the representation of women in senior management was 35 per cent, in line with our 2023 target under the HM Treasury Women in Finance Charter. Gender diversity – total workforce: -Male: 57 per cent -Female: 42.9 per cent -Unspecified: 0.1 per cent The score in the employee engagement survey for inclusion and belonging, social connection, and support from management was at 85 per cent, indicating a deep sense of belonging. We onboarded new members to the Group’s D&I Council to focus on inclusion of neurodiversity, disability, culture and religion. Our Sponsorship Programme expanded deeper into our talent pool, providing colleagues with the opportunity to work closely with a senior sponsor for 12 months on specific development objectives. We continued to deepen belonging with the roll out of Inclusive Leadership Profile and a Global Inclusion e-learning in August 2022. By the end of November 2022 this had been completed by over 11,000 colleagues. In 2022 we saw the global launch of various communities including PRU Women Empowered, PRU Young Professionals, Women in Tech, Mental Health First Aiders and the intersectional We DO Wellness, joining the well-established PRUPride. We launched the #IamRemarkable initiative empowering our colleagues to promote and celebrate their achievements in the workplace and beyond. | Above stretch target level |
Ensure the balance sheet is positioned to support growth opportunities within Asia, through targeting the Moody’s total leverage of 20 to 25 per cent over the medium term and having strong relationships with the rating agencies for any future issuances INVESTORS | Following the Group’s equity raise in Hong Kong in 2021, Mark established a programme of capital management. This responsibility was transitioned to James Turner in March 2022 as part of the CFO leadership. At 31 December 2022, the pro-forma Moody’s total leverage (i.e. after allowing for the debt redemption in January 2023) was 20 per cent, at the lower end of the medium-term range. | Above stretch target level |
Deliver on appropriate run-rate cost savings within central costs and complete the development of an effective head office operating model by 2023 INVESTORS | Mark first announced the $70 million annual central cost savings target in 2020 and undertook significant planning and execution over the coming period. This responsibility was transitioned to James Turner in March 2022 as part of the CFO leadership. The annual cost saving has been achieved and will result in a compounding reduction in 2023 central costs. | Approaching stretch target level |
Recognising Mr FitzPatrick’s very strong performance against both his individual and shared personal objectives during the first quarter of 2022 as Group Chief Financial Officer and Chief Operating Officer, the Committee judged that 19 per cent of a maximum of 20 per cent attributable to personal objectives was appropriate. | ||
130
Functional objectives
Summary of 2022 functional objectives | Achievement | Performance relative to target |
|---|---|---|
Develop and implement new Group Finance function taking the best of practices in London and Asia around financial controls, accuracy of financial reporting and appropriateness of key financial assumptions and judgements PEOPLE | Set up the foundations of One Finance team with cross-location of the Finance Leadership Team, supported by the appointment of an Asia-based Chief of Staff. Detailed planning was undertaken to transition certain roles and responsibilities from London to Hong Kong, and build up certain capabilities in Hong Kong. This included cross-locating the financial accounting and reporting teams in Hong Kong and London to enable sharing of best practice. This resulted in the Group delivering the HY 2022 results from Hong Kong for the first time with resilient performance and no material breach of financial controls. | Above stretch target level |
Support the transition of auditor to Ernst & Young to ensure an effective external audit for their first year of external reporting in 2023 REGULATORS | Established the principles and process for the orderly transition of auditor from KPMG to Ernst & Young, including: - providing oversight of the process and operational handover from KPMG to Ernst & Young; - implementation of shadowing protocols to minimise disruption to the internal team; - facilitating the building of relationships across the Group Finance team; and - appointing EY team to discrete projects such as conducting an assurance review for the Group ESG report and attendance at the Group ESG Committee. | Above stretch target level |
In recognition of Mr FitzPatrick’s very strong performance against his functional objectives during the first quarter of 2022, the Committee judged that 29 per cent of a maximum of 30 per cent attributable to functional objectives as Group Chief Financial Officer and Chief Operating Officer was appropriate. | ||
Mark FitzPatrick in the role of Interim Group Chief Executive from 1 April to 31 December 2022
Personal and strategic objectives
2022 key strategic objectives | Achievement | Performance relative to target |
|---|---|---|
Supporting the transition to the new Chief Executive Officer INVESTORS, PEOPLE | Ensured the readiness of the organisation and its stakeholders for the transition to the new Chief Executive Officer, restructuring the management team and creating the conditions for a smooth and successful transfer of responsibilities to the new Chief Executive Officer. | Approaching stretch target level |
Build leadership positions with competitive advantages and economies of scale within each of our four largest markets of China, India, Thailand and Indonesia. CUSTOMERS, INVESTORS | China was the largest single market contributor to the Group’s total APE sales in 2022, achieving APE sales growth of 19 per cent to $884 million underpinned by a diversified distribution strategy with a high-quality agency force and strong partnerships with banks. CPL has more than doubled new business profit between 2017 and 2022, with new business profit for 2022 now 44 per cent higher than that of the pre-pandemic year 2019. We continue to outperform the market on the Chinese Mainland industry-wide measure of gross written premium basis by 5 times in 2022. India: In ICICI Prudential, APE sales grew 4 per cent driven by strong growth in the protection and annuity business. This sales performance enabled ICICI Prudential to maintain its top three position in the private market with a market share of 6.3 per cent. Over the period, new business profit grew 20 per cent reflecting APE sales growth and a favourable product mix. | Approaching stretch target level |
131
2022 key strategic objectives | Achievement | Performance relative to target |
|---|---|---|
Thailand: We delivered higher-than-industry average APE sales growth, both in the bancassurance channel and for the overall industry as a whole in 2022. We have double-digit APE sales growth for 3 consecutive years from 2020 to 2022, and now have an overall market share of 7 per cent, being 6th in the market. We have completed a smooth and planned CEO succession with the appointment of a local Thai CEO. Indonesia: We regained our leadership position in the Indonesian life market with 11 per cent market share by weighted new business premium in 2022. Overall APE sales increased by 2 per cent in the year to $247 million, despite Covid-19-related restrictions in the first half of the year, and new business profit increased by 4 per cent compared with the prior year. | ||
Broaden health and wealth capabilities, expanding our product range to maintain competitive advantage, to access new customer segments and to create inclusive product offerings CUSTOMERS | In 2022, we continued to deepen our current and future health and wealth capabilities. In October we announced a strategic partnership with Google Cloud to make health and financial security more accessible across Asia and Africa. New policies in 2022 included 2.4 million health and protection cases, an increase of 9 per cent when compared with 2021, reflecting our customers’ increased focus on this area in light of the pandemic. While these policies were generally smaller in size than in previous years, we believe that the conversion of these customer interactions into sales by our diverse distribution channels is evidence of the power and quality of the Group’s franchise and brand. In 2022, we became the first multi-national insurer to set up a dedicated Syariah life insurance entity in Indonesia, PT Prudential Sharia Life Assurance (Prudential Syariah), as part of our strategy to meet the growing demands for Syariah solutions and support the growth of the Syariah community and economy. | Above stretch target level |
Recognising Mr FitzPatrick’s very strong performance against both his individual and shared personal objectives during the second, third and fourth quarters of 2022, the Committee judged that 18 per cent of a maximum of 20 per cent attributable to personal objectives as Interim Group Chief Executive Officer was appropriate. | ||
James Turner in the role of Group Chief Risk and Compliance Officer from 1 January 2022 to 31 March 2022
Personal and strategic objectives
2022 key strategic objectives | Achievement | Performance relative to target |
|---|---|---|
External stakeholders ● Lead strategic communications between Prudential and key regulators, ensuring a constructive and open relationship to foster mutual trust, respect and understanding, as well as supporting the continued enhancement of the relationship with the HKIA ● Work closely and lead discussions with peers in the insurance community to support the industry and its regulators to further develop the strength of the environment for provision of health and protection to the benefit of its customers (linked to the Group’s purpose) REGULATORS | Led the application for an early adoption of the Hong Kong Risk-Based Capital regime (HK RBC) framework by the Group’s Hong Kong business with work undertaken to validate key model components which received HKIA approval in April 2022. | Approaching stretch target level |
Recognising Mr Turner’s very strong performance against both his individual and shared personal objectives during the first quarter of 2022, the Committee judged that 18.5 per cent of a maximum of 20 per cent attributable to personal objectives as Group Chief Risk and Compliance Officer was appropriate. | ||
132
Functional objectives
Summary of 2022 functional objectives | Achievement | Performance relative to target |
|---|---|---|
Deliver GWS requirements for the financial control and investment management oversight roles as well as reporting requirements across both private (HKIA) and public (market) returns Develop GIECA into the thinking and decisions making around financial planning and financial management of the Group Ensure timely delivering of GWS transitional arrangements and ongoing compliance REGULATORS | Delivered GWS requirements with no breach for GWS attestation which was completed on time with all governance steps achieved. Completed GIECA development programme successfully in 2022 and have embedded GIECA processes and results into risk management, capital deployment, business planning and remuneration. Led the completion of activities to close GWS transitional arrangements in H1 2022 on time and ensured continuous ongoing compliance for other GWS requirements. | Above stretch target level |
Risk and compliance oversight and developments · Ensure the business is sufficiently informed on external risk and regulatory perspectives and challenges, where appropriate to take effective actions and decisions · Provide Non-executive and Executive management information, insight and risk opinions (including via the ACR process) to fully support Board members in strategic decision making · Support the identification and management of emerging and top risks by the business, including deep dives into areas identified in the Top Risk process REGULATORS | Supported the identification and management of the Group’s principal risks, including a series of associated deep dives. Delivered timely insights and analysis to the Group Risk Committee focusing on the impacts of emerged and emerging risks such as the pandemic impacts, enhanced controls and monitoring linked to the Russia-Ukraine conflict with key areas of focus including cyber and sanctions risks, and the management of credit risk in the balance sheet. Initiated design of an enterprise-wide and standardised Governance, Risk and Control platform to support efficient and consistent risk, control and compliance management (including operational risk management, regulatory requirements of the GWS regime and SOX financial reporting controls testing) across the Group, which is expected to provide greater visibility of risks and controls across functions and businesses delivering key information to support internal business decisions and external reporting requirements. Rolled out a revised stakeholder-focused Non-Financial Risk Appetite Framework across the Group in January 2022. | Approaching stretch target level |
In recognition of James Turner’s very strong performance against his functional objectives during the first quarter of 2022, the Committee judged that 37.5 per cent of a maximum of 40 per cent attributable to functional objectives as Group Chief Risk and Compliance Officer was appropriate. | ||
James Turner in the role of Group Chief Financial Officer from 1 April to 31 December 2022
Personal and strategic objectives
2022 key strategic objectives | Achievement | Performance relative to target |
|---|---|---|
Ensure the balance sheet is positioned to support growth opportunities within Asia, through targeting the Moody’s total leverage of 20 to 25 per cent over the medium term and having strong relationships with the rating agencies for any future issuances | Balance sheet is well positioned to support growth opportunities, with a Moody’s pro-forma total leverage (i.e. after allowing for the debt redemption in January 2023) of 20 per cent at FY22. We enter 2023 with a resilient balance sheet and a strong capital position to manage uncertainties and capture opportunities that arise. | Above stretch target level |
133
2022 key strategic objectives | Achievement | Performance relative to target |
|---|---|---|
INVESTORS | ||
Deliver the committed run-rate cost savings within central costs of $70m from 2023. INVESTORS | Achieved $70m annual cost savings from start of 2023 in line with external commitments. Kept our FY2022 head office expenditure broadly flat on a constant exchange rate basis with 2021. Continued to cultivate cost optimisation to manage delivery of efficiency and expense savings by making changes in our procurement operations. Delivered cost reductions to embed improved governance and oversight on spendings and investments. | Above stretch target level |
Recognising Mr Turner’s very strong performance against both his individual and shared personal objectives during the second, third and fourth quarters of 2022, the Committee judged that 19 per cent of a maximum of 20 per cent attributable to personal objectives as Group Chief Financial Officer was appropriate. | ||
Functional objectives
Summary of 2022 functional objectives | Achievement | Performance relative to target |
|---|---|---|
Deliver IFRS reporting changes to ensure systems in place to deliver comparative reporting from 2022 INVESTORS | Met key IFRS 17 milestones to ensure system in place to deliver comparative reporting and put in place a new operating model focus on business-led prioritization and to mitigate delivery risks in H2 2022. Materially progressed completion of Ernst & Young audit of IFRS 17 opening balance sheet for the readiness of market communication in H1 2023. | Approaching stretch target level |
Develop and implement a culture of one Finance function, taking the best of practices in London and Asia around financial controls, accuracy of financial reporting and appropriateness of key financial assumptions and judgements PEOPLE | Appointed a leadership team in multiple locations and built one highly functioning cross-location finance team that enabled sharing of best practices with minimised friction in delivering the HY22 and FY22 reported accounts with a clean audit opinion and financial controls with no material breaches. Successfully appointed Group Chief Investment Officer and Director of ESG and dedicated Finance Business Partners to support the Strategic Business Group structure. | Approaching stretch target level |
In recognition of James Turner’s very strong performance against his functional objectives during the second, third and fourth quarters of 2022, the Committee judged that 27 per cent of a maximum of 30 per cent attributable to functional objectives as Group Chief Financial Officer was appropriate. | ||
Mike Wells in the role of Group Chief Executive from 1 January to 31 March 2022
2022 key strategic objectives | Achievement | Performance relative to target |
|---|---|---|
Diversify from physical cross-border flows into Hong Kong by strengthening our domestic market position and increasing access to Greater Bay Area (GBA) CUSTOMERS | In 2022 we set the groundwork which enabled the Group to complete our footprint in all 11 cities in China’s Greater Bay Area (GBA) and which also supported the subsequent regulatory approval for a branch of our Hong Kong business to be established in Macau, strengthening our operations to capture the opportunities in the GBA. We focused on critical illness (CI) product innovation. For example, CPL developed a specialised critical illness product specifically developed to meet the needs of customers in the Greater Bay Area of the Chinese Mainland. This contributed 21 per cent of CPL’s relevant APE sales in that area. | Above stretch target level |
134
2022 key strategic objectives | Achievement | Performance relative to target |
|---|---|---|
Build leadership positions with competitive advantages and economies of scale within each of our four largest markets of China, India, Thailand and Indonesia. CUSTOMERS, INVESTORS | China: This is the largest single market contributor to the Group’s total APE sales in 2022, achieving APE sales growth of 19 per cent to $884 million underpinned by a diversified distribution strategy with a high-quality agency force and strong partnerships with banks. CPL has more than doubled new business profit between 2017 and 2022, with new business profit for 2022 now 44 per cent higher than that of the pre-pandemic year 2019. We continue to outperform the market on the Chinese Mainland industry-wide measure of gross written premium basis by 5 times in 2022. India: In ICICI Prudential, APE sales grew 4 per cent driven by strong growth in the protection and annuity business. This sales performance enabled ICICI Prudential to maintain its top three position in the private market with a market share of 6.3 per cent. Over the period, new business profit grew 20 per cent reflecting APE sales growth and a favourable product mix. Thailand: We delivered higher-than-industry average APE sales growth, both in the bancassurance channel and for the overall industry as a whole in 2022. We have double-digit APE sales growth for 3 consecutive years from 2020 to 2022, and now have an overall market share of 7 per cent, being 6th in the market. We have completed a smooth and planned CEO succession with the appointment of a local Thai CEO. Indonesia: We regained our leadership position in the Indonesian life market with 11 per cent market share by weighted new business premium in 2022. Overall APE sales increased by 2 per cent in the year to $247 million, despite Covid-19-related restrictions in the first half of the year, and new business profit increased by 4 per cent compared with the prior year. | At the target level |
Increased focus on improving customer experience, with a view to developing a consistent methodology across business units on customer measures, such as Net Promoter Score (NPS) CUSTOMERS | We have developed a consistent methodology to standardise customer feedback across each of our businesses, through a customer satisfaction survey conducted by an independent third-party vendor. Through analysing variables such as Net Promoter Score (NPS), we aim to craft more in-depth insights to improve customer service across each touchpoint. | At the target level |
Recognising Mr Wells’s very strong performance against both his individual and shared personal objectives during the first quarter of 2022, the Committee judged that 16 per cent of a maximum of 20 per cent attributable to personal objectives was appropriate. | ||
2022 bonus awards
The Committee determined the 2022 AIP awards below on the basis of the performance of the Group and of the individual executives. In making these decisions, it reflected on factors including:
· | The overall contribution of the executive; |
· | Behavioural, conduct and risk management considerations; and |
· | Wider experience of stakeholders and overall corporate performance. |
135
The AIP outcome was considered appropriate in the context of the above and, as such, no discretion was exercised.
40 per cent of the 2022 bonus awards will be deferred into shares for three years.
| | | | | | | | | | | | |
|
|
|
| | |
|
|
|
|
| 2022 | |
| | | | | | | | | Actual 2022 | | bonus award | |
| | | | | | | | | AIP award | | (including | |
| | | | | | | Maximum | | (% of | | cash and | |
| | | | | | | 2022 AIP | | maximum | | deferred | |
Executive Director | | Role | | 2022 salary1 | | (% of salary) | | opportunity) | | elements) | ||
Mark FitzPatrick2 |
| Group Chief Financial Officer and Chief Operating Officer/Interim Group Chief Executive | | | 1,353,539 |
| 175% / 200 | %3 | 98 | % | | 2,591,207 |
James Turner |
| Group Chief Risk and Compliance Officer/Group Chief Financial Officer | | | 1,051,736 |
| 175 | % | 96 | % | | 1,766,768 |
Mike Wells4 |
| Group Chief Executive | | | 360,961 |
| 200 | % | 96 | % | | 692,948 |
Notes
1Salaries are converted to US dollars using an exchange rate of 0.8088 for GBP and 7.8305 for HKD.
2In addition to base salary, the Interim Group Chief Executive received a monthly pensionable cash supplement of £30,167 from 1 April 2022, which is included in the annualised salary number.
3Upon promotion to Interim Group Chief Executive on 1 April 2022, maximum AIP potential changed to 200 per cent for Mr FitzPatrick.
4Mike Wells stepped down as Group Chief Executive on 31 March 2022 and was eligible for a 2022 AIP on a pro-rata basis.
Further details of Key Management Remuneration may also be found in note B2.3 of the consolidated financial statements.
Long-term incentives vesting in respect of performance to 31 December 2022
Prudential Long Term Incentive Plan (PLTIP)
Target setting
Our long-term incentive plans have stretching performance conditions that are aligned to the strategic priorities of the Group. In 2020, all Executive Directors were granted awards under the PLTIP. In determining the financial targets, the Committee had regard to the stretching nature of the three-year Business Plan for return on equity and capital positions as set by the Board. Further, in setting the conduct and diversity targets under the sustainability scorecard, the Committee considered input presented by the Group Chief Risk and Compliance Officer on behalf of the Group Risk Committee on conduct risk for the conduct measure and had regard to the Company’s commitment under the Women in Finance Charter for the diversity measure.
Further details may also be found in note B2.2 of the consolidated financial statements.
As described in the 2021 Directors’ remuneration report, the Committee also adjusted the performance conditions attached to the 2020 PLTIP awards in light of the demerger with Jackson to exclude the Jackson components of the Plan on which the targets were based, with effect from the date of the demerger, and appropriately account for the period that Jackson was not part of the Group. The Committee took care to ensure that the revised performance conditions were no more or less stretching than those originally attached to the awards. The performance assessment provided below is based on these adjusted targets.
136
Performance assessment
In deciding the proportion of the awards to be released, the Committee considered actual results against performance targets. The Committee also reviewed underlying Company performance to ensure vesting levels were appropriate, including an assessment of whether results were achieved within the Group’s risk framework and appetite. Finally, overall vesting levels were reviewed to ensure that levels of reward provided remain reflective of the Company’s performance.
| |||||
| Weighting | Threshold (20 per cent of award vests) | Stretch (100 per cent of award vests) | Performance achieved | Vesting outcome |
TSR1 | 50% | Median | Upper quartile | Below median | 0 per cent |
Return on Equity (RoE) | 30% | Group 3-year average return on shareholders' funds is 15.8% | Group 3-year average return on shareholders' funds is 21.8% | Above target (Group 3-year average return on shareholders' funds is 20.3%) | 85 per cent |
Local Capital operating capital generation2 | 5% | Cumulative Group LCSM Operating Capital Generation $4,442 million | Cumulative Group LCSM Operating Capital Generation $5,430 million | Above stretch target | 100 per cent |
ECap operating capital generation3 | 5% | Cumulative Group ECap Operating Capital Generation $3,787 million | Cumulative Group ECap Operating Capital Generation $4,629 million | Above stretch target | 100 per cent |
Conduct4 | 5% | Partial achievement | Stretch achievement | No conduct, culture or governance issues that resulted in significant capital add-ons or material fines | 100 per cent |
Diversity5 | 5% | 27 per cent of Leadership Team being female | 33 per cent of Leadership Team being female | 35 per cent of our Leadership Team was female | 100 per cent |
Total | 100% | - | - | - | 45.5 per cent |
Notes
1 | Group TSR is measured on a ranked basis over three years relative to peers. The peer group for the 2020 awards consists of AIA, Aegon, AXA Equitable, China Taiping Insurance, Great Eastern, Lincoln National, Manulife, MetLife, Ping An Insurance, Principal Financial, Prudential Financial and Sun Life Financial. No adjustments were made to the peer group in respect of the demerger. |
2 | The proposed Group Local Capital Summation Method (LCSM) operating capital generation targets are based on the cumulative 2020 to 2022 Board approved business plan. |
3 | This is cumulative three-year ECap Group operating capital generation, less cost of capital (based on the capital position at the start of the performance period). |
4 | Conduct is assessed through appropriate management action, ensuring there are no significant conduct/culture/governance issues that could result in significant capital add-ons or material fines. |
5 | Diversity is measured as the percentage of the Leadership Team that is female at the end of 2022. The target for this metric has been based on progress towards the goal that the Company set when it signed the Women in Finance Charter, where 30 per cent of our Leadership Team should be female by the end of 2022. In 2020 the Leadership Team was subdivided into the Leadership Team and the Executive Council. Both of these leadership groups are considered for the purposes of this assessment. |
Details of cumulative achievement under the capital measures have not been disclosed as the Committee considers that these are commercially sensitive and would put the Company at a disadvantage compared to its competitors. The Committee will keep this disclosure policy under review based on whether, in its view, disclosure would compromise the Company’s competitive position.
PLTIP vesting
The Committee considered a report from the Group Chief Risk and Compliance Officer which was approved by the Group Risk Committee. This report confirmed that the financial results were achieved within the Group’s risk framework and appetite. On the basis of this report and the performance of the Group described above, the Committee decided that it was not appropriate to apply any adjustment to the formulaic vesting outcome under the 2020 PLTIP awards. It also decided that no windfall gains had arisen, as outlined in the ‘Annual statement from the Chair of the Remuneration Committee’ section. The Committee determined the vesting of each Executive Director’s PLTIP awards as set out below:
| | | | | | | |
|
| Percentage |
| |
| | |
| | of the PLTIP | | Number | | Value of | |
| | award | | of shares | | shares | |
Executive Director | | vesting | | vesting2 | | vesting1 | |
Mark FitzPatrick | | 45.5 | % | 86,252 | | $ | 1,025,895 |
James Turner | | 45.5 | % | 87,458 | | $ | 1,040,240 |
Mike Wells | | 45.5 | % | 144,892 | | $ | 1,723,369 |
Notes
1 | The share price used to calculate the value of the PLTIP awards with performance periods which ended on 31 December 2022 and will vest in May 2023 for all Executive Directors, was the average share price for the three months up to 31 December 2022, being £9.62 converted at the exchange rate of 0.8088 USD. |
2 | The number of shares vesting includes accrued dividends. Shares vesting will be subject to a two-year holding period. |
137
Long-term incentives awarded in 2022
2022 share-based long-term incentive awards
The table below shows the conditional awards of shares made to Executive Directors under the PLTIP in 2022 and the performance conditions attached to these awards.
| | | | | | | | | | | | | | | | | | | |
| | | | | | | | | | Percentage | | | | | | | | |
|
|
| |
| |
| |
| |
| of awards |
| |
| |
| |
| |
|
| | | | Number | | | | | | released for | | | | Weighting of performance conditions |
| ||||
| | | | of shares | | Face value of award | | achieving | | End of | | | | | | |
| ||
| | | | subject | | % of | | | | threshold | | performance | | Group | | | | Sustainability |
|
Executive Director | | Role | | to award | | salary | | (USD)† | | targets‡ | | period | | TSR | | RoEV | | scorecard§ |
|
Mark FitzPatrick# | | Interim Group Chief Executive | | 452,257 | | 400 | % | 6,072,775 | | 20 | % | 31 December 2024 | | 50 | % | 30 | % | 20 | % |
James Turner |
| Group Chief Financial Officer |
| 182,217 |
| 250 | % | 2,700,968 |
| 20 | % | 31 December 2024 |
| 50 | % | 30 | % | 20 | % |
† | Awards for Executive Directors are calculated based on the average share price over the three dealing days prior to the grant date in April, being HKD 116.07/$14.82. |
§ | Each of the four measures within the sustainability scorecard has equal weighting. They are carbon reduction, GWS capital generation, diversity and conduct. |
# | Mr FitzPatrick received an award as Group Chief Financial Officer and Chief Operating Officer in April 2022 of 182,131 shares. Given the length of Mr FitzPatrick’s tenure as Interim Group Chief Executive, the Committee subsequently agreed that his 2022 PLTIP opportunity should be increased to align with that of the previous Group Chief Executive (ie 400 per cent of his Interim Group Chief Executive salary, inclusive of the monthly supplement). He therefore received an additional PLTIP award in May 2022 of 270,126 shares. The May 2022 grant was calculated based on the average share price over the three dealing days prior to the grant date, being HKD 97.78/$12.49. |
The Committee will review awards on vesting to ensure that participants do not benefit from windfall gains. The Committee will consider Prudential’s stretching performance targets, the share performance of Prudential and its peers, the prices of the indices on which Prudential is listed and any other factors deemed relevant when determining vesting.
Relative TSR
Under the Group TSR measure, 20 per cent of the award will vest for TSR at the median of the peer group, increasing to full vesting for performance within the upper quartile. The peer group for 2022 PLTIP awards remains unchanged from 2021 and is set out below:
AIA Group | Allianz | AXA | China Life |
China Pacific Insurance (CPIC) | China Taiping Insurance | Great Eastern | Manulife Financial |
New China Life Insurance (NCl) | Ping An Insurance | Sun Life Financial | Zurich Insurance Group |
Return on Embedded Value Equity (RoEV)
Performance will be assessed on the average three-year Group RoEV relative to the 2022 to 2024 Board approved Plan. 20 per cent of the award will vest for achieving the threshold level of 8 per cent, increasing to full vesting for reaching the stretch level of at least 10.8 per cent.
Sustainability scorecard
For 2022, the sustainability scorecard was revised to ensure that reward remained aligned with the strategic priorities and capital allocation framework of the Group following the Jackson demerger. In particular:
· | A new carbon reduction measure replaced ECap to reflect the Group’s evolving ESG strategy and external commitments to reduce the carbon emissions of all shareholder and policyholder assets by 25 per cent by 2025; and |
· | GWS operating capital generation replaced the LCSM following the Hong Kong Group-wide Supervision framework becoming effective in May 2021. |
138
Under the 2022 sustainability scorecard, performance will be assessed for each of the four measures at the end of the three-year performance period. Performance will be assessed on a sliding scale. Each of the measures has equal weighting and the 2022 measures are set out below:
Carbon reduction measure: | A reduction in weighted average carbon intensity (WACI) at the end of the performance period (31 December 2024) compared with the baseline as at 31 December 2019. Our carbon reduction objectives for the PLTIP are aligned with our published targets. Please see our ESG report for details of our carbon reduction target, our progress to date and the future actions that we plan in order to achieve our ambitions in this area, noting that future progress may not be linear. |
Vesting basis: | Performance below threshold results in nil vesting, 20 per cent vesting for achieving threshold of at least 22.5 per cent reduction in WACI (ie 299), increasing to full vesting for performance above stretch level of at least 27.5 per cent reduction in WACI (ie 280). The 2019 baseline has been the subject of limited scope assurance by EY. Please see our ESG report for details. |
Capital measure: | Cumulative three-year GWS operating capital generation relative to threshold. |
Vesting basis: | Performance below threshold results in nil vesting, 20 per cent vesting for achieving threshold, increasing to full vesting for performance above stretch level. The threshold figure for this metric will be published in the Annual Report for the final year of the performance period. |
Conduct measure: | Through strong risk management action, ensure there are no significant conduct/culture/governance issues that result in significant capital add-ons or material fines. |
Vesting basis: | Performance below threshold results in nil vesting, 20 per cent vesting for partial achievement of the Group’s expectations, increasing to full vesting for achieving the Group’s expectations. |
Diversity measure: | Percentage of the Executive Council and Leadership Team that are female at the end of 2024. |
Vesting basis: | Performance below threshold results in nil vesting, 20 per cent vests for meeting the threshold of at least 34 per cent of our Executive Council and Leadership Team being female at the end of 2024, increasing to full vesting for reaching the stretch level of at least 38 per cent being female at that date. |
Pay comparisons
Performance graph and table
The chart below illustrates the TSR performance of Prudential, the FTSE 100 (as the Company has a premium listing on the London Stock Exchange and is a constituent of the FTSE 100 index), and the peer group of international insurers used to benchmark the Company’s performance for the purposes of the 2022 PLTIP awards. The chart illustrates the performance of a hypothetical investment of $100 in ordinary shares of Prudential plc over the 10-year period 1 January 2013 to 31 December 2022 compared to a similar investment in the FTSE 100 or an index of the Company’s peers. Total shareholder return is based on Returns Index data calculated on a daily share price growth plus re-invested dividends (as measured at the ex-dividend dates).
Prudential TSR vs. FTSE 100 and peer group average – total return over 10-year period to December 2022
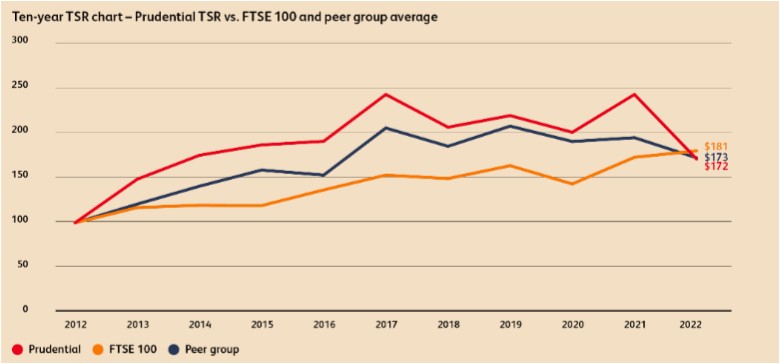
· Prudential · FTSE 100 · Peer group
139
The information in the table below shows the total remuneration for the Group Chief Executive over the same period:
$0001 |
| 2013 |
| 2014 |
| 2015 |
| 2015 |
| 2016 |
| 2017 |
| 2018 |
| 2019 |
| 2020 |
| 2021 |
| 2022 |
| 2022 | |
Group Chief Executive | | T Thiam | | T Thiam | | T Thiam2 | | M Wells2 | | M Wells | | M Wells | | M Wells | | M Wells | | M Wells | | M Wells | | M Wells3 |
| M FitzPatrick3 | |
Salary, pension and benefits |
| 2,201 |
| 2,406 |
| 938 |
| 3,048 |
| 3,029 |
| 2,415 |
| 2,423 |
| 2,122 |
| 2,126 |
| 2,249 |
| 663 | | 1,476 | |
Annual bonus payment |
| 3,207 |
| 3,501 |
| 1,077 |
| 1,903 |
| 2,904 |
| 2,673 |
| 2,848 |
| 2,804 |
| 1,355 |
| 3,057 |
| 693 | | 2,161 | |
(As % of maximum) |
| (99.8) | % | (100) | % | (77.3) | % | (99.7) | % | (99.5) | % | (94) | % | (95) | % | (96) | % | (46.0) | % | (96.7) | % | (96) | % | (98) | % |
LTIP vesting |
| 8,167 |
| 16,233 |
| 5,174 |
| 6,564 |
| 4,016 |
| 5,955 |
| 4,837 |
| 2,746 |
| 4,286 |
| 1,052 |
| 1,723 | | 1,026 | |
(As % of maximum) |
| (100) | % | (100) | % | (100) | % | (100) | % | (70.8) | % | (95.8) | % | (62.5) | % | (62.5) | % | (68.8) | % | (17.8) | % | (45.5) | % | (45.5) | % |
Other payments |
| — |
| — |
| — |
| — |
| — |
| — |
| — |
| — |
| — |
| — |
| — | | — | |
Group Chief Executive ‘single figure’ of total remuneration4 |
| 13,575 |
| 22,140 |
| 7,189 |
| 11,515 |
| 9,950 |
| 11,042 |
| 10,109 |
| 7,671 |
| 7,768 |
| 6,358 |
| 3,079 | | 4,663 | |
Notes
1 | All remuneration has been converted to USD using the average exchange rate for each respective financial year. |
2 | Tidjane Thiam left the Company on 31 May 2015. Mike Wells became Group Chief Executive on 1 June 2015. The figures shown for Mike Wells’s remuneration in 2015 relate only to his service as Group Chief Executive. |
3 | Mike Wells stood down from the Board on 31 March 2022. Mark FitzPatrick became Interim Group Chief Executive on 1 April 2022. The figures shown for Mark FitzPatrick’s remuneration in 2022 relate only to his service as Interim Group Chief Executive. |
4 | Further detail on the ‘single figure’ is provided in the ‘single figure’ table for the relevant year. The figures provided reflect the value of vesting LTIP awards on the date of their release other than for 2022 (for which an estimate is used). For Mark FitzPatrick, the LTIP vesting for 2022 also includes performance periods in which he occupied the role of Group Chief Financial Officer and Chief Operating Officer. |
Relative importance of spend on pay
The table below sets out the amounts payable in respect of 2021 and 2022 on all employee pay and dividends:
| | | | | | | |
|
| 2021 |
| 2022 |
| Percentage change |
|
All employee pay ($m)1,2 | | 1,057 | | 1,099 | | 4 | % |
Dividends including demerger dividend ($m)3 |
| 2,201 |
| 154 |
| -93 | % |
Dividends excluding demerger dividend ($m)3 |
| 466 |
| 154 |
| -67 | % |
Notes
1 | All employee pay as taken from note B2.1 to the consolidated financial statements. |
2 | FY 2021 excludes Jackson costs. |
3 | Dividends taken from note B5 to the consolidated financial statements. |
140
Percentage change in remuneration
The table below sets out how the change in remuneration for each Director between 2021 and 2022, between 2020 and 2021 and between 2019 and 2020 compared to a wider employee comparator group:
| | | | | | | | | | | | | | | | | | | |
| | Salary | | Benefits | | Bonus10 |
| ||||||||||||
| | (% change) | | (% change) | | (% change) |
| ||||||||||||
|
| 2021-22 |
| 2020-21 |
| 2019-20 |
| 2021-22 |
| 2020-21 |
| 2019-20 |
| 2021-22 |
| 2020-21 |
| 2019-20 |
|
Executive Directors1 |
| | |
|
|
|
| | |
|
|
|
| | |
|
|
| |
Mark FitzPatrick1,2 |
| 39 | % | 3 | % | 1 | % | 31 | % | 15 | % | 26 | % | 39 | % | 46 | % | (27) | % |
James Turner1,2 |
| 12 | % | (0.5) | % | 10 | % | 9 | % | 30 | % | 49 | % | 8.5 | % | 23 | % | (2) | % |
Mike Wells2 |
| (74) | % | (0.5) | % | 1 | % | (46) | % | 20 | % | 35 | % | (77) | % | 110 | % | (52) | % |
Chair and Non-executive Directors |
|
|
|
|
|
|
|
|
|
|
|
|
|
|
|
|
|
| |
Shriti Vadera3 |
| 2 | % | 907 | % | — |
| 35 | % | — |
| — |
| n/a |
| n/a |
| — | |
Jeremy Anderson4 |
| 3 | % | 13 | % | — |
| n/a |
| n/a |
| n/a |
| n/a |
| n/a |
| n/a | |
Arijit Basu5 | | — | | — | | — | | n/a | | — | | — | | n/a | | — | | — | |
David Law4 |
| 2 | % | 6 | % | 1 | % | n/a |
| n/a |
| n/a |
| n/a |
| n/a |
| n/a | |
Ming Lu9 |
| 58 | % | — |
| — |
| n/a |
| n/a |
| — |
| n/a |
| n/a |
| — | |
Anthony Nightingale6 |
| (59) | % | 0 | % | 4 | % | n/a |
| n/a |
| n/a |
| n/a |
| n/a |
| n/a | |
Philip Remnant |
| 0.7 | % | 0 | % | 1 | % | n/a |
| n/a |
| n/a |
| n/a |
| n/a |
| n/a | |
George Sartorel7 | | — | | — | | — | | n/a | | — | | — | | n/a | | — | | — | |
Alice Schroeder8 |
| (58) | % | 24 | % | 1 | % | n/a |
| n/a |
| n/a |
| n/a |
| n/a |
| n/a | |
Chua Sock Koong9 |
| 70 | % | — |
| — |
| n/a |
| n/a |
| — |
| n/a |
| n/a |
| — | |
Thomas Watjen4 |
| (9) | % | (4) | % | 10 | % | n/a |
| n/a |
| n/a |
| n/a |
| n/a |
| n/a | |
Jeanette Wong9 |
| 74 | % | — |
| — |
| n/a |
| — |
| — |
| n/a |
| — |
| — | |
Amy Yip |
| 1 | % | 0 | % | 0 | % | n/a |
| n/a |
| n/a |
| n/a |
| n/a |
| n/a | |
Average pay for all UK-based employees |
| 6.65 | % | 3.05 | % | 3.76 | % | (7.3) | % | 0.67 | % | (3.95) | % | 7.94 | % | 5.76 | % | (7.27) | % |
Notes
1 | The change in salaries for Executive Directors is calculated on a local currency basis. The change in benefits for Executive Directors is calculated in USD, as benefits values are denominated in a number of currencies. The change in bonus is calculated in USD. As 2021 benefits for James Turner have been restated, the 2020-21 change has been updated for his benefits. |
2 | Mike Wells left the Board on 31 March 2022. On 1 April 2022, Mark FitzPatrick was appointed Interim Group Chief Executive and James Turner was appointed Group Chief Financial Officer. |
3 | Shriti Vadera joined the Board and the Nominations Committee on 1 May 2020 and became Chair on 1 January 2021. The change in pay in 2020-21 reflects her pro-rated pay for 2020 as well as her change in role. |
4 | Fluctuations in pay are due to change in Committee memberships in 2022. |
5 | Arijit Basu joined the Board on 1 September 2022. |
6 | Anthony Nightingale retired from the Board on 26 May 2022. |
7 | George Sartorel joined the Board on 14 January 2022. |
8 | Alice Schroeder retired from the Board on 26 May 2022. |
9 | Chua Sock Koong, Ming Lu and Jeanette Wong joined the Board in 2021. |
10 | The change in bonus shows change in the value of the annual bonus and does not include the value of long-term incentive awards, in line with the reporting regulations. |
The regulations prescribe that this comparison should include all employees of the parent company. The number of individuals employed by the parent company is insufficient to be the basis of a representative comparison. Therefore, the Committee decided to use all UK-based employees as the basis for this calculation. The average pay for all employees has been calculated on a full-time equivalent basis by reference to the total pay awarded to UK employees in 2022, 2021, 2020 and 2019. The salary increase includes uplifts made through the annual salary review, as well as any additional changes in the year; for example to reflect promotions or role changes. There has been no material change to the level of taxable benefit coverage received by employees.
Group Chief Executive pay compared with employee pay and Gender pay gap
As reported in the 2021 Directors’ remuneration report, the UK headcount of Prudential Services Limited is below the 250-person threshold which triggers mandatory publication of the gender pay gap and the CEO pay ratio. Both the 2021 gender pay gap and the CEO pay ratio data were disclosed on a voluntary basis. After due consideration, we have decided that the UK gender pay gap and CEO pay ratio are not meaningful, given our relatively small employee headcount in the UK.
Consideration of workforce pay and approach to engagement
The Committee believes that the approach to executive remuneration is consistent with the pay, reward and progression policies for other employees within the Group. The base salary and total remuneration levels for the Executive Directors and other employees are competitively positioned within the relevant markets and reflect the operation of our remuneration structures which are effective in appropriately incentivising staff, having regard to our risk framework, risk appetites and to rewarding the ‘how’ as well as the ‘what’ of performance. During 2022, the Committee considered workforce remuneration and related policies in the businesses across the Group. Information presented to the Committee, by way of a dashboard, included how the Company’s incentive arrangements are aligned with the culture and informed the Committee’s decision-making on executive pay and policy. By way of example, employee salary increase budgets are considered as part of the year-end review of Executive Director compensation and salary increases.
As part of the Board’s wider approach to employee engagement, which also included a Group-wide engagement survey, the Committee continues to take additional measures to explain how the remuneration of Executive Directors aligns with the wider Company pay
141
policy. The Company operates a microsite on its intranet that outlines executive pay arrangements during the previous financial year and key areas of change for the year ahead. It explains to employees that total remuneration for Executive Directors is made up of a number of elements and is governed by both the Directors’ remuneration policy and the Group’s remuneration policy (which is also published on the Company’s website) with the relevant links to these documents. Directors remuneration is considered appropriate compared to the wider workforce. In 2022, salary increase budgets for other employees across the Group’s businesses were between 4.5 per cent and 5 per cent while Executive Directors received 3 per cent salary increases in January 2022. Employee engagement is led by the Responsibility & Sustainability Working Group. The Strategic Report section of this report describes how they discharged this responsibility during 2022.
The Celebration Award announced in 2021 of $1,000 of restricted shares made to our people around the world was released in October 2022. This one-off Award was to recognise the hard work and commitment demonstrated by our people and to give them a stake in the new chapter of the Company's development. The Group also operates a number of all-employee share plans, allowing our people to invest in the Company’s shares. During 2022, these plans were available across the Group’s footprint for the first time. Similar Syariah-complaint plans are available in our Syariah business. Through these plans, many of our employees are shareholders and can therefore vote on remuneration-related resolutions at AGMs.
As part of our continuing efforts to safeguard our employees’ wellbeing, we held our second Group Wellness Day on 26 August 2022. All employees Group-wide were encouraged to take that extra day off to rest and recharge, spend time with family and friends as referred to in ‘Reflecting stakeholders’ 2022 experiences’ section.
Chair and Non-executive Director remuneration in 2022
Chair fees
Shriti Vadera became the Chair of the Board on 1 January 2021. Her fee was revised on 1 July 2022 by 3 per cent, to £788,000 ($974,000), in line with the increase awarded to Executive Directors in January 2022.
Non-executive Directors’ fees
The Non-executive Directors’ fees are denominated in sterling. Fee levels were reviewed by the Board during 2022, and the basic fee was increased by 3 per cent effective from 1 July 2022. Increases in US dollar amounts reflect this increase, as well as changes in the exchange rate.
| | | | | | | | |
| | From | | From | | From | | From |
| | 1 July 2021 | | 1 July 2021 | | 1 July 2022 | | 1 July 2022 |
Annual fees |
| ($)2 |
| (£)2 |
| ($)2 |
| (£)2 |
Basic fee |
| 136,000 |
| 99,000 |
| 126,000 |
| 102,000 |
Additional fees: |
| |
| |
| |
| |
Audit Committee Chair |
| 103,000 |
| 75,000 |
| 93,000 |
| 75,000 |
Audit Committee member |
| 41,000 |
| 30,000 |
| 37,000 |
| 30,000 |
Remuneration Committee Chair |
| 89,000 |
| 65,000 |
| 80,000 |
| 65,000 |
Remuneration Committee member |
| 41,000 |
| 30,000 |
| 37,000 |
| 30,000 |
Risk Committee Chair |
| 103,000 |
| 75,000 |
| 93,000 |
| 75,000 |
Risk Committee member |
| 41,000 |
| 30,000 |
| 37,000 |
| 30,000 |
Nomination & Governance Committee Chair1 |
| — |
| — |
| — |
| — |
Nomination & Governance Committee member |
| 21,000 |
| 15,000 |
| 19,000 |
| 15,000 |
Responsibility & Sustainability Working Group Chair |
| 62,000 |
| 45,000 |
| 56,000 |
| 45,000 |
Responsibility & Sustainability Working Group member |
| 30,000 |
| 22,000 |
| 27,000 |
| 22,000 |
Senior Independent Director |
| 69,000 |
| 50,000 |
| 62,000 |
| 50,000 |
Notes
1 | There is no fee paid for the role of Nomination & Governance Committee Chair. |
2 | Fees were denominated in sterling and were converted to USD using an exchange rate of 0.7269 for 2021 and 0.8088 for 2022. |
If, in a particular year, the number of meetings is materially greater than usual, the Company may determine that the provision of additional fees is fair and reasonable.
142
The resulting fees paid to the Chair and Non-executive Directors are:
| | | | | | | | | | | | | | | | |
| | | | | | | | | | | | Total 2022 | | | | Total 2021 |
| | | | | | | | | | Total 2022 | | remuneration: | | Total 2021 | | remuneration: |
| | | | | | 2022 | | 2021 | | remuneration: | | the ‘single | | remuneration: | | the ‘single |
| | 2022 | | 2021 | | taxable | | taxable | | the ‘single | | figure’ in | | the ‘single | | figure’ in |
| | fees | | fees | | benefits* | | benefits* | | figure’ | | GBP | | figure’ | | GBP |
|
| ($000) |
| ($000) |
| ($000) |
| ($000) |
| ($000)† |
| (£000)‡ |
| ($000)† |
| (£000)‡ |
Chair |
|
|
|
|
|
|
|
|
|
|
|
|
|
|
|
|
Shriti Vadera |
| 960 |
| 1,052 |
| 124 |
| 102 |
| 1,084 |
| 877 |
| 1,154 |
| 839 |
Non-executive Directors |
| |
|
|
|
|
|
|
|
|
|
|
|
|
|
|
Jeremy Anderson |
| 284 |
| 306 |
| — |
| — |
| 284 |
| 229 |
| 306 |
| 222 |
Arijit Basu4 | | 63 | | — | | — | | — | | 63 | | 51 | | — | | — |
David Law |
| 291 |
| 318 |
| — |
| — |
| 291 |
| 236 |
| 318 |
| 231 |
Ming Lu1,6 |
| 180 |
| 126 |
| — |
| — |
| 180 |
| 146 |
| 126 |
| 92 |
Anthony Nightingale2 |
| 90 |
| 246 |
| — |
| — |
| 90 |
| 73 |
| 246 |
| 179 |
Philip Remnant |
| 279 |
| 308 |
| — |
| — |
| 279 | �� | 226 |
| 308 |
| 224 |
George Sartorel5 | | 192 | | — | | — | | — | | 192 | | 155 | | — | | — |
Alice Schroeder3 |
| 103 |
| 270 |
| — |
| — |
| 103 |
| 83 |
| 270 |
| 197 |
Chua Sock Koong1 |
| 212 |
| 139 |
| — |
| — |
| 212 |
| 172 |
| 139 |
| 101 |
Thomas Watjen |
| 205 |
| 250 |
| — |
| — |
| 205 |
| 166 |
| 250 |
| 182 |
Jeanette Wong1 | | 226 | | 144 | | — | | — | | 226 | | 183 | | 144 | | 105 |
Amy Yip |
| 161 |
| 177 |
| — |
| — |
| 161 |
| 131 |
| 177 |
| 129 |
Total |
| 3,245 |
| 3,336 |
| 124 |
| 102 |
| 3,369 |
| 2,725 |
| 3,438 |
| 2,501 |
* | Benefits include the cost of providing the use of a car and driver and medical insurance. |
† | Each remuneration element is rounded to the nearest $1,000/£1,000 and totals are the sum of these rounded figures. The Chair and Non-executive Directors are not entitled to participate in annual bonus plans or long-term incentive plans. |
‡ | Total remuneration has been converted to US dollars using the exchange rate of to 0.7269 for the 2021 single figure calculations and 0.8088 for the 2022 single figure calculations. As Non-executive Directors and the Chair don’t receive variable remuneration components, the table above doesn’t include a sum of total fixed and total variable remuneration. |
Notes
1 | Jeanette Wong, Chua Sock Koong and Ming Lu joined the Board on 12 May 2021. |
2 | Anthony Nightingale retired from the Board on 26 May 2022. |
3 | Alice Schroeder retired from the Board on 26 May 2022. |
4 | Arijit Basu joined the Board on 1 September 2022. |
5 | George Sartorel joined the Board on 14 January 2022. |
6 | Ming Lu donates his fee to Asia Art Archive, an independent non-profit organisation based in Hong Kong. |
143
Statement of Directors’ shareholdings
The interests of Directors in ordinary shares of the Company are set out below. ‘Beneficial interest’ includes shares owned outright, shares acquired under the Share Incentive Plan (SIP) and deferred annual incentive awards, detailed in the ‘Supplementary information’ section. It is only these shares that count towards the share ownership guidelines.
|
| 1 January |
|
|
| | | | | |
|
|
| |
|
|
| |
|
|
|
| | 2022 (or on | | | | | | | | | | | | | | | | | | |
|
| | date of | | | | | | | | | | | | | | | | | | |
|
| | appointment) | | During 2022 | | During 2022 | | 31 December 2022 (or on 31 March 2022 for Mike Wells) | | Share ownership guidelines |
| ||||||||||
| | | | Number | | Number | | Number of | | Number of shares | | | | | | | | | | Beneficial |
|
| | | | of | | of | | shares acquired | | disposed of | | | | | | | | | | interest as a |
|
| | Total | | shares | | shares | | between | | up to 31 December | | Total | | Number of | | | | Share | | percentage |
|
| | beneficial | | acquired | | held at | | 1 April | | 2022 (or up to | | beneficial | | shares | | | | ownership | | of |
|
| | interest | | up to 31 | | 31 March | | 2022 and 31 | | 31 March | | interest* | | subject to | | Total | | guidelines‡ | | basic |
|
| | (number of | | March | | 2022 | | December | | 2022 | | (number of | | performance | | interest | | (% of | | salary/ basic |
|
| | shares) |
| 2022 |
| by Mike Wells |
| 2022 |
| for Mike Wells |
| shares) |
| conditions† |
| in shares |
| salary/fee) |
| fees§ |
|
Chair |
|
|
|
|
|
| | | | |
|
|
|
|
|
|
|
|
|
| |
Shriti Vadera |
| 67,500 |
| — |
| — | | — | | — |
| 67,500 |
| — |
| 67,500 |
| 100 | % | 84 | % |
Executive Directors |
|
|
|
|
|
| | | | |
| |
| |
| |
|
|
| | |
Mark FitzPatrick |
| 228,600 |
| 48 |
| — | | 79,918 | | — |
| 308,566 |
| 763,861 |
| 1,072,427 |
| 250 | % | 361 | % |
James Turner |
| 204,735 |
| 10,000 |
| — | | 69,550 | | 13,822 |
| 270,463 |
| 480,819 |
| 751,282 |
| 250 | % | 306 | % |
Mike Wells1 |
| 1,264,572 |
| 49 |
| 1,264,621 | | | | |
| 1,264,621 |
| 753,758 |
| 2,018,379 |
| 400 | % | 1,910 | % |
Non-executive Directors |
|
|
|
|
|
| | | | |
| |
| |
| |
|
|
| | |
Jeremy Anderson |
| 9,157 |
| — |
| — | | — | | — |
| 9,157 |
| — |
| 9,157 |
| 100 | % | 86 | % |
Arijit Basu2 |
| — |
| — |
| — | | — | | — |
| — |
| — |
| — |
| 100 | % | — | |
David Law |
| 11,054 |
| — |
| — | | — | | — |
| 11,054 |
| — |
| 11,054 |
| 100 | % | 104 | % |
Ming Lu |
| 7,000 |
| — |
| — | | — | | — |
| 7,000 |
| — |
| 7,000 |
| 100 | % | 66 | % |
Anthony Nightingale3 |
| 50,000 |
| — |
| — | | — | | — |
| 50,000 |
| — |
| 50,000 |
| 100 | % | 472 | % |
Philip Remnant |
| 7,916 |
| — |
| — | | — | | — |
| 7,916 |
| — |
| 7,916 |
| 100 | % | 75 | % |
George Sartorel |
| — |
| — |
| — | | — | | — |
| — |
| — |
| — |
| 100 | % | — | |
Alice Schroeder3,4 |
| 20,000 |
| — |
| — | | — | | — |
| 20,000 |
| — |
| 20,000 |
| 100 | % | 189 | % |
Chua Sock Koong |
| 7,500 |
| — |
| — | | — | | — |
| 7,500 |
| — |
| 7,500 |
| 100 | % | 71 | % |
Thomas Watjen5 |
| 10,340 |
| — |
| — | | — | | — |
| 10,340 |
| — |
| 10,340 |
| 100 | % | 98 | % |
Jeanette Wong |
| — |
| 9,600 |
| — | | — | | — |
| 9,600 |
| — |
| 9,600 |
| 100 | % | 91 | % |
Amy Yip |
| 2,500 |
| 7,291 |
| — | | — | | — |
| 9,791 |
| — |
| 9,791 |
| 100 | % | 92 | % |
* | Beneficial interests include shares held directly or indirectly by connected persons. There were no changes of Directors’ interests in ordinary shares between 31 December 2022 and 7 March 2023 with the exception of UK-based Executive Directors, due to their participation in the monthly Share Incentive Plan (SIP). Mark FitzPatrick acquired a further 29 shares in the SIP during this period. |
† | Further information on share awards subject to performance conditions are detailed in the ‘share-based long-term incentive awards’ part of the ‘Supplementary information’ section. |
‡ | Holding requirement of the Articles of Association (2,500 ordinary shares) must be obtained within one year of appointment to the Board. Executive Directors have five years to reach their guideline. Non-executive Directors have three years from their date of joining to reach the guideline. |
§ | Based on the average closing price for the six months to 31 December 2022 (£9.63). |
The Company and its Directors, Chief Executives and shareholders have been granted a partial exemption from the disclosure requirements under Part XV of the Securities and Futures Ordinance (SFO). As a result of this exemption, Directors, Chief Executives and shareholders do not have an obligation under the SFO to notify the Company of shareholding interests, and the Company is not required to maintain a register of Directors’ and Chief Executives’ interests under section 352 of the SFO, nor a register of interests of substantial shareholders under section 336 of the SFO. The Company is, however, required to file with the Stock Exchange of Hong Kong Limited any disclosure of interests notified to it in the United Kingdom.
Notes
1 | Mike Wells stepped down from the Board on 31 March 2022 and retired from the Company on 14 July 2022. For the 1 January 2022 figure, Mike Wells’ beneficial interest in shares is made up of 297,320 ADRs (representing 594,640 ordinary shares) and 669,932 ordinary shares. For the 31 March 2022 figure, his beneficial interest in shares is made up of 297,320 ADRs (representing 594,640 ordinary shares) and 669,981 ordinary shares. |
2 | Arijit Basu was appointed to the Board on 1 September 2022. |
3 | Anthony Nightingale stepped down from the Board on 26 May 2022. Total interest in shares is shown at this date. |
4 | George Sartorel was appointed to the Board on 14 January 2022. |
5 | Alice Schroeder stepped down from the Board on 26 May 2022. Total interest in shares is shown at this date. For the 1 January 2022 figure, Alice Schroeder’s beneficial interest in shares is made up of 10,000 ADRs (representing 20,000 ordinary shares). For the 26 May 2022 figure, the beneficial interest in shares is made up of 10,000 ADRs (representing 20,000 ordinary shares). |
6 | For the 1 January 2022 figure, Thomas Watjen’s beneficial interest in shares is made up of 5,170 ADRs (representing 10,340 ordinary shares). For the 31 December 2022 figure, the beneficial interest in shares is made up of 5,170 ADRs (representing 10,340 ordinary shares). |
144
The bar chart below illustrates the Executive Directors’ shareholding as a percentage of base salary relative to the applicable share ownership guideline.
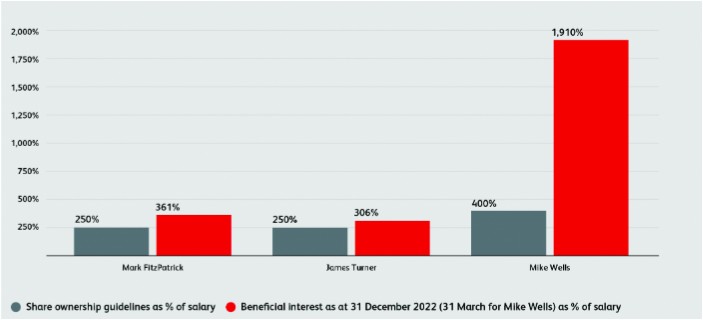
Outstanding share options
The following table sets out the share options held by the Executive Directors in the UK Savings-Related Share Option Scheme (SAYE) as at the end of the period. No other directors participated in any other option scheme.
| | | | | | | | | | | | | | | | | | | | | | | | |
| | | | | | | | Exercise period | | Number of options | ||||||||||||||
| | | | |
| Market |
| |
| |
| |
| |
| |
| |
| |
| |
| |
| | | | | | price at | | | | | | | | | | | | | | | | | | |
| | | | Exercise | | 31 Dec | | | | | | | | | | | | | | | | | | |
| | Date | | price | | 2022 | | | | | | Beginning | | | | | | | | | | | | |
|
| of grant |
| (pence) | | (pence) | | Beginning | | End | | of period | | Granted | | Exercised | | Cancelled | | Forfeited | | Lapsed | | End of period |
Mark FitzPatrick | | 21 Sep 17 |
| 1,455 |
| 1,127.50 | | 01 Dec 22 | | 31 May 23 |
| 2,061 |
| — |
| — |
| — |
| — |
| — |
| 2,061 |
Mike Wells1 | | 22 Sep 20 |
| 964 |
| 1,127.50 | | 14 Jul 22 | | 13 Jan 23 |
| 1,867 |
| — |
| — |
| — |
| — |
| — |
| 1,867 |
Notes
1 | Mike Wells retired from the Company on 14 July 2022, and the beginning and end dates of the exercise period are based on his retirement date in line with the plan rules. |
2 | No gain was made by Directors in 2022 on the exercise of SAYE options. |
3 | No price was paid for the award of any option. |
4 | The highest and lowest closing share prices during 2022 were £13.37 and £7.98 respectively. |
5 | All exercise prices are shown to the nearest pence. |
Directors’ terms of employment
Details of the service contracts of each Executive Director are outlined in the table below. The Directors’ remuneration policy contains further details of the terms included in Executive Director service contracts. As required by the Hong Kong Listing Rules, all service contracts in respect of the Executive Directors can be terminated by the Company by giving no more than 12 months’ notice (or payment in lieu of such notice) and without compensation payments other than any termination payments required by law.
| | | | | | |
| | | | Notice period | | Notice period |
| | Date of | | to the | | from the |
|
| contract |
| Company |
| Company |
Executive Directors |
|
|
|
|
|
|
Mark FitzPatrick | | 17 May 2017 |
| 12 months |
| 12 months |
Anil Wadhwani | | 25 February 2023 |
| 12 months |
| 12 months |
145
Letters of appointment of the Chair and Non-executive Directors
Details of Non-executive Directors’ individual appointments are outlined below. The Directors’ remuneration policy contains further details on their letters of appointment. The Chair and Non-executive Directors are not entitled to receive any payments for loss of office. As required by the Hong Kong Listing Rules, the appointment of the Chair and the Non-Executive Directors can be terminated by the Company by giving no more than six months’ notice (12 months’ notice for the Chair), or payment in lieu of such notice and without compensation payments other than any termination payments required by law.
| | | | | | | |
|
| |
| |
| Time on the Board at 2023 | |
Chair/Non-executive Director | | Appointment by the Board | | Notice period | | AGM | |
Chair |
| |
|
|
|
|
|
Shriti Vadera |
| | 1 May 2020 |
| |
| |
| | | (Chair from 1 January 2021) | | 12 months | | 3 years |
Non-executive Directors |
| |
|
|
|
|
|
Philip Remnant | | | 1 January 2013 |
| 6 months |
| 10 years 4 months |
Anthony Nightingale1 | | | 1 June 2013 |
| 6 months |
| n/a |
Alice Schroeder2 | | | 10 June 2013 |
| 6 months |
| n/a |
David Law | | | 15 September 2015 |
| 6 months |
| 7 years 8 months |
Thomas Watjen | | | 11 July 2017 |
| 6 months |
| 5 years 10 months |
Amy Yip | | | 2 September 2019 |
| 6 months |
| 3 years 8 months |
Jeremy Anderson | | | 1 January 2020 |
| 6 months |
| 3 years 4 months |
Ming Lu | | | 12 May 2021 |
| 6 months |
| 2 years |
Chua Sock Koong | | | 12 May 2021 |
| 6 months |
| 2 years |
Jeanette Wong | | | 12 May 2021 |
| 6 months |
| 2 years |
George Sartorel | | | 14 January 2022 |
| 6 months |
| 1 year 3 months |
Arijit Basu3 | | | 1 September 2022 |
| 6 months |
| 8 months |
Claudia Suessmuth Dyckerhoff | | | 1 January 2023 |
| 6 months |
| 4 months |
Notes
1 | Anthony Nightingale retired from the Board on 26 May 2022. |
2 | Alice Schroeder retired from the Board on 26 May 2022. |
Recruitment arrangements
In making decisions about the remuneration arrangements for those joining the Board, the Committee worked within the Directors’ remuneration policy approved by shareholders and was mindful of:
·The skills, knowledge and experience that each new Executive Director brought to the Board;
·The need to support the relocation of executives to enable them to assume their roles; and
·Its commitment to honour legacy arrangements.
Appointing high-calibre executives to the Board is necessary to ensure the Company is well positioned to develop and implement its strategy and deliver long-term value.
Anil Wadhwani
Anil Wadhwani took up the role of Chief Executive Officer on 25 February 2023. As set out in the ‘Statement of implementation of remuneration policy in 2023’ below, Mr Wadhwani was appointed on a salary of HK$12,281,000. He will receive pension benefits at 13 per cent of salary, in line with the employer pension contribution available to the wider workforce, plus contributions into the Hong Kong Mandatory Provident Fund. For 2023, he will have a maximum bonus opportunity of 200 per cent of salary under the AIP. Forty per cent of any bonus will be deferred for three years in line with the Directors’ remuneration policy. Long-term incentive awards, granted under the PLTIP, will have a face value on grant of 400 per cent of base salary. He will be subject to the shareholding guidelines of 400 per cent of salary and will have five years from the date of his appointment to build this level of ownership. Incentive opportunities are unchanged compared to that of the previous Chief Executive Officer.
Any awards and payments from his previous employer, Manulife, that Mr Wadhwani has forfeited as a consequence of joining Prudential will be replaced on a like-for-like basis, with replacement awards and payments released in accordance with the original vesting timeframe attached to the forfeited awards and payments. The performance shares and restricted shares together with share options will be bought out using share options over nominal-cost Prudential shares. The buy-out will make use of Listing Rule 9.4.2. In addition, performance shares will remain subject to the original Manulife performance conditions and only the “in the money” element of the options will be bought out. Full details of the replacement awards will be disclosed at the time the awards are made and in the 2023 Directors’ remuneration report. Mr Wadhwani also received compensation equal to salary, pension and housing benefits forfeited during the period between the end of his employment with Manulife and commencement of his employment with the Group and reimbursement of the cost to him of buying out his notice period with his current employer in order to facilitate his move to Prudential.
146
Payments to past Directors and payments for loss of office
There were no payments to Directors for loss of office in 2022.
Mike Wells’s leaving arrangements
Following the announcement of his retirement on 10 February 2022, Mr Wells stepped down from the Board on 31 March 2022. Mr Wells remained employed by the Group until 14 July 2022, receiving his salary and certain benefits (including pension benefits) until that date. The value of the salary and benefits for the period between 1 April 2022 and the end of his employment is USD 767,000 (rounded to the nearest thousand dollars). His 2022 bonus opportunity was pro-rated for the period worked in 2022. 60 per cent of this award will be paid in cash in the usual way, and 40 per cent will be deferred for three years (to be released in the Spring of 2026). The award will be subject to malus and clawback provisions.
Mr Wells’s outstanding deferred bonus awards will be released on the original timetable, subject to malus and clawback provisions. Outstanding long-term incentive awards will be pro-rated to the end of his employment and will vest in line with the original vesting dates, subject to satisfaction of the performance conditions as well as malus and clawback provisions. Awards will continue to accumulate dividend equivalents, and will be subject to a two-year holding period. No long-term incentive award was made in 2022.
Mr Wells’s outstanding options under the Prudential Savings Related Share Option Scheme and outstanding shares held under the Prudential Share Incentive Plan will be treated as a ‘good leaver’ in accordance with the applicable HMRC-approved rules.
Mr Wells will be subject to the share ownership guideline (400 per cent of his salary on the date he left the Board) for a period of two years after stepping down from the Board. During this period, he will be required to obtain clearance to deal in the Company’s shares. A capped contribution was made towards legal fees incurred in respect of his retirement agreement, and Mr Wells will receive a capped contribution of up to £1,600 per year towards the costs of filing UK tax returns for periods for which he has Prudential employment income taxable in the UK. Mr Wells is not eligible for any payments for loss of office.
Arrangements for James Turner
Given the Company’s exclusive focus on Asia and Africa and reflecting practice among Asian listed organisations not to have Chief Financial Officers as Board members or Executive Directors, James Turner, Group Chief Financial Officer, stepped down from the Board with effect from 1 January 2023. He remains Group Chief Financial Officer and a member of the Group Executive Committee, and will be a standing attendee at future Board meetings.
Mr Turner’s remuneration arrangements in respect of his departure from the Board were determined by the Committee in line with the Policy. Salary, pension and benefits will continue to be paid to Mr Turner as he remains a member of the Group Executive Committee. Mr Turner was eligible for a 2022 bonus as he remained an Executive Director for the full 2022 performance year. This award has been determined on performance achieved, as detailed earlier in the report. 60 per cent of this award will be paid in cash in the usual way, and 40 per cent will be deferred for three years (to be released in the Spring of 2026). The award will be subject to malus and clawback provisions.
Outstanding deferred bonus awards will be released on the original timetable. They remain subject to malus and clawback provisions and will continue to accumulate dividends until they are released.
Outstanding long-term incentive awards will vest in line with the original vesting dates, subject to the satisfaction of the original performance conditions. These awards will also continue to accumulate dividend equivalents until they are released and will remain subject to the original malus and clawback provisions and a two-year holding period following the end of the three-year performance period.
Mr Turner is required to hold the lower of his actual shareholding following his stepping down from the Board on 31 December 2022 and his current share ownership guideline of 250 per cent of salary for a period of two years. Thereafter, the Company’s shareholding guidelines that apply to members of the Group Executive Committee will apply to him. Mr Turner will continue to be required to obtain clearance to deal in the Company’s shares.
Arrangements for Mark FitzPatrick
Mark FitzPatrick stepped down as Interim Group Chief Executive and as a Board member on 24 February 2023 but will continue to assist with specific projects until 30 June 2023. Mr FitzPatrick is entitled to 12 months’ notice commencing on the date he stepped down from the Board.
Remuneration arrangements in respect of Mr FitzPatrick’s departure from the Board have been determined by the Group Remuneration Committee in line with the Directors’ remuneration policy approved by shareholders at the 2020 AGM. Mr FitzPatrick will not receive any loss of office payments in respect of his service as Executive Director.
Salary, pension and benefits
Salary, pension and certain benefits will continue to be paid until the end of his notice period on 24 February 2024 (subject to adjustment in the event that Mr FitzPatrick commences alternative employment before 24 February 2024) . The monthly pensionable cash supplement relating to the role of Interim Group Chief Executive ceased when Mr FitzPatrick stepped down from the Board.
147
Incentives
Mr FitzPatrick is eligible for an annual bonus under the Directors’ Remuneration Policy, which will be pro-rated for the period served as Interim Group Chief Executive (1 January to 24 February 2023). Payment will be subject to achievement against the performance metrics as set out in the ‘Statement of implementation of remuneration policy in 2023’ section, with any pay-out determined in the normal manner and at the normal time based on performance achieved in 2023. 40 per cent of any annual bonus earned will be deferred for three years (released in spring 2027), in line with normal practice. This award will be subject to malus and clawback provisions.
Outstanding deferred bonus awards will be released on the original timetable. They remain subject to malus and clawback provisions and will continue to accumulate dividends until they are released.
Outstanding long-term incentive awards will vest in line with the original vesting dates, subject to the satisfaction of the performance conditions. The 2021 and 2022 PLTIP awards will be pro-rated to the end of Mr FitzPatrick’s employment. These awards remain subject to malus and clawback provisions, and will continue to accumulate dividend equivalents until they are released. The awards will remain subject to a two-year holding period following the end of their respective performance periods. No long-term incentive award will be made in 2023 or any subsequent year.
Legal fees of up to £10,000 may be paid on Mr FitzPatrick’s behalf.
Any outstanding options under the Prudential Savings Related Share Option Scheme and any outstanding shares held under the Prudential Share Incentive Plan will be treated in accordance with the applicable plan rules.
In line with the Directors’ remuneration policy approved by shareholders at the 2020 AGM, Mr FitzPatrick is required to hold the lower of his current share ownership guideline of 250 per cent of salary and his actual shareholding when he steps down from the Board on 24 February 2023 for a period of two years from the date on which he stepped down from the Board. Mr FitzPatrick will continue to be required to obtain clearance to deal in the Company’s shares during this period.
Other Directors
A de minimis threshold of £10,000 has been set by the Committee; any payments or benefits provided to a past Director above this amount will be reported.
Statement of voting at general meeting
The Directors’ remuneration policy was approved by shareholders at the 2020 Annual General Meeting. At the 2022 Annual General Meeting, shareholders were asked to vote on the 2021 Directors’ remuneration report. Each of these resolutions received a significant vote in favour by shareholders and the Committee is grateful for this support and endorsement by our shareholders. The votes received were:
| | | | | | | | | | | | |
|
| |
| % of votes |
| Votes |
| % of votes |
| Total votes |
| Votes |
Resolution | | Votes for | | cast | | against | | cast | | cast | | withheld |
To approve the Directors’ remuneration policy (2020 AGM) |
| 1,930,172,979 |
| 95.84 |
| 83,796,656 |
| 4.16 |
| 2,013,969,635 |
| 1,043,445 |
To approve the Directors’ remuneration report (2022 AGM) |
| 2,015,901,709 |
| 93.09 |
| 149,605,401 |
| 6.91 |
| 2,165,507,110 |
| 55,524,844 |
Statement of implementation of remuneration policy in 2023
Base salary
Executive Directors’ remuneration packages were reviewed in 2022, with changes effective from 1 January 2023. When the Committee made these decisions, it considered the salary increases awarded to other employees in 2022 and the expected increases in 2023. The external market reference points used to provide context to the Committee were based on data for 2023 TSR Peer group, Asia-focused Insurers and Asia Financial Services Firms.
After due deliberation, the Committee considered there should be a 3 per cent salary increase to Mr FitzPatrick for 2023 which is less than the average 6 per cent salary increase received by the wider Prudential workforce. On this basis, 2023 will be the eleventh consecutive year in which the increases generally offered to executives have been below or close to the bottom of the range of salary increases budgeted for the broader workforce.
The annual salaries effective for 2023 are set out below:
· | Mark FitzPatrick: £847,000 effective 1 January 2023, plus a monthly pensionable cash supplement of £30,167 in the period he served as Interim Group Chief Executive; and |
· | Anil Wadhwani: HK$12,281,000 effective 25 February 2023. |
148
2023 pension entitlements
The Executive Directors’ pension benefits will remain aligned to the workforce rate currently considered to be 13 per cent of salary. In addition, statutory contributions will continue to be made into mandatory pension arrangements in the country in which the Executive Directors are based, in line with the local requirements.
Annual bonus
Award levels
As Interim Group Chief Executive, Mark FitzPatrick will continue to be eligible for a maximum bonus opportunity of 200 per cent of salary (plus the cash supplement for the period it was payable), pro-rated for the period served as an Executive Director from 1 January to 24 February 2023. Anil Wadhwani will be eligible for a maximum bonus opportunity of 200 per cent of salary as Chief Executive Officer. This will be pro-rated for the period worked since 25 February 2023.
Performance conditions
For 2023, the AIP for the Chief Executive Officer role will be based 80 per cent on financial measures and 20 per cent on personal objectives. The financial AIP measures and weightings will change to align with those adopted for the Asia business, increasing the focus on new business profit. The resulting 2023 financial AIP measures and weightings are as follows:
·Group EEV new business profit – 55 per cent;
·Group adjusted operating profit – 20 per cent;
·Group operating free surplus generated – 15 per cent; and
·Group Holding Company cash flow – 10 per cent.
The Committee reserves the right to vary 2023 AIP targets to ensure that they remain fair and stretching as the consequences of the re-opening of the border between the Chinese Mainland and Hong Kong become apparent.
2023 share-based long-term incentive awards
Award levels
Anil Wadhwani will be eligible to receive 2023 PLTIP awards of 400 per cent.
Performance conditions
Performance conditions for 2023 PLTIP awards have been revised to ensure that they remain aligned with the strategic priorities and in particular the Group’s exclusive focus on Asia and Africa. The weighting of the Return on Embedded Value (RoEV) measure, which reflects the efficiency with which the Group deploys shareholder equity to generate operating returns, will increase to 40 per cent (from 30 per cent) and the weighting of the scorecard (to be renamed the ‘business integrity scorecard’), which comprises metrics whose purpose is to ensure that reward remains aligned with the strategic priorities and capital allocation framework of the Group, will increase to 25 per cent (from 20 per cent). In line with the Group-wide Supervision Framework and regulatory expectations, Group Internal Economic Capital Assessment (‘GIECA’), an additional capital measure, will be introduced into the business integrity scorecard for 2023 with a weighting of 5 per cent. No other changes are proposed to the business integrity scorecard. Relative TSR will determine the vesting of the remaining 35 per cent of 2023 PLTIP awards (50 per cent for 2022 awards), providing alignment with the emphasis placed on this metric by many Asian and UK companies.
The weighting of measures for the 2023 PLTIP awards for all Executive Directors will therefore be as follows:
– | Relative TSR (35 per cent of award); |
– | A return on embedded value measure (40 per cent of award); and |
– | Business integrity scorecard of strategic measures (25 per cent of award). |
Relative TSR
Under the Group TSR measure, 20 per cent of the award will vest for TSR at the median of the peer group, increasing to full vesting for performance within the upper quartile. TSR is measured on a local currency basis since this has the benefit of simplicity and directness of comparison.
The TSR peer group has been revised from 2022 to further reflect the Group’s strategic focus and is set out below:
| | | |
AIA Group DBS Group MetLife | China Life Insurance Great Eastern New China Life | China Pacific Insurance Company Hang Seng Bank Ping An Insurance | China Taiping Insurance Manulife Financial Standard Chartered |
Return on Embedded Value
20 per cent of the award will vest for achieving the threshold level of performance of 9.2 per cent, increasing to full vesting for reaching the stretch level of at least 12.5 per cent. RoEV will be calculated as the total EEV operating profit as a percentage of the average EEV basis shareholders’ equity. RoEV will be assessed at the Group level.
149
Business integrity scorecard
Under the 2023 business integrity scorecard, performance will be assessed for each of the five measures at the end of the three-year performance period. Performance will be assessed on a sliding scale. Each of the measures has equal weighting and the 2023 measures are set out below:
Carbon reduction measure: | Weighted average carbon intensity (WACI) indicator at the end of the performance period (31 December 2025) compared with the baseline number as at 31 December 2019. Our carbon reduction objectives for the PLTIP are aligned with our published targets. Please see our ESG report for details of our carbon reduction target, our progress to date and the future actions that we plan in order to achieve our ambitions in this area, noting that future progress may not be linear. |
Vesting basis: | Performance below threshold results in nil vesting, 20 per cent vesting for achieving threshold of at least 25 per cent reduction in WACI (ie WACI of 290), increasing to full vesting for performance above stretch level of at least 35 per cent reduction in WACI (ie WACI of 251). The baseline and target WACI have been externally validated. |
GWS capital measure: | Cumulative three-year GWS operating capital generation relative to threshold. |
Vesting basis: | Performance below threshold results in nil vesting, 20 per cent vesting for achieving threshold, increasing to full vesting for performance above stretch level. The threshold figure for this metric will be published in the Annual Report for the final year of the performance period. |
GIECA measure: | The incorporation of a Group Internal Economic Capital Assessment (‘GIECA’) metric into the remuneration process will ensure adherence to the GWS guidelines on GIECA use and an alignment with management’s desire to fully embed the use of GIECA across the Group. |
Vesting basis: | Performance below threshold results in nil vesting, 20 per cent vesting for achieving threshold, increasing to full vesting for performance above stretch level. The threshold figure for this metric will be published in the Annual Report for the final year of the performance period. |
Conduct measure: | Through strong risk management action, ensure there are no significant conduct/culture/governance issues that result in significant capital add-ons or material fines. |
Vesting basis: | Performance below threshold results in nil vesting, 20 per cent vesting for partial achievement of the Group’s expectations, increasing to full vesting for achieving the Group’s expectations. |
Diversity measure: | Percentage of the Core Group of leaders that are female at the end of 2025. The Core Group of leaders, replacing the Executive Council and Leadership team, is defined as individuals who occupy a value-creator role across the organisation and/or individuals who have demonstrated future potential and succession to a value-creator role. |
Vesting basis: | Performance below threshold results in nil vesting, 20 per cent vests for meeting the threshold of at least 35% per cent of our Core Group of leaders being female at the end of 2025, increasing to full vesting for reaching the stretch level of at least 40 per cent being female at that date. |
Chair and Non-executive Directors
Fees for the Chair and Non-executive Directors were reviewed in 2022 with changes effective from 1 July 2022, as set out under the ‘Chairman and Non-executive Director remuneration in 2022’ section. The next regular fee level review will be conducted in 2023.
150
NEW DIRECTORS’ REMUNERATION POLICY
This section sets out the revised Directors’ remuneration policy (‘Policy’) which will be put forward to shareholders for a binding vote at the 2023 AGM on 25 May 2023. If approved, this Policy will apply immediately for three years following the AGM. This Policy has evolved from the current Policy which was approved at the AGM held on 14 May 2020 and has applied from that date.
As discussed in the Annual statement from the Chair of the Remuneration Committee (the ‘Committee’), the current Policy has operated as intended. Full details of the existing Policy can be found on our website at www.prudentialplc.com/~/media/Files/P/Prudential-V13/policies-and-statements/directors-remuneration-policy-2020-1.pdf
During 2022, the Committee reviewed the Policy, taking into account the Group’s strategic shift to focus exclusively on Asia and Africa, the views of our shareholders, the UK Corporate Governance Code, market practice and the broader regulatory and competitive environment. It also considered workforce remuneration and related policies in the businesses across the Group, including how the Company’s incentive arrangements are aligned with our footprint in Asia. Input was sought from the management team, while ensuring that conflicts of interest were suitably mitigated. The Committee is entirely made up of independent Non-executive Directors and no-one is present when their own remuneration is being discussed by the Committee. Advice is sought from the Group Risk Committee on risk management considerations to be applied in respect of executive remuneration, in line with the broader Group Risk Framework.
In reviewing the Policy, alternative remuneration structures were considered. Following careful consideration and discussion with our major investors, the Committee has decided to retain a typical UK-listed incentive structure but introduce some changes to the Policy to equip the Group to recruit and retain critical executive talent in our key markets.
Changes from 2020 Policy
The proposed Policy generally reflects that approved by shareholders in May 2020. However, the Committee felt that it was important to make certain changes to specific components in order to align reward with the strategic priorities of the Group and, in particular, its exclusive focus on Asia and Africa. The principal differences are set out below.
| ● | Deferral of the Annual Incentive Plan (‘AIP’) in cash rather than shares once the Executive Director’s Share Ownership Guideline is achieved; |
| ● | In respect of the Prudential Long Term Incentive Plan (‘PLTIP’) performance measures, reduce the relative weighting of the Total Shareholder Return (‘TSR’) performance measure from 50 per cent to 35 per cent and increase the weighting of Return on Embedded Value (‘RoEV’) to 40 per cent (from 30 per cent ) and business integrity scorecard to 25 per cent (from 20 per cent ). Full details of the relative TSR, RoEV and business integrity scorecard target ranges to be attached to 2023 PLTIP awards are disclosed prospectively in the 2022 Directors’ remuneration report. |
| ● | The sections dealing with malus and clawback and the treatment of Executive Directors leaving Prudential have been updated to reflect the terms of the 2023 Prudential Long Term Incentive Plan, which is being submitted to shareholders at the 2023 AGM for approval. |
151
Fixed pay Policy for Executive Directors
Component and purpose | Operation | Opportunity |
|---|---|---|
Base salary Paying salaries at a competitive level enables the Company to recruit and retain key Executive Directors. | Prudential’s Policy is to offer Executive Directors base salaries that are competitive within their local market. The Committee usually reviews salaries annually with changes normally effective from 1 January. In determining base salary for each Executive Director, the Committee considers factors such as: - Salary increases for other employees across the Group; - The performance and experience of the Executive Directors; - The size and scope of the role; - Group financial performance; - Internal relativities; and - External factors such as economic conditions and market data, taking into account the geographies and markets in which the Company operates. | Annual salary increases for Executive Directors will normally be in line with the increases for other employees unless there is a change in role or responsibility. |
Benefits Provided to Executive Directors to assist them in carrying out their duties efficiently. Relocation and location- specific benefits allow Prudential to attract high calibre Executive Directors in the international talent market and to deploy them appropriately within the Group. | Prudential’s Policy is for the Committee to have the discretion to offer Executive Directors benefits which reflect their individual circumstances and are competitive within their local market, including but not limited to : - Health and wellness benefits; - Protection and security benefits; - Transport benefits; - Family and education benefits; - All employee share plans and savings plans; - Relocation and location-specific benefits; and - Reimbursed business expenses (including any tax liability) incurred when travelling overseas in performance of duties. | The maximum paid will be the cost to the Company of providing these benefits. The cost of these benefits may vary from year to year but the Committee is mindful of achieving the best value from providers. |
Provision for an income in retirement Pension benefits provide Executive Directors with opportunities to save for an income in retirement. | Prudential’s Policy is to offer Executive Directors a pension provision that is competitive and appropriate in the context of pension benefits for the wider workforce. Executive Directors have the option to: - Receive payments into a defined contribution scheme; and/or - Take a cash supplement in lieu of contributions. In addition, Executive Directors may receive statutory contributions to mandatory pension arrangements in the country in which they are based in line with local requirements. | Executive Directors, either externally recruited or promoted from within the Company, will be entitled to receive pension contributions or a cash supplement (or a combination of the two) in line with the workforce rate, currently considered to be 13 per cent of base salary. In addition, statutory contributions will be made to mandatory pension arrangements in the country in which the Executive Directors are based, in line with the local requirements. |
152
Annual bonus Policy for Executive Directors
Annual bonus Payments under the Annual Incentive Plan (AIP) incentivise the delivery of stretching financial, functional and/or personal objectives which are drawn from the annual business plan measured over a period not exceeding one financial year. | |
Operation | Currently Executive Directors participate in the AIP. The AIP payments for Executive Directors are subject to the achievement of financial, functional and/or personal objectives except in the case of buy-out awards on recruitment – see the ‘Approach to recruitment remuneration’ section. |
Form and timing of payment | Executive Directors are currently required to defer 40 per cent of their bonus for three years into Prudential shares, with the remaining proportion of their bonus paid in cash following the end of the performance year. For bonus awards made in respect of the 2023 performance year onwards, 40 per cent of their bonus will be deferred in cash for three years provided that the Executive Director’s share ownership guideline is met. Deferred awards will be made in shares if the Executive Director’s share ownership guideline has not yet been achieved. The Committee retains discretion to vary the proportion of the bonus to be deferred and the length of the deferral period. The release of deferred bonus awards is not subject to any further performance conditions. Deferred bonus awards in shares carry the right to accumulate an amount to reflect the dividends payable in respect of the shares that vest during the deferral period. These dividend equivalents will normally be settled in shares, but there is the flexibility to deliver them in cash. The amount of the dividend equivalent payment may assume the re-investment of the relevant dividends in shares. The Committee has the authority to apply clawback and/or a malus adjustment to all, or a portion of, the cash and deferred award elements of the bonus. More details about clawback and malus are set out below. See the Policy on corporate transactions section for details of the Committee’s powers in the case of corporate transactions. |
Determining annual bonus awards | In assessing financial performance, the Committee determines the AIP award for each Executive Director with reference to the performance achieved against approved performance ranges. In assessing performance, the Committee will take into account the personal performance of the Executive Director and the Group’s risk framework and appetite, as well as other relevant factors. To assist them in their assessment the Committee considers advice from the Group Risk Committee on adherence to the Group’s risk framework and appetite and to all relevant conduct standards. The Committee may adjust the formulaic outcome based on the performance targets to reflect the underlying performance of the Company by applying discretion within the limits of the Policy. The Committee will disclose in the relevant Directors’ Remuneration Report where discretion is used. |
Opportunity | The maximum AIP opportunity is up to 200 per cent of salary for Executive Directors. Annual awards are disclosed in the relevant Annual report on remuneration. |
153
Performance measures | The Committee has the discretion, for each Executive Director, to determine the specific performance conditions attached to each AIP cycle and to set annual targets for these measures with reference to the business plans approved by the Board. The financial measures used for the AIP will typically include profit and cash flow targets and payments depend on the achievement of minimum capital thresholds and operation within the Board approved risk framework and appetite. For the measures to be used in 2023, please refer to the Annual report on remuneration. No bonus is payable under the AIP for performance at or below the threshold level, increasing to 100 per cent for achieving or exceeding the maximum level. The weightings of the performance measures for 2023 for the Group Chief Executive are 80 per cent Group financial measures and 20 per cent personal measures. The Committee retains the discretion to adjust and/or set different performance measures and/or targets if events occur (such as a change in strategy, a material acquisition and/or divestment of a Group business, a change in share capital of the Company, a change in the capital framework, or the requirements of the Company’s regulators or a change in prevailing market conditions) which cause the Committee to determine that the measures and/or targets are no longer appropriate and that amendment is required so that they achieve their original purpose (or comply with such regulatory requirements). |
Amendments | The Committee may make amendments to the rules of the deferred bonus plan which it considers appropriate (such as amendments which benefit the administration of the plan) but it will not make any amendments which are incompatible with the approved Directors’ remuneration Policy. |
Committee discretions | In determining awards under the AIP, the Committee retains the discretion to adjust the formulaic outcome against any or all measures if it considers that the outcome does not reflect the underlying financial or non-financial performance of the participant or any member of the Group over the performance period and/or there exists any other reason why an adjustment is appropriate, taking into account such factors as the Committee considers relevant. |
154
Long-term incentive Policy for Executive Directors
Prudential Long Term Incentive Plan (PLTIP) The Prudential Long Term Incentive Plan is designed to incentivise the delivery of: •Longer-term business plans; •Sustainable long-term returns for shareholders; and •Group strategic priorities, such as disciplined risk and capital management. | |
Opportunity | The value of shares awarded under the PLTIP (in respect of any given financial year) may not exceed 550 per cent of the Executive Director’s annual basic salary. Awards made in a particular year are usually significantly below this limit. On recruitment, any buy out awards will not count towards this limit provided that they replace forgone awards on a like for like basis – see further details in the ‘Approach to recruitment remuneration’ section. It is proposed that the Group Chief Executive receives a PLTIP award of 400 per cent of salary in 2023. The Committee would consult with major shareholders before making any increase to current award levels. Award levels are disclosed in the relevant Annual report on remuneration. |
Operation | Currently Executive Directors participate in the PLTIP. Prudential’s Policy is that Executive Directors may receive long-term incentive awards with full vesting only achieved if the Company meets stretching performance targets except in the case of buyout awards on recruitment – see the ‘Approach to recruitment remuneration’ section. |
Granting awards | Under the PLTIP the shares which are awarded will ordinarily vest to the extent that performance conditions have been met. If performance conditions are not achieved at the end of the three-year performance period, the unvested portion of any award lapses and performance cannot be retested. |
Holding period | Awards made under this Policy are normally subject to a holding period which ends on the fifth anniversary of the award (unless the Committee so determines, in exceptional circumstances, such as an Executive Director passing away). If the Committee so determines, the Company may sell such number of shares as is required to satisfy any tax liability that arises on vesting and the balance of shares will be subject to the holding period. |
Determining the release of the award | The Committee has the authority to apply clawback and/or a malus adjustment to all, or a portion of, a PLTIP award. More details about clawback and malus are set out below. Awards will normally carry the right to accumulate an amount to reflect the dividends payable on the shares that vest during the period between the awards being granted and the award vesting (or, if a holding period applies, the period between the awards being granted and the award being released). Dividend equivalents will normally be settled in shares, but there is the flexibility to deliver them in cash. The amount of the dividend equivalent payment may assume the re-investment of the relevant dividends in shares. |
155
Performance measures | The performance conditions attached to 2023 PLTIP awards for Executive Directors are: •Relative TSR (35 per cent of award); •A Return on Embedded Value measure (40 per cent of award); and •Business integrity scorecard (previously known as the ‘sustainability scorecard’) measures (25 per cent of award). Using a Return on Embedded Value metric alongside TSR and a business integrity scorecard will ensure that the full value of long-term incentive awards is attained only where capital is effectively created and deployed in a way which creates shareholder returns superior to those delivered by peers while business integrity expectations are met. The Committee may decide to attach different performance conditions and/or change the conditions’ weighting for future PLTIP awards. The performance conditions attached to each award will be disclosed in the relevant Annual report on remuneration. Relative TSR is measured over three years. 20 per cent of this portion of each award will vest for achieving the threshold level of median, increasing to full vesting for meeting the stretch level of upper quartile. For awards made in 2023, TSR is measured against a peer group of international insurers similar to Prudential in size, geographic footprint and products. The peer group for each award is disclosed in the relevant Annual report on remuneration. Average over a three-year period of Return on Embedded Value, defined as Operating return on average EEV shareholders’ equity, calculated as EEV operating profit net of non-controlling interests divided by average EEV shareholders’ equity, is assessed at Group level. Threshold and maximum achievement levels will be set at the beginning of the performance periods in line with the three-year business plan. 20 per cent of this portion of the award will vest for achieving threshold performance increasing to full vesting for meeting stretch targets. Performance against the measures in the business integrity scorecard is assessed at the end of the three-year performance period. For the 2023 awards these measures will be equally weighted. 20 per cent of this portion of the award will vest for achieving threshold performance increasing to full vesting for meeting stretch targets. The scorecard measures for each award are disclosed in the relevant Annual report on remuneration for the year of grant. The Committee also considers advice from the Group Risk Committee on whether results were achieved within the Group’s and businesses’ risk framework and appetite and to all relevant conduct standards. |
Committee discretions | For any awards made under the PLTIP to vest, the Committee must be satisfied that the quality of the Company’s underlying financial performance justifies the level of reward delivered at the end of the performance period. The Committee receives data about factors such as risk management and the cost of capital to support their decision. The Committee has the discretion to alter or disapply the holding period if it believes that it is appropriate. See the Policy on corporate transactions section for details of the Committee’s powers in the case of corporate transactions. The Committee retains the ability to amend the performance conditions and/or targets attached to an award and/or set different performance measures (or to revise the weighting of measures) which apply to new or outstanding long-term incentive awards if anything happens which causes the Committee to consider it appropriate, provided the Committee considers that the amended condition will not be materially more or less challenging to satisfy than the original condition in the circumstances. The Committee may consider exercising its discretion in circumstances such as a change in strategy, a material acquisition and/or divestment of a Group business or a change in the share capital of the Company, a change in the requirements of the Company’s regulators or a change in prevailing market conditions. The Committee would seek to consult with major shareholders before revising performance conditions on outstanding awards under the PLTIP. It is the intention of the Committee that PLTIP awards should normally reflect the outcomes of performance measures set. However, the Committee may, in its discretion, adjust (including by reducing to nil) the formulaic outcome under the PLTIP if it considers that: (i) the extent to which any performance condition has been met does not reflect the underlying financial or non-financial performance of the participant or any member of the Group over the performance period; or (ii) there exists any other reason why an adjustment is appropriate, taking into account such factors as the Committee considers relevant, including the context of circumstances that were unexpected or unforeseen at the date of grant. |
Amendments | The Committee may make amendments to the rules of the Plan which are minor and benefit the administration of the Plan, which take account of any changes in legislation, and/or which obtain or maintain favourable tax, exchange control or regulatory treatment. Otherwise, no amendments may be made to certain key provisions of the PLTIP to the advantage of participants without prior shareholder approval. |
156
Share ownership guidelines for Executive Directors It is imperative that the Company’s remuneration arrangements align the interests of Executive Directors and other shareholders. Share ownership guidelines reinforce this alignment. | |
In-employment guidelines | Under the Articles of Association, Executive Directors are required to hold at least 2,500 shares and have one year, from their date of appointment to the Board, to acquire these. The share ownership guidelines for the Group Chief Executive during their employment is 400 per cent of salary. Executive Directors normally have five years from the later of the date of their appointment or promotion, or the date of an increase in these guidelines, to build this level of ownership. Shares earned and deferred under the AIP are included in calculating the Executive Director’s shareholding for these purposes (on a net of tax basis), as are shares held by members of an Executive Director’s household. Unvested share awards under long-term incentive plans are not included but vested share awards under long-term incentive plans which are subject to a post-vesting holding period are included (on a net of tax basis, where the shares have not yet been delivered to the Executive Director). Progress against the share ownership guidelines is detailed in the Statement of Directors’ shareholdings section of the Annual report on remuneration. Should an Executive Director not meet the share ownership guidelines, the Committee retains the discretion to determine how this should be addressed, taking account of all the prevailing circumstances. In the absence of mitigating circumstances, if an Executive Director fails to comply with the share ownership guideline in the required timeframe and has not (in the opinion of the Committee) taken reasonable steps to achieve compliance, despite encouragement to do so, then the Committee may take steps including preventing the individual from selling shares or mandating the use of any cash bonuses to buy Prudential plc shares. |
Post Directorship guidelines | When an Executive Director leaves the Board, they will be required to hold the lower of their actual shareholding on the date of them stepping down from the Board and their in-employment share ownership guideline for a period of two years. The Committee has the discretion to disapply or reduce this requirement in extenuating circumstances, for example if the Executive Director takes up a role with a Regulator or for compassionate reasons (such as genuine financial hardship or on death). This obligation will be implemented by requiring Executive Directors leaving the Board to obtain clearance to deal in the Company’s shares during the two years during which this post Directorship share ownership guideline applies in the same way as they must during the time on the Board. |
157
Malus and clawback Policy
As detailed in the Policy table, the Committee may apply clawback and/or a malus adjustment to variable pay in certain circumstances as set out below. The Committee can delay the release of awards pending the completion of an investigation which could lead to the application of malus or clawback. The Committee may also introduce additional malus and/or clawback provisions where required to do so by regulatory requirements applicable to it.
| |
| Circumstances when the Committee may exercise its discretion to apply malus or clawback to an award |
Malus (applies in respect of any annual bonus or long-term incentive award) Allows deferred cash awards and unvested shares awarded under deferred bonus and LTIP plans to be forfeited or reduced in certain circumstances. | Malus may be applied where there are exceptional circumstances, such as: ●a material misstatement in the published results of any member of the Group, for any period during or after the performance period (or if no performance periods are applicable, the vesting period); ●an error in the assessment of any applicable performance conditions, the determination of the relevant bonus or the number of shares subject to an award (or where such assessment was based on inaccurate or misleading information); ●gross misconduct; ●a breach by the Executive Director of any restrictive covenants or other similar undertakings; ●where the Executive Director has caused a material financial loss for the Group as a result of (i) reckless, negligent or wilful actions or omissions; or (ii) inappropriate values or behaviour; ●where a member of the Group is censured by a regulatory body or suffers significant reputational damage; and ●insolvency or corporate failure. |
Clawback Allows cash and share awards, including shares subject to the holding period, to be recovered before or after release in certain circumstances. | Clawback may be applied where there are exceptional circumstances, such as the circumstances listed above: ●For the PLTIP, at any time before the fifth anniversary of the award date, and ●For the AIP, at any time before the fifth anniversary of the end of the bonus performance period. |
Notes to the remuneration Policy table for Executive Directors
Committee's judgement
The Committee is required to make judgements when assessing Company and individual performance under the Directors' remuneration Policy. In addition, the Committee has discretions under the Company's share plans, for example, determining if a leaver should retain their unvested awards (and if so, the basis on which they are retained) and whether to apply malus or clawback to an award. Exercise of such discretion during the year will be reported and explained in the next Annual report on remuneration.
The Committee may approve payments or awards in excess of, in a different form to, or calculated or delivered other than as described above, where the Committee considers such changes necessary or appropriate in light of regulatory requirements. If these changes are considered by the Committee to be material, the Company will seek to consult with its major shareholders.
Determining the performance measures
The Committee selected the performance measures that currently apply to variable pay plans on the following basis:
AIP
The performance measures are selected to incentivise the delivery of the Group’s business plan, specifically to ensure that financial objectives are delivered while maintaining adequate levels of capital. Executive Directors are also rewarded for the achievement of functional and/or personal objectives. These objectives include the Executive Director’s contribution to Group strategy as a member of the Board and achievement of the Group’s strategic priorities.
PLTIP
Awards made under the PLTIP in 2023 are subject to the achievement of Return on Embedded Value, relative TSR and a business integrity scorecard :
- Return on Embedded Value was selected as a performance measure for the PLTIP because it is a familiar measure for investors, is comparable across the market and also aligns performance incentives to the generation of long-term shareholder value.
- Relative TSR was selected as a performance measure because it focuses on the value delivered to shareholders – aligning the long-term interests of shareholders with those of Executive Directors.
- A business integrity scorecard was selected to ensure an alignment with the Group's strategic objectives, which are approved by the Board each year, and to reflect Prudential's cultural values.
158
The Committee may decide to attach different performance conditions and/or change the conditions’ weighting for future PLTIP awards.
Setting the performance ranges for financial targets
Where variable pay has performance conditions based on business plan measures (for example the financial metrics of the AIP and the Return on Embedded Value element of the PLTIP) the performance ranges are set by the Committee prior to, or at the beginning of, the performance period. Performance is based on the annual and longer-term plans approved by the Board. These reflect the long-term ambitions of the Group and its businesses, in the context of anticipated market conditions.
For market-based performance conditions (eg relative TSR) the Committee requires that performance is in the upper quartile, relative to Prudential’s peer group, for awards to vest in full.
Targets used to determine annual bonus outcomes will be disclosed in the Directors’ remuneration report for the year for which the bonus is paid.
Wherever possible, the targets attached to long-term incentive awards will be disclosed prospectively at the time of the award. Where long-term incentive targets are commercially sensitive, they will be published in the Annual Report for the final year of the performance period.
Key differences between Directors’ remuneration and the remuneration of the wider workforce
Across the Group, remuneration is reviewed regularly with the intention that all employees are paid appropriately in the context of their local market and given their individual skills, experience and performance. The Committee regularly receives information on workforce remuneration and related policies and takes this into account when determining Executive Director remuneration; for example it considers salary increase budgets for the workforce when determining the salaries of Executive Directors.
The remuneration principles that apply to Executive Directors are cascaded to employees as appropriate. Employees are regularly provided with an explanation of how decisions on executive pay are made and how they reflect the wider Company remuneration Policy.
Legacy payments
The Committee reserves the right to make any remuneration payments and/or payments for loss of office (including exercising any discretions available to it in connection with such payments) notwithstanding that they are not in line with the Policy set out above where the terms of the payment were agreed (i) before 15 May 2014 (the date the Company’s first shareholder-approved Directors’ remuneration Policy came into effect); (ii) before this Policy came into effect, provided that the terms of the payment were consistent with the shareholder-approved Directors’ remuneration Policy in force at the time they were agreed; or (iii) at a time when the relevant individual was not a Director of the Company and, in the opinion of the Committee, the payment was not in consideration for the individual becoming or having been a Director of the Company. For these purposes ‘payments’ includes the Committee satisfying awards of variable remuneration and, in relation to an award over shares, the terms of the payment are ’agreed’ at the time the award is granted.
Currency and references to ‘shares’
In this Policy, references to shares may include share awards settled in shares listed on any of the stock exchanges where the Company has a listing. Remuneration may be denominated and paid in any currency the Committee determines.
Scenarios of total remuneration
The chart below provides an illustration of the future total remuneration for the Executive Director in respect of his remuneration opportunity for 2023. Four scenarios of potential outcome are provided based on underlying assumptions shown in the notes to the chart.
The Committee is satisfied that the maximum potential remuneration of the Executive Director is appropriate. Prudential’s Policy is to offer Executive Directors remuneration which reflects the performance and experience of the Executive Director, internal relativities and Group financial and non-financial performance. In order for the maximum total remuneration to be payable:
159
The fourth scenario below illustrates the maximum potential remuneration (shown in the third scenario) on the assumption that the Company’s share price grows by 50 per cent over three years.
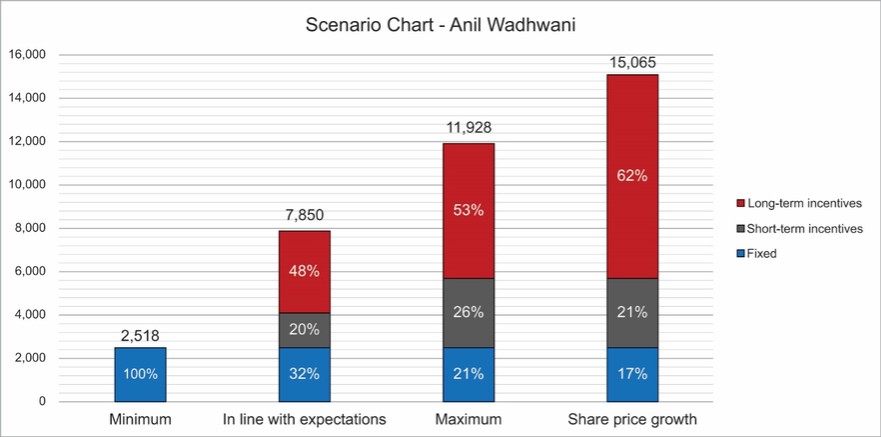
Notes
The scenarios in the chart above have been calculated on the following assumptions:
| Minimum | In line with expectations | Maximum | Share price growth |
Fixed pay | - Base salary at 1 January 2023. - Pension allowance for the year has been calculated at 13% of salary in line with this Policy. - Estimated value of benefits based on average amounts paid in 2022. | |||
Annual bonus | No bonus paid. | - 50% of maximum AIP. | - 100% of maximum AIP. | |
Long-term incentives (excludes dividends) | No PLTIP vesting. | - Vesting of 60% of award under PLTIP (midway between threshold and maximum). | - Vesting of 100% of award under PLTIP. | - Vesting of 100% of award under PLTIP; plus - Share price growth of 50 per cent over three years. |
160
Approach to recruitment remuneration
The table below outlines the approach that Prudential will take when recruiting a new Executive Director. This approach would also apply to internal promotions.
The approach to recruiting a Non-executive Director or a Chair is outlined in the ‘Recruitment of a new Chair or Non-executive Director’ section.
Element | Principles | Potential variations |
Base pay | The salary for a new Executive Director will be set using the approach set out in the fixed pay Policy table. | |
Benefits and pension | The benefits for a new Executive Director will be consistent with those outlined in the fixed pay Policy table. | |
Variable remuneration opportunity | The variable remuneration opportunities for a new Executive Director would be consistent with the limits and structures outlined in the variable pay Policy table. | |
Awards and contractual rights forfeited when leaving previous employer | On joining the Board from within the Group, the Committee may allow an Executive Director to retain any outstanding deferred bonus and/or long-term incentive awards and/or other contractual arrangements that they held on their appointment. These awards (which may have been made under plans not listed in this Policy) would usually remain subject to the original rules, performance conditions and vesting schedule applied to them when they were awarded. If an externally-appointed Executive Director forfeits one or more bonuses (including outstanding deferred bonuses) on leaving a previous employer, these payments or awards may be replaced in either cash, Prudential shares or options over Prudential shares with an award of an equivalent value. Replacement awards will normally be released on the same schedule as the foregone bonuses. If an externally-appointed Executive Director forfeits one or more long-term incentive awards on leaving a previous employer, these may be replaced with Prudential awards with an equivalent value. Replacement awards will generally be made under the terms of a long-term incentive plan approved by shareholders, and vest on the same schedule as the foregone awards. Where foregone awards were subject to performance conditions, performance conditions will normally be applied to awards replacing foregone long-term incentive awards; these will usually be the same as those applied to the long-term incentive awards made to Prudential Executive Directors in the year in which the forfeited award was made. Where foregone awards were not subject to performance conditions, performance conditions will not normally be applied to awards replacing them. If an externally-appointed Executive Director incurs costs in connection with joining Prudential (such as buying out their notice period with a previous employer at the Company’s request), the Executive Director may be reimbursed for these costs . | The Committee may consider compensating a newly-appointed Executive Director for other relevant contractual rights forfeited when leaving their previous employer and/or remuneration foregone as a result of leaving their previous employer. The use of Listing Rule 9.4.2 may be used to facilitate the recruitment of an Executive Director. The Committee does not anticipate using this rule on a routine basis but reserves the right to do so in an exceptional circumstance. For example, this rule may be required if, for any reason, like-for-like replacement awards on recruitment could not be made under existing plans. This provision would only be used to compensate for remuneration forfeited or foregone on leaving a previous employer. |
161
Policy on payment on loss of office
Element | Principle | Potential variations |
Notice periods | The Company’s Policy is that Executive Directors’ service contracts will not require the Company to give an Executive Director more than 12 months’ notice without prior shareholder approval. A shorter notice period may be offered where this is in line with market practice in an executive’s location. Contracts for new Executive Directors may be offered with a six-month notice period. The Company is required to give to, and to receive from, each of the current Executive Directors 12 months’ notice of termination. An Executive Director whose contract is terminated would be entitled to salary and benefits in respect of their notice period. The payment of the salary and benefits would either be phased over the notice period or, alternatively, a payment in lieu of notice may be made. In agreeing the terms of departure for any Executive Director, other than on death or disablement, the Company will have regard to the need to mitigate the costs for the Company, which would normally be reduced or cease if departing Executive Directors secure alternative paid employment during the notice period. | If an Executive Director is dismissed for cause their contract would be terminated with immediate effect and they would not receive any payments in relation to their notice period. Should an Executive Director die, their estate would not be entitled to receive payments and benefits in respect of their notice period – provisions are made under the Company’s life assurance scheme to provide for this circumstance. Should an Executive Director step down from the Board but remain employed by the Group, they would not receive any payment in lieu of notice in respect of their service as a Director. |
Outstanding deferred bonus awards | The treatment of outstanding deferred bonuses will be decided by the Committee taking into account the circumstances of the departure including the performance of the Executive Director. Deferred bonus awards are normally retained by participants leaving the Company. Awards will usually vest on the original timetable and will not normally be released early on termination. Prior to release, awards remain subject to the malus terms originally applied to them. The clawback provisions will continue to apply. | Any Executive Director dismissed for cause would forfeit all outstanding deferred bonus awards. Should an Executive Director die, outstanding deferred bonus awards will be released as soon as possible after the date of death. On ill-health and in other exceptional circumstances, the Committee has discretion to accelerate the vesting of any outstanding deferred bonus awards. Should an Executive Director step down from the Board but remain employed by the Group, they would retain any outstanding deferred bonus awards. These awards would remain subject to the original rules and vesting schedule applied to them when they were awarded. |
Unvested long-term incentive awards | The treatment of unvested long-term incentives will be decided by the Committee taking into account the circumstances of the departure including the performance of the Executive Directors. Where an Executive Director is determined to be a good leaver, unvested long-term incentive awards will normally subsist. These awards will ordinarily be pro-rated, unless the Committee determines otherwise to reflect the proportion of the performance period that has elapsed, and will vest on the original timescale. Awards will remain subject to the original performance conditions assessed over the entire performance period, unless the Committee decides to assess the performance conditions over a shorter period. Good leavers are defined as injury or disability, retirement with the approval of the employing company, the employing company ceasing to be a member of the Group, the business in which the individual is employed being transferred to a transferee that is not a member of the Group, or any other circumstances at the discretion of the Committee. Individuals who die in service will also be treated as good leavers. Where an individual is not determined to be a good leaver, unvested long-term incentive awards will lapse on cessation of employment. Prior to release, awards remain subject to the malus and clawback terms and holding periods originally applied to them. | Any Executive Director dismissed for cause would forfeit all unvested long-term incentive awards. If the Committee has judged that the departing Executive Director should retain their unvested long-term incentive awards with the expectation that: (i) the Executive Director is retiring from their professional executive career; and/or (ii) the Executive Director will not be seeking to secure alternative employment with another organisation of comparable size as the Company or that is within the financial services sector the Committee retains the power to lapse all unvested long-term incentive awards should the Committee deem that the Executive Director has secured similar paid executive employment elsewhere. On death, disablement and in other exceptional circumstances, the Committee has discretion to release unvested long-term incentive awards earlier than the end of the vesting period. The malus and clawback provisions will continue to apply. Should an Executive Director step down from the Board but remain employed by the Group, an Executive Director would retain any outstanding long-term incentive awards which they held on their change of role. These awards would remain subject to the original rules, performance conditions and vesting schedule. |
162
Vested long-term incentive awards, subject to the holding period | The treatment of vested long-term incentives will be decided by the Committee taking into account the circumstances of the departure. Executive Directors will normally retain their vested long-term incentive awards that remain subject to the holding period. Normally these awards will be released in accordance with the original timescale and will remain subject to the holding period. Prior to release, awards remain subject to the malus and clawback terms originally applied to them. | On death, disablement and in other exceptional circumstances, the Committee has discretion to release vested long-term incentive awards earlier than the end of the holding period. The malus and clawback provisions will continue to apply. Should an Executive Director step down from the Board but remain employed by the Group, they would retain any vested long-term incentive awards that remain subject to the holding period. These awards would remain subject to the original rules and release schedule applied to them when they were awarded (ie the holding period will continue to apply). |
Bonus for final year of service | The payment of a bonus for the final year of service will be decided by the Committee giving full consideration to the circumstances of the departure including the performance of the Executive Director. The Committee may award a departing Executive Director a bonus which will usually be pro-rated to reflect the portion of the final financial year in which they served which had elapsed on the last day that they worked. Any such bonus would normally be calculated with reference to financial, functional and/or personal performance measures in the usual way. The normal portion of any such bonus awarded would usually be deferred. | Any Executive Director dismissed for cause would not be eligible for any bonus that has not been paid. Should an Executive Director die whilst serving as an employee a time pro-rated bonus may be awarded. In such circumstances, deferral will not be applied and the payment will be made solely in cash. The Committee may decide to award an Executive Director stepping down from the Board but remaining with the Group a bonus pro-rated to reflect the portion of the financial year which had elapsed on the date of their change of role. This would be calculated with reference to financial, functional and/or personal performance measures in the usual way. The Committee may determine that a portion of such a bonus must be deferred. |
Other payments | Consistent with other employees, Executive Directors may receive payments to compensate them for the loss of employment rights on termination. Payments may include: ● A nominal amount for agreeing to non-solicitation and confidentiality clauses; ● Directors and Officers insurance cover for a specified period following the Executive Director’s termination date; ● Payment for outplacement services; ● Statutory redundancy payments (where applicable); ● Reimbursement of legal fees; ● Support with preparation of tax returns; and ● Repatriation assistance. The Committee reserves the right to make additional exit payments where such payments are made in good faith: ● In discharge of an existing legal obligation (or by way of damages for breach of such an obligation); or ● By way of settlement or compromise of any claim arising in connection with the termination of a Director's office or employment. | |
Post Directorship guidelines | When an Executive Director leaves the Board they will be subject to post-Director Share ownership guidelines. Further details are included in the section on ‘Share ownership guidelines for Executive Directors’. | |
163
Policy on corporate transactions
| |
Treatment | |
Deferred Annual Incentive Plan Awards | In the event of a corporate transaction (eg takeover, material merger, or demerger, winding up etc), the Committee will determine whether awards will: ● Vest; and/or ● Continue in accordance with the rules of the plan; and/or ● Lapse and, in exchange, the participant will be granted an award under any other share or cash incentive plan which the Committee considers to be broadly equivalent to the award. |
Prudential Long Term Incentive Plan | In the case of a corporate transaction (eg takeover, material merger, or demerger, winding up etc), the Committee will determine whether awards will: ● Be exchanged for replacement awards (either in cash or shares) of equal value unless the Committee and successor company agree that the original award will continue; or ● Vest (to the extent determined by the Committee). Where awards vest, the Committee will have regard to (i) the performance of the Company, (ii) unless the Committee determines otherwise, the proportion of the performance period that has elapsed and (iii) any other matter that the Committee considers relevant or appropriate. Vested awards will normally be released from any relevant holding period. |
Service contracts
Executive Directors’ service contracts provide details of the broad types of remuneration to which they are entitled, and about the kinds of plans in which they may be invited to participate. The service contracts offer no certainty as to the value of performance-related reward and confirm that any variable payment will be at the discretion of the Company.
Copies of the service contract between the Prudential Group and the Executive Directors are available for inspection at Prudential’s registered office during normal hours of business and will also be available at any General Meeting of the Company. Details of the duration of the Executive Directors’ service contracts are set out in the ‘Directors’ terms of employment and external appointments’ section of the Annual report on remuneration.
Statement of consideration of conditions elsewhere in the Company
Across the Group, remuneration is reviewed regularly with the intention that all employees are paid appropriately in the context of their local market and given their individual skills, experience and performance. Each businesss salary increase budget is set with reference to local market conditions. The Committee considers salary increase budgets across the workforce when determining the salaries of Executive Directors.
Prudential does not specifically consult with employees when setting the Directors’ remuneration Policy: Prudential is a global organisation with employees and agents in multiple businesses and geographies. The Board has mechanisms for engagement by Non-executive Directors to gather employees’ views on a range of topics and for these views to be represented to the Board. As many employees are also shareholders, they are able to participate in binding votes on the Directors’ remuneration Policy and annual advisory votes on the Annual report on remuneration.
Statement of consideration of shareholder views
The Committee and the Company undertake regular consultation with key institutional investors on the Directors’ remuneration Policy and its implementation. This engagement is led by the Committee Chair and is an integral part of the Company’s investor relations programme. The Committee is grateful to shareholders for the feedback that is provided and takes this into account when determining executive remuneration.
164
Remuneration Policy for Non-executive Directors and the Chair
| |||
| Fees | Benefits | Share Ownership Guidelines |
Non-executive Directors | All Non-executive Directors receive a basic fee for their duties as a Board member. Additional fees are paid for added responsibilities such as Chairship and membership of committees, acting as the Senior Independent Director or carrying out any other role determined by the Board from time to time. Fees are paid to Non-executive Directors, subject to the appropriate deductions. Fees may be denominated and paid in any currency as the Committee determines. The basic and additional fees are usually reviewed annually by the Board with any changes normally effective from 1 July. In determining the level of fees, the Board considers: ● The time commitment and other requirements of the role; ● Group financial performance; ● Salary increases for all employees; and ● Market data. If, in a particular year, the number of meetings and/or time commitment is materially greater than usual, the Company may determine that the provision of additional fees in respect of that year is fair and reasonable. Should a new committee or working group be formed, or the remit of an existing committee be materially expanded, or a new Non-executive Director role established, the new or additional fees paid for acting as the chair or a member of the committee will be commensurate with the new or additional responsibilities and time commitment involved. Non-executive Directors are not eligible to participate in annual bonus plans or long-term incentive plans. | Non-executive Directors do not currently receive benefits or a pension allowance or participate in the Group’s employee pension schemes. Travel and business expenses for Non-executive Directors are incurred in the normal course of business, for example, in relation to attendance at Board and Committee meetings. The costs associated with these are all met by the Company, including any tax liabilities arising on these business expenses. If as a consequence of the Company’s corporate structure, Non-executive Directors are required to prepare personal tax returns in Hong Kong and/or the UK, in addition to preparing their personal tax returns for the jurisdiction which is their place of residence, the Company will reimburse the costs of personal tax return preparation for whichever locations are not their place of residence (including payment of any tax cost associated with the provision of the benefit). | Under the Articles of Association, Non-executive Directors are required to hold at least 2,500 shares and have one year, from their date of appointment to the Board, to acquire these. It is further expected that Non-executive Directors will hold shares with a value equivalent to one times the annual basic fee (excluding additional fees for Chairship and membership of any committees). Non-executive Directors will normally be expected to attain this level of share ownership within three years of their date of appointment. |
165
Chair | The Chair receives an annual fee for the performance of their role. This fee is agreed by the Committee and is paid to the Chair in cash, subject to the appropriate deductions. On appointment, the fee may be fixed for a specified period of time. Following the fixed period (if applicable) this fee will normally be reviewed annually. Changes in the fee are usually effective from 1 July. The fee may be denominated and paid in any currency the Committee determines. In determining the level of the fee for the Chair the Committee considers: ● The time commitment and other requirements of the role; ● The performance and experience of the Chair; ● Internal relativities; ● Company financial performance; and ● Market data. The Chair is not eligible to participate in annual bonus plans or long-term incentive plans. | The Chair may be offered benefits including: ● Health and wellness benefits; ● Protection and security benefits; ● Transport benefits; ● Reimbursement of business expenses (and any associated tax liabilities) incurred when travelling overseas in performance of duties; and ● Relocation and location-specific benefits (where appropriate). If as a consequence of the Company’s corporate structure, the Chair is required to prepare personal tax returns in Hong Kong and/or the UK, in addition to preparing their personal tax return for the jurisdiction which is their place of residence, the Company will reimburse the costs of personal tax return preparation for whichever locations are not their place of residence (including payment of any tax cost associated with the provision of the benefit). The maximum paid will be the cost to the Company of providing these benefits. The Chair is not eligible to receive a pension allowance or to participate in the Group’s employee pension schemes. | Under the Articles of Association, the Chair is required to hold at least 2,500 shares and has one year, from their date of appointment to the Board, to acquire these. The Chair has a share ownership guideline. This is currently one times the annual fee and it is normally expected that this level of share ownership would be attained within five years of the date of appointment. |
Recruitment of a new Chair or Non-executive Director
The fees for a new Non-executive Director will be consistent with the current basic fee paid to other Non-executive Directors (as set out in the Annual report on remuneration for that year) and will be reflective of their additional responsibilities as chair and/or members of Board committees and any additional roles.
The fee for a new Chair will be set with reference to the time commitment and other requirements of the role, the experience of the candidate, as well as internal relativities among the other Executive and Non-executive Directors. To provide context for this decision, data would be sought for suitable market reference point(s).
Notice periods – Non-executive Directors and Chair
Non-executive Directors are appointed pursuant to letters of appointment with notice periods of six months without liability for compensation. A contractual notice period of 12 months by either party applies for the current Non-executive Chair. The notice period for a new Chair may be set at six months. The Chair and Non-executive Directors would not be entitled to any payments for loss of office. Details of the individual appointments of the Chair and Non-executive Directors are set out in the ‘Letters of appointment of the Chair and Non-executive Directors’ section of the Annual report on remuneration.
For information on the terms of appointment for the Chair and Non-executive Directors please see the Governance section.
166
Additional remuneration disclosures
Directors’ outstanding long-term incentive awards and other share awards
The table below sets out Executive Directors’ PLTIP awards.
Share-based long-term incentive awards
| | | | | | | | | | | | | | | | | | | | | | | | |
|
| |
| |
| Conditional |
| |
|
|
| |
| |
|
| | | | |
| |
| |
| | | | | | share | | | | | | | | | | | | | | | | | | |
| | | | | | awards | | | | | | | | | | | | Conditional | | | | Conditional | | |
| | | | | | outstanding | | | | | | | | | | | | shares | | Rights | | share | | |
| | | | | | at 1 Jan | | | | Market | | Dividend | | | | | | awards | | lapsed | | awards | | Date of |
| | | | | | 2022 | | Conditional | | price at | | equivalents | | Rights | | Rights | | outstanding | | in 2022 | | outstanding | | end of |
| | Plan | | Year of | | and at 31 | | awards in | | date of | | on vested | | exercised in | | lapsed in | | on date of | | following | | at 31 December | | performance |
| | name | | award | | March 20222 | | 2022 | | award | | shares1 | | 2022 | | 2022 | | retirement2 | | retirement | | 2022 | | period |
| | | | |
| (Number of shares) |
| (Number of shares) |
| (pence) |
| (Number of shares released) | | | | |
| (Number of shares) |
| |
| (Number of shares) |
| |
Mark FitzPatrick |
| PLTIP |
| 2019 |
| 147,235 |
| |
| 1605.5 | | 1,680 |
| 26,134 |
| 121,101 | | | | |
| | | 31 Dec 21 |
|
| PLTIP |
| 2020 |
| 180,972 |
| |
| 1049.5 |
|
|
|
| |
| | | | |
| 180,972 | | 31 Dec 22 |
|
| PLTIP |
| 2021 |
| 130,467 |
| |
| 1495.5 |
|
|
|
| |
| | | | |
| 130,467 | | 31 Dec 23 |
| | PLTIP | | 2022 | | | | 182,131 | | 1133.5 | | | | | | | | | | | | 182,131 | | 31 Dec 24 |
|
| PLTIP |
| 2022 |
| |
| 270,126 |
| 1030.0 |
|
|
|
| |
| | | | |
| 270,126 | | 31 Dec 24 |
|
| | | | | 458,674 |
| 452,257 |
| |
| 1,680 |
| 26,134 | | 121,101 | | | | |
| 763,696 | | |
James Turner |
| PLTIP |
| 2019 |
| 123,600 |
| |
| 1605.5 | | 1,410 | | 21,939 |
| 101,661 | | | | |
| | | 31 Dec 21 |
|
| PLTIP |
| 2020 |
| 183,500 |
| |
| 1049.5 |
|
|
|
| |
| | | | |
| 183,500 | | 31 Dec 22 |
|
| PLTIP |
| 2021 |
| 114,934 |
| |
| 1495.5 |
|
|
|
| |
| | | | |
| 114,934 | | 31 Dec 23 |
|
| PLTIP |
| 2022 |
| |
| 182,217 |
| 1133.5 |
|
|
|
| |
| | | | |
| 182,217 | | 31 Dec 24 |
|
| | | | | 422,034 |
| 182,217 |
| | | 1,410 |
| 21,939 | | 101,661 | | | | |
| 480,651 | | |
Mike Wells2 |
| PLTIP |
| 2019 |
| 356,155 |
| |
| 1605.5 | | 4,066 | | 63,218 |
| 292,937 | | | | |
| | | 31 Dec 21 |
|
| PLTIP |
| 2020 |
| 437,762 |
| |
| 1049.5 |
|
|
|
| |
| | 437,762 | | 133,955 |
| 303,807 | | 31 Dec 22 |
|
| PLTIP |
| 2021 |
| 315,596 |
| |
| 1495.5 |
|
|
|
| |
| | 315,596 | | 201,666 |
| 113,930 | | 31 Dec 23 |
|
| | | | | 1,109,513 |
| |
| | | 4,066 |
| 63,218 | | 292,937 | | 753,358 | | 335,621 |
| 417,737 | | |
Notes
1. | A dividend equivalent was accumulated on these awards. |
2. | Mike Wells stepped down from his role as Group Chief Executive on 1 April 2022 and retired from the Company on 14 July 2022. |
Other share awards
The table below sets out Executive Directors’ deferred bonus share awards.
| | | | | | | | | | | | | | | | | | | | | | | | |
|
| |
| Conditional |
| |
| |
| |
| Conditional |
| | | Conditional |
| |
| |
| |
| Market |
| | | | share | | | | | | | | share | | Dividends |
| share | | | | | | | | price at |
| | | | awards | | | | | | | | awards | | accumulated | | awards | | Date of | | | | Market | | date of |
| | | | outstanding | | | | Dividends | | Shares | | outstanding | | in 2022 | | outstanding | | end of | | | | price at | | vesting |
| | | | at 1 Jan | | Conditionally | | accumulated in | | released in | | on date of | | post 31 March | | at 31 December | | restricted | | Date of | | date of | | or |
| | Year of grant | | 2022 | | awarded in 20223 | | 20221 | | 2022 | | retirement2 | | 20221 | | 2022 | | period | | release | | award | | release |
| | | | (Number of shares) | | (Number of shares) | | (Number of shares) | | (Number of shares) | | (Number of shares) | | (Number of shares) | | (Number of shares) | | | |
| | (pence) | | (pence) |
Mark FitzPatrick |
| | |
|
|
|
|
|
|
|
|
|
| | |
|
|
|
|
|
|
|
|
|
Deferred 2018 annual incentive award |
| 2019 | | 40,926 |
| |
|
|
| 40,926 |
|
|
| | | | | |
| 31 Dec 21 |
| 1605.5 |
| 1129.5 |
Deferred 2019 annual incentive award |
| 2020 | | 51,973 |
| |
| 830 |
|
|
| |
| | | 52,803 | | |
| 31 Dec 22 |
| 1,047 |
|
|
Deferred 2020 annual incentive award |
| 2021 | | 25,459 |
| |
| 406 |
|
|
| |
| | | 25,865 | | |
| 31 Dec 23 |
| 1495.5 |
|
|
Deferred 2021 annual incentive award |
| 2022 | | |
| 47,926 |
| 765 |
|
|
| |
| | | 48,691 | | |
| 31 Dec 24 |
| 1133.5 |
|
|
|
| | | 118,358 |
| 47,926 |
| 2,001 |
| 40,926 | | |
| | | 127,359 | | | | | | | | |
James Turner |
| | | |
|
|
|
|
|
|
| |
| | | | |
|
|
|
|
|
|
|
Deferred 2018 annual incentive award |
| 2019 | | 26,166 |
| |
| |
| 26,166 |
| |
| | | | | |
| 31 Dec 21 |
| 1605.5 |
| 1129.5 |
Deferred 2019 annual incentive award |
| 2020 | | 44,883 |
| |
| 717 |
| |
| |
| | | 45,600 | | |
| 31 Dec 22 |
| 1,047 |
|
|
Deferred 2020 annual incentive award | | 2021 | | 25,789 | | | | 411 | | | | | | | | 26,200 | | | | 31 Dec 23 | | 1495.5 | | |
Deferred 2021 annual incentive award |
| 2022 | | |
| 43,622 |
| 696 |
| |
| |
| | | 44,318 | | |
| 31 Dec 24 |
| 1133.5 |
|
|
|
| | | 96,838 |
| 43,622 |
| 1,824 |
| 26,166 | | |
| | | 116,118 | | | | | | | | |
Mike Wells2 |
| | | |
|
|
|
|
|
|
|
|
| | | | |
|
|
|
|
|
|
|
Deferred 2018 annual incentive award |
| 2019 | | 70,354 |
| |
|
|
| 70,354 |
| 70,354 |
| | | | | |
| 31 Dec 21 |
| 1605.5 |
| |
Deferred 2019 annual incentive award |
| 2020 | | 89,269 |
| |
| |
|
|
| 89,269 |
| 1,426 | | 90,695 | | |
| 31 Dec 22 |
| 1,047 |
|
|
Deferred 2020 annual incentive award |
| 2021 | | 29,089 |
| |
| |
|
|
| 29,089 |
| 464 | | 29,553 | | |
| 31 Dec 23 |
| 1495.5 |
|
|
Deferred 2021 annual incentive award |
| 2022 | | |
| 78,771 |
| |
|
|
| |
| 1,259 | | 80,030 | | |
| 31 Dec 24 |
| 1133.5 |
|
|
|
| | | 188,712 |
| 78,771 |
| |
| 70,354 | | 188,712 |
| 3,149 | | 200,278 | | | | | | | | |
Notes
1. | A dividend equivalent was accumulated on these awards. |
2. | Mike Wells stepped down from his role as Group Chief Executive on 1 April 2022 and subsequently retired from the business on 14 July 2022. |
3. | For Mike Wells, the 2022 award was granted after he stepped down from his role as Group Chief Executive on 1 April 2022 in respect of the deferred portion of his 2021 AIP. |
167
All-employee share plans
It is important that all employees are offered the opportunity to own shares in Prudential, connecting them both to the success of the Company and to the interests of other shareholders. Executive Directors are invited to participate in these plans on the same basis as other staff in their location.
Save As You Earn (SAYE) schemes
UK-based Executive Directors are normally eligible to participate in the HM Revenue and Customs (HMRC) approved Prudential Savings-Related Share Option Scheme. This scheme allows all eligible employees to save towards the exercise of options over Prudential plc shares with the option price set at the beginning of the savings period at a discount of up to 20 per cent of the market price.
Since 2014, participants have been able to elect to enter into savings contracts of up to £500 per month for a period of three or five years. At the end of this term, participants may exercise their options within six months and purchase shares. If an option is not exercised within six months, participants are entitled to a refund of their cash savings plus interest if applicable under the rules. Shares are issued to satisfy those options which are exercised. No options may be granted under the schemes if the grant would cause the number of shares which have been issued, or which remain issuable pursuant to options granted in the preceding 10 years under the scheme and any other option schemes operated by the Company, or which have been issued under any other share incentive scheme of the Company, to exceed 10 per cent of the Company’s ordinary share capital at the proposed date of grant.
Details of Executive Directors’ rights under the SAYE scheme are set out in the ‘Outstanding share options’ table.
Share Incentive Plan (SIP)
UK-based Executive Directors are also eligible to participate in the Company’s Share Incentive Plan (SIP). Since April 2014, all UK-based employees have been able to purchase Prudential plc shares up to a value of £150 per month from their gross salary (partnership shares) through the SIP. For every four partnership shares bought, an additional matching share is awarded which is purchased by Prudential plc on the open market. Dividend shares accumulate while the employee participates in the plan. If the employee withdraws from the plan, or leaves the Group, matching shares may be forfeited.
The table below provides information about shares purchased under the SIP together with matching shares and dividend shares.
| | | | | | | | | | | | |
|
| |
| Share Incentive |
| Partnership |
| Matching |
| Dividend |
| Share Incentive |
| | | | Plan awards held | | shares | | shares | | shares | | Plan awards held |
| | Year of initial | | in Trust | | accumulated | | accumulated | | accumulated | | in Trust |
| | participation | | at 1 Jan 2022 | | in 2022 | | in 2022 | | in 2022 | | at 31 December 2022 |
| |
| | (Number of | | (Number of | | (Number of | | (Number of | | (Number of |
| | | | shares) | | shares) | | shares) | | shares) | | shares) |
Mark FitzPatrick |
| 2017 |
| 731 |
| 176 |
| 44 |
| 11 |
| 962 |
James Turner |
| 2011 |
| 856 |
| — |
| — |
| 12 |
| 868 |
|
| |
| |
| |
| Partnership |
| |
| Matching |
| Dividend |
| |
| | | | | | | | shares | | | | shares | | shares | | |
| | | | Share | | Partnership | | accumulated | | Matching | | accumulated | | accumulated | | Share |
| | | | Incentive | | shares | | between | | shares | | between | | between 1 | | Incentive |
| | | | Plan awards | | accumulated | | 1 April 2022 and | | accumulated | | 1 April 2022 and | | April 2022 and | | Plan awards |
| | Year of initial | | held in Trust | | up to | | date of | | up to | | date of | | or date of | | held in Trust at |
| | participation | | at 1 Jan 2022 | | 31 March 2022 | | retirement | | 31 March 2022 | | retirement | | retirement | | date of retirement |
|
| |
| (Number of |
| (Number of |
| (Number of |
| (Number of |
| (Number of |
| (Number of | | (Number of |
Mike Wells1 |
| 2015 |
| 1,088 |
| 39 |
| 59 |
| 10 |
| 14 |
| 10 |
| 1,220 |
Note
1. | Outstanding awards for Mike Wells are as stated at 31 March 2022 and as at date of retirement. |
This information has been prepared in line with the reporting requirements of the Hong Kong Stock Exchange and sets out Executive Directors' outstanding share awards and all employee share plan options.
Dilution
Dilution Releases from the Prudential Long Term Incentive Plan and the Prudential Agency Long Term Incentive Plan are satisfied using new issue shares rather than by purchasing shares in the open market. Shares relating to options granted under all-employee share plans are also satisfied by new issue shares. The combined dilution from all outstanding shares and options at 31 December 2022 was 0.32 per cent of the total share capital at the time. Deferred bonus awards will continue to be satisfied by the purchase of shares in the open market.
168
Share Ownership
Directors shareholdings
The current shareholding policy and the interests of directors in ordinary shares of Prudential are shown under the sections ‘Compensation Shareholding guidelines’ and ‘Compensation Directors’ Shareholdings’ above.
Prudential is not owned or controlled directly or indirectly by another corporation or by any government or by any other natural or legal person severally or jointly and Prudential does not know of any arrangements that might result in a change in Prudential’s control.
As of 28 February 2023, Prudential’s executive director did not have any options or rights to purchase securities from Prudential’s options and other share awards.
Outstanding options of directors and other executive officers
The SAYE schemes are open to all UK and certain overseas employees. Options under the UK scheme up to HM Revenue & Customs (HMRC) limits are granted at a 20 per cent discount and cannot normally be exercised until a minimum of three years has elapsed. No payment is made for the grant of any options.
The share options held by the directors and other executive officers as at the end of period are shown under the section ‘Compensation Outstanding share options’ above.
Options to purchase and discretionary awards of securities from Prudential
As of 22 March 2023, 98,053 options were outstanding, which Prudential issued under the SAYE schemes. As described above in ‘Outstanding options of directors and other executive officers’, each option represents the right of the bearer to subscribe for one share at a particular pre-determined exercise price at a pre-set exercise date.
As of 22 March 2023, 17,341,921 shares were outstanding under other awards. Of those 748,959 shares outstanding under the Annual Incentive Plan, 540,632 shares were outstanding under the Restricted Share Plan, 4,104,310 shares were outstanding under the PLTIP, 832,298 shares were outstanding under the Deferred Share Plans, 8,414,694 shares were outstanding under the PAA LTIP and 2,701,028 shares were outstanding under the Prudential Agency Long Term Incentive Plan. Such outstanding awards held by directors or other executive officers at 31 December 2022 are included under ‘Long-term incentive plans’ in the ‘Compensation’ section above.
The aggregate proceeds that would arise if all outstanding options under the SAYE schemes were exercised is £0.854 million. The latest expiration dates for exercise or release of the securities underlying the options or awards and the number of options or shares are set out in the table below.
| | | | | | |
|
| Options Outstanding |
| |
| |
| | Under Savings Related | | Shares Outstanding | | |
| | Share Option Scheme | | Under Other Awards | | Total |
Year of Expiration | | (in millions) | | (in millions) | | (in millions) |
2023 |
| 0.028 |
| 9.470 |
| 9.498 |
2024 |
| 0.005 |
| 4.911 |
| 4.916 |
2025 |
| 0.050 |
| 2.957 |
| 3.007 |
2026 |
| 0.003 |
| 0.003 |
| 0.006 |
2027 |
| 0.012 |
| — |
| 0.012 |
2028 |
| — |
| — |
| — |
Total |
| 0.098 |
| 17.341 |
| 17.439 |
Information concerning the Group’s share award and share option plans for its employees is provided above as well as in note B2.2 to the consolidated financial statements.
169
Employees
The average number of staff employed by the Group, for the following years were:
| | | | | | |
|
| 2022 |
| 2021 |
| 2020 |
Asia and Africa operationsnote (i) |
| 13,685 |
| 13,237 |
| 12,949 |
Head office function |
| 511 |
| 600 |
| 657 |
Total continuing operations |
| 14,196 |
| 13,837 |
| 13,606 |
Discontinued US operationsnote (ii) |
| — |
| 3,306 |
| 3,650 |
Total Group |
| 14,196 |
| 17,143 |
| 17,256 |
Notes
(i)The Asia and Africa operations staff numbers above exclude 744 commission-based sales staff (2021: 440; 2020: 502) who have an employment contract with the Company.
(ii)The ‘Head office function’ staff numbers include staff based in London and Hong Kong.
(iii)Average staff numbers of the discontinued US operations were for the period up to the demerger in September 2021.
At 31 December 2022, Prudential had:
-2 employees paying union subscriptions through the payroll in the UK.
-892 temporary employees in Asia and Africa and none in head office functions.
-752 fixed term contractors in Asia and Africa and 22 in head office functions.
170
ADDITIONAL INFORMATION
Risk Factors
A number of risk factors may affect the financial condition, results of operations and/or prospects of Prudential and its wholly and jointly owned businesses, as a whole, and, accordingly, the trading price of Prudential’s shares. The risk factors mentioned below should not be regarded as a complete, exhaustive and comprehensive statement of all potential risks and uncertainties. The information given is as of the date of this document, and any forward-looking statements are made subject to the factors specified under ‘Forward-looking statements’.
SUMMARY RISK FACTORS
The following is a summary of the risk factors that may affect Prudential. Further discussion of each of these risk factors is provided below.
RISKS RELATING TO PRUDENTIAL’S FINANCIAL SITUATION (including those from the external macroeconomic and geopolitical environment)
The global economic and geopolitical environment may impact on the Group directly by affecting trends in financial markets and asset values, as well as driving short-term volatility.
Risks in this category include the market risks to our investments and the credit quality of our investment portfolio as well as liquidity risk.
– | Prudential’s businesses are inherently subject to market fluctuations and general economic conditions, each of which may adversely affect the Group’s business, financial condition, results of operations and prospects. |
– | Geopolitical and political risks and uncertainty may adversely impact economic conditions, increase market volatility and regulatory compliance risks, cause operational disruption to the Group and impact the implementation of its strategic plans, which could have adverse effects on Prudential’s business, financial condition, results of operations and prospects. |
– | Covid-19 continues to have the potential to impact financial market volatility and global economic activity, increase operational disruption risks for businesses and adversely impact Prudential's sales in affected markets and its financial condition, results of operations and prospects. |
– | As a holding company, Prudential is dependent upon its subsidiaries to cover operating expenses and dividend payments. |
– | Prudential is subject to the risk of potential sovereign debt credit deterioration owing to the amounts of sovereign debt obligations held in its investment portfolio. |
– | Downgrades in Prudential’s financial strength and credit ratings could significantly impact its competitive position and damage its relationships with creditors or trading counterparties. |
– | Prudential is subject to the risk of exchange rate fluctuations owing to the geographical diversity of its businesses. |
RISKS RELATING TO SUSTAINABILITY AND ENVIRONMENTAL, SOCIAL AND GOVERNANCE (‘ESG’) MATTERS
These include sustainability risks associated with environmental considerations such as climate change (including physical and transition risks), social risks arising from diverse stakeholder commitments and expectations and governance-related risks.
– | The failure to understand and respond effectively to the risks associated with ESG factors could adversely affect Prudential’s achievement of its long-term strategy. |
RISKS RELATING TO PRUDENTIAL’S BUSINESS ACTIVITIES AND INDUSTRY
These include the Group’s non-financial risks (including operational and financial crime risk), transformation risks from significant change activity and the insurance risks assumed by the Group in providing its products.
– | The implementation of large-scale transformation, including complex strategic initiatives, gives rise to significant design and execution risks and may affect Prudential’s operational capability and capacity. Failure of these initiatives to meet their objectives may adversely impact the Group and the delivery of its strategy. |
– | Prudential’s businesses are conducted in highly competitive environments with rapidly developing demographic trends. The profitability of the Group’s businesses depends on management’s ability to respond to these pressures and trends. |
– | Adverse experience in the operational risks inherent in Prudential’s business, and those of its material outsourcing partners, could disrupt its business functions and have a negative impact on its business, financial condition, results of operations and prospects. |
– | Attempts to access or disrupt Prudential’s technology systems, and loss or misuse of personal data, could result in loss of trust from Prudential’s customers and employees and reputational damage, which could have material adverse effects on the Group’s business, financial condition, results of operations and prospects. |
– | Prudential’s digital platforms may heighten existing business risks to the Group or introduce new risks as the markets in which it operates, and its partnerships and product offerings evolve. |
– | Prudential operates in certain markets with joint venture partners and other shareholders and third parties. These businesses face the same risks as the rest of the Group and also give rise to certain risks to Prudential that the Group does not face with respect to its wholly owned subsidiaries. |
– | Adverse experience relative to the assumptions used in pricing products and reporting business results could significantly affect Prudential’s business, financial condition, results of operations and prospects. |
RISKS RELATING TO LEGAL AND REGULATORY REQUIREMENTS
These include risks associated with prospective regulatory and legal changes and compliance with existing regulations and laws – including their retrospective application – with which the Group must comply in the conduct of its business.
– | Prudential conducts its businesses subject to regulation and associated regulatory risks, including a change to the basis in the regulatory supervision of the Group, the effects of changes in the laws, regulations, policies and their interpretations and any accounting standards in the markets in which it operates. |
– | The conduct of business in a way that adversely impacts the fair treatment of customers could have a negative impact on Prudential’s business, financial condition, results of operations and prospects or on its relations with current and potential customers. |
– | Litigation, disputes and regulatory investigations may adversely affect Prudential’s business, financial condition, cash flows, results of operations and prospects. |
– | Changes in tax legislation may result in adverse tax consequences for the Group’s business, financial condition, results of operations and prospects. |
171
1.RISKS RELATING TO PRUDENTIAL’S FINANCIAL SITUATION
1.1 | Prudential’s businesses are inherently subject to market fluctuations and general economic conditions, each of which may adversely affect the Group’s business, financial condition, results of operations and prospects. |
Uncertainty, fluctuations or negative trends in global and national macroeconomic conditions and investment climates could have a material adverse effect on Prudential’s business and profitability. Prudential operates in a macroeconomic and global financial market environment that has materially changed in recent periods. This presents significant uncertainties and potential challenges. For example, the rise in energy and commodity prices, exacerbated by the Russia-Ukraine conflict and global supply chain stresses, has contributed to the current inflationary environment. This has resulted in central banks, led by the US, rapidly tightening financial conditions with potential for further increases in interest rates in major global economies and the markets in which the Group operates, adversely impacting the valuation of fixed income assets and future profits due to the use of higher discount rates. In addition, the rising rates for developed economies have also led to weakened exchange rates of a number of emerging economies in which the Group operates, adversely impacting Prudential’s consolidated financial statements upon the translation of results into US dollar, the Group’s reporting currency. Other market uncertainties also include the impact of factors such as the nature and extent of central banks and governments actions in response to the inflationary environment, and the rapid relaxation of the Chinese Mainland’s zero tolerance Covid-19 policy as well as border reopening. These uncertainties may apply for a prolonged period of time. The transition to a lower carbon economy, the timing and speed of which is uncertain and will vary by country, may also result in greater uncertainty, fluctuations or negative trends in asset valuations and reduced liquidity, particularly for carbon intensive sectors, and will have a bearing on inflation levels.
The uncertain macroeconomic and financial market environment may have a number of adverse impacts on the business, financial condition and results of the Group, including increased strategic, business, insurance, product and customer conduct risks. In general, upheavals in the financial markets may affect general levels of economic activity, employment and customer behaviour. As a result, insurers may experience an elevated incidence of claims, frauds, lapses, or surrenders of policies, and some policyholders may choose to defer or stop paying insurance premiums or reduce deposits into retirement plans. Uncertainty over livelihoods, elevated cost of living and challenges in affordability may adversely impact the demand for insurance products, and increase regulatory risk in meeting regulatory definitions and expectations with respect to vulnerable customers (see risk factor 3.8). In addition, there may be a higher incidence of counterparty failures. If sustained, this environment is likely to have a negative impact on the insurance sector over time and may consequently have a negative impact on Prudential’s business, balance sheet and profitability. For example, this could occur if the recoverable value of intangible assets for bancassurance agreements and deferred acquisition costs are reduced. New challenges related to market fluctuations and general economic conditions may continue to emerge. For example, sustained inflationary pressures driving interest rates to even higher levels may lead to increased lapses for some guaranteed savings products where higher levels of guarantees are offered by products of the Group’s competitors, reflecting consumer demand for returns at the level of, or exceeding, inflation. High inflation, combined with an economic downturn or recession, may also result in affordability challenges, adversely impacting the ability of consumers to purchase insurance products. Rising inflation, via medical claims inflation (with rising medical import prices a factor under current market conditions), may adversely impact the profitability of the Group’s businesses.
Global financial markets are subject to uncertainty and volatility created by a variety of factors. These factors include actual or expected changes in monetary policy in the Chinese Mainland, the US and other jurisdictions together with their impact on base interest rates and the valuation of all asset classes and inflation expectations; slowdowns or reversals in world or regional economic growth (particularly where this is abrupt, as has been the case with the impact of the Russia-Ukraine conflict and geopolitical tensions); sector-specific slowdowns or deteriorations which have the potential to have contagion impacts (such as the negative developments in the Chinese Mainland property sector); fluctuations in global energy prices; and concerns over sovereign debt. Other factors include fluctuations in global commodity prices, concerns on the serviceability of sovereign debt in certain economies (particularly as central banks continue to raise rates in response to high inflation and the high indebtedness across sub-Saharan Africa countries), the increased level of geopolitical and political risk and policy-related uncertainty (including those resulting from the Russia-Ukraine conflict and the uncertainty and potential impact on business sentiment and the broader market resulting from the relaxation of pandemic-related restrictions, and border reopening, as well as regulatory tightening across sectors in the Chinese Mainland) and socio-political, climate-driven and pandemic events. The extent of the financial market and economic impact of these factors may be highly uncertain and unpredictable and influenced by the actions, including the duration and effectiveness of mitigating measures of governments, policymakers and the public.
172
The adverse effects of such factors could be felt principally through the following items:
– | Changes to interest rates could reduce Prudential’s capital strength and impair its ability to write significant volumes of new business. Increases in interest rates could adversely impact the financial condition of the Group through changes in the present value of future fees for unit-linked based businesses and/or the present value of future profits for accident and health products; and/or reduce the value of its assets and/or have a negative impact on its assets under management and profit. Decreases in interest rates could increase the potential adverse impact of product guarantees included in non-unit-linked products with a savings component; reduce investment returns arising on the Group’s portfolios; impact the valuation of debt securities; and/or increase reinvestment risk for some of the Group’s investments from accelerated prepayments and increased redemptions. |
– | A reduction in the financial strength and flexibility of corporate entities, as experienced by a number of issuers within the Chinese Mainland property sector, which may deteriorate the credit rating profile and valuation of the Group’s invested credit portfolio (and which may result in an increase in regulatory capital requirements for the Group or its businesses), increased credit defaults and debt restructurings and wider credit and liquidity spreads resulting in realised and unrealised credit losses. Regulations imposing or increasing restrictions on the amount of company debt financing, such as those placing limits on debt or liability ratios, may also reduce the financial flexibility of corporate entities. Similarly, securitised assets in the Group's investment portfolio are subject to default risk and may be adversely impacted by delays or failures of borrowers to make payments of principal and interest when due. Where a widespread deterioration in the financial strength of corporate entities occurs, any assumptions on the ability and willingness of governments to provide financial support may need to be revised. |
– | Failure of, or legal, regulatory or reputational restrictions on the Group’s ability to deal with, counterparties who have transactions with Prudential (such as banks, reinsurers and counterparties to cash management and risk transfer or hedging transactions) to meet commitments could give rise to a negative impact on Prudential’s financial position and on the accessibility or recoverability of amounts due or the adequacy of collateral. Geographic or sector concentrations of counterparty credit risk could exacerbate the impact of these events where they materialise. |
– | Estimates of the value of financial instruments becoming more difficult because in certain illiquid, volatile or closed markets, determining the value at which financial instruments can be realised is highly subjective. Processes to ascertain such values require substantial elements of judgement, assumptions and estimates (which may change over time). Where the Group is required to sell its investments within a defined timeframe, such market conditions may result in the sale of these investments at below expected or recorded prices. |
– | Illiquidity of the Group’s investments. The Group holds certain investments that may, by their nature, lack liquidity or have the potential to lose liquidity rapidly, such as investment funds (including money market funds), privately placed fixed maturity securities, mortgage loans, complex structured securities and alternative investments. If these investments were required to be liquidated on short notice, the Group may experience difficulty in doing so and may be forced to sell them at a lower price than it otherwise would have been able to realise. |
– | A reduction in revenue from the Group’s products where fee income is linked to account values or the market value of the funds under management. Sustained inflationary pressures which may drive higher interest rates may also impact the valuation of fixed income investments and reduce fee income. |
– | Increased illiquidity, which includes the risk that expected cash inflows from investments and operations will not be adequate to meet the Group’s anticipated short-term and long-term policyholder benefits and expense payment obligations. Increased illiquidity also adds to the uncertainty over the accessibility of financial resources which in extreme conditions could impact the functioning of markets and reduce capital resources as valuations decline. This could occur where external capital is unavailable at sustainable cost, increased liquid assets are required to be held as collateral under derivative transactions or redemption restrictions are placed on Prudential’s investments in illiquid funds. In addition, significant redemption requests could also be made on Prudential’s issued funds and while this may not have a direct impact on the Group’s liquidity, it could result in reputational damage to Prudential. The potential impact of increased illiquidity is more uncertain than for other risks such as interest rate or credit risk. |
For some non-unit-linked products with a savings component it may not be possible to hold assets which will provide cash flows to match those relating to policyholder liabilities. This may particularly be the case in those markets where bond markets are less developed or where the duration of policyholder liabilities is longer than the duration of bonds issued and available in the market, and in certain markets where regulated premium and claim values are set with reference to the interest rate environment prevailing at the time of policy issue. This results in a mismatch due to the duration and uncertainty of the liability cash flows and the lack of sufficient assets of a suitable duration. While this residual asset/liability mismatch risk can be managed, it cannot be eliminated. If interest rates in these markets are lower than those used to calculate premium and claim values over a sustained period, this could have a material adverse effect on Prudential’s reported profit and the solvency of its business units. In addition, part of the profit from the Group’s operations is related to bonuses for policyholders declared on with-profits products, which are impacted by the difference between actual investment returns of the with-profits fund (which are broadly based on historical and current rates of return on equity, real estate and fixed income securities) and minimum guarantee rates offered to policyholders. This profit could be lower in particular in a sustained low interest rate environment.
Any of the foregoing factors and events, individually or together, could have a material adverse effect on Prudential’s business, financial condition, results of operations and prospects.
173
1.2 | Geopolitical and political risks and uncertainty may adversely impact economic conditions, increase market volatility and regulatory compliance risks, cause operational disruption to the Group and impact the implementation of its strategic plans, which could have adverse effects on Prudential’s business, financial condition, results of operations and prospects. |
The Group is exposed to geopolitical and political risks and uncertainty in the diverse markets in which it operates. Such risks may include:
– | The application of government regulations, executive powers, protectionist or restrictive economic and trade policies or measures adopted by businesses or industries which increase trade barriers or restrict trade, sales, financial transactions, or the transfer of capital, investment, data or other intellectual property, with respect to specific territories, markets, companies or individuals; |
– | An increase in the volume and pace of domestic regulatory changes, including those applying to specific sectors; |
– | The increased adoption or implementation of laws and regulations which may purport to have extra-territorial application; |
– | International trade disputes such as the implementation of trade tariffs; |
– | Withdrawals or expulsions from existing trading blocs or agreements or financial transaction systems, including those which facilitate cross-border payments; |
– | The domestic application of measures restricting national airspace with respect to aircraft of specific territories, markets, companies or individuals; |
– | Measures favouring local enterprises, such as changes to the maximum level of non-domestic ownership by foreign companies or differing treatment of foreign-owned businesses under regulations and tax rules; and |
– | Measures which require businesses of overseas companies to operate through locally incorporated entities or with requirements on minimum local representation on executive or management committees. |
The above measures may have an adverse impact on Prudential through their effects on the macroeconomic outlook and the environment for global regional and national financial markets. They may also increase uncertainties and long-term complexity of legal and regulatory compliance, and result in heightened sanctions risk driven by geopolitical conflicts, as well as increase reputational risks, or may adversely impact Prudential where they apply to, and impact, the economic, business, legal and regulatory environment in specific markets or territories in which the Group, its joint ventures or jointly owned businesses, sales and distribution networks, or third-party service providers have operations. For internationally active groups such as Prudential, operating across multiple jurisdictions, such measures may also add to the complexity of legal and regulatory compliance and increase the risk of conflicts between the requirements of one jurisdiction and another. See risk factor 4.1 below.
Geopolitical and political risks and uncertainty may also adversely impact the Group’s operations and its operational resilience. Increased geopolitical tensions may increase domestic and cross-border cyber intrusion activity and therefore increase cyber security risks. Geopolitical and political tensions may also lead to conflict, civil unrest and/or acts of civil disobedience. Such events could impact operational resilience by disrupting Prudential’s systems, operations, new business sales and renewals, distribution channels and services to customers, which may result in a reduction in contributions from business units to the central cash balances and profit of the Group, decreased profitability, financial loss, adverse customer impacts and reputational damage and may impact Prudential’s business, financial condition, results of operations and prospects.
Legislative or regulatory changes which adversely impact Hong Kong’s economy or its international trading and economic relationships, in particular, may result in adverse sales, operational and product distribution impacts to the Group due to the territory being a key market which also hosts Group head office functions.
1.3 | Covid-19 continues to have the potential to impact financial market volatility and global economic activity, increase operational disruption risks for businesses and adversely impact Prudential’s sales in affected markets and its financial condition, results of operations and prospects. |
Whilst most markets have moved to an endemic approach in managing Covid-19, the broader long-term macroeconomic impacts of Covid-19 continue to add uncertainty to the stability and outlook of equity markets, interest rates and credit spreads, and have the potential to affect market liquidity and reduce global economic activity. The potential adverse impacts to the Group of these effects are detailed in risk factor 1.1 above. Where measures to contain Covid-19 have been in effect, the level of sales activity in affected markets has been adversely impacted through a reduction in travel, and in agency and bancassurance activity. In particular, sales in the Group’s Hong Kong business have been adversely impacted by the border restrictions in place with the Chinese Mainland. The recent easing of pandemic-related restrictions and the reopening of borders may help with recovery in sales levels in Hong Kong, however, uncertainty remains on the return of Chinese Mainland customers as well as the resumption of their demand for the Group’s products in Hong Kong. The longer-term effects of Covid-19 have included, and may continue to include, latent morbidity impacts from the deferral of medical treatment by policyholders. It may be a factor in increasing morbidity claims and there may be implications from other factors such as long-term post-Covid-19 symptoms (although there is currently no consensus on the longer term impact on morbidity).
In response to previous pandemic-related restrictions, Prudential implemented changes to its sales and distribution processes in specific markets. These included virtual face-to-face sales of its products and the online recruitment, training and, where possible,
174
licensing of agents. Such changes may increase or introduce operational and regulatory risks, in particular those focused on customer outcomes and conduct. A failure to apply ongoing appropriate governance and management of these risks may adversely impact Prudential’s reputation and brand and the results of its operations. In markets where the level of sales under these processes is material or where such processes become permanent distribution channels, the commercial value of the Group’s existing sale and distribution arrangements, such as bancassurance arrangements, may be adversely impacted.
1.4 | As a holding company, Prudential is dependent upon its subsidiaries to cover operating expenses and dividend payments. |
The Group’s insurance and investment management operations are generally conducted through direct and indirect subsidiaries, which are subject to the risks discussed elsewhere in this ‘Risk Factors’ section.
As a holding company, Prudential’s principal sources of funds are remittances from subsidiaries, shareholder-backed funds, the shareholder transfer from long-term funds and any amounts that may be raised through the issuance of equity, debt and commercial paper.
Certain of Prudential’s subsidiaries are subject to insurance, asset management, foreign exchange and tax laws, rules and regulations (including in relation to distributable profits that can limit their ability to make remittances). In some circumstances, including where there are changes to general market conditions, this could limit Prudential’s ability to pay dividends to shareholders or to make available funds held in certain subsidiaries to cover operating expenses of other members of the Group.
A material change in the financial condition of any of Prudential’s subsidiaries may have a material effect on its business, financial condition, results of operations and prospects.
1.5 | Prudential is subject to the risk of potential sovereign debt credit deterioration owing to the amounts of sovereign debt obligations held in its investment portfolio. |
Investing in sovereign debt creates exposure to the direct or indirect consequences of geopolitical or political, social or economic changes (including changes in governments, heads of state or monarchs), military conflicts, pandemics and associated disruption, and other events affecting the markets in which the issuers of such debt are located and the creditworthiness of the sovereign. Investment in sovereign debt obligations involves risks not present in debt obligations of corporate issuers. In addition, the issuer of the debt or the governmental authorities that control the repayment of the debt may be unable or unwilling to repay principal or pay interest when due (or in their agreed currency) in accordance with the terms of such debt, and Prudential may have limited recourse to compel payment in the event of a default. A sovereign debtor’s willingness or ability to repay principal and to pay interest in a timely manner may be affected by, among other factors, its cash flow situation, its relations with its central bank, the extent and availability of its foreign currency reserves, the availability of sufficient foreign exchange on the date a payment is due, the relative size of the debt service burden to the economy as a whole, the sovereign debtor’s policy toward local and international lenders, geopolitical tensions and conflicts and the political constraints to which the sovereign debtor may be subject.
Moreover, governments may use a variety of techniques, such as intervention by their central banks or imposition of regulatory controls or taxes, to devalue their currencies’ exchange rates, or may adopt monetary, fiscal and other policies (including to manage their debt burdens) that have a similar effect, all of which could adversely impact the value of an investment in sovereign debt even in the absence of a technical default. Periods of economic uncertainty may affect the volatility of market prices of sovereign debt to a greater extent than the volatility inherent in debt obligations of other types of issuers.
In addition, if a sovereign default or other such events described above were to occur, as has happened on certain occasions in the past, other financial institutions may also suffer losses or experience solvency or other concerns, which may result in Prudential facing additional risks relating to investments in such financial institutions that are held in the Group’s investment portfolio. There is also risk that public perceptions about the stability and creditworthiness of financial institutions and the financial sector generally might be adversely affected as might counterparty relationships between financial institutions.
If a sovereign were to default on its obligations, or adopt policies that devalued or otherwise altered the currencies in which its obligations were denominated, this could have a material adverse effect on Prudential’s business, financial condition, results of operations and prospects.
175
1.6 | Downgrades in Prudential’s financial strength and credit ratings could significantly impact its competitive position and damage its relationships with creditors or trading counterparties. |
Prudential’s financial strength and credit ratings, which are used by the market to measure its ability to meet policyholder obligations, are an important factor affecting public confidence in Prudential’s products, and as a result its competitiveness. Downgrades in Prudential’s ratings as a result of, for example, decreased profitability, increased costs, increased indebtedness or other concerns could have an adverse effect on its ability to market products and retain current policyholders, as well as the Group’s ability to compete for acquisition and strategic opportunities. Downgrades may also impact the Group’s financial flexibility, including its ability to issue commercial paper at acceptable levels and pricing. The interest rates at which Prudential is able to borrow funds are affected by its credit ratings, which are in place to measure the Group’s ability to meet its contractual obligations.
In addition, changes in methodologies and criteria used by rating agencies could result in downgrades that do not reflect changes in the general economic conditions or Prudential’s financial condition.
In addition, any such downgrades could have a material adverse effect on Prudential’s business, financial condition, results of operations and prospects. Prudential cannot predict what actions rating agencies may take, or what actions Prudential may take in response to any such actions, which could adversely affect its business.
Any such downgrade of the Group could have an adverse effect on Prudential’s financial flexibility, requirements to post collateral under or in connection with transactions and ability to manage market risk exposures. In addition, the interest rates or other costs that the Group incurs in respect of its financing activities may increase as a result. A credit rating downgrade may also affect public confidence in the Group’s products and may adversely impact on its ability to market products, retain current policyholders or attract new policyholders.
1.7 | Prudential is subject to the risk of exchange rate fluctuations owing to the geographical diversity of its businesses. |
Due to the geographical diversity of Prudential’s businesses, Prudential is subject to the risk of exchange rate fluctuations. Prudential’s operations generally write policies and invest in assets denominated in local currencies. Although this practice limits the effect of exchange rate fluctuations on local operating results, it can lead to fluctuations in Prudential’s consolidated financial statements upon the translation of results into the Group’s presentation currency. This exposure is not currently separately managed. The Group presents its consolidated financial statements in US dollars. The results of some entities within the Group are not denominated in or linked to the US dollar and some enter into transactions which are conducted in non-US dollar currencies. Prudential is subject to the risk of exchange rate fluctuations from the translation of the results of these entities and non-US dollar transactions and the risks from the maintenance of the HK dollar peg to the US dollar. In cases where a non-US dollar denominated surplus arises in an operation which is to be used to support Group capital or shareholders’ interest (ie remittances), this currency exposure may be hedged where considered economically favourable. Prudential is also subject to the residual risks arising from currency swaps and other derivatives that are used to manage the currency exposure.
2. | RISKS RELATING TO SUSTAINABILITY AND ENVIRONMENTAL, SOCIAL AND GOVERNANCE (‘ESG’) MATTERS |
2.1 | The failure to understand and respond effectively to the risks associated with ESG factors could adversely affect Prudential’s achievement of its long-term strategy. |
A failure to manage the material risks associated with key ESG themes detailed below may undermine the Group from meeting its ESG commitments and the sustainability of Prudential by adversely impacting the Group’s reputation and brand, and its ability to attract and retain customers and employees, and therefore the results of its operations and delivery of its strategy and long-term financial success.
(a)Environmental risks
Environmental concerns, notably those associated with climate change and their social and economic impacts, present long-term risks to the sustainability of Prudential and may impact its customers and other stakeholders.
176
Prudential’s investment horizons are long-term, and it is therefore exposed to the potential long-term impact of climate change risks, which include the financial and non-financial impact of the transition to a lower carbon economy, physical, reputational and shareholder, customer or third-party litigation risks. The global transition to a lower carbon economy may have an adverse impact on investment valuations and liquidity as the financial assets of carbon intensive companies re-price, and this could result in some asset sectors facing significantly higher costs and a reduction in demand for their products and services. The speed of this transition, and the extent to which it is orderly and managed, will be influenced by factors such as changes in public policy, technology and market or investor sentiment. The potential impact of these factors on the valuation of investments may also have a broader economic impact that may adversely affect customers and their demand for the Group’s products. Direct physical and other risks from climate change and the transition to a lower carbon economy have the potential to disproportionately impact the Asia and Africa markets in which Prudential operates and invests, and the Group’s stakeholders increasingly expect and/or rely on the Group to support an orderly, inclusive and sustainable transition based on an understanding of relevant market and company-level transition plans taking into consideration the impact on the economies, businesses, communities and customers in these markets.
The Group’s ability to sufficiently understand and appropriately respond to transition risk and its ability to deliver on its external carbon reduction commitments and the implementation of ESG considerations in existing or new ESG-orientated products may be limited by insufficient or unreliable data on carbon exposure and transition plans for the investee company assets in which it invests. The direct physical impacts of climate change, driven by both specific short-term climate-related events such as natural disasters and longer-term changes to climate and the natural environment, are likely to become increasingly significant factors in the mortality and morbidity risk assessments for the Group’s insurance product underwriting and offerings and their associated claims profiles. Such short-term and long-term changes in markets where Prudential or its key third parties operate could adversely impact the Group’s operational resilience and its customers, which may potentially occur through migration or displacement both within and across borders.
The pace and volume of global standards and climate-related regulations emerging across the markets in which the Group operates, the need to deliver on existing and new exclusions or restrictions on investments in certain sectors, engagement and reporting commitments and the demand for externally assured reporting may give rise to compliance, operational and disclosure and litigation risks which may be increased by the multi-jurisdictional coordination required in adopting a consistent risk management approach. The launch of ESG-orientated products, or the (method of) incorporation of ESG considerations in the investment process for existing products, may increase the risks related to the perceived fulfilment of fiduciary duties to customers by the Group’s asset managers and may increase regulatory compliance, customer conduct, product disclosure and customer litigation risks. Prudential’s voluntary memberships of, or participation within, industry organisations and groups or their initiatives may increase stakeholder expectations of the Group’s acquiescence or compliance with their publicised positions or aims and therefore may increase the reputational risk of the Group where their positions or aims evolve. See risk factor 4.1 for details of ESG and sustainability-related regulatory and supervisory developments with potential impacts the Group.
A failure to understand, manage and provide greater transparency of its exposure to these climate-related risks may have increasingly adverse implications for Prudential and its stakeholders.
(b)Social risks
Social risks that could impact Prudential may arise from a failure to consider the rights, diversity, well-being, changing needs, human rights and interests of its customers and employees and the communities in which the Group or its third parties operate. Perceived inequity and income disparities (both with developed markets and within the Group’s markets), intensified by the pandemic, have the potential to further erode social cohesion across the Group’s markets which may increase operational and disruption risks for Prudential. Direct physical impacts of climate change and deterioration of the natural environment and the global transition to a lower carbon economy may disproportionately impact the stability of livelihoods and health of lower socioeconomic groups within the markets in which the Group operates. These risks are heightened as Prudential operates in multiple jurisdictions and vulnerable to climate change, with distinct local cultures and considerations.
Evolving social norms and emerging population risks associated with public health trends (such as an increase in obesity and mental health deterioration) and demographic changes (such as population urbanisation and ageing) may affect customer lifestyles and therefore may impact the level of claims under the Group’s insurance product offerings. As a provider of insurance and investment services, the Group is increasingly focused on making its products more accessible through digital innovation, technologies and distribution methods for a broadening range of products and services. As a result, Prudential has access to extensive amounts of customer personal data, including data related to personal health, and an increasing ability to analyse and interpret this data through the use of complex tools, machine learning and artificial intelligence technologies. The Group is therefore exposed to the regulatory, ethical and reputational risks associated with customer data misuse or security breaches. These risks are explained in risk factor 3.5. The increasing digitalisation of products, services and processes may also result in new and unforeseen regulatory requirements and stakeholder expectations, including those relating to how the Group supports its customers through this transformation.
177
The Group believes in supporting human rights and acting responsibly and with integrity in everything the Group does, and is committed to fostering an inclusive, diverse and open environment for its employees in accordance with the principles of the Universal Declaration of Human Rights and of the International Labour Organisation’s core labour standards. The potential for reputational risk extends to the Group’s supply chains and its investee companies, which may be exposed to factors such as poor labour standards and abuses of human rights by third parties. The Group is committed to zero tolerance of slavery, human trafficking, child labour and any other form of human rights abuse within the Group or in its supply chains globally.
(c)Governance
A failure to maintain high standards of corporate governance may adversely impact the Group and its customers and employees and increase the risk of poor decision-making and a lack of oversight and management of its key risks. Poor governance may arise where key governance committees have insufficient independence, a lack of diversity, skills or experience in their members, or unclear (or insufficient) oversight responsibilities and mandates. Inadequate oversight over remuneration also increases the risk of poor senior management behaviours.
Prudential operates across multiple jurisdictions and has a group and subsidiary governance structure which may add further complexity to these considerations. Participation in joint ventures or partnerships where Prudential does not have direct overall control, and the use of third-party service providers, increase the potential for reputational risks arising from inadequate governance.
Sustainability and ESG-related risks may directly or indirectly impact Prudential’s business and the achievement of its strategic focus on providing greater and more inclusive access to good health and financial security, responsible stewardship in managing the human impact of climate change and building human and social capital with its broad range of stakeholders, which range from customers, institutional investors, employees and suppliers, to policymakers, regulators, industry organisations and local communities. A failure to transparently and consistently implement the Group’s ESG strategy across operational, underwriting and investment activities, as well as a failure to implement and uphold responsible business practices, may adversely impact the financial condition and reputation of the Group. This may also negatively impact the Group’s stakeholders, who all have expectations, concerns and aims related to ESG and sustainability matters, which may differ, both within and across the markets in which the Group operates. In its investment activities, Prudential’s stakeholders increasingly have expectations of, and place reliance on, an approach to responsible investment that demonstrates how ESG and sustainability considerations are effectively integrated into investment decisions, responsible supply chain management and the performance of fiduciary and stewardship duties. These duties include effective implementation of exclusions, voting and active engagement decisions with respect to investee companies, as both an asset owner and an asset manager, in line with internally defined procedures and external commitments. The increased demands and expectations of stakeholders for transparency and disclosure of the activities that support these duties further heightens disclosure risks for the Group, including those associated with potentially overstating or mis-stating the positive environmental or societal impacts of the Group’s activities, products and services (eg greenwashing).
3. | RISKS RELATING TO PRUDENTIAL’S BUSINESS ACTIVITIES AND INDUSTRY |
3.1 | The implementation of large-scale transformation, including complex strategic initiatives, gives rise to significant design and execution risks and may affect Prudential’s operational capability and capacity. Failure of these initiatives to meet their objectives may adversely impact the Group and the delivery of its strategy. |
Where required in order to implement its business strategies for growth, meet customer needs, improve customer experiences, strengthen operational resilience, meet regulatory and industry requirements and maintain market competitiveness, Prudential from time to time undertakes corporate restructuring, transformation programmes and acquisitions and disposals across its business. Many of these change initiatives are complex, inter-connected and/or of large scale, and include improvement of business efficiencies through operating model changes, advancing the Group’s digital capability, expanding strategic partnerships and industry and regulatory-driven change. There may be a material adverse effect on Prudential’s business, employees, customers, financial condition, results of operations and prospects if these initiatives incur unplanned costs, are subject to implementation delays, or fail to fully meet their objectives. There may also be adverse implications for the Group in undertaking transformation initiatives such as placing additional strain on employees, operational capacity, and weakening the control environment. Implementing initiatives related to significant accounting standard changes, such as IFRS 17, and other regulatory changes in major businesses of the Group, such as those related to the sale and management of investment-linked products at the Indonesia businesses, may amplify these risks. Leadership changes and changes to the business and operational model of the Group increase uncertainty for its employees, which may affect operational capacity and the ability of the Group to deliver its strategy. Risks relating to these regulatory changes are explained in risk factor 4.1 below.
The speed of technological change in the business could outpace the Group’s ability to anticipate all the unintended consequences that may arise from such change. Innovative technologies, such as artificial intelligence, expose Prudential to potential additional regulatory, information security, operational, ethical and conduct risks which, if inadequately managed, could result in customer detriment and reputational damage.
178
3.2 | Prudential’s businesses are conducted in highly competitive environments with rapidly developing demographic trends. The profitability of the Group’s businesses depends on management’s ability to respond to these pressures and trends. |
The markets for financial services are highly competitive, with a number of factors affecting Prudential’s ability to sell its products and profitability, including price and yields offered, financial strength and ratings, range of product lines and product quality, ability to implement and comply with regulatory changes, the imposition of regulatory sanctions, brand strength and name recognition, investment management performance and fund management trends, historical bonus levels, the ability to respond to developing demographic trends, customer appetite for certain savings products (which may be impacted by broader economic pressures) and technological advances. In some of its markets, Prudential faces competitors that are larger, have greater financial resources or a greater market share, offer a broader range of products or have higher bonus rates. Further, heightened competition for talented and skilled employees, agents and independent financial advisers may limit Prudential’s potential to grow its business as quickly as planned or otherwise implement its strategy. Technological advances, including those enabling increased capability for gathering large volumes of customer health data and developments in capabilities and tools in analysing and interpreting such data (such as artificial intelligence and machine learning), may result in increased competition to the Group, both from within and outside the insurance industry, and may increase the competition risks resulting from a failure to be able to attract or retain talent.
The Group’s principal competitors include global life insurers, regional insurers and multinational asset managers. In most markets, there are also local companies that have a material market presence.
Prudential believes that competition will intensify across all regions in response to consumer demand, digital and other technological advances (including the emergence and maturing of new distribution channels), the need for economies of scale and the consequential impact of consolidation, regulatory actions and other factors. Prudential’s ability to generate an appropriate return depends significantly upon its capacity to anticipate and respond appropriately to these competitive pressures. This includes managing the potential adverse impacts to the commercial value of the Group’s existing sale and distribution arrangements, such as bancassurance arrangements, in markets where new distribution channels develop.
Failure to do so may adversely impact Prudential’s ability to attract and retain customers and, importantly, may limit Prudential’s ability to take advantage of new business arising in the markets in which it operates, which may have an adverse impact on the Group’s business, financial condition, results of operations and growth prospects.
3.3 | Adverse experience in the operational risks inherent in Prudential’s business, and those of its material outsourcing partners, could disrupt its business functions and have a negative impact on its business, financial condition, results of operations and prospects. |
Operational risks are present in all of Prudential’s businesses, including the risk of loss arising from inadequate or failed internal processes, systems or human error, fraud, the effects of natural or man-made catastrophic events (such as natural disasters, pandemics, cyber-attacks, acts of terrorism, civil unrest and other catastrophes) or other external events. These risks may also adversely impact Prudential through its partners. Prudential relies on the performance and operations of a number of bancassurance, product distribution, outsourcing (including but not limited to external technology, data hosting and payments) and service partners. These include back office support functions, such as those relating to technology infrastructure, development and support and customer facing operations and services, such as product distribution and services (including through digital channels) and investment operations. This creates reliance upon the resilient operational performance of these partners and exposes Prudential to the risk that the operations and services provided by these partners are disrupted or fail. Further, Prudential operates in extensive and evolving legal and regulatory environments which adds to the complexity of the governance and operation of its business processes and controls.
Exposure to such risks could impact Prudential’s operational resilience and ability to perform necessary business functions when there are disruptions to its systems, operations, new business sales and renewals, distribution channels and services to customers, or result in the loss of confidential or proprietary data. Such risks, as well as any weaknesses in administration systems (such as those relating to policyholder records) or actuarial reserving processes, may also result in increased expenses, as well as legal and regulatory sanctions, decreased profitability, financial loss and customer conduct risk impacts. This could damage Prudential’s reputation and relationship with its customers and business partners. A failure to adequately oversee service partners (or their technology and operational systems and processes) could result in significant service degradation or disruption to Prudential’s business operations and services to its customers, which may have reputational or conduct risk implications and could have a material adverse effect on the Group’s business, financial condition, results of operations and prospects.
179
Prudential’s business requires the processing of a large number of transactions for a diverse range of products. It also employs complex and inter-connected technology and finance systems, models, and user developed applications in its processes to perform a range of operational functions. These functions include the calculation of regulatory or internal capital requirements, the valuation of assets and liabilities and the acquisition of new business using artificial intelligence and digital applications. Many of these tools form an integral part of the information and decision-making frameworks used by Prudential and the risk of adverse consequences arising from erroneous or misinterpreted tools used in core business activities, decision-making and reporting exists. Errors or limitations in these tools, or their inappropriate usage, may lead to regulatory breaches, inappropriate decision-making, financial loss, customer detriment, inaccurate external reporting or reputational damage. The long-term nature of much of the Group’s business also means that accurate records are to be maintained securely for significant time periods.
The performance of the Group’s core business activities and the uninterrupted availability of services to customers rely significantly on, and require significant investment in, resilient IT applications, infrastructure and security architectural design, data governance and management and other operational systems, personnel, controls and processes. During large-scale disruptive events or times of significant change, or due to other factors impacting operational performance including adequacy of skilled/experienced personnel, the resilience and operational effectiveness of these systems and processes at Prudential and/or its third-party service providers may be adversely impacted. In particular, Prudential and its business partners are making increasing use of emerging technological tools and digital services, or forming strategic partnerships with third parties to provide these capabilities. Automated distribution channels and services to customers increase the criticality of providing uninterrupted services. A failure to implement appropriate governance and management of the incremental operational risks from emerging technologies may adversely impact Prudential’s reputation and brand, the results of its operations, its ability to attract and retain customers and its ability to deliver on its long-term strategy and therefore its competitiveness and long-term financial success.
Although Prudential’s technology, compliance and other operational systems, models and processes incorporate governance and controls designed to manage and mitigate the operational and model risks associated with its activities, there can be no complete assurance as to the resilience of these systems and processes to disruption or that governance and controls will always be effective. Due to human error, among other reasons, operational and model risk incidents do occur from time to time and no system or process can entirely prevent them. Prudential’s legacy and other technology systems, data and processes, as with operational systems and processes generally, may also be susceptible to failure or security/data breaches.
3.4 | Attempts to access or disrupt Prudential’s technology systems, and loss or misuse of personal data, could result in loss of trust from Prudential’s customers and employees and reputational damage, which could have material adverse effects on the Group’s business, financial condition, results of operations and prospects. |
Prudential and its business partners are increasingly exposed to the risk that individuals (which includes connected persons such as employees, contractors or representatives of Prudential or its third-party service providers, and unconnected persons) or groups may intentionally or unintentionally disrupt the availability, confidentiality and integrity of its technology systems or compromise the integrity and security of data (both corporate and customer), including disruption from ransomware (malicious software designed to restrict Prudential’s access to data until the payment of a sum of money and to exfiltrate data with a threat to publicly expose Prudential data if a ransom payment is not paid), and untargeted but sophisticated and automated attacks. Where these risks materialise, this could result in disruption to key operations, make it difficult to recover critical data or services or damage assets, any of which could result in loss of trust from Prudential’s customers and employees, reputational damage and direct or indirect financial loss. The Russia-Ukraine conflict has coincided with a significant increase in reported cyber threats and attacks during 2022. Cyber-security threats continue to evolve globally in sophistication and potential significance. Prudential’s increasing profile in its current markets and those in which it is entering, growing customer interest in interacting with their insurance providers and asset managers through the internet and social media, improved brand awareness, and increasing adoption of the Group’s digital platforms could also increase the likelihood of Prudential being considered a target by cyber criminals. Ransomware campaigns have increased in frequency and represent an increasing threat to the financial services sector, with recent highly publicised attacks on financial services companies.
There is an increasing requirement and expectation on Prudential and its business partners not only to hold the data of customers, shareholders and employees securely, but also to ensure its ongoing accuracy and that it is being used in a transparent, appropriate and ethical way, including in decision-making where automated processes are employed. As Prudential and its business partners increasingly adopt digital technology in business operations, the data the Group generates creates an opportunity to enhance customer engagement while maintaining a responsibility to keep customers’ personal data safe. Prudential adheres to data minimisation and ‘privacy-by-design’ principles, ensuring that the Group only collects and uses data for its intended purpose and does not retain it longer than necessary, and that privacy elements are present both at the onset and throughout the Group’s entire data processes. The handling of customer’s data is governed by specific policies and frameworks, such as the Group Information Security Policy, the Group Privacy Policy and the Group Data Policy. A failure to adhere to these polices may result in regulatory scrutiny and sanctions and detriment to customers and third-party partners, and may adversely impact the reputation and brand of the Group, its ability to attract and retain customers and deliver on its long-term strategy and therefore the results of its operations.
180
The risk to the Group of not meeting these requirements and expectations may be increased by the development of cloud-based infrastructure and the usage of digital distribution and service channels, which can collect a broader range of personal and health-related data from individuals at increased scale and speed, and the use of complex tools, machine learning and artificial intelligence technologies to process, analyse and interpret this data. New and currently unforeseeable regulatory issues may also arise from the increased use of emerging technology. Regulatory developments in cybersecurity and data protection continue to progress worldwide. Across the Group’s markets these include the ongoing development of a holistic data governance regime in the Chinese Mainland, including the Data Security Law and Personal Information Protection Law, and the revised Measures for Cybersecurity Review. In Thailand, the Personal Data Protection Act regulations came into effect in June 2022. Such developments may increase the complexity of requirements and obligations in this area, in particular where they include national security restrictions or impose differing and/or conflicting requirements compared with those of other jurisdictions. These risks may also increase the financial and reputational implications for Prudential of regulatory non-compliance or a significant breach of IT systems or data, including at its joint ventures or third-party service providers. The international transfer of data may, as a global organisation, increase regulatory risks for the Group.
The Group has not, to date, experienced or been affected by any cyber and data breaches which have had a material impact on its operations. However, Prudential has been, and likely will continue to be, subject to potential damage from computer viruses, unauthorised access and cyber-security attacks such as ‘denial of service’ attacks, phishing and disruptive software campaigns. Despite the multi-layers security defences in place, there can be no assurance that such events will not take place which may have material adverse consequential effects on Prudential’s business, financial condition, results of operations and prospects.
3.5 | Prudential’s digital platforms may heighten existing business risks to the Group or introduce new risks as the markets in which it operates, and its partnerships and product offerings evolve. |
Prudential’s digital platforms, including Pulse, are subject to a number of risks discussed within this ‘Risk Factors’ section. In particular, these include risks related to legal and regulatory compliance and the conduct of business; the execution of complex change initiatives; information security and data privacy; the use of models (including those using artificial intelligence) and the handling of personal data; the resilience and integrity of IT infrastructure and operations; and those relating to the management of third parties. These existing risks for the Group may be increased due to a number of factors:
– | The number of current and planned markets in which Pulse and other digital platforms operate, each with their own laws and regulations, regulatory and supervisory authorities, the scope of application of which may be uncertain or change at pace, may increase regulatory compliance risks; |
– | The implementation of planned digital platforms and services may require the delivery of complex, inter-connected change initiatives across current and planned markets. This may give rise to design and execution risks, which could be amplified where these change initiatives are delivered concurrently; |
– | The increased volume, breadth and sensitivity of data on which the business model of the platform is dependent and to which the Group has access, holds, analyses and processes through its models, which increases data security, privacy and usage risks. The use of complex models, including where they use artificial intelligence for critical decision-making, in the application’s features and offerings may give rise to ethical, operational, conduct, litigation and reputational risks where they do not function as intended; |
– | The digital platform and its services may rely on and/or collaborate with a number of third-party partners and providers, which may vary according to the market. This may increase operational disruption risks to the uninterrupted provision of services to customers, regulatory compliance and conduct risks, and the potential for reputational risks; and |
– | Support for, and development of, the platform may be provided outside of the individual markets in which the platform operates, which may increase the complexity of local legal and regulatory compliance. |
New product offerings and functionality may be developed and provided through the digital platforms, which may introduce new regulatory, operational, conduct and strategic risks for the Group. Regulations may be introduced, which limit the permitted scope of online or digitally distributed insurance and asset management services, and may restrict current or planned offerings provided by the platform.
A failure to implement appropriate governance and management of the incremental and new risks detailed above may adversely impact Prudential’s reputation and brand, its ability to attract and retain customers, its competitiveness and its ability to deliver on its long-term strategy.
181
3.6Prudential operates in certain markets with joint venture partners and other shareholders and third parties. These businesses face the same risks as the rest of the Group and also give rise to certain risks to Prudential that the Group does not face with respect to its wholly owned subsidiaries.
Prudential operates, and in certain markets is required by local regulation to operate, through joint ventures and other joint ownership or third-party arrangements (including associates). The financial condition, operations and reputation of the Group may be adversely impacted, or the Group may face regulatory censure, in the event that any of its partners fails or is unable to meet its obligations under the arrangements, encounters financial difficulty, or fails to comply with local or international regulation and standards such as those pertaining to the prevention of financial crime. Reputational risks to the Group are amplified where any joint ventures or jointly owned businesses carry the Prudential name.
A material proportion of the Group’s business comes from its joint venture and associate businesses in the Chinese Mainland and India, respectively. For such operations the level of control exercisable by the Group depends on the terms of the contractual agreements, in particular, those terms providing for the allocation of control among, and continued cooperation between, the participants. As a result, the level of oversight, control and access to management information the Group is able to exercise at these operations may be lower compared to the Group’s wholly owned businesses. This may increase the uncertainty for the Group over the financial condition of these operations, including the credit risk profile and valuation of their investment portfolios and the extent of their invested credit and counterparty credit risk exposure, resulting in heightened risks to the Group as a whole. This may particularly be the case where the geographies in which these operations are located experience market or sector-specific slowdowns, disruption, volatility or deterioration (such as the negative developments in the Chinese Mainland property sector). In addition, the level of control exercisable by the Group could be affected by changes in the maximum level of non-domestic ownership imposed on foreign companies in certain jurisdictions. The exposure of the Group to the risks detailed in risk factor 3.1 above may also increase should the Group’s strategic initiatives include the expansion of the Group’s operations through joint ventures or jointly owned businesses.
In addition, a significant proportion of the Group’s product distribution is carried out through agency arrangements and contractual arrangements with third-party service providers not controlled by Prudential, such as bancassurance arrangements, and the Group is therefore dependent upon the continuation of these relationships. The effectiveness of these arrangements, or temporary or permanent disruption to them, such as through significant deterioration in the reputation, financial position or other circumstances of the third-party service providers, material failure in controls (such as those pertaining to the third-party service providers’ systems failure or the prevention of financial crime), regulatory changes affecting the governance, operation, or failure to meet any regulatory requirements could adversely affect Prudential’s reputation and its business, financial condition, results of operations and prospects.
3.7 | Adverse experience relative to the assumptions used in pricing products and reporting business results could significantly affect Prudential’s business, financial condition, results of operations and prospects. |
In common with other life insurers, the profitability of the Group’s businesses depends on a mix of factors including mortality and morbidity levels and trends, policy surrenders and take-up rates on guarantee features of products, investment performance and impairments, unit cost of administration and new business acquisition expenses. The Group’s businesses are subject to inflation risk. In particular, the Group’s medical insurance businesses are also exposed to medical inflation risk. The potential adverse impacts to the Group’s persistency and morbidity experience resulting from Covid-19 related restrictions are described in risk factor 1.3 above. The potential adverse impacts to the profitability of the Group’s businesses from the upheavals in financial markets and levels of economic activity on customer behaviours are described in risk factor 1.1 above. While the Group has the ability to re-price some of its products, the frequency of re-pricing may need to be increased. Such repricing is dependent on the availability of operational and resource capacity to do so, as well as the Group’s ability to implement such re-pricing in light of the increased regulatory and societal expectations reflecting the affordability of insurance products and the protection of vulnerable customers, as well as the commercial considerations of the markets the Group operates in. The profitability of the Group’s businesses also may be adversely impacted by medical reimbursement downgrade experience following any re-pricing.
Prudential, like other insurers, needs to make assumptions about a number of factors in determining the pricing of its products, for setting reserves, and for reporting its capital levels and the results of its long-term business operations. A further factor is the assumptions that Prudential makes about future expected levels of the rates of early termination of products by its customers (known as persistency). This is relevant to a number of lines of business in the Group. Prudential’s persistency assumptions reflect a combination of recent past experience for each relevant line of business and expert judgement, especially where a lack of relevant and credible experience data exists. Any expected change in future persistency is also reflected in the assumptions. If actual levels of persistency are significantly different than assumed, the Group’s results of operations could be adversely affected.
In addition, Prudential’s business may be adversely affected by epidemics, pandemics and other effects that give rise to a large number of deaths or additional sickness claims, as well as increases to the cost of medical claims. Pandemics, significant influenza and other epidemics have occurred a number of times historically, but the likelihood, timing, or the severity of future events cannot be predicted. The effectiveness of external parties, including governmental and non-governmental organisations, in combating the spread and severity of any epidemics, as well as pharmaceutical treatments and vaccines (and their roll-outs) and non-pharmaceutical interventions, could have a material impact on the Group’s claims experience. The risks to the Group resulting from Covid-19 are included in risk factor 1.3 above.
182
Prudential uses reinsurance to selectively transfer mortality, morbidity and other risks. This exposes the Group to the counterparty risk of a reinsurer being unable to pay reinsurance claims or otherwise meet their commitments; the risk that a reinsurer changes reinsurance terms and conditions of coverage, or increases the price of reinsurance which Prudential is unable to pass on to its customers; the risk of ambiguity in the reinsurance terms and conditions leading to uncertainty whether an event is covered under a reinsurance contract; and the risk of being unable to replace an existing reinsurer, or find a new reinsurer, for the risk transfer being sought.
Any of the foregoing, individually or together, could have a material adverse effect on Prudential’s business, financial condition, results of operations and prospects.
4. | RISKS RELATING TO LEGAL AND REGULATORY REQUIREMENTS |
4.1 | Prudential conducts its businesses subject to regulation and associated regulatory risks, including a change to the basis in the regulatory supervision of the Group, the effects of changes in the laws, regulations, policies and their interpretations and any accounting standards in the markets in which it operates. |
Changes in government policy and legislation (including in relation to tax and data security), capital control measures on companies and individuals, regulation or regulatory interpretation applying to companies in the financial services and insurance industries in any of the markets in which Prudential operates (including those related to the conduct of business by Prudential or its third-party distributors), or decisions taken by regulators in connection with their supervision of members of the Group, which in some circumstances may be applied retrospectively, may adversely affect Prudential. The impact from any regulatory changes may be material to Prudential, for example changes may be required to its product range, distribution channels, handling and usage of data, competitiveness, profitability, capital requirements, risk management approaches, corporate or governance structure, financial and non-financial disclosures and reported results and financing requirements. Changes in regulations related to capital have the potential to change the extent of sensitivity of capital to market factors. Also, regulators in jurisdictions in which Prudential operates may impose requirements affecting the allocation of capital and liquidity between different business units in the Group, whether on a geographic, legal entity, product line or other basis. Regulators may also change solvency requirements, methodologies for determining components of the regulatory or statutory balance sheet including the reserves and the level of capital required to be held by individual businesses (with implications to the Group capital position), and the regulation and expectations of customers-facing processes including selling practices, and could introduce changes that impact products sold or that may be sold. Furthermore, as a result of interventions by governments in light of financial and global economic conditions, there may continue to be changes in government regulation and supervision of the financial services industry, including the possibility of higher capital requirements, restrictions on certain types of transactions and enhancement of supervisory powers.
In the markets in which it operates, Prudential is subject to regulatory requirements and obligations with respect to financial crime, including anti-money laundering, and sanctions compliance, which may either impose obligations on the Group to act in a certain manner or restrict the way that it can act in respect of specified individuals, organisations, businesses and/or governments. A failure to do so may adversely impact the reputation of Prudential and/or result in the imposition of legal or regulatory sanctions or restrictions on the Group. For internationally active groups such as Prudential, operating across multiple jurisdictions increases the complexity and volume of legal and regulatory compliance. Compliance with Prudential’s legal or regulatory obligations, including those in respect of international sanctions, in one jurisdiction may conflict with the law or policy objectives of another jurisdiction, or may be seen as supporting the law or policy objectives of that jurisdiction over another, creating additional legal, regulatory compliance and reputational risks for the Group. Geopolitical developments, such as the Russia-Ukraine conflict and US-China tensions, may result in an increase in the volume and complexity of international sanctions. These risks may be increased where uncertainty exists on the scope of regulatory requirements and obligations, and where the complexity of specific cases applicable to the Group is high.
Further information on specific areas of regulatory and supervisory requirements and changes are included below.
(a)Group-wide Supervision (‘GWS’)
To align Hong Kong’s regulatory regime with international standards and practices, the Hong Kong IA developed its GWS Framework for multinational insurance groups under its supervision based on a principle-based and outcome-focused approach, which allows the Hong Kong IA to exercise direct regulatory powers over the designated holding companies of multinational insurance groups. The GWS Framework became effective for Prudential upon designation by the Hong Kong IA on 14 May 2021. Whilst the regulatory requirements are in effect, given the early nature of the regime, there is a risk that the interpretations of the principle-based regulatory requirements made by the Group in complying with the regulatory requirements may differ in some aspects from the interpretations made by the Hong Kong IA in their supervision of these principle-based regulatory requirements or as a result of the potential for further regulatory guidance to be issued. Prudential constructively engages with the Hong Kong IA as its Group-wide supervisor to ensure ongoing sustainable compliance.
183
(b)Global regulatory requirements and systemic risk regulation
Currently there are also a number of ongoing global regulatory developments which could impact Prudential’s businesses in the many jurisdictions in which they operate. These include the work of the Financial Stability Board (‘FSB’) in the area of systemic risk including assessing and mitigating systemic risk through the Holistic Framework (‘HF’) (replacing the Global Systemically Important Insurer ‘G-SII’ designations) and the Insurance Capital Standard ('ICS’), both being developed by the International Association of Insurance Supervisors (‘IAIS’). In addition, regulators in a number of jurisdictions in which the Group operates are further developing their local capital regimes. There remains a high degree of uncertainty over the potential impact of such changes on the Group.
Efforts to curb systemic risk and promote financial stability are also under way. At the international level, the FSB continues to develop recommendations for the asset management and insurance sectors, including ongoing assessment of systemic risk measures. The IAIS has continued to focus on the following key developments.
In November 2019, the IAIS adopted the Common Framework (‘ComFrame’) which establishes supervisory standards and guidance focusing on the effective group-wide supervision of Internationally Active Insurance Groups (‘IAIGs’). Prudential was included in the first register of IAIGs released by the IAIS on 1 July 2020 and was designated an IAIG by the Hong Kong IA following an assessment against the established criteria in ComFrame.
The IAIS has also been developing the ICS as part of ComFrame. The implementation of ICS will be conducted in two phases: a five-year monitoring phase followed by an implementation phase. The Aggregation Method is one of the alternatives being considered to the default approach undertaken for the ICS during the monitoring period and the related proposals are being led by the National Association of Insurance Commissioners (‘NAIC’). In June 2022, the IAIS released a paper on comparable outcomes of the Aggregation Method for ICS. Feedback on this public consultation was received by 15 August 2022 and the IAIS expects to adopt the comparability criteria by March 2023.
In December 2020, the FSB endorsed a new HF, intended for the assessment and mitigation of systemic risk in the insurance sector, (implemented by the IAIS in 2020), and discontinued G-SII designations. Many of the previous G-SII measures have already been adopted into the Insurance Core Principles (‘ICPs’) and ComFrame, as well as under the Hong Kong IA’s GWS Framework. As an IAIG, Prudential is subject to these measures. The HF also includes a monitoring element for the identification of a build-up of systemic risk and to enable supervisors to take action where appropriate. The FSB reserves the right to publicly express its views on whether an individual insurer is systemically important in the global context and the application of any necessary policy measures to address such systemic importance. The FSB will also continue to review the process of assessing and mitigating systemic risk based on the HF and may adjust the process, including bringing back G-SII designations if deemed necessary.
There continues to be material change in the regulatory guidance in this area, including several areas still in development as part of the IAIS’ HF implementation and any new or changing regulations could have a further impact on Prudential. Recent developments include:
- | At its Annual General Meeting in November 2022, the IAIS Executive Committee agreed to publish the liquidity metrics that have been under development to facilitate the monitoring of the global insurance sector’s liquidity risk. |
- | A public consultation on the review of the individual insurer monitoring assessment methodology was launched in January 2023 to look at how to fine tune systemic risk indicators as part of the regular tri-annual review of the Global Monitoring Exercise. |
- | The IAIS Executive Committee also adopted an aggregate report on the outcomes of the intensive Targeted Jurisdictional Assessments of the implementation of the HF supervisory material. A public report is due to be released in the first half of 2023. A key conclusion is that significant progress has been made in implementing macroprudential supervisory requirements in recent years. |
(c)Regional regulatory regime developments, including climate-related regulatory changes
In 2022, regulators in Asia continue to focus on the financial and operational resilience of the insurance industry as well as customer and policyholder protection. New regulations were continuously, and often concurrently, issued in a number of markets to (1) manage insurance and financial risks, including capital and solvency, and (2) implement effective customer protection, information security and data privacy and residency, third party and technology risk management controls with appropriate corporate governance.
In some of the Group’s key markets, major regulatory changes and reforms are in progress, with some uncertainty on the full impact to Prudential:
–In the Chinese Mainland, regulatory developments across a number of industries including the financial sector, have continued at pace, potentially increasing compliance risk to the Group. Recent regulatory developments in the Chinese Mainland which include the following:
– | The China Banking and Insurance Regulatory Commission (‘CBIRC’) released the official regulation for its China Risk Oriented Solvency System (‘C-ROSS II’) Phase II, which became effective for Q1 2022 solvency reporting, subject to ongoing transitional arrangements; |
184
– | The Cyberspace Administration of China (‘CAC’) issued the Measures on Security Assessment of Outbound Data Transfers in Q3 2022, which, although provide more information on cross-border data transfers, imposed new requirements including a mandatory security assessment on outbound data transfers. Businesses that collect and process the personal information of the Chinese Mainland citizens are anticipating further requirements to be introduced; |
– | CBIRC issued updated rules since late 2022 for consumer rights protection and information disclosures, where insurers are required to establish mechanisms throughout the business strategy and product lifecycle with proper governance and customer protection. Sufficient product information and risk disclosures should be also provided for different life insurance products. These regulatory developments are intended to promote industry professionalisation, customer satisfaction, and sustainability in the long run; |
– | In light of the continuous market developments in Fintech, sustainability and social media, CBIRC is constantly refining its supervisory directions including use of new technology for onsite examinations, offsite surveillance and intelligence for risk identification; and urged financial institutions to deploy emerging technologies to improve the way businesses manage regulatory compliance. |
–In Indonesia, regulatory and supervisory focus on the insurance industry remains high. The Financial Services Authority of Indonesia, the Otoritas Jasa Keuangan (‘OJK’) has significantly revised investment linked products (‘ILP’) regulations with the aim of increasing insurance penetration and better protecting customer interests and improving market conduct. The final regulations were enacted in Q1 2022 for a full adoption in Q1 2023, and have implications for the product strategies and insurance and compliance risks for insurers. Industry discussion with respect to the implementation of some of the requirements under the new regulations is ongoing. General supervisory focus on insurer governance has increased, in particular on the autonomy of decision-making of local insurers. The OJK has also focused on consumer protection regulations more broadly, enacting updated regulations in April 2022, and has recently enhanced regulatory requirements on technology risk management. The Personal Data Protection Law came into effect in October 2022, which requires actions to enhance data protection governance and procedures including privacy assessments and designated data protection personnel within a two-year transition period. Moreover, a new financial sector law was passed by the Parliament. A notable change includes a new policy guarantee agency in the insurance sector. The Indonesia Deposit Insurance Corporation will expand their assurance coverage on bank savings to also include insurance in case of insurers going bankrupt, further details are expected.
–In Malaysia, the BNM has initiated a multi-phase review of its current RBC frameworks for insurers and takaful operators which has been conducted since 2019. The review aims to ensure that the frameworks remain effective under changing market conditions, facilitate consistent and comparable capital adequacy measurement across the insurance and takaful industry, where appropriate, and achieve greater alignment with key elements of the global capital standards such as ICS, where appropriate. The roll out of the RBC framework is planned in phases, which include quantitative impact studies carried out in 2022, the issuance of exposure drafts in 2023, a Qualitative Impact Study (‘QIS’) and a parallel run planned in 2024 prior to earliest implementation in 2025, subject to results of the QIS and parallel run.
–In Hong Kong, the Hong Kong IA has in place comprehensive regulations covering all aspects of the insurance product lifecycle. The regulator continues to place increasing focus of its supervision on culture and conduct aspects of local insurers. At the same time, the Hong Kong IA has sought to align the territory’s insurance regime with international standards and has been developing a risk-based capital (‘RBC’) framework. The RBC framework comprises three pillars: quantitative requirements, including assessment of capital adequacy and valuation; qualitative requirements, including corporate governance, Enterprise Risk Management as well as Own Risk and Solvency Assessment; and public disclosures and transparency of information. The Hong Kong IA approved the early adoption of the framework at the Group’s Hong Kong business in April 2022. In late 2022, the regulator also shared the ongoing industry priorities for 2023 including Insurtech, ESG, and cybersecurity, which are essential in enabling Hong Kong insurers’ development in the Greater Bay Area, further regulatory developments are anticipated. The Hong Kong Government also proposed to establish a Policyholder Protection Scheme in December 2022 as a safety net for policyholders in the event of an insurer’s insolvency. A public consultation is underway until end of March 2023, followed by an industry level consultation within the same year.
–In Thailand, the Personal Data Protection Commission was established in January 2022, as the regulator under Thailand’s Personal Data Protection Act which became effective in June 2022.
–In Vietnam, the amended Insurance Law is set to take effect on 1 January 2023. Key amendments include provisions for online sales; regulating outsourcing; and training and registration obligations of agents. The new law also contains provisions on RBC, with a five-year grace period, effective from 1 January 2028.
–In India, the Insurance Regulatory and Development Authority of India (‘IRDAI’) continues to focus on industry reform by boosting innovation, competition, and distribution efficiencies, while moving towards a principle-based regulatory regime with considerations of technology developments. The regulator is in the process of relaxing capital requirements and setting distribution tie-up limits for corporate agents, as well as lengthening the experimentation period for sandbox in order to introduce further ease of doing business for growing India’s insurance penetration by 2030.
The increasing use of emerging technological tools and digital services across industry, is likely to lead to new and unforeseen regulatory requirements and issues, including expectations regarding the governance and ethical use of technology, artificial intelligence and data. Distribution and product suitability linked to innovation continues to set the pace of conduct regulatory change in Asia. Prudential falls under the scope of these conduct regulations requiring that regulatory changes are appropriately implemented.
185
The pace and volume of climate-related regulatory changes is also increasing. Regulators including the Hong Kong IA, the Monetary Authority of Singapore, the BNM in Malaysia and the Financial Supervisory Commission in Taiwan are in the process of developing supervisory and disclosure requirements or guidelines related to environmental and climate change risk management. Other regulators are expected to develop, or are at the early stages of developing, similar requirements. While the Hong Kong IA has yet to propose any insurance-specific regulations on sustainability and climate, it has regularly emphasised its increasing focus in this area in order to support Hong Kong’s position as a regional green finance hub, and industry consultations are expected from the Hong Kong IA in 2023. International regulatory and supervisory bodies, such as the International Sustainability Standards Board (‘ISSB’) and Taskforce on Nature-related Disclosures, are progressing on global ESG and sustainability-related disclosure requirements. Recent high-profile examples of government and regulatory enforcement and civil actions against companies for misleading investors on ESG and sustainability-related information demonstrate that disclosure, reputational and litigation risks remain high and may increase, in particular as companies increase their disclosures or product offerings in this area. These changes and developments may give rise to regulatory compliance, customer conduct, operational, reputational and disclosure risks requiring Prudential to coordinate across multiple jurisdictions in order to apply a consistent risk management approach.
The rapid pace and high volume of regulatory changes and interventions, and swiftness of their application including those driven by the financial services industry, have been observed in recent years across many of the Group’s markets. The transformation and regulatory changes have the potential to introduce new, or increase existing, regulatory risks and supervisory interest while increasing the complexity of ensuring concurrent regulatory compliance across markets driven by potential for increased intra-Group connectivity and dependencies. In jurisdictions with ongoing policy initiatives and regulatory developments which will impact the way Prudential is supervised, these developments are monitored at market and group level and inform the Group’s risk framework and engagement with government policy makers, industry groups and regulators.
(d)IFRS 17
IFRS 17 became effective from 1 January 2023 and the first external reporting under this basis will be from half year 2023. The new standard requires a fundamental change to accounting, presentation and disclosures for insurance contracts as well as the application of significant judgement and new estimation techniques. The Group has been implementing IFRS 17 through a Group-wide implementation programme over a multi-year period, involving significant enhancements to technology, actuarial and finance systems and processes across the Group. The Group has yet to complete production of its 2022 comparatives using the IFRS 17 accounting standard. IFRS 17 presents a significant change to the method of accounting for insurance contracts. Therefore, in the short term, it may take time for investors, rating agencies and other stakeholders to gain familiarity with the new standard and to interpret the Group’s business performance and dynamics as reported under IFRS 17, and in particular to understand the comparisons with previous financial periods.
Apart from IFRS 17, any other changes or modification of IFRS accounting policies may also require a change in the way in which future results will be determined and/or a retrospective adjustment of reported results to ensure consistency.
(e)Inter-bank offered rate (‘IBOR’) reforms
In July 2014, the FSB announced widespread reforms to address the integrity and reliability of IBORs. The discontinuation of IBORs in their current form and their replacement with alternative risk-free reference rates such as the Secured Overnight Financing Rate (‘SOFR’) in the US and the Singapore Swap Offer Rate (‘SOR’) could, among other things, impact the Group through an adverse effect on the value of Prudential’s assets and liabilities which are linked to or which reference IBORs, a reduction in market liquidity during any period of transition and increased legal and conduct risks to the Group arising from changes required to documentation and its related obligations to its stakeholders.
(f)Investor contribution schemes
Various jurisdictions in which Prudential operates have created investor compensation schemes that require mandatory contributions from market participants in some instances in the event of a failure of a market participant. As a major participant in the majority of its chosen markets, circumstances could arise in which Prudential, along with other companies, may be required to make such contributions.
186
4.2The conduct of business in a way that adversely impacts the fair treatment of customers could have a negative impact on Prudential’s business, financial condition, results of operations and prospects or on its relations with current and potential customers.
In the course of its operations and at any stage of the customer and product lifecycle, the Group or its intermediaries may conduct business in a way that adversely impacts customer outcomes and the fair treatment of customers (‘conduct risk’). This may arise through a failure to design, provide and promote suitable products and services to customers that meet their needs, are clearly explained or deliver real value, provide and promote a high standard of customer service, appropriately and responsibly manage customer information, or appropriately handle and assess complaints. A failure to identify or implement appropriate governance and management of conduct risk may result in harm to customers and regulatory sanctions and restrictions, and may adversely impact Prudential’s reputation and brand, its ability to attract and retain customers, its competitiveness, and its ability to deliver on its long-term strategy. There is an increased focus by regulators and supervisors on customer protection, suitability, and inclusion across the markets in which the Group operates, therefore increasing regulatory compliance and reputational risks to the Group in the event the Group is unable to effectively implement the regulatory changes and reforms stated in risk factor 4.1 above.
Prudential is, and in the future may continue to be, subject to legal and regulatory actions in the ordinary course of its business on matters relevant to the delivery of customer outcomes. Such actions relate, and could in the future relate, to the application of current regulations or the failure to implement new regulations, regulatory reviews of broader industry practices and products sold (including in relation to lines of business that are no longer active) in the past under acceptable industry or market practices at the time and changes to the tax regime affecting products. Regulators may also focus on the approach that product providers use to select third-party distributors and to monitor the appropriateness of sales made by them and the responsibility of product providers for the deficiencies of third-party distributors.
There is a risk that new regulations introduced may have a material adverse effect on the sales of the products by Prudential and increase Prudential’s exposure to legal risks. Any regulatory action arising out of the Group’s position as a product provider could have an adverse impact on the Group’s business, financial condition, results of operations and prospects, or otherwise harm its reputation.
4.3Litigation, disputes and regulatory investigations may adversely affect Prudential’s business, financial condition, cash flows, results of operations and prospects.
Prudential is, and may in the future be, subject to legal actions, disputes and regulatory investigations in various contexts, including in the ordinary course of its insurance, investment management and other business operations. These legal actions, disputes and investigations may relate to aspects of Prudential’s businesses and operations that are specific to Prudential, or that are common to companies that operate in Prudential’s markets. Legal actions and disputes may arise under contracts, regulations or from a course of conduct taken by Prudential, including class action litigation. Although Prudential believes that it has adequately provided in all material respects for the costs of litigation and regulatory matters, no assurance can be provided that such provisions are sufficient. Given the large or indeterminate amounts of damages sometimes sought, other sanctions that might be imposed and the inherent unpredictability of litigation and disputes, it is possible that an adverse outcome could have an adverse effect on Prudential’s business, financial condition, cash flows, results of operations and prospects.
4.4Changes in tax legislation may result in adverse tax consequences for the Group’s business, financial condition, results of operations and prospects.
Tax rules, including those relating to the insurance industry, and their interpretation may change, possibly with retrospective effect in any of the jurisdictions in which Prudential operates. Significant tax disputes with tax authorities, and any change in the tax status of any member of the Group or in taxation legislation or its scope or interpretation could affect Prudential’s business, financial condition, results of operations and prospects.
The Organisation for Economic Co-operation and Development (‘OECD’) is currently undertaking a project intended to modernise the global international tax system, commonly referred to as Base Erosion and Profit-Shifting 2.0. The project has two pillars. The first pillar is focused on the allocation of taxing rights between jurisdictions for in-scope multinational enterprises that sell cross-border goods and services into countries with little or no local physical presence. The second pillar is focused on developing a global minimum tax rate of 15 per cent applicable to in-scope multinational enterprises.
On 8 October 2021 the OECD issued a statement setting out the high level principles which have been agreed by over 130 jurisdictions involved in the project. Based on the 8 October 2021 OECD statement, Prudential does not expect to be affected by proposals under the first pillar given they include an exemption for regulated financial services companies.
187
On 20 December 2021 the OECD published detailed model rules for the second pillar, with implementation of the rules initially envisaged by 2023. These rules will apply to Prudential when implemented into the national law of jurisdictions where it has entities within the scope of the rules. On 14 March 2022 the OECD issued detailed guidance to assist with interpreting the model rules. On 20 December 2022 the OECD issued additional documents including proposals for safe harbours and a consultation on the proposed information return. On 2 February 2023 the OECD also issued its first tranche of agreed administrative guidance which is intended to ensure that the model rules are implemented and applied in a co-ordinated manner. It is expected that a revised version of the guidance (which was issued in March 2022) will be released later this year. Furthermore, the OECD is expected to publish further agreed administrative guidance on an ongoing basis.
On 17 November 2022 the UK government confirmed its intention to implement rules into UK legislation for the second pillar through inclusion in the Spring Finance Bill 2023 with the rules applying to accounting periods beginning on or after 31 December 2023. On 23 December 2022, the parliament of the Republic of Korea approved the budget bill for 2023 which includes the enactment of rules for the second pillar. This enactment of the rules in the Republic of Korea is not, in isolation, expected to have any impact for Prudential.
A number of jurisdictions in which Prudential has operations have indicated that consideration is being given to introducing a domestic minimum tax for in-scope multinationals alongside introducing the model rules. As Prudential operates in a number of jurisdictions where the effective tax rate can be less than 15 per cent, the implementation of the model rules and/or equivalent domestic minimum tax rules may have an adverse impact on the Group. Until all expected OECD documents are published and details of implementing domestic legislation in relevant jurisdictions are available, the full extent of the long-term impact on Prudential’s business, tax liabilities and profits remain uncertain.
Significant Subsidiaries
The table below sets forth Prudential’s significant operating subsidiaries.
| ||
| Main activity | Country of incorporation |
Prudential Assurance Company Singapore (Pte) Limited | Insurance | Singapore |
PT Prudential Life Assurance | Insurance | Indonesia |
Prudential Hong Kong Limited | Insurance | Hong Kong, China |
Prudential Assurance Malaysia Berhad | Insurance | Malaysia |
Note
The Company has 100 per cent of the voting rights of the subsidiaries in Singapore and Hong Kong and 94.6 per cent of the voting rights in the Indonesia subsidiary attaching to the aggregate of the shares across the types of capital in issue. The percentage of share ownership for these subsidiaries is the same as the percentage of the voting power held. The Company has 51 per cent voting rights in Prudential Assurance Malaysia Berhad but this company is fully consolidated in the Group’s financial statements reflecting the economic interest of the Group.
Each significant subsidiary operates mainly in its country of incorporation.
188
Major Shareholders
The table below shows the holdings of major shareholders in the Company’s issued share capital as notified to the Company in accordance with the Disclosure Guidance and Transparency Rules. At 21 March 2023, Prudential had received the following notifications:
Significant Changes in Ownership
Notifications received within the last three years:
| | | | | | | | | | | | | | | |
| | | | | | | | | | | | % of total | | | |
| | | | | | | | | | | | voting rights | | | |
| | | | | | Date | | | Number of | | | attaching to | | | |
| | | | | | Prudential | | | Prudential | | | issued share | | | |
Year |
|
| Name of Company |
|
| was notified |
|
| shares held |
|
| capital |
|
| Change in interest |
2020 | | | Norges Bank | | | February | | | 77,815,026 | | | 2.99 | | | Decrease in interest |
2020 | | | Third Point LLC | | | June | | | 131,575,000 | | | 5.04 | | | Increase in interest |
2022 | | | Norges Bank | | | September | | | 82,512,136 | | | 3.00 | | | Decrease in interest |
2022 | | | Norges Bank | | | October | | | 82,396,692 | | | 2.99 | | | Decrease in interest |
2022 | | | Norges Bank | | | October | | | 82,498,574 | | | 3.00 | | | Increase in interest |
2022 | | | Norges Bank | | | October | | | 82,453,020 | | | 2.99 | | | Decrease in interest |
2022 | | | Norges Bank | | | October | | | 82,646,258 | | | 3.00 | | | Increase in interest |
2022 | | | Norges Bank | | | November | | | 82,044,963 | | | 2.98 | | | Decrease in interest |
2022 | | | Norges Bank | | | December | | | 83,673,195 | | | 3.04 | | | Increase in interest |
2022 | | | Norges Bank | | | December | | | 83,673,195 | | | 3.04 | | | Change in mix of shares and financial instruments held |
2022 | | | Norges Bank | | | December | | | 84,291,861 | | | 3.06 | | | Increase in interest |
2022 | | | Norges Bank | | | December | | | 85,354,285 | | | 3.10 | | | Increase in interest |
2023 | | | Norges Bank | | | January | | | 82,856,666 | | | 3.01 | | | Decrease in interest |
2023 | | | Norges Bank | | | March | | | 85,503,331 | | | 3.10 | | | Increase in interest |
Whilst no formal notice has been disclosed to the Company in accordance with the Disclosure Guidance and Transparency Rules, we understand that Third Point LLC no longer have a financial interest in the Company’s issued ordinary share capital.
Current major shareholders:
| | | | | | |
| | | | Percentage of | | |
Shareholder |
| Date advised |
| share capital |
| Shareholding |
BlackRock Inc | | 05 April 2012 | | 5.08 | % | 129,499,098 |
Norges Bank | | 13 March 2023 |
| 3.10 | % | 85,503,331 |
Major shareholders of Prudential have the same voting rights per share as other shareholders. See Governance – Memorandum and Articles of Association - Voting Rights’.
As at 21 March 2023, there were 127 shareholders with a US address on Prudential’s register of shareholders. These shares represented approximately 0.01 per cent of Prudential’s issued ordinary share capital. As at 21 March 2023, there were 86 registered Prudential ADR holders. The shares represented by these ADRs amounted to approximately 0.005 per cent of Prudential’s issued ordinary share capital.
Prudential does not know of any arrangements which may at a subsequent date result in a change of control of Prudential.
Intellectual Property
Prudential conducts business under the ‘Prudential’ and ‘Eastspring Investments’ brand names and logos. It is also the registered owner of over 100 domain names, including ‘www.prudentialplc.com’ and ‘www.eastspringinvestments.com’.
Prudential does not operate in the US under the Prudential name and there have been long-standing arrangements between it and Prudential Financial, Inc. and its subsidiary, the Prudential Insurance Company of America, relating to their respective uses of the Prudential name. Under these arrangements Prudential Financial Inc. has the right to use the Prudential name in the Americas and certain parts of the Caribbean, Japan, Korea and Taiwan. Following the demerger of M&G from the Group in October 2019, M&G has the right to use the Prudential brand in the United Kingdom and Europe. Prudential has the right to use the name everywhere else in the world although third parties have rights to the name in certain countries.
189
Legal Proceedings
The Group is involved in various litigation and regulatory proceedings. While the outcome of such litigation and regulatory issues cannot be predicted with certainty, the Company believes that their ultimate outcome will not have a material adverse effect on the Group’s financial condition, results of operations, or cash flows.
Material Contracts
On 6 August 2021, Prudential and Jackson entered into a demerger agreement to effect the demerger of Jackson ('the Jackson Demerger') and to govern the post-demerger obligations of the Group and the Jackson Group in respect of, among other things, data sharing and their respective indemnity obligations (the 'Jackson Demerger Agreement').
The Jackson Demerger Agreement contains mutual cross indemnities under which Jackson indemnifies the Group against losses, costs, damages and expenses of any kind suffered or arising directly or indirectly from or in consequence of the business carried on by the Jackson Group prior to the Jackson Demerger and Prudential indemnifies the Jackson Group against losses, costs, damages and expenses of any kind suffered or arising directly or indirectly from or in consequence of the business carried on by the Group other than the Jackson Group prior to the Jackson Demerger. Claims made under these mutual cross indemnities by the indemnified party are, subject to the right of the indemnifying party to defend any such claim, required to be paid by the indemnifying party. These mutual cross indemnities are unlimited in terms of amount and subject to customary time limits.
The Jackson Demerger Agreement sets out how guarantees, indemnities or other assurances given by the Group for the benefit of companies in the Jackson Group (or vice versa) will be dealt with following the Jackson Demerger. Under the Jackson Demerger Agreement, the beneficiary of such a guarantee must generally seek to obtain the guarantor's release from the guarantor's obligations thereunder and, pending release, indemnify the guarantor against all liabilities and costs arising under or by reason of the guarantee and ensure that the guarantor's exposure under the guarantee is not increased. The Jackson Demerger Agreement provides that both the Group and the Jackson Group have access to each other's records for a customary period following the Jackson Demerger and both the Group and the Jackson Group have agreed to keep certain information relating to the other confidential, subject to certain customary exemptions.
On 6 August 2021 Prudential entered into a registration rights agreement with Jackson (the 'Registration Rights Agreement'). The Registration Rights Agreement provides Prudential and certain permitted transferees with certain registration rights relating to Jackson shares beneficially owned by Prudential whereby, at any time following completion of the Jackson Demerger, Prudential and its permitted transferees may require Jackson to register under the U.S. Securities Act all or any portion of such shares a so-called "demand registration," subject to certain limitations. Jackson will not be obliged to effect more than one demand registration in any 90-day period. Prudential and its permitted transferees will also have "piggyback" registration rights, such that Prudential and the permitted transferees may include their respective shares in any future registrations of Jackson's equity securities, whether or not that registration relates to a primary offering by Jackson or a secondary offering by or on behalf of any of Jackson's stockholders.
The Registration Rights Agreement sets forth customary registration procedures, including an agreement by Jackson to make its management reasonably available to participate in road show presentations in connection with any underwritten offerings. Jackson has also agreed to indemnify Prudential and permitted transferees with respect to liabilities resulting from untrue statements or omissions in any registration statement used in any such registration, other than untrue statements or omissions resulting from information furnished to Jackson for use in a registration statement by Prudential or any permitted transferee.
Exchange Controls
Other than the requirement to report certain events and transactions to HM Revenue & Customs, there are currently no UK laws, decrees or regulations that restrict the export or import of capital, including, but not limited to, foreign exchange controls, or that affect the remittance of dividends or other payments to non-UK residents or to US holders of Prudential’s securities, except as otherwise set forth under ‘Taxation’ in this section.
190
Taxation
The following is a summary, under current law and practice, of the principal UK tax, US federal income tax, Hong Kong and Singapore tax considerations relating to an investment by a US taxpayer in Prudential ordinary shares or ADSs. This summary applies to you only if:
— | You are an individual US citizen or resident, a US corporation, or otherwise subject to US federal income tax on a net income basis in respect of your holding of Prudential ordinary shares or ADSs; |
— | You hold Prudential ordinary shares or ADSs or shares held or traded in Singapore through the Central Depository (CDP) as a capital asset for tax purposes; |
— | If you are an individual, you are not resident in the United Kingdom for UK tax purposes, and do not hold Prudential ordinary shares or ADSs for the purposes of a trade, profession, or vocation that you carry on in the United Kingdom through a branch or agency or if you are a corporation, you are not resident in the UK for UK tax purposes and do not hold the securities for the purpose of a trade carried on in the United Kingdom through a permanent establishment in the United Kingdom; and |
— | You are not domiciled in the UK for inheritance tax purposes. |
This summary does not address any tax consideration other than certain UK tax, US federal income tax, Hong Kong tax and Singapore tax considerations and does not purport to be a comprehensive description of all of the tax considerations that may be relevant to any particular investor, and does not address the tax treatment of investors that are subject to special rules. Prudential has assumed that you are familiar with the tax rules applicable to investments in securities generally and with any special rules to which you may be subject. You should consult your own tax advisers regarding the tax consequences of the ownership of Prudential ordinary shares or ADSs in the context of your own particular circumstances.
The discussion is based on laws, treaties, judicial decisions, and regulatory interpretations in effect on the date hereof, all of which are subject to change possibly retrospectively.
Beneficial owners of ADSs will be treated as owners of the underlying Prudential ordinary shares for US federal income tax purposes. Deposits and withdrawals of Prudential ordinary shares in exchange for ADSs generally will not result in the realisation of gain or loss for US federal income tax purposes.
UK Taxation of Dividends
UK tax is not required to be withheld in the United Kingdom at source from cash dividends paid to US resident holders.
UK Taxation of Capital Gains
A holder of Prudential ordinary shares or ADSs who for UK tax purposes is a US corporation that is not resident in the United Kingdom will not be liable for UK taxation on capital gains realised on the disposal of Prudential ordinary shares or ADSs unless at the time of disposal:
— | The holder carries or has carried on a trade in the United Kingdom through a permanent establishment in the United Kingdom, and |
— | The Prudential ordinary shares or ADSs are or have been used, held or acquired for use by or for the purposes of such trade or permanent establishment. |
Subject to the comments in the following paragraph, a holder of Prudential ordinary shares or ADSs who, for UK tax purposes, is an individual who is not resident in the United Kingdom will not be liable for UK taxation on capital gains realised on the disposal of Prudential ordinary shares or ADSs unless at the time of the disposal:
— | The holder carries or has carried on a trade in the United Kingdom through a branch or agency, and |
— | The Prudential ordinary shares or ADSs are or have been used, held, or acquired for use by or for the purposes of such trade or for the purposes of such branch or agency. |
A holder of Prudential ordinary shares or ADSs who is an individual who is temporarily a non-UK resident for UK tax purposes will, in certain circumstances, become liable to UK tax on capital gains in respect of gains realised while he or she was not resident in the UK.
191
UK Inheritance Tax
Prudential ordinary shares which are registered on the main Prudential share register are assets situated in the United Kingdom for the purposes of UK inheritance tax (the equivalent of US estate and gift tax). Prudential ADSs are likely to be treated in the same manner as the underlying Prudential ordinary shares and as situated in the United Kingdom. Subject to the discussion of the UK-US estate tax treaty in the next paragraph, UK inheritance tax may apply if an individual who holds Prudential ordinary shares which are registered on the main Prudential share register or ADSs gifts them or dies even if he or she is neither domiciled in the United Kingdom nor deemed to be domiciled there under UK law. For inheritance tax purposes, a transfer of Prudential ordinary shares or ADSs at less than full market value may be treated, to the extent of the undervalue, as a gift for these purposes. Special inheritance tax rules apply (1) to gifts if the donor retains some benefit, (2) to close companies and (3) to trustees of settlements. Prudential ordinary shares which are registered on the Hong Kong branch register should not be treated as situated in the United Kingdom for the purpose of UK inheritance tax.
However, as a result of the UK-US estate tax treaty, Prudential ordinary shares which are registered on the main Prudential share register or ADSs held by an individual who is domiciled in the United States for the purposes of the UK-US estate tax treaty and who is not a UK national will, subject to special rules relating to trusts and settlements, not be subject to UK inheritance tax on that individual’s death or on a gift of the Prudential ordinary shares or ADSs unless the Prudential ordinary shares or ADSs:
— | Are part of the business property of a permanent establishment of an enterprise in the United Kingdom, or |
— | Pertain to a fixed base in the UK used for the performance of independent personal services. |
The UK-US estate tax treaty provides a credit mechanism if the Prudential ordinary shares or ADSs are subject to both UK inheritance tax and to US estate and gift tax.
UK Stamp Duty and Stamp Duty Reserve Tax
Relevant legislation provides that, subject to certain exemptions, UK stamp duty would be payable on a transfer of, and UK stamp duty reserve tax (SDRT) would be payable upon a transfer or issue of, Prudential ordinary shares to the depositary of Prudential ordinary shares that is responsible for issuing ADSs (the ‘ADS Depositary’), or a nominee or agent of the ADS depositary, in exchange for American Depositary Receipts (ADRs) representing ADSs. For this purpose, the current rate of stamp duty and SDRT is 1.5 per cent (rounded up, in the case of stamp duty, to the nearest £5).
However, as a result of case law, HMRC’s current position is that they will not seek to levy a 1.5 per cent SDRT charge on an issue of UK shares to a person providing clearance services or issuing depositary receipts, wherever located. HMRC do not, however, agree that the relevant case law extends to transfers of shares to a person providing clearance services or issuing depositary receipts, wherever located, where that transfer is not an integral part of an issue of share capital. It is recommended that, should this charge arise, independent professional tax advice be sought without delay.
Provided that the instrument of transfer is not executed in the United Kingdom no UK stamp duty should be required to be paid on any transfer of Prudential ADRs representing ADSs. Based on Prudential’s understanding of HMRC’s application of the exemption from SDRT for depositary receipts a transfer of Prudential ADRs representing ADSs should not, in practice, give rise to a liability to SDRT.
Subject to the special rules relating to clearance services and issuers of depositary receipts, a transfer for value of Prudential ordinary shares (but excluding Prudential ordinary shares registered on the Hong Kong branch register unless the instruments of transfer are executed in the UK), as opposed to ADSs, will generally give rise to a charge to UK stamp duty, other than where the amount or value of the consideration for the transfer is £1,000 or under and the transfer instrument is certified to that effect, at the rate of 0.5 per cent (rounded up to the nearest £5). The rate is applied to the amount or value of the consideration payable for the relevant Prudential ordinary shares. To the extent that UK stamp duty is paid on a transfer of Prudential ordinary shares, no SDRT should generally be payable on the agreement for that transfer.
Subject to certain special rules relating to clearance services and issuers of depositary receipts, a transfer of ordinary shares from a nominee to their beneficial owner (other than on sale), including a transfer of underlying Prudential ordinary shares from the ADS Depositary or its nominee to an ADS holder, is not subject to UK stamp duty or SDRT. No UK SDRT should be payable on an agreement to transfer Prudential ordinary shares registered on the Hong Kong branch registers, subject to the special rule relating to clearance services and issuers of depositary receipts.
UK stamp duty is usually paid by the purchaser. Although SDRT is generally the liability of the purchaser, any such tax payable on the transfer or issue of Prudential ordinary shares to the ADS Depositary or its nominee would be payable by the ADS Depositary as the issuer of the ADSs. In accordance with the terms of the Deposit Agreement, the ADS Depositary will recover an amount in respect of such tax from the initial holders of the ADSs. However, due to HMRC’s position set out above, it is likely that no such tax will be charged in relation to an issue of Prudential ordinary shares into the ADS Depositary.
192
US Federal Income Tax Treatment of Distributions on Prudential Ordinary Shares or ADSs
If Prudential pays dividends, you must include those dividends in your income when you receive them. The dividends will be treated as foreign source income. You should determine the amount of your dividend income by converting pounds sterling into US dollars at the exchange rate in effect on the date of your (or the depositary’s, in the case of ADSs) receipt of the dividend. Subject to certain exceptions for short-term and hedged positions, the US dollar amount of dividends received by an individual will be subject to taxation at a lower rate than ordinary income if the dividends are ‘qualified dividends.’ Dividends received with respect to the ordinary shares or ADSs will be qualified dividends if Prudential was not, in the year prior to the year in which the dividend was paid, and is not, in the year in which the dividend is paid, a passive foreign investment company (PFIC) and either (i) at the time a dividend was paid, Prudential was eligible for the benefits of the 24 July 2001 Treaty between the United States and the United Kingdom or (ii) such ordinary shares or ADSs were, at the time of payment, readily tradeable on an established securities market in the United States. Following the change of tax residence of Prudential from the UK to Hong Kong effective from 3 March 2023, Prudential is no longer eligible for the benefits of the Treaty, and as a result, dividends paid on or after that date with respect to ordinary shares (which are not listed on an established securities market in the United States) are not expected to be qualified dividends. Dividends received with respect to ADSs are expected to be qualified dividends, as the ADSs are expected to continue to be listed, and be viewed as readily tradeable, on the New York Stock Exchange (an established securities market in the United States). Based on the nature of its business activities and its expectations regarding such activities in the future, Prudential believes that it was not treated as a PFIC within the meaning of the Code with respect to its 2022 taxable year and does not anticipate becoming a PFIC for its 2023 taxable year.
US Federal Income Tax Treatment of Capital Gains
If you sell your Prudential ordinary shares or ADSs, you will recognise a US source capital gain or loss equal to the difference between the US dollar value of the amount realised on the disposition and the US dollar basis in the ordinary shares of the ADSs. A gain on the sale of Prudential ordinary shares or ADSs held for more than one year will be treated as a long-term capital gain. The net long-term capital gain generally is subject to taxation at a lower rate than ordinary income. Your ability to offset capital losses against ordinary income is subject to limitations.
US Federal Medicare Tax on Net Investment Income
A 3.8 per cent surtax will generally apply to the net investment income of individuals whose modified adjusted gross income exceeds certain threshold amounts. These amounts are $200,000 in the case of single taxpayers, $250,000 in the case of married taxpayers filing joint returns, and $125,000 in the case of married taxpayers filing separately. Net investment income includes, among other items, dividends, interest, and net gain from the disposition of property (other than certain property held in a trade or business).
US Information Reporting and Backup Withholding
Under the US tax code, a US resident holder of Prudential ordinary shares or ADSs may be subject, under certain circumstances, to information reporting and possibly backup withholding with respect to dividends and proceeds from the sale or other disposition of Prudential ordinary shares or ADSs, unless the US resident holder provides proof of an applicable exemption or correct taxpayer identification number and otherwise complies with applicable requirements of the backup withholding rules. Any amount withheld under the backup withholding rules is not additional tax and may be refunded or credited against the US resident holder’s federal income tax liability, so long as the required information is furnished to the IRS.
Hong Kong Taxation of Dividends
No tax will be payable in Hong Kong in respect of dividends Prudential pays to its US resident holders. Dividends distributed to Prudential’s US resident holders will be free of withholding taxes in Hong Kong.
Hong Kong Taxation on gains of sale
No tax is imposed in Hong Kong in respect of capital gains. However, trading gains from the sale of property by persons carrying on a trade, profession or business in Hong Kong where the trading gains are derived from or arise in Hong Kong will be chargeable to Hong Kong profits tax. Hong Kong profits tax is currently charged at the rate of 16.5 per cent on corporations and at a maximum rate of 15 per cent on individuals. Certain categories of taxpayers whose business consists of buying and selling shares are likely to be regarded as deriving trading gains rather than capital gains (eg financial institutions, insurance companies and securities dealers) unless these taxpayers can prove that the investment securities are held for long-term investment purposes.
Trading gains from the sale of the Prudential ordinary share by US resident holders effected on the Hong Kong Stock Exchange will be considered to be derived from Hong Kong. A liability for Hong Kong profits tax would thus arise in respect of trading gains derived by US resident holders from the sale of Prudential ordinary shares effected on the Hong Kong Stock Exchange where such trading gains are realised by US resident holders from a business carried on in Hong Kong.
Hong Kong Stamp duty
Hong Kong stamp duty, currently charged at the ad valorem rate of 0.13 per cent on the higher of the consideration for or the value of the Prudential ordinary shares, will be payable by the purchaser on a purchase and by the seller on a sale of Prudential ordinary shares where the transfer is required to be registered in Hong Kong (ie a total of 0.26 per cent is ordinarily payable on a sale and purchase transaction involving ordinary shares). In addition, a fixed duty of HK$5 is currently payable on any instrument of transfer of ordinary shares.
193
Hong Kong Estate duty
Hong Kong estate duty has been abolished with effect to all deaths occurring on or after 11 February 2006.
Singapore Taxation on gains of sale
Disposal of the Prudential ordinary shares
Singapore does not impose tax on capital gains. However, gains of an income nature may be taxable in Singapore. There are no specific laws or regulations which deal with the characterisation of whether a gain is income or capital in nature. Gains arising from the disposal of the Prudential ordinary shares by US resident holders may be construed to be of an income nature and subject to Singapore income tax, especially if they arise from activities which are regarded as the carrying on of a trade or business and the gains are sourced in Singapore.
Adoption of FRS 109 for Singapore Tax Purposes
Any US resident holders who apply, or who are required to apply, the Singapore Financial Reporting Standard 109 Financial Instruments (FRS 109) for the purposes of Singapore income tax may be required to recognise gains or losses (not being gains or losses in the nature of capital) in accordance with the provisions of FRS 109 (as modified by the applicable provisions of Singapore income tax law) even though no sale or disposal is made. Taxpayers who may be subject to such tax treatment should consult their own accounting and tax advisers regarding the Singapore income tax consequences of their acquisition, holding and disposal of the Prudential ordinary shares.
Singapore Taxation of Dividend distributions
As Prudential is incorporated in England and Wales and is not tax resident in Singapore for Singapore tax purposes, dividends paid by Prudential will be considered as sourced outside Singapore (unless the Prudential ordinary shares are held as part of a trade or business carried out in Singapore in which event the US resident holders of such shares may be taxed on the dividends as they are derived).
Foreign-sourced dividends received or deemed received in Singapore by a US resident individual not resident in Singapore are exempt from Singapore income tax. This exemption will also apply in the case of a Singapore tax resident individual who receives their foreign-sourced income in Singapore on or after 1 January 2004 (except where such income is received through a partnership in Singapore).
Foreign-sourced dividends received or deemed received by corporate investors in Singapore (including US investors carrying on trade or business in Singapore) will ordinarily be liable to Singapore tax. However, foreign-sourced income in the form of dividends, branch profits and service income received or deemed to be received in Singapore by Singapore tax resident companies on or after 1 June 2003 can be exempt from tax if certain prescribed conditions are met, including the following:
I. | such income is subject to tax of a similar character to income tax (by whatever name called) under the law of the territory from which such income is received; and |
II. | at the time the income is received in Singapore, the highest rate of tax of a similar character to income tax (by whatever name called) levied under the law of the territory from which the income is received on any gains or profits from any trade or business carried on by any company in that territory at that time is not less than 15 per cent. |
Certain concessions and clarifications have also been announced by the Inland Revenue Authority of Singapore with respect to such conditions.
Singapore Stamp duty
As Prudential is incorporated in England and Wales and the Prudential ordinary shares are not registered on any register kept in Singapore, no stamp duty is payable in Singapore:
(i) | On the issuance of the Prudential ordinary shares; and |
(ii) | On any transfer of the Prudential ordinary shares. |
Prudential ordinary shares held or traded in Singapore through CDP will be registered on the HK Register. As such, Hong Kong stamp duty will be payable on a transfer of Prudential ordinary shares held or traded in Singapore through CDP. Please refer to the description under the Hong Kong stamp duty section above.
All persons, including US resident holders, who hold or transact in Prudential ordinary shares in Singapore through the SGX-ST and/or CDP should expect that they will have to bear Hong Kong stamp duty in respect of transactions in Prudential ordinary shares effected in Singapore through the SGX-ST and/or CDP. Such persons should consult their brokers, or custodians for information regarding what procedures may be instituted for collection of Hong Kong stamp duty from them.
194
Singapore Estate duty
Singapore estate duty has been abolished with respect to all deaths occurring on or after 15 February 2008.
Singapore Goods and Services Tax
There is no Goods and Services Tax (GST) payable in Singapore on the subscription or issuance of the Prudential ordinary shares. The clearing fees, instruments of transfer deposit fees and share withdrawal fees are subject to GST at the prevailing standard-rate (currently 8 per cent , increasing to 9 per cent from 1 January 2024) if the services are provided by a GST registered person to a holder of the Prudential ordinary shares. However, such fees could be zero-rated when provided to a US resident holder of the Prudential ordinary shares belonging outside Singapore provided certain conditions are met. For a holder of the Prudential ordinary shares belonging in Singapore who is registered for GST, the GST incurred is generally not recoverable as input tax credit from the Inland Revenue Authority of Singapore unless certain conditions are satisfied. These GST-registered holders of the Prudential ordinary shares should seek the advice of their tax advisors on these conditions.
Documents on Display
Prudential is subject to the informational requirements of the Securities Exchange Act of 1934 applicable to foreign private issuers. In accordance with these requirements, Prudential files its annual report on Form 20-F and other documents with the SEC.
The SEC maintains a website that contains reports and other information regarding registrants. All the SEC filings made electronically by registrants including Prudential can be accessed at www.sec.gov. Prudential’s SEC filings are also available on our corporate website at www.prudentialplc.com
Prudential also files reports and other documents with the London, Hong Kong and Singapore stock exchanges. This information may be viewed on the Company’s website or on the websites of each of those exchanges as well as via the UK Financial Conduct Authority’s National Storage Mechanism. The contents of the Company’s website are not incorporated by reference into this Form 20-F.
Controls and Procedures
Management has evaluated, with the participation of Prudential plc’s Chief Executive Officer and Group Chief Financial Officer, the effectiveness of Prudential plc’s disclosure controls and procedures (as defined in Rules 13a-15(e) and 15d-15(e) of the Securities Exchange Act of 1934, as amended (Exchange Act)) as of 31 December 2022. There are inherent limitations to the effectiveness of any system of disclosure controls and procedures, including the possibility of human error and the circumvention or overriding of the controls and procedures. Accordingly, even effective disclosure controls and procedures can only provide reasonable assurance of achieving their control objectives. Based upon Prudential plc’s evaluation, Prudential plc’s Chief Executive Officer and Group Chief Financial Officer have concluded that as of 31 December 2022 Prudential plc’s disclosure controls and procedures were effective to provide reasonable assurance that information required to be disclosed by Prudential plc in the reports Prudential plc files and submits under the Exchange Act is recorded, processed, summarised and reported, within the time periods specified in the applicable rules and forms and that it is accumulated and communicated to Prudential plc’s management, including Prudential plc’s Chief Executive Officer and Group Chief Financial Officer, as appropriate to allow timely decisions regarding required disclosure.
Prudential plc is required to undertake an annual assessment of the effectiveness of internal control over financial reporting under Section 404 of the Sarbanes-Oxley Act 2002 (Section 404). In accordance with the requirements of Section 404 the following report is provided by management in respect of Prudential plc’s internal control over financial reporting (as defined in Rules 13a-15(f) and 15d-15(f) under the Exchange Act).
Management’s Annual Report on Internal Control over Financial Reporting
Management acknowledges its responsibility for establishing and maintaining adequate internal control over financial reporting for Prudential plc. Internal control over financial reporting is a process designed to provide reasonable assurance regarding the reliability of financial reporting and the preparation of financial statements for external purposes in accordance with International Financial Reporting Standards as issued by the International Accounting Standards Board.
Management has conducted, with the participation of Prudential plc’s Chief Executive Officer and Group Chief Financial Officer, an evaluation of the effectiveness of internal control over financial reporting based on the criteria set forth in ‘2013 Internal Control—Integrated Framework’ issued by the Committee of Sponsoring Organizations of the Treadway Commission. Based on the assessment under these criteria, management has concluded that, as of 31 December 2022, Prudential plc’s internal control over financial reporting was effective.
In addition, there have been no changes in Prudential plc’s internal control over financial reporting during 2022 that have materially affected, or are reasonably likely to affect materially, Prudential plc’s internal control over financial reporting.
KPMG LLP, which has audited the consolidated financial statements of Prudential plc for the year ended 31 December 2022, has also audited the effectiveness of Prudential plc’s internal control over financial reporting in accordance with the standards of the Public
195
Company Accounting Oversight Board (US). KPMG LLP’s report on internal control over financial reporting is shown in the Financial Statements section.
Listing Information
Prudential ordinary shares are listed on the Premium Listing segment of the Official List of the UK Listing Authority and traded on the London Stock Exchange under the symbol ‘PRU’. Prudential ordinary shares are also listed on the Main Board of the Hong Kong Stock Exchange and are traded in board lots of 50 shares with the short name ‘PRU’ and stock code 2378; and via a secondary listing are listed on the Singapore Stock Exchange, traded in board lots of 100 shares, with the stock code ‘K6S’.
Prudential American Depositary Shares (ADSs) are listed for trading on the NYSE under the symbol ‘PUK’.
Trading on the Singapore Stock Exchange may be infrequent for certain periods during the year. This does not have any material impact on the liquidity of the Group.
Description of Securities Other than Equity Securities
Payments received from the ADR Depositary
Direct payments
J.P. Morgan Chase Bank, N.A. is the depositary (ADR Depositary) of Prudential’s ADR program.
Fees or charges payable by ADR holders
The ADR holders of Prudential are required to pay the following fees to the ADR Depositary for general depositary services:
| ||
Category | ADR Depositary actions | Associated fee or charge |
Depositing or surrendering the underlying shares | Each person to whom ADRs are delivered against deposits of shares, and each person surrendering ADRs for withdrawal of deposited securities | Up to US$5.00 for each 100 ADSs (or portion thereof) evidenced by the ADRs delivered or surrendered |
Cable fee | Cable fee for delivery of underlying shares in the home market on the back of a cancellation | US$25 for each delivery |
Currency charges | Charges incurred by the ADR Depositary in the conversion of foreign currency into US Dollars | Amount paid by the ADR Depositary, and such charges are reimbursable out of such foreign currency |
Purchases of Equity Securities by Prudential plc and Affiliated Purchasers
The following table sets forth information with respect to purchases made by or on behalf of Prudential or any ‘affiliated purchasers’ (as that term is defined in Rule 10b-18(a)(3) under the Securities Exchange Act of 1934, as amended) of Prudential’s ordinary shares or American depositary shares for the year ended 31 December 2022.
| | | | | | | | | |
|
| |
| |
| Total Number of | | |
|
| | | | | | Shares Purchased at | | Maximum Number of |
|
| | Total Number | | Average | | Part of Publicly | | Shares that May Yet be |
|
| | of Shares | | Price Paid | | Announced Plans or | | Purchased Under |
|
Period |
| Purchased* |
| Per Share ($) |
| Programs |
| Plans or Programs |
|
1 January – 31 January | | 63,019 | | 17.79 | | — | | — | |
1 February – 28 February | | 65,223 | | 16.84 | | — | | — | |
1 March – 31 March | | 73,193 | | 14.41 | | — | | — | |
1 April – 30 April | | 4,024,410 | | 14.63 | | — | | — | |
1 May – 31 May | | 460,897 | | 11.48 | | — | | — | |
1 June – 30 June | | 196,180 | | 12.25 | | — | | — | |
1 July – 31 July | | 87,338 | | 12.05 | | — | | — | |
1 August – 31 August | | 86,540 | | 11.90 | | — | | — | |
1 September – 30 September | | 90,843 | | 11.01 | | — | | — | |
1 October – 31 October | | 175,837 | | 9.53 | | — | | — | |
1 November – 30 November | | 79,326 | | 10.56 | | — | | — | |
1 December – 31 December | | 95,680 | | 12.96 | | — | | — | |
* | The shares listed in this column were acquired by employee benefit trusts during the year to satisfy future obligations to deliver shares under the Company’s employee incentive plans, the savings related share option scheme and the share participation plan. |
196
Principal Accountant Fees and Services
Prudential’s auditor is KPMG LLP (PCAOB ID: 1118) located in London, United Kingdom. Total fees payable to KPMG are set out for the years shown below:
| | | | | | | |
|
| Note |
| 2022 $m |
| 2021 $m |
|
Audit fees: | | | |
|
|
| |
Audit of the Company’s annual accounts | | 1 | | 2.3 | | 2.4 | |
Audit of subsidiaries pursuant to legislation | | 2 | | 4.4 | | 5.9 | |
| | | | 6.7 | | 8.3 | |
Audit-related assurance services | | 3 | | 3.5 | | 4.5 | |
Other fees paid to auditors: | | | |
| |
| |
Other assurance services | | | | 0.7 | | 1.1 | |
Services relating to corporate finance transactions | | | | — | | 1.6 | |
| | | | 0.7 | | 2.7 | |
Total fees paid to the auditor | | | | 10.9 | | 15.5 | |
Analysed into: | | | |
| |
| |
Fees payable to the auditor attributable to the continuing operations: | | | |
| |
| |
Non-audit services associated with the demerger and public offering | | | | — | | 1.9 | |
Other audit and non-audit services | | | | 10.9 | | 11.3 | |
| | | | 10.9 | | 13.2 | |
Fees payable to the auditor attributable to the discontinued US operations | | | | — | | 2.3 | |
| | | | 10.9 | | 15.5 | |
Notes
1. | Fees of $2.3 million in 2022 (2021: $2.4 million) for the audit of Prudential’s annual accounts comprised statutory audit fees of $1.4 million (2021: $1.5 million) and US reporting audit fees of $0.9 million (2021: $0.9 million). |
2. | Fees of $4.3 million in 2022 (2021: $5.9 million) for audit of subsidiaries pursuant to legislation mainly related to the audit of local and statutory accounts and to statutory audit work in connection with the submission of results to be consolidated in Prudential’s annual accounts. |
3. | Audit-related assurance services supplied comprised EEV and interim reporting audit fees, regulatory reporting, controls reporting and other similar work. Of the audit-related assurance service fees (as defined by SEC guidance) of $3.5 million in 2022 (2021: $4.5 million), $0.9 million (2021: $0.6 million) relates to services that are required by law and regulation. |
Change in Registrant’s Certifying Accountant
As reported in the 2020 Form 20-F, following a rigorous tendering process the Board resolved that it intends to recommend EY for appointment as the Group’s auditor for the financial year ending 31 December 2023 onwards, subject to shareholder approval at the Annual General Meeting in 2023. The Group Audit Committee is overseeing the Group’s relationship with EY, their independence from Prudential and the transition plan.
A letter from KPMG LLP to the SEC was attached as Exhibit 15.2 to Prudential’s 2020 Form 20-F filing.
Limitations on Enforcement of US Laws Against Prudential, Its Directors, Management and Others
Prudential plc is a public limited company incorporated and registered in England and Wales. Most of its directors and executive officers are resident outside the US, and a substantial portion of its assets and the assets of such persons are located outside the US. As a result, it may be difficult for you to effect service of process within the US upon these persons or to enforce against them or Prudential plc in US courts judgements obtained in US courts predicated upon the civil liability provisions of the federal securities laws of the US. We believe that there may be doubt as to the enforceability in England and Wales, in original actions or in actions for enforcement of judgements of US courts, of liabilities predicated solely upon the federal securities laws of the US.
197
Financial Statements
Index to the consolidated financial statements
198
Report of Independent Registered Public Accounting Firm
To the Shareholders and Board of Directors
Prudential plc:
Opinions on the Consolidated Financial Statements and Internal Control Over Financial Reporting
We have audited the accompanying consolidated statements of financial position of Prudential plc and subsidiaries (the Company) as of December 31, 2022 and 2021, the related consolidated statements of income, comprehensive income, changes in equity, and cash flows for each of the years in the three-year period ended 31 December 2022, and the related notes and the disclosures marked ‘audited’ within the Risk Review section on pages 50 to 66 of the 2022 Form 20-F of the Company, and the condensed financial statement Schedule II (collectively, the consolidated financial statements). We also have audited the Company’s internal control over financial reporting as of 31 December 2022, based on criteria established in Internal Control – Integrated Framework (2013) issued by the Committee of Sponsoring Organizations of the Treadway Commission.
In our opinion, the consolidated financial statements referred to above present fairly, in all material respects, the financial position of the Company as of 31 December 2022 and 2021, and the results of its operations and its cash flows for each of the years in the three-year period ended 31 December 2022, in conformity with International Financial Reporting Standards as issued by International Accounting Standards Board. Also in our opinion, the Company maintained, in all material respects, effective internal control over financial reporting as of 31 December 2022 based on criteria established in Internal Control – Integrated Framework (2013) issued by the Committee of Sponsoring Organizations of the Treadway Commission.
Basis for Opinions
The Company’s management is responsible for these consolidated financial statements, for maintaining effective internal control over financial reporting, and for its assessment of the effectiveness of internal control over financial reporting, included in the accompanying Management’s Annual Report on Internal Control over Financial Reporting within the Controls and Procedures section of the 2022 Form 20-F of the Company. Our responsibility is to express an opinion on the Company’s consolidated financial statements and an opinion on the Company’s internal control over financial reporting based on our audits. We are a public accounting firm registered with the Public Company Accounting Oversight Board (United States) (PCAOB) and are required to be independent with respect to the Company in accordance with the U.S. federal securities laws and the applicable rules and regulations of the Securities and Exchange Commission and the PCAOB.
We conducted our audits in accordance with the standards of the PCAOB. Those standards require that we plan and perform the audits to obtain reasonable assurance about whether the consolidated financial statements are free of material misstatement, whether due to error or fraud, and whether effective internal control over financial reporting was maintained in all material respects.
Our audits of the consolidated financial statements included performing procedures to assess the risks of material misstatement of the consolidated financial statements, whether due to error or fraud, and performing procedures that respond to those risks. Such procedures included examining, on a test basis, evidence regarding the amounts and disclosures in the consolidated financial statements. Our audits also included evaluating the accounting principles used and significant estimates made by management, as well as evaluating the overall presentation of the consolidated financial statements. Our audit of internal control over financial reporting included obtaining an understanding of internal control over financial reporting, assessing the risk that a material weakness exists, and testing and evaluating the design and operating effectiveness of internal control based on the assessed risk. Our audits also included performing such other procedures as we considered necessary in the circumstances. We believe that our audits provide a reasonable basis for our opinions.
Definition and Limitations of Internal Control Over Financial Reporting
A company’s internal control over financial reporting is a process designed to provide reasonable assurance regarding the reliability of financial reporting and the preparation of financial statements for external purposes in accordance with generally accepted accounting principles. A company’s internal control over financial reporting includes those policies and procedures that (1) pertain to the maintenance of records that, in reasonable detail, accurately and fairly reflect the transactions and dispositions of the assets of the company; (2) provide reasonable assurance that transactions are recorded as necessary to permit preparation of financial statements in accordance with generally accepted accounting principles, and that receipts and expenditures of the company are being made only in accordance with authorizations of management and directors of the company; and (3) provide reasonable assurance regarding prevention or timely detection of unauthorized acquisition, use, or disposition of the company’s assets that could have a material effect on the financial statements.
Because of its inherent limitations, internal control over financial reporting may not prevent or detect misstatements. Also, projections of any evaluation of effectiveness to future periods are subject to the risk that controls may become inadequate because of changes in conditions, or that the degree of compliance with the policies or procedures may deteriorate.
Critical Audit Matters
The critical audit matters communicated below are matters arising from the current period audit of the consolidated financial statements that were communicated or required to be communicated to the audit committee and that: (1) relate to accounts or disclosures that are material to the consolidated financial statements and (2) involved our especially challenging, subjective, or complex judgments. The
199
communication of critical audit matters does not alter in any way our opinion on the consolidated financial statements, taken as a whole, and we are not, by communicating the critical audit matters below, providing separate opinions on the critical audit matters or on the accounts or disclosures to which they relate.
Evaluation of insurance contract liabilities and investment contract liabilities with discretionary participation features
As discussed in notes A3.1 and C3 to the consolidated financial statements, the Company has recorded insurance contract liabilities and investment contract liabilities with discretionary participation features (policyholder liabilities) of $ 121.5 billion as of 31 December 2022.This represented 82 per cent of the Company’s total liabilities.
We identified the evaluation of insurance contract liabilities and investment contract liabilities with discretionary participation features as a critical audit matter. Due to the significant measurement uncertainty associated with the estimate, subjective auditor judgment, including specialized skills and knowledge, was required in evaluating the actuarial methodology and the mortality, morbidity, lapse, and expense assumptions used in determining the liabilities. Additionally, it involved subjective auditor judgment in assessing the calibration of complex reserving models.
The following are the primary procedures we performed to address this critical audit matter. We evaluated the design and tested the operating effectiveness of certain internal controls, with the involvement of actuarial professionals where appropriate, over the Company’s accounting process relating to the determination of insurance contract liabilities and investment contract liabilities with discretionary participation features. This included controls related to (1) the development of market inputs and actuarially determined assumptions and (2) changes to the calibration of models. We involved actuarial professionals with specialized skills and knowledge, who assisted in:
| o | evaluating the Company’s methodologies for selecting market inputs, assumptions relating to mortality, morbidity, lapses, and expenses by comparing them to generally accepted actuarial techniques; |
| o | challenging the selected inputs and assumptions where deviations from company or industry experience were identified; |
| o | assessing the impact of modelling and assumption changes by comparing the outcome of pre and post change model runs against our expectations. |
Assessment of fair value of certain level 2 and level 3 investments held at fair value
As discussed in notes A3.1 and C2.2 to the consolidated financial statements, the Company has recorded level 2 and level 3 investments held at fair value of $28.7 billion at 31 December 2022. For certain of these investments, a reliable third-party price is not readily available because the fair values are based on unobservable inputs.
We identified the assessment of the fair value of certain level 2 and level 3 investments held at fair value, which includes unlisted debt securities and unlisted equity funds, as a critical audit matter. Complex and subjective auditor judgment was involved in evaluating the significant inputs and assumptions, including liquidity premiums and credit spreads, and the pricing methodologies used in these fair value estimates. In addition, we made this determination due to the specialized skills and knowledge required to assess the estimates.
The following are the primary procedures we performed to address this critical audit matter. We evaluated the design and tested the operating effectiveness of certain internal controls over the Company’s process for estimating the fair value of certain level 2 and level 3 instruments. This included controls related to (1) the relevance and reliability of the significant inputs and assumptions used by the Company in its fair value estimates, (2) prices obtained from independent sources, including the qualitative and quantitative analysis of pricing statistics and trends and back testing recent trades, and (3) evaluation of pricing methodologies utilized by independent sources. We assessed the pricing methodologies with reference to relevant accounting standards and industry practice. We performed a retrospective review and compared the historical actual valuations with the most recently estimated valuations available at that time for a sample of unlisted equity funds in order to assess the reliability of the estimated valuations. We involved financial instrument valuation professionals with specialized skills and knowledge who assisted in developing an independent estimate of the fair value of a sample of unlisted debt securities and compared that estimate to the Company’s fair value estimate.
/s/ KPMG LLP
We have served as the Company’s auditor since 1999.
London, United Kingdom
23 March 2023
200
Prudential plc and subsidiaries
Consolidated Income Statement
Years ended 31 December
| | | | | | | | |
|
| Note |
| 2022 $m |
| 2021 $m |
| 2020 $m |
Continuing operations: | | | | | | | | |
Gross premiums earned |
| B1.3 |
| 23,344 |
| 24,217 |
| 23,495 |
Outward reinsurance premiums |
| B1.3 |
| (1,943) |
| (1,844) |
| (1,625) |
Earned premiums, net of reinsurance |
| |
| 21,401 |
| 22,373 |
| 21,870 |
Investment return |
| B1.3 |
| (30,159) |
| 3,486 |
| 13,762 |
Other income |
| B1.3 |
| 539 |
| 641 |
| 615 |
Total revenue, net of reinsurance |
| |
| (8,219) |
| 26,500 |
| 36,247 |
Benefits and claims |
| C3.2 |
| 17,997 |
| (17,738) |
| (34,463) |
Reinsurers’ share of benefits and claims |
| C3.2 |
| (6,168) |
| (971) |
| 6,313 |
Movement in unallocated surplus of with-profits funds |
| C3.2 |
| 1,868 |
| (202) |
| (438) |
Benefits and claims and movement in unallocated surplus of with-profits funds, net of reinsurance |
| |
| 13,697 |
| (18,911) |
| (28,588) |
Acquisition costs and other expenditure |
| B2 |
| (3,880) |
| (4,560) |
| (4,651) |
Finance costs: interest on core structural borrowings of shareholder-financed businesses |
|
|
| (200) |
| (328) |
| (316) |
Gain (loss) attaching to corporate transactions | | D1.1 | | 55 | | (35) | | (30) |
Total charges net of reinsurance |
| |
| 9,672 |
| (23,834) |
| (33,585) |
Share of profit from joint ventures and associates, net of related tax |
| D6.3 |
| 29 |
| 352 |
| 517 |
Profit before tax (being tax attributable to shareholders’ and policyholders’ returns)note (i) |
| |
| 1,482 |
| 3,018 |
| 3,179 |
Tax charge attributable to policyholders' returns |
| |
| (21) |
| (342) |
| (271) |
Profit before tax attributable to shareholders' returns |
| |
| 1,461 |
| 2,676 |
| 2,908 |
Total tax charge attributable to shareholders' and policyholders' returns |
| B3.1 |
| (475) |
| (804) |
| (711) |
Remove tax charge attributable to policyholders' returns |
| B3.1 |
| 21 |
| 342 |
| 271 |
Tax charge attributable to shareholders' returns |
| |
| (454) |
| (462) |
| (440) |
Profit after tax from continuing operations | | B1.4 | | 1,007 | | 2,214 | | 2,468 |
Loss after tax from discontinued US operationsnote (ii) | | D1.2 | | — | | (5,027) | | (283) |
Profit (loss) for the year |
|
|
| 1,007 |
| (2,813) |
| 2,185 |
| | | | | | | | |
Attributable to: | | | | | | | | |
Equity holders of the Company: | | | | | | | | |
From continuing operations | | | | 998 | | 2,192 | | 2,458 |
From discontinued US operations | | | | — | | (4,234) | | (340) |
| | | | 998 | | (2,042) | | 2,118 |
| | | | | | | | |
Non-controlling interests: | | | | | | | | |
From continuing operations | | | | 9 | | 22 | | 10 |
From discontinued US operations | | | | — | | (793) | | 57 |
| | | | 9 | | (771) | | 67 |
Profit (loss) for the year | | | | 1,007 | | (2,813) | | 2,185 |
| | | | | | | | | |
Earnings per share (in cents) |
| Note |
| 2022 |
| 2021 |
| 2020 |
|
Based on profit attributable to equity holders of the Company: |
| |
| | |
|
|
| |
Basic |
| B4 |
| | | | | | |
Based on profit from continuing operations | | | | 36.5 | ¢ | 83.4 | ¢ | 94.6 | ¢ |
Based on loss from discontinued US operationsnote (ii) | | | | — | ¢ | (161.1) | ¢ | (13.0) | ¢ |
Total basic earnings per share | | | | 36.5 | ¢ | (77.7) | ¢ | 81.6 | ¢ |
Diluted |
|
|
| | | | | | |
Based on profit from continuing operations | | | | 36.5 | ¢ | 83.4 | ¢ | 94.6 | ¢ |
Based on loss from discontinued US operationsnote (ii) | | | | — | ¢ | (161.1) | ¢ | (13.0) | ¢ |
Total diluted earnings per share | | | | 36.5 | ¢ | (77.7) | ¢ | 81.6 | ¢ |
Notes
(i) | This measure is the formal profit before tax measure under IFRS. It is not the result attributable to shareholders principally because total corporate tax of the Group includes those taxes on the income of consolidated with-profits and unit-linked funds that, through adjustments to benefits, are borne by policyholders. These amounts are required to be included in the tax charge under IAS 12. Consequently, the IFRS profit before tax measure is not representative of pre-tax profit attributable to shareholders as it is determined after deducting the cost of policyholder benefits and movements in the liability for unallocated surplus of with-profits funds after adjusting for tax borne by policyholders. |
(ii) | Discontinued operations for 2021 and 2020 related to the US operations (Jackson) that were demerged from the Group in September 2021. |
The accompanying notes are an integral part of these financial statements
201
Prudential plc and subsidiaries
Consolidated Statement of Comprehensive Income
Years ended 31 December
| | | | | | | | |
|
| Note |
| 2022 $m |
| 2021 $m |
| 2020 $m |
Continuing operations: | | | | | | | | |
Profit for the year |
|
|
| 1,007 |
| 2,214 |
| 2,468 |
Other comprehensive (loss) income: |
|
|
| |
| |
| |
Exchange movements arising during the year |
|
|
| (541) |
| (180) |
| 233 |
Valuation movements on retained interest in Jackson classified as available-for-sale securities: |
| |
| | | | | |
Unrealised (loss) gain arising during the year | | | | (125) | | 273 | | — |
Deduct net gains included in the income statement on disposal | | | | (62) | | (23) | | — |
| | | | (187) |
| 250 |
| — |
Total items that may be reclassified subsequently to profit or loss | | | | (728) | | 70 | | 233 |
Total comprehensive income from continuing operations | | |
| 279 |
| 2,284 |
| 2,701 |
Total comprehensive (loss) income from discontinued US operations | | D1.2 | | — | | (7,068) | | 9 |
Total comprehensive income (loss) for the year | | | | 279 | | (4,784) | | 2,710 |
| | | | | | | | |
Attributable to: | | | | | | | | |
Equity holders of the Company: | | | | | | | | |
From continuing operations | | | | 280 | | 2,277 | | 2,697 |
From discontinued US operations | | | | — | | (6,283) | | (40) |
| | | | 280 | | (4,006) | | 2,657 |
Non-controlling interests: | | | | | | | | |
From continuing operations | | | | (1) | | 7 | | 4 |
From discontinued US operations | | | | — | | (785) | | 49 |
| | | | (1) | | (778) | | 53 |
Total comprehensive income (loss) for the year | | | | 279 | | (4,784) | | 2,710 |
The accompanying notes are an integral part of these financial statements
202
Prudential plc and subsidiaries
Consolidated Statement of Changes in Equity
| | | | | | | | | | | | | | | | | | |
| | | | Year ended 31 Dec 2022 $m | ||||||||||||||
|
|
|
| |
| |
| |
| |
| Available |
| |
| |
| |
| | | | | | | | | | | | -for-sale | | | | Non- | | |
| | | | Share | | Share | | Retained | | Translation | | securities | | Shareholders' | | controlling | | Total |
| | Note | | capital | | premium | | earnings | | reserve | | reserves | | equity | | interests | | equity |
Reserves |
|
|
|
|
|
|
|
|
|
|
|
|
|
|
|
|
|
|
Profit for the year |
|
|
| — |
| — |
| 998 |
| — |
| — |
| 998 |
| 9 |
| 1,007 |
Other comprehensive loss |
| |
| — |
| — |
| — |
| (531) |
| (187) |
| (718) |
| (10) |
| (728) |
Total comprehensive income (loss) for the year | | | | — | | — | | 998 | | (531) | | (187) | | 280 | | (1) | | 279 |
Transactions with owners of the Company | | | | | | | | | | | | | | | | | | |
Dividends | | B5 | | — | | — | | (474) | | — | | — | | (474) | | (8) | | (482) |
Reserve movements in respect of share-based payments |
| |
| — |
| — |
| 24 |
| — |
| — |
| 24 |
| — |
| 24 |
Effect of transactions relating to non-controlling interests | | | | — | | — | | 49 | | — | | — | | 49 | | — | | 49 |
New share capital subscribed |
| C8 |
| — | | (4) |
| — |
| — |
| — |
| (4) |
| — |
| (4) |
Movement in own shares in respect of share-based payment plans |
|
|
| — |
| — |
| (3) |
| — |
| — |
| (3) |
| — |
| (3) |
Net increase (decrease) in equity |
|
|
| — |
| (4) |
| 594 |
| (531) |
| (187) |
| (128) |
| (9) |
| (137) |
Balance at 1 Jan |
|
|
| 182 |
| 5,010 |
| 10,216 |
| 1,430 |
| 250 |
| 17,088 |
| 176 |
| 17,264 |
Balance at 31 Dec |
|
|
| 182 |
| 5,006 | | 10,810 |
| 899 |
| 63 |
| 16,960 |
| 167 |
| 17,127 |
| | | | | | | | | | | | | | | | | | |
| | | | Year ended 31 Dec 2021 $m | ||||||||||||||
|
|
|
| |
| |
| |
| |
| Available |
| |
| |
| |
| | | | | | | | | | | | -for-sale | | | | Non- | | |
| | | | Share | | Share | | Retained | | Translation | | securities | | Shareholders' | | controlling | | Total |
| | Note | | capital | | premium | | earnings | | reserve | | reserves | | equity | | interests | | equity |
Reserves |
|
|
|
|
|
|
|
|
|
|
|
|
|
|
|
|
|
|
Profit for the year |
|
|
| — |
| — |
| 2,192 |
| — |
| — |
| 2,192 |
| 22 |
| 2,214 |
Other comprehensive (loss) income |
| |
| — |
| — |
| — |
| (165) |
| 250 |
| 85 |
| (15) |
| 70 |
Total comprehensive income (loss) from continuing operations |
|
|
| — |
| — |
| 2,192 |
| (165) |
| 250 |
| 2,277 |
| 7 |
| 2,284 |
Total comprehensive (loss) income from discontinued US operations | | D1.2 | | — | | — | | (4,234) | | 463 | | (2,512) | | (6,283) | | (785) | | (7,068) |
Total comprehensive (loss) income for the year |
| | | — | | — | | (2,042) | | 298 | | (2,262) | | (4,006) | | (778) | | (4,784) |
Transactions with owners of the Company | | | | | | | | | | | | | | | | | | |
Demerger dividend in specie of Jackson |
| B5 | | — | | — | | (1,735) | | — | | — | | (1,735) | | — | | (1,735) |
Other dividends |
| B5 | | — | | — | | (421) | | — | | — | | (421) | | (9) | | (430) |
Reserve movements in respect of share-based payments | | |
| — |
| — |
| 46 |
| — |
| — |
| 46 |
| — |
| 46 |
Effect of transactions relating to non-controlling interests* |
|
|
| — |
| — |
| (32) |
| — |
| — |
| (32) |
| (278) |
| (310) |
New share capital subscribed |
| C8 |
| 9 |
| 2,373 |
| — |
| — |
| — |
| 2,382 |
| — |
| 2,382 |
Movement in own shares in respect of share-based payment plans |
|
|
| — |
| — |
| (24) |
| — |
| — |
| (24) |
| — |
| (24) |
Net increase (decrease) in equity |
|
|
| 9 |
| 2,373 |
| (4,208) |
| 298 |
| (2,262) |
| (3,790) |
| (1,065) |
| (4,855) |
Balance at 1 Jan |
|
|
| 173 | | 2,637 | | 14,424 | | 1,132 | | 2,512 | | 20,878 | | 1,241 | | 22,119 |
Balance at 31 Dec |
|
|
| 182 |
| 5,010 | | 10,216 |
| 1,430 |
| 250 |
| 17,088 |
| 176 |
| 17,264 |
| * | The $(278) million in 2021 related to the derecognition of Athene’s non-controlling interest upon the demerger of Jackson. |
The accompanying notes are an integral part of these financial statements
203
Prudential plc and subsidiaries
Consolidated Statement of Changes in Equity (continued)
| | | | | | | | | | | | | | | | | | |
| | | | Year ended 31 Dec 2020 $m | ||||||||||||||
|
|
|
| |
| |
| |
| |
| Available |
| |
| |
| |
| | | | | | | | | | | | -for-sale | | | | Non- | | |
| | | | Share | | Share | | Retained | | Translation | | securities | | Shareholders' | | controlling | | Total |
| | Note | | capital | | premium | | earnings | | reserve | | reserves | | equity | | interests | | equity |
Reserves |
|
|
|
|
|
|
|
|
|
|
|
|
|
|
|
|
|
|
Profit for the year |
|
|
| — |
| — |
| 2,458 |
| — |
| — |
| 2,458 |
| 10 |
| 2,468 |
Other comprehensive income (loss) from continuing operations: |
| |
| — |
| — |
| — |
| 239 |
| — |
| 239 |
| (6) |
| 233 |
Total comprehensive income from continuing operations | | | | — | | — | | 2,458 | | 239 | | — | | 2,697 | | 4 | | 2,701 |
Total comprehensive (loss) income from discontinued US operations |
| D1.2 | | — | | — | | (340) | | — | | 300 | | (40) | | 49 | | 9 |
Total comprehensive income for the year | | | | — | | — | | 2,118 | | 239 | | 300 | | 2,657 | | 53 | | 2,710 |
Transactions with owners of the Company | |
|
| |
| |
| |
| |
| |
| |
| |
| |
Dividends | | B5 | | — | | — | | (814) | | — | | — | | (814) | | (18) | | (832) |
Reserve movements in respect of share-based payments |
| |
| — |
| — |
| 89 |
| — |
| — |
| 89 |
| — |
| 89 |
Effect of transactions relating to non-controlling interests |
| |
| — |
| — |
| (484) |
| — |
| — |
| (484) |
| 1,014 |
| 530 |
New share capital subscribed | | C8 | | 1 | | 12 | | — | | — | | — | | 13 | | — | | 13 |
Movement in own shares in respect of share-based payment plans | | | | — | | — | | (60) | | — | | — | | (60) | | — | | (60) |
Net increase in equity |
|
|
| 1 |
| 12 |
| 849 |
| 239 |
| 300 |
| 1,401 |
| 1,049 |
| 2,450 |
Balance at 1 Jan |
|
|
| 172 |
| 2,625 |
| 13,575 |
| 893 |
| 2,212 |
| 19,477 |
| 192 |
| 19,669 |
Balance at 31 Dec |
|
|
| 173 |
| 2,637 |
| 14,424 |
| 1,132 |
| 2,512 |
| 20,878 |
| 1,241 |
| 22,119 |
The accompanying notes are an integral part of these financial statements
204
Prudential plc and subsidiaries
Consolidated Statement of Financial Position
| | | | | | |
| | Note | | 31 Dec 2022 $m | | 31 Dec 2021 $m |
Assets |
|
| | | |
|
Goodwill |
| C4.1 | | 890 | | 907 |
Deferred acquisition costs and other intangible assets |
| C4.2 | | 7,155 | | 6,858 |
Property, plant and equipment | | C11 | | 419 | | 478 |
Reinsurers' share of insurance contract liabilities |
| C3.3 | | 2,807 | | 9,753 |
Deferred tax assets |
| C7.2 | | 310 | | 266 |
Current tax recoverable |
| C7.1 | | 18 | | 20 |
Accrued investment income |
| C1(vii) | | 1,135 | | 1,171 |
Other debtors | | C1(vii) | | 1,694 | | 1,779 |
Investment properties |
| | | 37 | | 38 |
Investments in joint ventures and associates accounted for using the equity method |
| | | 1,915 | | 2,183 |
Loans | | C1 | | 2,536 | | 2,562 |
Equity securities and holdings in collective investment schemesnote |
| C1 | | 57,679 | | 61,601 |
Debt securitiesnote |
| C1 | | 76,989 | | 99,094 |
Derivative assets |
| C2.2 | | 569 | | 481 |
Deposits |
| | | 6,275 | | 4,741 |
Cash and cash equivalents |
| C1(vi) | | 5,514 | | 7,170 |
Total assets |
| C1 | | 165,942 | | 199,102 |
| | | | | | |
Equity |
| | | | | |
Shareholders' equity |
| | | 16,960 | | 17,088 |
Non-controlling interests |
| | | 167 | | 176 |
Total equity |
| C1 | | 17,127 | | 17,264 |
| | | | | | |
Liabilities |
| | | | | |
Insurance contract liabilities |
| C3.2 | | 121,213 | | 150,755 |
Investment contract liabilities with discretionary participation features |
| C3.2 | | 309 | | 346 |
Investment contract liabilities without discretionary participation features |
| C3.2 | | 741 | | 814 |
Unallocated surplus of with-profits funds |
| C3.2 | | 3,495 | | 5,384 |
Core structural borrowings of shareholder-financed businesses |
| C5.1 | | 4,261 | | 6,127 |
Operational borrowings |
| C5.2 | | 815 | | 861 |
Obligations under funding, securities lending and sale and repurchase agreements |
| | | 582 | | 223 |
Net asset value attributable to unit holders of consolidated investment funds |
| | | 4,193 | | 5,664 |
Deferred tax liabilities |
| C7.2 | | 2,872 | | 2,862 |
Current tax liabilities |
| C7.1 | | 208 | | 185 |
Accruals, deferred income and other creditors |
| C1(viii) | | 8,777 | | 7,983 |
Provisions |
| C9 | | 348 | | 372 |
Derivative liabilities |
| C2.2 | | 1,001 | | 262 |
Total liabilities |
| C1 | | 148,815 | | 181,838 |
Total equity and liabilities |
| C1 | | 165,942 | | 199,102 |
Note
Included within equity securities and holdings in collective investment schemes and debt securities as at 31 December 2022 are $1,571 million of lent securities and assets subject to repurchase agreements (31 December 2021: $854 million).
The accompanying notes are an integral part of these financial statements
205
Prudential plc and subsidiaries
Consolidated Statement of Cash Flows
| | | | | | | | |
|
| Note |
| 2022 $m |
| 2021 $m |
| 2020 $m |
Continuing operations: | | | | | | | | |
Cash flows from operating activities |
|
|
| | |
|
|
|
Profit before tax (being tax attributable to shareholders' and policyholders' returns) |
|
|
| 1,482 | | 3,018 |
| 3,179 |
Adjustments to profit before tax for non-cash movements in operating assets and liabilities: |
|
|
| | | |
| |
Investments |
|
|
| 22,374 | | (14,553) |
| (20,978) |
Other non-investment and non-cash assets |
|
|
| 6,429 | | 2,658 |
| (7,185) |
Policyholder liabilities (including unallocated surplus of with-profits funds) |
| C3.2 |
| (29,208) | | 9,095 |
| 27,670 |
Other liabilities (including operational borrowings) |
|
|
| 15 | | 16 |
| 155 |
Investment income and interest payments included in profit before tax |
|
|
| (4,037) | | (3,738) |
| (2,931) |
Operating cash items: |
|
|
| | | |
| |
Interest receipts |
|
|
| 2,689 | | 2,328 |
| 1,833 |
Interest payments | | | | (16) | | (11) | | (25) |
Dividend receipts |
|
|
| 1,523 | | 1,480 |
| 1,305 |
Tax paid |
|
|
| (449) | | (453) |
| (551) |
Other non-cash items | | | | 276 | | 438 | | 301 |
Net cash flows from operating activitiesnote (i) |
|
|
| 1,078 | | 278 |
| 2,773 |
Cash flows from investing activities |
|
|
| | | |
| |
Purchases of property, plant and equipment |
| C11 |
| (34) | | (36) |
| (57) |
Proceeds from disposal of property, plant and equipment |
|
|
| – | | — |
| 6 |
Acquisition of business and intangiblesnote (ii) |
|
|
| (298) | | (773) |
| (1,142) |
Disposal of Jackson sharesnote (ii) |
|
|
| 293 | | 83 |
| — |
Net cash flows from investing activities |
|
|
| (39) | | (726) |
| (1,193) |
Cash flows from financing activities |
|
|
| | | |
| |
Structural borrowings of shareholder-financed operations:note (iii) |
| C5.1 |
| | | |
| |
Issuance of debt, net of costs |
|
|
| 346 | | 995 |
| 983 |
Redemption of debt |
|
|
| (2,075) | | (1,250) |
| — |
Interest paid |
|
|
| (204) |
| (314) |
| (294) |
Payment of principal portion of lease liabilities | | | | (101) | | (118) | | (128) |
Equity capital: |
|
|
| |
| |
| |
Issues of ordinary share capital |
| C8 |
| (4) |
| 2,382 |
| 13 |
External dividends: | | | | | | | | |
Dividends paid to equity holders of the Company |
| B5 |
| (474) |
| (421) |
| (814) |
Dividends paid to non-controlling interests | | | | (8) | | (9) | | (18) |
Net cash flows from financing activities |
|
|
| (2,520) |
| 1,265 |
| (258) |
Net (decrease) increase in cash and cash equivalents from continuing operations |
|
|
| (1,481) |
| 817 |
| 1,322 |
Net decrease in cash and cash equivalents from discontinued US operations | | D1.2 | | — | | (1,621) | | (339) |
Cash and cash equivalents at 1 Jan |
|
|
| 7,170 |
| 8,018 |
| 6,965 |
Effect of exchange rate changes on cash and cash equivalents |
|
|
| (175) |
| (44) |
| 70 |
Cash and cash equivalents at 31 Dec |
| C1(vi) |
| 5,514 |
| 7,170 |
| 8,018 |
Notes
(i) | Included in net cash flows from operating activities are dividends from joint ventures and associates of $112 million (2021: $175 million; 2020: $118 million). |
(ii) | Net cash flows from other investing activities include amounts paid for distribution rights and cash flows arising from the sale of subsidiaries, joint ventures and associates and investments that do not form part of the Group’s operating activities. |
(iii) | Structural borrowings of shareholder-financed businesses exclude borrowings to support short-term fixed income securities programmes, non-recourse borrowings of investment subsidiaries of shareholder-financed businesses and other borrowings of shareholder-financed businesses. Cash flows in respect of these borrowings are included within cash flows from operating activities. The changes in the carrying value of the structural borrowings of shareholder-financed businesses for the Group are analysed below: |
| | | | | | | | | | | | | | |
| | | | Cash movements $m | | Non-cash movements $m | | | ||||||
|
| Balance at |
| |
| |
| Foreign |
| |
| |
| Balance at |
| | 1 Jan | | Issuance | | Redemption | | exchange | | Demerger | | Other | | 31 Dec |
| | $m | | of debt | | of debt | | movement | | of Jackson | | movements | | $m |
2022 | | 6,127 | | 346 | | (2,075) | | (147) | | — | | 10 | | 4,261 |
2021 |
| 6,633 | | 995 | | (1,250) | | (13) |
| (250) | | 12 |
| 6,127 |
The accompanying notes are an integral part of these financial statements
206
Notes on the Consolidated Financial Statements
| | | | | | | | ||
| | Page |
| | | Page | | ||
208 | | C | Financial position (continued) | 253 | | ||||
208 | | 253 | | ||||||
209 | | | 253 | | |||||
209 | | | 254 | | |||||
| 209 | | 256 | | |||||
| 213 | | | Core structural borrowings of shareholder-financed businesses | 256 | | |||
218 | | | 257 | | |||||
218 | | 257 | | ||||||
| 218 | | | 258 | | ||||
| Determining operating segments and performance measure of operating segments | 219 | | | 260 | | |||
| 221 | | 260 | | |||||
| 223 | | | 260 | | ||||
224 | | | 260 | | |||||
| 224 | | 261 | | |||||
| 225 | | 263 | | |||||
| 228 | | 263 | | |||||
| 228 | | | Group objectives, policies and processes for managing capital | 263 | | |||
229 | | | 264 | | |||||
| 229 | | | 265 | | ||||
| 231 | | 266 | | |||||
233 | | | | | | ||||
234 | | 267 | | ||||||
| | | | 267 | | ||||
234 | | | 267 | | |||||
234 | | | 267 | | |||||
238 | | 268 | | ||||||
| 238 | | 269 | | |||||
| Fair value measurement hierarchy of Group assets and liabilities | 239 | | 269 | | ||||
| 243 | | 270 | | |||||
247 | | Investments in subsidiary undertakings, joint ventures and associates | 270 | | |||||
| Policyholder liabilities and unallocated surplus by business type | 247 | | | 270 | | |||
| Reconciliation of gross and reinsurers’ share of policyholder liabilities and unallocated surplus | 248 | | | 272 | | |||
| 250 | | | 272 | | ||||
| 250 | | | 274 | | ||||
| | | | | | | | | |
207
Prudential plc and subsidiaries
Notes to the consolidated financial statements
31 December 2022
A Basis of preparation and accounting policies
A1 Basis of preparation and exchange rates
Prudential plc (‘the Company’) together with its subsidiaries (collectively, ‘the Group’ or ‘Prudential’) provides life and health insurance and asset management products in Asia and Africa. The Group is headquartered in Hong Kong.
Basis of preparation
These consolidated financial statements have been prepared in accordance with IFRS Standards as issued by the IASB and in accordance with UK-adopted international accounting standards. At 31 December 2022, there were no unadopted standards effective for the year ended 31 December 2022 which had an impact on the consolidated financial statements of the Group, and there were no differences between UK-adopted international accounting standards and IFRS Standards as issued by the IASB in terms of their application to the Group.
The Group accounting policies are the same as those applied for the year ended 31 December 2021 with the exception of the adoption of the new and amended IFRS Standards as described in note A2.
Going concern basis of accounting
The Directors have made an assessment of going concern covering a period of at least 12 months from the date these consolidated financial statements are approved. In making this assessment, the Directors have considered both the Group’s current performance, solvency and liquidity and the Group’s business plan taking into account the Group’s principal risks and the mitigations available to address them, as well as the results of the Group’s stress and scenario testing.
Based on the above, the Directors have a reasonable expectation that the Company and the Group have adequate resources to continue their operations for a period of at least 12 months from the date these consolidated financial statements are approved. No material uncertainties that may cast significant doubt on the ability of the Company and the Group to continue as a going concern have been identified. The Directors therefore consider it appropriate to continue to adopt the going concern basis of accounting in preparing these consolidated financial statements for the year ended 31 December 2022.
Exchange rates
The exchange rates applied for balances and transactions in currencies other than the presentation currency of the Group, US dollars (USD) were:
| | | | | | | | | | | | |
| | Closing rate at year end | | Average rate for the year-to-date | ||||||||
USD : local currency |
| 31 Dec 2022 |
| 31 Dec 2021 |
| 31 Dec 2020 |
| 31 Dec 2022 |
| 31 Dec 2021 |
| 31 Dec 2020 |
Chinese yuan (CNY) |
| 6.95 |
| 6.37 |
| 6.54 |
| 6.73 |
| 6.45 |
| 6.90 |
Hong Kong dollar (HKD) |
| 7.81 |
| 7.80 |
| 7.75 |
| 7.83 |
| 7.77 |
| 7.76 |
Indian rupee (INR) | | 82.73 | | 74.34 | | 73.07 | | 78.63 | | 73.94 | | 74.12 |
Indonesian rupiah (IDR) |
| 15,567.50 |
| 14,252.50 |
| 14,050.00 |
| 14,852.24 |
| 14,294.88 |
| 14,541.70 |
Malaysian ringgit (MYR) |
| 4.41 |
| 4.17 |
| 4.02 |
| 4.40 |
| 4.15 |
| 4.20 |
Singapore dollar (SGD) |
| 1.34 |
| 1.35 |
| 1.32 |
| 1.38 |
| 1.34 |
| 1.38 |
Taiwan dollar (TWD) | | 30.74 | | 27.67 | | 28.10 | | 29.81 | | 27.93 | | 29.44 |
Thai baht (THB) |
| 34.56 |
| 33.19 |
| 30.02 |
| 35.06 |
| 32.01 |
| 31.29 |
UK pound sterling (GBP) | | 0.83 | | 0.74 | | 0.73 | | 0.81 | | 0.73 | | 0.78 |
Vietnamese dong (VND) |
| 23,575.00 |
| 22,790.00 |
| 23,082.50 |
| 23,409.87 |
| 22,934.86 |
| 23,235.84 |
Foreign exchange translation
In order to present the consolidated financial statements in USD, the results and financial position of entities not using USD as functional currency (ie the currency of the primary economic environment in which the entity operates) must be translated into USD.
208
All assets and liabilities of entities not operating in USD are converted at closing exchange rates while all income and expenses are converted at average exchange rates where this is a reasonable approximation of the rates prevailing on transaction dates. The impact of these foreign exchange translations into the Group’s USD presentation currency is recorded as a separate component in the Statement of comprehensive income. Upon the disposal of the entity, the related cumulative foreign exchange translation differences are recycled from other comprehensive income to the income statement as part of the gain or loss on disposal.
The general principle for converting foreign currency transactions to the functional currency of an entity is to translate at the functional currency spot rate prevailing at the date of the transactions. Foreign currency monetary assets and liabilities are translated at the spot exchange rate for the functional currency at the reporting date. Changes resulting from the foreign exchange translations into the functional currency of the entity are recognised in the income statement.
The consolidated financial statements do not represent Prudential’s statutory accounts for the purposes of the UK Companies Act. These financial statements are based on the prescribed formats. The Group’s external auditors have reported on the 2022, 2021 and 2020 statutory accounts. Statutory accounts for 2021 and 2020 have been delivered to the UK Registrar of Companies and those for 2022 will be delivered following the Company’s Annual General Meeting. The auditor’s reports were (i) unqualified, (ii) did not include a reference to any matters to which the auditors drew attention by way of emphasis without qualifying their report and (iii) did not contain a statement under Section 498(2) or (3) of the UK Companies Act 2006.
A2 New accounting pronouncements in 2022
The IASB has issued the following new accounting pronouncements to be effective from 1 January 2022:
– | Amendments to IAS 37 ‘Onerous contracts – Cost of Fulfilling a Contract’ issued in May 2020; |
– | Annual Improvements to IFRS Standards 2018-2020 issued in May 2020; |
– | Amendments to IAS 16 ‘Property, Plant and Equipment – Proceeds before Intended Use’ issued in May 2020; and |
– | Reference to the Conceptual Framework – Amendments to IFRS 3 ‘Business combination’ issued in May 2020. |
The adoption of these pronouncements has had no significant impact on the Group consolidated financial statements.
A3 Accounting policies
A3.1 Critical accounting policies, estimates and judgements
Note A3.1 presents the critical accounting policies, estimates and judgements applied in preparing the Group’s consolidated financial statements. Other accounting policies, where significant, are presented in the relevant individual notes. All accounting policies are applied consistently for the years presented and normally are not subject to changes unless new accounting standards, interpretations or amendments are introduced by the IASB.
The preparation of these consolidated financial statements requires Prudential to make accounting estimates and judgements about the amounts of assets, liabilities, revenues and expenses, which are both recognised and unrecognised (eg contingent liabilities) in the consolidated financial statements. Prudential evaluates its critical accounting estimates, including those related to long-term business provisioning and the fair value of assets as required. The notes below set out those critical accounting policies, the application of which requires the Group to make critical estimates and judgements. Also set out are further critical accounting policies affecting the presentation of the Group’s results and other items that require the application of critical estimates and judgements.
209
(a) Critical accounting policies with associated critical estimates and judgements
Measurement of policyholder liabilities and unallocated surplus of with-profits | ||
The measurement basis of policyholder liabilities is dependent upon the classification of the contracts under IFRS 4. Impacts $146.7 billion of policyholder liabilities and unallocated surplus of with-profits funds including those held by joint venture and associates. Policyholder liabilities are estimated based on a number of actuarial assumptions (eg mortality, morbidity, policyholder behaviour and expenses). The Group applies judgement in determining the actuarial assumptions to be applied to estimate the future amounts due to or from the policyholder in the measurement of the policyholder liabilities. |
| IFRS 4 permits the continued usage of previously applied Generally Accepted Accounting Practices (GAAP) for insurance contracts and investment contracts with discretionary participating features. A modified statutory basis of reporting was adopted by the Group on first time adoption of IFRS Standards in 2005. This was set out in the Statement of Recommended Practice issued by the Association of British Insurers (ABI SORP). The ABI SORP was withdrawn for the accounting periods beginning in or after 2015. As used in these consolidated financial statements, the term 'grandfathered' ABI SORP refers to the requirements of the pronouncements prior to its withdrawal. For investment contracts that do not contain discretionary participating features, IAS 39 is applied and, where the contract includes an investment management element, IFRS 15 ‘Revenue from Contracts with Customers’ applies. The current policies applied for the Group’s insurance businesses are noted below. |
| | Measurement of insurance contract liabilities and investment contract liabilities with discretionary participation features The policyholder liabilities for businesses of the insurance operations are generally determined in accordance with methods prescribed by local GAAP, adjusted to comply with the 'grandfathered' ABI SORP where necessary. Refinements to the local reserving methodology are generally treated as changes in estimates, dependent on their nature. The UK-style with-profits funds’ liabilities in Hong Kong are valued under the realistic basis in accordance with the requirements of ‘grandfathered’ FRS 27 ‘Life Assurance’ (issued by the UK Accounting Standards Board in 2004 and withdrawn in 2015). The realistic basis requires the value of liabilities to be calculated as the sum of a with-profits benefits reserve, future policy-related liabilities and the realistic current liabilities of the fund. In Taiwan and India, US GAAP principles are applied. Further details on how liabilities are determined for material product types are set out in note C3.4. This includes the approach to assumption setting including a margin for prudence. The sensitivity of the insurance operations to variations in key economic assumptions, as well as the insurance risks of mortality and morbidity, is discussed in note C6.1. In April 2022 Prudential Hong Kong Limited received approval from the Hong Kong IA to early adopt the new risk-based capital regime effective from 1 January 2022. The implication for IFRS reporting of the Group is as explained further in note C3.2. |
| | Measurement of unallocated surplus of with-profits funds Unallocated surplus of with-profits funds represents the excess of assets over policyholder liabilities, determined in accordance with the Group's accounting policies, that have yet to be appropriated between policyholders and shareholders for the Group's with-profits funds in Hong Kong and Malaysia. The unallocated surplus is recorded wholly as a liability with no allocation to equity. The annual excess or shortfall of income over expenditure of the with-profits funds, after declaration and attribution of the cost of bonuses to policyholders and shareholders, is transferred to or from the unallocated surplus each period through a charge or credit to the income statement. In Hong Kong, the unallocated surplus includes the shareholders' share of expected future bonuses, with the expected policyholder share being included in policyholder liabilities. Any excess of assets over liabilities and amounts expected to be paid out by the fund on future bonuses is also included in the unallocated surplus. The balance of the unallocated surplus is determined after full provision for deferred tax on unrealised appreciation or depreciation on investments. |
| Liability adequacy test The Group performs adequacy testing on its insurance liabilities to ensure that the carrying amounts (net of related deferred acquisition costs and, where relevant, present value of acquired in-force business) is sufficient to cover current estimates of future cash outflows of the in-force policies over the expected lives. Any deficiency is immediately charged to the income statement. The liability adequacy test is performed at the level of a portfolio of contracts that are subject to broadly similar risks and managed together as a single portfolio which may be at an entity or business unit level, depending on how the business is managed. | |
210
(b) Further critical accounting policies affecting the presentation of the Group's results
Presentation of results before tax attributable to shareholders | ||
Profit before tax is a significant IFRS income statement item. The Group has chosen to present a measure of profit before tax attributable to shareholders which distinguishes between tax borne by shareholders and tax attributable to policyholders to support understanding of the performance of the Group. Profit before tax attributable to shareholders is $1,461 million and compares to profit before tax of $1,482 million. | | The total tax charge for the Group reflects tax that, in addition to that relating to shareholders’ profit, is also attributable to policyholders through the interest in with-profits or unit-linked funds. Further detail is provided in note B3. Reported IFRS profit before the tax measure is therefore not representative of pre-tax profit attributable to shareholders. Accordingly, in order to provide a measure of pre-tax profit attributable to shareholders, the Group has chosen to adopt an income statement presentation of the tax charge and pre-tax results that distinguishes between policyholders’ and shareholders’ returns. |
Segmental analysis of results and earnings attributable to shareholders | ||
The Group uses adjusted operating profit as the segmental measure of its results. Total segmental adjusted operating profit is $4,106 million. | | The basis of calculation of adjusted operating profit is provided in note B1.2. For shareholder-backed business, with the exception of securities which are treated as available-for-sale (AFS), and assets classified as loans and receivables at amortised cost, all financial investments and investment properties are designated as assets at fair value through profit or loss. Short-term fluctuations in fair value affect the result for the year and the Group provides additional analysis of results before and after the effects of short-term fluctuations in investment returns, together with other items that are of a short-term, volatile or one-off in nature. Short-term fluctuations in investment returns on assets held by with-profits funds in Hong Kong, Malaysia and Singapore do not affect directly reported shareholder results. This is because (i) the unallocated surplus of with-profits funds is accounted for as a liability and (ii) excess or deficit of income and expenditure of the funds over the required surplus for distribution are transferred to or from policyholder liabilities (including the unallocated surplus). |
(c) Other items requiring application of critical estimates or judgements
Carrying value of distribution rights intangible assets | ||
The Group applies judgement to assess whether factors such as the financial performance of the distribution arrangements, changes in relevant legislation and regulatory requirements indicate an impairment of intangible assets representing distribution rights. To determine the impaired value, the Group estimates the discounted future expected cash flows arising from the cash generating unit containing the distribution rights. Affects $3.6 billion of assets as shown in note C4.2. | | Distribution rights relate to bancassurance partnership arrangements for the distribution of products for the term of the contractual agreement with the bank partner, for which an asset is recognised based on fees paid and fees payable not subject to performance conditions. Distribution rights impairment testing is conducted when there is an indication of an impairment. To assess indicators of an impairment, the Group monitors a number of internal and external factors, including indications that the financial performance of the arrangement is likely to be worse than expected and changes in relevant legislation and regulatory requirements that could impact the Group’s ability to continue to sell new business through the bancassurance channel, and then applies judgement to assess whether these factors indicate that an impairment has occurred. If an impairment has occurred, a charge is recognised in the income statement for the difference between the carrying value and recoverable amount of the asset. The recoverable amount is the greater of fair value less costs to sell and value in use. Value in use is calculated as the present value of future expected cash flows from the asset or the cash generating unit to which it is allocated. |
211
| | |
Deferred acquisition costs (DAC) for insurance contracts | ||
The Group estimates projected future profits/margins to assess whether adjustments to the carrying value or amortisation profile of DAC asset are necessary. Impacts $3.3 billion of DAC as shown in note C4.2. | | Except for acquisition costs of the UK-style with-profits funds’ contracts in Hong Kong, which are accounted for under the ‘grandfathered’ FRS 27, costs of acquiring new insurance business are accounted for in a way that is consistent with the principles of the ‘grandfathered’ ABI SORP. The Group determines qualifying costs that should be capitalised (ie those costs of acquiring new insurance contracts that meet the criteria under the Group’s accounting policy for DAC) shown by an explicit carrying value in the balance sheet. However, in some insurance operations, the deferral is implicit through the reserving basis. DAC is amortised against the profit margins within future revenues on the related insurance policies. For some business units this is approximated by amortising DAC on a straight-line basis over the expected duration of the policies. The recoverability of the DAC is measured and the DAC asset is deemed impaired if the projected margins (which are estimated based on a number of assumptions similar to those underlying policyholder liabilities) are less than the carrying value. To the extent that the future margins differ from those anticipated, an adjustment to the carrying value will be necessary either through a charge to the income statement (if the projected margins are lower than carrying value) or through a change in the amortisation profile. For those business units applying US GAAP to insurance assets and liabilities, as permitted by the ‘grandfathered’ ABI SORP, acquisition costs are deferred and amortised as per the US GAAP requirements under ASC 944 Financial Services - Insurance. |
Financial investments – Valuation | ||
Financial investments held at fair value represent $135.7 billion of the Group’s total assets. Financial investments held at amortised cost represent $8.4 billion of the Group’s total assets. The Group estimates the fair value of financial investments that are not actively traded using quotations from independent third parties or internally developed pricing models. |
| The Group holds the majority of its financial investments at fair value (primarily through profit or loss). Financial investments held at amortised cost primarily comprise loans and deposits. Determination of fair value The fair values of the financial instruments for which fair valuation is required under IFRS Standards are determined by the use of quoted market prices for exchange-quoted investments or by using quotations from independent third parties such as brokers and pricing services or by using appropriate valuation techniques. Further details are included in note C2.1. The estimated fair value of derivative financial instruments reflects the estimated amount the Group would receive or pay in an arm’s-length transaction. This amount is determined using quoted prices if exchange listed, quotations from independent third parties or valued internally using standard market practices. Quoted market prices are used to value investments having quoted prices. Actively traded investments without quoted prices are valued using prices provided by third parties such as brokers or pricing services. Financial investments measured at fair value are classified into a three-level hierarchy as described in note C2.1. If the market for a financial investment of the Group is not active, the Group establishes fair value by using quotations from independent third parties, such as brokers or pricing services, or by using internally developed pricing models. Priority is given to publicly available prices from independent sources when available, but overall the source of pricing and/or the valuation technique is chosen with the objective of arriving at a fair value measurement which reflects the price at which an orderly transaction would take place between market participants on the measurement date. Changes in assumptions relating to these variables could positively or negatively impact the reported fair value of these financial investments. Details of the financial investments classified as 'level 3' to which valuation techniques are applied and the sensitivity of profit before tax to a change in the valuation of these items, are presented in note C2.2. |
212
A3.2 New accounting pronouncements not yet effective
The following standards, interpretations and amendments have been issued by the IASB but are not yet effective for the Group in 2022. The Group prepares consolidated financial statements in accordance with IFRS Standards as issued by the IASB and UK-adopted international accounting standards. This is not intended to be a complete list as only those standards, interpretations and amendments that could have a material impact on the Group’s consolidated financial statements are discussed.
IFRS 9 ‘Financial instruments: Classification and measurement’
IFRS 9 became mandatorily effective for the annual periods beginning on or after 1 January 2018, with early application permitted and transitional rules apply. The Group met the eligibility criteria for temporary exemption under the Amendments to IFRS 4 from applying IFRS 9 and has accordingly deferred the adoption of IFRS 9 until 1 January 2023.
The Group is eligible as its activities are predominantly to issue insurance contracts based on the criteria as set out in the amendments to IFRS 4. The required disclosure of the fair value of the Group’s financial assets, showing the amounts for instruments that meet the ‘Solely for Payment of Principal and Interest’ (SPPI) criteria but do not meet the definition of held for trading and are not managed and evaluated on a fair value basis separately from all other financial assets, is provided below.
The Group is implementing this standard in conjunction with IFRS 17 as permitted. IFRS 9 replaces the existing IAS 39 ‘Financial Instruments - Recognition and Measurement’ and will affect the following three areas:
The classification and the measurement of financial assets and liabilities
IFRS 9 redefines the classification of financial assets. Based on the way in which the assets are managed in order to generate cash flows and their contractual cash flow characteristics (whether the cash flows represent ‘solely payments of principal and interest’), financial assets are classified into one of the following categories: amortised cost, fair value through other comprehensive income (FVOCI) and fair value through profit or loss (FVTPL). An option is also available at initial recognition to irrevocably designate a financial asset as at FVTPL if doing so eliminates or significantly reduces accounting mismatches.
Under IAS 39, 97 per cent of the Group’s financial investments are valued at FVTPL and the vast majority of its investments will continue to be classified as such under IFRS 9. The Company expects to make an election under IFRS 9 to measure its retained interest in Jackson’s equity securities at FVOCI. Under this designation, only dividend income from this retained interest is recognised in the profit or loss of the Company. Unrealised gains and losses are recognised in other comprehensive income and there is no recycling to the profit or loss on derecognition.
The existing IAS 39 amortised cost measurement for financial liabilities is largely maintained under IFRS 9. For financial liabilities designated at FVTPL IFRS 9 requires changes in fair value due to changes in the entity’s own credit risk to be recognised in other comprehensive income.
The calculation of the impairment charge relevant for financial assets held at amortised cost or FVOCI
A new impairment model based on an expected credit loss approach replaces the existing IAS 39 incurred loss impairment model, resulting in earlier recognition of credit losses compared to IAS 39. This aspect is the most complex area of IFRS 9 to implement and will involve significant judgements and estimation processes.
The Group has assessed the scope of assets to which these requirements will apply and expects that the vast majority of the financial investments of the Group to be held at FVTPL to which these requirements will not apply. Accordingly, no significant amount of additional impairment is expected to be recognised by the Group under the expected credit loss approach as a result of the adoption of IFRS 9.
The hedge accounting requirements which are more closely aligned with the risk management activities
The Group has not applied hedge accounting treatment under IAS 39 and therefore, there is no impact in this area for the Group upon the adoption of IFRS 9.
213
The parent company and a number of intermediate holding companies and non-insurance subsidiaries adopted IFRS 9 in 2018 in their individual or separate financial statements where these statements are prepared in accordance with IFRS, including the UK Financial Reporting Standard 101 ‘Reduced Disclosure Framework’. The public availability of the financial statements for these entities varies according to the local laws and regulations of each jurisdiction. The results for these entities continue to be accounted for on an IAS 39 basis in these consolidated financial statements.
The fair value of the Group’s directly held financial assets at 31 December 2022 and 2021 are shown below. Financial assets with contractual terms that give rise on specified dates to cash flows that are solely payments of principal and interest (SPPI) as defined by IFRS 9 are shown separately. This excludes financial assets that meet the definition of held for trading or are managed and evaluated on a fair value basis.
| | | | | | | | |
| | Financial assets that pass | | All other financial assets, net of | ||||
| | the SPPI test | | derivative liabilities | ||||
|
| |
| Movement in |
| |
| Movement in |
| | Fair value at | | the fair value | | Fair value at | | the fair value |
Financial assets, net of derivative liabilities | | 31 Dec 2022 | | during 2022 | | 31 Dec 2022 | | during 2022 |
| | $m | | $m | | $m | | $m |
Accrued investment income |
| 1,135 |
| — |
| — |
| — |
Other debtors |
| 1,694 |
| — |
| — |
| — |
Loansnote |
| 2,189 |
| 15 |
| 468 |
| (37) |
Equity securities and holdings in collective investment schemes |
| — |
| — |
| 57,679 |
| (8,420) |
Debt securities |
| — |
| — |
| 76,989 |
| (21,803) |
Derivative assets, net of derivative liabilities |
| — |
| — |
| (432) |
| (4,487) |
Deposits |
| 6,275 |
| — |
| — |
| — |
Cash and cash equivalents |
| 5,514 |
| — |
| — |
| — |
Total financial assets, net of derivative liabilities |
| 16,807 |
| 15 |
| 134,704 |
| (34,747) |
| | | | | | | | |
| | Financial assets that pass | | All other financial assets, net of | ||||
| | the SPPI test | | derivative liabilities | ||||
|
| |
| Movement in |
| |
| Movement in |
| | Fair value at | | the fair value | | Fair value at | | the fair value |
Financial assets, net of derivative liabilities | | 31 Dec 2021 | | during 2021 | | 31 Dec 2021 | | during 2021 |
| | $m | | $m | | $m | | $m |
Accrued investment income |
| 1,171 |
| — |
| — |
| — |
Other debtors |
| 1,779 |
| — |
| — |
| — |
Loansnote |
| 2,126 |
| 41 |
| 647 |
| (1) |
Equity securities and holdings in collective investment schemes |
| — |
| — |
| 61,601 |
| 4,061 |
Debt securities |
| 226 |
| — |
| 98,868 |
| (3,164) |
Derivative assets, net of derivative liabilities |
| — |
| — |
| 219 |
| (943) |
Deposits |
| 4,741 |
| — |
| — |
| — |
Cash and cash equivalents |
| 7,170 |
| — |
| — |
| — |
Total financial assets, net of derivative liabilities |
| 17,213 |
| 41 |
| 161,335 |
| (47) |
Note
The loans that pass the SPPI test in the tables above are primarily carried at amortised cost under IAS 39. Further information on these loans is as provided in note C2.2.
The underlying financial assets of the Group’s joint ventures and associates accounted for using the equity method are analysed below into those which meet the SPPI condition of IFRS 9, excluding any financial assets that meet the definition of held for trading or are managed and evaluated on a fair value basis, and all other financial assets.
214
Fair value information of the financial assets held by CITIC-Prudential Life Insurance Company (CPL), the Group’s individually material joint venture, is shown in the table below. The amounts disclosed represent 100 per cent of the entity’s financial assets and not the Group’s share of those amounts and have been prepared on the same basis as the Group’s consolidated financial statements.
| | | | | | | | | | | | |
| | Financial assets that pass | | | | | | | | | ||
| | the SPPI test* | | All other financial assets | ||||||||
|
| |
| |
| | | |
| Movement in the fair value | ||
| | Fair value at 31 Dec | | Fair value at 31 Dec | | during | ||||||
CPL (100% of the financial assets of the entity) | | 2022 | | 2021 | | 2022 | | 2021 | | 2022 | | 2021 |
Financial assets |
| $m |
| $m |
| $m |
| $m | | $m |
| $m |
Accrued investment income |
| 176 |
| 170 | | — | | — |
| — |
| — |
Other debtors |
| 667 |
| 620 | | — | | — |
| — |
| — |
Loans |
| 674 |
| 656 | | — | | — |
| — |
| — |
Equity securities and holdings in collective investment schemes |
| — |
| — | | 15,698 | | 12,882 |
| (1,314) |
| 254 |
Debt securities |
| — |
| — | | 11,478 | | 11,976 |
| 37 |
| 184 |
Deposits |
| 1,174 |
| 1,210 | | — | | — |
| — |
| — |
Cash and cash equivalents | | 561 |
| 422 | | — | | — |
| — |
| — |
Total financial assets |
| 3,252 |
| 3,078 | | 27,176 | | 24,858 |
| (1,277) |
| 438 |
*The carrying value approximates fair value for the financial assets in this category with no movement in the fair value during the year.
Fair value information for the Group’s share of financial assets of other joint ventures and associates in aggregate is set out in the table below:
| | | | | | | | | | | | |
| | Financial assets that pass | | | | | | | | | ||
| | the SPPI test* | | All other financial assets | ||||||||
|
| |
| | | | | |
| Movement in the fair value | ||
| | Fair value at 31 Dec | | Fair value at 31 Dec | | during | ||||||
Other JVs and associates (Prudential’s share) | | 2022 | | 2021 | | 2022 | | 2021 | | 2022 | | 2021 |
Financial assets |
| $m |
| $m |
| $m |
| $m |
| $m |
| $m |
Accrued investment income |
| 83 |
| 85 | | — | | — |
| — |
| — |
Other debtors |
| 143 |
| 187 | | — | | — |
| — |
| — |
Loans |
| — |
| 26 | | — | | — |
| — |
| — |
Equity securities and holdings in collective investment schemes |
| — |
| — | | 3,657 | | 3,859 |
| 133 |
| 680 |
Debt securities |
| — |
| — | | 3,476 | | 3,674 |
| (131) |
| (121) |
Deposits |
| 335 |
| 203 | | — | | — |
| — |
| — |
Cash and cash equivalents | | 380 |
| 510 | | — | | — |
| — |
| — |
Total financial assets |
| 941 |
| 1,011 | | 7,133 | | 7,533 |
| 2 |
| 559 |
*The carrying value approximates fair value for the financial assets in this category with no movement in the fair value during the year.
IFRS 17 ‘Insurance Contracts’
IFRS 17 ‘Insurance Contracts’ became effective on 1 January 2023 and replaces IFRS 4 ‘Insurance Contracts’. IFRS 4 permitted insurers to continue to use the statutory basis of accounting for insurance assets and liabilities that existed in their jurisdictions prior to January 2005. IFRS 17 replaced this with a new measurement model that significantly changes the way insurance and reinsurance contracts are accounted for, albeit the scope of IFRS 17 and IFRS 4 is very similar. Therefore, nearly all of the Group’s insurance and investment contracts with discretionary participation features accounted under IFRS 4 will be accounted for under IFRS 17. The transition date of the Group for IFRS 17 was 1 January 2022. The Group is adopting IFRS 17 on its mandatory effective date on 1 January 2023, alongside the adoption of IFRS 9.
IFRS 17 implementation programme
The requirements of the new standard are complex and require a fundamental change to accounting, presentation and disclosures for insurance contracts as well as the application of significant judgement and new estimation techniques. The implementation of this standard has involved significant enhancements to IT, actuarial and finance systems of the Group. The Group has been implementing IFRS 17 and IFRS 9 through a Group-wide implementation programme.
A Group-wide Steering Committee, chaired by the Group Chief Financial Officer, provides oversight and strategic direction to the implementation programme. Regular updates on progress are provided to the Group Audit Committee and during 2022 members of the Committee, as well as the Board, received training on the new requirements. Since the last Annual Report, the systems implementation has been completed and the transition impacts at 1 January 2022 have been calculated. The production of half year and full year 2022 comparatives using the IFRS 17 accounting standard is scheduled to be completed in the first half of 2023.
215
Overview of IFRS 17
IFRS 17 requires liabilities for insurance contracts to be measured as the total of:
– | fulfilment cash flows, comprising the best estimate of the present value of future cash flows within the contract boundary that are expected to arise and an explicit risk adjustment for non-financial risk; and |
– | a contractual service margin (CSM) that is representing the deferral of any day-one gains arising on initial recognition. |
Losses are recognised directly into the income statement. For measurement purposes, contracts are grouped together into contracts of similar risk, profitability profile and issue year, with further divisions for contracts that are managed separately.
The establishment of CSM on the Group’s in-force business and transition approach
Transition refers to the determination of the opening balance sheet for the first year of comparative information presented under IFRS 17 (ie at 1 January 2022). The future cash flows and risk adjustment are measured on a current basis in the same manner as they would be calculated for subsequent measurement. The key component of transition is therefore the determination of the CSM.
The standard requires IFRS 17 to be applied retrospectively (the ‘fully retrospective approach’) unless impracticable. If a fully retrospective approach is impracticable there is an option to choose either a modified retrospective approach or a fair value approach. If reasonable and supportable information necessary to apply the modified retrospective approach is not available, the fair value approach must be applied. The Group applied all three approaches on transition, after taking into account the information that is available to be used for the different groups of contracts of the Group. The fair value approach is applied, in particular, where suitable historical information required to apply the retrospective transition approaches is no longer practicably available.
Profit for insurance contracts under IFRS 17
IFRS 17 introduces a new measure of insurance revenue, based on the delivery of services to policyholders and excluding any premiums related to the investment elements of policies, which will be significantly different from existing premium revenue measures, currently reported in the income statement.
Profit for insurance contracts under IFRS 17 is represented by the recognition of the services provided to policyholders in the period (release of the CSM), release from non-economic risk (release of risk adjustment) and the excess of the actual investment return in the period over the effect of the unwind of the rate used to discount the General Measurement Model liabilities , together with operating variances as appropriate. CSM is released in line with coverage units that are a measure of the quantity of benefits provided under a contract and the period over which coverage is provided.
The CSM is released as profit over the coverage period of the insurance contract, reflecting the delivery of services to the policyholder. Under IFRS 17 insurance contracts are measured under either the General Measurement Model (GMM), the Variable Fee Approach (VFA) for contracts with direct participating features or the simplified Premium Allocation Approach (PAA). The Group predominantly uses the VFA and GMM, depending on the specific characteristics of the insurance contracts. The Group makes very limited use of the PAA for some small portfolios of short duration contracts. Reinsurance contracts held are measured under the GMM.
We estimate that over two-thirds of the CSM at transition is calculated using the VFA and relates to the Group’s with-profits products, the Group’s flagship critical illness products in Hong Kong and unit-linked products with a low proportion of protection riders. The contracts calculated using the GMM, include the Group’s non-profit protection business and unit-linked business with a high proportion of protection riders.
The fulfilment cash flows comprise the best estimate of the present value of future cash flows within the contract boundary that are expected to arise and an explicit risk adjustment for non-financial risk. The discount rate applied to derive the present value of future cash flows is determined on a bottom-up basis, starting with a liquid risk-free yield curve and adding an illiquidity premium to reflect the characteristics of the insurance contracts. The risk adjustment reflects the compensation the Group requires for bearing the uncertainty about the amount and timing of the cash flows from non-financial risk as the Group fulfils insurance contracts, determined by the Group using a confidence level approach.
216
The fulfilment cash flows are updated each reporting date to reflect current conditions. For contracts with direct participating features which are accounted for under the VFA, the CSM represents the variable fee to shareholders and it is adjusted to reflect the effect of changes in economics as well as experience variances and/or assumptions changes that relate to future services. For contracts accounted for under GMM, the CSM is accreted using the locked-in discount rates and only adjusted to reflect the effect of non-economic experience variances and/or assumptions changes that relate to future services. The adjustments to the CSM are determined using the locked-in discount rates.
Expected impact on transition (1 January 2022)
The Group is adopting IFRS 17 retrospectively to its 2022 comparatives as required by the standard. As permitted by IFRS 9, the Group is not planning to restate the 2022 comparatives on initial application of IFRS 9 but the Group is taking advantage of the classification overlay for selected assets, principally to change the classification of certain debt securities, so that they are valued at amortised cost rather than at fair value under IAS 39, and certain loans, so that they are valued at fair value instead of the prior amortised cost valuation. Changes from IFRS 9 have an immaterial impact on the Group's financial statements.
The adoption of IFRS 17 and the IFRS 9 classification overlay are estimated to increase the Group shareholders’ equity at 1 January 2022 to between $18.9 - $19.8 billion. This reflects the release of prudent margins from our legacy accounting basis, particularly in Hong Kong, recognition of the shareholders’ share of the inherited estate within the with-profit funds and the net impact of timing differences in the pattern of profit recognition. The overall net impact of the IFRS 9 classification overlay at 1 January 2022 is insignificant given the vast majority of the Group’s financial investments will continue to be carried at fair value through profit or loss under IFRS 9, as currently applied under IAS 39.
The Group is yet to complete production of its 2022 comparatives under the IFRS 17 accounting standard. In addition we continue to review our IFRS 17 accounting policies and approach to ensure they remain in line with market practice. Therefore the impacts discussed above are subject to change prior to finalisation of the Group’s financial statements for the year ending 31 December 2023.
Other new accounting pronouncements
In addition to the above, the following new accounting pronouncements have also been issued and are not yet effective but the Group is not expecting them to have a significant impact on the Group’s consolidated financial statements:
– | Amendments to IAS 1 ‘Classification of liabilities as current or non-current’ issued in January 2020 and effective from 1 January 2023. An exposure draft was issued in November 2021 proposing for this effective date to be delayed to periods starting no earlier than 1 January 2024; |
– | Amendments to IAS 1 and IFRS Practice Statement 2 ‘Disclosure of accounting policies’ issued in February 2021 and effective from 1 January 2023; |
– | Amendments to IAS 8 ‘Definition of accounting estimates’ issued in February 2021 and effective from 1 January 2023; |
– | Amendments to IAS 12 ‘Deferred tax related to assets and liabilities arising from a single transaction’ issued in May 2021 and effective from 1 January 2023; |
– | Amendments to IFRS 16 ‘Lease liability in a sale and leaseback’ issued in September 2022 and effective from 1 January 2024; and |
– | Amendments to IAS 1 ‘Non-current liabilities with covenants’ issued in October 2022 and effective from 1 January 2024. |
217
B Earnings performance
B1 Analysis of performance by segment
B1.1 Segment results
| | | | | | | | | |
|
| |
| 2022 $m |
| 2021 $m |
| 2020 $m |
|
| | Note | | note (i) | | note (i) | | note (i) | |
Continuing operations: | | | | | | | | | |
CPL |
|
|
| 368 |
| 343 |
| 251 | |
Hong Kong |
| |
| 1,036 |
| 975 |
| 891 | |
Indonesia |
|
|
| 343 |
| 446 |
| 519 | |
Malaysia |
|
|
| 364 |
| 350 |
| 309 | |
Singapore | | | | 678 | | 663 | | 574 | |
Growth markets and othernote (ii) |
| |
| 1,057 |
| 932 |
| 835 | |
Eastspring |
| |
| 260 |
| 314 |
| 283 | |
Other income and expenditure unallocated to a segment: |
|
|
| |
| |
| | |
Net investment return and other items |
| |
| 39 |
| 21 |
| (15) | |
Interest payable on core structural borrowings |
|
|
| (200) |
| (328) |
| (316) | |
Corporate expenditurenote (iii) |
|
|
| (276) |
| (298) |
| (412) | |
Total other income (expenditure) |
| B1.4 |
| (437) |
| (605) |
| (743) | |
Restructuring and IFRS 17 implementation costsnote (iv) |
| B1.4 |
| (294) |
| (185) |
| (162) | |
Adjusted operating profit | | B1.2 | | 3,375 | | 3,233 | | 2,757 | |
Short-term fluctuations in investment returns on shareholder-backed businessnote (v) |
| |
| (1,915) |
| (458) |
| (579) | |
Amortisation of acquisition accounting adjustments |
| |
| (10) |
| (5) |
| (5) | |
Gain (loss) attaching to corporate transactions |
| D1.1 |
| 11 |
| (94) |
| 735 | |
Profit before tax attributable to shareholders | | | | 1,461 | | 2,676 | | 2,908 | |
Tax charge attributable to shareholders' returns |
| B3 |
| (454) |
| (462) |
| (440) | |
Profit from continuing operations |
| |
| 1,007 |
| 2,214 |
| 2,468 | |
Loss from discontinued US operations |
| D1.2 |
| — |
| (5,027) |
| (283) | |
Profit (loss) for the year | | | | 1,007 | | (2,813) | | 2,185 | |
| | | | | | | | | |
Attributable to: | | | | | | | | | |
Equity holders of the Company | | | | | | | | | |
From continuing operations | | | | 998 | | 2,192 | | 2,458 | |
From discontinued US operations | | | | — | | (4,234) | | (340) | |
| | | | 998 | | (2,042) | | 2,118 | |
Non-controlling interests | | | | | | | | | |
From continuing operations |
| |
| 9 |
| 22 |
| 10 | |
From discontinued US operations | | | | — | | (793) | | 57 | |
| | | | 9 | | (771) | | 67 | |
Profit (loss) for the year | | | | 1,007 | | (2,813) | | 2,185 | |
| | | | | | | | | |
Basic earnings per share (in cents) |
| | | 2022 |
| 2021 |
| 2020 | |
| | Note | | note (i) | | note (i) | | note (i) | |
Based on adjusted operating profit, net of tax and non-controlling interest, from continuing operations | | B4 | | 100.5 | ¢ | 101.5 | ¢ | 86.6 | ¢ |
Based on profit from continuing operations, net of non-controlling interest |
| B4 |
| 36.5 | ¢ | 83.4 | ¢ | 94.6 | ¢ |
Based on loss from discontinued US operations, net of non-controlling interest | | B4 | | — | ¢ | (161.1) | ¢ | (13.0) | ¢ |
Notes
(i) | Segment results are attributed to the shareholders of the Group before deducting the amount attributable to the non-controlling interests. This presentation is applied consistently throughout the document. |
(ii) | Adjusted operating profit for growth markets and other includes other items of $211 million (2021: $217 million; 2020: $119 million) which in 2022 primarily included the impact of the adoption of the Risk-Based Capital regime in Hong Kong (as discussed further in note C3.2) partially offset by corporate taxes for life joint ventures and associates. |
(iii) | Corporate expenditure as shown above is for head office functions. |
(iv) | Restructuring and IFRS 17 implementation costs include those incurred in insurance and asset management operations of $(137) million (2021: $(101) million; 2020: $(97) million), largely comprising the costs of Group-wide projects including the implementation of IFRS 17, reorganisation programmes and initial costs of establishing new business initiatives and operations. |
(v) | In general, the short-term fluctuations reflect the value movements on shareholders’ assets and policyholder liabilities (net of reinsurance) arising from market movements in the year. In 2022, rising interest rates and widening credit spreads across a number of the Group’s life insurance markets led to unrealised bond losses which more than offset the impact of higher discount rates on policyholder liabilities. The interest rates rises in 2022 were more substantial than that seen in 2021. Short-term fluctuations also reflect losses on equities backing shareholder-backed business following market movements in 2022 (2021: equity gains) and the impact of refinements to the reserving basis in Hong Kong following the adoption of the Risk-Based Capital regime (as discussed further in note C3.2). |
218
B1.2 Determining operating segments and performance measure of operating segments
Operating segments
The Group's operating and reported segments for financial reporting purposes are defined and presented in accordance with IFRS 8 ‘Operating Segments’ on the basis of the management reporting structure and its financial management information. Under the Group's management and reporting structure, its chief operating decision maker is the Group Executive Committee (GEC), chaired by the Chief Executive Officer. Performance measures for insurance operations are analysed by geographical areas for the larger business units of CPL, Hong Kong, Indonesia, Malaysia and Singapore, with Eastspring, the asset management business, also analysed separately. CPL is managed jointly with CITIC, a Chinese state-owned conglomerate. All other Asia and Africa insurance operations are included in the ‘Growth markets and other’ segment alongside other amounts that are not included in the segment profit of an individual business unit, including tax on life joint ventures and associates and other items that are not representative of the underlying segment trading for the period.
Operations and transactions which do not form part of any business unit are reported as ‘Unallocated to a segment’ and generally comprise head office functions, as presented in the additional segmental analysis in note B1.4.
Performance measure
The performance measure of operating segments utilised by the Group is IFRS operating profit based on longer-term investment returns (adjusted operating profit) as described below. This measurement basis distinguishes adjusted operating profit from other constituents of total profit or loss for the year as follows:
– | Short-term fluctuations in investment returns on shareholder-backed business; |
– | Amortisation of acquisition accounting adjustments arising on the purchase of business; and |
– | Gain or loss on corporate transactions. |
Determination of adjusted operating profit for investment and liability movements
With-profits business
For with-profits business in Hong Kong, Singapore and Malaysia, the adjusted operating profit reflects the shareholders’ share in the bonuses declared to policyholders. Value movements in the underlying assets of the with-profits funds only affect the shareholder results through indirect effects of investment performance on declared policyholder bonuses and therefore, do not affect directly the determination of adjusted operating profit.
Assets and liabilities held within unit-linked funds
The policyholder unit liabilities are directly reflective of the underlying asset value movements. Accordingly, the adjusted operating profit reflects the current year value movements in both the unit liabilities and the backing assets, which offset one another.
Other shareholder-backed long-term insurance business
In the case of other shareholder-financed business, the measurement of adjusted operating profit reflects that, for the long-term insurance business, assets and liabilities are held for the longer term. For this business the Group believes trends in underlying performance are better understood if the effects of short-term fluctuations in market conditions, such as changes in interest rates or equity markets, are excluded. In determining the profit on this basis, the following key elements are applied to the results of the Group’s shareholder-financed businesses.
(a) Policyholder liabilities that are sensitive to market conditions
Under IFRS, the degree to which the carrying values of liabilities to policyholders are sensitive to current market conditions varies between business units depending upon the nature of the ‘grandfathered’ measurement basis. Taiwan and India apply US GAAP, whose policyholder liabilities are not sensitive to market movements as they are locked in at policy inception.
Movements in liabilities for some types of business do require bifurcation between the elements that relate to longer-term market condition and short-term effects to ensure that at the net level (ie after allocated investment return and charge for policyholder benefits) the adjusted operating profit reflects longer-term market returns.
219
For certain non-participating business, for example in Hong Kong, the economic features are more akin to asset management products with policyholder liabilities reflecting asset shares over the contract term. Consequently, for these products, the charge for policyholder benefits in the adjusted operating profit reflects the asset share feature that is calculated assuming a longer-term return assumption rather than volatile movements that would otherwise be reflected if the IFRS balance sheet reserving basis was applied.
For other types of non-participating business, expected longer-term investment returns and interest rates are used to determine the movement in policyholder liabilities for determining adjusted operating profit. This ensures assets and liabilities are reflected on a consistent basis.
(b) Assets backing other shareholder-backed long-term insurance business
Except in the case of assets backing liabilities which are directly matched (such as unit-linked business) adjusted operating profit for assets backing shareholder-financed business is determined on the basis of expected longer-term investment returns. Longer-term investment returns comprise actual income receivable for the year (interest/dividend income) and longer-term capital returns, determined for debt and equity-type securities on the basis described below. The difference between the actual investment returns in the reporting period and the longer-term investment returns is recognised within short-term fluctuations in investment returns.
Debt securities and loans
As a general principle, for debt securities and loans, the longer-term investment returns comprise the interest receivable for the year and the amortisation of interest-related realised gains and losses to the date when sold securities would have otherwise matured (or a suitable proxy for this period). All unrealised gains and losses are treated as a component of short-term investment fluctuations. Consideration is given to the need to recognise an expected longer-term level of defaults for the securities within the longer-term investment returns, based on past performance and having regard to the credit quality of the portfolio, with any difference with actual credit-related realised losses arising in the year being included in short-term fluctuations. If, under this analysis, realised gains and losses are principally considered to be interest related with no significant credit-related losses based on past performance, then all realised gains and losses to date for these operations are treated as interest related and amortised to adjusted operating profit over the period to the date those securities would otherwise have matured and no separate charge to longer-term investment returns for credit defaults is made.
For Group debt securities at 31 December 2022, the level of interest-related realised gains and losses on previously sold bonds that had yet to be amortised to adjusted operating profit from short-term investment fluctuations was a net loss of $(98) million (2021: net gain of $515 million; 2020: net gain of $525 million).
Equity-type securities
For equity-type securities that comprise both the Group's investments in direct equities and all of its collective investment scheme holdings, the longer-term rates of return are estimates of the long-term trend investment returns for income and capital having regard to past performance, current trends and future expectations. Different rates apply to different categories of the securities within this category.
For insurance operations, investments in equity-type securities held for non-linked shareholder-backed business amounted to $7,089 million as at 31 December 2022 (31 December 2021: $6,073 million). For Group’s investments in direct equities, the longer-term rates of return applied in 2022 ranged from 8.7 per cent to 16.9 per cent (2021: 7.3 per cent to 16.9 per cent; 2020: 5.8 per cent to 16.9 per cent). For Group’s collective investment scheme holdings, the longer-term rates of return applied ranged from 3.5 per cent to 10.7 per cent (2021: 3.6 per cent to 11.0 per cent; 2020: 3.7 per cent to 11.3 per cent) representing the range across business units of the weighted average expected longer-term return rates determined by reference to the underlying asset mix of the funds for each business unit. These rates are broadly stable from year to year but may be different between regions, reflecting, for example, differing expectations of inflation in each business unit.
The assumptions are for the returns expected to apply in equilibrium conditions. The assumed rates of return do not reflect any cyclical variability in economic performance and are not set by reference to prevailing asset valuations. The longer-term investment returns for the insurance joint ventures and associates accounted for using the equity method are determined on a similar basis as the other insurance operations described above.
220
Derivative value movements
Generally, derivative value movements are excluded from adjusted operating profit. The exception is where the derivative value movements broadly offset changes in the accounting value of other assets and liabilities included in adjusted operating profit.
Other non-insurance businesses
For these businesses, the determination of adjusted operating profit reflects the underlying economic substance of the arrangements. Generally, realised gains and losses are included in adjusted operating profit with temporary unrealised gains and losses being included in short-term fluctuations. In some instances, realised gains and losses on derivatives and other financial instruments are amortised to adjusted operating profit over a time period that reflects the underlying economic substance of the arrangements.
B1.3 | Revenue |
Premiums and annuity considerations for conventional and other protection type insurance policies are recognised as revenue when due. Premiums and annuity considerations for linked policies and other investment type policies are recognised as revenue when received or, in the case of unitised or unit-linked policies, when units are issued. These amounts exclude premium taxes and similar duties where Prudential collects and settles taxes borne by the policyholder.
Policy fees charged on linked policies for mortality, morbidity, asset management and policy administration are recognised when related services are provided.
(a)Analysis of total revenue by segment
| | | | | | | | | | | | | | | | | | | | |
| | 2022 $m | ||||||||||||||||||
| | Insurance operationsnote (i) | | | | | | | | | | | ||||||||
| | | | | | | | | | Growth | | | | Inter | | | | | | |
| | Hong | | | | | | | | markets | | | | -segment | | Total | | Unallocated | | |
|
| Kong |
| Indonesia |
| Malaysia |
| Singapore |
| and other |
| Eastspring |
| elimination |
| segment |
| to a segment |
| Total |
Gross premiums earned | | 8,792 | | 1,590 | | 1,843 | | 6,540 | | 4,579 | | — | | — | | 23,344 | | — | | 23,344 |
Outward reinsurance premiums | | (1,494) | | (34) | | (58) | | (299) | | (58) |
| — |
| — | | (1,943) |
| — |
| (1,943) |
Earned premiums, net of reinsurance | | 7,298 | | 1,556 | | 1,785 | | 6,241 | | 4,521 |
| — |
| — | | 21,401 |
| — |
| 21,401 |
Other incomenote (ii) | | 65 | | 12 | | — | | 15 | | 116 |
| 330 |
| — | | 538 |
| 1 |
| 539 |
Total external revenuenote (iii) | | 7,363 | | 1,568 | | 1,785 | | 6,256 | | 4,637 |
| 330 |
| — | | 21,939 |
| 1 |
| 21,940 |
Intra-group revenue | | — | | — | | — | | — | | 1 |
| 199 |
| (200) |
| — |
| — |
| — |
Interest incomenote B1.3(b) | | 996 | | 83 | | 217 | | 744 | | 628 |
| 4 |
| — |
| 2,672 |
| 50 |
| 2,722 |
Dividend and other investment income | | 689 | | 77 | | 183 | | 576 | | 107 |
| 1 |
| — |
| 1,633 |
| 25 |
| 1,658 |
Investment appreciation (depreciation) | | (23,704) | | (70) | | (365) | | (7,498) | | (2,876) | | (21) | | — | | (34,534) | | (5) | | (34,539) |
Total revenue, net of reinsurance | | (14,656) | | 1,658 | | 1,820 | | 78 | | 2,497 |
| 513 |
| (200) |
| (8,290) |
| 71 | | (8,219) |
| | | | | | | | | | | | | | | | | | | | |
| | 2021 $m | ||||||||||||||||||
| | Insurance operationsnote (i) | | | | | | | | | | | ||||||||
| | | | | | | | | | Growth | | | | Inter | | | | | | |
|
| Hong |
| |
| |
| |
| markets |
| |
| -segment |
| Total |
| Unallocated |
| |
| | Kong | | Indonesia | | Malaysia | | Singapore | | and other | | Eastspring | | elimination | | segment | | to a segment | | Total |
Gross premiums earned | | 10,032 | | 1,724 | | 1,900 | | 6,246 | | 4,315 | | — | | — | | 24,217 | | — | | 24,217 |
Outward reinsurance premiums | | (1,557) |
| (43) | | (47) |
| (137) | | (60) | | — | | — |
| (1,844) |
| — |
| (1,844) |
Earned premiums, net of reinsurance | | 8,475 |
| 1,681 | | 1,853 |
| 6,109 | | 4,255 | | — | | — |
| 22,373 |
| — |
| 22,373 |
Other incomenote (ii) | | 52 |
| 12 | | — |
| 22 | | 117 | | 437 | | — |
| 640 |
| 1 |
| 641 |
Total external revenuenote (iii) | | 8,527 |
| 1,693 | | 1,853 |
| 6,131 | | 4,372 | | 437 | | — |
| 23,013 |
| 1 |
| 23,014 |
Intra-group revenue | | — | | — | | — | | — | | 1 | | 217 | | (218) |
| — | | — | | — |
Interest incomenote B1.3(b) | | 934 |
| 87 | | 220 |
| 707 | | 618 | | 3 | | — |
| 2,569 |
| 1 |
| 2,570 |
Dividend and other investment income | | 679 |
| 74 | | 160 |
| 506 | | 86 | | — | | — |
| 1,505 |
| 19 |
| 1,524 |
Investment appreciation (depreciation) | | 57 | | 34 | | (300) | | (29) | | (361) | | 8 | | — | | (591) | | (17) | | (608) |
Total revenue, net of reinsurance | | 10,197 |
| 1,888 | | 1,933 |
| 7,315 | | 4,716 | | 665 | | (218) |
| 26,496 |
| 4 |
| 26,500 |
221
| | | | | | | | | | | | | | | | | | | | |
| | 2020 $m | ||||||||||||||||||
| | Insurance operationsnote (i) | | | | | | | | | | | ||||||||
| | | | | | | | | | Growth | | | | Inter | | | | | | |
|
| Hong |
| |
| |
| |
| markets |
| |
| -segment |
| Total |
| Unallocated |
| |
| | Kong | | Indonesia | | Malaysia | | Singapore | | and other | | Eastspring | | elimination | | segment | | to a segment | | Total |
| | | | | | | | | | note (vii) | | | | | | | | | | |
Gross premiums earned | | 11,091 | | 1,738 | | 1,783 | | 5,035 | | 3,848 | | — | | — | | 23,495 | | — | | 23,495 |
Outward reinsurance premiumsnote (iv) |
| (1,918) |
| (62) |
| (27) | | 432 | | (50) | | — | | — |
| (1,625) |
| — |
| (1,625) |
Earned premiums, net of reinsurance |
| 9,173 |
| 1,676 |
| 1,756 | | 5,467 | | 3,798 | | — | | — |
| 21,870 |
| — |
| 21,870 |
Other incomenote (ii) |
| 59 |
| 8 |
| — | | 38 | | 91 | | 417 | | — |
| 613 |
| 2 |
| 615 |
Total external revenenote (iii) |
| 9,232 |
| 1,684 |
| 1,756 | | 5,505 | | 3,889 | | 417 | | — |
| 22,483 |
| 2 |
| 22,485 |
Intra-group revenue |
| — | | — | | — | | — | | 1 | | 164 | | (165) |
| — |
| — |
| — |
Interestnote B1.3(b) |
| 646 |
| 104 |
| 210 | | 447 | | 570 | | 5 | | — |
| 1,982 |
| 15 |
| 1,997 |
Dividend and other investment income |
| 646 |
| 86 |
| 99 | | 364 | | 65 | | 5 | | — |
| 1,265 |
| 32 |
| 1,297 |
Investment appreciation (depreciation) | | 7,493 | | (201) | | 369 | | 2,045 | | 765 | | 21 | | — | | 10,492 | | (24) | | 10,468 |
Total revenue, net of reinsurance |
| 18,017 |
| 1,673 |
| 2,434 | | 8,361 | | 5,290 | | 612 | | (165) |
| 36,222 |
| 25 |
| 36,247 |
Notes
(i) | CPL, Prudential’s life business in the Chinese Mainland, is a joint venture with CITIC and is accounted for using the equity method under IFRS. The Group’s share of its results is presented in a single line within the Group’s profit before tax on a net of related tax basis, and therefore not shown in the analysis of revenue line items above. Revenue from external customers of CPL (Prudential’s share) in 2022 is $2,948 million (2021: $3,052 million; 2020: $1,866 million). Further financial information on CPL is provided in note D6.3. |
(ii) | Other income comprises income from external customers and consists primarily of revenue from the Group’s asset management business of $330 million (2021: $437 million; 2020: $417 million). The remaining other income consists primarily of policy fee revenue from external customers and asset management rebate revenue from external fund managers. Also included in other income is fee income on financial instruments that are not held at FVTPL of $2 million (2021: $1 million; 2020: $1 million). |
(iii) | Due to the nature of the business of the Group, there is no reliance on any major customers. Of the Group’s markets, only Hong Kong and Singapore have external revenue that exceeds 10 per cent of the Group total for the years presented. |
(iv) | The 2020 outward reinsurance premiums in Singapore included a credit of $542 million for the recapture of previously reinsured business following a change in regulatory requirements. |
(b)Additional analysis of investment return
Investment return included in the income statement principally comprises interest income, dividends, investment appreciation and depreciation (realised and unrealised gains and losses) on investments designated as fair value through profit or loss, and realised gains and losses (including impairment losses) on items held at amortised cost and/or designated as AFS. Movements in unrealised appreciation or depreciation of securities designated as AFS are recorded in other comprehensive income. Interest income is recognised as it accrues. Dividends on equity securities are recognised on the ex-dividend date and rental income is recognised on an accrual basis.
| | | | | | |
|
| 2022 $m |
| 2021 $m |
| 2020 $m |
Net realised and unrealised gains (losses) on securities at fair value through profit or lossnote (i) |
| (30,097) | | 624 |
| 9,741 |
Net realised and unrealised gains (losses) on derivatives at fair value through profit or lossnote (i) |
| (4,487) | | (943) |
| 916 |
Net realised (losses) on loansnote (i) |
| (14) | | (2) |
| — |
Interest incomenote (ii) | | 2,722 | | 2,570 | | 1,997 |
Dividend income |
| 1,531 | | 1,496 |
| 1,257 |
Other investment returns (including foreign exchange gains and losses) |
| 186 | | (259) |
| (149) |
Investment return |
| (30,159) | | 3,486 |
| 13,762 |
Notes
(i) | Net realised gains and losses on the Group’s investments for 2022 recognised in the income statement amounted to a net loss of $(9.3) billion (2021: a net gain of $6.0 billion; 2020: a net gain of $4.9 billion). The movement in the net amount of realised and unrealised gains and losses on the Group’s investments from 2021 to 2022 primarily reflects the effects of significant increases in interest rates during the year compared with 2021 as well as equity market falls during the year. |
(ii) | Interest income includes $362 million (2021: $280 million; 2020: $257 million) in respect of financial assets not at fair value through profit and loss. |
The overall financial strength of Prudential and the results, both current and future, of the insurance business are in part dependent upon the quality and performance of the various investment portfolios. Prudential’s insurance investments support a range of businesses operating in many geographic areas. Each of the operations formulates a strategy based on the nature of its underlying liabilities, its level of capital and its local regulatory requirements. Prudential’s insurance business’s investments, excluding assets to cover linked liabilities and those attributable to external unit holders of consolidated investment funds, are largely held by Prudential’s Singapore and Hong Kong operations.
222
All investments are carried at fair value in the statement of financial position with fair value movements, which are volatile from period to period, recorded in the income statement, except for loans and receivables, which are generally carried at amortised cost (unless designated at fair value through profit or loss), the Group’s retained interest in Jackson and certain centrally held debt securities, which are designated as available-for-sale and therefore the changes in unrealised fair value are booked in other comprehensive income. Subject to the effect of the exceptions, the year-on-year changes in investment returns primarily reflect the generality of overall market movements for equities and debt securities. In addition, foreign exchange rates affect the USD value of the translated income. Consistent with the treatment applied for other items of income and expenditure, investment return for operations not using USD as functional currency is translated at average exchange rates. The year-on-year movements in investment return of the Group mainly reflect the cumulative impact from the changes in interest rates on bond asset values and in the performance of the equity markets.
Allocation of investment return between policyholders and shareholders
Investment return is attributable to policyholders and shareholders. A key feature of the accounting policies under IFRS is that the investment return included in the income statement relates to all investment assets of the Group, irrespective of whether the return is attributable to shareholders, policyholders or the unallocated surplus of with-profits funds, the latter two of which have no direct impact on shareholders’ profit. The table below provides a breakdown of the investment return attributable to each type of business.
| | | | | | |
|
| 2022 $m |
| 2021 $m |
| 2020 $m |
Policyholder returns |
|
|
|
|
|
|
Assets backing unit-linked liabilities | | (2,574) |
| 516 |
| 1,549 |
With-profits business | | (21,287) |
| 2,700 |
| 8,384 |
| | (23,861) |
| 3,216 |
| 9,933 |
Shareholder returns | | (6,298) |
| 270 |
| 3,829 |
Total investment return | | (30,159) |
| 3,486 |
| 13,762 |
Policyholder returns
Investment returns allocated to policyholders are those from investments in which shareholders have no direct economic interest, namely unit-linked business for which the investment returns are wholly attributable to policyholders and with-profits business in which the shareholders’ economic interest (and the basis of recognising IFRS basis profits) is restricted to a share of the actuarially determined surplus for distribution. Except for this surplus, the investment returns of the with-profits funds are attributable to policyholders (through the asset-share liabilities) or the unallocated surplus, which is accounted for as a liability under IFRS 4 as shown in note C3.
Shareholder returns
For shareholder-backed non-with-profits business, the investment returns are generally not directly attributable to policyholders and, therefore, impact shareholders’ profit directly.
B1.4Additional segmental analysis of profit after tax
| | | | | | |
|
| 2022 $m |
| 2021 $m |
| 2020 $m |
CPL | | (144) |
| 278 |
| 394 |
Hong Kong | | (211) |
| 1,068 |
| 994 |
Indonesia | | 243 |
| 362 |
| 409 |
Malaysia | | 252 |
| 265 |
| 256 |
Singapore | | 406 |
| 394 |
| 521 |
Growth markets and othernote (i) | | 881 |
| 434 |
| 548 |
Eastspring | | 234 |
| 284 |
| 253 |
Total segment | | 1,661 |
| 3,085 |
| 3,375 |
Unallocated to a segment (central operations)note (ii) | | (654) |
| (871) |
| (907) |
Total profit after tax | | 1,007 |
| 2,214 |
| 2,468 |
Notes
(i) | The Growth markets and other segment comprises all other Asia and Africa insurance businesses alongside other amounts that are not included in the segment profit of an individual business unit, including tax on life joint ventures and associates and other items that are not representative of the underlying segment trading for the year, in line with the presentation used by management when assessing the performance of the underlying segments internally. |
(ii) | Comprising other income and expenditure of $(437) million (2021: $(605) million; 2020: $(743) million) attributable to the head office functions, $(294) million (2021: $(185) million; 2020: $(162) million) of restructuring and IFRS 17 implementation costs, $19 million (2021: $(25) million; 2020: $28 million) of short-term fluctuations on investment returns in central operations, $62 million (2021: $(35) million; 2020: $(30) million) of corporate transactions and related tax of $(4) million (2021: $(21) million; 2020: nil). |
223
B2 Acquisition costs and other expenditure
| | | | | | |
|
| 2022 $m |
| 2021 $m |
| 2020 $m |
Acquisition costs incurred for insurance policies |
| (2,325) | | (2,089) |
| (2,080) |
Acquisition costs deferred |
| 1,002 | | 848 |
| 617 |
Amortisation of acquisition costs |
| (475) | | (343) |
| (308) |
Administration costs and other expenditure (net of other reinsurance commission) | | (3,100) | | (3,128) | | (2,433) |
Movements in amounts attributable to external unit holders of consolidated investment funds | | 1,018 | | 152 | | (447) |
Total acquisition costs and other expenditure |
| (3,880) | | (4,560) |
| (4,651) |
Notes
(i) | Administration costs and other expenditure include fee expenses relating to financial liabilities held at amortised cost and are part of the determination of the effective interest rate. |
(ii) | Total depreciation and amortisation expenses are included in ‘Acquisition costs incurred for insurance policies’, ‘Administration costs and other expenditure (net of other reinsurance commission)’ and ‘Amortisation of acquisition costs’ and relate primarily to amortisation of DAC of insurance contracts and distribution rights intangibles. The segmental analysis of depreciation and amortisation is shown below. |
| | | | | | |
|
| 2022 $m |
| 2021 $m |
| 2020 $m |
Hong Kong | | (147) | | (123) | | (158) |
Indonesia |
| (61) | | (51) |
| (34) |
Malaysia |
| (70) | | (56) |
| (37) |
Singapore |
| (202) | | (162) |
| (144) |
Growth markets and other |
| (461) | | (390) |
| (301) |
Eastspring |
| (13) | | (17) |
| (16) |
Total segment |
| (954) | | (799) |
| (690) |
Unallocated to a segment (central operations) |
| (26) | | (31) |
| (35) |
Total depreciation and amortisation |
| (980) | | (830) |
| (725) |
(iii) | Interest expense is included in ‘Administration costs and other expenditure (net of other reinsurance commission)’ other than interest on core structural borrowings that is presented separately on the income statement as ‘Finance costs: interest on core structural borrowings of shareholder-financed businesses’. Interest expense of the central operations amounted to $(209) million (2021: $(331) million; 2020: $(334) million) comprising $(200) million (2021: $(328) million; 2020: $(316) million) of interest on core structural borrowings, $(2) million of interest on lease liabilities (2021: $(3) million; 2020: $(4) million) and $(7) million (2021: nil; 2020: $(14) million) of interest on other operational borrowings. Core structural borrowings and operational borrowings (other than lease liabilities) represent financial liabilities that are not classified at fair value through profit and loss. |
The ‘Total segment’ interest expense is $(16) million (2021: $(10) million; 2020: $(13) million) of which $(11) million arises in the Hong Kong segment (2021: $(3) million; 2020: $(5) million) with the remainder spread broadly evenly across the other markets. Included within interest expense is $(7) million (2021: $(10) million; 2020: $(13) million) of interest on lease liabilities.
��
B2.1 Staff and employment costs
The average number of staff employed by the Group during the years shown was:
| | | | | | |
|
| 2022 |
| 2021 |
| 2020 |
Asia and Africa operationsnote (i) |
| 13,685 | | 13,237 |
| 12,949 |
Head office function | | 511 | | 600 | | 657 |
Total continuing operations | | 14,196 | | 13,837 | | 13,606 |
Discontinued US operationsnote (ii) |
| — | | 3,306 |
| 3,650 |
Total Group |
| 14,196 | | 17,143 |
| 17,256 |
Notes
(i) | The Asia and Africa operations staff numbers above exclude 744 (2021: 440; 2020: 502) commission-based sales staff who have an employment contract with the Group. |
(ii) | Average staff numbers of the discontinued US operations were for the period up to the demerger in September 2021. |
The costs of employment were:
| | | | | | | | | | | | | | |
|
| 2022 $m | | 2021 $m | | 2020 $m | ||||||||
|
| Group | | |
| Discontinued |
| Group |
| |
| |
| Group |
|
| total |
| Continuing |
| US operations |
| total | | Continuing |
| Discontinued |
| total |
Wages and salaries |
| 1,018 | | 973 | | 511 | | 1,484 | | 917 | | 619 | | 1,536 |
Social security costs |
| 41 | | 42 | | 22 | | 64 | | 41 | | 26 | | 67 |
Defined contribution schemes |
| 40 | | 42 | | 29 | | 71 | | 42 | | 34 | | 76 |
Total Group |
| 1,099 | | 1,057 | | 562 | | 1,619 | | 1,000 | | 679 | | 1,679 |
224
B2.2 Share-based payment
The Company offers discretionary share awards to certain key employees and all-employee share plans in the UK and a number of Asia locations. The compensation expense charged to the income statement is primarily based upon the fair value of the awards granted, the vesting period and the vesting conditions. The Company has established trusts to facilitate the delivery of Prudential plc shares under some of these plans. The cost to the Company of acquiring these newly issued shares held in trusts is shown as a deduction from shareholders’ equity.
(a) Description of the plans
The Group operates a number of share award plans that provides Prudential plc shares, or ADRs, to participants upon vesting. The plans in operation include the Prudential Long Term Incentive Plan, the Prudential Annual Incentive Plan, savings-related share option schemes, share purchase plans and deferred bonus plans. Where Executive Directors participate in these plans, details about those schemes are provided in the Compensation and Employee section. The following information is provided about plans in which the Executive Directors do not participate:
| |
Share scheme | Description |
Prudential Asia and Africa (PAA) Long-Term Incentive Plan (PAA LTIP) | The PAA LTIP provides eligible employees with conditional awards. Awards are discretionary and vest after one, two or three years subject to the employee being in employment. Vesting of awards may also be subject to performance conditions. All awards are generally made in Prudential shares. In countries where share awards are not feasible for reasons including securities and/or tax considerations, awards will be replaced by the cash value of the shares that would otherwise have vested. |
Prudential Agency Long-Term Incentive Plan (LTIP) | Certain agents are eligible to be granted awards in Prudential shares under the Prudential Agency LTIP. These awards are structured in a similar way to the PAA LTIP described above, with most awards granted with a three year vesting period. |
Restricted Share Plan (RSP) | The Company operates the RSP for certain employees. Awards under this plan are discretionary, and the vesting of awards may be subject to performance conditions. All awards are made in Prudential shares. |
Deferred bonus plans | The Company operates a number of deferred bonus plans including the Group Deferred Bonus Plan (GDBP) and the Prudential Deferred Bonus Plan. There are no performance conditions attached to deferred share awards made under these arrangements. |
Savings-related share option schemes | Eligible agents in certain business units are able to participate in the International Savings-Related Share Option Scheme for Non-Employees, which is similar to the HMRC-approved Save As You Earn (SAYE) share option scheme in the UK. |
Share purchase plans | Eligible employees outside the UK are invited to participate in arrangements similar to the Company’s HMRC-approved UK Share Incentive Plan, which allows the purchase of Prudential plc shares. Staff based in Asia and Africa are eligible to participate in the Prudential All Employee Share Purchase Plan. |
225
(b) Outstanding options and awards
The following table shows the movement in outstanding options and awards under the Group’s share-based compensation plans:
| | | | | | | | | | | | | | | | | | |
| | | | Awards outstanding under | ||||||||||||||
| | Options outstanding under SAYE schemes | | incentive plans | ||||||||||||||
| | 2022 | | 2021 | | 2020 | | 2022 |
| 2021 |
| 2020 | ||||||
| | | | Weighted | | | | Weighted | | | | Weighted | | | | | | |
| | | | average | | | | average | | | | average | | | | | | |
| | Number | | exercise | | Number | | exercise | | Number | | exercise | | | ||||
| | of options | | price | | of options | | price | | of options | | price | | Number of awards | ||||
|
| millions |
| £ |
| millions |
| £ |
| millions |
| £ |
| millions | ||||
Balance at beginning of year: |
| 2.0 | | 11.61 | | 2.3 | | 11.86 | | 3.8 | | 12.38 |
| 24.6 | | 40.6 | | 33.0 |
Granted |
| 0.5 | | 7.37 | | 0.4 | | 11.90 | | 0.4 | | 9.64 |
| 6.5 | | 5.2 | | 20.2 |
Modification | | — | | — | | 0.1 | | 11.77 | | — | | — | | — | | 0.7 | | — |
Exercised |
| (0.3) | | 11.17 | | (0.7) | | 12.58 | | (0.9) | | 11.44 |
| (7.2) | | (8.6) | | (10.3) |
Forfeited |
| — | | 10.84 | | — | | 11.11 | | — | | 14.27 |
| (1.1) | | (3.1) | | (1.5) |
Cancelled |
| (0.3) | | 12.67 | | (0.1) | | 11.51 | | (0.1) | | 12.55 |
| (0.1) | | (0.1) | | (0.1) |
Lapsed/Expired |
| — | | 13.00 | | — | | 12.88 | | (0.9) | | 13.28 |
| (1.7) | | (0.6) | | (0.7) |
Jackson awards derecognised on demergernote | | — | | — | | — | | — | | — | | — | | — | | (9.5) | | — |
Balance at end of year |
| 1.9 | | 10.43 | | 2.0 | | 11.61 | | 2.3 | | 11.86 |
| 21.0 | | 24.6 | | 40.6 |
Options immediately exercisable at end of year |
| 0.3 | | 12.48 | | 0.2 | | 12.26 | | 0.5 | | 12.64 |
| | |
|
|
|
Note
On demerger of Jackson from the Prudential Group, outstanding share awards for Prudential plc participants were adjusted to receive the demerger dividend in the form of additional Prudential plc shares, to be released on the same timetable and to the same extent as their original share awards. In the case of the International Savings-Related Share Option Scheme for Non Employees the adjustments to outstanding options were confirmed as being fair and reasonable by an independent financial adviser in accordance with the rules of that plan and the Hong Kong Stock Exchange Listing Rules. Employees of Jackson were granted replacement awards over Jackson shares, in exchange for existing Group awards outstanding under incentive plans. As designated replacement awards were granted, no cancellation was recognised in respect of the original awards. As the replacement awards are an obligation of Jackson these awards were derecognised by the Group on demerger.
The weighted average share price of Prudential plc for 2022 was £10.33 (2021: £14.31; 2020: £11.64).
The following table provides a summary of the range of exercise prices for Prudential plc options outstanding at 31 December:
| | | | | | | | | | | | | | | | | | | | | | | | | | | | | | |
| | Outstanding | | Exercisable | ||||||||||||||||||||||||||
| | | | | | | | Weighted average | | | | | | | | | | | | | | | | | | | ||||
| | | | remaining | | Weighted average | | | | Weighted average | ||||||||||||||||||||
| | Number outstanding | | contractual life | | exercise prices | | Number exercisable | | exercise prices | ||||||||||||||||||||
| | millions | | years | | £ | | millions | | £ | ||||||||||||||||||||
|
| 2022 |
| 2021 |
| 2020 |
| 2022 |
| 2021 |
| 2020 |
| 2022 |
| 2021 |
| 2020 |
| 2022 |
| 2021 |
| 2020 |
| 2022 |
| 2021 |
| 2020 |
Between £7 and £8 | | 0.5 | | — | | — | | 4.1 | | — | | — | | 7.37 | | — | | — | | — | | — | | — | | — | | — | | — |
Between £9 and £10 |
| 0.4 | | 0.4 | | 0.4 |
| 2.2 | | 3.2 | | 4.2 |
| 9.64 | | 9.64 | | 9.64 |
| — | | — | | — |
| — | | — | | — |
Between £11 and £12 |
| 0.8 | | 1.2 | | 1.2 |
| 2.4 | | 2.7 | | 2.2 |
| 11.48 | | 11.38 | | 11.11 |
| 0.2 | | 0.1 | | 0.3 |
| 11.12 | | 11.04 | | 11.11 |
Between £13 and £14 | | 0.1 | | 0.2 | | 0.3 | | 1.4 | | 1.6 | | 2.2 | | 13.94 | | 13.94 | | 13.94 | | — | | 0.1 | | — | | — | | 13.94 | | — |
Between £14 and £15 |
| 0.1 | | 0.2 | | 0.4 |
| 0.4 | | 1.4 | | 1.3 |
| 14.55 | | 14.55 | | 14.55 |
| 0.1 | | — | | 0.2 |
| 14.55 | | — | | 14.55 |
Total |
| 1.9 |
| 2.0 |
| 2.3 |
| 2.6 |
| 2.6 |
| 2.4 |
| 10.43 |
| 11.61 |
| 11.86 |
| 0.3 |
| 0.2 |
| 0.5 |
| 12.48 |
| 12.26 |
| 12.64 |
The years shown above for weighted average remaining contractual life include the time period from end of vesting period to expiration of contract.
226
(c) Fair value of options and awards
The fair value amounts estimated on the date of grant relating to all options and awards were determined by using the following assumptions:
| | | | | | | | | | | | | | | | | | |
| | 2022 | | 2021 | | 2020 | ||||||||||||
|
| Prudential |
| SAYE |
| Other |
| Prudential | | SAYE |
| Other |
| Prudential |
| SAYE |
| Other |
| | LTIP (TSR) | | options | | awards | | LTIP (TSR) | | options | | awards | | LTIP (TSR) | | options | | awards |
Dividend yield (%) |
| — | | 1.11 | | — |
| — |
| 0.81 |
| — |
| — |
| 3.45 | | — |
Expected volatility (%) |
| 33.64 | | 25.68 | | — |
| 26.69 |
| 22.31 |
| — |
| 41.08 |
| 27.55 | | — |
Risk-free interest rate (%) |
| 2.79 | | 3.97 | | — |
| 0.36 |
| 1.18 |
| — |
| 0.39 |
| 0.27 | | — |
Expected option life (years) |
| — | | 4.52 | | — |
| — |
| 4.50 |
| — |
| — |
| 3.92 | | — |
Weighted average exercise price (£) |
| — | | 7.37 | | — |
| — |
| 11.90 |
| — |
| — |
| 9.64 | | — |
Weighted average share price at grant date (£) |
| 11.15 | | 9.54 | | — |
| 15.11 |
| 14.76 |
| — |
| 10.49 |
| 10.74 | | — |
Weighted average fair value at grant date (£) |
| 2.09 | | 3.45 | | 11.11 |
| 7.70 |
| 4.13 |
| 14.79 |
| 4.93 |
| 1.95 | | 10.54 |
The compensation costs for all awards and options are recognised in net income over the plans’ respective vesting periods. The Group uses the Black-Scholes model to value all options, and financial equivalence to value all awards other than those which have TSR performance conditions attached (some Prudential LTIP and RSP awards) for which the Group uses a Monte Carlo model in order to allow for the impact of these conditions. These models are used to calculate fair values for share options and awards at the grant date based on the quoted market price of the stock at the measurement date, the amount, if any, that the employees are required to pay, the dividend yield, expected volatility, risk-free interest rates and exercise prices.
For all options and awards, the expected volatility is based on the market implied volatilities as quoted on Bloomberg. The Prudential specific at-the-money implied volatilities are adjusted to allow for the different terms and discounted exercise price on SAYE options by using information on the volatility surface of the FTSE 100.
Risk-free interest rates are taken from swap spot rates with projection terms matching the corresponding vesting periods. For awards with a TSR condition, volatilities and correlations between Prudential and a basket of 12 competitor companies is required. For grants in 2022, the average volatility for the basket of competitors was 26.46 per cent (2021: 23.62 per cent; 2020: 41.40 per cent). Correlations for the basket are calculated for each pairing from the log of daily TSR returns for the three years prior to the valuation date. Market implied volatilities are used for both Prudential and the basket of competitors. Changes to the subjective input assumptions could materially affect the fair value estimate.
Other awards, without market performance conditions or exercise price, are valued based on grant date share price.
(d) Share-based payment expense charged to the income statement
The total expense recognised in 2022 in the consolidated financial statements relating to share-based compensation is $104 million (2021: $100 million; 2020: $103 million), of which $97 million (2021: $94 million; 2020: $97 million) is accounted for as equity-settled.
The Group had $27 million of liabilities at 31 December 2022 (31 December 2021: $32 million) relating to share-based payment awards accounted for as cash-settled.
227
B2.3 Key management remuneration
Key management constitutes the Directors of Prudential plc and other non-Director members of the GEC, as they have authority and responsibility for planning, directing and controlling the activities of the Group.
Total key management remuneration is analysed in the following table:
| | | | | | |
|
| 2022 $m |
| 2021 $m |
| 2020 $m |
Salaries and short-term benefits |
| 22.5 |
| 29.3 |
| 20.0 |
Post-employment benefits |
| 1.0 |
| 1.4 |
| 1.2 |
Share-based payments |
| 15.4 |
| 14.0 |
| 14.6 |
Payments on separation | | 1.0 | | 23.5 | | — |
|
| 39.9 |
| 68.2 |
| 35.8 |
The share-based payments charge comprises $6.7 million (2021: $7.5 million; 2020: $10.7 million), which is determined in accordance with IFRS 2 ‘Share-based Payment’ (see note B2.2) and $8.7 million (2021: $6.5 million; 2020: $3.9 million) of deferred share awards.
Additional details on the Directors’ emoluments, retirement benefits and other payments are given in the Compensation and Employees section. In addition to the total amounts disclosed of remuneration paid to the Directors in 2021, are amounts paid to those directors who stepped down from the Board in 2021 being $102,000 to Kai Nargolwala and $203,000 to Fields Wicker-Miurin. This is as disclosed in the 2021 Form 20-F.
B2.4 Fees payable to the auditor
| | | | | | |
|
| 2022 $m |
| 2021 $m |
| 2020 $m |
Audit of the Company's annual accounts | | 2.3 | | 2.4 | | 2.3 |
Audit of subsidiaries pursuant to legislation |
| 4.4 |
| 5.9 |
| 9.2 |
Audit fees payable to the auditor | | 6.7 | | 8.3 | | 11.5 |
Audit-related assurance servicesnote (i) | | 3.5 | | 4.5 | | 3.5 |
Other assurance services |
| 0.7 |
| 1.1 |
| 0.7 |
Services relating to corporate finance transactions |
| — |
| 1.6 |
| 0.3 |
Non-audit fees payable to the auditor | | 4.2 | | 7.2 | | 4.5 |
Total fees payable to the auditor |
| 10.9 |
| 15.5 |
| 16.0 |
| | | | | | |
Analysed into: | | | | | | |
Fees payable to the auditor attributable to continuing operations: | | | | | | |
One-off non-audit services associated with demerger and public offeringnote (ii) | | — | | 1.9 | | 0.4 |
Other audit and non-audit services | | 10.9 | | 11.3 | | 9.5 |
| | 10.9 | | 13.2 | | 9.9 |
Fees payable to the auditor attributable to discontinued US operations | | — | | 2.3 | | 6.1 |
| | 10.9 | | 15.5 | | 16.0 |
Notes
(i) | Of the audit-related assurance service fees of $3.5 million in 2022 (2021: $4.5 million; 2020: $3.5 million), $0.9 million (2021: $0.6 million; 2020: $0.7 million) relates to services that are required by law and regulation. |
(ii) | Of the $1.9 million one-off non-audit services fees associated with the demerger of the US operations and the public offering in Hong Kong in 2021, $0.1 million was for audit-related assurance and $0.1 million for other assurance services required by law and regulation. |
228
B3 Tax charge
Prudential is subject to tax in numerous jurisdictions and the calculation of the total tax charge inherently involves a degree of estimation and judgement. Current tax expense is charged or credited based upon amounts estimated to be payable or recoverable as a result of taxable amounts for the current year and adjustments made in relation to prior years. The positions taken in tax returns where applicable tax regulation is subject to interpretation are recognised in full in the determination of the tax charge in the consolidated financial statements if the Group considers that it is probable that the taxation authority will accept those positions. Otherwise, provisions are established based on the likely amount of the liability, or recovery, by providing for the single best estimate of the most likely outcome or the weighted average expected value where there are multiple outcomes.
The total tax charge includes tax expense attributable to both policyholders and shareholders. The tax expense attributable to policyholders comprises the tax on the income of the consolidated with-profits and unit-linked funds. In certain jurisdictions, life insurance companies are taxed on both their shareholders' profits and on their policyholders' insurance and investment returns on certain insurance and investment products. Although both types of tax are included in the total tax charge in the Group’s Consolidated income statement, they are presented separately in the Consolidated income statement to provide the most relevant information about tax that the Group pays on its profits.
Deferred taxes are provided under the liability method for all relevant temporary differences. IAS 12 ‘Income Taxes’ does not require all temporary differences to be provided for, in particular, the Group does not provide for deferred tax on undistributed earnings of subsidiaries where the Group is able to control the timing of the distribution and the temporary difference created is not expected to reverse in the foreseeable future. Deferred tax assets are only recognised when it is more likely than not that future taxable profits will be available against which these losses can be utilised.
Deferred tax is measured at the tax rates that are expected to apply to the period when the asset is realised or the liability settled, based on tax rates (and laws) that have been enacted or are substantively enacted at the end of the reporting period.
B3.1 Total tax charge by nature
The total tax charge in the income statement is as follows:
| | | | | | |
|
| 2022 $m |
| 2021 $m |
| 2020 $m |
Attributable to shareholders: | | | | | | |
Hong Kong | | (52) | | (40) | | (15) |
Indonesia | | (60) | | (74) | | (125) |
Malaysia | | (90) | | (71) | | (58) |
Singapore | | (78) | | (67) | | (87) |
Growth markets and other | | (144) | | (159) | | (125) |
Eastspring | | (26) | | (30) | | (30) |
Total segment | | (450) | | (441) | | (440) |
Unallocated to a segment (central operations) | | (4) | | (21) | | — |
Tax charge attributable to shareholders | | (454) | | (462) | | (440) |
Attributable to policyholders: | | | | | | |
Hong Kong | | (56) | | (79) | | (60) |
Indonesia | | (5) | | 4 | | (3) |
Malaysia | | — | | (2) | | (34) |
Singapore | | 44 | | (261) | | (170) |
Growth markets and other | | (4) | | (4) | | (4) |
Tax charge attributable to policyholders | | (21) | | (342) | | (271) |
Total tax charge |
| (475) |
| (804) |
| (711) |
Profit before tax includes Prudential's share of profit after tax from the joint ventures and associates that are equity-accounted for. Therefore, the actual tax charge in the income statement does not include tax arising from the results of joint ventures and associates including CPL.
The reconciliation of the expected to actual tax charge attributable to shareholders is provided in B3.2 below. The tax charge attributable to policyholders of $(21) million (2021: $(342) million; 2020: $(271) million) above is equal to the profit before tax attributable to policyholders as a result of accounting for policyholder income after the deduction of expenses and movement in unallocated surpluses on a post-tax basis. The reduction in the tax charge attributable to policyholders
229
results from the deferred tax impact of policyholder liability movements caused by adverse market movements in 2022, primarily in Singapore.
The total tax charge comprises:
| | | | | | |
|
| 2022 $m |
| 2021 $m |
| 2020 $m |
Current tax expense: | |
| |
| |
|
Corporation tax |
| (474) |
| (405) |
| (376) |
Adjustments in respect of prior years |
| (7) |
| 6 |
| (7) |
Total current tax charge |
| (481) |
| (399) |
| (383) |
| | | | | | |
Deferred tax arising from: |
| |
| |
|
|
Origination and reversal of temporary differences |
| 4 |
| (388) |
| (306) |
Impact of changes in local statutory tax rates |
| — |
| — |
| (1) |
Adjustment in respect of a tax loss, tax credit or temporary difference from a prior year |
| 2 |
| (17) |
| (21) |
Total deferred tax credit (charge) |
| 6 |
| (405) |
| (328) |
Total tax charge |
| (475) |
| (804) |
| (711) |
230
B3.2Reconciliation of shareholder effective tax rate
In the reconciliation below, the expected tax rate reflects the corporation tax rates that are expected to apply to the taxable profit or loss for the period. It reflects the corporation tax rates of each jurisdiction weighted by reference to the amount of profit or loss contributing to the aggregate result.
| | | | | | | | | | | | | |
| | 2022 | | 2021 | | 2020 | | ||||||
|
| |
| |
| |
| |
| |
| | |
| | Tax | | Percentage | | Tax | | Percentage | | Tax | | Percentage | |
| | attributable to | | impact | | attributable to | | impact on | | attributable to | | impact | |
| | shareholders | | on ETR | | shareholders | | ETR | | shareholders | | on ETR | |
| | $m | | % | | $m | | % | | $m | | % | |
Adjusted operating profit |
| 3,375 | | | | 3,233 |
| |
| 2,757 |
| | |
Non-operating resultnote (i) |
| (1,914) | | | | (557) |
| |
| 151 |
| | |
Profit before tax |
| 1,461 | | | | 2,676 |
| |
| 2,908 |
| | |
Tax charge at the expected rate |
| (287) | | 20 | % | (539) |
| 20 | % | (602) |
| 21 | % |
Effects of recurring tax reconciliation items: |
| | | | | |
| |
|
|
| | |
Income not taxable or taxable at concessionary ratesnote (ii) | | 61 | | (4) | % | 63 | | (2) | % | 102 | | (4) | % |
Deductions and losses not allowable for tax purposesnote (iii) |
| (196) | | 13 | % | (92) |
| 3 | % | (32) |
| 1 | % |
Items related to taxation of life insurance businessesnote (iv) |
| 108 | | (7) | % | 177 |
| (7) | % | 152 |
| (5) | % |
Deferred tax adjustments including unrecognised tax lossesnote (v) |
| (45) | | 3 | % | (111) |
| 4 | % | (172) |
| 6 | % |
Effect of results of joint ventures and associatesnote (vi) |
| 3 | | 0 | % | 80 |
| (3) | % | 129 |
| (4) | % |
Irrecoverable withholding taxesnote (vii) |
| (55) | | 4 | % | (60) |
| 2 | % | (35) |
| 1 | % |
Other |
| (15) | | 0 | % | (8) |
| 1 | % | 17 |
| (1) | % |
Total (charge) credit on recurring items |
| (139) | | 9 | % | 49 |
| (2) | % | 161 |
| (6) | % |
| | | | | | | | | | | | | |
Effects of non-recurring tax reconciliation items: |
| | |
| | |
|
|
|
|
| | |
Adjustments to tax charge in relation to prior years |
| 1 | | 0 | % | (11) |
| 0 | % | (25) |
| 1 | % |
Movements in provisions for open tax mattersnote (viii) |
| (40) | | 3 | % | 47 |
| (2) | % | 33 |
| (1) | % |
Impact of changes in local statutory tax rates | | — | | 0 | % | 6 | | 0 | % | (1) | | 0 | % |
Adjustments in relation to business disposals and corporate transactions | | 11 | | (1) | % | (14) | | 1 | % | (6) | | 0 | % |
Total (charge) credit on non-recurring items |
| (28) | | 2 | % | 28 |
| (1) | % | 1 | | 0 | % |
Total actual tax charge |
| (454) | | 31 | % | (462) |
| 17 | % | (440) |
| 15 | % |
Analysed into: |
|
| | | |
|
|
|
|
|
| | |
Tax charge on adjusted operating profit |
| (614) | | | | (548) |
| |
| (497) |
| | |
Tax credit on non-operating resultnote (i) |
| 160 | | | | 86 |
| |
| 57 |
| | |
Actual tax rate on: |
|
| | | |
|
| |
|
|
| | |
Adjusted operating profit: |
| | | | | |
| |
|
|
| | |
Including non-recurring tax reconciling itemsnote (ix) |
| 18 | % | | | 17 | % | | | 18 | % | | |
Excluding non-recurring tax reconciling items |
| 17 | % | | | 18 | % | | | 18 | % | | |
Total profitnote (ix) |
| 31 | % | | | 17 | % | | | 15 | % | | |
Notes
(i) | ‘Non-operating result’ is used to refer to items excluded from adjusted operating profit and includes short-term investment fluctuations in investment returns on shareholder-backed business, corporate transactions and amortisation of acquisition accounting adjustments. The tax charge on non-operating result is calculated using the tax rates applicable to investment profit or loss recorded in the non-operating result for each entity, and then adjusting for any discrete items included in the total tax charge that relate specifically to the amounts (other than investment related profit or loss) included in the non-operating result. The difference between this tax on non-operating result and the tax charge calculated on profit before tax is the tax charge on adjusted operating profit. |
(ii) | Income not taxable or taxable at concessionary rates primarily relates to non-taxable investment income in Malaysia and Singapore. |
(iii) | Deductions and losses not allowable for tax purposes primarily relates to non-deductible investment losses in Growth markets. |
(iv) | Items related to taxation of life insurance businesses primarily relates to Hong Kong where the taxable profit is computed as 5 per cent of net insurance premiums. |
231
(v) | The unrecognised tax losses reconciling amount reflects losses arising where it is unlikely that relief for the losses will be available in future years. |
(vi) | Profit before tax includes Prudential’s share of profit after tax from the joint ventures and associates. Therefore, the actual tax charge does not include tax arising from profit or loss of joint ventures and associates and is reflected as a reconciling item. |
(vii) | The Group incurs withholding tax on remittances received from certain jurisdictions and on certain investment income. Where these withholding taxes cannot be offset against corporate income tax or otherwise recovered, they represent a cost to the Group. Irrecoverable withholding tax on remittances is included in Other operations and is not allocated to any segment. Irrecoverable withholding tax on investment income is included in the relevant segment where the investment income is reflected. |
(viii) The statement of financial position contains the following provisions in relation to open tax matters:
| | |
|
| 2022 $m |
Balance at 1 Jan |
| (42) |
Movements in the current year included in tax charge attributable to shareholders | | (40) |
Other movements (including interest arising on open tax matters and amounts included in the Group’s share of profits from joint ventures and associates, net of related tax) | | 3 |
Balance at 31 Dec | | (79) |
(ix) | The actual tax rates of the relevant business operations are shown below: |
| | | | | | | | | | | | | | | | | |
| | 2022 % | | ||||||||||||||
| | | | | | | | | | Growth | | | | | | Total | |
| | Hong | | | | | | | | markets | | | | Other | | attributable to | |
|
| Kong |
| Indonesia |
| Malaysia |
| Singapore |
| and other |
| Eastspring |
| operations |
| shareholders |
|
Tax rate on adjusted operating profit | | 6 | % | 20 | % | 26 | % | 16 | % | 24 | % | 10 | % | (1) | % | 18 | % |
Tax rate on profit before tax |
| (33) | % | 20 | % | 26 | % | 16 | % | 14 | % | 10 | % | (1) | % | 31 | % |
| | | | | | | | | | | | | | | | | |
| | 2021 % | | ||||||||||||||
|
| |
| |
| |
| |
| Growth |
| |
| |
| Total |
|
| | Hong | | | | | | | | markets | | | | Other | | attributable to | |
| | Kong | | Indonesia | | Malaysia | | Singapore | | and other | | Eastspring | | operations | | shareholders |
|
Tax rate on adjusted operating profit |
| 5 | % | 17 | % | 21 | % | 15 | % | 22 | % | 10 | % | (3) | % | 17 | % |
Tax rate on profit before tax |
| 4 | % | 17 | % | 21 | % | 15 | % | 27 | % | 10 | % | (2) | % | 17 | % |
| | | | | | | | | | | | | | | | | |
| | 2020 % |
| ||||||||||||||
|
| |
| |
| |
| |
| Growth |
| |
| |
| Total |
|
| | Hong | | | | | | | | markets | | | | Other | | attributable to |
|
| | Kong | | Indonesia | | Malaysia | | Singapore | | and other | | Eastspring | | operations | | shareholders |
|
Tax rate on adjusted operating profit |
| 3 | % | 24 | % | 18 | % | 14 | % | 22 | % | 11 | % | 0 | % | 18 | % |
Tax rate on profit before tax |
| 1 | % | 23 | % | 18 | % | 14 | % | 19 | % | 11 | % | 0 | % | 15 | % |
232
B4 | Earnings per share |
| | | | | | | | | | | | | |
| | 2022 | | ||||||||||
| | | | | | | | Net of tax | | | | | |
|
| |
| |
| Non- |
| and non- |
| Basic |
| Diluted | |
| | Before | | | | controlling | | controlling | | earnings | | earnings | |
| | tax | | Tax | | interests | | interests | | per share | | per share | |
|
| $m |
| $m | | $m | | $m | | cents | | cents | |
Profit from continuing operations | | 1,461 | | (454) | | (9) | | 998 | | 36.5 | ¢ | 36.5 | ¢ |
Short-term fluctuations in investment returns on shareholder-backed business |
| 1,915 | | (155) |
| (2) | | 1,758 |
| 64.3 | ¢ | 64.3 | ¢ |
Amortisation of acquisition accounting adjustments |
| 10 |
| — |
| — | | 10 |
| 0.4 | ¢ | 0.4 | ¢ |
Loss attaching to corporate transactions |
| (11) | | (5) |
| — | | (16) |
| (0.7) | ¢ | (0.7) | ¢ |
Adjusted operating profit | | 3,375 |
| (614) |
| (11) | | 2,750 |
| 100.5 | ¢ | 100.5 | ¢ |
| | | | | | | | | | | | | |
| | 2021 | | ||||||||||
| | | | | | | | Net of tax | | | | | |
|
| |
| |
| Non- |
| and non- |
| Basic |
| Diluted | |
| | Before | | | | controlling | | controlling | | earnings | | earnings | |
| | tax | | Tax | | interests | | interests | | per share | | per share | |
|
| $m |
| $m | | $m | | $m | | cents | | cents | |
Loss for the year | | |
| |
| | | (2,042) |
| (77.7) | | (77.7) | ¢ |
Loss from discontinued US operations |
| | | | | | | 4,234 | | 161.1 | | 161.1 | ¢ |
Profit from continuing operations | | 2,676 | | (462) | | (22) | | 2,192 | | 83.4 | ¢ | 83.4 | ¢ |
Short-term fluctuations in investment returns on shareholder-backed business | | 458 | | (81) |
| 5 | | 382 |
| 14.5 | ¢ | 14.5 | ¢ |
Amortisation of acquisition accounting adjustments | | 5 |
| — |
| — | | 5 |
| 0.2 | ¢ | 0.2 | ¢ |
Loss attaching to corporate transactions | | 94 | | (5) |
| — | | 89 |
| 3.4 | ¢ | 3.4 | ¢ |
Adjusted operating profit | | 3,233 |
| (548) |
| (17) | | 2,668 |
| 101.5 | ¢ | 101.5 | ¢ |
| | | | | | | | | | | | | |
| | 2020 | | ||||||||||
| | | | | | | | Net of tax | | | | | |
|
| |
| |
| Non- |
| and non- |
| Basic |
| Diluted | |
| | Before | | | | controlling | | controlling | | earnings | | earnings | |
| | tax | | Tax | | interests | | interests | | per share | | per share | |
|
| $m |
| $m | | $m | | $m | | cents | | cents | |
| | B1.1 | | B3 | | | | | | | | | |
Profit for the year | | |
| |
| | | 2,118 |
| 81.6 | ¢ | 81.6 | ¢ |
Loss from discontinued US operations |
| |
| |
| | | 340 |
| 13 | ¢ | 13.0 | ¢ |
Profit from continuing operations | | 2,908 |
| (440) |
| (10) | | 2,458 |
| 94.6 | ¢ | 94.6 | ¢ |
Short-term fluctuations in investment returns on shareholder-backed business | | 579 | | (49) | | — | | 530 | | 20.4 | ¢ | 20.4 | ¢ |
Amortisation of acquisition accounting adjustments | | 5 | | — | | — | | 5 | | 0.2 | ¢ | 0.2 | ¢ |
Gain attaching to corporate transactions | | (735) |
| (8) |
| — | | (743) |
| (28.6) | ¢ | (28.6) | ¢ |
Adjusted operating profit | | 2,757 |
| (497) |
| (10) | | 2,250 |
| 86.6 | ¢ | 86.6 | ¢ |
Basic earnings per share are calculated based on earnings attributable to ordinary shareholders, after related tax and non-controlling interests, divided by the weighted average number of ordinary shares outstanding during the year, excluding those held in employee share trusts, which are treated as cancelled. For diluted earnings per share, the weighted average number of shares in issue is adjusted to assume conversion of all dilutive potential ordinary shares. The Group’s only class of potentially dilutive ordinary shares are those share options granted to employees where the exercise price is less than the average market price of the ordinary shares during the year. No adjustment is made if the impact is anti-dilutive overall.
The weighted average number of shares for calculating basic and diluted earnings per share, which excludes those held in employee share trusts, is set out as below:
| | | | | | |
Number of shares (in millions) | | 2022 |
| 2021 |
| 2020 |
Weighted average number of shares for calculation of basic earnings per share | | 2,736 | | 2,628 | | 2,597 |
Shares under option at end of year | | 1 |
| 2 |
| 2 |
Shares that would have been issued at fair value on assumed option price at end of year | | (1) |
| (2) |
| (2) |
Weighted average number of shares for calculation of diluted earnings per share | | 2,736 |
| 2,628 |
| 2,597 |
233
B5 Dividends
| | | | | | | | | | | | | | | |
| | 2022 | | 2021 | | 2020 | |||||||||
| | Cents per | | | | Cents per | | | | Cents per | | | |||
|
| share |
| $m |
| share |
| $m |
| share |
| $m | |||
Dividends relating to reporting year: | |
| | |
| |
| | |
| |
| | |
|
First interim dividend |
| 5.74 | ¢ | | 154 |
| 5.37 | ¢ |
| 140 |
| 5.37 | ¢ |
| 140 |
Second interim dividend |
| 13.04 | ¢ | | 359 |
| 11.86 | ¢ |
| 326 |
| 10.73 | ¢ |
| 280 |
Total relating to reporting year |
| 18.78 | ¢ | | 513 |
| 17.23 | ¢ |
| 466 |
| 16.10 | ¢ |
| 420 |
Dividends paid in reporting year: |
| |
| | |
| | |
| |
| | |
| |
Current year first interim dividend |
| 5.74 | ¢ | | 154 |
| 5.37 | ¢ |
| 138 |
| 5.37 | ¢ |
| 140 |
Second interim dividend for prior year |
| 11.86 | ¢ | | 320 |
| 10.73 | ¢ |
| 283 |
| 25.97 | ¢ |
| 674 |
Total paid in reporting year |
| 17.60 | ¢ | | 474 |
| 16.10 | ¢ |
| 421 |
| 31.34 | ¢ |
| 814 |
First and second interim dividends are recorded in the period in which they are paid. In addition to the dividends shown in the table above, on 13 September 2021, following approval by the Group's shareholders, Prudential plc demerged its US operations (Jackson) via a dividend in specie of $1,735 million.
Dividend per share
The 2022 first interim dividend of 5.74 cents per ordinary share was paid to eligible shareholders on 27 September 2022.
On 15 May 2023, Prudential will pay a second interim dividend of 13.04 cents per ordinary share for the year ended 31 December 2022. The second interim dividend will be paid to shareholders included on the UK register at 5.00pm (Greenwich Mean Time) and to shareholders on the HK branch register at 4.30pm (Hong Kong Time) on 24 March 2023 (Record Date), and also to the Holders of US American Depositary Receipts (ADRs) as at 24 March 2023. The second interim dividend will be paid on or about 22 May 2023 to shareholders with shares standing to the credit of their securities accounts with The Central Depository (Pte) Limited (CDP) at 5.00pm (Singapore Time) on the Record Date.
Shareholders holding shares on the UK or HK share registers will continue to receive their dividend payments in either GBP or HKD respectively, unless they elect otherwise. Shareholders holding shares on the UK or HK registers may elect to receive dividend payments in USD. Elections must be made through the relevant UK or HK share registrar on or before 19 April 2023. The corresponding amounts per share in GBP and HKD are expected to be announced on or about 27 April 2023. The USD to GBP and HKD conversion rates will be determined by the actual rates achieved by Prudential buying those currencies prior to the subsequent announcement.
Holders of ADRs will continue to receive their dividend payments in USD. Shareholders holding an interest in Prudential shares through CDP in Singapore will continue to receive their dividend payments in SGD at an exchange rate determined by CDP.
Shareholders on the UK register are eligible to participate in a Dividend Reinvestment Plan.
C Financial position
C1 Group assets and liabilities by business type
The analysis below is structured to show the investments and other assets and liabilities of the Group by reference to the differing degrees of policyholder and shareholder economic interest of the different types of business.
Debt securities are analysed below according to the issuing government for sovereign debt and to credit ratings for the rest of the securities. The Group uses the middle of the Standard & Poor’s, Moody’s and Fitch ratings, where available. Where ratings are not available from these rating agencies, local external rating agencies’ ratings and lastly internal ratings have been used. Securities with none of the ratings listed above are classified as unrated and included under the ‘below BBB- and unrated’ category. The total securities (excluding sovereign debt) that were unrated at 31 December 2022 were $1,152 million (31 December 2021: $1,130 million). Additionally, government debt is shown separately from the rating breakdowns in order to provide a more focused view of the credit portfolio.
234
In the table below, AAA is the highest possible rating. Investment grade financial assets are classified within the range of AAA to BBB- ratings. Financial assets which fall outside this range are classified as below BBB-.
| | | | | | | | | | | | | | | | | | |
|
| 31 Dec 2022 $m | ||||||||||||||||
| | Asia and Africa | | Unallo- | | Elimination | | | ||||||||||
| | Insurance | | | | | | | | cated | | of intra-group | | | ||||
| | With- | | Unit- | | | | | | Elimina- | | | | to a | | debtors and | | Group |
| | profits |
| linked |
| Other |
| Eastspring | | tions | | Total | | segment | | creditors | | total |
|
| note (i) |
| note (i) |
| note (i) |
| |
| |
| | | |
| |
| |
Debt securitiesnotes (ii)(iv) |
|
|
|
|
|
|
|
|
|
|
| | | | | | | |
Sovereign debt |
| |
| | | | | | | | | | | | | | | |
Indonesia |
| 482 |
| 589 |
| 483 |
| 3 |
| — |
| 1,557 | | — | | — | | 1,557 |
Singapore |
| 3,240 |
| 507 |
| 917 |
| 67 |
| — |
| 4,731 | | — | | — | | 4,731 |
Thailand |
| — |
| — |
| 1,456 |
| — |
| — |
| 1,456 | | — | | — | | 1,456 |
United Kingdom |
| — |
| 4 |
| — |
| — |
| — |
| 4 | | — | | — | | 4 |
United States |
| 19,983 |
| 54 |
| 1,854 |
| — |
| — |
| 21,891 | | — | | — | | 21,891 |
Vietnam |
| 1 |
| 12 |
| 2,397 |
| — |
| — |
| 2,410 | | — | | — | | 2,410 |
Other (predominantly Asia) |
| 2,041 |
| 646 |
| 3,288 |
| 27 |
| — |
| 6,002 | | — | | — | | 6,002 |
Subtotal |
| 25,747 |
| 1,812 |
| 10,395 |
| 97 |
| — |
| 38,051 | | — | | — | | 38,051 |
Other government bonds |
| | | | | | | | | | | | | | | | | |
AAA | | 1,480 | | 85 | | 108 | | — | | — | | 1,673 | | — | | — | | 1,673 |
AA+ to AA- | | 105 | | 21 | | 27 | | — | | — | | 153 | | — | | — | | 153 |
A+ to A- | | 746 | | 139 | | 248 | | — | | — | | 1,133 | | — | | — | | 1,133 |
BBB+ to BBB- | | 292 | | 77 | | 134 | | — | | — | | 503 | | — | | — | | 503 |
Below BBB- and unrated |
| 227 |
| 22 |
| 323 |
| — |
| — |
| 572 | | — | | — | | 572 |
Subtotal |
| 2,850 |
| 344 |
| 840 |
| — |
| — |
| 4,034 | | — | | — | | 4,034 |
Corporate bonds |
| | | | | | | | | | | | | | | | | |
AAA |
| 996 |
| 181 |
| 362 |
| — |
| — |
| 1,539 | | — | | — | | 1,539 |
AA+ to AA- |
| 1,951 |
| 385 |
| 1,556 |
| — |
| — |
| 3,892 | | — | | — | | 3,892 |
A+ to A- | | 7,230 | | 524 | | 4,348 | | — | | — | | 12,102 | | — | | — | | 12,102 |
BBB+ to BBB- | | 7,885 | | 1,325 | | 3,974 | | 1 | | — | | 13,185 | | — | | — | | 13,185 |
Below BBB- and unrated | | 2,090 | | 444 | | 1,282 | | — | | — | | 3,816 | | — | | — | | 3,816 |
Subtotal | | 20,152 | | 2,859 | | 11,522 | | 1 | | — | | 34,534 | | — | | — | | 34,534 |
Asset-backed securities | | | | | | | | | | | | | | | | | | |
AAA | | 168 | | 5 | | 126 | | — | | — | | 299 | | — | | — | | 299 |
AA+ to AA- | | 6 | | 1 | | 3 | | — | | — | | 10 | | — | | — | | 10 |
A+ to A- | | 20 | | — | | 14 | | — | | — | | 34 | | — | | — | | 34 |
BBB+ to BBB- | | 14 | | — | | 9 | | — | | — | | 23 | | — | | — | | 23 |
Below BBB- and unrated | | 2 | | 1 | | 1 | | — | | — | | 4 | | — | | — | | 4 |
Subtotal | | 210 | | 7 | | 153 | | — | | — | | 370 | | — | | — | | 370 |
Total debt securities | | 48,959 | | 5,022 | | 22,910 | | 98 | | — | | 76,989 | | — | | — | | 76,989 |
Loans | | | | | | | | | | | | | | | | | | |
Mortgage loans | | — | | — | | 140 | | — | | — | | 140 | | — | | — | | 140 |
Policy loans | | 1,498 | | — | | 422 | | — | | — | | 1,920 | | — | | — | | 1,920 |
Other loans | | 472 | | — | | 4 | | — | | — | | 476 | | — | | — | | 476 |
Total loans | | 1,970 | | — | | 566 | | — | | — | | 2,536 | | — | | — | | 2,536 |
Equity securities and holdings in collective investment schemes | | | | | | | | | | | | | | | | | | |
Direct equities | | 13,063 | | 11,379 | | 2,139 | | 61 | | — | | 26,642 | | 266 | | — | | 26,908 |
Collective investment schemes | | 19,057 | | 6,760 | | 4,950 | | 2 | | — | | 30,769 | | 2 | | — | | 30,771 |
Total equity securities and holdings in collective investment schemes | | 32,120 | | 18,139 | | 7,089 | | 63 | | — | | 57,411 | | 268 | | — | | 57,679 |
Other financial investmentsnote (iii) | | 1,793 | | 379 | | 2,816 | | 107 | | — | | 5,095 | | 1,749 | | — | | 6,844 |
Total financial investmentsnote (v) | | 84,842 | | 23,540 | | 33,381 | | 268 | | — | | 142,031 | | 2,017 | | — | | 144,048 |
Investment properties | | — | | — | | 37 | | — | | — | | 37 | | — | | — | | 37 |
Investments in joint ventures and associates accounted for using the equity method | | — | | — | | 1,601 | | 314 | | — | | 1,915 | | — | | — | | 1,915 |
Cash and cash equivalentsnote (vi) | | 1,038 | | 749 | | 1,791 | | 127 | | — | | 3,705 | | 1,809 | | — | | 5,514 |
Reinsurers' share of insurance contract liabilitiesnote C3.3 | | 145 | | — | | 2,662 | | — | | — | | 2,807 | | — | | — | | 2,807 |
Other assetsnote (vii) | | 1,156 | | 154 | | 9,665 | | 713 | | (67) | | 11,621 | | 3,409 | | (3,409) | | 11,621 |
Total assets | | 87,181 | | 24,443 | | 49,137 | | 1,422 | | (67) | | 162,116 | | 7,235 | | (3,409) | | 165,942 |
| | | | | | | | | | | | | | | | | | |
Shareholders' equity | | — | | — | | 14,407 | | 1,058 | | — | | 15,465 | | 1,495 | | — | | 16,960 |
Non-controlling interests | | — | | — | | 43 | | 124 | | — | | 167 | | — | | — | | 167 |
Total equity | | — | | — | | 14,450 | | 1,182 | | — | | 15,632 | | 1,495 | | — | | 17,127 |
| | | | | | | | | | | | | | | | | | |
Contract liabilities and unallocated surplus of with-profits funds | | 77,687 | | 22,842 | | 25,229 | | — | | — | | 125,758 | | — | | — | | 125,758 |
Core structural borrowings | | — | | — | | — | | — | | — | | — | | 4,261 | | — | | 4,261 |
Operational borrowings | | 118 | | — | | 86 | | 15 | | — | | 219 | | 596 | | — | | 815 |
Other liabilitiesnote (viii) | | 9,376 | | 1,601 | | 9,372 | | 225 | | (67) | | 20,507 | | 883 | | (3,409) | | 17,981 |
Total liabilities | | 87,181 | | 24,443 | | 34,687 | | 240 | | (67) | | 146,484 | | 5,740 | | (3,409) | | 148,815 |
Total equity and liabilities | | 87,181 | | 24,443 | | 49,137 | | 1,422 | | (67) | | 162,116 | | 7,235 | | (3,409) | | 165,942 |
235
| | | | | | | | | | | | | | | | | | |
|
| 31 Dec 2021 $m | ||||||||||||||||
| | Asia and Africa | | Unallo- | | Elimination | | | ||||||||||
| | Insurance | | | | | | | | cated | | of intra-group | | | ||||
| | With- | | Unit- | | | | | | Elimina- | | | | to a | | debtors and | | Group |
| | profits |
| linked |
| Other |
| Eastspring | | tions | | Total | | segment | | creditors | | total |
|
| note (i) |
| note (i) |
| note (i) |
| |
| |
| |
| |
| |
| |
Debt securitiesnotes (ii)(iv) |
|
|
|
|
|
|
|
|
|
|
| | | | | | | |
Sovereign debt |
| | | | | | | | | | | | | | | | | |
Indonesia |
| 414 |
| 598 |
| 609 |
| 11 |
| — |
| 1,632 | | — | | — | | 1,632 |
Singapore |
| 3,684 |
| 550 |
| 1,068 |
| 126 |
| — |
| 5,428 | | — | | — | | 5,428 |
Thailand |
| — |
| — |
| 1,577 |
| 3 |
| — |
| 1,580 | | — | | — | | 1,580 |
United Kingdom |
| — |
| 7 |
| — |
| — |
| — |
| 7 | | 226 | | — | | 233 |
United States |
| 28,552 |
| 47 |
| 3,525 |
| — |
| — |
| 32,124 | | — | | — | | 32,124 |
Vietnam |
| — |
| 20 |
| 3,022 |
| — |
| — |
| 3,042 | | — | | — | | 3,042 |
Other (predominantly Asia) |
| 2,030 |
| 720 |
| 4,001 |
| 21 |
| — |
| 6,772 | | — | | — | | 6,772 |
Subtotal |
| 34,680 |
| 1,942 |
| 13,802 |
| 161 |
| — |
| 50,585 | | 226 | | — | | 50,811 |
Other government bonds |
| | | | | | | | | | | — | | | | | | |
AAA | | 1,472 | | 86 | | 246 | | — | | — | | 1,804 | | — | | — | | 1,804 |
AA+ to AA- | | 45 | | 2 | | 12 | | — | | — | | 59 | | — | | — | | 59 |
A+ to A- | | 667 | | 119 | | 304 | | — | | — | | 1,090 | | — | | — | | 1,090 |
BBB+ to BBB- | | 121 | | 16 | | 116 | | — | | — | | 253 | | — | | — | | 253 |
Below BBB- and unrated |
| 204 |
| 15 |
| 450 |
| — |
| — |
| 669 | | — | | — | | 669 |
Subtotal |
| 2,509 |
| 238 |
| 1,128 |
| — |
| — |
| 3,875 | | — | | — | | 3,875 |
Corporate bonds |
| | | | | | | | | | | — | | | | | | |
AAA |
| 1,222 |
| 236 |
| 411 |
| — |
| — |
| 1,869 | | — | | — | | 1,869 |
AA+ to AA- |
| 2,203 |
| 359 |
| 1,858 |
| — |
| — |
| 4,420 | | — | | — | | 4,420 |
A+ to A- | | 9,046 | | 675 | | 5,294 | | — | | — | | 15,015 | | — | | — | | 15,015 |
BBB+ to BBB- | | 9,523 | | 1,711 | | 5,105 | | — | | — | | 16,339 | | — | | — | | 16,339 |
Below BBB- and unrated | | 4,009 | | 678 | | 1,827 | | — | | — | | 6,514 | | — | | — | | 6,514 |
Subtotal | | 26,003 | | 3,659 | | 14,495 | | — | | — | | 44,157 | | — | | — | | 44,157 |
Asset-backed securities | | | | | | | | | | | | — | | | | | | |
AAA | | 88 | | 6 | | 74 | | — | | — | | 168 | | — | | — | | 168 |
AA+ to AA- | | 6 | | 1 | | 4 | | — | | — | | 11 | | — | | — | | 11 |
A+ to A- | | 26 | | — | | 17 | | — | | — | | 43 | | — | | — | | 43 |
BBB+ to BBB- | | 15 | | — | | 9 | | — | | — | | 24 | | — | | — | | 24 |
Below BBB- and unrated | | 2 | | 2 | | 1 | | — | | — | | 5 | | — | | — | | 5 |
Subtotal | | 137 | | 9 | | 105 | | — | | — | | 251 | | — | | — | | 251 |
Total debt securities | | 63,329 | | 5,848 | | 29,530 | | 161 | | — | | 98,868 | | 226 | | — | | 99,094 |
Loans | | | | | | | | | | | | — | | | | | | |
Mortgage loans | | — | | — | | 150 | | — | | — | | 150 | | — | | — | | 150 |
Policy loans | | 1,365 | | — | | 368 | | — | | — | | 1,733 | | — | | — | | 1,733 |
Other loans | | 668 | | — | | 11 | | — | | — | | 679 | | — | | — | | 679 |
Total loans | | 2,033 | | — | | 529 | | — | | — | | 2,562 | | — | | — | | 2,562 |
Equity securities and holdings in collective investment schemes | | | | | | | | | | | |
| | | | | | |
Direct equities | | 10,290 | | 12,812 | | 2,286 | | 84 | | — | | 25,472 | | 683 | | — | | 26,155 |
Collective investment schemes | | 23,950 | | 7,704 | | 3,787 | | 3 | | — | | 35,444 | | 2 | | — | | 35,446 |
Total equity securities and holdings in collective investment schemes | | 34,240 | | 20,516 | | 6,073 | | 87 | | — | | 60,916 | | 685 | | — | | 61,601 |
Other financial investmentsnote (iii) | | 1,561 | | 149 | | 2,318 | | 106 | | — | | 4,134 | | 1,088 | | — | | 5,222 |
Total financial investmentsnote (v) | | 101,163 | | 26,513 | | 38,450 | | 354 | | — | | 166,480 | | 1,999 | | — | | 168,479 |
Investment properties | | — | | — | | 38 | | — | | — | | 38 | | — | | — | | 38 |
Investments in joint ventures and associates accounted for using the equity method | | — | | — | | 1,878 | | 305 | | — | | 2,183 | | — | | — | | 2,183 |
Cash and cash equivalentsnote (vi) | | 905 | | 911 | | 1,444 | | 181 | | — | | 3,441 | | 3,729 | | — | | 7,170 |
Reinsurers' share of insurance contract liabilitiesnote C3.3 | | 225 | | — | | 9,528 | | — | | — | | 9,753 | | — | | — | | 9,753 |
Other assetsnote (vii) | | 1,184 | | 166 | | 9,191 | | 759 | | (51) | | 11,249 | | 3,608 | | (3,378) | | 11,479 |
Total assets | | 103,477 | | 27,590 | | 60,529 | | 1,599 | | (51) | | 193,144 | | 9,336 | | (3,378) | | 199,102 |
| | | | | | | | | | | | | | | | | | |
Shareholders' equity | | — | | — | | 14,289 | | 1,120 | | — | | 15,409 | | 1,679 | | — | | 17,088 |
Non-controlling interests | | — | | — | | 45 | | 131 | | — | | 176 | | — | | — | | 176 |
Total equity | | — | | — | | 14,334 | | 1,251 | | — | | 15,585 | | 1,679 | | — | | 17,264 |
| | | | | | | | | | | | | | | | | | |
Contract liabilities and unallocated surplus of with-profits funds | | 94,002 | | 25,651 | | 37,646 | | — | | — | | 157,299 | | — | | — | | 157,299 |
Core structural borrowings | | — | | — | | — | | — | | — | | ��� | | 6,127 | | — | | 6,127 |
Operational borrowings | | 142 | | — | | 106 | | 18 | | — | | 266 | | 595 | | — | | 861 |
Other liabilitiesnote (viii) | | 9,333 | | 1,939 | | 8,443 | | 330 | | (51) | | 19,994 | | 935 | | (3,378) | | 17,551 |
Total liabilities | | 103,477 | | 27,590 | | 46,195 | | 348 | | (51) | | 177,559 | | 7,657 | | (3,378) | | 181,838 |
Total equity and liabilities | | 103,477 | | 27,590 | | 60,529 | | 1,599 | | (51) | | 193,144 | | 9,336 | | (3,378) | | 199,102 |
Notes
(i) | ‘With-profits’ comprises the with-profits assets and liabilities of the Hong Kong, Malaysia and Singapore operations. ‘Unit-linked’ comprises the assets and liabilities held in the unit-linked funds. ‘Other’ includes assets and liabilities of other participating business and other non-linked shareholder-backed business. |
(ii) | Of the Group’s debt securities, the following amounts were held by the consolidated investment funds. |
| | | | |
|
| 31 Dec 2022 $m |
| 31 Dec 2021 $m |
Debt securities held by consolidated investment funds | | 11,899 | | 15,076 |
(iii) | Other financial investments comprise derivative assets and deposits. |
236
(iv) | The credit ratings, information or data contained in this report which are attributed and specifically provided by Standard & Poor's, Moody's and Fitch Solutions and their respective affiliates and suppliers ('Content Providers') is referred to here as the 'Content'. Reproduction of any Content in any form is prohibited except with the prior written permission of the relevant party. The Content Providers do not guarantee the accuracy, adequacy, completeness, timeliness or availability of any Content and are not responsible for any errors or omissions (negligent or otherwise), regardless of the cause, or for the results obtained from the use of such Content. The Content Providers expressly disclaim liability for any damages, costs, expenses, legal fees, or losses (including lost income or lost profit and opportunity costs) in connection with any use of the Content. A reference to a particular investment or security, a rating or any observation concerning an investment that is part of the Content is not a recommendation to buy, sell or hold any such investment or security, nor does it address the suitability of an investment or security and should not be relied on as investment advice. |
(v) | Of the total financial investments of $144,048 million as at 31 December 2022 (31 December 2021: $168,479 million), $68,955 million (31 December 2021: $71,524 million) are expected to be recovered within one year, including equity securities and holdings in collective investment schemes. |
(vi) | Cash and cash equivalents consist of cash at bank and in hand, deposits held at call with banks, treasury bills and other short-term highly liquid investments with less than 90 days maturity from the date of acquisition and are analysed as follows: |
| | | | |
|
| 31 Dec 2022 $m |
| 31 Dec 2021 $m |
Cash | | 1,878 |
| 1,902 |
Cash equivalents | | 3,636 |
| 5,268 |
Total cash and cash equivalents | | 5,514 |
| 7,170 |
Analysed as: | |
|
|
|
Held by the Group's holding and non-regulated entities and available for general use | | 1,809 |
| 3,729 |
Other funds not available for general use by the Group, including funds held for the benefit of | | |
| |
policyholders | | 3,705 | | 3,441 |
Total cash and cash equivalents | | 5,514 | | 7,170 |
* | The Group’s cash and cash equivalents are held in the following currencies as at 31 December 2022: USD 45 per cent, GBP 11 per cent, HKD 5 per cent, SGD 5 per cent, MYR 14 per cent and other currencies 20 per cent (31 December 2021: USD 59 per cent, GBP 7 per cent, HKD 3 per cent, SGD 3 per cent, MYR 9 per cent and other currencies 19 per cent). |
(vii) | ‘Other assets’ at 31 December 2022, comprise goodwill, intangibles (including deferred acquisition costs), property, plant and equipment (see note C11), tax balances and accrued investment income and other debtors, which are analysed as follows: |
| | | | |
|
| 31 Dec 2022 $m |
| 31 Dec 2021 $m |
Interest receivable | | 885 |
| 872 |
Other accrued income | | 250 |
| 299 |
Total accrued investment income | | 1,135 |
| 1,171 |
Amounts receivable due from: | | |
| |
Policyholders | | 644 |
| 686 |
Intermediaries | | — |
| 4 |
Reinsurers | | 192 |
| 226 |
Other sundry debtors | | 858 |
| 863 |
Total other debtors | | 1,694 |
| 1,779 |
Total accrued investment income and other debtors | | 2,829 |
| 2,950 |
Analysed as: | | |
| |
Expected to be settled within one year | | 2,700 |
| 2,761 |
Expected to be settled beyond one year | | 129 |
| 189 |
| | 2,829 |
| 2,950 |
(viii) | Within ‘Other liabilities’ at 31 December 2022 are accruals, deferred income and other liabilities of $8,777 million (31 December 2021: $7,983 million), which are analysed as follows (detailed maturity analysis is provided in note C2.3): |
| | | | |
|
| 31 Dec 2022 $m |
| 31 Dec 2021 $m |
Accruals and deferred income | | 539 |
| 565 |
Creditors arising from direct insurance and reinsurance operations | | 3,000 |
| 1,120 |
Interest payable | | 59 |
| 77 |
Funds withheld under reinsurance agreements | | 2,040 |
| 1,545 |
Other creditors | | 3,139 |
| 4,676 |
Total accruals, deferred income and other creditors | | 8,777 |
| 7,983 |
237
C2 Fair value measurement
The Group uses the trade date method to account for regular purchases and sales of financial assets. The Group holds financial assets in accordance with IAS 39, whereby subject to specific criteria, financial instruments are required to be accounted for under one of the following categories:
– | Financial assets and liabilities at fair value through profit or loss (FVTPL): this comprises assets and liabilities designated by management as FVTPL on inception and derivatives. This includes instruments that are managed and the performance evaluated on a fair value basis, including liabilities related to net assets attributable to unit holders of consolidated investment funds and policyholder liabilities for investment contracts without discretionary participation features. All investments within this category are measured at fair value with all changes thereon being recognised in investment return in the income statement. |
– | Financial investments on an available-for-sale (AFS) basis: this comprises assets that are designated by management as AFS and/or do not fall into any of the other categories. These assets are initially recognised at fair value plus attributable transaction costs and are subsequently measured at fair value. Interest and/or dividend income is recognised in the income statement. Unrealised gains and losses are recognised in other comprehensive income. Upon disposal or impairment, accumulated unrealised gains and losses are transferred from other comprehensive income to the income statement as realised gains or losses. Subsequent to the demerger of Jackson in September 2021, the Group has designated its retained interest in Jackson (as described in note D1.2) as AFS equity securities. |
– | Loans and receivables: except for those designated as FVTPL or AFS, these instruments comprise non-quoted investments that have fixed or determinable payments, including loans collateralised by mortgages, deposits, loans to policyholders and other unsecured loans and receivables. These investments are initially recognised at fair value plus transaction costs. Subsequently, these instruments are carried at amortised cost using the effective interest method. The effective interest rate is the rate that exactly discounts estimated future cash receipts through the expected life of the financial instrument or, when appropriate, a shorter period to the net carrying amount of the financial asset. When assets held at amortised cost are subject to impairment testing, estimated future cash flows are compared to the carrying value of the asset. The estimated future cash flows are discounted using the financial asset’s original or variable effective interest rate and exclude credit losses that have not yet been incurred. If, in subsequent periods, an impaired loan or receivable recovers in value (in part or in full) and this recovery can be objectively related to an event occurring after the impairment, then any amount determined to have been recovered is reversed through the income statement. |
C2.1 Determination of fair value
The fair values of the financial instruments for which fair valuation is required under IFRS Standards are determined by the use of quoted market prices for exchange-quoted investments, or by using quotations from independent third parties, such as brokers and pricing services or by using appropriate valuation techniques.
The estimated fair value of derivative financial instruments reflects the estimated amount the Group would receive or pay in an arm's-length transaction. This amount is determined using quoted prices if exchange listed, quotations from independent third parties or valued internally using standard market practices.
Other than the loans which have been designated at fair value through profit or loss, the carrying value of loans and receivables is presented net of provisions for impairment. The fair value of loans is estimated from discounted cash flows expected to be received.
The fair value of the subordinated and senior debt issued by the parent company is determined using quoted prices from independent third parties.
The fair value of financial liabilities (other than subordinated debt, senior debt and derivative financial instruments) is determined using discounted cash flows of the amounts expected to be paid.
Valuation approach for level 2 fair valued assets and liabilities
A significant proportion of the Group’s level 2 assets are corporate bonds, structured securities and other non-national government debt securities. These assets, in line with market practice, are generally valued using a designated independent pricing service or quote from third-party brokers. These valuations are subject to a number of monitoring controls, such as comparison to multiple pricing sources where available, monthly price variances, stale price reviews and variance analysis on prices achieved on subsequent trades.
238
When prices are not available from pricing services, quotes are sourced directly from brokers. Prudential seeks to obtain a number of quotes from different brokers so as to obtain the most comprehensive information available on their executability. The selected quote is the one which best represents an executable quote for the security at the measurement date.
Generally, no adjustment is made to the prices obtained from independent third parties. Adjustments are made in only limited circumstances, where it is determined that the third-party valuations obtained do not reflect fair value (eg either because the value is stale and/or the values are extremely diverse in range). Securities valued in such manner are classified as level 3 where these significant inputs are not based on observable market data.
Valuation approach for level 3 fair valued assets and liabilities
Investments valued using valuation techniques include financial investments which by their nature do not have an externally quoted price based on regular trades, and financial investments for which markets are no longer active as a result of market conditions, eg market illiquidity.
The Group’s valuation policies, procedures and analyses for instruments categorised as level 3 are overseen by Business Unit committees as part of the Group’s wider financial reporting governance processes. The procedures undertaken include approval of valuation methodologies, verification processes, and resolution of significant or complex valuation issues. In addition, the Group has minimum standards for independent price verification to ensure valuation accuracy is regularly independently verified. Adherence to this policy is monitored across the business units.
C2.2Fair value measurement hierarchy of Group assets and liabilities
(a)Assets and liabilities carried at fair value on the statement of financial position
The table below shows the assets and liabilities carried at fair value analysed by level of the IFRS 13 'Fair Value Measurement' defined fair value hierarchy. This hierarchy is based on the inputs to the fair value measurement and reflects the lowest level input that is significant to that measurement.
All assets and liabilities held at fair value are classified as fair value through profit or loss, except for $266 million of financial assets classified as available-for-sale at 31 December 2022 (31 December 2021: $909 million), all of which (31 December 2021: $683 million) related to the Group’s retained interest in Jackson’s equity securities. All assets and liabilities held at fair value are measured on a recurring basis. As of 31 December 2022, the Group did not have any financial instruments that are measured at fair value on a non-recurring basis.
239
Financial instruments at fair value
| | | | | | | | | |
| | 31 Dec 2022 $m |
| ||||||
| | Level 1 | | Level 2 | | Level 3 | | |
|
|
| Quoted prices | | Valuation based | | Valuation based | | |
|
| | (unadjusted) | | on significant | | on significant | | |
|
| | in active | | observable | | unobservable | | |
|
|
| markets |
| market inputs |
| market inputs |
| Total |
|
|
| |
| note (i) |
| note (ii) |
| |
|
Loans |
| — | | 447 | | 3 | | 450 | |
Equity securities and holdings in collective investment schemes |
| 49,725 | | 7,130 | | 824 | | 57,679 | |
Debt securities |
| 57,215 | | 19,736 | | 38 | | 76,989 | |
Derivative assets |
| 82 | | 487 | | — | | 569 | |
Derivative liabilities |
| (778) | | (223) | | — | | (1,001) | |
Total financial investments, net of derivative liabilities |
| 106,244 | | 27,577 | | 865 | | 134,686 | |
Investment contract liabilities without discretionary participation features |
| — | | (741) | | — | | (741) | |
Net asset value attributable to unit holders of consolidated investment funds |
| (4,193) | | — | | — | | (4,193) | |
Total financial instruments at fair value |
| 102,051 | | 26,836 | | 865 | | 129,752 | |
Percentage of total (%) | | 78 | % | 21 | % | 1 | % | 100 | % |
| | | | | | | | | |
Analysed by business type: | | | | | | | | | |
Financial investments net of derivative liabilities, at fair value | | | | | | | | | |
With-profits | | 65,880 | | 14,605 | | 748 | | 81,233 | |
Unit-linked | | 21,319 | | 1,851 | | 4 | | 23,174 | |
Non-linked shareholder-backed business | | 19,045 | | 11,121 | | 113 | | 30,279 | |
Total financial investments net of derivative liabilities, at fair value | | 106,244 | | 27,577 | | 865 | | 134,686 | |
Percentage of total (%) | | 78 | % | 21 | % | 1 | % | 100 | % |
| | | | | | | | | |
Total financial investments net of derivative liabilities, at fair value | | 106,244 | | 27,577 | | 865 | | 134,686 | |
Other financial liabilities at fair value | | (4,193) | | (741) | | — | | (4,934) | |
Total financial instruments at fair value | | 102,051 | | 26,836 | | 865 | | 129,752 | |
| | | | | | | | | |
| | 31 Dec 2021 $m |
| ||||||
| | Level 1 | | Level 2 | | Level 3 | | |
|
| | Quoted prices | | Valuation based | | Valuation based | | |
|
| | (unadjusted) | | on significant | | on significant | | |
|
| | in active | | observable | | unobservable | | |
|
|
| markets |
| market inputs |
| market inputs |
| Total |
|
|
| |
| note (i) |
| note (ii) |
| |
|
Loans |
| — | | 616 |
| 5 |
| 621 | |
Equity securities and holdings in collective investment schemes |
| 54,107 | | 6,917 |
| 577 |
| 61,601 | |
Debt securities |
| 76,049 | | 22,987 |
| 58 |
| 99,094 | |
Derivative assets |
| 359 | | 122 |
| — |
| 481 | |
Derivative liabilities |
| (146) | | (116) |
| — |
| (262) | |
Total financial investments, net of derivative liabilities |
| 130,369 | | 30,526 |
| 640 |
| 161,535 | |
Investment contract liabilities without discretionary participation features |
| — | | (814) |
| — |
| (814) |
|
Net asset value attributable to unit holders of consolidated investment funds |
| (5,618) | | (46) |
| — |
| (5,664) |
|
Total financial instruments at fair value |
| 124,751 | | 29,666 |
| 640 |
| 155,057 |
|
Percentage of total (%) | | 81 | % | 19 | % | 0 | % | 100 | % |
| | | | | | | | | |
Analysed by business type: | | | | | | | | | |
Financial investments net of derivative liabilities, at fair value | | | | | | | | | |
With-profits | | 82,489 | | 15,438 | | 506 | | 98,433 | |
Unit-linked | | 24,024 | | 2,343 | | 5 | | 26,372 | |
Non-linked shareholder-backed business | | 23,856 | | 12,745 | | 129 | | 36,730 | |
Total financial investments net of derivative liabilities, at fair value | | 130,369 | | 30,526 | | 640 | | 161,535 | |
Percentage of total (%) | | 81 | % | 19 | % | 0 | % | 100 | % |
| | | | | | | | | |
Total financial investments net of derivative liabilities, at fair value | | 130,369 | | 30,526 | | 640 | | 161,535 | |
Other financial liabilities at fair value | | (5,618) | | (860) | | — | | (6,478) | |
Total financial instruments at fair value | | 124,751 | | 29,666 | | 640 | | 155,057 | |
Notes
(i) | Of the total level 2 debt securities of $19,736 million at 31 December 2022 (31 December 2021: $22,987 million), $37 million (31 December 2021: $24 million) are valued internally. |
240
(ii) | At 31 December 2022, the Group held $865 million (31 December 2021: $640 million) of net financial instruments at fair value within level 3. This represents less than 1 per cent of the total fair-valued financial assets, net of financial liabilities, for both years and comprises the following items: |
– | Equity securities and holdings in collective investment schemes of $824 million (31 December 2021: $557 million) consisting primarily of property and infrastructure funds held by the participating funds, which are externally valued using the net asset value of the invested entities. Equity securities of $1 million (31 December 2021: $1 million) are internally valued, representing less than 0.1 per cent for all periods of the total fair-valued financial assets net of financial liabilities. Internal valuations are inherently more subjective than external valuations; and |
– | Other sundry individual financial instruments of a net asset of $41 million (31 December 2021: net asset of $63 million). |
Of the net financial instruments of $865 million at 31 December 2022 (31 December 2021: $640 million) referred to above:
– | A net asset of $752 million (31 December 2021: $511 million) is held by the Group’s with-profits and unit-linked funds and therefore shareholders’ profit and equity are not impacted by movements in the valuation of these financial instruments; and |
– | A net asset of $113 million (31 December 2021: $129 million) is held to support non-linked shareholder-backed business, of which $111 million (31 December 2021: $112 million) are primarily private equity investments and corporate bonds externally valued using the net asset value of the invested entities and external prices adjusted to reflect the specific known conditions relating to these bonds (eg distressed securities) and are therefore inherently less subjective than internal valuations. If the value of all these level 3 financial instruments decreased by 10 per cent, the change in valuation would be $(11) million (31 December 2021: $(13) million), which would reduce shareholders’ equity by this amount before tax. All of this amount would pass through the income statement substantially as part of short-term fluctuations in investment returns outside of adjusted operating profit. |
(b) Transfers into and transfers out of levels
The Group’s policy is to recognise transfers into and out of levels as of the end of each reporting period except for material transfers which are recognised as of the date of the event or change in circumstances that caused the transfer. Transfers are deemed to have occurred when there is a material change in the observed valuation inputs or a change in the level of trading activities of the securities.
During 2022, the transfers between levels within the portfolios were primarily transfers from level 1 to level 2 of $2,640 million (31 December 2021: $3,789 million) and transfers from level 2 to level 1 of $1,982 million (31 December 2021: $1,742 million). These transfers primarily reflect the change in the observed valuation inputs of equity securities and debt securities and, in certain cases, the change in the level of trading activities of the securities. There were transfers from level 3 to level 2 of $15 million in the year (31 December 2021: $12 million) and no transfers into level 3 (31 December 2021: $30 million).
Reconciliation of movements in level 3 assets and liabilities measured at fair value
The following table reconciles the value of level 3 fair valued assets and liabilities at the beginning and end of the years shown.
Total investment return recorded in the income statement represents interest and dividend income, realised gains and losses, unrealised gains and losses on the assets classified at fair value through profit and loss and foreign exchange movements on an individual entity’s overseas investments. Total gains and losses recorded in other comprehensive income comprises the translation of investments into the Group's presentational currency of USD.
| | | | | | | | |
| | 2022 $m | ||||||
| | | | Equity | | | | |
| | | | securities | | | | |
| | | | and holdings | | | | |
| | | | in collective | | | | |
| | | | investment | | Debt | | |
|
| Loans |
| schemes |
| securities |
| Group total |
Balance at 1 Jan |
| 5 | | 577 | | 58 | | 640 |
Total losses in income statementnote |
| (2) | | (31) | | (2) | | (35) |
Total losses recorded in other comprehensive income |
| — |
| (6) |
| (3) |
| (9) |
Purchases and other additions | | — | | 305 | | — | | 305 |
Sales | | — | | (21) | | — | | (21) |
Transfers out of level 3 |
| — |
| — |
| (15) |
| (15) |
Balance at 31 Dec |
| 3 |
| 824 |
| 38 |
| 865 |
241
| | | | | | | | |
| | 2021 $m | ||||||
| | | | Equity | | | | |
| | | | securities | | | | |
| | | | and holdings | | | | |
| | | | in collective | | | | |
| | | | investment | | Debt | | |
|
| Loans |
| schemes |
| securities |
| Group total |
Balance at 1 Jan |
| 6 |
| 445 |
| 33 |
| 484 |
Total (losses) gains in income statementnote |
| (1) |
| 6 |
| (3) |
| 2 |
Total losses recorded in other comprehensive income |
| — |
| (5) |
| (2) |
| (7) |
Purchases and other additions |
| — |
| 143 |
| — |
| 143 |
Transfers (out of) into level 3 |
| — |
| (12) |
| 30 |
| 18 |
Balance at 31 Dec |
| 5 |
| 577 |
| 58 |
| 640 |
Note
Of the total net losses in the income statement of $(35) million in 2022 (2021: net gains of $2 million), $(12) million (2021: $2 million) relates to net unrealised gains and losses of financial instruments still held at the end of the year, which can be analysed as follows:
| | | | |
|
| 2022 $m |
| 2021 $m |
Loans | | (2) | | (1) |
Equity securities and holdings in collective investment schemes |
| (8) |
| 6 |
Debt securities |
| (2) |
| (3) |
Total net (losses) gains |
| (12) |
| 2 |
(c)Assets and liabilities at amortised cost and their fair value
The table below shows the financial assets and liabilities carried at amortised cost on the statement of financial position and their fair value. Cash deposits, accrued income, other debtors, accruals, deferred income and other liabilities are excluded from the analysis below, as these are carried at amortised cost which approximates fair value. The carrying value of investment contracts with discretionary participation features is on an IFRS 4 basis, which is also excluded from the analysis below, as it is impractical to determine the fair value of these contracts due to the lack of a reliable basis to measure participation features.
| | | | | | | | |
|
| 31 Dec 2022 $m |
| 31 Dec 2021 $m | ||||
| | Carrying | | Fair | | Carrying | | Fair |
|
| value |
| value |
| value |
| value |
Assets | | | | | | | | |
Loans |
| 2,086 | | 2,207 |
| 1,941 |
| 2,152 |
Liabilities |
| | | |
| |
| |
Core structural borrowings of shareholder-financed businesses |
| (4,261) | | (3,834) |
| (6,127) |
| (6,565) |
Operational borrowings (excluding lease liabilities) |
| (516) | | (516) |
| (514) |
| (514) |
Obligations under funding, securities lending and sale and repurchase agreements |
| (582) | | (582) |
| (223) |
| (223) |
Total net financial liabilities at amortised cost | | (3,273) | | (2,725) | | (4,923) | | (5,150) |
The fair value of the assets and liabilities in the table above, with the exception of the subordinated and senior debt issued by the parent company, has been estimated from the discounted cash flows expected to be received or paid. All the assets and liabilities in the table above have been classified within level 2 at 31 December 2022 and 2021, reflecting the observability of the inputs used to derive their fair value. The fair value of the subordinated and senior debt issued by the parent company is determined using quoted prices from independent third parties.
242
C2.3Additional information on financial instruments
(a)Financial risk
Liquidity analysis
Contractual maturities of financial liabilities on an undiscounted cash flow basis
The following table sets out the contractual maturities for applicable classes of financial liabilities, excluding derivative liabilities and investment contracts that are separately presented. The financial liabilities are included in the column relating to the contractual maturities of the undiscounted cash flows (including contractual interest payments) based on the earliest period in which the Group can be required to pay assuming conditions are consistent with those of year end.
| | | | | | | | | | | | | | | | | | | | |
| | 31 Dec 2022 $m | ||||||||||||||||||
| | | | Contractual maturity profile for financial liabilities | ||||||||||||||||
| | Total | | | | | | | | | | | | | | | | | | Total |
| | carrying | | 1 year | | | | | | | | 10-15 | | 15-20 | | Over | | No stated | | undiscounted |
|
| value |
| or less |
| 1-2 years |
| 2-5 years |
| 5-10 years |
| years |
| years |
| 20 years |
| maturity |
| cash flows |
Core structural borrowings of shareholder-financed businessesnote C5.1 |
| 4,261 | | 509 | | 124 | | 370 | | 2,598 | | 1,024 | | — | | — | | 750 | | 5,375 |
Lease liabilities under IFRS 16note C5.2 | | 299 | | 101 | | 76 | | 127 | | 28 | | 9 | | — | | — | | — | | 341 |
Other operational borrowingsnote C5.2 |
| 516 | | 516 | | — | | — | | — | | — | | — | | — | | — | | 516 |
Obligations under funding, securities lending and sale and repurchase agreements |
| 582 | | 582 | | — | | — | | — | | — | | — | | — | | — | | 582 |
Accruals, deferred income and other liabilities |
| 8,777 | | 6,258 | | — | | — | | — | | — | | — | | — | | 2,519 | | 8,777 |
Net asset value attributable to unit holders of consolidated unit trusts and similar funds |
| 4,193 | | 4,193 | | — | | — | | — | | — | | — | | — | | — | | 4,193 |
Total financial liabilities | | 18,628 | | 12,159 | | 200 | | 497 | | 2,626 | | 1,033 | | — | | — | | 3,269 | | 19,784 |
| | | | | | | | | | | | | | | | | | | | |
| | 31 Dec 2021 $m | ||||||||||||||||||
| | | | Contractual maturity profile for financial liabilities | ||||||||||||||||
| | Total | | | | | | | | | | | | | | | | | | Total |
| | carrying | | 1 year | | | | | | | | 10-15 | | 15-20 | | Over | | No stated | | undiscounted |
|
| value |
| or less |
| 1-2 years |
| 2-5 years |
| 5-10 years |
| years |
| years |
| 20 years |
| maturity |
| cash flows |
Core structural borrowings of shareholder-financed businessesnote C5.1 |
| 6,127 |
| 1,872 |
| 551 | | 702 |
| 1,817 |
| 1,642 |
| — |
| — |
| 750 |
| 7,334 |
Lease liabilities under IFRS 16note C5.2 | | 347 | | 110 | | 81 | | 135 | | 45 | | 11 | | — | | — | | — | | 382 |
Other operational borrowingsnote C5.2 |
| 514 |
| 514 |
| — | | — |
| — |
| — |
| — |
| — |
| — |
| 514 |
Obligations under funding, securities lending and sale and repurchase agreements |
| 223 |
| 223 |
| — | | — |
| — |
| — |
| — |
| — |
| — |
| 223 |
Accruals, deferred income and other liabilities |
| 7,983 |
| 5,972 |
| — | | — |
| — |
| — |
| — |
| — |
| 2,011 |
| 7,983 |
Net asset value attributable to unit holders of consolidated unit trusts and similar funds |
| 5,664 |
| 5,664 |
| — | | — |
| — |
| — |
| — |
| — |
| — |
| 5,664 |
Total financial liabilities |
| 20,858 |
| 14,355 |
| 632 | | 837 |
| 1,862 |
| 1,653 |
| — |
| — |
| 2,761 |
| 22,100 |
Maturity analysis of derivatives
The following table shows the carrying value of the gross and net derivative positions.
| | | | | | |
| | Carrying value of net derivatives $m | ||||
| | | | | | Net |
| | Derivative | | Derivative | | derivative |
|
| assets |
| liabilities |
| position |
31 Dec 2022 |
| 569 | | (1,001) | | (432) |
31 Dec 2021 |
| 481 |
| (262) |
| 219 |
All net derivatives have been included at fair value due within one year or less, representing the basis on which they are managed (ie to manage principally asset or liability value exposures). The Group has no cash flow hedges and, in general, contractual maturities are not considered essential for an understanding of the timing of the cash flows for these instruments.
243
Maturity analysis of investment contracts
The table below shows the maturity profile for investment contracts based on undiscounted cash flow projections of expected benefit payments.
| | | | | | | | | | | | | | | | |
| | Maturity profile for investment contracts $m | ||||||||||||||
| | Total | | | | | | | | | | | | | | Total |
| | carrying | | 1 year | | | | | | | | | | Over | | undiscounted |
|
| value |
| or less |
| 1-5 years |
| 5-10 years |
| 10-15 years |
| 15-20 years |
| 20 years |
| cash flows |
31 Dec 2022 |
| 420 | | 11 | | 369 | | 98 | | 22 | | 8 | | 4 | | 512 |
31 Dec 2021 |
| 459 | | 14 | | 442 | | 63 | | 16 | | 6 | | 2 | | 543 |
The undiscounted cash flows in the maturity profile shown above excludes contracts which have no stated maturity but which are repayable on demand.
Most investment contracts have options to surrender early, often subject to surrender or other penalties. Therefore, most contracts can be said to have a contractual maturity of less than one year, but the additional charges and term of the contracts mean these are unlikely to be exercised in practice and the more useful information is to present information on expected payment.
The vast majority of the Group’s financial assets are held to back the Group’s policyholder liabilities. Although asset/liability matching is an important component of managing policyholder liabilities (both those classified as insurance and those classified as investments), this profile is mainly relevant for managing market risk rather than liquidity risk. Within each business unit, this asset/liability matching is performed on a portfolio-by-portfolio basis.
In terms of liquidity risk, a large proportion of the policyholder liabilities contain discretionary surrender values or surrender charges, meaning that many of the Group’s liabilities are expected to be held for the long term. Much of the Group’s investment portfolios are in marketable securities, which can therefore be converted quickly to liquid assets.
For the reasons provided above, an analysis of the Group’s assets by contractual maturity is not considered meaningful to evaluate the nature and extent of the Group’s liquidity risk.
Credit risk
The Group’s maximum exposure to credit risk of financial instruments before any allowance for collateral or allocation of losses to policyholders is represented by the carrying value of financial instruments on the balance sheet that have exposures to credit risk comprising cash and cash equivalents, deposits, debt securities, loans and derivative assets, accrued investment income and other debtors. Further details of collateral in place in relation to derivatives, securities lending, repurchase and reverse repurchase agreements and other transactions are provided in note (c) below. The Group’s exposure to credit risk is further discussed in the Risk review report.
Of the total loans and receivables held at 31 December 2022, $6 million (31 December 2021: $7 million) are past their due date but are not impaired, of which $1 million are less than one year past their due date (31 December 2021: $2 million). The Group expects full recovery of these loans and receivables.
There are no financial assets that would have been past due or impaired had the terms not been renegotiated in both years.
In addition, the Group did not take possession of any other collateral held as security in both years.
Foreign exchange risk
As at 31 December 2022, the Group held 27 per cent (31 December 2021: 26 per cent) of its financial assets and 64 per cent (31 December 2021: 63 per cent) of its financial liabilities in currencies mainly USD, other than the functional currency of the relevant business units or the currency to which the functional currency is pegged (eg financial assets and liabilities of USD denominated business in Hong Kong). The exchange risks inherent in these exposures are mitigated through the use of derivatives, mainly forward currency contracts and currency swaps as described in note (b) below.
The amount of exchange gain recognised in the income statement in 2022, except for those arising on financial instruments measured at fair value through profit or loss, is $234 million (2021: loss of $(132) million).
244
(b) Derivatives and hedging
Derivative financial instruments are used to reduce or manage investment, interest rate and currency exposures, to facilitate efficient portfolio management and for investment purposes.
The Group does not regularly seek to apply fair value or cash flow hedging treatment under IAS 39. The Group has no net investment, fair value or cash flow hedges under IAS 39 at 31 December 2022 and 2021. All derivatives that are not designated as hedging instruments are carried at fair value, with movements in fair value being recorded in the income statement.
Embedded derivatives are embedded within other non-derivative host financial instruments and insurance contracts to create hybrid instruments. Embedded derivatives meeting the definition of an insurance contract are accounted for under IFRS 4. Where economic characteristics and risks of the embedded derivatives are not closely related to the economic characteristics and risks of the host instrument, and where the hybrid instrument is not measured at fair value with the changes in fair value recognised in the income statement, the embedded derivative is required to be bifurcated and carried at fair value as a derivative measured in accordance with IAS 39.
In addition, the Group applies the option under IFRS 4 to not separate and fair value surrender options embedded in host contracts and with-profits investment contracts whose strike price is either a fixed amount or a fixed amount plus interest.
Derivatives held and their purpose
The Group enters into a variety of exchange traded and over-the-counter derivative financial instruments, including futures, options, forward contracts, swaps and swaptions.
All over-the-counter derivative transactions are conducted under standardised ISDA (International Swaps and Derivatives Association Inc) master agreements and collateral agreements are in place between the individual entities and relevant counterparties under each of these market master agreements.
Derivatives are used for efficient portfolio management to obtain cost effective and management of exposure to various markets in accordance with the Group’s investment strategies and to manage exposure to interest rate, currency, credit and other business risks. The Group also uses interest rate derivatives to reduce exposure to interest rate volatility.
(c) Derecognition, collateral and offsetting
Derecognition of financial assets and liabilities
The Group’s policy is to derecognise financial assets when it is deemed that substantially all the risks and rewards of ownership have been transferred.
The Group derecognises financial liabilities only when the obligation specified in the contract is discharged, cancelled or has expired.
Reverse repurchase agreements
The Group is party to various reverse repurchase agreements under which securities are purchased from third parties with an obligation to resell the securities. The securities are not recognised as investments in the statement of financial position but the right to receive the cash paid is recognised as deposits.
The Group has entered into reverse repurchase transactions under which it purchased securities and had taken on the obligation to resell the securities. At 31 December 2022, the fair value of the collateral held in respect of these transactions, which is represented by the purchased securities, was $3,244 million (31 December 2021: $2,149 million).
Securities lending and repurchase agreements
The Group is also party to various securities lending agreements (including repurchase agreements) under which securities are loaned to third parties on a short-term basis. The loaned securities are not derecognised; rather, they continue to be recognised within the appropriate investment classification. To the extent cash collateral is received it is recognised on the statement of financial position with the obligation to repay the cash paid recognised as a liability. Other collateral is not recognised.
At 31 December 2022, the Group had $1,571 million (31 December 2021: $854 million) of lent securities and assets subject to repurchase agreements. The cash and securities collateral held or pledged under such agreements were $1,679 million (31 December 2021: $913 million).
245
Collateral and pledges under derivative transactions
At 31 December 2022, the Group had pledged $62 million (31 December 2021: $99 million) for liabilities and held collateral of $234 million (31 December 2021: $50 million) in respect of over-the-counter derivative transactions. These transactions are conducted under terms that are usual and customary to collateralised transactions including, where relevant, standard securities lending and repurchase agreements.
The Group has entered into collateral arrangements in relation to over-the-counter derivative transactions, which permit sale or re-pledging of underlying collateral. The Group has not sold any collateral held or re-pledged any collateral.
All over-the-counter derivative transactions are conducted under standardised International Swaps and Derivatives Association (ISDA) master agreements. The collateral management for these transactions is conducted under the usual and customary terms and conditions set out in the Credit Support Annex to the ISDA master agreement.
Offsetting assets and liabilities
The Group’s derivative instruments, repurchase agreements and securities lending agreements are subject to master netting arrangements and collateral arrangements. A master netting arrangement with a counterparty creates a right of offset for amounts due to and due from that same counterparty that is enforceable in the event of a default or bankruptcy. The Group recognises amounts subject to master netting arrangements on a gross basis within the consolidated balance sheets.
The following tables present the gross and net information about the Group’s financial instruments subject to master netting arrangements:
| | | | | | | | | | |
| | 31 Dec 2022 $m | ||||||||
| | Gross amount | | Related amounts not offset | | | ||||
| | included in the | | in the balance sheet | | | ||||
|
| balance |
| Financial |
| Cash |
| Securities |
| |
| | sheet | | instruments | | collateral | | collateral | | Net amount |
| | note (i) | | note (ii) | | | | note (iii) | | note (iv) |
Financial assets: |
|
|
|
|
|
|
|
|
|
|
Derivative assets |
| 457 | | (179) | | (217) | | — | | 61 |
Reverse repurchase agreements |
| 3,174 | | — | | — | | (3,174) | | — |
Total financial assets |
| 3,631 | | (179) | | (217) | | (3,174) | | 61 |
Financial liabilities: |
| | | | | | | | | |
Derivative liabilities |
| (284) | | 179 | | 27 | | 6 | | (72) |
Securities lending and repurchase agreements |
| (582) | | — | | 13 | | 566 | | (3) |
Total financial liabilities |
| (866) | | 179 | | 40 | | 572 | | (75) |
| | | | | | | | | | |
| | 31 Dec 2021 $m | ||||||||
| | Gross amount | | Related amounts not offset | | | ||||
| | included in the | | in the balance sheet | | | ||||
|
| balance |
| Financial |
| Cash |
| Securities |
| Net |
| | sheet | | instruments | | collateral | | collateral | | amount |
| | note (i) | | note (ii) | | | | note (iii) | | note (iv) |
Financial assets: |
|
|
|
|
|
|
|
|
|
|
Derivative assets |
| 170 |
| (94) |
| (31) | | (1) |
| 44 |
Reverse repurchase agreements |
| 2,135 |
| — |
| — |
| (2,134) |
| 1 |
Total financial assets |
| 2,305 |
| (94) |
| (31) |
| (2,135) |
| 45 |
Financial liabilities: |
|
|
|
|
| |
|
|
|
|
Derivative liabilities |
| (165) |
| 94 |
| 63 |
| — |
| (8) |
Securities lending and repurchase agreements |
| (222) |
| — |
| 153 |
| 69 |
| — |
Total financial liabilities |
| (387) |
| 94 |
| 216 |
| 69 |
| (8) |
Notes
(i) | The Group has not offset any of the amounts included in the balance sheet. |
(ii) | Represents the amount that could be offset under master netting or similar arrangements where the Group does not satisfy the full criteria to offset in the balance sheet. |
(iii) | Excludes initial margin amounts for exchange-traded derivatives. |
(iv) | In the tables above, the amounts of assets or liabilities included in the balance sheet would be offset first by financial instruments that have the right of offset under master netting or similar arrangements with any remaining amount reduced by the amount of cash and securities collateral. The actual amount of collateral may be greater than amounts presented in the tables. |
246
C3 Policyholder liabilities and unallocated surplus
C3.1 Policyholder liabilities and unallocated surplus by business type
(a)Movement in policyholder liabilities and unallocated surplus of with-profits funds
The items below represent the amount attributable to changes in policyholder liabilities and unallocated surplus of with-profits funds as a result of each of the components listed for the insurance operations of the Group. The policyholder liabilities shown include investment contracts without discretionary participation features (as defined in IFRS 4) and their full movement in the year. The items are shown gross of external reinsurance.
| | | | | | | | | |
| | With- | | Shareholder-backed business | | Total | | ||
| | profits | | Unit-linked | | Other | | | |
|
| business |
| liabilities |
| business |
| | |
| | $m | | $m | | $m | | $m | |
At 1 Jan 2021 |
| 86,410 |
| 32,506 |
| 46,639 |
| 165,555 | |
Comprising: |
|
|
|
|
|
|
|
| |
- Policyholder liabilities on the balance sheet |
| | | | | | | | |
(excludes $296,513 million from discontinued US operations) | | 81,193 | | 25,433 | | 38,107 | | 144,733 | |
- Unallocated surplus of with-profits funds on the balance sheetnote (i) |
| 5,217 |
| — |
| — |
| 5,217 | |
- Group’s share of policyholder liabilities relating to joint ventures and associatesnote (ii) |
| — |
| 7,073 |
| 8,532 |
| 15,605 | |
Premiums:note (iii) | | | | | | | | | |
New business | | 1,990 | | 3,038 | | 2,172 | | 7,200 | |
In-force | | 7,096 | | 2,406 | | 5,286 | | 14,788 | |
| | 9,086 | | 5,444 | | 7,458 | | 21,988 | |
Surrendersnotes (iii)(iv) | | (844) | | (3,326) | | (734) | | (4,904) | |
Maturities/deaths/other claim events | | (2,116) | | (215) | | (1,123) | | (3,454) | |
Net flows | | 6,126 | | 1,903 | | 5,601 | | 13,630 | |
Shareholders’ transfers post-tax | | (134) | | — | | — | | (134) | |
Investment-related items and other movementsnote (v) | | 2,499 | | 897 | | (3,505) | | (109) | |
Foreign exchange translation differencesnote (vi) | | (899) | | (550) | | (239) | | (1,688) | |
At 31 Dec 2021/1 Jan 2022 | | 94,002 | | 34,756 | | 48,496 | | 177,254 | |
Comprising: | | | | | | | | | |
- Policyholder liabilities on the balance sheet | | 88,618 | | 25,651 | | 37,646 | | 151,915 | |
- Unallocated surplus of with-profits funds on the balance sheetnote (i) | | 5,384 | | — | | — | | 5,384 | |
- Group's share of policyholder liabilities relating to joint ventures and associatesnote (ii) | | — | | 9,105 | | 10,850 | | 19,955 | |
Premiums:note (iii) | | | | | | | | | |
New business | | 2,244 | | 1,838 | | 2,697 | | 6,779 | |
In-force | | 5,809 | | 2,404 | | 5,623 | | 13,836 | |
| | 8,053 | | 4,242 | | 8,320 | | 20,615 | |
Surrendersnotes (iii)(iv) | | (1,233) | | (2,763) | | (677) | | (4,673) | |
Maturities/deaths/other claim events | | (2,103) | | (200) | | (1,712) | | (4,015) | |
Net flows | | 4,717 | | 1,279 | | 5,931 | | 11,927 | |
Shareholders' transfers post-tax | | (158) | | — | | — | | (158) | |
Investment-related items and other movementsnote (v) | | (20,677) | | (2,802) | | (14,623) | | (38,102) | |
Foreign exchange translation differencesnote (vi) | | (197) | | (1,836) | | (2,181) | | (4,214) | |
At 31 Dec 2022 | | 77,687 | | 31,397 | | 37,623 | | 146,707 | |
Comprising: | | | | | | | | | |
- Policyholder liabilities on the balance sheet | | 74,192 | | 22,842 | | 25,229 | | 122,263 | |
- Unallocated surplus of with-profits funds on the balance sheetnote (i) | | 3,495 | | — | | — | | 3,495 | |
- Group's share of policyholder liabilities relating to joint ventures and associatesnote(ii) | | — | | 8,555 | | 12,394 | | 20,949 | |
| | | | | | | | | |
Average policyholder liability balancesnote (vii) |
| |
| |
| |
| | |
2022 |
| 81,405 | | 33,076 | | 43,060 | | 157,541 | |
2021 |
| 84,905 | | 33,631 | | 47,568 | | 166,104 | |
247
Notes
(i) | Unallocated surplus of with-profits funds represents the excess of assets over policyholder liabilities, determined in accordance with the Group's accounting policies, that have yet to be appropriated between policyholders and shareholders for the Group's with-profits funds in Hong Kong and Malaysia. In Hong Kong, the unallocated surplus includes the shareholders' share of expected future bonuses, with the expected policyholder share being included in policyholder liabilities. Any excess of assets over liabilities and amounts expected to be paid out by the fund on future bonuses is also included in the unallocated surplus. |
(ii) | The Group’s investments in joint ventures and associates are accounted for on an equity method and the Group’s share of the policyholder liabilities as shown above relate to the life business of CPL, India and the Takaful business in Malaysia. |
(iii) | The analysis includes the impact of premiums, claims and investment movements on policyholders’ liabilities. The impact does not represent premiums, claims and investment movements as reported in the income statement. For example, premiums shown above are after any deductions for fees/charges; claims (surrenders, maturities, deaths and other claim events) shown above represent the policyholder liabilities provision released rather than the claims amount paid to the policyholder. The analysis also includes net flows of the Group’s insurance joint ventures and associate. |
(iv) | The rate of surrenders for shareholder-backed business (expressed as a percentage of opening policyholder liabilities) is 4.1 per cent in 2022 (2021: 5.1 per cent). |
(v) | Investment-related items and other movements in 2022 primarily represents the effects of higher interest rates on the discount rates applied in the measurement of the policyholder liabilities, together with bond losses due to rising interest rates and lower level of investment returns from equities following the falls in equity markets , primarily in Hong Kong and Singapore with profits-fund. Other business also includes the effect of the early adoption of the Risk-Based Capital Regime in Hong Kong as discussed in note C3.2 below. |
(vi) | Movements in the year have been translated at the average exchange rates for the year. The closing balance has been translated at the closing spot rates as at 31 December. Differences upon retranslation are included in foreign exchange translation differences. |
(vii) | Average policyholder liabilities have been based on opening and closing balances, adjusted for any acquisitions, disposals and other relevant corporate transactions arising in the year, and exclude unallocated surplus of with-profits funds. |
(b) Duration of policyholder liabilities
The table below shows the carrying value of policyholder liabilities and the maturity profile of the cash flows on a discounted basis, taking account of expected future premiums and investment returns:
| | | | | |
|
| 31 Dec 2022 $m |
| 31 Dec 2021 $m |
|
Policyholder liabilities |
| 122,263 |
| 151,915 | |
| | | | | |
Expected maturity: |
| 31 Dec 2022 % | | 31 Dec 2021 % | |
0 to 5 years |
| 22 |
| 20 | |
5 to 10 years |
| 18 |
| 18 | |
10 to 15 years |
| 14 |
| 15 | |
15 to 20 years |
| 11 |
| 12 | |
20 to 25 years |
| 10 |
| 10 | |
Over 25 years |
| 25 |
| 25 | |
(c) Policyholder liabilities and unallocated surplus by operating segment
The table below shows the policyholder liabilities and unallocated surplus, excluding joint ventures and associates and net of external reinsurance, by segment:
| | | | |
|
| 31 Dec 2022 $m |
| 31 Dec 2021 $m |
Hong Kong |
| 60,880 |
| 79,363 |
Indonesia |
| 3,648 |
| 4,257 |
Malaysia |
| 8,231 |
| 8,660 |
Singapore |
| 31,197 |
| 34,361 |
Growth markets and other |
| 18,995 |
| 20,905 |
Total segment |
| 122,951 |
| 147,546 |
C3.2 Reconciliation of gross and reinsurers’ share of policyholder liabilities and unallocated surplus
Claims paid include maturities, annuities, surrenders, deaths and other claim events. Maturity claims are recorded as charges on the policy maturity date. Annuity claims are recorded when each annuity instalment becomes due for payment. Surrenders are charged to the income statement when paid. Death and other claims are generally recorded when notified with additional contract liabilities held, where appropriate, for ‘incurred but not reported’ (IBNR) claims.
248
Further analysis of the movement in the year of the Group’s gross contract liabilities, reinsurers’ share of insurance contract liabilities and unallocated surplus of with-profits funds (excluding those held by joint ventures and associates) is provided below:
| | | | | | | | |
| | | | Reinsurers’ | | | | |
| | Gross | | share of | | | | Unallocated |
| | insurance | | insurance | | Investment | | surplus of |
| | contract | | contract | | contract | | with-profits |
| | liabilities | | liabilities | | liabilities | | funds |
|
| $m |
| $m |
| $m |
| $m |
At 1 Jan 2021 |
| (436,787) |
| 46,595 |
| (4,459) |
| (5,217) |
Removal of discontinued US operationsnote (i) | | 293,325 | | (35,232) | | 3,188 | | — |
Income (expense) included in the income statementnotes (i)(iii) |
| (9,082) |
| (1,552) |
| 189 |
| (202) |
Other movementsnote(ii) | | — | | — | | (75) | | — |
Foreign exchange translation differences |
| 1,789 |
| (58) |
| (3) |
| 35 |
Balance at 31 Dec 2021/1 Jan 2022 |
| (150,755) |
| 9,753 |
| (1,160) |
| (5,384) |
Income (expense) included in the income statementnotes (i),(iii) |
| 27,252 |
| (6,908) |
| 88 |
| 1,868 |
Other movementsnote(ii) |
| — |
| — |
| (26) |
| — |
Foreign exchange translation differences |
| 2,290 |
| (38) |
| 48 |
| 21 |
At 31 Dec 2022 |
| (121,213) |
| 2,807 |
| (1,050) |
| (3,495) |
Notes
(i) | The total charge for benefits and claims shown in the income statement comprises the amounts shown as ‘Income (expense) included in the income statement’ in the table above together with claims paid of $(9,343) million in the year (2021: $(8,845) million) and claim amounts attributable to reinsurers of $740 million (2021: $581 million). Claims incurred, net of reinsurance, shown in the segment analysis of benefits and claims items below include claims paid and movement in claims outstanding payables, net of reinsurance, in the year. |
(ii) | Other movements include premiums received and claims paid on investment contracts without discretionary participating features, which are taken directly to the statement of financial position in accordance with IAS 39. |
(iii) | The 2021 movement in the gross contract liabilities included $160 million for the impact of a change to allow for illiquidity premium in the calculation of the valuation interest rate (VIR) used to value long-term insurance liabilities in Thailand. The 2022 movement in the gross contract liabilities and reinsurers’ share of insurance contract liabilities included the impact from the early adoption of the Hong Kong Risk-Based Capital Regime as discussed below. |
The segmental analysis of the total charge for benefit and claims and movement in unallocated surplus, net of reinsurance in the income statement is shown below. The CPL segment is a joint venture accounted for using the equity method under IFRS, with the Group’s share of its results net of related tax presented in a single line within the Group’s profit before tax, and therefore not shown in the analysis of benefit and claims items below.
| | | | | | | | | | | | |
| | 2022 $m | ||||||||||
| | | | | | | | | | Growth | | |
| | Hong | | | | | | | | markets | | Total |
|
| Kong |
| Indonesia |
| Malaysia |
| Singapore |
| and other |
| segment |
Claims incurred, net of reinsurance | | (2,033) | | (1,228) | | (1,070) |
| (2,718) | | (1,768) | | (8,817) |
Decrease in policyholder liabilities, net of reinsurance | | 15,643 | | 270 | | (135) |
| 3,189 | | 1,679 | | 20,646 |
Movement in unallocated surplus of with-profits funds | | 1,815 | | — | | 53 |
| — | | — | | 1,868 |
Benefits and claims and movement in unallocated surplus, net of reinsurance | | 15,425 | | (958) | | (1,152) |
| 471 | | (89) | | 13,697 |
| | | | | | | | | | | | |
| | 2021 $m | ||||||||||
| | | | | | | | | | Growth | | |
| | Hong | | | | | | | | markets | | Total |
|
| Kong |
| Indonesia |
| Malaysia |
| Singapore |
| and other |
| segment |
Claims incurred, net of reinsurance | | (1,687) | | (1,184) | | (1,015) | | (3,037) | | (1,590) | | (8,513) |
(Increase) decrease in policyholder liabilities, net of reinsurance | | (6,088) | | 167 | | (260) | | (2,856) | | (1,159) | | (10,196) |
Movement in unallocated surplus of with-profits funds | | (250) | | — | | 48 | | — | | — | | (202) |
Benefits and claims and movement in unallocated surplus, net of reinsurance | | (8,025) | | (1,017) | | (1,227) | | (5,893) | | (2,749) | | (18,911) |
Hong Kong Risk-Based Capital Regime
In April 2022, the Group’s Hong Kong life business (PHKL) received approval from the Hong Kong Insurance Authority to early adopt the Hong Kong Risk-Based Capital (HK RBC) regime with effect from 1 January 2022. In light of this development and, given that the measurement technique set out within the local regulatory basis has been applied by PHKL to calculate IFRS liabilities, the Group has refined the reserving methodology of PHKL by reference to the method applied under the new HK RBC regime.
249
Under the basis previously applied, liabilities of non-participating business were generally determined on a net premium valuation basis to determine the future policyholder benefit provisions, subject to minimum floors. Using the principles underpinning the HK RBC regime, the IFRS reserving basis has been refined to one that is based on a gross premium valuation basis (including an allowance for the uncertainty of non-hedgeable risks), subject to minimum floors. Depending on the product, the minimum floor is set at the policyholder’s asset share or guaranteed cash surrender value or at a constraint that on day one no negative reserve exists at a product level. This new measurement technique better estimates the liability and brings the estimation basis for PHKL more in line with that used by the Group’s other insurance operations. This change of estimate has reduced policyholder liabilities (net of reinsurance) and increased profit before tax for 2022 by $945 million.
There has been no change to the reserving basis for with-profits liabilities, which under the Group’s accounting policy are valued under the realistic basis in accordance with the requirements of the ‘grandfathered’ UK standard FRS 27 ‘Life Assurance’.
C3.3 Reinsurers’ share of insurance contract liabilities
The measurement of reinsurance assets is consistent with the measurement of the underlying direct insurance contracts. The treatment of any gains or losses arising on the purchase of reinsurance contracts is dependent on the underlying accounting basis of the entity concerned.
| | | | |
|
| 31 Dec 2022 $m |
| 31 Dec 2021$m |
Insurance contract liabilities | | 2,592 |
| 9,550 |
Claims outstanding | | 215 |
| 203 |
Total operations | | 2,807 |
| 9,753 |
The Group cedes certain business to other insurance companies. Although the ceding of insurance does not relieve the Group from its liability to its policyholders, the Group participates in such agreements largely for the purpose of managing its loss exposure. The Group evaluates the financial condition of its reinsurers and monitors concentration of credit risk from similar geographic regions, activities or economic characteristics of the reinsurers to minimise its exposure from reinsurer insolvencies.
Of the reinsurers’ share of insurance contract liabilities balance of $2,807 million at 31 December 2022 (31 December 2021: $9,753 million), 98 per cent (31 December 2021: 99 per cent) was from reinsurers with rating A- and above by Standard & Poor’s or other external rating agencies.
The reinsurers’ share of insurance contract liabilities primarily relates to protection business written in Hong Kong. The year-on-year movement in the reinsurers’ share of insurance contract liabilities included the impact from the early adoption of the Hong Kong Risk-Based Capital Regime as discussed above in note C3.2. The Group’s Hong Kong business cedes insurance risk to limit exposure to underwriting losses under various agreements that cover individual risks, group risks or defined blocks of business, on a co-insurance, surplus, quota share, or catastrophe excess of loss basis. The amount of each risk retained depends on the evaluation of the specific risk, subject to certain circumstances, to maximum limits based on characteristics of coverage.
Net commissions received during 2022 on ceded business totalled $216 million (2021: $285 million) and claims incurred ceded to external reinsurers totalled $766 million (2021: $604 million). There was $1 million (2021: $3 million) of deferred gains in the year.
C3.4 Products and determining contract liabilities
IFRS 4 requires contracts written by insurers to be classified as either ‘insurance’ contracts or ‘investment’ contracts. The classification of the contract determines its accounting.
Contracts that transfer significant insurance risk to the Group are classified as insurance contracts. This judgement is applied in considering whether the material features of a contract gives rise to the transfer of significant insurance risk, which is made at the point of contract inception and not revisited. For the majority of the Group’s contracts, classification is based on a readily identifiable scenario that demonstrates a significant difference in cash flows if the covered event occurs (as opposed to does not occur) reducing the level of judgement involved.
250
Contracts that transfer financial risk to the Group but not significant insurance risk are classified as investment contracts. Insurance contracts and investment contracts with discretionary participation features are accounted for under IFRS 4. Investment contracts without such discretionary participation features are accounted for as financial instruments under IAS 39.
Investment contracts without discretionary participation features are measured in accordance with IAS 39 to reflect the deposit nature of the arrangement, with premiums and claims reflected as deposits and withdrawals, and taken directly to the statement of financial position as movements in the financial liability balance.
Investment contracts without fixed and guaranteed terms are classified as financial instruments and designated as FVTPL because the resulting liabilities are managed and their performance is evaluated on a fair value basis. Where the contract includes a surrender option, its carrying value is subject to a minimum carrying value equal to its surrender value.
Other investment contracts are measured at amortised cost.
The table below provides description of material feature of each of the products listed above, together with how their contract liabilities are determined.
Contract type | Description and material features | Determination of liabilities |
|---|---|---|
With-profits and participating contracts | Provides savings and/or protection where the basic sum assured can be enhanced by a profit share (or bonus) from the underlying fund as determined at the discretion of the business unit. Participating products often offer a guaranteed maturity or surrender value. Declared regular bonuses are guaranteed once vested. Future bonus rates and cash dividends are not guaranteed. Market value adjustments and surrender penalties are used for certain products where the law permits such adjustments. Guarantees are predominantly supported by the segregated funds and their estates. | As explained in note A3.1, with-profits contracts are predominantly sold in Hong Kong, Malaysia and Singapore. The total value of the with-profits funds is driven by the underlying asset valuation with movements reflected principally in the accounting value of policyholder liabilities and unallocated surplus. In Hong Kong, the unallocated surplus includes the shareholders’ share of expected future bonuses, with the expected policyholder share being included in policyholder liabilities. Any excess of assets over liabilities and amounts expected to be paid out by the fund on future bonuses is also included in the unallocated surplus. |
Unit-linked | Combines savings with protection, the cash value of the policy primarily depends on the value of the underlying unitised funds. | The attaching liabilities largely reflect the unit value obligation driven by the value of the investments of the unit fund. Additional contract liabilities are held for guaranteed benefits beyond the unit fund value, generally using a gross premium valuation method, as discussed below for health and protection business. These additional provisions are recognised as a component of other business liabilities. |
Health and protection | Health and protection features are offered as supplements to the products listed above or sold as standalone products. Protection covers mortality and/or morbidity benefits including health, disability, critical illness and accident coverage. | The approach to determine the contract liabilities is generally driven by the local solvency basis. The discount rates used to determine the contract liabilities are derived in line with the measurement basis applied in each business unit and are generally based on the risk-free rates applicable to the underlying contracts, including appropriate margins. A gross premium valuation (GPV) method is typically used in those local businesses where a risk-based capital framework is adopted for local solvency. Under the GPV method, all cash flows are valued explicitly using best estimate assumptions with a suitable margin for prudence. |
251
Contract type | Description and material features | Determination of liabilities |
|---|---|---|
This is achieved either through adding an explicit allowance above best estimate to the assumptions, or by applying an overlay constraint such that on day one no negative reserves (ie where future premium inflows are expected to exceed future claims and outflows) are derived at an individual policyholder level, or at a product/fund level, or a combination of both. The margin for prudence is released to profit over the life of the contract. Best estimate assumptions are reviewed annually with reference to experience and expectations around the short-term nature of any change (for example increases or decreases in claims levels as a result of Covid-19). Any changes made to best estimate impact the prudence mechanisms described above and, as a consequence, IFRS profit tends to be relatively insensitive to assumption changes made in any given year. Prior to the adoption of the new HK RBC regime in 2022, the Hong Kong business unit applied a net premium valuation method (NPV) to determine the future policyholder benefit provisions, subject to minimum floors at the policyholder’s asset share or guaranteed cash surrender value as appropriate. Upon the adoption of the HK RBC regime, the gross premium valuation method (including an allowance for the uncertainty of non-hedgeable risks), subject to minimum floors is applied. For India and Taiwan, US GAAP is applied for measuring insurance liabilities. For these businesses, the future policyholder benefit provisions for non-linked business are determined using the net level premium method, with an allowance for surrenders, maintenance and claims expenses. In Vietnam, an estimation basis to determine the contract liabilities is aligned substantially to that used by the business units applying the GPV method. | ||
Non-participating term contracts, whole life and endowment assurance | Non-participating savings and/or protection where the benefits are guaranteed, determined by a set of defined market-related parameters, or determined at the discretion of the business unit. These products often offer a guaranteed maturity and/or surrender value. It is common for regulations or market-driven demand and competition to provide some form of capital value protection and minimum crediting interest rate guarantees. This is reflected within the guaranteed maturity and surrender values. Guarantees are supported by shareholders. | The approach to determining the contract liabilities is generally driven by the local solvency basis, as discussed for health and protection business above. |
252
C4 Intangible assets
C4.1 Goodwill
Business combination
Business acquisitions are accounted for by applying the purchase method of accounting, which adjusts the net assets of the acquired company to fair value at the date of purchase. The excess of the acquisition consideration over the fair value of the assets and liabilities of the acquired business is recorded as goodwill. The Group chooses the full goodwill method or the partial goodwill method to calculate goodwill on an acquisition by acquisition basis. Expenses related to acquiring new subsidiaries are charged to the income statement in the period in which they are incurred and not included in goodwill. Income and expenses of acquired businesses are included in the income statement from the date of acquisition.
Where the Group writes a put option, which if exercised triggers the purchase of non-controlling interests as part of its business acquisition, the put option is recognised as a financial liability at the acquisition date. Where risks and rewards remain with the non-controlling interests, a corresponding amount is deducted from equity. Any subsequent changes to the carrying amount of the put option liability are also recognised within equity.
Goodwill
Goodwill is capitalised and carried on the Group consolidated statement of financial position as an intangible asset at initial value less any accumulated impairment losses. Goodwill impairment testing is conducted annually and when there is an indication of impairment.
Goodwill shown on the consolidated statement of financial position at 31 December 2022 represents amounts allocated to business units in respect of both acquired asset management and life businesses. There has been no impairment as at 31 December 2022 and 2021.
| | | | |
|
| 2022 $m |
| 2021 $m |
Carrying value at 1 Jan |
| 907 | | 961 |
Exchange differences |
| (17) | | (54) |
Carrying value at 31 Dec |
| 890 | | 907 |
Impairment testing
Goodwill does not generate cash flows independently of other groups of assets and thus is assigned to cash-generating units for the purposes of impairment testing. These cash-generating units (CGUs) are based upon how management monitors the business and represent the lowest level to which goodwill can be allocated on a reasonable basis. Of the carrying value at 31 December 2022, $445 million (31 December 2021: $465 million) relates to asset management business in Thailand and $234 million (31 December 2021: $233 million) relates to the acquisition of UOB Life in Singapore. Other goodwill amounts are allocated across CGUs, which are not individually material.
Goodwill is tested for impairment by comparing the CGU’s carrying amount, including any goodwill, with its recoverable amount. The Group’s methodology of assessing whether goodwill may be impaired for acquired life and asset management operations is discussed below.
For acquired life businesses, the Group routinely compares the aggregate of net asset value and acquired goodwill on an IFRS basis of the acquired life business with the value of the current in-force business as determined using the EEV methodology. Any excess of IFRS value over EEV carrying value is then compared with EEV basis value of current and projected future new business to determine whether there is any indication that the goodwill in the IFRS statement of financial position may be impaired. The methodology and assumptions underpinning the Group’s EEV basis of reporting are included in the EEV basis supplementary information in this Annual Report.
The goodwill in respect of asset management businesses comprises mainly the goodwill arising from the acquisition of Thanachart Fund Management Co., Ltd in 2019 and TMB Asset Management Co., Ltd in Thailand in 2018. The goodwill impairment testing for these businesses is prepared as a single CGU reflecting that these businesses are managed together. The recoverable amount of these businesses has been determined by calculating the value in use of combined business calculated using a discounted cash flow valuation.
253
For the combined Thailand asset management business, the valuation is based on a number of key assumptions as follows:
– | Cash flow projections based on the latest five-year business plan/forecast; |
– | A constant growth rate of 3.5 per cent (2021: 2.3 per cent) on forecast cash flows beyond the terminal year of the cash flow projection period; |
– | The risk discount rate applied in accordance with the nature of the businesses. The pre-tax discount rate applied is 9.0 per cent (2021: 9.0 per cent); and |
– | The continuation of asset management contracts on similar terms. |
The key assumptions used in the impairment testing, including the cash flow projections, are subject to fluctuations in the external market and economic conditions. The recent adverse conditions had contributed to reduced cash flow projections leading to a fall in the headroom in comparison to the prior year. While management believes that any reasonable change in each of the key assumptions would not cause the recoverable amount of the asset management businesses acquired to fall below its carrying amount, a more significant adverse change in the key assumptions applied concurrently could lead to impairment charges.
C4.2 Deferred acquisition costs and other intangible assets
Intangible assets acquired on the purchase of a subsidiary or portfolio of contracts are measured at fair value on acquisition. DAC are accounted for as described in note A3.1(c). Other intangible assets, such as distribution rights and software, are valued initially at the price paid to acquire or cost to develop them and are subsequently carried at cost less amortisation and any accumulated impairment losses. For intangibles other than DAC, amortisation follows the pattern in which the future economic benefits are expected to be consumed. If the pattern cannot be determined reliably, a straight-line method is applied. For software, the amortisation generally represents the licence period of the software acquired. Amortisation of intangible assets is charged to the ‘acquisition costs and other expenditure’ line in the Consolidated income statement. Impairment testing is conducted when there is an indication of impairment.
| | | | |
|
| 31 Dec 2022 $m |
| 31 Dec 2021 $m |
Shareholder-backed business: | | | | |
DAC related to insurance contracts as classified under IFRS 4 | | 3,215 | | 2,776 |
DAC related to investment management contracts, including life assurance contracts classified as financial instruments and investment management contracts under IFRS 4 | | 39 | | 39 |
DAC related to insurance and investment contracts | | 3,254 | | 2,815 |
Distribution rights | | 3,630 | | 3,782 |
Present value of acquired in-force policies for insurance contracts as classified under IFRS 4 | | 17 | | 28 |
Other intangibles | | 209 | | 184 |
Present value of acquired in-force and other intangibles | | 3,856 | | 3,994 |
Total of DAC and other intangible assets attributable to shareholders | | 7,110 | | 6,809 |
Other intangible assets, including computer software, attributable to with-profits funds | | 45 | | 49 |
Total of deferred acquisition costs and other intangible assets |
| 7,155 |
| 6,858 |
254
(a) | Movement in DAC and other intangible assets attributable to shareholders |
| | | | | | | | | | |
|
| 2022 $m | | 2021 $m | ||||||
| | | | | | PVIF and | | | | |
| | | | Distribution | | other | | | | |
|
| DAC |
| rights |
| intangibles |
| Total |
| Total |
| | | | note (i) | | notes (ii)(iii) | | | | |
Balance at 1 Jan |
| 2,815 | | 3,782 | | 212 | | 6,809 |
| 20,275 |
Removal of discontinued US operations |
| — | | — | | — |
| — |
| (13,881) |
Additions |
| 1,002 | | 206 | | 76 |
| 1,284 |
| 1,185 |
Amortisation to the income statement |
| (475) | | (301) | | (50) | | (826) |
| (651) |
Disposals and transfers |
| — | | — | | (5) |
| (5) |
| (7) |
Exchange differences and other movements |
| (88) | | (57) | | (7) |
| (152) |
| (112) |
Balance at 31 Dec |
| 3,254 | | 3,630 | | 226 |
| 7,110 |
| 6,809 |
Notes
(i) | Distribution rights relate to amounts that have been paid or have become unconditionally due for payment as a result of past events in respect of the bancassurance partnership arrangements for the bank distribution of Prudential’s insurance products for a fixed period of time. The distribution rights amounts are amortised on a basis to reflect the pattern in which the future economic benefits are expected to be consumed by reference to new business production levels. |
(ii) | All of the net PVIF balances relate to insurance contracts. The PVIF attaching to investment contracts have been fully amortised. |
(iii) | Other intangibles comprise other intangible assets such as software rights. Software rights include additions of $58 million, amortisation of $(24) million, disposals of $(3) million, foreign exchange of $(7) million and closing balance at 31 December 2022 of $138 million (31 December 2021: $114 million). |
(b)Movement in DAC related to insurance and investment contracts
| | | | | | | | |
| | 2022 $m | | 2021 $m | ||||
|
| Insurance |
| Investment |
| Insurance |
| Investment |
| | contracts | | contracts | | contracts | | contracts |
| | | | note | | | | note |
Balance at 1 Jan |
| 2,776 | | 39 |
| 16,182 |
| 34 |
Removal of discontinued US operations | | — | | — | | (13,863) | | — |
Additions |
| 993 | | 9 |
| 841 |
| 7 |
Amortisation |
| (470) | | (5) |
| (339) |
| (4) |
Exchange differences and other movements |
| (84) | | (4) |
| (45) |
| 2 |
Balance at 31 Dec |
| 3,215 |
| 39 |
| 2,776 |
| 39 |
Note
The carrying amount of the DAC balance relating to investment contracts comprises the following gross and accumulated amortisation amounts:
| | | | |
|
| 31 Dec 2022 $m |
| 31 Dec 2021 $m |
Gross amount |
| 59 |
| 55 |
Accumulated amortisation |
| (20) |
| (16) |
Carrying amount |
| 39 |
| 39 |
255
(c)Movement in PVIF and other intangibles attributable to shareholders
| | | | | | | | | | | | | | | | |
| | 2022 $m | | 2021 $m | ||||||||||||
| | | | | | Other | | | | | | | | Other | | |
| | | | | | intangibles | | | | | | | | intangibles | | |
| | | | Distribution | | (including | | | | | | Distribution | | (including | | |
| | PVIF | | rights | | software) | | Total | | PVIF | | rights | | software) | | Total |
Balance at 1 Jan |
| |
| |
| |
| |
|
|
|
|
|
|
|
|
Cost |
| 140 | | 5,037 | | 313 | | 5,490 |
| 177 |
| 4,845 |
| 424 |
| 5,446 |
Accumulated amortisation |
| (112) | | (1,255) | | (129) | | (1,496) |
| (143) |
| (994) |
| (250) |
| (1,387) |
|
| 28 | | 3,782 | | 184 | | 3,994 |
| 34 |
| 3,851 |
| 174 |
| 4,059 |
Removal of discontinued US operations |
| — | | — | | — | | — |
| — |
| — |
| (18) |
| (18) |
Additions |
| — | | 206 | | 76 | | 282 |
| — |
| 260 |
| 77 |
| 337 |
Amortisation charge |
| (10) | | (301) | | (40) | | (351) |
| (5) |
| (268) |
| (35) |
| (308) |
Disposals and transfers | | — | | — | | (5) | | (5) | | — | | — | | (7) | | (7) |
Exchange differences and other movements |
| (1) | | (57) | | (6) | | (64) |
| (1) |
| (61) |
| (7) |
| (69) |
Balance at 31 Dec |
| 17 | | 3,630 | | 209 | | 3,856 |
| 28 |
| 3,782 |
| 184 |
| 3,994 |
Comprising: |
| | | | | | | |
| |
| |
| |
| |
Cost |
| 134 | | 5,176 | | 373 | | 5,683 |
| 140 |
| 5,037 |
| 313 |
| 5,490 |
Accumulated amortisation |
| (117) | | (1,546) | | (164) | | (1,827) |
| (112) |
| (1,255) |
| (129) |
| (1,496) |
|
| 17 | | 3,630 | | 209 | | 3,856 |
| 28 |
| 3,782 |
| 184 |
| 3,994 |
C5 Borrowings
Although initially recognised at fair value (net of transaction costs), borrowings are subsequently accounted for on an amortised cost basis using the effective interest method. Under the effective interest method, the difference between the redemption value of the borrowing and the initial proceeds (net of related issue costs) is amortised through the income statement to the date of maturity or, for hybrid debt, over the expected life of the instrument.
C5.1 Core structural borrowings of shareholder-financed businesses
| | | | |
|
| 31 Dec 2022 $m |
| 31 Dec 2021 $m |
Subordinated debt: |
| | | |
US$1,000m 5.25% Notesnote (i) | | — | | 1,000 |
US$725m 4.375% Notesnote (ii) | | — | | 725 |
US$750m 4.875% Notes | | 750 | | 748 |
€20m Medium Term Notes 2023 |
| 21 | | 23 |
£435m 6.125% Notes 2031 |
| 520 | | 584 |
US$1,000m 2.95% Notes 2033 | | 995 | | 995 |
Senior debt:note (iii) | | | | |
£300m 6.875% Notes 2023note (iv) | | 361 | | 404 |
£250m 5.875% Notes 2029 | | 281 | | 313 |
US$1,000m 3.125% Notes 2030 | | 987 | | 985 |
US$350m 3.625% Notes 2032note (v) | | 346 | | — |
Bank loans: | | | | |
US$350m Loan 2024note(v) | | — | | 350 |
Total core structural borrowings of shareholder-financed businesses |
| 4,261 | | 6,127 |
Notes
(i) | The US$1,000 million notes were redeemed on 20 January 2022 using the proceeds from the issuance of ordinary shares during 2021 as discussed in note C8. |
(ii) | The US$725 million notes were redeemed on 20 January 2022 using the proceeds from the US$1,000 million subordinated debt issued in November 2021. |
(iii) | The senior debt ranks above subordinated debt in the event of liquidation. |
(iv) | The £300 million notes were redeemed on 20 January 2023. |
(v) | In March 2022, the Company issued US$350 million 3.625 per cent senior debt maturing on 24 March 2032 with proceeds, net of costs, of US$346 million, which was used to redeem the US$350 million bank loan in May 2022. |
256
C5.2 Operational borrowings
| | | | |
|
| 31 Dec 2022 $m |
| 31 Dec 2021 $m |
Shareholder-financed business: | | | | |
Borrowings in respect of short-term fixed income securities programmes – commercial paper |
| 501 | | 500 |
Lease liabilities under IFRS 16 |
| 185 | | 209 |
Other borrowings |
| 11 | | 10 |
Operational borrowings attributable to shareholder-financed businesses |
| 697 | | 719 |
| | | | |
With-profits business: | | | | |
Lease liabilities under IFRS 16 | | 114 | | 138 |
Other borrowings | | 4 | | 4 |
Operational borrowings attributable to with-profits businesses | | 118 | | 142 |
Total operational borrowings | | 815 | | 861 |
C6 Risk and sensitivity analysis
Group overview
The Group’s risk framework and the management of risks attaching to the Group’s consolidated financial statements including financial assets, financial liabilities and insurance liabilities, together with the inter-relationship with the management of capital, have been included in the audited sections of the Risk review report.
The financial and insurance assets and liabilities on the Group’s statement of financial position are, to varying degrees, subject to market and insurance risk and other changes of experience assumptions that may have a material effect on IFRS basis profit or loss and shareholders’ equity. The market and insurance risks and also ESG-related risks, including how they affect Group’s operations and how these are managed are discussed in the Risk review report referred to above. The ESG-related risks discussed in the Risk review report include in particular the potential long-term impact of environmental risks associated with climate change (including physical and transition risks) on the Group’s investments and liabilities. During 2022, the Group continued developing its scenario testing approach for climate change and applied three commonly used scenarios of plausible global responses to climate change to identify risks over the short, medium and long term. Each scenario is translated into potential sensitivities to economic factors, using third party calibrated inputs, which have then been applied during the year to the Group’s starting assets and liabilities to quantify possible future impacts thereon. Though the Group remains exposed to financial impact from plausible global responses addressing climate change, the results for each scenario are not outside observed market volatility experienced and therefore do not indicate the need for explicit allowance for climate change within the current valuations. In addition, given the nature of the business, the impact of climate change does not directly alter the Group’s assumptions for claims and lapses for its insurance business based on the annual review of experience. If experience or exposure changes, for example due to a step change in long-term morbidity and/or mortality expectations in a particular region due to climate events, the financial impacts from climate-related risks on our insurance liabilities could be more significant and would be allowed for as part of the regular review.
The most significant market and credit risks that the IFRS shareholders’ profit or loss and shareholders’ equity for the Group’s life assurance business are sensitive to, are shown in the following tables. The distinction between direct and indirect exposure is not intended to indicate the relative size of the sensitivity. In addition, insurance businesses are sensitive to mortality and/or morbidity risk as well as persistency risk depending on the products sold.
Type of business |
| Market and credit risk |
With-profits business | | Net neutral direct exposure (indirect exposure to investment performance, which is subject to smoothing through declared bonuses) |
Unit-linked business | | Net neutral direct exposure (indirect exposure to investment performance, through asset management fees) |
Non-participating business | | Asset/liability mismatch risk which results in sensitivity to interest rates and credit spreads, particularly for operations where the insurance liability basis is sensitive to current market movements Profit and shareholders’ equity are also sensitive to the impact of current market movements on assets held in excess of non-participating policyholder liabilities Indirect exposure to investment performance through policyholder charges and guarantees in some cases |
257
Sensitivity analyses of IFRS shareholders’ equity to key market and other risks for the insurance operations are provided in section C6.1 below. The sensitivity analyses provided show the effect on shareholders’ equity to changes in the relevant risk variables, all of which are considered to be reasonably possible at the relevant balance sheet date.
The sensitivity of the Group’s Eastspring and central operations to market risks is discussed in section C6.2.
The Group benefits from diversification benefits achieved through the geographical spread of the Group’s operations and, within those operations, through a broad mix of product types. These benefits are not reflected in the simplified sensitivities below.
Relevant correlation factors include:
–Correlation across geographic regions for both financial and non-financial risk factors; and
–Correlation across risk factors for mortality and morbidity, expenses, persistency and other risks.
The geographical diversity of the Group’s business means that it has some exposure to the risk of foreign exchange rate fluctuations. The Group has no exposure to currency fluctuation from business units that operate in USD, or currencies pegged to the USD (such as HKD), and reduced exposure to currencies partially managed to the USD within a basket of currencies (such as SGD). Sensitivities to exchange rate movements in the Group’s key markets are therefore expected to be limited.
C6.1 Insurance operations
(a) Sensitivity to key market risks
The table below shows the sensitivity of shareholders' equity as at 31 December 2022 and 2021 for insurance operations to the following market risks:
– | 1 per cent increase and 0.5 per cent decrease in interest rates (based on local government bond yields at the valuation date) in isolation and subject to a floor of zero; and |
– | Instantaneous 10 per cent rise and 20 per cent fall in the market value of equity and property assets. The equity risk sensitivity analysis assumes that all equity indices fall by the same percentage. |
The sensitivities below only allow for limited management actions such as changes to policyholder bonuses, where applicable. If the economic conditions set out in the sensitivities persisted, the financial impacts may differ to the instantaneous impacts shown below. Given the continuous risk management processes in place, management could take additional actions to help mitigate the impact of these stresses, including (but not limited to) rebalancing investment portfolios, increased use of reinsurance, repricing of in-force benefits, changes to new business pricing and the mix of new business being sold.
Where liabilities are valued using historic average rates for a short period (ie up to three years), the valuation interest rates are adjusted to assume a parallel increase or decrease in the interest rates used in the averaging approach to reflect the impact that could be seen in the near term. Credit risk sensitivities, such as the impact on the value of debt securities and policyholder liabilities from movements in credit spreads are not presented below. A one-letter credit downgrade in isolation (ie ignoring any consequential change in valuation) would not have a material impact on IFRS profit or shareholders’ equity.
| | | | |
Net effect on shareholders' equity from insurance operations |
| 31 Dec 2022 $m |
| 31 Dec 2021 $m |
Shareholders' equity of insurance operations |
| 14,407 | | 14,289 |
Sensitivity to key market risks:note | | | | |
Interest rates and consequential effects – 1% increase |
| (386) | | (796) |
Interest rates and consequential effects – 0.5% decrease |
| (122) | | 137 |
Equity/property market values – 10% rise |
| 190 | | 372 |
Equity/property market values – 20% fall |
| (729) | | (787) |
258
Note
The effect from the changes in interest rates or equity and property prices above, if they arose, would impact profit after tax for the insurance operations and would mostly be recorded within short-term fluctuations in investment returns. The impact on profit after tax would be the same as the net effect on shareholders’ equity. Changes to the results of the Africa insurance operations from interest rate or equity rate changes would not materially impact the Group.
The degree of sensitivity of the results of the non-linked shareholder-backed business of the insurance operations to movements in interest rates depends upon the degree to which the liabilities under the ‘grandfathered’ IFRS 4 measurement basis reflects market interest rates from period to period. This varies by business unit.
For example:
– | Taiwan and India businesses apply US GAAP, for which the results can be more sensitive as the effect of interest rate movements on the backing investments may not be offset by liability movements; and |
– | The level of options and guarantees in the products written in a particular business unit will affect the degree of sensitivity to interest rate movements. |
The sensitivity of the insurance operations presented as a whole at a given point in time will also be affected by a change in the relative size of the individual businesses.
The ‘increase of 1%’ sensitivities reflect that, for many operations the impact of interest rate movements on the value of government and corporate bond investments dominates, namely bonds are expected to decrease in value as interest rates increase to a greater extent than the offsetting decrease in liabilities from a corresponding change in discount rates. This arises because the discount rate in some operations does not fluctuate in line with interest rate movements. Under a 0.5% decrease interest rate scenario although in the majority of operations asset gains exceed the increase in liabilities, there are a number of operations where the increase in liabilities dominates, driven by an increase in the value of policyholder guarantees, hence this results in an overall small negative impact of an instantaneous decrease of rates at 31 December 2022.
Movements in equities backing with-profits and unit-linked business have been excluded from the equity and property sensitivities as they are generally matched by an equal movement in insurance liabilities (including unallocated surplus of with-profits funds). The impact on changes to future profitability as a result of changes to the asset values within unit-linked or with-profits funds have not been included in the instantaneous sensitivity above. The estimated sensitivities shown above include equity and property investments held by the Group’s joint venture and associate businesses. Generally, changes in equity and property investment values held outside unit-linked and with-profits funds are not directly offset by movements in non-linked policyholder liabilities. For Hong Kong’s non-participating business, liabilities largely reflect asset shares post the adoption of HK RBC and therefore the consequential movements in equities are offset by movements in policyholder liabilities.
(b)Sensitivity to insurance risk
For insurance operations, adverse persistency experience can impact the IFRS profitability of certain types of business written. This risk is managed at a business unit level through regular monitoring of experience and the implementation of management actions as necessary.
These actions could include product enhancements, increased management focus on premium collection, as well as other customer retention efforts. The potential financial impact of lapses is often mitigated through the specific features of the products, eg surrender charges, or through the availability of premium holiday or partial withdrawal policy features. The reserving basis, as discussed in note A3.1(a) and C3.4, is generally such that a change in lapse assumptions has an immaterial effect on immediate profitability.
Many of the business units are exposed to mortality and morbidity risk and a provision is made within policyholder liabilities to cover the potential exposure. If all these assumptions were strengthened by 5 per cent then it is estimated that profit after tax and shareholders’ equity would decrease by approximately $(101) million (2021: $(108) million), before consideration of other reserving adjustments eg a corresponding release of margin for prudence. Weakening these assumptions by 5 per cent would have a similar opposite impact.
259
C6.2 Eastspring and central operations
The profit for the year of Eastspring is sensitive to the level of assets under management, as this significantly affects the value of management fees earned by the business in the current and future periods. Assets under management will rise and fall as market conditions change, with a consequential impact on profitability.
Eastspring holds a small amount of investments direct on its balance sheet, including investments in respect of seeding capital into retail funds it sells to third parties (see note C1). Eastspring’s profit will therefore have some exposure to the market movements of these investments.
At 31 December 2022, the Group’s central operations held a 9.2 per cent (31 December 2021: 18.4 per cent) economic interest in the equity securities of Jackson. These equity securities are listed on the New York Stock Exchange and classified as available-for-sale with a fair value of $266 million at 31 December 2022 (31 December 2021: $683 million). If the value of these securities decreased by 20 per cent, the change in valuation would be $(53) million (31 December 2021: $(137) million), which would reduce shareholders’ equity by this amount before tax, all of which would pass through other comprehensive income outside of the profit or loss.
C7 Tax assets and liabilities
Accounting policies on deferred tax are included in note B3.
C7.1 Current tax
At 31 December 2022, of the $18 million (31 December 2021: $20 million) current tax recoverable, the majority is expected to be recovered within 12 months after the reporting period.
At 31 December 2022, the current tax liability from operations of $208 million (31 December 2021: $185 million) includes $79 million (31 December 2021: $42 million) of provisions for uncertain tax matters. Further detail is provided in note B3.2.
C7.2 Deferred tax
The statement of financial position contains the following deferred tax assets and liabilities in relation to:
| | | | | | | | |
| | 2022 $m | ||||||
| | | | | | Other | | |
| | | | | | movements | | |
| | | | | | including | | |
| | | | Movement in | | foreign | | |
| | Balance | | income | | exchange | | Balance |
|
| at 1 Jan |
| statement |
| movements |
| at 31 Dec |
Deferred tax assets | | | | | | | | |
Unrealised losses or gains on investments |
| 3 |
| 317 |
| (178) |
| 142 |
Balances relating to investment and insurance contracts |
| 34 |
| 1 |
| (33) |
| 2 |
Short-term temporary differences |
| 162 |
| (15) |
| (12) |
| 135 |
Unused tax losses |
| 67 |
| (32) |
| (4) |
| 31 |
Total deferred tax assets |
| 266 |
| 271 |
| (227) |
| 310 |
| | | | | | | | |
Deferred tax liabilities | | | | | | | | |
Unrealised losses or gains on investments |
| (242) |
| 44 |
| 185 |
| (13) |
Balances relating to investment and insurance contracts |
| (2,125) |
| (228) |
| 47 |
| (2,306) |
Short-term temporary differences |
| (495) |
| (81) |
| 23 |
| (553) |
Total deferred tax liabilities |
| (2,862) |
| (265) |
| 255 |
| (2,872) |
260
| | | | | | | | | | |
| | 2021 $m | ||||||||
|
| |
| |
| |
| Other |
| |
| | | | | | | | movements | | |
| | | | | | | | including | | |
| | | | Removal of | | Movement in | | foreign | | |
| | Balance | | discontinued | | income | | exchange | | Balance |
| | at 1 Jan | | US operations | | statement | | movements | | at 31 Dec |
Deferred tax assets | |
|
|
|
|
|
|
|
|
|
Unrealised losses or gains on investments | | — |
| — |
| 3 |
| — |
| 3 |
Balances relating to investment and insurance contracts | | 87 |
| — |
| (16) |
| (37) |
| 34 |
Short-term temporary differences | | 4,662 |
| (4,513) |
| 15 |
| (2) |
| 162 |
Unused tax losses | | 109 |
| (29) |
| (14) |
| 1 |
| 67 |
Total deferred tax assets | | 4,858 | | (4,542) | | (12) | | (38) | | 266 |
| | | | | | | | | | |
Deferred tax liabilities | |
|
|
|
|
|
|
|
|
|
Unrealised losses or gains on investments | | (1,063) |
| 691 |
| 127 |
| 3 |
| (242) |
Balances relating to investment and insurance contracts | | (1,765) |
| — |
| (433) |
| 73 |
| (2,125) |
Short-term temporary differences | | (3,247) |
| 2,832 |
| (87) |
| 7 |
| (495) |
Total deferred tax liabilities | | (6,075) | | 3,523 | | (393) | | 83 | | (2,862) |
At 31 December 2022, no deferred tax asset has been recognised in respect of unused tax losses and temporary deductible differences of $2,235 million (31 December 2021: $1,382 million). $837 million of the unused tax losses expired at the point of Prudential plc’s tax residency change from the UK to Hong Kong on 3 March 2023. A further $103 million (31 December 2021: $108 million) relates to unused tax losses that will expire within the next ten years (potential tax benefit: $22 million), and the remainder of $1,295 million (31 December 2021: $1,274 million) has no expiry date (potential tax benefit: $277 million).
Some of the Group’s businesses are located in jurisdictions in which a withholding tax charge is incurred upon the distribution of earnings. At 31 December 2022, deferred tax liabilities of $216 million (31 December 2021: $330 million) have not been recognised in respect of such withholding taxes as the Group is able to control the timing of the distributions and it is probable that the timing differences will not reverse in the foreseeable future.
C8 Share capital, share premium and own shares
Shares are classified as equity when their terms do not create an obligation to transfer assets. Amounts recorded in share capital represent the nominal value of the shares issued. The difference between the proceeds received on issue of the shares, net of share issue costs, and the nominal value of the shares issued, is credited to share premium. Where the Company purchases shares for the purposes of employee incentive plans, the consideration paid, net of issue costs, is deducted from retained earnings. Upon issue or sale any consideration received is credited to retained earnings net of related costs.
| | | | | | | | | | | | | |
| | 2022 | | 2021 | | ||||||||
Issued shares of 5p each fully paid |
| Number of ordinary |
| Share |
| Share |
| Number of ordinary |
| Share |
| Share |
|
| | shares | | capital | | premium | | shares | | capital | | premium | |
| |
| | $m | | $m | |
| | $m | | $m | |
Balance at 1 Jan |
| 2,746,412,265 | | 182 | | 5,010 | | 2,609,489,702 |
| 173 |
| 2,637 |
|
Shares issued under share-based schemes |
| 3,257,115 | | — | | 2 | | 6,142,213 |
| — |
| 8 |
|
Shares issued under Hong Kong public offer and international placing in 2021note | | — | | — | | (6) | | 130,780,350 | | 9 | | 2,365 | |
Balance at 31 Dec |
| 2,749,669,380 |
| 182 |
| 5,006 |
| 2,746,412,265 |
| 182 |
| 5,010 |
|
Note
In October 2021, Prudential completed the issuance of new ordinary shares on the Hong Kong Stock Exchange, resulting in net proceeds and an increase in shareholders' equity of $2.4 billion. The proceeds from this issuance were used to redeem high coupon debt instruments of US$1.3 billion in total in December 2021 and US$1.0 billion in January 2022, with the remainder used to increase Prudential's central stock of liquidity, as originally intended and disclosed in Prudential's prospectus for the issuance.
261
Options outstanding under save as you earn schemes to subscribe for shares at each year end shown below are as follows:
| | | | | | | | |
| | Number of | | | | | | |
| | shares to | | Share price range | | | ||
|
| subscribe for |
| from |
| to |
| Exercisable by year |
31 Dec 2022 | | 1,858,292 | | 737 | p | 1,455 | p | 2028 |
31 Dec 2021 |
| 2,022,535 | | 964 | p | 1,455 | p | 2027 |
Transactions by Prudential plc and its subsidiaries in Prudential plc shares
The Group buys and sells Prudential plc shares (‘own shares’) in relation to its employee share schemes. The cost of own shares of $270 million at 31 December 2022 (31 December 2021: $267 million) is deducted from retained earnings. The Company has established trusts to facilitate the delivery of shares under employee incentive plans. At 31 December 2022, 12.6 million (31 December 2021: 11.7 million) Prudential plc shares with a market value of $174 million (31 December 2021: $201 million) were held in such trusts, all of which are for employee incentive plans. The maximum number of shares held during the year was 13.0 million which was in September 2022.
Within the trusts, shares are notionally allocated by business unit reflecting the employees to which the awards were made.
The trusts purchased the following number of shares in respect of employee incentive plans:
| | | | | | | | | | | | | | | | |
| | 2022 | | 2021 | ||||||||||||
| | Number | | Share price | | | | Number | | Share price | | | ||||
|
| of shares |
| Low |
| High |
| Cost |
| of shares |
| Low |
| High |
| Cost |
| | | | £ | | £ | | $ | | | | £ | | £ | | $ |
January |
| 63,019 | | 12.93 | | 13.14 | | 1,120,889 | | 74,817 | | 14.12 | | 14.48 | | 1,443,158 |
February |
| 65,223 | | 12.43 | | 12.49 | | 1,098,500 | | 69,865 | | 12.42 | | 12.96 | | 1,251,067 |
March |
| 73,193 | | 10.37 | | 10.96 | | 1,055,044 | | 55,545 | | 14.91 | | 15.49 | | 1,189,784 |
April |
| 4,024,410 | | 10.64 | | 11.29 | | 58,880,934 | | 2,438,884 | | 15.45 | | 15.55 | | 52,512,098 |
May |
| 460,897 | | 8.95 | | 9.05 | | 5,288,807 | | 52,989 | | 15.82 | | 15.96 | | 1,183,836 |
June |
| 196,180 | | 10.13 | | 11.70 | | 2,402,464 | | 121,472 | | 14.62 | | 14.89 | | 2,508,974 |
July |
| 87,338 | | 10.06 | | 10.15 | | 1,052,807 | | 60,473 | | 13.62 | | 13.78 | | 1,145,078 |
August |
| 86,540 | | 9.81 | | 9.95 | | 1,029,843 | | 57,004 | | 14.20 | | 14.37 | | 1,128,450 |
September |
| 90,843 | | 9.24 | | 9.73 | | 1,000,619 | | 312,226 | | 14.89 | | 15.24 | | 7,961,098 |
October |
| 175,837 | | 9.06 | | 9.30 | | 1,675,634 | | 436,771 | | 14.48 | | 14.99 | | 8,410,274 |
November |
| 79,326 | | 8.99 | | 9.04 | | 837,944 | | 53,867 | | 14.77 | | 14.83 | | 1,072,374 |
December |
| 95,680 | | 10.63 | | 10.74 | | 1,240,296 | | 76,926 | | 13.20 | | 13.24 | | 1,355,942 |
Total |
| 5,498,486 | | | | | | 76,683,781 | | 3,810,839 | | | | | | 81,162,133 |
The cost in USD shown has been calculated from the share prices in pounds sterling using the monthly average exchange rate for the month in which those shares were purchased.
A portion of the share purchases in respect of employee incentive plans as shown in the table above were made on the Hong Kong Stock Exchange with the remainder being made on the London Stock Exchange.
Other than set out above, the Group did not purchase, sell or redeem any Prudential plc listed securities during 2022.
262
C9 Provisions
| | | | |
|
| 31 Dec 2022 $m |
| 31 Dec 2021 $m |
Staff benefits provisionsnote (i) |
| 341 |
| 355 |
Other provisions |
| 7 |
| 17 |
Total provisionsnote (ii) |
| 348 |
| 372 |
Notes
(i) | Provisions for staff benefits are generally expected to be paid out within the next three years. |
(ii) | Analysis of movement in total provisions is shown below: |
| | | | |
|
| 2022 $m |
| 2021 $m |
Balance at 1 Jan |
| 372 |
| 350 |
Removal of discontinued US operations | | — | | (14) |
Charged (credited) to income statement: |
| | | |
Additional provisions |
| 231 |
| 263 |
Unused amounts released |
| (20) |
| (15) |
Utilisation during the year |
| (221) |
| (204) |
Exchange differences |
| (14) |
| (8) |
Balance at 31 Dec |
| 348 |
| 372 |
C10 Capital
C10.1 Group objectives, policies and processes for managing capital
(a) Capital measure
The Group manages its Group GWS capital resources as its measure of capital. At 31 December 2022, estimated Group shareholder GWS capital resources is $23.2 billion (31 December 2021: $25.5 billion). The impacts of regulatory updates, estimated as at 31 December 2021, and $1.7 billion debt redemption in January 2022 are included within the 31 December 2021 capital resources.
(b) External capital requirements
Prudential plc is subject to the Group-wide Supervision (GWS) Framework issued by the Hong Kong Insurance Authority (IA).
Prudential applies the Insurance (Group Capital) Rules set out in the GWS Framework to determine group regulatory capital requirements (both minimum and prescribed levels). The summation of local statutory capital requirements across the Group is used to determine group regulatory capital requirements, with no allowance for diversification between business operations. The GWS eligible group capital resources are determined by the summation of capital resources across local solvency regimes for regulated entities and IFRS shareholders’ equity, with adjustments where applicable, for non-regulated entities.
The recent trend to more risk-based capital regimes being adopted in many of the Group's markets is continuing and this impacts on the Group's GWS capital measure, which is underpinned by the local regulatory regimes of the Group's subsidiaries, joint ventures and associates. C-ROSS Phase II became effective in the Chinese Mainland in the first quarter of 2022 and, in April 2022, Prudential Hong Kong Limited received approval from the Hong Kong IA to early adopt the new risk-based capital regime (HK RBC) effective from 1 January 2022.
More details on Group capital are given in section I(i) in the Additional unaudited financial information section.
(c) Meeting of capital management objectives
The GWS group capital adequacy requirements have been met since the GWS Framework became effective for Prudential upon designation. This includes maintaining total eligible group capital resources in excess of the Group Prescribed Capital Requirement (GPCR) of the supervised group and maintaining Tier 1 group capital resources in excess of the Group Minimum Capital Requirement (GMCR) of the supervised group.
The Group’s capital management framework focuses on achieving sustainable, profitable growth and maintaining a resilient balance sheet, with a disciplined approach to active capital allocation. As well as holding sufficient capital to meet
263
GWS requirements at Group level, the Group also closely manages the cash it holds within its central holding companies so that it can:
– | Fund new opportunities; |
– | Maintain flexibility and absorb shock events; |
– | Cover central costs; and |
– | Fund dividends. |
The Group monitors regulatory capital, economic capital and rating agency capital metrics and manages the business within its risk appetite by remaining within its economic and regulatory capital limits. Reserve adequacy testing under a range of scenarios and dynamic solvency testing is carried out, including under certain scenarios mandated by the local regulators.
The sensitivity of liabilities and other components of total capital vary depending upon the type of business concerned and this conditions the approach to asset/liability management.
C10.2 Local capital regulations
(a) Insurance operations
For regulated insurance entities, the capital resources and required capital included in the GWS capital measure for Hong Kong IA Group regulatory purposes are based on the local solvency regime applicable in each jurisdiction. The local valuation basis for the assets, liabilities and capital requirements of significant insurance operations are:
CPL
A risk-based capital, risk management and governance framework, known as the China Risk Oriented Solvency System (C-ROSS), applies in the Chinese Mainland. Under C-ROSS, insurers are required to maintain a core solvency ratio (core capital over minimum capital) and a comprehensive solvency ratio (capital resources over minimum capital) of not lower than 50 per cent and 100 per cent, respectively.
The actual capital is the difference between the admitted assets and admitted liabilities with trading and AFS assets marked-to-market and other assets at book value. Policyholder liabilities are based on a gross premium valuation method using best estimate assumptions with a separate risk margin.
The final regulations of C-ROSS Phase II became effective in the first quarter of 2022. The main updates to the local regulation were to introduce explicit tiering and admissibility rules on negative reserves in the capital resources and further updates to the risk calibrations used in calculating capital requirements.
Hong Kong
In April 2022, Prudential Hong Kong Limited received approval from the Hong Kong IA to early adopt the new risk-based capital regime (HK RBC) effective from 1 January 2022. The HK RBC framework requires liabilities to be based on a gross premium valuation method using best estimate assumptions and capital requirements to be risk-based, resulting in the release of prudent regulatory margins previously included in liabilities and an increase in required capital.
Indonesia
Solvency capital is determined using a risk-based capital approach. The capital resources are based on assets that are marked-to-market, with policyholder liabilities based on a gross premium valuation method using best estimate assumptions with a suitable margin for prudence. Liabilities are zeroised at policy level (ie negative liabilities are not permitted at a policy level). For unit-linked policies, an unearned premium reserve is established.
Malaysia
A risk-based capital framework applies in Malaysia. The local regulator, Bank Negara Malaysia (BNM), has set a Supervisory Target Capital Level of 130 per cent, below which supervisory actions of increasing intensity will be taken. Each insurer is also required to set its own Individual Target Capital Level to reflect its own risk profile and this is expected to be higher than the Supervisory Target Capital Level.
264
The capital resources are based on assets that are marked-to-market, with policyholder liabilities based on a gross premium valuation method using best estimate assumptions with a suitable margin for prudence. Liabilities are zeroised at a fund level (ie negative liabilities are not permitted at fund level). The BNM has initiated a review of its RBC framework and a discussion paper on the design of the updated RBC framework was issued on 30 June 2021 with industry feedback provided by 30 September 2021. The BNM have yet to issue their final technical specifications and the exact timing of implementation of potential revisions remains uncertain as these would need to be subject to quantitative impact studies and parallel run prior to introduction.
Market liberalisation measures were introduced by BNM in April 2009, which increases the limit from 49 per cent to 70 per cent on foreign equity ownership for insurance companies and Takaful operators in Malaysia. A higher foreign equity limit beyond 70 per cent for insurance companies will be considered by BNM on a case by case basis, for example, for companies who support expansion of providing insurance coverage to the most vulnerable in Malaysian society.
Singapore
A risk-based capital framework applies in Singapore. The local regulator, Monetary Authority of Singapore (MAS), has the authority to direct insurance companies to satisfy additional capital adequacy requirements in addition to those set forth under the Singapore Insurance Act, if considered appropriate. The capital resources are based on assets that are marked-to-market, with policyholder liabilities based on a gross premium valuation method using best estimate assumptions with a suitable margin for prudence. The updated risk-based capital framework (RBC2) permits the recognition of a prudent allowance for negative reserves in the capital resources.
(b) Asset management operations – regulatory and other surplus
Certain asset management subsidiaries of the Group are subject to local regulatory requirements. The movement in the year of the estimated surplus regulatory capital position (over the GPCR) of those subsidiaries, combined with the movement in the IFRS basis shareholders’ equity for unregulated asset management operations, is as follows:
| | | | |
|
| 2022 $m | | 2021 $m |
Balance at 1 Jan |
| 522 |
| 453 |
Gains during the year |
| 187 |
| 266 |
Movement in capital requirement |
| 15 |
| 3 |
Capital injection | | 3 | | 6 |
Distributions made to the parent company |
| (214) | | (201) |
Exchange and other movements |
| (47) |
| (5) |
Balance at 31 Dec |
| 466 |
| 522 |
C10.3 Transferability of capital resources
The amounts retained within the insurance companies are at levels that provide an appropriate level of capital strength in excess of the local regulatory minimum capital requirements. The businesses may, in general, remit dividends to parent entities, provided the statutory insurance fund meets the local regulatory solvency requirements and there are sufficient statutory accounting profits. For with-profits funds, the excess of assets over liabilities is retained within the funds, with distribution to shareholders tied to the shareholders’ share of declared bonuses.
Capital resources of the non-insurance business units are transferable after taking account an appropriate level of operating capital, based on local regulatory solvency requirements, where relevant.
265
C11 Property, plant and equipment
Property, plant and equipment comprise Group occupied properties and tangible assets. Property, plant and equipment also includes right-of-use assets for operating leases of properties occupied by the Group and leases of equipment and other tangible assets. All property, plant and equipment, including the right-of-use assets under operating leases, are held at cost less cumulative depreciation, calculated using the straight-line method, and impairment charge.
A reconciliation of the carrying amount of the Group's property, plant and equipment from the beginning to the end of the years shown is as follows:
| | | | | | | | | | | | | | | | |
| | 2022 $m | | 2021 $m | ||||||||||||
|
| Group |
| |
| |
| |
| Group |
| |
| |
| |
| | occupied | | Tangible | | Right-of- | | | | occupied | | Tangible | | Right-of- | | |
| | property | | assets | | use assets | | Total | | property | | assets | | use assets | | Total |
Balance at 1 Jan |
| |
| |
| | | |
|
|
|
|
| | |
|
Cost |
| 33 |
| 489 |
| 678 | | 1,200 |
| 355 |
| 707 |
| 710 | | 1,772 |
Accumulated depreciation |
| (10) |
| (349) |
| (363) | | (722) |
| (88) |
| (523) |
| (268) | | (879) |
Opening net book amount |
| 23 |
| 140 |
| 315 | | 478 |
| 267 |
| 184 |
| 442 | | 893 |
Removal of discontinued US operations | | — | | — | | — | | — | | (242) | | (32) | | (35) | | (309) |
Additions |
| — | | 34 | | 49 | | 83 |
| — |
| 36 |
| 59 | | 95 |
Depreciation and impairment charge |
| — | | (39) | | (106) | | (145) |
| (1) |
| (45) |
| (123) | | (169) |
Disposals, transfers and lease modifications |
| — | | (2) | | 26 | | 24 |
| — |
| — |
| (22) | | (22) |
Effect of movements in exchange rates | | (1) | | (7) | | (13) | | (21) | | (1) | | (3) | | (6) | | (10) |
Balance at 31 Dec |
| 22 | | 126 | | 271 | | 419 |
| 23 |
| 140 |
| 315 | | 478 |
Representing: |
| | | | | | | |
| |
| |
| | | |
Cost |
| 32 | | 486 | | 676 | | 1,194 |
| 33 |
| 489 |
| 678 | | 1,200 |
Accumulated depreciation |
| (10) | | (360) | | (405) | | (775) |
| (10) |
| (349) |
| (363) | | (722) |
Closing net book amount |
| 22 | | 126 | | 271 | | 419 |
| 23 |
| 140 |
| 315 | | 478 |
Right-of-use assets
The Group does not have any right-of-use assets that would meet the definition of investment property. As at 31 December 2022, total right-of-use assets comprised $267 million (31 December 2021: $311 million) of property and $4 million (31 December 2021: $4 million) of non-property assets. Of the $271 million (31 December 2021: $315 million) total right-of-use assets, $105 million (31 December 2021: $128 million) were held by the Group’s with-profits businesses.
Extension and termination options are included in a number of property and equipment leases across the Group. These are used to maximise operational flexibility in terms of managing the assets used in the Group’s operations. The majority of extension and termination options held are exercisable only by the Group and not by the respective lessor. The Group assesses at lease commencement whether it is reasonably certain to exercise the option. This assertion is revisited if there is a material change in circumstances. As at 31 December 2022, the undiscounted value of lease payments beyond the break period not recognised in the lease liabilities is $189 million (31 December 2021: $201 million).
The Group has non-cancellable property subleases which have been classified as operating leases under IFRS 16. The sublease rental income received in 2022 for the leases is $6 million (2021: $6 million).
Tangible assets
At 31 December 2022, of the $126 million (31 December 2021: $140 million) tangible assets, $53 million (31 December 2021: $63 million) were held by the Group’s with-profits businesses.
266
Capital expenditure: property, plant and equipment by segment
The capital expenditure on property, plant and equipment in 2022 of $34 million (2021: $36 million) arose as follows:
| | | | | |
|
| 2022 $m |
| 2021 $m |
|
Hong Kong | | 11 |
| 9 | |
Indonesia | | 1 |
| 1 | |
Malaysia | | 1 |
| 2 | |
Singapore | | 3 |
| 1 | |
Growth markets and other | | 16 |
| 19 | |
Eastspring | | 2 |
| 3 | |
Total segment | | 34 |
| 35 | |
Unallocated to a segment (central operations) | | — |
| 1 | |
Total capital expenditure on property, plant and equipment | | 34 |
| 36 | |
D Other information
D1Corporate transactions
D1.1 Gain (loss) attaching to corporate transactions
Corporate transactions include those associated with the disposal of the Group’s entities amongst other items. Where there is a disposal, income and expenses of entities sold during the year are included in the income statement up to the date of disposal. The gain or loss on disposal is calculated as the difference between sale proceeds net of selling costs, less the net assets of the entity at the date of disposal, adjusted for foreign exchange movements attaching to the sold entity that are required to be recycled to the income statement under IAS 21.
| | | | | | |
|
| 2022 $m |
| 2021 $m | | 2020 $m |
Gain (loss) attaching to corporate transactions as shown separately on the Consolidated income statementnote | | 55 | | (35) | | (30) |
Loss arising on reinsurance transaction undertaken by the Hong Kong business | | (44) | | (59) | | 765 |
Total gain (loss) attaching to corporate transactionsnote B1.1 | | 11 | | (94) | | 735 |
Note
The gain (loss) attaching to corporate transactions largely comprises a gain of $62 million (2021: $23 million) from the sale of shares relating to the Group’s retained interest in Jackson post the demerger. Other corporate transactions in 2021 largely represent costs associated with the demerger of Jackson.
D1.2 Discontinued US operations
On 13 September 2021, the Group completed the separation of its US operations (Jackson) through a demerger. In accordance with IFRS 5 ‘Non-current Assets Held for Sale and Discontinued Operations’, the US operations were classified as discontinued. The 2021 income statement included the results of Jackson up to 13 September 2021, the date of demerger.
The retained interest in Jackson is reported within the Consolidated statement of financial position as a financial investment at fair value and is included in ‘Unallocated to a segment (central operations)’ for segmental analysis. This investment has been classified as available-for-sale under IAS 39. During 2022, transactions reduced the Group’s holding to 9.2 per cent (both voting and economic interest) at 31 December 2022 (31 December 2021: 18.4 per cent economic interest with 18.5 per cent voting interest). The fair value of the Group’s holding at 31 December 2022 was $266 million (31 December 2021: $683 million).
The results for the discontinued US operations presented in the consolidated financial statements up to the demerger in September 2021 are analysed below.
267
(a)Income statement
| | | | |
|
| 2021 $m |
| 2020 $m |
Total revenue, net of reinsurance | | 45,972 |
| 19,763 |
Total charge, net of reinsurance | | (43,655) |
| (20,523) |
Profit (loss) before tax | | 2,317 |
| (760) |
Tax (charge) credit | | (363) |
| 477 |
Profit (loss) after tax | | 1,954 |
| (283) |
Remeasurement to fair valuenote (i) | | (8,259) |
| — |
Cumulative valuation movements on available-for-sale debt securities, net of related tax and change in DAC, and net investment hedges recycled from other comprehensive incomenote (ii) | | 1,278 |
| — |
Loss for the year | | (5,027) |
| (283) |
Attributable to: | | |
|
|
Equity holders of the Company | | (4,234) |
| (340) |
Non-controlling interests | | (793) |
| 57 |
Loss for the year | | (5,027) |
| (283) |
Notes
(i) | The loss on remeasurement to fair value on demerger was recognised in accordance with IFRIC 17 'Distributions of non-cash assets to owners' with the fair value determined with reference to the opening quoted price of Jackson shares on the New York Stock Exchange as at the date of demerger on 13 September 2021. |
(ii) | In accordance with IFRS, as a result of the demerger of Jackson, accumulated balances previously recognised through other comprehensive income relating to financial instruments held by Jackson classified as available-for-sale and historical net investment hedges were recycled from other comprehensive income to the results of discontinued operations in the Consolidated income statement. Total shareholders’ equity is unchanged as a result of this recycling. |
(b)Total comprehensive income
| | | | |
|
| 2021 $m |
| 2020 $m |
Loss for the year | | (5,027) |
| (283) |
Other comprehensive loss: | | |
|
|
Valuation movements on available-for-sale debt securities, net of related tax and change in DAC | | (763) |
| 292 |
Cumulative valuation movements on available-for-sale debt securities, net of related tax and change in DAC, and net investment hedges recycled through profit or loss at the point of demerger | | (1,278) |
| — |
Other comprehensive (loss) income for the year | | (2,041) |
| 292 |
Total comprehensive (loss) income for the year | | (7,068) |
| 9 |
Attributable to: | | |
|
|
Equity holders of the Company | | (6,283) |
| (40) |
Non-controlling interests | | (785) |
| 49 |
Total comprehensive (loss) income for the year | | (7,068) |
| 9 |
(c)Cash flows
| | | | |
|
| 2021 $m |
| 2020 $m |
Net cash flows from operating activities | | (423) |
| (807) |
Net cash flows from investing activities | | — |
| (2) |
Net cash flows from financing activitiesnote | | 2,329 |
| 470 |
Cash divested upon demerger | | (3,527) |
| — |
Net decrease in cash and cash equivalents |
| (1,621) |
| (339) |
Cash and cash equivalents at 1 Jan |
| 1,621 |
| 1,960 |
Cash and cash equivalents at 31 Dec | | — |
| 1,621 |
Note
Financing activities in 2021 largely reflected the issuance of debt of $2,350 million. No dividends were paid by Jackson during 2021 prior to demerger.
D2 Contingencies and related obligations
Litigation and regulatory matters
The Group is involved in various litigation and regulatory proceedings. While the outcome of such litigation and regulatory issues cannot be predicted with certainty, the Group believes that their ultimate outcome will not have a material adverse effect on the Group’s financial condition, results of operations, or cash flows.
268
Guarantees
The Group has provided guarantees and commitments to third parties entered into in the normal course of business and the Company has guaranteed public debt securities issued by one of its wholly-owned subsidiaries, Prudential Funding (Asia) PLC from early 2023. The Group considers the likelihood of outflows arising under such guarantees and commitments as remote.
Intra-group capital support arrangements
Prudential has put in place intra-group arrangements to formalise undertakings by Prudential to the regulators of the Hong Kong subsidiaries regarding their solvency levels. Other intra-group transactions are discussed in note D4 below.
D3 Post balance sheet events
Dividends
The 2022 second interim dividend approved by the Board of Directors after 31 December 2022 is as described in note B5.
Debt redemption
On 20 January 2023 the Company redeemed senior debt instruments of £300 million, as described in note C5.1.
D4 Related party transactions
Transactions between the Company and its subsidiaries or intra-group transactions are eliminated on consolidation. Intra-group transactions of the Group mainly related to a limited number of loans, guarantees or services provided by the Company to or from others business units, or between business units, including investment management services provided by the Group’s asset managers to the insurance operations businesses as shown in note B1.3. All intra-group transactions are subject to the same internal approval framework as external transactions. As the Group’s business units operate independently, overall there is limited interconnectedness across the Group. The Group reviews its recovery plan (that also covers intra-group transactions and the level of the Group’s interconnectivity risk) on an annual basis and details the remedial actions that could be used to restore financial strength and viability if the Group were to come under severe stress.
The Company has transactions and outstanding balances with collective investment schemes and similar entities that are not consolidated and where a Group company acts as manager, which are regarded as related parties for the purposes of IAS 24. The balances are included in the Group’s statement of financial position at fair value or amortised cost in accordance with IAS 39 classifications with the corresponding amounts included in the income statement. The transactions include amounts paid on issue of shares or units, amounts received on cancellation of shares or units and amounts paid in respect of the periodic charge and administration fee.
In addition, there are no material transactions between the Group’s joint ventures and associates, which are accounted for on an equity method basis, and other Group companies.
Key management personnel of the Company, as described in note B2.3, may from time to time purchase insurance, asset management or annuity products marketed by Group companies in the ordinary course of business on substantially the same terms as those prevailing at the time for comparable transactions with other persons.
In 2022, transactions with key management personnel were not deemed to be significant both by virtue of their size and in the context of the individuals’ financial positions. All of these transactions were on terms broadly equivalent to those that prevailed in arm’s-length transactions.
On 5 April 2021, pursuant to a separation agreement, Jackson National Life agreed to pay circa $23.5 million to Michael Falcon, the former chief executive officer of Jackson, as a series of cash lump sum payments for termination of loss of office, and agreed that Mr Falcon would retain 98,311 Prudential ADRs that had been previously deferred under the Deferred Annual Incentive Plan. Prudential agreed to reimburse Jackson National Life for such payments and settled this obligation prior to the demerger on 13 September 2021. On completion of the demerger, the Prudential ADRs were translated into Jackson Shares with an equivalent value. They will be released on the original timeline, ie in 2022 and 2023, and remain subject to the original malus and clawback provisions. Other transactions with those individuals meeting the definition of key management personnel in 2021 were not deemed to be significant using the criteria described above.
269
Additional details on the Directors’ interests in shares, transactions or arrangements are given in ‘Compensation and Employees’. Key management remuneration is disclosed in note B2.3.
D5 Commitments
The Group has provided, from time to time, certain commitments to third parties.
At 31 December 2022, the Group had $2,626 million unfunded commitments (31 December 2021: $2,878 million) primarily related to investments in infrastructure funds and alternative investment funds in Asia.
D6 Investments in subsidiary undertakings, joint ventures and associates
D6.1Basis of consolidation
The Group consolidates those investees it is deemed to control. The Group has control over an investee if all three of the followings are met: (1) it has power over an investee; (2) it is exposed to, or has rights to, variable returns from its involvement with the investee; and (3) it has the ability to use its power over the investee to affect its own returns.
(a)Subsidiaries
Subsidiaries are those investees that the Group controls. The majority of the Group’s subsidiaries are corporate entities.
The Group performs a re-assessment of consolidation whenever there is a change in the substance of the relationship between the Group and an investee. Where the Group is deemed to control an entity, it is treated as a subsidiary and its results, assets and liabilities are consolidated. Where the Group holds a minority share in an entity with no control over the entity, the investments are carried at fair value within financial investments in the Consolidated statement of financial position.
Entities consolidated by the Group include Qualifying Partnerships as defined under the UK Partnerships (Accounts) Regulations 2008 (the 'Partnerships Act'). The Group's limited partnership has taken advantage of the exemption under regulation 7 of the Partnerships Act from the financial statement requirements. This is under regulations 4 to 6, on the basis that the limited partnership is dealt with on a consolidated basis in these financial statements.
(b)Joint ventures and associates
Joint ventures are joint arrangements arising from a contractual agreement whereby the Group and other investors have joint control of the net assets of the arrangement. In a number of these arrangements, the Group’s share of the underlying net assets may be less than 50 per cent but the terms of the relevant agreement make it clear that control is jointly exercised between the Group and the third party. Associates are entities over which the Group has significant influence but does not control. Generally, it is presumed that the Group has significant influence if it holds between 20 per cent and 50 per cent voting rights of an entity.
With the exception of those referred to below, the Group accounts for its investments in joint ventures and associates using the equity method of accounting. The Group’s share of profit or loss of its joint ventures and associates is recognised in the income statement and its share of movements in other comprehensive income is recognised in other comprehensive income. The equity method of accounting does not apply to investments in joint ventures and associates held by the Group’s insurance or investment funds, including collective investment schemes which, as allowed by IAS 28 ‘Investments in Associates and Joint Ventures’, are carried at fair value through profit or loss.
(c)Structured entities
Structured entities are those that have been designed so that voting or similar rights are not the dominant factor in deciding who controls the entity. Voting rights relate to administrative tasks. Relevant activities are directed by means of contractual arrangements. The Group invests in both consolidated and unconsolidated structured entities including
270
investment vehicles such as collective investment schemes, collateralised debt obligations, mortgage-backed securities and similar asset-backed securities.
Collective investment schemes
The Group invests in collective investment schemes that invest mainly in equities, bonds, cash and cash equivalents and properties. In assessing control under IFRS 10 ‘Consolidated Financial Statements’, the Group determines whether it is acting as principal or agent and the variable returns from its involvement with these entities. The Group’s percentage ownership in these entities can fluctuate on a daily basis according to the participation of the Group and other investors.
Where the entity is managed by a Group asset manager:
– | Where the Group’s ownership holding in the entity exceeds 50 per cent, the Group is judged to have control over the entity; |
– | Where the Group’s ownership holding in the entity is between 20 per cent and 50 per cent, the facts and circumstances of the Group’s involvement in the entity are considered, including the rights to any fees earned by the asset manager, in forming a judgement as to whether the Group has control over the entity; |
– | Where the Group’s ownership holding in the entity is less than 20 per cent, the Group is judged to not have control over the entity. |
Where the entity is managed by an asset manager outside the Group, an assessment is made of whether the Group has existing rights that gives it the ability to direct the current activities of the entity and therefore control the entity. In assessing the Group’s ability to direct an entity, the Group considers its ability relative to other investors.
Where the Group is deemed to control an entity, it is treated as a subsidiary and is consolidated, with the interests of investors other than the Group being classified as liabilities, and presented within ‘Net asset value attributable to unit holders of consolidated investment funds’.
Where the Group does not control these entities (where the Group is deemed to be acting as an agent under IFRS 10) and they do not meet the definition of associates, they are carried at FVTPL within financial investments in the Consolidated statement of financial position.
Where the Group’s asset manager sets up investment funds as part of its asset management operations, unless the Group also participates in the ownership holding of the entities, the Group’s interest is limited to the fees charged to manage the assets of such entities. With no participation in ownership holding of these entities, the Group does not retain risks associated with investment funds. For these investment funds, the Group is not deemed to control the entities but deemed to be acting as an agent.
The Group generates returns and retains the ownership risks in these investment vehicles commensurate to its participation and does not have any further exposure to the residual risks of these investment vehicles.
Other structured entities
The Group holds investments in mortgage-backed securities, collateralised debt obligations and similar asset-backed securities, the majority of which are actively traded in a liquid market.
The Group consolidates the vehicles that hold the investments where the Group is deemed to control the vehicles. When assessing control over the vehicles, the factors considered include the purpose and design of the vehicle, the Group’s exposure to the variability of returns and the scope of the Group’s ability to direct the relevant activities of the vehicle including any kick-out or removal rights that are held by third parties. The outcome of the control assessment is dependent on the terms and conditions of the respective individual arrangements.
The majority of such vehicles are not consolidated. In these cases, the Group is not the sponsor of the vehicles in which it holds investments and has no administrative rights over the vehicles’ activities. The Group generates returns and retains the ownership risks commensurate to its holding and its exposure to the investments and does not have any further exposure to the residual risks or losses of the investments or the vehicles in which it holds investments. Accordingly, the Group does not have power over the relevant activities of such vehicles and all are carried at FVTPL within financial investments in the Consolidated statement of financial position.
271
The table below provides aggregate carrying amounts of the investments in unconsolidated structured entities reported in the Group’s Consolidated statement of financial position:
| | | | | | | | |
| | 31 Dec 2022 $m | | 31 Dec 2021 $m | ||||
| | | | Other | | | | Other |
| | Investment | | structured | | Investment | | structured |
Consolidated statement of financial position line items | | funds | | entities | | funds | | entities |
Equity securities and holdings in collective investment schemes |
| 30,771 |
| — |
| 35,446 |
| — |
Debt securities |
| — |
| 370 | | — |
| 251 |
Total investments in unconsolidated structured entities |
| 30,771 |
| 370 | | 35,446 |
| 251 |
The Group's maximum exposure to loss related to the interest in unconsolidated structured entities is limited to the carrying value in the Consolidated statement of financial position and the unfunded investment commitments provided by the Group (see note D5).
During the year, the Group receives dividend and interest income from its investments in these unconsolidated structured entities. Where the Group’s asset manager manages these entities, such as the collective investment schemes, the Group also receives asset management fees from these entities.
As at 31 December 2022 and 2021, the Group does not have an agreement, contractual or otherwise, or intention to provide financial support to structured entities (both consolidated and unconsolidated) that could expose the Group to a loss.
D6.2 Dividend restrictions and minimum capital requirements
Certain Group entities are subject to restrictions on the amounts of funds they may transfer in the form of cash dividends or otherwise to the parent company.
Under UK company law, UK companies can only declare dividends if they have sufficient distributable reserves.
The Group’s subsidiaries, joint ventures and associates may remit dividends to the Group, in general, provided the statutory insurance fund meets the capital adequacy standard required under local statutory regulations and has sufficient distributable reserves. Further details on local capital regulations in certain Asia operations are provided in note C10.2.
D6.3 Investments in joint ventures and associates
Joint ventures represent arrangements where the controlling parties through contractual or other agreement have the rights to the net assets of the arrangements. The Group has insurance and asset management joint ventures in Chinese Mainland with CITIC Group and an asset management joint venture in India with ICICI Bank. In addition, there is an asset management joint venture in Hong Kong with Bank of China International Holdings Limited (BOCI) and Takaful insurance joint venture in Malaysia. For the Group’s joint ventures that are accounted for using the equity method, the net-of-tax results of these operations are included in the Group’s profit before tax.
The Group’s associates, which are also accounted for using the equity method, include the Indian insurance entity (with the majority shareholder being ICICI Bank).
In addition, the Group has investments in collective investment schemes, funds holding collateralised debt obligations and property funds where the Group has significant influence. As allowed under IAS 28, these investments are accounted for on a FVTPL basis. The aggregate fair value of associates accounted for at fair value through profit or loss, where there are published price quotations, is approximately $0.3 billion at 31 December 2022 (31 December 2021: $0.6 billion).
For joint ventures and associates accounted for using the equity method, the 12 months financial information of these investments for the years ended 31 December 2022 and 2021 (covering the same period as that of the Group) has been used in these consolidated financial statements.
272
The Group’s share of the profit for shareholder-backed business (including short-term fluctuations in investment returns), net of related tax, in joint ventures and associates equity accounted for as shown in the Consolidated income statement, is allocated across segments as follows:
| | | | | | |
|
| 2022 $m |
| 2021 $m |
| 2020 $m |
CPL |
| (144) |
| 278 |
| 394 |
Hong Kong | | — | | 9 | | 3 |
Malaysia | | 24 | | 28 | | 30 |
Growth markets and othernote | | 5 | | (110) | | (27) |
Insurance operations | | (115) | | 205 | | 400 |
Eastspring |
| 144 |
| 147 |
| 117 |
Total segment and Group total |
| 29 |
| 352 |
| 517 |
Note
For growth markets and other, as well as the segment results for associates and joint ventures within the segment, the amount shown includes other items of $15 million (2021: $(38) million; 2020: $(103) million) which primarily comprise of taxes for all life joint ventures and associates together with other non-recurring items.
There is no other comprehensive income in the joint ventures and associates other than the foreign exchange differences that arise from translating the associates and joint ventures into the Group's presentational currency. There has been no unrecognised share of losses of a joint venture or associate that the Group has stopped recognising in total comprehensive income.
The Group’s interest in joint ventures and associates gives rise to no contingent liabilities or capital commitments that are material to the Group.
CITIC-Prudential Life Insurance Company (CPL)
CPL is the Group’s joint venture with the CITIC Group in which the Group owns a 50 per cent interest. The joint venture is incorporated in China and is principally engaged in underwriting insurance and investment contracts. The summarised financial information for CPL, which is considered to be a material joint venture to the Group, is set out below. The financial information represents the entity’s financial statements prepared in accordance with Group’s IFRS accounting policies, on a 100 per cent basis, for the years shown:
| | | | | | |
Statement of financial position: |
| 31 Dec 2022 $m |
| 31 Dec 2021 $m |
| |
Total assets | | 31,608 |
| 29,237 |
| |
Total liabilities (including non-controlling interest) | | 29,330 |
| 26,523 |
| |
Shareholders’ equity | | 2,278 |
| 2,714 |
| |
| | | | | | |
The above amounts of assets and liabilities include the following: | | |
| |
| |
Cash and cash equivalents | | 561 |
| 422 |
| |
Financial liabilities (excluding trade and other payables and provisions) | | 985 |
| 938 |
| |
| | | | | | |
Income statement: |
| 2022 $m |
| 2021 $m |
| 2020 $m |
Revenue | | 5,778 | | 7,374 |
| 5,492 |
Profit for the year after tax | | (248) |
| 453 |
| 599 |
The above profit for the year includes the following: | | |
| |
| |
Depreciation and amortisation | | (106) |
| (86) |
| (81) |
Interest income | | 599 |
| 465 |
| 378 |
Interest expense | | (3) |
| (2) |
| (2) |
Income tax credit (charge) | | 40 |
| (84) |
| (166) |
The summarised financial information above is reconciled to the carrying amount of the Group’s interest in the joint venture recognised in the consolidated financial statements as follows:
| | | | | | |
|
| 31 Dec 2022 $m |
| 31 Dec 2021 $m |
| |
Net assets of CITIC-Prudential Life as shown above | | 2,278 |
| 2,714 | | |
Proportion owned by the joint venture partner (50%) | | 1,139 |
| 1,357 | | |
Carrying amount of the Group’s interest in the joint venture (50%) | | 1,139 |
| 1,357 | | |
The Group has received no dividends from CPL in 2022 (2021: $57 million).
273
D6.4 Related undertakings
In accordance with Section 409 of the Companies Act 2006, a list of Prudential Group’s subsidiaries, joint ventures, associates and significant holdings (being holdings of more than 20 per cent) is disclosed below, along with the classes of shares held, the registered office address and the effective percentage of equity owned at 31 December 2022. The Group also operates through branches, none of which are significant.
The definitions of a subsidiary undertaking, joint venture and associate in accordance with the Companies Act 2006 are different from the definition under IFRS Standards. As a result, the related undertakings included within the list below may not be the same as the undertakings consolidated in the Group consolidated financial statements. The Group’s consolidation policy is described in note D6.1.
Simplified corporate structure as at 31 December 2022
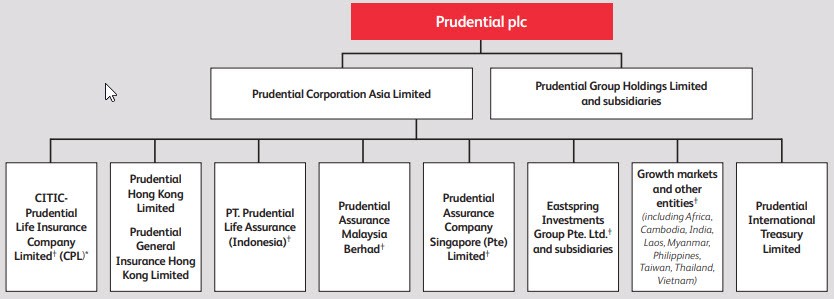
*CPL is a joint venture with CITIC, a leading state owned conglomerate
†Indirectly held by Prudential Corporation Asia Limited.
Direct subsidiary undertakings of the parent company, Prudential plc (shares held directly or via nominees)
Key to share classes:
| | |
Abbreviation | | Class of share held |
LBG | | Limited by Guarantee |
MI | | Membership Interest |
MI - WFOE | | Membership Interest of a Wholly Foreign Owned Enterprise in the Chinese Mainland |
MI – JV | | Membership Interest of a Sino-Foreign Equity Joint Venture in the Chinese Mainland |
OS | | Ordinary Shares |
PI | | Partnership Interest |
PS | | Preference Shares |
U | | Units |
| | | | | | |
Name of entity |
| Classes of |
| Proportion |
| Registered office address |
Prudential Corporation Asia Limited |
| OS |
| 100.00% | | 13th Floor, One International Finance Centre, 1 Harbour View Street, Central, Hong Kong |
Prudential Group Holdings Limited |
| OS |
| 100.00% | | 1 Angel Court, London, EC2R 7AG, United Kingdom |
274
Other subsidiaries, joint ventures, associates and significant holdings of the Group – no shares held directly by the parent company (Prudential plc) or its nominees
| | | | | | |
|
| Classes of |
| |
| |
| | shares | | Proportion | | |
Name of entity | | held | | held | | Registered office address |
Aberdeen Cash Creation Fund | | U | | 30.62% | | 28th Floor Bangkok City Tower, 179 South Sathorn Road, Thungmahamek, Sathorn, Bangkok 10120, Thailand |
Aberdeen Standard Global Opportunities Fund | | U | | 34.61% | | 21 Church Street, #01-01, Capital Square Two, Singapore 049480 |
Aberdeen Standard Singapore Equity Fund | | U | | 62.18% | | |
AC Financial Partners Limited Partnership | | PI | | 100.00% | | 65 Haymarket Terrace, Edinburgh, EH12 5HD |
Alternatives North America Ltd. | | U | | 100.00% | | PO Box 1093, Queensgate House, Grand Cayman, KY1-1102, Cayman Islands |
BOCHK Aggressive Growth Fund | | U | | 47.75% | | 27th Floor, Bank of China Tower, 1 Garden Road, Hong Kong |
BOCHK Balanced Growth Fund |
| U |
| 41.47% | | |
BOCHK China Equity Fund |
| U |
| 73.71% | | |
BOCHK Conservative Growth Fund | | U | | 42.71% | | |
BOCHK US Dollar Money Market Fund |
| U |
| 21.91% | | |
BOCI-Prudential Asset Management Limited |
| OS |
| 36.00% | | |
BOCI-Prudential Trustee Limited |
| OS |
| 36.00% | | Suites 1501-1507 & 1513-1516, 15th Floor, 1111 King's Road, Taikoo Shing, Hong Kong |
Cathay High Yield Ex China Cash Pay 1-5 Year 2% Issuer Capped ETF | | U | | 42.71% | | 6th Floor, No.39, Sec.2, Dunhua South. Road, Taipei, Taiwan |
CITIC-CP Asset Management Co., Ltd. |
| MI - JV |
| 26.95% | | Room 101-2, No.128 North Zhangjiabang Road, Pudong District, Shanghai, China |
CITIC-Prudential Fund Management Company Limited |
| MI - JV |
| 49.00% | | Level 9, HSBC Building, Shanghai IFC, 8 Century Avenue, Pudong, Shanghai, China |
CITIC-Prudential Life Insurance Company Limited |
| MI - JV |
| 50.00% | | Room 1101-A, 1201, 1301, 1401, 1501, 1601, 1701, 1801, Unit 01, Building 1, No. B2, North Road of East Third Ring Road, Chaoyang District, Beijing, PRC,100027, China |
275
| | | | | | |
|
| Classes of |
| |
| |
| | shares | | Proportion | | |
Name of entity | | held | | held | | Registered office address |
Eastspring Al-Wara' Investments Berhad |
| OS |
| 100.00% | | Level 25, Menara Hong Leong, No. 6 Jalan Damanlela, Bukit Damansara, 50490 Kuala Lumpur, Malaysia |
Eastspring Asia Pacific High Yield Equity Fund |
| U |
| 37.57% | | 4th Floor, No.1, Songzhi Road, Xinyi Dist., Taipei, Taiwan |
Eastspring Asset Management (Thailand) Co., Ltd. |
| OS |
| 59.50% | | 944 Mitrtown Office Tower, 9th Floor, Rama 4 Road, Wangmai, Pathumwan, Bangkok 10330, Thailand |
Eastspring Asset Management Korea Co. Ltd. | | OS | | 100.00% | | 22nd Floor (Seoul International Finance Center, Yeouido dong), 10 Gukjegeumyung-ro, Yeongdeungpo-gu, Seoul, Republic of Korea 07326 |
Eastspring Investment K-Short Term Bond Alpha Securities Investment Trust(Bond Balanced) | | U | | 27.54% | | 22nd Floor One IFC, 10 Gukjegeumyung-ro, Youngdungpo-gu, Seoul 07326, Korea |
Eastspring Investment Management (Shanghai) Company Limited | | MI - WFOE | | 100.00% | | Unit 306-308, 3rd Floor, Azia Center, 1233 Lujiazui Ring Road, China (Shanghai) Pilot Free Trade Zone, China |
Eastspring Investments - Asia Opportunities Equity Fund | | U | | 99.97% | | 26, Boulevard Royal, L-2449, Luxembourg |
Eastspring Investments - Global Growth Equity Fund | | U | | 59.04% | | |
Eastspring Investments - Global Low Volatility Equity Fund |
| U |
| 96.36% | | |
Eastspring Investments - Global Technology Fund | | U | | 82.06% | | |
Eastspring Investments - Pan European Fund |
| U |
| 61.34% | | |
Eastspring Investments - US High Yield Bond Fund | | U | | 46.85% | | |
Eastspring Investments - US Investment Grade Bond Fund |
| U |
| 68.91% | | |
Eastspring Investments - World Value Equity Fund | | U | | 95.64% | | |
Eastspring Investments (Hong Kong) Limited | | OS | | 100.00% | | 13th Floor, One International Finance Centre, 1 Harbour View Street, Central, Hong Kong |
Eastspring Investments (Luxembourg) S.A. |
| OS |
| 100.00% | | 26, Boulevard Royal, L-2449 Luxembourg, Grand Duchy of Luxembourg |
Eastspring Investments (Singapore) Limited |
| OS |
| 100.00% | | 10 Marina Boulevard, #32-01, Marina Bay Financial Centre, Singapore 018983 |
Eastspring Investments Asia Pacific Equity Fund |
| U |
| 93.92% | | 26, Boulevard Royal, L-2449, Luxembourg |
Eastspring Investments Asia Pacific ex-Japan Target Return Fund |
| U |
| 75.84% | | Eastspring Investments Berhad, Level 22, Menara Prudential, Persiaran TRX Barat, 55188 Tun Razak Exchange, Kuala Lumpur, Malaysia |
Eastspring Investments Asia Real Estate Multi Asset Income Fund |
| U |
| 73.95% | | 26, Boulevard Royal, L-2449, Luxembourg |
Eastspring Investments Asia Sustainable Bond Fund | | U | | 93.97% | | |
Eastspring Investments Asian Bond Fund | | U | | 42.30% | | |
Eastspring Investments Asian Dynamic Fund |
| U |
| 91.58% | | |
Eastspring Investments Asian Equity Fund |
| U |
| 98.97% | | |
Eastspring Investments Asian Equity Income Fund |
| U |
| 87.52% | | |
Eastspring Investments Asian High Yield Bond Fund |
| U |
| 44.35% | | |
Eastspring Investments Asian Investment Grade Bond Fund | | U | | 90.06% | | |
Eastspring Investments Asian Low Volatility Equity Fund | | U | | 89.01% | | |
Eastspring Investments Asian Multi Factor Equity Fund | | U | | 90.94% | | |
Eastspring Investments Berhad | | OS | | 100.00% | | Level 25, Menara Hong Leong, No. 6 Jalan Damanlela, Bukit Damansara, 50490 Kuala Lumpur, Wilayah Persekutuan, Malaysia |
Eastspring Investments China A Shares Growth Fund | | U | | 63.69% | | 26, Boulevard Royal, L-2449, Luxembourg |
Eastspring Investments Dragon Peacock Fund | | U | | 95.82% | | |
Eastspring Investments Emerging Markets Star Players | | U | | 40.88% | | Eastspring Investments Limited, Marunouchi Park Bldg., 2-6-1 Marunochi, Chiyoda-ku, Tokyo, Japan 100-6905 |
Eastspring Investments Equity Income Fund | | U | | 40.95% | | Eastspring Investments Berhad, Level 22, Menara Prudential, Persiaran TRX Barat, 55188 Tun Razak Exchange, Kuala Lumpur, Malaysia |
Eastspring Investments European Investment Grade Bond Fund | | U | | 99.91% | | 26, Boulevard Royal, L-2449, Luxembourg |
Eastspring Investments Fund Management Limited Liability Company | | MI | | 100.00% | | 23rd Floor, Saigon Trade Center, 37 Ton Duc Thang Street, District 1, Ho Chi Minh City, Vietnam |
Eastspring Investments Global Emerging Markets Bond Fund | | U | | 99.38% | | 26, Boulevard Royal, L-2449, Luxembourg |
Eastspring Investments Global Emerging Markets Dynamic Fund | | U | | 62.79% | | |
Eastspring Investments Global Emerging Markets ex-China Dynamic Fund | | U | | 99.96% | | |
Eastspring Investments Global Equity Navigator Fund | | U | | 97.19% | | |
Eastspring Investments Global Growth Fund | | U | | 40.22% | | Eastspring Investments Berhad, Level 22, Menara Prudential, Persiaran TRX Barat, 55188 Tun Razak Exchange, Kuala Lumpur, Malaysia |
Eastspring Investments Global Market Navigator Fund | | U | | 99.75% | | 26, Boulevard Royal, L-2449, Luxembourg |
Eastspring Investments Global Multi Asset Income Plus Growth Fund | | U | | 100.00% | | |
Eastspring Investments Greater China Equity Fund | | U | | 90.60% | | |
Eastspring Investments Group Pte. Ltd. | | OS | | 100.00% | | 10 Marina Boulevard, #32-01, Marina Bay Financial Centre, Singapore 018983 |
Eastspring Investments Incorporated | | OS | | 100.00% | | 874 Walker Road, Suite C, City of Dover, County of Kent, State of Delaware, 19904, USA |
Eastspring Investments India Consumer Equity Open Limited | | OS | | 100.00% | | 3rd Floor, 355 NEX, Rue du Savoir, Cybercity Ebene 72201, Mauritius |
Eastspring Investments India Equity Fund | | U | | 79.97% | | 26, Boulevard Royal, L-2449, Luxembourg |
Eastspring Investments India Equity Open Limited | | OS | | 100.00% | | 3rd Floor, 355 NEX, Rue du Savoir, Cybercity Ebene 72201, Mauritius |
Eastspring Investments India Infrastructure Equity Open Limited | | OS | | 100.00% | | |
Eastspring Investments Limited | | OS | | 100.00% | | Marunouchi Park Building, 6-1 Marunouchi 2-chome, Chiyoda-Ku, Tokyo, Japan |
276
| | | | | | |
|
| Classes of |
| |
| |
| | shares | | Proportion | | |
Name of entity | | held | | held | | Registered office address |
Eastspring Investments MY Focus Fund |
| U |
| 28.33% | | Eastspring Investments Berhad, Level 22, Menara Prudential, Persiaran TRX Barat, 55188 Tun Razak Exchange, Kuala Lumpur, Malaysia |
Eastspring Investments Private Fixed Income Fund Number 1 |
| U |
| 87.11% | | Units 306-308, 3rd Floor, Azia Center 1233 Lujiazui Ring Road, Shanghai, China |
Eastspring Investments Services Pte. Ltd. |
| OS |
| 100.00% | | 10 Marina Boulevard, #32-01, Marina Bay Financial Centre, Singapore 018983 |
Eastspring Investments SICAV-FIS - Alternative Investments Fund |
| U |
| 100.00% | | 26, Boulevard Royal, L-2449, Luxembourg |
Eastspring Investments SICAV-FIS - Asia Pacific Loan Fund | | U | | 100.00% | | 26, Boulevard Royal, L-2449, Luxembourg |
Eastspring Investments Syariah Equity Islamic Asia Pacific USD Kelas B |
| U |
| 88.02% | | Prudential Tower, 23rd Floor, Jl. Jend. Sudirman Kav.79, Jakarta 12910, Indonesia |
Eastspring Investments Unit Trusts - Dragon Peacock Fund |
| U |
| 97.69% | | 10 Marina Boulevard, #32-01, Marina Bay Financial Centre, Singapore 018983 |
Eastspring Investments Unit Trusts Singapore ASEAN Equity Fund |
| U |
| 98.74% | | |
Eastspring Investments Unit Trusts Singapore Select Bond Fund | | U | | 66.05% | | |
Eastspring Investments US Corporate Bond Fund | | U | | 60.04% | | 26, Boulevard Royal, L-2449, Luxembourg |
Eastspring Investments US High Investment Grade Bond Fund |
| U |
| 87.42% | | |
Eastspring Investments Vietnam Navigator Fund |
| U |
| 76.79% | | 23rd Floor, Saigon Trade Center Building, 37 Ton Duc Thang Street, Ben Nghe Ward, District 1, Ho Chi Minh City, Vietnam |
Eastspring Investments-Global Emerging Markets Fundamental Value Fund | | U | | 99.96% | | 26, Boulevard Royal, L-2449, Luxembourg |
Eastspring Investments-Japan Sustainable Value Fund | | U | | 100.00% | | |
Eastspring Overseas Investment Fund Management (Shanghai) Company Limited | | MI - WFOE | | 100.00% | | Unit 306-308, 3rd Floor, 1233 Lujiazui Ring Road, China (Shanghai) Pilot Free Trade Zone, China |
Eastspring Private Equity Fund 2 |
| U |
| 99.99% | | 10 Marina Boulevard, #32-01, Marina Bay Financial Centre Tower 2, Singapore 018983 |
Eastspring Securities Investment Trust Co., Ltd. | | OS | | 99.54% | | 4th Floor, No.1 Songzhi Road, Taipei 110, Taiwan |
Eastspring Singapore Alternatives VCC |
| U |
| 100.00% | | 10 Marina Boulevard, #32-01, Marina Bay Financial Centre, Singapore 018983 |
Eastspring Syariah Fixed Income USD Kelas A | | U | | 69.23% | | Prudential Tower Lantai 23, JI. Jend. Sudirman Kav. 79, Jakarta 12910, Indonesia |
FCP Ecobank Actions Uemoa |
| U |
| 43.63% | | Immeuble Ecobank, 2Er Etage -Avenue Houdaille Plateau, 01 B.P 4107 Abidjan O1 Cote D’Ivoire |
First Sentier Global Property Securities Fund |
| U |
| 67.50% | | 79 Robinson Road, #17-01, Singapore 068897 |
FSSA China Focus Fund |
| U |
| 67.76% | | 70 Sir John Rogerson’s Quay, Dublin 2, D02 R296, Ireland |
Fubon 1-5 Years US High Yield Bond Ex China | | U | | 61.05% | | 8th Floor, No.108, Sec.1, Dunhua South. Road, Taipei, Taiwan |
Fubon China Bond Umbrella Fund - Fubon China Quality Rmb Bond Fund |
| U |
| 23.37% | | |
Fubon China Currency Fund |
| U |
| 35.49% | | |
Fuh Hwa 1-5 Yr High Yield ETF | | U | | 44.22% | | 8th & 9th Floor, No.308, Sec. 2, Bade Road, Da-an District |
Fuh Hwa Emerging Market RMB Fixed Income Fund | | U | | 46.42% | | |
Fuh Hwa Rmb Money Market Fund | | U | | 37.52% | | |
Furnival Insurance Company PCC Limited | | OS | | 100.00% | | PO Box 155, Mill Court, La Charroterie, St Peter Port, GY1 4ET, Guernsey |
GIS Total Return Bond Fund |
| U | | 27.53% | | 78 Sir John Rogerson's Quay, Dublin, D02 HD32, Ireland |
277
| | | | | | |
|
| Classes of |
| |
| |
| | shares | | Proportion | | |
Name of entity | | held | | held | | Registered office address |
GS Twenty Two Limited |
| OS |
| 100.00% | | 1 Angel Court, London, EC2R 7AG, United Kingdom |
HSBC Asia Pacific Ex Japan Sustainable Equity UCITS ETF |
| U |
| 63.65% | | 25/28 North Wall Quay, IFSC, Dublin 1, Ireland |
HSBC Senior Global Infrastructure Debt Fund |
| U |
| 100.00% | | 8 Canada Square, London, E14 5HQ, United Kingdom |
ICICI Prudential Asset Management Company Limited |
| OS |
| 49.00% | | 12th Floor, Narain Manzil, 23, Barakhamba Road, New Delhi 110001, India |
ICICI Prudential Life Insurance Company Limited |
| OS |
| 22.07% | | ICICI PruLife Towers, 1089 Appasaheb Marathe Marg, Prabhadevi, Mumbai 400025, India |
ICICI Prudential Pension Funds Management Company Limited |
| OS |
| 22.07% | | |
ICICI Prudential Trust Limited |
| OS |
| 49.00% | | 12th Floor, Narain Manzil, 23, Barakhamba Road, New Delhi 110001, India |
India Innovation High Growth EQ QII | | U | | 100.00% | | Eastspring Investments Limited, Marunouchi Park Bldg., 2-6-1 Marunochi, Chiyoda-ku, Tokyo, Japan 100-6905 |
Invesco Fixed Maturity Selective Emerging Market Bonds 2024 | | U | | 100.00% | | 8th Floor, No 122, Tung Hua N. Rd. Taipei, Taiwan |
Invesco Select 6 Year Maturity Global Bond Fund |
| U |
| 100.00% | | |
iShares Core MSCI Asia | | U | | 61.46% | | 15th, 16th, 17th Floor, Champion Tower & 17th Floor ICBC Tower, Three Garden Road, Central, Hong Kong |
iShares Global High Yield Corp Bond UCITS ETF | | U | | 65.61% | | 200 Capital Dock, 79 Sir John Rogerson’s Quay, Dublin 2, Ireland |
iShares MSCI Europe ESG Enhanced UCITS ETF | | U | | 51.34% | | 12 Throgmorton Avenue, London, EC2N 2DL |
iShares MSCI Korea UCITS ETF USD (Acc) | | U | | 53.66% | | 200 Capital Dock, 79 Sir John Rogerson’s Quay, Dublin 2, Ireland |
iShares MSCI USA ESG Enhanced UCITS ETF |
| U |
| 41.86% | | 12 Throgmorton Avenue, London, EC2N 2DL |
KKP Active Equity Fund | | U | | 35.38% | | 19th Floor Muang Thai-Phatra Complex, Building Tower, A, 252/25 Ratchadapisek Road, Huaykwang, Bangkok 10310, Thailand |
Krungsri Greater China Equity Hedged Dividend Fund | | U | | 31.10% | | 12th, 18th Zone B Floor, Ploenchit Tower 898 Ploenchit Road, Lumpini Pathumwan, Bangkok 10330, Thailand |
Lasalle Property Securities SICAV-FIS |
| U |
| 99.97% | | 11-13 Bouldevard de la Foire, L-1528 Luxembourg |
M&G Asia Property Trust |
| U |
| 100.00% | | 138 Market Street, CapitaGreen #35-01, Singapore 048946 |
M&G Real Estate Asia Holding Company Pte. Ltd. |
| OS |
| 33.00% | | 138 Market Street, #35-01 CapitaGreen, Singapore 048946 |
278
| | | | | | |
|
| Classes of |
| |
| |
| | shares | | Proportion | | |
Name of entity | | held | | held | | Registered office address |
Manulife Asia Pacific Bond Fund |
| U |
| 57.81% | | 9th Floor, No 89 Son Ren Road, Taipei, Taiwan |
Manulife China Dim Sum High Yield Bond Fund |
| U |
| 22.54% | | |
Manulife China Offshore Bond Fund |
| U |
| 85.22% | | |
Manulife Taiwan Dynamic Fund |
| U |
| 20.53% | | |
Manulife USD High Yield Bond Fund |
| U |
| 29.47% | | |
Nomura Six Years Fixed Maturity Asia Pacific Emerging Market Bond Fund |
| U |
| 100.00% | | 101 Tower, 30th Floor, No. 7 Sec. 5, Xinyi Rd., Xinyi Dist., Taipei, Taiwan |
Nomura Six Years Fixed Maturity Emerging Market Bond Fund | | U | | 41.88% | | |
Nomura Six Years Ladder Maturity Asia Pacific Emerging Market Bond Fund |
| U |
| 97.86% | | |
North Sathorn Holdings Company Limited |
| OS |
| 100.00% | | No. 63, Athenee Tower, 34th Floor, Wireless Road, Lumpini Subdistrict Pathumwan District, Bangkok Metropolis, Thailand |
PCA IP Services Limited |
| OS |
| 100.00% | | 13th Floor, One International Finance Centre, 1 Harbour View Street, Central, Hong Kong |
PCA Life Assurance Co., Ltd. | | OS | | 99.79% | | 8th Floor, No.1 Songzhi Road, Taipei City, 11047, Taiwan |
PCA Reinsurance Co. Ltd. |
| OS |
| 100.00% | | Unit Level 13(A), Main Office Tower, Financial Park Labuan, Jalan Merdeka, 87000 Federal Territory of Labuan, Malaysia |
279
|
| Classes of |
| |
| |
| | shares | | Proportion | | |
Name of entity | | held | | held | | Registered office address |
PineBridge US Dual Core Income Fund | | U | | 37.37% | | 10th Floor, No. 144, Sec. 2, Minquan East Rd, Taipei |
Principal Global Silver Age Fund |
| U |
| 22.89% | | 44, 16th Floor, CIMB Thai Bank, Lungsuan Road, Lumpini, Bangkok 10330, Thailand |
Pru Life Insurance Corporation of U.K. | | OS | | 100.00% | | 9th Floor, Uptown Place Tower 1, 1 East 11th Drive, Uptown Bonifacio, 1634 Taguig City, Metro Manila, Philippines |
Pru Life UK Asset Management and Trust Corporation |
| OS |
| 100.00% | | |
Prudence Foundation | | LBG | | 100.00% | | 13th Floor, One International Finance Centre, 1 Harbour View Street, Central, Hong Kong |
Prudential (Cambodia) Life Assurance Plc | | OS | | 100.00% | | Phnom Penh Tower, 20th Floor, #445, Monivong Blvd., Boeung Prolit, 7 Makara, Phnom Penh, Cambodia |
Prudential (US Holdco 1) Limited |
| OS |
| 100.00% | | 1 Angel Court, London, EC2R 7AG, United Kingdom |
Prudential Africa Holdings Limited |
| OS |
| 100.00% | | |
Prudential Africa Services Limited |
| OS |
| 100.00% | | 3rd Floor, One Africa Place, LR. No. 1870/X/45, P.O. Box 25093-00100, Westlands, Nairobi, Kenya |
Prudential Assurance Company Singapore (Pte) Limited | | OS | | 100.00% | | 30 Cecil Street, #30-01 Prudential Tower, Singapore 049712 |
Prudential Assurance Malaysia Berhad* | | OS | | 51.00% | | Level 26, Menara Prudential, Persiaran TRX Barat, 55188 Tun Razak Exchange, Kuala Lumpur, Malaysia |
Prudential Assurance Uganda Limited | | OS | | 100.00% | | 9th Floor Zebra Plaza, Plot 23 Kampala Road, P.O. Box 2660, Kampala, Uganda |
Prudential BeGeneral Insurance Côte d'Ivoire S.A. | | OS | | 51.00% | | Abidjan Plateau, Avenue Noguès, Immeuble Woodin Center, 1er étage, 01 P.O. BOX 5173, Abidjan 01, Côte d'Ivoire |
Prudential Belife Insurance Côte d'Ivoire S.A. | | OS | | 51.00% | | |
Prudential Beneficial General Insurance Cameroon S.A. | | OS | | 50.71% | | 1944, Boulevard de la République Douala-Akwa, P.O. BOX 2328, Douala, Cameroon |
Prudential Beneficial Life Insurance Cameroon S.A. |
| OS |
| 51.00% | | |
Prudential Beneficial Life Insurance Togo S.A. |
| OS |
| 50.99% | | 2963 Rue de la Chance Agbalepedogan, P.O. Box 1115, Lome, Togo |
Prudential BSN Takaful Berhad† |
| OS |
| 49.00% | | Level 13, Menara Prudential, Persiaran TRX Barat, 55188 Tun Razak Exchange, Kuala Lumpur, Malaysia |
Prudential Corporation Holdings Limited |
| OS |
| 100.00% | | 1 Angel Court, London, EC2R 7AG, United Kingdom |
Prudential Financial Advisers Singapore Pte. Ltd. |
| OS |
| 100.00% | | 30 Cecil Street, #30-01 Prudential Tower, Singapore 049712 |
Prudential Financial Partners (Asia) Limited | | OS | | 100.00% | | 1 Angel Court, London, EC2R 7AG, England, United Kingdom |
Prudential Financial Partners HK Limited | | OS | | 100.00% | | 13th Floor, One International Finance Centre, 1 Harbour View Street, Central, Hong Kong |
Prudential General Insurance Hong Kong Limited |
| OS |
| 100.00% | | 59th Floor, One Island East, 18 Westlands Road, Quarry Bay, Hong Kong |
Prudential Group Secretarial Services HK Limited |
| OS |
| 100.00% | | 13th Floor, One International Finance Centre, 1 Harbour View Street, Central, Hong Kong |
Prudential Group Secretarial Services Limited |
| OS |
| 100.00% | | 1 Angel Court, London, EC2R 7AG, United Kingdom |
Prudential Holdings Limited |
| OS |
| 100.00% | | 4th Floor, Saltire Court, 20, Castle Terrace, Edinburgh, EH1 2EN, United Kingdom |
Prudential Hong Kong Limited |
| OS |
| 100.00% | | 59th Floor, One Island East, 18 Westlands Road, Quarry Bay, Hong Kong |
Prudential International Treasury Limited |
| OS |
| 100.00% | | 13th Floor, One International Finance Centre, 1 Harbour View Street, Central, Hong Kong |
Prudential IP Services Limited |
| OS |
| 100.00% | | 1 Angel Court, London, EC2R 7AG, United Kingdom |
Prudential Life Assurance (Lao) Company Limited |
| OS |
| 100.00% | | 5th Floor, Lao international Business and Tourist Center Project (Vientiane Center), Khouvieng Road, Nongchan Village, Sisattanak District, Vientiane Capital, Lao PDR |
Prudential Life Assurance (Thailand) Public Company Limited |
| OS |
| 99.93% | | 944 Mitrtown Office Tower, 10th, 29th-31st Floor, Rama 4 Road, Wangmai, Pathumwan, Bangkok, 10330, Thailand |
Prudential Life Assurance Kenya Limited |
| OS |
| 100.00% | | Vienna Court, Ground Floor, State House Crescent, Off State House Avenue, P.O. Box 25093-00603, Nairobi, Kenya |
Prudential Life Assurance Zambia Limited |
| OS |
| 100.00% | | Prudential House, Plot No. 32256, Thabo Mbeki Road, P.O. Box 31357, Lusaka, Zambia |
Prudential Life Insurance Ghana Limited | | OS | | 100.00% | | H/NO. 35, Opp. Hobats Clinic, North Street, Tesano, Accra, Accra Metropolitan, Greater Accra, P.O. Box AN 10476, Ghana |
Prudential Life Vault Limited |
| OS |
| 100.00% | | 48 Awolowo Road, South-West Ikoyi, Lagos, Nigeria |
280
| | | | | | |
|
| Classes of |
| |
| |
| | shares | | Proportion | | |
Name of entity | | held | | held | | Registered office address |
Prudential Mauritius Holdings Limited |
| OS |
| 100.00% | | 3rd Floor, 355 NEX, Rue du Savoir, Cybercity Ebene 72201, Mauritius |
Prudential Myanmar Life Insurance Limited |
| OS |
| 100.00% | | #15-01, 15th Floor, Sule Square, 221 Sule Pagoda Road, Kyauktada Township, Yangon, Myanmar |
Prudential Pensions Management Zambia Limited |
| OS |
| 49.00% | | Prudential House, Plot No. 32256, Thabo Mbeki Road, P.O. Box 31357, Lusaka, Zambia |
Prudential Services Asia Sdn. Bhd. | | OS | | 100.00% | | Suite 1005, 10th Floor, Wisma Hamzah-Kwong Hing, No. 1 Leboh Ampang, 50100 Kuala Lumpur, Malaysia |
| | PS | | 100.00% | | |
Prudential Services Limited |
| OS |
| 100.00% | | 1 Angel Court, London, EC2R 7AG, United Kingdom |
Prudential Services Philippines Corporation | | OS | | 100.00% | | 19th Floor Uptown Place Tower I East, 11th Drive Uptown Bonifacio Fort Bonifacio Bonifacio Global City, Taguig City, Fourth District, National Capital Region (NCR), 1630, Philippines |
Prudential Services Singapore Pte. Ltd. | | OS | | 100.00% | | 7 Straits View, #06-01 Marina One East Tower, Singapore 018936 |
Prudential Singapore Holdings Pte. Limited |
| OS |
| 100.00% | | 30 Cecil Street, #30-01 Prudential Tower, Singapore 049712 |
| | PS | | 100.00% | | |
Prudential Technology and Services India Private Limited | | OS | | 100.00% | | CoWrks NXT, EPIP Industrial Area, Whitefield Road, K.R Puram, Near SAP Labs, Hubli, Bangalore, Karnataka, 560066, India |
Prudential Vietnam Assurance Private Limited | | OS | | 100.00% | | 25th Floor, Saigon Trade Center, 37 Ton Duc Thang Street, District 1, Ho Chi Minh City, Vietnam |
Prudential Wealth Holdings Company Pte. Ltd. |
| OS |
| 100.00% | | 7 Straits View #07-01, Marina One East Tower, Singapore 018936, Singapore |
Prudential Wealth Management Singapore Pte. Ltd. | | OS | | 100.00% | | 8 Marina View #15-06A, Asia Square Tower 1, Singapore 018960, Singapore |
Prudential Zenith Life Insurance Limited |
| OS |
| 51.00% | | 13th Floor, Civic Towers, Ozumba Mbadiwe Avenue, Victoria Island, Lagos State, Lagos, Nigeria |
PRUInvest PHP Liquid Fund | | U | | 99.84% | | 9th Floor, Uptown Place Tower 1, 1 East 11th Drive, Uptown Bonifacio, 1634 Taguig City, Metro Manila, Philippines |
PRUInvest PH Equity Index Tracker Fund | | U | | 100.00% | | |
PT Prudential Sharia Life Assurance |
| OS |
| 94.62% | | Prudential Tower, 2nd Floor, Jl. Jend. Sudirman Kav. 79, Jakarta 12910, Indonesia |
PT. Eastspring Investments Indonesia |
| OS |
| 99.95% | | Prudential Tower, 23rd Floor, Jl. Jend. Sudirman Kav.79, Jakarta 12910, Indonesia |
PT. Prudential Life Assurance‡ |
| OS |
| 94.62% | | Prudential Tower, Jl. Jend. Sudirman Kav. 79, Jakarta 12910, Indonesia |
Pulse Ecosystems Pte. Ltd. |
| OS |
| 100.00% | | 7 Straits View, #06-01 Marina One East Tower, Singapore 018936 |
Pulse Wealth Limited |
| OS |
| 100.00% | | Suite 3703-04, 37/F, Tower 6, The Gateway, Harbour City, 9 Canton Road, Tsim Sha Tsui, Kowloon, Hong Kong |
Reksa Dana Eastspring IDR Fixed Income Fund |
| U |
| 98.81% | | Prudential Tower, 23rd Floor, Jl. Jend. Sudirman Kav.79, Jakarta 12910, Indonesia |
Reksa Dana Eastspring Investments Cash Reserve |
| U |
| 88.93% | | |
Reksa Dana Syariah Eastspring Syariah Fixed Income Amanah |
| U |
| 66.32% | | |
Reksa Dana Syariah Eastspring Syariah Money Market Khazanah |
| U |
| 99.30% | | |
Reksa Dana Syariah Penyertaan Terbatas Bahana Syariah Bumn Fund IV |
| U |
| 99.01% | | Graha CIMB Niaga 21st Floor. Jl Jend Sudirman Kav 58, Jakarta - 12190, Indonesia |
Rhodium Investment Funds - Singapore Bond Fund |
| U |
| 99.75% | | 10 Marina Boulevard, #32-01, Marina Bay Financial Centre Tower 2, Singapore 018983 |
Rhodium Passive Long Dated Bond Fund |
| U |
| 99.87% | | |
Robeco QI European Active Index Equities |
| U |
| 94.55% | | 6, route de Trèves, L-2633 Senningerberg, Grand Duchy of Luxembourg |
Schroder Asian Investment Grade Credit |
| U |
| 37.95% | | 138 Market Street, #23-01 CapitaGreen, Singapore 048946 |
Schroder Emerging Markets Fund |
| U |
| 67.30% | | |
Schroder Multi-Asset Revolution |
| U |
| 48.29% | | |
Schroder US Dollar Money Fund |
| U |
| 34.92% | | 9th floor, no. 108, section 5, xinyi road, taipei |
Scotts Spazio Pte. Ltd. |
| OS |
| 45.00% | | 316 Tanglin Road, #01-01,Singapore, 247978 |
Shenzhen Prudential Technology Limited | | MI - WFOE |
| 100.00% | | Unit 5, 8th Floor, China Resources Tower, No.2666 Keyuan South Road, Yuehai Street, Nanshan District, Shenzhen 518054, China |
281
| | | | | | |
|
| Classes of |
| |
| |
| | shares | | Proportion | | |
Name of entity | | held | | held | | Registered office address |
Sinopac RMB Money Market Fund |
| U |
| 27.12% | | 14th Floor, No.17,Po Ai Rd., Taipei, Taiwan |
Sri Han Suria Sdn. Bhd. |
| OS |
| 51.00% | | Suite 1005, 10th Floor, Wisma Hamzah-Kwong Hing, No. 1 Leboh Ampang, 50100 Kuala Lumpur, Malaysia |
Staple Limited |
| OS |
| 100.00% | | No. 63, Athenee Tower, 34th Floor, Wireless Road, Lumpini Subdistrict Pathumwan District, Bangkok Metropolis, Thailand |
Templeton Asian Growth Fund |
| U |
| 31.40% | | 8A, rue Albert Borschette, L-1246 Luxembourg |
Threadneedle (Lux) – Global Emerging Market Equities |
| U |
| 69.10% | | 44 Rue de la vallée, 2661 Luxembourg |
United Global Innovation Fund |
| U |
| 21.33% | | 23A, 25th Floor, Asia Centre Building, 173/27-30, 32-33 South Sathon Road, Thungmahamek, Sathon, Bangkok 10120, Thailand |
UOB Smart Global Healthcare Fund |
| U |
| 42.04% | | |
UOB Smart Japan Small and Mid Cap Fund |
| U |
| 29.79% | | |
UOB Smart Millennium Growth Fund | | U | | 38.65% | | |
USD Investment Grade Infrastructure Debt Fund SCSp | | U | | 21.53% | | 35a, Avenue J.F. Kennedy, L-1855, Luxembourg, Grand Duchy of Luxembourg |
* | Prudential Assurance Malaysia Berhad is consolidated at 100 per cent in the Group's consolidated financial statements reflecting the economic interest to the Group. |
† | Prudential BSN Takaful Berhad is a joint venture that is accounted for using the equity method, for which the Group has an economic interest of 70 per cent for all business sold up to 23 December 2016 and of 49 per cent for new business sold subsequent to this date. |
‡ | The holding of 94.62 per cent for PT. Prudential Life Assurance represents the proportion held in the Indonesia subsidiary attaching to the aggregate of the shares across the types of capital in issue. |
The below table lists the issued share capital of the subsidiaries of the Group which, in the opinion of the Directors, principally affect the results or assets of the Group:
Name of entity |
| Issued and fully paid up share/ registered capital |
Prudential Assurance Company Singapore (Pte) Limited | | 526,557,000 ordinary shares of SG$ 1 each |
PT. Prudential Life Assurance | | 105,500 ordinary shares and 6,000 preference shares of Rp 1,000,000 each |
Prudential Hong Kong Limited | | 3,641,479,873 ordinary shares of HK$ 1 each |
Prudential Assurance Malaysia Berhad | | 100,000,000 ordinary shares of RM 1 each |
282
Index to the Condensed Financial Information of Registrant Prudential plc
283
Schedule II
Condensed Financial Information of Registrant Prudential plc
Profit and Loss Accounts (FRS 101 Basis)
| | | | | | |
Years ended 31 Dec |
| 2022 $m |
| 2021 $m |
| 2020 $m |
Investment income, including dividends received from subsidiary undertakings |
| 800 |
| 3,642 |
| 539 |
Investment expenses and charges |
| (207) |
| (328) | | (14) |
Loss on revaluation of Jackson upon demerger | | — | | (439) | | — |
Corporate expenditure | | (158) |
| (244) |
| (572) |
Foreign currency exchange gains (losses) | | 25 |
| 11 |
| (19) |
Profit (loss) on ordinary activities before tax | | 460 |
| 2,642 |
| (66) |
Tax (charge) credit on profit on ordinary activities | | (5) |
| 6 |
| (19) |
Profit (loss) for the financial year | | 455 |
| 2,648 |
| (85) |
| | | | | | |
Other comprehensive income: | | |
| |
| |
Items that will not be reclassified to profit or loss | | |
| |
| |
Valuation movements on retained interest in Jackson measured at fair value through other comprehensive income | | (125) | | 273 | | — |
| | (125) |
| 273 |
| — |
Total comprehensive income (loss) for the year | | 330 |
| 2,921 |
| (85) |
The accompanying notes are an integral part of this condensed financial information
284
Schedule II
Condensed Financial Information of Registrant Prudential plc
Statements of Financial Position (FRS 101 Basis)
| | | | |
|
| 31 Dec 2022 $m |
| 31 Dec 2021 $m |
Fixed assets |
|
|
|
|
Investments in subsidiary undertakings |
| 13,178 |
| 13,114 |
| | | | |
Current assets |
| |
| |
Amounts owed by subsidiary undertakings |
| 7,501 |
| 7,013 |
Other debtors |
| — |
| 9 |
Other investments: equity securities - fair value through other comprehensive income | | 266 | | 683 |
Cash at bank and in hand |
| 45 |
| 1,711 |
|
| 7,812 |
| 9,416 |
Liabilities: amounts falling due within one year |
| |
| |
Subordinated liabilities | | (21) | | (1,725) |
Debenture loans | | (361) | | — |
Commercial paper |
| (501) |
| (500) |
Amounts owed to subsidiary undertakings |
| (614) |
| (161) |
Tax payable |
| (9) |
| (7) |
Accruals and deferred income |
| (63) |
| (85) |
|
| (1,569) |
| (2,478) |
Net current assets |
| 6,243 |
| 6,938 |
Total assets less current liabilities |
| 19,421 |
| 20,052 |
Liabilities: amounts falling due after more than one year |
| |
| |
Subordinated liabilities |
| (2,265) |
| (2,350) |
Debenture loans |
| (1,614) |
| (1,702) |
Other borrowings |
| — |
| (350) |
|
| (3,879) |
| (4,402) |
Total net assets |
| 15,542 |
| 15,650 |
Capital and reserves |
| |
| |
Share capital |
| 182 |
| 182 |
Share premium |
| 5,006 |
| 5,010 |
Profit and loss account |
| 10,354 |
| 10,458 |
Shareholders’ funds |
| 15,542 |
| 15,650 |
The accompanying notes are an integral part of this condensed financial information
285
Schedule II
Condensed Financial Information of Registrant Prudential plc
Statements of Changes in Equity (FRS 101 basis)
| | | | | | | | |
|
| | | | | |
| Total |
| | Share |
| Share |
| Profit and | | shareholders' |
| | capital | | premium | | loss account | | funds |
| | $m | | $m | | $m | | $m |
Balance at 1 Jan 2020 |
| 172 |
| 2,625 |
| 10,376 |
| 13,173 |
| | | | | | | | |
Total comprehensive loss for the year | | — | | — | | (85) | | (85) |
| | | | | | | | |
Transactions with owners, recorded directly in equity |
| | |
|
|
|
|
|
New share capital subscribed |
| 1 | | 12 |
| — |
| 13 |
Share-based payment transactions |
| — | | — |
| (1) |
| (1) |
Dividends | | — | | — | | (814) | | (814) |
Total contributions by and distributions to owners | | 1 | | 12 | | (815) | | (802) |
| | | | | | | | |
Balance at 31 Dec 2020/1 Jan 2021 |
| 173 |
| 2,637 |
| 9,476 |
| 12,286 |
| | | | | | | | |
Profit for the year | | — | | — | | 2,648 | | 2,648 |
Valuation movements on retained interest in Jackson measured at fair value through other comprehensive income | | — | | — | | 273 | | 273 |
Total comprehensive income for the year | | — | | — | | 2,921 | | 2,921 |
| | | | | | | | |
| | | | | | | | |
Transactions with owners, recorded directly in equity | | | | | | | | |
New share capital subscribed | | 9 | | 2,373 | | — | | 2,382 |
Demerger dividend in specie of Jackson | | — | | — | | (1,735) | | (1,735) |
Share-based payment transactions | | — | | — | | 217 | | 217 |
Other dividends | | — | | — | | (421) | | (421) |
Total contributions by and distributions to owners | | 9 | | 2,373 | | (1,939) | | 443 |
| | | | | | | | |
Balance at 31 Dec 2021 / 1 Jan 2022 | | 182 | | 5,010 | | 10,458 | | 15,650 |
| | | | | | | | |
Profit for the year | | — | | — | | 455 | | 455 |
Valuation movements on retained interest in Jackson measured at fair value through other comprehensive income | | — | | — | | (125) | | (125) |
Total comprehensive income for the year | | — | | — | | 330 | | 330 |
| | | | | | | | |
Transactions with owners, recorded directly in equity | | | | | | | | |
New share capital subscribed | | — | | (4) | | — | | (4) |
Share-based payment transactions | | — | | — | | 40 | | 40 |
Dividends | | — | | — | | (474) | | (474) |
Total contributions by and distributions to owners | | — | | (4) | | (434) | | (438) |
| | | | | | | | |
Balance at 31 Dec 2022 | | 182 | | 5,006 | | 10,354 | | 15,542 |
The accompanying notes are an integral part of this condensed financial information
286
Schedule II
Condensed Financial Information of Registrant Prudential plc
Statements of Cash Flows (FRS 101 Basis)
| | | | | | |
Years ended 31 December |
| 2022 $m |
| 2021 $m |
| 2020 $m |
Operating activities |
|
|
|
|
|
|
Net cash inflow from operating activities before interest and tax |
| 664 |
| 417 |
| 273 |
Interest paid |
| (204) |
| (328) |
| (320) |
Taxes (paid) received |
| (4) |
| (13) |
| 93 |
Equity dividends paid |
| (474) |
| (421) |
| (814) |
Net cash outflow from operating activities |
| (18) |
| (345) |
| (768) |
Financing activities |
| |
| |
| |
Issuance of ordinary share capital |
| (4) |
| 2,383 |
| 13 |
Issuance of core structural borrowings |
| 346 |
| 995 |
| 983 |
Redemption of core structural borrowings |
| (2,075) |
| (1,250) |
| — |
Movement in commercial paper and other borrowings to support a short-term fixed income securities program |
| 1 |
| (1) |
| (19) |
Dividend income and returns of capital from investment in subsidiary undertakings | | — | | 215 | | 112 |
Movement in share based payment receivable | | (111) | | — | | — |
Capitalisation of amount owed by subsidiary | | (62) | | — | | — |
Movement in net amount owed by subsidiary undertakings |
| (36) |
| (374) |
| (370) |
Net cash (outflow) inflow from financing activities |
| (1,941) |
| 1,968 |
| 719 |
Investing activities | | | | | | |
Disposal of Jackson shares | | 293 | | 83 | | — |
Net cash inflow from investing activities | | 293 | | 83 | | — |
Net cash (outflow) inflow for the year | | (1,666) | | 1,706 | | (49) |
Reconciliation of profit on ordinary activities before tax to net cash inflow from operating activities before interest and tax |
| |
| |
| |
Profit (loss) on ordinary activities before tax |
| 460 |
| 2,642 |
| (66) |
Add back: interest charged to profit or loss |
| 207 |
| 328 |
| 320 |
Adjustments for non-cash items: |
| |
| |
| |
Non-cash dividends paid | | — | | (2,968) | | — |
Revaluation of Jackson on distribution in 2021 | | — | | 439 | | — |
Gain on realisation of Jackson shares | | — | | (23) | | — |
Foreign currency exchange and other movements |
| 8 |
| (6) |
| 8 |
Decrease (increase) in debtors |
| 9 |
| (4) |
| (1) |
(Increase) decrease in creditors |
| (20) |
| 9 |
| 12 |
Net cash inflow from operating activities before interest and tax |
| 664 |
| 417 |
| 273 |
The accompanying notes are an integral part of this condensed financial information
287
Schedule II
Condensed Financial Information of Registrant Prudential plc
Notes to the Condensed Financial Statement Schedule
31 December 2022
1 | Basis of preparation |
The financial statements of the parent company, which comprise the profit and loss accounts, statement of financial position, statement of changes in equity, statement of cash flows and related notes, are prepared in accordance with UK Generally Accepted Accounting Practice, including Financial Reporting Standard 101 Reduced Disclosure Framework (‘FRS 101’).
In preparing these financial statements, the Company applies the recognition and measurement requirements in accordance with International Financial Reporting Standards (‘IFRS’) as issued by the International Accounting Standards Board (‘IASB’) but makes presentational amendments where necessary in order to comply with the UK Companies Act 2006.
The Company and Group manages its cash resources, remittances and financing primarily in US dollars. Accordingly, the functional currency of the Company is US dollars.
2 | Significant accounting policies |
Investments in subsidiary undertakings
Investments in subsidiary undertakings are shown at cost, less impairment. Investments are assessed for impairment by comparing the net assets of the subsidiary undertakings with the carrying value of the investment.
Amounts owed by subsidiary undertakings
Amounts owed by subsidiary undertakings are shown at cost, less provisions. Provisions are determined using the expected credit loss approach under IFRS 9.
Financial instruments
Under IFRS 9, except for derivative instruments (where applicable) that are mandatorily classified as fair value through profit or loss and the Company’s financial investment in Jackson’s equity securities (as discussed below), all of the financial assets and liabilities of the Company are held at amortised cost.The Company assesses impairment on its loans and receivables using the expected credit loss approach. The expected credit loss on the Company’s loans and receivables, the majority of which represent loans to its subsidiaries, have been assessed by taking into account the probability of default on those loans. In all cases, the subsidiaries are expected to have sufficient resources to repay the loan either now or over time based on projected earnings. For loans recallable on demand, the expected credit loss has been limited to the impact of discounting the value of the loan between the balance sheet date and the anticipated recovery date. For loans with a fixed maturity date the expected credit loss has been determined with reference to the historic experience of loans with equivalent credit characteristics.
Upon the demerger of Jackson in September 2021, the Company has made the election under IFRS 9 to measure its retained interest in Jackson’s equity securities at ‘fair value through other comprehensive income’. Under this designation, only dividend income from this retained interest is recognised in the profit or loss of the Company. Unrealised gains and losses are recognised in other comprehensive income and there is no recycling to the profit or loss on derecognition.
Borrowings
Borrowings are initially recognised at fair value, net of transaction costs, and subsequently accounted for on an amortised cost basis using the effective interest method. Under the effective interest method, the difference between the redemption value of the borrowing and the initial proceeds, net of transaction costs, is amortised through the profit and loss account to the date of maturity or, for subordinated debt, over the expected life of the instrument.
288
Dividends
Interim dividends are recorded in the period in which they are paid.
Foreign currency translation
Transactions not denominated in the Company’s functional currency, US dollars, are initially recorded at the functional rate of currency prevailing on the date of the transaction. Monetary assets and liabilities not denominated in the Company’s functional currency are translated to the Company's functional currency at year end spot rates. The impact of these currency translations is recorded within the profit and loss account for the year.
Tax
Current tax expense is charged or credited to operations based upon amounts estimated to be payable or recoverable as a result of taxable amounts for the current year. To the extent that losses of an individual UK company are not offset, they can be carried back for one year or carried forward indefinitely to be offset, subject to restrictions based on future taxable profits, against profits arising from the same company or other companies in the same UK tax group.
Deferred tax assets and liabilities are recognised in accordance with the provisions of IAS 12 ‘Income Taxes’. Deferred tax assets are recognised to the extent that it is regarded as more likely than not that future taxable profits will be available against which these losses can be utilised. Deferred tax is measured at the tax rates that are expected to be applied to temporary differences when they reverse, using tax rates enacted or substantively enacted at the reporting date.
Share-based payments
The Group offers share award and option plans for certain key employees and a Save As You Earn (‘SAYE’) plan for all UK and certain overseas employees. The share-based payment plans operated by the Group are mainly equity-settled.
Under IFRS 2 ‘Share-based payment’, where the Company, as the parent company, has the obligation to settle the options or awards of its equity instruments to employees of its subsidiary undertakings, and such share-based payments are accounted for as equity-settled in the Group financial statements, the Company records an increase in the investment in subsidiary undertakings for the value of the share options and awards granted with a corresponding credit entry recognised directly in equity. The value of the share options and awards granted is based upon the fair value of the options and awards at the grant date, the vesting period and the vesting conditions. Cash receipts from business units in respect of newly issued share schemes are treated as returns of capital within investments in subsidiaries.
3Dividends received from subsidiary undertakings
The parent company received dividends totalling $708 million from its consolidated subsidiary undertakings in 2022 (2021: $3,597 million; 2020: $406 million).
4Reconciliation from the FRS 101 parent company results to the IFRS Group results
The parent company financial statements are prepared in accordance with FRS 101 and the Group financial statements are prepared in accordance with IFRS Standards as issued by the IASB and international financial reporting standards adopted for use in the UK.
289
The tables below provide a reconciliation between the FRS 101 parent company results and the IFRS Group results.
| | | | | | |
Profit after tax |
| 2022 $m |
| 2021 $m |
| 2020 $m |
Profit (loss) for the financial year of the Company in accordance with FRS 101note (i) |
| 455 |
| 2,648 |
| (85) |
Accounting policy differencenote (ii) | | 108 | | 28 | | (18) |
Share in the IFRS result of the Group, net of distributions to the Companynote (iii) |
| 435 |
| (4,718) |
| 2,221 |
Profit (loss) after tax of the Group attributable to equity holders in accordance with IFRSnote (iv) |
| 998 |
| (2,042) | | 2,118 |
| | | | | | |
Shareholders' equity |
| 31 Dec 2022 $m |
| 31 Dec 2021 $m |
| |
Shareholders’ funds of the Company in accordance with FRS 101 |
| 15,542 |
| 15,650 | | |
Accounting policy differencenote (ii) | | 66 | | 19 | | |
Share in the IFRS net equity of the Groupnote (iii) |
| 1,352 |
| 1,419 | | |
Shareholders’ equity of the Group in accordance with IFRS |
| 16,960 |
| 17,088 | | |
Notes
(i) | The Company’s profit (loss) for the financial year includes distributions to the Company from subsidiaries. |
(ii) | Accounting policy difference represents the difference in accounting policy for expected credit losses on loan assets, and the difference in treatment of realised gains and losses on investments classified as fair value through other comprehensive income, as the Company has adopted IFRS 9 while the Group applies IAS 39. |
(iii) | The ‘Share in the IFRS result and net equity of the Group’ line represents the parent company’s equity in the earnings and net assets of its subsidiaries and associates. The movement relative to the prior period reflects movements in the results of the Group relative to the result of the Company. |
(iv) | The profit (loss) for the year of the parent company in accordance with IFRS includes dividends received from subsidiary undertakings (note 3). |
5Guarantees provided by the parent company
In certain instances the parent company has guaranteed that its subsidiaries will meet their obligations when they fall due for payment.
6Equity securities – fair value through other comprehensive income
The Company’s interest in the equity securities of Jackson Financial Inc are recognised as a financial investment at ‘fair value through other comprehensive income’. Transactions in 2022 reduced the Company’s interest in Jackson to 9.2 per cent (both voting and economic interest) at 31 December 2022 (31 December 2021: 18.4 per cent economic interest with 18.5 per cent voting interest).
The fair value of the Company’s holding in the equity securities of Jackson Financial Inc. is determined by the use of current market bid prices, and is categorised as Level 1: Quoted prices (unadjusted in active markets) of the IFRS 13 ‘Fair Value Measurement’ defined fair value hierarchy. A loss of $125 million (2021: $273 million gain) has been recognised in other comprehensive income for the year in respect of these instruments.
7Post balance sheet events
Dividends
The second interim dividend for the year ended 31 December 2022, which was approved by the Board of Directors after 31 December 2022, is described in note B5 of the Group IFRS consolidated financial statements.
Debt redemption
On 20 January 2023, the Company redeemed a senior debt instrument of £300 million, as described in note C5.1 of the Group IFRS consolidated financial statements.
Debt Transfer
On 2 March 2023 the Company transferred all its external debt instruments, classified as core structural borrowings, to a wholly-owned indirect subsidiary of the Company, Prudential Funding (Asia) plc, in exchange for assuming intercompany debt liabilities with similar terms to the transferred instruments. The Company has provided a guarantee to holders of the debt instruments in the event of default by Prudential Funding (Asia) plc.
290
The effect of this transaction, which in substance crystallises the difference between the fair value and the carrying value of the debt, is a gain of approximately $0.4 billion.
291
Index to the Additional Unaudited Financial Information
| | ||
Additional unaudited financial information | Page | ||
293 | |||
| 293 | ||
| 297 | ||
| 299 | ||
| 301 | ||
| | | |
| |||
| Reconciliation of adjusted operating profit to profit before tax | 301 | |
| 302 | ||
| 302 | ||
| 302 | ||
| 302 | ||
| Reconciliation of gross premiums earned to renewal insurance premiums | 303 | |
| Reconciliation of gross premiums earned to APE new business sales | 303 | |
292
I | Additional financial information |
I(i) | Group capital position |
Prudential applies the Insurance (Group Capital) Rules set out in the Group-wide Supervision (GWS) Framework issued by the Hong Kong IA to determine group regulatory capital requirements (both minimum and prescribed levels). For regulated insurance entities, the capital resources and required capital included in the GWS capital measure for Hong Kong IA Group regulatory purposes are based on the local solvency regime applicable in each jurisdiction. The Group holds material participating business in Hong Kong, Singapore and Malaysia. Alongside the total regulatory GWS capital basis, a shareholder GWS capital basis is also presented which excludes the contribution to the Group GWS eligible group capital resources, the Group Minimum Capital Requirements (GMCR) and the Group Prescribed Capital Requirements (GPCR) from these participating funds.
Regulatory updates
The GWS group capital adequacy requirements require that total eligible group capital resources are not less than the GPCR and that GWS Tier 1 group capital resources are not less than the GMCR. In line with the changes in the 2022 Half-Year Report and the updated GWS disclosure guidelines issued by the Hong Kong IA in December 2022 the GWS capital disclosures present the Group capital position by comparing the total eligible group capital resources to the GPCR, aligned with the basis of our EEV capital requirements. In addition, the total regulatory Tier 1 capital resources relative to the GMCR is also disclosed.
The recent trend to more risk-based capital regimes being adopted in many of the Group’s markets is continuing and this impacts on the Group’s GWS capital measure, which is underpinned by the local regulatory regimes of the Group’s subsidiaries, joint ventures and associates. C-ROSS Phase II became effective in the Chinese Mainland in the first quarter of 2022, and in April 2022 Prudential Hong Kong Limited received approval from the Hong Kong IA to early-adopt the new risk-based capital regime effective from 1 January 2022.
The impact of these changes on the GWS capital position, estimated as at 31 December 2021 and after allowing for the impact of the $1.7 billion debt redemption in January 2022, are shown below:
| | | | | | | | | | | | | | | | | |
|
| Shareholder basis | | Total regulatory basis |
| ||||||||||||
| | GMCR basis | | GPCR basis | | GMCR basis | | GPCR basis |
| ||||||||
|
| |
| Impact of |
| Post |
| Post |
| |
| Impact of |
| Post |
| Post |
|
| | As | | HK RBC & | | regulatory | | regulatory | | As | | HK RBC & | | regulatory | | regulatory |
|
$ billion | | disclosed | | C-ROSS II | | updates | | updates | | disclosed | | C-ROSS II | | updates | | updates |
|
Capital resources | | 15.2 | | +10.3 | | 25.5 | | 25.5 | | 42.7 | | (0.7) | | 42.0 | | 42.0 |
|
Required capital |
| 3.7 |
| +1.0 |
| 4.7 |
| 8.0 |
| 10.7 |
| +0.4 |
| 11.1 |
| 20.6 | |
GWS capital surplus |
| 11.5 |
| +9.3 |
| 20.8 |
| 17.5 |
| 32.0 |
| (1.1) |
| 30.9 |
| 21.4 | |
GWS coverage ratio |
| 408 | % | +137 | % | 545 | % | 320 | % | 398 | % | (20) | % | 378 | % | 204 | % |
The Hong Kong RBC framework requires liabilities to be valued on a best estimate basis and capital requirements to be risk-based, resulting in the release of prudent regulatory margins previously included in liabilities and an increase in required capital. In addition the shareholder position also recognises the value of future shareholder transfers from participating business on an economic basis within the capital resources along with an associated required capital. In total this results in a material increase in the GWS shareholder capital resources and required capital as presented above.
At a GWS total regulatory level, after including the contribution from participating business, the introduction of the Hong Kong RBC framework results in a fall in capital resources. The impact on the shareholder position as noted above is more than offset by the Hong Kong RBC framework requirement to reflect future discretionary policyholder bonuses within the participating business liabilities which were previously treated as capital.
In addition to the regulatory changes discussed above, the Hong Kong IA issued guidance in the first half of 2022 on the classification of GWS Tier 1 group capital and the GMCR that should be assessed against this Tier 1 group capital, in particular to ensure that participating business capital resources that are not classified as Tier 1 group capital by the application of local rules, do not attract a corresponding GMCR. Applying this guidance at 31 December 2021 would reduce the total regulatory GMCR presented above of $11.1 billion by $(4.6) billion to $6.5 billion with no impact on the GPCR.
293
Estimated GWS capital position
As at 31 December 2022, the estimated shareholder GWS capital surplus over the GPCR is $15.6 billion (31 December 2021: $17.5 billion), representing a coverage ratio of 307 per cent (31 December 2021: 320 per cent) and the estimated total GWS capital surplus over the GPCR is $18.1 billion (31 December 2021: $21.4 billion), representing a coverage ratio of 202 per cent (31 December 2021: 204 per cent). The estimated Group Tier 1 capital resources are $17.4 billion with headroom over the GMCR of $12.1 billion (31 December 2021: $14.9 billion), representing a coverage ratio of 328 per cent (31 December 2021: 328 per cent).
| | | | | | | | | | | | | | | |
| | 31 Dec 2022note (4) | | 31 Dec 2021note (1) |
| | | ||||||||
|
| |
| Add |
| |
| |
| Add |
| |
| Change | |
| | Shareholder | | policyholder | | Total | | Shareholder | | policyholder | | Total | | in total | |
| | | | note(3) | | note(5) | | | | note(3) | | note(5) |
| note (6) | |
Group capital resources ($bn) |
| 23.2 | | 12.6 | | 35.8 |
| 25.5 |
| 16.5 |
| 42.0 | | (6.2) | |
of which: Tier 1 capital resources ($bn) note (2) | | 15.9 | | 1.5 | | 17.4 | | 17.9 | | 3.5 | | 21.4 | | (4.0) | |
| | | | | | | | | | | | | | | |
Group Minimum Capital Requirement ($bn) |
| 4.4 | | 0.9 | | 5.3 |
| 4.7 |
| 1.8 |
| 6.5 | | (1.2) | |
Group Prescribed Capital Requirement ($bn) |
| 7.6 | | 10.1 | | 17.7 |
| 8.0 |
| 12.6 |
| 20.6 | | (2.9) | |
| | | | | | | | | | | | | | | |
GWS capital surplus over GPCR ($bn) | | 15.6 | | 2.5 | | 18.1 | | 17.5 | | 3.9 | | 21.4 | | (3.3) | |
GWS coverage ratio over GPCR (%) |
| 307 | % | | | 202 | % | 320 | % | | | 204 | % | (2) | % |
| | | | | | | | | | | | | | | |
GWS Tier 1 surplus over GMCR ($bn) | | | | | | 12.1 | | | | | | 14.9 | | (2.8) | |
GWS Tier 1 coverage ratio over GMCR (%) | | | | | | 328 | % | | | | | 328 | % | — | |
Notes
(1) | All 31 December 2021 GWS capital results reflect the impact of the regulatory updates discussed in the section above and are after allowing for the impact of the $1.7 billion debt redemption in January 2022. |
(2) | The classification of tiering of capital under the GWS framework reflects the different local regulatory regimes along with guidance issued by the Hong Kong IA. At 31 December 2022, total Tier 1 capital resources of $17.4 billion comprises: $23.2 billion of total shareholder capital resources; less $(4.0) billion of Prudential plc issued sub-ordinated and senior Tier 2 debt capital; less $(3.3) billion of local regulatory tiering classifications in Singapore and the Chinese Mainland which are classified as GWS Tier 2 capital resources; plus $1.5 billion of Tier 1 capital resources in policyholder funds. |
(3) | This allows for any associated diversification impacts between the shareholder and policyholder positions reflected in the total company results where relevant. |
(4) | The 31 December 2022 GWS capital results do not reflect the impact of the redemption of $0.4 billion of senior debt in January 2023. Allowing for this redemption reduces the estimated shareholder GWS capital surplus over GPCR to $15.2 billion with a coverage ratio of 302 per cent and reduces the estimated total GWS capital surplus over GPCR to $17.7 billion with a coverage ratio of 200 per cent. The total GWS Tier 1 over GMCR capital position is unaffected by this redemption. |
(5) | The total company GWS coverage ratio over GPCR presented above represents the eligible group capital resources coverage ratio as set out in the GWS framework while the total company GWS tier 1 coverage ratio over GMCR represents the tier 1 group capital coverage ratio. |
(6) | Refer to section on Material changes in GMCR, GPCR, tier 1 group capital and eligible group capital resources below. |
GWS sensitivity analysis
The estimated sensitivity of the GWS capital position (based on the GPCR) to changes in market conditions as at 31 December 2022 is shown below, for both the shareholder and the total capital position.
| | | | | | | | | |
| | 31 Dec 2022 |
| ||||||
| | Shareholder | | Total | | ||||
Impact of market sensitivities |
| Surplus ($bn) |
| Coverage ratio |
| Surplus ($bn) |
| Coverage ratio | |
Base position |
| 15.6 | | 307 | % | 18.1 |
| 202 | % |
Impact of: |
| | | | |
|
| | |
10% increase in equity markets |
| 0.3 | | (3) | % | 1.2 |
| 1 | % |
20% fall in equity markets |
| (1.9) | | (14) | % | (3.6) |
| (12) | % |
50 basis points reduction in interest rates |
| 0.4 | | 4 | % | 0.0 |
| 0 | % |
100 basis points increase in interest rates |
| (1.1) | | (15) | % | (0.6) |
| (3) | % |
100 basis points increase in credit spreads |
| (0.8) | | (9) | % | (1.2) |
| (6) | % |
The sensitivity results above reflect the impact on the Group’s long-term business operations at 31 December 2022. The sensitivity results assume instantaneous market movements and reflect all consequential impacts as at the valuation date. These results also allow for limited management actions such as changes to future policyholder bonuses and rebalancing investment portfolios where relevant. If such economic conditions persisted, the financial impacts may differ to the instantaneous impacts shown above. In this case, management could also take additional actions to help mitigate the impact of these stresses. These actions include, but are not limited to, market risk hedging, further rebalancing of investment portfolios, increased use of reinsurance, repricing of in-force benefits, changes to new business pricing and the mix of new business being sold.
294
GWS Risk Appetite and capital management
The Group’s capital management framework focuses on achieving sustainable, profitable growth and retaining a resilient balance sheet.
The Group monitors regulatory capital, economic capital and rating agency capital metrics and manages the business within its risk appetite by remaining within its economic and regulatory capital limits. In respect of regulatory capital limits, a capital buffer above the GPCR is held to ensure the Group can withstand volatility in markets and operational experience, with capital resources remaining sufficient to cover the GPCR even after significant stresses. The calibration of the capital buffer reflects the Group’s risk profile and the external economic environment, and is set and reviewed regularly by the Board.
Typically, this requires a Group shareholder coverage ratio of above 150 per cent of the shareholder GPCR to be maintained and de-risking management actions will be taken as necessary to maintain this buffer. No maximum limit on the GWS coverage ratio has been set. While the GWS shareholder capital position is a key metric for assessing regulatory solvency, and for risk management, there are some elements of the shareholder GWS capital surplus which will only become available as cash flow for distribution over time.
The uses of capital, for both organic and inorganic opportunities, are assessed by reference to expected shareholder returns and payback periods, relative to risk-adjusted hurdle rates which are set centrally.
Reflecting the Group’s capital allocation priorities, a portion of the free surplus generated in each period will be retained for reinvestment in the business, and dividends will be determined primarily based on the Group’s operating free surplus generation after allowing for the capital strain of writing new business and recurring central costs (on a right-sized basis). To the extent that free surplus arises which is not required to support organic and inorganic growth opportunities, consideration will be given to returning capital to shareholders.
Separate from the capital management framework applied for shareholder-owned capital, the capital held in ring-fenced with-profits funds supports policyholder investment freedom, which increases expected returns for our with-profits funds’ customers. GWS policyholder capital surplus is not available for distribution out of the ring-fenced funds other than as a defined proportion distributable to shareholders when policyholder bonuses are declared. Policyholder fund capital surplus is deployed over time to increase investment risk in the with-profits funds in order to target higher customer returns, or distributed as higher customer bonuses, in line with the specific with-profits bonus policies which apply to each ring-fenced fund. The result of applying these policies is that the aggregate policyholder fund GPCR coverage ratio is typically lower than the GPCR shareholder coverage ratio.
The total GWS coverage ratio, which is an aggregate of the policyholder and shareholder capital positions, is therefore usually lower than the shareholder coverage ratio, but also less sensitive in stress scenarios, as is shown in the GWS sensitivity analysis section above as at 31 December 2022. The total GWS coverage ratio is the Group’s regulatory solvency metric to which Group supervision applies, and this total regulatory coverage ratio is managed to ensure it remains above the GPCR by applying separate shareholder and policyholder risk appetite limits, as described above.
Material changes in GMCR, GPCR, tier 1 group capital and eligible group capital resources
The GWS guidelines on external disclosures for supervised groups requires detail to be provided on any material changes in GPCR, GMCR, eligible group capital resources and tier 1 group capital along with the reason for such changes.
– | Total eligible capital resources has decreased by $(6.2) billion to $35.8 billion at 31 December 2022 (31 December 2021: $42.0 billion).This includes a $(4.0) billion decrease in tier 1 group capital to $17.4 billion (31 December 2021: $21.4 billion). The fall in total eligible capital resources and tier 1 group capital are primarily driven by market movements over the year, driven largely by falling equity markets and increasing interest rates, and external dividends paid, partially offset by the positive contribution from operating capital generation. |
295
– | Total regulatory GPCR has decreased by $(2.9) billion to $17.7 billion at 31 December 2022 (31 December 2021: $20.6 billion) and the total regulatory GMCR has decreased by $(1.2) billion to $5.3 billion at 31 December 2022 (31 December 2021: $6.5 billion). The fall in GPCR and GMCR are primarily driven by market movements over the year and the release of capital as the policies mature or are surrendered, partially offset by an increase as a result of new business sold over the year. |
Reconciliation of Group IFRS shareholders’ equity to Group total GWS capital resources
| | |
| | 31 Dec 2022 |
|
| $bn |
Group IFRS shareholders’ equity |
| 17.0 |
Remove DAC, goodwill and intangibles recognised on the IFRS statement of financial position |
| (7.8) |
Add debt treated as capital under GWSnote (a) | | 4.0 |
Asset valuation differencesnote (b) | | (0.3) |
Liability valuation (including insurance contracts) differencesnote (c) |
| 9.2 |
Differences in associated net deferred tax liabilitiesnote (d) | | 1.3 |
Othernote (e) |
| (0.2) |
Contribution from Policyholder business | | 12.6 |
Group total GWS capital resources |
| 35.8 |
Notes
(a) | As per the GWS Framework, debt in issuance at the date of designation that satisfy the criteria for transitional arrangements and qualifying debt issued since the date of designation are included as Group capital resources but are treated as liabilities under IFRS. |
(b) | Asset valuation differences reflect differences in the basis of valuing assets between IFRS and local statutory valuation rules, including deductions for inadmissible assets. Differences include for some markets where government and corporate bonds are valued at book value under local regulations but are valued at market value under IFRS. |
(c) | Liability valuation differences reflect differences in the basis of valuing liabilities between IFRS and local statutory valuation rules. Material differences include in Hong Kong, Singapore and the Chinese Mainland where the local capital resources under the local risk-based capital solvency bases permits the recognition of certain negative reserves in the local statutory position that are not fully recognised under IFRS. This also includes the present value of future shareholder transfers from Hong Kong participating business which is included as an asset within the GWS capital resources. |
(d) | Differences in associated net deferred tax liabilities mainly results from the tax impact of changes in the valuation of assets and liabilities. |
(e) | Other differences include the removal of DAC and intangibles of the Group’s joint ventures and associates and, in Chinese Mainland, a difference from the inclusion of subordinated debt as local capital resources on a C-ROSS II basis as compared to being held as a liability under IFRS. |
Basis of preparation for the Group GWS capital position
Prudential applies the Insurance (Group Capital) Rules set out in the GWS Framework to determine group regulatory capital requirements (both minimum and prescribed levels). The summation of local statutory capital requirements across the Group is used to determine group regulatory capital requirements, with no allowance for diversification between business operations. The GWS eligible group capital resources is determined by the summation of capital resources across local solvency regimes for regulated entities and IFRS shareholders’ equity (with adjustments described below) for non-regulated entities.
In determining the GWS eligible group capital resources and required capital the following principles have been applied:
– | For regulated insurance entities, capital resources and required capital are based on the local solvency regime applicable in each jurisdiction, with minimum required capital set at the solo legal entity statutory minimum capital requirements and prescribed capital requirement set at the level at which the local regulator of a given entity can impose penalties, sanctions or intervention measures; |
- | The classification of tiering of eligible capital resources under the GWS framework reflects the different local regulatory regimes along with guidance issued by the Hong Kong IA. In general, if a local regulatory regime applies a tiering approach then this should be used to determine tiering of capital on a GWS capital basis, where a local regulatory regime does not apply a tiering approach then all capital resources should be included as Group Tier 1 capital. For non-regulated entities tiering of capital is determined in line with the Insurance (Group Capital) Rules. |
296
– | For asset management operations and other regulated entities, the capital position is derived based on the sectoral basis applicable in each jurisdiction, with minimum required capital based on the solo legal entity statutory minimum capital requirement; |
– | For non-regulated entities, the capital resources are based on IFRS shareholder equity after deducting intangible assets. No required capital is held in respect of unregulated entities; |
– | For entities where the Group’s shareholding is less than 100 per cent, the contribution of the entity to the GWS eligible group capital resources and required capital represents the Group’s share of these amounts and excludes any amounts attributable to non-controlling interests. This does not apply to investment holdings which are not part of the Group; |
– | Following the demerger of Jackson from Prudential plc in September 2021, the Group retains a non-controlling interest in Jackson. As agreed with the Hong Kong IA, this retained interest is included within the GWS eligible group capital resources valued at 60 per cent of the listed market value and contributes $0.2 billion to the GWS capital surplus (over GPCR) at 31 December 2022; |
– | Investments in subsidiaries, joint ventures and associates (including, if any, loans that are recognised as capital on the receiving entity’s balance sheet) are eliminated from the relevant holding company to prevent the double counting of capital resources; |
– | Under the GWS Framework, debt instruments in issuance at the date of designation that satisfy the criteria for transitional arrangements and qualifying debt issued since the date of designation are included in eligible group capital resources as tier 2 group capital. At 31 December 2022 all debt instruments with the exception of the senior debt issued in 2022 are included as Group capital resources. The eligible amount permitted to be included as Group capital resources for transitional debt is based on the net proceeds amount translated using 31 December 2020 exchange rates for debt not denominated in US dollars; |
– | The total company GWS capital basis is the capital measure for Hong Kong IA Group regulatory purposes as set out in the GWS framework. This framework defines the eligible group capital resources coverage ratio (or total company GWS coverage ratio over GPCR as presented above) as the ratio of total company eligible group capital resources to the total company GPCR and defines the tier 1 group capital coverage ratio (or total company GWS tier 1 coverage ratio over GMCR as presented above) as the ratio of total company tier 1 group capital to the total company GMCR; and |
– | Prudential also presents a shareholder GWS capital basis which excludes the contribution to the Group GWS eligible group capital resources, the GMCR and GPCR from participating business in Hong Kong, Singapore and Malaysia. In Hong Kong the present value of future shareholder transfers from the participating business are included in the shareholder GWS eligible capital resources along with an associated required capital, this is in line with the local solvency presentation. The shareholder GWS coverage ratio over GPCR presented above reflects the ratio of shareholder eligible group capital resources to the shareholder GPCR. |
I(ii) | Analysis of adjusted operating profit by driver |
This schedule classifies the Group’s adjusted operating profit into the underlying drivers using the following categories:
– | Spread income represents the difference between net investment income and amounts credited to certain policyholder accounts. It excludes the operating investment return on shareholder net assets, which has been separately disclosed as expected return on shareholder assets. |
– | Fee income represents profit driven by net investment performance, being fees that vary with the size of the underlying policyholder funds, net of investment management expenses. |
– | With-profits represents the pre-tax shareholders’ transfer from the with-profits business for the period. |
– | Insurance margin primarily represents profit derived from the insurance risks of mortality and morbidity. |
– | Margin on revenues primarily represents amounts deducted from premiums to cover acquisition costs and administration expenses (see below). |
– | Acquisition costs and administration expenses represent expenses incurred in the period attributable to shareholders. These exclude items such as restructuring and IFRS 17 implementation costs, which are not included in the segment profit, as well as items that are more appropriately included in other categories (eg investment expenses are netted against investment income as part of spread income or fee income as appropriate). |
– | DAC adjustments comprise DAC amortisation for the period, excluding amounts related to short-term fluctuations in investment returns, net of costs deferred in respect of new business written in the period. |
297
The following analysis expresses certain of the Group’s sources of adjusted operating profit as a margin of policyholder liabilities or other relevant drivers. The 2021 and 2020 comparative information has been presented at both AER and CER to eliminate the impact of exchange translation.
The reconciliation of the adjusted operating profit based on longer-term investment returns by segment to profit before tax attributable to shareholders is provided in the ‘Determining Adjusted Operating Profit of Operating Segments’ section.
| | | | | | | | | | | | | | | | | | | |
|
| 2022 |
| 2021 AER |
| 2021* CER |
| ||||||||||||
| | | ��� | Average | | | | | | Average | | | | | | Average | | |
|
| | Profit | | liability | | Margin | | Profit | | liability | | Margin | | Profit | | liability | | Margin |
|
| | $m | | $m | | bps | | $m | | $m | | bps | | $m | | $m | | bps |
|
| | | | note (a) | | note (b) | | | | note (a) | | note (b) | | | | note (a) | | note (b) |
|
Spread income |
| 307 |
| 42,722 |
| 72 |
| 312 |
| 47,270 |
| 66 |
| 299 | | 46,137 | | 65 | |
Fee income |
| 331 |
| 32,295 |
| 102 |
| 345 |
| 33,401 |
| 103 |
| 329 | | 32,062 | | 103 | |
With-profits |
| 160 |
| 81,405 |
| 20 |
| 135 |
| 84,905 |
| 16 |
| 133 | | 84,435 | | 16 | |
Insurance margin |
| 3,219 |
| |
| |
| 2,897 |
| |
| |
| 2,795 | | | | | |
Margin on revenues |
| 3,194 |
| |
| |
| 3,008 |
| |
| |
| 2,881 | | | | | |
Expenses: |
| |
|
|
|
|
| |
|
|
|
|
| | | | | | |
Acquisition costsnote (c) |
| (2,346) |
| 4,393 |
| (53) | % | (2,085) |
| 4,194 |
| (50) | % | (2,000) | | 4,013 | | (50) | % |
Administration expenses |
| (1,732) |
| 75,354 |
| (230) |
| (1,656) |
| 80,968 |
| (205) |
| (1,581) | | 78,472 | | (201) | |
DAC adjustments |
| 554 |
| |
| |
| 566 |
|
|
|
|
| 545 | | | | | |
Expected return on shareholder assets |
| 235 |
| |
| |
| 231 |
|
|
|
|
| 224 | | | | | |
| | 3,922 | | | | |
| 3,753 | | | | | | 3,625 | | | | | |
Share of related tax charges from joint ventures and associatesnote (d) |
| (76) |
| |
| |
| (44) |
|
|
|
|
| (42) | | | | | |
Long-term business |
| 3,846 |
| |
| |
| 3,709 |
|
|
|
|
| 3,583 | | | | | |
Eastspring |
| 260 |
| |
| |
| 314 |
|
|
|
|
| 299 | | | | | |
Adjusted operating profit |
| 4,106 |
| |
| |
| 4,023 |
|
|
|
|
| 3,882 | | | | | |
| | | | | | | | | | | | | |
|
| 2020 AER |
| 2020 CER† |
| ||||||||
| | | | Average | | | | | | Average | | |
|
| | Profit | | liability | | Margin | | Profit | | liability | | Margin |
|
| | $m | | $m | | bps | | $m | | $m | | bps |
|
| | | | note (a) | | note (b) | | | | note (a) | | note (b) |
|
Spread income |
| 296 |
| 39,895 | | 74 | | 304 | | 40,113 | | 76 | |
Fee income |
| 282 |
| 28,014 | | 101 | | 287 | | 28,425 | | 101 | |
With-profits |
| 117 |
| 73,375 | | 16 | | 118 | | 73,248 | | 16 | |
Insurance margin |
| 2,648 | | | | | | 2,689 | | | | | |
Margin on revenues |
| 3,007 | | | | | | 3,048 | | | | | |
Expenses: | | — | | | | | | — | | | | | |
Acquisition costsnote (c) |
| (1,928) |
| | | (51) | % | (1,964) | | 3,890 | | (50) | % |
Administration expenses |
| (1,591) |
| | | (234) | | (1,609) | | 68,758 | | (234) | |
DAC adjustments |
| 382 | | | | | | 392 | | | | | |
Expected return on shareholder assets |
| 212 | | | | | | 214 | | | | | |
|
| 3,425 | | | | | | 3,479 | | | | | |
Share of related tax charges from joint ventures and associatesnote (d) |
| (46) | | | | | | (49) | | | | | |
Long-term business | | 3,379 | | | | | | 3,430 | | | | | |
Eastspring | | 283 | | | | | | 286 | | | | | |
Adjusted operating profit |
| 3,662 | | | | | | 3,716 | | | | | |
* | For 2021, the CER results were calculated using the 2022 average exchange rates. |
† | For 2020, the CER results were calculated using the 2021 average exchange rates. |
Notes
(a) | The calculation of average liabilities is generally derived from opening and closing balances, except the average liabilities used to derive fee income margin which is calculated using quarter-end balances to provide a more meaningful analysis. Other than the average liabilities used to calculate the administration expense margin, the average liabilities in the analysis above exclude the liabilities for the Africa operations. |
(b) | Margin represents the operating return earned in the year as a proportion of the relevant class of policyholder liabilities excluding unallocated surplus. |
(c) | The ratio of acquisition costs is calculated as a percentage of APE sales in the year, including with-profits sales. Acquisition costs include only those relating to shareholder-backed business. The ratio of shareholder acquisition costs to shareholder APE sales (excluding with-profits) in 2022 is 62 per cent (2021: 61 per cent on both AER and CER basis; 2020: 66 per cent on both AER and CER basis). |
(d) | Under IFRS, the Group’s share of results from its investments in joint ventures and associates accounted for using the equity method is included as a single line in the Group’s profit before tax on a net of related tax basis. In the table above, the results of the |
298
joint ventures and associates are analysed by adjusted operating profit drivers and on a pre-tax basis, with related tax charges shown separately in order for the contribution from the joint ventures and associates to be included in the profit driver and margin analysis on a consistent basis with the rest of the business operations.
I(iii) | Analysis of adjusted operating profit by business unit |
The table below presents the 2021 and 2020 results on both AER and CER bases to eliminate the impact of exchange translation.
| | | | | | | | | | | | | | |
| | 2022 $m |
| 2021 $m |
| 2022 vs 2021 % |
| 2020 $m | ||||||
| | | | AER | | CER† | | AER | | CER | | AER | | CER‡ |
CPL | | 368 |
| 343 | | 329 | | 7 | % | 12 | % | 251 | | 269 |
Hong Kong | | 1,036 |
| 975 | | 969 | | 6 | % | 7 | % | 891 | | 889 |
Indonesia | | 343 |
| 446 | | 429 | | (23) | % | (20) | % | 519 | | 529 |
Malaysia | | 364 |
| 350 | | 330 | | 4 | % | 10 | % | 309 | | 313 |
Singapore | | 678 |
| 663 | | 646 | | 2 | % | 5 | % | 574 | | 589 |
Growth markets and other | | |
| | | | | | | | | | | |
Philippines | | 112 |
| 110 | | 100 | | 2 | % | 12 | % | 95 | | 96 |
Taiwan | | 93 |
| 94 | | 88 | | (1) | % | 6 | % | 85 | | 89 |
Thailand | | 266 |
| 236 | | 215 | | 13 | % | 24 | % | 210 | | 205 |
Vietnam | | 327 |
| 317 | | 310 | | 3 | % | 5 | % | 270 | | 274 |
Other* | | 335 |
| 219 | | 210 | | 53 | % | 60 | % | 221 | | 226 |
Share of related tax charges from joint ventures and associate | | (76) |
| (44) | | (42) | | 73 | % | 81 | % | (46) | | (49) |
Long-term business | | 3,846 |
| 3,709 | | 3,584 | | 4 | % | 7 | % | 3,379 | | 3,430 |
Eastspring | | 260 |
| 314 | | 299 | | (17) | % | (13) | % | 283 | | 286 |
Adjusted operating profit | | 4,106 |
| 4,023 | | 3,883 | | 2 | % | 6 | % | 3,662 | | 3,716 |
* | Includes other growth markets and a number of small items that are not expected to reoccur. |
† | For 2021, the CER results were calculated using the 2022 average exchange rates. |
‡ | For 2020, the CER results were calculated using the 2021 average exchange rates. |
299
(a) | Eastspring adjusted operating profit |
| | | | | | | | | | |
| | 2022 $m |
| 2021 $m |
| 2020 $m |
| |||
Operating income before performance-related feesnote (1) | | | 660 |
| | 747 |
| | 646 | |
Performance-related fees | | | 1 |
| | 15 |
| | 7 | |
Operating income (net of commission)note (2) | | | 661 |
| | 762 |
| | 653 | |
Operating expensenote (2) | | | (360) |
| | (403) |
| | (336) | |
Group's share of tax on joint ventures' operating profit | | | (41) |
| | (45) |
| | (34) | |
Adjusted operating profit | | | 260 |
| | 314 |
| | 283 | |
Average funds managed or advised by Eastspring | | $ | 229.4bn | | $ | 251.7bn | | $ | 227.1bn | |
Margin based on operating incomenote (3) | | | 29bps | |
| 30bps | |
| 28bps | |
Cost/income rationote II(v) | | | 55 | % |
| 54 | % |
| 52 | % |
| | | | | | | | | | |
Notes
(1) | Operating income before performance-related fees for Eastspring can be further analysed as follows (institutional below includes internal funds under management or under advice): |
| | | | | | | | | | | | |
|
| Retail |
| Margin |
| Institutional |
| Margin |
| Total |
| Margin |
| | $m | | bps | | $m | | bps | | $m | | bps |
2022 | | 392 | | 54 | | 268 | | 17 | | 660 | | 29 |
2021 |
| 449 |
| 56 |
| 298 |
| 17 |
| 747 |
| 30 |
2020 |
| 390 |
| 52 |
| 256 |
| 17 |
| 646 |
| 28 |
(2) | Operating income and expense include the Group’s share of contribution from joint ventures. In the consolidated income statement of the Group IFRS financial results, the net income after tax of the joint ventures and associates is shown as a single line item. |
(3) | Margin represents operating income before performance-related fees as a proportion of the related funds under management or advice. Monthly closing internal and external funds managed or advised by Eastspring have been used to derive the average. Any funds held by the Group’s insurance operations that are not managed or advised by Eastspring are excluded from these amounts. |
(b) | Eastspring total funds under management or advice |
Eastspring manages funds from external parties and also funds for the Group’s insurance operations. In addition, Eastspring advises on certain funds for the Group’s insurance operations where the investment management is delegated to third-party investment managers. The table below analyses the total funds managed or advised by Eastspring.
| | | | |
|
| 31 Dec 2022 $bn |
| 31 Dec 2021 $bn |
External funds under management, excluding funds managed on behalf of M&G plcnote (1) |
|
|
|
|
Retail |
| 60.1 |
| 68.5 |
Institutional |
| 11.3 |
| 13.2 |
Money market funds (MMF) |
| 10.5 |
| 12.3 |
| | 81.9 |
| 94.0 |
Funds managed on behalf of M&G plcnote (2) |
| 9.3 |
| 11.5 |
| | | | |
External funds under management |
| 91.2 |
| 105.5 |
Internal funds: | | | | |
Internal funds under management |
| 104.1 |
| 124.2 |
Internal funds under advice | | 26.1 | | 28.8 |
| | 130.2 | | 153.0 |
Total funds under management or advicenote (3) |
| 221.4 |
| 258.5 |
Notes
(1) | Movements in external funds under management, excluding those managed on behalf of M&G plc, are analysed below: |
| | | | |
|
| 2022 $m |
| 2021 $m |
At 1 Jan |
| 93,956 |
| 93,863 |
Market gross inflows | | 81,942 |
| 98,963 |
Redemptions | | (84,397) |
| (99,862) |
Market and other movements | | (9,552) |
| 992 |
At 31 Dec | | 81,949 |
| 93,956 |
* | The analysis of movements above includes $10,495 million relating to Asia Money Market Funds at 31 December 2022 (31 December 2021: $12,248 million). Investment flows for 2022 include Eastspring Money Market Funds gross inflows of $61,063 million (2021: $61,949 million) and net outflows of $(869) million (2021: net outflows of $(1,512) million). |
300
(2) | Movements in funds managed on behalf of M&G plc are analysed below: |
| | | | |
|
| 2022 $m |
| 2021 $m |
At 1 Jan |
| 11,529 |
| 15,737 |
Net flows | | (765) |
| (4,040) |
Market and other movements | | (1,529) |
| (168) |
At 31 Dec | | 9,235 |
| 11,529 |
(3) | Total funds under management or advice are analysed by asset class below: |
| | | | | | | | | | | | | | | | | |
|
| 31 Dec 2022 |
| 31 Dec 2021 |
| ||||||||||||
| | Funds under | | Funds under | | | | | | | | | | ||||
| | management | | advice | | Total | | Total | | ||||||||
| | $bn |
| % of Total |
| $bn |
| % of Total |
| $bn |
| % of total |
| $bn |
| % of total |
|
Equity | | 92.9 | | 42 | % | 7.8 | | 4 | % | 100.7 | | 46 | % | 107.1 | | 41 | % |
Fixed income | | 86.4 | | 39 | % | 18.3 | | 8 | % | 104.7 | | 47 | % | 133.6 | | 52 | % |
Alternatives | | 2.4 | | 1 | % | — | | — | | 2.4 | | 1 | % | 2.7 | | 1 | % |
Money Market Funds | | 13.6 | | 6 | % | — | | — | | 13.6 | | 6 | % | 15.1 | | 6 | % |
Total funds | | 195.3 | | 88 | % | 26.1 | | 12 | % | 221.4 | | 100 | % | 258.5 | | 100 | % |
I(iv) Group funds under management
For Prudential’s asset management businesses, funds managed on behalf of third parties are not recorded on the balance sheet. They are, however, a driver of profitability. Prudential therefore analyses the movement in the funds under management each year, focusing on those which are external to the Group and those primarily held by the Group’s insurance businesses. The table below analyses the funds of the Group held in the balance sheet and the external funds that are managed by Prudential’s asset management businesses.
| | | | |
|
| 31 Dec 2022 $bn |
| 31 Dec 2021 $bn |
Internal funds | | 168.6 |
| 193.9 |
Eastspring external funds, including M&G plc (as analysed in note I(iii) above) | | 91.2 |
| 105.5 |
Total Group funds under managementnote | | 259.8 |
| 299.4 |
Note
Total Group funds under management comprise:
| | | | |
|
| 31 Dec 2022 $bn |
| 31 Dec 2021 $bn |
Total investments and cash and cash equivalents held on the balance sheet | | 151.5 |
| 177.9 |
External funds of Eastspring including M&G plc | | 91.2 |
| 105.5 |
Internally managed funds held in joint ventures and associates, excluding assets attributable to external unit holders of the consolidated collective investment schemes and other adjustments | | 17.1 |
| 16.0 |
Total Group funds under management | | 259.8 |
| 299.4 |
II | Calculation of alternative performance measures |
Prudential uses alternative performance measures (APMs) to provide more relevant explanations of the Group’s financial position and performance. This section sets out explanations for each APM and reconciliations to relevant IFRS balances.
II(i) | Reconciliation of adjusted operating profit to profit before tax |
Adjusted operating profit presents the operating performance of the business. This measurement basis adjusts for the following items within total IFRS profit before tax:
– | Short-term fluctuations in investment returns on shareholder-backed business; |
– | Amortisation of acquisition accounting adjustments arising on the purchase of business; and |
– | Gain or loss on corporate transactions. |
More details on how adjusted operating profit is determined are included in note B1.2 of the Group IFRS consolidated financial statements. A full reconciliation to profit after tax is given in note B1.1 of the Group IFRS consolidated financial statements.
301
II(ii) | Calculation of IFRS gearing ratio |
IFRS gearing ratio is calculated as net core structural borrowings of shareholder-financed businesses divided by closing IFRS shareholders’ equity plus net core structural borrowings.
| | | | | |
|
| 31 Dec 2022 $m |
| 31 Dec 2021 $m |
|
Core structural borrowings of shareholder-financed businesses | | 4,261 |
| 6,127 | |
Less holding company cash and short-term investments | | (3,057) |
| (3,572) | |
Net core structural borrowings of shareholder-financed businesses | | 1,204 |
| 2,555 | |
Closing shareholders’ equity | | 16,960 |
| 17,088 | |
Closing shareholders’ equity plus net core structural borrowings | | 18,164 |
| 19,643 | |
IFRS gearing ratio | | 7 | % | 13 | % |
II(iii) | Return on IFRS shareholders’ equity |
This measure is calculated as adjusted operating profit, after tax and non-controlling interests, divided by average shareholders’ equity.
Detailed reconciliation of adjusted operating profit to IFRS profit before tax for the Group is shown in note B1.1 to the Group IFRS consolidated financial statements.
| | | | | |
|
| 2022 $m |
| 2021 $m |
|
Adjusted operating profit | | 3,375 |
| 3,233 | |
Tax on adjusted operating profit | | (614) |
| (548) | |
Adjusted operating profit attributable to non-controlling interests | | (11) |
| (17) | |
Adjusted operating profit, net of tax and non-controlling interests | | 2,750 |
| 2,668 | |
| | | | | |
Shareholders’ equity at 1 Jan | | 17,088 |
| 12,367 | |
Shareholders’ equity at 31 Dec | | 16,960 |
| 17,088 | |
Average shareholders’ equity | | 17,024 |
| 14,728 | |
Operating return on average shareholders’ equity (%) | | 16 | % | 18 | % |
II(iv) | Calculation of IFRS shareholders’ equity per share |
IFRS shareholders’ equity per share is calculated as closing IFRS shareholders’ equity divided by the number of issued shares at the end of the year.
| | | | | |
|
| 31 Dec 2022 |
| 31 Dec 2021 |
|
Number of issued shares at the end of the year (million shares) | | 2,750 |
| 2,746 | |
Closing IFRS shareholders’ equity ($ million) | | 16,960 |
| 17,088 | |
Shareholders’ equity per share (cents) | | 617 | ¢ | 622 | ¢ |
II(v) | Calculation of Eastspring cost/income ratio |
The cost/income ratio is calculated as operating expenses, adjusted for commissions and share of contribution from joint ventures and associates, divided by operating income, adjusted for commission, share of contribution from joint ventures and associates and performance-related fees.
| | | | | | | |
|
| 2022 $m |
| 2021 $m |
| 2020 $m | |
IFRS revenue | | 513 |
| 665 | | 612 | |
Share of revenue from joint ventures and associates | | 303 |
| 314 | | 235 | |
Commissions | | (155) |
| (217) | | (194) | |
Performance-related fees | | (1) |
| (15) | | (7) | |
Operating income before performance-related feesnote | | 660 |
| 747 | | 646 | |
| | | | | | | |
IFRS charges | | 398 |
| 498 | | 446 | |
Share of expenses from joint ventures and associates | | 117 |
| 122 | | 84 | |
Commissions | | (155) |
| (217) | | (194) | |
Operating expense | | 360 |
| 403 | | 336 | |
Cost/income ratio (operating expense/operating income before performance-related fees) | | 55 | % | 54 | % | 52 | % |
Note
IFRS revenue and charges for Eastspring are included within the IFRS Income statement in ‘other income’ and ‘acquisition costs and other expenditure’ respectively. Operating income and expense include the Group’s share of contribution from joint ventures and associates. In the Consolidated income statement of the Group IFRS consolidated financial statements, the net income after tax from the joint ventures and associates is shown as a single line item.
302
II(vi) Reconciliation of gross premiums earned to renewal insurance premiums
| | | | | | |
| | 2022 $m | | 2021 $m | ||
|
| |
| AER |
| CER |
IFRS gross premiums earned | | 23,344 | | 24,217 | | 23,546 |
Less: General insurance premium | | (124) | | (124) | | (123) |
Less: IFRS gross earned premium from new regular and single premium business | | (6,807) | | (6,500) | | (6,243) |
Add: Renewal premiums from joint ventures and associatesnote | | 2,262 | | 2,295 | | 2,182 |
Renewal insurance premiums | | 18,675 | | 19,888 | | 19,362 |
Note
For the purpose of the definition of renewal premiums from joint ventures and associates in the table above, premiums for the deposit component of insurance contracts from CPL are excluded.
II(vii) | Reconciliation of gross premiums earned to APE new business sales |
The Group reports APE new business sales as a measure of the new policies sold in the year. APE is calculated as the aggregate of regular premiums and one-tenth of single premiums on new business written during the year for all insurance products, including premiums for contracts designated as investment contracts under IFRS 4. The use of the one-tenth of single premiums is to normalise policy premiums into the equivalent of regular annual payments. This measure is commonly used in the insurance industry to allow comparisons of the amount of new business written in a period by life insurance companies, particularly when the sales contain both single premium and regular premium business. This differs from the IFRS measure of gross premiums earned as shown below:
| | | | | | |
|
| 2022 $m |
| 2021 $m |
| 2020 $m |
Gross premiums earned | | 23,344 |
| 24,217 |
| 23,495 |
Less: premiums from in-force renewal businessnote (a) | | (16,413) |
| (17,593) |
| (18,253) |
Less: 90% of single premiums on new business sold in the yearnote (b) | | (3,839) |
| (3,602) |
| (2,147) |
Add: APE sales from joint ventures and associates on equity accounting methodnote (c) | | 1,182 |
| 1,104 |
| 820 |
Other adjustmentsnote (d) | | 119 |
| 68 |
| (107) |
Annual premium equivalent (APE) | | 4,393 |
| 4,194 |
| 3,808 |
Notes
(a) | Gross premiums earned include premiums from existing in-force business as well as new business given the Group’s focus on recurring premium business. |
(b) | APE new business sales only include one-tenth of single premiums, recorded on policies sold in the year. Gross premiums earned include 100 per cent of such premiums. |
(c) | For the purpose of reporting APE new business sales, the Group’s share of amounts sold by the Group’s insurance joint ventures and associates are included. Under IFRS, joint ventures and associates are equity accounted and so no amounts are included within gross premiums earned. |
(d) | APE new business sales are annualised while gross premiums earned are recorded only when revenues are due. Other adjustments also reflect the inclusion of policies written in the year which are classified as investment contracts without discretionary participation features under IFRS 4, which are recorded as deposits and therefore not in gross premiums earned, and the exclusion of general insurance earned on an IFRS basis. |
303
Exhibits
Documents filed as exhibits to this Form 20-F:
Exhibit Number | Description |
1. | |
2.1 | Form of Deposit Agreement among Prudential, Morgan Guaranty Trust Company of New York, as depositary, and holders and beneficial owners from time to time of ADRs issued there under, including the form of ADR(1). General Data Protection Regulation Amendment Letter to the Deposit Agreement(3). |
2.2 | The total amount of long-term debt securities of Prudential plc authorised under any instrument does not exceed 10 per cent of the total assets of the Company on a consolidated basis. Prudential plc hereby agrees to furnish to the Securities and Exchange Commission, upon its request, a copy of any instrument defining the rights of holders of long-term debt of Prudential plc or of its subsidiaries for which consolidated or unconsolidated financial statements are required to be filed |
2.3 | |
4.1 | Prudential Long-Term Incentive plan(6), Prudential Deferred Annual Incentive Plan(6) |
4.2 | |
4.3 | Form of Letter of Appointment for Non-executive Directors(4) and form of Letter of Appointment for the Chair(5). Each Letter of appointment substantially follows the form exhibited. |
4.4 | |
4.6 | Demerger Agreement, between Prudential plc and Jackson Financial Inc, dated 6 August 2021(6) |
8. | |
12.1 | |
12.2 | |
13.1 | Annual certification pursuant to Section 906 of the Sarbanes-Oxley Act of 2002 |
14.1 | |
15.1 | |
101.INS | XBRL Instance Document |
101.SCH | XBRL Taxonomy Extension Schema Linkbase Document |
101.CAL | XBRL Taxonomy Extension Calculation Linkbase Document |
101.DEF | XBRL Taxonomy Extension Definition Linkbase Document |
101.LAB | XBRL Taxonomy Extension Label Linkbase Document |
101.PRE | XBRL Taxonomy Extension Presentation Linkbase Document |
104. | Cover page interactive data file (formatted as inline XBRL and contained in Exhibit 101) |
(1) | As previously filed with the Securities and Exchange Commission on 22 June 2000 as an exhibit to Prudential’s Form F-6 (in paper format). |
(2) | As previously filed with the Securities and Exchange Commission on 18 May 2009 as an exhibit to Prudential’s Form 20-F. |
(3) | As previously filed with the Securities and Exchange Commission on 22 March 2019 as an exhibit to Prudential’s Form 20-F. |
(4) | As previously filed with the Securities and Exchange Commission on 20 March 2020 as an exhibit to Prudential’s Form 20-F. |
(5) | As previously filed with the Securities and Exchange Commission on 15 March 2021 as an exhibit to Prudential’s Form 20-F. |
(6) | As previously filed with the Securities and Exchange Commission on 17 March 2022 as an exhibit to Prudential’s Form 20-F. |
304
SIGNATURES
The registrant hereby certifies that it meets all of the requirements for filing on Form 20-F and that it has duly caused and authorised the undersigned to sign this annual report on its behalf.
| | | |
|
| Prudential plc | |
| | | |
23 March 2023 | | By: | /s/ Anil Wadhwani |
| | Name: | Anil Wadhwani |
| | Title: | Chief Executive Officer |
305