Exhibit 99.2
2015
HALF-YEAR FINANCIAL REPORT
CONTENTS
HALF-YEAR MANAGEMENT REPORT | 2 |
| |
A/ Significant events of the first half of 2015 | 2 |
B/ Events subsequent to June 30, 2015 | 5 |
C/ Consolidated financial statements for the first half of 2015 | 7 |
D/ Risk factors and related party transactions | 29 |
E/ Outlook | 30 |
F/ Appendix — Definition of Financial Indicators | 32 |
G/ Appendix — Research and Development Pipeline | 34 |
The condensed half-year consolidated financial statements are unaudited but have been subject to a review by the statutory auditors in accordance with professional standards applicable in France.
A/ Significant events of the first half of 2015
A.1. PHARMACEUTICALS
A.1.1. Acquisitions and alliances
· In February 2015, Sanofi announced a research collaboration and licensing agreement with the Dutch biotechnology company Lead Pharma for the discovery, development and commercialization of small-molecule therapies directed against “ROR gamma t” nuclear hormone receptors to treat a broad range of auto-immune disorders including rheumatoid arthritis, psoriasis and inflammatory bowel disease, which are among the most common.
· Also in February 2015, Genzyme and Voyager Therapeutics (a gene therapy company) entered into a strategic collaboration agreement for the discovery, development and commercialization of new adeno-associated virus (AAV) gene therapies to treat serious disorders of the central nervous system. The collaboration covers programs targeting serious and debilitating conditions such as Parkinson’s disease, Friedreich’s ataxia and Huntington’s disease.
· In May 2015, Sanofi signed an agreement with Retrophin, Inc. with a view to acquiring a Rare Pediatric Disease Priority Review Voucher (Pediatric PRV) for a total consideration of $245 million. The transaction was completed in early July 2015. This PRV enables the review period for a new drug application (NDA) to the U.S. Food and Drug Administration (FDA) to be shortened from ten to six months.
A.1.2. Filings for marketing authorization for new products
· On January 19, 2015, the European Commission granted marketing authorization for Cerdelga® (eliglustat) capsules, a first-line oral therapy for certain adults living with Gaucher disease type 1. A small number of adult patients who metabolize Cerdelga® more quickly or at an undetermined rate, as detected by an established genetic laboratory test, will not be eligible for Cerdelga® treatment. Cerdelga® has also been approved in Australia (February) and Japan (March).
· In January 2015, Sanofi and Regeneron Pharmaceuticals, Inc. (Regeneron) announced that the FDA had accepted for priority review the Biologics License Application (BLA) for Praluent® (alirocumab), an investigational monoclonal antibody targeting PCSK9 (proprotein convertase subtilisin/kexin type 9) and intended for the treatment of patients with hypercholesterolemia. The BLA contains data from more than 5,000 patients included in 10 Phase III ODYSSEY trials. Marketing authorization was granted on July 24, 2015.
· On February 25, 2015, the FDA approved Toujeo® (insulin glargine [rDNA origin] injection, 300 U/mL), a once-daily long-acting basal insulin to improve glycemic control in adults living with type 1 and type 2 diabetes. This approval was based on results from the EDITION clinical trials program, which comprised a series of international Phase III studies evaluating the efficacy and safety of Toujeo® compared to Lantus® (insulin glargine [rDNA origin] injection, 100 U/mL) in more than 3,500 adults with type 1 or type 2 diabetes who were uncontrolled on their current therapy. Toujeo® has been available in the United States since the end of March 2015.
2015 Half-Year Financial Report · Sanofi
2
· In April 2015, the European Commission granted marketing authorization for Toujeo® (insulin glargine [rDNA origin] injection, 300 U/ml) for the treatment of adults with type 1 and type 2 diabetes.
· In May 2015, the FDA granted Breakthrough Therapy designation to olipudase alfa, an investigational enzyme replacement therapy developed by Genzyme for the treatment of Niemann-Pick disease type B, on the basis of data from a Phase Ib clinical trial. Breakthrough Therapy designation is intended to expedite the development and review of investigational new drugs that target serious or life-threatening conditions.
A.1.3. Research and development
For an update on our research and development (R&D) pipeline, refer to the appendix presented in Section G of this half-year management report.
The principal clinical trial results announced during the first half of 2015 were as follows:
· In March 2015, Sanofi announced the first results from the ELIXA Phase IIIb study evaluating the cardiovascular safety of Lyxumia® (lixisenatide) versus placebo in a high-risk population of adults with type 2 diabetes. The study showed that lixisenatide was not inferior to placebo in terms of cardiovascular safety, but did not demonstrate its superiority.
· In March 2015, Sanofi and Regeneron announced the publication of 18-month (78-week) results from the ODYSSEY LONG TERM Phase III trial of the investigational drug Praluent® (alirocumab) in 2,341 high-risk patients with hypercholesterolemia. Treatment with Praluent® 150 mg every two weeks reduced low-density lipoprotein cholesterol (LDL-C or “bad” cholesterol) by an additional 62% at week 24 when compared to placebo. Lowering of LDL-C, which is the primary efficacy endpoint of the study, was also maintained consistently over 78 weeks.
· In April 2015, the FDA granted Fast Track designation for the development of GZ/SAR402671, a new investigational oral substrate reduction therapy for the treatment of Fabry disease that is currently in Phase IIa of development.
· In May 2015, Sanofi and Regeneron announced additional positive results from a pivotal Phase IIb study of dupilumab in adult patients with moderate-to-severe asthma who are uncontrolled despite treatment with inhaled corticosteroids and long-acting beta agonists. The study achieved its primary endpoint of improving lung function in asthma patients with high blood eosinophils counts. A Phase III study was launched at the end of April 2015.
· In May 2015, Sanofi and Regeneron announced positive preliminary results from the SARIL-RA-TARGET Phase III study of sarilumab, an investigational, fully-human IL6 receptor antibody, in the treatment of rheumatoid arthritis patients who were inadequate responders to or intolerant of TNF-alpha inhibitors. The study met its co-primary efficacy endpoints of a greater improvement in signs and symptoms of rheumatoid arthritis at 24 weeks, and physical function at 12 weeks, compared to placebo.
· In June 2015, Sanofi announced positive results from the EDITION JP 1 and EDITION JP 2 Phase III extension studies in Japanese patients with uncontrolled diabetes. These results demonstrated similar blood sugar control with Toujeo® as compared to Lantus®, but with fewer people experiencing night-time low blood sugar during the 12 months of the study.
3
The principal decisions taken during the first half of 2015 in terms of project development were as follows:
· Sanofi decided to return to ImmunoGen the rights to the anti-CD19 monoclonal antibody that was being evaluated in Phase II.
· Phase II development of a combination of XL765 (Exelixis) with pimasertib (Merck KGaA) was halted.
· Sanofi decided not to proceed with the development of SAR252067, an anti-LIGHT monoclonal antibody that was being evaluated for Crohn’s disease in Phase I. The worldwide rights were returned to Kyowa Hakko Kirin.
· Sanofi decided not to proceed with the development of its GZ402663 gene therapy for age-related macular degeneration.
· Olipudase alfa (GZ402665), an investigational enzyme replacement therapy for the treatment of Niemann-Pick disease type B, moved into Phase II.
· Sanofi waived its rights to anti-GDF8 monoclonal antibody SAR391786 (myostatin, in collaboration with Regeneron), which was being evaluated for the treatment of sarcopenia in the elderly.
· Sanofi decided not to proceed with the development of fresolimumab in focal segmental glomerulosclerosis.
A.2. HUMAN VACCINES (Vaccines)
· In March 2015, the FDA licensed Quadracel® (vaccine against diphtheria, tetanus, pertussis and polio) for children aged from 4 to 6 years.
A.3. ANIMAL HEALTH
· In February 2015, Merial completed the acquisition of two equine health products from Bayer HealthCare: Legend®/Hyonate® (hyaluronate sodium), an injectable solution that treats non-infectious joint dysfunction in horses, and Marquis® (ponazuril), an antiprotozoal oral paste approved by the FDA for the treatment of equine protozoal myeloencephalitis.
A.4. OTHER SIGNIFICANT EVENTS OF THE FIRST HALF OF 2015
A.4.1. Corporate governance
· On April 2, 2015, Olivier Brandicourt took office as Chief Executive Officer of Sanofi.
· On May 4, 2015, the Annual General Meeting of Sanofi shareholders was held in Paris, France. All of the resolutions were adopted, including the distribution of a cash dividend of €2.85 per share payable from May 13, 2015. The meeting also approved the co-opting of Bonnie Bassler and Olivier Brandicourt as Directors, and the reappointment of Serge Weinberg, Suet-Fern Lee and Bonnie Bassler to serve for a four-year term of office (i.e. until the Annual General Meeting held to approve the financial statements for the year ended December 31, 2018). At the Board meeting that followed the Annual General Meeting, Serge Weinberg was reappointed as Chairman of the Board of Directors and Jean-René Fourtou was appointed as Chairman of the Compensation Committee.
4
A.4.2. Legal and arbitration proceedings
For a description of the most significant developments in legal and arbitration proceedings since publication of the financial statements for the year ended December 31, 2014, refer to Note B.14. to the condensed half-year consolidated financial statements.
The following events have occurred in respect of litigation, arbitration and other legal proceedings in which Sanofi and its affiliates are involved:
Patents
· Lantus® and Lantus® Solostar® Patent Litigation (United States, France and Japan)
In the United States, Eli Lilly and Company (“Lilly”) informed Sanofi in March 2015 that it had withdrawn its second 505(b)(2) application from FDA review. On May 8, 2015, the Court ordered the parties’ joint stipulation of dismissal of this case in light of Lilly’s withdrawal of its second 505(b)(2) application from FDA review. This case is now closed. The case on the first 505(b)(2) application remains outstanding and is scheduled for trial in September 2015.
In France, Sanofi unilaterally withdrew a lawsuit against Lilly regarding the compound and the process patent in June 2015. The case is now terminated on the merits. The case on a device patent is still pending.
In Japan, the request for preliminary injunction against Lilly’s insulin glargine biosimilar pre-loaded in its MirioPen® was withdrawn by Sanofi in July 2015.
B/ Events subsequent to June 30, 2015
· On July 3, 2015, Sanofi announced that Lantus XR® (insulin glargine [rDNA origin] injection, 300 U/ml) had obtained marketing authorization in Japan as a treatment for type 1 and other types of diabetes requiring insulin therapy. Lantus XR® is known as Toujeo® in the United States and Europe.
· On July 15, 2015, Sanofi announced its intention to change its business structure by creating five global business units: General Medicine and Emerging Markets, Specialty Care, Diabetes and Cardiovascular, Sanofi Pasteur, and Merial. The new structure will be put in place at the start of January 2016. The necessary legal processes and consultations with employee representative bodies will take place in accordance with the relevant legislation. There will be no change in the composition of the Executive Committee.
· On July 24, 2015, the FDA approved Praluent® (alirocumab) Injection, a PCSK9 inhibitor indicated as an adjunct to diet and maximally tolerated statin therapy for the treatment of adults with heterozygous familial hypercholesterolemia or clinical atherosclerotic cardiovascular disease (ASCVD) who require additional lowering of low-density lipoprotein (LDL). The effect of Praluent® on cardiovascular morbidity and mortality has not been determined. On the same day, the Committee for Medicinal Products for Human Use (CHMP) of the European Medicines Agency (EMA) adopted a positive opinion on the marketing authorization of Praluent®, recommending its approval for use in certain adult patients with hypercholesterolemia. The European Commission is expected to make a final decision on the marketing authorization application for Praluent® in the European Union in September 2015.
· On July 27, 2015, Sanofi and Genzyme announced that they had entered into a definitive agreement with AstraZeneca to acquire Caprelsa® (vandetanib), a rare disease therapy indicated for the treatment of symptomatic or progressive medullary thyroid carcinoma in patients with unresectable locally advanced or metastatic disease. Currently available in 28 countries, the product is in Phase III development for differentiated thyroid carcinoma, with the study expected to finish in the second half of 2015. Under the terms of the agreement, Genzyme will pay AstraZeneca up to $300 million, including an upfront payment of $165 million to acquire the global rights to sell and further develop Caprelsa®, and further development and sales milestone payments of up to $135 million.
5
The transaction is subject to closing conditions, including the receipt of antitrust clearance from the US Federal Trade Commission, and is expected to complete in the second half of 2015.
· On July 28, 2015, Sanofi and Regeneron entered into a new collaboration to discover, develop and commercialize new antibody cancer treatments in the emerging field of immuno-oncology. As part of the agreement, the two companies will jointly develop a programmed cell death protein 1 (“PD-1”) inhibitor currently in Phase I testing, and plan to initiate clinical trials in 2016 with new therapeutic candidates based on ongoing, innovative preclinical programs. Sanofi will make an upfront payment to Regeneron of $640 million and the companies will invest $1 billion for discovery through proof of concept development (usually a Phase IIa study) of monotherapy and novel combinations of immuno-oncology antibody candidates to be funded 25% by Regeneron ($250 million) and 75% by Sanofi ($750 million). The companies have also committed to equally fund an additional $650 million (or $325 million per company) for development of REGN2810, a PD-1 inhibitor. In addition, Sanofi will pay to Regeneron a one-time milestone of $375 million in the event that sales of a PD-1 product and any other collaboration antibody sold for use in combination with a PD-1 product exceed, in the aggregate, $2 billion in any consecutive 12-month period. Finally, the two companies have agreed to re-allocate $75 million (over three years) for immuno-oncology antibodies from Sanofi’s $160 million annual contribution to their existing antibody collaboration, which otherwise continues as announced in November 2009. Beyond the committed funding, additional funding will be allocated as programs enter post-proof of concept development.
· On July 29, 2015, Sanofi announced that the LixiLan-O Phase III clinical trial had met its primary objective in patients with type 2 diabetes treated with metformin. The fixed-ratio combination of insulin glargine 100 units/mL and lixisenatide, a GLP-1 receptor antagonist, demonstrated statistically superior reduction in HbA1c (average blood glucose over the previous three months) compared with lixisenatide and compared with insulin glargine 100 units/mL. Overall, the fixed-ratio combination had a safety profile reflecting those of lixisenatide and insulin glargine 100 units/mL. The study will be completed in the third quarter of 2015. Following an analysis of results from both Phase III studies, LixiLan-O and LixiLan-L, Sanofi will determine the next steps in the regulatory process.
6
C/ Consolidated financial statements for the first half of 2015
For definitions of financial indicators, refer to the appendix provided in Section F of this report. Unless otherwise indicated, all financial data in this report are presented in accordance with international financial reporting standards (IFRS), including international accounting standards and interpretations (see Note A. to the condensed half-year consolidated financial statements).
C.1. CONSOLIDATED RESULTS OF OPERATIONS
Consolidated income statements for the six months ended June 30, 2014 and June 30, 2015
(€ million) | | June 30,
2015 | | as % of
net sales | | June 30,
2014 | | as % of
net sales | |
Net sales | | 18,188 | | 100.0 | % | 15,917 | | 100.0 | % |
Other revenues | | 163 | | 0.9 | % | 154 | | 1.0 | % |
Cost of sales | | (5,724 | ) | (31.5 | )% | (5,124 | ) | (32.2 | )% |
Gross profit | | 12,627 | | 69.4 | % | 10,947 | | 68.8 | % |
Research and development expenses | | (2,489 | ) | (13.7 | )% | (2,327 | ) | (14.6 | )% |
Selling and general expenses | | (5,086 | ) | (28.0 | )% | (4,333 | ) | (27.2 | )% |
Other operating income | | 83 | | | | 116 | | | |
Other operating expenses | | (170 | ) | | | (87 | ) | | |
Amortization of intangible assets | | (1,229 | ) | | | (1,301 | ) | | |
Impairment of intangible assets | | (28 | ) | | | (74 | ) | | |
Fair value remeasurement of contingent consideration liabilities | | 71 | | | | (132 | ) | | |
Restructuring costs | | (381 | ) | | | (135 | ) | | |
Other gains and losses, and litigation | | — | | | | — | | | |
Operating income | | 3,398 | | 18.7 | % | 2,674 | | 16.8 | % |
Financial expenses | | (267 | ) | | | (292 | ) | | |
Financial income | | 58 | | | | 157 | | | |
Income before tax and associates and joint ventures | | 3,189 | | 17.5 | % | 2,539 | | 16.0 | % |
Income tax expense | | (739 | ) | | | (624 | ) | | |
Share of profit/(loss) of associates and joint ventures | | (66 | ) | | | 7 | | | |
Net income | | 2,384 | | 13.1 | % | 1,922 | | 12.1 | % |
Net income attributable to non-controlling interests | | 59 | | | | 61 | | | |
Net income attributable to equity holders of Sanofi | | 2,325 | | 12.8 | % | 1,861 | | 11.7 | % |
Average number of shares outstanding (million) | | 1,307.2 | | | | 1,317.2 | | | |
Average number of shares outstanding after dilution (million) | | 1,322.0 | | | | 1,333.8 | | | |
Basic earnings per share (in euros) | | 1.78 | | | | 1.41 | | | |
Diluted earnings per share (in euros) | | 1.76 | | | | 1.40 | | | |
7
C.2. SEGMENT INFORMATION
Operating segments
In accordance with IFRS 8 (Operating Segments), the segment information reported by Sanofi is prepared on the basis of internal management data provided to the Chief Executive Officer, who is the Group’s chief operating decision maker. The performance of those segments is monitored individually using internal reports and common indicators. The operating segment disclosures required under IFRS 8 are provided in Note B.18. to the condensed half-year consolidated financial statements.
We have defined our operating segments as “Pharmaceuticals”, “Human Vaccines (Vaccines)” and “Animal Health”. All other activities are combined in a separate segment, “Other”.
Segment results
We report segment results on the basis of “Business operating income”. This indicator is compliant with IFRS 8 and is used internally to measure operational performance and allocate resources. Business operating income is derived from Operating income, adjusted as follows:
· the amounts reported in the line items Restructuring costs, Fair value remeasurement of contingent consideration liabilities and Other gains and losses, and litigation are eliminated;
· amortization and impairment losses charged against intangible assets (excluding software and other rights) are eliminated;
· the share of profits/losses of associates and joint ventures is added;
· net income attributable to non-controlling interests is deducted;
· other acquisition-related effects (primarily the workdown of acquired inventories remeasured at fair value at the acquisition date, and the impact of acquisitions on investments in associates and joint ventures) are eliminated;
· restructuring costs relating to associates and joint ventures are eliminated;
· the additional expense relating to the U.S. Branded Prescription Drug Fee, booked in 2014 following publication in July 2014 of the final IRS regulation on this issue, is eliminated because it is non-recurring and unrelated to segment performance.
8
The table below shows a reconciliation, presented in accordance with IFRS 8, between ‘‘Business operating income’’ and Income before tax and associates and joint ventures:
(€ million) | | June 30,
2015
(6 months) | | June 30,
2014
(6 months) | | December 31,
2014
(12 months) | |
Business operating income | | 4,964 | | 4,290 | | 9,449 | |
Share of profit/(loss) of associates and joint ventures (1) | | (61 | ) | (39 | ) | (147 | ) |
Net income attributable to non-controlling interests (2) | | 62 | | 65 | | 127 | |
Amortization of intangible assets | | (1,229 | ) | (1,301 | ) | (2,482 | ) |
Impairment of intangible assets | | (28 | ) | (74 | ) | 26 | |
Fair value remeasurement of contingent consideration liabilities | | 71 | | (132 | ) | (303 | ) |
Expenses arising from the impact of acquisitions on inventories (3) | | — | | — | | — | |
Restructuring costs | | (381 | ) | (135 | ) | (411 | ) |
Additional expense related to U.S. Branded Prescription Drug Fee (4) | | — | | — | | (116 | ) |
Operating income | | 3,398 | | 2,674 | | 6,143 | |
Financial expenses | | (267 | ) | (292 | ) | (605 | ) |
Financial income | | 58 | | 157 | | 193 | |
Income before tax and associates and joint ventures | | 3,189 | | 2,539 | | 5,731 | |
(1) Excluding (i) restructuring costs of associates and joint ventures and (ii) expenses arising from the impact of acquisitions on associates and joint ventures.
(2) Excluding (i) restructuring costs and (ii) other adjustments attributable to non-controlling interests.
(3) This line records the impact of the workdown of acquired inventories remeasured at fair value at the acquisition date.
(4) Annual fee relating to 2013 U.S. sales: the IRS reforms of July 2014 altered the date on which the liability is recognized, such that the expense recognized during 2014 was based on both 2013 and 2014 sales.
Business net income
We believe that investors’ understanding of our operational performance is enhanced by reporting “business net income”(1). This non-GAAP financial measure represents the aggregate business operating income of all of our operating segments, less net financial expenses and the relevant income tax effects.
Business net income for the first half of 2015 was €3,566 million, 15.6% higher than the 2014 first half figure of €3,084 million, and represented 19.6% of net sales (versus 19.4% in the first half of 2014).
We also report “business earnings per share”, a non-GAAP financial measure which we define as business net income divided by the weighted average number of shares outstanding.
Business earnings per share was €2.73 in the first half of 2015, 16.7% higher than the 2014 first-half figure of €2.34, based on an average number of shares outstanding of 1,307.2 million in the first half of 2015 and 1,317.2 million in the first half of 2014.
(1) Refer to the appendix in section F for a definition.
9
The table below reconciles our business net income to Net income attributable to equity holders of Sanofi:
(€ million) | | June 30,
2015
(6 months) | | June 30,
2014
(6 months) | | December 31,
2014
(12 months) | |
Business net income | | 3,566 | | 3,084 | | 6,847 | |
Amortization of intangible assets | | (1,229 | ) | (1,301 | ) | (2,482 | ) |
Impairment of intangible assets | | (28 | ) | (74 | ) | 26 | |
Fair value remeasurement of contingent consideration liabilities | | 71 | | (132 | ) | (303 | ) |
Expenses arising from the impact of acquisitions on inventories | | — | | — | | — | |
Restructuring costs | | (381 | ) | (135 | ) | (411 | ) |
Other gains and losses, and litigation (1) | | — | | 35 | | 35 | |
Additional expense related to U.S. Branded Prescription Drug Fee (2) | | — | | — | | (116 | ) |
Tax effects on the items listed above, comprising: | | 561 | | 522 | | 1,094 | |
- Amortization of intangible assets | | 431 | | 451 | | 728 | |
- Impairment of intangible assets | | 10 | | 26 | | (18 | ) |
- Fair value remeasurement of contingent consideration liabilities | | (15 | ) | 14 | | 254 | |
- Restructuring costs | | 135 | | 44 | | 143 | |
- Other gains and losses, and litigation | | — | | (13 | ) | (13 | ) |
Other tax items (3) | | (111 | ) | (110 | ) | (110 | ) |
Share of items listed above attributable to non-controlling interests | | 3 | | 4 | | 8 | |
Associates and joint ventures: restructuring costs, and expenses arising from the impact of acquisitions | | (127 | ) | (32 | ) | (198 | ) |
Net income attributable to equity holders of Sanofi | | 2,325 | | 1,861 | | 4,390 | |
(1) In 2014, the gain arising on the Alnylam acquisition was reported in financial income and expenses.
(2) Annual fee relating to 2013 U.S. sales: the IRS reforms of July 2014 altered the date on which the liability is recognized, such that the expense recognized during 2014 was based on both 2013 and 2014 sales.
(3) Contribution on income distributed to equity holders of Sanofi.
The table below reconciles our business operating income to our business net income:
(€ million) | | June 30,
2015
(6 months) | | June 30,
2014
(6 months) | | December 31,
2014
(12 months) | |
Business operating income | | 4,964 | | 4,290 | | 9,449 | |
Financial income and expenses | | (209 | ) | (170 | ) | (447 | ) |
Income tax expense | | (1,189 | ) | (1,036 | ) | (2,155 | ) |
Business net income | | 3,566 | | 3,084 | | 6,847 | |
10
The following tables present our segment results for the first half of 2015, the first half of 2014, and the year ended December 31, 2014:
First half of 2015
(€ million) | | Pharmaceuticals | | Vaccines | | Animal
Health | | Other | | Total | |
Net sales | | 15,255 | | 1,584 | | 1,349 | | — | | 18,188 | |
Other revenues | | 129 | | 14 | | 20 | | — | | 163 | |
Cost of sales | | (4,442 | ) | (826 | ) | (456 | ) | — | | (5,724 | ) |
Research and development expenses | | (2,143 | ) | (262 | ) | (84 | ) | — | | (2,489 | ) |
Selling and general expenses | | (4,310 | ) | (344 | ) | (432 | ) | — | | (5,086 | ) |
Other operating income and expenses | | (39 | ) | 2 | | 5 | | (55 | ) | (87 | ) |
Share of profit/(loss) of associates and joint ventures | | 61 | | — | | — | | — | | 61 | |
Net income attributable to non-controlling interests | | (62 | ) | — | | — | | — | | (62 | ) |
Business operating income | | 4,449 | | 168 | | 402 | | (55 | ) | 4,964 | |
Financial income and expenses | | | | | | | | | | (209 | ) |
Income tax expense | | | | | | | | | | (1,189 | ) |
Business net income | | | | | | | | | | 3,566 | |
First half of 2014
(€ million) | | Pharmaceuticals | | Vaccines | | Animal
Health | | Other | | Total | |
Net sales | | 13,517 | | 1,346 | | 1,054 | | — | | 15,917 | |
Other revenues | | 126 | | 14 | | 14 | | — | | 154 | |
Cost of sales | | (4,046 | ) | (700 | ) | (378 | ) | — | | (5,124 | ) |
Research and development expenses | | (2,025 | ) | (230 | ) | (72 | ) | — | | (2,327 | ) |
Selling and general expenses | | (3,721 | ) | (271 | ) | (341 | ) | — | | (4,333 | ) |
Other operating income and expenses | | 19 | | 1 | | 17 | | (8 | ) | 29 | |
Share of profit/(loss) of associates and joint ventures | | 33 | | 6 | | — | | — | | 39 | |
Net income attributable to non-controlling interests | | (65 | ) | — | | — | | — | | (65 | ) |
Business operating income | | 3,838 | | 166 | | 294 | | (8 | ) | 4,290 | |
Financial income and expenses | | | | | | | | | | (170 | ) |
Income tax expense | | | | | | | | | | (1,036 | ) |
Business net income | | | | | | | | | | 3,084 | |
Year ended December 31, 2014
(€ million) | | Pharmaceuticals | | Vaccines | | Animal
Health | | Other | | Total | |
Net sales | | 27,720 | | 3,974 | | 2,076 | | — | | 33,770 | |
Other revenues | | 272 | | 33 | | 34 | | — | | 339 | |
Cost of sales | | (8,282 | ) | (1,948 | ) | (799 | ) | — | | (11,029 | ) |
Research and development expenses | | (4,174 | ) | (493 | ) | (157 | ) | — | | (4,824 | ) |
Selling and general expenses | | (7,692 | ) | (614 | ) | (682 | ) | (3 | ) | (8,991 | ) |
Other operating income and expenses | | 194 | | 2 | | 20 | | (52 | ) | 164 | |
Share of profit/(loss) of associates and joint ventures | | 106 | | 40 | | 1 | | — | | 147 | |
Net income attributable to non-controlling interests | | (126 | ) | — | | (1 | ) | — | | (127 | ) |
Business operating income | | 8,018 | | 994 | | 492 | | (55 | ) | 9,449 | |
Financial income and expenses | | | | | | | | | | (447 | ) |
Income tax expense | | | | | | | | | | (2,155 | ) |
Business net income | | | | | | | | | | 6,847 | |
11
The tables below provide an analysis of operating results for the Pharmaceuticals, Vaccines and Animal Health segments.
Pharmaceuticals segment first-half business operating income, 2015 and 2014
(€ million) | | June 30,
2015 | | as % of
net sales | | June 30,
2014 | | as % of
net sales | | Year-on-year
change | |
Net sales | | 15,255 | | 100.0 | % | 13,517 | | 100.0 | % | +12.9 | % |
Other revenues | | 129 | | 0.8 | % | 126 | | 0.9 | % | +2.4 | % |
Cost of sales | | (4,442 | ) | (29.1 | )% | (4,046 | ) | (29.9 | )% | +9.8 | % |
Gross profit | | 10,942 | | 71.7 | % | 9,597 | | 71.0 | % | +14.0 | % |
Research and development expenses | | (2,143 | ) | (14.0 | )% | (2,025 | ) | (15.0 | )% | +5.8 | % |
Selling and general expenses | | (4,310 | ) | (28.3 | )% | (3,721 | ) | (27.5 | )% | +15.8 | % |
Other operating income and expenses | | (39 | ) | | | 19 | | | | | |
Share of profit/(loss) of associates and joint ventures | | 61 | | | | 33 | | | | | |
Net income attributable to non-controlling interests | | (62 | ) | | | (65 | ) | | | | |
Business operating income | | 4,449 | | 29.2 | % | 3,838 | | 28.4 | % | +15.9 | % |
Vaccines segment first-half business operating income, 2015 and 2014
(€ million) | | June 30,
2015 | | as % of
net sales | | June 30,
2014 | | as % of
net sales | | Year-on-year
change | |
Net sales | | 1,584 | | 100.0 | % | 1,346 | | 100.0 | % | +17.7 | % |
Other revenues | | 14 | | 0.9 | % | 14 | | 1.0 | % | 0.0 | % |
Cost of sales | | (826 | ) | (52.1 | )% | (700 | ) | (52.0 | )% | +18.0 | % |
Gross profit | | 772 | | 48.7 | % | 660 | | 49.0 | % | +17.0 | % |
Research and development expenses | | (262 | ) | (16.5 | )% | (230 | ) | (17.1 | )% | +13.9 | % |
Selling and general expenses | | (344 | ) | (21.7 | )% | (271 | ) | (20.1 | )% | +26.9 | % |
Other operating income and expenses | | 2 | | | | 1 | | | | | |
Share of profit/(loss) of associates and joint ventures | | — | | | | 6 | | | | | |
Net income attributable to non-controlling interests | | — | | | | — | | | | | |
Business operating income | | 168 | | 10.6 | % | 166 | | 12.3 | % | +1.2 | % |
Animal Health segment first-half business operating income, 2015 and 2014
(€ million) | | June 30,
2015 | | as % of
net sales | | June 30,
2014 | | as % of
net sales | | Year-on-year
change | |
Net sales | | 1,349 | | 100.0 | % | 1,054 | | 100.0 | % | +28.0 | % |
Other revenues | | 20 | | 1.5 | % | 14 | | 1.3 | % | +42.9 | % |
Cost of sales | | (456 | ) | (33.8 | )% | (378 | ) | (35.8 | )% | +20.6 | % |
Gross profit | | 913 | | 67.7 | % | 690 | | 65.5 | % | +32.3 | % |
Research and development expenses | | (84 | ) | (6.2 | )% | (72 | ) | (6.8 | )% | +16.7 | % |
Selling and general expenses | | (432 | ) | (32.0 | )% | (341 | ) | (32.4 | )% | +26.7 | % |
Other operating income and expenses | | 5 | | | | 17 | | | | | |
Share of profit/(loss) of associates and joint ventures | | — | | | | — | | | | | |
Net income attributable to non-controlling interests | | — | | | | — | | | | | |
Business operating income | | 402 | | 29.8 | % | 294 | | 27.9 | % | +36.7 | % |
12
C.3. ANALYSIS OF CONSOLIDATED RESULTS FOR THE FIRST HALF OF 2015
C.3.1. Net sales
Consolidated net sales for the first half of 2015 amounted to €18,188 million, 14.3% higher than in the first half of 2014. Exchange rate movements had a favorable effect of 10.7 points, mainly reflecting the depreciation of the euro against other currencies (primarily the U.S. dollar). At constant exchange rates(1), net sales rose by 3.6% year-on-year.
Reconciliation of first-half reported net sales to net sales at constant exchange rates(1)
(€ million) | | June 30,
2015
(6 months) | | June 30,
2014
(6 months) | | Change | |
Reported net sales | | 18,188 | | 15,917 | | +14.3 | % |
Effect of exchange rates | | (1,692 | ) | | | | |
Net sales at constant exchange rates | | 16,496 | | 15,917 | | +3.6 | % |
C.3.1.1. Net sales by business segment
Our net sales comprise the net sales generated by our Pharmaceuticals, Human Vaccines (Vaccines) and Animal Health segments.
(€ million) | | June 30,
2015
(6 months) | | June 30,
2014
(6 months) | | Change on
a reported
basis | | Change at
constant
exchange rates | |
Pharmaceuticals | | 15,255 | | 13,517 | | +12.9 | % | +3.0 | % |
Vaccines | | 1,584 | | 1,346 | | +17.7 | % | +2.5 | % |
Animal Health | | 1,349 | | 1,054 | | +28.0 | % | +13.9 | % |
Total | | 18,188 | | 15,917 | | +14.3 | % | +3.6 | % |
Pharmaceuticals
Net sales of the Pharmaceuticals segment reached €15,255 million in the first half of 2015, up 12.9% on a reported basis and 3.0% at constant exchange rates. The year-on-year increase of €1,738 million includes positive exchange rate effects of €1,338 million, along with the following effects at constant exchange rates:
· growth in net sales for Genzyme (up €346 million), Generics (up €86 million), and Consumer Health Care (up €58 million);
· a €121 million fall in net sales for the Diabetes division;
· positive mix effects totaling €31 million.
(1) Refer to the appendix in section F for a definition.
13
(€ million)
Product | | Indication | | June 30,
2015
(6 months) | | June 30,
2014
(6 months) | | Change on
a reported
basis | | Change at
constant
exchange rates | |
Lantus® | | Diabetes | | 3,293 | | 3,005 | | +9.6 | % | -5.4 | % |
Apidra® | | Diabetes | | 184 | | 152 | | +21.1 | % | +11.2 | % |
Amaryl® | | Diabetes | | 206 | | 182 | | +13.2 | % | +0.5 | % |
Insuman® | | Diabetes | | 67 | | 65 | | +3.1 | % | +1.5 | % |
Blood glucose meters | | Diabetes | | 32 | | 32 | | 0.0 | % | 0.0 | % |
Lyxumia® | | Diabetes | | 18 | | 11 | | +63.6 | % | +54.5 | % |
Toujeo® | | Diabetes | | 20 | | — | | — | | — | |
Afrezza® | | Diabetes | | 3 | | — | | — | | — | |
Other products | | Diabetes | | 2 | | 3 | | -33.3 | % | -33.3 | % |
Total: Diabetes | | | | 3,825 | | 3,450 | | +10.9 | % | -3.5 | % |
Jevtana® | | Prostate cancer | | 159 | | 132 | | +20.5 | % | +10.6 | % |
Thymoglobulin® | | Organ rejection | | 124 | | 106 | | +17.0 | % | +2.8 | % |
Taxotere® | | Breast, lung, prostate, stomach, and head & neck cancer | | 115 | | 136 | | -15.4 | % | -24.3 | % |
Eloxatin® | | Colorectal cancer | | 111 | | 93 | | +19.4 | % | +5.4 | % |
Mozobil® | | Hematologic malignancies | | 69 | | 51 | | +35.3 | % | +19.6 | % |
Zaltrap® | | Colorectal cancer | | 40 | | 31 | | +29.0 | % | +19.4 | % |
Other products | | | | 129 | | 131 | | -1.5 | % | -13.7 | % |
Total: Oncology | | | | 747 | | 680 | | +9.9 | % | -1.9 | % |
Cerezyme® | | Gaucher disease | | 388 | | 343 | | +13.1 | % | +5.5 | % |
Cerdelga® | | Gaucher disease | | 26 | | — | | — | | — | |
Myozyme®/Lumizyme® | | Pompe disease | | 321 | | 254 | | +26.4 | % | +16.5 | % |
Fabrazyme® | | Fabry disease | | 287 | | 221 | | +29.9 | % | +14.9 | % |
Aldurazyme® | | Mucopolysaccharidosis | | 98 | | 86 | | +14.0 | % | +7.0 | % |
Other products | | | | 140 | | 119 | | +17.6 | % | +4.2 | % |
Sub-total: Rare diseases | | | | 1,260 | | 1,023 | | +23.2 | % | +12.3 | % |
Aubagio® | | Multiple sclerosis | | 374 | | 175 | | +113.7 | % | +84.0 | % |
Lemtrada® | | Multiple sclerosis | | 94 | | 11 | | +754.5 | % | +663.6 | % |
Sub-total: Multiple sclerosis | | | | 468 | | 186 | | +151.6 | % | +118.3 | % |
Total: Genzyme | | | | 1,728 | | 1,209 | | +42.9 | % | +28.6 | % |
Plavix® | | Atherothrombosis | | 1,028 | | 912 | | +12.7 | % | +2.1 | % |
Lovenox® | | Thrombosis | | 871 | | 837 | | +4.1 | % | +0.4 | % |
Renagel®/Renvela® | | Hyperphosphatemia | | 457 | | 309 | | +47.9 | % | +26.5 | % |
Aprovel®/CoAprovel® | | Hypertension | | 425 | | 372 | | +14.2 | % | +0.5 | % |
Synvisc® / Synvisc-One® | | Arthritis | | 201 | | 163 | | +23.3 | % | +3.7 | % |
Multaq® | | Atrial fibrillation | | 170 | | 139 | | +22.3 | % | +2.9 | % |
Allegra® | | Allergic rhinitis, urticaria | | 117 | | 119 | | -1.7 | % | -6.7 | % |
Stilnox®/Ambien®/Myslee® | | Sleep disorders | | 149 | | 151 | | -1.3 | % | -9.3 | % |
Depakine® | | Epilepsy | | 212 | | 191 | | +11.0 | % | +4.7 | % |
Tritace® | | Hypertension | | 145 | | 143 | | +1.4 | % | -2.8 | % |
Lasix® | | Edema, hypertension | | 89 | | 81 | | +9.9 | % | +4.9 | % |
Targocid® | | Bacterial infections | | 82 | | 75 | | +9.3 | % | +2.7 | % |
Orudis® | | Rheumatoid arthritis, osteoarthritis | | 93 | | 83 | | +12.0 | % | +3.6 | % |
Cordarone® | | Arrhythmia | | 67 | | 65 | | +3.1 | % | 0.0 | % |
Xatral® | | Benign prostatic hypertrophy | | 48 | | 47 | | +2.1 | % | -6.4 | % |
Actonel® | | Osteoporosis, Paget’s disease | | 13 | | 41 | | -68.3 | % | -70.7 | % |
Auvi-Q®/AllerjectTM | | Allergic rhinitis | | 52 | | 26 | | +100.0 | % | +65.4 | % |
Other prescription products | | | | 1,869 | | 1,836 | | +1.8 | % | -2.7 | % |
Total: Other prescription products | | | | 6,088 | | 5,590 | | +8.9 | % | +0.8 | % |
Consumer Health Care | | | | 1,869 | | 1,701 | | +9.9 | % | +3.4 | % |
Generics | | | | 998 | | 887 | | +12.5 | % | +9.7 | % |
Total Pharmaceuticals | | | | 15,255 | | 13,517 | | +12.9 | % | +3.0 | % |
14
Diabetes division
Net sales for the Diabetes division were €3,825 million, down 3.5% at constant exchange rates, mainly on the expected fall in sales of Lantus® in the United States. Outside the United States, the Diabetes division recorded net sales of €1,640 million (representing 43% of worldwide Diabetes sales), an increase of 10.3% at constant exchange rates.
Net sales of Lantus® fell by 5.4% in the first half (at constant exchange rates) to €3,293 million. In the United States, sales were down 14.3% at constant exchange rates at €2,093 million, mainly on negative pricing effects; these effects were expected, and resulted from increased rebates granted in order to maintain favorable formulary positions with key payers. The product performed well in Emerging Markets(1) (+19.7% at constant exchange rates, at €581 million), especially in Latin America (+21.4% at constant exchange rates), the Middle East (+22.5% at constant exchange rates) and China (+14.9% at constant exchange rates). In Western Europe, net sales rose by 6.2% at constant exchange rates to €453 million. A biosimilar of Lantus® was launched in some small Eastern European markets in July 2015.
First-half net sales of Apidra® totaled €184 million, up 11.2% at constant exchange rates, driven by a strong performance in Emerging Markets (+29.4% at constant exchange rates, at €46 million) and in Western Europe (+8.5% at constant exchange rates, at €51 million).
Net sales of Amaryl® were virtually unchanged year-on-year (+0.5% at constant exchange rates, at €206 million), reflecting a good performance in Emerging Markets (+6.5% at constant exchange rates, at €168 million) but also the effect of generic competition in Japan (-20.3% at constant exchange rates, at €24 million).
Lyxumia® generated first-half net sales of €18 million, up 54.5% at constant exchange rates.
Toujeo®, launched in the United States in March 2015 and in Germany in the second quarter, posted first-half net sales of €20 million.
Afrezza® (partnership with MannKind) was launched in the United States in February 2015, and recorded net sales of €3 million in the first half.
Oncology business
The Oncology business generated net sales of €747 million, down 1.9% at constant exchange rates. Good performances from Jevtana®, Mozobil® and Zaltrap® were offset by the ongoing impact of generic versions of Taxotere® in Japan.
Net sales of Jevtana® totaled €159 million in the first half of 2015, up 10.6% at constant exchange rates, propelled by a strong performance in the United States (+16.7% at constant exchange rates, at €60 million) and by sales in Japan (€7 million) where the product was launched in September 2014.
Net sales of Thymoglobulin® rose by 2.8% at constant exchange rates to €124 million, as sales advanced in the United States (+14.0% at constant exchange rates, at €70 million) but fell in Emerging Markets (-18.8% at constant exchange rates, at €27 million).
Taxotere® saw net sales decline by 24.3% at constant exchange rates to €115 million, reflecting competition from generics in Emerging Markets (-11.6% at constant exchange rates, at €69 million) and Japan (-35.0% at constant exchange rates, at €32 million). Net sales of Eloxatin® were 5.4% higher at constant exchange rates in the first half at €111 million, lifted by sales growth in China (+13.3% at constant exchange rates).
(1) World excluding United States, Canada, Western Europe, Japan, South Korea, Australia and New Zealand.
15
Net sales of Mozobil® reached €69 million, up 19.6% at constant exchange rates, mainly on sales growth in the United States (+18.5% at constant exchange rates, at €39 million).
Zaltrap® (aflibercept, developed in collaboration with Regeneron) recorded net sales of €40 million, up 19.4% at constant exchange rates. A surge in sales in Western Europe (+50.0% at constant exchange rates, at €25 million) on the back of recent launches more than offset lower sales in the United States (-28.6% at constant exchange rates, at €12 million).
Genzyme business
The Genzyme business generated net sales of €1,728 million, up 28.6% at constant exchange rates, driven by strong growth in sales of Aubagio® and the launch progress of Lemtrada®.
Rare Diseases posted net sales of €1,260 million, up 12.3% at constant exchange rates.
In Gaucher disease, net sales of Cerezyme® advanced by 5.5% at constant exchange rates to €388 million; strong growth in Emerging Markets (+22.3% at constant exchange rates, at €142 million) more than compensated for lower sales in the United States (-10.0% at constant exchange rates, at €99 million) following the launch of Cerdelga®. Cerdelga® reported net sales of €26 million, of which €25 million was generated in the United States.
Net sales of Myozyme®/Lumizyme® rose by 16.5% at constant exchange rates to €321 million, mainly as a result of an increase in the number of patients in the United States (+25.0% at constant exchange rates, at €99 million) and Emerging Markets (+27.3% at constant exchange rates, at €59 million).
Fabrazyme® achieved net sales growth of 14.9% at constant exchange rates, to €287 million. Net sales rose by 12.3% at constant exchange rates in the United States (to €147 million) and by 18.9% at constant exchange rates in Western Europe (to €64 million).
In multiple sclerosis, net sales of Aubagio® surged by 84.0% at constant exchange rates to €374 million. Net sales in the United States reached €265 million, up 64.1% at constant exchange rates. In Western Europe, the product continues to extend its geographical reach, with net sales totaling €82 million in the first half of 2015 (versus €38 million a year earlier). First-half net sales of Lemtrada® amounted to €94 million, including €39 million in Western Europe (primarily in Germany and the United Kingdom) and €45 million in the United States, where the product was launched at the end of 2014.
Other prescription products
Net sales of Plavix® were up 2.1% at constant exchange rates at €1,028 million. Growth was driven by Japan (+7.9% at constant exchange rates, at €406 million) and Emerging Markets (+5.1% at constant exchange rates, at €504 million), especially China (+8.4% at constant exchange rates, at €315 million). However, these positive effects were mitigated by generic competition in Western Europe (-24.1% at constant exchange rates, at €89 million). As expected, numerous generic versions of Plavix® were introduced in Japan at the end of June 2015. Sales of Plavix® in the United States and Puerto Rico are handled by BMS under the terms of the Sanofi-BMS alliance(1).
First-half net sales of Lovenox® were virtually unchanged, edging up by 0.4% at constant exchange rates to €871 million. Lower net sales in the United States as a result of generic competition (-42.6% at constant exchange rates, at €43 million) were offset by a good performance in Emerging Markets (+8.2% at constant exchange rates, at €320 million), especially in Latin America and Africa. Sales of the generic version of Lovenox® launched by Sanofi in 2012 are recorded by our Generics business (see below).
(1) See Note C.2 to the consolidated financial statements for the year ended December 31, 2014, on page F-38 of the Annual Report on Form 20-F; this report is available on www.sanofi.com.
16
Net sales of Renagel®/Renvela® rose by 26.5% at constant exchange rates to €457 million on a strong performance in the United States (+36.6% at constant exchange rates, at €339 million), reflecting reduced competition from Impax which since April 2014 has had the right to sell a limited number of authorized generics of Renvela®. Generics are now being sold in some European countries, and we still expect generics to be approved in the United States.
Net sales of Aprovel®/CoAprovel® were more or less stable (+0.5% at constant exchange rates, at €425 million). Generic competition eroded net sales in Western Europe by 30.2% to €75 million, but the effect was offset by growth in Emerging Markets (+19.3% at constant exchange rates, at €268 million), mainly in Latin America and China.
We have no comments on sales of our other prescription medicines.
Consumer Health Care
Net sales for the Consumer Health Care business rose by 3.4% at constant exchange rates in the first half of 2015 to €1,869 million.
The main growth drivers were the United States (+6.6% at constant exchange rates, at €496 million) on the back of a strong performance from Allegra® OTC following the launch of a new formulation, and Australia/New Zealand (+17.1% at constant exchange rates).
Net sales of Allegra® OTC were up 11.6% at constant exchange rates, driven mainly by the United States (+12.1% at constant exchange rates). Sales of Doliprane® (€155 million, down 1.9% at constant exchange rates) were hit by a January 2015 price cut in France.
(€ million) | | June 30,
2015
(6 months) | | June 30,
2014
(6 months) | | Change on
a reported
basis | | Change at
constant
exchange rates | |
Allegra® | | 258 | | 198 | | +30.3 | % | +11.6 | % |
Doliprane® | | 155 | | 158 | | -1.9 | % | -1.9 | % |
Essentiale® | | 95 | | 121 | | -21.5 | % | -12.4 | % |
Enterogermina® | | 93 | | 74 | | +25.7 | % | +16.2 | % |
Nasacort® | | 74 | | 68 | | +8.8 | % | -10.3 | % |
Maalox® | | 54 | | 50 | | +8.0 | % | +8.0 | % |
Lactacyd® | | 68 | | 57 | | +19.3 | % | +5.3 | % |
Dorflex® | | 43 | | 50 | | -14.0 | % | -10.0 | % |
No Spa® | | 44 | | 53 | | -17.0 | % | -1.9 | % |
Magné B6® | | 41 | | 40 | | +2.5 | % | +15.0 | % |
Other products | | 944 | | 832 | | +13.5 | % | +4.9 | % |
Total Consumer Health Care | | 1,869 | | 1,701 | | +9.9 | % | +3.4 | % |
Generics
The Generics business reported 2015 first-half net sales of €998 million, up 9.7% at constant exchange rates.
Emerging Markets generated net sales of €574 million, up 9.1% at constant exchange rates, boosted by Latin America and the Middle East. In the United States, net sales rose by 10.6% at constant exchange rates to €91 million, mainly due to increased sales of authorized generics of Lovenox®. In the Rest of the World region, sales were up 161.1% at constant exchange rates at €49 million, thanks largely to the performance of Allegra® generics in Japan.
17
2015 first-half Pharmaceuticals net sales by geographical region
(€ million) | | Western
Europe(1) | | Change at
constant
exchange
rates | | United
States | | Change at
constant
exchange
rates | | Emerging
Markets(2) | | Change at
constant
exchange
rates | | Rest
of the
World(3) | | Change at
constant
exchange
rates | |
Lantus® | | 453 | | +6.2 | % | 2,093 | | -14.3 | % | 581 | | +19.7 | % | 166 | | +4.1 | % |
Apidra® | | 51 | | +8.5 | % | 69 | | +1.8 | % | 46 | | +29.4 | % | 18 | | +12.5 | % |
Amaryl® | | 8 | | -20.0 | % | 1 | | 0.0 | % | 168 | | +6.5 | % | 29 | | -18.2 | % |
Insuman® | | 38 | | -5.0 | % | 1 | | 0.0 | % | 28 | | +16.7 | % | — | | — | |
Blood glucose meters | | 30 | | +3.4 | % | — | | — | | 1 | | 0.0 | % | 1 | | -50.0 | % |
Lyxumia® | | 10 | | +42.9 | % | — | | — | | 3 | | +200.0 | % | 5 | | +33.3 | % |
Toujeo® | | 1 | | — | | 18 | | — | | — | | — | | 1 | | — | |
Afrezza® | | — | | — | | 3 | | — | | — | | — | | — | | — | |
Other products | | — | | — | | — | | — | | 1 | | — | | 1 | | -66.7 | % |
Total: Diabetes | | 591 | | +5.6 | % | 2,185 | | -13.0 | % | 828 | | +17.7 | % | 221 | | -0.5 | % |
Jevtana® | | 73 | | 0.0 | % | 60 | | +16.7 | % | 16 | | -5.9 | % | 10 | | +800.0 | % |
Thymoglobulin® | | 18 | | +12.5 | % | 70 | | +14.0 | % | 27 | | -18.8 | % | 9 | | 0.0 | % |
Taxotere® | | 4 | | -62.5 | % | 3 | | -40.0 | % | 69 | | -11.6 | % | 39 | | -33.3 | % |
Eloxatin® | | 2 | | 0.0 | % | 2 | | 0.0 | % | 65 | | 12.0 | % | 42 | | -2.5 | % |
Mozobil® | | 19 | | +12.5 | % | 39 | | +18.5 | % | 8 | | +60.0 | % | 3 | | 0.0 | % |
Zaltrap® | | 25 | | +50.0 | % | 12 | | -28.6 | % | 3 | | +50.0 | % | — | | — | |
Other products | | 27 | | -6.9 | % | 79 | | -17.9 | % | 13 | | -20.0 | % | 10 | | 11.1 | % |
Total: Oncology | | 168 | | +3.1 | % | 265 | | -0.5 | % | 201 | | -4.2 | % | 113 | | -7.9 | % |
Cerezyme® | | 123 | | +2.5 | % | 99 | | -10.0 | % | 142 | | +22.3 | % | 24 | | 0.0 | % |
Cerdelga® | | 1 | | — | | 25 | | — | | — | | — | | — | | — | |
Myozyme®/Lumizyme® | | 142 | | +6.9 | % | 99 | | +25.0 | % | 59 | | +27.3 | % | 21 | | +31.3 | % |
Fabrazyme® | | 64 | | +18.9 | % | 147 | | +12.3 | % | 37 | | +12.9 | % | 39 | | +19.4 | % |
Aldurazyme® | | 35 | | +6.3 | % | 20 | | 0.0 | % | 33 | | +10.3 | % | 10 | | +11.1 | % |
Other products | | 23 | | +9.5 | % | 55 | | +15.0 | % | 19 | | +18.8 | % | 43 | | -14.3 | % |
Sub-total: Rare diseases | | 388 | | +7.6 | % | 445 | | +14.6 | % | 290 | | +20.3 | % | 137 | | +5.0 | % |
Aubagio® | | 82 | | +115.8 | % | 265 | | +64.1 | % | 13 | | +300.0 | % | 14 | | +333.3 | % |
Lemtrada® | | 39 | | +280.0 | % | 45 | | — | | 4 | | — | | 6 | | +400.0 | % |
Sub-total: Multiple sclerosis | | 121 | | +150.0 | % | 310 | | +92.4 | % | 17 | | +433.3 | % | 20 | | +350.0 | % |
Total: Genzyme | | 509 | | +24.6 | % | 755 | | +37.4 | % | 307 | | +25.5 | % | 157 | | +16.1 | % |
Plavix® | | 89 | | -24.1 | % | — | | -100.0 | % | 504 | | +5.1 | % | 435 | | +7.0 | % |
Lovenox® | | 461 | | +1.3 | % | 43 | | -42.6 | % | 320 | | +8.2 | % | 47 | | 0.0 | % |
Renagel®/Renvela® | | 62 | | -6.2 | % | 339 | | +36.6 | % | 45 | | +31.3 | % | 11 | | +20.0 | % |
Aprovel®/CoAprovel® | | 75 | | -30.2 | % | 8 | * | -33.3 | % | 268 | | +19.3 | % | 74 | | 0.0 | % |
Synvisc® / Synvisc-One® | | 15 | | +7.1 | % | 155 | | -0.8 | % | 24 | | +29.4 | % | 7 | | +20.0 | % |
Multaq® | | 20 | | -9.1 | % | 144 | | +4.5 | % | 5 | | 0.0 | % | 1 | | +100.0 | % |
Allegra® | | 6 | | 0.0 | % | — | | — | | 1 | | -50.0 | % | 110 | | -6.3 | % |
Stilnox®/Ambien®/Myslee® | | 19 | | -9.5 | % | 35 | | -14.7 | % | 33 | | +7.1 | % | 62 | | -13.2 | % |
Depakine® | | 70 | | +1.5 | % | — | | — | | 135 | | +8.6 | % | 7 | | -25.0 | % |
Tritace® | | 60 | | -7.7 | % | — | | — | | 82 | | +4.1 | % | 3 | | -40.0 | % |
Lasix® | | 38 | | -7.5 | % | 2 | | 0.0 | % | 30 | | +8.0 | % | 19 | | +33.3 | % |
Targocid® | | 40 | | -2.4 | % | — | | — | | 38 | | +13.3 | % | 4 | | -25.0 | % |
Orudis® | | 9 | | -10.0 | % | — | | — | | 82 | | +5.6 | % | 2 | | 0.0 | % |
Cordarone® | | 12 | | 0.0 | % | — | | — | | 39 | | +5.6 | % | 16 | | -11.8 | % |
Xatral® | | 18 | | -5.3 | % | — | | — | | 27 | | -7.7 | % | 3 | | 0.0 | % |
Actonel® | | 1 | | -88.9 | % | — | | — | | 8 | | -55.6 | % | 4 | | -78.6 | % |
Auvi-Q®/AllerjectTM | | 1 | | 0.0 | % | 45 | | +71.4 | % | — | | — | | 6 | | +50.0 | % |
Other prescription products | | 785 | | +0.4 | % | 164 | | -31.5 | % | 736 | | +5.1 | % | 184 | | -12.4 | % |
Total: Other prescription products | | 1,781 | | -4.1 | % | 935 | | -0.5 | % | 2,377 | | +7.1 | % | 995 | | -2.1 | % |
Consumer Health Care | | 363 | | 0.0 | % | 496 | | +6.6 | % | 887 | | +2.1 | % | 123 | | +15.0 | % |
Generics | | 284 | | 0.7 | % | 91 | | +10.6 | % | 574 | | +9.1 | % | 49 | | +161.1 | % |
Total Pharmaceuticals | | 3,696 | | +1.7 | % | 4,727 | | -1.8 | % | 5,174 | | +8.4 | % | 1,658 | | +2.2 | % |
(1) France, Germany, United Kingdom, Italy, Spain, Greece, Cyprus, Malta, Belgium, Luxembourg, Portugal, Netherlands, Austria, Switzerland, Sweden, Ireland, Finland, Norway, Iceland, Denmark.
(2) World excluding United States, Canada, Western Europe, Japan, South Korea, Australia and New Zealand.
(3) Japan, South Korea, Canada, Australia and New Zealand.
* Sales of active ingredient to the entity majority-owned by BMS in the United States.
18
Human Vaccines (Vaccines)
Vaccines segment net sales for the first half of 2015 amounted to €1,584 million, up 17.7% on a reported basis and 2.5% at constant exchange rates. This reflects on the downside the expected fall in influenza vaccine sales due to delays in the vaccination campaign in the southern hemisphere, and on the upside stronger U.S. sales due to fine performances from Menactra® and VaxServe (a Sanofi Pasteur company that supplies vaccines in the United States).
After stripping out influenza vaccine sales, first-half net sales for the rest of the Vaccines portfolio grew by 8.2% year-on-year at constant exchange rates.
(€ million) | | June 30,
2015
(6 months) | | June 30,
2014
(6 months) | | Change on
a reported
basis | | Change at
constant
exchange rates | |
Polio/Pertussis/Hib Vaccines (incl. Pentacel® and Pentaxim®) | | 555 | | 495 | | +12.1 | % | -1.4 | % |
Influenza Vaccines (including Vaxigrip® and Fluzone®) | | 136 | | 194 | | -29.9 | % | -32.0 | % |
Meningitis/Pneumonia Vaccines (including Menactra®) | | 242 | | 171 | | +41.5 | % | +19.3 | % |
Adult Booster Vaccines (including Adacel®) | | 213 | | 164 | | +29.9 | % | +10.4 | % |
Travel and Other Endemics Vaccines | | 179 | | 178 | | +0.6 | % | -9.0 | % |
Other Vaccines (including Vaxserve) | | 259 | | 144 | | +79.9 | % | +47.2 | % |
Total Vaccines | | 1,584 | | 1,346 | | +17.7 | % | +2.5 | % |
Net sales of Polio/Pertussis/Hib vaccines fell slightly year-on-year (-1.4% at constant exchange rates) to €555 million. In the United States, sales held fairly steady (+1.2% at constant exchange rates, at €207 million), despite a tough comparative with the first half of 2014. Emerging Markets generated net sales of €279 million, up 6.7% at constant exchange rates, driven largely by the performance of Pentaxim® in China. In the Rest of the World region, sales fell by 38.0% at constant exchange rates to €52 million, reflecting lower Japanese sales of Polio and Hib vaccines and Imovax®.
Net sales of Influenza vaccines were down 32.0% (at constant exchange rates) at €136 million. This was mainly due to reduced sales in Brazil (due to delays in shipments to the Butantan Institute following a technology transfer agreement with Sanofi Pasteur) and the absence of pandemic influenza vaccine sales in the United States during the first half of 2015. Emerging Markets net sales slipped by 25.6% at constant exchange rates to €122 million.
Meningitis/Pneumonia vaccines posted net sales of €242 million, up 19.3% at constant exchange rates, buoyed by the United States (+16.0% at constant exchange rates, at €187 million) and Emerging Markets (+29.7% at constant exchange rates, at €50 million).
Net sales of Adult Booster vaccines advanced by 10.4% at constant exchange rates to €213 million. Net sales of Travel and Other Endemics vaccines fell by 9.0% at constant exchange rates, to €179 million.
Other Vaccines saw net sales rise by 47.2% at constant exchange rates, thanks mainly to the performance of VaxServe, a Sanofi Pasteur company that supplies vaccines in the United States.
In addition to the Vaccines activity reflected in our consolidated net sales, sales generated by Sanofi Pasteur MSD, our joint venture with Merck & Co., Inc. in Europe, reached €300 million in the first half of 2015, down 4.2% (on a reported basis), mainly on a decline in sales of Gardasil® (-17.2% on a reported basis). Sales generated by Sanofi Pasteur MSD are not included in our consolidated net sales.
19
2015 first-half Vaccines net sales by geographical region
(€ million) | | Western
Europe(1) | | Change at
constant
exchange
rates | | United
States | | Change at
constant
exchange
rates | | Emerging
Markets(2) | | Change at
constant
exchange
rates | | Rest
of the
World(3) | | Change at
constant
exchange
rates | |
Polio/Pertussis/Hib Vaccines (including Pentacel® and Pentaxim®) | | 17 | | +41.7 | % | 207 | | +1.2 | % | 279 | | +6.7 | % | 52 | | -38.0 | % |
Influenza Vaccines (including Vaxigrip® and Fluzone®) | | 1 | | 0.0 | % | (2 | ) | -104.8 | % | 122 | | -25.6 | % | 15 | | +8.3 | % |
Meningitis/Pneumonia Vaccines (including Menactra®) | | 1 | | — | | 187 | | +16.0 | % | 50 | | +29.7 | % | 4 | | 0.0 | % |
Adult Booster Vaccines (including Adacel®) | | 13 | | -18.8 | % | 159 | | +4.9 | % | 31 | | +61.1 | % | 10 | | +42.9 | % |
Travel and Other Endemics Vaccines | | 14 | | +7.7 | % | 50 | | -10.9 | % | 84 | | -14.1 | % | 31 | | +3.7 | % |
Other Vaccines (including Vaxserve) | | (1 | ) | -200.0 | % | 246 | | +50.8 | % | 6 | | -16.7 | % | 8 | | +80.0 | % |
Total Vaccines | | 45 | | +4.7 | % | 847 | | +11.1 | % | 572 | | -3.1 | % | 120 | | -15.8 | % |
(1) France, Germany, United Kingdom, Italy, Spain, Greece, Cyprus, Malta, Belgium, Luxembourg, Portugal, Netherlands, Austria, Switzerland, Sweden, Ireland, Finland, Norway, Iceland, Denmark.
(2) World excluding United States, Canada, Western Europe, Japan, South Korea, Australia and New Zealand.
(3) Japan, South Korea, Canada, Australia and New Zealand.
20
Animal Health
Net sales for the Animal Health segment for the first half of 2015 were €1,349 million, up 28.0% on a reported basis and 13.9% at constant exchange rates.
(€ million) | | June 30,
2015
(6 months) | | June 30,
2014
(6 months) | | Change on
a reported
basis | | Change at
constant
exchange rates | |
Companion animals | | 907 | | 689 | | +31.6 | % | +14.7 | % |
Production animals | | 442 | | 365 | | +21.1 | % | +12.3 | % |
Total Animal Health | | 1,349 | | 1,054 | | +28.0 | % | +13.9 | % |
Of which fipronil products | | 387 | | 340 | | +13.8 | % | +1.5 | % |
Of which vaccines | | 391 | | 334 | | +17.1 | % | +8.1 | % |
Of which avermectin products | | 288 | | 212 | | +35.8 | % | +17.0 | % |
Of which other products | | 283 | | 168 | | +68.5 | % | +46.4 | % |
Net sales for the Companion Animals franchise advanced by 14.7% at constant exchange rates at €907 million. This reflects the resilience of the fipronil range (+1.5% at constant exchange rates, at €387 million), combined with the success of the new product NexGardTM (sales of which were more than double the 2014 first-half level) and a strong performance from Heartgard® as a result of supply shortages for rival products.
Sales of Production Animals franchise products increased by 12.3% at constant exchange rates to €442 million. The main factors were an increase in sales of products for ruminants in the United States on the back of the success of the parasite control product LongRangeTM, and a recovery in the avian market (especially in Asia).
2015 first-half Animal Health net sales by geographical region
(€ million) | | Western
Europe(1) | | Change at
constant
exchange
rates | | United
States | | Change at
constant
exchange
rates | | Emerging
Markets(2) | | Change at
constant
exchange
rates | | Rest
of the
World(3) | | Change at
constant
exchange
rates | |
Fipronil products | | 121 | | +6.3 | % | 192 | | -4.9 | % | 57 | | +20.0 | % | 17 | | -15.8 | % |
Vaccines | | 87 | | -1.1 | % | 94 | | +5.6 | % | 173 | | +7.2 | % | 37 | | +59.1 | % |
Avermectin products | | 27 | | -3.6 | % | 191 | | +25.0 | % | 29 | | +17.4 | % | 41 | | +5.4 | % |
Other Animal Health products | | 53 | | +15.9 | % | 175 | | +59.6 | % | 36 | | +29.6 | % | 19 | | +125.0 | % |
Total Animal Health | | 288 | | +4.4 | % | 652 | | +17.8 | % | 295 | | +13.0 | % | 114 | | +25.6 | % |
(1) France, Germany, United Kingdom, Italy, Spain, Greece, Cyprus, Malta, Belgium, Luxembourg, Portugal, Netherlands, Austria, Switzerland, Sweden, Ireland, Finland, Norway, Iceland, Denmark.
(2) World excluding United States, Canada, Western Europe, Japan, South Korea, Australia and New Zealand.
(3) Japan, South Korea, Canada, Australia and New Zealand.
21
C.3.1.2. Net Sales by Geographical Region
(€ million) | | June 30,
2015
(6 months) | | June 30,
2014
(6 months) | | Change on
a reported
basis | | Change at
constant
exchange rates | |
United States | | 6,226 | | 4,984 | | +24.9 | % | +1.5 | % |
Emerging Markets(1) | | 6,041 | | 5,294 | | +14.1 | % | +7.4 | % |
of which Eastern Europe, Russia and Turkey | | 1,202 | | 1,239 | | -3.0 | % | +5.7 | % |
of which Asia (excl. Pacific region) | | 1,783 | | 1,368 | | +30.3 | % | +9.0 | % |
of which Latin America | | 1,828 | | 1,618 | | +13.0 | % | +7.1 | % |
of which Africa | | 544 | | 486 | | +11.9 | % | +8.2 | % |
of which Middle East | | 588 | | 520 | | +13.1 | % | +3.8 | % |
Western Europe(2) | | 4,029 | | 3,906 | | +3.1 | % | +1.9 | % |
Rest of the world(3) | | 1,892 | | 1,733 | | +9.2 | % | +2.0 | % |
of which Japan | | 1,114 | | 1,062 | | +4.9 | % | -0.5 | % |
Total | | 18,188 | | 15,917 | | +14.3 | % | +3.6 | % |
(1) World excluding United States, Canada, Western Europe, Japan, South Korea, Australia and New Zealand.
(2) France, Germany, United Kingdom, Italy, Spain, Greece, Cyprus, Malta, Belgium, Luxembourg, Portugal, Netherlands, Austria, Switzerland, Sweden, Ireland, Finland, Norway, Iceland, Denmark.
(3) Japan, South Korea, Canada, Australia and New Zealand.
In the United States, net sales rose by 1.5% at constant exchange rates to €6,226 million on solid performances by Genzyme (+37.4% at constant exchange rates), Vaccines (+11.1% at constant exchange rates) and Animal Health (+17.8% at constant exchange rates), more than offsetting a fall in Diabetes division sales (-13.0% at constant exchange rates).
In Emerging Markets, net sales reached €6,041 million, up 7.4% at constant exchange rates, driven by Diabetes (+17.7% at constant exchange rates), Genzyme (+25.5% at constant exchange rates), Generics (+9.1% at constant exchange rates) and Animal Health (+13.0% at constant exchange rates). The Vaccines segment (-3.1% at constant exchange rates) was adversely affected by delays in the influenza vaccination campaign in the southern hemisphere.
Net sales in Latin America advanced by 7.1% at constant exchange rates to €1,828 million. Growth was boosted by buying patterns associated with local market conditions in Venezuela (+73.4% at constant exchange rates, at €399 million), but hampered by Brazil (-12.7% at constant exchange rates, at €617 million) due to lower vaccine sales. In China, net sales were up 8.5% at constant exchange rates at €1,021 million, reflecting strong performances in Diabetes, Animal Health and Vaccines, and also in Other Prescription Products (especially Plavix®). Eastern Europe posted sales of €1,202 million, up 5.7% at constant exchange rates, driven largely by Turkey (+19.4% at constant exchange rates, at €235 million). In Russia, net sales fell by 5.9% at constant exchange rates to €291 million in tough economic conditions.
Net sales in Western Europe fell by 1.9% at constant exchange rates to €4,029 million. The effects of ongoing generic competition for Plavix® and Aprovel® were partly offset by the performances of the Genzyme business (+24.6% at constant exchange rates) and the Diabetes division (+5.6% at constant exchange rates).
In the Rest of the World, net sales were up 2.0% at constant exchange rates at €1,892 million, driven by Generics, Consumer Health Care and Animal Health. In Japan, net sales were €1,114 million (-0.5% at constant exchange rates) due to the adverse impact of competition from generics of Taxotere®, Myslee® and Amaryl® combined with lower vaccine sales, partly offset by a good performance from Generics and increased sales of Plavix®.
22
C.3.2. Other revenues
Other revenues, which mainly comprise royalties under licensing agreements contracted in connection with ongoing operations, rose by 5.8% to €163 million (versus €154 million in the first half of 2014). At constant exchange rates, other revenues fell year-on-year, reflecting a drop in royalties received from Amgen on sales of Enbrel® in Europe.
C.3.3. Gross profit
Gross profit amounted to €12,627 million in the first half of 2015 (69.4% of net sales), versus €10,947 million in the first half of 2014 (68.8% of net sales). This represents a year-on-year increase of 15.3%, and an improvement of 0.6 of a point in the gross margin ratio.
The gross margin ratio for the Pharmaceuticals segment was 0.7 of a point higher at 71.7%, reflecting on the downside a dip in royalty revenue (0.1 of a point), but on the upside an improvement in the ratio of cost of sales to net sales (0.8 of a point), due largely to the favorable effect of exchange rates.
The gross margin ratio for the Vaccines segment was 0.3 of a point lower at 48.7%, reflecting a less favorable product mix.
The gross margin ratio for the Animal Health segment increased by 2.2 points to 67.7%, mainly as a result of favorable exchange rate effects.
C.3.4. Research and development expenses
Research and development (R&D) expenses amounted to €2,489 million in the first half of 2015 (versus €2,327 million in the first half of 2014) and represented 13.7% of net sales (versus 14.6% in the first half of 2014). The overall year-on-year increase of €162 million (+7.0%) included €118 million for the Pharmaceuticals segment (+5.8%), €32 million for the Vaccines segment (+13.9%) and €12 million for the Animal Health segment (+16.7%).
The majority of this increase was attributable to the adverse impact of exchange rates. At constant exchange rates, R&D expenses fell slightly year-on-year, due mainly to lower spend in the Diabetes and Oncology businesses.
C.3.5. Selling and general expenses
Selling and general expenses totaled €5,086 million (28.0% of net sales), compared with €4,333 million in the first half of 2014 (27.2% of net sales). This represents a year-on-year increase of €753 million (+17.4%), most of which was due to adverse exchange rate effects.
By segment, the year on-year increase was €589 million (+15.8%) for Pharmaceuticals, €73 million (+26.9%) for Vaccines and €91 million (+26.7%) for Animal Health. In addition to adverse exchange rate effects, the overall increase also reflects investment in new product launches in the Genzyme business (in multiple sclerosis), the Diabetes division, and Animal Health.
C.3.6. Other operating income and expenses
Overall, other operating income and expenses represented a net expense of €87 million in the first half of 2015, versus net income of €29 million in the first half of 2014. This year-on-year adverse movement of €116 million was attributable mainly to an operating foreign exchange loss of €100 million relating to the Group’s Venezuelan operations during the first half of 2015.
23
C.3.7. Amortization of intangible assets
Amortization charged against intangible assets in the first half of 2015 amounted to €1,229 million, versus €1,301 million in the first half of 2014. The overall year-on-year decrease of €72 million reflected a number of factors. On the one hand, there was a reduction in amortization charged against the intangible assets recognized on the acquisition of Aventis (€354 million in the first half of 2015, versus €507 million in the first half of 2014) as some products reached the end of their life cycles. Conversely, there was an increase in amortization charged against the intangible assets recognized on the acquisitions of Genzyme (€449 million in the first half of 2015, versus €420 million in the first half of 2014) and of Merial (€241 million in the first half of 2015, versus €194 million in the first half of 2014), due to the launch of new products and to adverse exchange rate effects.
C.3.8. Impairment of intangible assets
In the first half of 2015 this line item showed impairment losses of €28 million against intangible assets (versus €74 million in the first half of 2014), mainly on the discontinuation of research and development projects.
The impairment losses recognized in the first half of 2014 related primarily to Retinostat® and to the Pseudomonas aeruginosa vaccine (in collaboration with KaloBios).
C.3.9. Fair value remeasurement of contingent consideration liabilities
Fair value remeasurements of contingent consideration liabilities recognized on acquisitions in accordance with the revised IFRS 3 represented a net gain of €71 million in the first half of 2015, versus a net expense of €132 million in the first half of 2014.
This item mainly relates to the contingent value rights (CVRs) issued by Sanofi in connection with the Genzyme acquisition and to the contingent consideration payable to Bayer as a result of an acquisition made by Genzyme prior to the latter’s acquisition by Sanofi (see Note B.11. to our condensed half-year consolidated financial statements).
C.3.10. Restructuring costs
Restructuring costs amounted to €381 million in the first half of 2015, compared with €135 million in the first half of 2014.
In the first half of 2015, these costs related to ongoing transformation projects, primarily in France and the rest of Europe. In the first half of 2014, they mainly comprised employee-related expenses arising from headcount adjustment plans in Europe and North America.
C.3.11. Other gains and losses, and litigation
Nothing was recorded on this line in either the first half of 2015 or the first half of 2014.
C.3.12. Operating income
Operating income for the first half of 2015 was €3,398 million, 27.1% higher than the 2014 first-half figure of €2,674 million. This year-on-year change reflects the increase in gross profit, but also higher expenses (mainly selling and general expenses and restructuring costs).
24
C.3.13. Financial income and expenses
Net financial expense for the period was €209 million, versus €135 million for the first half of 2014, an increase of €74 million.
Financial expenses directly related to debt, net of cash and cash equivalents (see definition in section C.5. below) amounted to €142 million, compared with €144 million in the first half of 2014.
The year-on-year change in net financial expense was attributable mainly to:
· a lower level of gains on disposals of non-current financial assets (€22 million) than in the first half of 2014 (€81 million), when the principal gain arose on the sale by Genzyme of its equity interest in Isis Pharmaceuticals;
· a reduction in the net interest cost relating to defined-benefit pension plans (€58 million, compared with €70 million for the first half of 2014);
· a gain of €35 million arising on the acquisition of shares in Alnylam in February 2014.
C.3.14. Income before tax and associates and joint ventures
Income before tax and associates and joint ventures for the first half of 2015 was €3,189 million, compared with €2,539 million for the first half of 2014, a rise of 25.6%.
C.3.15. Income tax expense
Income tax expense was €739 million in the first half of 2015, versus €624 million a year earlier. This year-on-year increase was mainly due to the higher level of income before tax and associates and joint ventures.
The level of income tax expense is significantly impacted by tax gains arising on the amortization and impairment of intangible assets (€441 million in the first half of 2015, versus €477 million in the first half of 2014) and on restructuring costs (€135 million in the first half of 2015, versus €44 million in the first half of 2014). In addition, the tax effect of the fair value remeasurement of contingent consideration liabilities represented a gain of €15 million in the first half of 2015, compared with a gain of €14 million a year earlier. Overall, these effects reduced income tax expense by €26 million.
For interim accounting periods, Sanofi applies an estimated effective tax rate to business operating income, in accordance with IAS 34. The effective tax rate based on business net income(1) was 25.0% for the first half of 2015, versus 25.0% for the first half of 2014 and 24.0% for 2014 as a whole. The main impacts on this tax rate are the geographical mix of the results from Group entities, the tax effects of the elimination of intragroup margin on inventory, and settlements of recent proceedings involving the tax authorities in various countries.
C.3.16. Share of profit/(loss) of associates and joint ventures
Associates and joint ventures contributed a net loss of €66 million in the first half of 2015, versus net income of €7 million in the comparable period of 2014.
Since April 2014, this line item has included our share of the profits and losses of Regeneron (expense of €82 million in the first half of 2015, versus €7 million in the first half of 2014), including the impact of the fair value remeasurement of our share of the acquired intangible assets of Regeneron. It also includes our share of after-tax profits from territories managed by BMS under the Plavix® and Avapro®
(1) Calculated on the basis of business operating income minus net financial expenses, and before (i) the share of profit/loss of associates and joint ventures and (ii) net income attributable to non-controlling interests.
25
alliance (€20 million, versus €11 million in the first half of 2014), plus individually immaterial amounts for our share of profits and losses from other associates and joint ventures.
C.3.17. Net income
Net income for the first half of 2015 was €2,384 million, compared with €1,922 million for the first half of 2014.
C.3.18. Net income attributable to non-controlling interests
Net income attributable to non-controlling interests for the first half of 2015 amounted to €59 million, against €61 million for the first half of 2014. This line item mainly comprises the share of pre-tax profits paid to BMS from territories managed by Sanofi (€48 million, versus €57 million in the first half of 2014); the year-on-year fall was directly related to competition from generics of clopidogrel (the active ingredient of Plavix®) and of irbesartan (the active ingredient of Aprovel®) in Europe.
C.3.19. Net income attributable to equity holders of Sanofi
Net income attributable to equity holders of Sanofi amounted to €2,325 million in the first half of 2015, compared with €1,861 million in the first half of 2014.
Basic earnings per share (EPS) came to €1.78, 26.2% higher than the 2014 first-half figure of €1.41, based on an average number of shares outstanding of 1,307.2 million in the first half of 2015 and 1,317.2 million in the first half of 2014. Diluted EPS was €1.76, versus €1.40 for the first half of 2014, based on a number of shares after dilution of 1,322.0 million in the first half of 2015 and 1,333.8 million in the first half of 2014.
C.3.20. Business operating income
Business operating income (refer to the appendix in section F. for a definition) was €4,964 million in the first half of 2015, compared with €4,290 million in the first half of 2014, an increase of 15.7%. It represented 27.3% of net sales, compared with 27.0% in the first half of 2014.
The table below shows trends in business operating income by business segment for the first half of 2015 and the first half of 2014:
(€ million) | | June 30,
2015 | | June 30,
2014 | |
Pharmaceuticals | | 4,449 | | 3,838 | |
Vaccines | | 168 | | 166 | |
Animal Health | | 402 | | 294 | |
Other | | (55 | ) | (8 | ) |
Business operating income | | 4,964 | | 4,290 | |
C.3.21. Business net income
Business net income (refer to the appendix in section F. for a definition) amounted to €3,566 million in the first half of 2015 versus €3,084 million in the first half of 2014, an increase of 15.6%. It represented 19.6% of net sales, compared with 19.4% in the first half of 2014.
Business EPS for the first half of 2015 was €2.73, 16.7% higher than the 2014 first-half figure of €2.34, based on an average number of shares outstanding of 1,307.2 million in the first half of 2015 and 1,317.2 million in the first half of 2014.
26
C.4. CONSOLIDATED STATEMENT OF CASH FLOWS
Condensed consolidated statement of cash flows
(€ million) | | June 30,
2015 | | June 30,
2014 | |
Net cash provided by/(used in) operating activities | | 3,405 | | 2,534 | |
Net cash provided by/(used in) investing activities | | (1,027 | ) | (2,152 | ) |
Net cash provided by/(used in) financing activities | | (5,060 | ) | (4,339 | ) |
Impact of exchange rates on cash and cash equivalents | | 42 | | 6 | |
Net change in cash and cash equivalents | | (2,640 | ) | (3,951 | ) |
Net cash provided by operating activities came to €3,405 million in the first half of 2015, against €2,534 million in the first half of 2014.
Operating cash flow before changes in working capital for the first half of 2015 was €3,650 million, versus €3,211 million in the first half of 2014, reflecting improved first-half results. Working capital requirements rose by €245 million during the period, compared with a rise of €677 million a year earlier; this favorable trend was mainly due to an increase in other current liabilities during the first half of 2015.
Net cash used in investing activities totaled €1,027 million in the first half of 2015, compared with €2,152 million in the first half of 2014.
Acquisitions of property, plant and equipment and intangible assets amounted to €935 million (versus €637 million in the first half of 2014); the main items were investments in industrial and research facilities (€593 million), together with contractual payments for intangible rights under license and collaboration agreements (€280 million).
Acquisitions of investments during the first half of 2015 totaled €169 million, net of cash acquired and after including assumed liabilities and commitments. The main items were acquisitions of equity interests in Alnylam and Voyager Therapeutics, plus contingent consideration paid to Bayer in connection with the Genzyme acquisition. In the first half of 2014, acquisitions of investments amounted to €1,679 million, net of cash acquired and after including assumed liabilities and commitments, the main items being acquisitions of equity interests in Regeneron and Alnylam.
After-tax proceeds from disposals were €92 million in the first half of 2015, and arose on the divestment of various financial assets and product rights. In the first half of 2014, after-tax proceeds from disposals amounted to €182 million, and arose mainly from the sale of the equity interest in Isis Pharmaceuticals and a payment from Tolmar for the transfer of U.S. rights in respect of Eligard®.
Net cash used in financing activities amounted to €5,060 million in the first half of 2015, compared with €4,339 million in the first half of 2014. The 2015 first-half figure includes net external debt finance repaid (i.e. net change in short-term and long-term debt) of €570 million; this compares with net external debt finance raised of €115 million in the first half of 2014. It also includes the dividend payout to our shareholders (€3,694 million, versus €3,676 million in the first half of 2014), and the €781 million effect of changes in our share capital (repurchase and sale of own shares, net of capital increases).
The net change in cash and cash equivalents in the first half of 2015 was a decrease of €2,640 million, compared with a decrease of €3,951 million in the first half of 2014.
27
C.5. CONSOLIDATED BALANCE SHEET
Total assets stood at €97,923 million as of June 30, 2015, compared with €97,392 million as of December 31, 2014, an increase of €531 million.
Debt, net of cash and cash equivalents stood at €9,726 million as of June 30, 2015, compared with €7,171 million as of December 31, 2014. We define “debt, net of cash and cash equivalents” as (i) the sum total of short term debt, long term debt and interest rate and currency derivatives used to hedge debt, minus (ii) the sum total of cash and cash equivalents and interest rate and currency derivatives used to hedge cash and cash equivalents. The gearing ratio (a non-GAAP financial measure that we define as the ratio of debt, net of cash and cash equivalents, to total equity) rose from 12.7% as of December 31, 2014 to 17.1% as of June 30, 2015. For analyses of debt as of June 30, 2015 and December 31, 2014, refer to Note B.9. to our condensed half-year consolidated financial statements.
We expect that the future cash flows generated by our operating activities will be sufficient to repay our debt.
The financing arrangements in place as of June 30, 2015 at the Sanofi parent company level are not subject to covenants regarding financial ratios and do not contain any clauses linking credit spreads or fees to Sanofi’s credit rating.
Other key movements in the balance sheet are described below.
Total equity was €56,774 million as of June 30, 2015, versus €56,268 million as of December 31, 2014. This increase mainly reflects the following factors:
· increases: our net income for the six months ended June 30, 2015 (€2,384 million) and the net change in currency translation differences (€1,858 million, mainly on the U.S. dollar);
· decreases: the dividend payout to our shareholders in respect of the 2014 financial year (€3,694 million).
As of June 30, 2015, Sanofi held 4.9 million of its own shares, representing 0.37% of the share capital, and recorded as a deduction from equity.
Goodwill and Other intangible assets (€55,062 million in total) rose by €1,322 million year-on-year, the main factors being:
· increases: acquisitions of other intangible assets (€368 million), and currency translation differences on assets denominated in foreign currencies (€2,259 million, mainly on the U.S. dollar);
· decreases: amortization and impairment losses recognized during the period (€1,317 million).
Deferred taxes represented a net asset of €1,181 million, versus €755 million as of December 31, 2014, an increase of €426 million. This increase was mainly due to reversals of deferred tax liabilities on the remeasurement of acquired intangible assets (€169 million), tax losses available for carry-forward (€363 million), and movements in provisions for pensions and other post-employment benefits (€119 million reduction in deferred tax assets).
Provisions and other non-current liabilities (€9,206 million) decreased by €372 million, mainly due to movements in actuarial gains and losses on defined-benefit pension plans (reduction of €772 million) and currency translation differences (increase of €198 million).
Liabilities related to business combinations and to non-controlling interests were €9 million higher at €1,273 million. The main reason was the impact of contingent consideration payable to Bayer as a result of an acquisition made by Genzyme prior to the latter’s acquisition by Sanofi.
28
D/ Risk factors and related party transactions
D.1. RISK FACTORS
The risk factors to which Sanofi is exposed are described in our Annual Report on Form 20-F for the year ended December 31, 2014, filed with the U.S. Securities and Exchange Commission on March 11, 2015. The nature of these risks has not significantly changed during the first half of 2015. These risks may materialize during the second half of 2015 or during subsequent periods.
D.2. RELATED PARTY TRANSACTIONS
Our principal related parties are defined in Note D.33. to the consolidated financial statements included at item 18, page F-104 of our Annual Report on Form 20-F for the year ended December 31, 2014(1).
Note B.5. to the condensed half-year consolidated financial statements provides a description of the principal transactions and balances for the six months ended June 30, 2015 with associates and joint ventures that qualify as related parties.
During the first half of 2015 we entered into agreements and commitments with Olivier Brandicourt, who took office as our Chief Executive Officer on April 2, 2015; these related to termination benefits, a non-compete indemnity, and membership of the Sanofi top-up retirement plan. These agreements and commitments are described on pages 169 and 170 of our Annual Report on Form 20-F for the year ended December 31, 2014(1). Sanofi did not enter into any other transactions with key management personnel during the first half of 2015.
Financial relations with the Group’s principal shareholders fall within the ordinary course of business and were immaterial in the first half of 2015.
(1) This report is available on www.sanofi.com.
29
E/ Outlook
We anticipate that our 2015 full-year business earnings per share(1) at constant average exchange rates will be stable or slightly higher relative to 2014, barring major unforeseen events. In addition, the positive currency impact on 2015 full-year business EPS is estimated to be approximately 10 %, assuming that second half exchange rates remain identical to June 2015 average exchange rates.
Business net income(1) for the year ended December 31, 2014 amounted to €6,847 million, giving business earnings per share of €5.20.
This guidance has been prepared using accounting methods consistent with those used in the preparation of our historical financial information. It draws upon assumptions defined by Sanofi and its subsidiaries, in particular regarding the following factors:
· growth in the national markets in which we operate;
· healthcare reimbursement policies, pricing reforms, and other governmental measures affecting the pharmaceutical industry;
· developments in the competitive environment, in terms of innovative products and the introduction of generics;
· respect by others for our intellectual property rights;
· progress on our research and development programs;
· the impact of our operating cost control policy, and trends in our operating costs;
· trends in exchange rates and interest rates; and
· the average number of shares outstanding.
Some of the information, assumptions and estimates concerned are derived from or based, in whole or in part, on judgments and decisions made by Sanofi management that may be liable to change or adjustment in future.
(1) Refer to the appendix in section F for a definition.
30
Forward-Looking Statements
This document contains forward-looking statements as defined in the U.S. Private Securities Litigation Reform Act of 1995, as amended. Forward-looking statements are statements that are not historical facts. These statements include projections and estimates and their underlying assumptions, statements regarding plans, objectives, intentions and expectations with respect to future financial results, events, operations, services, product development and potential, and statements regarding future performance. Forward-looking statements are generally identified by the words “expects,” “anticipates,” “believes,” “intends,” “estimates,” “plans” and similar expressions. Although Sanofi’s management believes that the expectations reflected in such forward-looking statements are reasonable, investors are cautioned that forward-looking information and statements are subject to various risks and uncertainties, many of which are difficult to predict and generally beyond the control of Sanofi, that could cause actual results and developments to differ materially from those expressed in, or implied or projected by, the forward-looking information and statements.
These risks and uncertainties include among other things, the uncertainties inherent in research and development, future clinical data and analysis, including post marketing, decisions by regulatory authorities, such as the FDA or the EMA, regarding whether and when to approve any drug, device or biological application that may be filed for any such product candidates as well as their decisions regarding labeling and other matters that could affect the availability or commercial potential of such product candidates, the absence of guarantee that the product candidates if approved will be commercially successful, the future approval and commercial success of therapeutic alternatives, the Group’s ability to benefit from external growth opportunities, trends in exchange rates and prevailing interest rates, the impact of cost containment policies and subsequent changes thereto, the average number of shares outstanding as well as those discussed or identified in the public filings with the Securities and Exchange Commission (SEC) and the Autorité des marchés financiers (AMF) made by Sanofi, including those listed under “Risk Factors”(1) and “Cautionary Statement Regarding Forward-Looking Statements” in Sanofi’s annual report on Form 20-F for the year ended December 31, 2014. For an update on litigation, refer to Note B.14. “Legal and arbitration proceedings” to our condensed half-year consolidated financial statements for the six months ended June 30, 2015, and to section “A.4.2. Legal and arbitration proceedings” and section “D. Risk factors and related party transactions” on pages 5 and 29 respectively of the half-year management report.
Other than as required by applicable law, Sanofi does not undertake any obligation to update or revise any forward-looking information or statements.
(1) See pages 4 to 18 of the 2014 Annual Report on Form 20-F; this report is available on www.sanofi.com.
31
F/ Appendix — Definition of Financial Indicators
F.1. NET SALES ON A CONSTANT STRUCTURE BASIS AND AT CONSTANT EXCHANGE RATES
F.1.1. Net sales at constant exchange rates
When we refer to changes in our net sales “at constant exchange rates”, we exclude the effect of exchange rates by recalculating net sales for the relevant period using the exchange rates that were used for the previous period.
Reconciliation of 2015 first-half reported net sales to net sales at constant exchange rates
(€ million) | | June 30,
2015 | |
Reported net sales for the first half of 2015 | | 18,188 | |
Effect of exchange rates | | (1,692 | ) |
Net sales at constant exchange rates for the first half of 2015 | | 16,496 | |
F.1.2. Net sales on a constant structure basis
When we refer to changes in our net sales “on a constant structure basis”, we eliminate the effect of changes in structure by restating the net sales for the previous period as follows:
· by including sales generated by entities or product rights acquired in the current period for a portion of the previous period equal to the portion of the current period during which we owned them, based on sales information we receive from the party from whom we make the acquisition;
· similarly, by excluding sales for a portion of the previous period when we have sold an entity or rights to a product in the current period;
· for a change in consolidation method, by recalculating the previous period on the basis of the method used for the current period.
F.2. BUSINESS INCOME
F.2.1. Business operating income
We report segment results on the basis of “Business Operating Income”. This indicator, adopted in compliance with IFRS 8, is used internally to measure operational performance and to allocate resources. “Business Operating Income” is derived from Operating income, adjusted as follows
· the amounts reported in the line items Restructuring costs, Fair value remeasurement of contingent consideration liabilities and Other gains and losses, and litigation are eliminated;
· amortization and impairment losses charged against intangible assets (other than software and other rights) are eliminated;
· the share of profits/losses of associates and joint ventures is added;
· net income attributable to non-controlling interests is deducted;
· other acquisition-related effects (primarily, the workdown of acquired inventories remeasured at fair value at the acquisition date, and the impact of acquisitions on investments in associates and joint ventures) are eliminated;
32
· restructuring costs relating to associates and joint ventures are eliminated;
· the additional expense relating to the U.S. Branded Prescription Drug Fee, booked in 2014 following publication in July 2014 of the final IRS regulation on this issue, is eliminated because it is non-recurring and unrelated to segment performance.
F.2.2. Business net income
“Business net income” is a non-GAAP financial measure that we define as Net income attributable to equity holders of Sanofi determined under IFRS, excluding:
· amortization and impairment losses of intangible assets (other than software);
· fair value remeasurement of contingent consideration liabilities;
· other impacts associated with acquisitions (including impacts of acquisitions on associates and joint ventures);
· restructuring costs(1);
· other gains and losses(1);
· costs and provisions related to litigation(1);
· the tax effects related to the items listed above, and the effects of major tax disputes;
· the 3% tax on the distribution of dividends to equity holders of Sanofi;
· the additional expense relating to the U.S. Branded Prescription Drug Fee, booked in 2014 following publication in July 2014 of the final IRS regulation on this issue, which is eliminated because it is non-recurring and unrelated to segment performance; and
· the share of non-controlling interests in the items listed above.
We also report “business earnings per share” (“business EPS”), a non-GAAP financial measure that we define as business net income divided by the weighted average number of shares outstanding.
(1) Reported in the line items Restructuring costs and Other gains and losses, and litigation in the consolidated income statement.
33
G/ Appendix — Research and Development Pipeline
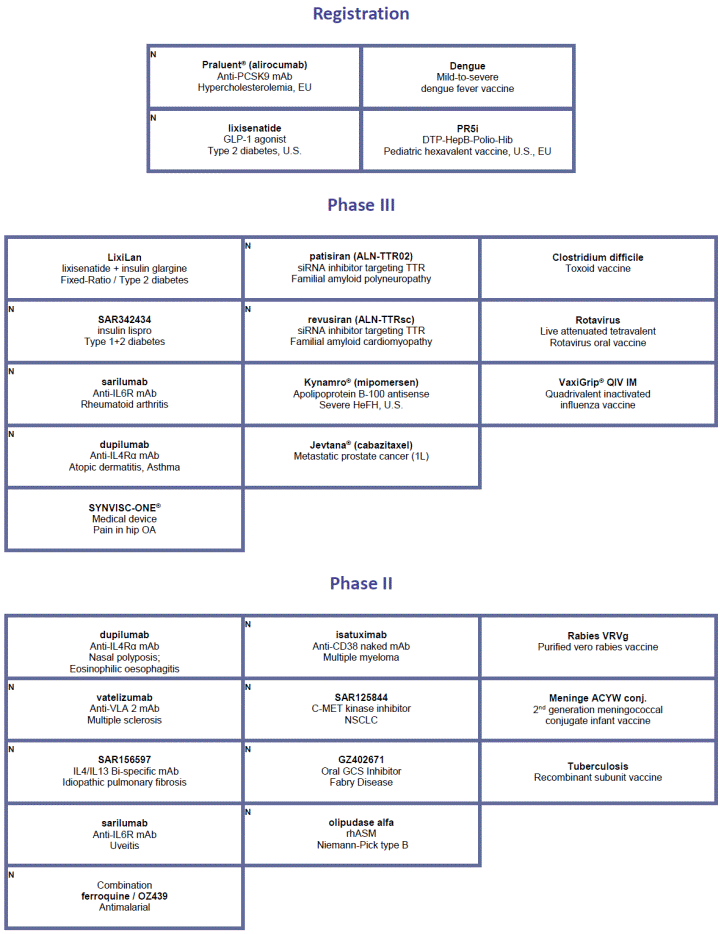
34
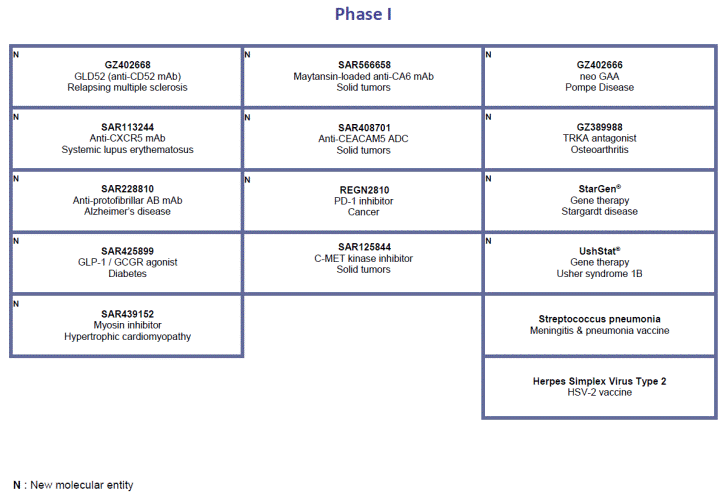
35