SECURITIES AND EXCHANGE COMMISSION
WASHINGTON, DC 20549
FORM 6-K
Report of Foreign Private Issuer
Pursuant to Rule 13a-16 or 15d-16 of
The Securities Exchange Act of 1934
For the month of March 2023
CHINA PETROLEUM & CHEMICAL CORPORATION
22 Chaoyangmen North Street,
Chaoyang District, Beijing, 100728
People's Republic of China
Tel: (8610) 59960114
(Indicate by check mark whether the registrant files or will file annual reports under cover of Form 20-F or Form 40-F.)
Form 20-F ✔ Form 40-F _____
(Indicate by check mark whether the registrant by furnishing the information contained in this form is also thereby furnishing the information to the Commission pursuant to Rule 12g3-2(b) under the Securities Exchange Act of 1934.)
Yes ____ No ✔
(If "Yes" is marked, indicate below the file number assigned to registrant in connection with Rule 12g3-2(b): 82-__________.)
N/A
This Form 6-K consists of:
A copy of 2022 annual report of China Petroleum & Chemical Corporation (the “Registrant”).
CONTENTS
| 2 | Company Profile |
| 3 | Principal Financial Data and Indicators |
| 7 | Chairman’s Address |
| 9 | Business Review and Prospects |
| 16 | Management’s Discussion and Analysis |
| 26 | Corporate Governance |
| 48 | Environment and Social Responsibilities |
| 50 | Significant Events |
| 57 | Connected Transactions |
| 59 | Report of the Board of Directors |
| 68 | Report of the Board of Supervisors |
| 70 | Changes in Share Capital and Shareholdings of Principal Shareholders |
| 72 | Bond General Information |
| 74 | Principal Wholly-owned and Controlled Subsidiaries |
| 75 | Financial Statements |
| 211 | Corporate Information |
| 212 | Documents for Inspection |
This annual report includes forward-looking statements. All statements, other than statements of historical facts, that address activities, events or developments that the Company expects or anticipates will or may occur in the future (including but not limited to projections, targets, reserve and other estimates and business plans) are forward-looking statements. The Company’s actual results or developments may differ materially from those indicated by these forward-looking statements as a result of various factors and uncertainties. The Company makes the forward-looking statements referred to herein as at 24 March 2023 and unless required by regulatory authorities, the Company undertakes no obligation to update these statements.
1
COMPANY PROFILE
IMPORTANT NOTICE: THE BOARD OF DIRECTORS, THE BOARD OF SUPERVISORS, DIRECTORS, SUPERVISORS AND SENIOR MANAGEMENT OF SINOPEC CORP. WARRANT THAT THERE ARE NO FALSE REPRESENTATIONS, MISLEADING STATEMENTS OR MATERIAL OMISSIONS IN THIS ANNUAL REPORT, AND JOINTLY AND SEVERALLY ACCEPT FULL RESPONSIBILITY FOR THE AUTHENTICITY, ACCURACY AND COMPLETENESS OF THE INFORMATION CONTAINED IN THIS ANNUAL REPORT. THERE IS NO OCCUPANCY OF NON-OPERATING FUNDS BY THE CONTROLLING SHAREHOLDERS OF SINOPEC CORP. ALL DIRECTORS ATTENDED THE 15TH MEETING OF THE EIGHTH SESSION OF THE BOARD. MR. MA YONGSHENG, CHAIRMAN OF THE BOARD, MR. YU BAOCAI, PRESIDENT, MS. SHOU DONGHUA, CHIEF FINANCIAL OFFICER AND HEAD OF THE FINANCIAL DEPARTMENT OF SINOPEC CORP. WARRANT THE AUTHENTICITY AND COMPLETENESS OF THE FINANCIAL STATEMENTS CONTAINED IN THIS ANNUAL REPORT. THE AUDIT COMMITTEE OF SINOPEC CORP. HAS REVIEWED THE ANNUAL REPORT OF SINOPEC CORP. FOR THE YEAR ENDED 31 DECEMBER 2022.
THE FINANCIAL STATEMENTS FOR THE YEAR ENDED 31 DECEMBER 2022 OF THE COMPANY PREPARED IN ACCORDANCE WITH THE PRC ACCOUNTING STANDARDS FOR BUSINESS ENTERPRISES (CASs) AND INTERNATIONAL FINANCIAL REPORTING STANDARDS (IFRS) HAVE BEEN AUDITED BY KPMG HUAZHEN LLP AND KPMG RESPECTIVELY. BOTH FIRMS HAVE ISSUED STANDARD UNQUALIFIED AUDITOR’S REPORT.
AS APPROVED AT THE 15TH MEETING OF THE EIGHTH SESSION OF THE BOARD OF DIRECTORS OF SINOPEC CORP., THE BOARD PROPOSED A FINAL CASH DIVIDEND OF RMB0.195 (TAX INCLUSIVE) PER SHARE FOR 2022, COMBINING WITH THE INTERIM CASH DIVIDEND OF RMB0.16 (TAX INCLUSIVE) PER SHARE, THE TOTAL CASH DIVIDEND FOR 2022 WILL BE RMB0.355 (TAX INCLUSIVE) PER SHARE. THE DIVIDEND PROPOSAL IS SUBJECT TO THE SHAREHOLDERS’ APPROVAL AT THE ANNUAL GENERAL MEETING FOR THE YEAR 2022.
COMPANY PROFILE
Sinopec Corp.’s H shares were listed in Hong Kong, New York and London exchanges on 18 and 19 October 2000, respectively, and A shares were listed in the Shanghai Stock Exchange on 8 August 2001. Sinopec Corp. is one of the largest integrated energy and chemical companies in China. Its principal operations include the exploration and production, pipeline transportation and sale of petroleum and natural gas; the production, sale, storage and transportation of refinery products, petrochemical products, coal chemical products, synthetic fibre, and other chemical products; the import and export, including an import and export agency business, of petroleum, natural gas, petroleum products, petrochemical and chemical products, and other commodities and technologies; and research, development and application of technologies and information; hydrogen energy business and related services such as hydrogen production, storage, transportation and sales; battery charging and swapping, solar energy, wind energy and other new energy business and related services.
DEFINITIONS:
In this report, unless the context otherwise requires, the following terms shall have the meaning as set out below:
Sinopec Corp.: China Petroleum & Chemical Corporation
Company: Sinopec Corp. and its subsidiaries
China Petrochemical Corporation: the controlling shareholder of Sinopec Corp., China Petrochemical Corporation
Sinopec Group: China Petrochemical Corporation and its subsidiaries
NDRC: China National Development and Reform Commission
RMC: Oil and Natural Gas Reserves Management Committee of the Company
Sinopec Finance Co.: Sinopec Finance Co., Ltd.
Century Bright: Sinopec Century Bright Capital Investment, Ltd.
CSRC: China Securities Regulatory Commission.
Hong Kong Stock Exchange: The Stock Exchange of Hong Kong Limited
Hong Kong Listing Rules: Rules Governing the Listing of Securities on The Stock Exchange of Hong Kong Limited
CONVERSION:
For domestic production of crude oil, 1 tonne = 7.1 barrels;
For overseas production of crude oil: 1 tonne = 7.26 barrels in 2022, 1 tonne = 7.22 barrels in 2021, 1 tonne = 7.20 barrels in 2020;
For production of natural gas, 1 cubic meter = 35.31 cubic feet;
Refinery throughput is converted at 1 tonne = 7.35 barrels.
2
PRINCIPAL FINANCIAL DATA AND INDICATORS
| 1. | FINANCIAL DATA AND INDICATORS PREPARED IN ACCORDANCE WITH CASs |
| (1) | Principal financial data |
| For the year ended 31 December | ||||
| 2022 | 2021 | Change | 2020 | |
| Items | RMB million | RMB million | (%) | RMB million |
| Operating income | 3,318,168 | 2,740,884 | 21.06 | 2,104,724 |
| Operating profit | 96,414 | 112,414 | (14.23) | 50,803 |
| Profit before taxation | 94,515 | 108,348 | (12.77) | 48,441 |
| Net profit attributable to equity shareholders of the Company | 66,302 | 71,208 | (6.89) | 33,271 |
| Net profit/(loss) attributable to equity shareholders of the Company excluding extraordinary gains and losses | 57,182 | 72,220 | (20.82) | (1,565) |
| Net cash flow from operating activities | 116,269 | 225,174 | (48.36) | 168,520 |
| 2022 | |||||
First Quarter | Second Quarter | Third Quarter | Fourth Quarter | Total | |
| RMB million | RMB million | RMB million | RMB million | RMB million | |
| Operating income | 771,386 | 840,740 | 841,196 | 864,846 | 3,318,168 |
| Net profit attributable to equity shareholders of the Company | 22,605 | 20,925 | 13,130 | 9,642 | 66,302 |
| Net profit attributable to equity shareholders of the Company excluding extraordinary gains and losses | 22,450 | 20,510 | 12,492 | 1,730 | 57,182 |
| Net cash flow (used in)/generate from operating activities | (46,781) | 51,728 | 54,297 | 57,025 | 116,269 |
| For the year ended 31 December | ||||
| 2022 | 2021 | Change | 2020 | |
| Items | RMB million | RMB million | (%) | RMB million |
| Total assets | 1,948,640 | 1,889,255 | 3.1 | 1,738,896 |
| Total liabilities | 1,011,487 | 973,214 | 3.9 | 850,176 |
| Total equity attributable to equity shareholders of the Company | 785,577 | 775,102 | 1.4 | 747,294 |
| Total number of shares (1,000 shares) | 119,896,408 | 121,071,210 | (1.0) | 121,071,210 |
| (2) | Principal financial indicators |
| For the year ended 31 December | ||||
| 2022 | 2021 | Change | 2020 | |
| Items | RMB Yuan | RMB Yuan | (%) | RMB Yuan |
| Basic earnings per share | 0.548 | 0.588 | (6.80) | 0.275 |
| Diluted earnings per share | 0.548 | 0.588 | (6.80) | 0.275 |
| Basic earnings per share (excluding extraordinary gains and losses) | 0.473 | 0.597 | (20.77) | (0.013) |
| Weighted average return on net assets (%) | 8.50 | 9.35 | (0.85) percentage points | 4.46 |
| Weighted average return (excluding extraordinary gains and losses) on net assets (%) | 7.33 | 9.49 | (2.16) percentage points | (0.21) |
| Net cash flow from operating activities per share | 0.962 | 1.860 | (48.28) | 1.392 |
| For the year ended 31 December | ||||
| 2022 | 2021 | Change | 2020 | |
| Items | RMB Yuan | RMB Yuan | (%) | RMB Yuan |
| Net assets attributable to equity shareholders of the Company per share | 6.552 | 6.402 | 2.34 | 6.172 |
| Liabilities to assets ratio (%) | 51.91 | 51.51 | 0.40 percentage points | 48.89 |
3
| (3) | Extraordinary items and corresponding amounts |
For the year ended 31 December (Income)/expenses | |||
| 2022 | 2021 | 2020 | |
| Items | RMB million | RMB million | RMB million |
| Net (gain)/loss on disposal of non-current assets | (672) | (665) | (973) |
| Donations | 447 | 165 | 301 |
| Government grants | (3,826) | (3,085) | (8,605) |
| Gain on holding and disposal of various investments | (13,902) | (259) | (37,520) |
| Other non-operating expenses, net | 2,178 | 4,720 | 2,992 |
| Net profit/(loss) acquired through business combination under common control during the reporting period | 0 | 101 | (472) |
| Subtotal | (15,775) | 977 | (44,277) |
| Tax effect | 2,304 | (72) | 6,736 |
| Total | (13,471) | 905 | (37,541) |
| Attributable to: Equity shareholders of the Company | (9,120) | 1,012 | (34,836) |
| Minority interests | (4,351) | (107) | (2,705) |
| (4) | Items measured by fair values |
Unit: RMB million
| Items | Beginning of the year | End of the year | Changes | Influence on the profit of the year |
| Other equity instruments investment | 767 | 730 | (37) | 76 |
| Receivables financing | 5,939 | 3,507 | (2,432) | 0 |
| Derivative financial instruments | 1,350 | (1,838) | (3,188) | (15,535) |
| Cash flow hedging | 13,798 | 13,860 | 62 | 12,609 |
| Financial assets held for trading | 0 | 2 | 2 | 11 |
| Total | 21,854 | 16,261 | (5,593) | (2,839) |
4
| (5) | Significant changes of items in the financial statements |
The table below sets forth reasons for those changes where the fluctuation was more than 30% during the reporting period:
| As of 31 December | Increase/(decrease) | ||||
| 2022 | 2021 | Amount | Percentage | ||
| Items | RMB million | RMB million | RMB million | (%) | Reasons for change |
| Cash at bank and on hand | 145,052 | 221,989 | (76,937) | (34.7) | Expanded investment scale, increased dividend, and raised occupation of inventory capital resulting from increase of prices of crudes and other commodities |
| Accounts receivable | 46,364 | 34,861 | 11,503 | 33.0 | Increase in the account receivables due to the rising prices of crude oil and refined oil products |
| Receivables financing | 3,507 | 5,939 | (2,432) | (40.9) | Improved efficiency in the use of capital and advanced turnover of bills |
| Derivative financial liabilities | 7,313 | 3,223 | 4,090 | 126.9 | Impact of changes in fair value of commodity-based hedging business including crude oil |
| Taxes payable | 28,379 | 81,267 | (52,888) | (65.1) | Impact of deferred payment of tax happened in the fourth quarter of last year |
| Non-current liabilities due within one year | 62,844 | 28,651 | 34,193 | 119.3 | Increase in long-term loans due within one year and debentures payable |
| Long-term loans | 94,964 | 49,341 | 45,623 | 92.5 | Increase in long-term loans to ensure investment and production and operation capital needs |
| Debentures payable | 12,997 | 42,649 | (29,652) | (69.5) | A result of partial amount of bonds payable reclassifying to non-current liabilities due within one year |
| Other comprehensive income | 3,072 | (690) | 3,762 | – | Increase in the translation difference of foreign currency statements due to the appreciation of US dollar against RMB |
| Refunds of taxes and levies | 12,010 | 4,641 | 7,369 | 158.8 | VAT credit refund in this year increased significantly year-on-year |
| Other cash received relating to operating activities | 269,895 | 158,049 | 111,846 | 70.8 | Impact of margin change of derivative business |
| Other cash paid relating to operating activities | (312,819) | (179,679) | (133,140) | 74.1 | |
| Cash received from disposal of investments | 1,980 | 9,812 | (7,832) | (79.8) | Impact of year-on-year decreased in structured deposits due this year |
| Cash received from returns on investments | 13,969 | 10,134 | 3,835 | 37.8 | Increase in dividends received from associates and joint ventures |
| Net cash received from disposal of fixed assets, intangible assets and other long-term assets | 212 | 1,478 | (1,266) | (85.7) | Impact of disposal of fixed assets decreased year on year |
| Net cash received from disposal of subsidiaries and other business entities | 10,041 | 5,205 | 4,836 | 92.9 | Mainly due to cash consideration for equity transfer of Shanghai SECCO |
| Other cash received relating to investing activities | 103,157 | 38,208 | 64,949 | 170.0 | Increased time deposits with maturities of more than three months year-on-year |
| Net cash paid for the acquisition of subsidiaries and other business entities | (7,881) | (1,106) | (6,775) | 612.6 | Impact of payment on the purchase price of the acquisition happened previous year |
| Other cash paid relating to investing activities | (33,505) | (50,923) | 17,418 | (34.2) | Decrease in time deposits with maturities over more than three months year-on-year |
| Cash received from capital contributions | 3,946 | 1,001 | 2,945 | 294.2 | Increase in capital injection received from minority shareholders year-on-year |
| Cash received from borrowings | 564,417 | 356,459 | 207,958 | 58.3 | Increase in short-term financing bonds and bank loans year-on-year in order to supply liquidity and project funds |
| Cash repayments of borrowings | (514,275) | (338,232) | (176,043) | 52.0 | Due to the increase of matured borrowings |
| Cash paid for dividends, profits distribution or interest | (71,831) | (49,027) | (22,804) | 46.5 | Increase in dividends year-on-year in return for shareholders |
| Including: Subsidiaries’ cash payments for distribution of dividends or profits to minority shareholders | (5,249) | (8,068) | 2,819 | (34.9) | Impact of decrease in dividends paid by some subsidiaries year-on-year |
5
| 2 | FINANCIAL INFORMATION EXTRACTED FROM THE FINANCIAL STATEMENTS PREPARED IN ACCORDANCE WITH IFRS |
Unit: RMB million
| For the year ended 31 December | |||||
| Items | 2022 | 2021 | 2020 | 2019 | 2018 |
| Revenue | 3,318,168 | 2,740,884 | 2,104,724 | 2,957,868 | 2,879,192 |
| Operating profit | 75,835 | 94,628 | 13,669 | 86,516 | 82,884 |
| Profit before taxation | 94,400 | 109,169 | 48,615 | 90,161 | 99,658 |
| Profit attributable to shareholders of the Company | 66,153 | 71,975 | 33,443 | 57,517 | 61,920 |
| Basic earnings per share (RMB) | 0.547 | 0.594 | 0.276 | 0.475 | 0.511 |
| Diluted earnings per share (RMB) | 0.547 | 0.594 | 0.276 | 0.475 | 0.511 |
| Return on capital employed (%) | 8.66 | 11.29 | 6.22 | 8.94 | 9.21 |
| Return on net assets (%) | 8.43 | 9.30 | 4.48 | 7.73 | 8.57 |
| Net cash generated from operating activities per share (RMB) | 0.962 | 1.860 | 1.392 | 1.275 | 1.455 |
Unit: RMB million
| As of 31 December | |||||
| Items | 2022 | 2021 | 2020 | 2019 | 2018 |
| Non-current assets | 1,425,500 | 1,331,231 | 1,283,236 | 1,318,258 | 1,097,045 |
| Net current liabilities | 144,245 | 83,256 | 67,335 | 133,166 | 63,514 |
| Non-current liabilities | 345,017 | 332,901 | 328,199 | 303,014 | 170,803 |
| Non-controlling interests | 151,532 | 140,892 | 141,377 | 138,359 | 139,922 |
| Total equity attributable to shareholders of the Company | 784,706 | 774,182 | 746,325 | 743,719 | 722,806 |
| Net assets per share (RMB) | 6.545 | 6.394 | 6.164 | 6.143 | 5.970 |
| Adjusted net assets per share (RMB) | 6.307 | 6.225 | 5.954 | 5.993 | 5.787 |
| 3 | FOR MAJOR DIFFERENCES BETWEEN THE AUDITED FINANCIAL STATEMENTS PREPARED UNDER CASs AND IFRS, PLEASE REFER TO PAGE 204 OF THE REPORT. |
6
CHAIRMAN’S ADDRESS
Dear Shareholders and Friends:
First of all, on behalf of the board of directors, management and entire staff, I would like to express my sincere gratitude to our shareholders and all walks of life in the community for their caring and support for Sinopec Corp.
In 2022, the Company encountered complicated, fickle and severe conditions, including global economic slowdown, geopolitical conflicts and weak domestic market demand. We completely, accurately and comprehensively implemented new development concept, carried out the world’s leading development strategy, and made relentless efforts to stabilize operations and to expand market reach. Remarkable results were achieved in all aspects of work through our initiatives to drive innovation, business development and reform in conjunction with enhanced management and risk control. In accordance with IFRS, the Company’s turnover for the year was RMB3.32 trillion. Profit attributable to equity shareholders of the Company was RMB66.2 billion. The liability-to-asset ratio as of the end of the year was 51.95%. In view of the Company’s profitability, shareholder returns and sustainable development in the future, the board of directors recommended the distribution of a final dividend of RMB0.195 per share (tax included). Taking into account the interim dividend of RMB0.16 per share (tax included), the total dividend for the year was RMB0.355 per share (tax included), which, together with the amount of share repurchase during the year, resulted in a dividend payout ratio of 71% for 2022.
Over the past year, the Company’s corporate governance were further enhanced. With an aim of strengthening strategic planning, the board of directors reviewed and approved of the Company’s medium and long-term development plan. Our ADR were delisted in an orderly manner. Our debut share buyback program since our listing was well implemented to repurchase our A-shares and H-shares in order to advocate the Company’s fair valuation. All independent directors executed their duties and reviewed all resolutions with diligence. They carried out thematic site surveys on technology innovation and offered valuable suggestions for our reform and development. The Company revised a number of governance rules to reinforce the corporate governance. As the internal control system was further improved, its implementation turned more effective. Meanwhile, the Company maintained sound information disclosure and investor relations management. As a result, we have been awarded Grade A rating of information disclosure by the Shanghai Stock Exchange for nine consecutive years. We attached great importance to the incorporation of Party building into the corporate development, resulting in effective implementation of the decisions and strategies made by the board of directors.
Over the past year, significant progress was made in the Company’s high-quality development. As for the upstream business, we vigorously expanded the resource base and proactively increased our reserves and output. Major breakthroughs were made in the exploration of shale oil fields in East China and ultra-deep fields in West China. The domestic oil and gas reserve replacement ratio reached 165%. As for refining operation, we stepped up efforts in the development of competitive production facilities, steadily promoted adjustment to increase the yield of chemical feedstock and refining specialties. Development of the Zhenhai refining project, the Hainan ethylene project and the Gulei refining and chemical integrated complex progressed smoothly. The sales network of refined oil products was further optimized. We accelerated the transformation towards an integrated energy service provider of “petrol, gas, hydrogen, power and services”. New progress was made in the development of “Industrial Internet+” and the digital and smart transformation. At the same time, the Company promoted the development of hydrogen energy, photovoltaics, and battery charging and swapping businesses. The first CCUS project with capacity of 1 million tonnes in China was completed and put into operation. Sinopec Carbon Industry Technology Co., Ltd., the first company in China with complete value chain for carbon industry was established. Positive results were achieved in the promotion of transition to low-carbon energy development.
7
Over the past year, the Company’s production and operation were further improved. In the face of weak demand, the downward cycle of the chemical industry and dramatic fluctuations in product prices, we adhered to efficiency-centered, market-oriented approach and continuously improved the business operations. As for the upstream business, the Company strengthened cost control, and domestic oil and gas production hit a record high, achieving the best profit level since 2016. Regarding the refining business, we focused on trade, storage and transportation, and production coordination, closely monitored the market development to better coordinate resources, optimized operations, and reinforced the competitive edge of our industrial chain. As for the chemicals business, we optimized the structure of feedstocks, plants and products slates, promoting the integration of production, marketing, as well as research and application. The proportion of three high value-added synthetic material products steadily increased. Meanwhile, the quality and efficiency of the coal chemical operations were further improved. We gave full play to the integration advantages of refined oil marketing business, expanded the market reach with high-quality services. Non-fuel business maintained steady growth and its overall profitability realized a stable growth.
Over the past year, the Company’s science and technology innovation competitiveness continued to improve. We deepened the reform of science and technology mechanism to motivate the R&D team, stepped up the investment on R&D, pushed for breakthroughs in core technology development, and enhanced the frontier fundamental research. Significant achievements were made in technology innovation, along with new progress in the development of core technologies relating to the exploration and development of ultra-deep oil and gas reservoir, the geology and engineering integration of shale oil and gas fields, as well as specialty rubber products. In addition, major breakthroughs were made in a number of key technologies such as high-isotactic polybutene-1. The number of patents authorized both at home and abroad reached a new high during the year. The Company’s comprehensive patent advantages continued to rank at the forefront of state-owned enterprises. Our competence to support and lead scientific and technological innovation continued to improve.
Over the past year, our ESG efforts achieved solid results. The board of directors attached great importance to ESG, focused on incorporating ESG into strategic management, strengthened top-level design and the foundation of management, enhanced ESG communication and disclosure. As a result, the Company’s ESG performance has been acknowledged by the capital market. We actively responded to global climate change initiative by implementing the plan to achieve carbon peak by 2030, launched the campaign to prevent and control pollution, vigorously developed clean energy, and contributed our efforts to the construction of ecological civilization. Relentless efforts were made to safeguard the energy supply and to maintain the stability of the industrial and supply chains. The Company actively explored the model of assisting in rural revitalization, such as driving industrial development through sales, revitalized rural areas through industrial development, and promoted growth through education. We offered full-fledged support to Beijing Winter Olympics and the Winter Paralympics, pushed forward our charity programs such as the “Spring Blossom Filling Station Project”, and continued to promote the coordinated local development of economy, environment and the society in China and overseas so that the development results benefit more people.
At present, the instability and uncertainty of global environment are increasing significantly, leading to intensified market competition in the energy and chemical industry. But the fundamentals of the Chinese economy, characterized by strong resilience, enormous and long-term potential, sustainability, remain unchanged. The government prioritizes the task to resume and expand domestic consumption. Therefore, the Company is poised to benefit from valuable strategic opportunities for high-quality development. Setting off from a new development stage, Sinopec Corp. will initiate the high-quality development plan driven by the strategy of building a world-class enterprise, focusing on “excellent products, outstanding brands, leading innovation capability and advanced governance”. We will steadily promote the corporate upgrading from size expansion to strong competitiveness and then ascending to excellence, striving to achieve better quality, higher efficiency, greater competitiveness and influence.
In 2023, we will seize the favorable opportunity arising from steady development of domestic economy and the recovery of demand for petroleum and petrochemical products, insist on driving growth in a stable manner, and strive to achieve effective quality improvement in different businesses and reasonable volume growth. At the same time, we will accelerate the process of building ourselves towards a world-class enterprise, whereby leading the Company to a new stage of high-quality development. We will pay more attention to bringing the benefits of our integrated operation into full play, improving the business operations, and enhancing the synergies and efficiency resulted from our complete industrial chain. We will attach greater importance to business transition and upgrading, the promotion of digital transformation and intelligentization, strive to build green and low-carbon competitiveness, step up efforts to drive science and technology innovation and inspire the creativity from innovation, and accelerate the breakthroughs in core technologies in exploration and development, specialty oil products, chemical materials and new energy and other fields to enhance the driving force of science and technology innovation. We will pay more attention to the incorporation of ESG into our development strategy, deepen reform and improve governance, unleash the dynamism of our system and mechanism, consolidate our foundation, keep the risks under control and further enhance our corporate governance to a new level.
For the upstream business, we will focus on consolidating the resource base, make every effort to increase the reserves, stabilize oil output, boost gas production and reduce costs, and promote profitable exploration of crude oil and profitable production of natural gas, shift the refined oil products to chemical feedstock and refining specialities, expedite the production facility structure adjustments and the development of competitive production capacities. As for the chemicals business, we will adhere to the “basic + high-end” approach, strengthen the integrated management of production, marketing, research and application for high value-added products to enhance the product competitiveness, and cultivate the new advantage of high-quality development. For the marketing business, we will promote innovative business model, develop new energy terminals, and strive for new achievements in developing ourselves as a “petrol, gas, hydrogen, power and services” provider. The Company will continue to maintain a solid financial position, strengthen cash flow management, continuously optimize the capital structure, and improve the efficiency of capital fund utilization. In 2023, the Company’s planned capital expenditure will be RMB165.8 billion.
In the new year, we will strive for excellence and spare no effort to forge ourselves towards a world class enterprise. Relentless efforts will be made to write a new chapter of Sinopec’s high-quality development, whereby creating greater value for shareholders and the society.
Ma Yongsheng
Chairman
Beijing, China
24 March 2023
8
BUSINESS REVIEW AND PROSPECTS
BUSINESS REVIEW
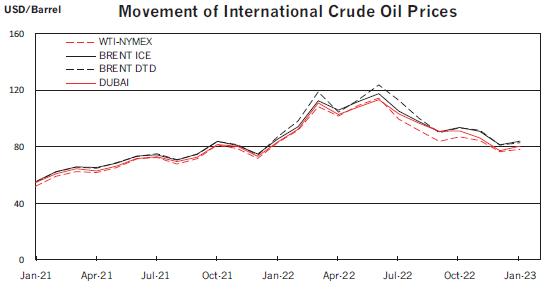
In 2022, global economy recorded slow growth and China registered a GDP growth of 3.0% year-on-year. International oil prices fluctuated widely, with a sharp rise in the first half and a remarkable drop in the second half. Affected by various factors, the domestic demand for natural gas, petrochemical products and oil products was weak.
Confronted with the severe and complex operating environment, the Company fully leveraged its integration advantages in coordinating all aspects of work, pressing ahead to stabilize operation, explore the market, develop through innovation, promote reform, strengthen management prevent risks and hold the bottom line, which helped yield high quality operating results.
| 1 | MARKET REVIEW |
| (1) | Crude Oil & Natural Gas |
In 2022, international crude oil prices fluctuated in a wide range, witnessing steep rise in the first half and sharp decline in the second half. The spot price of Platt’s Brent for the year averaged USD101.2 per barrel, up by 43.1% year on year. Based on the statistics of NDRC, the domestic apparent consumption of natural gas reached 366.3 billion cubic meters, down by 1.7% year on year.
| (2) | Refined Oil Products |
In 2022, the domestic demand for refined oil products was weak. According to statistics released by NDRC, the domestic apparent consumption of refined oil products (including gasoline, diesel and kerosene) up by 0.9% from the previous year, with diesel up by 11.8%, gasoline down by 4.6% and kerosene down by 32.4%. Prices for domestic refined oil products were adjusted 23 times throughout the year with 13 increases and 10 decreases.
| (3) | Chemical Products |
There was a contraction of domestic demand for chemicals in 2022. Based on our statistics, the domestic consumption of ethylene equivalent was down by 2.5% from the previous year, and the apparent consumption of synthetic fibre and synthetic rubber dropped by 2.8% and 3.2% respectively while that of synthetic resin kept flat. Domestic chemical product prices levelled off year on year.
9
| 2 | PRODUCTION & OPERATIONS REVIEW |
| (1) | Exploration and Production |
In 2022, the Company seized the favorable opportunity of high oil price, intensified efforts in high quality exploration and expanded the scale of profitable production capacity. Domestic oil and gas reserve replacement ratio amounted to 165% with domestic oil and gas equivalent production registering historical new high and profit reaching the best level in a decade. In terms of exploration, we focused on expanding resources, increasing reserve and obtaining more exploration licenses, launched the “Deep Earth” project, strengthened risk exploration and trap pre-exploration in new regions and areas, and achieved a number of oil and gas discoveries, including breakthroughs in Shunbei oil and gas in Tarim Basin, shale oil in Bohai Bay Basin and Subei Basin and shale gas in West and Southeast Sichuan. The Shengli Jiyang Shale Oil National Demonstration Zone progressed efficiently. In crude oil development, we accelerated the capacity building of major oilfields, such as Shunbei and Tahe, and strengthened fine-tuned development of mature oil fields. In natural gas development, we actively promoted the capacity building of key natural gas blocks in Shunbei Zone Two and continental facies gas in West Sichuan, scaled up mid-term and long-term LNG contracts, upgraded resources security and enhanced optimization, the profitability of whole natural gas business chain recorded a continuous growth. The Company’s production of oil and gas equivalent in 2022 was 488.99 million barrels, up by 1.9%, among which, domestic crude oil production totaled 250.79 million barrels, up by 0.5% and natural gas production reached 1,248.8 billion cubic feet, up by 4.1%.
Summary of Operations for the Exploration and Production Segment
| Change from | ||||
| 2022 | 2021 | 2020 | 2021 to 2022(%) | |
| Oil and gas production (mmboe) | 488.99 | 479.74 | 459.02 | 1.9 |
| Crude oil production (mmbbls) | 280.86 | 279.76 | 280.22 | 0.4 |
| China | 250.79 | 249.60 | 249.52 | 0.5 |
| Overseas | 30.07 | 30.16 | 30.70 | (0.3) |
| Natural gas production (bcf) | 1,248.75 | 1,199.44 | 1,072.33 | 4.1 |
Summary of Reserves of Crude Oil and Natural Gas
| Crude oil reserves (mmbbls) | ||
| Items | 31 December 2022 | 31 December 2021 |
| Proved reserves | 1,962 | 1,749 |
| Proved developed reserves | 1,766 | 1,578 |
| China | 1,489 | 1,291 |
| Consolidated companies | 1,489 | 1,291 |
| Shengli | 1,105 | 961 |
| Others | 384 | 330 |
| Overseas | 277 | 287 |
| Consolidated companies | 17 | 24 |
| Equity accounted entities | 260 | 263 |
| Proved undeveloped reserves | 196 | 171 |
| China | 153 | 125 |
| Consolidated companies | 153 | 125 |
| Shengli | 41 | 17 |
| Others | 112 | 108 |
| Overseas | 43 | 46 |
| Consolidated companies | 0 | 0 |
| Equity accounted entities | 43 | 46 |
10
| Natural gas reserves (bcf) | ||
| Items | 31 December 2022 | 31 December 2021 |
| Proved reserves | 8,806 | 8,456 |
| Proved developed reserves | 7,138 | 6,740 |
| China | 7,135 | 6,734 |
| Consolidated companies | 7,135 | 6,734 |
| Puguang | 1,417 | 1,582 |
| Fuling | 1,632 | 1,529 |
| Others | 4,086 | 3,623 |
| Overseas | 3 | 6 |
| Consolidated companies | 0 | 0 |
| Equity accounted entities | 3 | 6 |
| Proved undeveloped reserves | 1,668 | 1,716 |
| China | 1,667 | 1,715 |
| Consolidated companies | 1,667 | 1,715 |
| Fuling | 99 | 99 |
| Others | 1,568 | 1,616 |
| Overseas | 1 | 1 |
| Consolidated companies | 0 | 0 |
| Equity accounted entities | 1 | 1 |
Exploration and Production Activities
| Wells drilled (as of 31 December) | ||||||||
| 2022 | 2021 | |||||||
| Exploratory | Development | Exploratory | Development | |||||
| Productive | Dry | Productive | Dry | Productive | Dry | Productive | Dry | |
| China | 364 | 111 | 1,958 | 3 | 363 | 129 | 1,828 | 4 |
| Consolidated companies | 364 | 111 | 1,958 | 3 | 363 | 129 | 1,828 | 4 |
| Shengli | 159 | 48 | 1,029 | 2 | 170 | 58 | 944 | 2 |
| Others | 205 | 63 | 929 | 1 | 193 | 71 | 884 | 2 |
| Overseas | 5 | 1 | 200 | 0 | 2 | 1 | 114 | 0 |
| Consolidated companies | 0 | 0 | 0 | 0 | 0 | 0 | 2 | 0 |
| Equity accounted entities | 5 | 1 | 200 | 0 | 2 | 1 | 112 | 0 |
| Total | 369 | 112 | 2158 | 3 | 365 | 130 | 1,942 | 4 |
| Wells drilling (as of 31 December) | ||||||||
| 2022 | 2021 | |||||||
| Gross | Net | Gross | Net | |||||
| Exploratory | Development | Exploratory | Development | Exploratory | Development | Exploratory | Development | |
| China | 103 | 207 | 103 | 207 | 108 | 201 | 108 | 201 |
| Consolidated companies | 103 | 207 | 103 | 207 | 108 | 201 | 108 | 201 |
| Shengli | 29 | 61 | 29 | 61 | 33 | 55 | 33 | 55 |
| Others | 74 | 146 | 74 | 146 | 75 | 146 | 75 | 146 |
| Overseas | 0 | 2 | 0 | 1 | 0 | 123 | 0 | 62 |
| Consolidated companies | 0 | 0 | 0 | 0 | 0 | 3 | 0 | 1 |
| Equity accounted entities | 0 | 2 | 0 | 1 | 0 | 120 | 0 | 61 |
| Total | 103 | 209 | 103 | 208 | 108 | 324 | 108 | 263 |
| Oil productive wells (as of 31 December) | ||||
| 2022 | 2021 | |||
| Gross | Net | Gross | Net | |
| China | 54,089 | 54,089 | 53,851 | 53,851 |
| Consolidated companies | 54,089 | 54,089 | 53,851 | 53,851 |
| Shengli | 35,171 | 35,171 | 34,991 | 34,991 |
| Others | 18,918 | 18,918 | 18,860 | 18,860 |
| Overseas | 5,460 | 2,313 | 5,534 | 2,372 |
| Consolidated companies | 30 | 11 | 30 | 11 |
| Equity accounted entities | 5,430 | 2,302 | 5,504 | 2,361 |
| Total | 59,549 | 56,402 | 59,385 | 56,223 |
11
| Natural gas productive wells (as of 31 December) | ||||
| 2022 | 2021 | |||
| Region | Gross | Net | Gross | Net |
| China | 7,779 | 7,719 | 7,539 | 7,489 |
| Consolidated companies | 7,779 | 7,719 | 7,539 | 7,489 |
| Puguang | 82 | 82 | 79 | 79 |
| Fuling | 886 | 886 | 779 | 779 |
| Others | 6,811 | 6,751 | 6,681 | 6,631 |
| Total | 7,779 | 7,719 | 7,539 | 7,489 |
Unit: Square kilometers
Area under license (as of 31 December) | ||
| 2022 | 2021 | |
| Acreage with exploration licenses | 372,078 | 390,023 |
| China | 372,078 | 390,023 |
| Acreage with development licenses | 44,617 | 42,391 |
| China | 38,937 | 36,480 |
| Overseas | 5,680 | 5,911 |
| (2) | Refining |
In 2022, the Company actively addressed the challenges brought by the volatile fluctuation of crude oil price and slack market demand, strengthened coordination among procurement, storage and transportation as well as production, and focused on optimisation and integration of production and marketing. We enhanced global resources allocation and inventory management to reduce procurement cost. Closely following the market demand, we flexibly adjusted the utilisation rate, product mix and exports of refined oil products. Efforts were made to carry forward the adjustment to increase the yield of chemical feedstock and refining specialties, and to increase production of marketable products such as low-sulfur bunker fuel, base oil and needle coke etc. We accelerated the construction of world-class refining bases and advanced with structural adjustment projects in an orderly manner. We continued to increase high-purity hydrogen production capacity and have built up 9 hydrogen supply centers for hydrogen fuel cells. In 2022, the Company processed 242 million tonnes of crude oil and produced 140 million tonnes of refined oil products with diesel output up by 5.4% year on year.
| Summary of Operations for the Refining Segment | Unit: million tonnes |
| Change from | ||||
| 2022 | 2021 | 2020 | 2021 to 2022 (%) | |
| Refinery throughput | 242.27 | 255.28 | 236.91 | (5.1) |
| Gasoline, diesel and kerosene production | 140.15 | 146.21 | 141.50 | (4.1) |
| Gasoline | 59.05 | 65.21 | 57.91 | (9.4) |
| Diesel | 63.09 | 59.85 | 63.21 | 5.4 |
| Kerosene | 18.01 | 21.15 | 20.38 | (14.8) |
| Light chemical feedstock production | 42.65 | 45.41 | 40.22 | (6.1) |
| Light product yield (%) | 74.06 | 73.83 | 74.34 | 0.23 percentage points |
| Refinery yield (%) | 94.96 | 94.65 | 94.77 | 0.31 percentage points |
Note: Includes 100% of the production from domestic joint ventures.
| (3) | Marketing and Distribution |
In 2022, facing the sluggish demand for refined oil products, the Company brought advantages in integrated business and distribution network into full play and expanded the market through high quality service. We reinforced market analysis and forecast, strengthened resources coordination and implemented targeted differentiation strategy. The sales volume of diesel rose by 8.6% and the retail volume of vehicle LNG up by 9.7% year on year. We vigorously expanded the low-sulfur bunker fuel market and further consolidated our market position. We rapidly developed online business and client satisfaction upgraded significantly. The quality and profitability for the non-fuel business were further boosted. We optimised the allocation of service stations and stepped up the construction of new energy service network. Our battery swapping stations, carbon-neutral service stations and oil product depots were put into operations, and the number of hydrogen refueling stations ranked No. 1 in the world, making continuous efforts for the transition to an integrated energy service provider of petrol, gas, hydrogen, power and services. Total sales volume of refined oil products for the year was 207 million tonnes, of which domestic sales volume accounted for 163 million tonnes.
12
Summary of Operations for the Marketing and Distribution Segment
| Change from | ||||
| 2022 | 2021 | 2020 | 2021 to 2022 (%) | |
| Total sales volume of oil products (million tonnes)* | 206.74 | 220.79 | 217.91 | (6.4) |
| Total domestic sales volume of oil products (million tonnes) | 162.55 | 171.31 | 167.99 | (5.1) |
| Retail sales (million tonnes) | 106.91 | 114.30 | 113.19 | (6.5) |
| Direct sales and distribution (million tonnes) | 55.65 | 57.01 | 54.80 | (2.4) |
| Annual average throughput per station (tonne/station) | 3,470 | 3,720 | 3,686 | (6.7) |
31 December 2022 | 31 December 2021 | 31 December 2020 | Change from the end of the previous year to the end of the reporting period (%) | |
| Total number of service stations under the Sinopec brand | 30,808 | 30,725 | 30,713 | 0.3 |
| Number of company-operated stations | 30,808 | 30,725 | 30,707 | 0.3 |
Note: The total sales volume of refined oil products includes the amount of refined oil marketing and trading sales volume.
| (4) | Chemicals |
In 2022, in the face of the downward business cycle and high costs for feedstock, the Company closely followed the market demand, optimised the structure of feedstock, facilities and products with a profit-driven orientation, maintained high utilisation rate in profitable facilities, and reduced products with no marginal contribution. We sped up construction of advantageous and advanced production capacities and shutting down of none competitive capacities. Integration of production, marketing, research and application was further cemented to develop high-end products and new materials and to increase production of high value-added products such as PV-grade EVA, metallocene polyolefin and polybutadiene rubber. The coal chemical business also witnessed improvement in both quality and efficiency. Annual ethylene production was 13.44 million tonnes. By strengthening strategic customer cooperation and tailor-made product service, the total chemical sales volume reached 81.65 million tonnes with all products sold, up by 0.1%.
Summary of Operations for the Chemicals Segment Unit: thousand tonnes
| Change from | ||||
| 2022 | 2021 | 2020 | 2021 to 2022 (%) | |
| Ethylene | 13,437 | 13,380 | 12,060 | 0.4 |
| Synthetic resin | 18,544 | 18,999 | 17,370 | (2.4) |
| Synthetic rubber | 1,284 | 1,252 | 1,067 | 2.6 |
| Synthetic fiber monomer and polymer | 8,886 | 9,201 | 9,057 | (3.4) |
| Synthetic fiber | 1,112 | 1,357 | 1,313 | (18.1) |
Note: Includes 100% of the production of domestic joint ventures.
| (5) | Science and Technology Innovation |
In 2022, the Company continued increasing input in science and technology innovation, sought breakthroughs in key and core technologies, beefed up front-end basic research and further deepened the reform of the science and technology system and mechanism to enhance innovation in supporting and leading the business growth. In upstream, breakthroughs were made in the exploration and development theory for deep and ultra-deep oil and gas as well as shale oil and gas. In refining, we realized scaled-up test production and application for bio-jet fuel. In chemicals, the scaled-up production of large tow carbon fibre was achieved, and POE and polybutene-1 pilot units were commissioned in one shot with on-spec products. In addition, the wet oxidation process for sulfur-containing waste alkali fluid for mega ethylene crackers was industrialized. The complete set of software for online real-time optimization (RTO) of S-Zorb unit was put into operation successfully. In 2022, the Company filed 8,687 patent applications at home and abroad with 6,289 granted. The Company also won one gold award, one silver award and four excellent awards in China for patents.
13
| (6) | Health and Safety |
In 2022, the Company spared no effort to promote the HSE management system with professional management further strengthened. The Company enhanced the employee health and public safety and security management, improved operation conditions and enhanced the safety equipment allocation, thus the occupational, physical and psychological health of employees were safeguarded both at home and abroad. We implemented the all-staff safety production responsibility mechanism and further advanced the three-year safety production harnessing campaign. Specific measures were taken to tackle safety risk especially for hazardous chemicals, outdated production units and oil & gas storage facilities.
| (7) | Capital Expenditures |
In 2022, focusing on quality and return of investment, the Company continuously optimised its investment projects, with total capital expenditures of RMB189.1 billion. Capital expenditure for the exploration and production segment was RMB83.3 billion, mainly for crude oil production capacity construction of Shunbei, Tahe and Shengli offshore, natural gas capacity build-up of West Sichuan, Fuling and Weirong, the development and test of Shengli Jiyang National Demonstration Zone and the construction of oil and gas storage and transportation facilities. Capital expenditure for the refining segment was RMB22.9 billion, mainly for expansion of Zhenhai Refining and Chemical project, refining structural adjustment projects in Anqing and Yangzi and the construction of hydrogen supply centers. RMB19.1 billion was spent in the marketing and distribution segment, mainly for the development of integrated energy station network covering petrol, gas, hydrogen, power and service, renovation of the existing stations and non-fuel business. The chemical segment saw a capital expenditure of RMB58.6 billion, mainly for ethylene projects in Zhenhai, Sinopec-SK, Hainan, and Tianjin Nangang, aromatics projects in Jiujiang and Zhenhai, large tow carbon fibre project in Shanghai, PTA project in Yizheng, and caprolactam relocation project in Baling, etc. Capital expenditure for the corporate and others segment was RMB5.2 billion, mainly for R&D facilities and information technology application projects.
BUSINESS OUTLOOK
| 1 | Market Outlook |
Looking ahead to 2023, China is expected to achieve an overall upturn in economic performance. Domestic demand for natural gas, refined products and chemicals is expected to grow rapidly. International crude oil price is expected to fluctuate at medium and high price level due to the impacts of changes in global supply and demand, geopolitics and inventory.
| 2 | Production and Operation |
In 2023, guided by the strategy of building a world-class enterprise, the Company will proactively lead the industry transition and development, enhance science and technology innovation, improve production and operation, deepen reform, polish the governance and corporate image, consolidate the foundation of safety, and put focuses on the following work.
E&P: The Company will strengthen exploration in strategic areas, and increase high-quality reserves; strengthen efficient development and stabilize oil production while increasing gas production and reducing costs. In crude development, we will focus on production capacity increase, depletion control, recoverable reserves addition and costs reduction, accelerate the building of production capacity in Jiyang and Tahe, and strengthen the fine-tuned development of mature fields. In natural gas development, we will accelerate the building of production capacity of marine-face gas fields in west Sichuan and the northern part of Hubei, and improve natural gas production efficiency and profitability; diversify natural gas sourcing channels, cultivate high-loyalty customers, and continue to upgrade the natural gas production, supply, storage and marketing system. The planned annual production of crude oil is 280.23 million barrels, of which 29.03 million barrels from overseas. Planned natural gas production is 1,291.8 billion cubic feet.
14
Refining: Oriented by efficiency and profitability, the Company will coordinate production and marketing, and accelerate the optimization and upgrading of the business. We will deepen the implementation of differentiated procurement strategies, dynamically optimize the allocation of crude oil resources and reduce procurement costs; improve facility utilization, flexibly adjust the yield of refined oil products and the diesel-to-gasoline ratio; carry forward the adjustment to increase the yield of chemical feedstock in an orderly and cost effective manner, promote the shifting from refined products to specialty products, such as lube oil and grease, needle coke and other special products, and enhance overall profitability; optimize the structure and volume of export products. For the whole year, the Company plans to process 250 million tonnes of crude oil and produce 146 million tonnes of refined oil products.
Marketing: The Company will give full play to its advantages in integrated business, strengthen digital empowerment and expand market share. We will improve the market monitoring system, dynamically optimize the pricing strategy, and continuously improve the retail volume and profits; accurately make plans for incremental network layout, enhance the network integrity and stability; consolidate and enhance the marketing advantages of the low-sulphur bunker fuel, and accelerate the expansion of overseas markets and end-user retail; strengthen the development of Sinopec-brand products, improve the non-fuel business in both operation and profitability; innovate the business model, accelerate the development of new energy stations, and strive to make greater breakthroughs in building the company into an integrated energy service provider with business covering “petrol, gas, hydrogen, power and non-fuel services”. The annual domestic sales volume of refined oil products is planned to be 175 million tonnes.
Chemicals: The Company will take active response to the trough of the chemical business cycle, press ahead with the “basic + high-end” strategy and cultivate new advantages of “cost + value-added + green and low-carbon”. We will continue to diversify feedstocks and enhance cost advantages; adjust the facility utilization and product slate in a timely manner with market demand as our guide; continue to increase efforts in developing new materials and high value-added products to enhance profitability; accelerate the layout and development of large ethylene projects and the upgrading of the aromatics chain to continuously enhance market competitiveness. At the same time, the Company will optimize its marketing strategy based on demand, vigorously promote market development and enhance product value by providing customers with integrated solutions. The annual ethylene production plan is 14 million tonnes.
Science and Technology Development: The Company will firmly implement the innovation-driven strategy, make every effort to make breakthroughs in core technologies and promote the reform of the science and technology system to accelerate its progress towards becoming a world-leading clean energy and chemical company. Specific focuses include technology breakthroughs in oil and gas exploration and production with the emphases on oil and gas reserves increase, oil production stabilization, gas production increase, cost reduction, and efficiency improvement; coordinated development of integration of refining and chemical technologies, refined oil products structure optimization, clean, efficient and low-carbon utilization of resources; key technology development and application for the adjustment to increase the yield of chemical feedstock and refining specialties and hydrogen energy. We will accelerate the core technological breakthroughs for chemical and material upgrading, as well as those for diverse and clean-process basic chemicals and high value-added synthetic materials production.
Capex: The capital expenditure plan for 2023 is RMB165.8 billion, of which RMB74.4 billion will be spent in the E&P segment, mainly on the crude production capacity building in Jiyang and Tahe, natural gas production capacity building in west Sichuan and oil and gas storage and transportation facilities; RMB22.7 billion will be spent in the refining segment, mainly on the Yangzi refining restructuring and the Zhenhai expansion project; RMB16.6 billion will be spent in the marketing and distribution segment, mainly for the development of the integrated energy station network, the renovation of the existing stations and non-fuel business; RMB46.6 billion will be spent in the chemical segment, mainly for the ethylene projects in Zhenhai, Hainan, Tianjin Nangang and Maoming, PTA project in Yizheng and the relocation of CPL project in Baling; RMB5.5 billion will be spent in corporate and others, mainly for R&D and IT.
15
MANAGEMENT’S DISCUSSION AND ANALYSIS
THE FOLLOWING DISCUSSION AND ANALYSIS SHOULD BE READ IN CONJUNCTION WITH THE COMPANY’S AUDITED FINANCIAL STATEMENTS AND THE ACCOMPANYING NOTES. PARTS OF THE FOLLOWING FINANCIAL DATA WERE ABSTRACTED FROM THE COMPANY’S AUDITED FINANCIAL STATEMENTS THAT HAVE BEEN PREPARED ACCORDING TO THE IFRS. THE PRICES IN THE FOLLOWING DISCUSSION DO NOT INCLUDE VALUE-ADDED TAX.
| 1 | CONSOLIDATED RESULTS OF OPERATIONS |
In 2022, the Company’s revenue was RMB3,318.2 billion, increased by 21.1% compared with that of 2021. That was mainly due to increased prices of petroleum and petrochemical products resulting from increase of international crude oil prices. The Company actively deepened optimisation of production, stabilised operation, expanded market, enhanced adjustment of feedstocks, products and facilities to actively respond to unfavorable factors of weak demand, and realised RMB75.8 billion operating profit, down by 19.9% year on year.
The following table sets forth the main revenue and expenses from the Company’s consolidated financial statements:
| Year ended 31 December | |||
| 2022 | 2021 | Change (%) | |
| RMB million | RMB million | ||
| Revenue | 3,318,168 | 2,740,884 | 21.1 |
| Revenue from primary business | 3,257,356 | 2,679,500 | 21.6 |
| Other operating revenues | 60,812 | 61,384 | (0.9) |
| Operating expenses | (3,242,333) | (2,646,256) | 22.5 |
| Purchased crude oil, products and operating supplies and expenses | (2,684,756) | (2,076,665) | 29.3 |
| Selling, general and administrative expenses | (55,809) | (54,978) | 1.5 |
| Depreciation, depletion and amortisation | (109,906) | (115,680) | (5.0) |
| Exploration expenses, including dry holes | (10,591) | (12,382) | (14.5) |
| Personnel expenses | (103,585) | (103,492) | 0.1 |
| Taxes other than income tax | (263,991) | (259,032) | 1.9 |
| Impairment reversals/(losses) on trade and other receivables | 1,084 | (2,311) | – |
| Other operating income/(expenses), net | (14,779) | (21,716) | (31.9) |
| Operating profit | 75,835 | 94,628 | (19.9) |
| Net finance costs | (9,974) | (9,010) | 10.7 |
| Investment income and share of profits less losses from associates and joint ventures | 28,539 | 23,551 | 21.2 |
| Profit before taxation | 94,400 | 109,169 | (13.5) |
| Income tax expense | (18,757) | (23,318) | (19.6) |
| Profit for the year | 75,643 | 85,851 | (11.9) |
| Attributable to: | |||
| Shareholders of the Company | 66,153 | 71,975 | (8.1) |
| Non-controlling interests | 9,490 | 13,876 | (31.6) |
| (1) | Revenue |
In 2022, the Company’s revenue from primary business was RMB3,257.4 billion, representing an increase of 21.6% over 2021. This was mainly due to the increased price in petroleum and petrochemical products.
The following table sets forth the external sales volume, average realised prices and respective rates of change of the Company’s major products in 2022 and 2021:
| Average realised price | ||||||
| Sales volume (thousand tonnes) | (RMB/tonne, RMB/thousand cubic meters) | |||||
| Year ended 31 December | Change (%) | Year ended 31 December | Change (%) | |||
| 2022 | 2021 | 2022 | 2021 | |||
| Crude oil | 8,171 | 7,162 | 14.1 | 4,449 | 3,049 | 45.9 |
| Natural gas (million cubic meters) | 30,845 | 29,953 | 3.0 | 1,808 | 1,606 | 12.6 |
| Gasoline | 80,884 | 90,836 | (11.0) | 9,319 | 7,731 | 20.5 |
| Diesel | 81,657 | 78,335 | 4.2 | 7,738 | 5,891 | 31.4 |
| Kerosene | 17,361 | 21,270 | (18.4) | 6,545 | 3,772 | 73.5 |
| Basic chemical feedstock | 36,053 | 36,173 | (0.3) | 6,204 | 5,486 | 13.1 |
| Monomer and polymer for synthetic fibre | 7,412 | 6,955 | 6.6 | 6,116 | 6,537 | (6.4) |
| Synthetic resin | 17,471 | 17,923 | (2.5) | 8,272 | 8,325 | (0.6) |
| Synthetic fibre | 1,193 | 1,457 | (18.1) | 8,119 | 7,521 | 8.0 |
| Synthetic rubber | 1,364 | 1,286 | 6.1 | 11,363 | 11,099 | 2.4 |
| Chemical fertiliser | 779 | 976 | (20.2) | 3,015 | 2,807 | 7.4 |
16
Most crude oil and a small portion of natural gas produced by the Company were internally used for refining and chemical production, with the remaining sold to external customers. In 2022, the turnover from crude oil, natural gas and other upstream products sold externally amounted to RMB192.3 billion, representing an increase of 23.3% over 2021. The change was mainly due to increases in crude oil and natural gas prices and sales volume.
In 2022, petroleum products (mainly consisting of refined oil products and other refined petroleum products) sold by Refining Segment and Marketing and Distribution Segment achieved external sales revenues of RMB1,855.8 billion (accounting for 55.9% of the Company’s revenue), representing an increase of 20.9% over 2021, mainly due to the increase in prices of refined oil products, which effectively offset the impact of decrease in sales volume. The sales revenue of gasoline, diesel and kerosene was RMB1,499.3 billion, representing an increase of 20.5% over 2021, and accounting for 80.8% of the total sales revenue of petroleum products. Sales revenue of other refined petroleum products was RMB356.5 billion, representing an increase of 22.3% compared with that of 2021, accounting for 19.2% of the total sales revenue of petroleum products.
The Company’s external sales revenue of chemical products was RMB449.9 billion, representing an increase of 5.9% over 2021, accounting for 13.6% of the Company’s total revenue. This was mainly due to the increase in price of certain chemical products.
| (2) | Operating expenses |
In 2022, the Company’s operating expenses was RMB3,242.3 billion, increased by 22.5% compared with that of 2021. The operating expenses mainly consisted of the following:
Purchased crude oil, products and operating supplies and expenses was RMB2,684.8 billion, representing an increase of 29.3% over the same period of 2021, accounting for 82.8% of the total operating expenses, of which:
Crude oil purchasing expenses was RMB999.7 billion, representing an increase of 45.0% over the same period of 2021. Crude oil purchased externally used for processing in 2022 was 201.98 million tonnes (excluding the volume processed for third parties), representing a decrease of 5.0% over the same period of 2021. The average cost of processing crude oil purchased externally was RMB4,950 per tonne, representing an increase by 52.6% over 2021.
The Company’s other purchasing expenses was RMB1,685.0 billion, representing an increase of 21.5% over the same period of 2021. This was mainly attributable to the increased prices in naphtha and other feedstocks and traded crude oil and refined oil products.
Selling, general and administrative expenses was RMB55.8 billion, representing an increase of 1.5% over 2021.
Depreciation, depletion and amortisation was RMB109.9 billion, representing a decrease of 5.0% over the same period of 2021. That was mainly because that the proved reserve increased resulting from the increase of international crude oil prices in 2021, thus the depletion ratio of oil and gas assets decreased, which led to the depreciation and depletion decreased by RMB7.6 billion.
Exploration expenses was RMB10.6 billion, representing a decrease of 14.5% compared with 2021. That was mainly due to optimised drilling in shale gas and other unconventional resources, improved exploration success rate to effectively decrease the expenses in dry holes.
Personnel expenses was RMB103.6 billion, representing an increase of 0.1% over 2021.
Taxes other than income tax was RMB264.0 billion, representing an increase of 1.9% over the same period of 2021. That was mainly because that the special oil gain levy increased by RMB12.3 billion resulting from the increased crude oil price, and the consumption tax decreased by RMB7.1 billion resulting from the decreased sales volume of domestic refined oil products in the refining segment.
Impairment reversals on trade and other receivables was RMB1.1 billion. The impairment losses on trade and other receivables decreased by RMB3.4 billion over the same period of 2021, which was mainly due to the reversed provision in the impairment of entrusted loans in 2022.
Other operating expenses, net was RMB14.8 billion, representing a decrease of 31.9% over the same period of 2021. That was mainly due to the decrease of impairment in long-term assets.
| (3) | Operating profit was RMB75.8 billion, representing a decrease of 19.9% over the same period of 2021. That was mainly due to weak domestic demand of domestic petroleum and petrochemical products, and decreased operating margin for domestic refining and chemicals under high crude oil price circumstance. |
| (4) | Profit before taxation was RMB94.4 billion, representing a decrease of 13.5% compared with 2021. |
| (5) | Income tax expense was RMB18.8 billion, representing a decrease of 19.6% year on year. That was mainly because the profit in 2022 decreased year on year. |
| (6) | Profit attributable to non-controlling shareholders was RMB9.5 billion, representing a decrease of RMB4.4 billion and 31.6% over the same period of 2021. |
| (7) | Profit attributable to shareholders of the Company was RMB66.2 billion, representing a year-on-year decrease of 8.1%. |
17
| 2 | RESULTS OF SEGMENT OPERATIONS |
The Company manages its operations through four business segments, namely exploration and production segment, refining segment, marketing and distribution segment and chemicals segment, and corporate and others. Unless otherwise specified, the inter-segment transactions have not been eliminated from financial data discussed in this section. In addition, the operating revenue data of each segment include other operating revenues.
The following table shows the operating revenues by each segment, the contribution of external sales and inter-segment sales as a percentage of operating revenues before elimination of inter-segment sales, and the contribution of external sales as a percentage of consolidated operating revenues (i.e. after elimination of inter-segment sales) for the periods indicated.
Operating revenues Year ended 31 December | As a percentage of consolidated operating revenue before elimination of inter-segment sales Year ended 31 December | As a percentage of consolidated operating revenue after elimination of inter-segment sales Year ended 31 December | ||||
| 2022 | 2021 | 2022 | 2021 | 2022 | 2021 | |
| RMB million | RMB million | (%) | (%) | (%) | (%) | |
| Exploration and Production Segment | ||||||
| External sales* | 197,499 | 162,700 | 3.3 | 3.4 | 6.0 | 5.9 |
| Inter-segment sales | 121,912 | 87,298 | 2.1 | 1.8 | ||
| Operating revenues | 319,411 | 249,998 | 5.4 | 5.2 | ||
| Refining Segment | ||||||
| External sales* | 198,714 | 173,109 | 3.3 | 3.6 | 6.0 | 6.3 |
| Inter-segment sales | 1,376,425 | 1,212,455 | 23.3 | 24.9 | ||
| Operating revenues | 1,575,139 | 1,385,564 | 26.6 | 28.5 | ||
| Marketing and Distribution Segment | ||||||
| External sales* | 1,700,453 | 1,404,469 | 28.6 | 29.0 | 51.2 | 51.2 |
| Inter-segment sales | 13,421 | 7,075 | 0.2 | 0.1 | ||
| Operating revenues | 1,713,874 | 1,411,544 | 28.8 | 29.1 | ||
| Chemicals Segment | ||||||
| External sales* | 459,824 | 435,261 | 7.7 | 9.0 | 13.8 | 16.0 |
| Inter-segment sales | 80,328 | 70,242 | 1.4 | 1.4 | ||
| Operating revenues | 540,152 | 505,503 | 9.1 | 10.4 | ||
| Corporate and Others | ||||||
| External sales* | 761,678 | 565,345 | 12.8 | 11.7 | 23.0 | 20.6 |
| Inter-segment sales | 1,028,800 | 732,356 | 17.3 | 15.1 | ||
| Operating revenues | 1,790,478 | 1,297,701 | 30.1 | 26.8 | ||
| Operating revenue before elimination of inter-segment sales | 5,939,054 | 4,850,310 | 100.0 | 100.0 | ||
| Elimination of inter-segment sales | (2,620,886) | (2,109,426) | ||||
| Revenue | 3,318,168 | 2,740,884 | 100.0 | 100.0 | ||
* Other operating revenues are included.
18
The following table sets forth the operating revenues, operating expenses and operating profit by each segment before elimination of the inter-segment transactions for the periods indicated, and the percentage change of 2022 compared to 2021.
| Year ended 31 December | |||
| 2022 | 2021 | Change | |
| RMB million | RMB million | (%) | |
| Exploration and Production Segment | |||
| Operating revenues | 319,411 | 249,998 | 27.8 |
| Operating expenses | 265,695 | 245,313 | 8.3 |
| Operating profit | 53,716 | 4,685 | 1,046.6 |
| Refining Segment | |||
| Operating revenues | 1,575,139 | 1,385,564 | 13.7 |
| Operating expenses | 1,562,928 | 1,320,285 | 18.4 |
| Operating profit | 12,211 | 65,279 | (81.3) |
| Marketing and Distribution Segment | |||
| Operating revenues | 1,713,874 | 1,411,544 | 21.4 |
| Operating expenses | 1,689,337 | 1,390,340 | 21.5 |
| Operating profit | 24,537 | 21,204 | 15.7 |
| Chemicals Segment | |||
| Operating revenues | 540,152 | 505,503 | 6.9 |
| Operating expenses | 554,279 | 494,397 | 12.1 |
| Operating (loss)/profit | (14,127) | 11,106 | – |
| Corporate and Others | |||
| Operating revenues | 1,790,478 | 1,297,701 | 38.0 |
| Operating expenses | 1,789,160 | 1,300,926 | 37.5 |
| Operating profit/(loss) | 1,318 | (3,225) | – |
| Elimination of inter-segment profit/(loss) | (1,820) | (4,421) | – |
| (1) | Exploration and Production Segment |
Most crude oil and a small portion of the natural gas produced by the exploration and production segment were used for the Company’s refining and chemical production. Most of the natural gas and a small portion of crude oil were sold externally to other customers.
In 2022, the operating revenues of this segment was RMB319.4 billion, representing an increase of 27.8% over 2021. This was mainly attributed to the increase of both realised price and the sales volume of crude oil and natural gas.
In 2022, the segment sold 34.28 million tonnes of crude oil, representing an increase of 0.6% over 2021. Natural gas sales volume was 31.9 billion cubic meters (bcm), representing an increase of 3.3% over 2021. Regasified LNG sales volume was 21.5 bcm, representing an increase of 12.5% over 2021. LNG sales volume was 1.42 million tonnes, representing a decrease of 77.0% over 2021, as a result of flexible adjustment of sales strategy and structure based on purchase prices and market conditions to reduce sales volume of products with lower margin. Average realised prices of crude oil, natural gas, regasified LNG, and LNG were RMB4,312 per tonne, RMB1,816 per thousand cubic meters, RMB3,535 per thousand cubic meters, and RMB5,710 per tonne, respectively, representing an increase of 47.1%, 13.1%, 66.8%, and 46.1% respectively over 2021.
In 2022, the operating expenses of this segment was RMB265.7 billion, representing an increase of 8.3% over 2021. That was mainly due to the reasons that: special oil income levy and resource tax increased by RMB15.3 billion year on year; Procurement cost of LNG increased by RMB12.3 billion year on year; Depreciation, depletion and amortisation decreased by RMB7.6 billion year on year, as a result of the decrease of depletion ratio; Exploration expense decreased by RMB1.8 billion year on year.
In 2022, the oil and gas lifting cost was RMB773.1 per tonne, representing a year on year decrease of 0.5%.
In 2022, the operating profit of the exploration and production segment was RMB53.7 billion, representing an increase of RMB49.0 billion and 1,046.6% over the same period of 2021, which was mainly attributable to the fact that the segment seized the opportunity of high crude oil prices, improved proved reserve and production volume of oil and gas, enhanced cost control, optimized the operation of natural gas value chain, and realised in a significant rise in profitability.
| (2) | Refining Segment |
Business activities of the refining segment include purchasing crude oil from third parties and the exploration and production segment of the Company, as well as processing crude oil into refined petroleum products. Gasoline, diesel and kerosene were sold internally to the marketing and distribution segment of the Company; part of the chemical feedstock was sold internally to the chemicals segment of the Company; and other refined petroleum products were sold externally to both domestic and overseas customers.
19
In 2022, the operating revenues of this segment was RMB1,575.1 billion, representing an increase of 13.7% over 2021. This was mainly attributed to the increases in prices of gasoline, diesel, kerosene, naphtha, and refining by-products.
The following table sets forth the sales volumes, average realised prices and the respective changes of the Company’s major refined oil products
of the segment in 2022 and 2021.
| Sales Volume (thousand tonnes) | Average realised price (RMB/tonne) | |||||
| Year ended 31 December | Year ended 31 December | |||||
| 2022 | 2021 | Change (%) | 2022 | 2021 | Change (%) | |
| Gasoline | 57,562 | 63,827 | (9.8) | 8,967 | 7,208 | 24.4 |
| Diesel | 61,169 | 58,807 | 4.0 | 7,376 | 5,563 | 32.6 |
| Kerosene | 14,782 | 17,313 | (14.6) | 6,468 | 3,734 | 73.2 |
| Chemical feedstock | 41,470 | 45,234 | (8.3) | 5,016 | 3,989 | 25.8 |
| Other refined petroleum products | 65,945 | 68,783 | (4.1) | 4,553 | 5,061 | (10.0) |
In 2022, sales revenue of gasoline was RMB516.2 billion, representing an increase of 12.2% over 2021.
The sales revenue of diesel was RMB451.2 billion, representing an increase of 37.9% over 2021.
The sales revenue of kerosene was RMB95.6 billion, representing an increase of 47.9% over 2021.
The sales revenue of chemical feedstock was RMB208.0 billion, representing an increase of 15.3% over 2021.
The sales revenue of refined petroleum products other than gasoline, diesel, kerosene and chemical feedstock was RMB300.2 billion, representing a decrease of 13.8% over 2021.
In 2022, the segment’s operating expenses was RMB1,562.9 billion, representing an increase of 18.4% over 2021. This was mainly due to the rising procurement cost resulting from the international crude oil prices increase year on year.
In 2022, the average processing cost for crude oil was RMB4,962 per tonne, representing an increase of 49.0% over 2021. Total crude oil and other feedstock processed was 247.57 million tonnes (excluding volume processed for third parties), representing a decrease of 6.2% over 2021. The total cost of crude oil processed was RMB1,228.3 billion, representing an increase of 39.8% over 2021.
In 2022, refining margin was RMB344 per tonne, representing a decrease of RMB188 per tonne compared with that of the same period of 2021. This was mainly attributed to the decrease in domestic gasoline and diesel processing margin under high crude oil prices circumstance, and the significant increase in spread of imported crude and overseas freight and insurance cost year-on-year.
In 2022, the refining unit cash operating cost (defined as operating expenses less the processing cost of crude oil and refining feedstock, depreciation and amortisation, taxes other than income tax and other operating expenses, then divided by the throughput of crude oil and refining feedstock) was RMB223 per tonne, representing an increase of 4.6% over 2021, which was mainly attributed to the increase of unit fixed cost resulting from significant increase in the prices of fuels, as well as the decrease of processing volume.
In 2022, the operating profit of the segment totalled RMB12.2 billion, representing a decrease of RMB53.1 billion and 81.3% compared with that of 2021. This is mainly due to the sharp decrease in refining margin resulting from rising crude procurement cost, weak domestic oil products demand and decreased domestic gross margin of gasoline and diesel under high crude price circumstance.
| (3) | Marketing and Distribution Segment |
The business activities of the marketing and distribution segment include purchasing refined oil products from the refining segment and the third parties, conducting direct sales and wholesale to domestic customers and retailing, distributing oil products through the segment’s retail and distribution network as well as providing related services.
In 2022, the operating revenues of this segment was RMB1,713.9 billion, up by 21.4% year-on-year. This was mainly attributed to the increase in the sales prices of refined oil products. The sales revenues of gasoline totalled RMB754.4 billion, up by 7.4% year-on-year; the sales revenues of diesel were RMB633.9 billion, up by 37.0% year-on-year; the sales revenues of kerosene were RMB114.4 billion, up by 42.4% year-on-year.
The following table sets forth the sales volumes, average realised prices and respective percentage changes of the segment’s four major refined oil products in 2022 and 2021, including detailed information about retail, direct sales and distribution of gasoline and diesel:
| Sales volume (thousand tonnes) | Average realised price (RMB/tonne) | |||||
| Year ended 31 December | Year ended 31 December | |||||
| 2022 | 2021 | Change (%) | 2022 | 2021 | Change (%) | |
| Gasoline | 80,957 | 90,873 | (10.9) | 9,318 | 7,730 | 20.5 |
| Retail | 56,989 | 64,325 | (11.4) | 9,938 | 8,223 | 20.9 |
| Direct sales and distribution | 23,968 | 26,548 | (9.7) | 7,845 | 6,537 | 20.0 |
| Diesel | 81,932 | 78,566 | 4.3 | 7,737 | 5,890 | 31.4 |
| Retail | 34,481 | 33,644 | 2.5 | 8,176 | 6,537 | 25.1 |
| Direct sales and distribution | 47,451 | 44,923 | 5.6 | 7,419 | 5,406 | 37.2 |
| Kerosene | 17,474 | 21,296 | (17.9) | 6,546 | 3,772 | 73.5 |
| Fuel oil | 26,162 | 25,847 | 1.2 | 4,817 | 3,437 | 40.1 |
20
In 2022, the operating expenses of the segment were RMB1,689.3 billion, up by RMB299.0 billion and 21.5% year-on-year. This was mainly due to the rising oil products procurement costs resulting from the increase of crude price.
In 2022, the segment’s marketing expense (defined as the operating expenses less the purchase costs, taxes other than income tax, depreciation and amortization, divided by sales volume) was RMB208.6 per tonne, up by 5.5% year on year. This was mainly due to the increase of unit fixed cost resulting from the weak demand in domestic refined oil products and decreased operating volume.
In 2022, the operating revenues of non-fuel business was RMB38.1 billion, up by RMB2.7 billion year-on-year and the profit of non-fuel business was RMB4.3 billion, up by RMB0.2 billion.
In 2022, facing the challenge of weak domestic demand in the refined oil market, the segment brought integrated and network advantages into full play, coordinated internal and external resources, enhanced the effort in expanding market, and realised an operating profit of RMB24.5 billion, representing an increase of 15.7% year on year.
| (4) | Chemicals segment |
The business activities of the chemicals segment include purchasing chemical feedstock from the refining segment and the third parties and producing, marketing and distributing petrochemical and inorganic chemical products.
In 2022, the operating revenues of this segment was RMB540.2 billion, up by 6.9% year-on-year. This was mainly due to the increase in prices of basic organic chemicals, synthetic fibers, synthetic rubber year on year.
In 2022, the sales revenue generated by the segment’s six major categories of chemical products (namely basic organic chemicals, synthetic resin, synthetic fiber monomer and polymer, synthetic fibre, synthetic rubber, and chemical fertiliser) was RMB509.1 billion, up by 6.4% year-on-year, accounting for 94.2% of the operating revenues of the segment.
The following table sets forth the sales volume, average realised prices and respective changes of each of the segment’s six categories of chemical products in 2022 and 2021.
| Sales Volume (Thousand tonnes) | Average realised price (RMB/tonne) | |||||
| Year ended 31 December | Year ended 31 December | |||||
| 2022 | 2021 | Change (%) | 2022 | 2021 | Change (%) | |
| Basic organic chemicals | 46,972 | 48,059 | (2.3) | 6,192 | 5,311 | 16.6 |
| Synthetic fibre monomer and polymer | 7,496 | 7,010 | 6.9 | 6,140 | 6,580 | (6.7) |
| Synthetic resin | 17,475 | 17,924 | (2.5) | 8,272 | 8,325 | (0.6) |
| Synthetic fibre | 1,193 | 1,457 | (18.1) | 8,122 | 7,521 | 8.0 |
| Synthetic rubber | 1,367 | 1,289 | 6.0 | 11,369 | 11,104 | 2.4 |
| Chemical fertiliser | 812 | 981 | (17.2) | 2,988 | 2,797 | 6.9 |
In 2022, the operating expenses of the chemicals segment was RMB554.3 billion, representing an increase of 12.1% over 2021, mainly because of the price increase of naphtha and other chemical feedstock and fuels.
In 2022, impacted by weak demand in chemical products and increased feedstock prices, chemical margin slumped. The operating loss of this segment was RMB14.1 billion, representing a decrease of profit of RMB25.2 billion over 2021.
| (5) | Corporate and Others |
The business activities of corporate and others mainly consist of import and export business activities of the Company’s subsidiaries, R&D activities of the Company, and managerial activities of headquarters.
In 2022, the operating revenue generated from corporate and others was approximately RMB1,790.5 billion, representing an increase of 38.0% over 2021. This was mainly attributed to the great increase in the trading prices of crude oil and refined oil products.
In 2022, the operating expenses of corporate and others was RMB1,789.2 billion, representing an increase of 37.5% over 2021.
In 2022, the operating profit from corporate and others was RMB1.3 billion, representing an increase of RMB4.5 billion over the same period of 2021. This was mainly due to the provision for bad debts made in 2021, which was partially reversed in 2022, as well as profit of the trading company increased resulting from its optimised procurement rhythm.
21
| 3 | ASSETS, LIABILITIES, EQUITY AND CASH FLOWS |
The major funding sources of the Company are its operating activities and short-term and long-term loans. The major use of funds includes operating expenses, capital expenditures, and repayment of the short-term and long-term debts.
| (1) | Assets, liabilities and equity |
Unit: RMB million
As of 31 December 2022 | As of 31 December 2021 | Change | |
| Total assets | 1,948,640 | 1,889,255 | 59,385 |
| Current assets | 523,140 | 558,024 | (34,884) |
| Non-current assets | 1,425,500 | 1,331,231 | 94,269 |
| Total liabilities | 1,012,402 | 974,181 | 38,221 |
| Current liabilities | 667,385 | 641,280 | 26,105 |
| Non-current liabilities | 345,017 | 332,901 | 12,116 |
| Total equity attributable to shareholders of the Company | 784,706 | 774,182 | 10,524 |
| Share capital | 119,896 | 121,071 | (1,175) |
| Reserves | 664,810 | 653,111 | 11,699 |
| Non-controlling interests | 151,532 | 140,892 | 10,640 |
| Total equity | 936,238 | 915,074 | 21,164 |
As of 31 December 2022, the Company’s total assets was RMB1,948.6 billion, representing an increase of RMB59.4 billion compared with that of the end of 2021, of which:
Current assets were RMB523.1 billion, representing a decrease of RMB34.9 billion compared with that of the end of 2021, mainly because the cash and deposit decreased by RMB76.9 billion, and crude oil and refined oil product inventories increased by RMB36.8 billion as a result of international crude oil price increase.
The Company increased investment in transition, the construction in progress increased by RMB40.1 billion, and the net value of property plant and equipment increased by RMB31.8 billion; equity of associates and joint ventures increased by RMB24.8 billion due to the adjustment of Shanghai SECCO as a joint venture after the completion of its equity transaction.
The Company’s total liabilities were RMB1,012.4 billion, representing an increase of RMB38.2 billion compared with that of the end of 2021, of which:
Current liabilities were RMB667.4 billion, representing an increase of RMB26.1 billion as compared with that of the end of 2021. This was mainly because facing the increased capital occupation resulting from weak demand of domestic petroleum and petrochemical products, and high crude oil price in 2022, the Company increased short-term debt to improve short-term liquidity.
Non-current liabilities were RMB345.0 billion, representing an increase of RMB12.1 billion compared with that of the end of 2021. This was mainly due to an increase in long-term bank loans.
Total equity attributable to owners of the Company was RMB784.7 billion, representing an increase of RMB10.5 billion compared with that of the end of 2021.
| (2) | Cash Flow |
The following table sets forth the major items in the consolidated cash flow statements for 2022 and 2021.
22
Unit: RMB million
| Year ended 31 December | ||
| Major items of cash flows | 2022 | 2021 |
| Net cash generated from operating activities | 116,269 | 225,174 |
| Net cash used in investing activities | (95,010) | (145,198) |
| Net cash used in financing activities | (39,699) | (57,942) |
In 2022, the net cash generated from operating activities of the Company was RMB116.3 billion, representing a decrease of RMB108.9 billion over 2021. This was mainly due to the payment of taxes deferred from the fourth quarter of 2021, and the decrease in operating profit.
In 2022, the Company’s net cash used in investing activities was RMB95.0 billion, representing a decrease of cash outflow of RMB50.2 billion year-on-year. This was mainly due to a RMB59.2 billion year-on-year raise of withdrawals at maturity in time deposits with maturities over three months, an increase of RMB25.8 billion in capital expenditures, and a RMB19.2 billion year-on-year decline of increase in time deposits with maturities over three months.
In 2022, the Company’s net cash used in financing activities was RMB39.7 billion, representing a decrease of cash outflow of RMB18.2 billion year-on-year. This was mainly due to a year-on-year increase of RMB44.9 billion in net interest-bearing debt, and an increase of RMB21.8 billion in cash dividends distribution.
At the end of 2022, the cash and cash equivalents were RMB93.4 billion.
| (3) | Contingent Liabilities |
Please refer to “Material Guarantee Contracts and Their Performance” in the “Significant Events” section of this report
| (4) | Capital Expenditure |
Please refer to “Capital Expenditures” in the “Business Review and Prospects” section of this report.
| (5) | Research & Development and Environmental Expenditures |
R&D expenditures include expenses and capitalised cost occurred in the period. In 2022 the expenditures for R&D were RMB22.510 billion, of which expense was RMB12.773 billion, and capitalised cost was RMB9.737 billion.
Environmental expenditures refer to the normal routine pollutant discharge fees paid by the Company, excluding capitalised cost of pollutant treatment properties. In 2022, the Company paid environmental expenditures of RMB16.823 billion.
| (6) | Measurement of fair values of derivatives and relevant system |
The Company has established sound decision-making mechanism, business process and internal control systems relevant to financial instrument accounting and information disclosure.
23
Items relevant to measurement of main fair values
Unit: RMB million
| Items | Beginning of the year | End of the year | Profits and losses from variation of fair values in the current year | Accumulated variation of fair values recorded as equity | Impairment loss provision of the current year | Funding source | Purchase amount in the current year | Sell and redemption amount in the current year | Other changes |
| Financial assets held for trading | – | 2 | – | – | – | – | 1,228 | (1,226) | – |
| Fund | – | 2 | – | – | – | – | 222 | (220) | – |
| Derivative financial instruments | 1,350 | (1,838) | (15,535) | – | – | – | – | 12,347 | – |
| Cash flow hedges | 13,798 | 13,860 | (255) | 6,667 | – | – | – | (6,030) | (320) |
| Receivables financing | 5,939 | 3,507 | – | – | – | – | 32,546 | (34,978) | – |
| Other equity instrument investments | 767 | 730 | – | (79) | – | – | 148 | (151) | 45 |
| Total | 21,854 | 16,261 | (15,790) | 6,588 | – | – | 33,922 | (30,038) | (275) |
Derivatives investment:
In 2022, the Company traded in commodity and currency derivatives according to the Annual Business Plan for Financial Derivatives approved by the Board. Such business met the regulatory requirements of financial derivatives, operated in a standardized manner, and achieved the goals of suppressing price fluctuation, stabilising operating profit, and preventing market risks.
| 4 | ANALYSIS OF FINANCIAL STATEMENTS PREPARED UNDER CASS |
The major differences between the Company’s financial statements prepared under CASs and IFRS are set out in Section C of the financial statements of the Company on page 204 of this report.
| (1) | Under CASs, the operating income and operating profit or loss by reportable segments were as follows: |
| For the year ended 31 December | ||
| 2022 | 2021 | |
| RMB million | RMB million | |
| Operating income | ||
| Exploration and Production Segment | 319,411 | 249,998 |
| Refining Segment | 1,575,139 | 1,385,564 |
| Marketing and Distribution Segment | 1,713,874 | 1,411,544 |
| Chemicals Segment | 540,152 | 505,503 |
| Corporate and Others | 1,790,478 | 1,297,701 |
| Elimination of inter-segment sales | (2,620,886) | (2,109,426) |
| Consolidated operating income | 3,318,168 | 2,740,884 |
| Operating profit/(loss) | ||
| Exploration and Production Segment | 48,538 | 613 |
| Refining Segment | 11,611 | 65,360 |
| Marketing and Distribution Segment | 25,197 | 23,102 |
| Chemicals Segment | (14,256) | 11,361 |
| Corporate and Others | 15,480 | 9,521 |
| Elimination | (1,820) | (4,421) |
| Financial expenses, investment income and losses/gains from changes in fair value | 11,664 | 6,878 |
| Consolidated operating profit | 96,414 | 112,414 |
| Net profit attributable to equity shareholders of the Company | 66,302 | 71,208 |
Operating profit: In 2022, the operating profit of the Company was RMB96.4 billion, representing a decrease of RMB16.0 billion as compared with that of 2021.
Net profit: In 2022, the net profit attributable to the equity shareholders of the Company was RMB66.3 billion, representing a decrease of RMB4.9 billion or 6.9% compared with 2021.
24
| (2) | Financial data prepared under CASs |
As of 31 December 2022 | As of 31 December 2021 | Change | |
| RMB million | RMB million | ||
| Total assets | 1,948,640 | 1,889,255 | 59,385 |
| Non-current liabilities | 344,102 | 331,934 | 12,168 |
| Shareholder’s equity | 937,153 | 916,041 | 21,112 |
Change analysis:
At the end of 2022, the Company’s total assets were RMB1,948.6 billion, representing an increase of RMB59.4 billion compared with that of the end of 2021. This was mainly due to the increased investment in transformation and upgrading, resulting in the construction in progress increased by RMB40.1 billion, fixed asset increased by RMB31.8 billion, and long-term equity investment increased by RMB24.8 billion. Inventory increased by RMB36.8 billion as a result of the crude and refined oil prices increase, and cash at bank and on hand decreased by RMB76.9 billion.
At the end of 2022, the Company’s non-current liabilities was RMB344.1 billion, representing an increase of RMB12.2 billion compared with that of the end of 2021. This was mainly due to an increase of RMB45.6 billion in the long-term loans to ensure the fund demand of investment projects, and bills payable decreased by RMB29.7 billion.
At the end of 2022, total shareholders’ equity of the Company was RMB937.2 billion, representing an increase of RMB21.1 billion compared with that of the end of 2021.
| (3) | The results of the principal operations by segments |
| Segments | Operation income RMB million | Operation cost RMB million | Gross profit margin* (%) | Increase of operation income on a year-on-year basis (%) | Increase of operation cost on a year- on-year basis (%) | Increase/ (decrease) of gross profit margin on a year-on-year basis (%) |
| Exploration and Production | 319,411 | 214,834 | 24.4 | 27.8 | 4.1 | 11.5 |
| Refining | 1,575,139 | 1,317,846 | 1.7 | 13.7 | 24.1 | (4.3) |
| Marketing and Distribution | 1,713,874 | 1,618,973 | 5.4 | 21.4 | 22.8 | (1.0) |
| Chemicals | 540,152 | 529,241 | 1.2 | 6.9 | 13.3 | (5.7) |
| Corporate and Others | 1,790,478 | 1,757,535 | 1.8 | 38.0 | 38.5 | (0.4) |
| Elimination of inter-segment sales | (2,620,886) | (2,619,066) | N/A | N/A | N/A | N/A |
| Total | 3,318,168 | 2,819,363 | 7.1 | 21.1 | 27.2 | (2.6) |
| *: | Gross profit margin = (operation income – operation cost, tax and surcharges)/operation income. |
| 5 | THE CAUSE AND IMPACT OF THE CHANGE IN THE COMPANY’S ACCOUNTING POLICY, ACCOUNTING ESTIMATES AND ACCOUNTING METHODS |
For details, please refer to Note 3(26) to the financial statements prepared in accordance with CASs and Note 1 to the financial statement prepared in accordance with IFRS.
25
CORPORATE GOVERNANCE
1 IMPROVEMENTS IN CORPORATE GOVERNANCE DURING THE REPORTING PERIOD
During the reporting period, the Company complied with the Articles of Association as well as domestic and overseas laws and regulations, adhered to the standard operation, continuously improved the level of corporate governance. The Board of Directors strengthened strategic planning, scientifically formulated development strategy and approved the medium-term and long-term development planning of the Company. The Independent Non-executive Directors conscientiously fulfilled their duties, actively attended the board meetings and meetings of special committees of the Board, reviewed proposals with due care, conducted research on scientific and technological innovation, and offered advice and suggestions on Company’s reforms and development. The Company followed the latest regulatory requirements, and revised governance rules and regulations of the Company, such as Rules on Information Disclosure Management, Terms of Reference of the Independent Non-Executive Directors, Terms of Reference of the Secretary to the Board, and Rules on Insider Registration and Management etc., to strengthen the corporate governance basis. It enhanced the construction of internal control system to promote the effectiveness of the implementation of internal control system continuously. It also improved the Company’s transparency by focusing on high-quality information disclosure and investor relations management, and paying more attention to the communication and disclosure on ESG issues. As a result, the Company continuously obtained A-level rating of Shanghai Stock Exchange in the assessment of information disclosure. The Company bought back shares for the first time since listing synchronously in both domestic and overseas markets to maintain the Company’s value. It boosted the staff morale and enhanced the discipline inspection and supervision through continuously improving the quality of Party building, which contributed to the effective implementation of the Board resolutions and the high-quality development of the Company.
During the reporting period, there was no material inconsistency between Sinopec Corp.’s corporate governance and the requirements of the PRC Company Law and relevant regulations of the CSRC. The Board of Supervisors of Sinopec Corp. had no objection to any of the supervised matters. None of Sinopec Corp., the Board, the Directors, the Supervisors, the Senior Management, the controlling shareholders or de facto controllers of Sinopec Corp. were under the investigation by the CSRC or received any regulatory sanction or was criticised publicly by the CSRC, the Hong Kong Securities and Futures Commission, the Securities and Exchange Commission of the United States, or received any public censure from Shanghai Stock Exchange, Hong Kong Stock Exchange, New York Stock Exchange or London Stock Exchange.
| 2 | GENERAL MEETINGS |
During the reporting period, Sinopec Corp. convened 2021 Annual General Meeting, First A Shareholders Class Meeting for 2022, and First H Shareholders Class Meeting for 2022 on 18 May 2022, in accordance with the required procedures of noticing, convening and holding the general meetings pursuant to the relevant laws and regulations and the Articles of Association. For details of the meetings, please refer to the poll results announcements published on 19 May 2022 on China Securities Journal, Shanghai Securities News, Securities Times and the website of Shanghai Stock Exchange, as well as those published on 18 May 2022 on the website of Hong Kong Stock Exchange.
| 3 | EQUITY INTERESTS HELD BY DIRECTORS, SUPERVISORS AND OTHER SENIOR MANAGEMENT |
As of 31 December 2022, Mr. Ling Yiqun, Director, Senior Vice President, held 13,000 A shares of Sinopec Corp.
Save as disclosed in this report, during the reporting period, none of the Directors, Supervisors or Senior Management of Sinopec Corp. and their associates had any interests or short positions (including any interest or short position that is regarded or treated as being held in accordance with the Securities and Futures Ordinance (SFO)) in the shares, debentures and underlying shares of Sinopec Corp. or any associated corporations (as defined in Part XV of SFO) would fall to be disclosed to the Sinopec Corp. and the Hong Kong Stock Exchange under the Division 7 and 8 of Part XV of SFO, or which was recorded in the register required to be kept under section 352 of SFO, or otherwise should notified Sinopec Corp., or the Hong Kong Stock Exchange pursuant to the Model Code for Securities Transactions by Directors of Listed Company under the Hong Kong Listing Rules.
| 4 | COMPANY’S INDEPENDENCE FROM CONTROLLING SHAREHOLDER |
The Company is independent from its controlling shareholder in terms of, among other matters, business, assets and finances. The controlling shareholder of the Company exercised shareholder’s rights through the general meeting according to applicable laws and didn’t overstep the authority of the general meeting or directly or indirectly interfere with the Company’s operating decisions and operating activities. The Company has a well-integrated independent business and independent operating capabilities. During the reporting period, the Company did not identify the controlling shareholder taking advantage of its special position to misappropriate and damage the interests of the Company or the other shareholders.
26
| 5 | COMPETITION BETWEEN SINOPEC CORP. AND ITS CONTROLLING SHAREHOLDER |
Please refer to “Performance of the Undertaking by China Petrochemical Corporation” under the section “Significant Events” in this annual report for details.
| 6 | IMPROVEMENT AND IMPLEMENTATION OF THE INTERNAL CONTROL SYSTEM |
For details of internal control self-assessment and internal control auditing, please refer to the internal control assessment report and the internal control auditing report disclosed by the Company on the same date of this annual report.
| 7 | MANAGEMENT CONTROL OF SUBSIDIARIES |
The Company implements standardized control over different types of subsidiaries in accordance with laws and regulations, the Articles of Association and the internal control system. During the reporting period, the Company did not purchase any subsidiaries that met material criteria.
| 8 | SENIOR MANAGEMENT APPRAISAL AND INCENTIVE SCHEMES |
Sinopec Corp. has established and is continuously improving the fairness and transparency of its performance appraisal standards, incentive and restrictive mechanisms for Directors, Supervisors and other Senior Management. Sinopec Corp. has implemented incentive policies including the Measures of Sinopec Corp. for the Management of Performance Evaluations.
| 9 | CORPORATE GOVERNANCE REPORT (IN ACCORDANCE WITH HONG KONG LISTING RULES) |
| (1) | Compliance with the Corporate Governance Code |
During the reporting period, Sinopec Corp. complied with all code provisions of the Corporate Governance Code set out in Appendix 14 of the Hong Kong Listing Rules.
| A | CORPORATE PURPOSE, STRATEGY AND GOVERNANCE |
| A.1 | Corporate strategy, business model and culture |
| a. | The Outline of the 14th Five-Year Plan (2021-2025) and Vision 2035 of Sinopec Corp. has been approved by the Board on 25 March 2022, defining the medium-term and long-term development strategy and the long-range objectives through the year 2035 of the Company. The Company has always adhered to the underlying principle of pursuing progress while ensuring stability, applied the new development philosophy fully, accurately and comprehensively, actively promoted the high-quality development, and continuously created value for the country, the society and the shareholders. |
| b. | Sinopec Corp. attaches great importance to the construction of corporate culture. In the long process of reform and development, the Company has cultivated and formed its corporate culture, comprising the enterprise spirit of “loving China, strengthening the petrochemical industry”, as well as such fine traditions as being hard-working, meticulous and rigorous. The Company strives to provide cutting-edge technologies, premium products and quality services. The relevant content is published on Sinopec Corp.’s website at http://www.sinopec.com. |
| A.2 | Corporate Governance Functions |
| a. | The Board of Sinopec Corp. is responsible for performing duties of corporate governance, formulating and approving related corporate governance rules, adhering to the standard operation, improving the corporate governance, ensuring that the Company complies domestic and overseas laws and regulations, and disclosing the Company’s compliance with the Code of Corporate Governance in the Corporate Governance Report. |
| b. | The Board arranged training sessions for Directors, Supervisors and Senior Management, and made relevant records. During the reporting period, the Directors, Supervisors and Senior Management actively participated in the trainings and attached great importance to continuing professional development to ensure that their contribution to the Sinopec Corp. remains informed and relevant. |
The Directors’ attendance to the trainings is as follows:
| Laws and regulations update | Accounting/finance/operational management | ||||
| Name | Positions | Reading materials | Training and lectures | Reading materials | Research |
| Ma Yongsheng | Chairman, Non-executive Director | √ | √ | √ | √ |
| Zhao Dong | Non-executive Director | √ | √ | √ | √ |
| Yu Baocai | Executive Director, President | √ | √ | √ | √ |
| Ling Yiqun | Executive Director, Senior Vice President | √ | √ | √ | √ |
| Li Yonglin | Executive Director, Senior Vice President | √ | √ | √ | √ |
| Liu Hongbin | Executive Director, Senior Vice President | √ | √ | √ | √ |
| Cai Hongbin | Independent Non-executive Director | √ | √ | √ | √ |
| Ng, Kar Ling Johnny | Independent Non-executive Director | √ | √ | √ | √ |
| Shi Dan | Independent Non-executive Director | √ | √ | √ | √ |
| Bi Mingjian | Independent Non-executive Director | √ | √ | √ | √ |
27
| B | BOARD COMPOSITION AND NOMINATION |
| B.1 | Board composition, succession and evaluation |
| a. | The Board is the decision-making body of Sinopec Corp. and abides by good corporate governance practices and procedures. All decisions made by the Board are implemented by the Management of Sinopec Corp. |
| b. | The Board of Directors currently consists of ten members, among whom are four Executive Directors and six Non-executive Directors. Among the Non-executive Directors, there are four Independent Non-executive Directors, accounting for two-fifths of the total number of Directors. For details, please refer to the section “Introduction of Directors, Supervisors, and Other Senior Management” of this annual report. |
| c. | Sinopec Corp. has received from each of the Independent Non-executive Directors a letter of confirmation for 2023 regarding their compliance with relevant independence requirements set out in Rule 3.13 of the Hong Kong Listing Rules. Sinopec Corp. considers that each of the Independent Non-executive Directors is independent. The composition and operational mechanism of the Board ensure that independent and objective views and input are available to the Board of Sinopec Corp. For instance, matters such as connected transactions, profit distribution, appointment of director, etc., are required to obtain prior approval or independent opinions from Independent Non-executive Directors. The Board reviews and evaluates the effectiveness of such operational mechanism on an annual basis. |
| d. | The Board established the Board Diversity Policy which stipulates that the members of the Board shall be nominated and appointed based on the skills and experience for the overall optimum operation of the Board, while taking into account the targets and requirements of the board diversity. When deciding the composition of the Board, Sinopec Corp. shall consider factors in relation to the diversity of the Board, including but not limited to professional experience, skills, knowledge, term of office, regions, culture and educational backgrounds, gender, and age. The provisions of the Articles of Association concerning the term of office of directors help to ensure that the Board has a proper balance between continuous experience and new thinking, and enhance the level of diversity. Sinopec Corp. focuses on and annually evaluates the implementation of the Board Diversity Policy. Currently, the Board has achieved diversity in terms of gender, culture, educational backgrounds, professional specialties, etc. Female Director accounts for 10% of the Board members. The Directors come from different industries domestically and abroad with rich working experience. Professional backgrounds of Directors include petroleum and petrochemical corporate management, as well as economics, accounting, finance, and industry and energy economy, which are conductive to strategic planning and scientific decision-making. In terms of the candidates of Directors, the Board and the Nomination Committee will, as and when necessary, look for potential female director candidates through self-regulatory organizations, professional recommendation and other channels to achieve gender diversity of the Board. |
Sinopec Corp. has always devoted to establishing a workplace with diversity and equal opportunities, recruited female employees actively to increase the diversity of the team, and provided equal employment opportunities and environment for all employees, so as to offer them career development spaces to give full play to their personal characteristics and values. In 2022, female employees in the Company account for 31.0% of the total staff number. The Company adhered to the doctrine of gender equality, ensuring female employees have equal labor and social security rights as the males. For details, please refer to the Report of Sustainable Development of Sinopec Corp. for the year 2022.
| B.2 | Appointment, re-election and removal |
| a. | The term of office for each Director is three years, and the consecutive terms of office of any Independent Non-executive Director cannot exceed six years. During the reporting period, there was no new director nominated by the Board of Directors based on the actual situation of the Company, nor re-election or removal of Directors. For details about the tenure of each Director, please refer to the item 11 under this section. |
| b. | All Directors of Sinopec Corp. must be elected at the general meeting of shareholders. The Board has no power to appoint temporary Directors. |
| c. | Each of the Directors was able to devote sufficient time and efforts to handling the affairs of Sinopec Corp. |
| B.3 | Nomination Committee |
| a. | The Board of Directors established the Nomination Committee, consisting of the Independent Non-executive Director, Ms. Shi Dan, who serves as the chairman, and the Chairman of the Board, Mr. Ma Yongsheng, and the Independent Non-executive Director, Mr. Ng, Kar Ling Johnny, who serve as members. The principal responsibilities of the Nomination Committee are to provide suggestions to the Board on Board’s size and composition, the selecting standards and procedures, and candidates for Directors and Senior Management. When recommending candidates for Directors, the Nomination Committee mainly considers the skills, knowledge, experience and qualifications of the candidates, and also evaluates the time and energy they can devote as well as the Board Diversity Policy. Procedures to Propose a Person for Election as a Director of Sinopec Corp. and Terms of Reference of the Nomination Committee are published on Sinopec Corp.’s website at http://www.sinopec.com. |
| b. | The members of the Nomination Committee can engage professionals when performing their duties. Reasonable costs arising from such consultations are borne by Sinopec Corp. In the meantime, the Nomination Committee has also appointed consultant members and can require such member to provide advice. The working expenses of the Nomination Committee are included in the budget of Sinopec Corp. |
| c. | During the reporting period, the Nomination Committee held one meeting (please refer to “The Board Committees Meetings and Directors’ Attendance” under the section “Report of the Board of Directors” in this annual report). |
| C | DIRECTORS’ RESPONSIBILITIES, DELEGATION AND BOARD PROCEEDINGS |
| C.1 | Responsibility of Directors |
| a. | Sinopec Corp. engages professional consultants to prepare detailed materials for newly elected Directors, to notify them of the regulations of each listing place of Sinopec Corp. and to remind them of their rights, responsibilities, and obligations as Directors. Sinopec Corp. has purchased liability insurance for all Directors to minimize the potential risks that might arise from the adequate performance of their duties. |
| b. | All Non-executive Directors have the same duties and powers as the |
28
Executive Directors. In addition, the Independent Non-executive Directors are entitled to certain specific powers. The Articles of Association and the Rules of Procedure of Board Meetings clearly prescribe the duties and powers of Directors, and Non-executive Directors including Independent Non-executive Directors, which are published on the Sinopec Corp.’s website at http://www.sinopec.com.
| c. | Each of the Directors confirmed that he/she has complied with the Model Code for Securities Transactions by Directors of Listed Issuers (Model Code) during the reporting period. Meanwhile, Sinopec Corp. formulated the Rules Governing Shares Held by Company Directors, Supervisors and Senior Managers and Changes in Shares and the Rules on Insider Registration and Management, which is no less exacting than the Model Code, to further regulate the dealings of Sinopec Corp.’s securities by relevant personnel. |
| d. | All the Independent Non-executive Directors and other Non-executive Directors of the Sinopec Corp. regularly attended the Board meetings and the meetings held by the Board Committees they served, paid attention to production and operational status of the Company, and offered constructive suggestions on the Company’s reforms and development based on their skills and professional knowledge. For details about each Director’s attendance at the Board meetings and the general meetings, please refer to the section “Report of the Board of Directors” in this annual report. |
| C.2 | Chairman and President |
| a. | Mr. Ma Yongsheng, elected by all Directors, serves as Chairman of the Board. Mr. Yu Baocai, nominated and appointed by the Board, serves as President of Sinopec Corp. The respective main duties and responsibilities of the Chairman and the President are clearly distinguished from each other, and the scope of their respective duties and responsibilities are set out in the Articles of Association. |
| b. | The Chairman of the Board ensure that all the Directors could receive full, clear and complete information in time, and be informed of proposals of the Board meetings. |
| c. | The Chairman of the Board places great emphasis on communication with the Independent Non-executive Directors. The Chairman independently held two meetings with the Independent Non-executive Directors in respect of development strategy, medium-term and long-term development plans, corporate governance, and operational management, etc. |
| d. | The Chairman of the Board encourages open and active discussions. The Directors fully and deeply participated in the discussions of significant decisions in the Board meetings. |
| C.3 | Management functions |
| a. | The Board and the Management have clear duties and responsibilities under written rules. The Articles of Association and the Rules of Procedure of the General Meetings of Shareholders and the Rules of Procedure of the Board Meetings clearly set forth the scope of duties, powers, and delegation of power of the Board and Management, which are published on the website of Sinopec Corp. at http://www.sinopec.com. |
| C.4 | Board Committees |
| a. | In addition to the Audit Committee, the Remuneration and Appraisal Committee and Nomination Committee, the Board had established the Strategy Committee and the Sustainable Development Committee. The Strategy Committee is responsible for overseeing long-term development strategies and significant investment decisions of the Company. The Strategy Committee consists of eight Directors, including the Chairman of the Board, Mr. Ma Yongsheng, who serves as Chairman, Executive Directors, Mr. Yu Baocai, Mr. Ling Yiqun, Mr. Li Yonglin, Mr. Liu Hongbin, and Independent Non-executive Directors, Mr. Cai Hongbin, Ms. Shi Dan, and Mr. Bi Mingjian, who serve as members. The Sustainable Development Committee is responsible for preparing policies, governance, strategies and plans for sustainable development of the Company, which consists of four Directors, including the Chairman of the Board, Mr. Ma Yongsheng, who serves as Chairman, the Non-executive Director, Mr. Zhao Dong, the Executive Director, Mr. Li Yonglin, and the Independent Non-executive Director, Mr. Cai Hongbin, who serve as members. |
| b. | Each Board Committee shall report its decisions and recommendations to the Board and has formulated its terms of references. Terms of Reference of the Audit Committee, Terms of Reference of the Remuneration and Appraisal Committee, Terms of Reference of the Sustainable Development Committee and Terms of Reference of the Nomination Committee are published on the website of Sinopec Corp. at http://www.sinopec.com. |
| C.5 | Board proceedings and supply of and access to information |
| a. | The Articles of Association and the Rules of Procedure of Board Meetings of Sinopec Corp. clearly prescribe the proceedings of Board meetings, which are published on the website of Sinopec Corp. at http://www.sinopec.com. |
| b. | The Board of the Company held its meetings at least once a quarter. The Board will usually communicate the time and proposals of the Board meeting 14 days before convening the meeting. The relevant documents and materials for Board meetings and for the Board Committees are usually delivered to each Director 10 days in advance. Before the meetings were held, assigned persons were responsible for answering the possible questions raised by the Directors, ensuring the Directors could participate in the proceedings of the Board meetings effectively and positively, and fully understand the proposals to make decisions. In 2022, Sinopec Corp. held nine Board meetings. For details about each Director’s attendance at the Board meetings and the general meetings, please refer to the section “Report of the Board of Directors” in this annual report. |
| c. | Each Director of the Board can submit proposals to be included in the agenda of Board meetings, and each Director is entitled to request other related information. The agenda and other documents for reference for meetings of the Board and Board committees are distributed prior to the meetings to allow each Director sufficient time to review the materials so that Directors can make informed decisions. |
| d. | Each Director can obtain all related information in a comprehensive and timely manner. The Secretary to the Board is responsible for organising and preparing the materials for the Board meetings, including preparation of explanations for each proposal to ensure fully understanding by the Directors. The Management is responsible for providing the Directors with necessary information and materials. The Directors can require the Management, or require relevant departments via the Management |
29
to provide necessary information or explanations. The Directors can seek advice from professional consultants when necessary.
| e. | Resolutions and minutes of Board meetings and the meetings held by the Board Committees were recorded and archived by designated recorders, and were reviewed and confirmed by the Directors attended the relevant meetings. All the matters and final decisions were recorded fully and accurately in the meeting minutes. |
| f. | The Board has reviewed and evaluated its performance in 2022 and is of the view that the Board made decisions in compliance with domestic and overseas regulatory authorities’ requirements and the Company’s internal rules; that the Board has fully communicated, and considered the suggestions from the Party organisation, Board of Supervisors and management during its decision-making process; and that the Board safeguarded the legitimate rights and interests of Sinopec Corp. and its shareholders. |
| C.6 | Company Secretary |
| a. | The Hong Kong Stock Exchange recognised the Secretary to the Board as having the relevant qualifications as Company Secretary. The Secretary to the Board, nominated by the Chairman of the Board and appointed by the Board, is a senior management officer of Sinopec Corp. He reports to the Chairman and the President and is responsible for the Company and the Board. The Secretary to the Board gives opinions on corporate governance to the Board and arranges orientation training and professional development for the Directors. |
| b. | The Secretary to the Board assists the Directors in handling the day-to-day work of the Board, continuously informs the Directors of the regulations, policies or other requirements of domestic or overseas regulatory authorities in relation to corporate governance and ensures that the Directors comply with domestic and overseas laws and regulations when performing their duties and responsibilities. |
| c. | During the reporting period, the Secretary to the Board actively participated in career development training for more than 15 training hours. |
| D. | AUDIT, INTERNAL CONTROL AND RISK MANAGEMENT |
| D.1 | Financial reporting |
| a. | Directors are responsible for supervising the preparation of accounts for each fiscal period to ensure that the accounts truly and fairly reflect the condition of the business, the performance, and the cash flow of the Company during the period. The Board approved the Financial Report for 2022 and warranted that the annual report contained no false representations, no material omissions or misleading statements and jointly and severally accepted full responsibility for the authenticity, accuracy, and completeness of the content. |
| b. | The Management of Sinopec Corp. provides Directors with information about the financial, production and operating data of the Company, capital market updates, and securities regulatory developments every month to ensure that the Directors can learn about the latest developments of the Company and regulatory changes in a timely manner. |
| c. | Sinopec Corp. has adopted an internal control mechanism to ensure that the Management and relevant departments have provided the Board and the Audit Committee with sufficient financial data and related explanations and materials. |
| d. | The external auditors of Sinopec Corp. made a statement on their audit responsibilities in the auditor’s report contained in the financial report. |
| D.2 | Internal Control and Risk Management |
| a. | Sinopec Corp. has formulated and implemented its internal control and risk management system. The Board as a decision-making body is responsible for evaluating and reviewing the effectiveness of its internal control and risk management. The Board and the Audit Committee periodically (at least annually) receive reports of the Company regarding internal control and risk management information from the Management. All major internal control and risk management issues are reported to the Board and the Audit Committee. Sinopec Corp. has set up its internal control and risk management department and internal auditing departments, which are equipped with sufficient staff, and these departments periodically (at least twice per year) report to the Audit Committee. The internal control and risk management system of the Company are designed to manage rather than eliminate all the risks of the Company. |
| b. | In terms of internal control, Sinopec Corp. adopted the internal control framework prescribed in the internationally accepted Committee of Sponsoring Organisations of the Treadway Commission Report (COSO). Based upon the Articles of Association and the applicable management policies currently in effect, as well as in accordance with relevant domestic and overseas applicable regulations, Sinopec Corp. formulates and continuously improves the Internal Control Manual to achieve internal control of all factors of internal environment, risk assessment, controlling activities, information and communication, and internal supervision. At the same time, Sinopec Corp. has constantly supervised and evaluated its internal control, and conducted comprehensive and multi-level inspections including regular test, enterprise self-examination and auditing check, and included headquarters, branches and subsidiaries into the scope of internal control evaluation, with an internal control evaluation report being produced. The Board annually reviews the internal control evaluation report. For detailed information about the internal control during the reporting period, please refer to the “Report on Internal Control Evaluation” prepared by Sinopec Corp. |
30
Sinopec Corp. has formulated and implemented its information disclosure policy and insider registration policy. The Company regularly evaluates the policy implementation and makes disclosure in accordance with relevant regulations. Please refer to the website of Sinopec Corp.
(http://www.sinopec.com) for the details of the information disclosure policy.
(http://www.sinopec.com) for the details of the information disclosure policy.
| c. | In terms of risk management, Sinopec Corp. adopts the enterprise risk management framework provided by COSO, and establishes its risk management policy and risk management organisation system. The Company annually conducts risk evaluation to identify major and important risks and perform risk management duties. It has designed major and important risks tackling strategies and measures combined with its internal control system and periodically monitors their implementation to ensure adequate care, monitor and tackling of major risks. |
The Board of the Company attaches great importance to the ESG management approach and strategy, optimises ESG mechanism, strengthens the Board’s role in supervising and participation in ESG related issues, and integrates ESG considerations into the Company’s development strategy, major decision-making processes and production and operation. The Company keeps strictly to the anti-corruption laws and regulations of China, as well as anti-corruption and anti-bribery laws applicable in the country (region) where the business is conducted. The Company fully supports the UN Convention against Corruption, the UN Global Compact and other relevant initiatives, abides by the rules and commitments of the Company and business partners on clean practices and anti-corruption, and strengthens the construction of a culture of integrity. The Company has continuously improved the organizational and institutional systems of anti-corruption, organized and carried out anti-corruption training, and attached importance to risk assessment of anti-corruption. The Board has reviewed and evaluated the adequacy of resources, staff qualifications and experience, training programmes and budget of ESG performance and reporting during the reporting period. For details, please refer to the Report of Sustainable Development of Sinopec Corp. for the year 2022.
| d. | Based upon the review and evaluation of internal control and risk management of the reporting period, the Board is of the view that the internal control and risk management of the Company are effective. |
| D.3 | Audit Committee |
| a. | The Board has established an Audit Committee, formulated the Terms of Reference of the Audit Committee, and defined the scope of responsibility of the Audit Committee. The Audit Committee is responsible for supervising and evaluating internal and external audit work, reviewing and commenting on the financial reports of the Company, monitoring and evaluating the effectiveness of internal control related to financial reports and coordinating the communication between external auditor and management, internal auditor and related departments. The Audit Committee consists of Independent Non-executive Director, Mr. Ng, Kar Ling Johnny, who serves as the Chairman, and Independent Non-executive Directors, Mr. Cai Hongbin, Ms. Shi Dan, and Mr. Bi Mingjian, who serve as members. |
| b. | During the reporting period, the Audit Committee held five meetings (please refer to the “The Board Committees Meetings and Directors’ Attendance” under the section of “Report of the Board of Directors” in this annual report). The review opinions were issued at each meeting and submitted to the Board. During the reporting period, the Board and the Audit Committee had no disagreement. |
| c. | Audit Committee can engage independent professionals when performing its duties. Reasonable costs arising from such consultations are borne by Sinopec Corp. In the meantime, the Audit Committee has appointed consultant members and can request such members to provide advice. The working expenses of the Audit Committee are included in the budget of Sinopec Corp. In accordance with the policies of Sinopec Corp., the Senior Management and relevant departments of Sinopec Corp. shall actively cooperate with the Audit Committee. |
| d. | The Audit Committee has reviewed the adequacy and sufficiency of the resources for accounting, internal audit, financial reporting functions and the qualifications and experience of the relevant employees as well as the sufficiency of the training courses and the budget thereof. The Audit Committee is of the view that the Management has fulfilled the duties to establish an effective internal control system. The Company established a whistle-blowing policy in its internal control system reviewed and approved by the Audit Committee, providing several channels, including online reporting, reporting by letters, appeals and complaint mailbox, etc., to employees and others who have dealings with the Company (such as suppliers and customers) to raise concerns on improper matters of the Company secretly and anonymously. The Audit Committee has established an internal procedure, which contains receiving, retaining and handling complaints or anonymous reports concerning accounting, internal control or audit matters. |
| E. | REMUNERATION |
| E.1 | The level and make-up of remuneration and disclosure |
| a. | The remuneration policy of the Director is stipulated in Director’s service contracts approved at the general meeting. Remuneration of Executive Directors is determined according to the relevant regulations of the country and the implementation rules of the remuneration of senior management of Sinopec Corp.; Non-executive Directors don’t receive remuneration in the Company. Remuneration of Independent Non-executive Directors is approved at the general meeting, and the level is determined with comprehensively consideration of industry conditions, company size and other factors. For details about the annual remuneration of Directors, Supervisors, and other Senior Management, please refer to page 37 to page 45 in this annual report. |
| b. | The Board of Directors established Remuneration and Appraisal Committee, consisting of Independent Non-executive Director, Mr. Bi Mingjian, who serves as the Chairman, and the Chairman of the Board, Mr. Ma Yongsheng and the Independent Non-executive Director, Mr. Ng, Kar Ling Johnny, who serve as the members of the Remuneration and Appraisal Committee. The Remuneration and Appraisal Committee is responsible for reviewing the implementation of the annual remuneration plans for Directors, Supervisors, and other Senior Management as approved at the general meeting of the shareholders, and reporting to the Board. |
| c. | The Remuneration and Appraisal Committee always consults the Chairman of the Board and the President about the remuneration plans for other Executive Directors. After the Remuneration and Appraisal Committee’s review, it is of the view that all the Executive Directors of Sinopec Corp. have fulfilled the duty clauses in their service contracts in 2022. |
31
| d. | The members of the Remuneration and Appraisal Committee can engage independent professionals when performing its duties. Reasonable costs arising from such consultations are borne by Sinopec Corp. In the meantime, the Remuneration and Appraisal Committee has also appointed consultant members and can require such members to provide advice. The working expenses of the Remuneration and Appraisal Committee are included in the budget of Sinopec Corp. According to the policies of Sinopec Corp., the Senior Management and relevant departments of Sinopec Corp. shall actively cooperate with the Remuneration and Appraisal Committee. |
| e. | During the reporting period, the Remuneration and Appraisal Committee held one meeting (please refer to “The Board Committees Meetings and Directors’ Attendance” under the section of “Report of the Board of Directors” in this annual report). |
| F. | SHAREHOLDERS ENGAGEMENT |
| F.1 | Effective communication |
| a. | The policy on payment of dividends of Sinopec Corp. is disclosed in this annual report, please refer to page 62 in this annual report. |
| b. | Sinopec Corp. attach considerable significance to investor relations. The Chairman of the Board attends annual and interim results conferences, and the Management attends road shows to answer questions on subjects of concern to investors, such as introducing the development strategies and the production and business performance of the Company. The Independent Directors, Ms. Shi Dan, and Mr. Bi Mingjian, attended the annual and interim results conferences for 2022. The Board Secretariat of Sinopec Corp. is responsible for communicating with investors. In compliance with regulatory provisions, Sinopec Corp. enhances communication with investors by holding meetings with institutional investors, setting up an investor hotline, and communicating through internet platform, etc. |
| c. | According to relevant rules of Sinopec Corp., the Secretary to the Board is responsible for establishing an effective communication channel between Sinopec Corp. and its shareholders, for setting up special departments to communicate with the shareholders and for passing the opinions and proposals of the shareholders to the Board and Management in a timely manner. Contact details of Sinopec Corp. can be found in the “Investor Centre” column on Sinopec Corp.’s website, ensuring that shareholders can get in touch with the Company at any time. |
| F.2 | General meeting |
| a. | During the reporting period, separate resolutions were proposed for each substantially separate issue at the general meeting of shareholders. All resolutions were voted by poll in protection of the interest of all shareholders. Notices of the general meeting were dispatched to shareholders 45 days (excluding the date of the general meeting) in advance. |
| b. | The Chairman of the Board hosted the Annual General Meeting for 2021(AGM), the First A Shareholders Class Meeting for 2022, and the First H Shareholders Class Meeting for 2022. Several members of the Board of Directors, the Board of Supervisors, and Senior Management attended the meetings and conducted in-depth communication with the investors. Some members of the Nomination Committee, the Remuneration and Appraisal Committee, the Strategy Committee, and the Sustainable Development Committee attended the AGM, and members of the Audit Committee didn’t attend the AGM due to other working arrangement. The external auditors of the Company attended the AGM. During the AGM, specially-assigned person of the Company recorded questions raised by investors as well as the feedback, which were related to each Board Committee. On the meetings, investors didn’t raise questions that need to be answered or matters that need to be paid attention to by each Board Committee. After the AGM, the Company communicated specially with investors, and then made a report on the situation of the AGM to all the Directors. |
| c. | Shareholders who individually or collectively hold 10% of the total voting shares of Sinopec Corp. may request the Board in writing to convene the general meeting of shareholders. If the Board fails to approve the request to convene the meeting according to the Rules of Procedure of General Meetings of Shareholders, the shareholders may convene and hold the meeting at their discretion according to applicable laws, and reasonable expenses incurred will be borne by Sinopec Corp. These aforementioned provisions are subject to the following conditions: the proposals at the general meeting of shareholders must fall within the responsibilities of the general meeting of shareholders, with specific proposals and resolutions and in compliance with relevant laws, administrative regulations and the Articles of Association. When Sinopec Corp. holds the general meeting of shareholders, shareholders who individually or collectively hold 3% of the total voting shares of Sinopec Corp. may propose a supplemental proposal 10 days before the date of the general meeting. |
| d. | The eligibility for attending the general meeting, the rights of shareholders, the resolutions at the meeting and the voting procedures are clearly stated in the notice and circular of the general meeting of Sinopec Corp. dispatched to the shareholders. |
| e. | Sinopec Corp. has established a special department for communication with shareholders and publishes relevant contact details to facilitate shareholders to make enquiries in accordance with Articles of Association. |
| G. | AUDITORS |
The re-appointment of KPMG Huazhen LLP and KPMG as the external auditors of Sinopec Corp. for the year 2022 and the authorisation of the Board to determine their remunerations were approved at Sinopec Corp.’s Annual General Meeting for 2021 on 18 May 2022. The audit fee for 2022 is RMB40.66 million (including audit fee of internal control), which was approved at the 15th Meeting of the Eighth Session of the Board. The annual financial statements of the year ended 31 December 2022 have been audited by KPMG Huazhen LLP and KPMG. The Chinese certified public accountants signing the report are Yang Jie and He Shu from KPMG Huazhen LLP. During the reporting period, KPMG Huazhen LLP and KPMG and their affiliates firms provided non-audit service, such as tax consulting and due diligence investigation to the Company, and the fee charged was RMB2.98 million.
| (2) | Other information about Sinopec Corp.’s corporate governance |
Except for their working relationships with Sinopec Corp., none of the Directors, Supervisors or other Senior Management has any financial, business or family relationship or any relationship in other material aspects with one another. For information about shareholdings of substantial shareholders and changes in share capital, please refer to page 70 to page 71; for information about meetings of the Board, please refer to page 59 to page 60; for information about meetings held by Board Committees, please refer to page 61; for information about tenure of Non-executive Directors, please refer to page 37; for information about equity interests of Directors, Supervisors and other senior management, please refer to page 37 to page 44; for biographies of Directors, Supervisors and other senior management, please refer to page 33 to page 43.
10 DETAILED IMPLEMENTATION OF THE SHARE INCENTIVE SCHEME DURING THE REPORTING PERIOD
The Company did not implement any share incentive scheme during the reporting period.
32
11 INTRODUCTION OF DIRECTORS, SUPERVISORS AND OTHER SENIOR MANAGEMENT
| (1) | Directors |
Ma Yongsheng
Ma Yongsheng, aged 61, Chairman of the Board of Sinopec Corp. Mr. Ma is a professor level senior engineer with a Ph.D. degree. Mr. Ma is a member of the 13th and 14th National Committee of Chinese People’s Political Consultative Conference (CPPCC) and an academician of the Chinese Academy of Engineering. In April 2002, he was appointed as Chief Geologist of Sinopec Southern Exploration and Production Company; in April 2006, he was appointed as Executive Deputy Manager (in charge of overall management), Chief Geologist of Sinopec Southern Exploration and Production Company; in January 2007, he was appointed as General Manager and Party Secretary of CPC Committee of Sinopec Southern Exploration and Production Company; in March 2007, he served as General Manager and Deputy Party Secretary of CPC Committee of Sinopec Exploration Company; in May 2007, he was appointed as Deputy Commander of Sichuan-East China
Gas Pipeline Project Headquarter of Sinopec Corp.; in May 2008, he was appointed as Deputy Director General of Exploration and Production Department of Sinopec Corp. (Director General Level); in July 2010, he served as Deputy Chief Geologist of Sinopec Corp.; in August 2013, he was appointed as Chief Geologist of Sinopec Corp.; in December 2015, he served as Vice President of China Petrochemical Corporation and was appointed as Senior Vice President of Sinopec Corp.; in January 2017, he was appointed as Member of the Leading Party Member Group of China Petrochemical Corporation; in October 2018, he was appointed as President of Sinopec Corp; in April 2019, he was appointed as Director, President and Vice Secretary of the Leading Party Member Group of China Petrochemical Corporation; in November 2021, he was appointed as Chairman and Secretary of the Leading Party Member Group of China Petrochemical Corporation. Mr. Ma was elected as Director of Sinopec Corp. in February 2016, and was elected as the Chairman of the Board of Sinopec Corp. in November 2021.
Zhao Dong
Zhao Dong, aged 52, Director of Sinopec Corp. Mr. Zhao is a professor level senior accountant with a Ph.D. degree. Mr. Zhao is an alternate member of the 20th Central Committee of the Party. In July 2002, he was appointed as Chief Accountant and General Manager of Financial Assets Department of CNPC International (Nile) Ltd.; in January 2005, he was appointed as Deputy Chief Accountant and Executive Deputy Director of Financial and Capital Operation Department of China National Oil and Gas Exploration and Development Corporation; in April 2005, he was appointed as Deputy Chief Accountant and General Manager of Financial and Capital Operation Department of China National Oil and Gas Exploration and Development Corporation; in June 2008, he was appointed as Chief Accountant of China National Oil and Gas Exploration and Development Corporation; in October 2009, he was appointed as Chief Accountant of China National Oil and Gas Exploration and Development Corporation and Chief Financial Officer of PetroChina International Investment Company Limited; in September 2012, he was appointed as Deputy General Manager of CNPC Nile Company; in August 2013, he was appointed as General Manager of CNPC Nile Company; in November 2015, he was appointed as Chief Financial Officer of PetroChina Company Limited. In November 2016, he was appointed as a Member of the Leading Party Member Group and Chief Accountant of China Petrochemical Corporation; in May 2020, he was appointed as Director and Deputy Secretary of the Leading Party Member Group of China Petrochemical Corporation; in June 2022, he was appointed as Director, President and Vice Secretary of the Leading Party Member Group of China Petrochemical Corporation. In June 2017, he was elected as Chairman of Board of Supervisors of Sinopec Corp.; in May 2021, he was elected as Director of Sinopec Corp.
33
Yu Baocai
Yu Baocai, aged 58, Director and President of Sinopec Corp. Mr. Yu is a senior engineer with a master’s degree in economics. In September 1999, Mr. Yu was appointed as Deputy General Manager of Daqing Petrochemical Company; in December 2001, he was appointed as General Manager and Deputy Secretary of CPC Committee of Daqing Petrochemical Company; in September 2003, he was appointed as General Manager and Secretary of CPC Committee of Lanzhou Petrochemical Company; in June 2007, he was appointed as General Manager and Deputy Secretary of CPC Committee of Lanzhou Petrochemical Company and General Manager of Lanzhou Petroleum & Chemical Company; in September 2008, he was appointed as a member of the Leading Party Member Group and Deputy General Manager of China National Petroleum Corporation (CNPC) and since May 2011, he acted concurrently as Director of PetroChina Company Limited; in June 2018, he was appointed as a Member of the Leading Party Member Group and Vice President of China Petrochemical Corporation; in September 2020, he was appointed as Senior Vice President of Sinopec Corp. Mr. Yu was elected as Director of Sinopec Corp. in October 2018, and was appointed as President of Sinopec Corp. in November 2021.
Ling Yiqun
Ling Yiqun, aged 60, Director and Senior Vice President of Sinopec Corp. Mr. Ling is a professor level senior engineer with a Ph.D. degree. From 1983, he worked in the refinery of Beijing Yanshan Petrochemical Company and the Refining Department of Beijing Yanshan Petrochemical Company Ltd.; in February 2000, he was appointed as Deputy Director General of Refining Department of Sinopec Corp.; in June 2003, he was appointed as Director General of Refining Department of Sinopec Corp.; in July 2010, he was appointed as Vice President of Sinopec Corp.; in May 2012, he was appointed concurrently as Executive Director, President and Secretary of CPC Committee of Sinopec Refinery Product Sales Company Limited; in August 2013, he was appointed concurrently as President and Secretary of CPC Committee of Sinopec Qilu Petrochemical Company, and President of Sinopec Qilu Company; in March 2017, he was appointed as Vice President of China Petrochemical Corporation; since April 2019, he has been a member of the Leading Party Member Group of China Petrochemical Corporation. In February 2018, he was appointed as Senior Vice President of Sinopec Corp.; in May 2018, he was elected as Director of Sinopec Corp.
Li Yonglin
Li Yonglin, aged 56, Director and Senior Vice President of Sinopec Corp. Mr. Li is a professor level senior engineer with a Ph.D. degree. Mr. Li is a member of the 13th National Committee of CPPCC. He was appointed as Vice General Manager of Sinopec Maoming Company in March 2003; in July 2009, he was appointed as Chief of Preparatory Group for the Beihai Refining Off-Site Reconstruction Project; in November 2011, he was appointed as General Manager and Deputy Secretary of CPC Committee of Sinopec Beihai Refining & Chemical Co., Ltd.; in March 2015, he was appointed as Vice Director General of Refining Division of Sinopec Corp. (Director General Level); in December 2016 he was appointed as General Manager and Deputy Secretary of CPC Committee of Sinopec Tianjin Petrochemical Company, General Manager of Sinopec Tianjin Company and Vice Chairman of SINOPEC SABIC Tianjin Petrochemical Co., Ltd.; in October 2019, he was appointed as Secretary of CPC Committee of Sinopec Tianjin Petrochemical Company and Corporate Representative of Sinopec Tianjin Company; in July 2020, he was appointed as Assistant to the President of China Petrochemical Corporation, concurrently serving as General Manager of Human Resources Department and Head of Organizational Department of the Leading Party Member Group; in November 2020, he was appointed as a member of Leading Party Member Group and Vice President of China Petrochemical Corporation.; in May 2021, he was elected as Director of Sinopec Corp. and was appointed as Senior Vice President of Sinopec Corp.
34
Liu Hongbin
Liu Hongbin, aged 60, Director and Senior Vice President of Sinopec Corp. Mr. Liu is a senior engineer with a bachelor’s degree. In June 1995, he was appointed as Chief Engineer of Tuha Petroleum Exploration & Development Headquarters; in July 1999, he was appointed as Deputy General Manager of PetroChina Tuha Oilfield Company; in July 2000, he was appointed as Commander and Deputy Secretary of CPC Committee of Tuha Petroleum Exploration & Development Headquarters; in March 2002, he served as General Manager of the Planning Department of PetroChina Company Limited; in September 2005, he served as Director of the Planning Department of CNPC; in June 2007, he was appointed as Vice President of PetroChina Company Limited, and in November 2007, he served concurrently as General Manager and Secretary of CPC Committee of the Marketing Branch of PetroChina Company Limited; in June 2009, he served concurrently as General Manager and Deputy Secretary of CPC Committee of the Marketing Branch of PetroChina Company Limited; in July 2013, he was appointed as Member of the Leading Party Member Group and Deputy General Manager of CNPC and in August 2013, he served concurrently as an Executive Director and General Manager of Daqing Oilfield Company Limited, Head of enterprise Coordination in Heilongjiang Province, Director of Daqing Petroleum Administration Bureau and Deputy Secretary of CPC Committee of Daqing Oilfield; in May 2014, he served concurrently as Director of PetroChina Company Limited; in November 2019, he was appointed as a member of the Leading Party Member Group of China Petrochemical Corporation; in December 2019, he was appointed as Vice President of China Petrochemical Corporation. In March 2020, he was appointed as Senior Vice President of Sinopec Corp. In May 2020, he was elected as Director of Sinopec Corp.
Cai Hongbin
Cai Hongbin, aged 55, Independent Director of Sinopec Corp. Mr. Cai is Dean of Faculty of Business and Economics and Professor of Economics of the University of Hong Kong. Mr. Cai has a Ph.D. degree in Economics. From 1997 to 2005, Mr. Cai taught at the University of California, Los Angeles. Since 2005, he served as a professor and Ph.D. supervisor in Applied Economics Department at Guanghua School of Management at Peking University, and he once served as Director, Assistant to the Dean and Vice Dean of the Applied Economics Department. From December 2010 to January 2017, he served as Dean of Guanghua School of Management at Peking University. In June 2017, he joined the Faculty of Business and Economics of the University of Hong Kong. Mr. Cai once served as a member of the 12th National People’s Congress, a member of Beijing Municipal Committee of CPPCC, a member of the 11th Central Committee of China Democratic League, Deputy Chairman of Beijing Municipal Committee of China Democratic League and a Special Auditor of the National Audit Office. He currently serves as an Independent Director of CCB International (Holdings) Limited, China Merchants Finance Holdings Company Limited and Ping An Bank Co., Ltd. In May 2018, he was elected as Independent Director of Sinopec Corp.
Ng, Kar Ling Johnny
Ng, Kar Ling Johnny, aged 62, Independent Director of Sinopec Corp. Mr. Ng currently is a practicing Certified Public Accountant in Hong Kong, a practicing auditor and accountant in Macau, a Fellow of the Hong Kong Institute of Certified Public Accountants (FCPA), a Fellow of the Association of Chartered Certified Accountant (FCCA), and a Fellow of the Institute of Chartered Accountants in England and Wales (FCA). Mr. Ng obtained a bachelor’s degree and a master’s degree in business administration from the Chinese University of Hong Kong in 1984 and 1999, respectively. Mr. Ng joined KPMG (Hong Kong) in 1984 and became a Partner in 1996. He acted as a Managing Partner from June 2000 to September 2015 and Vice Chairman of KPMG China from October 2015 to March 2016. Mr. Ng currently serves as Independent Non-executive Director of China Vanke Co., Ltd., Metallurgical Corporation of China Ltd. and China Telecom Corporation Limited. In May 2018, he was elected as Independent Director of Sinopec Corp.
35
Shi Dan
Shi Dan, aged 61, Independent Director of Sinopec Corp. Ms. Shi is the legal representative and Chairman of China Industrial Economics Society, a member of Expert Advisory Committee of the National Energy Commission and a member of National Expert Committee on Climate Change and enjoys special government subsidies from the State Council. Ms. Shi obtained bachelor’s degree in engineering, master’s degree in economics, master’s degree of development economics and Ph.D. degree in management from Changchun University of Technology, Renmin University of China, Australian National University and Huazhong University of Science and Technology respectively. In October 1993, Ms. Shi was appointed as Research Fellow and Assistant to the Dean of the Institute of Industrial Economics of Chinese Academy of Social Sciences; in August 2010, Ms. Shi was appointed as a Research Fellow and Deputy Dean of National Academy of Economic Strategy, Chinese Academy of Social Sciences; in November 2013, she was appointed as a Research Fellow and Secretary of CPC Committee (Deputy Dean) of the Institute of Industrial Economics of Chinese Academy of Social Sciences; from November 2017 to August 2021, she served concurrently as External Director of China Energy Investment Corporation Limited. In March 2019, she was appointed as Dean of Institute of Industrial Economics of Chinese Academy of Social Sciences. In May 2021, she was elected as Independent Director of Sinopec Corp.
Bi Mingjian
Bi Mingjian, aged 67, Independent Director of Sinopec Corp. Mr. Bi obtained the certificate of diploma majoring in English from East China Normal University in 1982 and master’s degree in business administration from George Mason University in the United States of America in 1993 respectively. Mr. Bi served as a cadre at Shanghai Subei Haifeng Farm from April 1977 to April 1979; he studied at the External Training Program of the Cadre School of the Ministry of State Farms and Land Reclamation, and subsequently he studied at a farm in Saskatchewan Province of Canada from April 1979 to November 1980; he served as a cadre at the Foreign Affairs Bureau of the Ministry of State Farms and Land Reclamation from November 1980 to December 1983; he served as Deputy Division Chief of the State Farms and Land Reclamation Bureau of the Ministry of Agriculture from January 1984 to December 1985; he served as Operation Officer of the World Bank Representative Office in China from December 1985 to June 1988; he served as Deputy Director of the project office of China Rural Trust and Investment Corporation from June 1988 to October 1988; he served as Project Economist and Advisor of the World Bank from October 1988 to January 1994; he served as a cadre at People’s Construction Bank of China from January 1994 to July 1995; he served as Senior Manager,
Deputy Chief Executive Officer, member and Deputy Chairman of the Management Committee, Co-Chief Operating Officer and Co-Head of the Investment Banking Department of China International Capital Corporation Limited (CICC) from August 1995 to February 2006; he served as a Senior Advisor to CICC from March 2006 to November 2012; he served as a Managing Partner of HOPU Investment Management Co., Ltd. from November 2012 to March 2015; he served as a non-executive director for China Investment Securities Co., Ltd. (currently known as China CICC Wealth Management Securities Company Limited) from March 2017 to January 2020; from March 2015 to December 2019, he served as Chief Executive Officer and Chairman of Management Committee of CICC; from May 2015 to February 2020, he served as Executive Director of CICC. In May 2021, he was elected as Independent Director of Sinopec Corp.
36
LIST OF MEMBERS OF THE BOARD
Remuneration paid by Sinopec Corp. in 2022 (RMB1,000, | Whether paid by the shareholders of the Company or their related entities in | Equity interest in Sinopec Corp. (as at 31 December) | ||||||
| Name | Gender | Age | Position in Sinopec Corp. | Tenure | before tax) | 2022 | 2022 | 2021 |
| Ma Yongsheng | Male | 61 | Chairman of the Board, Non-executive Director | 2016.2-2024.5 | - | Yes | 0 | 0 |
| Zhao Dong | Male | 52 | Non-executive Director | 2021.5-2024.5 | - | Yes | 0 | 0 |
| Yu Baocai | Male | 58 | Executive Director, President | 2018.10-2024.5 | 1,704.8 | No | 0 | 0 |
| Ling Yiqun | Male | 60 | Executive Director, Senior Vice President | 2018.5-2024.5 | - | Yes | 13,000 | 13,000 |
| Li Yonglin | Male | 56 | Executive Director, Senior Vice President | 2021.5-2024.5 | - | Yes | 0 | 0 |
| Liu Hongbin | Male | 60 | Executive Director, Senior Vice President | 2020.5-2024.5 | 1,416.8 | No | 0 | 0 |
| Cai Hongbin | Male | 55 | Independent Non-Executive Director | 2018.5-2024.5 | 450.0 | No | 0 | 0 |
| Ng, Kar Ling Johnny | Male | 62 | Independent Non-Executive Director | 2018.5-2024.5 | 450.0 | No | 0 | 0 |
| Shi Dan | Female | 61 | Independent Non-Executive Director | 2021.5-2024.5 | 450.0 | No | 0 | 0 |
| Bi Mingjian | Male | 67 | Independent Non-Executive Director | 2021.5-2024.5 | 450.0 | No | 0 | 0 |
Note: Total remuneration of directors Mr. Yu Baocai and Mr. Liu Hongbin in 2022 includes incentive bonus based on the performance of 2019-2021.
37
| (2) | Supervisors |
Zhang Shaofeng
Zhang Shaofeng, aged 51, Chairman of Board of Supervisors of Sinopec Corp. Mr. Zhang is a professor level senior accountant with a master’s degree in business administration. In December 2008, he was appointed as Chief Accountant and Member of the CPC Committee of Trans-Asia Gas Pipeline Company Limited of China National Petroleum Corporation (CNPC); in July 2017, he was appointed as General Manager of Finance Department of CNPC (中國石油天然氣集團公司) and served concurrently as General Manager of Finance Department of PetroChina Company Limited; in December 2017, he was appointed as General Manager of Finance Department of CNPC (中國石油天然氣集團有限公司) and served concurrently as General Manager of Finance Department of PetroChina Company Limited; in July 2020, he was appointed as Member of the Leading Party Member Group and Chief Accountant of China Petrochemical Corporation. In September 2020, he was elected as Director of Sinopec Corp.; in May 2021, he was elected as Chairman of Board of Supervisors of Sinopec Corp.
Qiu Fasen
Qiu Fasen, aged 57, Supervisor of Sinopec Corp. Mr. Qiu is a professor level senior auditor with a master’s degree. In December 2001, he was appointed as the Deputy Director General of Audit Bureau of China Petrochemical Corporation and Deputy Director General of Audit Department of Sinopec Corp.; in January 2007, he was appointed as the Director General of Beijing branch of Audit Bureau (Department) of China Petrochemical Corporation; in November 2010, he was appointed as the Deputy Director General of Audit Bureau of China Petrochemical Corporation; in May 2014, he was appointed as Secretary of CPC Committee and Deputy General Manager of Sinopec Xinjiang Oil Products Company; in March 2015, he was appointed as General Manager and Deputy Secretary of CPC Committee of Sinopec Xinjiang Oil Products Company; in December 2018, he was appointed as Director General of Mineral Acreage (Community) Management Department of China Petrochemical Corporation; in December 2019, he was appointed as Vice President of Audit Department of Sinopec Corp. and Deputy Director General (Director General Level) of the Office of Audit Committee of Leading Party Member Group of China Petrochemical Corporation; in April 2021, he was appointed as President of Audit Department of Sinopec Corp. and Director General of the Office of Audit Committee of Leading Party Member Group of China Petrochemical Corporation; in July 2021, he was appointed as Secretary of the CPC Committee of the Audit Centre of China Petrochemical Corporation. In May 2022, he was appointed as Chief Auditor of China Petrochemical Corporation. In May 2022, he was elected as Supervisor of Sinopec Corp.
Zhang Zhiguo
Zhang Zhiguo, aged 60, Supervisor of Sinopec Corp. Mr. Zhang is a professor level senior administration engineer with a master’s degree. In September 2009, he was appointed as Deputy Director General of Corporate Office of China Petrochemical Corporation (Sinopec President’s office); in March 2015, he was appointed as Secretary of CPC Committee of Sinopec Management Institute (Sinopec Communist Party School); in December 2018, he was appointed as Director General of the Office of Leading Party Member Group Inspection Work of China Petrochemical Corporation; in December 2019, he was appointed as Director General of the General Management Department and Director of Leading Party Member Group Office of China Petrochemical Corporation. In May 2021, he was elected as Supervisor of Sinopec Corp.
38
Wu Bo
Wu Bo, aged 49, Supervisor of Sinopec Corp. Mr. Wu is a senior economist with a bachelor’s degree. In May 2012, he was appointed as Chief Accountant of Sinopec Hainan Refining and Chemical Company Limited; in August 2017, he was appointed as Deputy General Manager and Chief Accountant of Sinopec Chemical Sales Company Limited; in December 2018, he was appointed as Deputy General Manager and Chief Accountant of China International United Petroleum and Chemical Company Limited; in December 2019, he was appointed as General Manager of Finance Department of China Petrochemical Corporation; in July 2021, he was also appointed as Chairman of Sinopec Century Bright Capital Investment Limited. In May 2022, he was elected as Supervisor of Sinopec Corp.
Zhai Yalin
Zhai Yalin, aged 59, Supervisor of Sinopec Corp. Mr. Zhai is a professor level senior economist with a bachelor’s degree. In December 2001, he was appointed as Deputy Director General of Audit Bureau of China Petrochemical Corporation and Deputy Director General of Audit Department of Sinopec Corp.; in April 2018, he was appointed as Director General of the Inspection Team of Leading Party Member Group and Deputy Director General of Audit Bureau of China Petrochemical Corporation and Deputy Director General of Audit Department of Sinopec Corp; in October 2020, he was appointed as Executive Director and Secretary of the CPC Committee of Sinopec Baichuan Economic and Trade Co., Ltd.; in May 2022, he was appointed as General Manager of Sinopec Logistics Service Center. In May 2022, he was elected as Supervisor of Sinopec Corp.
Guo Hongjin
Guo Hongjin, aged 57, Employee’s Representative Supervisor of Sinopec Corp. Mr. Guo is a professor level senior engineer with a Ph.D. degree. In July 2013, he was appointed as Deputy General Manager of Sinopec Shengli Oilfield Company; in March 2018, he was appointed as General Manager and Deputy Secretary of CPC Committee of Sinopec Shengli Petroleum Administrative Bureau Co., Ltd. and General Manager of Sinopec Shengli Oilfield Company; in December 2018, he was appointed as Executive Director, General Manager and Deputy Secretary of CPC Committee of Sinopec Jianghan Petroleum Administrative Bureau Co., Ltd. and General Manager of Sinopec Jianghan Oilfield Company; in July 2019, he was appointed as Executive Director and Secretary of CPC Committee of Sinopec Jianghan Petroleum Administrative Bureau Co., Ltd. and the representative of Sinopec Jianghan Oilfield Company; in April 2020, he was appointed as General Manager of the Petroleum Exploration & Development Department of Sinopec Corp.; in May 2021, he was elected as Supervisor of Sinopec Corp. In May 2022, he was elected as Employee’s Representative Supervisor of Sinopec Corp.
39
Yin Zhaolin
Yin Zhaolin, aged 57, Employee’s Representative Supervisor of Sinopec Corp. Mr. Yin is a professor level senior engineer with a master’s degree in engineering. In April 2010, he was appointed as Deputy General Manager of Sinopec Maoming Company; in January 2017, he was appointed as Executive Deputy General Manager of Sinopec Maoming Company (administrated as a General Manager of a Level-I Largescale Enterprise); in April 2017, he was appointed as General Manager and Deputy Secretary of CPC Committee of Sinopec Maoming Petrochemical Company and General Manager of Sinopec Maoming Company; in July 2017, he was appointed to serve a temporary position as a member of the Standing Committee of the CPC Maoming Municipal Committee; in October 2020, he was appointed as Executive Director and Secretary of CPC Committee of the Sinopec Maoming Petrochemical Company and the representative of the Sinopec Maoming Company, head of Maoming-Zhanjiang Integration Leading Group; in May 2021, he was elected as Supervisor of Sinopec Corp. In May 2022, he was elected as Employee’s Representative Supervisor of Sinopec Corp.
Chen Yaohuan
Chen Yaohuan, aged 59, Employee’s Representative Supervisor of Sinopec Corp. Mr. Chen is a professor level senior engineer with a Master’s degree awarded by Central Party School of the CPC. In October 2008, he was appointed as Deputy Director General of Refining Department of Sinopec Corp.; in March 2015, he was appointed as Executive Director, General Manager and Deputy Secretary of the CPC Committee of Sinopec Beihai Refining and Chemical Limited Liability Company; in May 2015, he was appointed as a member of the Standing Committee of the CPC Beihai Municipal Committee; in June 2018, he was appointed as General Manager and Deputy Secretary of the CPC Committee of Guangzhou Branch of Sinopec Corp. and General Manager of Guangzhou Branch of Sinopec Assets Management Corporation; in July 2019, he was appointed as Deputy Director General (Director General Level) and Chief Engineer of Refining Department of Sinopec Corp.; in October 2019, he was appointed concurrently as Chairman of Sinopec Kantons International Limited and Sinopec Kantons Holdings Limited; in December 2019, he was appointed concurrently as General Manager of Refining Department of Sinopec Corp., Vice Chairman and Chairman of Audit Committee of Yanbu Aramco Sinopec Refining Company Ltd.; in August 2020, he was appointed concurrently as Executive Director and Secretary of CPC Committee of Sinopec Petroleum Marketing Company Limited and Chairman of Sinopec Petroleum Storage and Reserve Limited. In January 2021, he was elected as Employee’s Representative Supervisor of Sinopec Corp.
40
LIST OF MEMBERS OF THE BOARD OF SUPERVISORS
Remuneration paid by Sinopec Corp. in 2022 (RMB1,000, | Whether paid by the shareholders of the Company or their related entities in | Equity interests in Sinopec Corp. (as at 31 December) | ||||||
| Name | Gender | Age | Position in Sinopec Corp. | Tenure | before tax) | 2022 | 2022 | 2021 |
| Zhang Shaofeng | Male | 51 | Chairman of the Board of Supervisors | 2021.5-2024.5 | - | Yes | 0 | 0 |
| Qiu Fasen | Male | 57 | Supervisor | 2022.5-2024.5 | - | Yes | 0 | 0 |
| Zhang Zhiguo | Male | 60 | Supervisor | 2021.5-2024.5 | - | Yes | 0 | 0 |
| Wu Bo | Male | 49 | Supervisor | 2022.5-2024.5 | - | Yes | 0 | 0 |
| Zhai Yalin | Male | 59 | Supervisor | 2022.5-2024.5 | - | Yes | 0 | 0 |
| Guo Hongjin | Male | 57 | Employee’s Representative Supervisor | 2022.5-2024.5 | 1,588.1 | No | 0 | 0 |
| Yin Zhaolin | Male | 57 | Employee’s Representative Supervisor | 2022.5-2024.5 | 434.9 | No | 0 | 0 |
| Chen Yaohuan | Male | 59 | Employee’s Representative Supervisor | 2021.1-2024.5 | 1,684.2 | No | 0 | 0 |
Note: Total remuneration of employee’s representative supervisors Mr. Guo Hongjin and Mr. Chen Yaohuan in 2022 includes incentive bonus based on the performance of 2019-2021.
LIST OF FORMER MEMBERS OF THE BOARD OF SUPERVISORS
Remuneration paid by Sinopec Corp. in 2022 (RMB1,000, | Whether paid by the shareholders of the Company or their related entities in | Equity interests in Sinopec Corp. (as at 31 December) | ||||||
| Name | Gender | Age | Position in Sinopec Corp | Tenure | before tax) | 2022 | 2022 | 2021 |
| Jiang Zhenying | Male | 58 | Former Supervisor | 2018.5-2022.5 | - | Yes | 0 | 0 |
| Lv Lianggong | Male | 57 | Former Supervisor | 2022.5-2022.10 | - | Yes | 0 | 0 |
| Li Defang | Male | 61 | Former Employee’s Representative Supervisor | 2020.5-2022.5 | 1,056.6 | No | 40,000 | 40,000 |
| Lv Dapeng | Male | 61 | Former Employee’s Representative Supervisor | 2021.1-2022.5 | 179.7 | No | 0 | 0 |
| Note: | Mr. Li Defang holds 40,000 A shares of Sinopec Corp. (the actual holder of the said shares is the spouse of Mr. Li Defang); Total remuneration of Mr. Li Defang in 2022 includes incentive bonus based on the performance of 2019-2021. |
41
| (3) | Other Members of Senior Management |
Lv Lianggong
Lv Lianggong, aged 57, Senior Vice President of Sinopec Corp. Mr. Lv is a professor level senior engineer with a master’s degree. In December 2001, he was appointed as Deputy Manager of Sinopec Jinan Company; in August 2008, he was appointed as Manager and Deputy Secretary of the CPC Committee of Sinopec Jinan Company; in December 2008, he was appointed as General Manager and Deputy Secretary of the CPC Committee of Sinopec Jinan Company; in December 2016, he was appointed as General Manager and Deputy Secretary of the CPC Committee of Anqing Petrochemical General Plant of China Petrochemical Corporation and General Manager of Sinopec Anqing Company; in July 2017, he was appointed to serve a temporary position as a member of the Standing Committee of the CPC Anqing Municipal Committee; in September 2018, he was appointed as the General Manager and Deputy Secretary of the CPC Committee of Sinopec Zhenhai Refining & Chemical Company; in December 2019, he was appointed as Representative and Secretary of the CPC Committee of Sinopec Zhenhai Refining & Chemical Company; in December 2020, he was appointed as Deputy Chief Economist, Director General of Organization Department of Leading Party Member Group of China Petrochemical Corporation and President of Human Resource Department of Sinopec Corp.; in June 2021, he was appointed as Director General of the Office of the Organizational Structure Establishment Committee of Leading Party Member Group of China Petrochemical Corporation; in August 2022, he was appointed as a Member of the Leading Party Member Group and Deputy General Manager of China Petrochemical Corporation. In May 2022, he was elected as Supervisor of Sinopec Corp., and in October 2022, he was appointed as Senior Vice President of Sinopec Corp.
Shou Donghua
Shou Donghua, aged 54, Chief Financial Officer of Sinopec Corp. Ms. Shou is a professor level senior accountant with a Master’s degree of business administration. In July 2010, she was appointed as the Chief Financial Officer of Sinopec Zhenhai Refining & Chemical Company; in October 2014, she was appointed as Deputy Director General of Human Resource Department of Sinopec Corp.; in August 2017, she was appointed as the Secretary of CPC Committee of Sinopec Zhenhai Refining & Chemical Company and Deputy General Manager of Sinopec Zhenhai Refining & Chemical Company; in August 2018, she was appointed as the Director General of Finance Department of China Petrochemical Corporation and concurrently served as the Chairman of Sinopec Century Bright Capital Investment Limited; in December 2019, she was appointed as General Manager of Finance Department of Sinopec Corp. and concurrently served as the Chairman of Sinopec Century Bright Capital Investment Limited; in January 2020, she was appointed as Chief Financial Officer of Sinopec Corp.
Zhao Rifeng
Zhao Rifeng, aged 60, Vice President of Sinopec Corp. Mr. Zhao is a professor level Senior Engineer with a Master’s degree. In July 2000, he was appointed as Deputy General Manager of Sinopec Jinling Petrochemical Co., Ltd. and Deputy Manager of Sinopec Jinling Company; in October 2004, he was appointed as General Manager of Sinopec Jinling Company; in October 2006, he was appointed as Vice Chairman and General Manager of Sinopec Jinling Petrochemical Co., Ltd.; in November 2010, he was appointed as Chairman, General Manger, Deputy Secretary of CPC Committee of Sinopec Jinling Petrochemical Co., Ltd.; in August 2013, he was appointed as Director General of Refining Department of Sinopec Corp.; in December 2017, he was appointed as the Director General of the Marketing Department of Sinopec Corp. and Chairman and Secretary of CPC Committee of Sinopec Marketing Company Limited; in December 2019, he was appointed as the President of the Marketing Department of Sinopec Corp. and Chairman and Secretary of CPC Committee of Sinopec Marketing Company Limited. In February 2018, he was appointed as Vice President of Sinopec Corp.
42
Huang Wensheng
Huang Wensheng, aged 56, Vice President of Sinopec Corp., Secretary to the Board of Directors. Mr. Huang is a professor level senior economist with a university diploma. In March 2003, he was appointed as Deputy Director General of the Board Secretariat of Sinopec Corp.; in May 2006, he was appointed as Representative on Securities Matters of Sinopec Corp.; in August 2009, he was appointed as the Deputy Director General of President’s office of Sinopec Corp.; in September 2009, he was appointed as Director General of the Board Secretariat of Sinopec Corp.; in June 2018, he was appointed concurrently as Director General of Department of Capital Management and Financial Services of Sinopec Corp.; in July 2018, he was appointed concurrently as Chairman and Secretary of CPC Committee of Sinopec Capital Co., Ltd.; in December 2019, he was appointed as President of Department of Capital Management and Financial Services of Sinopec Corp. In May 2012, he was appointed as Secretary to the Board of Directors of Sinopec Corp.; in May 2014, he was appointed as Vice President of Sinopec Corp.
43
LIST OF MEMBERS OF THE SENIOR MANAGEMENT
Remuneration paid by Sinopec Corp. in 2022 (RMB1,000, | Whether paid by the shareholders of the Company or their related entities in | Equity interests in Sinopec Corp. (as at 31 December) | |||||
| Name | Gender | Age | Position in Sinopec Corp | before tax) | 2022 | 2022 | 2021 |
| Lv Lianggong | Male | 57 | Senior Vice President | - | Yes | 0 | 0 |
| Shou Donghua | Female | 54 | Chief Financial Officer | 1,785.6 | No | 0 | 0 |
| Zhao Rifeng | Male | 60 | Vice President | 1,812.3 | No | 0 | 0 |
| Huang Wensheng | Male | 56 | Vice President, Board Secretary | 1,783.8 | No | 0 | 0 |
| Note: | Total remuneration of list of the above members of the senior management in 2022 includes incentive bonus based on the performance of 2019-2021. |
LIST OF FORMER MEMBERS OF THE SENIOR MANAGEMENT
Remuneration paid by Sinopec Corp. in 2022 (RMB1,000, | Whether paid by the shareholders of the Company or their related entities in | Equity interests in Sinopec Corp. (as at 31 December) | |||||
| Name | Gender | Age | Position in Sinopec Corp | before tax) | 2022 | 2022 | 2021 |
| Chen Ge | Male | 60 | Former Senior Vice President | 1,757.6 | No | 0 | 0 |
| Yu Xizhi | Male | 60 | Former Vice President | 1,804.6 | No | 0 | 0 |
| Note: | Total remuneration of Mr. Chen Ge and Mr. Yu Xizhi in 2022 includes incentive bonus based on the performance of 2019-2021. |
12 INFORMATION ON APPOINTMENT OR TERMINATION OF DIRECTORS, SUPERVISORS AND SENIOR MANAGEMENT
On 18 May 2022, Mr. Jiang Zhenying resigned as Supervisor of Sinopec Corp. due to change of working arrangement; Mr. Li Defang and Mr. Lv Dapeng resigned as Employee’s Representative Supervisors of Sinopec Corp. due to their age; Mr. Guo Hongjin and Mr. Yin Zhaolin were redesignated as Employee’s Representative Supervisors from Non-employee’s Representative Supervisors. On the same day, Mr. Qiu Fasen, Mr. Lv Lianggong, Mr. Wu Bo and Mr. Zhai Yalin were elected as Supervisors of Sinopec Corp.
On 2 June 2022, Mr. Zhao Dong was appointed as President of China Petrochemical Corporation.
On 18 July 2022, Mr. Ng, Kar Ling Johnny resigned as Independent Non-Executive Director of Fangdd Network Group Ltd.
On 20 July 2022, Mr. Chen Ge resigned as Senior Vice President of Sinopec Corp. due to his age.
On 8 September 2022, Mr. Cai Hongbin was appointed as Independent Non-Executive Director of China Merchants Finance Holdings Company Limited.
On 17 October 2022, Mr. Lv Lianggong resigned as Supervisor of Sinopec Corp. due to change of working arrangement.
On 28 October 2022, Mr. Lv Lianggong was appointed as Senior Vice President of Sinopec Corp.
On 6 January 2023, Mr. Ng, Kar Ling Johnny was appointed as Independent Non-Executive Director of China Telecom Corporation Limited.
On 9 March 2023, Mr. Yu Xizhi resigned as Vice President of Sinopec Corp. due to his age.
44
| 13 | CHANGE OF SHAREHOLDING OF DIRECTORS, SUPERVISORS, AND THE SENIOR MANAGEMENT |
There is no change in shareholdings of the Company by Directors, Supervisors and other Senior Managements during the reporting period.
| 14 | CONTRACTUAL INTERESTS OF DIRECTORS AND SUPERVISORS |
As of 31 December 2022 or any time during the reporting period, no Director or Supervisor of the Company entered into any agreement with Sinopec Corp., its controlling shareholder, any subsidiary or related subsidiary which shall substantially benefit such Director or Supervisor.
| 15 | CONTRACTS WITH DIRECTORS AND SUPERVISORS |
The Company has entered into service contracts with all the Directors and Supervisors. None of the Directors and Supervisors has entered into or will enter into service contracts that are not terminable by the Company within one year without compensation (except for statutory compensation).
| 16 | REMUNERATION OF DIRECTORS, SUPERVISORS, AND THE SENIOR MANAGEMENT |
During this reporting period, a total of 16 Directors, Supervisors and other Senior Management received remuneration from Sinopec Corp. with a total amount of RMB18.8090 million.
| 17 | THE COMPANY’S EMPLOYEES |
As at 31 December 2022, the Company has a total of 374,791 employees. There are a total of 288,138 retired employees to be reimbursed by Sinopec Corp. Sinopec Marketing Co. Limited and China International United Petroleum & Chemicals Co. Limited (UNIPEC), the principal subsidiaries of Sinopec Corp., have 117,393 and 450 employees respectively. The male and female ratio of all employees is 2.2:1, and the male and female ratio of the members of senior management is 14.1:1.
THE BREAKDOWN OF NUMBER OF EMPLOYEES BY OPERATION SEGMENTS IS AS FOLLOWS: (INCLUDING EXPLORATION AND PRODUCTION, REFINING, MARKETING AND DISTRIBUTION, CHEMICALS, R&D AND OTHERS)
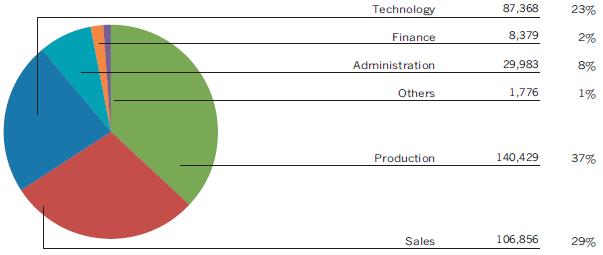
EMPLOYEES’ PROFESSIONAL STRUCTURE AS FOLLOWS: (INCLUDING PRODUCTION, SALES, TECHNOLOGY, FINANCE, ADMINISTRATION AND OTHERS)
45
EDUCATIONAL BACKGROUND STRUCTURE FOR EMPLOYEES AS FOLLOWS: (INCLUDING MASTER’S DEGREE AND ABOVE, UNDERGRADUATE, JUNIOR COLLEGE, TECHNICAL SECONDARY SCHOOL SENIOR HIGH SCHOOL AND TECHNICAL SCHOOL DEGREES OR BELOW)
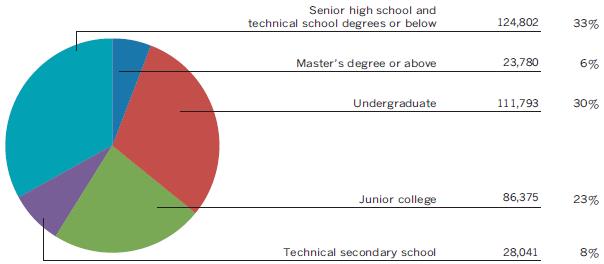
TECHNOLOGY PERSONNEL EDUCATIONAL STRUCTURE: (INCLUDING PHD, MASTER’S DEGREE, UNDERGRADUATE AND BELOW)
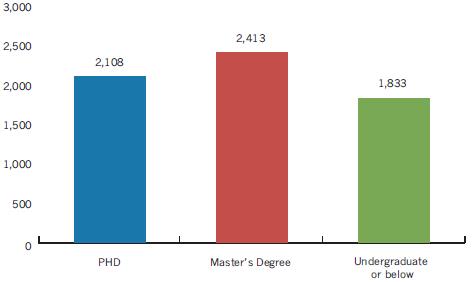
TECHNOLOGY PERSONNEL AGE STRUCTURE
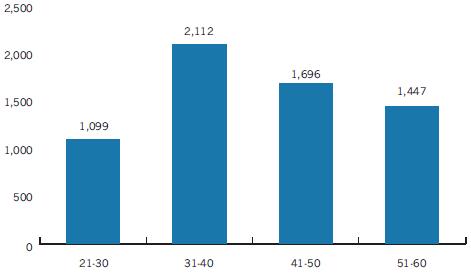
46
| 18 | CHANGES OF CORE TECHNICAL TEAM OR KEY TECHNICIANS |
During the reporting period, there are no significant changes of core technical team or key technicians.
| 19 | EMPLOYEE BENEFITS SCHEME |
Details of the Company’s employee benefits scheme are set out in Note 39 of the financial statements prepared under IFRS of this annual report. As at 31 December 2022, the Company had a total of 288,138 retired employees. All of them participated in the basic pension schemes administered by provincial governments (or those of autonomous regions or municipalities). Government-administered pension funds are responsible for the payments of basic pensions.
| 20 | REMUNERATION POLICY |
Based on a relatively unified basic remuneration system, Sinopec Corp. has established its remuneration distribution system based on the value of positions, performance & contribution, with an aim to improve employee capabilities, and has constantly improved employee performance evaluation and incentive & discipline mechanisms.
| 21 | TRAINING PROGRAMS |
During the reporting period, the Company strengthened coordination and the top-level design for training programs, improved the high-quality training system, and conducted training programs for all types of talents. The headquarters trained 5,732 key talents of various types. The training for managers became more systematic, resulting in the enhanced capabilities of leaders to apply the new development philosophy and drive the Company’s high-quality growth. The training for technical personnel became more efficient, and the programs were conducted for experts and talent development in areas such as the integration and innovation of strategic science, the high-quality development of oil and gas, the green and low-carbon development of refining and chemical industry. The training for international talents was strengthened, and the programs were conducted for overseas project managers, international trade managers. The Company improved training policy and training quality. The Company enhanced the intelligent and accurate level of training by promoting the application of Sinopec Network College. The Sinopec Network College trained a total of 55 million hours. Sinopec Corp.’s “Zhaoyang (Morning Suns) Program” training system for young talents won the 2022 Enterprise Leadership Award of the International Association for Continuing Engineering Education, and the Overseas Project Manager Training won the 2022 Excellence in Practice Award of the Association for Talent Development.
47
ENVIRONMENT AND SOCIAL RESPONSIBILITIES
| 1 | ENVIRONMENTAL INFORMATION |
The Company established the HSE management system since 2001 and continued to improve it. During the reporting period, the Company has formulated or revised 6 environmental management policies, and formed the environmental protection system consisting of 16 core policies as the main body.
| 2 | WORK CONDUCTED IN ECOLOGICAL PROTECTION, POLLUTION PREVENTION AND ENVIRONMENTAL RESPONSIBILITIES PERFORMANCE |
In the reporting period, the Company deepened the campaign of pollution prevention and the special action on ozone pollution prevention, focused on ecological and environmental protection in the Yangtze and Yellow River basins, promoted energy conservation and carbon reduction actions, persistently carried out Green Enterprise Action. The COD and sulphur dioxide emissions decreased by 8.3% and 4.0% respectively, and the solid waste was 100% properly disposed.
| 3 | MEASURES TAKEN TO MITIGATE CARBON EMISSION AND ITS EFFECT |
During the reporting period, the Company has actively invested in the new energy industry, orderly promoted the adjustment and optimization of energy consumption structure, strengthened the development and application of key low-carbon technologies, and achieved good results in carbon emission reduction. In 2022, the Company decreased GHG emissions by 2.46 million tonnes of CO2 equivalent, 1.534 million tonnes of CO2 were recycled, used 0.657 million tons of carbon dioxide for EOR, 834 million cubic meters of methane were recovered which was equivalent to reducing 12.50 million tonnes of CO2 emissions.
| 4 | ENVIRONMENTAL PROTECTION SOLUTIONS OF COMPANIES AND THEIR SUBSIDIARIES AS MAJOR POLLUTANT DISCHARGING COMPANIES IDENTIFIED BY ENVIRONMENTAL PROTECTION DEPARTMENTS |
| (1) | Pollutant discharge information |
In the reporting period, certain subsidiaries of Sinopec Corp. listed as major pollutant discharge units announced by national or local ecological and environmental authorities have acquired their pollutant discharge license in accordance with the requirements of the national list of fixed pollution source emission permit classification management and disclosed environmental information as required by the relevant authorities and local government. The details of such information were published on national pollutant discharge license management information platform (http://permit.mee.gov.cn/permitExt/defaults/default-index! getInformation.action) and the local government website.
Discharge information summarized by category is as follows:
| (a) | Discharge of air pollutants1 |
| No. | Pollutant type | Number of vents involved2 | Ways of discharge3 | Discharge standards implemented4 | Permitted concentration limit5 | Actual annual average concentration6 | Approved actual discharge amount | Discharge compliance |
| 1 | SO2 | 1,251 | continuous | Discharge Standards for Air Pollutants from Thermal Power Plants (GB 13223-2011) Discharge Standards for Air Pollutants from Boilers (GB13271-2014) Discharge Standards for Pollutants in the Petroleum Refining Industry (GB31570-2015) Discharge Standards for Pollutants in the Petrochemical Industry (GB31571-2015) Discharge Standards for Pollutants in the Synthetic Resin Industry (GB31572-2015) | 10-200 mg/m3 | 0.05-50 mg/m3 | 4,910 tonnes | The compliance rate is 99.99%, the details of which are subject to the announcement by the ecological authorities. |
| 2 | NOX | 1,243 | continuous | Discharge Standards for Air Pollutants from Thermal Power Plants (GB 13223-2011) Discharge Standards for Air Pollutants from Boilers (GB13271-2014) Discharge Standards for Pollutants in the Petroleum Refining Industry (GB31570-2015) Discharge Standards for Pollutants in the Petrochemical Industry (GB31571-2015) Discharge Standards for Pollutants in the Synthetic Resin Industry (GB31572-2015) | 20-240 mg/m3 | 10-100 mg/m3 | 19,247 tonnes | The compliance rate is 99.99%, the details of which are subject to the announcement by the ecological authorities. |
| Note 1: | This report discloses the discharge of the Company’s oilfield, refining and chemical companies and specialized companies that are included in the key management of emission permits. The data is calculated by self-monitoring data and is ultimately subject to the data published by the local ecological authorities. |
| Note 2: | Count the number of organized vents involved for this pollutant. |
| Note 3: | Intermittent discharge from some vents. |
| Note 4: | The discharge standards implemented are the major industrial discharge standards. Other standards such as local emission standards implemented by each company can be found in the public information of the ecological authorities. |
| Note 5: | The permitted concentration limit are major industrial discharge standard limit. The limit of other standards implemented by each company can be found in the public information of the ecological authorities. |
| Note 6: | The actual annual average concentration of the main discharge outlets is within the corresponding disclosure range, and the public information of the ecological and environmental department can be consulted for details. |
48
| (b) | Discharge of water pollutants1 |
| No. | Pollutant type | Number of vents involved | Ways of discharge2 | Discharge standards implemented3 | Permitted concentration limit4 | Actual annual average concentration5 | Approved actual discharge amount | Discharge compliance |
| 1 | COD | 76 | continuous | Discharge Standards for Pollutants in the Petroleum Refining Industry (GB31570-2015) Discharge Standards for Pollutants in the Petrochemical Industry (GB31571-2015) Discharge Standards for Pollutants in the Synthetic Resin Industry (GB31572-2015) | 40-60mg/L | 10-50 mg/L | 4,755 tonnes | Daily average data has 100% compliance rate. |
| 2 | Ammonia and nitrogen | 75 | continuous | Discharge Standards for Pollutants in the Petroleum Refining Industry (GB31570-2015) Discharge Standards for Pollutants in the Petrochemical Industry (GB31571-2015) Discharge Standards for Pollutants in the Synthetic Resin Industry (GB31572-2015) | 5-8mg/L | 0.05-4 mg/L | 75 tonnes | Daily average data has 100% compliance rate. |
| Note 1: | This report discloses the discharge of the Company’s oilfield, refining and chemical companies and specialized companies that are included in the key management of discharge permits. The data is calculated by self-monitoring data and is ultimately subject to the data published by the local ecological authorities. |
| Note 2: | Intermittent discharge from some vents. |
| Note 3: | The discharge standards implemented are the major industrial discharge standard. Other standards such as local emission standards implemented by each company can be found in the public information of the ecological authorities. |
| Note 4: | The permitted concentration limit are major industrial discharge standard limit. The limit of other standards implemented by each company can be found in the public information of the ecological authorities. |
| Note 5: | The actual annual average concentration of the main discharge outlets is within the corresponding disclosure range, and the public information of the ecological and environmental department can be consulted for details. |
| (2) | Construction and operation of pollution prevention facilities |
In the reporting period, the Company built prevention and control facilities for sewage, flue gas, solid waste and noise in accordance with the requirements of the national and local pollution prevention and environmental protection standards, maintained effective and stable operation of pollution prevention and control facilities. For details, please refer to the 2022 Sinopec Corp. Sustainability Report.
| (3) | Environmental influence evaluation for construction projects and other administrative permit for environmental protection |
In the reporting period, the Company standardized environmental protection management for construction projects, enforced whole process environmental management on construction and operation, with measures of the “simultaneous three” implemented, all new projects have acquired approval for environmental evaluation from government.
| (4) | Contingent scheme for sudden environmental incident |
In the reporting period, the Company complied with the requirements for environmental incident contingent scheme by the State and persistently improved its contingent scheme against sudden environmental incidents of enterprises and weather with severe pollution.
| (5) | Scheme for environmental self-monitoring |
In the reporting period, the Company continuously improved its self-monitoring scheme in accordance with the industry guideline, enforced the new requirements for sewage, flue gas and noise monitoring, and disclosed the monitor information as required.
| (6) | Administrative penalties due to environmental problems in the reporting period |
In the reporting period, there was no significant environmental administrative penalty on the Company. To the knowledge of the Company, Sinopec Corp. and its subsidiaries were subject to the environmental administrative penalty of RMB2.6 million due to its imperfect dust control facilities, failure to install triple recovery facilities for oil and gas at service stations, etc.
| (7) | Other environmental information to be disclosed |
In the reporting period, for subsidiaries not listed as major pollution units, the Company has acquired related permissions from national and local government, and enforced environmental protection measures. The above-mentioned subsidiaries are not obliged to disclose in accordance with the requirements of national and local ecological environment authorities.
| 5 | DONATION AND INVESTMENT IN PUBLIC WELFARE PROJECT |
During the reporting period, the Company implemented 226 donations with an expenditure of RMB398 million, including RMB383 million of funds and RMB15 million of material. For details, please refer to the 2022 Sinopec Corp. Sustainability Report.
| 6 | EXPAND THE ACHIEVEMENTS IN POVERTY-ALLEVIATION AND RURAL REVITALIZATION |
During the reporting period, the Company earnestly implemented the decisions and plans of rural revitalization of the State, improved assistance working mechanism, and coordinated to promote the support of industry, education and consumption. In 2022, the Company provided RMB211 million and introduced RMB231 million in rural development support either pro bono or for profit, trained 65.3 thousand participants, procured RMB1.156 billion of products from poverty areas. All of these data increased more than 10% year on year. The Company dispatched 927 cadres to be stationed in villages and recruited 31 internal volunteers to participate in the education and construction of targeted counties.
49
SIGNIFICANT EVENTS
| 1 | MAJOR PROJECTS |
| (1) | Zhenhai Refining & Chemical Expansion Project (phase 2) |
Zhenhai Refining & Chemical Expansion Project (phase 2) consists of building 11,000,000 tpa refinery project and 600,000 tpa propane dehydrogenation and downstream units, etc. The project began in June 2022 and mechanical completion is expected to be finished in December 2024. The Company’s self-owned fund accounts for 30% of the project investment and bank loan is the main source of the remaining funds. As of 31 December 2022, the accumulated amount invested was RMB6.7 billion.
| (2) | Tianjin Nangang Ethylene and Downstream High-end New Material Industry Cluster Project |
Tianjin Nangang Ethylene and Downstream High-end New Material Industry Cluster Project consists of 1,200,000 tpa ethylene units and downstream processing units, etc. The project began in May 2021 and mechanical completion is expected to be finished in the end of 2023. The Company’s self-owned fund accounts for approximately 30% of the project investment and bank loan is the main source of the remaining funds. As of 31 December 2022, the accumulated amount invested was RMB13.5 billion.
| (3) | Hainan 1,000,000 tpa Ethylene and Refining Expansion Project |
Hainan Ethylene and Refining Expansion Project mainly consists of 1,000,000 tpa ethylene and auxiliary units, etc. The project started at the end of December 2018 and was achieving the mechanical completion since June 2022. On 20 December 2022, the polypropylene plant was successfully commenced start-up phase and produced qualified products, and other plants entered the start-up phase successively. The Company’s self-owned fund accounts for approximately 30% of the project investment and bank loan is the main source of the remaining funds. As of 31 December 2022, the accumulated amount invested was RMB26.6 billion.
| (4) | Jiujiang Refining & Chemical PX Project |
Jiujiang Refining & Chemical PX Project mainly consists of aromatics extraction, xylene fractionation, disproportionation and transalkylation, adsorption separation and isomerization units, etc. Aromatics production capacity will increase 0.89 million tons per year after the project is completed. The project started construction in May 2020 and was put into operation in June 2022. The main source of the investment funds is bank loans. As of 31 December 2022, the accumulated investment was RMB3.5 billion.
| (5) | Yizheng PTA Project |
Yizheng 3 million tpa PTA Project mainly consists of oxidation units, purification units and auxiliary units, etc. The project started in July 2021 and the mechanical completion is expected to be finished in October 2023. The Company’s self-owned fund accounts for 30% of the project investment and bank loan is the main source of the remaining funds. As of 31 December 2022, the accumulated amount invested was RMB2.7 billion.
| (6) | Weirong Shale Gas Project (phases 1 & 2) |
Guided by the principle of “overall deployment, stage-wise implementation and fully consideration”, the building of first phase of production capacity was unfolded comprehensively since August 2018. The phase-one 1 billion-cubic-meter capacity per year was built up and put into operation in December 2020. It is expected to complete phase-two 2 billion-cubic-meter capacity per year in December 2023. The Company’s self-owned fund accounts for 30% of the project investment and bank loan is the main source of the remaining funds. As of 31 December 2022, the accumulated amount invested was RMB7.5 billion.
| (7) | Tianjin LNG Project (phase 2) |
Tianjin LNG Project (phase 2) mainly consists of a new wharf, and five new 220,000-cubic-meter storage tanks etc. LNG capacity will reach 11 million tons per year after phase 2 is completed. The project started in January 2019 and is expected to put into operation in November 2023. The Company’s self-owned fund accounts for approximately 30% of the project investment and bank loan is the main source of the remaining funds. As of 31 December 2022, the accumulated amount invested was RMB3.9 billion.
| (8) | Longkou LNG Project |
Longkou LNG Project mainly consists of a wharf, terminal and power plant warm drainage and water intake. The designed LNG capacity in the first phase is 6 million tons per year. One LNG berth with 0.266 million cubic meter will be modified and four 0.22 million cubic meter storage tanks will be newly built up. The project started in November 2021 and is expected to put into operation in December 2024. The Company’s self-owned fund accounts for approximately 30% of the project investment and bank loan is the main source of the remaining funds. As of 31 December 2022, the accumulated amount invested was RMB3.6 billion.
50
| 2. | ASSET TRANSACTIONS WITH INEOS |
On 28 July 2022, the Company entered into transaction documents with certain subsidiaries of INEOS Limited (INEOS) with respect to the cooperation on Shanghai SECCO Petrochemical Co., Ltd. (Shanghai SECCO) and other projects. Pursuant to the relevant transaction documents, the Company agreed to conditionally sell, and INEOS Investment (Shanghai) Company Limited agreed to conditionally purchase, 50% equity interest in Shanghai SECCO (SECCO Transaction); Sinopec Corp. agreed to purchase, and INEOS Styrolution APAC Pte Limited agreed to sell, 50% equity interest in INEOS Styrolution Advanced Materials (Ningbo) Pte Ltd (Ningbo Styrolution) and Sinopec Corp. agreed to provide corresponding shareholders’ loans to Ningbo Styrolution. Sinopec Corp. and INEOS Tianjin Holdings Limited also agreed to form the INEOS Sinopec HDPE (Tianjin) Limited (tentative name) as a joint venture on a 50:50 basis, for the construction of a 500,000 tonnes/year High Density Polyethylene (HDPE) project in Tianjin. On 28 December 2022, SECCO Transaction has satisfied the conditions precedent to completion and was completed. Upon completion of the SECCO Transaction, Shanghai SECCO ceased to be a subsidiary of the Company.
For details and definitions, please refer to the announcements published by Sinopec Corp. on China Securities Journal, Shanghai Securities News, Securities Times, and on the website of Shanghai Stock Exchange on 29 July 2022 and 29 December 2022, and on the website of Hong Kong Stock Exchange on 28 July 2022 and 28 December 2022.
| 3. | FORMATION OF A JOINT VENTURE |
On 28 July 2022, Sinopec Corp. entered into the Promoter Agreement and the Articles of Association of Carbon Technology Company with UNIPEC, Nanjing Chemical Company, Sinopec OEC, Nanjing Engineering and Shanghai Engineering. Pursuant to the Promoter Agreement, the parties will jointly establish Carbon Technology Company by way of capital contribution. The registered capital of Carbon Technology Company will be RMB2.5 billion, for which, each of Sinopec Corp. and Nanjing Chemical Company shall contribute RMB1.15 billion and RMB850 million in cash, accounting for 46% and 34% of the registered capital of Carbon Technology Company, respectively; and each of UNIPEC, Sinopec OEC, Nanjing Engineering and Shanghai Engineering shall contribute RMB125 million in cash, each accounting for 5% of the registered capital of Carbon Technology Company.
For details and definitions, please refer to the announcements published by Sinopec Corp. on China Securities Journal, Shanghai Securities News, Securities Times, and on the website of Shanghai Stock Exchange on 29 July 2022, and on the website of Hong Kong Stock Exchange on 28 July 2022.
| 4. | DELISTING AMERICAN DEPOSITARY SHARES FROM THE NEW YORK STOCK EXCHANGE AND THE LONDON STOCK EXCHANGE |
Based on comprehensive considerations, including the small volume of the underlying H Shares of Sinopec Corp’s outstanding American Depositary Shares (ADSs) compared to the total volume of its H Shares, the limited trading volume of its ADSs relative to the worldwide trading volume of its H Shares and the considerable administrative burden of maintaining the listing of the ADSs on the New York Stock Exchange (NYSE), the registration of the ADSs and the underlying H Shares with the United States Securities and Exchange Commission and complying with the periodic reporting and related obligations of the U.S. Securities Exchange Act of 1934 (as amended) in the long term, Sinopec Corp. determined to apply for the voluntary delisting of its ADSs from the NYSE and notified the NYSE on 12 August 2022 (Eastern Time in the U.S.). The delisting from the NYSE has taken effect on 8 September 2022 (U.S. Eastern time).
On 3 October 2022, Sinopec Corp. has applied for the cancellation of the listing of its ADSs as global depositary receipts on the standard listing segment of the Official List of the Financial Conduct Authority and of trading on the Main Market of the London Stock Exchange plc (the Delisting from the London Stock Exchange). The Delisting from the London Stock Exchange has taken effect on 1 November 2022 (London time).
On 2 November 2022, Sinopec Corp. has delivered a termination letter to Citibank, N.A., the depositary for its ADSs, for the termination of the ADS programme of Sinopec Corp. (the ADS Programme). The termination of the ADS Programme has taken effect on 5 December 2022 (Eastern Time in the U.S.).
For details, please refer to the announcements published by Sinopec Corp. on China Securities Journal, Shanghai Securities News, Securities Times, and on the website of Shanghai Stock Exchange on 13 August, 3 October and 3 November 2022, and on the website of Hong Kong Stock Exchange on 12 August, 3 October and 2 November 2022.
| 5. | THE DAILY RELATED TRANSACTIONS WITH CHINA OIL & GAS PIPELINE NETWORK CORPORATION (PIPECHINA) DURING THE REPORTING PERIOD |
On 27 January 2022, the Board approved the daily related transaction cap in relation to refined oil pipeline transportation services between the Sinopec Marketing Co. Limited and PipeChina for the period from 1 January 2022 to 31 December 2022.
For details, please refer to the announcements published by Sinopec Corp. on China Securities Journal, Shanghai Securities News, Securities Times, and on the website of Shanghai Stock Exchange on 28 January 2022, and on the website of Hong Kong Stock Exchange on 27 January 2022.
The actual aggregate amount of the daily related transaction between the Sinopec Marketing Co. Limited and PipeChina regarding refined oil pipeline transportation services from 1 January 2022 to 31 December 2022 was RMB4.982 billion.
51
| 6 | PERFORMANCE OF THE UNDERTAKINGS BY CHINA PETROCHEMICAL CORPORATION |
| Background | Type of Undertaking | Party | Contents | Term for performance | Whether bears deadline or not | Whether strictly performed or not |
| Undertakings related to Initial Public Offerings (IPOs) | IPOs | China Petrochemical Corporation | 1 Compliance with the connected transaction agreements; 2 Solving the issues regarding the legality of land-use rights certificates and property ownership rights certificates within a specified period of time; 3 Implementation of the Reorganisation Agreement (please refer to the definition of Reorganisation Agreement in the H share prospectus of Sinopec Corp.); 4 Granting licenses for intellectual property rights; 5 Avoiding competition within the same industry; 6 Abandonment of business competition and conflicts of interest with Sinopec Corp. | From 22 June 2001 | No | Yes |
| Other undertakings | Other | China Petrochemical Corporation | Given that China Petrochemical Corporation engages in the same or similar businesses as Sinopec Corp. with regard to the exploration and production of overseas petroleum and natural gas, China Petrochemical Corporation hereby grants a 10-year option to Sinopec Corp. with the following provisions: (i) within 10 years from the date of the undertaking, after a thorough analysis from political, economic and other perspectives, Sinopec Corp. is entitled to require China Petrochemical Corporation to sell its overseas oil and gas assets owned as of the date of the undertaking and still in its possession upon Sinopec Corp.’s exercise of the option to Sinopec Corp.; (ii) in relation to the overseas oil and gas assets acquired by China Petrochemical Corporation after the issuance of the undertaking, within 10 years of the completion of such acquisition, after a thorough analysis from political, economic and other perspectives, Sinopec Corp. is entitled to require China Petrochemical Corporation to sell these assets to Sinopec Corp. China Petrochemical Corporation undertakes to transfer the assets as required by Sinopec Corp. under aforesaid items (i) and (ii) to Sinopec Corp., provided that the exercise of such option complies with applicable laws and regulations, contractual obligations and other procedural requirements. | Within 10 years after 29 April 2014 or the date when China Petrochemical Corporation acquires the assets | Yes | Yes |
As of the date of this report, Sinopec Corp. had no undertakings in respect of financial performance, asset injections or asset restructuring that had not been fulfilled, nor has Sinopec Corp. made any profit forecast in relation to any asset or project.
52
| 7 | MATERIAL GUARANTEE CONTRACTS AND THEIR PERFORMANCE |
Unit: RMB million
| Major external guarantees (excluding guarantees for controlled subsidiaries) | |||||||||||||
| Guarantor | Relationship with the Company | Name of guaranteed company | Amount*1 | Transaction date (date of signing) | Period of guarantee | Type | Principal debt condition | guaranty | Whether completed or not | Whether overdue or not | Amount of overdue guarantee | Counter- guaranteed | Whether guaranteed for connected parties (yes or no)*2 |
| Sinopec Corp. | The listed company itself | Zhong An United Coal Chemical Co., Ltd. | 5,254 | Apr-2018 | April 2018-December 2031 | Joint and several liability guarantee | Normal performance | – | No | No | – | No | No |
| Sinopec Corp. | The listed company itself | Russian Amur Natural Gas Chemical Integrated LLC | 3,673*3 | Dec-2021 | December 2021-December 2035 (the mature date is estimated) | Joint and several liability guarantee | Normal performance | – | No | No | – | No | No |
Total amount of guarantees provided during the reporting period*4 | 409 | ||||||||||||
Total amount of guarantees outstanding at the end of reporting period*4 (A) | 8,927 | ||||||||||||
| Guarantees by the Company to the controlled subsidiaries | |||||||||||||
| Total amount of guarantee provided to controlled subsidiaries during the reporting period | 2,243 | ||||||||||||
| Total amount of guarantee for controlled subsidiaries outstanding at the end of the reporting period (B) | 13,400 | ||||||||||||
| Total amount of guarantees for the Company (including those provided for controlled subsidiaries) | |||||||||||||
| Total amount of guarantees (A+B) | 22,327 | ||||||||||||
| The proportion of the total amount of guarantees to the Sinopec Corp.’s net assets (%) | 2.84 | ||||||||||||
| including: | |||||||||||||
| Guarantees provided for shareholder, de facto controller and its related parties (C) | 0 | ||||||||||||
| Amount of debt guarantees provided directly or indirectly to the companies with liabilities to assets ratio over 70% (D) | 5,254 | ||||||||||||
| The amount of guarantees in excess of 50% of the net assets (E) | 0 | ||||||||||||
| Total amount of the above three guarantee items (C+D+E) | 5,254 | ||||||||||||
| Statement of guarantee undue that might be involved in any joint and several liabilities | None | ||||||||||||
| Statement of guarantee status | None | ||||||||||||
| * 1: | Guarantee amount refers to the actual amount of guarantee liability that the company may undertake during the reporting period within the approved guarantee limit. |
| * 2: | As defined in the Rules Governing the Listing of Stocks on Shanghai Stock Exchange. |
| * 3: | Excluding the interest corresponding to the loan principal agreed in the guarantee contract, export credit premium and other expenses |
| * 4: | The amount of guarantees provided during the reporting period and the outstanding balance of guarantees amount at the end of the reporting period include the guarantees provided by the controlled subsidiaries to external parties. The amount of the guarantees provided by these subsidiaries is derived from multiplying the guarantees provided by Sinopec Corp.’s subsidiaries by the percentage of shareholding of Sinopec Corp. in such subsidiaries. |
53
| 8. | SPECIFIC STATEMENTS AND INDEPENDENT OPINIONS FROM INDEPENDENT NON-EXECUTIVE DIRECTORS REGARDING OUTSTANDING EXTERNAL GUARANTEES PROVIDED BY THE COMPANY DURING AND BY THE END OF 2022: |
We, as independent directors of Sinopec Corp., hereby make the following statements after conducting a thorough check of external guarantees provided by the Company accumulated up to and during 2022 in accordance with the requirements of the domestic regulatory authorities:
The external guarantees prior to 2022 had been disclosed in previous annual report. The aggregate balance of outstanding external guarantees provided by Sinopec Corp. for the year 2022 was RMB22.3 billion, accounting for approximately 2.84% of the Company’s net assets. The total amount of guarantees provided during the reporting period was RMB2.7 billion, accounting for approximately 0.34% of the Company’s net assets.
In accordance with the Articles of Association of the Company and the relevant laws and regulations and securities regulatory authorities on external guarantees, we hereby present the following opinions:
In the reporting period, Sinopec Corp. strictly complied with the approval requirements for external guarantees by regulatory authorities and stock exchanges at home and abroad. There was no violation of decision-making procedures for offering external guarantees, no misconduct impairing the company’s and minority shareholders’ interest, thus no awareness of possible significant risks. Sinopec Corp. shall continue to strengthen its management and actively monitor guarantee risks. It shall strictly follow the approval and disclosure procedures in relation to guarantee businesses for any new external guarantees provided thereafter.
| 9 | SIGNIFICANT LITIGATION AND ARBITRATION |
No significant litigation or arbitration relating to the Company occurred during the reporting period.
| 10 | INSOLVENCY AND RESTRUCTURING |
During the reporting period, the Company was not involved in any insolvency or restructuring matters.
| 11 | OTHER MATERIAL CONTRACTS |
Saved as disclosed by Sinopec Corp., the Company did not enter into any material contracts subject to disclosure obligations during the reporting period.
| 12 | CREDIBILITY FOR THE COMPANY, CONTROLLING SHAREHOLDERS AND DE FACTO CONTROLLER |
During the reporting period, the Company and its controlling shareholder did not fail to perform any effective judgments of the courts or fail to repay any substantial amount of debt due.
| 13 | TRUSTEESHIP, CONTRACTING AND LEASES |
During the reporting period, the Company did not have any significant trusteeship, contracting or leases for the assets of any other company, nor has it placed its assets with any other company under a trust, contracting or lease agreement which is subject to disclosure obligations but not disclosed.
| 14 | ENTRUSTED FINANCING AND LOAN |
| (1) | ENTRUSTED FINANCING |
During the reporting period, the Company was not involved in any entrusted financing.
| (2) | ENTRUSTED LOAN |
unit: RMB million
| Class | Origin | Transaction amount | Undue amount | Overdue |
| Working capital loan | Self-owned fund | (154) | 0 | 0 |
| (3) | OTHER LOAN |
unit: RMB million
| Class | Origin | Transaction amount | Undue amount | Overdue |
| Project construction loan | Self-owned fund | 876 | 6,626 | 0 |
| (4) | OTHER FINANCING AND DERIVATIVE INVESTMENT |
During the reporting period, the Company was not involved in other financing or derivative investment.
54
| 15 | BUSINESS WITH SINOPEC FINANCE AND CENTURY BRIGHT |
| (1) | DEPOSIT |
unit: RMB million
| Transaction amount | ||||||||
| Related party | Related party relationship | Daily Cap | Interest rate range | Balance at beginning | Time deposit | Time deposit withdrawn | Net changes in current deposit | Balance in the end |
| Sinopec Finance | China Petrochemical Corporation 51%; Sinopec Corp. 49% | RMB80 billion by Sinopec Finance and Century Bright | current: 0.35%-1.725%; time deposit: 1.62%-7.40% | 15,708 | 9,981 | 19,803 | 6,713 | 12,599 |
| Century Bright | China Petrochemical Corporation 100% | current: 0.00%-0.50%; time deposit: 0.01%-5.70% | 45,974 | 273,082 | 247,518 | (19,073) | 52,465 | |
| Note: | generally, the deposit interest rate at Sinopec Finance and Century Bright is no lower than that of the same type of deposits for the same period from major commercial banks. |
| (2) | LOAN |
unit: RMB million
| Transaction amount | |||||||
| Related party | Related party relationship | Daily Cap | Interest rate range | Balance at beginning | Total withdrawal | Total repayment | Balance in the end |
| Century Bright | China Petrochemical Corporation 100% | 111,475 | 0.60%-5.40% | 3,199 | 187,411 | 189,112 | 1,498 |
| Sinopec Finance | China Petrochemical Corporation 51%; Sinopec Corp. 49% | 64,391 | 1.08%-5.23% | 13,364 | 74,239 | 59,554 | 28,049 |
| Note: | generally, the loan interest rate at Sinopec Finance and Century Bright is no higher than that of the same type of loan for the same period from major commercial banks. |
| (3) | CREDIT OR OTHER FINANCIAL BUSINESS |
unit: RMB million
| Related party | Related party relationship | Business nature | Balance in the end | Transaction amount |
| Sinopec Finance | China Petrochemical Corporation 51%; Sinopec Corp. 49% | Credit | 7,838 | 18,567 |
| Discounted bills | 0 | 5,057 |
Note: the occurred amount includes the newly issued bills and discounts in the year
55
In order to regulate connected transactions between the Company and Sinopec Finance Co. (Sinopec Corp.’s domestic settlement center) and to ensure the safety and liquidity of the deposits of the Company at Sinopec Finance Co., Sinopec Corp. and the Finance Company formulated the Risk Control System on Connected Transactions between China Petroleum & Chemical Corporation and Sinopec Finance Co., Ltd., which covers the risk control system and the risk management plan of the Company to prevent financial risks, ensuring the Company’s discretion to use and control its deposits with Sinopec Finance Co. At the same time, as the controlling shareholder of Sinopec Finance Co., China Petrochemical Corporation undertook that in case of an emergency when Sinopec Finance Co. has difficulty in making payments, China Petrochemical Corporation would increase the capital of Sinopec Finance Co. to meet the need for the purpose of making payment.
In order to regulate connected transactions between the Company and Century Bright (Sinopec Corp.’s overseas settlement center), Century Bright ensures the safety of the deposits of the Company at Century Bright by strengthening internal risk control and obtaining support from China Petrochemical Corporation. China Petrochemical Corporation has formulated a number of internal rules, including the Rules for the Internal Control System, the Rules for Implementation of Overseas Capital Management Methods, and the Provisional Methods for Overseas Fund Platform Management, to impose strict restrictions on Century Bright regarding the provision of overseas financial services. Century Bright has also established the Rules for the Implementation of the Internal Control System, which ensures the standardisation and safety of its corporate deposits business. At the same time, as the wholly controlling shareholder of Century Bright, China Petrochemical Corporation entered into a keep-well agreement with Century Bright in 2013, in which China Petrochemical Corporation undertakes that when Century Bright has difficulty in making payments, China Petrochemical Corporation will ensure that Century Bright will fulfill its repayment obligation through various channels.
The deposits of the Company at Sinopec Finance Co. and Century Bright during the reporting period are in strict compliance with the relevant caps as approved at the general meeting of Sinopec Corp. During daily operations, the Company can withdraw the full amount of its deposits at the Sinopec Finance Co. and Century Bright.
| 16 | APPROPRIATION OF NON-OPERATIONAL FUNDS BY THE CONTROLLING SHAREHOLDER AND ITS RELATED PARTIES AND THE PROGRESS FOR CLEARING UP |
Not applicable
| 17 | STRUCTURED ENTITY CONTROLLED BY THE COMPANY |
None
| 18 | INFLUENCE ON THE INDUSTRY FROM NEWLY-ENFORCED LAWS, ADMINISTRATIVE RULES, REGULATIONS AND INDUSTRY POLICIES |
The Ministry of Industry and Information Technology of the People’s Republic of China, the NDRC, and other departments jointly issued the Guiding Opinions on Promoting the High-quality Development of the Petrochemical and Chemical Industry during the “14th Five Year Plan”, calling for accelerating the transformation and upgrading of traditional industries, and accelerating the quality, efficiency, and motivation changes in the petrochemical and chemical industry. The notice of the NDRC on printing and distributing the “Measures for the Administration of Natural Gas Pipeline Transportation Prices (Provisional)” and the “Measures for the Supervision and Examination of Natural Gas Pipeline Transportation Pricing Costs (Provisional)” was officially implemented on 1 January 2022. This provision further clarified and detailed the pricing principles, methods, procedures, cost components, and verification methods of trans-provincial natural gas pipeline transportation prices.
In addition, relevant government departments also issued other policies and guidance related to energy work and green and low-carbon transformation, emphasizing the need to strengthen the foundation of energy supply security, while focusing on improving the elasticity and resilience of energy supply, promoting the development of the clean energy industry, and promoting the construction of energy infrastructure adapted to the green and low-carbon transformation.
56
CONNECTED TRANSACTIONS
| 1 | CONTINUING CONNECTED TRANSACTIONS AGREEMENTS BETWEEN SINOPEC CORP. AND CHINA PETROCHEMICAL CORPORATION |
Prior to Sinopec Corp.’s overseas listing, in order to ensure the smooth continuation of production and business conducted by the Company and China Petrochemical Corporation, two parties entered into the continuing connected transactions agreements.
On 27 August 2021, Sinopec Corp. and China Petrochemical Corporation entered into the continuing connected transactions sixth supplemental agreement. The resolution relating to continuing connected transactions for the three years from 2022 to 2024 was approved at the first extraordinary general meeting of Sinopec Corp. for the year of 2021 held on 20 October 2021. For details of the above continuing connected transactions, please refer to relevant announcements published on 30 August 2021 in China Securities Journal, Shanghai Securities News and Securities Times and on the website of the Shanghai Stock Exchange and on 29 August 2021 on the website of the Hong Kong Stock Exchange. The capitalised terms used in this section shall have the same meaning as that used in the above-mentioned announcements.
| 2 | COMPLIANCE OF DISCLOSURE AND APPROVALS OF CONTINUING CONNECTED TRANSACTIONS BETWEEN THE COMPANY AND SINOPEC GROUP WITH HONG KONG LISTING RULES AND THE SHANGHAI LISTING RULES |
Pursuant to the Hong Kong Listing Rules and the Shanghai Listing Rules, the continuing connected transactions between the Company and Sinopec Group are subject to disclosure, independent non-executive directors’ approval and/or independent shareholders’ approval (if needed) based on the nature and the value of the transactions. Sinopec Corp. has fully complied with the above requirements in relation to the continuing connected transaction between the Company and Sinopec Group.
The aggregated amount of the continuing connected transactions for 2022 of the Company was in compliance with the relevant requirements of the Hong Kong Listing Rules and the Shanghai Listing Rules. For performance details of continuing connected transaction agreements, please refer to Item 3 below.
| 3 | ACTUAL CONTINUING CONNECTED TRANSACTIONS ENTERED INTO BY THE COMPANY DURING THE YEAR |
In the reporting period, purchases expenses of the continuing connected transactions of the Company was RMB244.36 billion, representing 7.31% of the total amount of this type of transactions for the reporting period, including purchases of products and services (procurement, storage, transportation, exploration and production services, and production-related services) of RMB231.831 billion, payment of property rent of RMB938 million (the annual value of right-of-use assets relating to property lease of RMB2,565 million), payment of land rent of RMB11.046 billion (annual value of right-of-use assets relating to land lease of RMB30.222 billion), and interest expenses of RMB545 million. The sales income of the continuing connected transactions of the Company during the reporting period was RMB135.696 billion, representing 3.95% of the total amount of this type of transactions for the reporting period, including sales of products of RMB134.345 billion, agency commission income of RMB144 million, and interest income of RMB1,207 million. Entrusted loan provided by the Company to the Connected Subsidiaries was RMB550 million. For definitions, please refer to the announcements published by Sinopec Corp. on China Securities Journal, Shanghai Securities News, Securities Times, and on the website of Shanghai Stock Exchange on 30 August 2021, and on the website of Hong Kong Stock Exchange on 29 August 2021 and 3 September 2021.
The amounts of the above continuing connected transactions between the Company and Sinopec Group did not exceed the relevant caps for the continuing connected transactions as approved by the general meeting of shareholders and the Board.
The pricing principles for the continuing connected transactions are as follows:
| (a) | the government-prescribed price, if any, will apply; |
| (b) | where there is no government-prescribed price but where there is a government-guidance price, the government-guidance price will apply; |
| (c) | where there is neither a government-prescribed price nor a government-guidance price, the market price will apply; or |
| (d) | where none of the above is applicable, the price for the provision of the products or services is to be agreed between the relevant parties, which shall be the reasonable cost incurred in providing the same plus 6% or less of such cost. |
For details of the pricing principle, please refer to relevant announcements published on 30 August 2021 in China Securities Journal, Shanghai Securities News and Securities Times and on the website of the Shanghai Stock Exchange, and on the website of the Hong Kong Stock Exchange on 29 August 2021.
57
Decision-making procedures: The continuing connected transaction agreements were entered into in the ordinary course of the Company’s business and in accordance with normal commercial terms that are fair and reasonable to the Company and its shareholders. The Company, according to its internal control procedures, adjusts the scope and the relevant caps of continuing connected transactions every three years, and will announce and implement upon the approval of the Board and/or independent shareholders. For the other connected transactions, Sinopec Corp., in strict compliance with domestic and overseas regulatory rules, will publish the announcement and implement the transactions only after submitting the relevant proposals of connected transactions to the Board and/or the general meeting of shareholders for consideration and approval according to internal control procedures.
Related party transactions with the Sinopec Group that occurred during the year, as set out in Note 38 to the financial statements prepared under the IFRS in this annual report, also fall under the definition of connected transactions under Chapter 14A of the Hong Kong Listing Rules.
The above-mentioned connected transactions between the Company and Sinopec Group were approved at the 2nd meeting of the eighth session of the Board and have complied with the requirements under Chapter 14A of the Hong Kong Listing Rules.
The external auditor of Sinopec Corp. was engaged to report on the Company’s continuing connected transactions in accordance with the Hong Kong Standard on Assurance Engagements 3000, Assurance Engagement Other Than Audits or Reviews of Historical Financial Information, and with reference to Practice Note 740, Auditor’s Letter on Continuing Connected Transactions under the Hong Kong Listing Rules, issued by the Hong Kong Institute of Certified Public Accountants. The auditor has issued its unqualified letter containing its conclusions in respect of the above-mentioned continuing connected transactions in accordance with Rule 14A.56 of the Hong Kong Listing Rules. Sinopec Corp. has submitted a copy of the auditor’s letter to the Hong Kong Stock Exchange.
After reviewing the above-mentioned connected transactions, the independent non-executive directors of Sinopec Corp. have confirmed the following:
| (a) | The transactions have been conducted in the ordinary course of the Company’s business; |
| (b) | The transactions have been entered into based on either of the following terms: |
| i. | normal commercial terms; or |
| ii. | terms not less favorable than those available from or to independent third parties, where there is no available comparison to determine whether such terms are on normal commercial terms; and |
| (c) | The transactions were conducted pursuant to the terms of relevant agreements, and the terms were fair and reasonable and in the interests of Sinopec Corp. and its shareholders as a whole. |
| 4 | OTHER SIGNIFICANT CONNECTED TRANSACTIONS OCCURRED THIS YEAR |
For details, please refer to item 2 “Asset transactions with INEOS”, item 3 “Formation of a joint venture” and item 5 “The transactions with China Oil & Gas Pipeline Network Corporation” of the section “Significant Events”.
| 5 | FUNDS PROVIDED BETWEEN RELATED PARTIES |
Unit: RMB million
| Funds to related parties | Funds from related parties | ||||||
| Related Parties | Relations | Balance at the beginning of the year | Amount incurred | Balance at the end of the year | Balance at the beginning of the year | Amount incurred | Balance at the end of the year |
| Sinopec Group | Parent company and affiliated companies* | 9,797 | (683) | 9,114 | 30,682 | 2,094 | 32,776 |
| Other related parties | Associates and joint ventures | 7,143 | 452 | 7,595 | 3,593 | 2,370 | 5,963 |
| Total | 16,940 | (231) | 16,709 | 34,275 | 4,464 | 38,739 | |
| Reason for provision of funds between related parties | Loans and other accounts receivable and payable | ||||||
| Impacts on the Company | No material negative impact | ||||||
| * : | affiliated companies include subsidiaries, associates and joint ventures. |
58
REPORT OF THE BOARD OF DIRECTORS
The Board is pleased to present the report of the Board of Directors for the year ended 31 December 2022 for the shareholders’ review.
1 MEETINGS OF THE BOARD
During this reporting period, Sinopec Corp. held nine (9) Board meetings. The details are as follows:
| (1) | The 5th meeting of the eighth session of the Board was held by written resolution on 27 January 2022, whereby the proposals in relation to the following matters were approved: (i) the continuing related transactions with China Oil & Gas Pipeline Network Corporation for the year 2022; (ii) Internal Control Manual (2022). |
| (2) | The 6th meeting of the eighth session of the Board was held by written resolution on 7 March 2022, whereby the proposal in relation to transfer of parts of shares of Shanghai SECCO to introduce strategic investors was approved. |
| (3) | The 7th meeting of the eighth session of the Board was held by on-site meeting and via teleconference on 25 March 2022, whereby the proposals in relation to the following matters were approved: (i) Work Report of the Board for the year 2021; (ii) Report on the Fulfillment of the Key Targets for the year 2021 and the Work Arrangements for the year 2022; (iii) financial results and business performance of the Company for the year 2021; (iv) provision for impairment for the year 2021; (v) the connected transactions for the year 2021; (vi) profit distribution plan for the year 2021; (vii) audit costs for the year 2021; (viii) to authorize the Board to determine the interim profit distribution plan of Sinopec Corp. for the year 2022; (ix) to authorize the Board to determine the plan for issuance of debt financing instrument(s); (x) Continuous Risk Assessment Report of connected transactions between Sinopec Corp. and Sinopec Finance Co. and Century Bright; (xi) Report on the Implementation of Financial Derivatives Business for the year 2021 and the Work Plan for the year 2022; (xii) Internal Control Assessment Report of Sinopec Corp. for the year 2021; (xiii) Financial Statements of Sinopec Corp. for the year 2021; (xiv) Annual Report of the Company for the year 2021; (xv) the re-appointment of KPMG Huazhen (Special General Partnership) and KPMG as the external auditors of Sinopec Corp. for the year 2022 and the authorization of the Board to determine their remunerations; (xvi) Outline of the 14th Five-Year Plan (2021-2025) and Vision 2035 of Sinopec Corp.; (xvii) Report of Sustainable Development of Sinopec Corp. for the year 2021; (xviii) to grant to the Board a general mandate to issue new domestic shares and/or overseas-listed foreign shares of Sinopec Corp.; (xix) to grant to the Board a mandate to buy back domestic shares and/or overseas-listed foreign shares of Sinopec Corp.; (xx) to revise relevant governance regulations of the Company; (xxi) Notice of Annual General Meeting for 2021, First A Shareholders Class Meeting for 2022, and First H Shareholders Class Meeting for 2022. |
| (4) | The 8th meeting of the eighth session of the Board was held by written resolution on 27 April 2022, whereby the proposals in relation to the following matters were approved: (i) First Quarterly Report for 2022; (ii) Form 20-F of the Company for the year 2021; (iii) to invest in building the Phase II Project of Fujian Gulei Refining and Petrochemical Integration. |
| (5) | The 9th meeting of the eighth session of the Board was held by written resolution on 18 July 2022, whereby the proposals in relation to the following matters were approved: (i) to participate the auction for exploration right of Bayan Qaidam Mine Field; (ii) to invest in building 1.5 million t/a Ethylene and Refining and Petrochemical Integration Project (Phase I) in Yueyang area. |
| (6) | The 10th meeting of the eighth session of the Board was held by written resolution on 28 July 2022, whereby the proposals in relation to the following matters were approved: (i) the relevant asset transactions with INEOS; (ii) the establishment of Sinopec Carbon Technology Co., Ltd. |
| (7) | The 11th meeting of the eighth session of the Board was held by written resolution on 12 August 2022, whereby the proposal to delist the American depositary shares of Sinopec Corp. from the NYSE was approved. |
| (8) | The 12th meeting of the eighth session of the Board was held by on-site meeting and via video conference on 26 August 2022, whereby the proposals in relation to the following matters were approved: (i) Report on the Fulfillment of the Key Targets for the first half of the year 2022 and the Work Arrangements for the second half of the year 2022; (ii) profit distribution plan for the first half of the year 2022; (iii) the Continuous Risk Assessment Report of Connected Transactions between Sinopec Corp. and Sinopec Finance Co. and Century Bright for the first half of the year 2022; (iv) Financial Statements for the first half of the year 2022; (v) Interim Report for 2022; (vi) the programme on share buy-back by centralized bidding; (vii) Management Rules of Authorization of the Board of Sinopec Corp.; (viii) Terms of References of the President of Sinopec Corp. |
| (9) | The 13th meeting of the eighth session of the Board was held by written resolution on 28 October 2022, whereby the proposals in relation to the following matters were approved: (i) the appointment of Senior Vice President of Sinopec Corp.; (ii) Third Quarterly Report for 2022. |
For details of each meeting, please refer to the announcements published in China Securities Journal, Shanghai Securities News and Securities Times after each meeting and on the websites of Shanghai Stock Exchange, Hong Kong Stock Exchange and Sinopec Corp.
59
| 2 | IMPLEMENTATION OF RESOLUTIONS APPROVED AT THE GENERAL MEETINGS OF SHAREHOLDERS BY THE BOARD |
During this reporting period, in accordance with relevant laws and regulations as well as the Articles of Association, all members of the Board diligently implemented the resolutions approved at the general meetings of Sinopec Corp., and had completed all the tasks delegated to them at the general meetings.
| 3 | DIRECTORS’ ATTENDANCE TO THE GENERAL MEETINGS AND TO THE BOARD MEETINGS |
| (1) | Directors’ attendance to the general meetings |
Annual General Meeting for 2021, First A Shareholders Class Meeting for 2022, and First H Shareholders Class Meeting for 2022 were held on 18 May 2022. Mr. Ma Yongsheng, as Chairman of the Board, and Mr. Yu Baocai, as Director and President, attended the meetings.
| (2) | Directors’ attendance to the Board meetings |
| Positions | Name | Board meeting | ||||
No. of meetings held | On-site meeting | Meetings held by written resolution | Meetings attended by proxy | Absent | ||
| Chairman | Ma Yongsheng | 9 | 2 | 7 | 0 | 0 |
| Director | Zhao Dong | 9 | 2 | 7 | 0 | 0 |
| Director | Yu Baocai | 9 | 2 | 7 | 0 | 0 |
| Director | Ling Yiqun | 9 | 1 | 7 | 1 | 0 |
| Director | Li Yonglin | 9 | 2 | 7 | 0 | 0 |
| Director | Liu Hongbin | 9 | 1 | 7 | 1 | 0 |
| Independent Director | Cai Hongbin | 9 | 2 | 7 | 0 | 0 |
| Independent Director | Ng, Kar Ling Johnny | 9 | 1 | 7 | 1 | 0 |
| Independent Director | Shi Dan | 9 | 2 | 7 | 0 | 0 |
| Independent Director | Bi Mingjian | 9 | 2 | 7 | 0 | 0 |
Note 1: No directors were absent from two consecutive meetings of the Board.
60
| 4 | THE BOARD COMMITTEES MEETINGS AND DIRECTORS’ ATTENDANCE |
During the reporting period, the board committees held nine (9) meetings, among which, Audit Committee held five (5) meetings, the Strategy Committee, the Remuneration and Appraisal Committee, the Sustainable Development Committee, and the Nomination Committee, each held one (1) meeting. All members of each committee had attended the relevant meetings. Details of those meetings are as follows:
| (1) | The 3rd meeting of the eighth session of the Audit Committee was held by written resolution on 27 January 2022, whereby the proposal in relation to the Internal Control Manual (2022) was approved. |
| (2) | The 4th meeting of the eighth session of the Audit Committee was held by on-site meeting and via teleconference on 23 March 2022, whereby the proposals in relation to the following matters were approved: (i) Financial results and business performance of the Company for the year 2021; (ii) Continuous Risk Assessment Report of connected transactions between Sinopec Corp. and Sinopec Finance Co., Ltd. and Sinopec Century Bright Capital Investment Ltd.; (iii) Report on the Implementation of Financial Derivatives Business for the year 2021 and the Work Plan for the year 2022; (iv) Financial Statements of Sinopec Corp. for the year 2021; (v) Annual Report of the Company for the year 2021; (vi) Internal Control Assessment Report of Sinopec Corp. for the year 2021; (vii) Report on Audit Work in 2021 and Audit Work Arrangement in 2022. |
| (3) | The 1st meeting of the eighth session of the Strategy Committee was held by written resolution on 23 March 2022, whereby the proposals in relation to the following matters were approved: (i) Outline of the 14th Five-Year Plan (2021-2025) and Vision 2035 of Sinopec Corp.; (ii) the investments plan of 2022 of Sinopec Corp. |
| (4) | The 1st meeting of the eighth session of the Remuneration and Appraisal Committee was held by written resolution on 23 March 2022 whereby the proposal in relation to implementation of the rules of the remuneration of directors, supervisors and other senior management for 2021 was approved. |
| (5) | The 1st meeting of the eighth session of the Sustainable Development Committee was held by written resolution on 23 March 2022, whereby the proposals in relation to the following matters were approved: (i) Report of Sustainable Development of Sinopec Corp. for the year 2021; (ii) Report on the Environmental Protection Work of Sinopec Corp. for the year 2021 and the Plan of 2022; (iii) Report on the Anti-corruption Compliance Work of Sinopec Corp. for the year 2021 and the Plan of 2022. |
| (6) | The 5th meeting of the eighth board of the Audit Committee was held by written resolution on 27 April 2022, whereby the proposals in relation to the following matters were approved: (i) First Quarterly Report for 2022; (ii) Form 20-F of the Company for the year 2021. |
| (7) | The 6th meeting of the eighth board of the Audit Committee was held by on-site meeting and via teleconference on 24 August 2022, whereby the proposals in relation to the following matters were approved: (i) Notes on Financial Results and Business Performance for the first half of the year 2022; (ii) Financial Statements for the first half of the year 2022; (iii) Interim Report for 2022; (iv) Continuous Risk Assessment Report of Connected Transactions between Sinopec Corp. and Sinopec Finance Co., Ltd. and Sinopec Century Bright Capital Investment Limited for the first half of the year 2022; (v) Report on the Main Audit Work for the first half of 2022 and the Overall Arrangement of Audit Work for the second half of 2022. |
| (8) | The 7th meeting of the eighth board of the Audit Committee was held by written resolution on 28 October 2022, whereby the proposals in relation to the following matters were approved: (i) Third Quarterly Report; (ii) Report on the Implementation of the Internal Audit Plan in the third quarter of 2022. |
| (9) | The 2nd meeting of the eighth session of the Nomination Committee was held by written resolution on 28 October 2022, whereby the proposal in relation to the appointment of Senior Vice President of Sinopec Corp. was approved. |
| 5 | BOARD COMMITTEES ISSUED REVIEW OPINIONS TO THE BOARD WHEN PERFORMING THEIR DUTIES DURING THE REPORTING PERIOD, WITHOUT OBJECTION. |
| 6 | PERFORMANCE OF THE DIRECTORS |
During the reporting period, the Board has reviewed and evaluated the self-construction and the Directors’ performance of duties, and is of view that the Board diversity policy has been implemented effectively, as the Directors come from different industries at home and abroad with diverse professional background and rich management experience, which contributes to the Board diversity in terms of gender, culture, educational backgrounds, professional specialties, etc. The number of Directors is reasonable, and the structure and composition of the Board are fit for the Company’s strategic planning, reforms and development, as well as operational management. The Directors of Sinopec Corp. fulfilled their duties diligently in accordance with the Articles of Association, actively attended Board meetings and meetings of the Board committees (please refer to the Report of the Board of Directors in this annual report for their attendance of the meeting), reviewed the relevant documents with due care. They utilised their professional expertise to provide suggestions on decision-making of significant events. The Directors maintained timely and effective communication with the management, external auditors and internal audit department, and promoted scientific decision-making by offering advice on the Company’s development strategy, operations and reform. The Board attaches importance to investor relations. The Chairman of the Board, Directors and the Management communicate with shareholders smoothly and efficiently through multiple channels, including the General Meetings and results conferences.
61
The Independent Directors of Sinopec Corp. fulfilled their duties in good faith as required by Terms of Reference of the Independent Non-Executive Directors, followed up business operation of the company, and conducted research on scientific and technological innovation. The Independent Directors, Ms. Shi Dan, and Mr. Bi Mingjian, attended the Annual and Interim Results Conferences in 2022. The Chairman of the Audit Committee, Ng Kar Ling, offered training for finance, audit and internal control staff in the Company. The professional expertise of each Independent Director was brought into full play. The Independent Directors put forward specific requirements on auditing, issued their independent opinions on matters such as appointment of senior management, connected transactions, profit distribution plan, re-appointment of accounting firms, share buy-back proposal, providing financial assistance, focusing on the protection of the minority shareholders’ legitimate interests, which has helped the Board obtain independent views and input. None of the directors had any objection to the Company’s resolutions, and all the suggestions of every Director were accepted.
Pursuant to requirements of securities regulatory authority of China, Independent Directors of Sinopec Corp. reviewed the performance of the senior management of Sinopec Corp. who concurrently are senior management in China Petrochemical Corporation, and issued a special opinion as follows: “The President Mr. Yu Baocai, Senior Vice President Mr. Ling Yiqun, Mr. Li Yonglin, Mr. Lv Lianggong and Mr. Liu Hongbin, each of whom concurrently held position as senior management of China Petrochemical Corporation, have obtained the exemptions for holding concurrent position from CSRC in accordance with the applicable rules. In 2022, Mr. Yu Baocai, Mr. Ling Yiqun, Mr. Li Yonglin, Mr. Lv Lianggong and Mr. Liu Hongbin strictly abided by the provisions of laws and regulations, the Articles of Association and the service contracts, conscientiously fulfilled their duties of loyalty and diligence, implemented the resolutions of the Board, and gave sufficient time and attention to organize production and operation. They protected the interests of the Company and its shareholders effectively and had not violated the legitimate interests of Sinopec Corp. and its shareholders due to holding aforesaid concurrent positions in China Petrochemical Corporation.”
| 7 | BUSINESS RESULTS |
The financial results of the Company for the year ended 31 December 2022, which were prepared in accordance with IFRS and the financial position as at that date and the accompanying analysis are set out from page 149 to page 203 in this annual report. A fair review of the Company’s business, a discussion and analysis on business performance using financial key performance indicators and the material factors underlying our results and financial position during the reporting period, particulars of significant events affecting the Company and the outlook of the Company’s business are discussed throughout this annual report and included in the sections “Chairman’s Address”, “Business Review and Prospects”, “Management’s Discussion and Analysis” and “Significant Events” of this annual report. All of the above discussions constitute parts of the report of the Board of Directors.
| 8 | DIVIDEND |
The profit distribution policy of Sinopec Corp. maintains consistency and steadiness and considers the long-term interests of the Company, overall interests of all the shareholders and the sustainable development of the Company. Sinopec Corp. gives priority to adopting cash dividends for profit distribution and is allowed to declare an interim profit distribution. When the net profits and retained earnings of the Company are positive in current year and in the event that the cash flow of Sinopec Corp. can satisfy the normal operation and sustainable development, Sinopec Corp. should declare cash dividends and the distribution of profits in cash every year shall be no less than 30% of the net profits of the Company realised during the corresponding year.
The profit distribution plan of Sinopec Corp. for this year will be carried out in accordance with the policy and procedures stipulated in the Articles of Association, taking into account the advice from the minority shareholders. Meanwhile, the Independent Directors will issue independent opinions.
Proposals for dividend distribution
At the 15th meeting of the eighth session of the Board, the Board approved the proposal to distribute a final cash dividend of RMB0.195 (tax inclusive) per share for 2022. Taking into account the distributed interim cash dividend of RMB0.16 (tax inclusive) per share for the first half of 2022, the total cash dividend for the whole year is RMB0.355 (tax inclusive) per share.
The final cash dividend will be distributed on or before Friday, 30 June 2023 to all shareholders whose names appear on the register of members of Sinopec Corp. on the record date of Tuesday, 20 June 2023. In order to qualify for the final dividend for H shares, the holders of H shares must lodge all share certificates accompanied by the transfer documents with Hong Kong Registrars Limited located at 1712-1716, 17th Floor Hopewell Centre, 183 Queen’s Road East, Wan Chai, Hong Kong before 4:30 p.m. on Tuesday, 13 June 2023 for registration. The H shares register and transfer of members of Sinopec Corp. will be closed from Wednesday, 14 June 2023 to Tuesday, 20 June 2023 (both dates inclusive). The dividend will be denominated and declared in RMB, and distributed to the domestic shareholders and investors participating in the Shanghai-Hong Kong and Shenzhen-Hong Kong Stock Connect Programmes in RMB and to the overseas shareholders in Hong Kong Dollar. The exchange rate for the dividend calculated in Hong Kong Dollar is based on the average benchmark exchange rate of RMB against Hong Kong Dollar as published by the People’s Bank of China one week preceding the date of the declaration and distribution of such dividend.
In accordance with the Enterprise Income Tax Law of the People’s Republic of China and its implementation regulations which came into effect on 1 January 2008, Sinopec Corp. is required to withhold and pay enterprise income tax at the rate of 10% on behalf of the non-resident enterprise shareholders whose names appear on the register of members for H Shares of Sinopec Corp. when distributing the cash dividends or issuing bonus shares by way of capitalization from retained earnings. Any H Shares of the Sinopec Corp. which are not registered under the name of an individual shareholder, including those registered under HKSCC Nominees Limited, other nominees, agents or trustees, or other organisations or groups, shall be deemed as shares held by nonresident enterprise shareholders. On such basis, enterprise income tax shall be withheld from dividends payable to such shareholders. If holders of H Shares intend to change their shareholder status, please enquire about the relevant procedures with your agents or trustees. Sinopec Corp. will strictly comply with the law or the requirements of the relevant government authority to withhold and pay enterprise income tax on behalf of the relevant shareholders based on the registration of members for H shares of Sinopec Corp. as at the record date.
62
If the individual holders of H shares are residents of Hong Kong, Macau or countries which had an agreed tax rate of 10% for cash dividends or bonus shares by way of capitalisation from retained earnings with China under the relevant tax agreement, Sinopec Corp. should withhold and pay individual income tax on behalf of the relevant shareholders at a rate of 10%. If the individual holders of H Shares are residents of countries which had an agreed tax rate of less than 10% with China under relevant tax agreement, Sinopec Corp. shall withhold and pay individual income tax on behalf of the relevant shareholders at a rate of 10%. In that case, if the relevant individual holders of H Shares wish to reclaim the extra amount withheld due to the application of 10% tax rate, Sinopec Corp. would apply for the relevant agreed preferential tax treatment pursuant to the relevant tax agreement provided that the relevant shareholders submit the evidence required by the notice of the tax agreement to the share register of H Shares of Sinopec Corp. in a timely manner. Sinopec Corp. will assist with the tax refund after the approval of the competent tax authority. If the individual holders of H Shares are residents of countries which had an agreed tax rate of over 10% but less than 20% with China under the tax agreement, Sinopec Corp. shall withhold and pay the individual income tax at the agreed actual rate in accordance with the relevant tax agreements. If the individual holders of H Shares are residents of countries which had an agreed tax rate of 20% with China, or which had not entered into any tax agreement with China, or otherwise, Sinopec Corp. shall withhold and pay the individual income tax at a rate of 20%.
Pursuant to the Notice on the Tax Policies Related to the Pilot Program of the Shanghai-Hong Kong Stock Connect (關於滬港股票市場交易互聯互通機制試點有關稅收政策的通知) (Caishui [2014] No. 81) and the Notice on the Tax Policies Related to the Pilot Program of the Shenzhen-Hong Kong Stock Connect (關 於深港股票市場交易互聯互通機制試點有關稅收政策的通知) (Caishui [2016] No.127):
For dividends of domestic investors investing in the H Shares of Sinopec Corp. through Shanghai-Hong Kong and Shenzhen-Hong Kong Stock Connect Program, the Company shall withhold and pay income tax at the rate of 20% on behalf of individual investors and securities investment funds. The Company will not withhold or pay the income tax of dividends for domestic enterprise investors and those domestic enterprise investors shall report and pay the relevant tax by themselves. For dividends of investors of the Hong Kong Stock Exchange (including enterprises and individuals) investing in the A Shares of Sinopec Corp. through Shanghai-Hong Kong Stock Connect Program, the Company will withhold and pay income taxes at the rate of 10% on behalf of those investors and will report to the competent tax authorities for the withholding. For investors who are tax residents of other countries which have entered into a tax treaty with the PRC stipulating a dividend tax rate of lower than 10%, the enterprises and individuals may, or may entrust a withholding agent to, apply to the competent tax authorities for the entitlement of the rate under such tax treaty. Upon approval by the tax authorities, the amount paid in excess of the tax payable based on the tax rate according to such tax treaty will be refunded.
The dividend distribution and capital reserve capitalization declared by Sinopec Corp. in the past three years are as follows:
| 2022 | 2021 | 2020 | |
| Cash dividends (RMB/Share, tax inclusive) | 0.355 | 0.47 | 0.2 |
| Cash dividends paid in other ways (such as repurchase of shares) (RMB million) | 4,179 | 0 | 0 |
| Total amount of cash dividends (including dividends paid in other ways) (RMB million, tax inclusive) | 46,930 | 56,903 | 24,214 |
| Net profits attributed to the shareholders of the listed company shown in the consolidated statement for the dividend year (RMB million) | 66,302 | 71,208 | 33,271 |
| Ratio of the dividends to the net profit attributed to the shareholders of the listed company in the consolidated statement (%) | 70.8 | 79.9 | 72.8 |
Note: The final cash dividend for 2022 is subject to the approval at the 2022 annual general meeting.
The aggregate cash dividend declared by Sinopec Corp. during three years from 2020 to 2022 is RMB1.025 per share, with a total amount of RMB123.868 billion, the total paid amount for repurchase of shares was RMB4.179 billion, and the aggregate amount with cash dividend was RMB128.047 billion. The total dividend payment from 2020 to 2022 as a percentage of average net profit attributed to the shareholders of the listed company in the three years is 224.93%.
| 9 | RESPONSIBILITIES FOR THE COMPANY’S INTERNAL CONTROL |
The Board is fully responsible for establishing and maintaining the internal control system related to the financial statements as well as ensuring its effective implementation. In 2022, the Board assessed and evaluated the internal control of Sinopec Corp. according to the Basic Standard for Enterprise Internal Control, Application Guidelines for Enterprise Internal Control and Assessment Guidelines for Enterprise Internal Control. There were no material defects in relation to the internal control system as of 31 December 2022. The internal control system of Sinopec Corp. related to the financial statements is sound and effective.
2022 Internal Control Assessment Report of Sinopec Corp. was reviewed and approved at the 15th meeting of the eighth session of the Board on 24 March 2023, and all members of the Board warrant that the contents of the report are true, accurate and complete, and there are no false representations, misleading statements or material omissions contained in the report.
63
| 10 | DURING THE REPORTING PERIOD, THE IMPLEMENTATION OF ENVIRONMENTAL POLICIES BY THE COMPANY |
During the reporting period, the Company complied with the environmental policy in all material aspects. Details with regard to the Company’s performance in relation to environmental policies and performances are provided in the section “Environment and Social Responsibilities” in this annual report as well as the 2022 Sustainability Report of Sinopec Corp.
| 11 | DURING THE REPORTING PERIOD, THE COMPANY DID NOT VIOLATE LAWS OR REGULATIONS WHICH HAVE A MATERIAL IMPACT ON THE COMPANY |
| 12 | MAJOR SUPPLIERS AND CUSTOMERS |
The Company maintained a stable cooperation relationship with major suppliers and customers. During the reporting period, the total value of the purchasing from the top five suppliers accounted for 2.18% of the total purchasing value of the Company, among which the total purchasing value from the connected party (Sinopec Group) among the five largest supplier was RMB19.392 billion, accounted for 0.69% of the total purchasing value of the Company for the year.
The total revenue from the top five customers of the Company in 2022 was RMB269,920 million, accounting for 8.13% of the total revenue of the Company, among which the sales value to the connected party (Sinopec Group) among the five largest customers was RMB59,064 million, accounting for 1.78% of the total revenue for the year.
During the reporting period, other than disclosed above, to the best knowledge of the Board of the Directors of the Company, none of the Directors of the Company, their close associates, or shareholders holding more than 5% of the shares of the Company had any interest in the top five suppliers or the top five customers of the Company. There were no suppliers, customers, employees or others on which the Company’s success depends.
| 13 | BANK LOANS AND OTHER BORROWINGS |
Details of bank loans and other borrowings of the Company as of 31 December 2022 are set out in Note 30 to the financial statements prepared in accordance with IFRS in this annual report.
| 14 | FIXED ASSETS |
During the reporting period, changes to the fixed assets of the Company are set out in Note 17 to the financial statements prepared in accordance with IFRS in this annual report.
| 15 | RESERVES |
During the reporting period, the changes to the reserves of the Company are set out in the consolidated statement of changes in shareholders’ equity in the financial statements prepared in accordance with IFRS in this annual report.
| 16 | DONATIONS |
During the reporting period, the amount of charity donations made by the Company amounted to RMB447 million.
| 17 | PRE-EMPTIVE RIGHTS |
Pursuant to the Articles of Association and the laws of the PRC, the shareholders of Sinopec Corp. are not entitled to any pre-emptive rights. Therefore, the existing shareholders cannot request Sinopec Corp. to issue shares to them on a preferential basis in proportion to their shareholdings.
| 18 | REPURCHASE, SALES AND REDEMPTION OF SHARES |
| (1) | Progress in the implementation of share repurchase of Sinopec Corp. |
On 18 May 2022, the Annual General Meeting for 2021, the First A Shareholders Class Meeting for 2022 and the First H Shareholders Class Meeting for 2022 of Sinopec Corp. considered and approved the Resolution to Grant to the Board a Mandate to Buy Back Domestic Shares and/or Overseas-listed Foreign Shares of Sinopec Corp., and authorized the Board (or the director authorised by the Board) to buy back A Shares or H Shares not exceeding 10% of the number of A Shares or H Shares of the Company in issue.
On 26 August 2022, to preserve the value of both Company and shareholders’ equity interests, the twelfth meeting of the eighth session of the Board considered and approved the Plan on Repurchasing the Company’s Shares by Centralized Bidding Transactions. For details, please refer to the announcements disclosed by Sinopec Corp. on the website of the Shanghai Stock Exchange on 29 August 2022 and 20 September 2022.
On 21 September 2022, Sinopec Corp. commenced the repurchase of A shares and H shares. Sinopec Corp. has finished the repurchase of A shares on 25 November 2022, and completed the cancellation of all repurchased A shares on 30 December 2022. For details, please refer to the related announcements disclosed by Sinopec Corp. on the website of the Shanghai Stock Exchange on 26 November 2022 and 30 December 2022. Sinopec Corp. completed the cancellation of repurchased H shares on 14 October 2022 and 29 December 2022 respectively. For details, please refer to the related announcements disclosed by Sinopec Corp. on the website of the Hong Kong Stock Exchange on 14 October 2022 and 29 December 2022.
As of 31 December 2022, Sinopec Corp. has repurchased 442.30 million A shares, accounting for 0.37% of the Company’s total issued shares on 31 December 2022, the highest and lowest repurchase prices were RMB4.50 and RMB4.06 per share respectively, and the total amount paid was RMB1,888,163,981.61 (exclusive of transaction fees). For details, please refer to the Announcement on the Results of the Implementation of Share Repurchase disclosed by Sinopec Corp. on the website of the Shanghai Stock Exchange on 26 November 2022. Sinopec Corp. has repurchased 732.502 million H Shares, accounting for approximately 0.61% of the Company’s total issued shares on 31 December 2022, and the total amount paid was HK$2,499,261,860.00 (exclusive of transaction fees).
64
A Share Repurchase
| Month | Repurchase Amount (Share) | Price per share | Total Amount (RMB) | |
Highest (RMB/share) | Lowest (RMB/share) | |||
| September | 48,000,000 | 4.36 | 4.19 | 203,905,495.60 |
| October | 191,000,057 | 4.35 | 4.07 | 817,300,138.38 |
| November | 203,299,943 | 4.50 | 4.06 | 866,958,347.63 |
H Share Repurchase
| Month | Repurchase Amount (Share) | Price per share | Total Amount (HK$) | |
Highest (HK$/share) | Lowest (HK$/share) | |||
| September | 54,414,000 | 3.59 | 3.37 | 188,781,540.60 |
| October | 63,000,000 | 3.22 | 3.06 | 197,662,500.00 |
| November | 535,822,000 | 3.67 | 3.13 | 1,823,541,375.60 |
| December | 79,266,000 | 3.75 | 3.56 | 289,276,443.80 |
| (2) | Progress in the implementation of share repurchase of subsidiaries |
During the reporting period, Sinopec Shanghai Petrochemical Company Limited, a subsidiary of the Company, repurchased its H share. For details, please refer to the related announcements disclosed by Sinopec Shanghai Petrochemical Company Limited on the website of the Shanghai Stock Exchange and the Hong Kong Stock Exchange.
Save as disclosed above, during the reporting period, neither Sinopec Corp. nor any of its subsidiaries repurchased, sold or redeemed their listed shares.
| 19 | DIRECTORS’ INTERESTS IN COMPETING BUSINESS |
As at the end of the reporting period, the Company has resolved its competition with Sinopec Group in the chemical business. For details for the positions held by the Directors (excluding Independent Non-executive Directors) of Sinopec Corp. in the Sinopec Group during the reporting period, please refer to the section “Corporate Governance” of this annual report.
| 20 | DIRECTORS’ INTERESTS IN CONTRACTS |
No Director had a material interest, either directly or indirectly, in any contract of significance to the business of the Company to which Sinopec Corp. or any of its holding companies, subsidiaries or fellow subsidiaries was a party during the reporting period.
| 21 | MANAGEMENT CONTRACTS |
No contracts concerning management or administration of the whole or any substantial part of the business of the Company were entered into or existed during the reporting period.
| 22 | PERMITTED INDEMNITY PROVISIONS |
During the reporting period, Sinopec Corp. has purchased liability insurance for all Directors to minimise their risks arising from the performance of their duties. The permitted indemnity provisions are stipulated in such Directors’ liability insurance in respect of the liabilities and costs associated with the potential legal proceedings that may be brought against such Directors.
| 23 | EQUITY-LINKED AGREEMENTS |
As of 31 December 2022, the Company has not entered into any equity-linked agreement.
| 24 | OIL & GAS RESERVE APPRAISAL PRINCIPLES |
We manage our reserves estimation through a two-tier management system. Our Oil and Natural Gas Reserves Management Committee, or RMC, at the headquarter level oversees the overall reserves estimation process including organisation, coordination, monitoring and major decision-making, and reviews the reserves estimation of the Company. Each of our branches has a reserves management committee that manages and coordinates the reserves estimation, organises the estimation process and reviews the reserve estimation report at the branch level, being responsible to the RMC of the Company.
Our RMC consists of the senior management of the Company, related departments of headquarter, Petroleum Exploration and Production Research Institute of Sinopec (PEPRIS) and senior managers of oilfield branches. Mr. Liu Hongbin, the Chairman of RMC is Senior Vice President of Sinopec Corp., with over 30 years of experience in oil and gas industry. A majority of our RMC members hold master’s or Ph.D. degrees, and have an average of more than 20 years of technical experience in relevant professional fields, such as geology, engineering and economics.
Our reserves estimates are guided by procedural manuals and technical guidance formulated by the Company. A number of working divisions at the production bureau level, including the exploration, development and financial divisions, are responsible for initial collection and compilation of information about reserves. Experts from exploration, development and economic divisions prepare the initial report on the reserves estimate which is then reviewed by the RMC at the subsidiary level to ensure the qualitative and quantitative compliance with technical guidance as well as its accuracy and reasonableness. We also engage external consultants to assist in our compliance with the rules and regulations of the U.S. Securities and Exchange Commission. Our reserves estimation process is further facilitated by a specialised reserves database, which is improved and updated periodically.
65
25 CORE COMPETITIVENESS ANALYSIS
The Company is a large-scale integrated energy and petrochemical company with upstream, mid-stream and downstream operations. The Company is a large-scale oil and gas producer in China; in respect of refining capacity, it ranks first in China; equipped with a well-developed refined oil products sales network, the Company is the largest supplier of refined oil products in China; and in terms of ethylene production capacity, the Company ranks first in China, and has a well-established marketing network for chemical products.
The integrated business structure of the Company carries strong advantages in synergy among its various business segments, enabling the Company to continuously tap onto potentials in attaining an efficient and comprehensive utilization of its resources, and endowed the Company with strong resistance against risks, as well as remarkable capabilities in sustaining profitability.
The Company enjoys a favourable positioning with its operations located close to the consumer markets. Along with the steady growth in the Chinese economy, sales volume of both refined oil products and chemical products of the Company has been increasing steadily over the years; through continuous and specialised marketing efforts, the Company’s capability in international operations and market expansion has been further enhanced.
The Company owns a team of professionals with expertise in the production of oil and gas, operation of refineries and chemical plants, as well as marketing activities. The Company applies outstanding fine management measures with its remarkable capabilities in management of operations, and enjoys a favourable operational cost advantage in its downstream businesses.
The Company has formulated a well-established technology system and mechanism, and owns competent teams specialised in R&D covering a wide range of subjects; the four platforms for technology advancement is taking shape, which includes exploration and development of oil and gas, refining, petrochemicals and strategic emerging technology. With its overall technologies reaching state of the art level in the global arena, and some of them taking the lead globally, the Company enjoys a strong technical strength.
The Company always attaches great importance to the fulfilment of social responsibilities, and carries out the green and low carbon development strategy to pursue a sustainable development. Moreover, the Company enjoys an outstanding “Sinopec” brand name, plays an important role in the national economy and is a renowned and reputable company in China.
| 26 | RISK FACTORS |
In the course of its production and operations, the Company will actively take various measures to circumvent operational risks. However, in practice, it may not be possible to prevent the occurrence of all risks and uncertainties described below.
Risks with regard to the variations from macroeconomic situation: The business results of the Company are closely related to macroeconomic situation. The global economy experienced increasing inflationary pressure and uncertainty. The development of economy is increasingly constrained by climate change and environmental issues. The Company’s business could also be adversely affected by other factors such as the impact on export due to carbon tariffs and trade protectionism from certain countries, and negative impact on the investment of overseas oil and gas exploration and development and refining and chemical storage projects which results from the uncertainty of geopolitics, international crude oil price and etc.
Risks with regard to the cyclical effects from the industry: The majority of the Company’s operating income comes from the sales of refined oil products and petrochemical products, and part of those businesses and their related products are cyclic and are sensitive to macro-economy, cyclic changes of regional and global economy, the changes of the production capacity and output, demand of consumers, prices and supply of the raw materials, as well as prices and supply of the alternative products etc. Although the Company is an integrated company with upstream, midstream and downstream operations, it can only counteract the adverse influences of industry cycle to a certain extent.
Risks from the macroeconomic policies and government regulation: Although the Chinese government is gradually liberalizing the market entry regulations on petroleum and petrochemicals sector, the petroleum and petrochemical industries in China are still subject to entry regulations to a certain degree, which include: issuing the exploration and development licenses of crude oil and natural gas; issuing licenses in relation to exploration and development of crude oil and natural gas, issuing business licenses for trading crude oil and refined oil, setting caps for retail prices of gasoline, diesel and other oil products, the imposition of the special oil income levy; the formulation of refined oil import and export quotas and procedures; the formulation of safety, quality and environmental protection standards and the formulation of energy conservation policies; restrictions on high energy consumption and high pollution projects. In addition, the changes which have occurred or might occur in macroeconomic and industry policies such as the opening up the right of managing and using of imported crude oil; the enhancing control of refined oil export quotas; further reforming and improvement in pricing mechanism of natural gas, cost supervision of gas pipeline and access to third party; the accelerated establishment of unified natural gas energy measurement and pricing system; cancellation of qualification approval of the wholesale and storage of refined oil business, decentralisation of retail business authorisation of refined oil products to regional and city level government, further improvement in pricing mechanism of refined oil products, gas stations investment being fully opened to foreign investment; reforming in resource tax and environmental tax; launching a series of measures to strictly restrict energy efficiency and promote both energy conservation and carbon reduction in key areas; and issuing policies to promote transformation from the control of total energy consumption and energy consumption per unit of GDP to the control of total and intensity control of carbon emissions etc. Such changes might further intensify market competition and have certain effects on the operations and profitability of the Company.
Risks with regard to the changes from environmental legislation requirements: Our production activities generate waste liquids, gases, solids and noises etc. The Company has built up the supporting pollution prevention and risk control facilities to prevent and reduce the pollution to the environment. However, the relevant government authorities may issue and implement much stricter environmental protection laws and regulations, adopt much stricter environment protection standards. Under such situations, the Company may increase expenses in relation to the environment protection accordingly.
66
Risks from the uncertainties of obtaining additional oil and gas resources: The future sustainable development of the Company is partly dependent to a certain extent on our abilities in continuously discovering or acquiring additional oil and natural gas resources. To obtain additional oil and natural gas resources, the Company faces some inherent risks associated with exploration and development and/or with acquisition activities, and the Company has to invest a large amount of money with no guarantee of certainty. If the Company fails to acquire additional resources through further exploration, development and acquisition to increase the reserves of crude oil and natural gas, the oil and natural gas reserves and production of the Company may decline over time which may adversely affect the Company’s financial situation and operation performance.
Risks with regard to the external purchase of crude oil: A significant amount of crude oil as needed by the Company is satisfied through external purchases. In recent years, especially influenced by the mismatch between supply and demand of crude oil, geopolitics, global economic growth and other factors, the prices of crude oil fluctuate sharply. Additionally, the supply of crude oil may even be interrupted due to some extreme major incidents in certain regions. Although the Company has taken flexible countermeasures, it may not fully avoid risks associated with any significant fluctuation of international crude oil prices and sudden disruption of supply of crude oil from certain regions.
Risks with regard to the operation and natural disasters: The process of petroleum chemical production is exposed to the high risks of inflammation, explosion, toxicity, harm and environmental pollution and is vulnerable to extreme natural disasters. Such contingencies may cause serious impacts to the society, major financial losses to the Company and grievous injuries to people. The Company has always been laying great emphasis on the safety production, and has implemented a strict HSE management system as an effort to avoid such risks as far as possible. Meanwhile, the main assets and inventories of the Company as well as the possibility of damage to a third party have been insured. However, such measures may not shield the Company from financial losses or adverse impact resulting from such contingencies.
Investment risks: Petroleum and chemical sector is a capital-intensive industry. Although the Company has adopted a prudent investment strategy, improved the investment decision-making rules, developed negative investment lists, and conducted rigorous feasibility study and risk evaluation on each investment project, which consists of special verifications in raw material market, technical scheme, profitability, safety and environmental protection, legal compliance, etc., certain investment risks will still exist and expected returns may not be achieved due to major changes in factors such as market environment, prices of equipment and raw materials, and construction period during the implementation of the projects.
Risks with regard to overseas business development and management: The Company engages in oil and gas exploration, refining and chemical, warehouse logistics and international trading businesses in some regions outside China. The Company’s overseas businesses and assets are subject to the jurisdiction of the host country’s laws and regulations. In light of the complicated factors such as changes in international geopolitics, uncertainty of economic recovery, imbalance of global economy, competitiveness of industry and trade structure, exclusiveness of regional trading blocs, polarisation of benefits distribution in trade, and politicisation of economic and trade issues, as well as political, economic, social, security, legal and environmental risks in countries where overseas business and assets are located, including sanctions, barriers to entry, instability in the financial and taxation policies, contract defaults, tax dispute, the Company’s risks with regard to overseas business development and management could be increased.
Currency risks: At present, China implements an administered floating exchange rate regime based on market supply and demand which is regulated with reference to a basket of currencies in terms of the exchange rate of Renminbi. As the Company purchases a significant portion of crude oil in foreign currency which is based on US dollar denominated prices, the realized price of crude oil is based on international crude oil price. Despite the fact that, the price of the domestic refined oil products will change as the exchange rate of the Renminbi changes according to the pricing mechanism for the domestic refined oil products, and the price of other domestic petrochemical products will also be influenced by the price of the imported products, which to a large extent, smooths the impact of the Renminbi exchange rate on the processing and sales of the Company’s crude oil refined products. However, the fluctuation of the Renminbi exchange rate will still have an effect on the income of the upstream sector.
Cyber-security risks: The Company has a well-established network safety system. We establish an emergency response mechanism in relation to network security operation and information system, build an information platform of network security risk management and control, operate by a professional network security team, and devote significant resources to protecting our digital infrastructure and data against cyber-attacks. However, continuous attention should be paid to the coverage and efficiency of these protection measures. If our systems against cyber-security risk are proved to be insufficient or ineffective, we could be adversely affected by, among other things, disruptions to our business operations, and loss of proprietary information, thus causing harm to our personnel, property, environment and reputation. As cyber-security attacks continue to evolve, we may be required to expend additional resources to enhance our protective measures against cyber-security breaches, in particular increase investment in new solutions and technologies such as data security solution, business security solution, cloud computing, and Internet of Things devices.
By Order of the Board
Ma Yongsheng
Chairman
Beijing, China, 24 March 2023
67
REPORT OF THE BOARD OF SUPERVISORS
Dear Shareholders:
In 2022, the Board of Supervisors and each supervisor of Sinopec Corp. diligently performed their supervision responsibilities, actively participated in the supervision process of decision making, carefully reviewed and effectively supervised the major decisions of the Company, and endeavored to safeguard the interests of shareholders and the Company in accordance with the PRC Company Law and the Articles of Association of Sinopec Corp.
During the reporting period, the Board of Supervisors held four (4) meetings in total, and mainly reviewed and approved the proposals in relation to the Company’s annual report, financial statements, sustainable development report, internal control assessment report and working report of the Board of Supervisors etc. Details are as below:
On 25 March 2022, the 4th meeting of the eighth session of the Board of Supervisors was held, and the proposals in relation to the Financial Statements of Sinopec Corp. for 2021, Annual Report of Sinopec Corp. for 2021, Sustainable Development Report of Sinopec Corp. for 2021, Internal Control Assessment Report of Sinopec Corp. for 2021, Work Report of the Board of Supervisors of Sinopec Corp. for 2021, and Work Plan of the Board of Supervisors of Sinopec Corp. for 2022, were reviewed and approved at the meeting.
On 27 April 2022, the 5th meeting of the eighth session of the Board of Supervisors was held, and the proposal in relation to the First Quarterly Report of Sinopec Corp. for the three months ended 31 March 2022 and 20-F Report of Sinopec Corp. for 2021 were reviewed and approved at the meeting.
On 26 August 2022, the 6th meeting of the eighth session of the Board of Supervisors was held, the Interim Financial Statements of Sinopec Corp. for 2022, and the Interim Report of Sinopec Corp. for 2022 were reviewed and approved at the meeting.
On 18 October 2022, the 7th meeting of the eighth session of the Board of Supervisors was held, and the Third Quarterly Report of Sinopec Corp. for the three months ended 31 September 2022 was reviewed and approved at the meeting.
In addition, the Company organised the supervisors to attend the general meetings of shareholders and meetings of the Board. The Company also organised all of the supervisors to attend the trainings for directors and supervisors of listed companies organised by Beijing Securities Supervisory Bureau, which have further improved the Supervisors’ capabilities in performing supervisory duties.
In 2022, global economic growth slowed down, and China’s economic operation remained in a reasonable range. Through supervision and inspection on the production and operation management as well as financial management, the Board of Supervisors and all the supervisors concluded that facing the complex and changeable severe situation and unexpected changes, the company gave full play to the advantages of integration, made every effort to stabilize the operation and expanded the market, promoted innovation and development, strengthened reform and management, prevented risks and guarded the bottom line, coordinated and promoted all aspects of work, and achieved high-quality results. The Board of Supervisors had no objection to the supervised issues during the reporting period.
68
Firstly, the Board and the senior management of Sinopec Corp. performed their responsibilities pursuant to relevant laws and regulations. The Board diligently fulfilled its obligations and exercised its rights under the PRC Company Law and the Articles of Association, and made informed decisions on major issues. The senior management diligently executed the resolutions approved by the Board, made all-out efforts to tap potentials and enhance efficiency, optimise business structures, committed to achieving the annual target of business operations set by the Board. During the reporting period, the Board of Supervisors did not discover any behavior of any director or senior management which violated laws, regulations, or the Articles of Association, or was detrimental to the interests of Sinopec Corp. or its shareholders.
Secondly, the reports and financial statements prepared by Sinopec Corp. for 2022 complied with the relevant regulation of domestic and overseas securities regulators, the disclosed information truly, accurately, completely and fairly reflected Sinopec Corp.’s financial results and operation performance. The dividend distribution plan was made after comprehensive consideration of the long-term interests of Sinopec Corp. and the interests of the shareholders. No violation of confidential provisions by persons who prepared and reviewed the report was found.
Thirdly, Sinopec Corp.’s internal control system was effective. No material defects of internal control were found.
Fourthly, the consideration for assets transactions made by Sinopec Corp. was fair and reasonable, neither insider trading, damage to shareholders’ interest nor losses of corporate assets were discovered.
Fifthly, all connected transactions of the Company were in compliance with the relevant rules and regulations of domestic and overseas listing exchanges. The pricing of all the connected transaction was fair and reasonable. No behavior detrimental to the interests of Sinopec Corp. or its shareholders was discovered.
In 2023, the Board of Supervisors and each supervisor will continue to follow the principle of due diligence and integrity, earnestly perform the duties of supervision as delegated by the shareholders, strictly review the significant decisions, strengthen the process control and supervision, increase the strength of inspection and supervision on subsidiaries and protect Sinopec Corp.’s benefit and its shareholders’ interests.
Zhang Shaofeng
Chairman of the Board of Supervisors
24 March 2023
69
CHANGES IN SHARE CAPITAL AND SHAREHOLDINGS OF PRINCIPAL SHAREHOLDERS
| 1 | CHANGES IN THE SHARE CAPITAL |
Unit: share
| Item | Before change | Changes | After change | ||
| Amount | percentage (%) | Amount1 | Amount | percentage (%) | |
| RMB ordinary shares | 95,557,771,046 | 78.93 | (442,300,000) | 95,115,471,046 | 79.33 |
| Domestic listed foreign shares | – | – | – | – | – |
| Foreign shares listed overseas | 25,513,438,600 | 21.07 | (732,502,000) | 24,780,936,600 | 20.67 |
| Others | – | – | – | – | – |
| Total number of shares | 121,071,209,646 | 100 | (1,174,802,000) | 119,896,407,646 | 100 |
| Note 1: | During the reporting period, 442,300,000 A shares of Sinopec Corp. were repurchased and cancelled, and 732,502,000 H shares of Sinopec Corp. were repurchased and cancelled. During the reporting period, there was no issue of new shares, stock dividends, or conversion of provident fund into shares. |
| 2 | NUMBER OF SHAREHOLDERS AND THEIR SHAREHOLDINGS |
As of 31 December 2022, the total number of shareholders of Sinopec Corp. was 460,116 including 454,535 holders of A shares and 5,581 holders of H shares. As of 28 February 2023, the total number of shareholders of Sinopec Corp. was 456,042. Sinopec Corp. has complied with requirement for public float under the Hong Kong Listing Rules.
| (1) | Shareholdings of top ten shareholders |
The shareholdings of top ten shareholders as of 31 December 2022 are listed as below:
Unit: share
| Name of shareholders | Nature of Shareholders | Percentage of shareholdings % | Total number of shares held | Changes of Shareholding1 | Number of shares subject to pledges, marked or lock-up |
| China Petrochemical Corporation | State-owned Share | 67.20 | 80,572,167,393 | (2,137,060,000) | 0 |
HKSCC Nominees Limited2 | H Share | 20.55 | 24,634,899,298 | (751,307,861) | Unknown |
| 中國證券金融股份有限公司 | A Share | 1.94 | 2,325,374,407 | 0 | 0 |
| 中國石油天然氣集團有限公司 | A Share | 1.81 | 2,165,749,530 | 2,137,060,000 | 0 |
| 香港中央結算有限公司 | A Share | 0.96 | 1,145,800,026 | 90,846,205 | 0 |
中國人壽保險股份有限公司-傳統-普通保險產品-005L-CT001 滬 | A Share | 0.37 | 445,619,942 | (388,540,489) | 0 |
| 中央匯金資產管理有限責任公司 | A Share | 0.26 | 315,223,600 | 0 | 0 |
| 國信證券股份有限公司 | A Share | 0.20 | 235,151,924 | 32,788,339 | 0 |
中國工商銀行-上證 50 交易型 開放式指數證券投資基金 | A Share | 0.10 | 114,559,876 | 1,123,600 | 0 |
| 諶賀飛 | A Share | 0.08 | 93,611,700 | 93,611,700 | 0 |
| Note 1: | As compared with the number of shares held as of 31 December 2021. |
| Note 2: | Century Bright, an overseas wholly-owned subsidiary of China Petrochemical Corporation, held 767,916,000 H shares, accounting for 0.64% of the total issued share capital of Sinopec Corp. Those shareholdings were included in the total number of the shares held by HKSCC Nominees Limited. |
Statement on the connected relationship or acting in concert among the above-mentioned shareholders:
Sinopec Corp. is not aware of any connected relationship or acting in concert among or between the above-mentioned shareholders.
70
| (2) | Information disclosed by the shareholders of H shares in accordance with the SFO as of 31 December 2022 |
| Name of shareholders | Status of shareholders | Number of shares interested | % of Sinopec Corp.’s issued voting shares (H Share) |
| BlackRock, Inc. | Interest of corporation controlled by the substantial shareholder | 1,742,087,831(L) | 7.03(L) |
| Citigroup Inc. | Interest of corporation controlled by | 81,492,722(L) | 0.33(L) |
| the substantial shareholder | 46,520,916(S) | 0.19(S) | |
| Approved lending agent | 1,311,332,851(L) | 5.29(L) |
(L) : Long position, (S): Short position
| 3 | ISSUANCE AND LISTING OF SECURITIES |
| (1) | Issuance of securities during the reporting period |
There was no issuance of securities of Sinopec Corp. during the reporting period.
| (2) | Existing employee shares |
There were no existing employee shares of Sinopec Corp. during the reporting period.
| 4 | CHANGES IN THE CONTROLLING SHAREHOLDERS AND THE DE FACTO CONTROLLER |
There was no change in the controlling shareholder and the de facto controller of Sinopec Corp. during the reporting period.
| (1) | Controlling shareholder |
The controlling shareholder of Sinopec Corp. is China Petrochemical Corporation. Established in July 1998, China Petrochemical Corporation is a state-authorised investment organisation and a state-owned enterprise. The legal representative is Mr. Ma Yongsheng. Through re-organization in 2000, China Petrochemical Corporation injected its principal petroleum and petrochemical businesses into Sinopec Corp. and retained certain petrochemical facilities. It provides well-drilling services, well-logging services, downhole operation services, services in connection with manufacturing and maintenance of production equipment, engineering construction, and utility services including water and power and social services.
Shares of other listed companies directly held by China Petrochemical Corporation as of the end of the reporting period
| Name of Company | Number of Shares Held | Shareholding Percentage |
| Sinopec Engineering (Group) Co. Ltd | 2,907,856,000 | 65.67% |
| Sinopec Oilfield Service Corporation | 10,727,896,364 | 56.51% |
| Sinopec Oilfield Equipment Corporation | 456,756,300 | 48.54% |
| China Merchants Energy Shipping Co., Ltd | 1,095,463,711 | 13.48% |
| China National Petroleum Corporation | 1,830,210,000 | 1.00% |
| (2) | Other than HKSCC Nominees Limited, there was no other legal person shareholder holding 10% or more of the total issued share capital of Sinopec Corp. |
| (3) | Basic information of the de facto controller |
China Petrochemical Corporation is the de facto controller of Sinopec Corp.
| (4) | Diagram of the equity and controlling relationship between Sinopec Corp. and its de facto controller |
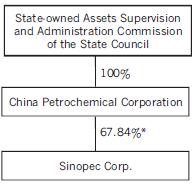
* : Inclusive of 767,916,000 H shares held by Century Bright (overseas wholly-owned subsidiary of China Petrochemical Corporation) through HKSCC Nominees Limited.
71
BOND GENERAL INFORMATION
| 1. | INTERBANK BOND MARKET DEBT FINANCING INSTRUMENT OF NON-FINANCIAL ENTERPRISES |
| Bond name | The first medium-term notes in 2020 | The second medium-term notes in 2020 | The third medium-term notes in 2020 | The first medium-term notes in 2021 | The second medium-term notes in 2021 | The third medium-term notes in 2021 | The first green medium-term notes in 2021 |
| Abbreviation | 20中石化 MTN001 | 20中石化 MTN002 | 20中石化 MTN003 | 21中石化 MTN001 | 21中石化 MTN002 | 21中石化 MTN003 | 21中石化 GN001 |
| code | 102000568 | 102000569 | 102001109 | 102101386 | 102101480 | 102101489 | 132100172 |
| Issuance date | 2020/3/31 | 2020/3/31 | 2020/5/27 | 2021/7/23 | 2021/8/5 | 2021/8/5 | 2021/12/27 |
| Interest commencement date | 2020/4/1 | 2020/4/1 | 2020/5/28 | 2021/7/27 | 2021/8/6 | 2021/8/9 | 2021/12/28 |
| Maturity date | 2023/4/1 | 2023/4/1 | 2023/5/28 | 2026/7/27 | 2024/8/6 | 2023/8/9 | 2024/12/28 |
| Amount issued (RMB billion) | 5 | 5 | 10 | 5 | 2 | 2 | 2.55 |
| Outstanding balance (RMB billion) | 5 | 5 | 10 | 5 | 2 | 2 | 2.55 |
| Interest rate (%) | 2.7 | 2.7 | 2.2 | 3.2 | 2.95 | 2.8 | 2.5 |
| Principal and interest repayment | Interest is paid once a year. The principal will be paid at maturity with last instalment of interest. | ||||||
| Investor Qualification Arrangement | Nationwide inter-bank bond market institutional investors | ||||||
| Applicable trading mechanism | Circulated and transferred in nationwide inter-bank bond market | ||||||
| Risk of suspension for listed trading (if any), and countermeasures | Not applicable | ||||||
| Trading market | Nationwide inter-bank bond market | ||||||
| Use of proceeds | Proceeds from the above-mentioned corporate bonds have been used for their designated purpose as disclosed in the corporate bond prospectus. All the proceeds have been completely used till now. | ||||||
| Credit rating | During the reporting period, United Credit Ratings Co., Ltd. issued the continuing credit rating report on May 23. The long-term credit rating of Sinopec Corp. remained AAA with its outlook being stable. | ||||||
| Special terms for Issuer or investor option or investor protection, whether triggered or executed | Not applicable | ||||||
| Guarantee, repayment scheme and other related events during the reporting period | No guarantee. Interest is paid as usual during the reporting period without triggering any guarantee. | ||||||
| Convening of corporate bond holders’ meeting | On 20 October 2022, the Company convened bondholders of three medium-term notes (20 Sinopec MTN001, 20 Sinopec MTN002, and 20 Sinopec MTN003) issued in 2020 to hold a bondholders’ meeting through online meeting on the reduction of registered capital caused by the cancellation of the Company’s share repurchase. The meeting passed the proposal that the holders of the three medium-term notes do not require the company to repay the bonds in advance or provide corresponding guarantees. Please refer to relevant announcements for details. | ||||||
| Performance of corporate bonds trustee | Corporate bonds trustee has performed its duties in accordance with regulatory requirements | ||||||
| Note: | Please refer to the website of Shanghai Stock Exchange (http://www.sse.com.cn), China Money Network (http://www.chinamoney.com.cn) and other websites for the name, office address, signing auditor, contact person and telephone number of the intermediary institutions providing services for the issuance of the debt financing instruments during the terms of the above-mentioned corporate bonds of the non-financial enterprises in the interbank market and other disclosed information in the offering circular. |
72
Principal accounting data and financial indicators for the two years ended 31 December 2022
| Principal data | 31 Dec. 2022 | 31 Dec. 2021 | Change | Reasons for change |
| Current ratio | 0.78 | 0.87 | (0.09) | Decrease in monetary funds |
| Quick ratio | 0.42 | 0.55 | (0.13) | Ditto |
| Liability-to-asset ratio | 51.91% | 51.51% | 0.4 percentage points | Increase in borrowings and decrease in monetary funds |
| Loan repayment rate | 100% | 100% | – | – |
| 2022 | 2021 | Change | Reasons for change | |
| Net profit/(loss) attributable to equity shareholders of the Company excluding extraordinary gains and losses (RMB million) | 57,182 | 72,220 | (15,038) | As a result of high crude oil prices and declining demand, refining and chemical business profits decreased |
| Net profit of the Company excluding extraordinary gains and losses (RMB million) | 62,287 | 85,935 | (23,648) | Ditto |
| EBITDA to total debt ratio | 1.02 | 1.41 | (0.39) | Decrease in total profit |
| EBITDA to interest coverage ratio | 12.16 | 15.12 | (2.96) | Ditto |
| Interest coverage ratio | 6.57 | 8.28 | (1.71) | Ditto |
| Cash interest coverage ratio | 14.80 | 43.56 | (28.76) | Year-on-year decrease in net operating cash flow |
| Interest payment rate | 100% | 100% | – | – |
| Note: | Liability-to-asset ratio indicates the ratio of total liabilities to total assets |
During the reporting period, the Company paid in full and on time the interest accrued for the other bonds and debt financing instruments. As at 31 December 2022, the standby credit line provided by several domestic financial institutions to the Company was RMB454.857 billion in total, facilitating the Company to get such amount of unsecured loans. The Company has fulfilled all the relevant undertakings in the corporate bond prospectus and had no significant matters which could influence the Company’s operation and debt paying ability.
On 18 April 2013, Sinopec Capital (2013) Limited, a wholly-owned overseas subsidiary of Sinopec Corp., issued senior notes guaranteed by the Company with four different maturities, 3 years, 5 years, 10 years and 30 years. The 3-year notes principal totaled USD750 million, with an annual interest rate of 1.250% and had been repaid and delisted; the 5-year notes principal totaled USD1 billion, with an annual interest rate of 1.875% and had been repaid and delisted; the 10-year notes principal totaled USD1.25 billion, with an annual interest rate of 3.125%; and the 30-year notes principal totaled USD500 million, with an annual interest rate of 4.250%. These notes were listed on the Hong Kong Stock Exchange on 25 April 2013, with interest payable semi-annually. The first payment of interest was made on 24 October 2013. During the reporting period, the Company has paid in full the current-period interests of all notes with 10 years and 30 years.
73
PRINCIPAL WHOLLY-OWNED AND CONTROLLED SUBSIDIARIES
On 31 December 2022, details of the principal wholly-owned and controlled subsidiaries of the Company were as follows:
| Name of Company | Registered Capital RMB million | Percentage of Shares Held by Sinopec Corp. (%) | Total Assets RMB million | Net Assets RMB million | Net Profit/ (Net Loss) RMB million | Principal Activities |
| Sinopec International Petroleum Exploration and Production Limited | 8,250 | 100 | 38,546 | 17,186 | 2,576 | Investment in exploration, production and sale of petroleum and natural gas |
| Sinopec Great Wall Energy & Chemical Company Limited | 22,761 | 100 | 31,986 | 17,879 | 3,531 | Coal chemical industry investment management, production and sale of coal chemical products |
| Sinopec Yangzi Petrochemical Company Limited | 15,651 | 100 | 31,129 | 16,602 | (4,558) | Manufacturing of intermediate petrochemical products and petroleum products |
| Sinopec Yizheng Chemical Fibre Limited Liability Company | 4,000 | 100 | 11,338 | 4,303 | (789) | Production and sale of polyester chips and polyester fibres |
| Sinopec Lubricant Company Limited | 3,374 | 100 | 9,299 | 4,987 | 244 | Production and sale of refined petroleum products, lubricant base oil, and petrochemical materials |
| Sinopec Qingdao Petrochemical Company Limited | 1,595 | 100 | 4,976 | 2,041 | 687 | Manufacturing of intermediate petrochemical products and petroleum products |
| Sinopec Chemical Sales Company Limited | 1,000 | 100 | 22,810 | 6,344 | 1,860 | Marketing and distribution of petrochemical products |
| China International United Petroleum and Chemical Company Limited | 5,000 | 100 | 258,399 | 54,442 | 6,439 | Trading of crude oil and petrochemical products |
| Sinopec Overseas Investment Holding Limited | 3,423 Million USD | 100 | 31,773 | 22,164 | 3,267 | Overseas investment and equity holding management |
| Sinopec Catalyst Company Limited | 1,500 | 100 | 13,807 | 6,705 | 823 | Production and sale of catalyst products |
| China Petrochemical International Company Limited | 1,400 | 100 | 23,490 | 4,947 | 1,175 | Trading of petrochemical products |
| Sinopec Beihai Refining and Chemical Limited Liability Company | 5,294 | 99 | 16,954 | 13,344 | 1,747 | Import and processing of crude oil, production, storage and sale of petroleum products and petrochemical products |
| Sinopec Qingdao Refining and Chemical Company Limited | 5,000 | 85 | 22,437 | 12,970 | 1,567 | Manufacturing of intermediate petrochemical products and petroleum products |
| Sinopec Hainan Refining and Chemical Company Limited | 9,606 | 100 | 45,728 | 23,256 | 55 | Manufacturing of intermediate petrochemical products and petroleum products |
| Sinopec Marketing Co., Limited | 28,403 | 70 | 516,792 | 246,984 | 19,902 | Marketing and distribution of refined petroleum products |
| Sinopec-SK(Wuhan) Petrochemical Company Limited | 7,193 | 59 | 26,032 | 9,738 | (1,101) | Production, sale, research and development of petroleum, petrochemical, ethylene and downstream by-products |
| Sinopec Kantons Holdings Limited | 248 Million HKD | 60 | 13,338 | 12,897 | 346 | Oil jetty and nature gas pipeline |
| Sinopec Shanghai Gaoqiao Petroleum and Chemical Limited | 10,000 | 55 | 39,593 | 24,046 | 3,157 | Manufacturing of intermediate petrochemical products and petroleum products |
| Sinopec Shanghai Petrochemical Company Limited | 10,824 | 50 | 41,243 | 26,372 | (2,868) | Manufacturing of synthetic fibres, resin and plastics, intermediate petrochemical products and petroleum products |
| Fujian Petrochemical Company Limited | 10,492 | 50 | 12,116 | 11,240 | (1,925) | Manufacturing of plastics, intermediate petrochemical products and petroleum products |
| Note 1: | All above subsidiaries except Fujian Petrochemical Company Limited are audited by KPMG Huazhen LLP or KPMG. |
| Note 2: | The above indicated total assets and net profit have been prepared in accordance with CASs. Except for Sinopec Kantons Holdings Limited and Sinopec Overseas Investment Holdings Ltd., which are incorporated in Bermuda and Hong Kong SAR, respectively, all of the above wholly-owned and non-wholly-owned subsidiaries are incorporated in the PRC. All of the above wholly-owned and controlling subsidiaries are limited liability companies except for Sinopec Shanghai Petrochemical Company Limited, Sinopec Marketing Co., Limited and Sinopec Kantons Holdings Limited. The Board of Directors considered that it would be redundant to disclose the particulars of all subsidiaries of Sinopec Corp. and, therefore, only those which have material impact on the results or assets of Sinopec Corp. are set out above. |
74
REPORT OF THE PRC AUDITOR
KPMG Huazhen LLP 8th Floor, KPMG Tower Oriental Plaza 1 East Chang An Avenue Beijing 100738 China Telephone +86 (10) 8508 5000 Fax +86 (10) 8518 5111 Internet kpmg.com/cn | 畢馬威華振會計師事務所 (特殊普通合夥) 中國北京 東長安街1號 東方廣場畢馬威大樓8層 郵政編碼:100738 電話 +86 (10) 8508 5000 傳真 +86 (10) 8518 5111 網址 kpmg.com/cn |
AUDITOR’S REPORT
畢馬威華振審字第2302663號
The Shareholders of China Petroleum & Chemical Corporation:
OPINION
We have audited the accompanying financial statements of China Petroleum & Chemical Corporation (“the Company”), which comprise the consolidated and company balance sheets as at 31 December 2022, the consolidated and company income statements, the consolidated and company cash flow statements, the consolidated and company statements of changes in shareholders’ equity for the year then ended, and notes to the financial statements.
In our opinion, the accompanying financial statements present fairly, in all material respects, the consolidated and company financial position of the Company as at 31 December 2022, and the consolidated and company financial performance and cash flows of the Company for the year then ended in accordance with Accounting Standards for Business Enterprises issued by the Ministry of Finance of the People’s Republic of China.
BASIS FOR OPINION
We conducted our audit in accordance with China Standards on Auditing for Certified Public Accountants (“CSAs”). Our responsibilities under those standards are further described in the Auditor’s Responsibilities for the Audit of the Financial Statements section of our report. We are independent of the Company in accordance with the China Code of Ethics for Certified Public Accountants (“the Code”), and we have fulfilled our other ethical responsibilities in accordance with the Code. We believe that the audit evidence we have obtained is sufficient and appropriate to provide a basis for our opinion.
KEY AUDIT MATTERS
Key audit matters are those matters that, in our professional judgement, were of most significance in our audit of the financial statements of the current period. These matters were addressed in the context of our audit of the financial statements as a whole, and in forming our opinion thereon, and we do not provide a separate opinion on these matters.
| Assessment of impairment of fixed assets relating to oil and gas producing activities | |
| Refer to Note 3 (8) Oil and gas properties, (12) Impairment of other non-financial long-term assets, Note 13 Fixed assets, and Note 58 Principal accounting estimates and judgements to the financial statements | |
| The Key Audit Matter | How the matter was addressed in our audit |
The Company reported fixed assets of Renminbi (“RMB”) 630,758 million as at 31 December 2022, a portion of which related to oil and gas producing activities. The Company reported impairment losses of RMB2,891 million for the fixed assets relating to oil and gas producing activities for the year ended 31 December 2022. The Company groups fixed assets relating to oil and gas producing activities into cash-generating units (“CGUs”) for impairment assessment. The Company compares the carrying amount of individual CGU with its value in use, using a discounted cash flow forecast, which was prepared based on the future production profiles included in the oil and gas reserves reports, to determine the impairment loss to be recognised. We identified assessment of impairment of fixed assets relating to oil and gas producing activities as a key audit matter. The value in use amounts of these CGUs are sensitive to the changes to future selling prices and production costs for crude oil and natural gas, future production profiles, and discount rates. Therefore a higher degree of subjective auditor judgment was required to evaluate the Company’s impairment assessment of fixed assets relating to oil and gas producing activities. | The following are the primary procedures we performed to address this key audit matter: • we evaluated the design and tested the operating effectiveness of certain internal controls related to the process for impairment assessment of fixed assets relating to oil and gas producing activities; • we assessed the competence, capabilities and objectivity of the Company’s reserves specialists and evaluated the methodology adopted by them in estimating the oil and gas reserves against the recognised industry standards; • we compared future selling prices for crude oil and natural gas used in the discounted cash flow forecasts with the Company’s business plans and forecasts by external analysts; • we compared future production costs and future production profiles used in the discounted cash flow forecasts with oil and gas reserves reports issued by the reserves specialists; and • we involved valuation professionals with specialised skills and knowledge, who assisted in assessing the discount rates applied in the discounted cash flow forecasts against a discount rate range that was independently developed using publicly available market data for comparable companies in the same industry. |
75
OTHER INFORMATION
The Company’s management is responsible for the other information. The other information comprises all the information included in 2022 annual report of the Company, other than the financial statements and our auditor’s report thereon.
Our opinion on the financial statements does not cover the other information and we do not express any form of assurance conclusion thereon.
In connection with our audit of the financial statements, our responsibility is to read the other information and, in doing so, consider whether the other information is materially inconsistent with the financial statements or our knowledge obtained in the audit or otherwise appears to be materially misstated.
If, based on the work we have performed, we conclude that there is a material misstatement of this other information, we are required to report that fact. We have nothing to report in this regard.
RESPONSIBILITIES OF MANAGEMENT AND THOSE CHARGED WITH GOVERNANCE FOR THE FINANCIAL STATEMENTS
Management is responsible for the preparation and fair presentation of the financial statements in accordance with the Accounting Standards for Business Enterprises, and for the design, implementation and maintenance of such internal control necessary to enable that the financial statements are free from material misstatement, whether due to fraud or error.
In preparing the financial statements, management is responsible for assessing the Company’s ability to continue as a going concern, disclosing, as applicable, matters related to going concern and using the going concern basis of accounting unless management either intends to liquidate the Company or to cease operations, or has no realistic alternative but to do so.
Those charged with governance are responsible for overseeing the Company’s financial reporting process.
AUDITOR’S RESPONSIBILITIES FOR THE AUDIT OF THE FINANCIAL STATEMENTS
Our objectives are to obtain reasonable assurance about whether the financial statements as a whole are free from material misstatement, whether due to fraud or error, and to issue an auditor’s report that includes our opinion. Reasonable assurance is a high level of assurance, but is not a guarantee that an audit conducted in accordance with CSAs will always detect a material misstatement when it exists. Misstatements can arise from fraud or error and are considered material if, individually or in the aggregate, they could reasonably be expected to influence the economic decisions of users taken on the basis of these financial statements.
As part of an audit in accordance with CSAs, we exercise professional judgement and maintain professional scepticism throughout the audit. We also:
| • | Identify and assess the risks of material misstatement of the financial statements, whether due to fraud or error, design and perform audit procedures responsive to those risks, and obtain audit evidence that is sufficient and appropriate to provide a basis for our opinion. The risk of not detecting a material misstatement resulting from fraud is higher than for one resulting from error, as fraud may involve collusion, forgery, intentional omissions, misrepresentations, or the override of internal control. |
| • | Obtain an understanding of internal control relevant to the audit in order to design audit procedures that are appropriate in the circumstances. |
| • | Evaluate the appropriateness of accounting policies used and the reasonableness of accounting estimates and related disclosures made by management. |
| • | Conclude on the appropriateness of management’s use of the going concern basis of accounting and, based on the audit evidence obtained, whether a material uncertainty exists related to events or conditions that may cast significant doubt on the Company’s ability to continue as a going concern. If we conclude that a material uncertainty exists, we are required to draw attention in our auditor’s report to the related disclosures in the financial statements or, if such disclosures are inadequate, to modify our opinion. Our conclusions are based on the audit evidence obtained up to the date of our auditor’s report. However, future events or conditions may cause the Company to cease to continue as a going concern. |
| • | Evaluate the overall presentation, structure and content of the financial statements, including the disclosures, and whether the financial statements represent the underlying transactions and events in a manner that achieves fair presentation. |
| • | Obtain sufficient appropriate audit evidence regarding the financial information of the entities or business activities within the Company to express an opinion on the financial statements. We are responsible for the direction, supervision and performance of the group audit. We remain solely responsible for our audit opinion. |
We communicate with those charged with governance regarding, among other matters, the planned scope and timing of the audit and significant audit findings, including any significant deficiencies in internal control that we identify during our audit.
76
AUDITOR’S RESPONSIBILITIES FOR THE AUDIT OF THE FINANCIAL STATEMENTS (Continued)
We also provide those charged with governance with a statement that we have complied with relevant ethical requirements regarding independence, and communicate with them all relationships and other matters that may reasonably be thought to bear on our independence and, where applicable, related safeguards.
From the matters communicated with those charged with governance, we determine those matters that were of most significance in the audit of the financial statements of the current period and are therefore the key audit matters. We describe these matters in our auditor’s report unless law or regulation precludes public disclosure about the matter or when, in extremely rare circumstances, we determine that a matter should not be communicated in our report because the adverse consequences of doing so would reasonably be expected to outweigh the public interest benefits of such communication.
| KPMG Huazhen LLP | Certified Public Accountants |
| Beijing, China | Registered in the People’s |
| Republic of China | |
| Yang Jie (Engagement Partner) | |
| He Shu |
24 March 2023
77
| (A) | FINANCIAL STATEMENTS PREPARED UNDER CHINA ACCOUNTING STANDARDS FOR BUSINESS ENTERPRISES CONSOLIDATED BALANCE SHEET |
As at 31 December 2022
| Notes | At 31 December | At 31 December | |
| 2022 | 2021 | ||
| RMB million | RMB million | ||
| Assets | |||
| Current assets | |||
| Cash at bank and on hand | 5 | 145,052 | 221,989 |
| Financial assets held for trading | 2 | – | |
| Derivative financial assets | 6 | 19,335 | 18,371 |
| Accounts receivable | 7 | 46,364 | 34,861 |
| Receivables financing | 8 | 3,507 | 5,939 |
| Prepayments | 9 | 7,956 | 9,267 |
| Other receivables | 10 | 27,009 | 35,664 |
| Inventories | 11 | 244,241 | 207,433 |
| Other current assets | 29,674 | 24,500 | |
| Total current assets | 523,140 | 558,024 | |
| Non-current assets | |||
| Long-term equity investments | 12 | 233,941 | 209,179 |
| Other equity instrument investments | 730 | 767 | |
| Fixed assets | 13 | 630,758 | 598,932 |
| Construction in progress | 14 | 196,045 | 155,939 |
| Right-of-use assets | 15 | 178,359 | 184,974 |
| Intangible assets | 16 | 120,694 | 119,210 |
| Goodwill | 17 | 6,464 | 8,594 |
| Long-term deferred expenses | 18 | 12,034 | 10,007 |
| Deferred tax assets | 19 | 19,952 | 19,389 |
| Other non-current assets | 20 | 26,523 | 24,240 |
| Total non-current assets | 1,425,500 | 1,331,231 | |
| Total assets | 1,948,640 | 1,889,255 | |
| Liabilities and shareholders’ equity | |||
| Current liabilities | |||
| Short-term loans | 22 | 21,313 | 27,366 |
| Derivative financial liabilities | 6 | 7,313 | 3,223 |
| Bills payable | 23 | 10,782 | 11,721 |
| Accounts payable | 24 | 258,642 | 203,919 |
| Contract liabilities | 25 | 125,444 | 124,622 |
| Employee benefits payable | 26 | 13,617 | 14,048 |
| Taxes payable | 27 | 28,379 | 81,267 |
| Other payables | 28 | 119,892 | 114,701 |
| Non-current liabilities due within one year | 29 | 62,844 | 28,651 |
| Other current liabilities | 30 | 19,159 | 31,762 |
| Total current liabilities | 667,385 | 641,280 | |
| Non-current liabilities | |||
| Long-term loans | 31 | 94,964 | 49,341 |
| Debentures payable | 32 | 12,997 | 42,649 |
| Lease liabilities | 33 | 166,407 | 170,233 |
| Provisions | 34 | 47,587 | 43,525 |
| Deferred tax liabilities | 19 | 8,079 | 7,910 |
| Other non-current liabilities | 35 | 14,068 | 18,276 |
| Total non-current liabilities | 344,102 | 331,934 | |
| Total liabilities | 1,011,487 | 973,214 | |
| Shareholders’ equity | |||
| Share capital | 36 | 119,896 | 121,071 |
| Capital reserve | 37 | 118,875 | 120,188 |
| Other comprehensive income | 38 | 3,072 | (690) |
| Specific reserve | 2,813 | 2,664 | |
| Surplus reserves | 39 | 217,834 | 213,224 |
| Retained earnings | 323,087 | 318,645 | |
| Total equity attributable to shareholders of the Company | 785,577 | 775,102 | |
| Minority interests | 151,576 | 140,939 | |
| Total shareholders’ equity | 937,153 | 916,041 | |
| Total liabilities and shareholders’ equity | 1,948,640 | 1,889,255 |
These financial statements have been approved for issue by the board of directors on 24 March 2023.
| Ma Yongsheng | Yu Baocai | Shou Donghua |
| Chairman | President | Chief Financial Officer |
| (Legal representative) |
The accompanying notes form part of these financial statements.
78
BALANCE SHEET
As at 31 December 2022
| Notes | At 31 December | At 31 December | |
| 2022 | 2021 | ||
| RMB million | RMB million | ||
| Assets | |||
| Current assets | |||
| Cash at bank and on hand | 54,578 | 110,691 | |
| Financial assets held for trading | 2 | – | |
| Derivative financial assets | 3,892 | 4,503 | |
| Accounts receivable | 7 | 33,841 | 21,146 |
| Receivables financing | 703 | 227 | |
| Prepayments | 9 | 4,461 | 4,540 |
| Other receivables | 10 | 38,517 | 46,929 |
| Inventories | 70,376 | 63,661 | |
| Other current assets | 21,260 | 23,408 | |
| Total current assets | 227,630 | 275,105 | |
| Non-current assets | |||
| Long-term equity investments | 12 | 382,879 | 360,847 |
| Other equity instrument investments | 201 | 201 | |
| Fixed assets | 13 | 296,530 | 284,622 |
| Construction in progress | 14 | 81,501 | 66,146 |
| Right-of-use assets | 15 | 91,549 | 105,712 |
| Intangible assets | 8,095 | 9,334 | |
| Long-term deferred expenses | 4,183 | 2,875 | |
| Deferred tax assets | 7,737 | 8,715 | |
| Other non-current assets | 41,365 | 34,227 | |
| Total non-current assets | 914,040 | 872,679 | |
| Total assets | 1,141,670 | 1,147,784 | |
| Liabilities and shareholders’ equity | |||
| Current liabilities | |||
| Short-term loans | 4,010 | 16,550 | |
| Derivative financial liabilities | 4,299 | 1,121 | |
| Bills payable | 4,038 | 6,058 | |
| Accounts payable | 107,105 | 85,307 | |
| Contract liabilities | 9,769 | 7,505 | |
| Employee benefits payable | 8,467 | 8,398 | |
| Taxes payable | 12,044 | 46,333 | |
| Other payables | 247,480 | 211,179 | |
| Non-current liabilities due within one year | 39,990 | 16,737 | |
| Other current liabilities | 1,002 | 13,702 | |
| Total current liabilities | 438,204 | 412,890 | |
| Non-current liabilities | |||
| Long-term loans | 56,755 | 34,258 | |
| Debentures payable | 9,537 | 31,522 | |
| Lease liabilities | 91,878 | 104,426 | |
| Provisions | 38,298 | 35,271 | |
| Other non-current liabilities | 2,121 | 3,103 | |
| Total non-current liabilities | 198,589 | 208,580 | |
| Total liabilities | 636,793 | 621,470 | |
| Shareholders’ equity | |||
| Share capital | 119,896 | 121,071 | |
| Capital reserve | 63,628 | 67,897 | |
| Other comprehensive income | 827 | 6,024 | |
| Specific reserve | 1,745 | 1,658 | |
| Surplus reserves | 217,834 | 213,224 | |
| Retained earnings | 100,947 | 116,440 | |
| Total shareholders’ equity | 504,877 | 526,314 | |
| Total liabilities and shareholders’ equity | 1,141,670 | 1,147,784 |
These financial statements have been approved for issue by the board of directors on 24 March 2023.
| Ma Yongsheng | Yu Baocai | Shou Donghua |
| Chairman | President | Chief Financial Officer |
| (Legal representative) |
The accompanying notes form part of these financial statements.
79
CONSOLIDATED INCOME STATEMENT
For the year ended 31 December 2022
| Notes | 2022 | 2021 | |
| RMB million | RMB million | ||
| Operating income | 40 | 3,318,168 | 2,740,884 |
| Less: Operating costs | 40 | 2,819,363 | 2,216,551 |
| Taxes and surcharges | 41 | 263,991 | 259,032 |
| Selling and distribution expenses | 44 | 58,567 | 57,891 |
| General and administrative expenses | 45 | 57,208 | 62,535 |
| Research and development expenses | 46 | 12,773 | 11,481 |
| Financial expenses | 42 | 9,974 | 9,010 |
| Including: Interest expenses | 16,769 | 15,018 | |
| Interest income | 6,266 | 5,732 | |
| Exploration expenses, including dry holes | 47 | 10,591 | 12,382 |
| Add: Other income | 48 | 8,219 | 5,850 |
| Investment income | 49 | 14,462 | 6,032 |
| Including: Income from investment in associates and joint ventures | 14,479 | 23,253 | |
| (Losses)/gains from changes in fair value | 50 | (1,715) | 3,341 |
| Credit impairment reversals/(losses) | 1,084 | (2,311) | |
| Impairment losses | 51 | (12,009) | (13,165) |
| Asset disposal gains | 672 | 665 | |
| Operating profit | 96,414 | 112,414 | |
| Add: Non-operating income | 52 | 2,960 | 3,516 |
| Less: Non-operating expenses | 53 | 4,859 | 7,582 |
| Profit before taxation | 94,515 | 108,348 | |
| Less: Income tax expense | 54 | 18,757 | 23,318 |
| Net profit | 75,758 | 85,030 | |
| Including: Net loss of acquiree before business combination under common control | – | (200) | |
| Classification by continuity of operations: | |||
| Net profit from continuing operations | 75,758 | 85,030 | |
| Net profit from discontinued operations | – | – | |
| Classification by ownership: | |||
| Equity shareholders of the Company | 66,302 | 71,208 | |
| Minority interests | 9,456 | 13,822 | |
| Basic earnings per share | 64 | 0.548 | 0.588 |
| Diluted earnings per share | 64 | 0.548 | 0.588 |
| Other comprehensive income | 38 | ||
| Items that may not be reclassified subsequently to profit or loss | (67) | (4) | |
| Changes in fair value of other equity instrument investments | (67) | (4) | |
| Items that may be reclassified subsequently to profit or loss | 21,896 | 17,511 | |
| Other comprehensive income that can be reclassified to profit under the equity method | 2,856 | 441 | |
| Cost of hedging reserve | 149 | (220) | |
| Cash flow hedges | 11,637 | 19,018 | |
| Foreign currency translation differences | 7,254 | (1,728) | |
| Total other comprehensive income | 21,829 | 17,507 | |
| Total comprehensive income | 97,587 | 102,537 | |
| Attributable to: | |||
| Equity shareholders of the Company | 85,428 | 88,782 | |
| Minority interests | 12,159 | 13,755 |
These financial statements have been approved for issue by the board of directors on 24 March 2023.
| Ma Yongsheng | Yu Baocai | Shou Donghua |
| Chairman | President | Chief Financial Officer |
| (Legal representative) |
The accompanying notes form part of these financial statements.
80
INCOME STATEMENT
For the year ended 31 December 2022
| Notes | 2022 | 2021 | |
| RMB million | RMB million | ||
| Operating income | 40 | 1,302,073 | 1,045,000 |
| Less: Operating costs | 40 | 1,052,885 | 808,540 |
| Taxes and surcharges | 165,940 | 156,174 | |
| Selling and distribution expenses | 1,964 | 1,774 | |
| General and administrative expenses | 24,415 | 30,551 | |
| Research and development expenses | 11,490 | 10,102 | |
| Financial expenses | 10,459 | 10,644 | |
| Including: Interest expenses | 18,986 | 13,602 | |
| Interest income | 8,662 | 2,953 | |
| Exploration expenses, including dry holes | 9,087 | 10,502 | |
| Add: Other income | 5,908 | 4,045 | |
| Investment income | 49 | 29,221 | 30,881 |
| Including: Income from investment in associates and joint ventures | 4,449 | 8,151 | |
| (Losses)/gains from changes in fair value | (980) | 644 | |
| Credit impairment reversal | 9 | 1 | |
| Impairment losses | (6,999) | (7,192) | |
| Asset disposal gains | 139 | 58 | |
| Operating profit | 53,131 | 45,150 | |
| Add: Non-operating income | 1,209 | 776 | |
| Less: Non-operating expenses | 1,992 | 2,209 | |
| Profit before taxation | 52,348 | 43,717 | |
| Less: Income tax expense | 6,244 | 4,273 | |
| Net profit | 46,104 | 39,444 | |
| Classification by continuity of operations: | |||
| Net profit from continuing operations | 46,104 | 39,444 | |
| Net profit from discontinued operations | – | – | |
| Other comprehensive income | |||
| Items that may be reclassified subsequently to profit or loss | 5,736 | 13,612 | |
| Other comprehensive income that can be reclassified to profit or loss under the equity method | 10 | 12 | |
| Cash flow hedges reserve | 5,726 | 13,600 | |
| Total other comprehensive income | 5,736 | 13,612 | |
| Total comprehensive income | 51,840 | 53,056 |
These financial statements have been approved for issue by the board of directors on 24 March 2023.
| Ma Yongsheng | Yu Baocai | Shou Donghua |
| Chairman | President | Chief Financial Officer |
| (Legal representative) |
The accompanying notes form part of these financial statements.
81
CONSOLIDATED CASH FLOW STATEMENT
For the year ended 31 December 2022
| Notes | 2022 | 2021 | |
| RMB million | RMB million | ||
| Cash flows from operating activities: | |||
| Cash received from sale of goods and rendering of services | 3,550,138 | 2,980,918 | |
| Refund of taxes and levies | 12,010 | 4,641 | |
| Other cash received relating to operating activities | 269,895 | 158,049 | |
| Sub-total of cash inflows | 3,832,043 | 3,143,608 | |
| Cash paid for goods and services | (2,914,966) | (2,317,629) | |
| Cash paid to and for employees | (102,171) | (95,778) | |
| Payments of taxes and levies | (385,818) | (325,348) | |
| Other cash paid relating to operating activities | (312,819) | (179,679) | |
| Sub-total of cash outflows | (3,715,774) | (2,918,434) | |
| Net cash flow from operating activities | 56(a) | 116,269 | 225,174 |
| Cash flows from investing activities: | |||
| Cash received from disposal of investments | 1,980 | 9,812 | |
| Cash received from returns on investments | 13,969 | 10,134 | |
| Net cash received from disposal of fixed assets, intangible assets and other long-term assets | 212 | 1,478 | |
| Net cash received from disposal of subsidiaries and other business entities | 56(d) | 10,041 | 5,205 |
| Other cash received relating to investing activities | 103,157 | 38,208 | |
| Sub-total of cash inflows | 129,359 | 64,837 | |
| Cash paid for acquisition of fixed assets, intangible assets and other long-term assets | (172,527) | (144,921) | |
| Cash paid for acquisition of investments | (10,456) | (13,085) | |
| Net cash paid for the acquisition of subsidiaries and other business entities | (7,881) | (1,106) | |
| Other cash paid relating to investing activities | (33,505) | (50,923) | |
| Sub-total of cash outflows | (224,369) | (210,035) | |
| Net cash flow from investing activities | (95,010) | (145,198) | |
| Cash flows from financing activities: | |||
| Cash received from capital contributions | 3,946 | 1,001 | |
| Including: Cash received from minority shareholders’ capital contributions to subsidiaries | 3,946 | 1,001 | |
| Cash received from borrowings | 564,417 | 356,459 | |
| Other cash received relating to financing activities | 989 | 133 | |
| Sub-total of cash inflows | 569,352 | 357,593 | |
| Cash repayments of borrowings | (514,275) | (338,232) | |
| Cash paid for dividends, profits distribution or interest | (71,831) | (49,027) | |
| Including: Subsidiaries’ cash payments for distribution of dividends or profits to minority shareholders | (5,249) | (8,068) | |
| Other cash paid relating to financing activities | 56(e) | (22,945) | (28,276) |
| Sub-total of cash outflows | (609,051) | (415,535) | |
| Net cash flow from financing activities | (39,699) | (57,942) | |
| Effects of changes in foreign exchange rate | 3,288 | (1,003) | |
| Net (decrease)/increase in cash and cash equivalents | 56(b) | (15,152) | 21,031 |
| Add: Cash and cash equivalents at the beginning of the year | 108,590 | 87,559 | |
| Cash and cash equivalents at the end of the period | 56(c) | 93,438 | 108,590 |
These financial statements have been approved for issue by the board of directors on 24 March 2023.
| Ma Yongsheng | Yu Baocai | Shou Donghua |
| Chairman | President | Chief Financial Officer |
| (Legal representative) |
The accompanying notes form part of these financial statements.
82
CASH FLOW STATEMENT
For the year ended 31 December 2022
| Notes | 2022 | 2021 | |
| RMB million | RMB million | ||
| Cash flows from operating activities: | |||
| Cash received from sale of goods and rendering of services | 1,455,182 | 1,155,516 | |
| Refund of taxes and levies | 6,627 | 2,959 | |
| Other cash received relating to operating activities | 18,597 | 13,868 | |
| Sub-total of cash inflows | 1,480,406 | 1,172,343 | |
| Cash paid for goods and services | (1,085,666) | (823,402) | |
| Cash paid to and for employees | (52,488) | (49,784) | |
| Payments of taxes and levies | (224,935) | (181,187) | |
| Other cash paid relating to operating activities | (72,928) | (25,895) | |
| Sub-total of cash outflows | (1,436,017) | (1,080,268) | |
| Net cash flow from operating activities | 44,389 | 92,075 | |
| Cash flows from investing activities: | |||
| Cash received from disposal of investments | 7,174 | 32,738 | |
| Cash received from returns on investments | 24,835 | 22,712 | |
| Net cash received from disposal of fixed assets, intangible assets and other long-term assets | 26 | 72 | |
| Net cash received from disposal of subsidiaries and other business units | 3,259 | – | |
| Other cash received relating to investing activities | 233,475 | 136,276 | |
| Sub-total of cash inflows | 268,769 | 191,798 | |
| Cash paid for acquisition of fixed assets, intangible assets and other long-term assets | (82,711) | (70,578) | |
| Cash paid for acquisition of investments | (28,108) | (52,212) | |
| Other cash paid relating to investing activities | (178,354) | (134,009) | |
| Sub-total of cash outflows | (289,173) | (256,799) | |
| Net cash flow from investing activities | (20,404) | (65,001) | |
| Cash flows from financing activities: | |||
| Cash received from borrowings | 207,045 | 159,879 | |
| Other cash received relating to financing activities | 403,573 | 298,755 | |
| Sub-total of cash inflows | 610,618 | 458,634 | |
| Cash repayments of borrowings | (194,735) | (151,310) | |
| Cash paid for dividends or interest | (65,474) | (42,933) | |
| Other cash paid relating to financing activities | (385,406) | (284,979) | |
| Sub-total of cash outflows | (645,615) | (479,222) | |
| Net cash flow from financing activities | (34,997) | (20,588) | |
| Effects of changes in foreign exchange rate | (335) | 8 | |
| Net (decrease)/increase in cash and cash equivalents | (11,347) | 6,494 | |
| Add: Cash and cash equivalents at the beginning of the year | 34,575 | 28,081 | |
| Cash and cash equivalents at the end of the period | 23,228 | 34,575 |
These financial statements have been approved for issue by the board of directors on 24 March 2023.
| Ma Yongsheng | Yu Baocai | Shou Donghua |
| Chairman | President | Chief Financial Officer |
| (Legal representative) |
The accompanying notes form part of these financial statements.
83
CONSOLIDATED STATEMENT OF CHANGES IN EQUITY
For the year ended 31 December 2022
| Share capital | Capital reserve | Other comprehensive income | Specific reserve | Surplus reserves | Retained earnings | Total shareholders ’ equity attributable to equity shareholders of the Company | Minority interests | Total shareholders’ equity | |
| RMB million | RMB million | RMB million | RMB million | RMB million | RMB million | RMB million | RMB million | RMB million | |
| Balance at 1 January 2021 | 121,071 | 127,389 | 1,038 | 1,941 | 209,280 | 286,575 | 747,294 | 141,426 | 888,720 |
| Change for the year | |||||||||
| 1. Net profit | – | – | – | – | – | 71,208 | 71,208 | 13,822 | 85,030 |
| 2. Other comprehensive income (Note 38) | – | – | 17,574 | – | – | – | 17,574 | (67) | 17,507 |
| Total comprehensive income | – | – | 17,574 | – | – | 71,208 | 88,782 | 13,755 | 102,537 |
| Amounts transferred to initial carrying amount of hedged items | – | – | (19,302) | – | – | – | (19,302) | (648) | (19,950) |
| Transactions with owners, recorded directly in shareholders’ equity: | |||||||||
| 3. Appropriations of profits: | |||||||||
| – Appropriations for surplus reserves | – | – | – | – | 3,944 | (3,944) | – | – | – |
| – Distributions to shareholders (Note 55) | – | – | – | – | – | (35,110) | (35,110) | – | (35,110) |
| 4. Contributions to subsidiaries from minority interests | – | – | – | – | – | – | – | 1,973 | 1,973 |
| 5. Transaction with minority interests | – | (1,396) | – | – | – | – | (1,396) | (6,796) | (8,192) |
| 6. Distributions to minority interests | – | – | – | – | – | – | – | (8,982) | (8,982) |
| 7. Adjustment for business combination of entities under common control | – | (6,124) | – | – | – | – | (6,124) | – | (6,124) |
| Total transactions with owners, recorded directly in shareholders’ equity | – | (7,520) | – | – | 3,944 | (39,054) | (42,630) | (13,805) | (56,435) |
| 8. Net increase in specific reserve for the year | – | – | – | 723 | – | – | 723 | 52 | 775 |
| 9. Others | – | 319 | – | – | – | (84) | 235 | 159 | 394 |
| Balance at 31 December 2021 | 121,071 | 120,188 | (690) | 2,664 | 213,224 | 318,645 | 775,102 | 140,939 | 916,041 |
| Balance at 1 January 2022 | 121,071 | 120,188 | (690) | 2,664 | 213,224 | 318,645 | 775,102 | 140,939 | 916,041 |
| Change for the year | |||||||||
| 1. Net profit | – | – | – | – | – | 66,302 | 66,302 | 9,456 | 75,758 |
| 2. Other comprehensive income (Note 38) | – | – | 19,126 | – | – | – | 19,126 | 2,703 | 21,829 |
| Total comprehensive income | – | – | 19,126 | – | – | 66,302 | 85,428 | 12,159 | 97,587 |
| Amounts transferred to initial carrying amount of hedged items | – | – | (15,363) | – | – | – | (15,363) | (439) | (15,802) |
| Transactions with owners, recorded directly in shareholders’ equity: | |||||||||
| 3. Decrease of shareholders’ capital: | |||||||||
| – Purchase of own shares (Note 36) | (1,175) | (3,004) | – | – | – | – | (4,179) | – | (4,179) |
| 4. Appropriations of profits: | |||||||||
| – Appropriations for surplus reserves (Note 39) | – | – | – | – | 4,610 | (4,610) | – | – | – |
| – Distributions to shareholders (Note 55) | – | – | – | – | – | (56,903) | (56,903) | – | (56,903) |
| 5. Contributions to subsidiaries from minority interests | – | – | – | – | – | – | – | 5,395 | 5,395 |
| 6. Transaction with minority interests | – | – | – | – | – | – | – | (1,713) | (1,713) |
| 7. Distributions to minority interests | – | – | – | – | – | – | – | (6,691) | (6,691) |
| 8. Other contributions | – | 2,678 | – | – | – | – | 2,678 | 2,191 | 4,869 |
| Total transactions with owners, recorded directly in shareholders’ equity | (1,175) | (326) | – | – | 4,610 | (61,513) | (58,404) | (818) | (59,222) |
| 9. Net increase in specific reserve for the year | – | – | – | 149 | – | – | 149 | 30 | 179 |
| 10. Other equity movements under the equity method | – | (1,009) | – | – | – | – | (1,009) | – | (1,009) |
| 11. Transfer of other comprehensive income to retained earnings | – | – | (1) | – | – | 1 | – | – | – |
| 12. Others | – | 22 | – | – | – | (348) | (326) | (295) | (621) |
| Balance at 31 December 2022 | 119,896 | 118,875 | 3,072 | 2,813 | 217,834 | 323,087 | 785,577 | 151,576 | 937,153 |
These financial statements have been approved for issue by the board of directors on 24 March 2023.
| Ma Yongsheng | Yu Baocai | Shou Donghua |
| Chairman | President | Chief Financial Officer |
| (Legal representative) |
The accompanying notes form part of these financial statements.
84
STATEMENT OF CHANGES IN EQUITY
For the year ended 31 December 2022
| Share capital | Capital reserve | Other comprehensive income | Specific reserve | Surplus reserves | Retained earnings | Total shareholders’ equity | |
| RMB million | RMB million | RMB million | RMB million | RMB million | RMB million | RMB million | |
| Balance at 1 January 2021 | 121,071 | 68,976 | 5,910 | 1,189 | 209,280 | 115,849 | 522,275 |
| Change for the year | |||||||
| 1. Net profit | – | – | – | – | – | 39,444 | 39,444 |
| 2. Other comprehensive income | – | – | 13,612 | – | – | – | 13,612 |
| Total comprehensive income | – | – | 13,612 | – | – | 39,444 | 53,056 |
| Amounts transferred to initial carrying amount of hedged items | – | – | (13,498) | – | – | – | (13,498) |
| Transactions with owners, recorded directly in shareholders’ equity: | |||||||
| 3. Appropriations of profits: | – | – | – | – | – | – | – |
| – Appropriations for surplus reserves | – | – | – | – | 3,944 | (3,944) | – |
| – Distributions to shareholders (Note 55) | – | – | – | – | – | (35,110) | (35,110) |
| Total transactions with owners, recorded directly in shareholders’ equity | – | – | – | – | 3,944 | (39,054) | (35,110) |
| 4. Net increase in specific reserve for the year | – | – | – | 469 | – | – | 469 |
| 5. Others | – | (1,079) | – | – | – | 201 | (878) |
| Balance at 31 December 2021 | 121,071 | 67,897 | 6,024 | 1,658 | 213,224 | 116,440 | 526,314 |
| Balance at 1 January 2022 | 121,071 | 67,897 | 6,024 | 1,658 | 213,224 | 116,440 | 526,314 |
| Change for the year | |||||||
| 1. Net profit | – | – | – | – | – | 46,104 | 46,104 |
| 2. Other comprehensive income | – | – | 5,736 | – | – | – | 5,736 |
| Total comprehensive income | – | – | 5,736 | – | – | 46,104 | 51,840 |
| Amounts transferred to initial carrying amount of hedged items | – | – | (10,933) | – | – | – | (10,933) |
| Transactions with owners, recorded directly in shareholders’ equity: | |||||||
| 3. Shareholders’ decrease of capital: | |||||||
-Purchase of own shares (Note 36) | (1,175) | (3,004) | – | – | – | – | (4,179) |
| 4. Appropriations of profits: | |||||||
-Appropriations for surplus reserves (Note 39) | – | – | – | – | 4,610 | (4,610) | – |
-Distributions to shareholders (Note 55) | – | – | – | – | – | (56,903) | (56,903) |
| Total transactions with owners, recorded directly in shareholders’ equity | (1,175) | (3,004) | – | – | 4,610 | (61,513) | (61,082) |
| 5. Net increase in specific reserve for the year | – | – | – | 87 | – | – | 87 |
| 6. Other equity movements under the equity method | – | (1,265) | – | – | – | – | (1,265) |
| 7. Others | – | – | – | – | – | (84) | (84) |
| Balance at 31 December 2022 | 119,896 | 63,628 | 827 | 1,745 | 217,834 | 100,947 | 504,877 |
These financial statements have been approved for issue by the board of directors on 24 March 2023.
| Ma Yongsheng | Yu Baocai | Shou Donghua |
| Chairman | President | Chief Financial Officer |
| (Legal representative) |
The accompanying notes form part of these financial statements.
85
NOTES TO THE FINANCIAL STATEMENTS
For the year ended 31 December 2022
| 1 | STATUS OF THE COMPANY |
China Petroleum & Chemical Corporation (the “Company”) was established on 25 February 2000 as a joint stock limited company. The company is registered in Beijing, the People’s Republic of China, and the headquarter is located in Beijing, the People’s Republic of China. The approval date of the financial report is 24 March 2023.
According to the State Council’s approval to the “Preliminary Plan for the Reorganisation of China Petrochemical Corporation” (the “Reorganisation”), the Company was established by China Petrochemical Corporation, which transferred its core businesses together with the related assets and liabilities at 30 September 1999 to the Company. Such assets and liabilities had been valued jointly by China United Assets Appraisal Corporation, Beijing Zhong Zheng Appraisal Company, CIECC Assets Appraisal Corporation and Zhong Fa International Properties Valuation Corporation. The net asset value was determined at RMB98,249,084,000. The valuation was reviewed and approved by the Ministry of Finance (the “MOF”) (Cai Ping Zi [2000] No. 20 “Comments on the Review of the Valuation Regarding the Formation of a Joint Stock Limited Company by China Petrochemical Corporation”).
In addition, pursuant to the notice Cai Guan Zi [2000] No. 34 “Reply to the Issue Regarding Management of State-Owned Equity by China Petroleum and Chemical Corporation” issued by the MOF, 68.8 billion domestic state-owned shares with a par value of RMB1.00 each were issued to Sinopec Group Company, the amount of which is equivalent to 70% of the above net asset value transferred from Sinopec Group Company to the Company in connection with the Reorganisation.
Pursuant to the notice Guo Jing Mao Qi Gai [2000] No. 154 “Reply on the Formation of China Petroleum and Chemical Corporation”, the Company obtained the approval from the State Economic and Trade Commission on 21 February 2000 for the formation of a joint stock limited company.
The Company took over the exploration, development and production of crude oil and natural gas, refining, chemicals and related sales and marketing business of Sinopec Group Company after the establishment of the Company.
The Company and its subsidiaries (the “Group”) engage in the oil and gas and chemical operations and businesses, including:
| (1) | the exploration, development and production of crude oil and natural gas; |
| (2) | the refining, transportation, storage and marketing of crude oil and petroleum product; and |
| (3) | the production and sale of chemical. |
Details of the Company’s principal subsidiaries are set out in Note 59.
| 2 | BASIS OF PREPARATION |
| (1) | Statement of compliance of China Accounting Standards for Business Enterprises (“CASs”) |
The financial statements have been prepared in accordance with the requirements of Accounting Standards for Business Enterprises – Basic Standards, specific standards and relevant regulations (hereafter referred as CASs collectively) issued by the MOF on or after 15 February 2006. These financial statements also comply with the disclosure requirements of “Regulation on the Preparation of Information Disclosures of Companies Issuing Public Shares, No.15: General Requirements for Financial Reports” issued by the China Securities Regulatory Commission (“CSRC”). These financial statements present truly and completely the consolidated and company financial position as at 31 December 2022, and the consolidated and company financial performance and the consolidated and company cash flows for the year ended 31 December 2022.
These financial statements are prepared on a basis of going concern.
| (2) | Accounting period |
The accounting year of the Group is from 1 January to 31 December.
| (3) | Measurement basis |
The financial statements of the Group have been prepared under the historical cost convention, except for the assets and liabilities set out below:
– Financial assets held for trading (see Note 3(11))
– Other equity instrument investments (see Note 3(11))
– Derivative financial instruments (see Note 3(11))
– Receivables financing (see Note 3(11))
| (4) | Functional currency and presentation currency |
The functional currency of the Company’s and most of its subsidiaries are Renminbi. The Company and its subsidiaries determine their functional currency according to the main economic environment in where they operate. The Group’s consolidated financial statements are presented in Renminbi. Some of subsidiaries use other currency as the functional currency. The Company translates the financial statements of subsidiaries from their respective functional currencies into Renminbi (see Note 3(2)) if the subsidiaries’ functional currencies are not Renminbi.
86
| 3 | SIGNIFICANT ACCOUNTING POLICIES |
The Group determines specific accounting policies and accounting estimates based on the characteristics of production and operational activities, mainly reflected in the accounting for allowance for financial assets (Note 3(11)), valuation of inventories (Note 3(4)), depreciation of fixed assets and depletion of oil and gas properties (Notes 3(7), (8)), measurement of provisions (Note 3(16)), etc.
Principal accounting estimates and judgements of the Group are set out in Note 58.
| (1) | Accounting treatment of business combination involving entities under common control and not under common control |
| (a) | Business combination involving entities under common control |
A business combination involving entities or businesses under common control is a business combination in which all of the combining entities or businesses are ultimately controlled by the same party or parties both before and after the business combination, and that control is not transitory. The assets and liabilities that the acquirer receives in the acquisition are accounted for at the acquiree’s carrying amount on the acquisition date. The difference between the carrying amount of the acquired net assets and the carrying amount of the consideration paid for the acquisition (or the total nominal value of shares issued) is recognised in the share premium of capital reserve, or the retained earnings in case of any shortfall in the share premium of capital reserve. Any costs directly attributable to the combination shall be recognised in profit or loss for the current period when occurred. The expense incurred for equity securities and debt securities issued as the consideration of the combination is recognised in the initial cost of the securities. The combination date is the date on which the acquirer effectively obtains control of the acquiree.
| (b) | Business combination involving entities not under common control |
A business combination involving entities or businesses not under common control is a business combination in which all of the combining entities or businesses are not ultimately controlled by the same party or parties both before and after the business combination. Difference between the consideration paid by the Group as the acquirer, comprises of the aggregate of the fair value at the acquisition date of assets given, liabilities incurred or assumed, and equity securities issued by the acquirer in exchange for control of the acquiree, and the Group’s interest in the fair value of the identifiable net assets of the acquiree, is recognised as goodwill (Note 3(10)) if it is an excess, otherwise in the profit or loss. The expense incurred for equity securities and debt securities issued as the consideration of the combination is recognised in the initial cost of the securities. Any other expense directly attributable to the business combination is recognised in the profit or loss for the year. The difference between the fair value and the book value of the assets given is recognised in profit or loss. The acquiree’s identifiable assets, liabilities and contingent liabilities, if satisfying the recognition criteria, are recognised by the Group at their fair value at the acquisition date. The acquisition date is the date on which the acquirer effectively obtains control of the acquiree.
| (c) | Method for preparation of consolidated financial statements |
The scope of consolidated financial statements is based on control and the consolidated financial statements comprise the Company and its subsidiaries. Control means an entity is exposed to, or has rights to, variable returns from its involvement with the entity and has the ability to affect those returns through its power over the entity. The financial statements of subsidiaries are included in the consolidated financial statements from the date that control commences until the date that control ceases.
Where the Company combines a subsidiary during the reporting period through a business combination involving entities under common control, the financial statements of the subsidiary are included in the consolidated financial statements as if the combination had occurred at the beginning of the earliest comparative year presented or, if later, at the date that common control was established. Therefore the opening balances and the comparative figures of the consolidated financial statements are restated. In the preparation of the consolidated financial statements, the subsidiary’s assets, liabilities and results of operations are included in the consolidated balance sheet and the consolidated income statement, respectively, based on their carrying amounts in the subsidiary’s financial statements, from the date that common control was established.
Where the Company acquires a subsidiary during the reporting year through a business combination involving entities not under common control, the identifiable assets, liabilities and results of operations of the subsidiaries are consolidated into consolidated financial statements from the date that control commences, based on the fair value of those identifiable assets and liabilities at the acquisition date.
Where the Company acquired a minority interest from a subsidiary’s minority shareholders, the difference between the investment cost and the newly acquired interest into the subsidiary’s identifiable net assets at the acquisition date is adjusted to the capital reserve (capital surplus) in the consolidated balance sheet. Where the Company partially disposed an investment of a subsidiary that do not result in a loss of control, the difference between the proceeds and the corresponding share of the interest into the subsidiary is adjusted to the capital reserve (capital surplus) in the consolidated balance sheet. If the credit balance of capital reserve (capital surplus) is insufficient, any excess is adjusted to retained profits.
In a business combination involving entities not under common control achieved in stages, the Group remeasures its previously held equity interest in the acquiree on the acquisition date. The difference between the fair value and the net book value is recognised as investment income for the year. If other comprehensive income was recognised regarding the equity interest previously held in the acquiree before the acquisition date, the relevant other comprehensive income is transferred to investment income in the period in which the acquisition occurs.
87
| 3 | SIGNIFICANT ACCOUNTING POLICIES (Continued) |
| (1) | Accounting treatment of business combination involving entities under common control and not under common control (Continued) |
| (c) | Method for preparation of consolidated financial statements (Continued) |
Where control of a subsidiary is lost due to partial disposal of the equity investment held in a subsidiary, or any other reasons, the Group derecognises assets, liabilities, minority interests and other equity items related to the subsidiary. The remaining equity investment is remeasured to fair value at the date in which control is lost. The sum of consideration received from disposal of equity investment and the fair value of the remaining equity investment, net of the fair value of the Group’s previous share of the subsidiary’s identifiable net assets recorded from the acquisition date, is recognised in investment income in the period in which control is lost. Other comprehensive income related to the previous equity investment in the subsidiary, is transferred to investment income when control is lost. Other comprehensive income related to the equity investment of the original subsidiary shall be converted into the current investment income in the event of loss of control.
Minority interest is presented separately in the consolidated balance sheet within shareholders’ equity. Net profit or loss attributable to minority shareholders is presented separately in the consolidated income statement below the net profit line item.
The excess of the loss attributable to the minority interests during the period over the minority interests’ share of the equity at the beginning of the reporting period is deducted from minority interests.
Where the accounting policies and accounting period adopted by the subsidiaries are different from those adopted by the Company, adjustments are made to the subsidiaries’ financial statements according to the Company’s accounting policies and accounting period. Intra-group balances and transactions, and any unrealised profit or loss arising from intra-group transactions, are eliminated in preparing the consolidated financial statements. Unrealised losses resulting from intra-group transactions are eliminated in the same way as unrealised gains but only to the extent that there is no evidence of impairment.
The unrealised profit or loss arising from the sale of assets by the Company to its subsidiaries is eliminated in full against the net profit attributed to shareholders; the unrealised profit or loss from the sale of assets by subsidiaries to the Company is eliminated according to the distribution ratio between shareholders of the parent company and minority interests. For sale of assets that occurred between subsidiaries, the unrealised gains and losses is eliminated according to the distribution ratio for its subsidiaries seller between net profit attributable to shareholders of the parent company and minority interests.
| (2) | Transactions in foreign currencies and translation of financial statements in foreign currencies |
Foreign currency transactions are, on initial recognition, translated into Renminbi at the spot exchange rates quoted by the People’s Bank of China (‘’PBOC rates’’) at the transaction dates.
Foreign currency monetary items are translated at the PBOC rates at the balance sheet date. Exchange differences, except for those directly related to the acquisition, construction or production of qualified assets, are recognised as income or expenses in the income statement. Non-monetary items denominated in foreign currency measured at historical cost are not translated. Non-monetary items denominated in foreign currency that are measured at fair value are translated using the exchange rates at the date when the fair value was determined. The difference between the translated amount and the original currency amount is recognised as other comprehensive income, if it is classified as other equity instrument investments; or charged to the income statement if it is measured at fair value through profit or loss.
The assets and liabilities of foreign operation are translated into Renminbi at the spot exchange rates at the balance sheet date. The equity items, excluding “Retained earnings”, are translated into Renminbi at the spot exchange rates at the transaction dates. The income and expenses of foreign operation are translated into Renminbi at the spot exchange rates or an exchange rate that approximates the spot exchange rates on the transaction dates. The resulting exchange differences are separately presented as other comprehensive income in the balance sheet within equity. Upon disposal of a foreign operation, the cumulative amount of the exchange differences recognised in which relate to that foreign operation is transferred to profit or loss in the year in which the disposal occurs.
88
| 3 | SIGNIFICANT ACCOUNTING POLICIES (Continued) |
| (3) | Cash and cash equivalents |
Cash and cash equivalents comprise cash on hand, demand deposits, short-term and highly liquid investments which are readily convertible into known amounts of cash and are subject to an insignificant risk of change in value.
| (4) | Inventories |
Inventories are initially measured at cost. Cost includes the cost of purchase and processing, and other expenditures incurred in bringing the inventories to their present location and condition. The cost of inventories is mainly calculated using the weighted average method. In addition to the cost of purchase of raw material, work in progress and finished goods include direct labour and an appropriate allocation of manufacturing overhead costs.
At the balance sheet date, inventories are stated at the lower of cost and net realisable value.
Any excess of the cost over the net realisable value of each item of inventories is recognised as a provision for diminution in the value of inventories and included in the current period profit and loss. Net realisable value is the estimated selling price in the normal course of business less the estimated costs of completion and the estimated costs necessary to make the sale and relevant taxes. The net realisable value of materials held for use in the production is measured based on the net realisable value of the finished goods in which they will be incorporated. The net realisable value of the quantity of inventory held to satisfy sales or service contracts is measured based on the contract price. If the quantities held by the Group are more than the quantities of inventories specified in sales contracts, the net realisable value of the excess portion of inventories is measured based on general selling prices.
Inventories include raw materials, work in progress, semi-finished goods, finished goods and reusable materials. Reusable materials include low-value consumables, packaging materials and other materials, which can be used repeatedly but do not meet the definition of fixed assets. Reusable materials are amortised in full when received for use. The amounts of the amortisation are included in the cost of the related assets or profit or loss.
Inventories are recorded by perpetual method.
| (5) | Long-term equity investments |
| (a) | Investment in subsidiaries |
In the Company’s separate financial statements, long-term equity investments in subsidiaries are accounted for using the cost method. Except for cash dividends or profits distributions declared but not yet distributed that have been included in the price or consideration paid in obtaining the investments, the Company recognises its share of the cash dividends or profit distributions declared by the investee as investment income irrespective of whether these represent the net profit realised by the investee before or after the investment. Investments in subsidiaries are stated at cost less impairment losses (see Note 3(12)) in the balance sheet. At initial recognition, such investments are measured as follows:
The initial investment cost of a long-term equity investment obtained through a business combination involving entities under common control is the Company’s share of the carrying amount of the subsidiary’s equity at the combination date. The difference between the initial investment cost and the carrying amounts of the consideration given is adjusted to share premium in capital reserve. If the balance of the share premium is insufficient, any excess is adjusted to retained earnings.
For a long-term equity investment obtained through a business combination not involving enterprises under common control, the initial investment cost comprises the aggregate of the fair values of assets transferred, liabilities incurred or assumed, and equity securities issued by the Company, in exchange for control of the acquiree. For a long-term equity investment obtained through a business combination not involving enterprises under common control, if it is achieved in stages, the initial cost comprises the carrying value of previously-held equity investment in the acquiree immediately before the acquisition date, and the additional investment cost at the acquisition date.
An investment in a subsidiary acquired otherwise than through a business combination is initially recognised at actual purchase cost if the Group acquires the investment by cash, or at the fair value of the equity securities issued if an investment is acquired by issuing equity securities, or at the value stipulated in the investment contract or agreement if an investment is contributed by investors.
89
| 3 | SIGNIFICANT ACCOUNTING POLICIES (Continued) |
| (5) | Long-term equity investments (Continued) |
| (b) | Investment in joint ventures and associates |
A joint venture is an incorporated entity over which the Group, based on legal form, contractual terms and other facts and circumstances, has joint control with the other parties to the joint venture and rights to the net assets of the joint venture. Joint control is the contractually agreed sharing of control of an arrangement, which exists only when decisions about the relevant activities require the unanimous consent of the Group and the parties sharing control.
An associate is the investee that the Group has significant influence on their financial and operating policies. Significant influence represents the right to participate in the financial and operating policy decisions of the investee but is not control or joint control over the establishment of these policies. The Group generally considers the following circumstances in determining whether it can exercise significant influence over the investee: whether there is representative appointed to the board of directors or equivalent governing body of the investee; whether to participate in the investee’s policy-making process; whether there are significant transactions with the investees; whether there is management personnel sent to the investee; whether to provide critical technical information to the investee.
An investment in a joint ventures or an associate is accounted for using the equity method, unless the investment is classified as held for sale.
The initial cost of investment in joint ventures and associates is stated at the consideration paid except for cash dividends or profits distributions declared but unpaid at the time of acquisition and therefore included in the consideration paid should be deducted if the investment is made in cash. Under the circumstances that the long-term investment is obtained through non-monetary asset exchange, the initial cost of the investment is stated at the fair value of the assets exchanged if the transaction has commercial substance, the difference between the fair value of the assets exchanged and its carrying amount is charged to profit or loss; or stated at the carrying amount of the assets exchanged if the transaction lacks commercial substance.
The Group’s accounting treatments when adopting the equity method include:
Where the initial investment cost of a long-term equity investment exceeds the Group’s interest in the fair value of the investee’s identifiable net assets at the date of acquisition, the investment is initially recognised at the initial investment cost. Where the initial investment cost is less than the Group’s interest in the fair value of the investee’s identifiable net assets at the time of acquisition, the investment is initially recognised at the investor’s share of the fair value of the investee’s identifiable net assets, and the difference is charged to profit or loss.
After the acquisition of the investment, the Group recognises its share of the investee’s net profits or losses and other comprehensive income as investment income or losses and other comprehensive income, and adjusts the carrying amount of the investment accordingly. Once the investee declares any cash dividends or profits distributions, the carrying amount of the investment is reduced by that attributable to the Group.
The Group recognises its share of the investee’s net profits or losses after making appropriate adjustments to align the accounting policies or accounting periods with those of the Group based on the fair values of the investee’s net identifiable assets at the time of acquisition. Under the equity accounting method, unrealised profits and losses resulting from transactions between the Group and its associates or joint ventures are eliminated to the extent of the Group’s interest in the associates or joint ventures. Unrealised losses resulting from transactions between the Group and its associates or joint ventures are fully recognised in the event that there is an evidence of impairment.
The Group discontinues recognising its share of net losses of the investee after the carrying amount of the long-term equity investment and any long-term interest that is in substance forms part of the Group’s net investment in the associate or the joint venture is reduced to zero, except to the extent that the Group has an obligation to assume additional losses. However, if the Group has incurred obligations for additional losses and the conditions on recognition of provision are satisfied in accordance with the accounting standard on contingencies, the Group continues recognising the investment losses and the provision. Where net profits are subsequently made by the associate or joint venture, the Group resumes recognising its share of those profits only after its share of the profits equals the share of losses not recognised.
The Group adjusts the carrying amount of the long-term equity investment for changes in owners’ equity of the investee other than those arising from net profits or losses and other comprehensive income, and recognises the corresponding adjustment in capital reserve.
| (c) | The impairment assessment method and provision accrual on investment |
The impairment assessment and provision accrual on investments in subsidiaries, associates and joint ventures are stated in Note 3(12).
90
| 3 | SIGNIFICANT ACCOUNTING POLICIES (Continued) |
| (6) | Leases |
A lease is a contract that a lessor transfers the right to use an identified asset for a period of time to a lessee in exchange for consideration.
| (a) | As Lessee |
The Group recognises a right-of-use asset at the commencement date, and recognises the lease liability at the present value of the lease payments that are not paid at that date. The lease payments include fixed payments, the exercise price of a purchase option if the Group is reasonably certain to exercise that option, and payments of penalties for terminating the lease if the lease term reflects the Group exercising that option, etc. Variable payments that are based on a percentage of sales are not included in the lease payments, and should be recognised in profit or loss when incurred. Lease liabilities to be paid within one year (including one year) from balance sheet date is presented in non-current liabilities due within one year.
Right-of-use assets of the Group mainly comprise land. Right-of-use assets are measured at cost which comprises the amount of the initial measurement of the lease liability, any lease payments made at or before the commencement date, any initial direct costs incurred by the lessee, less any lease incentives received. The Group depreciates the right-of-use assets over the shorter of the asset’s useful life and the lease term on a straight-line basis. When the recoverable amount of a right-of-use asset is less than its carrying amount, the carrying amount is reduced to the recoverable amount.
Payments associated with short-term leases with lease terms within 12 months and leases for which the underlying assets are individually of low value when it is new are recognised on a straight-line basis over the lease term as an expense in profit or loss or as cost of relevant assets, instead of recognising right-of-use assets and lease liabilities.
| (b) | As Lessor |
A lease that transfers substantially all the risks and rewards incidental to ownership of an asset is a finance lease. An operating lease is a lease other than a finance lease.
When the Group leases self-owned plants and buildings, equipment and machinery, lease income from an operating lease is recognised on a straight-line basis over the period of the lease. The Group recognises variable lease income which is based on a certain percentage of sales as rental income when occurred.
| (7) | Fixed assets and construction in progress |
Fixed assets represent the tangible assets held by the Group using in the production of goods, rendering of services and for operation and administrative purposes with useful life over one year.
Fixed assets are stated in the balance sheet at cost less accumulated depreciation and impairment losses (see Note 3(12)). Construction in progress is stated in the balance sheet at cost less impairment losses (see Note 3(12)).
The cost of a purchased fixed asset comprises the purchase price, related taxes, and any directly attributable expenditure for bringing the asset to working condition for its intended use. The cost of self-constructed assets includes the cost of materials, direct labour, capitalised borrowing costs (see Note 3(19)), and any other costs directly attributable to bringing the asset to working condition for its intended use. According to legal or contractual obligations, costs of dismantling and removing the items and restoring the site on which the related assets located are included in the initial cost.
Construction in progress is transferred to fixed assets when the asset is ready for its intended use. No depreciation is provided against construction in progress.
When an enterprise sells products or by-products produced before a fixed asset is available for its intended use, the proceeds and related cost are accounted for in accordance with CAS 14 – Revenue and CAS 1 – Inventories respectively, and recognised in profit or loss for the current period.
Where the individual component parts of an item of fixed asset have different useful lives or provide benefits to the Group in different patterns thus necessitating use of different depreciation rates or methods, each part is recognised as a separate fixed asset.
The subsequent costs including the cost of replacing part of an item of fixed assets are recognised in the carrying amount of the item if the recognition criteria are satisfied, and the carrying amount of the replaced part is derecognised. The costs of the day-to-day servicing of fixed assets are recognised in profit or loss as incurred.
The Group terminates the recognition of an item of fixed asset when it is in a state of disposal or it is estimated that it is unable to generate any economic benefits through use or disposal. Gains or losses arising from the retirement or disposal of an item of fixed asset are determined as the difference between the net disposal proceeds and the carrying amount of the item and are recognised in profit or loss on the date of retirement or disposal.
91
| 3 | SIGNIFICANT ACCOUNTING POLICIES (Continued) |
| (7) | Fixed assets and construction in progress (Continued) |
Other than oil and gas properties, the cost of fixed assets less residual value and accumulated impairment losses is depreciated using the straight-line method over their estimated useful lives, unless the fixed asset is classified as held for sale. The estimated useful lives and the estimated rate of residual values adopted for respective classes of fixed assets are as follows:
| Estimated useful life | Estimated rate of residual value | |
| Plants and buildings | 12-50 years | 3% |
| Equipment, machinery and others | 4-30 years | 3% |
Useful lives, residual values and depreciation methods are reviewed at least each year end.
| (8) | Oil and gas properties |
Oil and gas properties include the mineral interests in properties, wells and related support equipment arising from oil and gas exploration and production activities.
The acquisition cost of mineral interest is capitalised as oil and gas properties. Costs of development wells and related support equipment are capitalised. The cost of exploratory wells is initially capitalised as construction in progress pending determination of whether the well has found proved reserves. Exploratory well costs are charged to expenses upon the determination that the well has not found proved reserves. However, in the absence of a determination of the discovery of proved reserves, exploratory well costs are not carried as an asset for more than one year following completion of drilling. If, after one year has passed, a determination of the discovery of proved reserves cannot be made, the exploratory well costs are impaired and charged to expense. All other exploration costs, including geological and geophysical costs, are charged to profit or loss in the year as incurred.
The Group estimates future dismantlement costs for oil and gas properties with reference to engineering estimates after taking into consideration the anticipated method of dismantlement required in accordance with the industry practices. These estimated future dismantlement costs are discounted at credit-adjusted risk-free rate and are capitalised as oil and gas properties, which are subsequently amortised as part of the costs of the oil and gas properties.
Capitalised costs of proved oil and gas properties are amortised on a unit-of-production method based on volumes produced and reserves.
| (9) | Intangible assets |
Intangible assets, where the estimated useful life is finite, are stated in the balance sheet at cost less accumulated amortisation and provision for impairment losses (see Note 3(12)). For an intangible asset with finite useful life, its cost less estimated residual value and accumulated impairment losses is amortised on a straight-line basis over the expected useful lives, unless the intangible assets are classified as held for sale.
An intangible asset is regarded as having an indefinite useful life and is not amortised when there is no foreseeable limit to the year over which the asset is expected to generate economic benefits for the Group.
Useful lives and amortisation methods are reviewed at least each year end.
When an enterprise sells products or by-products produced in the course of research and development, the proceeds and related cost are accounted for in accordance with CAS 14 – Revenue and CAS 1 – Inventories respectively, and recognised in profit or loss for the current period.
| (10) | Goodwill |
The initial cost of goodwill represents the excess of cost of acquisition over the acquirer’s interest in the fair value of the identifiable net assets of the acquiree under the business combination involving entities not under common control.
Goodwill is not amortised and is stated at cost less accumulated impairment losses (see Note 3(12)). On disposal of an asset group or a set of asset groups, any attributable amount of purchased goodwill is written off and included in the calculation of the profit or loss on disposal.
92
| 3 | SIGNIFICANT ACCOUNTING POLICIES (Continued) |
| (11) | Financial Instruments |
Financial instruments, refer to the contracts that form one party’s financial assets and form the financial liabilities or equity instruments of the other party. The Group recognises a financial asset or a financial liability when the Group enters into and becomes a party to the underlining contract of the financial instrument.
| (a) | Financial assets |
| (i) | Classification and measurement |
The Group classifies financial assets into different categories depending on the business model for managing the financial assets and the contractual terms of cash flows of the financial assets: (1) financial assets measured at amortised cost, (2) financial assets measured at fair value through other comprehensive income, (3) financial assets measured at fair value through profit or loss. A contractual cash flow characteristic which could have only a de minimis effect, or could have an effect that is more than de minimis but is not genuine, does not affect the classification of the financial asset.
Financial assets are initially recognised at fair value. For financial assets measured at fair value through profit or loss, the relevant transaction costs are recognised in profit or loss. The transaction costs for other financial assets are included in the initially recognised amount. However, accounts receivable arising from sales of goods or rendering services, without significant financing component, are initially recognised based on the transaction price expected to be entitled by the Group.
Debt instruments
The debt instruments held by the Group refer to the instruments that meet the definition of financial liabilities from the perspective of the issuer, and are measured in the following ways:
| – | Measured at amortised cost: |
The business model for managing such financial assets by the Group are held for collection of contractual cash flows. The contractual cash flow characteristics are to give rise on specified dates to cash flows that are solely payments of principal and interest on the principal amount outstanding. Interest income from these financial assets is recognised using the effective interest rate method. The financial assets include cash at bank and on hand and receivables.
| – | Measured at fair value through other comprehensive income: |
The business model for managing such financial assets by the Group are held for collection of contractual cash flows and for selling the financial assets, the contractual cash flow characteristics of such financial assets are consistent with the basic lending arrangements. Movements in the carrying amount are taken through other comprehensive income, except for the recognition of impairment gains or losses, foreign exchange gains and losses and interest income calculated using the effective interest rate method, which are recognised in profit or loss. The financial assets include receivables financing.
Equity instruments
Equity instruments that the Group has no power to control, jointly control or exercise significant influence over, are measured at fair value through profit or loss and presented as financial assets held for trading.
In addition, the Group designates some equity instruments that are not held for trading as financial assets at fair value through other comprehensive income, and presented in other equity instrument investments. The relevant dividends of these financial assets are recognised in profit or loss. When derecognised, the cumulative gain or loss previously recognised in other comprehensive income is transferred to retained earnings.
| (ii) | Impairment |
The Group recognises a loss allowance for expected credit losses on financial assets measured at amortised cost and receivables financing measured at fair value through other comprehensive income.
The Group measures and recognises expected credit losses, considering reasonable and supportable information about the relevant past events, current conditions and forecasts of future economic conditions.
The Group measures the expected credit losses of financial instruments on different stages at each balance sheet date. For financial instruments that have no significant increase in credit risk since the initial recognition, on first stage, the Group measures the loss allowance at an amount equal to 12-month expected credit losses. If there has been a significant increase in credit risk since the initial recognition of a financial instrument but credit impairment has not occurred, on second stage, the Group recognises a loss allowance at an amount equal to lifetime expected credit losses. If credit impairment has occurred since the initial recognition of a financial instrument, on third stage, the Group recognises a loss allowance at an amount equal to lifetime expected credit losses.
93
| 3 | SIGNIFICANT ACCOUNTING POLICIES (Continued) |
| (11) | Financial Instruments (Continued) |
| (a) | Financial assets (Continued) |
| (ii) | Impairment (Continued) |
For financial instruments that have low credit risk at the balance sheet date, the Group assumes that there is no significant increase in credit risk since the initial recognition, and measures the loss allowance at an amount equal to 12-month expected credit losses.
For financial instruments on the first stage and the second stage, and that have low credit risk, the Group calculates interest income according to carrying amount without deducting the impairment allowance and effective interest rate. For financial instruments on the third stage, interest income is calculated according to the carrying amount minus amortised cost after the provision of impairment allowance and effective interest rate.
For accounts receivable and receivables financing related to revenue, the Group measures the loss allowance at an amount equal to lifetime expected credit losses.
The Group recognises the loss allowance accrued or written back in profit or loss.
| (iii) | Derecognition |
The Group derecognises a financial asset when a) the contractual right to receive cash flows from the financial asset expires; b) the Group transfers the financial asset and substantially all the risks and rewards of ownership of the financial asset; c) the financial assets have been transferred and the Group neither transfers nor retains substantially all the risks and rewards of ownership of the financial asset, but the Group has not retained control.
On derecognition of other equity instrument investments, the difference between the carrying amounts and the sum of the consideration received and any cumulative gain or loss previously recognised in other comprehensive income, is recognised in retained earnings. While on derecognition of other financial assets, this difference is recognised in profit or loss.
| (b) | Financial liabilities |
The Group, at initial recognition, classifies financial liabilities as either financial liabilities subsequently measured at amortised cost or financial liabilities at fair value through profit or loss.
The Group’s financial liabilities are mainly financial liabilities measured at amortised cost, including bills payable, accounts payable, other payables, loans and debentures payable, etc. These financial liabilities are initially measured at the amount of their fair value after deducting transaction costs and use the effective interest rate method for subsequent measurement.
Where the present obligations of financial liabilities are completely or partially discharged, the Group derecognises these financial liabilities or discharged parts of obligations. The differences between the carrying amounts and the consideration received are recognised in profit or loss.
Financial guarantee liabilities
Financial guarantees are contracts that requires the Group to make specified payments to reimburse the holder for a loss it incurs because a specified debtor fails to make payment when due in accordance with the original or modified terms of a debt instrument.
Financial guarantees issued are initially recognised at fair value, which is determined by reference to fees charged in an arm’s length transaction for similar services, when such information is obtainable, or to interest rate differentials, by comparing the actual rates charged by lenders when the guarantee is made available with the estimated rates that lenders would have charged, had the guarantees not been available, where reliable estimates of such information can be made. Where consideration is received or receivable for the issuance of the guarantee, the consideration is recognised in accordance with the Group’s policies applicable to that category of asset. Where no such consideration is received or receivable, an immediate expense is recognised in profit or loss.
Subsequent to initial recognition, the amount initially recognised as deferred income is amortised in profit or loss over the term of the guarantee as income from financial guarantees issued.
94
| 3 | SIGNIFICANT ACCOUNTING POLICIES (Continued) |
| (11) | Financial Instruments (Continued) |
| (c) | Determination of fair value |
If there is an active market for financial instruments, the quoted price in the active market is used to measure fair values of the financial instruments. If no active market exists for financial instruments, valuation techniques are used to measure fair values. In valuation, the Group adopts valuation techniques that are applicable in the current situation and have sufficient available data and other information to support it, and selects input values that are consistent with the asset or liability characteristics considered by market participants in the transaction of relevant assets or liabilities, and gives priority to relevant observable input values. Use of unobservable input values where relevant observable input values cannot be obtained or are not practicable.
| (d) | Derivative financial instruments and hedge accounting |
Derivative financial instruments are recognised initially at fair value. At each balance sheet date, the fair value is remeasured. The gain or loss on remeasurement to fair value is recognised immediately in profit or loss, except where the derivatives qualify for hedge accounting.
Hedge accounting is a method which recognises the offsetting effects on profit or loss of changes in the fair values of the hedging instrument and the hedged item in the same accounting period, to represent the effect of risk management activities.
Hedged items are the items that expose the Group to risks of changes in future cash flows and that are designated as being hedged and that must be reliably measurable. The Group’s hedged items include a forecast transaction that is settled with an undetermined future market price and exposes the Group to risk of variability in cash flows, etc.
A hedging instrument is a designated derivative whose changes in cash flows are expected to offset changes in the cash flows of the hedged item.
The hedging relationship meets all of the following hedge effectiveness requirements:
| (1) | There is an economic relationship between the hedged item and the hedging instrument, which share a risk and that gives rise to opposite changes in fair value that tend to offset each other. |
| (2) | The effect of credit risk does not dominate the value changes that result from that economic relationship. |
| (3) | The hedge ratio of the hedging relationship is the same as that resulting from the quantity of the hedged item that the entity actually hedges and the quantity of the hedging instrument that the entity actually uses to hedge that quantity of hedged item. However, that designation shall not reflect an imbalance between the weightings of the hedged item and the hedging instrument. |
| – | Cash flow hedges |
Cash flow hedge is a hedge of the exposure to variability in cash flows that is attributable to a particular risk associated with all, or a component of, a recognised asset or liability (such as all or some future interest payments on variable-rate debt) or a highly probable forecast transaction, and could affect profit or loss. As long as a cash flow hedge meets the qualifying criteria for hedge accounting, the hedging relationship shall be accounted for as follows:
| – | The cumulative gain or loss on the hedging instrument from inception of the hedge; |
| – | The cumulative change in present value of the expected future cash flows on the hedged item from inception of the hedge. |
The gain or loss on the hedging instrument that is determined to be an effective hedge is recognised in other comprehensive income.
The portion of the gain or loss on the hedging instrument that is determined to be an ineffective hedge is recognised in profit or loss.
If a hedged forecast transaction subsequently results in the recognition of a non-financial asset or non-financial liability, or a hedged forecast transaction for a non-financial asset or a non-financial liability becomes a firm commitment for which fair value hedge accounting is applied, the entity shall remove that amount from the cash flow hedge reserve and include it directly in the initial cost or other carrying amount of the asset or the liability. This is not a reclassification adjustment and hence it does not affect other comprehensive income.
95
| 3 | SIGNIFICANT ACCOUNTING POLICIES (Continued) |
| (11) | Financial Instruments (Continued) |
| (d) | Derivative financial instruments and hedge accounting (Continued) |
| (3) | (Continued) |
| – | Cash flow hedges (Continued) |
For cash flow hedges, other than those covered by the preceding two policy statements, that amount shall be reclassified from the cash flow hedge reserve to profit or loss as a reclassification adjustment in the same period or periods during which the hedged expected future cash flows affect profit or loss.
If the amount that has been accumulated in the cash flow hedge reserve is a loss and the Group expects that all or a portion of that loss will not be recovered in one or more future periods, the Group immediately reclassify the amount that is not expected to be recovered into profit or loss.
When the hedging relationship no longer meets the risk management objective on the basis of which it qualified for hedge accounting (ie the entity no longer pursues that risk management objective), or when a hedging instrument expires or is sold, terminated, exercised, or there is no longer an economic relationship between the hedged item and the hedging instrument or the effect of credit risk starts to dominate the value changes that result from that economic relationship or no longer meets the criteria for hedge accounting, the Group discontinues prospectively the hedge accounting treatments. If the hedged future cash flows are still expected to occur, that amount shall remain in the cash flow hedge reserve and shall be accounted for as cash flow hedges. If the hedged future cash flows are no longer expected to occur, that amount shall be immediately reclassified from the cash flow hedge reserve to profit or loss as a reclassification adjustment. A hedged future cash flow that is no longer highly probable to occur may still be expected to occur, if the hedged future cash flows are still expected to occur, that amount shall remain in the cash flow hedge reserve and shall be accounted for as cash flow hedges.
| – | Fair value hedges |
A fair value hedge is a hedge of the exposure to changes in the fair value of a recognized asset or liability or an unrecognised firm commitment, or a portion of such an asset, liability or firm commitment.
The gain or loss from remeasuring the hedging instrument is recognised in profit or loss. The gain or loss on the hedged item attributable to the hedged risk adjusts the carrying amount of the recognised hedged item not measured at fair value and is recognised in profit or loss.
Any adjustment to the carrying amount of a hedged item is amortised to profit or loss if the hedged item is a financial instrument (or a component thereof) measured at amortised cost. The amortisation is based on a recalculated effective interest rate at the date that amortisation begins.
| (12) | Impairment of other non-financial long-term assets |
Internal and external sources of information are reviewed at each balance sheet date for indications that the following assets, including fixed assets, construction in progress, right-of-use assets, goodwill, intangible assets, long-term deferred expenses and investments in subsidiaries, associates and joint ventures may be impaired.
Assets are tested for impairment whenever events or changes in circumstances indicate that their carrying amounts may not be recoverable. The recoverable amounts of goodwill and intangible assets with uncertain useful lives are estimated annually no matter there are any indications of impairment. Goodwill is tested for impairment together with related asset units or groups of asset units.
An asset unit is the smallest identifiable group of assets that generates cash inflows largely independent of the cash inflows from other assets or groups of assets. An asset unit comprises related assets that generate associated cash inflows. In identifying an asset unit, the Group primarily considers whether the asset unit is able to generate cash inflows independently as well as the management style of production and operational activities, and the decision for the use or disposal of asset.
96
| 3 | SIGNIFICANT ACCOUNTING POLICIES (Continued) |
| (12) | Impairment of other non-financial long-term assets (Continued) |
The recoverable amount is the greater of the fair value less costs to sell and the present value of expected future cash flows generated by the asset (or asset unit, set of asset units).
Fair value less costs to sell of an asset is based on its selling price in an arm’s length transaction less any direct costs attributable to the disposal. Present value of expected future cash flows is the estimation of future cash flows to be generated from the use of and upon disposal of the asset, discounted at an appropriate pre-tax discount rate over the asset’s remaining useful life.
If the recoverable amount of an asset is less than its carrying amount, the carrying amount is reduced to the recoverable amount. The amount by which the carrying amount is reduced is recognised as an impairment loss in profit or loss. A provision for impairment loss of the asset is recognised accordingly. Impairment losses related to an asset unit or a set of asset units first reduce the carrying amount of any goodwill allocated to the asset unit or set of asset units, and then reduce the carrying amount of the other assets in the asset unit or set of asset units on a pro rata basis. However, the carrying amount of an impaired asset will not be reduced below the highest of its individual fair value less costs to sell (if determinable), the present value of expected future cash flows (if determinable) and zero.
Once an impairment loss is recognised, it is not reversed in a subsequent period.
| (13) | Long-term deferred expenses |
Long-term deferred expenses are amortised on a straight-line basis over their beneficial periods
| (14) | Employee benefits |
Employee benefits are all forms of considerations and compensation given in exchange for services rendered by employees, including short-term compensation, post-employment benefits, termination benefits and other long term employee benefits.
| (a) | Short-term compensation |
Short term compensation includes salaries, bonuses, allowances and subsidies, employee benefits, medical insurance premiums, work-related injury insurance premium, maternity insurance premium, contributions to housing fund, unions and education fund and short-term absence with payment etc. When an employee has rendered service to the Group during an accounting period, the Group shall recognise the short-term compensation actually incurred as a liability and charge to the cost of an asset or to profit or loss in the same period, and non-monetary benefits are valued with the fair value.
| (b) | Post-employment benefits |
The Group classifies post-employment benefits into either Defined Contribution Plan (DC plan) or Defined Benefit Plan (DB plan). DC plan means the Group only contributes a fixed amount to an independent fund and no longer bears other payment obligation; DB plan is post-employment benefits other than DC plan. In this reporting period, the post-employment benefits of the Group primarily comprise basic pension insurance and unemployment insurance and both of them are DC plans.
Basic pension insurance
Employees of the Group participate in the social insurance system established and managed by local labor and social security department. The Group makes basic pension insurance to the local social insurance agencies every month, at the applicable benchmarks and rates stipulated by the government for the benefits of its employees. After the employees retire, the local labor and social security department has obligations to pay them the basic pension. When an employee has rendered service to the Group during an accounting period, the Group shall recognise the accrued amount according to the above social security provisions as a liability and charge to the cost of an asset or to profit or loss in the same period.
| (c) | Termination benefits |
When the Group terminates the employment relationship with employees before the employment contracts expire, or provides compensation as an offer to encourage employees to accept voluntary redundancy, a provision for the termination benefits provided is recognised in profit or loss under the conditions of both the Group has a formal plan for the termination of employment or has made an offer to employees for voluntary redundancy, which will be implemented shortly; and the Group is not allowed to withdraw from termination plan or redundancy offer unilaterally.
97
| 3 | SIGNIFICANT ACCOUNTING POLICIES (Continued) |
| (15) | Income tax |
Current tax and deferred tax are recognised in profit or loss except to the extent that they relate to business combinations and items recognised directly in equity (including other comprehensive income).
Current tax is the expected tax payable calculated at the applicable tax rate on taxable income for the year, plus any adjustment to tax payable in respect of previous years.
At the balance sheet date, current tax assets and liabilities are offset if the Group has a legally enforceable right to set them off and also intends either to settle on a net basis or to realise the asset and settle the liability simultaneously.
Deferred tax assets and liabilities are recognised based on deductible temporary differences and taxable temporary differences respectively. Temporary difference is the difference between the carrying amounts of assets and liabilities and their tax bases. Unused tax losses and unused tax credits able to be utilised in subsequent years are treated as temporary differences. Deferred tax assets are recognised to the extent that it is probable that future taxable income will be available to offset the deductible temporary differences.
Temporary differences arise in a transaction, which is not a business combination, and at the time of transaction, does not affect accounting profit or taxable profit (or unused tax losses), will not result in deferred tax. Temporary differences arising from the initial recognition of goodwill will not result in deferred tax.
At the balance sheet date, the amounts of deferred tax recognised is measured based on the expected manner of recovery or settlement of the carrying amount of the assets and liabilities, using tax rates that are expected to be applied in the period when the asset is recovered or the liability is settled in accordance with tax laws.
The carrying amount of deferred tax assets is reviewed at each balance sheet date. If it is unlikely to obtain sufficient taxable income to offset against the benefit of deferred tax asset, the carrying amount of the deferred tax assets is written down. Any such write-down should be subsequently reversed where it becomes probable that sufficient taxable income will be available.
At the balance sheet date, deferred tax assets and liabilities are offset if all the following conditions are met:
| – | the taxable entity has a legally enforceable right to offset current tax assets and current tax liabilities; and |
| – | they relate to income taxes levied by the same tax authority on either: |
| – | the same taxable entity; or |
| – | different taxable entities which either to intend to settle the current tax liabilities and assets on a net basis, or to realise the assets and settle the liabilities simultaneously, in each future period in which significant amounts of deferred tax liabilities or assets are expected to be settled or recovered. |
| (16) | Provisions |
Provisions are recognised when the Group has a present obligation as a result of a contingent event, it is probable that an outflow of economic benefits will be required to settle the obligations and a reliable estimate can be made. Where the effect of time value of money is material, provisions are determined by discounting the expected future cash flows.
Provisions for future dismantlement costs are initially recognised based on the present value of the future costs expected to be incurred in respect of the Group’s expected dismantlement and abandonment costs at the end of related oil and gas exploration and development activities. Any subsequent change in the present value of the estimated costs, other than the change due to passage of time which is regarded as interest costs, is reflected as an adjustment to the provision of oil and gas properties.
An onerous contract exists when the Group has a contract under which the unavoidable costs of meeting the obligations under the contract exceed the economic benefits expected to be received from the contract. Provisions for onerous contracts are measured at the present value of the lower of the expected cost of terminating the contract and the net cost of continuing with the fulfilling the contract. The cost of fulfilling the contract includes both the incremental costs of fulfilling that contract and an allocation of other costs that relate directly to fulfilling that contract.
98
| 3 | SIGNIFICANT ACCOUNTING POLICIES (Continued) |
| (17) | Revenue recognition |
Revenue arises in the course of the Group’s ordinary activities, and increases in economic benefits in the form of inflows that result in an increase in equity, other than those relating to contributions from equity participants.
The Group sells crude oil, natural gas, petroleum and chemical products, etc. Revenue is recognised according to the expected consideration amount, when a customer obtains control over the relevant goods or services. To determine whether a customer obtains control of a promised asset, the Group shall consider indicators of the transfer of control, which include, but are not limited to, the Group has a present right to payment for the asset; the Group has transferred physical possession of the asset to the customer; the customer has the significant risks and rewards of ownership of the asset; the customer has accepted the asset.
Sales of goods
Sales are recognised when control of the goods have transferred. Obtaining control of relevant goods means that a customer can direct the use of the goods and obtain almost all the economic benefits from it. Advance from customers but goods not yet delivered is recorded as contract liabilities and is recognised as revenues when a customer obtains control over the relevant goods.
| (18) | Government grants |
Government grants are non-reciprocal transfers of monetary or non-monetary assets from the government to the Group except for capital contributions from the government in the capacity as an investor in the Group.
Government grants are recognised when there is reasonable assurance that the grants will be received and the Group is able to comply with the conditions attaching to them. Government grants in the form of monetary assets are recorded based on the amount received or receivable, whereas non-monetary assets are measured at fair value.
Government grants received in relation to assets are recorded as deferred income, and recognised evenly in profit or loss over the assets’ useful lives. Government grants received in relation to revenue are recorded as deferred income, and recognised as income in future periods as compensation when the associated future expenses or losses arise; or directly recognised as income in the current period as compensation for past expenses or losses.
| (19) | Borrowing costs |
Borrowing costs incurred on borrowings for the acquisition, construction or production of qualified assets are capitalised into the cost of the related assets in the capitalisable period.
Except for the above, other borrowing costs are recognised as financial expenses in the income statement when incurred.
| (20) | Repairs and maintenance expenses |
Repairs and maintenance (including overhauling expenses) expenses are recognised in profit or loss when incurred.
| (21) | Environmental expenditures |
Environmental expenditures that relate to current ongoing operations or to conditions caused by past operations is expensed as incurred. Liabilities related to future remediation costs are recorded when environmental assessments and/or cleanups are probable and the costs can be reliably estimated. As facts concerning environmental contingencies become known to the Group, the Group reassesses its position both with respect to accrued liabilities and other potential exposures.
| (22) | Research and development costs |
Research costs and development costs that cannot meet the capitalisation criteria are recognised in profit or loss when incurred.
99
| 3 | SIGNIFICANT ACCOUNTING POLICIES (Continued) |
| (23) | Dividends |
Dividends and distributions of profits proposed in the profit appropriation plan which will be authorised and declared after the balance sheet date, are not recognised as a liability at the balance sheet date and are separately disclosed in the notes to the financial statements. Dividends are recognised as a liability in the period in which they are declared.
| (24) | Related parties |
If a party has the power to control, jointly control or exercise significant influence over another party, or vice versa, or where two or more parties are subject to common control, joint control from another party, they are considered to be related parties, except for the two parties significantly influenced by a party. Related parties may be individuals or enterprises. Where enterprises are subject to state control but are otherwise unrelated, they are not related parties.
In addition to the related parties stated above, the Company determines related parties based on the disclosure requirements of Administrative Procedures on the Information Disclosures of Listed Companies issued by the CSRC.
| (25) | Segment reporting |
Reportable segments are identified based on operating segments which are determined based on the structure of the Group’s internal organisation, management requirements and internal reporting system. An operating segment is a component of the Group that meets the following respective conditions:
| • | engage in business activities from which it may earn revenues and incur expenses; |
| • | whose operating results are regularly reviewed by the Group’s management to make decisions about resource to be allocated to the segment and assess its performance; and |
| • | for which financial information regarding financial position, results of operations and cash flows are available. |
Inter-segment revenues are measured on the basis of actual transaction price for such transactions for segment reporting, and segment accounting policies are consistent with those for the consolidated financial statements.
| (26) | Changes in significant accounting policies |
In 2022, the Group has adopted the revised accounting requirements and guidance under CAS newly issued by the Ministry of Finance (“MOF”), mainly include:
| – | “Accounting for selling outputs that are produced before fixed assets are available for intended use or produced in the course of research and development” (“accounting for sales before intended use”) in CAS Bulletin No.15 (Caikuai [2021] No.35) |
| – | “Determining whether a contract is onerous” in CAS Bulletin No.15 |
| (a) | Accounting for sales before intended use |
In accordance with CAS Bulletin No.15, the Group accounts for the proceeds and related cost arising from the sale of products or by-products produced before the fixed asset is available for its intended use and in the course of research and development in accordance with CAS 14 – Revenue and CAS 1 – Inventories respectively, and recognises them in profit or loss for the current period. The net amount of proceeds from such sales before intended use less related costs is no longer offset against the cost of the fixed asset or research and development expenditure.
The adoption of Bulletin No.15 does not have a significant impact on the financial position and financial performance of the Group.
| (b) | “Determining whether a contract is onerous” |
In accordance with CAS Bulletin No.15, when determining whether a contract is onerous, the Group includes in its estimated cost of fulfilling the contract the amount of the incremental cost of fulfilling the contract and the allocation of other costs directly attributable to fulfilling the contract.
The adoption of Bulletin No.15 does do not have a significant impact on the financial position and financial performance of the Group.
100
| 4 | TAXATION |
Major types of tax applicable to the Group are value-added tax, resources tax, consumption tax, income tax, crude oil special gain levy, city construction tax, education surcharge and local education surcharge etc.
Tax rate of products is presented as below:
| Type of taxes | Tax rate | Tax basis and method |
| Value Added Tax (the “VAT”) | 13%, 9%, 6% | Based on taxable value added amount. Tax payable is calculated using the taxable sales amount multiplied by the applicable tax rate less current period’s deductible VAT input. |
| Resource Tax | 6% | Based on the revenue from sales of crude oil and natural gas. |
| Consumption Tax | RMB2,109.76 per tonnage for Gasoline, RMB1,411.20 per tonnage for Diesel, RMB2,105.20 per tonnage for Naphtha, RMB1,948.64 per tonnage for Solvent oil, RMB1,711.52 per tonnage for Lubricant oil, RMB1,218.00 per tonnage for Fuel oil, and RMB1,495.20 per tonnage for Jet fuel oil. | Based on quantities |
| Corporate Income Tax | 5% to 50% | Based on taxable income. |
| Crude Oil Special Gain Levy | 20% to 40% | Based on the sales of domestic crude oil at prices higher than a specific level. |
| City Construction Tax | 1%, 5% or 7% | Based on the actual paid VAT and consumption tax. |
| Education surcharges | 3% | Based on the actual paid VAT and consumption tax. |
| Local Education surcharges | 2% | Based on the actual paid VAT and consumption tax. |
5 CASH AT BANK AND ON HAND
The Group
| At 31 December 2022 | At 31 December 2021 | |||||
Original currency million | Exchange rates | RMB million | Original currency million | Exchange rates | RMB million | |
| Cash on hand | ||||||
| Renminbi | 2 | 1 | ||||
| Cash at bank | ||||||
| Renminbi | 69,282 | 144,294 | ||||
| US Dollar | 690 | 6.9646 | 4,809 | 2,027 | 6.3757 | 12,924 |
| Hong Kong Dollar | 5,162 | 0.8933 | 4,611 | 3,533 | 0.8176 | 2,888 |
| EUR | 1 | 7.4229 | 7 | 3 | 7.2197 | 20 |
| Others | 1,277 | 180 | ||||
| 79,988 | 160,307 | |||||
| Deposits at related parities | ||||||
| Renminbi | 12,690 | 15,758 | ||||
| US Dollar | 7,433 | 6.9646 | 51,774 | 6,943 | 6.3757 | 44,266 |
| EUR | 56 | 7.4229 | 413 | 67 | 7.2197 | 483 |
| Others | 187 | 1,175 | ||||
| 65,064 | 61,682 | |||||
| Total | 145,052 | 221,989 | ||||
Deposits at related parties represent deposits placed at Sinopec Finance Company Limited and Sinopec Century Bright Capital Investment Limited. Deposits interest is calculated based on market rate.
At 31 December 2022, time deposits with financial institutions of the Group amounted to RMB51,614 million (2021: RMB113,399 million).
101
6 DERIVATIVE FINANCIAL ASSETS AND DERIVATIVE FINANCIAL LIABILITIES
Derivative financial assets and derivative financial liabilities of the Group are primarily commodity futures and swaps contracts. See Note 63 for commodity price risk.
| 7 | ACCOUNTS RECEIVABLE |
| The Group | The Company | |||
| At 31 December | At 31 December | At 31 December | At 31 December | |
| 2022 | 2021 | 2022 | 2021 | |
| RMB million | RMB million | RMB million | RMB million | |
| Accounts receivable | 50,443 | 38,894 | 33,919 | 21,239 |
| Less: Allowance for doubtful accounts | 4,079 | 4,033 | 78 | 93 |
| Total | 46,364 | 34,861 | 33,841 | 21,146 |
Ageing analysis on accounts receivable is as follows:
| The Group | ||||||||
| At 31 December 2022 | At 31 December 2021 | |||||||
| Amount | Percentage to total accounts receivable | Allowance | Percentage of allowance to accounts receivable balance | Amount | Percentage to total accounts receivable | Allowance | Percentage of allowance to accounts receivable balance | |
| RMB million | % | RMB million | % | RMB million | % | RMB million | % | |
| Within one year | 46,097 | 91.4 | 58 | 0.1 | 34,263 | 88.1 | 83 | 0.2 |
| Between one and two years | 216 | 0.4 | 64 | 29.6 | 623 | 1.6 | 181 | 29.0 |
| Between two and three years | 269 | 0.5 | 181 | 67.3 | 3,411 | 8.8 | 3,190 | 93.5 |
| Over three years | 3,861 | 7.7 | 3,776 | 97.8 | 597 | 1.5 | 579 | 97.0 |
| Total | 50,443 | 100.0 | 4,079 | 38,894 | 100.0 | 4,033 | ||
| The Company | ||||||||
| At 31 December 2022 | At 31 December 2021 | |||||||
| Amount | Percentage to total accounts receivable | Allowance | Percentage of allowance to accounts receivable balance | Amount | Percentage to total accounts receivable | Allowance | Percentage of allowance to accounts receivable balance | |
| RMB million | % | RMB million | % | RMB million | % | RMB million | % | |
| Within one year | 33,555 | 98.9 | 1 | 0.0 | 20,196 | 95.1 | 9 | 0.1 |
| Between one and two years | 108 | 0.3 | 11 | 10.2 | 946 | 4.5 | 6 | 0.6 |
| Between two and three years | 191 | 0.6 | 1 | 0.5 | 20 | 0.1 | 2 | 10.0 |
| Over three years | 65 | 0.2 | 65 | 100.0 | 77 | 0.3 | 76 | 98.7 |
| Total | 33,919 | 100.0 | 78 | 21,239 | 100.0 | 93 | ||
At 31 December 2022 and 31 December 2021, the total amounts of the top five accounts receivable of the Group are set out below:
| At 31 December | At 31 December | |
| 2022 | 2021 | |
| Total amount (RMB million) | 15,846 | 10,444 |
| Percentage to the total balance of accounts receivable | 31.4% | 26.9% |
| Allowance for doubtful accounts | 2,187 | 2,062 |
Sales are generally on a cash term. Credit is generally only available for major customers with well-established trading records. Amounts due from China Petrochemical Corporation (“Sinopec Group Company”) and fellow subsidiaries are repayable under the same terms.
Accounts receivable (net of allowance for doubtful accounts) primarily represent receivables that are neither past due nor impaired. These receivables relate to a wide range of customers for whom there is no recent history of default. Information about the impairment of accounts receivable and the Group exposure to credit risk can be found in Note 63.
During 2022 and 2021, the Group and the Company had no individually significant accounts receivable been fully or substantially provided allowance for doubtful accounts.
During 2022 and 2021, the Group and the Company had no individually significant write-off or recovery of doubtful debts which had been fully or substantially provided for in prior years.
102
| 7 | ACCOUNTS RECEIVABLE (Continued) |
Ageing started from the overdue date of accounts receivable. The Group always measured the provision for impairment of accounts receivable based on the amount equivalent to the expected credit loss during the entire duration. The ECLs were calculated based on historical actual credit loss experience. The rates were considered the differences between economic conditions during the period over which the historical data has been collected, current conditions and the Group’s view of economic conditions over the expected lives of the receivables. The Group performed the calculation of ECL rates by the operating segment and geographical location.
| Impairment provision on individual basis | Impairment provision on provision matrix basis | |||||
| 31 December 2022 | Gross carrying amount | Carrying amount | Impairment provision on individual basis | Weighted- average loss rate | Impairment provision | Loss allowance |
| RMB million | RMB million | RMB million | % | RMB million | RMB million | |
| Current and within 1 year past due | 46,097 | 7,014 | 2 | 0.1% | 56 | 58 |
| 1 to 2 years past due | 216 | 29 | 25 | 20.9% | 39 | 64 |
| 2 to 3 years past due | 269 | 193 | 148 | 43.4% | 33 | 181 |
| Over 3 years past due | 3,861 | 3,487 | 3,405 | 99.2% | 371 | 3,776 |
| Total | 50,443 | 10,723 | 3,580 | 499 | 4,079 | |
| Impairment provision on individual basis | Impairment provision on provision matrix basis | |||||
| 31 December 2021 | Gross carrying amount | Carrying amount | Impairment provision on individual basis | Weighted- average loss rate | Impairment provision | Loss allowance |
| RMB million | RMB million | RMB million | % | RMB million | RMB million | |
| Current and within 1 year past due | 34,263 | 4,280 | 26 | 0.2% | 57 | 83 |
| 1 to 2 years past due | 623 | 500 | 137 | 35.8% | 44 | 181 |
| 2 to 3 years past due | 3,411 | 3,324 | 3,146 | 50.6% | 44 | 3,190 |
| Over 3 years past due | 597 | 208 | 190 | 100.0% | 389 | 579 |
| Total | 38,894 | 8,312 | 3,499 | 534 | 4,033 | |
| 8 | RECEIVABLES FINANCING |
Receivables financing represents mainly the bills of acceptance issued by banks for sales of goods and products and certain trade accounts receivable. The business model of financial assets is achieved both by collecting contractual cash flows and selling of these assets.
At 31 December 2022, the Group’s derecognised but outstanding bills due to endorsement or discount amounted to RMB34,978 million (2021: RMB36,400 million).
At 31 December 2022, the Group considers that its bills of acceptance issued by banks do not pose a significant credit risk and will not cause any significant loss due to the default of drawers.
103
| 9 | PREPAYMENTS |
| The Group | The Company | |||
| At 31 December | At 31 December | At 31 December | At 31 December | |
| 2022 | 2021 | 2022 | 2021 | |
| RMB million | RMB million | RMB million | RMB million | |
| Prepayments | 8,067 | 9,350 | 4,473 | 4,556 |
| Less: Allowance for doubtful accounts | 111 | 83 | 12 | 16 |
| Total | 7,956 | 9,267 | 4,461 | 4,540 |
| The Group | ||||||||
| At 31 December 2022 | At 31 December 2021 | |||||||
| Amount | Percentage to total prepayments | Allowance | Percentage of allowance to prepayments balance | Amount | Percentage to total prepayments | Allowance | Percentage of allowance to prepayments balance | |
| RMB million | % | RMB million | % | RMB million | % | RMB million | % | |
| Within one year | 7,608 | 94.3 | – | – | 8,541 | 91.3 | – | – |
| Between one and two years | 249 | 3.1 | 32 | 12.9 | 444 | 4.8 | 7 | 1.6 |
| Between two and three years | 67 | 0.8 | 10 | 14.9 | 166 | 1.8 | 25 | 15.1 |
| Over three years | 143 | 1.8 | 69 | 48.3 | 199 | 2.1 | 51 | 25.8 |
| Total | 8,067 | 100.0 | 111 | 9,350 | 100.0 | 83 | ||
| The Company | ||||||||
| At 31 December 2022 | At 31 December 2021 | |||||||
| Amount | Percentage to total prepayments | Allowance | Percentage of allowance to prepayments balance | Amount | Percentage to total prepayments | Allowance | Percentage of allowance to prepayments balance | |
| RMB million | % | RMB million | % | RMB million | % | RMB million | % | |
| Within one year | 4,331 | 96.8 | – | – | 3,965 | 87.0 | – | – |
| Between one and two years | 39 | 0.9 | 1 | 2.6 | 369 | 8.1 | 2 | 0.5 |
| Between two and three years | 13 | 0.3 | 3 | 23.1 | 99 | 2.2 | 10 | 10.1 |
| Over three years | 90 | 2.0 | 8 | 8.9 | 123 | 2.7 | 4 | 3.3 |
| Total | 4,473 | 100.0 | 12 | 4,556 | 100.0 | 16 | ||
At 31 December 2022 and 31 December 2021, the total amounts of the top five prepayments of the Group are set out below:
| At 31 December | At 31 December | |
| 2022 | 2021 | |
| Total amount (RMB million) | 2,565 | 2,939 |
| Percentage to the total balance of prepayments | 31.8% | 31.4% |
104
| 10 | OTHER RECEIVABLES |
| The Group | The Company | |||
| At 31 December | At 31 December | At 31 December | At 31 December | |
| 2022 | 2021 | 2022 | 2021 | |
| RMB million | RMB million | RMB million | RMB million | |
| Other receivables | 28,562 | 37,254 | 39,416 | 47,827 |
| Less: Allowance for doubtful accounts | 1,553 | 1,590 | 899 | 898 |
| Total | 27,009 | 35,664 | 38,517 | 46,929 |
Other receivables mainly include security deposits and deposits.
Ageing analysis of other receivables is as follows:
| The Group | ||||||||
| At 31 December 2022 | At 31 December 2021 | |||||||
| Amount | Percentage to total other receivables | Allowance | Percentage of allowance to other receivables balance | Amount | Percentage to total other receivables | Allowance | Percentage of allowance to other receivables balance | |
| RMB million | % | RMB million | % | RMB million | % | RMB million | % | |
| Within one year | 17,846 | 62.6 | 25 | 0.1 | 26,579 | 71.3 | 35 | 0.1 |
| Between one and two years | 496 | 1.7 | 44 | 8.9 | 597 | 1.6 | 112 | 18.8 |
| Between two and three years | 353 | 1.2 | 139 | 39.4 | 7,661 | 20.6 | 165 | 2.2 |
| Over three years | 9,867 | 34.5 | 1,345 | 13.6 | 2,417 | 6.5 | 1,278 | 52.9 |
| Total | 28,562 | 100.0 | 1,553 | 37,254 | 100.0 | 1,590 | ||
| The Company | ||||||||
| At 31 December 2022 | At 31 December 2021 | |||||||
| Amount | Percentage to total other receivables | Allowance | Percentage of allowance to other receivables balance | Amount | Percentage to total other receivables | Allowance | Percentage of allowance to other receivables balance | |
| RMB million | % | RMB million | % | RMB million | % | RMB million | % | |
| Within one year | 25,945 | 65.8 | – | – | 28,176 | 58.9 | – | – |
| Between one and two years | 2,847 | 7.2 | 5 | 0.2 | 3,740 | 7.8 | 2 | 0.1 |
| Between two and three years | 3,929 | 10.0 | 2 | 0.1 | 1,414 | 3.0 | 2 | 0.1 |
| Over three years | 6,695 | 17.0 | 892 | 13.3 | 14,497 | 30.3 | 894 | 6.2 |
| Total | 39,416 | 100.0 | 899 | 47,827 | 100.0 | 898 | ||
At 31 December 2022 and at 31 December 2021, the total amounts of the top five other receivables of the Group are set out below:
| At 31 December | At 31 December | |
| 2022 | 2021 | |
| Total amount (RMB million) | 13,936 | 19,056 |
| Ageing | Within one year, one to two years, two to three years and over three years | Within one year, one to two years, two to three years and over three years |
| Percentage to the total balance of other receivables | 48.8% | 51.2% |
| Allowance for doubtful accounts | 72.0 | 74.0 |
During the year ended 31 December 2022 and 2021, the Group and the Company had no individually significant other receivables been fully or substantially provided allowance for doubtful accounts.
During the year ended 31 December 2022 and 2021, the Group and the Company had no individually significant write-off or recovery of doubtful debts which had been fully or substantially provided for in prior years.
105
| 11 | INVENTORIES |
The Group
| At 31 December | At 31 December | |
| 2022 | 2021 | |
| RMB million | RMB million | |
| Raw materials | 139,307 | 109,940 |
| Work in progress | 14,536 | 15,701 |
| Finished goods | 93,994 | 84,174 |
| Spare parts and consumables | 2,987 | 2,515 |
| 250,824 | 212,330 | |
| Less: Provision for diminution in value of inventories | 6,583 | 4,897 |
| Total | 244,241 | 207,433 |
At 31 December 2022, the provision for diminution in value of inventories of the Group was primarily due to the costs of finished goods and raw materials were higher than net realisable value.
| 12 | LONG-TERM EQUITY INVESTMENTS |
The Group
| Investments in joint ventures | Investments in associates | Provision for impairment losses | Total | |
| RMB million | RMB million | RMB million | RMB million | |
| Balance at 1 January 2022 | 63,384 | 149,500 | (3,705) | 209,179 |
| Additions for the year | 16,387 | 3,724 | – | 20,111 |
| Share of profits less losses under the equity method | 138 | 14,341 | – | 14,479 |
| Change of other comprehensive loss under the equity method | 3,046 | (190) | – | 2,856 |
| Other equity movements under the equity method | 11 | (1,020) | – | (1,009) |
| Dividends declared | (6,400) | (7,698) | – | (14,098) |
| Disposals for the year | (268) | (444) | – | (712) |
| Foreign currency translation differences | 1,546 | 1,755 | (183) | 3,118 |
| Movement of provision for impairment | – | – | (2) | (2) |
| Other movements | 2 | 17 | – | 19 |
| Balance at 31 December 2022 | 77,846 | 159,985 | (3,890) | 233,941 |
The Company
| Investments in subsidiaries | Investments in joint ventures | Investments in associates | Provision for impairment losses | Total | |
| RMB million | RMB million | RMB million | RMB million | RMB million | |
| Balance at 1 January 2022 | 277,310 | 17,609 | 73,854 | (7,926) | 360,847 |
| Additions for the year | 22,782 | 2,982 | 35 | – | 25,799 |
| Share of profits less losses under the equity method | – | (284) | 4,733 | – | 4,449 |
| Change of other comprehensive loss under the equity method | – | – | 10 | – | 10 |
| Other equity movements under the equity method | – | 5 | (1,270) | – | (1,265) |
| Dividends declared | – | (3,263) | (1,832) | – | (5,095) |
| Disposals for the year | (2,047) | – | (6) | – | (2,053) |
| Movement of provision for impairment | – | – | – | (3) | (3) |
| Other movement | – | 190 | – | – | 190 |
| Balance at 31 December 2022 | 298,045 | 17,239 | 75,524 | (7,929) | 382,879 |
For the year ended 31 December 2022, the Group and the Company had no individually significant long-term investment impairment.
Details of the Company’s principal subsidiaries are set out in Note 59.
106
| 12 | LONG-TERM EQUITY INVESTMENTS (Continued) |
Principal joint ventures and associates of the Group are as follows:
| (a) | Principal joint ventures and associates |
| Name of investees | Principal place of business | Register location | Legal representative | Principal activities | Registered Capital RMB million | Percentage of equity/voting right directly or indirectly held by the Company |
| 1. Joint ventures | ||||||
| Fujian Refining & Petrochemical Company Limited (“FREP”) | PRC | PRC | Liu Xiangdong | Manufacturing refining oil products | 14,758 | 50.00% |
| BASF-YPC Company Limited (“BASF-YPC”) | PRC | PRC | Gu Yuefeng | Manufacturing and distribution of petrochemical products | 13,141 | 40.00% |
| Taihu Limited (“Taihu”) | Russia | Cyprus | NA | Crude oil and natural gas extraction | 25,000 USD | 49.00% |
| Sinopec SABIC Tianjin Petrochemical Company Limited (“Sinopec SABIC Tianjin”) | PRC | PRC | SAMI ALOSAIMI | Manufacturing and distribution of petrochemical products | 10,520 | 50.00% |
| Shanghai SECCO Petrochemical Co., Ltd. (“Shanghai SECCO”) | PRC | PRC | Wang Jingyi | Manufacturing and distribution of petrochemical products | 3,115 | 50.00% |
| 2. Associates | ||||||
| China Oil & Gas Pipeline Network Corporation (“PipeChina”) (i) | PRC | PRC | Zhang Wei | Operation of oil and natural gas pipelines and auxiliary facilities | 500,000 | 14.00% |
| Sinopec Finance Company Limited (“Sinopec Finance”) | PRC | PRC | Jiang Yongfu | Provision of non-banking financial services | 18,000 | 49.00% |
| Sinopec Capital Co.,Ltd. (“Sinopec Capital”) | PRC | PRC | Sun Mingrong | Project management, equity investment management, investment consulting, self-owned equity management | 10,000 | 49.00% |
| Zhongtian Synergetic Energy Company Limited (“Zhongtian Synergetic Energy”) | PRC | PRC | Yang Dong | Mining coal and manufacturing of coal-chemical products | 17,516 | 38.75% |
| Caspian Investments Resources Ltd. (“CIR”) | The Republic of Kazakhstan | British Virgin Islands | NA | Crude oil and natural gas extraction | 10,002 USD | 50.00% |
Joint ventures and associates above are limited companies.
107
12 LONG-TERM EQUITY INVESTMENTS (Continued)
| (b) | Major financial information of principal joint ventures |
Summarised balance sheet and reconciliation to their carrying amounts in respect of the Group’s principal joint ventures:
| FREP | BASF-YPC | Taihu | Sinopec SABIC Tianjin | Shanghai SECCO* | |||||
| At 31 | At 31 | At 31 | At 31 | At 31 | At 31 | At 31 | At 31 | At 31 | |
| December | December | December | December | December | December | December | December | December | |
| 2022 | 2021 | 2022 | 2021 | 2022 | 2021 | 2022 | 2021 | 2022 | |
| RMB million | RMB million | RMB million | RMB million | RMB million | RMB million | RMB million | RMB million | RMB million | |
| Current assets | |||||||||
| Cash and cash equivalents | 3,733 | 6,562 | 3,061 | 5,375 | 1,625 | 1,258 | 4,506 | 4,820 | 1,323 |
| Other current assets | 11,311 | 9,217 | 5,993 | 6,953 | 15,269 | 2,188 | 2,554 | 3,437 | 3,647 |
| Total current assets | 15,044 | 15,779 | 9,054 | 12,328 | 16,894 | 3,446 | 7,060 | 8,257 | 4,970 |
| Non-current assets | 12,708 | 13,744 | 9,244 | 9,336 | 10,488 | 14,032 | 18,466 | 18,835 | 26,677 |
| Current liabilities | |||||||||
| Current financial liabilities | (829) | (1,177) | (63) | (77) | (55) | (32) | (2,950) | (597) | (6,609) |
| Other current liabilities | (9,951) | (5,008) | (2,245) | (2,546) | (2,727) | (1,931) | (3,282) | (3,547) | (2,368) |
| Total current liabilities | (10,780) | (6,185) | (2,308) | (2,623) | (2,782) | (1,963) | (6,232) | (4,144) | (8,977) |
| Non-current liabilities | |||||||||
| Non-current financial liabilities | (3,742) | (6,857) | – | – | (157) | (85) | (6,393) | (7,599) | – |
| Other non-current liabilities | (237) | (242) | (107) | (92) | (1,852) | (1,439) | (635) | (382) | (944) |
| Total non-current liabilities | (3,979) | (7,099) | (107) | (92) | (2,009) | (1,524) | (7,028) | (7,981) | (944) |
| Net assets | 12,993 | 16,239 | 15,883 | 18,949 | 22,591 | 13,991 | 12,266 | 14,967 | 21,726 |
| Net assets attributable to shareholders of the company | 12,993 | 16,239 | 15,883 | 18,949 | 21,941 | 13,523 | 12,266 | 14,967 | 21,726 |
| Net assets attributable to minority interests | – | – | – | – | 650 | 468 | – | – | – |
| Share of net assets from joint ventures | 6,497 | 8,120 | 6,353 | 7,580 | 10,751 | 6,626 | 6,133 | 7,484 | 10,863 |
| Carrying Amounts | 6,497 | 8,120 | 6,353 | 7,580 | 10,751 | 6,626 | 6,133 | 7,484 | 10,863 |
Summarised income statement
| For the year ended 31 December 2022 | FREP | BASF-YPC | Taihu | Sinopec SABIC Tianjin | ||||
| 2022 | 2021 | 2022 | 2021 | 2022 | 2021 | 2022 | 2021 | |
| RMB million | RMB million | RMB million | RMB million | RMB million | RMB million | RMB million | RMB million | |
| Turnover | 59,347 | 47,224 | 25,076 | 27,499 | 19,542 | 15,190 | 24,294 | 24,631 |
| Interest income | 107 | 147 | 116 | 52 | 975 | 451 | 144 | 209 |
| Interest expense | (338) | (411) | (7) | (5) | (274) | (107) | (111) | (89) |
| Profit/(loss) before taxation | (2,004) | 2,261 | 3,542 | 8,218 | 1,657 | 2,864 | (2,396) | 1,393 |
| Tax expense | 578 | (597) | (885) | (2,054) | (201) | (601) | 603 | (407) |
| Profit/(loss) for the year | (1,426) | 1,664 | 2,657 | 6,164 | 1,456 | 2,263 | (1,793) | 986 |
| Other comprehensive loss | – | – | – | – | 7,144 | (123) | – | – |
| Total comprehensive income/(loss) | (1,426) | 1,664 | 2,657 | 6,164 | 8,600 | 2,140 | (1,793) | 986 |
| Dividends from joint ventures | 910 | 128 | 2,462 | 454 | – | – | 454 | 500 |
| Share of net profit/(loss) from joint ventures | (713) | 832 | 1,063 | 2,466 | 703 | 1,081 | (897) | 493 |
| Share of other comprehensive loss from joint ventures (ii) | – | – | – | – | 3,422 | (60) | – | – |
| * | The share of profit and other comprehensive income for the period from 29 December 2022 to 31 December 2022 from Shanghai SECCO was immaterial. |
The share of profit and other comprehensive income for the year ended 31 December 2022 in all individually immaterial joint ventures accounted for using equity method in aggregate was loss RMB18 million (2021: profit RMB4,494 million) and loss RMB376 million (2021: RMB215 million) respectively. As at 31 December 2022, the carrying amount of all individually immaterial joint ventures accounted for using equity method in aggregate was RMB34,194 million (2021: RMB30,640 million).
108
| 12 | LONG-TERM EQUITY INVESTMENTS (Continued) |
| (c) | Major financial information of principal associates |
Summarised balance sheet and reconciliation to their carrying amounts in respect of the Group’s principal associates:
| PipeChina | Sinopec Finance | Sinopec Capital | Zhongtian Synergetic Energy | CIR | ||||||
| At 31 | At 31 | At 31 | At 31 | At 31 | At 31 | At 31 | At 31 | At 31 | At 31 | |
| December | December | December | December | December | December | December | December | December | December | |
| 2022 | 2021 | 2022 | 2021 | 2022 | 2021 | 2022 | 2021 | 2022 | 2021 | |
| RMB million | RMB million | RMB million | RMB million | RMB million | RMB million | RMB million | RMB million | RMB million | RMB million | |
| Current assets | 104,889 | 86,335 | 212,850 | 194,458 | 14,444 | 13,140 | 3,212 | 3,532 | 885 | 576 |
| Non-current assets | 816,301 | 768,161 | 57,394 | 55,086 | 249 | 102 | 51,035 | 51,331 | 1,106 | 870 |
| Current liabilities | (132,266) | (136,150) | (236,840) | (217,987) | (101) | (28) | (3,811) | (8,577) | (714) | (822) |
| Non-current liabilities | (199,675) | (103,243) | (673) | (602) | (990) | (676) | (23,435) | (22,216) | (138) | (144) |
| Net assets | 589,249 | 615,103 | 32,731 | 30,955 | 13,602 | 12,538 | 27,001 | 24,070 | 1,139 | 480 |
| Net assets attributable to shareholders of the Company | 525,235 | 526,241 | 32,731 | 30,955 | 13,602 | 12,538 | 27,001 | 24,070 | 1,139 | 480 |
| Net assets attributable to minority interests | 64,014 | 88,862 | – | – | – | – | – | – | – | – |
| Share of net assets from associates | 73,533 | 73,674 | 16,038 | 15,168 | 6,665 | 6,144 | 10,463 | 9,327 | 570 | 240 |
| Carrying Amounts | 73,533 | 73,674 | 16,038 | 15,168 | 6,665 | 6,144 | 10,463 | 9,327 | 570 | 240 |
Summarised income statement
| For the year ended 31 December 2021 | PipeChina | Sinopec Finance | Sinopec Capital | ZTHC Energy | CIR | |||||
| 2022 | 2021 | 2022 | 2021 | 2022 | 2021 | 2022 | 2021 | 2022 | 2021 | |
| RMB million | RMB million | RMB million | RMB million | RMB million | RMB million | RMB million | RMB million | RMB million | RMB million | |
| Turnover | 112,832 | 101,572 | 5,636 | 5,177 | 5 | 2 | 17,551 | 16,959 | 2,090 | 1,826 |
| Profit for the year | 31,908 | 29,776 | 2,338 | 2,168 | 1,281 | 990 | 4,562 | 4,184 | 574 | 461 |
| Other comprehensive income | – | 2 | 89 | 26 | (68) | – | – | – | 85 | 3 |
| Total comprehensive income | 31,908 | 29,778 | 2,427 | 2,194 | 1,213 | 990 | 4,562 | 4,184 | 659 | 464 |
| Dividends declared by associates | 2,019 | 442 | 319 | 490 | 73 | – | 632 | 86 | – | 1,152 |
| Share of profit from associates | 3,670 | 3,205 | 1,145 | 1,062 | 627 | 485 | 1,768 | 1,621 | 287 | 231 |
| Share of other comprehensive income from associates (ii) | – | – | 44 | 13 | (33) | – | – | – | 43 | 2 |
The share of profit and other comprehensive income for the year ended 31 December 2022 in all individually immaterial associates accounted for using equity method in aggregate was RMB6,844 million (2021: RMB7,283 million) and loss RMB244 million (2021: profit RMB271 million) respectively. As at 31 December 2022, the carrying amount of all individually immaterial associates accounted for using equity method in aggregate was RMB51,881 million (2021: RMB44,176 million).
Notes:
| (i) | Sinopec is able to exercise significant influence in PipeChina since Sinopec has a member in PipeChina’s Board of Directors and has a member in PipeChina’s Management Board. |
| (ii) | Including foreign currency translation differences. |
109
| 13 | FIXED ASSETS |
The Group
| At 31 December | At 31 December | |
| 2022 | 2021 | |
| RMB million | RMB million | |
| Fixed assets (a) | 630,700 | 598,925 |
| Fixed assets pending for disposal | 58 | 7 |
| Total | 630,758 | 598,932 |
| (a) | Fixed assets |
| Plants and buildings | Oil and gas properties | Equipment, machinery and others | Total | |
| RMB million | RMB million | RMB million | RMB million | |
| Cost: | ||||
| Balance at 1 January 2022 | 143,165 | 793,045 | 1,048,227 | 1,984,437 |
| Additions for the year | 146 | 4,277 | 3,528 | 7,951 |
| Transferred from construction in progress | 8,832 | 40,397 | 72,738 | 121,967 |
| Reclassifications | 1,042 | (289) | (753) | – |
| Decreases for the year | (960) | (479) | (18,736) | (20,175) |
| Exchange adjustments | 207 | 3,768 | 321 | 4,296 |
| Balance at 31 December 2022 | 152,432 | 840,719 | 1,105,325 | 2,098,476 |
| Less: Accumulated depreciation: | ||||
| Balance at 1 January 2022 | 63,479 | 611,012 | 613,498 | 1,287,989 |
| Additions for the year | 4,736 | 31,059 | 50,383 | 86,178 |
| Reclassifications | 259 | (209) | (50) | – |
| Decreases for the year | (677) | (438) | (11,209) | (12,324) |
| Exchange adjustments | 101 | 3,378 | 195 | 3,674 |
| Balance at 31 December 2022 | 67,898 | 644,802 | 652,817 | 1,365,517 |
| Less: Provision for impairment losses: | ||||
| Balance at 1 January 2022 | 4,687 | 49,826 | 43,010 | 97,523 |
| Additions for the year | 312 | 2,754 | 2,016 | 5,082 |
| Decreases for the year | (102) | (8) | (476) | (586) |
| Exchange adjustments | – | 238 | 2 | 240 |
| Balance at 31 December 2022 | 4,897 | 52,810 | 44,552 | 102,259 |
| Net book value: | ||||
| Balance at 31 December 2022 | 79,637 | 143,107 | 407,956 | 630,700 |
| Balance at 31 December 2021 | 74,999 | 132,207 | 391,719 | 598,925 |
The Company
| At 31 December | At 31 December | |
| 2022 | 2021 | |
| RMB million | RMB million | |
| Fixed assets (a) | 296,480 | 284,618 |
| Fixed assets pending for disposal | 50 | 4 |
| Total | 296,530 | 284,622 |
110
| 13 | FIXED ASSETS (Continued) |
| (a) | Fixed assets (Continued) |
The Company (Continued)
| Plants and buildings | Oil and gas properties | Equipment, machinery and others | Total | |
| RMB million | RMB million | RMB million | RMB million | |
| Cost: | ||||
| Balance at 1 January 2022 | 51,696 | 646,020 | 514,422 | 1,212,138 |
| Additions for the year | 8 | 3,982 | 552 | 4,542 |
| Transferred from construction in progress | 1,657 | 31,343 | 30,556 | 63,556 |
| Reclassifications | 705 | (281) | (424) | – |
| Transferred from subsidiaries | 17 | 1,286 | 204 | 1,507 |
| Transferred to subsidiaries | (2,302) | (67) | (9,032) | (11,401) |
| Decreases for the year | (739) | (343) | (6,887) | (7,969) |
| Balance at 31 December 2022 | 51,042 | 681,940 | 529,391 | 1,262,373 |
| Accumulated depreciation: | ||||
| Balance at 1 January 2022 | 27,372 | 499,833 | 330,453 | 857,658 |
| Additions for the year | 1,550 | 23,659 | 21,798 | 47,007 |
| Reclassifications | 117 | (206) | 89 | – |
| Transferred from subsidiaries | 7 | 957 | 38 | 1,002 |
| Transferred to subsidiaries | (427) | – | (7,097) | (7,524) |
| Decreases for the year | (520) | (304) | (5,101) | (5,925) |
| Balance at 31 December 2022 | 28,099 | 523,939 | 340,180 | 892,218 |
| Provision for impairment losses: | ||||
| Balance at 1 January 2022 | 2,228 | 43,307 | 24,327 | 69,862 |
| Additions for the year | 307 | 2,364 | 1,327 | 3,998 |
| Transferred to subsidiaries | 5 | 151 | 10 | 166 |
| Decreases for the year | (39) | (6) | (306) | (351) |
| Balance at 31 December 2022 | 2,501 | 45,816 | 25,358 | 73,675 |
| Net book value: | ||||
| Balance at 31 December 2022 | 20,442 | 112,185 | 163,853 | 296,480 |
| Balance at 31 December 2021 | 22,096 | 102,880 | 159,642 | 284,618 |
The additions to oil and gas properties of the Group and the Company for the year ended 31 December 2022 included RMB4,277 million (2021: RMB2,163 million) and RMB3,982 million (2021: RMB1,525 million), respectively of the estimated dismantlement costs for site restoration.
In 2022, the impairment loss on fixed assets was mainly due to the impairment loss of the exploration and development segment of RMB2,891 million (2021: RMB2,467 million), and the impairment loss of the chemical segment of RMB1,790 million (2021: RMB5,184 million). RMB2 million (2021: RMB894 million), impairment loss of the refining segment and RMB398 million (2021: RMB873 million) of the marketing and distribution segment. The impairment losses in the exploration and development segment were mainly impairment losses on fixed assets related to oil and gas production activities. Among them, oil and gas properties and other fixed assets provided impairment losses of RMB2,754 million and RMB137 million respectively, which were mainly related to the decline in oil and gas reserves of individual oilfields and high extraction cost. The Exploration and Development segment allocates fixed assets related to oil and gas production activities into individually identifiable groups of assets and estimates their recoverable amounts. The recoverable amounts were determined based on the present values of the expected future cash flows of the assets using a pre-tax discount rate 8.17% to 14.86% (2021: 10.47%). If the Group’s estimate of future oil prices is lowered, further impairment losses may be incurred and the aggregate amount of impairment losses may be significant. With other conditions remaining constant and a 5% drop in oil prices, the Group’s impairment loss on fixed assets related to oil and gas production activities will increase by approximately RMB1,693 million (2021: RMB3,628 million); with other conditions remaining unchanged and operating costs increasing by 5%, the Group’s impairment loss on fixed assets related to oil and gas production activities will increase by approximately RMB1,508 million (2021: RMB2,400 million); With other conditions remaining unchanged and the discount rate increasing by 5%, the Group’s impairment loss on fixed assets related to oil and gas production activities will increase by approximately RMB126 million (2021: RMB180 million). Impairment losses recognised in the chemical segment and refining segment relate to certain refinery and chemical production facilities and are not individually significant. The impairment losses were mainly due to the suspension of operations of certain production facilities, and evidence that indicate the economic performance of certain production facilities continuously was lower than the expectation, thus the carrying amounts of these facilities were written down to their recoverable amounts, which were determined based on the present values of forecasted future cash flows of the cash generating units using pre-tax discount rates ranging from 7.64% to 18.68% (2021: 10.50% to 13.90%).
At 31 December 2022 and 31 December 2021, the Group and the Company had no individually significant fixed assets which were pledged.
At 31 December 2022 and 31 December 2021, the Group and the Company had no individually significant fixed assets which were temporarily idle or pending for disposal.
At 31 December 2022 and 31 December 2021, the Group and the Company had no individually significant fully depreciated fixed assets which were still in use.
111
| 14 | CONSTRUCTION IN PROGRESS |
| The Group | The Company | |
| RMB million | RMB million | |
| Cost: | ||
| Balance at 1 January 2022 | 158,069 | 66,448 |
| Additions for the year | 180,741 | 88,463 |
| Disposals for the year | (388) | (1,366) |
| Dry hole costs written off | (6,416) | (5,737) |
| Transferred to fixed assets | (121,967) | (63,556) |
| Reclassification to other assets | (11,492) | (2,449) |
| Exchange adjustments | 145 | – |
| Balance at 31 December 2022 | 198,692 | 81,803 |
| Provision for impairment losses: | ||
| Balance at 1 January 2022 | 2,130 | 302 |
| Additions for the year | 581 | – |
| Decreases for the year | (148) | – |
| Exchange adjustments | 84 | – |
| Balance at 31 December 2022 | 2,647 | 302 |
| Net book value: | ||
| Balance at 31 December 2022 | 196,045 | 81,501 |
| Balance at 31 December 2021 | 155,939 | 66,146 |
At 31 December 2022, major construction projects of the Group are as follows:
| Project name | Budgeted amount | Balance at 1 January 2022 | Net change for the year | Balance at 31 December 2022 | Percentage of project investment to budgeted amount | Source of funding | Accumulated interest capitalised at 31 December 2022 |
| RMB million | RMB million | RMB million | RMB million | RMB million | |||
| Hainan Refining and Chemical Ethylene and Refining Reconstruction and Expansion Project | 28,565 | 15,602 | (1,820) | 13,782 | 93% | Bank loans & self-financing | 369 |
| Tianjin Nangang Ethylene and Downstream High-end New Material Industry Cluster Project | 29,052 | 2,999 | 9,855 | 12,854 | 44% | Bank loans & self-financing | 160 |
| Caprolactam Industry Chain Relocation and Upgrading Transformation Development Project | 13,939 | 3,700 | 7,300 | 11,000 | 79% | Bank loans & self-financing | 120 |
| Zhenhai Refining and Chemical Refining and High-end Synthetic New Material Project | 41,639 | 2,128 | 4,204 | 6,332 | 16% | Self-financing | – |
| Western Sichuan Gas Field Leikoupo Formation Gas Reservoir Development and Construction Project | 8,591 | 1,956 | 1,738 | 3,694 | 43% | Bank loans & self-financing | 43 |
112
15 RIGHT-OF-USE ASSETS
The Group
| Land | Others | Total | |
| RMB million | RMB million | RMB million | |
| Cost: | |||
| Balance at 1 January 2022 | 172,104 | 46,921 | 219,025 |
| Additions for the year | 1,527 | 9,108 | 10,635 |
| Decreases for the year | (2,081) | (4,229) | (6,310) |
| Balance at 31 December 2022 | 171,550 | 51,800 | 223,350 |
| Accumulated depreciation: | |||
| Balance at 1 January 2022 | 18,904 | 15,147 | 34,051 |
| Additions for the year | 6,328 | 7,519 | 13,847 |
| Decreases for the year | (1,048) | (1,859) | (2,907) |
| Balance at 31 December 2022 | 24,184 | 20,807 | 44,991 |
| Net book value: | |||
| Balance at 31 December 2022 | 147,366 | 30,993 | 178,359 |
| Balance at 31 December 2021 | 153,200 | 31,774 | 184,974 |
The Company
| Land | Others | Total | |
| RMB million | RMB million | RMB million | |
| Cost: | |||
| Balance at 1 January 2022 | 115,489 | 2,956 | 118,445 |
| Additions for the year | 699 | 2,215 | 2,914 |
| Decreases for the year | (13,239) | (845) | (14,084) |
| Balance at 31 December 2022 | 102,949 | 4,326 | 107,275 |
| Accumulated depreciation: | |||
| Balance at 1 January 2022 | 11,204 | 1,529 | 12,733 |
| Additions for the year | 3,589 | 1,175 | 4,764 |
| Decreases for the year | (1,385) | (386) | (1,771) |
| Balance at 31 December 2022 | 13,408 | 2,318 | 15,726 |
| Net book value: | |||
| Balance at 31 December 2022 | 89,541 | 2,008 | 91,549 |
| Balance at 31 December 2021 | 104,285 | 1,427 | 105,712 |
113
| 16 | INTANGIBLE ASSETS |
The Group
| Land use rights | Patents | Non-patent technology | Operation rights | Others | Total | |
| RMB million | RMB million | RMB million | RMB million | RMB million | RMB million | |
| Cost: | ||||||
| Balance at 1 January 2022 | 111,864 | 6,533 | 5,140 | 53,791 | 8,217 | 185,545 |
| Additions for the year | 9,453 | 166 | 267 | 880 | 1,337 | 12,103 |
| Decreases for the year | (3,529) | (1,959) | – | (541) | (302) | (6,331) |
| Balance at 31 December 2022 | 117,788 | 4,740 | 5,407 | 54,130 | 9,252 | 191,317 |
| Accumulated amortisation: | ||||||
| Balance at 1 January 2022 | 28,194 | 4,907 | 3,800 | 23,670 | 4,492 | 65,063 |
| Additions for the year | 3,588 | 217 | 232 | 2,294 | 580 | 6,911 |
| Decreases for the year | (728) | (1,455) | – | (240) | (194) | (2,617) |
| Balance at 31 December 2022 | 31,054 | 3,669 | 4,032 | 25,724 | 4,878 | 69,357 |
| Provision for impairment losses: | ||||||
| Balance at 1 January 2022 | 236 | 482 | 130 | 407 | 17 | 1,272 |
| Additions for the year | 3 | – | – | 7 | 3 | 13 |
| Decreases for the year | (2) | – | – | (17) | – | (19) |
| Balance at 31 December 2022 | 237 | 482 | 130 | 397 | 20 | 1,266 |
| Net book value: | ||||||
| Balance at 31 December 2022 | 86,497 | 589 | 1,245 | 28,009 | 4,354 | 120,694 |
| Balance at 31 December 2021 | 83,434 | 1,144 | 1,210 | 29,714 | 3,708 | 119,210 |
Amortisation of the intangible assets of the Group charged for the year ended 31 December 2022 is RMB6,489 million (2021: RMB6,363 million).
| 17 | GOODWILL |
Goodwill is allocated to the following Group’s cash-generating units:
| At 31 December | At 31 December | ||
| Name of investees | Principal activities | 2022 | 2021 |
| RMB million | RMB million | ||
| Sinopec Zhenhai Refining and Chemical Branch | Manufacturing of intermediate petrochemical products and petroleum products | 4,043 | 4,043 |
| Sinopec Beijing Yanshan Petrochemical Branch | Manufacturing of intermediate petrochemical products and petroleum products | 1,004 | 1,004 |
| Shanghai SECCO | Production and sale of petrochemical products | – | 2,541 |
| Other units without individual significant goodwill | 1,417 | 1,006 | |
| Total | 6,464 | 8,594 |
Goodwill represents the excess of the cost of purchase over the fair value of the underlying assets and liabilities. The recoverable amounts of the above cash generating units are determined based on value in use calculations. These calculations use cash flow projections based on financial budgets approved by management. The pre-tax discount rates reflect specific risks relating to the cash generating unit. For impairment test of the goodwill, the pre-tax discount rates ranging 10.1% to 12.2% (2021: 11.4% to 11.7%) were used by management. Based on the estimated recoverable amount, no major impairment loss was recognised for the year ended 31 December, 2022.
Key assumptions used for cash flow forecasts for these cash generating units are the sales volume and gross margin. The sales volume was based on the production capacity and/or the sales volume in the period immediately before the budget period. The sales price was based on the future trend of the prices of crude oil and petrochemical products. The budgeted gross margin was based on the gross margin achieved in the period immediately before the budget period.
| 18 | LONG-TERM DEFERRED EXPENSES |
Long-term deferred expenses primarily represent catalysts expenditures and improvement expenditures of leased fixed assets.
114
| 19 | DEFERRED TAX ASSETS AND LIABILITIES |
Deferred tax assets and liabilities before the offsetting adjustments are as follows:
| Deferred tax assets | Deferred tax liabilities | |||
| At 31 December | At 31 December | At 31 December | At 31 December | |
| 2022 | 2021 | 2022 | 2021 | |
| RMB million | RMB million | RMB million | RMB million | |
| Receivables and inventories | 4,271 | 3,763 | (17) | – |
| Payables | 3,091 | 2,858 | – | – |
| Cash flow hedges | 85 | 258 | (736) | (2,709) |
| Fixed assets | 15,714 | 16,777 | (16,519) | (15,037) |
| Tax value of losses carried forward | 4,643 | 4,749 | – | – |
| Other equity instrument investments | 131 | 127 | (6) | (9) |
| Intangible assets | 1,067 | 1,008 | (85) | (492) |
| Others | 1,395 | 1,056 | (1,161) | (870) |
| Deferred tax assets/(liabilities) | 30,397 | 30,596 | (18,524) | (19,117) |
The offsetting amount between deferred tax assets and liabilities are as follows:
| At 31 December | At 31 December | |
| 2022 | 2021 | |
| RMB million | RMB million | |
| Deferred tax assets | 10,445 | 11,207 |
| Deferred tax liabilities | 10,445 | 11,207 |
Deferred tax assets and liabilities after the offsetting adjustments are as follows:
| At 31 December | At 31 December | |
| 2022 | 2021 | |
| RMB million | RMB million | |
| Deferred tax assets | 19,952 | 19,389 |
| Deferred tax liabilities | 8,079 | 7,910 |
At 31 December 2022, certain subsidiaries of the Company did not recognise deferred tax of deductible loss carried forward of RMB21,268 million (2021: RMB18,342 million), of which RMB8,972 million (2021: RMB5,564 million) was incurred for the year ended 31 December 2022, because it was not probable that the related tax benefit will be realised. These deductible losses carried forward of RMB1,875 million, RMB1,669 million, RMB3,442 million, RMB5,310 million and RMB8,972 million will expire in 2023, 2024, 2025, 2026, 2027 and after, respectively.
Periodically, management performed assessment on the probability that future taxable profit will be available over the period which the deferred tax assets can be realised or utilised. In assessing the probability, both positive and negative evidence was considered, including whether it is probable that the operations will have sufficient future taxable profits over the periods which the deferred tax assets are deductible or utilised and whether the tax losses result from identifiable causes which are unlikely to recur.
| 20 | OTHER NON-CURRENT ASSETS |
Other non-current assets mainly represent long-term receivables, prepayments for construction projects and purchases of equipment.
115
| 21 | DETAILS OF IMPAIRMENT LOSSES |
At 31 December 2022, impairment losses of the Group are analysed as follows:
| Note | Balance at 1 January 2022 | Provision for the year | Written back for the year | Written off for the year | Other increase/ (decrease) | Balance at 31 December 2022 | |
| RMB million | RMB million | RMB million | RMB million | RMB million | RMB million | ||
| Allowance for doubtful accounts | |||||||
| Included: Accounts receivable | 7 | 4,033 | 417 | (561) | (49) | 239 | 4,079 |
| Prepayments | 9 | 83 | 10 | – | – | 18 | 111 |
| Other receivables | 10 | 1,590 | 155 | (166) | (29) | 3 | 1,553 |
| Other non-current assets | 1,933 | – | (929) | – | 181 | 1,185 | |
| 7,639 | 582 | (1,656) | (78) | 441 | 6,928 | ||
| Inventories | 11 | 4,897 | 6,407 | (85) | (4,530) | (106) | 6,583 |
| Long-term equity investments | 12 | 3,705 | 2 | – | (1) | 184 | 3,890 |
| Fixed assets | 13 | 97,523 | 5,082 | – | (532) | 186 | 102,259 |
| Construction in progress | 14 | 2,130 | 581 | – | (85) | 21 | 2,647 |
| Intangible assets | 16 | 1,272 | 4 | – | (7) | (3) | 1,266 |
| Goodwill | 17 | 7,861 | – | – | – | – | 7,861 |
| Others | 49 | 8 | – | – | – | 57 | |
| Total | 125,076 | 12,666 | (1,741) | (5,233) | 723 | 131,491 |
The reasons for recognising impairment losses are set out in the respective notes of respective assets.
| 22 | SHORT-TERM LOANS |
The Group’s short-term loans represent:
| At 31 December 2022 | At 31 December 2021 | |||||
| Original currency million | Exchange rates | RMB million | Original currency million | Exchange rates | RMB million | |
| Short-term bank loans | 14,461 | 24,959 | ||||
| – Renminbi loans | 14,325 | 24,959 | ||||
| – US Dollar loans | 20 | 6.9646 | 136 | – | 6.3757 | – |
| Short-term other loans | – | – | ||||
| – Renminbi loans | – | – | ||||
| Short-term loans from Sinopec Group Company and fellow subsidiaries | 6,852 | 2,407 | ||||
| – Renminbi loans | 5,911 | 1,320 | ||||
| – US Dollar loans | 130 | 6.9646 | 906 | 146 | 6.3757 | 934 |
| – Euro loans | 5 | 7.4229 | 35 | 21 | 7.2197 | 153 |
| Total | 21,313 | 27,366 | ||||
At 31 December 2022, the Group’s interest rates on short-term loans were from interest 1.65% to 5.51% (At 31 December 2021: 0.53% to 4.20%) per annum. The majority of the above loans are by credit.
At 31 December 2022 and 31 December 2021, the Group had no significant overdue short-term loans.
| 23 | BILLS PAYABLE |
Bills payable primarily represented bank accepted bills for the purchase of material, goods and products. Bills payable were due within one year.
At 31 December 2022 and 31 December 2021, the Group had no overdue unpaid bills.
| 24 | ACCOUNTS PAYABLE |
At 31 December 2022 and 31 December 2021, the Group had no individually significant accounts payable aged over one year.
| 25 | CONTRACT LIABILITIES |
As at 31 December 2022 and 31 December 2021, the Group’s contract liabilities primarily represent advances from customers. Related performance obligations are satisfied and revenue is recognised within one year.
116
| 26 | EMPLOYEE BENEFITS PAYABLE |
| (1) | Employee benefits payable: |
| Balance at the beginning of the year | Accrued during the year | Decreased during the year | Balance at the end of the year | |
| Short-term employee benefits | 13,967 | 96,020 | (96,451) | 13,536 |
| Post-employment benefits- defined contribution plans | 69 | 13,508 | (13,504) | 73 |
| Termination benefits | 12 | 148 | (152) | 8 |
| Total | 14,048 | 109,676 | (110,107) | 13,617 |
| (2) | Short-term employee benefits |
| Balance at the beginning of the year | Accrued during the year | Decreased during the year | Balance at the end of the year | |
| Salaries, bonuses, allowances | 10,730 | 70,115 | (69,604) | 11,241 |
| Staff welfare | 2,586 | 7,686 | (8,637) | 1,635 |
| Social insurance | 277 | 6,499 | (6,468) | 308 |
| Medical insurance | 265 | 5,931 | (5,892) | 304 |
| Work-related injury insurance | 6 | 435 | (438) | 3 |
| Maternity insurance | 6 | 133 | (138) | 1 |
| Housing fund | 48 | 6,832 | (6,833) | 47 |
| Labour union fee, staff and workers’ education fee | 279 | 2,288 | (2,302) | 265 |
| Other short-term employee benefits | 47 | 2,600 | (2,607) | 40 |
| Total | 13,967 | 96,020 | (96,451) | 13,536 |
| (3) | Post-employment benefits – defined contribution plans |
| Balance at the beginning of the year | Accrued during the year | Decreased during the year | Balance at the end of the year | |
| Basic pension insurance | 50 | 8,991 | (8,978) | 63 |
| Unemployment insurance | 8 | 316 | (322) | 2 |
| Annuity | 11 | 4,201 | (4,204) | 8 |
| Total | 69 | 13,508 | (13,504) | 73 |
| 27 | TAXES PAYABLE |
The Group
| At 31 December | At 31 December | |
| 2022 | 2021 | |
| RMB million | RMB million | |
| Value-added tax payable | 934 | 8,818 |
| Consumption tax payable | 13,038 | 56,084 |
| Income tax payable | 4,725 | 4,809 |
| Mineral resources compensation fee payable | 6 | 8 |
| Other taxes | 9,676 | 11,548 |
| Total | 28,379 | 81,267 |
| 28 | OTHER PAYABLES |
At 31 December 2022 and 31 December 2021, other payables of the Group over one year primarily represented payables for constructions.
117
| 29 | NON-CURRENT LIABILITIES DUE WITHIN ONE YEAR |
The Group’s non-current liabilities due within one year represent:
| At 31 December 2022 | At 31 December 2021 | |||||
| Original currency million | Exchange rates | RMB million | Original currency million | Exchange rates | RMB million | |
| Long-term bank loans | ||||||
| –Renminbi loans | 13,875 | 3,281 | ||||
| –US Dollar loans | – | 6.9646 | 1 | 2 | 6.3757 | 12 |
| Long-term loans from Sinopec Group Company and fellow subsidiaries | ||||||
| –Renminbi loans | 440 | 466 | ||||
| Long-term loans due within one year | 14,316 | 3,759 | ||||
| Debentures payable due within one year | ||||||
| –Renminbi debentures | 30,700 | 7,000 | ||||
| Lease liabilities due within one year | 16,004 | 15,173 | ||||
| Others | 1,824 | 2,719 | ||||
| Non-current liabilities due within one year | 62,844 | 28,651 | ||||
At 31 December 2022 and 31 December 2021, the Group had no significant overdue long-term loans.
| 30 | OTHER CURRENT LIABILITIES |
At 31 December 2022 and 31 December 2021, other current liabilities mainly represent output VAT to be transferred.
| 31 | LONG-TERM LOANS |
The Group’s long-term loans represent:
| At 31 December 2022 | At 31 December 2021 | ||||||
| Interest rate and final maturity | Original currency million | Exchange rates | RMB million | Original currency million | Exchange rates | RMB million | |
| Long-term bank loans | |||||||
| – Renminbi loans | Interest rates ranging from interest 1.00% to 4.66% per annum at 31 December 2022 (2021: 1.08% to 4.00%) with maturities through 2039 | 86,532 | 38,880 | ||||
| – US Dollar loans | Interest rates at 0.00% per annum at 31 December 2022 (2021: 1.55%) with maturities through 2038 | 8 | 6.9646 | 53 | 10 | 6.3757 | 64 |
| Less: Portion with one year (Note 29) | (13,876) | (3,293) | |||||
| Long-term bank loans | 72,709 | 35,651 | |||||
| Long-term loans from Sinopec Group Company and fellow subsidiaries | |||||||
| – Renminbi loans | Interest rates ranging from interest 1.08% to 5.23% per annum at 31 December 2022 (2021: 1.08% to 5.23%) with maturities through 2037 | 22,695 | 12,988 | ||||
| – US Dollar loans | – | 6.9646 | – | 183 | 6.3757 | 1,168 | |
| Less: Portion with one year (Note 29) | (440) | (466) | |||||
| Long-term loans from Sinopec Group Company and fellow subsidiaries | 22,255 | 13,690 | |||||
| Total | 94,964 | 49,341 | |||||
The maturity analysis of the Group’s long-term loans is as follows:
| At 31 December | At 31 December | |
| 2022 | 2021 | |
| RMB million | RMB million | |
| Between one and two years | 10,852 | 18,373 |
| Between two and five years | 73,387 | 26,633 |
| After five years | 10,725 | 4,335 |
| Total | 94,964 | 49,341 |
Long-term loans are carried at amortised costs.
118
| 32 | DEBENTURES PAYABLE |
The Group
| At 31 December | At 31 December | |
| 2022 | 2021 | |
| RMB million | RMB million | |
| Debentures payable: | ||
| – Corporate Bonds (i) | 43,697 | 49,649 |
| Less: Portion with one year (Note 29) | 30,700 | 7,000 |
| Total | 12,997 | 42,649 |
Note:
| (i) | Corporate bonds are carried at amortised cost, including USD denominated corporate bonds of RMB12,164 million, and RMB denominated corporate bonds of RMB31,533 million (2021: USD denominated corporate bonds of RMB11,127 million, and RMB denominated corporate bonds of RMB38,521 million). |
| 33 | LEASE LIABILITY |
The Group
| At 31 December | At 31 December | |
| 2022 | 2021 | |
| RMB million | RMB million | |
| Lease liabilities | 182,411 | 185,406 |
| Deduct:Portion of lease liabilities with one year (Note 29) | 16,004 | 15,173 |
| Total | 166,407 | 170,233 |
| 34 | PROVISIONS |
Provisions primarily represent provision for future dismantlement costs of oil and gas properties. The Group has established certain standardised measures for the dismantlement of its retired oil and gas properties by making reference to the industry practices and is thereafter constructively obligated to take dismantlement measures of its retired oil and gas properties. Movement of provision of the Group’s obligations for the dismantlement of its retired oil and gas properties is as follows:
| The Group | |
| RMB million | |
| Balance at 1 January 2022 | 40,495 |
| Provision for the year | 4,277 |
| Accretion expenses | 1,103 |
| Decrease for the year | (2,438) |
| Exchange adjustments | 162 |
| Balance at 31 December 2022 | 43,599 |
| 35 | OTHER NON-CURRENT LIABILITIES |
Other non-current liabilities primarily represent long-term payables, special payables and deferred income.
119
| 36 | SHARE CAPITAL |
The Group
| At 31 December | At 31 December | |
| 2022 | 2021 | |
| RMB million | RMB million | |
| Registered, issued and fully paid: | ||
| 95,115,471,046 listed A shares (2021: 95,557,771,046) of RMB1.00 each | 95,115 | 95,558 |
| 24,780,936,600 listed H shares (2021: 25,513,438,600) of RMB1.00 each | 24,781 | 25,513 |
| Total | 119,896 | 121,071 |
The Company was established on 25 February 2000 with a registered capital of 68.8 billion domestic state-owned shares with a par value of RMB1.00 each. Such shares were issued to Sinopec Group Company in consideration for the assets and liabilities transferred to the Company (Note 1).
Pursuant to the resolutions passed at an Extraordinary General Meeting held on 25 July 2000 and approvals from relevant government authorities, the Company is authorised to increase its share capital to a maximum of 88.3 billion shares with a par value of RMB1.00 each and offer not more than 19.5 billion shares with a par value of RMB1.00 each to investors outside the PRC. Sinopec Group Company is authorised to offer not more than 3.5 billion shares of its shareholdings in the Company to investors outside the PRC. The shares sold by Sinopec Group Company to investors outside the PRC would be converted into H shares.
In October 2000, the Company issued 15,102,439,000 H shares with a par value of RMB1.00 each, representing 12,521,864,000 H shares and 25,805,750 American Depositary Shares (“ADSs”, each representing 100 H shares), at prices of HKD1.59 per H share and USD20.645 per ADS, respectively, by way of a global initial public offering to Hong Kong SAR and overseas investors. As part of the global initial public offering, 1,678,049,000 state-owned ordinary shares of RMB1.00 each owned by Sinopec Group Company were converted into H shares and sold to Hong Kong SAR and overseas investors.
In July 2001, the Company issued 2.8 billion listed A shares with a par value of RMB1.00 each at RMB4.22 by way of a public offering to natural persons and institutional investors in the PRC.
During the year ended 31 December 2010, the Company issued 88,774 listed A shares with a par value of RMB1.00 each, as a result of exercise of 188,292 warrants entitled to the Bonds with Warrants.
During the year ended 31 December 2011, the Company issued 34,662 listed A shares with a par value of RMB1.00 each, as a result of conversion by the holders of the 2011 Convertible Bonds.
During the year ended 31 December 2012, the Company issued 117,724,450 listed A shares with a par value of RMB1.00 each, as a result of conversion by the holders of the 2011 Convertible Bonds.
On 14 February 2013, the Company issued 2,845,234,000 listed H shares (“the Placing”) with a par value of RMB1.00 each at the Placing Price of HKD8.45 per share. The aggregate gross proceeds from the Placing amounted to approximately HKD24,042,227,300.00 and the aggregate net proceeds (after deduction of the commissions and estimated expenses) amounted to approximately HKD23,970,100,618.00.
In June 2013, the Company issued 21,011,962,225 listed A shares and 5,887,716,600 listed H shares as a result of bonus issues of 2 shares converted from the retained earnings, and 1 share transferred from capital reserve for every 10 existing shares.
During the year ended 31 December 2013, the Company issued 114,076 listed A shares with a par value of RMB1.00 each, as a result of exercise of conversion by the holders of the 2011 Convertible Bonds.
During the year ended 31 December 2014, the Company issued 1,715,081,853 listed A shares with a par value of RMB1.00 each, as a result of exercise of conversion by the holders of the 2011 Convertible Bonds.
During the year ended 31 December 2015, the Company issued 2,790,814,006 listed A shares with a par value of RMB1.00 each, as a result of conversion by the holders of the 2011 Convertible Bonds.
During the year ended 31 December 2022, the Company repurchased 442,300,000 listed A shares and 732,502,000 listed H shares respectively, which had been cancelled in the year ended 31 December 2022.
All A shares and H shares rank pari passu in all material aspects.
120
| 36 | SHARE CAPITAL (Continued) |
The Group (Continued)
Capital management
Management optimises the structure of the Group’s capital, which comprises of equity and debts and bonds. In order to maintain or adjust the capital structure of the Group, management may cause the Group to issue new shares, adjust the capital expenditure plan, sell assets to reduce debt, or adjust the proportion of short-term and long-term loans and bonds. Management monitors capital on the basis of the debt-to-capital ratio, which is calculated by dividing long-term loans (excluding current portion) and debentures payable, by the total of equity attributable to shareholders of the Company and long-term loans (excluding current portion) and debentures payable, and liability-to-asset ratio, which is calculated by dividing total liabilities by total assets. Management’s strategy is to make appropriate adjustments according to the Group’s operating and investment needs and the changes of market conditions, and to maintain the debt-to-capital ratio and the liability-to-asset ratio of the Group at a range considered reasonable. As at 31 December 2022, the debt-to-capital ratio and the liability-to-asset ratio of the Group were 12.1% (2021: 10.6%) and 51.9% (2021: 51.5%), respectively.
The schedule of the contractual maturities of loans and commitments are disclosed in Notes 31, 32 and 60, respectively.
There were no changes in the management’s approach to capital management of the Group during the year. Neither the Company nor any of its subsidiaries is subject to externally imposed capital requirements.
| 37 | CAPITAL RESERVE |
The movements in capital reserve of the Group are as follows:
| RMB million | |
| Balance at 1 January 2022 | 120,188 |
| Purchase of own shares | (3,004) |
| Other contributions | 2,678 |
| Other equity movements under the equity method | (1,009) |
| Others | 22 |
| Balance at 31 December 2022 | 118,875 |
Capital reserve represents mainly: (a) the difference between the total amount of the par value of shares issued and the amount of the net assets transferred from Sinopec Group Company in connection with the Reorganisation; (b) share premiums derived from issuances of H shares and A shares by the Company and excess of cash paid by investors over their proportionate shares in share capital, the proportionate shares of unexercised portion of the Bond with Warrants at the expiration date, and the amount transferred from the proportionate liability component and the derivative component of the converted portion of the 2011 Convertible Bonds; (c) difference between consideration paid for the combination of entities under common control and the transactions with minority interests over the carrying amount of the net assets acquired.
121
| 38 | OTHER COMPREHENSIVE INCOME |
The Group
| (a) | The changes of other comprehensive income in consolidated income statement |
| 2022 | |||
| Before-tax amount | Tax effect | Net-of-tax amount | |
| RMB million | RMB million | RMB million | |
| Cash flow hedges: | |||
| Effective portion of changes in fair value of hedging instruments recognised during the year | 6,667 | (1,675) | 4,992 |
| Less: Reclassification adjustments for amounts transferred to the consolidated income statement | (8,127) | 1,482 | (6,645) |
| Subtotal | 14,794 | (3,157) | 11,637 |
| Fair value hedges | 149 | – | 149 |
| Changes in fair value of other equity instrument investments | (79) | 12 | (67) |
| Other comprehensive loss that can be reclassified to profit or loss under the equity method | 2,856 | – | 2,856 |
| Foreign currency translation differences | 7,254 | – | 7,254 |
| Other comprehensive income | 24,974 | (3,145) | 21,829 |
| 2021 | |||
| Before-tax amount | Tax effect | Net-of-tax amount | |
| RMB million | RMB million | RMB million | |
| Cash flow hedges: | |||
| Effective portion of changes in fair value of hedging instruments recognised during the year | 15,659 | (3,881) | 11,778 |
| Less: Reclassification adjustments for amounts transferred to the consolidated income statement | (8,858) | 1,618 | (7,240) |
| Subtotal | 24,517 | (5,499) | 19,018 |
| Fair value hedges | (220) | – | (220) |
| Changes in fair value of other equity instrument investments | (6) | 2 | (4) |
| Other comprehensive loss that can be reclassified to profit or loss under the equity method | 441 | – | 441 |
| Foreign currency translation differences | (1,728) | – | (1,728) |
| Other comprehensive income | 23,004 | (5,497) | 17,507 |
| (b) | The change of each item in other comprehensive income |
| Equity Attributable to shareholders of the company | ||||||||
| Other comprehensive income that can be converted into profit or loss under the equity method | Changes in fair value of other equity instrument investments | fair value hedges | Cash flow hedges | Foreign Currency translation differences | Subtotal | Minority interests | Total other Comprehensive income | |
| RMB million | RMB million | RMB million | RMB million | RMB million | RMB million | RMB million | RMB million | |
| 1 January 2021 | (6,089) | (20) | 81 | 7,805 | (739) | 1,038 | (2,600) | (1,562) |
| Changes in 2021 | 324 | 2 | (110) | (591) | (1,353) | (1,728) | (715) | (2,443) |
| 31 December 2021 | (5,765) | (18) | (29) | 7,214 | (2,092) | (690) | (3,315) | (4,005) |
| 1 January 2022 | (5,765) | (18) | (29) | 7,214 | (2,092) | (690) | (3,315) | (4,005) |
| Changes in 2022 | 1,610 | (65) | 323 | (4,190) | 6,084 | 3,762 | 2,264 | 6,026 |
| 31 December 2022 | (4,155) | (83) | 294 | 3,024 | 3,992 | 3,072 | (1,051) | 2,021 |
As at 31 December 2022, cash flow hedge reserve amounted to a gain of RMB3,079 million (31 December 2021: a gain of RMB7,244 million), of which a gain of RMB3,024 million was attribute to shareholders of the Company (31 December 2021: a gain of RMB7,214 million).
122
| 39 | SURPLUS RESERVES |
Movements in surplus reserves are as follows:
| The Group | |||
| Statutory | Discretionary | ||
| surplus reserve | surplus reserves | Total | |
| RMB million | RMB million | RMB million | |
| Balance at 1 January 2022 | 96,224 | 117,000 | 213,224 |
| Appropriation | 4,610 | – | 4,610 |
| Balance at 31 December 2022 | 100,834 | 117,000 | 217,834 |
The PRC Company Law and Articles of Association of the Company have set out the following profit appropriation plans:
| (a) | 10% of the net profit is transferred to the statutory surplus reserve. In the event that the reserve balance reaches 50% of the registered capital, no transfer is needed; |
| (b) | After the transfer to the statutory surplus reserve, a transfer to discretionary surplus reserve can be made upon the passing of a resolution at the shareholders’ meeting. |
| 40 | OPERATING INCOME AND OPERATING COSTS |
| The Group | The Company | |||
| 2022 | 2021 | 2022 | 2021 | |
| RMB million | RMB million | RMB million | RMB million | |
| Income from principal operations | 3,257,356 | 2,679,500 | 1,269,093 | 1,013,961 |
| Income from other operations | 60,812 | 61,384 | 32,980 | 31,039 |
| Operating income | 3,318,168 | 2,740,884 | 1,302,073 | 1,045,000 |
| Operating costs | 2,819,363 | 2,216,551 | 1,052,885 | 808,540 |
The income from principal operations mainly represents revenue from the sales of refined petroleum products, chemical products, crude oil and natural gas, which are recognised at a point in time. The income from other operations mainly represents revenue from sale of materials, services providing, rental income and others. Operating costs primarily represent the products cost related to the principal operations. The Group’s segmental information is set out in Note 62.
The detailed information about the Group’s operating income is as follows:
| 2022 | 2021 | |
| RMB million | RMB million | |
| Income from principal operations | 3,257,356 | 2,679,500 |
| Gasoline | 796,667 | 726,057 |
| Diesel | 743,551 | 542,260 |
| Crude oil | 517,183 | 429,038 |
| Chemical feedstock | 42,785 | 44,079 |
| Basic organic chemicals | 223,679 | 198,453 |
| Synthetic resin | 144,524 | 149,208 |
| Kerosene | 168,017 | 112,519 |
| Natural gas | 83,853 | 68,443 |
| Synthetic fiber monomers and polymers | 45,335 | 45,464 |
| Others (i) | 491,762 | 363,979 |
| Income from other operations | 60,812 | 61,384 |
| Sale of materials and others | 59,590 | 59,990 |
| Rental income | 1,222 | 1,394 |
| Total | 3,318,168 | 2,740,884 |
Notes:
| (i) | Others are primarily liquefied petroleum gas and other refinery and chemical byproducts and joint products and so on. |
| (ii) | The above operating incomes, except rental income, are all income from contracts. |
123
| 41 | TAXES AND SURCHARGES |
The Group
| 2022 | 2021 | |
| RMB million | RMB million | |
| Consumption tax | 206,838 | 213,894 |
| City construction tax | 17,081 | 18,044 |
| Special oil income levy | 13,874 | 1,573 |
| Education surcharge | 12,337 | 13,409 |
| Resources tax | 8,752 | 6,432 |
| Others | 5,109 | 5,680 |
| Total | 263,991 | 259,032 |
The applicable tax rate of the taxes and surcharges are set out in Note 4.
| 42 | FINANCIAL EXPENSES |
The Group
| 2022 | 2021 | |
| RMB million | RMB million | |
| Interest expenses incurred | 7,877 | 5,679 |
| Less: Capitalised interest expenses | 1,307 | 996 |
| Add: Interest expense on lease liabilities | 9,096 | 9,200 |
| Net interest expenses | 15,666 | 13,883 |
| Accretion expenses (Note 34) | 1,103 | 1,135 |
| Interest income | (6,266) | (5,732) |
| Net foreign exchange gains | (529) | (276) |
| Total | 9,974 | 9,010 |
The interest rates per annum at which borrowing costs were capitalised during the year ended 31 December 2022 by the Group ranged from 1.89% to 4.25% (2021: 1.84% to 4.35%).
| 43 | CLASSIFICATION OF EXPENSES BY NATURE |
The operating costs, selling and distribution expenses, general and administrative expenses, research and development expenses and exploration expenses (including dry holes) in consolidated income statement classified by nature are as follows:
| 2022 | 2021 | |
| RMB million | RMB million | |
| Purchased crude oil, products and operating supplies and expenses | 2,684,756 | 2,076,665 |
| Personnel expenses | 103,585 | 103,492 |
| Depreciation, depletion and amortisation | 109,906 | 115,680 |
| Exploration expenses (including dry holes) | 10,591 | 12,382 |
| Other expenses | 49,664 | 52,621 |
| Total | 2,958,502 | 2,360,840 |
| 44 | SELLING AND DISTRIBUTION EXPENSES |
Selling expenses mainly include wages and salaries of sales staff, depreciation and amortization of sales equipment and related systems, etc.
| 45 | GENERAL AND ADMINISTRATIVE EXPENSES |
Administrative expenses mainly include salaries and salaries of administrative personnel, depreciation and amortization of office facilities, office systems and software, and repair costs.
| 46 | RESEARCH AND DEVELOPMENT EXPENSES |
The research and development expenditures are mainly used for the replacement of resources in upstream, optimising structure and operation upgrades in refining sector, structured adjustment of materials and products in chemical segment.
| 47 | EXPLORATION EXPENSES |
Exploration expenses include geological and geophysical expenses and written-off of unsuccessful dry hole costs.
| 48 | OTHER INCOME |
Other income are mainly the government grants related to the business activities.
124
49 INVESTMENT INCOME
| The Group | The Company | |||
| 2022 | 2021 | 2022 | 2021 | |
| RMB million | RMB million | RMB million | RMB million | |
| Income from investment of subsidiaries accounted for under cost method | – | – | 20,338 | 21,416 |
| Income from investment accounted for under equity method | 14,479 | 23,253 | 4,449 | 8,151 |
| Investment income from disposal of business and long-term equity investments (i) | 13,754 | 82 | 2,406 | 56 |
| Dividend income from holding of other equity instrument investments | 76 | 34 | 4 | 22 |
| Investment (loss)/income from holding/disposal of financial assets and liabilities and derivative financial instruments at fair value through profit or loss | (15,063) | (17,687) | 184 | (376) |
| Gain from ineffective portion of cash flow hedges | 997 | 266 | 465 | 409 |
| Others | 219 | 84 | 1,375 | 1,203 |
| Total | 14,462 | 6,032 | 29,221 | 30,881 |
Note:
| (i) | The Company and Sinopec Shanghai Gaoqiao Petrochemical Co., Ltd. (“Gaoqiao Petrochemical”) and INEOS Investment (Shanghai) Company Limited (“INEOS Shanghai”) entered into an equity transfer agreement on 28 July 2022. According to the agreement, the Company and Gaoqiao Petrochemical transferred 15% and 35% equity interests in Shanghai SECCO to INEOS Shanghai respectively at a total consideration of RMB10,863 million. The above transactions were considered and approved by the 10th Session of 8th Directorate Meeting of the Company. The transactions were completed on 28 December 2022 and the Company lost control over Shanghai SECCO. The investment income from disposal of Shanghai SECCO is RMB13,697 million. The Group accounted for its remaining 50% equity interest retained in Shanghai SECCO, at fair value upon initial recognition, as an interest in a joint venture from the date when control was lost. |
50 INCOME FROM CHANGES IN FAIR VALUE
The Group
| 2022 | 2021 | |
| RMB million | RMB million | |
| Net fair value (losses)/gains on financial assets and financial liabilities at fair value through loss or profit | (461) | 2,913 |
| Unrealised or (losses)/gains from ineffective portion cash flow hedges, net | (1,252) | 428 |
| Others | (2) | – |
| Total | (1,715) | 3,341 |
51 IMPAIRMENT LOSSES
The Group
| 2022 | 2021 | |
| RMB million | RMB million | |
| Prepayments | 10 | (40) |
| Inventories | 6,322 | 3,130 |
| Long-term equity investment | 2 | 206 |
| Fixed assets | 5,082 | 9,420 |
| Intangible assets | 4 | 262 |
| Construction in progress | 581 | 144 |
| Others | 8 | 43 |
| Total | 12,009 | 13,165 |
52 NON-OPERATING INCOME
The Group
| 2022 | 2021 | |
| RMB million | RMB million | |
| Government grants | 1,003 | 806 |
| Others | 1,957 | 2,710 |
| Total | 2,960 | 3,516 |
53 NON-OPERATING EXPENSES
The Group
| 2022 | 2021 | |
| RMB million | RMB million | |
| Fines, penalties and compensation | 39 | 220 |
| Donations | 447 | 165 |
| Asset scrap and damage loss | 1,394 | 3,727 |
| Others | 2,979 | 3,470 |
| Total | 4,859 | 7,582 |
125
| 54 | INCOME TAX EXPENSE |
The Group
| 2022 | 2021 | |
| RMB million | RMB million | |
| Provision for income tax for the year | 18,796 | 17,522 |
| Deferred taxation | 1,718 | 6,258 |
| Under-provision for income tax in respect of preceding year | (1,757) | (462) |
| Total | 18,757 | 23,318 |
Reconciliation between actual income tax expense and accounting profit at applicable tax rates is as follows:
| 2022 | 2021 | |
| RMB million | RMB million | |
| Profit before taxation | 94,515 | 108,348 |
| Expected income tax expense at a tax rate of 25% | 23,629 | 27,087 |
| Tax effect of non-deductible expenses | 4,553 | 6,142 |
| Tax effect of non-taxable income | (5,900) | (8,085) |
| Tax effect of preferential tax rate (i) | (3,091) | (2,766) |
| Effect of income taxes at foreign operations | (128) | (222) |
| Tax effect of utilisation of previously unrecognised tax losses and temporary differences | (850) | (701) |
| Tax effect of tax losses not recognised and temporary differences | 2,243 | 1,391 |
| Write-down of deferred tax assets | 58 | 934 |
| Adjustment for under provision for income tax in respect of preceding years | (1,757) | (462) |
| Actual income tax expense | 18,757 | 23,318 |
Note:
| (i) | The provision for PRC current income tax is based on a statutory income tax rate of 25% of the assessable income of the Group as determined in accordance with the relevant income tax rules and regulations of the PRC, except for certain entities of the Group in western regions in the PRC are taxed at preferential income tax rate of 15% through the year 2022. According to Announcement [2020] No.23 of the MOF “Announcement of the MOF, the State Taxation Administration and the National Development and Reform Commission on continuation of the income tax policy of western development enterprises”, the preferential income tax rate extends from 1 January 2021 to 31 December 2030. |
| 55 | DIVIDENDS |
| (a) | Dividends of ordinary shares declared after the balance sheet date |
Pursuant to a resolution passed at the director’s meeting on 24 March 2023, final dividends in respect of the year ended 31 December 2022 of RMB0.195 (2021: RMB0.31) per share totaling RMB23,380 million (2021: RMB37,532 million) were proposed for shareholders’ approval at the Annual General Meeting. Final cash dividend proposed after the balance sheet date has not been recognised as a liability at the balance sheet date.
| (b) | Dividends of ordinary shares declared during the year |
Pursuant to the shareholders’ approval at the General Meeting on 26 August 2022, the interim dividends for the year ending 31 December 2022 of RMB0.16 (2021: RMB0.16) per share totaling RMB19,371 million (2021: RMB19,371 million) were approved. Dividends were paid on 19 September 2022.
Pursuant to the shareholders’ approval at the Annual General Meeting on 18 May 2022, a final dividend of RMB0.31 per share totaling RMB37,532 million according to total shares on 9 June 2022 was approved. All dividends have been paid in the year ended 31 December 2022.
Pursuant to the shareholders’ approval at the Annual General Meeting on 25 May 2021, a final dividend of RMB0.13 per share totaling RMB15,739 million according to total shares on 16 June 2021 was approved. All dividends have been paid in the year ended 31 December 2021.
126
| 56 | SUPPLEMENTAL INFORMATION TO THE CASH FLOW STATEMENT |
The Group
| (a) | Reconciliation of net profit to cash flows from operating activities: |
| 2022 | 2021 | |
| RMB million | RMB million | |
| Net profit | 75,758 | 85,030 |
| Add: Impairment losses on assets | 12,009 | 13,165 |
| Credit impairment (reversals)/loss | (1,084) | 2,311 |
| Depreciation of right-of-use assets | 13,760 | 12,972 |
| Depreciation of fixed assets | 86,178 | 92,824 |
| Amortisation of intangible assets and long-term deferred expenses | 9,968 | 9,884 |
| Dry hole costs written off | 6,416 | 7,702 |
| Net loss on disposal of non-current assets | 722 | 3,062 |
| Fair value loss/(gain) | 1,715 | (3,341) |
| Financial expenses | 10,503 | 9,286 |
| Investment income | (14,462) | (6,032) |
| Decrease in deferred tax assets | 663 | 5,456 |
| Increase in deferred tax liabilities | 1,055 | 802 |
| Increase in inventories | (45,421) | (58,372) |
| Safety fund reserve | 179 | 775 |
| Decrease/(increase) in operating receivables | 1,974 | (8,177) |
| (Decrease)/increase in operating payables | (43,664) | 57,827 |
| Net cash flow from operating activities | 116,269 | 225,174 |
| (b) | Net change in cash: |
| 2022 | 2021 | |
| RMB million | RMB million | |
| Cash balance at the end of the year | 93,438 | 108,590 |
| Less: Cash at the beginning of the year | 108,590 | 87,559 |
| Net (decrease)/increase of cash | (15,152) | 21,031 |
| (c) | The analysis of cash held by the Group is as follows: |
| 2022 | 2021 | |
| RMB million | RMB million | |
| Cash at bank and on hand | ||
| – Cash on hand | 2 | 1 |
| – Demand deposits | 93,436 | 108,589 |
| Cash at the end of the year | 93,438 | 108,590 |
| (d) | Net cash received from disposal of subsidiaries and other business entities: |
| 2022 | 2021 | |
| RMB million | RMB million | |
| Cash received from disposal of 50% equity interests in Shanghai SECCO | 10,041 | – |
| Cash received from disposal of equity interests in the relevant companies, oil and gas pipeline and ancillary facilities | – | 4,225 |
| Others | – | 980 |
| Total | 10,041 | 5,205 |
| (e) | Other cash paid relating to financing activities: |
| 2022 | 2021 | |
| RMB million | RMB million | |
| Repayments of lease liabilities | 18,672 | 19,412 |
| Cash payments to purchase shares | 4,179 | – |
| Others | 94 | 8,864 |
| Total | 22,945 | 28,276 |
127
| 57 | RELATED PARTIES AND RELATED PARTY TRANSACTIONS |
| (1) | Related parties having the ability to exercise control over the Group |
| The name of the company | : | China Petrochemical Corporation |
| Unified social credit identifier | : | 9111000010169286X1 |
| Registered address | : | No. 22, Chaoyangmen North Street, Chaoyang District, Beijing |
| Principal activities | : | Exploration, production, storage and transportation (including pipeline transportation), sales and utilisation of crude oil and natural gas; refining; wholesale and retail of gasoline, kerosene and diesel; production, sales, storage and transportation of petrochemical and other chemical products; industrial investment and investment management; exploration, construction, installation and maintenance of petroleum and petrochemical constructions and equipments; manufacturing electrical equipment; research, development, application and consulting services of information technology and alternative energy products; import & export of goods and technology. |
| Relationship with the Group | : | Ultimate holding company |
| Types of legal entity | : | State-owned |
| Authorised representative | : | Ma Yongsheng |
| Registered capital | : | RMB326,547 million |
Sinopec Group Company is an enterprise controlled by the PRC government. Sinopec Group Company directly and indirectly holds 67.84% shareholding of the Company.
| (2) | Related parties not having the ability to exercise control over the Group |
Related parties under common control of a parent company with the Company:
Sinopec Finance (Note)
Sinopec Shengli Petroleum Administration Bureau
Sinopec Zhongyuan Petroleum Exploration Bureau
Sinopec Assets Management Corporation
Sinopec Engineering Incorporation
Sinopec Century Bright Capital Investment Limited
Sinopec Petroleum Storage and Reserve Limited
Associates of the Group:
PipeChina
Sinopec Finance
Sinopec Capital
Zhongtian Synergetic Energy
CIR
Joint ventures of the Group:
FREP
BASF-YPC
Taihu
Sinopec SABIC Tianjin
Shanghai SECCO
Note: Sinopec Finance is under common control of a parent company with the Company and is also the associate of the Group.
128
| 57 | RELATED PARTIES AND RELATED PARTY TRANSACTIONS (Continued) |
| (3) | The principal related party transactions with Sinopec Group Company and fellow subsidiaries, associates and joint ventures, which were carried out in the ordinary course of business, are as follows: |
| The Group | |||
| Note | 2022 | 2021 | |
| RMB million | RMB million | ||
| Sales of goods | (i) | 352,691 | 297,381 |
| Purchases | (ii) | 184,986 | 191,888 |
| Transportation and storage | (iii) | 18,291 | 19,443 |
| Exploration and development services | (iv) | 37,317 | 33,930 |
| Production related services | (v) | 48,465 | 44,405 |
| Ancillary and social services | (vi) | – | 1,730 |
| Agency commission income | (vii) | 173 | 194 |
| Interest income | (viii) | 1,203 | 715 |
| Interest expense | (ix) | 541 | 385 |
| Net deposits placed with related parties | (viii) | (3,382) | (8,265) |
| Net funds obtained from related parties | (x) | 36,608 | 30,305 |
The amounts set out in the table above in respect of the year ended 31 December 2022 and 2021 represent the relevant costs and income as determined by the corresponding contracts with the related parties.
Included in the transactions disclosed above, for the year ended 31 December 2022 are: a) purchases by the Group from Sinopec Group Company and fellow subsidiaries amounting to RMB158,874 million (2021: RMB173,718 million) comprising purchases of products and services (i.e. procurement, transportation and storage, exploration and development services and production related services) of RMB146,114 million (2021: RMB160,048 million), ancillary and social services provided by Sinopec Group Company and fellow subsidiaries of RMB nil million (2021: RMB1,730 million), lease charges for land, buildings and others paid by the Group of RMB11,046 million, RMB938 million and RMB235 million (2021: RMB10,831 million, RMB565 million and RMB159 million), respectively and interest expenses of RMB541 million (2021: RMB385 million); and b) sales by the Group to Sinopec Group Company and fellow subsidiaries amounting to RMB58,403 million (2021: RMB54,453 million), comprising RMB57,151 million (2021: RMB53,671 million) for sales of goods, RMB1,203 million (2021: RMB715 million) for interest income and RMB49 million (2021: RMB67 million) for agency commission income.
For the year ended 31 December 2022, no individually significant right-of-use assets were leased from Sinopec Group Company and fellow subsidiaries, associates and joint ventures by the Group. The interest expense recognised for the year ended 31 December 2022 on lease liabilities in respect of amounts due to Sinopec Group Company and fellow subsidiaries, associates and joint ventures was RMB7,811 million (2021: RMB7,863 million).
For the year ended 31 December 2022, the amount of rental the Group paid to Sinopec Group Company and fellow subsidiaries, associates and joint ventures for land, buildings and others are RMB11,051 million, RMB943 million and RMB352 million (2021: RMB10,834 million, RMB572 million and RMB269 million), including pursuant to the continuing connected transaction agreements signed in 2000, the Sixth Supplementary Agreement on 27 August 2021, the amount of rental the Group paid to Sinopec Group Company for land and buildings are RMB11,046 million and RMB938 million (2021: RMB10,831 million and RMB565 million).
As at 31 December 2022 and 31 December 2021, there was no guarantee given to banks by the Group in respect of banking facilities to Sinopec Group Company and fellow subsidiaries, associates and joint ventures, except for the disclosure set out in Note 61(b). Guarantees given to banks by the Group in respect of banking facilities to associates and joint ventures are disclosed in Note 61(b).
Notes:
| (i) | Sales of goods represent the sale of crude oil, intermediate petrochemical products, petroleum products and ancillary materials. |
| (ii) | Purchases represent the purchase of materials and utility supplies directly related to the Group’s operations such as the procurement of raw and ancillary materials and related services, supply of water, electricity and gas. |
| (iii) | Transportation and storage represent the cost for the use of railway, road and marine transportation services, pipelines, loading, unloading and storage facilities. |
| (iv) | Exploration and development services comprise direct costs incurred in the exploration and development such as geophysical, drilling, well testing and well measurement services. |
| (v) | Production related services represent ancillary services rendered in relation to the Group’s operations such as equipment repair and general maintenance, insurance premium, technical research, communications, firefighting, security, product quality testing and analysis, information technology, design and engineering, construction of oilfield ground facilities, refineries and chemical plants, manufacture of replacement parts and machinery, installation, project management and environmental protection, and management services. |
| (vi) | Ancillary and social services represent expenditures for social welfare and support services such as educational facilities, media communication services, sanitation, accommodation, canteens and property maintenance. The term of the Cultural, Educational, Hygiene and Auxiliary Service Agreement expired on 31 December 2021, and is not renewed due to the significant decrease in the service scale after the separation and transfer of assets and business such as the Three Supplies and One Industry Assets etc. Cultural and educational services related or similar to training and auxiliary services thereunder have been incorporated into the Mutual Supply Agreement. |
| (vii) | Agency commission income represents commission earned for acting as an agent in respect of sales of products and purchase of materials for certain entities owned by Sinopec Group Company. |
129
| 57 | RELATED PARTIES AND RELATED PARTY TRANSACTIONS (Continued) |
| (3) | The principal related party transactions with Sinopec Group Company and fellow subsidiaries, associates and joint ventures, which were carried out in the ordinary course of business, are as follows (Continued): |
Notes (Continued):
| (viii) | Interest income represents interest received from deposits placed with Sinopec Finance and Sinopec Century Bright Capital Investment Limited, finance companies controlled by Sinopec Group Company. The applicable interest rate is determined in accordance with the prevailing saving deposit rate. |
| (ix) | Interest expense represents interest charges on the loans obtained from Sinopec Group Company and fellow subsidiaries. |
| (x) | The Group obtained loans, discounted bills and issued the acceptance bills from Sinopec Group Company and fellow subsidiaries, etc. |
In connection with the Reorganisation, the Company and Sinopec Group Company entered into a number of agreements under which 1) Sinopec Group Company will provide goods and products and a range of ancillary, social and supporting services to the Group and 2) the Group will sell certain goods to Sinopec Group Company. These agreements impacted the operating results of the Group for the year ended 31 December 2022. The terms of these agreements are summarised as follows:
| (a) | The Company has entered into a non-exclusive “Agreement for Mutual Provision of Products and Ancillary Services” (“Mutual Provision Agreement”) with Sinopec Group Company effective from 1 January 2000 in which Sinopec Group Company has agreed to provide the Group with certain ancillary production services, construction services, information advisory services, supply services and other services and products. While each of Sinopec Group Company and the Company is permitted to terminate the Mutual Provision Agreement upon at least six months’ notice, Sinopec Group Company has agreed not to terminate the agreement if the Group is unable to obtain comparable services from a third party. The pricing policy for these services and products provided by Sinopec Group Company to the Group is as follows: |
| • | the government-prescribed price; |
| • | where there is no government-prescribed price, the government-guidance price; |
| • | where there is neither a government-prescribed price nor a government-guidance price, the market price; or |
| • | where none of the above is applicable, the price to be agreed between the parties, which shall be based on a reasonable cost incurred in providing such services plus a profit margin not exceeding 6%. |
| (b) | The Company has entered into a non-exclusive “Agreement for Provision of Cultural and Educational, Health Care and Community Services” with Sinopec Group Company effective from 1 January 2000 in which Sinopec Group Company has agreed to provide the Group with certain cultural, educational, health care and community services on the same pricing terms and termination conditions as agreed to in the above Mutual Provision Agreement. |
| (c) | The Company has entered into a number of lease agreements with Sinopec Group Company to lease certain lands and buildings effective on 1 January 2000. The lease term is 40 or 50 years for lands and 20 years for buildings, respectively. The Company and Sinopec Group Company can renegotiate the rental amount every three years for land. The Company and Sinopec Group Company can renegotiate the rental amount for buildings every year. However such amount cannot exceed the market price as determined by an independent third party. |
| (d) | The Company has entered into agreements with Sinopec Group Company effective from 1 January 2000 under which the Group has been granted the right to use certain trademarks, patents, technology and computer software developed by Sinopec Group Company. |
| (e) | The Company has entered into a service station franchise agreement with Sinopec Group Company effective from 1 January 2000 under which its service stations and retail stores would exclusively sell the refined products supplied by the Group. |
| (f) | On the basis of a series of continuing connected transaction agreements signed in 2000, the Company and Sinopec Group Company have signed the Sixth Supplementary Agreement on 27 August 2021, which took effect on 1 January 2022 and made adjustment to “Mutual Supply Agreement” and “Buildings Leasing Contract”. |
130
| 57 | RELATED PARTIES AND RELATED PARTY TRANSACTIONS (Continued) |
| (4) | Balances with Sinopec Group Company and fellow subsidiaries, associates and joint ventures |
The balances with Sinopec Group Company and fellow subsidiaries, associates and joint ventures at 31 December 2022 and 31 December 2021 are as follows:
| The ultimate holding company | Other related companies | |||
| At 31 December | At 31 December | At 31 December | At 31 December | |
| 2022 | 2021 | 2022 | 2021 | |
| RMB million | RMB million | RMB million | RMB million | |
| Cash at bank and on hand | – | – | 65,064 | 61,682 |
| Accounts receivable | 20 | 30 | 11,460 | 8,625 |
| Receivables financing | – | – | 596 | 186 |
| Other receivables | 32 | – | 10,017 | 13,941 |
| Prepayments and other current assets | 4 | 19 | 322 | 577 |
| Other non-current assets | – | – | 8,633 | 3,116 |
| Bills payable | – | 5 | 4,689 | 3,798 |
| Accounts payable | 299 | 228 | 33,349 | 10,139 |
| Contract liabilities | 15 | 50 | 4,721 | 4,627 |
| Other payables and other current liabilities | 46 | 85 | 38,266 | 50,564 |
| Other non-current liabilities | – | – | 5,180 | 2,779 |
| Short-term loans | – | – | 6,852 | 2,407 |
| Long-term loans (including current portion) | – | – | 22,695 | 14,156 |
| Lease liabilities (including current portion) | 70,860 | 72,176 | 85,677 | 86,585 |
Amounts due from/to Sinopec Group Company and fellow subsidiaries, associates and joint ventures, other than short-term loans and long-term loans, bear no interest, are unsecured and are repayable in accordance with normal commercial terms. The terms and conditions associated with short-term loans and long-term loans payable to Sinopec Group Company and fellow subsidiaries are set out in Note 22 and Note 31.
As at and for the year ended 31 December 2022, and as at and for the year ended 31 December 2021, no individually significant impairment losses for bad and doubtful debts were recorded in respect of amounts due from Sinopec Group Company and fellow subsidiaries, associates and joint ventures.
| (5) | Key management personnel emoluments |
Key management personnel are those persons having authority and responsibility for planning, directing and controlling the activities of the Group, directly or indirectly, including directors and supervisors of the Group. The key management personnel compensations are as follows:
| 2022 | 2021 | |
| RMB thousand | RMB thousand | |
| Short-term employee benefits | 9,299 | 4,612 |
| Retirement scheme contributions | 566 | 379 |
| Total | 9,865 | 4,991 |
| 58 | PRINCIPAL ACCOUNTING ESTIMATES AND JUDGEMENTS |
The Group’s financial condition and results of operations are sensitive to accounting methods, assumptions and estimates that underlie the preparation of the financial statements. The Group bases the assumptions and estimates on historical experience and on various other assumptions that it believes to be reasonable and which form the basis for making judgements about matters that are not readily apparent from other sources. On an on-going basis, management evaluates its estimates. Actual results may differ from those estimates as facts, circumstances and conditions change.
The selection of critical accounting policies, the judgements and other uncertainties affecting application of those policies and the sensitivity of reported results to changes in conditions and assumptions are factors to be considered when reviewing the financial statements. The significant accounting policies are set forth in Note 3. The Group believes the following critical accounting policies involve the most significant judgements and estimates used in the preparation of the financial statements.
131
| 58 | PRINCIPAL ACCOUNTING ESTIMATES AND JUDGEMENTS (Continued) |
| (a) | Oil and gas properties and reserves |
The accounting for the exploration and production segment’s oil and gas activities is subject to accounting rules that are unique to the oil and gas industry. The Group has used the successful efforts method to account for oil and gas business activities. The successful efforts method reflects the volatility that is inherent in exploring for mineral resources in that costs of unsuccessful exploratory efforts are charged to expense. These costs primarily include dry hole costs, seismic costs and other exploratory costs.
Engineering estimates of the Group’s oil and gas reserves are inherently imprecise and represent only approximate amounts because of the subjective judgements involved in developing such information. There are authoritative guidelines regarding the engineering criteria that have to be met before estimated oil and gas reserves can be designated as “proved”. Proved and proved developed reserves estimates are updated at least annually and take into account recent production and technical information about each field. In addition, as prices and cost levels change from year to year, the estimate of proved and proved developed reserves also changes. This change is considered a change in estimate for accounting purposes and is reflected on a prospective basis in related depreciation rates. Oil and gas reserves have a direct impact on the assessment of the recoverability of the carrying amounts of oil and gas properties reported in the financial statements. If proved reserves estimates are revised downwards, the Group’s earnings could be affected by changes in depreciation expense or an immediate write-down of the carrying amount of oil and properties.
Future dismantlement costs for oil and gas properties are estimated with reference to engineering estimates after taking into consideration the anticipated method of dismantlement required in accordance with industry practices in the similar geographic area, with reference to the standard procedures and cost estimates of dismantlement of oil and gas properties and taking into consideraion the estimation of economic life of oil and gas properties, technology and price level. The present values of these estimated future dismantlement costs are capitalised as oil and gas properties with equivalent amounts recognised as provisions for dismantlement costs.
Despite the inherent imprecision in these engineering estimates, these estimates are used in determining depreciation expense, impairment expense and future dismantlement costs. Capitalised costs of proved oil and gas properties are amortised on a unit-of-production method based on volumes produced and reserves.
| (b) | Impairment for assets |
If circumstances indicate that the net book value of a long-lived asset may not be recoverable, the asset may be considered “impaired”, and an impairment loss may be recognised in accordance with “CASs 8 – Impairment of Assets”. The carrying amounts of long-lived assets are reviewed periodically in order to assess whether the recoverable amounts have declined below the carrying amounts. These assets are tested for impairment whenever events or changes in circumstances indicate that their recorded carrying amounts may not be recoverable. When such a decline has occurred, the carrying amount is reduced to recoverable amount. For goodwill, the recoverable amount is estimated annually. The recoverable amount is the greater of the fair value less costs to sell and the present value of expected future cash flows. It is difficult to precisely estimate the fair value because quoted market prices for the Group’s assets or cash-generating units are not readily available. In determining the value in use, expected cash flows generated by the asset or the cash-generating units are discounted to their present value, which requires significant judgement relating to future selling prices of crude oil, natural gas, refined and chemical products, the production costs, the product mix, production volumes, production profiles, the oil and gas reserves and discount rate. Management uses all readily available information in determining an amount that is a reasonable approximation of recoverable amount, including estimates based on reasonable and supportable assumptions and projections of sales volume, selling price, amount of operating costs and discount rate.
| (c) | Depreciation |
Fixed assets other than oil and gas properties, are depreciated on a straight-line basis over the estimated useful lives of the assets, after taking into account the estimated residual value. Management reviews the estimated useful lives of the assets at least annually in order to determine the amount of depreciation expense to be recorded during any reporting period. The useful lives are based on the Group’s historical experience with similar assets and taking into account anticipated technological changes. The depreciation expense for future periods is adjusted if there are significant changes from previous estimates.
| (d) | Measurement of expected credit losses |
ECLs are a probability-weighted estimate of credit losses. Credit losses are measured as the present value of all cash shortfalls (i.e. the difference between the cash flows due to the entity in accordance with the contract and the cash flows that the Group expects to receive).
The Group measures and recognises expected credit losses, considering reasonable and supportable information about the relevant past events, current conditions and forecasts of future economic conditions. The Group regularly monitors and reviews the assumptions used for estimating expected credit losses.
| (e) | Allowance for diminution in value of inventories |
If the costs of inventories become higher than their net realisable values, an allowance for diminution in value of inventories is recognised. Net realisable value represents the estimated selling price in the ordinary course of business, less the estimated costs of completion and the estimated costs necessary to make the sale. Management bases the estimates on all available information, including the current market prices of the finished goods, and historical operating costs. If the actual selling prices were to be lower or the costs of completion were to be higher than estimated, the actual allowance for diminution in value of inventories would be higher than estimated.
132
| 59 | PRINCIPAL SUBSIDIARIES |
The Company’s principal subsidiaries have been consolidated into the Group’s financial statements for the year ended 31 December 2022. The following list contains the particulars of subsidiaries which principally affected the results, assets and liabilities of the Group:
| Full name of enterprise | Principal activities | Registered capital/paid- up capital | Actual investment at 31 December 2022 | Percentage of equity interest/ voting right held by the Group | Minority Interests at 31 December 2022 |
| million | million | % | RMB million | ||
| (a) Subsidiaries acquired through group restructuring: | |||||
| China Petrochemical International Company Limited | Trading of petrochemical products | RMB1,400 | RMB1,856 | 100.00 | 12 |
| China International United Petroleum and Chemical Company Limited | Trading of crude oil and petrochemical products | RMB5,000 | RMB6,585 | 100.00 | 5,508 |
| Sinopec Catalyst Company Limited | Production and sale of catalyst products | RMB1,500 | RMB2,424 | 100.00 | 264 |
| Sinopec Yangzi Petrochemical Company Limited | Manufacturing of intermediate petrochemical products and petroleum products | RMB15,651 | RMB15,651 | 100.00 | – |
| Sinopec Lubricant Company Limited | Production and sale of refined petroleum products, lubricant base oil, and petrochemical materials | RMB3,374 | RMB3,374 | 100.00 | 90 |
| Sinopec Yizheng Chemical Fibre Limited Liability Company | Production and sale of polyester chips and polyester fibres | RMB4,000 | RMB7,348 | 100.00 | – |
| Marketing Company | Marketing and distribution of refined petroleum products | RMB28,403 | RMB20,000 | 70.42 | 80,010 |
| Sinopec Kantons Holdings Limited (“Sinopec Kantons”) | Provision of crude oil jetty services and natural gas pipeline transmission services | HKD248 | HKD3,952 | 60.33 | 5,133 |
| Sinopec Shanghai Petrochemical Company Limited (“Shanghai Petrochemical”) | Manufacturing of synthetic fibres, resin and plastics, intermediate petrochemical products and petroleum products | RMB10,824 | RMB5,820 | 50.44 | 13,134 |
| Fujian Petrochemical Company Limited (“Fujian Petrochemical”) (i) | Manufacturing of plastics, intermediate petrochemical products and petroleum products | RMB10,492 | RMB5,246 | 50.00 | 5,620 |
| (b) Subsidiaries established by the Group: | |||||
| Sinopec International Petroleum Exploration and Production Limited (“SIPL”) | Investment in exploration, production and sale of petroleum and natural gas | RMB8,250 | RMB8,250 | 100.00 | 7,065 |
| Sinopec Overseas Investment Holding Limited (“SOIH”) | Investment holding of overseas business | USD3,423 | USD3,423 | 100.00 | – |
| Sinopec Chemical Sales Company Limited | Marketing and distribution of petrochemical products | RMB1,000 | RMB1,165 | 100.00 | 157 |
| Sinopec Great Wall Energy & Chemical Company Limited | Coal chemical industry investment management, production and sale of coal chemical products | RMB22,761 | RMB22,890 | 100.00 | 23 |
| Sinopec Beihai Refining and Chemical Limited Liability Company | Import and processing of crude oil, production, storage and sale of petroleum products and petrochemical products | RMB5,294 | RMB5,240 | 98.98 | 136 |
| ZhongKe (Guangdong) Refinery & Petrochemical Company Limited | Crude oil processing and petroleum products manufacturing | RMB6,397 | RMB5,776 | 90.30 | 2,334 |
| Sinopec Qingdao Refining and Chemical Company Limited | Manufacturing of intermediate petrochemical products and petroleum products | RMB5,000 | RMB4,250 | 85.00 | 1,946 |
| Sinopec-SK (Wuhan) Petrochemical Company Limited (“Sinopec-SK”) | Production, sale, research and development of ethylene and downstream byproducts | RMB7,193 | RMB7,193 | 59.00 | 3,993 |
| (c) Subsidiaries acquired through business combination under common control: | |||||
| Sinopec Hainan Refining and Chemical Company Limited | Manufacturing of intermediate petrochemical products and petroleum products | RMB9,606 | RMB12,615 | 100.00 | 25 |
| Sinopec Qingdao Petrochemical Company Limited | Manufacturing of intermediate petrochemical products and petroleum products | RMB1,595 | RMB7,233 | 100.00 | – |
| Gaoqiao Petrochemical Company Limited | Manufacturing of intermediate petrochemical products and petroleum products | RMB10,000 | RMB4,804 | 55.00 | 10,821 |
| Sinopec Baling Petrochemical Co. Ltd. (“Baling Petrochemical”) | Crude oil processing and petroleum products manufacturing | RMB3,000 | RMB3,340 | 55.00 | 2,542 |
| * | The minority interests of subsidiaries which the Group holds 100% of equity interests at the end of the year are the minority interests of their subsidiaries. |
Except for Sinopec Kantons and SOIH, which are incorporated in Bermuda and Hong Kong SAR, respectively, all of the above principal subsidiaries are incorporated and operate their businesses principally in the PRC.
Note:
| (i) | The Group consolidated the financial statements of the entity because it is exposed to, or has rights to, variable returns from its involvement with the entity and has the ability to affect those return through its power over the entity. |
133
| 59 | PRINCIPAL SUBSIDIARIES (Continued) |
Summarised financial information on subsidiaries with material minority interests
Set out below are the summarised financial information which the amount before inter-company eliminations for each subsidiary whose minority interests that are material to the Group.
Summarised consolidated balance sheet
| Marketing Company | SIPL | Shanghai Petrochemical | Fujian Petrochemical | Sinopec Kantons | Gaoqiao Petrochemical | Sinopec-SK | ||||||||
| At 31 | At 31 | At 31 | At 31 | At 31 | At 31 | At 31 | At 31 | At 31 | At 31 | At 31 | At 31 | At 31 | At 31 | |
| December | December | December | December | December | December | December | December | December | December | December | December | December | December | |
| 2022 | 2021 | 2022 | 2021 | 2022 | 2021 | 2022 | 2021 | 2022 | 2021 | 2022 | 2021 | 2022 | 2021 | |
| RMB million | RMB million | RMB million | RMB million | RMB million | RMB million | RMB million | RMB million | RMB million | RMB million | RMB million | RMB million | RMB million | RMB million | |
| Current assets | 190,697 | 159,599 | 25,677 | 22,759 | 15,766 | 20,932 | 1,901 | 1,464 | 5,436 | 4,761 | 23,991 | 16,253 | 5,781 | 6,791 |
| Current liabilities | (212,593) | (193,315) | (9,468) | (1,430) | (13,998) | (15,796) | (169) | (142) | (209) | (196) | (10,162) | (8,668) | (8,488) | (8,122) |
| Net current (liabilities)/assets | (21,896) | (33,716) | 16,209 | 21,329 | 1,768 | 5,136 | 1,732 | 1,322 | 5,227 | 4,565 | 13,829 | 7,585 | (2,707) | (1,331) |
| Non-current assets | 326,095 | 326,437 | 12,869 | 8,954 | 25,477 | 26,106 | 10,215 | 13,208 | 7,902 | 8,195 | 15,602 | 21,308 | 20,251 | 20,650 |
| Non-current liabilities | (57,215) | (59,604) | (11,892) | (17,823) | (873) | (847) | (707) | (700) | (232) | (170) | (5,385) | (10,679) | (7,806) | (7,512) |
| Net non-current assets/(liabilities) | 268,880 | 266,833 | 977 | (8,869) | 24,604 | 25,259 | 9,508 | 12,508 | 7,670 | 8,025 | 10,217 | 10,629 | 12,445 | 13,138 |
Summarised consolidated statement of comprehensive income and cash flow
| Year ended 31 December | Marketing Company | SIPL | Shanghai Petrochemical | Fujian Petrochemical | Sinopec Kantons | Gaoqiao Petrochemical | Sinopec-SK | |||||||
| 2022 | 2021 | 2022 | 2021 | 2022 | 2021 | 2022 | 2021 | 2022 | 2021 | 2022 | 2021 | 2022 | 2021 | |
| RMB million | RMB million | RMB million | RMB million | RMB million | RMB million | RMB million | RMB million | RMB million | RMB million | RMB million | RMB million | RMB million | RMB million | |
| Turnover | 1,710,428 | 1,408,523 | 3,308 | 2,166 | 82,518 | 89,280 | 4,931 | 5,549 | 529 | 528 | 69,298 | 46,506 | 57,857 | 50,208 |
| Net profit/(loss) for the year | 19,902 | 18,582 | 2,576 | 1,429 | (2,868) | 2,004 | (1,925) | 951 | 346 | 871 | 3,157 | 3,536 | (1,101) | 1,606 |
| Total comprehensive income | 22,418 | 18,439 | 6,438 | 1,045 | (2,690) | 2,145 | (1,925) | 951 | 734 | 677 | 3,161 | 3,677 | (1,101) | 1,606 |
| Comprehensive income attributable to minority interests | 8,110 | 6,822 | 2,659 | 579 | (1,331) | 1,065 | (962) | 476 | 291 | 268 | 1,423 | 1,655 | (451) | 659 |
| Dividends paid to minority interests | 3,453 | 7,064 | – | – | 548 | 541 | 333 | 64 | 169 | 164 | 984 | 256 | 397 | – |
| Net cash flow from operating activities | 43,408 | 28,923 | 1,458 | 690 | (7,337) | 4,060 | 2 | (292) | 133 | 133 | (1,247) | (1,577) | (1,538) | 5,476 |
134
| 60 | COMMITMENTS |
Capital commitments
At 31 December 2022 and 31 December 2021, capital commitments of the Group are as follows:
| At 31 December | At 31 December | |
| 2022 | 2021 | |
| RMB million | RMB million | |
| Authorised and contracted for (i) | 167,507 | 184,430 |
| Authorised but not contracted for | 94,407 | 90,227 |
| Total | 261,914 | 274,657 |
These capital commitments relate to oil and gas exploration and development, refining and petrochemical production capacity expansion projects, the construction of service stations and oil depots and investment commitments.
Note:
| (i) | The investment commitments of the Group is RMB1,751 million (2021: RMB3,648 million). |
Commitments to joint ventures
Pursuant to certain of the joint venture agreements entered into by the Group, the Group is obliged to purchase products from the joint ventures based on market prices.
Exploration and production licenses
Exploration licenses for exploration activities are registered with the Ministry of Natural Resources. The maximum term of the Group’s exploration licenses is 7 years, and may be renewed twice within 30 days prior to expiration of the original term with each renewal being for a two-year term. The Group is obligated to make progressive annual minimum exploration investment relating to the exploration blocks in respect of which the license is issued. The Ministry of Natural Resources also issues production licenses to the Group on the basis of the reserve reports approved by relevant authorities. The maximum term of a full production license is 30 years unless a special dispensation is given by the State Council. The maximum term of the production licenses issued to the Group is 80 years as a special dispensation was given to the Group by the State Council. The Group’s production license is renewable upon application by the Group 30 days prior to expiration.
The Group is required to make payments of exploration license fees and production right usage fees to the Ministry of Natural Resources annually which are expensed. Expenses recognised were approximately RMB270 million for the year ended 31 December 2022 (2021: RMB181 million).
Estimated future annual payments are as follows:
| At 31 December | At 31 December | |
| 2022 | 2021 | |
| RMB million | RMB million | |
| Within one year | 369 | 301 |
| Between one and two years | 152 | 112 |
| Between two and three years | 146 | 110 |
| Between three and four years | 115 | 102 |
| Between four and five years | 62 | 64 |
| Thereafter | 857 | 846 |
| Total | 1,701 | 1,535 |
The implementation of commitments in previous year and the Group’s commitments did not have material discrepancy.
135
| 61 | CONTINGENT LIABILITIES |
| (a) | The Company has been advised by its PRC lawyers that, except for liabilities constituting or arising out of or relating to the business assumed by the Company in the Reorganisation, no other liabilities were assumed by the Company, and the Company is not jointly and severally liable for other debts and obligations incurred by Sinopec Group Company prior to the Reorganisation. |
| (b) | At 31 December 2022 and 31 December 2021, the guarantees by the Group in respect of facilities granted to the parties below are as follows: |
| At 31 December | At 31 December | |
| 2022 | 2021 | |
| RMB million | RMB million | |
| Joint ventures(i) | 8,927 | 9,117 |
| Associates(ii) | – | 5,746 |
| Total | 8,927 | 14,863 |
Notes:
| (i) | The Group provided a guarantee in respect to standby credit facilities granted to Zhongan United Coal Chemical Co., Ltd. (“Zhongan United”) by banks amount to RMB7,100 million (31 December 2021: RMB7,100 million). As at 31 December 2022, the amount withdrawn (the portion corresponding to the shareholding ratio of the Group) by Zhongan United from banks and guaranteed by the Group was RMB5,254 million (31 December 2021: RMB5,680 million). The Group provided a guarantee in respect to standby credit facilities granted to Amur Gas Chemical Complex Limited Liability Company (“Amur Gas”) by banks amount to RMB25,351 million (31 December 2021: RMB23,208 million). As at 31 December 2022, the amount withdrawn (the portion corresponding to the shareholding ratio of the Group) by Amur Gas from banks and guaranteed by the Group was RMB3,673 million (31 December 2021: RMB3,264 million). |
The Group provided a guarantee in respect to payment obligation under the raw material supply agreement of Amur Gas amounting to RMB16,924 million (31 December 2021: RMB15,493 million). As at 31 December 2022, Amur Gas has not yet incurred the relevant payment obligations and therefore the Group has no guarantee amount (31 December 2021: Nil).
The Group provided a guarantee in respect the engineering services agreement of Amur Gas. As at 31 December 2022, the engineering services agreement was terminated, accordingly the guarantee agreement was terminated.
| (ii) | The Group provided a guarantee in respect to standby credit facilities granted to Zhongtian Synergetic Energy by banks amounting to RMB17,050 million. As at 31 December 2021, the amount withdrawn (the portion corresponding to the shareholding ratio of the Group) by Zhongtian Synergetic Energy and guaranteed by the Group was RMB5,746 million. During the year ended 31 December 2022, the guarantee provided by the Group was terminated. |
Management monitors the risk that the specified debtor will default on the contract and recognises a provision when ECLs on the financial guarantees are determined to be higher than the carrying amount in respect of the guarantees. At 31 December 2022 and 2021, the Group estimates that there is no material liability has been accrued for ECLs related to the Group’s obligation under these guarantee arrangements.
Environmental contingencies
Under existing legislation, management believes that there are no probable liabilities that will have a material adverse effect on the financial position or operating results of the Group. The PRC government, however, has moved, and may move further towards more rigorous enforcement of applicable laws, and towards the adoption of more stringent environmental standards. Environmental liabilities are subject to considerable uncertainties which affect the Group’s ability to estimate the ultimate cost of remediation efforts. These uncertainties include (i) the exact nature and extent of the contamination at various sites including, but not limited to refineries, oil fields, service stations, terminals and land development areas, whether operating, closed or sold, (ii) the extent of required cleanup efforts, (iii) varying costs of alternative remediation strategies, (iv) changes in environmental remediation requirements, and (v) the identification of new remediation sites. The amount of such future cost is indeterminable due to such factors as the unknown magnitude of possible contamination and the unknown timing and extent of the corrective actions that may be required. Accordingly, the outcome of environmental liabilities under proposed or future environmental legislation cannot reasonably be estimated at present, and could be material.
The Group recognised normal routine pollutant discharge fees of approximately RMB16,823 million in the consolidated financial statements for the year ended 31 December 2022 (2021: RMB10,968 million).
Legal contingencies
The Group is defendant in certain lawsuits as well as the named party in other proceedings arising in the ordinary course of business. Management has assessed the likelihood of an unfavourable outcome of such contingencies, lawsuits or other proceedings and believes that any resulting liabilities will not have a material adverse effect on the financial position, operating results or cash flows of the Group.
136
| 62 | SEGMENT REPORTING |
Segment information is presented in respect of the Group’s operating segments. The format is based on the Group’s management and internal reporting structure.
In a manner consistent with the way in which information is reported internally to the Group’s chief operating decision maker for the purposes of resource allocation and performance assessment, the Group has identified the following five reportable segments. No operating segments have been aggregated to form the following reportable segments.
| (i) | Exploration and production – which explores and develops oil fields, produces crude oil and natural gas and sells such products to the refining segment of the Group and external customers. |
| (ii) | Refining – which processes and purifies crude oil, which is sourced from the exploration and production segment of the Group and external suppliers, and manufactures and sells petroleum products to the chemicals and marketing and distribution segments of the Group and external customers. |
| (iii) | Marketing and distribution – which owns and operates oil depots and service stations in the PRC, and distributes and sells refined petroleum products (mainly gasoline and diesel) in the PRC through wholesale and retail sales networks. |
| (iv) | Chemicals – which manufactures and sells petrochemical products, derivative petrochemical products and other chemical products to external customers. |
| (v) | Corporate and others – which largely comprise the trading activities of the import and export companies of the Group and research and development undertaken by other subsidiaries. |
The segments were determined primarily because the Group manages its exploration and production, refining, marketing and distribution, chemicals, and corporate and others businesses separately. The reportable segments are each managed separately because they manufacture and/or distribute distinct products with different production processes and due to their distinct operating and gross margin characteristics.
| (1) | Information of reportable segmental revenues, profits or losses, assets and liabilities |
The Group’s chief operating decision maker evaluates the performance and allocates resources to its operating segments on an operating profit basis, without considering the effects of finance costs or investment income. Inter-segment transfer pricing is based on the market price or cost plus an appropriate margin, as specified by the Group’s policy.
Assets and liabilities dedicated to a particular segment’s operations are included in that segment’s total assets and liabilities. Segment assets include all tangible and intangible assets, except for cash at bank and on hand, long-term equity investments, deferred tax assets and other unallocated assets. Segment liabilities exclude short-term loans, non-current liabilities due within one year, long-term loans, debentures payable, deferred tax liabilities, other non-current liabilities and other unallocated liabilities.
137
62 SEGMENT REPORTING (Continued)
| (1) | Information of reportable segmental revenues, profits or losses, assets and liabilities (Continued) |
Reportable information on the Group’s operating segments is as follows:
| 2022 | 2021 | |
| RMB million | RMB million | |
| Income from principal operations | ||
| Exploration and production | ||
| External sales | 192,330 | 156,026 |
| Inter-segment sales | 121,912 | 87,298 |
| 314,242 | 243,324 | |
| Refining | ||
| External sales | 194,839 | 167,948 |
| Inter-segment sales | 1,376,425 | 1,212,455 |
| 1,571,264 | 1,380,403 | |
| Marketing and distribution | ||
| External sales | 1,660,924 | 1,367,605 |
| Inter-segment sales | 13,421 | 7,075 |
| 1,674,345 | 1,374,680 | |
| Chemicals | ||
| External sales | 449,911 | 424,774 |
| Inter-segment sales | 80,328 | 70,242 |
| 530,239 | 495,016 | |
| Corporate and others | ||
| External sales | 759,352 | 563,147 |
| Inter-segment sales | 1,028,800 | 732,356 |
| 1,788,152 | 1,295,503 | |
| Elimination of inter-segment sales | (2,620,886) | (2,109,426) |
| Consolidated income from principal operations | 3,257,356 | 2,679,500 |
| Income from other operations | ||
| Exploration and production | 5,169 | 6,674 |
| Refining | 3,875 | 5,161 |
| Marketing and distribution | 39,529 | 36,864 |
| Chemicals | 9,913 | 10,487 |
| Corporate and others | 2,326 | 2,198 |
| Consolidated income from other operations | 60,812 | 61,384 |
| Consolidated operating income | 3,318,168 | 2,740,884 |
| 2022 | 2021 | |
| RMB million | RMB million | |
| Operating profit/(loss) | ||
| By segment | ||
| Exploration and production | 48,538 | 613 |
| Refining | 11,611 | 65,360 |
| Marketing and distribution | 25,197 | 23,102 |
| Chemicals | (14,256) | 11,361 |
| Corporate and others | 15,480 | 9,521 |
| Elimination | (1,820) | (4,421) |
| Total segment operating profit | 84,750 | 105,536 |
| Investment income | ||
| Exploration and production | 3,273 | 3,023 |
| Refining | (375) | 547 |
| Marketing and distribution | 1,637 | 1,796 |
| Chemicals | 17,624 | 11,269 |
| Corporate and others | (7,697) | (10,603) |
| Total segment investment income | 14,462 | 6,032 |
| Less: Financial expenses | 9,974 | 9,010 |
| Add: Other income | 8,219 | 5,850 |
| (Losses)/gains from changes in fair value | (1,715) | 3,341 |
| Asset disposal gains | 672 | 665 |
| Operating profit | 96,414 | 112,414 |
| Add: Non-operating income | 2,960 | 3,516 |
| Less: Non-operating expenses | 4,859 | 7,582 |
| Profit before taxation | 94,515 | 108,348 |
138
62 SEGMENT REPORTING (Continued)
| (1) | Information of reportable segmental revenues, profits or losses, assets and liabilities (Continued) |
| At 31 December | At 31 December | |
| 2022 | 2021 | |
| RMB million | RMB million | |
| Assets | ||
| Segment assets | ||
| Exploration and production | 412,543 | 371,100 |
| Refining | 327,706 | 304,785 |
| Marketing and distribution | 388,961 | 377,499 |
| Chemicals | 242,794 | 222,803 |
| Corporate and others | 148,014 | 133,961 |
| Total segment assets | 1,520,018 | 1,410,148 |
| Cash at bank and on hand | 145,052 | 221,989 |
| Long-term equity investments | 233,941 | 209,179 |
| Deferred tax assets | 19,952 | 19,389 |
| Other unallocated assets | 29,677 | 28,550 |
| Total assets | 1,948,640 | 1,889,255 |
| Liabilities | ||
| Segment liabilities | ||
| Exploration and production | 172,875 | 159,358 |
| Refining | 84,220 | 129,103 |
| Marketing and distribution | 217,177 | 210,215 |
| Chemicals | 82,826 | 65,103 |
| Corporate and others | 215,386 | 197,447 |
| Total segment liabilities | 772,484 | 761,226 |
| Short-term loans | 21,313 | 27,366 |
| Non-current liabilities due within one year | 62,844 | 28,651 |
| Long-term loans | 94,964 | 49,341 |
| Debentures payable | 12,997 | 42,649 |
| Deferred tax liabilities | 8,079 | 7,910 |
| Other non-current liabilities | 14,068 | 18,276 |
| Other unallocated liabilities | 24,738 | 37,795 |
| Total liabilities | 1,011,487 | 973,214 |
| 2022 | 2021 | |
| RMB million | RMB million | |
| Capital expenditure | ||
| Exploration and production | 83,300 | 68,148 |
| Refining | 22,863 | 22,469 |
| Marketing and distribution | 19,140 | 21,897 |
| Chemicals | 58,612 | 51,648 |
| Corporate and others | 5,181 | 3,786 |
| 189,096 | 167,948 | |
| Depreciation, depletion and amortisation | ||
| Exploration and production | 45,321 | 52,880 |
| Refining | 20,588 | 20,743 |
| Marketing and distribution | 23,461 | 23,071 |
| Chemicals | 17,716 | 16,093 |
| Corporate and others | 2,820 | 2,893 |
| 109,906 | 115,680 | |
| Impairment losses on long-lived assets | ||
| Exploration and production | 2,891 | 2,467 |
| Refining | 2 | 860 |
| Marketing and distribution | 415 | 1,211 |
| Chemicals | 1,790 | 5,332 |
| Corporate and others | 571 | 165 |
| 5,669 | 10,035 |
139
| 62 | SEGMENT REPORTING (Continued) |
| (2) | Geographical information |
The following tables set out information about the geographical information of the Group’s external sales and the Group’s non-current assets, excluding financial assets and deferred tax assets. In presenting information on the basis of geographical segments, segment revenue is based on the geographical location of customers, and segment assets are based on the geographical location of the assets.
| 2022 | 2021 | |
| RMB million | RMB million | |
| External sales | ||
| Mainland China | 2,824,140 | 2,166,040 |
| Singapore | 263,087 | 278,024 |
| Others | 230,941 | 296,820 |
| 3,318,168 | 2,740,884 |
| At 31 December | At 31 December | |
| 2022 | 2021 | |
| RMB million | RMB million | |
| Non-current assets | ||
| Mainland China | 1,353,771 | 1,268,814 |
| Others | 44,739 | 40,551 |
| 1,398,510 | 1,309,365 |
| 63 | FINANCIAL INSTRUMENTS |
Overview
Financial assets of the Group include cash at bank and on hand, financial assets held for trading, derivative financial assets, accounts receivable, receivables financing, other receivables and other equity instrument investments. Financial liabilities of the Group include short-term loans, derivative financial liabilities, bills payable, accounts payable, employee benefits payable, other payables, long-term loans, debentures payable and lease liabilities.
The Group has exposure to the following risks from its uses of financial instruments:
| • | credit risk; |
| • | liquidity risk; and |
| • | market risk. |
The Board of Directors has overall responsibility for the establishment and oversight of the Group’s risk management framework, and developing and monitoring the Group’s risk management policies.
The Group’s risk management policies are established to identify and analyse the risks faced by the Group, and set appropriate risk limits and controls and to monitor risks and adherence to limits. Risk management policies and systems are reviewed regularly to reflect changes in market conditions and the Group’s activities. The Group, through its training and management standards and procedures, aims to develop a disciplined and constructive control environment in which all employees understand their roles and obligations. Internal audit department undertakes both regular and ad hoc reviews of risk management controls and procedures, the results of which are reported to the Group’s audit committee.
Credit risk
| (i) | Risk management |
Credit risk is the risk of financial loss to the Group if a customer or counterparty to a financial instrument fails to meet its contractual obligations, and arises principally from the Group’s deposits placed with financial institutions (including structured deposits) and receivables from customers. To limit exposure to credit risk relating to deposits, the Group primarily places cash deposits only with large financial institutions in the PRC with acceptable credit ratings. The majority of the Group’s accounts receivable relates to sales of petroleum and chemical products to related parties and third parties operating in the petroleum and chemical industries. No single customer accounted for greater than 10% of total accounts receivable at 31 December 2022, except for the amounts due from Sinopec Group Company and fellow subsidiaries. The Group performs ongoing credit evaluations of its customers’ financial condition and generally does not require collateral on accounts receivable. The Group maintains an impairment loss for doubtful accounts and actual losses have been within management’s expectations.
The carrying amounts of cash at bank and on hand, financial assets held for trading, derivative financial assets, accounts receivable, receivables financing and other receivables, represent the Group’s maximum exposure to credit risk in relation to financial assets.
140
| 63 | FINANCIAL INSTRUMENTS (Continued) |
Credit risk (Continued)
| (ii) | Impairment of financial assets |
The Group’s primary type of financial assets that are subject to the expected credit loss model is accounts receivable, receivables financing and other receivables.
The Group’s cash deposits are placed only with large financial institutions with acceptable credit ratings, and there is no material impairment loss identified.
For accounts receivable and receivables financing, the Group applies the “No.22 Accounting Standards for Business Enterprises – Financial instruments: recognition and measurement” simplified approach to measuring expected credit losses which uses a lifetime expected loss allowance for all accounts receivable and receivables financing.
To measure the expected credit losses, accounts receivable and receivables financing have been grouped based on shared credit risk characteristics and the days past due.
The expected loss rates are based on the payment profiles of sales over a period of 36 months before 31 December 2022 or 31 December 2021, respectively, and the corresponding historical credit losses experienced within this period and calculate expected credit losses for the above financial assets using an allowance matrix The historical loss rates are adjusted to reflect current and forward-looking information on macroeconomic factors affecting the ability of the customers to settle the accounts receivable and receivables financing.
The detailed analysis of accounts receivable and receivables financing is listed in Note 7 and Note 8.
The Group’s other receivables are considered to have low credit risk (Note 10), and the loss allowance recognised during the year was therefore limited to 12 months expected credit losses. The Group considers “low credit risk” for other receivables when they have a low risk of default and the issuer has a strong capacity to meet its contractual cash flow obligations in the near term.
Liquidity risk
Liquidity risk is the risk that the Group encounters short fall of capital when meeting its obligation of financial liabilities. The Group’s approach to managing liquidity is to ensure, as far as possible, that it will always have sufficient liquidity to meet its liabilities when due, under both normal and stressed capital conditions, without incurring unacceptable losses or risking damage to the Group’s reputation. The Group prepares monthly cash flow budget to ensure that they will always have sufficient liquidity to meet its financial obligations as they fall due. The Group arranges and negotiates financing with financial institutions and maintains a certain level of standby credit facilities to reduce the liquidity risk.
At 31 December 2022, the Group has standby credit facilities with several PRC financial institutions which provide the Group to borrow up to RMB454,857 million (2021: RMB441,559 million) on an unsecured basis, at a weighted average interest rate of 2.38% per annum (2021: 2.81%). At 31 December 2022, the Group’s outstanding borrowings under these facilities were RMB21,313 million (2021: RMB11,700 million) and were included in loans.
The following table sets out the remaining contractual maturities at the balance sheet date of the Group’s financial liabilities, which are based on contractual undiscounted cash flows (including interest payments computed using contractual rates or, if floating, based on prevailing rates at the balance sheet date) and the earliest date the Group would be required to repay:
| At 31 December 2022 | ||||||
| Carrying amount | Total contractual undiscounted cash flow | Within one year or on demand | More than one year but less than two years | More than two years but less than five years | More than five years | |
| RMB million | RMB million | RMB million | RMB million | RMB million | RMB million | |
| Short-term loans | 21,313 | 21,635 | 21,635 | – | – | – |
| Derivative financial liabilities | 7,313 | 7,313 | 7,313 | – | – | – |
| Bills payable | 10,782 | 10,782 | 10,782 | – | – | – |
| Accounts payable | 258,642 | 258,642 | 258,642 | – | – | – |
| Other payables | 119,892 | 119,892 | 119,892 | – | – | – |
| Non-current liabilities due within one year | 62,844 | 64,111 | 64,111 | – | – | – |
| Long-term loans | 94,964 | 102,939 | 2,149 | 12,960 | 76,473 | 11,357 |
| Debentures payable | 12,997 | 16,657 | 422 | 4,948 | 5,669 | 5,618 |
| Lease liabilities | 166,407 | 282,477 | – | 12,905 | 36,984 | 232,588 |
| Total | 755,154 | 884,448 | 484,946 | 30,813 | 119,126 | 249,563 |
141
| 63 | FINANCIAL INSTRUMENTS (Continued) |
Liquidity risk (Continued)
| At 31 December 2021 | ||||||
| Carrying amount | Total contractual undiscounted cash flow | Within one year or on demand | More than one year but less than two years | More than two years but less than five years | More than five years | |
| RMB million | RMB million | RMB million | RMB million | RMB million | RMB million | |
| Short-term loans | 27,366 | 27,787 | 27,787 | – | – | – |
| Derivative financial liabilities | 3,223 | 3,223 | 3,223 | – | – | – |
| Bills payable | 11,721 | 11,721 | 11,721 | – | – | – |
| Accounts payable | 203,919 | 203,919 | 203,919 | – | – | – |
| Other payables | 114,701 | 114,701 | 114,701 | – | – | – |
| Non-current liabilities due within one year | 28,651 | 29,554 | 29,554 | – | – | – |
| Long-term loans | 49,341 | 53,704 | 1,230 | 19,350 | 27,786 | 5,338 |
| Debentures payable | 42,649 | 47,553 | 1,195 | 30,645 | 10,443 | 5,270 |
| Lease liabilities | 170,233 | 280,652 | – | 12,030 | 35,412 | 233,210 |
| Total | 651,804 | 772,814 | 393,330 | 62,025 | 73,641 | 243,818 |
Management believes that the Group’s current cash on hand, expected cash flows from operations and available standby credit facilities from financial institutions will be sufficient to meet the Group’s short-term and long-term capital requirements.
Market risk
Market risk is the risk that changes in market prices, such as foreign exchange rates and interest rates. The objective of market risk management is to manage and control market risk exposures within acceptable parameters, while optimising the return on risk.
| (a) | Currency risk |
Currency risk arises on financial instruments that are denominated in a currency other than the functional currency in which they are measured.
The Group does not have significant financial instruments that are denominated in foreign currencies other than the functional currencies of respective entities as at 31 December, and consequently does not have significant explosure to foreign currency risk.
| (b) | Interest rate risk |
The Group’s interest rate risk exposure arises primarily from its short-term and long-term loans. Loans carrying interest at variable interest rates and at fixed interest rates expose the Group to cash flow interest rate risk and fair value interest rate risk respectively. The interest rates and terms of repayment of short-term and long-term loans of the Group are disclosed in Note 22 and Note 31, respectively.
At 31 December 2022, it is estimated that a general increase/decrease of 100 basis points in variable interest rates, with all other variables held constant, would decrease/increase the Group’s net profit for the year by approximately RMB524 million (2021: decrease/increase RMB254 million). This sensitivity analysis has been determined assuming that the change of interest rates was applied to the Group’s debts outstanding at the balance sheet date with exposure to cash flow interest rate risk. The analysis is performed on the same basis for 2021.
| (c) | Commodity price risk |
The Group engages in oil and gas operations and is exposed to commodity price risk related to price volatility of crude oil, refined oil products and chemical products. The fluctuations in prices of crude oil, refined oil products and chemical products could have significant impact on the Group. The Group uses derivative financial instruments, including commodity futures and swaps contracts, to manage a portion of such risk.
Based on the dynamic study and judging of the market, combined with the resource demand and production and operation plan, the Group evaluate and monitor the market risk exposure caused by transaction positions, and continuously manage and hedge the risk of commodity price fluctuation caused by market changes.
At 31 December 2022, the Group had certain commodity contracts of crude oil, refined oil products and chemical products designated as qualified cash flow hedges and economic hedges. At 31 December 2022, the fair value of such derivative hedging financial instruments is derivative financial assets of RMB19,328 million (2021: RMB18,359 million) and derivative financial liabilities of RMB7,235 million (2021: RMB3,214 million).
At 31 December 2022, it is estimated that a general increase/decrease of USD10 per barrel in basic price of derivative financial instruments, with all other variables held constant, would impact the fair value of derivative financial instruments, which would decrease/increase the Group’s net profit for the year by approximately RMB5,104 million (2021: decrease/increase RMB2,996 million), and increase/decrease the Group’s other comprehensive income by approximately RMB192 million (2021: decrease/increase RMB1,160 million). This sensitivity analysis has been determined assuming that the change in prices had occurred at the balance sheet date and the change was applied to the Group’s derivative financial instruments at that date with exposure to commodity price risk. The analysis is performed on the same basis for 2021.
142
| 63 | FINANCIAL INSTRUMENTS (Continued) |
Fair values
| (i) | Financial instruments carried at fair value |
The following table presents the carrying value of financial instruments measured at fair value at the balance sheet date across the three levels of the fair value hierarchy. With the fair value of each financial instrument categorised in its entirely based on the lowest level of input that is significant to that fair value measurement. The levels are defined as follows:
| • | Level 1 (highest level): fair values measured using quoted prices (unadjusted) in active markets for identical financial instruments. |
| • | Level 2: fair values measured using quoted prices in active markets for similar financial instruments, or using valuation techniques in which all significant inputs are directly or indirectly based on observable market data. |
| • | Level 3 (lowest level): fair values measured using valuation techniques in which any significant input is not based on observable market data. |
At 31 December 2022
The Group
| Level 1 | Level 2 | Level 3 | Total | |
| RMB million | RMB million | RMB million | RMB million | |
| Assets | ||||
| Financial assets held for trading: | ||||
| – Fund Investments | 2 | – | – | 2 |
| Derivative financial assets: | ||||
| – Derivative financial assets | 7,857 | 11,478 | – | 19,335 |
| Receivables financing: | ||||
| – Receivables financing | – | – | 3,507 | 3,507 |
| Other equity instrument investments: | ||||
| – Other Investments | 114 | – | 616 | 730 |
| 7,973 | 11,478 | 4,123 | 23,574 | |
| Liabilities | ||||
| Derivative financial liabilities: | ||||
| – Derivative financial liabilities | 1,293 | 6,020 | – | 7,313 |
| 1,293 | 6,020 | – | 7,313 |
At 31 December 2021
The Group
| Level 1 | Level 2 | Level 3 | Total | |
| RMB million | RMB million | RMB million | RMB million | |
| Assets | ||||
| Derivative financial assets: | ||||
| – Derivative financial assets | 5,883 | 12,488 | – | 18,371 |
| Receivables financing: | ||||
| – Receivables financing | – | – | 5,939 | 5,939 |
| Other equity instrument investments: | ||||
| – Other Investments | 179 | – | 588 | 767 |
| 6,062 | 12,488 | 6,527 | 25,077 | |
| Liabilities | ||||
| Derivative financial liabilities: | ||||
| – Derivative financial liabilities | 804 | 2,419 | – | 3,223 |
| 804 | 2,419 | – | 3,223 |
During the year ended 31 December 2022 and 2021, there was no transfer between instruments in Level 1 and Level 2.
Management of the Group uses discounted cash flow model with inputted interest rate and commodity index, which were influenced by historical fluctuation and the probability of market fluctuation, to evaluate the fair value of the structured deposits and receivables financing classified as Level 3 financial assets.
143
| 63 | FINANCIAL INSTRUMENTS (Continued) |
| (ii) | Fair values of financial instruments carried at other than fair value |
The fair values of the Group’s financial instruments carried at other than fair value (other than long-term indebtedness and investments in unquoted equity securities) approximate their carrying amounts due to the short-term maturity of these instruments. The fair values of long-term indebtedness are estimated by discounting future cash flows using current market interest rates offered to the Group for debt with substantially the same characteristic and maturities range from 2.66% to 4.35% (2021: from 0.30% to 4.65%). The following table presents the carrying amount and fair value of the Group’s long-term indebtedness other than loans from Sinopec Group Company and fellow subsidiaries at 31 December 2022 and 31 December 2021:
| At 31 December | At 31 December | |
| 2022 | 2021 | |
| RMB million | RMB million | |
| Carrying amount | 130,282 | 88,593 |
| Fair value | 125,866 | 85,610 |
The Group has not developed an internal valuation model necessary to estimate the fair values of loans from Sinopec Group Company and fellow subsidiaries as it is not considered practicable to estimate their fair values because the cost of obtaining discount and borrowing rates for comparable borrowings would be excessive based on the Group’s existing capital structure and the terms of the borrowings.
Except for the above items, the financial assets and liabilities of the Group are carried at amounts not materially different from their fair values at 31 December 2022 and 31 December 2021.
| 64 | BASIC AND DILUTED EARNINGS PER SHARE |
| (i) | Basic earnings per share |
Basic earnings per share is calculated by the net profit attributable to equity shareholders of the Company and the weighted average number of outstanding ordinary shares of the Company:
| 2022 | 2021 | |
| Net profit attributable to equity shareholders of the Company (RMB million) | 66,302 | 71,208 |
| Weighted average number of outstanding ordinary shares of the Company (million) | 120,889 | 121,071 |
| Basic earnings per share (RMB/share) | 0.548 | 0.588 |
The calculation of the weighted average number of ordinary shares is as follows:
| 2022 | 2021 | |
| Weighted average number of outstanding ordinary shares of the Company at 1 January (million) | 121,071 | 121,071 |
| Impact of repurchasing shares (million) | (182) | – |
| Weighted average number of outstanding ordinary shares of the Company at 31 December (million) | 120,889 | 121,071 |
| (ii) | Diluted earnings per share |
There are no potential dilutive ordinary shares, and diluted earnings per share are equal to the basic earning per share.
144
| 65 | RETURN ON NET ASSETS AND EARNINGS PER SHARE |
In accordance with “Regulation on the Preparation of Information Disclosures of Companies Issuing Public Shares No.9 – Calculation and Disclosure of the Return on Net Assets and Earnings Per Share” (2010 revised) issued by the CSRC and relevant accounting standards, the Group’s return on net assets and earnings per share are calculated as follows:
| 2022 | 2021 | |||||
| Weighted average return on net assets | Basic earnings per share | Diluted earnings per share | Weighted average return on net assets | Basic earnings per share | Diluted earnings per share | |
| (%) | (RMB/Share) | (RMB/Share) | (%) | (RMB/Share) | (RMB/Share) | |
| Net profit attributable to the Company’s ordinary equity shareholders | 8.50 | 0.548 | 0.548 | 9.35 | 0.588 | 0.588 |
| Net profit deducted extraordinary gains and losses attributable to the Company’s ordinary equity shareholders | 7.33 | 0.473 | 0.473 | 9.49 | 0.597 | 0.597 |
| 66 | EXTRAORDINARY GAINS AND LOSSES |
Pursuant to “Explanatory Announcement No.1 on Information Disclosure for Companies Offering Their Securities to the Public-Extraordinary Gain and Loss” (2008), the extraordinary gains and losses of the Group are as follows:
| 2022 | 2021 | |
| RMB million | RMB million | |
| Extraordinary (gains)/losses for the year: | ||
| Net gains on disposal of non-current assets | (672) | (665) |
| Donations | 447 | 165 |
| Government grants | (3,826) | (3,085) |
| Gain on holding and disposal of business and various investments | (13,902) | (259) |
| Other non-operating losses, net | 2,178 | 4,720 |
| Net profit acquired through business combination under common control during the reporting period | – | 101 |
| (15,775) | 977 | |
| Tax effect | 2,304 | (72) |
| Total | (13,471) | 905 |
| Attributable to: | ||
| Equity shareholders of the Company | (9,120) | 1,012 |
| Minority interests | (4,351) | (107) |
145
REPORT OF THE INTERNATIONAL AUDITOR
KPMG 8th Floor, Prince’s Building Central, Hong Kong G P O Box 50, Hong Kong Telephone +852 2522 6022 Fax +852 2845 2588 Internet kpmg.com/cn | 畢馬威會計師事務所 香港中環太子大廈8樓 香港郵政總局信箱50號 電話+852 2522 6022 傳真+852 2845 2588 網址kpmg.com/cn |
Independent auditor’s report
to the shareholders of China Petroleum & Chemical Corporation
(established in the People’s Republic of China with limited liability)
OPINION
We have audited the consolidated financial statements of China Petroleum & Chemical Corporation (“the Company”) and its subsidiaries (“the Group”) set out on pages 149 to 203, which comprise the consolidated statement of financial position as at 31 December 2022, the consolidated income statement, the consolidated statement of comprehensive income, the consolidated statement of changes in equity and the consolidated statement of cash flows for the year then ended and notes to the consolidated financial statements, including a summary of significant accounting policies.
In our opinion, the consolidated financial statements give a true and fair view of the consolidated financial position of the Group as at 31 December 2022 and of its consolidated financial performance and its consolidated cash flows for the year then ended in accordance with International Financial Reporting Standards (“IFRSs”) issued by the International Accounting Standards Board (“IASB”) and have been properly prepared in compliance with the disclosure requirements of the Hong Kong Companies Ordinance.
BASIS FOR OPINION
We conducted our audit in accordance with Hong Kong Standards on Auditing (“HKSAs”) issued by the Hong Kong Institute of Certified Public Accountants (“HKICPA”). Our responsibilities under those standards are further described in the Auditor’s responsibilities for the audit of the consolidated financial statements section of our report. We are independent of the Group in accordance with the HKICPA’s Code of Ethics for Professional Accountants (“the Code”) together with any ethical requirements that are relevant to our audit of the consolidated financial statements in the People’s Republic of China, and we have fulfilled our other ethical responsibilities in accordance with these requirements and the Code. We believe that the audit evidence we have obtained is sufficient and appropriate to provide a basis for our opinion.
KEY AUDIT MATTER
Key audit matter is the matter that, in our professional judgment, was of most significance in our audit of the consolidated financial statements of the current period. The matter was addressed in the context of our audit of the consolidated financial statements as a whole, and in forming our opinion thereon, and we do not provide a separate opinion on this matter.
| Assessment of impairment of property, plant and equipment relating to oil and gas producing activities | |
| Refer to notes 2(g), 2(n), 8, 17 and 43 to the consolidated financial statements | |
| The Key Audit Matter | How the matter was addressed in our audit |
The Company reported property, plant and equipment of Renminbi (“RMB”) 630,700 million as at 31 December 2022, a portion of which related to oil and gas producing activities. The Company reported impairment losses of RMB2,891 million for the property, plant and equipment relating to oil and gas producing activities for the year ended 31 December 2022. The Company groups property, plant and equipment relating to oil and gas producing activities into cash-generating units (“CGUs”) for impairment assessment. The Company compares the carrying amount of individual CGU with its value in use, using a discounted cash flow forecast, which was prepared based on the future production profiles included in the oil and gas reserves reports, to determine the impairment loss to be recognised. We identified assessment of impairment of property, plant and equipment relating to oil and gas producing activities as a key audit matter. The value in use amounts of these CGUs are sensitive to the changes to future selling prices and production costs for crude oil and natural gas, future production profiles, and discount rates. Therefore a higher degree of subjective auditor judgment was required to evaluate the Company’s impairment assessment of property, plant and equipment relating to oil and gas producing activities. | The following are the primary procedures we performed to address this key audit matter: • we evaluated the design and tested the operating effectiveness of certain internal controls related to the process for impairment assessment of property, plant and equipment relating to oil and gas producing activities; • we assessed the competence, capabilities and objectivity of the Company’s reserves specialists and evaluated the methodology adopted by them in estimating the oil and gas reserves against the recognised industry standards; • we compared future selling prices for crude oil and natural gas used in the discounted cash flow forecasts with the Company’s business plans and forecasts by external analysts; • we compared future production costs and future production profiles used in the discounted cash flow forecasts with oil and gas reserves reports issued by the reserves specialists; and • we involved valuation professionals with specialised skills and knowledge, who assisted in assessing the discount rates applied in the discounted cash flow forecasts against a discount rate range that was independently developed using publicly available market data for comparable companies in the same industry. |
146
INFORMATION OTHER THAN THE CONSOLIDATED FINANCIAL STATEMENTS AND AUDITOR’S REPORT THEREON
The directors are responsible for the other information. The other information comprises all the information included in the annual report, other than the consolidated financial statements and our auditor’s report thereon.
Our opinion on the consolidated financial statements does not cover the other information and we do not express any form of assurance conclusion thereon.
In connection with our audit of the consolidated financial statements, our responsibility is to read the other information and, in doing so, consider whether the other information is materially inconsistent with the consolidated financial statements or our knowledge obtained in the audit or otherwise appears to be materially misstated.
If, based on the work we have performed, we conclude that there is a material misstatement of this other information, we are required to report that fact. We have nothing to report in this regard.
RESPONSIBILITIES OF THE DIRECTORS FOR THE CONSOLIDATED FINANCIAL STATEMENTS
The directors are responsible for the preparation of the consolidated financial statements that give a true and fair view in accordance with IFRSs issued by the IASB and the disclosure requirements of the Hong Kong Companies Ordinance and for such internal control as the directors determine is necessary to enable the preparation of consolidated financial statements that are free from material misstatement, whether due to fraud or error.
In preparing the consolidated financial statements, the directors are responsible for assessing the Group’s ability to continue as a going concern, disclosing, as applicable, matters related to going concern and using the going concern basis of accounting unless the directors either intend to liquidate the Group or to cease operations, or have no realistic alternative but to do so.
The directors are assisted by the Audit Committee in discharging their responsibilities for overseeing the Group’s financial reporting process.
AUDITOR’S RESPONSIBILITIES FOR THE AUDIT OF THE CONSOLIDATED FINANCIAL STATEMENTS
Our objectives are to obtain reasonable assurance about whether the consolidated financial statements as a whole are free from material misstatement, whether due to fraud or error, and to issue an auditor’s report that includes our opinion. This report is made solely to you, as a body, and for no other purpose. We do not assume responsibility towards or accept liability to any other person for the contents of this report.
Reasonable assurance is a high level of assurance but is not a guarantee that an audit conducted in accordance with HKSAs will always detect a material misstatement when it exists. Misstatements can arise from fraud or error and are considered material if, individually or in the aggregate, they could reasonably be expected to influence the economic decisions of users taken on the basis of these consolidated financial statements.
As part of an audit in accordance with HKSAs, we exercise professional judgement and maintain professional scepticism throughout the audit. We also:
| • | Identify and assess the risks of material misstatement of the consolidated financial statements, whether due to fraud or error, design and perform audit procedures responsive to those risks, and obtain audit evidence that is sufficient and appropriate to provide a basis for our opinion. The risk of not detecting a material misstatement resulting from fraud is higher than for one resulting from error, as fraud may involve collusion, forgery, intentional omissions, misrepresentations or the override of internal control. |
| • | Obtain an understanding of internal control relevant to the audit in order to design audit procedures that are appropriate in the circumstances but not for the purpose of expressing an opinion on the effectiveness of the Group’s internal control. |
| • | Evaluate the appropriateness of accounting policies used and the reasonableness of accounting estimates and related disclosures made by the directors. |
| • | Conclude on the appropriateness of the directors’ use of the going concern basis of accounting and, based on the audit evidence obtained, whether a material uncertainty exists related to events or conditions that may cast significant doubt on the Group’s ability to continue as a going concern. If we conclude that a material uncertainty exists, we are required to draw attention in our auditor’s report to the related disclosures in the consolidated financial statements or, if such disclosures are inadequate, to modify our opinion. Our conclusions are based on the audit evidence obtained up to the date of our auditor’s report. However, future events or conditions may cause the Group to cease to continue as a going concern. |
| • | Evaluate the overall presentation, structure and content of the consolidated financial statements, including the disclosures, and whether the consolidated financial statements represent the underlying transactions and events in a manner that achieves fair presentation. |
147
| • | Obtain sufficient appropriate audit evidence regarding the financial information of the entities or business activities within the Group to express an opinion on the consolidated financial statements. We are responsible for the direction, supervision and performance of the group audit. We remain solely responsible for our audit opinion. |
We communicate with the Audit Committee regarding, among other matters, the planned scope and timing of the audit and significant audit findings, including any significant deficiencies in internal control that we identify during our audit.
We also provide the Audit Committee with a statement that we have complied with relevant ethical requirements regarding independence and communicate with them all relationships and other matters that may reasonably be thought to bear on our independence and, where applicable, actions taken to eliminate threats or safeguards applied.
From the matters communicated with the Audit Committee, we determine those matters that were of most significance in the audit of the consolidated financial statements of the current period and are therefore the key audit matters. We describe these matters in our auditor’s report unless law or regulation precludes public disclosure about the matter or when, in extremely rare circumstances, we determine that a matter should not be communicated in our report because the adverse consequences of doing so would reasonably be expected to outweigh the public interest benefits of such communication.
The engagement partner on the audit resulting in this independent auditor’s report is Ho Ying Man, Simon.
KPMG
Certified Public Accountants
8th Floor, Prince’s Building
10 Chater Road
Central, Hong Kong
24 March 2023
148
| (B) | FINANCIAL STATEMENTS PREPARED UNDER INTERNATIONAL FINANCIAL REPORTING STANDARDS (“IFRS”) |
CONSOLIDATED INCOME STATEMENT
for the year ended 31 December 2022
(Amounts in million, except per share data)
| Note | Year ended 31 December | ||
| 2022 | 2021 | ||
| RMB | RMB | ||
| Revenue | |||
| Revenue from primary business | 3 | 3,257,356 | 2,679,500 |
| Other operating revenues | 4 | 60,812 | 61,384 |
| 3,318,168 | 2,740,884 | ||
| Operating expenses | |||
| Purchased crude oil, products and operating supplies and expenses | (2,684,756) | (2,076,665) | |
| Selling, general and administrative expenses | 5 | (55,809) | (54,978) |
| Depreciation, depletion and amortisation | (109,906) | (115,680) | |
| Exploration expenses, including dry holes | (10,591) | (12,382) | |
| Personnel expenses | 6 | (103,585) | (103,492) |
| Taxes other than income tax | 7 | (263,991) | (259,032) |
| Impairment reversals/(losses) on trade and other receivables | 1,084 | (2,311) | |
| Other operating income/(expenses), net | 8 | (14,779) | (21,716) |
| Total operating expenses | (3,242,333) | (2,646,256) | |
| Operating profit | 75,835 | 94,628 | |
| Finance costs | |||
| Interest expense | 9 | (16,769) | (15,018) |
| Interest income | 6,266 | 5,732 | |
| Foreign currency exchange gains, net | 529 | 276 | |
| Net finance costs | (9,974) | (9,010) | |
| Investment income | 10 | 14,060 | 298 |
| Share of profits less losses from associates and joint ventures | 21,22 | 14,479 | 23,253 |
| Profit before taxation | 94,400 | 109,169 | |
| Income tax expense | 11 | (18,757) | (23,318) |
| Profit for the year | 75,643 | 85,851 | |
| Attributable to: | |||
| Shareholders of the Company | 66,153 | 71,975 | |
| Non-controlling interests | 9,490 | 13,876 | |
| Profit for the year | 75,643 | 85,851 | |
| Earnings per share: | |||
| Basic | 16 | 0.547 | 0.594 |
| Diluted | 16 | 0.547 | 0.594 |
The notes on pages 156 to 203 form part of these consolidated financial statements. Details of dividends payable to shareholders of the Company attributable to the profit for the year are set out in Note 14.
149
CONSOLIDATED STATEMENT OF COMPREHENSIVE INCOME
for the year ended 31 December 2022
(Amounts in million)
| Note | Year ended 31 December | ||
| 2022 | 2021 | ||
| RMB | RMB | ||
| Profit for the year | 75,643 | 85,851 | |
| Other comprehensive income: | 15 | ||
| Items that may not be reclassified subsequently to profit or loss | |||
| Equity investments at fair value through other comprehensive income | (67) | (4) | |
| Total items that may not be reclassified subsequently to profit or loss | (67) | (4) | |
| Items that may be reclassified subsequently to profit or loss | |||
| Cost of hedging reserve | 149 | (220) | |
| Share of other comprehensive income of associates and joint ventures | 2,856 | 441 | |
| Cash flow hedges | 11,637 | 19,018 | |
| Foreign currency translation differences | 7,254 | (1,728) | |
| Total items that may be reclassified subsequently to profit or loss | 21,896 | 17,511 | |
| Total other comprehensive income | 21,829 | 17,507 | |
| Total comprehensive income for the year | 97,472 | 103,358 | |
| Attributable to: | |||
| Shareholders of the Company | 85,279 | 89,549 | |
| Non-controlling interests | 12,193 | 13,809 | |
| Total comprehensive income for the year | 97,472 | 103,358 | |
The notes on pages 156 to 203 form part of these consolidated financial statements.
150
CONSOLIDATED STATEMENT OF FINANCIAL POSITION
As at 31 December 2022
(Amounts in million)
| Note | 31 December | 31 December | |
| 2022 | 2021 | ||
| RMB | RMB | ||
| Non-current assets | |||
| Property, plant and equipment, net | 17 | 630,700 | 598,925 |
| Construction in progress | 18 | 196,045 | 155,939 |
| Right-of-use assets | 19 | 264,856 | 268,408 |
| Goodwill | 20 | 6,464 | 8,594 |
| Interest in associates | 21 | 159,150 | 148,729 |
| Interest in joint ventures | 22 | 74,791 | 60,450 |
| Financial assets at fair value through other comprehensive income | 26 | 730 | 767 |
| Deferred tax assets | 29 | 19,952 | 19,389 |
| Long-term prepayments and other assets | 23 | 72,812 | 70,030 |
| Total non-current assets | 1,425,500 | 1,331,231 | |
| Current assets | |||
| Cash and cash equivalents | 93,438 | 108,590 | |
| Time deposits with financial institutions | 51,614 | 113,399 | |
| Financial assets at fair value through profit or loss | 2 | – | |
| Derivative financial assets | 24 | 19,335 | 18,371 |
| Trade accounts receivable | 25 | 46,364 | 34,861 |
| Financial assets at fair value through other comprehensive income | 26 | 3,507 | 5,939 |
| Inventories | 27 | 244,241 | 207,433 |
| Prepaid expenses and other current assets | 28 | 64,639 | 69,431 |
| Total current assets | 523,140 | 558,024 | |
| Current liabilities | |||
| Short-term debts | 30 | 59,037 | 35,252 |
| Loans from Sinopec Group Company and fellow subsidiaries | 30 | 7,292 | 2,873 |
| Lease liabilities | 31 | 16,004 | 15,173 |
| Derivative financial liabilities | 24 | 7,313 | 3,223 |
| Trade accounts payable and bills payable | 32 | 269,424 | 215,640 |
| Contract liabilities | 33 | 125,444 | 124,622 |
| Other payables | 34 | 178,146 | 239,688 |
| Income tax payable | 4,725 | 4,809 | |
| Total current liabilities | 667,385 | 641,280 | |
| Net current liabilities | 144,245 | 83,256 | |
| Total assets less current liabilities | 1,281,255 | 1,247,975 | |
| Non-current liabilities | |||
| Long-term debts | 30 | 85,706 | 78,300 |
| Loans from Sinopec Group Company and fellow subsidiaries | 30 | 22,255 | 13,690 |
| Lease liabilities | 31 | 166,407 | 170,233 |
| Deferred tax liabilities | 29 | 8,079 | 7,910 |
| Provisions | 35 | 47,587 | 43,525 |
| Other long-term liabilities | 14,983 | 19,243 | |
| Total non-current liabilities | 345,017 | 332,901 | |
| 936,238 | 915,074 | ||
| Equity | |||
| Share capital | 36 | 119,896 | 121,071 |
| Reserves | 664,810 | 653,111 | |
| Total equity attributable to shareholders of the Company | 784,706 | 774,182 | |
| Non-controlling interests | 151,532 | 140,892 | |
| Total equity | 936,238 | 915,074 |
Approved and authorised for issue by the board of directors on 24 March 2023.
| Ma Yongsheng | Yu Baocai | Shou Donghua |
| Chairman | President | Chief Financial Officer |
| (Legal representative) |
The notes on pages 156 to 203 form part of these consolidated financial statements.
151
CONSOLIDATED STATEMENT OF CHANGES IN EQUITY
for the year ended 31 December 2021
(Amounts in million)
| Share capital | Capital reserve | Share premium | Statutory surplus reserve | Discretionary surplus reserve | Other reserves | Retained earnings | Total equity attributable to shareholders of the Company | Non- controlling interests | Total equity | |
| RMB | RMB | RMB | RMB | RMB | RMB | RMB | RMB | RMB | RMB | |
| Balance at 1 January 2021 | 121,071 | 34,263 | 55,850 | 92,280 | 117,000 | 3,500 | 322,361 | 746,325 | 141,377 | 887,702 |
| Profit for the year | – | – | – | – | – | – | 71,975 | 71,975 | 13,876 | 85,851 |
| Other comprehensive income (Note 15) | – | – | – | – | – | 17,574 | – | 17,574 | (67) | 17,507 |
| Total comprehensive income for the year | – | – | – | – | – | 17,574 | 71,975 | 89,549 | 13,809 | 103,358 |
| Amounts transferred to initial carrying amount of hedged items | – | – | – | – | – | (19,302) | – | (19,302) | (648) | (19,950) |
| Transactions with owners, recorded directly in equity: | ||||||||||
| Contributions by and distributions to owners: | ||||||||||
| Final dividend for 2020 (Note 14) | – | – | – | – | – | – | (15,739) | (15,739) | – | (15,739) |
| Interim dividend for 2021 (Note 14) | – | – | – | – | – | – | (19,371) | (19,371) | – | (19,371) |
| Appropriation (Note (a)) | – | – | – | 3,944 | – | – | (3,944) | – | – | – |
| Distributions to non-controlling interests | – | – | – | – | – | – | – | – | (8,982) | (8,982) |
| Contributions to subsidiaries from non-controlling interests | – | – | – | – | – | – | – | – | 1,973 | 1,973 |
| Distribution to sellers in the business combination of entities under common control | – | (6,124) | – | – | – | – | – | (6,124) | – | (6,124) |
| Total contributions by and distributions to owners | – | (6,124) | – | 3,944 | – | – | (39,054) | (41,234) | (7,009) | (48,243) |
| Transaction with non-controlling interests | – | (1,396) | – | – | – | – | – | (1,396) | (6,796) | (8,192) |
| Total transactions with owners | – | (7,520) | – | 3,944 | – | – | (39,054) | (42,630) | (13,805) | (56,435) |
| Others | – | 319 | – | – | – | 723 | (802) | 240 | 159 | 399 |
| Balance at 31 December 2021 | 121,071 | 27,062 | 55,850 | 96,224 | 117,000 | 2,495 | 354,480 | 774,182 | 140,892 | 915,074 |
The notes on pages 156 to 203 form part of these consolidated financial statements.
152
| Share capital | Capital reserve | Share premium | Statutory surplus reserve | Discretionary surplus reserve | Other reserves | Retained earnings | Total equity attributable to shareholders of the Company | Non- controlling interests | Total equity | |
| RMB | RMB | RMB | RMB | RMB | RMB | RMB | RMB | RMB | RMB | |
| Balance at 1 January 2022 | 121,071 | 27,062 | 55,850 | 96,224 | 117,000 | 2,495 | 354,480 | 774,182 | 140,892 | 915,074 |
| Profit for the year | – | – | – | – | – | – | 66,153 | 66,153 | 9,490 | 75,643 |
| Other comprehensive income (Note 15) | – | – | – | – | – | 19,126 | – | 19,126 | 2,703 | 21,829 |
| Total comprehensive income for the year | – | – | – | – | – | 19,126 | 66,153 | 85,279 | 12,193 | 97,472 |
| Amounts transferred to initial carrying amount of hedged items | – | – | – | – | – | (15,363) | – | (15,363) | (439) | (15,802) |
| Transactions with owners, recorded directly in equity: | ||||||||||
| Purchase of own shares (Note 36) | (1,175) | – | (3,004) | – | – | – | – | (4,179) | – | (4,179) |
| Contributions by and distributions to owners: | ||||||||||
| Final dividend for 2021 (Note 14) | – | – | – | – | – | – | (37,532) | (37,532) | – | (37,532) |
| Interim dividend for 2022 (Note 14) | – | – | – | – | – | – | (19,371) | (19,371) | – | (19,371) |
| Appropriation (Note (a)) | – | – | – | 4,610 | – | – | (4,610) | – | – | – |
| Distributions to non-controlling interests | – | – | – | – | – | – | – | – | (6,691) | (6,691) |
| Contributions to subsidiaries from non-controlling interests | – | – | – | – | – | – | – | – | 5,395 | 5,395 |
| Other contributions | – | 2,678 | – | – | – | – | – | 2,678 | 2,191 | 4,869 |
| Total contributions by and distributions to owners | – | 2,678 | – | 4,610 | – | – | (61,513) | (54,225) | 895 | (53,330) |
| Transaction with non-controlling interests | – | – | – | – | – | – | – | – | (1,713) | (1,713) |
| Total transactions with owners | (1,175) | 2,678 | (3,004) | 4,610 | – | – | (61,513) | (58,404) | (818) | (59,222) |
| Other equity movements under the equity method | – | (1,009) | – | – | – | – | – | (1,009) | – | (1,009) |
| Others | – | 22 | – | – | – | 149 | (150) | 21 | (296) | (275) |
| Balance at 31 December 2022 | 119,896 | 28,753 | 52,846 | 100,834 | 117,000 | 6,407 | 358,970 | 784,706 | 151,532 | 936,238 |
Notes:
| (a) | According to the PRC Company Law and the Articles of Association of the Company, the Company is required to transfer 10% of its net profit determined in accordance with the accounting policies complying with Accounting Standards for Business Enterprises (“CASs”), adopted by the Group to statutory surplus reserve. In the event that the reserve balance reaches 50% of the registered capital, no transfer is required. The transfer to this reserve must be made before distribution of a dividend to shareholders. Statutory surplus reserve can be used to make good previous years’ losses, if any, and may be converted into share capital by issuing of new shares to shareholders in proportion to their existing shareholdings or by increasing the par value of the shares currently held by them, provided that the balance after such issue is not less than 25% of the registered capital. |
During the year ended 31 December 2022, the Company transferred RMB4,610 million (2021: RMB3,944 million) to the statutory surplus reserve, being 10% of the current year’s net profit determined in accordance with the accounting policies complying with CASs.
| (b) | The usage of the discretionary surplus reserve is similar to that of statutory surplus reserve. |
| (c) | As at 31 December 2022, the amount of retained earnings available for distribution was RMB100,947 million (2021: RMB116,440 million), being the amount determined in accordance with CASs. According to the Articles of Association of the Company, the amount of retained earnings available for distribution to shareholders of the Company is lower of the amount determined in accordance with the accounting policies complying with CASs and the amount determined in accordance with the accounting policies complying with International Financial Reporting Standards (“IFRS”). |
| (d) | The capital reserve mainly represents (i) the difference between the total amount of the par value of shares issued and the amount of the net assets transferred from Sinopec Group Company in connection with the Reorganisation (Note 1); and (ii) the difference between the considerations paid over or received the amount of the net assets of entities and related operations acquired from or sold to Sinopec Group Company and non-controlling interests. |
| (e) | The application of the share premium account is governed by Sections 167 and 168 of the PRC Company Law. |
The notes on pages 156 to 203 form part of these consolidated financial statements.
153
CONSOLIDATED STATEMENT OF CASH FLOWS
for the year ended 31 December 2022
(Amounts in million)
| Note | Year ended 31 December | ||
| 2022 | 2021 | ||
| RMB | RMB | ||
| Net cash generated from operating activities | (a) | 116,269 | 225,174 |
| Investing activities | |||
| Capital expenditure | (153,744) | (127,965) | |
| Exploratory wells expenditure | (18,783) | (16,956) | |
| Purchase of investments | (9,234) | (4,935) | |
| Payment for financial assets at fair value through profit or loss | (1,222) | (8,150) | |
| Proceeds from settlement of financial assets at fair value through profit or loss | 1,220 | 8,248 | |
| Payment for acquisition of subsidiary, net of cash acquired | (7,881) | (1,106) | |
| Proceeds from disposal of investments | 10,801 | 6,769 | |
| Proceeds from disposal of property, plant, equipment and other non-current assets | 212 | 1,478 | |
| Increase in time deposits with maturities over three months | (31,670) | (50,844) | |
| Decrease in time deposits with maturities over three months | 93,455 | 34,298 | |
| Interest received | 6,918 | 3,372 | |
| Investment and dividend income received | 13,969 | 10,134 | |
| Proceeds from other investing activities | 949 | 459 | |
| Net cash used in investing activities | (95,010) | (145,198) | |
| Financing activities | |||
| Proceeds from bank and other loans | 564,417 | 356,459 | |
| Repayments of bank and other loans | (514,275) | (338,232) | |
| Contributions to subsidiaries from non-controlling interests | 3,946 | 1,001 | |
| Dividends paid by the Company | (56,903) | (35,110) | |
| Distributions by subsidiaries to non-controlling interests | (5,249) | (8,068) | |
| Interest paid | (9,679) | (5,849) | |
| Payments made to acquire non-controlling interests | – | (8,198) | |
| Cash payments to purchase own shares | (4,179) | – | |
| Repayments of lease liabilities | (18,672) | (19,412) | |
| Proceeds from other financing activities | 989 | 133 | |
| Repayments of other financing activities | (94) | (666) | |
| Net cash used in financing activities | (39,699) | (57,942) | |
| Net (decrease)/increase in cash and cash equivalents | (18,440) | 22,034 | |
| Cash and cash equivalents at 1 January | 108,590 | 87,559 | |
| Effect of foreign currency exchange rate changes | 3,288 | (1,003) | |
| Cash and cash equivalents at 31 December | 93,438 | 108,590 | |
The notes on pages 156 to 203 form part of these consolidated financial statements.
154
NOTES TO CONSOLIDATED STATEMENT OF CASH FLOWS
for the year ended 31 December 2022
(Amounts in million)
| (a) | Reconciliation from profit before taxation to net cash generated from operating activities |
| Year ended 31 December | ||
| 2022 | 2021 | |
| RMB | RMB | |
| Operating activities | ||
| Profit before taxation | 94,400 | 109,169 |
| Adjustments for: | ||
| Depreciation, depletion and amortisation | 109,906 | 115,680 |
| Dry hole costs written off | 6,416 | 7,702 |
| Share of profits from associates and joint ventures | (14,479) | (23,253) |
| Investment income | (14,060) | (298) |
| Interest income | (6,266) | (5,732) |
| Interest expense | 16,769 | 15,018 |
| Loss/(gain) on foreign currency exchange rate changes and derivative financial instruments | 3,064 | (3,723) |
| Loss on disposal of property, plant, equipment and other non-current assets, net | 722 | 3,062 |
| Impairment losses on assets | 12,009 | 13,165 |
| Impairment (reversals)/losses on trade and other receivables | (1,084) | 2,311 |
| 207,397 | 233,101 | |
| Net changes from: | ||
| Accounts receivable and other current assets | 1,974 | (8,177) |
| Inventories | (45,421) | (58,372) |
| Accounts payable and other current liabilities | (30,363) | 82,408 |
| 133,587 | 248,960 | |
| Income tax paid | (17,318) | (23,786) |
| Net cash generated from operating activities | 116,269 | 225,174 |
The notes on pages 156 to 203 form part of these consolidated financial statements.
155
NOTES TO THE CONSOLIDATED FINANCIAL STATEMENTS
for the year ended 31 December 2022
1 PRINCIPAL ACTIVITIES, ORGANISATION AND BASIS OF PREPARATION
Principal activities
China Petroleum & Chemical Corporation (the “Company”) is an energy and chemical company incorporated in the People’s Republic of China (the “PRC”) that, through its subsidiaries (hereinafter collectively referred to as the “Group”), engages in oil and gas and chemical operations. Oil and gas operations consist of exploring for, developing and producing crude oil and natural gas; transporting crude oil and natural gas by pipelines; refining crude oil into finished petroleum products; and marketing crude oil, natural gas and refined petroleum products. Chemical operations include the manufacture and marketing of a wide range of chemicals for industrial uses.
Organisation
The Company was established in the PRC on 25 February 2000 as a joint stock limited company as part of the reorganisation (the “Reorganisation”) of China Petrochemical Corporation (“Sinopec Group Company”), the ultimate holding company of the Group and a ministry-level enterprise under the direct supervision of the State Council of the PRC. Prior to the incorporation of the Company, the oil and gas and chemical operations of the Group were carried on by oil administration bureaux, petrochemical and refining production enterprises and sales and marketing companies of Sinopec Group Company.
As part of the Reorganisation, certain of Sinopec Group Company’s core oil and gas and chemical operations and businesses together with the related assets and liabilities were transferred to the Company. On 25 February 2000, in consideration for Sinopec Group Company transferring such oil and gas and chemical operations and businesses and the related assets and liabilities to the Company, the Company issued 68.8 billion domestic state-owned ordinary shares with a par value of RMB1.00 each to Sinopec Group Company. The shares issued to Sinopec Group Company on 25 February 2000 represented the entire registered and issued share capital of the Company on that date. The oil and gas and chemical operations and businesses transferred to the Company were related to (i) the exploration, development and production of crude oil and natural gas, (ii) the refining, transportation, storage and marketing of crude oil and petroleum products, and (iii) the production and sales of chemicals.
Basis of preparation
The accompanying consolidated financial statements have been prepared in accordance with all applicable IFRS as issued by the International Accounting Standards Board (“IASB”). IFRS includes International Accounting Standards (“IAS”) and related interpretations (“IFRIC”). These consolidated financial statements also comply with the applicable disclosure provisions of the Rules Governing the Listing of Securities on the Stock Exchange of Hong Kong Limited. A summary of the significant accounting policies adopted by the Group are set out in Note 2.
The accounting policies adopted are consistent with those of the previous financial year, except for the adoption of new and amended standards as set out below.
| (a) | New and amended standards and interpretations adopted by the Group |
The IASB has issued the following amendments to IFRSs that are first effective for the current accounting period of the Group:
| • | Amendment to IAS 16, Property, Plant and Equipment: Proceeds before Intended Use |
| • | Amendment to IAS 37, Provisions, contingent liabilities and contingent assets: Onerous contracts – cost of fulfilling a contract |
None of these developments have had a material effect on how the Group’s results and financial position for the current or prior periods have been prepared or presented. The Group has not applied any new standard or interpretation that is not yet effective for the current accounting period.
| (b) | New and amended standards and interpretations not yet adopted by the Group |
A number of new accounting standards and interpretations have been published that are not mandatory for 31 December 2022 reporting periods and have not been early adopted by the Group. These standards are not expected to have a material impact on the entity in the current or future reporting periods and on foreseeable future transactions.
The preparation of the consolidated financial statements in accordance with IFRS requires management to make judgements, estimates and assumptions that affect the application of policies and reported amounts of assets and liabilities and disclosure of contingent assets and liabilities at the date of the consolidated financial statements and the reported amounts of revenues and expenses during the period. The estimates and associated assumptions are based on historical experience and various other factors that are believed to be reasonable under the circumstances, the results of which form the basis of making the judgements about the carrying values of assets and liabilities that are not readily apparent from other sources. Actual results could differ from those estimates.
The estimates and underlying assumptions are reviewed on an ongoing basis. Revisions to accounting estimates are recognised in the period in which the estimate is revised if the revision affects only that period, or in the period of the revision and future periods if the revision affects both current and future periods.
Key assumptions and estimation made by management in the application of IFRS that have significant effect on the consolidated financial statements and the major sources of estimation uncertainty are disclosed in Note 43.
156
2 SIGNIFICANT ACCOUNTING POLICIES
| (a) | Basis of consolidation |
The consolidated financial statements comprise the Company and its subsidiaries, and interest in associates and joint ventures.
| (i) | Subsidiaries and non-controlling interests |
Subsidiaries are those entities controlled by the Group. The Group controls an entity when the Group is exposed to, or has rights to, variable returns from its involvement with the entity and has the ability to affect those returns through its power over the entity. When assessing whether the Group has power, only substantive rights (held by the Group and other parties) are considered.
The financial statements of subsidiaries are included in the consolidated financial statements from the date that control effectively commences until the date that control effectively ceases.
Non-controlling interests at the date of statement of financial position, being the portion of the net assets of subsidiaries attributable to equity interests that are not owned by the Company, whether directly or indirectly through subsidiaries, are presented in the consolidated statement of financial position and consolidated statement of changes in equity within equity, separately from equity attributable to the shareholders of the Company. Non-controlling interests in the results of the Group are presented on the face of the consolidated income statement and the consolidated statement of comprehensive income as an allocation of the total profit or loss and total comprehensive income for the year between non-controlling interests and the shareholders of the Company.
Changes in the Group’s interests in a subsidiary that do not result in a loss of control are accounted for as equity transactions, whereby adjustments are made to the amounts of controlling and non-controlling interests within consolidated equity to reflect the change in relative interests, but no adjustments are made to goodwill and no gain or loss is recognised.
If a business combination involving entities not under common control is achieved in stages, the acquisition date carrying value of the acquirer’s previously held equity interest in the acquiree is remeasured to fair value at the acquisition date. Any gains or losses arising from such remeasurement are recognised in the consolidated income statement.
When the Group loses control of a subsidiary, it is accounted for as a disposal of the entire interest in that subsidiary, with a resulting gain or loss being recognised in profit or loss. Any interest retained in that former subsidiary at the date when control is lost is recognised at fair value and this amount is regarded as the fair value on initial recognition of a financial asset (Note 2(j)) or, when appropriate, the cost on initial recognition of an investment in an associate or joint venture (Note 2(a)(ii)).
In the Company’s statement of financial position, investments in subsidiaries are stated at cost less impairment losses (Note 2(n)).
The particulars of the Group’s principal subsidiaries are set out in Note 41.
| (ii) | Associates and joint ventures |
An associate is an entity, not being a subsidiary, in which the Group exercises significant influence over its management. Significant influence is the power to participate in the financial and operating policy decisions of the investee but is not control or joint control over those policies.
The investments in joint arrangements are classified as either joint operations or joint ventures depending on the contractual rights and obligations each investor has rather than the legal structure of the joint arrangement. A joint venture is a joint arrangement whereby the parties that have joint control of the arrangement have rights to the net assets of the arrangement.
Investments in associates and joint ventures are accounted for in the consolidated and separate financial statements using the equity method from the date that significant influence or joint control commences until the date that significant influence or joint control ceases. Under the equity method, the investment is initially recorded at cost and adjusted thereafter for the post acquisition change in the Group’s share of the investee’s net assets and any impairment loss relating to the investment (Notes 2(i) and (n)).
The Group’s share of the post-acquisition, post-tax results of the investees and any impairment losses for the year are recognised in the consolidated income statement, whereas the Group’s share of the post-acquisition, post-tax items of the investees’ other comprehensive income is recognised in the consolidated statement of comprehensive income.
When the Group’s share of losses exceeds its interest in the associate or the joint venture, the Group’s interest is reduced to nil and recognition of further losses is discontinued except to the extent that the Group has incurred legal or constructive obligations or made payments on behalf of the investee. For this purpose, the Group’s interest is the carrying amount of the investment under the equity method, together with any other long-term interests that in substance form part of the Group’s net investment in the associate or the joint venture, after applying the expected credit losses (“ECLs”) model to such other long-term interests where applicable.
When the Group ceases to have significant influence over an associate or joint control over a joint venture, it is accounted for as a disposal of the entire interest in that investee, with a resulting gain or loss being recognised in profit or loss. Any interest retained in that former investee at the date when significant influence or joint control is lost is recognised at fair value and this amount is regarded as the fair value on initial recognition of a financial asset (see Note 2(j)) or, when appropriate, the cost on initial recognition of an investment in an associate.
157
2 SIGNIFICANT ACCOUNTING POLICIES (Continued)
| (a) | Basis of consolidation (Continued) |
| (iii) | Transactions eliminated on consolidation |
Inter-company balances and transactions and any unrealised gains arising from inter-company transactions are eliminated on consolidation. Unrealised gains arising from transactions with associates and joint ventures are eliminated to the extent of the Group’s interest in the entity. Unrealised losses are eliminated in the same way as unrealised gains, but only to the extent that there is no evidence of impairment.
| (iv) | Merger accounting for common control combination |
The consolidated financial statements incorporate the financial statements of the combining entities or businesses in which the common control combination occurs as if they had been combined from the date when the combining entities or businesses first came under the control of the controlling party. The net assets of the combining entities or businesses are combined using the existing book values from the controlling parties’ perspective. No amount is recognised as consideration for goodwill or excess of acquirers’ interest in the net fair value of acquiree’s identifiable assets, liabilities and contingent liabilities over cost at the time of common control combination, to the extent of the continuation of the controlling party’s interest.
The consolidated income statement includes the results of each of the combining entities or businesses from the earliest date presented or since the date when the combining entities or businesses first came under the common control, where there is a shorter period, regardless of the date of the common control combination. The comparative amounts in the consolidated financial statements are presented as if the entities or businesses had been combined at the beginning of the earliest period presented or when they first came under common control, whichever is shorter.
A uniform set of accounting policies is adopted by those entities. All intra-Group transactions, balances and unrealised gains on transactions between combining entities or businesses are eliminated on consolidation. Transaction costs, including professional fees, registration fees, costs of furnishing information to shareholders, costs or losses incurred in combining operations of the previously separate businesses, etc., incurred in relation to the common control combination that is to be accounted for by using merger accounting is recognised as an expense in the period in which it is incurred.
| (b) | Translation of foreign currencies |
The presentation currency of the Group is Renminbi. Foreign currency transactions during the year are translated into Renminbi at the applicable rates of exchange quoted by the People’s Bank of China (“PBOC”) prevailing on the transaction dates. Foreign currency monetary assets and liabilities are translated into Renminbi at the PBOC’s rates at the date of the statement of financial position.
Exchange differences, other than those capitalised as construction in progress, are recognised as income or expense in the “finance costs” section of the consolidated income statement.
The results of foreign operations are translated into Renminbi at the applicable rates quoted by the PBOC prevailing on the transaction dates. The statement of financial position items, including goodwill arising on consolidation of foreign operations are translated into Renminbi at the closing foreign exchange rates at the date of the statement of financial position. The income and expenses of foreign operation are translated into Renminbi at the spot exchange rates or an exchange rate that approximates the spot exchange rates on the transaction dates. The resulting exchange differences are recognised in other comprehensive income and accumulated in equity in the other reserves.
On disposal of a foreign operation, the cumulative amount of the exchange differences relating to that foreign operation is reclassified from equity to the consolidated income statement when the profit or loss on disposal is recognised.
| (c) | Cash and cash equivalents |
Cash equivalents consist of time deposits with financial institutions with an initial term of less than three months when purchased. Cash equivalents are stated at cost, which approximates fair value.
| (d) | Trade, bills and other receivables |
Trade, bills and other receivables are recognised initially at their transaction price, unless they contain significant financing components when they are recognised at fair value. They are subsequently measured at amortised cost using the effective interest method, less loss allowances for ECLs (Note 2(j)). Trade, bills and other receivables are derecognised if the Group’s contractual rights to the cash flows from these financial assets expire or if the Group transfers these financial assets to another party without retaining control or substantially all risks and rewards of the assets.
| (e) | Inventories |
Inventories are stated at the lower of cost and net realisable value. Cost mainly includes the cost of purchase computed using the weighted average method and, in the case of work in progress and finished goods, direct labour and an appropriate proportion of production overheads. Net realisable value is the estimated selling price in the ordinary course of business, less the estimated costs of completion and the estimated costs necessary to make the sale.
158
2 SIGNIFICANT ACCOUNTING POLICIES (Continued)
| (f) | Property, plant and equipment |
An item of property, plant and equipment is initially recorded at cost, less accumulated depreciation and impairment losses (Note 2(n)). The cost of an asset comprises its purchase price, any directly attributable costs of bringing the asset to working condition and location for its intended use. The Group recognises in the carrying amount of an item of property, plant and equipment the cost of replacing part of such an item when that cost is incurred, when it is probable that the future economic benefits embodied with the item will flow to the Group and the cost of the item can be measured reliably. All other expenditure is recognised as an expense in the consolidated income statement in the year in which it is incurred.
Gains or losses arising from the retirement or disposal of an item of property, plant and equipment, other than oil and gas properties, are determined as the difference between the net disposal proceeds and the carrying amount of the item and are recognised as income or expense in the consolidated income statement on the date of retirement or disposal.
Depreciation is provided to write off the cost amount of items of property, plant and equipment, other than oil and gas properties, over its estimated useful life on a straight-line basis, after taking into account its estimated residual value, as follows:
| Estimated usage period | Estimated residuals rate | |
| Buildings | 12 to 50 years | 3% |
| Equipment, machinery and others | 4 to 30 years | 3% |
Where parts of an item of property, plant and equipment have different useful lives, the cost of the item is allocated on a reasonable basis between the parts and each part is depreciated separately. Both the useful life of an asset and its residual value, if any, are reassessed annually.
| (g) | Oil and gas properties |
The Group uses the successful efforts method of accounting for its oil and gas producing activities. Under this method, costs of development wells, the related supporting equipment and proved mineral interests in properties are capitalised. The cost of exploratory wells is initially capitalised as construction in progress pending determination of whether the well has found proved reserves. The impairment of exploratory well costs occurs upon the determination that the well has not found proved reserves. The exploratory well costs are usually not carried as an asset for more than one year following completion of drilling, unless (i) the well has found a sufficient quantity of reserves to justify its completion as a producing well if the required capital expenditure is made; (ii) drilling of the additional exploratory wells is under way or firmly planned for the near future; or (iii) other activities are being undertaken to sufficiently progress the assessing of the reserves and the economic and operating viability of the project. All other exploration costs, including geological and geophysical costs, other dry hole costs and annual lease rentals to explore for or use oil and natural gas, are expensed as incurred. Capitalised costs of proved oil and gas properties are amortised on a unit-of-production method based on volumes produced and reserves.
Management estimates future dismantlement costs for oil and gas properties with reference to engineering estimates after taking into consideration the anticipated method of dismantlement required in accordance with the industry practices and the future cash flows are adjusted to reflect such risks specific to the liability, as appropriate. These estimated future dismantlement costs are discounted at pre-tax risk-free rate and are capitalised as oil and gas properties, which are subsequently amortised as part of the costs of the oil and gas properties.
| (h) | Construction in progress |
Construction in progress represents buildings, oil and gas properties, various plant and equipment under construction and pending installation, and is stated at cost less impairment losses (Note 2(n)). Cost comprises direct costs of construction as well as interest charges, and foreign exchange differences on related borrowed funds to the extent that they are regarded as an adjustment to interest charges, during the periods of construction.
Items may be produced while bringing an item of property, plant and equipment to the location and condition necessary for it to be capable of operating in the manner intended by management. The proceeds from selling any such items and the related costs are recognised in profit or loss.
Construction in progress is transferred to property, plant and equipment when the asset is substantially ready for its intended use.
No depreciation is provided in respect of construction in progress.
| (i) | Goodwill |
Goodwill represents amounts arising on acquisition of subsidiaries, associates or joint ventures. Goodwill represents the difference between the cost of acquisition and the fair value of the net identifiable assets acquired.
Prior to 1 January 2008, the acquisition of the non-controlling interests of a consolidated subsidiary was accounted for using the acquisition method whereby the difference between the cost of acquisition and the fair value of the net identifiable assets acquired (on a proportionate share) was recognised as goodwill. From 1 January 2008, any difference between the amount by which the non-controlling interest is adjusted (such as through an acquisition of the non-controlling interests) and the cash or other considerations paid is recognised in equity.
Goodwill is stated at cost less accumulated impairment losses. Goodwill arising on a business combination is allocated to each cash-generating unit, or groups of cash-generating units, that is expected to benefit the synergies of the combination and is tested annually for impairment (Note 2(n)). In respect of associates or joint ventures, the carrying amount of goodwill is included in the carrying amount of the interest in the associate or joint venture and the investment as a whole is tested for impairment whenever there is objective evidence of impairment (Note 2(n)).
159
2 SIGNIFICANT ACCOUNTING POLICIES (Continued)
| (j) | Financial assets |
| (i) | Classification and measurement |
The Group classifies financial assets into different categories depending on the business model for managing the financial assets and the contractual terms of cash flows of the financial assets: a) financial assets measured at amortised cost, b) financial assets measured at fair value through other comprehensive income (“FVOCI”), c) financial assets measured at fair value through profit or loss. A contractual cash flow characteristic which could have only a de minimis effect on the contractual cash flows of the financial assets, or could have an effect that is more than de minimis but is not genuine, does not affect the classification of the financial asset.
Financial assets are initially recognised at fair value. For financial assets measured at fair value through profit or loss, the relevant transaction costs are recognised in profit or loss. The transaction costs for other financial assets are included in the initially recognised amount. However, trade accounts receivable and bills receivable arising from sale of goods or rendering services, without significant financing component, are initially recognised based on the transaction price expected to be entitled by the Group.
Debt instruments
Debt instruments held by the Group mainly includes cash and cash equivalents, time deposits with financial institutions, receivables. These financial assets are measured at amortised cost and FVOCI.
| • | Amortised cost: The business model for managing such financial assets by the Group are held for collection of contractual cash flows. The contractual cash flow characteristics are to give rise on specified dates to cash flows that are solely payments of principal and interest on the principal amount outstanding. Interest income from these financial assets is recognised using the effective interest rate method. |
| • | FVOCI: The business model for managing such financial assets by the Group are held for collection of contractual cash flows and for selling the financial assets, where the assets’ cash flows represent solely payments of principal and interest on the principal amount outstanding. Movements in the carrying amount are taken through other comprehensive income, except for the recognition of impairment gains or losses, foreign exchange gains and losses and interest income calculated using the effective interest rate method, which are recognised in profit or loss. |
Equity instruments
Equity instruments that the Group has no power to control, jointly control or exercise significant influence over, are measured at fair value through profit or loss and presented in financial assets at fair value through profit or loss.
In addition, the Group designates some equity instruments that are not held for trading as financial assets at FVOCI, are presented in financial assets at FVOCI. The relevant dividends of these financial assets are recognised in profit or loss. When derecognised, the cumulative gain or loss previously recognised in other comprehensive income is transferred to retained earnings.
| (ii) | Impairment |
The Group recognises a loss allowance for ECLs on a financial asset that is measured at amortised cost and a debt instrument that is measured at FVOCI.
The Group measures and recognises ECLs, considering reasonable and supportable information about the relevant past events, current conditions and forecasts of future economic conditions.
The Group measures the ECLs of financial instruments on different stages at each the date of the statement of financial position. For financial instruments that have no significant increase in credit risk since the initial recognition, on first stage, the Group measures the loss allowance at an amount equal to 12-month ECLs. If there has been a significant increase in credit risk since the initial recognition of a financial instrument but credit impairment has not occurred, on second stage, the Group recognises a loss allowance at an amount equal to lifetime ECLs. If credit impairment has occurred since the initial recognition of a financial instrument, on third stage, the Group recognises a loss allowance at an amount equal to lifetime ECLs.
For financial instruments that have low credit risk at the date of the statement of financial position, the Group assumes that there is no significant increase in credit risk since the initial recognition, and measures the loss allowance at an amount equal to 12-month ECLs.
For financial instruments on the first stage and the second stage, and that have low credit risk, the Group calculates interest income according to carrying amount without deducting the impairment allowance and effective interest rate. For financial instruments on the third stage, interest income is calculated according to the carrying amount minus amortised cost after the provision of impairment allowance and effective interest rate.
For trade accounts receivable and bills receivable and financial assets at FVOCI related to revenue, the Group measures the loss allowance at an amount equal to lifetime ECLs.
The Group recognises the loss allowance accrued or written back in profit or loss.
160
2 SIGNIFICANT ACCOUNTING POLICIES (Continued)
| (j) | Financial assets (Continued) |
| (iii) | Derecognition |
The Group derecognises a financial asset when: a) the contractual right to receive cash flows from the financial asset expires; b) the Group transfers the financial asset and substantially all the risks and rewards of ownership of the financial asset; c) the financial asset has been transferred and the Group neither transfers nor retains substantially all the risks and rewards of ownership of the financial asset, but the Group has not retained control.
On derecognition of equity instruments at FVOCI, the amount accumulated in the fair value reserve is transferred to retained earnings. It is not recycled through profit or loss. While on derecognition of other financial assets, this difference is recognised in profit or loss.
| (iv) | Financial guarantees issued |
Financial guarantees are contracts that require the issuer (i.e. the guarantor) to make specified payments to reimburse the beneficiary of the guarantee (the “holder”) for a loss the holder incurs because a specified debtor fails to make payment when due in accordance with the terms of a debt instrument.
Financial guarantees issued are initially recognised at fair value, which is determined by reference to fees charged in an arm’s length transaction for similar services, when such information is obtainable, or to interest rate differentials, by comparing the actual rates charged by lenders when the guarantee is made available with the estimated rates that lenders would have charged, had the guarantees not been available, where reliable estimates of such information can be made. Where consideration is received or receivable for the issuance of the guarantee, the consideration is recognised in accordance with the Group’s policies applicable to that category of asset. Where no such consideration is received or receivable, an immediate expense is recognised in profit or loss.
Subsequent to initial recognition, the amount initially recognised as deferred income is amortised in profit or loss over the term of the guarantee as income from financial guarantees issued.
The Group monitors the risk that the specified debtor will default on the contract and recognises a provision when ECLs on the financial guarantees are determined to be higher than the carrying amount in respect of the guarantees (i.e. the amount initially recognised, less accumulated amortisation).
| (k) | Financial liabilities |
The Group, at initial recognition, classifies financial liabilities as either financial liabilities subsequently measured at amortised cost or financial liabilities at fair value through profit or loss.
The Group’s financial liabilities are mainly financial liabilities measured at amortised cost, including trade accounts payable and bills payable, other payables, and loans, etc. These financial liabilities are initially measured at the amount of their fair value after deducting transaction costs and use the effective interest rate method for subsequent measurement.
Where the present obligations of financial liabilities are completely or partially discharged, the Group derecognises these financial liabilities or discharged parts of obligations. The differences between the carrying amounts and the consideration received are recognised in profit or loss.
| (l) | Determination of fair value for financial instruments |
If there is an active market for financial instruments, the quoted price in the active market is used to measure fair values of the financial instruments. If no active market exists for financial instruments, valuation techniques are used to measure fair values. In valuation, the Group adopts valuation techniques that are applicable in the current situation and have sufficient available data and other information to support it, and selects input values that are consistent with the asset or liability characteristics considered by market participants in the transaction of relevant assets or liabilities, and gives priority to relevant observable input values. Use of unobservable input values where relevant observable input values cannot be obtained or are not practicable.
161
2 SIGNIFICANT ACCOUNTING POLICIES (Continued)
| (m) | Derivative financial instruments and hedge accounting |
Derivative financial instruments are recognised initially at fair value. At each date of the statement of financial position, the fair value is remeasured. The gain or loss on remeasurement to fair value is recognised immediately in profit or loss, except where the derivatives qualify for hedge accounting.
Hedge accounting is a method which recognises the offsetting effects on profit or loss (or other comprehensive income) of changes in the fair values of the hedging instrument and the hedged item in the same accounting period, to represent the effect of risk management activities.
Hedged items are the items that expose the Group to risks of changes in future cash flows and that are designated as being hedged and that must be reliably measurable. The Group’s hedged items include a forecast transaction that is settled with an undetermined future market price and exposes the Group to risk of variability in cash flows, etc.
A hedging instrument is a designated derivative whose changes in cash flows are expected to offset changes in cash flows of the hedged item.
The hedging relationship meets all of the following hedge effectiveness requirements:
| (i) | There is an economic relationship between the hedged item and the hedging instrument, which shares a risk and that gives rise to opposite changes in fair value that tend to offset each other. |
| (ii) | The effect of credit risk does not dominate the value changes that result from that economic relationship. |
| (iii) | The hedge ratio of the hedging relationship is the same as that resulting from the quantity of the hedged item that the entity actually hedges and the quantity of the hedging instrument that the entity actually uses to hedge that quantity of hedged item. However, that designation does not reflect an imbalance between the weightings of the hedged item and the hedging instrument. |
Cash flow hedges
Cash flow hedge is a hedge of the exposure to variability in cash flows that is attributable to a particular risk associated with all, or a component of, a recognised asset or liability (such as all or some future interest payments on variable-rate debt) or a highly probable forecast transaction, and could affect profit or loss. Hedge effectiveness is determined at the inception of the hedge relationship, and through periodic prospective effectiveness assessments to ensure that an economic relationship exists between the hedged item and hedging instrument.
As long as a cash flow hedge meets the qualifying criteria for hedge accounting, the separate component of equity associated with the hedged item (cash flow hedge reserve) is adjusted to the lower of the following (in absolute amounts):
| (i) | The cumulative gain or loss on the hedging instrument from inception of the hedge; and |
| (ii) | The cumulative change in fair value (present value) of the hedged item (i.e. the present value of the cumulative change in the hedged expected future cash flows) from inception of the hedge. |
The gain or loss on the hedging instrument that is determined to be an effective hedge is recognised in other comprehensive income.
The portion of the gain or loss on the hedging instrument that is determined to be an ineffective hedge is recognised in profit or loss.
If a hedged forecast transaction subsequently results in the recognition of a non-financial asset or non-financial liability, or a hedged forecast transaction for a non-financial asset or a non-financial liability becomes a firm commitment for which fair value hedge accounting is applied, the entity removes that amount from the cash flow hedge reserve and include it directly in the initial cost or other carrying amount of the asset or the liability. This is not a reclassification adjustment and hence it does not affect other comprehensive income.
For cash flow hedges, other than those covered by the preceding policy statements, that amount is reclassified from the cash flow hedge reserve to profit or loss as a reclassification adjustment in the same period or periods during which the hedged expected future cash flows affect profit or loss.
If the amount that has been accumulated in the cash flow hedge reserve is a loss and the Group expects that all or a portion of that loss will not be recovered in one or more future periods, the Group immediately reclassifies the amount that is not expected to be recovered into profit or loss.
When the hedging relationship no longer meets the risk management objective on the basis of which it qualified for hedge accounting (i.e. the entity no longer pursues that risk management objective), or when a hedging instrument expires or is sold, terminated, exercised, or there is no longer an economic relationship between the hedged item and the hedging instrument or the effect of credit risk starts to dominate the value changes that result from that economic relationship or no longer meets the criteria for hedge accounting, the Group discontinues prospectively the hedge accounting treatments. If the hedged future cash flows are still expected to occur, that amount remains in the cash flow hedge reserve and is accounted for as cash flow hedges. If the hedged future cash flows are no longer expected to occur, that amount is immediately reclassified from the cash flow hedge reserve to profit or loss as a reclassification adjustment. A hedged future cash flow that is no longer highly probable to occur may still be expected to occur, if the hedged future cash flows are still expected to occur, that amount remains in the cash flow hedge reserve and is accounted for as cash flow hedges.
162
2 SIGNIFICANT ACCOUNTING POLICIES (Continued)
| (m) | Derivative financial instruments and hedge accounting (Continued) |
Fair value hedges
A fair value hedge is a hedge of the exposure to changes in the fair value of a recognised asset or liability or an unrecognised firm commitment, or a portion of such an asset, liability or firm commitment.
The gain or loss from remeasuring the hedging instrument is recognised in profit or loss. The gain or loss on the hedged item attributable to the hedged risk adjusts the carrying amount of the recognised hedged item not measured at fair value and is recognised in profit or loss.
Any adjustment to the carrying amount of a hedged item is amortised to profit or loss if the hedged item is a financial instrument (or a component thereof) measured at amortised cost.The amortisation is based on a recalculated effective interest rate at the date that amortisation begins.
| (n) | Impairment of assets |
The carrying amounts of assets, including property, plant and equipment, construction in progress, right-of-use assets and other assets, are reviewed at each date of the statement of financial position to identify indicators that the assets may be impaired. These assets are tested for impairment whenever events or changes in circumstances indicate that their recorded carrying amounts may not be recoverable. When such a decline has occurred, the carrying amount is reduced to the recoverable amount. For goodwill, the recoverable amount is estimated at each date of the statement of financial position.
The recoverable amount is the greater of the fair value less costs to disposal and the value in use. In determining the value in use, expected future cash flows generated by the asset are discounted to their present value using a pre-tax discount rate that reflects current market assessments of the time value of money and the risks specific to the asset. Where an asset does not generate cash inflows largely independent of those from other assets, the recoverable amount is determined for the smallest group of assets that generates cash inflows independently (i.e. a cash-generating unit).
The amount of the reduction is recognised as an expense in the consolidated income statement. Impairment losses recognised in respect of cash-generating units are allocated first to reduce the carrying amount of any goodwill allocated to the cash-generating unit and then, to reduce the carrying amount of the other assets in the unit on a pro rata basis, except that the carrying value of an asset will not be reduced below its individual fair value less costs to disposal, or value in use, if determinable.
Management assesses at each date of the statement of financial position whether there is any indication that an impairment loss recognised for an asset, except in the case of goodwill, in prior years may no longer exist. An impairment loss is reversed if there has been a favourable change in the estimates used to determine the recoverable amount. A subsequent increase in the recoverable amount of an asset, when the circumstances and events that led to the write-down or write-off cease to exist, is recognised as an income. The reversal is reduced by the amount that would have been recognised as depreciation had the write-down or write-off not occurred. An impairment loss in respect of goodwill is not reversed.
| (o) | Trade, bills and other payables |
Trade, bills and other payables generally are financial liabilities and are initially recognised at fair value and thereafter stated at amortised cost unless the effect of discounting would be immaterial, in which case they are stated at invoice amounts.
| (p) | Interest-bearing borrowings |
Interest-bearing borrowings are recognised initially at fair value less attributable transaction costs. Subsequent to initial recognition, interest-bearing borrowings are stated at amortised cost with any difference between cost and redemption value being recognised in the consolidated income statement over the period of borrowings using the effective interest method.
| (q) | Provisions and contingent liability |
A provision is recognised for liability of uncertain timing or amount when the Group has a legal or constructive obligation arising as a result of a past event, when it is probable that an outflow of economic benefits will be required to settle the obligation and a reliable estimate can be made.
When it is not probable that an outflow of economic benefits will be required, or the amount cannot be estimated reliably, the obligation is disclosed as a contingent liability, unless the probability of outflow of economic benefits is remote. Possible obligations, whose existence will only be confirmed by the occurrence or non-occurrence of one or more future events are also disclosed as contingent liabilities unless the probability of outflow of economic benefits is remote.
Where some or all of the expenditure required to settle a provision is expected to be reimbursed by another party, a separate asset is recognised for any expected reimbursement that would be virtually certain. The amount recognised for the reimbursement is limited to the carrying amount of the provision.
163
2 SIGNIFICANT ACCOUNTING POLICIES (Continued)
| (q) | Provisions and contingent liability (Continued) |
Provisions for future dismantlement costs are initially recognised based on the present value of the future costs expected to be incurred in respect of the Group’s expected dismantlement and abandonment costs at the end of related oil and gas exploration and development activities. Any subsequent change in the present value of the estimated costs, other than the change due to passage of time which is regarded as interest cost, is reflected as an adjustment to the provision and oil and gas properties.
An onerous contract exists when the Group has a contract under which the unavoidable costs of meeting the obligations under the contract exceed the economic benefits expected to be received from the contract. Provisions for onerous contracts are measured at the present value of the lower of the expected cost of terminating the contract and the net cost of continuing with the fulfilling the contract. The cost of fulfilling the contract includes both the incremental costs of fulfilling that contract and an allocation of other costs that relate directly to fulfilling that contract.
| (r) | Revenue recognition |
Revenue arises in the course of the Group’s ordinary activities, and increases in economic benefits in the form of inflows that result in an increase in equity, other than those relating to contributions from equity participants.
The Group sells crude oil, natural gas, petroleum and chemical products, etc. Revenue is recognised according to the expected consideration amount, when a customer obtains control over the relevant goods or services. To determine whether a customer obtains control of a promised goods or services (assets), the Group shall consider indicators of the transfer of control, which include, but are not limited to, the Group has a present right to payment for the assets; the Group has transferred physical possession of the assets to the customer; the customer has the significant risks and rewards of ownership of the assets; the customer has accepted the assets.
Sales of goods
Sales are recognised when control of the goods have transferred. Obtaining control of relevant goods means that a customer can direct the use of the goods and obtain almost all the economic benefits from it. Advance from customers but goods not yet delivered is recorded as contract liabilities and is recognised as revenues when a customer obtains control over the relevant goods.
| (s) | Government grants |
Grants from the government are recognised at their fair value where there is a reasonable assurance that the grant will be received and the Group will comply with all attached conditions.
Government grants relating to costs are deferred and recognised in the profit or loss over the period necessary to match them with the costs that they are intended to compensate.
Government grants relating to the purchase of property, plant and equipment are included in non-current liabilities as deferred income and are recognised to profit or loss on a straight-line basis over the expected lives of the related assets.
| (t) | Borrowing costs |
Borrowing costs are expensed in the consolidated income statement in the period in which they are incurred, except to the extent that they are capitalised as being attributable to the construction of an asset which necessarily takes a period of time to get ready for its intended use.
| (u) | Repairs and maintenance expenditure |
Repairs and maintenance expenditure is expensed as incurred.
| (v) | Environmental expenditures |
Environmental expenditures that relate to current ongoing operations or to conditions caused by past operations are expensed as incurred.
Liabilities related to future remediation costs are recorded when environmental assessments and/or cleanups are probable and the costs can be reliably estimated. As facts concerning environmental contingencies become known to the Group, the Group reassesses its position both with respect to accrued liabilities and other potential exposures.
| (w) | Research and development expense |
Research and development expenditures that cannot be capitalised are expensed in the period in which they are incurred. Research and development expense amounted to RMB12,773 million for the year ended 31 December 2022 (2021: RMB11,481 million).
164
2 SIGNIFICANT ACCOUNTING POLICIES (Continued)
| (x) | Leases |
A lease is a contract that a lessor transfers the right to use an identified asset for a period of time to a lessee in exchange for consideration.
| (i) | As lessee |
The Group recognises a right-of-use asset at the date at which the leased asset is available for use by the Group, and recognises a lease liability measured at the present value of the remaining lease payments. The lease payments include fixed payments, the exercise price of a purchase option if the Group is reasonably certain to exercise that option, and payments of penalties for terminating the lease if the lease term reflects the Group exercising that option, etc. Variable payments that are based on a percentage of sales are not included in the lease payments, and should be recognised in profit or loss when incurred. Lease liabilities to be paid within one year (including one year) from the date of the statement of financial position is presented in current liabilities.
Right-of-use assets of the Group mainly comprise land. Right-of-use assets are measured at cost which comprises the amount of the initial measurement of the lease liability, any lease payments made at or before the commencement date, any initial direct costs incurred by the lessee, less any lease incentives received. The Group depreciates the right-of-use assets over the shorter of the asset’s useful life and the lease term on a straight-line basis. When the recoverable amount of a right-of-use asset is less than its carrying amount, the carrying amount is reduced to the recoverable amount.
Payments associated with short-term leases with lease terms within 12 months and all leases of low-value assets are recognised on a straight-line basis over the lease term as an expense in profit or loss or as cost of relevant assets, instead of recognising right-of-use assets and lease liabilities.
A lessee shall account for a lease modification as a separate lease if both: (1) the modification increases the scope of the lease by adding the right to use one or more underlying assets; and (2) the consideration for the lease increases by an amount commensurate with the stand-alone price for the increase in scope and any appropriate adjustments to that stand-alone price to reflect the circumstances of the articular contract.
For a lease modification that is not accounted for as a separate lease, except for the practical expedient which applies only to rent concessions occurring as a direct consequence of the COVID-19 pandemic, the Group determine the lease term of the modified lease at the effective date of the modification, and remeasure the lease liability by discounting the revised lease payments using a revised discount rate. The Group decrease the carrying amount of the right-of-use asset to reflect the partial or full termination of the lease for lease modifications that decrease the scope or shorten the term of the lease, and shall recognise in profit or loss any gain or loss relating to the partial or full termination of the lease. The Group make a corresponding adjustment to the right-of-use asset for all other lease modifications.
| (ii) | As lessor |
A lease that transfers substantially all the risks and rewards incidental to ownership of an asset is a finance lease. An operating lease is a lease other than a finance lease.
When the Group leases self-owned plants and buildings, equipment and machinery, lease income from an operating lease is recognised on a straight-line basis over the period of the lease. The Group recognises variable lease income which is based on a certain percentage of sales as rental income when occurred.
| (y) | Employee benefits |
The contributions payable under the Group’s retirement plans are recognised as an expense in the consolidated income statement as incurred and according to the contribution determined by the plans. Further information is set out in Note 39.
Termination benefits, such as employee reduction expenses, are recognised when, and only when, the Group demonstrably commits itself to terminate employment or to provide benefits as a result of voluntary redundancy by having a detailed formal plan which is without realistic possibility of withdrawal.
| (z) | Income tax |
Income tax comprises current and deferred tax. Current tax is calculated on taxable income by applying the applicable tax rates. Deferred tax is provided using the statement of financial position liability method on all temporary differences between the carrying amounts of assets and liabilities for financial reporting purposes and the amounts used for taxation purposes only to the extent that it is probable that future taxable income will be available against which the assets can be utilised. Deferred tax is calculated on the basis of the enacted tax rates or substantially enacted tax rates that are expected to apply in the period when the asset is realised or the liability is settled. The effect on deferred tax of any changes in tax rates is charged or credited to the consolidated income statement, except for the effect of a change in tax rate on the carrying amount of deferred tax assets and liabilities which were previously charged or credited to other comprehensive income or directly in equity.
The tax value of losses expected to be available for utilisation against future taxable income is set off against the deferred tax liability within the same legal tax unit and jurisdiction to the extent appropriate, and is not available for set off against the taxable profit of another legal tax unit. The carrying amount of a deferred tax asset is reviewed at each date of statement of financial position and is reduced to the extent that it is no longer probable that the related tax benefit will be realised.
165
2 SIGNIFICANT ACCOUNTING POLICIES (Continued)
| (aa) | Dividends |
Dividends and distributions of profits proposed in the profit appropriation plan which will be authorised and declared after the date of statement of financial position, are not recognised as a liability at the date of statement of financial position and are separately disclosed in the notes to the financial statements. Dividends are recognised as a liability in the period in which they are declared.
| (bb) | Segment reporting |
Operating segments, and the amounts of each segment item reported in the consolidated financial statements, are identified from the financial information provided regularly to the Group’s chief operating decision maker for the purposes of allocating resources to, and assessing the performance of the Group’s various lines of business.
3 REVENUE FROM PRIMARY BUSINESS
Revenue from primary business mainly represents revenue from the sales of refined petroleum products, chemical products, crude oil and natural gas, which are recognised at a point in time.
| 2022 | 2021 | |
| RMB million | RMB million | |
| Gasoline | 796,667 | 726,057 |
| Diesel | 743,551 | 542,260 |
| Crude oil | 517,183 | 429,038 |
| Chemical feedstock | 42,785 | 44,079 |
| Basic organic chemicals | 223,679 | 198,453 |
| Synthetic resin | 144,524 | 149,208 |
| Kerosene | 168,017 | 112,519 |
| Natural gas | 83,853 | 68,443 |
| Synthetic fiber monomers and polymers | 45,335 | 45,464 |
| Others (i) | 491,762 | 363,979 |
| 3,257,356 | 2,679,500 |
Note:
| (i) | Others are primarily liquefied petroleum gas and other refinery and chemical byproducts and joint products. |
4 OTHER OPERATING REVENUES
| 2022 | 2021 | |
| RMB million | RMB million | |
| Sale of materials and others | 59,590 | 59,990 |
| Rental income | 1,222 | 1,394 |
| 60,812 | 61,384 |
5 SELLING, GENERAL AND ADMINISTRATIVE EXPENSES
The following items are included in selling, general and administrative expenses:
| 2022 | 2021 | |
| RMB million | RMB million | |
| Variable lease payments, low-value and short-term lease payment | 2,205 | 2,393 |
| Auditor’s remuneration: | ||
| – Audit services | 66 | 59 |
| – Others | 3 | 8 |
6 PERSONNEL EXPENSES
| 2022 | 2021 | |
| RMB million | RMB million | |
| Salaries, wages and other benefits | 90,395 | 91,560 |
| Contributions to retirement schemes (Note 39) | 13,190 | 11,932 |
| 103,585 | 103,492 |
166
7 TAXES OTHER THAN INCOME TAX
| 2022 | 2021 | |
| RMB million | RMB million | |
| Consumption tax (i) | 206,838 | 213,894 |
| City construction tax (ii) | 17,081 | 18,044 |
| Special oil income levy | 13,874 | 1,573 |
| Education surcharge (ii) | 12,337 | 13,409 |
| Resources tax | 8,752 | 6,432 |
| Others | 5,109 | 5,680 |
| 263,991 | 259,032 |
Notes:
| (i) | Consumption tax was levied based on sales quantities of taxable products, tax rate of products is presented as below: |
| Products | RMB/Ton |
| Gasoline | 2,109.76 |
| Diesel | 1,411.20 |
| Naphtha | 2,105.20 |
| Solvent oil | 1,948.64 |
| Lubricant oil | 1,711.52 |
| Fuel oil | 1,218.00 |
| Jet fuel oil | 1,495.20 |
| (ii) | City construction tax and education surcharge is levied on an entity based on its paid amount of value-added tax and consumption tax. |
8 OTHER OPERATING INCOME/(EXPENSES), NET
| 2022 | 2021 | |
| RMB million | RMB million | |
| Government grants (i) | 9,277 | 6,706 |
| Ineffective portion of change in fair value of cash flow hedges | (255) | 694 |
| Net realised and unrealised loss on derivative financial instruments not qualified as hedging | (15,535) | (14,873) |
| Impairment losses on long-lived assets (ii) | (5,669) | (10,035) |
| Loss on disposal of property, plant, equipment and other non-current assets, net | (722) | (3,062) |
| Fines, penalties and compensations | (39) | (220) |
| Donations | (447) | (165) |
| Others | (1,389) | (761) |
| (14,779) | (21,716) |
Notes:
| (i) | Government grants for the years ended 31 December 2022 and 2021 primarily represent financial appropriation income and non-income tax refunds received from respective government agencies without conditions or other contingencies attached to the receipts of the grants. |
| (ii) | Impairment losses on long-lived assets for the year ended 31 December 2022 primarily represent impairment losses recognised in the exploration and production (“E&P”) segment of RMB2,891 million (2021: RMB2,467 million), the chemicals segment of RMB1,790 million (2021: RMB5,332 million), the refining segment of RMB2 million (2021: RMB860 million), and the marketing and distribution segment of RMB415 million (2021: RMB1,211 million). The impairment losses in the E&P segment were mainly the impairment losses of properties, plant and equipment relating to oil and gas producing activities. The primary factors resulting in the E&P segment impairment loss were downward revision of oil and gas reserve in certain fields and high extraction cost. E&P segment determines recoverable amounts of properties, plant and equipment relating to oil and gas producing activities, which include significant judgments and assumptions. The recoverable amounts were determined based on the present values of the expected future cash flows of the assets using a pre-tax discount rate 8.17% to 14.86% (2021: 10.47%). Further future downward revisions to the Group’s oil or nature gas price outlook would lead to further impairments which, in aggregate, are likely to be material. It is estimated that a general decrease of 5% in oil price, with all other variables held constant, would result in additional impairment loss on the Group’s properties, plant and equipment relating to oil and nature gas producing activities by approximately RMB1,693 million (2021: RMB3,628 million). It is estimated that a general increase of 5% in operating cost, with all other variables held constant, would result in additional impairment loss on the Group’s properties, plant and equipment relating to oil and gas producing activities by approximately RMB1,508 million (2021: RMB2,400 million). It is estimated that a general increase of 5% in discount rate, with all other variables held constant, would result in additional impairment loss on the Group’s properties, plant and equipment relating to oil and gas producing activities by approximately RMB126 million (2021: RMB180 million). Impairment losses recognised in the chemical segment and refining segment relate to certain refinery and chemical production facilities and are not individually significant. The impairment losses were mainly due to the suspension of operations of certain production facilities, and evidence that indicate the economic performance of certain production facilities continuously was lower than the expectation, thus the carrying amounts of these facilities were written down to their recoverable amounts, which were determined based on the present values of forecasted future cash flows of the cash generating units using pre-tax discount rates ranging from 7.64% to 18.68% (2021: 10.50% to 13.90%). |
167
9 INTEREST EXPENSE
| 2022 | 2021 | |
| RMB million | RMB million | |
| Interest expense incurred | 7,877 | 5,679 |
| Less: Interest expense capitalised* | (1,307) | (996) |
| 6,570 | 4,683 | |
| Interest expense on lease liabilities | 9,096 | 9,200 |
| Accretion expenses (Note 35) | 1,103 | 1,135 |
| Interest expense | 16,769 | 15,018 |
| * Interest rates per annum at which borrowing costs were capitalised for construction in progress | 1.89% to 4.25% | 1.84% to 4.35% |
10 INVESTMENT INCOME
| 2022 | 2021 | |
| RMB million | RMB million | |
| Investment income from disposal of business and long-term equity investments (i) | 13,754 | 82 |
| Dividend income from holding of other equity instrument investments | 76 | 34 |
| Others | 230 | 182 |
| 14,060 | 298 |
Note:
| (i) | The Company and Sinopec Shanghai Gaoqiao Petrochemical Co., Ltd. (“Gaoqiao Petrochemical”) and INEOS Investment (Shanghai) Company Limited (“INEOS Shanghai”) entered into an equity transfer agreement on 28 July 2022. According to the agreement, the Company and Gaoqiao Petrochemical transferred 15% and 35% equity interests in Shanghai SECCO Petrochemical Co., Ltd. (“Shanghai SECCO”) to INEOS Shanghai respectively at a total consideration of RMB10,863 million. The above transactions were considered and approved by the 10th Session of 8th Directorate Meeting of the Company. The transactions were completed on 28 December 2022 and the Company lost control over Shanghai SECCO. The Group accounted for its remaining 50% equity interest retained in Shanghai SECCO, at fair value upon initial recognition, as an interest in a joint venture from the date when control was lost. The investment income from disposal of Shanghai SECCO is RMB13,697 million. |
11 INCOME TAX EXPENSE
Income tax expense in the consolidated income statement represents:
| 2022 | 2021 | |
| RMB million | RMB million | |
| Current tax | ||
| – Provision for the year | 18,796 | 17,522 |
| – Adjustment of prior years | (1,757) | (462) |
| Deferred taxation (Note 29) | 1,718 | 6,258 |
| 18,757 | 23,318 |
Reconciliation between actual income tax expense and the expected income tax expense at applicable statutory tax rates is as follows:
| 2022 | 2021 | |
| RMB million | RMB million | |
| Profit before taxation | 94,400 | 109,169 |
| Expected PRC income tax expense at a statutory tax rate of 25% | 23,600 | 27,292 |
| Tax effect of non-deductible expenses | 4,509 | 5,948 |
| Tax effect of non-taxable income | (5,827) | (8,096) |
| Tax effect of preferential tax rate (i) | (3,091) | (2,766) |
| Effect of income taxes at foreign operations | (128) | (222) |
| Tax effect of utilisation of previously unrecognised tax losses and temporary differences | (850) | (701) |
| Tax effect of tax losses not recognised and temporary differences | 2,243 | 1,391 |
| Write-down of deferred tax assets | 58 | 934 |
| Adjustment of prior years | (1,757) | (462) |
| Actual income tax expense | 18,757 | 23,318 |
Note:
| (i) | The provision for PRC current income tax is based on a statutory income tax rate of 25% of the assessable income of the Group as determined in accordance with the relevant income tax rules and regulations of the PRC, except for certain entities of the Group in western regions in the PRC are taxed at preferential income tax rate of 15% through the year 2022. According to Announcement [2020] No. 23 of the MOF “Announcement of the MOF, the State Taxation Administration and the National Development and Reform Commission on continuation of the income tax policy of western development enterprises”, the preferential tax rate of 15% extends from 1 January 2021 to 31 December 2030. |
168
12 DIRECTORS’ AND SUPERVISORS’ EMOLUMENTS
| (a) | Directors’ and supervisors’ emoluments |
The emoluments of every director and supervisor is set out below:
| Emoluments paid or receivable in respect of director’s other services in connection with the management of the affairs of the Company or its subsidiary undertaking | Emoluments paid or receivable in respect of a person’s services as a director, whether of the Company or its subsidiary undertaking | ||||
| 2022 | |||||
| Salaries, allowances and benefits in kind | Bonuses | Retirement scheme contributions | Directors’/ Supervisors’ fee | Total | |
| Name | RMB’000 | RMB’000 | RMB’000 | RMB’000 | RMB’000 |
| Directors | |||||
| Ma Yongsheng | – | – | – | – | – |
| Zhao Dong | – | – | – | – | – |
| Yu Baocai | 298 | 1,291 | 116 | – | 1,705 |
| Ling Yiqun | – | – | – | – | – |
| Li Yonglin | – | – | – | – | – |
| Liu Hongbin | 298 | 1,005 | 113 | – | 1,416 |
| Independent non-executive directors | |||||
| Cai Hongbin | – | – | – | 450 | 450 |
| Johnny Karling Ng | – | – | – | 450 | 450 |
| Shi Dan | – | – | – | 450 | 450 |
| Bi Mingjian | – | – | – | 450 | 450 |
| Supervisors | |||||
| Zhang Shaofeng | – | – | – | – | – |
| Qiu Fasen(i) | – | – | – | – | – |
| Jiang Zhenying(ii) | – | – | – | – | – |
| Lv Lianggong(iii) | – | – | – | – | – |
| Zhang Zhiguo | – | – | – | – | – |
| Wu Bo(i) | – | – | – | – | – |
| Zhai Yalin(i) | – | – | – | – | – |
| Yin Zhaolin | 237 | 140 | 58 | – | 435 |
| Guo Hongjin | 356 | 1,119 | 113 | – | 1,588 |
| Li Defang(iv) | 155 | 858 | 44 | – | 1,057 |
| Lv Dapeng(iv) | 31 | 140 | 9 | – | 180 |
| Chen Yaohuan | 375 | 1,196 | 113 | – | 1,684 |
| Total | 1,750 | 5,749 | 566 | 1,800 | 9,865 |
169
12 DIRECTORS’ AND SUPERVISORS’ EMOLUMENTS (Continued)
| (a) | Directors’ and supervisors’ emoluments (Continued) |
The emoluments of every director and supervisor is set out below: (Continued)
| Emoluments paid or receivable in respect of director’s other services in connection with the management of the affairs of the Company or its subsidiary undertaking | Emoluments paid or receivable in respect of a person’s services as a director, whether of the Company or its subsidiary undertaking | ||||
| 2021 | |||||
| Salaries, allowances and benefits in kind | Bonuses | Retirement scheme contributions | Directors’/ Supervisors’ fee | Total | |
| Name | RMB’000 | RMB’000 | RMB’000 | RMB’000 | RMB’000 |
| Directors | |||||
| Ma Yongsheng | 291 | 322 | 102 | – | 715 |
| Zhao Dong | – | – | – | – | – |
| Yu Baocai | 24 | 409 | 9 | – | 442 |
| Ling Yiqun | – | – | – | – | – |
| Li Yonglin | – | – | – | – | – |
| Liu Hongbin | – | – | – | – | – |
| Zhang Yuzhuo(v) | – | – | – | – | – |
| Independent non-executive directors | |||||
| Cai Hongbin | – | – | – | 417 | 417 |
| Johnny Karling Ng | – | – | – | 417 | 417 |
| Shi Dan | – | – | – | 300 | 300 |
| Bi Mingjian | – | – | – | 300 | 300 |
| Tang Min(vi) | – | – | – | 117 | 117 |
| Supervisors | |||||
| Zhang Shaofeng | – | – | – | – | – |
| Jiang Zhenying(ii) | – | – | – | – | – |
| Zhang Zhiguo | – | – | – | – | – |
| Yin Zhaolin | – | – | – | – | – |
| Guo Hongjin | 202 | 140 | 61 | – | 403 |
| Li Defang(iv) | 154 | 100 | 44 | – | 298 |
| Lv Dapeng(iv) | 216 | 140 | 61 | – | 417 |
| Chen Yaohuan | 371 | 692 | 102 | – | 1,165 |
| Zou Huiping(vii) | – | – | – | – | – |
| Sun Huanquan(viii) | – | – | – | – | – |
| Yu Renming(viii) | – | – | – | – | – |
| Total | 1,258 | 1,803 | 379 | 1,551 | 4,991 |
Notes:
| (i) | Mr. Qiu Fasen was elected to be supervisor from 18 May 2022; Mr. Wu Bo was elected to be supervisor from 18 May 2022; Mr. Zhai Yalin was elected to be supervisor from 18 May 2022. |
| (ii) | Due to change of working arrangement, Mr. Jiang Zhenying has tendered his resignation as supervisor from 18 May 2022. |
| (iii) | Mr. Lv Lianggong was elected to be supervisor from 18 May 2022; Due to change of working arrangement, Mr. Lv Lianggong has tendered his resignation as supervisor on 17 October 2022. |
| (iv) | Mr. Li Defang ceased being supervisor from 18 May 2022. Mr. Lv Dapeng ceased being supervisor from 18 May 2022. |
| (v) | Due to change of working arrangement, Mr. Zhang Yuzhuo has tendered his resignation as chairman, non-executive director, chairman of Strategy Committee and Sustainable Development Committee of the Board, member of Nomination Committee of the Board from 2 August 2021. |
| (vi) | Mr. Tang Min ceased being independent non-executive director from 25 May 2021. |
| (vii) | Mr. Zou Huiping ceased being supervisor from 28 January 2021. |
| (viii) | Mr. Sun Huanquan ceased being supervisor from 11 January 2021; Mr. Yu Renming ceased being supervisor from 11 January 2021. |
170
13 SENIOR MANAGEMENT’S EMOLUMENTS
For the year ended 31 December 2022, the five highest paid individuals in the Company included one director and four senior management. The total salaries, wages and other benefits was RMB8,325 thousand, and the total amount of their retirement scheme contributions was RMB566 thousand. For the year ended 31 December 2021, the five highest paid individuals in the Company included five senior management.
| Number of individuals | ||
| 2022 | 2021 | |
| Emoluments | ||
| HKD1,500,001 to HKD2,000,000 | – | 5 |
| HKD2,000,001 to HKD2,500,000 | 5 | – |
During 2022 and 2021, the Company did not incur any emoluments paid or receivable in respect of a person accepting office as a director, or any payments to any director for loss of office.
14 DIVIDENDS
Dividends payable to shareholders of the Company attributable to the year represent:
| 2022 | 2021 | |
| RMB million | RMB million | |
| Dividends declared and paid during the year of RMB0.16 per share (2021: RMB0.16 per share) | 19,371 | 19,371 |
| Dividends declared after the date of the statement of financial position of RMB0.195 per share (2021: RMB0.31 per share) | 23,380 | 37,532 |
| 42,751 | 56,903 |
Pursuant to the shareholders’ approval at the General Meeting on 26 August 2022, the interim dividends for the year ended 31 December 2022 of RMB0.16 (2021: RMB0.16) per share totaling RMB19,371 million (2021: RMB19,371 million) were approved. Dividends were paid on 19 September 2022.
Pursuant to a resolution passed at the director’s meeting on 24 March 2023, final dividends in respect of the year ended 31 December 2022 of RMB0.195 (2021: RMB0.31) per share totaling RMB23,380 million (2021: RMB37,532 million) were proposed for shareholders’ approval at the Annual General Meeting. Final cash dividend proposed after the date of the statement of financial position has not been recognised as a liability at the date of the statement of financial position.
Dividends payable to shareholders of the Company attributable to the previous financial year, approved during the year represent:
| 2022 | 2021 | |
| RMB million | RMB million | |
| Final cash dividends in respect of the previous financial year, approved during the year of RMB0.31 per share (2021: RMB0.13 per share) | 37,532 | 15,739 |
Pursuant to the shareholders’ approval at the Annual General Meeting on 18 May 2022, a final dividend of RMB0.31 per share totaling RMB37,532 million according to total shares on 9 June 2022 was approved. All dividends have been paid in the year ended 31 December 2022.
Pursuant to the shareholders’ approval at the Annual General Meeting on 25 May 2021, a final dividend of RMB0.13 per share totaling RMB15,739 million according to total shares on 16 June 2021 was approved. All dividends have been paid in the year ended 31 December 2021.
171
15 OTHER COMPREHENSIVE INCOME
| 2022 | 2021 | |||||
| Before tax | Tax | Net of tax | Before tax | Tax | Net of tax | |
| amount | effect | amount | amount | effect | amount | |
| RMB million | RMB million | RMB million | RMB million | RMB million | RMB million | |
| Cash flow hedges: | ||||||
| Effective portion of changes in fair value of hedging instruments recognised during the year | 6,667 | (1,675) | 4,992 | 15,659 | (3,881) | 11,778 |
| Reclassification adjustments for amounts transferred to the consolidated income statement | 8,127 | (1,482) | 6,645 | 8,858 | (1,618) | 7,240 |
| Net movement during the year recognised in other comprehensive income (i) | 14,794 | (3,157) | 11,637 | 24,517 | (5,499) | 19,018 |
| Changes in the fair value of instruments at fair value through other comprehensive income | (79) | 12 | (67) | (6) | 2 | (4) |
| Net movement during the year recognisedin other comprehensive income | (79) | 12 | (67) | (6) | 2 | (4) |
| Cost of hedging reserve | 149 | – | 149 | (220) | – | (220) |
| Share of other comprehensive income of associates and joint ventures | 2,856 | – | 2,856 | 441 | – | 441 |
| Foreign currency translation differences | 7,254 | – | 7,254 | (1,728) | – | (1,728) |
| Other comprehensive income | 24,974 | (3,145) | 21,829 | 23,004 | (5,497) | 17,507 |
Note:
| (i) | As at 31 December 2022, cash flow hedge reserve amounted to a gain of RMB3,079 million (31 December 2021: a gain of RMB7,244 million), of which a gain of RMB3,024 million was attributable to shareholders of the Company (31 December 2021: a gain of RMB7,214 million). |
16 BASIC AND DILUTED EARNINGS PER SHARE
The calculation of basic earnings per share for the year ended 31 December 2022 is based on the profit attributable to ordinary shareholders of the Company of RMB66,153 million (2021: RMB71,975 million) and the weighted average number of shares of 120,889,248,735 (2021: 121,071,209,646) during the year.
There are no potential dilutive ordinary shares, and diluted earnings per share are equal to the basic earning per share.
172
17 PROPERTY, PLANT AND EQUIPMENT
| Plants and buildings RMB million | Oil and gas, properties RMB million | Equipment, machinery and others RMB million | Total RMB million | |
| Cost: | ||||
| Balance at 1 January 2021 | 138,550 | 757,592 | 996,702 | 1,892,844 |
| Additions | 509 | 2,192 | 5,177 | 7,878 |
| Transferred from construction in progress | 5,487 | 40,357 | 65,182 | 111,026 |
| Reclassifications | 646 | (617) | (29) | – |
| Invest into the joint ventures and associated companies | (8) | – | (188) | (196) |
| Reclassification to other long-term assets | (665) | (22) | (1,027) | (1,714) |
| Disposals | (1,297) | (5,517) | (17,495) | (24,309) |
| Exchange adjustments | (57) | (940) | (95) | (1,092) |
| Balance at 31 December 2021 | 143,165 | 793,045 | 1,048,227 | 1,984,437 |
| Balance at 1 January 2022 | 143,165 | 793,045 | 1,048,227 | 1,984,437 |
| Additions | 146 | 4,277 | 3,528 | 7,951 |
| Transferred from construction in progress | 8,832 | 40,397 | 72,738 | 121,967 |
| Reclassifications | 1,042 | (289) | (753) | – |
| Invest into the joint ventures and associated companies | (64) | – | (150) | (214) |
| Reclassification to other long-term assets | (66) | (50) | (1,417) | (1,533) |
| Disposals | (830) | (429) | (17,169) | (18,428) |
| Exchange adjustments | 207 | 3,768 | 321 | 4,296 |
| Balance at 31 December 2022 | 152,432 | 840,719 | 1,105,325 | 2,098,476 |
| Accumulated depreciation and impairment losses: | ||||
| Balance at 1 January 2021 | 63,540 | 620,720 | 614,969 | 1,299,229 |
| Depreciation for the year | 4,586 | 39,670 | 48,568 | 92,824 |
| Impairment losses for the year | 742 | 1,904 | 6,774 | 9,420 |
| Reclassifications | 185 | (410) | 225 | – |
| Invest into the joint ventures and associated companies | (5) | – | (133) | (138) |
| Reclassification to other long-term assets | (82) | (7) | (170) | (259) |
| Written back on disposals | (771) | (135) | (13,668) | (14,574) |
| Exchange adjustments | (29) | (904) | (57) | (990) |
| Balance at 31 December 2021 | 68,166 | 660,838 | 656,508 | 1,385,512 |
| Balance at 1 January 2022 | 68,166 | 660,838 | 656,508 | 1,385,512 |
| Depreciation for the year | 4,736 | 31,059 | 50,383 | 86,178 |
| Impairment losses for the year | 312 | 2,754 | 2,016 | 5,082 |
| Reclassifications | 259 | (209) | (50) | – |
| Invest into the joint ventures and associated companies | (20) | – | (60) | (80) |
| Reclassification to other long-term assets | (25) | (40) | (160) | (225) |
| Written back on disposals | (734) | (406) | (11,465) | (12,605) |
| Exchange adjustments | 101 | 3,616 | 197 | 3,914 |
| Balance at 31 December 2022 | 72,795 | 697,612 | 697,369 | 1,467,776 |
| Net book value: | ||||
| Balance at 1 January 2021 | 75,010 | 136,872 | 381,733 | 593,615 |
| Balance at 31 December 2021 | 74,999 | 132,207 | 391,719 | 598,925 |
| Balance at 31 December 2022 | 79,637 | 143,107 | 407,956 | 630,700 |
The Group compares the carrying amount of individual cash-generating units which were grouped for the property, plant and equipment related to oil and gas producing activities with its value in use, using a discounted cash flow forecast prepared based on the future production profiles included in the oil and gas reserve reports, and recorded impairment losses amounting to RMB2,891 million for the year ended 31 December 2022 (2021: RMB2,467 million).
The addition to oil and gas properties of the Group for the year ended 31 December 2022 included RMB4,277 million (2021: RMB2,163 million) of estimated dismantlement costs for site restoration.
At 31 December 2022 and 31 December 2021, the Group had no individual significant property, plant and equipment which had been pledged.
At 31 December 2022 and 31 December 2021, the Group had no individual significant property, plant and equipment which were temporarily idle or pending for disposal.
At 31 December 2022 and 31 December 2021, the Group had no individual significant fully depreciated property, plant and equipment which were still in use.
173
18 CONSTRUCTION IN PROGRESS
| 2022 | 2021 | |
| RMB million | RMB million | |
| Balance at 1 January | 155,939 | 125,525 |
| Additions | 180,741 | 159,729 |
| Dry hole costs written off | (6,416) | (7,702) |
| Transferred to property, plant and equipment | (121,967) | (111,026) |
| Reclassification to other long-term assets | (11,492) | (10,302) |
| Impairment losses for the year | (581) | (144) |
| Disposals and others | (240) | (107) |
| Exchange adjustments | 61 | (34) |
| Balance at 31 December | 196,045 | 155,939 |
As at 31 December 2022, the amount of capitalised cost of exploratory wells included in construction in progress related to the exploration and production segment was RMB17,062 million (2021: RMB12,255 million). The geological and geophysical costs paid during the year ended 31 December 2022 were RMB3,478 million (2021: RMB4,174 million).
19 RIGHT-OF-USE ASSETS
| Land | Others | Total | |
| RMB million | RMB million | RMB million | |
| Cost | |||
| Balance at 1 January 2021 | 253,355 | 40,701 | 294,056 |
| Additions | 13,263 | 9,650 | 22,913 |
| Decreases | (2,862) | (3,430) | (6,292) |
| Balance at 31 December 2021 | 263,756 | 46,921 | 310,677 |
| Balance at 1 January 2022 | 263,756 | 46,921 | 310,677 |
| Additions | 10,981 | 9,108 | 20,089 |
| Decreases | (5,610) | (4,229) | (9,839) |
| Balance at 31 December 2022 | 269,127 | 51,800 | 320,927 |
| Accumulated depreciation | |||
| Balance at 1 January 2021 | 17,563 | 10,481 | 28,044 |
| Additions | 9,966 | 6,863 | 16,829 |
| Decreases | (407) | (2,197) | (2,604) |
| Balance at 31 December 2021 | 27,122 | 15,147 | 42,269 |
| Balance at 1 January 2022 | 27,122 | 15,147 | 42,269 |
| Additions | 10,045 | 7,519 | 17,564 |
| Decreases | (1,903) | (1,859) | (3,762) |
| Balance at 31 December 2022 | 35,264 | 20,807 | 56,071 |
| Net book value | |||
| Balance at 1 January 2021 | 235,792 | 30,220 | 266,012 |
| Balance at 31 December 2021 | 236,634 | 31,774 | 268,408 |
| Balance at 31 December 2022 | 233,863 | 30,993 | 264,856 |
174
20 GOODWILL
| 31 December | 31 December | |
| 2022 | 2021 | |
| RMB million | RMB million | |
| Cost | 14,325 | 16,455 |
| Less: Accumulated impairment losses | (7,861) | (7,861) |
| 6,464 | 8,594 |
Impairment tests for cash-generating units containing goodwill
Goodwill is allocated to the following Group’s cash-generating units:
| 31 December | 31 December | ||
| Principal activities | 2022 | 2021 | |
| RMB million | RMB million | ||
| Sinopec Zhenhai Refining and Chemical Branch | Manufacturing of intermediate petrochemical products and petroleum products | 4,043 | 4,043 |
| Sinopec Beijing Yanshan Petrochemical Branch | Manufacturing of intermediate petrochemical products and petroleum products | 1,004 | 1,004 |
| Shanghai SECCO | Production and sale of petrochemical products | – | 2,541 |
| Other units without individually significant goodwill | 1,417 | 1,006 | |
| 6,464 | 8,594 |
Goodwill represents the excess of the cost of purchase over the fair value of the underlying assets and liabilities. The recoverable amounts of the above cash generating units are determined based on value in use calculations. These calculations use cash flow projections based on financial budgets approved by management. The pre-tax discount rates reflect specific risks relating to the cash generating unit. For impairment test of the goodwill, the pre-tax discount rates ranged 10.1% to 12.2% (2021: 11.4% to 11.7%) were used by management. Based on the estimated recoverable amount, no major impairment loss was recognised for the year ended 31 December, 2022.
Key assumptions used for cash flow forecasts for these cash generating units are the sales volume and gross margin. The sales volume was based on the production capacity and/or the sales volume in the period immediately before the budget period.The sales price was based on the future trend of the prices of crude oil and petrochemical products. The budgeted gross margin was based on the gross margin achieved in the period immediately before the budget period.
21 INTEREST IN ASSOCIATES
The Group’s investments in associates are with companies primarily engaged in the oil and gas, petrochemical, and marketing and distribution operations in the PRC.
The Group’s principal associates are as follows:
| Name of company | % of ownership interests | Principal activities | Measurement method | Country of incorporation | Principal place of business |
| PipeChina (i) | 14.00 | Operation of oil and natural gas pipeline and auxiliary facilities | Equity method | PRC | PRC |
| Sinopec Finance Company Limited (“Sinopec Finance”) | 49.00 | Provision of non-banking financial services | Equity method | PRC | PRC |
| Sinopec Capital Company Limited (“Sinopec Capital”) | 49.00 | Project and equity investment, investment management, investment consulting, self-owned equity management | Equity method | PRC | PRC |
| Zhongtian Synergetic Energy Company Limited (“Zhongtian Synergetic Energy”) | 38.75 | Mining coal and manufacturing of coal-chemical products | Equity method | PRC | PRC |
| Caspian Investments Resources Ltd. (“CIR”) | 50.00 | Crude oil and natural gas extraction | Equity method | British Virgin Islands | The Republic of Kazakhstan |
175
21 INTEREST IN ASSOCIATES (Continued)
Summarised financial information and reconciliation to their carrying amounts in respect of the Group’s principal associates:
| PipeChina | Sinopec Finance | Sinopec Capital | Zhongtian Synergetic Energy | CIR | ||||||
| 31 | 31 | 31 | 31 | 31 | 31 | 31 | 31 | 31 | 31 | |
| December | December | December | December | December | December | December | December | December | December | |
| 2022 | 2021 | 2022 | 2021 | 2022 | 2021 | 2022 | 2021 | 2022 | 2021 | |
| RMB million | RMB million | RMB million | RMB million | RMB million | RMB million | RMB million | RMB million | RMB million | RMB million | |
| Current assets | 104,889 | 86,335 | 212,850 | 194,458 | 14,444 | 13,140 | 3,212 | 3,532 | 885 | 576 |
| Non-current assets | 816,301 | 768,161 | 57,394 | 55,086 | 249 | 102 | 51,035 | 51,331 | 1,106 | 870 |
| Current liabilities | (132,266) | (136,150) | (236,840) | (217,987) | (101) | (28) | (3,811) | (8,577) | (714) | (822) |
| Non-current liabilities | (199,675) | (103,243) | (673) | (602) | (990) | (676) | (23,435) | (22,216) | (138) | (144) |
| Net assets | 589,249 | 615,103 | 32,731 | 30,955 | 13,602 | 12,538 | 27,001 | 24,070 | 1,139 | 480 |
| Net assets attributable to owners of the Company | 525,235 | 526,241 | 32,731 | 30,955 | 13,602 | 12,538 | 27,001 | 24,070 | 1,139 | 480 |
| Net assets attributable to non-controlling interests | 64,014 | 88,862 | – | – | – | – | – | – | – | – |
| Share of net assets from associates | 73,533 | 73,674 | 16,038 | 15,168 | 6,665 | 6,144 | 10,463 | 9,327 | 570 | 240 |
| Carrying Amounts | 73,533 | 73,674 | 16,038 | 15,168 | 6,665 | 6,144 | 10,463 | 9,327 | 570 | 240 |
Summarised statement of comprehensive income
| Year ended 31 December | PipeChina | Sinopec Finance | Sinopec Capital | Zhongtian Synergetic Energy | CIR | |||||
| 2022 | 2021 | 2022 | 2021 | 2022 | 2021 | 2022 | 2021 | 2022 | 2021 | |
| RMB million | RMB million | RMB million | RMB million | RMB million | RMB million | RMB million | RMB million | RMB million | RMB million | |
| Revenue | 112,832 | 101,572 | 5,636 | 5,177 | 5 | 2 | 17,551 | 16,959 | 2,090 | 1,826 |
| Profit for the year | 31,908 | 29,776 | 2,338 | 2,168 | 1,281 | 990 | 4,562 | 4,184 | 574 | 461 |
| Other comprehensive income | – | 2 | 89 | 26 | (68) | – | – | – | 85 | 3 |
| Total comprehensive income | 31,908 | 29,778 | 2,427 | 2,194 | 1,213 | 990 | 4,562 | 4,184 | 659 | 464 |
| Dividends declared by associates | 2,019 | 442 | 319 | 490 | 73 | – | 632 | 86 | – | 1,152 |
| Share of profit from associates | 3,670 | 3,205 | 1,145 | 1,062 | 627 | 485 | 1,768 | 1,621 | 287 | 231 |
| Share of other comprehensive income from associates (ii) | – | – | 44 | 13 | (33) | – | – | – | 43 | 2 |
The share of profit and other comprehensive income for the year ended 31 December 2022 in all individually immaterial associates accounted for using equity method in aggregate was RMB6,844 million (2021: RMB7,283 million) and loss RMB244 million (2021: profit RMB271 million) respectively. As at 31 December 2022, the carrying amount of all individually immaterial associates accounted for using equity method in aggregate was RMB51,881 million (2021: RMB44,176 million).
Notes:
| (i) | The Group has a member in the Board of Directors of PipeChina. According to the structure and the resolution mechanism of the Board of Directors, the Group can exercise significant influence on PipeChina. |
| (ii) | Including foreign currency translation differences. |
176
22 INTEREST IN JOINT VENTURES
The Group’s principal interests in joint ventures are as follows:
| Name of entity | % of ownership interests | Principal activities | Measurement method | Country of incorporation | Principal place of business |
| Fujian Refining & Petrochemical Company Limited (“FREP”) | 50.00 | Manufacturing refining oil products | Equity method | PRC | PRC |
| BASF-YPC Company Limited (“BASF-YPC”) | 40.00 | Manufacturing and distribution of petrochemical products | Equity method | PRC | PRC |
| Taihu Limited (“Taihu”) | 49.00 | Crude oil and natural gas extraction | Equity method | Cyprus | Russia |
| Sinopec SABIC Tianjin Petrochemical Company Limited (“Sinopec SABIC Tianjin”) | 50.00 | Manufacturing and distribution of petrochemical products | Equity method | PRC | PRC |
| Shanghai SECCO | 50.00 | Manufacturing and distribution of petrochemical products | Equity method | PRC | PRC |
Summarised statement of financial position and reconciliation to their carrying amounts in respect of the Group’s principal joint ventures:
| FREP | BASF-YPC | Taihu | Sinopec SABIC Tianjin | Shanghai SECCO* | |||||
| 31 December | 31 December | 31 December | 31 December | 31 December | 31 December | 31 December | 31 December | 31 December | |
| 2022 | 2021 | 2022 | 2021 | 2022 | 2021 | 2022 | 2021 | 2022 | |
| RMB million | RMB million | RMB million | RMB million | RMB million | RMB million | RMB million | RMB million | RMB million | |
| Current assets | |||||||||
| Cash and cash equivalents | 3,733 | 6,562 | 3,061 | 5,375 | 1,625 | 1,258 | 4,506 | 4,820 | 1,323 |
| Other current assets | 11,311 | 9,217 | 5,993 | 6,953 | 15,269 | 2,188 | 2,554 | 3,437 | 3,647 |
| Total current assets | 15,044 | 15,779 | 9,054 | 12,328 | 16,894 | 3,446 | 7,060 | 8,257 | 4,970 |
| Non-current assets | 12,708 | 13,744 | 9,244 | 9,336 | 10,488 | 14,032 | 18,466 | 18,835 | 26,677 |
| Current liabilities | |||||||||
| Current financial liabilities | (829) | (1,177) | (63) | (77) | (55) | (32) | (2,950) | (597) | (6,609) |
| Other current liabilities | (9,951) | (5,008) | (2,245) | (2,546) | (2,727) | (1,931) | (3,282) | (3,547) | (2,368) |
| Total current liabilities | (10,780) | (6,185) | (2,308) | (2,623) | (2,782) | (1,963) | (6,232) | (4,144) | (8,977) |
| Non-current liabilities | |||||||||
| Non-current financial liabilities | (3,742) | (6,857) | – | – | (157) | (85) | (6,393) | (7,599) | – |
| Other non-current liabilities | (237) | (242) | (107) | (92) | (1,852) | (1,439) | (635) | (382) | (944) |
| Total non-current liabilities | (3,979) | (7,099) | (107) | (92) | (2,009) | (1,524) | (7,028) | (7,981) | (944) |
| Net assets | 12,993 | 16,239 | 15,883 | 18,949 | 22,591 | 13,991 | 12,266 | 14,967 | 21,726 |
| Net assets attributable to owners of the company | 12,993 | 16,239 | 15,883 | 18,949 | 21,941 | 13,523 | 12,266 | 14,967 | 21,726 |
| Net assets attributable to non-controlling interests | – | – | – | – | 650 | 468 | – | – | – |
| Share of net assets from joint ventures | 6,497 | 8,120 | 6,353 | 7,580 | 10,751 | 6,626 | 6,133 | 7,484 | 10,863 |
| Carrying Amounts | 6,497 | 8,120 | 6,353 | 7,580 | 10,751 | 6,626 | 6,133 | 7,484 | 10,863 |
Summarised statement of comprehensive income
| Year ended 31 December | FREP | BASF-YPC | Taihu | Sinopec SABIC Tianjin | ||||
| 2022 | 2021 | 2022 | 2021 | 2022 | 2021 | 2022 | 2021 | |
| RMB million | RMB million | RMB million | RMB million | RMB million | RMB million | RMB million | RMB million | |
| Revenue | 59,347 | 47,224 | 25,076 | 27,499 | 19,542 | 15,190 | 24,294 | 24,631 |
| Depreciation, depletion and amortisation | (1,822) | (2,789) | (1,431) | (1,467) | (882) | (667) | (1,270) | (1,164) |
| Interest income | 107 | 147 | 116 | 52 | 975 | 451 | 144 | 209 |
| Interest expense | (338) | (411) | (7) | (5) | (274) | (107) | (111) | (89) |
| (Loss)/profit before taxation | (2,004) | 2,261 | 3,542 | 8,218 | 1,657 | 2,864 | (2,396) | 1,393 |
| Income tax expense | 578 | (597) | (885) | (2,054) | (201) | (601) | 603 | (407) |
| (Loss)/profit for the year | (1,426) | 1,664 | 2,657 | 6,164 | 1,456 | 2,263 | (1,793) | 986 |
| Other comprehensive income | – | – | – | – | 7,144 | (123) | – | – |
| Total comprehensive income | (1,426) | 1,664 | 2,657 | 6,164 | 8,600 | 2,140 | (1,793) | 986 |
| Dividends declared by joint ventures | 910 | 128 | 2,462 | 454 | – | – | 454 | 500 |
| Share of net (loss)/profit from joint ventures | (713) | 832 | 1,063 | 2,466 | 703 | 1,081 | (897) | 493 |
| Share of other comprehensive income from joint ventures (i) | – | – | – | – | 3,422 | (60) | – | – |
| * | The share of profit and other comprehensive income for the period from 29 December 2022 to 31 December 2022 from Shanghai SECCO was immaterial. |
The share of profit and other comprehensive income for the year ended 31 December 2022 in all individually immaterial joint ventures accounted for using equity method in aggregate was loss RMB18 million (2021: profit RMB4,494 million) and loss RMB376 million (2021: profit RMB215 million) respectively. As at 31 December 2022, the carrying amount of all individually immaterial joint ventures accounted for using equity method in aggregate was RMB34,194 million (2021: RMB30,640 million).
Note:
| (i) | Including foreign currency translation differences. |
177
23 LONG-TERM PREPAYMENTS AND OTHER ASSETS
| 31 December | 31 December | |
| 2022 | 2021 | |
| RMB million | RMB million | |
| Operating rights of service stations | 28,009 | 29,714 |
| Long-term receivables from and prepayment to Sinopec Group Company and fellow subsidiaries | 3,235 | 1,520 |
| Prepayments for construction projects to third parties | 7,505 | 7,470 |
| Others (i) | 34,063 | 31,326 |
| 72,812 | 70,030 |
Note:
| (i) | Others mainly comprise catalyst expenditures and improvement expenditures of property, plant and equipment. |
The cost of operating rights of service stations is charged to expense on a straight-line basis over the respective periods of the rights. The movement of operating rights of service stations is as follows:
| 2022 | 2021 | |
| RMB million | RMB million | |
| Operating rights of service stations | ||
| Cost: | ||
| Balance at 1 January | 53,791 | 53,567 |
| Additions | 880 | 912 |
| Decreases | (541) | (688) |
| Balance at 31 December | 54,130 | 53,791 |
| Accumulated amortisation: | ||
| Balance at 1 January | 24,077 | 21,711 |
| Additions | 2,301 | 2,699 |
| Decreases | (257) | (333) |
| Balance at 31 December | 26,121 | 24,077 |
| Net book value at 31 December | 28,009 | 29,714 |
24 DERIVATIVE FINANCIAL ASSETS AND DERIVATIVE FINANCIAL LIABILITIES
Derivative financial assets and derivative financial liabilities of the Group are primarily commodity futures and swaps contracts. See Note 42.
25 TRADE ACCOUNTS RECEIVABLE
| 31 December | 31 December | |
| 2022 | 2021 | |
| RMB million | RMB million | |
| Amounts due from third parties | 38,942 | 30,159 |
| Amounts due from Sinopec Group Company and fellow subsidiaries | 7,261 | 2,199 |
| Amounts due from associates and joint ventures | 4,240 | 6,536 |
| 50,443 | 38,894 | |
| Less: Loss allowance for expected credit losses | (4,079) | (4,033) |
| 46,364 | 34,861 |
The ageing analysis of trade accounts receivable (net of loss allowance for expected credit losses) is as follows:
| 31 December | 31 December | |
| 2022 | 2021 | |
| RMB million | RMB million | |
| Within one year | 46,039 | 34,180 |
| Between one and two years | 152 | 442 |
| Between two and three years | 88 | 221 |
| Over three years | 85 | 18 |
| 46,364 | 34,861 |
178
25 TRADE ACCOUNTS RECEIVABLE (Continued)
Loss allowance for expected credit losses are analysed as follows:
| 2022 | 2021 | |
| RMB million | RMB million | |
| Balance at 1 January | 4,033 | 3,860 |
| Provision for the year | 417 | 436 |
| Written back for the year | (561) | (127) |
| Written off for the year | (49) | (30) |
| Others | 239 | (106) |
| Balance at 31 December | 4,079 | 4,033 |
Sales are generally on a cash term. Credit is generally only available for major customers with well-established trading records. Amounts due from Sinopec Group Company and fellow subsidiaries are repayable under the same terms.
These receivables relate to a wide range of customers for whom there is no recent history of default.
Information about the impairment of trade accounts receivable and the Group’s exposure to credit risk can be found in Note 42.
26 FINANCIAL ASSETS AT FAIR VALUE THROUGH OTHER COMPREHENSIVE INCOME
| 31 December | 31 December | |
| 2022 | 2021 | |
| RMB million | RMB million | |
| Non-current assets | ||
| Unlisted equity instruments | 616 | 588 |
| Listed equity instruments | 114 | 179 |
| Current assets | ||
| Trade accounts receivable and bills receivable (i) | 3,507 | 5,939 |
| 4,237 | 6,706 |
Note:
| (i) | As at 31 December 2022 and 2021, bills receivable and certain trade accounts receivable were classified as financial assets at fair value through other comprehensive income, as relevant business model is achieved both by collecting contractual cash flows and selling of these assets. |
27 INVENTORIES
| 31 December | 31 December | |
| 2022 | 2021 | |
| RMB million | RMB million | |
| Crude oil and other raw materials | 139,307 | 109,940 |
| Work in progress | 14,536 | 15,701 |
| Finished goods | 93,994 | 84,174 |
| Spare parts and consumables | 2,987 | 2,515 |
| 250,824 | 212,330 | |
| Less: Allowance for diminution in value of inventories | (6,583) | (4,897) |
| 244,241 | 207,433 |
The cost of inventories recognised as an expense in the consolidated income statement amounted to RMB2,774,951 million for the year ended 31 December 2022 (2021: RMB2,177,141 million). It includes the write-down of inventories of RMB6,407 million mainly related to finished goods and raw materials (2021: RMB3,148 million mainly related to finished goods).
179
28 PREPAID EXPENSES AND OTHER CURRENT ASSETS
| 31 December | 31 December | |
| 2022 | 2021 | |
| RMB million | RMB million | |
| Receivables | 27,311 | 35,918 |
| Advances to suppliers | 7,956 | 9,267 |
| Value-added input tax to be deducted | 25,355 | 19,137 |
| Prepaid income tax | 4,017 | 5,109 |
| 64,639 | 69,431 |
29 DEFERRED TAX ASSETS AND LIABILITIES
Deferred tax assets and liabilities before offset are attributable to the items detailed in the table below:
| Deferred tax assets | Deferred tax liabilities | |||
| 31 December | 31 December | 31 December | 31 December | |
| 2022 | 2021 | 2022 | 2021 | |
| RMB million | RMB million | RMB million | RMB million | |
| Receivables and inventories | 4,271 | 3,763 | (17) | – |
| Payables | 3,091 | 2,858 | – | – |
| Cash flow hedges | 85 | 258 | (736) | (2,709) |
| Property, plant and equipment | 15,714 | 16,777 | (16,519) | (15,037) |
| Tax losses carried forward | 4,643 | 4,749 | – | – |
| Financial assets at fair value through other comprehensive income | 131 | 127 | (6) | (9) |
| Intangible assets | 1,067 | 1,008 | (85) | (492) |
| Others | 1,395 | 1,056 | (1,161) | (870) |
| Deferred tax assets/(liabilities) | 30,397 | 30,596 | (18,524) | (19,117) |
The offsetting amount between deferred tax assets and liabilities are as follows:
| 31 December | 31 December | |
| 2022 | 2021 | |
| RMB million | RMB million | |
| Deferred tax assets | 10,445 | 11,207 |
| Deferred tax liabilities | 10,445 | 11,207 |
Deferred tax assets and liabilities after the offsetting adjustments are as follows:
| 31 December | 31 December | |
| 2022 | 2021 | |
| RMB million | RMB million | |
| Deferred tax assets | 19,952 | 19,389 |
| Deferred tax liabilities | 8,079 | 7,910 |
As at 31 December 2022, certain subsidiaries of the Company did not recognise deferred tax of deductible loss carried forward of RMB21,268 million (2021: RMB18,342 million), of which RMB8,972 million (2021: RMB5,564 million) was incurred for the year ended 31 December 2022, because it was not probable that the future taxable profits will be available. These deductible losses carried forward of RMB1,875 million, RMB1,669 million, RMB3,442 million, RMB5,310 million and RMB8,972 million will expire in 2023, 2024, 2025, 2026, 2027 and after, respectively.
Periodically, management performed assessment on the probability that future taxable profit will be available over the period which the deferred tax assets can be realised or utilised. In assessing the probability, both positive and negative evidence was considered, including whether it is probable that the operations will have sufficient future taxable profits over the periods which the deferred tax assets are deductible or utilised and whether the tax losses result from identifiable causes which are unlikely to recur.
180
29 DEFERRED TAX ASSETS AND LIABILITIES (Continued)
Movements in the deferred tax assets and liabilities are as follows:
| Balance at 1 January 2021 | Recognised in consolidated income statement | Recognised in other comprehensive income | Others | Transferred from reserve | Balance at 31 December 2021 | |
| RMB million | RMB million | RMB million | RMB million | RMB million | RMB million | |
| Receivables and inventories | 2,411 | 1,378 | (26) | – | – | 3,763 |
| Payables | 1,286 | 1,572 | – | – | – | 2,858 |
| Cash flow hedges | (2,630) | (203) | (5,499) | – | 5,881 | (2,451) |
| Property, plant and equipment | 2,378 | (1,004) | 41 | 325 | – | 1,740 |
| Tax losses carried forward | 13,322 | (8,554) | (19) | – | – | 4,749 |
| Financial assets at fair value through other comprehensive income | 116 | – | 2 | – | – | 118 |
| Intangible assets | 352 | 63 | – | 101 | – | 516 |
| Others | (305) | 490 | (3) | 4 | – | 186 |
| Net deferred tax assets/(liabilities) | 16,930 | (6,258) | (5,504) | 430 | 5,881 | 11,479 |
| Balance at 1 January 2022 | Recognised in consolidated income statement | Recognised in other comprehensive income | Others | Transferred from reserve | Balance at 31 December 2022 | |
| RMB million | RMB million | RMB million | RMB million | RMB million | RMB million | |
| Receivables and inventories | 3,763 | 514 | – | (23) | – | 4,254 |
| Payables | 2,858 | 233 | – | – | – | 3,091 |
| Cash flow hedges | (2,451) | 203 | (3,157) | (13) | 4,767 | (651) |
| Property, plant and equipment | 1,740 | (3,341) | – | 796 | – | (805) |
| Tax losses carried forward | 4,749 | 525 | – | (631) | – | 4,643 |
| Financial assets at fair value through other comprehensive income | 118 | (5) | 12 | – | – | 125 |
| Intangible assets | 516 | 80 | – | 386 | – | 982 |
| Others | 186 | 73 | – | (25) | – | 234 |
| Net deferred tax assets/(liabilities) | 11,479 | (1,718) | (3,145) | 490 | 4,767 | 11,873 |
30 SHORT-TERM AND LONG-TERM DEBTS AND LOANS FROM SINOPEC GROUP COMPANY AND FELLOW SUBSIDIARIES
Short-term debts represent:
| 31 December | 31 December | |
| 2022 | 2021 | |
| RMB million | RMB million | |
| Third parties’ debts | ||
| Short-term bank loans | 14,461 | 24,959 |
| RMB denominated | 14,325 | 24,959 |
| USD denominated | 136 | – |
| Current portion of long-term bank loans | 13,876 | 3,293 |
| RMB denominated | 13,875 | 3,281 |
| USD denominated | 1 | 12 |
| Current portion of long-term corporate bonds | 30,700 | 7,000 |
| RMB denominated | 30,700 | 7,000 |
| 59,037 | 35,252 | |
| Loans from Sinopec Group Company and fellow subsidiaries | ||
| Short-term loans | 6,852 | 2,407 |
| RMB denominated | 5,911 | 1,320 |
| USD denominated | 906 | 934 |
| European Dollar (“EUR”) denominated | 35 | 153 |
| Current portion of long-term loans | 440 | 466 |
| RMB denominated | 440 | 466 |
| 7,292 | 2,873 | |
| 66,329 | 38,125 |
The Group’s weighted average interest rates on short-term loans were 2.63% (2021: 2.72%) per annum at 31 December 2022. The above borrowings are unsecured.
181
30 SHORT-TERM AND LONG-TERM DEBTS AND LOANS FROM SINOPEC GROUP COMPANY AND FELLOW SUBSIDIARIES (Continued)
Long-term debts represent:
| Interest rate and final maturity | 31 December | 31 December | |
| 2022 | 2021 | ||
| RMB million | RMB million | ||
| Third parties’ debts | |||
| Long-term bank loans | |||
| RMB denominated | Interest rates ranging from 1.00% to 4.66% per annum at 31 December 2022 with maturities through 2040 | 86,532 | 38,880 |
| USD denominated | Interest rates at 0.00% per annum at 31 December 2022 with maturities through 2038 | 53 | 64 |
| 86,585 | 38,944 | ||
| Corporate bonds | |||
| RMB denominated | Fixed interest rates ranging from 2.20% to 3.20% per annum at 31 December 2022 with maturities through 2026 | 31,534 | 38,522 |
| USD denominated | Fixed interest rates ranging from 3.13% to 4.25% per annum at 31 December 2022 with maturities through 2043 | 12,163 | 11,127 |
| 43,697 | 49,649 | ||
| Total third parties’ long-term debts | 130,282 | 88,593 | |
| Less: Current portion | (44,576) | (10,293) | |
| 85,706 | 78,300 | ||
| Long-term loans from Sinopec Group Company and fellow subsidiaries | |||
| RMB denominated | Interest rates ranging from 1.08% to 5.23% per annum at 31 December 2022 with maturities through 2037 | 22,695 | 12,988 |
| USD denominated | Interest rates at 1.65% per annum at 31 December 2022 with maturities in 2027 | – | 1,168 |
| Less: Current portion | (440) | (466) | |
| 22,255 | 13,690 | ||
| 107,961 | 91,990 | ||
Short-term and long-term bank loans, short-term other loans and loans from Sinopec Group Company and fellow subsidiaries are primarily unsecured and carried at amortised cost.
31 LEASE LIABILITIES
| 31 December | 31 December | |
| 2022 | 2021 | |
| RMB million | RMB million | |
| Lease liabilities | ||
| Current | 16,004 | 15,173 |
| Non-current | 166,407 | 170,233 |
| 182,411 | 185,406 |
182
32 TRADE ACCOUNTS PAYABLE AND BILLS PAYABLE
| 31 December | 31 December | |
| 2022 | 2021 | |
| RMB million | RMB million | |
| Amounts due to third parties | 224,994 | 193,547 |
| Amounts due to Sinopec Group Company and fellow subsidiaries | 25,358 | 4,227 |
| Amounts due to associates and joint ventures | 8,290 | 6,145 |
| 258,642 | 203,919 | |
| Bills payable | 10,782 | 11,721 |
| Trade accounts payable and bills payable measured at amortised cost | 269,424 | 215,640 |
The ageing analysis of trade accounts payable and bills payable is as follows:
| 31 December | 31 December | |
| 2022 | 2021 | |
| RMB million | RMB million | |
| Within 1 month or on demand | 206,325 | 138,741 |
| Between 1 month and 6 months | 43,310 | 25,280 |
| Over 6 months | 19,789 | 51,619 |
| 269,424 | 215,640 |
33 CONTRACT LIABILITIES
As at 31 December 2022 and 2021, the Group’s contract liabilities primarily represent advances from customers. Related performance obligations are expected to be satisfied and revenue is recognised within one year.
34 OTHER PAYABLES
| 31 December | 31 December | |
| 2022 | 2021 | |
| RMB million | RMB million | |
| Salaries and welfare payable | 13,617 | 14,048 |
| Interest payable | 549 | 822 |
| Payables for constructions | 68,492 | 54,596 |
| Other payables | 71,833 | 93,764 |
| Taxes other than income tax | 23,655 | 76,458 |
| 178,146 | 239,688 |
35 PROVISIONS
Provisions primarily represent provision for future dismantlement costs of oil and gas properties. The Group has mainly committed to the PRC government to establish certain standardised measures for the dismantlement of its oil and gas properties by making reference to the industry practices and is thereafter constructively obligated to take dismantlement measures of its oil and gas properties.
Movement of provision of the Group’s obligations for the dismantlement of its oil and gas properties is as follow:
| 2022 | 2021 | |
| RMB million | RMB million | |
| Balance at 1 January | 40,495 | 43,713 |
| Provision for the year | 4,277 | 2,163 |
| Accretion expenses | 1,103 | 1,135 |
| Decrease for the year | (2,438) | (6,435) |
| Exchange adjustments | 162 | (81) |
| Balance at 31 December | 43,599 | 40,495 |
183
36 SHARE CAPITAL
| 31 December | 31 December | |
| 2022 | 2021 | |
| RMB million | RMB million | |
| Registered, issued and fully paid | ||
| 95,115,471,046 listed A shares (2021: 95,557,771,046) of RMB1.00 each | 95,115 | 95,558 |
| 24,780,936,600 listed H shares (2021: 25,513,438,600) of RMB1.00 each | 24,781 | 25,513 |
| 119,896 | 121,071 |
The Company was established on 25 February 2000 with a registered capital of 68.8 billion domestic state-owned shares with a par value of RMB1.00 each. Such shares were issued to Sinopec Group Company in consideration for the assets and liabilities transferred to the Company (Note 1).
Pursuant to the resolutions passed at an Extraordinary General Meeting held on 25 July 2000 and approvals from relevant government authorities, the Company is authorised to increase its share capital to a maximum of 88.3 billion shares with a par value of RMB1.00 each and offer not more than 19.5 billion shares with a par value of RMB1.00 each to investors outside the PRC. Sinopec Group Company is authorised to offer not more than 3.5 billion shares of its shareholdings in the Company to investors outside the PRC. The shares sold by Sinopec Group Company to investors outside the PRC would be converted into H shares.
In October 2000, the Company issued 15,102,439,000 H shares with a par value of RMB1.00 each, representing 12,521,864,000 H shares and 25,805,750 American Depositary Shares (“ADSs”, each representing 100 H shares), at prices of HKD1.59 per H share and USD20.645 per ADS, respectively, by way of a global initial public offering to Hong Kong and overseas investors. As part of the global initial public offering, 1,678,049,000 state-owned ordinary shares of RMB1.00 each owned by Sinopec Group Company were converted into H shares and sold to Hong Kong and overseas investors.
In July 2001, the Company issued 2.8 billion listed A shares with a par value of RMB1.00 each at RMB4.22 by way of a public offering to natural persons and institutional investors in the PRC.
During the year ended 31 December 2010, the Company issued 88,774 listed A shares with a par value of RMB1.00 each, as a result of exercise of 188,292 warrants entitled to the Bonds with Warrants.
During the year ended 31 December 2011, the Company issued 34,662 listed A shares with a par value of RMB1.00 each, as a result of conversion by the holders of the 2011 Convertible Bonds.
During the year ended 31 December 2012, the Company issued 117,724,450 listed A shares with a par value of RMB1.00 each, as a result of conversion by the holders of the 2011 Convertible Bonds.
On 14 February 2013, the Company issued 2,845,234,000 listed H shares (“the Placing”) with a par value of RMB1.00 each at the Placing Price of HKD8.45 per share. The aggregate gross proceeds from the Placing amounted to approximately HKD24,042,227,300.00 and the aggregate net proceeds (after deduction of the commissions and estimated expenses) amounted to approximately HKD23,970,100,618.00.
In June 2013, the Company issued 21,011,962,225 listed A shares and 5,887,716,600 listed H shares as a result of bonus issues of 2 shares converted from the retained earnings, and 1 share transferred from the share premium for every 10 existing shares.
During the year ended 31 December 2013, the Company issued 114,076 listed A shares with a par value of RMB1.00 each, as a result of exercise of conversion by the holders of the 2011 Convertible Bonds.
During the year ended 31 December 2014, the Company issued 1,715,081,853 listed A shares with a par value of RMB1.00 each, as a result of exercise of conversion by the holders of the 2011 Convertible Bonds.
During the year ended 31 December 2015, the Company issued 2,790,814,006 listed A shares with a par value of RMB1.00 each, as a result of exercise of conversion by the holders of the 2011 Convertible Bonds.
During the year ended 31 December 2022, the Company repurchased 442,300,000 listed A shares and 732,502,000 listed H shares respectively, which had been cancelled in the year ended 31 December 2022.
All A shares and H shares rank pari passu in all material aspects.
Capital management
Management optimises the structure of the Group’s capital, which comprises of equity, debts and bonds. In order to maintain or adjust the capital structure of the Group, management may cause the Group to issue new shares, adjust the capital expenditure plan, sell assets to reduce debt, or adjust the proportion of short-term and long-term loans and bonds. Management monitors capital on the basis of the debt-to-capital ratio, which is calculated by dividing long-term loans (excluding current portion) and debentures payable, including long-term debts and loans from Sinopec Group Company and fellow subsidiaries, by the total of equity attributable to shareholders of the Company and long-term loans (excluding current portion) and debentures payable, and liability-to-asset ratio, which is calculated by dividing total liabilities by total assets. Management’s strategy is to make appropriate adjustments according to the Group’s operating and investment needs and the changes of market conditions, and to maintain the debt-to-capital ratio and the liability-to-asset ratio of the Group at a range considered reasonable. As at 31 December 2022, the debt-to-capital ratio and the liability-to-asset ratio of the Group were 12.1% (2021: 10.6%) and 52.0% (2021: 51.6%), respectively.
The schedule of the contractual maturities of loans and commitments are disclosed in Notes 30 and 37, respectively.
There were no changes in the management’s approach to capital management of the Group during the year. Neither the Company nor any of its subsidiaries is subject to externally imposed capital requirements.
184
37 COMMITMENTS AND CONTINGENT LIABILITIES
Capital commitments
At 31 December 2022 and 2021, capital commitments of the Group are as follows:
| 31 December | 31 December | |
| 2022 | 2021 | |
| RMB million | RMB million | |
| Authorised and contracted for (i) | 167,507 | 184,430 |
| Authorised but not contracted for | 94,407 | 90,227 |
| 261,914 | 274,657 |
These capital commitments relate to oil and gas exploration and development, refining and petrochemical production capacity expansion projects, the construction of service stations and oil depots and investment commitments.
Note:
| (i) | The investment commitments of the Group is RMB1,751 million (2021: RMB3,648 million). |
Commitments to joint ventures
Pursuant to certain of the joint venture agreements entered into by the Group, the Group is obliged to purchase products from the joint
ventures based on market prices.
Exploration and production licenses
Exploration licenses for exploration activities are registered with the Ministry of Natural Resources. The maximum term of the Group’s exploration licenses is 7 years, and may be renewed twice within 30 days prior to expiration of the original term with each renewal being for a two-year term. The Group is obligated to make progressive annual minimum exploration investment relating to the exploration blocks in respect of which the license is issued. The Ministry of Natural Resources also issues production licenses to the Group on the basis of the reserve reports approved by relevant authorities. The maximum term of a full production license is 30 years unless a special dispensation is given by the State Council. The maximum term of production licenses issued to the Group is 80 years as a special dispensation was given to the Group by the State Council. The Group’s production license is renewable upon application by the Group 30 days prior to expiration.
The Group is required to make payments of exploration license fees and production right usage fees to the Ministry of Natural Resources annually which are expensed. Expenses recognised were approximately RMB270 million for the year ended 31 December 2022 (2021: RMB181 million).
Estimated future annual payments are as follows:
| 31 December | 31 December | |
| 2022 | 2021 | |
| RMB million | RMB million | |
| Within one year | 369 | 301 |
| Between one and two years | 152 | 112 |
| Between two and three years | 146 | 110 |
| Between three and four years | 115 | 102 |
| Between four and five years | 62 | 64 |
| Thereafter | 857 | 846 |
| 1,701 | 1,535 |
Contingent liabilities
At 31 December 2022 and 2021, the guarantees by the Group in respect of facilities granted to the parties below are as follows:
| 31 December | 31 December | |
| 2022 | 2021 | |
| RMB million | RMB million | |
| Joint ventures (ii) | 8,927 | 9,117 |
| Associates (iii) | – | 5,746 |
| 8,927 | 14,863 |
185
37 COMMITMENTS AND CONTINGENT LIABILITIES (Continued)
Contingent liabilities (Continued)
Management monitors the risk that the specified debtor will default on the contract and recognises a provision when ECLs on the financial guarantees are determined to be higher than the carrying amount in respect of the guarantees. At 31 December 2022 and 2021, the Group estimates that there is no material liability has been accrued for ECLs related to the Group’s obligation under these guarantee arrangements.
Notes:
| (ii) | The Group provided a guarantee in respect to standby credit facilities granted to Zhongan United Coal Chemical Co., Ltd. (“Zhongan United”) by banks amount to RMB7,100 million (31 December 2021: RMB7,100 million). As at 31 December 2022, the amount withdrawn (the portion corresponding to the shareholding ratio of the Group) by Zhongan United from banks and guaranteed by the Group was RMB5,254 million (31 December 2021: RMB5,680 million). The Group provided a guarantee in respect to standby credit facilities granted to Amur Gas Chemical Complex Limited Liability Company (“Amur Gas”) by banks amount to RMB25,351 million (31 December 2021: RMB23,208 million). As at 31 December 2022, the amount withdrawn (the portion corresponding to the shareholding ratio of the Group) by Amur Gas from banks and guaranteed by the Group was RMB3,673 million (31 December 2021: RMB3,264 million). |
The Group provided a guarantee in respect to payment obligation under the raw material supply agreement of Amur Gas amount to RMB16,924 million (31 December 2021: RMB15,493 million). As at 31 December 2022, Amur Gas has not yet incurred the relevant payment obligations and therefore the Group has no guarantee amount (31 December 2021: Nil).
The Group provided a guarantee in respect the engineering services agreement of Amur Gas. As at 31 December 2022, the engineering services agreement was terminated, accordingly the guarantee agreement was terminated.
| (iii) | The Group provided a guarantee in respect to standby credit facilities granted to Zhongtian Synergetic Energy by banks amount to RMB17,050 million. As at 31 December 2021, the amount withdrawn (the portion corresponding to the shareholding ratio of the Group) by Zhongtian Synergetic Energy and guaranteed by the Group was RMB5,746 million. During the year ended 31 December 2022, the guarantee provided by the Group was terminated. |
Environmental contingencies
Under existing legislation, management believes that there are no probable liabilities that will have a material adverse effect on the financial position or operating results of the Group. The PRC government, however, has moved, and may move further towards more rigorous enforcement of applicable laws, and towards the adoption of more stringent environmental standards. Environmental liabilities are subject to considerable uncertainties which affect management’s ability to estimate the ultimate cost of remediation efforts. These uncertainties include (i) the exact nature and extent of the contamination at various sites including, but not limited to refineries, oil fields, service stations, terminals and land development areas,whether operating, closed or sold, (ii) the extent of required cleanup efforts, (iii) varying costs of alternative remediation strategies, (iv) changes in environmental remediation requirements, and (v) the identification of new remediation sites. The amount of such future cost is indeterminable due to such factors as the unknown magnitude of possible contamination and the unknown timing and extent of the corrective actions that may be required. Accordingly, the outcome of environmental liabilities under proposed or future environmental legislation cannot reasonably be estimated at present, and could be material.
The Group paid normal routine pollutant discharge fees of approximately RMB16,823 million in the consolidated financial statements for the year ended 31 December 2022 (2021: RMB10,968 million).
Legal contingencies
The Group is defendant in certain lawsuits as well as the named party in other proceedings arising in the ordinary course of business. Management has assessed the likelihood of an unfavourable outcome of such contingencies, lawsuits or other proceedings and believes that any resulting liabilities will not have a material adverse effect on the financial position, operating results or cash flows of the Group.
38 RELATED PARTY TRANSACTIONS
Parties are considered to be related to the Group if the Group has the ability, directly or indirectly, to control or jointly control the party or exercise significant influence over the party in making financial and operating decisions, or vice versa, or where the Group and the party are subject to control or common control. Related parties may be individuals (being members of key management personnel, significant shareholders and/or their close family members) or other entities and include entities which are under the significant influence of related parties of the Group where those parties are individuals, and post-employment benefit plans which are for the benefit of employees of the Group or of any entity that is a related party of the Group.
| (a) | Transactions with Sinopec Group Company and fellow subsidiaries, associates and joint ventures |
The Group is part of a larger group of companies under Sinopec Group Company, which is controlled by the PRC government, and has significant transactions and relationships with Sinopec Group Company and fellow subsidiaries. Because of these relationships, it is possible that the terms of these transactions are not the same as those that would result from transactions among wholly unrelated parties.
186
38 RELATED PARTY TRANSACTIONS (Continued)
| (a) | Transactions with Sinopec Group Company and fellow subsidiaries, associates and joint ventures (Continued) |
The principal related party transactions with Sinopec Group Company and fellow subsidiaries, associates and joint ventures, which were carried out in the ordinary course of business are as follows:
| Notes | 2022 | 2021 | |
| RMB million | RMB million | ||
| Sales of goods | (i) | 352,691 | 297,381 |
| Purchases | (ii) | 184,986 | 191,888 |
| Transportation and storage | (iii) | 18,291 | 19,443 |
| Exploration and development services | (iv) | 37,317 | 33,930 |
| Production related services | (v) | 48,465 | 44,405 |
| Ancillary and social services | (vi) | – | 1,730 |
| Agency commission income | (vii) | 173 | 194 |
| Interest income | (viii) | 1,203 | 715 |
| Interest expense | (ix) | 541 | 385 |
| Net deposits placed with related parties | (viii) | (3,382) | (8,265) |
| Net funds obtained from related parties | (x) | 36,608 | 30,305 |
The amounts set out in the table above in respect of the year ended 31 December 2022 and 2021 represent the relevant costs and income as determined by the corresponding contracts with the related parties.
Included in the transactions disclosed above, for the year ended 31 December 2022 are: a) purchases by the Group from Sinopec Group Company and fellow subsidiaries amounting to RMB158,874 million (2021: RMB173,718 million) comprising purchases of products and services (i.e. procurement, transportation and storage, exploration and development services and production related services) of RMB146,114 million (2021: RMB160,048 million), ancillary and social services provided by Sinopec Group Company and fellow subsidiaries of RMB Nil (2021: RMB1,730 million), lease charges for land, buildings and others paid by the Group of RMB11,046 million, RMB938 million and RMB235 million (2021: RMB10,831 million, RMB565 million and RMB159 million), respectively and interest expenses of RMB541 million (2021: RMB385 million); and b) sales by the Group to Sinopec Group Company and fellow subsidiaries amounting to RMB58,403 million (2021: RMB54,453 million), comprising RMB57,151 million (2021: RMB53,671 million) for sales of goods, RMB1,203 million (2021: RMB715 million) for interest income and RMB49 million (2021: RMB67 million) for agency commission income.
For the year ended 31 December 2022, no individually significant right-of-use assets were leased from Sinopec Group Company and fellow subsidiaries, associates and joint ventures by the Group. The interest expense recognised for the year ended 31 December 2022 on lease liabilities in respect of amounts due to Sinopec Group Company and fellow subsidiaries, associates and joint ventures was RMB7,811 million (2021: RMB7,863 million).
For the year ended 31 December 2022, the amount of rental the Group paid to Sinopec Group Company and fellow subsidiaries, associates and joint ventures for land, buildings and others are RMB11,051 million, RMB943 million and RMB352 million (2021: RMB10,834 million, RMB572 million and RMB269 million), including pursuant to the continuing connected transaction agreements signed in 2000, the Sixth Supplementary Agreement on 27 August 2021, the amount of rental the Group paid to Sinopec Group Company for land and buildings are RMB11,046 million and RMB938 million (2021: RMB10,831 million and RMB565 million).
As at 31 December 2022 and 2021, there was no guarantee given to banks by the Group in respect of banking facilities to Sinopec Group Company and fellow subsidiaries, associates and joint ventures, except for the guarantees disclosed in Note 37. Guarantees given to banks by the Group in respect of banking facilities to associates and joint ventures are disclosed in Note 37.
The directors of the Company are of the opinion that the above transactions with related parties were conducted in the ordinary course of business and on normal commercial terms or in accordance with the agreements governing such transactions, and this has been confirmed by the independent non-executive directors.
Notes:
| (i) | Sales of goods represent the sale of crude oil, intermediate petrochemical products, petroleum products and ancillary materials. |
| (ii) | Purchases represent the purchase of materials and utility supplies directly related to the Group’s operations such as the procurement of raw and ancillary materials and related services, supply of water, electricity and gas. |
| (iii) | Transportation and storage represent the cost for the use of railway, road and marine transportation services, pipelines, loading, unloading and storage facilities. |
| (iv) | Exploration and development services comprise direct costs incurred in the exploration and development such as geophysical, drilling, well testing and well measurement services. |
| (v) | Production related services represent ancillary services rendered in relation to the Group’s operations such as equipment repair and general maintenance, insurance premium, technical research, communications, firefighting, security, product quality testing and analysis, information technology, design and engineering, construction of oilfield ground facilities, refineries and chemical plants, manufacture of replacement parts and machinery, installation, project management, environmental protection and management services. |
187
38 RELATED PARTY TRANSACTIONS (Continued)
| (a) | Transactions with Sinopec Group Company and fellow subsidiaries, associates and joint ventures (Continued) |
Notes: (Continued)
| (vi) | Ancillary and social services represent expenditures for social welfare and support services such as educational facilities, media communication services, sanitation, accommodation, canteens, and property maintenance. The term of the Cultural, Educational, Hygiene and Auxiliary Service Agreement expired on 31 December 2021, and is not renewed due to the significant decrease in the service scale after the separation and transfer of assets and business such as the Three Supplies and One Industry Assets etc. Cultural and educational services related or similar to training and auxiliary services thereunder have been incorporated into the Mutual Supply Agreement. |
| (vii) | Agency commission income represents commission earned for acting as an agent in respect of sales of products and purchase of materials for certain entities owned by Sinopec Group Company. |
| (viii) | Interest income represents interest received from deposits placed with Sinopec Finance and Sinopec Century Bright Capital Investment Limited, finance companies controlled by Sinopec Group Company. The applicable interest rate is determined in accordance with the prevailing saving deposit rate. The balance of deposits at 31 December 2022 was RMB65,064 million (2021: RMB61,682 million). |
| (ix) | Interest expense represents interest charges on the loans obtained from Sinopec Group Company and fellow subsidiaries. |
| (x) | The Group obtained loans, discounted bills and issued the acceptance bills from Sinopec Group Company and fellow subsidiaries. |
In connection with the Reorganisation, the Company and Sinopec Group Company entered into a number of agreements under which 1) Sinopec Group Company will provide goods and products and a range of ancillary, social and supporting services to the Group and 2) the Group will sell certain goods to Sinopec Group Company. These agreements impacted the operating results of the Group for the year ended 31 December 2022. The terms of these agreements are summarised as follows:
| • | The Company has entered into a non-exclusive “Agreement for Mutual Provision of Products and Ancillary Services” (“Mutual Provision Agreement”) with Sinopec Group Company effective from 1 January 2000 in which Sinopec Group Company has agreed to provide the Group with certain ancillary production services, construction services, information advisory services, supply services and other services and products. While each of Sinopec Group Company and the Company is permitted to terminate the Mutual Provision Agreement upon at least six months notice, Sinopec Group Company has agreed not to terminate the agreement if the Group is unable to obtain comparable services from a third party. The pricing policy for these services and products provided by Sinopec Group Company to the Group is as follows: |
| (1) | the government-prescribed price; |
| (2) | where there is no government-prescribed price, the government-guidance price; |
| (3) | where there is neither a government-prescribed price nor a government-guidance price, the market price; or |
| (4) | where none of the above is applicable, the price to be agreed between the parties, which shall be based on a reasonable cost incurred in providing such services plus a profit margin not exceeding 6%. |
| • | The Company has entered into a non-exclusive “Agreement for Provision of Cultural and Educational, Health Care and Community Services” with Sinopec Group Company effective from 1 January 2000 in which Sinopec Group Company has agreed to provide the Group with certain cultural, educational, health care and community services on the same pricing terms and termination conditions as described in the above Mutual Provision Agreement. The term of the Cultural, Educational, Hygiene and Auxiliary Service Agreement expired on 31 December 2021, and is not renewed due to the significant decrease in the service scale after the separation and transfer of assets and business such as the Three Supplies and One Industry Assets etc. Cultural and educational services related or similar to training and auxiliary services thereunder have been incorporated into the Mutual Supply Agreement. |
| • | The Company has entered into a series of lease agreements with Sinopec Group Company to lease certain lands and buildings effective on 1 January 2000. The lease term is 40 or 50 years for lands and 20 years for buildings, respectively. The Company and Sinopec Group Company can renegotiate the rental amount every three years for land. The Company and Sinopec Group Company can renegotiate the rental amount for buildings every year. However such amount cannot exceed the market price as determined by an independent third party. |
| • | The Company has entered into agreements with Sinopec Group Company effective from 1 January 2000 under which the Group has been granted the right to use certain trademarks, patents, technology and computer software developed by Sinopec Group Company. |
| • | The Company has entered into a service stations franchise agreement with Sinopec Group Company effective from 1 January 2000 under which its service stations and retail stores would exclusively sell the refined products supplied by the Group. |
| • | On the basis of a series of continuing connected transaction agreements signed in 2000, the Company and Sinopec Group Company have signed the Sixth Supplementary Agreement on 27 August 2021, which took effect on 1 January 2022 and made adjustment to “Mutual Supply Agreement” and “Buildings Leasing Contract”, etc. |
188
38 RELATED PARTY TRANSACTIONS (Continued)
| (a) | Transactions with Sinopec Group Company and fellow subsidiaries, associates and joint ventures (Continued) |
Amounts due from/to Sinopec Group Company and fellow subsidiaries, associates and joint ventures included in the following accounts captions are summarised as follows:
| 31 December | 31 December | |
| 2022 | 2021 | |
| RMB million | RMB million | |
| Trade accounts receivable | 11,480 | 8,655 |
| Financial assets at fair value through other comprehensive income | 596 | 186 |
| Prepaid expenses and other current assets | 10,375 | 14,537 |
| Long-term prepayments and other assets | 8,633 | 3,116 |
| Total | 31,084 | 26,494 |
| Trade accounts payable and bills payable | 38,337 | 14,170 |
| Contract liabilities | 4,736 | 4,677 |
| Other payables | 38,312 | 50,649 |
| Other long-term liabilities | 5,180 | 2,779 |
| Short-term loans and current portion of long-term loans from Sinopec Group Company and fellow subsidiaries | 7,292 | 2,873 |
| Long-term loans excluding current portion from Sinopec Group Company and fellow subsidiaries | 22,255 | 13,690 |
| Lease liabilities (including to be paid within one year) | 156,537 | 158,761 |
| Total | 272,649 | 247,599 |
Amounts due from/to Sinopec Group Company and fellow subsidiaries, associates and joint ventures, other than short-term loans and long-term loans, bear no interest, are unsecured and are repayable in accordance with normal commercial terms. The terms and conditions associated with short-term loans and long-term loans payable to Sinopec Group Company and fellow subsidiaries are set out in Note 30.
As at and for the year ended 31 December 2022, and as at and for the year ended 31 December 2021, no individually significant loss allowance for expected credit losses were recognised in respect of amounts due from Sinopec Group Company and fellow subsidiaries, associates and joint ventures.
| (b) | Key management personnel emoluments |
Key management personnel are those persons having authority and responsibility for planning, directing and controlling the activities of the Group, directly or indirectly, including directors and supervisors of the Group. The key management personnel compensation is as follows:
| 2022 | 2021 | |
| RMB’000 | RMB’000 | |
| Short-term employee benefits | 9,299 | 4,612 |
| Retirement scheme contributions | 566 | 379 |
| 9,865 | 4,991 |
| (c) | Contributions to defined contribution retirement plans |
The Group participates in various defined contribution retirement plans organised by municipal and provincial governments for its staff. The details of the Group’s employee benefits plan are disclosed in Note 39. As at 31 December 2022 and 2021, the accrual for the contribution to post-employment benefit plans was not material.
| (d) | Transactions with other state-controlled entities in the PRC |
The Group is a state-controlled energy and chemical enterprise and operates in an economic regime currently dominated by entities directly or indirectly controlled by the PRC government through its government authorities, agencies, affiliations and other organisations (collectively referred as “state-controlled entities”).
Apart from transactions with Sinopec Group Company and fellow subsidiaries, the Group has transactions with other state-controlled entities, include but not limited to the followings:
| • | sales and purchases of goods and ancillary materials; |
| • | rendering and receiving services; |
| • | lease of assets; |
| • | depositing and borrowing money; and |
| • | uses of public utilities. |
These transactions are conducted in the ordinary course of the Group’s business on terms comparable to those with other entities that are not state-controlled.
189
39 EMPLOYEE BENEFITS PLAN
As stipulated by the regulations of the PRC, the Group participates in various defined contribution retirement plans organised by municipal and provincial governments for its staff. The Group is required to make contributions to the retirement plans at rates ranging from 13.0% to 16.0% of the salaries, bonuses and certain allowances of its staff. In addition, the Group provides a supplementary retirement plan for its staff at rates not exceeding 8% of the salaries. The Group has no other material obligation for the payment of pension benefits associated with these plans beyond the annual contributions described above. The Group’s contributions for the year ended 31 December 2022 were RMB13,190 million (2021: RMB11,932 million).
40 SEGMENT REPORTING
Segment information is presented in respect of the Group’s business segments. The format is based on the Group’s management and internal reporting structure.
In a manner consistent with the way in which information is reported internally to the Group’s chief operating decision maker for the purposes of resource allocation and performance assessment, the Group has identified the following five reportable segments. No operating segments have been aggregated to form the following reportable segments.
| (i) | Exploration and production, which explores and develops oil fields, produces crude oil and natural gas and sells such products to the refining segment of the Group and external customers. |
| (ii) | Refining, which processes and purifies crude oil, that is sourced from the exploration and production segment of the Group and external suppliers, and manufactures and sells petroleum products to the chemicals and marketing and distribution segments of the Group and external customers. |
| (iii) | Marketing and distribution, which owns and operates oil depots and service stations in the PRC, and distributes and sells refined petroleum products (mainly gasoline and diesel) in the PRC through wholesale and retail sales networks. |
| (iv) | Chemicals, which manufactures and sells petrochemical products, derivative petrochemical products and other chemical products mainly to external customers. |
| (v) | Corporate and others, which largely comprises the trading activities of the import and export companies of the Group and research and development undertaken by other subsidiaries. |
The segments were determined primarily because the Group manages its exploration and production, refining, marketing and distribution, chemicals, and corporate and others businesses separately. The reportable segments are each managed separately because they manufacture and/or distribute distinct products with different production processes and due to their distinct operating and gross margin characteristics.
190
40 SEGMENT REPORTING (Continued)
| (1) | Information of reportable segmental revenues, profits or losses, assets and liabilities |
The Group’s chief operating decision maker evaluates the performance and allocates resources to its operating segments on an operating profit basis, without considering the effects of finance costs or investment income. Inter-segment transfer pricing is based on the market price or cost plus an appropriate margin, as specified by the Group’s policy.
Assets and liabilities dedicated to a particular segment’s operations are included in that segment’s total assets and liabilities. Segment assets include all tangible and intangible assets, except for interest in associates and joint ventures, investments, deferred tax assets, cash and cash equivalents, time deposits with financial institutions and other unallocated assets. Segment liabilities exclude short-term debts, income tax payable, long-term debts, loans from Sinopec Group Company and fellow subsidiaries, deferred tax liabilities and other unallocated liabilities.
Information of the Group’s reportable segments is as follows:
| 2022 | 2021 | |
| RMB million | RMB million | |
| Revenue from primary business | ||
| Exploration and production | ||
| External sales | 192,330 | 156,026 |
| Inter-segment sales | 121,912 | 87,298 |
| 314,242 | 243,324 | |
| Refining | ||
| External sales | 194,839 | 167,948 |
| Inter-segment sales | 1,376,425 | 1,212,455 |
| 1,571,264 | 1,380,403 | |
| Marketing and distribution | ||
| External sales | 1,660,924 | 1,367,605 |
| Inter-segment sales | 13,421 | 7,075 |
| 1,674,345 | 1,374,680 | |
| Chemicals | ||
| External sales | 449,911 | 424,774 |
| Inter-segment sales | 80,328 | 70,242 |
| 530,239 | 495,016 | |
| Corporate and others | ||
| External sales | 759,352 | 563,147 |
| Inter-segment sales | 1,028,800 | 732,356 |
| 1,788,152 | 1,295,503 | |
| Elimination of Inter-segment sales | (2,620,886) | (2,109,426) |
| Revenue from primary business | 3,257,356 | 2,679,500 |
| Other operating revenues | ||
| Exploration and production | 5,169 | 6,674 |
| Refining | 3,875 | 5,161 |
| Marketing and distribution | 39,529 | 36,864 |
| Chemicals | 9,913 | 10,487 |
| Corporate and others | 2,326 | 2,198 |
| Other operating revenues | 60,812 | 61,384 |
| Revenue | 3,318,168 | 2,740,884 |
191
40 SEGMENT REPORTING (Continued)
| (1) | Information of reportable segmental revenues, profits or losses, assets and liabilities (Continued) |
| 2022 | 2021 | |
| RMB million | RMB million | |
| Result | ||
| Operating profit/(loss) | ||
| By segment | ||
| – Exploration and production | 53,716 | 4,685 |
| – Refining | 12,211 | 65,279 |
| – Marketing and distribution | 24,537 | 21,204 |
| – Chemicals | (14,127) | 11,106 |
| – Corporate and others | 1,318 | (3,225) |
| – Elimination | (1,820) | (4,421) |
| Total segment operating profit | 75,835 | 94,628 |
| Share of profit/(loss) from associates and joint ventures | ||
| – Exploration and production | 2,883 | 2,783 |
| – Refining | (645) | 662 |
| – Marketing and distribution | 3,142 | 3,731 |
| – Chemicals | 3,365 | 11,323 |
| – Corporate and others | 5,734 | 4,754 |
| Aggregate share of profits from associates and joint ventures | 14,479 | 23,253 |
| Investment income | ||
| – Exploration and production | – | 55 |
| – Refining | 35 | (10) |
| – Marketing and distribution | 31 | 3 |
| – Chemicals | 14,258 | (54) |
| – Corporate and others | (264) | 304 |
| Aggregate investment income | 14,060 | 298 |
| Net finance costs | (9,974) | (9,010) |
| Profit before taxation | 94,400 | 109,169 |
| 31 December | 31 December | |
| 2022 | 2021 | |
| RMB million | RMB million | |
| Assets | ||
| Segment assets | ||
| – Exploration and production | 412,543 | 371,100 |
| – Refining | 327,706 | 304,785 |
| – Marketing and distribution | 388,961 | 377,499 |
| – Chemicals | 242,794 | 222,803 |
| – Corporate and others | 148,014 | 133,961 |
| Total segment assets | 1,520,018 | 1,410,148 |
| Interest in associates and joint ventures | 233,941 | 209,179 |
| Financial assets at fair value through other comprehensive income | 730 | 767 |
| Deferred tax assets | 19,952 | 19,389 |
| Cash and cash equivalents, time deposits with financial institutions | 145,052 | 221,989 |
| Other unallocated assets | 28,947 | 27,783 |
| Total assets | 1,948,640 | 1,889,255 |
| Liabilities | ||
| Segment liabilities | ||
| – Exploration and production | 179,151 | 166,486 |
| – Refining | 86,428 | 146,763 |
| – Marketing and distribution | 237,534 | 228,826 |
| – Chemicals | 84,472 | 69,977 |
| – Corporate and others | 221,885 | 198,828 |
| Total segment liabilities | 809,470 | 810,880 |
| Short-term debts | 59,037 | 35,252 |
| Income tax payable | 4,725 | 4,809 |
| Long-term debts | 85,706 | 78,300 |
| Loans from Sinopec Group Company and fellow subsidiaries | 29,547 | 16,563 |
| Deferred tax liabilities | 8,079 | 7,910 |
| Other unallocated liabilities | 15,838 | 20,467 |
| Total liabilities | 1,012,402 | 974,181 |
192
40 SEGMENT REPORTING (Continued)
| (1) | Information of reportable segmental revenues, profits or losses, assets and liabilities (Continued) |
| 2022 | 2021 | |
| RMB million | RMB million | |
| Capital expenditure | ||
| Exploration and production | 83,300 | 68,148 |
| Refining | 22,863 | 22,469 |
| Marketing and distribution | 19,140 | 21,897 |
| Chemicals | 58,612 | 51,648 |
| Corporate and others | 5,181 | 3,786 |
| 189,096 | 167,948 | |
| Depreciation, depletion and amortisation | ||
| Exploration and production | 45,321 | 52,880 |
| Refining | 20,588 | 20,743 |
| Marketing and distribution | 23,461 | 23,071 |
| Chemicals | 17,716 | 16,093 |
| Corporate and others | 2,820 | 2,893 |
| 109,906 | 115,680 | |
| Impairment losses on long-lived assets | ||
| Exploration and production | 2,891 | 2,467 |
| Refining | 2 | 860 |
| Marketing and distribution | 415 | 1,211 |
| Chemicals | 1,790 | 5,332 |
| Corporate and others | 571 | 165 |
| 5,669 | 10,035 |
| (2) | Geographical information |
The following tables set out information about the geographical information of the Group’s external sales and the Group’s non-current assets, excluding financial instruments and deferred tax assets. In presenting information on the basis of geographical segments, segment revenue is based on the geographical location of customers, and segment assets are based on the geographical location of the assets.
| 2022 | 2021 | |
| RMB million | RMB million | |
| External sales | ||
| Mainland China | 2,824,140 | 2,166,040 |
| Singapore | 263,087 | 278,024 |
| Others | 230,941 | 296,820 |
| 3,318,168 | 2,740,884 |
| 31 December | 31 December | |
| 2022 | 2021 | |
| RMB million | RMB million | |
| Non-current assets | ||
| Mainland China | 1,353,771 | 1,268,814 |
| Others | 44,739 | 40,551 |
| 1,398,510 | 1,309,365 |
193
41 PRINCIPAL SUBSIDIARIES
As at 31 December 2022, the following list contains the particulars of subsidiaries which principally affected the results, assets and liabilities of the Group.
| Name of company | Particulars of issued capital (million) | Interests held by the Company % | Interests held by non-controlling interests % | Principal activities |
| Sinopec Great Wall Energy & Chemical Company Limited | RMB22,761 | 100.00 | – | Coal chemical industry investment management, production and sale of coal chemical products |
| Sinopec Yangzi Petrochemical Company Limited | RMB15,651 | 100.00 | – | Manufacturing of intermediate petrochemical products and petroleum products |
| Sinopec Overseas Investment Holding Limited (“SOIH”) | USD3,423 | 100.00 | – | Investment holding of overseas business |
| Sinopec International Petroleum Exploration and Production Limited (“SIPL”) | RMB8,250 | 100.00 | – | Investment in exploration, production and sale of petroleum and natural gas |
| Sinopec Yizheng Chemical Fibre Limited Liability Company | RMB4,000 | 100.00 | – | Production and sale of polyester chips and polyester fibres |
| Sinopec Lubricant Company Limited | RMB3,374 | 100.00 | – | Production and sale of refined petroleum products, lubricant base oil, and petrochemical materials |
| China International United Petroleum and Chemical Company Limited | RMB5,000 | 100.00 | – | Trading of crude oil and petrochemical products |
| Sinopec Qingdao Petrochemical Company Limited | RMB1,595 | 100.00 | – | Manufacturing of intermediate petrochemical products and petroleum products |
| Sinopec Catalyst Company Limited | RMB1,500 | 100.00 | – | Production and sale of catalyst products |
| China Petrochemical International Company Limited | RMB1,400 | 100.00 | – | Trading of petrochemical products |
| Sinopec Chemical Sales Company Limited | RMB1,000 | 100.00 | – | Marketing and distribution of petrochemical products |
| Sinopec Hainan Refining and Chemical Company Limited | RMB9,606 | 100.00 | – | Manufacturing of intermediate petrochemical products and petroleum products |
| Sinopec Beihai Refining and Chemical Limited Liability Company | RMB5,294 | 98.98 | 1.02 | Import and processing of crude oil, production, storage and sale of petroleum products and petrochemical products |
| ZhongKe (Guangdong) Refinery & Petrochemical Company Limited | RMB6,397 | 90.30 | 9.70 | Crude oil processing and petroleum products manufacturing |
| Sinopec Qingdao Refining and Chemical Company Limited | RMB5,000 | 85.00 | 15.00 | Manufacturing of intermediate petrochemical products and petroleum products |
| Marketing Company | RMB28,403 | 70.42 | 29.58 | Marketing and distribution of refined petroleum products |
| Sinopec Kantons Holdings Limited (“Sinopec Kantons”) | HKD248 | 60.33 | 39.67 | Provision of crude oil jetty services and natural gas pipeline transmission services |
| Sinopec-SK (Wuhan) Petrochemical Company Limited (“Sinopec-SK”) | RMB7,193 | 59.00 | 41.00 | Production, sale, research and development of petrochemical products, ethylene and downstream byproducts |
| Gaoqiao Petrochemical | RMB10,000 | 55.00 | 45.00 | Manufacturing of intermediate petrochemical products and petroleum products |
| Sinopec Baling Petrochemical Co.Ltd. (“Baling Petrochemical”) | RMB3,000 | 55.00 | 45.00 | Crude oil processing and petroleum products manufacturing |
| Sinopec Shanghai Petrochemical Company Limited (“Shanghai Petrochemical”) | RMB10,824 | 50.44 | 49.56 | Manufacturing of synthetic fibres, resin and plastics, intermediate petrochemical products and petroleum products |
| Fujian Petrochemical Company Limited (“Fujian Petrochemical”) (i) | RMB10,492 | 50.00 | 50.00 | Manufacturing of plastics, intermediate petrochemical products and petroleum products |
Except for Sinopec Kantons and SOIH, which are incorporated in Bermuda and Hong Kong SAR respectively, all of the above principal subsidiaries are incorporated and operate their businesses principally in the PRC. All of the above principal subsidiaries are limited companies.
Notes:
| (i) | The Group consolidated the financial statements of the entity because it is exposed to, or has rights to, variable returns from its involvement with the entity and has the ability to affect those returns through its power over the entity. |
194
41 PRINCIPAL SUBSIDIARIES (Continued)
Summarised financial information on subsidiaries with material non-controlling interests
Set out below are the summarised financial information which the amount before inter-company eliminations for each subsidiary that has non-controlling interests that are material to the Group.
Summarised consolidated statement of financial position
| Marketing Company | SIPL* | Shanghai Petrochemical | Fujian Petrochemical | Sinopec Kantons | Gaoqiao Petrochemical | Sinopec-SK | ||||||||
At 31 December | At 31 December | At 31 December | At 31 December | At 31 December | At 31 December | At 31 December | At 31 December | At 31 December | At 31 December | At 31 December | At 31 December | At 31 December | At 31 December | |
| 2022 | 2021 | 2022 | 2021 | 2022 | 2021 | 2022 | 2021 | 2022 | 2021 | 2022 | 2021 | 2022 | 2021 | |
| RMB | RMB | RMB | RMB | RMB | RMB | RMB | RMB | RMB | RMB | RMB | RMB | RMB | RMB | |
| million | million | million | million | million | million | million | million | million | million | million | million | million | million | |
| Current assets | 190,697 | 159,599 | 25,677 | 22,759 | 15,766 | 20,932 | 1,901 | 1,464 | 5,436 | 4,761 | 23,991 | 16,253 | 5,781 | 6,791 |
| Current liabilities | (212,593) | (193,315) | (9,468) | (1,430) | (13,998) | (15,796) | (169) | (142) | (209) | (196) | (10,162) | (8,668) | (8,488) | (8,122) |
| Net current (liabilities)/ assets | (21,896) | (33,716) | 16,209 | 21,329 | 1,768 | 5,136 | 1,732 | 1,322 | 5,227 | 4,565 | 13,829 | 7,585 | (2,707) | (1,331) |
| Non-current assets | 326,095 | 326,437 | 12,869 | 8,954 | 25,370 | 25,988 | 10,215 | 13,208 | 7,902 | 8,195 | 15,602 | 21,308 | 20,251 | 20,650 |
| Non-current liabilities | (57,215) | (59,604) | (11,892) | (17,823) | (783) | (747) | (707) | (700) | (232) | (170) | (5,385) | (10,679) | (7,806) | (7,512) |
| Net non-current assets/(liabilities) | 268,880 | 266,833 | 977 | (8,869) | 24,587 | 25,241 | 9,508 | 12,508 | 7,670 | 8,025 | 10,217 | 10,629 | 12,445 | 13,138 |
| Net assets | 246,984 | 233,117 | 17,186 | 12,460 | 26,355 | 30,377 | 11,240 | 13,830 | 12,897 | 12,590 | 24,046 | 18,214 | 9,738 | 11,807 |
| Attributable to owners of the Company | 166,974 | 157,557 | 10,121 | 6,341 | 13,229 | 15,254 | 5,620 | 6,915 | 7,764 | 7,579 | 13,225 | 10,018 | 5,745 | 6,966 |
| Attributable to non-controlling interests | 80,010 | 75,560 | 7,065 | 6,119 | 13,126 | 15,123 | 5,620 | 6,915 | 5,133 | 5,011 | 10,821 | 8,196 | 3,993 | 4,841 |
Summarised consolidated statement of comprehensive income
| Year ended 31 December | Marketing Company | SIPL* | Shanghai Petrochemical | Fujian Petrochemical | Sinopec Kantons | Gaoqiao Petrochemical | Sinopec-SK | |||||||
| 2022 | 2021 | 2022 | 2021 | 2022 | 2021 | 2022 | 2021 | 2022 | 2021 | 2022 | 2021 | 2022 | 2021 | |
| RMB | RMB | RMB | RMB | RMB | RMB | RMB | RMB | RMB | RMB | RMB | RMB | RMB | RMB | |
| million | million | million | million | million | million | million | million | Million | million | million | million | million | million | |
| Revenue | 1,710,428 | 1,408,523 | 3,308 | 2,166 | 82,443 | 89,198 | 4,931 | 5,549 | 529 | 528 | 69,298 | 46,506 | 57,857 | 50,208 |
| Profit/(loss) for the year | 19,902 | 18,582 | 2,576 | 1,429 | (2,842) | 2,077 | (1,925) | 951 | 346 | 871 | 3,157 | 3,536 | (1,101) | 1,606 |
| Total comprehensive income | 22,418 | 18,439 | 6,438 | 1,045 | (2,665) | 2,218 | (1,925) | 951 | 734 | 677 | 3,161 | 3,677 | (1,101) | 1,606 |
| Comprehensive income attributable to non-controlling interests | 8,110 | 6,822 | 2,659 | 579 | (1,318) | 1,101 | (962) | 476 | 291 | 268 | 1,423 | 1,655 | (451) | 659 |
| Dividends paid to non-controlling interests | 3,453 | 7,064 | – | – | 548 | 541 | 333 | 64 | 169 | 164 | 984 | 256 | 397 | – |
Summarised statement of cash flows
| Year ended 31 December | Marketing Company | SIPL* | Shanghai Petrochemical | Fujian Petrochemical | Sinopec Kantons | Gaoqiao Petrochemical | Sinopec-SK | |||||||
| 2022 | 2021 | 2022 | 2021 | 2022 | 2021 | 2022 | 2021 | 2022 | 2021 | 2022 | 2021 | 2022 | 2021 | |
| RMB | RMB | RMB | RMB | RMB | RMB | RMB | RMB | RMB | RMB | RMB | RMB | RMB | RMB | |
| million | million | million | million | million | million | million | Million | million | Million | million | million | million | million | |
| Net cash generated from/(used in) operating activities | 43,408 | 28,923 | 1,458 | 690 | (7,459) | 3,950 | 2 | (292) | 133 | 133 | (1,247) | (1,577) | (1,538) | 5,476 |
| Net cash (used in)/generated from investing activities | (23,490) | 2,420 | 11,824 | 15 | 4,390 | (2,359) | 653 | 420 | (1,153) | 1,276 | 4,235 | 1,432 | (1,556) | (1,789) |
| Net cash (used in)/generated from financing activities | (15,984) | (31,081) | (1,369) | (1,172) | (1,169) | (3,393) | (682) | (142) | (434) | (1,066) | (2,986) | 146 | 1,541 | (653) |
| Net increase/ (decrease) in cash and cash equivalents | 3,934 | 262 | 11,913 | (467) | (4,238) | (1,802) | (27) | (14) | (1,454) | 343 | 2 | 1 | (1,553) | 3,034 |
| Cash and cash equivalents at 1 January | 8,999 | 8,642 | 7,068 | 7,699 | 5,112 | 6,916 | 54 | 68 | 3,432 | 3,182 | 1 | – | 4,100 | 1,066 |
| Effect of foreign currency exchange rate changes | 271 | 95 | 1,059 | (164) | 15 | (2) | – | – | 246 | (93) | – | – | (3) | – |
| Cash and cash equivalents at 31 December | 13,204 | 8,999 | 20,040 | 7,068 | 889 | 5,112 | 27 | 54 | 2,224 | 3,432 | 3 | 1 | 2,544 | 4,100 |
| * | The non-controlling interests of subsidiaries which the Group holds 100% of equity interests at the end of the year are the non-controlling interests of their subsidiaries. |
195
42 FINANCIAL RISK MANAGEMENT AND FAIR VALUES
Overview
Financial assets of the Group include cash and cash equivalents, time deposits with financial institutions, financial assets at fair value through profit or loss, derivative financial assets, trade accounts receivable, amounts due from Sinopec Group Company and fellow subsidiaries, amounts due from associates and joint ventures, financial assets at FVOCI and other receivables. Financial liabilities of the Group include short-term debts, loans from Sinopec Group Company and fellow subsidiaries, derivative financial liabilities, trade accounts payable and bills payable, amounts due to Sinopec Group Company and fellow subsidiaries, amounts due to associates and joint ventures, other payables, long-term debts and lease liabilities.
The Group has exposure to the following risks from its uses of financial instruments:
• credit risk;
• liquidity risk; and
• market risk.
The Board of Directors has overall responsibility for the establishment, oversight of the Group’s risk management framework, and developing and monitoring the Group’s risk management policies.
The Group’s risk management policies are established to identify and analyse the risks faced by the Group, and set appropriate risk limits and controls to monitor risks and adherence to limits. Risk management policies and systems are reviewed regularly to reflect changes in market conditions and the Group’s activities. The Group, through its training and management controls and procedures, aims to develop a disciplined and constructive control environment in which all employees understand their roles and obligations. Internal audit department undertakes both regular and ad hoc reviews of risk management controls and procedures, the results of which are reported to the Group’s audit committee.
Credit risk
| (i) | Risk management |
Credit risk is the risk of financial loss to the Group if a customer or counterparty to a financial instrument fails to meet its contractual obligations, and arises principally from the Group’s deposits placed with financial institutions (including structured deposits) and receivables from customers. To limit exposure to credit risk relating to deposits, the Group primarily places cash deposits only with large financial institutions in the PRC with acceptable credit ratings. The majority of the Group’s trade accounts receivable relate to sales of petroleum and chemical products to related parties and third parties operating in the petroleum and chemical industries. No single customer accounted for greater than 10% of total trade accounts receivable at 31 December 2022, except the amounts due from Sinopec Group Company and fellow subsidiaries. Management performs ongoing credit evaluations of the Group’s customers’ financial condition and generally does not require collateral on trade accounts receivable. The Group maintains a loss allowance for expected credit losses and actual losses have been within management’s expectations.
The carrying amounts of cash and cash equivalents, time deposits with financial institutions, financial assets at fair value through profit or loss, derivative financial assets, trade accounts receivable, financial assets at FVOCI and other receivables, represent the Group’s maximum exposure to credit risk in relation to financial assets.
| (ii) | Impairment of financial assets |
The Group’s primary type of financial assets that are subject to the expected credit loss model is trade accounts receivable, financial assets at FVOCI and other receivables.
The Group’s cash deposits are placed only with large financial institutions with acceptable credit ratings, and there is no material impairment loss identified.
For trade accounts receivable and financial assets at FVOCI, the Group applies the IFRS 9 simplified approach to measuring ECLs which uses a lifetime expected loss allowance for all trade accounts receivable and financial assets at FVOCI.
To measure the ECLs, trade accounts receivable and financial assets at FVOCI have been grouped based on shared credit risk characteristics and the days past due.
The ECLs were calculated based on historical actual credit loss experience. The rates were considered the differences between economic conditions during the period over which the historical data has been collected, current conditions and the Group’s view of economic conditions over the expected lives of the receivables. The Group performed the calculation of ECL rates by the operating segment.
196
42 FINANCIAL RISK MANAGEMENT AND FAIR VALUES (Continued)
Credit risk (Continued)
| (ii) | Impairment of financial assets (Continued) |
The following table provides information about the exposure to credit risk and ECLs for accounts receivable as at December 31, 2022 and 2021.
| Impairment provision on individual basis | Impairment provision on provision matrix basis | |||||
| Gross carrying amount | Carrying amount | Impairment provision on individual basis | Weighted- average loss rate | Impairment provision | Loss allowance | |
| 31 December 2022 | RMB million | RMB million | RMB million | % | RMB million | RMB million |
| Current and within 1 year past due | 46,097 | 7,014 | 2 | 0.1% | 56 | 58 |
| 1 to 2 years past due | 216 | 29 | 25 | 20.9% | 39 | 64 |
| 2 to 3 years past due | 269 | 193 | 148 | 43.4% | 33 | 181 |
| Over 3 years past due | 3,861 | 3,487 | 3,405 | 99.2% | 371 | 3,776 |
| Total | 50,443 | 10,723 | 3,580 | 499 | 4,079 | |
| Impairment provision on individual basis | Impairment provision on provision matrix basis | |||||
| Gross carrying amount | Carrying amount | Impairment provision on individual basis | Weighted- average loss rate | Impairment provision | Loss allowance | |
| 31 December 2021 | RMB million | RMB million | RMB million | % | RMB million | RMB million |
| Current and within 1 year past due | 34,263 | 4,280 | 26 | 0.2% | 57 | 83 |
| 1 to 2 years past due | 623 | 500 | 137 | 35.8% | 44 | 181 |
| 2 to 3 years past due | 3,411 | 3,324 | 3,146 | 50.6% | 44 | 3,190 |
| Over 3 years past due | 597 | 208 | 190 | 100.0% | 389 | 579 |
| Total | 38,894 | 8,312 | 3,499 | 534 | 4,033 | |
All of the entity’s other receivables are considered to have low credit risk, and the loss allowance recognised during the period was therefore limited to 12 months expected losses. The Group considers there was no significant increase in credit risk for other receivables by taking into account of their past history of making payments when due and current ability to pay, and thus the impairment provision recognised during the period was limited to 12 months expected losses.
Liquidity risk
Liquidity risk is the risk that the Group will not be able to meet its financial obligations as they fall due. The Group’s approach to managing liquidity is to ensure, as far as possible, that it will always have sufficient liquidity to meet its liabilities when due, under both normal and stressed conditions, without incurring unacceptable losses or risking damage to the Group’s reputation. Management prepares monthly cash flow budget to ensure that the Group will always have sufficient liquidity to meet its financial obligations as they fall due. The Group arranges and negotiates financing with financial institutions and maintains a certain level of standby credit facilities to reduce the Group’s liquidity risk.
As at 31 December 2022, the Group has standby credit facilities with several PRC financial institutions which provide borrowings up to RMB454,857 million (2021: RMB441,559 million) on an unsecured basis, at a weighted average interest rate of 2.38% per annum (2021: 2.81%). As at 31 December 2022, the Group’s outstanding borrowings under these facilities were RMB21,313 million (2021: RMB11,700 million) and were included in debts.
The following table sets out the remaining contractual maturities at the date of the statement of financial position of the Group’s financial liabilities, which are based on contractual undiscounted cash flows (including interest payments computed using contractual rates or, if floating, based on prevailing rates current at the date of the statement of financial position) and the earliest date the Group would be required to repay:
| 31 December 2022 | ||||||
| Total | ||||||
| contractual | Within | More than 1 | More than 2 | |||
| Carrying | undiscounted | 1 year or | year but less | years but less | More than | |
| amount | cash flow | on demand | than 2 years | than 5 years | 5 years | |
| RMB million | RMB million | RMB million | RMB million | RMB million | RMB million | |
| Short-term debts | 59,037 | 59,774 | 59,774 | – | – | – |
| Long-term debts | 85,706 | 94,823 | 2,207 | 13,620 | 68,180 | 10,816 |
| Loans from Sinopec Group Company and fellow subsidiaries | 29,547 | 32,222 | 7,813 | 4,288 | 13,962 | 6,159 |
| Lease liabilities | 182,411 | 299,176 | 16,699 | 12,905 | 36,984 | 232,588 |
| Derivative financial liabilities | 7,313 | 7,313 | 7,313 | – | – | – |
| Trade accounts payable and bills payable | 269,424 | 269,424 | 269,424 | – | – | – |
| Other payables | 121,716 | 121,716 | 121,716 | – | – | – |
| 755,154 | 884,448 | 484,946 | 30,813 | 119,126 | 249,563 | |
197
42 FINANCIAL RISK MANAGEMENT AND FAIR VALUES (Continued)
Liquidity risk (Continued)
| 31 December 2021 | ||||||
| Total | ||||||
| contractual | Within | More than 1 | More than 2 | |||
| Carrying | undiscounted | 1 year or | year but less | years but less | More than | |
| amount | cash flow | on demand | than 2 years | than 5 years | 5 years | |
| RMB million | RMB million | RMB million | RMB million | RMB million | RMB million | |
| Short-term debts | 35,252 | 35,871 | 35,871 | – | – | – |
| Long-term debts | 78,300 | 85,718 | 2,169 | 49,390 | 27,518 | 6,641 |
| Loans from Sinopec Group Company and fellow subsidiaries | 16,563 | 18,457 | 3,174 | 604 | 10,712 | 3,967 |
| Lease liabilities | 185,406 | 296,485 | 15,833 | 12,031 | 35,411 | 233,210 |
| Derivative financial liabilities | 3,223 | 3,223 | 3,223 | – | – | – |
| Trade accounts payable and bills payable | 215,640 | 215,640 | 215,640 | – | – | – |
| Other payables | 117,420 | 117,420 | 117,420 | – | – | – |
| 651,804 | 772,814 | 393,330 | 62,025 | 73,641 | 243,818 | |
Management believes that the Group’s current cash on hand, expected cash flows from operations and available standby credit facilities from financial institutions will be sufficient to meet the Group’s short-term and long-term capital requirements.
Market risk
Market risk is the risk that changes in market prices, such as foreign exchange rates and interest rates. The objective of market risk management is to manage and control market risk exposures within acceptable parameters, while optimising the return on risk.
| (a) | Currency risk |
Currency risk arises on financial instruments that are denominated in a currency other than the functional currency in which they are measured.
The Group does not have significant financial instruments that are denominated in foreign currencies other than the functional currencies of respective entities as at 31 December, and consequently does not have significant exposure to foreign currency risk.
| (b) | Interest rate risk |
The Group’s interest rate risk exposure arises primarily from its short-term and long-term debts and loans from Sinopec Group Company and fellow subsidiaries. Debts bearing interest at variable rates and at fixed rates expose the Group to cash flow interest rate risk and fair value interest rate risk respectively. The interest rates and terms of repayment of short-term and long-term debts, and loans from Sinopec Group Company and fellow subsidiaries of the Group are disclosed in Note 30.
As at 31 December 2022, it is estimated that a general increase/decrease of 100 basis points in variable interest rates, with all other variables held constant, would decrease/increase the Group’s profit for the year by approximately RMB524 million (2021: decrease/increase by approximately RMB254 million). This sensitivity analysis has been determined assuming that the change of interest rates was applied to the Group’s debts outstanding at the date of the statement of financial position with exposure to cash flow interest rate risk. The analysis is performed on the same basis for 2021.
| (c) | Commodity price risk |
The Group engages in oil and gas operations and is exposed to commodity price risk related to price volatility of crude oil, refined oil products and chemical products. The fluctuations in prices of crude oil, refined oil products and chemical products could have significant impact on the Group. The Group uses derivative financial instruments, including commodity futures and swaps contracts, to manage a portion of this risk.
Based on the dynamic study and judging of the market, combined with the resource demand and production and operation plan, the Group evaluate and monitor the market risk exposure caused by transaction positions, and continuously manage and hedge the risk of commodity price fluctuation caused by market changes.
As at 31 December 2022, the Group had certain commodity contracts of crude oil, refined oil products and chemical products designated as qualified cash flow hedges and economic hedges. As at 31 December 2022, the fair value of such derivative hedging financial instruments is derivative financial assets of RMB19,328 million (2021: RMB18,359 million) and derivative financial liabilities of RMB7,235 million (2021: RMB3,214 million).
As at 31 December 2022, it is estimated that a general increase/decrease of USD10 per barrel in basic price of derivative financial instruments, with all other variables held constant, would impact the fair value of derivative financial instruments, which would decrease/increase the Group’s profit for the year by approximately RMB5,104 million (2021: decrease/increase RMB2,996 million), and increase/decrease the Group’s other reserves by approximately RMB192 million (2021: decrease/increase RMB1,160 million). This sensitivity analysis has been determined assuming that the change in prices had occurred at the date of the statement of financial position and the change was applied to the Group’s derivative financial instruments at that date with exposure to commodity price risk. The analysis is performed on the same basis for 2021.
198
42 FINANCIAL RISK MANAGEMENT AND FAIR VALUES (Continued)
Fair values
| (i) | Financial instruments carried at fair value |
The following table presents the carrying value of financial instruments measured at fair value at the date of the statement of financial position across the three levels of the fair value hierarchy defined in IFRS 7, ‘Financial Instruments: Disclosures’, with the fair value of each financial instrument categorised in its entirety based on the lowest level of input that is significant to that fair value measurement. The levels are defined as follows:
| • | Level 1 (highest level): fair values measured using quoted prices (unadjusted) in active markets for identical financial instruments. |
| • | Level 2: fair values measured using quoted prices in active markets for similar financial instruments, or using valuation techniques in which all significant inputs are directly or indirectly based on observable market data. |
| • | Level 3 (lowest level): fair values measured using valuation techniques in which any significant input is not based on observable market data. |
At 31 December 2022
| Level 1 | Level 2 | Level 3 | Total | |
| RMB million | RMB million | RMB million | RMB million | |
| Assets | ||||
| Financial assets at fair value through profit or loss: | ||||
| – Fund Investments | 2 | – | – | 2 |
| Derivative financial assets: | ||||
| – Derivative financial assets | 7,857 | 11,478 | – | 19,335 |
| Financial assets at fair value through other comprehensive income: | ||||
| – Equity instruments | 114 | – | 616 | 730 |
| – Trade accounts receivable and bills receivable | – | – | 3,507 | 3,507 |
| 7,973 | 11,478 | 4,123 | 23,574 | |
| Liabilities | ||||
| Derivative financial liabilities: | ||||
| – Derivative financial liabilities | 1,293 | 6,020 | – | 7,313 |
| 1,293 | 6,020 | – | 7,313 |
At 31 December 2021
| Level 1 | Level 2 | Level 3 | Total | |
| RMB million | RMB million | RMB million | RMB million | |
| Assets | ||||
| Derivative financial assets: | ||||
| – Derivative financial assets | 5,883 | 12,488 | – | 18,371 |
| Financial assets at fair value through other comprehensive income: | ||||
| – Equity instruments | 179 | – | 588 | 767 |
| – Trade accounts receivable and bills receivable | – | – | 5,939 | 5,939 |
| 6,062 | 12,488 | 6,527 | 25,077 | |
| Liabilities | ||||
| Derivative financial liabilities: | ||||
| – Derivative financial liabilities | 804 | 2,419 | – | 3,223 |
| 804 | 2,419 | – | 3,223 |
During the years ended 31 December 2022 and 2021, there was no transfer between instruments in Level 1 and Level 2.
Management of the Group uses discounted cash flow model with inputted interest rate and commodity index, which were influenced by historical fluctuation and the probability of market fluctuation, to evaluate the fair value of the structured deposits and trade accounts receivable and bills receivable classified as Level 3 financial assets.
199
42 FINANCIAL RISK MANAGEMENT AND FAIR VALUES (Continued)
Fair values (Continued)
| (ii) | Fair values of financial instruments carried at other than fair value |
The disclosures of the fair value estimates, and their methods and assumptions of the Group’s financial instruments, are made to comply with the requirements of IFRS 7 and IFRS 9 and should be read in conjunction with the Group’s consolidated financial statements and related notes. The estimated fair value amounts have been determined by the Group using market information and valuation methodologies considered appropriate. However, considerable judgement is required to interpret market data to develop the estimates of fair value. Accordingly, the estimates presented herein are not necessarily indicative of the amounts the Group could realise in a current market exchange. The use of different market assumptions and/or estimation methodologies may have a material effect on the estimated fair value amounts.
The fair values of the Group’s financial instruments carried at other than fair value (other than long-term indebtedness and investments in unquoted equity securities) approximate their carrying amounts due to the short-term maturity of these instruments. The fair values of long-term indebtedness are estimated by discounting future cash flows using current market interest rates offered to the Group for debt with substantially the same characteristic and maturities range from 2.66% to 4.35% (2021: 0.30% to 4.65%). The following table presents the carrying amount and fair value of the Group’s long-term indebtedness other than loans from Sinopec Group Company and fellow subsidiaries at 31 December 2022 and 2021:
| 31 December | 31 December | |
| 2022 | 2021 | |
| RMB million | RMB million | |
| Carrying amount | 130,282 | 88,593 |
| Fair value | 125,866 | 85,610 |
The Group has not developed an internal valuation model necessary to estimate the fair values of loans from Sinopec Group Company and fellow subsidiaries as it is not considered practicable to estimate their fair values because the cost of obtaining discount and borrowing rates for comparable borrowings would be excessive based on the Group’s existing capital structure and the terms of the borrowings.
Except for the above items, the financial assets and liabilities of the Group are carried at amounts not materially different from their fair values at 31 December 2022 and 2021.
43 ACCOUNTING ESTIMATES AND JUDGEMENTS
The Group’s financial condition and results of operations are sensitive to accounting methods, assumptions and estimates that underlie the preparation of the consolidated financial statements. Management bases the assumptions and estimates on historical experience and on various other assumptions that it believes to be reasonable and which form the basis for making judgements about matters that are not readily apparent from other sources. On an ongoing basis, management evaluates its estimates. Actual results may differ from those estimates as facts, circumstances and conditions change.
The selection of critical accounting policies, the judgements and other uncertainties affecting application of such policies and the sensitivity of reported results to changes in conditions and assumptions are factors to be considered when reviewing the consolidated financial statements. The significant accounting policies are set forth in Note 2. Management believes the following critical accounting policies involve the most significant judgements and estimates used in the preparation of the consolidated financial statements.
Oil and gas properties and reserves
The accounting for the exploration and production’s oil and gas activities is subject to accounting rules that are unique to the oil and gas industry. There are two methods to account for oil and gas business activities, the successful efforts method and the full cost method. The Group has elected to use the successful efforts method. The successful efforts method reflects the volatility that is inherent in exploring for mineral resources in that costs of unsuccessful exploratory efforts are charged to expense as they are incurred. These costs primarily include dry hole costs, seismic costs and other exploratory costs. Under the full cost method, these costs are capitalised and written-off or depreciated over time.
Engineering estimates of the Group’s oil and gas reserves are inherently imprecise and represent only approximate amounts because of the subjective judgements involved in developing such information. There are authoritative guidelines regarding the engineering criteria that have to be met before estimated oil and gas reserves can be designated as “proved”. Proved and proved developed reserves estimates are updated at least annually and take into account recent production and technical information about each field. In addition, as prices and cost levels change from year to year, the estimates of proved and proved developed reserves also change. This change is considered a change in estimate for accounting purposes and is reflected on a prospective basis in relation to depreciation rates. Oil and gas reserves have a direct impact on the assessment of the recoverability of the carrying amounts of oil and gas properties reported in the financial statements. If proved reserves estimates are revised downwards, earnings could be affected by changes in depreciation expense or an immediate write-down of the property’s carrying amount.
Future dismantlement costs for oil and gas properties are estimated with reference to engineering estimates after taking into consideration the anticipated method of dismantlement required in accordance with industry practices in similar geographic area, including estimation of economic life of oil and gas properties, technology and price level. The present values of these estimated future dismantlement costs are capitalised as oil and gas properties with equivalent amounts recognised as provisions for dismantlement costs.
Despite the inherent imprecision in these engineering estimates, these estimates are used in determining depreciation expense, impairment loss and future dismantlement costs. Capitalised costs of proved oil and gas properties are amortised on a unit-of-production method based on volumes produced and reserves.
200
43 ACCOUNTING ESTIMATES AND JUDGEMENTS (Continued)
Impairment for long-lived assets
If circumstances indicate that the net book value of a long-lived asset, may not be recoverable, the asset may be considered “impaired”, and an impairment loss may be recognised in accordance with IAS 36 “Impairment of Assets”. The carrying amounts of long-lived assets are reviewed periodically in order to assess whether the recoverable amounts have declined below the carrying amounts. These assets are tested for impairment whenever events or changes in circumstances, including environmental protection and energy structure transition variables, indicate that their recorded carrying amounts may not be recoverable. When such a decline has occurred, the carrying amount is reduced to recoverable amount. For goodwill, the recoverable amount is estimated annually. The recoverable amount is the greater of the net selling price and the value in use. It is difficult to precisely estimate selling price because quoted market prices for the Group’s assets or cash-generating units are not readily available. In determining the value in use, expected cash flows generated by the asset or the cash-generating units are discounted to their present value, which requires significant judgement relating to future selling prices of crude oil, natural gas, refined and chemical products, the production costs, the product mix, production volumes, production profiles, the oil and gas reserves and discount rate. Management uses all readily available information in determining an amount that is a reasonable approximation of recoverable amount, including estimates based on reasonable and supportable assumptions and projections of sale volume, selling price, amount of operating costs and discount rate.
Depreciation
Property, plant and equipment, other than oil and gas properties, are depreciated on a straight-line basis over the estimated useful lives of the assets, after taking into account the estimated residual value. Management reviews the estimated useful lives of the assets at least annually in order to determine the amount of depreciation expense to be recorded during any reporting period. The useful lives are based on the Group’s historical experience with similar assets and take into account anticipated technological changes. The depreciation expense for future periods is adjusted if there are significant changes from previous estimates.
Measurement of expected credit losses
The Group measures and recognises ECLs using readiness matrix, considering reasonable and supportable information about the relevant past events, current conditions and forecasts of future economic conditions. The Group regularly monitors and reviews the assumptions used for estimating ECLs.
Allowance for diminution in value of inventories
If the costs of inventories become higher than their net realisable values, an allowance for diminution in value of inventories is recognised. Net realisable value represents the estimated selling price in the ordinary course of business, less the estimated costs of completion and the estimated costs necessary to make the sale. Management bases the estimates on all available information, including the current market prices of the finished goods, and historical operating costs. If the actual selling prices were to be lower or the costs of completion were to be higher than estimated, the actual allowance for diminution in value of inventories could be higher than estimated.
44 PARENT AND ULTIMATE HOLDING COMPANY
The directors consider the parent and ultimate holding company of the Group as at 31 December 2022 is Sinopec Group Company, a state-owned enterprise established in the PRC. This entity does not produce financial statements available for public use.
201
45 STATEMENT OF FINANCIAL POSITION AND RESERVE MOVEMENT OF THE COMPANY
| STATEMENT OF FINANCIAL POSITION OF THE COMPANY (Amounts in million) | Note | 31 December | 31 December |
| 2022 | 2021 | ||
| RMB | RMB | ||
| Non-current assets | |||
| Property, plant and equipment, net | 296,480 | 284,618 | |
| Construction in progress | 81,501 | 66,146 | |
| Right-of-use assets | 97,656 | 113,304 | |
| Investment in subsidiaries | 290,191 | 269,456 | |
| Interest in associates | 75,449 | 73,782 | |
| Interest in joint ventures | 17,239 | 17,609 | |
| Financial assets at fair value through other comprehensive income | 201 | 201 | |
| Deferred tax assets | 7,737 | 8,715 | |
| Long-term prepayments and other assets | 47,586 | 38,848 | |
| Total non-current assets | 914,040 | 872,679 | |
| Current assets | |||
| Cash and cash equivalents | 23,228 | 34,575 | |
| Time deposits with financial institutions | 31,350 | 76,116 | |
| Financial assets at fair value through profit or loss | 2 | – | |
| Derivative financial assets | 3,892 | 4,503 | |
| Trade accounts receivable | 33,841 | 21,146 | |
| Financial assets at fair value through other comprehensive income | 703 | 227 | |
| Dividends receivable | 1,977 | 971 | |
| Inventories | 70,376 | 63,661 | |
| Prepaid expenses and other current assets | 62,261 | 73,906 | |
| Total current assets | 227,630 | 275,105 | |
| Current liabilities | |||
| Short-term debts | 35,954 | 24,387 | |
| Loans from Sinopec Group Company and fellow subsidiaries | 673 | 867 | |
| Lease liabilities | 6,682 | 7,085 | |
| Derivative financial liabilities | 4,299 | 1,121 | |
| Trade accounts payable and bills payable | 111,143 | 91,365 | |
| Contract liabilities | 9,769 | 7,505 | |
| Other payables | 269,684 | 280,560 | |
| Total current liabilities | 438,204 | 412,890 | |
| Net current liabilities | 210,574 | 137,785 | |
| Total assets less current liabilities | 703,466 | 734,894 | |
| Non-current liabilities | |||
| Long-term debts | 54,859 | 56,765 | |
| Loans from Sinopec Group Company and fellow subsidiaries | 11,433 | 9,015 | |
| Lease liabilities | 91,878 | 104,426 | |
| Provisions | 38,298 | 35,271 | |
| Other long-term liabilities | 2,954 | 3,955 | |
| Total non-current liabilities | 199,422 | 209,432 | |
| 504,044 | 525,462 | ||
| Equity | |||
| Share capital | 119,896 | 121,071 | |
| Reserves | (a) | 384,148 | 404,391 |
| Total equity | 504,044 | 525,462 |
202
45 STATEMENT OF FINANCIAL POSITION AND RESERVE MOVEMENT OF THE COMPANY (Continued)
| (a) | RESERVES MOVEMENT OF THE COMPANY |
The reconciliation between the opening and closing balances of each component of the Group’s consolidated reserves is set out in the consolidated statement of changes in equity. Details of the change in the Company’s individual component of reserves between the beginning and the end of the year are as follows:
| The Company | ||
| 2022 | 2021 | |
| RMB million | RMB million | |
| Capital reserve | ||
| Balance at 1 January | 8,303 | 9,382 |
| Other equity movements under the equity method | (1,265) | – |
| Others | – | (1,079) |
| Balance at 31 December | 7,038 | 8,303 |
| Share premium | ||
| Balance at 1 January | 55,850 | 55,850 |
| Purchase of own shares | (3,004) | – |
| Balance at 31 December | 52,846 | 55,850 |
| Statutory surplus reserve | ||
| Balance at 1 January | 96,224 | 92,280 |
| Appropriation | 4,610 | 3,944 |
| Balance at 31 December | 100,834 | 96,224 |
| Discretionary surplus reserve | ||
| Balance at 1 January | 117,000 | 117,000 |
| Balance at 31 December | 117,000 | 117,000 |
| Other reserves | ||
| Balance at 1 January | 9,464 | 8,881 |
| Share of other comprehensive income of associates and joint ventures, net of deferred tax | 10 | 12 |
| Cash flow hedges, net of deferred tax | (5,207) | 102 |
| Special reserve | 87 | 469 |
| Balance at 31 December | 4,354 | 9,464 |
| Retained earnings | ||
| Balance at 1 January | 117,550 | 116,919 |
| Profit for the year | 45,884 | 39,950 |
| Distribution to owners (Note 14) | (56,903) | (35,110) |
| Appropriation | (4,610) | (3,944) |
| Special reserve | (87) | (469) |
| Others | 242 | 204 |
| Balance at 31 December | 102,076 | 117,550 |
| 384,148 | 404,391 | |
203
(C) DIFFERENCES BETWEEN CONSOLIDATED FINANCIAL STATEMENTS PREPARED IN ACCORDANCE WITH THE ACCOUNTING POLICIES COMPLYING WITH CASS AND IFRS (UNAUDITED)
Other than the differences in the classifications of certain financial statements captions and the accounting for the items described below, there are no material differences between the Group’s consolidated financial statements prepared in accordance with the accounting policies complying with CASs and IFRS. The reconciliation presented below is included as supplemental information, is not required as part of the basic financial statements and does not include differences related to classification, presentation or disclosures. Such information has not been subject to independent audit or review. The major differences are:
| (i) | GOVERNMENT GRANTS |
Under CASs, grants from the government are credited to capital reserve if required by relevant governmental regulations. Under IFRS, government grants relating to the purchase of fixed assets are recognised as deferred income and are transferred to the income statement over the useful life of these assets.
| (ii) | SAFETY PRODUCTION FUND |
Under CASs, safety production fund should be recognised in profit or loss with a corresponding increase in reserve according to PRC regulations. Such reserve is reduced for expenses incurred for safety production purposes or, when safety production related fixed assets are purchased, is reduced by the purchased cost with a corresponding increase in the accumulated depreciation. Such fixed assets are not depreciated thereafter. Under IFRS, payments are expensed as incurred, or capitalised as fixed assets and depreciated according to applicable depreciation methods.
Effects of major differences between the shareholders’ equity under CASs and the total equity under IFRS are analysed as follows:
| Note | 31 December | 31 December | |
| 2022 | 2021 | ||
| RMB million | RMB million | ||
| Shareholders’ equity under CASs | 937,153 | 916,041 | |
| Adjustments: | |||
| Government grants | (i) | (915) | (967) |
| Total equity under IFRS* | 936,238 | 915,074 |
Effects of major differences between the net profit under CASs and the profit for the year under IFRS are analysed as follows:
| Note | 2022 | 2021 | |
| RMB million | RMB million | ||
| Net profit under CASs | 75,758 | 85,030 | |
| Adjustments: | |||
| Government grants | (i) | 52 | 51 |
| Safety production fund | (ii) | 179 | 775 |
| Others | (346) | (5) | |
| Profit for the year under IFRS* | 75,643 | 85,851 |
| * | The figures are extracted from the consolidated financial statements prepared in accordance with the accounting policies complying with IFRS during the year ended 31 December 2021 and 2022 which have been audited by KPMG. |
204
(D) SUPPLEMENTAL INFORMATION ON OIL AND GAS PRODUCING ACTIVITIES (UNAUDITED)
In accordance with “Accounting Standards Codification (ASC) Topic 932 Extractive Activities – Oil and Gas”, issued by the Financial Accounting Standards Board of the United States, “Rule 4-10 of Regulation S-X”, issued by Securities and Exchange Commission (SEC), and in accordance with “Industrial Information Disclosure Guidelines for Public Company – No.8 Oil and Gas Exploitation”, issued by Shanghai Stock Exchange, this section provides supplemental information on oil and gas exploration and producing activities of the Group and its equity method investments at 31 December 2022 and 2021, and for the years then ended in the following six separate tables. Tables I through III provide historical cost information under IFRS pertaining to capitalised costs related to oil and gas producing activities; costs incurred in oil and gas exploration and development; and results of operation related to oil and gas producing activities. Tables IV through VI present information on the Group’s and its equity method investments’ estimated net proved reserve quantities; standardised measure of discounted future net cash flows; and changes in the standardised measure of discounted cash flows.
Tables I to VI of supplemental information on oil and gas producing activities set out below represent information of the Company and its consolidated subsidiaries and equity method investments.
Table I: Capitalised costs related to oil and gas producing activities
| 2022 | 2021 | |||||
| RMB million | RMB million | |||||
| Other | Other | |||||
| Total | China | countries | Total | China | countries | |
| The Group | ||||||
| Property cost, wells and related equipments and facilities | 840,719 | 796,403 | 44,316 | 793,045 | 752,352 | 40,693 |
| Supporting equipments and facilities | 202,262 | 202,238 | 24 | 188,766 | 188,742 | 24 |
| Uncompleted wells, equipments and facilities | 53,142 | 53,118 | 24 | 43,349 | 43,236 | 113 |
| Total capitalised costs | 1,096,123 | 1,051,759 | 44,364 | 1,025,160 | 984,330 | 40,830 |
| Accumulated depreciation, depletion, amortisation and impairment losses | (832,093) | (789,133) | (42,960) | (787,623) | (748,705) | (38,918) |
| Net capitalised costs | 264,030 | 262,626 | 1,404 | 237,537 | 235,625 | 1,912 |
| Equity method investments | ||||||
| Share of net capitalised costs of associates and joint ventures | 4,723 | – | 4,723 | 3,521 | – | 3,521 |
| Total of the Group’s and its equity method investments’ net capitalised costs | 268,753 | 262,626 | 6,127 | 241,058 | 235,625 | 5,433 |
Table II: Costs incurred in oil and gas exploration and development
| 2022 | 2021 | |||||
| RMB million | RMB million | |||||
| Other | Other | |||||
| Total | China | countries | Total | China | countries | |
| The Group | ||||||
| Exploration | 23,269 | 23,269 | – | 21,762 | 21,762 | – |
| Development | 52,984 | 52,984 | – | 46,147 | 45,590 | 557 |
| Total costs incurred | 76,253 | 76,253 | – | 67,909 | 67,352 | 557 |
| Equity method investments | ||||||
| Share of costs of exploration and development of associates and joint ventures | 1,796 | – | 1,796 | 442 | – | 442 |
| Total of the Group’s and its equity method investments’ exploration and development costs | 78,049 | 76,253 | 1,796 | 68,351 | 67,352 | 999 |
205
Table III: Results of operations related to oil and gas producing activities
| 2022 | 2021 | |||||
| RMB million | RMB million | |||||
| Other | Other | |||||
| Total | China | countries | Total | China | countries | |
| The Group | ||||||
| Revenues | ||||||
| Sales | 96,616 | 96,616 | – | 72,953 | 72,953 | – |
| Transfers | 118,120 | 114,812 | 3,308 | 86,650 | 84,484 | 2,166 |
| 214,736 | 211,428 | 3,308 | 159,603 | 157,437 | 2,166 | |
| Production costs excluding taxes | (50,385) | (49,372) | (1,013) | (49,649) | (48,674) | (975) |
| Exploration expenses | (10,591) | (10,591) | – | (12,382) | (12,382) | – |
| Depreciation, depletion, amortisation and impairment losses | (46,771) | (46,322) | (449) | (54,104) | (53,644) | (460) |
| Taxes other than income tax | (26,466) | (26,466) | – | (11,249) | (11,249) | – |
| Profit before taxation | 80,523 | 78,677 | 1,846 | 32,219 | 31,488 | 731 |
| Income tax expense | (20,351) | (19,669) | (682) | (8,225) | (7,872) | (353) |
| Results of operation from producing activities | 60,172 | 59,008 | 1,164 | 23,994 | 23,616 | 378 |
| Equity method investments | ||||||
| Revenues | ||||||
| Sales | 11,170 | – | 11,170 | 8,812 | – | 8,812 |
| 11,170 | – | 11,170 | 8,812 | – | 8,812 | |
| Production costs excluding taxes | (1,864) | – | (1,864) | (2,246) | – | (2,246) |
| Exploration expenses | – | – | – | – | – | – |
| Depreciation, depletion, amortisation and impairment losses | (847) | – | (847) | (533) | – | (533) |
| Taxes other than income tax | (7,288) | – | (7,288) | (4,391) | – | (4,391) |
| Profit before taxation | 1,171 | – | 1,171 | 1,642 | – | 1,642 |
| Income tax expense | (288) | – | (288) | (355) | – | (355) |
| Share of profit for producing activities of associates and joint ventures | 883 | – | 883 | 1,287 | – | 1,287 |
| Total of the Group’s and its equity method investments’ results of operations for producing activities | 61,055 | 59,008 | 2,047 | 25,281 | 23,616 | 1,665 |
The results of operations for producing activities for the years ended 31 December 2022 and 2021 are shown above. Revenues include sales to unaffiliated parties and transfers (essentially at third-party sales prices) to other segments of the Group. Income taxes are based on statutory tax rates, reflecting allowable deductions and tax credits. General corporate overhead and interest income and expense are excluded from the results of operations.
206
Table IV: Reserve quantities information
The Group’s and its equity method investments’ estimated net proved underground oil and gas reserves and changes thereto for the years ended 31 December 2022 and 2021 are shown in the following table.
Proved oil and gas reserves are those quantities of oil and gas, which by analysis of geoscience and engineering data, can be estimated with reasonable certainty to be economically producible from a given date forward, from known reservoirs, and under existing economic conditions, operating methods, and government regulation before contracts providing the right to operate expire, unless evidence indicates that renewal is reasonably certain, regardless of whether the estimate is a deterministic estimate or probabilistic estimate. Due to the inherent uncertainties and the limited nature of reservoir data, estimates of underground reserves are subject to change as additional information becomes available.
Proved developed oil and gas reserves are proved reserves that can be expected to be recovered through existing wells with existing equipment and operating methods or in which the cost of the required equipment is relatively minor compared with the cost of a new well.
“Net” reserves exclude royalties and interests owned by others and reflect contractual arrangements and obligation of rental fee in effect at the time of the estimate.
| 2022 | 2021 (Revised) Note | |||||
| Other | Other | |||||
| Total | China | countries | Total | China | countries | |
| The Group | ||||||
| Proved developed and undeveloped reserves (oil) (million barrels) | ||||||
| Beginning of the year | 1,440 | 1,416 | 24 | 1,252 | 1,232 | 20 |
| Revisions of previous estimates | 275 | 277 | (2) | 209 | 200 | 9 |
| Improved recovery | 84 | 84 | – | 126 | 126 | – |
| Extensions and discoveries | 108 | 108 | – | 101 | 101 | – |
| Production | (248) | (243) | (5) | (248) | (243) | (5) |
| End of the year | 1,659 | 1,642 | 17 | 1,440 | 1,416 | 24 |
| Non-controlling interest in proved developed and undeveloped reserves at the end of the year | 6 | – | 6 | 8 | – | 8 |
| Proved developed reserves | ||||||
| Beginning of the year | 1,315 | 1,291 | 24 | 1,145 | 1,130 | 15 |
| End of the year | 1,506 | 1,489 | 17 | 1,315 | 1,291 | 24 |
| Proved undeveloped reserves | ||||||
| Beginning of the year | 125 | 125 | – | 107 | 102 | 5 |
| End of the year | 153 | 153 | – | 125 | 125 | – |
| Proved developed and undeveloped reserves (gas) (billion cubic feet) | ||||||
| Beginning of the year | 8,449 | 8,449 | – | 8,181 | 8,181 | – |
| Revisions of previous estimates | 806 | 806 | – | 662 | 662 | – |
| Improved recovery | 17 | 17 | – | 36 | 36 | – |
| Extensions and discoveries | 664 | 664 | – | 678 | 678 | – |
| Production | (1,134) | (1,134) | – | (1,108) | (1,108) | – |
| End of the year | 8,802 | 8,802 | – | 8,449 | 8,449 | – |
| Proved developed reserves | ||||||
| Beginning of the year | 6,734 | 6,734 | – | 6,357 | 6,357 | – |
| End of the year | 7,135 | 7,135 | – | 6,734 | 6,734 | – |
| Proved undeveloped reserves | ||||||
| Beginning of the year | 1,715 | 1,715 | – | 1,824 | 1,824 | – |
| End of the year | 1,667 | 1,667 | – | 1,715 | 1,715 | – |
207
Table IV: Reserve quantities information (Continued)
| 2022 | 2021 (Revised) Note | |||||
| Other | Other | |||||
| Total | China | countries | Total | China | countries | |
| Equity method investments | ||||||
| Proved developed and undeveloped reserves of associates and joint ventures (oil) (million barrels) | ||||||
| Beginning of the year | 309 | – | 309 | 290 | – | 290 |
| Revisions of previous estimates | 9 | – | 9 | 33 | – | 33 |
| Improved recovery | 6 | – | 6 | 1 | – | 1 |
| Extensions and discoveries | 4 | – | 4 | 10 | – | 10 |
| Production | (25) | – | (25) | (25) | – | (25) |
| End of the year | 303 | – | 303 | 309 | – | 309 |
| Proved developed reserves | ||||||
| Beginning of the year | 263 | – | 263 | 244 | – | 244 |
| End of the year | 260 | – | 260 | 263 | – | 263 |
| Proved undeveloped reserves | ||||||
| Beginning of the year | 46 | – | 46 | 46 | – | 46 |
| End of the year | 43 | – | 43 | 46 | – | 46 |
| Proved developed and undeveloped reserves of associates and joint ventures (gas) (billion cubic feet) | ||||||
| Beginning of the year | 7 | – | 7 | 10 | – | 10 |
| Revisions of previous estimates | – | – | – | 1 | – | 1 |
| Improved recovery | – | – | – | – | – | – |
| Extensions and discoveries | – | – | – | – | – | – |
| Production | (3) | – | (3) | (4) | – | (4) |
| End of the year | 4 | – | 4 | 7 | – | 7 |
| Proved developed reserves | ||||||
| Beginning of the year | 6 | – | 6 | 8 | – | 8 |
| End of the year | 3 | – | 3 | 6 | – | 6 |
| Proved undeveloped reserves | ||||||
| Beginning of the year | 1 | – | 1 | 2 | – | 2 |
| End of the year | 1 | – | 1 | 1 | – | 1 |
| Total of the Group and its equity method investments | ||||||
| Proved developed and undeveloped reserves (oil) (million barrels) | ||||||
| Beginning of the year | 1,749 | 1,416 | 333 | 1,542 | 1,232 | 310 |
| End of the year | 1,962 | 1,642 | 320 | 1,749 | 1,416 | 333 |
| Proved developed and undeveloped reserves (gas) (billion cubic feet) | ||||||
| Beginning of the year | 8,456 | 8,449 | 7 | 8,191 | 8,181 | 10 |
| End of the year | 8,806 | 8,802 | 4 | 8,456 | 8,449 | 7 |
Note: The Company has revised some classifications of the changes in the net quantities of the proved reserves during the year ended 31 December 2021.
208
Table V: Standardised measure of discounted future net cash flows
The standardized measure of discounted future net cash flows, related to the above proved oil and gas reserves, is calculated in accordance with the requirements of “ASC Topic 932 Extractive Activities – Oil and Gas”, “SEC Rule 4-10 of Regulation S-X”, and “Industrial Information Disclosure Guidelines for Public Company – No.8 Oil and Gas Exploitation”. Estimated future cash inflows from production are computed by applying the average, first-day-of-the-month price adjusted for differential for oil and gas during the twelve-month period before the ending date of the period covered by the report to year-end quantities of estimated net proved reserves. Future price changes are limited to those provided by contractual arrangements in existence at the end of each reporting year. Future development and production costs are those estimated future expenditures necessary to develop and produce year-end estimated proved reserves based on year-end cost indices, assuming continuation of year-end economic conditions. Estimated future income taxes are calculated by applying appropriate year-end statutory tax rates to estimated future pre-tax net cash flows, less the tax basis of related assets. Discounted future net cash flows are calculated using 10% discount factors. This discounting requires a year-by-year estimate of when the future expenditure will be incurred and when the reserves will be produced.
The information provided does not represent management’s estimate of the Group’s and its equity method investments’ expected future cash flows or value of proved oil and gas reserves. Estimates of proved reserve quantities are imprecise and change over time as new information becomes available. Moreover, probable and possible reserves, which may become proved in the future, are excluded from the calculations. The arbitrary valuation requires assumptions as to the timing and amount of future development and production costs. The calculations are made for the years ended 31 December 2022 and 2021 and should not be relied upon as an indication of the Group’s and its equity method investments’ future cash flows or value of its oil and gas reserves.
| 2022 | 2021 | |||||
| RMB million | RMB million | |||||
| Other | Other | |||||
| Total | China | countries | Total | China | countries | |
| The Group | ||||||
| Future cash flows | 1,490,949 | 1,479,098 | 11,851 | 941,015 | 930,302 | 10,713 |
| Future production costs | (635,757) | (630,922) | (4,835) | (413,006) | (407,903) | (5,103) |
| Future development costs | (98,212) | (96,575) | (1,637) | (79,562) | (77,687) | (1,875) |
| Future income tax expenses | (190,893) | (187,900) | (2,993) | (113,598) | (111,178) | (2,420) |
| Undiscounted future net cash flows | 566,087 | 563,701 | 2,386 | 334,849 | 333,534 | 1,315 |
| 10% annual discount for estimated timing of cash flows | (170,126) | (169,810) | (316) | (93,354) | (93,164) | (190) |
| Standardised measure of discounted future net cash flows | 395,961 | 393,891 | 2,070 | 241,495 | 240,370 | 1,125 |
| Discounted future net cash flows attributable to non-controlling interests | 681 | – | 681 | 370 | – | 370 |
| Equity method investments | ||||||
| Future cash flows | 57,107 | – | 57,107 | 49,217 | – | 49,217 |
| Future production costs | (18,011) | – | (18,011) | (18,026) | – | (18,026) |
| Future development costs | (7,393) | – | (7,393) | (6,328) | – | (6,328) |
| Future income tax expenses | (5,831) | – | (5,831) | (4,513) | – | (4,513) |
| Undiscounted future net cash flows | 25,872 | – | 25,872 | 20,350 | – | 20,350 |
| 10% annual discount for estimated timing of cash flows | (13,015) | – | (13,015) | (10,201) | – | (10,201) |
| Standardised measure of discounted future net cash flows | 12,857 | – | 12,857 | 10,149 | – | 10,149 |
| Total of the Group’s and its equity method investments’ results of standardised measure of discounted future net cash flows | 408,818 | 393,891 | 14,927 | 251,644 | 240,370 | 11,274 |
209
Table VI: Changes in the standardised measure of discounted cash flows
| 2022 | 2021 (Revised) Note | |
| RMB million | RMB million | |
| The Group | ||
| Sales and transfers of oil and gas produced, net of production costs | (137,885) | (98,705) |
| Net changes in prices and production costs | 185,589 | 135,697 |
| Net changes in estimated future development cost | (22,685) | (7,413) |
| Net changes due to extensions, discoveries and improved recoveries | 58,610 | 46,425 |
| Revisions of previous quantity estimates | 78,310 | 42,637 |
| Previously estimated development costs incurred during the year | 11,885 | 5,475 |
| Accretion of discount | 32,342 | 16,448 |
| Net changes in income taxes | (51,700) | (72,118) |
| Net changes for the year | 154,466 | 68,446 |
| Equity method investments | ||
| Sales and transfers of oil and gas produced, net of production costs | (2,018) | (2,174) |
| Net changes in prices and production costs | 3,301 | 4,967 |
| Net changes in estimated future development cost | (694) | (752) |
| Net changes due to extensions, discoveries and improved recoveries | 562 | 503 |
| Revisions of previous quantity estimates | 505 | 1,659 |
| Previously estimated development costs incurred during the year | 311 | 287 |
| Accretion of discount | 1,388 | 1,022 |
| Net changes in income taxes | (647) | (1,292) |
| Net changes for the year | 2,708 | 4,220 |
| Total of the Group’s and its equity method investments’ results of net changes for the year | 157,174 | 72,666 |
Note: As revised for the year ended 31 December 2021 due to the changes shown in Table IV.
210
CORPORATE INFORMATION
STATUTORY NAME
中國石油化工股份有限公司
ENGLISH NAME
China Petroleum & Chemical Corporation
CHINESE ABBREVIATION
中國石化
ENGLISH ABBREVIATION
Sinopec Corp.
LEGAL REPRESENTATIVE
Mr. Ma Yongsheng
AUTHORISED REPRESENTATIVES
Mr. Yu Baocai
Mr. Huang Wensheng
SECRETARY TO THE BOARD
Mr. Huang Wensheng
REPRESENTATIVE ON SECURITIES MATTERS
Mr. Zhang Zheng
REGISTERED ADDRESS AND PLACE OF
BUSINESS
No.22 Chaoyangmen North Street,
Chaoyang District
Beijing, PRC
| Postcode | : | 100728 |
| Tel. | : | 86-10-59960028 |
| Fax | : | 86-10-59960386 |
| Website | : | http://www.sinopec.com |
| E-mail addresses | : | ir@sinopec.com |
REGISTERED ADDRESS CHANGE
INFORMATION
No change during the reporting period
PLACE OF BUSINESS IN HONG KONG
20th Floor, Office Tower
Convention Plaza
1 Harbour Road
Wanchai
Hong Kong
CHANGES IN THE PLACES FOR INFORMATION
DISCLOSURE AND THE PROVISION OF
REPORTS
No change during the reporting period
LEGAL ADVISORS
Domestic China:
Haiwen & Partners
20th Floor, Fortune Financial Centre
No. 5, Dong San Huan Central Road
Chaoyang District
Beijing PRC
Postcode: 100020
Hong Kong, China:
Zhong Lun Law Firm
4th Floor, Jardine House
1 Recreation Plaza
Central, Hong Kong
U.S.A.:
Skadden, Arps, Slate, Meagher & Flom LLP
30/F, China World Office 2
No. 1, Jian Guo Men Wai Avenue,
Beijing, PRC
REGISTRARS
A Shares:
China Securities Registration and Clearing Company Limited Shanghai Branch Company
188 Yanggao South Road
Shanghai Pilot Free Trade Zone, PRC
H Shares:
Hong Kong Registrars Limited
R1712-1716, 17th Floor, Hopewell Centre
183 Queen’s Road East
Hong Kong
DEPOSITARY FOR ADRS
The US:
Citibank, N.A.
388 Greenwich St., 14th Floor
New York NY 10013
United States of America
COPIES OF THIS ANNUAL REPORT ARE
AVAILABLE AT
The PRC:
China Petroleum & Chemical Corporation
Board Secretariat
No.22 Chaoyangmen North Street,
Chaoyang District
Beijing, PRC
The US:
Citibank, N.A.
388 Greenwich St., 14th Floor
New York NY 10013
USA
PLACES OF LISTING OF SHARES, STOCK
NAMES AND STOCK CODES
A Shares:
Shanghai Stock Exchange
| Stock name | : | SINOPEC CORP |
| Stock code | : | 600028 |
H Shares:
Hong Kong Stock Exchange
| Stock short name | : | SINOPEC CORP |
| Stock code | : | 00386 |
NAMES AND ADDRESSES OF AUDITORS OF
SINOPEC CORP.
| Domestic Auditors | : | KPMG Huazhen LLP Certified Public Accountants in China |
| Address | : | 8th Floor KPMG Tower Oriental Plaza 1 East Chang An Avenue, Beijing, PRC |
| Postcode | : | 100738 |
| Overseas Auditors | : | KPMG Public Interest Entity Auditor registered in accordance with the Accounting and Financial Reporting Council Ordinance |
| Address | : | 8th Floor, Prince’s Building 10 Chater Road Central, Hong Kong |
211
DOCUMENTS FOR INSPECTION
The Company’s 2022 annual report is disclosed on the website of the Shanghai Stock Exchange (http://www.sse.com.cn) and the Company’s designated information disclosure media “China Securities News”, “Shanghai Securities News” and “Securities Times”. The following documents will be available for inspection during normal business hours after 24 March 2023 at the registered address of Sinopec Corp. upon requests by the relevant regulatory authorities and shareholders in accordance with the Articles of Association and the laws and regulations of PRC:
| a) | The original copies of the 2022 annual report signed by Mr. Ma Yongsheng, the Chairman; |
| b) | The original copies of the audited financial statements and consolidated financial statements as of 31 December 2022 prepared under IFRS and CASs, signed by Mr. Ma Yongsheng, the Chairman, Mr. Yu Baocai, the President, Ms. Shou Donghua, the Chief Financial Officer and head of the financial department of Sinopec Corp.; |
| c) | The original auditors’ reports signed by the auditors; and |
| d) | Copies of the documents that Sinopec Corp. has published during the reporting period. |
By Order of the Board
Ma Yongsheng
Chairman
Beijing, PRC, 24 March 2023
If there is any inconsistency between the Chinese and English versions of this annual report, the Chinese version shall prevail.
212
SIGNATURE
Pursuant to the requirements of the Securities Exchange Act of 1934, the Registrant has duly caused this report to be signed on its behalf by the undersigned, thereunto duly authorized.
China Petroleum & Chemical Corporation
By: /s/ Huang Wensheng
Name: Huang Wensheng
Title: Vice President and Secretary to the Board of Directors
Date: March 30, 2023