Our consolidated statements of operations data for the years ended December 31, 2004, 2005 and 2006 are set forth below:
Our historical operating results as a percentage of net revenues for the years ended December 31, 2004, 2005 and 2006 are set forth below:
Year Ended December 31, 2006 compared to Year Ended December 31, 2005
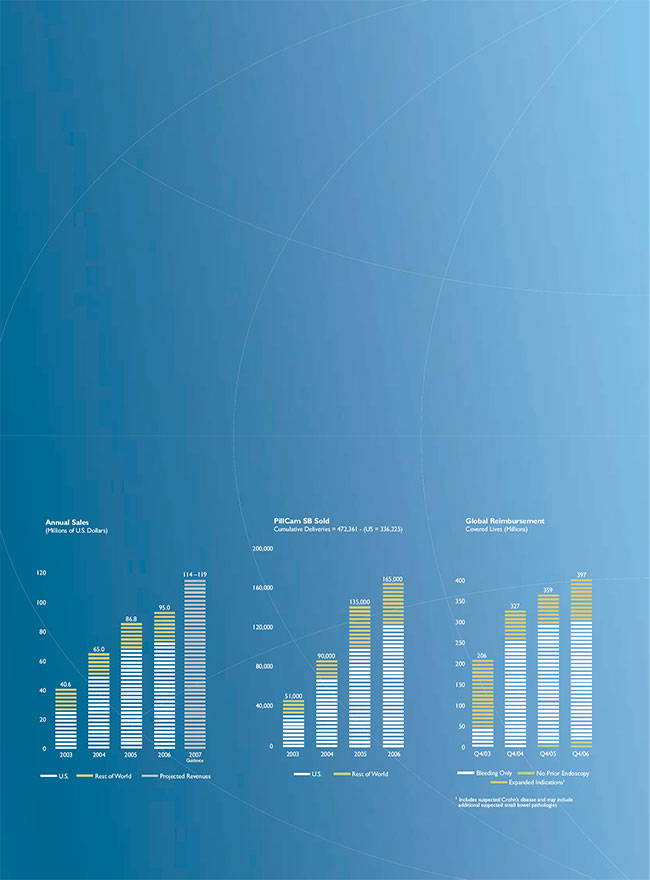
Revenues. Revenues increased by $8.2 million, or 9.5%, to $95.0 million in 2005 from $86.8 million in 2005. This increase was primarily due to an increase of $13.8 million, or 22.1%, in sales of our PillCam SB capsule and an increase of $0.8 million in service contract revenues. Approximately 97% of the $13.8 million increase in sales of the PillCam SB capsule was attributable to increases in number of capsules sold, and approximately 3% was attributable to the higher average selling price of capsules compared to 2005. The increase in service contract revenues was attributable mainly to the increased number of maintenance agreements in the United States. These increases were partially offset by a decrease of $3.6 million, or 22.5%, in revenues from sales of capital equipment, namely workstation and data recorder, and by a decrease of $3.0 million in revenues from our PillCam ESO capsules. Approximately 52% of the decrease in revenues from capital equipment sales is attributable to lower quantities and 48% of the decrease is attributable to lower average selling price. We sold a smaller number of capital equipment items primarily because a majority of gastroenterologists in the United States already have access to a capsule endoscopy system. The lower selling price is mainly due to promotional activities during the year and an increase of second systems sold to existing customers, which were sold at a significant discount.
Cost of revenues and gross margins.Cost of revenues increased to $24.2 million in 2006 compared to $22.1 million in 2005, while gross margins remained at 74.6% in 2006, similar to 2005. The increase in cost of revenues was mainly due to an increase of $1.4 million in consumption of raw materials, an increase of $0.3 million in labor expenses and an increase of $0.6 in other manufacturing costs. The increase was slightly offset by a decrease of $0.2 million in royalties payable to the Office of the Chief Scientist.
Research and development.Gross research and development expenses increased by $3.9 million, or 43.5%, to $12.7 million in 2006 from $8.8 million in 2005. This increase was due mainly to a $1.4 million increase in labor expenses, $0.6 million of stock-options compensation expenses as a result of the adoption of FAS 123R, an increase of $0.6 million in investments in R&D projects, an increase of $0.7 million in investments in clinical trials and an increase of $0.5 million in other expenses.
Research and development expenses, net of grants received from the office of the Israeli Chief Scientist, totaled $10.8 million in 2006, compared to $7.6 million in 2005. Grants totaling $1.9 million were received in 2006 compared to $1.2 million received in 2005. In both years, the grants were received for new products under development.
Sales and marketing.Sales and marketing expenses increased by $7.4 million, or 28.6%, to $50.7 million in 2006 from $43.3 million in 2005. This increase consisted primarily of an increase of $6.1 million in employment-related expenses due to increased number of sales and marketing employees, mainly in the United States, an additional $1.8 million of stock options-related compensation expenses as a result of the adoption of FAS 123R, an increase of $1.0 million in expenses related to our participation in trade shows and other marketing events, an increase of $0.5 million in clinical and regulatory activities in Japan and an increase of $0.8 in travel expenses. These increases were offset by a decrease of $1.5 million in commissions to Ethicon Endo-Surgery for sales of our PillCam ESO capsule and ancillary products, and a decrease of $1.3 million in the provision for uncollectible sales tax at our U.S. subsidiary of 2005.
General and administrative.General and administrative expenses increased by $6.3 million, or 66.0%, to $16.0 million in 2006 from $9.7 million in 2005. This increase was primarily due to an expense of $2.8 million resulting from additional stock-options compensation expense following the adoption of FAS 123R, an increase of $2.3 million in salaries and fringe benefits, resulting mainly from turnover in management, an increase of $0.7 million in legal and other professional expenses and an increase of $0.5 million in investments in information systems.
Financing income, net.Financing income, net, increased by $3.2 million to $4.0 million in 2006 from $0.8 million in 2005. The increase was due mainly to a change in our investment policy. Financing income in 2006 was generated from interest income of $1.6 million from short-term deposits, income of $1.8 million from marketable securities and $0.8 million of exchange gains, offset by bank expenses of $0.3 million.
19
Taxes on income.We had a tax expense of $0.1 million in 2006 compared to a tax benefit of $0.3 million in 2005.
Minority share in losses of subsidiary.Minority share in losses of a subsidiary, Given Imaging K.K., was $1.3 million in 2006 compared to $1.1 million in 2005. Given Imaging K.K. did not generate any significant revenues in 2005 and 2006 because at that time the Given System had not yet been approved for marketing by the relevant regulatory authority in Japan.
Year Ended December 31, 2005 compared to Year Ended December 31, 2004
Revenues. Revenues increased by $21.8 million, or 33.5%, to $86.8 million in 2005 from $65.0 million in 2004. This increase was primarily due to an increase of $20.9 million, or 50.2%, in PillCam SB capsule sales, an increase of $2.6 million in PillCam ESO sales and an increase of $0.4 million in service contract revenues. We estimate that all of the increase in revenues from sales of the PillCam SB capsule was attributable to increases in the number of capsules sold. In addition, we estimate that 83% of the $2.6 million increase in sales of the PillCam ESO capsule was attributable to increases in product sales and approximately 17% was attributable to the higher average selling price of the PillCam ESO capsules compared to 2004. These increases were partially offset by a decrease of $2.1 million, or 10.7%, in workstation and data recorder sales. We estimate that approximately 19% of the decrease was attributable to lower product sales, and 81% of the decrease was attributable to lower average selling prices resulting mainly from promotional activities during the year and an increase of second systems sold to existing customers, which were sold at a significantly lower price. These increases in sales of PillCam capsules were also partially offset by a reduction of approximately $0.1 million, or 0.7%, in selling prices resulting from changes in exchange rates between the U.S. dollar and other currencies.
Cost of revenues and gross margin.Cost of revenues increased to $22.1 million in 2005 compared to $17.7 million in 2004, but was lower in 2005 as a percentage of total revenues than in 2004. Consequently, gross margins were 74.6% in 2005 compared to 72.7% in 2004. The improvement in gross margins is attributable mainly to our efforts to reduce manufacturing costs by using advanced and lower cost components, by implementing more efficiency measures in our manufacturing process, and by terminating our technical services agreement with Pemstar and the resulting reduction in the scope of manufacturing and technical services Pemstar provides us and our payments for these services. The increase in quantities of capsules manufactured and sold during the year had an additional positive effect on gross margins. The improvement in gross margins was partially offset by an increase of $0.7 million in royalties payable to the Office of the Chief Scientist, or OCS, and an increase of $1.0 million related to manufacturing expenses, including depreciation.
Research and development.Gross research and development expenses increased by $1.4 million, or 20.0%, to $8.8 million in 2005 from $7.4 million in 2004. This increase was due mainly to a $0.5 million increase related to additional personnel and employee-related expenses, an increase of $0.5 million in investments in R&D projects and to an increase of $0.4 million in expenses related to patent registration, maintenance and depreciation.
Research and development expenses, net of grants received from OCS, totaled $7.6 million in 2005, compared to $6.2 million in 2004. Grants totaling $1.2 million were received in 2005 compared to $1.1 million received in 2004. In both years, the grants were received for new products under development.
Sales and marketing.Sales and marketing expenses increased by $9.6 million, or 28.6%, to $43.3 million in 2005 from $33.7 million in 2004. This increase, which was consistent with our growth in revenues, consisted primarily of an increase of $4.0 million related to the hiring of additional personnel, increase in salaries and other employment-related expenses, mainly in the United States, the initial payment of $2.2 million in commissions to Ethicon Endo-Surgery for sales of our PillCam ESO capsule and ancillary products, an increase of $0.3 million due to participation in trade shows and other marketing events, an increase of $0.6 million due to clinical and regulatory activities in Japan of our Japanese subsidiary, Given Imaging K.K., an increase of $0.4 in legal and accounting expenses of our U.S. subsidiary, an increase of $0.7 million in payments to outside service providers
20
at our subsidiaries and a $1.8 million provision, before tax effect, for uncollectible sales tax at our U.S. subsidiary.
General and administrative.General and administrative expenses increased by $2.8 million, or 39.6%, to $9.7 million in 2005 from $6.9 million in 2004. This increase was primarily due to an increase of $0.7 million in legal and other professional expenses related to the investigation of our failure to collect and remit sales tax in the United States and the implementation of remedial measures, as more fully described under Item 15 below, an increase of $0.7 million in salaries and fringe benefits, resulting mainly from turnover in management, and an increase of $0.6 million in investments in information systems. Other general and administrative expenses increased by $0.8 million.
Financing income, net.Financing income, net, decreased by $0.2 million, or 20.3% to $0.8 million in 2005 from $1.0 million in 2004. Financing income in 2005 was generated from interest income of $2.4 million from short-term deposits and from marketable securities, offset by currency translation losses of $0.8 million, interest on sales tax of $0.5 million and bank expenses of $0.2 million.
Taxes on income.We had a tax benefit of $0.3 million in 2005 compared to a tax benefit of $0.7 million in 2004.
Minority share in losses of subsidiary.Minority share in losses of a subsidiary, Given Imaging K.K, was $1.1 million in 2005 compared to $0.7 million in 2004. Given Imaging K.K. did not generate any significant revenues in 2005 because at that time the Given System had not yet been approved for marketing by the relevant regulatory authority in Japan.
Quarterly Results of Operations
We believe that some of our customers delay purchasing until the end of the fiscal quarter because they believe this will enable them to negotiate more favorable terms. Therefore, a significant portion of our revenues is frequently concentrated at the end of each fiscal quarter making it difficult for us to determine the revenues for each quarter until its end and resulting in lower than expected quarterly revenues if external or other events cause a large number of potential customers to defer their purchasing decisions even for a short period of time. In addition, we believe that demand for systems and capsules is affected by seasonal factors during the summer months when physicians and administrators are more likely to postpone purchasing decisions relating to the Given System due to summer vacations, and patients are more likely to postpone less urgent diagnostic procedures until later in the year. We believe that the seasonal effect in the third quarter may become more pronounced assuming the portion of our revenues derived from reorders continues to grow.
21
The tables below set forth unaudited consolidated statement of operations data for each of the eight consecutive quarters ended December 31, 2006. In management’s opinion, the unaudited consolidated financial statements have been prepared on the same basis as our audited consolidated financial statements contained elsewhere in this Form 20-F and include all adjustments, consisting only of normal recurring adjustments, necessary for a fair presentation of such financial information.
| | Three months ended | |
| | March 31, | | | June 30, | | | Sept. 30, | | | Dec. 31, | | | March 31, | | | June 30, | | | Sept. 30, | | | Dec. 31, | |
| | 2005 | | | 2005 | | | 2005 | | | 2005 | | | 2006 | | | 2006 | | | 2006 | | | 2006 | |
| | | | | | | | | | | | | | (In thousands) | | | | | | | | | | | | | |
| Revenue | $ | 22,009 | | | $ | 20,526 | | | $ | 19,841 | | | $ | 24,400 | | | $ | 20,268 | | | $ | 23,239 | | | $ | 24,050 | | | $ | 27,472 | |
| Cost of revenues | | (6,401 | ) | | | (5,051 | ) | | | (4,618 | ) | | | (6,000 | ) | | | (5,140 | ) | | | (5,771 | ) | | | (6,058 | ) | | | (7,185 | ) |
| Gross profit | | 15,608 | | | | 15,475 | | | | 15,223 | | | | 18,400 | | | | 15,128 | | | | 17,468 | | | | 17,992 | | | | 20,287 | |
| Operating expenses: | | | | | | | | | | | | | | | | | | | | | | | | | | | | | | | |
| Research and | | | | | | | | | | | | | | | | | | | | | | | | | | | | | | | |
| development, net. | | (1,903 | ) | | | (1,617 | ) | | | (1,687 | ) | | | (2,382 | ) | | | (3,046 | ) | | | (2,735 | ) | | | (2,306 | ) | | | (2,724 | ) |
| Sales and marketing | | (10,812 | ) | | | (11,637 | ) | | | (9,778 | ) | | | (11,054 | ) | | | (12,693 | ) | | | (13,191 | ) | | | (11,239 | ) | | | (13,609 | ) |
| General and | | | | | | | | | | | | | | | | | | | | | | | | | | | | | | | |
| administrative | | (2,039 | ) | | | (2,435 | ) | | | (2,539 | ) | | | (2,644 | ) | | | (3,726 | ) | | | (4,118 | ) | | | (4,410 | ) | | | (3,773 | ) |
| Total operating expenses | | (14,754 | ) | | | (15,689 | ) | | | (14,004 | ) | | | (16,080 | ) | | | (19,465 | ) | | | (20,044 | ) | | | (17,955 | ) | | | (20,106 | ) |
| Operating profit (loss) | | 854 | | | | (214 | ) | | | 1,219 | | | | 2,320 | | | | (4,337 | ) | | | (2,576 | ) | | | 37 | | | | 181 | |
| Financing income (expenses), | | | | | | | | | | | | | | | | | | | | | | | | | | | | | | | |
| net | | 51 | | | | (415 | ) | | | 519 | | | | 607 | | | | 959 | | | | 1,418 | | | | 581 | | | | 1,022 | |
| Taxes on income. | | 74 | | | | (16 | ) | | | (53 | ) | | | 281 | | | | 271 | | | | (45 | ) | | | (254 | ) | | | (99 | ) |
| Minority share in losses of | | | | | | | | | | | | | | | | | | | | | | | | | | | | | | | |
| subsidiary | | 269 | | | | 281 | | | | 253 | | | | 313 | | | | 61 | | | | 539 | | | | 377 | | | | 357 | |
| Net profit (loss) | $ | 1,248 | | | $ | (364 | ) | | $ | 1,938 | | | $ | 3,521 | | | $ | (3,046 | ) | | $ | (664 | ) | | $ | 741 | | | $ | 1,461 | |
Impact of Currency Fluctuations
Currency Risk.Our sales to our customers in 2006 were denominated 73% in U.S. dollars, 22% in Euros and 5% in other currencies, depending on the location of the customer or the distributor used to fulfill our customers’ orders. In 2006, 25% of our expenses, principally salaries and related personnel expenses were denominated in Shekels, and we expect this level of Shekel expenses to continue for the foreseeable future. During 2006 the U.S. dollar weakened against the Shekel by 8.2%. In addition, 58% of our expenses were denominated in U.S. dollars, 12% were denominated in Euros and 5% were denominated in Yen or other currencies. If the value of a currency in which our revenues are denominated weakens against the value of a currency in which our expenses are denominated, there will be a negative impact on the profit margins for sales of our products. In addition, as of December 31, 2006, 42% of our cash and cash equivalents were denominated in currencies other than U.S. dollar and we are therefore subject to the risk of exchange rate fluctuations between the U.S. dollar, Yen, the Shekel, the Australian dollar and the Euro. In 2006, we have used different hedging tools in order to minimize the effect of currency fluctuations on our income. If we wish to maintain the dollar-denominated value of our product in non-U.S. markets, devaluation in the local currencies of our customers relative to the U.S. dollar could cause our customers to cancel or decrease orders or default on payment.
B. LIQUIDITY AND CAPITAL RESOURCES
From our inception through December 31, 2006, we raised a total of $151 million through public and private sales of our equity securities. As of December 31, 2006, we had $44.5 million in cash and cash equivalents and an additional amount of $52 million invested in marketable securities. Our working capital, which we calculate by subtracting our current liabilities from our current assets, was $79 million.
We believe that our cash reserves and expected cash from operations will be sufficient to meet our anticipated cash needs for working capital and capital expenditures in 2007. We have also applied to the Office of Chief Scientist for a grant to support our research and development activities in 2007.
22
The following table sets forth the components of our cash flows for the periods indicated:
| | | Year ended December 31, | |
| | | 2004 | | | 2005 | | | 2006 | |
| | | (In thousands) | |
| Net cash provided by operating activities | | $ | 11,868 | | | $ | 13,488 | | | $ | 2,861 | |
| Net cash used in investing activities | | | (3,230 | ) | | | (29,883 | )(1) | | | (30,757 | )(1) |
| Net cash provided by financing activities | | | 46,816 | | | | 1,069 | | | | 6,795 | |
| Effect of exchange rate changes on cash | | | 40 | | | | (179 | ) | | | 255 | |
| Increase (decease) in cash and cash equivalents | | $ | 55,494 | | | $ | (15,505 | ) | | $ | (20,846 | ) |
_____________
|
| (1) | Includes $21.9 million net invested in marketable securities in 2005 and $24.9 million net in 2006. |
Net cash provided by operating activities was $2.9 million in 2006, compared to $13.5 million in 2005 and $11.9 million in 2004. The decrease in net cash in 2006 resulted primarily from a reduction of $2.6 million in net income (excluding compensation expenses which do not have an effect on cash flow) to $3.7 million, compared to a net income of $6.3 million in 2005, an increase of $2.0 million in inventories, a net increase in trading securities of $5.1 million and a decrease of $4.8 in accounts receivable due to $5.0 million received in 2006 from Ethicon Endo - Surgery for the milestone achieved in 2005 under our agreement with Ethicon. The increase in net cash in 2005 resulted primarily from net income of $6.3 million, a $3.4 million improvement compared to the $2.9 million net income in 2004, and an increase of $2.4 million in inventories and of $5.8 in accounts payable due to increased sales and operating expenses during the year. The increase in net cash provided by operations in 2005 was partially offset by an increase of $6.1 million in our accounts receivable due to increased sales and a longer collection cycle in the United States due to our efforts to correct our errors in sales tax collection and an increase of $5.0 million in other accounts receivable due to accounting for the milestone achieved in 2005 but payable by Ethicon Endo-Surgery on or before April 1, 2006.
Net cash used in investing activities was $30.8 million in 2006 compared to $29.9 million in 2005 and $3.2 million in 2004. Investing activities in 2006 consisted primarily of investing $24.9 million in marketable securities and $5.9 million in capital expenditures and the capitalization of costs associated with our patents and trademarks. Our capital expenditures in 2006 consisted primarily of $1.9 million in machinery and equipment, $0.5 million in new real property leases on our facilities, $1.3 million in computers and software, $0.4 million in office furniture and equipment and $1.2 million in patents. Our capital expenditures in 2005 consisted primarily of $2.3 million in machinery and equipment, $2.8 million in new real property leases on our facilities, $0.9 million in computers and software, $0.5 million in office furniture and equipment and $0.9 million in patents. Our capital expenditures in 2004 consisted primarily of $1.4 million in machinery and equipment, $0.3 million in a new real property lease on our facilities and $0.8 million in patents. We expect to continue investing significant amounts in 2007 in order to support our growth plans.
Net cash provided by financing activities was $6.8 million in 2006, compared to $1.1 million in 2005 and $46.8 million in 2004. In 2006, net cash provided by financing activities resulted primarily from proceeds of $2.0 million received from the exercise of employee stock options and an amount of $4.8 million representing a minority investment in our Japanese subsidiary, Given Imaging K.K. In 2005, net cash provided by financing activities resulted primarily from proceeds from the exercise of employee stock options. The high level of net cash from financing activities in 2004 was primarily attributable to the completion of our follow-on public equity offering in June 2004 in which we raised net proceeds of $44.3 million.
Market Risk
We invest our some of our excess cash in short-term bank accounts and deposits located with a number of banks inside and outside of Israel. These instruments have maturities of three months or less when acquired. Due to the short-term nature of these investments, we believe that there is no
23
material exposure to interest rate risk arising from our investments. We invest the majority of our excess cash in longer-term financial instruments in order to achieve a higher yield. Based on our investment policy, such instruments are highly rated by rating agencies and therefore we believe that there is no material exposure to the principal amount nor to interest rate risks arising from these longer-term investments.
Corporate Tax
Israeli companies were generally subject to income tax at the corporate rate of 31% in 2006. This tax rate has been reduced to 29% in 2007 and is expected to be gradually reduced to a rate of 25% by 2010 As of December 31, 2006, our net operating loss carry-forwards for Israeli tax purposes amounted to $13.9 million. Under Israeli law, net operating losses can be carried forward indefinitely and offset against certain future taxable income.
In addition, our investment program in equipment and leasehold improvements at our manufacturing facility in Yoqneam, Israel has been granted approved enterprise status and we are, therefore, eligible for tax benefits under the Law for the Encouragement of Capital Investments, 1959 (the “Investment Law”). Subject to compliance with applicable requirements, the portion of our undistributed income derived from our approved enterprise program will be exempt from corporate tax for a period of ten years commencing in the first year in which we generate taxable income. The ten-year period may not extend beyond the later of 14 years from the year in which approval was granted or 12 years from the year in which operations or production by the enterprise began. We received our approved enterprise status in 1999. According to a recent reform to the Investment Law, we are permitted to claim tax benefits in respect of future investments retroactively on our corporate tax returns instead of filing an application for tax benefits in advance with the Investment Center, the administrator of the Investment Law, and without prior approval and without submitting any reports to the Investment Center. Audits of any claim for tax benefits will take place by the Israeli income tax authority as part of the general tax audits it may perform from time to time. We cannot assure you that we will receive approvals in the future for approved enterprise status or that tax benefits for approved investments will continue at current levels or at all.
The period of tax benefits for our approved enterprise programs has not yet commenced because we are yet to realize taxable income. We expect that a substantial portion of the income we derive in the future will be from this approved enterprise program. These benefits should result in income recognized by us being tax exempt for a specified period after we begin to report taxable income and exhaust any net operating loss carry-forwards. These benefits may not be applied to reduce the tax rate for any income that is not derived from sales of our products manufactured at our facility in Yoqneam, Israel.
Our approved enterprise status imposes certain requirements on us, such as the location of our manufacturing facility, location of certain subcontractors and the extent to which we may outsource portions of our production process. These requirements limit our freedom to pursue production arrangements that may otherwise be more favorable to us if we want to maintain these tax benefits. Therefore, we may be required to weigh the possible loss of these benefits against other benefits from pursuing arrangements which are not, or which may not be considered by the relevant Israeli authorities to be, in compliance with these requirements. If we do not meet these requirements, the law permits the authorities to cancel the tax benefits retroactively.
As of December 31, 2006, the net operating loss carry-forwards of our subsidiaries for tax purposes amounted to $26.6 million. A subsidiary’s net operating loss carry-forwards for tax purposes relating to a jurisdiction are generally available to offset future taxable income of such subsidiary in that jurisdiction, subject to applicable expiration dates.
Government Grants
Our research and development efforts have been financed, in part, through grants from the Office of the Chief Scientist of the Israeli Ministry of Industry, Trade and Labor. We have received
24
approval for grants totaling $6.8 million from the Office of the Chief Scientist, including $1.9 million which was provided by the Office of Chief Scientist to support our 2006 research and development.
Under Israeli law, royalties on the revenues derived from sales of the Given System or any part of the Given System are payable to the Israeli government, generally at the rate of 3.0% during the first three years of sales and 3.5% beginning with the fourth year. The maximum aggregate royalties paid generally cannot exceed 100% of the grants made to us. The amount bears interest equal to the 12-month London Interbank Offered Rate (LIBOR) applicable to dollar deposits that is published on the first business day of each calendar year. Royalties are paid on our consolidated revenues. As of December 31, 2006, we paid a total of $2.5 million in royalties to the Office of the Chief Scientist, leaving our remaining royalty payment obligation at $4.3 million as of that date.
The government of Israel does not own proprietary rights in technology developed using its funding and there is no restriction on the export of products manufactured using the technology. The technology is, however, subject to other legal restrictions, including the obligation to manufacture the products based on this technology in Israel and to obtain the Office of the Chief Scientist’s consent to transfer the technology or product rights to a third party. These restrictions may impair our ability to outsource manufacturing or enter into similar arrangements for those products or technologies and these restrictions continue to apply even after we have paid the full amount of royalties payable for the grants. If the Office of the Chief Scientist consents to the manufacture of the products outside Israel, the regulations allow the Office of the Chief Scientist to require the payment of increased royalties, ranging from 120% to 300% of the amount of the grant plus interest, depending on the percentage of foreign manufacture. If the manufacturing is performed outside of Israel by us, the rate of royalties payable by us on revenues from the sale of products manufactured outside of Israel will increase by 1% over the regular rates. If the manufacturing is performed outside of Israel by a third party, the rate of royalties payable by us on those revenues will be a percentage equal to the percentage of our total investment in the Given System that was funded by grants. In response to our request, the Office of the Chief Scientist has approved the manufacture of limited quantities of the PillCam capsules using the back-up production line that we have installed at Pemstar’s facilities in Ireland without increasing royalty rates.
C. RESEARCH AND DEVELOPMENT
Our research and development expenditures, excluding grants received from the Office of the Chief Scientist, were $12.7 million for the year ended December 31, 2006, $8.8 million for the year ended December 31, 2005 and $7.4 million for the year ended December 31, 2004. Our research and development activities are conducted by our research and development and regulatory affairs staff primarily at our headquarters in Israel. As of December 31, 2006, our research and development, clinical and regulatory and engineering staff consisted of 78 employees. Our research and development efforts are focused primarily on developing new capsules to be used in the detection of abnormalities in the stomach and the colon, improvements to our existing products and new technologies for future expansion of our product offering. In 2006, we completed the development of the newest version of our AGILE Patency capsule and received FDA clearance to market this product in the United States in May 2006. In addition, we completed the development of RAPID Access and received FDA clearance for this product in May 2006. Finally, during 2006, we completed the development of the first generation PillCam COLON capsule for diagnosis of disorders in the colon and received the CE mark to market this product in Europe and submitted it for clearance by the FDA.
We view our innovation and focus on capsule endoscopy technology as an important competitive advantage and intend to continue our focus on research and development activities. During 2007, we intend to complete the development of and obtain regulatory clearance to several new or improved products. For example, we intend to introduce a new version of our RAPID software, RAPID 5.0, which is required for optimal performance of capsule endoscopy of the colon with our PillCam COLON capsule and new versions of our PillCam SB and PillCam ESO capsules, which we also expect will become commercially available in the second half of 2007.
25
In addition to our own research and development activities, we are involved in government-funded research programs. One important program is our leadership of a European consortium that will develop an integrated imaging and bio-sensing system to screen for cancer of the gastrointestinal (GI) tract. This “Nano-based capsule-Endoscopy with Molecular Imaging and Optical biopsy,”or NEMO project, began in December 2006.
In addition to Given Imaging, this consortium includes other European companies and institutions. The NEMO group will invest a total of 4.7 million over the next three years in this research, of which the European Commission will contribute2.8 million. Given Imaging’s expected gross and net contribution during this period is1.3 million and0.6 million, respectively.
The objective of the NEMO project is to increase patient compliance with currently recommended screening guidelines by developing an advanced cancer screening system that is patient-friendly, highly-sensitive and specific for early detection of cancer. To achieve this, NEMO will attempt to integrate optical technologies with Nano-technologies, bio-sensing and maneuvering technologies to create a unique PillCam capsule endoscope capable of secretion analysis and the detection of marked and deep tissue disorders. We believe that the combination of the image and molecular analysis to mark the tumor may provide a novel and effective medical device for mass screening of gastrointestinal cancer.
D. TREND INFORMATION
See discussion in Parts A and B of Item 5 “Operating Results and Financial Review and Prospects.”
E. OFF-BALANCE SHEET ARRANGEMENTS
N/A
F. CONTRACTUAL OBLIGATIONS
The following table of our material contractual obligations as of December 31, 2006, summarizes the aggregate effect that these obligations are expected to have on our cash flows in the periods indicated:
| | | Payments due by period |
| Contractual obligations | | Total | | 2007 | | 2008 | | 2009 | | 2010 | | Later Years |
| | | | | | | | | | (In thousands) | | | | | | |
| Capital leases(1) | | $ | 33 | | $ | 13 | | $ | 20 | | $ | — | | | | | | |
| Operating leases(2) | | | 15,212 | | | 2,884 | | | 2,432 | | | 1,880 | | | 1,439 | | | 6,577 |
| Purchasing Obligations | | | 15,138 | | | 3,808 | | | 2,329 | | | 2,250 | | | 2,250 | | | 4,500 |
| Total | | $ | 30,383 | | $ | 6,705 | | $ | 4,781 | | $ | 4,130 | | $ | 3,689 | | $ | 11,077 |
(1) Consists of capital leases for motor vehicles.
(2) Consists of operating leases for office and manufacturing space and motor vehicles.
See Note 8 to our consolidated financial statements included in this annual report for our royalty commitments to the Office of the Chief Scientist in Israel.
26
 | Somekh Chalkin | Telephone | 972 3 684 8000 |
| KPMG Millennium Tower | Fax | 972 3 684 8444 |
| 17 Ha’arba’a Street, PO Box 609 | Internet | www.kpmg.co.iI |
| Tel Aviv 61006 Israel | | |
REPORT OF INDEPENDENT REGISTERED PUBLIC ACCOUNTING FIRM
The Board of Directors and Shareholders
Given Imaging Ltd.:
We have audited the accompanying consolidated balance sheets of Given Imaging Ltd. (the “Company”) and its subsidiaries as of December 31, 2006 and 2005, and the related consolidated statements of operations, changes in shareholders’ equity and cash flows for each of the years in the three year period ended December 31, 2006. These consolidated financial statements are the responsibility of the Company’s Board of Directors and of its management. Our responsibility is to express an opinion on these consolidated financial statements based on our audits.
We conducted our audits in accordance with the standards of the Public Company Accounting Oversight Board (United States). Those standards require that we plan and perform the audit to obtain reasonable assurance about whether the financial statements are free of material misstatement. An audit includes examining, on a test basis, evidence supporting the amounts and disclosures in the financial statements. An audit also includes assessing the accounting principles used and significant estimates made by management, as well as evaluating the overall financial statements presentation. We believe that our audits provide a reasonable basis for our opinion.
In our opinion, the consolidated financial statements referred to above present fairly, in all material respects, the financial position of the Company and its subsidiaries as of December 31, 2006 and 2005, and the consolidated results of their operations and their cash flows for each of the years in the three year period ended December 31, 2006, in conformity with U.S. generally accepted accounting principles.
As discussed in Note 1K to the consolidated financial statements, effective January 1, 2006, the Company has adopted Statement of Financial Accounting Standard No. 123 (revised 2004), “Share-Based Payment”.
| | Somekh Chaikin
Certified Public Accountants (Israel)
Member Firm of KPMG International |
Tel-Aviv, Israel
April 12, 2007
27
Given Imaging Ltd. and its Subsidiaries
Consolidated Balance Sheets
(In thousands except per share data)
| | | | | December 31 |
| | | Note | | 2005 | | 2006 |
| Assets | | | | | | | | |
| Current assets | | | | | | | | |
| Cash and cash equivalents | | 1D; 2 | | $ | 65,356 | | $ | 44,510 |
| Short-term investments | | 5 | | | 288 | | | 17,245 |
| Accounts receivable: | | | | | | | | |
| Trade, net | | 1E | | | 18,325 | | | 18,887 |
| Other | | 3 | | | 6,264 | | | 1,463 |
| Inventories | | 1F; 4 | | | 16,172 | | | 18,168 |
| Advances to suppliers | | | | | 332 | | | 82 |
| Deferred taxes. | | 1P; 14C | | | 1,219 | | | 1,374 |
| Prepaid expenses | | | | | 1,020 | | | 1,340 |
| Total current assets | | | | | 108,976 | | | 103,069 |
| Deposits | | | | | 401 | | | 469 |
| Assets held for employees’ severance payments | | 1G; 10 | | | 1,690 | | �� | 1,984 |
| Marketable securities | | 1H; 5 | | | 21,664 | | | 34,769 |
| Fixed assets, at cost, less accumulated depreciation | | 1I; 6 | | | 13,862 | | | 14,811 |
| Other assets, at cost, less accumulated amortization | | 1J; 7 | | | 2,517 | | | 3,075 |
| |
| Total Assets | | | | $ | 149,110 | | $ | 158,177 |
The accompanying notes are an integral part of these consolidated financial statements.
28
Given Imaging Ltd. and its Subsidiaries
Consolidated Balance Sheets
(In thousands except share data)
| | | | | | | December 31 | |
| | | Note | | | 2005 | | | 2006 | |
| Liabilities and shareholders’ equity | | | | | | | | | | | |
| Current liabilities | | | | | | | | | | | |
| Current installments of obligation under capital lease | | 8B | | | $ | 11 | | | $ | 13 | |
| Accounts payable: | | | | | | | | | | | |
| Trade | | | | | | 5,529 | | | | 5,550 | |
| Other | | 9 | | | | 13,886 | | | | 14,620 | |
| Deferred income | | 1N; 8C | | | | 3,333 | | | | 3,871 | |
| Total current liabilities | | | | | | 22,759 | | | | 24,054 | |
| |
| Long-term liabilities | | | | | | | | | | | |
| Deferred income | | 8C | | | | 22,172 | | | | 20,411 | |
| Obligation under capital lease. | | 8B | | | | 34 | | | | 20 | |
| Liability in respect of employees’ severance payments | | 10 | | | | 2,040 | | | | 2,407 | |
| Total long-term liabilities. | | | | | | 24,246 | | | | 22,838 | |
| Total liabilities | | | | | | 47,005 | | | | 46,892 | |
| |
| Commitments and contingencies. | | 8 | | | | | | | | | |
| Minority interest | | | | | | 61 | | | | 3,499 | |
| Shareholders’ equity | | | | | | | | | | | |
| Share capital: | | 11 | | | | | | | | | |
| Ordinary Shares, NIS 0.05 par value each (90,000,000 shares | | | | | | | | | | | |
| authorized as of December 31, 2005 and 2006, 27,950,281 and | | | | | | | | | | | |
| 28,641,291 shares issued and fully paid as of December 31, 2005 | | | | | | | | | | | |
| and 2006, respectively) | | | | | | 327 | | | | 335 | |
| Additional paid-in capital | | | | | | 148,955 | | | | 156,197 | |
| Capital reserve | | | | | | 2,166 | | | | 2,166 | |
| Accumulated deficit | | | | | | (49,404 | ) | | | (50,912 | ) |
| Total shareholders’ equity | | | | | | 102,044 | | | | 107,786 | |
| Total liabilities and shareholders’ equity | | | | | $ | 149,110 | | | $ | 158,177 | |
The accompanying notes are an integral part of these consolidated financial statements.
29
Given Imaging Ltd. and its Subsidiaries
Consolidated Statements of Operations
(In thousands except share and per share data)
| | | | | Year Ended December 31, | |
| | | Note | | 2004 | | | 2005 | | | 2006 | |
| |
| Revenues | | 1N; 12 | | $ | 65,020 | | | $ | 86,776 | | | $ | 95,029 | |
| Cost of revenues | | | | | 17,734 | | | | 22,070 | | | | 24,154 | |
| Gross profit | | | | | 47,286 | | | | 64,706 | | | | 70,875 | |
| Operating expenses | | | | | | | | | | | | | | |
| Research and development, gross | | 1Q | | | (7,363 | ) | | | (8,833 | ) | | | (12,678 | ) |
| Royalty bearing government grants | | 1O; 8A | | | 1,140 | | | | 1,244 | | | | 1,867 | |
| Research and development, net | | | | | (6,223 | ) | | | (7,589 | ) | | | (10,811 | ) |
| Sales and marketing | | | | | (33,652 | ) | | | (43,281 | ) | | | (50,732 | ) |
| General and administrative | | | | | (6,916 | ) | | | (9,657 | ) | | | (16,027 | ) |
| Total operating expenses | | | | | (46,791 | ) | | | (60,527 | ) | | | (77,570 | ) |
| Operating profit (loss) | | | | | 495 | | | | 4,179 | | | | (6,695 | ) |
| Financial income, net | | 13 | | | 956 | | | | 762 | | | | 3,980 | |
| Profit (loss) before taxes on income and minority | | | | | | | | | | | | | | |
| share | | | | | 1,451 | | | | 4,941 | | | | (2,715 | ) |
| Taxes on income | | 1P, 14 | | | 690 | | | | 286 | | | | (127 | ) |
| Profit (loss) before minority share | | | | | 2,141 | | | | 5,227 | | | | (2,842 | ) |
| Minority share in losses of subsidiary | | | | | 747 | | | | 1,116 | | | | 1,334 | |
| Net profit (loss) | | | | $ | 2,888 | | | $ | 6,343 | | | $ | (1,508 | ) |
| Profit (loss) per share | | | | | | | | | | | | | | |
| Basic profit (loss) per Ordinary Share | | 1L | | $ | 0.11 | | | $ | 0.23 | | | $ | (0.05 | ) |
| Diluted profit (loss) per Ordinary Share | | | | $ | 0.10 | | | $ | 0.21 | | | $ | (0.05 | ) |
| Weighted average number of Ordinary Shares | | | | | | | | | | | | | | |
| used to compute basic profit (loss) per | | | | | | | | | | | | | | |
| Ordinary Share | | 1L | | | 26,633,964 | | | | 27,781,223 | | | | 28,053,849 | |
| Weighted average number of Ordinary Shares | | | | | | | | | | | | | | |
| used to compute diluted profit (loss) per | | | | | | | | | | | | | | |
| Ordinary Share | | 1L | | | 29,353,448 | | | | 29,695,164 | | | | 28,053,849 | |
The accompanying notes are an integral part of these consolidated financial statements.
30
Given Imaging Ltd. and its Subsidiaries
Consolidated Statements of Changes in Shareholders’ Equity
(In thousands except share data)
| | | | | | | | Additional | | | | | | | | | | | | | |
| | | Ordinary shares | | Paid-In | | Capital | | Unearned | | Accumulated | | | | |
| | | Shares | | Amount | | Capital | | Reserve | | Compensation | | Deficit | | Total | |
| |
| Balance as of December 31, 2003 | | 25,649,188 | | $ | 301 | | $ | 100,996 | | $ | 2,166 | | $ | (30 | ) | $ | (58,635 | ) | $ | 44,798 | |
| Changes during the year 2004: | | | | | | | | | | | | | | | | | | | | | |
| Ordinary shares issued | | 1,500,000 | | | 17 | | | 44,250 | | | — | | | — | | | — | | | 44,267 | |
| Exercise of stock options | | 472,198 | | | 5 | | | 2,581 | | | — | | | — | | | — | | | 2,586 | |
| Forfeiture of stock options | | — | | | — | | | (11 | ) | | — | | | 3 | | | — | | | (8 | ) |
| Non-employees’ stock options | | — | | | — | | | 62 | | | — | | | — | | | — | | | 62 | |
| Amortization of unearned | | | | | | | | | | | | | | | | | | | | | |
| compensation | | — | | | — | | | — | | | — | | | 24 | | | — | | | 24 | |
| Net profit | | — | | | — | | | — | | | — | | | — | | | 2,888 | | | 2,888 | |
| Balance as of December 31, 2004 | | 27,621,386 | | $ | 323 | | $ | 147,878 | | $ | 2,166 | | $ | (3 | ) | $ | (55,747 | ) | $ | 94,617 | |
| Changes during the year 2005: | | | | | | | | | | | | | | | | | | | | | |
| Exercise of stock options | | 328,895 | | | 4 | | | 1,077 | | | — | | | — | | | — | | | 1,081 | |
| Amortization of unearned | | | | | | | | | | | | | | | | | | | | | |
| compensation | | — | | | ��� | | | — | | | — | | | 3 | | | — | | | 3 | |
| Net profit | | — | | | — | | | — | | | — | | | — | | | 6,343 | | | 6,343 | |
| Balance as of December 31, 2005 | | 27,950,281 | | $ | 327 | | $ | 148,955 | | $ | 2,166 | | $ | — | | $ | (49,404 | ) | $ | 102,044 | |
| Changes during the year 2006: | | | | | | | | | | | | | | | | | | | | | |
| Exercise of stock options | | 591,010 | | | 7 | | | 2,029 | | | — | | | — | | | — | | | 2,036 | |
| Restricted shares issued | | 100,000 | | | 1 | | | — | | | — | | | — | | | — | | | 1 | |
| Stock based compensation | | — | | | — | | | 5,213 | | | — | | | — | | | — | | | 5,213 | |
| Net loss | | — | | | — | | | — | | | — | | | — | | | (1,508 | ) | | (1,508 | ) |
| Balance as of December 31, 2006 | | 28,641,291 | | $ | 335 | | $ | 156,197 | | $ | 2,166 | | $ | — | | $ | (50,912 | ) | $ | 107,786 | |
The accompanying notes are an integral part of these consolidated financial statements.
31
Given Imaging Ltd. and its Subsidiaries
Consolidated Statements of Cash Flows
(In thousands)
| | Year Ended December 31, | |
| | 2004 | | | 2005 | | | 2006 | |
| Cash flows from operating activities: | | | | | | | | | | | |
| Net profit (loss) | $ | 2,888 | | | $ | 6,343 | | | $ | (1508 | ) |
| Adjustments required to reconcile net profit (loss) to net cash | | | | | | | | | | | |
| provided by operating activities: | | | | | | | | | | | |
| Minority share in losses of subsidiary | | (747 | ) | | | (1,116 | ) | | | (1,334 | ) |
| Depreciation and amortization. | | 3,147 | | | | 3,596 | | | | 4,237 | |
| Deferred taxes. | | (737 | ) | | | (482 | ) | | | (155 | ) |
| Employees’ stock option compensation | | 16 | | | | 3 | | | | 5,213 | |
| Non-employees’ stock option compensation | | 62 | | | | — | | | | — | |
| Other | | 48 | | | | 98 | | | | 18 | |
| Net increase in trading securities | | — | | | | — | | | | (5,060 | ) |
| Increase in accounts receivable–trade | | (5,316 | ) | | | (6,064 | ) | | | (562 | ) |
| Decrease (increase) in other accounts receivable | | (804 | ) | | | (4,993 | ) | | | 4,801 | |
| Decrease (increase) in prepaid expenses | | 360 | | | | (66 | ) | | | (320 | ) |
| Decrease (increase) in advances to suppliers | | (508 | ) | | | 223 | | | | 250 | |
| Increase in inventories | | (5,648 | ) | | | (2,378 | ) | | | (1,996 | ) |
| Increase in accounts payable | | 7,107 | | | | 5,769 | | | | 500 | |
| Increase (decrease) in deferred income | | 12,000 | | | | 12,555 | | | | (1,223 | ) |
| Net cash provided by operating activities | $ | 11,868 | | | $ | 13,488 | | | $ | 2,861 | |
| |
| Cash flows from investing activities: | | | | | | | | | | | |
| Purchase of fixed assets and other assets | $ | (3,245 | ) | | $ | (7,948 | ) | | $ | (5,876 | ) |
| Proceeds from sales of fixed assets | | 57 | | | | — | | | | — | |
| Deposits, net | | (42 | ) | | | (16 | ) | | | (41 | ) |
| Proceeds from sales of marketable securities | | — | | | | — | | | | 13,120 | |
| Investments in marketable securities | | — | | | | (21,919 | ) | | | (37,960 | ) |
| Net cash used in investing activities | $ | (3,230 | ) | | $ | (29,883 | ) | | $ | (30,757 | ) |
| |
| Cash flows from financing activities: | | | | | | | | | | | |
| Principal payments on capital lease obligation | $ | (37 | ) | | $ | (12 | ) | | $ | (14 | ) |
| Proceeds from the issuance of Ordinary Shares | | 46,853 | | | | 1,081 | | | | 2,037 | |
| Issuance of shares by consolidated company | | — | | | | — | | | | 4,772 | |
| Net cash provided by financing activities | $ | 46,816 | | | $ | 1,069 | | | $ | 6,795 | |
| Effect of exchange rate changes on cash | $ | 40 | | | $ | (179 | ) | | $ | 255 | |
| Increase (decrease) in cash and cash equivalents | $ | 55,494 | | | $ | (15,505 | ) | | $ | (20,846 | ) |
| Cash and cash equivalents at beginning of year | | 25,367 | | | | 80,861 | | | | 65,356 | |
| Cash and cash equivalents at end of year | $ | 80,861 | | | $ | 65,356 | | | $ | 44,510 | |
| Supplementary cash flow information | | | | | | | | | | | |
| Income taxes paid | $ | 107 | | | $ | 163 | | | $ | 300 | |
The accompanying notes are an integral part of these consolidated financial statements.
32
Given Imaging Ltd. and its Subsidiaries
Notes To The Consolidated Financial Statements
(In thousands except share and per share data)
Note 1—Organization and Summary of Significant Accounting Policies
A. General
Given Imaging Ltd. (the “Company”) was incorporated in Israel in January 1998.
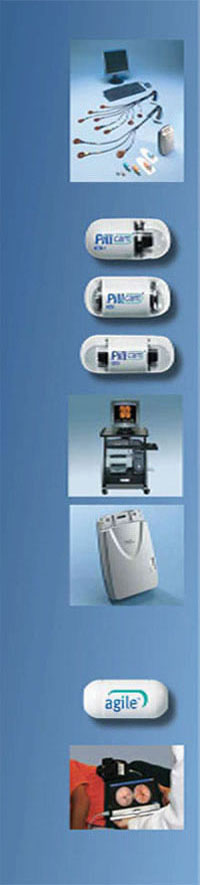
The Company has developed the Given System, a proprietary wireless imaging system that represents a new approach to visual examination of the gastrointestinal tract. The system uses a miniaturized video camera contained in a capsule, referred to as the PillCam capsule, which is ingested by the patient and delivers high quality color images in a painless and noninvasive manner.
The Given System consists of three principal components:
a single-use, disposable PillCam color-imaging capsule that is ingested by the patient;
a portable data recorder and array of sensors that are worn by the patient; and
a computer workstation with a proprietary RAPID software for downloading, processingand analyzing recorded data.
After receiving marketing clearance from the United States Food and Drug Administration (“FDA”) in August of 2001, the Company commenced the marketing of the Given System with its first video capsule, the PillCam Small Bowel Capsule, or PillCam SB, for detection of disorders of the small bowel. In November 2004, following receipt of FDA marketing clearance, the Company began marketing and sales of its second video capsule, PillCam ESO, for detection of disorders in the esophagus. The Company markets the PillCam ESO capsule through a strategic marketing alliance with InScope, a division of Ethicon Endo-Surgery, a Johnson & Johnson company (see Note 8C). In late 2006, the Company completed the development of its third video capsule, PillCam Colon, for visual examination of the colon and received the regulatory clearance that permits the Company to market and sell this capsule in Europe. The Company has also submitted this capsule for FDA clearance in the United States.
The medical device industry in which the Company is involved is characterized by the risks of regulatory barriers and reimbursement issues. Penetration into the world market requires the investment of considerable resources and continuous development efforts. The Company’s future success is dependent upon several factors including technological quality, regulatory approvals, sufficient reimbursement for its products and the cost and diagnostic-effectiveness of its products compared to other methods for the examination of the gastrointestinal tract.
B. Basis of presentation
The accompanying consolidated financial statements have been prepared in accordance with accounting principles generally accepted in the United States of America and include the accounts of the Company and its wholly-owned subsidiaries in the United States, Germany, France, the Netherlands and Australia and its 51% owned subsidiary in Japan. The accounts of its subsidiaries are consolidated from the date of their inception. All the subsidiaries were established for the purpose of marketing and selling the Given System. All intercompany balances and transactions have been eliminated in consolidation. The Company considers that it operates in only one segment.
C. Functional and reporting currency
The Company’s functional and reporting currency is the U.S. dollar.
Transactions denominated in foreign currencies other than the U.S. dollar are translated into the functional currency using current exchange rates. Gains and losses from the translation of foreign currency transactions are recorded in other income or expenses.
33
Given Imaging Ltd. and its Subsidiaries
Notes To The Consolidated Financial Statements—(Continued)
(In thousands except share and per share data)
D. Cash and cash equivalents
All highly-liquid investments with original maturity of three months or less from the date of deposit are considered to be cash equivalents.
E. Provision for doubtful accounts receivable
The provision for doubtful accounts receivable is calculated on the basis of specific identification of balances, the collection of which, in management’s opinion, is doubtful. In determining the adequacy of the provision, management bases its opinion on the estimated risk, in reliance on available information with respect to the debtor’s financial position and an evaluation of the collateral received.
The activity in the provision for doubtful accounts for the three years ended December 31, 2006 is as follows:
| | | Year ended December 31, |
| | | 2004 | | 2005 | | 2006 |
| Opening balance | | $ — | | $115 | | $431 |
| Additions during the year. | | 115 | | 316 | | 356 |
| Closing balance | | $115 | | $431 | | $787 |
F. Inventories
Inventories are stated at lower of cost or market. Cost is determined using the average cost method for raw materials and components and finished goods and on the basis of actual manufacturing costs for work in progress.
G. Assets held for employees’ severance payments
Assets held for employees’ severance payments represent contributions to insurance policies that are recorded at their current redemption value.
H. Marketable securities
The Company accounts for marketable securities under Statement of Financial Accounting Standards (SFAS) No. 115 “Accounting for Certain Investments in Debt and Equity Securities (“Statement 115”). Marketable securities consist of U.S. government bonds and corporate bonds, which the Company classified as “held to maturity” and auction rate securities and money market funds, which the Company classified as “trading”, all in accordance with the guidance of statement 115.
Held-to-maturity debt securities are securities that the Company has the ability and intent to hold until maturity and are recorded at amortized cost, adjusted for the amortization or accretion of premiums or discounts. Premiums and discounts are amortized or accreted over the life of the related held-to-maturity security as an adjustment to yield using the effective-interest method.
Trading securities are bought and held principally for the purpose of selling them in the near term. Trading securities are recorded at fair value and changes in the fair value, based on closing market prices of the at balance sheet date, represent unrealized gains and losses which are included in earnings.
34
Given Imaging Ltd. and its Subsidiaries
Notes To The Consolidated Financial Statements—(Continued)
(In thousands except share and per share data)
A decline in the market value of any “held-to-maturity” security below cost that is deemed to be other than temporary results in a reduction in the carrying amount to fair value. The impairment is charged to earnings and a new cost basis for the security is established.
I. Fixed assets
Fixed assets are stated at cost. Depreciation is computed by the straight-line method over the estimated useful lives of the assets at the following annual rates:
| | | % | |
| Computers and software | | 33 | |
| Instruments and laboratory equipment | | 15 | |
| Leasehold improvements | | 10 | |
| Motor vehicles | | 15 | |
| Machinery and equipment. | | 15 | |
| Communication equipment. | | 15 | |
| Office furniture and equipment | | 10–15 | |
Motor vehicles purchased under capital lease arrangements are recorded at the present value of the minimum lease payments at lease inception. Such assets and leasehold improvements are depreciated and amortized respectively, using the straight-line method over the shorter of the lease term or estimated useful life of the asset.
The Company accounts for long-lived assets and certain intangible assets in accordance with the provisions of SFAS No. 144, “Accounting for the Impairment of or Disposal of Long-Lived Assets” (“Statement 144”). This Statement requires that long-lived assets and certain identifiable intangible assets be reviewed for impairment whenever events or changes in circumstances indicate that the carrying amount of an asset may not be recoverable. Recoverability of assets to be held and used is measured by a comparison of the carrying amount of an asset to undiscounted future net cash flows expected to be generated by the asset. If such assets are considered to be impaired, the impairment to be recognized is measured by the amount by which the carrying amount of the assets exceeds the fair value of the assets.
J. Other assets |
| |
| a. | The Company developed proprietary software for its computer workstations that permits downloading and viewing recorded data from the portable data recorder. The costs of developing this software were capitalized in accordance with SFAS No. 86, “Accounting for Costs of Computer Software to be Sold, Leased or Otherwise Marketed” (“Statement 86”). As such, capitalization of software development costs begins upon the establishment of technological feasibility as defined in Statement 86 and continues up to the time the software is available for general release to customers, at which time capitalized software costs are amortized on a straight-line basis over the expected life of the related product, which is generally five years. |
| |
| b. | Legal expenses related to patent and trademark registration have been capitalized and amortized over the remaining life of the asset, which is generally eight years. |
| |
| c. | Technology and content costs are generally expensed as incurred, except for certain costs relating to the development of the Company’s web site that are capitalized and amortized over their estimated useful lives which are generally three years. |
| |
35
Given Imaging Ltd. and its Subsidiaries
Notes To The Consolidated Financial Statements—(Continued)
(In thousands except share and per share data)
K. Stock compensation plans
Employees and directors
Effective January 1, 2006, the Company adopted the fair value recognition provisions of SFAS No. 123 (revised 2004), “Share-Based Payment” (“SFAS No. 123R”). This Statement requires compensation expense relating to share-based payments to be recognized in net income using a fair-value measurement method. Under the fair value method, the estimated fair value of awards is charged to income on a straight-line basis over the requisite service period, which is generally the vesting period. The Company elected the modified-prospective method and therefore prior periods were not restated. Under the modified-prospective method, compensation costs recognized in 2006 include also compensation costs for all share-based payments granted prior to, but not yet vested, as of December 31, 2005.
Stock-based compensation recognized in the Consolidated Statement of Operations for the year ended December 31, 2006 is based on awards ultimately expected to vest. As a result the expense has been reduced for estimated forfeitures. SFAS No. 123R required forfeitures to be estimated at the time of grant and revised, in necessary, in subsequent periods if actual forfeitures differ from those estimates. In the Company’s pro forma information required under SFAS No. 123, “Accounting for Stock-Based Compensation” (“SFAS No. 123”) for the periods prior to fiscal 2006, the Company accounted for forfeitures as they occurred.
The effect of the implementation of SFAS No. 123R was to increase expenses by $5,213, which changed the profit before taxes and net profit to losses by the same amount. The per share effect $(0.19) was to turn the basic and diluted earnings per share into loss per share.
Prior to January 1, 2006, the Company has followed SFAS No. 123, which permitted entities to recognize as an expense over the vesting period, the fair value on the date of grant of all stock-based awards. Alternatively, Statement 123 allowed entities to continue to apply the provisions of Accounting Principles Board Opinion No. 25, “Accounting for Stock Issued to Employees and related interpretations” (“APB Opinion No. 25”) and provide pro forma net income and pro forma earnings per share disclosures for employee stock option grants as if the fair-value based method defined in Statement 123 had been applied.
The Company elected to apply the intrinsic value-based method prescribed in APB Opinion No. 25 for its stock compensation to employees and directors and provide the pro forma disclosure provisions of SFAS No. 123, as amended by SFAS No. 148, “Accounting for Stock-Based Compensation - Transition and Disclosure, an amendment of SFAS No. 123”.
As such, the Company computed and recorded compensation expense for grants whose terms were fixed with respect to the number of shares and option price only if the market price on the date of grant exceeded the exercise price of the stock option. The compensation cost for the fixed plans was recorded over the period the employee performs the service to which the stock compensation relates.
36
Given Imaging Ltd. and its Subsidiaries
Notes To The Consolidated Financial Statements—(Continued)
(In thousands except share and per share data)
The following table shows the effect on net profit and profit per Ordinary Share if the Company had applied the fair value recognition provisions of Statement 123:
| | | Year ended December 31, | |
| | | 2004 | | | 2005 | |
| Net profit as reported | | $ | 2,888 | | | $ | 6,343 | |
| —Compensation expenses according to APB 25 included in the | | | | | | | | |
| reported net profit | | | 16 | | | | 3 | |
| —Application of compensation expenses according to Statement 123. | | | (13,432 | ) | | | (10,327 | ) |
| Pro forma net loss. | | $ | (10,528 | ) | | $ | (3,981 | ) |
| Basic profit (loss) per Ordinary Share: | | | | | | | | |
| As reported | | $ | 0.11 | | | $ | 0.23 | |
| Pro forma | | $ | (0.39 | ) | | $ | (0.14 | ) |
| Diluted profit (loss) per ordinary share: | | | | | | | | |
| As reported | | $ | 0.10 | | | $ | 0.21 | |
| Pro forma | | $ | (0.39 | ) | | $ | (0.14 | ) |
Non-Employees
Effective January 1, 2006, the Company applies the provisions of SFAS No. 123R to account for stock based compensation to non-employees. Prior to January 1, 2006, the Company applied the fair value-based method of accounting set forth in Statement 123 and Emerging Issues Task Force (“EITF”) Issue No. 96-18, “Accounting for Equity Instruments That Are Issued to Other Than Employees for Acquiring, or in Conjunction with Selling, Goods or Services” for such compensation expenses. Using the fair value method, the total compensation expense is computed based on the fair value of the options on the date the options are granted to the non-employees and are recognized over the vesting period.
The Company recorded compensation expense of $62 in the year ended December 31, 2004 related to the above options. There were no such expenses in 2005 or 2006.
L. Profit (loss) per Ordinary Share
Basic and diluted profit (loss) per Ordinary Share is presented in conformity with SFAS No. 128, “Earnings Per Share”, for all years presented. Basic profit (loss) per Ordinary Share is calculated by dividing the net profit (loss) attributable to Ordinary Shares, by the weighted average number of Ordinary Shares outstanding. Diluted profit (loss) per Ordinary share calculation is similar to Basic Earnings Per Share except that the weighed average of common shares outstanding is increased to include the number of additional common shares that would have been outstanding if the dilutive potential common shares from options had been exercised.
37
Given Imaging Ltd. and its Subsidiaries
Notes To The Consolidated Financial Statements—(Continued)
(In thousands except share and per share data)
The following table summarizes information related to the computation of basic and diluted profit (loss) per Ordinary Share for the years indicated.
| | | Year ended December 31, | |
| | | 2004 | | 2005 | | 2006 | |
| Net profit (loss) attributable to Ordinary Shares | | $ | 2,888 | | $ | 6,343 | | $ | (1,508 | ) |
| Weighted average number of Ordinary Shares | | | | | | | | | | |
| outstanding Used in basic profit (loss) per Ordinary | | | | | | | | | | |
| Share calculation | | | 26,633,964 | | | 27,781,223 | | | 28,053,849 | |
| Add assumed exercise of outstanding dilutive potential | | | | | | | | | | |
| Ordinary Shares | | | 2,719,484 | | | 1,913,941 | | | — | |
| Weighted average number of Ordinary Shares | | | | | | | | | | |
| outstanding Used in diluted profit (loss) per | | | | | | | | | | |
| Ordinary Share calculation | | | 29,353,448 | | | 29,695,164 | | | 28,053,849 | |
| |
| Basic profit (loss) per Ordinary Share | | $ | 0.11 | | $ | 0.23 | | $ | (0.05 | ) |
| |
| Diluted profit (loss) per Ordinary Share | | $ | 0.10 | | $ | 0.21 | | $ | (0.05 | ) |
| |
| Number of options excluded from the diluted earning | | | | | | | | | | |
| per share calculation because of anti-dilutive effect | | | 165,500 | | | 2,448,114 | | | 4,114,604 | |
M. Use of estimates
The preparation of the consolidated financial statements requires management of the Company to make a number of estimates and assumptions relating to the reported amounts of assets and liabilities and the disclosure of contingent assets and liabilities at the date of the consolidated financial statements and the reported amounts of revenues and expenses during the period. Actual results could differ from these estimates.
N. Revenue recognition
Revenues from sales of products are recognized upon delivery provided that the collection of the resulting receivable is reasonably assured, there is persuasive evidence of an arrangement, no significant obligations in respect of installation remain and the price is fixed or determinable.
For sales contracts, which include a Post Contract Customer Support (“PCS”) component, revenues allocated to PCS in accordance with EITF 00-21 “Revenue Arrangements with Multiple Deliverables”, are deferred and recognized ratably over the term of the support period, which is generally one year.
The Company accrues estimated warranty costs at time of shipment based on contractual rights and historical experience. The Company’s policy is not to grant return rights.
Taxes collected from customers and remitted to Governmental Authorities are presented in the financial statements on a net basis.
The Company routinely evaluates its products for inclusion of any embedded software that is more than incidental thereby requiring consideration of AICPA Statements of Position 97-2, “Software Revenue Recognition”. Based on such evaluation, the Company has concluded that none of its products have such embedded software.
O. Government-Sponsored Research and Development
The Company records grants received from the Office of the Chief Scientist of the Israeli Ministry of Industry and Trade (the “OCS”) as a reduction of research and development expenses.
38
Given Imaging Ltd. and its Subsidiaries
Notes To The Consolidated Financial Statements—(Continued)
(In thousands except share and per share data)
Royalties payable to OCS are recognized pursuant to sale of related products and are classified under cost of revenues.
P. Taxes on income
The Company accounts for income taxes under SFAS No. 109 “Accounting for Income Taxes” (“Statement 109”).
Under Statement 109 deferred tax assets or liabilities are recognized in respect of temporary differences between the tax bases of assets and liabilities and their financial reporting amounts as well as in respect of tax losses and other deductions which may be deductible for tax purposes in future years, based on enacted statutory tax rates applicable to the periods in which such deferred taxes will be realized. Valuation allowances are established when necessary to reduce deferred tax assets to the amount expected to be realized.
Q. Research and development costs
Research and development costs are expensed as incurred.
R. Allowance for product warranty
It is the Company’s policy to grant a warranty for certain products. The balance sheet provision for warranties for all periods through December 31, 2006 is determined based upon the Company’s experience regarding the relationship between sales and warranty expenses.
S. Concentration of credit risk
Financial instruments that may subject the Company to significant concentrations of credit risk consist principally of cash and cash equivalents, trade accounts receivable and marketable securities.
Cash and cash equivalents are deposited with major financial institutions in Europe, the United States, Japan, Australia and Israel.
The Company performs ongoing credit evaluations of the financial condition of its customers. The risk of collection associated with trade receivables is reduced by the large number and geographical dispersion of the Company’s customer base and the Company’s policy of requiring collateral or security with respect to receivables due from distributors.
T. Recent accounting pronouncements
In June 2006, the Financial Accounting Standards Board (“FASB”) issued FASB Interpretation No. 48, “Accounting for Uncertainty in Income Taxes - an interpretation of FASB Statement No. 109” (“FIN 48”), which clarifies the accounting for uncertainty in income taxes. This Interpretation prescribes a recognition threshold and measurement attribute for the financial statement recognition and measurement of a tax position taken or expected to be taken in a tax return. This Interpretation also provides guidance on de-recognition, classification, accounting in interim periods, disclosure, and transition. This Interpretation is effective for fiscal years beginning after December 15, 2006. The Company is currently evaluating the impact of FIN 48 on its consolidated financial position, results of operations and cash flows.
39
Given Imaging Ltd. and its Subsidiaries
Notes To The Consolidated Financial Statements—(Continued)
(In thousands except share and per share data)
Note 2—Cash and Cash Equivalents
| | | Interest rate | | | | | | |
| | | as of | | | | | | |
| | | December 31 | | | December 31 |
| | | 2006 | | | 2005 | | | 2006 |
| | | % | | | | | | |
| Denominated in U.S. dollars | | 5.15–5.26 | | | $ | 57,912 | | $ | 25,794 |
| Denominated in New Israeli Shekels | | 4.7–5.0 | | | | 2,855 | | | 3,099 |
| Denominated in Euro. | | 2.95 | | | | 3,396 | | | 7,766 |
| Denominated in Australian dollars | | | | | | 732 | | | 469 |
| Denominated in Japanese Yen. | | | | | | 461 | | | 7,382 |
| | | | | | $ | 65,356 | | $ | 44,510 |
Note 3—Accounts Receivable—Other
| | | December 31 |
| | | 2005 | | 2006 |
| Government institutions | | $ | 921 | | $ | 1,389 |
| InScope (Note 8C) | | | 5,000 | | | — |
| Other | | | 343 | | | 74 |
| | | $ | 6,264 | | $ | 1,463 |
| |
| |
| Note 4—Inventories | | | |
| |
| | | December 31 |
| | | 2005 | | 2006 |
| Raw materials and components | | $ | 7,399 | | $ | 7,721 |
| Work in progress | | | 3,251 | | | 3,533 |
| Finished goods | | | 5,522 | | | 6,914 |
| | | $ | 16,172 | | $ | 18,168 |
Note 5—Marketable Securities
As of December 31, 2006 and 2005, marketable securities consist U.S. government bonds and corporate bonds, which the Company classified as “held-to-maturity” (“the Bonds”). As of December 31, 2006, marketable securities also included auction rate securities and money market funds, which are classified as “trading”.
The amortized cost, gross unrealized losses and fair value of the “held-to-maturity” Bonds by major interest type were as follows:
| | | December 31, 2006 |
| | | Amortized | | Gross Unrealized | | | Fair |
| | | Cost | | Holding Losses | | | Value |
| Up to 5% | | $ | 33,574 | | $ | (601 | ) | | $ | 32,973 |
| 5.1%–6%, 8.125% | | | 13,380 | | | (212 | ) | | | 13,168 |
| | | $ | 46,954 | | $ | (813 | ) | | $ | 46,141 |
40
Given Imaging Ltd. and its Subsidiaries
Notes To The Consolidated Financial Statements—(Continued)
(In thousands except share and per share data)
| | | December 31, 2005 |
| | | Amortized | | Gross Unrealized | | Fair |
| | | Cost | | Holding Losses | | Value |
| 3.375%–4.3% | | $ | 17,697 | | $(198) | | $ | 17,499 |
| 5.9%–6% | | | 4,255 | | (86) | | | 4,169 |
| | | $ | 21,952 | | $(284) | | $ | 21,668 |
Maturities of the “held-to-maturity” Bonds were as follows at December 31, 2006 and 2005:
| | | Amortized | | Fair |
| | | Cost | | Value |
| | | 2006 | | 2006 |
| Current maturities | | $ | 12,185 | | $ | 12,063 |
| Due after one year through five years | | | 34,769 | | | 34,078 |
| | | $ | 46,954 | | $ | 46,141 |
| |
| | | Amortized | | Fair |
| | | Cost | | Value |
| | | 2005 | | 2005 |
| Current maturities | | $ | 288 | | $ | 284 |
| Due after one year through five years | | | 21,664 | | | 21,384 |
| | | $ | 21,952 | | $ | 21,668 |
As of December 31, 2006, marketable securities also included $5,060 in bonds classified as “trading” (2005 - $0). These investments are subject to price volatility associated with any interest-bearing instrument. Net realized gains on trading securities during the year ended December 31, 2006 were $133, and are included in financial income. Net unrealized losses on trading securities held as of December 31, 2006 were $15 and are included in financial income.
Short-term investments are comprised of:
| | | December 31 |
| | | 2005 | | 2006 |
| Current maturities of “held-to-maturity” securities | | $ | 288 | | $ | 12,185 |
| Trading securities | | | — | | | 5,060 |
| | | $ | 288 | | $ | 17,245 |
41
Given Imaging Ltd. and its Subsidiaries
Notes To The Consolidated Financial Statements—(Continued)
(In thousands except share and per share data)
Note 6—Fixed Assets, at Cost, Less Accumulated Depreciation
| | | | December 31 | |
| | | 2005 | | | 2006 | |
| Computers and software. | | $ | 4,942 | | | $ | 6,234 | |
| Instruments and laboratory equipment | | | 682 | | | | 791 | |
| Leasehold improvements | | | 3,847 | | | | 4,259 | |
| Motor vehicles. | | | 55 | | | | 155 | |
| Machinery and equipment | | | 12,702 | | | | 14,952 | |
| Communication equipment | | | 388 | | | | 418 | |
| Office furniture and equipment | | | 1,273 | | | | 1,248 | |
| Fixed assets | | | 23,889 | | | | 28,057 | |
| Accumulated depreciation | | | (10,027 | ) | | | (13,246 | ) |
| Fixed assets less accumulated depreciation | | $ | 13,862 | | | $ | 14,811 | |
| | | | | | | | | |
| Depreciation expenses for the years ended December 31, | | | | | | | | |
| 2004, 2005 and 2006 were $2,561, $2,936 and $3,599, | | | | | | | | |
| respectively. | | | | | | | | |
Note 7—Other Assets, at Cost, Less Accumulated Amortization
| | | | December 31 | |
| | | | 2005 | | | | 2006 | |
| Software development costs | | $ | 647 | | | $ | 647 | |
| Patents and trademarks | | | 3,425 | | | | 4,594 | |
| Web site application | | | 895 | | | | 922 | |
| Other assets | | | 4,967 | | | | 6,163 | |
| Accumulated amortization | | | (2,450 | ) | | | (3,088 | ) |
| Other assets, net | | $ | 2,517 | | | $ | 3,075 | |
Amortization expenses for the years ended December 31, 2004, 2005 and 2006 were $586, $660 and $638, respectively.. Estimated amortization expense for the next five years is: $573 in 2007, $560 in 2008, $516 in 2009, $453 in 2010, and $381 in 2011.
Note 8—Commitments and Contingencies
A. Office of the Chief Scientist Grants
The Company’s research and development efforts have been partially financed through grants from the Office of the Chief Scientist of the Israeli Ministry of Industry and Trade (the “OCS”). In return for the OCS’s participation, the Company is committed to pay royalties to the Israeli Government at the rate of 3% for each of the first three years and, from the fourth year onwards, at the rate of 3.5% of the sales of its product, up to 100% of the amount of the grants received, plus LIBOR interest. The grants are presented as an off-set to related research and development expenses. The Company is entitled to the grants only upon incurring research and development expenditures. There are no future performance obligations related to the grants received from the OCS. However, under certain limited circumstances, the OCS may withdraw its approval of a research program or amend the terms of its approval.
Upon withdrawal of approval, the grant recipient may be required to refund the grant, in whole or in part, with or without interest, as the OCS determines. As of December 31, 2006, the Company has received from the OCS office a total cumulative amount of $6,751 of which
42
Given Imaging Ltd. and its Subsidiaries
Notes To The Consolidated Financial Statements—(Continued)
(In thousands except share and per share data)
the Company has already repaid $2,534 as royalties. The total outstanding future obligation, for royalties, based on royalty-bearing government participation totaled, before interest, approximately $4,217 as of December 31, 2006. Royalties payable to the OCS are recognized pursuant to sale of related products and are classified under cost of revenues.
B. Leases
Capital lease for motor vehicles
The capital lease is to be repaid in five years and bears interest of 7.47%. The vehicles are pledged as collateral.
Operating leases
The Company and its subsidiaries currently lease office space and manufacturing space for periods of up to 15 years (including options to extend the terms of the leases). The current lease for the Company’s headquarters is in Yoqneam, Israel. This facility houses the Company’s corporate headquarters, research and development and manufacturing facilities. Under this lease agreement, the Company will pay approximately $1,300 a year in rent and management fee. These payments are subject to adjustments based on changes in the Israeli Consumer Price Index. In addition, to secure its obligations under the lease, the Company provided a bank guaranty in the amount of approximately $750 in favor of the lessor. The lease expires on December 31, 2015. The Company has an option to extend the lease until December 31, 2020.
The Company and its subsidiaries signed several motor vehicle lease agreements. The companies deposited a total amount of $196 to guarantee their performance under the terms of the lease agreements.
The Company is committed to minimum annual payments over the next five years as follows:
| | | Capital leases | | Operating leases |
| 2007 | | $ | 13 | | $ | 2,884 |
| 2008 | | | 20 | | | 2,432 |
| 2009 | | | — | | | 1,880 |
| 2010 | | | — | | | 1,439 |
| 2011 and thereafter. | | | — | | | 6,577 |
| | | $ | 33 | | $ | 15,212 |
Rental expenses under the lease agreements for the years ended December 31, 2004, 2005 and 2006 were $1,999, $2,353 and $2,914, respectively.
C. Agreement with InScope
On May 10, 2004, the Company entered into an exclusive sales representation, co-promotion and cooperation agreement with InScope, a division of Ethicon Endo-Surgery, a Johnson & Johnson company. InScope has exclusive rights to market the Company’s PillCam ESO capsule for visual examination of the esophagus. Under the terms of the agreement, the Company received, as of December 31, 2006, milestone payments of $25,000. The Company pays InScope a commission of 50% on sales of PillCam ESO capsules and a 10% commission on sales of capital equipment parts of the Given System, such as workstations and portable data recorders. According to a September 2006 amendment to the original agreement, the payment by InScope to the Company of the remaining $25,000 milestone payment originally due February 2007, plus 7% interest, will be made in six equal annual installments of $5,240 each,
43
Given Imaging Ltd. and its Subsidiaries
Notes To The Consolidated Financial Statements—(Continued)
(In thousands except share and per share data)
beginning in January 2008. Beginning in 2009, the remaining installments at any given time may be accelerated and paid sooner if one or more reimbursement or commission thresholds are achieved. In addition, pursuant to this amendment, the 10% commission the Company pays InScope on sales of capital equipment parts of the Given System will be paid only in respect of capital equipment sold to customers that use this equipment to perform procedures with the PillCam ESO capsule. InScope will fund certain reimbursement and clinical study activities concerning the PillCam ESO capsule.
Subject to achieving specified minimum sales targets and meeting certain conditions, the exclusive term of the agreement will continue for up to 11 years, followed by a four-year co-exclusive transition period with the Company.
All milestone payments received have been deferred and are being systematically recognized, on a straight-line basis, by the Company as a reduction of commission expense over the 15 year term of the agreement.
Milestone payments are included under deferred income in the Consolidated Balance Sheet.
D. Agreements with key single—source suppliers and commitments to suppliers
| (1) | In 2004, the Company entered into an agreement with a Canadian company (“Canadian Company”) that supplies a component that is integrated into the PillCam capsules. Under the agreement, the Company has agreed to purchase a minimum quantity of components during the first 36 months following the development and testing phase, and if it fails to do so it must make certain payments to the Canadian Company in respect of the shortfall. The agreement also includes non-compete provisions prohibiting the Canadian company from selling the component to other parties and, for a certain period of time following termination of the agreement, from transferring any of the intellectual property and design specifications associated with the development of the component to any potential competitors in the Company’s market. The initial term of the agreement was scheduled to expire in April 2007. |
In July 2005, the Company agreed with the Canadian Company that it will develop and manufacture an additional version of the component. The minimum purchase requirements will not apply to this version. In addition, the initial term of the agreement was extended until April 2012, subject to earlier termination in specified circumstances, with the option to extend annually thereafter for up to five years.
| (2) | The Company is a party to a development, manufacturing and supply agreement with another supplier (“Supplier”), under which the Supplier has developed a component, that is integrated into the PillCam capsules and is also manufacturing and supplying this component exclusively to the Company. Under this contract, the Supplier may not offer the component as a standard catalog part. In the event that the Supplier ceases operations or enters into liquidation, the Company is entitled to receive all information necessary to manufacture the component upon the payment of reasonable royalties to be agreed upon with the Supplier. The agreement permits the Supplier to disregard the exclusive sales requirement if the Company fails to purchase agreed-upon minimum quantities. |
In February 2006, the Company signed an amendment to this agreement and agreed that the Supplier will develop and manufacture an enhanced version of the component. This amendment also extended the initial term of the agreement until November 2012, with an option to extend that term by mutual agreement. The Company has agreed to purchase the enhanced component only from the Supplier and the Supplier has agreed to sell the component exclusively to the Company.
44
Given Imaging Ltd. and its Subsidiaries
Notes To The Consolidated Financial Statements—(Continued)
(In thousands except share and per share data)
| (3) | The Company’s annual commitments under agreements with suppliers for the next 5 years are as follows: |
| |
| 2007 | | $ | 3,808 |
| 2008 | | | 2,329 |
| 2009 | | | 2,250 |
| 2010 | | | 2,250 |
| 2011 and thereafter | | | 4,500 |
| | | $ | 15,137 |
Payments under such agreements with suppliers for the years ended December 31, 2004, 2005 and 2006 were $3,723, $8,568 and $8,875 respectively.
E. Patent Litigation
On May 19, 2006, Olympus Corporation, Olympus Medical Systems Corp. and Olympus America Inc., collectively referred to in this section as “Olympus”, filed a complaint against the Company in the District Court for the Eastern District of Pennsylvania. In the complaint, Olympus alleged that the Company’s capsule endoscopes infringe one of its patents (“Olympus Patent”). The Olympus Patent will expire in December 2008. In addition, Olympus seeks a declaratory judgment that its endoscope product will not infringe the Company’s’ first U.S. Patent, known as the ‘531 patent, and that the ‘531 patent is invalid. In its complaint, Olympus requested an injunction that will prevent the Company from selling in the United States any product that infringes on the Olympus Patent as well as damages in an unspecified amount.
The Company filed its answer and counterclaim on October 20, 2006. In this answer and counterclaim the Company denied infringement of the Olympus Patent and that the Olympus Patent is invalid. In addition, the Company alleged that the ‘531 patent is valid and will be infringed by Olympus once it begins marketing and selling its capsule endoscopy product in the United States. The Company also alleged that Olympus will infringe three other Company patents. In the complaint, the Company requested an injunction to prevent Olympus from selling in the United States any product that infringes on the Company’s patents. If Olympus sells its capsule endoscopy system in the United States, the Company may also request the assessment of damages.
On March 30, 2007 Olympus filed an amended complaint asserting that the Company’s capsule endoscopes infringe three additional patents owned by it. The Company is examining the amended complaint and will file its answer with the court within the time period permitted by the applicable procedural rules.
The Company believes it has a reasonable chance of success in this case. However, litigation is in early stages and the outcome is uncertain at this time. The ongoing litigation and any unfavorable outcome may have an adverse effect on the Company’s results of operation.
F. Provision for Sales Tax
During the year ended December 31, 2005, the Company made a provision of $1,800 for potential uncollectible sales tax, interest and penalties resulting from the failure of the Company’s U.S. subsidiary to appropriately collect and remit sales tax on sales in the U.S. since the fourth quarter of 2001. The provision represented the Company’s estimate of the amounts it might not collect from its customers for remittance to the different jurisdictions, and any interest and penalties the Company may have to pay for failure to timely remit the sales tax. During 2005 and 2006 the Company has all required sales and use tax returns and collected tax
45
Given Imaging Ltd. and its Subsidiaries
Notes To The Consolidated Financial Statements—(Continued)
(In thousands except share and per share data)
amounts from its customers. As of December 31, 2006, accounts payable included $702 representing sales and use taxes, interest and penalties remaining to be resolved.
G. Investment in the Japanese Subsidiary
In 2006, the Company and its Japanese partners completed additional equity financing of approximately $9.6 million (in Japanese YEN) to finance the operations of Given Imaging K.K., the Company’s Japanese subsidiary, until it starts generating enough cash to finance its operations. The Company’s portion of the funding of approximately $4.8 million was paid out of its cash reserves. Following completion of this additional equity financing, the Company continues to have a controlling interest of 51% of its Japanese subsidiary
Note 9—Accounts Payable – Other| | | | | | | |
| | | | December 31 |
| | | 2005 | | 2006 |
| Government institutions | | $ | 3,693 | | $ | 2,137 |
| Liabilities regarding employees. | | | 4,700 | | | 6,863 |
| Advances from customers | | | 39 | | | 58 |
| Warranty | | | 71 | | | 102 |
| Royalties to the OCS | | | 306 | | | 214 |
| Commissions | | | 2,161 | | | 2,057 |
| Accrued expenses | | | 2,916 | | | 3,189 |
| | | $ | 13,886 | | $ | 14,620 |
Note 10—Liability in Respect of Employee Severance Payments
Under Israeli law and labor agreements the Company is required to pay severance payments to each employee who was employed by the Company for over one year and has been terminated by the Company or resigned under certain specified circumstances. The Company’s liability for severance payments is covered mainly by deposits with insurance companies in the name of the employee and/or by purchase of insurance policies. The liability is calculated on the basis of the latest salary of the employee multiplied by the number of years of employment as of the balance sheet date. The liability for employee severance payments included in the balance sheet represents the total amount due for such severance payment, while the assets held for severance benefits included in the balance sheet represents the Company’s contributions to insurance policies. The Company may make withdrawals from the funds only upon complying with the Israeli severance pay law or labor agreements.
The U.S. subsidiary has a defined contribution retirement plan for its employees. Employees are allowed to contribute up to 18% of their salary in any one year, subject to a regulatory limit. The Company contributes 3% of an employee’s salary subject to regulatory limits. Employees are vested in the Company’s contributions after 30 days of employment.
Expenses recorded in respect of employee severance payments for the years ended December 31, 2004, 2005 and 2006 are $525, $664 and $862, respectively.
46
Given Imaging Ltd. and its Subsidiaries
Notes To The Consolidated Financial Statements—(Continued)
(In thousands except share and per share data)
Note 11—Share Capital
A. Ordinary shares
All of the issued and outstanding Ordinary Shares of the Company are authorized, issued, fully paid and non-assessable. The Ordinary Shares of the Company are not redeemable and have no preemptive rights. The ownership or voting of Ordinary Shares by non-residents of Israel is not restricted in any way by the Company’s memorandum or articles of association or the laws of the State of Israel, except that citizens of countries which are, or have been, in a state of war with Israel may not be recognized as owners of Ordinary Shares.
B. Employees’ and non employees’ stock options
In 2003, the Company adopted a stock option plan for directors, employees and consultants.The 2003 Plan replaced and superseded previous option plans adopted by the Company in 1998 and 2000. Under these plans, the Board of Directors (or a compensation committee appointed by the board) (the “Board”) has the authority to grant options to employees of the Company and its subsidiaries, directors or consultants. Each option entitles the holder to purchase one Ordinary Share of par value of NIS 0.05 and expires after 10 years from the date of grant. The Company has reserved for issuance a total of 2,500,000 Ordinary Shares under the plan. As of December 31, 2006, 21,516 options out of this plan had not been granted.
The purchase price of each share pursuant to the options granted under the 2003 Plan shall be the fair market value on the date the Board approves the grant of the option or as otherwise determined by the Board.
Unless otherwise determined by the Board, where a grant of options under the 2003 Plan is the first grant of options made to a person, 50% of the options vest and become exercisable on the second anniversary of the date of grant. An additional 25% of the options vest and become exercisable on each of the third and fourth anniversaries of the date of the grant. If, however, a grant under the 2003 Plan is made to a person who previously received stock options under the 2003 Plan or a previous plan of the Company, 25% of the options granted are immediately vested and exercisable and an additional 25% of the options vest and become exercisable on each of the first, second and third anniversaries of the date of the grant.
In 2006, the Company adopted the 2006 Equity Incentive Plan (“the Plan”) permitting the grant of equity awards, including options and restricted stock of the Company, to eligible employees, directors and consultants of the Company and its subsidiaries. The Plan is administered by the Company’s Board of Directors and Compensation and Nominating Committee. The Plan contains provisions concerning the vesting, price, exercise and other terms of awards; however, the Compensation and Nominating Committee has authority to grant awards under different terms at its discretion. The Company has reserved for issuance a total of 2,500,000 Ordinary Shares under the Plan. As of December 31, 2006, there were 539,500 shares outstanding under this plan, and 100,000 shares of restricted stock had been issued.
Equity awards under this plan must be granted at no less than the fair market value of the Company’s ordinary shares on the date of the grant and the term of the awards may not exceed ten years. The Company’s current policy is that options granted under the Plan expire five years following the date of the grant.
Generally, where a grant of an award under the plan is the first grant of equity to an employee or consultant, 50% of the award is exercisable on the second anniversary of the date of grant, and 25% becomes exercisable on each of the third and fourth anniversaries of the date of the grant. In cases of subsequent grants, awards vest in four equal installments beginning
47
Given Imaging Ltd. and its Subsidiaries
Notes To The Consolidated Financial Statements—(Continued)
(In thousands except share and per share data)
with the first anniversary of the grant. To the extent the awards have vested, they may be exercised in whole or in part from time to time until their expiration.
In case of participating employees and consultants, all unvested awards are cancelled upon the termination of their employment or service. All vested awards may be exercised within 180 days following termination. All vested awards not exercised within this period are automatically forfeited and cancelled. Unvested awards to non-employee directors whose service is terminated or discontinued for any reason other than for cause after more than five years of service on the Company’s board of directors, will automatically vest and become exercisable immediately prior to termination or discontinuation of service. These vested awards may be exercised within 180 days following termination or discontinuation of service, except in cases where termination or discontinuation of service is a result of statutory requirements, death, disability or other circumstances of forced cessation of service, in which case awards may be exercised at any time until their expiration date. In a case of termination for cause of a plan participant, all awards, whether vested or unvested, are automatically forfeited and cancelled.
Under this plan, in the event of an acquisition or merger in which the Company is not the surviving entity and the acquiring entity does not agree to assume the awards, all outstanding, but unvested, awards will be accelerated and exercisable, ten days prior to the acquisition or merger. In addition, if the employment of a holder of outstanding awards is terminated in anticipation of or during the 12 month period following an acquisition or merger, all awards that are scheduled to vest within two years of such acquisition or merger, will be automatically accelerated and exercisable, subject to certain adjustments and exceptions.
Awards granted under the 2006 equity plan to Israeli residents may be granted under Section 102 of the Israeli Income Tax Ordinance pursuant to which the awards or the Ordinary Shares issued upon their exercise must be deposited with a trustee for at least two years following the date of the grant. Under Section 102, any tax payable by an employee from the grant or exercise of the awards is deferred until the transfer of the awards or ordinary shares by the trustee to the employee or upon the sale of the awards or ordinary shares. Gains on awards granted under the plan are subject to capital gains tax of 25% and the Company is not entitled to a tax deduction. Options granted under the plan to U.S. residents may also qualify as incentive stock options (ISO) within the meaning of Section 422 of the U.S. Internal Revenue Code of 1986. Options that do not contain terms that will qualify them as ISOs are treated as Non-Qualified Stock Options.
Prior to the adoption of Statement 123R, effective January 1, 2006, the fair value of each option granted is estimated on the date of grant, using the Black-Scholes model with the following assumptions:
1. Dividend yield of zero percent.
2. Risk-free average interest rate as follows:
| Year ended December 31, | | % |
| 2004 | | 1.0-2.5 |
| 2005 | | 3.0-4.3 |
| 3. | Estimated expected lives of five years as of the date of grant. |
| |
| 4. | Expected average volatility of 74% and 62%, for the year ended December 31, 2004 and 2005, respectively, which represents a weighted average standard deviation rate for the price of the Company’s Ordinary Shares on the NASDAQ National Market. |
The fair value of each option granted in 2006 was estimated on the date of grant using the Black—Scholes model, with the following assumptions:
1. Dividend yield of zero percent.
48
Given Imaging Ltd. and its Subsidiaries
Notes To The Consolidated Financial Statements—(Continued)
(In thousands except share and per share data)
| 2. | Risk free average interest rate of 4.89% which represents the risk free rate of US$zero— coupon Government Bonds. |
| |
| 3. | Weighted average expected life of 3.69 years, which represents the period for which the options granted are expected to be outstanding. |
The expected life of the options granted to employees and directors, is calculated based on the Simplified Method as allowed under Staff Accounting Bulletin No. 107 (SAB 107), giving consideration to the contractual term of the options and their vesting schedules.
| 4. | Expected average volatility of 53.17% which represents a weighted average standard deviation rate for the price of the Company’s Ordinary Shares in the NASDAQ National Market. |
The following table summarizes information relating to stock options for Ordinary Shares outstanding and exercisable, as of December 31, 2006:
| | | Options outstanding |
| | | Number outstanding at | | Weighted average remaining |
| Exercise price | | December 31, 2006 | | contractual life (in years) |
| $1–$10 | | 855,368 | | 4.86 |
| $10.01–$20 | | 1,862,025 | | 5.65 |
| $20.01–$30 | | 889,920 | | 6.45 |
| $30.01–$40 | | 507,291 | | 7.90 |
| | | 4,114,604 | | |
| |
| | | Options exercisable |
| | | Number exercisable at | | Weighted average remaining |
| Exercise price | | December 31, 2006 | | contractual life (in years) |
| $1–$10 | | 844,368 | | 4.84 |
| $10.01–$20 | | 1,294,525 | | 6.07 |
| $20.01–$30 | | 236,250 | | 7.71 |
| $30.01–$40 | | 410,674 | | 7.88 |
| | | 2,785,817 | | |
The stock option activity under the Plans is as follows:
| | | | | | Weighted average | | Weighted average |
| | | Number of shares | | exercise price | | grant date fair value |
| Balance at January 1, 2004 | | 3,881,396 | | | | | |
| Granted | | 1,011,340 | | | $34.09 | | $23.31 |
| Forfeited | | (119,000 | ) | | 14.84 | | 10.36 |
| Exercised | | (472,198 | ) | | 5.44 | | 4.11 |
| Balance at December 31, 2004 | | 4,301,538 | | | | | |
| Granted | | 266,000 | | | 25.06 | | 13.93 |
| Forfeited | | (205,483 | ) | | 26.96 | | 16.78 |
| Exercised | | (328,895 | ) | | 3.29 | | 2.78 |
| Balance at December 31, 2005 | | 4,033,160 | | | | | |
| Granted | | 1,077,070 | | | 18.75 | | 10.21 |
| Forfeited | | (404,616 | ) | | 25.87 | | 15.29 |
| Exercised | | (591,010 | ) | | 3.45 | | 2.95 |
| Balance at December 31, 2006 | | 4,114,604 | | | | | |
49
Given Imaging Ltd. and its Subsidiaries
Notes To The Consolidated Financial Statements—(Continued)
(In thousands except share and per share data)
The aggregate intrinsic value of options outstanding as at December 31, 2006, is $19,673. The aggregate intrinsic value of options excisable as at December 31, 2006, is $18,778. The total intrinsic value of options exercised during the year ended December 31, 2006, is $10,610.
On May 30, 2006, the Company issued 100,000 restricted shares to its CEO. The restricted shares will vest in four installments over a period of four years, beginning on May 30, 2007. The fair value of the restricted shares as of the date of issue is being amortized over the vesting period.
Unrecognized compensation costs related to the restricted shares, as of December 31, 2006, to be recognized over 3.4 years, were $1,516 and compensation expenses of $263 were recognized in 2006.
The following summarizes the allocation of the stock-based compensation charge for both employees and non-employee stock option grants:
| | | Year ended December 31, |
| | | 2004 | | 2005 | | 2006 |
| Research and development costs | | $63 | | $— | | $ 569 |
| Selling and marketing expenses. | | 1 | | — | | 1,839 |
| General and administrative expenses | | 14 | | 3 | | 2,805 |
| | | $78 | | $ 3 | | $5,213 |
As of December 31, 2006, there was approximately $10,200 of unrecognized compensation costs related to non-vested options to be recognized over a weighted average period of 2.67 years. The total grant date fair value of options vested during the year ended December 31, 2006, was $8,368
Note 12—Revenues
| A. | Revenues by activities | | | | | | | | | |
| |
| | | | | Year ended December 31, |
| | | | | 2004 | | | 2005 | | | 2006 |
| | Workstations and recorders | | $ | 18,669 | | $ | 16,145 | | $ | 12,513 |
| | PillCam SB capsule | | | 41,622 | | | 62,528 | | | 76,360 |
| | PillCam ESO capsule | | | 1,829 | | | 4,384 | | | 1,438 |
| | Patency capsules and scanners | | | 188 | | | 174 | | | 353 |
| | Service | | | 2,712 | | | 3,545 | | | 4,365 |
| | | | $ | 65,020 | | $ | 86,776 | | $ | 95,029 |
| |
| |
| |
| B. | Revenues by geographic areas | | | | | | | | | |
| |
| | | | | Year ended December 31, |
| | | | | 2004 | | | 2005 | | | 2006 |
| | United States | | $ | 46,694 | | $ | 63,896 | | $ | 66,415 |
| | Europe | | | 13,447 | | | 16,765 | | | 21,053 |
| | Rest of the world | | | 4,879 | | | 6,115 | | | 7,561 |
| | | | $ | 65,020 | | $ | 86,776 | | $ | 95,029 |
50
Given Imaging Ltd. and its Subsidiaries
Notes To The Consolidated Financial Statements—(Continued)
(In thousands except share and per share data)
Note 13—Financial Income, net
| | | | 2004 | | | | 2005 | | | | 2006 | |
| Currency gains (losses) | | $ | 444 | | | $ | (837 | ) | | $ | 778 | |
| Interest income | | | 685 | | | | 1,963 | | | | 1,639 | |
| Income from marketable securities | | | — | | | | 422 | | | | 1,849 | |
| Other | | | (173 | ) | | | (786 | ) | | | (286 | ) |
| | | $ | 956 | | | $ | 762 | | | $ | 3,980 | |
Note 14—Taxes on Income
A. Company
| (1) | Israeli income tax is computed on the basis of the Company’s results in New Israeli Shekels (“NIS”) determined for statutory purposes. The Company is assessed for tax purposes under the Income Tax Law (Inflationary Adjustments 1985), the purpose of which is to prevent taxation on inflationary profits. |
Pursuant to the Israeli tax law, the Company was awarded “Approved Enterprise” status under the government alternative benefits track. The program is for investments in the development of infrastructure and for investments in locally produced and imported equipment. The main benefits to which the Company will be entitled, if it implements all the terms of an approved program, are the exemption from tax on income deriving from an approved enterprise, and reduced tax rates on dividends originating from this income.
The income derived from an approved enterprise will be exempt from tax for a ten year period, commencing on the date that taxable income is first generated by the approved enterprise (limited to the earlier of a maximum period of 12 years from the year of commencement of operations or 14 years from the year the approval letter was received). As of December 31, 2006, the benefit term had not commenced.
Dividend distributions originating from income of the Approved Enterprise will be subject to tax at the rate of 15%, provided that the dividend is distributed during the period stipulated under Israeli law.
In the event of a dividend distribution (including withdrawals and charges that are deemed to be dividends) out of the income originating from the approved enterprise, and on which the Company received a tax exemption, the distribution is subject to corporate taxes at rates varying from 10% - 25% depending on the percentage of foreign investment holding in the Company as defined by the Law.
If the Company derives income from sources other than the approved enterprise during the relevant period of benefits, such income will be taxable at regular corporate tax rates (see (4) below).
On March 30, 2005, the Knesset approved a reform of the Encouragement of Capital Investments Law–1959. The primary changes are as follows:
| a. | Companies that meet the criteria of the Alternate Path of tax benefits will receive those benefits without prior approval. In addition there will be no requirement to file reports with the Investment Center. Audit will take place via the Income Tax Authorities as part of the tax audits. Request for pre-ruling is possible. |
| |
| b. | Tax benefits of the Alternate Path include lower tax rates or zero tax depending on the investment zone and the path chosen, lower tax rates on dividends and accelerated depreciation. |
| |
51
Given Imaging Ltd. and its Subsidiaries
Notes To The Consolidated Financial Statements—(Continued)
(In thousands except share and per share data)
| c. | In order to receive benefits in the Grant Path or the Alternate Path, the Industrial Enterprise must contribute to the economic independence of the Country’s economy in one of the following ways: |
| |
| | 1. | Its primary activity is in the Biotechnology or Nanotechnology fields and pre-approval is received from the head of research and development at the Office of the Chief Scientist; |
| |
| | 2. | Its revenue from a specific country is not greater than 75% of its total revenues that year; |
| |
| | 3. | 25% or more of its revenues are derived from a specific market of at least 12 million residents. |
The amendments to the Law do not retroactively apply for investment programs having an Approved Enterprise approval certificate from the Investment Center issued up to December 31, 2004 (even when investments under these programs are conducted after January 1, 2005). Consequently, the amendments should not impact an existing Approved Enterprise, which received written approval. The new tax regime shall apply for a new Approved Enterprise and for an Approved Enterprise expansion for which the first year of benefits may be as early as 2004.
| (2) | The Company has net operating loss carryforwards in Israel of approximately $13.9 million as of December 31, 2006. These net operating loss carryforwards are linked to the Israeli Consumer Price Index and are available to offset future taxable income, if any, indefinitely. |
| |
| (3) | As explained above, the Israeli Company is exempt from tax for a ten-year period. Therefore, the Israeli Company has not recorded deferred tax assets and liabilities. |
| |
| (4) | On July 25, 2005 the Knesset passed the Law for the Amendment of the Income Tax Ordinance (No. 147 and Temporary Order) - 2005 (“the Amendment”). |
The Amendment provides for a gradual reduction in corporate tax rate in the following manner: in 2006 - 31%, 2007 - 29%, 2008 - 27%, 2009 - 26% and from 2010 onward 25%. Furthermore, as from 2010, upon reduction of the corporate tax rate to 25%, capital gains will be subject to tax of 25%.
This change has no effect on the financial statements of the Company.
B. Subsidiaries
At December 31, 2006 the subsidiaries had local, federal and state net operating loss carryforwards of approximately $26.6 million. Federal and state losses carryforwards in the US subsidiary, totaling $9.1 million will be expired through 2026. Operating loss carryforwards in the Japanese subsidiary, totaling $6.4 million will be expired through 2013. The remaining balance could be utilized with no limitation of time.
52
Given Imaging Ltd. and its Subsidiaries
Notes To The Consolidated Financial Statements—(Continued)
(In thousands except share and per share data)
C. Profit (loss) before tax and tax expense (benefit) included in the statement of operations
| | | | | | Year ended December 31 | |
| | | | | | | | 2005 | | | | |
| | | Profit (loss) before taxes on income and minority | | | | | | | | | | | | |
| | | share: | | | | | | | | | | | | |
| | | Israel | | $ | 4,494 | | | $ | 5,011 | | | $ | 3,459 | |
| | | Foreign jurisdiction | | | (3,043 | ) | | | (70 | ) | | | (6,174 | ) |
| | | | | $ | 1,451 | | | $ | 4,941 | | | $ | (2,715 | ) |
| | | Taxes on income: | | | | | | | | | | | | |
| | | Current taxes: | | | | | | | | | | | | |
| | | Israel | | $ | — | | | | $ — | | | $ | 200 | |
| | | Foreign jurisdiction | | | 47 | | | | 196 | | | | 82 | |
| | | | | $ | 47 | | | $ | 196 | | | $ | 282 | |
| | | Deferred taxes: | | | | | | | | | | | | |
| | | Israel | | $ | — | | | | $ — | | | $ | — | |
| | | Foreign jurisdiction | | | (737 | ) | | | (482 | ) | | | (155 | ) |
| | | | | $ | (737 | ) | | $ | (482 | ) | | $ | (155 | ) |
| | | Tax expense (benefit) | | $ | (690 | ) | | $ | (286 | ) | | $ | 127 | |
| |
| D. | | Deferred Taxes | | | | | | | | | | | | |
In assessing the realizability of deferred tax assets, management considers whether it is more likely than not that some portion or all of the deferred tax assets will not be realized. The ultimate realization of deferred tax assets is dependent upon the generation of future taxable income during the periods in which those temporary differences become deductible. Management considers projected future taxable income and tax planning strategies in making this assessment.
Based upon projections for future taxable income over the periods in which the deferred tax assets are deductible, management believes it is more likely than not that the Company will realize the benefits of these deductible differences, net of the existing valuation allowances at December 31, 2006. The amount of the deferred tax asset considered realizable, however, could be reduced in the near term if estimates of future taxable income during the carryforward period are reduced.
The tax effects of significant items comprising the Company’s deferred taxes:
| | | | December 31 | |
| | | | | | 2006 | |
| Net operating tax assets regarding carryforward losses of | | | | | | | | |
| subsidiaries | | $ | 9,960 | | | $ | 10,137 | |
| Other timing difference | | | 1,576 | | | | 2,343 | |
| Deferred tax asset | | | 11,536 | | | | 12,480 | |
| Valuation allowance | | | (10,317 | ) | | | (11,106 | ) |
| Net deferred tax asset | | $ | 1,219 | | | $ | 1,374 | |
The net changes in the total valuation allowance for the years ended December 31, 2004, 2005 and 2006 are $3,840, ($2,779) and $789, respectively.
53
Given Imaging Ltd. and its Subsidiaries
Notes To The Consolidated Financial Statements—(Continued)
(In thousands except share and per share data)
E. Reconciliation of the statutory tax expense (benefit) to actual taxes on income
| | | | Year ended December 31, | |
| | | | 2004 | | | | 2005 | | | | 2006 | |
| Profit (loss) before taxes on income and minority | | | | | | | | | | | | |
| share | | $ | 1,451 | | | $ | 4,941 | | | $ | (2,715 | ) |
| Tax rate | | | 0 | % | | | 0 | % | | | 0 | % |
| Statutory income tax on the above amount | | | — | | | | — | | | | — | |
| Increase (decrease) in taxed on income resulting from: | | | | | | | | | | | | |
| Differences between the definition of capital and | | | | | | | | | | | | |
| assets for tax purposes. | | | — | | | | — | | | | 200 | |
| Changes in valuation allowance | | | 3,840 | | | | (2,779 | ) | | | 789 | |
| Foreign tax rate differential in subsidiaries | | | (4,530 | ) | | | 2,493 | | | | (862 | ) |
| Tax expense (benefit) | | $ | (690 | ) | | $ | (286 | ) | | $ | 127 | |
Note 15—Fair Value of Financial Instruments
The Company’s financial instruments include cash and cash equivalents, accounts receivable, deposits, assets held for severance benefits, marketable securities and accounts payable. Except for marketable securities considering the short term nature of these financial instruments, their carrying amounts approximate fair value. The fair value of the Company’s marketable securities is disclosed in Note 5.
54

Board of Directors
Nachum (Homi) Shamir
President and Chief Executive Officer
Doron Birger
Chairman
James M. Cornelius
Director and Chief Executive Officer,
Bristol-Myers Squibb
Michael Grobstein
Former Vice Chairman, Ernst &Young
Chen Barir
Chairman, Berman & Co. Trading and
Investments Ltd.
Prof. Anat Loewenstein
Director, Department of Ophthalmology,
Tel Aviv Medical Center
Eyal Lifschitz
Chief Executive Officer and General Manager,
Peregrine Ventures
Management Team
Nachum (Homi) Shamir
President and Chief Executive Officer
Kevin Rubey
Chief Operations Officer
Yuval Yanai
Chief Financial Officer
Mark Gilreath
Chief Marketing Officer
Ori Braun
Senior Vice President, Business Development
Manfred Gehrtz
President, Europe, Middle East and Africa (EMEA)
Chris Rowland
President, Given Imaging, Inc.
Investor Information
Shareholders, securities analysts and investors seeking more information about the Company can access www.givenimaging.com for the following information:
| |
n | News releases describing significant company events and financial results for each quarter and the fiscal year. |
| |
n | Annual report on Form 20-F for 2006 filed on May 16, 2007 with the Securities and Exchange Commission. Information can also be obtained by calling in the United States:1-866-GIVEN IR and in Israel: + 972-4-9097790. |
NASDAQ Information
Ticker Symbol: GIVN
Transfer Agent
American Stock Transfer and Trust Company
59 Maiden Lane, Plaza Level
New York, NY 10038
Tel: 1-212-936-5100
Investor Relations
Lazar Partners
420 Lexington Avenue, Suite 442
New York, NY 10170
Tel: 1-866-GIVEN IR
Independent Auditors
Somekh Chaikin, a member of KPMG International
Copyright ©2007 Given Imaging Ltd. All Rights Reserved. GIVEN, GIVEN & Design, PILLCAM, PILLCAM & Logo, PILLCAM IMAGING CAPSULE & Design, AGILE, RAPID, RAPID ACCESS, ORDERWIN, ORDER WHEN I NEED, FINGERS HOLDING A CAPSULE & Logo, FINGERS HOLDING PILLCAM CAPSULE & Logo, ICCE, ICCE Logos, and International Conference on Capsule Endoscopy are Trademarks and/or Registered Trademarks of Given Imaging Ltd. its subsidiaries and/or affiliates in the United States and/or other countries. All other company or product names are the trademarks or registered trademarks of their respective holders. All rights not expressly granted are reserved.

| | |
Corporate Headquarters
Given Imaging Ltd.
2 Hacarmel St.
New Industrial Park
POB 258
Yoqneam 20692
Israel
Phone: +972 (4) 909 7777
Fax: +972 (4) 959 2466
info@givenimaging.com Americas Headquarters
Given Imaging Inc.
3950 Shackleford Road, Suite 500
Duluth, GA 30096
United States
Phone: +1 (770) 662-0870
Fax: +1 (770) 662-0510
infousa@givenimaging.com Germany & European Operations
Given Imaging GmbH
Borsteler Chaussee 47
Hamburg 22453
Germany
Phone: +49 40 513 3000
Fax: +49 40 4606 9611
infode@givenimaging.com | Australia & New Zealand
Given Imaging Pty. Ltd.
Unit 4, Rydelink Business Park
277 Lane Cove Road
Mail: Box 8, 293 Lane Cove Road
North Ryde, NSW 2113
Australia
Phone: +61 2 9889 3944
Fax: +61 2 9889 3955
infoaus@givenimaging.com France
Given Imaging s.a.s.
46, rue de Paris
MAISONS-LAFFITTE 78600
France
Phone: +33 (0) 1 34 93 80 00
Fax: +33 (0) 1 34 93 80 11
infofr@givenimaging.com Japan
Given Imaging KK
Akasaka Tokyu Building
2-14-3 Nagata-cho Chiyoda-ku,
Tokyo, 100-0014 Japan
Tel: +81 3 5157 2201
Fax: +81 3 3506 9009
shirlee@givenimaging.com |
Expandig the scope of GI
|