Table of Contents
UNITED STATES
SECURITIES AND EXCHANGE COMMISSION
Washington, D.C. 20549
FORM N-CSR
CERTIFIED SHAREHOLDER REPORT OF REGISTERED MANAGEMENT
INVESTMENT COMPANIES
Investment Company Act file number 811-10263
GuideStone Funds
(Exact name of registrant as specified in charter)
| 2401 Cedar Springs Road Dallas, TX | 75201-1407 | |
| (Address of principal executive offices) | (Zip code) |
Rodney R. Miller, Esq.
GuideStone Financial Resources of the Southern Baptist Convention
2401 Cedar Springs Road
Dallas, TX 75201-1407
(Name and address of agent for service)
registrant’s telephone number, including area code: 214-720-2142
Date of fiscal year end: December 31
Date of reporting period: June 30, 2007
Form N-CSR is to be used by management investment companies to file reports with the Commission not later than 10 days after the transmission to stockholders of any report that is required to be transmitted to stockholders under Rule 30e-1 under the Investment Company Act of 1940 (17 CFR 270.30e-1). The Commission may use the information provided on Form N-CSR in its regulatory, disclosure review, inspection, and policymaking roles.
A registrant is required to disclose the information specified by Form N-CSR, and the Commission will make this information public. A registrant is not required to respond to the collection of information contained in Form N-CSR unless the Form displays a currently valid Office of Management and Budget (“OMB”) control number. Please direct comments concerning the accuracy of the information collection burden estimate and any suggestions for reducing the burden to Secretary, Securities and Exchange Commission, 100 F Street, NE, Washington, DC 20549. The OMB has reviewed this collection of information under the clearance requirements of 44 U.S.C. § 3507.
Table of Contents
| Item 1. | Reports to Stockholders. |
The Report to Shareholders is attached herewith.
Table of Contents

Semi-Annual Report
June 30, 2007
DATE TARGET FUNDS:
| • | MyDestination 2005 Fund |
| • | MyDestination 2015 Fund |
| • | MyDestination 2025 Fund |
| • | MyDestination 2035 Fund |
| • | MyDestination 2045 Fund |
BLENDED FUNDS:
| • | Flexible Income Fund |
| • | Growth & Income Fund |
| • | Capital Opportunities Fund |
| • | Global Equity Fund |
| • | Flexible Income Fund I |
| • | Growth & Income Fund I |
| • | Capital Opportunities Fund I |
| • | Global Equity Fund I |
SELECT FUNDS:
| • | Money Market Fund |
| • | Low-Duration Bond Fund |
| • | Medium-Duration Bond Fund |
| • | Extended-Duration Bond Fund |
| • | Global Bond Fund |
| • | Equity Index Fund |
| • | Real Estate Securities Fund |
| • | Value Equity Fund |
| • | Growth Equity Fund |
| • | Small Cap Equity Fund |
| • | International Equity Fund |

Well Done…good and faithful servant. MATTHEW 25:21
Table of Contents
GuideStone Funds
GuideStone Financial Resources of the Southern Baptist Convention (“GuideStone Financial Resources”)
GuideStone Capital Management (“GSCM”)
GuideStone Financial Services (“GSFS”)
PFPC Distributors, Inc. (“PFPC”)
NOTICE CONCERNING YOUR PRIVACY RIGHTS
This notice will provide you with information concerning our policies with respect to nonpublic personal information that we collect about you in connection with the following financial products and services provided and/or serviced by the entities listed above: individual retirement accounts (“IRAs”) and/or personal mutual fund accounts.
The confidentiality of your information is important to us as we recognize that you depend on us to keep your information confidential, as described in this notice.
We collect nonpublic personal information about you with regard to your IRA and/or personal mutual fund accounts from the following sources:
| • | Information we receive from you on applications or other forms; |
| • | Information about your transactions with us, our affiliates or others (including our third-party service providers); |
| • | Information we receive from others such as service providers, broker-dealers and your personal agents or representatives; and |
| • | Information you and others provide to us in correspondence sent to us, whether written, electronic or by telephone. |
We may disclose such nonpublic personal financial information about you to one or more of our affiliates. An affiliate of an organization means any entity that controls, is controlled by, or is under common control with that organization. For example, GuideStone Financial Resources, GSCM and GSFS are affiliates of one another. GuideStone Funds, GuideStone Financial Resources, GSCM, GSFS and PFPC do not sell your personal information to nonaffiliated third parties.
We may also disclose any of the personal information that we collect about you to nonaffiliated third parties as permitted by law. For example, we may provide your information to nonaffiliated companies that provide account services or that perform marketing services on our behalf and to other financial institutions with whom we have joint marketing agreements. We restrict access to nonpublic personal information about you to those of our employees who need to know that information in order for us to provide and/or service products or services to you. We also maintain physical, electronic, and procedural safeguards to guard your personal information.
These procedures will continue to remain in effect after you cease to receive financial products and services from us.
If you have any questions concerning our customer information policy, please contact a customer service representative at 1-888-98-GUIDE.
Table of Contents
| 2 | ||
| 3 | ||
| 4 | ||
Date Target Funds: | ||
| 7 | ||
| 9 | ||
| 11 | ||
| 13 | ||
| 15 | ||
| 17 | ||
Blended Funds: | ||
| 21 | ||
| 23 | ||
| 25 | ||
| 27 | ||
| 29 | ||
| 36 | ||
| 38 | ||
| 40 | ||
| 42 | ||
| 44 | ||
Select Funds: | ||
| 49 | ||
| 52 | ||
| 63 | ||
| 81 | ||
| 85 | ||
| 93 | ||
| 99 | ||
| 101 | ||
| 106 | ||
| 109 | ||
| 119 | ||
| 127 | ||
| 128 | ||
| 141 | ||
| 161 | ||
Board Review of New Sub-Advisory Agreements for International Equity Fund and Small Cap Equity Fund | 163 | |
This report has been prepared for shareholders of GuideStone Funds. It is not authorized for distribution to prospective investors unless accompanied or preceded by a current prospectus, which contains more complete information about the Funds. Investors are reminded to read the prospectus carefully before investing. Past performance is no guarantee of future results. Share prices will fluctuate and there may be a gain or loss when shares are redeemed.
| 1 |
Table of Contents

We are pleased to present you with the GuideStone Funds semi-annual report for the six months ended June 30, 2007.
As of June 30, 2007, we can report assets for GuideStone Funds totaled $9.7 billion representing a 14% increase over the same period last year.
On January 3, 2007, GuideStone Funds launched five new Date Target Funds, known as MyDestination Funds. Each MyDestination Fund invests in a diversified mix of the Select Funds which grows more conservative over time to meet a specified investment strategy. Designed to simplify investment decisions, the MyDestination Funds provide shareholders with the option of choosing a single fund in which investment professionals manage the asset allocation and rebalance the portfolio.
In keeping with our commitment to maximize shareholder returns and manage costs, GuideStone Funds elected to eliminate the GS8 Class, effective June 1, 2007. The shares of the GS8 Class of each Fund were exchanged for shares of the GS6 Class of the same Fund on a share-for-share basis. Former GS8 shareholders now benefit from the lower expense structure of the GS6 Class.
We appreciate your ongoing confidence in GuideStone Funds and will continue to enhance the products and services delivered to you – our shareholders.
If you have any questions concerning the report, please contact us at 1-888-98-GUIDE (1-888-984-8433) or by email at info@guidestone.org. Visit our redesigned website at www.GuideStoneFunds.org. Thank you for choosing to invest in GuideStone Funds.
Sincerely,

John R. Jones
The MyDestination Funds attempt to achieve their objectives by investing in the GuideStone Select Funds. By investing in these fund-of-funds, you will incur the expenses of the MyDestination Funds in addition to those of the underlying Select Funds. You may invest in the Select Funds directly, except the Global Bond Fund. The MyDestination Funds are also subject to the risks of the underlying funds they hold.
| 2 |
Table of Contents
FROM THE CHIEF INVESTMENT OFFICER

Rodric E. Cummins, CFA
Global economic growth fueled strong corporate earnings and propelled the equity bull market well into its fifth year of advance in the first half of 2007. Healthy fundamentals, reasonable valuations, and a financial system awash in liquidity drove major equity indices to new highs. Equity markets in the U.S. advanced to record highs while climbing a wall of worry that resulted in increased volatility during the period. The Federal Reserve’s (“the Fed”) past monetary tightening campaign is now showing a noticeable effect on economic growth, which advanced at a meager 0.7% rate during the first quarter. Late-stage economic cycle jitters related to decelerating economic growth, inflation, rising interest rates, falling productivity, and bearish signals from central banks added to a growing level of uncertainty in the financial markets toward the period’s close.
Investors with globally diversified exposure to equity markets were handsomely rewarded during the period. Markets were led in the first six months of 2007 by stocks of non-U.S. companies, particularly those domiciled in emerging countries. Developed international markets, as represented by the MSCI® EAFE (Morgan Stanley Capital International Europe, Australasia, Far East) Index (Net), posted a return of 10.74% for the six months ending June 30. Emerging markets stocks returned 17.55% for the period, as measured by the MSCI® Emerging Markets Index (Net). U.S. stock markets also posted a strong first half as the S&P 500® index returned 6.96% for the six month period. The markets were not as kind to holders of publicly traded real estate securities. The most dramatic and sustained performance run in the history real estate securities came to an abrupt halt as the asset class suffered a major correction during the second quarter by posting a return of -9.45%, as measured by the Dow Jones Wilshire Real Estate Securities Index. Rising interest rates across the yield curve resulted in generally positive but modest returns for bondholders, as the Lehman Aggregate Bond Index posted a return of 0.98% year-to-date through June 30.
A disciplined, long-term investment approach consistently positions investors with the opportunity to capitalize on periods of strong advancement among various asset classes, as experienced in equity markets from the beginning of the current bull market in October 2002. Since that time, the S&P 500® Index has approximately doubled in value for investors, and portfolio values have increased even more for equity allocations made internationally and in the extended U.S. stock market of small capitalization companies. However, long secular market advances are often characterized by explosive market rallies such as that experienced over the past six and twelve month periods. History shows that investors’ long-term returns are significantly diminished if they are on the sidelines during such periods. A disciplined and consistent approach is a key to long-term investment success.
GuideStone Funds’ commitment to a strategic and disciplined investment philosophy has kept each fund true to its stated objectives over the years while on the lookout for attractive investment opportunities for our investors. The use of external portfolio management results in proven, world-class investment management firms navigating the portfolios on a daily basis through both prosperous and treacherous waters. As you will see reflected in our performance report, our sub-advisers have successfully positioned the Funds to take full advantage of the investment opportunities that lie within each fund’s defined investment set. We believe the Funds continue to be well-situated to take advantage of the investment opportunities around the globe.
Asset Class Performance Comparison
The following graph illustrates the performance of the major assets classes during 2007.

1 | The S&P 500® Index includes 500 of the largest stocks (in terms of market value) in the United States. |
2 | The Russell 2000® Index is a small-cap index consisting of the smallest 2000 companies in the Russell 3000® index, representing approximately 8% of the Russell 3000® Index total market capitalization. |
3 | The MSCI ACWI® (All Country World Index) Ex-U.S. is a free float-adjusted market capitalization index that is designed to measure equity market performance in the global developed and emerging markets excluding the U.S. |
4 | The Lehman Brothers Aggregate Bond Index includes fixed rate debt issues rated investment grade or higher by Moody’s Investor’s Service, Standard and Poor’s Corporation, or Fitch Investor’s Service, in that order. |
| 3 |
Table of Contents
About Your Expenses (Unaudited)
As a shareholder of the Funds, you incur ongoing costs, including advisory fees and to the extent applicable, distribution (12b-1) fees and/or shareholder services fees, as well as other Fund expenses. This Example is intended to help you to understand your ongoing costs (in dollars) of investing in the Funds and to compare these costs with the ongoing costs of investing in other mutual funds. It is based on an investment of $1,000 invested at the beginning of the period and held for the entire period from January 1, 2007 to June 30, 2007.
Actual Expenses
The first section of the table below provides information about actual account values and actual expenses. You may use the information in this section, together with the amount you invested, to estimate the expenses that you incurred during the period. Simply divide your account value by $1,000 (for example, an $8,600 account value divided by $1,000 = 8.6), then multiply the result by the number in the first section under the heading entitled “Expenses Paid During Period” to estimate the expenses attributable to your investment during this period.
Hypothetical Example for Comparison Purposes
The second section of the table below provides information about hypothetical account values and hypothetical expenses based on the Fund’s actual expense ratio and an assumed rate of return of 5% per year before expenses, which is not the Fund’s actual return. Thus, you should not use the hypothetical account values and expenses to estimate the actual ending account balance or your expenses for the period. Rather, these figures are provided to enable you to compare the ongoing costs of investing in the Fund and other funds. To do so, compare this 5% hypothetical example with the 5% hypothetical examples that appear in the shareholder reports of the other funds. Please note that the expenses shown in the table are meant to highlight your ongoing costs only. Therefore, the second section of the table is useful in comparing ongoing costs only and will not help you determine the relative total costs of owning different funds.
ACTUAL
Fund | Class | Beginning Account Value 1/1/2007 | Ending Account Value 6/30/2007 | Annualized Expense Ratio (1) | Expenses Paid During Period (2) | |||||||||
MyDestination 2005 | GS4 | $ | 1,000.00 | $ | 1,037.00 | 0.20 | % | $ | 1.01 | |||||
| GS6 | 1,000.00 | 1,035.00 | 0.49 | 2.47 | ||||||||||
MyDestination 2015 | GS4 | 1,000.00 | 1,048.00 | 0.20 | 1.02 | |||||||||
| GS6 | 1,000.00 | 1,046.00 | 0.50 | 2.54 | ||||||||||
MyDestination 2025 | GS4 | 1,000.00 | 1,054.00 | 0.20 | 1.02 | |||||||||
| GS6 | 1,000.00 | 1,053.00 | 0.50 | 2.55 | ||||||||||
MyDestination 2035 | GS4 | 1,000.00 | 1,065.00 | 0.20 | 1.02 | |||||||||
| GS6 | 1,000.00 | 1,062.00 | 0.49 | 2.51 | ||||||||||
MyDestination 2045 | GS4 | 1,000.00 | 1,064.00 | 0.20 | 1.02 | |||||||||
| GS6 | 1,000.00 | 1,062.00 | 0.50 | 2.56 | ||||||||||
Flexible Income | GS4 | 1,000.00 | 1,031.18 | 0.13 | 0.65 | |||||||||
| GS6 | 1,000.00 | 1,028.79 | 0.45 | 2.26 | ||||||||||
Growth & Income | GS4 | 1,000.00 | 1,043.12 | 0.13 | 0.66 | |||||||||
| GS6 | 1,000.00 | 1,041.80 | 0.48 | 2.43 | ||||||||||
Capital Opportunities | GS4 | 1,000.00 | 1,061.68 | 0.13 | 0.66 | |||||||||
| GS6 | 1,000.00 | 1,059.04 | 0.58 | 2.96 | ||||||||||
Global Equity | GS4 | 1,000.00 | 1,079.51 | 0.13 | 0.67 | |||||||||
| GS6 | 1,000.00 | 1,077.50 | 0.47 | 2.42 | ||||||||||
Flexible Income I | GS2 | 1,000.00 | 1,031.84 | 0.17 | 0.86 | |||||||||
Growth & Income I | GS2 | 1,000.00 | 1,044.05 | 0.17 | 0.86 | |||||||||
Capital Opportunities I | GS2 | 1,000.00 | 1,062.50 | 0.17 | 0.87 | |||||||||
Global Equity I | GS2 | 1,000.00 | 1,080.36 | 0.17 | 0.88 | |||||||||
| 4 |
Table of Contents
ACTUAL
Fund | Class | Beginning Account Value 1/1/2007 | Ending Account Value 6/30/2007 | Annualized Expense Ratio (1) | Expenses Paid During Period (2) | |||||||||
Money Market | GS2 | $ | 1,000.00 | $ | 1,025.63 | 0.26 | % | $ | 1.31 | |||||
| GS4 | 1,000.00 | 1,024.65 | 0.45 | 2.26 | ||||||||||
| GS6 | 1,000.00 | 1,022.58 | 0.87 | 4.36 | ||||||||||
Low-Duration Bond. | GS2 | 1,000.00 | 1,016.97 | 0.45 | 2.25 | |||||||||
| GS4 | 1,000.00 | 1,016.69 | 0.61 | 3.05 | ||||||||||
| GS6 | 1,000.00 | 1,014.27 | 1.00 | 4.99 | ||||||||||
Medium-Duration Bond | GS2 | 1,000.00 | 1,004.53 | 0.50 | 2.49 | |||||||||
| GS4 | 1,000.00 | 1,003.77 | 0.62 | 3.08 | ||||||||||
| GS6 | 1,000.00 | 1,001.05 | 1.00 | 4.96 | ||||||||||
Extended-Duration Bond | GS2 | 1,000.00 | 1,001.98 | 0.55 | 2.73 | |||||||||
| GS4 | 1,000.00 | 1,001.57 | 0.73 | 3.62 | ||||||||||
| GS6 | 1,000.00 | 999.88 | 1.00 | 4.96 | ||||||||||
Global Bond | GS4 | 1,000.00 | 1,014.31 | 0.77 | 3.85 | |||||||||
Equity Index | GS2 | 1,000.00 | 1,068.98 | 0.22 | 1.13 | |||||||||
| GS4 | 1,000.00 | 1,067.64 | 0.40 | 2.05 | ||||||||||
| GS6 | 1,000.00 | 1,066.47 | 0.60 | 3.07 | ||||||||||
Real Estate Securities. | GS4 | 1,000.00 | 946.78 | 1.16 | 5.60 | |||||||||
Value Equity | GS2 | 1,000.00 | 1,074.35 | 0.71 | 3.65 | |||||||||
| GS4 | 1,000.00 | 1,072.50 | 0.90 | 4.62 | ||||||||||
| GS6 | 1,000.00 | 1,070.76 | 1.22 | 6.26 | ||||||||||
Growth Equity | GS2 | 1,000.00 | 1,067.68 | 0.90 | 4.61 | |||||||||
| GS4 | 1,000.00 | 1,067.53 | 1.02 | 5.23 | ||||||||||
| GS6 | 1,000.00 | 1,064.60 | 1.40 | 7.17 | ||||||||||
Small Cap Equity | GS2 | 1,000.00 | 1,088.26 | 1.08 | 5.59 | |||||||||
| GS4 | 1,000.00 | 1,086.88 | 1.21 | 6.26 | ||||||||||
| GS6 | 1,000.00 | 1,085.46 | 1.57 | 8.12 | ||||||||||
International Equity | GS2 | 1,000.00 | 1,107.59 | 0.97 | 5.07 | |||||||||
| GS4 | 1,000.00 | 1,106.34 | 1.15 | 6.01 | ||||||||||
| GS6 | 1,000.00 | 1,104.56 | 1.45 | 7.57 | ||||||||||
HYPOTHETICAL (assuming a 5% return before expenses)
Fund | Class | Beginning Account Value 1/1/2007 | Ending Account Value 6/30/2007 | Annualized Expense Ratio (1) | Expenses Paid During Period (2) | |||||||||
MyDestination 2005 | GS4 | $ | 1,000.00 | $ | 1,023.80 | 0.20 | % | $ | 1.00 | |||||
| GS6 | 1,000.00 | 1,022.36 | 0.49 | 2.46 | ||||||||||
MyDestination 2015 | GS4 | 1,000.00 | 1,023.80 | 0.20 | 1.00 | |||||||||
| GS6 | 1,000.00 | 1,022.32 | 0.50 | 2.51 | ||||||||||
MyDestination 2025 | GS4 | 1,000.00 | 1,023.80 | 0.20 | 1.00 | |||||||||
| GS6 | 1,000.00 | 1,022.32 | 0.50 | 2.51 | ||||||||||
MyDestination 2035 | GS4 | 1,000.00 | 1,023.80 | 0.20 | 1.00 | |||||||||
| GS6 | 1,000.00 | 1,022.36 | 0.49 | 2.46 | ||||||||||
MyDestination 2045 | GS4 | 1,000.00 | 1,023.80 | 0.20 | 1.00 | |||||||||
| GS6 | 1,000.00 | 1,022.32 | 0.50 | 2.51 | ||||||||||
Flexible Income | GS4 | 1,000.00 | 1,024.15 | 0.13 | 0.65 | |||||||||
| GS6 | 1,000.00 | 1,022.56 | 0.45 | 2.26 | ||||||||||
| 5 |
Table of Contents
About Your Expenses (Unaudited) (Continued)
HYPOTHETICAL (assuming a 5% return before expenses)
Fund | Class | Beginning Account Value 1/1/2007 | Ending Account Value 6/30/2007 | Annualized Expense Ratio (1) | Expenses Paid During Period (2) | |||||||||
Growth & Income | GS4 | $ | 1,000.00 | $ | 1,024.15 | 0.13 | % | $ | 0.65 | |||||
| GS6 | 1,000.00 | 1,022.41 | 0.48 | 2.41 | ||||||||||
Capital Opportunities | GS4 | 1,000.00 | 1,024.15 | 0.13 | 0.65 | |||||||||
| GS6 | 1,000.00 | 1,021.92 | 0.58 | 2.91 | ||||||||||
Global Equity | GS4 | 1,000.00 | 1,024.15 | 0.13 | 0.65 | |||||||||
| GS6 | 1,000.00 | 1,022.46 | 0.47 | 2.36 | ||||||||||
Flexible Income I | GS2 | 1,000.00 | 1,023.95 | 0.17 | 0.85 | |||||||||
Growth & Income I | GS2 | 1,000.00 | 1,023.95 | 0.17 | 0.85 | |||||||||
Capital Opportunities I | GS2 | 1,000.00 | 1,023.95 | 0.17 | 0.85 | |||||||||
Global Equity I | GS2 | 1,000.00 | 1,023.95 | 0.17 | 0.85 | |||||||||
Money Market | GS2 | 1,000.00 | 1,023.51 | 0.26 | 1.30 | |||||||||
| GS4 | 1,000.00 | 1,022.56 | 0.45 | 2.26 | ||||||||||
| GS6 | 1,000.00 | 1,020.48 | 0.87 | 4.36 | ||||||||||
Low-Duration Bond | GS2 | 1,000.00 | 1,022.56 | 0.45 | 2.26 | |||||||||
| GS4 | 1,000.00 | 1,021.77 | 0.61 | 3.06 | ||||||||||
| GS6 | 1,000.00 | 1,019.84 | 1.00 | 5.01 | ||||||||||
Medium-Duration Bond | GS2 | 1,000.00 | 1,022.32 | 0.50 | 2.51 | |||||||||
| GS4 | 1,000.00 | 1,021.72 | 0.62 | 3.11 | ||||||||||
| GS6 | 1,000.00 | 1,019.84 | 1.00 | 5.01 | ||||||||||
Extended-Duration Bond | GS2 | 1,000.00 | 1,022.07 | 0.55 | 2.76 | |||||||||
| GS4 | 1,000.00 | 1,021.17 | 0.73 | 3.66 | ||||||||||
| GS6 | 1,000.00 | 1,019.84 | 1.00 | 5.01 | ||||||||||
Global Bond | GS4 | 1,000.00 | 1,020.98 | 0.77 | 3.86 | |||||||||
Equity Index | GS2 | 1,000.00 | 1,023.70 | 0.22 | 1.10 | |||||||||
| GS4 | 1,000.00 | 1,022.81 | 0.40 | 2.01 | ||||||||||
| GS6 | 1,000.00 | 1,021.82 | 0.60 | 3.01 | ||||||||||
Real Estate Securities | GS4 | 1,000.00 | 1,019.04 | 1.16 | 5.81 | |||||||||
Value Equity | GS2 | 1,000.00 | 1,021.27 | 0.71 | 3.56 | |||||||||
| GS4 | 1,000.00 | 1,020.33 | 0.90 | 4.51 | ||||||||||
| GS6 | 1,000.00 | 1,018.74 | 1.22 | 6.11 | ||||||||||
Growth Equity | GS2 | 1,000.00 | 1,020.33 | 0.90 | 4.51 | |||||||||
| GS4 | 1,000.00 | 1,019.74 | 1.02 | 5.11 | ||||||||||
| GS6 | 1,000.00 | 1,017.85 | 1.40 | 7.00 | ||||||||||
Small Cap Equity | GS2 | 1,000.00 | 1,019.44 | 1.08 | 5.41 | |||||||||
| GS4 | 1,000.00 | 1,018.79 | 1.21 | 6.06 | ||||||||||
| GS6 | 1,000.00 | 1,017.01 | 1.57 | 7.85 | ||||||||||
International Equity | GS2 | 1,000.00 | 1,019.98 | 0.97 | 4.86 | |||||||||
| GS4 | 1,000.00 | 1,019.09 | 1.15 | 5.76 | ||||||||||
| GS6 | 1,000.00 | 1,017.60 | 1.45 | 7.25 | ||||||||||
| (1) | Expenses include the effect of contractual waivers by GuideStone Capital Management. The Date Target and Blended Funds’ proportionate share of the operating expenses of the Select Funds is not reflected in the tables above. |
| (2) | Expenses are equal to the Fund’s annualized expense ratios for the period January 1, 2007 through June 30, 2007, multiplied by the average account value over the period, multiplied by 181/365 (to reflect the one-half year period). |
| 6 |
Table of Contents
Average Annual Total Returns as of 06/30/07
| GS4 Class* | GS6 Class* | |||||
Six Months | 3.70 | % | 3.50 | % | ||
Since Inception | 3.70 | % | 3.50 | % | ||
Inception Date | 12/29/06 | 12/29/06 |
The performance data quoted represents past performance and does not guarantee future results. Current performance may be lower or higher. Performance data current to the most recent month-end may be obtained at www.GuideStoneFunds.org. The investment return and principal value of an investment will fluctuate so that shares, when redeemed, may be worth more or less than their original cost.
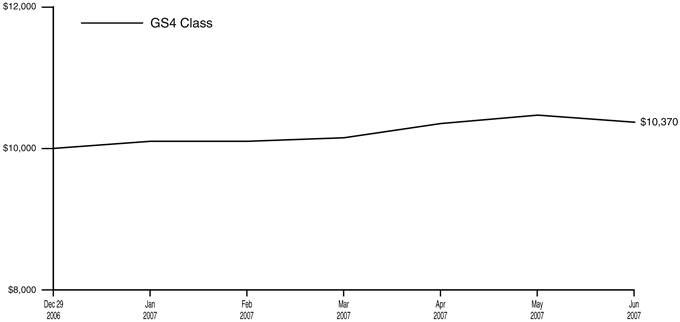
The graph illustrates the results of a hypothetical $10,000 investment in the GS4 Class of the Fund since December 29, 2006 (commencement of operations), with all dividends and capital gains reinvested.
| * | These returns reflect expense waivers by the Fund’s investment advisor. Without these waivers, returns would have been lower. Returns shown do not reflect the deduction of taxes that a shareholder would pay on Fund distributions or the redemption of Fund shares. |
This fund attempts to achieve its objective by investing in the GuideStone Select Funds. By investing in this fund, you will incur the expenses and risks of the fund in addition to those of the underlying Select Funds. You may invest in the underlying funds directly, except for the Global Bond Fund.
| 7 |
Table of Contents
MyDestination 2005 Fund SCHEDULE OF INVESTMENTS | June 30, 2007 (Unaudited) |
| Shares | Value | ||||
AFFILIATED MUTUAL FUNDS — 85.2% | |||||
GuideStone Funds Money Market Fund (GS4 Class)¥ | 405,036 | $ | 405,036 | ||
GuideStone Funds Low-Duration Bond Fund (GS4 Class)¥ | 446,835 | 5,625,652 | |||
GuideStone Funds Medium-Duration Bond Fund (GS4 Class)¥ | 485,639 | 6,405,577 | |||
GuideStone Funds Extended-Duration Bond Fund (GS4 Class)¥ | 51,530 | 743,064 | |||
GuideStone Funds Global Bond Fund (GS4 Class)¥ | 118,380 | 1,189,719 | |||
GuideStone Funds Equity Index Fund (GS4 Class)¥ | 60,621 | 1,232,428 | |||
GuideStone Funds Real Estate Securities Fund (GS4 Class)¥ | 166,514 | 1,973,186 | |||
GuideStone Funds Value Equity Fund (GS4 Class)¥ | 287,405 | 5,687,739 | |||
GuideStone Funds Growth Equity Fund (GS4 Class)¥ | 297,542 | 5,644,373 | |||
GuideStone Funds Small Cap Equity Fund (GS4 Class)¥ | 92,192 | 1,603,223 | |||
GuideStone Funds International Equity Fund (GS4 Class)¥ | 232,070 | 4,901,308 | |||
Total Affiliated Mutual Funds (Cost $35,212,654) | 35,411,305 | ||||
EXCHANGE TRADED FUND — 14.8% | |||||
iShares Lehman Treasury Inflation Protected Securities Fund | |||||
(Cost $6,224,484) | 62,329 | 6,169,324 | |||
TOTAL INVESTMENTS — 100.0% (Cost $41,437,138) | 41,580,629 | ||||
Other Assets in Excess of Liabilities — 0.0% | 5,520 | ||||
NET ASSETS — 100.0% | $ | 41,586,149 | |||
PORTFOLIO SUMMARY (based on net assets)
| % | ||
Domestic Equity Funds | 38.8 | |
Bond Funds | 33.6 | |
Exchange Traded Fund | 14.8 | |
International Equity Fund | 11.8 | |
Money Market Fund | 1.0 | |
| 100.0 | ||
See Notes to Financial Statements.
| 8 |
Table of Contents
Average Annual Total Returns as of 06/30/07
| GS4 Class* | GS6 Class* | |||||
Six Months | 4.80 | % | 4.60 | % | ||
Since Inception | 4.80 | % | 4.60 | % | ||
Inception Date | 12/29/06 | 12/29/06 |
The performance data quoted represents past performance and does not guarantee future results. Current performance may be lower or higher. Performance data current to the most recent month-end may be obtained at www.GuideStoneFunds.org. The investment return and principal value of an investment will fluctuate so that shares, when redeemed, may be worth more or less than their original cost.
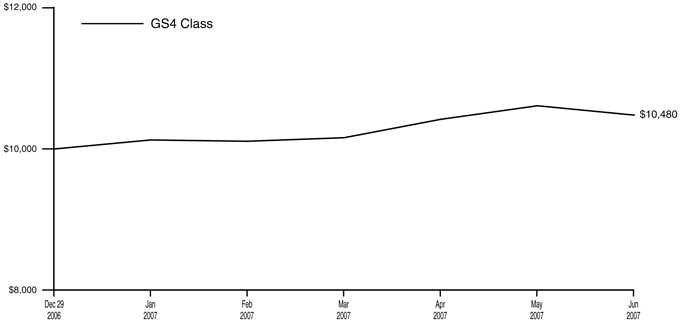
The graph illustrates the results of a hypothetical $10,000 investment in the GS4 Class of the Fund since December 29, 2006 (commencement of operations), with all dividends and capital gains reinvested.
| * | These returns reflect expense waivers by the Fund’s investment advisor. Without these waivers, returns would have been lower. Returns shown do not reflect the deduction of taxes that a shareholder would pay on Fund distributions or the redemption of Fund shares. |
This fund attempts to achieve its objective by investing in the GuideStone Select Funds. By investing in this fund, you will incur the expenses and risks of the fund in addition to those of the underlying Select Funds. You may invest in the underlying funds directly, except for the Global Bond Fund.
| 9 |
Table of Contents
| MyDestination 2015 Fund | ||
| SCHEDULE OF INVESTMENTS | June 30, 2007 (Unaudited) |
| Shares | Value | ||||
AFFILIATED MUTUAL FUNDS — 92.3% | |||||
GuideStone Funds Money Market Fund (GS4 Class)¥ | 585,847 | $ | 585,847 | ||
GuideStone Funds Low-Duration Bond Fund (GS4 Class)¥ | 554,456 | 6,980,604 | |||
GuideStone Funds Medium-Duration Bond Fund (GS4 Class)¥ | 910,880 | 12,014,513 | |||
GuideStone Funds Extended-Duration Bond Fund (GS4 Class)¥ | 339,038 | 4,888,929 | |||
GuideStone Funds Global Bond Fund (GS4 Class)¥ | 612,561 | 6,156,243 | |||
GuideStone Funds Equity Index Fund (GS4 Class)¥ | 182,225 | 3,704,641 | |||
GuideStone Funds Real Estate Securities Fund (GS4 Class)¥ | 579,266 | 6,864,302 | |||
GuideStone Funds Value Equity Fund (GS4 Class)¥ | 1,082,661 | 21,425,855 | |||
GuideStone Funds Growth Equity Fund (GS4 Class)¥ | 1,128,706 | 21,411,557 | |||
GuideStone Funds Small Cap Equity Fund (GS4 Class)¥ | 321,799 | 5,596,080 | |||
GuideStone Funds International Equity Fund (GS4 Class)¥ | 800,087 | 16,897,845 | |||
Total Affiliated Mutual Funds (Cost $105,897,610) | 106,526,416 | ||||
EXCHANGE TRADED FUND — 7.4% iShares Lehman Treasury Inflation Protected Securities Fund | |||||
(Cost $8,668,344) | 86,905 | 8,601,857 | |||
TOTAL INVESTMENTS — 99.7% (Cost $114,565,954) | 115,128,273 | ||||
Other Assets in Excess of Liabilities — 0.3% | 328,832 | ||||
NET ASSETS — 100.0% | $ | 115,457,105 | |||
PORTFOLIO SUMMARY (based on net assets)
| % | ||
Domestic Equity Funds | 51.1 | |
Bond Funds | 26.0 | |
International Equity Fund | 14.7 | |
Exchange Traded Fund | 7.4 | |
Money Market Fund | 0.5 | |
| 99.7 | ||
See Notes to Financial Statements.
| 10 |
Table of Contents
Average Annual Total Returns as of 06/30/07
| GS4 Class* | GS6 Class* | |||||
Six Months | 5.40 | % | 5.30 | % | ||
Since Inception | 5.40 | % | 5.30 | % | ||
Inception Date | 12/29/06 | 12/29/06 |
The performance data quoted represents past performance and does not guarantee future results. Current performance may be lower or higher. Performance data current to the most recent month-end may be obtained at www.GuideStoneFunds.org. The investment return and principal value of an investment will fluctuate so that shares, when redeemed, may be worth more or less than their original cost.
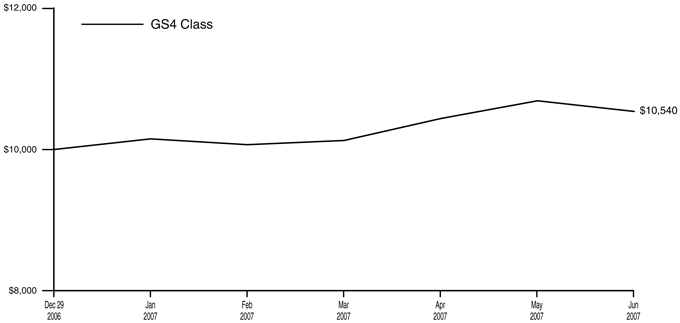
The graph illustrates the results of a hypothetical $10,000 investment in the GS4 Class of the Fund since December 29, 2006 (commencement of operations), with all dividends and capital gains reinvested.
| * | These returns reflect expense waivers by the Fund’s investment advisor. Without these waivers, returns would have been lower. Returns shown do not reflect the deduction of taxes that a shareholder would pay on Fund distributions or the redemption of Fund shares. |
This Fund attempts to achieve its objective by investing in the GuideStone Select Funds. By investing in this fund, you will incur the expenses and risks of the fund in addition to those of the underlying Select Funds. You may invest in the underlying funds directly, except for the Global Bond Fund.
| 11 |
Table of Contents
| MyDestination 2025 Fund | ||
| SCHEDULE OF INVESTMENTS | June 30, 2007 (Unaudited) |
| Shares | Value | ||||
AFFILIATED MUTUAL FUNDS — 99.7% | |||||
GuideStone Funds Money Market Fund (GS4 Class)¥ | 552,854 | $ | 552,854 | ||
GuideStone Funds Medium-Duration Bond Fund (GS4 Class)¥ | 309,382 | 4,080,748 | |||
GuideStone Funds Extended-Duration Bond Fund (GS4 Class)¥ | 283,893 | 4,093,734 | |||
GuideStone Funds Global Bond Fund (GS4 Class)¥ | 540,552 | 5,432,552 | |||
GuideStone Funds Equity Index Fund (GS4 Class)¥ | 141,938 | 2,885,609 | |||
GuideStone Funds Real Estate Securities Fund (GS4 Class)¥ | 425,101 | 5,037,452 | |||
GuideStone Funds Value Equity Fund (GS4 Class)¥ | 759,971 | 15,039,816 | |||
GuideStone Funds Growth Equity Fund (GS4 Class)¥ | 791,926 | 15,022,830 | |||
GuideStone Funds Small Cap Equity Fund (GS4 Class)¥ | 301,299 | 5,239,589 | |||
GuideStone Funds International Equity Fund (GS4 Class)¥ | 734,040 | 15,502,932 | |||
Total Affiliated Mutual Funds (Cost $72,433,908) | 72,888,116 | ||||
TOTAL INVESTMENTS — 99.7% (Cost $72,433,908) | 72,888,116 | ||||
Other Assets in Excess of Liabilities — 0.3% | 232,334 | ||||
NET ASSETS — 100.0% | $ | 73,120,450 | |||
PORTFOLIO SUMMARY (based on net assets)
| % | ||
Domestic Equity Funds | 59.1 | |
International Equity Fund | 21.2 | |
Bond Funds | 18.6 | |
Money Market Fund | 0.8 | |
| 99.7 | ||
See Notes to Financial Statements.
| 12 |
Table of Contents
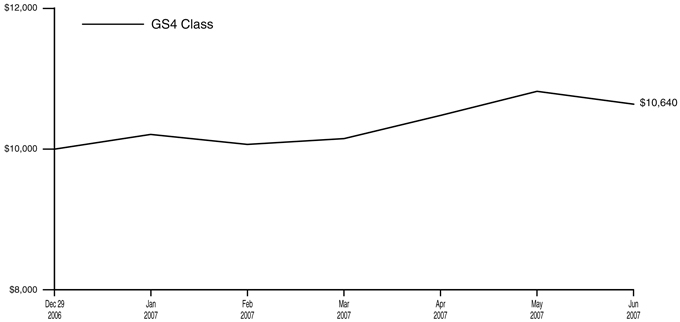
Average Annual Total Returns as of 06/30/07
| GS4 Class* | GS6 Class* | |||||
Six Months | 6.50 | % | 6.20 | % | ||
Since Inception | 6.50 | % | 6.20 | % | ||
Inception Date | 12/29/06 | 12/29/06 |
The performance data quoted represents past performance and does not guarantee future results. Current performance may be lower or higher. Performance data current to the most recent month-end may be obtained at www.GuideStoneFunds.org. The investment return and principal value of an investment will fluctuate so that shares, when redeemed, may be worth more or less than their original cost.

The graph illustrates the results of a hypothetical $10,000 investment in the GS4 Class of the Fund since December 29, 2006 (commencement of operations), with all dividends and capital gains reinvested,
| * | These returns reflect expense waivers by the Fund’s investment advisor. Without these waivers, returns would have been lower. Returns shown do not reflect the deduction of taxes that a shareholder would pay on Fund distributions or the redemption of Fund shares. |
This Fund attempts to achieve its objective by investing in the GuideStone Select Funds. By investing in this fund, you will incur the expenses and risks of the fund in addition to those of the underlying Select Funds. You may invest in the underlying funds directly, except for the Global Bond Fund.
| 13 |
Table of Contents
| MyDestination 2035 Fund | ||
| SCHEDULE OF INVESTMENTS | June 30, 2007 (Unaudited) |
| Shares | Value | |||||
AFFILIATED MUTUAL FUNDS — 101.0% | ||||||
GuideStone Funds Money Market Fund (GS4 Class)¥ | 417,727 | $ | 417,727 | |||
GuideStone Funds Medium-Duration Bond Fund (GS4 Class)¥ | 19,754 | 260,554 | ||||
GuideStone Funds Extended-Duration Bond Fund (GS4 Class)¥ | 18,208 | 262,565 | ||||
GuideStone Funds Global Bond Fund (GS4 Class)¥ | 84,701 | 851,248 | ||||
GuideStone Funds Equity Index Fund (GS4 Class)¥ | 50,428 | 1,025,203 | ||||
GuideStone Funds Real Estate Securities Fund (GS4 Class)¥ | 148,991 | 1,765,544 | ||||
GuideStone Funds Value Equity Fund (GS4 Class)¥ | 271,203 | 5,367,111 | ||||
GuideStone Funds Growth Equity Fund (GS4 Class)¥ | 282,644 | 5,361,753 | ||||
GuideStone Funds Small Cap Equity Fund (GS4 Class)¥ | 121,082 | 2,105,612 | ||||
GuideStone Funds International Equity Fund (GS4 Class)¥ | 278,910 | 5,890,581 | ||||
Total Affiliated Mutual Funds (Cost $22,888,421) | 23,307,898 | |||||
TOTAL INVESTMENTS — 101.0% (Cost $22,888,421) | 23,307,898 | |||||
Liabilities in Excess of Other Assets — (1.0)% | (227,587 | ) | ||||
NET ASSETS — 100.0% | $ | 23,080,311 | ||||
PORTFOLIO SUMMARY (based on net assets)
| % | ||
Domestic Equity Funds | 67.7 | |
International Equity Fund | 25.5 | |
Bond Funds | 6.0 | |
Money Market Fund | 1.8 | |
| 101.0 | ||
See Notes to Financial Statements.
| 14 |
Table of Contents
Average Annual Total Returns as of 06/30/07
| GS4 Class* | GS6 Class* | |||||
Six Months | 6.40 | % | 6.20 | % | ||
Since Inception | 6.40 | % | 6.20 | % | ||
Inception Date | 12/29/06 | 12/29/06 |
The performance data quoted represents past performance and does not guarantee future results. Current performance may be lower or higher. Performance data current to the most recent month-end may be obtained at www.GuideStoneFunds.org. The investment return and principal value of an investment will fluctuate so that shares, when redeemed, may be worth more or less than their original cost.
The graph illustrates the results of a hypothetical $10,000 investment in the GS4 Class of the Fund since December 29, 2006 (commencement of operations), with all dividends and capital gains reinvested.
| * | These returns reflect expense waivers by the Fund’s investment advisor. Without these waivers, returns would have been lower. Returns shown do not reflect the deduction of taxes that a shareholder would pay on Fund distributions or the redemption of Fund shares. |
This Fund attempts to achieve its objective by investing in the GuideStone Select Funds. By investing in this fund, you will incur the expenses and risks of the fund in addition to those of the underlying Select Funds. You may invest in the underlying funds directly, except for the Global Bond Fund.
| 15 |
Table of Contents
| MyDestination 2045 Fund | ||
| SCHEDULE OF INVESTMENTS | June 30, 2007 (Unaudited) |
| Shares | Value | ||||
AFFILIATED MUTUAL FUNDS — 99.7% | |||||
GuideStone Funds Money Market Fund (GS4 Class)¥ | 205,064 | $ | 205,064 | ||
GuideStone Funds Equity Index Fund (GS4 Class)¥ | 19,963 | 405,846 | |||
GuideStone Funds Real Estate Securities Fund (GS4 Class)¥ | 68,705 | 814,152 | |||
GuideStone Funds Value Equity Fund (GS4 Class)¥ | 98,749 | 1,954,251 | |||
GuideStone Funds Growth Equity Fund (GS4 Class)¥ | 103,031 | 1,954,494 | |||
GuideStone Funds Small Cap Equity Fund (GS4 Class)¥ | 46,980 | 816,982 | |||
GuideStone Funds International Equity Fund (GS4 Class)¥ | 105,457 | 2,227,260 | |||
Total Affiliated Mutual Funds (Cost $8,114,487) | 8,378,049 | ||||
TOTAL INVESTMENTS — 99.7% (Cost $8,114,487) | 8,378,049 | ||||
Other Assets in Excess of Liabilities — 0.3% | 24,283 | ||||
NET ASSETS — 100.0% | $ | 8,402,332 | |||
PORTFOLIO SUMMARY (based on net assets)
| % | ||
Domestic Equity Funds | 70.8 | |
International Equity Fund | 26.5 | |
Money Market Fund | 2.4 | |
| 99.7 | ||
See Notes to Financial Statements.
| 16 |
Table of Contents
STATEMENTS OF ASSETS AND LIABILITIES
June 30, 2007 (Unaudited)
| MyDestination 2005 Fund | MyDestination 2015 Fund | MyDestination 2025 Fund | MyDestination 2035 Fund | MyDestination 2045 Fund | |||||||||||
Assets | |||||||||||||||
Investments in securities of affiliated issuers, at value | $ | 35,411,305 | $ | 106,526,416 | $ | 72,888,116 | $ | 23,307,898 | $ | 8,378,049 | |||||
Investments in securities of unaffiliated issuers, at value | 6,169,324 | 8,601,857 | — | — | — | ||||||||||
Total investments (1) | 41,580,629 | 115,128,273 | 72,888,116 | 23,307,898 | 8,378,049 | ||||||||||
Receivables: | |||||||||||||||
Dividends | 3,089 | 7,485 | 5,124 | 1,443 | 870 | ||||||||||
Interest | 4 | 8 | 6 | 3 | 2 | ||||||||||
Fund shares sold | 81,555 | 486,316 | 457,232 | 11,091 | 49,898 | ||||||||||
Receivable from advisor | 2,342 | — | — | 5,073 | 7,263 | ||||||||||
Prepaid expenses and other assets | 29,316 | 29,277 | 29,283 | 29,283 | 29,285 | ||||||||||
Total Assets | 41,696,935 | 115,651,359 | 73,379,761 | 23,354,791 | 8,465,367 | ||||||||||
Liabilities | |||||||||||||||
Payables: | |||||||||||||||
Investment securities purchased | 77,939 | 152,891 | 225,000 | 242,000 | 30,000 | ||||||||||
Accrued expenses: | |||||||||||||||
Advisory fees | — | 8,430 | 1,967 | — | — | ||||||||||
Distribution (12b-1) fees | 98 | 108 | 135 | 107 | 102 | ||||||||||
Shareholder servicing fees | 105 | 114 | 144 | 113 | 109 | ||||||||||
Other expenses | 32,644 | 32,711 | 32,065 | 32,260 | 32,824 | ||||||||||
Total Liabilities | 110,786 | 194,254 | 259,311 | 274,480 | 63,035 | ||||||||||
Net Assets | $ | 41,586,149 | $ | 115,457,105 | $ | 73,120,450 | $ | 23,080,311 | $ | 8,402,332 | |||||
Net Assets Consist of: | |||||||||||||||
Paid-in capital | $ | 41,204,370 | $ | 114,322,427 | $ | 72,378,710 | $ | 22,584,515 | $ | 8,106,648 | |||||
Undistributed net investment income | 209,806 | 465,311 | 212,826 | 49,253 | 12,875 | ||||||||||
Undistributed net realized gain on investments | 28,482 | 107,048 | 74,706 | 27,066 | 19,247 | ||||||||||
Net unrealized appreciation on investments and futures | 143,491 | 562,319 | 454,208 | 419,477 | 263,562 | ||||||||||
Net Assets | $ | 41,586,149 | $ | 115,457,105 | $ | 73,120,450 | $ | 23,080,311 | $ | 8,402,332 | |||||
Net Asset Value: | |||||||||||||||
$0.001 par value, unlimited shares authorized | |||||||||||||||
Net assets applicable to the GS4 Class | $ | 40,494,076 | �� | $ | 114,237,965 | $ | 71,542,154 | $ | 21,875,060 | $ | 7,270,509 | ||||
GS4 shares outstanding | 3,904,109 | 10,902,393 | 6,788,977 | 2,054,475 | 683,620 | ||||||||||
Net asset value, offering and redemption price per GS4 share | $ | 10.37 | $ | 10.48 | $ | 10.54 | $ | 10.65 | $ | 10.64 | |||||
Net assets applicable to the GS6 Class | $ | 1,092,073 | $ | 1,219,140 | $ | 1,578,296 | $ | 1,205,251 | $ | 1,131,823 | |||||
GS6 shares outstanding | 105,481 | 116,574 | 149,934 | 113,443 | 106,537 | ||||||||||
Net asset value, offering and redemption price per GS6 share | $ | 10.35 | $ | 10.46 | $ | 10.53 | $ | 10.62 | $ | 10.62 | |||||
(1) Investments in securities of affiliated issuers, at cost | $ | 35,212,654 | $ | 105,897,610 | $ | 72,433,908 | $ | 22,888,421 | $ | 8,114,487 | |||||
Investments in securities of unaffiliated issuers, at cost | 6,224,484 | 8,668,344 | — | — | — | ||||||||||
Total investments at cost | $ | 41,437,138 | $ | 114,565,954 | $ | 72,433,908 | $ | 22,888,421 | $ | 8,114,487 | |||||
See Notes to Financial Statements.
| 17 |
Table of Contents
STATEMENTS OF OPERATIONS
For the Period December 29, 2006(1) - June 30, 2007 (Unaudited)
| MyDestination 2005 Fund | MyDestination 2015 Fund | MyDestination 2025 Fund | MyDestination 2035 Fund | MyDestination 2045 Fund | ||||||||||||||||
Investment Income | ||||||||||||||||||||
Income dividends received from affiliated funds | $ | 185,295 | $ | 455,673 | $ | 241,711 | $ | 62,955 | $ | 21,351 | ||||||||||
Dividends | 44,123 | 56,288 | — | — | — | |||||||||||||||
Total Investment Income | 229,418 | 511,961 | 241,711 | 62,955 | 21,351 | |||||||||||||||
Expenses | ||||||||||||||||||||
Investment advisory fees | 8,209 | 21,669 | 12,669 | 5,217 | 2,611 | |||||||||||||||
Transfer agent fees: | ||||||||||||||||||||
GS4 | 13,642 | 13,649 | 13,656 | 13,528 | 13,651 | |||||||||||||||
GS6 | 3,371 | 3,372 | 3,372 | 3,372 | 3,372 | |||||||||||||||
GS8 | 2,766 | 2,766 | 2,766 | 2,766 | 2,766 | |||||||||||||||
Custodian fees | 4,198 | 4,198 | 4,198 | 4,198 | 4,198 | |||||||||||||||
Distribution (12b-1) fees: | ||||||||||||||||||||
GS6 | 484 | 496 | 539 | 493 | 491 | |||||||||||||||
GS8 | 1,192 | 1,235 | 1,295 | 1,221 | 1,213 | |||||||||||||||
Shareholder servicing fees: | ||||||||||||||||||||
GS6 | 516 | 529 | 574 | 526 | 524 | |||||||||||||||
GS8 | 805 | 835 | 876 | 825 | 820 | |||||||||||||||
Accounting and administration fees | 3,588 | 6,241 | 4,371 | 3,040 | 2,536 | |||||||||||||||
Professional fees | 24,335 | 24,335 | 24,335 | 24,335 | 24,335 | |||||||||||||||
Blue sky fees: | ||||||||||||||||||||
GS4 | 6,108 | 6,203 | 6,146 | 6,137 | 6,132 | |||||||||||||||
GS6 | 3,793 | 3,761 | 3,790 | 3,795 | 3,797 | |||||||||||||||
GS8 | 2,883 | 2,860 | 2,881 | 2,885 | 2,887 | |||||||||||||||
Shareholder reporting fees: | ||||||||||||||||||||
GS4 | 5,443 | 5,443 | 5,443 | 5,443 | 5,443 | |||||||||||||||
GS6 | 39 | 39 | 46 | 21 | 32 | |||||||||||||||
GS8 | 28 | 28 | 28 | 27 | 28 | |||||||||||||||
Trustee fees | 928 | 928 | 928 | 928 | 928 | |||||||||||||||
Line of credit facility fees | 538 | 538 | 538 | 515 | 538 | |||||||||||||||
Other expenses | 1,230 | 1,232 | 1,232 | 1,231 | 1,232 | |||||||||||||||
Total Expenses | 84,096 | 100,357 | 89,683 | 80,503 | 77,534 | |||||||||||||||
Expenses waived and reimbursed (See Footnote 3a and 3c) | (63,999 | ) | (53,222 | ) | (60,313 | ) | (66,309 | ) | (68,571 | ) | ||||||||||
Fees paid indirectly | (485 | ) | (485 | ) | (485 | ) | (492 | ) | (487 | ) | ||||||||||
Net Expenses | 19,612 | 46,650 | 28,885 | 13,702 | 8,476 | |||||||||||||||
Net Investment Income | 209,806 | 465,311 | 212,826 | 49,253 | 12,875 | |||||||||||||||
Realized and Unrealized Gain | ||||||||||||||||||||
Capital gain distributions received from affiliated funds | 26,494 | 104,853 | 73,934 | 24,769 | 8,934 | |||||||||||||||
Net realized gain on investment securities of affiliated issuers | 1,988 | 2,195 | 772 | 2,297 | 10,313 | |||||||||||||||
Net realized gain | 28,482 | 107,048 | 74,706 | 27,066 | 19,247 | |||||||||||||||
Change in unrealized appreciation (depreciation) on investment securities of affiliated issuers | 198,651 | 628,805 | 454,208 | 419,477 | 263,562 | |||||||||||||||
Change in unrealized appreciation (depreciation) on investment securities of unaffiliated issuers | (55,160 | ) | (66,486 | ) | — | — | — | |||||||||||||
Net change in unrealized appreciation (depreciation) | 143,491 | 562,319 | 454,208 | 419,477 | 263,562 | |||||||||||||||
Net Realized and Unrealized Gain | 171,973 | 669,367 | 528,914 | 446,543 | 282,809 | |||||||||||||||
Net Increase in Net Assets Resulting from Operations | $ | 381,779 | $ | 1,134,678 | $ | 741,740 | $ | 495,796 | $ | 295,684 | ||||||||||
(1) | Commencement of operations. |
See Notes to Financial Statements.
| 18 |
Table of Contents
STATEMENTS OF CHANGES IN NET ASSETS
| MyDestination 2005 Fund | MyDestination 2015 Fund | MyDestination 2025 Fund | MyDestination 2035 Fund | MyDestination 2045 Fund | ||||||||||||||||
| For the Period 12/29/06(1) to 06/30/07 (Unaudited) | ||||||||||||||||||||
Operations: | ||||||||||||||||||||
Net investment income | $ | 209,806 | $ | 465,311 | $ | 212,826 | $ | 49,253 | $ | 12,875 | ||||||||||
Net realized gain on investment securities | 28,482 | 107,048 | 74,706 | 27,066 | 19,247 | |||||||||||||||
Net change in unrealized appreciation (depreciation) on investment securities | 143,491 | 562,319 | 454,208 | 419,477 | 263,562 | |||||||||||||||
Net increase in net assets resulting from operations | 381,779 | 1,134,678 | 741,740 | 495,796 | 295,684 | |||||||||||||||
Capital Share Transactions: | ||||||||||||||||||||
Proceeds from shares sold | ||||||||||||||||||||
GS4 shares | 42,827,401 | 115,858,786 | 73,267,951 | 23,806,516 | 9,743,907 | |||||||||||||||
GS6 shares | 1,067,923 | 1,220,666 | 1,544,459 | 1,161,184 | 1,087,156 | |||||||||||||||
GS8 shares | 1,029,207 | 1,136,394 | 1,317,164 | 1,111,749 | 1,050,708 | |||||||||||||||
Total proceeds from shares sold | 44,924,531 | 118,215,846 | 76,129,574 | 26,079,449 | 11,881,771 | |||||||||||||||
Value of shares redeemed | ||||||||||||||||||||
GS4 shares | (2,636,566 | ) | (2,653,603 | ) | (2,349,466 | ) | (2,293,525 | ) | (2,634,872 | ) | ||||||||||
GS6 shares | (10,010 | ) | (42,482 | ) | (10,000 | ) | (10,000 | ) | (10,000 | ) | ||||||||||
GS8 shares | (1,073,585 | ) | (1,197,334 | ) | (1,391,398 | ) | (1,191,409 | ) | (1,130,251 | ) | ||||||||||
Total value of shares redeemed | (3,720,161 | ) | (3,893,419 | ) | (3,750,864 | ) | (3,494,934 | ) | (3,775,123 | ) | ||||||||||
Net increase from capital share transactions | 41,204,370 | 114,322,427 | 72,378,710 | 22,584,515 | 8,106,648 | |||||||||||||||
Total increase in net assets | 41,586,149 | 115,457,105 | 73,120,450 | 23,080,311 | 8,402,332 | |||||||||||||||
Net Assets: | ||||||||||||||||||||
Beginning of Period | — | — | — | — | — | |||||||||||||||
End of Period* | $ | 41,586,149 | $ | 115,457,105 | $ | 73,120,450 | $ | 23,080,311 | $ | 8,402,332 | ||||||||||
* Including undistributed net investment income | $ | 209,806 | $ | 465,311 | $ | 212,826 | $ | 49,253 | $ | 12,875 | ||||||||||
(1) | Commencement of operations. |
See Notes to Financial Statements.
| 19 |
Table of Contents
FINANCIAL HIGHLIGHTS (Unaudited)
For a Share Outstanding For the Period December 29, 2006* - June 30, 2007
| Ratios to Average Net Assets | ||||||||||||||||||||||||||||||||||||||||||||||
| Net Asset Value, Beginning of Period | Net Investment Income (1) | Capital Gain Distributions Received from Affiliated Funds | Realized and Unrealized Gain on Investments | Dividends from Net Investment Income | Distributions from Net Realized Capital Gains | Net Asset Value, End of Period | Total Return (2) | Net Assets, End of Period (000) | Expenses, Net (3)(4) | Expenses, Including Expense Reduction (3)(4) | Expenses, Before Waivers and Expense Reduction (3)(4) | Investment Income, Net (1)(3) | Investment Income/ (Loss), Excluding Waivers and Expense Reduction (1)(3) | Portfolio Turnover Rate (2) | ||||||||||||||||||||||||||||||||
MyDestination 2005 Fund |
| |||||||||||||||||||||||||||||||||||||||||||||
GS4 Class | ||||||||||||||||||||||||||||||||||||||||||||||
2007 | $ | 10.00 | $ | 0.14 | # | $ | 0.02 | $ | 0.21 | $ | — | $ | — | $ | 10.37 | 3.70 | % | $ | 40,494 | 0.20 | % | 0.20 | % | 0.83 | % | 2.67 | % | 2.04 | % | 1 | % | |||||||||||||||
GS6 Class | ||||||||||||||||||||||||||||||||||||||||||||||
2007 | $ | 10.00 | $ | 0.10 | # | $ | 0.02 | $ | 0.23 | $ | — | $ | — | $ | 10.35 | 3.50 | % | $ | 1,092 | 0.49 | % | 0.49 | % | 2.61 | % | 1.92 | % | (0.20 | )% | 1 | % | |||||||||||||||
MyDestination 2015 Fund |
| |||||||||||||||||||||||||||||||||||||||||||||
GS4 Class | ||||||||||||||||||||||||||||||||||||||||||||||
2007 | $ | 10.00 | $ | 0.11 | # | $ | 0.03 | $ | 0.34 | $ | — | $ | — | $ | 10.48 | 4.80 | % | $ | 114,238 | 0.20 | % | 0.20 | % | 0.39 | % | 2.19 | % | 2.00 | % | 0 | %** | |||||||||||||||
GS6 Class | ||||||||||||||||||||||||||||||||||||||||||||||
2007 | $ | 10.00 | $ | 0.08 | # | $ | 0.03 | $ | 0.35 | $ | — | $ | — | $ | 10.46 | 4.60 | % | $ | 1,219 | 0.50 | % | 0.50 | % | 2.11 | % | 1.48 | % | (0.13 | )% | 0 | %** | |||||||||||||||
MyDestination 2025 Fund |
| |||||||||||||||||||||||||||||||||||||||||||||
GS4 Class | ||||||||||||||||||||||||||||||||||||||||||||||
2007 | $ | 10.00 | $ | 0.09 | # | $ | 0.03 | $ | 0.42 | $ | — | $ | — | $ | 10.54 | 5.40 | % | $ | 71,542 | 0.20 | % | 0.20 | % | 0.58 | % | 1.76 | % | 1.38 | % | 0 | %** | |||||||||||||||
GS6 Class | ||||||||||||||||||||||||||||||||||||||||||||||
2007 | $ | 10.00 | $ | 0.06 | # | $ | 0.03 | $ | 0.44 | $ | — | $ | — | $ | 10.53 | 5.30 | % | $ | 1,578 | 0.50 | % | 0.50 | % | 2.18 | % | 1.07 | % | (0.61 | )% | 0 | %** | |||||||||||||||
MyDestination 2035 Fund |
| |||||||||||||||||||||||||||||||||||||||||||||
GS4 Class | ||||||||||||||||||||||||||||||||||||||||||||||
2007 | $ | 10.00 | $ | 0.06 | # | $ | 0.02 | $ | 0.57 | $ | — | $ | — | $ | 10.65 | 6.50 | % | $ | 21,875 | 0.20 | % | 0.20 | % | 1.28 | % | 1.12 | % | 0.04 | % | 0 | %** | |||||||||||||||
GS6 Class | ||||||||||||||||||||||||||||||||||||||||||||||
2007 | $ | 10.00 | $ | 0.02 | # | $ | 0.02 | $ | 0.58 | $ | — | $ | — | $ | 10.62 | 6.20 | % | $ | 1,205 | 0.49 | % | 0.49 | % | 2.68 | % | 0.43 | % | (1.76 | )% | 0 | %** | |||||||||||||||
MyDestination 2045 Fund |
| |||||||||||||||||||||||||||||||||||||||||||||
GS4 Class | ||||||||||||||||||||||||||||||||||||||||||||||
2007 | $ | 10.00 | $ | 0.04 | # | $ | 0.02 | $ | 0.58 | $ | — | $ | — | $ | 10.64 | 6.40 | % | $ | 7,271 | 0.20 | % | 0.20 | % | 2.75 | % | 0.83 | % | (1.72 | )% | 7 | % | |||||||||||||||
GS6 Class | ||||||||||||||||||||||||||||||||||||||||||||||
2007 | $ | 10.00 | $ | 0.01 | # | $ | 0.02 | $ | 0.59 | $ | — | $ | — | $ | 10.62 | 6.20 | % | $ | 1,132 | 0.50 | % | 0.50 | % | 3.22 | % | 0.18 | % | (2.54 | )% | 7 | % | |||||||||||||||
| # | Calculated using the average shares outstanding method. |
| * | Commencement of operations. |
| ** | Rounds to less than 0.005%. |
| (1) | Recognition of net investment income by the Fund is affected by the timing of the declaration of dividends by the underlying investment companies in which the Fund invests. |
| (2) | Not annualized. |
| (3) | Annualized. |
| (4) | Does not include expenses of the investment companies in which the Fund invests. |
See Notes to Financial Statements.
| 20 |
Table of Contents
Average Annual Total Returns as of 06/30/07
| GS4 Class* | GS6 Class* | Benchmark** | |||||||
Six Months | 3.12 | % | 2.88 | % | 3.67 | % | |||
One Year | 7.88 | % | 7.39 | % | 9.20 | % | |||
Five Year | 5.14 | % | 4.84 | % | 5.49 | % | |||
Since Inception | 4.44 | % | 4.14 | % | 4.81 | % | |||
Inception Date | 08/27/01 | 08/27/01 | 08/27/01 |
The performance data quoted represents past performance and does not guarantee future results. Current performance may be lower or higher. Performance data current to the most recent month-end may be obtained at www.GuideStoneFunds.org. The investment return and principal value of an investment will fluctuate so that shares, when redeemed, may be worth more or less than their original cost.
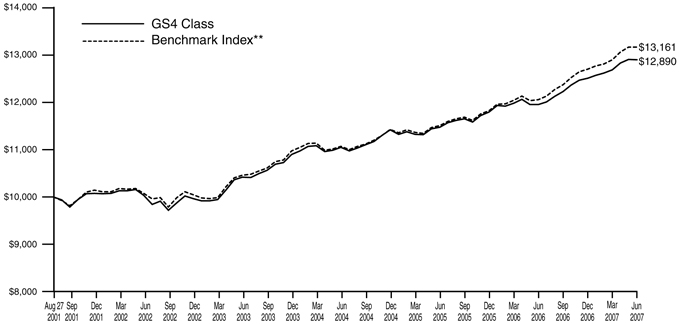
The graph compares the results of a hypothetical $10,000 investment in the GS4 Class of the Fund since August 27, 2001 (commencement of operations), with all dividends and capital gains reinvested, with the Fund’s weighted composite benchmark index.
| * | These returns reflect expense waivers by the Fund’s investment advisor. Without these waivers, returns would have been lower. Returns shown do not reflect the deduction of taxes that a shareholder would pay on Fund distributions or the redemption of Fund shares. |
** | Represents a weighted composite benchmark index consisting of the Russell 3000® Index, the MSCI ACWI® Ex-U.S. and the Merrill Lynch 1-3 Year Treasury Index. |
The Russell 3000® Index measures the performance of the 2,976 largest U.S. companies based on total market capitalization, which represents approximately 98% of the investable U.S. equity market.
The MSCI ACWI® Ex-U.S. is a market-capitalization weighted index composed of companies representative of the market structure of developed and emerging market countries in the Americas (excluding the U.S.), Europe/Middle East, and Asia/ Pacific Regions. It excludes closed markets and those shares in otherwise free markets that are not purchasable by foreigners.
The Merrill Lynch 1-3 Year Treasury Index is composed of all U.S. Treasury Notes and Bonds with maturities greater than or equal to one year and less than three years.
Unlike a mutual fund, the performance of an index assumes no taxes, transaction costs, management fees or other expenses.
The Blended Funds attempt to achieve their objectives by investing in the GuideStone Select Funds. By investing in these fund-of-funds, you will incur the expenses and risks of the Blended Funds in addition to those of the underlying funds. You may invest in the Select Funds directly, except the Global Bond Fund.
| 21 |
Table of Contents
| Flexible Income Fund | ||
| SCHEDULE OF INVESTMENTS | June 30, 2007 (Unaudited) |
| Shares | Value | ||||||
AFFILIATED MUTUAL FUNDS — 98.9% | |||||||
GuideStone Funds Money Market Fund (GS4 Class)¥ | 2,565,383 | $ | 2,565,383 | ||||
GuideStone Funds Low-Duration Bond Fund (GS4 Class)¥ | 18,333,019 | 230,812,708 | |||||
GuideStone Funds Equity Index Fund (GS4 Class)¥ | 260,117 | 5,288,180 | |||||
GuideStone Funds Value Equity Fund (GS4 Class)¥ | 1,177,101 | 23,294,824 | |||||
GuideStone Funds Growth Equity Fund (GS4 Class)¥ | 1,239,167 | 23,507,006 | |||||
GuideStone Funds Small Cap Equity Fund (GS4 Class)¥ | 358,652 | 6,236,953 | |||||
GuideStone Funds International Equity Fund (GS4 Class)¥ | 885,821 | 18,708,529 | |||||
Total Affiliated Mutual Funds (Cost $266,669,406) | 310,413,583 | ||||||
| Par | |||||||
U.S. TREASURY OBLIGATIONS — 1.1% | |||||||
U.S. Treasury Bill | |||||||
4.95%, 08/09/07‡‡ | $ | 70,000 | 69,654 | ||||
U.S. Treasury Note | |||||||
4.75%, 12/31/08 | 3,375,000 | 3,365,773 | |||||
Total U.S. Treasury Obligations (Cost $3,433,508) | 3,435,427 | ||||||
TOTAL INVESTMENTS — 100.0% (Cost $270,102,914) | 313,849,010 | ||||||
Liabilities in Excess of Other Assets — 0.0% | (84,181 | ) | |||||
NET ASSETS — 100.0% | $ | 313,764,829 | |||||
PORTFOLIO SUMMARY (based on net assets)
| % | ||
Bond Fund | 73.5 | |
Domestic Equity Funds | 18.6 | |
International Equity Fund | 6.0 | |
U.S. Treasury Obligations | 1.1 | |
Money Market Fund | 0.8 | |
Futures Contracts | 0.2 | |
| 100.2 | ||
See Notes to Financial Statements.
| 22 |
Table of Contents
Average Annual Total Returns as of 06/30/07
| GS4 Class* | GS6 Class* | Benchmark** | |||||||
Six Months | 4.31 | % | 4.18 | % | 4.70 | % | |||
One Year | 12.36 | % | 12.10 | % | 14.11 | % | |||
Five Year | 8.75 | % | 8.39 | % | 9.18 | % | |||
Since Inception | 6.81 | % | 6.49 | % | 7.19 | % | |||
Inception Date | 08/27/01 | 08/27/01 | 08/27/01 |
The performance data quoted represents past performance and does not guarantee future results. Current performance may be lower or higher. Performance data current to the most recent month-end may be obtained at www.GuideStoneFunds.org. The investment return and principal value of an investment will fluctuate so that shares, when redeemed, may be worth more or less than their original cost.
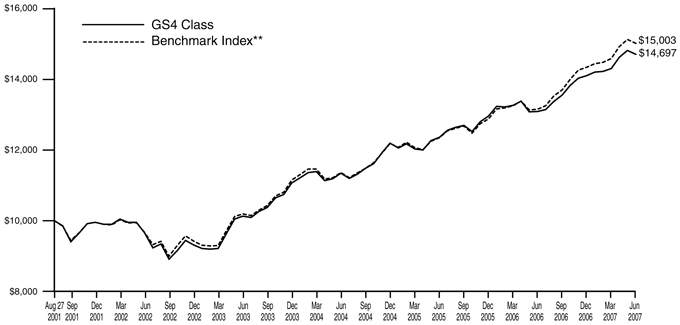
The graph compares the results of a hypothetical $10,000 investment in the GS4 Class of the Fund since August 27, 2001 (commencement of operations), with all dividends and capital gains reinvested, with the Fund’s weighted composite benchmark index.
| * | These returns reflect expense waivers by the Fund’s investment advisor. Without these waivers, returns would have been lower. Returns shown do not reflect the deduction of taxes that a shareholder would pay on Fund distributions or the redemption of Fund shares. |
** | Represents a weighted composite benchmark index consisting of the Russell 3000® Index, the MSCI ACWI® Ex-U.S. and the Lehman Brothers Aggregate Bond Index. |
The Russell 3000® Index measures the performance of the 2,976 largest U.S. companies based on total market capitalization, which represents approximately 98% of the investable U.S. equity market.
The MSCI ACWI® Ex-U.S. is a market-capitalization weighted index composed of companies representative of the market structure of developed and emerging market countries in the Americas (excluding the U.S.), Europe/Middle East, and Asia/Pacific Regions. It excludes closed markets and those shares in otherwise free markets that are not purchased by foreigners.
The Lehman Brothers Aggregate Bond Index represents securities that are SEC-registered, taxable, and dollar denominated. The index covers the U.S. investment grade fixed rate bond market, with index components for government and corporate securities, mortgage pass-through securities, and asset-backed securities.
Unlike a mutual fund, the performance of an index assumes no taxes, transaction costs, management fees or other expenses.
The Blended Funds attempt to achieve their objectives by investing in the GuideStone Select Funds. By investing in these fund-of-funds, you will incur the expenses and risks of the Blended Funds in addition to those of the underlying funds. You may invest in the Select Funds directly, except the Global Bond Fund.
| 23 |
Table of Contents
Growth & Income Fund | ||
SCHEDULE OF INVESTMENTS | June 30, 2007 (Unaudited) |
| Shares | Value | |||||
AFFILIATED MUTUAL FUNDS — 99.2% | ||||||
GuideStone Funds Money Market Fund (GS4 Class)¥ | 12,904,319 | $ | 12,904,319 | |||
GuideStone Funds Low-Duration Bond Fund (GS4 Class)¥ | 16,023,302 | 201,733,375 | ||||
GuideStone Funds Medium-Duration Bond Fund (GS4 Class)¥ | 25,034,655 | 330,207,098 | ||||
GuideStone Funds Extended-Duration Bond Fund (GS4 Class)¥ | 9,096,868 | 131,176,839 | ||||
GuideStone Funds Equity Index Fund (GS4 Class)¥ | 2,199,908 | 44,724,138 | ||||
GuideStone Funds Value Equity Fund (GS4 Class)¥ | 9,994,992 | 197,800,894 | ||||
GuideStone Funds Growth Equity Fund (GS4 Class)¥ | 10,532,473 | 199,801,016 | ||||
GuideStone Funds Small Cap Equity Fund (GS4 Class)¥ | 2,927,129 | 50,902,775 | ||||
GuideStone Funds International Equity Fund (GS4 Class)¥ | 8,289,803 | 175,080,632 | ||||
Total Affiliated Mutual Funds (Cost $1,117,686,226) | 1,344,331,086 | |||||
| Par | ||||||
U.S. TREASURY OBLIGATIONS — 0.8% | ||||||
U.S. Treasury Bill | ||||||
4.95%, 08/09/07‡‡ | $ | 600,000 | 597,034 | |||
U.S. Treasury Note | ||||||
4.38%, 08/15/12 | 9,825,000 | 9,606,246 | ||||
Total U.S. Treasury Obligations (Cost $10,268,198) | 10,203,280 | |||||
TOTAL INVESTMENTS — 100.0% (Cost $1,127,954,424) | 1,354,534,366 | |||||
Other Assets in Excess of Liabilities — 0.0% | 593,782 | |||||
NET ASSETS — 100.0% | $ | 1,355,128,148 | ||||
PORTFOLIO SUMMARY (based on net assets)
| % | ||
Bond Funds | 48.9 | |
Domestic Equity Funds | 36.4 | |
International Equity Fund | 12.9 | |
Money Market Fund | 1.0 | |
U.S. Treasury Obligations | 0.8 | |
Futures Contracts | 0.7 | |
| 100.7 | ||
See Notes to Financial Statements.
| 24 |
Table of Contents
Average Total Returns as of 06/30/07
| GS4 Class* | GS6 Class* | Benchmark** | |||||||
Six Months | 6.17 | % | 5.91 | % | 6.54 | % | |||
One Year | 15.85 | % | 15.37 | % | 18.22 | % | |||
Five Year | 10.57 | % | 10.09 | % | 11.38 | % | |||
Since Inception | 7.61 | % | 7.19 | % | 8.15 | % | |||
Inception Date | 08/27/01 | 08/27/01 | 08/27/01 |
The performance data quoted represents past performance and does not guarantee future results. Current performance may be lower or higher. Performance data current to the most recent month-end may be obtained at www.GuideStoneFunds.org. The investment return and principal value of an investment will fluctuate so that shares, when redeemed, may be worth more or less than their original cost.
The graph compares the results of a hypothetical $10,000 investment in the GS4 Class of the Fund since August 27, 2001 (commencement of operations), with all dividends and capital gains reinvested, with the Fund’s weighted composite benchmark index.
| * | These returns reflect expense waivers by the Fund’s investment advisor. Without these waivers, returns would have been lower. Returns shown do not reflect the deduction of taxes that a shareholder would pay on Fund distributions or the redemption of Fund shares. |
** | Represents a weighted composite benchmark index consisting of the Russell 3000® Index, the MSCI ACWI® Ex-U.S. and the Lehman Brothers Aggregate Bond Index. |
The Russell 3000® Index measures the performance of the 2,976 largest U.S. companies based on total market capitalization, which represents approximately 98% of the investable U.S. equity market.
The MSCI ACWI® Ex-U.S. is a market-capitalization weighted index composed of companies representative of the market structure of developed and emerging market countries in the Americas (excluding the U.S.), Europe/Middle East, and Asia/Pacific Regions. It excludes closed markets and those shares in otherwise free markets that are not purchasable by foreigners.
The Lehman Brothers Aggregate Bond Index represents securities that are SEC-registered, taxable, and dollar denominated. The index covers the U.S. investment grade fixed rate bond market, with index components for government and corporate securities, mortgage pass-through securities, and asset-backed securities.
Unlike a mutual fund, the performance of an index assumes no taxes, transaction costs, management fees or other expenses.
The Blended Funds attempt to achieve their objectives by investing in the GuideStone Select Funds. By investing in these fund-of-funds, you will incur the expenses and risks of the Blended Funds in addition to those of the underlying funds. You may invest in the Select Funds directly, except the Global Bond Fund.
| 25 |
Table of Contents
Capital Opportunities Fund | ||
SCHEDULE OF INVESTMENTS | June 30, 2007 (Unaudited) |
| Shares | Value | ||||||
AFFILIATED MUTUAL FUNDS — 99.6% | |||||||
GuideStone Funds Money Market Fund (GS4 Class)¥ | 15,641,324 | $ | 15,641,324 | ||||
GuideStone Funds Low-Duration Bond Fund (GS4 Class)¥ | 6,495,962 | 81,784,162 | |||||
GuideStone Funds Medium-Duration Bond Fund (GS4 Class)¥ | 10,223,381 | 134,846,399 | |||||
GuideStone Funds Extended-Duration Bond Fund (GS4 Class)¥ | 3,650,828 | 52,644,942 | |||||
GuideStone Funds Equity Index Fund (GS4 Class)¥ | 2,734,754 | 55,597,555 | |||||
GuideStone Funds Value Equity Fund (GS4 Class)¥ | 12,500,835 | 247,391,517 | |||||
GuideStone Funds Growth Equity Fund (GS4 Class)¥ | 13,111,032 | 248,716,271 | |||||
GuideStone Funds Small Cap Equity Fund (GS4 Class)¥ | 3,594,880 | 62,514,962 | |||||
GuideStone Funds International Equity Fund (GS4 Class)¥ | 9,994,217 | 211,077,861 | |||||
Total Affiliated Mutual Funds (Cost $866,659,286) | 1,110,214,993 | ||||||
| Par | |||||||
U.S. TREASURY OBLIGATIONS — 0.4% | |||||||
U.S. Treasury Bill | |||||||
4.95%, 08/09/07‡‡ | $ | 730,000 | 726,391 | ||||
U.S. Treasury Note | |||||||
4.38%, 08/15/12 | 4,350,000 | 4,253,147 | |||||
Total U.S. Treasury Obligations (Cost $4,945,209) | 4,979,538 | ||||||
TOTAL INVESTMENTS — 100.0% (Cost $871,604,495) | 1,115,194,531 | ||||||
Liabilities in Excess of Other Assets — 0.0% | (236,448 | ) | |||||
NET ASSETS — 100.0% | $ | 1,114,958,083 | |||||
PORTFOLIO SUMMARY (based on net assets)
| % | ||
Domestic Equity Funds | 55.1 | |
Bond Funds | 24.2 | |
International Equity Fund | 18.9 | |
Money Market Fund | 1.4 | |
Futures Contracts | 1.2 | |
U.S. Treasury Obligations | 0.4 | |
| 101.2 | ||
See Notes to Financial Statements.
| 26 |
Table of Contents
Average Annual Total Returns as of 06/30/07
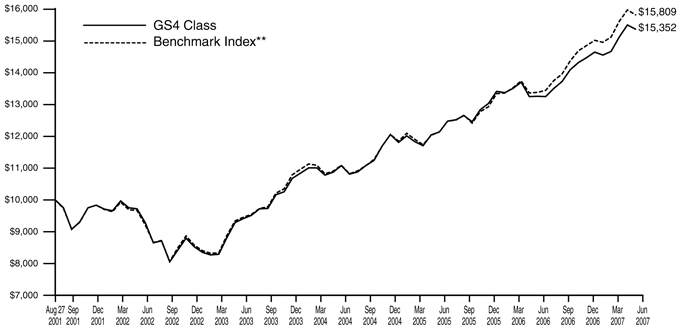
| GS4 Class* | GS6 Class* | Benchmark** | |||||||
Six Months | 7.95 | % | 7.75 | % | 8.39 | % | |||
One Year | 19.27 | % | 18.88 | % | 22.42 | % | |||
Five Year | 12.25 | % | 11.90 | % | 13.51 | % | |||
Since Inception | 8.21 | % | 7.93 | % | 8.97 | % | |||
Inception Date | 08/27/01 | 08/27/01 | 08/27/01 |
The performance data quoted represents past performance and does not guarantee future results. Current performance may be lower or higher. Performance data current to the most recent month-end may be obtained at www.GuideStoneFunds.org. The investment return and principal value of an investment will fluctuate so that shares, when redeemed, may be worth more or less than their original cost.

The graph compares the results of a hypothetical $10,000 investment in the GS4 Class of the Fund since August 27, 2001 (commencement of operations), with all dividends and capital gains reinvested, with the Fund’s weighted composite benchmark index.
| * | These returns reflect expense waivers by the Fund’s investment advisor. Without these waivers, returns would have been lower. Returns shown do not reflect the deduction of taxes that a shareholder would pay on Fund distributions or the redemption of Fund shares. |
** | Represents a weighted composite benchmark index consisting of the Russell 3000® Index and the MSCI ACWI® Ex-U.S. |
The Russell 3000® Index measures the performance of the 2,976 largest U.S. companies based on total market capitalization, which represents approximately 98% of the investable U.S. equity market.
The MSCI ACWI® Ex-U.S. is a market-capitalization weighted index composed of companies representative of the market structure of developed and emerging market countries in the Americas (excluding the U.S.), Europe/Middle East, and Asia/Pacific Regions. It excludes closed markets and those shares in otherwise free markets that are not purchasable by foreigners.
Unlike a mutual fund, the performance of an index assumes no taxes, transaction costs, management fees or other expenses.
The Blended Funds attempt to achieve their objectives by investing in the GuideStone Select Funds. By investing in these fund-of-funds, you will incur the expenses and risks of the Blended Funds in addition to those of the underlying funds. You may invest in the Select Funds directly, except the Global Bond Fund.
| 27 |
Table of Contents
Global Equity Fund SCHEDULE OF INVESTMENTS | June 30, 2007 (Unaudited) |
| Shares | Value | ||||||
AFFILIATED MUTUAL FUNDS — 100.0% | |||||||
GuideStone Funds Money Market Fund (GS4 Class)¥ | 18,474,986 | $ | 18,474,986 | ||||
GuideStone Funds Equity Index Fund (GS4 Class)¥ | 3,381,232 | 68,740,445 | |||||
GuideStone Funds Value Equity Fund (GS4 Class)¥ | 15,577,565 | 308,280,003 | |||||
GuideStone Funds Growth Equity Fund (GS4 Class)¥ | 16,349,788 | 310,155,479 | |||||
GuideStone Funds Small Cap Equity Fund (GS4 Class)¥ | 4,401,476 | 76,541,659 | |||||
GuideStone Funds International Equity Fund (GS4 Class)¥ | 12,306,700 | 259,917,503 | |||||
Total Affiliated Mutual Funds (Cost $757,135,881) | 1,042,110,075 | ||||||
| Par | |||||||
U.S. TREASURY OBLIGATION — 0.1% | |||||||
U.S. Treasury Bill | |||||||
4.95%, 08/09/07‡‡ | |||||||
(Cost $755,928) | $ | 760,000 | 756,243 | ||||
TOTAL INVESTMENTS — 100.1% (Cost $757,891,809) | 1,042,866,318 | ||||||
Liabilities in Excess of Other Assets — (0.1)% | (544,147 | ) | |||||
NET ASSETS — 100.0% | $ | 1,042,322,171 | |||||
PORTFOLIO SUMMARY (based on net assets)
| % | ||
Domestic Equity Funds | 73.3 | |
International Equity Fund | 24.9 | |
Money Market Fund | 1.8 | |
Futures Contracts | 1.4 | |
U.S. Treasury Obligation | 0.1 | |
| 101.5 | ||
See Notes to Financial Statements.
| 28 |
Table of Contents
STATEMENTS OF ASSETS AND LIABILITIES
June 30, 2007 (Unaudited)
| Flexible Income Fund | Growth & Income Fund | Capital Opportunities Fund | Global Equity Fund | |||||||||
Assets | ||||||||||||
Investments in securities of affiliated issuers, at value | $ | 310,413,583 | $ | 1,344,331,086 | $ | 1,110,214,993 | $ | 1,042,110,075 | ||||
Investments in securities of unaffiliated issuers, at value | 3,435,427 | 10,203,280 | 4,979,538 | 756,243 | ||||||||
Total investments (1) | 313,849,010 | 1,354,534,366 | 1,115,194,531 | 1,042,866,318 | ||||||||
Receivables: | ||||||||||||
Dividends | 9,098 | 55,816 | 52,767 | 65,028 | ||||||||
Interest | 80,092 | 161,441 | 71,551 | 65 | ||||||||
Investment securities sold | — | 744,049 | — | — | ||||||||
Fund shares sold | 19,771 | 88,064 | 11,472 | 36,465 | ||||||||
Prepaid expenses and other assets | 25,361 | 38,414 | 39,217 | 31,475 | ||||||||
Total Assets | 313,983,332 | 1,355,622,150 | 1,115,369,538 | 1,042,999,351 | ||||||||
Liabilities | ||||||||||||
Payables: | ||||||||||||
Fund shares redeemed | 157,314 | 282,863 | 245,894 | 516,565 | ||||||||
Variation margin | 900 | 11,700 | 15,300 | 18,000 | ||||||||
Accrued expenses: | ||||||||||||
Advisory fees | 20,405 | 117,381 | 96,837 | 90,530 | ||||||||
Distribution (12b-1) fees | 1,156 | 1,677 | 1,108 | 1,680 | ||||||||
Shareholder servicing fees | 1,258 | 1,829 | 1,241 | 1,830 | ||||||||
Other expenses | 37,470 | 78,552 | 51,075 | 48,575 | ||||||||
Total Liabilities | 218,503 | 494,002 | 411,455 | 677,180 | ||||||||
Net Assets | $ | 313,764,829 | $ | 1,355,128,148 | $ | 1,114,958,083 | $ | 1,042,322,171 | ||||
Net Assets Consist of: | ||||||||||||
Paid-in capital | $ | 254,155,628 | $ | 1,027,919,735 | $ | 775,792,217 | $ | 659,419,378 | ||||
Undistributed net investment income | 4,455,178 | 14,459,614 | 6,993,234 | 2,025,651 | ||||||||
Undistributed net realized gain on investments | 11,426,212 | 86,348,543 | 88,557,195 | 95,982,998 | ||||||||
Net unrealized appreciation on investments and futures | 43,727,811 | 226,400,256 | 243,615,437 | 284,894,144 | ||||||||
Net Assets | $ | 313,764,829 | $ | 1,355,128,148 | $ | 1,114,958,083 | $ | 1,042,322,171 | ||||
Net Asset Value: | ||||||||||||
$0.001 par value, unlimited shares authorized | ||||||||||||
Net assets applicable to the GS4 Class | $ | 300,166,968 | $ | 1,335,073,513 | $ | 1,101,452,762 | $ | 1,022,512,570 | ||||
GS4 shares outstanding | 22,131,653 | 87,578,156 | 64,657,353 | 54,986,206 | ||||||||
Net asset value, offering and redemption price per GS4 share | $ | 13.56 | $ | 15.24 | $ | 17.04 | $ | 18.60 | ||||
Net assets applicable to the GS6 Class | $ | 13,597,861 | $ | 20,054,635 | $ | 13,505,321 | $ | 19,809,601 | ||||
GS6 shares outstanding | 1,462,945 | 2,063,386 | 1,195,453 | 1,532,414 | ||||||||
Net asset value, offering and redemption price per GS6 share | $ | 9.29 | $ | 9.72 | $ | 11.30 | $ | 12.93 | ||||
(1) Investments in securities of affiliated issuers, at cost | $ | 266,669,406 | $ | 1,117,686,226 | $ | 866,659,286 | $ | 757,135,881 | ||||
Investments in securities of unaffiliated issuers, at cost | 3,433,508 | 10,268,198 | 4,945,209 | 755,928 | ||||||||
Total investments at cost | $ | 270,102,914 | $ | 1,127,954,424 | $ | 871,604,495 | $ | 757,891,809 | ||||
See Notes to Financial Statements.
| 29 |
Table of Contents
STATEMENTS OF OPERATIONS
For the Six Months Ended June 30, 2007 (Unaudited)
| Flexible Income Fund | Growth & Income Fund | Capital Opportunities Fund | Global Equity Fund | |||||||||||||
Investment Income | ||||||||||||||||
Income dividends received from affiliated funds | $ | 4,619,760 | $ | 15,148,988 | $ | 7,640,085 | $ | 2,723,405 | ||||||||
Interest | 74,829 | 246,229 | 114,986 | 18,717 | ||||||||||||
Total Investment Income | 4,694,589 | 15,395,217 | 7,755,071 | 2,742,122 | ||||||||||||
Expenses | ||||||||||||||||
Investment advisory fees | 158,334 | 687,221 | 565,559 | 518,629 | ||||||||||||
Transfer agent fees | ||||||||||||||||
GS4 shares | 17,247 | 28,344 | 21,779 | 22,040 | ||||||||||||
GS6 shares | 3,521 | 3,534 | 3,543 | 3,521 | ||||||||||||
GS8 shares | 2,878 | 2,895 | 2,884 | 2,886 | ||||||||||||
Custodian fees | 4,822 | 12,781 | 10,513 | 10,004 | ||||||||||||
Distribution (12b-1) fees: | ||||||||||||||||
GS6 shares | 6,517 | 8,479 | 5,193 | 8,862 | ||||||||||||
GS8 shares | 7,327 | 11,022 | 10,871 | 9,546 | ||||||||||||
Shareholder servicing fees: | ||||||||||||||||
GS6 shares | 7,164 | 9,299 | 5,694 | 9,721 | ||||||||||||
GS8 shares | 5,124 | 7,692 | 7,588 | 6,664 | ||||||||||||
Accounting and administration fees | 40,609 | 97,064 | 85,827 | 81,409 | ||||||||||||
Professional fees | 23,147 | 23,157 | 23,157 | 23,157 | ||||||||||||
Blue sky fees | ||||||||||||||||
GS4 shares | 7,494 | 11,748 | 14,386 | 11,498 | ||||||||||||
GS6 shares | 2,360 | 3,275 | 3,362 | 2,817 | ||||||||||||
GS8 shares | 1,078 | 2,317 | 1,641 | 1,382 | ||||||||||||
Shareholder reporting fees | ||||||||||||||||
GS4 shares | 6,749 | 18,893 | 13,715 | 13,819 | ||||||||||||
GS6 shares | 14 | 5 | 4 | 2 | ||||||||||||
GS8 shares | 27 | 39 | 28 | 29 | ||||||||||||
Trustee fees | 1,432 | 6,188 | 5,050 | 4,651 | ||||||||||||
Line of credit facility fees | 675 | 2,931 | 2,393 | 2,205 | ||||||||||||
Other expenses | 7,245 | 11,685 | 7,846 | 7,765 | ||||||||||||
Total Expenses | 303,764 | 948,569 | 791,033 | 740,607 | ||||||||||||
Expenses waived (See Footnote 3a and 3c) | (63,185 | ) | (11,451 | ) | (18,714 | ) | (22,830 | ) | ||||||||
Fees paid indirectly | (967 | ) | (1,226 | ) | (1,082 | ) | (1,306 | ) | ||||||||
Net Expenses | 239,612 | 935,892 | 771,237 | 716,471 | ||||||||||||
Net Investment Income | 4,454,977 | 14,459,325 | 6,983,834 | 2,025,651 | ||||||||||||
Realized and Unrealized Gain (Loss) | ||||||||||||||||
Capital gain distributions received from affiliated funds | 107,374 | 2,053,017 | 1,594,101 | 1,421,020 | ||||||||||||
Net realized gain on investment securities of affiliated issuers | 6,518,677 | 45,551,749 | 39,841,610 | 36,160,816 | ||||||||||||
Net realized loss on investment securities of unaffiliated issuers | (16,182 | ) | (33,960 | ) | (31,195 | ) | — | |||||||||
Net realized gain on futures transactions | 77,276 | 612,868 | 664,415 | 708,726 | ||||||||||||
Net realized gain | 6,687,145 | 48,183,674 | 42,068,931 | 38,290,562 | ||||||||||||
Change in unrealized appreciation (depreciation) on investment securities of affiliated issuers | (1,403,994 | ) | (4,664,075 | ) | 18,241,001 | 38,401,694 | ||||||||||
Change in unrealized appreciation (depreciation) on investment securities of unaffiliated issuers | 7,633 | (67,890 | ) | 12,181 | 291 | |||||||||||
Change in unrealized appreciation (depreciation) on futures | (15,296 | ) | (229,967 | ) | (34,479 | ) | (101,000 | ) | ||||||||
Net change in unrealized appreciation (depreciation) | (1,411,657 | ) | (4,961,932 | ) | 18,218,703 | 38,300,985 | ||||||||||
Net Realized and Unrealized Gain | 5,275,488 | 43,221,742 | 60,287,634 | 76,591,547 | ||||||||||||
Net Increase in Net Assets Resulting from Operations | $ | 9,730,465 | $ | 57,681,067 | $ | 67,271,468 | $ | 78,617,198 | ||||||||
See Notes to Financial Statements.
| 30 |
Table of Contents
(This page intentionally left blank)
| 31 |
Table of Contents
STATEMENTS OF CHANGES IN NET ASSETS
| Flexible Income Fund | Growth & Income Fund | |||||||||||||||
| For the Six Months Ended 06/30/07 (Unaudited) | For the Year Ended 12/31/06 | For the Six Months Ended 06/30/07 (Unaudited) | For the Year Ended 12/31/06 | |||||||||||||
Operations: | ||||||||||||||||
Net investment income | $ | 4,454,977 | $ | 9,558,099 | $ | 14,459,325 | $ | 32,611,327 | ||||||||
Net realized gain on investment securities and futures transactions | 6,687,145 | 7,521,573 | 48,183,674 | 64,875,048 | ||||||||||||
Net change in unrealized appreciation (depreciation) on investment securities and futures | (1,411,657 | ) | 1,176,010 | (4,961,932 | ) | 16,487,354 | ||||||||||
Net increase in net assets resulting from operations | 9,730,465 | 18,255,682 | 57,681,067 | 113,973,729 | ||||||||||||
Dividends and Distributions to Shareholders: | ||||||||||||||||
Dividends from net investment income(1) | ||||||||||||||||
GS4 shares | (32 | ) | (9,432,798 | ) | 289 | (37,055,835 | ) | |||||||||
GS6 shares | — | (521,636 | ) | — | (608,167 | ) | ||||||||||
GS8 shares | — | (217,451 | ) | — | (298,157 | ) | ||||||||||
Distributions from net realized capital gains | ||||||||||||||||
GS4 shares | — | (3,380,204 | ) | — | (39,876,138 | ) | ||||||||||
GS6 shares | — | (202,252 | ) | — | (688,428 | ) | ||||||||||
GS8 shares | — | (90,433 | ) | — | (369,454 | ) | ||||||||||
Total dividends and distributions | (32 | ) | (13,844,774 | ) | 289 | (78,896,179 | ) | |||||||||
Capital Share Transactions: | ||||||||||||||||
Proceeds from shares sold | ||||||||||||||||
GS4 shares | 20,634,941 | 48,268,169 | 34,168,422 | 97,344,717 | ||||||||||||
GS6 shares | 358,931 | 18,487 | 3,469,326 | 1,078,834 | ||||||||||||
GS8 shares | 71,747 | 190,451 | 466,712 | 2,360,849 | ||||||||||||
Reinvestment of dividends and distributions | ||||||||||||||||
GS4 shares | 32 | 12,806,009 | — | 76,917,838 | ||||||||||||
GS6 shares | — | 723,888 | (288 | ) | 1,296,595 | |||||||||||
GS8 shares | — | 307,884 | — | 667,611 | ||||||||||||
Total proceeds from shares sold and reinvested | 21,065,651 | 62,314,888 | 38,104,172 | 179,666,444 | ||||||||||||
Value of shares redeemed | ||||||||||||||||
GS4 shares | (38,445,104 | ) | (37,007,976 | ) | (155,709,564 | ) | (83,449,394 | ) | ||||||||
GS6 shares | (3,463 | ) | (34 | ) | (139,670 | ) | (57,598 | ) | ||||||||
GS8 shares | (5,988,774 | ) | (23,806 | ) | (9,332,931 | ) | (290,737 | ) | ||||||||
Total value of shares redeemed | (44,437,341 | ) | (37,031,816 | ) | (165,182,165 | ) | (83,797,729 | ) | ||||||||
Net increase (decrease) from capital share transactions (See Footnote 7) | (23,371,690 | ) | 25,283,072 | (127,077,993 | ) | 95,868,715 | ||||||||||
Total increase (decrease) in net assets | (13,641,257 | ) | 29,693,980 | (69,396,637 | ) | 130,946,265 | ||||||||||
Net Assets: | ||||||||||||||||
Beginning of Period | 327,406,086 | 297,712,106 | 1,424,524,785 | 1,293,578,520 | ||||||||||||
End of Period* | $ | 313,764,829 | $ | 327,406,086 | $ | 1,355,128,148 | $ | 1,424,524,785 | ||||||||
* Including undistributed net investment income | $ | 4,455,178 | $ | 233 | $ | 14,459,614 | $ | — | ||||||||
(1) | Includes dividends paid from the short-term portion of capital gain distributions received from affiliated funds. |
See Notes to Financial Statements.
| 32 |
Table of Contents
| Capital Opportunities Fund | Global Equity Fund | |||||||||||||
| For the Six Months Ended 06/30/07 (Unaudited) | For the Year Ended 12/31/06 | For the Six Months Ended 06/30/07 (Unaudited) | For the Year Ended 12/31/06 | |||||||||||
| $ | 6,983,834 | $ | 18,037,853 | $ | 2,025,651 | $ | 8,895,748 | |||||||
| 42,068,931 | 79,489,081 | 38,290,562 | 92,841,935 | |||||||||||
| 18,218,703 | 17,389,707 | 38,300,985 | 23,307,691 | |||||||||||
| 67,271,468 | 114,916,641 | 78,617,198 | 125,045,374 | |||||||||||
| — | (23,978,727 | ) | — | (16,325,661 | ) | |||||||||
| — | (260,944 | ) | — | (330,326 | ) | |||||||||
| — | (205,398 | ) | — | (116,960 | ) | |||||||||
| — | (50,378,326 | ) | — | (52,469,226 | ) | |||||||||
| — | (611,374 | ) | — | (1,183,298 | ) | |||||||||
| — | (536,666 | ) | — | (505,083 | ) | |||||||||
| — | (75,971,435 | ) | — | (70,930,554 | ) | |||||||||
| 24,239,539 | 50,622,132 | 33,295,925 | 75,250,021 | |||||||||||
| 3,617,085 | 1,063,580 | 1,725,778 | 648,927 | |||||||||||
| 874,231 | 1,966,580 | 743,774 | 692,148 | |||||||||||
| (964 | ) | 74,356,367 | 66 | 68,793,854 | ||||||||||
| — | 872,318 | — | 1,513,624 | |||||||||||
| — | 742,063 | — | 622,043 | |||||||||||
| 28,729,891 | 129,623,040 | 35,765,543 | 147,520,617 | |||||||||||
| (125,937,679 | ) | (73,037,809 | ) | (119,401,712 | ) | (106,442,575 | ) | |||||||
| (97,228 | ) | (144 | ) | (90,865 | ) | (66,258 | ) | |||||||
| (9,593,603 | ) | (707,360 | ) | (8,612,044 | ) | (218,026 | ) | |||||||
| (135,628,510 | ) | (73,745,313 | ) | (128,104,621 | ) | (106,726,859 | ) | |||||||
| (106,898,619 | ) | 55,877,727 | (92,339,078 | ) | 40,793,758 | |||||||||
| (39,627,151 | ) | 94,822,933 | (13,721,880 | ) | 94,908,578 | |||||||||
| 1,154,585,234 | 1,059,762,301 | 1,056,044,051 | 961,135,473 | |||||||||||
| $ | 1,114,958,083 | $ | 1,154,585,234 | $ | 1,042,322,171 | $ | 1,056,044,051 | |||||||
| $ | 6,993,234 | $ | 9,400 | $ | 2,025,651 | $ | — | |||||||
See Notes to Financial Statements.
| 33 |
Table of Contents
FINANCIAL HIGHLIGHTS (Unaudited)
For a Share Outstanding For the Years Ended December 31, unless otherwise indicated
| Ratios to Average Net Assets | ||||||||||||||||||||||||||||||||||||||||||||||||||
| Net Asset Value, Beginning of Period | Net Investment Income (1) | Capital Gain Distributions Received from Affiliated Funds | Realized and Unrealized Gain (Loss) on Investments | Dividends from Net Investment Income (2) | Distributions from Net Realized Capital Gains | Net Asset Value, End of Period | Total Return (3) | Net Assets, End of Period (000) | Expenses, Net (4)(5) | Expenses, Including Expense Reduction (4)(5) | Expenses, Before Waivers and Expense Reduction (4)(5) | Investment Income, Net (1)(4) | Investment Income, Excluding Waivers and Expense Reduction (1)(4) | Portfolio Turnover Rate (3) | ||||||||||||||||||||||||||||||||||||
Flexible Income Fund |
| |||||||||||||||||||||||||||||||||||||||||||||||||
GS4 Class | ||||||||||||||||||||||||||||||||||||||||||||||||||
2007(6) | $ | 13.15 | $ | 0.19 | # | $ | — | † | $ | 0.22 | $ | — | $ | — | $ | 13.56 | 3.12 | % | $ | 300,167 | 0.13 | % | 0.13 | % | 0.17 | % | 2.87 | % | 2.83 | % | 5 | % | ||||||||||||||||||
2006 | 12.94 | 0.40 | # | 0.17 | 0.20 | (0.41 | ) | (0.15 | ) | 13.15 | 5.99 | 308,802 | 0.13 | 0.13 | 0.18 | 3.08 | 3.03 | 9 | ||||||||||||||||||||||||||||||||
2005 | 13.18 | 0.33 | # | 0.09 | 0.02 | (0.32 | ) | (0.36 | ) | 12.94 | 3.31 | 280,256 | 0.13 | 0.13 | 0.19 | 2.51 | 2.45 | 20 | ||||||||||||||||||||||||||||||||
2004 | 13.00 | 0.21 | # | 0.04 | 0.37 | (0.31 | ) | (0.13 | ) | 13.18 | 4.76 | 270,913 | 0.13 | 0.13 | 0.17 | 1.60 | 1.56 | 11 | ||||||||||||||||||||||||||||||||
2003 | 12.40 | 0.31 | 0.02 | 0.82 | (0.22 | ) | (0.33 | ) | 13.00 | 9.33 | 253,828 | 0.13 | 0.13 | 0.20 | 2.01 | 1.94 | 13 | |||||||||||||||||||||||||||||||||
2002 | 13.15 | 0.38 | 0.10 | (0.62 | ) | (0.44 | ) | (0.17 | ) | 12.40 | (1.10 | ) | 263,646 | 0.13 | 0.13 | 0.17 | 2.86 | 2.82 | 14 | |||||||||||||||||||||||||||||||
GS6 Class | ||||||||||||||||||||||||||||||||||||||||||||||||||
2007(6) | $ | 9.03 | $ | 0.12 | # | $ | — | † | $ | 0.14 | $ | — | $ | — | $ | 9.29 | 2.88 | % | $ | 13,598 | 0.45 | % | 0.45 | % | 0.45 | % | 2.57 | % | 2.57 | % | 5 | % | ||||||||||||||||||
2006 | 9.05 | 0.25 | # | 0.17 | 0.09 | (0.38 | ) | (0.15 | ) | 9.03 | 5.66 | 12,860 | 0.50 | 0.50 | 0.53 | 2.70 | 2.67 | 9 | ||||||||||||||||||||||||||||||||
2005 | 9.42 | 0.20 | # | 0.09 | (0.02 | ) | (0.28 | ) | (0.36 | ) | 9.05 | 2.90 | 12,161 | 0.50 | 0.50 | 0.56 | 2.10 | 2.04 | 20 | |||||||||||||||||||||||||||||||
2004 | 9.41 | 0.11 | # | 0.04 | 0.27 | (0.28 | ) | (0.13 | ) | 9.42 | 4.52 | 11,815 | 0.36 | 0.36 | 0.45 | 1.14 | 1.05 | 11 | ||||||||||||||||||||||||||||||||
2003 | 9.12 | 0.21 | 0.02 | 0.59 | (0.20 | ) | (0.33 | ) | 9.41 | 9.06 | 19,674 | 0.35 | 0.35 | 0.46 | 1.90 | 1.79 | 13 | |||||||||||||||||||||||||||||||||
2002 | 9.83 | 0.23 | 0.10 | (0.45 | ) | (0.42 | ) | (0.17 | ) | 9.12 | (1.27 | ) | 16,234 | 0.32 | 0.32 | 0.43 | 2.82 | 2.71 | 14 | |||||||||||||||||||||||||||||||
Growth & Income Fund |
| |||||||||||||||||||||||||||||||||||||||||||||||||
GS4 Class | ||||||||||||||||||||||||||||||||||||||||||||||||||
2007(6) | $ | 14.61 | $ | 0.16 | # | $ | 0.02 | $ | 0.45 | $ | — | $ | — | $ | 15.24 | 4.31 | % | $ | 1,335,074 | 0.13 | % | 0.13 | % | 0.13 | % | 2.14 | % | 2.14 | % | 4 | % | |||||||||||||||||||
2006 | 14.20 | 0.36 | # | 0.39 | 0.50 | (0.40 | ) | (0.44 | ) | 14.61 | 8.78 | 1,400,001 | 0.13 | 0.13 | 0.14 | 2.44 | 2.43 | 7 | ||||||||||||||||||||||||||||||||
2005 | 14.27 | 0.32 | # | 0.21 | 0.36 | (0.36 | ) | (0.60 | ) | 14.20 | 6.24 | 1,273,855 | 0.13 | 0.13 | 0.14 | 2.18 | 2.17 | 10 | ||||||||||||||||||||||||||||||||
2004 | 13.41 | 0.26 | # | 0.11 | 0.99 | (0.30 | ) | (0.20 | ) | 14.27 | 10.13 | 1,283,982 | 0.13 | 0.13 | 0.13 | 1.90 | 1.90 | 6 | ||||||||||||||||||||||||||||||||
2003 | 11.82 | 0.29 | 0.15 | 1.78 | (0.36 | ) | (0.27 | ) | 13.41 | 18.79 | 1,120,080 | 0.13 | 0.13 | 0.13 | 2.22 | 2.22 | 10 | |||||||||||||||||||||||||||||||||
2002 | 13.44 | 0.36 | 0.12 | (1.33 | ) | (0.42 | ) | (0.35 | ) | 11.82 | (6.37 | ) | 1,019,700 | 0.13 | 0.13 | 0.13 | 2.68 | 2.68 | 12 | |||||||||||||||||||||||||||||||
GS6 Class | ||||||||||||||||||||||||||||||||||||||||||||||||||
2007(6) | $ | 9.33 | $ | 0.09 | # | $ | 0.02 | $ | 0.28 | $ | — | $ | — | $ | 9.72 | 4.18 | % | $ | 20,055 | 0.48 | % | 0.48 | % | 0.41 | % | 1.82 | % | 1.89 | % | 4 | % | |||||||||||||||||||
2006 | 9.36 | 0.20 | # | 0.39 | 0.19 | (0.37 | ) | (0.44 | ) | 9.33 | 8.30 | 16,080 | 0.48 | 0.48 | 0.48 | 2.11 | 2.11 | 7 | ||||||||||||||||||||||||||||||||
2005 | 9.71 | 0.18 | # | 0.21 | 0.19 | (0.33 | ) | (0.60 | ) | 9.36 | 5.96 | 13,888 | 0.48 | 0.48 | 0.48 | 1.82 | 1.82 | 10 | ||||||||||||||||||||||||||||||||
2004 | 9.28 | 0.12 | # | 0.11 | 0.66 | (0.26 | ) | (0.20 | ) | 9.71 | 9.66 | 13,118 | 0.46 | 0.46 | 0.52 | 1.28 | 1.22 | 6 | ||||||||||||||||||||||||||||||||
2003 | 8.34 | 0.16 | 0.15 | 1.23 | (0.33 | ) | (0.27 | ) | 9.28 | 18.52 | 22,650 | 0.45 | 0.45 | 0.54 | 2.00 | 1.91 | 10 | |||||||||||||||||||||||||||||||||
2002 | 9.72 | 0.21 | 0.12 | (0.96 | ) | (0.40 | ) | (0.35 | ) | 8.34 | (6.59 | ) | 17,009 | 0.37 | 0.37 | 0.45 | 2.64 | 2.56 | 12 | |||||||||||||||||||||||||||||||
| † | Amount represents less than $0.005 per share. |
| # | Calculated using the average shares outstanding method. |
| ** | Rounds to less than 0.005%. |
| (1) | Recognition of net investment income by the Fund is affected by the timing of the declaration of dividends by the underlying investment companies in which the Fund invests. |
| (2) | Includes dividends paid from the short-term portion of capital gain distributions received from affiliated funds. |
| (3) | Not annualized. |
| (4) | Annualized. |
| (5) | Does not include expenses of the investment companies in which the Fund invests. |
| (6) | For the six months ended June 30, 2007. |
See Notes to Financial Statements.
| 34 |
Table of Contents
| Ratios to Average Net Assets | ||||||||||||||||||||||||||||||||||||||||||||||||||
| Net Asset Value, Beginning of Period | Net Investment Income (1) | Capital Gain Distributions Received from Affiliated Funds | Realized and Unrealized Gain (Loss) on Investments | Dividends from Net Investment Income (2) | Distributions from Net Realized Capital Gains | Net Asset Value, End of Period | Total Return (3) | Net Assets, End of Period (000) | Expenses, Net (4)(5) | Expenses, Including Expense Reduction (4)(5) | Expenses, Before Waivers and Expense Reduction (4)(5) | Investment Income, Net (1)(4) | Investment Income, Excluding Waivers and Expense Reduction (1)(4) | Portfolio Turnover Rate (3) | ||||||||||||||||||||||||||||||||||||
Capital Opportunities Fund |
| |||||||||||||||||||||||||||||||||||||||||||||||||
GS4 Class | ||||||||||||||||||||||||||||||||||||||||||||||||||
2007(6) | $ | 16.05 | $ | 0.10 | # | $ | 0.02 | $ | 0.87 | $ | — | $ | — | $ | 17.04 | 6.17 | % | $ | 1,101,453 | 0.13 | % | 0.13 | % | 0.13 | % | 1.26 | % | 1.26 | % | 3 | % | |||||||||||||||||||
2006 | 15.45 | 0.27 | # | 0.63 | 0.81 | (0.35 | ) | (0.76 | ) | 16.05 | 11.03 | 1,137,039 | 0.13 | 0.13 | 0.14 | 1.66 | 1.65 | 7 | ||||||||||||||||||||||||||||||||
2005 | 15.03 | 0.23 | # | 0.31 | 0.68 | (0.31 | ) | (0.49 | ) | 15.45 | 8.09 | 1,046,061 | 0.13 | 0.13 | 0.14 | 1.50 | 1.49 | 5 | ||||||||||||||||||||||||||||||||
2004 | 13.62 | 0.19 | # | 0.08 | 1.47 | (0.21 | ) | (0.12 | ) | 15.03 | 12.80 | 1,043,625 | 0.13 | 0.13 | 0.13 | 1.33 | 1.33 | 3 | ||||||||||||||||||||||||||||||||
2003 | 11.17 | 0.19 | 0.07 | 2.56 | (0.23 | ) | (0.14 | ) | 13.62 | 25.23 | 900,021 | 0.13 | 0.13 | 0.14 | 1.54 | 1.53 | 8 | |||||||||||||||||||||||||||||||||
2002 | 13.37 | 0.22 | 0.06 | (2.05 | ) | (0.24 | ) | (0.19 | ) | 11.17 | (13.25 | ) | 745,968 | 0.13 | 0.13 | 0.14 | 1.72 | 1.71 | 10 | |||||||||||||||||||||||||||||||
GS6 Class | ||||||||||||||||||||||||||||||||||||||||||||||||||
2007(6) | $ | 10.67 | $ | 0.05 | # | $ | 0.02 | $ | 0.56 | $ | — | $ | — | $ | 11.30 | 5.91 | % | $ | 13,505 | 0.58 | % | 0.57 | % | 0.47 | % | 0.91 | % | 1.01 | % | 3 | % | |||||||||||||||||||
2006 | 10.61 | 0.14 | # | 0.63 | 0.35 | (0.30 | ) | (0.76 | ) | 10.67 | 10.58 | 9,448 | 0.59 | 0.59 | 0.59 | 1.27 | 1.27 | 7 | ||||||||||||||||||||||||||||||||
2005 | 10.57 | 0.11 | # | 0.31 | 0.37 | (0.26 | ) | (0.49 | ) | 10.61 | 7.43 | 7,571 | 0.62 | 0.62 | 0.62 | 1.01 | 1.01 | 5 | ||||||||||||||||||||||||||||||||
2004 | 9.67 | 0.07 | # | 0.08 | 1.03 | (0.16 | ) | (0.12 | ) | 10.57 | 12.28 | 7,042 | 0.56 | 0.56 | 0.61 | 0.66 | 0.61 | 3 | ||||||||||||||||||||||||||||||||
2003 | 8.01 | 0.11 | 0.07 | 1.82 | (0.20 | ) | (0.14 | ) | 9.67 | 24.93 | 13,585 | 0.52 | 0.52 | 0.62 | 1.20 | 1.10 | 8 | |||||||||||||||||||||||||||||||||
2002 | 9.73 | 0.12 | 0.06 | (1.50 | ) | (0.21 | ) | (0.19 | ) | 8.01 | (13.56 | ) | 9,859 | 0.42 | 0.42 | 0.55 | 1.54 | 1.41 | 10 | |||||||||||||||||||||||||||||||
Global Equity Fund |
| |||||||||||||||||||||||||||||||||||||||||||||||||
GS4 Class | ||||||||||||||||||||||||||||||||||||||||||||||||||
2007(6) | $ | 17.23 | $ | 0.04 | # | $ | 0.02 | $ | 1.31 | $ | — | $ | — | $ | 18.60 | 7.95 | % | $ | 1,022,513 | 0.13 | % | 0.13 | % | 0.14 | % | 0.41 | % | 0.40 | % | 0 | %** | |||||||||||||||||||
2006 | 16.28 | 0.15 | # | 0.88 | 1.13 | (0.28 | ) | (0.93 | ) | 17.23 | 13.20 | 1,031,999 | 0.13 | 0.13 | 0.14 | 0.90 | 0.89 | 4 | ||||||||||||||||||||||||||||||||
2005 | 15.55 | 0.13 | # | 0.41 | 0.98 | (0.23 | ) | (0.56 | ) | 16.28 | 9.75 | 940,769 | 0.13 | 0.13 | 0.14 | 0.85 | 0.84 | 4 | ||||||||||||||||||||||||||||||||
2004 | 13.64 | 0.11 | # | 0.04 | 1.96 | (0.12 | ) | (0.08 | ) | 15.55 | 15.47 | 936,734 | 0.13 | 0.13 | 0.13 | 0.77 | 0.77 | 2 | ||||||||||||||||||||||||||||||||
2003 | 10.40 | 0.10 | — | 3.23 | (0.09 | ) | — | 13.64 | 31.99 | 801,407 | 0.13 | 0.13 | 0.14 | 0.82 | 0.81 | 4 | ||||||||||||||||||||||||||||||||||
2002 | 13.14 | 0.08 | — | † | (2.71 | ) | (0.08 | ) | (0.03 | ) | 10.40 | (20.04 | ) | 616,043 | 0.13 | 0.13 | 0.14 | 0.68 | 0.67 | 6 | ||||||||||||||||||||||||||||||
GS6 Class | ||||||||||||||||||||||||||||||||||||||||||||||||||
2007(6) | $ | 12.00 | $ | 0.01 | # | $ | 0.02 | $ | 0.90 | $ | — | $ | — | $ | 12.93 | 7.75 | % | $ | 19,810 | 0.47 | % | 0.47 | % | 0.41 | % | 0.11 | % | 0.17 | % | 0 | %** | |||||||||||||||||||
2006 | 11.67 | 0.07 | # | 0.88 | 0.55 | (0.24 | ) | (0.93 | ) | 12.00 | 12.79 | 16,887 | 0.47 | 0.47 | 0.47 | 0.58 | 0.58 | 4 | ||||||||||||||||||||||||||||||||
2005 | 11.35 | 0.06 | # | 0.41 | 0.60 | (0.19 | ) | (0.56 | ) | 11.67 | 9.40 | 14,441 | 0.50 | 0.50 | 0.50 | 0.48 | 0.48 | 4 | ||||||||||||||||||||||||||||||||
2004 | 10.00 | 0.04 | # | 0.04 | 1.43 | (0.08 | ) | (0.08 | ) | 11.35 | 15.17 | 13,202 | 0.44 | 0.44 | 0.50 | 0.37 | 0.31 | 2 | ||||||||||||||||||||||||||||||||
2003 | 7.65 | 0.05 | — | 2.36 | (0.06 | ) | — | 10.00 | 31.53 | 17,973 | 0.43 | 0.43 | 0.48 | 0.53 | 0.48 | 4 | ||||||||||||||||||||||||||||||||||
2002 | 9.70 | 0.04 | — | † | (2.00 | ) | (0.06 | ) | (0.03 | ) | 7.65 | (20.25 | ) | 12,805 | 0.35 | 0.35 | 0.44 | 0.53 | 0.44 | 6 | ||||||||||||||||||||||||||||||
See Notes to Financial Statements.
| 35 |
Table of Contents
Average Annual Total Returns as of 06/30/07
| GS2 Class* | Benchmark** | |||||
Six Months | 3.18 | % | 3.67 | % | ||
One Year | 7.99 | % | 9.20 | % | ||
Since Inception | 5.53 | % | 5.92 | % | ||
Inception Date | 07/01/03 | 07/01/03 |
The performance data quoted represents past performance and does not guarantee future results. Current performance may be lower or higher. Performance data current to the most recent month-end may be obtained at www.GuideStoneFunds.org. The investment return and principal value of an investment will fluctuate so that shares, when redeemed, may be worth more or less than their original cost.
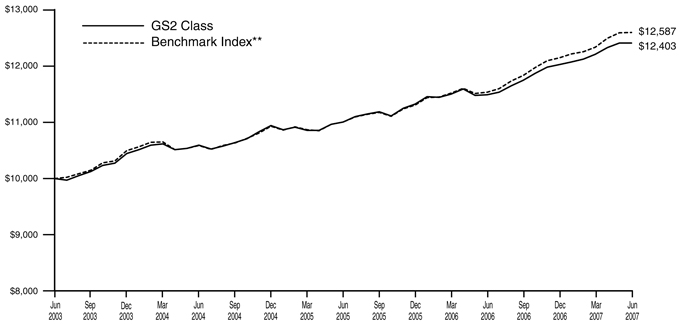
The graph compares the results of a hypothetical $10,000 investment in the GS2 Class of the Fund since July 1, 2003 (commencement of operations), with all dividends and capital gains reinvested, with the Fund’s weighted composite benchmark index.
| * | These returns reflect expense waivers by the Fund’s investment advisor. Without these waivers, returns would have been lower. Returns shown do not reflect the deduction of taxes that a shareholder would pay on Fund distributions or the redemption of Fund shares. |
** | Represents a weighted composite benchmark index consisting of the Russell 3000® Index, the MSCI ACWI® Ex-U.S. and the Merrill Lynch 1-3 Year Treasury Index. |
The Russell 3000® Index measures the performance of the 2,976 largest U.S. companies based on total market capitalization, which represents approximately 98% of the investable U.S. equity market.
The MSCI ACWI® Ex-U.S. is a market-capitalization weighted index composed of companies representative of the market structure of developed and emerging market countries in the Americas (excluding the U.S.), Europe/Middle East, and Asia/Pacific Regions. It excludes closed markets and those shares in otherwise free markets that are not purchasable by foreigners.
The Merrill Lynch 1-3 Year Treasury Index is composed of all U.S. Treasury Notes and Bonds with maturities greater than or equal to one year and less than three years.
Unlike a mutual fund, the performance of an index assumes no taxes, transaction costs, management fees or other expenses.
The Blended Funds attempt to achieve their objectives by investing in the GuideStone Select Funds. By investing in these fund-of-funds, you will incur the expenses and risks of the Blended Funds in addition to those of the underlying funds. You may invest in the Select Funds directly, except the Global Bond Fund.
| 36 |
Table of Contents
Flexible Income Fund I | ||
SCHEDULE OF INVESTMENTS | June 30, 2007 (Unaudited) |
| Shares | Value | ||||||
AFFILIATED MUTUAL FUNDS — 99.1% | |||||||
GuideStone Funds Money Market Fund (GS2 Class)¥ | 495,854 | $ | 495,854 | ||||
GuideStone Funds Low-Duration Bond Fund (GS2 Class)¥ | 5,529,214 | 48,601,788 | |||||
GuideStone Funds Equity Index Fund (GS2 Class)¥ | 95,228 | 1,113,217 | |||||
GuideStone Funds Value Equity Fund (GS2 Class)¥ | 438,495 | 4,902,370 | |||||
GuideStone Funds Growth Equity Fund (GS2 Class)¥ | 412,138 | 4,941,538 | |||||
GuideStone Funds Small Cap Equity Fund (GS2 Class)¥ | 106,387 | 1,311,753 | |||||
GuideStone Funds International Equity Fund (GS2 Class)¥ | 224,943 | 3,936,508 | |||||
Total Affiliated Mutual Funds (Cost $66,480,513) | 65,303,028 | ||||||
| Par | |||||||
U.S. TREASURY OBLIGATIONS — 1.0% | |||||||
U.S. Treasury Bill | |||||||
4.95%, 08/09/07‡‡ | $ | 20,000 | 19,901 | ||||
U.S. Treasury Note | |||||||
4.75%, 12/31/08 | 620,000 | 618,305 | |||||
Total U.S. Treasury Obligations (Cost $637,876) | 638,206 | ||||||
TOTAL INVESTMENTS — 100.1% (Cost $67,118,389) | 65,941,234 | ||||||
Liabilities in Excess of Other Assets — (0.1)% | (48,563 | ) | |||||
NET ASSETS — 100.0% | $ | 65,892,671 | |||||
PORTFOLIO SUMMARY (based on net assets)
| % | ||
Bond Fund | 73.7 | |
Domestic Equity Funds | 18.6 | |
International Equity Fund | 6.0 | |
U.S. Treasury Obligations | 1.0 | |
Money Market Fund | 0.8 | |
Futures Contracts | 0.2 | |
| 100.3 | ||
See Notes to Financial Statements.
| 37 |
Table of Contents
Average Annual Total Returns as of 06/30/07
| GS2 Class* | Benchmark** | |||||
Six Months | 4.41 | % | 4.70 | % | ||
One Year | 12.55 | % | 14.11 | % | ||
Since Inception | 9.78 | % | 10.14 | % | ||
Inception Date | 07/01/03 | 07/01/03 |
The performance data quoted represents past performance and does not guarantee future results. Current performance may be lower or higher. Performance data current to the most recent month-end may be obtained at www.GuideStoneFunds.org. The investment return and principal value of an investment will fluctuate so that shares, when redeemed, may be worth more or less than their original cost.
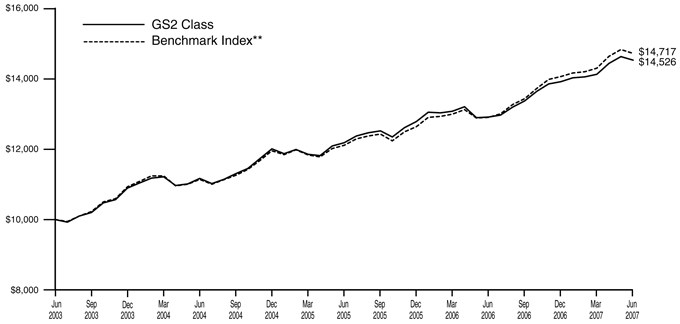
The graph compares the results of a hypothetical $10,000 investment in the GS2 Class of the Fund since July 1, 2003 (commencement of operations), with all dividends and capital gains reinvested, with the Fund’s weighted composite benchmark index.
| * | These returns reflect expense waivers by the Fund’s investment advisor. Without these waivers, returns would have been lower. Returns shown do not reflect the deduction of taxes that a shareholder would pay on Fund distributions or the redemption of Fund shares. |
** | Represents a weighted composite benchmark index consisting of the Russell 3000® Index, the MSCI ACWI® Ex-U.S. and the Lehman Brothers Aggregate Bond Index. |
The Russell 3000® Index measures the performance of the 2,976 largest U.S. companies based on total market capitalization, which represents approximately 98% of the investable U.S. equity market.
The MSCI ACWI® Ex-U.S. is a market-capitalization weighted index composed of companies representative of the market structure of developed and emerging market countries in the Americas (excluding the U.S.), Europe/Middle East, and Asia/Pacific Regions. It excludes closed markets and those shares in otherwise free markets that are not purchased by foreigners.
The Lehman Brothers Aggregate Bond Index represents securities that are SEC-registered, taxable, and dollar denominated. The index covers the U.S. investment grade fixed rate bond market, with index components for government and corporate securities, mortgage pass-through securities, and asset-backed securities.
Unlike a mutual fund, the performance of an index assumes no taxes, transaction costs, management fees or other expenses.
The Blended Funds attempt to achieve their objectives by investing in the GuideStone Select Funds. By investing in these fund-of-funds, you will incur the expenses and risks of the Blended Funds in addition to those of the underlying funds. You may invest in the Select Funds directly, except the Global Bond Fund.
| 38 |
Table of Contents
Growth & Income Fund I | ||
SCHEDULE OF INVESTMENTS | June 30, 2007 (Unaudited) |
| Shares | Value | ||||||
AFFILIATED MUTUAL FUNDS — 99.3% | |||||||
GuideStone Funds Money Market Fund (GS2 Class)¥ | 3,971,229 | $ | 3,971,229 | ||||
GuideStone Funds Low-Duration Bond Fund (GS2 Class)¥ | 5,787,427 | 50,871,486 | |||||
GuideStone Funds Medium-Duration Bond Fund (GS2 Class)¥ | 10,066,298 | 83,248,287 | |||||
GuideStone Funds Extended-Duration Bond Fund (GS2 Class)¥ | 4,278,010 | 33,026,237 | |||||
GuideStone Funds Equity Index Fund (GS2 Class)¥ | 964,049 | 11,269,735 | |||||
GuideStone Funds Value Equity Fund (GS2 Class)¥ | 4,458,831 | 49,849,727 | |||||
GuideStone Funds Growth Equity Fund (GS2 Class)¥ | 4,194,592 | 50,293,154 | |||||
GuideStone Funds Small Cap Equity Fund (GS2 Class)¥ | 1,039,616 | 12,818,461 | |||||
GuideStone Funds International Equity Fund (GS2 Class)¥ | 2,520,540 | 44,109,447 | |||||
Total Affiliated Mutual Funds (Cost $332,430,202) | 339,457,763 | ||||||
| Par | |||||||
U.S. TREASURY OBLIGATIONS — 0.8% | |||||||
U.S. Treasury Bill | |||||||
4.95%, 08/09/07‡‡ | $ | 210,000 | 208,962 | ||||
U.S. Treasury Note | |||||||
4.38%, 08/15/12 | 2,600,000 | 2,542,111 | |||||
Total U.S. Treasury Obligations (Cost $2,764,598) | 2,751,073 | ||||||
TOTAL INVESTMENTS — 100.1% (Cost $335,194,800) | 342,208,836 | ||||||
Liabilities in Excess of Other Assets — (0.1)% | (200,673 | ) | |||||
NET ASSETS — 100.0% | $ | 342,008,163 | |||||
PORTFOLIO SUMMARY (based on net assets)
| % | ||
Bond Funds | 48.9 | |
Domestic Equity Funds | 36.3 | |
International Equity Fund | 12.9 | |
Money Market Fund | 1.2 | |
U.S. Treasury Obligations | 0.8 | |
Futures Contracts | 0.7 | |
| 100.8 | ||
See Notes to Financial Statements.
| 39 |
Table of Contents
Average Annual Total Returns as of 06/30/07
| GS2 Class* | Benchmark** | |||||
Six Months | 6.25 | % | 6.54 | % | ||
One Year | 16.04 | % | 18.22 | % | ||
Since Inception | 13.01 | % | 13.71 | % | ||
Inception Date | 07/01/03 | 07/01/03 |
The performance data quoted represents past performance and does not guarantee future results. Current performance may be lower or higher. Performance data current to the most recent month-end may be obtained at www.GuideStoneFunds.org. The investment return and principal value of an investment will fluctuate so that shares, when redeemed, may be worth more or less than their original cost.
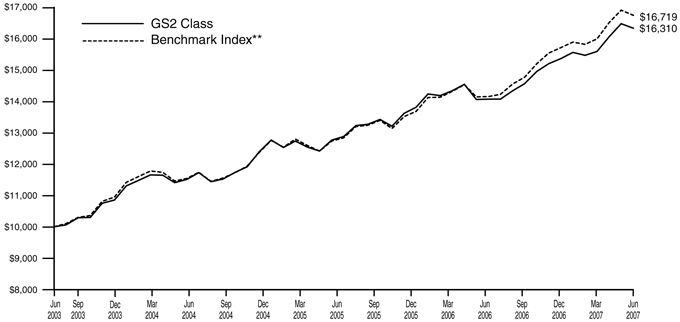
The graph compares the results of a hypothetical $10,000 investment in the GS2 Class of the Fund since July 1, 2003 (commencement of operations), with all dividends and capital gains reinvested, with the Fund’s weighted composite benchmark index.
| * | These returns reflect expense waivers by the Fund’s investment advisor. Without these waivers, returns would have been lower. Returns shown do not reflect the deduction of taxes that a shareholder would pay on Fund distributions or the redemption of Fund shares. |
** | Represents a weighted composite benchmark index consisting of the Russell 3000® Index, the MSCI ACWI® Ex-U.S. and the Lehman Brothers Aggregate Bond Index. |
The Russell 3000® Index measures the performance of the 2,976 largest U.S. companies based on total market capitalization, which represents approximately 98% of the investable U.S. equity market.
The MSCI ACWI® Ex-U.S. is a market-capitalization weighted index composed of companies representative of the market structure of developed and emerging market countries in the Americas (excluding the U.S.), Europe/Middle East, and Asia/Pacific Regions. It excludes closed markets and those shares in otherwise free markets that are not purchasable by foreigners.
The Lehman Brothers Aggregate Bond Index represents securities that are SEC-registered, taxable, and dollar denominated. The index covers the U.S. investment grade fixed rate bond market, with index components for government and corporate securities, mortgage pass-through securities, and asset-backed securities.
Unlike a mutual fund, the performance of an index assumes no taxes, transaction costs, management fees or other expenses.
The Blended Funds attempt to achieve their objectives by investing in the GuideStone Select Funds. By investing in these fund-of-funds, you will incur the expenses and risks of the Blended Funds in addition to those of the underlying funds. You may invest in the Select Funds directly, except the Global Bond Fund.
| 40 |
Table of Contents
Capital Opportunities Fund I | ||
SCHEDULE OF INVESTMENTS | June 30, 2007 (Unaudited) |
| Shares | Value | ||||||
AFFILIATED MUTUAL FUNDS — 99.6% | |||||||
GuideStone Funds Money Market Fund (GS2 Class)¥ | 3,960,480 | $ | 3,960,480 | ||||
GuideStone Funds Low-Duration Bond Fund (GS2 Class)¥ | 2,073,369 | 18,224,915 | |||||
GuideStone Funds Medium-Duration Bond Fund (GS2 Class)¥ | 3,632,660 | 30,042,102 | |||||
GuideStone Funds Extended-Duration Bond Fund (GS2 Class)¥ | 1,517,188 | 11,712,688 | |||||
GuideStone Funds Equity Index Fund (GS2 Class)¥ | 1,059,009 | 12,379,812 | |||||
GuideStone Funds Value Equity Fund (GS2 Class)¥ | 4,928,236 | 55,097,673 | |||||
GuideStone Funds Growth Equity Fund (GS2 Class)¥ | 4,614,358 | 55,326,157 | |||||
GuideStone Funds Small Cap Equity Fund (GS2 Class)¥ | 1,128,218 | 13,910,922 | |||||
GuideStone Funds International Equity Fund (GS2 Class)¥ | 2,685,508 | 46,996,396 | |||||
Total Affiliated Mutual Funds (Cost $228,245,223) | 247,651,145 | ||||||
| Par | |||||||
U.S. TREASURY OBLIGATIONS — 0.5% | |||||||
U.S. Treasury Bill | |||||||
4.95%, 08/09/07‡‡ | $ | 180,000 | 179,110 | ||||
U.S. Treasury Note | |||||||
4.38%, 08/15/12 | 1,025,000 | 1,002,179 | |||||
Total U.S. Treasury Obligations (Cost $1,189,372) | 1,181,289 | ||||||
TOTAL INVESTMENTS — 100.1% (Cost $229,434,595) | 248,832,434 | ||||||
Liabilities in Excess of Other Assets — (0.1)% | (163,566 | ) | |||||
NET ASSETS — 100.0% | $ | 248,668,868 | |||||
PORTFOLIO SUMMARY (based on net assets)
| % | ||
Domestic Equity Funds | 55.0 | |
Bond Funds | 24.1 | |
International Equity Fund | 18.9 | |
Money Market Fund | 1.6 | |
Futures Contracts | 1.2 | |
U.S. Treasury Obligations | 0.5 | |
| 101.3 | ||
See Notes to Financial Statements.
| 41 |
Table of Contents
Average Annual Total Returns as of 06/30/07
| GS2 Class* | Benchmark** | |||||
Six Months | 8.04 | % | 8.39 | % | ||
One year | 19.45 | % | 22.42 | % | ||
Since Inception | 16.18 | % | 17.32 | % | ||
Inception Date | 07/01/03 | 07/01/03 |
The performance data quoted represents past performance and does not guarantee future results. Current performance may be lower or higher. Performance data current to the most recent month-end may be obtained at www.GuideStoneFunds.org. The investment return and principal value of an investment will fluctuate so that shares, when redeemed, may be worth more or less than their original cost.
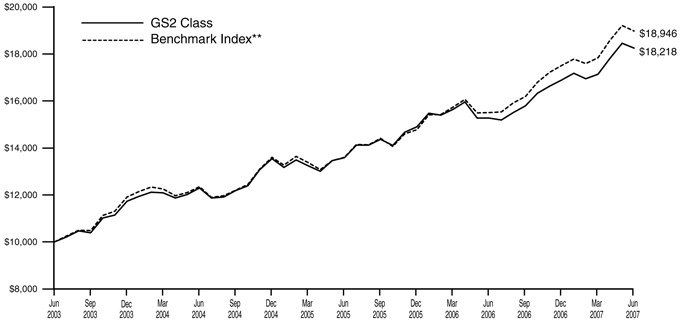
The graph compares the results of a hypothetical $10,000 investment in the GS2 Class of the Fund since July 1, 2003 (commencement of operations), with all dividends and capital gains reinvested, with the Fund’s weighted composite benchmark index.
| * | These returns reflect expense waivers by the Fund’s investment advisor. Without these waivers, returns would have been lower. Returns shown do not reflect the deduction of taxes that a shareholder would pay on Fund distributions or the redemption of Fund shares. |
** | Represents a weighted composite benchmark index consisting of the Russell 3000® Index and the MSCI ACWI® Ex-U.S. |
The Russell 3000® Index measures the performance of the 2,976 largest U.S. companies based on total market capitalization, which represents approximately 98% of the investable U.S. equity market.
The MSCI ACWI® Ex-U.S. is a market-capitalization weighted index composed of companies representative of the market structure of developed and emerging market countries in the Americas (excluding the U.S.), Europe/Middle East, and Asia/Pacific Regions. It excludes closed markets and those shares in otherwise free markets that are not purchasable by foreigners.
Unlike a mutual fund, the performance of an index assumes no taxes, transaction costs, management fees or other expenses.
The Blended Funds attempt to achieve their objectives by investing in the GuideStone Select Funds. By investing in these fund-of-funds, you will incur the expenses and risks of the Blended Funds in addition to those of the underlying funds. You may invest in the Select Funds directly, except the Global Bond Fund.
| 42 |
Table of Contents
Global Equity Fund I | ||
SCHEDULE OF INVESTMENTS | June 30, 2007 (Unaudited) |
| Shares | Value | ||||||
AFFILIATED MUTUAL FUNDS — 100.0% | |||||||
GuideStone Funds Money Market Fund (GS2 Class) | 3,520,994 | $ | 3,520,994 | ||||
GuideStone Funds Equity Index Fund (GS2 Class) | 1,126,784 | 13,172,105 | |||||
GuideStone Funds Value Equity Fund (GS2 Class) | 5,286,142 | 59,099,066 | |||||
GuideStone Funds Growth Equity Fund (GS2 Class) | 4,954,495 | 59,404,390 | |||||
GuideStone Funds Small Cap Equity Fund (GS2 Class) | 1,188,658 | 14,656,149 | |||||
GuideStone Funds International Equity Fund (GS2 Class) | 2,846,453 | 49,812,932 | |||||
Total Affiliated Mutual Funds (Cost $178,459,223) | 199,665,636 | ||||||
| Par | |||||||
U.S. TREASURY OBLIGATION — 0.0% | |||||||
U.S. Treasury Bill | |||||||
4.95%, 08/09/07‡‡ | |||||||
(Cost $139,250) | $ | 140,000 | 139,308 | ||||
TOTAL INVESTMENTS — 100.0% (Cost $178,598,473) | 199,804,944 | ||||||
Liabilities in Excess of Other Assets — 0.0% | (65,775 | ) | |||||
NET ASSETS — 100.0% | $ | 199,739,169 | |||||
PORTFOLIO SUMMARY (based on net assets)
| % | |||
Domestic Equity Funds | 73.3 | ||
International Equity Fund | 24.9 | ||
Money Market Fund | 1.8 | ||
Futures Contracts | 1.4 | ||
U.S. Treasury Obligation | — | ** | |
| 101.4 | |||
| ** | Rounds to less than 0.005%. |
See Notes to Financial Statements.
| 43 |
Table of Contents
STATEMENTS OF ASSETS AND LIABILITIES
June 30, 2007 (Unaudited)
| Flexible Income Fund I | Growth & Income Fund I | Capital Opportunities Fund I | Global Equity Fund I | ||||||||||
Assets | |||||||||||||
Investments in securities of affiliated issuers, at value | $ | 65,303,028 | $ | 339,457,763 | $ | 247,651,145 | $ | 199,665,636 | |||||
Investments in securities of unaffiliated issuers, at value | 638,206 | 2,751,073 | 1,181,289 | 139,308 | |||||||||
Total investments (1) | 65,941,234 | 342,208,836 | 248,832,434 | 199,804,944 | |||||||||
Receivables: | |||||||||||||
Dividends | 2,072 | 16,811 | 15,339 | 14,260 | |||||||||
Interest | 14,720 | 42,744 | 16,882 | 14 | |||||||||
Fund shares sold | 10,616 | 33,472 | — | — | |||||||||
Total Assets | 65,968,642 | 342,301,863 | 248,864,655 | 199,819,218 | |||||||||
Liabilities | |||||||||||||
Payables: | |||||||||||||
Fund shares redeemed | 52,861 | 226,880 | 141,655 | 33,513 | |||||||||
Variation margin | 180 | 2,970 | 3,510 | 3,240 | |||||||||
Accrued expenses: | |||||||||||||
Advisory fees | 4,371 | 39,006 | 26,497 | 20,329 | |||||||||
Other expenses | 18,559 | 24,844 | 24,125 | 22,967 | |||||||||
Total Liabilities | 75,971 | 293,700 | 195,787 | 80,049 | |||||||||
Net Assets | $ | 65,892,671 | $ | 342,008,163 | $ | 248,668,868 | $ | 199,739,169 | |||||
Net Assets Consist of: | |||||||||||||
Paid-in capital | $ | 64,365,890 | $ | 316,087,663 | $ | 213,277,910 | $ | 165,191,481 | |||||
Undistributed net investment income | 1,426,433 | 6,014,800 | 2,651,240 | 816,563 | |||||||||
Accumulated net realized gain on investments | 1,276,567 | 12,907,516 | 13,360,494 | 12,544,473 | |||||||||
Net unrealized appreciation (depreciation) on investments and futures transactions | (1,176,219 | ) | 6,998,184 | 19,379,224 | 21,186,652 | ||||||||
Net Assets | $ | 65,892,671 | $ | 342,008,163 | $ | 248,668,868 | $ | 199,739,169 | |||||
Net Asset Value: | |||||||||||||
$0.001 par value, unlimited shares authorized | |||||||||||||
Net assets applicable to the GS2 Class | $ | 65,892,671 | $ | 342,008,163 | $ | 248,668,868 | $ | 199,739,169 | |||||
GS2 shares outstanding | 6,354,047 | 28,853,164 | 18,058,130 | 12,698,683 | |||||||||
Net asset value, offering and redemption price per GS2 share | $ | 10.37 | $ | 11.85 | $ | 13.77 | $ | 15.73 | |||||
(1) Investments in securities of affiliated issuers, at cost | $ | 66,480,513 | $ | 332,430,202 | $ | 228,245,223 | $ | 178,459,223 | |||||
Investments in securities of unaffiliated issuers, at cost | 637,876 | 2,764,598 | 1,189,372 | 139,250 | |||||||||
Total investments at cost | $ | 67,118,389 | $ | 335,194,800 | $ | 229,434,595 | $ | 178,598,473 | |||||
See Notes to Financial Statements.
| 44 |
Table of Contents
STATEMENTS OF OPERATIONS
For the Six Months Ended June 30, 2007 (Unaudited)
| Flexible Income Fund I | Growth & Income Fund I | Capital Opportunities Fund I | Global Equity Fund I | |||||||||||||
Investment Income | ||||||||||||||||
Income dividends received from affiliated funds | $ | 1,464,312 | $ | 6,231,857 | $ | 2,826,406 | $ | 971,979 | ||||||||
Interest | 16,913 | 61,001 | 24,629 | 3,463 | ||||||||||||
Total Investment Income | 1,481,225 | 6,292,858 | 2,851,035 | 975,442 | ||||||||||||
Expenses | ||||||||||||||||
Investment advisory fees | 33,037 | 166,117 | 119,610 | 95,433 | ||||||||||||
Transfer agent fees | 359 | 3,308 | 3,316 | 3,081 | ||||||||||||
Custodian fees | 3,731 | 5,859 | 5,532 | 4,535 | ||||||||||||
Accounting and administration fees | 10,940 | 41,591 | 32,902 | 26,719 | ||||||||||||
Professional fees | 23,157 | 23,157 | 23,157 | 23,158 | ||||||||||||
Shareholder reporting fees | 111 | 123 | 140 | 138 | ||||||||||||
Trustee fees | 274 | 1,275 | 907 | 712 | ||||||||||||
Line of credit facility fees | 126 | 595 | 421 | 330 | ||||||||||||
Other expenses | 6,237 | 7,269 | 6,254 | 6,240 | ||||||||||||
Total Expenses | 77,972 | 249,294 | 192,239 | 160,346 | ||||||||||||
Expenses waived and reimbursed (See Footnote 3a and 3c) | (22,431 | ) | 29,663 | 8,582 | 10 | |||||||||||
Fees paid indirectly | (668 | ) | (899 | ) | (1,026 | ) | (958 | ) | ||||||||
Net Expenses | 54,873 | 278,058 | 199,795 | 159,398 | ||||||||||||
Net Investment Income | 1,426,352 | 6,014,800 | 2,651,240 | 816,044 | ||||||||||||
Realized and Unrealized Gain (Loss) | ||||||||||||||||
Capital gain distributions received from affiliated funds | 39,965 | 916,194 | 621,160 | 477,575 | ||||||||||||
Net realized gain on investment securities of affiliated issuers | 392,217 | 3,546,833 | 2,649,121 | 1,628,328 | ||||||||||||
Net realized loss on investment securities of unaffiliated issuers | (2,220 | ) | (17,284 | ) | (2,333 | ) | — | |||||||||
Net realized gain on futures transactions | 12,777 | 163,109 | 213,572 | 225,156 | ||||||||||||
Net realized gain | 442,739 | 4,608,852 | 3,481,520 | 2,331,059 | ||||||||||||
Change in unrealized appreciation (depreciation) on investment securities of affiliated issuers | 241,023 | 3,941,311 | 8,635,447 | 11,821,627 | ||||||||||||
Change in unrealized appreciation (depreciation) on investment securities of unaffiliated issuers | 969 | (9,870 | ) | (5,065 | ) | 53 | ||||||||||
Change in unrealized appreciation (depreciation) on futures | 1,200 | (16,373 | ) | (17,048 | ) | (17,067 | ) | |||||||||
Net change in unrealized appreciation (depreciation) | 243,192 | 3,915,068 | 8,613,334 | 11,804,613 | ||||||||||||
Net Realized and Unrealized Gain | 685,931 | 8,523,920 | 12,094,854 | 14,135,672 | ||||||||||||
Net Increase in Net Assets Resulting from Operations | $ | 2,112,283 | $ | 14,538,720 | $ | 14,746,094 | $ | 14,951,716 | ||||||||
See Notes to Financial Statements.
| 45 |
Table of Contents
STATEMENTS OF CHANGES IN NET ASSETS
| Flexible Income Fund I | Growth & Income Fund I | |||||||||||||||
| For the Six Months Ended 06/30/07 (Unaudited) | For the Year Ended 12/31/06 | For the Six Months Ended 06/30/07 (Unaudited) | For the Year Ended 12/31/06 | |||||||||||||
Operations: | ||||||||||||||||
Net investment income | $ | 1,426,352 | $ | 2,514,034 | $ | 6,014,800 | $ | 9,722,475 | ||||||||
Net realized gain on investment securities and futures transactions | 442,739 | 1,700,387 | 4,608,852 | 14,297,372 | ||||||||||||
Net change in unrealized appreciation (depreciation) on investment securities and futures | 243,192 | (888,336 | ) | 3,915,068 | (2,699,005 | ) | ||||||||||
Net increase in net assets resulting from operations | 2,112,283 | 3,326,085 | 14,538,720 | 21,320,842 | ||||||||||||
Dividends and Distributions to Shareholders: | ||||||||||||||||
Dividends from net investment income(1) | — | (2,664,833 | ) | — | (11,094,525 | ) | ||||||||||
Distributions from net realized capital gains | — | (1,273,583 | ) | — | (10,048,649 | ) | ||||||||||
Total dividends and distributions | — | (3,938,416 | ) | — | (21,143,174 | ) | ||||||||||
Capital Share Transactions: | ||||||||||||||||
Proceeds from GS2 shares sold | 11,838,644 | 6,364,329 | 81,969,270 | 18,379,727 | ||||||||||||
Reinvestment of dividends and distributions into GS2 shares | — | 3,938,416 | — | 21,106,662 | ||||||||||||
Value of GS2 shares redeemed | (5,246,441 | ) | (6,733,659 | ) | (16,951,042 | ) | (16,456,454 | ) | ||||||||
Net increase from capital share transactions (See Footnote 7) | 6,592,203 | 3,569,086 | 65,018,228 | 23,029,935 | ||||||||||||
Total increase in net assets | 8,704,486 | 2,956,755 | 79,556,948 | 23,207,603 | ||||||||||||
Net Assets: | ||||||||||||||||
Beginning of Period | 57,188,185 | 54,231,430 | 262,451,215 | 239,243,612 | ||||||||||||
End of Period* | $ | 65,892,671 | $ | 57,188,185 | $ | 342,008,163 | $ | 262,451,215 | ||||||||
* Including undistributed (distributions in excess of) net investment income | $ | 1,426,433 | $ | 81 | $ | 6,014,800 | $ | — | ||||||||
(1) | Includes dividends paid from the short-term portion of capital gain distributions received from affiliated funds. |
See Notes to Financial Statements.
| 46 |
Table of Contents
| Capital Opportunities Fund I | Global Equity Fund I | |||||||||||||
| For the Six Months Ended 06/30/07 (Unaudited) | For the Year Ended 12/31/06 | For the Six Months Ended 06/30/07 (Unaudited) | For the Year Ended 12/31/06 | |||||||||||
| $ | 2,651,240 | $ | 4,666,539 | $ | 816,044 | $ | 1,956,536 | |||||||
| 3,481,520 | 14,788,669 | 2,331,059 | 15,548,662 | |||||||||||
| 8,613,334 | (1,169,345 | ) | 11,804,613 | (813,574 | ) | |||||||||
| 14,746,094 | 18,285,863 | 14,951,716 | 16,691,624 | |||||||||||
| — | (6,115,489 | ) | — | (3,422,335 | ) | |||||||||
| — | (8,535,324 | ) | — | (8,647,866 | ) | |||||||||
| — | (14,650,813 | ) | — | (12,070,201 | ) | |||||||||
| 55,861,584 | 18,830,322 | 52,579,788 | 11,000,461 | |||||||||||
| — | 14,650,813 | — | 12,070,201 | |||||||||||
| (9,475,159 | ) | (9,428,660 | ) | (10,010,214 | ) | (11,299,905 | ) | |||||||
| 46,386,425 | 24,052,475 | 42,569,574 | 11,770,757 | |||||||||||
| 61,132,519 | 27,687,525 | 57,521,290 | 16,392,180 | |||||||||||
| 187,536,349 | 159,848,824 | 142,217,879 | 125,825,699 | |||||||||||
| $ | 248,668,868 | $ | 187,536,349 | $ | 199,739,169 | $ | 142,217,879 | |||||||
| $ | 2,651,240 | $ | — | $ | 816,563 | $ | 519 | |||||||
See Notes to Financial Statements.
| 47 |
Table of Contents
FINANCIAL HIGHLIGHTS (Unaudited)
For a Share Outstanding For the Years Ended December 31, unless otherwise indicated
| Ratios to Average Net Assets | |||||||||||||||||||||||||||||||||||||||||||||||||
| Net Asset Value, Beginning of Period | Net��Investment Income (1) | Capital Gain Distributions Received from Affiliated Funds | Realized and Unrealized Gain (Loss) on Investments | Dividends from Net Investment Income (2) | Distributions from Net Realized Capital Gains | Net Asset Value, End of Period | Total Return (3) | Net Assets, End of Period (000) | Expenses, Net (4)(5) | Expenses, Including Expense Reduction (4)(5) | Expenses, Before Waivers and Expense Reduction (4)(5) | Investment Income, Net (1)(4) | Investment Income, Excluding Waivers and Expense Reduction (1)(4) | Portfolio Turnover Rate (3) | |||||||||||||||||||||||||||||||||||
Flexible Income Fund I |
| ||||||||||||||||||||||||||||||||||||||||||||||||
GS2 Class | |||||||||||||||||||||||||||||||||||||||||||||||||
2007(6) | $ | 10.05 | $ | 0.22 | $ | 0.01 | $ | 0.09 | $ | — | $ | — | $ | 10.37 | 3.18 | % | $ | 65,893 | 0.17 | % | 0.17 | % | 0.24 | % | 4.37 | % | 4.30 | % | 13 | % | |||||||||||||||||||
2006 | 10.15 | 0.46 | 0.19 | (0.02 | ) | (0.49 | ) | (0.24 | ) | 10.05 | 6.21 | 57,188 | 0.17 | 0.17 | 0.30 | 4.53 | 4.40 | 16 | |||||||||||||||||||||||||||||||
2005 | 10.31 | 0.36 | 0.10 | (0.10 | ) | (0.38 | ) | (0.14 | ) | 10.15 | 3.46 | 54,231 | 0.17 | 0.17 | 0.30 | 3.52 | 3.39 | 16 | |||||||||||||||||||||||||||||||
2004 | 10.31 | 0.25 | 0.05 | 0.19 | (0.36 | ) | (0.13 | ) | 10.31 | 4.77 | 31,447 | 0.17 | 0.17 | 0.39 | 2.42 | 2.20 | 23 | ||||||||||||||||||||||||||||||||
2003(7) | 10.00 | 0.18 | 0.10 | 0.16 | (0.12 | ) | (0.01 | ) | 10.31 | 4.40 | 28,636 | 0.17 | 0.17 | 0.51 | 4.16 | 3.82 | 8 | ||||||||||||||||||||||||||||||||
Growth & Income Fund I |
| ||||||||||||||||||||||||||||||||||||||||||||||||
GS2 Class | |||||||||||||||||||||||||||||||||||||||||||||||||
2007(6) | $ | 11.35 | $ | 0.21 | # | $ | 0.03 | $ | 0.26 | $ | — | $ | — | $ | 11.85 | 4.41 | % | $ | 342,008 | 0.17 | % | 0.17 | % | 0.19 | % | 3.67 | % | 3.65 | % | 7 | % | ||||||||||||||||||
2006 | 11.32 | 0.46 | # | 0.45 | 0.09 | (0.50 | ) | (0.47 | ) | 11.35 | 8.85 | 262,451 | 0.17 | 0.17 | 0.18 | 3.93 | 3.92 | 13 | |||||||||||||||||||||||||||||||
2005 | 11.23 | 0.40 | # | 0.25 | 0.07 | (0.46 | ) | (0.17 | ) | 11.32 | 6.42 | 239,244 | 0.17 | 0.17 | 0.18 | 3.49 | 3.48 | 11 | |||||||||||||||||||||||||||||||
2004 | 10.62 | 0.34 | # | 0.14 | 0.60 | (0.36 | ) | (0.11 | ) | 11.23 | 10.26 | 122,166 | 0.17 | 0.17 | 0.22 | 3.07 | 3.02 | 10 | |||||||||||||||||||||||||||||||
2003(7) | 10.00 | 0.21 | 0.17 | 0.51 | (0.26 | ) | (0.01 | ) | 10.62 | 8.94 | 71,982 | 0.17 | 0.17 | 0.28 | 4.76 | 4.65 | 5 | ||||||||||||||||||||||||||||||||
Capital Opportunities Fund I |
| ||||||||||||||||||||||||||||||||||||||||||||||||
GS2 Class | |||||||||||||||||||||||||||||||||||||||||||||||||
2007(6) | $ | 12.96 | $ | 0.15 | $ | 0.03 | $ | 0.63 | $ | — | $ | — | $ | 13.77 | 6.25 | % | $ | 248,669 | 0.17 | % | 0.17 | % | 0.16 | % | 2.24 | % | 2.25 | % | 5 | % | |||||||||||||||||||
2006 | 12.62 | 0.34 | 0.73 | 0.35 | (0.44 | ) | (0.64 | ) | 12.96 | 11.21 | 187,536 | 0.17 | 0.17 | 0.20 | 2.73 | 2.70 | 9 | ||||||||||||||||||||||||||||||||
2005 | 12.17 | 0.29 | 0.38 | 0.33 | (0.39 | ) | (0.16 | ) | 12.62 | 8.20 | 159,849 | 0.17 | 0.17 | 0.20 | 2.42 | 2.39 | 8 | ||||||||||||||||||||||||||||||||
2004 | 11.11 | 0.24 | 0.09 | 1.09 | (0.26 | ) | (0.10 | ) | 12.17 | 12.88 | 70,608 | 0.17 | 0.17 | 0.27 | 2.13 | 2.03 | 7 | ||||||||||||||||||||||||||||||||
2003(7) | 10.00 | 0.15 | 0.09 | 1.07 | (0.18 | ) | (0.02 | ) | 11.11 | 13.02 | 57,489 | 0.17 | 0.17 | 0.31 | 3.24 | 3.10 | 3 | ||||||||||||||||||||||||||||||||
Global Equity Fund I |
| ||||||||||||||||||||||||||||||||||||||||||||||||
GS2 Class | |||||||||||||||||||||||||||||||||||||||||||||||||
2007(6) | $ | 14.56 | $ | 0.06 | $ | 0.04 | $ | 1.07 | $ | — | $ | — | $ | 15.73 | 8.04 | % | $ | 199,739 | 0.17 | % | 0.17 | % | 0.17 | % | 0.87 | % | 0.87 | % | 4 | % | |||||||||||||||||||
2006 | 14.01 | 0.21 | 1.09 | 0.57 | (0.36 | ) | (0.96 | ) | 14.56 | 13.33 | 142,218 | 0.17 | 0.17 | 0.21 | 1.47 | 1.43 | 8 | ||||||||||||||||||||||||||||||||
2005 | 13.16 | 0.18 | 0.52 | 0.62 | (0.31 | ) | (0.16 | ) | 14.01 | 9.98 | 125,826 | 0.17 | 0.17 | 0.21 | 1.38 | 1.34 | 5 | ||||||||||||||||||||||||||||||||
2004 | 11.62 | 0.15 | 0.05 | 1.60 | (0.15 | ) | (0.11 | ) | 13.16 | 15.48 | 33,543 | 0.17 | 0.17 | 0.41 | 1.29 | 1.05 | 7 | ||||||||||||||||||||||||||||||||
2003(7) | 10.00 | 0.09 | — | 1.63 | (0.09 | ) | (0.01 | ) | 11.62 | 17.16 | 25,678 | 0.17 | 0.17 | 0.50 | 1.69 | 1.36 | 1 | ||||||||||||||||||||||||||||||||
| # | Calculated using the average shares outstanding method. |
| (1) | Recognition of net investment income by the Fund is affected by the timing of the declaration of dividends by the underlying investment companies in which the Fund invests. |
| (2) | Includes dividends paid from the short-term portion of capital gain distributions received from aff iliated funds. |
| (3) | Not annualized. |
| (4) | Annualized. |
| (5) | Does not include expenses of the investment companies in which the Fund invests. |
| (6) | For the six months ended June 30, 2007. |
| (7) | Inception date was July 1, 2003. |
See Notes to Financial Statements.
| 48 |
Table of Contents
Average Annual Total Returns as of 06/30/07
| GS2 Class* | GS4 Class* | GS6 Class* | Benchmark** | |||||||||
Six Months | 2.56 | % | 2.46 | % | 2.26 | % | 2.49 | % | ||||
One Year | 5.23 | % | 5.03 | % | 4.60 | % | 5.07 | % | ||||
Five Year | 2.71 | % | 2.52 | % | 2.19 | % | 2.67 | % | ||||
Since Inception | 2.60 | % | 2.47 | % | 2.14 | % | 2.61 | % | ||||
Inception Date | 08/27/01 | 08/27/01 | 08/27/01 | 08/27/01 |
30-Day Annualized Yield as of 06/30/07
| GS2 Class* | GS4 Class* | GS6 Class* | |||||||
| 5.12 | % | 4.92 | % | 4.44 | % |
The performance data quoted represents past performance and does not guarantee future results. Current performance may be lower or higher. Performance data current to the most recent month-end may be obtained at www.GuideStoneFunds.org. Investment return will fluctuate so that shares, when redeemed, may be worth more or less than their original cost. The yield for the Money Market Fund represents annualization of the Fund’s declared dividends over the period indicated, excluding capital gains distributions. The 7-day annualized yield more closely reflects the current earnings of the Fund than the total return.
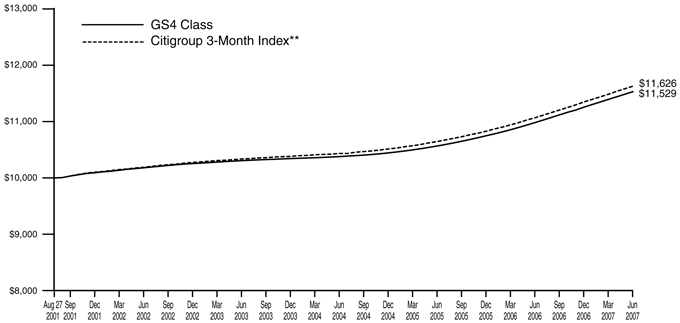
The graph compares the results of a hypothetical $10,000 investment in the GS4 Class of the Fund since August 27, 2001 (commencement of operations), with all dividends and capital gains reinvested, with the Citigroup 3-Month Index.
| * | These performance figures reflect expense waivers by the Fund’s investment advisor. Without these waivers, performance would have been lower. Performance figures shown do not reflect the deduction of taxes that a shareholder would pay on Fund distributions or the redemption of Fund shares. |
| ** | The Citigroup 3-Month Index is composed of the monthly return equivalents of yield averages that are not marked to market. The 3-Month Treasury Bill Index consists of the last three 3-month Treasury bill issues. |
Unlike a mutual fund, the performance of an index assumes no taxes, transaction costs, management fees or other expenses.
An investment in the Fund is not insured or guaranteed by the FDIC or any other governmental agency. Although the Fund seeks to maintain a value of $1.00 per share, it is possible to lose money.
| 49 |
Table of Contents
| Money Market Fund | ||
| SCHEDULE OF INVESTMENTS | June 30, 2007 (Unaudited) |
| Par | Value | |||||
CERTIFICATES OF DEPOSIT — 25.8% | ||||||
American Express Centurion Bank | ||||||
5.28%, 07/10/07 | $ | 10,000,000 | $ | 10,000,000 | ||
Barclays Bank PLC NY | ||||||
5.32%, 09/06/07 | 45,000,000 | 45,000,000 | ||||
5.27%, 10/02/07 | 8,500,000 | 8,500,000 | ||||
BNP Paribas NY | ||||||
5.35%, 07/30/07 | 12,500,000 | 12,500,000 | ||||
5.33%, 11/30/07 | 15,000,000 | 15,000,000 | ||||
Calyon NY | ||||||
5.27%, 04/02/08† | 25,000,000 | 24,994,344 | ||||
Citibank NA | ||||||
5.30%, 08/09/07 | 25,000,000 | 25,000,000 | ||||
First Tennessee Bank NA | ||||||
5.30%, 07/23/07 | 40,000,000 | 40,000,000 | ||||
Harris NA | ||||||
5.30%, 11/13/07 | 25,000,000 | 25,000,000 | ||||
HBOS Treasury | ||||||
Services PLC NY | ||||||
5.27%, 10/03/07 | 23,000,000 | 23,000,000 | ||||
Mizuho Corporate Bank NY | ||||||
5.31%, 07/09/07 | 40,000,000 | 40,000,000 | ||||
5.33%, 08/21/07 | 13,000,000 | 13,000,000 | ||||
Total Certificates of Deposit (Cost $281,994,344) | 281,994,344 | |||||
COMMERCIAL PAPER — 58.1% | ||||||
Atlantis One Funding Corporation | ||||||
5.21%, 07/30/07 | 19,000,000 | 18,920,335 | ||||
BASF AG | ||||||
5.23%, 07/05/07 | 2,050,000 | 2,048,810 | ||||
5.22%, 07/10/07 | 16,000,000 | 15,979,120 | ||||
5.22%, 07/16/07 | 25,000,000 | 24,945,677 | ||||
Bear Stearns Co., Inc. | ||||||
5.18%, 08/10/07 | 2,810,000 | 2,793,827 | ||||
Brahms Funding Corporation | ||||||
5.32%, 07/25/07 | 15,000,000 | 14,946,800 | ||||
CAFCO LLC | ||||||
5.26%, 09/21/07 | 9,000,000 | 8,892,170 | ||||
CC USA, Inc. | ||||||
5.23%, 07/10/07 | 1,000,000 | 998,693 | ||||
Chariot Funding LLC | ||||||
5.30%, 07/23/07 | 36,181,000 | 36,063,814 | ||||
CIT Group, Inc. | ||||||
5.24%, 07/16/07 | 20,000,000 | 19,956,333 | ||||
Citibank Credit Card Master Trust | ||||||
5.25%, 07/18/07 | 4,450,000 | 4,438,978 | ||||
5.25%, 08/24/07 | 25,000,000 | 24,803,313 | ||||
Citigroup Funding, Inc. | ||||||
5.25%, 07/05/07 | 2,000,000 | 1,998,833 | ||||
5.18%, 11/14/07 | 5,000,000 | 4,902,250 | ||||
5.19%, 11/26/07 | 6,000,000 | 5,871,980 | ||||
Countrywide Financial Corporation | ||||||
5.48%, 07/02/07 | 17,218,000 | 17,215,379 | ||||
CRC Funding LLC | ||||||
5.24%, 07/24/07 | 6,000,000 | 5,979,933 | ||||
Fairway Finance Corporation | ||||||
5.25%, 07/16/07 | 17,000,000 | 16,962,848 | ||||
Five Finance, Inc. | ||||||
5.23%, 07/05/07 | 2,000,000 | 1,998,838 | ||||
General Electric Capital Corporation | ||||||
5.23%, 09/05/07 | 20,000,000 | 19,808,233 | ||||
5.17%, 03/07/08 | 12,000,000 | 11,569,167 | ||||
General Electric Capital Services, Inc. | ||||||
5.19%, 08/21/07 | 11,000,000 | 10,919,123 | ||||
Goldman Sachs Group, Inc. | ||||||
5.21%, 07/27/07 | 20,000,000 | 19,924,744 | ||||
Grampian Funding LLC | ||||||
5.15%, 08/03/07 | 2,800,000 | 2,786,794 | ||||
5.19%, 11/19/07 | 12,000,000 | 11,756,305 | ||||
Greenwich Capital Holdings, Inc. | ||||||
5.20%, 08/14/07 | 20,000,000 | 19,872,889 | ||||
5.17%, 12/05/07 | 20,000,000 | 19,549,061 | ||||
MBNA Credit Card Master Note Trust | ||||||
5.25%, 08/21/07 | 20,000,000 | 19,851,250 | ||||
MetLife, Inc. | ||||||
5.24%, 09/17/07 | 44,000,000 | 43,500,453 | ||||
Morgan Stanley | ||||||
5.45%, 07/02/07† | 25,000,000 | 25,000,000 | ||||
5.44%, 07/06/07 | 8,000,000 | 8,000,000 | ||||
Nestle Capital Corporation | ||||||
5.20%, 07/19/07 | 25,000,000 | 24,935,063 | ||||
5.15%, 08/10/07 | 7,180,000 | 7,138,914 | ||||
Nightingale Finance LLC | ||||||
5.27%, 09/11/07 | 8,000,000 | 7,915,680 | ||||
Nyala Funding LLC | ||||||
5.26%, 07/16/07 | 18,000,000 | 17,960,550 | ||||
Rio Tinto, Ltd. | ||||||
5.29%, 07/23/07 | 35,000,000 | 34,886,853 | ||||
Scaldis Capital LLC | ||||||
5.26%, 07/25/07 | 18,000,000 | 17,936,940 | ||||
Skandinaviska Enskilda Banken AB | ||||||
5.21%, 08/08/07 | 5,000,000 | 4,972,529 | ||||
St. George Bank, Ltd. | ||||||
5.21%, 08/07/07 | 24,345,000 | 24,214,639 | ||||
UBS Finance Delaware LLC | ||||||
5.26%, 09/04/07 | 3,000,000 | 2,971,535 | ||||
5.26%, 09/06/07 | 11,200,000 | 11,090,462 | ||||
5.13%, 10/02/07 | 13,000,000 | 12,827,718 | ||||
Unicredito Italiano Bank | ||||||
5.15%, 08/10/07 | 21,695,000 | 21,570,856 | ||||
Valcour Bay Capital Co. LLC | ||||||
5.31%, 08/10/07 | 5,000,000 | 4,970,500 | ||||
Total Commercial Paper (Cost $635,648,189) | 635,648,189 | |||||
MASTER NOTES — 3.3% | ||||||
Citigroup Global Markets, Inc. | ||||||
5.45%, 07/02/07† | 15,000,000 | 15,000,000 | ||||
Goldman Sachs Group, Inc. | ||||||
5.37%, 07/24/07†@ | 21,150,000 | 21,150,000 | ||||
Total Master Notes (Cost $36,150,000) | 36,150,000 | |||||
See Notes to Financial Statements.
| 50 |
Table of Contents
| Par | Value | |||||
MUNICIPAL BOND — 0.9% | ||||||
Bergen County, New Jersey Improvement Authority, Series D Revenue Bond (Wachovia Bank NA Insured) | ||||||
5.39%, 07/05/07† | ||||||
(Cost $10,000,000) | $ | 10,000,000 | $ | 10,000,000 | ||
VARIABLE RATE OBLIGATIONS — 10.9% | ||||||
Allstate Life Global Funding II | ||||||
5.35%, 07/27/07 144A† | 20,000,000 | 20,000,000 | ||||
Bosma Industries for the Blind, Inc. | ||||||
5.47%, 07/05/07† | 785,000 | 785,000 | ||||
CC USA, Inc. | ||||||
5.34%, 07/05/07 144A† | 24,000,000 | 24,003,489 | ||||
Cullinan Finance Corporation | ||||||
5.30%, 07/25/07 144A† | 7,040,000 | 7,039,308 | ||||
Dorada Finance, Inc. | ||||||
5.35%, 09/25/07 144A† | 8,300,000 | 8,300,804 | ||||
General Electric Capital Corporation | ||||||
5.45%, 07/17/07† | 2,240,000 | 2,240,371 | ||||
5.28%, 07/24/07† | 5,500,000 | 5,500,000 | ||||
Metropolitan Life Global Funding I | ||||||
5.43%, 07/30/07 144A† | 10,000,000 | 10,000,000 | ||||
Park Street Properties I LLC | ||||||
5.32%, 07/05/07† | 450,000 | 450,000 | ||||
Principal Life Income Funding Trusts | ||||||
5.39%, 09/07/07† | 6,400,000 | 6,401,661 | ||||
Racers Trust | ||||||
5.37%, 07/23/07 144A† | 8,600,000 | 8,600,000 | ||||
Sedna Finance, Inc. | ||||||
5.32%, 09/29/07 144A† | 6,000,000 | 5,999,350 | ||||
Shipley Group LP | ||||||
5.42%, 07/02/07† | 1,300,000 | 1,300,000 | ||||
Skandinaviska Enskilda Banken AB | ||||||
5.34%, 09/10/07 144A† | 10,000,000 | 10,000,000 | ||||
Westpac Banking Corporation | ||||||
5.42%, 09/11/07† | 8,250,000 | 8,250,000 | ||||
Total Variable Rate Obligations (Cost $118,869,983) | 118,869,983 | |||||
TOTAL INVESTMENTS — 99.0% (Cost $1,082,662,516) | 1,082,662,516 | |||||
Other Assets in Excess of Liabilities — 1.0% | 10,807,620 | |||||
NET ASSETS — 100.0% | $ | 1,093,470,136 | ||||
PORTFOLIO SUMMARY (based on net assets)
| % | ||
Commercial Paper | 58.1 | |
Certificates of Deposit | 25.8 | |
Variable Rate Obligations | 10.9 | |
Master Notes | 3.3 | |
Municipal Bond | 0.9 | |
| 99.0 | ||
See Notes to Financial Statements.
| 51 |
Table of Contents
Average Annual Total Returns as of 06/30/07
| GS2 Class* | GS4 Class* | GS6 Class* | Benchmark** | |||||||||
Six Months | 1.70 | % | 1.67 | % | 1.43 | % | 2.11 | % | ||||
One Year | 4.58 | % | 4.43 | % | 3.94 | % | 5.07 | % | ||||
Five Year | 3.01 | % | 2.85 | % | 2.56 | % | 2.77 | % | ||||
Since Inception | 3.20 | % | 3.13 | % | 2.80 | % | 3.24 | % | ||||
Inception Date | 08/27/01 | 08/27/01 | 08/27/01 | 08/27/01 |
The performance data quoted represents past performance and does not guarantee future results. Current performance may be lower or higher. Performance data current to the most recent month-end may be obtained at www.GuideStoneFunds.org. The investment return and principal value of an investment will fluctuate so that shares, when redeemed, may be worth more or less than their original cost.
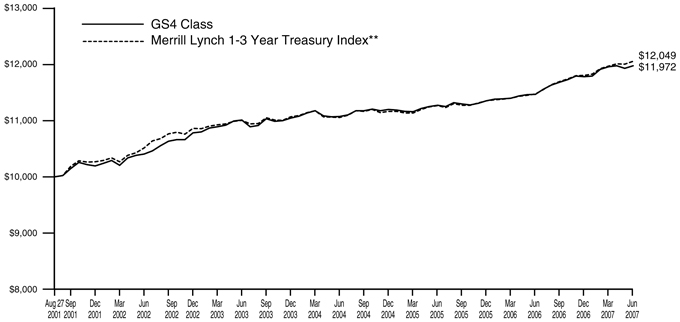
The graph compares the results of a hypothetical $10,000 investment in the GS4 Class of the Fund since August 27, 2001 (commencement of operations), with all dividends and capital gains reinvested, with the Merrill Lynch 1-3 Year Treasury Index.
| * | These returns reflect expense waivers by the Fund’s investment advisor. Without these waivers, returns would have been lower. Returns shown do not reflect the deduction of taxes that a shareholder would pay on Fund distributions or the redemption of Fund shares. |
| ** | The Merrill Lynch 1-3 Year Treasury Index is composed of all U.S. Treasury Notes and Bonds with maturities greater than or equal to one year and less than three years. |
Unlike a mutual fund, the performance of an index assumes no taxes, transaction costs, management fees or other expenses.
| 52 |
Table of Contents
| Low-Duration Bond Fund | ||
| SCHEDULE OF INVESTMENTS | June 30, 2007 (Unaudited) |
| Par | Value | |||||
AGENCY OBLIGATIONS — 8.6% | ||||||
Federal Home Loan Bank | ||||||
4.80%, 07/02/07 | $ | 8,300,000 | $ | 8,297,786 | ||
5.16%, 07/25/07 | 19,500,000 | 19,436,781 | ||||
Federal National Mortgage Association | ||||||
4.95%, 07/02/07 | 38,200,000 | 38,189,495 | ||||
Small Business Administration | ||||||
6.95%, 11/10/16 | 937,746 | 960,637 | ||||
Total Agency Obligations (Cost $66,877,562) | 66,884,699 | |||||
ASSET-BACKED SECURITIES — 15.9% | ||||||
Accredited Mortgage Loan Trust | ||||||
5.37%, 02/25/37† | 2,497,887 | 2,497,880 | ||||
Amresco Independence Funding, Inc. | ||||||
6.75%, 06/15/26 144A† | 560,698 | 558,601 | ||||
Asset-Backed Securities Corporation Home Equity | ||||||
5.60%, 09/25/34† | 174,672 | 174,587 | ||||
5.37%, 11/25/36† | 969,655 | 969,702 | ||||
BA Credit Card Trust | ||||||
5.32%, 08/15/12† | 2,625,000 | 2,624,280 | ||||
4.72%, 05/15/13 | 2,725,000 | 2,670,716 | ||||
Bear Stearns Asset-Backed Securities, Inc. | ||||||
5.40%, 02/25/29† | 748,088 | 748,191 | ||||
5.41%, 11/25/35† | 983,192 | 983,028 | ||||
5.40%, 01/25/36† | 1,755,472 | 1,755,150 | ||||
5.37%, 11/25/36† | 1,309,035 | 1,309,035 | ||||
5.51%, 02/25/37† | 3,871,871 | 3,874,291 | ||||
Business Loan Express | ||||||
7.25%, 01/01/25 144A† | 321,671 | 315,272 | ||||
Capital Auto Receivables Asset Trust | ||||||
4.05%, 07/15/09‡‡ | 1,676,480 | 1,668,380 | ||||
5.31%, 10/20/09 144A | 1,900,000 | 1,898,010 | ||||
5.32%, 03/20/10 144A | 2,300,000 | 2,296,009 | ||||
Capital One Prime Auto Receivables Trust | ||||||
4.94%, 07/15/12 | 1,950,000 | 1,931,389 | ||||
Carmax Auto Owner Trust | ||||||
5.24%, 07/15/11 | 4,000,000 | 3,994,936 | ||||
Carrington Mortgage Loan Trust | ||||||
5.39%, 04/25/36† | 370,887 | 370,923 | ||||
Chase Issuance Trust | ||||||
3.22%, 06/15/10 | 2,425,000 | 2,410,730 | ||||
Chase Manhattan Auto Owner Trust | ||||||
5.13%, 05/15/11 | 1,500,000 | 1,496,675 | ||||
5.11%, 04/15/14 | 1,500,000 | 1,490,264 | ||||
Citigroup Mortgage Loan Trust, Inc. | ||||||
5.38%, 04/25/36 STEP | 541,290 | 541,219 | ||||
Countrywide Asset-Backed Certificates | ||||||
5.47%, 03/25/25† | 596,397 | 596,455 | ||||
5.41%, 02/01/27† | 500,802 | 500,836 | ||||
DaimlerChrysler Auto Trust | ||||||
3.49%, 12/08/08 | 249,335 | 249,034 | ||||
FHLMC Structured | ||||||
Pass-Through Securities | ||||||
5.58%, 08/25/31† | 1,618,568 | 1,625,513 | ||||
Fieldstone Mortgage Investment | ||||||
Corporation | ||||||
5.44%, 02/25/36 STEP | 861,673 | 861,795 | ||||
First Franklin Mortgage Loan Asset-Backed Certificates | ||||||
5.37%, 11/25/36† | 1,555,476 | 1,555,471 | ||||
5.37%, 12/25/36† | 1,214,493 | 1,214,357 | ||||
Ford Credit Auto Owner Trust | ||||||
5.34%, 12/15/09† | 3,025,000 | 3,024,988 | ||||
Fremont Home Loan Trust | ||||||
5.37%, 10/25/36† | 346,496 | 346,326 | ||||
GE Capital Credit Card Master Note Trust | ||||||
4.13%, 06/15/13 | 1,000,000 | 966,663 | ||||
Green Tree Financial Corporation | ||||||
6.04%, 11/01/29 | 34,416 | 34,383 | ||||
GSAA Trust | ||||||
5.64%, 12/25/34† | 949,223 | 951,109 | ||||
Home Equity Asset Trust | ||||||
5.44%, 01/25/36† | 422,914 | 422,958 | ||||
5.43%, 02/25/36† | 244,678 | 244,712 | ||||
Honda Auto Receivables Owner Trust | ||||||
3.30%, 06/15/08 | 194,261 | 194,075 | ||||
5.10%, 09/18/08 | 878,130 | 877,993 | ||||
2.91%, 10/20/08 | 582,112 | 579,443 | ||||
3.53%, 10/21/08 | 590,749 | 589,157 | ||||
3.87%, 04/20/09 | 1,672,267 | 1,662,008 | ||||
4.46%, 05/20/09 | 1,702,720 | 1,696,183 | ||||
Hyundai Auto Receivables Trust | ||||||
5.13%, 02/16/09 | 90,871 | 90,856 | ||||
IFC SBA Loan-Backed | ||||||
Adjustable Rate Certificate | ||||||
6.25%, 01/15/24 144A† | 382,686 | 379,338 | ||||
Indymac Residential Asset-Backed Trust | ||||||
5.38%, 06/25/36† | 287,069 | 287,089 | ||||
John Deere Owner Trust | ||||||
5.07%, 04/15/14 | 2,330,000 | 2,303,038 | ||||
JP Morgan Mortgage Acquisition Corporation | ||||||
5.40%, 05/25/25 STEP | 189,077 | 189,087 | ||||
Long Beach Auto Receivables Trust | ||||||
5.17%, 08/15/11 | 4,100,000 | 4,087,751 | ||||
Long Beach Mortgage Loan Trust | ||||||
5.39%, 03/25/36 STEP | 606,951 | 606,997 | ||||
5.35%, 06/25/36† | 204,952 | 204,973 | ||||
5.36%, 11/25/36† | 1,003,622 | 1,003,619 | ||||
MASTR Asset-Backed Securities Trust | ||||||
5.39%, 12/25/35† | 714,669 | 714,795 | ||||
MBNA Credit Card Master Note Trust | ||||||
5.82%, 03/15/10† | 1,800,000 | 1,802,131 | ||||
MBNA Master Credit Card Trust | ||||||
5.58%, 08/15/13† | 2,200,000 | 2,217,946 | ||||
Merrill Lynch Mortgage Investors, Inc. | ||||||
5.35%, 06/25/37† | 908,615 | 908,649 | ||||
See Notes to Financial Statements.
| 53 |
Table of Contents
Low-Duration Bond Fund
SCHEDULE OF INVESTMENTS (Continued)
| Par | Value | |||||
Morgan Stanley ABS Capital I | ||||||
5.42%, 05/25/32 STEP | $ | 279,196 | $ | 279,191 | ||
5.35%, 06/25/36† | 1,591,110 | 1,590,649 | ||||
5.36%, 06/25/36† | 85,567 | 85,566 | ||||
5.43%, 02/25/37† | 3,253,320 | 3,253,310 | ||||
5.46%, 05/25/37† | 3,220,000 | 3,217,988 | ||||
Morgan Stanley Home Equity Loans | ||||||
5.39%, 02/25/36 STEP | 1,230,455 | 1,230,506 | ||||
Nelnet Student Loan Trust | ||||||
5.33%, 10/27/14† | 1,994,429 | 1,994,429 | ||||
5.37%, 01/26/15† | 2,442,938 | 2,443,448 | ||||
5.45%, 07/25/16† | 496,270 | 496,804 | ||||
5.45%, 10/25/16† | 691,941 | 692,001 | ||||
New Century Home Equity Loan Trust | ||||||
5.40%, 01/25/36 STEP | 371,943 | 371,838 | ||||
Nissan Auto Receivables Owner Trust | ||||||
5.18%, 08/15/08 | 1,258,252 | 1,258,056 | ||||
Nomura Home Equity Loan, Inc. | ||||||
5.40%, 02/25/36† | 635,589 | 635,486 | ||||
5.39%, 03/25/36† | 1,639,625 | 1,639,738 | ||||
Novastar Home Equity Loan | ||||||
5.37%, 06/25/36† | 852,983 | 852,844 | ||||
Option One Mortgage Loan Trust | ||||||
5.42%, 11/25/35 STEP | 253,989 | 254,006 | ||||
5.37%, 07/25/36† | 589,626 | 589,648 | ||||
5.36%, 02/25/37† | 1,206,975 | 1,206,972 | ||||
Ownit Mortgage Loan Asset-Backed Certificates | ||||||
5.44%, 08/25/36† | 759,918 | 759,916 | ||||
PG&E Energy Recovery Funding LLC | ||||||
4.37%, 06/25/14 | 350,000 | 336,615 | ||||
Popular ABS Mortgage Pass-Through Trust | ||||||
5.57%, 09/25/34† | 339,379 | 339,445 | ||||
Quest Trust | ||||||
5.88%, 06/25/34† | 38,973 | 38,986 | ||||
Renaissance Home Equity Loan Trust | ||||||
5.40%, 05/25/36† | 767,411 | 767,547 | ||||
Residential Asset Mortgage Products, Inc. | ||||||
5.40%, 07/25/36† | 1,892,079 | 1,892,163 | ||||
Residential Asset Securities Corporation | ||||||
5.39%, 04/25/36 STEP | 343,686 | 343,749 | ||||
Saxon Asset Securities Trust | ||||||
5.38%, 03/25/36 STEP | 667,948 | 667,843 | ||||
Securitized Asset-Backed Receivables LLC Trust | ||||||
5.37%, 05/25/36† | 1,229,457 | 1,229,505 | ||||
SLM Student Loan Trust | ||||||
5.33%, 07/25/13† | 1,570,106 | 1,570,063 | ||||
5.35%, 10/25/18† | 2,026,771 | 2,026,455 | ||||
Soundview Home Equity Loan Trust | ||||||
5.39%, 04/25/36† | 67,984 | 67,986 | ||||
5.44%, 01/25/37† | 2,177,569 | 2,177,734 | ||||
Specialty Underwriting & Residential Finance | ||||||
5.35%, 06/25/37† | 398,662 | 398,473 | ||||
5.37%, 11/25/37† | 1,184,041 | 1,183,672 | ||||
Structured Asset Investment Loan Trust | ||||||
5.39%, 03/25/36 STEP | 812,519 | 812,185 | ||||
5.37%, 07/25/36† | 451,899 | 451,377 | ||||
Structured Asset Receivables Trust | ||||||
5.11%, 04/21/11 144A† | 3,094,063 | 3,092,130 | ||||
Structured Asset Securities Corporation | ||||||
4.90%, 04/25/35† | 1,681,174 | 1,674,973 | ||||
5.37%, 10/25/36† | 1,404,294 | 1,404,004 | ||||
USAA Auto Owner Trust | ||||||
3.16%, 02/17/09 | 386,551 | 385,787 | ||||
5.31%, 03/16/09 | 1,331,894 | 1,332,456 | ||||
3.90%, 07/15/09 | 1,202,652 | 1,196,599 | ||||
4.89%, 08/15/12 | 2,500,000 | 2,481,780 | ||||
Wachovia Auto Loan Owner Trust | ||||||
5.08%, 04/20/12 144A | 3,000,000 | 2,981,279 | ||||
Wachovia Student Loan Trust | ||||||
5.34%, 10/25/13 144A† | 43,377 | 43,377 | ||||
World Omni Auto Receivables Trust | ||||||
5.01%, 10/15/10 | 2,778,781 | 2,772,737 | ||||
Total Asset-Backed Securities (Cost $124,344,120) | 124,090,312 | |||||
COMMERCIAL PAPER — 1.8% | ||||||
Bank of America Corporation | ||||||
5.25%, 09/21/07 | ||||||
(Cost $14,227,964) | 14,400,000 | 14,229,252 | ||||
CORPORATE BONDS — 11.4% | ||||||
Abbott Laboratories | ||||||
5.38%, 05/15/09D | 690,000 | 690,829 | ||||
American Express Centurion Bank | ||||||
5.32%, 05/07/08† | 1,900,000 | 1,900,165 | ||||
Anadarko Petroleum Corporation | ||||||
5.76%, 09/15/09† | 925,000 | 926,298 | ||||
ASIF Global Financing XXIII | ||||||
3.90%, 10/22/08 144A | 420,000 | 412,256 | ||||
Bank One Corporation | ||||||
2.63%, 06/30/08D | 360,000 | 350,328 | ||||
6.00%, 08/01/08D | 550,000 | 553,362 | ||||
Bear Stearns Co., Inc. | ||||||
5.30%, 01/09/08† | 3,200,000 | 3,199,552 | ||||
BellSouth Corporation | ||||||
4.20%, 09/15/09 | 2,217,000 | 2,160,345 | ||||
Caterpillar Financial Services Corporation | ||||||
5.43%, 10/28/08† | 5,500,000 | 5,506,259 | ||||
Citigroup, Inc. | ||||||
3.50%, 02/01/08D | 1,600,000 | 1,584,040 | ||||
3.63%, 02/09/09D | 2,750,000 | 2,679,377 | ||||
Clorox Co. | ||||||
5.49%, 12/14/07† | 1,500,000 | 1,500,920 | ||||
Comcast LCI Holdings | ||||||
7.63%, 02/15/08 | 725,000 | 733,483 | ||||
See Notes to Financial Statements.
| 54 |
Table of Contents
| Par | Value | |||||
ConocoPhillips Australia Funding Co. | ||||||
5.45%, 04/09/09† | $ | 1,100,000 | $ | 1,100,756 | ||
CSX Corporation | ||||||
6.25%, 10/15/08 | 1,710,000 | 1,724,364 | ||||
DaimlerChrysler NA Holding Corporation | ||||||
5.84%, 09/10/07† | 3,800,000 | 3,803,188 | ||||
Dominion Resources, Inc. | ||||||
5.66%, 09/28/07† | 3,500,000 | 3,501,008 | ||||
Federated Department Stores, Inc. | ||||||
6.63%, 09/01/08 | 150,000 | 151,026 | ||||
FedEx Corporation | ||||||
5.44%, 08/08/07† | 1,800,000 | 1,800,373 | ||||
Gannett Co., Inc. | ||||||
4.13%, 06/15/08 | 2,390,000 | 2,357,924 | ||||
General Electric Capital Corporation | ||||||
9.83%, 12/15/08 | 350,000 | 372,568 | ||||
5.39%, 03/16/09† | 3,800,000 | 3,802,094 | ||||
4.25%, 09/13/10 | 2,400,000 | 2,319,235 | ||||
5.00%, 12/01/10 | 3,475,000 | 3,431,417 | ||||
Goldman Sachs Capital III | ||||||
5.36%, 12/31/49† | 1,560,000 | 1,559,236 | ||||
HSBC Bank USA NA | ||||||
5.42%, 09/21/07† | 400,000 | 400,119 | ||||
HSBC Finance Corporation | ||||||
4.13%, 12/15/08D | 700,000 | 687,644 | ||||
JP Morgan Chase Capital XXIII | ||||||
6.36%, 05/15/47† | 1,345,000 | 1,335,312 | ||||
May Department Stores Co. (The) | ||||||
3.95%, 07/15/07 | 1,370,000 | 1,369,297 | ||||
Merrill Lynch & Co., Inc. | ||||||
4.83%, 10/27/08D | 1,720,000 | 1,704,909 | ||||
Morgan Stanley | ||||||
5.50%, 01/18/08† | 1,600,000 | 1,601,302 | ||||
5.41%, 05/07/09† | 300,000 | 300,172 | ||||
5.60%, 01/09/12† | 475,000 | 474,602 | ||||
5.63%, 01/09/12 | 2,451,000 | 2,448,118 | ||||
Oracle Corporation and Ozark Holding, Inc. | ||||||
5.00%, 01/15/11D | 450,000 | 443,871 | ||||
PSEG Funding Trust I | ||||||
5.38%, 11/16/07 | 275,000 | 274,779 | ||||
SLM Corporation | ||||||
4.00%, 01/15/09 | 2,151,000 | 2,067,487 | ||||
Sprint Capital Corporation | ||||||
6.38%, 05/01/09D | 1,080,000 | 1,093,735 | ||||
8.38%, 03/15/12 | 1,000,000 | 1,090,454 | ||||
State Street Capital Trust IV | ||||||
6.36%, 06/01/47† | 1,315,000 | 1,324,663 | ||||
Time Warner Cable, Inc. | ||||||
5.40%, 07/02/12 144A | 1,325,000 | 1,302,584 | ||||
Time Warner, Inc. | ||||||
5.59%, 11/13/09† | 6,000,000 | 6,009,066 | ||||
Transocean, Inc. | ||||||
5.55%, 09/05/08† | 1,900,000 | 1,901,776 | ||||
TXU Electric Delivery Co. | ||||||
5.73%, 09/16/08 144A† | 2,025,000 | 2,026,251 | ||||
U.S. Bancorp | ||||||
5.35%, 04/28/09† | 3,700,000 | 3,702,986 | ||||
U.S. Bank NA | ||||||
6.50%, 02/01/08 | 580,000 | 582,264 | ||||
U.S. Central Federal Credit Union | ||||||
2.75%, 05/30/08 | 610,000 | 595,062 | ||||
UBS Preferred Funding Trust I | ||||||
8.62%, 10/29/49† | 300,000 | 326,057 | ||||
Union Pacific Corporation | ||||||
5.75%, 10/15/07 | 375,000 | 375,225 | ||||
6.79%, 11/09/07 | 650,000 | 652,416 | ||||
USB Capital IX | ||||||
6.19%, 04/15/49†D | 750,000 | 756,167 | ||||
Verizon Communications, Inc. | ||||||
5.40%, 04/03/09† | 905,000 | 905,651 | ||||
Wachovia Corporation | ||||||
3.50%, 08/15/08D | 540,000 | 528,933 | ||||
5.48%, 03/15/11† | 540,000 | 541,190 | ||||
5.75%, 06/15/17D | 705,000 | 696,859 | ||||
Wells Fargo & Co. | ||||||
5.45%, 01/24/12†D | 2,000,000 | 2,001,394 | ||||
ZFS Finance USA Trust I | ||||||
5.88%, 05/09/32 144A†D | 845,000 | 830,263 | ||||
6.15%, 12/15/35 144A†D | 845,000 | 846,905 | ||||
Total Corporate Bonds (Cost $89,712,470) | 89,317,916 | |||||
FOREIGN BONDS — 5.9% | ||||||
Cayman Islands — 0.3% | ||||||
Petroleum Export, Ltd. | ||||||
4.62%, 06/15/10 144A | 1,133,333 | 1,119,508 | ||||
4.63%, 06/15/10 144A | 1,133,333 | 1,119,519 | ||||
| 2,239,027 | ||||||
France — 1.1% | ||||||
French Treasury Bill | ||||||
3.98%, 09/13/07(E)W | 6,390,000 | 8,579,300 | ||||
Iceland — 0.2% | ||||||
Glitnir Banki HF | ||||||
5.63%, 04/20/10 144A† | 1,525,000 | 1,523,617 | ||||
Italy — 0.2% | ||||||
Telecom Italia Capital SA | ||||||
4.00%, 11/15/08 | 2,000,000 | 1,958,124 | ||||
Luxembourg — 0.6% | ||||||
Unicredito Luxembourg Finance SA | ||||||
5.43%, 10/24/08 144A† | 3,800,000 | 3,802,257 | ||||
VTB Capital SA for Vneshtorgbank | ||||||
5.96%, 08/01/08 144A† | 800,000 | 801,800 | ||||
| 4,604,057 | ||||||
Netherlands — 2.6% | ||||||
Dutch Treasury Certificate | ||||||
3.99%, 08/31/07(E)W | 15,050,000 | 20,237,092 | ||||
New Zealand — 0.1% | ||||||
General Electric Capital Corporation | ||||||
6.50%, 09/28/15(Z) | 1,185,000 | 826,213 | ||||
Norway — 0.2% | ||||||
Eksportfinans | ||||||
3.38%, 01/15/08 | 1,630,000 | 1,614,748 | ||||
See Notes to Financial Statements.
| 55 |
Table of Contents
Low-Duration Bond Fund
SCHEDULE OF INVESTMENTS (Continued)
| Par | Value | |||||
South Korea — 0.4% | ||||||
Export-Import Bank of Korea | ||||||
5.45%, 06/01/09† | $ | 1,300,000 | $ | 1,300,669 | ||
5.58%, 10/04/11 144A† | 1,700,000 | 1,701,899 | ||||
| 3,002,568 | ||||||
United Kingdom — 0.2% | ||||||
Nationwide Building Society | ||||||
3.50%, 07/31/07 144A | 325,000 | 324,635 | ||||
Vodafone Group PLC | ||||||
3.95%, 01/30/08 | 230,000 | 227,951 | ||||
5.64%, 02/27/12† | 950,000 | 952,363 | ||||
| 1,504,949 | ||||||
Total Foreign Bonds (Cost $45,960,333) | 46,089,695 | |||||
MORTGAGE-BACKED SECURITIES — 51.8% | ||||||
Adjustable Rate Mortgage Trust | ||||||
5.59%, 11/25/35† | 1,357,846 | 1,360,533 | ||||
5.57%, 03/25/36† | 2,590,671 | 2,601,015 | ||||
5.96%, 03/25/37† | 3,980,936 | 3,973,871 | ||||
American Home Mortgage Assets | ||||||
5.59%, 11/25/35† | 1,433,633 | 1,436,282 | ||||
American Home Mortgage Investment Trust | ||||||
4.29%, 10/25/34† | 1,762,220 | 1,727,918 | ||||
Arkle Master Issuer PLC | ||||||
5.30%, 11/19/07 144A† | 1,800,000 | 1,807,055 | ||||
Bank of America Commercial Mortgage, Inc. | ||||||
3.88%, 09/11/36 | 2,227,222 | 2,147,516 | ||||
4.76%, 07/10/45 | 1,620,000 | 1,587,225 | ||||
Bank of America Funding Corporation | ||||||
4.58%, 12/20/36† | 2,802,207 | 2,757,424 | ||||
Bank of America Mortgage Securities | ||||||
6.50%, 10/01/19 | 569,260 | 575,230 | ||||
Bear Stearns Adjustable Rate Mortgage Trust | ||||||
4.19%, 12/01/33† | 1,366,627 | 1,375,468 | ||||
4.62%, 01/25/34† | 799,244 | 800,868 | ||||
4.00%, 07/25/34† | 2,070,442 | 2,022,521 | ||||
Bear Stearns Alt-A Trust | ||||||
5.69%, 06/25/34† | 1,260,467 | 1,261,952 | ||||
6.18%, 05/25/36† | 2,046,405 | 2,054,266 | ||||
Bear Stearns Commercial Mortgage Securities | ||||||
5.43%, 03/15/19 144A† | 1,761,573 | 1,761,934 | ||||
3.87%, 02/11/41 | 3,650,000 | 3,564,049 | ||||
Chase Manhattan Bank - First Union National Bank | ||||||
7.44%, 08/15/31 | 2,102,745 | 2,170,603 | ||||
Citigroup Commercial Mortgage Trust | ||||||
4.15%, 09/20/49 144A | 747,148 | 736,698 | ||||
Commercial Mortgage Acceptance Corporation | ||||||
6.03%, 09/15/30 | 778,490 | 778,881 | ||||
Commercial Mortgage Pass-Through Certificates | ||||||
7.42%, 08/15/33 | 2,076,082 | 2,152,377 | ||||
Countrywide Alternative Loan Trust | ||||||
6.00%, 10/25/32 | 354,869 | 351,646 | ||||
5.50%, 05/31/35 | 1,437,331 | 1,426,392 | ||||
Countrywide Home Loan Mortgage Pass-Through Trust | ||||||
4.25%, 09/25/33† | 2,641,641 | 2,638,237 | ||||
5.59%, 01/25/35† | 369,652 | 369,928 | ||||
CS First Boston Mortgage Securities Corporation | ||||||
4.30%, 07/15/36 | 1,000,000 | 977,759 | ||||
5.02%, 08/15/38 | 980,000 | 966,128 | ||||
Deutsche ALT-A Securities, Inc. | ||||||
5.40%, 03/30/36† | 965,936 | 966,033 | ||||
DLJ Commercial Mortgage Corporation | ||||||
7.18%, 11/10/33 | 2,096,724 | 2,182,196 | ||||
Federal Home Loan Mortgage Corporation | ||||||
8.50%, 12/01/07 | 318 | 319 | ||||
8.50%, 01/01/08 | 559 | 561 | ||||
8.00%, 05/01/08 | 2,697 | 2,714 | ||||
8.75%, 07/01/08 | 1,019 | 1,034 | ||||
8.00%, 01/01/09 | 444 | 449 | ||||
7.50%, 03/01/09 | 5,258 | 5,315 | ||||
16.25%, 07/01/11 | 149 | 159 | ||||
15.25%, 08/01/11 | 1,359 | 1,545 | ||||
5.38%, 09/15/11 | 5,229,589 | 5,207,825 | ||||
4.00%, 08/01/15 | 2,101,569 | 2,002,359 | ||||
5.00%, 11/15/16 | 1,896,754 | 1,878,476 | ||||
5.50%, 04/15/17 | 4,174,319 | 4,161,794 | ||||
3.50%, 12/01/18 | 3,275,396 | 2,991,817 | ||||
10.75%, 02/01/19 | 80,846 | 86,414 | ||||
5.55%, 02/15/19† | 6,100,000 | 6,098,570 | ||||
4.25%, 06/15/24 | 1,769,578 | 1,744,660 | ||||
7.27%, 07/01/27† | 38,782 | 39,421 | ||||
5.50%, 10/15/27 | 2,399,367 | 2,395,818 | ||||
5.88%, 06/01/28† | 305,767 | 304,144 | ||||
5.67%, 12/15/30† | 1,211,365 | 1,214,112 | ||||
6.00%, 04/01/33 | 1,541,211 | 1,537,566 | ||||
4.58%, 06/01/33† | 3,595,537 | 3,589,924 | ||||
3.98%, 04/01/34† | 3,235,253 | 3,173,406 | ||||
4.39%, 10/01/34† | 974,568 | 958,737 | ||||
5.50%, 05/15/35 | 2,110,509 | 2,098,263 | ||||
4.71%, 08/01/35† | 2,782,452 | 2,747,060 | ||||
4.77%, 08/01/35† | 2,346,466 | 2,346,576 | ||||
4.81%, 10/01/35† | 1,375,258 | 1,370,686 | ||||
5.03%, 12/01/35† | 6,670,347 | 6,579,185 | ||||
5.22%, 02/01/36† | 4,148,470 | 4,117,734 | ||||
5.88%, 04/01/36† | 3,999,490 | 4,010,325 | ||||
5.71%, 11/01/36† | 4,578,284 | 4,531,492 | ||||
Federal Housing Authority | ||||||
7.43%, 09/01/22 | 1,672 | 1,665 | ||||
Federal National Mortgage Association | ||||||
6.00%, 08/01/08 | 53,544 | 53,460 | ||||
6.50%, 11/01/08 | 71,732 | 71,775 | ||||
5.50%, 12/01/17 | 7,440,371 | 7,357,447 | ||||
4.00%, 07/01/18 | 195,149 | 181,620 | ||||
4.00%, 08/01/18 | 801,898 | 746,307 | ||||
4.00%, 05/01/19 | 4,334,820 | 4,022,430 | ||||
4.00%, 06/01/19 | 7,211,501 | 6,691,804 | ||||
4.00%, 08/01/19 | 398,415 | 369,703 | ||||
4.00%, 10/01/19 | 1,393,671 | 1,293,235 | ||||
See Notes to Financial Statements.
| 56 |
Table of Contents
| Par | Value | |||||
4.00%, 11/25/19 | $ | 739,017 | $ | 657,990 | ||
4.00%, 12/01/19 | 946,281 | 878,087 | ||||
4.00%, 01/01/20 | 218,017 | 201,732 | ||||
4.00%, 07/01/20 | 53,074 | 49,110 | ||||
5.75%, 08/25/23 | 757,350 | 755,776 | ||||
5.50%, 09/25/24 | 3,139,275 | 3,131,803 | ||||
7.06%, 12/01/24† | 181,106 | 180,895 | ||||
9.00%, 05/01/25 | 89,436 | 96,583 | ||||
9.00%, 07/01/25 | 105,638 | 113,906 | ||||
6.00%, 02/25/27 | 2,970,938 | 2,986,318 | ||||
5.50%, 11/25/27 | 3,953,714 | 3,941,011 | ||||
5.92%, 05/25/30† | 2,333,158 | 2,345,679 | ||||
5.97%, 05/25/30† | 2,367,981 | 2,370,833 | ||||
5.57%, 09/25/30† | 100,157 | 100,198 | ||||
7.25%, 09/01/31† | 92,009 | 92,725 | ||||
3.31%, 03/25/32 | 443,408 | 405,300 | ||||
4.26%, 04/01/33† | 705,133 | 709,926 | ||||
4.14%, 06/01/33† | 227,485 | 226,162 | ||||
5.50%, 06/01/33 | 25,247 | 24,461 | ||||
5.50%, 07/01/33 | 22,980 | 22,265 | ||||
4.23%, 10/01/33† | 1,565,609 | 1,552,405 | ||||
5.50%, 10/01/33 | 126,788 | 122,844 | ||||
4.28%, 12/01/33† | 508,906 | 503,782 | ||||
4.50%, 06/01/34 | 70,721 | 64,516 | ||||
5.75%, 08/25/34 | 15,177 | 15,130 | ||||
4.50%, 09/01/34 | 268,090 | 244,228 | ||||
4.91%, 09/01/34† | 1,248,108 | 1,238,867 | ||||
5.09%, 09/01/34† | 837,537 | 834,859 | ||||
4.75%, 10/01/34† | 1,290,360 | 1,275,590 | ||||
5.11%, 10/01/34† | 1,469,691 | 1,464,013 | ||||
4.50%, 12/01/34 | 86,837 | 79,108 | ||||
4.50%, 02/01/35 | 3,121,503 | 2,841,344 | ||||
5.50%, 02/01/35 | 3,339,733 | 3,236,547 | ||||
4.50%, 03/01/35 | 1,810,796 | 1,648,274 | ||||
4.50%, 04/01/35 | 3,003,421 | 2,733,860 | ||||
4.50%, 05/01/35 | 1,129,612 | 1,028,228 | ||||
4.50%, 06/01/35 | 64,482 | 58,694 | ||||
4.86%, 06/01/35† | 2,154,987 | 2,136,856 | ||||
4.50%, 08/01/35 | 1,837,770 | 1,672,828 | ||||
4.69%, 08/01/35† | 5,801,794 | 5,727,894 | ||||
5.50%, 08/01/35 TBA | 1,000,000 | 964,063 | ||||
4.38%, 09/01/35† | 2,740,212 | 2,677,287 | ||||
4.50%, 09/01/35 | 1,148,886 | 1,045,773 | ||||
4.63%, 09/01/35† | 3,637,918 | 3,584,683 | ||||
5.50%, 09/01/35 | 11,280,164 | 10,907,150 | ||||
7.50%, 09/01/35 | 1,960,248 | 2,047,388 | ||||
4.50%, 10/01/35 | 800,070 | 728,262 | ||||
5.33%, 10/01/35† | 2,314,197 | 2,271,970 | ||||
4.50%, 11/01/35 | 701,527 | 638,564 | ||||
4.92%, 12/01/35† | 292,912 | 290,956 | ||||
6.00%, 02/01/36 | 873,871 | 866,024 | ||||
4.50%, 06/01/36 | 55,840 | 50,778 | ||||
4.50%, 07/01/36 | 897,931 | 816,536 | ||||
6.00%, 07/01/36 | 2,732,293 | 2,704,581 | ||||
5.92%, 09/01/36† | 3,827,895 | 3,847,928 | ||||
6.00%, 10/01/36 | 2,154,879 | 2,133,023 | ||||
8.75%, 10/01/36 IOW | 2,367,140 | 630,958 | ||||
5.58%, 12/01/36† | 1,405,496 | 1,401,558 | ||||
5.50%, 07/01/37 TBA | 18,200,000 | 17,551,625 | ||||
6.00%, 07/12/37 TBA | 19,000,000 | 18,807,031 | ||||
6.16%, 04/01/40† | 381,169 | 390,518 | ||||
6.23%, 07/01/44† | 545,166 | 551,850 | ||||
6.50%, 12/31/49 | 3,066,000 | 3,089,401 | ||||
FHLMC Structured Pass-Through Securities | ||||||
6.32%, 05/25/43† | 1,877,752 | 1,913,198 | ||||
6.43%, 07/25/44† | 3,381,752 | 3,408,254 | ||||
First Horizon Alternative Mortgage Securities | ||||||
4.74%, 06/25/34† | 1,009,545 | 996,493 | ||||
First Horizon Asset Securities, Inc. | ||||||
5.33%, 10/25/35† | 3,206,850 | 3,184,959 | ||||
General Electric Capital Commercial Mortgage Corporation | ||||||
4.09%, 01/10/38 | 2,000,000 | 1,960,259 | ||||
5.56%, 06/10/38 | 730,073 | 730,742 | ||||
4.35%, 06/10/48 | 2,870,000 | 2,794,565 | ||||
GMAC Commercial Mortgage Securities, Inc. | ||||||
7.72%, 03/15/33 | 2,074,118 | 2,163,432 | ||||
7.18%, 08/15/36 | 1,249,324 | 1,282,254 | ||||
Government National Mortgage Association | ||||||
6.00%, 12/15/08 | 77,988 | 78,210 | ||||
6.00%, 02/15/11 | 147,536 | 148,191 | ||||
5.38%, 06/20/17† | 21,924 | 22,102 | ||||
5.38%, 06/20/21† | 12,361 | 12,509 | ||||
6.13%, 10/20/27† | 83,840 | 84,773 | ||||
8.50%, 10/15/29 | 57,712 | 62,049 | ||||
8.50%, 01/15/30 | 25,759 | 27,698 | ||||
5.92%, 02/16/30† | 324,353 | 328,849 | ||||
8.50%, 03/15/30 | 4,878 | 5,245 | ||||
8.50%, 04/15/30 | 14,694 | 15,799 | ||||
8.50%, 05/15/30 | 141,629 | 152,287 | ||||
8.50%, 06/15/30 | 27,431 | 29,496 | ||||
8.50%, 07/15/30 | 161,026 | 173,142 | ||||
8.50%, 08/15/30 | 24,217 | 26,039 | ||||
8.50%, 09/15/30 | 2,598 | 2,794 | ||||
8.50%, 10/15/30 | 46,097 | 49,566 | ||||
8.50%, 11/15/30 | 71,364 | 76,734 | ||||
8.50%, 12/15/30 | 67,738 | 72,837 | ||||
8.50%, 02/15/31 | 58,644 | 62,965 | ||||
3.75%, 05/20/34† | 1,635,159 | 1,629,411 | ||||
3.75%, 06/20/34† | 2,233,632 | 2,225,780 | ||||
6.00%, 06/15/36 | 935,156 | 930,662 | ||||
Greenpoint Mortgage Funding Trust | ||||||
5.59%, 11/25/45† | 564,300 | 565,048 | ||||
GS Mortgage Securities Corporation II | ||||||
6.04%, 08/15/18 144A | 357,718 | 361,910 | ||||
6.14%, 10/18/30 | 1,805,975 | 1,811,503 | ||||
5.51%, 04/10/38† | 1,320,000 | 1,317,792 | ||||
6.48%, 01/10/40 IO 144AW† | 33,242,589 | 503,452 | ||||
GSR Mortgage Loan Trust | ||||||
5.15%, 06/01/34† | 1,731,557 | 1,750,262 | ||||
4.77%, 09/25/34† | 4,170,963 | 4,156,736 | ||||
4.54%, 09/25/35† | 4,641,689 | 4,572,357 | ||||
4.55%, 09/25/35† | 3,018,216 | 2,990,656 | ||||
4.66%, 10/25/35† | 2,182,909 | 2,171,594 | ||||
HarborView Mortgage Loan Trust | ||||||
5.63%, 11/19/35 STEP | 1,899,795 | 1,906,088 | ||||
5.31%, 12/19/35† | 4,012,591 | 3,987,108 | ||||
See Notes to Financial Statements.
| 57 |
Table of Contents
Low-Duration Bond Fund
SCHEDULE OF INVESTMENTS (Continued)
| Par | Value | |||||
Impac Secured Assets CMN Owner Trust | ||||||
5.44%, 05/25/36† | $ | 505,142 | $ | 505,161 | ||
5.40%, 01/25/37† | 1,343,634 | 1,343,628 | ||||
JP Morgan Mortgage Trust | ||||||
3.88%, 08/25/34† | 3,246,604 | 3,196,703 | ||||
4.76%, 07/25/35† | 4,209,676 | 4,152,891 | ||||
LB-UBS Commercial Mortgage Trust | ||||||
4.21%, 11/15/27 | 3,100,000 | 3,044,737 | ||||
4.82%, 04/15/30 | 2,129,475 | 2,097,307 | ||||
6.68%, 08/15/33 IO 144AW† | 32,786,922 | 321,656 | ||||
Luminent Mortgage Trust | ||||||
5.58%, 11/26/35† | 2,572,067 | 2,579,442 | ||||
Merrill Lynch Mortgage Investors, Inc. | ||||||
4.23%, 08/25/34† | 2,835,260 | 2,806,140 | ||||
MLCC Mortgage Investors, Inc. | ||||||
5.70%, 03/15/25 STEP | 539,634 | 540,815 | ||||
4.73%, 12/25/34† | 2,191,963 | 2,167,046 | ||||
5.40%, 02/25/36 STRIP† | 2,372,733 | 2,355,876 | ||||
Morgan Stanley Capital I | ||||||
6.53%, 03/15/31 | 2,811,902 | 2,840,273 | ||||
NationsLink Funding Corporation | ||||||
6.32%, 01/20/31 | 1,866,408 | 1,878,544 | ||||
Opteum Mortgage Acceptance Corporation | ||||||
5.41%, 12/25/35† | 2,095,825 | 2,094,755 | ||||
5.38%, 07/25/36† | 1,723,055 | 1,722,171 | ||||
PNC Mortgage Acceptance Corporation | ||||||
5.91%, 03/12/34 | 1,507,735 | 1,513,431 | ||||
Provident Funding Mortgage Loan Trust | ||||||
4.05%, 04/25/34† | 3,409,067 | 3,348,227 | ||||
Residential Accredit Loans, Inc. | ||||||
6.00%, 12/25/16 | 31,680 | 31,584 | ||||
5.72%, 01/25/33† | 687,905 | 689,620 | ||||
Residential Funding Mortgage Securities I | ||||||
6.50%, 03/25/32 | 131,513 | 131,431 | ||||
Structured Adjustable Rate Mortgage Loan Trust | ||||||
4.92%, 03/25/34† | 1,302,523 | 1,302,004 | ||||
5.33%, 08/25/34† | 1,575,250 | 1,565,745 | ||||
5.62%, 09/25/34† | 320,267 | 320,738 | ||||
5.40%, 05/25/35† | 2,805,838 | 2,800,212 | ||||
Structured Asset Mortgage Investments, Inc. | ||||||
7.22%, 10/19/34† | 612,429 | 616,971 | ||||
5.60%, 05/25/35† | 1,340,760 | 1,341,736 | ||||
5.39%, 08/25/36† | 1,283,344 | 1,282,758 | ||||
Structured Asset Securities Corporation | ||||||
5.37%, 05/25/36† | 946,534 | 946,449 | ||||
Thornburg Mortgage Securities Trust | ||||||
5.44%, 04/25/36† | 1,900,000 | 1,896,748 | ||||
TIAA Retail Commercial Trust | ||||||
6.68%, 06/19/31 144A | 2,790,000 | 2,844,241 | ||||
Wachovia Bank Commercial Mortgage Trust | ||||||
4.04%, 02/15/34 | 2,249,652 | 2,189,820 | ||||
5.00%, 07/15/41 | 1,620,000 | 1,598,664 | ||||
4.38%, 10/15/41 | 2,949,118 | 2,878,513 | ||||
5.76%, 05/15/43† | 1,600,000 | 1,594,446 | ||||
Washington Mutual Commercial Mortgage Securities Trust | ||||||
4.24%, 05/25/36 144A | 1,003,404 | 992,213 | ||||
Washington Mutual Mortgage Securities Corporation | ||||||
7.47%, 03/25/32† | 181,371 | 180,691 | ||||
Washington Mutual, Inc. | ||||||
5.86%, 12/25/27 STEP | 3,422,245 | 3,421,921 | ||||
4.67%, 05/25/35† | 3,550,000 | 3,458,893 | ||||
5.56%, 05/04/37† | 2,950,696 | 2,951,050 | ||||
5.90%, 06/25/37† | 4,300,000 | 4,295,700 | ||||
6.43%, 06/25/42† | 105,602 | 105,477 | ||||
5.63%, 01/25/45† | 1,695,529 | 1,698,240 | ||||
5.51%, 04/25/45† | 139,937 | 139,961 | ||||
5.64%, 08/25/45† | 747,416 | 749,099 | ||||
5.61%, 10/25/45† | 793,279 | 794,648 | ||||
6.01%, 06/25/46† | 2,662,168 | 2,679,283 | ||||
Wells Fargo Mortgage-Backed Securities Trust | ||||||
4.75%, 04/25/19 | 3,168,090 | 3,008,694 | ||||
3.99%, 01/25/35† | 2,518,644 | 2,466,333 | ||||
4.54%, 02/25/35† | 4,096,281 | 4,013,458 | ||||
Total Mortgage-Backed Securities (Cost $408,149,152) | 404,530,389 | |||||
MUNICIPAL BOND — 0.1% | ||||||
Sales Tax Asset Receivable Corporation, New York, Series B Revenue Bond (FSA Insured) | ||||||
3.60%, 10/15/08 | ||||||
(Cost $425,000) | 425,000 | 417,031 | ||||
| Number of Contracts | ||||||
PURCHASED OPTIONS — 0.5% | ||||||
Call Options — 0.1% | ||||||
10-Year U.S. Treasury Note Futures, Strike Price $109.00, Expires 08/24/07 | 62 | 2,906 | ||||
10-Year U.S. Treasury Note Futures, Strike Price $111.00, Expires 08/24/07 | 183 | 2,860 | ||||
1-Year Eurodollar Mid-CRV Futures, Strike Price $95.00, Expires 09/14/07 | 234 | 52,650 | ||||
1-Year Eurodollar Mid-CRV Futures, Strike Price $95.25, Expires 09/14/07 | 1,374 | 137,400 | ||||
5-Year U.S. Treasury Note Futures, Strike Price $109.50, Expires 08/24/07 | 280 | 4,375 | ||||
90-Day Eurodollar Futures, Strike Price $95.00, Expires 09/17/07 | 29 | 725 | ||||
See Notes to Financial Statements.
| 58 |
Table of Contents
| Number of Contracts | Value | |||||||
90-Day Eurodollar Futures, Strike Price $95.25, Expires 03/17/08 | 78 | $ | 14,625 | |||||
90-Day Eurodollar Futures, Strike Price $95.25, Expires 06/16/08 | 327 | 81,750 | ||||||
90-Day Eurodollar Futures, Strike Price $95.25, Expires 12/17/07 | 115 | 5,750 | ||||||
| 303,041 | ||||||||
Call Swaptions — 0.2% | ||||||||
3-Month LIBOR, Strike Price $4.75, Expires 03/31/08 | 2,750 | 33,960 | ||||||
3-Month LIBOR, Strike Price $4.75, Expires 09/26/08 | 1,750 | 34,428 | ||||||
3-Month LIBOR, Strike Price $4.75, Expires 12/15/08 | 800 | 18,158 | ||||||
3-Month LIBOR, Strike Price $5.00, Expires 02/01/08 | 3,760 | 60,308 | ||||||
3-Month LIBOR, Strike Price $5.00, Expires 12/15/08 | 7,250 | 245,344 | ||||||
3-Month LIBOR, Strike Price $5.00, Expires 12/20/07 | 2,130 | 26,177 | ||||||
3-Month LIBOR, Strike Price $5.04, Expires 09/17/07 | 710 | 3,569 | ||||||
3-Month LIBOR, Strike Price $5.75, Expires 12/15/08 | 3,900 | 287,364 | ||||||
Euro vs. U.S. Dollar, Strike Price $1.36, Expires 05/21/08 | 22,000 | 71,361 | ||||||
Euro vs. U.S. Dollar, Strike Price $1.38, Expires 05/21/10 | 18,000 | 90,359 | ||||||
U.S. Dollar vs. Japanese Yen, Strike Price $104.00, Expires 03/17/10 | 65,000 | 493,740 | ||||||
U.S. Dollar vs. Japanese Yen, Strike Price $105.40, Expires 03/31/10 | 12,010 | 67,919 | ||||||
| 1,432,687 | ||||||||
Put Options — 0.0% | ||||||||
90-Day Eurodollar Futures, Strike Price $90.50, Expires 09/17/07 | 618 | 3,863 | ||||||
90-Day Eurodollar Futures, Strike Price $91.75, Expires 12/17/07 | 5 | 31 | ||||||
| 3,894 | ||||||||
Put Swaptions — 0.2% | ||||||||
Euro vs. U.S. Dollar, Strike Price $1.36, Expires 05/19/08 | 502,000 | 1,463,536 | ||||||
Euro vs. U.S. Dollar, Strike Price $1.38, Expires 05/21/10 | 40,000 | 139,861 | ||||||
U.S. Dollar vs. Japanese Yen, Strike Price $104.00, Expires 03/17/10 | 65,000 | 162,955 | ||||||
U.S. Dollar vs. Japanese Yen, Strike Price $105.40, Expires 03/31/10 | 10,000 | 28,376 | ||||||
| 1,794,728 | ||||||||
Total Purchased Options (Cost $5,532,735) | 3,534,350 | |||||||
| Shares | Value | |||||||
MONEY MARKET FUNDS — 7.6% | ||||||||
GuideStone Funds Money Market Fund (GS4 Class)¥ | 29,092,804 | $ | 29,092,804 | |||||
Northern Institutional Liquid Assets Portfolio§ | 30,545,646 | 30,545,646 | ||||||
Total Money Market Funds (Cost $59,638,450) | 59,638,450 | |||||||
| Par | ||||||||
U.S. TREASURY OBLIGATIONS — 3.2% | ||||||||
U.S. Treasury Bills | ||||||||
4.65%, 08/30/07‡‡ | $ | 30,000 | 29,776 | |||||
4.44%, 09/13/07‡‡ | 440,000 | 435,955 | ||||||
4.58%, 09/13/07‡‡ | 500,000 | 495,404 | ||||||
4.60%, 09/13/07 | 240,000 | 237,794 | ||||||
4.61%, 09/13/07‡‡ | 90,000 | 89,173 | ||||||
4.65%, 09/13/07 | 680,000 | 673,750 | ||||||
4.66%, 09/13/07 | 225,000 | 222,932 | ||||||
| 2,184,784 | ||||||||
U.S. Treasury Inflationary Index Bond | ||||||||
2.38%, 01/15/17D | 10,600,000 | 10,605,614 | ||||||
U.S. Treasury Notes | ||||||||
3.88%, 09/15/10D | 12,098,000 | 11,740,734 | ||||||
5.13%, 05/15/16D | 300,000 | 301,782 | ||||||
| 12,042,516 | ||||||||
Total U.S. Treasury Obligations (Cost $24,997,507) | 24,832,914 | |||||||
TOTAL INVESTMENTS — 106.8% (Cost $839,865,293) | 833,565,008 | |||||||
| Number of Contracts | �� | |||||||
WRITTEN OPTIONS — (0.1)% | ||||||||
Call Swaptions — (0.1)% | ||||||||
3-Month LIBOR, Strike Price $4.75, Expires 09/26/08 | (760 | ) | (38,280 | ) | ||||
3-Month LIBOR, Strike Price $4.90, Expires 03/31/08 | (500 | ) | (15,279 | ) | ||||
3-Month LIBOR, Strike Price $4.95, Expires 03/31/08 | (700 | ) | (23,939 | ) | ||||
3-Month LIBOR, Strike Price $4.95, Expires 09/26/08 | (2,170 | ) | (325,444 | ) | ||||
3-Month LIBOR, Strike Price $5.00, Expires 12/15/08 | (270 | ) | (19,188 | ) | ||||
3-Month LIBOR, Strike Price $5.10, Expires 02/01/08 | (1,630 | ) | (58,325 | ) | ||||
3-Month LIBOR, Strike Price $5.15, Expires 12/20/07 | (930 | ) | (30,329 | ) | ||||
3-Month LIBOR, Strike Price $5.20, Expires 12/15/08 | (2,420 | ) | (237,535 | ) | ||||
Total Written Options (Premiums received $(1,124,267)) | (748,319 | ) | ||||||
See Notes to Financial Statements.
| 59 |
Table of Contents
Low-Duration Bond Fund
SCHEDULE OF INVESTMENTS (Continued)
| Par | Value | |||||||
SECURITY SOLD SHORT — (0.1)% | ||||||||
Federal National Mortgage Association | ||||||||
6.00%, 07/12/37 TBA | ||||||||
(Cost $(994,375)) | $ | (1,000,000 | ) | $ | (989,063 | ) | ||
Liabilities in Excess of Other Assets — (6.6)% | (51,601,428 | ) | ||||||
NET ASSETS — 100.0% | $ | 780,226,198 | ||||||
Swap agreements outstanding at June 30, 2007:
Description | Expiration Date | Notional Value | Unrealized Appreciation (Depreciation) | |||||
British Pounds | ||||||||
Receive fixed rate payments of 5.00% and pay variable rate payments on the six month LIBOR floating rate(b) | 12/20/08 | 13,700,000 | $ | (347,486 | ) | |||
Receive fixed rate payments of 5.00% and pay variable rate payments on the six month LIBOR floating rate(d) | 09/15/10 | 20,600,000 | (1,490,185 | ) | ||||
Receive floating par in the event of default on the Dow Jones ITRAXX6HI4 Index and pay fixed rate payments of 0.85%(k) | 12/20/16 | 2,600,000 | (22,578 | ) | ||||
Receive variable rate payments on the six month LIBOR floating rate and pay fixed rate payments of 4.00%(k) | 12/15/35 | 100,000 | 9,561 | |||||
Receive variable rate payments on the six month LIBOR floating rate and pay fixed rate payments of 4.00%(d) | 12/15/35 | 2,000,000 | 191,226 | |||||
| (1,659,462 | ) | |||||||
Euro | ||||||||
Receive fixed rate payments of 2.09% and pay variable rate payments on the France CPI Ex Tobacco(j) | 10/15/10 | 1,500,000 | 18,013 | |||||
Receive fixed rate payments of 4.00% and pay variable rate payments on the six month EURIBOR rate(k) | 12/15/11 | 23,100,000 | 969,264 | |||||
Receive floating par in the event of default on the Dow Jones ITRAXX6HIVOL Index and pay fixed rate payments of 0.85%(g) | 12/20/16 | 900,000 | (7,815 | ) | ||||
Receive floating par in the event of default on the Dow Jones ITRAXX6HI4 Index and pay fixed rate payments of 0.85%(d) | 12/20/16 | 3,100,000 | (26,920 | ) | ||||
See Notes to Financial Statements.
| 60 |
Table of Contents
Description | Expiration Date | Notional Value | Unrealized Appreciation (Depreciation) | ||||||
Receive floating par in the event of default on the Dow Jones ITRAXX6HI4 Index and pay fixed rate payments of 0.85%(j) | 12/20/16 | 2,100,000 | $ | (18,236 | ) | ||||
| 934,306 | |||||||||
Japanese Yen | |||||||||
Receive fixed rate payments of 0.055% and pay floating par in the event of default on American International Group, 5.60% due 10/18/16(e) | 03/20/08 | 3,000,000 | 106 | ||||||
Receive fixed rate payments of 2.00% and pay variable rate payments on the six month LIBOR floating rate(b) | 12/20/16 | 200,000,000 | 14,372 | ||||||
Receive fixed rate payments of 2.00% and pay variable rate payments on the six month LIBOR floating rate(d) | 12/20/16 | 80,000,000 | 5,749 | ||||||
| 20,227 | |||||||||
U.S. Dollars | |||||||||
Receive fixed rate payments of 0.22% and pay floating par in the event of default on Russian Federation, 7.50% due 3/31/30(i) | 07/20/07 | $ | 900,000 | 42 | |||||
Receive floating par in the event of default on the Dow Jones CDX HVOL7 Index and pay fixed rate payments of 0.75%(d) | 12/20/11 | 9,000,000 | 50,495 | ||||||
Receive floating par in the event of default on Progress Energy, Inc., 5.625% due 01/15/16 and pay fixed rate payments of 0.09%(d) | 06/20/12 | 1,000,000 | 2,910 | ||||||
Receive floating par in the event of default on Target Corporation, 5.875% due 03/01/12 and pay fixed rate payments of 0.11%(c) | 06/20/12 | 900,000 | 2,111 | ||||||
Receive variable rate payments on the three month LIBOR floating rate and pay fixed rate payments of 5.00%(f) | 06/20/14 | 36,200,000 | 1,189,252 | ||||||
Receive floating par in the event of default on the Dow Jones CDX IG7 Index and pay fixed rate payments of 0.65%(c) | 12/20/16 | 7,300,000 | 19,888 | ||||||
Receive floating par in the event of default on Autozone, 5.875% due 10/15/12 and pay fixed rate payments of 0.665%(l) | 06/20/17 | 1,300,000 | (690 | ) | |||||
Receive floating par in the event of default on Newell Rubbermaid, 6.75% due 03/15/12 and pay fixed rate payments of 0.48%(b) | 06/20/17 | 300,000 | (152 | ) | |||||
Receive floating par in the event of default on Liz Claiborne, 5% due 07/08/13 and pay fixed rate payments of 0.95%(a) | 06/20/17 | 500,000 | 14,394 | ||||||
Receive floating par in the event of default on Liz Claiborne, 5% due 07/08/13 and pay fixed rate payments of 0.95%(a) | 06/20/17 | 100,000 | 2,879 | ||||||
Receive floating par in the event of default on Newell Rubbermaid, 6.75% due 03/15/12 and pay fixed rate payments of 0.485%(l) | 06/20/17 | 700,000 | (620 | ) | |||||
Receive floating par in the event of default on Autozone, 5.875% due 10/15/12 and pay fixed rate payments of 0.635%(l) | 06/20/17 | 600,000 | 1,332 | ||||||
Receive floating par in the event of default on Autozone, 5.875% due 10/15/12 and pay fixed rate payments of 0.64%(l) | 06/20/17 | 500,000 | 671 | ||||||
Receive fixed rate payments of 5.00% and pay variable rate payments on the three month LIBOR floating rate(l) | 12/19/17 | 7,300,000 | 373,559 | ||||||
See Notes to Financial Statements.
| 61 |
Table of Contents
Low-Duration Bond Fund
SCHEDULE OF INVESTMENTS (Continued)
Description | Expiration Date | Notional Value | Unrealized Appreciation (Depreciation) | ||||||
Receive floating par in the event of default on Morgan Stanley ABS Capital I, 7.0225% due 12/27/33 and pay fixed rate payments of 0.54%(c) | 12/27/33 | $ | 2,400,000 | $ | (49,440 | ) | |||
Receive floating par in the event of default on Long Beach Mortgage Trust, 6.7225% due 02/25/2034 and pay fixed rate payments of 0.49%(d) | 02/25/34 | 2,400,000 | (59,520 | ) | |||||
Receive floating par in the event of default on Specialty Underwriting & Residential Finance, 6.6225% due 02/25/35 and pay fixed rate payments of 0.59%(d) | 02/25/35 | 2,400,000 | (53,304 | ) | |||||
Receive floating par in the event of default on Structured Asset Investment Loan Trust, 6.1425% due 02/25/35 and pay fixed rate payments of 0.61%(d) | 02/25/35 | 2,400,000 | 7,680 | ||||||
Receive floating par in the event of default on the ABX.HE.A.06-1 Index and pay fixed rate payments of 0.54%(a) | 07/25/45 | 1,000,000 | 36,250 | ||||||
Receive floating par in the event of default on the ABX.HE.A.06-1 Index and pay fixed rate payments of 0.54%(h) | 07/25/45 | 8,000,000 | 290,000 | ||||||
Receive floating par in the event of default on the ABX.HE.A.06-1 Index and pay fixed rate payments of 0.54%(b) | 07/25/45 | 1,000,000 | 36,250 | ||||||
| 1,863,987 | |||||||||
| $ | 1,159,058 | ||||||||
PORTFOLIO SUMMARY (based on net assets)
| % | |||
Futures Contracts | 200.2 | ||
Mortgage-Backed Securities | 51.8 | ||
Asset-Backed Securities | 15.9 | ||
Corporate Bonds | 13.9 | ||
Money Market Funds | 7.6 | ||
Agency Obligations | 6.1 | ||
Foreign Bonds | 5.9 | ||
U.S. Treasury Obligations | 3.2 | ||
Commercial Paper | 1.8 | ||
Purchased Options | 0.5 | ||
Municipal Bond | 0.1 | ||
Swap Agreements | 0.1 | ||
Security Sold Short | (0.1 | ) | |
Written Options | (0.1 | ) | |
Forward Foreign Currency Contracts | (0.7 | ) | |
| 306.2 | |||
See Notes to Financial Statements.
| 62 |
Table of Contents
Average Annual Total Returns as of 06/30/07
| GS2 Class* | GS4 Class* | GS6 Class* | Benchmark** | |||||||||
Six Months | 0.45 | % | 0.38 | % | 0.11 | % | 0.98 | % | ||||
One Year | 5.57 | % | 5.44 | % | 4.99 | % | 6.12 | % | ||||
Five Year | 5.14 | % | 5.00 | % | 4.64 | % | 4.48 | % | ||||
Since Inception | 5.08 | % | 5.06 | % | 4.69 | % | 4.80 | % | ||||
Inception Date | 08/27/01 | 08/27/01 | 08/27/01 | 08/27/01 |
The performance data quoted represents past performance and does not guarantee future results. Current performance may be lower or higher. Performance data current to the most recent month-end may be obtained at www.GuideStoneFunds.org. The investment return and principal value of an investment will fluctuate so that shares, when redeemed, may be worth more or less than their original cost.
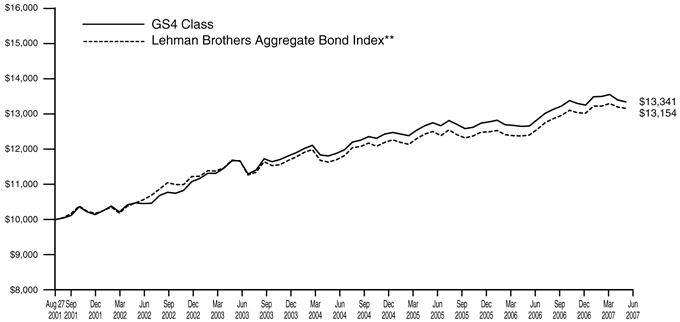
The graph compares the results of a hypothetical $10,000 investment in the GS4 Class of the Fund since August 27, 2001 (commencement of operations), with all dividends and capital gains reinvested, with the Lehman Brothers Aggregate Bond Index.
| * | These returns reflect expense waivers by the Fund’s investment advisor. Without these waivers, returns would have been lower. Returns shown do not reflect the deduction of taxes that a shareholder would pay on Fund distributions or the redemption of Fund shares. |
| ** | The Lehman Brothers Aggregate Bond Index represents securities that are SEC-registered, taxable, and dollar denominated. The index covers the U.S. investment grade fixed rate bond market, with index components for government and corporate securities, mortgage pass-through securities, and asset-backed securities. |
Unlike a mutual fund, the performance of an index assumes no taxes, transaction costs, management fees or other expenses.
| 63 |
Table of Contents
Medium-Duration Bond Fund | ||
SCHEDULE OF INVESTMENTS | June 30, 2007 (Unaudited) |
| Par | Value | |||||
AGENCY OBLIGATIONS — 6.5% | ||||||
Federal Agricultural Mortgage Corporation | ||||||
5.50%, 07/15/11 144A | $ | 4,200,000 | $ | 4,227,594 | ||
Federal Farm Credit Bank | ||||||
4.85%, 12/16/09 | 2,700,000 | 2,675,127 | ||||
4.50%, 08/08/11 | 3,000,000 | 2,892,810 | ||||
5.40%, 06/08/17 | 1,700,000 | 1,692,860 | ||||
Federal Home Loan Bank | ||||||
4.80%, 07/02/07 | 5,300,000 | 5,298,587 | ||||
4.25%, 09/12/08 | 3,000,000 | 2,965,701 | ||||
5.40%, 01/02/09 | 990,000 | 989,612 | ||||
3.50%, 02/13/09 | 1,000,000 | 974,014 | ||||
4.38%, 09/11/09 | 3,000,000 | 2,952,000 | ||||
4.08%, 04/26/10 | 1,500,000 | 1,457,751 | ||||
4.38%, 09/17/10 | 700,000 | 683,705 | ||||
5.00%, 03/08/13 | 5,000,000 | 4,925,085 | ||||
5.25%, 09/13/13 | 2,900,000 | 2,886,265 | ||||
4.88%, 12/13/13 | 13,000,000 | 12,670,632 | ||||
Federal Home Loan Mortgage Corporation | ||||||
4.48%, 09/19/08 | 10,000,000 | 9,907,920 | ||||
6.63%, 09/15/09 | 970,000 | 998,947 | ||||
6.88%, 09/15/10 | 1,490,000 | 1,563,727 | ||||
6.00%, 06/15/11 | 1,440,000 | 1,479,545 | ||||
5.63%, 11/23/35 | 1,260,000 | 1,182,588 | ||||
Federal National Mortgage Association | ||||||
5.00%, 03/17/08 | 375,000 | 361,524 | ||||
5.13%, 09/02/08 | 8,000,000 | 7,988,800 | ||||
7.25%, 01/15/10 | 1,400,000 | 1,468,179 | ||||
7.13%, 06/15/10 | 1,600,000 | 1,684,365 | ||||
6.00%, 05/15/11 | 2,370,000 | 2,434,452 | ||||
Tennessee Valley Authority | ||||||
5.38%, 04/01/46 | 1,800,000 | 1,712,887 | ||||
Total Agency Obligations (Cost $78,842,356) | 78,074,677 | |||||
ASSET-BACKED SECURITIES — 4.1% | ||||||
Amortizing Residential Collateral Trust | ||||||
5.60%, 04/25/32† | 62,085 | 62,143 | ||||
Argent Securities, Inc. | ||||||
5.37%, 10/25/36† | 1,162,450 | 1,162,504 | ||||
Asset-Backed Securities Corporation Home Equity | ||||||
5.60%, 09/25/34† | 291,120 | 290,977 | ||||
Bayview Financial Acquisition Trust | ||||||
5.77%, 02/28/44† | 963,550 | 963,862 | ||||
Bear Stearns Asset-Backed Securities, Inc. | ||||||
6.00%, 02/01/36 | 4,627,868 | 4,554,836 | ||||
6.50%, 02/01/36 | 4,616,123 | 4,554,944 | ||||
Chase Credit Card Master Trust | ||||||
5.44%, 02/15/10† | 1,700,000 | 1,700,701 | ||||
Countrywide Home Equity Loan Trust | ||||||
5.67%, 03/15/29† | 1,052,011 | 1,053,924 | ||||
5.61%, 05/15/29† | 718,862 | 720,055 | ||||
5.56%, 12/15/35† | 2,735,074 | 2,737,668 | ||||
5.54%, 02/15/36† | 1,206,297 | 1,206,121 | ||||
5.46%, 08/15/36† | 2,992,594 | 2,993,435 | ||||
CS First Boston Mortgage Securities Corporation | ||||||
5.46%, 05/25/35 STEP | 365,168 | 365,209 | ||||
EMC Mortgage Loan Trust | ||||||
5.87%, 11/25/41 144A† | 318,118 | 319,352 | ||||
First Franklin Mortgage Loan Asset-Backed Certificates | ||||||
5.37%, 11/25/36† | 1,637,343 | 1,637,338 | ||||
First Horizon Asset Back Trust | ||||||
5.61%, 10/25/34† | 421,291 | 422,288 | ||||
Fleet Home Equity Loan Trust | ||||||
5.53%, 05/30/31† | 348,481 | 348,352 | ||||
Ford Credit Auto Owner Trust | ||||||
5.33%, 09/15/08† | 71,178 | 71,178 | ||||
Honda Auto Receivables Owner Trust | ||||||
5.34%, 11/15/07 | 252,714 | 252,714 | ||||
5.10%, 09/18/08 | 925,597 | 925,452 | ||||
Lehman XS Trust | ||||||
5.62%, 11/25/35† | 3,289,913 | 3,296,601 | ||||
5.59%, 01/30/40† | 1,753,028 | 1,754,922 | ||||
Madison Avenue Manufactured Housing Contract | ||||||
5.67%, 09/25/08† | 1,118,583 | 1,121,206 | ||||
MASTR Asset-Backed Securities Trust | ||||||
5.51%, 03/25/35 STEP | 203,817 | 203,838 | ||||
MBNA Credit Card Master Note Trust | ||||||
5.82%, 03/15/10† | 1,900,000 | 1,902,250 | ||||
Morgan Stanley Dean Witter Credit Corporation HELOC Trust | ||||||
5.51%, 07/25/17 STEP | 169,496 | 169,632 | ||||
Nelnet Student Loan Trust | ||||||
5.37%, 01/26/15† | 1,736,546 | 1,736,909 | ||||
Nissan Auto Receivables Owner Trust | ||||||
5.18%, 08/15/08 | 1,292,259 | 1,292,057 | ||||
Provident Bank Home Equity Loan Trust | ||||||
5.59%, 08/25/31† | 192,619 | 192,680 | ||||
Quest Trust | ||||||
5.88%, 06/25/34† | 34,102 | 34,113 | ||||
Residential Asset Mortgage Products, Inc. | ||||||
5.56%, 03/25/34 STEP | 486,710 | 487,298 | ||||
Residential Funding Securities Corporation | ||||||
5.77%, 06/25/33 144A† | 869,520 | 870,252 | ||||
Salomon Brothers Mortgage Securities VII | ||||||
5.80%, 03/30/28 STEP | 87,978 | 88,002 | ||||
Securitized Asset-Backed Receivables LLC Trust | ||||||
5.55%, 02/25/37† | 4,743,865 | 4,745,433 | ||||
Structured Asset Securities Corporation | ||||||
5.00%, 04/25/31 144A† | 4,600,000 | 4,600,000 | ||||
Total Asset-Backed Securities (Cost $48,974,589) | 48,838,246 | |||||
See Notes to Financial Statements.
| 64 |
Table of Contents
| Par | Value | |||||
COMMERCIAL PAPER — 0.2% | ||||||
Bank of America Corporation | ||||||
5.25%, 09/25/07 | $ | 900,000 | $ | 888,802 | ||
General Electric Capital Corporation | ||||||
5.17%, 11/06/07 | 1,500,000 | 1,472,298 | ||||
Total Commercial Paper (Cost $2,361,150) | 2,361,100 | |||||
CORPORATE BONDS — 12.3% | ||||||
AES Corporation | ||||||
9.50%, 06/01/09D | 42,000 | 44,100 | ||||
8.75%, 05/15/13 144A | 520,000 | 551,200 | ||||
9.00%, 05/15/15 144A | 760,000 | 808,450 | ||||
Allied Waste North America, Inc. | ||||||
7.13%, 05/15/16 D | 375,000 | 368,438 | ||||
American Achievement Corporation | ||||||
8.25%, 04/01/12†D | 30,000 | 30,375 | ||||
American Express Co. | ||||||
6.80%, 09/01/45†D | 300,000 | 309,861 | ||||
American International Group, Inc. | ||||||
6.25%, 03/15/37†D | 1,005,000 | 953,340 | ||||
Amerigas Partners LP | ||||||
7.25%, 05/20/15 | 80,000 | 79,600 | ||||
AmerisourceBergen Corporation | ||||||
5.88%, 09/15/15 | 130,000 | 125,656 | ||||
Ameritech Capital Funding Corporation | ||||||
6.25%, 05/18/09 | 100,000 | 100,846 | ||||
AMFM, Inc. | ||||||
8.00%, 11/01/08 | 1,075,000 | 1,102,966 | ||||
Anadarko Petroleum Corporation | ||||||
5.76%, 09/15/09† | 1,070,000 | 1,071,501 | ||||
6.45%, 09/15/36 | 140,000 | 135,087 | ||||
ANZ Capital Trust I | ||||||
4.48%, 01/29/49 144A | 125,000 | 121,341 | ||||
5.36%, 12/29/49 144A | 800,000 | 770,456 | ||||
ASIF Global Financing XIX | ||||||
4.90%, 01/17/13 144A | 100,000 | 97,042 | ||||
Astoria Financial Corporation | ||||||
5.75%, 10/15/12 | 450,000 | 448,560 | ||||
AT&T, Inc. | ||||||
4.13%, 09/15/09 | 250,000 | 243,229 | ||||
5.30%, 11/15/10D | 175,000 | 174,308 | ||||
5.10%, 09/15/14 | 550,000 | 525,388 | ||||
Bank of America Corporation | ||||||
5.38%, 08/15/11D | 240,000 | 239,169 | ||||
5.64%, 10/14/16† | 1,700,000 | 1,709,100 | ||||
Bank One Corporation | ||||||
4.13%, 09/01/07D | 1,100,000 | 1,097,625 | ||||
BellSouth Capital Funding | ||||||
7.88%, 02/15/30D | 460,000 | 520,806 | ||||
BellSouth Corporation | ||||||
4.75%, 11/15/12D | 40,000 | 38,272 | ||||
6.88%, 10/15/31D | 10,000 | 10,319 | ||||
Boardwalk Pipelines LP | ||||||
5.88%, 11/15/16 | 625,000 | 610,464 | ||||
Boeing Co. | ||||||
6.63%, 02/15/38 | 210,000 | 230,322 | ||||
CenterPoint Energy Resources Corporation | ||||||
5.95%, 01/15/14 | 525,000 | 520,244 | ||||
Charter Communications Operating LLC | ||||||
8.00%, 04/30/12 144A@ | 250,000 | 254,375 | ||||
Chesapeake Energy Corporation | ||||||
6.25%, 01/15/18 | 140,000 | 131,425 | ||||
Chubb Corporation | ||||||
6.38%, 03/29/37† | 625,000 | 612,281 | ||||
Cincinnati Bell, Inc. | ||||||
7.00%, 02/15/15 | 130,000 | 128,050 | ||||
CitiFinancial, Inc. | ||||||
6.63%, 06/01/15 | 300,000 | 314,528 | ||||
Citizens Communications Co. | ||||||
9.25%, 05/15/11D | 40,000 | 43,400 | ||||
7.13%, 03/15/19 | 60,000 | 57,000 | ||||
7.88%, 01/15/27 | 150,000 | 146,625 | ||||
Clear Channel Communications, Inc. | ||||||
4.63%, 01/15/08D | 20,000 | 19,833 | ||||
4.25%, 05/15/09D | 250,000 | 241,728 | ||||
5.50%, 09/15/14 | 765,000 | 654,673 | ||||
Clorox Co. | ||||||
5.49%, 12/14/07† | 1,500,000 | 1,500,920 | ||||
Comcast Cable Communications Holdings, Inc. | ||||||
6.75%, 01/30/11 | 740,000 | 766,544 | ||||
8.38%, 03/15/13 | 225,000 | 251,457 | ||||
9.46%, 11/15/22D | 275,000 | 349,793 | ||||
Commonwealth Edison Co. | ||||||
5.40%, 12/15/11 | 650,000 | 637,306 | ||||
Community Health Systems, Inc. | ||||||
8.88%, 07/15/15 144A | 280,000 | 285,250 | ||||
Complete Production Services, Inc. | ||||||
8.00%, 12/15/16 144AD | 280,000 | 284,200 | ||||
ConocoPhillips | ||||||
8.75%, 05/25/10 | 230,000 | 250,549 | ||||
ConocoPhillips Holding Co. | ||||||
6.95%, 04/15/29 | 1,670,000 | 1,827,875 | ||||
Cox Communications, Inc. | ||||||
4.63%, 01/15/10 | 800,000 | 781,854 | ||||
Cox Enterprises, Inc. | ||||||
4.38%, 05/01/08 144A | 600,000 | 594,104 | ||||
CSC Holdings, Inc. | ||||||
7.63%, 04/01/11D | 590,000 | 588,525 | ||||
6.75%, 04/15/12 | 60,000 | 57,300 | ||||
7.63%, 07/15/18D | 45,000 | 42,975 | ||||
DaimlerChrysler NA Holding Corporation | ||||||
5.84%, 09/10/07† | 3,700,000 | 3,703,104 | ||||
5.88%, 03/15/11D | 590,000 | 593,499 | ||||
5.75%, 09/08/11D | 900,000 | 902,065 | ||||
7.30%, 01/15/12 | 550,000 | 583,885 | ||||
6.50%, 11/15/13D | 100,000 | 103,413 | ||||
DaVita, Inc. | ||||||
6.63%, 03/15/13 144A | 310,000 | 304,188 | ||||
Dean Foods Co. | ||||||
7.00%, 06/01/16D | 375,000 | 360,000 | ||||
DI Finance | ||||||
9.50%, 02/15/13 | 90,000 | 96,188 | ||||
See Notes to Financial Statements.
| 65 |
Table of Contents
Medium-Duration Bond Fund
SCHEDULE OF INVESTMENTS (Continued)
| Par | Value | |||||
DirecTV Holdings LLC | ||||||
8.38%, 03/15/13 | $ | 155,000 | $ | 162,944 | ||
Dominion Resources, Inc. | ||||||
4.13%, 02/15/08 | 70,000 | 69,440 | ||||
5.13%, 12/15/09 | 230,000 | 228,484 | ||||
4.75%, 12/15/10 | 70,000 | 68,418 | ||||
5.70%, 09/17/12D | 770,000 | 771,469 | ||||
DRS Technologies, Inc. | ||||||
6.63%, 02/01/16 | 90,000 | 87,300 | ||||
Dryden Investor Trust | ||||||
7.16%, 07/23/08 | 697,599 | 709,845 | ||||
Duke Energy Corporation | ||||||
5.63%, 11/30/12D | 710,000 | 710,611 | ||||
Dynegy Holdings, Inc. | ||||||
7.75%, 06/01/19 144A | 395,000 | 369,325 | ||||
E*Trade Financial Corporation | ||||||
7.38%, 09/15/13 | 40,000 | 40,800 | ||||
Eastman Kodak Co. | ||||||
7.25%, 11/15/13D | 490,000 | 492,450 | ||||
EchoStar DBS Corporation | ||||||
5.75%, 10/01/08 | 500,000 | 500,000 | ||||
7.00%, 10/01/13 | 10,000 | 9,900 | ||||
6.63%, 10/01/14D | 30,000 | 28,725 | ||||
7.13%, 02/01/16 | 230,000 | 225,975 | ||||
Edison Mission Energy | ||||||
7.00%, 05/15/17 144A | 240,000 | 227,400 | ||||
7.20%, 05/15/19 144A | 320,000 | 302,400 | ||||
7.63%, 05/15/27 144A | 120,000 | 114,000 | ||||
El Paso Corporation | ||||||
7.00%, 06/15/17 | 1,040,000 | 1,033,806 | ||||
8.05%, 10/15/30D | 400,000 | 422,204 | ||||
7.80%, 08/01/31 | 950,000 | 966,774 | ||||
7.75%, 01/15/32D | 99,000 | 100,219 | ||||
El Paso Natural Gas Co. | ||||||
8.38%, 06/15/32 | 210,000 | 247,296 | ||||
El Paso Performance-Linked Trust | ||||||
7.75%, 07/15/11 144A | 1,460,000 | 1,511,100 | ||||
Electronic Data Systems Corporation | ||||||
7.13%, 10/15/09 | 1,000,000 | 1,029,682 | ||||
Energy Transfer Partners LP | ||||||
5.65%, 08/01/12 | 275,000 | 272,091 | ||||
5.95%, 02/01/15 | 475,000 | 468,145 | ||||
Entergy Gulf States, Inc. | ||||||
6.09%, 12/08/08 144A† | 1,900,000 | 1,905,736 | ||||
Enterprise Products Operating LP | ||||||
4.95%, 06/01/10 | 650,000 | 638,710 | ||||
7.03%, 01/15/38†D | 275,000 | 265,581 | ||||
8.38%, 08/01/45†D | 350,000 | 374,136 | ||||
Exelon Corporation | ||||||
5.63%, 06/15/35 | 920,000 | 824,647 | ||||
Firstar Bank NA | ||||||
7.13%, 12/01/09D | 170,000 | 176,755 | ||||
FirstEnergy Corporation | ||||||
6.45%, 11/15/11 | 70,000 | 71,847 | ||||
7.38%, 11/15/31D | 1,350,000 | 1,465,735 | ||||
Ford Motor Co. | ||||||
7.45%, 07/16/31D | 550,000 | 442,062 | ||||
Ford Motor Credit Co. | ||||||
6.63%, 06/16/08 | 350,000 | 349,843 | ||||
7.38%, 10/28/09 | 3,700,000 | 3,674,748 | ||||
5.70%, 01/15/10 | 125,000 | 119,487 | ||||
7.88%, 06/15/10D | 500,000 | 500,227 | ||||
7.38%, 02/01/11 | 680,000 | 664,840 | ||||
10.61%, 06/15/11† | 607,000 | 656,239 | ||||
7.25%, 10/25/11D | 50,000 | 48,165 | ||||
Forest City Enterprises, Inc. | ||||||
7.63%, 06/01/15 | 20,000 | 20,250 | ||||
6.50%, 02/01/17 | 70,000 | 66,675 | ||||
Freeport-McMoRan Copper & Gold, Inc. | ||||||
8.38%, 04/01/17 | 420,000 | 449,400 | ||||
Freescale Semiconductor, Inc. | ||||||
8.88%, 12/15/14 144A | 75,000 | 72,000 | ||||
Fresenius Medical Care Capital Trust II | ||||||
7.88%, 02/01/08 | 169,000 | 170,268 | ||||
General Electric Capital Corporation | ||||||
5.41%, 03/04/08† | 4,300,000 | 4,303,947 | ||||
4.13%, 09/01/09D | 740,000 | 722,451 | ||||
6.00%, 06/15/12D | 460,000 | 468,701 | ||||
5.45%, 01/15/13 | 150,000 | 148,611 | ||||
General Electric Co. | ||||||
5.00%, 02/01/13 | 920,000 | 893,042 | ||||
General Motors Acceptance Corporation | ||||||
6.13%, 08/28/07D | 1,740,000 | 1,741,249 | ||||
5.13%, 05/09/08 | 570,000 | 562,995 | ||||
5.85%, 01/14/09D | 220,000 | 216,896 | ||||
5.63%, 05/15/09D | 1,490,000 | 1,457,454 | ||||
7.75%, 01/19/10 | 500,000 | 506,454 | ||||
6.88%, 09/15/11 | 575,000 | 566,108 | ||||
General Motors Corporation | ||||||
8.25%, 07/15/23D | 210,000 | 192,412 | ||||
8.38%, 07/05/33(E) | 170,000 | 219,114 | ||||
Georgia Gulf Corporation | ||||||
9.50%, 10/15/14D | 60,000 | 60,000 | ||||
Georgia-Pacific Corporation | ||||||
8.13%, 05/15/11 | 4,000 | 4,105 | ||||
7.50%, 12/20/12 | 571,428 | 573,445 | ||||
Goldman Sachs Group LP | ||||||
4.50%, 06/15/10D | 930,000 | 907,356 | ||||
Greenpoint Financial Corporation | ||||||
3.20%, 06/06/08 | 300,000 | 293,700 | ||||
HCA, Inc. | ||||||
6.30%, 10/01/12D | 32,000 | 29,680 | ||||
9.13%, 11/15/14 144A | 60,000 | 63,225 | ||||
6.50%, 02/15/16D | 686,000 | 583,958 | ||||
9.25%, 11/15/16 144A | 480,000 | 512,400 | ||||
9.63%, 11/15/16 PIK 144AD | 91,000 | 98,052 | ||||
7.69%, 06/15/25 | 250,000 | 218,698 | ||||
Hertz Corporation | ||||||
8.88%, 01/01/14 | 115,000 | 120,462 | ||||
Hess Corporation | ||||||
7.88%, 10/01/29D | 150,000 | 169,546 | ||||
7.30%, 08/15/31 | 1,170,000 | 1,258,406 | ||||
Host Marriott LP | ||||||
6.75%, 06/01/16D | 30,000 | 29,550 | ||||
HSBC Bank USA NA | ||||||
5.42%, 09/21/07† | 300,000 | 300,089 | ||||
See Notes to Financial Statements.
| 66 |
Table of Contents
| Par | Value | |||||
HSBC Finance Corporation | ||||||
4.63%, 01/15/08D | $ | 1,130,000 | $ | 1,125,769 | ||
8.00%, 07/15/10 | 440,000 | 470,254 | ||||
7.00%, 05/15/12 | 390,000 | 411,044 | ||||
6.38%, 11/27/12 | 70,000 | 71,948 | ||||
Idearc, Inc. | ||||||
8.00%, 11/15/16 | 340,000 | 345,100 | ||||
ILFC E-Capital Trust II | ||||||
6.25%, 12/21/45 144A†D | 280,000 | 273,536 | ||||
Intelsat Corporation | ||||||
9.00%, 06/15/11 | 95,000 | 99,988 | ||||
iStar Financial, Inc. | ||||||
5.13%, 04/01/11D | 175,000 | 171,434 | ||||
5.65%, 09/15/11 | 250,000 | 246,578 | ||||
5.95%, 10/15/13 | 200,000 | 197,279 | ||||
6.50%, 12/15/13 | 125,000 | 126,810 | ||||
JC Penny Co., Inc. | ||||||
7.40%, 04/01/37D | 50,000 | 52,772 | ||||
JPMorgan Chase & Co. | ||||||
5.75%, 01/02/13 | 320,000 | 320,455 | ||||
5.15%, 10/01/15D | 1,890,000 | 1,800,151 | ||||
Kansas City Southern Railway | ||||||
9.50%, 10/01/08 | 119,000 | 123,760 | ||||
Kerr-McGee Corporation | ||||||
6.95%, 07/01/24D | 1,000,000 | 1,040,103 | ||||
7.88%, 09/15/31 | 1,830,000 | 2,120,838 | ||||
Kinder Morgan Energy Partners LP | ||||||
6.30%, 02/01/09 | 150,000 | 151,665 | ||||
6.75%, 03/15/11D | 150,000 | 155,357 | ||||
7.13%, 03/15/12 | 30,000 | 31,591 | ||||
5.00%, 12/15/13D | 200,000 | 189,506 | ||||
6.00%, 02/01/17D | 260,000 | 254,898 | ||||
Koch Forest Products, Inc. | ||||||
6.56%, 12/20/12 | 3,047,619 | 3,058,374 | ||||
6.98%, 12/20/12 | 350,952 | 352,191 | ||||
L-3 Communications Corporation | ||||||
7.63%, 06/15/12 | 250,000 | 257,188 | ||||
6.38%, 10/15/15 | 370,000 | 351,500 | ||||
Lamar Media Corporation | ||||||
7.25%, 01/01/13 | 110,000 | 110,275 | ||||
6.63%, 08/15/15 | 80,000 | 76,200 | ||||
Land O’ Lakes, Inc. | ||||||
9.00%, 12/15/10 | 125,000 | 131,875 | ||||
Lehman Brothers Holdings Capital Trust VII | ||||||
5.86%, 11/29/49†D | 275,000 | 269,661 | ||||
Lehman Brothers Holdings, Inc. | ||||||
5.25%, 02/06/12D | 1,120,000 | 1,101,987 | ||||
Liberty Media Corporation | ||||||
7.88%, 07/15/09 | 10,000 | 10,423 | ||||
5.70%, 05/15/13D | 25,000 | 23,623 | ||||
3.75%, 02/15/30 CONV | 40,000 | 25,050 | ||||
Lincoln National Corporation | ||||||
7.00%, 05/17/49†D | 525,000 | 539,578 | ||||
Lyondell Chemical Co. | ||||||
8.00%, 09/15/14 | 55,000 | 56,788 | ||||
8.25%, 09/15/16 | 35,000 | 36,750 | ||||
Merrill Lynch & Co., Inc. | ||||||
3.38%, 09/14/07 | 420,000 | 418,313 | ||||
Midamerican Energy Holdings Co. | ||||||
6.13%, 04/01/36 | 750,000 | 726,974 | ||||
5.95%, 05/15/37 144A | 150,000 | 141,845 | ||||
Mizuho JGB Investment LLC | ||||||
9.87%, 12/31/49 144A†@ | 250,000 | 259,941 | ||||
Morgan Stanley | ||||||
5.50%, 01/18/08† | 400,000 | 400,326 | ||||
3.63%, 04/01/08D | 110,000 | 108,516 | ||||
5.63%, 01/09/12 | 410,000 | 409,518 | ||||
5.81%, 10/18/16† | 340,000 | 340,231 | ||||
Nelnet, Inc. | ||||||
7.40%, 09/29/36† | 475,000 | 474,007 | ||||
Nevada Power Co. | ||||||
5.88%, 01/15/15 | 350,000 | 343,648 | ||||
New Cingular Wireless Services, Inc. | ||||||
7.88%, 03/01/11 | 650,000 | 699,421 | ||||
8.13%, 05/01/12 | 135,000 | 148,587 | ||||
Nextel Communications, Inc. | ||||||
5.95%, 03/15/14 | 294,000 | 280,400 | ||||
7.38%, 08/01/15 | 130,000 | 130,057 | ||||
Niagara Mohawk Power Corporation | ||||||
7.75%, 10/01/08 | 1,340,000 | 1,374,411 | ||||
Nortek, Inc. | ||||||
8.50%, 09/01/14 | 62,000 | 59,365 | ||||
NRG Energy, Inc. | ||||||
7.25%, 02/01/14 | 220,000 | 221,100 | ||||
7.38%, 02/01/16 | 80,000 | 80,400 | ||||
7.38%, 01/15/17 | 35,000 | 35,219 | ||||
Omnicom Group, Inc. | ||||||
5.90%, 04/15/16 | 700,000 | 692,620 | ||||
ONEOK Partners LP | ||||||
6.65%, 10/01/36 | 375,000 | 373,130 | ||||
Oxford Industries, Inc. | ||||||
8.88%, 06/01/11 | 95,000 | 98,562 | ||||
Pacific Energy Partners LP | ||||||
7.13%, 06/15/14 | 60,000 | 62,141 | ||||
Pacific Gas & Electric Co. | ||||||
6.05%, 03/01/34D | 580,000 | 563,663 | ||||
5.80%, 03/01/37D | 250,000 | 233,985 | ||||
PartnerRe Finance II | ||||||
6.44%, 12/01/49† | 75,000 | 71,343 | ||||
Patrons’ Legacy | ||||||
5.65%, 01/17/17 144A | 1,320,891 | 1,285,155 | ||||
Peabody Energy Corporation | ||||||
6.88%, 03/15/13D | 145,000 | 145,000 | ||||
7.88%, 11/01/26D | 2,000,000 | 2,080,000 | ||||
Pemex Project Funding Master Trust | ||||||
9.13%, 10/13/10 | 1,075,000 | 1,185,188 | ||||
6.63%, 06/15/35D | 60,000 | 60,975 | ||||
PHH Corporation | ||||||
6.00%, 03/01/08 | 1,075,000 | 1,077,532 | ||||
Phoenix Life Insurance Co. | ||||||
7.15%, 12/15/34 144A | 425,000 | 437,714 | ||||
Pogo Producing Co. | ||||||
6.63%, 03/15/15 | 30,000 | 29,850 | ||||
6.88%, 10/01/17D | 145,000 | 144,638 | ||||
Popular North America, Inc. | ||||||
5.20%, 12/12/07 | 400,000 | 399,367 | ||||
4.25%, 04/01/08 | 300,000 | 296,982 | ||||
5.65%, 04/15/09 | 250,000 | 249,944 | ||||
See Notes to Financial Statements.
| 67 |
Table of Contents
Medium-Duration Bond Fund
SCHEDULE OF INVESTMENTS (Continued)
| Par | Value | |||||
Pride International, Inc. | ||||||
7.38%, 07/15/14D | $ | 130,000 | $ | 130,975 | ||
Progress Energy, Inc. | ||||||
5.63%, 01/15/16 | 150,000 | 147,165 | ||||
7.75%, 03/01/31 | 350,000 | 405,821 | ||||
Prudential Funding LLC | ||||||
6.60%, 05/15/08 144A | 600,000 | 605,234 | ||||
PVNGS II Funding Corporation, Inc. | ||||||
8.00%, 12/30/15 | 1,579,000 | 1,724,942 | ||||
Qwest Capital Funding, Inc. | ||||||
7.25%, 02/15/11D | 200,000 | 200,000 | ||||
Qwest Corporation | ||||||
5.63%, 11/15/08D | 600,000 | 600,750 | ||||
8.88%, 03/15/12 | 200,000 | 216,500 | ||||
7.50%, 06/15/23 | 500,000 | 502,500 | ||||
Rabobank Capital Funding II | ||||||
5.26%, 12/29/13 144A† | 50,000 | 48,014 | ||||
Rabobank Capital Funding Trust III | ||||||
5.25%, 10/31/49 144A† | 350,000 | 328,298 | ||||
Reinsurance Group of America, Inc. | ||||||
6.75%, 12/15/35† | 250,000 | 244,005 | ||||
Residential Capital LLC | ||||||
6.38%, 06/30/10 | 850,000 | 839,589 | ||||
6.00%, 02/22/11 | 400,000 | 387,364 | ||||
6.50%, 06/01/12D | 120,000 | 117,216 | ||||
Safeco Corporation | ||||||
4.20%, 02/01/08 | 450,000 | 447,018 | ||||
SemGroup LP | ||||||
8.75%, 11/15/15 144A | 65,000 | 65,650 | ||||
Service Corporation International | ||||||
7.63%, 10/01/18 | 90,000 | 91,575 | ||||
7.50%, 04/01/27 144A | 200,000 | 189,500 | ||||
Sinclair Broadcast Group, Inc. | ||||||
8.00%, 03/15/12D | 9,000 | 9,270 | ||||
SLM Corporation | ||||||
3.54%, 04/01/09† | 1,130,000 | 1,059,567 | ||||
Sonat, Inc. | ||||||
7.63%, 07/15/11 | 460,000 | 480,138 | ||||
Southern Natural Gas Co. | ||||||
8.00%, 03/01/32 | 400,000 | 455,657 | ||||
Sovereign Bank | ||||||
4.38%, 08/01/13† | 525,000 | 518,217 | ||||
Sprint Capital Corporation | ||||||
6.13%, 11/15/08 | 310,000 | 311,857 | ||||
7.63%, 01/30/11 | 250,000 | 263,232 | ||||
8.38%, 03/15/12 | 340,000 | 370,754 | ||||
6.88%, 11/15/28D | 275,000 | 262,474 | ||||
8.75%, 03/15/32 | 410,000 | 461,727 | ||||
Sprint Nextel Corporation | ||||||
6.00%, 12/01/16D | 40,000 | 38,013 | ||||
Steel Dynamics, Inc. | ||||||
6.75%, 04/01/15 144A | 225,000 | 221,625 | ||||
Suburban Propane Partners LP | ||||||
6.88%, 12/15/13D | 195,000 | 189,150 | ||||
Sungard Data Systems, Inc. | ||||||
9.13%, 08/15/13 | 120,000 | 123,450 | ||||
Swiss Re Capital I LP | ||||||
6.85%, 05/29/49 144A†D | 825,000 | 831,238 | ||||
Tenet Healthcare Corporation | ||||||
9.88%, 07/01/14D | 7,000 | 6,965 | ||||
9.25%, 02/01/15 | 1,382,000 | 1,319,810 | ||||
Tennessee Gas Pipeline Co. | ||||||
7.63%, 04/01/37D | 50,000 | 55,115 | ||||
TEPPCO Partners, LP | ||||||
7.00%, 06/01/49† | 75,000 | 72,388 | ||||
Time Warner Cable, Inc. | ||||||
5.40%, 07/02/12 144A | 1,100,000 | 1,081,390 | ||||
6.55%, 05/01/37 144AD | 325,000 | 315,121 | ||||
Time Warner, Inc. | ||||||
5.59%, 11/13/09† | 7,600,000 | 7,611,484 | ||||
6.88%, 05/01/12 | 110,000 | 114,877 | ||||
7.70%, 05/01/32@ | 600,000 | 650,678 | ||||
Time Warner Entertainment Co. LP | ||||||
8.38%, 07/15/33 | 590,000 | 686,695 | ||||
Transcontinental Gas Pipe Line Corporation | ||||||
6.65%, 04/15/08 144A† | 1,500,000 | 1,494,375 | ||||
Transocean, Inc. | ||||||
5.55%, 09/05/08† | 2,000,000 | 2,001,870 | ||||
TXU Corporation | ||||||
4.80%, 11/15/09 | 500,000 | 488,978 | ||||
5.55%, 11/15/14 | 120,000 | 102,471 | ||||
6.50%, 11/15/24 | 130,000 | 108,141 | ||||
6.55%, 11/15/34D | 1,450,000 | 1,180,038 | ||||
TXU Energy Co. LLC | ||||||
7.00%, 03/15/13 | 150,000 | 154,904 | ||||
Unilever Capital Corporation | ||||||
7.13%, 11/01/10D | 285,000 | 298,963 | ||||
Union Pacific Corporation | ||||||
6.65%, 01/15/11 | 260,000 | 268,399 | ||||
United Air Lines, Inc. | ||||||
9.21%, 01/21/17#@ | 108,051 | 7,564 | ||||
9.56%, 10/19/18#@ | 236,236 | 136,574 | ||||
United Telephone Co. of Kansas | ||||||
6.89%, 07/01/08@ | 500,000 | 501,058 | ||||
Ventas Realty LP | ||||||
8.75%, 05/01/09 | 70,000 | 73,587 | ||||
9.00%, 05/01/12 | 30,000 | 32,925 | ||||
6.50%, 06/01/16 | 70,000 | 68,600 | ||||
Verizon Communications, Inc. | ||||||
5.55%, 02/15/16 | 2,100,000 | 2,049,400 | ||||
5.85%, 09/15/35D | 600,000 | 552,131 | ||||
Verizon Global Funding Corporation | ||||||
7.38%, 09/01/12 | 290,000 | 312,678 | ||||
4.38%, 06/01/13D | 140,000 | 130,535 | ||||
Visteon Corporation | ||||||
8.25%, 08/01/10D | 145,000 | 144,638 | ||||
Wachovia Bank NA | ||||||
5.39%, 03/23/09† | 750,000 | 750,470 | ||||
Wachovia Capital Trust III | ||||||
5.80%, 08/29/49† | 580,000 | 577,947 | ||||
Wachovia Corporation | ||||||
5.25%, 08/01/14D | 1,850,000 | 1,799,678 | ||||
Washington Mutual, Inc. | ||||||
8.25%, 04/01/10 | 250,000 | 266,180 | ||||
Waste Management, Inc. | ||||||
7.75%, 05/15/32 | 980,000 | 1,081,364 | ||||
Wells Fargo Capital X | ||||||
5.95%, 12/15/36D | 200,000 | 187,173 | ||||
See Notes to Financial Statements.
| 68 |
Table of Contents
| Par | Value | |||||
Westlake Chemical Corporation | ||||||
6.63%, 01/15/16D | $ | 85,000 | $ | 80,962 | ||
Weyerhaeuser Co. | ||||||
6.75%, 03/15/12 | 735,000 | 761,232 | ||||
Williams Cos., Inc. | ||||||
7.50%, 01/15/31 | 20,000 | 20,800 | ||||
7.75%, 06/15/31D | 200,000 | 212,750 | ||||
8.75%, 03/15/32D | 983,000 | 1,142,738 | ||||
Windstream Corporation | ||||||
8.63%, 08/01/16 | 490,000 | 520,625 | ||||
Xerox Corporation | ||||||
7.13%, 06/15/10 | 250,000 | 259,452 | ||||
6.75%, 02/01/17 | 70,000 | 71,931 | ||||
XTO Energy, Inc. | ||||||
7.50%, 04/15/12 | 43,000 | 46,276 | ||||
ZFS Finance USA Trust II | ||||||
6.45%, 12/15/49 144A† | 500,000 | 485,788 | ||||
Total Corporate Bonds (Cost $147,533,163) | 147,355,807 | |||||
FOREIGN BONDS — 10.6% | ||||||
Australia — 0.0% | ||||||
QBE Insurance Group, Ltd. | ||||||
5.65%, 07/01/23 144A† | 525,000 | 506,591 | ||||
Bermuda — 0.5% | ||||||
Arch Capital Group, Ltd. | ||||||
7.35%, 05/01/34 | 475,000 | 493,281 | ||||
Aspen Insurance Holdings, Ltd. | ||||||
6.00%, 08/15/14 | 325,000 | 314,970 | ||||
Catlin Insurance Co., Ltd. | ||||||
7.25%, 12/31/49 144A† | 375,000 | 357,417 | ||||
Endurance Specialty Holdings, Ltd. | ||||||
6.15%, 10/15/15D | 425,000 | 412,301 | ||||
Intelsat Bermuda, Ltd. | ||||||
9.25%, 06/15/16D | 60,000 | 64,050 | ||||
Merna Reinsurance, Ltd. | ||||||
7.11%, 07/01/12 144A† | 950,000 | 950,000 | ||||
Tyco International Group SA | ||||||
6.13%, 11/01/08 | 90,000 | 90,832 | ||||
6.00%, 11/15/13 | 2,920,000 | 3,002,300 | ||||
| 5,685,151 | ||||||
Brazil — 0.2% | ||||||
Federative Republic of Brazil | ||||||
8.88%, 04/15/24 | 99,000 | 122,018 | ||||
10.13%, 05/15/27 | 21,000 | 29,662 | ||||
7.13%, 01/20/37D | 28,000 | 30,310 | ||||
11.00%, 08/17/40D | 1,000,000 | 1,312,750 | ||||
Petrobras International Finance Co. | ||||||
6.13%, 10/06/16 | 870,000 | 856,950 | ||||
| 2,351,690 | ||||||
Canada — 0.5% | ||||||
Anadarko Finance Co. | ||||||
7.50%, 05/01/31 | 460,000 | 495,662 | ||||
Bombardier, Inc. | ||||||
7.25%, 11/15/16 144A(E)@ | 250,000 | 354,013 | ||||
Canadian Government Inflationary Index | ||||||
4.00%, 12/01/31(C) | 230,000 | 358,153 | ||||
Canadian Natural Resources, Ltd. | ||||||
5.70%, 05/15/17D | 225,000 | 217,550 | ||||
5.85%, 02/01/35D | 50,000 | 45,217 | ||||
6.50%, 02/15/37D | 450,000 | 443,102 | ||||
6.25%, 03/15/38 | 150,000 | 142,395 | ||||
ChevronTexaco Capital Co. | ||||||
3.50%, 09/17/07D | 690,000 | 687,681 | ||||
Conoco Funding Co. | ||||||
7.25%, 10/15/31 | 315,000 | 356,836 | ||||
General Motors Nova Scotia Finance Co. | ||||||
6.85%, 10/15/08D | 1,670,000 | 1,665,825 | ||||
Hydro Quebec | ||||||
6.30%, 05/11/11 | 305,000 | 315,203 | ||||
OPTI Canada, Inc. | ||||||
8.25%, 12/15/14 144AD | 125,000 | 127,500 | ||||
Quebecor Media, Inc. | ||||||
7.75%, 03/15/16 | 40,000 | 40,800 | ||||
Rogers Cable, Inc. | ||||||
5.50%, 03/15/14D | 250,000 | 242,765 | ||||
6.75%, 03/15/15 | 10,000 | 10,325 | ||||
Rogers Wireless, Inc. | ||||||
6.38%, 03/01/14D | 90,000 | 91,083 | ||||
Sun Media Corporation | ||||||
7.63%, 02/15/13 | 50,000 | 50,500 | ||||
Western Oil Sands, Inc. | ||||||
8.38%, 05/01/12 | 165,000 | 181,294 | ||||
| 5,825,904 | ||||||
Cayman Islands — 0.5% | ||||||
MUFG Capital Finance 1, Ltd. | ||||||
6.35%, 07/25/25†D | 450,000 | 441,034 | ||||
Petroleum Export, Ltd. | ||||||
4.62%, 06/15/10 144A | 600,000 | 592,681 | ||||
4.63%, 06/15/10 144A | 800,000 | 790,249 | ||||
Resona Preferred Global Securities Cayman, Ltd. | ||||||
7.19%, 07/30/49 144A†D | 690,000 | 706,593 | ||||
Shinsei Finance Cayman, Ltd. | ||||||
6.42%, 07/20/49 144A†D | 830,000 | 808,358 | ||||
Systems 2001 Asset Trust LLC | ||||||
6.66%, 09/15/13 144A | 807,465 | 837,531 | ||||
Vale Overseas, Ltd. | ||||||
8.25%, 01/17/34D | 40,000 | 46,988 | ||||
6.88%, 11/21/36 | 1,126,000 | 1,134,654 | ||||
Willow Re, Ltd. | ||||||
10.49%, 06/16/10 144A† | 300,000 | 299,957 | ||||
| 5,658,045 | ||||||
Chile — 0.0% | ||||||
Codelco, Inc. | ||||||
4.75%, 10/15/14 144A | 210,000 | 196,331 | ||||
Colombia — 0.1% | ||||||
Republic of Colombia | ||||||
7.38%, 09/18/37D | 458,000 | 509,525 | ||||
France — 3.1% | ||||||
AXA SA | ||||||
6.46%, 12/14/18 144A†D | 275,000 | 256,143 | ||||
6.38%, 12/14/36 144A†D | 275,000 | 248,843 | ||||
Compagnie Generale de Geophysique - Veritas | ||||||
7.75%, 05/15/17 | 155,000 | 157,712 | ||||
See Notes to Financial Statements.
| 69 |
Table of Contents
Medium-Duration Bond Fund
SCHEDULE OF INVESTMENTS (Continued)
| Par | Value | |||||
Compagnie Generale de Geophysique SA | ||||||
7.50%, 05/15/15 | $ | 200,000 | $ | 201,000 | ||
French Treasury Bill | ||||||
3.98%, 09/13/07(E)W | 27,060,000 | 36,331,122 | ||||
Legrand SA | ||||||
8.50%, 02/15/25D | 250,000 | 293,125 | ||||
| 37,487,945 | ||||||
Germany — 1.5% | ||||||
Bundesobligation | ||||||
4.50%, 08/17/07(E) | 11,500,000 | 15,569,492 | ||||
Deutsche Bundesrepublik | ||||||
3.75%, 01/04/15(E)D | 1,450,000 | 1,862,835 | ||||
| 17,432,327 | ||||||
Iceland — 0.5% | ||||||
Glitnir Banki HF | ||||||
6.33%, 07/28/11 144A | 600,000 | 611,229 | ||||
6.69%, 06/15/16 144A† | 1,000,000 | 1,030,862 | ||||
Kaupthing Bank HF | ||||||
6.05%, 04/12/11 144A† | 1,630,000 | 1,644,015 | ||||
5.75%, 10/04/11 144A | 250,000 | 249,371 | ||||
7.13%, 05/19/16 144AD | 350,000 | 370,336 | ||||
Landsbanki Islands HF | ||||||
6.10%, 08/25/11 144A | 1,500,000 | 1,520,340 | ||||
| 5,426,153 | ||||||
India — 0.1% | ||||||
ICICI Bank, Ltd. | ||||||
6.38%, 04/30/22 144A†D | 618,000 | 588,298 | ||||
6.38%, 04/30/22†D | 430,000 | 409,026 | ||||
| 997,324 | ||||||
Ireland — 0.1% | ||||||
DEPFA ACS Bank | ||||||
5.13%, 03/16/37 144A | 800,000 | 735,719 | ||||
VTB 24 Capital PLC | ||||||
6.15%, 12/07/09† | 370,000 | 372,464 | ||||
| 1,108,183 | ||||||
Italy — 0.2% | ||||||
Republic of Italy | ||||||
3.80%, 03/27/08(J) | 156,000,000 | 1,295,196 | ||||
Telecom Italia Capital SA | ||||||
4.00%, 01/15/10D | 225,000 | 216,426 | ||||
5.25%, 11/15/13D | 165,000 | 157,433 | ||||
4.95%, 09/30/14D | 835,000 | 774,798 | ||||
5.25%, 10/01/15 | 130,000 | 121,080 | ||||
| 2,564,933 | ||||||
Japan — 0.1% | ||||||
Aiful Corporation | ||||||
5.00%, 08/10/10 144A | 600,000 | 585,245 | ||||
Resona Bank, Ltd. | ||||||
4.13%, 06/27/49 144A(E)†@ | 500,000 | 641,747 | ||||
5.85%, 07/15/49 144A†@ | 475,000 | 454,922 | ||||
| 1,681,914 | ||||||
Luxembourg — 0.9% | ||||||
FMC Finance III SA | ||||||
6.88%, 07/15/17 144A | 250,000 | 246,250 | ||||
Gaz Capital for Gazprom | ||||||
6.21%, 11/22/16 144AD | 1,300,000 | 1,269,450 | ||||
6.51%, 03/07/22 144AD | 640,000 | 633,280 | ||||
GazInvest Luxemburg SA for Gazprombank | ||||||
7.25%, 10/30/08 | 700,000 | 714,490 | ||||
RSHB Capital SA for OJSC Russian Agricultural Bank | ||||||
6.30%, 05/15/17 144A | 1,240,000 | 1,216,812 | ||||
TNK-BP Finance SA | ||||||
7.50%, 07/18/16 144A | 780,000 | 806,130 | ||||
6.63%, 03/20/17 144AD | 260,000 | 252,538 | ||||
Unicredito Luxembourg Finance SA | ||||||
5.43%, 10/24/08 144A† | 4,000,000 | 4,002,376 | ||||
VTB Capital SA for Vneshtorgbank | ||||||
5.96%, 08/01/08† | 800,000 | 801,232 | ||||
5.96%, 08/01/08 144A† | 970,000 | 972,183 | ||||
| 10,914,741 | ||||||
Marshall Islands — 0.0% | ||||||
Teekay Shipping Corporation | ||||||
8.88%, 07/15/11D | 176,000 | 187,440 | ||||
Mexico — 0.2% | ||||||
America Movil SA de CV | ||||||
5.50%, 03/01/14D | 300,000 | 294,706 | ||||
United Mexican States | ||||||
6.75%, 09/27/34D | 2,100,000 | 2,244,900 | ||||
| 2,539,606 | ||||||
Netherlands — 0.5% | ||||||
Deutsche Telekom International Finance BV | ||||||
5.75%, 03/23/16 | 510,000 | 498,351 | ||||
8.25%, 06/15/30 | 600,000 | 721,169 | ||||
Intergas Finance BV | ||||||
6.38%, 05/14/17 144AD | 980,000 | 940,800 | ||||
NXP BV | ||||||
7.88%, 10/15/14 | 30,000 | 29,700 | ||||
9.50%, 10/15/15D | 105,000 | 103,950 | ||||
Rabobank Nederland | ||||||
0.20%, 06/20/08(J) | 150,000,000 | 1,210,215 | ||||
Royal KPN NV | ||||||
8.00%, 10/01/10 | 780,000 | 835,410 | ||||
TPSA Finance BV | ||||||
7.75%, 12/10/08 144AD | 375,000 | 386,190 | ||||
TuranAlem Finance BV | ||||||
8.25%, 01/22/37D | 100,000 | 96,489 | ||||
8.25%, 01/22/37 144A | 1,440,000 | 1,389,600 | ||||
| 6,211,874 | ||||||
Panama — 0.1% | ||||||
Republic of Panama | ||||||
7.13%, 01/29/26 | 538,000 | 575,660 | ||||
6.70%, 01/26/36D | 549,000 | 562,725 | ||||
| 1,138,385 | ||||||
Russia — 0.2% | ||||||
Russian Federation | ||||||
8.25%, 03/31/10 | 1,933,387 | 2,011,109 | ||||
7.50%, 03/31/30 STEP | 656,700 | 724,410 | ||||
| 2,735,519 | ||||||
South Korea — 0.0% | ||||||
Export-Import Bank of Korea | ||||||
5.25%, 02/10/14 144A | 235,000 | 228,610 | ||||
See Notes to Financial Statements.
| 70 |
Table of Contents
| Par | Value | |||||
Supranational — 0.8% | ||||||
Inter-American Development Bank | ||||||
1.00%, 03/24/15 | $ | 13,000,000 | $ | 9,270,911 | ||
United Kingdom — 0.5% | ||||||
HBOS Capital Funding LP | ||||||
6.07%, 12/31/49 144A† | 600,000 | 598,005 | ||||
HBOS Treasury Services PLC | ||||||
5.25%, 02/21/17 144A | 3,800,000 | 3,734,997 | ||||
HSBC Capital Funding LP | ||||||
4.61%, 12/29/49 144A† | 960,000 | 902,116 | ||||
Royal Bank of Scotland Group PLC | ||||||
5.35%, 12/21/07 144A† | 1,100,000 | 1,100,671 | ||||
| 6,335,789 | ||||||
Venezuela — 0.0% | ||||||
Petrozuata Finance, Inc. | ||||||
8.22%, 04/01/17 144A | 140,000 | 140,700 | ||||
Total Foreign Bonds (Cost $127,224,155) | 127,135,591 | |||||
LOAN AGREEMENTS — 0.8% | ||||||
Ford Motor Co. Tranche B | ||||||
8.32%, 11/29/13† | 2,686,500 | 2,703,366 | ||||
SLM Corporation Bridge Loan | ||||||
0.00%, 06/30/08@ | 7,200,000 | 7,164,000 | ||||
Total Loan Agreements (Cost $9,850,500) | 9,867,366 | |||||
MORTGAGE-BACKED SECURITIES — 57.4% | ||||||
ABN AMRO Mortgage Corporation | ||||||
13.80%, 06/25/33 IOW@ | 633,151 | 74,279 | ||||
Bank of America Commercial Mortgage, Inc. | ||||||
5.12%, 10/10/45† | 3,000,000 | 2,863,442 | ||||
5.63%, 07/10/46 | 1,000,000 | 981,824 | ||||
5.35%, 09/10/47 STRIP† | 3,000,000 | 2,893,355 | ||||
Bank of America Funding Corporation | ||||||
5.40%, 07/20/36† | 3,269,363 | 3,265,462 | ||||
Bear Stearns Adjustable Rate Mortgage Trust | ||||||
5.63%, 02/25/33† | 364,398 | 361,866 | ||||
3.52%, 06/25/34† | 1,300,000 | 1,264,625 | ||||
Bear Stearns Alt-A Trust | ||||||
5.64%, 02/25/34 STEP | 181,763 | 181,780 | ||||
5.38%, 05/25/35† | 913,185 | 905,956 | ||||
CC Mortgage Funding Corporation | ||||||
5.67%, 07/25/34† | 299,541 | 299,585 | ||||
Chase Mortgage Finance Corporation | ||||||
4.36%, 02/01/37† | 1,862,717 | 1,846,419 | ||||
4.50%, 02/01/37† | 925,397 | 917,171 | ||||
Citigroup Commercial Mortgage Trust | ||||||
5.39%, 11/15/36 144A† | 506,454 | 506,755 | ||||
Commerical Mortgage Asset Trust | ||||||
7.55%, 01/17/10† | 440,000 | 453,389 | ||||
Countrywide Alternative Loan Trust | ||||||
5.50%, 10/25/33 | 223,242 | 213,162 | ||||
5.67%, 09/25/35† | 3,067,216 | 3,072,731 | ||||
5.65%, 10/25/35† | 1,988,917 | 1,990,425 | ||||
5.62%, 11/20/35† | 1,067,976 | 1,069,748 | ||||
5.64%, 11/20/35† | 2,191,274 | 2,195,721 | ||||
5.65%, 11/20/35† | 3,320,543 | 3,332,257 | ||||
5.70%, 11/20/35† | 957,849 | 962,110 | ||||
5.59%, 12/25/35† | 1,095,857 | 1,095,788 | ||||
5.62%, 12/25/35† | 1,818,748 | 1,819,224 | ||||
5.59%, 02/25/36† | 1,989,518 | 1,992,535 | ||||
Countrywide Home Loan Mortgage Pass-Through Trust | ||||||
5.56%, 03/25/36† | 799,540 | 800,644 | ||||
CS First Boston Mortgage Securities Corporation | ||||||
11.31%, 04/25/33 IOW@ | 42,483 | 1,667 | ||||
10.47%, 05/25/33 IOW@ | 36,213 | 903 | ||||
13.79%, 06/25/33 IOW@ | 36,926 | 1,822 | ||||
8.47%, 07/25/33 IOW†@ | 463,096 | 1,145 | ||||
13.58%, 07/25/33 IOW@ | 786,893 | 104,456 | ||||
8.49%, 08/25/33 IOW†@ | 560,675 | 2,031 | ||||
6.53%, 06/15/34 | 1,500,000 | 1,544,350 | ||||
Federal Home Loan Mortgage Corporation | ||||||
7.00%, 11/01/14 | 90,947 | 93,784 | ||||
7.00%, 04/01/15 | 61,548 | 63,468 | ||||
8.00%, 06/01/15 | 503 | 504 | ||||
7.00%, 12/01/15 | 60,944 | 62,752 | ||||
6.00%, 04/15/16 | 80,023 | 79,975 | ||||
8.50%, 06/01/16 | 15,166 | 16,078 | ||||
4.50%, 05/01/18 | 205,824 | 196,196 | ||||
4.50%, 06/01/18 | 48,854 | 46,566 | ||||
8.50%, 06/01/18 | 10,594 | 11,231 | ||||
4.50%, 09/01/18 | 194,879 | 185,751 | ||||
4.50%, 10/01/18 | 143,455 | 136,736 | ||||
4.50%, 11/01/18 | 148,022 | 141,089 | ||||
4.50%, 12/01/18 | 456,254 | 434,883 | ||||
5.00%, 12/01/18 | 856,633 | 831,019 | ||||
4.50%, 01/01/19 | 54,264 | 51,723 | ||||
4.50%, 03/01/19 | 107,177 | 102,143 | ||||
4.50%, 06/01/19 | 1,986,107 | 1,893,079 | ||||
5.00%, 06/01/20 | 725,530 | 702,978 | ||||
5.00%, 07/01/20 | 737,208 | 713,002 | ||||
0.07%, 04/15/22 POW@ | 42,926 | 42,820 | ||||
8.00%, 08/01/24 | 7,261 | 7,684 | ||||
7.50%, 11/01/29 | 22,145 | 23,155 | ||||
6.50%, 12/01/29 | 478,157 | 488,162 | ||||
7.50%, 12/01/29 | 35,266 | 36,875 | ||||
7.50%, 02/01/31 | 49,526 | 51,679 | ||||
7.19%, 07/01/31† | 63,791 | 64,117 | ||||
7.23%, 08/01/31† | 11,079 | 11,156 | ||||
7.50%, 11/01/31 | 48,679 | 50,778 | ||||
7.10%, 04/01/32† | 12,012 | 12,116 | ||||
4.28%, 03/01/34† | 17,911 | 17,663 | ||||
5.00%, 07/01/34 TBA | 200,000 | 187,438 | ||||
5.50%, 05/01/35 | 2,622,585 | 2,535,333 | ||||
0.00%, 08/15/35W† | 146,106 | 166,353 | ||||
5.00%, 09/01/35 | 2,191,584 | 2,059,680 | ||||
5.00%, 10/01/35 | 869,525 | 817,190 | ||||
5.00%, 11/01/35 | 1,927,086 | 1,811,100 | ||||
5.00%, 12/01/35 | 3,811,769 | 3,582,348 | ||||
6.00%, 02/01/36 | 2,120,085 | 2,102,082 | ||||
6.07%, 01/01/37† | 2,499,507 | 2,508,812 | ||||
4.00%, 01/01/49 | 4,398,394 | 4,086,577 | ||||
See Notes to Financial Statements.
| 71 |
Table of Contents
Medium-Duration Bond Fund
SCHEDULE OF INVESTMENTS (Continued)
| Par | Value | |||||
Federal Housing Administration | ||||||
7.43%, 10/01/18 | $ | 215,186 | $ | 213,017 | ||
Federal National Mortgage Association | ||||||
6.50%, 05/25/08 | 62,068 | 62,103 | ||||
4.00%, 06/01/13 | 97,621 | 94,011 | ||||
4.00%, 07/01/13 | 130,198 | 125,383 | ||||
4.00%, 08/01/13 | 181,727 | 174,938 | ||||
4.00%, 09/01/13 | 344,576 | 331,569 | ||||
4.00%, 10/01/13 | 712,974 | 685,754 | ||||
8.00%, 06/01/15 | 44,852 | 46,912 | ||||
8.00%, 06/15/15 | 13,807 | 14,441 | ||||
8.00%, 07/01/15 | 32,880 | 34,390 | ||||
8.00%, 09/01/15 | 71,610 | 73,746 | ||||
5.00%, 12/25/15 | 244,031 | 242,448 | ||||
6.00%, 05/01/16 | 201,792 | 202,995 | ||||
6.00%, 07/01/16 | 25,744 | 25,897 | ||||
6.00%, 07/19/16 TBA | 550,000 | 552,406 | ||||
5.00%, 11/01/17 | 253,685 | 246,068 | ||||
5.00%, 12/01/17 | 2,003,042 | 1,942,399 | ||||
5.00%, 01/01/18 | 3,171,578 | 3,076,439 | ||||
5.00%, 02/01/18 | 558,525 | 541,773 | ||||
5.50%, 02/01/18 | 218,483 | 215,244 | ||||
4.50%, 04/01/18 | 165,967 | 158,139 | ||||
5.00%, 04/01/18 | 158,532 | 153,794 | ||||
4.50%, 05/01/18 | 1,421,285 | 1,354,251 | ||||
5.00%, 05/01/18 | 1,035,660 | 1,004,704 | ||||
4.50%, 06/01/18 | 3,476,288 | 3,312,330 | ||||
5.00%, 06/01/18 | 131,993 | 127,561 | ||||
4.50%, 07/01/18 | 331,071 | 315,456 | ||||
4.00%, 09/01/18 | 4,388,031 | 4,083,836 | ||||
4.50%, 09/01/18 | 2,876,316 | 2,740,653 | ||||
4.50%, 10/01/18 | 76,218 | 72,623 | ||||
4.50%, 11/01/18 | 294,528 | 280,637 | ||||
5.00%, 11/01/18 | 534,504 | 518,527 | ||||
4.50%, 12/01/18 | 367,463 | 350,132 | ||||
4.50%, 01/01/19 | 76,891 | 73,265 | ||||
4.50%, 03/01/19 | 106,706 | 101,673 | ||||
5.00%, 04/01/19 | 887,978 | 861,436 | ||||
4.00%, 05/01/19 | 11,565,637 | 10,751,186 | ||||
4.50%, 07/01/19 | 66,355 | 63,132 | ||||
4.50%, 08/01/19 | 59,989 | 57,075 | ||||
4.50%, 09/01/19 | 893,608 | 851,461 | ||||
4.50%, 03/01/20 | 255,531 | 243,478 | ||||
4.50%, 04/01/20 | 665,812 | 634,408 | ||||
4.50%, 08/01/20 | 407,666 | 387,011 | ||||
4.50%, 09/01/20 | 298,469 | 283,346 | ||||
4.50%, 03/01/21 | 374,788 | 355,618 | ||||
4.50%, 08/01/21 | 34,069 | 32,327 | ||||
6.67%, 08/25/21 IOW@ | 290 | 8,088 | ||||
8.41%, 10/25/21 IOW@ | 566 | 12,324 | ||||
16.81%, 01/25/22† | 152,585 | 169,582 | ||||
4.75%, 03/25/22† | 131,759 | 131,164 | ||||
4.50%, 04/01/22 | 336,927 | 319,718 | ||||
9.50%, 05/01/22 | 7,226 | 7,828 | ||||
4.50%, 06/01/22 | 1,548,379 | 1,469,292 | ||||
5.00%, 07/01/22 TBA | 7,500,000 | 7,246,875 | ||||
5.50%, 07/01/22 TBA | 10,800,000 | 10,638,000 | ||||
5.63%, 07/01/22† | 33,069 | 33,364 | ||||
6.00%, 01/01/23 | 181,196 | 181,849 | ||||
9.50%, 07/01/24 | 13,253 | 14,304 | ||||
5.61%, 07/01/27† | 45,378 | 45,699 | ||||
7.04%, 08/01/27† | 116,921 | 117,386 | ||||
5.61%, 11/01/27† | 96,684 | 97,369 | ||||
6.50%, 12/25/28 | 9,757 | 9,719 | ||||
7.39%, 02/01/30† | 185,188 | 187,970 | ||||
5.92%, 05/25/30† | 2,472,501 | 2,485,770 | ||||
7.38%, 06/01/30† | 32,675 | 33,185 | ||||
8.00%, 10/01/30 | 75,306 | 79,331 | ||||
5.77%, 10/18/30† | 73,074 | 73,789 | ||||
7.36%, 12/01/30† | 19,701 | 19,937 | ||||
5.61%, 01/01/31† | 13,557 | 13,662 | ||||
6.95%, 05/01/31† | 19,223 | 19,167 | ||||
6.88%, 06/01/31† | 71,719 | 72,598 | ||||
6.92%, 06/01/31† | 12,620 | 12,703 | ||||
6.00%, 01/01/32 | 109,693 | 109,206 | ||||
6.00%, 03/01/32 | 369,869 | 368,303 | ||||
6.50%, 03/01/32 | 426,483 | 437,798 | ||||
6.00%, 04/01/32 | 774,250 | 770,662 | ||||
5.55%, 06/01/32† | 22,811 | 22,989 | ||||
6.50%, 07/01/32 TBA | 21,480,000 | 21,681,375 | ||||
5.63%, 08/01/32† | 41,823 | 42,153 | ||||
7.13%, 02/01/33† | 9,079 | 9,132 | ||||
5.50%, 05/01/33 | 19,638,683 | 19,027,761 | ||||
5.63%, 05/01/33† | 95,152 | 95,897 | ||||
4.50%, 07/01/33 TBA | 1,800,000 | 1,636,312 | ||||
0.01%, 07/25/33 IOW†@ | 457,176 | 33,050 | ||||
3.85%, 10/01/33† | 1,485,481 | 1,483,896 | ||||
5.50%, 04/01/34 | 15,777,371 | 15,287,935 | ||||
0.01%, 04/25/34 IOW†@ | 659,244 | 49,196 | ||||
0.01%, 06/25/34 IOW†@ | 1,001,986 | 79,080 | ||||
6.00%, 07/01/34 TBA | 44,150,000 | 43,667,087 | ||||
5.50%, 09/01/34 | 15,114,219 | 14,633,362 | ||||
7.50%, 09/01/34 | 38,655 | 40,179 | ||||
4.50%, 10/01/34 | 329,303 | 300,357 | ||||
6.00%, 10/01/34 | 190,097 | 188,702 | ||||
4.50%, 11/01/34 | 1,374,851 | 1,253,172 | ||||
5.50%, 11/01/34 | 19,360,441 | 18,744,491 | ||||
4.50%, 12/01/34 | 418,396 | 381,155 | ||||
4.61%, 12/01/34† | 843,850 | 831,492 | ||||
6.00%, 01/01/35 | 2,650,870 | 2,631,426 | ||||
4.50%, 02/01/35 | 453,118 | 412,787 | ||||
5.50%, 02/01/35 | 25,087,601 | 24,289,442 | ||||
4.50%, 03/01/35 | 765,029 | 696,367 | ||||
4.50%, 03/01/35 | 643,110 | 585,390 | ||||
4.50%, 03/01/35 | 404,366 | 368,374 | ||||
4.50%, 04/01/35 | 973,246 | 885,896 | ||||
4.50%, 05/01/35 | 834,166 | 759,298 | ||||
6.00%, 05/01/35 | 3,280,170 | 3,250,713 | ||||
7.50%, 05/01/35 | 424,668 | 439,343 | ||||
0.17%, 05/25/35W† | 97,956 | 100,746 | ||||
7.50%, 06/01/35 | 55,639 | 57,561 | ||||
4.50%, 07/01/35 | 482,548 | 439,239 | ||||
5.00%, 07/01/35 TBA | 72,750,000 | 68,157,656 | ||||
5.50%, 07/01/35 TBA | 3,800,000 | 3,664,625 | ||||
6.00%, 07/01/35 | 1,075,860 | 1,066,198 | ||||
5.50%, 07/13/35 TBA | 62,100,000 | 59,887,688 | ||||
4.50%, 09/01/35 | 131,499 | 119,697 | ||||
5.50%, 09/01/35 | 1,713,194 | 1,656,542 | ||||
4.50%, 10/01/35 | 329,950 | 300,336 | ||||
6.00%, 10/01/35 | 317,733 | 314,880 | ||||
7.50%, 10/01/35 | 870,981 | 901,080 | ||||
5.61%, 11/01/35† | 42,246 | 42,583 | ||||
6.00%, 11/01/35 | 1,706,650 | 1,691,324 | ||||
7.01%, 11/01/35† | 587,987 | 609,034 | ||||
7.03%, 11/01/35† | 1,808,750 | 1,873,507 | ||||
7.04%, 11/01/35† | 561,984 | 582,113 | ||||
See Notes to Financial Statements.
| 72 |
Table of Contents
| Par | Value | |||||
5.00%, 02/01/36 | $ | 15,603,886 | $ | 14,660,547 | ||
6.00%, 02/01/36 | 1,213,766 | 1,201,456 | ||||
6.00%, 03/01/36 | 918,940 | 909,619 | ||||
5.50%, 04/01/36 | 798,826 | 765,826 | ||||
5.66%, 05/01/36† | 558,401 | 562,921 | ||||
6.00%, 05/01/36 | 914,743 | 905,466 | ||||
5.50%, 06/01/36 | 954,985 | 921,519 | ||||
6.00%, 07/01/36 | 1,307,710 | 1,294,446 | ||||
5.00%, 07/13/36 TBA | 3,000,000 | 2,810,625 | ||||
6.00%, 08/01/36 | 953,158 | 943,491 | ||||
7.50%, 08/01/36 | 43,517 | 45,011 | ||||
6.00%, 09/01/36 | 219,000 | 216,779 | ||||
0.00%, 09/25/36 W† | 93,999 | 99,909 | ||||
6.00%, 10/01/36 | 12,002,594 | 11,881,926 | ||||
7.50%, 10/01/36 | 388,448 | 401,783 | ||||
5.00%, 01/01/37 | 500,000 | 468,495 | ||||
6.00%, 01/01/37 | 949,132 | 939,505 | ||||
5.52%, 02/01/37† | 4,870,022 | 4,852,903 | ||||
6.50%, 02/01/37 | 7,119,928 | 7,187,673 | ||||
5.00%, 03/01/37 | 2,999,998 | 2,810,967 | ||||
6.50%, 03/01/37 | 1,588,046 | 1,603,115 | ||||
0.00%, 04/15/37 W† | 98,156 | 109,742 | ||||
5.61%, 12/01/37† | 202,297 | 203,930 | ||||
5.61%, 01/01/38† | 91,364 | 92,106 | ||||
6.38%, 06/01/40† | 172,459 | 175,724 | ||||
6.38%, 10/01/40† | 450,756 | 458,818 | ||||
5.61%, 11/01/40† | 72,512 | 73,106 | ||||
FFCA Secured Lending Corporation | ||||||
8.70%, 07/18/20 IO 144AW†@ | 1,468,630 | 54,679 | ||||
FHLMC Structured Pass-Through Securities | ||||||
6.43%, 07/25/44† | 3,305,274 | 3,331,177 | ||||
First Horizon Alternative Mortgage Securities | ||||||
4.74%, 06/25/34† | 1,068,249 | 1,054,438 | ||||
First Union National Bank Commercial Mortgage Trust | ||||||
7.20%, 10/01/32 | 1,500,000 | 1,565,855 | ||||
General Electric Capital Commercial Mortgage Corporation | ||||||
5.51%, 11/10/45† | 1,230,000 | 1,196,349 | ||||
GMAC Commercial Mortgage Securities, Inc. | ||||||
6.28%, 11/15/39 | 2,000,000 | 2,049,292 | ||||
Government National Mortgage Association | ||||||
7.00%, 10/15/25 | 67,416 | 70,316 | ||||
7.00%, 01/15/26 | 28,354 | 29,572 | ||||
7.00%, 07/15/27 | 220,564 | 230,034 | ||||
7.00%, 12/15/27 | 4,078 | 4,253 | ||||
7.00%, 01/15/28 | 33,053 | 34,456 | ||||
7.00%, 03/15/28 | 265,203 | 276,590 | ||||
7.00%, 07/15/28 | 28,521 | 29,732 | ||||
7.50%, 07/15/28 | 15,646 | 16,395 | ||||
6.50%, 08/15/28 | 29,517 | 30,154 | ||||
7.00%, 08/15/28 | 42,926 | 44,749 | ||||
7.50%, 08/15/28 | 24,189 | 25,347 | ||||
6.50%, 09/15/28 | 176,444 | 180,254 | ||||
7.00%, 10/15/28 | 79,881 | 83,274 | ||||
7.50%, 03/15/29 | 69,938 | 73,302 | ||||
7.50%, 11/15/29 | 42,321 | 44,335 | ||||
5.13%, 11/20/29† | 131,347 | 132,978 | ||||
8.50%, 08/15/30 | 5,926 | 6,372 | ||||
8.50%, 11/20/30 | 43,780 | 46,900 | ||||
6.50%, 08/15/31 | 256,762 | 260,874 | ||||
7.50%, 08/15/31 | 92,826 | 97,196 | ||||
6.50%, 10/15/31 | 390,490 | 397,255 | ||||
6.00%, 11/15/31 | 1,079,849 | 1,074,322 | ||||
6.50%, 11/15/31 | 389,550 | 395,787 | ||||
6.00%, 12/15/31 | 304,789 | 303,229 | ||||
6.00%, 01/15/32 | 547,240 | 546,049 | ||||
6.00%, 02/15/32 | 585,037 | 582,042 | ||||
6.50%, 02/15/32 | 683,095 | 695,940 | ||||
7.50%, 02/15/32 | 46,270 | 48,396 | ||||
12.74%, 02/16/32† | 245,462 | 291,837 | ||||
6.00%, 04/15/32 | 565,022 | 563,793 | ||||
6.50%, 04/15/32 | 413,898 | 420,526 | ||||
7.50%, 04/15/32 | 101,394 | 106,054 | ||||
6.50%, 06/15/32 | 1,387,124 | 1,413,060 | ||||
6.50%, 07/15/32 | 209,191 | 212,542 | ||||
6.50%, 08/15/32 | 643,165 | 653,463 | ||||
6.50%, 09/15/32 | 701,906 | 713,146 | ||||
6.00%, 10/15/32 | 686,265 | 682,752 | ||||
6.00%, 11/15/32 | 631,348 | 628,592 | ||||
6.00%, 12/15/32 | 282,275 | 280,830 | ||||
6.50%, 12/15/32 | 43,300 | 43,994 | ||||
6.00%, 01/15/33 | 302,166 | 300,620 | ||||
6.00%, 02/15/33 | 230,168 | 228,990 | ||||
6.50%, 03/15/33 | 110,833 | 112,608 | ||||
5.00%, 04/15/33 | 338,190 | 320,634 | ||||
6.50%, 04/15/33 | 1,714,511 | 1,741,965 | ||||
5.00%, 05/15/33 | 2,397,571 | 2,273,032 | ||||
6.00%, 05/15/33 | 1,758,626 | 1,749,623 | ||||
5.00%, 06/15/33 | 316,649 | 300,210 | ||||
6.00%, 06/15/33 | 213,025 | 211,935 | ||||
5.00%, 07/15/33 | 735,759 | 697,562 | ||||
5.00%, 08/15/33 | 1,483,668 | 1,404,278 | ||||
5.00%, 09/15/33 | 1,055,129 | 997,960 | ||||
5.00%, 10/15/33 | 571,713 | 541,162 | ||||
6.00%, 10/15/33 | 954,560 | 949,674 | ||||
6.50%, 10/15/33 | 374,098 | 380,088 | ||||
5.00%, 11/15/33 | 71,978 | 68,239 | ||||
6.00%, 12/15/33 | 1,175,970 | 1,169,950 | ||||
5.00%, 01/15/34 | 476,113 | 451,233 | ||||
5.00%, 03/15/34 | 599,050 | 567,745 | ||||
5.00%, 04/15/34 | 226,723 | 214,876 | ||||
5.00%, 05/15/34 | 142,111 | 134,684 | ||||
5.00%, 06/15/34 | 940,110 | 890,982 | ||||
5.00%, 08/15/34 | 596,347 | 565,183 | ||||
5.00%, 11/15/34 | 1,409,739 | 1,336,067 | ||||
5.00%, 12/15/34 | 1,305,005 | 1,236,807 | ||||
5.00%, 01/15/35 | 853,475 | 808,235 | ||||
5.00%, 02/15/35 | 24,158 | 22,878 | ||||
5.00%, 03/15/35 | 32,205 | 30,497 | ||||
5.00%, 04/15/35 | 4,706,587 | 4,457,104 | ||||
5.00%, 05/15/35 | 69,492 | 65,808 | ||||
5.00%, 06/15/35 | 138,401 | 131,065 | ||||
5.00%, 07/15/35 | 327,410 | 310,055 | ||||
5.00%, 08/15/35 | 390,314 | 369,624 | ||||
5.00%, 09/15/35 | 1,817,461 | 1,721,123 | ||||
5.00%, 10/15/35 | 1,249,781 | 1,183,534 | ||||
5.00%, 11/15/35 | 7,468,493 | 7,072,609 | ||||
5.00%, 12/15/35 | 26,059 | 24,678 | ||||
5.00%, 03/15/36 | 872,007 | 825,374 | ||||
5.00%, 04/15/36 | 38,340 | 36,280 | ||||
See Notes to Financial Statements.
| 73 |
Table of Contents
Medium-Duration Bond Fund
SCHEDULE OF INVESTMENTS (Continued)
| Par | Value | |||||
5.00%, 06/15/36 | $ | 1,327,628 | $ | 1,256,298 | ||
6.00%, 06/15/36 | 935,156 | 930,662 | ||||
5.00%, 09/15/36 | 7,351,628 | 6,956,046 | ||||
5.00%, 10/15/36 | 35,461 | 33,555 | ||||
5.00%, 04/15/37 | 989,572 | 935,957 | ||||
5.00%, 05/15/37 | 335,176 | 317,016 | ||||
5.00%, 06/15/37 | 65,223 | 61,689 | ||||
5.00%, 07/19/37 TBA | 3,600,000 | 3,404,250 | ||||
GreenPoint Mortgage Funding Trust | ||||||
5.40%, 03/25/37† | 4,641,674 | 4,643,274 | ||||
GS Mortgage Securities Corporation II | ||||||
4.68%, 07/10/39 | 1,300,000 | 1,242,558 | ||||
GSMPS Mortgage Loan Trust | ||||||
5.55%, 02/25/35 144A† | 510,493 | 510,128 | ||||
5.67%, 09/25/35 144A† | 2,696,349 | 2,709,209 | ||||
GSR Mortgage Loan Trust | ||||||
4.54%, 10/25/35† | 1,392,507 | 1,371,707 | ||||
HarborView Mortgage Loan Trust | ||||||
5.63%, 11/19/35 STEP | 562,482 | 564,345 | ||||
5.56%, 01/19/36 STEP | 395,968 | 396,234 | ||||
5.57%, 01/19/36 STEP | 1,687,283 | 1,688,972 | ||||
5.51%, 12/19/37 STEP† | 1,811,413 | 1,813,381 | ||||
Impac CMB Trust | ||||||
5.68%, 10/25/34† | 268,093 | 268,198 | ||||
5.58%, 11/25/35 STEP | 1,951,875 | 1,951,154 | ||||
Impac Secured Assets CMN Owner Trust | ||||||
5.57%, 05/25/35† | 1,602,760 | 1,604,922 | ||||
Indymac ARM Trust | ||||||
6.65%, 09/28/31† | 30,287 | 30,216 | ||||
Indymac Index Mortgage Loan Trust | ||||||
5.10%, 09/25/35† | 671,038 | 653,466 | ||||
5.54%, 04/25/46† | 1,348,151 | 1,349,071 | ||||
JP Morgan Chase Commercial Mortgage Securities Corporation | ||||||
4.90%, 09/12/37 | 2,900,000 | 2,729,500 | ||||
4.92%, 10/15/42† | 200,000 | 188,450 | ||||
5.43%, 12/12/43 | 1,500,000 | 1,451,855 | ||||
JP Morgan Mortgage Trust | ||||||
4.07%, 07/25/35† | 959,165 | 938,954 | ||||
4.20%, 07/25/35† | 971,821 | 952,466 | ||||
4.77%, 07/25/35† | 937,878 | 925,113 | ||||
LB-UBS Commercial Mortgage Trust | ||||||
4.66%, 07/15/30 | 1,000,000 | 954,753 | ||||
4.74%, 07/15/30 | 830,000 | 775,360 | ||||
5.16%, 02/15/31 | 2,000,000 | 1,909,727 | ||||
7.91%, 06/15/36 IO 144AW†@ | 4,492,975 | 143,771 | ||||
4.95%, 09/15/40 | 900,000 | 851,649 | ||||
Luminent Mortgage Trust | ||||||
5.49%, 12/25/36† | 4,651,951 | 4,647,507 | ||||
5.52%, 02/25/46† | 1,362,565 | 1,361,074 | ||||
MASTR Adjustable Rate Mortgages Trust | ||||||
5.20%, 05/25/34 | 515,310 | 512,388 | ||||
5.83%, 11/25/46† | 1,850,239 | 1,850,817 | ||||
MASTR Reperforming Loan Trust | ||||||
7.00%, 08/25/34 144A | 1,106,074 | 1,131,988 | ||||
Merrill Lynch-Countrywide Financial Corporation Commercial Mortgage Trust | ||||||
5.49%, 03/01/45 | 1,300,000 | 1,259,492 | ||||
MLCC Mortgage Investors, Inc. | ||||||
5.67%, 09/25/27 STEP | 730,779 | 732,236 | ||||
Morgan Stanley Capital I | ||||||
5.16%, 10/12/42† | 3,000,000 | 2,869,908 | ||||
5.51%, 11/12/49† | 2,300,000 | 2,240,394 | ||||
Opteum Mortgage Acceptance Corporation | ||||||
5.49%, 08/25/35† | 867,543 | 867,409 | ||||
Prime Mortgage Trust | ||||||
5.50%, 05/25/35 144A | 8,520,717 | 8,334,341 | ||||
6.00%, 05/25/35 144A | 1,218,503 | 1,216,458 | ||||
6.00%, 11/25/36 144A | 4,416,984 | 4,338,997 | ||||
Sequoia Mortgage Trust | ||||||
5.72%, 07/20/33† | 373,228 | 373,316 | ||||
5.68%, 11/20/34 STEP | 426,371 | 427,916 | ||||
Structured Adjustable Rate Mortgage Loan Trust | ||||||
5.66%, 08/25/35† | 1,113,155 | 1,115,834 | ||||
Structured Asset Mortgage Investments, Inc. | ||||||
5.63%, 12/25/35† | 1,411,770 | 1,414,583 | ||||
5.55%, 02/25/36† | 1,350,644 | 1,351,023 | ||||
Thornburg Mortgage Securities Trust | ||||||
5.43%, 06/25/09† | 3,866,798 | 3,860,501 | ||||
5.52%, 12/25/35† | 4,120,331 | 4,119,262 | ||||
5.49%, 01/25/36† | 5,853,724 | 5,848,656 | ||||
Wachovia Bank Commercial Mortgage Trust | ||||||
5.37%, 10/15/44 STRIP† | 3,000,000 | 2,906,967 | ||||
WAMU Alternative Mortgage Pass-Through Certificates | ||||||
5.87%, 11/25/46† | 2,820,885 | 2,821,326 | ||||
Washington Mutual, Inc. | ||||||
8.47%, 01/25/08 IOW†@ | 712,590 | 3,924 | ||||
8.46%, 05/25/08 IOW@ | 1,595,767 | 4,185 | ||||
8.55%, 06/25/08 IOW†@ | 2,484,891 | 15,930 | ||||
5.86%, 12/25/27 STEP | 3,121,389 | 3,121,093 | ||||
4.68%, 02/25/33† | 128,148 | 127,242 | ||||
6.43%, 06/25/42† | 92,204 | 92,095 | ||||
5.61%, 07/25/45† | 2,216,222 | 2,219,719 | ||||
5.64%, 07/25/45† | 1,412,828 | 1,415,264 | ||||
5.64%, 08/25/45† | 4,409,757 | 4,419,682 | ||||
5.61%, 10/25/45† | 4,083,053 | 4,090,102 | ||||
5.58%, 11/25/45† | 1,653,457 | 1,658,859 | ||||
5.59%, 12/25/45† | 1,104,122 | 1,106,937 | ||||
5.61%, 12/25/45† | 2,340,738 | 2,347,231 | ||||
8.61%, 01/01/49 IOW†@ | 1,791,177 | 9,896 | ||||
Wells Fargo Mortgage-Backed Securities Trust | ||||||
3.54%, 09/25/34† | 2,440,000 | 2,363,027 | ||||
4.98%, 10/25/35† | 1,862,954 | 1,875,744 | ||||
5.09%, 03/25/36† | 3,396,746 | 3,364,922 | ||||
Zuni Mortgage Loan Trust | ||||||
5.45%, 07/25/36† | 2,728,989 | 2,727,603 | ||||
Total Mortgage-Backed Securities (Cost $698,662,824) | 688,576,569 | |||||
See Notes to Financial Statements.
| 74 |
Table of Contents
| Par | Value | |||||
MUNICIPAL BONDS — 0.3% | ||||||
South Carolina Transportation Infrastructure Bank, Series A Revenue Bond (AMBAC Insured) | ||||||
5.00%, 10/01/23 | $ | 2,700,000 | $ | 2,772,360 | ||
Virginia State Housing Development Authority, Commonwealth Mortgage, Series H Revenue Bond (MBIA Insured) | ||||||
5.38%, 07/01/36 | 1,000,000 | 1,027,580 | ||||
Total Municipal Bonds (Cost $3,631,611) | 3,799,940 | |||||
| Number of Contracts | ||||||
PURCHASED OPTIONS — 0.3% | ||||||
Call Options — 0.2% | ||||||
10-Year U.S. Treasury Note Futures, Strike Price $110.00, Expires 08/24/07 | 175 | 5,469 | ||||
10-Year U.S. Treasury Note Futures, Strike Price $112.00, Expires 08/24/07 | 618 | 9,656 | ||||
1-Year Eurodollar Mid-CRV Futures, Strike Price $95.00, Expires 09/14/07 | 250 | 56,250 | ||||
1-Year Eurodollar Mid-CRV Futures, Strike Price $95.25, Expires 09/14/07 | 2 | 200 | ||||
5-Year U.S. Treasury Note Futures, Strike Price $102.00, Expires 08/24/07 | 268 | 569,500 | ||||
90-Day Eurodollar Futures, Strike Price $95.00, Expires 03/17/08 | 13 | 4,062 | ||||
90-Day Eurodollar Futures, Strike Price $95.25, Expires 03/17/08 | 947 | 1,225,688 | ||||
90-Day Eurodollar Futures, Strike Price $95.25, Expires 06/16/08 | 437 | 109,250 | ||||
90-Day Eurodollar Futures, Strike Price $95.25, Expires 12/17/07 | 153 | 7,650 | ||||
Euro vs. Japanese Yen, Strike Price $158.35, Expires 06/04/08 | 43,000 | 121,187 | ||||
Euro vs. U.S. Dollar, Strike Price $1.36, Expires 05/21/08 | 16,000 | 53,818 | ||||
Euro vs. U.S. Dollar, Strike Price $1.38, Expires 05/21/10 | 34,000 | 162,989 | ||||
| 2,325,719 | ||||||
Call Swaptions — 0.1% | ||||||
3-Month LIBOR, Strike Price $4.75, Expires 03/31/08 | 4,270 | 52,730 | ||||
3-Month LIBOR, Strike Price $4.75, Expires 12/15/08 | 4,870 | 110,536 | ||||
3-Month LIBOR, Strike Price $5.00, Expires 02/01/08 | 4,270 | 68,489 | ||||
3-Month LIBOR, Strike Price $5.00, Expires 12/15/08 | 9,140 | 309,302 | ||||
3-Month LIBOR, Strike Price $5.00, Expires 12/20/07 | 2,240 | 27,529 | ||||
3-Month LIBOR, Strike Price $5.04, Expires 09/17/07 | 750 | 3,770 | ||||
6-Month LIBOR, Strike Price $5.19, Expires 09/14/07 | 350 | 3 | ||||
U.S. Dollar vs. Japanese Yen, Strike Price $105.40, Expires 03/31/10 | 11,770 | 309,879 | ||||
| 882,238 | ||||||
Put Options — 0.0% | ||||||
30-Year Federal National Mortgage Association, Strike Price $85.13, Expires 09/06/07 | 3,300 | 205 | ||||
30-Year Federal National Mortgage Association, Strike Price $90.00, Expires 09/06/07 | 920 | 1,735 | ||||
3-Month LIBOR, Strike Price $5.55, Expires 12/15/08 | 43,000 | 224,513 | ||||
90-Day Eurodollar Futures, Strike Price $95.00, Expires 09/17/07 | 29 | 725 | ||||
Euro vs. Japanese Yen, Strike Price $148.40, Expires 06/03/10 | 20,000 | 153,030 | ||||
Euro vs. U.S. Dollar, Strike Price $1.36, Expires 05/21/08 | 16,000 | 40,181 | ||||
| 420,389 | ||||||
Put Swaption — 0.0% | ||||||
U.S. Dollar vs. Japanese Yen, Strike Price $105.40, Expires 03/31/10 | 9,000 | 255,384 | ||||
Total Purchased Options (Cost $5,525,684) | 3,883,730 | |||||
| Shares | ||||||
PREFERRED STOCKS — 0.1% | ||||||
CORTS Trust for Ford Motor Co. | 9,100 | 185,367 | ||||
General Motors Corporation CONVD | 40,650 | 898,365 | ||||
Total Preferred Stocks (Cost $873,008) | 1,083,732 | |||||
RIGHTS — 0.0% | ||||||
United Mexican States Recovery Rights Series E, 06/30/07 | ||||||
(Cost $0) | 1,100,000 | 8,141 | ||||
MONEY MARKET FUNDS — 25.5% | ||||||
GuideStone Funds Money Market Fund (GS4 Class)¥ | 131,870,175 | 131,870,175 | ||||
Northern Institutional Liquid Assets Portfolio§ | 173,193,120 | 173,193,120 | ||||
Total Money Market Funds (Cost $305,063,295) | 305,063,295 | |||||
See Notes to Financial Statements.
| 75 |
Table of Contents
Medium-Duration Bond Fund
SCHEDULE OF INVESTMENTS (Continued)
| Par | Value | |||||||
U.S. TREASURY OBLIGATIONS — 13.4% | ||||||||
U.S. Treasury Bills | ||||||||
4.65%, 08/30/07 | $ | 500,000 | $ | 496,274 | ||||
4.45%, 09/13/07‡‡ | 90,000 | 89,173 | ||||||
4.53%, 09/13/07D | 100,000 | 99,081 | ||||||
4.60%, 09/13/07‡‡ | 320,000 | 317,058 | ||||||
4.65%, 09/13/07‡‡ | 1,085,000 | 1,075,027 | ||||||
4.66%, 09/13/07‡‡ | 130,000 | 128,805 | ||||||
| 2,205,418 | ||||||||
U.S. Treasury Bond | ||||||||
4.50%, 02/15/36D | 7,227,000 | 6,546,086 | ||||||
U.S. Treasury Inflationary Index Bonds | ||||||||
0.88%, 04/15/10D | 11,540,000 | 11,955,603 | ||||||
2.38%, 04/15/11D | 7,010,000 | 7,217,539 | ||||||
3.38%, 01/15/12 | 60,000 | 72,079 | ||||||
2.00%, 07/15/14D | 6,200,000 | 6,525,108 | ||||||
1.88%, 07/15/15D | 6,400,000 | 6,425,950 | ||||||
2.50%, 07/15/16D | 4,980,000 | 5,039,218 | ||||||
2.38%, 01/15/17D | 2,800,000 | 2,801,483 | ||||||
2.38%, 01/15/25D | 2,740,000 | 2,888,605 | ||||||
2.00%, 01/15/26D | 1,660,000 | 1,565,649 | ||||||
2.38%, 01/15/27D | 2,900,000 | 2,853,957 | ||||||
3.88%, 04/15/29D | 4,468,000 | 6,781,024 | ||||||
| 54,126,215 | ||||||||
U.S. Treasury Notes | ||||||||
3.38%, 02/15/08D | 850,000 | 841,700 | ||||||
4.88%, 10/31/08 D | 10,700,000 | 10,688,305 | ||||||
3.25%, 01/15/09 | 1,100,000 | 1,073,274 | ||||||
4.88%, 08/15/09D | 3,100,000 | 3,098,791 | ||||||
3.38%, 10/15/09D | 1,400,000 | 1,354,938 | ||||||
3.50%, 02/15/10D | 700,000 | 676,320 | ||||||
4.50%, 02/28/11D | 13,200,000 | 13,024,691 | ||||||
4.88%, 04/30/11D | 5,500,000 | 5,493,560 | ||||||
5.13%, 06/30/11 | 64,000 | 64,505 | ||||||
4.63%, 12/31/11D | 14,370,000 | 14,195,994 | ||||||
4.75%, 01/31/12D | 500,000 | 496,407 | ||||||
4.63%, 02/29/12D | 2,700,000 | 2,666,253 | ||||||
4.50%, 04/30/12D | 150,000 | 147,258 | ||||||
4.25%, 08/15/14D | 650,000 | 621,969 | ||||||
4.88%, 08/15/16D | 7,200,000 | 7,113,938 | ||||||
4.75%, 02/15/37D | 6,020,000 | 5,678,088 | ||||||
| 67,235,991 | ||||||||
U.S. Treasury STRIPS | ||||||||
5.30%, 11/15/21WD | 18,680,000 | 8,809,133 | ||||||
5.31%, 08/15/24WD | 19,700,000 | 8,032,005 | ||||||
5.30%, 11/15/24W | 2,200,000 | 888,300 | ||||||
5.31%, 02/15/25W | 4,100,000 | 1,631,197 | ||||||
5.29%, 08/15/25W | 5,600,000 | 2,178,137 | ||||||
5.28%, 05/15/26WD | 1,500,000 | 561,066 | ||||||
5.26%, 08/15/26WD | 6,500,000 | 2,408,770 | ||||||
5.25%, 11/15/26WD | 10,000,000 | 3,664,920 | ||||||
5.27%, 11/15/26W | 3,600,000 | 1,314,400 | ||||||
5.26%, 08/15/27WD | 1,050,000 | 370,147 | ||||||
5.36%, 11/15/27WD | 400,000 | 139,747 | ||||||
| 29,997,822 | ||||||||
Total U.S. Treasury Obligations (Cost $163,168,858) | 160,111,532 | |||||||
TOTAL INVESTMENTS — 131.5% (Cost $1,591,711,193) | 1,576,159,726 | |||||||
| Number of Contracts | ||||||||
WRITTEN OPTIONS — (0.1)% | ||||||||
Call Swaptions — (0.1)% | ||||||||
3-Month LIBOR, Strike Price $4.90, Expires 03/31/08 | (1,120 | ) | (34,226 | ) | ||||
3-Month LIBOR, Strike Price $4.95, Expires 03/31/08 | (700 | ) | (23,939 | ) | ||||
3-Month LIBOR, Strike Price $4.95, Expires 09/26/08 | (1,200 | ) | (60,442 | ) | ||||
3-Month LIBOR, Strike Price $5.00, Expires 12/15/08 | (1,640 | ) | (116,549 | ) | ||||
3-Month LIBOR, Strike Price $5.15, Expires 12/20/07 | (970 | ) | (31,633 | ) | ||||
3-Month LIBOR, Strike Price $5.20, Expires 12/15/08 | (3,050 | ) | (299,373 | ) | ||||
6-Month LIBOR, Strike Price $4.85, Expires 09/14/07 | (100 | ) | (1 | ) | ||||
| (566,163 | ) | |||||||
Put Swaption — 0.0% | ||||||||
3-Month LIBOR, Strike Price $5.10, Expires 02/01/08 | (1,860 | ) | (66,555 | ) | ||||
Total Written Options | ||||||||
(Premiums received $(1,169,675)) | (632,718 | ) | ||||||
| Par | ||||||||
SECURITIES SOLD SHORT — (1.0)% | ||||||||
Federal National Mortgage Association | ||||||||
6.50%, 07/14/33 TBA | $ | (8,400,000 | ) | (8,478,750 | ) | |||
6.00%, 07/14/35 TBA | (4,000,000 | ) | (3,956,248 | ) | ||||
Total Securities Sold Short (Cost $(12,445,812)) | (12,434,998 | ) | ||||||
Liabilities in Excess of Other Assets — (30.4)% | (364,475,980 | ) | ||||||
NET ASSETS — 100.0% | $ | 1,198,616,030 | ||||||
See Notes to Financial Statements.
| 76 |
Table of Contents
Swap agreements outstanding at June 30, 2007:
Description | Expiration Date | Notional Value | Unrealized Appreciation (Depreciation) | ||||||
British Pounds | |||||||||
Receive fixed rate payments of 5.00% and pay variable rate payments on the six month LIBOR floating rate(b) | 12/20/08 | 1,600,000 | $ | (40,582 | ) | ||||
Receive fixed rate payments of 5.00% and pay variable rate payments on the six month LIBOR floating rate(k) | 09/15/10 | 4,000,000 | (289,356 | ) | |||||
Receive fixed rate payments of 5.00% and pay variable rate payments on the six month LIBOR floating rate(d) | 09/15/10 | 10,200,000 | (737,859 | ) | |||||
Receive fixed rate payments of 5.00% and pay variable rate payments on the six month LIBOR floating rate(f) | 09/15/15 | 2,500,000 | (324,070 | ) | |||||
Receive fixed rate payments of 5.00% and pay variable rate payments on the six month LIBOR floating rate(l) | 09/15/15 | 400,000 | (51,895 | ) | |||||
Receive variable rate payments on the six month LIBOR floating rate and pay fixed rate payments of 4.00%(k) | 12/15/35 | 4,900,000 | 468,503 | ||||||
Receive variable rate payments on the six month LIBOR floating rate and pay fixed rate payments of 4.00%(d) | 12/15/35 | 3,700,000 | 353,768 | ||||||
| (621,491 | ) | ||||||||
Euro | |||||||||
Receive fixed rate payments of 2.1455% and pay variable rate payments on the France CPI Ex Tobacco(b) | 10/15/10 | 300,000 | 4,945 | ||||||
Receive fixed rate payments of 4.00% and pay variable rate payments on the six month EURIBOR rate(k) | 12/15/2011 | 30,400,000 | 1,275,568 | ||||||
Receive floating par in the event of default on the Dow Jones ITRAXX6HIVOL Index and pay fixed rate payments of 0.85%(g) | 12/20/16 | 1,200,000 | (10,420 | ) | |||||
Receive floating par in the event of default on the Dow Jones ITRAXX6HI4 Index and pay fixed rate payments of 0.85%(g) | 12/20/16 | 2,900,000 | (25,183 | ) | |||||
Receive floating par in the event of default on the Dow Jones ITRAXX6HI4 Index and pay fixed rate payments of 0.85%(k) | 12/20/16 | 3,600,000 | (31,262 | ) | |||||
Receive floating par in the event of default on the Dow Jones ITRAXX6HI4 Index and pay fixed rate payments of 0.85%(d) | 12/20/16 | 1,300,000 | (11,289 | ) | |||||
Receive floating par in the event of default on the Dow Jones ITRAXX6HI4 Index and pay fixed rate payments of 0.85%(j) | 12/20/16 | 2,900,000 | (25,184 | ) | |||||
| 1,177,175 | |||||||||
Japanese Yen | |||||||||
Receive fixed rate payments of 2.00% and pay variable rate payments on the six month LIBOR floating rate(b) | 12/20/16 | 210,000,000 | 15,091 | ||||||
Receive fixed rate payments of 2.00% and pay variable rate payments on the six month LIBOR floating rate(d) | 12/20/16 | 80,000,000 | 5,749 | ||||||
| 20,840 | |||||||||
Mexican Pesos | |||||||||
Receive fixed rate payments of 8.17% and pay variable rate payments on the six month MX BRR TIIE(h) | 11/04/16 | 93,000,000 | 47,220 | ||||||
U.S. Dollars | |||||||||
Receive fixed rate payments of 0.20% and pay floating par in the event of default on Russian Federation, 7.50% due 3/31/30(k) | 07/20/07 | $ | 1,400,000 | 49 | |||||
Receive fixed rate payments of 0.22% and pay floating par in the event of default on Russian Federation, 7.50% due 3/31/30(i) | 07/20/07 | 1,900,000 | 90 | ||||||
See Notes to Financial Statements.
| 77 |
Table of Contents
Medium-Duration Bond Fund
SCHEDULE OF INVESTMENTS (Continued)
Description | Expiration Date | Notional Value | Unrealized Appreciation (Depreciation) | ||||||
Receive fixed rate payments of 0.24% and pay floating par in the event of default on Russian Federation, 7.50% due 3/31/30(i) | 02/20/08 | $ | 1,300,000 | $ | (102 | ) | |||
Receive fixed rate payments of 0.055% and pay floating par in the event of default on American International Group, 5.60% due 10/18/16(e) | 03/20/08 | 5,600,000 | 197 | ||||||
Receive floating par in the event of default on Republic of Philippines, 8.25% due 1/15/14 and pay fixed rate of 2.47%(e) | 09/20/08 | 1,000,000 | (25,632 | ) | |||||
Receive floating par in the event of default on RadioShack Corporation, 7.375% due 5/15/11 and pay fixed rate payments of 0.37%(b) | 12/20/08 | 300,000 | (65 | ) | |||||
Receive floating par in event of default on Emerson Electric Co., 4.625% due 10/15/12 and pay fixed rate payments of 0.22%(c) | 12/20/08 | 300,000 | (757 | ) | |||||
Receive floating par in event of default on Devon Financing Corporation, 6.875% due 9/30/11 and pay fixed rate payments of 0.35%(h) | 12/20/08 | 500,000 | (1,946 | ) | |||||
Receive floating par in event of default on Anadarko Petroleum Corporation, 5.000% due 10/01/12 and pay fixed rate payments of 0.27%(h) | 12/20/08 | 300,000 | (390 | ) | |||||
Receive floating par in event of default on Carnival Corporation, 6.150% due 4/15/08 and pay fixed rate payments of 0.44%(b) | 12/20/08 | 300,000 | (1,622 | ) | |||||
Receive floating par in event of default on Countrywide Home Loan, 6.250% due 4/15/09 and pay fixed rate payments of 0.42%(c) | 12/20/08 | 300,000 | 154 | ||||||
Receive floating par in event of default on Occidental Petroleum, 6.750% due 1/15/12 and pay fixed rate payments of 0.28%(h) | 12/20/08 | 300,000 | (865 | ) | |||||
Receive floating par in event of default on Kroger Co. 6.750% due 4/15/12 and pay fixed rate payments of 0.53%(c) | 12/20/08 | 300,000 | (1,794 | ) | |||||
Receive fixed rate payments of 5.00% and pay variable rate payments on the three month LIBOR floating rate(b) | 06/18/09 | 55,000,000 | (158,674 | ) | |||||
Receive fixed rate payments of 5.00% and pay variable rate payments on the three month LIBOR floating rate(d) | 12/19/09 | 5,200,000 | (34,700 | ) | |||||
Receive fixed rate payments of 5.00% and pay variable rate payments on the three month LIBOR floating rate(e) | 12/19/09 | 17,000,000 | (113,442 | ) | |||||
Receive fixed rate payments of 5.00% and pay variable rate payments on the three month LIBOR floating rate(k) | 12/19/09 | 10,000,000 | (85,500 | ) | |||||
Receive fixed rate payments of 10.75% and pay variable rate payments on the BCSWAPD Index(g) | 01/04/10 | 16,100,000 | 14,818 | ||||||
Receive floating par in the event of default on Republic of Turkey, 11.875% due 1/15/30 and pay fixed rate of 2.70%(c) | 09/20/10 | 400,000 | (20,532 | ) | |||||
Receive floating par in the event of default on Republic of Turkey, 11.875% due 1/15/30 and pay fixed rate of 2.25%(c) | 09/20/10 | 1,000,000 | (38,150 | ) | |||||
Receive fixed rate payments of 5.00% and pay variable rate payments on the three month LIBOR floating rate(g) | 12/19/10 | 31,400,000 | — | ||||||
See Notes to Financial Statements.
| 78 |
Table of Contents
Description | Expiration Date | Notional Value | Unrealized Appreciation (Depreciation) | ||||||
Receive floating par in the event of default on DaimlerChrysler NA Holding, 5.75% due 9/8/11 and pay fixed rate of 0.58%(d) | 09/20/11 | $ | 900,000 | $ | (11,457 | ) | |||
Receive floating par in the event of default on Core Investment Grade Bond and pay fixed rate of 1.65%(g) | 12/20/11 | 5,000,000 | (923 | ) | |||||
Receive floating par in the event of default on the Dow Jones CDX HY-7 100 Index and pay fixed rate payments of 3.25%(m) | 12/20/11 | 4,000,000 | (48,047 | ) | |||||
Receive floating par in the event of default on the Dow Jones CDX X07 Index and pay fixed rate payments of 1.65%(g) | 12/20/11 | 4,000,000 | (3,190 | ) | |||||
Receive floating par in the event of default on the Dow Jones CDX HVOL7 Index and pay fixed rate payments of 0.75%(d) | 12/20/11 | 1,700,000 | 9,538 | ||||||
Receive floating par in the event of default on International Lease Finance Corp, 5.40% due 2/15/12 and pay fixed rate of 0.17%(d) | 03/20/12 | 400,000 | (89 | ) | |||||
Receive floating par in the event of default on XL Capital (Europe) PLC, 6.50% due 1/15/12 and pay fixed rate of 0.205%(d) | 03/20/12 | 500,000 | 2,020 | ||||||
Receive floating par in the event of default on Target Corp BP MYC, 5.875% due 03/01/12 and pay fixed rate payments of 0.11%(d) | 06/20/12 | 1,200,000 | 2,814 | ||||||
Receive floating par in the event of default on Schlumberger Limited BP BRC, 1.5% due 06/01/23 and pay fixed rate payments of 0.12%(c) | 06/20/12 | 2,000,000 | (2,135 | ) | |||||
Receive floating par in the event of default on Internationall Lease Finance Corp BP BRC, 6.375% due 03/15/09 and pay fixed rate payments of 0.175%(d) | 06/20/12 | 1,100,000 | 15 | ||||||
Receive floating par in the event of default on Progress Energy, Inc. BP BRC, 5.625% due 01/15/16 and pay fixed rate payments of 0.09%(d) | 06/20/12 | 1,000,000 | 2,910 | ||||||
Receive floating par in the event of default on Sealed Air Corp, 5.625% due 7/15/13 and pay fixed rate of 0.58%(c) | 09/20/13 | 400,000 | (3,302 | ) | |||||
Receive floating par in the event of default on CitiFinancial, 6.625% due 6/1/15 and pay fixed rate of 0.145%(d) | 06/20/15 | 300,000 | 441 | ||||||
Receive floating par in the event of default on Republic of Hungary, 4.75% due 2/3/15 and pay fixed rate of 0.535%(c) | 05/20/16 | 1,600,000 | (25,902 | ) | |||||
Receive floating par in the event of default on Republic of Hungary, 4.75% due 2/3/15 and pay fixed rate of 0.54%(g) | 05/20/16 | 1,400,000 | (23,149 | ) | |||||
Receive floating par in the event of default on Republic of Hungary, 4.75% due 2/3/15 and pay fixed rate of 0.545%(k) | 05/20/16 | 2,800,000 | (47,267 | ) | |||||
Receive floating par in the event of default on Omnicom Group Inc., 5.90% due 4/15/2016 and pay fixed rate of 0.39%(c) | 06/20/16 | 700,000 | (192 | ) | |||||
Receive floating par in the event of default on Bank of America, 5.62% due 10/14/2016 and pay fixed rate of 0.17%(f) | 12/20/16 | 1,700,000 | 3,003 | ||||||
Receive floating par in the event of default on the Dow Jones CDX IG7 Index and pay fixed rate payments of 0.65%(c) | 12/20/16 | 7,800,000 | 21,250 | ||||||
See Notes to Financial Statements.
| 79 |
Table of Contents
Medium-Duration Bond Fund
SCHEDULE OF INVESTMENTS (Continued)
Description | Expiration Date | Notional Value | Unrealized Appreciation (Depreciation) | ||||||
Receive floating par in the event of default on Federal Republic of Brazil, 12.5% due 03/06/30 and pay fixed rate payments of 1.04%(k) | 05/20/17 | $ | 1,000,000 | $ | (249 | ) | |||
Receive floating par in the event of default on Autozone BP RYL, 5.875% due 10/15/12 and pay fixed rate payments of 0.665%(l) | 06/20/17 | 1,700,000 | (902 | ) | |||||
Receive floating par in the event of default on Newell Rubbermaid BP UAG, 6.75% due 03/15/12 and pay fixed rate payments of 0.48%(b) | 06/20/17 | 500,000 | (254 | ) | |||||
Receive floating par in the event of default on Newell Rubbermaid BP RYL, 6.75% due 03/15/12 and pay fixed rate payments of 0.485%(l) | 06/20/17 | 900,000 | (797 | ) | |||||
Receive floating par in the event of default on Autozone BP RYL, 5.875% due 10/15/12 and pay fixed rate payments of 0.635%(l) | 06/20/17 | 900,000 | 1,997 | ||||||
Receive floating par in the event of default on Autozone BP RYL, 5.875% due 10/15/12 and pay fixed rate payments of 0.64%(l) | 06/20/17 | 600,000 | 805 | ||||||
Receive fixed rate payments of 5.00% and pay variable rate payments on the three month LIBOR floating rate(c) | 12/19/17 | 500,000 | 25,586 | ||||||
Receive fixed rate payments of 5.00% and pay variable rate payments on the three month LIBOR floating rate(k) | 12/19/17 | 2,600,000 | 133,049 | ||||||
Receive fixed rate payments of 5.00% and pay variable rate payments on the three month LIBOR floating rate(k) | 12/19/37 | 4,200,000 | (480,504 | ) | |||||
Receive fixed rate payments of 5.00% and pay variable rate payments on the three month LIBOR floating rate(c) | 12/19/37 | 600,000 | (68,644 | ) | |||||
Receive floating par in the event of default on the ABX.HE.A.06-1 Index and pay fixed rate payments of 0.54%(b) | 07/25/45 | 7,700,000 | 279,124 | ||||||
Receive floating par in the event of default on the ABX.HE.A.06-1 Index and pay fixed rate payments of 0.54%(b) | 07/25/45 | 2,000,000 | 72,500 | ||||||
| (630,814 | ) | ||||||||
| $ | (7,070 | ) | |||||||
PORTFOLIO SUMMARY (based on net assets)
| % | |||
Futures Contracts | 108.5 | ||
Mortgage-Backed Securities | 57.4 | ||
Money Market Funds | 25.5 | ||
U.S. Treasury Obligations | 13.4 | ||
Corporate Bonds | 12.3 | ||
Foreign Bonds | 10.6 | ||
Agency Obligations | 6.5 | ||
Asset-Backed Securities | 4.1 | ||
Loan Agreements | 0.8 | ||
Municipal Bonds | 0.3 | ||
Purchased Options | 0.3 | ||
Commercial Paper | 0.2 | ||
Preferred Stocks | 0.1 | ||
Swap Agreements | — | ** | |
Rights | — | ** | |
Written Options | (0.1 | ) | |
Securities Sold Short | (1.0 | ) | |
Forward Foreign Currency Contracts | (3.9 | ) | |
| 235.0 | |||
| ** | Rounds to less than 0.005%. |
See Notes to Financial Statements.
| 80 |
Table of Contents
Average Annual Total Returns as of 06/30/07
| GS2 Class* | GS4 Class* | GS6 Class* | Benchmark** | |||||||||
Six Months | 0.20 | % | 0.16 | % | (0.01 | )% | (0.88 | )% | ||||
One Year | 8.41 | % | 8.38 | % | 8.07 | % | 7.06 | % | ||||
Five Year | 7.98 | % | 7.85 | % | 7.54 | % | 6.65 | % | ||||
Since Inception | 7.29 | % | 7.20 | % | 6.84 | % | 6.28 | % | ||||
Inception Date | 08/27/01 | 08/27/01 | 08/27/01 | 08/27/01 |
The performance data quoted represents past performance and does not guarantee future results. Current performance may be lower or higher. Performance data current to the most recent month-end may be obtained at www.GuideStoneFunds.org. The investment return and principal value of an investment will fluctuate so that shares, when redeemed, may be worth more or less than their original cost.
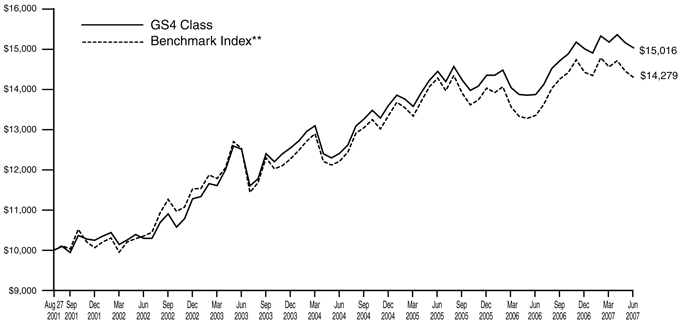
The graph compares the results of a hypothetical $10,000 investment in the GS4 Class of the Fund since August 27, 2001 (commencement of operations), with all dividends and capital gains reinvested, with the weighted composite benchmark index.
| * | These returns reflect expense waivers by the Fund’s investment advisor. Without these waivers, returns would have been lower. Returns shown do not reflect the deduction of taxes that a shareholder would pay on Fund distributions or the redemption of Fund shares. |
| ** | Represents a weighted composite benchmark index consisting of the Lehman Brothers Long-Term Government Bond Index and the Lehman Brothers Long-Term Credit Bond Index. |
The Lehman Brothers Long-Term Government Bond Index is composed of all bonds covered by the Lehman Brothers Government Bond Index with maturities of 10 years or greater.
The Lehman Brothers Long-Term Credit Index is composed of a subset of the Lehman Brothers Credit Bond Index covering all corporate, publicly issued, fixed-rate, nonconvertible U.S. debt issues rated at least Baa with at least $50 million principal outstanding and maturity greater than 10 years.
Unlike a mutual fund, the performance of an index assumes no taxes, transaction costs, management fees or other expenses.
| 81 |
Table of Contents
| Extended-Duration Bond Fund | ||
| SCHEDULE OF INVESTMENTS | June 30, 2007 (Unaudited) |
| Par | Value | |||||
AGENCY OBLIGATION — 0.3% | ||||||
Federal National Mortgage Association | ||||||
2.29%, 02/19/09(G) | ||||||
(Cost $1,477,847) | $ | 2,500,000 | $ | 1,617,696 | ||
ASSET-BACKED SECURITY — 0.4% | ||||||
Community Program Loan Trust | ||||||
4.50%, 04/01/29 | ||||||
(Cost $1,678,409) | 1,950,000 | 1,825,991 | ||||
CORPORATE BONDS — 15.7% | ||||||
Albertson’s, Inc. | ||||||
7.75%, 06/15/26 | 800,000 | 810,840 | ||||
6.63%, 06/01/28 | 105,000 | 95,150 | ||||
7.45%, 08/01/29D | 985,000 | 965,624 | ||||
8.00%, 05/01/31D | 110,000 | 112,980 | ||||
Anadarko Petroleum Corporation | ||||||
5.95%, 09/15/16 | 1,080,000 | 1,056,376 | ||||
6.45%, 09/15/36D | 760,000 | 733,332 | ||||
Apache Corporation | ||||||
6.00%, 01/15/37 | 1,640,000 | 1,569,096 | ||||
Arrow Electronics, Inc. | ||||||
6.88%, 07/01/13 | 250,000 | 258,769 | ||||
ASIF Global Financing XXVII | ||||||
2.38%, 02/26/09 144A(G) | 6,700,000 | 4,334,251 | ||||
AT&T Corporation | ||||||
6.50%, 03/15/29 | 125,000 | 120,652 | ||||
Avnet, Inc. | ||||||
6.00%, 09/01/15 | 875,000 | 844,605 | ||||
Barclays Financial LLC | ||||||
4.16%, 02/22/10 144A(T) | 25,000,000 | 674,294 | ||||
4.10%, 03/22/10 144A(T) | 7,000,000 | 188,437 | ||||
4.06%, 09/16/10 144A(W) | 730,000,000 | 770,733 | ||||
Borden, Inc. | ||||||
7.88%, 02/15/23 | 1,200,000 | 1,032,000 | ||||
Bristol-Myers Squibb Co. | ||||||
4.86%, 09/15/23 CONV† | 1,000,000 | 1,017,500 | ||||
Chesapeake Energy Corporation | ||||||
6.88%, 01/15/16 | 610,000 | 599,325 | ||||
6.50%, 08/15/17 | 45,000 | 42,862 | ||||
6.88%, 11/15/20 | 320,000 | 308,000 | ||||
CIT Group, Inc. | ||||||
5.50%, 12/01/14(U) | 600,000 | 1,114,138 | ||||
Comcast Corporation | ||||||
5.50%, 03/15/11 | 500,000 | 497,896 | ||||
5.65%, 06/15/35 | 570,000 | 497,518 | ||||
6.50%, 11/15/35 | 555,000 | 539,695 | ||||
6.45%, 03/15/37 | 2,480,000 | 2,397,748 | ||||
Commonwealth Edison Co. | ||||||
4.75%, 12/01/11@ | 335,000 | 322,504 | ||||
Constellation Energy Group, Inc. | ||||||
4.55%, 06/15/15 | 750,000 | 679,837 | ||||
Continental Airlines, Inc. | ||||||
6.95%, 02/02/11 | 267,375 | 267,542 | ||||
8.31%, 04/02/18D | 470,105 | 482,739 | ||||
7.57%, 03/15/20 | 414,730 | 416,026 | ||||
Corning, Inc. | ||||||
6.20%, 03/15/16 | 230,000 | 230,970 | ||||
7.25%, 08/15/36 | 850,000 | 878,867 | ||||
Cox Communications, Inc. | ||||||
6.75%, 03/15/11 | 250,000 | 258,928 | ||||
Cummins, Inc. | ||||||
6.75%, 02/15/27 | 750,000 | 732,038 | ||||
5.65%, 03/01/28 | 1,400,000 | 1,033,556 | ||||
7.13%, 03/01/28 | 425,000 | 430,468 | ||||
DCP Midstream LP | ||||||
6.45%, 11/03/36 144AD | 490,000 | 485,610 | ||||
Devon Energy Corporation | ||||||
4.95%, 08/15/08 CONV | 963,000 | 1,519,132 | ||||
Dillard’s, Inc. | ||||||
7.75%, 07/15/26 | 890,000 | 857,287 | ||||
7.00%, 12/01/28 | 500,000 | 451,818 | ||||
El Paso Corporation | ||||||
7.00%, 05/15/11 | 400,000 | 409,834 | ||||
Federated Retail Holdings, Inc. | ||||||
6.38%, 03/15/37 | 240,000 | 231,617 | ||||
First Industrial LP | ||||||
7.60%, 07/15/28 | 1,000,000 | 1,082,143 | ||||
Foot Locker, Inc. | ||||||
8.50%, 01/15/22 | 1,000,000 | 1,020,000 | ||||
Ford Motor Co. | ||||||
6.63%, 10/01/28 | 680,000 | 511,700 | ||||
6.38%, 02/01/29 | 1,255,000 | 931,838 | ||||
Ford Motor Credit Co. | ||||||
5.70%, 01/15/10 | 135,000 | 129,046 | ||||
7.00%, 10/01/13 | 315,000 | 292,204 | ||||
8.00%, 12/15/16 | 1,000,000 | 959,397 | ||||
General Motors Acceptance Corporation | ||||||
6.88%, 08/28/12 | 250,000 | 244,591 | ||||
Georgia-Pacific Corporation | ||||||
8.00%, 01/15/24 | 30,000 | 29,250 | ||||
7.38%, 12/01/25 | 240,000 | 226,200 | ||||
7.25%, 06/01/28 | 300,000 | 277,500 | ||||
7.75%, 11/15/29 | 3,700,000 | 3,496,500 | ||||
8.88%, 05/15/31 | 60,000 | 60,150 | ||||
GTE Corporation | ||||||
6.94%, 04/15/28 | 10,000 | 10,314 | ||||
HCA, Inc. | ||||||
6.30%, 10/01/12D | 1,500,000 | 1,391,250 | ||||
7.58%, 09/15/25 | 1,000,000 | 868,243 | ||||
7.05%, 12/01/27 | 500,000 | 408,796 | ||||
Health Care Property Investors, Inc. | ||||||
6.00%, 03/01/15 | 1,500,000 | 1,468,809 | ||||
Highwoods Properties, Inc. | ||||||
7.50%, 04/15/18 | 1,500,000 | 1,627,235 | ||||
Historic TW, Inc. | ||||||
6.63%, 05/15/29 | 60,000 | 58,422 | ||||
HSBC Bank USA NA | ||||||
3.31%, 08/25/10 144A | 700,000 | 770,630 | ||||
IMC Global, Inc. | ||||||
7.38%, 08/01/18 | 500,000 | 493,750 | ||||
7.30%, 01/15/28 | 690,000 | 665,850 | ||||
iStar Financial, Inc. | ||||||
5.70%, 03/01/14 | 1,171,000 | 1,144,000 | ||||
JC Penney Corporation, Inc. | ||||||
6.38%, 10/15/36 | 490,000 | 468,131 | ||||
Kinder Morgan Energy Partners LP | ||||||
5.80%, 03/15/35 | 280,000 | 249,542 | ||||
Kinder Morgan, Inc. | ||||||
7.25%, 03/01/28 | 500,000 | 481,432 | ||||
See Notes to Financial Statements.
| 82 |
Table of Contents
| Par | Value | |||||
Lennar Corporation | ||||||
5.60%, 05/31/15 | $ | 935,000 | $ | 877,522 | ||
6.50%, 04/15/16 144AD | 625,000 | 606,262 | ||||
MidAmerican Energy Holdings Co. | ||||||
5.88%, 10/01/12 | 1,000,000 | 1,009,754 | ||||
Motorola, Inc. | ||||||
6.50%, 11/15/28 | 500,000 | 480,566 | ||||
NiSource Finance Corporation | ||||||
6.15%, 03/01/13 | 1,000,000 | 1,008,969 | ||||
Northern Telecom Capital | ||||||
7.88%, 06/15/26 | 450,000 | 427,500 | ||||
Owens Corning, Inc. | ||||||
6.50%, 12/01/16 144A | 240,000 | 240,566 | ||||
7.00%, 12/01/36 144A | 355,000 | 346,973 | ||||
Pemex Project Funding Master Trust | ||||||
8.63%, 02/01/22 | 1,000,000 | 1,234,841 | ||||
8.63%, 12/01/23 | 1,000,000 | 1,221,000 | ||||
Pioneer Natural Resources Co. | ||||||
7.20%, 01/15/28 | 2,500,000 | 2,323,448 | ||||
Preston Corporation | ||||||
7.00%, 05/01/11 CONV | 250,000 | 239,768 | ||||
Pulte Homes, Inc. | ||||||
7.88%, 06/15/32 | 1,500,000 | 1,588,704 | ||||
6.38%, 05/15/33D | 1,000,000 | 883,551 | ||||
Qwest Corporation | ||||||
7.25%, 09/15/25 | 1,000,000 | 1,002,500 | ||||
6.88%, 09/15/33 | 2,250,000 | 2,120,625 | ||||
Raytheon Co. | ||||||
6.40%, 12/15/18 | 2,600,000 | 2,714,985 | ||||
7.20%, 08/15/27D | 250,000 | 281,317 | ||||
7.00%, 11/01/28 | 750,000 | 829,656 | ||||
Southern Natural Gas Co. | ||||||
7.35%, 02/15/31 | 1,750,000 | 1,863,872 | ||||
Sprint Capital Corporation | ||||||
6.88%, 11/15/28 | 3,305,000 | 3,154,464 | ||||
Swift Energy Co. | ||||||
7.63%, 07/15/11 | 150,000 | 152,625 | ||||
Tennessee Gas Pipeline Co. | ||||||
7.00%, 10/15/28 | 750,000 | 776,116 | ||||
Time Warner, Inc. | ||||||
7.63%, 04/15/31 | 35,000 | 37,604 | ||||
6.50%, 11/15/36 | 120,000 | 114,297 | ||||
Toll Brothers Finance Corporation | ||||||
5.15%, 05/15/15 | 1,285,000 | 1,161,221 | ||||
Toro Co. | ||||||
6.63%, 05/01/37 | 300,000 | 289,397 | ||||
Union Pacific Resources Group | ||||||
7.15%, 05/15/28 | 250,000 | 255,018 | ||||
Verizon Global Funding Corporation | ||||||
5.85%, 09/15/35 | 2,420,000 | 2,226,930 | ||||
Verizon Maryland, Inc. | ||||||
5.13%, 06/15/33 | 50,000 | 40,590 | ||||
Verizon New York, Inc. | ||||||
7.38%, 04/01/32 | 385,000 | 406,117 | ||||
WellPoint, Inc. | ||||||
6.38%, 06/15/37 | 2,080,000 | 2,060,614 | ||||
Western Union Co. | ||||||
6.20%, 11/17/36 144A | 2,155,000 | 2,069,169 | ||||
Williams Cos., Inc. | ||||||
7.50%, 01/15/31 | 1,250,000 | 1,300,000 | ||||
Xerox Capital Trust I | ||||||
8.00%, 02/01/27 | 1,500,000 | 1,543,752 | ||||
XTO Energy, Inc. | ||||||
6.10%, 04/01/36D | 50,000 | 47,067 | ||||
Total Corporate Bonds (Cost $82,596,678) | 86,574,877 | |||||
FOREIGN BONDS — 12.2% | ||||||
Australia — 0.1% | ||||||
Qantas Airways, Ltd. | ||||||
6.05%, 04/15/16 144A | 345,000 | 335,482 | ||||
Brazil — 1.3% | ||||||
Federative Republic of Brazil | ||||||
10.25%, 01/10/28(B)D | 2,525,000 | 1,459,500 | ||||
8.25%, 01/20/34D | 4,750,000 | 5,844,875 | ||||
| 7,304,375 | ||||||
Canada — 4.6% | ||||||
British Columbia Generic Residual | ||||||
4.72%, 06/09/14 STRIP(C)W | 10,230,000 | 6,866,416 | ||||
Canada Generic Residual | ||||||
4.57%, 06/01/25 STRIP(C)W | 4,110,000 | 1,693,771 | ||||
Canadian Government | ||||||
4.25%, 09/01/08(C) | 4,745,000 | 4,461,837 | ||||
4.00%, 06/01/16(C) | 575,000 | 518,188 | ||||
Kinder Morgan Finance Co. | ||||||
5.70%, 01/05/16 | 125,000 | 115,398 | ||||
6.40%, 01/05/36 | 665,000 | 589,460 | ||||
Methanex Corporation | ||||||
6.00%, 08/15/15 | 25,000 | 24,098 | ||||
Ontario Generic Residual | ||||||
5.03%, 07/13/22 STRIP(C)W | 3,900,000 | 1,717,062 | ||||
4.98%, 03/08/29 STRIP(C)W | 7,000,000 | 2,243,417 | ||||
Saskatchewan Residual | ||||||
4.93%, 04/10/14 STRIP(C)W | 7,500,000 | 5,102,323 | ||||
4.74%, 02/04/22 STRIP(C)W | 3,000,000 | 1,364,469 | ||||
Talisman Energy, Inc. | ||||||
5.85%, 02/01/37 | 140,000 | 123,978 | ||||
6.25%, 02/01/38 | 370,000 | 344,014 | ||||
| 25,164,431 | ||||||
Cayman Islands — 0.1% | ||||||
Enersis SA | ||||||
7.40%, 12/01/16 | 625,000 | 673,640 | ||||
Egypt — 1.2% | ||||||
Egypt Government AID Bonds | ||||||
4.45%, 09/15/15 | 7,365,000 | 6,917,562 | ||||
Luxembourg — 0.1% | ||||||
Telecom Italia Capital SA | ||||||
6.38%, 11/15/33 | 410,000 | 387,388 | ||||
6.00%, 09/30/34 | 250,000 | 225,944 | ||||
| 613,332 | ||||||
Malaysia — 0.0% | ||||||
Telekom Malaysia BHD | ||||||
7.88%, 08/01/25 144A | 225,000 | 266,755 | ||||
Mexico — 1.0% | ||||||
Mexican Bonos | ||||||
9.00%, 12/20/12(M) | 23,000,000 | 2,254,973 | ||||
8.00%, 12/07/23(M) | 34,000,000 | 3,238,080 | ||||
| 5,493,053 | ||||||
See Notes to Financial Statements.
| 83 |
Table of Contents
Extended-Duration Bond Fund
SCHEDULE OF INVESTMENTS (Continued)
| Par | Value | ||||||
Netherlands — 0.3% | |||||||
Rabobank Nederland | |||||||
13.50%, 01/28/08(I) | $ | 110,000,000 | $ | 1,761,223 | |||
Philippines — 0.2% | |||||||
Philippine Long Distance Telephone Co. | |||||||
8.35%, 03/06/17 | 500,000 | 561,250 | |||||
Quezon Power (Philippines), Ltd. | |||||||
8.86%, 06/15/17 | 414,700 | 431,288 | |||||
| 992,538 | |||||||
Spain — 0.6% | |||||||
Telefonica Emisones SAU | |||||||
7.05%, 06/20/36 | 3,105,000 | 3,225,573 | |||||
Supranational — 2.1% | |||||||
Inter-American Development Bank | |||||||
11.42%, 05/11/09(B)W | 7,500,000 | 3,155,132 | |||||
6.00%, 12/15/17(Z) | 12,250,000 | 8,514,636 | |||||
| 11,669,768 | |||||||
Sweden — 0.4% | |||||||
Swedish Government | |||||||
6.50%, 05/05/08(K) | 14,640,000 | 2,186,624 | |||||
United Kingdom — 0.2% | |||||||
Vodafone Group PLC | |||||||
6.15%, 02/27/37 | 1,000,000 | 933,326 | |||||
Total Foreign Bonds (Cost $56,420,645) | 67,537,682 | ||||||
MORTGAGE-BACKED SECURITIES — 0.1% | |||||||
Federal Home Loan Mortgage Corporation | |||||||
5.00%, 12/01/31 | 195,003 | 183,763 | |||||
Federal National Mortgage Association | |||||||
5.00%, 07/25/23 | 374,504 | 372,540 | |||||
Total Mortgage-Backed Securities (Cost $519,965) | 556,303 | ||||||
| Shares | |||||||
PREFERRED STOCK — 0.0% | |||||||
Chesapeake Energy Corporation CONV | |||||||
(Cost $33,898) | 330 | 38,455 | |||||
MONEY MARKET FUNDS — 23.1% | |||||||
GuideStone Funds Money Market Fund (GS4 Class)¥ | 6,930,461 | 6,930,461 | |||||
Northern Institutional Liquid Assets Portfolio§ | 120,788,546 | 120,788,546 | |||||
Total Money Market Funds (Cost $127,719,007) | 127,719,007 | ||||||
| Par | |||||||
U.S. TREASURY OBLIGATIONS — 68.9% | |||||||
U.S. Treasury Bonds | |||||||
8.13%, 08/15/19D | $ | 8,530,000 | 10,789,120 | ||||
8.00%, 11/15/21D | 192,687,000 | 246,594,271 | |||||
5.38%, 02/15/31D | 1,160,000 | 1,191,538 | |||||
4.50%, 02/15/36D | 122,693,000 | 111,133,111 | |||||
| 369,708,040 | |||||||
U.S. Treasury Note | |||||||
4.63%, 10/31/11D | 11,075,000 | 10,949,542 | |||||
Total U.S. Treasury Obligations (Cost $395,077,256) | 380,657,582 | ||||||
TOTAL INVESTMENTS — 120.7% (Cost $665,523,705) | |||||||
| 666,527,593 | |||||||
Liabilities in Excess of Other Assets — (20.7)% | (114,352,580 | ) | |||||
NET ASSETS — 100.0% | $ | 552,175,013 | |||||
PORTFOLIO SUMMARY (based on net assets)
| % | |||
U.S. Treasury Obligations | 68.9 | ||
Money Market Funds | 23.1 | ||
Corporate Bonds | 15.7 | ||
Foreign Bonds | 12.2 | ||
Asset-Backed Security | 0.4 | ||
Agency Obligations | 0.3 | ||
Mortgage-Backed Securities | 0.1 | ||
Preferred Stock | — | ** | |
| 120.7 | |||
| ** | Rounds to less than 0.005%. |
See Notes to Financial Statements.
| 84 |
Table of Contents
Average Annual Total Returns as of 06/30/07
| GS4 Class* | Benchmark** | |||||
Six Months | 1.43 | % | 1.09 | % | ||
Since Inception | 1.47 | % | 1.18 | % | ||
Inception Date | 12/29/06 | 12/29/06 |
The performance data quoted represents past performance and does not guarantee future results. Current performance may be lower or higher. Performance data current to the most recent month-end may be obtained at www.GuideStoneFunds.org. The investment return and principal value of an investment will fluctuate so that shares, when redeemed, may be worth more or less than their original cost.
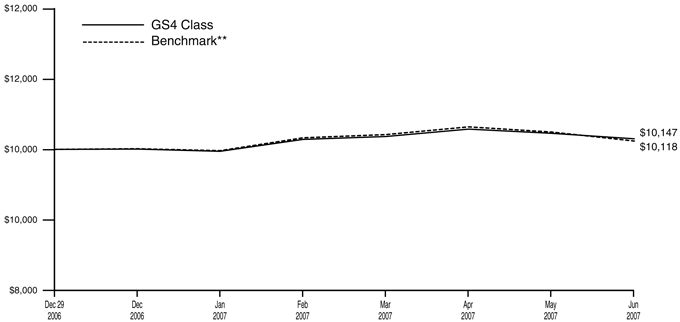
The graph compares the results of a hypothetical $10,000 investment in the GS4 Class of the Fund since December 29, 2006 (commencement of operations), with all dividends and capital gains reinvested, with the weighted composite index.
| * | These returns reflect expense waivers by the Fund’s investment advisor. Without these waivers, returns would have been lower. Returns shown do not reflect the deduction of taxes that a shareholder would pay on Fund distributions or the redemption of Fund shares. |
| ** | Represents a weighted composite benchmark index consisting of the JPMorgan Emerging Markets Bond Index Plus, the Lehman Brothers Global Aggregate Index — Unhedged, and the Lehman Brothers U.S. Corporate High Yield Index — 2% Issuer Capped. |
The JPMorgan Emerging Markets Bond Index Plus is a traditional, market-capitalization weighted index comprised of U.S. dollar denominated Brady bonds, Eurobonds, and traded loans issued by sovereign entities.
The Lehman Brothers Global Aggregate Index provides a broad-based measure of the global investment-grade fixed-rate debt markets.
The Lehman Brothers U.S. Corporate High-Yield 2% Issuer Capped Index is an issuer-constrained version of the U.S. Corporate High-Yield Index that covers the US denominated, non-investment grade, fixed-rate, and taxable corporate bond market.
Unlike a mutual fund, the performance of an index assumes no taxes, transaction costs, management fees or other expenses.
The Global Bond Fund invests in high yield securities, commonly known as “junk bonds”. While offering higher currency yields, these securities generally are considered speculative and are subject to greater risks than higher-rated bonds. Securities of emerging countries may involve additional risks including price volatility, reduced liquidity, currency fluctuation and financial reporting requirements as well as political and economic instability. This fund is not available for direct investment.
| 85 |
Table of Contents
Global Bond Fund | ||
SCHEDULE OF INVESTMENTS | June 30, 2007 (Unaudited) |
| Par | Value | |||||
AGENCY OBLIGATION — 0.2% | ||||||
Federal National Mortgage Association | ||||||
5.00%, 03/17/08‡‡ | ||||||
(Cost $168,668) | $ | 175,000 | $ | 168,711 | ||
ASSET-BACKED SECURITIES — 4.9% | ||||||
Bear Stearns Asset Backed Securities Trust | ||||||
5.80%, 10/25/33 STEP | 175,025 | 175,469 | ||||
Capital One Master Trust | ||||||
5.52%, 12/15/10† | 600,000 | 601,055 | ||||
Carrington Mortgage Loan Trust | ||||||
5.64%, 10/25/35† | 273,527 | 274,160 | ||||
GMAC Mortgage Corporation Loan Trust | ||||||
5.39%, 12/25/36† | 1,900,000 | 1,898,900 | ||||
Lehman XS Trust | ||||||
5.41%, 02/25/37† | 840,981 | 840,919 | ||||
Morgan Stanley Mortgage Loan Trust | ||||||
5.44%, 10/25/36† | 647,634 | 647,671 | ||||
Origen Manufactured Housing | ||||||
5.47%, 11/15/18† | 164,359 | 164,335 | ||||
RAAC Series | ||||||
5.66%, 07/25/37 144A† | 623,836 | 623,996 | ||||
Residential Asset Securities Corporation | ||||||
6.35%, 03/25/32 | 99,111 | 98,776 | ||||
SACO I, Inc. | ||||||
5.49%, 09/25/35† | 175,280 | 175,222 | ||||
Security National Mortgage Loan Trust | ||||||
5.60%, 01/25/37 144A† | 334,248 | 334,979 | ||||
Total Asset-Backed Securities (Cost $5,834,778) | 5,835,482 | |||||
CORPORATE BONDS — 25.1% | ||||||
Activant Solutions, Inc. | ||||||
9.50%, 05/01/16 | 65,000 | 64,188 | ||||
Advanced Medical Optics, Inc. | ||||||
7.50%, 05/01/17 144AD | 45,000 | 42,750 | ||||
AES Corporation | ||||||
8.38%, 03/01/11(U) | 50,000 | 104,914 | ||||
8.75%, 05/15/13 144A | 500,000 | 530,000 | ||||
Affinion Group, Inc. | ||||||
10.13%, 10/15/13 | 140,000 | 150,150 | ||||
11.50%, 10/15/15 | 95,000 | 103,938 | ||||
Allegheny Energy Supply | ||||||
7.80%, 03/15/11 | 90,000 | 93,825 | ||||
Alliant Techsystems, Inc. | ||||||
6.75%, 04/01/16 | 100,000 | 97,500 | ||||
Allied Security Escrow Corporation | ||||||
11.38%, 07/15/11 | 110,000 | 111,100 | ||||
Allied Waste North America, Inc. | ||||||
6.38%, 04/15/11 | 130,000 | 127,075 | ||||
7.13%, 05/15/16 | 225,000 | 221,063 | ||||
AMC Entertainment, Inc. | ||||||
11.00%, 02/01/16 | 170,000 | 188,700 | ||||
American International Group, Inc. | ||||||
5.05%, 10/01/15D | 100,000 | 95,352 | ||||
Anadarko Petroleum Corporation | ||||||
5.95%, 09/15/16 | 20,000 | 19,563 | ||||
Appleton Papers, Inc. | ||||||
8.13%, 06/15/11 | 40,000 | 41,400 | ||||
9.75%, 06/15/14 | 100,000 | 105,500 | ||||
Ashtead Capital, Inc. | ||||||
9.00%, 08/15/16 144A | 140,000 | 147,350 | ||||
Ashton Woods USA LLC | ||||||
9.50%, 10/01/15 | 40,000 | 37,200 | ||||
Associated Materials, Inc. | ||||||
9.75%, 04/15/12D | 120,000 | 126,000 | ||||
Autonation, Inc. | ||||||
7.36%, 04/15/13† | 425,000 | 426,062 | ||||
Avis Budget Car Rental LLC | ||||||
7.86%, 05/15/14† | 225,000 | 229,500 | ||||
Ball Corporation | ||||||
6.88%, 12/15/12 | 300,000 | 301,500 | ||||
Boeing Capital Corporation, Ltd. | ||||||
5.80%, 01/15/13D | 60,000 | 60,960 | ||||
Buffets, Inc. | ||||||
12.50%, 11/01/14 | 105,000 | 101,062 | ||||
Case New Holland, Inc. | ||||||
9.25%, 08/01/11 | 240,000 | 252,768 | ||||
CCH I Holdings LLC | ||||||
11.75%, 05/15/14 STEPD | 170,000 | 167,875 | ||||
12.13%, 01/15/15 STEPD | 55,000 | 55,825 | ||||
11.00%, 10/01/15 | 350,000 | 367,062 | ||||
Charter Communications Holdings LLC | ||||||
12.13%, 01/15/12 STEP | 70,000 | 72,538 | ||||
Chesapeake Energy Corporation | ||||||
7.50%, 09/15/13D | 265,000 | 270,962 | ||||
6.25%, 01/15/18 | 30,000 | 28,162 | ||||
Cincinnati Bell Telephone Co. | ||||||
6.30%, 12/01/28 | 155,000 | 138,725 | ||||
Citizens Communications Co. | ||||||
9.25%, 05/15/11 | 200,000 | 217,000 | ||||
Clear Channel Communications, Inc. | ||||||
4.63%, 01/15/08D | 50,000 | 49,582 | ||||
CMP Susquehanna Corporation | ||||||
9.88%, 05/15/14 144A | 80,000 | 80,400 | ||||
Colorado Interstate Gas Co. | ||||||
5.95%, 03/15/15 | 20,000 | 19,575 | ||||
6.80%, 11/15/15 | 125,000 | 129,177 | ||||
Comcast Corporation | ||||||
6.50%, 01/15/15D | 60,000 | 61,612 | ||||
6.50%, 01/15/17D | 60,000 | 61,366 | ||||
Community Health Systems, Inc. | ||||||
8.88%, 07/15/15 144A | 230,000 | 234,312 | ||||
Complete Production Services, Inc. | ||||||
8.00%, 12/15/16 144AD | 80,000 | 81,200 | ||||
Continental Airlines, Inc. | ||||||
8.75%, 12/01/11D | 50,000 | 49,250 | ||||
Countrywide Financial Corporation | ||||||
5.80%, 06/07/12 | 90,000 | 89,460 | ||||
6.25%, 05/15/16 | 280,000 | 275,449 | ||||
DaVita, Inc. | ||||||
6.63%, 03/15/13 144A | 140,000 | 137,375 | ||||
See Notes to Financial Statements.
| 86 |
Table of Contents
| Par | Value | |||||
Delhaize America, Inc. | ||||||
9.00%, 04/15/31 | $ | 301,000 | $ | 365,158 | ||
Dex Media East LLC | ||||||
9.88%, 11/15/09 | 200,000 | 207,750 | ||||
12.13%, 11/15/12D | 70,000 | 75,512 | ||||
Dex Media West LLC | ||||||
9.88%, 08/15/13 | 275,000 | 295,625 | ||||
Dex Media, Inc. | ||||||
7.43%, 11/15/13 STEPW | 10,000 | 9,462 | ||||
DI Finance | ||||||
9.50%, 02/15/13 | 180,000 | 192,375 | ||||
Dollar General Corporation | ||||||
10.63%, 07/15/15 144A | 110,000 | 106,700 | ||||
Duke Energy Corporation | ||||||
3.75%, 03/05/08 | 50,000 | 49,443 | ||||
Dynegy Holdings, Inc. | ||||||
7.75%, 06/01/19 144A | 160,000 | 142,130 | ||||
EchoStar DBS Corporation | ||||||
7.13%, 02/01/16 | 600,000 | 589,500 | ||||
Education Management LLC | ||||||
8.75%, 06/01/14 | 10,000 | 10,300 | ||||
10.25%, 06/01/16D | 125,000 | 132,188 | ||||
El Paso Natural Gas Co. | ||||||
8.63%, 01/15/22 | 90,000 | 105,797 | ||||
8.38%, 06/15/32 | 75,000 | 88,320 | ||||
Enterprise Products Operating LP | ||||||
8.38%, 08/01/45†D | 60,000 | 64,138 | ||||
EPL Finance Corporation | ||||||
11.75%, 11/15/13 | 30,000 | 31,800 | ||||
EXCO Resources, Inc. | ||||||
7.25%, 01/15/11 | 125,000 | 125,000 | ||||
FirstEnergy Corporation | ||||||
6.45%, 11/15/11 | 100,000 | 102,638 | ||||
7.38%, 11/15/31 | 25,000 | 27,143 | ||||
Ford Motor Credit Co. | ||||||
6.63%, 06/16/08 | 90,000 | 89,960 | ||||
5.63%, 10/01/08 | 240,000 | 236,968 | ||||
5.80%, 01/12/09 | 500,000 | 489,600 | ||||
8.11%, 01/13/12†D | 37,500 | 37,440 | ||||
9.81%, 04/15/12† | 100,000 | 107,274 | ||||
Forest Oil Corporation | ||||||
8.00%, 06/15/08 | 100,000 | 101,750 | ||||
Freeport-McMoRan Copper & Gold, Inc. | ||||||
8.38%, 04/01/17 | 470,000 | 502,900 | ||||
Freescale Semiconductor, Inc. | ||||||
8.88%, 12/15/14 144A | 25,000 | 24,000 | ||||
FTD, Inc. | ||||||
7.75%, 02/15/14 | 55,000 | 54,725 | ||||
General Electric Capital Corporation | ||||||
6.75%, 03/15/32D | 30,000 | 32,651 | ||||
General Motors Corporation | ||||||
8.38%, 07/05/33(E) | 250,000 | 322,226 | ||||
Georgia Gulf Corporation | ||||||
9.50%, 10/15/14 D | 125,000 | 125,000 | ||||
GMAC LLC | ||||||
6.75%, 12/01/14 | 650,000 | 623,364 | ||||
8.00%, 11/01/31D | 600,000 | 615,207 | ||||
Goldman Sachs Group, Inc. | ||||||
6.65%, 05/15/09 | 20,000 | 20,458 | ||||
Graham Packaging Co., Inc. | ||||||
9.88%, 10/15/14D | 115,000 | 116,869 | ||||
Graphic Packaging International Corporation | ||||||
9.50%, 08/15/13D | 125,000 | 130,469 | ||||
H&E Equipment Services, Inc. | ||||||
8.38%, 07/15/16 | 50,000 | 52,750 | ||||
Hanover Compressor Co. | ||||||
7.50%, 04/15/13 | 40,000 | 40,400 | ||||
Hawaiian Telcom Communications, Inc. | ||||||
12.50%, 05/01/15D | 80,000 | 91,200 | ||||
Hawker Beechcraft Acquisition Co., LLC | ||||||
9.75%, 04/01/17 144AD | 140,000 | 146,650 | ||||
HCA, Inc. | ||||||
7.88%, 02/01/11 | 240,000 | 244,205 | ||||
6.50%, 02/15/16 | 100,000 | 85,125 | ||||
9.25%, 11/15/16 144A | 60,000 | 64,050 | ||||
9.63%, | ||||||
11/15/16 PIK 144AD | 45,000 | 48,488 | ||||
Hertz Corporation | ||||||
8.88%, 01/01/14 | 500,000 | 523,750 | ||||
Hess Corporation | ||||||
6.65%, 08/15/11 | 60,000 | 62,047 | ||||
HSBC Finance Corporation | ||||||
4.63%, 01/15/08 | 120,000 | 119,551 | ||||
Idearc, Inc. | ||||||
8.00%, 11/15/16 | 95,000 | 96,425 | ||||
Intelsat Corporation | ||||||
9.00%, 06/15/11 | 160,000 | 168,400 | ||||
9.00%, 08/15/14 | 240,000 | 251,400 | ||||
JPMorgan Chase & Co. | ||||||
3.63%, 05/01/08 | 100,000 | 98,542 | ||||
Kerr-McGee Corporation | ||||||
6.95%, 07/01/24 | 30,000 | 31,203 | ||||
Keystone Automotive Operations, Inc. | ||||||
9.75%, 11/01/13 | 85,000 | 74,375 | ||||
Kimball Hill, Inc. | ||||||
10.50%, 12/15/12D | 20,000 | 18,300 | ||||
Koppers, Inc. | ||||||
9.88%, 10/15/13 | 75,000 | 80,438 | ||||
Kraft Foods, Inc. | ||||||
4.13%, 11/12/09 | 40,000 | 38,771 | ||||
L-3 Communications Corporation | ||||||
7.63%, 06/15/12 | 600,000 | 617,250 | ||||
6.13%, 01/15/14 | 45,000 | 42,638 | ||||
6.38%, 10/15/15 | 450,000 | 427,500 | ||||
Lamar Media Corporation | ||||||
6.63%, 08/15/15 | 100,000 | 95,250 | ||||
Lehman Brothers Holdings, Inc. | ||||||
5.25%, 02/06/12D | 130,000 | 127,909 | ||||
Leiner Health Products, Inc. | ||||||
11.00%, 06/01/12D | 185,000 | 175,750 | ||||
Level 3 Financing, Inc. | ||||||
9.25%, 11/01/14 144A | 20,000 | 20,300 | ||||
9.25%, 11/01/14D | 50,000 | 50,750 | ||||
8.75%, 02/15/17 144A | 40,000 | 39,750 | ||||
Levi Strauss & Co. | ||||||
9.75%, 01/15/15 | 100,000 | 107,500 | ||||
8.88%, 04/01/16 | 30,000 | 30,900 | ||||
Lyondell Chemical Co. | ||||||
8.00%, 09/15/14 | 190,000 | 196,175 | ||||
8.25%, 09/15/16 | 140,000 | 147,000 | ||||
See Notes to Financial Statements.
| 87 |
Table of Contents
Global Bond Fund
SCHEDULE OF INVESTMENTS (Continued)
| Par | Value | |||||
Metals USA Holdings Corporation | ||||||
11.37%, 01/15/12 PIK 144A† | $ | 190,000 | $ | 190,950 | ||
Metals USA, Inc. | ||||||
0.11%, 12/01/15 | 140,000 | 153,300 | ||||
MetroPCS Wireless, Inc. | ||||||
9.25%, 11/01/14 144A | 5,000 | 5,192 | ||||
9.25%, 11/01/14 144AD | 35,000 | 36,312 | ||||
Midwest Generation LLC | ||||||
8.30%, 07/02/09 | 84,279 | 86,017 | ||||
8.56%, 01/02/16 | 450,792 | 480,939 | ||||
Mirant Mid-Atlantic LLC | ||||||
9.13%, 06/30/17 | 152,070 | 171,934 | ||||
Morgan Stanley | ||||||
3.63%, 04/01/08 D | 60,000 | 59,190 | ||||
4.75%, 04/01/14 D | 50,000 | 46,758 | ||||
Neiman-Marcus Group, Inc. | ||||||
9.00%, 10/15/15 PIKD | 80,000 | 86,000 | ||||
10.38%, 10/15/15D | 60,000 | 66,300 | ||||
Nevada Power Co. | ||||||
8.25%, 06/01/11 | 290,000 | 315,246 | ||||
5.88%, 01/15/15 | 100,000 | 98,185 | ||||
NewPage Corporation | ||||||
11.61%, 05/01/12† | 185,000 | 202,575 | ||||
Noranda Aluminium Holding Corporation | ||||||
11.14%, 11/15/14 PIK 144A†D | 60,000 | 58,800 | ||||
Norcraft Holdings LP | ||||||
9.14%, 09/01/12 STEPW | 195,000 | 179,400 | ||||
NRG Energy, Inc. | ||||||
7.38%, 02/01/16 | 300,000 | 301,500 | ||||
NTK Holdings, Inc. | ||||||
12.37%, 03/01/14WD | 180,000 | 131,400 | ||||
Nutro Products, Inc. | ||||||
10.75%, 04/15/14 144A | 70,000 | 81,693 | ||||
Orion Power Holdings, Inc. | ||||||
12.00%, 05/01/10 | 55,000 | 62,425 | ||||
Owens Brockway Glass Container, Inc. | ||||||
8.25%, 05/15/13 | 300,000 | 312,000 | ||||
PAETEC Holding Corporation | ||||||
9.50%, 07/15/15 144A | 50,000 | 50,250 | ||||
Pemex Project Funding Master Trust | ||||||
6.63%, 06/15/35D | 1,810,000 | 1,839,412 | ||||
Penhall International Corporation | ||||||
12.00%, 08/01/14 144A | 170,000 | 184,450 | ||||
PetroHawk Energy Corporation | ||||||
9.13%, 07/15/13 | 70,000 | 74,375 | ||||
Qwest Communications International, Inc. | ||||||
8.86%, 02/15/09† | 66,000 | 66,990 | ||||
7.25%, 02/15/11 | 35,000 | 35,438 | ||||
Qwest Corporation | ||||||
7.88%, 09/01/11 | 100,000 | 104,750 | ||||
8.88%, 03/15/12 | 20,000 | 21,650 | ||||
8.61%, 06/15/13† | 100,000 | 109,000 | ||||
7.63%, 06/15/15 | 300,000 | 311,250 | ||||
Realogy Corporation | ||||||
12.38%, 04/15/15 144AD | 175,000 | 160,125 | ||||
Rental Services Corporation | ||||||
9.50%, 12/01/14 144A | 90,000 | 92,250 | ||||
RH Donnelley, Inc. | ||||||
10.88%, 12/15/12 | 100,000 | 106,875 | ||||
Rural Cellular Corporation | ||||||
8.36%, 06/01/13 144A† | 60,000 | 60,000 | ||||
Saint Acquisition Corporation | ||||||
12.50%, 05/15/17 144A | 145,000 | 137,750 | ||||
Sbarro, Inc. | ||||||
10.38%, 02/01/15 | 50,000 | 48,938 | ||||
SemGroup LP | ||||||
8.75%, 11/15/15 144A | 105,000 | 106,050 | ||||
Service Corporation International | ||||||
7.50%, 04/01/27 144A | 75,000 | 71,062 | ||||
Sinclair Broadcast Group, Inc. | ||||||
8.00%, 03/15/12 | 55,000 | 56,650 | ||||
SLM Corporation | ||||||
5.00%, 10/01/13 | 380,000 | 324,639 | ||||
4.75%, 03/17/14(E) | 170,000 | 192,225 | ||||
Smurfit-Stone Container Enterprises, Inc. | ||||||
8.00%, 03/15/17D | 135,000 | 131,625 | ||||
Sprint Capital Corporation | ||||||
8.38%, 03/15/12 | 60,000 | 65,427 | ||||
Stone Energy Corporation | ||||||
8.25%, 12/15/11 | 95,000 | 95,475 | ||||
Suburban Propane Partners LP | ||||||
6.88%, 12/15/13 | 145,000 | 140,650 | ||||
Tenet Healthcare Corporation | ||||||
6.38%, 12/01/11 | 110,000 | 101,062 | ||||
9.88%, 07/01/14D | 375,000 | 373,125 | ||||
Time Warner, Inc. | ||||||
6.88%, 05/01/12 | 90,000 | 93,990 | ||||
TL Acquisitions, Inc. | ||||||
10.50%, 01/15/15 144A | 100,000 | 98,724 | ||||
TransDigm, Inc. | ||||||
7.75%, 07/15/14 144A | 20,000 | 20,300 | ||||
Triad Hospitals, Inc. | ||||||
7.00%, 11/15/13 | 50,000 | 52,685 | ||||
TRW Automotive, Inc. | ||||||
6.38%, 03/15/14 144A(E) | 147,000 | 197,109 | ||||
Tube City IMS Corporation | ||||||
9.75%, 02/01/15 144AD | 60,000 | 61,800 | ||||
TXU Corporation | ||||||
5.55%, 11/15/14 | 10,000 | 8,539 | ||||
6.50%, 11/15/24 | 20,000 | 16,637 | ||||
6.55%, 11/15/34D | 360,000 | 292,975 | ||||
TXU Electric Delivery Co. | ||||||
6.38%, 01/15/15 | 100,000 | 101,578 | ||||
Unicredito Italiano Capital Trust III | ||||||
4.03%, 10/29/49(E)† | 250,000 | 303,986 | ||||
Universal Hospital Services, Inc. | ||||||
8.50%, 06/01/15 PIK 144A | 20,000 | 19,900 | ||||
8.76%, 06/01/15 144A† | 20,000 | 20,100 | ||||
Univision Communications, Inc. | ||||||
9.75%, 03/15/15 PIK 144AD | 55,000 | 54,588 | ||||
US Oncology Holdings, Inc. | ||||||
9.80%, 03/15/12 PIK 144A†D | 100,000 | 98,750 | ||||
Valor Telecommunications Enterprises LLC | ||||||
7.75%, 02/15/15 | 125,000 | 131,580 | ||||
See Notes to Financial Statements.
| 88 |
Table of Contents
| Par | Value | |||||
Vangent, Inc. | ||||||
9.63%, 02/15/15 144A | $ | 50,000 | $ | 50,807 | ||
Verizon Global Funding Corporation | ||||||
6.88%, 06/15/12D | 30,000 | 31,624 | ||||
Verso Paper Holdings LLC | ||||||
9.11%, 08/01/14 144A† | 160,000 | 164,000 | ||||
Visteon Corporation | ||||||
8.25%, 08/01/10D | 190,000 | 189,525 | ||||
W&T Offshore, Inc. | ||||||
8.25%, 06/15/14 144A | 50,000 | 49,625 | ||||
Wachovia Corporation | ||||||
5.25%, 08/01/14D | 120,000 | 116,736 | ||||
Waste Management, Inc. | ||||||
7.38%, 08/01/10 | 50,000 | 52,421 | ||||
7.38%, 05/15/29 | 50,000 | 52,800 | ||||
Weyerhaeuser Co. | ||||||
6.75%, 03/15/12 | 120,000 | 124,283 | ||||
Williams Cos., Inc. | ||||||
7.13%, 09/01/11 | 525,000 | 540,750 | ||||
7.50%, 01/15/31D | 130,000 | 135,200 | ||||
Windstream Corporation | ||||||
8.63%, 08/01/16 | 650,000 | 690,625 | ||||
WMG Acquisition Corporation | ||||||
7.38%, 04/15/14 | 75,000 | 70,125 | ||||
WMG Holdings Corporation | ||||||
10.16%, 12/15/14 STEPW | 100,000 | 76,500 | ||||
Xerox Corporation | ||||||
9.75%, 01/15/09 | 500,000 | 529,102 | ||||
XTO Energy, Inc. | ||||||
7.50%, 04/15/12 | 30,000 | 32,285 | ||||
Total Corporate Bonds (Cost $29,911,410) | 29,800,167 | |||||
FOREIGN BONDS — 44.4% | ||||||
Argentina — 0.8% | ||||||
Republic of Argentina | ||||||
2.00%, 01/03/10(R)† | 1,140,000 | 496,353 | ||||
7.00%, 09/12/13 | 488,000 | 464,210 | ||||
| 960,563 | ||||||
Australia — 1.7% | ||||||
Australian Government Bond | ||||||
5.25%, 03/15/19(A) | 1,320,000 | 1,027,454 | ||||
Queensland Treasury Corporation | ||||||
6.00%, 06/14/11(A) | 1,220,000 | 1,010,428 | ||||
| 2,037,882 | ||||||
Bermuda — 0.3% | ||||||
AES China Generating Co., Ltd. | ||||||
8.25%, 06/26/10 | 120,000 | 120,010 | ||||
Intelsat Subsidiary Holding Co., Ltd. | ||||||
8.25%, 01/15/13D | 300,000 | 306,000 | ||||
| 426,010 | ||||||
Brazil — 5.2% | ||||||
Brazilian Notes | ||||||
10.41%, 07/02/08(B)W | 3,884,000 | 1,816,158 | ||||
10.46%, 01/02/09(B)W | 4,239,000 | 1,882,608 | ||||
Federative Republic of Brazil | ||||||
11.00%, 08/17/40D | 1,900,000 | 2,494,225 | ||||
| 6,192,991 | ||||||
Canada — 2.0% | ||||||
Abitibi-Consolidated Co. of Canada | ||||||
6.00%, 06/20/13D | 75,000 | 62,437 | ||||
8.38%, 04/01/15D | 55,000 | 48,400 | ||||
Abitibi-Consolidated, Inc. | ||||||
7.40%, 04/01/18 | 10,000 | 8,150 | ||||
Ainsworth Lumber Co., Ltd. | ||||||
7.25%, 10/01/12D | 30,000 | 23,250 | ||||
Bombardier, Inc. | ||||||
7.25%, 11/15/16(E) | 161,000 | 228,355 | ||||
Conoco Funding Co. | ||||||
6.35%, 10/15/11 | 70,000 | 72,247 | ||||
Methanex Corporation | ||||||
8.75%, 08/15/12 | 70,000 | 77,350 | ||||
Novelis, Inc. | ||||||
7.25%, 02/15/15D | 115,000 | 118,594 | ||||
OPTI Canada, Inc. | ||||||
7.88%, 12/15/14 144A | 120,000 | 120,600 | ||||
8.25%, 12/15/14 144AD | 50,000 | 51,000 | ||||
Quebecor Media, Inc. | ||||||
7.75%, 03/15/16 | 100,000 | 102,000 | ||||
Rogers Cable, Inc. | ||||||
7.88%, 05/01/12 | 240,000 | 259,769 | ||||
8.75%, 05/01/32D | 60,000 | 72,942 | ||||
Rogers Wireless, Inc. | ||||||
9.63%, 05/01/11 | 450,000 | 506,792 | ||||
7.25%, 12/15/12 | 250,000 | 264,261 | ||||
Western Oil Sands, Inc. | ||||||
8.38%, 05/01/12 | 300,000 | 329,625 | ||||
| 2,345,772 | ||||||
Cayman Islands — 0.8% | ||||||
Shinsei Finance Cayman, Ltd. | ||||||
6.42%, 07/20/49 144A† | 120,000 | 116,871 | ||||
Vale Overseas, Ltd. | ||||||
6.88%, 11/21/36 | 787,000 | 793,049 | ||||
| 909,920 | ||||||
Colombia — 0.4% | ||||||
Republic of Colombia | ||||||
7.38%, 09/18/37 | 400,000 | 445,000 | ||||
Denmark — 2.9% | ||||||
FS Funding A/S | ||||||
8.88%, 05/15/16 144A(E) | 190,000 | 282,872 | ||||
Nordea Kredit Realkreditaktie- selskab | ||||||
4.00%, 10/01/38(D) | 9,169,941 | 1,462,197 | ||||
Nordic Telephone Co. Holdings ApS | ||||||
8.88%, 05/01/16 144AD | 265,000 | 282,225 | ||||
Nykredit Realkredit A/S | ||||||
4.00%, 10/01/38(D) | 8,495,543 | 1,351,957 | ||||
| 3,379,251 | ||||||
Ecuador — 0.1% | ||||||
Republic of Ecuador | ||||||
10.00%, 08/15/30 STEP | 150,000 | 123,750 | ||||
Egypt — 1.8% | ||||||
Egyptian Treasury Bill | ||||||
7.20%, 01/29/08W(Y) | 12,525,000 | 2,111,659 | ||||
France — 0.4% | ||||||
AXA SA | ||||||
5.78%, 07/31/49(E)† | 200,000 | 271,754 | ||||
See Notes to Financial Statements.
| 89 |
Table of Contents
Global Bond Fund
SCHEDULE OF INVESTMENTS (Continued)
| Par | Value | |||||
Compagnie Generale de Geophysique SA | ||||||
7.50%, 05/15/15 | $ | 90,000 | $ | 90,450 | ||
Europcar Groupe SA | ||||||
8.13%, 05/15/14(E) | 74,000 | 105,414 | ||||
| 467,618 | ||||||
Germany — 4.8% | ||||||
Bundesobligation | ||||||
3.50%, 10/14/11(E) | 2,400,000 | 3,119,386 | ||||
Bundesrepublik Deutschland | ||||||
4.00%, 07/04/16(E)D | 1,950,000 | 2,533,438 | ||||
| 5,652,824 | ||||||
Hungary — 1.8% | ||||||
Hungary Government Bond | ||||||
5.50%, 02/12/14(H) | 210,000,000 | 1,076,928 | ||||
6.75%, 02/24/17(H) | 195,000,000 | 1,078,340 | ||||
| 2,155,268 | ||||||
Iceland — 0.1% | ||||||
Kaupthing Bank HF | ||||||
7.13%, 05/19/16 144A | 150,000 | 158,716 | ||||
Ireland — 0.4% | ||||||
Ardagh Glass Finance PLC | ||||||
7.13%, 06/15/17 144A(E) | 112,000 | 146,494 | ||||
Smurfit Kappa Funding PLC | ||||||
7.75%, 04/01/15(E) | 200,000 | 285,065 | ||||
| 431,559 | ||||||
Israel — 1.4% | ||||||
Israel Government Bond - Shahar | ||||||
6.50%, 01/31/16(S) | 6,600,000 | 1,654,112 | ||||
Japan — 1.2% | ||||||
Japanese 20-Year Government Bond | ||||||
2.10%, 03/20/27(J) | 90,000,000 | 719,420 | ||||
Japanese Government | ||||||
1.40%, 12/20/13(J) | 17,000,000 | 136,326 | ||||
1.10%, 12/10/16(J) | 17,000,000 | 135,891 | ||||
Resona Bank, Ltd. | ||||||
5.99%, 08/10/49(U)† | 250,000 | 489,929 | ||||
| 1,481,566 | ||||||
Jersey — 0.3% | ||||||
RZB Finance Jersey IV, Ltd. | ||||||
5.17%, 05/16/16(E)† | 250,000 | 322,613 | ||||
Luxembourg — 2.5% | ||||||
Basell AF SCA | ||||||
8.38%, 08/15/15 144AD | 200,000 | 192,500 | ||||
Fortis Hybrid Financing | ||||||
5.13%, 06/29/49(E)† | 250,000 | 325,911 | ||||
Gaz Capital for Gazprom | ||||||
6.21%, 11/22/16 144A | 200,000 | 195,300 | ||||
6.51%, 03/07/22 144A | 140,000 | 138,530 | ||||
Hayes Lemmerz Finance Luxembourg SA | ||||||
8.25%, 06/15/15 144A(E) | 82,000 | 111,094 | ||||
Kuznetski Capital for Bank of Moscow | ||||||
6.81%, 05/10/17† | 271,000 | 265,921 | ||||
Lecta SA | ||||||
6.43%, 02/15/14 144A(E)† | 102,000 | 138,881 | ||||
RSHB Capital SA for OJSC Russian Agricultural Bank | ||||||
7.18%, 05/16/13 144A | 150,000 | 156,600 | ||||
6.97%, 09/21/16†D | 100,000 | 102,035 | ||||
6.30%, 05/15/17 144A | 386,000 | 378,782 | ||||
TNK-BP Finance SA | ||||||
7.50%, 07/18/16 144A | 250,000 | 258,375 | ||||
Tyco International Group SA | ||||||
6.38%, 10/15/11 | 90,000 | 92,801 | ||||
UBS Luxembourg SA for OJSC Vimpel Communications | ||||||
8.25%, 05/23/16 | 255,000 | 266,832 | ||||
Wind Acquisition Finance SA | ||||||
9.75%, 12/01/15 144A(E) | 200,000 | 308,249 | ||||
| 2,931,811 | ||||||
Mexico — 3.3% | ||||||
Axtel SAB de CV | ||||||
7.63%, 02/01/17 144A | 490,000 | 486,325 | ||||
7.63%, 02/01/17 | 20,000 | 19,850 | ||||
Kansas City Southern de Mexico SA de CV | ||||||
7.63%, 12/01/13 144A | 140,000 | 140,000 | ||||
Mexican Bonos | ||||||
8.00%, 12/19/13(M) | 28,000,000 | 2,640,737 | ||||
8.00%, 12/17/15(M) | 5,800,000 | 547,627 | ||||
United Mexican States | ||||||
6.75%, 09/27/34D | 93,000 | 99,417 | ||||
| 3,933,956 | ||||||
Netherlands — 2.1% | ||||||
ABN Amro Bank NV | ||||||
4.31%, 02/10/49(E)† | 395,000 | 486,339 | ||||
Carlson Wagonlit BV | ||||||
9.53%, 05/01/15 144A(E)† | 200,000 | 283,210 | ||||
Clondalkin Acquisition BV | ||||||
6.15%, 12/15/13 144A(E)† | 66,000 | 89,328 | ||||
Deutsche Telekom International Finance BV | ||||||
5.75%, 03/23/16 | 80,000 | 78,173 | ||||
ELM BV for Swiss Life Insurance & Pension Group | ||||||
5.85%, 04/12/49(E)† | 250,000 | 330,514 | ||||
ELM BV for Swiss Reinsurance Co. | ||||||
5.25%, 05/25/49(E)† | 200,000 | 260,839 | ||||
Impress Holdings BV | ||||||
6.88%, 09/15/13 144A(E)† | 200,000 | 277,458 | ||||
NXP BV | ||||||
9.50%, 10/15/15D | 75,000 | 74,250 | ||||
OI European Group BV | ||||||
6.88%, 03/31/17 144A(E) | 120,000 | 162,009 | ||||
TuranAlem Finance BV | ||||||
7.13%, 12/21/09(U) | 200,000 | 392,586 | ||||
| 2,434,706 | ||||||
Panama — 0.3% | ||||||
Republic of Panama | ||||||
9.38%, 04/01/29 | 80,000 | 106,400 | ||||
6.70%, 01/26/36 | 255,000 | 261,375 | ||||
| 367,775 | ||||||
See Notes to Financial Statements.
| 90 |
Table of Contents
| Par | Value | |||||
Peru — 0.1% | ||||||
Republic of Peru | ||||||
7.35%, 07/21/25 | $ | 40,000 | $ | 44,720 | ||
6.55%, 03/14/37 | 19,000 | 19,142 | ||||
| 63,862 | ||||||
Russia — 1.3% | ||||||
OAO Gazprom | ||||||
6.79%, 10/29/09(R) | 10,040,000 | 393,978 | ||||
7.00%, 10/27/11(R) | 3,350,000 | 132,218 | ||||
Russian Federation | ||||||
7.50%, 03/31/30 STEP | 937,290 | 1,033,930 | ||||
| 1,560,126 | ||||||
South Africa — 0.4% | ||||||
Edcon Holdings Proprietary, Ltd. | ||||||
4.14%, 06/15/15 144A(E)† | 224,000 | 303,174 | ||||
New Reclamation Group (Proprietary), Ltd. | ||||||
8.13%, 02/01/13 144A(E) | 153,040 | 213,605 | ||||
| 516,779 | ||||||
Sweden — 0.1% | ||||||
Corral Finans AB | ||||||
5.46%, 04/15/10 PIK 144A(E)† | 142,000 | 195,219 | ||||
Thailand — 0.4% | ||||||
True Move Co., Ltd. | ||||||
10.75%, 12/16/13 144A | 461,000 | 490,965 | ||||
Turkey — 3.4% | ||||||
Republic of Turkey | ||||||
14.00%, 01/19/11(L) | 3,500,000 | 2,637,333 | ||||
11.88%, 01/15/30D | 180,000 | 276,750 | ||||
6.88%, 03/17/36D | 1,190,000 | 1,131,988 | ||||
| 4,046,071 | ||||||
United Kingdom — 2.9% | ||||||
Ashtead Holdings PLC | ||||||
8.63%, 08/01/15 144AD | 160,000 | 164,000 | ||||
FCE Bank PLC | ||||||
7.13%, 01/16/12(E) | 200,000 | 269,365 | ||||
First Hydro Finance PLC | ||||||
9.00%, 07/31/21(U) | 100,000 | 247,500 | ||||
United Kingdom Gilt | ||||||
4.25%, 03/07/11(U) | 1,000,000 | 1,907,105 | ||||
Virgin Media Finance PLC | ||||||
9.75%, 04/15/14(U) | 100,000 | 212,298 | ||||
9.13%, 08/15/16D | 625,000 | 657,812 | ||||
| 3,458,080 | ||||||
Venezuela — 1.2% | ||||||
Petrozuata Finance, Inc. | ||||||
8.22%, 04/01/17 144A | 376,000 | 377,880 | ||||
8.22%, 04/01/17 | 100,000 | 101,500 | ||||
Republic of Venezuela | ||||||
8.50%, 10/08/14D | 26,000 | 26,390 | ||||
5.75%, 02/26/16D | 835,000 | 717,975 | ||||
9.38%, 01/13/34 | 207,000 | 216,315 | ||||
| 1,440,060 | ||||||
Total Foreign Bonds (Cost $52,071,188) | 52,696,484 | |||||
MORTGAGE-BACKED SECURITIES — 19.5% | ||||||
Bayview Commercial Asset Trust | ||||||
5.55%, 07/25/36 144A† | 350,188 | 349,914 | ||||
Countrywide Alternative Loan Trust | ||||||
5.55%, 07/20/35† | 728,036 | 727,706 | ||||
Countrywide Home Loan Mortgage Pass-Through Trust | ||||||
5.72%, 09/25/35 144A† | 858,692 | 864,148 | ||||
Federal National Mortgage Association | ||||||
5.00%, 07/01/22 TBA | 300,000 | 289,875 | ||||
5.50%, 07/01/22 TBA | 1,300,000 | 1,280,500 | ||||
5.00%, 08/01/22 TBA | 1,000,000 | 965,937 | ||||
5.50%, 08/01/35 TBA | 2,000,000 | 1,928,125 | ||||
5.00%, 07/01/37 TBA | 5,700,000 | 5,340,188 | ||||
5.50%, 07/01/37 TBA | 2,400,000 | 2,314,500 | ||||
6.50%, 07/01/37 TBA | 1,200,000 | 1,211,250 | ||||
5.00%, 08/01/37 TBA | 1,000,000 | 937,188 | ||||
6.00%, 08/01/37 TBA | 2,100,000 | 2,077,031 | ||||
Government National Mortgage Association | ||||||
6.00%, 07/01/37 TBA | 1,200,000 | 1,193,626 | ||||
6.50%, 07/01/37 TBA | 800,000 | 812,500 | ||||
MASTR Adjustable Rate Mortgages Trust | ||||||
5.78%, 12/25/46† | 907,879 | 908,176 | ||||
MASTR Reperforming Loan Trust | ||||||
5.67%, 05/25/35 144A† | 870,287 | 871,751 | ||||
Thornburg Mortgage Securities Trust | ||||||
5.49%, 01/25/36† | 990,630 | 989,772 | ||||
Total Mortgage-Backed Securities (Cost $23,152,614) | 23,062,187 | |||||
| Number of Contracts | ||||||
PURCHASED OPTIONS — 0.1% | ||||||
Call Options — 0.1% | ||||||
3-Month Euro EURIBOR Interest Rate Future, Strike Price $95.50, Expires 09/17/07 | 44 | 21,215 | ||||
90-Day Sterling Futures, Strike Price $93.75, Expires 03/19/08 | 55 | 21,399 | ||||
90-Day Sterling Futures, Strike Price $94.75, Expires 03/19/08 | 98 | 1,230 | ||||
90-Day Sterling Futures, Strike Price $95.00, Expires 012/19/07 | 445 | 5,585 | ||||
| 49,429 | ||||||
Put Option — 0.0% | ||||||
U.S. Dollar vs. Japanese Yen, Strike Price $117.50, Expires 07/14/07 | 5,500,000 | 380 | ||||
Total Purchased Options (Cost $293,660) | 49,809 | |||||
See Notes to Financial Statements.
| 91 |
Table of Contents
Global Bond Fund
SCHEDULE OF INVESTMENTS (Continued)
| Shares | Value | ||||||
MONEY MARKET FUNDS — 28.7% | |||||||
GuideStone Funds Money Market Fund (GS4 Class)¥ | 8,609,489 | $ | 8,609,489 | ||||
Northern Institutional Liquid Assets Portfolio§ | 25,465,168 | 25,465,168 | |||||
Total Money Market Funds (Cost $34,074,657) | 34,074,657 | ||||||
| Par | |||||||
U.S. TREASURY OBLIGATIONS — 11.9% | |||||||
U.S. Treasury Bonds | |||||||
6.25%, 05/15/30D | $ | 570,000 | 651,671 | ||||
4.50%, 02/15/36D | 795,000 | 720,096 | |||||
| 1,371,767 | |||||||
U.S. Treasury Inflationary Index Bonds | |||||||
2.00%, 01/15/16D | 1,800,000 | 1,779,518 | |||||
3.88%, 04/15/29D | 1,360,000 | 2,097,921 | |||||
| 3,877,439 | |||||||
U.S. Treasury Notes | |||||||
4.88%, 04/30/11D | 5,600,000 | 5,593,442 | |||||
4.38%, 03/31/12D | 2,210,000 | 2,170,291 | |||||
4.50%, 04/30/12D | 30,000 | 29,451 | |||||
4.75%, 02/15/37D | 1,170,000 | 1,103,549 | |||||
| 8,896,733 | |||||||
Total U.S. Treasury Obligations (Cost $14,515,984) | 14,145,939 | ||||||
TOTAL INVESTMENTS — 134.8% (Cost $160,022,959) | 159,833,436 | ||||||
Liabilities in Excess of Other Assets — (34.8)% | (41,280,901 | ) | |||||
NET ASSETS — 100.0% | $ | 118,552,535 | |||||
PORTFOLIO SUMMARY (based on net assets)
| % | |||
Foreign Bonds | 44.4 | ||
Money Market Funds | 28.7 | ||
Corporate Bonds | 25.1 | ||
Futures Contracts | 21.8 | ||
Mortgage-Backed Securities | 19.5 | ||
U.S. Treasury Obligations | 11.9 | ||
Asset-Backed Securities | 4.9 | ||
Agency Obligations | 0.2 | ||
Purchased Options | 0.1 | ||
Forward Foreign Currency Contracts | (2.8 | ) | |
| 153.8 | |||
See Notes to Financial Statements.
| 92 |
Table of Contents
Average Annual Total Returns as of 06/30/07
| GS2 Class* | GS4 Class* | GS6 Class* | Benchmark** | |||||||||
Six Months | 6.90 | % | 6.77 | % | 6.65 | % | 6.96 | % | ||||
One Year | 20.16 | % | 19.96 | % | 19.69 | % | 20.59 | % | ||||
Five Year | 10.46 | % | 10.27 | % | 10.14 | % | 10.71 | % | ||||
Since Inception | 5.62 | % | 5.59 | % | 5.45 | % | 6.01 | % | ||||
Inception Date | 08/27/01 | 08/27/01 | 08/27/01 | 08/27/01 |
The performance data quoted represents past performance and does not guarantee future results. Current performance may be lower or higher. Performance data current to the most recent month-end may be obtained at www.GuideStoneFunds.org. The investment return and principal value of an investment will fluctuate so that shares, when redeemed, may be worth more or less than their original cost.
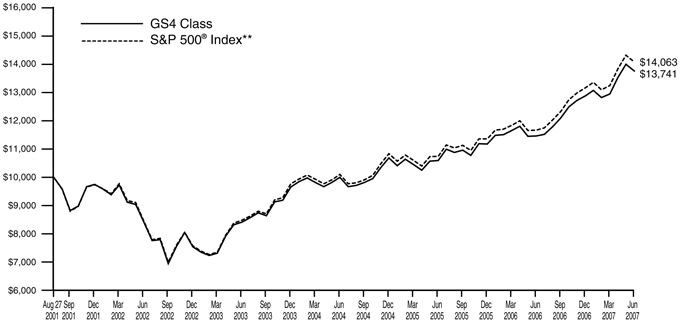
The graph compares the results of a hypothetical $10,000 investment in the GS4 Class of the Fund since August 27, 2001 (commencement of operations), with all dividends and capital gains reinvested, with the S&P 500® Index.
| * | These returns reflect expense waivers by the Fund’s investment advisor. Without these waivers, returns would have been lower. Returns shown do not reflect the deduction of taxes that a shareholder would pay on Fund distributions or the redemption of Fund shares. |
** | The S&P 500® Index is an unmanaged index (with no defined investment objective) of common stocks, includes reinvestment of dividends, and is a registered trademark of McGraw-Hill Co., Inc. The S&P 500® Index includes 500 of the largest stocks (in terms of market value) in the United States. |
Unlike a mutual fund, the performance of an index assumes no taxes, transaction costs, management fees or other expenses.
| 93 |
Table of Contents
Equity Index Fund | ||
SCHEDULE OF INVESTMENTS | June 30, 2007 (Unaudited) |
| Shares | Value | ||||
COMMON STOCKS — 97.2% | |||||
Auto & Transportation — 2.4% | |||||
Burlington Northern Santa Fe Corporation | 14,600 | $ | 1,243,044 | ||
CH Robinson Worldwide, Inc. | 7,000 | 367,640 | |||
CSX Corporation | 18,200 | 820,456 | |||
FedEx Corporation | 12,700 | 1,409,319 | |||
Ford Motor Co. D | 76,827 | 723,710 | |||
General Motors CorporationD | 22,900 | 865,620 | |||
Genuine Parts Co. | 7,000 | 347,200 | |||
Goodyear Tire & Rubber Co. (The)D* | 8,300 | 288,508 | |||
Harley-Davidson, Inc.D | 10,500 | 625,905 | |||
Norfolk Southern Corporation | 16,100 | 846,377 | |||
PACCAR, Inc. | 10,212 | 888,853 | |||
Southwest Airlines Co. | 31,900 | 475,629 | |||
Union Pacific Corporation | 11,200 | 1,289,680 | |||
United Parcel Service, Inc. Class B | 43,400 | 3,168,200 | |||
| 13,360,141 | |||||
Consumer Discretionary — 11.0% | |||||
Allied Waste Industries, Inc.* | 10,400 | 139,984 | |||
Amazon.com, Inc.D* | 12,684 | 867,712 | |||
Apollo Group, Inc. Class A* | 5,721 | 334,278 | |||
AutoNation, Inc.D* | 6,325 | 141,933 | |||
AutoZone, Inc.* | 1,900 | 259,578 | |||
Avon Products, Inc. | 17,900 | 657,825 | |||
Bed Bath & Beyond, Inc.* | 11,200 | 403,088 | |||
Best Buy Co., Inc. | 16,425 | 766,555 | |||
Big Lots, Inc.* | 4,600 | 135,332 | |||
Black & Decker Corporation | 2,700 | 238,437 | |||
Carnival CorporationD | 18,400 | 897,368 | |||
CBS Corporation Class B | 29,900 | 996,268 | |||
Cintas Corporation | 5,500 | 216,865 | |||
Circuit City Stores, Inc.D | 5,800 | 87,464 | |||
Clear Channel Communications, Inc. | 20,100 | 760,182 | |||
Coach, Inc.* | 15,000 | 710,850 | |||
Convergys Corporation* | 5,700 | 138,168 | |||
Costco Wholesale CorporationD | 18,300 | 1,070,916 | |||
Darden Restaurants, Inc. | 5,950 | 261,741 | |||
Dillard’s, Inc. Class AD | 2,600 | 93,418 | |||
DIRECTV Group, Inc. (The)* | 31,400 | 725,654 | |||
Dollar General CorporationD | 12,800 | 280,576 | |||
Donnelley (R.R.) & Sons Co. | 8,900 | 387,239 | |||
Eastman Kodak Co.D | 11,800 | 328,394 | |||
eBay, Inc.* | 46,100 | 1,483,498 | |||
Electronic Arts, Inc.* | 12,700 | 600,964 | |||
Estee Lauder Cos., Inc. Class AD | 4,700 | 213,897 | |||
Family Dollar Stores, Inc. | 6,200 | 212,784 | |||
Gannett Co., Inc. | 9,500 | 522,025 | |||
Gap, Inc. (The)D | 21,600 | 412,560 | |||
Google, Inc.* | 8,935 | 4,676,400 | |||
Harman International Industries, Inc. | 2,700 | 315,360 | |||
Hasbro, Inc. | 6,500 | 204,165 | |||
Hilton Hotels Corporation | 15,800 | 528,826 | |||
Home Depot, Inc. (The) | 80,650 | 3,173,578 | |||
IAC InterActiveCorp* | 8,900 | 308,029 | |||
International Flavors & Fragrances, Inc. | 3,300 | 172,062 | |||
Interpublic Group Cos., Inc.D* | 18,948 | 216,007 | |||
Jones Apparel Group, Inc. | 4,500 | 127,125 | |||
Kimberly-Clark Corporation | 18,500 | 1,237,465 | |||
Kohl’s Corporation* | 13,200 | 937,596 | |||
Leggett & Platt, Inc. | 7,300 | 160,965 | |||
Limited Brands | 14,000 | 384,300 | |||
Liz Claiborne, Inc.D | 4,308 | 160,688 | |||
Lowe’s Cos., Inc. | 61,500 | 1,887,435 | |||
Macy’s, Inc.D | 18,612 | 740,385 | |||
Marriott International, Inc. Class A | 13,500 | 583,740 | |||
Mattel, Inc. | 16,200 | 409,698 | |||
McDonald’s Corporation | 48,800 | 2,477,088 | |||
McGraw-Hill Co., Inc. (The) | 14,200 | 966,736 | |||
Meredith Corporation | 1,600 | 98,560 | |||
Monster Worldwide, Inc.* | 5,200 | 213,720 | |||
New York Times Co. Class AD | 6,000 | 152,400 | |||
Newell Rubbermaid, Inc. | 11,400 | 335,502 | |||
NIKE, Inc. Class B | 15,300 | 891,837 | |||
Nordstrom, Inc. | 9,400 | 480,528 | |||
Office Depot, Inc.* | 11,300 | 342,390 | |||
OfficeMax, Inc.D | 3,200 | 125,760 | |||
Omnicom Group, Inc.D | 13,800 | 730,296 | |||
Penney (JC) Co., Inc. | 9,200 | 665,896 | |||
Polo Ralph Lauren CorporationD | 2,500 | 245,275 | |||
RadioShack CorporationD | 5,600 | 185,584 | |||
Robert Half International, Inc. | 6,900 | 251,850 | |||
Scripps Co. (E.W.) Class AD | 3,500 | 159,915 | |||
Sears Holdings CorporationD* | 3,389 | 574,436 | |||
Snap-On, Inc. | 2,400 | 121,224 | |||
Stanley Works (The) | 3,400 | 206,380 | |||
Staples, Inc. | 29,100 | 690,543 | |||
Starbucks Corporation* | 30,300 | 795,072 | |||
Starwood Hotels & Resorts Worldwide, Inc.D | 8,700 | 583,509 | |||
Target Corporation | 34,800 | 2,213,280 | |||
Tiffany & Co.D | 5,500 | 291,830 | |||
Time Warner, Inc. | 155,200 | 3,265,408 | |||
TJX Cos., Inc. | 18,500 | 508,750 | |||
Tribune Co. | 3,129 | 91,993 | |||
VeriSign, Inc.* | 10,000 | 317,300 | |||
VF Corporation | 3,700 | 338,846 | |||
Wal-Mart Stores, Inc. | 99,000 | 4,762,890 | |||
Walt Disney Co. (The) | 80,902 | 2,761,994 | |||
Waste Management, Inc. | 21,100 | 823,955 | |||
Wendy’s International, Inc.D | 3,600 | 132,300 | |||
Whirlpool Corporation D | 3,195 | 355,248 | |||
Wyndham Worldwide CorporationD* | 7,680 | 278,477 | |||
Yahoo!, Inc.* | 49,600 | 1,345,648 | |||
Yum! Brands, Inc. D | 21,400 | 700,208 | |||
| 60,052,005 | |||||
Consumer Staples — 5.6% | |||||
Campbell Soup Co. | 8,900 | 345,409 | |||
Clorox Co. | 6,200 | 385,020 | |||
Coca-Cola Co. (The) | 81,800 | 4,278,958 | |||
Coca-Cola Enterprises, Inc.D | 11,400 | 273,600 | |||
Colgate-Palmolive Co. | 20,800 | 1,348,880 | |||
ConAgra Foods, Inc. | 20,400 | 547,944 | |||
Dean Foods Co. | 5,200 | 165,724 | |||
General Mills, Inc. | 14,000 | 817,880 | |||
Heinz (H.J.) Co. | 13,300 | 631,351 | |||
Hershey Co. (The) | 7,100 | 359,402 | |||
Kellogg Co. | 10,200 | 528,258 | |||
Kraft Foods, Inc. Class A | 65,700 | 2,315,925 | |||
Kroger Co. | 28,700 | 807,331 | |||
McCormick & Co., Inc. | 5,300 | 202,354 | |||
See Notes to Financial Statements.
| 94 |
Table of Contents
| Shares | Value | ||||
Pepsi Bottling Group, Inc. D | 5,500 | $ | 185,240 | ||
PepsiCo, Inc. | 66,440 | 4,308,634 | |||
Procter & Gamble Co. | 128,417 | 7,857,836 | |||
Safeway, Inc.D | 18,000 | 612,540 | |||
Sara Lee Corporation | 30,100 | 523,740 | |||
SUPERVALU, Inc. | 8,548 | 395,944 | |||
SYSCO CorporationD | 25,100 | 828,049 | |||
Tyson Foods, Inc. Class A | 10,400 | 239,616 | |||
Walgreen Co. | 40,600 | 1,767,724 | |||
Whole Foods Market, Inc.D | 5,700 | 218,310 | |||
Wrigley (W.M.), Jr. Co. | 8,825 | 488,111 | |||
| 30,433,780 | |||||
Financial Services — 21.9% | |||||
ACE, Ltd. | 13,200 | 825,264 | |||
AFLAC, Inc. | 20,100 | 1,033,140 | |||
Allstate Corporation (The) | 24,852 | 1,528,647 | |||
AMBAC Financial Group, Inc. | 4,200 | 366,198 | |||
American Express Co. | 48,400 | 2,961,112 | |||
American International Group, Inc. | 105,892 | 7,415,617 | |||
Ameriprise Financial, Inc. | 9,640 | 612,815 | |||
AON Corporation | 12,000 | 511,320 | |||
Apartment Investment & Management Co. Class A REITD | 4,200 | 211,764 | |||
Archstone-Smith Trust REIT | 9,300 | 549,723 | |||
Assurant, Inc. | 4,100 | 241,572 | |||
Automatic Data Processing, Inc. | 22,300 | 1,080,881 | |||
AvalonBay Communities, Inc. REITD | 3,200 | 380,416 | |||
Bank of America Corporation | 181,563 | 8,876,615 | |||
Bank of New York Co., Inc. (The) | 30,700 | 1,272,208 | |||
BB&T Corporation | 22,000 | 894,960 | |||
Bear Stearns Cos., Inc. (The) | 4,910 | 687,400 | |||
Block (H&R), Inc.D | 13,200 | 308,484 | |||
Boston Properties, Inc. REITD | 4,800 | 490,224 | |||
Capital One Financial CorporationD | 16,737 | 1,312,850 | |||
CB Richard Ellis Group, Inc. Class AD* | 7,600 | 277,400 | |||
Chicago Mercantile Exchange Holdings, Inc. | 1,400 | 748,104 | |||
Chubb Corporation | 16,400 | 887,896 | |||
CIGNA Corporation | 11,900 | 621,418 | |||
Cincinnati Financial Corporation | 7,086 | 307,532 | |||
CIT Group, Inc. | 7,900 | 433,157 | |||
Citigroup, Inc. | 202,430 | 10,382,635 | |||
Comerica, Inc. | 6,400 | 380,608 | |||
Commerce Bancorp, Inc.D | 7,700 | 284,823 | |||
Compass Bancshares, Inc. | 5,300 | 365,594 | |||
Countrywide Financial CorporationD | 23,948 | 870,510 | |||
Developers Diversified Realty Corporation REITD | 5,100 | 268,821 | |||
Dow Jones & Co., Inc.D | 2,654 | 152,472 | |||
E*TRADE Financial Corporation* | 17,500 | 386,575 | |||
Equifax, Inc. | 5,700 | 253,194 | |||
Equity Residential Properties Trust REIT | 12,000 | 547,560 | |||
Fannie Mae | 39,900 | 2,606,667 | |||
Federated Investors, Inc. Class B | 3,600 | 137,988 | |||
Fidelity National Information Services, Inc. | 6,700 | 363,676 | |||
Fifth Third BancorpD | 22,594 | 898,563 | |||
First Data Corporation | 31,117 | 1,016,592 | |||
First Horizon National CorporationD | 5,200 | 202,800 | |||
Fiserv, Inc.* | 7,000 | 397,600 | |||
Franklin Resources, Inc. | 6,700 | 887,549 | |||
Freddie MacD | 27,300 | 1,657,110 | |||
General Growth Properties, Inc. REIT | 10,000 | 529,500 | |||
Genworth Financial, Inc. Class A | 17,700 | 608,880 | |||
Goldman Sachs Group, Inc. | 16,754 | 3,631,430 | |||
Hartford Financial Services Group, Inc. | 12,900 | 1,270,779 | |||
Host Hotels & Resorts, Inc. REITD | 21,300 | 492,456 | |||
Hudson City Bancorp, Inc. | 19,800 | 241,956 | |||
Huntington Bancshares, Inc.D | 14,900 | 338,826 | |||
Janus Capital Group, Inc.D | 7,700 | 214,368 | |||
JPMorgan Chase & Co. | 139,630 | 6,765,074 | |||
KeyCorp D | 16,000 | 549,280 | |||
Kimco Realty Corporation REIT | 9,200 | 350,244 | |||
Legg Mason, Inc.D | 5,340 | 525,349 | |||
Lehman Brothers Holdings, Inc. | 21,600 | 1,609,632 | |||
Lincoln National Corporation | 11,219 | 795,956 | |||
Loews Corporation | 18,300 | 932,934 | |||
M & T Bank Corporation | 3,100 | 331,390 | |||
Marsh & McLennan Cos., Inc.D | 22,600 | 697,888 | |||
Marshall & Ilsley CorporationD | 10,500 | 500,115 | |||
MBIA, Inc.D | 5,400 | 335,988 | |||
Mellon Financial Corporation | 17,000 | 748,000 | |||
Merrill Lynch & Co., Inc. | 35,680 | 2,982,134 | |||
MetLife, Inc. | 30,300 | 1,953,744 | |||
MGIC Investment CorporationD | 3,400 | 193,324 | |||
Moody’s Corporation | 9,500 | 590,900 | |||
Morgan Stanley | 43,000 | 3,606,840 | |||
National City Corporation | 23,757 | 791,583 | |||
Northern Trust Corporation | 8,100 | 520,344 | |||
Paychex, Inc. | 13,900 | 543,768 | |||
Plum Creek Timber Co., Inc. REITD | 7,200 | 299,952 | |||
PNC Financial Services Group, Inc. | 14,000 | 1,002,120 | |||
Principal Financial Group | 10,900 | 635,361 | |||
Progressive Corporation (The)D | 30,196 | 722,590 | |||
ProLogis REIT | 10,400 | 591,760 | |||
Prudential Financial, Inc. | 19,200 | 1,866,816 | |||
Public Storage, Inc. REITD | 5,025 | 386,021 | |||
Regions Financial Corporation D | 29,429 | 974,100 | |||
Ryder System, Inc. D | 2,500 | 134,500 | |||
Safeco CorporationD | 4,300 | 267,718 | |||
Schwab (Charles) Corporation (The) | 41,350 | 848,502 | |||
Simon Property Group, Inc. REIT | 9,000 | 837,360 | |||
SLM Corporation | 16,900 | 973,102 | |||
Sovereign Bancorp, Inc.D | 14,765 | 312,132 | |||
State Street Corporation | 16,200 | 1,108,080 | |||
SunTrust Banks, Inc. | 14,400 | 1,234,656 | |||
Synovus Financial Corporation | 13,400 | 411,380 | |||
T. Rowe Price Group, Inc. | 10,900 | 565,601 | |||
Torchmark CorporationD | 4,000 | 268,000 | |||
Travelers Cos., Inc. | 27,156 | 1,452,846 | |||
See Notes to Financial Statements.
| 95 |
Table of Contents
Equity Index Fund
SCHEDULE OF INVESTMENTS (Continued)
| Shares | Value | ||||
UnumProvident Corporation | 14,000 | $ | 365,540 | ||
US Bancorp | 71,100 | 2,342,745 | |||
Vornado Realty Trust REITD | 5,500 | 604,120 | |||
Wachovia Corporation | 77,883 | 3,991,501 | |||
Washington Mutual, Inc.D | 36,046 | 1,537,001 | |||
Wells Fargo & Co. | 136,460 | 4,799,298 | |||
Western Union Co. | 31,317 | 652,333 | |||
XL Capital, Ltd. Class AD | 7,400 | 623,746 | |||
Zions Bancorporation | 4,500 | 346,095 | |||
| 119,705,712 | |||||
Healthcare — 11.8% | |||||
Abbott Laboratories | 63,200 | 3,384,360 | |||
Aetna, Inc. | 20,900 | 1,032,460 | |||
Allergan, Inc. | 12,430 | 716,465 | |||
AmerisourceBergen Corporation | 7,744 | 383,096 | |||
Amgen, Inc.* | 47,365 | 2,618,811 | |||
Bard (C.R.), Inc. | 4,200 | 347,046 | |||
Bausch & Lomb, Inc.D | 2,400 | 166,656 | |||
Baxter International, Inc. | 26,400 | 1,487,376 | |||
Becton Dickinson & Co. | 9,900 | 737,550 | |||
Biogen Idec, Inc.D* | 11,630 | 622,205 | |||
Biomet, Inc.D | 9,900 | 452,628 | |||
Boston Scientific Corporation* | 48,100 | 737,854 | |||
Bristol-Myers Squibb Co. | 80,700 | 2,546,892 | |||
Cardinal Health, Inc. | 16,000 | 1,130,240 | |||
Celgene Corporation* | 15,600 | 894,348 | |||
Conventry Health Care, Inc.* | 6,530 | 376,454 | |||
CVS Corporation | 62,827 | 2,290,044 | |||
Eli Lilly & Co. | 40,600 | 2,268,728 | |||
Express Scripts, Inc.* | 11,000 | 550,110 | |||
Forest Laboratories, Inc.* | 13,000 | 593,450 | |||
Genzyme Corporation* | 10,700 | 689,080 | |||
Gilead Sciences, Inc.* | 38,400 | 1,488,768 | |||
Hospira, Inc* | 6,350 | 247,904 | |||
Humana, Inc.* | 6,800 | 414,188 | |||
IMS Health, Inc. | 8,000 | 257,040 | |||
Johnson & Johnson | 118,090 | 7,276,706 | |||
King Pharmaceuticals, Inc.* | 9,900 | 202,554 | |||
Laboratory Corporation of America HoldingsD* | 5,000 | 391,300 | |||
Manor Care, Inc.D | 3,000 | 195,870 | |||
McKesson Corporation | 12,000 | 715,680 | |||
Medco Health Solutions, Inc.* | 11,576 | 902,812 | |||
Medtronic, Inc. | 47,200 | 2,447,792 | |||
Merck & Co., Inc. | 88,300 | 4,397,340 | |||
Millipore CorporationD* | 2,200 | 165,198 | |||
Mylan Laboratories, Inc.D | 9,900 | 180,081 | |||
Patterson Cos., Inc.D* | 5,600 | 208,712 | |||
Pfizer, Inc. | 287,383 | 7,348,383 | |||
Quest Diagnostics, Inc.D | 6,500 | 335,725 | |||
Schering-Plough Corporation | 60,600 | 1,844,664 | |||
St. Jude Medical, Inc.* | 14,100 | 585,009 | |||
Stryker Corporation | 12,100 | 763,389 | |||
Tenet Healthcare CorporationD* | 19,150 | 124,667 | |||
Thermo Fisher Scientific, Inc.* | 17,510 | 905,617 | |||
UnitedHealth Group, Inc. | 55,000 | 2,812,700 | |||
Varian Medical Systems, Inc.D* | 5,300 | 225,303 | |||
Watson Pharmaceuticals, Inc.* | 4,300 | 139,879 | |||
WellPoint, Inc.* | 25,012 | 1,996,708 | |||
Wyeth | 54,700 | 3,136,498 | |||
Zimmer Holdings, Inc.* | 9,620 | 816,642 | |||
| 64,552,982 | |||||
Integrated Oils — 6.7% | |||||
Chevron Corporation | 87,941 | 7,408,167 | |||
ConocoPhillips | 66,758 | 5,240,503 | |||
Exxon Mobil Corporation | 230,144 | 19,304,479 | |||
Hess Corporation | 11,000 | 648,560 | |||
Marathon Oil Corporation | 27,984 | 1,677,920 | |||
Murphy Oil CorporationD | 7,700 | 457,688 | |||
Occidental Petroleum Corporation | 34,000 | 1,967,920 | |||
| 36,705,237 | |||||
Materials & Processing — 3.7% | |||||
Air Products & Chemicals, Inc. | 8,800 | 707,256 | |||
Alcoa, Inc. | 35,300 | 1,430,709 | |||
Allegheny Technologies, Inc. | 4,100 | 430,008 | |||
American Standard Cos., Inc. | 7,100 | 418,758 | |||
Archer-Daniels-Midland Co. | 26,527 | 877,778 | |||
Ashland, Inc. | 2,200 | 140,690 | |||
Avery Dennison CorporationD | 3,800 | 252,624 | |||
Ball Corporation | 4,192 | 222,889 | |||
Bemis Co. | 4,300 | 142,674 | |||
Dow Chemical Co. (The) | 39,000 | 1,724,580 | |||
du Pont (E.I.) de Nemours & Co. | 37,455 | 1,904,212 | |||
Eastman Chemical Co. | 3,400 | 218,722 | |||
Ecolab, Inc. | 7,300 | 311,710 | |||
Fluor CorporationD | 3,600 | 400,932 | |||
Freeport-McMoRan Copper & Gold, Inc. | 15,262 | 1,263,999 | |||
Hercules, Inc.* | 4,600 | 90,390 | |||
International Paper Co. | 17,735 | 692,552 | |||
Masco Corporation | 15,900 | 452,673 | |||
MeadWestvaco Corporation | 7,445 | 262,957 | |||
Monsanto Co. | 22,120 | 1,493,985 | |||
Newmont Mining Corporation | 18,300 | 714,798 | |||
Nucor Corporation | 12,300 | 721,395 | |||
Pactiv Corporation* | 5,300 | 169,017 | |||
PPG Industries, Inc. | 6,700 | 509,937 | |||
Praxair, Inc. | 12,980 | 934,430 | |||
Precision Castparts Corporation | 5,600 | 679,616 | |||
Rohm & Haas Co.D | 5,800 | 317,144 | |||
Sealed Air Corporation | 6,600 | 204,732 | |||
Sherwin-Williams Co. | 4,500 | 299,115 | |||
Sigma-Aldrich CorporationD | 5,400 | 230,418 | |||
Temple-Inland, Inc. | 4,300 | 264,579 | |||
United States Steel Corporation | 4,800 | 522,000 | |||
Vulcan Materials Co.D | 3,900 | 446,706 | |||
Weyerhaeuser Co. | 8,860 | 699,320 | |||
| 20,153,305 | |||||
Other — 4.7% | |||||
3M Co. | 29,400 | 2,551,626 | |||
Brunswick CorporationD | 3,800 | 123,994 | |||
Eaton Corporation | 5,900 | 548,700 | |||
General Electric Co. | 420,900 | 16,112,052 | |||
Honeywell International, Inc. | 31,800 | 1,789,704 | |||
ITT Industries, Inc. | 7,400 | 505,272 | |||
Johnson Controls, Inc. | 7,992 | 925,234 | |||
Textron, Inc. | 5,100 | 561,561 | |||
Tyco International, Ltd.D | 80,584 | 2,722,933 | |||
| 25,841,076 | |||||
Other Energy — 4.0% | |||||
Anadarko Petroleum Corporation | 18,800 | 977,412 | |||
Apache Corporation | 13,648 | 1,113,540 | |||
See Notes to Financial Statements.
| 96 |
Table of Contents
| Shares | Value | ||||
Baker Hughes, Inc. D | 13,200 | $ | 1,110,516 | ||
BJ Services Co. | 12,000 | 341,280 | |||
Chesapeake Energy CorporationD | 17,100 | 591,660 | |||
Consol Energy, Inc.D | 7,500 | 345,825 | |||
Devon Energy Corporation | 18,100 | 1,417,049 | |||
Dynegy, Inc. Class A* | 15,624 | 147,491 | |||
El Paso Corporation | 28,600 | 492,778 | |||
ENSCO International, Inc. | 6,200 | 378,262 | |||
EOG Resources, Inc. | 9,900 | 723,294 | |||
Halliburton Co. | 37,075 | 1,279,087 | |||
Nabors Industries, Ltd.D* | 11,400 | 380,532 | |||
National Oilwell Varco, Inc.* | 7,300 | 760,952 | |||
Noble Corporation | 5,500 | 536,360 | |||
Peabody Energy Corporation | 10,800 | 522,504 | |||
Rowan Cos., Inc.D | 4,600 | 188,508 | |||
Schlumberger, Ltd. | 47,900 | 4,068,626 | |||
Smith International, Inc. | 8,100 | 474,984 | |||
Sunoco, Inc. | 4,900 | 390,432 | |||
TransOcean, Inc.* | 11,900 | 1,261,162 | |||
Valero Energy Corporation | 22,600 | 1,669,236 | |||
Weatherford International, Ltd.* | 13,798 | 762,201 | |||
Williams Cos., Inc. | 24,300 | 768,366 | |||
XTO Energy, Inc.D | 15,466 | 929,507 | |||
| 21,631,564 | |||||
Producer Durables — 4.6% | |||||
Agilent Technologies, Inc.* | 16,200 | 622,728 | |||
Applied Materials, Inc. | 56,700 | 1,126,629 | |||
Boeing Co. (The) | 32,400 | 3,115,584 | |||
Caterpillar, Inc. | 26,200 | 2,051,460 | |||
Centex Corporation D | 5,000 | 200,500 | |||
Cooper Industries, Ltd. Class A | 7,400 | 422,466 | |||
Cummins, Inc. | 4,200 | 425,082 | |||
Danaher Corporation | 9,700 | 732,350 | |||
Deere & Co. | 9,200 | 1,110,808 | |||
Dover Corporation | 8,400 | 429,660 | |||
DR Horton, Inc.D | 11,200 | 223,216 | |||
Emerson Electric Co. | 32,400 | 1,516,320 | |||
Goodrich Corporation | 5,100 | 303,756 | |||
Grainger (W.W.), Inc. | 2,900 | 269,845 | |||
Illinois Tool Works, Inc. | 16,800 | 910,392 | |||
Ingersoll-Rand Co., Ltd. Class AD | 12,400 | 679,768 | |||
KB HomeD | 3,100 | 122,047 | |||
KLA-Tencor CorporationD | 7,800 | 428,610 | |||
Lennar Corporation Class A | 5,600 | 204,736 | |||
Lexmark International, Inc.* | 4,000 | 197,240 | |||
Lockheed Martin Corporation | 14,700 | 1,383,711 | |||
Molex, Inc.D | 5,750 | 172,557 | |||
Northrop Grumman Corporation | 14,156 | 1,102,328 | |||
Novellus Systems, Inc.* | 5,100 | 144,687 | |||
Pall Corporation | 5,000 | 229,950 | |||
Parker Hannifin CorporationD | 4,700 | 460,177 | |||
Pitney Bowes, Inc. | 9,000 | 421,380 | |||
Pulte Homes, Inc. | 8,608 | 193,250 | |||
Raytheon Co. | 18,200 | 980,798 | |||
Rockwell Collins, Inc. | 6,900 | 487,416 | |||
Tektronix, Inc.D | 3,300 | 111,342 | |||
Teradyne, Inc.* | 7,700 | 135,366 | |||
Terex Corporation* | 4,200 | 341,460 | |||
United Technologies Corporation | 40,500 | 2,872,665 | |||
Waters Corporation* | 4,100 | 243,376 | |||
Xerox Corporation* | 38,500 | 711,480 | |||
| 25,085,140 | |||||
Technology — 12.8% | |||||
Adobe Systems, Inc.* | 23,900 | 959,585 | |||
Advanced Micro Devices, Inc. D* | 22,800 | 326,040 | |||
Affiliated Computer Services, Inc. Class A* | 4,100 | 232,552 | |||
Altera Corporation | 14,600 | 323,098 | |||
Analog Devices, Inc. | 13,500 | 508,140 | |||
Apple, Inc.* | 35,300 | 4,308,012 | |||
Applera Corporation-Applied Biosystems Group | 7,500 | 229,050 | |||
Autodesk, Inc.D* | 9,460 | 445,377 | |||
Avaya, Inc.* | 18,448 | 310,664 | |||
BMC Software, Inc.* | 8,300 | 251,490 | |||
Broadcom Corporation Class A* | 19,150 | 560,138 | |||
CA, Inc. | 16,870 | 435,752 | |||
Ciena CorporationD* | 3,528 | 127,467 | |||
Cisco Systems, Inc.* | 247,800 | 6,901,230 | |||
Citrix Systems, Inc.* | 7,400 | 249,158 | |||
Cognizant Technology Solutions Corporation Class A* | 5,900 | 443,031 | |||
Computer Sciences Corporation* | 7,300 | 431,795 | |||
Compuware CorporationD* | 12,300 | 145,878 | |||
Corning, Inc.* | 64,000 | 1,635,200 | |||
Dell, Inc.* | 92,400 | 2,638,020 | |||
Electronic Data Systems Corporation | 20,900 | 579,557 | |||
EMC Corporation* | 85,600 | 1,549,360 | |||
General Dynamics Corporation | 16,500 | 1,290,630 | |||
Hewlett-Packard Co. | 107,002 | 4,774,429 | |||
Intel Corporation | 236,800 | 5,626,368 | |||
International Business Machines Corporation | 55,700 | 5,862,425 | |||
Intuit, Inc.* | 13,900 | 418,112 | |||
Jabil Circuit, Inc. | 7,700 | 169,939 | |||
JDS Uniphase CorporationD* | 8,875 | 119,191 | |||
Juniper Networks, Inc.* | 23,300 | 586,461 | |||
L-3 Communications Holdings, Inc. | 5,100 | 496,689 | |||
Linear Technology CorporationD | 10,400 | 376,272 | |||
LSI Logic Corporation* | 31,500 | 236,565 | |||
Maxim Integrated Products, Inc. | 13,000 | 434,330 | |||
MEMC Electronic Materials, Inc.* | 9,100 | 556,192 | |||
Micron Technology, Inc.D* | 30,900 | 387,177 | |||
Microsoft Corporation | 344,030 | 10,138,564 | |||
Motorola, Inc. | 94,600 | 1,674,420 | |||
National Semiconductor Corporation | 11,400 | 322,278 | |||
NCR Corporation* | 7,300 | 383,542 | |||
Network Appliance, Inc.* | 15,200 | 443,840 | |||
Novell, Inc.* | 14,400 | 112,176 | |||
Nvidia Corporation* | 14,700 | 607,257 | |||
Oracle Corporation* | 162,000 | 3,193,020 | |||
PerkinElmer, Inc. | 5,000 | 130,300 | |||
QLogic Corporation* | 6,700 | 111,555 | |||
QUALCOMM, Inc. | 67,900 | 2,946,181 | |||
Rockwell Automation, Inc.D | 6,600 | 458,304 | |||
SanDisk CorporationD* | 9,300 | 455,142 | |||
Solectron Corporation* | 37,900 | 139,472 | |||
See Notes to Financial Statements.
| 97 |
Table of Contents
Equity Index Fund
SCHEDULE OF INVESTMENTS (Continued)
| Shares | Value | ||||||
Sun Microsystems, Inc.* | 146,200 | $ | 769,012 | ||||
Symantec Corporation* | 36,770 | 742,754 | |||||
Tellabs, Inc.* | 17,900 | 192,604 | |||||
Texas Instruments, Inc. | 58,600 | 2,205,118 | |||||
Unisys CorporationD* | 13,900 | 127,046 | |||||
Xilinx, Inc. | 12,200 | 326,594 | |||||
| 70,404,553 | |||||||
Utilities — 8.0% | |||||||
AES Corporation* | 27,200 | 595,136 | |||||
Allegheny Energy, Inc.* | 6,800 | 351,832 | |||||
Alltel Corporation | 14,100 | 952,455 | |||||
Ameren CorporationD | 8,400 | 411,684 | |||||
American Electric Power Co., Inc. | 16,100 | 725,144 | |||||
AT&T, Inc. | 251,872 | 10,452,688 | |||||
Centerpoint Energy, Inc. D | 13,300 | 231,420 | |||||
CenturyTel, Inc.D | 4,500 | 220,725 | |||||
Citizens Communications Co. | 14,000 | 213,780 | |||||
CMS Energy CorporationD | 9,000 | 154,800 | |||||
Comcast Corporation Class A* | 126,672 | 3,562,017 | |||||
Consolidated Edison, Inc.D | 10,700 | 482,784 | |||||
Constellation Energy Group, Inc. | 7,300 | 636,341 | |||||
Dominion Resources, Inc. | 14,200 | 1,225,602 | |||||
DTE Energy Co.D | 7,300 | 352,006 | |||||
Duke Energy Corporation | 52,368 | 958,335 | |||||
Edison InternationalD | 13,300 | 746,396 | |||||
Embarq Corporation | 6,144 | 389,345 | |||||
Entergy Corporation | 8,252 | 885,852 | |||||
Exelon Corporation | 27,224 | 1,976,462 | |||||
FirstEnergy Corporation | 12,784 | 827,508 | |||||
FPL Group, Inc. | 16,900 | 958,906 | |||||
Integrys Energy Group, Inc. | 3,100 | 157,263 | |||||
KeySpan Corporation | 7,100 | 298,058 | |||||
Nicor, Inc.D | 1,900 | 81,548 | |||||
NiSource, Inc. | 11,300 | 234,023 | |||||
PG&E Corporation | 14,200 | 643,260 | |||||
Pinnacle West Capital CorporationD | 4,000 | 159,400 | |||||
PPL Corporation | 15,600 | 729,924 | |||||
Progress Energy, Inc.D | 10,500 | 478,695 | |||||
Public Service Enterprise Group, Inc. | 10,300 | 904,134 | |||||
Questar Corporation | 7,000 | 369,950 | |||||
Qwest Communications International, Inc. D* | 63,700 | 617,890 | |||||
Sempra EnergyD | 10,700 | 633,761 | |||||
Southern Co. (The)D | 30,700 | 1,052,703 | |||||
Spectra Energy Corporation | 25,684 | 666,757 | |||||
Sprint Nextel Corporation | 117,793 | 2,439,493 | |||||
TECO Energy, Inc.D | 8,600 | 147,748 | |||||
TXU Corporation | 19,000 | 1,278,700 | |||||
Verizon Communications, Inc. | 119,074 | 4,902,277 | |||||
Windstream CorporationD | 19,499 | 287,805 | |||||
Xcel Energy Inc.D | 16,700 | 341,849 | |||||
| 43,736,456 | |||||||
Total Common Stocks (Cost $371,980,214) | 531,661,951 | ||||||
MONEY MARKET FUNDS — 10.3% | |||||||
GuideStone Funds Money Market Fund (GS4 Class)¥ | 14,526,744 | 14,526,744 | |||||
Northern Institutional Liquid Assets Portfolio§ | 42,035,182 | 42,035,182 | |||||
Total Money Market Funds (Cost $56,561,926) | 56,561,926 | ||||||
| Par | |||||||
U.S. TREASURY OBLIGATIONS — 0.2% | |||||||
U.S. Treasury Bills | |||||||
4.70%, 08/09/07‡‡ | $ | 170,000 | 169,160 | ||||
4.86%, 08/09/07‡‡ | 185,000 | 184,085 | |||||
4.95%, 08/09/07‡‡ | 700,000 | 696,540 | |||||
Total U.S. Treasury Obligations (Cost $1,049,411) | 1,049,785 | ||||||
TOTAL INVESTMENTS — 107.7% (Cost $429,591,551) | 589,273,662 | ||||||
Liabilities in Excess of Other Assets — (7.7)% | (42,165,651 | ) | |||||
NET ASSETS — 100.0% | $ | 547,108,011 | |||||
PORTFOLIO SUMMARY (based on net assets)
| % | ||
Financial Services | 21.9 | |
Technology | 12.8 | |
Healthcare | 11.8 | |
Consumer Discretionary | 11.0 | |
Money Market Funds | 10.3 | |
Utilities | 8.0 | |
Integrated Oils | 6.7 | |
Consumer Staples | 5.6 | |
Other | 4.7 | |
Producer Durables | 4.6 | |
Other Energy | 4.0 | |
Materials & Processing | 3.7 | |
Futures Contracts | 2.6 | |
Auto & Transportation | 2.4 | |
U.S. Treasury Obligations | 0.2 | |
| 110.3 | ||
See Notes to Financial Statements.
| 98 |
Table of Contents
Average Annual Total Returns as of 06/30/07
| GS4 Class* | Benchmark** | |||||
Six Months | (5.32 | )% | (5.97 | )% | ||
Since Inception | (4.94 | )% | (5.70 | )% | ||
Inception Date | 12/29/06 | 12/29/06 |
The performance data quoted represents past performance and does not guarantee future results. Current performance may be lower or higher. Performance data current to the most recent month-end may be obtained at www.GuideStoneFunds.org. The investment return and principal value of an investment will fluctuate so that shares, when redeemed, may be worth more or less than their original cost.
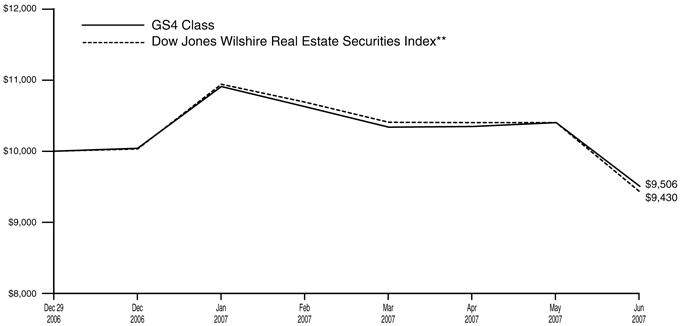
The graph compares the results of a hypothetical $10,000 investment in the GS4 Class of the Fund since December 29, 2006 (commencement of operations), with all dividends and capital gains reinvested, with the Dow Jones Wilshire RESI Index.
| * | These returns reflect expense waivers by the Fund’s investment advisor. Without these waivers, returns would have been lower. Returns shown do not reflect the deduction of taxes that a shareholder would pay on Fund distributions or the redemption of Fund shares. |
| ** | The Dow Jones Wilshire RESI Index is a capitalization weighted index designed to provide a broad measure of the performance of publicly traded real estate securities, such as Real Estate Investment Trusts (REITs) and Real Estate Operating Companies (REOCs). |
| Unlike | a mutual fund, the performance of an index assumes no taxes, transaction costs, management fees or other expenses. |
This fund invests substantial assets in Real Estate Investment Trusts (REITs) that involve risks not associated with investing in stocks. Risks include declines in the value of real estate, general and economic conditions, changes in the value of the underlying property and defaults by borrowers. The value of assets in the real estate industry may go through cycles of relative underperformance and outperformance in comparison to equity securities markets in general.
| 99 |
Table of Contents
| Real Estate Securities Fund | ||
| SCHEDULE OF INVESTMENTS | June 30, 2007 (Unaudited) |
| Shares | Value | ||||||
COMMON STOCKS — 91.7% | |||||||
Consumer Discretionary — 1.8% | |||||||
Starwood Hotels & Resorts Worldwide, Inc. | 32,065 | $ | 2,150,599 | ||||
Financial Services — 89.9% | |||||||
AMB Property Corporation REIT | 65,450 | 3,483,249 | |||||
American Campus Communities, Inc. REITD | 11,750 | 332,408 | |||||
Apartment Investment & Management Co. Class A REITD | 70,950 | 3,577,299 | |||||
Archstone-Smith Trust REIT | 45,000 | 2,659,950 | |||||
AvalonBay Communities, Inc. REIT | 59,250 | 7,043,640 | |||||
BioMed Realty Trust, Inc. REITD | 61,750 | 1,551,160 | |||||
Boston Properties, Inc. REITD | 24,950 | 2,548,144 | |||||
BRE Properties, Inc. REIT | 25,650 | 1,520,788 | |||||
Brookfield Properties CorporationD | 83,963 | 2,041,141 | |||||
DiamondRock Hospitality Co. REITD | 106,050 | 2,023,434 | |||||
Digital Realty Trust, Inc. REITD | 57,600 | 2,170,368 | |||||
Douglas Emmett, Inc. REITD | 30,700 | 759,518 | |||||
Equity Lifestyle Properties, Inc. REITD | 45,400 | 2,369,426 | |||||
Essex Property Trust, Inc. REITD | 32,900 | 3,826,270 | |||||
Federal Realty Investors Trust REIT | 42,450 | 3,279,687 | |||||
FelCor Lodging Trust, Inc. REITD | 82,450 | 2,146,173 | |||||
General Growth Properties, Inc. REIT | 130,200 | 6,894,090 | |||||
Host Hotels & Resorts, Inc. REITD | 156,977 | 3,629,308 | |||||
LaSalle Hotel Properties REITD | 53,750 | 2,333,825 | |||||
Macerich Co. (The) REITD | 54,900 | 4,524,858 | |||||
Mack-Cali Realty Corporation REITD | 53,750 | 2,337,587 | |||||
Parkway Properties, Inc. REITD | 20,600 | 989,418 | |||||
Post Properties, Inc. REITD | 32,400 | 1,689,012 | |||||
ProLogis REIT | 82,400 | 4,688,560 | |||||
Public Storage, Inc. REITD | 52,030 | 3,996,945 | |||||
Regency Centers Corporation REIT | 62,150 | 4,381,575 | |||||
Simon Property Group, Inc. REIT | 108,750 | 10,118,100 | |||||
SL Green Realty Corporation REITD | 60,100 | 7,445,789 | |||||
Strategic Hotels & Resorts, Inc. REITD | 19,850 | 446,426 | |||||
Tanger Factory Outlet Centrs REITD | 52,300 | 1,958,635 | |||||
Taubman Centers, Inc. REITD | 17,550 | 870,656 | |||||
Vornado Realty Trust REITD | 74,988 | 8,236,682 | |||||
| 105,874,121 | |||||||
Total Common Stocks (Cost $118,141,952) | 108,024,720 | ||||||
MONEY MARKET FUNDS — 41.6% | |||||||
GuideStone Funds Money Market Fund (GS4 Class)¥ | 9,126,283 | 9,126,283 | |||||
Northern Institutional Liquid Assets Portfolio§ | 39,882,340 | 39,882,340 | |||||
Total Money Market Funds (Cost $49,008,623) | 49,008,623 | ||||||
| Par | |||||||
U.S. TREASURY OBLIGATION — 0.4% | |||||||
U.S. Treasury Bill | |||||||
4.95%, 08/09/07‡‡ | |||||||
(Cost $547,052) | $ | 550,000 | 547,281 | ||||
TOTAL INVESTMENTS — 133.7% (Cost $167,697,627) | 157,580,624 | ||||||
Liabilities in Excess of Other Assets — (33.7)% | (39,736,149 | ) | |||||
NET ASSETS — 100.0% | $ | 117,844,475 | |||||
PORTFOLIO SUMMARY (based on net assets)
| % | ||
Financial Services | 89.9 | |
Money Market Funds | 41.6 | |
Futures Contracts | 7.7 | |
Consumer Discretionary | 1.8 | |
U.S. Treasury Obligation | 0.4 | |
| 141.4 | ||
See Notes to Financial Statements.
| 100 |
Table of Contents
Average Annual Total Returns as of 06/30/07
| GS2 Class* | GS4 Class* | GS6 Class* | Benchmark** | |||||||||
Six Months | 7.44 | % | 7.25 | % | 7.08 | % | 6.23 | % | ||||
One Year | 21.55 | % | 21.30 | % | 20.88 | % | 21.87 | % | ||||
Five Year | 12.95 | % | 12.75 | % | 12.41 | % | 13.31 | % | ||||
Since Inception | 9.52 | % | 9.16 | % | 8.97 | % | 9.75 | % | ||||
Inception Date | 08/27/01 | 08/27/01 | 08/27/01 | 08/27/01 |
The performance data quoted represents past performance and does not guarantee future results. Current performance may be lower or higher. Performance data current to the most recent month-end may be obtained at www.GuideStoneFunds.org. The investment return and principal value of an investment will fluctuate so that shares, when redeemed, may be worth more or less than their original cost.
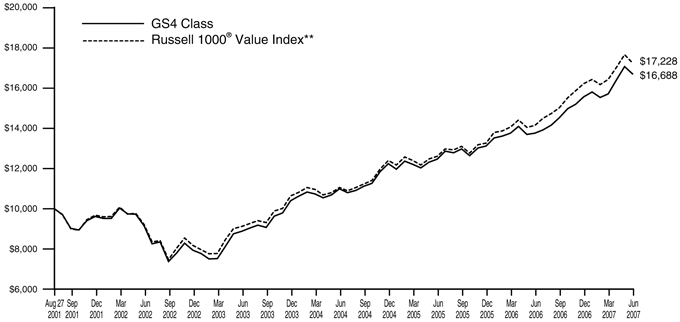
The graph compares the results of a hypothetical $10,000 investment in the GS4 Class of the Fund since August 27, 2001 (commencement of operations), with all dividends and capital gains reinvested, with the Russell 1000® Value Index.
| * | These returns reflect expense waivers by the Fund’s investment advisor. Without these waivers, returns would have been lower Returns shown do not reflect the deduction of taxes that a shareholder would pay on Fund distributions or the redemption of Fund shares. |
** | The Russell 1000® Value Index is a large-cap index consisting of those Russell 1000® index securities with a less-than-average growth orientation. Companies in this index tend to exhibit lower price-to-book and price-earnings-ratios, higher dividend yields and lower forecasted growth values than the growth universe. |
Unlike a mutual fund, the performance of an index assumes no taxes, transaction costs, management fees or other expenses.
| 101 |
Table of Contents
| Value Equity Fund | ||
| SCHEDULE OF INVESTMENTS | June 30, 2007 (Unaudited) |
| Shares | Value | ||||
COMMON STOCKS — 96.6% | |||||
Auto & Transportation — 2.6% | |||||
Burlington Northern Santa Fe Corporation | 145,200 | $ | 12,362,328 | ||
Con-Way, Inc.D | 21,400 | 1,075,136 | |||
CSX Corporation | 214,400 | 9,665,152 | |||
FedEx Corporation | 1,900 | 210,843 | |||
General Motors CorporationD | 165,600 | 6,259,680 | |||
Magna International, Inc.D | 20,700 | 1,883,493 | |||
Norfolk Southern Corporation | 56,300 | 2,959,691 | |||
Tidewater, Inc.D | 64,200 | 4,550,496 | |||
TRW Automotive Holdings Corporation* | 91,100 | 3,355,213 | |||
Union Pacific Corporation | 27,200 | 3,132,080 | |||
| 45,454,112 | |||||
Consumer Discretionary — 10.3% | |||||
Avon Products, Inc. | 202,700 | 7,449,225 | |||
Big Lots, Inc.D* | 92,600 | 2,724,292 | |||
Carnival CorporationD | 191,600 | 9,344,332 | |||
CBS Corporation Class B | 25,300 | 842,996 | |||
Circuit City Stores, Inc.D | 234,100 | 3,530,228 | |||
Clear Channel Communications, Inc.D | 203,100 | 7,681,242 | |||
Coach, Inc.* | 61,800 | 2,928,702 | |||
Costco Wholesale CorporationD | 5,900 | 345,268 | |||
Darden Restaurants, Inc. | 37,900 | 1,667,221 | |||
DIRECTV Group, Inc. (The)* | 159,000 | 3,674,490 | |||
Dollar Tree Stores, Inc.* | 32,400 | 1,411,020 | |||
Eastman Kodak Co.D | 211,276 | 5,879,811 | |||
EchoStar Communications Corporation Class A* | 7,300 | 316,601 | |||
Gannett Co., Inc.D | 128,500 | 7,061,075 | |||
Gap, Inc. (The) | 101,000 | 1,929,100 | |||
Hasbro, Inc. | 128,200 | 4,026,762 | |||
Home Depot, Inc. (The) | 176,188 | 6,932,998 | |||
Interpublic Group Cos., Inc.D* | 276,100 | 3,147,540 | |||
ITT Educational Services, Inc.* | 16,600 | 1,948,508 | |||
Jack in the Box, Inc.* | 8,800 | 624,272 | |||
Kimberly-Clark Corporation | 144,700 | 9,678,983 | |||
Kohl’s Corporation* | 23,500 | 1,669,205 | |||
Macy’s, Inc.D | 201,500 | 8,015,670 | |||
Mattel, Inc.D | 194,900 | 4,929,021 | |||
McDonald’s Corporation | 258,700 | 13,131,612 | |||
Office Depot, Inc.D* | 104,400 | 3,163,320 | |||
Rogers Communications, Inc. Class BD | 29,400 | 1,249,206 | |||
Royal Caribbean Cruises, Ltd.D | 104,681 | 4,499,189 | |||
Sears Holdings Corporation* | 3,200 | 542,400 | |||
Shaw Communications, Inc. Class BD | 88,600 | 3,724,744 | |||
Sony Corporation ADRD | 134,800 | 6,924,676 | |||
Stanley Works (The) | 187,500 | 11,381,250 | |||
Time Warner Cable, Inc.D* | 2,300 | 90,091 | |||
Time Warner, Inc. | 974,000 | 20,492,960 | |||
Wal-Mart Stores, Inc. | 190,500 | 9,164,955 | |||
Walt Disney Co. (The) | 43,800 | 1,495,332 | |||
Waste Management, Inc. | 100,000 | 3,905,000 | |||
Wyndham Worldwide CorporationD* | 36,630 | 1,328,204 | |||
| 178,851,501 | |||||
Consumer Staples — 4.1% | |||||
Coca-Cola Co. (The)D | 115,600 | 6,047,036 | |||
Colgate-Palmolive Co. | 2,000 | 129,700 | |||
ConAgra Foods, Inc. | 110,900 | 2,978,774 | |||
General Mills, Inc. | 94,500 | 5,520,690 | |||
J.M. Smucker Co. (The) | 22,500 | 1,432,350 | |||
Kellogg Co. | 2,600 | 134,654 | |||
Kraft Foods, Inc. Class A | 690,100 | 24,326,025 | |||
Kroger Co. | 131,900 | 3,710,347 | |||
Pepsi Bottling Group, Inc. | 66,300 | 2,232,984 | |||
PepsiCo, Inc. | 38,900 | 2,522,665 | |||
Procter & Gamble Co. | 204,700 | 12,525,593 | |||
Safeway, Inc. | 164,100 | 5,584,323 | |||
Sara Lee Corporation | 157,100 | 2,733,540 | |||
Tyson Foods, Inc. Class AD | 74,300 | 1,711,872 | |||
| 71,590,553 | |||||
Financial Services — 28.7% | |||||
ACE, Ltd. | 71,900 | 4,495,188 | |||
AFLAC, Inc. | 1,500 | 77,100 | |||
Allstate Corporation (The) | 313,500 | 19,283,385 | |||
American Express Co. | 117,500 | 7,188,650 | |||
American International Group, Inc. | 347,950 | 24,366,939 | |||
Assurant, Inc. | 55,000 | 3,240,600 | |||
AXIS Capital Holdings, Ltd. | 82,900 | 3,369,885 | |||
Bank of America Corporation | 742,834 | 36,317,154 | |||
Bank of New York Co., Inc. (The) | 30,200 | 1,251,488 | |||
BB&T Corporation | 21,700 | 882,756 | |||
Bear Stearns Cos., Inc. (The) | 4,700 | 658,000 | |||
Brascan CorporationD | 77,100 | 3,076,290 | |||
Capital One Financial CorporationD | 164,300 | 12,887,692 | |||
Chubb Corporation | 257,800 | 13,957,292 | |||
CIGNA Corporation | 71,900 | 3,754,618 | |||
CIT Group, Inc. | 28,800 | 1,579,104 | |||
Citigroup, Inc. | 1,065,433 | 54,646,058 | |||
Comerica, Inc.D | 142,200 | 8,456,634 | |||
Countrywide Financial CorporationD | 172,400 | 6,266,740 | |||
Credicorp, Ltd.D | 3,500 | 214,095 | |||
Everest Re Group, Ltd. | 17,900 | 1,944,656 | |||
Fannie Mae | 195,700 | 12,785,081 | |||
Fifth Third BancorpD | 21,100 | 839,147 | |||
First Data Corporation | 24,900 | 813,483 | |||
Freddie Mac | 200,400 | 12,164,280 | |||
Goldman Sachs Group, Inc. | 41,565 | 9,009,214 | |||
Hartford Financial Services Group, Inc. | 164,304 | 16,185,587 | |||
Jones Lang LaSalle, Inc.D | 32,800 | 3,722,800 | |||
JPMorgan Chase & Co.D | 1,008,812 | 48,876,941 | |||
KeyCorp | 35,750 | 1,227,298 | |||
Legg Mason, Inc. | 46,700 | 4,594,346 | |||
Lehman Brothers Holdings, Inc. | 45,600 | 3,398,112 | |||
Lincoln National CorporationD | 10,600 | 752,070 | |||
Loews Corporation | 113,400 | 5,781,132 | |||
Marsh & McLennan Cos., Inc. | 21,900 | 676,272 | |||
See Notes to Financial Statements.
| 102 |
Table of Contents
| Shares | Value | ||||
Mellon Financial Corporation | 900 | $ | 39,600 | ||
Merrill Lynch & Co., Inc. | 241,800 | 20,209,644 | |||
MetLife, Inc. | 18,500 | 1,192,880 | |||
MGIC Investment CorporationD | 81,800 | 4,651,148 | |||
Morgan Stanley | 233,100 | 19,552,428 | |||
National City Corporation | 20,100 | 669,732 | |||
PartnerRe, Ltd.D | 5,000 | 387,500 | |||
PMI Group, Inc. (The)D | 69,000 | 3,082,230 | |||
PNC Financial Services Group, Inc. | 13,600 | 973,488 | |||
Principal Financial Group | 50,900 | 2,966,961 | |||
Progressive Corporation (The) | 29,600 | 708,328 | |||
Prudential Financial, Inc. | 13,800 | 1,341,774 | |||
Regions Financial CorporationD | 27,700 | 916,870 | |||
Reinsurance Group of America, Inc.D | 4,500 | 271,080 | |||
Safeco CorporationD | 58,000 | 3,611,080 | |||
Simon Property Group, Inc. REIT | 3,900 | 362,856 | |||
SLM Corporation | 166,300 | 9,575,554 | |||
State Street CorporationD | 3,500 | 239,400 | |||
SunTrust Banks, Inc. | 78,000 | 6,687,720 | |||
Travelers Cos., Inc. | 396,300 | 21,202,050 | |||
UnumProvident Corporation | 134,500 | 3,511,795 | |||
US Bancorp | 195,000 | 6,425,250 | |||
Wachovia CorporationD | 256,945 | 13,168,421 | |||
Washington Mutual, Inc.D | 434,200 | 18,514,288 | |||
Wells Fargo & Co. | 553,500 | 19,466,595 | |||
Western Union Co. | 1,600 | 33,328 | |||
XL Capital, Ltd. Class AD | 115,200 | 9,710,208 | |||
| 498,212,295 | |||||
Healthcare — 9.5% | |||||
Aetna, Inc. | 281,600 | 13,911,040 | |||
AmerisourceBergen Corporation | 85,600 | 4,234,632 | |||
Amgen, Inc.* | 12,800 | 707,712 | |||
Baxter International, Inc. | 201,500 | 11,352,510 | |||
Biogen Idec, Inc.D* | 10,800 | 577,800 | |||
Boston Scientific CorporationD* | 316,100 | 4,848,974 | |||
Bristol-Myers Squibb Co. | 282,500 | 8,915,700 | |||
Cardinal Health, Inc. | 69,100 | 4,881,224 | |||
Community Health Systems, Inc.D* | 46,800 | 1,893,060 | |||
CVS Corporation | 28,238 | 1,029,275 | |||
Eli Lilly & Co. | 19,700 | 1,100,836 | |||
Johnson & Johnson | 71,500 | 4,405,830 | |||
McKesson Corporation | 67,300 | 4,013,772 | |||
Merck & Co., Inc. | 15,100 | 751,980 | |||
Millennium Pharmaceuticals, Inc.D* | 449,200 | 4,748,044 | |||
Omnicare, Inc.D | 58,900 | 2,123,934 | |||
Pfizer, Inc. | 1,840,100 | 47,051,357 | |||
Tenet Healthcare CorporationD* | 839,900 | 5,467,749 | |||
Teva Pharmaceutical Industries, Ltd. ADRD | 137,752 | 5,682,270 | |||
Thermo Fisher Scientific, Inc.* | 8,400 | 434,448 | |||
UnitedHealth Group, Inc. | 197,800 | 10,115,492 | |||
Watson Pharmaceuticals, Inc.D* | 168,500 | 5,481,305 | |||
WellPoint, Inc.* | 176,300 | 14,074,029 | |||
Wyeth | 113,700 | 6,519,558 | |||
| 164,322,531 | |||||
Integrated Oils — 9.3% | |||||
BP PLC ADR | 61,068 | 4,405,445 | |||
Chevron Corporation | 609,170 | 51,316,481 | |||
ConocoPhillips | 476,400 | 37,397,400 | |||
Exxon Mobil Corporation | 477,300 | 40,035,924 | |||
Marathon Oil Corporation | 130,396 | 7,818,544 | |||
Murphy Oil CorporationD | 74,000 | 4,398,560 | |||
Occidental Petroleum Corporation | 269,000 | 15,569,720 | |||
| 160,942,074 | |||||
Materials & Processing — 4.0% | |||||
Alcan, Inc.D | 50,400 | 4,097,520 | |||
Alcoa, Inc. | 287,200 | 11,640,216 | |||
Archer-Daniels-Midland Co. | 25,700 | 850,413 | |||
Ball Corporation | 24,600 | 1,307,982 | |||
Corn Products International, Inc. | 17,400 | 790,830 | |||
Dow Chemical Co. (The) | 196,200 | 8,675,964 | |||
du Pont (E.I.) de Nemours & Co. | 205,000 | 10,422,200 | |||
Freeport-McMoRan Copper & Gold, Inc. | 2,700 | 223,614 | |||
International Paper Co. | 17,090 | 667,364 | |||
Louisiana-Pacific CorporationD | 165,000 | 3,121,800 | |||
MeadWestvaco Corporation | 343,700 | 12,139,484 | |||
Methanex CorporationD | 119,100 | 2,994,174 | |||
Newmont Mining Corporation | 9,900 | 386,694 | |||
Nova Chemicals CorporationD | 28,200 | 1,003,074 | |||
Nucor CorporationD | 14,800 | 868,020 | |||
Owens-Illinois, Inc.* | 55,100 | 1,928,500 | |||
Pactiv Corporation* | 40,184 | 1,281,468 | |||
Smurfit-Stone Container CorporationD* | 250,200 | 3,330,162 | |||
Southern Copper CorporationD | 25,500 | 2,403,630 | |||
Timken Co. | 17,000 | 613,870 | |||
Weyerhaeuser Co. | 8,501 | 670,984 | |||
| 69,417,963 | |||||
Other — 4.8% | |||||
3M Co. | 53,000 | 4,599,870 | |||
General Electric Co. | 1,056,200 | 40,431,336 | |||
Honeywell International, Inc. | 405,359 | 22,813,605 | |||
Johnson Controls, Inc. | 1,600 | 185,232 | |||
Teleflex, Inc.D | 19,500 | 1,594,710 | |||
Tyco International, Ltd.D | 412,300 | 13,931,617 | |||
| 83,556,370 | |||||
Other Energy — 1.6% | |||||
Anadarko Petroleum CorporationD | 128,600 | 6,685,914 | |||
Apache Corporation | 13,000 | 1,060,670 | |||
Devon Energy Corporation | 17,800 | 1,393,562 | |||
EOG Resources, Inc. | 9,400 | 686,764 | |||
Holly CorporationD | 55,100 | 4,087,869 | |||
Massey Energy Co.D | 137,100 | 3,653,715 | |||
Sunoco, Inc. | 50,300 | 4,007,904 | |||
Valero Energy Corporation | 66,800 | 4,933,848 | |||
See Notes to Financial Statements.
| 103 |
Table of Contents
Value Equity Fund
SCHEDULE OF INVESTMENTS (Continued)
| Shares | Value | ||||||
Williams Cos., Inc.D | 39,122 | $ | 1,237,038 | ||||
| 27,747,284 | |||||||
Producer Durables — 4.5% | |||||||
Caterpillar, Inc. | 22,800 | 1,785,240 | |||||
Centex Corporation | 76,500 | 3,067,650 | |||||
Cummins, Inc. | 24,800 | 2,510,008 | |||||
Deere & Co. | 8,400 | 1,014,216 | |||||
Emerson Electric Co. | 186,400 | 8,723,520 | |||||
Gerdau Ameristeel CorporationD | 167,900 | 2,456,377 | |||||
Grainger (W.W.), Inc. | 17,400 | 1,619,070 | |||||
Illinois Tool Works, Inc. | 174,800 | 9,472,412 | |||||
Ingersoll-Rand Co., Ltd. Class A | 70,200 | 3,848,364 | |||||
Lennar Corporation Class AD | 77,700 | 2,840,712 | |||||
Lexmark International, Inc.* | 64,900 | 3,200,219 | |||||
Lockheed Martin Corporation | 43,000 | 4,047,590 | |||||
Northrop Grumman Corporation | 177,900 | 13,853,073 | |||||
NVR, Inc.D* | 4,400 | 2,990,900 | |||||
Parker Hannifin Corporation | 37,800 | 3,700,998 | |||||
Pitney Bowes, Inc.D | 86,100 | 4,031,202 | |||||
Raytheon Co. | 38,800 | 2,090,932 | |||||
United Technologies Corporation | 101,700 | 7,213,581 | |||||
| 78,466,064 | |||||||
Technology — 5.2% | |||||||
Alcatel Lucent Sponsored ADRD | 609,163 | 8,528,282 | |||||
Avnet, Inc.D* | 59,400 | 2,354,616 | |||||
Computer Sciences Corporation* | 53,900 | 3,188,185 | |||||
Compuware Corporation* | 280,600 | 3,327,916 | |||||
Electronic Data Systems Corporation | 114,400 | 3,172,312 | |||||
General Dynamics Corporation | 13,700 | 1,071,614 | |||||
Hewlett-Packard Co. | 167,300 | 7,464,926 | |||||
Intel Corporation | 412,000 | 9,789,120 | |||||
International Business Machines CorporationD | 187,800 | 19,765,950 | |||||
Jabil Circuit, Inc. | 159,809 | 3,526,985 | |||||
LSI Logic CorporationD* | 386,300 | 2,901,113 | |||||
Microsoft Corporation | 138,100 | 4,069,807 | |||||
Motorola, Inc. | 303,025 | 5,363,542 | |||||
Nokia Corporation ADRD | 284,600 | 8,000,106 | |||||
Oracle Corporation* | 88,300 | 1,740,393 | |||||
Seagate Technology, Inc.+ | 4,600 | — | |||||
Solectron Corporation* | 1,305,500 | 4,804,240 | |||||
Sun Microsystems, Inc.* | 104,600 | 550,196 | |||||
Symantec Corporation* | 30,800 | 622,160 | |||||
Vishay Intertechnology, Inc.D* | 84,700 | 1,339,954 | |||||
| 91,581,417 | |||||||
Utilities — 12.0% | |||||||
Alltel Corporation | 13,526 | 913,681 | |||||
American Electric Power Co., Inc. | 245,100 | 11,039,304 | |||||
AT&T, Inc. | 1,339,796 | 55,601,534 | |||||
Comcast Corporation Class A* | 514,100 | 14,456,492 | |||||
Dominion Resources, Inc.D | 82,900 | 7,155,099 | |||||
DTE Energy Co.D | 20,600 | 993,332 | |||||
Duke Energy CorporationD | 253,400 | 4,637,220 | |||||
Edison International | 80,500 | 4,517,660 | |||||
Energen Corporation | 33,100 | 1,818,514 | |||||
Energy East Corporation | 145,900 | 3,806,531 | |||||
Entergy Corporation | 169,500 | 18,195,825 | |||||
Exelon Corporation | 14,400 | 1,045,440 | |||||
FirstEnergy Corporation | 85,452 | 5,531,308 | |||||
FPL Group, Inc. | 16,000 | 907,840 | |||||
Pepco Holdings, Inc. | 56,900 | 1,604,580 | |||||
PG&E Corporation | 38,000 | 1,721,400 | |||||
PPL CorporationD | 122,300 | 5,722,417 | |||||
Progress Energy, Inc. Contingent Value Obligation+* | 3,100 | 1,209 | |||||
Public Service Enterprise Group, Inc. | 40,700 | 3,572,646 | |||||
Qwest Communications International, Inc.D* | 1,164,600 | 11,296,620 | |||||
Southern Co. (The)D | 29,600 | 1,014,984 | |||||
Spectra Energy Corporation | 166,050 | 4,310,658 | |||||
Sprint Nextel Corporation | 531,007 | 10,997,155 | |||||
Telephone & Data Systems, Inc.D | 22,400 | 1,401,568 | |||||
TXU Corporation | 5,000 | 336,500 | |||||
Verizon Communications, Inc. | 874,524 | 36,004,153 | |||||
| 208,603,670 | |||||||
Total Common Stocks (Cost $1,330,293,628) | 1,678,745,834 | ||||||
MONEY MARKET FUNDS — 10.8% | |||||||
GuideStone Funds Money Market Fund (GS4 Class)¥ | 57,255,306 | 57,255,306 | |||||
Northern Institutional Liquid Assets Portfolio§ | 129,799,332 | 129,799,332 | |||||
Total Money Market Funds (Cost $187,054,638) | 187,054,638 | ||||||
| Par | |||||||
U.S. TREASURY OBLIGATIONS — 0.2% | |||||||
U.S. Treasury Bills | |||||||
4.51%, 08/09/07‡‡ | $ | 10,000 | 9,950 | ||||
4.67%, 08/09/07‡‡ | 10,000 | 9,951 | |||||
4.95%, 08/09/07‡‡ | 4,050,000 | 4,029,978 | |||||
Total U.S. Treasury Obligations (Cost $4,048,200) | 4,049,879 | ||||||
TOTAL INVESTMENTS — 107.6% (Cost $1,521,396,466) | 1,869,850,351 | ||||||
Liabilities in Excess of Other Assets — (7.6)% | (132,134,862 | ) | |||||
Net Assets — 100.0% | $ | 1,737,715,489 | |||||
See Notes to Financial Statements.
| 104 |
Table of Contents
PORTFOLIO SUMMARY (based on net assets)
| % | ||
Financial Services | 28.7 | |
Utilities | 12.0 | |
Money Market Funds | 10.8 | |
Consumer Discretionary | 10.3 | |
Healthcare | 9.5 | |
Integrated Oils | 9.3 | |
Technology | 5.2 | |
Other | 4.8 | |
Producer Durables | 4.5 | |
Consumer Staples | 4.1 | |
Materials & Processing | 4.0 | |
Futures Contracts | 3.3 | |
Auto & Transportation | 2.6 | |
Other Energy | 1.6 | |
U.S. Treasury Obligations | 0.2 | |
| 110.9 | ||
See Notes to Financial Statements.
| 105 |
Table of Contents
Average Annual Total Returns as of 06/30/07
| GS2 Class* | GS4 Class* | GS6 Class* | Benchmark** | |||||||||
Six Months | 6.77 | % | 6.75 | % | 6.46 | % | 8.13 | % | ||||
One Year | 12.69 | % | 12.65 | % | 12.18 | % | 19.04 | % | ||||
Five Year | 8.51 | % | 8.41 | % | 8.06 | % | 9.28 | % | ||||
Since Inception | 3.15 | % | 3.03 | % | 2.72 | % | 3.36 | % | ||||
Inception Date | 08/27/01 | 08/27/01 | 08/27/01 | 08/27/01 |
The performance data quoted represents past performance and does not guarantee future results. Current performance may be lower or higher. Performance data current to the most recent month-end may be obtained at www.GuideStoneFunds.org. The investment return and principal value of an investment will fluctuate so that shares, when redeemed, may be worth more or less than their original cost.
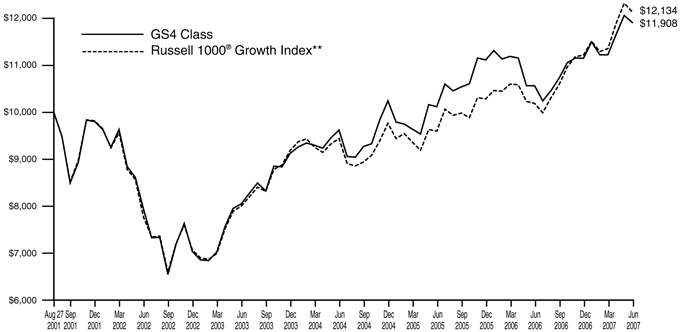
The graph compares the results of a hypothetical $10,000 investment in the GS4 Class of the Fund since August 27, 2001 (commencement of operations), with all dividends and capital gains reinvested, with the Russell 1000® Growth Index.
| * | These returns reflect expense waivers by the Fund’s investment advisor. Without these waivers, returns would have been lower. Returns shown do not reflect the deduction of taxes that a shareholder would pay on Fund distributions or the redemption of Fund shares. |
** | The Russell 1000® Growth Index is a large-cap index consisting of those Russell 1000® Index securities with greater-than-average growth orientation. Companies in this index tend to exhibit higher price-to-book and price-earnings-ratios, lower dividend yields and higher forecasted growth values than the value universe. |
Unlike a mutual fund, the performance of an index assumes no taxes, transaction costs, management fees or other expenses.
| 106 |
Table of Contents
Growth Equity Fund | ||
SCHEDULE OF INVESTMENTS | June 30, 2007 (Unaudited) |
| Shares | Value | ||||
COMMON STOCKS — 95.2% | |||||
Auto & Transportation — 4.2% | |||||
Burlington Northern Santa Fe Corporation | 130,987 | $ | 11,152,233 | ||
CH Robinson Worldwide, Inc. | 238,760 | 12,539,675 | |||
Expeditors International Washington, Inc.D | 385,590 | 15,924,867 | |||
FedEx Corporation | 113,226 | 12,564,689 | |||
Toyota Motor Corporation ADRD | 35,596 | 4,480,825 | |||
Union Pacific Corporation | 99,004 | 11,400,311 | |||
| 68,062,600 | |||||
Consumer Discretionary — 16.6% | |||||
Amazon.com, Inc.D* | 371,200 | 25,393,792 | |||
Coach, Inc.* | 159,300 | 7,549,227 | |||
eBay, Inc.* | 377,800 | 12,157,604 | |||
Google, Inc.* | 166,133 | 86,950,690 | |||
Iron Mountain, Inc.D* | 164,200 | 4,290,546 | |||
Lowe’s Cos., Inc. | 786,041 | 24,123,598 | |||
Macy’s, Inc. | 239,235 | 9,516,768 | |||
Marriott International, Inc. Class AD | 215,200 | 9,305,248 | |||
McDonald’s Corporation | 259,607 | 13,177,651 | |||
Penney (JC) Co., Inc. | 147,200 | 10,654,336 | |||
Starbucks CorporationD* | 1,045,800 | 27,441,792 | |||
VeriSign, Inc.* | 233,756 | 7,417,078 | |||
Walt Disney Co. (The) | 313,100 | 10,689,234 | |||
Yahoo!, Inc.* | 403,000 | 10,933,390 | |||
Yum! Brands, Inc. | 382,598 | 12,518,607 | |||
| 272,119,561 | |||||
Consumer Staples — 3.5% | |||||
Colgate-Palmolive Co. | 141,300 | 9,163,305 | |||
Kraft Foods, Inc. Class A | 144,325 | 5,087,456 | |||
PepsiCo, Inc. | 185,600 | 12,036,160 | |||
Procter & Gamble Co. | 183,300 | 11,216,127 | |||
Walgreen Co. | 463,100 | 20,163,374 | |||
| 57,666,422 | |||||
Financial Services — 13.8% | |||||
American International | |||||
Group, Inc. | 84,800 | 5,938,544 | |||
CB Richard Ellis Group, Inc. Class AD* | 253,980 | 9,270,270 | |||
Chicago Mercantile Exchange Holdings, Inc.D | 36,900 | 19,717,884 | |||
Citigroup, Inc. | 93,900 | 4,816,131 | |||
Commerce Bancorp, Inc.D | 333,610 | 12,340,234 | |||
Countrywide Financial CorporationD | 415,000 | 15,085,250 | |||
Franklin Resources, Inc.D | 83,600 | 11,074,492 | |||
Goldman Sachs Group, Inc. | 102,178 | 22,147,082 | |||
Intercontinental Exchange, Inc.D* | 174,900 | 25,858,965 | |||
Lehman Brothers Holdings, Inc. | 112,025 | 8,348,103 | |||
Mastercard, Inc. Class AD | 67,144 | 11,137,175 | |||
Merrill Lynch & Co., Inc. | 108,800 | 9,093,504 | |||
Moody’s CorporationD | 267,545 | 16,641,299 | |||
Progressive Corporation (The)D | 758,680 | 18,155,212 | |||
SLM Corporation | 64,200 | 3,696,636 | |||
UBS AGD | 190,227 | 11,415,522 | |||
US BancorpD | 179,600 | 5,917,820 | |||
Wells Fargo & Co. | 224,004 | 7,878,221 | |||
Zions BancorporationD | 95,500 | 7,344,905 | |||
| 225,877,249 | |||||
Healthcare — 19.6% | |||||
Abbott Laboratories | 119,300 | 6,388,515 | |||
Abraxis BioScience, Inc.D* | 148,400 | 3,298,932 | |||
Aetna, Inc. | 154,500 | 7,632,300 | |||
Allergan, Inc.D | 396,000 | 22,825,440 | |||
Amylin Pharmaceuticals, Inc.D* | 252,685 | 10,400,515 | |||
Cephalon, Inc.D* | 60,300 | 4,847,517 | |||
Cerner CorporationD* | 203,890 | 11,309,778 | |||
CVS Corporation | 356,230 | 12,984,583 | |||
Genentech, Inc.* | 661,149 | 50,022,533 | |||
Genzyme Corporation* | 593,887 | 38,246,323 | |||
Gilead Sciences, Inc.D* | 249,800 | 9,684,746 | |||
Intuitive Surgical, Inc.D* | 69,300 | 9,616,761 | |||
Merck & Co., Inc. | 204,000 | 10,159,200 | |||
Patterson Cos., Inc.D* | 132,200 | 4,927,094 | |||
Schering-Plough Corporation | 344,361 | 10,482,349 | |||
Shire PLC ADR | 95,900 | 7,109,067 | |||
St. Jude Medical, Inc.* | 154,200 | 6,397,758 | |||
Stryker CorporationD | 141,100 | 8,901,999 | |||
Teva Pharmaceutical Industries, Ltd. ADRD | 193,900 | 7,998,375 | |||
Thermo Fisher Scientific, Inc.* | 96,500 | 4,990,980 | |||
UnitedHealth Group, Inc. | 515,227 | 26,348,709 | |||
Varian Medical Systems, Inc.* | 406,900 | 17,297,319 | |||
WellPoint, Inc.* | 93,700 | 7,480,071 | |||
Wyeth | 157,000 | 9,002,380 | |||
Zimmer Holdings, Inc.* | 144,300 | 12,249,627 | |||
| 320,602,871 | |||||
Integrated Oils — 0.9% | |||||
Exxon Mobil Corporation | 151,100 | 12,674,268 | |||
Marathon Oil Corporation | 31,216 | 1,871,712 | |||
| 14,545,980 | |||||
Materials & Processing — 2.8% | |||||
Air Products & Chemicals, Inc. | 138,881 | 11,161,866 | |||
Allegheny Technologies, Inc. | 42,700 | 4,478,376 | |||
Freeport-McMoRan Copper & Gold, Inc. | 57,433 | 4,756,601 | |||
Monsanto Co. | 159,198 | 10,752,233 | |||
Praxair, Inc. | 123,116 | 8,863,121 | |||
Precision Castparts Corporation | 32,800 | 3,980,608 | |||
St. Joe Co.D | 49,943 | 2,314,358 | |||
| 46,307,163 | |||||
Other — 1.7% | |||||
General Electric Co. | 500,200 | 19,147,656 | |||
Textron, Inc. | 75,000 | 8,258,250 | |||
| 27,405,906 | |||||
Other Energy — 6.9% | |||||
Anadarko Petroleum Corporation | 38,175 | 1,984,718 | |||
Apache Corporation | 13,309 | 1,085,881 | |||
Baker Hughes, Inc.D | 23,187 | 1,950,723 | |||
Cameron International Corporation* | 30,441 | 2,175,618 | |||
Devon Energy Corporation | 24,806 | 1,942,062 | |||
See Notes to Financial Statements.
| 107 |
Table of Contents
Growth Equity Fund
SCHEDULE OF INVESTMENTS (Continued)
| Shares | Value | ||||||
EOG Resources, Inc. | 65,200 | $ | 4,763,512 | ||||
National Oilwell Varco, Inc.* | 102,300 | 10,663,752 | |||||
Schlumberger, Ltd. | 806,270 | 68,484,574 | |||||
TransOcean, Inc.D* | 45,600 | 4,832,688 | |||||
Weatherford International, Ltd.D* | 154,300 | 8,523,532 | |||||
XTO Energy, Inc.D | 110,400 | 6,635,040 | |||||
| 113,042,100 | |||||||
Producer Durables — 3.3% | |||||||
Boeing Co. (The) | 186,129 | 17,898,164 | |||||
Caterpillar, Inc. | 57,400 | 4,494,420 | |||||
Deere & Co. | 67,300 | 8,125,802 | |||||
Lockheed Martin Corporation | 129,429 | 12,183,152 | |||||
Pulte Homes, Inc. | 254,835 | 5,721,046 | |||||
United Technologies Corporation | 74,200 | 5,263,006 | |||||
| 53,685,590 | |||||||
Technology — 17.3% | |||||||
Adobe Systems, Inc.* | 186,000 | 7,467,900 | |||||
Apple, Inc.* | 395,504 | 48,267,308 | |||||
Autodesk, Inc.D* | 371,815 | 17,505,050 | |||||
Broadcom Corporation Class A* | 464,300 | 13,580,775 | |||||
Cisco Systems, Inc.* | 770,036 | 21,445,503 | |||||
Dell, Inc.* | 188,600 | 5,384,530 | |||||
EMC Corporation* | 449,400 | 8,134,140 | |||||
General Dynamics Corporation | 157,765 | 12,340,378 | |||||
Hewlett-Packard Co. | 356,500 | 15,907,030 | |||||
Intel Corporation | 958,570 | 22,775,623 | |||||
Microsoft Corporation | 453,700 | 13,370,539 | |||||
Network Appliance, Inc.* | 412,225 | 12,036,970 | |||||
QUALCOMM, Inc. | 1,060,770 | 46,026,810 | |||||
Salesforce.com, Inc.D* | 510,510 | 21,880,459 | |||||
SanDisk CorporationD* | 75,700 | 3,704,758 | |||||
Seagate Technology, Inc.+ | 5,600 | — | |||||
Telecorp PCS, Inc. Escrow+ | 928 | — | |||||
Texas Instruments, Inc. | 379,000 | 14,261,770 | |||||
| 284,089,543 | |||||||
Utilities — 4.6% | |||||||
America Movil SA de CV ADR Series L | 478,671 | 29,644,095 | |||||
AT&T, Inc. | 507,354 | 21,055,191 | |||||
Comcast Corporation Class A* | 919,005 | 25,842,421 | |||||
| 76,541,707 | |||||||
Total Common Stocks (Cost $1,210,757,051) | 1,559,946,692 | ||||||
FOREIGN COMMON STOCKS — 0.9% | |||||||
China — 0.9% | |||||||
Industrial & Commercial Bank of China Class H (Cost $14,853,451) | 26,356,000 | 14,628,739 | |||||
MONEY MARKET FUNDS — 13.6% | |||||||
GuideStone Funds Money Market Fund (GS4 Class) ¥ | 64,345,184 | 64,345,184 | |||||
Northern Institutional Liquid Assets Portfolio§ | 157,647,087 | 157,647,087 | |||||
Total Money Market Funds (Cost $221,992,271) | 221,992,271 | ||||||
| Par | |||||||
U.S. TREASURY OBLIGATION — 0.2% | |||||||
U.S. Treasury Bill | |||||||
4.95%, 08/09/07‡‡ | |||||||
(Cost $3,729,907) | $ | 3,750,000 | 3,731,461 | ||||
TOTAL INVESTMENTS — 109.9% (Cost $1,451,332,680) | 1,800,299,163 | ||||||
Liabilities in Excess of Other Assets — (9.9)% | (162,325,467 | ) | |||||
NET ASSETS — 100.0% | $ | 1,637,973,696 | |||||
PORTFOLIO SUMMARY (based on net assets)
| % | ||
Healthcare | 19.6 | |
Technology | 17.3 | |
Consumer Discretionary | 16.6 | |
Financial Services | 14.7 | |
Money Market Funds | 13.6 | |
Other Energy | 6.9 | |
Utilities | 4.6 | |
Auto & Transportation | 4.2 | |
Futures Contracts | 3.9 | |
Consumer Staples | 3.5 | |
Producer Durables | 3.3 | |
Materials & Processing | 2.8 | |
Other | 1.7 | |
Integrated Oils | 0.9 | |
U.S. Treasury Obligation | 0.2 | |
| 113.8 | ||
See Notes to Financial Statements.
| 108 |
Table of Contents
Average Annual Total Returns as of 06/30/07
| GS2 Class* | GS4 Class* | GS6 Class* | Benchmark** | |||||||||
Six Months | 8.83 | % | 8.69 | % | 8.55 | % | 6.45 | % | ||||
One Year | 15.46 | % | 15.26 | % | 14.95 | % | 16.43 | % | ||||
Five Year | 12.20 | % | 12.08 | % | 11.73 | % | 13.88 | % | ||||
Since Inception | 9.62 | % | 9.45 | % | 9.15 | % | 11.24 | % | ||||
Inception Date | 08/27/01 | 08/27/01 | 08/27/01 | 08/27/01 |
The performance data quoted represents past performance and does not guarantee future results. Current performance may be lower or higher. Performance data current to the most recent month-end may be obtained at www.GuideStoneFunds.org. The investment return and principal value of an investment will fluctuate so that shares, when redeemed, may be worth more or less than their original cost.
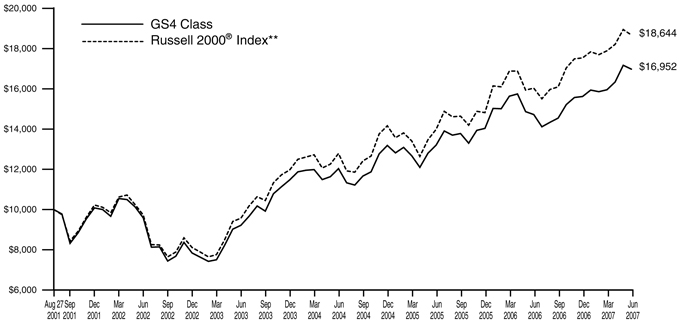
The graph compares the results of a hypothetical $10,000 investment in the GS4 Class of the Fund since August 27, 2001 (commencement of operations), with all dividends and capital gains reinvested, with the Russell 2000® Index.
| * | These returns reflect expense waivers by the Fund’s investment advisor. Without these waivers, returns would have been lower. Returns shown do not reflect the deduction of taxes that a shareholder would pay on Fund distributions or the redemption of Fund shares. |
** | The Russell 2000® Index is a small-cap equity index comprised of the 2,000 smallest companies in the Russell 3000® Index, which represents approximately 8% of the total market capitalization of the Russell 3000® Index. |
Unlike a mutual fund, the performance of an index assumes no taxes, transaction costs, management fees or other expenses.
Small company stocks are generally riskier than large company stocks due to greater volatility and less liquidity.
| 109 |
Table of Contents
Small Cap Equity Fund | ||
SCHEDULE OF INVESTMENTS | June 30, 2007 (Unaudited) |
| Shares | Value | ||||
COMMON STOCKS — 87.4% | |||||
Auto & Transportation — 3.2% | |||||
AAR CorporationD* | 25,350 | $ | 836,804 | ||
Accuride CorporationD* | 31,300 | 482,333 | |||
AirTran Holdings, Inc.D* | 75,600 | 825,552 | |||
Arkansas Best CorporationD | 9,490 | 369,825 | |||
Autoliv, Inc. | 25,000 | 1,421,750 | |||
Celadon Group, Inc.D* | 53,700 | 853,830 | |||
Con-Way, Inc. | 26,500 | 1,331,360 | |||
Copa Holdings SA Class A | 8,500 | 571,540 | |||
DryShips, Inc. | 14,800 | 642,024 | |||
Excel Maritime Carriers, Ltd.D | 42,500 | 1,070,150 | |||
Frontline, Ltd.D | 28,500 | 1,306,725 | |||
Greenbrier Co., Inc.D | 11,500 | 347,530 | |||
Gulfmark Offshore, Inc.D* | 20,500 | 1,050,010 | |||
Horizon Lines, Inc. Class A | 27,000 | 884,520 | |||
JB Hunt Transport Services, Inc.D | 31,200 | 914,784 | |||
Polaris Industries, Inc. | 13,700 | 741,992 | |||
Saia, Inc.D* | 25,500 | 695,130 | |||
Thor Industries, Inc.D | 11,580 | 522,721 | |||
TRW Automotive Holdings Corporation* | 42,100 | 1,550,543 | |||
Tsakos Energy Navigation, Ltd.D | 17,800 | 1,244,398 | |||
U.S. Auto Parts Network, Inc.* | 26,200 | 247,852 | |||
UTI Worldwide, Inc.D | 44,100 | 1,181,439 | |||
Vitran Corporation, Inc.D* | 17,400 | 371,316 | |||
| 19,464,128 | |||||
Consumer Discretionary — 15.1% | |||||
Advisory Board Co. (The)D* | 41,700 | 2,316,852 | |||
Aeropostale, Inc.D* | 32,600 | 1,358,768 | |||
American Greetings Corporation Class A | 26,500 | 750,745 | |||
AMN Healthcare Services, Inc.D* | 48,900 | 1,075,800 | |||
Arbitron, Inc.D | 15,200 | 783,256 | |||
Asbury Automotive Group, Inc.D | 42,000 | 1,047,900 | |||
Big Lots, Inc.D* | 33,200 | 976,744 | |||
Black & Decker Corporation | 8,400 | 741,804 | |||
Blyth, Inc.D | 37,900 | 1,007,382 | |||
Bon-Ton Stores, Inc. (The) | 4,400 | 176,264 | |||
Bowne & Co., Inc.D | 69,100 | 1,348,141 | |||
Buffalo Wild Wings, Inc.D* | 23,800 | 989,842 | |||
Build-A-Bear Workshop, Inc.D* | 14,520 | 379,553 | |||
Capella Education Co.* | 21,200 | 975,836 | |||
CEC Entertainment, Inc.D* | 25,200 | 887,040 | |||
Central Garden and Pet Co.D* | 25,400 | 311,404 | |||
Central Garden and Pet Co. Class AD* | 43,200 | 506,736 | |||
Chemed CorporationD | 11,800 | 782,222 | |||
Citi Trends, Inc.D* | 5,600 | 212,576 | |||
Computer Learning Centers* | 24,439 | 2 | |||
Convergys Corporation* | 27,300 | 661,752 | |||
Corporate Executive Board Co. | 20,900 | 1,356,619 | |||
CoStar Group, Inc.D* | 23,200 | 1,226,816 | |||
CROCS, Inc.D* | 34,160 | 1,469,905 | |||
Ctrip.com International, Ltd. ADRD | 10,800 | 849,204 | |||
Deckers Outdoor CorporationD* | 17,200 | 1,735,480 | |||
Dollar Tree Stores, Inc.* | 34,900 | 1,519,895 | |||
DSW, Inc.D* | 20,700 | 720,774 | |||
Elizabeth Arden, Inc.D* | 27,400 | 664,724 | |||
Entravision Communications Corporation Class AD* | 195,958 | 2,043,842 | |||
EZCORP, Inc. Class AD* | 82,200 | 1,088,328 | |||
FirstService CorporationD* | 27,500 | 990,550 | |||
GSI Commerce, Inc.D* | 40,900 | 928,839 | |||
Gymboree CorporationD* | 16,300 | 642,383 | |||
Hasbro, Inc. | 69,800 | 2,192,418 | |||
Heelys, Inc.D* | 16,100 | 416,346 | |||
Helen of Troy, Ltd.D* | 8,800 | 237,600 | |||
Hibbett Sports, Inc.D* | 23,800 | 651,644 | |||
Home Inns & Hotels Management, Inc. ADRD* | 23,100 | 744,051 | |||
Home Solutions of America, Inc.D* | 88,500 | 529,230 | |||
Houston Wire & Cable Co.D* | 17,500 | 497,175 | |||
Iconix Brand Group, Inc.D* | 112,700 | 2,504,194 | |||
ICT Group, Inc.D* | 24,900 | 465,879 | |||
inVentiv Health, Inc.* | 14,700 | 538,167 | |||
Jack in the Box, Inc.D* | 18,200 | 1,291,108 | |||
Jakks Pacific, Inc.D* | 25,400 | 714,756 | |||
Jo-Ann Stores, Inc.D* | 8,900 | 253,027 | |||
Kenexa CorporationD* | 44,600 | 1,681,866 | |||
Kforce, Inc.* | 116,300 | 1,858,474 | |||
Knot, Inc.D* | 45,000 | 908,550 | |||
Labor Ready, Inc.D* | 59,300 | 1,370,423 | |||
Life Time Fitness, Inc.D* | 32,400 | 1,724,652 | |||
Liquidity Services, Inc.D* | 39,470 | 741,247 | |||
LoopNet, Inc.D* | 32,400 | 755,892 | |||
Maidenform Brands, Inc.D* | 57,400 | 1,139,964 | |||
Matthews International Corporation Class AD | 4,600 | 200,606 | |||
Monro Muffler Brake, Inc.D | 21,000 | 786,450 | |||
Movado Group, Inc. | 14,200 | 479,108 | |||
MWI Veterinary Supply, Inc.D* | 27,000 | 1,077,030 | |||
Navigant Consulting, Inc.D* | 30,500 | 566,080 | |||
On Assignment, Inc.D* | 84,100 | 901,552 | |||
Orient-Express Hotels, Ltd. Class A | 24,600 | 1,313,640 | |||
Parlux Fragrance, Inc.D* | 60,400 | 268,176 | |||
Perficient, Inc.D* | 13,900 | 287,730 | |||
PetMed Express, Inc.D* | 38,900 | 499,476 | |||
Physicians Formula Holdings, Inc.D* | 32,800 | 515,780 | |||
Playtex Products, Inc.D* | 65,600 | 971,536 | |||
Pool CorporationD | 61,225 | 2,389,612 | |||
PriceSmart, Inc.D | 19,200 | 474,816 | |||
Resources Connection, Inc.* | 68,800 | 2,282,784 | |||
Rocky Brands, Inc.D* | 26,100 | 483,372 | |||
Rush Enterprises, Inc. Class AD* | 45,481 | 987,847 | |||
Ruth’s Chris Steak HouseD* | 16,800 | 285,432 | |||
Schawk, Inc.D | 12,800 | 256,256 | |||
Select Comfort CorporationD* | 211,865 | 3,436,450 | |||
Shaw Communications, Inc. Class BD | 12,900 | 542,316 | |||
Sonic CorporationD* | 28,400 | 628,208 | |||
Source Interlink Cos., Inc.D* | 26,700 | 132,966 | |||
Steiner Leisure, Ltd.D* | 14,800 | 726,976 | |||
See Notes to Financial Statements.
| 110 |
Table of Contents
| Shares | Value | ||||
Strayer Education, Inc.D | 21,100 | $ | 2,779,081 | ||
Tech Data Corporation* | 31,600 | 1,215,336 | |||
Tempur-Pedic International, Inc.D | 20,330 | 526,547 | |||
THQ, Inc.* | 60,500 | 1,846,460 | |||
Town Sports International Holdings, Inc.D* | 37,500 | 724,500 | |||
True Religion Apparel, Inc.D* | 40,470 | 822,755 | |||
United Natural Foods, Inc.D* | 30,800 | 818,664 | |||
United Online, Inc.D | 85,700 | 1,413,193 | |||
United Stationers, Inc.D* | 21,700 | 1,446,088 | |||
Universal Electronics, Inc.* | 46,385 | 1,684,703 | |||
USANA Health Sciences, Inc.D* | 36,700 | 1,641,958 | |||
ValueClick, Inc.D* | 16,320 | 480,787 | |||
VistaPrint, Ltd.D* | 20,400 | 780,300 | |||
WESCO International, Inc.* | 10,600 | 640,770 | |||
Westwood One, Inc.D | 99,400 | 714,686 | |||
Zumiez, Inc.D* | 15,100 | 570,478 | |||
| 92,345,146 | |||||
Consumer Staples — 1.1% | |||||
Chiquita Brands International, Inc.D | 28,090 | 532,586 | |||
Herbalife, Ltd. | 34,200 | 1,356,030 | |||
J & J Snack Foods Corporation | 60,252 | 2,273,911 | |||
Nash Finch Co.D | 26,200 | 1,296,900 | |||
Sanderson Farms, Inc.D | 29,700 | 1,337,094 | |||
Spartan Stores, Inc. | 14,800 | 487,068 | |||
| 7,283,589 | |||||
Financial Services — 19.0% | |||||
A.G. Edwards, Inc. | 14,100 | 1,192,155 | |||
Advance America Cash Advance Centers, Inc.D | 60,400 | 1,071,496 | |||
Advanta Corporation Class BD | 33,600 | 1,046,304 | |||
Affiliated Managers Group, Inc.D* | 3,370 | 433,921 | |||
Aircastle, Ltd.D | 25,400 | 1,011,174 | |||
American Equity Investment Life Holding Co.D | 49,100 | 593,128 | |||
American Financial Group, Inc.D | 22,200 | 758,130 | |||
American Home Mortgage Investment Corporation REITD | 26,120 | 480,086 | |||
American Physicians Capital, Inc.D* | 11,700 | 473,850 | |||
AmeriCredit CorporationD* | 22,800 | 605,340 | |||
Argonaut Group, Inc. | 30,000 | 936,300 | |||
Assurant, Inc. | 23,900 | 1,408,188 | |||
Assured Guaranty, Ltd. | 38,900 | 1,149,884 | |||
Asta Funding, Inc.D | 37,580 | 1,444,199 | |||
Authorize.Net Holdings, Inc.D* | 99,700 | 1,783,633 | |||
AXIS Capital Holdings, Ltd.D | 34,700 | 1,410,555 | |||
Banco Latinoamericano de Exportaciones SAD | 53,400 | 1,003,920 | |||
BancorpSouth, Inc.D | 66,200 | 1,619,252 | |||
Bank of Florida CorporationD* | 32,500 | 564,850 | |||
BankUnited Financial Corporation Class AD | 77,400 | 1,553,418 | |||
Brookline Bancorp, Inc.D | 84,323 | 970,558 | |||
Center Financial CorporationD | 13,200 | 223,344 | |||
Central Pacific Financial CorporationD | 24,600 | 812,046 | |||
City National Corporation | 22,600 | 1,719,634 | |||
Clayton Holdings, Inc.D* | 49,600 | 564,944 | |||
Cohen & Steers, Inc.D | 42,500 | 1,846,625 | |||
Colonial BancGroup, Inc. | 75,900 | 1,895,223 | |||
Commerce Group, Inc.D | 50,800 | 1,763,776 | |||
CompuCredit CorporationD* | 23,200 | 812,464 | |||
Corus Bankshares, Inc.D | 110,080 | 1,899,981 | |||
Credicorp, Ltd. | 29,800 | 1,822,866 | |||
CVB Financial Corporation | — | 2 | |||
Cybersource CorporationD* | 56,076 | 676,277 | |||
Dollar Financial CorporationD* | 7,500 | 213,750 | |||
Downey Financial CorporationD | 23,420 | 1,545,252 | |||
East West Bancorp, Inc.D | 33,400 | 1,298,592 | |||
Eaton Vance Corporation | 21,500 | 949,870 | |||
Endurance Specialty Holdings, Ltd.D | 43,300 | 1,733,732 | |||
Equifax, Inc. | 17,144 | 761,536 | |||
Evercore Partners, Inc. Class AD | 20,100 | 598,377 | |||
Everest Re Group, Ltd. | 10,300 | 1,118,992 | |||
ExlService Holdings, Inc.D* | 25,900 | 485,366 | |||
Fair Isaac & Co., Inc. | 33,300 | 1,335,996 | |||
Federated Investors, Inc. Class B | 30,700 | 1,176,731 | |||
First Acceptance CorporationD* | 29,311 | 297,800 | |||
First Bancorp Puerto RicoD | 23,800 | 261,562 | |||
First Cash Financial Services, Inc.D* | 50,100 | 1,174,344 | |||
First Regional BancorpD* | 18,900 | 480,816 | |||
FirstFed Financial CorporationD* | 33,200 | 1,883,436 | |||
Franklin Bank CorporationD* | 80,400 | 1,197,960 | |||
Fremont General CorporationD | 61,690 | 663,784 | |||
GFI Group, Inc.D* | 17,400 | 1,261,152 | |||
Global Payments, Inc. | 92,800 | 3,679,520 | |||
H&E Equipment Services, Inc.D* | 15,800 | 438,292 | |||
Hanmi Financial CorporationD | 14,900 | 254,194 | |||
Hanover Insurance Group, Inc. | 27,700 | 1,351,483 | |||
HCC Insurance Holdings, Inc. | 82,135 | 2,744,130 | |||
Heartland Payment Systems, Inc.D | 28,100 | 824,173 | |||
Hilb, Rogal & Hobbs Co.D | 70,372 | 3,016,144 | |||
Huron Consulting Group, Inc.D* | 31,916 | 2,330,187 | |||
Infinity Property & Casualty CorporationD | 17,000 | 862,410 | |||
Investors Financial Services Corporation | 38,400 | 2,368,128 | |||
IPC Holdings, Ltd.D | 46,200 | 1,491,798 | |||
Jack Henry & Associates, Inc. | 110,500 | 2,845,375 | |||
Jefferies Group, Inc. | 35,200 | 949,696 | |||
Jones Lang LaSalle, Inc. | 15,800 | 1,793,300 | |||
See Notes to Financial Statements.
| 111 |
Table of Contents
Small Cap Equity Fund
SCHEDULE OF INVESTMENTS (Continued)
| Shares | Value | ||||
Kingsway Financial Services, Inc.D | 20,000 | $ | 369,600 | ||
Markel Corporation* | 2,735 | 1,325,272 | |||
Max Re Capital, Ltd.D | 18,700 | 529,210 | |||
Mercantile Bank CorporationD | 9,400 | 254,740 | |||
Meruelo Maddux Properties, Inc.D* | 7,000 | 57,120 | |||
Midwest Banc Holdings, Inc.D | 7,500 | 108,750 | |||
Montpelier Re Holdings, Ltd.D | 36,900 | 684,126 | |||
National Financial Partners CorporationD | 5,600 | 259,336 | |||
Ocwen Financial CorporationD* | 53,200 | 709,156 | |||
Odyssey Re Holdings CorporationD | 4,800 | 205,872 | |||
Ohio Casualty Corporation | 35,471 | 1,536,249 | |||
optionsXpress Holdings, Inc.D | 103,800 | 2,663,508 | |||
PartnerRe, Ltd.D | 18,700 | 1,449,250 | |||
Platinum Underwriters Holdings, Ltd.D | 40,300 | 1,400,425 | |||
PMI Group, Inc. (The)D | 44,500 | 1,987,815 | |||
Portfolio Recovery Associates, Inc.D | 26,400 | 1,584,528 | |||
Primus Guaranty, Ltd.D* | 77,000 | 825,440 | |||
PrivateBancorp, Inc.D | 67,361 | 1,939,997 | |||
Reinsurance Group of America, Inc. | 27,800 | 1,674,672 | |||
RenaissanceRe Holdings, Ltd. | 27,300 | 1,692,327 | |||
Resource Capital Corporation REITD | 40,000 | 559,200 | |||
RLI CorporationD | 21,300 | 1,191,735 | |||
Ryder System, Inc.D | 17,500 | 941,500 | |||
Safeco Corporation | 25,400 | 1,581,404 | |||
Safety Insurance Group, Inc.D | 22,500 | 931,500 | |||
Smithtown Bancorp, Inc.D | 3,200 | 81,184 | |||
Sotheby’s Holdings Class AD | 12,700 | 584,454 | |||
SWS Group, Inc.D | 31,400 | 678,868 | |||
Tower Group, Inc. | 29,610 | 944,559 | |||
Triad Guaranty, Inc.D* | 44,170 | 1,763,708 | |||
Waddell & Reed Financial, Inc. Class A | 28,800 | 749,088 | |||
Williams Scotsman International, Inc.D* | 109,945 | 2,617,790 | |||
Wright Express CorporationD* | 51,500 | 1,764,905 | |||
Zenith National Insurance CorporationD | 41,100 | 1,935,399 | |||
| 116,518,088 | |||||
Healthcare — 11.4% | |||||
Akorn, Inc.D* | 32,070 | 224,169 | |||
Amedisys, Inc.D* | 94,133 | 3,419,864 | |||
American Dental Partners, Inc.D* | 28,900 | 750,533 | |||
Analogic Corporation | 3,000 | 220,530 | |||
Animal Health International, Inc.D* | 45,000 | 652,050 | |||
Apria Healthcare Group, Inc.D* | 42,800 | 1,231,356 | |||
Arqule, Inc.D* | 29,820 | 210,231 | |||
AtriCure, Inc.D* | 45,600 | 388,968 | |||
BioMarin Pharmaceuticals, Inc.D* | 83,200 | 1,492,608 | |||
Bio-Rad Laboratories, Inc. Class A* | 15,400 | 1,163,778 | |||
Biovail CorporationD | 32,100 | 815,982 | |||
Cardiome Pharma CorporationD* | 20,600 | 189,726 | |||
Centene Corporation* | 20,290 | 434,612 | |||
Chattem, Inc.D* | 20,800 | 1,318,304 | |||
Coley Pharmaceutical Group, Inc.D* | 11,561 | 41,851 | |||
Collagenex Pharmaceuticals, Inc.D* | 6,500 | 80,600 | |||
Computer Programs & Systems, Inc.D | 18,600 | 576,228 | |||
CONMED Corporation* | 20,800 | 609,024 | |||
Cypress Bioscience, Inc.D* | 17,700 | 234,702 | |||
Dade Behring Holdings, Inc. | 14,800 | 786,176 | |||
Digene CorporationD* | 20,500 | 1,231,025 | |||
DJO, Inc.D* | 39,800 | 1,642,546 | |||
Emergency Medical Services LP Class AD* | 3,300 | 129,129 | |||
Five Star Quality Care, Inc.+ | 2,086 | — | |||
Haemonetics Corporation* | 24,000 | 1,262,640 | |||
Healthcare Services Group, Inc.D | 21,600 | 637,200 | |||
HealthExtras, Inc.D* | 96,100 | 2,842,638 | |||
Healthspring, Inc.* | 4,200 | 80,052 | |||
Healthways, Inc.D* | 14,100 | 667,917 | |||
HMS Holdings CorporationD* | 27,800 | 532,092 | |||
Icon PLC ADR* | 33,850 | 1,480,599 | |||
Idenix Pharmaceuticals, Inc.D* | 30,800 | 181,720 | |||
Invacare CorporationD | 64,200 | 1,176,786 | |||
Invitrogen Corporation* | 22,100 | 1,629,875 | |||
King Pharmaceuticals, Inc.* | 64,900 | 1,327,854 | |||
Kyphon, Inc.D* | 41,700 | 2,007,855 | |||
LCA-Vision, Inc.D | 93,310 | 4,409,831 | |||
LHC Group, Inc.D* | 21,000 | 550,200 | |||
Lifecell CorporationD* | 23,950 | 731,433 | |||
Magellan Health Services, Inc.* | 42,000 | 1,951,740 | |||
Martek Biosciences CorporationD* | 34,700 | 901,159 | |||
Matria Healthcare, Inc.D* | 48,500 | 1,468,580 | |||
Medarex, Inc.D* | 71,230 | 1,017,877 | |||
Medicines Co.D* | 21,300 | 375,306 | |||
Mentor CorporationD | 36,700 | 1,492,956 | |||
Meridian Bioscience, Inc.D | 26,250 | 568,575 | |||
MGI Pharma, Inc.D* | 21,590 | 482,968 | |||
Nektar TherapeuticsD* | 48,720 | 462,353 | |||
Omnicell, Inc.* | 38,200 | 793,796 | |||
Omrix Biopharmaceuticals, Inc.D* | 6,500 | 204,490 | |||
Option Care, Inc.D | 124,291 | 1,914,081 | |||
Orthofix International NVD* | 7,100 | 319,287 | |||
PDL BioPharma, Inc.D* | 22,400 | 521,920 | |||
Pediatrix Medical Group, Inc.* | 31,500 | 1,737,225 | |||
Pharmion CorporationD* | 58,800 | 1,702,260 | |||
Phase Forward, Inc.D* | 25,800 | 434,214 | |||
PolyMedica CorporationD | 28,505 | 1,164,429 | |||
Progenics Pharmaceuticals, Inc.D* | 9,080 | 195,855 | |||
See Notes to Financial Statements.
| 112 |
Table of Contents
| Shares | Value | ||||
Psychiatric Solutions, Inc.D* | 39,900 | $ | 1,446,774 | ||
Respironics, Inc.* | 43,800 | 1,865,442 | |||
Salix Pharmaceuticals, Ltd.D* | 40,220 | 494,706 | |||
Stereotaxis, Inc.D* | 64,200 | 838,452 | |||
Stericycle, Inc.D* | 24,600 | 1,093,716 | |||
STERIS Corporation | 26,600 | 813,960 | |||
SuperGen, Inc.D* | 34,700 | 192,932 | |||
Symmetry Medical, Inc.D* | 118,900 | 1,903,589 | |||
Syneron Medical, Ltd.D* | 54,900 | 1,369,755 | |||
Techne CorporationD* | 18,500 | 1,058,385 | |||
United Therapeutics CorporationD* | 3,900 | 248,664 | |||
VCA Antech, Inc.* | 56,200 | 2,118,178 | |||
Vital Images, Inc.D* | 22,900 | 621,964 | |||
West Pharmaceutical Services, Inc.D | 14,400 | 678,960 | |||
| 69,817,232 | |||||
Integrated Oils — 0.0% | |||||
Petrocorp, Inc. Escrow Shares+ | 500 | — | |||
Materials & Processing — 9.4% | |||||
Acuity Brands, Inc. | 12,500 | 753,500 | |||
Albemarle Corporation | 8,200 | 315,946 | |||
Apogee Enterprises, Inc.D | 26,300 | 731,666 | |||
Ball Corporation | 27,000 | 1,435,590 | |||
Barnes Group, Inc.D | 9,200 | 291,456 | |||
Beacon Roofing Supply, Inc.D* | 202,817 | 3,445,861 | |||
Brush Engineered Materials, Inc.* | 31,500 | 1,322,685 | |||
Building Materials Holding CorporationD | 12,600 | 178,794 | |||
Cal Dive International, Inc.D* | 50,800 | 844,804 | |||
Carpenter Technology Corporation | 21,200 | 2,762,572 | |||
Celanese Corporation Class A | 26,300 | 1,019,914 | |||
Century Aluminum Co.D* | 31,000 | 1,693,530 | |||
Ceradyne, Inc.D* | 15,800 | 1,168,568 | |||
CF Industries Holdings, Inc. | 17,600 | 1,054,064 | |||
ChipMOS TECHNOLOGIES Bermuda, Ltd.D* | 700 | 5,033 | |||
Clarcor, Inc.D | 48,000 | 1,796,640 | |||
Claymont Steel, Inc.D* | 19,600 | 419,244 | |||
Cleveland-Cliffs, Inc.D | 22,100 | 1,716,507 | |||
Commercial Metals Co. | 44,672 | 1,508,574 | |||
Corn Products International, Inc. | 18,600 | 845,370 | |||
Dynamic Materials CorporationD | 16,800 | 630,000 | |||
Eagle Materials, Inc.D | 28,000 | 1,373,400 | |||
Energizer Holdings, Inc.* | 10,100 | 1,005,960 | |||
EnerSys, Inc.* | 1,900 | 34,770 | |||
Foster Wheeler, Ltd.* | 8,900 | 952,211 | |||
GrafTech International, Ltd.* | 52,500 | 884,100 | |||
Granite Construction, Inc. | 13,100 | 840,758 | |||
Harsco Corporation | 29,300 | 1,523,600 | |||
Haynes International, Inc.* | 11,400 | 962,502 | |||
Hexcel CorporationD* | 36,172 | 762,144 | |||
Innerworkings, Inc.D* | 56,800 | 909,936 | |||
Interline Brands, Inc.* | 15,700 | 409,456 | |||
Lennox International, Inc. | 24,500 | 838,635 | |||
Lundin Mining CorporationD* | 54,040 | 656,046 | |||
Methanex CorporationD | 60,200 | 1,513,428 | |||
Mobile Mini, Inc.D* | 58,500 | 1,708,200 | |||
Nova Chemicals CorporationD | 43,000 | 1,529,510 | |||
NuCO2, Inc.D* | 28,200 | 723,894 | |||
PolyOne Corporation* | 80,200 | 576,638 | |||
Quintana Maritime, Ltd. | 15,470 | 244,735 | |||
RBC Bearings, Inc.D* | 33,700 | 1,390,125 | |||
Reliance Steel & Aluminum Co.D | 33,400 | 1,879,084 | |||
RTI International Metals, Inc.* | 13,800 | 1,040,106 | |||
Schnitzer Steel Industries, Inc. Class AD | 40,000 | 1,917,600 | |||
Senomyx, Inc.D* | 54,700 | 738,450 | |||
Spartech CorporationD | 26,300 | 698,265 | |||
Steel Dynamics, Inc.D | 53,520 | 2,243,023 | |||
Timken Co. | 44,000 | 1,588,840 | |||
Tredegar CorporationD | 34,100 | 726,330 | |||
UAP Holding Corporation | 35,900 | 1,082,026 | |||
Universal Stainless & AlloyD* | 15,300 | 539,019 | |||
US Concrete, Inc.D* | 23,700 | 205,953 | |||
Watsco, Inc.D | 41,600 | 2,263,040 | |||
| 57,702,102 | |||||
Other — 0.7% | |||||
Hillenbrand Industries, Inc. | 21,400 | 1,391,000 | |||
Lancaster Colony CorporationD | 27,100 | 1,135,219 | |||
Ritchie Bros. Auctioneers, Inc.D | 25,600 | 1,603,072 | |||
SPX Corporation | 8,600 | 755,166 | |||
| 4,884,457 | |||||
Other Energy — 4.6% | |||||
Alon USA Energy, Inc.D | 18,200 | 800,982 | |||
Arena Resources, Inc.D* | 31,000 | 1,801,410 | |||
ATP Oil & Gas CorporationD* | 8,500 | 413,440 | |||
Berry Petroleum Co.D | 27,700 | 1,043,736 | |||
Bill Barrett CorporationD* | 9,700 | 357,251 | |||
CARBO Ceramics, Inc.D | 20,400 | 893,724 | |||
Compton Petroleum CorporationD* | 44,900 | 446,755 | |||
Comstock Resources, Inc.* | 46,000 | 1,378,620 | |||
Core Laboratories NVD* | 8,800 | 894,872 | |||
Dawson Geophysical Co.* | 5,000 | 307,300 | |||
Denbury Resources, Inc.* | 42,500 | 1,593,750 | |||
Edge Petroleum CorporationD* | 22,300 | 312,423 | |||
EnerNOC, Inc.D* | 9,200 | 350,796 | |||
EXCO Resources, Inc.D* | 139,200 | 2,427,648 | |||
Foundation Coal Holdings, Inc. | 5,900 | 239,776 | |||
Frontier Oil CorporationD | 28,300 | 1,238,691 | |||
Global Industries, Ltd.* | 32,100 | 860,922 | |||
Hercules Offshore, Inc.D* | 19,550 | 633,029 | |||
Holly Corporation | 19,600 | 1,454,124 | |||
NATCO Group, Inc. Class A* | 16,300 | 750,452 | |||
Parallel Petroleum CorporationD* | 38,500 | 843,150 | |||
Parker Drilling Co.* | 128,100 | 1,350,174 | |||
Patterson-UTI Energy, Inc.D | 39,700 | 1,040,537 | |||
See Notes to Financial Statements.
| 113 |
Table of Contents
Small Cap Equity Fund
SCHEDULE OF INVESTMENTS (Continued)
| Shares | Value | ||||
Petroquest Energy, Inc.D* | 53,500 | $ | 777,890 | ||
Quicksilver Resources, Inc.D* | 26,200 | 1,167,996 | |||
T-3 Energy Services, Inc.D* | 18,600 | 622,170 | |||
TODCO Class A* | 15,900 | 750,639 | |||
Unit Corporation* | 4,900 | 308,259 | |||
Universal Compression Holdings, Inc.D* | 29,600 | 2,145,112 | |||
W-H Energy Services, Inc.* | 12,200 | 755,302 | |||
| 27,960,930 | |||||
Producer Durables — 7.2% | |||||
Actuant Corporation Class AD | 59,534 | 3,754,214 | |||
Alliant Techsystems, Inc.D* | 15,300 | 1,516,995 | |||
Altra Holdings, Inc.D* | 26,900 | 464,832 | |||
Arris Group, Inc.D* | 31,900 | 561,121 | |||
Beazer Homes USA, Inc.D | 6,900 | 170,223 | |||
Bucyrus International, Inc. Class AD | 32,500 | 2,300,350 | |||
Cognex CorporationD | 40,200 | 904,902 | |||
Color Kinetics, Inc.D* | 15,200 | 507,832 | |||
Columbus McKinnon Corporation* | 16,830 | 541,926 | |||
Covanta Holding CorporationD* | 17,800 | 438,770 | |||
Curtiss-Wright CorporationD | 39,600 | 1,845,756 | |||
Cymer, Inc.* | 9,800 | 393,960 | |||
Dionex CorporationD* | 15,000 | 1,064,850 | |||
EnPro Industries, Inc.D* | 49,400 | 2,113,826 | |||
Esterline Technologies Corporation* | 10,300 | 497,593 | |||
Faro Technologies, Inc.D* | 26,900 | 857,034 | |||
Flow International CorporationD* | 47,400 | 597,240 | |||
Gardner Denver, Inc.D* | 50,700 | 2,157,285 | |||
Genlyte Group, Inc.* | 22,176 | 1,741,703 | |||
Gerdau Ameristeel CorporationD | 92,000 | 1,345,960 | |||
Graco, Inc.D | 53,100 | 2,138,868 | |||
Headwaters, Inc.D* | 89,500 | 1,545,665 | |||
Heico CorporationD | 20,100 | 845,808 | |||
Heico Corporation Class A | 9,600 | 337,440 | |||
InterDigital Communications CorporationD* | 34,100 | 1,096,997 | |||
Knoll, Inc.D | 32,200 | 721,280 | |||
Ladish Co., Inc.D* | 7,600 | 326,800 | |||
Lindsay CorporationD | 12,100 | 535,909 | |||
Measurement Specialties, Inc.D* | 88,400 | 2,093,312 | |||
Meritage Homes CorporationD* | 17,900 | 478,825 | |||
MKS Instruments, Inc.D* | 15,900 | 440,430 | |||
MTC Technologies, Inc.D* | 22,800 | 559,968 | |||
NVR, Inc.* | 2,200 | 1,495,450 | |||
Orbital Sciences Corporation* | 74,200 | 1,558,942 | |||
Regal-Beloit CorporationD | 11,500 | 535,210 | |||
Rudolph Technologies, Inc.D* | 26,100 | 433,521 | |||
SBA Communications Corporation Class A* | 27,500 | 923,725 | |||
Smith & Wesson Holding CorporationD* | 50,200 | 840,850 | |||
Tektronix, Inc. | 21,100 | 711,914 | |||
Tennant Co.D | 14,300 | 521,950 | |||
TOUSA, Inc.D | 51,900 | 217,461 | |||
Varian Semiconductor Equipment Associates, Inc.* | 14,025 | 561,842 | |||
X-Rite, Inc.D | 83,755 | 1,237,061 | |||
| 43,935,600 | |||||
Technology — 12.1% | |||||
ADTRAN, Inc. | 28,200 | 732,354 | |||
Advanced Analogic Technologies, Inc.D* | 67,600 | 655,720 | |||
Alvarion, Ltd.D* | 82,300 | 767,859 | |||
American Reprographics Co.D* | 85,900 | 2,644,861 | |||
American Science & Engineering, Inc.D* | 4,700 | 267,195 | |||
ANADIGICS, Inc.D* | 82,900 | 1,143,191 | |||
Ansys, Inc.D* | 16,800 | 445,200 | |||
Applied Micro Circuits Corporation* | 177,200 | 443,000 | |||
Atheros Communications, Inc.D* | 8,900 | 274,476 | |||
Avnet, Inc.* | 22,600 | 895,864 | |||
Blue Coat Systems, Inc.D* | 5,900 | 292,168 | |||
Bottomline Technologies, Inc.D* | 21,500 | 265,525 | |||
CACI International, Inc. Class AD* | 11,957 | 584,099 | |||
Cbeyond, Inc.D* | 18,600 | 716,286 | |||
CDC Corporation Class AD* | 42,390 | 356,500 | |||
Cogent Communications Group, Inc.D* | 35,000 | 1,045,450 | |||
Coherent, Inc.D* | 8,800 | 268,488 | |||
CommVault Systems, Inc.D* | 19,800 | 341,946 | |||
Compuware Corporation* | 109,300 | 1,296,298 | |||
Comtech TelecommunicationsD* | 30,450 | 1,413,489 | |||
CPI International, Inc.D* | 45,000 | 892,350 | |||
Cree, Inc.D* | 15,200 | 392,920 | |||
DealerTrack Holdings, Inc.* | 67,300 | 2,479,332 | |||
Epicor Software CorporationD* | 130,100 | 1,934,587 | |||
Equinix, Inc.D* | 26,150 | 2,391,940 | |||
F5 Networks, Inc.* | 10,700 | 862,420 | |||
FLIR Systems, Inc.D* | 6,000 | 277,500 | |||
FormFactor, Inc.* | 27,700 | 1,060,910 | |||
Foundry Networks, Inc.* | 60,600 | 1,009,596 | |||
Imergent, Inc.D | 55,900 | 1,367,314 | |||
Informatica Corporation* | 56,000 | 827,120 | |||
Ingram Micro, Inc. Class A* | 96,100 | 2,086,331 | |||
j2 Global Communications, Inc.* | 31,000 | 1,081,900 | |||
Komag, Inc.D* | 56,700 | 1,808,163 | |||
Lionbridge Technologies, Inc.D* | 129,700 | 763,933 | |||
Macrovision Corporation* | 9,100 | 273,546 | |||
Micros Systems, Inc.* | 20,900 | 1,136,960 | |||
MicroStrategy, Inc. Class A* | 2,300 | 217,327 | |||
Neoware, Inc.D* | 27,000 | 365,580 | |||
Ness Technologies, Inc.* | 23,600 | 307,036 | |||
NETGEAR, Inc.D* | 10,800 | 391,500 | |||
Novatel Wireless, Inc.D* | 61,800 | 1,608,036 | |||
Nuance Communications, Inc.D* | 69,370 | 1,160,560 | |||
Omniture, Inc.D* | 41,900 | 960,348 | |||
Openwave Systems, Inc.D | 23,800 | 148,988 | |||
Parametric Technology Corporation* | 19,400 | 419,234 | |||
See Notes to Financial Statements.
| 114 |
Table of Contents
| Shares | Value | |||||
PDF Solutions, Inc.D* | 62,600 | $ | 740,558 | |||
PerkinElmer, Inc. | 71,600 | 1,865,896 | ||||
Power Intergrations, Inc.D* | 70,800 | 1,854,960 | ||||
PROS Holdings, Inc.* | 21,000 | 275,100 | ||||
Radisys CorporationD* | 83,477 | 1,035,115 | ||||
RADVision, Ltd.D* | 36,300 | 763,389 | ||||
RF Micro Devices, Inc.D* | 58,900 | 367,536 | ||||
Scansource, Inc.D* | 69,700 | 2,229,703 | ||||
Secure Computing CorporationD* | 25,700 | 195,063 | ||||
Semtech CorporationD* | 66,200 | 1,147,246 | ||||
SI International, Inc.D* | 30,000 | 990,600 | ||||
Sierra Wireless, Inc.* | 14,300 | 355,927 | ||||
Silicon Motion Technology Corporation ADRD* | 81,800 | 2,031,094 | ||||
Sirf Technology Holdings, Inc.D* | 36,700 | 761,158 | ||||
SkillSoft PLC ADRD* | 47,900 | 444,991 | ||||
Smart Modular Technologies WWH, Inc.D* | 27,200 | 374,272 | ||||
Solera Holdings, Inc.* | 108,900 | 2,110,482 | ||||
SRA International, Inc. Class AD* | 28,600 | 722,436 | ||||
Stratasys, Inc.D* | 32,596 | 1,531,360 | ||||
Switch & Data Facilities Co., Inc.D* | 21,300 | 408,747 | ||||
Synaptics, Inc.D* | 28,400 | 1,016,436 | ||||
Synnex CorporationD* | 34,500 | 711,045 | ||||
Taleo Corporation Class A* | 15,000 | 337,950 | ||||
TekelecD* | 19,800 | 285,516 | ||||
Tessera Technologies, Inc.D* | 19,500 | 790,725 | ||||
Trident Microsystems, Inc.* | 23,050 | 422,968 | ||||
Ultimate Software Group, Inc.D* | 58,301 | 1,686,648 | ||||
Vasco Data Security InternationalD* | 14,400 | 327,744 | ||||
VeriFone Holdings, Inc.D* | 47,800 | 1,684,950 | ||||
Viasat, Inc.D* | 30,100 | 966,210 | ||||
Vishay Intertechnology, Inc.* | 100,000 | 1,582,000 | ||||
Volterra Semiconductor CorporationD* | 40,900 | 580,780 | ||||
Websense, Inc.* | 89,702 | 1,906,168 | ||||
Zebra Technologies Corporation* | 18,700 | 724,438 | ||||
| 74,304,611 | ||||||
Utilities — 3.6% | ||||||
Alliant Energy Corporation | 49,800 | 1,934,730 | ||||
CenturyTel, Inc. | 25,000 | 1,226,250 | ||||
El Paso Electric Co.D* | 44,000 | 1,080,640 | ||||
Empire District Electric Co.D | 10,780 | 241,149 | ||||
Energen Corporation | 40,200 | 2,208,588 | ||||
Energy East Corporation | 76,900 | 2,006,321 | ||||
General Communication, Inc. Class AD* | 42,700 | 546,987 | ||||
MDU Resources Group, Inc. | 31,650 | 887,466 | ||||
NeuStar, Inc. Class A* | 10,900 | 315,773 | ||||
NiSource, Inc. | 51,200 | 1,060,352 | ||||
NTELOS Holdings Corporation | 42,100 | 1,163,644 | ||||
Oneok, Inc. | 38,700 | 1,950,867 | ||||
Orbcomm, Inc.D* | 27,900 | 457,839 | ||||
Pepco Holdings, Inc. | 39,600 | 1,116,720 | ||||
Pinnacle West Capital CorporationD | 24,900 | 992,265 | ||||
Premiere Global Services, Inc.* | 92,900 | 1,209,558 | ||||
Telephone & Data Systems, Inc. | 8,000 | 500,560 | ||||
Unisource Energy CorporationD | 8,250 | 271,342 | ||||
Westar Energy, Inc.D | 30,500 | 740,540 | ||||
Wisconsin Energy Corporation | 48,800 | 2,158,424 | ||||
| 22,070,015 | ||||||
Total Common Stocks (Cost $453,108,641) | 536,285,898 | |||||
FOREIGN COMMON STOCKS — 0.7% | ||||||
Bahamas — 0.2% | ||||||
Ultrapetrol Bahamas, Ltd.* | 34,800 | 824,760 | ||||
Bermuda — 0.0% | ||||||
CastlePoint Holdings, Ltd. | 10,080 | 148,075 | ||||
Canada — 0.0% | ||||||
InterOil CorporationD* | 7,800 | 147,732 | ||||
Greece — 0.1% | ||||||
Navios Maritime Holdings, Inc. | 36,300 | 438,504 | ||||
Hong Kong — 0.1% | ||||||
KHD Humboldt Wedag International, Ltd.D* | 8,900 | 547,350 | ||||
Seaspan CorporationD | 10,300 | 331,454 | ||||
| 878,804 | ||||||
Israel — 0.3% | ||||||
Check Point Software Technologies, Ltd.* | 66,500 | 1,516,865 | ||||
Mellanox Technologies, Ltd.D* | 14,100 | 292,152 | ||||
| 1,809,017 | ||||||
Total Foreign Common Stocks (Cost $4,148,757) | 4,246,892 | |||||
EXCHANGE TRADED FUND — 0.1% | ||||||
iShares Russell 2000D | ||||||
(Cost $309,242) | 4,350 | 360,789 | ||||
MONEY MARKET FUNDS — 51.9% | ||||||
GuideStone Funds Money Market Fund (GS4 Class) ¥ | 51,493,311 | 51,493,311 | ||||
Northern Institutional Liquid Assets Portfolio§ | 266,829,890 | 266,829,890 | ||||
Total Money Market Funds (Cost $318,323,201) | 318,323,201 | |||||
| Par | ||||||
AGENCY OBLIGATION — 0.0% | ||||||
Federal National Mortgage Association | ||||||
5.00%, 03/17/08‡‡ | ||||||
(Cost $28,917) | $ | 30,000 | 28,922 | |||
ASSET-BACKED SECURITIES — 0.3% | ||||||
Bear Stearns Asset Backed Securities Trust | ||||||
5.77%, 10/27/32† | 38,587 | 38,727 | ||||
5.77%, 12/25/33† | 411,202 | 413,100 | ||||
See Notes to Financial Statements.
| 115 |
Table of Contents
Small Cap Equity Fund
SCHEDULE OF INVESTMENTS (Continued)
| Par | Value | |||||
EMC Mortgage Loan Trust | ||||||
5.97%, 02/25/41 144A | $ | 111,061 | $ | 111,061 | ||
Lehman XS Trust | ||||||
5.62%, 11/25/35† | 401,866 | 402,660 | ||||
MASTR Specialized Loan Trust | ||||||
5.67%, 05/25/37 144A† | 400,000 | 400,580 | ||||
Option One Mortgage Loan Trust | ||||||
6.12%, 11/25/32† | 44,425 | 44,479 | ||||
Renaissance Home Equity Loan Trust | ||||||
5.75%, 06/25/33† | 30,219 | 30,256 | ||||
Securitized Asset-Backed Receivables LLC Trust | ||||||
5.55%, 02/25/37† | 387,254 | 387,382 | ||||
Wachovia Asset Securitization, Inc. | ||||||
5.69%, 09/27/32† | 135,242 | 135,555 | ||||
5.75%, 12/25/32† | 77,173 | 77,248 | ||||
5.61%, 03/25/33† | 90,464 | 90,535 | ||||
Total Asset-Backed Securities (Cost $2,130,119) | 2,131,583 | |||||
CORPORATE BONDS — 1.0% | ||||||
Anadarko Petroleum Corporation | ||||||
6.45%, 09/15/36 | 230,000 | 221,929 | ||||
Bank of America Corporation | ||||||
5.38%, 08/15/11 | 160,000 | 159,446 | ||||
Cardinal Health, Inc. | ||||||
5.85%, 12/15/17D | 60,000 | 58,378 | ||||
Citigroup, Inc. | ||||||
4.13%, 02/22/10 | 290,000 | 281,495 | ||||
Comcast Corporation | ||||||
6.50%, 01/15/17 | 350,000 | 357,966 | ||||
Community Health Systems, Inc. | ||||||
8.88%, 07/15/15 144A | 30,000 | 30,563 | ||||
ConocoPhillips Holding Co. | ||||||
6.95%, 04/15/29 | 200,000 | 218,907 | ||||
Dominion Resources, Inc. | ||||||
5.70%, 09/17/12 | 120,000 | 120,229 | ||||
Duke Energy Corporation | ||||||
5.63%, 11/30/12 | 160,000 | 160,138 | ||||
Dynegy Holdings, Inc. | ||||||
7.75%, 06/01/19 144A | 20,000 | 18,700 | ||||
Ford Motor Credit Co. | ||||||
7.38%, 10/28/09 | 550,000 | 546,246 | ||||
General Electric Capital Corporation | ||||||
4.13%, 09/01/09 | 290,000 | 283,123 | ||||
GMAC LLC | ||||||
6.63%, 05/15/12 | 550,000 | 531,666 | ||||
Goldman Sachs Group LP | ||||||
4.50%, 06/15/10 | 100,000 | 97,565 | ||||
Hertz Corporation | ||||||
8.88%, 01/01/14 | 10,000 | 10,475 | ||||
HSBC Finance Corporation | ||||||
4.63%, 09/15/10 | 290,000 | 282,223 | ||||
Idearc, Inc. | ||||||
8.00%, 11/15/16 | 30,000 | 30,450 | ||||
JPMorgan Chase & Co. | ||||||
6.13%, 06/27/17D | 250,000 | 252,410 | ||||
Kinder Morgan Energy Partners LP | ||||||
6.00%, 02/01/17 | 100,000 | 98,038 | ||||
Lehman Brothers Holdings, Inc. | ||||||
5.50%, 04/04/16 | 120,000 | 116,508 | ||||
MetLife, Inc. | ||||||
6.40%, 12/15/36 | 100,000 | 92,928 | ||||
Morgan Stanley | ||||||
5.63%, 01/09/12 | 160,000 | 159,812 | ||||
NRG Energy, Inc. | ||||||
7.38%, 02/01/16 | 30,000 | 30,150 | ||||
Pacific Gas & Electric Co. | ||||||
6.05%, 03/01/34 | 80,000 | 77,747 | ||||
Pemex Project Funding Master Trust | ||||||
6.63%, 06/15/35 | 90,000 | 91,463 | ||||
Residential Capital LLC | ||||||
6.00%, 02/22/11 | 260,000 | 251,787 | ||||
Sprint Nextel Corporation | ||||||
6.00%, 12/01/16 | 110,000 | 104,535 | ||||
SunTrust Capital VIII | ||||||
6.10%, 12/15/36† | 100,000 | 91,873 | ||||
Time Warner, Inc. | ||||||
5.88%, 11/15/16 | 100,000 | 97,432 | ||||
6.50%, 11/15/36 | 100,000 | 95,248 | ||||
Travelers Cos., Inc. (The) | ||||||
6.25%, 03/15/37† | 100,000 | 96,266 | ||||
TXU Electric Delivery Co. | ||||||
6.38%, 01/15/15 | 50,000 | 50,789 | ||||
Verizon Global Funding Corporation | ||||||
7.38%, 09/01/12 | 100,000 | 107,820 | ||||
Wachovia Corporation | ||||||
5.63%, 10/15/16 | 270,000 | 262,979 | ||||
Wells Fargo & Co. | ||||||
5.30%, 08/26/11 | 240,000 | 238,260 | ||||
Weyerhaeuser Co. | ||||||
6.75%, 03/15/12 | 80,000 | 82,855 | ||||
Windstream Corporation | ||||||
8.63%, 08/01/16 | 20,000 | 21,250 | ||||
Wyeth | ||||||
5.95%, 04/01/37 | 60,000 | 57,535 | ||||
XTO Energy, Inc. | ||||||
7.50%, 04/15/12 | 110,000 | 118,380 | ||||
Total Corporate Bonds (Cost $ 5,981,501) | 6,005,564 | |||||
FOREIGN BONDS — 0.3% | ||||||
Brazil — 0.0% | ||||||
Federative Republic of Brazil | ||||||
11.00%, 08/17/40 | 103,000 | 135,213 | ||||
Petrobras International Finance Co. | ||||||
6.13%, 10/06/16 | 80,000 | 78,800 | ||||
| 214,013 | ||||||
Canada — 0.0% | ||||||
OPTI Canada, Inc. | ||||||
7.88%, 12/15/14 144A | 40,000 | 40,200 | ||||
Cayman Islands — 0.1% | ||||||
Resona Preferred Global Securities Cayman, Ltd. | ||||||
7.19%, 07/30/49 144A† | 60,000 | 61,443 | ||||
Shinsei Finance Cayman, Ltd. | ||||||
6.42%, 07/20/49 144A† | 100,000 | 97,392 | ||||
See Notes to Financial Statements.
| 116 |
Table of Contents
| Par | Value | |||||
Vale Overseas, Ltd. | ||||||
6.88%, 11/21/36 | $ | 100,000 | $ | 100,769 | ||
| 259,604 | ||||||
India — 0.0% | ||||||
ICICI Bank, Ltd. | ||||||
6.38%, 04/30/22 144A† | 110,000 | 104,713 | ||||
Italy — 0.0% | ||||||
Telecom Italia Capital SA | ||||||
5.25%, 10/01/15 | 60,000 | 55,883 | ||||
Japan — 0.0% | ||||||
Aiful Corporation | ||||||
6.00%, 12/12/11 144A | 100,000 | 99,650 | ||||
Luxembourg — 0.1% | ||||||
FMC Finance III SA | ||||||
6.88%, 07/15/17 144A | 40,000 | 39,200 | ||||
Gaz Capital for Gazprom | ||||||
6.21%, 11/22/16 144A | 110,000 | 107,415 | ||||
RSHB Capital SA for OJSC | ||||||
Russian Agricultural Bank | ||||||
6.30%, 05/15/17 144A | 110,000 | 107,943 | ||||
TNK-BP Finance SA | ||||||
6.63%, 03/20/17 144A | 100,000 | 97,130 | ||||
| 351,688 | ||||||
Mexico — 0.0% | ||||||
United Mexican States | ||||||
6.75%, 09/27/34 | 100,000 | 106,900 | ||||
Netherlands — 0.1% | ||||||
Deutsche Telekom International Finance BV | ||||||
5.75%, 03/23/16 | 75,000 | 73,287 | ||||
Intergas Finance BV | ||||||
6.38%, 05/14/17 144A | 110,000 | 105,325 | ||||
Royal KPN NV | ||||||
8.00%, 10/01/10 | 110,000 | 117,814 | ||||
TuranAlem Finance BV | ||||||
8.25%, 01/22/37 144A | 210,000 | 202,650 | ||||
| 499,076 | ||||||
Russia — 0.0% | ||||||
Russian Federation | ||||||
7.50%, 03/31/30 STEP | 99,500 | 109,540 | ||||
Total Foreign Bonds (Cost $1,839,829) | 1,841,267 | |||||
MORTGAGE-BACKED SECURITIES — 4.7% | ||||||
American Home Mortgage Investment Trust | ||||||
1.00%, 07/25/37† | 400,000 | 399,828 | ||||
5.67%, 04/25/44 | 53,019 | 53,082 | ||||
5.61%, 11/25/45† | 348,501 | 349,234 | ||||
Bear Stearns Adjustable Rate Mortgage Trust | ||||||
4.19%, 02/25/35† | 288,778 | 286,636 | ||||
5.08%, 08/25/35† | 424,389 | 424,522 | ||||
Bear Stearns Mortgage Funding Trust | ||||||
5.53%, 12/25/36† | 295,535 | 296,266 | ||||
Countrywide Alternative Loan Trust | ||||||
5.56%, 07/25/35† | 289,881 | 290,267 | ||||
5.58%, 07/25/35† | 408,471 | 409,078 | ||||
5.51%, 09/25/46† | 402,638 | 402,200 | ||||
Federal Home Loan Mortgage Corporation | ||||||
5.74%, 03/01/37† | 431,453 | 432,000 | ||||
Federal National Mortgage Association | ||||||
5.50%, 07/01/22 TBA | 1,400,000 | 1,379,000 | ||||
5.00%, 08/01/22 TBA | 1,200,000 | 1,157,437 | ||||
5.00%, 07/01/37 TBA | 3,000,000 | 2,810,625 | ||||
5.50%, 07/01/37 TBA | 4,000,000 | 3,857,500 | ||||
6.00%, 07/01/37 TBA | 4,500,000 | 4,450,779 | ||||
5.00%, 08/01/37 TBA | 3,000,000 | 2,809,686 | ||||
6.50%, 08/01/37 TBA | 1,500,000 | 1,512,657 | ||||
First Horizon Alternative Mortgage Securities | ||||||
5.92%, 02/25/36† | 241,711 | 242,601 | ||||
GMAC Commercial Mortgage Securities, Inc. | ||||||
5.24%, 11/10/45† | 100,000 | 96,027 | ||||
Government National Mortgage Association | ||||||
6.00%, 07/01/37 TBA | 1,000,000 | 994,688 | ||||
Greenpoint Mortgage Funding Trust | ||||||
5.58%, 10/25/45† | 136,488 | 136,643 | ||||
Impac CMB Trust | ||||||
6.12%, 03/25/33† | 43,030 | 43,052 | ||||
Lehman XS Trust | ||||||
5.62%, 12/25/35† | 200,418 | 200,682 | ||||
5.44%, 06/25/37† | 395,422 | 395,237 | ||||
5.58%, 02/25/46† | 383,924 | 384,981 | ||||
5.39%, 08/25/46† | 386,522 | 386,289 | ||||
MASTR Adjustable Rate Mortgages Trust | ||||||
3.79%, 11/21/34† | 200,000 | 196,070 | ||||
5.78%, 12/25/46† | 363,152 | 362,300 | ||||
Merrill Lynch Mortgage Investors, Inc. | ||||||
4.49%, 02/25/35† | 371,422 | 364,528 | ||||
Residential Accredit Loans, Inc. | ||||||
0.06%, 12/26/34 | 393,402 | 392,652 | ||||
5.72%, 10/25/45† | 234,361 | 234,980 | ||||
Structured Adjustable Rate Mortgage Loan Trust | ||||||
4.99%, 11/25/34† | 218,209 | 217,682 | ||||
Structured Asset Mortgage Investments, Inc. | ||||||
5.53%, 08/25/36† | 359,433 | 359,134 | ||||
Terwin Mortgage Trust | ||||||
5.40%, 10/25/37† | 415,152 | 415,141 | ||||
Thornburg Mortgage Securities Trust | ||||||
5.55%, 12/25/35† | 357,600 | 357,909 | ||||
Washington Mutual Mortgage Pass-Through Certificates | ||||||
5.87%, 05/25/47† | 400,000 | 400,000 | ||||
5.87%, 05/25/47† | 400,000 | 399,500 | ||||
Washington Mutual, Inc. | ||||||
0.06%, 11/25/36 | 336,337 | 335,384 | ||||
Wells Fargo Mortgage-Backed Securities Trust | ||||||
5.72%, 05/25/33† | 380,742 | 383,286 | ||||
3.54%, 09/25/34† | 400,000 | 387,381 | ||||
Total Mortgage-Backed Securities (Cost $28,956,763) | 29,006,944 | |||||
See Notes to Financial Statements.
| 117 |
Table of Contents
Small Cap Equity Fund
SCHEDULE OF INVESTMENTS (Continued)
| Par | Value | ||||||
U.S. TREASURY OBLIGATIONS — 2.6% | |||||||
U.S. Treasury Bills | |||||||
4.71%, 08/09/07‡‡ | $ | 50,000 | $ | 49,753 | |||
4.74%, 08/09/07‡‡ | 50,000 | 49,753 | |||||
4.75%, 08/09/07‡‡ | 60,000 | 59,704 | |||||
4.85%, 08/09/07‡‡ | 125,000 | 124,382 | |||||
4.86%, 08/09/07‡‡ | 60,000 | 59,703 | |||||
4.88%, 08/09/07 | 10,000 | 9,951 | |||||
4.95%, 08/09/07‡‡ | 875,000 | 870,674 | |||||
U.S. Treasury Inflationary Index Bonds | |||||||
2.50%, 07/15/16 | 330,000 | 333,924 | |||||
2.38%, 01/15/17D | 320,000 | 320,169 | |||||
2.38%, 01/15/27D | 900,000 | 885,711 | |||||
U.S. Treasury Notes | |||||||
5.00%, 06/30/12 | 10,000,000 | 9,976,570 | |||||
4.75%, 02/15/37D | 3,000,000 | 2,829,612 | |||||
Total U.S. Treasury Obligations (Cost $15,494,319) | 15,569,906 | ||||||
TOTAL INVESTMENTS — 149.0% (Cost $830,321,289) | 913,800,966 | ||||||
Liabilities in Excess of Other Assets — (49.0)% | (300,430,690 | ) | |||||
Net Assets — 100.0% | $ | 613,370,276 | |||||
PORTFOLIO SUMMARY (based on net assets)
| % | |||
Money Market Funds | 51.9 | ||
Financial Services | 18.9 | ||
Consumer Discretionary | 15.3 | ||
Technology | 12.4 | ||
Healthcare | 11.4 | ||
Futures Contracts | 11.1 | ||
Materials & Processing | 9.5 | ||
Producer Durables | 7.3 | ||
Mortgage-Backed Securities | 4.7 | ||
Other Energy | 4.6 | ||
Utilities | 3.6 | ||
Auto & Transportation | 3.4 | ||
U.S. Treasury Obligations | 2.5 | ||
Corporate Bonds | 1.0 | ||
Consumer Staples | 1.0 | ||
Other | 0.8 | ||
Asset-Backed Securities | 0.3 | ||
Foreign Bonds | 0.3 | ||
Exchange Traded Fund | 0.1 | ||
Integrated Oils | 0.0 | ** | |
Agency Obligations | 0.0 | ** | |
| 160.1 | |||
| ** | Rounds to less than 0.005%. |
See Notes to Financial Statements.
| 118 |
Table of Contents
Average Annual Total Returns as of 06/30/07
| GS2 Class* | GS4 Class* | GS6 Class* | Benchmark** | |||||||||
Six Months | 10.76 | % | 10.63 | % | 10.46 | % | 12.25 | % | ||||
One Year | 27.16 | % | 26.92 | % | 26.54 | % | 29.62 | % | ||||
Five Year | 17.68 | % | 17.46 | % | 17.18 | % | 19.45 | % | ||||
Since Inception | 14.41 | % | 14.22 | % | 13.77 | % | 15.01 | % | ||||
Inception Date | 08/27/01 | 08/27/01 | 08/27/01 | 08/27/01 |
The performance data quoted represents past performance and does not guarantee future results. Current performance may be lower or higher. Performance data current to the most recent month-end may be obtained at www.GuideStoneFunds.org. The investment return and principal value of an investment will fluctuate so that shares, when redeemed, may be worth more or less than their original cost.
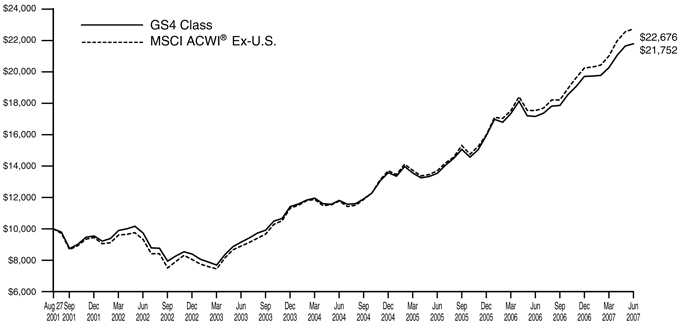
The graph compares the results of a hypothetical $10,000 investment in the GS4 Class of the Fund since August 27, 2001 (commencement of operations), with all dividends and capital gains reinvested, with the MSCI ACWI® Ex-U.S.
| * | These returns reflect expense waivers by the Fund’s investment advisor. Without these waivers, returns would have been lower. Returns shown do not reflect the deduction of taxes that a shareholder would pay on Fund distributions or the redemption of Fund shares. |
** | The MSCI ACWI® Ex-U.S. is a market-capitalization weighted index composed of companies representative of the market structure of developed and emerging market countries in the Americas (excluding the U.S.), Europe/Middle East, and Asia/Pacific Regions. It excludes closed markets and those shares in otherwise free markets that are not purchasable by foreigners. |
Unlike a mutual fund, the performance of an index assumes no taxes, transaction costs, management fees or other expenses.
Foreign securities may involve additional risks, social and political instability, reduced market liquidity and currency volatility.
| 119 |
Table of Contents
| International Equity Fund | ||
| SCHEDULE OF INVESTMENTS | June 30, 2007 (Unaudited) |
| Shares | Value | ||||
FOREIGN COMMON STOCKS — 94.3% | |||||
Argentina — 0.0% | |||||
Banco Macro SA ADRD | 16,400 | $ | 539,068 | ||
Australia — 4.3% | |||||
Amcor, Ltd.D | 785,696 | 4,975,876 | |||
Asciano GroupD* | 40,435 | 347,265 | |||
BHP Billiton, Ltd.D | 236,246 | 7,016,153 | |||
BlueScope Steel, Ltd.D | 285,977 | 2,506,952 | |||
Brambles, Ltd.* | 129,152 | 1,333,653 | |||
Coca-Cola Amatil, Ltd.D | 659,905 | 5,337,332 | |||
Commonwealth Bank of Australia | 29,496 | 1,381,624 | |||
Equinox Minerals, Ltd.* | 96,300 | 310,077 | |||
Insurance Australia Group, Ltd.D | 136,670 | 660,454 | |||
Lend Lease Corporation, Ltd. | 414,209 | 6,510,640 | |||
Macquarie Bank, Ltd.D | 18,341 | 1,321,711 | |||
National Australia Bank, Ltd. | 252,743 | 8,789,602 | |||
QBE Insurance Group, Ltd. | 50,311 | 1,330,798 | |||
Telstra Corporation, Ltd. | 3,233,934 | 11,916,345 | |||
Toll Holdings, Ltd.D | 40,435 | 496,730 | |||
Wesfarmers, Ltd.D | 100,726 | 3,905,146 | |||
Woodside Petroleum, Ltd. | 340,257 | 13,197,528 | |||
| 71,337,886 | |||||
Austria — 0.1% | |||||
OMV AGD | 6,900 | 462,179 | |||
Raiffeisen International Bank Holding AGD | 6,000 | 955,810 | |||
Telekom Austria AG | 21,700 | 543,344 | |||
Wienerberger AG | 6,600 | 488,624 | |||
| 2,449,957 | |||||
Bahrain — 0.0% | |||||
Investcorp Bank BSC GDR* | 13,739 | 350,344 | |||
Belgium — 1.2% | |||||
Colruyt SA | 40,100 | 8,411,855 | |||
Delhaize Group | 32,424 | 3,196,980 | |||
Fortis | 159,184 | 6,793,086 | |||
Mobistar SA | 16,000 | 1,368,613 | |||
UCB SA | 13,294 | 788,985 | |||
| 20,559,519 | |||||
Brazil — 1.4% | |||||
All America Latina Logistica SA | 28,600 | 389,340 | |||
Aracruz Celulose SA ADR D | 2,800 | 185,472 | |||
Banco do Brasil SA | 153,300 | 2,205,327 | |||
Banco Itau Holding Financeira SA ADR D | 29,700 | 1,319,868 | |||
BR Malls Participacoes SA* | 16,600 | 215,998 | |||
Brasil Ecodiesel Industria e Comercio de Biocombustiveis e Oleos Vegetais SA* | 42,000 | 269,985 | |||
Centrais Eletricas Brasileiras SA | 13,535,400 | 405,571 | |||
Companhia Brasileira de Distribuicao Grupo Pao de Acucar ADRD | 31,700 | 1,225,205 | |||
Companhia de Concessoes Rodoviarias | 19,200 | 356,628 | |||
Companhia Energetica de Minas Gerais ADRD | 29,600 | 624,560 | |||
Companhia Vale do Rio Doce ADRD | 186,100 | 7,015,970 | |||
CPFL Energia SA ADRD | 2,200 | 133,606 | |||
Gafisa SA ADRD* | 16,800 | 524,160 | |||
Gerdau SA ADRD | 9,100 | 234,052 | |||
Investimentos Itau SA | 5,411 | 33,661 | |||
JHSF Participacoes SA* | 14,400 | 83,981 | |||
Localiza Rent A Car SA | 20,600 | 232,377 | |||
Lojas Renner SA | 36,200 | 671,830 | |||
NET Servicos de Comunicacao SA ADRD | 1,000 | 16,530 | |||
Petroleo Brasileiro SA ADRD | 29,800 | 3,179,064 | |||
Positivo Informatica SA | 5,500 | 116,330 | |||
Tegma Gestao Logistica SA* | 14,300 | 192,742 | |||
Tele Norte Leste Participacoes SA ADRD | 95,400 | 1,809,738 | |||
Terna Participacoes SA | 35,600 | 509,362 | |||
Tim Participacoes SA ADRD | 11,700 | 403,299 | |||
Totvs SA | 6,200 | 201,813 | |||
Usinas Siderurgicas de Minas Gerais SA | 7,800 | 513,935 | |||
Votorantim Celulose e Papel SA ADRD | 6,800 | 154,836 | |||
| 23,225,240 | |||||
Canada — 3.2% | |||||
Alcan, Inc. | 28,500 | 2,324,947 | |||
Bank of Nova ScotiaD | 28,400 | 1,383,409 | |||
Barrick Gold Corporation | 210,900 | 6,132,405 | |||
Cameco Corporation | 70,200 | 3,558,601 | |||
Canadian Imperial Bank of CommerceD | 5,500 | 495,607 | |||
Canadian Natural Resources, Ltd. D | 42,800 | 2,843,824 | |||
EnCana Corporation | 19,100 | 1,174,778 | |||
Falcon Oil & Gas, Ltd.* | 265,400 | 353,784 | |||
First Quantum Minerals, Ltd. | 26,700 | 2,278,367 | |||
Manulife Financil CorporationD | 20,400 | 762,953 | |||
Methanex Corporation | 28,600 | 709,865 | |||
Potash Corporation of Saskatchewan | 67,500 | 5,277,071 | |||
Research In Motion, Ltd.* | 11,100 | 2,234,067 | |||
Rogers Communications, Inc. Class BD | 91,300 | 3,892,838 | |||
Royal Bank of CanadaD | 13,200 | 701,604 | |||
Shaw Communications, Inc. Class B | 19,100 | 807,211 | |||
Shoppers Drug Mart CorporationD | 15,000 | 694,767 | |||
Suncor Energy, Inc. | 94,700 | 8,530,779 | |||
Talisman Energy, Inc. | 137,100 | 2,651,265 | |||
Teck Cominco, Ltd. Class B | 88,700 | 3,763,661 | |||
TELUS Corporation | 7,400 | 442,993 | |||
Toronto-Dominion Bank | 6,800 | 465,100 | |||
TransCanada CorporationD | 37,600 | 1,293,278 | |||
Yellow Pages Income Fund | 124,700 | 1,627,158 | |||
| 54,400,332 | |||||
Chile — 0.2% | |||||
Banco de Credito e Inversiones | 23,100 | 759,710 | |||
Banco Santander Chile SA ADR | 9,500 | 470,630 | |||
Centros Comerciales Sudamericanos SA | 83,438 | 345,583 | |||
Embotelladora Andina SA ADR Class A | 20,000 | 382,600 | |||
Embotelladora Andina SA ADR Class B | 36,500 | 747,885 | |||
Empresas CMPC SA | 7,600 | 280,921 | |||
See Notes to Financial Statements.
| 120 |
Table of Contents
| Shares | Value | ||||
Enersis SA ADRD | 21,900 | $ | 439,095 | ||
| 3,426,424 | |||||
China — 0.6% | |||||
AAC Acoustic Technology Holdings, Inc. D* | 336,000 | 378,576 | |||
China Construction Bank Class H 144AD | 1,778,000 | 1,223,353 | |||
China Life Insurance Co., Ltd. Class H D | 191,000 | 686,400 | |||
China Medical Technologies, Inc. ADRD* | 7,900 | 251,378 | |||
China Shenhua Energy Co., Ltd. Class H | 748,500 | 2,613,317 | |||
China Yurun Food Group, Ltd. | 1,431,000 | 1,599,517 | |||
Great Wall Motor Co., Ltd. | 515,000 | 748,209 | |||
Industrial & Commercial Bank of China Class HD | 2,485,000 | 1,379,284 | |||
Simcere Pharmaceutical Group ADR* | 27,000 | 380,970 | |||
| 9,261,004 | |||||
Colombia — 0.1% | |||||
BanColombia SA | 76,200 | 593,260 | |||
BanColombia SA ADRD | 12,900 | 423,507 | |||
| 1,016,767 | |||||
Czech Republic — 0.0% | |||||
CEZ AS | 11,219 | 578,702 | |||
Denmark — 0.4% | |||||
H Lundbeck A/SD | 78,000 | 1,986,032 | |||
Novo-Nordisk AS Class B | 41,900 | 4,572,239 | |||
| 6,558,271 | |||||
Egypt — 0.4% | |||||
El Sewedy Cables Holding Co.* | 21,230 | 305,108 | |||
MobiNil - Egyptian Mobile Services | 34,645 | 1,094,399 | |||
National Societe General Bank* | 5,979 | 39,902 | |||
Orascom Construction Industries | 59,414 | 3,887,768 | |||
Orascom Construction Industries GDR 144A | 3,863 | 505,552 | |||
Orascom Telecom Holding SAE | 34,630 | 442,084 | |||
Orascom Telecom Holding SAE GDRD | 4,867 | 310,659 | |||
| 6,585,472 | |||||
Estonia — 0.0% | |||||
Tallink Group, Ltd.* | 441,460 | 860,394 | |||
Finland — 1.5% | |||||
Elisa OYJ | 65,500 | 1,792,529 | |||
Metso CorporationD | 10,878 | 645,157 | |||
Neste Oil OYJD | 75,922 | 2,993,311 | |||
Nokia OYJ | 476,900 | 13,432,075 | |||
Stora Enso OYJ Class RD | 32,300 | 611,158 | |||
UPM-Kymmene OYJ | 219,713 | 5,441,900 | |||
| 24,916,130 | |||||
France — 9.1% | |||||
Accor SAD | 11,900 | 1,058,494 | |||
Air France-KLM | 16,400 | 767,783 | |||
Air Liquide SA | 12,580 | 1,659,058 | |||
ALSTOM | 9,140 | 1,536,673 | |||
AXA SA | 107,700 | 4,666,004 | |||
BNP Paribas SA | 74,000 | 8,849,753 | |||
Bouygues SA | 58,887 | 4,956,598 | |||
Cap Gemini SA | 25,572 | 1,881,775 | |||
Carrefour SA | 85,930 | 6,064,005 | |||
Casino Guichard Perrachon SAD | 24,300 | 2,466,671 | |||
Compagnie de Saint-GobainD | 97,286 | 10,977,511 | |||
Compagnie Generale de Geophysique—VeritasD* | 6,325 | 1,591,758 | |||
Dassault Systemes SA D | 11,100 | 702,492 | |||
Electricite de France | 5,600 | 608,470 | |||
France Telecom SA | 169,293 | 4,674,260 | |||
Groupe Danone | 27,800 | 2,258,315 | |||
Lafarge SA | 47,512 | 8,706,943 | |||
L’Oreal SA | 76,500 | 9,090,749 | |||
PagesJaunes Groupe SA | 17,972 | 378,729 | |||
Peugeot SA | 13,300 | 1,076,097 | |||
Renault SA | 60,206 | 9,713,957 | |||
Safran SA | 25,800 | 663,114 | |||
Sanofi-Aventis D | 111,367 | 9,058,884 | |||
Schneider Electric SA | 40,033 | 5,642,060 | |||
Societe BIC SAD | 14,600 | 1,078,130 | |||
Societe Generale Class A | 61,454 | 11,439,086 | |||
Societe Television Francaise 1D | 166,400 | 5,781,266 | |||
Total SA | 304,981 | 24,874,000 | |||
Valeo SAD | 57,100 | 3,076,607 | |||
Veolia Environnement SAD | 25,515 | 2,003,973 | |||
Vivendi SA | 117,295 | 5,065,823 | |||
| 152,369,038 | |||||
Germany — 5.2% | |||||
Allianz AG | 30,600 | 7,189,354 | |||
BASF AG | 64,069 | 8,432,117 | |||
Bayer AG | 77,071 | 5,851,909 | |||
Bayerische Motoren Werke AGD | 67,605 | 4,392,930 | |||
Beiersdorf AGD | 24,209 | 1,731,344 | |||
Commerzbank AG | 27,200 | 1,306,528 | |||
Continental AGD | 27,000 | 3,816,580 | |||
DaimlerChrysler AG | 36,500 | 3,388,421 | |||
Deutsche Bank AG | 28,561 | 4,167,505 | |||
Deutsche Telekom AG | 286,931 | 5,316,486 | |||
E.ON AG | 34,097 | 5,735,827 | |||
Hannover Rueckversicherung AGD | 62,800 | 3,055,641 | |||
Heidelberger Druckmaschinen AGD | 49,800 | 2,421,755 | |||
Infineon Technologies AG* | 39,200 | 653,112 | |||
MAN AG | 23,218 | 3,354,881 | |||
Merck KGaA | 19,747 | 2,727,457 | |||
Metro AG | 9,900 | 823,783 | |||
RWE AG | 80,178 | 8,571,781 | |||
SAP AG | 26,600 | 1,370,592 | |||
Siemens AG | 51,250 | 7,392,180 | |||
ThyssenKrupp AG | 35,586 | 2,125,479 | |||
Wacker Chemie AGD | 11,350 | 2,688,299 | |||
| 86,513,961 | |||||
Greece — 0.2% | |||||
Public Power Corporation | 102,000 | 2,885,295 | |||
Hong Kong — 3.7% | |||||
Bank of East Asia, Ltd. D | 224,600 | 1,263,863 | |||
China Mengniu Dairy Co., Ltd. | 456,000 | 1,571,670 | |||
China Mobile, Ltd. | 462,000 | 4,960,213 | |||
CLP Holdings, Ltd. | 1,150,000 | 7,714,025 | |||
CNOOC, Ltd. | 10,530,000 | 11,931,630 | |||
Esprit Holdings, Ltd. | 60,500 | 767,547 | |||
Hang Lung Properties, Ltd. | 249,000 | 858,214 | |||
See Notes to Financial Statements.
| 121 |
Table of Contents
International Equity Fund
SCHEDULE OF INVESTMENTS (Continued)
| Shares | Value | ||||
Hong Kong & China Gas Co.D | 4,052,400 | $ | 8,540,970 | ||
Hong Kong Electric Holdings, Ltd. | 699,000 | 3,526,646 | |||
Hutchison Whampoa, Ltd. | 862,000 | 8,560,249 | |||
Jardine Matheson Holdings, Ltd. | 124,000 | 2,951,200 | |||
Kerry Properties, Ltd. D | 88,500 | 555,728 | |||
Li & Fung, Ltd. | 375,000 | 1,350,042 | |||
Shui On Land, Ltd.D | 748,000 | 670,590 | |||
Sun Hung Kai Properties, Ltd. | 48,000 | 577,655 | |||
Swire Pacific, Ltd. Class A | 184,000 | 2,044,915 | |||
Techtronic Industries Co.D | 577,000 | 770,396 | |||
United Laboratories, Ltd. (The)* | 370,000 | 164,198 | |||
Wharf Holdings, Ltd. | 682,000 | 2,725,663 | |||
| 61,505,414 | |||||
Hungary — 0.4% | |||||
MOL Hungarian Oil and Gas PLC | 25,611 | 3,887,174 | |||
MOL Hungarian Oil and Gas PLC ADRD | 14,381 | 2,182,317 | |||
OTP Bank PLC | 8,954 | 520,057 | |||
| 6,589,548 | |||||
India — 1.4% | |||||
Andhra Bank, Ltd. | 728,084 | 1,537,374 | |||
Asian Paints, Ltd. | 61,700 | 1,228,013 | |||
Bharat Heavy Electricals, Ltd. | 26,912 | 1,016,745 | |||
Bharti Airtel, Ltd.* | 210,581 | 4,324,658 | |||
Container Corporation of India, Ltd. | 25,722 | 1,475,326 | |||
GAIL India, Ltd. GDRD | 28,500 | 1,316,700 | |||
Gujarat Ambuja Cements, Ltd. | 740,200 | 2,263,970 | |||
Hero Honda Motors, Ltd. | 74,260 | 1,263,542 | |||
Housing Development Finance Corporation | 23,684 | 1,183,298 | |||
Indraprastha Gas, Ltd. | 93,800 | 278,831 | |||
Infosys Technologies, Ltd. ADRD | 19,600 | 987,448 | |||
Power Finance Corporation, Ltd.* | 9,791 | 35,575 | |||
Ranbaxy Laboratories, Ltd. | 115,832 | 1,010,916 | |||
Sesa GOA, Ltd. | 22,920 | 1,000,361 | |||
Steel Authority of India | 300,204 | 965,402 | |||
Sterlite Industries (India), Ltd. | 12,730 | 183,061 | |||
Sterlite Industries (India), Ltd. ADRD* | 3,333 | 48,895 | |||
Sun Pharma Advanced Research Co., Ltd. | 52,600 | 173,998 | |||
Sun Pharmaceuticals Industries, Ltd. | 52,600 | 1,325,176 | |||
Tata Motors, Ltd. | 55,590 | 915,279 | |||
Tata Motors, Ltd. ADRD | 4,900 | 80,458 | |||
| 22,615,026 | |||||
Indonesia — 1.0% | |||||
Bank Rakyat Indonesia | 5,459,600 | 3,474,565 | |||
PT Bank Central Asia TBK | 2,222,000 | 1,340,332 | |||
PT Bank Mandiri Persero TBK | 4,395,500 | 1,520,303 | |||
PT Panin Life TBK | 26,999,000 | 612,595 | |||
PT Ramayana Lestari Sentosa TBK | 6,099,500 | 681,848 | |||
PT Telekomunikasi Indonesia TBK | 8,131,600 | 8,865,109 | |||
| 16,494,752 | |||||
Ireland — 0.9% | |||||
Allied Irish Banks PLC | 137,758 | 3,781,463 | |||
Bank of Ireland | 154,000 | 3,120,227 | |||
CRH PLC | 119,462 | 5,920,525 | |||
DEPFA Bank PLC | 41,600 | 737,579 | |||
Irish Life & Permanent PLC | 35,300 | 892,951 | |||
| 14,452,745 | |||||
Israel — 0.6% | |||||
Bank Hapoalim, Ltd. | 84,023 | 409,150 | |||
Check Point Software Technologies, Ltd.* | 100,000 | 2,281,000 | |||
Syneron Medical, Ltd. D* | 9,900 | 247,005 | |||
Teva Pharmaceutical Industries, Ltd. ADR | 158,100 | 6,521,625 | |||
| 9,458,780 | |||||
Italy — 1.8% | |||||
ENI SpAD | 178,474 | 6,497,869 | |||
Fiat SpA | 94,182 | 2,813,287 | |||
Intesa Sanpaolo SpA | 1,379,109 | 10,322,085 | |||
Mediaset SpA | 286,700 | 2,970,411 | |||
Saipem SpA | 45,708 | 1,568,864 | |||
UniCredito Italiano SpA | 771,704 | 6,924,812 | |||
| 31,097,328 | |||||
Japan — 19.1% | |||||
Advantest CorporationD | 103,800 | 4,527,155 | |||
Aeon Co., Ltd.D | 171,100 | 3,182,286 | |||
Aisin Seiki Co., Ltd. | 43,300 | 1,593,088 | |||
Astellas Pharma, Inc. | 228,600 | 9,951,643 | |||
Canon, Inc.D | 391,550 | 22,992,134 | |||
Citizen Holdings Co., Ltd.D | 25,000 | 225,584 | |||
Daikin Industries, Ltd. | 176,000 | 6,418,193 | |||
Daito Trust Construction Co., Ltd. D | 40,500 | 1,930,843 | |||
Daiwa House Industry Co., Ltd. | 41,000 | 586,737 | |||
Denso Corporation | 122,500 | 4,795,533 | |||
East Japan Railway Co. | 62 | 478,376 | |||
Eisai Co., Ltd. | 108,100 | 4,723,476 | |||
Fanuc, Ltd. | 98,700 | 10,196,662 | |||
FUJIFILM Holdings Corporation | 24,000 | 1,074,030 | |||
Fujitsu, Ltd. | 81,000 | 597,344 | |||
Funai Electric Co., Ltd. | 16,900 | 986,891 | |||
Hirose Electric Co., Ltd.D | 41,000 | 5,401,178 | |||
Honda Motor Co., Ltd. D | 195,200 | 7,134,213 | |||
Hoya CorporationD | 118,500 | 3,936,365 | |||
Idemitsu Kosan Co., Ltd. | 4,600 | 515,574 | |||
Inpex Holdings, Inc. | 169 | 1,578,477 | |||
Kansai Electric Power Co., Inc. (The) | 17,500 | 414,315 | |||
Kao Corporation | 322,000 | 8,342,579 | |||
KDDI Corporation | 713 | 5,287,058 | |||
Kenedix, Inc. | 684 | 1,277,726 | |||
Keyence Corporation D | 28,900 | 6,321,031 | |||
Kuraray Co., Ltd. | 151,000 | 1,772,142 | |||
Millea Holdings, Inc. | 305,100 | 12,538,526 | |||
Mitsubishi Corporation | 360,100 | 9,446,684 | |||
Mitsubishi Estate Co., Ltd. | 262,100 | 7,131,249 | |||
Mitsubishi Gas Chemical Co., Inc. | 164,000 | 1,501,141 | |||
Mitsubishi Heavy Industries, Ltd. D | 60,000 | 385,462 | |||
Mitsubishi UFJ Financial Group, Inc. | 641 | 7,080,284 | |||
See Notes to Financial Statements.
| 122 |
Table of Contents
| Shares | Value | ||||
Mitsui & Co., Ltd. | 228,000 | $ | 4,546,112 | ||
Mitsui OSK Lines, Ltd. | 63,000 | 856,544 | |||
Mizuho Financial Group, Inc. | 430 | 2,979,005 | |||
Murata Manufacturing Co., Ltd. | 10,500 | 792,244 | |||
NGK Spark Plug Co., Ltd.D | 22,000 | 383,269 | |||
Nikon CorporationD | 87,000 | 2,430,700 | |||
Nintendo Co., Ltd. | 9,500 | 3,479,797 | |||
Nippon Electric Glass Co., Ltd.D | 53,000 | 936,244 | |||
Nippon Telegraph & Telephone Corporation | 80 | 355,411 | |||
Nippon Yusen Kabushiki KaishaD | 185,700 | 1,705,801 | |||
Nissan Motor Co., Ltd. | 349,500 | 3,749,762 | |||
Nitto Denko Corporation | 136,700 | 6,905,779 | |||
Nomura Holdings, Inc. | 30,000 | 584,772 | |||
NTT DoCoMo, Inc. | 4,090 | 6,477,563 | |||
NTT Urban Development CorporationD | 425 | 824,975 | |||
Odakyu Electric Railway Co., Ltd. | 93,000 | 574,051 | |||
Onward Kashiyama Co., Ltd. | 114,000 | 1,456,422 | |||
ORIX Corporation | 42,174 | 11,115,097 | |||
Ricoh Co., Ltd. | 109,000 | 2,523,046 | |||
Rohm Co., Ltd. D | 65,400 | 5,816,284 | |||
Secom Co., Ltd. | 105,000 | 4,954,721 | |||
Shimamura Co., Ltd.D | 26,100 | 2,789,653 | |||
Shin-Etsu Chemical Co., Ltd. | 104,100 | 7,448,698 | |||
SMC CorporationD | 29,100 | 3,876,061 | |||
Softbank CorporationD | 268,300 | 5,796,370 | |||
Sony Corporation | 89,600 | 4,606,441 | |||
Sumco Corporation | 59,900 | 3,011,419 | |||
Sumitomo Chemical Co., Ltd. | 471,000 | 3,167,415 | |||
Sumitomo CorporationD | 143,000 | 2,613,198 | |||
Sumitomo Metal Industries, Ltd. | 153,000 | 902,156 | |||
Sumitomo Mitsui Financial Group, Inc. D | 620 | 5,790,863 | |||
Sumitomo Realty & Development Co., Ltd. D | 43,000 | 1,403,939 | |||
Sumitomo Trust & Banking Co., Ltd. | 258,000 | 2,462,132 | |||
Suzuki Motor CorporationD | 89,700 | 2,549,848 | |||
Takeda Pharmaceutical Co., Ltd. | 283,200 | 18,308,808 | |||
TDK Corporation | 30,700 | 2,972,134 | |||
Terumo Corporation | 32,300 | 1,248,715 | |||
TIS, Inc.D | 11,200 | 257,429 | |||
Tokyo Electric Power Company, Inc. | 26,200 | 842,656 | |||
Tokyo Electron, Ltd. | 59,000 | 4,351,025 | |||
Tokyo Gas Co., Ltd.D | 205,000 | 972,345 | |||
Tokyo Tatemono Co., Ltd. D | 93,000 | 1,160,942 | |||
Tokyu CorporationD | 99,000 | 662,546 | |||
Toshiba Corporation D | 303,000 | 2,645,482 | |||
Toyota Motor Corporation | 219,500 | 13,905,381 | |||
Trend Micro, Inc.D | 34,000 | 1,099,046 | |||
Uni-Charm CorporationD | 7,100 | 403,078 | |||
Ushio, Inc. | 26,000 | 577,543 | |||
West Japan Railway Co. | 497 | 2,316,979 | |||
Yahoo! Japan Corporation | 5,483 | 1,863,663 | |||
Yamada Denki Co., Ltd.D | 18,490 | 1,934,223 | |||
Yamato Holdings Co., Ltd. | 67,500 | 955,553 | |||
| 320,667,319 | |||||
Kazakhstan — 0.0% | |||||
KazakhGold Group, Ltd. GDR* | 1,400 | 27,370 | |||
Luxembourg — 0.1% | |||||
SESD | 37,700 | 816,214 | |||
Tenaris SA ADRD | 19,100 | 935,136 | |||
| 1,751,350 | |||||
Malaysia — 0.3% | |||||
AirAsia BHD* | 1,471,200 | 809,639 | |||
Bumiputra-Commerce Holdings BHD | 851,300 | 2,884,927 | |||
Gamuda BHD | 115,900 | 270,238 | |||
Malayan Banking BHD | 303,000 | 1,053,150 | |||
Transmile Group BHD | 160,200 | 210,661 | |||
| 5,228,615 | |||||
Mexico — 0.7% | |||||
America Movil SA de CV ADR Series L | 52,800 | 3,269,904 | |||
Cemex SA de CV | 1,277,072 | 4,691,719 | |||
Consorcio ARA SAB de CV | 79,100 | 127,397 | |||
Corporacion Moctezuma SA de CV | 177,000 | 571,787 | |||
Empresas ICA SAB de CV | 37,500 | 190,216 | |||
Grupo Televisa SA ADR | 31,100 | 858,671 | |||
Impulsora Del Desarrollo Y El Empleo en America Latina SAB de CV* | 20,000 | 31,379 | |||
Urbi Desarrollos Urbanos SA* | 123,400 | 568,256 | |||
Wal-Mart de Mexico SA de CV Series V | 168,600 | 639,848 | |||
| 10,949,177 | |||||
Netherlands — 4.3% | |||||
ABN AMRO Holding NV | 31,129 | 1,434,591 | |||
Aegon NV | 59,658 | 1,182,098 | |||
Akzo Nobel NV | 44,100 | 3,817,603 | |||
ASML Holding NV* | 55,911 | 1,551,296 | |||
ING Groep NV | 483,878 | 21,474,399 | |||
Koninklijke Numico NVD | 10,905 | 568,667 | |||
Randstad Holding NV | 24,300 | 1,935,515 | |||
Reed Elsevier NV | 468,654 | 8,969,030 | |||
Royal Dutch Shell PLC Class A | 513,024 | 20,962,570 | |||
Royal Dutch Shell PLC Class B | 81,337 | 3,402,245 | |||
Royal KPN NV | 82,500 | 1,375,651 | |||
TNT NV | 64,000 | 2,895,743 | |||
Unilever NV | 91,300 | 2,849,534 | |||
| 72,418,942 | |||||
New Zealand — 0.2% | |||||
Telecom Corporation of New Zealand, Ltd.D | 843,191 | 2,983,562 | |||
Nigeria — 0.1% | |||||
United Bank for Africa PLC | 2,780,255 | 1,095,715 | |||
Norway — 1.0% | |||||
DnB NOR ASAD | 48,400 | 625,422 | |||
Norsk Hydro ASA | 84,000 | 3,247,781 | |||
Norske Skogindustrier ASA | 27,284 | 394,203 | |||
Orkla ASA | 240,000 | 4,558,288 | |||
Tandberg ASA | 63,200 | 1,422,735 | |||
Telenor ASA | 256,500 | 5,034,785 | |||
Yara International ASA | 28,000 | 845,183 | |||
| 16,128,397 | |||||
Peru — 0.1% | |||||
Credicorp, Ltd. | 25,100 | 1,535,367 | |||
See Notes to Financial Statements.
| 123 |
Table of Contents
International Equity Fund
SCHEDULE OF INVESTMENTS (Continued)
| Shares | Value | ||||
Philippines — 0.2% | |||||
Ayala Land, Inc. | 4,488,800 | $ | 1,698,465 | ||
Globe Telecom, Inc. | 18,542 | 543,230 | |||
International Container Terminal Services, Inc. | 617,500 | 380,514 | |||
| 2,622,209 | |||||
Russia — 1.3% | |||||
CTC Media, Inc.D* | 10,400 | 282,256 | |||
Evraz Group SA GDR | 6,558 | 269,534 | |||
Integra Group Holdings GDR* | 18,125 | 329,875 | |||
Kalina ADR | 7,200 | 282,600 | |||
LUKOIL ADR | 51,870 | 3,929,152 | |||
Magnit OAO | 23,700 | 1,041,615 | |||
Mining and Metallurgical Co. Norilsk Nickel ADRD | 4,284 | 947,407 | |||
Mobile Telesystems ADR* | 69,200 | 4,191,444 | |||
OAO Gazprom ADRD | 87,672 | 3,660,306 | |||
Pharmstandard GDR D* | 5,000 | 83,900 | |||
Seventh Continent | 22,600 | 598,900 | |||
Severstal GDRD | 25,559 | 353,992 | |||
Vimpel-Communications ADR | 12,500 | 1,317,000 | |||
VTB Bank OJSC GDR 144A* | 240,406 | 2,639,658 | |||
Wimm-Bill-Dann Foods OJSC ADRD | 6,620 | 688,546 | |||
X 5 Retail Group NV GDR* | 50,322 | 1,474,435 | |||
| 22,090,620 | |||||
Singapore — 0.9% | |||||
CapitaLand, Ltd.D | 289,000 | 1,529,250 | |||
DBS Group Holdings, Ltd. | 446,000 | 6,643,018 | |||
Oversea-Chinese Banking Corporation | 465,800 | 2,784,302 | |||
Singapore Telecommunications, Ltd. | 1,639,592 | 3,641,753 | |||
United Overseas Bank, Ltd. | 73,000 | 1,049,159 | |||
| 15,647,482 | |||||
South Africa — 1.1% | |||||
ABSA Group, Ltd. | 35,135 | 653,732 | |||
Alexander Forbes, Ltd. | 375,700 | 911,674 | |||
Barloworld, Ltd. | 17,453 | 486,486 | |||
Bidvest Group, Ltd. | 108,175 | 2,204,061 | |||
FirstRand, Ltd.D | 266,481 | 852,136 | |||
Foschini, Ltd. | 5,528 | 47,720 | |||
Gold Fields, Ltd.D | 15,497 | 239,883 | |||
Harmony Gold Mining Co., Ltd.* | 26,326 | 373,500 | |||
Impala Platinum Holdings, Ltd. | 29,081 | 888,786 | |||
MTN Group, Ltd.D | 104,243 | 1,421,864 | |||
Murray & Roberts Holdings, Ltd. | 49,352 | 446,909 | |||
Naspers, Ltd. | 40,669 | 1,047,295 | |||
Pick’n Pay Stores, Ltd.D | 72,990 | 366,628 | |||
Sasol, Ltd. | 127,778 | 4,809,190 | |||
Standard Bank Group, Ltd. | 307,912 | 4,282,667 | |||
Woolworths Holdings, Ltd. | 54,957 | 166,407 | |||
| 19,198,938 | |||||
South Korea — 1.9% | |||||
Daelim Industrial Co., Ltd. | 15,071 | 2,243,072 | |||
Daewoo Shipbuilding & Marine Engineering Co., Ltd. | 11,700 | 662,348 | |||
Hyundai Heavy Industries Co., Ltd. | 380 | 141,906 | |||
Hyundai Motor Co. | 10,140 | 801,234 | |||
Kookmin Bank | 48,491 | 4,256,774 | |||
Korea Electric Power Corporation | 85,510 | 3,794,891 | |||
Lotte Shopping Co., Ltd. | 4,249 | 1,655,723 | |||
LS Industrial Systems Co., Ltd. | 10,100 | 426,914 | |||
S1 Corporation | 3,490 | 188,317 | |||
Samsung Electronics Co., Ltd. | 9,748 | 5,972,147 | |||
Samsung Electronics Co., Ltd. (Non-Voting Shares) GDR 144A | 9,909 | 2,319,321 | |||
Samsung Electronics Co., Ltd. GDR 144A | 700 | 216,650 | |||
Samsung Fire & Marine Insurance Co., Ltd. | 5,500 | 1,059,696 | |||
Samsung Securities Co., Ltd. | 34,100 | 2,742,469 | |||
Shinhan Financial Group Co., Ltd. | 24,920 | 1,515,943 | |||
SK Telecom Co., Ltd. | 6,600 | 1,521,676 | |||
S-Oil Corporation | 20,840 | 1,603,858 | |||
Taeyoung Engineering & Construction | 64,470 | 767,625 | |||
| 31,890,564 | |||||
Spain — 3.0% | |||||
Actividades de Construccion y Servicios SA | 60,638 | 3,883,590 | |||
Banco Bilbao Vizcaya Argentaria SAD | 125,100 | 3,081,573 | |||
Banco Santander Central Hispano SA | 725,669 | 13,445,772 | |||
Grupo Ferrovial SA | 6,900 | 682,202 | |||
Iberdrola SA | 98,209 | 5,520,227 | |||
Inditex SAD | 121,802 | 7,215,637 | |||
Repsol YPF SAD | 87,908 | 3,480,150 | |||
Telefonica SA | 592,250 | 13,258,192 | |||
| 50,567,343 | |||||
Sri Lanka — 0.0% | |||||
Dialog Telekom, Ltd. | 412,610 | 87,052 | |||
Sweden — 1.6% | |||||
Assa Abloy AB Class B | 109,700 | 2,430,043 | |||
Atlas Copco AB Class A | 37,000 | 622,149 | |||
Hennes & Mauritz AB Class B | 115,000 | 6,835,229 | |||
Nordea Bank AB | 126,000 | 1,982,213 | |||
Sandvik AB | 122,700 | 2,493,757 | |||
Telefonaktiebolaget LM Ericsson Class B | 2,153,000 | 8,644,488 | |||
TeliaSonera AB | 226,800 | 1,674,669 | |||
Volvo AB | 146,250 | 2,929,619 | |||
| 27,612,167 | |||||
Switzerland — 4.6% | |||||
ABB, Ltd. | 116,855 | 2,659,492 | |||
Adecco SA | 8,839 | 687,076 | |||
Baloise Holding AG | 21,560 | 2,137,467 | |||
Compagnie Financiere Richemont AG Class A | 67,274 | 4,048,006 | |||
Credit Suisse Group | 69,657 | 4,981,203 | |||
Holcim, Ltd. | 24,267 | 2,638,279 | |||
Nestle SA | 33,024 | 12,598,595 | |||
Novartis AG | 327,576 | 18,504,088 | |||
Petroplus Holdings AG* | 8,501 | 875,502 | |||
Roche Holding AG | 58,923 | 10,486,992 | |||
Swiss Reinsurance | 50,669 | 4,641,720 | |||
Swisscom AG | 3,312 | 1,135,407 | |||
UBS AG | 9,000 | 542,284 | |||
Xstrata PLC | 130,590 | 7,833,093 | |||
See Notes to Financial Statements.
| 124 |
Table of Contents
| Shares | Value | ||||
Zurich Financial Services AG | 9,900 | $ | 3,073,741 | ||
| 76,842,945 | |||||
Taiwan — 1.3% | |||||
Advantech Co., Ltd. | 149,473 | 477,535 | |||
AU Optronics Corporation | 583,740 | 994,628 | |||
Catcher Technology Co., Ltd. | 65,000 | 608,151 | |||
Cathay Financial Holding Co., Ltd. | 668,273 | 1,596,161 | |||
Delta Electronics, Inc. | 44,000 | 173,371 | |||
Delta Networks, Inc. | 255,000 | 146,754 | |||
High Tech Computer Corporation | 175,200 | 3,129,142 | |||
HON HAI Precision Industry Co., Ltd. | 134,000 | 1,157,914 | |||
Largan Precision Co., Ltd. | 27,000 | 378,720 | |||
MediaTek, Inc. | 121,000 | 1,884,987 | |||
Novatek Microelectronics Corp., Ltd. | 449,000 | 2,349,784 | |||
Phoenixtec Power Co., Ltd. | 405,605 | 427,005 | |||
PixArt Imaging, Inc. | 48,000 | 717,094 | |||
Richtek Technology Corporation | 28,000 | 443,011 | |||
Silitech Technology Corporation | 130,000 | 678,361 | |||
Taiwan Fertilizer Co., Ltd. | 496,000 | 1,041,319 | |||
Taiwan Semiconductor Manufacturing Co., Ltd. | 1,771,816 | 3,822,240 | |||
Taiwan Semiconductor Manufacturing Co., Ltd. ADRD | 146,948 | 1,635,531 | |||
Vanguard International Semiconductor Corporation | 411,020 | 411,445 | |||
| 22,073,153 | |||||
Thailand — 0.2% | |||||
Airports of Thailand Public Co., Ltd. | 579,200 | 989,799 | |||
Bank of Ayudhya PCL | 1,106,900 | 788,639 | |||
Central Pattana PCL | 555,200 | 430,169 | |||
Siam Commercial Bank Public Co., Ltd. | 472,400 | 998,847 | |||
| 3,207,454 | |||||
Turkey — 0.3% | |||||
Coca-Cola Icecek Uretim AS | 81,653 | 615,897 | |||
Migros Turk TAS | 93,874 | 1,573,503 | |||
Sinpas Gayrimenkul Yatirim Ortakligi AS* | 20,890 | 109,822 | |||
TAV Havalimanlari Holding AS* | 14,477 | 126,846 | |||
Türkiye Garanti Bankasi AS | — | 1 | |||
Türkiye Is Bankasi | 173,980 | 815,219 | |||
Yapi ve Kredi Bankasi* | 591,482 | 1,315,907 | |||
| 4,557,195 | |||||
United Kingdom — 14.3% | |||||
Anglo American PLCD | 70,051 | 4,058,845 | |||
ARM Holdings PLCD | 110,000 | 323,607 | |||
AstraZeneca PLC | 112,557 | 6,057,340 | |||
Aviva PLC | 457,465 | 6,830,099 | |||
BAE Systems PLC | 458,800 | 3,731,355 | |||
Barclays PLC | 169,431 | 2,368,047 | |||
Barratt Developments PLC | 60,967 | 1,215,716 | |||
BG Group PLC | 1,064,948 | 17,568,073 | |||
BHP Billiton PLC | 124,156 | 3,459,212 | |||
BP PLC | 822,769 | 9,962,845 | |||
British Airways PLC* | 203,236 | 1,707,986 | |||
British Land Co. PLC REIT | 22,200 | 597,373 | |||
BT Group PLC | 432,819 | 2,889,922 | |||
Cattles PLC | 237,000 | 1,865,617 | |||
Centrica PLC | 824,000 | 6,428,452 | |||
Compass Group PLC | 381,004 | 2,645,330 | |||
Daily Mail and General Trust PLC | 36,700 | 564,156 | |||
Emap PLC | 130,000 | 2,148,480 | |||
Firstgroup PLC | 132,900 | 1,782,746 | |||
GKN PLC | 427,284 | 3,417,123 | |||
GlaxoSmithKline PLC | 807,946 | 21,172,932 | |||
HBOS PLC | 733,658 | 14,519,058 | |||
HSBC Holdings PLCD | 246,556 | 4,502,380 | |||
International Power PLC | 570,268 | 4,918,473 | |||
Johnston Press PLC | 306,500 | 2,531,189 | |||
Kingfisher PLC | 940,000 | 4,275,473 | |||
Lloyds TSB Group PLC | 701,262 | 7,829,666 | |||
Marks & Spencer Group PLC | 109,054 | 1,375,274 | |||
Michael Page International PLC | 223,084 | 2,354,124 | |||
National Grid PLC | 260,142 | 3,855,272 | |||
Next PLC | 66,600 | 2,686,843 | |||
Prudential PLC | 287,000 | 4,114,985 | |||
Reckitt Benckiser PLC | 245,739 | 13,496,450 | |||
Reed Elsevier PLC | 85,300 | 1,107,403 | |||
Reuters Group PLC | 91,300 | 1,134,879 | |||
Rexam PLC | 241,400 | 2,417,733 | |||
Rio Tinto PLC | 198,400 | 15,247,136 | |||
Royal Bank of Scotland Group PLC | 1,398,386 | 17,775,381 | |||
Scottish & Southern Energy PLC | 75,100 | 2,185,227 | |||
Standard Chartered PLC | 64,300 | 2,104,683 | |||
Tesco PLC | 531,300 | 4,465,020 | |||
Travis Perkins PLC | 56,100 | 2,140,448 | |||
Tullow Oil PLC | 281,600 | 2,759,565 | |||
Unilever PLC | 279,354 | 9,059,737 | |||
Vodafone Group PLC | 1,699,405 | 5,726,338 | |||
Wm Morrison Supermarkets PLC | 705,000 | 4,282,552 | |||
WPP Group PLC | 87,070 | 1,308,725 | |||
Yell Group PLC | 121,000 | 1,123,183 | |||
| 240,092,453 | |||||
Total Foreign Common Stocks (Cost $1,078,885,590) | 1,579,322,786 | ||||
DOMESTIC EXCHANGE TRADED FUNDS — 0.3% | |||||
USA — 0.3% | |||||
iShares MSCI Australia Index FundD | 71,900 | 2,043,398 | |||
iShares MSCI United Kingdom Index FundD | 109,000 | 2,784,950 | |||
iShares S&P Global Consumer Staples Sector Index FundD | 16,500 | 946,110 | |||
Total Domestic Exchange Traded Funds (Cost $5,475,967) | 5,774,458 | ||||
FOREIGN EXCHANGE TRADED FUND — 0.3% | |||||
France — 0.3% | |||||
streetTRACKS MSCI Europe Consumer Staples* | |||||
(Cost $3,685,159) | 36,000 | 3,840,942 | |||
FOREIGN PREFERRED STOCKS — 0.8% | |||||
Brazil — 0.4% | |||||
Centrais Eletricas Brasileiras SA Class B | 43,181,800 | 1,275,978 | |||
See Notes to Financial Statements.
| 125 |
Table of Contents
International Equity Fund
SCHEDULE OF INVESTMENTS (Continued)
| Shares | Value | ||||||
Companhia de Tecidos do Norte de Minas - Coteminas | 2,595,260 | $ | 410,344 | ||||
Companhia Energetica de Minas Gerais | 15,080 | 318,955 | |||||
Eletropaulo Metropolitana de Sao Paulo SA Class B | 4,320,200 | 284,318 | |||||
Investimentos Itau SA | 549,147 | 3,413,309 | |||||
NET Servicos de Comunicacao SA* | 10,400 | 171,716 | |||||
| 5,874,620 | |||||||
Germany — 0.3% | |||||||
Fresenius AG | 64,891 | 4,949,053 | |||||
South Korea — 0.1% | |||||||
Samsung Electronics Co., Ltd. | 4,643 | 2,173,619 | |||||
Total Foreign Preferred Stocks (Cost $9,352,561) | 12,997,292 | ||||||
RIGHTS — 0.0% | |||||||
BanColombia SA, expires 07/10/07 | |||||||
(Cost $0) | 76,200 | — | |||||
MONEY MARKET FUNDS — 15.8% | |||||||
GuideStone Funds Money Market Fund (GS4 Class)¥ | 57,234,400 | 57,234,400 | |||||
Northern Institutional Liquid Assets Portfolio§ | 207,617,645 | 207,617,645 | |||||
Total Money Market Funds (Cost $264,852,045) | 264,852,045 | ||||||
| Par | |||||||
U.S. TREASURY OBLIGATION — 0.0% | |||||||
U.S. Treasury Bill | |||||||
4.52%, 09/13/07‡‡ | |||||||
(Cost $237,770) | $ | 240,000 | 237,794 | ||||
TOTAL INVESTMENTS — 111.5% (Cost $1,362,489,092) | 1,867,025,317 | ||||||
Liabilities in Excess of Other Assets — (11.5)% | (192,359,916 | ) | |||||
NET ASSETS — 100.0% | $ | 1,674,665,401 | |||||
PORTFOLIO SUMMARY (based on net assets)
| % | |||
Japan | 19.1 | ||
Money Market Funds | 15.8 | ||
United Kingdom | 14.3 | ||
France | 9.1 | ||
Germany | 5.5 | ||
Switzerland | 4.6 | ||
Netherlands | 4.3 | ||
Australia | 4.3 | ||
Hong Kong | 3.7 | ||
Futures Contracts | 3.3 | ||
Canada | 3.2 | ||
Spain | 3.0 | ||
South Korea | 2.0 | ||
Italy | 1.8 | ||
Brazil | 1.8 | ||
Sweden | 1.6 | ||
Finland | 1.5 | ||
India | 1.4 | ||
Russia | 1.3 | ||
Taiwan | 1.3 | ||
Belgium | 1.2 | ||
South Africa | 1.1 | ||
Indonesia | 1.0 | ||
Norway | 1.0 | ||
Singapore | 0.9 | ||
Ireland | 0.9 | ||
Mexico | 0.7 | ||
Exchange Traded Funds | 0.6 | ||
Israel | 0.6 | ||
China | 0.6 | ||
Hungary | 0.4 | ||
Egypt | 0.4 | ||
Denmark | 0.4 | ||
Malaysia | 0.3 | ||
Turkey | 0.3 | ||
Chile | 0.2 | ||
Thailand | 0.2 | ||
New Zealand | 0.2 | ||
Greece | 0.2 | ||
Philippines | 0.2 | ||
Austria | 0.1 | ||
Luxembourg | 0.1 | ||
Peru | 0.1 | ||
Nigeria | 0.1 | ||
Colombia | 0.1 | ||
Estonia | — | ** | |
Czech Republic | — | ** | |
Argentina | — | ** | |
Bahrain | — | ** | |
U.S. Treasury Obligation | — | ** | |
Sri Lanka | — | ** | |
Kazakhstan | — | ** | |
Rights | — | ** | |
Forward Foreign Currency Contracts | (1.2 | ) | |
| 113.6 | |||
| ** | Rounds to less than 0.005%. |
See Notes to Financial Statements.
| 126 |
Table of Contents
SCHEDULE OF INVESTMENTS – ABBREVIATIONS AND FOOTNOTES
INVESTMENT ABBREVIATIONS:
ADR | — | American Depository Receipt | ||
CONV | — | Convertible | ||
GDR | — | Global Depository Receipt | ||
IO | — | Interest Only (Principal amount shown is notional) | ||
PIK | — | Payment-in-Kind Bonds | ||
PO | — | Principal Only | ||
REIT | — | Real Estate Investment Trust | ||
STEP | — | Stepped Coupon Bonds (1) | ||
STRIP | — | Stripped Security | ||
TBA | — | To be announced | ||
144A | — | Security was purchased pursuant to Rule 144A under the Securities Act of 1933 and may not be resold subject to that rule except to qualified institutional buyers. As of June 30, 2007, the total market values and percentages of net assets for 144A securities by fund were as follows: | ||
Fund | Value of 144A Securities | Percentage of Net Assets | ||||
Money Market | $ | 93,942,951 | 8.59 | % | ||
Low-Duration Bond | 36,743,655 | 4.71 | ||||
Medium-Duration Bond | 80,892,889 | 6.75 | ||||
Extended-Duration Bond | 11,089,162 | 2.01 | ||||
Global Bond | 13,181,092 | 11.12 | ||||
Small Cap Equity | 1,623,965 | 0.26 | ||||
International Equity | 6,904,534 | 0.41 | ||||
INVESTMENT FOOTNOTES:
‡‡ | — | All or a portion of the security was held as collateral for open futures, options and/or swap contracts. | ||
@ | — | Illiquid. | ||
* | — | Non-income producing security. | ||
# | — | Security in default. | ||
+ | — | Security is valued at fair value (2). | ||
§ | — | Security purchased with the cash proceeds from securities loaned. | ||
† | — | Variable rate security (1). | ||
W | — | Interest rates shown reflect the effective yields as of June 30, 2007. | ||
¥ | — | Affiliated fund. | ||
D | — | Security either partially or fully on loan. | ||
| (1) | Interest rates shown reflect the rates currently in effect. Maturity date for money market instruments is the date of the next interest rate reset. |
| (2) | Fair valued securities were held in the Value Equity, Growth Equity, Small Cap Equity, and International Equity Funds at an aggregate market value of $1,209, $0, $0 and $513,495, respectively, which amounted to 0.00% of the Value Equity, Growth Equity, and Small Cap Equity Funds and 0.03% of the International Equity Fund. |
FOREIGN BOND FOOTNOTES:
(A) | — | Par is denominated in Australian Dollars. | ||
(B) | — | Par is denominated in Brazilian Real. | ||
(C) | — | Par is denominated in Canadian Dollars. | ||
(D) | — | Par is denominated in Danish Kroner. | ||
(E) | — | Par is denominated in Euro. | ||
(G) | — | Par is denominated in Singapore Dollars. | ||
(H) | — | Par is denominated in Hungarian Forint. | ||
(I) | — | Par is denominated in Iceland Kronur. | ||
(J) | — | Par is denominated in Japanese Yen. | ||
(K) | — | Par is denominated in Swedish Kronor. | ||
(L) | — | Par is denominated in Turkish New Lira. | ||
(M) | — | Par is denominated in Mexican Pesos. | ||
(R) | — | Par is denominated in Argentinian Pesos. | ||
(S) | — | Par is denominated in Israeli New Shekels. | ||
(T) | — | Par is denominated in Thailand Baht. | ||
(U) | — | Par is denominated in British Pounds. | ||
(W) | — | Par is denominated in South Korean Won. | ||
(Y) | — | Par is denominated in Egyptian Pounds. | ||
(Z) | — | Par is denominated in New Zealand Dollars. | ||
SWAP AGREEMENT FOOTNOTES:
(a) | — | Counterparty to contract is Goldman Sachs Capital Markets, LP. | ||
(b) | — | Counterparty to contract is UBS AG. | ||
(c) | — | Counterparty to contract is Morgan Stanley Capital Services. | ||
(d) | — | Counterparty to contract is Barclays Capital. | ||
(e) | — | Counterparty to contract is Lehman Brothers Special Financing, Inc. | ||
(f) | — | Counterparty to contract is Citibank NA London. | ||
(g) | — | Counterparty to contract is JPMorgan Chase Bank. | ||
(h) | — | Counterparty to contract is Merrill Lynch Capital Services, Inc. | ||
(i) | — | Counterparty to contract is HSBC Bank USA, N.A. | ||
(j) | — | Counterparty to contract is BNP Paribas. | ||
(k) | — | Counterparty to contract is Deutsche Bank AG. | ||
(l) | — | Counterparty to contract is Royal Bank of Scotland. | ||
(m) | — | Counterparty to contract is Credit Suisse International. | ||
| 127 |
Table of Contents
STATEMENTS OF ASSETS AND LIABILITIES
June 30, 2007 (Unaudited)
| Money Market Fund | Low-Duration Bond Fund | Medium-Duration Bond Fund | ||||||||||
Assets | ||||||||||||
Investments in securities of unaffiliated issuers, at value | $ | 1,082,662,516 | $ | 804,472,204 | $ | 1,444,289,551 | ||||||
Investments in securities of affiliated issuers, at value | — | 29,092,804 | 131,870,175 | |||||||||
Total investments (1)(2) | 1,082,662,516 | 833,565,008 | 1,576,159,726 | |||||||||
Cash | 657 | 13,610,803 | 7,397,062 | |||||||||
Cash collateral for futures | — | — | 2,750,000 | |||||||||
Foreign currency (3) | — | 3,078,041 | 5,813,203 | |||||||||
Receivables: | ||||||||||||
Dividends and reclaims | 85 | 85,906 | 508,133 | |||||||||
Interest | 3,132,351 | 3,377,661 | 9,384,068 | |||||||||
Interest on swaps | — | 930 | 12,589 | |||||||||
Investment securities sold | 10,124,260 | 16,815,310 | 27,920,900 | |||||||||
Maturities | — | 850,959 | 58,114 | |||||||||
Fund shares sold | 3,031,920 | 198,125 | 172,765 | |||||||||
Variation margin | — | 200,741 | 281,059 | |||||||||
Securities lending | — | 2,982 | 22,754 | |||||||||
Unrealized appreciation on foreign currency exchange contracts | — | 175,971 | 213,461 | |||||||||
Unrealized appreciation on swap agreements | — | 3,236,004 | 2,741,204 | |||||||||
Prepaid expenses and other assets | 43,921 | 47,239 | 35,812 | |||||||||
Total Assets | 1,098,995,710 | 875,245,680 | 1,633,470,850 | |||||||||
Liabilities | ||||||||||||
Securities sold short, at value (5) | — | 989,063 | 12,434,998 | |||||||||
Options written at value (4) | — | 748,319 | 632,718 | |||||||||
Unrealized depreciation on foreign currency exchange contracts | — | 522,118 | 671,507 | |||||||||
Unrealized depreciation on swap agreements | — | 2,076,946 | 2,748,274 | |||||||||
Collateral held for securities on loan at value | — | 30,545,646 | 173,193,120 | |||||||||
Payables: | ||||||||||||
Investment securities purchased | — | 59,466,835 | 243,931,121 | |||||||||
Fund shares redeemed | 3,182,225 | 8,067 | 124,128 | |||||||||
Interest on swaps | — | 61,395 | 72,994 | |||||||||
Variation margin | — | 210,588 | 363,072 | |||||||||
Distributions | 1,935,805 | — | — | |||||||||
Securities lending | — | 895 | 6,826 | |||||||||
Deferred foreign capital gains taxes | — | — | — | |||||||||
Accrued expenses | ||||||||||||
Advisory fees | 186,131 | 210,647 | 358,448 | |||||||||
Distribution (12b-1) fees | 582 | 471 | 1,167 | |||||||||
Shareholder servicing fees | 154,211 | 101,649 | 165,391 | |||||||||
Other expenses | 66,620 | 76,843 | 151,056 | |||||||||
Total Liabilities | 5,525,574 | 95,019,482 | 434,854,820 | |||||||||
Net Assets | $ | 1,093,470,136 | $ | 780,226,198 | $ | 1,198,616,030 | ||||||
Net Assets Consist of: | ||||||||||||
Paid-in capital | $ | 1,093,484,171 | $ | 807,045,995 | $ | 1,224,832,608 | ||||||
Undistributed (distributions in excess of) net investment income | (205 | ) | 1,039,122 | 919,960 | ||||||||
Undistributed (accumulated) net realized gain (loss) on investments, foreign currency transactions and derivative transactions | (13,830 | ) | (20,075,738 | ) | (8,372,113 | ) | ||||||
Net unrealized appreciation (depreciation) on investments, foreign currency translations and derivative transactions | — | (7,783,181 | ) | (18,764,425 | ) | |||||||
Net Assets | $ | 1,093,470,136 | $ | 780,226,198 | $ | 1,198,616,030 | ||||||
Net Asset Value: | ||||||||||||
$0.001 par value, unlimited shares authorized | ||||||||||||
Net assets applicable to the GS2 Class | $ | 108,961,196 | $ | 130,155,314 | $ | 140,313,774 | ||||||
GS2 shares outstanding | 108,962,617 | 14,812,012 | 16,967,574 | |||||||||
Net asset value, offering and redemption price per GS2 share | $ | 1.00 | $ | 8.79 | $ | 8.27 | ||||||
Net assets applicable to the GS4 Class | $ | 979,083,687 | $ | 644,789,272 | $ | 1,044,495,751 | ||||||
GS4 shares outstanding | 979,059,571 | 51,192,805 | 79,175,044 | |||||||||
Net asset value, offering and redemption price per GS4 share | $ | 1.00 | $ | 12.60 | $ | 13.19 | ||||||
Net assets applicable to the GS6 Class | $ | 5,425,253 | $ | 5,281,612 | $ | 13,806,505 | ||||||
GS6 shares outstanding | 5,427,477 | 598,448 | 1,656,463 | |||||||||
Net asset value, offering and redemption price per GS6 share | $ | 1.00 | $ | 8.83 | $ | 8.33 | ||||||
(1) Investments in securities of unaffiliated issuers, at cost | $ | 1,082,662,516 | $ | 810,772,489 | $ | 1,459,841,018 | ||||||
Investments in securities of affiliated issuers, at cost | — | 29,092,804 | 131,870,175 | |||||||||
Total investments at cost | $ | 1,082,662,516 | $ | 839,865,293 | $ | 1,591,711,193 | ||||||
(2) Includes securities loaned of: | $ | — | $ | 29,842,022 | $ | 177,713,309 | ||||||
(3) Foreign currency at cost | $ | — | $ | 3,024,811 | $ | 5,750,646 | ||||||
(4) Premiums received on options written | $ | — | $ | (1,124,267 | ) | $ | (1,169,675 | ) | ||||
(5) Securities Sold Short at Cost | $ | — | $ | (994,375 | ) | $ | (12,445,812 | ) | ||||
(6) Net of ($145,824) accrued foreign capital gains taxes on appreciated securities | ||||||||||||
See Notes to Financial Statements.
| 128 |
Table of Contents
| Extended-Duration Bond Fund | Global Bond Fund | Equity Index Fund | Real Estate Securities Fund | Value Equity Fund | Growth Equity Fund | Small Cap Equity Fund | International Equity Fund | ||||||||||||||||||||
| $ | 659,597,132 | $ | 151,223,947 | $ | 574,746,918 | $ | 148,454,341 | $ | 1,812,595,045 | $ | 1,735,953,979 | $ | 862,307,655 | $ | 1,809,790,917 | ||||||||||||
| 6,930,461 | 8,609,489 | 14,526,744 | 9,126,283 | 57,255,306 | 64,345,184 | 51,493,311 | 57,234,400 | ||||||||||||||||||||
| 666,527,593 | 159,833,436 | 589,273,662 | 157,580,624 | 1,869,850,351 | 1,800,299,163 | 913,800,966 | 1,867,025,317 | ||||||||||||||||||||
| 228,043 | — | 81 | — | — | — | 307 | 594,114 | ||||||||||||||||||||
| — | — | — | — | — | — | 1,524,910 | 3,200,000 | ||||||||||||||||||||
| (224,151 | ) | 3,302,125 | — | — | — | 55,107 | — | 7,304,805 | |||||||||||||||||||
| 27,107 | 40,783 | 579,694 | 312,382 | 2,001,576 | 1,156,186 | 496,089 | 3,422,393 | ||||||||||||||||||||
| 6,802,629 | 1,940,281 | 85 | 138 | 859 | 610 | 215,692 | 6,211 | ||||||||||||||||||||
| — | — | — | — | — | — | — | — | ||||||||||||||||||||
| — | 6,410,828 | 371,513 | 2,025,510 | 5,723,496 | 3,721,308 | 8,418,205 | 13,026,927 | ||||||||||||||||||||
| — | — | — | — | — | — | — | — | ||||||||||||||||||||
| 63,052 | 40,000 | 100,235 | 50,077 | 138,525 | 128,690 | 19,819 | 114,541 | ||||||||||||||||||||
| — | 32,539 | — | — | — | — | — | 366,528 | ||||||||||||||||||||
| 48,811 | 3,436 | 3,094 | — | 15,417 | 16,289 | 165,842 | 72,132 | ||||||||||||||||||||
| — | 152,780 | — | — | — | — | — | 136,604 | ||||||||||||||||||||
| — | — | — | — | — | — | — | — | ||||||||||||||||||||
| 24,253 | 11,201 | 31,291 | 12,102 | 51,270 | 32,794 | 27,928 | 56,705 | ||||||||||||||||||||
| 673,497,337 | 171,767,409 | 590,359,655 | 159,980,833 | 1,877,781,494 | 1,805,410,147 | 924,669,758 | 1,895,326,277 | ||||||||||||||||||||
| — | — | — | — | — | — | — | — | ||||||||||||||||||||
| — | — | — | — | — | — | — | — | ||||||||||||||||||||
| — | 560,848 | — | — | — | — | — | 111,513 | ||||||||||||||||||||
| — | — | — | — | — | — | — | — | ||||||||||||||||||||
| 120,788,547 | 25,465,168 | 42,035,182 | 39,882,340 | 129,799,332 | 157,647,087 | 266,829,890 | 207,617,645 | ||||||||||||||||||||
| — | 27,080,555 | 832,741 | 1,934,857 | 8,729,871 | 8,109,964 | 43,462,519 | 10,710,229 | ||||||||||||||||||||
| 165,041 | — | 147,984 | 163,144 | 148,808 | 188,587 | 28,294 | 101,040 | ||||||||||||||||||||
| — | — | — | — | — | — | — | — | ||||||||||||||||||||
| — | 8,090 | 16,650 | 34,560 | 68,130 | 75,600 | 258,255 | 8,730 | ||||||||||||||||||||
| — | — | — | — | — | — | — | — | ||||||||||||||||||||
| 14,641 | 1,289 | 928 | — | 4,626 | 4,886 | 49,730 | 21,639 | ||||||||||||||||||||
| — | — | — | — | — | — | — | 145,824 | ||||||||||||||||||||
| 213,972 | 37,591 | 63,063 | 88,471 | 959,989 | 1,082,657 | 480,638 | 1,127,705 | ||||||||||||||||||||
| 1,322 | — | 1,114 | — | 1,676 | 1,095 | 1,625 | 2,245 | ||||||||||||||||||||
| 76,128 | 16,639 | 73,674 | 19,417 | 239,634 | 222,690 | 85,420 | 219,508 | ||||||||||||||||||||
| 62,673 | 44,694 | 80,308 | 13,569 | 113,939 | 103,885 | 103,111 | 594,798 | ||||||||||||||||||||
| 121,322,324 | 53,214,874 | 43,251,644 | 42,136,358 | 140,066,005 | 167,436,451 | 311,299,482 | 220,660,876 | ||||||||||||||||||||
| $ | 552,175,013 | $ | 118,552,535 | $ | 547,108,011 | $ | 117,844,475 | $ | 1,737,715,489 | $ | 1,637,973,696 | $ | 613,370,276 | $ | 1,674,665,401 | ||||||||||||
| $ | 550,798,647 | $ | 118,858,337 | $ | 375,850,127 | $ | 114,109,443 | $ | 1,320,400,540 | $ | 1,414,103,132 | $ | 482,647,297 | $ | 1,014,107,638 | ||||||||||||
| 852,497 | 786,822 | 105,544 | 136,749 | 256,225 | (172,493 | ) | 460,378 | 5,498,169 | |||||||||||||||||||
| (490,593 | ) | (375,600 | ) | 11,651,718 | 13,769,603 | 69,548,107 | (123,870,782 | ) | 47,503,717 | 150,528,076 | |||||||||||||||||
| 1,014,462 | (717,024 | ) | 159,500,622 | (10,171,320 | ) | 347,510,617 | 347,913,839 | 82,758,884 | 504,531,518 | (6) | |||||||||||||||||
| $ | 552,175,013 | $ | 118,552,535 | $ | 547,108,011 | $ | 117,844,475 | $ | 1,737,715,489 | $ | 1,637,973,696 | $ | 613,370,276 | $ | 1,674,665,401 | ||||||||||||
| $ | 69,997,428 | N/A | $ | 87,753,301 | N/A | $ | 226,563,867 | $ | 226,853,262 | $ | 79,547,354 | $ | 271,677,149 | ||||||||||||||
| 9,061,268 | N/A | 7,508,733 | N/A | 20,271,272 | 18,915,441 | 6,453,912 | 15,525,887 | ||||||||||||||||||||
| $ | 7.72 | N/A | $ | 11.69 | N/A | $ | 11.18 | $ | 11.99 | $ | 12.33 | $ | 17.50 | ||||||||||||||
| $ | 466,416,356 | $ | 118,552,535 | $ | 446,299,965 | $ | 117,844,475 | $ | 1,491,477,938 | $ | 1,398,469,319 | $ | 514,628,896 | $ | 1,376,131,204 | ||||||||||||
| 32,345,587 | 11,795,861 | 21,953,628 | 9,942,067 | 75,355,533 | 73,734,415 | 29,596,740 | 65,156,148 | ||||||||||||||||||||
| $ | 14.42 | $ | 10.05 | $ | 20.33 | $ | 11.85 | $ | 19.79 | $ | 18.97 | $ | 17.39 | $ | 21.12 | ||||||||||||
| $ | 15,761,229 | N/A | $ | 13,054,745 | N/A | $ | 19,673,684 | $ | 12,651,115 | $ | 19,194,026 | $ | 26,857,048 | ||||||||||||||
| 2,041,812 | N/A | 1,110,476 | N/A | 1,773,643 | 1,081,143 | 1,608,152 | 1,559,548 | ||||||||||||||||||||
| $ | 7.72 | N/A | $ | 11.76 | N/A | $ | 11.09 | $ | 11.70 | $ | 11.94 | $ | 17.22 | ||||||||||||||
| $ | 658,593,244 | $ | 151,413,470 | $ | 415,064,807 | $ | 158,571,344 | $ | 1,464,141,160 | $ | 1,386,987,496 | $ | 778,827,978 | $ | 1,305,254,692 | ||||||||||||
| 6,930,461 | 8,609,489 | 14,526,744 | 9,126,283 | 57,255,306 | 64,345,184 | 51,493,311 | 57,234,400 | ||||||||||||||||||||
| $ | 665,523,705 | $ | 160,022,959 | $ | 429,591,551 | $ | 167,697,627 | $ | 1,521,396,466 | $ | 1,451,332,680 | $ | 830,321,289 | $ | 1,362,489,092 | ||||||||||||
| $ | 273,250,971 | $ | 28,294,574 | $ | 47,279,785 | $ | 38,724,071 | $ | 155,554,597 | $ | 154,332,992 | $ | 260,723,744 | $ | 202,685,308 | ||||||||||||
| $ | (222,817 | ) | $ | 3,316,918 | $ | — | $ | — | $ | — | $ | 55,128 | $ | — | $ | 7,231,717 | |||||||||||
| $ | — | $ | — | $ | — | $ | — | $ | — | $ | — | $ | — | $ | — | ||||||||||||
| $ | — | $ | — | $ | — | $ | — | $ | — | $ | — | $ | — | $ | — | ||||||||||||
See Notes to Financial Statements.
| 129 |
Table of Contents
STATEMENTS OF OPERATIONS
For the Six Months Ended June 30, 2007 (Unaudited)
| Money Market Fund | Low-Duration Bond Fund | Medium-Duration Bond Fund | ||||||||||
Investment Income | ||||||||||||
Dividends | $ | — | $ | — | $ | 52,277 | ||||||
Income dividends received from affiliated funds | 85 | 824,203 | 3,186,188 | |||||||||
Interest | 28,632,202 | 19,238,042 | 29,772,350 | |||||||||
Securities Lending | — | 17,261 | 97,544 | |||||||||
Less foreign taxes withheld | — | — | (5,031 | ) | ||||||||
Total Investment Income | 28,632,287 | 20,079,506 | 33,103,328 | |||||||||
Expenses | ||||||||||||
Investment advisory fees | 1,092,710 | 1,643,566 | 2,614,845 | |||||||||
Transfer agent fees: | ||||||||||||
GS2 shares | 1,885 | 1,720 | 1,743 | |||||||||
GS4 shares | 20,607 | 13,051 | 14,039 | |||||||||
GS6 shares | 3,516 | 3,557 | 3,531 | |||||||||
GS8 shares | 2,992 | 2,888 | 2,885 | |||||||||
Custodian fees | 10,955 | 49,312 | 81,536 | |||||||||
Distribution (12b-1) fees: | ||||||||||||
GS6 shares | 2,474 | 2,515 | 6,855 | |||||||||
GS8 shares | 7,012 | 6,311 | 6,760 | |||||||||
Shareholder servicing fees: | ||||||||||||
GS4 shares | 904,297 | 636,206 | 1,019,563 | |||||||||
GS6 shares | 7,413 | 7,761 | 20,551 | |||||||||
GS8 shares | 9,346 | 8,417 | 9,006 | |||||||||
Accounting and administration fees | 187,225 | 187,670 | 265,501 | |||||||||
Professional fees | 28,632 | 30,398 | 33,492 | |||||||||
Blue sky fees: | ||||||||||||
GS2 shares | 408 | 407 | 406 | |||||||||
GS4 shares | 17,839 | 6,715 | 7,565 | |||||||||
GS6 shares | 2,324 | 7,637 | 2,316 | |||||||||
GS8 shares | 1,097 | 5,181 | 1,117 | |||||||||
Shareholder reporting fees: | ||||||||||||
GS2 shares | 162 | 104 | 64 | |||||||||
GS4 shares | 9,595 | 2,503 | 3,724 | |||||||||
GS6 shares | 14 | 18 | 6 | |||||||||
GS8 shares | 42 | 27 | 25 | |||||||||
Trustee fees | 4,583 | 4,011 | 5,361 | |||||||||
Line of credit facility fees | 2,214 | 1,893 | 2,524 | |||||||||
Other expenses | 25,839 | 25,160 | 23,472 | |||||||||
Total expenses | 2,343,181 | 2,647,028 | 4,126,887 | |||||||||
Expenses waived/reimbursed net of amount recaptured (See Footnote 3a and 3c) | 1,625 | (270,213 | ) | (368,156 | ) | |||||||
Fees paid indirectly | (2,159 | ) | (196,864 | ) | (164,027 | ) | ||||||
Net expenses | 2,342,647 | 2,179,951 | 3,594,704 | |||||||||
Net Investment Income (Loss) | 26,289,640 | 17,899,555 | 29,508,624 | |||||||||
Realized and Unrealized Gain (Loss) | ||||||||||||
Net realized gain (loss) from: | ||||||||||||
Investment securities (net of capital gains taxes of $4,841 for International Equity) | (4,666 | ) | (653,442 | ) | (2,964,825 | ) | ||||||
Futures transactions | — | 239,409 | 202,140 | |||||||||
Swap agreements | — | 117,940 | (1,637,288 | ) | ||||||||
Option contracts written | — | 359,311 | 361,993 | |||||||||
Option contracts purchased | — | (887,128 | ) | (1,918,633 | ) | |||||||
Foreign currency transactions | — | 329,533 | 1,962,279 | |||||||||
Net realized gain (loss) | (4,666 | ) | (494,377 | ) | (3,994,334 | ) | ||||||
Net change in unrealized appreciation (depreciation) on: | ||||||||||||
Investment securities (net of estimated deferred capital gains taxes of ($145,824) for International Equity) | — | (2,181,622 | ) | (17,098,004 | ) | |||||||
Futures | — | (2,181,988 | ) | (4,035,543 | ) | |||||||
Swap agreements | — | 1,064,141 | 1,149,665 | |||||||||
Option contracts written | — | 333,904 | 534,200 | |||||||||
Option contracts purchased | — | (1,340,729 | ) | (258,126 | ) | |||||||
Foreign currency translations | — | (77,970 | ) | (17,687 | ) | |||||||
Net change in unrealized appreciation (depreciation) | — | (4,384,264 | ) | (19,725,495 | ) | |||||||
Net Realized and Unrealized Gain (Loss) | (4,666 | ) | (4,878,641 | ) | (23,719,829 | ) | ||||||
Net Increase in Net Assets Resulting from Operations | $ | 26,284,974 | $ | 13,020,914 | $ | 5,788,795 | ||||||
See Notes to Financial Statements.
| 130 |
Table of Contents
| Extended-Duration Bond Fund | Global Bond Fund | Equity Index Fund | Real Estate Securities Fund | Value Equity Fund | Growth Equity Fund | Small Cap Equity Fund | International Equity Fund | |||||||||||||||||||||||
| $ | 413 | $ | — | $ | 5,013,212 | $ | 1,059,301 | $ | 17,590,240 | $ | 6,030,227 | $ | 2,754,090 | $ | 26,275,116 | |||||||||||||||
| 197,815 | 269,466 | 332,165 | 211,539 | 1,675,541 | 1,656,232 | 676,704 | 1,254,372 | |||||||||||||||||||||||
| 14,607,262 | 3,272,910 | 20,610 | 13,116 | 100,141 | 95,884 | 38,125 | 20,344 | |||||||||||||||||||||||
| 241,517 | 11,699 | 21,272 | 11,287 | 81,753 | 114,447 | 557,946 | 236,387 | |||||||||||||||||||||||
| — | — | — | (1,533 | ) | (45,385 | ) | (85,113 | ) | (3,207 | ) | (2,293,777 | ) | ||||||||||||||||||
| 15,047,007 | 3,554,075 | 5,387,259 | 1,293,710 | 19,402,290 | 7,811,677 | 4,023,658 | 25,492,442 | |||||||||||||||||||||||
| 1,316,908 | 223,562 | 435,348 | 630,945 | 5,572,471 | 6,802,458 | 2,974,576 | 7,269,564 | |||||||||||||||||||||||
| 1,574 | — | 1,596 | — | 1,621 | 1,628 | 1,559 | 1,580 | |||||||||||||||||||||||
| 14,024 | 4,850 | 15,394 | 319 | 18,070 | 15,391 | 16,896 | 20,348 | |||||||||||||||||||||||
| 3,481 | — | 3,501 | — | 3,535 | 3,544 | 3,491 | 3,522 | |||||||||||||||||||||||
| 2,869 | — | 2,861 | — | 2,891 | 2,883 | 2,864 | 2,880 | |||||||||||||||||||||||
| 15,961 | 18,141 | 14,625 | 12,139 | 38,780 | 36,106 | 51,098 | 512,762 | |||||||||||||||||||||||
| 7,861 | — | 7,020 | — | 9,232 | 6,026 | 9,062 | 12,424 | |||||||||||||||||||||||
| 6,999 | — | 7,917 | — | 8,926 | 7,490 | 8,288 | 10,156 | |||||||||||||||||||||||
| 437,246 | 103,921 | 424,706 | 136,945 | 1,360,528 | 1,282,016 | 464,602 | 1,209,688 | |||||||||||||||||||||||
| 23,560 | — | 21,182 | — | 27,610 | 18,060 | 27,112 | 37,162 | |||||||||||||||||||||||
| 9,321 | — | 10,547 | — | 11,857 | 9,982 | 11,022 | 13,498 | |||||||||||||||||||||||
| 106,932 | 38,211 | 108,092 | 26,659 | 301,961 | 281,702 | 113,868 | 341,351 | |||||||||||||||||||||||
| 29,665 | 24,335 | 27,750 | 24,336 | 27,751 | 27,751 | 29,282 | 31,079 | |||||||||||||||||||||||
| 406 | — | 406 | — | 406 | 406 | 406 | 407 | |||||||||||||||||||||||
| 5,764 | 5,706 | 8,810 | 5,706 | 11,255 | 6,558 | 6,807 | 14,347 | |||||||||||||||||||||||
| 1,648 | — | 2,831 | — | 2,322 | 2,716 | 2,349 | 2,596 | |||||||||||||||||||||||
| 1,282 | — | 862 | — | 1,226 | 1,340 | 1,603 | 1,401 | |||||||||||||||||||||||
| 25 | — | 4 | — | 8 | 2 | 19 | 34 | |||||||||||||||||||||||
| 3,912 | 914 | 5,113 | 1,068 | 8,397 | 5,707 | 10,101 | 12,039 | |||||||||||||||||||||||
| 1 | — | 1 | — | 3 | 6 | 2 | 1 | |||||||||||||||||||||||
| 18 | — | 16 | — | 39 | 24 | 11 | 22 | |||||||||||||||||||||||
| 2,246 | 431 | 2,461 | 517 | 7,230 | 7,011 | 2,630 | 6,587 | |||||||||||||||||||||||
| 1,054 | 220 | 1,164 | 257 | 3,420 | 3,331 | 1,243 | 3,112 | |||||||||||||||||||||||
| 11,086 | 9,561 | 18,510 | 424 | 18,742 | 18,859 | 13,651 | 30,929 | |||||||||||||||||||||||
| 2,003,843 | 429,852 | 1,120,717 | 839,315 | 7,438,281 | 8,540,997 | 3,752,542 | 9,537,489 | |||||||||||||||||||||||
| (26,424 | ) | (7,130 | ) | (66,068 | ) | (3,339 | ) | (64,804 | ) | (553,684 | ) | (188,653 | ) | (824,391 | ) | |||||||||||||||
| (787 | ) | (4,233 | ) | (1,357 | ) | (977 | ) | (1,804 | ) | (3,143 | ) | (609 | ) | (3,512 | ) | |||||||||||||||
| 1,976,632 | 418,489 | 1,053,292 | 834,999 | 7,371,673 | 7,984,170 | 3,563,280 | 8,709,586 | |||||||||||||||||||||||
| 13,070,375 | 3,135,586 | 4,333,967 | 458,711 | 12,030,617 | (172,493 | ) | 460,378 | 16,782,856 | ||||||||||||||||||||||
| 856,801 | (97,218 | ) | 15,215,857 | 13,626,107 | 79,647,241 | 38,558,916 | 37,122,558 | 132,341,933 | ||||||||||||||||||||||
| — | 24,852 | 176,277 | 176,226 | 3,132,485 | 3,983,203 | 331,714 | 591,702 | |||||||||||||||||||||||
| — | — | — | — | — | — | — | — | |||||||||||||||||||||||
| — | — | — | — | — | — | — | — | |||||||||||||||||||||||
| — | (564,866 | ) | — | — | — | — | — | — | ||||||||||||||||||||||
| 365,579 | 261,632 | — | — | — | (21,394 | ) | — | (1,384,348 | ) | |||||||||||||||||||||
| 1,222,380 | (375,600 | ) | 15,392,134 | 13,802,333 | 82,779,726 | 42,520,725 | 37,454,272 | 131,549,287 | ||||||||||||||||||||||
| (13,493,952 | ) | (714,935 | ) | 16,301,315 | (23,819,846 | ) | 24,984,320 | 62,409,853 | 11,866,404 | 9,744,477 | ||||||||||||||||||||
| — | (112,585 | ) | (204,320 | ) | (65,389 | ) | (1,154,444 | ) | (1,233,599 | ) | (554,851 | ) | 24,898 | |||||||||||||||||
| — | — | — | — | — | — | — | — | |||||||||||||||||||||||
| — | — | — | — | — | — | — | — | |||||||||||||||||||||||
| — | 42,213 | — | — | — | — | — | — | |||||||||||||||||||||||
| 2,499 | (475,896 | ) | — | — | — | (21 | ) | 7 | 677,919 | |||||||||||||||||||||
| (13,491,453 | ) | (1,261,203 | ) | 16,096,995 | (23,885,235 | ) | 23,829,876 | 61,176,233 | 11,311,560 | 10,447,294 | ||||||||||||||||||||
| (12,269,073 | ) | (1,636,803 | ) | 31,489,129 | (10,082,902 | ) | 106,609,602 | 103,696,958 | 48,765,832 | 141,996,581 | ||||||||||||||||||||
| $ | 801,302 | $ | 1,498,783 | $ | 35,823,096 | $ | (9,624,191 | ) | $ | 118,640,219 | $ | 103,524,465 | $ | 49,226,210 | $ | 158,779,437 | ||||||||||||||
See Notes to Financial Statements.
| 131 |
Table of Contents
STATEMENTS OF CHANGES IN NET ASSETS
| Money Market Fund | ||||||||
| For the Six Months Ended 06/30/07 (Unaudited) | For the Year Ended 12/31/06 | |||||||
Operations: | ||||||||
Net investment income | $ | 26,289,640 | $ | 42,093,683 | ||||
Net realized gain (loss) on investment securities, foreign currency transactions and futures transactions | (4,666 | ) | (790 | ) | ||||
Net change in unrealized appreciation (depreciation) on investment securities, foreign currency translations, and futures contracts | — | — | ||||||
Net increase (decrease) in net assets resulting from operations | 26,284,974 | 42,092,893 | ||||||
Dividends and Distributions to Shareholders: | ||||||||
Dividends from net investment income | ||||||||
GS2 shares | (2,669,385 | ) | (4,561,908 | ) | ||||
GS4 shares | (23,409,935 | ) | (37,128,467 | ) | ||||
GS6 shares | (111,480 | ) | (196,811 | ) | ||||
GS8 shares | (99,045 | ) | (206,497 | ) | ||||
Distributions from net realized capital gains | ||||||||
GS2 shares | — | — | ||||||
GS4 shares | — | — | ||||||
GS6 shares | — | — | ||||||
GS8 shares | — | — | ||||||
Return of Capital | ||||||||
GS4 shares | — | — | ||||||
Total dividends and distributions | (26,289,845 | ) | (42,093,683 | ) | ||||
Capital Share Transactions: | ||||||||
Proceeds from shares sold | ||||||||
GS2 shares | 123,038,187 | 79,181,546 | ||||||
GS4 shares | 1,737,403,487 | 2,625,551,003 | ||||||
GS6 shares | 531,008 | 3 | ||||||
GS8 shares | 214,065 | 183,052 | ||||||
Reinvestment of dividends and distributions | ||||||||
GS2 shares | 2,359,964 | 4,122,997 | ||||||
GS4 shares | 11,681,747 | 20,032,228 | ||||||
GS6 shares | 112,139 | 196,806 | ||||||
GS8 shares | 96,906 | 206,490 | ||||||
Total proceeds from shares sold and reinvested | 1,875,437,503 | 2,729,474,125 | ||||||
Value of shares redeemed | ||||||||
GS2 shares | (116,995,304 | ) | (75,848,387 | ) | ||||
GS4 shares | (1,700,579,458 | ) | (2,481,322,504 | ) | ||||
GS6 shares | (1,777 | ) | — | |||||
GS8 shares | (5,768,409 | ) | (77,413 | ) | ||||
Total value of shares redeemed | (1,823,344,948 | ) | (2,557,248,304 | ) | ||||
Net increase (decrease) from capital share transactions (See Footnote 7) | 52,092,555 | 172,225,821 | ||||||
Total increase (decrease) in net assets | 52,087,684 | 172,225,031 | ||||||
Net Assets: | ||||||||
Beginning of Period | 1,041,382,452 | 869,157,421 | ||||||
End of Period* | $ | 1,093,470,136 | $ | 1,041,382,452 | ||||
* Including undistributed (distributions in excess of) net investment income | $ | (205 | ) | $ | — | |||
See Notes to Financial Statements.
| 132 |
Table of Contents
| Low-Duration Bond Fund | Medium-Duration Bond Fund | Extended-Duration Bond Fund | Global Bond Fund | ||||||||||||||||||||||||||
| For the Six Months Ended 06/30/07 (Unaudited) | For the Year Ended 12/31/06 | For the Six Months Ended 06/30/07 (Unaudited) | For the Year Ended 12/31/06 | For the Six Months Ended 06/30/07 (Unaudited) | For the Year Ended 12/31/06 | For the Six Months Ended 06/30/07 (Unaudited) | For the Period 12/29/06- 12/31/06 | ||||||||||||||||||||||
| $ | 17,899,555 | $ | 37,880,031 | $ | 29,508,624 | $ | 51,166,682 | $ | 13,070,375 | $ | 22,113,194 | $ | 3,135,586 | $ | 37,118 | ||||||||||||||
| (494,377) | (7,653,828 | ) | (3,994,334 | ) | (123,182 | ) | 1,222,380 | 7,000,360 | (375,600 | ) | (14,639 | ) | |||||||||||||||||
| (4,384,264) | 5,566,014 | (19,725,495 | ) | (2,260,372 | ) | (13,491,453 | ) | (10,267,607 | ) | (1,261,203 | ) | 26,622 | |||||||||||||||||
| 13,020,914 | 35,792,217 | 5,788,795 | 48,783,128 | 801,302 | 18,845,947 | 1,498,783 | 49,101 | ||||||||||||||||||||||
| (3,590,524) | (6,176,871 | ) | (4,702,111 | ) | (7,048,220 | ) | (2,607,216 | ) | (4,592,657 | ) | — | — | |||||||||||||||||
| (12,656,949) | (31,326,942 | ) | (22,593,606 | ) | (42,144,853 | ) | (9,068,955 | ) | (16,960,882 | ) | (2,333,894 | ) | (37,349 | ) | |||||||||||||||
| �� | (132,641) | (537,130 | ) | (438,526 | ) | (799,560 | ) | (562,754 | ) | (1,130,524 | ) | — | — | ||||||||||||||||
| (97,187) | (248,064 | ) | (131,335 | ) | (295,361 | ) | (148,346 | ) | (377,081 | ) | — | — | |||||||||||||||||
| — | — | — | — | (1,089,726 | ) | (218,937 | ) | — | — | ||||||||||||||||||||
| — | — | — | — | (4,016,550 | ) | (916,112 | ) | — | — | ||||||||||||||||||||
| — | — | — | — | (250,814 | ) | (57,846 | ) | — | — | ||||||||||||||||||||
| — | — | — | — | (88,500 | ) | (20,424 | ) | — | — | ||||||||||||||||||||
| — | — | — | — | — | — | — | (5,039 | ) | |||||||||||||||||||||
| (16,477,301) | (38,289,007 | ) | (27,865,578 | ) | (50,287,994 | ) | (17,832,861 | ) | (24,274,463 | ) | (2,333,894 | ) | (42,388 | ) | |||||||||||||||
| 27,162,119 | 11,679,234 | 29,844,861 | 14,336,480 | 13,135,738 | 7,532,886 | — | — | ||||||||||||||||||||||
| 40,112,526 | 95,576,676 | 64,645,432 | 167,068,043 | 37,094,490 | 124,460,706 | 14,578,000 | 10 | ||||||||||||||||||||||
| 59,560 | 10,173,105 | 67,692 | 8,912 | 28,326 | — | — | — | ||||||||||||||||||||||
| 2,676 | 10,036,153 | 22,980 | 49,857 | 5,133 | 16,629 | — | — | ||||||||||||||||||||||
| 3,563,638 | 6,065,107 | 4,649,062 | 6,832,970 | 3,672,258 | 4,709,175 | — | — | ||||||||||||||||||||||
| 12,655,941 | 31,324,774 | 22,592,478 | 42,143,289 | 13,079,103 | 17,893,535 | 2,333,894 | 42,388 | ||||||||||||||||||||||
| 132,642 | 537,130 | 438,526 | 799,560 | 813,568 | 1,189,044 | — | — | ||||||||||||||||||||||
| 97,187 | 248,064 | 131,335 | 295,361 | 236,846 | 397,744 | — | — | ||||||||||||||||||||||
| 83,786,289 | 165,640,243 | 122,392,366 | 231,534,472 | 68,065,462 | 156,199,719 | 16,911,894 | 42,398 | ||||||||||||||||||||||
| (5,075,938) | (14,483,247 | ) | (3,128,999 | ) | (6,603,831 | ) | (3,196,545 | ) | (7,599,575 | ) | — | — | |||||||||||||||||
| (103,807,458) | (217,968,892 | ) | (134,256,565 | ) | (83,398,997 | ) | (39,162,247 | ) | (65,754,001 | ) | (2,159,550 | ) | — | ||||||||||||||||
| (9,722) | (16,799,428 | ) | (21 | ) | (5,173 | ) | (10 | ) | — | — | — | ||||||||||||||||||
| (5,060,706) | (10,218,770 | ) | (5,388,825 | ) | (8,533 | ) | (5,570,742 | ) | (7,795 | ) | — | — | |||||||||||||||||
| (113,953,824) | (259,470,337 | ) | (142,774,410 | ) | (90,016,534 | ) | (47,929,544 | ) | (73,361,371 | ) | (2,159,550 | ) | — | ||||||||||||||||
| (30,167,535) | (93,830,094 | ) | (20,382,044 | ) | 141,517,938 | 20,135,918 | 82,838,348 | 14,752,344 | 42,398 | ||||||||||||||||||||
| (33,623,922) | (96,326,884 | ) | (42,458,827 | ) | 140,013,072 | 3,104,359 | 77,409,832 | 13,917,233 | 49,111 | ||||||||||||||||||||
| 813,850,120 | 910,177,004 | 1,241,074,857 | 1,101,061,785 | 549,070,654 | 471,660,822 | 104,635,302 | 104,586,191 | ||||||||||||||||||||||
| $ | 780,226,198 | $ | 813,850,120 | $ | 1,198,616,030 | $ | 1,241,074,857 | $ | 552,175,013 | $ | 549,070,654 | $ | 118,552,535 | $ | 104,635,302 | ||||||||||||||
| $ | 1,039,122 | $ | (383,132 | ) | $ | 919,960 | $ | (723,086 | ) | $ | 852,497 | $ | 169,393 | $ | 786,822 | $ | (14,870 | ) | |||||||||||
See Notes to Financial Statements.
| 133 |
Table of Contents
STATEMENTS OF CHANGES IN NET ASSETS
| Equity Index Fund | Real Estate Securities Fund | |||||||||||||||
| For the Six Months Ended 06/30/07 (Unaudited) | For the Year Ended 12/31/06 | For the Six Months Ended 06/30/07 (Unaudited) | For the Period 12/29/06- 12/31/06 | |||||||||||||
Operations: | ||||||||||||||||
Net investment income (loss) | $ | 4,333,967 | $ | 8,129,782 | $ | 458,711 | $ | (10,185 | ) | |||||||
Net realized gain (loss) on investment securities, foreign currency transactions and futures transactions | 15,392,134 | 2,746,207 | 13,802,333 | (32,730 | ) | |||||||||||
Net change in unrealized appreciation (depreciation) on investment securities, foreign currency translations, and futures contracts | 16,096,995 | 62,669,376 | (23,885,235 | ) | 447,558 | |||||||||||
Net increase in net assets resulting from operations | 35,823,096 | 73,545,365 | (9,624,191 | ) | 404,643 | |||||||||||
Dividends and Distributions to Shareholders: | ||||||||||||||||
Dividends from net investment income | ||||||||||||||||
GS2 shares | (1,141,951 | ) | (1,811,027 | ) | — | — | ||||||||||
GS4 shares | (2,982,438 | ) | (5,917,983 | ) | (321,962 | ) | — | |||||||||
GS6 shares | (143,849 | ) | (294,832 | ) | — | — | ||||||||||
GS8 shares | — | (113,746 | ) | — | — | |||||||||||
Distributions from net realized capital gains | ||||||||||||||||
GS2 shares | — | (754,969 | ) | — | — | |||||||||||
GS4 shares | — | (2,752,967 | ) | — | — | |||||||||||
GS6 shares | — | (143,616 | ) | — | — | |||||||||||
GS8 shares | — | (63,092 | ) | — | — | |||||||||||
Total dividends and distributions | (4,268,238 | ) | (11,852,232 | ) | (321,962 | ) | — | |||||||||
Capital Share Transactions: | ||||||||||||||||
Proceeds from shares sold | ||||||||||||||||
GS2 shares | 14,266,996 | 7,932,747 | — | — | ||||||||||||
GS4 shares | 25,535,233 | 44,732,850 | 90,628,091 | 175,910 | ||||||||||||
GS6 shares | 195,831 | 520,858 | — | — | ||||||||||||
GS8 shares | 81,660 | 52,202 | — | — | ||||||||||||
Reinvestment of dividends and distributions | ||||||||||||||||
GS2 shares | 1,141,951 | 2,548,084 | — | — | ||||||||||||
GS4 shares | 2,982,265 | 8,670,638 | — | — | ||||||||||||
GS6 shares | 143,849 | 438,448 | 321,932 | — | ||||||||||||
GS8 shares | — | 176,838 | — | — | ||||||||||||
Total proceeds from shares sold and reinvested | 44,347,785 | 65,072,665 | 90,950,023 | 175,910 | ||||||||||||
Value of shares redeemed | ||||||||||||||||
GS2 shares | (6,935,607 | ) | (5,326,752 | ) | — | — | ||||||||||
GS4 shares | (74,243,958 | ) | (42,290,763 | ) | (70,194,845 | ) | (25,189 | ) | ||||||||
GS6 shares | (2,319,396 | ) | (105,112 | ) | — | — | ||||||||||
GS8 shares | (6,840,747 | ) | (16,915 | ) | — | — | ||||||||||
Total value of shares redeemed | (90,339,708 | ) | (47,739,542 | ) | (70,194,845 | ) | (25,189 | ) | ||||||||
Net increase (decrease) from capital share transactions (See Footnote 7) | (45,991,923 | ) | 17,333,123 | 20,755,178 | 150,721 | |||||||||||
Total increase (decrease) in net assets | (14,437,065 | ) | 79,026,256 | 10,809,025 | 555,364 | |||||||||||
Net Assets: | ||||||||||||||||
Beginning of Period | 561,545,076 | 482,518,820 | 107,035,450 | 106,480,086 | ||||||||||||
End of Period* | $ | 547,108,011 | $ | 561,545,076 | $ | 117,844,475 | $ | 107,035,450 | ||||||||
* Including undistributed (distributions in excess of) net investment income | $ | 105,544 | $ | 39,815 | $ | 136,749 | $ | — | ||||||||
See Notes to Financial Statements.
| 134 |
Table of Contents
| Value Equity Fund | Growth Equity Fund | Small Cap Equity Fund | International Equity Fund | ||||||||||||||||||||||||||
| For the Six Months Ended 06/30/07 (Unaudited) | For the Year Ended 12/31/06 | For the Six Months Ended 06/30/07 (Unaudited) | For the Year Ended 12/31/06 | For the Six Months Ended 06/30/07 (Unaudited) | For the Year Ended 12/31/06 | For the Six Months Ended 06/30/07 (Unaudited) | For the Year Ended 12/31/06 | ||||||||||||||||||||||
| $ | 12,030,617 | $ | 23,255,442 | $ | (172,493 | ) | $ | (1,702,251 | ) | $ | 460,378 | $ | (1,150,662 | ) | $ | 16,782,856 | $ | 20,384,136 | |||||||||||
| 82,779,726 | 147,357,722 | 42,520,725 | 74,339,186 | 37,454,272 | 54,810,682 | 131,549,287 | 155,451,985 | ||||||||||||||||||||||
| 23,829,876 | 90,837,349 | 61,176,233 | (66,891,553 | ) | 11,311,560 | 6,655,443 | 10,447,294 | 121,230,851 | |||||||||||||||||||||
| 118,640,219 | 261,450,513 | 103,524,465 | 5,745,382 | 49,226,210 | 60,315,463 | 158,779,437 | 297,066,972 | ||||||||||||||||||||||
| (2,725,881) | (4,415,960 | ) | — | — | — | — | — | (4,337,809 | ) | ||||||||||||||||||||
| (8,931,864) | (18,405,273 | ) | — | — | — | — | — | (20,582,825 | ) | ||||||||||||||||||||
| (198,603) | (348,342 | ) | — | — | — | — | — | (419,099 | ) | ||||||||||||||||||||
| — | (111,201 | ) | — | — | — | — | — | (114,866 | ) | ||||||||||||||||||||
| (1,831,824) | (26,469,711 | ) | — | — | — | (7,266,322 | ) | — | (22,414,884 | ) | |||||||||||||||||||
| (6,874,105) | (127,117,029 | ) | — | — | — | (38,915,250 | ) | — | (119,856,372 | ) | |||||||||||||||||||
| (160,483) | (2,615,565 | ) | — | — | — | (1,946,822 | ) | — | (2,709,902 | ) | |||||||||||||||||||
| — | (992,929 | ) | — | — | — | (718,391 | ) | — | (889,165 | ) | |||||||||||||||||||
| (20,722,760) | (180,476,010 | ) | — | — | — | (48,846,785 | ) | — | (171,324,922 | ) | |||||||||||||||||||
| 41,725,454 | 11,350,209 | 41,173,836 | 18,448,736 | 11,510,371 | 8,276,686 | 62,651,247 | 16,785,257 | ||||||||||||||||||||||
| 85,927,359 | 55,916,491 | 68,321,906 | 73,453,988 | 31,266,074 | 60,055,857 | 129,515,683 | 100,447,788 | ||||||||||||||||||||||
| 623,027 | 79,937 | 250,435 | 375,355 | 248,181 | 213,366 | 515,870 | 330,919 | ||||||||||||||||||||||
| 180,040 | 269,845 | 82,218 | 97,250 | 66,601 | 127,287 | 179,320 | 159,389 | ||||||||||||||||||||||
| 4,553,766 | 30,795,143 | — | — | — | 7,266,323 | — | 26,683,375 | ||||||||||||||||||||||
| 15,804,874 | 145,514,189 | — | — | — | 38,912,441 | (34 | ) | 140,427,878 | |||||||||||||||||||||
| 359,086 | 2,963,907 | — | — | — | 1,946,822 | — | 3,129,000 | ||||||||||||||||||||||
| — | 1,104,130 | — | — | — | 718,391 | — | 1,004,032 | ||||||||||||||||||||||
| 149,173,606 | 247,993,851 | 109,828,395 | 92,375,329 | 43,091,227 | 117,517,173 | 192,862,086 | 288,967,638 | ||||||||||||||||||||||
| (13,177,107) | (14,490,017 | ) | (8,135,156 | ) | (11,648,012 | ) | (5,216,481 | ) | (10,679,211 | ) | (16,060,797 | ) | (33,456,390 | ) | |||||||||||||||
| (129,838,282) | (129,899,750 | ) | (101,341,968 | ) | (97,743,433 | ) | (43,517,947 | ) | (87,995,931 | ) | (138,573,937 | ) | (217,111,405 | ) | |||||||||||||||
| (739) | (15,502 | ) | (62,775 | ) | (68,887 | ) | (17,502 | ) | (197 | ) | (40,196 | ) | (20,378 | ) | |||||||||||||||
| (7,715,236) | (33,300 | ) | (6,319,878 | ) | (10,826 | ) | (7,120,943 | ) | (30,749 | ) | (8,816,906 | ) | (24,684 | ) | |||||||||||||||
| (150,731,364) | (144,438,569 | ) | (115,859,777 | ) | (109,471,158 | ) | (55,872,873 | ) | (98,706,088 | ) | (163,491,836 | ) | (250,612,857 | ) | |||||||||||||||
| (1,557,758) | 103,555,282 | (6,031,382 | ) | (17,095,829 | ) | (12,781,646 | ) | 18,811,085 | 29,370,250 | 38,354,781 | |||||||||||||||||||
| 96,359,701 | 184,529,785 | 97,493,083 | (11,350,447 | ) | 36,444,564 | 30,279,763 | 188,149,687 | 164,096,831 | |||||||||||||||||||||
| 1,641,355,788 | 1,456,826,003 | 1,540,480,613 | 1,551,831,060 | 576,925,712 | 546,645,949 | 1,486,515,714 | 1,322,418,883 | ||||||||||||||||||||||
| $ | 1,737,715,489 | $ | 1,641,355,788 | $ | 1,637,973,696 | $ | 1,540,480,613 | $ | 613,370,276 | $ | 576,925,712 | $ | 1,674,665,401 | $ | 1,486,515,714 | ||||||||||||||
| $ | 256,225 | $ | 81,956 | $ | (172,493 | ) | $ | — | $ | 460,378 | $ | — | $ | 5,498,169 | $ | (11,284,687 | ) | ||||||||||||
See Notes to Financial Statements.
| 135 |
Table of Contents
FINANCIAL HIGHLIGHTS (Unaudited)
For a Share Outstanding For the Years Ended December 31, unless otherwise indicated
| Net Asset Value, Beginning of Period | Net Investment Income | Realized (Loss) on | Dividends from Net Investment Income | Distributions from Net Realized Capital Gains | Net Asset Value, End of Period | Total Return (2) | Net Assets, End of Period (000) | Ratios to Average Net Assets (1) | Portfolio Turnover Rate (2) | |||||||||||||||||||||||||||||||||||||
| Expenses, Net | Expenses, Including Expense Reduction | Expenses, Before Waivers and Expense Reduction | Investment Income, Net | Investment Income, Excluding Waivers and Expense Reduction | ||||||||||||||||||||||||||||||||||||||||||
Money Market Fund |
| |||||||||||||||||||||||||||||||||||||||||||||
GS2 Class | ||||||||||||||||||||||||||||||||||||||||||||||
2007(3) | $ | 1.00 | $ | 0.03 | $ | — | † | $ | (0.03 | ) | $ | — | $ | 1.00 | 2.56 | % | $ | 108,961 | 0.26 | % | 0.26 | % | 0.26 | % | 5.10 | % | 5.10 | % | N/A | |||||||||||||||||
2006 | 1.00 | 0.05 | — | † | (0.05 | ) | — | 1.00 | 4.92 | 100,559 | 0.26 | 0.26 | 0.26 | 4.82 | 4.82 | N/A | ||||||||||||||||||||||||||||||
2005 | 1.00 | 0.03 | — | † | (0.03 | ) | — | 1.00 | 3.07 | 93,103 | 0.27 | 0.27 | 0.26 | 3.03 | 3.04 | N/A | ||||||||||||||||||||||||||||||
2004 | 1.00 | 0.01 | — | † | (0.01 | ) | — | 1.00 | 1.19 | 61,374 | 0.27 | 0.27 | 0.27 | 1.17 | 1.17 | N/A | ||||||||||||||||||||||||||||||
2003 | 1.00 | 0.01 | — | † | (0.01 | ) | — | † | 1.00 | 1.04 | 63,373 | 0.27 | 0.27 | 0.28 | 0.91 | 0.90 | N/A | |||||||||||||||||||||||||||||
2002 | 1.00 | 0.02 | — | (0.02 | ) | — | † | 1.00 | 1.80 | 5,493 | 0.25 | 0.25 | 0.55 | 1.75 | 1.45 | N/A | ||||||||||||||||||||||||||||||
GS4 Class | ||||||||||||||||||||||||||||||||||||||||||||||
2007(3) | $ | 1.00 | $ | 0.02 | $ | — | † | $ | (0.02 | ) | $ | — | $ | 1.00 | 2.46 | % | $ | 979,084 | 0.45 | % | 0.45 | % | 0.45 | % | 4.91 | % | 4.91 | % | N/A | |||||||||||||||||
2006 | 1.00 | 0.05 | — | † | (0.05 | ) | — | 1.00 | 4.72 | 930,582 | 0.46 | 0.46 | 0.46 | 4.64 | 4.64 | N/A | ||||||||||||||||||||||||||||||
2005 | 1.00 | 0.03 | — | † | (0.03 | ) | — | 1.00 | 2.88 | 766,322 | 0.46 | 0.46 | 0.46 | 2.84 | 2.84 | N/A | ||||||||||||||||||||||||||||||
2004 | 1.00 | 0.01 | — | † | (0.01 | ) | — | 1.00 | 0.99 | 838,087 | 0.46 | 0.46 | 0.45 | 0.98 | 0.99 | N/A | ||||||||||||||||||||||||||||||
2003 | 1.00 | 0.01 | — | † | (0.01 | ) | — | † | 1.00 | 0.85 | 853,062 | 0.45 | 0.45 | 0.45 | 0.84 | 0.84 | N/A | |||||||||||||||||||||||||||||
2002 | 1.00 | 0.02 | — | (0.02 | ) | — | † | 1.00 | 1.60 | 906,302 | 0.45 | 0.44 | 0.50 | 1.58 | 1.52 | N/A | ||||||||||||||||||||||||||||||
GS6 Class | ||||||||||||||||||||||||||||||||||||||||||||||
2007(3) | $ | 1.00 | $ | 0.02 | $ | — | † | $ | (0.02 | ) | $ | — | $ | 1.00 | 2.26 | % | $ | 5,425 | 0.87 | % | 0.87 | % | 0.89 | % | 4.50 | % | 4.48 | % | N/A | |||||||||||||||||
2006 | 1.00 | 0.04 | — | † | (0.04 | ) | — | 1.00 | 4.29 | 4,784 | 0.87 | 0.87 | 1.09 | 4.21 | 3.99 | N/A | ||||||||||||||||||||||||||||||
2005 | 1.00 | 0.02 | — | † | (0.02 | ) | — | 1.00 | 2.50 | 4,587 | 0.83 | 0.83 | 1.43 | 2.47 | 1.87 | N/A | ||||||||||||||||||||||||||||||
2004 | 1.00 | 0.01 | — | † | (0.01 | ) | — | 1.00 | 0.73 | 4,476 | 0.72 | 0.72 | 1.09 | 0.68 | 0.31 | N/A | ||||||||||||||||||||||||||||||
2003 | 1.00 | 0.01 | — | † | (0.01 | ) | — | † | 1.00 | 0.57 | 8,035 | 0.73 | 0.73 | 0.91 | 0.61 | 0.43 | N/A | |||||||||||||||||||||||||||||
2002 | 1.00 | 0.01 | — | (0.01 | ) | — | † | 1.00 | 1.38 | 16,538 | 0.65 | 0.65 | 0.77 | 1.35 | 1.23 | N/A | ||||||||||||||||||||||||||||||
Low-Duration Bond Fund |
| |||||||||||||||||||||||||||||||||||||||||||||
GS2 Class | ||||||||||||||||||||||||||||||||||||||||||||||
2007(3) | $ | 8.89 | $ | 0.20 | # | $ | (0.05 | ) | $ | (0.25 | ) | $ | — | $ | 8.79 | 1.70 | % | $ | 130,155 | 0.45 | % | 0.45 | % | 0.48 | % | 4.61 | % | 4.58 | % | 108 | % | |||||||||||||||
2006 | 9.06 | 0.38 | # | (0.03 | ) | (0.52 | ) | — | 8.89 | 3.94 | 105,991 | 0.45 | 0.45 | 0.47 | 4.22 | 4.20 | 168 | |||||||||||||||||||||||||||||
2005 | 9.32 | 0.30 | # | (0.15 | ) | (0.41 | ) | — | † | 9.06 | 1.60 | 104,681 | 0.45 | 0.45 | 0.48 | 3.30 | 3.27 | 196 | ||||||||||||||||||||||||||||
2004 | 9.51 | 0.21 | # | (0.07 | ) | (0.28 | ) | (0.05 | ) | 9.32 | 1.47 | 59,777 | 0.45 | 0.45 | 0.49 | 2.22 | 2.18 | 289 | ||||||||||||||||||||||||||||
2003 | 9.76 | 0.22 | # | 0.03 | (0.37 | ) | (0.13 | ) | 9.51 | 2.61 | 53,726 | 0.45 | 0.45 | 0.50 | 2.30 | 2.25 | 179 | |||||||||||||||||||||||||||||
2002 | 9.85 | 0.37 | # | 0.19 | (0.50 | ) | (0.15 | ) | 9.76 | 5.89 | 6,320 | 0.46 | 0.45 | 0.78 | 3.71 | 3.38 | 182 | |||||||||||||||||||||||||||||
GS4 Class | ||||||||||||||||||||||||||||||||||||||||||||||
2007(3) | $ | 12.63 | $ | 0.28 | # | $ | (0.07 | ) | $ | (0.24 | ) | $ | — | $ | 12.60 | 1.67 | % | $ | 644,789 | 0.61 | % | 0.61 | % | 0.67 | % | 4.43 | % | 4.37 | % | 108 | % | |||||||||||||||
2006 | 12.66 | 0.58 | # | (0.11 | ) | (0.50 | ) | — | 12.63 | 3.75 | 697,687 | 0.61 | 0.61 | 0.66 | 4.05 | 4.00 | 168 | |||||||||||||||||||||||||||||
2005 | 12.87 | 0.40 | # | (0.22 | ) | (0.39 | ) | — | † | 12.66 | 1.39 | 789,077 | 0.61 | 0.61 | 0.67 | 3.13 | 3.07 | 196 | ||||||||||||||||||||||||||||
2004 | 13.00 | 0.27 | # | (0.09 | ) | (0.26 | ) | (0.05 | ) | 12.87 | 1.38 | 789,866 | 0.61 | 0.61 | 0.67 | 2.06 | 2.00 | 289 | ||||||||||||||||||||||||||||
2003 | 13.16 | 0.32 | # | — | (0.35 | ) | (0.13 | ) | 13.00 | 2.45 | 727,265 | 0.61 | 0.61 | 0.67 | 2.43 | 2.37 | 179 | |||||||||||||||||||||||||||||
2002 | 13.06 | 0.46 | # | 0.27 | (0.48 | ) | (0.15 | ) | 13.16 | 5.71 | 763,987 | 0.62 | 0.61 | 0.72 | 3.50 | 3.39 | 182 | |||||||||||||||||||||||||||||
GS6 Class | ||||||||||||||||||||||||||||||||||||||||||||||
2007(3) | $ | 8.93 | $ | 0.18 | # | $ | (0.05 | ) | $ | (0.23 | ) | $ | — | $ | 8.83 | 1.43 | % | $ | 5,282 | 1.00 | % | 1.00 | % | 1.31 | % | 4.04 | % | 3.73 | % | 108 | % | |||||||||||||||
2006 | 9.09 | 0.60 | # | (0.30 | ) | (0.46 | ) | — | 8.93 | 3.43 | 5,159 | 1.00 | 1.00 | 1.05 | 3.63 | 3.58 | 168 | |||||||||||||||||||||||||||||
2005 | 9.36 | 0.25 | # | (0.16 | ) | (0.36 | ) | — | † | 9.09 | 0.96 | 11,380 | 0.94 | 0.94 | 1.05 | 2.74 | 2.63 | 196 | ||||||||||||||||||||||||||||
2004 | 9.54 | 0.17 | # | (0.06 | ) | (0.24 | ) | (0.05 | ) | 9.36 | 1.17 | 16,087 | 0.85 | 0.85 | 0.90 | 1.82 | 1.77 | 289 | ||||||||||||||||||||||||||||
2003 | 9.79 | 0.21 | # | — | (0.33 | ) | (0.13 | ) | 9.54 | 2.20 | 22,452 | 0.85 | 0.84 | 0.87 | 2.18 | 2.15 | 179 | |||||||||||||||||||||||||||||
2002 | 9.86 | 0.33 | # | 0.22 | (0.47 | ) | (0.15 | ) | 9.79 | 5.70 | 20,985 | 0.79 | 0.79 | 0.93 | 3.35 | 3.21 | 182 | |||||||||||||||||||||||||||||
| † | Amount represents less than $0.005 per share. |
| # | Calculated using the average shares outstanding method. |
| (1) | Annualized. |
| (2) | Not annualized. |
| (3) | For the six months ended June 30, 2007. |
| (4) | Inception date was December 29, 2006. |
See Notes to Financial Statements.
| 136 |
Table of Contents
| Net Asset Value, Beginning of Period | Net Investment Income | Realized and Unrealized Gain (Loss) on Investments | Dividends from Net Investment Income | Distributions from Net Realized Capital Gains | Return of Capital | Net Asset Value, End of Period | Total Return (2) | Net Assets, End of Period (000) | Ratios to Average Net Assets (1) | Portfolio Turnover Rate (2) | ||||||||||||||||||||||||||||||||||||||||
| Expenses, Net | Expenses, Including Expense Reduction | Expenses, Before Waivers and Expense Reduction | Investment Income, Net | Investment Income, Excluding Waivers and Expense Reduction | ||||||||||||||||||||||||||||||||||||||||||||||
Medium-Duration Bond Fund |
| |||||||||||||||||||||||||||||||||||||||||||||||||
GS2 Class | ||||||||||||||||||||||||||||||||||||||||||||||||||
2007(3) | $ | 8.52 | $ | 0.21 | # | $ | (0.17 | ) | $ | (0.29 | ) | $ | — | $ | — | $ | 8.27 | 0.45 | % | $ | 140,314 | 0.50 | % | 0.50 | % | 0.48 | % | 4.95 | % | 4.97 | % | 216 | % | |||||||||||||||||
2006 | 8.71 | 0.39 | # | (0.01 | ) | (0.57 | ) | — | — | 8.52 | 4.50 | 113,051 | 0.50 | 0.50 | 0.50 | 4.60 | 4.60 | 440 | ||||||||||||||||||||||||||||||||
2005 | 9.06 | 0.34 | # | (0.10 | ) | (0.53 | ) | (0.06 | ) | — | 8.71 | 2.62 | 100,800 | 0.50 | 0.50 | 0.53 | 3.84 | 3.81 | 465 | |||||||||||||||||||||||||||||||
2004 | 9.24 | 0.28 | # | 0.21 | (0.45 | ) | (0.22 | ) | — | 9.06 | 5.34 | 52,865 | 0.50 | 0.50 | 0.53 | 2.97 | 2.94 | 372 | ||||||||||||||||||||||||||||||||
2003 | 9.47 | 0.28 | # | 0.36 | (0.58 | ) | (0.29 | ) | — | 9.24 | 6.80 | 46,521 | 0.50 | 0.50 | 0.55 | 2.96 | 2.91 | 458 | ||||||||||||||||||||||||||||||||
2002 | 9.65 | 0.46 | # | 0.40 | (0.67 | ) | (0.37 | ) | — | 9.47 | 9.25 | 7,218 | 0.51 | 0.50 | 0.82 | 4.77 | 4.45 | 543 | ||||||||||||||||||||||||||||||||
GS4 Class | ||||||||||||||||||||||||||||||||||||||||||||||||||
2007(3) | $ | 13.42 | $ | 0.32 | # | $ | (0.27 | ) | $ | (0.28 | ) | $ | — | $ | — | $ | 13.19 | 0.38 | % | $ | 1,044,496 | 0.62 | % | 0.62 | % | 0.67 | % | 4.81 | % | 4.76 | % | 216 | % | |||||||||||||||||
2006 | 13.40 | 0.60 | # | (0.03 | ) | (0.55 | ) | — | — | 13.42 | 4.37 | 1,108,958 | 0.62 | 0.62 | 0.69 | 4.48 | 4.41 | 440 | ||||||||||||||||||||||||||||||||
2005 | 13.63 | 0.50 | # | (0.16 | ) | (0.51 | ) | (0.06 | ) | — | 13.40 | 2.50 | 981,935 | 0.62 | 0.62 | 0.71 | 3.71 | 3.62 | 465 | |||||||||||||||||||||||||||||||
2004 | 13.58 | 0.39 | # | 0.31 | (0.43 | ) | (0.22 | ) | — | 13.63 | 5.20 | 853,377 | 0.62 | 0.62 | 0.72 | 2.85 | 2.75 | 372 | ||||||||||||||||||||||||||||||||
2003 | 13.54 | 0.46 | # | 0.43 | (0.56 | ) | (0.29 | ) | — | 13.58 | 6.62 | 741,743 | 0.62 | 0.62 | 0.71 | 3.37 | 3.28 | 458 | ||||||||||||||||||||||||||||||||
2002 | 13.37 | 0.62 | # | 0.57 | (0.65 | ) | (0.37 | ) | — | 13.54 | 9.15 | 767,926 | 0.63 | 0.62 | 0.77 | 4.62 | 4.47 | 543 | ||||||||||||||||||||||||||||||||
GS6 Class | ||||||||||||||||||||||||||||||||||||||||||||||||||
2007(3) | $ | 8.59 | $ | 0.19 | # | $ | (0.18 | ) | $ | (0.27 | ) | $ | — | $ | — | $ | 8.33 | 0.11 | % | $ | 13,807 | 1.00 | % | 1.00 | % | 0.96 | % | 4.43 | % | 4.47 | % | 216 | % | |||||||||||||||||
2006 | 8.78 | 0.35 | # | (0.02 | ) | (0.52 | ) | — | — | 8.59 | 3.89 | 13,709 | 1.05 | 1.05 | 1.05 | 4.05 | 4.05 | 440 | ||||||||||||||||||||||||||||||||
2005 | 9.12 | 0.29 | # | (0.09 | ) | (0.48 | ) | (0.06 | ) | — | 8.78 | 2.18 | 13,195 | 1.00 | 1.00 | 1.06 | 3.29 | 3.21 | 465 | |||||||||||||||||||||||||||||||
2004 | 9.30 | 0.24 | # | 0.21 | (0.41 | ) | (0.22 | ) | — | 9.12 | 4.88 | 16,524 | 0.90 | 0.90 | 0.95 | 2.61 | 2.56 | 372 | ||||||||||||||||||||||||||||||||
2003 | 9.53 | 0.29 | # | 0.31 | (0.54 | ) | (0.29 | ) | — | 9.30 | 6.33 | 22,640 | 0.90 | 0.90 | 0.96 | 3.03 | 2.97 | 458 | ||||||||||||||||||||||||||||||||
2002 | 9.70 | 0.42 | # | 0.41 | (0.63 | ) | (0.37 | ) | — | 9.53 | 8.90 | 19,289 | 0.90 | 0.90 | 1.03 | 4.37 | 4.24 | 543 | ||||||||||||||||||||||||||||||||
Extended-Duration Bond Fund |
| |||||||||||||||||||||||||||||||||||||||||||||||||
GS2 Class | ||||||||||||||||||||||||||||||||||||||||||||||||||
2007(3) | $ | 8.13 | $ | 0.20 | # | $ | (0.18 | ) | $ | (0.30 | ) | $ | (0.13 | ) | $ | — | $ | 7.72 | 0.20 | % | $ | 69,997 | 0.55 | % | 0.55 | % | 0.55 | % | 4.95 | % | 4.95 | % | 4 | % | ||||||||||||||||
2006 | 8.44 | 0.40 | # | (0.03 | ) | (0.65 | ) | (0.03 | ) | — | 8.13 | 4.75 | 59,916 | 0.57 | 0.57 | 0.57 | 4.91 | 4.91 | 100 | |||||||||||||||||||||||||||||||
2005 | 8.90 | 0.44 | # | 0.04 | (0.68 | ) | (0.26 | ) | — | 8.44 | 5.65 | 57,372 | 0.56 | 0.56 | 0.57 | 4.90 | 4.89 | 38 | ||||||||||||||||||||||||||||||||
2004 | 9.23 | 0.47 | # | 0.27 | (0.76 | ) | (0.31 | ) | — | 8.90 | 8.49 | 32,309 | 0.57 | 0.57 | 0.57 | 5.17 | 5.17 | 66 | ||||||||||||||||||||||||||||||||
2003 | 9.64 | 0.54 | # | 0.51 | (0.79 | ) | (0.67 | ) | — | 9.23 | 11.32 | 29,004 | 0.59 | 0.59 | 0.60 | 5.49 | 5.48 | 121 | ||||||||||||||||||||||||||||||||
2002 | 9.84 | 0.65 | 0.29 | (0.90 | ) | (0.24 | ) | — | 9.64 | 10.27 | 6,506 | 0.64 | 0.64 | 0.88 | 6.47 | 6.23 | 45 | |||||||||||||||||||||||||||||||||
GS4 Class | ||||||||||||||||||||||||||||||||||||||||||||||||||
2007(3) | $ | 14.81 | $ | 0.35 | # | $ | (0.32 | ) | $ | (0.29 | ) | $ | (0.13 | ) | $ | — | $ | 14.42 | 0.16 | % | $ | 466,416 | 0.73 | % | 0.73 | % | 0.74 | % | 4.76 | % | 4.75 | % | 4 | % | ||||||||||||||||
2006 | 14.82 | 0.69 | # | (0.04 | ) | (0.63 | ) | (0.03 | ) | — | 14.81 | 4.56 | 467,877 | 0.73 | 0.73 | 0.76 | 4.75 | 4.72 | 100 | |||||||||||||||||||||||||||||||
2005 | 14.93 | 0.71 | # | 0.10 | (0.66 | ) | (0.26 | ) | — | 14.82 | 5.54 | 393,851 | 0.73 | 0.73 | 0.76 | 4.72 | 4.69 | 38 | ||||||||||||||||||||||||||||||||
2004 | 14.78 | 0.75 | # | 0.45 | (0.74 | ) | (0.31 | ) | — | 14.93 | 8.37 | 399,459 | 0.73 | 0.73 | 0.75 | 5.01 | 4.99 | 66 | ||||||||||||||||||||||||||||||||
2003 | 14.62 | 0.83 | # | 0.77 | (0.77 | ) | (0.67 | ) | — | 14.78 | 11.19 | 385,110 | 0.73 | 0.73 | 0.75 | 5.46 | 5.44 | 121 | ||||||||||||||||||||||||||||||||
2002 | 14.37 | 0.90 | 0.47 | (0.88 | ) | (0.24 | ) | — | 14.62 | 10.03 | 401,198 | 0.73 | 0.73 | 0.82 | 6.29 | 6.20 | 45 | |||||||||||||||||||||||||||||||||
GS6 Class | ||||||||||||||||||||||||||||||||||||||||||||||||||
2007(3) | $ | 8.13 | $ | 0.18 | # | $ | (0.18 | ) | $ | (0.28 | ) | $ | (0.13 | ) | $ | — | $ | 7.72 | (0.01 | )% | $ | 15,761 | 1.00 | % | 1.00 | % | 1.00 | % | 4.48 | % | 4.48 | % | 4 | % | ||||||||||||||||
2006 | 8.44 | 0.36 | # | (0.03 | ) | (0.61 | ) | (0.03 | ) | — | 8.13 | 4.09 | 15,730 | 1.08 | 1.08 | 1.08 | 4.39 | 4.39 | 100 | |||||||||||||||||||||||||||||||
2005 | 8.89 | 0.39 | # | 0.05 | (0.63 | ) | (0.26 | ) | — | 8.44 | 5.19 | 15,100 | 1.09 | 1.09 | 1.09 | 4.37 | 4.37 | 38 | ||||||||||||||||||||||||||||||||
2004 | 9.22 | 0.44 | # | 0.27 | (0.73 | ) | (0.31 | ) | — | 8.89 | 8.05 | 24,043 | 0.98 | 0.98 | 0.96 | 4.76 | 4.78 | 66 | ||||||||||||||||||||||||||||||||
2003 | 9.63 | 0.52 | # | 0.50 | (0.76 | ) | (0.67 | ) | — | 9.22 | 10.95 | 27,978 | 0.93 | 0.93 | 0.94 | 5.25 | 5.24 | 121 | ||||||||||||||||||||||||||||||||
2002 | 9.83 | 0.62 | 0.29 | (0.87 | ) | (0.24 | ) | — | 9.63 | 9.93 | 24,812 | 0.91 | 0.91 | 1.03 | 6.18 | 6.06 | 45 | |||||||||||||||||||||||||||||||||
Global Bond Fund |
| �� | ||||||||||||||||||||||||||||||||||||||||||||||||
GS4 Class | ||||||||||||||||||||||||||||||||||||||||||||||||||
2007 | $ | 10.12 | $ | 0.29 | $ | (0.14 | ) | $ | (0.22 | ) | $ | — | $ | — | $ | 10.05 | 1.43 | % | $ | 118,553 | 0.77 | % | 0.77 | % | 0.76 | % | 5.73 | % | 5.74 | % | 123 | % | ||||||||||||||||||
2006(4) | 10.12 | — | † | — | † | — | † | — | — | † | 10.12 | 0.04 | 104,635 | 1.04 | 1.04 | 1.42 | 4.32 | 3.94 | — | |||||||||||||||||||||||||||||||
See Notes to Financial Statements.
| 137 |
Table of Contents
FINANCIAL HIGHLIGHTS (Unaudited) (Continued)
For a Share Outstanding For the Years Ended December 31, unless otherwise indicated
| Ratios to Average Net Assets (1) | ||||||||||||||||||||||||||||||||||||||||||||||||||
| Net Asset Value, Beginning of Period | Net Investment Income | Realized and Unrealized Gain (Loss) on Investments | Dividends from Net Investment Income | Distributions from Net Realized Capital Gains | Excess Distribution/ Return of Capital | Net Asset Value, End of Period | Total Return(2) | Net Assets, End of Period (000) | Expenses, Net | Expenses, Including Expense Reduction | Expenses, Before Waivers and Expense Reduction | Investment Income/ (Loss), Net | Investment Income/ (Loss), Excluding Waivers and Expense Reduction | Portfolio Turnover Rate (2) | ||||||||||||||||||||||||||||||||||||
Equity Index Fund |
| |||||||||||||||||||||||||||||||||||||||||||||||||
GS2 Class | ||||||||||||||||||||||||||||||||||||||||||||||||||
2007(3) | $ | 11.08 | $ | 0.10 | # | $ | 0.66 | $ | (0.15 | ) | $ | — | $ | — | $ | 11.69 | 6.90 | % | $ | 87,753 | 0.22 | % | 0.22 | % | 0.22 | % | 1.73 | % | 1.73 | % | 2 | % | ||||||||||||||||||
2006 | 9.96 | 0.18 | # | 1.33 | (0.28 | ) | (0.11 | ) | — | 11.08 | 15.37 | 74,634 | 0.23 | 0.23 | 0.23 | 1.74 | 1.74 | 5 | ||||||||||||||||||||||||||||||||
2005 | 9.78 | 0.16 | # | 0.30 | (0.24 | ) | (0.04 | ) | — | 9.96 | 4.80 | 62,214 | 0.23 | 0.23 | 0.24 | 1.63 | 1.62 | 6 | ||||||||||||||||||||||||||||||||
2004 | 9.08 | 0.16 | # | 0.81 | (0.27 | ) | — | — | † | 9.78 | 10.77 | 36,148 | 0.25 | 0.25 | 0.23 | 1.75 | 1.77 | 2 | ||||||||||||||||||||||||||||||||
2003 | 7.22 | 0.12 | # | 1.91 | (0.17 | ) | — | — | 9.08 | 28.19 | 33,009 | 0.25 | 0.25 | 0.28 | 1.46 | 1.43 | 2 | |||||||||||||||||||||||||||||||||
2002 | 9.58 | 0.14 | (2.29 | ) | (0.18 | ) | (0.03 | ) | — | 7.22 | (22.57 | ) | 4,737 | 0.25 | 0.25 | 0.60 | 1.40 | 1.05 | 3 | |||||||||||||||||||||||||||||||
GS4 Class | ||||||||||||||||||||||||||||||||||||||||||||||||||
2007(3) | $ | 19.17 | $ | 0.15 | # | $ | 1.15 | $ | (0.14 | ) | $ | — | $ | — | $ | 20.33 | 6.77 | % | $ | 446,300 | 0.40 | % | 0.40 | % | 0.42 | % | 1.55 | % | 1.53 | % | 2 | % | ||||||||||||||||||
2006 | 16.97 | 0.28 | # | 2.28 | (0.25 | ) | (0.11 | ) | — | 19.17 | 15.19 | 466,429 | 0.40 | 0.40 | 0.43 | 1.57 | 1.54 | 5 | ||||||||||||||||||||||||||||||||
2005 | 16.47 | 0.24 | # | 0.51 | (0.21 | ) | (0.04 | ) | — | 16.97 | 4.61 | 402,865 | 0.40 | 0.40 | 0.43 | 1.46 | 1.43 | 6 | ||||||||||||||||||||||||||||||||
2004 | 15.12 | 0.25 | # | 1.35 | (0.25 | ) | — | — | 16.47 | 10.60 | 417,962 | 0.40 | 0.40 | 0.41 | 1.60 | 1.59 | 2 | |||||||||||||||||||||||||||||||||
2003 | 11.93 | 0.18 | # | 3.16 | (0.15 | ) | — | — | 15.12 | 28.03 | 382,067 | 0.40 | 0.40 | 0.44 | 1.33 | 1.29 | 2 | |||||||||||||||||||||||||||||||||
2002 | 15.64 | 0.17 | (3.69 | ) | (0.16 | ) | (0.03 | ) | — | 11.93 | (22.59 | ) | 295,261 | 0.40 | 0.40 | 0.51 | 1.21 | 1.10 | 3 | |||||||||||||||||||||||||||||||
GS6 Class | ||||||||||||||||||||||||||||||||||||||||||||||||||
2007(3) | $ | 11.15 | $ | 0.08 | # | $ | 0.66 | $ | (0.13 | ) | $ | — | $ | — | $ | 11.76 | 6.65 | % | $ | 13,055 | 0.60 | % | 0.60 | % | 0.70 | % | 1.35 | % | 1.25 | % | 2 | % | ||||||||||||||||||
2006 | 10.02 | 0.14 | # | 1.34 | (0.24 | ) | (0.11 | ) | — | 11.15 | 14.97 | 14,233 | 0.60 | 0.60 | 0.78 | 1.37 | 1.19 | 5 | ||||||||||||||||||||||||||||||||
2005 | 9.83 | 0.13 | # | 0.31 | (0.21 | ) | (0.04 | ) | — | 10.02 | 4.54 | 12,019 | 0.56 | 0.56 | 0.82 | 1.30 | 1.04 | 6 | ||||||||||||||||||||||||||||||||
2004 | 9.14 | 0.13 | # | 0.81 | (0.25 | ) | — | — | 9.83 | 10.37 | 11,502 | 0.45 | 0.45 | 0.72 | 1.41 | 1.14 | 2 | |||||||||||||||||||||||||||||||||
2003 | 7.26 | 0.10 | # | 1.93 | (0.15 | ) | — | — | 9.14 | 28.09 | 17,395 | 0.45 | 0.45 | 0.73 | 1.28 | 1.00 | 2 | |||||||||||||||||||||||||||||||||
2002 | 9.63 | 0.13 | (2.31 | ) | (0.16 | ) | (0.03 | ) | — | 7.26 | (22.71 | ) | 12,890 | 0.45 | 0.45 | 0.81 | 1.21 | 0.85 | 3 | |||||||||||||||||||||||||||||||
Real Estate Securities Fund |
| |||||||||||||||||||||||||||||||||||||||||||||||||
GS4 Class | ||||||||||||||||||||||||||||||||||||||||||||||||||
2007 | $ | 12.55 | $ | 0.04 | # | $ | (0.71 | ) | $ | (0.03 | ) | $ | — | $ | — | $ | 11.85 | (5.32 | )% | $ | 117,844 | 1.16 | % | 1.16 | % | 1.15 | % | 0.63 | % | 0.64 | % | 69 | % | |||||||||||||||||
2006(4) | 12.50 | — | † | 0.05 | — | — | — | 12.55 | 0.40 | 107,035 | 1.33 | 1.33 | 1.88 | (1.16 | ) | (1.71 | ) | — | ||||||||||||||||||||||||||||||||
Value Equity Fund |
| |||||||||||||||||||||||||||||||||||||||||||||||||
GS2 Class | ||||||||||||||||||||||||||||||||||||||||||||||||||
2007(3) | $ | 10.62 | $ | 0.09 | # | $ | 0.70 | $ | (0.14 | ) | $ | (0.09 | ) | $ | — | $ | 11.18 | 7.44 | % | $ | 226,564 | 0.71 | % | 0.71 | % | 0.71 | % | 1.61 | % | 1.61 | % | 22 | % | |||||||||||||||||
2006 | 10.75 | 0.18 | # | 1.78 | (0.28 | ) | (1.81 | ) | — | 10.62 | 18.76 | 181,940 | 0.72 | 0.71 | 0.72 | 1.70 | 1.69 | 76 | ||||||||||||||||||||||||||||||||
2005 | 11.44 | 0.20 | # | 0.65 | (0.28 | ) | (1.26 | ) | — | 10.75 | 7.40 | 156,279 | 0.73 | 0.72 | 0.73 | 1.72 | 1.71 | 54 | ||||||||||||||||||||||||||||||||
2004 | 9.94 | 0.17 | # | 1.59 | (0.26 | ) | — | † | — | 11.44 | 17.83 | 75,123 | 0.75 | 0.74 | 0.74 | 1.64 | 1.64 | 56 | ||||||||||||||||||||||||||||||||
2003 | 7.77 | 0.14 | # | 2.26 | (0.23 | ) | — | — | 9.94 | 31.09 | 69,991 | 0.76 | 0.75 | 0.78 | 1.62 | 1.59 | 54 | |||||||||||||||||||||||||||||||||
2002 | 9.64 | 0.16 | (1.80 | ) | (0.23 | ) | — | — | † | 7.77 | (17.22 | ) | 5,265 | 0.76 | 0.72 | 1.06 | 1.77 | 1.43 | 70 | |||||||||||||||||||||||||||||||
GS4 Class | ||||||||||||||||||||||||||||||||||||||||||||||||||
2007(3) | $ | 18.65 | $ | 0.14 | # | $ | 1.21 | $ | (0.12 | ) | $ | (0.09 | ) | $ | — | $ | 19.79 | 7.25 | % | $ | 1,491,478 | 0.90 | % | 0.90 | % | 0.90 | % | 1.42 | % | 1.42 | % | 22 | % | |||||||||||||||||
2006 | 17.50 | 0.28 | # | 2.93 | (0.25 | ) | (1.81 | ) | — | 18.65 | 18.64 | 1,434,773 | 0.90 | 0.89 | 0.91 | 1.52 | 1.50 | 76 | ||||||||||||||||||||||||||||||||
2005 | 17.74 | 0.28 | # | 0.99 | (0.25 | ) | (1.26 | ) | — | 17.50 | 7.13 | 1,279,940 | 0.90 | 0.89 | 0.93 | 1.53 | 1.49 | 54 | ||||||||||||||||||||||||||||||||
2004 | 15.28 | 0.24 | # | 2.45 | (0.23 | ) | — | — | 17.74 | 17.71 | 1,305,669 | 0.90 | 0.89 | 0.92 | 1.49 | 1.46 | 56 | |||||||||||||||||||||||||||||||||
2003 | 11.85 | 0.21 | # | 3.43 | (0.21 | ) | — | — | 15.28 | 30.84 | 1,152,116 | 0.90 | 0.88 | 0.94 | 1.59 | 1.53 | 54 | |||||||||||||||||||||||||||||||||
2002 | 14.57 | 0.21 | (2.73 | ) | (0.20 | ) | — | — | † | 11.85 | (17.37 | ) | 938,583 | 0.90 | 0.87 | 0.98 | 1.57 | 1.46 | 70 | |||||||||||||||||||||||||||||||
GS6 Class | ||||||||||||||||||||||||||||||||||||||||||||||||||
2007(3) | $ | 10.55 | $ | 0.06 | # | $ | 0.68 | $ | (0.11 | ) | $ | (0.09 | ) | $ | — | $ | 11.09 | 7.08 | % | $ | 19,674 | 1.22 | % | 1.22 | % | 1.17 | % | 1.10 | % | 1.15 | % | 22 | % | |||||||||||||||||
2006 | 10.69 | 0.12 | # | 1.78 | (0.23 | ) | (1.81 | ) | — | 10.55 | 18.21 | 17,798 | 1.24 | 1.23 | 1.24 | 1.18 | 1.17 | 76 | ||||||||||||||||||||||||||||||||
2005 | 11.39 | 0.14 | # | 0.64 | (0.22 | ) | (1.26 | ) | — | 10.69 | 6.78 | 15,003 | 1.25 | 1.24 | 1.27 | 1.17 | 1.14 | 54 | ||||||||||||||||||||||||||||||||
2004 | 9.90 | 0.12 | # | 1.59 | (0.22 | ) | — | — | 11.39 | 17.35 | 17,968 | 1.15 | 1.14 | 1.22 | 1.20 | 1.12 | 56 | |||||||||||||||||||||||||||||||||
2003 | 7.75 | 0.11 | # | 2.23 | (0.19 | ) | — | — | 9.90 | 30.46 | 19,680 | 1.15 | 1.13 | 1.20 | 1.33 | 1.26 | 54 | |||||||||||||||||||||||||||||||||
2002 | 9.61 | 0.15 | (1.82 | ) | (0.19 | ) | — | — | † | 7.75 | (17.48 | ) | 13,987 | 1.15 | 1.11 | 1.29 | 1.38 | 1.20 | 70 | |||||||||||||||||||||||||||||||
| † | Amount represents less than $0.005 per share. |
| # | Calculated using the average shares outstanding method. |
| (1) | Annualized. |
| (2) | Not annualized. |
| (3) | For the six months ended June 30, 2007. |
| (4) | Inception date was December 29, 2006. |
See Notes to Financial Statements.
| 138 |
Table of Contents
| Ratios to Average Net Assets (1) | |||||||||||||||||||||||||||||||||||||||||||||
| Net Asset Value, Beginning of Period | Net Investment Income/ (Loss) | Realized and Unrealized Gain (Loss) on Investments | Dividends from Net Investment Income | Distributions from Net Realized Capital Gains | Net Asset Value, End of Period | Total Return(2) | Net Assets, End of Period (000) | Expenses, Net | Expenses, Including Expense Reduction | Expenses, Before Waivers and Expense Reduction | Investment Income/ (Loss), Net | Investment Income/ (Loss), Excluding Waivers and Expense Reduction | Portfolio Turnover Rate (2) | ||||||||||||||||||||||||||||||||
Growth Equity Fund |
| ||||||||||||||||||||||||||||||||||||||||||||
GS2 Class | |||||||||||||||||||||||||||||||||||||||||||||
2007(3) | $ | 11.23 | $ | 0.01 | $ | 0.75 | $ | — | $ | — | $ | 11.99 | 6.77 | % | $ | 226,853 | 0.90 | % | 0.90 | % | 0.90 | % | 0.09 | % | 0.09 | % | 24 | % | |||||||||||||||||
2006 | 11.18 | — | † | 0.05 | — | — | 11.23 | 0.45 | 179,852 | 0.89 | 0.88 | 0.90 | 0.00 | (0.02 | ) | 48 | |||||||||||||||||||||||||||||
2005 | 10.29 | (0.03 | ) | 0.92 | — | — | 11.18 | 8.65 | 172,118 | 0.87 | 0.86 | 0.89 | (0.10 | ) | (0.13 | ) | 49 | ||||||||||||||||||||||||||||
2004 | 9.16 | — | † | 1.13 | — | — | 10.29 | 12.34 | 84,177 | 0.87 | 0.86 | 0.89 | 0.01 | (0.02 | ) | 56 | |||||||||||||||||||||||||||||
2003 | 7.07 | (0.01 | ) | 2.10 | — | — | 9.16 | 29.56 | 79,547 | 0.81 | 0.79 | 0.85 | (0.03 | ) | (0.09 | ) | 77 | ||||||||||||||||||||||||||||
2002 | 9.83 | 0.01 | (2.77 | ) | — | — | 7.07 | (28.08 | ) | 4,553 | 0.78 | 0.75 | 1.14 | 0.09 | (0.30 | ) | 41 | ||||||||||||||||||||||||||||
GS4 Class | |||||||||||||||||||||||||||||||||||||||||||||
2007(3) | $ | 17.77 | $ | — | † | $ | 1.20 | $ | — | $ | — | $ | 18.97 | 6.75 | % | $ | 1,398,469 | 1.02 | % | 1.02 | % | 1.09 | % | (0.03 | )% | (0.10 | )% | 24 | % | ||||||||||||||||
2006 | 17.71 | (0.02 | ) | 0.08 | — | — | 17.77 | 0.34 | 1,343,147 | 1.01 | 1.00 | 1.09 | (0.12 | ) | (0.21 | ) | 48 | ||||||||||||||||||||||||||||
2005 | 16.33 | (0.04 | ) | 1.42 | — | — | 17.71 | 8.45 | 1,362,599 | 0.99 | 0.98 | 1.08 | (0.22 | ) | (0.32 | ) | 49 | ||||||||||||||||||||||||||||
2004 | 14.55 | (0.02 | ) | 1.80 | — | — | 16.33 | 12.23 | 1,405,754 | 0.99 | 0.98 | 1.08 | (0.11 | ) | (0.21 | ) | 56 | ||||||||||||||||||||||||||||
2003 | 11.23 | (0.01 | ) | 3.33 | — | — | 14.55 | 29.56 | 1,285,223 | 0.92 | 0.90 | 1.01 | (0.07 | ) | (0.18 | ) | 77 | ||||||||||||||||||||||||||||
2002 | 15.63 | (0.01 | ) | (4.39 | ) | — | — | 11.23 | (28.15 | ) | 1,049,709 | 0.90 | 0.88 | 1.02 | (0.05 | ) | (0.19 | ) | 41 | ||||||||||||||||||||||||||
GS6 Class | |||||||||||||||||||||||||||||||||||||||||||||
2007(3) | $ | 10.99 | $ | (0.02 | ) | $ | 0.73 | $ | — | $ | — | $ | 11.70 | 6.46 | % | $ | 12,651 | 1.40 | % | 1.40 | % | 1.40 | % | (0.41 | )% | (0.41 | )% | 24 | % | ||||||||||||||||
2006 | 10.99 | (0.05 | ) | 0.05 | — | — | 10.99 | — | 11,706 | 1.41 | 1.40 | 1.48 | (0.52 | ) | (0.60 | ) | 48 | ||||||||||||||||||||||||||||
2005 | 10.17 | (0.09 | ) | 0.91 | — | — | 10.99 | 8.06 | 11,406 | 1.34 | 1.33 | 1.47 | (0.57 | ) | (0.71 | ) | 49 | ||||||||||||||||||||||||||||
2004 | 9.08 | (0.07 | ) | 1.16 | — | — | 10.17 | 12.00 | 13,780 | 1.24 | 1.23 | 1.44 | (0.42 | ) | (0.63 | ) | 56 | ||||||||||||||||||||||||||||
2003 | 7.03 | (0.02 | ) | 2.07 | — | — | 9.08 | 29.16 | 18,099 | 1.17 | 1.15 | 1.33 | (0.33 | ) | (0.51 | ) | 77 | ||||||||||||||||||||||||||||
2002 | 9.81 | (0.02 | ) | (2.76 | ) | — | — | 7.03 | (28.34 | ) | 12,503 | 1.15 | 1.12 | 1.36 | (0.28 | ) | (0.52 | ) | 41 | ||||||||||||||||||||||||||
Small Cap Equity Fund |
| ||||||||||||||||||||||||||||||||||||||||||||
GS2 Class | |||||||||||||||||||||||||||||||||||||||||||||
2007(3) | $ | 11.33 | $ | 0.02 | # | $ | 0.98 | $ | — | $ | — | $ | 12.33 | 8.83 | % | $ | 79,547 | 1.08 | % | 1.08 | % | 1.08 | % | 0.29 | % | 0.29 | % | 53 | % | ||||||||||||||||
2006 | 11.40 | (0.01 | )# | 1.32 | — | (1.38 | ) | 11.33 | 11.40 | 66,695 | 1.06 | 1.05 | 1.06 | (0.05 | ) | (0.06 | ) | 86 | |||||||||||||||||||||||||||
2005 | 12.51 | (0.01 | )# | 0.84 | — | (1.94 | ) | 11.40 | 6.48 | 62,009 | 1.10 | 1.09 | 1.07 | (0.06 | ) | (0.04 | ) | 97 | |||||||||||||||||||||||||||
2004 | 11.52 | (0.01 | ) | 1.74 | — | (0.74 | ) | 12.51 | 15.04 | 28,639 | 1.18 | 1.15 | 1.20 | (0.10 | ) | (0.15 | ) | 148 | |||||||||||||||||||||||||||
2003 | 7.88 | (0.03 | ) | 3.67 | — | — | 11.52 | 46.19 | 25,415 | 1.18 | 1.12 | 1.27 | (0.26 | ) | (0.41 | ) | 131 | ||||||||||||||||||||||||||||
2002 | 10.12 | (0.01 | ) | (2.23 | ) | — | — | 7.88 | (22.13 | ) | 4,869 | 1.18 | 1.11 | 1.60 | (0.12 | ) | (0.61 | ) | 160 | ||||||||||||||||||||||||||
GS4 Class | |||||||||||||||||||||||||||||||||||||||||||||
2007(3) | $ | 16.00 | $ | 0.01 | # | $ | 1.38 | $ | — | $ | — | $ | 17.39 | 8.69 | % | $ | 514,629 | 1.21 | % | 1.21 | % | 1.28 | % | 0.16 | % | 0.09 | % | 53 | % | ||||||||||||||||
2006 | 15.61 | (0.03 | )# | 1.80 | — | (1.38 | ) | 16.00 | 11.27 | 486,358 | 1.21 | 1.20 | 1.25 | (0.20 | ) | (0.25 | ) | 86 | |||||||||||||||||||||||||||
2005 | 16.48 | (0.03 | )# | 1.10 | — | (1.94 | ) | 15.61 | 6.37 | 463,367 | 1.22 | 1.21 | 1.27 | (0.19 | ) | (0.26 | ) | 97 | |||||||||||||||||||||||||||
2004 | 14.99 | (0.02 | ) | 2.25 | — | (0.74 | ) | 16.48 | 14.89 | 432,763 | 1.25 | 1.22 | 1.37 | (0.16 | ) | (0.31 | ) | 148 | |||||||||||||||||||||||||||
2003 | 10.25 | (0.04 | ) | 4.78 | — | — | 14.99 | 46.24 | 357,703 | 1.25 | 1.19 | 1.43 | (0.34 | ) | (0.58 | ) | 131 | ||||||||||||||||||||||||||||
2002 | 13.18 | (0.02 | ) | (2.91 | ) | — | — | 10.25 | (22.23 | ) | 232,992 | 1.25 | 1.19 | 1.51 | (0.19 | ) | (0.51 | ) | 160 | ||||||||||||||||||||||||||
GS6 Class | |||||||||||||||||||||||||||||||||||||||||||||
2007(3) | $ | 11.00 | $ | (0.01 | )# | $ | 0.95 | $ | — | $ | — | $ | 11.94 | 8.55 | % | $ | 19,194 | 1.57 | % | 1.57 | % | 1.54 | % | (0.20 | )% | (0.17 | )% | 53 | % | ||||||||||||||||
2006 | 11.16 | (0.07 | )# | 1.29 | — | (1.38 | ) | 11.00 | 10.84 | 17,483 | 1.58 | 1.57 | 1.57 | (0.57 | ) | (0.57 | ) | 86 | |||||||||||||||||||||||||||
2005 | 12.34 | (0.06 | )# | 0.82 | — | (1.94 | ) | 11.16 | 6.00 | 15,577 | 1.57 | 1.56 | 1.59 | (0.53 | ) | (0.56 | ) | 97 | |||||||||||||||||||||||||||
2004 | 11.41 | (0.08 | ) | 1.75 | — | (0.74 | ) | 12.34 | 14.66 | 17,875 | 1.50 | 1.47 | 1.69 | (0.43 | ) | (0.65 | ) | 148 | |||||||||||||||||||||||||||
2003 | 7.83 | (0.04 | ) | 3.62 | — | — | 11.41 | 45.72 | 22,520 | 1.50 | 1.44 | 1.70 | (0.59 | ) | (0.85 | ) | 131 | ||||||||||||||||||||||||||||
2002 | 10.09 | (0.04 | ) | (2.22 | ) | — | — | 7.83 | (22.40 | ) | 12,878 | 1.50 | 1.43 | 1.82 | (0.44 | ) | (0.83 | ) | 160 | ||||||||||||||||||||||||||
See Notes to Financial Statements.
| 139 |
Table of Contents
FINANCIAL HIGHLIGHTS (Unaudited) (Continued)
For a Share Outstanding For the Years Ended December 31, unless otherwise indicated
| Ratios to Average Net Assets (1) | ||||||||||||||||||||||||||||||||||||||||||||||||||
| Net Asset Value, Beginning of Period | Net Investment Income | Realized and Unrealized Gain (Loss) on Investments | Dividends from Net Investment Income | Distributions from Net Realized Capital Gains | Return of Capital | Net Asset Value, End of Period | Total Return(2) | Net Assets, End of Period (000) | Expenses, Net | Expenses, Including Expense Reduction | Expenses, Before Waivers and Expense Reduction | Investment Income, Net | Investment Income, Excluding Waivers and Expense Reduction | Portfolio Turnover Rate (2) | ||||||||||||||||||||||||||||||||||||
International Equity Fund |
| |||||||||||||||||||||||||||||||||||||||||||||||||
GS2 Class | ||||||||||||||||||||||||||||||||||||||||||||||||||
2007(3) | $ | 15.80 | $ | 0.19 | # | $ | 1.51 | $ | — | $ | — | $ | — | $ | 17.50 | 10.76 | % | $ | 271,677 | 0.97 | % | 0.97 | % | 1.06 | % | 2.35 | % | 2.26 | % | 32 | % | |||||||||||||||||||
2006 | 14.71 | 0.25 | 3.23 | (0.35 | ) | (2.04 | ) | — | 15.80 | 23.78 | 199,989 | 0.97 | 0.96 | 1.10 | 1.60 | 1.46 | 26 | |||||||||||||||||||||||||||||||||
2005 | 12.93 | 0.29 | 1.99 | (0.30 | ) | (0.20 | ) | — | 14.71 | 17.66 | 176,819 | 0.97 | 0.95 | 1.12 | 1.59 | 1.43 | 30 | |||||||||||||||||||||||||||||||||
2004 | 11.06 | 0.16 | 1.93 | (0.22 | ) | — | — | 12.93 | 18.93 | 87,300 | 0.97 | 0.95 | 1.13 | 1.32 | 1.14 | 33 | ||||||||||||||||||||||||||||||||||
2003 | 8.26 | 0.08 | # | 2.90 | (0.18 | ) | — | — | 11.06 | 36.06 | 50,390 | 0.97 | 0.95 | 1.14 | 0.86 | 0.67 | 33 | |||||||||||||||||||||||||||||||||
2002 | 9.50 | 0.11 | (1.22 | ) | (0.13 | ) | — | — | † | 8.26 | (11.72 | ) | 5,416 | 0.96 | 0.93 | 1.43 | 1.29 | 0.79 | 30 | |||||||||||||||||||||||||||||||
GS4 Class | ||||||||||||||||||||||||||||||||||||||||||||||||||
2007(3) | $ | 19.09 | $ | 0.21 | # | $ | 1.82 | $ | — | $ | — | $ | — | $ | 21.12 | 10.63 | % | $ | 1,376,131 | 1.15 | % | 1.15 | % | 1.25 | % | 2.15 | % | 2.05 | % | 32 | % | |||||||||||||||||||
2006 | 17.37 | 0.26 | 3.82 | (0.32 | ) | (2.04 | ) | — | 19.09 | 23.58 | 1,254,839 | 1.15 | 1.14 | 1.29 | 1.43 | 1.28 | 26 | |||||||||||||||||||||||||||||||||
2005 | 15.20 | 0.23 | 2.41 | (0.27 | ) | (0.20 | ) | — | 17.37 | 17.39 | 1,120,234 | 1.15 | 1.13 | 1.31 | 1.42 | 1.24 | 30 | |||||||||||||||||||||||||||||||||
2004 | 12.96 | 0.17 | 2.26 | (0.19 | ) | — | — | 15.20 | 18.80 | 1,072,556 | 1.15 | 1.13 | 1.31 | 1.22 | 1.04 | 33 | ||||||||||||||||||||||||||||||||||
2003 | 9.66 | 0.15 | # | 3.31 | (0.16 | ) | — | — | 12.96 | 35.81 | 920,664 | 1.15 | 1.13 | 1.31 | 1.39 | 1.21 | 33 | |||||||||||||||||||||||||||||||||
2002 | 11.09 | 0.11 | (1.43 | ) | (0.11 | ) | — | — | † | 9.66 | (11.94 | ) | 698,704 | 1.15 | 1.12 | 1.35 | 1.00 | 0.77 | 30 | |||||||||||||||||||||||||||||||
GS6 Class | ||||||||||||||||||||||||||||||||||||||||||||||||||
2007(3) | $ | 15.59 | $ | 0.15 | # | $ | 1.48 | $ | — | $ | — | $ | — | $ | 17.22 | 10.46 | % | $ | 26,857 | 1.45 | % | 1.45 | % | 1.51 | % | 1.85 | % | 1.79 | % | 32 | % | |||||||||||||||||||
2006 | 14.56 | 0.18 | 3.17 | (0.28 | ) | (2.04 | ) | — | 15.59 | 23.14 | 23,877 | 1.47 | 1.46 | 1.60 | 1.10 | 0.96 | 26 | |||||||||||||||||||||||||||||||||
2005 | 12.80 | 0.13 | 2.06 | (0.23 | ) | (0.20 | ) | — | 14.56 | 17.15 | 19,123 | 1.45 | 1.43 | 1.64 | 1.11 | 0.91 | 30 | |||||||||||||||||||||||||||||||||
2004 | 10.95 | 0.12 | 1.90 | (0.17 | ) | — | — | 12.80 | 18.52 | 19,551 | 1.35 | 1.33 | 1.58 | 1.06 | 0.81 | 33 | ||||||||||||||||||||||||||||||||||
2003 | 8.19 | 0.10 | # | 2.80 | (0.14 | ) | — | — | 10.95 | 35.47 | 20,434 | 1.36 | 1.34 | 1.50 | 1.14 | 0.98 | 33 | |||||||||||||||||||||||||||||||||
2002 | 9.43 | 0.06 | (1.21 | ) | (0.09 | ) | — | — | † | 8.19 | (12.18 | ) | 14,078 | 1.37 | 1.34 | 1.64 | 0.88 | 0.58 | 30 | |||||||||||||||||||||||||||||||
| † | Amount represents less than $0.005 per share. |
| # | Calculated using the average shares outstanding method. |
| (1) | Annualized. |
| (2) | Not annualized. |
| (3) | For the six months ended June 30, 2007. |
See Notes to Financial Statements.
| 140 |
Table of Contents
NOTES TO FINANCIAL STATEMENTS (Unaudited)
1. DESCRIPTION OF THE FUNDS
GuideStone Funds (the “Trust”) was organized as a Delaware statutory trust on March 2, 2000. The Trust has established twenty-four series (each a “Fund” and together, the “Funds”). Each Fund is a diversified, open-end management investment company, registered under the Investment Company Act of 1940, as amended (the “1940 Act”). The MyDestination 2005, MyDestination 2015, MyDestination 2025, MyDestination 2035 and MyDestination 2045 Funds commenced operations on December 29, 2006.
The MyDestination 2005 Fund, MyDestination 2015 Fund, MyDestination 2025 Fund, MyDestination 2035 Fund and MyDestination 2045 Fund are each referred to as a “Date Target Fund” and together are referred to as the “Date Target Funds.” The Flexible Income Fund, Growth & Income Fund, Capital Opportunities Fund, Global Equity Fund, Flexible Income Fund I, Growth & Income Fund I, Capital Opportunities Fund I and Global Equity Fund I are each referred to as a “Blended Fund” and together are referred to as the “Blended Funds.” The remaining Funds are each referred to as a “Select Fund” and are together referred to as the “Select Funds.” The Low-Duration Bond Fund, Medium-Duration Bond Fund, Extended-Duration Bond Fund and Global Bond Fund are together referred to as the “Bond Funds.” The Equity Index Fund, Real Estate Securities Fund, Value Equity Fund, Growth Equity Fund, Small Cap Equity Fund, and International Equity Fund are together referred to as the “Equity Funds.” The Money Market Fund is referred to as the “Money Market Fund.”
There are three classes of shares issued by the Funds —the GS2 Class, the GS4 Class and the GS6 Class, except for the Global Bond Fund and the Real Estate Securities Fund, which issued the GS4 Class only, and the Date Target Funds, which issued the GS4 Class and the GS6 Class only. All classes of shares have identical voting, dividend and liquidation rights. The distribution fee (class specific expense) differs among classes. Income, expenses (other than class specific expenses) and realized and unrealized gains or losses on investments are allocated to each class of shares based upon its relative net assets.
Effective June 1, 2007, GS8 Class shares were no longer offered in any of the GuideStone Funds. GS8 Class shareholders redeemed or exchanged their shares for GS6 Class shares on June 1.
Each Fund is a separate mutual fund with its own investment objective, strategies and risks. The Select Funds invest directly in particular types of fixed income obligations, stocks and other investments. The Blended and Date Target Funds primarily invest in a different mix of the Select Funds to meet a specified investment strategy. The Blended and Date Target Funds are commonly referred to as “Fund of Funds”.
2. SIGNIFICANT ACCOUNTING POLICIES
The following significant accounting policies are in conformity with generally accepted accounting principles in the United States of America which requires management to make estimates and assumptions that affect the reported amounts of assets and liabilities and disclosures of contingent assets and liabilities at the date of the financial statements and the reported amounts of income and expenses during the reporting period. Actual results could differ from those estimates.
a. Valuation of Securities
The Funds (except the Money Market Fund) each value securities traded on national securities exchanges or included in national market systems at the last quoted sale price, or official close price, on the principal exchange on which they were traded, or, in the absence of any sale or official close price, at the closing bid price. Securities which are primarily traded on foreign exchanges are generally valued at the closing values of such securities on their respective exchanges, except that when an occurrence subsequent to the time when the foreign security is valued is likely to have changed such value, then the fair value of those securities will be determined through procedures established by or under the direction of the Board of Trustees. Non-exchange
| 141 |
Table of Contents
traded securities for which an over-the-counter quotation is readily available are valued at the last quoted bid price. Debt securities, excluding asset-backed and mortgage-backed securities, are valued at the mean of the last bid and asked prices available. Asset-backed and mortgage-backed securities are valued at the last bid price. Options and warrants for which the primary market is a national securities exchange are valued at the last sale price on the exchange on which they are traded, or, in the absence of any sale, at the closing bid price. Options and warrants not traded on a national securities exchange are valued at the last quoted bid price. Short-term securities maturing in more than 60 days from the valuation date are valued at the mean of the last bid and asked prices; those maturing in 60 days or less are valued at amortized cost. Futures contracts are valued at the closing settlement price on the exchange on which they are primarily traded. Forward foreign exchange contracts are valued based upon closing exchange rates from each respective foreign market. Swap agreements are valued daily based upon the terms specific to each agreement with its counterparty. To the extent available, valuations of portfolio securities are provided by independent pricing services approved by the Board of Trustees. Debt securities are valued on the basis of broker quotations or valuations provided by a pricing service which may use a matrix, formula or other objective method that takes into consideration market indices, matrices, yield curves and other specific adjustments. Certain fixed income securities are valued by the sub-adviser using various methodologies. Securities for which market quotations are not readily available are valued at fair value according to methods established in good faith by the Board of Trustees.
For securities that principally trade on a foreign market or exchange, a significant gap in time can exist between the time of a particular security’s last trade and the time at which a Fund calculates its net asset value. The closing prices of such securities may no longer reflect their market value at the time the Fund calculates its net asset value if an event that could materially affect the value of those securities (a “Significant Event”) has occurred between the time of the security’s last close and the time that the Fund calculates its net asset value. A Significant Event may relate to a single issuer or to an entire market sector. If a Fund becomes aware of a Significant Event that has occurred with respect to a security or group of securities after the closing of the exchange or market on which the security or securities principally trade, but before the time at which the Fund calculates its net asset value, a Valuation Committee meeting may be called. The Trust uses Interactive Data (“ID”) as a third party fair valuation vendor. ID provides a fair value for foreign equity securities held by the Trust based on certain factors and methodologies applied by ID in the event that there is movement in the U.S. market that exceeds a specific threshold established by the Valuation Committee in consultation with, and approved by, the Trustees. Such methodologies generally involve tracking valuation correlations between the U.S. market and each non-U.S. security. As part of the valuation procedures a “confidence interval” is used, when the threshold is exceeded, to determine the level of correlation between the value of a foreign equity security and movements in the U.S. market before a particular security will be fair valued. In the event that the threshold established by the Committee is exceeded on a specific day, the Trust will typically value non-U.S. equity securities in its portfolio that exceed the applicable confidence interval based upon the fair values provided by ID.
The Money Market Fund uses the amortized cost method, which approximates market value, to determine the value of its portfolio securities.
The Blended and Date Target Funds value their investments in the underlying Select Funds daily at the closing net asset value of each respective Select Fund.
b. Repurchase Agreements
Each Fund may agree to purchase securities from financial institutions subject to the seller’s agreement to repurchase them at a mutually agreed upon date and price. It is the Fund’s policy that repurchase agreements are fully collateralized by U.S. Treasury and Government Agency securities. All collateral is held by the Fund’s custodian bank or a bank with which the custodian bank has entered into a subcustodian agreement, or is segregated in the Federal Reserve Book Entry System. In connection with transactions in repurchase agreements, if the seller defaults and the value of the collateral declines, or if the seller enters an insolvency proceeding, realization of the collateral by the Fund may be delayed or limited.
| 142 |
Table of Contents
c. Derivative Financial Instruments
The Funds may engage in various portfolio strategies to seek to increase its return by hedging its portfolio against adverse movements in the equity, debt and currency markets. Losses may arise due to changes in the value of the contract if the counterparty does not perform under the contract. The Funds, in their normal course of business, may enter into contracts that contain a variety of representations and warranties, and which provide general indemnifications. The Funds’ exposure may include future claims that may be made against the Funds that have not yet occurred. However, based on experience, the Funds expect the risk of loss to be remote.
Financial Futures Contracts — The Funds (except the Money Market Fund) may purchase or sell financial futures contracts and the options on such futures contracts for the purpose of hedging risk on existing securities, the intended purchase of securities or to gain market exposure on cash balances. Financial futures contracts are contracts for the delivery of securities at a specified future date at an agreed upon price or yield. Upon entering into a contract, the Funds deposit and maintain as collateral such initial margin as required by the exchange on which the transaction is effected.
Pursuant to the contract, the Funds agree to pay to or receive from the broker an amount of cash equal to the daily fluctuation in the value of the contract. Such payments or receipts are known as variation margin and are recorded by the Funds as unrealized gains or losses until the contract is closed or settled.
Risks of entering into futures contracts include the possibility that there will be an imperfect price correlation between the futures and the underlying securities. Second, it is possible that a lack of liquidity for futures contracts could exist in the secondary market, resulting in an inability to close a futures position prior to its maturity date. Third, the purchase of a futures contract involves the risk that a Fund could lose more than the original margin deposit required to initiate a futures transaction.
Options — Certain Funds are authorized to write and purchase put and call options. The risk in writing a call option is that the Funds give up the opportunity for profit if the market price of the security increases. The risk in writing a put option is that the Funds may incur a loss if the market price of the security decreases and the option is exercised. The risk in purchasing an option is that the Funds pay a premium whether or not the option is exercised. The Funds also have the additional risk of being unable to enter into a closing transaction at an acceptable price if a liquid secondary market does not exist. The Funds also may write over-the-counter options where completing the obligation depends upon the credit standing of the other party and this party’s ability to perform. Option contracts also involve the risk that they may not work as intended due to unanticipated developments in market conditions or other causes.
Options purchased are recorded as an asset and written options are recorded as liabilities to the extent of premiums paid or received. Each Fund will realize a gain or loss when the option transaction expires or closes. When an option is exercised, the proceeds on sales for a written call option, the purchase cost for a written put option or the cost of a security for a purchased put or call option is adjusted by the amount of the premium received or paid.
Certain Funds may write swaption contracts to manage exposure to fluctuations in interest rates and to enhance portfolio yield. Swaption contracts written by the Funds represent an option that gives the purchaser the right, but not the obligation, to enter into a previously agreed upon swap contract on a future date. If a written call swaption is exercised, the writer will enter a swap
| 143 |
Table of Contents
and is obligated to pay the fixed rate and receive a floating rate in exchange. If a written put swaption is exercised, the writer will enter a swap and is obligated to pay the floating rate and receive a fixed rate in exchange. Swaptions are marked to market daily based upon quotations from market makers. When a Fund writes a swaption, the premium received is recorded as a liability and is subsequently adjusted to the current market value of the swaption.
Entering into a swaption contract involves, to varying degrees, the elements of credit, market and interest rate risk in excess of the amounts reported in the Statement of Assets and Liabilities, associated with both option contracts and swap contracts. The Funds bear the market risk arising from any change in index values or interest rates.
Forward Foreign Exchange Contracts — Certain Funds may enter into forward foreign currency exchange contracts to hedge against adverse exchange rate fluctuation to the U.S. dollar or between different foreign currencies in connection with either specific security transactions or portfolio positions. Each contract is valued daily and the change in value is recorded as an unrealized gain or loss. When the contract is closed, a realized gain or loss is recorded equal to the difference between the opening value and the closing value of the contract. The Funds could be exposed to risk if the counterparties to the contracts are unable to meet the terms of the contract and from unanticipated movements in the value of a foreign currency relative to the U.S. dollar.
Foreign Currency Options and Futures — The International Equity Fund, Small Cap Equity Fund and the Bond Funds may also enter into futures contracts on foreign currencies and related options on transactions as a short or long hedge against possible variations in foreign exchange rates.
TBAs — The Bond Funds and the Small Cap Equity Fund may enter into “TBA” (to be announced) purchase commitments to purchase securities for a fixed price at a future date, typically not exceeding 45 days. TBAs may be considered securities in themselves, and involve a risk of loss if the value of the security to be purchased declines prior to settlement date. This risk is in addition to the risk of decline in each Fund’s other assets. Unsettled TBAs are valued at the current market value of the underlying securities, according to the procedures described under “Valuation of Securities” above.
Dollar Rolls — During the six months ended June 30, 2007, the Trust entered into dollar roll transactions, pursuant to which they sell a mortgage-backed TBA or security and simultaneously purchase a similar, but not identical, TBA with the same issuer, rate and terms. The Funds may execute a “roll” to obtain better underlying mortgage securities or to increase yield. The Funds account for dollar roll transactions as purchases and sales, which has the effect of increasing their portfolio turnover rates. Risks associated with dollar rolls are that actual mortgages received by the Funds may be less favorable than those anticipated or that counterparties may fail to perform under the terms of the contracts.
Swap Agreements — Each Select Fund may enter into swap agreements. The Equity Funds may enter into equity swap contracts, the Bond Funds and the Small Cap Equity Fund may enter into interest rate and credit default swaps, the International Equity and Bond Funds may enter into currency swaps and each Select Fund may enter into total return swaps.
Swap agreements are the exchange of one security or asset for another. A swap may be entered into in order to, among other things, change the maturity of a fund’s portfolio, to protect a fund’s value from changes in interest rates, to expose a fund to a different security or market, or to help a fund achieve a strategy relative to an index or other benchmark. By entering into a swap agreement, a fund is exposed to the risk of unanticipated movements in interest rates or in the value of an underlying security or index, or that the
| 144 |
Table of Contents
counterparty will not fulfill its obligation under the agreement. Credit default swaps involve the payment of amounts based on a specified rate multiplied by a notional amount as well as upon an event of default. In connection with these agreements, securities may be set aside as collateral by the Fund’s custodian.
d. Foreign Currency Translations
Securities and other assets and liabilities denominated in foreign currencies are translated daily into U.S. dollars. Foreign currency amounts related to the purchase or sale of securities and income and expenses are translated at the exchange rate on the transaction date. The effect of changes in foreign exchange rates on realized and unrealized security gains or losses is reflected as a component of such gains or losses. In the statement of operations, net realized gains or losses from foreign currency transactions, if any, may arise from sales of foreign currency, closed forward contracts, exchange gains or losses realized between the trade date and settlement date on securities transactions, and other translation gains or losses on dividends, interest income and foreign withholding taxes.
e. Dividends and Distributions to Shareholders
Dividends from net investment income for the Money Market Fund are declared daily and paid monthly. Dividends from net investment income for the Bond Funds are declared and paid monthly. Dividends from net investment income, if any, for the Equity Index Fund, Real Estate Securities Fund, Growth Equity Fund and Value Equity Fund are declared and paid semi-annually. Dividends from net investment income, if any, for the Small Cap Equity Fund, International Equity Fund, the Blended Funds and the Date Target Funds are declared and paid annually. Net realized capital gains, if any, will be distributed at least annually by each of the Funds. Dividends and distributions to shareholders are recorded on the ex-dividend date.
f. Security Transactions, Income and Realized Gains and Losses
Security transactions are accounted for on the date securities are purchased or sold (the trade date). Dividend income is recognized on the ex-dividend date and interest income is accrued daily, including the amortization of market premium and the accretion of market discount. Realized gains and losses from security transactions are identified on an identified cost basis.
g. Expenses
Expenses arising in connection with a Fund are charged directly to that Fund. Expenses common to all Funds of the Trust are generally allocated to each Fund in proportion to their relative net assets. Each class of shares bears its pro-rata portion of expenses attributable to its class, except that each class separately bears expenses related specifically to that class, such as printing, transfer agent, service and distribution fees.
h. REITs
The Real Estate Securities Fund invests substantial assets in real estate investment trusts (REITs) that involve risks not associated with investing in stocks. Risks include declines in the value of real estate, general and economic conditions, changes in the value of the underlying property and defaults by borrowers. The value of assets in the real estate industry may go through cycles of relative underperformance and outperformance in comparison to equity securities markets in general.
Dividend income is recorded using management’s estimate of the income included in distributions received from REIT investments. The actual amounts of income, return of capital, and capital gains are only determined by each REIT after its fiscal year-end, and may differ from the estimated amount.
i. Short Sales
A short sale is a transaction in which a Fund sells a security it does not own. The Low-Duration Bond, Medium-Duration Bond and Small Cap Equity Funds will occasionally enter into a short sale to initiate a dollar roll transaction. The Fund’s obligation to replace the security borrowed and sold short will be fully collateralized at all times by cash equivalents deposited in an account with the Fund’s custodian. If the price of the security sold short increases between the time of the short sale and the time the Fund replaces the borrowed security, the Fund will realize a loss, and if the price declines during the period, the Fund will realize a gain. Any realized gain will be decreased, and any realized loss increased, by the amount of transaction costs.
| 145 |
Table of Contents
At June 30, 2007, the value of securities sold short in the Low-Duration Bond Fund and the Medium-Duration Bond Fund amounted to $989,063 and $12,434,998, respectively.
j. Loan Participations
Loan participations typically represent direct participation in a loan to a corporate borrower, and generally are offered by banks or other financial institutions or lending syndicates. The Bond Funds and the Small Cap Equity Fund may participate in such syndications, or can buy part of a loan, becoming a part lender. When purchasing loan participations, a Fund assumes the credit risk associated with the corporate borrower and may assume the credit risk associated with an interposed bank or other financial intermediary.
The Bond Funds and the Small Cap Equity Fund invest in loan participations with credit quality comparable to that of issuers of its securities investments. Indebtedness of companies whose creditworthiness is poor involves substantially greater risks, and may be highly speculative.
3. FEES AND OTHER TRANSACTIONS WITH AFFILIATES
a. Investment Advisory Fees
Pursuant to a separate investment advisory agreement, GuideStone Capital Management (“GSCM” or “Investment Advisor”) acts as the Investment Advisor to the Funds. As Investment Advisor it supervises the investments of the Funds and for such services is paid a fee.
GSCM and the Trust have entered into sub-advisory agreements with various sub-advisers to manage each Select Fund’s investments. Under the general supervision of GSCM, the sub-advisers make the day-to-day investment decisions for the Select Funds and for such services each sub-adviser receives a fee from the Funds.
The advisory fees paid to GSCM and aggregate sub-advisory fees paid to the sub-advisers, listed at the end of this report, are computed daily based upon the net assets of each Fund. The actual advisory and sub-advisory fees accrued during the six months ended June 30, 2007, based upon average daily net assets, were as follows:
Fund | Advisory Fees | Sub-Adviser Fees | |||
MyDestination 2005 | 0.10% | — | |||
MyDestination 2015 | 0.10% | — | |||
MyDestination 2025 | 0.10% | — | |||
MyDestination 2035 | 0.10% | — | |||
MyDestination 2045 | 0.10% | — | |||
Flexible Income | 0.10% | — | |||
Growth & Income | 0.10% | — | |||
Capital Opportunities | 0.10% | — | |||
Global Equity | 0.10% | — | |||
Flexible Income I | 0.10% | — | |||
Growth & Income I | 0.10% | — | |||
Capital Opportunities I | 0.10% | — | |||
Global Equity I | 0.10% | — | |||
Money Market | 0.14% | 0.07 | % | ||
Low-Duration Bond | 0.20% | 0.21 | % | ||
Medium-Duration Bond | 0.23% | 0.20 | % | ||
Extended-Duration Bond | 0.27% | 0.21 | % | ||
Global Bond | 0.21% | 0.20 | % | ||
Equity Index | 0.14% | 0.02 | % | ||
Real Estate Securities | 0.30% | 0.58 | % | ||
Value Equity | 0.43% | 0.24 | % | ||
Growth Equity | 0.48% | 0.38 | % | ||
Small Cap Equity | 0.30% | 0.71 | % | ||
International Equity | 0.47% | 0.47 | % |
| 146 |
Table of Contents
For the six months ended June 30, 2007, advisory fees and waivers for each Fund were as follows:
| Gross Advisory Fee | Waiver/ Reimbursements | Net Advisory Fee (Reimbursement) | |||||||||
MyDestination 2005 | $ | 8,209 | $ | (63,999 | ) | $ | (55,790 | ) | |||
MyDestination 2015 | 21,669 | (53,222 | ) | (31,553 | ) | ||||||
MyDestination 2025 | 12,669 | (60,313 | ) | (47,644 | ) | ||||||
MyDestination 2035 | 5,217 | (66,309 | ) | (61,092 | ) | ||||||
MyDestination 2045 | 2,611 | (68,571 | ) | (65,960 | ) | ||||||
Flexible Income | 156,666 | (63,185 | ) | 93,481 | |||||||
Growth & Income | 678,857 | (11,451 | ) | 667,406 | |||||||
Capital Opportunities | 558,801 | (18,714 | ) | 540,087 | |||||||
Global Equity | 512,967 | (22,830 | ) | 490,137 | |||||||
Flexible Income I | 32,666 | (22,431 | ) | 10,235 | |||||||
Growth & Income I | 164,087 | 29,663 | 193,750 | ||||||||
Capital Opportunities I | 118,122 | 8,582 | 126,704 | ||||||||
Global Equity I | 94,320 | 10 | 94,330 | ||||||||
Money Market | 746,241 | 1,625 | 747,866 | ||||||||
Low-Duration Bond | 804,042 | (270,213 | ) | 533,829 | |||||||
Medium-Duration Bond | 1,409,716 | (368,156 | ) | 1,041,560 | |||||||
Extended-Duration Bond | 740,752 | (26,424 | ) | 714,328 | |||||||
Global Bond | 114,845 | (7,130 | ) | 107,715 | |||||||
Equity Index | 386,406 | (66,068 | ) | 320,338 | |||||||
Real Estate Securities | 216,229 | (3,339 | ) | 212,890 | |||||||
Value Equity | 3,599,380 | (64,804 | ) | 3,534,576 | |||||||
Growth Equity | 3,801,290 | (553,684 | ) | 3,247,606 | |||||||
Small Cap Equity | 883,317 | (188,653 | ) | 694,664 | |||||||
International Equity | 3,624,799 | (824,391 | ) | 2,800,408 | |||||||
b. Distribution and Shareholder Servicing Fees
The Board of Trustees has adopted Shareholder Service Plans for the GS4 and GS6 Class of each Select Fund and the GS6 Class of each Blended and Date Target Fund (“Service Plans”) and a separate Plan of Distribution for the GS6 Class of each Select Fund, Blended Fund and Date Target Fund pursuant to Rule 12b-1 under the 1940 Act (“12b-1 Plan”).
Under the Service Plans, the GS4 and GS6 Class of each Select Fund and the GS6 Class of each applicable Blended and Date Target Fund are authorized to pay fees to parties that provide services for and maintain shareholder accounts. The GS4 and GS6 Class of each Select Fund are authorized to pay service fees of 0.19% and 0.30% of average daily net assets, respectively. The GS6 Class of each applicable Blended and Date Target Fund is authorized to pay service fees of 0.11% of average daily net assets.
Under the 12b-1 Plan, the assets of each Select Fund, Blended Fund and Date Target Fund may be used to compensate GuideStone Financial Resources, the Distributor or others for certain expenses relating to the distribution of shares of the Funds to investors. Under the 12b-1 Plan, the maximum amount payable as a percentage of average daily net assets on an annual basis is 0.10% by the GS6 Class of each Select Fund, Blended Fund and Date Target Fund.
c. Expense Limitation
GSCM has agreed, through April 30, 2008, to waive fees and reimburse expenses of the GS2 Class, GS4 Class and GS6 Class of each Fund (excluding interest, taxes, brokerage commissions and extraordinary expenses) which exceed, in the aggregate, the annual percentage rate of each class’s average daily net assets as follows:
Fund | GS2 Class | GS4 Class | GS6 Class | ||||||
MyDestination 2005 | NA | 0.20 | % | 0.50 | % | ||||
MyDestination 2015 | NA | 0.20 | % | 0.50 | % | ||||
MyDestination 2025 | NA | 0.20 | % | 0.50 | % | ||||
MyDestination 2035 | NA | 0.20 | % | 0.50 | % | ||||
MyDestination 2045 | NA | 0.20 | % | 0.50 | % | ||||
Flexible Income | NA | 0.13 | % | 0.50 | % | ||||
Growth & Income | NA | 0.13 | % | 0.60 | % | ||||
Capital Opportunities | NA | 0.13 | % | 0.70 | % | ||||
Global Equity | NA | 0.13 | % | 0.57 | % | ||||
Flexible Income I | 0.17 | % | NA | NA | |||||
Growth & Income I | 0.17 | % | NA | NA | |||||
Capital Opportunities I | 0.17 | % | NA | NA | |||||
Global Equity I | 0.17 | % | NA | NA | |||||
Money Market | 0.27 | % | 0.46 | % | 0.87 | % | |||
Low-Duration Bond | 0.45 | % | 0.61 | % | 1.00 | % | |||
Medium-Duration Bond | 0.50 | % | 0.62 | % | 1.05 | % | |||
Extended-Duration Bond | 0.65 | % | 0.73 | % | 1.20 | % | |||
Global Bond | NA | 1.04 | % | NA | |||||
Equity Index | 0.25 | % | 0.40 | % | 0.60 | % | |||
Real Estate Securities | NA | 1.33 | % | NA | |||||
Value Equity | 0.76 | % | 0.90 | % | 1.30 | % | |||
Growth Equity | 0.90 | % | 1.02 | % | 1.42 | % | |||
Small Cap Equity | 1.14 | % | 1.21 | % | 1.61 | % | |||
International Equity | 0.97 | % | 1.15 | % | 1.50 | % |
Each Fund in turn agrees to reimburse GSCM for any operating expenses in excess of the expense limitation paid, waived or assumed by GSCM for that Fund during the limitation period, provided GSCM would not be entitled to reimbursement for any amount that would cause operating expenses to exceed the expense limitation during the year in which the reimbursement would be made, and provided further that no amount will be reimbursed by the Fund more than three years after the year in which it was incurred or waived by GSCM.
| 147 |
Table of Contents
At June 30, 2007, the amounts subject to possible future reimbursement under the expense limitation agreement are as follows:
GS2 Class | GS4 Class | GS6 Class | |||||||
MyDestination 2005 | NA | $ | 45,678 | $ | 9,909 | ||||
MyDestination 2015 | NA | 39,054 | 7,775 | ||||||
MyDestination 2025 | NA | 44,161 | 8,773 | ||||||
MyDestination 2035 | NA | 46,974 | 10,461 | ||||||
MyDestination 2045 | NA | 44,427 | 13,121 | ||||||
Flexible Income | NA | 447,151 | 29,159 | ||||||
Growth & Income | NA | 165,974 | 7,910 | ||||||
Capital Opportunities | NA | 209,762 | 1,025 | ||||||
Global Equity | NA | 244,369 | 7,090 | ||||||
Flexible Income I | $ | 229,991 | NA | NA | |||||
Growth & Income I | 62,985 | NA | NA | ||||||
Capital Opportunities I | 149,080 | NA | NA | ||||||
Global Equity I | 167,046 | NA | NA | ||||||
Money Market | — | — | 70,089 | ||||||
Low-Duration Bond | 89,898 | 1,477,852 | 35,808 | ||||||
Medium-Duration Bond | — | 2,212,148 | 13,477 | ||||||
Extended-Duration Bond | — | 296,134 | — | ||||||
Global Bond | NA | — | NA | ||||||
Equity Index | — | 269,668 | 105,671 | ||||||
Real Estate Securities | NA | — | NA | ||||||
Value Equity | — | 564,257 | 9,904 | ||||||
Growth Equity | 43,527 | 3,605,920 | 56,805 | ||||||
Small Cap Equity | — | 978,787 | 37,592 | ||||||
International Equity | 666,682 | 5,403,187 | 116,046 | ||||||
During the six months ended June 30, 2007, GSCM recaptured the following amounts:
| GS2 Class | GS4 Class | GS6 Class | |||||
Growth & Income | NA | — | $ | 5,904 | |||
Capital Opportunities | NA | — | 5,491 | ||||
Global Equity | NA | — | 5,259 | ||||
Growth & Income I | 29,663 | NA | NA | ||||
Capital Opportunities I | 8,582 | NA | NA | ||||
Global Equity I | 10 | NA | NA | ||||
Global Bond | NA | 3,296 | NA | ||||
Medium-Duration Bond | 11,522 | — | 2,804 | ||||
Real Estate Securities | NA | 4,866 | NA | ||||
Value Equity | — | — | 4,387 | ||||
Small Cap Equity | — | — | 2,500 | ||||
d. Brokerage Service and Other Arrangements
The Investment Advisor directs the sub-advisers to place security trades with designated brokers who have agreed to pay certain custody, transfer agency or other operating expenses through the use of Brokerage Service Arrangements on behalf of the Equity Funds. During the six months ended June 30, 2007, no operating expenses were paid through the use of Brokerage Service Arrangements.
In addition, the Funds have entered into arrangements with its custodian whereby net interest earned on uninvested cash balances was used to reduce a portion of each Fund’s custody expenses. Custody expense in the accompanying financial statements is presented before reduction for credits. During the six months ended June 30, 2007, expenses reduced were as follows:
Fund | Reduction to Expenses | ||
MyDestination 2005 | $ | 485 | |
MyDestination 2015 | 485 | ||
MyDestination 2025 | 485 | ||
MyDestination 2035 | 492 | ||
MyDestination 2045 | 487 | ||
Flexible Income | 967 | ||
Growth & Income | 1,226 | ||
Capital Opportunities | 1,082 | ||
Global Equity | 1,306 | ||
Flexible Income I | 668 | ||
Growth & Income I | 899 | ||
Capital Opportunities I | 1,026 | ||
Global Equity I | 958 | ||
Money Market | 2,159 | ||
Low-Duration Bond | 196,864 | ||
Medium-Duration Bond | 164,027 | ||
Extended-Duration Bond | 787 | ||
Global Bond | 4,233 | ||
Equity Index | 1,357 | ||
Real Estate Securities | 977 | ||
Value Equity | 1,804 | ||
Growth Equity | 3,143 | ||
Small Cap Equity | 609 | ||
International Equity | 3,512 | ||
e. Administrator, Transfer Agent and Distributor
Certain employees of PFPC Inc. (“PFPC”), an indirect, wholly-owned subsidiary of The PNC Financial Services Group, Inc. (“PNC”), are officers of the Funds. PFPC serves as Administrator and Transfer agent of the Funds.
| 148 |
Table of Contents
For its services as Administrator, PFPC is entitled to receive fees, computed daily and paid monthly, based upon the average daily net assets of each Fund. The fees, excluding out of pocket expenses, currently range between .004% and .02% of average daily net assets. For its services as Transfer Agent, PFPC receives a fee based mainly upon the number of accounts serviced. Certain minimum fees and transaction charges may apply. For the six months ended, PFPC received $2,726,955 in aggregate fees and expenses for services rendered under the various agreements described above.
PFPC Distributors, Inc. (“PDI”), also an indirect, wholly owned subsidiary of PNC, serves as the Distributor for the Funds. The Funds do not pay any fees to PDI in its capacity as Distributor.
4. SECURITIES LENDING
Through an agreement with The Northern Trust Company (“Northern Trust”) (the Funds’ custodian) the Select Funds may lend portfolio securities to certain brokers, dealers and other financial institutions that pay the Select Funds a negotiated fee. The Select Funds receive cash or U.S. Government securities as collateral against the loaned securities in an amount at least equal to the market value of the loaned securities. The Funds continue to own the loaned securities and the securities remain in the investment portfolio. However, in the event of default or bankruptcy by the other party to the agreement, realization and/or retention of the collateral may be subject to legal proceedings. Cash collateral has been invested in a short-term money market fund of Northern Trust. At June 30, 2007, the market values of loaned securities and collateral received were as follows:
Fund | Value of Securities Loaned | Value of Collateral | ||||
Low-Duration Bond | $ | 29,842,022 | $ | 30,551,681 | ||
Medium-Duration Bond | 177,713,309 | 188,369,223 | ||||
Extended-Duration Bond | 273,250,971 | 279,381,625 | ||||
Global Bond | 28,294,574 | 29,190,424 | ||||
Equity Index | 47,279,785 | 48,629,226 | ||||
Real Estate Securities | 38,724,071 | 39,882,340 | ||||
Value Equity | 155,554,597 | 161,083,836 | ||||
Growth Equity | 154,332,992 | 157,653,595 | ||||
Small Cap Equity | 260,723,744 | 269,463,045 | ||||
International Equity | 202,685,308 | 212,284,295 | ||||
5. 10% SHAREHOLDERS
The Date Target and Blended Funds do not invest in the underlying funds for the purpose of exercising management or control; however, investments made by each Date Target and Blended Fund within each of its principal investment strategies may represent a significant portion of an underlying fund’s net assets. At June 30, 2007, the Blended Funds were the owner of record of the following approximate percentages of the total outstanding shares of the underlying funds as detailed below:
GS2 Class | Flexible Income Fund I | Growth & Income Fund I | Capital Opportunities Fund I | Global Equity Fund I | ||||||||
Low-Duration Bond | 37.33 | % | 39.07 | % | 14.00 | % | — | |||||
Medium-Duration Bond | — | 59.33 | 21.41 | — | ||||||||
Extended-Duration Bond | — | 47.21 | 16.74 | — | ||||||||
Equity Index | 1.27 | 12.84 | 14.10 | 15.01 | % | |||||||
Value Equity | 2.16 | 22.00 | 24.31 | 26.08 | ||||||||
Growth Equity | 2.18 | 22.18 | 24.39 | 26.19 | ||||||||
Small Cap Equity | 1.65 | 16.11 | 17.48 | 18.42 | ||||||||
International Equity | 1.45 | 16.23 | 17.30 | 18.33 | ||||||||
GS4 Class | Flexible Income Fund | Growth & Income Fund | Capital Opportunities Fund | Global Equity Fund | ||||||||
Low-Duration Bond | 35.81 | % | 31.30 | % | 12.69 | % | — | |||||
Medium-Duration Bond | — | 31.62 | 12.91 | — | ||||||||
Extended-Duration Bond | — | 28.12 | 11.29 | — | ||||||||
Equity Index | 1.18 | 10.02 | 12.46 | 15.40 | % | |||||||
Value Equity | 1.56 | 13.26 | 16.59 | 20.67 | ||||||||
Growth Equity | 1.68 | 14.28 | 17.78 | 22.17 | ||||||||
Small Cap Equity | 1.21 | 9.89 | 12.15 | 14.87 | ||||||||
International Equity | 1.36 | 12.72 | 15.34 | 18.89 | ||||||||
As of June 30, 2007, the Date Target Funds did not own 10% or more of the total outstanding shares of the underlying funds they invested in.
| 149 |
Table of Contents
6. INVESTMENT TRANSACTIONS
For the six months ended June 30, 2007, the cost of purchases and proceeds from sales and maturities (other than short-term and U.S. Government obligations) for each Fund were as follows:
| Purchases | Sale and Maturity Proceeds | |||||
MyDestination 2005 | $ | 40,921,584 | $ | 88,400 | ||
MyDestination 2015 | 113,487,944 | 39,500 | ||||
MyDestination 2025 | 71,612,750 | 29,900 | ||||
MyDestination 2035 | 22,438,300 | 50,200 | ||||
MyDestination 2045 | 8,207,100 | 333,400 | ||||
Flexible Income | 1,800,000 | 24,064,000 | ||||
Growth & Income | 10,500,000 | 130,749,000 | ||||
Capital Opportunities | 10,500,000 | 112,518,000 | ||||
Global Equity | 1,000,000 | 93,823,000 | ||||
Flexible Income I | 10,986,000 | 4,254,000 | ||||
Growth & Income I | 78,200,000 | 13,719,000 | ||||
Capital Opportunities I | 55,274,000 | 9,511,000 | ||||
Global Equity I | 48,787,000 | 6,714,000 | ||||
Low-Duration Bond | 570,382,906 | 680,244,229 | ||||
Medium-Duration Bond | 2,120,764,711 | 2,115,512,760 | ||||
Extended-Duration Bond | 15,335,467 | 5,315,441 | ||||
Global Bond | 158,230,308 | 130,647,250 | ||||
Equity Index | 12,537,019 | 56,276,965 | ||||
Real Estate Securities | 109,374,832 | 91,567,340 | ||||
Value Equity | 358,883,710 | 352,346,989 | ||||
Growth Equity | 361,544,875 | 366,005,596 | ||||
Small Cap Equity | 316,930,915 | 299,146,196 | ||||
International Equity | 509,788,515 | 482,649,586 | ||||
For the six months ended June 30, 2007, the cost of purchases and proceeds from sales and maturities of long-term U.S. Government obligations for each Fund were as follows:
| Purchases | Sale and Maturity Proceeds | |||||
Flexible Income | $ | 14,278,232 | $ | 14,515,032 | ||
Growth & Income | 46,306,695 | 48,499,182 | ||||
Capital Opportunities | 22,285,479 | 22,777,579 | ||||
Flexible Income I | 4,253,478 | 4,230,105 | ||||
Growth & Income I | 10,644,236 | 10,482,070 | ||||
Capital Opportunities I | 2,380,718 | 2,193,500 | ||||
Low-Duration Bond | 229,123,585 | 255,454,847 | ||||
Medium-Duration Bond | 693,054,115 | 831,950,573 | ||||
Extended-Duration Bond | 25,837,207 | 14,344,723 | ||||
Global Bond | 7,776,108 | 7,528,022 | ||||
Small Cap Equity | 14,269,737 | — | ||||
| 150 |
Table of Contents
Futures Contracts
Investments in securities as of June 30, 2007 included securities that were valued and pledged as collateral to cover initial margin deposits. The market value of this collateral and open futures contracts is as follows:
| Value of Collateral | Open Purchase (Sale) Contracts | Notional Value on Futures | Net Unrealized Gain (Loss) on Futures | ||||||||||
Flexible Income Fund | |||||||||||||
September 2007 S&P 500® | $ | 69,654 | 2 | $ | 757,700 | $ | (18,285 | ) | |||||
Growth & Income Fund | |||||||||||||
September 2007 S&P 500® | 597,034 | 26 | 9,850,100 | $ | (179,686 | ) | |||||||
Capital Opportunities Fund | |||||||||||||
September 2007 S&P 500® | 726,391 | 34 | 12,880,900 | $ | 25,401 | ||||||||
Global Equity Fund | |||||||||||||
September 2007 S&P 500® | 756,243 | 40 | 15,154,000 | $ | (80,365 | ) | |||||||
Flexible Income Fund I | |||||||||||||
September 2007 S&P 500® E-Mini | 19,901 | 2 | 151,540 | $ | 936 | ||||||||
Growth & Income Fund I | |||||||||||||
September 2007 S&P 500® E-Mini | 208,962 | 33 | 2,500,410 | $ | (15,852 | ) | |||||||
Capital Opportunities Fund I | |||||||||||||
September 2007 S&P 500® E-Mini | 179,110 | 39 | 2,955,030 | $ | (18,615 | ) | |||||||
Global Equity Fund I | |||||||||||||
September 2007 S&P 500® E-Mini | 139,308 | 36 | 2,727,720 | $ | (19,819 | ) | |||||||
Low-Duration Bond Fund | |||||||||||||
March 2008 90-Day Euro | 187,757 | 949 | 224,889,275 | $ | 257,425 | ||||||||
June 2008 90-Day Euro | 556,855 | 2,422 | 574,165,375 | (881,838 | ) | ||||||||
September 2008 90-Day Euro | 258,549 | 480 | 113,778,000 | 51,938 | |||||||||
December 2008 90-Day Euro | 161,611 | 548 | 129,848,600 | 88,593 | |||||||||
June 2008 90-Day Sterling | 96,581 | 492 | 115,681,466 | (758,038 | ) | ||||||||
September 2007 5-Year U.S. Treasury Note | 149,773 | (104 | ) | 70,981,281 | 167,320 | ||||||||
September 2007 Euro-BOBL | 232,800 | 209 | 30,043,838 | (70,718 | ) | ||||||||
September 2007 Euro-Bund | 21,720 | 42 | 6,295,595 | (71,310 | ) | ||||||||
September 2007 2-Year U.S. Treasury Note | 379,101 | 247 | 140,405,281 | 64,363 | |||||||||
September 2007 10-Year U.S. Treasury Note | 227,334 | (1,267 | ) | 133,925,859 | (487,843 | ) | |||||||
September 2007 U.S. Long Treasury Bond | 18,442 | (205 | ) | 22,088,750 | (267,180 | ) | |||||||
| $ | (1,907,288 | ) | |||||||||||
Medium-Duration Bond Fund | |||||||||||||
March 2008 90-Day Euro | 211,945 | 813 | 192,660,675 | $ | 86,940 | ||||||||
June 2008 90-Day Euro | 490,800 | 1,776 | 421,023,000 | (1,644,135 | ) | ||||||||
September 2008 90-Day Euro | 99,572 | 417 | 98,844,638 | 82,088 | |||||||||
December 2007 90-Day Euro | 55,721 | 228 | 53,987,550 | 21,475 | |||||||||
December 2008 90-Day Euro | 27,880 | 114 | 27,012,300 | 61,275 | |||||||||
October 2007 5-Year U.S. Treasury Note | 51,323 | (227 | ) | 31,535,672 | (14,629 | ) | |||||||
March 2008 90-Day Sterling | — | 30 | 7,055,254 | (24,087 | ) | ||||||||
June 2008 90-Day Sterling | 272,768 | 1,124 | 264,280,422 | (1,644,322 | ) | ||||||||
December 2008 90-Day Sterling | 41,017 | 169 | 39,740,355 | (321,797 | ) | ||||||||
September 2007 Euro-BOBL | 310,400 | 275 | 39,531,366 | (93,050 | ) | ||||||||
September 2007 Euro-Bund | — | 56 | 6,451,648 | (81,519 | ) | ||||||||
September 2007 10-Year U.S. Treasury Note | 169,946 | (605 | ) | 85,102,078 | (125,485 | ) | |||||||
September 2007 U.S. Long Treasury Bond | 39,863 | (151 | ) | 33,079,250 | (508,086 | ) | |||||||
| $ | (4,205,332 | ) | |||||||||||
| 151 |
Table of Contents
| Value of Collateral | Open Purchase (Sale) Contracts | Notional Value on Futures | Net Unrealized Gain (Loss) on Futures | |||||||||
Global Bond Fund | ||||||||||||
December 2007 90-Day Euro | $ | 67,978 | 44 | $ | 10,418,650 | $ | (39,270 | ) | ||||
March 2008 90-Day Euro | 71,124 | 46 | 10,900,850 | (51,404 | ) | |||||||
September 2007 Euro Bund | 18,582 | 19 | 2,848,007 | (24,693 | ) | |||||||
September 2007 10-Year U.S. Treasury Note | 4,138 | 6 | 634,219 | (5,763 | ) | |||||||
October 2007 5-Year U.S. Treasury Note | 6,791 | 10 | 1,040,781 | 8,545 | ||||||||
| $ | (112,585 | ) | ||||||||||
Equity Index Fund | ||||||||||||
September 2007 S&P 500® | 1,049,785 | 37 | 14,017,450 | $ | (181,489 | ) | ||||||
Real Estate Securities Fund | ||||||||||||
September 2007 Russell 2000® IMM-Mini | 547,281 | 108 | 9,094,680 | $ | (54,318 | ) | ||||||
Value Equity Fund | ||||||||||||
September 2007 S&P 500® | 3,880,720 | 140 | 53,039,000 | $ | (915,465 | ) | ||||||
September 2007 S&P 500® E-Mini | 169,159 | 57 | 4,318,890 | (27,803 | ) | |||||||
| $ | (943,268 | ) | ||||||||||
Growth Equity Fund | ||||||||||||
September 2007 S&P 500® | 3,731,461 | 168 | 63,646,800 | $ | (1,052,623 | ) | ||||||
Small Cap Equity Fund | ||||||||||||
September 2007 Russell 2000® IMM-Mini | 2,706,131 | 3 | 66,862,741 | $ | (724,835 | ) | ||||||
September 2007 5-Year U.S. Treasury Note | 10,734 | 11 | 312,234 | 360 | ||||||||
September 2007 10-Year U.S. Treasury Note | 39,972 | 794 | 1,162,734 | 3,211 | ||||||||
| $ | (721,264 | ) | ||||||||||
International Equity Fund | ||||||||||||
September 2007 DJ Euro Stoxx 50® | 1,248,078 | 315 | 19,249,171 | $ | 117,996 | |||||||
September 2007 FTSE 100 Index® | 795,139 | 92 | 12,263,467 | (26,045 | ) | |||||||
September 2007 MSCI Pan-Euro® | 185,645 | 115 | 4,105,664 | 62,915 | ||||||||
September 2007 SPI 200® | 474,437 | 55 | 7,317,273 | (120,165 | ) | |||||||
September 2007 TOPIX Index® | 734,495 | 81 | 11,677,157 | (9,803 | ) | |||||||
| $ | 24,898 | |||||||||||
Forward Foreign Currency Contracts
As of June 30, 2007, the following Funds have forward foreign currency exchange contracts that obligate it to deliver currencies at specified future dates. The unrealized appreciation and/or depreciation on these contracts is included in the accompanying financial statements. The terms of the open contracts are as follows:
Fund/Expiration Date | Currency to be Delivered | Amount of Currency to be Delivered | Currency to be Received | Amount of Currency to be Received | Net Unrealized Appreciation (Depreciation) | |||||||
Low-Duration Bond Fund | ||||||||||||
07/18/07 | New Zealand Dollars | 1,113,479 | U.S. Dollars | 807,272 | $ | (49,797 | ) | |||||
07/24/07 | U.S. Dollars | 10,067,272 | Japanese Yen | 1,217,858,000 | (142,632 | ) | ||||||
07/24/07 | Japanese Yen | 1,801,000 | U.S. Dollars | 14,677 | (211 | ) | ||||||
07/24/07 | Euro | 1,820,000 | Swedish Kronor | 16,733,275 | (15,686 | ) | ||||||
07/25/07 | Euro | 1,840,000 | Norwegian Krone | 14,939,010 | 42,013 | |||||||
07/26/07 | Euro | 22,204,000 | U.S. Dollars | 29,797,144 | (283,324 | ) | ||||||
07/26/07 | U.S. Dollars | 2,777,201 | Euro | 2,050,000 | 14,897 | |||||||
08/09/07 | British Pounds | 265,000 | U.S. Dollars | 529,061 | (2,789 | ) | ||||||
| 152 |
Table of Contents
Fund/Expiration Date | Currency to be Delivered | Amount of Currency to be Delivered | Currency to be Received | Amount of Currency to be Received | Net Unrealized Appreciation (Depreciation) | |||||||
08/16/07 | U.S. Dollars | 5,851,000 | Chinese Yuan | 45,169,720 | $ | 119,061 | ||||||
09/06/07 | U.S. Dollars | 1,414,815 | Swiss Francs | 1,719,000 | (23 | ) | ||||||
01/10/08 | U.S. Dollars | 1,781,705 | Chinese Yuan | 13,128,000 | (13,051 | ) | ||||||
03/05/08 | U.S. Dollars | 3,915,000 | Chinese Yuan | 28,747,845 | (14,605 | ) | ||||||
| $ | (346,147 | ) | ||||||||||
Medium-Duration Bond Fund | ||||||||||||
07/18/07 | U.S. Dollars | 304,763 | Australian Dollars | 359,663 | $ | 6,970 | ||||||
07/18/07 | Australian Dollars | 359,315 | U.S. Dollars | 304,475 | (5,525 | ) | ||||||
07/24/07 | U.S. Dollars | 3,417,998 | Japanese Yen | 413,482,000 | (48,482 | ) | ||||||
07/26/07 | Euro | 833,359 | U.S. Dollars | 1,123,351 | (5,627 | ) | ||||||
07/26/07 | Euro | 41,194,000 | U.S. Dollars | 55,267,683 | (539,145 | ) | ||||||
08/08/07 | Canadian Dollars | 667,776 | U.S. Dollars | 597,045 | (30,451 | ) | ||||||
08/08/07 | Euro | 1,448,485 | U.S. Dollars | 1,980,557 | 17,348 | |||||||
08/09/07 | Canadian Dollars | 227,000 | U.S. Dollars | 212,367 | (945 | ) | ||||||
08/09/07 | British Pounds | 1,994,000 | U.S. Dollars | 3,980,931 | (20,985 | ) | ||||||
08/16/07 | U.S. Dollars | 6,143,000 | Chinese Yuan | 47,423,960 | 125,003 | |||||||
09/19/07 | U.S. Dollars | 2,828,000 | Russian Rubles | 74,079,460 | 60,580 | |||||||
01/10/08 | U.S. Dollars | 1,886,480 | Chinese Yuan | 13,900,000 | (13,818 | ) | ||||||
01/11/08 | U.S. Dollars | 350,000 | Russian Rubles | 9,062,200 | 3,560 | |||||||
03/05/08 | U.S. Dollars | 1,750,000 | Chinese Yuan | 12,850,250 | (6,529 | ) | ||||||
| $ | (458,046 | ) | ||||||||||
Global Bond Fund | ||||||||||||
08/08/07 | Australian Dollars | 2,166,544 | U.S. Dollars | 1,784,574 | $ | (50,216 | ) | |||||
08/08/07 | Euro | 1,742,885 | U.S. Dollars | 2,364,433 | 1,961 | |||||||
08/08/07 | U.S. Dollars | 1,341,606 | Euro | 989,863 | 4,281 | |||||||
08/08/07 | British Pounds | 1,900,000 | U.S. Dollars | 3,790,600 | (22,720 | ) | ||||||
08/08/07 | U.S. Dollars | 8,613,980 | Japanese Yen | 1,081,407,800 | (370,054 | ) | ||||||
08/08/07 | Japanese Yen | 71,733,160 | U.S. Dollars | 585,750 | (28,247 | ) | ||||||
08/08/07 | Mexican Pesos | 27,994,878 | U.S. Dollars | 2,555,559 | (29,769 | ) | ||||||
08/08/07 | U.S. Dollars | 1,127,842 | Philippines Pesos | 53,471,000 | 67 | |||||||
08/08/07 | Philippines Pesos | 53,471,000 | U.S. Dollars | 1,159,070 | 31,228 | |||||||
08/08/07 | Turkish Lira | 3,447,500 | U.S. Dollars | 2,588,602 | 26,132 | |||||||
08/08/07 | U.S. Dollars | 2,292,721 | Turkish Lira | 3,173,147 | 76,531 | |||||||
08/08/07 | South African Rand | 6,775,620 | U.S. Dollars | 953,480 | (300 | ) | ||||||
08/08/07 | Turkish Lira | 784,197 | Euro | 425,000 | (12,550 | ) | ||||||
08/14/07 | Brazilian Real | 4,418,745 | U.S. Dollars | 2,230,000 | (46,679 | ) | ||||||
08/14/07 | U.S. Dollars | 912,579 | Brazilian Real | 1,771,200 | 12,580 | |||||||
08/14/07 | U.S. Dollars | 759,260 | Korean Won | 700,000,000 | (313 | ) | ||||||
| $ | (408,068 | ) | ||||||||||
International Equity Fund | ||||||||||||
07/18/07 | Japanese Yen | 199,107,726 | British Pounds | 844,751 | $ | 74,688 | ||||||
07/18/07 | Japanese Yen | 190,822,968 | British Pounds | 804,787 | 61,916 | |||||||
07/31/07 | British Pounds | 10,194,500 | U.S. Dollars | 20,351,535 | (111,513 | ) | ||||||
| $ | 25,091 | |||||||||||
| 153 |
Table of Contents
Options Written
Transactions in options written during the six months ended June 30, 2007 were as follows:
Low-Duration Bond Fund | Number of Contracts | Premiums Received | |||||
Options written, 12/31/06 | 4,652 | $ | 817,243 | ||||
Options written | 8,450 | 989,905 | |||||
Options expired | (189 | ) | (195,180 | ) | |||
Options closed | (3,533 | ) | (487,701 | ) | |||
Options written, 06/30/07 | 9,380 | $ | 1,124,267 | ||||
Medium-Duration Bond Fund | Number of Contracts | Premiums Received | |||||
Options written, 12/31/06 | 9,293 | $ | 1,044,466 | ||||
Options written | 9,679 | 1,036,459 | |||||
Options expired | (2,467 | ) | (272,466 | ) | |||
Options closed | (5,865 | ) | (638,784 | ) | |||
Options written, 06/30/07 | 10,640 | $ | 1,169,675 | ||||
7. CAPITAL SHARE TRANSACTIONS
Transactions in shares of capital stock were as follows:
For the Period 12/29/06(1) to 06/30/07 | |||||||||
| GS4 | GS6 | GS8 | |||||||
MyDestination 2005 | |||||||||
Shares sold | 4,165,574 | 106,482 | 102,780 | ||||||
Shares reinvested | — | — | — | ||||||
Shares redeemed | (261,465 | ) | (1,001 | ) | (102,780 | ) | |||
Net increase | 3,904,109 | 105,481 | — | ||||||
MyDestination 2015 | |||||||||
Shares sold | 11,164,446 | 120,673 | 113,014 | ||||||
Shares reinvested | — | — | — | ||||||
Shares redeemed | (262,053 | ) | (4,099 | ) | (113,014 | ) | |||
Net increase | 10,902,393 | 116,574 | — | ||||||
MyDestination 2025 | |||||||||
Shares sold | 7,021,334 | 150,934 | 130,123 | ||||||
Shares reinvested | — | — | — | ||||||
Shares redeemed | (232,357 | ) | (1,000 | ) | (130,123 | ) | |||
Net increase | 6,788,977 | 149,934 | — | ||||||
MyDestination 2035 | |||||||||
Shares sold | 2,281,076 | 114,443 | 110,187 | ||||||
Shares reinvested | — | — | — | ||||||
Shares redeemed | (226,601 | ) | (1,000 | ) | (110,187 | ) | |||
Net increase | 2,054,475 | 113,443 | — | ||||||
MyDestination 2045 | |||||||||
Shares sold | 943,248 | 107,537 | 104,251 | ||||||
Shares reinvested | — | — | — | ||||||
Shares redeemed | (259,628 | ) | (1,000 | ) | (104,251 | ) | |||
Net increase | 683,620 | 106,537 | — | ||||||
(1) | Commencement of operations. |
| 154 |
Table of Contents
| Six Months Ended June 30, 2007 | Year Ended December 31, 2006 | |||||||||||||||||
| GS4 | GS6 | GS8 | GS4 | GS6 | GS8 | |||||||||||||
Flexible Income Fund | ||||||||||||||||||
Shares sold | 1,534,521 | 38,581 | 8,171 | 3,656,910 | 1,952 | 20,520 | ||||||||||||
Shares reinvested | 2 | — | — | 965,157 | 79,237 | 33,701 | ||||||||||||
Shares redeemed | (2,886,504 | ) | (373 | ) | (644,652 | ) | (2,794,715 | ) | (4 | ) | (2,547 | ) | ||||||
Net increase (decrease) | (1,351,981 | ) | 38,208 | (636,481 | ) | 1,827,352 | 81,185 | 51,674 | ||||||||||
Growth & Income Fund | ||||||||||||||||||
Shares sold | 2,274,263 | 355,056 | 49,264 | 6,656,150 | 108,276 | 242,284 | ||||||||||||
Shares reinvested | (20 | ) | — | — | 5,184,934 | 136,009 | 70,158 | |||||||||||
Shares redeemed | (10,498,206 | ) | (14,477 | ) | (955,598 | ) | (5,727,250 | ) | (5,934 | ) | (30,147 | ) | ||||||
Net increase (decrease) | (8,223,963 | ) | 340,579 | (906,334 | ) | 6,113,834 | 238,351 | 282,295 | ||||||||||
Capital Opportunities Fund | ||||||||||||||||||
Shares sold | 1,453,117 | 318,227 | 80,894 | 3,141,769 | 92,585 | 177,712 | ||||||||||||
Shares reinvested | (60 | ) | — | — | 4,554,611 | 80,040 | 68,198 | |||||||||||
Shares redeemed | (7,651,500 | ) | (8,621 | ) | (841,290 | ) | (4,562,176 | ) | (13 | ) | (63,800 | ) | ||||||
Net increase (decrease) | (6,198,443 | ) | 309,606 | (760,396 | ) | 3,134,204 | 172,612 | 182,110 | ||||||||||
Global Equity Fund | ||||||||||||||||||
Shares sold | 1,851,244 | 132,150 | 60,068 | 4,436,590 | 51,247 | 55,947 | ||||||||||||
Shares reinvested | 4 | — | — | 3,930,458 | 123,874 | 51,063 | ||||||||||||
Shares redeemed | (6,750,890 | ) | (7,060 | ) | (657,471 | ) | (6,254,366 | ) | (5,418 | ) | (17,766 | ) | ||||||
Net increase (decrease) | (4,899,642 | ) | 125,090 | (597,403 | ) | 2,112,682 | 169,703 | 89,244 | ||||||||||
| GS2 | GS2 | |||||||||||||||||
Flexible Income Fund I | ||||||||||||||||||
Shares sold | 1,173,250 | 614,244 | ||||||||||||||||
Shares reinvested | — | 385,613 | ||||||||||||||||
Shares redeemed | (511,482 | ) | (648,186 | ) | ||||||||||||||
Net increase | 661,768 | 351,671 | ||||||||||||||||
Growth & Income Fund I | ||||||||||||||||||
Shares sold | 7,193,556 | 1,573,469 | ||||||||||||||||
Shares reinvested | — | 1,820,120 | ||||||||||||||||
Shares redeemed | (1,464,753 | ) | (1,411,973 | ) | ||||||||||||||
Net increase | 5,728,803 | 1,981,616 | ||||||||||||||||
Capital Opportunities Fund I | ||||||||||||||||||
Shares sold | 4,289,048 | 1,427,771 | ||||||||||||||||
Shares reinvested | — | 1,106,323 | ||||||||||||||||
Shares redeemed | (705,862 | ) | (722,160 | ) | ||||||||||||||
Net increase | 3,583,186 | 1,811,934 | ||||||||||||||||
Global Equity Fund I | ||||||||||||||||||
Shares sold | 3,590,135 | 749,622 | ||||||||||||||||
Shares reinvested | — | 811,924 | ||||||||||||||||
Shares redeemed | (660,137 | ) | (772,028 | ) | ||||||||||||||
Net increase | 2,929,998 | 789,518 | ||||||||||||||||
| 155 |
Table of Contents
| Six Months Ended June 30, 2007 | Year Ended December 31, 2006 | |||||||||||||||||||||||
| GS2 | GS4 | GS6 | GS8 | GS2 | GS4 | GS6 | GS8 | |||||||||||||||||
Money Market Fund | ||||||||||||||||||||||||
Shares sold | 123,038,187 | 1,737,403,487 | 531,008 | 214,065 | 79,181,546 | 2,625,551,003 | 3 | 183,052 | ||||||||||||||||
Shares reinvested | 2,359,964 | 11,681,747 | 112,139 | 96,906 | 4,122,997 | 20,032,228 | 196,806 | 206,490 | ||||||||||||||||
Shares redeemed | (116,995,304 | ) | (1,700,579,458 | ) | (1,777 | ) | (5,768,409 | ) | (75,848,387 | ) | (2,481,322,504 | ) | — | (77,413 | ) | |||||||||
Net increase (decrease) | 8,402,847 | 48,505,776 | 641,370 | (5,457,438 | ) | 7,456,156 | 164,260,727 | 196,809 | 312,129 | |||||||||||||||
Low-Duration Bond Fund | ||||||||||||||||||||||||
Shares sold | 3,057,456 | 3,166,799 | 6,716 | 299 | 1,297,497 | 7,540,226 | 1,126,024 | 1,110,208 | ||||||||||||||||
Shares reinvested | 402,797 | 1,001,219 | 14,923 | 10,905 | 677,209 | 2,479,092 | 59,684 | 27,560 | ||||||||||||||||
Shares redeemed | (572,301 | ) | (8,194,618 | ) | (1,086 | ) | (572,478 | ) | (1,607,636 | ) | (17,130,252 | ) | (1,858,956 | ) | (1,130,399 | ) | ||||||||
Net increase (decrease) | 2,887,952 | (4,026,600 | ) | 20,553 | (561,274 | ) | 367,070 | (7,110,934 | ) | (673,248 | ) | 7,369 | ||||||||||||
Medium-Duration Bond Fund | ||||||||||||||||||||||||
Shares sold | 3,512,536 | 4,818,975 | 8,054 | 2,619 | 1,671,942 | 12,489,105 | 1,025 | 5,732 | ||||||||||||||||
Shares reinvested | 551,707 | 1,688,524 | 51,630 | 15,364 | 801,315 | 3,170,861 | 93,047 | 34,362 | ||||||||||||||||
Shares redeemed | (369,258 | ) | (9,975,311 | ) | (2 | ) | (641,527 | ) | (770,305 | ) | (6,269,958 | ) | (598 | ) | (989 | ) | ||||||||
Net increase (decrease) | 3,694,985 | (3,467,812 | ) | 59,682 | (623,544 | ) | 1,702,952 | 9,390,008 | 93,474 | 39,105 | ||||||||||||||
Extended-Duration Bond Fund | ||||||||||||||||||||||||
Shares sold | 1,625,501 | 2,513,371 | 3,595 | 636 | 928,267 | 8,351,957 | — | 2,034 | ||||||||||||||||
Shares reinvested | 462,790 | 890,706 | 102,598 | 29,671 | 580,534 | 1,230,516 | 146,627 | 49,077 | ||||||||||||||||
Shares redeemed | (395,915 | ) | (2,651,413 | ) | (1 | ) | (713,261 | ) | (934,248 | ) | (4,562,953 | ) | — | (956 | ) | |||||||||
Net increase (decrease) | 1,692,376 | 752,664 | 106,192 | (682,954 | ) | 574,553 | 5,019,520 | 146,627 | 50,155 | |||||||||||||||
Global Bond Fund(1) | ||||||||||||||||||||||||
Shares sold | 1,435,479 | 1 | ||||||||||||||||||||||
Shares reinvested | 229,849 | 4,189 | ||||||||||||||||||||||
Shares redeemed | (212,198 | ) | — | |||||||||||||||||||||
Net increase | 1,453,130 | 4,190 | ||||||||||||||||||||||
Equity Index Fund | ||||||||||||||||||||||||
Shares sold | 1,270,567 | 1,268,171 | 16,306 | 7,212 | 760,927 | 2,502,116 | 46,073 | 4,865 | ||||||||||||||||
Shares reinvested | 97,770 | 146,765 | 12,243 | — | 237,789 | 469,656 | 40,598 | 16,350 | ||||||||||||||||
Shares redeemed | (594,872 | ) | (3,793,889 | ) | (195,052 | ) | (567,728 | ) | (508,852 | ) | (2,375,932 | ) | (9,295 | ) | (1,563 | ) | ||||||||
Net increase (decrease) | 773,465 | (2,378,953 | ) | (166,503 | ) | (560,516 | ) | 489,864 | 595,840 | 77,376 | 19,652 | |||||||||||||
| 156 |
Table of Contents
| Six Months Ended June 30, 2007 | Year Ended December 31, 2006 | |||||||||||||||||||||||
| GS2 | GS4 | GS6 | GS8 | GS2 | GS4 | GS6 | GS8 | |||||||||||||||||
Real Estate Securities Fund(1) | ||||||||||||||||||||||||
Shares sold | 6,878,840 | 14,017 | ||||||||||||||||||||||
Shares reinvested | 27,030 | — | ||||||||||||||||||||||
Shares redeemed | (5,490,828 | ) | (2,008 | ) | ||||||||||||||||||||
Net increase | 1,415,042 | 12,009 | ||||||||||||||||||||||
Value Equity Fund | ||||||||||||||||||||||||
Shares sold | 3,921,913 | 4,377,109 | 54,122 | 16,806 | 1,004,773 | 2,999,625 | 6,797 | 24,170 | ||||||||||||||||
Shares reinvested | 407,678 | 799,033 | 32,408 | — | 2,869,649 | 7,841,423 | 278,467 | 103,981 | ||||||||||||||||
Shares redeemed | (1,186,306 | ) | (6,761,556 | ) | (68 | ) | (666,653 | ) | (1,286,505 | ) | (7,023,963 | ) | (1,460 | ) | (2,985 | ) | ||||||||
Net increase (decrease) | 3,143,285 | (1,585,414 | ) | 86,462 | (649,847 | ) | 2,587,917 | 3,817,085 | 283,804 | 125,166 | ||||||||||||||
Growth Equity Fund | ||||||||||||||||||||||||
Shares sold | 3,594,829 | 3,674,775 | 21,223 | 7,396 | 1,675,252 | 4,244,023 | 33,874 | 8,954 | ||||||||||||||||
Shares reinvested | — | — | — | — | — | — | — | — | ||||||||||||||||
Shares redeemed | (692,048 | ) | (5,510,351 | ) | (5,617 | ) | (536,812 | ) | (1,061,893 | ) | (5,622,252 | ) | (6,212 | ) | (1,013 | ) | ||||||||
Net increase (decrease) | 2,902,781 | (1,835,576 | ) | 15,606 | (529,416 | ) | 613,359 | (1,378,229 | ) | 27,662 | 7,941 | |||||||||||||
Small Cap Equity Fund | ||||||||||||||||||||||||
Shares sold | 1,010,737 | 1,838,435 | 20,653 | 5,878 | 686,981 | 3,634,970 | 17,275 | 10,645 | ||||||||||||||||
Shares reinvested | — | (2 | ) | — | — | 637,396 | 2,416,922 | 175,865 | 65,487 | |||||||||||||||
Shares redeemed | (441,606 | ) | (2,638,888 | ) | (1,599 | ) | (591,970 | ) | (880,093 | ) | (5,341,920 | ) | (16 | ) | (2,722 | ) | ||||||||
Net increase (decrease) | 569,131 | (800,455 | ) | 19,054 | (586,092 | ) | 444,284 | 709,972 | 193,124 | 73,410 | ||||||||||||||
International Equity Fund | ||||||||||||||||||||||||
Shares sold | 3,839,685 | 6,463,588 | 30,407 | 10,936 | 1,037,499 | 5,262,328 | 19,348 | 9,817 | ||||||||||||||||
Shares reinvested | — | (2 | ) | — | — | 1,675,167 | 7,326,014 | 199,772 | 64,362 | |||||||||||||||
Shares redeemed | (968,869 | ) | (7,035,442 | ) | (2,421 | ) | (513,033 | ) | (2,075,826 | ) | (11,343,731 | ) | (1,299 | ) | (1,494 | ) | ||||||||
Net increase (decrease) | 2,870,816 | (571,856 | ) | 27,986 | (502,097 | ) | 636,840 | 1,244,611 | 217,821 | 72,685 | ||||||||||||||
(1) | Inception date was December 29, 2006. |
8. BANK BORROWINGS
The Trust, on behalf of and for the benefit of the Funds, has a credit agreement with Bank of America, N.A., dated December 1, 2006, whereby each Fund is permitted to have bank borrowings for temporary or emergency purposes to fund shareholder redemptions. The agreement permits borrowings up to $50 million, collectively. Interest is charged to each Fund based on its borrowings at a rate equal to the Bank prime rate minus two percent or the Wall Street Journal LIBOR One Month Floating Rate plus 0.50%. Each Fund also pays a facility fee equal to its pro rata share of the amount of the credit facility at a rate of 0.12% per annum. None of the Funds had any outstanding borrowings during the six months ended June 30, 2007.
| 157 |
Table of Contents
9. FEDERAL INCOME TAXES
Each Fund’s policy is to comply with all sections of the Internal Revenue Code that apply to regulated investment companies and to distribute substantially all of its taxable income to shareholders. No provision for income or excise taxes is thus required. Each Fund is treated as a separate entity for federal income tax purposes.
Net investment income (loss) and net realized gains (losses) may differ for financial statement and tax purposes primarily because of deferred losses on certain futures contracts and losses deferred due to “wash sale” transactions. The character of distributions made during the year from net investment income or net realized gains may differ from their ultimate characterization for federal income tax purposes. Also, due to the timing of dividend distributions, the fiscal year in which amounts are distributed may differ from the year that the income or realized gains (losses) were recorded by the funds. Income dividends and capital gain distributions are determined in accordance with federal income tax regulations, which may differ from GAAP. These differences are primarily due to differing treatments for futures and options transactions, foreign currency transactions, paydowns, losses deferred due to wash sales, investments in Passive Foreign Investment Companies (“PFIC’s”) and excise tax regulations. Distributions during the year ended December 31, 2006 were characterized as follows for tax purposes:
Fund | Ordinary Income | Long-Term Capital Gain | Return of Capital | ||||||
Flexible Income | $ | 10,179,210 | $ | 3,665,564 | — | ||||
Growth & Income | 38,147,927 | 40,748,252 | — | ||||||
Capital Opportunities | 24,736,064 | 51,235,371 | — | ||||||
Global Equity | 17,264,066 | 53,666,488 | — | ||||||
Flexible Income I | 2,665,895 | 1,272,521 | — | ||||||
Growth & Income I | 11,122,184 | 10,020,990 | — | ||||||
Capital Opportunities I | 6,171,476 | 8,479,337 | — | ||||||
Global Equity I | 3,516,616 | 8,553,585 | — | ||||||
Money Market | 42,093,683 | — | — | ||||||
Low-Duration Bond | 38,289,007 | — | — | ||||||
Medium-Duration Bond | 50,287,994 | — | — | ||||||
Extended-Duration Bond | 23,061,143 | 1,213,320 | — | ||||||
Global Bond | 37,349 | — | $ | 5,039 | |||||
Equity Index | 8,794,069 | 3,058,163 | — | ||||||
Value Equity | 38,680,720 | 141,795,290 | — | ||||||
Small Cap Equity | 16,751,192 | 32,095,593 | — | ||||||
International Equity | 41,665,598 | 129,659,324 | — | ||||||
At December 31, 2006, the components of distributable earnings on a tax basis were as follows:
Fund | Undistributed Ordinary Income | Undistributed Gain/ (Capital | Net Unrealized | ||||||||
Flexible Income | $ | 13,737 | $ | 5,039,842 | $ | 44,825,189 | |||||
Growth & Income | 134,394 | 39,127,651 | 230,265,012 | ||||||||
Capital Opportunities | 142,127 | 46,415,417 | 225,336,854 | ||||||||
Global Equity | 132,746 | 57,714,890 | 246,437,959 | ||||||||
Flexible Income I | 2,076 | 1,125,962 | (1,713,540 | ) | |||||||
Growth & Income I | 28,107 | 9,711,600 | 1,642,073 | ||||||||
Capital Opportunities I | 31,345 | 10,226,203 | 10,387,316 | ||||||||
Global Equity I | 21,343 | 10,189,838 | 9,384,791 | ||||||||
Money Market | — | (8,532 | ) | — | |||||||
Low-Duration Bond | 162,068 | (18,445,864 | ) | (3,485,920 | ) | ||||||
Medium-Duration Bond | 1,281,343 | (3,490,933 | ) | (1,930,205 | ) | ||||||
Extended-Duration Bond | 391,035 | 5,219,297 | 12,796,593 | ||||||||
Global Bond | — | — | 599,086 | ||||||||
Equity Index | 39,815 | — | 140,548,424 | ||||||||
Real Estate Securities | — | — | 13,702,844 | ||||||||
Value Equity | 3,335,335 | 5,601,254 | 310,460,901 | ||||||||
Growth Equity | — | (159,767,108 | ) | 280,113,207 | |||||||
Small Cap Equity | 3,554,302 | 7,555,381 | 70,387,086 | ||||||||
International Equity | 1,777,551 | 22,428,184 | 477,680,895 | ||||||||
Post-October loss deferrals have been included in undistributed ordinary income and undistributed long-term capital gains, depending upon the character of the loss deferral.
For federal income tax purposes, capital loss carryovers and their expiration dates, were as follows as of December 31, 2006:
| Money Market | Low- Duration Bond | Medium- Duration Bond | Growth Equity | |||||||||
Expiring December 31, | ||||||||||||
2010 | — | — | — | $ | 36,470,601 | |||||||
2011 | $ | 2,028 | — | — | 123,296,507 | |||||||
2013 | 5,370 | $ | 9,988,046 | $ | 1,264,463 | — | ||||||
2014 | 1,134 | 8,457,818 | 2,226,470 | — | ||||||||
Total | $ | 8,532 | $ | 18,445,864 | $ | 3,490,933 | $ | 159,767,108 | ||||
| 158 |
Table of Contents
For federal income tax purposes, post-October loss deferrals, which will reverse in 2007, were as follows as of December 31, 2006:
| Capital | FX | Total | |||||||
Money Market | $ | 632 | — | $ | 632 | ||||
Low-Duration Bond | 1,070,013 | $ | 523,681 | 1,593,694 | |||||
Global Bond | — | 69,777 | 69,777 | ||||||
Equity Index | 885,213 | — | 885,213 | ||||||
Real Estate Securities | 21,659 | — | 21,659 | ||||||
International Equity | — | 108,304 | 108,304 | ||||||
At June 30, 2007, the net unrealized appreciation from investments for those securities having an excess of value over cost and net unrealized depreciation from investments for those securities having an excess of cost over value (based on cost for federal income tax purposes) was as follows:
Fund | Net Unrealized Appreciation (Depreciation) | Appreciated Securities | Depreciated Securities | ||||||||
MyDestination 2005 | $ | 143,491 | $ | 493,137 | $ | (349,646 | ) | ||||
MyDestination 2015 | 562,319 | 1,486,713 | (924,394 | ) | |||||||
MyDestination 2025 | 454,208 | 974,839 | (520,631 | ) | |||||||
MyDestination 2035 | 419,477 | 566,873 | (147,396 | ) | |||||||
MyDestination 2045 | 263,562 | 325,118 | (61,556 | ) | |||||||
Flexible Income | 43,428,828 | 45,668,183 | (2,239,355 | ) | |||||||
Growth & Income | 225,533,047 | 236,154,240 | (10,621,193 | ) | |||||||
Capital Opportunities | 243,590,036 | 248,734,646 | (5,144,610 | ) | |||||||
Global Equity | 284,839,944 | 284,839,944 | — | ||||||||
Flexible Income I | (1,471,548 | ) | 1,843,736 | (3,315,284 | ) | ||||||
Growth & Income I | 5,573,514 | 20,650,639 | (15,077,125 | ) | |||||||
Capital Opportunities I | 19,017,698 | 24,263,532 | (5,245,834 | ) | |||||||
Global Equity I | 21,206,471 | 21,640,530 | (434,059 | ) | |||||||
Low-Duration Bond | (6,663,575 | ) | 1,374,439 | (8,038,014 | ) | ||||||
Medium-Duration Bond | (18,773,404 | ) | 5,019,573 | (23,792,977 | ) | ||||||
Extended-Duration Bond | (704,433 | ) | 17,118,987 | (17,823,420 | ) | ||||||
Global Bond | (189,523 | ) | 708,686 | (898,209 | ) | ||||||
Equity Index | 156,849,739 | 184,360,976 | (27,511,237 | ) | |||||||
Real Estate Securities | (10,117,003 | ) | 628,554 | (10,745,557 | ) | ||||||
Value Equity | 335,445,221 | 353,333,117 | (17,887,896 | ) | |||||||
Growth Equity | 342,523,060 | 364,122,202 | (21,599,142 | ) | |||||||
Small Cap Equity | 82,253,026 | 97,998,682 | (15,745,656 | ) | |||||||
International Equity | 487,538,387 | 498,197,138 | (10,658,751 | ) | |||||||
The differences between book basis and tax-basis unrealized appreciation is attributable primarily to the tax deferral of losses on wash sales and on investments in PFIC’s.
At June 30, 2007, the aggregate cost of investment securities for federal income tax purposes was as follows (excluding foreign currency and derivative related items):
Fund | Federal Tax Cost | ||
MyDestination 2005 | $ | 41,437,138 | |
MyDestination 2015 | 114,565,954 | ||
MyDestination 2025 | 72,433,908 | ||
MyDestination 2035 | 22,888,421 | ||
MyDestination 2045 | 8,114,487 | ||
Flexible Income | 270,420,182 | ||
Growth & Income | 1,129,001,319 | ||
Capital Opportunities | 871,604,495 | ||
Global Equity | 758,026,374 | ||
Flexible Income I | 67,412,782 | ||
Growth & Income I | 336,635,322 | ||
Capital Opportunities I | 229,814,736 | ||
Global Equity I | 178,598,473 | ||
Money Market | 1,082,662,516 | ||
Low-Duration Bond | 840,228,583 | ||
Medium-Duration Bond | 1,594,933,130 | ||
Extended-Duration Bond | 667,232,026 | ||
Global Bond | 160,022,959 | ||
Equity Index | 432,423,923 | ||
Real Estate Securities | 167,697,627 | ||
Value Equity | 1,534,405,130 | ||
Growth Equity | 1,457,776,103 | ||
Small Cap Equity | 831,547,940 | ||
International Equity | 1,379,486,930 | ||
| 159 |
Table of Contents
At December 31, 2006, capital contributions, accumulated undistributed net investment income and accumulated net realized gain (loss) from investments have been adjusted for current period permanent book/tax differences which arose principally from differing book/tax treatments of paydown gains, net operating losses and foreign currency transactions. The following amounts were reclassified within the capital accounts:
Fund | Paid in Capital | Accumulated Undistributed Income | Accumulated Net Realized Gain (Loss) on Investments, Currency Translations and Derivative Transactions | |||||||||
Flexible Income | — | $ | 612,161 | $ | (612,161 | ) | ||||||
Growth & Income | — | 5,346,259 | (5,346,259 | ) | ||||||||
Capital Opportunities | — | 6,412,948 | (6,412,948 | ) | ||||||||
Global Equity | — | 7,873,941 | (7,873,941 | ) | ||||||||
Flexible Income I | — | 150,880 | (150,880 | ) | ||||||||
Growth & Income I | — | 1,372,050 | (1,372,050 | ) | ||||||||
Capital Opportunities I | — | 1,448,411 | (1,448,411 | ) | ||||||||
Global Equity I | — | 1,466,148 | (1,466,148 | ) | ||||||||
Low-Duration Bond | — | (67,136 | ) | 67,136 | ||||||||
Medium-Duration Bond | — | (1,289,737 | ) | 1,289,737 | ||||||||
Extended-Duration Bond | — | 969,512 | (969,512 | ) | ||||||||
Global Bond | $ | (5,039 | ) | (9,600 | ) | 14,639 | ||||||
Equity Index | — | (1,381 | ) | 1,381 | ||||||||
Real Estate Securities | (10,185 | ) | 10,185 | — | ||||||||
Growth Equity | (1,702,251 | ) | 1,702,251 | — | ||||||||
Small Cap Equity | — | 1,150,662 | (1,150,662 | ) | ||||||||
International Equity | — | 1,013,509 | (1,013,509 | ) | ||||||||
Net investment income, net realized gain (loss) on investments and net assets were not affected by these reclassifications.
10. NEW ACCOUNTING PRONOUNCEMENTS
In July 2006, the Financial Accounting Standards Board (“FASB”) issued FASB Interpretation No. 48 (“FIN 48”) “Accounting for Uncertainty in Income Taxes, an interpretation of FAS Statement No. 109”. FIN 48 provides guidance for how uncertain tax positions should be recognized, measured, presented and disclosed in the financial statements. FIN 48 requires the evaluation of tax positions taken in the course of preparing the Funds tax returns to determine whether the tax positions are “more-likely-than-not” of being sustained by the applicable tax authority. Tax benefits of positions not deemed to meet the more-likely-than-not threshold would be booked as a tax expense in the current year and recognized as: a liability for unrecognized tax benefits; a reduction of an income tax refund receivable; a reduction of deferred tax asset; an increase in deferred tax liability; or a combination thereof. Adoption of FIN 48 is required for the last net asset value calculation in the first required financial statement reporting period for fiscal years beginning after December 15, 2006. At this time, management has evaluated the impact of FIN 48 and has determined it will have no impact on the financial statements.
In September 2006, the Financial Accounting Standards Board issued FASB Statement No. 157, Fair Value Measurements, (“Statement 157”). Statement 157 establishes a framework for measuring fair value in generally accepted accounting principles, clarifies the definition of fair value within that framework, and expands disclosures about the use of fair value measurements. Statement 157 is intended to increase consistency and comparability among fair value estimates used in financial reporting. Statement 157 is effective for fiscal years beginning after November 15, 2007. Management does not expect the adoption of Statement 157 to have an impact on the amounts reported in the financial statements.
| 160 |
Table of Contents
Information pertaining to the Trustees and officers of the Trust is set forth below. The statement of additional information (SAI) includes additional information about the Trustees and is available without charge, upon request, by calling 1-888-98-GUIDE.
Name, (DOB), Address and Position(s) with Trust | Term of Office | Principal Occupation(s) | Number of | Other Trusteeships/ | ||||
| DISINTERESTED TRUSTEES | ||||||||
Michael R. Buster (11/18/57) 2401 Cedar Springs Road Dallas, TX 75201-1407 Trustee | Since 2002 | Executive Pastor, Prestonwood Baptist Church, 1989 - present. | 24 | None | ||||
William Craig George (7/8/58) 2401 Cedar Springs Road Dallas, TX 75201-1407 Trustee | Since 2004 | Regional loan administrator, SunTrust Bank, 1995 - present. | 24 | None | ||||
Joseph A. Mack (11/22/39) 2401 Cedar Springs Road Dallas, TX 75201-1407 Trustee | Since 2002 | Director, Office of Public Policy, South Carolina Baptist Convention, 1999 - Present, | 24 | None | ||||
Kevin P. Mahoney (7/26/57) 2401 Cedar Springs Road Dallas, TX 75201-1407 Trustee | Since 2004 | Executive Pastor, FBC West Palm Beach, FL, July 2000 - present. | 24 | None | ||||
Franklin Raymond Morgan (6/1/43) 2401 Cedar Springs Road Dallas, TX 75201-1407 Trustee | Since 2005 | Retired - Senior Vice President, Director of International Administration, Prudential Securities, Inc., January 1962 - May 2003. | 24 | None | ||||
James Ray Taylor (10/19/33) 2401 Cedar Springs Road Dallas, TX 75201-1407 Trustee | Since 2002 | Retired since 1994. | 24 | None | ||||
| INTERESTED TRUSTEES2 | ||||||||
Barry Hartis (10/6/45) 2401 Cedar Springs Road Dallas, TX 75201-1407 Trustee | Since 2005 | Certified Public Accountant 1976 - present; Vice President of Business and Finance, Greensboro College, January 1998 - June 30, 2005. | 24 | None | ||||
Gerald B. Jones (5/24/32) 2401 Cedar Springs Road Dallas, TX 75201-1407 Trustee | Since 2000 | President, Flying Investments, November 2006 - present. Owner Jones Motorcars, Inc. 1957 - October 2006. | 24 | Bank of Arkansas — Director | ||||
| OFFICERS WHO ARE NOT TRUSTEES | ||||||||
Jeffrey P. Billinger (12/5/46) 2401 Cedar Springs Road Dallas, TX 75201-1407 Vice President and Treasurer | Since 2000 | Executive Officer and Treasurer, GuideStone Financial Resources of the Southern Baptist Convention, 1995 - present. | N/A | N/A | ||||
Rodric E. Cummins (6/28/57) 2401 Cedar Springs Road Dallas, TX 75201-1407 Vice President and Investment Officer | Since 2000 | Executive Officer and Chief Investment Officer, GuideStone Financial Resources of the Southern Baptist Convention, 1998 - present. | N/A | N/A | ||||
| 161 |
Table of Contents
FUND MANAGEMENT (Continued)
Name, (DOB), Address and Position(s) with Trust | Term of Office | Principal Occupation(s) | Number of | Other Trusteeships/ Held by Trustee | ||||
John R. Jones (12/6/53) 2401 Cedar Springs Road Dallas, TX 75201-1407 President | Since 2000 | Executive Vice President and Chief Operating Officer, GuideStone Financial Resources of the Southern Baptist Convention, 1995 - present. | N/A | N/A | ||||
Rodney R. Miller (5/23/53) 2401 Cedar Springs Road Dallas, TX 75201-1407 Vice President, Secretary and Chief Legal Officer | Since 2000 | General Counsel, Legal and Compliance, GuideStone Financial Resources of the Southern Baptist Convention, 1995 - present. | N/A | N/A | ||||
Curtis D. Sharp (10/30/47) 2401 Cedar Springs Road Dallas, TX 75201-1407 Chief Compliance Officer and AML Officer | Since 2006 | Executive Officer, Denominational and Public Relations Services, GuideStone Financial Resources of the Southern Baptist Convention, 1985 - present. | N/A | N/A | ||||
Patricia A. Weiland (8/25/59) 2401 Cedar Springs Road Dallas, TX 75201-1407 Vice President — Fund Operations and Sales | Since 2000 | Executive Officer, Financial Solutions and Services, GuideStone Financial Resources of the Southern Baptist Convention, 2006 - present; Director, Mutual Funds, GuideStone Financial Resources of the Southern Baptist Convention, 2000 - 2006. | N/A | N/A | ||||
1 | Each Trustee and officer serves for an indefinite term, until his/her successor is elected. Officers serve at the pleasure of the Board of Trustees. |
2 | Messrs. Jones and Hartis serve as trustees and are to be “interested persons” of the Trust as the term is defined in the Investment Company Act of 1940, as amended, due to their positions on the Board of Trustees of GuideStone Financial Resources of the Southern Baptist Convention. |
PROXY VOTING
A description of the policies and procedures that GuideStone Funds uses to determine how to vote proxies relating to their portfolio securities as well as information regarding how GuideStone Funds voted proxies during the most recent 12-month period ended June 30 is available without charge by calling 1-888-98-GUIDE, by visiting our website at www.GuideStoneFunds.org or by visiting the SEC’s website at www.sec.gov.
QUARTERLY SCHEDULES OF INVESTMENTS
In addition to the semi-annual and annual reports that GuideStone Funds delivers to shareholders and makes available through its website, GuideStone Funds files a complete schedule of portfolio holdings with the Securities and Exchange Commission (SEC) for each Fund’s first and third fiscal quarters on Form N-Q. GuideStone Funds does not deliver the schedule for the first and third fiscal quarters to shareholders, however the schedule is posted to our website, www.GuideStoneFunds.org. You may also obtain the Form N-Q filings by accessing the SEC’s website at www.sec.gov or copy them at the SEC’s Public Reference Room in Washington, DC. Information on the operation of the SEC’s Public Reference Room may be obtained by calling the SEC at (800) 732-0330. You can also request copies of this information, upon payment of a fee for duplication, at the SEC’s email address (publicinfo@sec.gov) or by writing the Public Reference section of the SEC, Washington, DC 20549-0102.
| 162 |
Table of Contents
BOARD REVIEW OF NEW SUB-ADVISORY AGREEMENTS FOR INTERNATIONAL EQUITY FUND AND SMALL CAP EQUITY FUND
As required by the Investment Company Act of 1940, as amended (the “1940 Act”), the Board of Trustees (the “Board”) of GuideStone Funds (the “Trust”), including all of the Trustees who are not “interested persons” of the Trust, as that term is defined in the 1940 Act (the “Independent Trustees”), recently considered the approval of (i) a new sub-advisory agreement among GuideStone Capital Management (the “Adviser”), The Boston Company Asset Management, LLC (“Boston Company”) and the Trust on behalf of the International Equity Fund (the “Boston Company Sub-Advisory Agreement”); and (ii) a new sub-advisory agreement among the Adviser, Western Asset Management Company (“WAMCO”), Western Asset Management Company Limited (“WAMCL”) (WAMCO and WAMCL together known as “Western”), and the Trust on behalf of the Small Cap Equity Fund (the “Western Sub-Advisory Agreement”). The Boston Company Sub-Advisory Agreement was approved for an initial two-year term at the meeting of the Board held on February 22-23, 2007 and the Western Sub-Advisory Agreement was approved for an initial two-year term at the meeting of the Board held on May 21-22, 2007 (together, the Boston Company Sub-Advisory Agreement and the Western Sub-Advisory Agreement are the “New Sub-Advisory Agreements”). The Board’s decision to approve the New Sub-Advisory Agreements reflects the exercise of its business judgment to enter into each new sub-advisory arrangement. In approving the New Sub-Advisory Agreements, the Board considered information provided by the Adviser, Boston Company and Western (Boston Company and Western are each a “Sub-Adviser” and together, “Sub-Advisers”) with the assistance and advice of counsel to the Independent Trustees and counsel to the Trust.
The Board’s consideration of various factors and its conclusions with respect to such factors formed the basis for the Board’s determination to approve the New Sub-Advisory Agreements. The factors considered by the Board included, but were not limited to: (i) the resources of the Sub-Adviser; (ii) the experience and expertise of the Sub-Adviser; (iii) the financial capability of the Sub-Adviser; (iv) the compliance procedures and history of the Sub-Adviser; (v) the performance of similarly managed funds and accounts in comparison to relevant benchmarks for the funds; (vi) the amount of the contractual sub-advisory fee in comparison to similarly managed funds and the Sub-Adviser’s other clients and the effect of any fee waiver and expense reimbursement arrangement; (vii) the total expenses of the fund in comparison to similarly managed funds and the use of past and anticipated expense caps; (viii) the anticipated profitability of the Sub-Adviser with respect to the fund and its overall business; (ix) the extent of any anticipated economies of scale and whether the fee structure reflects such economies of scale; (x) the existence of any collateral benefits to be realized by the Sub-Adviser; and (xi) the existence of any collateral benefits to be realized by the fund. No one factor was determinative in the Board’s consideration of the New Sub-Advisory Agreements.
The Board undertook a review of the terms of the New Sub-Advisory Agreements and the nature and quality of the services to be provided by each Sub-Adviser. Management provided the Board with substantial detailed information in the form of reports about the Sub-Advisers prior to the meetings which addressed most, if not all, of the factors listed previously. Management also provided additional information about the Sub-Advisers in presentations made during the meetings, discussed the comprehensive screening process used to recommend the Sub-Advisers and responded to questions from the Board. In addition, the Independent Trustees met separately in executive session with counsel to the Independent Trustees to discuss and consider information presented in connection with the approval of the New Sub-Advisory Agreements as well as the Board’s responsibilities and duties in approving each agreement.
APPROVAL OF NEW SUB-ADVISORY AGREEMENTS FOR INTERNATIONAL EQUITY FUND AND SMALL CAP EQUITY FUND
In considering the approval of the New Sub-Advisory Agreements, the Board took into account the materials provided prior to and during the meetings, and the extensive discussions during the meetings, including the discussions the Independent Trustees had during their executive session with their independent legal counsel. More specifically, the Board examined the nature, extent and quality of the services to be provided by the Sub-Advisers to the Funds. The Board evaluated each Sub-Adviser’s experience in serving as a Sub-Adviser to its client accounts and portfolios and noted that Western currently provides investment advice to two other series of the Trust. The Board considered the experience of key personnel at each Sub-Adviser in providing investment management services and the systems used by such persons, and the ability of each Sub-Adviser to attract and retain
| 163 |
Table of Contents
capable personnel. The Board also considered the reputation, compliance history, compliance program and financial condition of the Sub-Advisers. The Board noted the terms of the New Sub-Advisory Agreements and the responsibilities that each Sub-Adviser would have to its respective Fund, including the responsibility of the day-to-day management of the investment portfolio of the Fund, compliance with the Fund’s policies and objectives, and the implementation of Board of Trustees directives as they relate to the Fund. The Board concluded that the International Equity Fund and Small Cap Equity Fund are likely to benefit from the extent and quality of these services as a result of each Sub-Adviser’s experience, personnel, operations and resources.
The Board considered reports for each Sub-Adviser. The reports compiled by management included, among other things, a summary of the composite investment performance of the Sub-Adviser’s client accounts and portfolios, including a comparison with the relevant benchmark for the respective fund and the peer universe of similarly managed funds, information regarding management style, risk versus return analysis, organizational structures, investment management experience, investment philosophies and personnel. Management also provided additional information regarding compliance procedures and policies, brokerage and soft dollar practices, compliance history, financial information and potential economies of scale.
The Board reviewed the services to be provided to each Fund by each Sub-Adviser, examined the investment philosophy and process of each Sub-Adviser and noted that each Sub-Adviser would fulfill a particular investment mandate for the International Equity Fund and Small Cap Equity Fund. The Board was able to review a composite performance record for the client accounts managed by Boston Company and determined that, although past performance is not a guarantee of future performance, the performance was favorable and the International Equity Fund would benefit from the investment management expertise of Boston Company. The Board noted that the proposed investment strategy for the Small Cap Equity Fund had not been implemented previously for a small cap equity fund by Western, and therefore, an investment performance history for a comparably managed fund was not available. The Board then considered simulated historical performance information for the portion of the Small Cap Equity Fund’s assets proposed to be managed by Western, and it was noted that the simulated historical performance of the strategy to be implemented by Western, which covered a period of 15 years, indicated that the long-term performance of the strategy was positive.
The Board examined the proposed fees, noting that the proposed sub-advisory fees to be paid to Boston Company included breakpoints at various asset levels and would allow shareholders to benefit from economies of scale. The Board further noted that the proposed sub-advisory fees to be paid to Western do not provide economies of scale benefits to shareholders. The Board also noted that the fee schedules for each fund were below or on par with the standard fee for each Sub-Adviser. The Board also considered that the aggregate management fee for the International Equity Fund would remain the same and the aggregate management fee for the Small Cap Equity Fund would remain the same, or decrease after the hiring of Western given the Adviser’s proposed allocation of each Funds assets among the sub-advisers to each Fund based on both current Fund assets and projected asset growth in the near term.
The Board also considered information related to the financial capability of each Sub-Adviser. Specifically, the Board considered the representations of the Adviser with respect to the level of assets and shareholder’s equity for the Sub-Advisers who made their most recent year-end financial statements available to the Adviser for review. The Board also relied upon other relevant information, particularly the independent negotiation of the fee schedules, the level of the fees, and the Sub-Adviser’s performance history. The Board noted that, based on the Adviser’s representations and the other information provided, no concerns appeared to be raised regarding the financial capability of the Sub-Advisers. The Board noted that there is no historical profitability information with regard to the Sub-Advisers’ arrangement with the Funds.
Finally, the Board reviewed information regarding the compliance history and compliance program of each Sub-Adviser, noting that Boston Company and Western had no significant compliance or regulatory issues based on available information. The Board also considered that the Trust currently employs Western to manage assets of two other Funds of the Trust, and that the Adviser and the Board were familiar with each Sub-Adviser’s organization generally.
Based on all of the information presented to the Board and its consideration of relevant factors, the Board, in the exercise of its reasonable judgment determined to approve each New Sub-Advisory Agreement.
| 164 |
Table of Contents
INVESTMENT SUB-ADVISERS (Assets under management as of 6/30/2007)
GuideStone Funds employs a broad array of proven investment managers for the benefit of their investors. Each manager is distinctive in their investment management process and business approach.
Fund | Sub-Adviser | Firm Established | Total Assets Managed | ||||
| Money Market | BlackRock Institutional Management Corporation | 1988 | $ | 1.23Tr | |||
| Low-Duration Bond | BlackRock Financial Management, Inc. Payden & Rygel PIMCO (Pacific Investment Management Company LLC) | 1988 1983 1971 | | 1.23Tr 53.45B 692.7B | |||
| Medium-Duration Bond | Goldman Sachs Asset Management, L.P. PIMCO (Pacific Investment Management Company LLC) Western Asset Management Company | 1984 1971 1971 | | 701.1B 692.7B 604.49B | |||
| Extended-Duration Bond | Loomis, Sayles & Company, L.P. STW Fixed Income Management Ltd. | 1926 1977 | | 115B 10.3B | |||
| Global Bond | Western Asset Management Company | 1971 | 604.49B | ||||
| Equity Index | Northern Trust Investments, N.A. | 1889 | 767B | ||||
| Real Estate Securities | RREEF America L.L.C. | 1975 | 40.7B | ||||
| Value Equity | Aronson+Johnson+Ortiz, LP Barrow, Hanley, Mewhinney & Straus, Inc. Equinox Capital Management LLC Northern Trust Investments, N.A. TCW Investment Management Company | 1984 1979 1989 1889 1971 | | 30.6B 71.7B 1.25B 767B 161.5B | |||
| Growth Equity | Marsico Capital Management LLC RCM Capital Management LLC Sands Capital Management, LLC TCW Investment Management Company | 1997 1970 1992 1971 | | 93.6B 157.24B 19.22B 161.5B | |||
| Small Cap Equity | Aronson+Johnson+Ortiz, L.P. Lord, Abbett & Company LLC Lotsoff Capital Management Provident Investment Council, Inc. TimesSquare Capital Management, LLC Western Asset Management Company | 1984 1929 1981 1951 2000 1971 | | 30.6B 117.46B 5.36B 3.0B 10.1B 604.49B | |||
| International Equity | AllianceBernstein L.P. Capital Guardian Trust Company Genesis Asset Managers, LLP Mondrian Investment Partners Ltd Philadelphia International Advisors, L.P. The Boston Company Asset Management, LLC Walter Scott & Partners Limited | 1962 1968 1989 1990 1956 1970 1983 | | 792.9B 152.87B 22.9B 61.8B 10.1B 76B 33.17B | |||
| Custodian for GuideStone Funds Assets | The Northern Trust Company | 1889 | 4.0T | ||||
You should consider the investment objectives, risks, charges and expenses of each investment fund carefully before investing. To obtain a prospectus with this and other information about GuideStone Funds call 1-888-98-GUIDE, visit www.GuideStoneFunds.org or write to GuideStone Funds, 2401 Cedar Springs, Dallas, TX 75201-1498. Read it carefully before you invest. Shares of GuideStone Funds are distributed by PFPC Distributors, Inc., 760 Moore Road, King of Prussia, PA 19406.
| 165 |
Table of Contents
 | 2401 Cedar Springs Road, Dallas, TX 75201-1498 1-888-98-GUIDE • www.GuideStoneFunds.org | Funds distributed by PFPC Distributors, Inc. 760 Moore Road, King of Prussia, PA 19406 | ||
8/07 2239
12134
Table of Contents
| Item 2. | Code of Ethics. |
Not applicable.
| Item 3. | Audit Committee Financial Expert. |
Not applicable.
| Item 4. | Principal Accountant Fees and Services. |
Not applicable.
| Item 5. | Audit Committee of Listed registrants. |
Not applicable.
| Item 6. | Schedule of Investments. |
Schedule of Investments in securities of unaffiliated issuers as of the close of the reporting period is included as part of the report to shareholders filed under Item 1 of this form.
| Item 7. | Disclosure of Proxy Voting Policies and Procedures for Closed-End Management Investment Companies. |
Not applicable.
| Item 8. | Portfolio Managers of Closed-End Management Investment Companies. |
Not applicable.
Table of Contents
| Item 9. | Purchases of Equity Securities by Closed-End Management Investment Company and Affiliated Purchasers. |
Not applicable.
| Item 10. | Submission of Matters to a Vote of Security Holders. |
Not applicable.
| Item 11. | Controls and Procedures. |
| (a) | The registrant’s principal executive and principal financial officers, or persons performing similar functions, have concluded that the registrant’s disclosure controls and procedures (as defined in Rule 30a-3(c) under the Investment Company Act of 1940, as amended (the “1940 Act”) (17 CFR 270.30a-3(c))) are effective, as of a date within 90 days of the filing date of the report that includes the disclosure required by this paragraph, based on their evaluation of these controls and procedures required by Rule 30a-3(b) under the 1940 Act (17 CFR 270.30a-3(b)) and Rules 13a-15(b) or 15d-15(b) under the Securities Exchange Act of 1934, as amended (17 CFR 240.13a-15(b) or 240.15d-15(b)). |
| (b) | There were no changes in the registrant’s internal control over financial reporting (as defined in Rule 30a-3(d) under the 1940 Act (17 CFR 270.30a-3(d)) that occurred during the registrant’s second fiscal quarter of the period covered by this report that has materially affected, or is reasonably likely to materially affect, the registrant’s internal control over financial reporting. |
| Item 12. | Exhibits. |
(a)(1) | Not applicable. | |
(a)(2) | Certifications pursuant to Rule 30a-2(a) under the 1940 Act and Section 302 of the Sarbanes-Oxley Act of 2002 are attached hereto. | |
(a)(3) | Not applicable. | |
(b) | Certifications pursuant to Rule 30a-2(b) under the 1940 Act and Section 906 of the Sarbanes-Oxley Act of 2002 are attached hereto. | |
Table of Contents
SIGNATURES
Pursuant to the requirements of the Securities Exchange Act of 1934 and the Investment Company Act of 1940, the registrant has duly caused this report to be signed on its behalf by the undersigned, thereunto duly authorized.
| (registrant) GuideStone Funds | ||
| By (Signature and Title)* | /s/ John R. Jones | |
| John R. Jones, | ||
| President | ||
| (principal executive officer) | ||
| Date August 29, 2007 | ||
Pursuant to the requirements of the Securities Exchange Act of 1934 and the Investment Company Act of 1940, this report has been signed below by the following persons on behalf of the registrant and in the capacities and on the dates indicated.
| By (Signature and Title)* | /s/ John R. Jones | |
| John R. Jones, | ||
| President | ||
| (principal executive officer) | ||
| Date August 29, 2007 | ||
| By (Signature and Title)* | /s/ Jeffrey P. Billinger | |
Jeffrey P. Billinger, Vice President and Treasurer | ||
| (principal financial officer) | ||
| Date August 28, 2007 | ||
| * | Print the name and title of each signing officer under his or her signature. |