Table of Contents
UNITED STATES
SECURITIES AND EXCHANGE COMMISSION
Washington, D.C. 20549
FORM N-CSR
CERTIFIED SHAREHOLDER REPORT OF REGISTERED MANAGEMENT
INVESTMENT COMPANIES
Investment Company Act file number | 811-10263 |
GuideStone Funds
| (Exact name of registrant as specified in charter) |
2401 Cedar Springs Road Dallas, TX | 75201-1407 | |
| (Address of principal executive offices) | (Zip code) |
Rodney R. Miller, Esq.
GuideStone Financial Resources of the Southern Baptist Convention
2401 Cedar Springs Road
Dallas, TX 75201-1407
| (Name and address of agent for service) |
registrant’s telephone number, including area code: 214-720-2142
Date of fiscal year end: December 31
Date of reporting period: June 30, 2009
Form N-CSR is to be used by management investment companies to file reports with the Commission not later than 10 days after the transmission to stockholders of any report that is required to be transmitted to stockholders under Rule 30e-1 under the Investment Company Act of 1940 (17 CFR 270.30e-1). The Commission may use the information provided on Form N-CSR in its regulatory, disclosure review, inspection, and policymaking roles.
A registrant is required to disclose the information specified by Form N-CSR, and the Commission will make this information public. A registrant is not required to respond to the collection of information contained in Form N-CSR unless the Form displays a currently valid Office of Management and Budget (“OMB”) control number. Please direct comments concerning the accuracy of the information collection burden estimate and any suggestions for reducing the burden to Secretary, Securities and Exchange Commission, 100 F Street, NE, Washington, DC 20549. The OMB has reviewed this collection of information under the clearance requirements of 44 U.S.C. § 3507.
Table of Contents
| Item 1. | Reports to Stockholders. |
The Report to Shareholders is attached herewith.
Table of Contents

Table of Contents
GuideStone Funds
GuideStone Financial Resources of the Southern Baptist Convention (“GuideStone Financial Resources”)
GuideStone Capital Management (“GSCM”)
GuideStone Trust Services (“GSTS”)
GuideStone Financial Services (“GFS”)
GuideStone Advisors (“GA”)
PFPC Distributors, Inc. (“PFPC”)
NOTICE CONCERNING YOUR PRIVACY RIGHTS
This notice will provide you with information concerning our policies with respect to nonpublic personal information that we collect about you in connection with the following financial products and services provided and/or serviced by the entities listed above: individual retirement accounts (“IRAs”) and/or personal mutual fund accounts.
The confidentiality of your information is important to us as we recognize that you depend on us to keep your information confidential, as described in this notice.
We collect nonpublic personal information about you with regard to your IRA and/or personal mutual fund accounts from the following sources:
| • | Information we receive from you on applications or other forms; |
| • | Information about your transactions with us, our affiliates or others (including our third-party service providers); |
| • | Information we receive from others such as service providers, broker-dealers and your personal agents or representatives; and |
| • | Information you and others provide to us in correspondence sent to us, whether written, electronic or by telephone. |
We may disclose such nonpublic personal financial information about you to one or more of our affiliates. An affiliate of an organization means any entity that controls, is controlled by, or is under common control with that organization. For example, GuideStone Financial Resources, GSCM, GSTS, GFS and GA are affiliates of one another. GuideStone Funds, GuideStone Financial Resources, GSCM, GSTS, GFS, GA and PFPC do not sell your personal information to nonaffiliated third parties.
We may also disclose any of the personal information that we collect about you to nonaffiliated third parties as permitted by law. For example, we may provide your information to nonaffiliated companies that provide account services or that perform marketing services on our behalf and to other financial institutions with whom we have joint marketing agreements. We restrict access to nonpublic personal information about you to those of our employees who need to know that information in order for us to provide and/or service products or services to you. We also maintain physical, electronic, and procedural safeguards to guard your personal information.
These procedures will continue to remain in effect after you cease to receive financial products and services from us.
If you have any questions concerning our customer information policy, please contact a customer service representative at 1-888-98-GUIDE.
Table of Contents
| Letter from the President | 2 | |
| From the Chief Investment Officer | 3 | |
| About Your Expenses (Unaudited) | 6 | |
| Date Target Funds: | ||
| 9 | ||
| 10 | ||
| 11 | ||
| 12 | ||
| 13 | ||
| 14 | ||
| Asset Allocation Funds: | ||
| 19 | ||
| 20 | ||
| 21 | ||
| 22 | ||
| 23 | ||
| 29 | ||
| 30 | ||
| 31 | ||
| 32 | ||
| 33 | ||
| Select Funds: | ||
| 39 | ||
| 41 | ||
| 51 | ||
| 68 | ||
| 73 | ||
| 74 | ||
| 84 | ||
| 90 | ||
| 91 | ||
| 95 | ||
| 98 | ||
| 108 | ||
| 122 | ||
| 123 | ||
| Notes to Financial Statements | 137 | |
| Fund Management | 174 | |
| Board Review of Advisory Agreements | 177 | |
This report has been prepared for shareholders of GuideStone Funds. It is not authorized for distribution to prospective investors unless accompanied or preceded by a current prospectus, which contains more complete information about the Funds. Investors are reminded to read the prospectus carefully before investing. Past performance is no guarantee of future results. Share prices will fluctuate and there may be a gain or loss when shares are redeemed. Fund shares are distributed by PFPC Distributors, Inc., 760 Moore Rd., King of Prussia, PA 19406.
1
Table of Contents

Dear Valued Shareholders:
We are pleased to present you with the GuideStone Funds semi-annual report for the period ended June 30, 2009. Although the capital markets still contend with economic hardships, GuideStone Funds experienced strong investment performance over the course of the past six months. With the exception of two funds, all of the GuideStone Funds closed out the first half of the year with positive year-to-date returns. We have continued to work diligently to enhance the products and services delivered to our shareholders. Milestones reached during the first two quarters included:
| • | The Inflation Protected Bond Fund was launched on June 25th. The fund seeks to provide inflation protection and income consistent with investment in inflation-indexed debt securities. This fund may be suitable for investors with long time horizons who want a hedge against inflation and hold diversified portfolios. |
| • | The GS6 Share Class was eliminated effective May 1st. Shares of the GS6 Class of each Fund were exchanged for shares of the GS4 Class of the same Fund on a share-for-share basis. Former GS6 shareholders now benefit from the lower fee structure of the GS4 Class. |
Additionally, retirement plan participants investing in GuideStone Funds will soon receive fund-specific investment advice through GuideStone Advisors, a registered investment adviser. The advice will be available online through a web-based tool or by contacting a GuideStone financial advisor.
Thank you for choosing to invest in GuideStone Funds. We appreciate your ongoing confidence and invite you to contact us at 1-888-98-GUIDE (1-888-984-8433) or visit our Web site at www.GuideStoneFunds.org.
| Sincerely, |
/s/ John R. Jones |
| John R. Jones |
2
Table of Contents
FROM THE CHIEF INVESTMENT OFFICER
Rodric E. Cummins, CFA | Financial Market Review | |
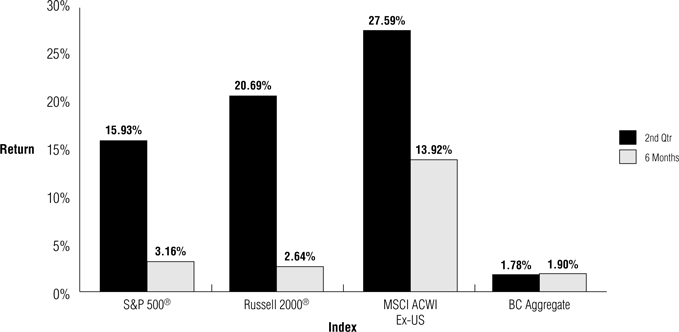
After a tumultuous 2008 and first quarter of 2009, risky assets such as equities surged forward in the second quarter with anticipation that the severity of the worst economic downturn in decades is abating. The S&P 500® Index posted a return of 15.93% for the period, the best quarterly performance since 1998. | ||
The renewed optimism was fueled by a few “green shoots” appearing on the barren economic landscape. Better than expected quarterly earnings from many financial institutions and a smattering of improving economic data provided signs that the coordinated global effort by central banks to restore economic growth is gaining positive traction. These small indications of progress were received as a welcome relief for investors who for the past 18 months have watched hard-earned investment balances erode under the pressures of a global financial crisis and an economic recession. |

Most economists continue to point to a modest economic recovery beginning in the second half of 2009. The future path of economic growth will hold the key to the direction and magnitude of capital market returns in the periods ahead. It is clear that central banks are committed to providing the stimulus needed to restart the global economic engine, yet there are many financial and economic challenges that pose significant headwinds for the future. As global economies begin the long process toward recovery, periods of excitement and doubt about the strength and sustainability of future economic growth will certainly fuel further market volatility.
Equity Market Review
For equity markets, the second quarter of 2009 began in a similar fashion to how the first quarter ended: with a continuation of a significant rally that began in early March. The stock market’s resurgence came on the back of a variety of “less bad” readings on the U.S. and global economy, some apparent healing in the banking system and credit markets, and optimism about the impact of massive fiscal stimulus and monetary policy initiatives. Measures of financial stress, including bond spreads and options volatility, steadily decreased as investors regained some of their appetite for risk. Fears of a “depression” scenario began to fade.
U.S. large-capitalization equities rallied back to life and began the process of recapturing the ground that has been lost. Benchmark indexes such as the S&P 500® Index and Russell 1000® Index rose 15.93% and 16.50%, respectively, during the quarter. The S&P 500® Index finished the quarter 36% above its March 9 “low” and posted its best quarterly return since 1998. The broader U.S equity market as measured by the Russell 3000® Index gained 16.82%. Emerging country stocks soared and a falling U.S. dollar helped to push international stocks ahead of domestic stocks during the quarter. The MSCI All Country World ex-U.S. Index (Net), representing both developed and emerging international markets, rose 27.59%. However, over the last 12 months, most foreign stock indexes remain deeper in the red than those measuring U.S. stocks.
As summer approached, some of the vigor behind the market rally dissipated. Rekindled concerns regarding the actual strength of the economy — including factors such as rising unemployment, tepid retail sales and enormous state government budget deficits all served to temper enthusiasm. Equity returns for the month of June were muted and for some, slightly negative.
The prices of many commodities staged a revival during the quarter, as global economic growth prospects appeared to brighten to some extent in emerging market countries. Crude oil had its largest quarterly percentage price increase (about 35%) since 1990.
In terms of equity market capitalization and style, the second quarter yielded a blend of similar and disparate results. Higher “beta” and lower-quality equities tended to lead the overall market higher. Companies with negative earnings and those which do not pay a dividend also outperformed. Small-cap companies outpaced their large-cap counterparts by about 4.2% based on Russell 2000® Index and Russell 1000® Index performance. Across the broad market, large- and medium-capitalization arenas, growth and value essentially were in a dead heat as financial stock strength in the value indexes was matched by strong performance in technology and industrial companies in growth indexes. The exception to that pattern occurred in the small-cap space, where growth topped value by well over 5% led by the technology and consumer discretionary sectors. The Russell 1000® Value Index and Russell 1000® Growth Index had total quarterly returns of 16.70% and 16.32%, respectively. Over the last 12 months, growth led value by about 4.5%.
The developed international stock market index, represented by the MSCI EAFE Index (Net), recorded its highest quarterly return in over 20 years during the second quarter (+25.43%). From a country perspective, notable strong performance came from the Nordic countries, Canada, Singapore and Spain. Emerging market performance exceeded the developed market returns, as signs of stronger Chinese growth and rising commodity prices reinvigorated investment inflows. As measured by the MSCI Emerging Markets Index (Net), these stocks leaped 34.73% for the quarter. Exceptional rallies occurred in the “BRIC” countries of Brazil, Russia, India and China.
Although facing a continued difficult operating environment, public real estate companies, including REITs, were able to raise much needed capital in the second quarter. This sign of stabilization helped to boost the stock prices of many REITS, albeit with ongoing elevated day-to-day volatility. The Dow Jones U.S. Select Real Estate Securities Index gained 31.69% for the quarter. However, this index is down over 45% from a year ago.
3
Table of Contents
Fixed Income Market Review
A broad overtone of renewed optimism seemed to spread throughout the fixed-income markets as investors willingly abandoned safe haven assets to reintroduce risk into their portfolios. Underpinning investors’ more positive outlook were “green shoots” (improving economic data), increased stability in the credit markets partially due to government intervention, improved liquidity and traction in the equity markets. These factors led many to believe the worst of the economic crisis may be over allowing them to focus on the future and underlying fundamentals (in lieu of depression scenarios). Investors’ cash flows were directed toward spread (non-U.S. Treasury) assets to opportunistically take advantage of historically attractive valuations. The quarter was characterized by a strong performance recovery in non-U.S. Treasury sectors while Treasury performance lagged in response to rising yields. The broad U.S. bond market, as measured by the Barclays Capital Aggregate Bond Index (“Aggregate Index”), posted a quarterly return of 1.78%. Within the index, dispersion in returns was wide across different sectors, industries and maturities.
The U.S. Treasury yield curve became steeper during the quarter as short-term yields remained relatively stable while yields of mid- to long-term maturities increased. The steeper yield curve reflected the increased risk appetite of investors, the significant level of Treasury debt issuance to pay for the budget deficit and the possibility of future inflation once the economy hits high gear. Given the inverse relationship between bond prices and yields, the U.S. Treasury sector was one of the worst performing segments of the bond market, posting a quarterly return of (3.02%). Long-maturity Treasuries, generating a quarterly return of (6.67%), dragged down the sector’s performance as these bonds were more price sensitive to rising rates. The quarter ended with the 10-year note yield at 3.53% (up 87 basis points) and the 30-year bond at 4.33% (up 80 basis points).
Spread sectors rallied as all non-Treasury sectors of the Aggregate Index outperformed U.S. Treasuries during the quarter. The investment grade corporate bond sector posted a quarterly return of 10.45%, led by long-maturity financials which were up 22.76%. Corporate bonds outside the financial sector were also robust, producing returns in excess of 10.00%. Asset-backed securities (“ABS”) were one of the better performing sectors at 7.64%, with top performing segments being credit cards and autos. The ABS sector continued to benefit from the government’s Term Asset-Backed Securities Loan Facility (“TALF”) program. Mortgages, one of the largest bond sectors, outpaced Treasuries but lagged other spread sectors amidst the improving credit markets. Mortgages posted a quarterly return of 0.70%.
The higher risk extended bond sectors benefited from investors’ strong appetite for risk as rallies in these sectors posted meaningful absolute returns. Portfolios containing allocations to these sectors were advantaged. High yield bonds (defined as below investment grade corporate bonds) posted a quarterly return of 22.80%, outpacing its investment grade counterparts and the broad equity market. Generally, the lower the quality of the bond, the higher the return as triple C-rated bonds led the high yield market during the quarter. Emerging market debt was another top performing extended sector, posting a quarterly return of 10.71%.
Asset Class Performance Comparison
The following graph illustrates the performance of the major assets classes during 2009.
4
Table of Contents
1 The S&P 500® Index includes 500 of the largest stocks (in terms of market value) in the United States.
2 The Russell 2000® Index is a small-cap index consisting of approximately 2000 of the smallest companies in the Russell 3000® index, representing approximately 8% of the Russell 3000® Index total market capitalization.
3 The MSCI ACWI® Ex-U.S. is a free float-adjusted market capitalization index that is designed to measure equity market performance in the global developed and emerging markets excluding the U.S.
4 The Barclays Capital U.S. Aggregate Bond Index represents securities that are SEC-registered, taxable and dollar denominated. The index covers the U.S. investment grade bond market, with index components for government and corporate securities, mortgage pass-through securities and asset-backed securities.
5
Table of Contents
About Your Expenses (Unaudited)
As a shareholder of the Funds, you incur ongoing costs, including advisory fees and to the extent applicable, distribution (12b-1) fees and/or shareholder services fees, as well as other Fund expenses. This example is intended to help you to understand your ongoing costs (in dollars) of investing in the Funds and to compare these costs with the ongoing costs of investing in other mutual funds. It is based on an investment of $1,000 invested at the beginning of the period and held for the entire period from January 1, 2009 to June 30, 2009.
Actual Expenses
The first section of the table below provides information about actual account values and actual expenses. You may use the information in this section, together with the amount you invested, to estimate the expenses that you incurred over the period. Simply divide your account value by $1,000 (for example, an $8,600 account value divided by $1,000 = 8.6), then multiply the result by the number in the first section under the heading entitled “Expenses Paid During Period” to estimate the expenses attributable to your investment during this period.
Hypothetical Example for Comparison Purposes
The second section of the table below provides information about hypothetical account values and hypothetical expenses based on the Fund’s actual expense ratio and an assumed rate of return of 5% per year before expenses, which is not the Fund’s actual return. Thus, you should not use the hypothetical account values and expenses to estimate the actual ending account balance or your expenses for the period. Rather, these figures are provided to enable you to compare the ongoing costs of investing in the Fund and other funds. To do so, compare this 5% hypothetical example with the 5% hypothetical examples that appear in the shareholder reports of the other funds. Please note that the expenses shown in the table are meant to highlight your ongoing costs only. Therefore, the second section of the table is useful in comparing ongoing costs only and will not help you determine the relative total costs of owning different funds.
ACTUAL | ||||||||||||||
Fund | Class | Beginning Account Value 01/01/2009 | Ending Account Value 06/30/2009 | Annualized Expense Ratio (1) | Expenses Paid During Period (2) | |||||||||
MyDestination 2005 | GS4 | $ | 1,000.00 | $ | 1,062.24 | 0.20 | % | $ | 1.02 | |||||
MyDestination 2015 | GS4 | 1,000.00 | 1,061.83 | 0.18 | 0.92 | |||||||||
MyDestination 2025 | GS4 | 1,000.00 | 1,061.10 | 0.20 | 1.02 | |||||||||
MyDestination 2035 | GS4 | 1,000.00 | 1,052.73 | 0.20 | 1.02 | |||||||||
MyDestination 2045 | GS4 | 1,000.00 | 1,040.57 | 0.20 | 1.01 | |||||||||
Conservative Allocation | GS4 | 1,000.00 | 1,068.49 | 0.12 | 0.62 | |||||||||
Balanced Allocation | GS4 | 1,000.00 | 1,075.77 | 0.12 | 0.62 | |||||||||
Growth Allocation | GS4 | 1,000.00 | 1,065.86 | 0.12 | 0.61 | |||||||||
Aggressive Allocation | GS4 | 1,000.00 | 1,055.87 | 0.12 | 0.61 | |||||||||
Conservative Allocation I | GS2 | 1,000.00 | 1,072.50 | 0.16 | 0.82 | |||||||||
Balanced Allocation I | GS2 | 1,000.00 | 1,077.02 | 0.14 | 0.72 | |||||||||
Growth Allocation I | GS2 | 1,000.00 | 1,066.66 | 0.15 | 0.77 | |||||||||
Aggressive Allocation I | GS2 | 1,000.00 | 1,055.56 | 0.15 | 0.76 | |||||||||
Money Market | GS2 | 1,000.00 | 1,003.66 | 0.24 | 1.19 | |||||||||
| GS4 | 1,000.00 | 1,002.68 | 0.44 | 2.18 | ||||||||||
Low-Duration Bond | GS2 | 1,000.00 | 1,071.24 | 0.36 | 1.85 | |||||||||
| GS4 | 1,000.00 | 1,069.92 | 0.52 | 2.67 | ||||||||||
Medium-Duration Bond | GS2 | 1,000.00 | 1,084.72 | 0.48 | 2.48 | |||||||||
| GS4 | 1,000.00 | 1,083.68 | 0.58 | 3.00 | ||||||||||
6
Table of Contents
ACTUAL | ||||||||||||||
Fund | Class | Beginning Account Value 01/01/2009 | Ending Account Value 06/30/2009 | Annualized Expense Ratio (1) | Expenses Paid During Period (2) | |||||||||
Extended-Duration Bond | GS2 | $ | 1,000.00 | $ | 1,095.12 | 0.54 | % | $ | 2.81 | |||||
| GS4 | 1,000.00 | 1,094.04 | 0.69 | 3.58 | ||||||||||
Inflation Protected Bond | GS4 | 1,000.00 | 1,008.00 | 0.02 | — | |||||||||
Global Bond | GS4 | 1,000.00 | 1,175.08 | 0.81 | 4.36 | |||||||||
Equity Index | GS2 | 1,000.00 | 1,031.93 | 0.22 | 1.16 | |||||||||
| GS4 | 1,000.00 | 1,030.39 | 0.37 | 1.86 | ||||||||||
Real Estate Securities | GS4 | 1,000.00 | 910.88 | 1.29 | 3.20 | |||||||||
Value Equity | GS2 | 1,000.00 | 988.27 | 0.69 | 3.40 | |||||||||
| GS4 | 1,000.00 | 988.41 | 0.85 | 4.19 | ||||||||||
Growth Equity | GS2 | 1,000.00 | 1,105.76 | 0.88 | 4.59 | |||||||||
| GS4 | 1,000.00 | 1,106.15 | 0.97 | 5.07 | ||||||||||
Small Cap Equity | GS2 | 1,000.00 | 1,027.58 | 1.04 | 5.24 | |||||||||
| GS4 | 1,000.00 | 1,025.87 | 1.15 | 5.78 | ||||||||||
International Equity | GS2 | 1,000.00 | 1,090.18 | 0.94 | 4.87 | |||||||||
| GS4 | 1,000.00 | 1,088.99 | 1.12 | 5.80 | ||||||||||
HYPOTHETICAL (assuming a 5% return before expenses) | ||||||||||||||
Fund | Class | Beginning Account Value 01/01/2009 | Ending Account Value 06/30/2009 | Annualized Expense Ratio (1) | Expenses Paid During Period (2) | |||||||||
MyDestination 2005 | GS4 | $ | 1,000.00 | $ | 1,023.80 | 0.20 | % | $ | 1.00 | |||||
MyDestination 2015 | GS4 | 1,000.00 | 1,023.90 | 0.18 | 0.90 | |||||||||
MyDestination 2025 | GS4 | 1,000.00 | 1,023.80 | 0.20 | 1.00 | |||||||||
MyDestination 2035 | GS4 | 1,000.00 | 1,023.80 | 0.20 | 1.00 | |||||||||
MyDestination 2045 | GS4 | 1,000.00 | 1,023.80 | 0.20 | 1.00 | |||||||||
Conservative Allocation | GS4 | 1,000.00 | 1,024.20 | 0.12 | 0.60 | |||||||||
Balanced Allocation | GS4 | 1,000.00 | 1,024.20 | 0.12 | 0.60 | |||||||||
Growth Allocation | GS4 | 1,000.00 | 1,024.20 | 0.12 | 0.60 | |||||||||
Aggressive Allocation | GS4 | 1,000.00 | 1,024.20 | 0.12 | 0.60 | |||||||||
Conservative Allocation I | GS2 | 1,000.00 | 1,024.00 | 0.16 | 0.80 | |||||||||
Balanced Allocation I | GS2 | 1,000.00 | 1,024.10 | 0.14 | 0.70 | |||||||||
Growth Allocation I | GS2 | 1,000.00 | 1,024.05 | 0.15 | 0.75 | |||||||||
Aggressive Allocation I | GS2 | 1,000.00 | 1,024.05 | 0.15 | 0.75 | |||||||||
Money Market | GS2 | 1,000.00 | 1,023.60 | 0.24 | 1.20 | |||||||||
| GS4 | 1,000.00 | 1,022.61 | 0.44 | 2.21 | ||||||||||
Low-Duration Bond | GS2 | 1,000.00 | 1,023.01 | 0.36 | 1.81 | |||||||||
| GS4 | 1,000.00 | 1,022.22 | 0.52 | 2.61 | ||||||||||
Medium-Duration Bond | GS2 | 1,000.00 | 1,022.41 | 0.48 | 2.41 | |||||||||
| GS4 | 1,000.00 | 1,021.92 | 0.58 | 2.91 | ||||||||||
Extended-Duration Bond | GS2 | 1,000.00 | 1,022.12 | 0.54 | 2.71 | |||||||||
| GS4 | 1,000.00 | 1,021.37 | 0.69 | 3.46 | ||||||||||
Inflation Protected Bond | GS4 | 1,000.00 | 1,024.68 | 0.02 | — | |||||||||
Global Bond | GS4 | 1,000.00 | 1,020.79 | 0.81 | 4.05 | |||||||||
Equity Index | GS2 | 1,000.00 | 1,023.65 | 0.22 | 1.15 | |||||||||
| GS4 | 1,000.00 | 1,022.96 | 0.37 | 1.86 | ||||||||||
7
Table of Contents
About Your Expenses (Unaudited) (Continued)
HYPOTHETICAL (assuming a 5% return before expenses) | ||||||||||||||
Fund | Class | Beginning Account Value 01/01/2009 | Ending Account Value 06/30/2009 | Annualized Expense Ratio (1) | Expenses Paid During Period (2) | |||||||||
Real Estate Securities | GS4 | $ | 1,000.00 | $ | 1,018.40 | 1.29 | % | $ | 6.46 | |||||
Value Equity | GS2 | 1,000.00 | 1,021.37 | 0.69 | 3.46 | |||||||||
| GS4 | 1,000.00 | 1,020.58 | 0.85 | 4.26 | ||||||||||
Growth Equity | GS2 | 1,000.00 | 1,020.43 | 0.88 | 4.41 | |||||||||
| GS4 | 1,000.00 | 1,019.98 | 0.97 | 4.86 | ||||||||||
Small Cap Equity | GS2 | 1,000.00 | 1,019.63 | 1.04 | 5.22 | |||||||||
| GS4 | 1,000.00 | 1,019.09 | 1.15 | 5.76 | ||||||||||
International Equity | GS2 | 1,000.00 | 1,020.13 | 0.94 | 4.71 | |||||||||
| GS4 | 1,000.00 | 1,019.24 | 1.12 | 5.61 | ||||||||||
| (1) | Expenses include the effect of contractual waivers by GuideStone Capital Management. The Date Target Funds’ and Asset Allocation Funds’ proportionate share of the operating expenses of the Select Funds is not reflected in the tables above. |
| (2) | Expenses are equal to the Fund’s annualized expense ratios for the period January 1, 2009 through June 30, 2009, multiplied by the average account value over the period, multiplied by 181/365 (to reflect the one-half year period). |
8
Table of Contents
| MyDestination 2005 Fund | ||
| SCHEDULE OF INVESTMENTS | June 30, 2009 (Unaudited) |
| Shares | Value | ||||||
MUTUAL FUNDS — 98.9% | |||||||
GuideStone Money Market Fund (GS4 Class)¥ | 536,123 | $ | 536,123 | ||||
GuideStone Low-Duration Bond Fund (GS4 Class)¥ | 750,681 | 9,496,115 | |||||
GuideStone Medium-Duration Bond Fund (GS4 Class)¥ | 725,684 | 9,325,038 | |||||
GuideStone Extended-Duration Bond Fund (GS4 Class)¥ | 41,118 | 567,422 | |||||
GuideStone Inflation Protected Bond Fund (GS4 Class)¥ | 800,000 | 8,064,000 | |||||
GuideStone Global Bond Fund (GS4 Class)¥ | 122,780 | 1,015,392 | |||||
GuideStone Equity Index Fund (GS4 Class)¥ | 112,885 | 1,342,203 | |||||
GuideStone Real Estate Securities Fund (GS4 Class)¥ | 438,867 | 2,067,062 | |||||
GuideStone Value Equity Fund (GS4 Class)¥ | 636,258 | 6,515,283 | |||||
GuideStone Growth Equity Fund (GS4 Class)¥ | 515,857 | 6,566,858 | |||||
GuideStone Small Cap Equity Fund (GS4 Class)¥ | 202,023 | 1,844,470 | |||||
GuideStone International Equity Fund (GS4 Class)¥ | 677,382 | 6,868,652 | |||||
Total Mutual Funds | 54,208,618 | ||||||
| Par | |||||||
U.S. TREASURY OBLIGATIONS — 1.3% | |||||||
U.S. Treasury Bill | |||||||
0.27%, 11/19/09‡‡ | $ | 160,000 | 159,846 | ||||
U.S. Treasury Note | |||||||
1.88%, 02/28/14 | 545,000 | 531,077 | |||||
Total U.S. Treasury Obligations | 690,923 | ||||||
TOTAL INVESTMENTS — 100.2% | 54,899,541 | ||||||
Liabilities in Excess of Other Assets — (0.2)% | (98,990 | ) | |||||
NET ASSETS — 100.0% | $ | 54,800,551 | |||||
PORTFOLIO SUMMARY (based on net assets) | |||||||
| % | |||||||
Bond Funds | 51.9 | ||||||
Domestic Equity Funds | 33.5 | ||||||
International Equity Fund | 12.5 | ||||||
U.S. Treasury Obligations | 1.3 | ||||||
Money Market Fund | 1.0 | ||||||
Futures Contracts | 0.9 | ||||||
| 101.1 | |||||||
FAS 157 DISCLOSURE
The following is a summary of the inputs used, as of June 30, 2009, in valuing the Fund’s investments carried at fair value:
Valuation Inputs | Investments in Securities | Other Financial Instruments*** | |||||
Level 1 — Quoted Prices | |||||||
Futures Contracts | $ | — | $ | (8,578 | ) | ||
Mutual Funds | 54,208,618 | — | |||||
Level 2 — Other Significant Observable Inputs | |||||||
U.S. Treasury Obligations | 690,923 | — | |||||
Level 3 — Significant Unobservable Inputs | — | — | |||||
Total | $ | 54,899,541 | $ | (8,578 | ) | ||
| *** | Other financial instruments are derivative instruments not reflected in the Schedule of Investments, such as futures, forwards and swap contracts, which are valued at the unrealized appreciation (depreciation) on the investment. Details of these investments can be found in the Notes to Financial Statements. |
See Notes to Financial Statements.
9
Table of Contents
| MyDestination 2015 Fund | ||
| SCHEDULE OF INVESTMENTS | June 30, 2009 (Unaudited) |
| Shares | Value | |||||
MUTUAL FUNDS — 99.3% | ||||||
GuideStone Money Market Fund (GS4 Class)¥ | 1,657,534 | $ | 1,657,534 | |||
GuideStone Low-Duration Bond Fund (GS4 Class)¥ | 837,718 | 10,597,133 | ||||
GuideStone Medium-Duration Bond Fund (GS4 Class)¥ | 1,448,641 | 18,615,036 | ||||
GuideStone Extended-Duration Bond Fund (GS4 Class)¥ | 523,589 | 7,225,533 | ||||
GuideStone Inflation Protected Bond Fund (GS4 Class)¥ | 1,500,000 | 15,120,000 | ||||
GuideStone Global Bond Fund (GS4 Class)¥ | 986,285 | 8,156,579 | ||||
GuideStone Equity Index Fund (GS4 Class)¥ | 409,102 | 4,864,226 | ||||
GuideStone Real Estate Securities Fund (GS4 Class)¥ | 2,049,755 | 9,654,347 | ||||
GuideStone Value Equity Fund (GS4 Class)¥ | 2,601,883 | 26,643,287 | ||||
GuideStone Growth Equity Fund (GS4 Class)¥ | 2,070,214 | 26,353,829 | ||||
GuideStone Small Cap Equity Fund (GS4 Class)¥ | 830,899 | 7,586,106 | ||||
GuideStone International Equity Fund (GS4 Class)¥ | 2,758,297 | 27,969,127 | ||||
Total Mutual Funds | 164,442,737 | |||||
| Par | ||||||
U.S. TREASURY OBLIGATIONS — 0.7% | ||||||
U.S. Treasury Bill | ||||||
0.27%, 11/19/09‡‡ | $ | 325,000 | 324,688 | |||
U.S. Treasury Note | ||||||
4.25%, 08/15/15 | 730,000 | 782,754 | ||||
Total U.S. Treasury Obligations | 1,107,442 | |||||
TOTAL INVESTMENTS — 100.0% | 165,550,179 | |||||
Other Assets in Excess of Liabilities — 0.0% | 18,683 | |||||
NET ASSETS — 100.0% | $ | 165,568,862 | ||||
PORTFOLIO SUMMARY (based on net assets) | ||||||
| % | ||||||
Domestic Equity Funds | 45.4 | |||||
Bond Funds | 36.1 | |||||
International Equity Fund | 16.8 | |||||
Money Market Fund | 1.0 | |||||
Futures Contracts | 0.9 | |||||
U.S. Treasury Obligations | 0.7 | |||||
| 100.9 | ||||||
FAS 157 DISCLOSURE
The following is a summary of the inputs used, as of June 30, 2009, in valuing the Fund’s investments carried at fair value:
Valuation Inputs | Investments in Securities | Other Financial Instruments*** | |||||
Level 1 — Quoted Prices | |||||||
Futures Contracts | $ | — | $ | (27,266 | ) | ||
Mutual Funds | 164,442,737 | — | |||||
Level 2 — Other Significant Observable Inputs | |||||||
U.S. Treasury Obligations | 1,107,442 | — | |||||
Level 3 — Significant Unobservable Inputs | — | — | |||||
Total | $ | 165,550,179 | $ | (27,266 | ) | ||
| *** | Other financial instruments are derivative instruments not reflected in the Schedule of Investments, such as futures, forwards and swap contracts, which are valued at the unrealized appreciation (depreciation) on the investment. Details of these investments can be found in the Notes to Financial Statements. |
See Notes to Financial Statements.
10
Table of Contents
| MyDestination 2025 Fund | ||
| SCHEDULE OF INVESTMENTS | June 30, 2009 (Unaudited) |
| Shares | Value | |||||
MUTUAL FUNDS — 99.3% | ||||||
GuideStone Money Market Fund (GS4 Class)¥ | 1,730,974 | $ | 1,730,974 | |||
GuideStone Medium-Duration Bond Fund (GS4 Class)¥ | 647,065 | 8,314,791 | ||||
GuideStone Extended-Duration Bond Fund (GS4 Class)¥ | 608,506 | 8,397,379 | ||||
GuideStone Global Bond Fund (GS4 Class)¥ | 1,070,512 | 8,853,134 | ||||
GuideStone Equity Index Fund (GS4 Class)¥ | 339,216 | 4,033,276 | ||||
GuideStone Real Estate Securities Fund (GS4 Class)¥ | 1,745,568 | 8,221,624 | ||||
GuideStone Value Equity Fund (GS4 Class)¥ | 2,240,722 | 22,944,991 | ||||
GuideStone Growth Equity Fund (GS4 Class)¥ | 1,801,659 | 22,935,114 | ||||
GuideStone Small Cap Equity Fund (GS4 Class)¥ | 878,258 | 8,018,492 | ||||
GuideStone International Equity Fund (GS4 Class)¥ | 2,442,731 | 24,769,297 | ||||
Total Mutual Funds | 118,219,072 | |||||
| Par | ||||||
U.S. TREASURY OBLIGATIONS — 0.6% | ||||||
U.S. Treasury Bill | ||||||
0.27%, 11/19/09‡‡ | $ | 265,000 | 264,746 | |||
U.S. Treasury Note | ||||||
4.63%, 02/15/17 | 375,000 | 408,135 | ||||
Total U.S. Treasury Obligations | 672,881 | |||||
TOTAL INVESTMENTS — 99.9% | 118,891,953 | |||||
Other Assets in Excess of Liabilities — 0.1% | 159,143 | |||||
NET ASSETS — 100.0% | $ | 119,051,096 | ||||
PORTFOLIO SUMMARY (based on net assets) | ||||||
| % | ||||||
Domestic Equity Funds | 55.6 | |||||
Bond Funds | 21.5 | |||||
International Equity Fund | 20.7 | |||||
Money Market Fund | 1.5 | |||||
Futures Contracts | 1.3 | |||||
U.S. Treasury Obligations | 0.6 | |||||
| 101.2 | ||||||
FAS 157 DISCLOSURE
The following is a summary of the inputs used, as of June 30, 2009, in valuing the Fund’s investments carried at fair value:
Valuation Inputs | Investments in Securities | Other Financial Instruments*** | |||||
Level 1 — Quoted Prices | |||||||
Futures Contracts | $ | — | $ | (1,563 | ) | ||
Mutual Funds | 118,219,072 | — | |||||
Level 2 — Other Significant Observable Inputs | |||||||
U.S. Treasury Obligations | 672,881 | — | |||||
Level 3 — Significant Unobservable Inputs | — | — | |||||
Total | $ | 118,891,953 | $ | (1,563 | ) | ||
| *** | Other financial instruments are derivative instruments not reflected in the Schedule of Investments, such as futures, forwards and swap contracts, which are valued at the unrealized appreciation (depreciation) on the investment. Details of these investments can be found in the Notes to Financial Statements. |
See Notes to Financial Statements.
11
Table of Contents
| MyDestination 2035 Fund | ||
| SCHEDULE OF INVESTMENTS | June 30, 2009 (Unaudited) |
| Shares | Value | ||||||
MUTUAL FUNDS — 100.0% | |||||||
GuideStone Money Market Fund (GS4 Class)¥ | 1,115,778 | $ | 1,115,778 | ||||
GuideStone Medium-Duration Bond Fund (GS4 Class)¥ | 68,583 | 881,286 | |||||
GuideStone Extended-Duration Bond Fund (GS4 Class)¥ | 65,244 | 900,365 | |||||
GuideStone Global Bond Fund (GS4 Class)¥ | 253,586 | 2,097,160 | |||||
GuideStone Equity Index Fund (GS4 Class)¥ | 168,137 | 1,999,149 | |||||
GuideStone Real Estate Securities Fund (GS4 Class)¥ | 794,609 | 3,742,607 | |||||
GuideStone Value Equity Fund (GS4 Class)¥ | 1,130,775 | 11,579,132 | |||||
GuideStone Growth Equity Fund (GS4 Class)¥ | 908,127 | 11,560,452 | |||||
GuideStone Small Cap Equity Fund (GS4 Class)¥ | 502,734 | 4,589,960 | |||||
GuideStone International Equity Fund (GS4 Class)¥ | 1,265,073 | 12,827,845 | |||||
Total Mutual Funds | 51,293,734 | ||||||
| Par | |||||||
U.S. TREASURY OBLIGATIONS — 0.4% | |||||||
U.S. Treasury Bill | |||||||
0.27%, 11/19/09‡‡ | $ | 130,000 | 129,875 | ||||
U.S. Treasury Note | |||||||
5.13%, 05/15/16 | 53,000 | 59,460 | |||||
Total U.S. Treasury Obligations | 189,335 | ||||||
TOTAL INVESTMENTS — 100.4% | 51,483,069 | ||||||
Liabilities in Excess of Other Assets — (0.4)% | (179,563 | ) | |||||
NET ASSETS — 100.0% | $ | 51,303,506 | |||||
PORTFOLIO SUMMARY (based on net assets) | |||||||
| % | |||||||
Domestic Equity Funds | 65.2 | ||||||
International Equity Fund | 25.0 | ||||||
Bond Funds | 7.6 | ||||||
Money Market Fund | 2.2 | ||||||
Futures Contracts | 1.5 | ||||||
U.S. Treasury Obligations | 0.4 | ||||||
| 101.9 | |||||||
FAS 157 DISCLOSURE
The following is a summary of the inputs used, as of June 30, 2009, in valuing the Fund’s investments carried at fair value:
Valuation Inputs | Investments in Securities | Other Financial Instruments*** | ||||
Level 1 — Quoted Prices | ||||||
Futures Contracts | $ | — | $ | 2,751 | ||
Mutual Funds | 51,293,734 | — | ||||
Level 2 — Other Significant Observable Inputs | ||||||
U.S. Treasury Obligations | 189,335 | — | ||||
Level 3 — Significant Unobservable Inputs | — | — | ||||
Total | $ | 51,483,069 | $ | 2,751 | ||
| *** | Other financial instruments are derivative instruments not reflected in the Schedule of Investments, such as futures, forwards and swap contracts, which are valued at the unrealized appreciation (depreciation) on the investment. Details of these investments can be found in the Notes to Financial Statements. |
See Notes to Financial Statements.
12
Table of Contents
| MyDestination 2045 Fund | ||
| SCHEDULE OF INVESTMENTS | June 30, 2009 (Unaudited) |
| Shares | Value | |||||
MUTUAL FUNDS — 99.4% | ||||||
GuideStone Money Market Fund (GS4 Class)¥ | 990,646 | $ | 990,646 | |||
GuideStone Equity Index Fund (GS4 Class)¥ | 116,483 | 1,384,982 | ||||
GuideStone Real Estate Securities Fund (GS4 Class)¥ | 602,101 | 2,835,895 | ||||
GuideStone Value Equity Fund (GS4 Class)¥ | 650,182 | 6,657,867 | ||||
GuideStone Growth Equity Fund (GS4 Class)¥ | 522,648 | 6,653,304 | ||||
GuideStone Small Cap Equity Fund (GS4 Class)¥ | 307,933 | 2,811,426 | ||||
GuideStone International Equity Fund (GS4 Class)¥ | 738,115 | 7,484,490 | ||||
Total Mutual Funds | 28,818,610 | |||||
| Par | ||||||
U.S. TREASURY OBLIGATION — 0.3% | ||||||
U.S. Treasury Bill | ||||||
0.27%, 11/19/09‡‡ (Cost $104,883) | $ | 105,000 | 104,899 | |||
TOTAL INVESTMENTS — 99.7% | 28,923,509 | |||||
Other Assets in Excess of Liabilities — 0.3% | 80,123 | |||||
NET ASSETS — 100.0% | $ | 29,003,632 | ||||
PORTFOLIO SUMMARY (based on net assets) | ||||||
| % | ||||||
Domestic Equity Funds | 70.2 | |||||
International Equity Fund | 25.8 | |||||
Money Market Fund | 3.4 | |||||
Futures Contracts | 2.5 | |||||
U.S. Treasury Obligation | 0.3 | |||||
| 102.2 | ||||||
FAS 157 DISCLOSURE
The following is a summary of the inputs used, as of June 30, 2009, in valuing the Fund’s investments carried at fair value:
Valuation Inputs | Investments in Securities | Other Financial Instruments*** | |||||
Level 1 — Quoted Prices | |||||||
Futures Contracts | $ | — | $ | (7,480 | ) | ||
Mutual Funds | 28,818,610 | — | |||||
Level 2 — Other Significant Observable Inputs | |||||||
U.S. Treasury Obligation | 104,899 | — | |||||
Level 3 — Significant Unobservable Inputs | — | — | |||||
Total | $ | 28,923,509 | $ | (7,480 | ) | ||
| *** | Other financial instruments are derivative instruments not reflected in the Schedule of Investments, such as futures, forwards and swap contracts, which are valued at the unrealized appreciation (depreciation) on the investment. Details of these investments can be found in the Notes to Financial Statements. |
See Notes to Financial Statements.
13
Table of Contents
STATEMENTS OF ASSETS AND LIABILITIES
June 30, 2009 (Unaudited)
| MyDestination 2005 Fund | MyDestination 2015 Fund | MyDestination 2025 Fund | MyDestination 2035 Fund | MyDestination 2045 Fund | ||||||||||||||||
Assets | ||||||||||||||||||||
Investments in securities of affiliated issuers, at value | $ | 54,208,618 | $ | 164,442,737 | $ | 118,219,072 | $ | 51,293,734 | $ | 28,818,610 | ||||||||||
Investments in securities of unaffiliated issuers, at value | 690,923 | 1,107,442 | 672,881 | 189,335 | 104,899 | |||||||||||||||
Total investments (1) | 54,899,541 | 165,550,179 | 118,891,953 | 51,483,069 | 28,923,509 | |||||||||||||||
Receivables: | ||||||||||||||||||||
Dividends | 98 | 313 | 324 | 181 | 180 | |||||||||||||||
Interest | 3,416 | 11,656 | 6,516 | 347 | — | |||||||||||||||
Investment securities sold | — | — | — | 18,068 | — | |||||||||||||||
Fund shares sold | 6,612 | 42,566 | 191,221 | 85,560 | 88,511 | |||||||||||||||
Receivable from advisor | — | — | — | 282 | 3,971 | |||||||||||||||
Prepaid expenses and other assets | 14,437 | 15,001 | 15,053 | 14,372 | 14,064 | |||||||||||||||
Total Assets | 54,924,104 | 165,619,715 | 119,105,067 | 51,601,879 | 29,030,235 | |||||||||||||||
Liabilities | ||||||||||||||||||||
Cash overdraft | 598 | 598 | 598 | 598 | 598 | |||||||||||||||
Payables: | ||||||||||||||||||||
Investment securities purchased | — | — | — | 270,262 | — | |||||||||||||||
Fund shares redeemed | 96,134 | — | 8,000 | — | — | |||||||||||||||
Variation margin | 3,135 | 9,405 | 9,690 | 3,954 | 4,560 | |||||||||||||||
Accrued expenses: | ||||||||||||||||||||
Investment advisory fees | 60 | 13,735 | 9,169 | — | — | |||||||||||||||
Distribution (12b-1) fees | 123 | 232 | 248 | 168 | 108 | |||||||||||||||
Other expenses | 23,503 | 26,883 | 26,266 | 23,391 | 21,337 | |||||||||||||||
Total Liabilities | 123,553 | 50,853 | 53,971 | 298,373 | 26,603 | |||||||||||||||
Net Assets | $ | 54,800,551 | $ | 165,568,862 | $ | 119,051,096 | $ | 51,303,506 | $ | 29,003,632 | ||||||||||
Net Assets Consist of: | ||||||||||||||||||||
Paid-in capital | $ | 71,330,076 | $ | 228,133,705 | $ | 168,935,783 | $ | 71,474,169 | $ | 36,768,105 | ||||||||||
Undistributed net investment income | 368,744 | 1,245,726 | 919,863 | 367,190 | 183,510 | |||||||||||||||
Accumulated net realized loss on investments and futures transactions | (5,421,745 | ) | (10,717,056 | ) | (5,708,234 | ) | (1,301,824 | ) | (1,698,508 | ) | ||||||||||
Net unrealized appreciation (depreciation) on investments and futures | (11,476,524 | ) | (53,093,513 | ) | (45,096,316 | ) | (19,236,029 | ) | (6,249,475 | ) | ||||||||||
Net Assets | $ | 54,800,551 | $ | 165,568,862 | $ | 119,051,096 | $ | 51,303,506 | $ | 29,003,632 | ||||||||||
Net Asset Value: | ||||||||||||||||||||
$0.001 par value, unlimited shares authorized | ||||||||||||||||||||
Net assets applicable to the GS4 Class | $ | 54,800,551 | $ | 165,568,862 | $ | 119,051,096 | $ | 51,303,506 | $ | 29,003,632 | ||||||||||
GS4 shares outstanding | 6,982,260 | 23,137,056 | 18,312,024 | 8,399,208 | 4,873,593 | |||||||||||||||
Net asset value, offering and redemption price per GS4 share | $ | 7.85 | $ | 7.16 | $ | 6.50 | $ | 6.11 | $ | 5.95 | ||||||||||
| ||||||||||||||||||||
(1) Investments in securities of affiliated issuers, at cost | $ | 65,674,697 | $ | 217,512,327 | $ | 163,317,977 | $ | 70,532,959 | $ | 35,060,621 | ||||||||||
Investments in securities of unaffiliated issuers, at cost | 692,790 | 1,104,099 | 668,729 | 188,890 | 104,883 | |||||||||||||||
Total investments at cost | $ | 66,367,487 | $ | 218,616,426 | $ | 163,986,706 | $ | 70,721,849 | $ | 35,165,504 | ||||||||||
See Notes to Financial Statements.
14
Table of Contents
STATEMENTS OF OPERATIONS
For the Six Months Ended June 30, 2009 (Unaudited)
| MyDestination 2005 Fund | MyDestination 2015 Fund | MyDestination 2025 Fund | MyDestination 2035 Fund | MyDestination 2045 Fund | ||||||||||||||||
Investment Income | ||||||||||||||||||||
Income distributions received from affiliated funds | $ | 554,340 | $ | 1,759,295 | $ | 1,360,759 | $ | 448,655 | $ | 207,037 | ||||||||||
Dividends | 108,306 | 196,556 | — | — | — | |||||||||||||||
Interest | 2,972 | 5,551 | 3,154 | 559 | 78 | |||||||||||||||
Total Investment Income | 665,618 | 1,961,402 | 1,363,913 | 449,214 | 207,115 | |||||||||||||||
Expenses | ||||||||||||||||||||
Investment advisory fees | 25,826 | 74,861 | 51,864 | 21,244 | 11,418 | |||||||||||||||
Transfer agent fees: | ||||||||||||||||||||
GS4 | 9,039 | 9,614 | 9,794 | 9,343 | 9,235 | |||||||||||||||
GS6 | 2,385 | 2,402 | 2,397 | 2,397 | 2,397 | |||||||||||||||
Custodian fees | 5,841 | 6,175 | 7,024 | 5,932 | 5,010 | |||||||||||||||
Distribution (12b-1) fees: | ||||||||||||||||||||
GS6 | 405 | 679 | 818 | 514 | 333 | |||||||||||||||
Shareholder servicing fees: | ||||||||||||||||||||
GS6 | 445 | 746 | 900 | 565 | 367 | |||||||||||||||
Accounting and administration fees | 4,134 | 7,608 | 5,925 | 3,240 | 2,935 | |||||||||||||||
Professional fees | 21,535 | 21,535 | 21,535 | 21,535 | 21,535 | |||||||||||||||
Blue sky fees: | ||||||||||||||||||||
GS4 | 1,705 | 2,196 | 1,821 | 1,700 | 1,729 | |||||||||||||||
GS6 | 269 | 272 | 268 | 268 | 280 | |||||||||||||||
Shareholder reporting fees: | ||||||||||||||||||||
GS4 | 1,812 | 2,760 | 2,961 | 2,214 | 2,013 | |||||||||||||||
GS6 | 36 | 60 | 60 | 60 | 60 | |||||||||||||||
Trustee fees | 282 | 795 | 507 | 183 | 72 | |||||||||||||||
Line of credit facility fees | 252 | 707 | 468 | 181 | 86 | |||||||||||||||
Other expenses | 5,574 | 5,827 | 5,838 | 5,669 | 5,598 | |||||||||||||||
Total Expenses | 79,540 | 136,237 | 112,180 | 75,045 | 63,068 | |||||||||||||||
Expenses waived/reimbursed net of amount recaptured(1) | (27,342 | ) | (1,864 | ) | (7,682 | ) | (31,851 | ) | (39,941 | ) | ||||||||||
Net Expenses | 52,198 | 134,373 | 104,498 | 43,194 | 23,127 | |||||||||||||||
Net Investment Income | 613,420 | 1,827,029 | 1,259,415 | 406,020 | 183,988 | |||||||||||||||
Realized and Unrealized Gain (Loss) | ||||||||||||||||||||
Capital gain distributions received from affiliated funds | 57,768 | 112,471 | 53,925 | 5,126 | 69 | |||||||||||||||
Net realized loss on investment securities of affiliated issuers | (4,233,530 | ) | (6,872,947 | ) | (5,093,635 | ) | (634,470 | ) | (969,629 | ) | ||||||||||
Net realized loss on investment securities of unaffiliated issuers | (3,721 | ) | (47,552 | ) | (27,487 | ) | (4,099 | ) | — | |||||||||||
Net realized gain (loss) on futures transactions | (44,606 | ) | 67,152 | 96,871 | 68,807 | 69,015 | ||||||||||||||
Net realized loss | (4,224,089 | ) | (6,740,876 | ) | (4,970,326 | ) | (564,636 | ) | (900,545 | ) | ||||||||||
Change in unrealized appreciation on investment securities of affiliated issuers | 6,394,552 | 13,953,754 | 11,131,455 | 3,181,735 | 2,466,704 | |||||||||||||||
Change in unrealized appreciation on investment securities of unaffiliated issuers | 246,419 | 383,362 | 4,111 | 410 | — | |||||||||||||||
Change in unrealized depreciation on futures | (25,126 | ) | (61,115 | ) | (28,201 | ) | (13,136 | ) | (19,114 | ) | ||||||||||
Net change in unrealized appreciation (depreciation) | 6,615,845 | 14,276,001 | 11,107,365 | 3,169,009 | 2,447,590 | |||||||||||||||
Net Realized and Unrealized Gain (Loss) | 2,391,756 | 7,535,125 | 6,137,039 | 2,604,373 | 1,547,045 | |||||||||||||||
Net Increase in Net Assets Resulting from Operations | $ | 3,005,176 | $ | 9,362,154 | $ | 7,396,454 | $ | 3,010,393 | $ | 1,731,033 | ||||||||||
| (1) | See Note 3a and 3c in Notes to Financial Statements. |
See Notes to Financial Statements.
15
Table of Contents
STATEMENTS OF CHANGES IN NET ASSETS
| MyDestination 2005 Fund | ||||||||
| For the Six Months Ended 06/30/09 (Unaudited) | For the Year Ended 12/31/08 | |||||||
Operations: | ||||||||
Net investment income | $ | 613,420 | $ | 1,954,641 | ||||
Net realized loss on investment securities and futures transactions | (4,224,089 | ) | (957,809 | ) | ||||
Net change in unrealized appreciation (depreciation) on investment securities and futures | 6,615,845 | (16,571,994 | ) | |||||
Net increase (decrease) in net assets resulting from operations | 3,005,176 | (15,575,162 | ) | |||||
Dividends and Distributions to Shareholders: | ||||||||
Dividends from net investment income(1) | ||||||||
GS4 shares | (340,576 | ) | (2,047,981 | ) | ||||
GS6 shares | (5,830 | ) | (31,478 | ) | ||||
Distributions from net realized capital gains | ||||||||
GS4 shares | — | (1,475,258 | ) | |||||
GS6 shares | — | (33,204 | ) | |||||
Total dividends and distributions | (346,406 | ) | (3,587,921 | ) | ||||
Capital Share Transactions: | ||||||||
Proceeds from shares sold | ||||||||
GS4 shares | 7,247,110 | 24,467,910 | ||||||
GS6 shares | 355,125 | 504,471 | ||||||
Proceeds from exchange of GS6 shares for GS4 shares(2) | ||||||||
GS4 shares | 1,382,278 | — | ||||||
GS6 shares | (1,382,278 | ) | — | |||||
Reinvestment of dividends and distributions | ||||||||
GS4 shares | 340,576 | 3,523,239 | ||||||
GS6 shares | 5,830 | 64,682 | ||||||
Total proceeds from shares sold and reinvested | 7,948,641 | 28,560,302 | ||||||
Value of shares redeemed | ||||||||
GS4 shares | (7,485,227 | ) | (16,249,160 | ) | ||||
GS6 shares | (133,418 | ) | (461,028 | ) | ||||
Total value of shares redeemed | (7,618,645 | ) | (16,710,188 | ) | ||||
Net increase from capital share transactions(3) | 329,996 | 11,850,114 | ||||||
Total increase (decrease) in net assets | 2,988,766 | (7,312,969 | ) | |||||
Net Assets: | ||||||||
Beginning of Period | 51,811,785 | 59,124,754 | ||||||
End of Period* | $ | 54,800,551 | $ | 51,811,785 | ||||
| ||||||||
*Including undistributed net investment income | $ | 368,744 | $ | 101,730 | ||||
| (1) | Includes dividends paid from the short-term portion of capital gain distributions received from affiliated funds. |
| (2) | See Note 1 in Notes to Financial Statements. |
| (3) | See Note 7 in Notes to Financial Statements. |
See Notes to Financial Statements.
16
Table of Contents
| MyDestination 2015 Fund | MyDestination 2025 Fund | MyDestination 2035 Fund | MyDestination 2045 Fund | ||||||||||||||||||||||||||
| For the Six Months Ended 06/30/09 (Unaudited) | For the Year Ended 12/31/08 | For the Six Months Ended 06/30/09 (Unaudited) | For the Year Ended 12/31/08 | For the Six Months Ended 06/30/09 (Unaudited) | For the Year Ended 12/31/08 | For the Six Months Ended 06/30/09 (Unaudited) | For the Year Ended 12/31/08 | ||||||||||||||||||||||
| $ | 1,827,029 | $ | 4,877,655 | $ | 1,259,415 | $ | 2,684,323 | $ | 406,020 | $ | 789,624 | $ | 183,988 | $ | 307,365 | ||||||||||||||
| (6,740,876) | (3,479,814 | ) | (4,970,326 | ) | (486,393 | ) | (564,636 | ) | (590,341 | ) | (900,545 | ) | (796,458 | ) | |||||||||||||||
| 14,276,001 | (59,891,445 | ) | 11,107,365 | (48,820,051 | ) | 3,169,009 | (19,527,146 | ) | 2,447,590 | (7,649,855 | ) | ||||||||||||||||||
| 9,362,154 | (58,493,604 | ) | 7,396,454 | (46,622,121 | ) | 3,010,393 | (19,327,863 | ) | 1,731,033 | (8,138,948 | ) | ||||||||||||||||||
| (1,929,930) | (3,988,233 | ) | (925,137 | ) | (2,302,358 | ) | (217,884 | ) | (625,387 | ) | (125,001 | ) | (180,010 | ) | |||||||||||||||
| (32,689) | (18,577 | ) | (23,117 | ) | (33,073 | ) | (6,754 | ) | (5,228 | ) | (3,261 | ) | (30 | ) | |||||||||||||||
| — | (5,474,206 | ) | — | (4,533,694 | ) | (118,981 | ) | (1,798,281 | ) | (4,125 | ) | (665,336 | ) | ||||||||||||||||
| — | (46,540 | ) | — | (95,733 | ) | (5,779 | ) | (57,955 | ) | (222 | ) | (34,799 | ) | ||||||||||||||||
| (1,962,619) | (9,527,556 | ) | (948,254 | ) | (6,964,858 | ) | (349,398 | ) | (2,486,851 | ) | (132,609 | ) | (880,175 | ) | |||||||||||||||
| 18,761,385 | 55,390,960 | 19,676,125 | 44,588,486 | 10,830,166 | 24,099,520 | 9,580,158 | 15,130,813 | ||||||||||||||||||||||
| 1,621,277 | 705,881 | 1,038,155 | 1,409,701 | 842,870 | 792,304 | 357,764 | 352,767 | ||||||||||||||||||||||
| 2,917,331 | — | 3,159,998 | — | 2,109,355 | — | 1,269,575 | — | ||||||||||||||||||||||
| (2,917,331) | — | (3,159,998 | ) | — | (2,109,355 | ) | — | (1,269,575 | ) | — | |||||||||||||||||||
| 1,929,930 | 9,462,439 | 925,137 | 6,836,052 | 336,865 | 2,423,668 | 129,126 | 845,346 | ||||||||||||||||||||||
| 32,689 | 65,117 | 23,117 | 128,806 | 12,533 | 63,183 | 3,483 | 34,829 | ||||||||||||||||||||||
| 22,345,281 | 65,624,397 | 21,662,534 | 52,963,045 | 12,022,434 | 27,378,675 | 10,070,531 | 16,363,755 | ||||||||||||||||||||||
| (11,523,332) | (21,287,889 | ) | (7,961,412 | ) | (7,208,810 | ) | (2,233,989 | ) | (3,015,460 | ) | (1,571,614 | ) | (1,237,722 | ) | |||||||||||||||
| (44,365) | (406,299 | ) | (9,820 | ) | (418,340 | ) | (7,283 | ) | (191,533 | ) | (21,937 | ) | (67,470 | ) | |||||||||||||||
| (11,567,697) | (21,694,188 | ) | (7,971,232 | ) | (7,627,150 | ) | (2,241,272 | ) | (3,206,993 | ) | (1,593,551 | ) | (1,305,192 | ) | |||||||||||||||
| 10,777,584 | 43,930,209 | 13,691,302 | 45,335,895 | 9,781,162 | 24,171,682 | 8,476,980 | 15,058,563 | ||||||||||||||||||||||
| 18,177,119 | (24,090,951 | ) | 20,139,502 | (8,251,084 | ) | 12,442,157 | 2,356,968 | 10,075,404 | 6,039,440 | ||||||||||||||||||||
| 147,391,743 | 171,482,694 | 98,911,594 | 107,162,678 | 38,861,349 | 36,504,381 | 18,928,228 | 12,888,788 | ||||||||||||||||||||||
| $ | 165,568,862 | $ | 147,391,743 | $ | 119,051,096 | $ | 98,911,594 | $ | 51,303,506 | $ | 38,861,349 | $ | 29,003,632 | $ | 18,928,228 | ||||||||||||||
| $ | 1,245,726 | $ | 1,381,316 | $ | 919,863 | $ | 608,702 | $ | 367,190 | $ | 185,808 | $ | 183,510 | $ | 127,784 | ||||||||||||||
See Notes to Financial Statements.
17
Table of Contents
FINANCIAL HIGHLIGHTS (Unaudited)
For a Share Outstanding For the Years Ended December 31, unless otherwise indicated
| Ratios to Average Net Assets | |||||||||||||||||||||||||||||||||||||||||||||||||
| Net Asset Value, Beginning of Period | Net Investment Income (1) | Capital Gain Distributions Received from Affiliated Funds | Realized and Unrealized Gain (Loss) on Investments | Dividends from Net Investment Income | Distributions from Net Realized Capital Gains | Net Asset Value, End of Period | Total Return | Net Assets, End of Period (000) | Expenses, Net (2)(3) | Expenses, Including Expense Reduction (2)(3) | Expenses, Before Waivers and Expense Reduction (2)(4) | Investment Income, Net (1) | Investment Income/ (Loss), Excluding Waivers and Expense Reduction (1) | Portfolio Turnover Rate | |||||||||||||||||||||||||||||||||||
MyDestination 2005 Fund* |
| ||||||||||||||||||||||||||||||||||||||||||||||||
GS4 Class |
| ||||||||||||||||||||||||||||||||||||||||||||||||
2009(5) | $ | 7.44 | $ | 0.09 | # | $ | 0.01 | $ | 0.36 | $ | (0.05 | ) | $ | — | $ | 7.85 | 6.22 | % | $ | 54,801 | 0.20 | % | 0.20 | % | 0.30 | % | 2.41 | % | 2.31 | % | 37 | % | |||||||||||||||||
2008 | 10.35 | 0.30 | # | 0.08 | (2.75 | ) | (0.31 | ) | (0.23 | ) | 7.44 | (22.78 | ) | 50,678 | 0.20 | 0.20 | 0.29 | 3.25 | 3.16 | 40 | |||||||||||||||||||||||||||||
2007 | 10.00 | 0.33 | # | 0.62 | (0.31 | ) | (0.28 | ) | (0.01 | ) | 10.35 | 6.42 | 57,667 | 0.20 | 0.20 | 0.43 | 3.16 | 2.93 | 21 | ||||||||||||||||||||||||||||||
MyDestination 2015 Fund* |
| ||||||||||||||||||||||||||||||||||||||||||||||||
GS4 Class |
| ||||||||||||||||||||||||||||||||||||||||||||||||
2009(5) | $ | 6.83 | $ | 0.08 | # | $ | — | $ | 0.34 | $ | (0.09 | ) | $ | — | $ | 7.16 | 6.18 | % | $ | 165,569 | 0.18 | % | 0.18 | % | 0.18 | % | 2.47 | % | 2.47 | % | 20 | % | |||||||||||||||||
2008 | 10.33 | 0.26 | # | 0.09 | (3.39 | ) | (0.19 | ) | (0.27 | ) | 6.83 | (29.31 | ) | 146,140 | 0.20 | 0.20 | 0.18 | 2.87 | 2.89 | 22 | |||||||||||||||||||||||||||||
2007 | 10.00 | 0.29 | # | 0.83 | (0.50 | ) | (0.28 | ) | (0.01 | ) | 10.33 | 6.12 | 169,953 | 0.20 | 0.20 | 0.24 | 2.74 | 2.70 | 7 | ||||||||||||||||||||||||||||||
MyDestination 2025 Fund* |
| ||||||||||||||||||||||||||||||||||||||||||||||||
GS4 Class |
| ||||||||||||||||||||||||||||||||||||||||||||||||
2009(5) | $ | 6.18 | $ | 0.07 | # | $ | — | $ | 0.30 | $ | (0.05 | ) | $ | — | $ | 6.50 | 6.11 | % | $ | 119,051 | 0.20 | % | 0.20 | % | 0.21 | % | 2.46 | % | 2.45 | % | 9 | % | |||||||||||||||||
2008 | 10.24 | 0.21 | # | 0.09 | (3.89 | ) | (0.15 | ) | (0.32 | ) | 6.18 | (35.00 | ) | 96,826 | 0.20 | 0.20 | 0.21 | 2.47 | 2.46 | 10 | |||||||||||||||||||||||||||||
2007 | 10.00 | 0.25 | # | 1.13 | (0.85 | ) | (0.28 | ) | (0.01 | ) | 10.24 | 5.29 | 105,102 | 0.20 | 0.20 | 0.30 | 2.37 | 2.27 | 5 | ||||||||||||||||||||||||||||||
MyDestination 2035 Fund* |
| ||||||||||||||||||||||||||||||||||||||||||||||||
GS4 Class |
| ||||||||||||||||||||||||||||||||||||||||||||||||
2009(5) | $ | 5.85 | $ | 0.05 | # | $ | — | $ | 0.26 | $ | (0.03 | ) | $ | (0.02 | ) | $ | 6.11 | 5.27 | % | $ | 51,304 | 0.20 | % | 0.20 | % | 0.34 | % | 1.94 | % | 1.80 | % | 2 | % | ||||||||||||||||
2008 | 10.24 | 0.17 | # | 0.09 | (4.25 | ) | (0.10 | ) | (0.30 | ) | 5.85 | (38.86 | ) | 37,637 | 0.20 | 0.20 | 0.40 | 2.02 | 1.82 | 5 | |||||||||||||||||||||||||||||
2007 | 10.00 | 0.19 | # | 1.31 | (0.98 | ) | (0.28 | ) | — | † | 10.24 | 5.20 | 35,117 | 0.20 | 0.20 | 0.64 | 1.83 | 1.39 | 2 | ||||||||||||||||||||||||||||||
MyDestination 2045 Fund* |
| ||||||||||||||||||||||||||||||||||||||||||||||||
GS4 Class |
| ||||||||||||||||||||||||||||||||||||||||||||||||
2009(5) | $ | 5.75 | $ | 0.05 | # | $ | — | $ | 0.18 | $ | (0.03 | ) | $ | — | † | $ | 5.95 | 4.06 | % | $ | 29,004 | 0.20 | % | 0.20 | % | 0.54 | % | 1.65 | % | 1.31 | % | 5 | % | ||||||||||||||||
2008 | 10.12 | 0.16 | # | 0.10 | (4.34 | ) | (0.06 | ) | (0.23 | ) | 5.75 | (40.29 | ) | 17,998 | 0.20 | 0.20 | 0.79 | 1.97 | 1.38 | 5 | |||||||||||||||||||||||||||||
2007 | 10.00 | 0.17 | # | 1.37 | (1.09 | ) | (0.28 | ) | (0.05 | ) | 10.12 | 4.46 | 11,659 | 0.19 | 0.19 | 1.48 | 1.60 | 0.31 | 9 | ||||||||||||||||||||||||||||||
| † | Amount represents less than $0.005 per share. |
| # | Calculated using the average shares outstanding method. |
| * | Inception date was December 29, 2006. |
| (1) | Recognition of net investment income by the Fund is affected by the timing of the declaration of dividends by the underlying investment companies in which the Fund invests. |
| (2) | Does not include expenses of the investment companies in which the Fund invests. |
| (3) | Interest expense paid by the MyDestination 2005, MyDestination 2015 and MyDestination 2025 Funds on borrowings did not have a material impact on the expense ratios of the Funds. |
| (4) | The ratio also excludes previously recaptured fees. |
| (5) | For the six months ended June 30, 2009. All ratios for the period have been annualized. Total return and portfolio turnover for the period have not been annualized. |
See Notes to Financial Statements.
18
Table of Contents
| Conservative Allocation Fund | ||
| SCHEDULE OF INVESTMENTS | June 30, 2009 (Unaudited) |
| Shares | Value | |||||
MUTUAL FUNDS — 97.6% | ||||||
GuideStone Money Market Fund (GS4 Class)¥ | 1,695,282 | $ | 1,695,282 | |||
GuideStone Low-Duration Bond Fund (GS4 Class)¥ | 11,704,031 | 148,055,993 | ||||
GuideStone Inflation Protected Bond Fund (GS4 Class)¥ | 3,680,000 | 37,094,400 | ||||
GuideStone Equity Index Fund (GS4 Class)¥ | 328,085 | 3,900,926 | ||||
GuideStone Value Equity Fund (GS4 Class)¥ | 1,735,953 | 17,776,163 | ||||
GuideStone Growth Equity Fund (GS4 Class)¥ | 1,393,283 | 17,736,491 | ||||
GuideStone Small Cap Equity Fund (GS4 Class)¥ | 489,122 | 4,465,688 | ||||
GuideStone International Equity Fund (GS4 Class)¥ | 1,841,825 | 18,676,110 | ||||
Total Mutual Funds | 249,401,053 | |||||
| Par | ||||||
U.S. TREASURY OBLIGATIONS — 2.4% | ||||||
U.S. Treasury Bill | ||||||
0.27%, 11/19/09‡‡ | $ | 795,000 | 794,237 | |||
U.S. Treasury Note | ||||||
4.88%, 04/30/11 | 4,930,000 | 5,272,024 | ||||
Total U.S. Treasury Obligations | 6,066,261 | |||||
TOTAL INVESTMENTS — 100.0% | 255,467,314 | |||||
Other Assets in Excess of Liabilities — 0.0% | 105,619 | |||||
NET ASSETS — 100.0% | $ | 255,572,933 | ||||
PORTFOLIO SUMMARY (based on net assets) | ||||||
| % | ||||||
Bond Funds | 72.4 | |||||
Domestic Equity Funds | 17.2 | |||||
International Equity Fund | 7.3 | |||||
U.S. Treasury Obligations | 2.4 | |||||
Money Market Fund | 0.7 | |||||
Futures Contracts | 0.6 | |||||
| 100.6 | ||||||
FAS 157 DISCLOSURE
The following is a summary of the inputs used, as of June 30, 2009, in valuing the Fund’s investments carried at fair value:
Valuation Inputs | Investments in Securities | Other Financial Instruments*** | |||||
Level 1 — Quoted Prices | |||||||
Futures Contracts | $ | — | $ | (27,130 | ) | ||
Mutual Funds | 249,401,053 | — | |||||
Level 2 — Other Significant Observable Inputs | |||||||
U.S. Treasury Obligations | 6,066,261 | — | |||||
Level 3 — Significant Unobservable Inputs | — | — | |||||
Total | $ | 255,467,314 | $ | (27,130 | ) | ||
| *** | Other financial instruments are derivative instruments not reflected in the Schedule of Investments, such as futures, forwards and swap contracts, which are valued at the unrealized appreciation (depreciation) on the investment. Details of these investments can be found in the Notes to Financial Statements. |
See Notes to Financial Statements.
19
Table of Contents
| Balanced Allocation Fund | ||
| SCHEDULE OF INVESTMENTS | June 30, 2009 (Unaudited) |
| Shares | Value | |||||
MUTUAL FUNDS — 98.2% | ||||||
GuideStone Money Market Fund (GS4 Class)¥ | 10,308,818 | $ | 10,308,818 | |||
GuideStone Low-Duration Bond Fund (GS4 Class)¥ | 11,004,301 | 139,204,403 | ||||
GuideStone Medium-Duration Bond Fund (GS4 Class)¥ | 14,604,856 | 187,672,404 | ||||
GuideStone Extended-Duration Bond Fund (GS4 Class)¥ | 6,055,833 | 83,570,493 | ||||
GuideStone Global Bond Fund (GS4 Class)¥ | 6,001,766 | 49,634,604 | ||||
GuideStone Equity Index Fund (GS4 Class)¥ | 2,264,788 | 26,928,330 | ||||
GuideStone Value Equity Fund (GS4 Class)¥ | 13,055,558 | 133,688,911 | ||||
GuideStone Growth Equity Fund (GS4 Class)¥ | 10,568,793 | 134,540,737 | ||||
GuideStone Small Cap Equity Fund (GS4 Class)¥ | 3,395,361 | 30,999,646 | ||||
GuideStone International Equity Fund (GS4 Class)¥ | 14,932,131 | 151,411,805 | ||||
Total Mutual Funds | 947,960,151 | |||||
| Par | ||||||
U.S. TREASURY OBLIGATIONS — 1.8% | ||||||
U.S. Treasury Bill | ||||||
0.27%, 11/19/09‡‡ | $ | 3,985,000 | 3,981,175 | |||
U.S. Treasury Note | ||||||
1.88%, 02/28/14 | 13,700,000 | 13,350,006 | ||||
Total U.S. Treasury Obligations | 17,331,181 | |||||
TOTAL INVESTMENTS — 100.0% | 965,291,332 | |||||
Other Assets in Excess of Liabilities — 0.0% | 231,136 | |||||
NET ASSETS — 100.0% | $ | 965,522,468 | ||||
PORTFOLIO SUMMARY (based on net assets) | ||||||
| % | ||||||
Bond Funds | 47.6 | |||||
Domestic Equity Funds | 33.8 | |||||
International Equity Fund | 15.7 | |||||
U.S. Treasury Obligations | 1.8 | |||||
Futures Contracts | 1.3 | |||||
Money Market Fund | 1.1 | |||||
| 101.3 | ||||||
FAS 157 DISCLOSURE
The following is a summary of the inputs used, as of June 30, 2009, in valuing the Fund’s investments carried at fair value:
Valuation Inputs | Investments in Securities | Other Financial Instruments*** | |||||
Level 1 — Quoted Prices | |||||||
Futures Contracts | $ | — | $ | (253,292 | ) | ||
Mutual Funds | 947,960,151 | — | |||||
Level 2 — Other Significant Observable Inputs | |||||||
U.S. Treasury Obligations | 17,331,181 | — | |||||
Level 3 — Significant Unobservable Inputs | — | — | |||||
Total | $ | 965,291,332 | $ | (253,292 | ) | ||
| *** | Other financial instruments are derivative instruments not reflected in the Schedule of Investments, such as futures, forwards and swap contracts, which are valued at the unrealized appreciation (depreciation) on the investment. Details of these investments can be found in the Notes to Financial Statements. |
See Notes to Financial Statements.
20
Table of Contents
| Growth Allocation Fund | ||
| SCHEDULE OF INVESTMENTS | June 30, 2009 (Unaudited) |
| Shares | Value | |||||
MUTUAL FUNDS — 98.7% | ||||||
GuideStone Money Market Fund (GS4 Class)¥ | 11,411,782 | $ | 11,411,782 | |||
GuideStone Low-Duration Bond Fund (GS4 Class)¥ | 3,989,890 | 50,472,112 | ||||
GuideStone Medium-Duration Bond Fund (GS4 Class)¥ | 5,254,268 | 67,517,348 | ||||
GuideStone Extended-Duration Bond Fund (GS4 Class)¥ | 2,219,282 | 30,626,085 | ||||
GuideStone Global Bond Fund (GS4 Class)¥ | 2,200,921 | 18,201,613 | ||||
GuideStone Equity Index Fund (GS4 Class)¥ | 2,652,889 | 31,542,854 | ||||
GuideStone Value Equity Fund (GS4 Class)¥ | 14,087,692 | 144,257,968 | ||||
GuideStone Growth Equity Fund (GS4 Class)¥ | 11,241,014 | 143,098,106 | ||||
GuideStone Small Cap Equity Fund (GS4 Class)¥ | 3,686,051 | 33,653,645 | ||||
GuideStone International Equity Fund (GS4 Class)¥ | 16,099,449 | 163,248,409 | ||||
Total Mutual Funds | 694,029,922 | |||||
| Par | ||||||
U.S. TREASURY OBLIGATIONS — 1.3% | ||||||
U.S. Treasury Bill | ||||||
0.27%, 11/19/09‡‡ | $ | 4,285,000 | 4,280,886 | |||
U.S. Treasury Note | ||||||
1.88%, 02/28/14 | 5,075,000 | 4,945,349 | ||||
Total U.S. Treasury Obligations | 9,226,235 | |||||
TOTAL INVESTMENTS — 100.0% | 703,256,157 | |||||
Other Assets in Excess of Liabilities — 0.0% | 78,392 | |||||
NET ASSETS — 100.0% | $ | 703,334,549 | ||||
PORTFOLIO SUMMARY (based on net assets) | ||||||
| % | ||||||
Domestic Equity Funds | 50.1 | |||||
Bond Funds | 23.7 | |||||
International Equity Fund | 23.3 | |||||
Futures Contracts | 2.0 | |||||
Money Market Fund | 1.6 | |||||
U.S. Treasury Obligations | 1.3 | |||||
| 102.0 | ||||||
FAS 157 DISCLOSURE
The following is a summary of the inputs used, as of June 30, 2009, in valuing the Fund’s investments carried at fair value:
Valuation Inputs | Investments in Securities | Other Financial Instruments*** | |||||
Level 1 — Quoted Prices | |||||||
Futures Contracts | $ | — | $ | (80,297 | ) | ||
Mutual Funds | 694,029,922 | — | |||||
Level 2 — Other Significant Observable Inputs | |||||||
U.S. Treasury Obligations | 9,226,235 | — | |||||
Level 3 — Significant Unobservable Inputs | — | — | |||||
Total | $ | 703,256,157 | $ | (80,297 | ) | ||
| *** | Other financial instruments are derivative instruments not reflected in the Schedule of Investments, such as futures, forwards and swap contracts, which are valued at the unrealized appreciation (depreciation) on the investment. Details of these investments can be found in the Notes to Financial Statements. |
See Notes to Financial Statements.
21
Table of Contents
| Aggressive Allocation Fund | ||
| SCHEDULE OF INVESTMENTS | June 30, 2009 (Unaudited) |
| Shares | Value | ||||||
MUTUAL FUNDS — 99.7% | |||||||
GuideStone Money Market Fund (GS4 Class)¥ | 15,655,030 | $ | 15,655,030 | ||||
GuideStone Equity Index Fund (GS4 Class)¥ | 3,039,997 | 36,145,569 | |||||
GuideStone Value Equity Fund (GS4 Class)¥ | 15,562,573 | 159,360,752 | |||||
GuideStone Growth Equity Fund (GS4 Class)¥ | 12,654,749 | 161,094,956 | |||||
GuideStone Small Cap Equity Fund (GS4 Class)¥ | 4,263,977 | 38,930,113 | |||||
GuideStone International Equity Fund (GS4 Class)¥ | 17,757,050 | 180,056,483 | |||||
Total Mutual Funds | 591,242,903 | ||||||
| Par | |||||||
U.S. TREASURY OBLIGATIONS — 0.3% | |||||||
U.S. Treasury Bills | |||||||
0.23%, 11/19/09‡‡ | $ | 50,000 | 49,952 | ||||
0.25%, 11/19/09‡‡ | 75,000 | 74,928 | |||||
0.26%, 11/19/09‡‡ | 45,000 | 44,957 | |||||
0.27%, 11/19/09‡‡ | 95,000 | 94,909 | |||||
0.27%, 11/19/09‡‡ | 1,710,000 | 1,708,358 | |||||
0.28%, 11/19/09‡‡ | 75,000 | 74,928 | |||||
0.29%, 11/19/09‡‡ | 15,000 | 14,985 | |||||
Total U.S. Treasury Obligations | 2,063,017 | ||||||
TOTAL INVESTMENTS — 100.0% | 593,305,920 | ||||||
Liabilities in Excess of Other Assets — 0.0% | (28,024 | ) | |||||
NET ASSETS — 100.0% | $ | 593,277,896 | |||||
PORTFOLIO SUMMARY (based on net assets) | |||||||
| % | |||||||
Domestic Equity Funds | 66.7 | ||||||
International Equity Fund | 30.4 | ||||||
Futures Contracts | 2.8 | ||||||
Money Market Fund | 2.6 | ||||||
U.S. Treasury Obligations | 0.3 | ||||||
| 102.8 | |||||||
FAS 157 DISCLOSURE
The following is a summary of the inputs used, as of June 30, 2009, in valuing the Fund’s investments carried at fair value:
Valuation Inputs | Investments in Securities | Other Financial Instruments*** | |||||
Level 1 — Quoted Prices | |||||||
Futures Contracts | $ | — | $ | (357,443 | ) | ||
Mutual Funds | 591,242,903 | — | |||||
Level 2 — Other Significant Observable Inputs | |||||||
U.S. Treasury Obligations | 2,063,017 | — | |||||
Level 3 — Significant Unobservable Inputs | — | — | |||||
Total | $ | 593,305,920 | $ | (357,443 | ) | ||
| *** | Other financial instruments are derivative instruments not reflected in the Schedule of Investments, such as futures, forwards and swap contracts, which are valued at the unrealized appreciation (depreciation) on the investment. Details of these investments can be found in the Notes to Financial Statements. |
See Notes to Financial Statements.
22
Table of Contents
STATEMENTS OF ASSETS AND LIABILITIES
June 30, 2009 (Unaudited)
| Conservative Allocation Fund | Balanced Allocation Fund | Growth Allocation Fund | Aggressive Allocation Fund | |||||||||||||
Assets | ||||||||||||||||
Investments in securities of affiliated issuers, at value | $ | 249,401,053 | $ | 947,960,151 | $ | 694,029,922 | $ | 591,242,903 | ||||||||
Investments in securities of unaffiliated issuers, at value | 6,066,261 | 17,331,181 | 9,226,235 | 2,063,017 | ||||||||||||
Total investments (1) | 255,467,314 | 965,291,332 | 703,256,157 | 593,305,920 | ||||||||||||
Receivables: | ||||||||||||||||
Dividends | 237 | 2,556 | 2,003 | 3,310 | ||||||||||||
Interest | 40,492 | 85,853 | 31,802 | — | ||||||||||||
Fund shares sold | 91,698 | 358,846 | 231,763 | 159,045 | ||||||||||||
Prepaid expenses and other assets | 33,823 | 17,397 | 16,272 | 15,296 | ||||||||||||
Total Assets | 255,633,564 | 965,755,984 | 703,537,997 | 593,483,571 | ||||||||||||
Liabilities | ||||||||||||||||
Cash overdraft | — | — | 364 | 114 | ||||||||||||
Payables: | ||||||||||||||||
Fund shares redeemed | 3,988 | 5,998 | 539 | 4,034 | ||||||||||||
Variation margin | 9,975 | 81,225 | 91,200 | 102,600 | ||||||||||||
Accrued expenses: | ||||||||||||||||
Investment Advisory fees | 10,970 | 68,441 | 47,475 | 38,728 | ||||||||||||
Distribution (12b-1) fees | 1,042 | 1,445 | 950 | 1,075 | ||||||||||||
Other expenses | 34,656 | 76,407 | 62,920 | 59,124 | ||||||||||||
Total Liabilities | 60,631 | 233,516 | 203,448 | 205,675 | ||||||||||||
Net Assets | $ | 255,572,933 | $ | 965,522,468 | $ | 703,334,549 | $ | 593,277,896 | ||||||||
Net Assets Consist of: | ||||||||||||||||
Paid-in-capital | $ | 260,541,701 | $ | 1,138,240,146 | $ | 885,948,518 | $ | 803,534,319 | ||||||||
Undistributed net investment income | 1,012,339 | 6,249,604 | 4,777,166 | 3,952,787 | ||||||||||||
Accumulated net realized gain (loss) on investments and futures transactions | 7,571,241 | (8,727,145 | ) | (7,790,203 | ) | (1,987,786 | ) | |||||||||
Net unrealized appreciation (depreciation) on investments and futures | (13,552,348 | ) | (170,240,137 | ) | (179,600,932 | ) | (212,221,424 | ) | ||||||||
Net Assets | $ | 255,572,933 | $ | 965,522,468 | $ | 703,334,549 | $ | 593,277,896 | ||||||||
Net Asset Value: | ||||||||||||||||
$0.001 par value, unlimited shares authorized Net assets applicable to the GS4 Class | $ | 255,572,933 | $ | 965,522,468 | $ | 703,334,549 | $ | 593,277,896 | ||||||||
GS4 shares outstanding | 23,435,677 | 98,894,966 | 75,117,395 | 69,704,238 | ||||||||||||
Net asset value, offering and redemption price per GS4 share | $ | 10.91 | $ | 9.76 | $ | 9.36 | $ | 8.51 | ||||||||
| ||||||||||||||||
(1) Investments in securities of affiliated issuers, at cost | $ | 262,918,206 | $ | 1,117,876,438 | $ | 873,534,324 | $ | 803,107,070 | ||||||||
Investments in securities of unaffiliated issuers, at cost | 6,074,326 | 17,401,739 | 9,242,468 | 2,062,831 | ||||||||||||
Total investments at cost | $ | 268,992,532 | $ | 1,135,278,177 | $ | 882,776,792 | $ | 805,169,901 | ||||||||
See Notes to Financial Statements.
23
Table of Contents
STATEMENTS OF OPERATIONS
For the Six Months Ended June 30, 2009 (Unaudited)
| Conservative Allocation Fund | Balanced Allocation Fund | Growth Allocation Fund | Aggressive Allocation Fund | |||||||||||||
Investment Income | ||||||||||||||||
Income distributions received from affiliated funds | $ | 3,072,911 | $ | 12,525,828 | $ | 7,114,835 | $ | 4,279,716 | ||||||||
Interest | 13,516 | 78,382 | 34,672 | 1,424 | ||||||||||||
Total Investment Income | 3,086,427 | 12,604,210 | 7,149,507 | 4,281,140 | ||||||||||||
Expenses | ||||||||||||||||
Investment advisory fees | 126,766 | 452,061 | 328,486 | 272,446 | ||||||||||||
Transfer agent fees: | ||||||||||||||||
GS4 shares | 12,825 | 26,762 | 20,717 | 19,860 | ||||||||||||
GS6 shares | 2,418 | 2,428 | 2,416 | 2,426 | ||||||||||||
Custodian fees | 4,914 | 12,553 | 10,470 | 8,796 | ||||||||||||
Distribution (12b-1) fees: | ||||||||||||||||
GS6 shares | 3,587 | 5,188 | 3,296 | 3,629 | ||||||||||||
Shareholder servicing fees: | ||||||||||||||||
GS6 shares | 3,942 | 5,708 | 3,626 | 3,995 | ||||||||||||
Accounting and administration fees | 11,901 | 34,535 | 25,993 | 21,908 | ||||||||||||
Professional fees | 21,869 | 21,869 | 21,869 | 21,869 | ||||||||||||
Blue sky fees: | ||||||||||||||||
GS4 shares | 6,416 | 4,444 | 7,072 | 6,402 | ||||||||||||
GS6 shares | 250 | 185 | 202 | 212 | ||||||||||||
Shareholder reporting fees: | ||||||||||||||||
GS4 shares | 9,171 | 27,691 | 21,664 | 20,788 | ||||||||||||
GS6 shares | 73 | 73 | 73 | 85 | ||||||||||||
Trustee fees | 1,432 | 5,506 | 4,302 | 3,832 | ||||||||||||
Line of credit facility fees | 1,262 | 4,512 | 3,317 | 2,786 | ||||||||||||
Other expenses | 6,206 | 6,681 | 6,396 | 6,281 | ||||||||||||
Total Expenses | 213,032 | 610,196 | 459,899 | 395,315 | ||||||||||||
Expenses waived/reimbursed net of amount recaptured(1) | (51,637 | ) | (65,588 | ) | (66,540 | ) | (66,979 | ) | ||||||||
Net Expenses | 161,395 | 544,608 | 393,359 | 328,336 | ||||||||||||
Net Investment Income | 2,925,032 | 12,059,602 | 6,756,148 | 3,952,804 | ||||||||||||
Realized and Unrealized Loss | ||||||||||||||||
Capital gain distributions received from affiliated funds | 215 | 1,288,866 | 464,505 | 1,763 | ||||||||||||
Net realized gain (loss) on investment securities of affiliated issuers | 8,955,362 | (7,034,847 | ) | (6,907,182 | ) | (2,396,312 | ) | |||||||||
Net realized loss on investment securities of unaffiliated issuers | (5,188 | ) | (312,257 | ) | (166,823 | ) | — | |||||||||
Net realized gain (loss) on futures transactions | (694,060 | ) | (244,764 | ) | (408,552 | ) | 769,240 | |||||||||
Net realized gain | 8,256,329 | (6,303,002 | ) | (7,018,052 | ) | (1,625,309 | ) | |||||||||
Change in unrealized appreciation on investment securities of affiliated issuers | 5,524,844 | 59,605,024 | 41,477,175 | 28,073,250 | ||||||||||||
Change in unrealized appreciation (depreciation) on investment securities of unaffiliated issuers | (8,128 | ) | (70,773 | ) | (16,423 | ) | 26 | |||||||||
Change in unrealized depreciation on futures | (53,636 | ) | (269,089 | ) | (227,849 | ) | (494,872 | ) | ||||||||
Net change in unrealized appreciation (depreciation) | 5,463,080 | 59,265,162 | 41,232,903 | 27,578,404 | ||||||||||||
Net Realized and Unrealized Gain (Loss) | 13,719,409 | 52,962,160 | 34,214,851 | 25,953,095 | ||||||||||||
Net Increase in Net Assets Resulting from Operations | $ | 16,644,441 | $ | 65,021,762 | $ | 40,970,999 | $ | 29,905,899 | ||||||||
| (1) | See Note 3a and 3c in Notes to Financial Statements. |
See Notes to Financial Statements.
24
Table of Contents
(This page intentionally left blank)
25
Table of Contents
STATEMENTS OF CHANGES IN NET ASSETS
| Conservative Allocation Fund | Balanced Allocation Fund | |||||||||||||||
| For the Six Months Ended 06/30/09 (Unaudited) | For the Year Ended 12/31/08 | For the Six Months Ended 06/30/09 (Unaudited) | For the Year Ended 12/31/08 | |||||||||||||
Operations: | ||||||||||||||||
Net investment income | $ | 2,925,032 | $ | 10,269,108 | $ | 12,059,602 | $ | 35,620,140 | ||||||||
Net realized gain (loss) on investment securities and futures transactions | 8,256,329 | 8,824,621 | (6,303,002 | ) | 61,327,554 | |||||||||||
Net change in unrealized appreciation (depreciation) on investment securities and futures | 5,463,080 | (60,614,730 | ) | 59,265,162 | (415,693,032 | ) | ||||||||||
Net increase (decrease) in net assets resulting from operations | 16,644,441 | (41,521,001 | ) | 65,021,762 | (318,745,338 | ) | ||||||||||
Dividends and Distributions to Shareholders: | ||||||||||||||||
Dividends from net investment income(1) | ||||||||||||||||
GS4 shares | (1,789,789 | ) | (9,693,871 | ) | (5,621,650 | ) | (40,400,725 | ) | ||||||||
GS6 shares | (129,158 | ) | (568,343 | ) | (188,348 | ) | (1,249,223 | ) | ||||||||
Distributions from net realized capital gains | ||||||||||||||||
GS4 shares | (1,004,425 | ) | (11,948,499 | ) | (6,561,723 | ) | (87,603,110 | ) | ||||||||
GS6 shares | (78,277 | ) | (724,405 | ) | (235,776 | ) | (2,600,874 | ) | ||||||||
Total dividends and distributions | (3,001,649 | ) | (22,935,118 | ) | (12,607,497 | ) | (131,853,932 | ) | ||||||||
Capital Share Transactions: | ||||||||||||||||
Proceeds from shares sold | ||||||||||||||||
GS4 shares | 15,879,549 | 47,483,596 | 25,912,828 | 49,002,929 | ||||||||||||
GS6 shares | 1,736,060 | 10,824,099 | 712,549 | 2,037,778 | ||||||||||||
Proceeds from exchange of GS6 shares for GS4 shares(2) | ||||||||||||||||
GS4 shares | 11,903,681 | — | 16,986,754 | — | ||||||||||||
GS6 shares | (11,903,681 | ) | — | (16,986,754 | ) | — | ||||||||||
Reinvestment of dividends and distributions | ||||||||||||||||
GS4 shares | 2,791,838 | 21,623,391 | 12,182,027 | 127,987,706 | ||||||||||||
GS6 shares | 207,435 | 1,292,748 | 424,124 | 3,850,097 | ||||||||||||
Total proceeds from shares sold and reinvested | 20,614,882 | 81,223,834 | 39,231,528 | 182,878,510 | ||||||||||||
Value of shares redeemed | ||||||||||||||||
GS4 shares | (35,144,409 | ) | (74,845,193 | ) | (47,936,116 | ) | (178,146,050 | ) | ||||||||
GS6 shares | (196,592 | ) | (13,199,672 | ) | (95,773 | ) | (1,652,196 | ) | ||||||||
Total value of shares redeemed | (35,341,001 | ) | (88,044,865 | ) | (48,031,889 | ) | (179,798,246 | ) | ||||||||
Net increase (decrease) from capital share transactions(3) | (14,726,119 | ) | (6,821,031 | ) | (8,800,361 | ) | 3,080,264 | |||||||||
Total increase (decrease) in net assets | (1,083,327 | ) | (71,277,150 | ) | 43,613,904 | (447,519,006 | ) | |||||||||
Net Assets: | ||||||||||||||||
Beginning of Period | 256,656,260 | 327,933,410 | 921,908,564 | 1,369,427,570 | ||||||||||||
End of Period* | $ | 255,572,933 | $ | 256,656,260 | $ | 965,522,468 | $ | 921,908,564 | ||||||||
| ||||||||||||||||
*Including undistributed net investment income | $ | 1,012,339 | $ | 6,254 | $ | 6,249,604 | $ | — | ||||||||
| (1) | Includes dividends paid from the short-term portion of capital gain distributions received from affiliated funds. |
| (2) | See Note 1 in Notes to Financial Statements. |
| (3) | See Note 7 in Notes to Financial Statements. |
See Notes to Financial Statements.
26
Table of Contents
| Growth Allocation Fund | Aggressive Allocation Fund | |||||||||||||
For the Six | For the Year Ended 12/31/08 | For the Six Months Ended 06/30/09 (Unaudited) | For the Year Ended 12/31/08 | |||||||||||
| $ | 6,756,148 | $ | 19,512,882 | $ | 3,952,804 | $ | 9,729,470 | |||||||
| (7,018,052 | ) | 33,387,179 | (1,625,309 | ) | 25,916,936 | |||||||||
| 41,232,903 | (402,388,211 | ) | 27,578,404 | (436,941,190 | ) | |||||||||
| 40,970,999 | (349,488,150 | ) | 29,905,899 | (401,294,784 | ) | |||||||||
| (1,930,146 | ) | (21,309,114 | ) | (17 | ) | (9,439,716 | ) | |||||||
| (48,836 | ) | (523,396 | ) | — | (296,932 | ) | ||||||||
| (3,758,322 | ) | (71,442,300 | ) | (4,616,754 | ) | (74,709,707 | ) | |||||||
| (114,025 | ) | (1,729,302 | ) | (175,394 | ) | (2,468,492 | ) | |||||||
| (5,851,329 | ) | (95,004,112 | ) | (4,792,165 | ) | (86,914,847 | ) | |||||||
| 18,697,326 | 39,141,307 | 24,051,188 | 39,353,913 | |||||||||||
| 1,111,513 | 2,441,653 | 495,847 | 1,160,837 | |||||||||||
| 11,004,801 | — | 12,055,110 | — | |||||||||||
| (11,004,801 | ) | — | (12,055,110 | ) | — | |||||||||
| 5,688,215 | 92,746,748 | 4,616,710 | 84,148,111 | |||||||||||
| 162,861 | 2,252,698 | 175,394 | 2,765,424 | |||||||||||
| 25,659,915 | 136,582,406 | 29,339,139 | 127,428,285 | |||||||||||
| (35,076,486 | ) | (122,227,222 | ) | (20,194,651 | ) | (100,170,087 | ) | |||||||
| (245,720 | ) | (1,641,495 | ) | (156,279 | ) | (1,067,413 | ) | |||||||
| (35,322,206 | ) | (123,868,717 | ) | (20,350,930 | ) | (101,237,500 | ) | |||||||
| (9,662,291 | ) | 12,713,689 | 8,988,209 | 26,190,785 | ||||||||||
| 25,457,379 | (431,778,573 | ) | 34,101,943 | (462,018,846 | ) | |||||||||
| 677,877,170 | 1,109,655,743 | 559,175,953 | 1,021,194,799 | |||||||||||
| $ | 703,334,549 | $ | 677,877,170 | $ | 593,277,896 | $ | 559,175,953 | |||||||
| $ | 4,777,166 | $ | — | $ | 3,952,787 | $ | — | |||||||
See Notes to Financial Statements.
27
Table of Contents
FINANCIAL HIGHLIGHTS (Unaudited)
For a Share Outstanding For the Years Ended December 31, unless otherwise indicated
| Ratios to Average Net Assets | ||||||||||||||||||||||||||||||||||||||||||||||||||
| Net Asset Value, Beginning of Period | Net Investment Income (1) | Capital Gain Distributions Received from Affiliated Funds | Realized and Unrealized Gain (Loss) on Investments | Dividends from Net Investment Income (2) | Distributions from Net Realized Capital Gains | Net Asset Value, End of Period | Total Return | Net Assets, End of Period (000) | Expenses, Net (3) | Expenses, Including Expense Reduction (3) | Expenses, Before Waivers and Expense Reduction (3)(4) | Investment Income, Net (1) | Investment Income/ (Loss), Excluding Waivers and Expense Reduction (1) | Portfolio Turnover Rate | ||||||||||||||||||||||||||||||||||||
| Conservative Allocation Fund | ||||||||||||||||||||||||||||||||||||||||||||||||||
| GS4 Class | ||||||||||||||||||||||||||||||||||||||||||||||||||
2009(5) | $ | 10.33 | $ | 0.12 | # | $ | — | $ | 0.58 | $ | (0.08 | ) | $ | (0.04 | ) | $ | 10.91 | 6.85 | % | $ | 255,573 | 0.12 | % | 0.12 | % | 0.16 | % | 2.33 | % | 2.29 | % | 23 | % | |||||||||||||||||
2008 | 13.02 | 0.42 | # | 0.03 | (2.17 | ) | (0.42 | ) | (0.55 | ) | 10.33 | (13.11 | ) | 246,617 | 0.12 | 0.12 | 0.15 | 3.36 | 3.33 | 17 | ||||||||||||||||||||||||||||||
2007 | 13.15 | 0.43 | # | 0.21 | 0.21 | (0.44 | ) | (0.54 | ) | 13.02 | 6.48 | 313,829 | 0.13 | 0.13 | 0.16 | 3.13 | 3.10 | 13 | ||||||||||||||||||||||||||||||||
2006 | 12.94 | 0.40 | # | 0.17 | 0.20 | (0.41 | ) | (0.15 | ) | 13.15 | 5.99 | 308,802 | 0.13 | 0.13 | 0.18 | 3.08 | 3.03 | 9 | ||||||||||||||||||||||||||||||||
2005 | 13.18 | 0.33 | # | 0.09 | 0.02 | (0.32 | ) | (0.36 | ) | 12.94 | 3.31 | 280,256 | 0.13 | 0.13 | 0.19 | 2.51 | 2.45 | 20 | ||||||||||||||||||||||||||||||||
2004 | 13.00 | 0.21 | # | 0.04 | 0.37 | (0.31 | ) | (0.13 | ) | 13.18 | 4.76 | 270,913 | 0.13 | 0.13 | 0.17 | 1.60 | 1.56 | 11 | ||||||||||||||||||||||||||||||||
| Balanced Allocation Fund | ||||||||||||||||||||||||||||||||||||||||||||||||||
| GS4 Class | ||||||||||||||||||||||||||||||||||||||||||||||||||
2009(5) | $ | 9.20 | $ | 0.12 | # | $ | 0.01 | $ | 0.56 | $ | (0.06 | ) | $ | (0.07 | ) | $ | 9.76 | 7.58 | % | $ | 965,522 | 0.12 | % | 0.12 | % | 0.13 | % | 2.72 | % | 2.71 | % | 9 | % | |||||||||||||||||
2008 | 14.13 | 0.39 | # | 0.13 | (3.99 | ) | (0.43 | ) | (1.03 | ) | 9.20 | (24.41 | ) | 905,743 | 0.12 | 0.12 | 0.13 | 3.05 | 3.04 | 19 | ||||||||||||||||||||||||||||||
2007 | 14.61 | 0.41 | # | 0.48 | 0.16 | (0.48 | ) | (1.05 | ) | 14.13 | 7.16 | 1,348,204 | 0.13 | 0.13 | 0.13 | 2.68 | 2.68 | 7 | ||||||||||||||||||||||||||||||||
2006 | 14.20 | 0.36 | # | 0.39 | 0.50 | (0.40 | ) | (0.44 | ) | 14.61 | 8.78 | 1,400,001 | 0.13 | 0.13 | 0.14 | 2.44 | 2.43 | 7 | ||||||||||||||||||||||||||||||||
2005 | 14.27 | 0.32 | # | 0.21 | 0.36 | (0.36 | ) | (0.60 | ) | 14.20 | 6.24 | 1,273,855 | 0.13 | 0.13 | 0.14 | 2.18 | 2.17 | 10 | ||||||||||||||||||||||||||||||||
2004 | 13.41 | 0.26 | # | 0.11 | 0.99 | (0.30 | ) | (0.20 | ) | 14.27 | 10.13 | 1,283,982 | 0.13 | 0.13 | 0.13 | 1.90 | 1.90 | 6 | ||||||||||||||||||||||||||||||||
| Growth Allocation Fund | ||||||||||||||||||||||||||||||||||||||||||||||||||
| GS4 Class | ||||||||||||||||||||||||||||||||||||||||||||||||||
2009(5) | $ | 8.86 | $ | 0.09 | # | $ | 0.01 | $ | 0.48 | $ | (0.03 | ) | $ | (0.05 | ) | $ | 9.36 | 6.59 | % | $ | 703,335 | 0.12 | % | 0.12 | % | 0.14 | % | 2.11 | % | 2.09 | % | 7 | % | |||||||||||||||||
2008 | 15.34 | 0.28 | # | 0.13 | (5.50 | ) | (0.29 | ) | (1.10 | ) | 8.86 | (32.98 | ) | 667,769 | 0.12 | 0.12 | 0.13 | 2.15 | 2.14 | 13 | ||||||||||||||||||||||||||||||
2007 | 16.05 | 0.30 | # | 0.78 | 0.07 | (0.43 | ) | (1.43 | ) | 15.34 | 7.16 | 1,095,092 | 0.13 | 0.13 | 0.13 | 1.80 | 1.80 | 5 | ||||||||||||||||||||||||||||||||
2006 | 15.45 | 0.27 | # | 0.63 | 0.81 | (0.35 | ) | (0.76 | ) | 16.05 | 11.03 | 1,137,039 | 0.13 | 0.13 | 0.14 | 1.66 | 1.65 | 7 | ||||||||||||||||||||||||||||||||
2005 | 15.03 | 0.23 | # | 0.31 | 0.68 | (0.31 | ) | (0.49 | ) | 15.45 | 8.09 | 1,046,061 | 0.13 | 0.13 | 0.14 | 1.50 | 1.49 | 5 | ||||||||||||||||||||||||||||||||
2004 | 13.62 | 0.19 | # | 0.08 | 1.47 | (0.21 | ) | (0.12 | ) | 15.03 | 12.80 | 1,043,625 | 0.13 | 0.13 | 0.13 | 1.33 | 1.33 | 3 | ||||||||||||||||||||||||||||||||
| Aggressive Allocation Fund | ||||||||||||||||||||||||||||||||||||||||||||||||||
| GS4 Class | ||||||||||||||||||||||||||||||||||||||||||||||||||
2009(5) | $ | 8.13 | $ | 0.06 | # | $ | — | † | $ | 0.39 | $ | — | † | $ | (0.07 | ) | $ | 8.51 | 5.59 | % | $ | 593,278 | 0.12 | % | 0.12 | % | 0.15 | % | 1.49 | % | 1.46 | % | 1 | % | ||||||||||||||||
2008 | 16.31 | 0.16 | # | 0.12 | (7.01 | ) | (0.14 | ) | (1.31 | ) | 8.13 | (41.05 | ) | 547,313 | 0.12 | 0.12 | 0.13 | 1.21 | 1.20 | 7 | ||||||||||||||||||||||||||||||
2007 | 17.23 | 0.17 | # | 1.11 | (0.04 | ) | (0.36 | ) | (1.80 | ) | 16.31 | 7.17 | 1,000,850 | 0.13 | 0.13 | 0.13 | 0.94 | 0.94 | 2 | |||||||||||||||||||||||||||||||
2006 | 16.28 | 0.15 | # | 0.88 | 1.13 | (0.28 | ) | (0.93 | ) | 17.23 | 13.20 | 1,031,999 | 0.13 | 0.13 | 0.14 | 0.90 | 0.89 | 4 | ||||||||||||||||||||||||||||||||
2005 | 15.55 | 0.13 | # | 0.41 | 0.98 | (0.23 | ) | (0.56 | ) | 16.28 | 9.75 | 940,769 | 0.13 | 0.13 | 0.14 | 0.85 | 0.84 | 4 | ||||||||||||||||||||||||||||||||
2004 | 13.64 | 0.11 | # | 0.04 | 1.96 | (0.12 | ) | (0.08 | ) | 15.55 | 15.47 | 936,734 | 0.13 | 0.13 | 0.13 | 0.77 | 0.77 | 2 | ||||||||||||||||||||||||||||||||
| † | Amount represents less than $0.005 per share. |
| # | Calculated using the average shares outstanding method. |
| (1) | Recognition of net investment income by the Fund is affected by the timing of the declaration of dividends by the underlying investment companies in which the Fund invests. |
| (2) | Includes dividends paid from the short-term portion of capital gain distributions received from affiliated Funds. |
| (3) | Does not include expenses of the investment companies in which the Fund invests. |
| (4) | The ratio also excludes previously recaptured fees. |
| (5) | For the six months ended June 30, 2009. All ratios for the period have been annualized. Total return and portfolio turnover for the period have not been annualized. |
See Notes to Financial Statements.
28
Table of Contents
Conservative Allocation Fund I SCHEDULE OF INVESTMENTS | June 30, 2009 (Unaudited) |
| Shares | Value | |||||
MUTUAL FUNDS — 98.3% | ||||||
GuideStone Money Market Fund (GS2 Class)¥ | 271,001 | $ | 271,001 | |||
GuideStone Low-Duration Bond Fund (GS2 Class)¥ | 3,897,660 | 33,130,107 | ||||
GuideStone Inflation Protected Bond Fund (GS4 Class)¥ | 820,000 | 8,265,600 | ||||
GuideStone Equity Index Fund (GS2 Class)¥ | 136,447 | 871,895 | ||||
GuideStone Value Equity Fund (GS2 Class)¥ | 752,362 | 3,972,474 | ||||
GuideStone Growth Equity Fund (GS2 Class)¥ | 494,798 | 3,963,333 | ||||
GuideStone Small Cap Equity Fund (GS2 Class)¥ | 164,364 | 1,000,978 | ||||
GuideStone International Equity Fund (GS2 Class)¥ | 528,656 | 4,176,383 | ||||
Total Mutual Funds | 55,651,771 | |||||
| Par | ||||||
U.S. TREASURY OBLIGATIONS — 1.7% | ||||||
U.S. Treasury Bill | ||||||
0.27%, 11/19/09‡‡ | $ | 180,000 | 179,827 | |||
U.S. Treasury Note | ||||||
4.88%, 04/30/11 | 725,000 | 775,298 | ||||
Total U.S. Treasury Obligations | 955,125 | |||||
TOTAL INVESTMENTS — 100.0% | 56,606,896 | |||||
Other Assets in Excess of Liabilities — 0.0% | 4,024 | |||||
NET ASSETS — 100.0% | $ | 56,610,920 | ||||
| PORTFOLIO SUMMARY (based on net assets) | ||||||
| % | ||||||
Bond Funds | 73.1 | |||||
Domestic Equity Funds | 17.3 | |||||
International Equity Fund | 7.4 | |||||
U.S. Treasury Obligations | 1.7 | |||||
Money Market Fund | 0.5 | |||||
Futures Contracts | 0.4 | |||||
| 100.4 | ||||||
FAS 157 DISCLOSURE
The following is a summary of the inputs used, as of June 30, 2009, in valuing the Fund’s investments carried at fair value:
Valuation Inputs | Investments in Securities | Other Financial Instruments*** | |||||
Level 1 — Quoted Prices | |||||||
Futures Contracts | $ | — | $ | (5,401 | ) | ||
Mutual Funds | 55,651,771 | — | |||||
Level 2 — Other Significant Observable Inputs | |||||||
U.S. Treasury Obligations | 955,125 | — | |||||
Level 3 — Significant Unobservable Inputs | — | — | |||||
Total | $ | 56,606,896 | $ | (5,401 | ) | ||
| *** | Other financial instruments are derivative instruments not reflected in the Schedule of Investments, such as futures, forwards and swap contracts, which are valued at the unrealized appreciation (depreciation) on the investment. Details of these investments can be found in the Notes to Financial Statements. |
See Notes to Financial Statements.
29
Table of Contents
SCHEDULE OF INVESTMENTS | June 30, 2009 (Unaudited) |
| Shares | Value | |||||
MUTUAL FUNDS — 98.7% | ||||||
GuideStone Money Market Fund (GS2 Class)¥ | 2,507,617 | $ | 2,507,617 | |||
GuideStone Low-Duration Bond Fund (GS2 Class)¥ | 4,690,822 | 39,871,990 | ||||
GuideStone Medium-Duration Bond Fund (GS2 Class)¥ | 7,268,837 | 53,789,395 | ||||
GuideStone Extended-Duration Bond Fund (GS2 Class)¥ | 3,676,898 | 23,936,604 | ||||
GuideStone Global Bond Fund (GS4 Class)¥ | 1,719,643 | 14,221,452 | ||||
GuideStone Equity Index Fund (GS2 Class)¥ | 1,207,850 | 7,718,158 | ||||
GuideStone Value Equity Fund (GS2 Class)¥ | 7,248,219 | 38,270,598 | ||||
GuideStone Growth Equity Fund (GS2 Class)¥ | 4,807,420 | 38,507,438 | ||||
GuideStone Small Cap Equity Fund (GS2 Class)¥ | 1,458,500 | 8,882,266 | ||||
GuideStone International Equity Fund (GS2 Class)¥ | 5,492,288 | 43,389,076 | ||||
Total Mutual Funds | 271,094,594 | |||||
| Par | ||||||
U.S. TREASURY OBLIGATIONS — 1.3% | ||||||
U.S. Treasury Bill | ||||||
0.27%, 11/19/09‡‡ | $ | 800,000 | 799,232 | |||
U.S. Treasury Note | ||||||
1.88%, 02/28/14 | 2,850,000 | 2,777,191 | ||||
Total U.S. Treasury Obligations | 3,576,423 | |||||
TOTAL INVESTMENTS — 100.0% | 274,671,017 | |||||
Other Assets in Excess of Liabilities — 0.0% | 44,424 | |||||
NET ASSETS — 100.0% | $ | 274,715,441 | ||||
PORTFOLIO SUMMARY (based on net assets) | ||||||
| % | ||||||
Bond Funds | 48.0 | |||||
Domestic Equity Funds | 34.0 | |||||
International Equity Fund | 15.8 | |||||
U.S. Treasury Obligations | 1.3 | |||||
Futures Contracts | 1.0 | |||||
Money Market Fund | 0.9 | |||||
| 101.0 | ||||||
FAS 157 DISCLOSURE
The following is a summary of the inputs used, as of June 30, 2009, in valuing the Fund’s investments carried at fair value:
Valuation Inputs | Investments in Securities | Other Financial Instruments*** | |||||
Level 1 — Quoted Prices | |||||||
Futures Contracts | $ | — | $ | (55,349 | ) | ||
Mutual Funds | 271,094,594 | ||||||
Level 2 — Other Significant Observable Inputs | |||||||
U.S. Treasury Obligations | 3,576,423 | — | |||||
Level 3 — Significant Unobservable Inputs | — | — | |||||
Total | $ | 274,671,017 | $ | (55,349 | ) | ||
| *** | Other financial instruments are derivative instruments not reflected in the Schedule of Investments, such as futures, forwards and swap contracts, which are valued at the unrealized appreciation (depreciation) on the investment. Details of these investments can be found in the Notes to Financial Statements. |
See Notes to Financial Statements.
30
Table of Contents
| Growth Allocation Fund I | ||||
| SCHEDULE OF INVESTMENTS | June 30, 2009 (Unaudited) |
| Shares | Value | ||||||
MUTUAL FUNDS — 99.3% | |||||||
GuideStone Money Market Fund (GS2 Class)¥ | 2,455,716 | $ | 2,455,716 | ||||
GuideStone Low-Duration Bond Fund (GS2 Class)¥ | 1,459,965 | 12,409,706 | |||||
GuideStone Medium-Duration Bond Fund (GS2 Class)¥ | 2,245,191 | 16,614,417 | |||||
GuideStone Extended-Duration Bond Fund (GS2 Class)¥ | 1,156,875 | 7,531,258 | |||||
GuideStone Global Bond Fund (GS4 Class)¥ | 541,465 | 4,477,919 | |||||
GuideStone Equity Index Fund (GS2 Class)¥ | 1,214,877 | 7,763,064 | |||||
GuideStone Value Equity Fund (GS2 Class)¥ | 6,716,210 | 35,461,590 | |||||
GuideStone Growth Equity Fund (GS2 Class)¥ | 4,389,818 | 35,162,444 | |||||
GuideStone Small Cap Equity Fund (GS2 Class)¥ | 1,359,805 | 8,281,215 | |||||
GuideStone International Equity Fund (GS2 Class)¥ | 5,084,132 | 40,164,645 | |||||
Total Mutual Funds | 170,321,974 | ||||||
| Par | |||||||
U.S. TREASURY OBLIGATIONS — 0.8% | |||||||
U.S. Treasury Bill | |||||||
0.27%, 11/19/09‡‡ | $ | 495,000 | 494,525 | ||||
U.S. Treasury Note | |||||||
1.88%, 02/28/14 | 875,000 | 852,646 | |||||
Total U.S. Treasury Obligations | 1,347,171 | ||||||
TOTAL INVESTMENTS — 100.1% | 171,669,145 | ||||||
Liabilities in Excess of Other Assets — (0.1)% | (129,082 | ) | |||||
NET ASSETS — 100.0% | $ | 171,540,063 | |||||
PORTFOLIO SUMMARY (based on net assets) | |||||||
| % | |||||||
Domestic Equity Funds | 50.5 | ||||||
Bond Funds | 24.0 | ||||||
International Equity Fund | 23.4 | ||||||
Futures Contracts | 1.5 | ||||||
Money Market Fund | 1.4 | ||||||
U.S. Treasury Obligations | 0.8 | ||||||
| 101.6 | |||||||
FAS 157 DISCLOSURE
The following is a summary of the inputs used, as of June 30, 2009, in valuing the Fund’s investments carried at fair value:
Valuation Inputs | Investments in Securities | Other Financial Instruments*** | |||||
Level 1 — Quoted Prices | |||||||
Futures Contracts | $ | — | $ | (10,856 | ) | ||
Mutual Funds | 170,321,974 | — | |||||
Level 2 — Other Significant Observable Inputs | |||||||
U.S. Treasury Obligation | 1,347,171 | — | |||||
Level 3 — Significant Unobservable Inputs | — | — | |||||
Total | $ | 171,669,145 | $ | (10,856 | ) | ||
| *** | Other financial instruments are derivative instruments not reflected in the Schedule of Investments, such as futures, forwards and swap contracts, which are valued at the unrealized appreciation (depreciation) on the investment. Details of these investments can be found in the Notes to Financial Statements. |
See Notes to Financial Statements.
31
Table of Contents
| Aggressive Allocation Fund I | ||||
| SCHEDULE OF INVESTMENTS | June 30, 2009 (Unaudited) |
| Shares | Value | ||||||
MUTUAL FUNDS — 99.8% | |||||||
GuideStone Money Market Fund (GS2 Class)¥ | 2,946,979 | $ | 2,946,979 | ||||
GuideStone Equity Index Fund (GS2 Class)¥ | 1,088,096 | 6,952,932 | |||||
GuideStone Value Equity Fund (GS2 Class)¥ | 5,966,834 | 31,504,883 | |||||
GuideStone Growth Equity Fund (GS2 Class)¥ | 3,969,409 | 31,794,965 | |||||
GuideStone Small Cap Equity Fund (GS2 Class)¥ | 1,265,448 | 7,706,581 | |||||
GuideStone International Equity Fund (GS2 Class)¥ | 4,503,577 | 35,578,259 | |||||
Total Mutual Funds | 116,484,599 | ||||||
| Par | |||||||
U.S. TREASURY OBLIGATION — 0.3% | |||||||
U.S. Treasury Bill | |||||||
0.27%, 11/19/09‡‡ (Cost $319,644) | $ | 320,000 | 319,693 | ||||
TOTAL INVESTMENTS — 100.1% | 116,804,292 | ||||||
Liabilities in Excess of Other Assets — (0.1)% | (151,300 | ) | |||||
NET ASSETS — 100.0% | $ | 116,652,992 | |||||
PORTFOLIO SUMMARY (based on net assets) | |||||||
| % | |||||||
Domestic Equity Funds | 66.8 | ||||||
International Equity Fund | 30.5 | ||||||
Futures Contracts | 2.6 | ||||||
Money Market Fund | 2.5 | ||||||
U.S. Treasury Obligation | 0.3 | ||||||
| 102.7 | |||||||
FAS 157 DISCLOSURE
The following is a summary of the inputs used, as of June 30, 2009, in valuing the Fund’s investments carried at fair value:
Valuation Inputs | Investments in Securities | Other Financial Instruments*** | |||||
Level 1 — Quoted Prices | |||||||
Futures Contracts | $ | — | $ | (55,652 | ) | ||
Mutual Funds | 116,484,599 | — | |||||
Level 2 — Other Significant Observable Inputs | |||||||
U.S. Treasury Obligations | 319,693 | — | |||||
Level 3 — Significant Unobservable Inputs | — | — | |||||
Total | $ | 116,804,292 | $ | (55,652 | ) | ||
| *** | Other financial instruments are derivative instruments not reflected in the Schedule of Investments, such as futures, forwards and swap contracts, which are valued at the unrealized appreciation (depreciation) on the investment. Details of these investments can be found in the Notes to Financial Statements. |
See Notes to Financial Statements.
32
Table of Contents
STATEMENTS OF ASSETS AND LIABILITIES
June 30, 2009 (Unaudited)
| Conservative Allocation Fund I | Balanced Allocation Fund I | Growth Allocation Fund I | Aggressive Allocation Fund I | |||||||||||||
Assets | ||||||||||||||||
Investments in securities of affiliated issuers, at value | $ | 55,651,771 | $ | 271,094,594 | $ | 170,321,974 | $ | 116,484,599 | ||||||||
Investments in securities of unaffiliated issuers, at value | 955,125 | 3,576,423 | 1,347,171 | 319,693 | ||||||||||||
Total investments (1) | 56,606,896 | 274,671,017 | 171,669,145 | 116,804,292 | ||||||||||||
Cash | 85 | — | — | 175 | ||||||||||||
Receivables: | ||||||||||||||||
Dividends | 313 | 1,157 | 839 | 959 | ||||||||||||
Interest | 5,955 | 17,855 | 5,483 | — | ||||||||||||
Fund shares sold | 15,963 | 85,922 | 17,500 | — | ||||||||||||
Prepaid expenses and other assets | 156 | 157 | 156 | 157 | ||||||||||||
Total Assets | 56,629,368 | 274,776,108 | 171,693,123 | 116,805,583 | ||||||||||||
Liabilities | ||||||||||||||||
Fund shares redeemed | — | — | 103,551 | 107,495 | ||||||||||||
Variation margin | 1,425 | 17,100 | 15,960 | 18,525 | ||||||||||||
Accrued expenses: | ||||||||||||||||
Investment Advisory fees | 219 | 22,896 | 13,621 | 7,512 | ||||||||||||
Other expenses | 16,804 | 20,671 | 19,928 | 19,059 | ||||||||||||
Total Liabilities | 18,448 | 60,667 | 153,060 | 152,591 | ||||||||||||
Net Assets | $ | 56,610,920 | $ | 274,715,441 | $ | 171,540,063 | $ | 116,652,992 | ||||||||
Net Assets Consist of: | ||||||||||||||||
Paid-in-capital | $ | 66,670,681 | $ | 365,576,712 | $ | 250,470,277 | $ | 190,640,700 | ||||||||
Undistributed net investment income | 1,734,968 | 11,203,814 | 4,417,803 | 4,728,621 | ||||||||||||
Accumulated net realized loss on investments and futures transactions | (5,151,599 | ) | (19,570,313 | ) | (6,984,000 | ) | (7,225,120 | ) | ||||||||
Net unrealized appreciation (depreciation) on investments and futures | (6,643,130 | ) | (82,494,772 | ) | (76,364,017 | ) | (71,491,209 | ) | ||||||||
Net Assets | $ | 56,610,920 | $ | 274,715,441 | $ | 171,540,063 | $ | 116,652,992 | ||||||||
Net Asset Value: | ||||||||||||||||
$0.001 par value, unlimited shares authorized | ||||||||||||||||
Net assets applicable to the GS2 Class | $ | 56,610,920 | $ | 274,715,441 | $ | 171,540,063 | $ | 116,652,992 | ||||||||
GS2 shares outstanding | 6,600,757 | 33,869,900 | 21,873,098 | 15,346,181 | ||||||||||||
Net asset value, offering and redemption price per GS2 share | $ | 8.58 | $ | 8.11 | $ | 7.84 | $ | 7.60 | ||||||||
| ||||||||||||||||
(1) Investments in securities of affiliated issuers, at cost | $ | 62,288,326 | $ | 353,526,705 | $ | 246,676,056 | $ | 187,920,205 | ||||||||
Investments in securities of unaffiliated issuers, at cost | 956,299 | 3,583,735 | 1,346,250 | 319,644 | ||||||||||||
Total investments at cost | $ | 63,244,625 | $ | 357,110,440 | $ | 248,022,306 | $ | 188,239,849 | ||||||||
See Notes to Financial Statements.
33
Table of Contents
STATEMENTS OF OPERATIONS
For the Six Months Ended June 30, 2009 (Unaudited)
| Conservative Allocation Fund I | Balanced Allocation Fund I | Growth Allocation Fund I | Aggressive Allocation Fund I | |||||||||||||
Investment Income | ||||||||||||||||
Income distributions received from affiliated funds | $ | 1,069,645 | $ | 6,090,211 | $ | 3,065,687 | $ | 1,555,532 | ||||||||
Interest | 2,066 | 16,749 | 6,229 | 232 | ||||||||||||
Total Investment Income | 1,071,711 | 6,106,960 | 3,071,916 | 1,555,764 | ||||||||||||
Expenses | ||||||||||||||||
Investment advisory fees | 27,129 | 127,963 | 79,773 | 53,542 | ||||||||||||
Transfer agent fees | 1,882 | 1,939 | 1,902 | 1,905 | ||||||||||||
Custodian fees | 4,701 | 6,340 | 5,648 | 4,396 | ||||||||||||
Accounting and administration fees | 4,694 | 12,168 | 8,135 | 6,190 | ||||||||||||
Professional fees | 21,869 | 21,869 | 21,869 | 21,869 | ||||||||||||
Shareholder reporting fees | 183 | 291 | 219 | 255 | ||||||||||||
Trustee fees | 288 | 1,475 | 997 | 746 | ||||||||||||
Line of credit facility fees | 265 | 1,257 | 794 | 547 | ||||||||||||
Other expenses | 4,988 | 5,389 | 5,084 | 5,015 | ||||||||||||
Total Expenses | 65,999 | 178,691 | 124,421 | 94,465 | ||||||||||||
Expenses waived/reimbursed net of amount recaptured(1) | (23,669 | ) | — | (5,114 | ) | (13,977 | ) | |||||||||
Net expenses | 42,330 | 178,691 | 119,307 | 80,488 | ||||||||||||
Net Investment Income | 1,029,381 | 5,928,269 | 2,952,609 | 1,475,276 | ||||||||||||
Realized and Unrealized Loss | ||||||||||||||||
Capital gain distributions received from affiliated funds | 60 | 643,012 | 199,612 | 450 | ||||||||||||
Net realized loss on investment securities of affiliated issuers | (2,649,870 | ) | (7,715,855 | ) | (3,362,892 | ) | (2,442,923 | ) | ||||||||
Net realized loss on investment securities of unaffiliated issuers | (731 | ) | (70,775 | ) | (40,058 | ) | — | |||||||||
Net realized gain (loss) on futures transactions | (12,377 | ) | (409,247 | ) | (29,040 | ) | 89,548 | |||||||||
Net realized loss | (2,662,918 | ) | (7,552,865 | ) | (3,232,378 | ) | (2,352,925 | ) | ||||||||
Change in unrealized appreciation on investment securities of affiliated issuers | 5,463,882 | 20,472,210 | 10,935,584 | 7,008,625 | ||||||||||||
Change in unrealized appreciation (depreciation) on investment securities of unaffiliated issuers | (1,199 | ) | (7,395 | ) | 867 | 16 | ||||||||||
Change in unrealized depreciation on futures | (18,075 | ) | (99,221 | ) | (57,828 | ) | (67,892 | ) | ||||||||
Net change in unrealized appreciation (depreciation) | 5,444,608 | 20,365,594 | 10,878,623 | 6,940,749 | ||||||||||||
Net Realized and Unrealized Gain | 2,781,690 | 12,812,729 | 7,646,245 | 4,587,824 | ||||||||||||
Net Increase in Net Assets Resulting from Operations | $ | 3,811,071 | $ | 18,740,998 | $ | 10,598,854 | $ | 6,063,100 | ||||||||
| (1) | See Note 3a and 3c in Notes to Financial Statements. |
See Notes to Financial Statements.
34
Table of Contents
(This page intentionally left blank)
35
Table of Contents
STATEMENTS OF CHANGES IN NET ASSETS
| Conservative Allocation Fund I | Balanced Allocation Fund I | |||||||||||||||
| For the Six Months Ended 06/30/09 (Unaudited) | For the Year Ended 12/31/08 | For the Six Months Ended 06/30/09 (Unaudited) | For the Year Ended 12/31/08 | |||||||||||||
Operations: | ||||||||||||||||
Net investment income | $ | 1,029,381 | $ | 3,230,044 | $ | 5,928,269 | $ | 16,247,663 | ||||||||
Net realized loss on investment securities and futures transactions | (2,662,918 | ) | (1,755,621 | ) | (7,552,865 | ) | (6,648,178 | ) | ||||||||
Net change in unrealized appreciation (depreciation) on investment securities and futures | 5,444,608 | (9,880,455 | ) | 20,365,594 | (94,588,586 | ) | ||||||||||
Net increase (decrease) in net assets resulting from operations | 3,811,071 | (8,406,032 | ) | 18,740,998 | (84,989,101 | ) | ||||||||||
Dividends and Distributions to Shareholders: | ||||||||||||||||
Dividends from net investment income(1) | — | (2,524,105 | ) | — | (13,746,934 | ) | ||||||||||
Distributions from net realized capital gains | — | (1,170,532 | ) | — | (13,133,636 | ) | ||||||||||
Total dividends and distributions | — | (3,694,637 | ) | — | (26,880,570 | ) | ||||||||||
Capital Share Transactions: | ||||||||||||||||
Proceeds from GS2 shares sold | 3,373,766 | 8,306,973 | 8,035,617 | 21,418,152 | ||||||||||||
Reinvestment of dividends and distributions into GS2 shares | — | 3,682,376 | — | 26,811,396 | ||||||||||||
Value of GS2 shares redeemed | (4,890,532 | ) | (12,802,980 | ) | (12,183,733 | ) | (30,030,801 | ) | ||||||||
Net increase (decrease) from capital share transactions(2) | (1,516,766 | ) | (813,631 | ) | (4,148,116 | ) | 18,198,747 | |||||||||
Total increase (decrease) in net assets | 2,294,305 | (12,914,300 | ) | 14,592,882 | (93,670,924 | ) | ||||||||||
Net Assets: | ||||||||||||||||
Beginning of Period | 54,316,615 | 67,230,915 | 260,122,559 | 353,793,483 | ||||||||||||
End of Period* | $ | 56,610,920 | $ | 54,316,615 | $ | 274,715,441 | $ | 260,122,559 | ||||||||
| ||||||||||||||||
*Including undistributed net investment income | $ | 1,734,968 | $ | 705,587 | $ | 11,203,814 | $ | 5,275,545 | ||||||||
| (1) | Includes dividends paid from the short-term portion of capital gain distributions received from affiliated funds. |
| (2) | See Note 7 in Notes to Financial Statements. |
See Notes to Financial Statements.
36
Table of Contents
| Growth Allocation Fund I | Aggressive Allocation Fund I | |||||||||||||
| For the Six Months Ended 06/30/09 (Unaudited) | For the Year Ended 12/31/08 | For the Six Months Ended 06/30/09 (Unaudited) | For the Year Ended 12/31/08 | |||||||||||
| $ | 2,952,609 | $ | 7,717,434 | $ | 1,475,276 | $ | 3,252,965 | |||||||
| (3,232,378 | ) | (1,955,658 | ) | (2,352,925 | ) | (4,896,449 | ) | |||||||
| 10,878,623 | (86,939,096 | ) | 6,940,749 | (76,732,258 | ) | |||||||||
| 10,598,854 | (81,177,320 | ) | 6,063,100 | (78,375,742 | ) | |||||||||
| — | (7,164,765 | ) | — | — | ||||||||||
| — | (13,479,284 | ) | — | (14,453,029 | ) | |||||||||
| — | (20,644,049 | ) | — | (14,453,029 | ) | |||||||||
| 7,433,549 | 14,603,125 | 5,024,130 | 9,952,658 | |||||||||||
| — | 20,568,986 | — | 14,434,397 | |||||||||||
| (8,307,316 | ) | (23,114,496 | ) | (3,989,885 | ) | (20,849,161 | ) | |||||||
| (873,767 | ) | 12,057,615 | 1,034,245 | 3,537,894 | ||||||||||
| 9,725,087 | (89,763,754 | ) | 7,097,345 | (89,290,877 | ) | |||||||||
| 161,814,976 | 251,578,730 | 109,555,647 | 198,846,524 | |||||||||||
| $ | 171,540,063 | $ | 161,814,976 | $ | 116,652,992 | $ | 109,555,647 | |||||||
| $ | 4,417,803 | $ | 1,465,194 | $ | 4,728,621 | $ | 3,253,345 | |||||||
See Notes to Financial Statements.
37
Table of Contents
FINANCIAL HIGHLIGHTS (Unaudited)
For a Share Outstanding For the Years Ended December 31, unless otherwise indicated
| Ratios to Average Net Assets | |||||||||||||||||||||||||||||||||||||||||||||||||
| Net Asset Value, Beginning of Period | Net Investment Income (1) | Capital Gain Distributions Received from Affiliated Funds | Realized and Unrealized Gain (Loss) on Investments | Dividends from Net Investment Income (2) | Distributions from Net Realized Capital Gains | Net Asset Value, End of Period | Total Return | Net Assets, End of Period (000) | Expenses, Net (3) | Expenses, Including Expense Reduction (3) | Expenses, Before Waivers/ Reimbursements and Expense Reduction (3)(4) | Investment Income, Net (1) | Investment Income, Excluding Waivers/ Reimbursements and Expense Reduction (1) | Portfolio Turnover Rate | |||||||||||||||||||||||||||||||||||
Conservative Allocation Fund I |
| ||||||||||||||||||||||||||||||||||||||||||||||||
GS2 Class |
| ||||||||||||||||||||||||||||||||||||||||||||||||
2009(5) | $ | 8.00 | $ | 0.15 | $ | — | $ | 0.43 | $ | — | $ | — | $ | 8.58 | 7.25 | % | $ | 56,611 | 0.16 | % | 0.16 | % | 0.25 | % | 3.83 | % | 3.74 | % | 24 | % | |||||||||||||||||||
2008 | 9.86 | 0.49 | 0.03 | (1.81 | ) | (0.39 | ) | (0.18 | ) | 8.00 | (12.98 | ) | 54,317 | 0.15 | 0.15 | 0.22 | 5.21 | 5.14 | 25 | ||||||||||||||||||||||||||||||
2007 | 10.05 | 0.50 | 0.23 | (0.07 | ) | (0.54 | ) | (0.31 | ) | 9.86 | 6.55 | 67,231 | 0.16 | 0.16 | 0.22 | 4.77 | 4.71 | 25 | |||||||||||||||||||||||||||||||
2006 | 10.15 | 0.46 | 0.19 | (0.02 | ) | (0.49 | ) | (0.24 | ) | 10.05 | 6.21 | 57,188 | 0.17 | 0.17 | 0.30 | 4.53 | 4.40 | 16 | |||||||||||||||||||||||||||||||
2005 | 10.31 | 0.36 | 0.10 | (0.10 | ) | (0.38 | ) | (0.14 | ) | 10.15 | 3.46 | 54,231 | 0.17 | 0.17 | 0.30 | 3.52 | 3.39 | 16 | |||||||||||||||||||||||||||||||
2004 | 10.31 | 0.25 | 0.05 | 0.19 | (0.36 | ) | (0.13 | ) | 10.31 | 4.77 | 31,447 | 0.17 | 0.17 | 0.39 | 2.42 | 2.20 | 23 | ||||||||||||||||||||||||||||||||
Balanced Allocation Fund I |
| ||||||||||||||||||||||||||||||||||||||||||||||||
GS2 Class |
| ||||||||||||||||||||||||||||||||||||||||||||||||
2009(5) | $ | 7.53 | $ | 0.17 | # | $ | 0.02 | $ | 0.39 | $ | — | $ | — | $ | 8.11 | 7.70 | % | $ | 274,715 | 0.14 | % | 0.14 | % | 0.14 | % | 4.72 | % | 4.72 | % | 10 | % | ||||||||||||||||||
2008 | 11.07 | 0.51 | # | 0.17 | (3.38 | ) | (0.42 | ) | (0.42 | ) | 7.53 | (24.26 | ) | 260,123 | 0.14 | 0.14 | 0.14 | 5.16 | 5.16 | 23 | |||||||||||||||||||||||||||||
2007 | 11.35 | 0.55 | # | 0.66 | (0.38 | ) | (0.62 | ) | (0.49 | ) | 11.07 | 7.32 | 353,793 | 0.16 | 0.16 | 0.14 | 4.62 | 4.64 | 12 | ||||||||||||||||||||||||||||||
2006 | 11.32 | 0.46 | # | 0.45 | 0.09 | (0.50 | ) | (0.47 | ) | 11.35 | 8.85 | 262,451 | 0.17 | 0.17 | 0.18 | 3.93 | 3.92 | 13 | |||||||||||||||||||||||||||||||
2005 | 11.23 | 0.40 | # | 0.25 | 0.07 | (0.46 | ) | (0.17 | ) | 11.32 | 6.42 | 239,244 | 0.17 | 0.17 | 0.18 | 3.49 | 3.48 | 11 | |||||||||||||||||||||||||||||||
2004 | 10.62 | 0.34 | # | 0.14 | 0.60 | (0.36 | ) | (0.11 | ) | 11.23 | 10.26 | 122,166 | 0.17 | 0.17 | 0.22 | 3.07 | 3.02 | 10 | |||||||||||||||||||||||||||||||
Growth Allocation Fund I |
| ||||||||||||||||||||||||||||||||||||||||||||||||
GS2 Class |
| ||||||||||||||||||||||||||||||||||||||||||||||||
2009(5) | $ | 7.35 | $ | 0.13 | # | $ | 0.01 | $ | 0.35 | $ | — | $ | — | $ | 7.84 | 6.67 | % | $ | 171,540 | 0.15 | % | 0.15 | % | 0.16 | % | 3.78 | % | 3.77 | % | 9 | % | ||||||||||||||||||
2008 | 12.53 | 0.39 | # | 0.16 | (4.69 | ) | (0.34 | ) | (0.70 | ) | 7.35 | (32.82 | ) | 161,815 | 0.15 | 0.15 | 0.14 | 3.65 | 3.66 | 18 | |||||||||||||||||||||||||||||
2007 | 12.96 | 0.41 | 0.92 | (0.37 | ) | (0.58 | ) | (0.81 | ) | 12.53 | 7.40 | 251,579 | 0.16 | 0.16 | 0.15 | 3.20 | 3.21 | 9 | |||||||||||||||||||||||||||||||
2006 | 12.62 | 0.34 | 0.73 | 0.35 | (0.44 | ) | (0.64 | ) | 12.96 | 11.21 | 187,536 | 0.17 | 0.17 | 0.20 | 2.73 | 2.70 | 9 | ||||||||||||||||||||||||||||||||
2005 | 12.17 | 0.29 | 0.38 | 0.33 | (0.39 | ) | (0.16 | ) | 12.62 | 8.20 | 159,849 | 0.17 | 0.17 | 0.20 | 2.42 | 2.39 | 8 | ||||||||||||||||||||||||||||||||
2004 | 11.11 | 0.24 | 0.09 | 1.09 | (0.26 | ) | (0.10 | ) | 12.17 | 12.88 | 70,608 | 0.17 | 0.17 | 0.27 | 2.13 | 2.03 | 7 | ||||||||||||||||||||||||||||||||
Aggressive Allocation Fund I |
| ||||||||||||||||||||||||||||||||||||||||||||||||
GS2 Class |
| ||||||||||||||||||||||||||||||||||||||||||||||||
2009(5) | $ | 7.20 | $ | 0.10 | # | $ | — | $ | 0.30 | $ | — | $ | — | $ | 7.60 | 5.56 | % | $ | 116,653 | 0.15 | % | 0.15 | % | 0.18 | % | 2.82 | % | 2.79 | % | 3 | % | ||||||||||||||||||
2008 | 14.07 | 0.24 | # | 0.14 | (6.15 | ) | — | (1.10 | ) | 7.20 | (40.87 | ) | 109,556 | 0.15 | 0.15 | 0.16 | 2.08 | 2.07 | 10 | ||||||||||||||||||||||||||||||
2007 | 14.56 | 0.27 | 1.37 | (0.56 | ) | (0.52 | ) | (1.05 | ) | 14.07 | 7.38 | 198,847 | 0.16 | 0.16 | 0.15 | 1.81 | 1.82 | 7 | |||||||||||||||||||||||||||||||
2006 | 14.01 | 0.21 | 1.09 | 0.57 | (0.36 | ) | (0.96 | ) | 14.56 | 13.33 | 142,218 | 0.17 | 0.17 | 0.21 | 1.47 | 1.43 | 8 | ||||||||||||||||||||||||||||||||
2005 | 13.16 | 0.18 | 0.52 | 0.62 | (0.31 | ) | (0.16 | ) | 14.01 | 9.98 | 125,826 | 0.17 | 0.17 | 0.21 | 1.38 | 1.34 | 5 | ||||||||||||||||||||||||||||||||
2004 | 11.62 | 0.15 | 0.05 | 1.60 | (0.15 | ) | (0.11 | ) | 13.16 | 15.48 | 33,543 | 0.17 | 0.17 | 0.41 | 1.29 | 1.05 | 7 | ||||||||||||||||||||||||||||||||
| # | Calculated using the average shares outstanding method. |
| (1) | Recognition of net investment income by the Fund is affected by the timing of the declaration of dividends by the underlying investment companies in which the Fund invests. |
| (2) | Includes dividends paid from the short-term portion of capital gain distributions received from affiliated Funds. |
| (3) | Does not include expenses of the investment companies in which the Fund invests. |
| (4) | The ratio also excludes previously recaptured fees. |
| (5) | For the six months ended June 30, 2009. All ratios for the period have been annualized. Total return and portfolio turnover for the period have not been annualized. |
See Notes to Financial Statements.
38
Table of Contents
SCHEDULE OF INVESTMENTS | June 30, 2009 (Unaudited) |
| Par | Value | |||||
AGENCY OBLIGATIONS — 8.5% | ||||||
Federal Home Loan Bank | ||||||
0.73%, 02/05/10† | $ | 6,620,000 | $ | 6,620,000 | ||
0.82%, 02/26/10† | 6,800,000 | 6,800,000 | ||||
Federal Home Loan Mortgage Corporation | ||||||
0.56%, 08/17/09 | 40,000,000 | 39,970,756 | ||||
0.72%, 11/05/09 | 5,000,000 | 4,987,300 | ||||
0.90%, 05/05/11† | 17,000,000 | 16,989,448 | ||||
Federal National Mortgage Association | ||||||
0.60%, 08/26/09 | 8,000,000 | 7,992,533 | ||||
0.80%, 05/13/11† | 15,000,000 | 15,005,319 | ||||
Total Agency Obligations | 98,365,356 | |||||
CERTIFICATES OF DEPOSIT — 22.6% | ||||||
Banco Bilbao Vizcaya Argentaria S.A. NY | ||||||
0.97%, 07/01/09 | 2,000,000 | 2,000,000 | ||||
1.07%, 10/29/09 | 6,000,000 | 6,000,199 | ||||
0.90%, 11/16/09 | 5,000,000 | 5,000,191 | ||||
BNP Paribas NY | ||||||
0.43%, 11/16/09 | 25,000,000 | 25,000,000 | ||||
0.56%, 11/30/09 | 10,000,000 | 10,000,000 | ||||
0.55%, 12/04/09 | 20,000,000 | 20,000,000 | ||||
Chase Bank USA NA | ||||||
0.52%, 07/15/09 | 1,200,000 | 1,200,000 | ||||
DnB NORBank ASA NY | ||||||
0.67%, 12/10/09 | 7,000,000 | 7,000,000 | ||||
Intesa Sanpaolo SpA NY | ||||||
0.60%, 12/11/09 | 5,000,000 | 5,000,000 | ||||
Rabobank Nederland NV NY | ||||||
0.40%, 10/13/09 | 17,000,000 | 17,000,000 | ||||
1.02%, 05/04/10† | 17,000,000 | 17,000,000 | ||||
Royal Bank of Scotland PLC NY | ||||||
1.25%, 07/09/09 | 15,000,000 | 15,000,000 | ||||
0.63%, 09/18/09 | 7,000,000 | 7,000,153 | ||||
0.63%, 09/30/09 | 2,000,000 | 2,000,000 | ||||
Sanpaolo IMI SpA NY | ||||||
0.86%, 07/02/09 | 15,000,000 | 15,000,000 | ||||
State Street Bank and Trust Co. | ||||||
0.61%, 07/27/09 | 35,000,000 | 35,000,000 | ||||
Sumitomo Mitsui Bank NY | ||||||
0.90%, 07/21/09 | 12,000,000 | 12,000,133 | ||||
Svenska Handelsbanken NY | ||||||
0.62%, 11/30/09 | 5,000,000 | 5,000,105 | ||||
0.57%, 12/14/09 | 10,000,000 | 10,000,460 | ||||
0.52%, 12/17/09 | 15,000,000 | 15,000,351 | ||||
UBS AG Stamford | ||||||
0.71%, 08/04/09 | 17,000,000 | 17,000,000 | ||||
0.74%, 09/02/09 | 12,000,000 | 12,000,000 | ||||
Total Certificates of Deposit | 260,201,592 | |||||
COMMERCIAL PAPER — 61.2% | ||||||
Antalis US Funding Corporation | ||||||
0.63%, 07/08/09 | 10,000,000 | 9,998,775 | ||||
0.45%, 08/14/09 | 16,000,000 | 15,991,200 | ||||
Atlantis One Funding Corporation | ||||||
0.45%, 08/05/09 | 25,000,000 | 24,989,062 | ||||
0.39%, 09/02/09 | 15,000,000 | 14,989,763 | ||||
BASF SE | ||||||
0.40%, 07/20/09 | 25,000,000 | 24,994,722 | ||||
CAFCO LLC | ||||||
0.50%, 07/01/09 | 25,000,000 | 25,000,000 | ||||
Cancara Asset Securitisation LLC | ||||||
0.50%, 08/14/09 | 17,000,000 | 16,989,611 | ||||
CBA Delaware Finance, Inc. | ||||||
0.34%, 09/16/09 | 25,000,000 | 24,981,819 | ||||
Citigroup Funding, Inc. | ||||||
0.45%, 07/07/09 | 12,000,000 | 11,999,100 | ||||
0.40%, 07/10/09 | 20,000,000 | 19,998,000 | ||||
Danske Corporation | ||||||
0.49%, 08/10/09 | 6,000,000 | 5,996,733 | ||||
0.76%, 11/02/09 | 8,000,000 | 7,979,196 | ||||
DnB NORBank ASA | ||||||
0.80%, 07/07/09 | 8,000,000 | 7,998,933 | ||||
Erasmus Capital Corporation | ||||||
0.55%, 07/14/09 | 10,000,000 | 9,998,014 | ||||
0.50%, 09/01/09 | 21,000,000 | 20,981,917 | ||||
Fairway Finance LLC | ||||||
0.41%, 08/18/09 | 45,000,000 | 44,975,400 | ||||
ING US Funding LLC | ||||||
0.68%, 07/27/09 | 20,000,000 | 19,990,178 | ||||
Intesa Funding LLC | ||||||
0.69%, 07/06/09 | 39,000,000 | 38,996,262 | ||||
JPMorgan Chase Funding, Inc. | ||||||
0.37%, 08/06/09 | 7,376,000 | 7,373,271 | ||||
0.35%, 08/13/09 | 5,000,000 | 4,997,910 | ||||
National Australia Funding Delaware, Inc. | ||||||
0.33%, 09/14/09 | 25,000,000 | 24,982,813 | ||||
Nestle Capital Corporation | ||||||
0.04%, 07/01/09 | 30,000,000 | 30,000,000 | ||||
Nieuw Amsterdam Receivables Corporation | ||||||
0.70%, 08/11/09 | 10,000,000 | 9,992,028 | ||||
Old Line Funding LLC | ||||||
0.40%, 07/15/09 | 15,000,000 | 14,997,667 | ||||
0.45%, 08/04/09 | 10,000,000 | 9,995,750 | ||||
Royal Bank of Scotland PLC | ||||||
1.21%, 07/21/09 | 12,000,000 | 11,991,933 | ||||
1.08%, 07/31/09 | 12,000,000 | 11,989,200 | ||||
0.75%, 09/02/09 | 10,000,000 | 9,986,875 | ||||
Santander Central Hispano Finance Delaware, Inc. | ||||||
1.65%, 08/03/09 | 5,000,000 | 4,992,438 | ||||
Scaldis Capital LLC | ||||||
0.70%, 08/04/09 | 1,000,000 | 999,339 | ||||
0.60%, 08/07/09 | 27,000,000 | 26,983,350 | ||||
Societe Generale North America, Inc. | ||||||
1.39%, 07/07/09 | 4,000,000 | 3,999,073 | ||||
0.71%, 07/24/09 | 7,000,000 | 6,996,825 | ||||
0.35%, 08/26/09 | 230,000 | 229,875 | ||||
0.38%, 09/09/09 | 12,000,000 | 11,991,133 | ||||
0.38%, 09/16/09 | 10,000,000 | 9,991,872 | ||||
0.58%, 12/11/09 | 18,000,000 | 17,953,138 | ||||
Straight-A Funding LLC | ||||||
0.50%, 08/03/09 | 7,500,000 | 7,496,562 | ||||
See Notes to Financial Statements.
39
Table of Contents
Money Market Fund
SCHEDULE OF INVESTMENTS (Continued)
| Par | Value | ||||||
Tempo Finance Corporation | |||||||
0.55%, 07/06/09 | $ | 15,000,000 | $ | 14,998,854 | |||
Thunder Bay Funding LLC | |||||||
0.48%, 07/13/09 | 40,455,000 | 40,448,527 | |||||
UBS Finance Delaware LLC | |||||||
1.20%, 07/06/09 | 14,000,000 | 13,997,667 | |||||
0.68%, 09/04/09 | 15,000,000 | 14,981,583 | |||||
Wells Fargo & Co. | |||||||
0.05%, 07/01/09 | 45,103,000 | 45,103,000 | |||||
Total Commercial Paper | 704,319,368 | ||||||
VARIABLE RATE OBLIGATIONS — 9.5% | |||||||
Bank of Montreal | |||||||
0.82%, 07/06/09 144A† | 9,200,000 | 9,200,000 | |||||
Dexia Credit Local | |||||||
1.01%, 07/17/09† | 14,000,000 | 14,000,000 | |||||
HSBC USA, Inc. | |||||||
1.56%, 07/14/09† | 1,645,000 | 1,645,000 | |||||
ING Bank NV | |||||||
0.98%, 08/24/09 144A† | 4,750,000 | 4,750,000 | |||||
ING USA Global Funding Trust | |||||||
1.08%, 09/18/09† | 2,725,000 | 2,725,000 | |||||
KBC Bank NV NY | |||||||
0.49%, 07/01/09† | 6,690,000 | 6,690,000 | |||||
Lloyds Banking Group PLC | |||||||
1.29%, 08/07/09 144A† | 7,450,000 | 7,450,000 | |||||
Nordea Bank AB | |||||||
1.45%, 07/24/09 144A† | 6,900,000 | 6,900,000 | |||||
Procter & Gamble International Funding SCA | |||||||
1.00%, 08/07/09†D | 27,000,000 | 27,000,000 | |||||
Rabobank Nederland NV | |||||||
0.56%, 07/07/09 144A† | 11,800,000 | 11,800,000 | |||||
Wachovia Bank NA | |||||||
1.59%, 07/06/09†D | 6,250,000 | 6,250,000 | |||||
Wisconsin Housing & Economic Development Series D Authority Home Ownership Revenue Bond | |||||||
0.90%, 07/01/09† | 5,000,000 | 5,000,000 | |||||
0.90%, 07/01/09† | 5,350,000 | 5,350,000 | |||||
Total Variable Rate Obligations | 108,760,000 | ||||||
| Shares | |||||||
MONEY MARKET FUND — 1.1% | |||||||
Northern Institutional Liquid Assets Portfolio§ | 12,249,000 | 12,249,000 | |||||
| Par | |||||||
U.S. TREASURY OBLIGATIONS — 5.2% | |||||||
U.S. Treasury Bills | |||||||
0.45%, 08/13/09 | $ | 6,000,000 | 5,996,811 | ||||
0.41%, 08/20/09 | 15,000,000 | 14,991,458 | |||||
0.47%, 08/20/09 | 12,000,000 | 11,992,175 | |||||
0.49%, 08/27/09D | 5,000,000 | 4,996,117 | |||||
0.32%, 09/03/09 | 10,757,000 | 10,750,880 | |||||
0.55%, 07/01/10 | 11,000,000 | 10,939,384 | |||||
Total U.S. Treasury Obligations | 59,666,825 | ||||||
TOTAL INVESTMENTS — 108.1% | 1,243,562,141 | ||||||
Liabilities in Excess of Other Assets — (8.1)% | (92,701,685 | ) | |||||
NET ASSETS — 100.0% | $ | 1,150,860,456 | |||||
PORTFOLIO SUMMARY (based on net assets)
| % | ||||
Commercial Paper | 61.2 | |||
Certificates of Deposit | 22.6 | |||
Variable Rate Obligations | 9.5 | |||
Agency Obligations | 8.5 | |||
U.S. Treasury Obligations | 5.2 | |||
Money Market Fund | 1.1 | |||
| 108.1 | ||||
FAS 157 DISCLOSURE
The following is a summary of the inputs used, as of June 30, 2009, in valuing the Fund’s investments carried at fair value:
Valuation Inputs | Investments in Securities | Other Financial Instruments*** | ||||
Level 1 — Quoted Prices | ||||||
Money Market Fund | $ | 12,249,000 | $ | — | ||
Level 2 — Other Significant | ||||||
Observable Inputs | ||||||
Agency Obligations | 98,365,356 | — | ||||
Certificates Of Deposit | 260,201,592 | — | ||||
Commercial Paper | 704,319,368 | — | ||||
Variable Rate Obligations | 108,760,000 | — | ||||
U.S. Treasury Obligations | 59,666,825 | — | ||||
Level 3 — Significant Unobservable Inputs | — | — | ||||
Total | $ | 1,243,562,141 | $ | — | ||
| *** | Other financial instruments are derivative instruments not reflected in the Schedule of Investments, such as futures, forwards and swap contracts, which are valued at the unrealized appreciation (depreciation) on the investment. Details of these investments can be found in the Notes to Financial Statements. |
See Notes to Financial Statements.
40
Table of Contents
SCHEDULE OF INVESTMENTS | June 30, 2009 (Unaudited) |
| Par | Value | |||||
AGENCY OBLIGATIONS — 2.5% | ||||||
Federal Home Loan Bank | ||||||
5.38%, 06/13/14 | $ | 895,000 | $ | 993,998 | ||
5.25%, 09/12/14 | 895,000 | 992,591 | ||||
Federal Home Loan Mortgage Corporation | ||||||
3.25%, 02/25/11 | 3,000,000 | 3,103,800 | ||||
5.88%, 03/21/11 | 2,310,000 | 2,422,002 | ||||
1.75%, 06/15/12 | 2,300,000 | 2,293,282 | ||||
Federal National Mortgage Association | ||||||
6.25%, 02/01/11 | 1,275,000 | 1,341,540 | ||||
2.00%, 02/11/11 | 1,780,000 | 1,792,672 | ||||
5.25%, 08/01/12 | 1,580,000 | 1,642,942 | ||||
Small Business Administration | ||||||
6.95%, 11/10/16 | 515,985 | 548,375 | ||||
Total Agency Obligations | 15,131,202 | |||||
ASSET-BACKED SECURITIES — 10.7% | ||||||
Accredited Mortgage Loan Trust | ||||||
0.36%, 02/25/37† | 856,079 | 786,952 | ||||
American Express Issuance Trust | ||||||
4.02%, 01/18/11 | 2,580,000 | 2,619,087 | ||||
Amresco Independence Funding, Inc. | ||||||
1.69%, 06/15/26 144A | 295,275 | 185,517 | ||||
Asset-Backed Securities Corporation Home Equity | ||||||
0.59%, 09/25/34† | 100,868 | 64,868 | ||||
Bear Stearns Asset-Backed Securities Trust | ||||||
0.36%, 11/25/36† | 435,476 | 372,453 | ||||
1.31%, 10/25/37† | 1,280,357 | 687,418 | ||||
0.50%, 01/25/47† | 1,751,858 | 1,268,464 | ||||
BMW Vehicle Lease Trust | ||||||
0.79%, 06/15/10 | 490,000 | 490,166 | ||||
2.04%, 04/15/11 | 1,800,000 | 1,806,193 | ||||
Business Loan Express | ||||||
2.25%, 01/01/25 144A† | 189,016 | 102,499 | ||||
Capital Auto Receivables Asset Trust | ||||||
5.32%, 03/20/10 144A | 267,978 | 267,978 | ||||
Carmax Auto Owner Trust | ||||||
5.24%, 07/15/11 | 2,105,748 | 2,137,823 | ||||
CenterPoint Energy Transition Bond Co., LLC | ||||||
4.97%, 08/01/14 | 2,813,020 | 2,937,862 | ||||
Chase Issuance Trust | ||||||
0.34%, 03/15/13† | 1,100,000 | 1,080,789 | ||||
Citigroup Mortgage Loan Trust, Inc. | ||||||
0.37%, 07/25/45† | 2,674,272 | 1,876,639 | ||||
Conseco Financial Corporation | ||||||
6.04%, 11/01/29 | 23,851 | 20,938 | ||||
CSAB Mortgage Backed Trust | ||||||
5.72%, 09/25/36 STEP | 900,000 | 571,459 | ||||
Daimler Chrysler Auto Trust | ||||||
1.25%, 07/08/11† | 970,922 | 971,467 | ||||
FHLMC Structured Pass-Through Securities | ||||||
0.57%, 08/25/31† | 1,089,157 | 873,361 | ||||
First Franklin Mortgage Loan Asset-Backed Certificates | ||||||
0.36%, 12/25/36† | 5,428 | 5,368 | ||||
Ford Credit Auto Lease Trust | ||||||
1.24%, 06/15/10 144A | 600,000 | 594,656 | ||||
2.60%, 05/15/11 144A | 830,000 | 832,075 | ||||
Ford Credit Auto Owner Trust | ||||||
5.07%, 12/15/10 | 1,638,532 | 1,661,655 | ||||
1.22%, 01/15/11† | 901,945 | 902,613 | ||||
0.36%, 02/15/12† | 2,520,000 | 2,494,262 | ||||
3.96%, 04/15/12 | 3,585,000 | 3,622,403 | ||||
2.79%, 08/15/13 | 2,150,000 | 2,151,243 | ||||
Fremont Home Loan Trust | ||||||
0.36%, 10/25/36† | 89,582 | 55,956 | ||||
GSAA Trust | ||||||
0.63%, 12/25/34† | 498,936 | 231,819 | ||||
Honda Auto Receivables Owner Trust | ||||||
5.12%, 10/15/10 | 386,923 | 389,506 | ||||
2.22%, 08/15/11 | 1,000,000 | 1,005,803 | ||||
2.79%, 01/15/13 | 1,520,000 | 1,528,277 | ||||
IFC SBA Loan-Backed Adjustable Rate Certificate | ||||||
1.25%, 01/15/24 144A† | 244,888 | 196,351 | ||||
JP Morgan Mortgage Acquisition Corporation | ||||||
0.36%, 05/25/37† | 1,933,630 | 1,675,689 | ||||
Long Beach Mortgage Loan Trust | ||||||
0.35%, 11/25/36† | 145,015 | 134,559 | ||||
Morgan Stanley ABS Capital I | ||||||
0.36%, 11/25/36† | 903,194 | 852,546 | ||||
0.35%, 01/25/37† | 719,958 | 623,061 | ||||
0.42%, 02/25/37† | 1,338,741 | 980,105 | ||||
0.37%, 05/25/37† | 1,554,369 | 986,376 | ||||
Nissan Auto Lease Trust | ||||||
2.01%, 04/15/11 | 940,000 | 937,062 | ||||
Option One Mortgage Loan Trust | ||||||
0.35%, 02/25/37† | 35,663 | 35,176 | ||||
PG&E Energy Recovery Funding LLC | ||||||
4.37%, 06/25/14 | 350,000 | 361,558 | ||||
Securitized Asset-Backed Receivables LLC Trust | ||||||
0.35%, 01/25/37† | 710,668 | 599,442 | ||||
SLM Student Loan Trust | ||||||
2.19%, 10/25/16† | 3,985,000 | 4,007,416 | ||||
2.39%, 01/25/18† | 3,975,000 | 3,987,788 | ||||
1.08%, 10/25/18† | 866,546 | 858,829 | ||||
Soundview Home Equity Loan Trust | ||||||
0.43%, 01/25/37† | 882,222 | 733,964 | ||||
0.37%, 08/25/37† | 1,085,439 | 948,027 | ||||
Specialty Underwriting & Residential Finance | ||||||
0.36%, 11/25/37† | 152,084 | 146,964 | ||||
Structured Asset Investment Loan Trust | ||||||
0.36%, 07/25/36† | 118,399 | 107,313 | ||||
Structured Asset Securities Corporation | ||||||
4.90%, 04/25/35† | 1,238,819 | 731,482 | ||||
0.36%, 10/25/36† | 387,475 | 353,721 | ||||
See Notes to Financial Statements.
41
Table of Contents
Low-Duration Bond Fund
SCHEDULE OF INVESTMENTS (Continued)
| Par | Value | |||||
Structured Asset Receivables Trust | ||||||
1.60%, 04/21/11 144A† | $ | 1,835,115 | $ | 1,559,847 | ||
TXU Electric Delivery Transition Bond Co., LLC | ||||||
4.81%, 11/17/14 | 2,360,000 | 2,466,322 | ||||
USAA Auto Owner Trust | ||||||
4.89%, 08/15/12 | 1,474,759 | 1,496,911 | ||||
Volkswagen Auto Lease Trust | ||||||
2.87%, 07/15/11 | 700,000 | 702,587 | ||||
Wachovia Auto Loan Owner Trust | ||||||
5.08%, 04/20/12 144A | 3,000,000 | 3,052,485 | ||||
Wells Fargo Home Equity Trust | ||||||
0.40%, 04/25/37† | 1,235,221 | 1,026,970 | ||||
Total Asset-Backed Securities | 64,160,120 | |||||
CORPORATE BONDS — 17.7% | ||||||
3M Co. | ||||||
4.50%, 11/01/11 | 590,000 | 627,591 | ||||
Abbott Laboratories | ||||||
5.60%, 05/15/11D | 750,000 | 801,651 | ||||
AEP Texas Central Transition Funding LLC | ||||||
4.98%, 07/01/13 | 2,900,000 | 3,033,339 | ||||
Allstate Corporation | ||||||
6.20%, 05/16/14 | 500,000 | 524,984 | ||||
American Electric Power Co., Inc. | ||||||
5.25%, 06/01/15D | 1,600,000 | 1,572,403 | ||||
American Honda Finance Corporation | ||||||
2.95%, 06/29/11 144A† | 600,000 | 598,621 | ||||
American International Group, Inc. | ||||||
1.59%, 07/19/13(E)† | 400,000 | 289,105 | ||||
8.25%, 08/15/18 144A | 2,700,000 | 1,591,056 | ||||
Amgen, Inc. | ||||||
4.00%, 11/18/09 | 1,000,000 | 1,013,662 | ||||
Bank of America Corporation | ||||||
4.38%, 12/01/10D | 1,290,000 | 1,293,744 | ||||
Bank of America NA | ||||||
1.16%, 06/23/10† | 2,500,000 | 2,488,765 | ||||
Bank of New York Mellon Corporation | ||||||
0.71%, 03/23/12† | 980,000 | 931,369 | ||||
4.30%, 05/15/14 | 790,000 | 803,611 | ||||
BellSouth Corporation | ||||||
4.75%, 11/15/12 | 1,300,000 | 1,346,964 | ||||
Berkshire Hathaway Finance Corporation | ||||||
4.00%, 04/15/12 144A | 3,495,000 | 3,614,424 | ||||
Board of Trustees of The Leland Stanford Junior University | ||||||
3.63%, 05/01/14 | 425,000 | 428,922 | ||||
Bottling Group LLC | ||||||
6.95%, 03/15/14 | 1,320,000 | 1,507,093 | ||||
Caterpillar Financial Services Corporation | ||||||
5.75%, 02/15/12D | 575,000 | 602,522 | ||||
Chevron Corporation | ||||||
3.45%, 03/03/12D | 3,375,000 | 3,483,513 | ||||
Chicago Transit Authority | ||||||
6.90%, 12/01/40 | 1,300,000 | 1,391,091 | ||||
Cisco Systems, Inc. | ||||||
5.25%, 02/22/11D | 750,000 | $ | 791,140 | |||
Citigroup Capital XXI | ||||||
8.30%, 12/21/57† | 3,100,000 | 2,422,948 | ||||
Citigroup Funding, Inc. | ||||||
1.38%, 05/05/11 | 2,110,000 | 2,113,939 | ||||
Comcast Corporation | ||||||
1.44%, 07/14/09† | 1,735,000 | 1,735,493 | ||||
ConocoPhillips | ||||||
4.75%, 10/15/12D | 1,225,000 | 1,291,639 | ||||
4.75%, 02/01/14D | 400,000 | 416,900 | ||||
COX Communications, Inc. | ||||||
7.75%, 11/01/10D | 1,225,000 | 1,275,619 | ||||
7.13%, 10/01/12 | 420,000 | 451,808 | ||||
CSX Corporation | ||||||
5.75%, 03/15/13D | 1,225,000 | 1,257,091 | ||||
CVS Caremark Corporation | ||||||
4.00%, 09/15/09D | 1,085,000 | 1,091,370 | ||||
0.97%, 06/01/10† | 1,380,000 | 1,370,586 | ||||
5.75%, 08/15/11 | 975,000 | 1,031,557 | ||||
Duke Energy Ohio, Inc. | ||||||
5.70%, 09/15/12 | 1,375,000 | 1,399,591 | ||||
Eaton Corporation | ||||||
5.95%, 03/20/14D | 600,000 | 629,087 | ||||
Eli Lilly & Co. | ||||||
3.55%, 03/06/12D | 1,300,000 | 1,347,632 | ||||
Enterprise Products Operating LLC | ||||||
4.95%, 06/01/10 | 1,080,000 | 1,096,186 | ||||
Express Scripts, Inc. | ||||||
5.25%, 06/15/12 | 550,000 | 568,621 | ||||
Florida Power Corporation | ||||||
6.65%, 07/15/11 | 600,000 | 648,295 | ||||
FPL Group Capital, Inc. | ||||||
5.63%, 09/01/11D | 475,000 | 508,013 | ||||
General Dynamics Corporation | ||||||
1.80%, 07/15/11 | 1,520,000 | 1,517,975 | ||||
General Electric Capital Corporation | ||||||
5.00%, 12/01/10D‡‡ | 1,740,000 | 1,791,694 | ||||
1.80%, 03/11/11 | 2,615,000 | 2,639,667 | ||||
5.90%, 05/13/14 | 460,000 | 472,861 | ||||
6.50%, 09/15/37 144A(U)† | 1,600,000 | 1,645,197 | ||||
Goldman Sachs Group, Inc. | ||||||
1.63%, 07/15/11D | 400,000 | 402,374 | ||||
6.00%, 05/01/14 | 600,000 | 626,849 | ||||
6.25%, 09/01/17 | 300,000 | 297,296 | ||||
Hewlett-Packard Co. | ||||||
4.25%, 02/24/12D | 1,961,000 | 2,048,049 | ||||
John Deere Capital Corporation | ||||||
1.81%, 01/18/11† | 760,000 | 755,334 | ||||
JPMorgan Chase & Co. | ||||||
5.60%, 06/01/11D | 520,000 | 544,655 | ||||
2.20%, 06/15/12D | 1,350,000 | 1,357,795 | ||||
Kraft Foods, Inc. | ||||||
5.63%, 08/11/10D | 495,000 | 512,274 | ||||
Lehman Brothers Holdings, Inc. | ||||||
6.63%, 01/18/12# | 600,000 | 91,500 | ||||
6.75%, 12/28/17# | 2,600,000 | 260 | ||||
6.88%, 05/02/18# | 2,400,000 | 396,000 | ||||
Metropolitan Life Global Funding I | ||||||
2.55%, 06/10/11 144A† | 1,625,000 | 1,623,004 | ||||
See Notes to Financial Statements.
42
Table of Contents
| Par | Value | |||||
Microsoft Corporation | ||||||
2.95%, 06/01/14D | $ | 900,000 | $ | 894,483 | ||
MidAmerican Energy Co. | ||||||
5.13%, 01/15/13 | 515,000 | 535,017 | ||||
MidAmerican Energy Holdings Co. | ||||||
5.88%, 10/01/12D | 550,000 | 586,185 | ||||
Midamerican Funding LLC | ||||||
6.75%, 03/01/11 | 600,000 | 641,022 | ||||
Morgan Stanley | ||||||
3.01%, 05/14/10† | 1,500,000 | 1,496,006 | ||||
2.25%, 03/13/12 | 2,030,000 | 2,049,210 | ||||
6.00%, 05/13/14 | 400,000 | 405,410 | ||||
Nabors Industries, Inc. | ||||||
6.15%, 02/15/18 | 3,300,000 | 3,173,062 | ||||
Novartis Capital Corporation | ||||||
4.13%, 02/10/14D | 210,000 | 216,393 | ||||
Oracle Corporation | ||||||
5.00%, 01/15/11 | 1,040,000 | 1,090,634 | ||||
Overseas Private Investment Corporation | ||||||
25.44%, 07/12/10W | 1,760,216 | 1,802,352 | ||||
8.30%, 07/12/12W | 2,100,000 | 2,265,852 | ||||
5.75%, 04/15/14 | 1,600,000 | 1,698,344 | ||||
Pacific Gas & Electric Co. | ||||||
1.60%, 06/10/10† | 1,000,000 | 1,005,218 | ||||
Pfizer, Inc. | ||||||
4.45%, 03/15/12 | 700,000 | 734,934 | ||||
3.63%, 06/03/13(E) | 100,000 | 142,453 | ||||
Procter & Gamble Co. | ||||||
4.60%, 01/15/14 | 535,000 | 563,224 | ||||
3.50%, 02/15/15D | 200,000 | 202,100 | ||||
Progress Energy, Inc. | ||||||
7.10%, 03/01/11D | 1,120,000 | 1,191,650 | ||||
Roche Holdings, Inc. | ||||||
4.50%, 03/01/12 144A | 2,296,000 | 2,415,284 | ||||
Sprint Capital Corporation | ||||||
8.38%, 03/15/12D | 1,000,000 | 990,000 | ||||
Time Warner Cable, Inc. | ||||||
5.40%, 07/02/12 | 1,325,000 | 1,370,461 | ||||
Time Warner, Inc. | ||||||
1.15%, 11/13/09† | 2,100,000 | 2,095,178 | ||||
Union Pacific Corporation | ||||||
6.13%, 01/15/12 | 365,000 | 381,711 | ||||
US Bancorp | ||||||
4.20%, 05/15/14D | 900,000 | 911,164 | ||||
Verizon Global Funding Corporation | ||||||
7.25%, 12/01/10D | 675,000 | 718,942 | ||||
6.88%, 06/15/12D | 445,000 | 489,278 | ||||
Verizon Wireless Capital LLC | ||||||
3.75%, 05/20/11 144A | 4,325,000 | 4,415,535 | ||||
5.25%, 02/01/12 144AD | 2,585,000 | 2,727,940 | ||||
5.55%, 02/01/14 144A | 400,000 | 425,080 | ||||
Wachovia Corporation | ||||||
0.75%, 03/15/11†D | 540,000 | 521,314 | ||||
5.30%, 10/15/11 | 394,000 | 410,806 | ||||
Wells Fargo & Co. | ||||||
7.98%, 03/15/49† | 400,000 | 332,487 | ||||
XTO Energy, Inc. | ||||||
5.00%, 08/01/10 | 1,020,000 | 1,045,633 | ||||
Total Corporate Bonds | 106,059,091 | |||||
FOREIGN BONDS — 11.5% | ||||||
Australia — 2.1% | ||||||
Australia & New Zealand Banking Group, Ltd. | ||||||
0.89%, 06/18/12 144A† | 1,575,000 | 1,571,252 | ||||
BHP Billiton Finance USA, Ltd. | ||||||
5.50%, 04/01/14 | 200,000 | 214,773 | ||||
Commonwealth Bank of Australia | ||||||
2.40%, 01/12/12 144AD | 1,004,000 | 1,008,471 | ||||
Macquarie Bank, Ltd. | ||||||
2.60%, 01/20/12 144A | 880,000 | 883,767 | ||||
4.10%, 12/17/13 144A | 3,410,000 | 3,498,206 | ||||
National Australia Bank, Ltd. | ||||||
1.42%, 02/08/10 144A† | 1,600,000 | 1,599,987 | ||||
2.55%, 01/13/12 144AD | 1,191,000 | 1,200,080 | ||||
Suncorp-Metway, Ltd. | ||||||
0.99%, 12/17/10 144A† | 2,405,000 | 2,409,473 | ||||
| 12,386,009 | ||||||
Bermuda — 0.1% | ||||||
Ingersoll-Rand Global Holding Co., Ltd. | ||||||
2.42%, 08/13/10† | 545,000 | 532,242 | ||||
Canada — 1.3% | ||||||
Export Development Canada | ||||||
2.38%, 03/19/12 | 1,410,000 | 1,424,307 | ||||
Province of Ontario | ||||||
3.13%, 09/08/10 | 760,000 | 776,110 | ||||
2.75%, 02/22/11D | 775,000 | 795,493 | ||||
1.17%, 05/22/12† | 1,475,000 | 1,470,804 | ||||
4.10%, 06/16/14 | 2,195,000 | 2,240,972 | ||||
Royal Bank of Canada | ||||||
5.65%, 07/20/11 | 550,000 | 586,647 | ||||
Toronto-Dominion Bank | ||||||
2.08%, 09/10/10(E)† | 550,000 | 770,927 | ||||
| 8,065,260 | ||||||
Cayman Islands — 0.1% | ||||||
Petroleum Export, Ltd. | ||||||
4.62%, 06/15/10 144A | 377,778 | 370,674 | ||||
4.63%, 06/15/10 144A | 377,778 | 370,687 | ||||
| 741,361 | ||||||
France — 1.5% | ||||||
BNP Paribas | ||||||
1.65%, 06/11/12† | 600,000 | 597,971 | ||||
Caisse d’Amortissement de la Dette Sociale | ||||||
3.75%, 07/12/09(E) | 1,600,000 | 2,246,707 | ||||
Dexia Credit Local | ||||||
1.26%, 09/23/11 144A† | 1,100,000 | 1,097,149 | ||||
Societe Financement de l’Economie Francaise | ||||||
2.13%, 01/30/12 144AD | 1,640,000 | 1,644,042 | ||||
2.38%, 03/26/12 | 2,395,000 | 2,412,481 | ||||
2.38%, 03/26/12 144A | 1,155,000 | 1,146,257 | ||||
| 9,144,607 | ||||||
Germany — 1.6% | ||||||
Bundesobligation | ||||||
2.25%, 04/11/14(E)D | 4,295,000 | 5,962,026 | ||||
Deutsche Bank AG | ||||||
5.00%, 10/12/10 | 515,000 | 528,546 | ||||
See Notes to Financial Statements.
43
Table of Contents
Low-Duration Bond Fund
SCHEDULE OF INVESTMENTS (Continued)
| Par | Value | |||||
Kreditanstalt fuer Wiederaufbau | ||||||
3.50%, 03/10/14 | $ | 1,605,000 | $ | 1,636,709 | ||
Landwirtschaftliche Rentenbank | ||||||
4.13%, 07/15/13 | 1,315,000 | 1,374,092 | ||||
| 9,501,373 | ||||||
Japan — 0.1% | ||||||
Japan Finance Corporation | ||||||
2.00%, 06/24/11 | 500,000 | 501,145 | ||||
Netherlands — 1.8% | ||||||
Deutsche Telekom International Finance BV | ||||||
8.50%, 06/15/10 | 900,000 | 946,714 | ||||
EDP Finance BV | ||||||
5.38%, 11/02/12 144A | 550,000 | 576,819 | ||||
Fortis Bank Nederland Holding NV | ||||||
1.74%, 06/10/11(E)† | 600,000 | 846,547 | ||||
ING Bank NV | ||||||
2.63%, 02/09/12 144A | 1,200,000 | 1,215,090 | ||||
Koninklijke KPN NV | ||||||
8.00%, 10/01/10 | 1,430,000 | 1,500,909 | ||||
LeasePlan Corporation NV | ||||||
3.00%, 05/07/12 144A | 1,525,000 | 1,544,454 | ||||
Nederlandse Waterschapsbank NV | ||||||
4.63%, 07/25/11(E) | 1,000,000 | 1,478,705 | ||||
Shell International Finance BV | ||||||
4.00%, 03/21/14 | 2,650,000 | 2,723,999 | ||||
| 10,833,237 | ||||||
Norway — 0.4% | ||||||
Eksportfinans A/S | ||||||
5.00%, 02/14/12 | 1,125,000 | 1,194,408 | ||||
StatoilHydro ASA | ||||||
3.88%, 04/15/14D | 1,385,000 | 1,406,197 | ||||
| 2,600,605 | ||||||
Supranational — 0.7% | ||||||
Asian Development Bank | ||||||
2.75%, 05/21/14 | 1,295,000 | 1,273,742 | ||||
European Investment Bank | ||||||
4.75%, 04/15/11(E) | 1,500,000 | 2,222,364 | ||||
3.13%, 06/04/14 | 600,000 | 601,946 | ||||
| 4,098,052 | ||||||
Sweden — 0.1% | ||||||
Swedbank AB | ||||||
2.80%, 02/10/12 144A | 600,000 | 607,552 | ||||
Switzerland — 0.3% | ||||||
UBS AG | ||||||
1.53%, 06/19/10† | 1,550,000 | 1,527,531 | ||||
United Kingdom — 1.4% | ||||||
Bank of England PLC | ||||||
2.38%, 03/19/12 144A | 600,000 | 598,512 | ||||
Barclays Bank PLC | ||||||
4.25%, 10/27/11(E)D | 1,000,000 | 1,472,400 | ||||
2.70%, 03/05/12 144A | 740,000 | 750,063 | ||||
BP Capital Markets PLC | ||||||
5.25%, 11/07/13D | 525,000 | 564,036 | ||||
3.63%, 05/08/14 | 600,000 | 599,054 | ||||
Lloyds TSB Bank PLC | ||||||
1.42%, 06/09/11(E)† | 400,000 | 560,044 | ||||
Royal Bank of Scotland PLC | ||||||
2.63%, 05/11/12 144A | 2,025,000 | 2,032,977 | ||||
Vodafone Group PLC | ||||||
0.94%, 02/27/12† | 950,000 | 908,510 | ||||
4.15%, 06/10/14 | 1,040,000 | 1,024,810 | ||||
| 8,510,406 | ||||||
Total Foreign Bonds | 69,049,380 | |||||
MORTGAGE-BACKED SECURITIES — 46.1% | ||||||
Adjustable Rate Mortgage Trust | ||||||
0.58%, 11/25/35† | 831,401 | 437,415 | ||||
5.94%, 03/25/37† | 3,348,887 | 1,625,101 | ||||
American Home Mortgage Investment Trust | ||||||
4.29%, 10/25/34† | 1,176,153 | 834,030 | ||||
American Home Mortgage Assets | ||||||
0.58%, 11/25/35† | 754,878 | 391,060 | ||||
2.26%, 11/25/46† | 1,447,285 | 483,737 | ||||
Bank of America Commercial Mortgage, Inc. | ||||||
3.88%, 09/11/36 | 1,097,207 | 1,092,435 | ||||
Bank of America Funding Corporation | ||||||
6.10%, 01/20/47† | 1,214,201 | 644,697 | ||||
Bank of America Mortgage Securities, Inc. | ||||||
6.50%, 10/25/31 | 285,537 | 280,325 | ||||
6.14%, 10/20/46† | 1,878,090 | 1,024,930 | ||||
Bear Stearns Adjustable Rate Mortgage Trust | ||||||
5.10%, 01/25/34† | 470,205 | 360,773 | ||||
4.64%, 07/25/34† | 1,165,382 | 1,007,140 | ||||
4.82%, 10/25/34† | 488,244 | 340,908 | ||||
2.94%, 03/25/35† | 1,951,778 | 1,686,803 | ||||
Bear Stearns Alt-A Trust | ||||||
0.68%, 11/25/34† | 546,913 | 272,381 | ||||
5.49%, 09/25/35† | 751,044 | 406,789 | ||||
Bear Stearns Commercial Mortgage Securities | ||||||
0.43%, 03/15/19 144A† | 1,364,095 | 1,173,296 | ||||
4.48%, 06/11/41 | 600,000 | 591,940 | ||||
4.03%, 02/13/46 | 195,691 | 195,366 | ||||
Chase Manhattan Bank - First Union National Bank | ||||||
7.44%, 08/15/31† | 438,940 | 438,129 | ||||
Commercial Mortgage Pass-Through Certificates | ||||||
7.42%, 08/15/33† | 1,492,771 | 1,505,836 | ||||
Countrywide Alternative Loan Trust | ||||||
6.00%, 10/25/32 | 201,406 | 174,185 | ||||
5.50%, 05/31/35 | 849,168 | 619,925 | ||||
Countrywide Home Loan Mortgage Pass-Through Trust | ||||||
5.10%, 09/25/33† | 24,482 | 18,525 | ||||
0.58%, 02/25/35† | 245,121 | 149,354 | ||||
Deutsche ALT-A Securities, Inc. | ||||||
5.87%, 10/25/36 STEP | 800,000 | 431,120 | ||||
5.89%, 10/25/36 STEP | 800,000 | 431,503 | ||||
DLJ Commercial Mortgage Corporation | ||||||
7.18%, 11/10/33 | 1,865,716 | 1,902,575 | ||||
See Notes to Financial Statements.
44
Table of Contents
| Par | Value | |||||
Federal Home Loan Mortgage Corporation | ||||||
15.25%, 08/01/11 | $ | 699 | $ | 799 | ||
5.38%, 09/15/11 | 2,593,615 | 2,693,039 | ||||
4.00%, 08/01/15 | 1,082,825 | 1,093,465 | ||||
5.00%, 11/15/16 | 827,138 | 849,136 | ||||
3.50%, 12/01/18 | 2,573,768 | 2,521,931 | ||||
10.75%, 02/01/19 | 64,260 | 67,536 | ||||
0.55%, 02/15/19† | 4,093,894 | 4,016,041 | ||||
6.00%, 11/01/22 | 1,535,008 | 1,625,334 | ||||
4.25%, 06/15/24 | 309,911 | 311,689 | ||||
5.17%, 07/01/27† | 22,549 | 22,700 | ||||
0.67%, 12/15/30† | 739,423 | 729,400 | ||||
3.73%, 06/01/33† | 1,945,812 | 1,942,967 | ||||
6.00%, 07/01/33 | 1,044,579 | 1,099,929 | ||||
3.51%, 04/01/34† | 1,813,296 | 1,850,429 | ||||
4.41%, 10/01/34† | 582,141 | 591,604 | ||||
4.33%, 08/01/35† | 1,407,953 | 1,454,233 | ||||
4.89%, 10/01/35† | 924,246 | 947,293 | ||||
5.83%, 04/01/36† | 2,708,758 | 2,798,796 | ||||
Federal Housing Authority | ||||||
7.43%, 09/01/22 | 1,510 | 1,495 | ||||
Federal National Mortgage Association | ||||||
5.50%, 12/01/18 | 974,138 | 1,027,959 | ||||
4.00%, 11/25/19 | 710,499 | 717,877 | ||||
5.50%, 09/25/24 | 563,247 | 567,805 | ||||
4.43%, 12/01/24† | 72,787 | 73,462 | ||||
9.00%, 05/01/25 | 77,399 | 84,895 | ||||
9.00%, 07/01/25 | 86,148 | 94,499 | ||||
6.00%, 02/25/27 | 1,450,486 | 1,494,139 | ||||
5.50%, 11/25/27 | 2,162,188 | 2,234,889 | ||||
0.91%, 05/25/30† | 1,569,836 | 1,545,596 | ||||
0.96%, 05/25/30† | 1,593,267 | 1,564,139 | ||||
0.56%, 09/25/30† | 32,102 | 31,872 | ||||
4.53%, 09/01/31† | 71,667 | 72,513 | ||||
3.31%, 03/25/32 | 306,191 | 288,066 | ||||
3.46%, 04/01/33† | 371,847 | 387,623 | ||||
4.45%, 06/01/33† | 201,140 | 202,305 | ||||
5.50%, 06/01/33 | 18,715 | 19,420 | ||||
5.50%, 07/01/33 | 17,886 | 18,560 | ||||
5.17%, 10/01/33† | 821,988 | 846,438 | ||||
5.50%, 10/01/33 | 95,861 | 99,470 | ||||
4.88%, 12/01/33† | 248,623 | 256,552 | ||||
4.50%, 06/01/34 | 57,674 | 57,854 | ||||
4.50%, 09/01/34 | 226,294 | 226,822 | ||||
4.88%, 09/01/34† | 866,192 | 884,004 | ||||
5.09%, 09/01/34† | 607,247 | 619,458 | ||||
4.73%, 10/01/34† | 922,241 | 952,820 | ||||
5.09%, 10/01/34† | 1,030,309 | 1,056,373 | ||||
4.50%, 12/01/34 | 67,678 | 67,836 | ||||
4.50%, 02/01/35 | 2,499,583 | 2,503,073 | ||||
4.50%, 03/01/35 | 1,464,745 | 1,466,790 | ||||
4.50%, 04/01/35 | 2,457,843 | 2,461,275 | ||||
4.50%, 05/01/35 | 771,589 | 772,666 | ||||
4.50%, 06/01/35 | 60,104 | 60,188 | ||||
5.00%, 06/01/35 | 31,275,482 | 31,953,525 | ||||
4.50%, 08/01/35 | 1,543,115 | 1,545,270 | ||||
4.68%, 08/01/35† | 4,680,072 | 4,837,374 | ||||
4.43%, 09/01/35† | 2,110,633 | 2,189,496 | ||||
4.50%, 09/01/35 | 965,908 | 967,256 | ||||
4.50%, 10/01/35 | 594,878 | 595,709 | ||||
5.34%, 10/01/35† | 1,850,190 | 1,933,996 | ||||
4.50%, 11/01/35 | 630,125 | 631,005 | ||||
4.65%, 11/01/35† | 2,883,889 | 2,943,552 | ||||
5.49%, 12/01/35† | 155,027 | 161,074 | ||||
5.50%, 07/01/37 TBA | 1,700,000 | 1,754,720 | ||||
6.00%, 07/01/37 TBA | 100,000 | 104,500 | ||||
5.50%, 08/01/37 | 4,674,436 | 4,846,259 | ||||
2.64%, 07/01/44† | 313,345 | 306,580 | ||||
6.50%, 12/31/49 | 487,731 | 490,917 | ||||
FHLMC Multifamily Structured Pass-Through Certificates | ||||||
2.23%, 07/25/13 | 1,215,000 | 1,215,292 | ||||
3.61%, 06/25/14 | 1,095,000 | 1,112,159 | ||||
FHLMC Structured Pass-Through Securities | ||||||
1.31%, 05/25/43† | 1,362,469 | 1,334,300 | ||||
2.84%, 07/25/44† | 2,315,041 | 2,290,529 | ||||
First Horizon Alternative Mortgage Securities | ||||||
3.57%, 06/25/34† | 751,567 | 485,837 | ||||
GE Capital Commercial Mortgage Corporation | ||||||
4.09%, 01/10/38 | 800,404 | 796,150 | ||||
5.56%, 06/10/38 | 391,449 | 401,949 | ||||
GMAC Commercial Mortgage Securities, Inc. | ||||||
7.72%, 03/15/33† | 1,612,166 | 1,626,874 | ||||
6.70%, 04/15/34 | 2,378,813 | 2,422,292 | ||||
Government National Mortgage Association | ||||||
6.00%, 02/15/11 | 9,166 | 9,209 | ||||
5.38%, 06/20/17† | 17,089 | 17,612 | ||||
5.38%, 06/20/21† | 7,927 | 8,189 | ||||
4.13%, 10/20/27† | 58,411 | 59,232 | ||||
8.50%, 10/15/29 | 27,894 | 31,160 | ||||
0.94%, 02/16/30† | 233,792 | 233,759 | ||||
8.50%, 03/15/30 | 4,221 | 4,717 | ||||
8.50%, 04/15/30 | 13,331 | 14,897 | ||||
8.50%, 05/15/30 | 137,494 | 153,644 | ||||
8.50%, 06/15/30 | 13,311 | 14,874 | ||||
8.50%, 07/15/30 | 77,987 | 87,145 | ||||
8.50%, 08/15/30 | 22,236 | 24,847 | ||||
8.50%, 09/15/30 | 2,397 | 2,678 | ||||
8.50%, 11/15/30 | 52,488 | 58,653 | ||||
8.50%, 12/15/30 | 65,149 | 72,801 | ||||
8.50%, 02/15/31 | 42,135 | 47,024 | ||||
3.75%, 05/20/34† | 1,075,614 | 1,097,272 | ||||
6.00%, 06/15/36 | 721,427 | 752,623 | ||||
6.00%, 07/01/37 TBA | 49,500,000 | 51,557,319 | ||||
6.50%, 10/20/37 | 3,183,153 | 3,371,978 | ||||
6.00%, 07/20/38 | 3,471,805 | 3,619,780 | ||||
6.50%, 07/20/38 | 3,124,103 | 3,309,604 | ||||
6.50%, 07/21/38 TBA | 500,000 | 530,469 | ||||
6.50%, 08/20/38 | 736,298 | 780,017 | ||||
6.50%, 09/20/38 | 2,165,065 | 2,293,621 | ||||
6.00%, 02/15/39 | 2,651,573 | 2,765,405 | ||||
Greenpoint Mortgage Funding Trust | ||||||
0.49%, 01/25/37† | 1,198,580 | 483,639 | ||||
0.58%, 11/25/45† | 351,960 | 167,498 | ||||
GS Mortgage Securities Corporation II | ||||||
6.04%, 08/15/18 144A | 205,466 | 205,427 | ||||
(40.29)%, 01/10/40 IO 144AW† | 20,252,244 | 116,523 | ||||
See Notes to Financial Statements.
45
Table of Contents
Low-Duration Bond Fund
SCHEDULE OF INVESTMENTS (Continued)
| Par | Value | |||||
GSR Mortgage Loan Trust | ||||||
3.97%, 06/01/34† | $ | 617,584 | $ | 506,947 | ||
4.60%, 09/25/34† | 784,874 | 537,513 | ||||
3.84%, 09/25/35† | 1,678,064 | 1,279,883 | ||||
4.48%, 09/25/35† | 3,505,171 | 2,946,808 | ||||
HarborView Mortgage Loan Trust | ||||||
5.31%, 12/19/35† | 2,791,050 | 1,753,796 | ||||
0.52%, 11/19/36† | 2,425,476 | 940,453 | ||||
Impac Secured Assets CMN Owner Trust | ||||||
0.39%, 01/25/37† | 396,193 | 371,614 | ||||
Indymac Index Mortgage Loan Trust | ||||||
0.58%, 06/25/37† | 917,363 | 202,455 | ||||
0.50%, 09/25/46† | 1,402,660 | 546,682 | ||||
JP Morgan Mortgage Trust | ||||||
4.08%, 08/25/34† | 82,437 | 71,527 | ||||
5.02%, 02/25/35† | 850,950 | 743,871 | ||||
4.74%, 07/25/35† | 2,909,384 | 2,356,568 | ||||
LB-UBS Commercial Mortgage Trust | ||||||
6.16%, 07/14/16 144A | 1,581,230 | 1,616,113 | ||||
7.95%, 05/15/25† | 3,849,054 | 3,911,646 | ||||
6.37%, 12/15/28 | 1,520,000 | 1,554,011 | ||||
7.72%, 04/15/37 IO 144AW† | 16,405,019 | 80,552 | ||||
Luminent Mortgage Trust | ||||||
0.57%, 11/26/35† | 1,910,073 | 845,042 | ||||
0.48%, 12/25/36† | 1,448,899 | 567,351 | ||||
MASTR Adjustable Rate Mortgages Trust | ||||||
5.51%, 12/25/33† | 832,050 | 700,988 | ||||
Merrill Lynch Mortgage Investors, Inc. | ||||||
3.35%, 08/25/34† | 2,050,996 | 1,808,551 | ||||
MLCC Mortgage Investors, Inc. | ||||||
4.56%, 12/25/34† | 1,492,103 | 1,320,376 | ||||
5.33%, 02/25/36† | 1,594,962 | 1,113,837 | ||||
Morgan Stanley Capital I | ||||||
5.36%, 12/15/44 | 3,567,062 | 3,590,697 | ||||
Opteum Mortgage Acceptance Corporation | ||||||
0.40%, 04/25/36† | 128,504 | 126,899 | ||||
0.37%, 07/25/36† | 297,464 | 282,014 | ||||
Permanent Master Issuer PLC | ||||||
1.18%, 01/15/16† | 2,195,000 | 2,137,715 | ||||
PNC Mortgage Acceptance Corporation | ||||||
7.30%, 10/12/33 | 1,867,706 | 1,914,494 | ||||
5.91%, 03/12/34 | 270,927 | 271,331 | ||||
Provident Funding Mortgage Loan Trust | ||||||
3.84%, 04/25/34† | 1,654,205 | 1,463,218 | ||||
Residential Accredit Loans, Inc. | ||||||
0.71%, 01/25/33† | 389,452 | 347,524 | ||||
Residential Asset Securitization Trust | ||||||
0.61%, 05/25/35† | 1,128,806 | 702,534 | ||||
Residential Funding Mortgage Securities I | ||||||
6.50%, 03/25/32 | 66,507 | 66,889 | ||||
Structured Adjustable Rate Mortgage Loan Trust | ||||||
4.33%, 03/25/34† | 904,052 | 735,025 | ||||
5.07%, 08/25/34† | 1,180,153 | 866,383 | ||||
0.61%, 09/25/34† | 207,432 | 124,598 | ||||
Structured Asset Mortgage Investments, Inc. | ||||||
2.21%, 10/19/34† | 582,837 | 380,142 | ||||
0.56%, 07/19/35† | 169,255 | 110,095 | ||||
0.59%, 02/25/36† | 1,059,258 | 485,957 | ||||
0.38%, 08/25/36† | 333,293 | 319,052 | ||||
Structured Asset Securities Corporation | ||||||
0.36%, 05/25/36† | 258,357 | 240,496 | ||||
TBW Mortgage Backed Pass Through Certificates | ||||||
6.01%, 07/25/37 STEP | 700,000 | 357,579 | ||||
Thornburg Mortgage Securities Trust | ||||||
0.43%, 07/25/36† | 805,108 | 700,410 | ||||
0.41%, 03/25/37† | 2,454,185 | 2,150,502 | ||||
0.44%, 06/25/37† | 1,427,887 | 1,244,534 | ||||
0.42%, 11/25/46† | 2,560,723 | 2,299,919 | ||||
TIAA Retail Commercial Trust | ||||||
6.68%, 06/19/31 144A† | 491,890 | 493,742 | ||||
5.69%, 08/15/39† | 2,167,955 | 2,205,803 | ||||
Wachovia Bank Commercial Mortgage Trust | ||||||
4.04%, 02/15/34 | 1,198,803 | 1,173,893 | ||||
Washington Mutual Alternative Mortgage Pass-Through Certificates | ||||||
2.18%, 05/25/47† | 1,095,514 | 215,971 | ||||
Washington Mutual Mortgage Pass-Through Certificates | ||||||
0.85%, 12/25/27† | 2,437,352 | 1,819,558 | ||||
4.53%, 11/25/30† | 104,374 | 85,707 | ||||
3.15%, 06/25/34† | 1,922,951 | 1,672,292 | ||||
4.68%, 05/25/35† | 3,550,000 | 1,972,683 | ||||
5.69%, 02/25/37† | 1,300,338 | 725,733 | ||||
5.63%, 05/25/37† | 1,399,227 | 903,218 | ||||
5.81%, 07/25/37† | 3,338,694 | 1,837,154 | ||||
2.74%, 06/25/42† | 44,595 | 32,370 | ||||
0.62%, 01/25/45† | 1,078,362 | 501,252 | ||||
0.63%, 08/25/45† | 533,266 | 289,220 | ||||
0.60%, 10/25/45† | 553,417 | 289,526 | ||||
2.32%, 06/25/46† | 2,009,552 | 903,870 | ||||
2.08%, 01/25/47† | 1,142,489 | 402,535 | ||||
Wells Fargo Mortgage-Backed Securities Trust | ||||||
3.54%, 12/25/34† | 1,599,110 | 1,472,951 | ||||
4.55%, 02/25/35† | 2,989,164 | 2,576,825 | ||||
5.24%, 04/25/36† | 2,888,009 | 1,811,349 | ||||
5.61%, 07/25/36† | 2,309,333 | 1,530,075 | ||||
6.00%, 07/25/37 | 2,658,683 | 2,332,891 | ||||
Total Mortgage-Backed Securities | 276,676,772 | |||||
MUNICIPAL BONDS — 1.8% | ||||||
Citizens Property Insurance Corporation High Risk Account Series A-1 Revenue Bond | ||||||
5.00%, 06/01/12 | 1,100,000 | 1,121,659 | ||||
State of California General Obligation Bond | ||||||
5.00%, 11/01/32 | 1,600,000 | 1,377,200 | ||||
7.50%, 04/01/34 | 1,600,000 | 1,464,544 | ||||
5.65%, 04/01/39† | 1,800,000 | 1,771,938 | ||||
See Notes to Financial Statements.
46
Table of Contents
| Par | Value | |||||||
7.55%, 04/01/39 | $ | 3,400,000 | $ | 3,098,760 | ||||
State of Georgia General Obligation Bond | ||||||||
5.50%, 07/01/11 | 1,750,000 | 1,905,925 | ||||||
Total Municipal Bonds | 10,740,026 | |||||||
| Number of Contracts | ||||||||
PURCHASED OPTIONS — 0.0% | ||||||||
Put Options — 0.0% | ||||||||
6-Month Euro-BOBL Futures, Strike Price $98.25 expires 09/11/09 | 60 | 34,500 | ||||||
| Notional Amount | ||||||||
30-Year Federal National Mortgage Association, Strike Price $88.50, Expires 07/07/09 | $ | 34,700,000 | — | |||||
| 34,500 | ||||||||
Total Purchased Options | 34,500 | |||||||
| Shares | ||||||||
PREFERRED STOCK — 0.2% | ||||||||
Wells Fargo & Co. (Cost $970,070) | 1,400 | 1,098,958 | ||||||
MONEY MARKET FUNDS — 6.0% | ||||||||
GuideStone Money Market Fund (GS4 Class)¥ | 4,323,398 | 4,323,398 | ||||||
Northern Institutional Liquid Assets Portfolio§ | 32,032,492 | 32,032,492 | ||||||
Total Money Market Funds | 36,355,890 | |||||||
| Par | ||||||||
REPURCHASE AGREEMENTS — 13.4% | ||||||||
Bank of America, NA | ||||||||
0.09% (dated 06/30/09, due 07/01/09, repurchase price $35,800,090, collateralized by Federal Home Loan Mortgage Corporation Bond, 5.000%, due 07/01/35, total market value $36,868,058) | $ | 35,800,000 | 35,800,000 | |||||
JPMorgan Securities, Inc. | ||||||||
0.06% (dated 06/30/09, due 07/01/09, repurchase price $44,500,074, collateralized by Federal National Mortgage Association Bond and Federal National Mortgage Association Discount Note, 0.000% to 5.000%, due 12/31/09 to 07/01/34, total market value $45,867,970) | 44,500,000 | 44,500,000 | ||||||
Total Repurchase Agreements | 80,300,000 | |||||||
U.S. TREASURY OBLIGATIONS — 2.2% | ||||||||
U.S. Treasury Bill | ||||||||
0.13%, 07/16/09 | 10,000 | 10,000 | ||||||
U.S. Treasury Inflationary Index Bonds | ||||||||
4.25%, 01/15/10D | 2,550,000 | 3,296,325 | ||||||
2.38%, 01/15/17D | 1,000,000 | 1,104,559 | ||||||
2.13%, 01/15/19D | 3,800,000 | 3,902,401 | ||||||
| 8,303,285 | ||||||||
U.S. Treasury Notes | ||||||||
2.38%, 08/31/10 | 1,720,000 | 1,756,215 | ||||||
0.88%, 04/30/11D‡‡ | 1,260,000 | 1,256,702 | ||||||
0.88%, 05/31/11 | 1,185,000 | 1,181,117 | ||||||
1.75%, 11/15/11‡‡ | 500,000 | 505,471 | ||||||
2.25%, 05/31/14 | 395,000 | 389,815 | ||||||
| 5,089,320 | ||||||||
Total U.S. Treasury Obligations | 13,402,605 | |||||||
TOTAL INVESTMENTS — 112.1% | 673,008,544 | |||||||
| Number of Contracts | ||||||||
WRITTEN OPTIONS — 0.0% | ||||||||
Put Options — 0.0% | ||||||||
6-Month Euro-BOBL Futures, Strike Price $98.50 expires 09/11/09 | (60 | ) | (19,125 | ) | ||||
90-Day Eurodollar Futures, Strike Price $98.63, Expires 12/14/09 | (24 | ) | (6,450 | ) | ||||
| (25,575 | ) | |||||||
| Notional Amount | ||||||||
Put Swaptions — 0.0% | ||||||||
3-Month LIBOR, Strike Price $3.75, Expires 11/24/09 | $ | (7,000,000 | ) | (85,610 | ) | |||
Total Written Options | (111,185 | ) | ||||||
| Par | ||||||||
SECURITIES SOLD SHORT — (6.7)% | ||||||||
Federal National Mortgage Association | ||||||||
5.00%, 07/01/38 TBA | $ | (31,000,000 | ) | (31,561,875 | ) | |||
4.50%, 08/13/39 TBA | (9,000,000 | ) | (8,946,558 | ) | ||||
Total Securities Sold Short | (40,508,433 | ) | ||||||
Liabilities in Excess of Other Assets — (5.4)% | (32,263,923 | ) | ||||||
NET ASSETS — 100.0% | $ | 600,125,003 | ||||||
See Notes to Financial Statements.
47
Table of Contents
Low-Duration Bond Fund
SCHEDULE OF INVESTMENTS (Continued)
Swap agreements outstanding at June 30, 2009:
Reference Obligation | Fixed Deal (Pay) Rate | Maturity Date | Counter- party | Currency | Notional Amount | Market Value | Upfront Premiums Paid/ (Received) | Unrealized Appreciation (Depreciation) | |||||||||||||||
Credit Default Swaps on Corporate Issues — Buy Protection |
| ||||||||||||||||||||||
American Electric Power, 6.25% due 06/01/15 | (6.26 | )% | 06/20/15 | CITI | USD | $ | 1,600,000 | $ | (1,155 | ) | $ | — | $ | (1,155 | ) | ||||||||
Nabors Industries, 06.15% due 02/15/18 | (0.63 | )% | 03/20/18 | CITI | USD | 3,300,000 | 202,187 | — | 202,187 | ||||||||||||||
Morgan Stanley ABS Capital I, 7.02% due 12/27/33 | (0.54 | )% | 02/25/34 | MSCS | USD | 507,432 | 313,427 | — | 313,427 | ||||||||||||||
Long Beach Mortgage Trust, 6.72% due 02/25/34 | (0.49 | )% | 02/25/35 | BAR | USD | 514,123 | 319,708 | — | 319,708 | ||||||||||||||
Specialty Underwriting & Residential Finance, 6.62% due 02/25/35 | (0.59 | )% | 02/25/35 | BAR | USD | 458,106 | 258,817 | — | 258,817 | ||||||||||||||
Structured Asset Investment Loan Trust, 6.14% due 02/25/35 | (0.61 | )% | 12/27/33 | BAR | USD | 1,137,620 | 1,129,177 | — | 1,129,177 | ||||||||||||||
| $ | 2,222,161 | $ | — | $ | 2,222,161 | ||||||||||||||||||
Reference Obligation | Fixed Deal (Pay) Rate | Maturity Date | Counter- party | Currency | Notional Amount | Market Value | Upfront Premiums Paid/ (Received) | Unrealized Appreciation (Depreciation) | |||||||||||||||
Credit Default Swaps on Credit Indices — Buy Protection |
| ||||||||||||||||||||||
Dow Jones CDX HY-8 Index | (1.63 | )% | 06/20/12 | CITI | USD | $ | 4,900,000 | $ | 1,193,783 | $ | — | $ | 1,193,783 | ||||||||||
Dow Jones CDX IG9 10Y Index | (0.80 | )% | 12/20/17 | GSC | USD | 6,929,600 | 366,526 | 102,702 | 263,824 | ||||||||||||||
Dow Jones CDX IG9 10Y Index | (0.80 | )% | 12/20/17 | GSC | USD | 5,270,400 | 278,766 | 75,845 | 202,921 | ||||||||||||||
Dow Jones CDX IG9 10Y Index | (0.80 | )% | 12/20/17 | BAR | USD | 2,440,000 | 129,059 | 29,046 | 100,013 | ||||||||||||||
Dow Jones CDX IG9 10Y Index | (0.80 | )% | 12/20/17 | RBS | USD | 2,049,600 | 108,409 | 26,395 | 82,014 | ||||||||||||||
| $ | 2,076,543 | $ | 233,988 | $ | 1,842,555 | ||||||||||||||||||
Reference Obligation | Pay/Receive Floating Rate | Fixed Rate | Maturity Date | Counter- party | Currency | Notional Amount | Market Value | Upfront Premiums Paid/ (Received) | Unrealized Appreciation (Depreciation) | ||||||||||||||
Interest Rate Swaps — Buy Protection | |||||||||||||||||||||||
France CPI Ex Tobacco Index | Receive | 2.09 | % | 10/15/10 | RBS | EUR | 1,500,000 | $ | 72,464 | $ | (183 | ) | $ | 72,647 | |||||||||
| $ | 72,464 | $ | (183 | ) | $ | 72,647 | |||||||||||||||||
Total Swap agreements outstanding at June 30, 2009 | $ | 4,371,168 | $ | 233,805 | $ | 4,137,363 | |||||||||||||||||
See Notes to Financial Statements.
48
Table of Contents
PORTFOLIO SUMMARY (based on net assets) |
| ||
| % | |||
Mortgage-Backed Securities | 46.1 | ||
Futures Contracts | 42.3 | ||
Corporate Bonds | 17.7 | ||
Repurchase Agreements | 13.4 | ||
Foreign Bonds | 11.5 | ||
Asset-Backed Securities | 10.7 | ||
Money Market Funds | 6.0 | ||
Agency Obligations | 2.5 | ||
Forward Foreign Currency Contracts | 2.4 | ||
U.S. Treasury Obligations | 2.2 | ||
Municipal Bonds | 1.8 | ||
Swap Agreements | 0.7 | ||
Preferred Stock | 0.2 | ||
Purchased Options | — | ** | |
Written Options | — | ** | |
Securities Sold Short | (6.7 | ) | |
| 150.8 | |||
| ** | Rounds to less than 0.005%. |
FAS 157 DISCLOSURE
The following is a summary of the inputs used, as of June 30, 2009, in valuing the Fund’s investments carried at fair value:
Valuation Inputs | Investments in Securities | Other Financial Instruments*** | ||||||
Assets: | ||||||||
Level 1 — Quoted Prices | ||||||||
Futures Contracts | $ | — | $ | 2,486,429 | ||||
Money Market Funds | 36,355,890 | — | ||||||
Preferred Stock | 1,098,958 | — | ||||||
Purchased Options | 34,500 | — | ||||||
Level 2 — Other Significant Observable Inputs | ||||||||
Agency Obligations | 15,131,202 | — | ||||||
Asset-Backed Securities | 64,160,120 | — | ||||||
Corporate Bonds | 102,094,895 | — | ||||||
Foreign Bonds | 69,049,380 | — | ||||||
Forward Foreign Currency Contracts | — | (127,701 | ) | |||||
Mortgage-Backed Securities | 276,676,772 | — | ||||||
Municipal Bonds | 10,740,026 | — | ||||||
Repurchase Agreements | 80,300,000 | — | ||||||
Swap Agreements | — | 4,371,168 | ||||||
U.S. Treasury Obligations | 13,402,605 | — | ||||||
Level 3 — Significant Unobservable Inputs | ||||||||
Corporate Bonds | 3,964,196 | — | ||||||
Total Assets | $ | 673,008,544 | $ | 6,729,896 | ||||
Liabilities: | ||||||||
Level 1 — Quoted Prices | ||||||||
Written Options | $ | (25,575 | ) | $ | — | |||
Level 2 — Other Significant Observable Inputs | ||||||||
Securities Sold Short | (40,508,433 | ) | — | |||||
Written Options | (85,610 | ) | — | |||||
Level 3 — Significant Unobservable Inputs | — | — | ||||||
Total Liabilities | $ | (40,619,618 | ) | $ | — | |||
| *** | Other financial instruments are derivative instruments not reflected in the Schedule of Investments, such as futures, forwards and swap contracts, which are valued at the unrealized appreciation (depreciation) on the investment. Details of these investments can be found in the Notes to Financial Statements. |
See Notes to Financial Statements.
49
Table of Contents
Low-Duration Bond Fund
SCHEDULE OF INVESTMENTS (Continued)
The following is a reconciliation of assets in which significant unobservable inputs (Level 3) were used in determining fair value:
| Investments in Securities | Other Financial Instruments*** | |||||
Balance, 12/31/08 | $ | 3,740,617 | $ | — | ||
Accrued discounts/premiums | 90,509 | — | ||||
Realized gain (loss) | — | — | ||||
Change in unrealized appreciation (depreciation) | 133,070 | — | ||||
Net purchases (sales) | — | — | ||||
Transfers in and/or out of Level 3 | — | |||||
Balance, 06/30/09 | $ | 3,964,196 | $ | — | ||
See Notes to Financial Statements.
50
Table of Contents
SCHEDULE OF INVESTMENTS | June 30, 2009 (Unaudited) |
| Par | Value | |||||
AGENCY OBLIGATIONS — 1.0% | ||||||
Federal Farm Credit Bank | ||||||
5.05%, 11/06/17 | $ | 400,000 | $ | 418,033 | ||
Federal Home Loan Bank | ||||||
1.63%, 07/27/11 | 2,440,000 | 2,454,672 | ||||
5.50%, 08/13/14 | 620,000 | 692,951 | ||||
Federal Home Loan Mortgage Corporation | ||||||
0.89%, 02/01/11†‡‡ | 1,409,000 | 1,407,009 | ||||
0.93%, 05/04/11† | 286,000 | 286,737 | ||||
0.94%, 08/05/11† | 6,000 | 6,002 | ||||
5.30%, 12/01/15 | 1,300,000 | 1,442,366 | ||||
Federal National Mortgage Association | ||||||
5.25%, 08/01/12 | 500,000 | 519,918 | ||||
Tennessee Valley Authority | ||||||
5.38%, 04/01/46 | 1,800,000 | 1,766,320 | ||||
Total Agency Obligations | 8,994,008 | |||||
ASSET-BACKED SECURITIES — 4.2% | ||||||
Access Group, Inc. | ||||||
2.39%, 10/27/25† | 1,838,642 | 1,853,868 | ||||
Argent Securities, Inc. | ||||||
0.36%, 10/25/36† | 21,972 | 21,597 | ||||
Asset-Backed Securities Corporation Home Equity | ||||||
0.59%, 09/25/34† | 168,112 | 108,113 | ||||
Bayview Financial Acquisition Trust | ||||||
0.99%, 02/28/44† | 615,786 | 473,433 | ||||
Bear Stearns Asset-Backed Securities, Inc. | ||||||
6.00%, 10/25/36 | 3,580,384 | 1,987,927 | ||||
6.50%, 10/25/36 | 3,367,640 | 1,816,745 | ||||
CIT Mortgage Loan Trust | ||||||
1.31%, 10/25/37 144A† | 926,240 | 694,680 | ||||
1.56%, 10/25/37 144A† | 430,000 | 121,475 | ||||
1.76%, 10/25/37 144A† | 800,000 | 216,000 | ||||
Countrywide Home Equity Loan Trust | ||||||
0.61%, 02/15/34† | 461,023 | 158,533 | ||||
0.56%, 12/15/35† | 1,183,037 | 413,943 | ||||
0.46%, 07/15/36† | 1,622,545 | 488,007 | ||||
Daimler Chrysler Auto Trust | ||||||
1.80%, 09/10/12† | 4,300,000 | 4,281,807 | ||||
EMC Mortgage Loan Trust | ||||||
0.86%, 11/25/41 144A† | 217,729 | 163,934 | ||||
FBR Securitization Trust | ||||||
0.57%, 10/25/35† | 704,308 | 671,356 | ||||
Ford Credit Auto Owner Trust | ||||||
1.52%, 12/15/10† | 901,047 | 902,568 | ||||
1.22%, 01/15/11† | 2,284,928 | 2,286,620 | ||||
1.74%, 06/15/12† | 2,600,000 | 2,608,332 | ||||
Franklin Auto Trust | ||||||
1.90%, 06/20/12† | 700,000 | 701,236 | ||||
GMAC Mortgage Corporation Loan Trust | ||||||
7.00%, 09/25/37 | 515,640 | 197,182 | ||||
GSAMP Trust | ||||||
0.42%, 05/25/46 144A† | 667,380 | 642,754 | ||||
HFC Home Equity Loan Asset-Backed Certificates | ||||||
1.52%, 11/20/36† | 1,185,162 | 776,699 | ||||
Lehman XS Trust | ||||||
0.61%, 11/25/35 STEP† | 2,288,890 | 966,035 | ||||
0.58%, 12/25/35† | 268,652 | 125,812 | ||||
0.58%, 02/25/36† | 1,308,549 | 582,499 | ||||
Madison Avenue Manufactured Housing Contract | ||||||
0.66%, 03/25/32† | 580,985 | 542,022 | ||||
Morgan Stanley Dean Witter Credit Corporation HELOC Trust | ||||||
0.50%, 07/25/17 STEP | 132,289 | 55,416 | ||||
Nelnet Student Loan Trust | ||||||
2.57%, 04/25/24† | 780,000 | 768,518 | ||||
Provident Bank Home Equity Loan Trust | ||||||
0.85%, 08/25/31† | 141,001 | 47,169 | ||||
Residential Asset Mortgage Products, Inc. | ||||||
0.79%, 03/25/34† | 411,443 | 148,776 | ||||
Residential Funding Securities LLC | ||||||
0.76%, 06/25/33 144A† | 389,907 | 258,009 | ||||
Salomon Brothers Mortgage Securities VII | ||||||
0.79%, 03/25/28 STEP | 65,928 | 63,023 | ||||
Securitized Asset-Backed Receivables LLC Trust | ||||||
0.54%, 02/25/37† | 3,322,928 | 1,315,085 | ||||
SLM Student Loan Trust | ||||||
2.59%, 04/25/23† | 7,366,643 | 7,513,544 | ||||
Structured Asset Securities Corporation | ||||||
0.61%, 04/25/31 144A† | 3,479,402 | 1,942,925 | ||||
Total Asset-Backed Securities | 35,915,642 | |||||
CORPORATE BONDS — 25.6% | ||||||
Ace INA Holdings, Inc. | ||||||
5.80%, 03/15/18 | 575,000 | 573,882 | ||||
AES Corporation | ||||||
8.75%, 05/15/13 144A | 325,000 | 331,500 | ||||
7.75%, 10/15/15 | 270,000 | 252,450 | ||||
8.00%, 10/15/17 | 1,490,000 | 1,393,150 | ||||
Allied Waste North America, Inc. | ||||||
7.13%, 05/15/16D | 125,000 | 125,794 | ||||
Allstate Life Global Funding Trusts | ||||||
5.38%, 04/30/13 | 400,000 | 413,950 | ||||
American Achievement Corporation | ||||||
8.25%, 04/01/12 144A | 30,000 | 28,200 | ||||
American Electric Power Co., Inc. | ||||||
5.25%, 06/01/15 | 2,300,000 | 2,260,330 | ||||
American Express Bank FSB | ||||||
6.00%, 09/13/17 | 1,100,000 | 1,004,962 | ||||
American Express Co. | ||||||
7.00%, 03/19/18 | 500,000 | 486,296 | ||||
6.80%, 09/01/66† | 1,340,000 | 966,050 | ||||
American Express Credit Corporation | ||||||
5.88%, 05/02/13D | 4,300,000 | 4,273,374 | ||||
American General Finance Corporation | ||||||
6.90%, 12/15/17D | 780,000 | 422,912 | ||||
See Notes to Financial Statements.
51
Table of Contents
Medium-Duration Bond Fund
SCHEDULE OF INVESTMENTS (Continued)
| Par | Value | |||||
American International Group, Inc. | ||||||
5.60%, 10/18/16 | $ | 600,000 | $ | 324,820 | ||
5.85%, 01/16/18 | 1,220,000 | 646,345 | ||||
8.25%, 08/15/18 144A | 3,200,000 | 1,885,696 | ||||
6.25%, 03/15/37 | 680,000 | 178,500 | ||||
AmerisourceBergen Corporation | ||||||
5.88%, 09/15/15D | 130,000 | 124,066 | ||||
Anadarko Petroleum Corporation | ||||||
6.45%, 09/15/36 | 110,000 | 99,178 | ||||
ANZ Capital Trust II | ||||||
5.36%, 12/29/49 144A‡‡ | 800,000 | 645,800 | ||||
Apache Corporation | ||||||
6.00%, 09/15/13D | 680,000 | 740,583 | ||||
ASIF Global Financing XIX | ||||||
4.90%, 01/17/13 144A | 100,000 | 85,139 | ||||
Astoria Financial Corporation | ||||||
5.75%, 10/15/12 | 450,000 | 406,531 | ||||
AT&T, Inc. | ||||||
5.10%, 09/15/14 | 550,000 | 571,982 | ||||
5.50%, 02/01/18 | 4,350,000 | 4,350,983 | ||||
6.40%, 05/15/38 | 1,400,000 | 1,374,919 | ||||
6.55%, 02/15/39D | 910,000 | 911,340 | ||||
BAC Capital Trust XIV | ||||||
5.63%, 12/31/49† | 40,000 | 20,010 | ||||
Baker Hughes, Inc. | ||||||
7.50%, 11/15/18 | 870,000 | 1,020,588 | ||||
Bank of America Corporation | ||||||
1.40%, 10/14/16†D | 1,700,000 | 1,288,467 | ||||
5.75%, 12/01/17 | 3,130,000 | 2,791,522 | ||||
5.65%, 05/01/18D | 2,925,000 | 2,588,944 | ||||
8.13%, 12/15/49† | 20,000 | 16,729 | ||||
Bear Stearns LLC | ||||||
6.95%, 08/10/12 | 1,600,000 | 1,740,182 | ||||
5.70%, 11/15/14 | 1,000,000 | 1,020,036 | ||||
6.40%, 10/02/17 | 1,250,000 | 1,254,203 | ||||
7.25%, 02/01/18D | 4,360,000 | 4,602,734 | ||||
BellSouth Capital Funding | ||||||
7.88%, 02/15/30 | 460,000 | 509,536 | ||||
BellSouth Corporation | ||||||
4.75%, 11/15/12D | 40,000 | 41,445 | ||||
6.88%, 10/15/31 | 10,000 | 10,331 | ||||
Boardwalk Pipelines LP | ||||||
5.88%, 11/15/16 | 625,000 | 594,158 | ||||
Boeing Co. | ||||||
6.63%, 02/15/38 | 210,000 | 229,201 | ||||
Capital One Bank USA NA | ||||||
8.80%, 07/15/19D | 600,000 | 613,990 | ||||
Caterpillar Financial Services Corporation | ||||||
6.20%, 09/30/13 | 980,000 | 1,038,546 | ||||
CenterPoint Energy Resources Corporation | ||||||
5.95%, 01/15/14 | 525,000 | 523,286 | ||||
Chesapeake Energy Corporation | ||||||
6.25%, 01/15/18D | 140,000 | 116,900 | ||||
7.25%, 12/15/18 | 205,000 | 179,375 | ||||
Chicago Transit Authority | ||||||
6.90%, 12/01/40 | 1,800,000 | 1,926,126 | ||||
Chubb Corporation | ||||||
6.50%, 05/15/38D | 150,000 | 163,163 | ||||
6.38%, 03/29/67† | 375,000 | 300,432 | ||||
CitiFinancial, Inc. | ||||||
6.63%, 06/01/15 | 300,000 | 269,832 | ||||
Citigroup, Inc. | ||||||
2.13%, 04/30/12 | 500,000 | 502,537 | ||||
6.50%, 08/19/13 | 850,000 | 826,403 | ||||
5.00%, 09/15/14 | 920,000 | 772,098 | ||||
5.50%, 02/15/17D | 1,160,000 | 946,584 | ||||
6.13%, 11/21/17 | 1,000,000 | 878,139 | ||||
6.13%, 05/15/18 | 4,800,000 | 4,205,251 | ||||
5.88%, 05/29/37 | 350,000 | 274,296 | ||||
6.88%, 03/05/38 | 1,340,000 | 1,186,863 | ||||
Comcast Cable Communications LLC | ||||||
6.75%, 01/30/11 | 230,000 | 243,112 | ||||
Comcast Cable Communications Holdings, Inc. | ||||||
8.38%, 03/15/13 | 225,000 | 256,708 | ||||
9.46%, 11/15/22 | 275,000 | 322,158 | ||||
Comcast Corporation | ||||||
6.50%, 01/15/17 | 60,000 | 63,747 | ||||
5.70%, 05/15/18 | 1,890,000 | 1,903,432 | ||||
Comcast Holdings Corporation | ||||||
10.63%, 07/15/12 | 550,000 | 643,928 | ||||
Commonwealth Edison Co. | ||||||
5.40%, 12/15/11 | 650,000 | 680,261 | ||||
5.90%, 03/15/36D | 200,000 | 192,500 | ||||
Community Health Systems, Inc. | ||||||
8.88%, 07/15/15 | 280,000 | 275,800 | ||||
Complete Production Services, Inc. | ||||||
8.00%, 12/15/16 | 280,000 | 240,800 | ||||
ConocoPhillips | ||||||
8.75%, 05/25/10 | 230,000 | 245,554 | ||||
ConocoPhillips Holding Co. | ||||||
6.95%, 04/15/29 | 1,570,000 | 1,696,368 | ||||
Countrywide Home Loans, Inc. | ||||||
5.63%, 07/15/09 | 1,900,000 | 1,901,020 | ||||
COX Communications, Inc. | ||||||
4.63%, 01/15/10 | 800,000 | 803,896 | ||||
8.38%, 03/01/39 144A | 500,000 | 559,129 | ||||
CSC Holdings, Inc. | ||||||
7.63%, 04/01/11 | 590,000 | 587,050 | ||||
6.75%, 04/15/12 | 60,000 | 58,200 | ||||
CVS Pass-Through Trust | ||||||
6.94%, 01/10/30 144A | 971,630 | 881,456 | ||||
Daimler Finance NA LLC | ||||||
5.88%, 03/15/11 | 590,000 | 600,048 | ||||
5.75%, 09/08/11 | 900,000 | 918,820 | ||||
7.30%, 01/15/12 | 550,000 | 569,876 | ||||
6.50%, 11/15/13 | 100,000 | 101,749 | ||||
DaVita, Inc. | ||||||
6.63%, 03/15/13 | 310,000 | 293,725 | ||||
Dean Foods Co. | ||||||
7.00%, 06/01/16D | 375,000 | 344,063 | ||||
Delta Air Lines, Inc. | ||||||
6.82%, 08/10/22 | 453,780 | 372,100 | ||||
DI Finance | ||||||
9.50%, 02/15/13 | 90,000 | 86,850 | ||||
DIRECTV Holdings LLC | ||||||
8.38%, 03/15/13 | 155,000 | 156,163 | ||||
See Notes to Financial Statements.
52
Table of Contents
| Par | Value | |||||
DISH DBS Corporation | ||||||
7.00%, 10/01/13D | $ | 10,000 | $ | 9,550 | ||
6.63%, 10/01/14 | 30,000 | 27,750 | ||||
7.75%, 05/31/15D | 200,000 | 191,500 | ||||
Dominion Resources, Inc. | ||||||
5.13%, 12/15/09 | 230,000 | 232,940 | ||||
1.66%, 06/17/10† | 4,000,000 | 3,981,644 | ||||
4.75%, 12/15/10 | 70,000 | 71,968 | ||||
5.70%, 09/17/12 | 1,230,000 | 1,309,308 | ||||
6.00%, 11/30/17 | 3,800,000 | 3,953,148 | ||||
Dow Chemical Co. | ||||||
7.60%, 05/15/14 | 550,000 | 567,071 | ||||
Duke Energy Carolinas LLC | ||||||
5.63%, 11/30/12 | 580,000 | 622,107 | ||||
Dynegy Holdings, Inc. | ||||||
7.75%, 06/01/19 | 395,000 | 309,581 | ||||
Eastman Kodak Co. | ||||||
7.25%, 11/15/13D | 490,000 | 301,350 | ||||
Edison Mission Energy | ||||||
7.00%, 05/15/17D | 240,000 | 185,400 | ||||
7.20%, 05/15/19 | 320,000 | 240,000 | ||||
7.63%, 05/15/27D | 120,000 | 77,400 | ||||
El Paso Corporation | ||||||
7.00%, 06/15/17 | 710,000 | 650,185 | ||||
7.80%, 08/01/31 | 750,000 | 615,532 | ||||
7.75%, 01/15/32D | 99,000 | 81,083 | ||||
El Paso Natural Gas Co. | ||||||
7.50%, 11/15/26 | 300,000 | 298,222 | ||||
8.38%, 06/15/32 | 210,000 | 229,474 | ||||
El Paso Performance-Linked Trust | ||||||
7.75%, 07/15/11 144AD | 1,460,000 | 1,440,125 | ||||
Energy Future Holdings Corporation | ||||||
5.55%, 11/15/14 | 120,000 | 76,370 | ||||
6.50%, 11/15/24 | 370,000 | 187,250 | ||||
6.55%, 11/15/34 | 1,620,000 | 786,930 | ||||
Energy Transfer Partners LP | ||||||
5.95%, 02/01/15D | 975,000 | 983,485 | ||||
6.70%, 07/01/18 | 1,180,000 | 1,208,341 | ||||
Enterprise Products Operating LLC | ||||||
4.95%, 06/01/10 | 650,000 | 659,742 | ||||
8.38%, 08/01/66† | 350,000 | 282,099 | ||||
7.03%, 01/15/68† | 350,000 | 258,502 | ||||
EQT Corporation | ||||||
8.13%, 06/01/19 | 85,000 | 91,137 | ||||
Exelon Corporation | ||||||
5.63%, 06/15/35 | 675,000 | 544,991 | ||||
Express Scripts, Inc. | ||||||
5.25%, 06/15/12 | 225,000 | 232,618 | ||||
6.25%, 06/15/14 | 225,000 | 238,327 | ||||
FirstEnergy Corporation | ||||||
6.45%, 11/15/11 | 60,000 | 62,660 | ||||
7.38%, 11/15/31 | 1,490,000 | 1,410,066 | ||||
Florida Gas Transmission Co., LLC | ||||||
7.90%, 05/15/19 144A | 500,000 | 550,498 | ||||
Ford Motor Credit Co., LLC | ||||||
7.38%, 10/28/09 | 650,000 | 644,478 | ||||
5.70%, 01/15/10D | 125,000 | 120,659 | ||||
7.88%, 06/15/10D | 500,000 | 475,036 | ||||
5.88%, 06/15/11†D | 607,000 | 527,331 | ||||
12.00%, 05/15/15 | 1,320,000 | 1,235,656 | ||||
8.00%, 12/15/16 | 1,300,000 | 995,164 | ||||
Forest City Enterprises, Inc. | ||||||
7.63%, 06/01/15 | 20,000 | 12,700 | ||||
6.50%, 02/01/17 | 70,000 | 38,850 | ||||
Freeport-McMoRan Copper & Gold, Inc. | ||||||
8.38%, 04/01/17 | 1,420,000 | 1,432,664 | ||||
Freescale Semiconductor, Inc. | ||||||
8.88%, 12/15/14D | 75,000 | 38,250 | ||||
Frontier Communications Corporation | ||||||
9.25%, 05/15/11 | 415,000 | 434,713 | ||||
7.88%, 01/15/27 | 50,000 | 40,250 | ||||
General Electric Capital Corporation | ||||||
5.45%, 01/15/13 | 150,000 | 154,070 | ||||
General Electric Co. | ||||||
5.00%, 02/01/13 | 920,000 | 958,056 | ||||
General Motors Corporation | ||||||
8.25%, 07/15/23# | 210,000 | 26,775 | ||||
8.38%, 07/05/33(E)# | 170,000 | 28,499 | ||||
Georgia-Pacific Corporation LLC | ||||||
8.13%, 05/15/11D | 4,000 | 4,020 | ||||
GlaxoSmithKline Capital, Inc. | ||||||
5.65%, 05/15/18 | 1,470,000 | 1,559,751 | ||||
GMAC, Inc. | ||||||
7.75%, 01/19/10 144A | 326,000 | 321,110 | ||||
6.88%, 09/15/11 144A | 1,101,000 | 974,385 | ||||
7.50%, 12/31/13 144AD | 177,000 | 138,945 | ||||
6.75%, 12/01/14D | 1,900,000 | 1,462,213 | ||||
8.00%, 12/31/18 144A | 65,000 | 41,925 | ||||
8.00%, 11/01/31D | 200,000 | 137,268 | ||||
Goldman Sachs Capital II | ||||||
5.79%, 12/29/49† | 60,000 | 36,589 | ||||
Goldman Sachs Group, Inc. | ||||||
4.50%, 06/15/10D | 930,000 | 953,202 | ||||
5.75%, 10/01/16 | 1,900,000 | 1,863,100 | ||||
6.25%, 09/01/17 | 1,700,000 | 1,684,678 | ||||
5.95%, 01/18/18 | 2,300,000 | 2,234,574 | ||||
GrafTech Finance, Inc. | ||||||
10.25%, 02/15/12 | 37,000 | 35,150 | ||||
HCA, Inc. | ||||||
6.30%, 10/01/12 | 32,000 | 29,520 | ||||
9.13%, 11/15/14 | 60,000 | 59,550 | ||||
6.50%, 02/15/16D | 686,000 | 557,375 | ||||
9.25%, 11/15/16 | 480,000 | 474,000 | ||||
9.63%, 11/15/16 PIK | 489,000 | 485,333 | ||||
7.69%, 06/15/25 | 250,000 | 154,777 | ||||
Hertz Corporation | ||||||
8.88%, 01/01/14D | 115,000 | 106,375 | ||||
Hess Corporation | ||||||
8.13%, 02/15/19 | 410,000 | 467,565 | ||||
7.88%, 10/01/29D | 260,000 | 282,746 | ||||
7.30%, 08/15/31 | 1,060,000 | 1,097,211 | ||||
Host Hotels & Resorts LP | ||||||
6.75%, 06/01/16D | 30,000 | 26,175 | ||||
HSBC Finance Corporation | ||||||
8.00%, 07/15/10 | 440,000 | 456,911 | ||||
7.00%, 05/15/12 | 390,000 | 402,336 | ||||
6.38%, 11/27/12 | 70,000 | 71,254 | ||||
Humana, Inc. | ||||||
7.20%, 06/15/18 | 240,000 | 216,616 | ||||
See Notes to Financial Statements.
53
Table of Contents
Medium-Duration Bond Fund
SCHEDULE OF INVESTMENTS (Continued)
| Par | Value | |||||
ILFC E-Capital Trust II | ||||||
6.25%, 12/21/65 144A† | $ | 280,000 | $ | 107,800 | ||
International Business Machines Corporation | ||||||
1.65%, 07/28/11† | 3,700,000 | 3,724,668 | ||||
International Lease Finance Corporation | ||||||
4.95%, 02/01/11 | 300,000 | 255,277 | ||||
JC Penney Co., Inc. | ||||||
7.40%, 04/01/37 | 50,000 | 39,559 | ||||
JPMorgan Chase & Co. | ||||||
5.75%, 01/02/13 | 320,000 | 330,268 | ||||
5.15%, 10/01/15 | 1,890,000 | 1,865,464 | ||||
JPMorgan Chase Bank NA | ||||||
6.00%, 10/01/17 | 800,000 | 779,915 | ||||
Kerr-McGee Corporation | ||||||
6.95%, 07/01/24 | 450,000 | 418,482 | ||||
7.88%, 09/15/31 | 1,830,000 | 1,790,316 | ||||
Kinder Morgan Energy Partners LP | ||||||
6.75%, 03/15/11 | 110,000 | 115,335 | ||||
7.13%, 03/15/12 | 500,000 | 534,978 | ||||
5.85%, 09/15/12 | 40,000 | 41,731 | ||||
5.00%, 12/15/13 | 200,000 | 196,987 | ||||
6.00%, 02/01/17 | 510,000 | 506,713 | ||||
5.95%, 02/15/18 | 830,000 | 813,820 | ||||
6.95%, 01/15/38 | 60,000 | 58,298 | ||||
Kraft Foods, Inc. | ||||||
6.50%, 08/11/17 | 300,000 | 316,466 | ||||
Kroger Co. | ||||||
6.15%, 01/15/20 | 500,000 | 511,852 | ||||
L-3 Communications Corporation | ||||||
7.63%, 06/15/12 | 250,000 | 251,250 | ||||
6.38%, 10/15/15 | 120,000 | 109,500 | ||||
Lamar Media Corporation | ||||||
6.63%, 08/15/15 | 20,000 | 17,000 | ||||
Land O’ Lakes, Inc. | ||||||
9.00%, 12/15/10 | 125,000 | 126,875 | ||||
Lehman Brothers Holdings Capital Trust VII | ||||||
5.86%, 11/29/49# | 2,330,000 | 233 | ||||
Lehman Brothers Holdings, Inc. | ||||||
6.63%, 01/18/12# | 200,000 | 30,500 | ||||
5.25%, 02/06/12# | 390,000 | 59,475 | ||||
5.63%, 01/24/13# | 2,300,000 | 359,375 | ||||
6.20%, 09/26/14# | 300,000 | 45,750 | ||||
6.50%, 07/19/17# | 150,000 | 15 | ||||
6.75%, 12/28/17# | 3,340,000 | 334 | ||||
Liberty Media Corporation | ||||||
5.70%, 05/15/13 | 25,000 | 21,750 | ||||
3.75%, 02/15/30 CONV | 40,000 | 14,600 | ||||
Merrill Lynch & Co., Inc. | ||||||
1.24%, 02/05/10† | 600,000 | 593,042 | ||||
5.45%, 02/05/13 | 2,645,000 | 2,576,428 | ||||
5.70%, 05/02/17 | 400,000 | 343,617 | ||||
6.40%, 08/28/17D | 775,000 | 687,123 | ||||
6.88%, 04/25/18 | 525,000 | 486,695 | ||||
MetLife Capital Trust IV | ||||||
7.88%, 12/15/37 144A | 300,000 | 243,594 | ||||
MetLife Capital Trust X | ||||||
9.25%, 04/08/38 144A† | 300,000 | 267,614 | ||||
MetLife, Inc. | ||||||
6.40%, 12/15/36 | 150,000 | 107,531 | ||||
MidAmerican Energy Holdings Co. | ||||||
6.13%, 04/01/36 | 750,000 | 743,774 | ||||
5.95%, 05/15/37 | 150,000 | 145,273 | ||||
Morgan Stanley | ||||||
6.75%, 04/15/11 | 700,000 | 733,605 | ||||
5.63%, 01/09/12 | 410,000 | 419,840 | ||||
5.75%, 08/31/12D | 3,325,000 | 3,437,914 | ||||
1.60%, 03/01/13(E)† | 500,000 | 623,785 | ||||
1.56%, 10/18/16† | 340,000 | 275,473 | ||||
5.95%, 12/28/17 | 450,000 | 432,507 | ||||
6.63%, 04/01/18 | 1,775,000 | 1,772,409 | ||||
Nevada Power Co. | ||||||
5.88%, 01/15/15 | 350,000 | 358,969 | ||||
6.65%, 04/01/36D | 300,000 | 306,092 | ||||
New Cingular Wireless Services, Inc. | ||||||
8.13%, 05/01/12 | 135,000 | 151,240 | ||||
Nextel Communications, Inc. | ||||||
5.95%, 03/15/14 | 44,000 | 34,870 | ||||
7.38%, 08/01/15 | 130,000 | 104,325 | ||||
Nisource Finance Corporation | ||||||
10.75%, 03/15/16 | 200,000 | 222,108 | ||||
Nortek, Inc. | ||||||
8.50%, 09/01/14 | 62,000 | 17,980 | ||||
NRG Energy, Inc. | ||||||
7.25%, 02/01/14D | 285,000 | 277,163 | ||||
7.38%, 02/01/16 | 80,000 | 75,900 | ||||
7.38%, 01/15/17 | 35,000 | 33,075 | ||||
Occidental Petroleum Corporation | ||||||
7.00%, 11/01/13 | 1,120,000 | 1,283,473 | ||||
Omnicom Group, Inc. | ||||||
5.90%, 04/15/16 | 700,000 | 702,141 | ||||
ONEOK Partners LP | ||||||
6.65%, 10/01/36 | 375,000 | 346,789 | ||||
6.85%, 10/15/37 | 325,000 | 309,863 | ||||
Overseas Private Investment Corporation | ||||||
25.44%, 07/12/10W | 2,437,222 | 2,495,565 | ||||
8.30%, 07/12/12W | 3,000,000 | 3,236,931 | ||||
Oxford Industries, Inc. | ||||||
8.88%, 06/01/11 | 95,000 | 95,475 | ||||
Pacific Energy Partners LP | ||||||
7.13%, 06/15/14 | 60,000 | 61,477 | ||||
Pacific Gas & Electric Co. | ||||||
8.25%, 10/15/18 | 40,000 | 48,896 | ||||
6.05%, 03/01/34 | 580,000 | 603,666 | ||||
5.80%, 03/01/37 | 250,000 | 252,114 | ||||
6.25%, 03/01/39D | 325,000 | 348,551 | ||||
Patrons’ Legacy | ||||||
5.65%, 04/17/18 144A | 1,290,357 | 920,967 | ||||
Peabody Energy Corporation | ||||||
6.88%, 03/15/13 | 145,000 | 144,275 | ||||
7.88%, 11/01/26 | 1,500,000 | 1,301,250 | ||||
Pemex Project Funding Master Trust | ||||||
9.13%, 10/13/10 | 235,000 | 254,106 | ||||
6.63%, 06/15/35 | 159,000 | 144,003 | ||||
PepsiCo, Inc. | ||||||
7.90%, 11/01/18 | 650,000 | 792,151 | ||||
Phoenix Life Insurance Co. | ||||||
7.15%, 12/15/34 144A | 425,000 | 117,822 | ||||
See Notes to Financial Statements.
54
Table of Contents
| Par | Value | |||||
Pricoa Global Funding I | ||||||
1.14%, 01/30/12 144A† | $ | 2,300,000 | $ | 2,159,415 | ||
0.80%, 09/27/13 144A† | 1,700,000 | 1,312,657 | ||||
Pride International, Inc. | ||||||
7.38%, 07/15/14 | 130,000 | 129,675 | ||||
Private Export Funding Corporation | ||||||
5.45%, 09/15/17 | 3,200,000 | 3,438,614 | ||||
Progress Energy, Inc. | ||||||
5.63%, 01/15/16 | 150,000 | 153,105 | ||||
7.75%, 03/01/31 | 350,000 | 412,355 | ||||
PVNGS II Funding Corporation, Inc. | ||||||
8.00%, 12/30/15D | 1,229,000 | 1,200,154 | ||||
Qwest Capital Funding, Inc. | ||||||
7.25%, 02/15/11D | 200,000 | 195,000 | ||||
Qwest Corporation | ||||||
8.88%, 03/15/12 | 200,000 | 202,500 | ||||
Reed Elsevier Capital, Inc. | ||||||
8.63%, 01/15/19 | 860,000 | 978,739 | ||||
Reinsurance Group of America, Inc. | ||||||
6.75%, 12/15/65† | 250,000 | 141,490 | ||||
Roche Holdings, Inc. | ||||||
6.00%, 03/01/19 144A | 905,000 | 966,762 | ||||
Service Corporation International | ||||||
7.63%, 10/01/18 | 90,000 | 83,925 | ||||
7.50%, 04/01/27 | 200,000 | 158,000 | ||||
Simon Property Group LP REIT | ||||||
6.13%, 05/30/18D | 1,000,000 | 931,717 | ||||
SLM Corporation | ||||||
5.45%, 04/25/11 | 350,000 | 322,133 | ||||
5.00%, 10/01/13 | 350,000 | 283,357 | ||||
Sonat, Inc. | ||||||
7.63%, 07/15/11 | 460,000 | 453,023 | ||||
Southern Natural Gas Co. | ||||||
8.00%, 03/01/32 | 400,000 | 425,246 | ||||
Sovereign Bank | ||||||
2.74%, 08/01/13† | 250,000 | 188,814 | ||||
Sprint Capital Corporation | ||||||
8.38%, 03/15/12D | 340,000 | 336,600 | ||||
6.90%, 05/01/19 | 30,000 | 24,975 | ||||
8.75%, 03/15/32 | 170,000 | 137,700 | ||||
Steel Dynamics, Inc. | ||||||
7.38%, 11/01/12 | 65,000 | 61,913 | ||||
6.75%, 04/01/15 | 225,000 | 201,375 | ||||
Suburban Propane Partners LP | ||||||
6.88%, 12/15/13 | 195,000 | 180,375 | ||||
SunTrust Preferred Capital I | ||||||
5.85%, 12/31/49† | 357,000 | 242,884 | ||||
Tenet Healthcare Corporation | ||||||
9.25%, 02/01/15D | 1,382,000 | 1,271,440 | ||||
Tennessee Gas Pipeline Co. | ||||||
7.00%, 10/15/28D | 175,000 | 167,635 | ||||
7.63%, 04/01/37 | 50,000 | 50,890 | ||||
TEPPCO Partners LP | ||||||
6.65%, 04/15/18 | 650,000 | 660,916 | ||||
Terex Corporation | ||||||
7.38%, 01/15/14D | 90,000 | 82,800 | ||||
Time Warner Cable, Inc. | ||||||
5.40%, 07/02/12 | 500,000 | 517,155 | ||||
8.75%, 02/14/19 | 650,000 | 758,484 | ||||
8.25%, 04/01/19 | 310,000 | 352,335 | ||||
6.55%, 05/01/37 | 325,000 | 312,599 | ||||
6.75%, 06/15/39 | 290,000 | 283,144 | ||||
Time Warner, Inc. | ||||||
1.15%, 11/13/09† | 7,600,000 | 7,582,550 | ||||
6.88%, 05/01/12 | 60,000 | 64,226 | ||||
7.70%, 05/01/32 | 220,000 | 216,759 | ||||
Time Warner Entertainment Co. LP | ||||||
8.38%, 07/15/33 | 590,000 | 662,216 | ||||
Travelers Cos., Inc. | ||||||
6.25%, 03/15/37†D | 400,000 | 322,849 | ||||
Unilever Capital Corporation | ||||||
7.13%, 11/01/10 | 285,000 | 304,395 | ||||
Union Pacific Corporation | ||||||
6.65%, 01/15/11 | 260,000 | 272,956 | ||||
United Air Lines, Inc. | ||||||
9.21%, 01/21/17#@ | 81,116 | 625 | ||||
9.56%, 10/19/18#@ | 174,416 | 52,325 | ||||
United Parcel Service, Inc. | ||||||
4.50%, 01/15/13D | 1,290,000 | 1,353,954 | ||||
UnitedHealth Group, Inc. | ||||||
4.88%, 02/15/13D | 370,000 | 374,299 | ||||
4.88%, 04/01/13D | 410,000 | 412,185 | ||||
Valero Energy Corporation | ||||||
6.63%, 06/15/37 | 575,000 | 491,959 | ||||
Ventas Realty LP | ||||||
9.00%, 05/01/12 | 40,000 | 41,400 | ||||
6.50%, 06/01/16 | 70,000 | 63,000 | ||||
Verizon Communications, Inc. | ||||||
5.55%, 02/15/16D | 2,100,000 | 2,176,627 | ||||
6.10%, 04/15/18 | 290,000 | 297,973 | ||||
5.85%, 09/15/35 | 600,000 | 559,856 | ||||
6.40%, 02/15/38 | 1,145,000 | 1,124,569 | ||||
8.95%, 03/01/39 | 860,000 | 1,089,311 | ||||
Verizon Global Funding Corporation | ||||||
7.38%, 09/01/12 | 290,000 | 324,658 | ||||
4.38%, 06/01/13 | 140,000 | 142,977 | ||||
Verizon Wireless Capital | ||||||
8.50%, 11/15/18 144A@ | 325,000 | 389,057 | ||||
Wachovia Bank NA | ||||||
7.80%, 08/18/10 | 250,000 | 260,250 | ||||
6.60%, 01/15/38 | 900,000 | 880,105 | ||||
Wachovia Capital Trust III | ||||||
5.80%, 08/29/49† | 580,000 | 348,118 | ||||
Wachovia Corporation | ||||||
5.25%, 08/01/14D | 1,850,000 | 1,812,345 | ||||
5.63%, 10/15/16 | 520,000 | 497,488 | ||||
5.75%, 02/01/18D | 600,000 | 590,246 | ||||
Waste Management, Inc. | ||||||
7.75%, 05/15/32 | 980,000 | 1,041,578 | ||||
WEA Finance LLC | ||||||
7.13%, 04/15/18 144AD | 500,000 | 464,800 | ||||
WellPoint, Inc. | ||||||
5.88%, 06/15/17 | 720,000 | 705,769 | ||||
Wells Fargo & Co. | ||||||
4.38%, 01/31/13 | 600,000 | 605,662 | ||||
7.98%, 03/15/49†D | 6,100,000 | 5,070,430 | ||||
Wells Fargo Capital X | ||||||
5.95%, 12/15/36 | 200,000 | 148,420 | ||||
Wells Fargo Capital XIII | ||||||
7.70%, 12/29/49† | 575,000 | 477,615 | ||||
Wells Fargo Capital XV | ||||||
9.75%, 09/26/44† | 990,000 | 958,634 | ||||
See Notes to Financial Statements.
55
Table of Contents
Medium-Duration Bond Fund
SCHEDULE OF INVESTMENTS (Continued)
| Par | Value | |||||
Westlake Chemical Corporation | ||||||
6.63%, 01/15/16 | $ | 85,000 | $ | 74,800 | ||
Weyerhaeuser Co. | ||||||
6.75%, 03/15/12 | 735,000 | 735,711 | ||||
Whirlpool Corporation | ||||||
8.00%, 05/01/12 | 125,000 | 129,453 | ||||
8.60%, 05/01/14 | 150,000 | 156,904 | ||||
Williams Cos., Inc. | ||||||
7.50%, 01/15/31 | 20,000 | 17,644 | ||||
7.75%, 06/15/31 | 200,000 | 180,446 | ||||
8.75%, 03/15/32 | 983,000 | 990,347 | ||||
Windstream Corporation | ||||||
8.63%, 08/01/16 | 630,000 | 606,375 | ||||
Xerox Corporation | ||||||
6.75%, 02/01/17 | 70,000 | 63,792 | ||||
XTO Energy, Inc. | ||||||
7.50%, 04/15/12 | 43,000 | 47,663 | ||||
5.50%, 06/15/18 | 1,120,000 | 1,124,273 | ||||
6.50%, 12/15/18D | 875,000 | 940,403 | ||||
6.75%, 08/01/37 | 30,000 | 31,419 | ||||
ZFS Finance USA Trust I | ||||||
6.15%, 12/15/65 144A†D | 525,000 | 409,500 | ||||
Total Corporate Bonds | 218,642,175 | |||||
FOREIGN BONDS — 10.5% | ||||||
Australia — 0.0% | ||||||
QBE Insurance Group, Ltd. | ||||||
5.65%, 07/01/23 144A†@ | 525,000 | 372,818 | ||||
Bermuda — 0.3% | ||||||
Arch Capital Group, Ltd. | ||||||
7.35%, 05/01/34D | 400,000 | 317,248 | ||||
Aspen Insurance Holdings, Ltd. | ||||||
6.00%, 08/15/14D | 325,000 | 302,024 | ||||
Catlin Insurance Co., Ltd. | ||||||
7.25%, 12/31/49 144A†@ | 375,000 | 210,256 | ||||
Endurance Specialty Holdings, Ltd. | ||||||
6.15%, 10/15/15D | 425,000 | 354,875 | ||||
Merna Reinsurance, Ltd. | ||||||
2.35%, 07/07/10 144A† | 950,000 | 884,830 | ||||
Qtel International Finance, Ltd. | ||||||
6.50%, 06/10/14 144A | 260,000 | 264,818 | ||||
| 2,334,051 | ||||||
Canada — 0.8% | ||||||
Anadarko Finance Co. | ||||||
7.50%, 05/01/31 | 460,000 | 450,037 | ||||
Canadian Government Inflationary Index | ||||||
4.00%, 12/01/31(C) | 230,000 | 341,061 | ||||
Canadian Natural Resources, Ltd. | ||||||
5.85%, 02/01/35 | 50,000 | 47,230 | ||||
6.50%, 02/15/37 | 325,000 | 325,469 | ||||
6.25%, 03/15/38 | 150,000 | 150,222 | ||||
Conoco Funding Co. | ||||||
7.25%, 10/15/31 | 315,000 | 346,310 | ||||
Export Development Canada | ||||||
3.13%, 04/24/14 | 800,000 | 805,380 | ||||
Hydro Quebec | ||||||
6.30%, 05/11/11 | 305,000 | 330,714 | ||||
OPTI Canada, Inc. | ||||||
8.25%, 12/15/14 | 125,000 | 83,125 | ||||
Province of Ontario | ||||||
4.10%, 06/16/14 | 1,300,000 | 1,327,227 | ||||
6.50%, 03/08/29(C) | 1,500,000 | 1,537,373 | ||||
Rogers Cable, Inc. | ||||||
6.75%, 03/15/15 | 10,000 | 10,605 | ||||
Rogers Communications, Inc. | ||||||
6.80%, 08/15/18D | 300,000 | 322,157 | ||||
Rogers Wireless, Inc. | ||||||
6.38%, 03/01/14D | 340,000 | 364,804 | ||||
Sun Media Corporation | ||||||
7.63%, 02/15/13 | 90,000 | 59,625 | ||||
TransCanada Pipelines, Ltd. | ||||||
7.63%, 01/15/39 | 275,000 | 321,985 | ||||
| 6,823,324 | ||||||
Cayman Islands — 0.5% | ||||||
MUFG Capital Finance 1, Ltd. | ||||||
6.35%, 07/25/25†D | 450,000 | 393,705 | ||||
Petrobras International Finance Co. | ||||||
6.13%, 10/06/16 | 501,000 | 516,030 | ||||
Petroleum Export, Ltd. | ||||||
4.62%, 06/15/10 144A | 200,000 | 196,239 | ||||
4.63%, 06/15/10 144A | 266,667 | 261,662 | ||||
Resona Preferred Global Securities Cayman, Ltd. | ||||||
7.19%, 07/30/49 144A†D | 690,000 | 504,250 | ||||
Shinsei Finance Cayman, Ltd. | ||||||
6.42%, 07/20/49 144A† | 1,130,000 | 452,462 | ||||
Systems 2001 Asset Trust LLC | ||||||
6.66%, 09/15/13 144A | 601,037 | 602,363 | ||||
Transocean, Inc. | ||||||
7.50%, 04/15/31D | 500,000 | 555,556 | ||||
Vale Overseas, Ltd. | ||||||
6.88%, 11/21/36 | 601,000 | 572,155 | ||||
Willow Re, Ltd. | ||||||
0.00%, 06/16/10 144A# | 300,000 | 119,967 | ||||
| 4,174,389 | ||||||
Chile — 0.0% | ||||||
Codelco, Inc. | ||||||
4.75%, 10/15/14 144A | 210,000 | 216,826 | ||||
France — 0.9% | ||||||
AXA SA | ||||||
6.46%, 12/14/18 144A† | 150,000 | 94,645 | ||||
Compagnie Generale de Geophysique - Veritas | ||||||
7.50%, 05/15/15 | 200,000 | 184,500 | ||||
7.75%, 05/15/17 | 155,000 | 141,825 | ||||
EDF SA | ||||||
6.95%, 01/26/39 144A | 4,500,000 | 5,069,070 | ||||
French Government Bond | ||||||
5.75%, 10/25/32(E) | 500,000 | 839,675 | ||||
Legrand SA | ||||||
8.50%, 02/15/25 | 250,000 | 215,755 | ||||
Societe Financement de l’Economie Francaise | ||||||
3.38%, 05/05/14 144A | 1,300,000 | 1,304,685 | ||||
| 7,850,155 | ||||||
Germany — 0.7% | ||||||
Deutsche Bank AG | ||||||
6.00%, 09/01/17 | 3,100,000 | 3,167,416 | ||||
See Notes to Financial Statements.
56
Table of Contents
| Par | Value | |||||
Deutsche Bundesrepublik | ||||||
3.75%, 01/04/15(E) | $ | 1,450,000 | $ | 2,141,652 | ||
6.25%, 01/04/30(E) | 300,000 | 527,162 | ||||
| 5,836,230 | ||||||
Iceland — 0.1% | ||||||
Glitnir Banki HF | ||||||
6.33%, 07/28/11 144A#@ | 600,000 | 100,500 | ||||
6.38%, 09/25/12 144A#@ | 580,000 | 97,150 | ||||
6.69%, 06/15/16 144A#@D | 1,000,000 | 600 | ||||
7.45%, 09/14/16 144A#@ | 100,000 | 60 | ||||
Kaupthing Bank HF | ||||||
5.75%, 10/04/11 144A#@ | 250,000 | 33,750 | ||||
7.63%, 02/28/15 144A#@ | 2,490,000 | 192,975 | ||||
7.13%, 05/19/16 144A#@ | 350,000 | 875 | ||||
Landsbanki Islands HF | ||||||
6.10%, 08/25/11 144A#@ | 1,500,000 | 52,500 | ||||
| 478,410 | ||||||
India — 0.1% | ||||||
ICICI Bank, Ltd. | ||||||
6.38%, 04/30/22†D | 430,000 | 336,345 | ||||
6.38%, 04/30/22 144A† | 618,000 | 483,335 | ||||
| 819,680 | ||||||
Ireland — 0.2% | ||||||
DEPFA ACS Bank | ||||||
5.13%, 03/16/37 144A@ | 800,000 | 507,565 | ||||
Vimpel Communications | ||||||
8.38%, 04/30/13 144A | 850,000 | 775,625 | ||||
VIP Finance Ireland Ltd. for OJSC Vimpel Communications | ||||||
9.13%, 04/30/18 | 320,000 | 278,800 | ||||
| 1,561,990 | ||||||
Italy — 0.1% | ||||||
Telecom Italia Capital SA | ||||||
6.20%, 07/18/11 | 150,000 | 155,354 | ||||
5.25%, 11/15/13 | 165,000 | 161,952 | ||||
4.95%, 09/30/14 | 260,000 | 249,185 | ||||
5.25%, 10/01/15 | 130,000 | 125,658 | ||||
| 692,149 | ||||||
Japan — 0.1% | ||||||
Aiful Corporation | ||||||
5.00%, 08/10/10 144A | 600,000 | 366,081 | ||||
Resona Bank, Ltd. | ||||||
4.13%, 06/27/38 144A(E)†@ | 325,000 | 328,269 | ||||
5.85%, 07/15/49 144A†@ | 475,000 | 359,094 | ||||
| 1,053,444 | ||||||
Jersey — 0.1% | ||||||
HSBC Capital Funding LP | ||||||
4.61%, 12/29/49 144A† | 960,000 | 677,462 | ||||
Swiss Re Capital I LP | ||||||
6.85%, 05/29/49 144A† | 650,000 | 358,174 | ||||
| 1,035,636 | ||||||
Luxembourg — 1.0% | ||||||
ArcelorMittal | ||||||
6.13%, 06/01/18 | 800,000 | 701,151 | ||||
Enel Finance International SA | ||||||
5.70%, 01/15/13 144A | 700,000 | 732,125 | ||||
Evraz Group SA | ||||||
8.88%, 04/24/13 144A | 680,000 | 561,000 | ||||
FMC Finance III SA | ||||||
6.88%, 07/15/17 | 250,000 | 233,750 | ||||
Gaz Capital for Gazprom | ||||||
6.21%, 11/22/16 144A | 540,000 | 453,600 | ||||
6.51%, 03/07/22 144A | 440,000 | 331,100 | ||||
Hellas Telecommunications SA | ||||||
4.94%, 10/15/12(E)† | 375,000 | 364,305 | ||||
RSHB Capital SA for OJSC Russian Agricultural Bank | ||||||
6.30%, 05/15/17 144A | 1,240,000 | 1,072,600 | ||||
TNK-BP Finance SA | ||||||
7.50%, 07/18/16 144A | 780,000 | 668,850 | ||||
6.63%, 03/20/17 144A | 260,000 | 206,700 | ||||
7.88%, 03/13/18 144A | 340,000 | 282,200 | ||||
Tyco International Group SA | ||||||
6.00%, 11/15/13 | 2,920,000 | 2,971,932 | ||||
| 8,579,313 | ||||||
Marshall Islands — 0.0% | ||||||
Teekay Shipping Corporation | ||||||
8.88%, 07/15/11 | 176,000 | 175,560 | ||||
Mexico — 0.3% | ||||||
America Movil Sab de CV | ||||||
5.63%, 11/15/17 | 270,000 | 265,250 | ||||
Kansas City Southern de Mexico SA de CV | ||||||
9.38%, 05/01/12D | 120,000 | 114,600 | ||||
Petroleos Mexicanos | ||||||
8.00%, 05/03/19 144A | 720,000 | 784,800 | ||||
United Mexican States | ||||||
6.75%, 09/27/34 | 1,031,000 | 1,044,918 | ||||
| 2,209,568 | ||||||
Netherlands — 0.7% | ||||||
Deutsche Telekom International Finance BV | ||||||
5.75%, 03/23/16 | 510,000 | 522,893 | ||||
Fortis Bank Nederland Holding NV | ||||||
1.74%, 06/10/11(E)† | 700,000 | 987,638 | ||||
ING Bank NV | ||||||
3.90%, 03/19/14 144A | 500,000 | 509,562 | ||||
Intergas Finance BV | ||||||
6.38%, 05/14/17 144A | 612,000 | 468,180 | ||||
Koninklijke KPN NV | ||||||
8.00%, 10/01/10 | 780,000 | 818,678 | ||||
LeasePlan Corporation NV | ||||||
3.00%, 05/07/12 144A@ | 2,200,000 | 2,228,065 | ||||
Rabobank Nederland NV | ||||||
11.00%, 06/30/19 144A† | 612,000 | 684,013 | ||||
| 6,219,029 | ||||||
Norway — 0.0% | ||||||
StatoilHydro ASA | ||||||
5.25%, 04/15/19 | 350,000 | 360,879 | ||||
Peru — 0.1% | ||||||
Republic of Peru | ||||||
7.13%, 03/30/19 | 380,000 | 407,550 | ||||
South Korea — 0.0% | ||||||
Export-Import Bank of Korea | ||||||
5.25%, 02/10/14 144A | 235,000 | 228,843 | ||||
See Notes to Financial Statements.
57
Table of Contents
Medium-Duration Bond Fund
SCHEDULE OF INVESTMENTS (Continued)
| Par | Value | |||||
Spain — 0.1% | ||||||
Telefonica Emisiones SAU | ||||||
6.42%, 06/20/16 | $ | 900,000 | $ | 963,643 | ||
Supranational — 1.2% | ||||||
Asian Development Bank | ||||||
2.75%, 05/21/14 | 2,000,000 | 1,967,169 | ||||
European Investment Bank | ||||||
3.00%, 04/08/14 | 2,000,000 | 1,992,652 | ||||
3.13%, 06/04/14 | 2,300,000 | 2,307,459 | ||||
Inter-American Development Bank | ||||||
3.00%, 04/22/14 | 1,900,000 | 1,877,347 | ||||
International Finance Corporation | ||||||
3.00%, 04/22/14 | 1,900,000 | 1,860,554 | ||||
| 10,005,181 | ||||||
Sweden — 0.2% | ||||||
Swedbank AB | ||||||
2.80%, 02/10/12 144AD | 2,000,000 | 2,025,172 | ||||
Switzerland — 0.8% | ||||||
Credit Suisse Group | ||||||
5.00%, 05/15/13 | 2,900,000 | 2,967,323 | ||||
UBS AG | ||||||
1.53%, 06/19/10† | 3,700,000 | 3,646,365 | ||||
| 6,613,688 | ||||||
United Kingdom — 2.2% | ||||||
BP Capital Markets PLC | ||||||
5.25%, 11/07/13D | 1,240,000 | 1,332,199 | ||||
HSBC Holdings PLC | ||||||
6.80%, 06/01/38 | 425,000 | 428,460 | ||||
Inmarsat Finance PLC | ||||||
10.38%, 11/15/12 STEPW | 375,000 | 390,000 | ||||
Lloyds TSB Bank PLC | ||||||
1.42%, 06/09/11(E)† | 500,000 | 700,055 | ||||
2.80%, 04/02/12 144A | 5,600,000 | 5,661,320 | ||||
Royal Bank of Scotland PLC | ||||||
9.12%, 03/31/10 | 550,000 | 448,319 | ||||
2.63%, 05/11/12 144A | 6,100,000 | 6,124,031 | ||||
7.64%, 03/31/45† | 300,000 | 121,633 | ||||
United Kingdom Gilt | ||||||
4.00%, 03/07/22(U)D | 1,900,000 | 3,135,846 | ||||
| 18,341,863 | ||||||
Total Foreign Bonds | 89,379,391 | |||||
LOAN AGREEMENTS — 1.1% | ||||||
Chrysler Finance Co. Bridge Loan | ||||||
4.46%, 08/03/14@ | 6,652,572 | 6,175,802 | ||||
Ford Motor Co. Tranche B | ||||||
3.35%, 11/29/13†@ | 52,892 | 38,136 | ||||
Georgia Pacific Corporation | ||||||
2.43%, 12/20/12@ | 224,785 | 212,141 | ||||
3.29%, 12/20/12†@ | 3,238,095 | 3,055,952 | ||||
Total Loan Agreements | 9,482,031 | |||||
MORTGAGE-BACKED SECURITIES — 53.1% | ||||||
ABN AMRO Mortgage Corporation | ||||||
0.01%, 06/25/33 IOW | 275,952 | 34,355 | ||||
American Home Mortgage Assets | ||||||
2.26%, 11/25/46† | 1,665,061 | 556,526 | ||||
2.04%, 02/25/47† | 2,461,473 | 809,839 | ||||
Bank of America Commercial Mortgage, Inc. | ||||||
5.12%, 10/10/45† | 3,000,000 | 2,561,510 | ||||
Bank of America Funding Corporation | ||||||
0.40%, 07/20/36† | 1,679,199 | 1,435,344 | ||||
Bank of America Mortgage Securities, Inc. | ||||||
4.19%, 07/25/34† | 519,640 | 416,372 | ||||
Bear Stearns Adjustable Rate Mortgage Trust | ||||||
5.61%, 02/25/33† | 214,747 | 199,503 | ||||
4.25%, 04/25/34† | 292,709 | 250,873 | ||||
5.29%, 05/25/34† | 1,154,413 | 910,616 | ||||
2.94%, 03/25/35† | 1,911,116 | 1,651,661 | ||||
5.08%, 06/25/35† | 941,970 | 596,931 | ||||
Bear Stearns Alt-A Trust | ||||||
0.95%, 02/25/34† | 122,859 | 72,120 | ||||
5.36%, 05/25/35† | 674,243 | 451,401 | ||||
5.49%, 09/25/35† | 985,745 | 533,911 | ||||
Bear Stearns Structured Products, Inc. | ||||||
5.65%, 01/26/36† | 1,696,506 | 936,565 | ||||
Chase Mortgage Finance Corporation | ||||||
4.55%, 02/25/37† | 408,839 | 344,257 | ||||
4.68%, 02/25/37† | 977,722 | 838,429 | ||||
Citigroup Commercial Mortgage Trust | ||||||
0.39%, 08/15/21 144A† | 4,962 | 4,194 | ||||
Citigroup Mortgage Loan Trust, Inc. | ||||||
4.90%, 12/25/35† | 2,326,366 | 1,705,904 | ||||
Commerical Mortgage Asset Trust | ||||||
7.55%, 11/17/32† | 164,288 | 166,208 | ||||
Countrywide Alternative Loan Trust | ||||||
5.50%, 10/25/33 | 178,871 | 148,854 | ||||
0.66%, 09/25/35† | 2,314,911 | 1,053,104 | ||||
2.84%, 09/25/35† | 326,044 | 153,024 | ||||
0.64%, 10/25/35† | 1,483,382 | 637,763 | ||||
0.62%, 11/20/35† | 745,257 | 331,754 | ||||
0.64%, 11/20/35† | 1,764,897 | 777,189 | ||||
0.65%, 11/20/35† | 2,712,045 | 1,224,883 | ||||
0.61%, 12/25/35† | 1,575,363 | 696,007 | ||||
0.58%, 01/25/36† | 792,623 | 346,227 | ||||
0.58%, 02/25/36† | 1,687,921 | 754,040 | ||||
6.00%, 08/25/37 | 1,493,443 | 933,168 | ||||
0.52%, 06/25/46† | 1,271,079 | 485,536 | ||||
0.50%, 09/25/46† | 1,667,081 | 635,622 | ||||
2.72%, 11/25/47† | 2,850,963 | 914,575 | ||||
Countrywide Home Loan Mortgage Pass-Through Trust | ||||||
5.08%, 02/19/34 | 1,713,311 | 1,412,799 | ||||
4.52%, 11/20/34 | 329,658 | 215,389 | ||||
0.73%, 11/25/34 144A† | 36,530 | 25,229 | ||||
0.67%, 03/25/35 144A† | 127,939 | 90,269 | ||||
4.89%, 08/20/35 | 1,402,469 | 768,595 | ||||
0.55%, 03/25/36† | 564,834 | 231,333 | ||||
See Notes to Financial Statements.
58
Table of Contents
| Par | Value | |||||
Credit Suisse Mortgage Capital Certificates | ||||||
5.66%, 03/15/39 STRIP† | $ | 550,000 | $ | 393,023 | ||
5.38%, 02/15/40 | 2,200,000 | 1,480,140 | ||||
CS First Boston Mortgage Securities Corporation | ||||||
0.01%, 07/25/33 IOW†@ | 209,707 | — | ||||
16.70%, 07/25/33 IOW†@ | 490,500 | 43,924 | ||||
0.01%, 08/25/33 IOW†@ | 295,959 | — | ||||
6.53%, 06/15/34 | 1,500,000 | 1,538,168 | ||||
Federal Home Loan Mortgage Corporation | ||||||
7.00%, 11/01/14 | 33,059 | 35,185 | ||||
7.00%, 04/01/15 | 40,799 | 43,423 | ||||
7.00%, 12/01/15 | 25,954 | 27,478 | ||||
8.50%, 06/01/16 | 12,862 | 13,872 | ||||
4.50%, 05/01/18 | 148,529 | 154,064 | ||||
4.50%, 06/01/18 | 32,047 | 33,237 | ||||
8.50%, 06/01/18 | 6,238 | 6,728 | ||||
4.50%, 09/01/18 | 129,850 | 134,673 | ||||
4.50%, 10/01/18 | 102,922 | 106,371 | ||||
4.50%, 11/01/18 | 105,074 | 107,906 | ||||
4.50%, 12/01/18 | 324,206 | 336,249 | ||||
5.00%, 12/01/18 | 595,949 | 619,084 | ||||
4.50%, 01/01/19 | 39,556 | 41,025 | ||||
4.50%, 03/01/19 | 75,909 | 78,285 | ||||
4.50%, 06/01/19 | 1,408,192 | 1,460,500 | ||||
5.00%, 06/01/20 | 494,406 | 515,851 | ||||
5.00%, 07/01/20 | 494,815 | 514,886 | ||||
3.82%, 04/15/22 POW†@ | 25,407 | 22,932 | ||||
8.00%, 08/01/24 | 4,601 | 5,085 | ||||
7.50%, 11/01/29 | 15,487 | 16,778 | ||||
7.50%, 12/01/29 | 25,612 | 27,748 | ||||
7.50%, 02/01/31 | 33,262 | 36,012 | ||||
5.13%, 07/01/31† | 53,926 | 54,622 | ||||
5.11%, 08/01/31† | 3,804 | 3,861 | ||||
7.50%, 11/01/31 | 10,330 | 11,173 | ||||
3.98%, 04/01/32† | 7,580 | 7,763 | ||||
2.98%, 03/01/34† | 9,432 | 9,578 | ||||
5.00%, 12/01/34 | 120,573 | 123,244 | ||||
5.50%, 05/01/35 | 2,040,665 | 2,113,663 | ||||
0.01%, 08/15/35W† | 72,571 | 74,548 | ||||
5.00%, 11/01/35 | 1,659,354 | 1,694,291 | ||||
5.50%, 11/01/35 | 644,802 | 667,867 | ||||
5.00%, 12/01/35 | 388,390 | 396,568 | ||||
5.50%, 01/01/36 | 358,909 | 371,748 | ||||
6.00%, 02/01/36 | 1,681,255 | 1,757,995 | ||||
5.00%, 03/01/36 | 101,202 | 103,332 | ||||
6.00%, 11/01/36 | 23,237 | 24,298 | ||||
6.06%, 01/01/37† | 2,232,186 | 2,350,346 | ||||
5.68%, 04/01/37† | 3,382,837 | 3,504,027 | ||||
6.00%, 04/01/37 | 11,825 | 12,365 | ||||
0.01%, 04/15/37W† | 48,885 | 46,801 | ||||
0.20%, 06/15/37W† | 134,647 | 118,776 | ||||
0.82%, 06/15/37† | 2,346,113 | 2,313,776 | ||||
5.50%, 07/01/37 | 567,247 | 586,386 | ||||
6.00%, 07/01/37 | 3,399 | 3,552 | ||||
5.64%, 09/01/37† | 4,213,504 | 4,408,901 | ||||
6.00%, 09/01/37 | 155,610 | 162,592 | ||||
6.00%, 11/01/37 | 111,333 | 116,328 | ||||
5.50%, 12/01/37 | 133,415 | 137,916 | ||||
5.50%, 04/01/38 | 248,478 | 256,861 | ||||
6.00%, 04/01/38 | 24,887 | 26,004 | ||||
6.00%, 05/01/38 | 893,301 | 933,327 | ||||
5.00%, 07/01/38 TBA | 200,000 | 203,375 | ||||
5.50%, 07/01/38 | 120,036 | 124,080 | ||||
6.00%, 07/01/38 | 54,776 | 57,230 | ||||
5.00%, 08/01/38 | 361,982 | 369,604 | ||||
6.00%, 12/01/38 | 161,412 | 168,645 | ||||
5.50%, 01/01/39 | 294,609 | 304,503 | ||||
6.00%, 01/01/39 | 76,788 | 80,227 | ||||
6.00%, 02/01/39 | 26,073 | 27,241 | ||||
5.00%, 06/01/39 | 1,000,000 | 1,018,398 | ||||
5.50%, 07/01/39 TBA | 44,000,000 | 45,416,272 | ||||
Federal Housing Administration | ||||||
7.43%, 10/01/18 | 181,254 | 190,969 | ||||
Federal National Mortgage Association | ||||||
4.00%, 06/01/13 | 49,936 | 50,813 | ||||
4.00%, 07/01/13 | 67,491 | 68,926 | ||||
4.00%, 08/01/13 | 95,688 | 97,368 | ||||
4.00%, 09/01/13 | 185,161 | 188,407 | ||||
4.00%, 10/01/13 | 386,876 | 393,642 | ||||
8.00%, 06/01/15 | 26,829 | 28,594 | ||||
8.00%, 06/15/15 | 10,797 | 11,507 | ||||
8.00%, 07/01/15 | 21,710 | 23,138 | ||||
8.00%, 09/01/15 | 41,203 | 43,289 | ||||
6.00%, 05/01/16 | 122,573 | 130,686 | ||||
6.00%, 07/01/16 | 8,004 | 8,534 | ||||
5.00%, 11/01/17 | 162,592 | 170,305 | ||||
5.00%, 12/01/17 | 850,558 | 889,907 | ||||
5.00%, 01/01/18 | 2,071,710 | 2,169,852 | ||||
5.00%, 02/01/18 | 417,873 | 437,641 | ||||
5.50%, 02/01/18 | 145,772 | 152,732 | ||||
5.00%, 04/01/18 | 707,493 | 740,833 | ||||
5.00%, 05/01/18 | 985,296 | 1,030,775 | ||||
4.50%, 06/01/18 | 1,044,923 | 1,084,064 | ||||
5.00%, 06/01/18 | 122,391 | 128,159 | ||||
4.00%, 09/01/18 | 3,103,745 | 3,173,902 | ||||
4.50%, 09/01/18 | 99,963 | 103,707 | ||||
4.50%, 10/01/18 | 206,145 | 213,867 | ||||
4.50%, 11/01/18 | 47,225 | 48,994 | ||||
5.00%, 11/01/18 | 198,673 | 208,097 | ||||
4.50%, 12/01/18 | 77,279 | 80,174 | ||||
4.50%, 01/01/19 | 54,850 | 56,905 | ||||
5.00%, 02/01/19 | 135,033 | 140,974 | ||||
4.50%, 03/01/19 | 75,988 | 78,834 | ||||
5.00%, 03/01/19 | 1,024,036 | 1,069,093 | ||||
5.00%, 04/01/19 | 1,387,584 | 1,450,544 | ||||
4.50%, 05/01/19 | 299,263 | 310,005 | ||||
4.50%, 06/01/19 | 147,570 | 152,868 | ||||
4.50%, 07/01/19 | 47,742 | 49,455 | ||||
5.00%, 07/01/19 TBA | 4,500,000 | 4,656,096 | ||||
4.50%, 08/01/19 | 147,173 | 152,456 | ||||
5.00%, 08/01/19 | 511,019 | 533,504 | ||||
6.00%, 09/01/19 | 683,408 | 728,641 | ||||
5.00%, 10/01/19 | 223,227 | 233,049 | ||||
5.00%, 11/01/19 | 925,339 | 966,054 | ||||
4.50%, 04/01/20 | 469,568 | 487,157 | ||||
4.50%, 08/01/20 | 281,198 | 289,974 | ||||
4.50%, 09/01/20 | 201,173 | 207,452 | ||||
6.00%, 12/01/20 | 1,282,713 | 1,367,613 | ||||
4.50%, 03/01/21 | 333,904 | 341,299 | ||||
4.50%, 08/01/21 | 30,575 | 31,252 | ||||
16.67%, 08/25/21 IOW†@ | 193 | 3,779 | ||||
13.00%, 10/25/21 IOW†@ | 363 | 8,539 | ||||
21.11%, 01/25/22† | 28,748 | 29,700 | ||||
See Notes to Financial Statements.
59
Table of Contents
Medium-Duration Bond Fund
SCHEDULE OF INVESTMENTS (Continued)
| Par | Value | |||||
4.50%, 04/01/22 | $ | 251,689 | $ | 257,210 | ||
9.50%, 05/01/22 | 4,476 | 4,915 | ||||
4.50%, 06/01/22 | 1,223,482 | 1,250,317 | ||||
3.71%, 07/01/22† | 23,525 | 23,700 | ||||
6.00%, 01/01/23 | 124,646 | 131,761 | ||||
4.50%, 04/01/23 | 1,567,450 | 1,601,830 | ||||
4.50%, 06/01/23 | 1,785,407 | 1,824,567 | ||||
5.50%, 07/01/23 TBA | 3,600,000 | 3,766,500 | ||||
4.50%, 12/01/23 | 207,831 | 212,390 | ||||
5.00%, 12/01/23 | 861,326 | 892,581 | ||||
5.50%, 01/01/24 | 803,116 | 841,591 | ||||
4.00%, 07/01/24 TBA | 1,000,000 | 1,000,000 | ||||
9.50%, 07/01/24 | 7,938 | 8,700 | ||||
5.50%, 08/01/24 TBA | 1,000,000 | 1,043,125 | ||||
2.88%, 07/01/27† | 26,860 | 26,726 | ||||
4.03%, 08/01/27† | 75,301 | 76,047 | ||||
2.88%, 11/01/27† | 64,802 | 64,480 | ||||
5.50%, 04/01/29 | 545 | 568 | ||||
7.39%, 02/01/30† | 167,923 | 169,490 | ||||
0.91%, 05/25/30† | 1,663,558 | 1,637,870 | ||||
5.34%, 06/01/30† | 30,469 | 30,524 | ||||
8.00%, 10/01/30 | 55,072 | 60,091 | ||||
0.77%, 10/18/30† | 57,566 | 56,963 | ||||
5.11%, 12/01/30† | 7,872 | 8,044 | ||||
2.88%, 01/01/31† | 8,868 | 8,821 | ||||
3.07%, 05/01/31† | 18,448 | 18,671 | ||||
3.00%, 06/01/31† | 7,351 | 7,470 | ||||
6.00%, 01/01/32 | 97,713 | 103,043 | ||||
6.00%, 03/01/32 | 244,711 | 258,107 | ||||
6.00%, 04/01/32 | 571,810 | 602,913 | ||||
2.88%, 06/01/32† | 10,071 | 10,018 | ||||
3.71%, 08/01/32† | 37,920 | 37,789 | ||||
3.59%, 02/01/33† | 4,223 | 4,272 | ||||
5.50%, 03/01/33 | 99,548 | 103,295 | ||||
3.71%, 05/01/33† | 85,166 | 84,893 | ||||
5.00%, 05/01/33 | 597,420 | 611,212 | ||||
5.50%, 05/01/33 | 159,510 | 165,516 | ||||
6.00%, 05/01/33 | 20,046 | 21,136 | ||||
5.00%, 06/01/33 | 19,496 | 19,946 | ||||
5.50%, 06/01/33 | 26,999 | 28,016 | ||||
5.00%, 07/01/33 | 32,398 | 33,146 | ||||
5.50%, 07/01/33 | 319,687 | 331,723 | ||||
0.01%, 07/25/33 IOW† | 335,511 | 4,740 | ||||
5.00%, 08/01/33 | 49,595 | 50,740 | ||||
5.00%, 09/01/33 | 26,614 | 27,228 | ||||
5.50%, 09/01/33 | 8,673 | 8,999 | ||||
5.00%, 10/01/33 | 83,130 | 85,050 | ||||
5.00%, 11/01/33 | 54,136 | 55,386 | ||||
6.00%, 12/01/33 | 7,097 | 7,474 | ||||
5.00%, 02/01/34 | 40,010 | 40,934 | ||||
5.50%, 02/01/34 | 10,993 | 11,400 | ||||
5.00%, 03/01/34 | 42,326 | 43,303 | ||||
5.00%, 04/01/34 | 29,563 | 30,245 | ||||
5.50%, 04/01/34 | 1,756 | 1,821 | ||||
0.01%, 04/25/34 IOW† | 519,514 | 23,417 | ||||
5.50%, 06/01/34 | 153,132 | 158,897 | ||||
0.01%, 06/25/34 IOW† | 726,807 | 7,319 | ||||
5.50%, 07/14/34 TBA | 3,000,000 | 3,096,564 | ||||
5.00%, 08/01/34 | 289,776 | 296,239 | ||||
5.50%, 08/01/34 | 17,907 | 18,581 | ||||
5.50%, 10/01/34 | 1,198 | 1,242 | ||||
6.00%, 10/01/34 | 72,710 | 76,461 | ||||
4.50%, 12/01/34 | 325,936 | 326,697 | ||||
4.57%, 12/01/34† | 653,294 | 674,497 | ||||
5.50%, 12/01/34 | 121,783 | 126,291 | ||||
6.00%, 12/01/34 | 2,503 | 2,632 | ||||
6.00%, 01/01/35 | 2,244,596 | 2,360,376 | ||||
4.50%, 02/01/35 | 362,655 | 363,501 | ||||
4.50%, 03/01/35 | 1,211,756 | 1,213,448 | ||||
5.00%, 03/01/35 | 247,442 | 252,961 | ||||
4.50%, 04/01/35 | 816,901 | 818,042 | ||||
6.00%, 04/01/35 | 1,849,507 | 1,947,751 | ||||
4.50%, 05/01/35 | 643,717 | 644,616 | ||||
6.00%, 05/01/35 | 3,004,130 | 3,151,579 | ||||
1.14%, 05/25/35W† | 65,062 | 63,339 | ||||
5.00%, 06/01/35 | 2,688,798 | 2,748,771 | ||||
4.50%, 07/01/35 | 396,362 | 396,915 | ||||
5.50%, 07/01/35 | 776 | 804 | ||||
6.00%, 07/01/35 | 933,482 | 979,299 | ||||
5.00%, 08/01/35 | 201,403 | 205,770 | ||||
5.50%, 08/01/35 | 1,953 | 2,023 | ||||
6.00%, 08/01/35 | 781 | 819 | ||||
4.50%, 09/01/35 | 110,177 | 110,331 | ||||
5.00%, 09/01/35 | 7,623,978 | 7,813,565 | ||||
5.50%, 09/01/35 | 690,160 | 715,064 | ||||
4.50%, 10/01/35 | 269,319 | 269,695 | ||||
6.00%, 10/01/35 | 255,417 | 268,697 | ||||
2.88%, 11/01/35† | 32,220 | 32,057 | ||||
3.41%, 11/01/35† | 493,898 | 501,565 | ||||
3.42%, 11/01/35† | 441,310 | 448,172 | ||||
3.43%, 11/01/35† | 450,714 | 457,744 | ||||
3.43%, 11/01/35† | 455,011 | 462,108 | ||||
3.44%, 11/01/35† | 433,902 | 440,669 | ||||
6.00%, 11/01/35 | 2,223,540 | 2,336,309 | ||||
5.00%, 12/01/35 | 5,799,524 | 5,928,880 | ||||
5.50%, 12/01/35 | 8,754 | 9,078 | ||||
6.00%, 01/01/36 | 187,900 | 197,123 | ||||
6.00%, 02/01/36 | 16,938 | 17,743 | ||||
5.50%, 04/01/36 | 645,208 | 664,457 | ||||
6.50%, 04/01/36 | 816,254 | 870,729 | ||||
4.12%, 05/01/36† | 397,445 | 398,973 | ||||
0.76%, 08/25/36† | 2,908,497 | 2,865,714 | ||||
5.00%, 09/01/36 | 789,272 | 806,383 | ||||
6.00%, 09/01/36 | 430,987 | 451,467 | ||||
3.46%, 09/25/36W† | 50,606 | 49,912 | ||||
6.00%, 10/01/36 | 12,449 | 13,041 | ||||
6.50%, 10/01/36 | 524,104 | 559,082 | ||||
5.50%, 11/01/36 | 1,723,418 | 1,782,644 | ||||
6.50%, 11/01/36 | 326,688 | 348,848 | ||||
5.50%, 12/01/36 | 5,289 | 5,471 | ||||
6.00%, 12/01/36 | 452,436 | 473,936 | ||||
6.00%, 01/01/37 | 248,558 | 260,359 | ||||
5.50%, 02/01/37† | 3,699,390 | 3,876,464 | ||||
5.50%, 02/01/37 | 1,808 | 1,871 | ||||
5.50%, 03/01/37 | 92,322 | 95,625 | ||||
6.50%, 03/01/37 | 762,956 | 813,636 | ||||
5.50%, 04/01/37 | 23,416 | 24,219 | ||||
6.00%, 04/01/37 | 111,787 | 116,994 | ||||
6.50%, 04/01/37 | 607,468 | 647,819 | ||||
5.50%, 05/01/37 | 128,491 | 132,826 | ||||
6.00%, 05/01/37 | 121,538 | 127,199 | ||||
6.50%, 05/01/37 | 745,268 | 794,773 | ||||
5.50%, 06/01/37 | 23,322 | 24,109 | ||||
6.00%, 06/01/37 | 11,375 | 11,905 | ||||
5.50%, 07/01/37 | 13,257 | 13,704 | ||||
6.00%, 07/01/37 TBA | 16,410,217 | 17,161,993 | ||||
5.50%, 08/01/37 | 2,151 | 2,224 | ||||
6.00%, 08/01/37 | 58,908 | 61,652 | ||||
See Notes to Financial Statements.
60
Table of Contents
| Par | Value | |||||
6.50%, 08/01/37 | $ | 896,859 | $ | 956,433 | ||
6.50%, 09/01/37 | 713,778 | 761,191 | ||||
5.50%, 10/01/37 | 64,734 | 66,919 | ||||
6.50%, 10/01/37 | 730,101 | 778,599 | ||||
6.00%, 11/01/37 | 14,214 | 14,876 | ||||
2.88%, 12/01/37† | 141,452 | 140,758 | ||||
6.00%, 12/01/37 | 3,496 | 3,659 | ||||
2.88%, 01/01/38† | 63,316 | 63,004 | ||||
5.50%, 01/01/38 | 103,821 | 107,318 | ||||
6.00%, 01/01/38 | 39,623 | 41,464 | ||||
5.00%, 02/01/38 | 4,559,256 | 4,649,294 | ||||
5.50%, 02/01/38 | 232,229 | 240,140 | ||||
6.00%, 02/01/38 | 196,357 | 205,462 | ||||
4.50%, 03/01/38 | 60,572 | 60,530 | ||||
5.00%, 03/01/38 | 1,456,104 | 1,484,859 | ||||
5.50%, 03/01/38 | 521,333 | 538,917 | ||||
6.00%, 03/01/38 | 237,766 | 248,792 | ||||
4.50%, 04/01/38 | 1,701,223 | 1,700,047 | ||||
5.00%, 04/01/38 | 2,027,450 | 2,067,490 | ||||
5.50%, 04/01/38 | 1,037,049 | 1,072,021 | ||||
6.00%, 04/01/38 | 13,386 | 14,006 | ||||
5.00%, 05/01/38 | 320,585 | 326,934 | ||||
5.50%, 05/01/38 | 251,475 | 259,945 | ||||
6.00%, 05/01/38 | 234,698 | 245,581 | ||||
5.00%, 06/01/38 | 1,133,603 | 1,155,990 | ||||
5.50%, 06/01/38 | 1,454,275 | 1,503,261 | ||||
6.00%, 06/01/38 | 58,455 | 61,165 | ||||
5.00%, 07/01/38 TBA | 16,900,000 | 17,206,313 | ||||
5.50%, 07/01/38 | 1,663,353 | 1,719,381 | ||||
6.00%, 07/01/38 | 78,424 | 82,060 | ||||
5.50%, 07/14/38 TBA | 32,100,000 | 33,133,235 | ||||
5.50%, 08/01/38 | 459,677 | 475,161 | ||||
5.50%, 09/01/38 | 1,021,672 | 1,056,111 | ||||
6.00%, 09/01/38 | 783,078 | 819,389 | ||||
5.50%, 10/01/38 | 519,117 | 536,916 | ||||
5.50%, 11/01/38 | 750,369 | 775,644 | ||||
5.50%, 12/01/38 | 88,847 | 91,839 | ||||
6.00%, 12/01/38 | 86,885 | 90,914 | ||||
5.50%, 01/01/39 | 248,048 | 256,402 | ||||
6.00%, 01/01/39 | 37,234 | 38,956 | ||||
5.50%, 02/01/39 | 146,386 | 151,313 | ||||
5.50%, 03/01/39 | 18,507 | 19,130 | ||||
5.00%, 07/01/39 TBA | 6,000,000 | 6,108,750 | ||||
4.50%, 07/13/39 TBA | 3,000,000 | 2,993,436 | ||||
4.00%, 08/13/39 TBA | 2,000,000 | 1,933,125 | ||||
2.84%, 06/01/40† | 115,405 | 115,063 | ||||
2.84%, 10/01/40† | 353,547 | 352,525 | ||||
2.88%, 11/01/40† | 51,303 | 51,048 | ||||
FFCA Secured Lending Corporation | ||||||
68.16%, 09/18/27 IO 144AW†@ | 1,024,316 | 18,315 | ||||
FHLMC Structured Pass-Through Securities | ||||||
2.84%, 07/25/44† | 2,335,711 | 2,310,980 | ||||
First Horizon Alternative Mortgage Securities | ||||||
3.57%, 06/25/34† | 801,671 | 518,226 | ||||
First Horizon Asset Securities, Inc. | ||||||
4.75%, 12/25/34† | 129,929 | 114,650 | ||||
First Union National Bank Commercial Mortgage Trust | ||||||
7.20%, 10/01/32 | 1,354,070 | 1,375,258 | ||||
GE Capital Commercial Mortgage Corporation | ||||||
5.33%, 11/10/45 STRIP† | $ | 1,230,000 | $ | 1,035,121 | ||
GMAC Commercial Mortgage Securities, Inc. | ||||||
6.28%, 11/15/39 | 2,000,000 | 2,034,237 | ||||
GMAC Mortgage Corporation Loan Trust | ||||||
4.71%, 06/25/34† | 483,810 | 431,487 | ||||
Government National Mortgage Association | ||||||
7.00%, 10/15/25 | 58,969 | 64,237 | ||||
7.00%, 01/15/26 | 20,478 | 22,317 | ||||
7.00%, 07/15/27 | 157,216 | 171,399 | ||||
7.00%, 12/15/27 | 1,523 | 1,660 | ||||
7.00%, 01/15/28 | 31,499 | 34,352 | ||||
7.00%, 03/15/28 | 189,060 | 206,110 | ||||
7.00%, 07/15/28 | 23,521 | 25,652 | ||||
7.50%, 07/15/28 | 15,027 | 16,492 | ||||
6.50%, 08/15/28 | 19,080 | 20,607 | ||||
7.00%, 08/15/28 | 37,029 | 40,383 | ||||
7.50%, 08/15/28 | 15,476 | 16,984 | ||||
6.50%, 09/15/28 | 111,167 | 120,065 | ||||
6.00%, 10/15/28 | 16,263 | 17,093 | ||||
7.00%, 10/15/28 | 72,831 | 79,429 | ||||
6.00%, 12/15/28 | 2,516 | 2,644 | ||||
6.00%, 01/15/29 | 523 | 551 | ||||
7.50%, 03/15/29 | 49,537 | 54,321 | ||||
7.50%, 11/15/29 | 24,412 | 26,796 | ||||
4.13%, 11/20/29† | 82,158 | 83,397 | ||||
8.50%, 08/15/30 | 4,309 | 4,815 | ||||
8.50%, 11/20/30 | 24,946 | 27,776 | ||||
6.00%, 04/15/31 | 4,397 | 4,626 | ||||
6.50%, 08/15/31 | 164,073 | 174,232 | ||||
7.50%, 08/15/31 | 53,645 | 58,733 | ||||
6.50%, 10/15/31 | 312,115 | 332,611 | ||||
6.00%, 11/15/31 | 895,749 | 934,203 | ||||
6.50%, 11/15/31 | 295,509 | 313,806 | ||||
6.00%, 12/15/31 | 225,289 | 234,961 | ||||
6.00%, 01/15/32 | 297,273 | 312,451 | ||||
6.00%, 02/15/32 | 501,319 | 522,869 | ||||
6.50%, 02/15/32 | 487,729 | 522,845 | ||||
36.08%, 02/16/32† | 174,256 | 235,850 | ||||
6.00%, 04/15/32 | 381,324 | 400,792 | ||||
6.50%, 04/15/32 | 308,143 | 327,221 | ||||
7.50%, 04/15/32 | 92,261 | 100,553 | ||||
6.50%, 06/15/32 | 998,539 | 1,069,051 | ||||
6.50%, 07/15/32 | 133,614 | 141,887 | ||||
6.50%, 08/15/32 | 434,293 | 461,182 | ||||
6.50%, 09/15/32 | 493,475 | 524,028 | ||||
6.00%, 10/15/32 | 519,335 | 541,630 | ||||
6.00%, 11/15/32 | 403,943 | 422,230 | ||||
6.00%, 12/15/32 | 223,601 | 233,226 | ||||
6.50%, 12/15/32 | 37,048 | 39,342 | ||||
6.00%, 01/15/33 | 231,455 | 241,391 | ||||
6.00%, 02/15/33 | 163,789 | 170,820 | ||||
6.50%, 03/15/33 | 81,045 | 86,063 | ||||
5.00%, 04/15/33 | 211,790 | 217,316 | ||||
6.50%, 04/15/33 | 1,171,977 | 1,244,539 | ||||
5.00%, 05/15/33 | 1,852,519 | 1,894,541 | ||||
6.00%, 05/15/33 | 1,050,230 | 1,095,316 | ||||
5.00%, 06/15/33 | 241,961 | 248,275 | ||||
6.00%, 06/15/33 | 168,111 | 175,328 | ||||
5.00%, 07/15/33 | 584,092 | 599,333 | ||||
See Notes to Financial Statements.
61
Table of Contents
Medium-Duration Bond Fund
SCHEDULE OF INVESTMENTS (Continued)
| Par | Value | |||||
5.00%, 08/15/33 | $ | 1,173,101 | $ | 1,200,091 | ||
5.00%, 09/15/33 | 821,503 | 839,345 | ||||
5.00%, 10/15/33 | 458,193 | 468,748 | ||||
6.00%, 10/15/33 | 649,199 | 677,069 | ||||
6.50%, 10/15/33 | 248,317 | 263,691 | ||||
5.00%, 11/15/33 | 56,276 | 57,464 | ||||
6.00%, 12/15/33 | 914,185 | 953,431 | ||||
5.00%, 01/15/34 | 375,415 | 384,859 | ||||
5.00%, 03/15/34 | 459,635 | 471,198 | ||||
5.00%, 04/15/34 | 178,513 | 183,003 | ||||
5.00%, 05/15/34 | 103,291 | 105,890 | ||||
5.00%, 06/15/34 | 721,393 | 739,541 | ||||
6.00%, 06/15/34 | 81,020 | 84,904 | ||||
5.00%, 08/15/34 | 462,231 | 473,859 | ||||
5.00%, 11/15/34 | 1,054,456 | 1,080,982 | ||||
5.00%, 12/15/34 | 962,019 | 986,220 | ||||
5.00%, 01/15/35 | 684,469 | 701,046 | ||||
6.00%, 02/15/36 | 12,448 | 12,986 | ||||
6.00%, 06/15/36 | 721,427 | 752,623 | ||||
6.00%, 07/15/36 | 79,087 | 82,507 | ||||
6.00%, 08/15/36 | 785,765 | 818,567 | ||||
6.00%, 07/01/37 TBA | 23,300,000 | 24,268,395 | ||||
5.50%, 05/15/38 | 276,116 | 285,629 | ||||
5.00%, 07/01/38 TBA | 900,000 | 917,438 | ||||
6.50%, 07/21/38 TBA | 22,000,000 | 23,340,636 | ||||
6.00%, 12/15/38 | 375,828 | 391,293 | ||||
5.50%, 01/15/39 | 956,651 | 989,611 | ||||
5.50%, 02/15/39 | 121,990 | 126,193 | ||||
5.50%, 03/15/39 | 1,356,504 | 1,403,239 | ||||
Greenpoint Mortgage Funding Trust | ||||||
0.49%, 01/25/37† | 1,518,201 | 612,609 | ||||
0.39%, 02/25/47† | 3,371,459 | 1,673,809 | ||||
GS Mortgage Securities Corporation II | ||||||
4.68%, 07/10/39 | 1,300,000 | 1,251,482 | ||||
GSMPS Mortgage Loan Trust | ||||||
0.54%, 02/25/35 144A† | 281,935 | 197,273 | ||||
0.66%, 09/25/35 144A† | 2,286,408 | 1,574,291 | ||||
GSR Mortgage Loan Trust | ||||||
4.48%, 09/25/35† | 1,051,551 | 884,043 | ||||
HarborView Mortgage Loan Trust | ||||||
0.62%, 11/19/35 STEP | 412,181 | 197,841 | ||||
5.73%, 12/19/35† | 673,535 | 374,377 | ||||
0.55%, 01/19/36 STEP | 241,029 | 106,136 | ||||
0.56%, 01/19/36 STEP | 1,138,860 | 474,283 | ||||
5.94%, 08/19/36† | 1,617,142 | 712,057 | ||||
0.50%, 01/19/38† | 1,430,196 | 609,109 | ||||
Impac CMB Trust | ||||||
1.03%, 10/25/34† | 137,810 | 46,592 | ||||
0.57%, 11/25/35 STEP | 1,259,989 | 600,443 | ||||
Impac Secured Assets CMN Owner Trust | ||||||
0.56%, 03/25/36† | 961,484 | 389,432 | ||||
Indymac ARM Trust | ||||||
4.13%, 01/25/32† | 20,918 | 13,560 | ||||
Indymac INDA Mortgage Loan Trust | ||||||
6.15%, 11/25/37† | 759,809 | 496,168 | ||||
Indymac Index Mortgage Loan Trust | ||||||
0.61%, 07/25/35† | 2,398,121 | 1,085,295 | ||||
5.22%, 08/25/35† | 436,490 | 279,617 | ||||
5.10%, 09/25/35† | 562,033 | 347,476 | ||||
5.30%, 09/25/35† | 604,337 | 373,520 | ||||
0.53%, 04/25/46† | 1,038,403 | 467,405 | ||||
0.50%, 09/25/46† | 1,754,929 | 683,978 | ||||
JP Morgan Alternative Loan Trust | ||||||
0.57%, 01/25/36† | 821,485 | 371,042 | ||||
JP Morgan Chase Commercial Mortgage Securities Corporation | ||||||
4.90%, 09/12/37 | 3,340,000 | 2,846,342 | ||||
JP Morgan Mortgage Trust | ||||||
5.02%, 02/25/35† | 1,116,872 | 976,330 | ||||
4.04%, 07/25/35† | 718,365 | 607,212 | ||||
4.07%, 07/25/35† | 639,760 | 546,502 | ||||
4.77%, 07/25/35† | 650,046 | 552,523 | ||||
5.06%, 07/25/35† | 561,635 | 434,378 | ||||
LB-UBS Commercial Mortgage Trust | ||||||
4.66%, 07/15/30 | 1,000,000 | 961,267 | ||||
4.95%, 09/15/30 | 810,000 | 694,020 | ||||
17.89%, 06/15/36 IO 144Aن@ | 4,197,414 | 63,451 | ||||
Luminent Mortgage Trust | ||||||
0.50%, 07/25/36† | 611,296 | 259,202 | ||||
0.48%, 12/25/36† | 3,969,585 | 1,554,387 | ||||
0.51%, 02/25/46† | 1,089,300 | 475,309 | ||||
MASTR Adjustable Rate Mortgages Trust | ||||||
3.91%, 05/25/34† | 339,436 | 265,594 | ||||
5.65%, 11/25/35 144A† | 1,294,553 | 567,392 | ||||
0.51%, 05/25/47† | 3,796,105 | 1,532,863 | ||||
MASTR Reperforming Loan Trust | ||||||
7.00%, 08/25/34 144A | 827,614 | 910,376 | ||||
MLCC Mortgage Investors, Inc. | ||||||
2.12%, 11/25/29 STEP | 465,770 | 330,797 | ||||
Nomura Asset Acceptance Corporation | ||||||
6.50%, 03/25/34 144A | 132,984 | 112,594 | ||||
6.50%, 10/25/34 144A | 153,300 | 127,707 | ||||
Prime Mortgage Trust | ||||||
5.50%, 05/25/35 144A | 6,697,295 | 5,259,638 | ||||
6.00%, 05/25/35 144A | 4,396,727 | 3,223,741 | ||||
RBSGC Mortgage Pass Through Certificates | ||||||
0.76%, 01/25/37† | 1,348,913 | 526,014 | ||||
Residential Accredit Loans, Inc. | ||||||
2.34%, 01/25/46† | 1,030,909 | 463,744 | ||||
Residential Funding Mortgage Securities I | ||||||
5.18%, 09/25/35† | 664,797 | 509,150 | ||||
5.21%, 09/25/35† | 585,112 | 432,552 | ||||
Sequoia Mortgage Trust | ||||||
1.92%, 07/20/33† | 258,906 | 210,162 | ||||
2.22%, 10/20/34 STEP | 243,074 | 159,705 | ||||
Structured Adjustable Rate Mortgage Loan Trust | ||||||
3.78%, 05/25/34† | 422,792 | 338,861 | ||||
4.95%, 09/25/34† | 198,772 | 148,949 | ||||
5.28%, 11/25/34† | 816,514 | 590,593 | ||||
0.65%, 08/25/35† | 671,238 | 355,426 | ||||
Structured Asset Mortgage Investments, Inc. | ||||||
0.56%, 07/19/35† | 222,147 | 144,500 | ||||
See Notes to Financial Statements.
62
Table of Contents
| Par | Value | |||||
0.62%, 12/25/35† | $ | 991,376 | $ | 447,838 | ||
0.54%, 02/25/36† | 1,036,177 | 410,525 | ||||
2.84%, 08/25/47† | 2,489,353 | 939,132 | ||||
Structured Asset Securities Corporation | ||||||
4.45%, 09/25/33† | 928,505 | 693,854 | ||||
5.00%, 10/25/36 144A† | 290,122 | 203,024 | ||||
Thornburg Mortgage Securities Trust | ||||||
6.19%, 09/25/37† | 1,381,290 | 887,768 | ||||
6.21%, 09/25/37† | 1,456,449 | 1,052,624 | ||||
Wachovia Bank Commercial Mortgage Trust | ||||||
5.38%, 10/15/44 STRIP† | 3,000,000 | 2,713,827 | ||||
WAMU Alternative Mortgage Pass-Through Certificates | ||||||
2.18%, 11/25/46† | 2,373,623 | 817,022 | ||||
Washington Mutual Mortgage Pass-Through Certificates | ||||||
0.85%, 12/25/27† | 2,223,079 | 1,659,597 | ||||
4.54%, 02/25/33† | 24,317 | 17,445 | ||||
3.14%, 06/25/34† | 501,640 | 439,634 | ||||
5.59%, 12/25/36† | 763,619 | 470,096 | ||||
5.69%, 02/25/37† | 1,301,847 | 726,575 | ||||
5.83%, 02/25/37† | 842,658 | 527,155 | ||||
2.74%, 06/25/42† | 39,019 | 28,323 | ||||
0.60%, 07/25/45† | 1,452,326 | 664,853 | ||||
0.63%, 07/25/45† | 939,230 | 441,904 | ||||
0.63%, 08/25/45† | 3,146,272 | 1,706,401 | ||||
0.60%, 10/25/45† | 2,848,470 | 1,490,208 | ||||
0.57%, 11/25/45† | 1,228,851 | 594,542 | ||||
0.58%, 12/25/45† | 786,752 | 368,547 | ||||
0.60%, 12/25/45† | 1,667,914 | 779,468 | ||||
2.10%, 04/25/47† | 1,714,613 | 700,838 | ||||
Wells Fargo Alternative Loan Trust | ||||||
6.58%, 12/28/37† | 2,363,259 | 1,309,628 | ||||
Wells Fargo Mortgage-Backed Securities Trust | ||||||
3.94%, 10/25/35† | 757,872 | 606,843 | ||||
Total Mortgage-Backed Securities | 454,006,911 | |||||
MUNICIPAL BONDS — 0.9% | ||||||
California Educational Facilities Authority, Series A Revenue Bond | ||||||
5.00%, 10/01/39 | 1,000,000 | 990,680 | ||||
Illinois Finance Authority | ||||||
5.75%, 07/01/33 | 1,800,000 | 1,934,496 | ||||
Los Angeles Department of Water & Power, Series A-1 Revenue Bond (AMBAC Insured) | ||||||
5.00%, 07/01/37 | 1,500,000 | 1,426,335 | ||||
South Carolina Transportation Infrastructure Bank, Series A Revenue Bond (AMBAC Insured) | ||||||
5.00%, 10/01/23 | 2,700,000 | 2,714,526 | ||||
Virginia State Housing Development Authority, Commonwealth Mortgage, Series H Revenue Bond (MBIA Insured) | ||||||
5.38%, 07/01/36 | 1,000,000 | 996,460 | ||||
Total Municipal Bonds | 8,062,497 | |||||
| Notional Amount | ||||||
PURCHASED OPTIONS — 0.0% | ||||||
Put Options — 0.0% | ||||||
30-Year Federal National Mortgage Association, Strike Price $81.28, Expires 07/07/09 | $ | 19,000,000 | — | |||
30-Year Federal National Mortgage Association, Strike Price $88.75, Expires 07/07/09 | 48,000,000 | — | ||||
30-Year Government National Mortgage Association, Strike Price $83.13, Expires 07/14/09 | 52,300,000 | — | ||||
Total Purchased Options (Cost $13,980) | — | |||||
| Shares | ||||||
PREFERRED STOCKS — 0.3% | ||||||
CORTS Trust for Ford Motor Co.D | 9,100 | 124,215 | ||||
Federal Home Loan Mortgage Corporation | 55,675 | 67,924 | ||||
Federal National Mortgage Association | 42,050 | 56,746 | ||||
General Motors Corporation CONV | 40,650 | 106,706 | ||||
Preferred Blocker (GMAC), Inc. | 290 | 124,718 | ||||
Wells Fargo & Co. | 2,400 | 1,883,928 | ||||
Total Preferred Stocks | 2,364,237 | |||||
| Par | ||||||
REPURCHASE AGREEMENTS — 12.5% | ||||||
Bank of America NA | ||||||
0.09% (dated 06/30/09, due 07/01/09, repurchase price $46,300,116, collateralized by Federal Home Loan Mortgage Corporation Bond, 5.000%, due 07/01/35, total market value $47,680,733) | $ | 46,300,000 | 46,300,000 | |||
See Notes to Financial Statements.
63
Table of Contents
Medium-Duration Bond Fund
SCHEDULE OF INVESTMENTS (Continued)
| Par | Value | |||||||
JPMorgan Securities, Inc. | ||||||||
0.06% (dated 06/30/09, due 07/01/09, repurchase price $60,300,101, collateralized by Federal National Mortgage Association Bond and Federal National Mortgage Association Discount Note , 0.000% to 5.000%, due 11/02/09 to 07/01/34, total market value $62,104,807) | $ | 60,300,000 | $ | 60,300,000 | ||||
Total Repurchase Agreements | 106,600,000 | |||||||
| Shares | ||||||||
MONEY MARKET FUNDS — 10.1% | ||||||||
GuideStone Money Market Fund (GS4 Class)¥ | 47,350,030 | 47,350,030 | ||||||
Northern Institutional Liquid Assets Portfolio§ | 39,184,485 | 39,184,485 | ||||||
Total Money Market Funds | 86,534,515 | |||||||
| Par | ||||||||
U.S. TREASURY OBLIGATIONS — 3.7% | ||||||||
U.S. Treasury Bills | ||||||||
0.11%, 07/23/09 | $ | 740,000 | 739,954 | |||||
0.39%, 09/17/09 | 206,000 | 205,923 | ||||||
| 945,877 | ||||||||
U.S. Treasury Bonds | ||||||||
4.50%, 05/15/38D | 360,000 | 371,757 | ||||||
3.50%, 02/15/39D | 504,000 | 435,961 | ||||||
| 807,718 | ||||||||
U.S. Treasury Inflationary Index Bonds | ||||||||
2.00%, 07/15/14D | 1,400,000 | 1,622,735 | ||||||
1.63%, 01/15/15 | 1,000,000 | 1,112,831 | ||||||
2.00%, 01/15/16D | 500,000 | 545,874 | ||||||
2.50%, 07/15/16D | 600,000 | 665,754 | ||||||
2.38%, 01/15/17D | 200,000 | 220,912 | ||||||
2.38%, 01/15/25D | 1,140,000 | 1,328,220 | ||||||
2.00%, 01/15/26D | 160,000 | 168,663 | ||||||
2.38%, 01/15/27D‡‡ | 2,060,000 | 2,259,736 | ||||||
1.75%, 01/15/28‡‡ | 3,000 | 2,888 | ||||||
3.88%, 04/15/29D‡‡ | 4,468,000 | 7,367,059 | ||||||
| 15,294,672 | ||||||||
U.S. Treasury Notes | ||||||||
0.88%, 04/30/11† | 1,428,000 | 1,424,263 | ||||||
1.75%, 03/31/14 | 20,000 | 19,350 | ||||||
2.25%, 05/31/14D | 10,000 | 9,869 | ||||||
2.75%, 06/30/14D | 10,870,000 | 10,907,425 | ||||||
3.25%, 05/31/16D | 940,000 | 944,407 | ||||||
3.13%, 05/15/19D | 272,000 | 263,161 | ||||||
| 13,568,475 | ||||||||
U.S. Treasury STRIPS | ||||||||
4.26%, 05/15/20ΩD | 800,000 | 506,537 | ||||||
4.55%, 11/15/26ΩD | 600,000 | 275,170 | ||||||
| 781,707 | ||||||||
Total U.S. Treasury Obligations | 31,398,449 | |||||||
TOTAL INVESTMENTS — 123.0% | 1,051,379,856 | |||||||
| Number of Contracts | ||||||||
WRITTEN OPTIONS — 0.0% | ||||||||
Put Options — 0.0% | ||||||||
90-Day Eurodollar Futures, Strike Price $98.50, Expires 09/14/09 | (27 | ) | (1,181 | ) | ||||
90-Day Eurodollar Futures, Strike Price $98.63, Expires 12/14/09 | (29 | ) | (7,794 | ) | ||||
| (8,975 | ) | |||||||
| Notional Amount | ||||||||
Put Swaptions — 0.0% | ||||||||
3-Month LIBOR, Strike Price $4.25, Expires 08/24/09 | $ | (1,000,000 | ) | (5,173 | ) | |||
3-Month LIBOR, Strike Price $4.25, Expires 08/24/09 | (1,000,000 | ) | (5,173 | ) | ||||
3-Month LIBOR, Strike Price $4.90, Expires 07/07/09 | (22,500,000 | ) | — | |||||
| (10,346 | ) | |||||||
Total Written Options | ||||||||
(Premiums received $(39,303)) | (19,321 | ) | ||||||
| Par | ||||||||
SECURITY SOLD SHORT — (0.1)% | ||||||||
Federal National Mortgage Association | ||||||||
4.50%, 08/13/39 TBA (Cost $(997,813)) | $ | (1,000,000 | ) | (994,062 | ) | |||
Liabilities in Excess of Other Assets — (22.9)% | (195,811,454 | ) | ||||||
NET ASSETS — 100.0% | $ | 854,555,019 | ||||||
See Notes to Financial Statements.
64
Table of Contents
Swap agreements outstanding at June 30, 2009:
Reference Obligation | Fixed Deal (Pay) Rate | Maturity Date | Counter- party | Currency | Notional Amount | Market Value | Upfront Premiums Paid/ Received | Unrealized Appreciation (Depreciation) | |||||||||||||||
Credit Default Swaps on Corporate Issues — Buy Protection |
| ||||||||||||||||||||||
DaimlerChrysler NA Holdings, | |||||||||||||||||||||||
5.75 due 09/08/11 | 0.58 | % | 05/20/17 | BAR | USD | $ | 900,000 | $ | 18,658 | $ | — | $ | 18,658 | ||||||||||
Target Corporation, | |||||||||||||||||||||||
5.88% due 03/01/12 | (0.11 | )% | 06/20/12 | MSCS | USD | 1,200,000 | 13,975 | — | 13,975 | ||||||||||||||
CitiFinancial, | |||||||||||||||||||||||
6.63% due 06/01/15 | (0.15 | )% | 09/20/11 | BAR | USD | 300,000 | 52,103 | — | 52,103 | ||||||||||||||
American Electric Power, | |||||||||||||||||||||||
5.25% 06/01/15 | (6.26 | )% | 08/25/37 | CITI | USD | 2,300,000 | (1,660 | ) | — | (1,660 | ) | ||||||||||||
OMNICOM Group, Inc., | |||||||||||||||||||||||
5.90% due 04/15/16 | (0.39 | )% | 06/20/15 | MSCS | USD | 700,000 | 17,489 | — | 17,489 | ||||||||||||||
Dominion Resources, | |||||||||||||||||||||||
6.00% due 11/30/17 | (0.69 | )% | 06/20/12 | CITI | USD | 3,800,000 | (39,679 | ) | — | (39,679 | ) | ||||||||||||
| $ | 60,886 | $ | — | $ | 60,886 | ||||||||||||||||||
Reference Obligation | Implied Credit Spread | Fixed Deal (Pay) Rate | Maturity Date | Counter- party | Currency | Notional Amount | Market Value | Upfront Premiums Paid/ (Received) | Unrealized Appreciation (Depreciation) | |||||||||||||||||
Credit Default Swaps on Corporate Issues — Sell Protection |
| |||||||||||||||||||||||||
GMAC LLC, | ||||||||||||||||||||||||||
6.88% due 08/28/12 | 8.43 | % | (3.53 | )% | 09/20/17 | DEUT | USD | $ | 8,400,000 | $ | (2,137,324 | ) | $ | — | $ | (2,137,324 | ) | |||||||||
Federated Republic of Brazil, | ||||||||||||||||||||||||||
12.25% due 03/06/30 | 1.93 | % | (1.04 | )% | 05/20/17 | DEUT | USD | 1,000,000 | (59,170 | ) | — | (59,170 | ) | |||||||||||||
| $ | (2,196,494 | ) | $ | — | $ | (2,196,494 | ) | |||||||||||||||||||
Reference Obligation | Fixed Deal (Pay) Rate | Maturity Date | Counter- party | Currency | Notional Amount | Market Value | Upfront Premiums Paid/ (Received) | Unrealized Appreciation (Depreciation) | |||||||||||||||
Credit Default Swaps on Credit Indices — Buy Protection |
| ||||||||||||||||||||||
Dow Jones CDX HY-8 Index | (1.60 | )% | 06/20/12 | MLCS | USD | $ | 1,200,000 | $ | 293,325 | $ | — | $ | 293,325 | ||||||||||
Dow Jones CDX NA IG 1.1 Index | (1.50 | )% | 12/20/13 | DEUT | USD | 20,000,000 | 157,158 | 584,055 | (426,897 | ) | |||||||||||||
Dow Jones CDX IG9 Index | (8.00 | )% | 06/20/18 | RBS | USD | 7,222,400 | 382,012 | 93,012 | 289,000 | ||||||||||||||
Dow Jones CDX IG10 10Y Index | (1.50 | )% | 06/20/18 | DEUT | USD | 3,025,600 | 19,862 | (80,776 | ) | 100,638 | |||||||||||||
Dow Jones CDX IG10 Index | (1.50 | )% | 12/20/17 | MSCS | USD | 12,102,400 | 79,449 | (440,372 | ) | 519,821 | |||||||||||||
| $ | 931,806 | $ | 155,919 | $ | 775,887 | ||||||||||||||||||
Reference Obligation | Implied Credit Spread | Fixed Deal (Pay) Rate | Maturity Date | Counter- party | Currency | Notional Amount | Market Value | Upfront Premiums Paid/ (Received) | Unrealized Appreciation (Depreciation) | ||||||||||||||||||
Credit Default Swaps on Credit Indices — Sell Protection |
| ||||||||||||||||||||||||||
ABX.HE.AAA Index | 3.95 | % | (0.09 | )% | 08/25/37 | CS | USD | $ | 1,000,000 | $ | (749,119 | ) | $ | (261,635 | ) | $ | (487,484 | ) | |||||||||
Reference Obligation | Pay/ Receive Floating Rate | Fixed Rate | Maturity Date | Counter- party | Currency | Notional Amount | Market Value | Upfront Premiums Paid/ (Received) | Unrealized Appreciation (Depreciation) | ||||||||||||||||||
Interest Rate Swaps — Buy Protection |
| ||||||||||||||||||||||||||
3-Month LIBOR | Receive | 4.00 | % | 12/17/29 | JPM | USD | $ | 1,200,000 | $ | 32,222 | $ | (21,138 | ) | $ | 53,360 | ||||||||||||
3-Month LIBOR | Receive | 3.25 | % | 12/16/16 | JPM | USD | 6,400,000 | 154,317 | (6,073 | ) | 160,390 | ||||||||||||||||
3-Month LIBOR | Receive | 3.00 | % | 12/16/14 | DEUT | USD | 2,100,000 | 26,753 | 3,994 | 22,759 | |||||||||||||||||
3-Month LIBOR | Receive | 4.00 | % | 12/17/29 | DEUT | USD | 700,000 | 19,746 | 16,129 | 3,617 | |||||||||||||||||
3-Month LIBOR | Receive | 4.00 | % | 12/17/29 | BOA | USD | 300,000 | 8,295 | 7,933 | 362 | |||||||||||||||||
See Notes to Financial Statements.
65
Table of Contents
Medium-Duration Bond Fund
SCHEDULE OF INVESTMENTS (Continued)
Reference Obligation | Pay/ Receive Floating Rate | Fixed Rate | Maturity Date | Counter- party | Currency | Notional Amount | Market Value | Upfront Premiums Paid/ (Received) | Unrealized Appreciation (Depreciation) | |||||||||||||||||
3-Month LIBOR | Receive | 4.00 | % | 12/17/29 | BOA | USD | $ | 2,800,000 | $ | 77,425 | $ | 187,957 | $ | (110,532 | ) | |||||||||||
3-Month LIBOR | Pay | (4.00 | )% | 12/17/29 | JPM | USD | 800,000 | (21,481 | ) | (54,183 | ) | 32,702 | ||||||||||||||
3-Month LIBOR | Pay | (3.50 | )% | 12/17/29 | DEUT | USD | 700,000 | (19,807 | ) | (48,507 | ) | 28,700 | ||||||||||||||
3-Month LIBOR | Pay | (4.00 | )% | 12/17/29 | JPM | USD | 1,500,000 | (40,278 | ) | (106,776 | ) | 66,498 | ||||||||||||||
3-Month LIBOR | Pay | (3.25 | )% | 12/16/16 | JPM | USD | 1,300,000 | (31,372 | ) | (64,031 | ) | 32,659 | ||||||||||||||
3-Month LIBOR | Receive | 3.50 | % | 12/16/19 | JPM | USD | 1,700,000 | 59,466 | 59,145 | 321 | ||||||||||||||||
KWCDC Indes | Pay | (2.82 | )% | 01/28/11 | DEUT | KRW | 927,000,000 | 486 | — | 486 | ||||||||||||||||
KWCDC Index | Pay | (2.83 | )% | 01/28/11 | JPM | KRW | 901,000,000 | (6,234 | ) | — | (6,234 | ) | ||||||||||||||
KWCDC Index | Pay | (3.87 | )% | 06/12/11 | DEUT | KRW | 400,000,000 | 301 | (38 | ) | 339 | |||||||||||||||
KWCDC Index | Pay | (3.90 | )% | 06/15/11 | JPM | KRW | 720,000,000 | 3,328 | (23 | ) | 3,351 | |||||||||||||||
KWCDC Index | Pay | (3.72 | )% | 06/22/11 | JPM | KRW | 2,300,000,000 | 3,099 | (64 | ) | 3,163 | |||||||||||||||
KWCDC Index | Pay | (3.69 | )% | 06/26/11 | DEUT | KRW | 2,280,000,000 | 667 | (186 | ) | 853 | |||||||||||||||
France CPI Ex Tobacco | Pay | (2.15 | )% | 10/15/10 | UBS | EUR | 300,000 | 17,238 | 36 | 17,202 | ||||||||||||||||
6-Month MXBRRTIIE Index | Pay | (8.17 | )% | 11/04/16 | MLCS | MXN | 52,700,000 | 73,878 | 7,930 | 65,948 | ||||||||||||||||
3-Month BRR CDI Index | Receive | 10.12 | % | 01/02/12 | MSCS | BRL | 16,300,000 | (359,524 | ) | (183,620 | ) | (175,904 | ) | |||||||||||||
3-Month CBK | Pay | (5.75 | )% | 12/19/28 | RBS | CAD | 500,000 | (3,488 | ) | (4,234 | ) | 746 | ||||||||||||||
| $ | (4,963 | ) | $ | (205,749 | ) | $ | 200,786 | |||||||||||||||||||
Total Swap agreements outstanding at June 30, 2009 | $ | (1,957,884 | ) | $ | (311,465 | ) | $ | (1,646,419 | ) | |||||||||||||||||
PORTFOLIO SUMMARY (based on net assets)
| % | |||
Futures Contracts | 61.3 | ||
Mortgage-Backed Securities | 53.1 | ||
Corporate Bonds | 25.6 | ||
Repurchase Agreements | 12.5 | ||
Foreign Bonds | 10.5 | ||
Money Market Funds | 10.1 | ||
Asset-Backed Securities | 4.2 | ||
U.S. Treasury Obligations | 3.7 | ||
Loan Agreements | 1.1 | ||
Agency Obligations | 1.0 | ||
Municipal Bonds | 0.9 | ||
Forward Foreign Currency Contracts | 0.6 | ||
Preferred Stocks | 0.3 | ||
Purchased Options | — | ** | |
Written Options | — | ** | |
Security Sold Short | (0.1 | ) | |
Swap Agreements | (0.2 | ) | |
| 184.6 | |||
| ** | Rounds to less than 0.005%. |
See Notes to Financial Statements.
66
Table of Contents
FAS 157 DISCLOSURE
The following is a summary of the inputs used, as of June 30, 2009, in valuing the Fund’s investments carried at fair value:
Valuation Inputs | Investments in Securities | Other Financial Instruments*** | ||||||
Assets: | ||||||||
Level 1 — Quoted Prices | ||||||||
Futures Contracts | $ | — | $ | 4,283,530 | ||||
Money Market Funds | 86,534,515 | — | ||||||
Preferred Stocks | 2,364,237 | — | ||||||
Level 2 — Other Significant Observable Inputs | ||||||||
Agency Obligations | 8,994,008 | — | ||||||
Asset-Backed Securities | 35,915,642 | — | ||||||
Corporate Bonds | 215,405,244 | — | ||||||
Foreign Bonds | 89,379,391 | — | ||||||
Forward Foreign Currency Contracts | — | (481,953 | ) | |||||
Loan Agreements | 9,482,031 | — | ||||||
Mortgage-Backed Securities | 453,815,942 | — | ||||||
Municipal Bonds | 8,062,497 | — | ||||||
Repurchase Agreements | 106,600,000 | — | ||||||
U.S. Treasury Obligations | 31,398,449 | — | ||||||
Level 3 — Significant Unobservable Inputs | ||||||||
Corporate Bonds | 3,236,931 | — | ||||||
Mortgage-Backed Securities | 190,969 | — | ||||||
Total Assets | $ | 1,051,379,856 | $ | 3,801,577 | ||||
Liabilities: | ||||||||
Level 1 — Quoted Prices | $ | — | $ | — | ||||
Written Options | (8,975 | ) | — | |||||
Level 2 — Other Significant Observable Inputs | ||||||||
Security Sold Short | (994,062 | ) | — | |||||
Swap Agreements | — | (1,957,884 | ) | |||||
Written Options | (10,346 | ) | — | |||||
Level 3 — Significant Unobservable Inputs | — | — | ||||||
Total Liabilities | $ | (1,013,383 | ) | $ | (1,957,884 | ) | ||
| *** | Other financial instruments are derivative instruments not reflected in the Schedule of Investments, such as futures, forwards and swap contracts, which are valued at the unrealized appreciation (depreciation) on the investment. Details of these investments can be found in the Notes to Financial Statements. |
The following is a reconciliation of assets in which significant unobservable inputs (Level 3) were used in determining fair value:
| Investments in Securities | Other Financial Instruments*** | ||||||
Balance, 12/31/08 | $ | 3,554,980 | $ | — | |||
Accrued discounts/premiums | |||||||
Corporate Bonds | 43,593 | — | |||||
Mortgage-Backed Securities | 899 | — | |||||
Realized gain (loss) | — | — | |||||
Change in unrealized appreciation (depreciation) | |||||||
Corporate Bonds | (210,187 | ) | — | ||||
Mortgage-Backed Securities | 8,708 | — | |||||
Net purchases (sales) | |||||||
Corporate Bonds | (3,728 | ) | — | ||||
Mortgage-Backed Securities | (2,895 | ) | — | ||||
Transfers in and/or out of Level 3 | |||||||
Corporate Bonds | 36,530 | — | |||||
Mortgage-Backed Securities | — | — | |||||
Balance, 06/30/09 | $ | 3,427,900 | $ | — | |||
See Notes to Financial Statements.
67
Table of Contents
| Extended-Duration Bond Fund | ||
| SCHEDULE OF INVESTMENTS | June 30, 2009 (Unaudited) |
| Par | Value | |||||
ASSET-BACKED SECURITIES — 8.6% | ||||||
Capital One Multi-Asset Execution Trust | ||||||
5.75%, 07/15/20 | $ | 11,500,000 | $ | 11,836,543 | ||
Citibank Credit Card Issuance Trust | ||||||
6.15%, 06/15/39 | 12,650,000 | 12,587,905 | ||||
Community Program Loan Trust | ||||||
4.50%, 04/01/29 | 1,950,000 | 1,732,144 | ||||
Discover Card Master Trust | ||||||
5.65%, 03/16/20 | 9,100,000 | 9,116,913 | ||||
Total Asset-Backed Securities | 35,273,505 | |||||
CORPORATE BONDS — 56.2% | ||||||
Aflac, Inc. | ||||||
8.50%, 05/15/19 | 2,700,000 | 2,889,896 | ||||
Allegheny Technologies, Inc. | ||||||
9.38%, 06/01/19 | 1,778,000 | 1,887,219 | ||||
American Express Co. | ||||||
8.15%, 03/19/38 | 8,000,000 | 8,480,824 | ||||
American International Group, Inc. | ||||||
5.85%, 01/16/18 | 6,027,000 | 3,193,050 | ||||
8.25%, 08/15/18 144A | 5,474,000 | 3,225,719 | ||||
6.25%, 05/01/36 | 3,020,000 | 1,298,999 | ||||
Anadarko Petroleum Corporation | ||||||
6.45%, 09/15/36 | 1,840,000 | 1,658,984 | ||||
Archer-Daniels-Midland Co. | ||||||
6.45%, 01/15/38 | 1,885,000 | 2,050,675 | ||||
Arrow Electronics, Inc. | ||||||
6.88%, 07/01/13 | 205,000 | 210,436 | ||||
AT&T Corporation | ||||||
6.50%, 03/15/29 | 125,000 | 119,798 | ||||
6.50%, 09/01/37 | 10,015,000 | 9,965,195 | ||||
Avnet, Inc. | ||||||
6.00%, 09/01/15 | 875,000 | 805,632 | ||||
BAC Capital Trust VI | ||||||
5.63%, 03/08/35 | 7,685,000 | 5,016,169 | ||||
BAC Capital Trust XI | ||||||
6.63%, 05/23/36 | 3,321,000 | 2,510,978 | ||||
Barclays Financial LLC | ||||||
4.16%, 02/22/10 144A(T) | 25,000,000 | 736,968 | ||||
4.10%, 03/22/10 144A(T) | 7,000,000 | 209,117 | ||||
4.06%, 09/16/10 144A(W) | 730,000,000 | 587,003 | ||||
Bell South Telecommunications, Inc. | ||||||
7.00%, 12/01/45 | 1,000,000 | 876,350 | ||||
Bruce Mansfield Unit | ||||||
6.85%, 06/01/34@ | 1,245,000 | 1,096,277 | ||||
Camden Property Trust | ||||||
5.70%, 05/15/17D | 25,000 | 22,620 | ||||
Caterpillar Financial Services Corporation | ||||||
6.13%, 02/17/14D | 1,225,000 | 1,308,011 | ||||
5.85%, 09/01/17 | 100,000 | 101,984 | ||||
5.45%, 04/15/18 | 35,000 | 33,379 | ||||
Caterpillar, Inc. | ||||||
8.25%, 12/15/38D | 1,000,000 | 1,242,975 | ||||
Chesapeake Energy Corporation | ||||||
6.88%, 01/15/16D | 610,000 | 541,375 | ||||
6.50%, 08/15/17 | 45,000 | 38,025 | ||||
6.88%, 11/15/20D | 320,000 | 259,200 | ||||
Chevron Phillips Chemical Co. LLC | ||||||
8.25%, 06/15/19 144A | 1,185,000 | 1,238,308 | ||||
CIT Group Holdings, Inc. | ||||||
5.40%, 01/30/16 | 16,000 | 9,046 | ||||
CIT Group, Inc. | ||||||
5.00%, 02/13/14D | 81,000 | 48,147 | ||||
5.13%, 09/30/14 | 179,000 | 105,616 | ||||
5.50%, 12/01/14(U) | 600,000 | 513,301 | ||||
5.00%, 02/01/15 | 17,000 | 10,024 | ||||
5.65%, 02/13/17D | 65,000 | 36,723 | ||||
12.00%, 12/18/18 144A | 645,000 | 303,306 | ||||
5.80%, 10/01/36D | 67,000 | 36,070 | ||||
Citigroup Capital XXI | ||||||
8.30%, 12/21/57† | 1,871,000 | 1,462,366 | ||||
Citigroup, Inc. | ||||||
6.88%, 06/01/25 | 2,441,000 | 2,346,751 | ||||
6.63%, 06/15/32 | 3,128,000 | 2,571,510 | ||||
5.88%, 05/29/37 | 4,141,000 | 3,245,318 | ||||
Comcast Corporation | ||||||
5.65%, 06/15/35 | 660,000 | 606,443 | ||||
6.50%, 11/15/35 | 555,000 | 562,818 | ||||
6.45%, 03/15/37 | 2,415,000 | 2,387,672 | ||||
6.95%, 08/15/37 | 625,000 | 653,729 | ||||
Commonwealth Edison Co. | ||||||
4.75%, 12/01/11@ | 201,000 | 181,421 | ||||
ConocoPhillips | ||||||
5.90%, 05/15/38D | 1,000,000 | 1,001,984 | ||||
6.50%, 02/01/39 | 1,968,000 | 2,101,911 | ||||
Constellation Energy Group, Inc. | ||||||
4.55%, 06/15/15 | 750,000 | 650,879 | ||||
Continental Airlines, Inc. | ||||||
6.95%, 02/02/11 | 100,575 | 99,066 | ||||
9.00%, 07/08/16 | 2,000,000 | 2,010,000 | ||||
8.31%, 04/02/18D | 442,456 | 327,418 | ||||
7.57%, 03/15/20 | 389,823 | 319,655 | ||||
Corning, Inc. | ||||||
6.20%, 03/15/16 | 230,000 | 223,042 | ||||
7.25%, 08/15/36 | 850,000 | 826,858 | ||||
Cox Communications, Inc. | ||||||
6.75%, 03/15/11 | 250,000 | 263,810 | ||||
CSX Corporation | ||||||
6.15%, 05/01/37 | 84,000 | 78,347 | ||||
Cummins, Inc. | ||||||
6.75%, 02/15/27 | 750,000 | 589,256 | ||||
5.65%, 03/01/28 | 1,520,000 | 809,645 | ||||
7.13%, 03/01/28 | 425,000 | 341,079 | ||||
DCP Midstream LP | ||||||
6.45%, 11/03/36 144A | 490,000 | 393,075 | ||||
Dillard’s, Inc. | ||||||
7.75%, 07/15/26 | 890,000 | 431,650 | ||||
7.00%, 12/01/28 | 500,000 | 245,000 | ||||
Dow Chemical Co. | ||||||
9.40%, 05/15/39 | 3,386,000 | 3,494,359 | ||||
Duke Realty LP | ||||||
5.95%, 02/15/17 | 70,000 | 54,339 | ||||
First Industrial LP | ||||||
7.60%, 07/15/28 | 1,000,000 | 562,983 | ||||
Foot Locker, Inc. | ||||||
8.50%, 01/15/22 | 1,000,000 | 875,000 | ||||
Ford Motor Co. | ||||||
6.63%, 10/01/28 | 680,000 | 370,600 | ||||
6.38%, 02/01/29 | 1,255,000 | 683,975 | ||||
See Notes to Financial Statements.
68
Table of Contents
| Par | Value | |||||
Ford Motor Credit Co., LLC | ||||||
5.70%, 01/15/10D | $ | 135,000 | $ | 130,311 | ||
7.00%, 10/01/13D | 315,000 | 253,488 | ||||
8.00%, 12/15/16 | 1,000,000 | 765,511 | ||||
General Electric Capital Corporation | ||||||
4.88%, 03/04/15D | 510,000 | 496,769 | ||||
5.63%, 05/01/18 | 30,000 | 28,422 | ||||
6.75%, 03/15/32 | 4,865,000 | 4,379,293 | ||||
6.15%, 08/07/37 | 6,114,000 | 5,051,185 | ||||
5.88%, 01/14/38 | 150,000 | 119,066 | ||||
Georgia-Pacific Corporation | ||||||
7.38%, 12/01/25 | 240,000 | 187,200 | ||||
7.25%, 06/01/28 | 300,000 | 225,750 | ||||
7.75%, 11/15/29 | 3,700,000 | 2,913,750 | ||||
Georgia-Pacific LLC | ||||||
8.00%, 01/15/24 | 30,000 | 25,650 | ||||
8.88%, 05/15/31 | 60,000 | 52,200 | ||||
GMAC, Inc. | ||||||
6.88%, 08/28/12 144AD | 158,000 | 133,510 | ||||
8.00%, 11/01/31 144A | 199,000 | 141,290 | ||||
Goldman Sachs Group, Inc. | ||||||
5.00%, 10/01/14 | 815,000 | 820,085 | ||||
6.15%, 04/01/18 | 415,000 | 404,706 | ||||
GTE Corporation | ||||||
6.94%, 04/15/28 | 10,000 | 10,053 | ||||
Halliburton Co. | ||||||
7.45%, 09/15/39D | 5,070,000 | 5,933,593 | ||||
HCA, Inc. | ||||||
6.30%, 10/01/12 | 1,500,000 | 1,383,750 | ||||
7.58%, 09/15/25 | 1,000,000 | 620,729 | ||||
7.05%, 12/01/27 | 500,000 | 307,030 | ||||
HCP, Inc. | ||||||
6.00%, 03/01/15 | 1,500,000 | 1,325,278 | ||||
Highwoods Realty LP | ||||||
5.85%, 03/15/17 | 260,000 | 207,363 | ||||
7.50%, 04/15/18 | 1,500,000 | 1,299,940 | ||||
Historic TW, Inc. | ||||||
6.63%, 05/15/29D | 60,000 | 54,397 | ||||
Home Depot, Inc. | ||||||
5.88%, 12/16/36 | 875,000 | 774,434 | ||||
HSBC Bank USA NA | ||||||
5.88%, 11/01/34 | 2,000,000 | 1,859,952 | ||||
iStar Financial, Inc. | ||||||
8.63%, 06/01/13 | 635,000 | 330,427 | ||||
5.95%, 10/15/13D | 305,000 | 134,304 | ||||
5.70%, 03/01/14 | 1,171,000 | 492,230 | ||||
JC Penney Corporation, Inc. | ||||||
6.38%, 10/15/36 | 810,000 | 601,109 | ||||
JPMorgan Chase Capital XXV | ||||||
6.80%, 10/01/37 | 11,884,000 | 10,249,427 | ||||
Kinder Morgan Energy Partners LP | ||||||
5.80%, 03/15/35 | 280,000 | 237,093 | ||||
Kraft Foods, Inc. | ||||||
6.50%, 11/01/31 | 815,000 | 811,576 | ||||
Lennar Corporation | ||||||
5.60%, 05/31/15 | 935,000 | 740,988 | ||||
6.50%, 04/15/16D | 625,000 | 503,125 | ||||
Lowe’s Cos., Inc. | ||||||
6.65%, 09/15/37 | 3,051,000 | 3,338,636 | ||||
M&T Bank Corporation | ||||||
6.63%, 12/04/17 | 8,970,000 | 8,546,132 | ||||
Macy’s Retail Holdings, Inc. | ||||||
6.38%, 03/15/37 | 240,000 | 163,577 | ||||
MBIA Insurance Corporation | ||||||
14.00%, 01/15/33 144A†D | 4,750,000 | 1,806,116 | ||||
McDonald’s Corporation | ||||||
6.30%, 10/15/37 | 2,713,000 | 2,937,981 | ||||
MetLife, Inc. | ||||||
7.72%, 02/15/19 | 7,300,000 | 7,821,695 | ||||
MidAmerican Energy Holdings Co. | ||||||
5.88%, 10/01/12 | 1,000,000 | 1,065,791 | ||||
Monsanto Co. | ||||||
5.88%, 04/15/38 | 2,054,000 | 2,102,867 | ||||
Morgan Stanley | ||||||
6.75%, 04/15/11 | 195,000 | 204,361 | ||||
4.75%, 04/01/14 | 100,000 | 94,557 | ||||
5.45%, 01/09/17 | 5,000 | 4,676 | ||||
5.95%, 12/28/17 | 185,000 | 177,808 | ||||
6.63%, 04/01/18 | 70,000 | 69,898 | ||||
6.25%, 08/09/26 | 100,000 | 93,438 | ||||
Mosaic Global Holdings, Inc. | ||||||
7.38%, 08/01/18 | 500,000 | 460,736 | ||||
7.30%, 01/15/28 | 690,000 | 589,215 | ||||
Motorola, Inc. | ||||||
6.50%, 11/15/28 | 500,000 | 340,773 | ||||
Nextel Communications, Inc. | ||||||
6.88%, 10/31/13 | 215,000 | 178,988 | ||||
5.95%, 03/15/14 | 325,000 | 257,562 | ||||
7.38%, 08/01/15D | 550,000 | 441,375 | ||||
NGPL PipeCo LLC | ||||||
7.12%, 12/15/17 144A | 640,000 | 671,915 | ||||
NiSource Finance Corporation | ||||||
6.15%, 03/01/13 | 1,000,000 | 994,831 | ||||
6.40%, 03/15/18 | 1,640,000 | 1,507,119 | ||||
Nortel Networks Capital Corporation | ||||||
7.88%, 06/15/26# | 450,000 | 144,000 | ||||
Nucor Corporation | ||||||
6.40%, 12/01/37 | 6,000,000 | 6,187,488 | ||||
Owens Corning, Inc. | ||||||
6.50%, 12/01/16D | 240,000 | 210,672 | ||||
7.00%, 12/01/36 | 355,000 | 252,210 | ||||
PacifiCorp | ||||||
6.25%, 10/15/37D | 1,833,000 | 2,004,250 | ||||
Pioneer Natural Resources Co. | ||||||
7.20%, 01/15/28D | 2,500,000 | 1,968,350 | ||||
Prologis | ||||||
5.63%, 11/15/15 | 35,000 | 27,787 | ||||
Pulte Homes, Inc. | ||||||
5.20%, 02/15/15 | 40,000 | 33,600 | ||||
7.88%, 06/15/32D | 1,500,000 | 1,117,500 | ||||
6.38%, 05/15/33 | 1,000,000 | 665,000 | ||||
Qwest Corporation | ||||||
7.25%, 09/15/25 | 1,000,000 | 770,000 | ||||
6.88%, 09/15/33D | 2,250,000 | 1,653,750 | ||||
Regions Financial Corporation | ||||||
7.38%, 12/10/37 | 11,088,000 | 7,892,649 | ||||
SLM Corporation | ||||||
5.00%, 10/01/13 | 250,000 | 202,398 | ||||
5.38%, 05/15/14 | 200,000 | 160,904 | ||||
Southern Natural Gas Co. | ||||||
7.35%, 02/15/31 | 1,750,000 | 1,710,119 | ||||
Sprint Capital Corporation | ||||||
6.90%, 05/01/19 | 55,000 | 45,788 | ||||
See Notes to Financial Statements.
69
Table of Contents
Extended-Duration Bond Fund
SCHEDULE OF INVESTMENTS (Continued)
| Par | Value | |||||
6.88%, 11/15/28 | $ | 2,350,000 | $ | 1,680,250 | ||
8.75%, 03/15/32 | 20,000 | 16,200 | ||||
Swift Energy Co. | ||||||
7.63%, 07/15/11D | 150,000 | 141,000 | ||||
Target Corporation | ||||||
6.50%, 10/15/37 | 5,400,000 | 5,480,131 | ||||
7.00%, 01/15/38 | 5,150,000 | 5,506,643 | ||||
Tennessee Gas Pipeline Co. | ||||||
7.00%, 10/15/28D | 750,000 | 718,436 | ||||
Time Warner, Inc. | ||||||
7.63%, 04/15/31 | 35,000 | 34,114 | ||||
6.50%, 11/15/36 | 120,000 | 105,394 | ||||
Toll Brothers Finance Corporation | ||||||
5.15%, 05/15/15 | 1,285,000 | 1,139,102 | ||||
Toro Co. | ||||||
6.63%, 05/01/37@ | 300,000 | 218,600 | ||||
Union Pacific Resources Group | ||||||
7.15%, 05/15/28 | 250,000 | 228,211 | ||||
United Technologies Corporation | ||||||
6.13%, 07/15/38 | 5,948,000 | 6,478,901 | ||||
Verizon Communications, Inc. | ||||||
6.40%, 02/15/38D | 968,000 | 950,727 | ||||
6.90%, 04/15/38D | 2,570,000 | 2,689,598 | ||||
8.95%, 03/01/39 | 105,000 | 132,997 | ||||
7.35%, 04/01/39 | 979,000 | 1,070,157 | ||||
Verizon Global Funding Corporation | ||||||
5.85%, 09/15/35 | 2,420,000 | 2,258,087 | ||||
Verizon Maryland, Inc. | ||||||
5.13%, 06/15/33 | 50,000 | 37,155 | ||||
Verizon New York, Inc. | ||||||
7.38%, 04/01/32 | 385,000 | 376,115 | ||||
Wachovia Bank NA | ||||||
5.85%, 02/01/37 | 6,077,000 | 5,377,859 | ||||
6.60%, 01/15/38 | 3,757,000 | 3,673,948 | ||||
WellPoint, Inc. | ||||||
6.38%, 06/15/37 | 2,080,000 | 1,913,013 | ||||
Western Union Co. | ||||||
6.20%, 11/17/36 | 2,155,000 | 2,037,180 | ||||
Williams Cos., Inc. | ||||||
7.50%, 01/15/31 | 1,250,000 | 1,102,731 | ||||
7.75%, 06/15/31 | 80,000 | 72,178 | ||||
8.75%, 03/15/32 | 70,000 | 70,523 | ||||
Xerox Capital Trust I | ||||||
8.00%, 02/01/27D | 1,500,000 | 1,142,325 | ||||
XTO Energy, Inc. | ||||||
6.10%, 04/01/36 | 50,000 | 48,615 | ||||
Total Corporate Bonds | 231,061,044 | |||||
FOREIGN BONDS — 29.5% | ||||||
Australia — 2.1% | ||||||
General Electric Capital Australia Funding, Ltd. | ||||||
8.00%, 02/13/12(A) | 60,000 | 49,816 | ||||
New South Wales Treasury Corporation | ||||||
7.00%, 12/01/10(A) | 1,125,000 | 945,991 | ||||
6.00%, 05/01/12(A) | 60,000 | 49,566 | ||||
Qantas Airways, Ltd. | ||||||
6.05%, 04/15/16 144AD | 345,000 | 312,076 | ||||
Queensland Treasury Corporation | ||||||
6.00%, 06/14/11(A) | 785,000 | 653,090 | ||||
Rio Tinto Finance USA, Ltd. | ||||||
7.13%, 07/15/28 | 6,830,000 | 6,533,892 | ||||
| 8,544,431 | ||||||
Brazil — 0.6% | ||||||
Federative Republic of Brazil | ||||||
10.25%, 01/10/28(B) | 2,525,000 | 1,275,708 | ||||
8.25%, 01/20/34 | 1,000,000 | 1,192,500 | ||||
7.13%, 01/20/37 | 80,000 | 87,200 | ||||
| 2,555,408 | ||||||
Canada — 6.9% | ||||||
British Columbia Generic Residual | ||||||
3.24%, 06/09/14 STRIP(C)Ω | 7,230,000 | 5,323,901 | ||||
Canada Generic Residual | ||||||
4.37%, 06/01/25 STRIP(C)Ω | 3,685,000 | 1,606,237 | ||||
Canadian National Railway Co. | ||||||
6.38%, 11/15/37D | 2,770,000 | 3,044,454 | ||||
Canadian Pacific Railway Co. NY | ||||||
7.13%, 10/15/31 | 500,000 | 470,123 | ||||
CIT Group Funding Co. | ||||||
5.20%, 06/01/15 | 240,000 | 139,186 | ||||
Methanex Corporation | ||||||
6.00%, 08/15/15 | 25,000 | 19,266 | ||||
Ontario Generic Residual | ||||||
5.29%, 07/13/22 STRIP(C)Ω | 3,900,000 | 1,656,364 | ||||
5.41%, 03/08/29 STRIP(C)Ω | 7,000,000 | 2,139,449 | ||||
Saskatchewan Residual | ||||||
3.19%, 04/10/14 STRIP(C)Ω | 6,500,000 | 4,756,850 | ||||
5.11%, 02/04/22 STRIP(C) | 3,000,000 | 1,311,860 | ||||
Talisman Energy, Inc. | ||||||
5.85%, 02/01/37 | 670,000 | 573,663 | ||||
6.25%, 02/01/38D | 450,000 | 406,571 | ||||
TransCanada Pipelines, Ltd. | ||||||
6.20%, 10/15/37D | 6,291,000 | 6,462,310 | ||||
7.63%, 01/15/39 | 360,000 | 421,508 | ||||
| 28,331,742 | ||||||
Cayman Islands — 0.2% | ||||||
Enersis SA | ||||||
7.40%, 12/01/16D | 625,000 | 671,963 | ||||
Finland — 0.1% | ||||||
Nokia OYJ | ||||||
6.63%, 05/15/39 | 510,000 | 540,327 | ||||
See Notes to Financial Statements.
70
Table of Contents
| Par | Value | ||||||
France — 0.6% | |||||||
EDF SA | |||||||
6.95%, 01/26/39 144A | $ | 2,300,000 | $ | 2,590,858 | |||
Ireland — 0.0% | |||||||
Elan Finance PLC | |||||||
7.75%, 11/15/11 | 30,000 | 27,900 | |||||
8.88%, 12/01/13 | 85,000 | 78,200 | |||||
| 106,100 | |||||||
Luxembourg — 2.3% | |||||||
Covidien International Finance SA | |||||||
6.55%, 10/15/37 | 5,307,000 | 5,897,711 | |||||
Telecom Italia Capital SA | |||||||
7.18%, 06/18/19D | 1,750,000 | 1,777,097 | |||||
6.38%, 11/15/33 | 410,000 | 365,446 | |||||
6.00%, 09/30/34 | 415,000 | 351,553 | |||||
7.72%, 06/04/38D | 1,273,000 | 1,300,134 | |||||
| 9,691,941 | |||||||
Malaysia — 0.0% | |||||||
Telekom Malaysia BHD | |||||||
7.88%, 08/01/25 144A | 225,000 | 248,103 | |||||
Mexico — 1.1% | |||||||
Mexican Bonos | |||||||
9.00%, 12/20/12(M) | 11,350,000 | 927,962 | |||||
7.25%, 12/15/16(M) | 13,150,000 | 961,416 | |||||
8.00%, 12/07/23(M) | 34,000,000 | 2,486,306 | |||||
| 4,375,684 | |||||||
Netherlands — 1.3% | |||||||
Koninklijke Philips Electronics NV | |||||||
6.88%, 03/11/38 | 5,000,000 | 5,373,115 | |||||
Norway — 0.5% | |||||||
Norway Government Bond | |||||||
5.00%, 05/15/15(K) | 540,000 | 90,103 | |||||
4.25%, 05/19/17(K) | 11,940,000 | 1,903,212 | |||||
| 1,993,315 | |||||||
Philippines — 0.1% | |||||||
Quezon Power (Philippines), Ltd. | |||||||
8.86%, 06/15/17 | 355,000 | 317,725 | |||||
Spain — 2.1% | |||||||
Santander Perpetual SA Unipersonal | |||||||
6.67%, 10/24/17 144A† | 11,600,000 | 8,596,528 | |||||
Supranational — 2.0% | |||||||
Inter-American Development Bank | |||||||
6.00%, 12/15/17(Z) | 7,865,000 | 4,943,168 | |||||
International Bank for Reconstruction & Development | |||||||
1.43%, 03/05/14(G) | 4,700,000 | 3,134,842 | |||||
| 8,078,010 | |||||||
United Kingdom — 9.6% | |||||||
Barclays Bank PLC | |||||||
7.70%, 10/25/49 144A†D | 8,640,000 | 7,198,399 | |||||
HBOS PLC | |||||||
6.75%, 05/21/18 144A | 10,684,000 | 8,077,585 | |||||
HSBC Holdings PLC | |||||||
6.50%, 09/15/37 | 6,500,000 | 6,307,418 | |||||
Standard Chartered Bank | |||||||
6.40%, 09/26/17 144A | 10,027,000 | 9,074,485 | |||||
Tesco PLC | |||||||
6.15%, 11/15/37 144AD | 7,550,000 | 7,663,423 | |||||
Vodafone Group PLC | |||||||
6.15%, 02/27/37 | 1,000,000 | 987,082 | |||||
| 39,308,392 | |||||||
Total Foreign Bonds | 121,323,642 | ||||||
MORTGAGE-BACKED SECURITY — 0.0% | |||||||
Federal Home Loan Mortgage Corporation | |||||||
5.00%, 12/01/31 (Cost $138,916) | 147,607 | 151,136 | |||||
MUNICIPAL BONDS — 1.5% | |||||||
New Jersey State Turnpike Authority Series F Revenue Bond | |||||||
7.41%, 01/01/40 | 1,470,000 | 1,713,402 | |||||
State of California General Obligation Bond | |||||||
7.50%, 04/01/34 | 2,455,000 | 2,247,160 | |||||
7.55%, 04/01/39 | 2,535,000 | 2,310,399 | |||||
Total Municipal Bonds | 6,270,961 | ||||||
U.S. TREASURY OBLIGATION — 0.6% | |||||||
U.S. Treasury STRIP | |||||||
4.39%, 05/15/38WD (Cost $3,047,945) | 8,940,000 | 2,560,354 | |||||
| Shares | |||||||
PREFERRED STOCKS — 0.1% | |||||||
Chesapeake Energy Corporation CONVD | 330 | 24,255 | |||||
El Paso Energy Capital Trust I CONVD | 5,350 | 167,990 | |||||
Preferred Blocker (GMAC), Inc. | 82 | 35,265 | |||||
Total Preferred Stocks | 227,510 | ||||||
MONEY MARKET FUNDS — 6.3% | |||||||
GuideStone Money Market Fund (GS4 Class)¥ | 10,532,979 | 10,532,979 | |||||
Northern Institutional Liquid Assets Portfolio§ | 15,327,187 | 15,327,187 | |||||
Total Money Market Funds | 25,860,166 | ||||||
TOTAL INVESTMENTS — 102.8% | 422,728,318 | ||||||
Liabilities in Excess of Other Assets — (2.8)% | (11,591,790 | ) | |||||
NET ASSETS — 100.0% | $ | 411,136,528 | |||||
See Notes to Financial Statements.
71
Table of Contents
Extended-Duration Bond Fund
SCHEDULE OF INVESTMENTS (Continued)
PORTFOLIO SUMMARY (based on net assets)
| % | |||
Corporate Bonds | 56.2 | ||
Foreign Bonds | 29.5 | ||
Asset-Backed Securities | 8.6 | ||
Money Market Funds | 6.3 | ||
Municipal Bonds | 1.5 | ||
U.S. Treasury Obligation | 0.6 | ||
Preferred Stocks | 0.1 | ||
Mortgage-Backed Security | 0.0 | ** | |
| 102.8 | |||
| ** | Rounds to less than 0.005%. |
FAS 157 DISCLOSURE
The following is a summary of the inputs used, as of June 30, 2009, in valuing the Fund’s assets carried at fair value:
Valuation Inputs | Investments in Securities | Other Financial Instruments*** | ||||
Level 1 — Quoted Prices | ||||||
Money Market Funds | $ | 25,860,166 | $ | — | ||
Preferred Stocks | 227,510 | — | ||||
Level 2 — Other Significant Observable Inputs | ||||||
Asset-Backed Securities | 35,273,505 | — | ||||
Corporate Bonds | 230,851,927 | — | ||||
Foreign Bonds | 121,323,642 | — | ||||
Mortgage-Backed Security | 151,136 | — | ||||
Municipal Bonds | 6,270,961 | — | ||||
U.S. Treasury Obligation | 2,560,354 | — | ||||
Level 3 — Significant Unobservable Inputs | ||||||
Corporate Bonds | 209,117 | — | ||||
Total | $ | 422,728,318 | $ | — | ||
| *** | Other financial instruments are derivative instruments not reflected in the Schedule of Investments, such as futures, forwards and swap contracts, which are valued at the unrealized appreciation (depreciation) on the investment. Details of these investments can be found in the Notes to Financial Statements. |
The following is a reconciliation of assets in which significant unobservable inputs (Level 3) were used in determining fair value:
| Investments in Securities | Other Financial Instruments*** | ||||||
Balance, 12/31/08 | $ | 716,628 | $ | — | |||
Accrued discounts/premiums | 2,988 | — | |||||
Realized gain (loss) | — | — | |||||
Changed in unrealized appreciation (depreciation) | (171,928 | ) | — | ||||
Net purchases (sales) | — | — | |||||
Transfers in and/or out of Level 3 | (338,571 | ) | — | ||||
Balance, 06/30/09 | $ | 209,117 | $ | — | |||
See Notes to Financial Statements.
72
Table of Contents
| Inflation Protected Bond Fund | ||
| SCHEDULE OF INVESTMENTS | June 30, 2009 (Unaudited) |
| Par | Value | |||||
U.S. TREASURY OBLIGATIONS — 86.2% | ||||||
U.S. Treasury Inflationary Index Bonds | ||||||
3.50%, 01/15/11 | $ | 145,000 | $ | 185,578 | ||
2.38%, 04/15/11 | 250,000 | 276,869 | ||||
3.38%, 01/15/12 | 1,800,000 | 2,299,944 | ||||
2.00%, 04/15/12 | 1,660,000 | 1,796,045 | ||||
3.00%, 07/15/12 | 2,370,000 | 2,980,949 | ||||
0.63%, 04/15/13 | 3,160,000 | 3,153,875 | ||||
1.88%, 07/15/13 | 2,250,000 | 2,682,292 | ||||
2.00%, 01/15/14 | 1,330,000 | 1,571,696 | ||||
1.25%, 04/15/14‡‡ | 4,020,000 | 4,071,705 | ||||
2.00%, 07/15/14 | 840,000 | 973,641 | ||||
1.63%, 01/15/15 | 2,030,000 | 2,259,047 | ||||
1.88%, 07/15/15 | 1,510,000 | 1,675,436 | ||||
2.00%, 01/15/16 | 1,960,000 | 2,139,825 | ||||
2.50%, 07/15/16 | 1,290,000 | 1,431,372 | ||||
2.38%, 01/15/17 | 1,290,000 | 1,424,881 | ||||
2.63%, 07/15/17 | 1,500,000 | 1,646,386 | ||||
1.63%, 01/15/18 | 2,385,000 | 2,406,923 | ||||
1.38%, 07/15/18 | 2,480,000 | 2,382,464 | ||||
2.38%, 01/15/25 | 4,030,000 | 4,695,374 | ||||
2.00%, 01/15/26 | 2,730,000 | 2,877,822 | ||||
2.38%, 01/15/27 | 2,010,000 | 2,204,888 | ||||
1.75%, 01/15/28 | 4,200,000 | 4,043,578 | ||||
3.63%, 04/15/28 | 1,020,000 | 1,639,652 | ||||
2.50%, 01/15/29 | 2,815,000 | 2,977,349 | ||||
3.88%, 04/15/29 | 2,780,000 | 4,583,801 | ||||
| 58,381,392 | ||||||
U.S. Treasury Note | ||||||
4.00%, 08/15/18 | 530,000 | 549,917 | ||||
U.S. Treasury STRIPS | ||||||
4.52%, 11/15/27Ω | 860,000 | 377,035 | ||||
Total U.S. Treasury Obligations | 59,308,344 | |||||
| Shares | ||||||
MONEY MARKET FUND — 9.6% | ||||||
GuideStone Money Market Fund (GS4 Class)¥ | 6,654,220 | 6,654,220 | ||||
TOTAL INVESTMENTS — 95.8% | 65,962,564 | |||||
Other Assets in Excess of Liabilities — 4.2% | 2,856,897 | |||||
NET ASSETS — 100.0% | $ | 68,819,461 | ||||
PORTFOLIO SUMMARY (based on net assets)
| % | |||
U.S. Treasury Obligations | 86.2 | ||
Money Market Fund | 9.6 | ||
Futures Contracts | (3.9 | ) | |
| 91.9 | |||
FAS 157 DISCLOSURE
The following is a summary of the inputs used, as of June 30, 2009, in valuing the Fund’s assets carried at fair value:
Valuation Inputs | Investments in Securities | Other Financial Instruments*** | |||||
Assets: | |||||||
Level 1 — Quoted Prices | |||||||
Futures Contracts | $ | — | $ | (1,076 | ) | ||
Money Market Fund | 6,654,220 | — | |||||
Level 2 — Other Significant Observable Inputs | |||||||
U.S. Treasury Obligations | 59,308,344 | — | |||||
Level 3 — Significant Unobservable Inputs | — | — | |||||
Total | $ | 65,962,564 | $ | (1,076 | ) | ||
See Notes to Financial Statements.
73
Table of Contents
| Global Bond Fund | ||
| SCHEDULE OF INVESTMENTS | June 30, 2009 (Unaudited) |
| Par | Value | |||||
AGENCY OBLIGATIONS — 0.2% | ||||||
Federal Home Loan Mortgage Corporation | ||||||
5.00%, 12/14/18 | $ | 206,000 | $ | 195,938 | ||
Federal National Mortgage Association | ||||||
0.34%, 01/25/10Ω‡‡ | 133,000 | 132,766 | ||||
Total Agency Obligations | 328,704 | |||||
ASSET-BACKED SECURITIES — 3.0% | ||||||
ARG Funding Corporation | ||||||
2.64%, 05/20/11 144A† | 665,000 | 621,823 | ||||
Bear Stearns Asset-Backed Securities Trust | ||||||
0.79%, 10/25/33 STEP | 126,216 | 116,965 | ||||
Capital One Multi-Asset Execution Trust | ||||||
0.35%, 03/16/15† | 720,000 | 692,334 | ||||
Carrington Mortgage Loan Trust | ||||||
0.63%, 10/25/35† | 90,824 | 70,354 | ||||
Chase Issuance Trust | ||||||
0.69%, 11/15/12† | 1,135,000 | 1,095,687 | ||||
0.57%, 04/15/19† | 760,000 | 528,926 | ||||
Citibank Credit Card Issuance Trust | ||||||
6.30%, 06/20/14 | 710,000 | 670,927 | ||||
Discover Card Master Trust I | ||||||
0.41%, 06/16/15† | 655,000 | 613,358 | ||||
GMAC Mortgage Corporation Loan Trust | ||||||
0.49%, 12/25/36† | 1,474,558 | 443,324 | ||||
Lehman XS Trust | ||||||
0.40%, 02/25/37† | 521,916 | 240,034 | ||||
Morgan Stanley Mortgage Loan Trust | ||||||
0.43%, 10/25/36† | 146,397 | 132,714 | ||||
Origen Manufactured Housing | ||||||
0.47%, 11/15/18† | 82,772 | 68,765 | ||||
RAAC Series | ||||||
0.65%, 07/25/37 144A† | 144,151 | 140,863 | ||||
Residential Asset Securities Corporation | ||||||
6.35%, 03/25/32 | 65,996 | 36,398 | ||||
Security National Mortgage Loan Trust | ||||||
0.59%, 01/25/37 144A† | 198,454 | 134,392 | ||||
Total Asset-Backed Securities | 5,606,864 | |||||
CORPORATE BONDS — 44.3% | ||||||
Activant Solutions, Inc. | ||||||
9.50%, 05/01/16 | 15,000 | 11,662 | ||||
AES Corporation | ||||||
8.38%, 03/01/11(U) | 50,000 | 74,342 | ||||
8.75%, 05/15/13 144A | 312,000 | 318,240 | ||||
8.00%, 10/15/17 | 315,000 | 294,525 | ||||
Affinion Group, Inc. | ||||||
10.13%, 10/15/13 | 100,000 | 93,000 | ||||
10.13%, 10/15/13 144A | 110,000 | 102,300 | ||||
11.50%, 10/15/15 | 105,000 | 90,300 | ||||
Allegheny Energy Supply | ||||||
7.80%, 03/15/11D | 90,000 | 93,148 | ||||
Allied Waste North America, Inc. | ||||||
7.13%, 05/15/16D | 225,000 | 226,429 | ||||
AMC Entertainment, Inc. | ||||||
8.75%, 06/01/19 144A | 20,000 | 18,900 | ||||
American General Finance Corporation | ||||||
5.75%, 09/15/16 | 700,000 | 376,216 | ||||
American International Group, Inc. | ||||||
5.05%, 10/01/15 | 100,000 | 54,007 | ||||
AMH Holdings, Inc. | ||||||
11.25%, 03/01/14 STEP | 15,000 | 6,675 | ||||
Amkor Technology, Inc. | ||||||
7.75%, 05/15/13 | 660,000 | 608,025 | ||||
Anadarko Petroleum Corporation | ||||||
5.95%, 09/15/16 | 20,000 | 19,761 | ||||
Appleton Papers, Inc. | ||||||
8.13%, 06/15/11 | 40,000 | 26,200 | ||||
9.75%, 06/15/14 | 100,000 | 34,500 | ||||
Ashtead Capital, Inc. | ||||||
9.00%, 08/15/16 144A | 140,000 | 119,350 | ||||
Ashton Woods USA LLC | ||||||
38.21%, 06/30/15 STEP 144AΩ@ | 20,800 | 7,800 | ||||
Associated Materials, Inc. | ||||||
9.75%, 04/15/12D | 120,000 | 105,600 | ||||
AT&T Corporation | ||||||
6.50%, 03/15/29 | 580,000 | 555,863 | ||||
AT&T, Inc. | ||||||
6.55%, 02/15/39D | 454,000 | 454,669 | ||||
Autonation, Inc. | ||||||
3.13%, 04/15/13† | 200,000 | 177,250 | ||||
Baltimore Gas & Electric Co. | ||||||
5.20%, 06/15/33 | 1,125,000 | 938,143 | ||||
Banca Popolare di Lodi Investors Trust III | ||||||
6.74%, 06/30/36(E)† | 260,000 | 206,354 | ||||
Belden & Blake Corporation | ||||||
8.75%, 07/15/12D | 165,000 | 134,475 | ||||
Berry Petroleum Co. | ||||||
10.25%, 06/01/14 | 70,000 | 71,050 | ||||
Biomet, Inc. | ||||||
10.38%, 10/15/17 PIK | 555,000 | 539,738 | ||||
Blockbuster, Inc. | ||||||
9.00%, 09/01/12D | 110,000 | 53,350 | ||||
Boeing Capital Corporation, Ltd. | ||||||
5.80%, 01/15/13 | 60,000 | 64,369 | ||||
Boston Scientific Corporation | ||||||
7.00%, 11/15/35 | 215,000 | 175,225 | ||||
Buffets Restaurants Holdings, Inc. | ||||||
12.50%, 11/01/14# | 105,000 | — | ||||
Caterpillar Financial Services Corporation | ||||||
6.13%, 02/17/14 | 440,000 | 469,816 | ||||
5.45%, 04/15/18 | 25,000 | 23,842 | ||||
CCH I Holdings LLC | ||||||
11.00%, 10/01/15#@ | 520,000 | 65,000 | ||||
CDX North America High Yield | ||||||
7.63%, 06/29/12 144A | 948,460 | 827,531 | ||||
See Notes to Financial Statements.
74
Table of Contents
| Par | Value | |||||
Cengage Learning Acquisitions, Inc. | ||||||
10.50%, 01/15/15 144A | $ | 100,000 | $ | 81,500 | ||
Ceridian Corporation | ||||||
12.25%, 11/15/15 144AD | 60,000 | 43,425 | ||||
Charter Communications Holdings LLC | ||||||
12.13%, 01/15/12# | 50,000 | 500 | ||||
Charter Communications Operating LLC | ||||||
10.88%, 09/15/14 144A#@ | 140,000 | 145,600 | ||||
Chesapeake Energy Corporation | ||||||
6.50%, 08/15/17 | 1,190,000 | 1,005,550 | ||||
6.25%, 01/15/18 | 30,000 | 25,050 | ||||
7.25%, 12/15/18 | 110,000 | 96,250 | ||||
Chiquita Brands International, Inc. | ||||||
7.50%, 11/01/14D | 450,000 | 380,250 | ||||
CII Carbon LLC | ||||||
11.13%, 11/15/15 144A | 190,000 | 137,988 | ||||
Cincinnati Bell Telephone Co. | ||||||
6.30%, 12/01/28 | 155,000 | 96,875 | ||||
CIT Group Holdings, Inc. | ||||||
5.40%, 01/30/16 | 4,000 | 2,261 | ||||
CIT Group, Inc. | ||||||
5.40%, 02/13/12 | 2,000 | 1,361 | ||||
5.00%, 02/13/14D | 242,000 | 143,846 | ||||
5.13%, 09/30/14 | 73,000 | 43,072 | ||||
5.00%, 02/01/15D | 477,000 | 281,261 | ||||
5.85%, 09/15/16D | 73,000 | 41,265 | ||||
12.00%, 12/18/18 144AD | 1,332,000 | 626,362 | ||||
CMP Susquehanna Radio Holdings Corporation | ||||||
9.88%, 05/15/14 144A† | 6,000 | 2,576 | ||||
Colorado Interstate Gas Co. | ||||||
5.95%, 03/15/15 | 20,000 | 19,748 | ||||
6.80%, 11/15/15 | 125,000 | 129,036 | ||||
Comcast Corporation | ||||||
6.50%, 01/15/15 | 60,000 | 63,715 | ||||
6.50%, 01/15/17 | 60,000 | 63,747 | ||||
5.65%, 06/15/35 | 500,000 | 459,426 | ||||
Commerzbank Capital Funding Trust I | ||||||
5.01%, 04/12/37(E)† | 900,000 | 416,207 | ||||
Community Health Systems, Inc. | ||||||
8.88%, 07/15/15D | 100,000 | 98,500 | ||||
Complete Production Services, Inc. | ||||||
8.00%, 12/15/16 | 80,000 | 68,800 | ||||
ConocoPhillips | ||||||
6.50%, 02/01/39 | 150,000 | 160,207 | ||||
Continental Airlines, Inc. | ||||||
9.00%, 07/08/16 | 1,250,000 | 1,256,250 | ||||
5.98%, 04/19/22D | 545,000 | 449,625 | ||||
Countrywide Financial Corporation | ||||||
5.80%, 06/07/12 | 90,000 | 90,621 | ||||
6.25%, 05/15/16 | 280,000 | 248,743 | ||||
Cricket Communications, Inc. | ||||||
7.75%, 05/15/16 144A | 150,000 | 145,125 | ||||
CSX Corporation | ||||||
6.15%, 05/01/37 | 138,000 | 128,713 | ||||
Cummins, Inc. | ||||||
5.65%, 03/01/28 | 1,500,000 | 798,992 | ||||
DAE Aviation Holdings, Inc. | ||||||
11.25%, 08/01/15 144A | 230,000 | 134,550 | ||||
DaVita, Inc. | ||||||
6.63%, 03/15/13 | 140,000 | 132,650 | ||||
Delhaize America, Inc. | ||||||
9.00%, 04/15/31 | 301,000 | 366,361 | ||||
Deutsche Postbank Funding Trust IV | ||||||
5.98%, 06/29/49(E)† | 300,000 | 218,846 | ||||
Developers Diversified Realty Corporation | ||||||
5.38%, 10/15/12 | 315,000 | 213,088 | ||||
DI Finance | ||||||
9.50%, 02/15/13 | 180,000 | 173,700 | ||||
DISH DBS Corporation | ||||||
7.00%, 10/01/13D | 600,000 | 573,000 | ||||
Dole Food Co., Inc. | ||||||
7.25%, 06/15/10 | 360,000 | 356,400 | ||||
Dollar General Corporation | ||||||
10.63%, 07/15/15 | 80,000 | 86,800 | ||||
11.88%, 07/15/17 PIKD | 5,000 | 5,425 | ||||
Dominion Resources, Inc. | ||||||
8.88%, 01/15/19 | 250,000 | 298,634 | ||||
DR Horton, Inc. | ||||||
6.50%, 04/15/16D | 345,000 | 296,700 | ||||
Dynegy Holdings, Inc. | ||||||
7.50%, 06/01/15 | 307,000 | 257,496 | ||||
7.75%, 06/01/19 | 746,000 | 584,678 | ||||
Edison Mission Energy | ||||||
7.63%, 05/15/27 | 180,000 | 116,100 | ||||
Education Management LLC | ||||||
10.25%, 06/01/16D | 185,000 | 181,762 | ||||
El Paso Corporation | ||||||
8.25%, 02/15/16 | 335,000 | 327,462 | ||||
El Paso Natural Gas Co. | ||||||
8.63%, 01/15/22 | 90,000 | 97,657 | ||||
8.38%, 06/15/32 | 75,000 | 81,955 | ||||
El Pollo Loco, Inc. | ||||||
11.75%, 12/01/12 144A | 20,000 | 20,600 | ||||
11.75%, 11/15/13D | 65,000 | 52,325 | ||||
Embarq Corporation | ||||||
8.00%, 06/01/36 | 1,245,000 | 1,097,592 | ||||
Energy Future Holdings Corporation | ||||||
5.55%, 11/15/14D | 10,000 | 6,364 | ||||
11.25%, 11/01/17 PIK | 943,400 | 580,191 | ||||
6.50%, 11/15/24 | 370,000 | 187,250 | ||||
6.55%, 11/15/34 | 300,000 | 145,728 | ||||
Energy Transfer Partners LP | ||||||
9.00%, 04/15/19 | 100,000 | 114,386 | ||||
Enterprise Products Operating LLC | ||||||
9.75%, 01/31/14 | 250,000 | 287,646 | ||||
Enterprise Products Operating LLC | ||||||
8.38%, 08/01/66† | 60,000 | 48,360 | ||||
Erac USA Finance Co. | ||||||
6.38%, 10/15/17 144A | 245,000 | 221,556 | ||||
7.00%, 10/15/37 144A | 1,065,000 | 849,226 | ||||
Eurohypo Capital Funding Trust 1 | ||||||
6.45%, 12/23/49(E)† | 27,000 | 8,522 | ||||
EXCO Resources, Inc. | ||||||
7.25%, 01/15/11 | 125,000 | 121,875 | ||||
See Notes to Financial Statements.
75
Table of Contents
Global Bond Fund
SCHEDULE OF INVESTMENTS (Continued)
| Par | Value | |||||
FirstEnergy Corporation | ||||||
7.38%, 11/15/31 | $ | 45,000 | $ | 42,586 | ||
Ford Motor Co. | ||||||
6.63%, 10/01/28 | 850,000 | 463,250 | ||||
Ford Motor Credit Co., LLC | ||||||
5.70%, 01/15/10D | 1,250,000 | 1,206,587 | ||||
3.26%, 01/13/12† | 37,500 | 29,062 | ||||
7.00%, 10/01/13D | 650,000 | 523,071 | ||||
Freeport-McMoRan Copper & Gold, Inc. | ||||||
8.38%, 04/01/17 | 470,000 | 474,191 | ||||
Freescale Semiconductor, Inc. | ||||||
10.13%, 12/15/16 | 130,000 | 44,850 | ||||
Fresenius US Finance II, Inc. | ||||||
8.75%, 07/15/15 144A(E) | 30,000 | 45,032 | ||||
Frontier Communications Corporation | ||||||
9.25%, 05/15/11 | 200,000 | 209,500 | ||||
7.13%, 03/15/19 | 120,000 | 102,900 | ||||
7.88%, 01/15/27 | 405,000 | 326,025 | ||||
General Electric Capital Corporation | ||||||
3.49%, 03/08/12(G) | 200,000 | 129,112 | ||||
7.63%, 12/10/14(Z) | 905,000 | 547,304 | ||||
4.88%, 03/04/15D | 370,000 | 360,401 | ||||
6.50%, 09/28/15(Z) | 255,000 | 143,348 | ||||
6.75%, 09/26/16(Z) | 150,000 | 85,467 | ||||
5.63%, 05/01/18 | 25,000 | 23,685 | ||||
6.75%, 03/15/32 | 30,000 | 27,005 | ||||
5.88%, 01/14/38 | 100,000 | 79,378 | ||||
General Motors Corporation | ||||||
8.38%, 07/05/33(E)# | 250,000 | 41,910 | ||||
Georgia Gulf Corporation | ||||||
9.50%, 10/15/14@ | 125,000 | 38,125 | ||||
Georgia-Pacific LLC | ||||||
8.00%, 01/15/24 | 355,000 | 303,525 | ||||
8.88%, 05/15/31 | 785,000 | 682,950 | ||||
GMAC, Inc. | ||||||
5.75%, 05/21/10 144A | 117,000 | 109,980 | ||||
5.38%, 06/06/11 144AD | 415,000 | 356,900 | ||||
6.00%, 12/15/11 144AD | 1,016,000 | 878,840 | ||||
7.50%, 12/31/13 144A | 87,000 | 68,295 | ||||
6.75%, 12/01/14 144A | 399,000 | 317,205 | ||||
8.00%, 12/31/18 144A | 104,000 | 67,080 | ||||
8.00%, 11/01/31 144A | 757,000 | 537,470 | ||||
Goldman Sachs Group, Inc. | ||||||
5.00%, 10/01/14D | 600,000 | 603,743 | ||||
6.15%, 04/01/18D | 300,000 | 292,559 | ||||
Goodyear Tire & Rubber Co. | ||||||
7.00%, 03/15/28 | 690,000 | 534,750 | ||||
Graham Packaging Co., Inc. | ||||||
8.50%, 10/15/12D | 25,000 | 24,250 | ||||
H&E Equipment Services, Inc. | ||||||
8.38%, 07/15/16 | 205,000 | 165,538 | ||||
Hawaiian Telcom Communications, Inc. | ||||||
12.50%, 05/01/15#@ | 65,000 | 6 | ||||
Hawker Beechcraft Acquisition Co., LLC | ||||||
8.88%, 04/01/15 PIKD | 330,000 | 140,250 | ||||
HCA, Inc. | ||||||
8.75%, 11/01/10(U) | 140,000 | 231,479 | ||||
7.88%, 02/01/11D | 240,000 | 237,300 | ||||
6.25%, 02/15/13 | 480,000 | 422,400 | ||||
5.75%, 03/15/14 | 40,000 | 32,200 | ||||
6.38%, 01/15/15 | 870,000 | 711,225 | ||||
7.19%, 11/15/15 | 205,000 | 158,487 | ||||
6.50%, 02/15/16D | 220,000 | 178,750 | ||||
9.25%, 11/15/16 | 60,000 | 59,250 | ||||
9.63%, 11/15/16 PIK | 194,000 | 192,545 | ||||
7.50%, 12/15/23 | 555,000 | 364,286 | ||||
8.36%, 04/15/24 | 90,000 | 59,868 | ||||
7.69%, 06/15/25 | 775,000 | 479,808 | ||||
7.58%, 09/15/25 | 570,000 | 353,816 | ||||
Hertz Corporation | ||||||
8.88%, 01/01/14 | 250,000 | 231,250 | ||||
Hess Corporation | ||||||
6.65%, 08/15/11D | 60,000 | 63,891 | ||||
8.13%, 02/15/19 | 310,000 | 353,525 | ||||
Hexion US Finance Corporation | ||||||
9.75%, 11/15/14 | 1,170,000 | 532,350 | ||||
Highwoods Realty LP | ||||||
5.85%, 03/15/17 | 180,000 | 143,559 | ||||
Hollandwide Parent BV | ||||||
29.76%, 08/01/14(E)Ω | 190,000 | 2,665 | ||||
Home Depot, Inc. | ||||||
5.40%, 03/01/16D | 120,000 | 119,952 | ||||
5.88%, 12/16/36 | 1,690,000 | 1,495,765 | ||||
Host Hotels & Resorts LP | ||||||
2.63%, 04/15/27 144A | 750,000 | 640,312 | ||||
Idearc, Inc. | ||||||
8.00%, 11/15/16# | 185,000 | 5,781 | ||||
Intel Corporation | ||||||
2.95%, 12/15/35 | 15,000 | 12,675 | ||||
International Lease Finance Corporation | ||||||
4.75%, 07/01/09D | 345,000 | 345,000 | ||||
6.63%, 12/07/09(U) | 395,000 | 620,415 | ||||
5.00%, 04/15/10 | 145,000 | 132,825 | ||||
5.63%, 09/15/10D | 115,000 | 103,343 | ||||
5.55%, 09/05/12 | 50,000 | 38,872 | ||||
6.38%, 03/25/13 | 245,000 | 186,543 | ||||
International Paper Co. | ||||||
5.50%, 01/15/14 | 575,000 | 528,750 | ||||
7.95%, 06/15/18 | 635,000 | 613,569 | ||||
iStar Financial, Inc. | ||||||
5.65%, 09/15/11D | 92,000 | 53,384 | ||||
5.50%, 06/15/12 | 75,000 | 38,084 | ||||
8.63%, 06/01/13 | 75,000 | 39,027 | ||||
5.95%, 10/15/13 | 954,000 | 420,086 | ||||
5.70%, 03/01/14 | 62,000 | 26,062 | ||||
6.05%, 04/15/15D | 20,000 | 8,008 | ||||
5.88%, 03/15/16D | 22,000 | 8,810 | ||||
JC Penney Corporation, Inc. | ||||||
6.38%, 10/15/36 | 1,270,000 | 942,480 | ||||
7.63%, 03/01/38 | 1,300,000 | 872,699 | ||||
Jefferson Smurfit Corporation | ||||||
7.50%, 06/01/13# | 625,000 | 235,937 | ||||
Jones Apparel Group, Inc. | ||||||
6.13%, 11/15/34 | 135,000 | 85,725 | ||||
K Hovnanian Enterprises, Inc. | ||||||
6.38%, 12/15/14 | 795,000 | 417,375 | ||||
Kerr-McGee Corporation | ||||||
6.95%, 07/01/24 | 30,000 | 27,899 | ||||
Keystone Automotive Operations, Inc. | ||||||
9.75%, 11/01/13 | 45,000 | 15,075 | ||||
See Notes to Financial Statements.
76
Table of Contents
| Par | Value | |||||
Kinder Morgan Energy Partners LP | ||||||
5.95%, 02/15/18 | $ | 1,060,000 | $ | 1,039,336 | ||
7.40%, 03/15/31 | 255,000 | 249,446 | ||||
6.50%, 02/01/37 | 75,000 | 68,699 | ||||
6.95%, 01/15/38 | 90,000 | 87,447 | ||||
Knight, Inc. | ||||||
5.15%, 03/01/15 | 150,000 | 130,875 | ||||
Kraft Foods, Inc. | ||||||
4.13%, 11/12/09 | 40,000 | 40,423 | ||||
L-3 Communications Corporation | ||||||
7.63%, 06/15/12 | 600,000 | 603,000 | ||||
6.13%, 01/15/14 | 45,000 | 42,075 | ||||
6.38%, 10/15/15 | 450,000 | 410,625 | ||||
Lamar Media Corporation | ||||||
6.63%, 08/15/15 | 20,000 | 17,000 | ||||
Lehman Brothers Holdings, Inc. | ||||||
5.25%, 02/06/12# | 130,000 | 19,825 | ||||
Leiner Health Products, Inc. | ||||||
11.00%, 06/01/12#@ | 285,000 | 1,425 | ||||
Lennar Corporation | ||||||
5.60%, 05/31/15 | 1,400,000 | 1,109,500 | ||||
Level 3 Communications, Inc. | ||||||
3.50%, 06/15/12D | 195,000 | 137,475 | ||||
Level 3 Financing, Inc. | ||||||
9.25%, 11/01/14 | 260,000 | 214,500 | ||||
8.75%, 02/15/17 | 1,185,000 | 906,525 | ||||
Mariner Energy, Inc. | ||||||
8.00%, 05/15/17D | 70,000 | 58,450 | ||||
Marsh & McLennan Cos., Inc. | ||||||
5.88%, 08/01/33 | 1,000,000 | 793,622 | ||||
Maxtor Corporation | ||||||
5.75%, 03/01/12@ | 104,000 | 86,840 | ||||
MBIA Insurance Corporation | ||||||
14.00%, 01/15/33 144A† | 435,000 | 165,402 | ||||
Merrill Lynch & Co., Inc. | ||||||
6.11%, 01/29/37 | 2,000,000 | 1,549,132 | ||||
Metals USA, Inc. | ||||||
11.13%, 12/01/15 | 140,000 | 115,675 | ||||
MetroPCS Wireless, Inc. | ||||||
9.25%, 11/01/14 | 10,000 | 9,988 | ||||
Michaels Stores, Inc. | ||||||
10.00%, 11/01/14D | 50,000 | 42,250 | ||||
Midwest Generation LLC | ||||||
8.30%, 07/02/09 | 18,255 | 18,164 | ||||
Mirant Mid Atlantic Pass Through Trust | ||||||
10.06%, 12/30/28 | 165,630 | 159,212 | ||||
Morgan Stanley | ||||||
4.75%, 04/01/14D | 50,000 | 47,279 | ||||
Motorola, Inc. | ||||||
6.50%, 09/01/25 | 720,000 | 505,081 | ||||
6.50%, 11/15/28D | 155,000 | 105,640 | ||||
6.63%, 11/15/37 | 625,000 | 426,052 | ||||
Mutual of Omaha Insurance Co. | ||||||
6.80%, 06/15/36 144A | 1,200,000 | 824,519 | ||||
Neiman-Marcus Group, Inc. | ||||||
9.00%, 10/15/15 PIKD | 363,653 | 216,374 | ||||
7.13%, 06/01/28 | 30,000 | 18,300 | ||||
Nevada Power Co. | ||||||
8.25%, 06/01/11 | 290,000 | 309,076 | ||||
5.88%, 01/15/15 | 100,000 | 102,563 | ||||
NewPage Corporation | ||||||
7.28%, 05/01/12† | 265,000 | 131,175 | ||||
Nextel Communications, Inc. | ||||||
5.95%, 03/15/14 | 970,000 | 768,725 | ||||
7.38%, 08/01/15D | 1,615,000 | 1,296,038 | ||||
Noranda Aluminium Acquisition Corporation | ||||||
5.41%, 05/15/15 PIK | 72,570 | 40,367 | ||||
Norcraft Holdings LP | ||||||
9.75%, 09/01/12 STEP | 195,000 | 183,300 | ||||
Nortek, Inc. | ||||||
8.50%, 09/01/14 | 5,000 | 1,450 | ||||
NRG Energy, Inc. | ||||||
7.38%, 02/01/16 | 300,000 | 284,625 | ||||
NTK Holdings, Inc. | ||||||
99.00%, 03/01/14Ω | 160,000 | 13,600 | ||||
Oncor Electric Delivery Co. | ||||||
6.38%, 01/15/15 | 100,000 | 104,685 | ||||
Orion Power Holdings, Inc. | ||||||
12.00%, 05/01/10 | 55,000 | 57,200 | ||||
Owens Corning, Inc. | ||||||
7.00%, 12/01/36D | 220,000 | 156,299 | ||||
Oxford Industries, Inc. | ||||||
11.38%, 07/15/15 | 135,000 | 132,806 | ||||
Panhandle Eastern Pipeline Co. | ||||||
7.00%, 06/15/18 | 1,100,000 | 1,118,468 | ||||
Peabody Energy Corporation | ||||||
6.88%, 03/15/13D | 190,000 | 189,050 | ||||
Pemex Project Funding Master Trust | ||||||
6.63%, 06/15/35 | 1,540,000 | 1,394,750 | ||||
Penhall International Corporation | ||||||
12.00%, 08/01/14 144A@ | 205,000 | 74,825 | ||||
PetroHawk Energy Corporation | ||||||
9.13%, 07/15/13 | 70,000 | 70,000 | ||||
Pioneer Natural Resources Co. | ||||||
5.88%, 07/15/16 | 900,000 | 780,510 | ||||
7.20%, 01/15/28 | 315,000 | 248,012 | ||||
Plains Exploration & Production Co. | ||||||
10.00%, 03/01/16D | 75,000 | 77,438 | ||||
Quicksilver Resources, Inc. | ||||||
11.75%, 01/01/16D | 95,000 | 98,800 | ||||
Qwest Capital Funding, Inc. | ||||||
6.50%, 11/15/18 | 225,000 | 174,375 | ||||
Qwest Communications International, Inc. | ||||||
7.25%, 02/15/11D | 35,000 | 34,125 | ||||
7.50%, 02/15/14 | 20,000 | 18,350 | ||||
Qwest Corporation | ||||||
7.88%, 09/01/11 | 100,000 | 100,500 | ||||
3.88%, 06/15/13† | 100,000 | 89,875 | ||||
7.63%, 06/15/15 | 300,000 | 283,500 | ||||
6.50%, 06/01/17 | 65,000 | 57,525 | ||||
7.50%, 06/15/23D | 125,000 | 100,000 | ||||
7.25%, 09/15/25 | 90,000 | 69,300 | ||||
6.88%, 09/15/33 | 2,500,000 | 1,837,500 | ||||
7.25%, 10/15/35 | 110,000 | 80,300 | ||||
RailAmerica, Inc. | ||||||
9.25%, 07/01/17 144A | 110,000 | 106,700 | ||||
Realogy Corporation | ||||||
12.38%, 04/15/15 | 235,000 | 66,975 | ||||
RH Donnelley Corporation | ||||||
6.88%, 01/15/13# | 320,000 | 18,000 | ||||
See Notes to Financial Statements.
77
Table of Contents
Global Bond Fund
SCHEDULE OF INVESTMENTS (Continued)
| Par | Value | |||||
RH Donnelley, Inc. | ||||||
11.75%, 05/15/15 144A# | $ | 310,000 | $ | 144,150 | ||
RSC Equipment Rental, Inc. | ||||||
9.50%, 12/01/14D | 160,000 | 129,200 | ||||
10.00%, 07/15/17 | 80,000 | 80,000 | ||||
Ryerson, Inc. | ||||||
12.00%, 11/01/15 144A | 160,000 | 131,200 | ||||
Sandridge Energy, Inc. | ||||||
9.88%, 05/15/16 144A | 185,000 | 179,450 | ||||
Service Corporation International | ||||||
7.50%, 04/01/27 | 75,000 | 59,250 | ||||
Simon Property Group LP | ||||||
5.75%, 12/01/15 | 25,000 | 23,055 | ||||
5.88%, 03/01/17 | 15,000 | 13,793 | ||||
10.35%, 04/01/19 | 130,000 | 147,944 | ||||
SLM Corporation | ||||||
6.50%, 06/15/10(Z) | 275,000 | 130,016 | ||||
5.38%, 01/15/13 | 650,000 | 543,426 | ||||
5.00%, 10/01/13 | 380,000 | 307,645 | ||||
4.75%, 03/17/14(E) | 170,000 | 172,902 | ||||
5.38%, 05/15/14 | 1,000,000 | 804,520 | ||||
8.45%, 06/15/18 | 769,000 | 658,839 | ||||
Smurfit-Stone Container Enterprises, Inc. | ||||||
8.00%, 03/15/17# | 335,000 | 125,625 | ||||
Sprint Capital Corporation | ||||||
8.38%, 03/15/12 | 60,000 | 59,400 | ||||
6.88%, 11/15/28 | 755,000 | 539,825 | ||||
Steel Dynamics, Inc. | ||||||
7.38%, 11/01/12 | 45,000 | 42,862 | ||||
Stone Energy Corporation | ||||||
8.25%, 12/15/11 | 115,000 | 94,875 | ||||
Suburban Propane Partners LP | ||||||
6.88%, 12/15/13D | 145,000 | 134,125 | ||||
Sungard Data Systems, Inc. | ||||||
10.25%, 08/15/15D | 190,000 | 176,462 | ||||
Swift Transportation Co., Inc. | ||||||
8.63%, 05/15/15 144A† | 40,000 | 13,400 | ||||
12.50%, 05/15/17 144AD | 190,000 | 67,450 | ||||
Tenet Healthcare Corporation | ||||||
7.38%, 02/01/13 | 1,100,000 | 995,500 | ||||
9.00%, 05/01/15 144A | 85,000 | 86,062 | ||||
10.00%, 05/01/18 144A | 55,000 | 58,025 | ||||
8.88%, 07/01/19 144AD | 377,000 | 380,770 | ||||
6.88%, 11/15/31 | 85,000 | 51,425 | ||||
Terex Corporation | ||||||
10.88%, 06/01/16 | 80,000 | 80,400 | ||||
Time Warner Cable, Inc. | ||||||
5.85%, 05/01/17 | 1,200,000 | 1,200,181 | ||||
8.75%, 02/14/19 | 190,000 | 221,711 | ||||
8.25%, 04/01/19 | 130,000 | 147,753 | ||||
6.75%, 06/15/39D | 80,000 | 78,109 | ||||
Time Warner, Inc. | ||||||
6.88%, 05/01/12 | 90,000 | 96,339 | ||||
Toledo Edison Co. | ||||||
6.15%, 05/15/37 | 125,000 | 118,043 | ||||
“Toys ”R“ Us, Inc.” | ||||||
7.38%, 10/15/18D | 335,000 | 241,200 | ||||
Unicredito Italiano Capital Trust III | ||||||
4.03%, 10/29/49(E)† | 250,000 | 201,661 | ||||
United Rentals, Inc. | ||||||
7.00%, 02/15/14D | 655,000 | 538,738 | ||||
UnitedHealth Group, Inc. | ||||||
5.80%, 03/15/36 | 790,000 | 640,929 | ||||
Universal Hospital Services, Inc. | ||||||
4.64%, 06/01/15† | 20,000 | 16,200 | ||||
8.50%, 06/01/15 PIK | 20,000 | 18,950 | ||||
Univision Communications, Inc. | ||||||
12.00%, 07/01/14 | 215,000 | 212,312 | ||||
US Investigations Services, Inc. | ||||||
10.50%, 11/01/15 144A | 150,000 | 123,000 | ||||
US Oncology Holdings, Inc. | ||||||
6.90%, 03/15/12 PIK | 141,000 | 119,498 | ||||
US Oncology, Inc. | ||||||
9.13%, 08/15/17 144A | 155,000 | 154,612 | ||||
USG Corporation | ||||||
6.30%, 11/15/16 | 1,250,000 | 931,250 | ||||
Valor Telecommunications Enterprises Finance Corporation | ||||||
7.75%, 02/15/15 | 125,000 | 122,595 | ||||
Vanguard Health Holding Co. II LLC | ||||||
9.00%, 10/01/14 | 220,000 | 211,750 | ||||
Ventas Realty LP | ||||||
9.00%, 05/01/12 | 305,000 | 315,675 | ||||
Verizon Communications, Inc. | ||||||
5.85%, 09/15/35 | 22,000 | 20,528 | ||||
6.40%, 02/15/38D | 18,000 | 17,679 | ||||
Verizon Global Funding Corporation | ||||||
6.88%, 06/15/12D | 30,000 | 32,985 | ||||
Verizon New York, Inc. | ||||||
7.38%, 04/01/32 | 205,000 | 200,269 | ||||
Visteon Corporation | ||||||
8.25%, 08/01/10# | 57,000 | 1,995 | ||||
12.25%, 12/31/16 144A# | 142,000 | 5,680 | ||||
W&T Offshore, Inc. | ||||||
8.25%, 06/15/14 144A | 50,000 | 38,750 | ||||
Wachovia Corporation | ||||||
5.25%, 08/01/14D | 120,000 | 117,558 | ||||
Waste Management, Inc. | ||||||
7.38%, 08/01/10 | 50,000 | 52,116 | ||||
7.38%, 05/15/29 | 50,000 | 49,429 | ||||
WellPoint, Inc. | ||||||
7.00%, 02/15/19 | 80,000 | 82,846 | ||||
Wendy’s/Arby’s Restaurants LLC | ||||||
10.00%, 07/15/16 144AD | 50,000 | 48,062 | ||||
Western Union Co. | ||||||
6.20%, 11/17/36 | 620,000 | 586,103 | ||||
Westvaco Corporation | ||||||
8.20%, 01/15/30 | 150,000 | 132,816 | ||||
7.95%, 02/15/31 | 135,000 | 119,477 | ||||
Weyerhaeuser Co. | ||||||
6.75%, 03/15/12 | 120,000 | 120,116 | ||||
Whiting Petroleum Corporation | ||||||
7.00%, 02/01/14 | 130,000 | 121,225 | ||||
Williams Cos., Inc. | ||||||
7.13%, 09/01/11 | 525,000 | 535,687 | ||||
7.50%, 01/15/31D | 130,000 | 114,684 | ||||
Windstream Corporation | ||||||
8.63%, 08/01/16 | 650,000 | 625,625 | ||||
WMG Acquisition Corporation | ||||||
9.50%, 06/15/16 144A | 30,000 | 30,000 | ||||
See Notes to Financial Statements.
78
Table of Contents
| Par | Value | |||||
XTO Energy, Inc. | ||||||
7.50%, 04/15/12 | $ | 30,000 | $ | 33,253 | ||
Total Corporate Bonds | 82,424,152 | |||||
FOREIGN BONDS — 33.6% | ||||||
Argentina — 0.1% | ||||||
Republic of Argentina | ||||||
7.00%, 09/12/13 | 488,000 | 274,931 | ||||
Australia — 1.6% | ||||||
FMG Finance Party, Ltd. | ||||||
9.75%, 09/01/13(E) | 80,000 | 102,689 | ||||
National Capital Instruments LLC | ||||||
2.10%, 12/29/49(E)† | 150,000 | 106,266 | ||||
New South Wales Treasury Corporation | ||||||
7.00%, 12/01/10(A) | 2,825,000 | 2,375,489 | ||||
Rio Tinto Finance USA, Ltd. | ||||||
9.00%, 05/01/19D | 380,000 | 423,075 | ||||
| 3,007,519 | ||||||
Bermuda — 0.5% | ||||||
White Mountains Re Group, Ltd. | ||||||
6.38%, 03/20/17 144A | 1,250,000 | 951,995 | ||||
Brazil — 2.8% | ||||||
Brazil Notas do Tesouro Nacional, Series F | ||||||
10.00%, 01/01/12(B) | 2,000,000 | 1,046,564 | ||||
Federative Republic of Brazil | ||||||
10.25%, 01/10/28(B) | 6,000,000 | 3,031,386 | ||||
11.00%, 08/17/40D | 700,000 | 914,200 | ||||
Globo Comunicacao e Participacoes SA | ||||||
7.25%, 04/26/22 | 170,000 | 166,600 | ||||
| 5,158,750 | ||||||
Canada — 7.9% | ||||||
Bell Canada | ||||||
6.55%, 05/01/29 144A(C) | 380,000 | 308,394 | ||||
7.30%, 02/23/32 144A(C) | 640,000 | 563,788 | ||||
6.10%, 03/16/35 144A(C) | 380,000 | 292,572 | ||||
Bombardier, Inc. | ||||||
7.25%, 11/15/16(E) | 161,000 | 193,043 | ||||
Canadian Government | ||||||
5.25%, 06/01/12(C) | 10,000,000 | 9,422,001 | ||||
Conoco Funding Co. | ||||||
6.35%, 10/15/11 | 70,000 | 76,437 | ||||
Methanex Corporation | ||||||
8.75%, 08/15/12 | 45,000 | 42,919 | ||||
Nortel Networks, Ltd. | ||||||
6.88%, 09/01/23# | 380,000 | 53,200 | ||||
Novelis, Inc. | ||||||
7.25%, 02/15/15 | 125,000 | 95,625 | ||||
OPTI Canada, Inc. | ||||||
7.88%, 12/15/14D | 100,000 | 65,250 | ||||
8.25%, 12/15/14 | 70,000 | 46,550 | ||||
Province of Manitoba | ||||||
6.38%, 09/01/15(Z) | 815,000 | 506,567 | ||||
Province of Quebec | ||||||
6.75%, 11/09/15(Z) | 2,650,000 | 1,664,331 | ||||
Rogers Cable, Inc. | ||||||
7.88%, 05/01/12 | 240,000 | 258,846 | ||||
Rogers Wireless, Inc. | ||||||
9.63%, 05/01/11 | 450,000 | 491,076 | ||||
Stone Container Finance Company Of Canada II | ||||||
7.38%, 07/15/14# | 650,000 | 300,625 | ||||
Sun Media Corporation | ||||||
7.63%, 02/15/13 | 100,000 | 66,250 | ||||
Talisman Energy, Inc. | ||||||
6.25%, 02/01/38 | 80,000 | 72,279 | ||||
Teck Resources, Ltd. | ||||||
9.75%, 05/15/14 144A | 55,000 | 56,980 | ||||
10.25%, 05/15/16 144A | 50,000 | 52,439 | ||||
10.75%, 05/15/19 144A | 95,000 | 102,282 | ||||
| 14,731,454 | ||||||
Cayman Islands — 1.2% | ||||||
MUFG Capital Finance 2, Ltd. | ||||||
4.85%, 07/25/36(E)† | 500,000 | 513,061 | ||||
Odebrecht Finance, Ltd. | ||||||
7.50%, 10/18/17 | 130,000 | 130,006 | ||||
7.50%, 10/18/17 144A | 100,000 | 99,500 | ||||
Shinsei Finance Cayman, Ltd. | ||||||
6.42%, 07/20/49 144A† | 120,000 | 48,049 | ||||
SMFG Preferred Capital, Ltd. | ||||||
6.16%, 12/31/49(U)† | 350,000 | 391,240 | ||||
TGI International, Ltd. | ||||||
9.50%, 10/03/17 | 130,000 | 131,300 | ||||
Vale Overseas, Ltd. | ||||||
6.88%, 11/21/36 | 927,000 | 882,509 | ||||
| 2,195,665 | ||||||
Colombia — 0.3% | ||||||
Republic of Colombia | ||||||
7.38%, 03/18/19 | 100,000 | 107,250 | ||||
7.38%, 09/18/37D | 400,000 | 410,000 | ||||
| 517,250 | ||||||
Denmark — 0.4% | ||||||
Nordic Telephone Co. Holdings ApS | ||||||
6.87%, 05/01/16(E)† | 111,000 | 145,596 | ||||
8.25%, 05/01/16(E) | 200,000 | 276,363 | ||||
8.88%, 05/01/16 144A | 265,000 | 257,050 | ||||
| 679,009 | ||||||
Finland — 0.1% | ||||||
M-real OYJ | ||||||
6.15%, 12/15/10(E)† | 300,000 | 248,306 | ||||
France — 1.3% | ||||||
AXA SA | ||||||
6.21%, 10/05/49(E)† | 360,000 | 320,264 | ||||
Banque Federative du Credit Mutuel | ||||||
4.47%, 10/28/35(E)† | 157,000 | 123,086 | ||||
Compagnie Generale de Geophysique - Veritas | ||||||
7.50%, 05/15/15 | 90,000 | 83,025 | ||||
Credit Agricole SA | ||||||
4.13%, 11/09/49(E)† | 500,000 | 445,408 | ||||
Dexia Credit Local | ||||||
4.30%, 11/18/49(E)† | 500,000 | 268,507 | ||||
Europcar Groupe SA | ||||||
4.78%, 05/15/13(E)† | 155,000 | 128,400 | ||||
See Notes to Financial Statements.
79
Table of Contents
Global Bond Fund
SCHEDULE OF INVESTMENTS (Continued)
| Par | Value | |||||
France Government Bond OAT | ||||||
4.00%, 04/25/45(E) | $ | 320,000 | $ | 419,253 | ||
French Government Bond | ||||||
4.70%, 10/25/32(E)Ω | 1,030,000 | 498,216 | ||||
Korreden SA | ||||||
11.00%, 08/01/14(E)† | 69,333 | 31,611 | ||||
Rhodia SA | ||||||
4.19%, 10/15/13(E)† | 50,000 | 51,029 | ||||
| 2,368,799 | ||||||
Germany — 3.2% | ||||||
ABN AMRO SA | ||||||
9.63%, 03/01/13 | 100,000 | 102,890 | ||||
Bayerische Landesbank | ||||||
5.75%, 10/23/17(E) | 550,000 | 691,599 | ||||
Bundesrepublik Deutschland | ||||||
4.00%, 07/04/16(E) | 2,000 | 2,973 | ||||
3.75%, 01/04/19(E) | 3,140,000 | 4,554,658 | ||||
HSH Nordbank AG | ||||||
1.59%, 02/14/17(E)† | 52,000 | 29,200 | ||||
HT1 Funding GmbH | ||||||
6.35%, 07/29/49(E)† | 433,000 | 235,607 | ||||
Kabel Deutschland GmbH | ||||||
10.75%, 07/01/14(E) | 106,000 | 153,164 | ||||
Kreditanstalt fuer Wiederaufbau | ||||||
10.75%, 02/01/10(I) | 26,800,000 | 217,652 | ||||
| 5,987,743 | ||||||
Iceland — 0.1% | ||||||
Kaupthing Bank HF | ||||||
5.75%, 10/04/11 144A# | 100,000 | 13,500 | ||||
7.13%, 05/19/16 144A#@ | 150,000 | 375 | ||||
6.13%, 10/04/16 144A# | 700,000 | 94,500 | ||||
| 108,375 | ||||||
Ireland — 0.7% | ||||||
Ardagh Glass Finance PLC | ||||||
7.13%, 06/15/17(E)D | 85,000 | 90,547 | ||||
7.13%, 06/15/17 144A(E) | 112,000 | 117,840 | ||||
Ardagh Glass Group PLC | ||||||
10.75%, 03/01/15 PIK(E) | 89,568 | 60,941 | ||||
Elan Finance PLC | ||||||
7.75%, 11/15/11 | 875,000 | 813,750 | ||||
8.88%, 12/01/13 | 235,000 | 216,200 | ||||
Vimpel Communications | ||||||
8.38%, 04/30/13 144A | 100,000 | 91,250 | ||||
| 1,390,528 | ||||||
Italy — 0.1% | ||||||
Banco Popolare SC | ||||||
6.16%, 06/29/49(E)† | 200,000 | 131,869 | ||||
Japan — 0.8% | ||||||
Japanese 20-Year Government Bond | ||||||
2.10%, 03/20/27(J) | 30,000,000 | 317,732 | ||||
Japanese 30-Year Government Bond | ||||||
2.30%, 12/20/36(J) | 29,000,000 | 307,565 | ||||
Japanese Government CPI Linked Bond | ||||||
1.30%, 09/10/17(J) | 60,000,000 | 549,481 | ||||
Resona Bank, Ltd. | ||||||
5.99%, 08/10/49(U)† | 300,000 | 366,492 | ||||
| 1,541,270 | ||||||
Jersey — 0.3% | ||||||
HSBC Capital Funding LP | ||||||
5.37%, 03/24/14(E)† | 420,000 | 382,980 | ||||
RZB Finance Jersey IV, Ltd. | ||||||
5.17%, 05/16/16(E)† | 250,000 | 149,054 | ||||
| 532,034 | ||||||
Luxembourg — 2.3% | ||||||
Evraz Group SA | ||||||
8.88%, 04/24/13 | 100,000 | 85,250 | ||||
8.88%, 04/24/13 144A | 160,000 | 132,000 | ||||
9.50%, 04/24/18 144A | 100,000 | 77,750 | ||||
Fortis Hybrid Financing | ||||||
5.13%, 06/29/49(E)† | 250,000 | 161,329 | ||||
Gaz Capital for Gazprom | ||||||
6.21%, 11/22/16 144A | 200,000 | 168,000 | ||||
Gaz Capital SA | ||||||
7.29%, 08/16/37D | 190,000 | 144,068 | ||||
HSH Nordbank Luxembourg | ||||||
7.41%, 06/30/49(E) | 450,000 | 85,224 | ||||
Kuznetski Capital for Bank of Moscow | ||||||
6.81%, 05/10/17† | 271,000 | 200,540 | ||||
Lecta SA | ||||||
3.91%, 02/15/14(E)† | 200,000 | 166,940 | ||||
3.91%, 02/15/14 144A(E)† | 102,000 | 85,140 | ||||
RSHB Capital SA for OJSC Russian Agricultural Bank | ||||||
7.18%, 05/16/13 | 200,000 | 192,430 | ||||
7.13%, 01/14/14 144A | 120,000 | 113,400 | ||||
9.00%, 06/11/14 144A | 560,000 | 568,400 | ||||
6.97%, 09/21/16† | 100,000 | 87,130 | ||||
6.30%, 05/15/17 144A | 386,000 | 333,890 | ||||
TNK-BP Finance SA | �� | |||||
7.50%, 07/18/16 144A | 250,000 | 214,375 | ||||
7.88%, 03/13/18 | 870,000 | 735,150 | ||||
Tyco International Group SA | ||||||
6.38%, 10/15/11 | 90,000 | 94,886 | ||||
UBS Luxembourg SA for OJSC Vimpel Communications | ||||||
8.25%, 05/23/16 | 255,000 | 214,200 | ||||
Wind Acquisition Finance SA | ||||||
9.75%, 12/01/15(E) | 53,000 | 72,864 | ||||
9.75%, 12/01/15 144A(E) | 200,000 | 274,960 | ||||
10.75%, 12/01/15 144A | 105,000 | 105,525 | ||||
| 4,313,451 | ||||||
Mexico — 1.6% | ||||||
Axtel SAB de CV | ||||||
7.63%, 02/01/17 | 20,000 | 16,100 | ||||
7.63%, 02/01/17 144AD | 490,000 | 394,450 | ||||
Kansas City Southern de Mexico SA de CV | ||||||
7.63%, 12/01/13 | 140,000 | 121,100 | ||||
12.50%, 04/01/16 144A | 160,000 | 163,200 | ||||
Mexican Bonos | ||||||
8.00%, 12/07/23(M) | 30,500,000 | 2,230,363 | ||||
United Mexican States | ||||||
6.05%, 01/11/40D | 156,000 | 142,506 | ||||
| 3,067,719 | ||||||
Netherlands — 1.8% | ||||||
ABN Amro Bank NV | ||||||
4.31%, 02/10/49(E)† | 595,000 | 347,236 | ||||
See Notes to Financial Statements.
80
Table of Contents
| Par | Value | |||||
Carlson Wagonlit BV | ||||||
7.12%, 05/01/15(E)† | $ | 151,000 | $ | 99,561 | ||
7.12%, 05/01/15 144A(E)† | 200,000 | 136,077 | ||||
Clondalkin Acquisition BV | ||||||
3.28%, 12/15/13 144A(E)† | 66,000 | 67,127 | ||||
Clondalkin Industries BV | ||||||
8.00%, 03/15/14 144A(E) | 150,000 | 122,049 | ||||
Deutsche Telekom International Finance BV | ||||||
5.75%, 03/23/16 | 80,000 | 82,022 | ||||
ELM BV for Swiss Life Insurance & Pension Group | ||||||
5.85%, 04/12/49(E)† | 300,000 | 185,177 | ||||
ELM BV for Swiss Reinsurance Co. | ||||||
5.25%, 05/25/49(E)† | 400,000 | 314,398 | ||||
Impress Holdings BV | ||||||
4.56%, 09/15/13 144A(E)† | 200,000 | 246,903 | ||||
9.25%, 09/15/14 144A(E) | 150,000 | 188,334 | ||||
KazMunaiGaz Finance Sub BV | ||||||
8.38%, 07/02/13 144A | 230,000 | 213,325 | ||||
Lukoil International Finance BV | ||||||
6.36%, 06/07/17 | 650,000 | 581,750 | ||||
OI European Group BV | ||||||
6.88%, 03/31/17 144A(E) | 100,000 | 123,452 | ||||
Shell International Finance BV | ||||||
6.38%, 12/15/38 | 130,000 | 141,836 | ||||
SNS Reaal | ||||||
6.26%, 03/17/38(E)† | 260,000 | 174,468 | ||||
UPC Holding BV | ||||||
8.00%, 11/01/16(E) | 304,000 | 360,366 | ||||
| 3,384,081 | ||||||
Norway — 0.7% | ||||||
Norway Government Bond | ||||||
5.00%, 05/15/15(K) | 355,000 | 59,234 | ||||
4.25%, 05/19/17(K) | 8,060,000 | 1,284,748 | ||||
| 1,343,982 | ||||||
Panama — 0.2% | ||||||
Panama Government International Bond | ||||||
7.25%, 03/15/15 | 51,000 | 55,845 | ||||
Republic of Panama | ||||||
9.38%, 04/01/29D | 80,000 | 100,800 | ||||
6.70%, 01/26/36 | 249,000 | 242,775 | ||||
| 399,420 | ||||||
Peru — 0.1% | ||||||
Republic of Peru | ||||||
8.38%, 05/03/16 | 50,000 | 57,875 | ||||
7.35%, 07/21/25D | 40,000 | 43,000 | ||||
6.55%, 03/14/37D | 19,000 | 18,525 | ||||
| 119,400 | ||||||
Russia — 0.5% | ||||||
Russian Federation | ||||||
7.50%, 03/31/30 STEP | 871,680 | 866,886 | ||||
South Africa — 0.2% | ||||||
Edcon Holdings Proprietary, Ltd. | ||||||
6.78%, 06/15/15(E)† | 96,000 | 56,563 | ||||
6.78%, 06/15/15 144A(E)† | 224,000 | 131,981 | ||||
Edcon Proprietary, Ltd. | ||||||
4.53%, 06/15/14(E)†D | 67,000 | 56,964 | ||||
New Reclamation Group (Proprietary), Ltd. | ||||||
8.13%, 02/01/13 144A(E) | 76,520 | 57,430 | ||||
| 302,938 | ||||||
Supranational — 0.5% | ||||||
Inter-American Development Bank | ||||||
11.02%, 09/23/13(N)Ω | 15,900,000,000 | 989,437 | ||||
Sweden — 0.1% | ||||||
Corral Finans AB | ||||||
2.94%, 04/15/10 PIK 144A(E) | 152,450 | 139,013 | ||||
Thailand — 0.2% | ||||||
True Move Co., Ltd. | ||||||
10.75%, 12/16/13 144A | 461,000 | 354,970 | ||||
Turkey — 1.0% | ||||||
Republic of Turkey | ||||||
10.00%, 02/15/12(L) | 310,000 | 207,331 | ||||
6.88%, 03/17/36 | 1,695,000 | 1,559,400 | ||||
| 1,766,731 | ||||||
United Arab Emirates — 0.5% | ||||||
DP World, Ltd. | ||||||
6.85%, 07/02/37 144A | 1,300,000 | 868,590 | ||||
United Kingdom — 1.7% | ||||||
Ashtead Holdings PLC | ||||||
8.63%, 08/01/15 144AD | 160,000 | 137,200 | ||||
Barclays Bank PLC | ||||||
6.37%, 12/15/49(U)† | 350,000 | 348,370 | ||||
FCE Bank PLC | ||||||
7.13%, 01/16/12(E)D | 200,000 | 238,977 | ||||
Lloyds TSB Bank PLC | ||||||
4.39%, 05/12/17(E)† | 470,000 | 332,969 | ||||
Royal Bank of Scotland Group PLC | ||||||
7.09%, 10/29/49(E)† | 500,000 | 244,343 | ||||
Vedanta Resources PLC | ||||||
8.75%, 01/15/14 | 320,000 | 292,800 | ||||
Virgin Media Finance PLC | ||||||
9.75%, 04/15/14(U) | 450,000 | 699,620 | ||||
9.13%, 08/15/16 | 860,000 | 832,050 | ||||
| 3,126,329 | ||||||
Venezuela — 0.5% | ||||||
Republic of Venezuela | ||||||
8.50%, 10/08/14 | 26,000 | 18,590 | ||||
5.75%, 02/26/16D | 1,065,000 | 619,936 | ||||
9.38%, 01/13/34D | 207,000 | 130,410 | ||||
Venezuela Government Bond | ||||||
7.00%, 03/31/38 | 246,000 | 121,155 | ||||
| 890,091 | ||||||
See Notes to Financial Statements.
81
Table of Contents
Global Bond Fund
SCHEDULE OF INVESTMENTS (Continued)
| Par | Value | ||||||
Virgin Islands (British) — 0.3% | |||||||
GTL Trade Finance, Inc. | |||||||
7.25%, 10/20/17 | $ | 320,000 | $ | 310,816 | |||
7.25%, 10/20/17 144AD | 309,000 | 293,550 | |||||
| 604,366 | |||||||
Total Foreign Bonds | 62,362,901 | ||||||
MORTGAGE-BACKED SECURITIES — 6.4% | |||||||
Bayview Commercial Asset Trust | |||||||
0.54%, 07/25/36 144A† | 263,083 | 143,167 | |||||
Countrywide Alternative Loan Trust | |||||||
0.55%, 07/20/35† | 504,216 | 223,525 | |||||
Countrywide Home Loan Mortgage Pass-Through Trust | |||||||
0.71%, 09/25/35 144A† | 635,170 | 428,994 | |||||
Credit Suisse Mortgage Capital Certificates | |||||||
5.70%, 09/15/40† | 220,000 | 151,065 | |||||
Federal Home Loan Mortgage Corporation | |||||||
5.50%, 12/17/37 | 1,915,715 | 1,980,776 | |||||
5.00%, 03/01/38 | 638,107 | 649,911 | |||||
Federal National Mortgage Association | |||||||
5.00%, 07/01/19 TBA | 400,000 | 413,875 | |||||
6.50%, 10/01/36 | 587,184 | 626,372 | |||||
5.50%, 07/01/37 TBA | 400,000 | 412,875 | |||||
6.00%, 07/01/37 TBA | 200,000 | 209,000 | |||||
5.00%, 07/01/38 TBA | 5,500,000 | 5,599,687 | |||||
Government National Mortgage Association | |||||||
6.00%, 07/01/38 TBA | 200,000 | 208,250 | |||||
JPMorgan Chase Commercial Mortgage Securities Corporation | |||||||
5.42%, 01/15/49 | 80,000 | 58,887 | |||||
6.01%, 06/15/49† | 165,000 | 126,000 | |||||
MASTR Adjustable Rate Mortgages Trust | |||||||
2.14%, 12/25/46† | 762,424 | 185,141 | |||||
MASTR Reperforming Loan Trust | |||||||
0.66%, 05/25/35 144A† | 674,558 | 464,953 | |||||
Total Mortgage-Backed Securities | 11,882,478 | ||||||
| Shares | |||||||
PREFERRED STOCKS — 1.1% | |||||||
Bank of America Corporation CONV | 602 | 503,290 | |||||
CIT Group, Inc. | 4,849 | 34,670 | |||||
CMP Susquehanna Radio Holdings Corporation | 1,492 | 634 | |||||
El Paso Energy Capital Trust I CONV | 500 | 15,700 | |||||
Fannie Mae | 3,700 | 5,604 | |||||
Federal Home Loan Mortgage Corporation | 10,625 | 12,963 | |||||
Federal National Mortgage Association | 15,650 | 20,971 | |||||
Freddie Mac | 24,500 | 24,573 | |||||
Lucent Technologies Capital Trust I CONV | 1,891 | 1,153,510 | |||||
Preferred Blocker (GMAC), Inc. | 615 | 264,488 | |||||
Total Preferred Stocks | 2,036,403 | ||||||
COMMON STOCKS — 0.0% | |||||||
Consumer Discretionary — 0.0% | |||||||
Buffets Restaurants Holdings, Inc.* | 201 | 181 | |||||
Financial Services — 0.0% | |||||||
Freddie Mac* | 104,601 | 64,852 | |||||
Total Common Stocks | 65,033 | ||||||
RIGHTS/WARRANTS — 0.0% | |||||||
Buffets Restaurants Holdings, Inc. | 89 | — | |||||
CMP Susquehanna Radio Holdings Corporation | 1,705 | 48 | |||||
Total Rights/Warrants | 48 | ||||||
MONEY MARKET FUNDS — 15.8% | |||||||
GuideStone Money Market Fund (GS4 Class)¥ | 16,337,770 | 16,337,770 | |||||
Northern Institutional Liquid Assets Portfolio§ | 13,075,144 | 13,075,144 | |||||
Total Money Market Funds | 29,412,914 | ||||||
| Par | |||||||
U.S. TREASURY OBLIGATIONS — 3.7% | |||||||
U.S. Treasury Inflationary Index Bonds | |||||||
2.00%, 01/15/16D | $ | 1,290,000 | 1,408,354 | ||||
1.38%, 07/15/18D‡‡ | 660,000 | 634,043 | |||||
3.88%, 04/15/29D‡‡ | 1,260,000 | 2,077,550 | |||||
| 4,119,947 | |||||||
U.S. Treasury Notes | |||||||
4.50%, 04/30/12 | 30,000 | 32,475 | |||||
1.88%, 04/30/14D | 1,250,000 | 1,213,379 | |||||
4.50%, 05/15/17 | 920,000 | 993,097 | |||||
2.75%, 02/15/19D | 450,000 | 421,593 | |||||
| 2,660,544 | |||||||
Total U.S. Treasury Obligations | 6,780,491 | ||||||
TOTAL INVESTMENTS — 108.1% | 200,899,988 | ||||||
Liabilities in Excess of Other Assets — (8.1)% | (15,036,893 | ) | |||||
NET ASSETS — 100.0% | $ | 185,863,095 | |||||
See Notes to Financial Statements.
82
Table of Contents
PORTFOLIO SUMMARY (based on net assets)
| % | |||
Corporate Bonds | 44.3 | ||
Foreign Bonds | 33.6 | ||
Money Market Funds | 15.8 | ||
Futures Contracts | 7.3 | ||
Mortgage-Backed Securities | 6.4 | ||
U.S. Treasury Obligations | 3.7 | ||
Asset-Backed Securities | 3.0 | ||
Forward Foreign Currency Contracts | 1.6 | ||
Preferred Stocks | 1.1 | ||
Agency Obligations | 0.2 | ||
Common Stocks | — | ** | |
Rights/Warrants | — | ** | |
| 117.0 | |||
| ** | Rounds to less than 0.005%. |
FAS 157 DISCLOSURE
The following is a summary of the inputs used, as of June 30, 2009, in valuing the Fund’s assets carried at fair value:
Valuation Inputs | Investments in Securities | Other Financial Instruments*** | |||||
Assets: | |||||||
Level 1 — Quoted Prices | |||||||
Common Stocks | $ | 65,033 | $ | — | |||
Futures Contracts | — | (55,190 | ) | ||||
Money Market Funds | 29,412,914 | — | |||||
Preferred Stocks | 882,259 | —�� | |||||
Level 2 — Other Significant Observable Inputs | |||||||
Agency Obligations | 328,704 | — | |||||
Asset-Backed Securities | 5,606,864 | — | |||||
Corporate Bonds | 82,424,152 | — | |||||
Foreign Bonds | 62,362,901 | — | |||||
Forward Foreign Currency Contracts | — | (170,821 | ) | ||||
Mortgage-Backed Securities | 11,882,478 | — | |||||
Preferred Stocks | 1,154,144 | — | |||||
Rights/Warrants | 48 | — | |||||
U.S. Treasury Obligations | 6,780,491 | — | |||||
Level 3 — Significant Unobservable Inputs | — | — | |||||
Total | $ | 200,899,988 | $ | (226,011 | ) | ||
| *** | Other financial instruments are derivative instruments not reflected in the Schedule of Investments, such as futures, forwards and swap contracts, which are valued at the unrealized appreciation (depreciation) on the investment. Details of these investments can be found in the Notes to Financial Statements. |
The following is a reconciliation of assets in which significant unobservable inputs (Level 3) were used in determining fair value:
| Investments in Securities | Other Financial Instruments*** | ||||||
Balance, 12/31/08 | $ | 1,205,795 | $ | — | |||
Accrued discounts/premiums | (8,882 | ) | — | ||||
Realized gain (loss) | — | — | |||||
Change in unrealized appreciation (depreciation) | (325,196 | ) | — | ||||
Net purchases (sales) | — | — | |||||
Transfers in and/or out of Level 3 | (871,717 | ) | — | ||||
Balance, 06/30/09 | $ | — | $ | — | |||
See Notes to Financial Statements.
83
Table of Contents
| Equity Index Fund | ||
| SCHEDULE OF INVESTMENTS | June 30, 2009 (Unaudited) |
| Shares | Value | ||||
COMMON STOCKS — 96.6% | |||||
Auto & Transportation — 2.6% | |||||
Burlington Northern Santa Fe Corporation | 10,500 | $ | 772,170 | ||
CH Robinson Worldwide, Inc. | 6,600 | 344,190 | |||
CSX Corporation | 15,100 | 522,913 | |||
Expeditors International Washington, Inc. | 8,200 | 273,388 | |||
FedEx Corporation | 11,900 | 661,878 | |||
Ford Motor Co.* | 122,593 | 744,139 | |||
Goodyear Tire & Rubber Co. (The)* | 9,100 | 102,466 | |||
Harley-Davidson, Inc.D | 9,000 | 145,890 | |||
Johnson Controls, Inc.D | 22,676 | 492,523 | |||
Norfolk Southern Corporation | 14,100 | 531,147 | |||
PACCAR, Inc.D | 14,068 | 457,351 | |||
Southwest Airlines Co. | 27,100 | 182,383 | |||
Union Pacific Corporation | 19,200 | 999,552 | |||
United Parcel Service, Inc. Class B | 38,200 | 1,909,618 | |||
| 8,139,608 | |||||
Consumer Discretionary — 10.8% | |||||
Amazon.com, Inc.* | 12,284 | 1,027,679 | |||
Apollo Group, Inc. Class A* | 4,221 | 300,197 | |||
Automatic Data Processing, Inc. | 19,500 | 691,080 | |||
AutoNation, Inc.D* | 4,125 | 71,569 | |||
AutoZone, Inc.* | 1,400 | 211,554 | |||
Avon Products, Inc. | 16,600 | 427,948 | |||
Bed Bath & Beyond, Inc.D* | 10,200 | 313,650 | |||
Best Buy Co., Inc. | 12,925 | 432,858 | |||
Big Lots, Inc.D* | 3,100 | 65,193 | |||
Black & Decker Corporation | 2,500 | 71,650 | |||
Block (H&R), Inc. | 12,500 | 215,375 | |||
Carnival Corporation | 16,900 | 435,513 | |||
CBS Corporation Class B | 25,300 | 175,076 | |||
Cintas Corporation | 5,000 | 114,200 | |||
Coach, Inc. | 12,200 | 327,936 | |||
Comcast Corporation Class A | 110,972 | 1,607,984 | |||
Convergys CorporationD* | 4,700 | 43,616 | |||
Costco Wholesale Corporation | 16,800 | 767,760 | |||
Darden Restaurants, Inc. | 5,250 | 173,145 | |||
DeVry, Inc. | 2,300 | 115,092 | |||
DIRECTV Group, Inc. (The)D* | 20,400 | 504,084 | |||
Eastman Kodak Co.D | 9,900 | 29,304 | |||
eBay, Inc.* | 41,700 | 714,321 | |||
Estee Lauder Cos., Inc. Class AD | 4,300 | 140,481 | |||
Expedia, Inc.* | 8,039 | 121,469 | |||
Family Dollar Stores, Inc. | 5,200 | 147,160 | |||
Fastenal Co.D | 4,800 | 159,216 | |||
GameStop Corporation Class A* | 6,100 | 134,261 | |||
Gannett Co., Inc.D | 8,700 | 31,059 | |||
Gap, Inc. (The) | 17,800 | 291,920 | |||
Genuine Parts Co. | 6,000 | 201,360 | |||
Harman International Industries, Inc.D | 2,300 | 43,240 | |||
Hasbro, Inc. | 5,100 | 123,624 | |||
Home Depot, Inc. (The) | 65,320 | 1,543,512 | |||
Interpublic Group Cos., Inc.D* | 18,048 | 91,142 | |||
Iron Mountain, Inc.D* | 6,700 | 192,625 | |||
Kimberly-Clark Corporation | 16,100 | 844,123 | |||
Kohl’s CorporationD* | 11,600 | 495,900 | |||
Leggett & Platt, Inc. | 5,800 | 88,334 | |||
Limited Brands | 10,100 | 120,897 | |||
Lowe’s Cos., Inc. | 56,200 | 1,090,842 | |||
Macy’s, Inc.D | 16,312 | 191,829 | |||
Marriott International, Inc. Class AD | 11,041 | 243,666 | |||
Mattel, Inc. | 13,400 | 215,070 | |||
McDonald’s Corporation | 42,100 | 2,420,329 | |||
McGraw-Hill Co., Inc. (The) | 11,900 | 358,309 | |||
Meredith CorporationD | 1,400 | 35,770 | |||
Monster Worldwide, Inc.D* | 4,600 | 54,326 | |||
New York Times Co. Class AD | 4,400 | 24,244 | |||
Newell Rubbermaid, Inc.D | 10,200 | 106,182 | |||
News Corporation | 88,800 | 808,968 | |||
NIKE, Inc. Class BD | 15,000 | 776,700 | |||
Nordstrom, Inc.D | 6,200 | 123,318 | |||
Office Depot, Inc.* | 10,500 | 47,880 | |||
Omnicom Group, Inc. | 11,800 | 372,644 | |||
O’Reilly Automotive, Inc.D* | 5,200 | 198,016 | |||
Paychex, Inc.D | 12,700 | 320,040 | |||
Penney (JC) Co., Inc. | 8,600 | 246,906 | |||
Polo Ralph Lauren CorporationD | 2,100 | 112,434 | |||
RadioShack CorporationD | 5,100 | 71,196 | |||
Robert Half International, Inc.D | 5,800 | 136,996 | |||
Scripps Networks Interactive, Inc. | 3,400 | 94,622 | |||
Sears Holdings CorporationD* | 2,189 | 145,612 | |||
Snap-On, Inc. | 2,200 | 63,228 | |||
Stanley Works (The) | 2,900 | 98,136 | |||
Staples, Inc. | 27,800 | 560,726 | |||
Starbucks CorporationD* | 28,500 | 395,865 | |||
Starwood Hotels & Resorts Worldwide, Inc.D | 7,000 | 155,400 | |||
Target Corporation | 29,000 | 1,144,630 | |||
Tiffany & Co.D | 4,600 | 116,656 | |||
Time Warner Cable, Inc.* | 13,395 | 424,220 | |||
Time Warner, Inc. | 45,866 | 1,155,364 | |||
TJX Cos., Inc. | 15,900 | 500,214 | |||
VF Corporation | 3,300 | 182,655 | |||
Wal-Mart Stores, Inc. | 85,200 | 4,127,088 | |||
Walt Disney Co. (The) | 70,702 | 1,649,478 | |||
Washington Post Co. | 231 | 81,354 | |||
Western Union Co. | 27,017 | 443,079 | |||
Whirlpool CorporationD | 2,894 | 123,169 | |||
Wyndham Worldwide Corporation | 7,080 | 85,810 | |||
Yum! Brands, Inc. | 17,800 | 593,452 | |||
| 33,703,530 | |||||
Consumer Staples — 7.8% | |||||
Campbell Soup Co. | 7,900 | 232,418 | |||
Clorox Co. | 5,500 | 307,065 | |||
Coca-Cola Co. (The) | 76,000 | 3,647,240 | |||
Coca-Cola Enterprises, Inc. | 11,800 | 196,470 | |||
Colgate-Palmolive Co. | 19,300 | 1,365,282 | |||
ConAgra Foods, Inc. | 17,600 | 335,456 | |||
CVS Caremark Corporation | 55,427 | 1,766,459 | |||
Dean Foods Co.* | 6,600 | 126,654 | |||
Dr Pepper Snapple Group, Inc.* | 9,400 | 199,186 | |||
General Mills, Inc. | 12,800 | 717,056 | |||
Heinz (H.J.) Co. | 12,400 | 442,680 | |||
Hershey Co. (The) | 6,200 | 223,200 | |||
Hormel Foods Corporation | 2,600 | 89,804 | |||
See Notes to Financial Statements.
84
Table of Contents
| Shares | Value | ||||
J.M. Smucker Co. (The)D | 4,403 | $ | 214,250 | ||
Kellogg Co. | 9,900 | 461,043 | |||
Kraft Foods, Inc. Class A | 56,800 | 1,439,312 | |||
Kroger Co. | 25,000 | 551,250 | |||
McCormick & Co., Inc.D | 4,800 | 156,144 | |||
Pepsi Bottling Group, Inc. | 5,100 | 172,584 | |||
PepsiCo, Inc. | 59,740 | 3,283,310 | |||
Procter & Gamble Co. | 111,710 | 5,708,381 | |||
Safeway, Inc. | 16,100 | 327,957 | |||
Sara Lee Corporation | 26,300 | 256,688 | |||
SUPERVALU, Inc. | 8,048 | 104,222 | |||
Sysco Corporation | 22,600 | 508,048 | |||
Tyson Foods, Inc. Class A | 10,900 | 137,449 | |||
Walgreen Co. | 37,700 | 1,108,380 | |||
Whole Foods Market, Inc.D | 5,600 | 106,288 | |||
| 24,184,276 | |||||
Financial Services — 13.8% | |||||
Aflac, Inc. | 17,900 | 556,511 | |||
Allstate Corporation (The) | 20,652 | 503,909 | |||
American Express Co. | 45,200 | 1,050,448 | |||
American International Group, Inc.D* | 103,092 | 119,587 | |||
Ameriprise Financial, Inc. | 9,940 | 241,244 | |||
AON Corporation | 10,500 | 397,635 | |||
Apartment Investment & Management Co. Class A REITD | 5,086 | 45,011 | |||
Assurant, Inc. | 4,300 | 103,587 | |||
AvalonBay Communities, Inc. REIT | 3,091 | 172,910 | |||
Bank of America Corporation | 309,369 | 4,083,671 | |||
Bank of New York Mellon Corporation | 46,062 | 1,350,077 | |||
BB&T Corporation | 25,000 | 549,500 | |||
Boston Properties, Inc. REITD | 5,447 | 259,822 | |||
Capital One Financial Corporation | 17,137 | 374,958 | |||
Chubb Corporation | 13,800 | 550,344 | |||
Cincinnati Financial CorporationD | 5,986 | 133,787 | |||
CIT Group, Inc.D | 13,400 | 28,810 | |||
Citigroup, Inc.D | 209,930 | 623,492 | |||
CME Group, Inc. | 2,555 | 794,886 | |||
Comerica, Inc. | 6,000 | 126,900 | |||
Discover Financial Services | 18,500 | 189,995 | |||
Dun & Bradstreet Corporation | 2,000 | 162,420 | |||
E*TRADE Financial CorporationD* | 40,900 | 52,352 | |||
Equifax, Inc. | 4,800 | 125,280 | |||
Equity Residential Properties Trust REIT | 10,500 | 233,415 | |||
Federated Investors, Inc. Class BD | 3,300 | 79,497 | |||
Fidelity National Information Services, Inc.D | 6,900 | 137,724 | |||
Fifth Third Bancorp | 28,294 | 200,887 | |||
First Horizon National Corporation* | 7,638 | 91,652 | |||
First Horizon National Corporation Placeholder Shares+ | 138,751 | — | |||
Fiserv, Inc.* | 6,100 | 278,770 | |||
Franklin Resources, Inc. | 5,800 | 417,658 | |||
Genworth Financial, Inc. Class A | 16,600 | 116,034 | |||
Goldman Sachs Group, Inc. | 19,254 | 2,838,810 | |||
Hartford Financial Services Group, Inc. | 12,800 | 151,936 | |||
HCP, Inc. REITD | 9,996 | 211,815 | |||
Health Care REIT, Inc.D | 4,000 | 136,400 | |||
Host Hotels & Resorts, Inc. REITD | 22,800 | 191,292 | |||
Hudson City Bancorp, Inc. | 20,400 | 271,116 | |||
Huntington Bancshares, Inc.D | 21,400 | 89,452 | |||
IntercontinentalExchange, Inc.* | 2,800 | 319,872 | |||
Invesco, Ltd. | 16,129 | 287,419 | |||
Janus Capital Group, Inc.D | 5,700 | 64,980 | |||
JPMorgan Chase & Co. | 149,189 | 5,088,837 | |||
KeyCorp | 27,500 | 144,100 | |||
Kimco Realty Corporation REITD | 11,700 | 117,585 | |||
Legg Mason, Inc.D | 5,740 | 139,941 | |||
Leucadia National Corporation* | 6,600 | 139,194 | |||
Lincoln National Corporation | 11,519 | 198,242 | |||
Loews Corporation | 13,491 | 369,653 | |||
M&T Bank CorporationD | 3,200 | 162,976 | |||
Marsh & McLennan Cos., Inc. | 19,700 | 396,561 | |||
Marshall & Ilsley Corporation | 13,300 | 63,840 | |||
Mastercard, Inc. Class A | 2,800 | 468,468 | |||
MBIA, Inc.D* | 7,400 | 32,042 | |||
MetLife, Inc. | 31,200 | 936,312 | |||
Moody’s Corporation | 7,300 | 192,355 | |||
Morgan Stanley | 51,900 | 1,479,669 | |||
NASDAQ OMX Group, Inc.* | 5,500 | 117,205 | |||
Northern Trust Corporation | 8,934 | 479,577 | |||
NYSE Euronext | 9,900 | 269,775 | |||
People’s United Financial, Inc. | 13,000 | 195,520 | |||
Plum Creek Timber Co., Inc. REITD | 6,400 | 190,592 | |||
PNC Financial Services Group, Inc.D | 17,759 | 689,227 | |||
Principal Financial GroupD | 11,600 | 218,544 | |||
Progressive Corporation (The)* | 25,396 | 383,734 | |||
ProLogis REIT | 16,800 | 135,408 | |||
Prudential Financial, Inc. | 17,600 | 655,072 | |||
Public Storage REITD | 4,625 | 302,845 | |||
Regions Financial Corporation | 45,129 | 182,321 | |||
Ryder System, Inc.D | 2,100 | 58,632 | |||
Schwab (Charles) Corporation (The) | 36,306 | 636,807 | |||
Simon Property Group, Inc. REITD | 10,772 | 554,014 | |||
SLM Corporation* | 18,100 | 185,887 | |||
State Street Corporation | 18,800 | 887,360 | |||
SunTrust Banks, Inc. | 17,900 | 294,455 | |||
T. Rowe Price Group, Inc.D | 9,900 | 412,533 | |||
Torchmark CorporationD | 3,200 | 118,528 | |||
Total System Services, Inc. | 7,387 | 98,912 | |||
Travelers Cos., Inc. | 22,656 | 929,802 | |||
Unum Group | 12,300 | 195,078 | |||
US Bancorp | 72,200 | 1,293,824 | |||
Ventas, Inc. REIT | 6,200 | 185,132 | |||
Vornado Realty Trust REITD | 6,199 | 279,139 | |||
Wells Fargo & Co. | 178,064 | 4,319,833 | |||
XL Capital, Ltd. Class A | 13,000 | 148,980 | |||
Zions BancorporationD | 4,700 | 54,332 | |||
| 43,118,708 | |||||
Healthcare — 13.8% | |||||
Abbott Laboratories | 59,100 | 2,780,064 | |||
See Notes to Financial Statements.
85
Table of Contents
| Equity Index Fund | ||
| SCHEDULE OF INVESTMENTS (Continued) |
| Shares | Value | ||||
Aetna, Inc. | 17,200 | $ | 430,860 | ||
Allergan, Inc. | 11,630 | 553,355 | |||
AmerisourceBergen CorporationD | 11,888 | 210,893 | |||
Amgen, Inc.* | 38,965 | 2,062,807 | |||
Bard (C.R.), Inc. | 3,700 | 275,465 | |||
Baxter International, Inc. | 23,400 | 1,239,264 | |||
Becton Dickinson & Co. | 9,300 | 663,183 | |||
Biogen Idec, Inc.* | 10,930 | 493,490 | |||
Boston Scientific Corporation* | 58,200 | 590,148 | |||
Bristol-Myers Squibb Co. | 76,300 | 1,549,653 | |||
Cardinal Health, Inc. | 13,579 | 414,838 | |||
Celgene Corporation* | 17,500 | 837,200 | |||
Cephalon, Inc.D* | 3,000 | 169,950 | |||
CIGNA Corporation | 10,700 | 257,763 | |||
Conventry Health Care, Inc.* | 5,530 | 103,466 | |||
DaVita, Inc.D* | 3,900 | 192,894 | |||
DENTSPLY International, Inc.D | 5,600 | 170,912 | |||
Eli Lilly & Co. | 38,900 | 1,347,496 | |||
Express Scripts, Inc.* | 10,524 | 723,525 | |||
Forest Laboratories, Inc.* | 11,400 | 286,254 | |||
Genzyme Corporation* | 10,400 | 578,968 | |||
Gilead Sciences, Inc.* | 34,500 | 1,615,980 | |||
Hospira, Inc* | 5,950 | 229,194 | |||
Humana, Inc.* | 6,300 | 203,238 | |||
IMS Health, Inc. | 6,800 | 86,360 | |||
Intuitive Surgical, Inc.D* | 1,500 | 245,490 | |||
Johnson & Johnson | 105,390 | 5,986,152 | |||
King Pharmaceuticals, Inc.D* | 9,100 | 87,633 | |||
Laboratory Corporation of America Holdings* | 4,300 | 291,497 | |||
Life Technologies Corporation* | 6,533 | 272,557 | |||
McKesson Corporation | 10,600 | 466,400 | |||
Medco Health Solutions, Inc.* | 18,452 | 841,596 | |||
Medtronic, Inc. | 43,100 | 1,503,759 | |||
Merck & Co., Inc.D | 80,600 | 2,253,576 | |||
Millipore Corporation* | 2,100 | 147,441 | |||
Mylan Laboratories, Inc.D* | 12,000 | 156,600 | |||
Patterson Cos., Inc.D* | 3,400 | 73,780 | |||
PerkinElmer, Inc. | 4,400 | 76,560 | |||
Pfizer, Inc. | 257,883 | 3,868,245 | |||
Quest Diagnostics, Inc. | 5,800 | 327,294 | |||
Schering-Plough Corporation | 62,100 | 1,559,952 | |||
St. Jude Medical, Inc.* | 13,500 | 554,850 | |||
Stryker Corporation | 9,100 | 361,634 | |||
Tenet Healthcare Corporation* | 15,750 | 44,415 | |||
Thermo Fisher | |||||
Scientific, Inc.* | 16,110 | 656,805 | |||
UnitedHealth Group, Inc. | 45,800 | 1,144,084 | |||
Varian Medical Systems, Inc.* | 4,600 | 161,644 | |||
Watson Pharmaceuticals, Inc.* | 3,900 | 131,391 | |||
WellPoint, Inc.* | 18,712 | 952,254 | |||
Wyeth | 51,100 | 2,319,429 | |||
Zimmer Holdings, Inc.* | 8,320 | 354,432 | |||
| 42,906,690 | |||||
Integrated Oils — 7.3% | |||||
Chevron Corporation | 76,641 | 5,077,466 | |||
ConocoPhillips | 56,458 | 2,374,624 | |||
Exxon Mobil Corporation | 186,744 | 13,055,273 | |||
Hess Corporation | 10,900 | 585,875 | |||
Marathon Oil Corporation | 26,984 | 813,028 | |||
Murphy Oil Corporation | 7,400 | 401,968 | |||
Sunoco, Inc. | 4,700 | 109,040 | |||
Tesoro CorporationD | 5,500 | 70,015 | |||
Valero Energy Corporation | 21,244 | 358,811 | |||
| 22,846,100 | |||||
Materials & Processing — 3.9% | |||||
Air Products & Chemicals, Inc. | 8,200 | 529,638 | |||
AK Steel Corporation | 4,300 | 82,517 | |||
Alcoa, Inc. | 37,600 | 388,408 | |||
Allegheny Technologies, Inc.D | 3,900 | 136,227 | |||
Archer-Daniels-Midland Co. | 24,527 | 656,588 | |||
Avery Dennison Corporation | 4,000 | 102,720 | |||
Ball Corporation | 3,492 | 157,699 | |||
Bemis Co., Inc.D | 3,800 | 95,760 | |||
CB Richard Ellis Group, Inc. Class A* | 9,400 | 87,984 | |||
CF Industries Holdings, Inc. | 1,900 | 140,866 | |||
Donnelley (R.R.) & Sons Co. | 7,600 | 88,312 | |||
Dow Chemical Co. (The) | 41,500 | 669,810 | |||
Du Pont (E.I.) de Nemours & Co. | 34,955 | 895,547 | |||
Eastman Chemical Co. | 2,700 | 102,330 | |||
Ecolab, Inc. | 6,300 | 245,637 | |||
Fluor Corporation | 6,800 | 348,772 | |||
Freeport-McMoRan Copper & Gold, Inc. | 15,662 | 784,823 | |||
International Flavors & Fragrances, Inc. | 2,900 | 94,888 | |||
International Paper Co. | 16,935 | 256,226 | |||
Jacobs Engineering Group, Inc.* | 4,700 | 197,823 | |||
Masco CorporationD | 13,500 | 129,330 | |||
MeadWestvaco CorporationD | 6,445 | 105,762 | |||
Monsanto Co. | 20,820 | 1,547,759 | |||
Newmont Mining Corporation | 18,500 | 756,095 | |||
Nucor Corporation | 11,889 | 528,228 | |||
Owens-Illinois, Inc.* | 6,200 | 173,662 | |||
Pactiv Corporation* | 4,800 | 104,160 | |||
PPG Industries, Inc. | 6,100 | 267,790 | |||
Praxair, Inc. | 11,880 | 844,312 | |||
Precision Castparts Corporation | 5,200 | 379,756 | |||
Quanta Services, Inc. | 7,400 | 171,162 | |||
Sealed Air Corporation | 6,000 | 110,700 | |||
Sherwin-Williams Co.D | 3,700 | 198,875 | |||
Sigma-Aldrich Corporation | 4,600 | 227,976 | |||
Titanium Metals Corporation | 3,500 | 32,165 | |||
United States Steel CorporationD | 5,600 | 200,144 | |||
Vulcan Materials Co.D | 4,644 | 200,156 | |||
Weyerhaeuser Co.D | 7,960 | 242,223 | |||
| 12,282,830 | |||||
Other — 2.1% | |||||
3M Co. | 26,700 | 1,604,670 | |||
General Electric Co. | 404,800 | 4,744,256 | |||
Textron, Inc.D | 9,600 | 92,736 | |||
| 6,441,662 | |||||
Other Energy — 5.0% | |||||
Anadarko Petroleum Corporation | 19,051 | 864,725 | |||
Apache Corporation | 12,848 | 926,983 | |||
Baker Hughes, Inc. | 12,000 | 437,280 | |||
BJ Services Co. | 11,700 | 159,471 | |||
Cabot Oil & Gas Corporation | 3,800 | 116,432 | |||
See Notes to Financial Statements.
86
Table of Contents
| Shares | Value | ||||
Cameron International Corporation* | 8,000 | $ | 226,400 | ||
Chesapeake Energy Corporation | 21,966 | 435,586 | |||
Consol Energy, Inc. | 6,800 | 230,928 | |||
Denbury Resources, Inc.* | 9,300 | 136,989 | |||
Devon Energy Corporation | 17,200 | 937,400 | |||
Diamond Offshore Drilling, Inc.D | 2,800 | 232,540 | |||
El Paso Corporation | 26,400 | 243,672 | |||
ENSCO International, Inc. | 5,600 | 195,272 | |||
EOG Resources, Inc. | 9,600 | 652,032 | |||
EQT Corporation | 4,800 | 167,568 | |||
Exterran Holdings, Inc.* | 13 | 209 | |||
FMC Technologies, Inc.D* | 4,700 | 176,626 | |||
Halliburton Co. | 34,075 | 705,353 | |||
Massey Energy Co.D | 3,400 | 66,436 | |||
Nabors Industries, Ltd.* | 11,300 | 176,054 | |||
National Oilwell Varco, Inc.* | 15,900 | 519,294 | |||
Noble Energy, Inc. | 6,700 | 395,099 | |||
Occidental Petroleum Corporation | 31,200 | 2,053,272 | |||
Peabody Energy Corporation | 10,100 | 304,616 | |||
Pioneer Natural Resources Co. | 4,500 | 114,750 | |||
Range Resources CorporationD | 5,784 | 239,515 | |||
Rowan Cos., Inc.D | 4,600 | 88,872 | |||
Schlumberger, Ltd. | 45,700 | 2,472,827 | |||
Smith International, Inc. | 8,123 | 209,167 | |||
Southwestern Energy Co.* | 13,200 | 512,820 | |||
Spectra Energy Corporation | 24,284 | 410,885 | |||
Williams Cos., Inc. | 22,300 | 348,103 | |||
XTO Energy, Inc. | 22,457 | 856,510 | |||
| 15,613,686 | |||||
Producer Durables — 5.7% | |||||
Agilent Technologies, Inc.* | 13,200 | 268,092 | |||
American Tower Corporation Class A* | 15,500 | 488,715 | |||
Applied Materials, Inc. | 50,300 | 551,791 | |||
Boeing Co. (The) | 28,000 | 1,190,000 | |||
Caterpillar, Inc. | 23,200 | 766,528 | |||
Centex Corporation | 5,200 | 43,992 | |||
Cooper Industries, Ltd. Class A | 6,200 | 192,510 | |||
Cummins, Inc. | 7,600 | 267,596 | |||
Danaher Corporation | 9,800 | 605,052 | |||
Deere & Co. | 16,100 | 643,195 | |||
Dover Corporation | 7,000 | 231,630 | |||
DR Horton, Inc.D | 10,200 | 95,472 | |||
Eaton Corporation | 6,528 | 291,214 | |||
Emerson Electric Co. | 29,000 | 939,600 | |||
Flowserve Corporation | 2,200 | 153,582 | |||
General Dynamics Corporation | 14,800 | 819,772 | |||
Goodrich Corporation | 4,900 | 244,853 | |||
Grainger (W.W.), Inc. | 2,500 | 204,700 | |||
Honeywell International, Inc. | 28,800 | 904,320 | |||
Illinois Tool Works, Inc. | 15,000 | 560,100 | |||
ITT Industries, Inc.D | 6,800 | 302,600 | |||
KB HomeD | 2,900 | 39,672 | |||
KLA-Tencor Corporation | 6,500 | 164,125 | |||
L-3 Communications Holdings, Inc. | 4,400 | 305,272 | |||
Lennar Corporation Class A | 5,600 | 54,264 | |||
Lexmark International, Inc.* | 2,900 | 45,965 | |||
Lockheed Martin Corporation | 12,600 | 1,016,190 | |||
Manitowoc Co., Inc.D | 5,000 | 26,300 | |||
Motorola, Inc. | 86,900 | 576,147 | |||
Northrop Grumman Corporation | 12,656 | 578,126 | |||
Novellus Systems, Inc.D* | 4,100 | 68,470 | |||
Pall Corporation | 4,400 | 116,864 | |||
Parker Hannifin Corporation | 6,150 | 264,204 | |||
Pitney Bowes, Inc. | 7,800 | 171,054 | |||
Pulte Homes, Inc.D | 8,408 | 74,243 | |||
Raytheon Co. | 15,300 | 679,779 | |||
Republic Services, Inc. | 12,100 | 295,361 | |||
Rockwell Automation, Inc. | 5,300 | 170,236 | |||
Rockwell Collins, Inc. | 6,000 | 250,380 | |||
Stericycle, Inc.* | 3,200 | 164,896 | |||
Teradyne, Inc.D* | 6,900 | 47,334 | |||
United Technologies Corporation | 36,300 | 1,886,148 | |||
Waste Management, Inc. | 18,900 | 532,224 | |||
Waters Corporation* | 3,700 | 190,439 | |||
Xerox Corporation | 32,300 | 209,304 | |||
| 17,692,311 | |||||
Technology — 16.5% | |||||
Adobe Systems, Inc.* | 20,300 | 574,490 | |||
Advanced Micro Devices, Inc.D* | 23,100 | 89,397 | |||
Affiliated Computer Services, Inc. Class A* | 3,600 | 159,912 | |||
Akamai Technologies, Inc.* | 6,400 | 122,752 | |||
Altera Corporation | 11,600 | 188,848 | |||
Amphenol Corporation | 6,600 | 208,824 | |||
Analog Devices, Inc. | 10,800 | 267,624 | |||
Apple, Inc.* | 34,100 | 4,856,863 | |||
Autodesk, Inc.* | 8,360 | 158,673 | |||
BMC Software, Inc.* | 7,100 | 239,909 | |||
Broadcom Corporation Class A* | 16,150 | 400,358 | |||
CA, Inc. | 15,570 | 271,385 | |||
Ciena CorporationD* | 3,928 | 40,655 | |||
Cisco Systems, Inc.* | 220,400 | 4,108,256 | |||
Citrix Systems, Inc.* | 7,200 | 229,608 | |||
Cognizant Technology Solutions Corporation Class A* | 11,400 | 304,380 | |||
Computer Sciences Corporation* | 5,700 | 252,510 | |||
Compuware Corporation* | 9,600 | 65,856 | |||
Corning, Inc. | 59,200 | 950,752 | |||
Dell, Inc.* | 67,100 | 921,283 | |||
Electronic Arts, Inc.* | 12,500 | 271,500 | |||
EMC Corporation* | 77,300 | 1,012,630 | |||
FLIR Systems, Inc.* | 5,400 | 121,824 | |||
Google, Inc.* | 9,135 | 3,851,225 | |||
Harris Corporation | 5,000 | 141,800 | |||
Hewlett-Packard Co. | 91,502 | 3,536,552 | |||
Intel Corporation | 213,200 | 3,528,460 | |||
International Business Machines Corporation | 50,500 | 5,273,210 | |||
Intuit, Inc.* | 12,600 | 354,816 | |||
Jabil Circuit, Inc. | 8,100 | 60,102 | |||
JDS Uniphase Corporation* | 8,475 | 48,477 | |||
Juniper Networks, Inc.* | 20,300 | 479,080 | |||
Linear Technology Corporation | 8,800 | 205,480 | |||
LSI Corporation* | 24,300 | 110,808 | |||
McAfee, Inc.* | 5,800 | 244,702 | |||
MEMC Electronic Materials, Inc.* | 8,500 | 151,385 | |||
Microchip Technology, Inc.D | 7,300 | 164,615 | |||
See Notes to Financial Statements.
87
Table of Contents
| Equity Index Fund | ||
| SCHEDULE OF INVESTMENTS (Continued) |
| Shares | Value | ||||||
Micron Technology, Inc.* | 31,200 | $ | 157,872 | ||||
Microsoft Corporation | 292,630 | 6,955,815 | |||||
Molex, Inc.D | 5,250 | 81,638 | |||||
National Semiconductor CorporationD | 7,400 | 92,870 | |||||
NetApp, Inc.* | 13,000 | 256,360 | |||||
Novell, Inc.D* | 13,400 | 60,702 | |||||
NVIDIA Corporation* | 20,250 | 228,622 | |||||
Oracle Corporation | 144,600 | 3,097,332 | |||||
QLogic CorporationD* | 4,700 | 59,596 | |||||
QUALCOMM, Inc. | 63,500 | 2,870,200 | |||||
Salesforce.com, Inc.D* | 3,900 | 148,863 | |||||
SanDisk Corporation* | 9,000 | 132,210 | |||||
Sun Microsystems, Inc.* | 28,600 | 263,692 | |||||
Symantec Corporation* | 31,670 | 492,785 | |||||
Tellabs, Inc.* | 15,000 | 85,950 | |||||
Teradata Corporation* | 6,700 | 156,981 | |||||
Texas Instruments, Inc. | 48,200 | 1,026,660 | |||||
VeriSign, Inc.D* | 7,600 | 140,448 | |||||
Western Digital Corporation* | 8,500 | 225,250 | |||||
Xilinx, Inc.D | 10,800 | 220,968 | |||||
Yahoo!, Inc.* | 53,700 | 840,942 | |||||
| 51,564,757 | |||||||
Utilities — 7.3% | |||||||
AES Corporation* | 25,100 | 291,411 | |||||
Allegheny Energy, Inc. | 6,700 | 171,855 | |||||
Ameren CorporationD | 7,800 | 194,142 | |||||
American Electric Power Co., Inc. | 18,600 | 537,354 | |||||
AT&T, Inc. | 225,472 | 5,600,724 | |||||
Centerpoint Energy, Inc. | 12,300 | 136,284 | |||||
CenturyTel, Inc.D | 4,200 | 128,940 | |||||
CMS Energy CorporationD | 8,600 | 103,888 | |||||
Consolidated Edison, Inc.D | 10,800 | 404,136 | |||||
Constellation Energy Group, Inc. | 7,200 | 191,376 | |||||
Dominion Resources, Inc. | 22,940 | 766,655 | |||||
DTE Energy Co. | 6,100 | 195,200 | |||||
Duke Energy Corporation | 49,968 | 729,033 | |||||
Dynegy, Inc. Class A* | 18,824 | 42,730 | |||||
Edison International | 12,800 | 402,688 | |||||
Embarq Corporation | 5,444 | 228,975 | |||||
Entergy Corporation | 7,552 | 585,431 | |||||
Exelon Corporation | 25,424 | 1,301,963 | |||||
FirstEnergy Corporation | 11,984 | 464,380 | |||||
FPL Group, Inc. | 15,700 | 892,702 | |||||
Frontier Communications CorporationD | 12,000 | 85,680 | |||||
Integrys Energy Group, Inc.D | 2,800 | 83,972 | |||||
MetroPCS Communications, Inc.* | 9,700 | 129,107 | |||||
Nicor, Inc.D | 1,700 | 58,854 | |||||
NiSource, Inc. | 10,300 | 120,098 | |||||
Northeast Utilities | 6,100 | 136,091 | |||||
Pepco Holdings, Inc. | 7,600 | 102,144 | |||||
PG&E Corporation | 13,900 | 534,316 | |||||
Pinnacle West Capital Corporation | 3,800 | 114,570 | |||||
PPL Corporation | 14,300 | 471,328 | |||||
Progress Energy, Inc. | 10,426 | 394,416 | |||||
Public Service Enterprise Group, Inc. | 19,100 | 623,233 | |||||
Questar Corporation | 6,400 | 198,784 | |||||
Qwest Communications International, Inc.D | 55,800 | 231,570 | |||||
SCANA CorporationD | 4,400 | 142,868 | |||||
Sempra Energy | 9,400 | 466,522 | |||||
Southern Co. (The) | 30,300 | 944,148 | |||||
Sprint Nextel Corporation* | 108,993 | 524,256 | |||||
TECO Energy, Inc. | 8,000 | 95,440 | |||||
Verizon Communications, Inc. | 108,674 | 3,339,552 | |||||
Windstream Corporation | 16,699 | 139,604 | |||||
Wisconsin Energy CorporationD | 4,300 | 175,053 | |||||
Xcel Energy Inc. | 16,900 | 311,129 | |||||
| 22,792,602 | |||||||
Total Common Stocks | 301,286,760 | ||||||
MONEY MARKET FUNDS — 10.3% | |||||||
GuideStone Money Market Fund (GS4 Class)¥ | 11,924,199 | 11,924,199 | |||||
Northern Institutional Liquid Assets Portfolio§ | 20,248,889 | 20,248,889 | |||||
Total Money Market Funds | 32,173,088 | ||||||
| Par | |||||||
U.S. TREASURY OBLIGATIONS — 0.8% | |||||||
U.S. Treasury Bills | |||||||
0.27%, 11/19/09‡‡ | $ | 1,770,000 | 1,768,301 | ||||
0.28%, 11/19/09‡‡ | 705,000 | 704,323 | |||||
Total U.S. Treasury Obligations | 2,472,624 | ||||||
TOTAL INVESTMENTS — 107.7% | 335,932,472 | ||||||
Liabilities in Excess of Other Assets — (7.7)% | (23,985,120 | ) | |||||
NET ASSETS — 100.0% | $ | 311,947,352 | |||||
PORTFOLIO SUMMARY (based on net assets)
| % | ||
Technology | 16.5 | |
Financial Services | 13.8 | |
Healthcare | 13.8 | |
Consumer Discretionary | 10.8 | |
Money Market Funds | 10.3 | |
Consumer Staples | 7.8 | |
Integrated Oils | 7.3 | |
Utilities | 7.3 | |
Producer Durables | 5.7 | |
Other Energy | 5.0 | |
Materials & Processing | 3.9 | |
Futures Contracts | 3.2 | |
Auto & Transportation | 2.6 | |
Other | 2.1 | |
U.S. Treasury Obligations | 0.8 | |
| 110.9 | ||
See Notes to Financial Statements.
88
Table of Contents
FAS 157 DISCLOSURE
The following is a summary of the inputs used, as of June 30, 2009, in valuing the Fund’s assets carried at fair value:
Valuation Inputs | Investments in Securities | Other Financial Instruments*** | |||||
Level 1 — Quoted Prices | |||||||
Common Stocks | $ | 301,286,760 | $ | — | |||
Futures Contracts | — | (180,787 | ) | ||||
Money Market Funds | 32,173,088 | — | |||||
Level 2 — Other Significant Observable Inputs | |||||||
U.S. Treasury Obligations | 2,472,624 | — | |||||
Level 3 — Significant Unobservable Inputs | — | — | |||||
Total | $ | 335,932,472 | $ | (180,787 | ) | ||
| *** | Other financial instruments are derivative instruments not reflected in the Schedule of Investments, such as futures, forwards and swap contracts, which are valued at the unrealized appreciation (depreciation) on the investment. Details of these investments can be found in the Notes to Financial Statements. |
See Notes to Financial Statements.
89
Table of Contents
| Real Estate Securities Fund | ||
| SCHEDULE OF INVESTMENTS | June 30, 2009 (Unaudited) |
| Shares | Value | ||||
COMMON STOCKS — 92.9% | |||||
Financial Services — 92.9% | |||||
AMB Property Corporation REITD | 143,900 | $ | 2,706,759 | ||
American Campus Communities, Inc. REIT | 120,400 | 2,670,472 | |||
Apartment Investment & Management Co. Class A REITD | 72,350 | 640,298 | |||
AvalonBay Communities, Inc. REIT | 63,335 | 3,542,960 | |||
BioMed Realty Trust, Inc. REITD | 139,450 | 1,426,573 | |||
Boston Properties, Inc. REITD | 82,050 | 3,913,785 | |||
Cogdell Spencer, Inc. REITD | 102,950 | 441,656 | |||
DCT Industrial Trust, Inc. REITD | 74,800 | 305,184 | |||
DiamondRock Hospitality Co. REITD | 105,050 | 657,613 | |||
Digital Realty Trust, Inc. REITD | 100,400 | 3,599,340 | |||
Duke Realty Corporation REITD | 202,400 | 1,775,048 | |||
Equity Lifestyle Properties, Inc. REIT | 22,500 | 836,550 | |||
Equity Residential Properties Trust REIT | 135,950 | 3,022,168 | |||
Essex Property Trust, Inc. REITD | 28,450 | 1,770,444 | |||
Government Properties Income Trust REIT* | 19,950 | 409,574 | |||
HCP, Inc. REITD | 110,850 | 2,348,912 | |||
Host Hotels & Resorts, Inc. REITD | 102,827 | 862,719 | |||
Kilroy Realty Corporation REITD | 81,300 | 1,669,902 | |||
Kimco Realty Corporation REITD | 349,000 | 3,507,450 | |||
LaSalle Hotel Properties REITD | 85,950 | 1,060,623 | |||
LTC Properties, Inc. REITD | 16,235 | 332,006 | |||
Macerich Co. (The) REITD | 22,300 | 392,703 | |||
Medical Properties Trust, Inc. REITD | 139,059 | 844,088 | |||
Nationwide Health Properties, Inc. REITD | 117,910 | 3,035,003 | |||
Post Properties, Inc. REITD | 78,950 | 1,061,088 | |||
ProLogis REITD | 386,400 | 3,114,384 | |||
Public Storage REITD | 98,980 | 6,481,210 | |||
Regency Centers Corporation REITD | 107,550 | 3,754,570 | |||
Senior Housing Properties Trust REITD | 176,335 | 2,877,787 | |||
Simon Property Group, Inc. REITD | 184,828 | 9,505,696 | |||
SL Green Realty Corporation REITD | 146,650 | 3,364,151 | |||
Sunstone Hotel Investors, Inc. REITD | 135,700 | 725,995 | |||
Ventas, Inc. REITD | 116,586 | 3,481,258 | |||
Vornado Realty Trust REITD | 86,343 | 3,888,038 | |||
Total Common Stocks | 80,026,007 | ||||
MONEY MARKET FUNDS — 35.0% | |||||
GuideStone Money Market Fund (GS4 Class)¥ | 4,500,242 | 4,500,242 | |||
Northern Institutional Liquid Assets Portfolio§ | 25,654,407 | 25,654,407 | |||
Total Money Market Funds | 30,154,649 | ||||
| Par | |||||||
U.S. TREASURY OBLIGATION — 1.1% | |||||||
U.S. Treasury Bill | |||||||
0.27%, 11/19/09‡‡ (Cost $918,975) | $ | 920,000 | 919,117 | ||||
TOTAL INVESTMENTS — 129.0% | 111,099,773 | ||||||
Liabilities in Excess of Other Assets — (29.0)% | (24,947,039 | ) | |||||
NET ASSETS — 100.0% | $ | 86,152,734 | |||||
PORTFOLIO SUMMARY (based on net assets)
| % | ||
Financial Services | 92.9 | |
Money Market Funds | 35.0 | |
Futures Contracts | 6.3 | |
U.S. Treasury Obligation | 1.1 | |
| 135.3 | ||
FAS 157 DISCLOSURE
The following is a summary of the inputs used, as of June 30, 2009, in valuing the Fund’s assets carried at fair value:
Valuation Inputs | Investments in Securities | Other Financial Instruments*** | |||||
Level 1 — Quoted Prices | |||||||
Common Stocks | $ | 80,026,007 | $ | — | |||
Futures Contracts | — | (115,310 | ) | ||||
Money Market Funds | 30,154,649 | — | |||||
Level 2 — Other Significant Observable Inputs | |||||||
U.S. Treasury Obligation | 919,117 | — | |||||
Level 3 — Significant Unobservable Inputs | — | — | |||||
Total Assets | $ | 111,099,773 | $ | (115,310 | ) | ||
| *** | Other financial instruments are derivative instruments not reflected in the Schedule of Investments, such as futures, forwards and swap contracts, which are valued at the unrealized appreciation (depreciation) on the investment. Details of these investments can be found in the Notes to Financial Statements. |
See Notes to Financial Statements.
90
Table of Contents
| Value Equity Fund | ||
| SCHEDULE OF INVESTMENTS | June 30, 2009 (Unaudited) |
| Shares | Value | ||||
COMMON STOCKS — 95.4% | |||||
Auto & Transportation — 1.6% | |||||
Burlington Northern Santa Fe Corporation | 116,600 | $ | 8,574,764 | ||
Copa Holdings SA Class AD | 43,500 | 1,775,670 | |||
CSX Corporation | 19,300 | 668,359 | |||
FedEx Corporation | 15,300 | 850,986 | |||
Ford Motor Co.* | 152,500 | 925,675 | |||
Johnson Controls, Inc.D | 13,200 | 286,704 | |||
Norfolk Southern CorporationD | 38,900 | 1,465,363 | |||
PACCAR, Inc. | 1,200 | 39,012 | |||
Union Pacific Corporation | 33,800 | 1,759,628 | |||
| 16,346,161 | |||||
Consumer Discretionary — 11.5% | |||||
Aeropostale, Inc.D* | 66,400 | 2,275,528 | |||
Big Lots, Inc.D* | 69,900 | 1,469,997 | |||
BJ’s Wholesale Club, Inc.D* | 32,700 | 1,053,921 | |||
Block (H&R), Inc. | 130,700 | 2,251,961 | |||
Carnival CorporationD | 303,600 | 7,823,772 | |||
Coach, Inc. | 96,500 | 2,593,920 | |||
Comcast Corporation Class A | 552,800 | 8,010,072 | |||
DIRECTV Group, Inc. (The)D* | 69,300 | 1,712,403 | |||
eBay, Inc.* | 41,500 | 710,895 | |||
Estee Lauder Cos., Inc. Class AD | 89,400 | 2,920,698 | |||
Gannett Co., Inc.D | 154,000 | 549,780 | |||
Gap, Inc. (The) | 324,800 | 5,326,720 | |||
Garmin, Ltd.D | 114,600 | 2,729,772 | |||
Home Depot, Inc. (The)D | 540,488 | 12,771,731 | |||
Interpublic Group Cos., Inc.D* | 298,000 | 1,504,900 | |||
Kimberly-Clark Corporation | 142,400 | 7,466,032 | |||
Kohl’s Corporation* | 1,000 | 42,750 | |||
Liberty Media Corporation* | 25,100 | 671,425 | |||
Lowe’s Cos., Inc. | 49,200 | 954,972 | |||
Mattel, Inc. | 306,300 | 4,916,115 | |||
McDonald’s Corporation | 136,000 | 7,818,640 | |||
Netflix, Inc.D* | 45,600 | 1,885,104 | |||
News Corporation | 110,200 | 1,003,922 | |||
Panera Bread Co.D* | 29,200 | 1,455,912 | |||
Paychex, Inc.D | 108,500 | 2,734,200 | |||
Polo Ralph Lauren CorporationD | 42,700 | 2,286,158 | |||
Shaw Communications, Inc. Class B | 128,100 | 2,159,766 | |||
Stanley Works (The) | 246,600 | 8,344,944 | |||
Time Warner Cable, Inc.* | 39,980 | 1,266,167 | |||
Time Warner, Inc. | 494,532 | 12,457,261 | |||
TJX Cos., Inc. | 84,100 | 2,645,786 | |||
Walt Disney Co. (The) | 90,100 | 2,102,033 | |||
| 113,917,257 | |||||
Consumer Staples — 4.7% | |||||
Coca-Cola Co. (The) | 24,100 | 1,156,559 | |||
ConAgra Foods, Inc. | 181,700 | 3,463,202 | |||
CVS Caremark Corporation | 154,273 | 4,916,680 | |||
Dean Foods Co.* | 210,700 | 4,043,333 | |||
General Mills, Inc. | 9,600 | 537,792 | |||
Herbalife, Ltd.D | 62,200 | 1,961,788 | |||
Kraft Foods, Inc. Class AD | 484,200 | 12,269,628 | |||
Kroger Co.D | 95,600 | 2,107,980 | |||
Pepsi Bottling Group, Inc. | 80,400 | 2,720,736 | |||
Procter & Gamble Co. | 96,896 | 4,951,386 | |||
Safeway, Inc.D | 68,900 | 1,403,493 | |||
Sara Lee Corporation | 265,000 | 2,586,400 | |||
Sysco Corporation | 208,100 | 4,678,088 | |||
| 46,797,065 | |||||
Financial Services — 16.5% | |||||
Allstate Corporation (The) | 295,000 | 7,198,000 | |||
American Express Co.D | 348,200 | 8,092,168 | |||
American Financial Group, Inc. | 106,700 | 2,302,586 | |||
American International Group, Inc.D* | 73,100 | 84,796 | |||
Ameriprise Financial, Inc. | 102,900 | 2,497,383 | |||
Assurant, Inc.D | 45,200 | 1,088,868 | |||
AXIS Capital Holdings, Ltd.D | 67,500 | 1,767,150 | |||
Bank of America Corporation | 703,426 | 9,285,223 | |||
Bank of New York Mellon Corporation | 88,690 | 2,599,504 | |||
BB&T CorporationD | 31,800 | 698,964 | |||
Capital One Financial Corporation | 278,955 | 6,103,535 | |||
Chubb Corporation | 105,845 | 4,221,099 | |||
Cincinnati Financial Corporation | 73,100 | 1,633,785 | |||
Citigroup, Inc.D | 619,333 | 1,839,419 | |||
CME Group, Inc. | 3,000 | 933,330 | |||
Credicorp, Ltd. | 45,800 | 2,665,560 | |||
Endurance Specialty Holdings, Ltd. | 84,700 | 2,481,710 | |||
Federated Investors, Inc. Class BD | 61,700 | 1,486,353 | |||
Franklin Resources, Inc.D | 51,300 | 3,694,113 | |||
Goldman Sachs Group, Inc. | 46,465 | 6,850,800 | |||
Hartford Financial Services Group, Inc. | 15,804 | 187,593 | |||
Hudson City Bancorp, Inc. | 224,500 | 2,983,605 | |||
Invesco, Ltd. | 89,200 | 1,589,544 | |||
JPMorgan Chase & Co. | 739,980 | 25,240,718 | |||
Knight Capital Group, Inc. Class A* | 74,300 | 1,266,815 | |||
Lincoln National Corporation | 44,500 | 765,845 | |||
Loews Corporation | 16,248 | 445,195 | |||
MetLife, Inc. | 28,100 | 843,281 | |||
Moody’s Corporation | 101,600 | 2,677,160 | |||
Morgan Stanley | 117,700 | 3,355,627 | |||
NewAlliance Bancshares, Inc.D | 104,800 | 1,205,200 | |||
NYSE Euronext | 109,800 | 2,992,050 | |||
Odyssey Re Holdings CorporationD | 7,300 | 291,854 | |||
Platinum Underwriters Holdings, Ltd.D | 56,100 | 1,603,899 | |||
PNC Financial Services Group, Inc.D | 22,300 | 865,463 | |||
Progressive Corporation (The)* | 86,400 | 1,305,504 | |||
Prudential Financial, Inc. | 9,900 | 368,478 | |||
SEI Investments Co. | 53,400 | 963,336 | |||
Simon Property Group, Inc. REIT | 6,700 | 344,581 | |||
SLM CorporationD* | 487,100 | 5,002,517 | |||
State Street Corporation | 11,300 | 533,360 | |||
SunTrust Banks, Inc.D | 99,700 | 1,640,065 | |||
T. Rowe Price Group, Inc. | 43,700 | 1,820,979 | |||
Torchmark CorporationD | 57,200 | 2,118,688 | |||
Travelers Cos., Inc. | 342,700 | 14,064,408 | |||
US BancorpD | 92,400 | 1,655,808 | |||
W.R. Berkley CorporationD | 97,100 | 2,084,737 | |||
Wells Fargo & Co.D | 662,649 | 16,075,865 | |||
See Notes to Financial Statements.
91
Table of Contents
Value Equity Fund
SCHEDULE OF INVESTMENTS (Continued)
| Shares | Value | ||||
XL Capital, Ltd. Class AD | 148,400 | $ | 1,700,664 | ||
| 163,517,185 | |||||
Healthcare — 13.3% | |||||
Aetna, Inc. | 69,700 | 1,745,985 | |||
AmerisourceBergen CorporationD | 171,200 | 3,037,088 | |||
Amgen, Inc.* | 58,900 | 3,118,166 | |||
Boston Scientific Corporation* | 604,900 | 6,133,686 | |||
Bristol-Myers Squibb Co. | 856,900 | 17,403,639 | |||
Cardinal Health, Inc.D | 147,300 | 4,500,015 | |||
Eli Lilly & Co. | 23,700 | 820,968 | |||
Endo Pharmaceuticals Holdings, Inc.D* | 55,300 | 990,976 | |||
Forest Laboratories, Inc.D* | 52,500 | 1,318,275 | |||
Hologic, Inc.D* | 288,600 | 4,106,778 | |||
Johnson & Johnson | 213,100 | 12,104,080 | |||
Lincare Holdings, Inc.D* | 45,600 | 1,072,512 | |||
McKesson Corporation | 67,700 | 2,978,800 | |||
Medtronic, Inc. | 93,100 | 3,248,259 | |||
Merck & Co., Inc. | 83,700 | 2,340,252 | |||
Pfizer, Inc. | 1,934,200 | 29,013,000 | |||
Schering-Plough Corporation | 12,300 | 308,976 | |||
Tenet Healthcare Corporation* | 1,001,200 | 2,823,384 | |||
Thermo Fisher Scientific, Inc.* | 18,800 | 766,476 | |||
UnitedHealth Group, Inc. | 407,000 | 10,166,860 | |||
Watson Pharmaceuticals, Inc.* | 185,100 | 6,236,019 | |||
WellPoint, Inc.D* | 298,059 | 15,168,223 | |||
Wyeth | 50,500 | 2,292,195 | |||
Zimmer Holdings, Inc.* | 10,300 | 438,780 | |||
| 132,133,392 | |||||
Integrated Oils — 10.6% | |||||
Chevron CorporationD | 413,900 | 27,420,875 | |||
ConocoPhillips | 430,500 | 18,106,830 | |||
Exxon Mobil Corporation | 464,900 | 32,501,159 | |||
Hess Corporation | 14,000 | 752,500 | |||
Marathon Oil CorporationD | 464,896 | 14,007,316 | |||
Murphy Oil Corporation | 31,000 | 1,683,920 | |||
Sunoco, Inc.D | 109,600 | 2,542,720 | |||
Valero Energy CorporationD | 466,800 | 7,884,252 | |||
| 104,899,572 | |||||
Materials & Processing — 3.2% | |||||
Air Products & Chemicals, Inc. | 6,600 | 426,294 | |||
Alcoa, Inc.D | 295,100 | 3,048,383 | |||
Allegheny Technologies, Inc. | 34,200 | 1,194,606 | |||
Archer-Daniels-Midland Co. | 56,800 | 1,520,536 | |||
Ball Corporation | 35,200 | 1,589,632 | |||
Bemis Co., Inc. | 48,800 | 1,229,760 | |||
Dow Chemical Co. (The) | 54,500 | 879,630 | |||
Du Pont (E.I.) de Nemours & Co.D | 247,300 | 6,335,826 | |||
Freeport-McMoRan Copper & Gold, Inc. | 8,000 | 400,880 | |||
Lennox International, Inc.D | 30,100 | 966,511 | |||
Lubrizol Corporation | 54,800 | 2,592,588 | |||
MeadWestvaco CorporationD | 272,800 | 4,476,648 | |||
Nucor Corporation | 15,200 | 675,336 | |||
Owens Corning* | 44,700 | 571,266 | |||
Owens-Illinois, Inc.D* | 43,600 | 1,221,236 | |||
Reliance Steel & Aluminum Co. | 30,400 | 1,167,056 | |||
Southern Copper Corporation | 2,100 | 42,924 | |||
United States Steel CorporationD | 104,400 | 3,731,256 | |||
| 32,070,368 | |||||
Other — 2.6% | |||||
3M Co. | 73,800 | 4,435,380 | |||
General Electric Co.D | 1,266,900 | 14,848,068 | |||
Tyco International, Ltd. | 268,975 | 6,987,971 | |||
| 26,271,419 | |||||
Other Energy — 4.8% | |||||
Anadarko Petroleum Corporation | 86,000 | 3,903,540 | |||
Apache Corporation | 33,100 | 2,388,165 | |||
Baker Hughes, Inc. | 89,800 | 3,272,312 | |||
Chesapeake Energy CorporationD | 207,400 | 4,112,742 | |||
Devon Energy Corporation | 68,400 | 3,727,800 | |||
EOG Resources, Inc. | 12,100 | 821,832 | |||
Halliburton Co. | 43,400 | 898,380 | |||
National Oilwell Varco, Inc.* | 20,500 | 669,530 | |||
Occidental Petroleum Corporation | 250,900 | 16,511,729 | |||
Patterson-UTI Energy, Inc.D | 197,200 | 2,535,992 | |||
Schlumberger, Ltd. | 31,800 | 1,720,698 | |||
SEACOR Holdings, Inc.* | 15,900 | 1,196,316 | |||
Spectra Energy CorporationD | 267,450 | 4,525,254 | |||
Williams Cos., Inc. | 27,800 | 433,958 | |||
XTO Energy, Inc. | 28,100 | 1,071,734 | |||
| 47,789,982 | |||||
Producer Durables — 7.3% | |||||
Applied Materials, Inc. | 520,900 | 5,714,273 | |||
Boeing Co. (The) | 60,900 | 2,588,250 | |||
Caterpillar, Inc. | 14,500 | 479,080 | |||
Cummins, Inc.D | 53,800 | 1,894,298 | |||
Danaher Corporation | 4,600 | 284,004 | |||
Deere & Co. | 15,400 | 615,230 | |||
Dover Corporation | 54,200 | 1,793,478 | |||
Emerson Electric Co. | 225,600 | 7,309,440 | |||
Gardner Denver, Inc.* | 45,200 | 1,137,684 | |||
General Dynamics Corporation | 15,400 | 853,006 | |||
Goodrich Corporation | 43,100 | 2,153,707 | |||
Honeywell International, Inc. | 415,300 | 13,040,420 | |||
Illinois Tool Works, Inc.D | 244,700 | 9,137,098 | |||
Joy Global, Inc.D | 36,000 | 1,285,920 | |||
KLA-Tencor Corporation | 141,300 | 3,567,825 | |||
L-3 Communications Holdings, Inc. | 38,500 | 2,671,130 | |||
Lennar Corporation Class A | 371,256 | 3,597,471 | |||
Motorola, Inc. | 695,600 | 4,611,828 | |||
Northrop Grumman Corporation | 85,965 | 3,926,881 | |||
Raytheon Co.D | 71,477 | 3,175,723 | |||
United Technologies Corporation | 3,300 | 171,468 | |||
Waste Management, Inc. | 104,100 | 2,931,456 | |||
| 72,939,670 | |||||
Technology — 7.8% | |||||
Activision Blizzard, Inc.* | 11,700 | 147,771 | |||
Avnet, Inc.* | 58,500 | 1,230,255 | |||
CA, Inc. | 144,900 | 2,525,607 | |||
Computer Sciences Corporation* | 35,800 | 1,585,940 | |||
Corning, Inc. | 10,800 | 173,448 | |||
See Notes to Financial Statements.
92
Table of Contents
| Shares | Value | ||||||
Dell, Inc.* | 390,200 | $ | 5,357,446 | ||||
EMC Corporation* | 87,300 | 1,143,630 | |||||
Flextronics International, Ltd.* | 828,338 | 3,404,469 | |||||
Hewlett-Packard Co. | 228,100 | 8,816,065 | |||||
Ingram Micro, Inc. Class A* | 93,900 | 1,643,250 | |||||
Intel Corporation | 599,800 | 9,926,690 | |||||
International Business Machines Corporation | 166,300 | 17,365,046 | |||||
LSI CorporationD* | 96,448 | 439,803 | |||||
Microsoft Corporation | 338,600 | 8,048,522 | |||||
NeuStar, Inc. Class AD* | 121,300 | 2,688,008 | |||||
Sybase, Inc.* | 19,800 | 620,532 | |||||
Symantec Corporation* | 207,700 | 3,231,812 | |||||
Texas Instruments, Inc. | 136,800 | 2,913,840 | |||||
Tyco Electronics, Ltd.D | 282,075 | 5,243,774 | |||||
Western Digital Corporation* | 51,100 | 1,354,150 | |||||
Yahoo!, Inc.* | 4,000 | 62,640 | |||||
| 77,922,698 | |||||||
Utilities — 11.5% | |||||||
AES Corporation* | 199,100 | 2,311,551 | |||||
Alliant Energy CorporationD | 91,000 | 2,377,830 | |||||
American Electric Power Co., Inc. | 219,700 | 6,347,133 | |||||
AT&T, Inc. | 1,428,777 | 35,490,821 | |||||
Dominion Resources, Inc. | 29,000 | 969,180 | |||||
DTE Energy Co.D | 84,500 | 2,704,000 | |||||
Duke Energy CorporationD | 330,800 | 4,826,372 | |||||
Edison International | 80,500 | 2,532,530 | |||||
Entergy Corporation | 86,700 | 6,720,984 | |||||
Exelon Corporation | 29,100 | 1,490,211 | |||||
FirstEnergy Corporation | 59,052 | 2,288,265 | |||||
FPL Group, Inc. | 17,600 | 1,000,736 | |||||
Nokia Corporation ADRD | 327,600 | 4,776,408 | |||||
NRG Energy, Inc.D* | 60,500 | 1,570,580 | |||||
NV Energy, Inc.D | 208,000 | 2,244,320 | |||||
PG&E Corporation | 17,700 | 680,388 | |||||
Progress Energy, Inc. Contingent Value Obligation+* | 3,100 | 1,209 | |||||
Public Service Enterprise Group, Inc. | 108,300 | 3,533,829 | |||||
Qwest Communications International, Inc.D | 1,528,900 | 6,344,935 | |||||
Sempra EnergyD | 76,800 | 3,811,584 | |||||
Southern Co. (The)D | 38,400 | 1,196,544 | |||||
Sprint Nextel Corporation* | 136,100 | 654,641 | |||||
Verizon Communications, Inc. | 660,424 | 20,294,829 | |||||
| 114,168,880 | |||||||
Total Common Stocks | 948,773,649 | ||||||
FOREIGN COMMON STOCKS — 0.4% | |||||||
Bermuda — 0.3% | |||||||
Lazard, Ltd. Class A | 90,800 | 2,444,336 | |||||
Russia — 0.1% | |||||||
CTC Media, Inc.D* | 119,000 | 1,406,580 | |||||
Total Foreign Common Stocks | 3,850,916 | ||||||
MONEY MARKET FUNDS — 10.8% | |||||||
GuideStone Money Market Fund (GS4 Class)¥ | 36,312,700 | 36,312,700 | |||||
Northern Institutional Liquid Assets Portfolio§ | 71,083,280 | 71,083,280 | |||||
Total Money Market Funds (Cost $107,395,980) | 107,395,980 | ||||||
| Par | |||||||
U.S. TREASURY OBLIGATIONS — 0.7% | |||||||
U.S. Treasury Bills | |||||||
0.27%, 11/19/09‡‡ | $ | 6,705,000 | 6,698,563 | ||||
0.28%, 11/19/09‡‡ | 35,000 | 34,966 | |||||
0.28%, 11/19/09‡‡ | 390,000 | 389,626 | |||||
0.30%, 11/19/09‡‡ | 95,000 | 94,909 | |||||
Total U.S. Treasury Obligations | 7,218,064 | ||||||
TOTAL INVESTMENTS — 107.3% | 1,067,238,609 | ||||||
Liabilities in Excess of Other Assets — (7.3)% | (73,016,459 | ) | |||||
Net Assets — 100.0% | $ | 994,222,150 | |||||
PORTFOLIO SUMMARY (based on net assets)
| % | ||
Financial Services | 16.5 | |
Healthcare | 13.3 | |
Consumer Discretionary | 11.5 | |
Utilities | 11.5 | |
Money Market Funds | 10.8 | |
Intergrated Oils | 10.6 | |
Technology | 7.8 | |
Producer Durables | 7.3 | |
Other Energy | 4.8 | |
Consumer Staples | 4.7 | |
Futures Contracts | 4.1 | |
Materials & Processing | 3.2 | |
Other | 2.6 | |
Auto & Transportation | 1.6 | |
U.S. Treasury Obligation | 0.7 | |
Foreign Common Stocks | 0.4 | |
| 111.4 | ||
See Notes to Financial Statements.
93
Table of Contents
Value Equity Fund
SCHEDULE OF INVESTMENTS (Continued)
FAS 157 DISCLOSURE
The following is a summary of the inputs used, as of June 30, 2009, in valuing the Fund’s assets carried at fair value:
Valuation Inputs | Investments in Securities | Other Financial Instruments*** | |||||
Level 1 — Quoted Prices | |||||||
Common Stocks | $ | 948,772,440 | $ | — | |||
Foreign Common Stocks | 3,850,916 | — | |||||
Futures Contracts | — | (785,520 | ) | ||||
Money Market Funds | 107,395,980 | — | |||||
Level 2 — Other Significant Observable Inputs | |||||||
U.S. Treasury Obligations | 7,218,064 | — | |||||
Level 3 — Significant Unobservable Inputs | |||||||
Common Stocks | 1,209 | — | |||||
Total Assets | $ | 1,067,238,609 | $ | (785,520 | ) | ||
| *** | Other financial instruments are derivative instruments not reflected in the Schedule of Investments, such as futures, forwards and swap contracts, which are valued at the unrealized appreciation (depreciation) on the investment. Details of these investments can be found in the Notes to Financial Statements. |
The following is a reconciliation of assets in which significant unobservable inputs (Level 3) were used in determining fair value:
| Investments in Securities | Other Financial Instruments*** | |||||
Balance, 12/31/08 | $ | 1,209 | $ | — | ||
Accrued discounts/premiums | — | — | ||||
Realized gain (loss) | — | — | ||||
Changed in unrealized appreciation (depreciation) | — | — | ||||
Net purchases (sales) | — | — | ||||
Transfers in and/or out of Level 3 | — | — | ||||
Balance, 06/30/09 | $ | 1,209 | $ | — | ||
See Notes to Financial Statements.
94
Table of Contents
| Growth Equity Fund | ||
| SCHEDULE OF INVESTMENTS | June 30, 2009 (Unaudited) |
| Shares | Value | ||||
COMMON STOCKS — 92.3% | |||||
Auto & Transportation — 2.2% | |||||
Delta Air Lines, Inc.* | 189,680 | $ | 1,098,247 | ||
Expeditors International Washington, Inc. | 114,480 | 3,816,763 | |||
FedEx Corporation | 53,130 | 2,955,091 | |||
Norfolk Southern CorporationD | 97,038 | 3,655,422 | |||
Union Pacific Corporation | 204,740 | 10,658,764 | |||
| 22,184,287 | |||||
Consumer Discretionary — 16.1% | |||||
Amazon.com, Inc.D* | 328,230 | 27,459,722 | |||
Apollo Group, Inc. Class A* | 34,500 | 2,453,640 | |||
AutoZone, Inc.* | 12,200 | 1,843,542 | |||
Avon Products, Inc. | 109,680 | 2,827,550 | |||
Bed Bath & Beyond, Inc.* | 83,700 | 2,573,775 | |||
Best Buy Co., Inc. | 230,120 | 7,706,719 | |||
Carnival Corporation | 123,900 | 3,192,903 | |||
Coach, Inc. | 34,530 | 928,166 | |||
Costco Wholesale Corporation | 87,003 | 3,976,037 | |||
Darden Restaurants, Inc. | 78,410 | 2,585,962 | |||
DIRECTV Group, Inc. (The)D* | 130,107 | 3,214,944 | |||
Dollar Tree, Inc.* | 44,700 | 1,881,870 | |||
eBay, Inc.* | 113,500 | 1,944,255 | |||
Estee Lauder Cos., Inc. Class AD* | 55,700 | 1,819,719 | |||
FTI Consulting, Inc.* | 6,580 | 333,738 | |||
GameStop Corporation Class AD* | 69,000 | 1,518,690 | |||
Gap, Inc. (The) | 49,750 | 815,900 | |||
Home Depot, Inc. (The) | 123,800 | 2,925,394 | |||
Iron Mountain, Inc.D* | 209,240 | 6,015,650 | |||
Kohl’s CorporationD* | 202,240 | 8,645,760 | |||
Krispy Kreme Doughnuts, Inc. | 7,410 | 296 | |||
Lowe’s Cos., Inc. | 480,044 | 9,317,654 | |||
McDonald’s Corporation | 417,135 | 23,981,091 | |||
NIKE, Inc. Class BD | 366,895 | 18,997,823 | |||
Paychex, Inc.D | 13,420 | 338,184 | |||
Priceline.com, Inc.D* | 25,700 | 2,866,835 | |||
Starbucks CorporationD* | 754,810 | 10,484,311 | |||
Wal-Mart Stores, Inc. | 169,244 | 8,198,179 | |||
Yum! Brands, Inc. | 239,122 | 7,972,328 | |||
| 166,820,637 | |||||
Consumer Staples — 3.7% | |||||
Church & Dwight Co., Inc.D | 25,400 | 1,379,474 | |||
Colgate-Palmolive Co. | 81,140 | 5,739,844 | |||
CVS Caremark CorporationD | 390,244 | 12,437,076 | |||
Hansen Natural CorporationD* | 66,000 | 2,034,120 | |||
J.M. Smucker Co. (The) | 27,470 | 1,336,690 | |||
Kroger Co.D | 41,520 | 915,516 | |||
PepsiCo, Inc. | 201,890 | 11,095,874 | |||
Procter & Gamble Co. | 31,530 | 1,611,183 | |||
Whole Foods Market, Inc.D | 84,900 | 1,611,402 | |||
| 38,161,179 | |||||
Financial Services — 15.6% | |||||
American Express Co.D | 58,172 | 1,351,917 | |||
Annaly Mortgage Management, Inc. REIT | 119,900 | 1,815,286 | |||
Bank of America CorporationD | 425,797 | 5,620,520 | |||
Boston Properties, Inc. REITD | 29,000 | 1,383,300 | |||
Capital One Financial Corporation | 86,800 | 1,899,184 | |||
CME Group, Inc. | 28,900 | 8,991,079 | |||
Goldman Sachs Group, Inc.D | 96,192 | 14,182,548 | |||
IntercontinentalExchange, Inc.D* | 142,230 | 16,248,355 | |||
Invesco, Ltd. | 96,300 | 1,716,066 | |||
JPMorgan Chase & Co.D | 749,444 | 25,563,535 | |||
Mastercard, Inc. Class A | 70,771 | 11,840,696 | |||
Moody’s CorporationD | 176,400 | 4,648,140 | |||
Morgan Stanley | 294,072 | 8,383,993 | |||
MSCI, Inc.* | 41,830 | 1,022,325 | |||
Schwab (Charles) Corporation | |||||
(The) | 260,420 | 4,567,767 | |||
State Street CorporationD | 51,170 | 2,415,224 | |||
US BancorpD | 220,105 | 3,944,282 | |||
Visa, Inc.D | 550,014 | 34,243,872 | |||
Wells Fargo & Co.D | 476,342 | 11,486,673 | |||
| 161,324,762 | |||||
Healthcare — 12.7% | |||||
Abbott Laboratories | 235,788 | 11,091,468 | |||
Abraxis Bioscience, Inc.D* | 32,700 | 1,205,322 | |||
Aetna, Inc. | 35,920 | 899,796 | |||
Allergan, Inc. | 353,250 | 16,807,635 | |||
Amgen, Inc.* | 75,100 | 3,975,794 | |||
Baxter International, Inc. | 57,990 | 3,071,150 | |||
Becton Dickinson & Co.D | 21,300 | 1,518,903 | |||
Boston Scientific Corporation* | 359,900 | 3,649,386 | |||
Celgene CorporationD* | 53,520 | 2,560,397 | |||
Cephalon, Inc.D* | 29,390 | 1,664,943 | |||
Express Scripts, Inc.* | 72,740 | 5,000,875 | |||
Genzyme CorporationD* | 287,988 | 16,032,292 | |||
Gilead Sciences, Inc.D* | 189,288 | 8,866,250 | |||
Hologic, Inc.D* | 50,450 | 717,903 | |||
Illumina, Inc.D* | 21,800 | 848,892 | |||
Intuitive Surgical, Inc.D* | 106,000 | 17,347,960 | |||
Mylan Laboratories, Inc.D* | 229,700 | 2,997,585 | |||
Myriad Genetics, Inc.D* | 86,875 | 3,097,094 | |||
Myriad Pharmaceuticals, Inc.* | 21,718 | 100,989 | |||
Qiagen NV* | 47,700 | 886,743 | |||
St. Jude Medical, Inc.* | 183,010 | 7,521,711 | |||
Stryker CorporationD | 131,500 | 5,225,810 | |||
Teva Pharmaceutical Industries, Ltd. ADR | 107,630 | 5,310,464 | |||
Thermo Fisher Scientific, Inc.* | 96,400 | 3,930,228 | |||
Varian Medical Systems, Inc.D* | 200,200 | 7,035,028 | |||
| 131,364,618 | |||||
Integrated Oils — 0.4% | |||||
Chevron Corporation | 64,470 | 4,271,138 | |||
Materials & Processing — 5.7% | |||||
ABB, Ltd. ADRD | 177,480 | 2,800,634 | |||
Air Products & Chemicals, Inc. | 30,356 | 1,960,694 | |||
Crown Holdings, Inc.* | 55,990 | 1,351,599 | |||
Dow Chemical Co. (The)D | 216,840 | 3,499,798 | |||
Freeport-McMoRan Copper & Gold, Inc. | 158,130 | 7,923,894 | |||
Monsanto Co. | 262,902 | 19,544,135 | |||
Newmont Mining Corporation | 94,700 | 3,870,389 | |||
Praxair, Inc. | 188,306 | 13,382,907 | |||
Precision Castparts Corporation | 67,120 | 4,901,774 | |||
| 59,235,824 | |||||
Other — 0.4% | |||||
3M Co. | 34,440 | 2,069,844 | |||
Foster Wheeler AG* | 27,040 | 642,200 | |||
See Notes to Financial Statements.
95
Table of Contents
Growth Equity Fund
SCHEDULE OF INVESTMENTS (Continued)
| Shares | Value | ||||||
SPX CorporationD | 31,000 | $ | 1,518,070 | ||||
| 4,230,114 | |||||||
Other Energy — 8.4% | |||||||
Chesapeake Energy CorporationD | 131,800 | 2,613,594 | |||||
Consol Energy, Inc. | 25,140 | 853,754 | |||||
Devon Energy Corporation | 124,260 | 6,772,170 | |||||
EOG Resources, Inc. | 10,008 | 679,743 | |||||
First Solar, Inc.D* | 21,064 | 3,414,896 | |||||
FMC Technologies, Inc.D* | 268,700 | 10,097,746 | |||||
National Oilwell Varco, Inc.* | 494,800 | 16,160,168 | |||||
Petroleo Brasileiro SA ADRD | 163,593 | 6,704,041 | |||||
Schlumberger, Ltd.D | 230,500 | 12,472,355 | |||||
Southwestern Energy Co.* | 90,960 | 3,533,796 | |||||
Transocean, Ltd.* | 305,136 | 22,668,554 | |||||
XTO Energy, Inc.D | 25,578 | 975,545 | |||||
| 86,946,362 | |||||||
Producer Durables — 3.8% | |||||||
America Movil SA de CV ADR Series LD | 216,900 | 8,398,368 | |||||
American Tower Corporation Class AD* | 108,760 | 3,429,203 | |||||
AMETEK, Inc. | 41,770 | 1,444,407 | |||||
Boeing Co. (The) | 13,960 | 593,300 | |||||
Danaher Corporation | 21,360 | 1,318,766 | |||||
General Dynamics Corporation | 122,738 | 6,798,458 | |||||
ITT Industries, Inc. | 27,280 | 1,213,960 | |||||
Lockheed Martin CorporationD | 75,593 | 6,096,575 | |||||
Raytheon Co. | 80,140 | 3,560,620 | |||||
Republic Services, Inc. | 74,530 | 1,819,277 | |||||
United Technologies CorporationD | 94,810 | 4,926,328 | |||||
| 39,599,262 | |||||||
Technology — 22.5% | |||||||
Activision Blizzard, Inc.D* | 294,600 | 3,720,798 | |||||
Amphenol Corporation | 152,025 | 4,810,071 | |||||
Apple, Inc.D* | 363,467 | 51,768,605 | |||||
Broadcom Corporation Class AD* | 770,960 | 19,112,098 | |||||
Check Point Software Technologies, Ltd.* | 135,660 | 3,183,940 | |||||
Cisco Systems, Inc.* | 713,497 | 13,299,584 | |||||
Citrix Systems, Inc.D* | 36,400 | 1,160,796 | |||||
Cognizant Technology Solutions Corporation Class A* | 81,720 | 2,181,924 | |||||
EMC Corporation* | 379,590 | 4,972,629 | |||||
F5 Networks, Inc.D* | 24,680 | 853,681 | |||||
Google, Inc.* | 91,602 | 38,618,487 | |||||
Hewlett-Packard Co. | 232,126 | 8,971,670 | |||||
Intel Corporation | 387,950 | 6,420,573 | |||||
International Business Machines Corporation | 52,736 | 5,506,693 | |||||
Intersil Corporation Class AD | 117,280 | 1,474,210 | |||||
Juniper Networks, Inc.D* | 207,880 | 4,905,968 | |||||
Macrovision Solutions Corporation* | 7 | 153 | |||||
Marvell Technology Group, Ltd.* | 293,100 | 3,411,684 | |||||
McAfee, Inc.* | 17,970 | 758,154 | |||||
Microsoft Corporation | 181,050 | 4,303,558 | |||||
Oracle Corporation | 311,500 | 6,672,330 | |||||
QUALCOMM, Inc. | 742,940 | 33,580,888 | |||||
Salesforce.com, Inc.D* | 241,000 | 9,198,970 | |||||
Trimble Navigation, Ltd.D* | 39,350 | 772,441 | |||||
VMware, Inc.D* | 123,600 | 3,370,572 | |||||
| 233,030,477 | |||||||
Utilities — 0.8% | |||||||
AES Corporation* | 210,850 | 2,447,969 | |||||
Allegheny Energy, Inc. | 24,560 | 629,964 | |||||
Entergy CorporationD | 6,650 | 515,508 | |||||
FPL Group, Inc. | 12,040 | 684,594 | |||||
Sprint Nextel CorporationD* | 516,860 | 2,486,097 | |||||
Xcel Energy Inc. | 47,000 | 865,270 | |||||
| 7,629,402 | |||||||
Total Common Stocks | 954,798,062 | ||||||
FOREIGN COMMON STOCKS — 3.9% | |||||||
Canada — 0.9% | |||||||
Potash Corporation of SaskatchewanD | 41,320 | 3,844,826 | |||||
Research In Motion, Ltd.* | 83,223 | 5,912,994 | |||||
| 9,757,820 | |||||||
China — 0.5% | |||||||
Mindray Medical International, Ltd. ADRD | 206,400 | 5,762,688 | |||||
Finland — 0.2% | |||||||
Nokia Corporation ADRD | 127,700 | 1,861,866 | |||||
France — 0.4% | |||||||
Total SA ADRD | 79,520 | 4,312,370 | |||||
Switzerland — 1.0% | |||||||
Ace, Ltd. | 65,280 | 2,887,334 | |||||
Alcon, Inc. | 21,220 | 2,464,067 | |||||
Weatherford International, Ltd.* | 257,070 | 5,028,289 | |||||
| 10,379,690 | |||||||
Taiwan — 0.5% | |||||||
Taiwan Semiconductor Manufacturing Co., Ltd. ADRD | 522,289 | 4,914,739 | |||||
United Kingdom — 0.4% | |||||||
BHP Billiton PLC ADRD | 89,100 | 4,050,486 | |||||
Total Foreign Common Stocks | 41,039,659 | ||||||
MONEY MARKET FUNDS — 12.1% | |||||||
GuideStone Money Market Fund (GS4 Class)¥ | 31,151,191 | 31,151,191 | |||||
Northern Institutional Liquid Assets Portfolio§ | 93,789,900 | 93,789,900 | |||||
Total Money Market Funds | 124,941,091 | ||||||
| Par | |||||||
U.S. TREASURY OBLIGATION — 0.8% | |||||||
U.S. Treasury Bill 0.27%, 11/19/09‡‡ (Cost $8,306,207) | $ | 8,315,000 | 8,307,017 | ||||
TOTAL INVESTMENTS — 109.1% | 1,129,085,829 | ||||||
Liabilities in Excess of Other Assets — (9.1)% | (94,548,233 | ) | |||||
NET ASSETS — 100.0% | $ | 1,034,537,596 | |||||
See Notes to Financial Statements.
96
Table of Contents
PORTFOLIO SUMMARY (based on net assets)
| % | ||
Technology | 22.5 | |
Consumer Discretionary | 16.1 | |
Financial Services | 15.6 | |
Healthcare | 12.7 | |
Money Market Funds | 12.1 | |
Other Energy | 8.4 | |
Materials & Processing | 5.7 | |
Foreign Common Stocks | 3.9 | |
Producer Durables | 3.8 | |
Consumer Staples | 3.7 | |
Futures Contracts | 3.6 | |
Auto & Transportation | 2.2 | |
U.S. Treasury Obligation | 0.8 | |
Utilities | 0.8 | |
Integrated Oils | 0.4 | |
Other | 0.4 | |
| 112.7 | ||
FAS 157 DISCLOSURE
The following is a summary of the inputs used, as of June 30, 2009, in valuing the Fund’s assets carried at fair value:
Valuation Inputs | Investments in Securities | Other Financial Instruments*** | ||||
Level 1 — Quoted Prices | ||||||
Common Stocks | $ | 954,798,062 | $ | — | ||
Foreign Common Stocks | 41,039,659 | — | ||||
Futures Contracts | — | 265,904 | ||||
Money Market Funds | 124,941,091 | — | ||||
Level 2 — Other Significant Observable Inputs | ||||||
U.S. Treasury Obligation | 8,307,017 | — | ||||
Level 3 — Significant Unobservable Inputs | — | — | ||||
Total Assets | $ | 1,129,085,829 | $ | 265,904 | ||
| *** | Other financial instruments are derivative instruments not reflected in the Schedule of Investments, such as futures, forwards and swap contracts, which are valued at the unrealized appreciation (depreciation) on the investment. Details of these investments can be found in the Notes to Financial Statements. |
See Notes to Financial Statements.
97
Table of Contents
| Small Cap Equity Fund | ||
| SCHEDULE OF INVESTMENTS | June 30, 2009 (Unaudited) |
| Shares | Value | ||||
COMMON STOCKS — 84.9% | |||||
Auto & Transportation — 3.3% | |||||
American Commercial Lines, Inc.D* | 25,050 | $ | 387,774 | ||
Arkansas Best Corporation | 18,119 | 477,436 | |||
ATC Technology CorporationD* | 48,200 | 698,900 | |||
Con-Way, Inc. | 12,000 | 423,720 | |||
Diana Shipping, Inc.D | 48,400 | 644,688 | |||
Genco Shipping & Trading, Ltd.D | 18,500 | 401,820 | |||
Genesee & Wyoming, Inc. Class A* | 29,300 | 776,743 | |||
Heartland Express, Inc.D | 80,300 | 1,182,016 | |||
HUB Group, Inc.* | 20,900 | 431,376 | |||
JB Hunt Transport Services, Inc.D | 40,000 | 1,221,200 | |||
Knight Transportation, Inc.D | 87,200 | 1,443,160 | |||
Old Dominion Freight Line, Inc.D* | 13,800 | 463,266 | |||
Overseas Shipholding Group, Inc.D | 12,900 | 439,116 | |||
Republic Airways Holdings, Inc.* | 85,800 | 560,274 | |||
Skywest, Inc. | 46,200 | 471,240 | |||
UTI Worldwide, Inc.* | 58,800 | 670,320 | |||
WABCO Holdings, Inc.D | 38,600 | 683,220 | |||
| 11,376,269 | |||||
Consumer Discretionary — 12.8% | |||||
Aaron Rents, Inc.D | 16,601 | 495,042 | |||
Advisory Board Co. (The)D* | 47,800 | 1,228,460 | |||
Aeropostale, Inc.* | 35,055 | 1,201,335 | |||
American Public Education, Inc.D* | 19,400 | 768,434 | |||
AMN Healthcare Services, Inc.D* | 67,500 | 430,650 | |||
AnnTaylor Stores CorporationD* | 52,600 | 419,748 | |||
Arbitron, Inc.D | 22,100 | 351,169 | |||
BJ’s Wholesale Club, Inc.D* | 11,600 | 373,868 | |||
California Pizza Kitchen, Inc.D* | 47,100 | 625,959 | |||
Capella Education Co.D* | 18,500 | 1,109,075 | |||
Carter’s, Inc.* | 38,932 | 958,116 | |||
Cato Corporation Class A | 25,300 | 441,232 | |||
CEC Entertainment, Inc.* | 20,100 | 592,548 | |||
Charlotte Russe Holding, Inc.D* | 63,000 | 811,440 | |||
Cheesecake Factory, Inc.D* | 25,500 | 441,150 | |||
Chico’s FAS, Inc.D* | 29,400 | 286,062 | |||
Chipotle Mexican Grill, Inc.D* | 9,300 | 680,698 | |||
Coinstar, Inc.* | 18,737 | 500,278 | |||
Constant Contact, Inc.D* | 17,400 | 345,216 | |||
Corinthian Colleges, Inc.D* | 81,230 | 1,375,224 | |||
Corporate Executive Board Co. | 43,800 | 909,288 | |||
CoStar Group, Inc.D* | 22,400 | 893,088 | |||
CROCS, Inc.D* | 50,000 | 170,000 | |||
Deckers Outdoor Corporation* | 7,400 | 519,998 | |||
DG Fastchannel, Inc.D* | 18,633 | 340,984 | |||
Dillard’s, Inc. Class A | 49,100 | 451,720 | |||
DynCorp International, Inc.D* | 45,800 | 768,982 | |||
EZCORP, Inc. Class A* | 49,100 | 529,298 | |||
FGX International Holdings, Ltd.D* | 30,000 | 341,400 | |||
FTI Consulting, Inc.* | 31,500 | 1,597,680 | |||
Guess ?, Inc.D | 11,000 | 283,580 | |||
Healthcare Services Group, Inc.D | 22,600 | 404,088 | |||
Hewitt Associates, Inc. Class A* | 17,000 | 506,260 | |||
hhgregg, Inc.D* | 18,400 | 278,944 | |||
Hibbett Sports, Inc.D* | 14,500 | 261,000 | |||
Houston Wire & Cable Co.D | 43,800 | 521,658 | |||
Huron Consulting Group, Inc.D* | 13,700 | 633,351 | |||
ICF International, Inc.* | 13,684 | 377,541 | |||
Iconix Brand Group, Inc.D* | 36,900 | 567,522 | |||
Insight Enterprises, Inc.* | 25,500 | 246,330 | |||
J Crew Group, Inc.D* | 13,500 | 364,770 | |||
Kforce, Inc.D* | 68,000 | 562,360 | |||
MAXIMUS, Inc. | 12,000 | 495,000 | |||
Mohawk Industries, Inc.D* | 7,100 | 253,328 | |||
Monro Muffler Brake, Inc.D | 27,700 | 712,167 | |||
MPS Group, Inc.D* | 97,800 | 747,192 | |||
Netease.com ADRD* | 11,600 | 408,088 | |||
Netflix, Inc.D* | 22,596 | 934,119 | |||
On Assignment, Inc.D* | 111,800 | 437,138 | |||
PetMed Express, Inc.D* | 36,700 | 551,601 | |||
PF Chang’s China Bistro, Inc.D* | 27,500 | 881,650 | |||
PHH CorporationD* | 44,900 | 816,282 | |||
Pool CorporationD | 34,625 | 573,390 | |||
Rent-A-Center, Inc.D* | 35,700 | 636,531 | |||
Resources Connection, Inc.D* | 92,100 | 1,581,357 | |||
Robert Half International, Inc.D | 45,300 | 1,069,986 | |||
Rush Enterprises, Inc. Class AD* | 59,621 | 694,585 | |||
Steven Madden, Ltd.D* | 49,000 | 1,247,050 | |||
SYKES Enterprises, Inc.* | 90,400 | 1,635,336 | |||
Tech Data Corporation* | 24,100 | 788,311 | |||
Tempur-Pedic International, Inc.D | 36,600 | 478,362 | |||
Tetra Tech, Inc.D* | 6,300 | 180,495 | |||
Texas Roadhouse, Inc. Class AD* | 18,900 | 206,199 | |||
Timberland Co.* | 40,500 | 537,435 | |||
TiVo, Inc.* | 16,100 | 168,728 | |||
Ulta Salon Cosmetics & Fragrance, Inc.D* | 19,100 | 212,392 | |||
Universal Electronics, Inc.D* | 36,882 | 743,910 | |||
ValueClick, Inc.* | 79,400 | 835,288 | |||
WESCO International, Inc.D* | 34,400 | 861,376 | |||
| 43,652,842 | |||||
Consumer Staples — 2.5% | |||||
Chattem, Inc.D* | 8,300 | 565,230 | |||
Chiquita Brands International, Inc.D* | 45,500 | 466,830 | |||
Green Mountain Coffee Roasters, Inc.D* | 16,171 | 956,029 | |||
Hansen Natural Corporation* | 38,200 | 1,177,324 | |||
Helen of Troy, Ltd.* | 37,583 | 631,018 | |||
Herbalife, Ltd. | 53,700 | 1,693,698 | |||
J & J Snack Foods Corporation | 27,052 | 971,167 | |||
Pantry, Inc.* | 37,500 | 622,500 | |||
SUPERVALU, Inc. | 50,900 | 659,155 | |||
TreeHouse Foods, Inc.D* | 8,888 | 255,708 | |||
United Natural Foods, Inc.D* | 23,600 | 619,500 | |||
| 8,618,159 | |||||
See Notes to Financial Statements.
98
Table of Contents
| Shares | Value | ||||
Financial Services — 16.1% | |||||
American Financial Group, Inc.D | 50,500 | $ | 1,089,790 | ||
American Physicians Capital, Inc. | 11,700 | 458,172 | |||
AMERISAFE, Inc.* | 28,018 | 435,960 | |||
Amtrust Financial Services, Inc. | 48,700 | 555,180 | |||
Argo Group International Holdings, Ltd.* | 29,952 | 845,246 | |||
Assured Guaranty, Ltd.D | 27,700 | 342,926 | |||
AXIS Capital Holdings, Ltd.D | 49,000 | 1,282,820 | |||
Banco Latinoamericano de Exportaciones SAD | 62,000 | 770,660 | |||
Bank of the Ozarks, Inc.D | 33,200 | 718,116 | |||
BOK Financial CorporationD | 11,300 | 425,671 | |||
Brown & Brown, Inc. | 63,800 | 1,271,534 | |||
Cash America International, Inc. | 21,500 | 502,885 | |||
City Holding Co. | 24,900 | 755,964 | |||
Cohen & Steers, Inc.D | 26,500 | 396,175 | |||
Cybersource CorporationD* | 56,181 | 859,569 | |||
Delphi Financial Group, Inc.D | 50,700 | 985,101 | |||
Duff & Phelps Corporation | 34,100 | 606,298 | |||
Endurance Specialty Holdings, Ltd. | 35,100 | 1,028,430 | |||
Evercore Partners, Inc. Class AD | 27,400 | 538,136 | |||
Federated Investors, Inc. Class BD | 35,700 | 860,013 | |||
First Cash Financial Services, Inc.D* | 40,800 | 714,816 | |||
First Niagara Financial Group, Inc. | 15,300 | 174,726 | |||
FPIC Insurance Group, Inc.* | 11,500 | 352,130 | |||
Global Payments, Inc. | 91,400 | 3,423,844 | |||
Greenhill & Co., Inc.D | 2,544 | 183,702 | |||
H&E Equipment Services, Inc.* | 48,300 | 451,605 | |||
Hanover Insurance Group, Inc. | 29,400 | 1,120,434 | |||
HCC Insurance Holdings, Inc.D | 104,535 | 2,509,885 | |||
Horace Mann Educators Corporation | 75,900 | 756,723 | |||
IBERIABANK Corporation | 5,400 | 212,814 | |||
Infinity Property & Casualty Corporation | 24,600 | 896,916 | |||
Investment Technology Group, Inc.* | 28,000 | 570,920 | |||
Jack Henry & Associates, Inc.D | 53,900 | 1,118,425 | |||
Janus Capital Group, Inc.D | 41,300 | 470,820 | |||
Jefferies Group, Inc.D* | 18,500 | 394,605 | |||
Knight Capital Group, Inc. Class AD* | 53,500 | 912,175 | |||
Life Partners Holdings, Inc.D | 8,475 | 120,176 | |||
Mobile Mini, Inc.D* | 51,000 | 748,170 | |||
MSCI, Inc.* | 22,500 | 549,900 | |||
NewAlliance Bancshares, Inc. | 69,600 | 800,400 | |||
Ocwen Financial CorporationD* | 53,200 | 690,004 | |||
Odyssey Re Holdings CorporationD | 21,400 | 855,572 | |||
optionsXpress Holdings, Inc.D | 208,490 | 3,237,850 | |||
Park National CorporationD | 14,400 | 813,312 | |||
Platinum Underwriters Holdings, Ltd.D | 32,500 | 929,175 | |||
Portfolio Recovery Associates, Inc.D* | 26,500 | 1,026,345 | |||
Prosperity Bancshares, Inc.D | 8,627 | 257,343 | |||
Provident Financial Services, Inc. | 65,700 | 597,870 | |||
PS Business Parks, Inc. REIT | 19,600 | 949,424 | |||
RLI CorporationD | 23,500 | 1,052,800 | |||
Safety Insurance Group, Inc. | 43,500 | 1,329,360 | |||
StanCorp Financial Group, Inc. | 44,100 | 1,264,788 | |||
Sterling Bancshares, Inc. | 71,800 | 454,494 | |||
Stifel Financial CorporationD* | 13,600 | 654,024 | |||
Sunstone Hotel Investors, Inc. REIT | 90,300 | 483,105 | |||
SWS Group, Inc.D | 61,700 | 861,949 | |||
Taubman Centers, Inc. REIT | 19,700 | 529,142 | |||
Torchmark CorporationD | 21,800 | 807,472 | |||
Tower Group, Inc. | 48,894 | 1,211,593 | |||
TradeStation Group, Inc.* | 65,500 | 554,130 | |||
Trustmark CorporationD | 48,400 | 935,088 | |||
United Bankshares, Inc.D | 32,700 | 638,958 | |||
W.R. Berkley Corporation | 19,700 | 422,959 | |||
World Acceptance CorporationD* | 42,400 | 844,184 | |||
Wright Express CorporationD* | 75,600 | 1,925,532 | |||
| 54,538,305 | |||||
Healthcare — 11.0% | |||||
Abaxis, Inc.D* | 12,300 | 252,642 | |||
Acorda Therapeutics, Inc.* | 6,500 | 183,235 | |||
Alexion Pharmaceuticals, Inc.D* | 10,420 | 428,470 | |||
Align Technology, Inc.D* | 57,000 | 604,200 | |||
Allos Therapeutics, Inc.* | 4,967 | 41,176 | |||
Allscripts-Misys Healthcare Solutions, Inc.* | 11,100 | 176,046 | |||
Amedisys, Inc.D* | 55,134 | 1,820,525 | |||
American Dental Partners, Inc.D* | 37,900 | 343,753 | |||
AMERIGROUP CorporationD* | 28,300 | 759,855 | |||
athenahealth, Inc.D* | 18,757 | 694,197 | |||
BioMarin Pharmaceuticals, Inc.D* | 49,700 | 775,817 | |||
Bio-Rad Laboratories, Inc. Class AD* | 15,800 | 1,192,584 | |||
Biovail CorporationD | 38,900 | 523,205 | |||
Brookdale Senior Living, Inc.D | 35,400 | 344,796 | |||
CardioNet, Inc.D* | 22,200 | 362,304 | |||
Catalyst Health Solutions, Inc.* | 81,700 | 2,037,598 | |||
Cooper Cos., Inc.D | 39,500 | 976,835 | |||
Cubist Pharmaceuticals, Inc.* | 40,200 | 736,866 | |||
Dionex CorporationD* | 17,600 | 1,074,128 | |||
Endo Pharmaceuticals Holdings, Inc.D* | 41,500 | 743,680 | |||
Five Star Quality Care, Inc.+ | 2,086 | — | |||
Genoptix, Inc.D* | 17,400 | 556,626 | |||
Haemonetics Corporation* | 18,200 | 1,037,400 | |||
Hanger Orthopedic Group, Inc.D* | 24,909 | 338,513 | |||
Health Net, Inc.* | 62,900 | 978,095 | |||
ICON PLC ADRD* | 90,400 | 1,950,832 | |||
Illumina, Inc.D* | 4,775 | 185,939 | |||
Immucor, Inc.* | 49,700 | 683,872 | |||
Inverness Medical Innovations, Inc.D* | 20,900 | 743,622 | |||
Lincare Holdings, Inc.D* | 37,000 | 870,240 | |||
Magellan Health Services, Inc.* | 40,700 | 1,335,774 | |||
Martek Biosciences CorporationD* | 22,100 | 467,415 | |||
See Notes to Financial Statements.
99
Table of Contents
Small Cap Equity Fund
SCHEDULE OF INVESTMENTS (Continued)
| Shares | Value | ||||
MedAssets, Inc.D* | 55,400 | $ | 1,077,530 | ||
Mednax, Inc.* | 6,200 | 261,206 | |||
NuVasive, Inc.D* | 21,450 | 956,670 | |||
Omnicare, Inc. | 26,200 | 674,912 | |||
Orthofix International NVD* | 24,100 | 602,741 | |||
Orthovita, Inc.D* | 35,800 | 184,370 | |||
PerkinElmer, Inc. | 78,300 | 1,362,420 | |||
Phase Forward, Inc.D* | 42,700 | 645,197 | |||
Psychiatric Solutions, Inc.D* | 44,800 | 1,018,752 | |||
Savient Pharmaceuticals, Inc.D* | 14,300 | 198,198 | |||
Sepracor, Inc.* | 37,100 | 642,572 | |||
STERIS CorporationD | 22,500 | 586,800 | |||
Symmetry Medical, Inc.* | 98,300 | 916,156 | |||
Techne Corporation | 22,300 | 1,422,963 | |||
Thoratec CorporationD* | 19,627 | 525,611 | |||
United Therapeutics CorporationD* | 8,500 | 708,305 | |||
VCA Antech, Inc.D* | 48,900 | 1,305,630 | |||
Volcano CorporationD* | 46,000 | 643,080 | |||
WellCare Health Plans, Inc.D* | 28,600 | 528,814 | |||
| 37,482,167 | |||||
Integrated Oils — 0.7% | |||||
Frontier Oil CorporationD | 26,300 | 344,793 | |||
Holly CorporationD | 33,800 | 607,724 | |||
Sunoco, Inc. | 24,000 | 556,800 | |||
Tesoro CorporationD | 27,800 | 353,894 | |||
Western Refining, Inc.D* | 55,000 | 388,300 | |||
| 2,251,511 | |||||
Materials & Processing — 7.7% | |||||
AAON, Inc.D | 22,300 | 444,216 | |||
AK Steel Corporation | 20,200 | 387,638 | |||
Albemarle Corporation | 31,500 | 805,455 | |||
Apogee Enterprises, Inc.D | 61,700 | 758,910 | |||
Ball Corporation | 21,100 | 952,876 | |||
Beacon Roofing Supply, Inc.* | 104,067 | 1,504,809 | |||
Belden CDT, Inc. | 43,700 | 729,790 | |||
Bemis Co., Inc. | 30,700 | 773,640 | |||
Carpenter Technology Corporation | 47,800 | 994,718 | |||
CLARCOR, Inc. | 44,300 | 1,293,117 | |||
Dycom Industries, Inc.* | 72,300 | 800,361 | |||
EMCOR Group, Inc.* | 16,700 | 336,004 | |||
Granite Construction, Inc.D | 16,900 | 562,432 | |||
H.B. Fuller Co. | 25,000 | 469,250 | |||
Hexcel CorporationD* | 53,772 | 512,447 | |||
IAMGOLD CorporationD | 67,434 | 682,432 | |||
Interline Brands, Inc.* | 55,000 | 752,400 | |||
Jones Lang LaSalle, Inc.D | 34,200 | 1,119,366 | |||
Kaiser Aluminum Corporation | 12,600 | 452,466 | |||
Lennox International, Inc.D | 24,600 | 789,906 | |||
Lubrizol Corporation | 21,500 | 1,017,165 | |||
Michael Baker Corporation* | 10,500 | 444,780 | |||
Minerals Technologies, Inc. | 16,700 | 601,534 | |||
MYR Group, Inc.D* | 20,831 | 421,203 | |||
NewMarket Corporation | 12,600 | 848,358 | |||
OM Group, Inc.D* | 25,800 | 748,716 | |||
Orion Marine Group, Inc.D* | 9,100 | 172,900 | |||
Owens Corning* | 6,300 | 80,514 | |||
RBC Bearings, Inc.D* | 21,900 | 447,855 | |||
Reliance Steel & Aluminum Co.D | 38,500 | 1,478,015 | |||
Solutia, Inc.* | 40,000 | 230,400 | |||
Sonoco Products Co. | 21,500 | 514,925 | |||
URS Corporation* | 10,200 | 505,104 | |||
Watsco, Inc.D | 54,100 | 2,647,113 | |||
Worthington Industries, Inc.D | 56,700 | 725,193 | |||
| 26,006,008 | |||||
Metals Mining — 0.1% | |||||
Pan American Silver Corporation* | 12,000 | 219,960 | |||
Other — 0.5% | |||||
Lancaster Colony CorporationD | 15,800 | 696,306 | |||
SPX Corporation | 20,600 | 1,008,782 | |||
| 1,705,088 | |||||
Other Energy — 5.1% | |||||
Approach Resources, Inc.D* | 42,400 | 292,560 | |||
Arena Resources, Inc.D* | 64,100 | 2,041,585 | |||
Atlas America, Inc.D | 20,900 | 373,483 | |||
Atwood Oceanics, Inc.* | 13,900 | 346,249 | |||
Cabot Oil & Gas Corporation | 5,800 | 177,712 | |||
Cal Dive International, Inc.* | 130,500 | 1,126,215 | |||
CARBO Ceramics, Inc.D | 16,500 | 564,300 | |||
Comstock Resources, Inc.* | 40,200 | 1,328,610 | |||
Concho Resources, Inc.* | 38,700 | 1,110,303 | |||
Dril-Quip, Inc.* | 9,700 | 369,570 | |||
EnerNOC, Inc.D* | 13,196 | 285,957 | |||
EXCO Resources, Inc.* | 178,739 | 2,309,308 | |||
Exterran Holdings, Inc.D* | 79,200 | 1,270,368 | |||
Hercules Offshore, Inc.D* | 240,900 | 956,373 | |||
NATCO Group, Inc. Class A* | 25,600 | 842,752 | |||
Oil States International, Inc.D* | 35,000 | 847,350 | |||
Patterson-UTI Energy, Inc.D | 37,900 | 487,394 | |||
Penn Virginia CorporationD | 22,100 | 361,777 | |||
Quicksilver Resources, Inc.D* | 50,600 | 470,074 | |||
SEACOR Holdings, Inc.D* | 12,800 | 963,072 | |||
T-3 Energy Services, Inc.* | 25,849 | 307,862 | |||
Whiting Petroleum | |||||
CorporationD* | 14,200 | 499,272 | |||
| 17,332,146 | |||||
Producer Durables — 7.2% | |||||
A.O. Smith CorporationD | 25,298 | 823,956 | |||
Actuant Corporation Class A | 57,668 | 703,550 | |||
Arris Group, Inc.D* | 85,900 | 1,044,544 | |||
Clean Harbors, Inc.* | 22,000 | 1,187,780 | |||
Columbus McKinnon Corporation* | 38,900 | 492,085 | |||
Cubic CorporationD | 11,700 | 418,743 | |||
Curtiss-Wright Corporation | 37,100 | 1,102,983 | |||
Cymer, Inc.* | 34,400 | 1,022,712 | |||
Darling International, Inc.* | 40,900 | 269,940 | |||
Duoyuan Global Water, Inc. ADRD* | 10,200 | 247,656 | |||
Faro Technologies, Inc.D* | 42,400 | 658,472 | |||
Gardner Denver, Inc.* | 41,500 | 1,044,555 | |||
Graco, Inc.D | 35,600 | 783,912 | |||
HEICO CorporationD | 12,000 | 435,120 | |||
HEICO Corporation Class A | 9,100 | 266,266 | |||
IDEX Corporation | 51,811 | 1,272,996 | |||
Kennametal, Inc. | 21,000 | 402,780 | |||
Lexmark International, Inc.D* | 64,800 | 1,027,080 | |||
Middleby CorporationD* | 25,900 | 1,137,528 | |||
Moog, Inc. Class A* | 18,500 | 477,485 | |||
Orbital Sciences Corporation* | 83,600 | 1,268,212 | |||
Regal-Beloit CorporationD | 42,300 | 1,680,156 | |||
SBA Communications Corporation Class AD* | 75,882 | 1,862,144 | |||
See Notes to Financial Statements.
100
Table of Contents
| Shares | Value | ||||
Stericycle, Inc.D* | 12,000 | $ | 618,360 | ||
Tessera Technologies, Inc.* | 17,900 | 452,691 | |||
Thomas & Betts Corporation* | 6,700 | 193,362 | |||
Toro Co.D | 18,100 | 541,190 | |||
TransDigm Group, Inc.D* | 33,000 | 1,194,600 | |||
Triumph Group, Inc. | 20,900 | 836,000 | |||
Varian Semiconductor Equipment Associates, Inc.D* | 28,525 | 684,315 | |||
Zebra Technologies Corporation* | 15,976 | 377,992 | |||
| 24,529,165 | |||||
Technology — 12.8% | |||||
3Com CorporationD* | 108,000 | 508,680 | |||
Advanced Analogic Technologies, Inc.D* | 142,900 | 655,911 | |||
American Reprographics Co.* | 39,200 | 326,144 | |||
Amkor Technology, Inc.D* | 113,700 | 537,801 | |||
Ariba, Inc.* | 49,876 | 490,780 | |||
Atheros Communications, Inc.D* | 45,400 | 873,496 | |||
Avnet, Inc.* | 23,500 | 494,205 | |||
Blackboard, Inc.D* | 17,200 | 496,392 | |||
Brocade Communications Systems, Inc.* | 67,300 | 526,286 | |||
Cadence Design Systems, Inc.* | 92,500 | 545,750 | |||
CommVault Systems, Inc.* | 35,500 | 588,590 | |||
Compellent Technologies, Inc.* | 12,032 | 183,488 | |||
Compuware Corporation* | 94,600 | 648,956 | |||
CPI International, Inc.D* | 56,400 | 490,116 | |||
Cree, Inc.D* | 14,100 | 414,399 | |||
DealerTrack Holdings, Inc.D* | 117,900 | 2,004,300 | |||
DigitalGlobe, Inc.* | 20,600 | 395,520 | |||
DTS, Inc.D* | 13,000 | 351,910 | |||
EarthLink, Inc.* | 95,600 | 708,396 | |||
EPIQ Systems, Inc.D* | 29,100 | 446,685 | |||
F5 Networks, Inc.* | 24,431 | 845,068 | |||
Flextronics International, Ltd.D* | 112,900 | 464,019 | |||
FormFactor, Inc.D* | 43,600 | 751,664 | |||
Hittite Microwave CorporationD* | 20,800 | 722,800 | |||
Informatica Corporation* | 45,500 | 782,145 | |||
Ingram Micro, Inc. Class A* | 75,600 | 1,323,000 | |||
Kenexa Corporation* | 28,900 | 334,373 | |||
LogMeIn | 3,800 | 60,800 | |||
Longtop Financial Technologies, Ltd. ADRD* | 6,300 | 154,728 | |||
Macrovision Solutions Corporation* | 22,804 | 497,355 | |||
Mantech International Corporation Class AD* | 11,600 | 499,264 | |||
Monolithic Power Systems, Inc.* | 83,226 | 1,865,095 | |||
Monotype Imaging Holdings, Inc.* | 22,400 | 152,544 | |||
Netezza CorporationD* | 88,700 | 737,984 | |||
Netlogic Microsystems, Inc.D* | 24,934 | 909,094 | |||
NeuStar, Inc. Class A* | 42,700 | 946,232 | |||
Nuance Communications, Inc.D* | 54,833 | 662,931 | |||
OpenTable, Inc.D* | 6,300 | 190,071 | |||
Palm, Inc.D* | 16,000 | 265,120 | |||
Power Intergrations, Inc.D | 94,600 | 2,250,534 | |||
Riverbed Technology, Inc.* | 19,800 | 459,162 | |||
Scansource, Inc.D* | 65,000 | 1,593,800 | |||
Semtech Corporation* | 57,067 | 907,936 | |||
Silicon Laboratories, Inc.D* | 19,500 | 739,830 | |||
SkillSoft PLC ADRD* | 130,000 | 1,014,000 | |||
Solera Holdings, Inc.* | 168,079 | 4,269,207 | |||
SRA International, Inc. Class A* | 37,300 | 654,988 | |||
Stanley, Inc.* | 31,400 | 1,032,432 | |||
STEC, Inc.D* | 57,400 | 1,331,106 | |||
Stratasys, Inc.D* | 30,292 | 332,909 | |||
Sybase, Inc.D* | 48,533 | 1,521,024 | |||
Synaptics, Inc.D* | 16,350 | 631,927 | |||
Taleo Corporation Class AD* | 20,400 | 372,708 | |||
Ultimate Software Group, Inc.D* | 45,500 | 1,102,920 | |||
Viasat, Inc.* | 41,400 | 1,061,496 | |||
Vishay Intertechnology, Inc.* | 54,200 | 368,018 | |||
| 43,496,089 | |||||
Utilities — 5.1% | |||||
Alliant Energy CorporationD | 41,000 | 1,071,330 | |||
Centerpoint Energy, Inc.D | 65,900 | 730,172 | |||
CenturyTel, Inc.D | 17,800 | 546,460 | |||
El Paso Electric Co.* | 36,300 | 506,748 | |||
Energen Corporation | 28,900 | 1,153,110 | |||
General Communication, Inc. Class A* | 79,600 | 551,628 | |||
IDACORP, Inc.D | 24,500 | 640,430 | |||
ITC Holdings Corporation | 7,981 | 362,018 | |||
j2 Global Communications, Inc.D* | 76,200 | 1,719,072 | |||
National Fuel Gas Co.D | 12,600 | 454,608 | |||
NiSource, Inc.D | 76,400 | 890,824 | |||
NTELOS Holdings Corporation | 84,700 | 1,560,174 | |||
NV Energy, Inc. | 117,000 | 1,262,430 | |||
OGE Energy Corporation | 45,200 | 1,280,064 | |||
Oneok, Inc. | 43,300 | 1,276,917 | |||
Pepco Holdings, Inc. | 82,400 | 1,107,456 | |||
Portland General Electric Co. | 42,200 | 822,056 | |||
TECO Energy, Inc.D | 34,600 | 412,778 | |||
UGI Corporation | 15,800 | 402,742 | |||
USA Mobility, Inc.D* | 37,300 | 475,948 | |||
| 17,226,965 | |||||
Total Common Stocks | 288,434,674 | ||||
FOREIGN COMMON STOCKS — 0.7% | |||||
Israel — 0.1% | |||||
RRSat Global Communications Network, Ltd. | 35,500 | 434,520 | |||
Netherlands — 0.1% | |||||
AerCap Holdings NV* | 50,600 | 365,332 | |||
Puerto Rico — 0.2% | |||||
Oriental Financial GroupD | 62,700 | 608,190 | |||
Singapore — 0.3% | |||||
Verigy, Ltd.* | 88,200 | 1,073,394 | |||
Total Foreign Common Stocks | 2,481,436 | ||||
PREFERRED STOCKS — 0.0% | |||||
Federal Home Loan Mortgage Corporation | 5,125 | 6,252 | |||
Federal National Mortgage Association | 3,750 | 5,067 | |||
See Notes to Financial Statements.
101
Table of Contents
Small Cap Equity Fund
SCHEDULE OF INVESTMENTS (Continued)
| Shares | Value | |||||
Preferred Blocker (GMAC), Inc. | 73 | $ | 31,395 | |||
Total Preferred Stocks | 42,714 | |||||
MONEY MARKET FUNDS — 24.6% | ||||||
GuideStone Money Market Fund (GS4 Class)¥ | 22,939,664 | 22,939,664 | ||||
Northern Institutional Liquid Assets Portfolio§ | 60,576,786 | 60,576,786 | ||||
Total Money Market Funds | 83,516,450 | |||||
| Par | ||||||
AGENCY OBLIGATIONS — 0.8% | ||||||
Federal Home Loan Mortgage Corporation | ||||||
4.38%, 01/25/10 | $ | 260,000 | 265,736 | |||
Federal National Mortgage Association | ||||||
0.34%, 01/25/10W‡‡ | 2,146,000 | 2,142,219 | ||||
5.25%, 08/01/12 | 110,000 | 114,382 | ||||
5.00%, 02/13/17 | 230,000 | 251,356 | ||||
Total Agency Obligations | 2,773,693 | |||||
ASSET-BACKED SECURITIES — 0.5% | ||||||
Bear Stearns Asset-Backed Securities Trust | ||||||
0.76%, 10/27/32† | 27,898 | 19,105 | ||||
0.76%, 12/25/33† | 301,960 | 202,149 | ||||
Drive Auto Receivables Trust | ||||||
5.33%, | ||||||
04/15/14 STEP 144A | 317,715 | 299,423 | ||||
EMC Mortgage Loan Trust | ||||||
0.96%, | ||||||
02/25/41 STEP 144A | 81,511 | 42,636 | ||||
GSAA Trust | ||||||
0.58%, 07/25/37† | 200,000 | 61,183 | ||||
Lehman XS Trust | ||||||
0.61%, 11/25/35† | 287,200 | 122,541 | ||||
0.61%, 12/25/35† | 143,281 | 35,124 | ||||
0.43%, 06/25/37† | 228,751 | 159,324 | ||||
0.57%, 02/25/46† | 295,243 | 123,653 | ||||
0.38%, 08/25/46† | 153,351 | 124,263 | ||||
MASTR Specialized Loan Trust | ||||||
0.66%, 05/25/37 144A† | 265,954 | 79,643 | ||||
Nelnet Student Loan Trust | ||||||
2.57%, 04/25/24† | 80,000 | 78,822 | ||||
Option One Mortgage Loan Trust | ||||||
1.11%, 11/25/32† | 26,316 | 17,755 | ||||
Renaissance Home Equity Loan Trust | ||||||
0.74%, 06/25/33† | 20,444 | 12,495 | ||||
Securitized Asset-Backed Receivables LLC Trust | ||||||
0.54%, 02/25/37† | 271,259 | 107,354 | ||||
Wachovia Asset Securitization, Inc. | ||||||
0.68%, 09/27/32† | 68,794 | 32,941 | ||||
0.74%, 12/25/32† | 36,519 | 14,976 | ||||
0.60%, 03/25/33† | 40,298 | 23,287 | ||||
Washington Mutual Master Note Trust | ||||||
0.35%, 09/15/13 144A† | 200,000 | 199,693 | ||||
Total Asset-Backed Securities | 1,756,367 | |||||
CORPORATE BONDS — 2.9% | ||||||
AES Corporation | ||||||
7.75%, 10/15/15 | 30,000 | 28,050 | ||||
8.00%, 10/15/17 | 140,000 | 130,900 | ||||
8.00%, 06/01/20 | 190,000 | 171,475 | ||||
Alcoa, Inc. | ||||||
6.00%, 07/15/13 | 80,000 | 78,229 | ||||
American Express Co. | ||||||
8.13%, 05/20/19 | 180,000 | 187,108 | ||||
6.80%, 09/01/66† | 140,000 | 100,931 | ||||
American International Group, Inc. | ||||||
5.85%, 01/16/18 | 190,000 | 100,660 | ||||
Anadarko Petroleum Corporation | ||||||
6.45%, 09/15/36 | 320,000 | 288,519 | ||||
Apache Corporation | ||||||
5.63%, 01/15/17 | 110,000 | 115,580 | ||||
AT&T, Inc. | ||||||
5.50%, 02/01/18 | 90,000 | 90,020 | ||||
5.80%, 02/15/19 | 130,000 | 132,232 | ||||
BAC Capital Trust XIV | ||||||
5.63%, 12/31/49† | 10,000 | 5,003 | ||||
Baker Hughes, Inc. | ||||||
7.50%, 11/15/18 | 70,000 | 82,116 | ||||
Bank of America Corporation | ||||||
5.75%, 12/01/17 | 190,000 | 169,453 | ||||
8.13%, 12/15/49† | 20,000 | 16,729 | ||||
8.00%, 12/29/49† | 60,000 | 50,182 | ||||
Bear Stearns LLC | ||||||
7.25%, 02/01/18 | 170,000 | 179,464 | ||||
Cardinal Health, Inc. | ||||||
5.85%, 12/15/17 | 60,000 | 56,217 | ||||
Caterpillar Financial Services Corporation | ||||||
6.20%, 09/30/13 | 110,000 | 116,572 | ||||
Chesapeake Energy Corporation | ||||||
6.88%, 11/15/20 | 100,000 | 81,000 | ||||
Citigroup, Inc. | ||||||
6.50%, 08/19/13 | 140,000 | 136,113 | ||||
5.00%, 09/15/14 | 160,000 | 134,278 | ||||
6.88%, 03/05/38 | 130,000 | 115,143 | ||||
Comcast Corporation | ||||||
6.50%, 01/15/17 | 360,000 | 382,480 | ||||
Community Health Systems, Inc. | ||||||
8.88%, 07/15/15 | 30,000 | 29,550 | ||||
ConocoPhillips Holding Co. | ||||||
6.95%, 04/15/29 | 180,000 | 194,488 | ||||
Countrywide Financial Corporation | ||||||
6.25%, 05/15/16 | 50,000 | 44,418 | ||||
CVS Pass-Through Trust | ||||||
6.94%, 01/10/30 144A | 87,447 | 79,331 | ||||
DaVita, Inc. | ||||||
6.63%, 03/15/13 | 35,000 | 33,163 | ||||
Dominion Resources, Inc. | ||||||
5.70%, 09/17/12 | 120,000 | 127,737 | ||||
See Notes to Financial Statements.
102
Table of Contents
| Par | Value | |||||
Duke Energy Carolinas LLC | ||||||
5.63%, 11/30/12 | $ | 130,000 | $ | 139,438 | ||
Dynegy Holdings, Inc. | ||||||
7.75%, 06/01/19 | 45,000 | 35,269 | ||||
Edison Mission Energy | ||||||
7.20%, 05/15/19 | 100,000 | 75,000 | ||||
Embarq Corporation | ||||||
6.74%, 06/01/13 | 150,000 | 151,545 | ||||
Energy Future Holdings Corporation | ||||||
11.25%, 11/01/17 PIK | 530,000 | 325,950 | ||||
6.50%, 11/15/24 | 20,000 | 10,122 | ||||
6.55%, 11/15/34 | 10,000 | 4,858 | ||||
Energy Transfer Partners LP | ||||||
6.70%, 07/01/18 | 100,000 | 102,402 | ||||
FirstEnergy Corporation | ||||||
7.38%, 11/15/31 | 110,000 | 104,099 | ||||
Ford Motor Credit Co., LLC | ||||||
7.38%, 10/28/09 | 550,000 | 545,327 | ||||
12.00%, 05/15/15D | 140,000 | 131,054 | ||||
Freeport-McMoRan Copper & Gold, Inc. | ||||||
8.38%, 04/01/17 | 65,000 | 65,580 | ||||
General Electric Capital Corporation | ||||||
6.38%, 11/15/67† | 130,000 | 86,864 | ||||
GMAC LLC | ||||||
6.63%, 05/15/12 144AD | 348,000 | 294,060 | ||||
GMAC, Inc. | ||||||
7.50%, 12/31/13 144AD | 37,000 | 29,045 | ||||
8.00%, 12/31/18 144A | 32,000 | 20,640 | ||||
Goldman Sachs Capital II | ||||||
5.79%, 12/29/49† | 10,000 | 6,098 | ||||
Goldman Sachs Group, Inc. | ||||||
4.50%, 06/15/10 | 100,000 | 102,495 | ||||
5.95%, 01/18/18 | 100,000 | 97,155 | ||||
HCA, Inc. | ||||||
9.63%, 11/15/16 PIK | 52,000 | 51,610 | ||||
Hertz Corporation | ||||||
8.88%, 01/01/14 | 10,000 | 9,250 | ||||
Hess Corporation | ||||||
7.30%, 08/15/31 | 130,000 | 134,564 | ||||
HSBC Finance Corporation | ||||||
4.63%, 09/15/10 | 290,000 | 292,445 | ||||
Humana, Inc. | ||||||
7.20%, 06/15/18 | 30,000 | 27,077 | ||||
JPMorgan Chase & Co. | ||||||
6.13%, 06/27/17D | 200,000 | 197,915 | ||||
Kinder Morgan Energy Partners LP | ||||||
6.00%, 02/01/17 | 70,000 | 69,549 | ||||
6.95%, 01/15/38 | 120,000 | 116,596 | ||||
Kroger Co. | ||||||
6.15%, 01/15/20 | 70,000 | 71,659 | ||||
L-3 Communications Corporation | ||||||
6.38%, 10/15/15 | 85,000 | 77,563 | ||||
Lehman Brothers Holdings Capital Trust VII | ||||||
5.86%, 11/29/49# | 10,000 | 1 | ||||
Lehman Brothers Holdings E-Capital Trust I | ||||||
0.00%, 08/19/65# | 50,000 | 5 | ||||
Lehman Brothers Holdings, Inc. | ||||||
6.50%, 07/19/17# | 160,000 | 16 | ||||
6.75%, 12/28/17# | 120,000 | 12 | ||||
Merrill Lynch & Co., Inc. | ||||||
5.45%, 02/05/13 | 220,000 | 214,296 | ||||
MetLife, Inc. | ||||||
6.75%, 06/01/16 | 50,000 | 50,972 | ||||
6.40%, 12/15/36 | 120,000 | 86,025 | ||||
Morgan Stanley | ||||||
5.63%, 01/09/12 | 160,000 | 163,840 | ||||
NewPage Corporation | ||||||
10.00%, 05/01/12 | 30,000 | 14,550 | ||||
NRG Energy, Inc. | ||||||
7.25%, 02/01/14 | 10,000 | 9,725 | ||||
7.38%, 02/01/16 | 30,000 | 28,463 | ||||
Occidental Petroleum Corporation | ||||||
7.00%, 11/01/13 | 100,000 | 114,596 | ||||
Oncor Electric Delivery Co. | ||||||
6.38%, 01/15/15 | 50,000 | 52,343 | ||||
Pacific Gas & Electric Co. | ||||||
5.63%, 11/30/17 | 30,000 | 31,808 | ||||
6.05%, 03/01/34 | 80,000 | 83,264 | ||||
Pemex Project Funding Master Trust | ||||||
6.63%, 06/15/35 | 90,000 | 81,511 | ||||
PepsiCo, Inc. | ||||||
7.90%, 11/01/18 | 60,000 | 73,122 | ||||
Qwest Communications International, Inc. | ||||||
7.50%, 02/15/14 | 70,000 | 64,225 | ||||
Roche Holdings, Inc. | ||||||
6.00%, 03/01/19 144A | 50,000 | 53,412 | ||||
Sonat, Inc. | ||||||
7.63%, 07/15/11 | 100,000 | 98,483 | ||||
Sprint Capital Corporation | ||||||
6.90%, 05/01/19 | 100,000 | 83,250 | ||||
Steel Dynamics, Inc. | ||||||
7.38%, 11/01/12D | 25,000 | 23,813 | ||||
SunTrust Capital VIII | ||||||
6.10%, 12/15/36† | 100,000 | 65,123 | ||||
Terex Corporation | ||||||
7.38%, 01/15/14 | 10,000 | 9,200 | ||||
Time Warner Cable, Inc. | ||||||
6.75%, 07/01/18 | 110,000 | 114,765 | ||||
7.30%, 07/01/38 | 90,000 | 94,044 | ||||
Travelers Cos., Inc. | ||||||
6.25%, 03/15/37† | 100,000 | 80,712 | ||||
United Parcel Service, Inc. | ||||||
4.50%, 01/15/13D | 100,000 | 104,958 | ||||
UnitedHealth Group, Inc. | ||||||
4.88%, 02/15/13 | 100,000 | 101,162 | ||||
Ventas Realty LP | ||||||
9.00%, 05/01/12 | 20,000 | 20,700 | ||||
Verizon Communications, Inc. | ||||||
8.95%, 03/01/39 | 60,000 | 75,998 | ||||
Verizon Global Funding Corporation | ||||||
7.38%, 09/01/12 | 100,000 | 111,951 | ||||
Wachovia Corporation | ||||||
5.63%, 10/15/16 | 270,000 | 258,311 | ||||
WellPoint, Inc. | ||||||
5.88%, 06/15/17 | 110,000 | 107,826 | ||||
See Notes to Financial Statements.
103
Table of Contents
Small Cap Equity Fund
SCHEDULE OF INVESTMENTS (Continued)
| Par | Value | |||||
Weyerhaeuser Co. | ||||||
6.75%, 03/15/12 | $ | 80,000 | $ | 80,077 | ||
Williams Cos., Inc. | ||||||
7.88%, 09/01/21 | 50,000 | 49,345 | ||||
7.50%, 01/15/31 | 30,000 | 26,466 | ||||
7.75%, 06/15/31 | 50,000 | 45,111 | ||||
8.75%, 03/15/32 | 10,000 | 10,075 | ||||
Windstream Corporation | ||||||
8.63%, 08/01/16 | 20,000 | 19,250 | ||||
Wyeth | ||||||
5.95%, 04/01/37 | 60,000 | 62,285 | ||||
XTO Energy, Inc. | ||||||
7.50%, 04/15/12 | 110,000 | 121,929 | ||||
Total Corporate Bonds | 9,719,390 | |||||
FOREIGN BONDS — 0.6% | ||||||
Australia — 0.1% | ||||||
Rio Tinto Finance USA, Ltd. | ||||||
9.00%, 05/01/19 | 180,000 | 200,404 | ||||
Canada — 0.1% | ||||||
Devon Financing Corporation | ||||||
6.88%, 09/30/11 | 150,000 | 162,999 | ||||
OPTI Canada, Inc. | ||||||
7.88%, 12/15/14 | 30,000 | 19,575 | ||||
8.25%, 12/15/14 | 10,000 | 6,650 | ||||
| 189,224 | ||||||
Cayman Islands — 0.1% | ||||||
Petrobras International Finance Co. | ||||||
6.13%, 10/06/16 | 50,000 | 51,500 | ||||
Resona Preferred Global Securities Cayman, Ltd. | ||||||
7.19%, 07/30/49 144A† | 60,000 | 43,848 | ||||
Shinsei Finance Cayman, Ltd. | ||||||
6.42%, 07/20/49 144A† | 100,000 | 40,041 | ||||
Vale Overseas, Ltd. | ||||||
6.88%, 11/21/36 | 60,000 | 57,120 | ||||
| 192,509 | ||||||
France — 0.0% | ||||||
Compagnie Generale de Geophysique - Veritas | ||||||
7.50%, 05/15/15 | 50,000 | 46,125 | ||||
Iceland — 0.0% | ||||||
Glitnir Banki HF | ||||||
6.69%, 06/15/16 144A#@ | 130,000 | 78 | ||||
Kaupthing Bank HF | ||||||
7.63%, 02/28/15 144A#@ | 310,000 | 24,025 | ||||
| 24,103 | ||||||
India — 0.0% | ||||||
ICICI Bank, Ltd. | ||||||
6.38%, 04/30/22 144A†D | 110,000 | 86,030 | ||||
Ireland — 0.0% | ||||||
Vimpel Communications | ||||||
8.38%, 04/30/13 144A | 100,000 | 91,250 | ||||
Italy — 0.0% | ||||||
Telecom Italia Capital SA | ||||||
5.25%, 10/01/15 | 60,000 | 57,996 | ||||
Japan — 0.0% | ||||||
Aiful Corporation | ||||||
6.00%, 12/12/11 144A | 100,000 | 49,023 | ||||
Luxembourg — 0.1% | ||||||
Evraz Group SA | ||||||
8.88%, 04/24/13 144A | 120,000 | 99,000 | ||||
FMC Finance III SA | ||||||
6.88%, 07/15/17 | 40,000 | 37,400 | ||||
Gaz Capital for Gazprom | ||||||
6.21%, 11/22/16 144A | 110,000 | 92,400 | ||||
RSHB Capital SA for OJSC Russian Agricultural Bank | ||||||
6.30%, 05/15/17 144A | 110,000 | 95,150 | ||||
TNK-BP Finance SA | ||||||
6.63%, 03/20/17 144A | 100,000 | 79,500 | ||||
| 403,450 | ||||||
Mexico — 0.0% | ||||||
America Movil Sab de CV | ||||||
5.63%, 11/15/17 | 30,000 | 29,472 | ||||
Kansas City Southern de Mexico SA de CV | ||||||
9.38%, 05/01/12D | 20,000 | 19,100 | ||||
United Mexican States | ||||||
6.75%, 09/27/34 | 50,000 | 50,675 | ||||
| 99,247 | ||||||
Netherlands — 0.1% | ||||||
Deutsche Telekom International Finance BV | ||||||
5.75%, 03/23/16 | 75,000 | 76,896 | ||||
Koninklijke KPN NV | ||||||
8.00%, 10/01/10 | 110,000 | 115,455 | ||||
| 192,351 | ||||||
Russia — 0.0% | ||||||
Russian Federation | ||||||
7.50%, 03/31/30 STEP | 12,480 | 12,411 | ||||
United Kingdom — 0.1% | ||||||
BP Capital Markets PLC | ||||||
5.25%, 11/07/13 | 120,000 | 128,923 | ||||
Vedanta Resources PLC | ||||||
8.75%, 01/15/14 144A | 100,000 | 91,500 | ||||
WPP Finance UK | ||||||
8.00%, 09/15/14 | 100,000 | 101,659 | ||||
| 322,082 | ||||||
Total Foreign Bonds | 1,966,205 | |||||
MORTGAGE-BACKED SECURITIES — 5.1% | ||||||
American Home Mortgage Investment Trust | ||||||
0.66%, 04/25/44 STEP | 36,949 | 27,442 | ||||
0.60%, 11/25/45† | 261,397 | 115,207 | ||||
Bear Stearns Adjustable Rate Mortgage Trust | ||||||
5.32%, 02/25/35† | 106,535 | 70,942 | ||||
4.04%, 08/25/35† | 265,436 | 169,826 | ||||
Bear Stearns Mortgage Funding Trust | ||||||
0.52%, 12/25/46† | 245,848 | 39,879 | ||||
Commercial Mortgage Lease-Backed Certificates | ||||||
6.75%, 06/20/31 144A | 291,010 | 300,520 | ||||
See Notes to Financial Statements.
104
Table of Contents
| Par | Value | |||||||
Countrywide Alternative Loan Trust | ||||||||
0.55%, 06/25/35† | $ | 223,218 | $ | 93,260 | ||||
0.57%, 06/25/35† | 297,575 | 138,542 | ||||||
0.50%, 09/25/46† | 323,444 | 122,459 | ||||||
CS First Boston Mortgage Securities Corporation | ||||||||
6.00%, 10/25/35 | 127,873 | 82,458 | ||||||
Federal Home Loan Mortgage Corporation | ||||||||
6.00%, 05/01/37† | 64,086 | 67,393 | ||||||
6.19%, 09/01/37† | 57,919 | 60,717 | ||||||
5.50%, 07/01/39 TBA | 100,000 | 103,219 | ||||||
Federal National Mortgage Association | ||||||||
4.90%, 09/01/35† | 123,226 | 126,673 | ||||||
5.50%, 07/01/37 TBA | 2,200,000 | 2,270,814 | ||||||
6.00%, 07/01/37 TBA | 300,000 | 313,500 | ||||||
6.50%, 07/01/37 TBA | 1,800,000 | 1,917,000 | ||||||
5.00%, 07/01/38 TBA | 6,900,000 | 7,025,063 | ||||||
First Horizon Alternative Mortgage Securities | ||||||||
3.70%, 02/25/36† | 167,024 | 77,654 | ||||||
0.68%, 02/25/37† | 100,972 | 44,697 | ||||||
General Electric Capital Commercial Mortgage Corporation | ||||||||
5.52%, 03/10/44† | 300,000 | 245,955 | ||||||
GMAC Commercial Mortgage Securities, Inc. | ||||||||
5.24%, 11/10/45† | 100,000 | 82,822 | ||||||
Government National Mortgage Association | ||||||||
6.00%, 07/01/37 TBA | 400,000 | 416,625 | ||||||
5.00%, 07/01/38 TBA | 500,000 | 509,688 | ||||||
5.50%, 07/01/38 TBA | 400,000 | 411,880 | ||||||
6.00%, 07/01/38 TBA | 200,000 | 208,250 | ||||||
5.00%, 07/01/39 TBA | 100,000 | 101,657 | ||||||
Greenpoint Mortgage Funding Trust | ||||||||
0.57%, 10/25/45† | 69,515 | 34,524 | ||||||
Harborview Mortgage Loan Trust | ||||||||
0.55%, 06/19/35† | 281,264 | 131,705 | ||||||
Homestar Mortgage Acceptance Corporation | ||||||||
0.76%, 07/25/34† | 114,879 | 61,071 | ||||||
Impac CMB Trust | ||||||||
1.11%, 03/25/33† | 20,838 | 15,277 | ||||||
Indymac INDA Mortgage Loan Trust | ||||||||
6.15%, 11/25/37† | 166,434 | 108,685 | ||||||
MASTR Adjustable Rate Mortgages Trust | ||||||||
3.29%, 11/21/34† | 200,000 | 126,028 | ||||||
2.14%, 12/25/46† | 304,970 | 74,056 | ||||||
Merrill Lynch Mortgage Investors, Inc. | ||||||||
5.03%, 05/25/34† | 51,342 | 45,571 | ||||||
4.48%, 02/25/35† | 279,876 | 224,531 | ||||||
Morgan Stanley Capital I | ||||||||
5.69%, 04/15/49† | 250,000 | 182,231 | ||||||
Residential Accredit Loans, Inc. | ||||||||
5.53%, 12/26/34† | 296,013 | 178,338 | ||||||
0.71%, 10/25/45† | 186,403 | 84,612 | ||||||
Structured Adjustable Rate Mortgage Loan Trust | ||||||||
3.96%, 11/25/34† | 87,876 | 62,741 | ||||||
Structured Asset Mortgage Investments, Inc. | ||||||||
0.52%, 08/25/36† | 284,837 | 117,326 | ||||||
0.49%, 09/25/47† | 348,427 | 118,824 | ||||||
Terwin Mortgage Trust | ||||||||
0.39%, 10/25/37 144A† | 107,587 | 96,372 | ||||||
WAMU Mortgage Pass-Through Certificates | ||||||||
5.60%, 11/25/36† | 252,302 | 147,351 | ||||||
Washington Mutual Alternative Mortgage Pass-Through Certificates | ||||||||
2.18%, 05/25/47† | 337,081 | 66,452 | ||||||
Wells Fargo Mortgage-Backed Securities Trust | ||||||||
0.71%, 05/25/33† | 210,697 | 208,355 | ||||||
5.24%, 04/25/36† | 239,151 | 175,372 | ||||||
Total Mortgage-Backed Securities | 17,403,564 | |||||||
U.S. TREASURY OBLIGATIONS — 1.3% | ||||||||
U.S. Treasury Bill | ||||||||
0.27%, 11/19/09‡‡ | 2,275,000 | 2,272,816 | ||||||
U.S. Treasury Bonds | ||||||||
3.50%, 02/15/39D | 809,000 | 699,787 | ||||||
4.25%, 05/15/39D | 10,000 | 9,902 | ||||||
| 709,689 | ||||||||
U.S. Treasury Inflationary Index Bonds | ||||||||
2.38%, 01/15/27‡‡ | 295,000 | 323,603 | ||||||
1.75%, 01/15/28‡‡ | 350,000 | 336,965 | ||||||
2.50%, 01/15/29‡‡ | 200,000 | 211,534 | ||||||
| 872,102 | ||||||||
U.S. Treasury Notes | ||||||||
2.63%, 04/30/16 | 310,000 | 299,829 | ||||||
3.25%, 05/31/16D | 320,000 | 321,500 | ||||||
3.13%, 05/15/19D | 48,000 | 46,440 | ||||||
| 667,769 | ||||||||
Total U.S. Treasury Obligations | 4,522,376 | |||||||
TOTAL INVESTMENTS — 121.4% | 412,616,869 | |||||||
| Number of Contracts | ||||||||
WRITTEN OPTIONS — 0.0% | ||||||||
Put Options — 0.0% | ||||||||
90-Day Eurodollar Futures, Strike Price $98.38, Expires 03/15/10 | (18 | ) | (9,450 | ) | ||||
(Premiums received $(15,945)) | ||||||||
Liabilities in Excess of Other Assets — (21.4)% | (72,830,140 | ) | ||||||
NET ASSETS — 100.0% | $ | 339,777,279 | ||||||
See Notes to Financial Statements.
105
Table of Contents
Small Cap Equity Fund
SCHEDULE OF INVESTMENTS (Continued)
PORTFOLIO SUMMARY (based on net assets)
| % | |||
Money Market Funds | 24.6 | ||
Futures Contracts | 19.7 | ||
Financial Services | 16.1 | ||
Consumer Discretionary | 12.8 | ||
Technology | 12.8 | ||
Healthcare | 11.0 | ||
Materials & Processing | 7.7 | ||
Producer Durables | 7.2 | ||
Mortgage-Backed Securities | 5.1 | ||
Other Energy | 5.1 | ||
Utilities | 5.1 | ||
Auto & Transportation | 3.3 | ||
Corporate Bonds | 2.9 | ||
Consumer Staples | 2.5 | ||
U.S. Treasury Obligations | 1.3 | ||
Agency Obligations | 0.8 | ||
Foreign Common Stocks | 0.7 | ||
Integrated Oils | 0.7 | ||
Foreign Bonds | 0.6 | ||
Asset-Backed Securities | 0.5 | ||
Other | 0.5 | ||
Metals Mining | 0.1 | ||
Forward Foreign Currency Contracts | — | ** | |
Preferred Stocks | — | ** | |
Written Options | — | ** | |
| 141.1 | |||
| ** | Rounds to less than 0.005%. |
FAS 157 DISCLOSURE
The following is a summary of the inputs used, as of June 30, 2009, in valuing the Fund’s assets carried at fair value:
Valuation Inputs | Investments in Securities | Other Financial Instruments*** | ||||||
Assets: | ||||||||
Level 1 — Quoted Prices | ||||||||
Common Stocks | $ | 288,373,874 | $ | — | ||||
Foreign Common Stocks | 2,481,436 | — | ||||||
Futures Contracts | — | (1,633,863 | ) | |||||
Money Market Funds | 83,516,450 | — | ||||||
Preferred Stocks | 42,714 | — | ||||||
Level 2 — Other Significant Observable Inputs | ||||||||
Agency Obligations | 2,773,693 | — | ||||||
Asset-Backed Securities | 1,756,367 | — | ||||||
Common Stocks | 60,800 | — | ||||||
Corporate Bonds | 9,719,390 | — | ||||||
Foreign Bonds | 1,966,205 | — | ||||||
Forward Foreign Currency Contracts | — | (13,080 | ) | |||||
Mortgage-Backed Securities | 17,403,564 | — | ||||||
U.S. Treasury Obligations | 4,522,376 | — | ||||||
Level 3 — Significant Unobservable Inputs | — | — | ||||||
Total Assets | $ | 412,616,869 | $ | (1,646,943 | ) | |||
Liabilities: | ||||||||
Level 1 — Quoted Prices | ||||||||
Written Options | $ | (9,450 | ) | $ | — | |||
Level 2 — Other Significant Observable Inputs | — | — | ||||||
Level 3 — Significant Unobservable Inputs | — | — | ||||||
Total Liabilities | $ | (9,450 | ) | $ | — | |||
| *** | Other financial instruments are derivative instruments not reflected in the Schedule of Investments, such as futures, forwards and swap contracts, which are valued at the unrealized appreciation (depreciation) on the investment. Details of these investments can be found in the Notes to Financial Statements. |
See Notes to Financial Statements.
106
Table of Contents
The following is a reconciliation of assets in which significant unobservable inputs (Level 3) were used in determining fair value:
| Investments in Securities | Other Financial Instruments*** | ||||||
Balance, 12/31/08 | $ | 65,945 | $ | — | |||
Accrued discounts/premiums | 957 | — | |||||
Realized gain (loss) | — | — | |||||
Changed in unrealized appreciation (depreciation) | (48,611 | ) | — | ||||
Net purchases (sales) | — | — | |||||
Transfers in and/or out of Level 3 | (18,291 | ) | — | ||||
Balance, 06/30/09 | $ | — | $ | — | |||
See Notes to Financial Statements.
107
Table of Contents
| International Equity Fund | ||
| SCHEDULE OF INVESTMENTS | June 30, 2009 (Unaudited) |
| Shares | Value | ||||
FOREIGN COMMON STOCKS — 97.1% | |||||
Argentina — 0.0% | |||||
Banco Macro SA ADRD* | 24,300 | $ | 393,417 | ||
Australia — 4.5% | |||||
ABB Grain, Ltd. ‡‡ | 1,426 | 10,686 | |||
ABC Learning Centres, Ltd.+@* | 2,281 | 993 | |||
AGL Energy, Ltd.‡‡ | 12,361 | 133,969 | |||
Allco Finance Group, Ltd.+*‡‡ | 147,022 | 8,589 | |||
Amcor, Ltd.‡‡ | 790,743 | 3,179,540 | |||
AMP, Ltd.‡‡ | 242,979 | 955,470 | |||
Ansell, Ltd.‡‡ | 13,349 | 94,336 | |||
Asciano Group*‡‡ | 41,271 | 44,397 | |||
ASX, Ltd.‡‡ | 851 | 25,365 | |||
Austereo Group, Ltd. | 457 | 517 | |||
Australia and New Zealand Banking Group, Ltd.‡‡ | 12,199 | 162,096 | |||
Australian Worldwide Exploration, Ltd.*‡‡ | 225,561 | 467,117 | |||
AWB, Ltd.‡‡ | 93,465 | 88,871 | |||
AXA Asia Pacific Holdings, Ltd.‡‡ | 11,046 | 34,624 | |||
Beach Petroleum, Ltd. | 94,351 | 60,062 | |||
BHP Billiton, Ltd.‡‡ | 197,612 | 5,528,679 | |||
Billabong International, Ltd.‡‡ | 4,052 | 28,570 | |||
BlueScope Steel, Ltd.‡‡ | 38,414 | 78,314 | |||
Boral, Ltd.‡‡ | 8,281 | 27,158 | |||
Brambles, Ltd.‡‡ | 20,052 | 96,301 | |||
Caltex Australia, Ltd.‡‡ | 3,195 | 35,657 | |||
CFS Retail Property Trust REIT | 16,818 | 22,361 | |||
Challenger Financial Services Group, Ltd.‡‡ | 25,856 | 46,670 | |||
Coca-Cola Amatil, Ltd.‡‡ | 889,443 | 6,170,916 | |||
Cochlear, Ltd. | 20,570 | 956,398 | |||
Commonwealth Bank of Australia‡‡ | 11,128 | 349,712 | |||
Computershare, Ltd. | 2,076 | 15,089 | |||
Consolidated Media Holdings, Ltd.‡‡ | 33,353 | 61,008 | |||
CSL, Ltd.‡‡ | 101,067 | 2,618,296 | |||
CSR, Ltd.‡‡ | 19,434 | 26,622 | |||
David Jones, Ltd.‡‡ | 8,382 | 30,732 | |||
Dexus Property Group REIT‡‡ | 16,883 | 10,203 | |||
Downer EDI, Ltd.‡‡ | 146,212 | 658,602 | |||
Flight Centre, Ltd.‡‡ | 3,162 | 22,040 | |||
Goodman Group REIT | 7,891 | 2,353 | |||
GPT Group REIT‡‡ | 39,326 | 15,528 | |||
Iluka Resources, Ltd.*‡‡ | 5,421 | 12,493 | |||
Incitec Pivot, Ltd. | 349,904 | 671,049 | |||
Insurance Australia Group, Ltd.‡‡ | 8,764 | 24,788 | |||
JB Hi-Fi, Ltd.D‡‡ | 97,488 | 1,209,763 | |||
Leighton Holdings, Ltd.‡‡ | 1,256 | 23,784 | |||
Lend Lease Corporation, Ltd. | 1,317 | 7,439 | |||
Macquarie Airports‡‡ | 25,147 | 46,809 | |||
Macquarie Group, Ltd.D‡‡ | 62,306 | 1,963,066 | |||
Macquarie Infrastructure Group‡‡ | 24,356 | 28,065 | |||
Macquarie Office Trust REIT | 7,996 | 1,353 | |||
Metcash Ltd. | 19,144 | 66,487 | |||
Mineral Deposits, Ltd.* | 138,300 | 69,094 | |||
Mirvac Group REIT‡‡ | 9,451 | 8,225 | |||
National Australia Bank, Ltd.‡‡ | 521,152 | 9,423,573 | |||
Newcrest Mining, Ltd.‡‡ | 3,186 | 78,328 | |||
OneSteel, Ltd.‡‡ | 9,460 | 19,667 | |||
Orica, Ltd.‡‡ | 3,038 | 53,171 | |||
Origin Energy, Ltd.‡‡ | 7,270 | 85,764 | |||
OZ Minerals, Ltd. | 629,946 | 467,003 | |||
QBE Insurance Group, Ltd.‡‡ | 100,330 | 1,608,838 | |||
Quantas Airways, Ltd.‡‡ | 34,152 | 55,315 | |||
Ramsay Health Care, Ltd.‡‡ | 10,283 | 95,621 | |||
Rio Tinto, Ltd.‡‡ | 1,858 | 78,153 | |||
Santos, Ltd.‡‡ | 7,196 | 84,891 | |||
Sigma Pharmaceuticals, Ltd.‡‡ | 71,978 | 70,760 | |||
Sonic Healthcare, Ltd. | 4,705 | 46,709 | |||
Stockland REIT‡‡ | 11,804 | 30,532 | |||
Telstra Corporation, Ltd.‡‡ | 3,052,142 | 8,337,441 | |||
Transpacific Industries Group, Ltd.+@‡‡ | 10,659 | 15,460 | |||
Transurban Group‡‡ | 12,362 | 41,638 | |||
Wesfarmers, Ltd.‡‡ | 262,838 | 4,798,287 | |||
Westfield Group REIT‡‡ | 15,603 | 143,080 | |||
Westpac Banking Corporation‡‡ | 59,533 | 971,429 | |||
Woodside Petroleum, Ltd.‡‡ | 2,011 | 70,020 | |||
WorleyParsons, Ltd.‡‡ | 2,098 | 40,253 | |||
| 52,816,189 | |||||
Austria — 0.2% | |||||
OMV AGD | 64,159 | 2,402,261 | |||
Wienerberger AGD* | 30,558 | 378,529 | |||
| 2,780,790 | |||||
Belgium — 0.4% | |||||
Bekaert SAD | 2,922 | 300,099 | |||
Colruyt SA | 3,054 | 696,632 | |||
Delhaize Group‡‡ | 19,661 | 1,382,804 | |||
Fortis* | 345,986 | 1,179,448 | |||
KBC Groep NV*‡‡ | 4,014 | 73,204 | |||
Nyrstar* | 40,146 | 340,168 | |||
Tessenderlo Chemie NV‡‡ | 2,178 | 69,206 | |||
Umicore‡‡ | 4,984 | 113,058 | |||
| 4,154,619 | |||||
Bermuda — 0.1% | |||||
Catlin Group, Ltd.‡‡ | 9,309 | 49,200 | |||
Hiscox, Ltd. | 157,423 | 749,781 | |||
Seadrill, Ltd.D | 60,000 | 856,590 | |||
| 1,655,571 | |||||
Brazil — 2.2% | |||||
Amil Participacoes SA* | 140,037 | 674,636 | |||
Banco do Brasil SA | 158,126 | 1,706,744 | |||
BM&FBOVESPA SA* | 183,800 | 1,097,453 | |||
BR Malls Participacoes SA* | 35,500 | 269,217 | |||
Brasil Telecom Participacoes SA ADRD | 33,759 | 1,296,346 | |||
CIA Paranaense de Energia ADRD | 100,871 | 1,425,307 | |||
Companhia Brasileira de Distribuicao Grupo Pao de Acucar ADRD | 9,380 | 360,755 | |||
Companhia Brasileira de Meios de Pagamento* | 48,600 | 417,918 | |||
Gerdau SA ADRD | 12,400 | 129,828 | |||
Global Village Telecom Holding SA* | 24,700 | 410,049 | |||
Hypermarcas SA* | 16,000 | 197,601 | |||
Itau Unibanco Banco Multiplo SA ADRD | 56,062 | 887,461 | |||
Localiza Rent A Car SA | 54,700 | 337,775 | |||
Lojas Renner SA | 52,105 | 577,024 | |||
See Notes to Financial Statements.
108
Table of Contents
| Shares | Value | ||||
Marfrig Frigorificos e Comercio de Alimentos SA* | 123,537 | $ | 914,155 | ||
Natura Cosmeticos SA | 61,920 | 808,957 | |||
PDG Realty SA Empreendimentos e Participacoes | 9,500 | 100,454 | |||
Petroleo Brasileiro SA ADRD | 188,540 | 6,987,991 | |||
Redecard SA* | 96,700 | 1,480,480 | |||
Tegma Gestao Logistica SA | 31,778 | 121,631 | |||
Tele Norte Leste Participacoes SA ADRD | 17,380 | 258,441 | |||
Terna Participacoes SA | 35,600 | 693,105 | |||
Totvs SA | 13,573 | 467,280 | |||
Tractebel Energia SA | 62,235 | 593,924 | |||
Triunfo Participacoes e Investimentos SA* | 50,300 | 78,293 | |||
Usinas Siderurgicas de Minas Gerais SA | 45,100 | 948,262 | |||
Vale SA ADRD | 125,700 | 1,990,827 | |||
| 25,231,914 | |||||
Canada — 1.6% | |||||
Canadian National Railway Co. | 48,780 | 2,095,634 | |||
Encana Corporation | 65,800 | 3,255,126 | |||
Falcon Oil & Gas, Ltd.D* | 335,000 | 126,725 | |||
First Quantum Minerals, Ltd.D | 47,595 | 2,301,697 | |||
Goldcorp, Inc.D | 101,890 | 3,540,677 | |||
Kinross Gold Corporation | 114,100 | 2,072,572 | |||
Potash Corporation of SaskatchewanD | 6,400 | 595,520 | |||
Research In Motion, Ltd.* | 22,170 | 1,575,178 | |||
Talisman Energy, Inc. | 199,300 | 2,863,176 | |||
Teck Cominco, Ltd. Class B* | 13,100 | 208,920 | |||
| 18,635,225 | |||||
Chile — 0.3% | |||||
Banco Santander Chile SA ADRD | 9,200 | 429,548 | |||
Centros Comerciales Sudamericanos SA | 56,982 | 149,067 | |||
Embotelladora Andina SA ADR Class A | 20,000 | 295,000 | |||
Embotelladora Andina SA ADR Class B | 43,500 | 740,370 | |||
Enersis SA ADRD | 44,100 | 814,527 | |||
Multiexport Foods SA* | 75,038 | 12,102 | |||
S.A.C.I. Falabella SA | 87,572 | 346,182 | |||
Sociedad Quimica y Minera de Chile SA ADRD | 4,100 | 148,379 | |||
| 2,935,175 | |||||
China — 3.0% | |||||
AAC Acoustic Technology Holdings, Inc. | 48,000 | 38,214 | |||
Anhui Conch Cement Co., Ltd.D | 127,821 | 799,907 | |||
Bank of China, Ltd. | 4,796,000 | 2,283,500 | |||
China Construction Bank Class H | 2,988,000 | 2,317,131 | |||
China Life Insurance Co., Ltd. Class H | 1,019,000 | 3,747,266 | |||
China Medical Technologies, Inc. ADRD | 10,900 | 217,019 | |||
China Petroleum & Chemical Corporation Class H | 1,484,700 | 1,132,196 | |||
China Railway Group, Ltd.D* | 1,665,000 | 1,338,437 | |||
China Shenhua Energy Co., Ltd. Class H | 1,458,453 | 5,372,718 | |||
China South Locomotive and Rolling Stock Corporation | 1,089,000 | 637,939 | |||
China Zhongwang Holdings, Ltd.* | 971,600 | 1,333,904 | |||
Ctrip.com International, Ltd. ADR* | 8,600 | 398,180 | |||
Great Wall Motor Co., Ltd. | 273,000 | 216,637 | |||
Guangzhou R&F Properties Co., Ltd.D | 250,400 | 562,185 | |||
Huaneng Power International, Inc.D | 3,700,000 | 2,597,144 | |||
Industrial & Commercial Bank of China Class H | 7,421,000 | 5,170,728 | |||
New World Department Store China, Ltd. | 587,337 | 443,342 | |||
Parkson Retail Group, Ltd.D | 1,211,194 | 1,731,606 | |||
Shanda Interactive Entertainment, Ltd. ADRD* | 12,800 | 669,312 | |||
Shandong Weigao Group Medical Polymer Co., Ltd. | 216,000 | 554,629 | |||
Sina CorporationD* | 27,100 | 798,908 | |||
Suntech Power Holdings Co., Ltd. ADRD* | 24,500 | 437,570 | |||
Tencent Holdings, Ltd. | 64,200 | 749,271 | |||
Want Want China Holdings Ltd. | 357,873 | 202,255 | |||
Xinao Gas Holdings, Ltd. | 475,553 | 812,423 | |||
| 34,562,421 | |||||
Colombia — 0.2% | |||||
BanColombia SA | 76,200 | 582,873 | |||
BanColombia SA ADRD | 42,074 | 1,283,257 | |||
| 1,866,130 | |||||
Cyprus — 0.1% | |||||
Bank of Cyprus Public Co., Ltd. | 220,790 | 1,248,241 | |||
Czech Republic — 0.2% | |||||
CEZ AS | 42,817 | 1,928,871 | |||
Denmark — 0.9% | |||||
A P Moller - Maersk A/S‡‡ | 115 | 688,902 | |||
D/S Norden‡‡ | 4,822 | 164,868 | |||
Danisco A/S‡‡ | 1,924 | 75,388 | |||
H Lundbeck A/SD‡‡ | 96,049 | 1,827,454 | |||
Novo-Nordisk A/S Class B‡‡ | 93,974 | 5,080,680 | |||
TDC A/S | 86 | 2,989 | |||
Vestas Wind Systems A/SD* | 37,783 | 2,708,216 | |||
| 10,548,497 | |||||
Egypt — 0.3% | |||||
Commercial International Bank, Ltd. | 24,734 | 216,655 | |||
El Sewedy Cables Holding Co. | 59,535 | 712,845 | |||
Orascom Construction Industries | 70,794 | 2,417,044 | |||
Orascom Construction Industries GDR | 6,530 | 215,490 | |||
| 3,562,034 | |||||
Estonia — 0.0% | |||||
Tallink Group, Ltd.* | 746,660 | 345,661 | |||
Finland — 0.7% | |||||
Fortum OYJ‡‡ | 14,705 | 334,603 | |||
Konecranes OYJ‡‡ | 6,980 | 164,015 | |||
Metso Corporation | 8,290 | 154,675 | |||
Nokia OYJ ADR‡‡ | 350,897 | 5,139,184 | |||
Sampo OYJ | 5,553 | 104,776 | |||
Tietoenator OYJ‡‡ | 10,982 | 145,897 | |||
See Notes to Financial Statements.
109
Table of Contents
International Equity Fund
SCHEDULE OF INVESTMENTS (Continued)
| Shares | Value | ||||
UPM-Kymmene OYJD | 233,934 | $ | 2,037,976 | ||
| 8,081,126 | |||||
France — 8.1% | |||||
Air Liquide SA | 19,051 | 1,740,121 | |||
Alcatel-Lucent*‡‡ | 38,653 | 96,954 | |||
AlstomD‡‡ | 8,377 | 494,220 | |||
Atos Origin SA*‡‡ | 2,752 | 93,254 | |||
AXA SA‡‡ | 242,393 | 4,553,179 | |||
BNP Paribas SA‡‡ | 59,521 | 3,861,855 | |||
Bouygues SA‡‡ | 25,743 | 967,850 | |||
Cap Gemini SA‡‡ | 12,744 | 469,120 | |||
Carrefour SAD‡‡ | 195,237 | 8,331,733 | |||
Casino Guichard Perrachon SAD | 18,273 | 1,231,735 | |||
Christian Dior SA‡‡ | 40,785 | 3,042,154 | |||
Ciments Francais SA‡‡ | 1,054 | 89,190 | |||
CNP Assurances‡‡ | 2,194 | 209,465 | |||
Compagnie de Saint-GobainD‡‡ | 189,801 | 6,343,741 | |||
Compagnie Generale de Geophysique - VeritasD* | 36,555 | 656,916 | |||
Compagnie Generale des Etablissements Michelin Class B | 5,406 | 307,942 | |||
Compagnie Generale d’Optique Essilor International SAD | 23,230 | 1,107,354 | |||
Credit Agricole SA‡‡ | 133,289 | 1,659,685 | |||
France Telecom SA‡‡ | 256,255 | 5,809,353 | |||
Gaz de France SA‡‡ | 61,088 | 2,274,421 | |||
Groupe DanoneD | 43,173 | 2,130,717 | |||
IPSOS‡‡ | 896 | 22,500 | |||
Lafarge SAD* | 45,661 | 3,067,346 | |||
Lagardere SCA‡‡ | 2,554 | 84,807 | |||
Nexans SAD‡‡ | 10,812 | 574,325 | |||
Peugeot SA*‡‡ | 2,257 | 59,272 | |||
Publicis Groupe‡‡ | 4,552 | 138,764 | |||
Rallye SA | 1,865 | 49,344 | |||
Sanofi-Aventis‡‡ | 63,541 | 3,732,253 | |||
Schneider Electric SAD | 28,545 | 2,174,422 | |||
SCOR SE | 11,289 | 231,377 | |||
SEB SA | 1,479 | 61,207 | |||
Societe BIC SA | 3,280 | 188,242 | |||
Societe Generale Class A‡‡ | 105,987 | 5,781,609 | |||
Suez Environnement SAD | 77,432 | 1,351,853 | |||
Teleperformance | 4,204 | 127,801 | |||
Thales SA‡‡ | 4,802 | 214,727 | |||
Total SA‡‡ | 439,772 | 23,739,779 | |||
Total SA ADRD | 42,900 | 2,326,467 | |||
UBISOFT Entertainment*‡‡ | 5,324 | 129,547 | |||
Unibail-Rodamco REIT‡‡ | 5,042 | 750,893 | |||
Valeo SA*‡‡ | 10,498 | 193,074 | |||
Veolia Environnement SAD | 11,651 | 343,075 | |||
Vivendi SAD‡‡ | 125,775 | 3,005,734 | |||
Wendel Investissement | 11,244 | 362,796 | |||
| 94,182,173 | |||||
Germany — 5.9% | |||||
Adidas-Salomon AG‡‡ | 3,126 | 118,843 | |||
Allianz AG‡‡ | 39,178 | 3,607,104 | |||
Arcandor AG ‡‡ | 28,768 | 24,618 | |||
BASF AG‡‡ | 105,643 | 4,198,569 | |||
Bayer AG‡‡ | 91,744 | 4,919,063 | |||
Beiersdorf AG | 23,910 | 1,124,005 | |||
Daimler AG‡‡ | 43,890 | 1,587,313 | |||
Deutsche Bank AG‡‡ | 46,779 | 2,834,644 | |||
Deutsche Boerse AG | 24,210 | 1,877,487 | |||
Deutsche Lufthansa AG‡‡ | 163,763 | 2,051,546 | |||
Deutsche Telekom AG‡‡ | 500,384 | 5,896,533 | |||
E.ON AG‡‡ | 32,608 | 1,153,674 | |||
Fresenius Medical Care AG & Co. KGaAD | 56,805 | 2,541,295 | |||
GEA Group AG‡‡ | 36,578 | 553,676 | |||
Hannover Rueckversicherung AG* | 69,430 | 2,567,477 | |||
Hochtief AG‡‡ | 2,493 | 125,554 | |||
K+S AG | 17,293 | 971,113 | |||
Lanxess AG‡‡ | 1,821 | 45,114 | |||
Linde AG | 26,313 | 2,156,852 | |||
MAN AG‡‡ | 2,667 | 163,500 | |||
Merck KGaA | 16,930 | 1,721,904 | |||
Metro AGD‡‡ | 39,211 | 1,871,355 | |||
MTU Aero Engines Holding AG‡‡ | 18,787 | 685,243 | |||
Muenchener Rueckversicherungs AG‡‡ | 19,378 | 2,614,887 | |||
Norddeutsche Affinerie AG‡‡ | 2,052 | 59,416 | |||
RWE AG‡‡ | 182,343 | 14,347,907 | |||
Salzgitter AG‡‡ | 757 | 66,288 | |||
SAP AG‡‡ | 92,913 | 3,736,958 | |||
Siemens AG‡‡ | 16,962 | 1,169,777 | |||
Software AG‡‡ | 730 | 51,624 | |||
SolarWorld AGD | 11,341 | 266,808 | |||
Suedzucker AG‡‡ | 4,711 | 95,630 | |||
Symrise AG | 101,877 | 1,503,509 | |||
ThyssenKrupp AG‡‡ | 26,652 | 661,411 | |||
Tognum AG‡‡ | 28,611 | 375,684 | |||
United Internet AGD* | 29,849 | 349,229 | |||
Volkswagen AG‡‡ | 833 | 281,792 | |||
Wincor Nixdorf AG‡‡ | 14,180 | 793,315 | |||
| 69,170,717 | |||||
Greece — 0.5% | |||||
Coca Cola Hellenic Bottling Co. SA | 114,329 | 2,357,696 | |||
National Bank of Greece SA* | 44,920 | 1,247,725 | |||
Public Power Corporation* | 121,217 | 2,499,740 | |||
| 6,105,161 | |||||
Hong Kong — 4.4% | |||||
ASM Pacific Technology, Ltd. | 300 | 1,542 | |||
Beijing Enterprises Holdings, Ltd. | 116,000 | 579,248 | |||
Belle International Holdings, Ltd. | 954,000 | 839,515 | |||
BOC Hong Kong Holdings, Ltd.‡‡ | 59,500 | 104,259 | |||
Cheung Kong Holdings, Ltd.‡‡ | 8,000 | 91,974 | |||
Cheung Kong Infrastructure Holdings, Ltd. | 2,000 | 7,019 | |||
China Mobile, Ltd. | 734,652 | 7,355,952 | |||
China Overseas Land & Investment, Ltd. | 2,259,892 | 5,248,747 | |||
China Power International Development, Ltd.* | 50,000 | 16,064 | |||
China Resources Land, Ltd. | 342,000 | 758,132 | |||
China Unicom Hong Kong, Ltd. | 1,834,000 | 2,427,964 | |||
Chinese Estates Holdings, Ltd. | 8,000 | 14,658 | |||
CLP Holdings, Ltd.‡‡ | 12,500 | 82,903 | |||
CNOOC, Ltd. | 1,026,000 | 1,272,232 | |||
Dairy Farm International Holdings, Ltd. | 305,100 | 1,970,946 | |||
Esprit Holdings, Ltd.‡‡ | 9,400 | 52,458 | |||
Giordano International, Ltd. | 8,000 | 1,682 | |||
See Notes to Financial Statements.
110
Table of Contents
| Shares | Value | ||||
Great Eagle Holdings, Ltd. | 3,000 | $ | 6,294 | ||
Hang Lung Group, Ltd. | 5,000 | 23,548 | |||
Hang Lung Properties, Ltd.‡‡ | 1,000 | 3,310 | |||
Hang Seng Bank, Ltd. | 600 | 8,439 | |||
Henderson Land Development Co., Ltd.‡‡ | 11,000 | 63,090 | |||
Hengan International Group Co., Ltd. | 284,000 | 1,330,211 | |||
Hong Kong Electric Holdings, Ltd.‡‡ | 650,000 | 3,614,815 | |||
Hong Kong Exchanges and Clearing, Ltd.‡‡ | 64,100 | 998,299 | |||
Hopewell Highway Infrastructure, Ltd. | 1,350 | 756 | |||
Hopewell Holdings | 22,000 | 68,980 | |||
Hutchison Telecommunications International, Ltd.*‡‡ | 94,000 | 13,739 | |||
Hutchison Whampoa, Ltd.‡‡ | 502,600 | 3,284,713 | |||
Hysan Development Co., Ltd. | 370,000 | 950,058 | |||
Jardine Matheson Holdings, Ltd. | 124,000 | 3,400,080 | |||
Li & Fung, Ltd.D | 1,308,000 | 3,510,481 | |||
Link REIT‡‡ | 11,000 | 23,476 | |||
Midland Holdings, Ltd. | 10,000 | 6,090 | |||
Mongolia Energy Co., Ltd.* | 1,000 | 369 | |||
New World Development, Ltd. | 17,000 | 30,753 | |||
Noble Group, Ltd. | 900,000 | 1,130,903 | |||
Orient Overseas International, Ltd. | 1,000 | 4,271 | |||
Pacific Basin Shipping, Ltd.D | 432,000 | 275,921 | |||
PCCW, Ltd. | 14,000 | 3,649 | |||
Shangri-La Asia, Ltd. | 288,000 | 427,352 | |||
Shenzhen International Holdings | 7,500 | 503 | |||
Sun Hung Kai Properties, Ltd.‡‡ | 416,000 | 5,195,941 | |||
Swire Pacific, Ltd. Class A‡‡ | 5,000 | 50,451 | |||
Television Broadcasts, Ltd. | 8,000 | 32,155 | |||
Texwinca Holdings, Ltd. | 20,410 | 16,301 | |||
VTech Holdings, Ltd. | 110,946 | 757,291 | |||
Wharf Holdings, Ltd.‡‡ | 1,095,250 | 4,642,417 | |||
Wheelock & Co., Ltd.‡‡ | 20,000 | 51,561 | |||
WM Morrison Supermarkets PLC‡‡ | 112,790 | 438,854 | |||
Yue Yuen Industrial Holdings, Ltd. | 18,500 | 43,588 | |||
| 51,233,954 | |||||
Hungary — 0.2% | |||||
MOL Hungarian Oil and Gas PLC* | 28,930 | 1,782,538 | |||
MOL Hungarian Oil and Gas PLC ADR* | 7,460 | 232,603 | |||
| 2,015,141 | |||||
India — 1.9% | |||||
Ambuja Cements, Ltd. | 527,815 | 964,071 | |||
Andhra Bank, Ltd. | 518,268 | 887,671 | |||
Asian Paints, Ltd. | 37,948 | 940,917 | |||
Bharat Heavy Electricals, Ltd. | 14,675 | 675,179 | |||
Bharti Airtel, Ltd.* | 36,375 | 609,085 | |||
Cairn India, Ltd.* | 61,564 | 299,113 | |||
Container Corporation of India, Ltd. | 32,963 | 671,577 | |||
Dabur India, Ltd. | 175,495 | 460,489 | |||
HDFC Bank, Ltd. | 93,949 | 2,928,295 | |||
Housing Development Finance Corporation | 88,459 | 4,329,699 | |||
ICICI Bank, Ltd. | 27,395 | 412,998 | |||
ICICI Bank, Ltd. ADRD | 49,500 | 1,460,250 | |||
Indraprastha Gas, Ltd. | 93,800 | 264,238 | |||
Infosys Technologies, Ltd. | 64,150 | 2,378,927 | |||
Infosys Technologies, Ltd. ADRD | 71,150 | 2,616,897 | |||
Larsen & Toubro, Ltd. | 22,340 | 731,127 | |||
Shriram Transport Finance Co., Ltd. | 73,200 | 461,234 | |||
Sun Pharmaceuticals Industries, Ltd. | 50,744 | 1,155,179 | |||
Welspun-Gujarat Stahl, Ltd. | 108,472 | 436,220 | |||
| 22,683,166 | |||||
Indonesia — 0.9% | |||||
Astra International TBK, PT | 230,500 | 537,438 | |||
Bank Danamon Indonesia TBK | 881,219 | 416,545 | |||
Bank Rakyat Indonesia | 7,655,300 | 4,724,799 | |||
Indocement Tunggal Prakarsa TBK PT | 1,206,796 | 916,255 | |||
PT Bank Central Asia TBK | 1,017,000 | 351,205 | |||
PT Panin Life TBK@* | 26,999,000 | 290,952 | |||
PT Ramayana Lestari Sentosa TBK | 3,782,500 | 188,986 | |||
PT Telekomunikasi Indonesia TBK | 4,415,807 | 3,244,531 | |||
| 10,670,711 | |||||
Ireland — 0.2% | |||||
CRH PLCD | 104,842 | 2,391,687 | |||
Experian PLC‡‡ | 12,700 | 94,911 | |||
| 2,486,598 | |||||
Israel — 0.9% | |||||
Check Point Software Technologies, Ltd.D* | 41,910 | 983,628 | |||
Israel Chemicals, Ltd. | 26,383 | 261,883 | |||
Nice Systems, Ltd. ADRD* | 36,290 | 837,210 | |||
Teva Pharmaceutical Industries, Ltd. ADR | 179,655 | 8,864,178 | |||
| 10,946,899 | |||||
Italy — 2.0% | |||||
Alleanza Assicurazioni SpA | 12,816 | 87,873 | |||
Banca Italease SpA*‡‡ | 28,655 | 59,092 | |||
Banco Popolare SC* | 79,969 | 596,825 | |||
Buzzi Unicem SpA‡‡ | 12,359 | 174,593 | |||
DiaSorin SpA | 12,501 | 310,583 | |||
Enel SpAD‡‡ | 261,741 | 1,274,134 | |||
ENI SpA‡‡ | 180,721 | 4,271,914 | |||
Fiat SpA*‡‡ | 150,561 | 1,202,779 | |||
Finmeccanica SpA‡‡ | 3,549 | 49,937 | |||
Impregilo SpA | 23,888 | 83,025 | |||
Intesa Sanpaolo SpA*‡‡ | 1,746,861 | 5,624,126 | |||
Mediaset SpA‡‡ | 390,917 | 2,189,493 | |||
Pirelli & C SpA*‡‡ | 289,339 | 101,232 | |||
Prysmian SpA | 6,051 | 90,914 | |||
Saipem SpAD | 120,301 | 2,926,391 | |||
Telecom Italia SpA | 105,592 | 145,909 | |||
UniCredito Italiano SpA*‡‡ | 1,566,715 | 3,945,195 | |||
Unione di Banche Italiane SCPA‡‡ | 1,424 | 110 | |||
See Notes to Financial Statements.
111
Table of Contents
International Equity Fund
SCHEDULE OF INVESTMENTS (Continued)
| Shares | Value | ||||
Unipol Gruppo Finanziario SpA* | 77,439 | $ | 90,657 | ||
| 23,224,782 | |||||
Japan — 15.9% | |||||
77 Bank, Ltd. (The)D | 139,000 | 810,899 | |||
Acom Co., Ltd. | 150 | 3,760 | |||
Advantest Corporation | 3,800 | 69,030 | |||
Aeon Credit Service Co., Ltd. | 123,600 | 1,620,458 | |||
Aioi Insurance Co., Ltd. | 7,000 | 32,044 | |||
Aisin Seiki Co., Ltd. | 6,600 | 143,530 | |||
Alps Electric Co., Ltd. | 40,700 | 221,804 | |||
Amada Co., Ltd. | 9,000 | 55,961 | |||
Asahi Glass Co., Ltd.D‡‡ | 116,000 | 933,202 | |||
Astellas Pharma, Inc.‡‡ | 216,700 | 7,693,092 | |||
Bridgestone Corporation‡‡ | 300 | 4,718 | |||
Brother Industries, Ltd. | 3,300 | 29,323 | |||
Canon Marketing Japan, Inc.‡‡ | 7,600 | 106,503 | |||
Canon, Inc.D‡‡ | 457,450 | 15,005,367 | |||
Central Glass Co., Ltd. | 42,000 | 167,416 | |||
Central Japan Railway Co.‡‡ | 217 | 1,335,766 | |||
Chubu Electric Power Co., Inc.‡‡ | 6,600 | 152,779 | |||
Chuo Mitsui Trust Holdings, Inc.‡‡ | 5,000 | 19,152 | |||
Circle K Sunkus Co., Ltd.‡‡ | 5,300 | 82,855 | |||
Coca-Cola West Holdings Co., Ltd. | 1,600 | 30,643 | |||
COMSYS Holdings Corporation | 11,000 | 121,835 | |||
Credit Saison Co., Ltd. | 7,400 | 94,329 | |||
Dai Nippon Printing Co., Ltd.‡‡ | 14,000 | 192,412 | |||
Daiei, Inc. (The)* | 37,850 | 169,733 | |||
Daifuku Co., Ltd. | 10,500 | 74,879 | |||
Daiichi Sankyo Co., Ltd.‡‡ | 5,600 | 100,449 | |||
Daito Trust Construction Co., Ltd.‡‡ | 37,100 | 1,756,122 | |||
Daiwa Securities Group, Inc.‡‡ | 3,000 | 17,906 | |||
Denso Corporation‡‡ | 23,400 | 602,398 | |||
DIC Corporation | 11,000 | 17,242 | |||
Doutor Nichires Holdings Co., Ltd. | 5,600 | 75,686 | |||
East Japan Railway Co.‡‡ | 7,400 | 446,297 | |||
Ebara Corporation* | 35,000 | 120,984 | |||
Elpida Memory, Inc.* | 2,500 | 27,119 | |||
FamilyMart Co., Ltd.‡‡ | 3,000 | 94,358 | |||
Fanuc, Ltd.‡‡ | 41,000 | 3,302,642 | |||
Fast Retailing Co., Ltd. | 8,300 | 1,085,587 | |||
Fuji Heavy Industries, Ltd. | 9,000 | 36,529 | |||
Fuji Oil Co., Ltd. | 8,100 | 94,508 | |||
FUJIFILM Holdings Corporation‡‡ | 73,000 | 2,318,783 | |||
Fujikura, Ltd. | 4,000 | 20,138 | |||
Fujitsu, Ltd.D‡‡ | 70,000 | 382,208 | |||
Furukawa Electric Co., Ltd. | 4,000 | 18,104 | |||
Glory, Ltd.‡‡ | 5,100 | 101,381 | |||
Godo Steel, Ltd. | 100,000 | 298,957 | |||
Gunma Bank, Ltd. | 107,000 | 596,450 | |||
H2O Retailing Corporation | 7,000 | 39,892 | |||
Hakuhodo DY Holdings, Inc.‡‡ | 960 | 51,819 | |||
Hanwa Co., Ltd. | 17,000 | 63,881 | |||
Haseko Corporation* | 13,000 | 13,495 | |||
Hino Motors, Ltd. | 24,000 | 74,988 | |||
Hirose Electric Co., Ltd. | 10,000 | 1,069,186 | |||
Hisamitsu Pharmaceutical Co., Inc. | 28,900 | 899,984 | |||
Hitachi Capital Corporation‡‡ | 12,600 | 170,947 | |||
Hitachi Chemical Co., Ltd. | 40,300 | 651,343 | |||
Hitachi High-Technologies Corporation | 500 | 8,548 | |||
Hitachi Information Systems, Ltd. | 15,900 | 335,875 | |||
Hitachi Software Engineering Co., Ltd. | 1,300 | 22,280 | |||
Hitachi Transport System, Ltd. | 1,700 | 19,835 | |||
Hitachi, Ltd.‡‡ | 21,000 | 65,615 | |||
Hokuhoku Financial Group, Inc. | 132,000 | 331,593 | |||
Honda Motor Co., Ltd.D‡‡ | 130,600 | 3,606,124 | |||
Hosiden Corporation | 18,600 | 237,291 | |||
Hoya Corporation | 62,600 | 1,258,043 | |||
Ibiden Co., Ltd. | 9,500 | 267,738 | |||
Inpex Holdings, Inc.‡‡ | 849 | 6,803,633 | |||
Isuzu Motors, Ltd.‡‡ | 77,000 | 123,891 | |||
Itochu Corporation | 7,000 | 48,830 | |||
Iwatani Corporation | 123,000 | 346,011 | |||
Japan Steel Works, Ltd.D | 223,000 | 2,759,288 | |||
JFE Holdings, Inc.‡‡ | 1,900 | 64,099 | |||
JFE Shoji Holdings, Inc. | 83,000 | 307,583 | |||
JGC CorporationD‡‡ | 60,000 | 971,610 | |||
JS Group Corporation | 21,700 | 335,631 | |||
JSR Corporation‡‡ | 8,200 | 140,703 | |||
JTEKT Corporation | 3,000 | 30,550 | |||
Jupiter Telecommunications Co., Ltd. | 453 | 344,211 | |||
Kagoshima Bank, Ltd. | 17,000 | 125,292 | |||
Kaken Pharmaceutical Co., Ltd.‡‡ | 15,000 | 133,908 | |||
Kandenko Co., Ltd.‡‡ | 12,000 | 89,064 | |||
Kaneka Corporation‡‡ | 25,000 | 178,284 | |||
Kansai Electric Power Co., Inc. (The) | 100 | 2,211 | |||
Kansai Paint Co., Ltd.‡‡ | 33,000 | 237,390 | |||
Kao Corporation‡‡ | 352,000 | 7,691,493 | |||
Kawasaki Kisen Kaisha, Ltd.‡‡ | 38,000 | 156,994 | |||
KDDI Corporation‡‡ | 1,705 | 9,061,712 | |||
Keio Corporation | 7,000 | 40,764 | |||
Keyence Corporation | 5,000 | 1,022,474 | |||
Kinden Corporation‡‡ | 9,000 | 79,130 | |||
Kissei Pharmaceutical Co., Ltd. | 4,000 | 97,369 | |||
Kobayashi Pharmaceutical Co., Ltd. | 800 | 30,311 | |||
Koito Manufacturing Co., Ltd. | 44,000 | 533,472 | |||
Komatsu, Ltd. | 67,800 | 1,050,061 | |||
Konami Corporation | 200 | 3,843 | |||
Kose Corporation‡‡ | 4,400 | 92,947 | |||
Kubota Corporation‡‡ | 2,000 | 16,546 | |||
Kuraray Co., Ltd. | 52,500 | 584,211 | |||
Kureha Corporation | 81,000 | 429,657 | |||
Kyocera Corporation‡‡ | 2,300 | 173,571 | |||
Kyoei Steel, Ltd.D | 12,500 | 355,530 | |||
Lawson, Inc.D‡‡ | 25,100 | 1,104,728 | |||
Leopalace21 Corporation‡‡ | 4,600 | 41,161 | |||
Lintec Corporation‡‡ | 3,500 | 60,892 | |||
Makita Corporation | 900 | 21,815 | |||
Marubeni Corporation | 140,000 | 621,996 | |||
Matsumotokiyoshi Holdings Co., Ltd.‡‡ | 1,600 | 33,002 | |||
Matsushita Electric Industrial Co., Ltd.‡‡ | 5,000 | 67,577 | |||
Mazda Motor Corporation | 20,000 | 51,279 | |||
See Notes to Financial Statements.
112
Table of Contents
| Shares | Value | ||||
Mediceo Paltac Holdings Co., Ltd. | 1,700 | $ | 19,500 | ||
Millea Holdings, Inc. | 237,300 | 6,576,955 | |||
Minebea Co., Ltd. | 70,000 | 298,645 | |||
Miraca Holdings, Inc. | 12,500 | 306,223 | |||
Mitsubishi Corporation‡‡ | 218,400 | 4,053,555 | |||
Mitsubishi Electric Corporation‡‡ | 3,000 | 19,027 | |||
Mitsubishi Estate Co., Ltd.‡‡ | 7,000 | 117,060 | |||
Mitsubishi Gas Chemical Co., Inc. | 310,000 | 1,699,071 | |||
Mitsubishi Logistics Corporation | 1,000 | 11,097 | |||
Mitsubishi Materials Corporation | 14,000 | 43,743 | |||
Mitsubishi UFJ Financial Group, Inc.‡‡ | 319,200 | 1,981,436 | |||
Mitsubishi UFJ Lease & Finance Co., Ltd.‡‡ | 4,150 | 135,698 | |||
Mitsui & Co., Ltd.‡‡ | 16,000 | 190,336 | |||
Mitsui Chemicals, Inc. | 2,000 | 6,415 | |||
Mitsui Fudosan Co., Ltd.‡‡ | 92,000 | 1,607,266 | |||
Mitsui Mining & Smelting Co., Ltd.* | 13,000 | 33,736 | |||
Mitsui OSK Lines, Ltd.‡‡ | 48,000 | 312,410 | |||
Mitsui Sumitomo Insurance Group Holdings, Inc.‡‡ | 2,500 | 65,786 | |||
Mitsumi Electric Co., Ltd. | 3,200 | 68,594 | |||
Mizuho Financial Group, Inc.D‡‡ | 152,500 | 357,762 | |||
Mochida Pharmaceutical Co., Ltd. | 9,000 | 86,697 | |||
Musashino Bank, Ltd. (The) | 4,700 | 158,073 | |||
Nabtesco Corporation | 5,000 | 49,515 | |||
Namco Bandai Holdings, Inc. | 4,300 | 47,314 | |||
NEC Corporation*‡‡ | 32,000 | 125,894 | |||
NEC Electronics Corporation*‡‡ | 14,200 | 129,272 | |||
Nichirei Corporation | 15,000 | 59,013 | |||
Nihon Kohden Corporation | 11,700 | 154,000 | |||
Nintendo Co., Ltd.‡‡ | 12,378 | 3,421,665 | |||
Nippon Building Fund, Inc. REIT | 1 | 8,574 | |||
Nippon Electric Glass Co., Ltd. | 122,000 | 1,370,260 | |||
Nippon Express Co., Ltd.‡‡ | 238,000 | 1,084,569 | |||
Nippon Kayaku Co., Ltd. | 50,000 | 345,669 | |||
Nippon Meat Packers, Inc. | 72,000 | 911,071 | |||
Nippon Mining Holdings, Inc. | 19,500 | 101,614 | |||
Nippon Oil Corporation‡‡ | 220,000 | 1,301,708 | |||
Nippon Paper Group, Inc. | 300 | 7,770 | |||
Nippon Sheet Glass Co., Ltd. | 35,000 | 102,455 | |||
Nippon Steel Corporation‡‡ | 98,000 | 376,395 | |||
Nippon Telegraph & Telephone Corporation‡‡ | 89,900 | 3,658,151 | |||
Nipponkoa Insurance Co., Ltd. | 6,000 | 35,003 | |||
Nishi-Nippon City Bank, Ltd. (The) | 35,000 | 88,649 | |||
Nissan Motor Co., Ltd.D‡‡ | 76,100 | 462,912 | |||
Nissan Shatai Co., Ltd. | 14,000 | 115,534 | |||
Nissay Dowa General Insurance Co., Ltd. | 8,000 | 38,698 | |||
Nisshin Seifun Group, Inc.‡‡ | 9,500 | 113,406 | |||
Nitto Denko Corporation‡‡ | 99,000 | 3,021,332 | |||
Nomura Holdings, Inc.D‡‡ | 180,500 | 1,525,167 | |||
Nomura Real Estate Holdings, Inc. | 1,000 | 17,335 | |||
NTT DoCoMo, Inc.‡‡ | 618 | 905,814 | |||
OJI Paper Co., Ltd. | 30,000 | 129,237 | |||
Okinawa Electric Power Co., Inc.D‡‡ | 8,000 | 431,826 | |||
OKUMA Corporation | 20,000 | 94,462 | |||
Omron Corporation | 34,400 | 498,137 | |||
Onward Holdings Co., Ltd. | 3,000 | 19,370 | |||
ORIX CorporationD‡‡ | 14,410 | 869,073 | |||
Osaka Gas Co., Ltd.‡‡ | 273,000 | 872,829 | |||
Pacific Metals Co., Ltd. | 10,000 | 77,646 | |||
Point, Inc. | 1,620 | 87,109 | |||
Promise Co., Ltd.‡‡ | 3,150 | 40,317 | |||
QP Corporation | 1,200 | 12,506 | |||
Rakuten, Inc.D | 3,193 | 1,925,710 | |||
Ricoh Co., Ltd.‡‡ | 5,000 | 64,618 | |||
Rohm Co., Ltd.‡‡ | 3,000 | 218,924 | |||
Rohto Pharmaceutical Co., Ltd. | 1,000 | 11,304 | |||
Santen Pharmaceutical Co., Ltd.D | 37,300 | 1,136,404 | |||
Sanyo Electric Co., Ltd.* | 25,000 | 64,878 | |||
SBI Holdings, Inc. | 176 | 35,973 | |||
Secom Co., Ltd.‡‡ | 600 | 24,415 | |||
Seiko Epson Corporation‡‡ | 5,300 | 86,651 | |||
Seino Holdings Corporation | 11,000 | 91,690 | |||
Sekisui House, Ltd.‡‡ | 351,000 | 3,570,665 | |||
Seven & Holdings Co., Ltd.‡‡ | 326,900 | 7,702,943 | |||
Sharp Corporation‡‡ | 3,000 | 31,235 | |||
Shimamura Co., Ltd.D | 21,100 | 1,682,130 | |||
Shin-Etsu Chemical Co., Ltd.‡‡ | 95,800 | 4,455,120 | |||
Shinko Electric Industries Co., Ltd. | 4,700 | 58,351 | |||
Shinsei Bank, Ltd.* | 35,000 | 56,314 | |||
Showa Shell Sekiyu KK | 6,300 | 66,836 | |||
SKY Perfect JSAT Holdings, Inc. | 151 | 57,682 | |||
Snow Brand Milk Products Co., Ltd. | 6,500 | 20,039 | |||
Softbank Corporation‡‡ | 2,400 | 46,886 | |||
Sompo Japan Insurance, Inc.‡‡ | 3,000 | 20,117 | |||
Sony Corporation‡‡ | 39,500 | 1,035,319 | |||
Stanley Electric Co., Ltd.D | 32,600 | 662,592 | |||
Sumco Corporation‡‡ | 5,500 | 78,502 | |||
Sumitomo Bakelite Co., Ltd.‡‡ | 26,000 | 130,897 | |||
Sumitomo CorporationD‡‡ | 155,200 | 1,582,046 | |||
Sumitomo Electric Industries, Ltd. | 65,600 | 739,519 | |||
Sumitomo Forestry Co., Ltd.‡‡ | 21,500 | 181,891 | |||
Sumitomo Metal Mining Co., Ltd.‡‡ | 5,000 | 70,743 | |||
Sumitomo Mitsui Financial Group, Inc.D‡‡ | 17,900 | 730,233 | |||
Sumitomo Realty & Development Co., Ltd.‡‡ | 3,000 | 55,151 | |||
Sumitomo Trust & Banking Co., Ltd.‡‡ | 15,000 | 80,967 | |||
Suzuken Co., Ltd.‡‡ | 2,900 | 84,139 | |||
Taiyo Yuden Co., Ltd. | 4,000 | 44,179 | |||
Takeda Pharmaceutical Co., Ltd.‡‡ | 269,700 | 10,526,517 | |||
TDK Corporation‡‡ | 2,000 | 94,254 | |||
Toho Co., Ltd. | 100 | 1,635 | |||
Toho Gas Co., Ltd.‡‡ | 139,000 | 565,610 | |||
Tohoku Electric Power Co., Inc.‡‡ | 600 | 12,550 | |||
Tokai Rika Co., Ltd. | 8,400 | 134,194 | |||
Tokuyama Corporation‡‡ | 30,000 | 220,792 | |||
See Notes to Financial Statements.
113
Table of Contents
International Equity Fund
SCHEDULE OF INVESTMENTS (Continued)
| Shares | Value | ||||
Tokyo Electric Power Co., Inc.‡‡ | 4,300 | $ | 110,697 | ||
Tokyo Electron, Ltd.‡‡ | 3,500 | 169,668 | |||
Tokyo Gas Co., Ltd.‡‡ | 224,000 | 802,201 | |||
Tokyo Steel Manufacturing Co., Ltd.‡‡ | 12,100 | 147,458 | |||
Tokyu Land CorporationD | 176,000 | 803,862 | |||
Toppan Forms Co., Ltd. | 7,500 | 96,305 | |||
Toppan Printing Co., Ltd.‡‡ | 9,000 | 91,088 | |||
Toyo Seikan Kaisha, Ltd.‡‡ | 8,900 | 188,929 | |||
Toyo Suisan Kaisha, Ltd.‡‡ | 4,000 | 82,504 | |||
Toyota Auto Body Co., Ltd.‡‡ | 7,500 | 137,255 | |||
Toyota Motor Corporation‡‡ | 233,640 | 8,900,802 | |||
Toyota Tsusho Corporation | 800 | 11,908 | |||
Trend Micro, Inc. | 66,000 | 2,116,988 | |||
Ube Industries, Ltd. | 6,000 | 16,816 | |||
Uni-Charm CorporationD | 18,900 | 1,445,923 | |||
UNY Co., Ltd. | 109,000 | 933,461 | |||
Urban Corporation+* | 4,300 | — | |||
USS Co., Ltd. | 1,900 | 98,023 | |||
West Japan Railway Co.‡‡ | 839 | 2,778,232 | |||
Xebio Co., Ltd. | 800 | 17,398 | |||
Yamaha Corporation | 3,000 | 37,556 | |||
Yamato Holdings Co., Ltd.‡‡ | 33,000 | 440,525 | |||
Yamato Kogyo Co., Ltd. | 2,300 | 68,163 | |||
Yamazaki Baking Co., Ltd.D | 40,000 | 451,757 | |||
Yokogawa Electric Corporation | 7,900 | 53,304 | |||
Yokohama Rubber Co., Ltd. | 12,000 | 59,542 | |||
| 185,719,875 | |||||
Jersey — 0.0% | |||||
Kazmunaigas Exploration Production GDR | 7,206 | 136,914 | |||
Randgold Resources, Ltd.D | 1,551 | 100,129 | |||
| 237,043 | |||||
Kazakhstan — 0.0% | |||||
KazakhGold Group, Ltd. GDR* | 26,174 | 157,044 | |||
Luxembourg — 0.2% | |||||
ArcelorMittalD‡‡ | 40,129 | 1,316,748 | |||
Evraz Group SA GDR | 1,012 | 19,177 | |||
Oriflame Cosmetics SA ADR | 10,669 | 463,981 | |||
Tenaris SA ADRD | 8,600 | 232,544 | |||
| 2,032,450 | |||||
Malaysia — 0.2% | |||||
AirAsia BHD* | 1,663,200 | 525,221 | |||
Bumiputra-Commerce Holdings BHD | 738,337 | 1,900,981 | |||
KNM Group BHD | 691,300 | 165,204 | |||
| 2,591,406 | |||||
Mexico — 1.1% | |||||
America Movil SA de CV ADR Series LD | 203,040 | 7,861,709 | |||
Corporacion Moctezuma SA de CV | 211,737 | 397,160 | |||
Grupo Financiero Inbursa SAD | 317,675 | 844,110 | |||
Grupo Televisa SA ADR | 97,686 | 1,660,662 | |||
Megacable Holdings SAB de CV* | 375,962 | 526,759 | |||
Urbi Desarrollos Urbanos SA* | 368,300 | 559,376 | |||
Wal-Mart de Mexico SAB de CV Series VD | 226,325 | 671,159 | |||
| 12,520,935 | |||||
Netherlands — 3.4% | |||||
Akzo Nobel NV‡‡ | 47,759 | 2,101,093 | |||
ASML Holding NVD | 21,605 | 467,058 | |||
CSM‡‡ | 14,340 | 211,631 | |||
European Aeronautic Defence and Space Co., NVD‡‡ | 31,684 | 511,599 | |||
Imtech NV‡‡ | 7,794 | 151,325 | |||
ING Groep NV‡‡ | 398,328 | 4,007,700 | |||
Koninklijke Ahold NV‡‡ | 223,070 | 2,561,066 | |||
Koninklijke BAM Groep NV | 18,999 | 154,134 | |||
Koninklijke Boskalis Westminster NV | 11,534 | 261,478 | |||
Koninklijke DSM NV | 13,075 | 409,585 | |||
Koninklijke Philips Electronics NV ADRD‡‡ | 50,899 | 937,532 | |||
Reed Elsevier NVD | 646,933 | 7,117,960 | |||
Royal Dutch Shell PLC+ | 1,474 | — | |||
Royal Dutch Shell PLC‡‡ | 22,673 | 566,238 | |||
Royal Dutch Shell PLC Class A | 306,365 | 7,656,565 | |||
Royal Dutch Shell PLC Class B‡‡ | 131,802 | 3,308,982 | |||
SBM Offshore NVD | 139,600 | 2,383,365 | |||
TNT NV | 122,589 | 2,380,995 | |||
TomTom NV*‡‡ | 92,834 | 1,116,097 | |||
Unilever NV | 165,147 | 3,976,752 | |||
| 40,281,155 | |||||
New Zealand — 0.2% | |||||
Telecom Corporation of New Zealand, Ltd. | 1,060,562 | 1,868, 067 | |||
Nigeria — 0.2% | |||||
First City Monument Bank PLC | 9,843,791 | 565,636 | |||
Guaranty Trust Bank GDR@ | 122,156 | 613,223 | |||
United Bank for Africa PLC@ | 6,798,400 | 622,001 | |||
| 1,800,860 | |||||
Norway — 0.9% | |||||
DnB NOR ASA* | 229,000 | 1,745,060 | |||
Fred Olsen Energy ASAD | 9,700 | 329,611 | |||
StatoilHydro ASA | 203,637 | 4,009,307 | |||
Tandberg ASAD | 26,200 | 441,071 | |||
Telenor ASA* | 480,000 | 3,691,360 | |||
Yara International ASA | 16,950 | 474,484 | |||
| 10,690,893 | |||||
Panama — 0.1% | |||||
Copa Holdings SAD | 22,400 | 914,368 | |||
Papua New Guinea — 0.1% | |||||
Lihir Gold, Ltd.* | 267,100 | 634,928 | |||
Peru — 0.2% | |||||
Compania de Minas Buenaventura SA ADRD | 8,901 | 213,891 | |||
Credicorp, Ltd. | 30,601 | 1,780,978 | |||
| 1,994,869 | |||||
Philippines — 0.2% | |||||
International Container Terminal Services, Inc. | 1,408,850 | 453,760 | |||
Philippine Long Distance Telephone Co. | 31,350 | 1,560,171 | |||
| 2,013,931 | |||||
Poland — 0.0% | |||||
Powszechna Kasa Oszczednosci Bank Polski SA | 30,003 | 241,106 | |||
See Notes to Financial Statements.
114
Table of Contents
| Shares | Value | ||||
Russia — 1.7% | |||||
Gazprom OAO ADRD | 234,095 | $ | 4,747,447 | ||
Kalina ADR+@* | 7,200 | 38,880 | |||
LSR Group GDR* | 77,900 | 289,009 | |||
LUKOIL ADRD | 78,656 | 3,515,923 | |||
Magnit OAO@ | 42,326 | 1,576,643 | |||
Mobile Telesystems ADRD | 46,496 | 1,717,097 | |||
NovaTek OAO GDR | 39,334 | 1,876,232 | |||
Novorossiysk Commercial Sea Port GDR* | 110,536 | 1,061,146 | |||
Pharmstandard GDR* | 17,199 | 259,705 | |||
Raspadskaya@ | 283,572 | 640,873 | |||
Rosneft Oil Co. GDR* | 68,163 | 381,713 | |||
Sberbank | 1,181,737 | 1,494,897 | |||
Seventh Continent@* | 26,476 | 158,856 | |||
VTB Bank OJSC GDR | 169,851 | 373,672 | |||
X 5 Retail Group NV GDR* | 116,056 | 1,769,854 | |||
| 19,901,947 | |||||
Singapore — 1.5% | |||||
Ascendas, Ltd. REIT | 4,000 | 4,391 | |||
CapitaMall Trust REIT | 10,000 | 9,666 | |||
ComfortDelgro Corporation, Ltd. | 42,000 | 37,117 | |||
DBS Group Holdings, Ltd.‡‡ | 9,000 | 73,322 | |||
Golden Agri-Resources, Ltd. | 2,352,720 | 617,256 | |||
Haw Par Corporation, Ltd. | 4,000 | 12,648 | |||
Indofood Agri Resources, Ltd.* | 34,000 | 28,639 | |||
Jardine Cycle & Carriage, Ltd. | 6,000 | 79,536 | |||
Keppel Corporation, Ltd. | 8,000 | 38,111 | |||
Oversea-Chinese Banking Corporation‡‡ | 785,345 | 3,622,000 | |||
SembCorp Industries, Ltd. | 633,000 | 1,319,843 | |||
SembCorp Marine, Ltd. | 28,000 | 52,002 | |||
Singapore Airlines, Ltd. | 2,000 | 18,365 | |||
Singapore Exchange, Ltd. | 5,000 | 24,510 | |||
Singapore Technologies Engineering, Ltd. | 6,000 | 10,149 | |||
Singapore Telecommunications, Ltd.‡‡ | 2,850,000 | 5,903,065 | |||
United Overseas Bank, Ltd.‡‡ | 312,000 | 3,162,220 | |||
United Overseas Land, Ltd. | 3,186 | 7,259 | |||
Wilmar International Ltd. | 666,000 | 2,308,285 | |||
Yangzijiang Shipbuilding Holdings, Ltd. | 24,000 | 12,925 | |||
| 17,341,309 | |||||
South Africa — 1.2% | |||||
African Bank Investments, Ltd. | 50,760 | 182,799 | |||
AngloGold Ashanti, Ltd. | 8,402 | 308,372 | |||
Aveng, Ltd. | 69,744 | 316,556 | |||
Bidvest Group, Ltd. | 167,387 | 2,099,921 | |||
FirstRand, Ltd. | 154,865 | 282,367 | |||
Impala Platinum Holdings, Ltd. | 68,765 | 1,519,986 | |||
Imperial Holdings, Ltd. | 33,370 | 252,290 | |||
Mr. Price Group, Ltd. | 80,403 | 292,782 | |||
MTN Group, Ltd. | 68,954 | 1,057,928 | |||
Naspers, Ltd. | 21,680 | 570,730 | |||
Pick’n Pay Stores, Ltd. | 82,990 | 355,153 | |||
Sasol, Ltd. | 101,197 | 3,543,027 | |||
Shoprite Holdings, Ltd. | 27,517 | 196,263 | |||
Standard Bank Group, Ltd. | 306,380 | 3,524,189 | |||
| 14,502,363 | |||||
South Korea — 1.4% | |||||
Amorepacific CorporationD | 1,994 | 1,069,039 | |||
Daewoo Securities Co., Ltd. | 11,690 | 174,348 | |||
GS Engineering & Construction Corporation | 9,126 | 530,102 | |||
Hyundai Engineering & Construction Co., Ltd. | 10,130 | 424,618 | |||
Hyundai Mobis | 5,888 | 515,336 | |||
Korea Electric Power Corporation* | 76,520 | 1,780,932 | |||
KTBNetwork* | 39,229 | 131,949 | |||
LG Electronics, Inc. | 6,460 | 593,289 | |||
POSCO | 2,569 | 854,014 | |||
Samsung Electronics Co., Ltd. | 10,981 | 5,102,831 | |||
Samsung Electronics Co., Ltd. (Non-Voting Shares) GDR 144A* | 6,007 | 919,475 | |||
Samsung Fire & Marine Insurance Co., Ltd. | 10,217 | 1,507,748 | |||
Shinhan Financial Group Co., Ltd.* | 105,311 | 2,665,944 | |||
| 16,269,625 | |||||
Spain — 4.4% | |||||
Banco Bilbao Vizcaya Argentaria SA‡‡ | 29,537 | 370,440 | |||
Banco Espanol de Credito SA | 7,327 | 75,498 | |||
Banco Santander SA‡‡ | 1,250,885 | 15,021,219 | |||
Bolsas y Mercados Espanoles | 2,901 | 85,789 | |||
Construcciones y Auxiliar de Ferrocarriles SA‡‡ | 186 | 83,263 | |||
Corporacion Financiera Alba | 7,249 | 349,011 | |||
EnagasD | 48,875 | 960,935 | |||
Endesa SA‡‡ | 3,226 | 77,207 | |||
Gamesa Corporation Tecnologica SA | 13,805 | 261,641 | |||
Gas Natural SDG SA‡‡ | 2,722 | 49,527 | |||
Iberdrola SAD‡‡ | 974,791 | 7,904,117 | |||
Inditex SA | 52,185 | 2,501,524 | |||
Laboratorios Almirall SA | 11,553 | 128,037 | |||
Mapfre SA | 732,390 | 2,383,661 | |||
Promotora de Informaciones SA* | 18,183 | 95,911 | |||
Red Electrica de Espana | 18,972 | 857,271 | |||
Repsol YPF SA‡‡ | 11,122 | 248,705 | |||
Tecnicas Reunidas SA | 8,135 | 383,794 | |||
Telefonica SA‡‡ | 885,846 | 20,032,599 | |||
Union Fenosa SA‡‡ | 6,542 | 71,034 | |||
| 51,941,183 | |||||
Sri Lanka — 0.0% | |||||
Dialog Telekom, Ltd.* | 2,779,310 | 126,970 | |||
Sweden — 0.6% | |||||
Assa Abloy AB Class BD | 203,922 | 2,841,557 | |||
Boliden AB | 9,407 | 71,028 | |||
Electrolux AB* | 4,576 | 63,913 | |||
Hennes & Mauritz AB Class B‡‡ | 9,012 | 449,744 | |||
Industrivarden AB‡‡ | 3,524 | 31,633 | |||
Investor AB‡‡ | 776 | 11,970 | |||
Nordea Bank AB‡‡ | 25,534 | 202,229 | |||
Ratos AB | 4,334 | 87,639 | |||
Securitas AB‡‡ | 7,103 | 60,307 | |||
Skandinaviska Enskilda Banken AB* | 15,435 | 67,825 | |||
Skanska AB‡‡ | 27,430 | 306,668 | |||
Ssab Svenskt Stal AB | 21,527 | 250,439 | |||
Svenska Cellulosa AB‡‡ | 18,035 | 189,358 | |||
See Notes to Financial Statements.
115
Table of Contents
International Equity Fund
SCHEDULE OF INVESTMENTS (Continued)
| Shares | Value | ||||
Svenska Handelsbanken ABD‡‡ | 44,220 | $ | 835,432 | ||
Swedbank AB* | 21,600 | 125,714 | |||
Tele2 AB‡‡ | 29,958 | 302,506 | |||
Telefonaktiebolaget LM Ericsson Class B‡‡ | 81,313 | 797,884 | |||
| 6,695,846 | |||||
Switzerland — 6.2% | |||||
ABB, Ltd.D*‡‡ | 150,134 | 2,360,028 | |||
Actelion, Ltd.* | 14,482 | 757,721 | |||
Alcon, Inc. | 4,800 | 557,376 | |||
Baloise Holding AG | 12,501 | 927,896 | |||
Clariant AG*‡‡ | 17,405 | 109,888 | |||
Compagnie Financiere Richemont SAD‡‡ | 103,908 | 2,159,351 | |||
Credit Suisse Group‡‡ | 23,317 | 1,064,399 | |||
Helvetia Holding AG | 267 | 70,648 | |||
Julius Baer Holding AG | 55,064 | 2,137,591 | |||
Nestle SA‡‡ | 472,149 | 17,781,360 | |||
Novartis AG‡‡ | 398,134 | 16,137,151 | |||
OC Oerlikon Corporation AG | 712 | 39,710 | |||
Roche Holding AG‡‡ | 68,007 | 9,244,521 | |||
SGS SA | 380 | 470,738 | |||
Sonova Holding AGD | 16,679 | 1,355,442 | |||
STMicroelectronics NV‡‡ | 78,252 | 585,438 | |||
Straumann Holding AG | 630 | 114,746 | |||
Sulzer AG | 1,888 | 119,548 | |||
Swatch Group AG | 30,534 | 2,024,942 | |||
Swiss Life Holding* | 722 | 62,329 | |||
Swisscom AG | 335 | 102,823 | |||
Syngenta AG | 19,274 | 4,474,591 | |||
Synthes, Inc.D | 16,834 | 1,625,223 | |||
UBS AG* | 138,411 | 1,692,957 | |||
Xstrata PLC | 116,482 | 1,259,622 | |||
Zurich Financial Services AG‡‡ | 31,639 | 5,573,333 | |||
| 72,809,372 | |||||
Taiwan — 1.6% | |||||
Acer, Inc. | 483,000 | 840,576 | |||
AU Optronics Corporation | 215,949 | 210,618 | |||
Cathay Financial Holding Co., Ltd.* | 186,000 | 275,230 | |||
Chunghwa Telecom Co., Ltd. | 1,093,421 | 2,182,843 | |||
High Tech Computer Corporation | 12,300 | 173,947 | |||
HON HAI Precision Industry Co., Ltd. | 309,950 | 958,852 | |||
MediaTek, Inc. | 238,290 | 2,846,988 | |||
Quanta Computer, Inc. | 95,890 | 154,897 | |||
Siliconware Precision Industries Co. | 303,000 | 351,391 | |||
Taiwan Semiconductor Manufacturing Co., Ltd. | 4,493,094 | 7,490,772 | |||
Taiwan Semiconductor Manufacturing Co., Ltd. ADR | 237,825 | 2,237,933 | |||
Yuanta Financial Holding Co., Ltd. | 1,278,000 | 860,829 | |||
| 18,584,876 | |||||
Thailand — 0.2% | |||||
Central Pattana PCL ADR@D | 1,119,192 | 643,856 | |||
CP ALL PCL@ | 924,068 | 463,797 | |||
Siam Commercial Bank Public Co., Ltd.@ | 599,923 | 1,320,640 | |||
| 2,428,293 | |||||
Turkey — 0.4% | |||||
Coca-Cola Icecek Uretim AS | 89,253 | 509,752 | |||
Tupras Turkiye Petrol Rafine | 21,442 | 261,624 | |||
Türkiye Garanti Bankasi AS* | 936,244 | 2,527,762 | |||
Türkiye Is Bankasi | 1 | 2 | |||
Yapi ve Kredi Bankasi* | 962,755 | 1,424,637 | |||
| 4,723,777 | |||||
United Kingdom — 15.5% | |||||
3i Group PLC | 5,952 | 23,697 | |||
Aegis Group PLC‡‡ | 107,834 | 163,216 | |||
Aggreko PLC | 18,437 | 157,274 | |||
AMEC PLC‡‡ | 224,857 | 2,415,669 | |||
Anglo American PLC‡‡ | 278,111 | 8,048,414 | |||
Antofagasta PLC‡‡ | 150,624 | 1,455,861 | |||
ARM Holdings PLC D | 510,410 | 1,005,571 | |||
Arriva PLC | 404 | 2,699 | |||
AstraZeneca PLC‡‡ | 151,478 | 6,655,184 | |||
Atkins WS PLC | 53,941 | 528,912 | |||
Autonomy Corporation PLC* | 96,491 | 2,281,190 | |||
Aveva Group PLC‡‡ | 6,413 | 75,595 | |||
Aviva PLC‡‡ | 991,925 | 5,572,980 | |||
BAE Systems PLC‡‡ | 858,330 | 4,780,033 | |||
Barclays PLC‡‡ | 411,845 | 1,917,512 | |||
BBA Aviation PLC | 11,203 | 21,012 | |||
Berkeley Group Holdings PLC* | 4,733 | 62,605 | |||
BG Group PLC‡‡ | 638,079 | 10,686,614 | |||
BHP Billiton PLC‡‡ | 490,026 | 11,002,809 | |||
BP PLC‡‡ | 1,662,120 | 13,065,512 | |||
Bradford & Bingley PLC+D* | 28,672 | — | |||
Brit Insurance Holdings PLC | 14,959 | 46,452 | |||
British Land Co. PLC‡‡ REIT | 4,751 | 29,858 | |||
BT Group PLC‡‡ | 610,226 | 1,019,001 | |||
Bunzl PLC‡‡ | 6,171 | 51,016 | |||
Cable & Wireless PLC‡‡ | 71,824 | 157,277 | |||
Capita Group PLC (The) | 67,749 | 796,385 | |||
Carnival PLC | 114,890 | 3,037,498 | |||
Centrica PLC‡‡ | 499,048 | 1,830,902 | |||
Compass Group PLC‡‡ | 1,148,102 | 6,455,158 | |||
CSR PLCD* | 84,084 | 483,826 | |||
Drax Group PLC‡‡ | 23,600 | 170,449 | |||
Electrocomponents PLC‡‡ | 32,962 | 76,327 | |||
Eurasian Natural Resources Corporation‡‡ | 12,342 | 132,896 | |||
Friends Provident Group PLC‡‡ | 66,564 | 71,872 | |||
G4S PLC | 4,455 | 15,282 | |||
Game Group PLC‡‡ | 276,481 | 748,254 | |||
GKN PLCD | 630,407 | 1,286,058 | |||
GlaxoSmithKline PLC‡‡ | 876,892 | 15,414,823 | |||
Hays PLC‡‡ | 146,445 | 206,598 | |||
HMV Group PLC‡‡ | 80,196 | 148,760 | |||
Home Retail Group PLC‡‡ | 36,808 | 157,447 | |||
HSBC Holdings PLC‡‡ | 778,227 | 6,433,692 | |||
Hunting PLC | 3,408 | 25,203 | |||
ICAP PLC | 141,980 | 1,053,469 | |||
IG Group Holdings PLC | 247,495 | 1,141,116 | |||
IMI PLC‡‡ | 30,761 | 157,770 | |||
Intermediate Capital Group PLC‡‡ | 21,575 | 171,708 | |||
International Personal Finance PLC | 25,091 | 30,237 | |||
International Power PLC | 97,632 | 382,285 | |||
Intertek Group PLC | 106,219 | 1,822,655 | |||
Invensys PLC‡‡ | 18,331 | 67,403 | |||
Investec PLC | 15,172 | 81,560 | |||
See Notes to Financial Statements.
116
Table of Contents
| Shares | Value | ||||||
J Sainsbury PLC‡‡ | 66,246 | $ | 341,132 | ||||
John Wood Group PLC | 56,463 | 248,024 | |||||
Kesa Electricals PLC‡‡ | 89,222 | 162,934 | |||||
Kingfisher PLC | 60,538 | 177,083 | |||||
Land Securities Group PLC REIT‡‡ | 4,507 | 34,943 | |||||
Legal & General Group PLC‡‡ | 213,713 | 199,674 | |||||
Lloyds TSB Group PLC‡‡ | 94,051 | 108,204 | |||||
Logica PLC | 7,619 | 9,902 | |||||
Man Group PLC‡‡ | 34,468 | 157,361 | |||||
Marks & Spencer Group PLC | 221,900 | 1,117,112 | |||||
Micro Focus International PLC | 100,919 | 621,789 | |||||
Mondi PLC‡‡ | 69,308 | 236,032 | |||||
National Express Group PLC | 353,792 | 1,801,468 | |||||
National Grid PLC | 150,044 | 1,351,514 | |||||
Next PLCD | 52,486 | 1,268,479 | |||||
Old Mutual PLC‡‡ | 80,397 | 107,045 | |||||
Pearson PLC | 97,136 | 974,029 | |||||
Persimmon PLC | 9,059 | 52,163 | |||||
Petrofac, Ltd.‡‡ | 328,981 | 3,626,298 | |||||
Prudential PLC | 419,888 | 2,856,452 | |||||
Reckitt Benckiser Group PLC‡‡ | 138,362 | 6,296,322 | |||||
Reed Elsevier PLC‡‡ | 104,963 | 781,399 | |||||
Rexam PLC | 382,209 | 1,788,962 | |||||
Rio Tinto PLC‡‡ | 55,316 | 1,915,670 | |||||
Rolls-Royce Group PLC+ | 4,1882,326 | 68,905 | |||||
Rolls-Royce Group PLC*‡‡ | 462,139 | 2,748,519 | |||||
Scottish & Southern Energy PLC | 16,060 | 300,945 | |||||
Segro PLC REIT | 36,116 | 14,409 | |||||
Signet Jewelers, Ltd.* | 78,744 | 1,597,344 | |||||
Spirax-Sarco Engineering PLC | 36,480 | 506,242 | |||||
Stagecoach Group PLC‡‡ | 23,597 | 49,207 | |||||
Standard Chartered PLC | 295,719 | 5,546,283 | |||||
Subsea 7, Inc.D* | 46,200 | 471,330 | |||||
Tate & Lyle PLC‡‡ | 15,030 | 78,756 | |||||
Tesco PLC‡‡ | 978,945 | 5,694,931 | |||||
Thomas Cook Group PLC‡‡ | 16,792 | 56,772 | |||||
Tomkins PLC‡‡ | 96,146 | 234,105 | |||||
Travis Perkins PLC | 165,500 | 1,433,553 | |||||
Trinity Mirror PLC | 1,958 | 1,844 | |||||
Tullett Prebon PLC | 10,107 | 49,219 | |||||
Tullow Oil PLC | 254,318 | 3,922,530 | |||||
Unilever PLC‡‡ | 381,008 | 8,926,105 | |||||
United Business Media, Ltd. | 2,595 | 17,045 | |||||
United Utilities Group PLC‡‡ | 14,311 | 117,016 | |||||
Vodafone Group PLC‡‡ | 2,691,924 | 5,190,489 | |||||
WH Smith PLC | 51,869 | 356,912 | |||||
Wolseley PLC* | 546 | 10,402 | |||||
WPP PLC‡‡ | 557,341 | 3,697,543 | |||||
Yell Group PLC* | 231,321 | 99,899 | |||||
| 181,049,892 | |||||||
Total Foreign Common Stocks | 1,133,539,566 | ||||||
FOREIGN PREFERRED STOCKS — 1.0% | |||||||
Belgium — 0.0% | |||||||
Fortis+* | 106,120 | 149 | |||||
Brazil — 0.8% | |||||||
Banco Bradesco SA | 150,350 | 2,209,788 | |||||
Eletropaulo Metropolitana de Sao Paulo SA Class B | 57,767 | 1,013,833 | |||||
Investimentos Itau SA | 522,260 | 2,300,132 | |||||
Petroleo Brasileiro SA | 169,000 | 2,808,186 | |||||
Ultrapar Participacoes SA | 23,494 | 740,370 | |||||
| 9,072,309 | |||||||
Chile — 0.0% | |||||||
Embotelladora Andina SA | 66,700 | 173,014 | |||||
Germany — 0.0% | |||||||
Fresenius AG‡‡ | 3,325 | 179,537 | |||||
Volkswagen AG‡‡ | 848 | 59,196 | |||||
| 238,733 | |||||||
Hong Kong — 0.0% | |||||||
China Resources Power Holdings Co., Ltd.* | 11,400 | 4,854 | |||||
Russia — 0.0% | |||||||
URSA Bank@ | 860,100 | 258,030 | |||||
South Korea — 0.2% | |||||||
Samsung Electronics Co., Ltd. | 5,543 | 1,696,903 | |||||
Total Foreign Preferred Stocks | 11,443,992 | ||||||
RIGHTS — 0.1% | |||||||
Asciano Group+ | 41,271 | 8,314 | |||||
Casino Guichard Perrachon SA* | 19,303 | 74,468 | |||||
China Resources Power Holdings Co.+ | 114,000 | 253,593 | |||||
Golden Agri-Resources, Ltd. | 399,962 | 55,228 | |||||
Rio Tinto PLC* | 25,658 | 865,327 | |||||
Rio Tinto, Ltd.+* | 1 | 25 | |||||
Total Rights | 1,256,955 | ||||||
MONEY MARKET FUNDS — 10.3% | |||||||
GuideStone Money Market Fund (GS4 Class)¥ | 23,461,799 | 23,461,799 | |||||
Northern Institutional Liquid Assets Portfolio§ | 96,658,606 | 96,658,606 | |||||
Total Money Market Funds | 120,120,405 | ||||||
TOTAL INVESTMENTS — 108.5% | 1,266,360,918 | ||||||
SECURITIES SOLD SHORT — (1.7)% | |||||||
Australia — (0.1)% | |||||||
Adelaide Brighton, Ltd. | (29,913 | ) | (54,234 | ) | |||
Alumina, Ltd. | (33,729 | ) | (39,273 | ) | |||
Bank of Queensland, Ltd. | (1,000 | ) | (7,317 | ) | |||
Bendigo and Adelaide Bank, Ltd. | (1,000 | ) | (5,600 | ) | |||
Centennial Coal Co., Ltd. | (11,184 | ) | (22,170 | ) | |||
Cochlear, Ltd. | (1,697 | ) | (78,902 | ) | |||
Duet Group | (36,797 | ) | (45,663 | ) | |||
Energy Resources of Australia, Ltd. | (3,998 | ) | (75,385 | ) | |||
Fairfax Media, Ltd. | (40,000 | ) | (39,323 | ) | |||
Goodman Fielder, Ltd. | (299 | ) | (314 | ) | |||
GWA International, Ltd. | (14,061 | ) | (26,060 | ) | |||
Harvey Norman Holdings, Ltd. | (15,117 | ) | (40,198 | ) | |||
Incitec Pivot, Ltd. | (15,888 | ) | (30,470 | ) | |||
Nufarm, Ltd. | (3,999 | ) | (29,582 | ) | |||
OZ Minerals, Ltd. | (31,000 | ) | (22,981 | ) | |||
Perpetual, Ltd. | (1,000 | ) | (23,006 | ) | |||
Primary Health Care, Ltd. | (15,712 | ) | (66,469 | ) | |||
Seek, Ltd. | (12,999 | ) | (43,679 | ) | |||
Seven Network, Ltd. | (2,299 | ) | (9,929 | ) | |||
See Notes to Financial Statements.
117
Table of Contents
International Equity Fund
SCHEDULE OF INVESTMENTS (Continued)
| Shares | Value | ||||||
Sims Metal Management, Ltd. | (2,000 | ) | $ | (42,724 | ) | ||
SP Ausnet | (35,837 | ) | (22,236 | ) | |||
Spark Infrastructure Group 144A | (85,731 | ) | (78,063 | ) | |||
Suncorp-Metway, Ltd. | (1,000 | ) | (5,399 | ) | |||
Toll Holdings, Ltd. | (8,995 | ) | (45,301 | ) | |||
United Group, Ltd. | (4,502 | ) | (37,547 | ) | |||
West Australian Newspapers Holdings, Ltd. | (10,997 | ) | (38,636 | ) | |||
| (930,461 | ) | ||||||
Belgium — 0.0% | |||||||
Telenet Group Holding NV* | (7,278 | ) | (154,375 | ) | |||
Bermuda — 0.0% | |||||||
Signet Jewelers, Ltd.* | (1,986 | ) | (40,287 | ) | |||
Denmark — (0.1)% | |||||||
D/S Torm A/S | (3,252 | ) | (33,081 | ) | |||
DSV A/S* | (6,362 | ) | (78,799 | ) | |||
FLSmidth & Co. A/S* | (1,099 | ) | (39,025 | ) | |||
Topdanmark A/S* | (1,077 | ) | (125,788 | ) | |||
Trygvesta AS | (4,533 | ) | (267,278 | ) | |||
William Demant Holding* | (1,844 | ) | (95,353 | ) | |||
| (639,324 | ) | ||||||
Finland — (0.1)% | |||||||
Elisa OYJ | (3,010 | ) | (49,531 | ) | |||
Kesko OYJ | (2,122 | ) | (56,144 | ) | |||
Nokian Renkaat OYJ | (9,264 | ) | (174,148 | ) | |||
Sanoma OYJ | (12,581 | ) | (195,025 | ) | |||
YIT OYJ | (5,542 | ) | (57,532 | ) | |||
| (532,380 | ) | ||||||
France — (0.1)% | |||||||
Areva SA | (102 | ) | (59,460 | ) | |||
Bureau Veritas SA | (4,250 | ) | (208,645 | ) | |||
Electricite de France | (1,960 | ) | (95,343 | ) | |||
Eramet | (286 | ) | (74,687 | ) | |||
Eutelsat Communications* | (2,406 | ) | (62,054 | ) | |||
Ipsen SA | (2,596 | ) | (113,370 | ) | |||
JC Decaux SA* | (15,050 | ) | (238,894 | ) | |||
Orpea* | (6,737 | ) | (296,763 | ) | |||
Pagesjaunes Groupe | (13,632 | ) | (132,509 | ) | |||
Renault SA* | (3,135 | ) | (115,095 | ) | |||
Societe Television Francaise 1 | (12,219 | ) | (137,012 | ) | |||
| (1,533,832 | ) | ||||||
Germany — (0.1)% | |||||||
Beiersdorf AG | (1,630 | ) | (76,626 | ) | |||
Celesio AG | (3,594 | ) | (82,435 | ) | |||
Fraport AG Frankfurt Airport Services Worldwide | (4,111 | ) | (175,840 | ) | |||
Hamburger Hafen und Logistik AG | (1,952 | ) | (75,169 | ) | |||
Krones AG | (2,841 | ) | (108,127 | ) | |||
Nordex AG* | (4,743 | ) | (74,389 | ) | |||
Porsche Automobil Holding SE | (1,519 | ) | (101,859 | ) | |||
SGL Carbon AG* | (3,094 | ) | (95,533 | ) | |||
Solarworld AG | (5,974 | ) | (140,544 | ) | |||
Stada Arzneimittel AG | (2,761 | ) | (68,983 | ) | |||
Symrise AG | (17,485 | ) | (258,045 | ) | |||
United Internet AG* | (7,906 | ) | (92,499 | ) | |||
Vossloh AG | (606 | ) | (72,729 | ) | |||
| (1,422,778 | ) | ||||||
Italy — 0.0% | |||||||
A2A SpA | (93,599 | ) | (170,567 | ) | |||
Geox SpA | (11,524 | ) | (82,207 | ) | |||
| (252,774 | ) | ||||||
Japan — (0.4)% | |||||||
ABC-Mart, Inc. | (3,100 | ) | (79,805 | ) | |||
Air Water, Inc. | (5,000 | ) | (54,705 | ) | |||
Aozora Bank, Ltd.* | (17,000 | ) | (26,294 | ) | |||
Asahi Kasei Corporation | (2,000 | ) | (10,194 | ) | |||
Bank of Kyoto, Ltd. (The) | (5,000 | ) | (46,452 | ) | |||
Bank of Yokohama, Ltd. (The) | (8,000 | ) | (42,933 | ) | |||
Capcom Co., Ltd. | (4,100 | ) | (73,884 | ) | |||
Casio Computer Co., Ltd. | (500 | ) | (4,479 | ) | |||
Chiba Bank, Ltd. (The) | (10,000 | ) | (65,501 | ) | |||
Citizen Holdings Co., Ltd. | (6,800 | ) | (34,941 | ) | |||
Daido Steel Co., Ltd. | (14,000 | ) | (57,549 | ) | |||
Daikin Industries, Ltd. | (3,500 | ) | (112,991 | ) | |||
Denki Kagaku Kogyo KK | (20,000 | ) | (55,847 | ) | |||
Disco Corporation | (1,100 | ) | (46,816 | ) | |||
Don Quijote Co., Ltd. | (4,400 | ) | (84,634 | ) | |||
Eisai Co., Ltd. | (3,100 | ) | (110,697 | ) | |||
Electric Power Development Co., Ltd. | (1,300 | ) | (36,975 | ) | |||
Fuji Electric Holdings Co., Ltd. | (26,000 | ) | (43,183 | ) | |||
Hikari Tsushin, Inc. | (3,200 | ) | (72,248 | ) | |||
Hiroshima Bank, Ltd. (The) | (14,000 | ) | (58,421 | ) | |||
Hitachi Construction Machinery Co., Ltd. | (2,400 | ) | (39,238 | ) | |||
Hitachi Koki Co., Ltd. | (2,200 | ) | (19,366 | ) | |||
Hitachi Metals, Ltd. | (10,000 | ) | (85,223 | ) | |||
Hokuto Corporation | (200 | ) | (4,123 | ) | |||
Hosiden Corporation | (1,800 | ) | (22,964 | ) | |||
Idemitsu Kosan Co., Ltd. | (600 | ) | (51,570 | ) | |||
IHI Corporation* | (1,000 | ) | (1,734 | ) | |||
Isetan Mitsukoshi Holdings, Ltd. | (3,400 | ) | (34,729 | ) | |||
IT Holdings Corporation | (2,100 | ) | (37,363 | ) | |||
Jafco Co., Ltd. | (700 | ) | (23,615 | ) | |||
Japan Petroleum Exploration Co., Ltd. | (800 | ) | (44,428 | ) | |||
Japan Steel Works, Ltd. | (5,000 | ) | (61,867 | ) | |||
Joyo Bank, Ltd. (The) | (24,000 | ) | (122,572 | ) | |||
Kajima Corporation | (15,000 | ) | (46,868 | ) | |||
Kawasaki Heavy Industries, Ltd. | (13,000 | ) | (35,896 | ) | |||
Komatsu, Ltd. | (3,000 | ) | (46,463 | ) | |||
Komeri Co., Ltd. | (1,500 | ) | (33,243 | ) | |||
Kurita Water Industries, Ltd. | (3,400 | ) | (110,116 | ) | |||
Kyowa Exeo Corporation | (1,000 | ) | (9,965 | ) | |||
McDonald’s Holdings Co. Japan, Ltd. | (4,700 | ) | (87,282 | ) | |||
Mitsubishi Chemical Holdings Corporation | (10,000 | ) | (42,456 | ) | |||
Mitsubishi Heavy Industries, Ltd. | (5,000 | ) | (20,761 | ) | |||
Mitsubishi Tanabe Pharma Corporation | (3,000 | ) | (34,567 | ) | |||
Mitsui Engineering & Shipbuilding Co., Ltd. | (12,000 | ) | (28,276 | ) | |||
Mizuho Trust & Banking Co., Ltd.* | (84,000 | ) | (108,995 | ) | |||
Mori Seiki Co., Ltd. | (800 | ) | (8,346 | ) | |||
NET One Systems Co., Ltd. | (6 | ) | (10,576 | ) | |||
NGK Spark Plug Co., Ltd. | (16,000 | ) | (152,966 | ) | |||
Nihon Unisys, Ltd. | (4,200 | ) | (36,491 | ) | |||
Nippon Shokubai Co., Ltd. | (5,000 | ) | (38,356 | ) | |||
See Notes to Financial Statements.
118
Table of Contents
| Shares | Value | ||||||
Nissan Chemical Industries, Ltd. | (8,000 | ) | $ | (90,268 | ) | ||
Nisshin Steel Co., Ltd. | (24,000 | ) | (53,812 | ) | |||
Nissin Foods Holdings Co., Ltd. | (200 | ) | (6,062 | ) | |||
Nitori Co., Ltd. | (550 | ) | (39,051 | ) | |||
NOK Corporation | (2,700 | ) | (31,475 | ) | |||
Nomura Research Institute, Ltd. | (5,900 | ) | (131,370 | ) | |||
NSK Ltd. | (27,000 | ) | (137,333 | ) | |||
NTT Data Corporation | (7 | ) | (22,671 | ) | |||
Olympus Corporation | (6,000 | ) | (142,316 | ) | |||
Oracle Corporation | (1,200 | ) | (44,096 | ) | |||
Oriental Land Co., Ltd. | (200 | ) | (13,411 | ) | |||
Osaka Securities Exchange Co., Ltd. | (8 | ) | (38,449 | ) | |||
Otsuka Corporation | (1,100 | ) | (58,805 | ) | |||
Rakuten, Inc. | (94 | ) | (56,692 | ) | |||
Sankyu, Inc. | (15,000 | ) | (59,168 | ) | |||
Santen Pharmaceutical Co., Ltd. | (500 | ) | (15,233 | ) | |||
Shimadzu Corporation | (1,000 | ) | (8,014 | ) | |||
Shimamura Co., Ltd. | (1,000 | ) | (79,722 | ) | |||
Shimizu Corporation | (10,000 | ) | (43,598 | ) | |||
Showa Denko KK | (44,000 | ) | (79,016 | ) | |||
Sojitz Corporation | (2,800 | ) | (6,162 | ) | |||
Sugi Holdings Co., Ltd. | (2,700 | ) | (55,634 | ) | |||
Sumitomo Chemical Co., Ltd. | (20,000 | ) | (90,310 | ) | |||
Sumitomo Heavy Industries, Ltd. | (10,000 | ) | (44,740 | ) | |||
Sumitomo Metal Industries, Ltd. | (7,000 | ) | (18,674 | ) | |||
Sumitomo Rubber Industries, Inc. | (11,600 | ) | (93,441 | ) | |||
Sundrug Co., Ltd. | (700 | ) | (15,514 | ) | |||
Suruga Bank, Ltd. | (23,000 | ) | (220,366 | ) | |||
Sysmex Corporation | (1,400 | ) | (50,864 | ) | |||
T&D Holdings, Inc. | (300 | ) | (8,626 | ) | |||
Taiheiyo Cement Corporation | (5,000 | ) | (8,616 | ) | |||
Taisei Corporation | (6,000 | ) | (14,512 | ) | |||
Taiyo Nippon Sanso Corporation | (5,000 | ) | (47,958 | ) | |||
Teijin, Ltd. | (1,000 | ) | (3,228 | ) | |||
Tokai Carbon Co., Ltd. | (2,000 | ) | (10,484 | ) | |||
Tokyo Broadcasting System, Inc. | (700 | ) | (11,016 | ) | |||
Toray Industries, Inc. | (10,000 | ) | (51,072 | ) | |||
Toshiba Corporation | (29,000 | ) | (105,361 | ) | |||
Tosoh Corporation | (9,000 | ) | (25,598 | ) | |||
Toyota Boshoku Corporation | (7,500 | ) | (112,187 | ) | |||
Trend Micro, Inc. | (2,500 | ) | (80,189 | ) | |||
Tsumura & Co. | (1,600 | ) | (49,992 | ) | |||
Ushio, Inc. | (3,600 | ) | (57,624 | ) | |||
Yahoo! Japan Corporation | (428 | ) | (136,617 | ) | |||
Yakult Honsha Co., Ltd. | (3,100 | ) | (59,274 | ) | |||
Yamada Denki Co., Ltd. | (1,500 | ) | (87,663 | ) | |||
Yamaguchi Financial Group, Inc. | (1,000 | ) | (13,214 | ) | |||
Yamatake Corporation | (300 | ) | (5,995 | ) | |||
| (5,154,457 | ) | ||||||
Netherlands — (0.1)% | |||||||
Aalberts Industries NV | (8,568 | ) | (67,190 | ) | |||
ASML Holding NV | (9,530 | ) | (206,020 | ) | |||
Fugro NV | (1,570 | ) | (65,018 | ) | |||
James Hardie Industries NV* | (9,554 | ) | (32,334 | ) | |||
Nutreco Holding NV | (2,193 | ) | (85,480 | ) | |||
OPG Groep NV | (5,310 | ) | (67,415 | ) | |||
Randstad Holding NV* | (11,158 | ) | (308,601 | ) | |||
SBM Offshore NV | (12,973 | ) | (221,477 | ) | |||
Smit Internationale NV | (1,148 | ) | (67,978 | ) | |||
| (1,121,513 | ) | ||||||
Papua New Guinea — 0.0% | |||||||
Oil Search, Ltd. | (17,370 | ) | (76,423 | ) | |||
Spain — (0.1)% | |||||||
Abengoa SA | (4,976 | ) | (110,119 | ) | |||
Acciona SA | (1,984 | ) | (243,815 | ) | |||
Cintra Concesiones de Infraestructuras de Transporte SA | (38,647 | ) | (239,636 | ) | |||
Grifols SA | (6,739 | ) | (119,024 | ) | |||
Obrascon Huarte Lain SA | (5,271 | ) | (104,188 | ) | |||
| (816,782 | ) | ||||||
Sweden — (0.1)% | |||||||
Alliance Oil Co., Ltd.* | (9,586 | ) | (108,723 | ) | |||
Atlas Copco AB, Class A | (6,376 | ) | (63,846 | ) | |||
Hexagon AB | (19,801 | ) | (178,384 | ) | |||
Lundin Petroleum AB* | (19,155 | ) | (148,231 | ) | |||
Modern Times Group AB | (3,086 | ) | (85,804 | ) | |||
Sandvik AB | (12,712 | ) | (94,335 | ) | |||
Teliasonera AB | (97,798 | ) | (513,415 | ) | |||
| (1,192,738 | ) | ||||||
Switzerland — (0.1)% | |||||||
EFG International AG | (10,310 | ) | (111,493 | ) | |||
Galenica AG | (1,111 | ) | (327,456 | ) | |||
Givaudan SA | (409 | ) | (250,508 | ) | |||
Kudelski SA | (6,255 | ) | (103,449 | ) | |||
Logitech International SA* | (6,231 | ) | (86,307 | ) | |||
Lonza Group AG | (1,168 | ) | (115,989 | ) | |||
Nobel Biocare Holding AG | (3,122 | ) | (68,155 | ) | |||
Temenos Group AG* | (4,486 | ) | (76,380 | ) | |||
Valiant Holding | (403 | ) | (74,402 | ) | |||
Xstrata PLC | (7,069 | ) | (76,443 | ) | |||
| (1,290,582 | ) | ||||||
United Kingdom — (0.4)% | |||||||
Admiral Group PLC | (5,526 | ) | (79,095 | ) | |||
Aggreko PLC | (368 | ) | (3,139 | ) | |||
Amlin PLC | (12,608 | ) | (62,695 | ) | |||
ARM Holdings PLC | (6,113 | ) | (12,043 | ) | |||
Associated British Foods PLC | (8,118 | ) | (101,837 | ) | |||
Bellway PLC | (19,378 | ) | (194,312 | ) | |||
British Sky Broadcasting Group PLC | (27,627 | ) | (206,806 | ) | |||
Burberry Group PLC | (26,378 | ) | (183,569 | ) | |||
Cairn Energy PLC* | (5,126 | ) | (197,507 | ) | |||
Charter International PLC | (3,246 | ) | (23,124 | ) | |||
Cookson Group PLC | (15,611 | ) | (67,097 | ) | |||
Dana Petroleum PLC* | (846 | ) | (19,514 | ) | |||
De La Rue PLC | (1,195 | ) | (17,910 | ) | |||
easyJet PLC* | (9,080 | ) | (40,371 | ) | |||
Firstgroup PLC | (30,977 | ) | (182,321 | ) | |||
ICAP PLC | (1,356 | ) | (10,061 | ) | |||
Inmarsat PLC | (27,132 | ) | (243,498 | ) | |||
International Power PLC | (31,570 | ) | (123,615 | ) | |||
Intertek Group PLC | (17,454 | ) | (299,500 | ) | |||
ITV PLC | (242,670 | ) | (139,734 | ) | |||
Kazakhmys PLC | (1,832 | ) | (18,988 | ) | |||
London Stock Exchange Group PLC | (1,732 | ) | (20,018 | ) | |||
Lonmin PLC | (4,972 | ) | (95,950 | ) | |||
Marks & Spencer Group PLC | (5,338 | ) | (26,873 | ) | |||
See Notes to Financial Statements.
119
Table of Contents
International Equity Fund
SCHEDULE OF INVESTMENTS (Continued)
| Shares | Value | ||||||
Meggitt PLC | (32,353 | ) | $ | (84,365 | ) | ||
Misys PLC | (36,529 | ) | (103,668 | ) | |||
Northumbrian Water Group PLC | (28,724 | ) | (116,960 | ) | |||
Pennon Group PLC | (18,754 | ) | (148,948 | ) | |||
Premier Farnell PLC | (18,118 | ) | (37,558 | ) | |||
Premier Oil PLC* | (1,151 | ) | (20,678 | ) | |||
Provident Financial PLC | (4,533 | ) | (59,177 | ) | |||
Prudential PLC | (26,218 | ) | (178,358 | ) | |||
Rentokil Initial PLC | (81,340 | ) | (119,769 | ) | |||
Rexam PLC | (4,083 | ) | (19,111 | ) | |||
Royal Bank of Scotland Group PLC* | (41,885 | ) | (26,626 | ) | |||
RSA Insurance Group PLC | (12,232 | ) | (24,189 | ) | |||
Sage Group PLC | (37,176 | ) | (108,929 | ) | |||
Serco Group PLC | (10,240 | ) | (71,094 | ) | |||
SIG PLC | (36,801 | ) | (59,485 | ) | |||
Smith & Nephew PLC | (3,319 | ) | (24,545 | ) | |||
Smiths Group PLC | (9,577 | ) | (110,529 | ) | |||
Standard Life PLC | (10,000 | ) | (30,617 | ) | |||
Vedanta Resources PLC | (2,425 | ) | (51,386 | ) | |||
VT Group PLC | (12,328 | ) | (91,675 | ) | |||
Weir Group PLC (The) | (18,954 | ) | (144,066 | ) | |||
Wellstream Holdings PLC | (28,481 | ) | (240,141 | ) | |||
Whitbread PLC | (3,043 | ) | (40,877 | ) | |||
| (4,282,328 | ) | ||||||
Total Securities Sold Short | (19,441,034 | ) | |||||
Liabilities in Excess of Other Assets — (6.8)% | (79,443,545 | ) | |||||
NET ASSETS — 100.0% | $ | 1,167,476,339 | |||||
PORTFOLIO SUMMARY (based on net assets)
| % | |||
Foreign Common Stocks | |||
Japan | 15.9 | ||
United Kingdom | 15.5 | ||
France | 8.1 | ||
Switzerland | 6.2 | ||
Germany | 5.9 | ||
Australia | 4.5 | ||
Hong Kong | 4.4 | ||
Spain | 4.4 | ||
Netherlands | 3.4 | ||
China | 3.0 | ||
Brazil | 2.2 | ||
Italy | 2.0 | ||
India | 1.9 | ||
Russia | 1.7 | ||
Canada | 1.6 | ||
Taiwan | 1.6 | ||
Singapore | 1.5 | ||
South Korea | 1.4 | ||
South Africa | 1.2 | ||
Mexico | 1.1 | ||
Denmark | 0.9 | ||
Indonesia | 0.9 | ||
Israel | 0.9 | ||
Norway | 0.9 | ||
Finland | 0.7 | ||
Sweden | 0.6 | ||
Greece | 0.5 | ||
Belgium | 0.4 | ||
Turkey | 0.4 | ||
Chile | 0.3 | ||
Egypt | 0.3 | ||
Austria | 0.2 | ||
Colombia | 0.2 | ||
Czech Republic | 0.2 | ||
Hungary | 0.2 | ||
Ireland | 0.2 | ||
Luxembourg | 0.2 | ||
Malaysia | 0.2 | ||
New Zealand | 0.2 | ||
Nigeria | 0.2 | ||
Peru | 0.2 | ||
Philippines | 0.2 | ||
Thailand | 0.2 | ||
Bermuda | 0.1 | ||
Cyprus | 0.1 | ||
Panama | 0.1 | ||
Papua New Guinea | 0.1 | ||
Argentina | — | ** | |
Estonia | — | ** | |
Jersey | — | ** | |
Kazakhstan | — | ** | |
Poland | — | ** | |
Sri Lanka | — | ** | |
Total Foreign Common Stocks | 97.1 | ||
Total Money Market Funds | 10.3 | ||
Total Futures Contracts | 3.0 | ||
Total Foreign Preferred Stocks | 1.0 | ||
Total Rights | 0.1 | ||
Total Forward Foreign Currency Contracts | 0.6 | ||
Total Securities Sold Short | (1.7 | ) | |
Total Investments | 110.4 | ||
| ** | Rounds to less than 0.005%. |
See Notes to Financial Statements.
120
Table of Contents
FAS 157 DISCLOSURE
The following is a summary of the inputs used, as of June 30, 2009, in valuing the Fund’s assets carried at fair value:
Valuation Inputs | Investments in Securities | Other Financial Instruments*** | ||||||
Assets: | ||||||||
Level 1 — Quoted Prices | ||||||||
Foreign Common Stocks | $ | 1,131,519,540 | $ | — | ||||
Foreign Preferred Stocks | 11,443,992 | — | ||||||
Futures Contracts | — | (112,707 | ) | |||||
Money Market Funds | 120,120,405 | — | ||||||
Rights | 1,256,955 | — | ||||||
Level 2 — Other Significant Observable Inputs | ||||||||
Foreign Common Stocks | 2,020,026 | — | ||||||
Forward Foreign Currency Contracts | — | 147,921 | ||||||
Level 3 — Significant Unobservable Inputs | — | — | ||||||
Total Assets | $ | 1,266,360,918 | $ | 35,214 | ||||
Liabilities: | ||||||||
Level 1 — Quoted Prices | ||||||||
Securities Sold Short | $ | (19,441,034 | ) | $ | — | |||
Level 2 — Other Significant Observable Inputs | — | — | ||||||
Level 3 — Significant Unobservable Inputs | — | — | ||||||
Total Liabilities | $ | (19,441,034 | ) | $ | — | |||
| *** | Other financial instruments are derivative instruments not reflected in the Schedule of Investments, such as futures, forwards and swap contracts, which are valued at the unrealized appreciation (depreciation) on the investment. Details of these investments can be found in the Notes to Financial Statements. |
The following is a reconciliation of assets in which significant unobservable inputs (Level 3) were used in determining fair value:
| Investments in Securities | Other Financial Instruments*** | ||||||
Balance, 12/31/08 | $ | 31,580 | $ | — | |||
Accrued discounts/premiums | — | — | |||||
Realized gain (loss) | — | — | |||||
Changed in unrealized appreciation (depreciation) | — | — | |||||
Net purchases (sales) | (31,580 | ) | — | ||||
Transfers in and/or out of Level 3 | — | — | |||||
Balance, 06/30/09 | $ | — | $ | — | |||
See Notes to Financial Statements.
121
Table of Contents
SCHEDULE OF INVESTMENTS – ABBREVIATIONS AND FOOTNOTES
| INVESTMENT ABBREVIATIONS: | ||||
| ADR | — | American Depository Receipt | ||
| CONV | — | Convertible | ||
| GDR | — | Global Depository Receipt | ||
| IO | — | Interest Only (Principal amount shown is notional) | ||
| PIK | — | Payment-in-Kind Bonds | ||
| PO | — | Principal Only | ||
| REIT | — | Real Estate Investment Trust | ||
| STEP | — | Stepped Coupon Bonds (1) | ||
| STRIP | — | Stripped Security | ||
| TBA | — | To be announced. | ||
| 144A | — | Security was purchased pursuant to Rule 144A under the Securities Act of 1933 and may not be resold subject to that rule except to qualified institutional buyers. As of June 30, 2009, the total market values and percentages of net assets for 144A securities by fund were as follows: | ||
Fund | Value of 144A Securities | Percentage of 144A Securities | ||||
Money Market | $ | 40,100,000 | 3.48 | % | ||
Low-Duration Bond | 53,658,714 | 8.94 | ||||
Medium-Duration Bond | 69,572,234 | 8.14 | ||||
Extended-Duration Bond | 53,207,784 | 12.94 | ||||
Global Bond | 20,151,597 | 10.84 | ||||
Small Cap Equity | 2,286,620 | 0.67 | ||||
International Equity | 841,412 | 0.07 | ||||
INVESTMENT FOOTNOTES:
| ‡‡ | — | All or a portion of the security was held as collateral for open futures, options and/or swap contracts. | ||
| @ | — | Illiquid. | ||
| * | — | Non-income producing security. | ||
| # | — | Security in default. | ||
| + | — | Security is valued at fair value (2). | ||
| § | — | Security purchased with the cash proceeds from securities loaned. | ||
| † | — | Variable rate security (1). | ||
| W | — | Interest rates shown reflect the effective yields as of June 30, 2009. | ||
| ¥ | — | Affiliated fund. | ||
| D | — | Security either partially or fully on loan. |
| (1) | Interest rates shown reflect the rates currently in effect. Maturity date for money market instruments is the date of the next interest rate reset. | |||
| (2) | Fair valued securities were held in the Equity Index Fund, Value Equity Fund, Small Cap Equity Fund and International Equity Fund at an aggregate market value of $0, $1,209, $0 and $394,908, respectively, which amounted to 0.00% of the Equity Index Fund, Value Equity Fund and Small Cap Equity Fund and 0.03% of the International Equity Fund. | |||
FOREIGN BOND FOOTNOTES:
| (A) | — | Par is denominated in Australian Dollars (AUD). | ||
| (B) | — | Par is denominated in Brazilian Real (BRL). | ||
| (C) | — | Par is denominated in Canadian Dollars (CAD). | ||
| (E) | — | Par is denominated in Euro (EUR). | ||
| (G) | — | Par is denominated in Singapore Dollars (SGD). | ||
| (I) | — | Par is denominated in Iceland Kronur (ISK). | ||
| (J) | — | Par is denominated in Japanese Yen (JPY). | ||
| (K) | — | Par is denominated in Norweigan Krone (NOK). | ||
| (L) | — | Par is denominated in Turkish Lira (TRY). | ||
| (M) | — | Par is denominated in Mexican Pesos (MXN). | ||
| (N) | — | Par is denominated in Indonesian Rupiahs (IDR). | ||
| (T) | — | Par is denominated in Thailand Baht (THB). | ||
| (U) | — | Par is denominated in British Pounds (GBP). | ||
| (W) | — | Par is denominated in South Korean Won (KRW). | ||
| (Z) | — | Par is denominated in New Zealand Dollars (NZD). |
SWAP AGREEMENT FOOTNOTES:
| BAR | — | Counterparty to contract is Barclays Capital. | ||
| BOA | — | Counterparty to contract is Bank of America. | ||
| BTAB | — | Counterparty to contract is BT Alex Brown. | ||
| CITI | — | Counterparty to contract is Citibank NA London. | ||
| CITIG | — | Counterparty to contract is Citigroup Global Markets, Inc. | ||
| CS | — | Counterparty to contract is Credit Suisse International. | ||
| DEUT | — | Counterparty to contract is Deutsche Bank AG. | ||
| GSC | — | Counterparty to contract is Goldman Sachs Capital Markets, LP. | ||
| HKSB | — | Counterparty to contract is Hong Kong & Shanghai Bank. | ||
| HSBC | — | Counterparty to contract is HSBC Securities. | ||
| JPM | — | Counterparty to contract is JPMorgan Chase Bank. | ||
| MLCS | — | Counterparty to contract is Merrill Lynch Capital Services, Inc. | ||
| MSCS | — | Counterparty to contract is Morgan Stanley Capital Services. | ||
| RBS | — | Counterparty to contract is Royal Bank of Scotland. | ||
| UBS | — | Counterparty to contract is UBS AG |
122
Table of Contents
STATEMENTS OF ASSETS AND LIABILITIES
June 30, 2009 (Unaudited)
| Money Market Fund | Low-Duration Bond Fund | Medium-Duration Bond Fund | |||||||||
Assets | |||||||||||
Investments in securities of unaffiliated issuers, at value | $ | 1,243,562,141 | $ | 668,685,146 | $ | 1,004,029,826 | |||||
Investments in securities of affiliated issuers, at value | — | 4,323,398 | 47,350,030 | ||||||||
Total investments (1)(2) | 1,243,562,141 | 673,008,544 | 1,051,379,856 | ||||||||
Cash | 601 | 118,492 | 5,454,996 | ||||||||
Cash collateral for futures, swaps and short holdings | — | — | 695,000 | ||||||||
Foreign currency (3) | — | 1,885,714 | 2,468,999 | ||||||||
Receivables: | |||||||||||
Dividends and reclaims | — | 2,766 | 6,953 | ||||||||
Interest | 636,241 | 3,310,337 | 6,200,978 | ||||||||
Securities lending | 4,231 | 13,545 | 12,218 | ||||||||
Investment securities sold | — | 55,112,961 | 56,945,591 | ||||||||
Maturities | — | 4,276,896 | 122,305 | ||||||||
Fund shares sold | 5,045,750 | 97,884 | 36,408 | ||||||||
Variation margin | — | 7,519 | 66 | ||||||||
Unrealized appreciation on foreign currency exchange contracts | — | 323,185 | 272,559 | ||||||||
Unrealized appreciation on swap agreements | — | 4,372,323 | 1,511,252 | ||||||||
Prepaid expenses and other assets | 56,861 | 22,083 | 25,796 | ||||||||
Total Assets | 1,249,305,825 | 742,552,249 | 1,125,132,977 | ||||||||
Liabilities | |||||||||||
Securities sold short, at value (4) | — | 40,508,433 | 994,062 | ||||||||
Options written at value (5) | — | 111,185 | 19,321 | ||||||||
Unrealized depreciation on foreign currency exchange contracts | — | 450,886 | 754,512 | ||||||||
Unrealized depreciation on swap agreements | — | 1,155 | 3,469,136 | ||||||||
Collateral held for securities on loan at value | 12,249,000 | 32,032,492 | 39,184,485 | ||||||||
Collateral held for swap agreements | — | 2,550,000 | 1,550,000 | ||||||||
Payables: | |||||||||||
Investment securities purchased | 17,629,384 | 66,397,440 | 223,874,552 | ||||||||
Fund shares redeemed | 68,127,115 | 23,389 | 73,880 | ||||||||
Variation margin | — | 50,791 | 191,871 | ||||||||
Distributions | 73,235 | — | — | ||||||||
Securities lending | 846 | 2,709 | 2,443 | ||||||||
Accrued expenses | |||||||||||
Advisory fees | 152,627 | 125,591 | 214,887 | ||||||||
Distribution (12b-1) fees | 951 | 533 | 1,261 | ||||||||
Shareholder servicing fees | 160,792 | 80,584 | 114,594 | ||||||||
Other expenses | 51,419 | 92,058 | 132,954 | ||||||||
Total Liabilities | 98,445,369 | 142,427,246 | 270,577,958 | ||||||||
Net Assets | $ | 1,150,860,456 | $ | 600,125,003 | $ | 854,555,019 | |||||
Net Assets Consist of: | |||||||||||
Paid-in-capital | $ | 1,150,724,070 | $ | 633,359,071 | $ | 932,299,077 | |||||
Undistributed net investment income | 84,502 | 4,233,878 | 5,702,990 | ||||||||
Undistributed (accumulated) net realized gain (loss) on investments, foreign currency transactions and derivative transactions | 51,884 | (9,445,383 | ) | 2,598,060 | |||||||
Net unrealized appreciation (depreciation) on investments, foreign currency translations and derivative transactions | — | (28,022,563 | ) | (86,045,108 | ) | ||||||
Net Assets | $ | 1,150,860,456 | $ | 600,125,003 | $ | 854,555,019 | |||||
Net Asset Value: | |||||||||||
$0.001 par value, unlimited shares authorized | |||||||||||
Net assets applicable to the GS2 Class | $ | 167,612,750 | $ | 100,275,475 | $ | 114,303,317 | |||||
GS2 shares outstanding | 167,595,804 | 11,792,405 | 15,449,466 | ||||||||
Net asset value, offering and redemption price per GS2 share | $ | 1.00 | $ | 8.50 | $ | 7.40 | |||||
Net assets applicable to the GS4 Class | $ | 983,247,706 | $ | 499,849,528 | $ | 740,251,702 | |||||
GS4 shares outstanding | 983,093,618 | 39,512,556 | 57,611,231 | ||||||||
Net asset value, offering and redemption price per GS4 share | $ | 1.00 | $ | 12.65 | $ | 12.85 | |||||
| |||||||||||
(1) Investments in securities of unaffiliated issuers, at cost | $ | 1,243,562,141 | $ | 702,765,457 | $ | 1,092,285,658 | |||||
Investments in securities of affiliated issuers, at cost | — | 4,323,398 | 47,350,030 | ||||||||
Total investments at cost | $ | 1,243,562,141 | $ | 707,088,855 | $ | 1,139,635,688 | |||||
(2) Includes securities loaned of: | $ | 11,966,507 | $ | 30,458,566 | $ | 46,488,755 | |||||
(3) Foreign currency at cost | $ | — | $ | 1,869,930 | $ | 2,448,579 | |||||
(4) Securities Sold Short at cost | $ | — | $ | (40,047,031 | ) | $ | (997,813 | ) | |||
(5) Premiums received on options written | $ | — | $ | (107,107 | ) | $ | (39,303 | ) | |||
See Notes to Financial Statements.
123
Table of Contents
| Extended-Duration Bond fund | Inflation Protected Bond Fund | Global Bond Fund | |||||||||
Assets | |||||||||||
Investments in securities of unaffiliated issuers, at value | $ | 412,195,339 | $ | 59,308,344 | $ | 184,562,218 | |||||
Investments in securities of affiliated issuers, at value | 10,532,979 | 6,654,220 | 16,337,770 | ||||||||
Total investments (1)(2) | 422,728,318 | 65,962,564 | 200,899,988 | ||||||||
Cash | — | — | 153,292 | ||||||||
Cash collateral for futures and swaps | — | — | — | ||||||||
Foreign currency (3) | — | — | 2,906,742 | ||||||||
Receivables: | |||||||||||
Dividends and reclaims | 1,989 | 829 | 13,510 | ||||||||
Interest | 6,460,390 | 494,004 | 3,076,014 | ||||||||
Securities lending | 4,250 | — | 6,765 | ||||||||
Investment securities sold | — | 2,126,251 | 747,243 | ||||||||
Fund shares sold | 8,076 | 242,364 | 123,974 | ||||||||
Variation margin | — | 232 | — | ||||||||
Unrealized appreciation on foreign currency exchange contracts | — | — | 1,013,743 | ||||||||
Prepaid expenses and other assets | 20,668 | — | 15,808 | ||||||||
Total Assets | 429,223,691 | 68,826,244 | 208,957,079 | ||||||||
Liabilities | |||||||||||
Cash overdraft | 598 | — | — | ||||||||
Securities sold short, at value (4) | — | — | — | ||||||||
Options written at value(5) | — | — | — | ||||||||
Unrealized depreciation on foreign currency exchange contracts | — | — | 1,184,564 | ||||||||
Collateral held for securities on loan at value | 15,327,188 | — | 13,075,144 | ||||||||
Payables: | |||||||||||
Investment securities purchased | 2,437,901 | — | 8,658,398 | ||||||||
Fund shares redeemed | 65,841 | — | — | ||||||||
Variation margin | — | 1,781 | 16,979 | ||||||||
Distributions | — | — | — | ||||||||
Securities lending | 850 | — | 1,352 | ||||||||
Deferred foreign capital gains taxes | — | — | — | ||||||||
Accrued expenses | |||||||||||
Advisory fees | 144,135 | 638 | 68,848 | ||||||||
Distribution (12b-1) fees | 1,294 | — | — | ||||||||
Shareholder servicing fees | 53,948 | 1,428 | 28,822 | ||||||||
Other expenses | 55,408 | 2,936 | 59,877 | ||||||||
Total Liabilities | 18,087,163 | 6,783 | 23,093,984 | ||||||||
Net Assets | $ | 411,136,528 | $ | 68,819,461 | $ | 185,863,095 | |||||
Net Assets Consist of: | |||||||||||
Paid-in-capital | $ | 446,974,854 | $ | 68,259,048 | $ | 224,370,954 | |||||
Undistributed (distributions in excess of) net investment income | 2,004,075 | 9,624 | (596,981 | ) | |||||||
Undistributed (accumulated) net realized gain (loss) on investments, foreign currency transactions and derivative transactions | (15,841,576 | ) | 6,468 | (10,572,540 | ) | ||||||
Net unrealized appreciation (depreciation) on investments, foreign currency translations and derivative transactions | (22,000,825 | ) | 544,321 | (27,338,338 | ) | ||||||
Net Assets | $ | 411,136,528 | $ | 68,819,461 | $ | 185,863,095 | |||||
Net Asset Value: | |||||||||||
$0.001 par value, unlimited shares authorized | |||||||||||
Net assets applicable to the GS2 Class | $ | 61,267,508 | N/A | N/A | |||||||
GS2 shares outstanding | 9,408,032 | N/A | N/A | ||||||||
Net asset value, offering and redemption price per GS2 share | $ | 6.51 | N/A | N/A | |||||||
Net assets applicable to the GS4 Class | $ | 349,869,020 | $ | 68,819,461 | $ | 185,863,095 | |||||
GS4 shares outstanding | 25,348,733 | 6,825,712 | 22,483,965 | ||||||||
Net asset value, offering and redemption price per GS4 share | $ | 13.80 | $ | 10.08 | $ | 8.27 | |||||
| |||||||||||
(1) Investments in securities of unaffiliated issuers, at cost | $ | 434,206,833 | $ | 58,762,986 | $ | 211,854,323 | |||||
Investments in securities of affiliated issuers, at cost | 10,532,979 | 6,654,220 | 16,337,770 | ||||||||
Total investments at cost | $ | 444,739,812 | $ | 65,417,206 | $ | 228,192,093 | |||||
(2) Includes securities loaned of: | $ | 14,386,908 | $ | — | $ | 13,960,546 | |||||
(3) Foreign currency at cost | $ | — | $ | — | $ | 2,773,513 | |||||
(4) Securities Sold Short at cost | $ | — | $ | — | $ | — | |||||
(5) Premiums received on options written | $ | — | $ | — | $ | — | |||||
(6) Net of ($320,217) accrued foreign capital gains taxes on appreciated securities | |||||||||||
See Notes to Financial Statements.
124
Table of Contents
| Equity Index Fund | Real Estate Securities Fund | Value Equity Fund | Growth Equity Fund | Small Cap Equity Fund | International Equity Fund | |||||||||||||||||
| $ | 324,008,273 | $ | 106,599,531 | $ | 1,030,925,909 | $ | 1,097,934,638 | $ | 389,677,205 | $ | 1,242,899,119 | |||||||||||
| 11,924,199 | 4,500,242 | 36,312,700 | 31,151,191 | 22,939,664 | 23,461,799 | |||||||||||||||||
| 335,932,472 | 111,099,773 | 1,067,238,609 | 1,129,085,829 | 412,616,869 | 1,266,360,918 | |||||||||||||||||
| — | — | — | — | 153,555 | 354,866 | |||||||||||||||||
| — | — | — | — | 686,462 | 12,166,257 | |||||||||||||||||
| — | — | — | 2,323 | 2,850 | 2,083,078 | |||||||||||||||||
| 349,054 | 334,040 | 1,152,511 | 637,566 | 148,847 | 4,917,035 | |||||||||||||||||
| — | — | — | — | 267,456 | — | |||||||||||||||||
| 52,483 | 8,025 | 153,342 | 39,940 | 39,593 | 149,035 | |||||||||||||||||
| 261,388 | 3,051,512 | 35,915,608 | 7,444,568 | 5,369,327 | 4,429,872 | |||||||||||||||||
| 38,883 | 27,203 | 146,016 | 197,948 | 30,456 | 124,976 | |||||||||||||||||
| — | — | — | — | — | 61,114 | |||||||||||||||||
| — | — | — | — | — | 522,825 | |||||||||||||||||
| 18,140 | 16,191 | 26,230 | 30,667 | 18,316 | 27,381 | |||||||||||||||||
| 336,652,420 | 114,536,744 | 1,104,632,316 | 1,137,438,841 | 419,333,731 | 1,291,197,357 | |||||||||||||||||
| — | — | 598 | 598 | — | — | |||||||||||||||||
| — | — | — | — | — | 19,441,034 | |||||||||||||||||
| — | — | — | — | 9,450 | — | |||||||||||||||||
| — | — | — | — | 13,080 | 374,904 | �� | ||||||||||||||||
| 20,248,889 | 25,654,407 | 71,083,280 | 93,789,900 | 60,576,786 | 96,658,606 | |||||||||||||||||
| 4,030,876 | 2,483,206 | 38,219,923 | 7,960,262 | 18,213,095 | 5,060,137 | |||||||||||||||||
| 163,513 | 127,221 | 74,073 | 19,231 | 219,624 | 19,148 | |||||||||||||||||
| 62,700 | 8,560 | 252,315 | 233,700 | 108,088 | 404,265 | |||||||||||||||||
| — | — | — | — | — | 42,505 | |||||||||||||||||
| 10,497 | 1,605 | 30,669 | 7,988 | 7,919 | 29,808 | |||||||||||||||||
| — | — | — | — | — | 320,217 | |||||||||||||||||
| 23,461 | 64,904 | 510,199 | 664,987 | 243,568 | 709,820 | |||||||||||||||||
| 109 | — | 987 | 768 | 1,001 | 1,383 | |||||||||||||||||
| 40,692 | 13,621 | 135,266 | 144,107 | 46,402 | 156,890 | |||||||||||||||||
| 124,331 | 30,486 | 102,856 | 79,704 | 117,439 | 502,301 | |||||||||||||||||
| 24,705,068 | 28,384,010 | 110,410,166 | 102,901,245 | 79,556,452 | 123,721,018 | |||||||||||||||||
| $ | 311,947,352 | $ | 86,152,734 | $ | 994,222,150 | $ | 1,034,537,596 | $ | 339,777,279 | $ | 1,167,476,339 | |||||||||||
| $ | 363,411,596 | $ | 167,971,341 | $ | 1,492,452,552 | $ | 1,321,054,788 | $ | 516,502,521 | $ | 1,550,170,506 | |||||||||||
| 94,492 | 23,493 | 290,047 | (25,025 | ) | 233,038 | 9,886,983 | ||||||||||||||||
| (9,082,576 | ) | (76,307,705 | ) | (211,533,853 | ) | (270,938,483 | ) | (148,418,677 | ) | (297,916,276 | ) | |||||||||||
| (42,476,160 | ) | (5,534,395 | ) | (286,986,596 | ) | (15,553,684 | ) | (28,539,603 | ) | (94,664,874 | )(6) | |||||||||||
| $ | 311,947,352 | $ | 86,152,734 | $ | 994,222,150 | $ | 1,034,537,596 | $ | 339,777,279 | $ | 1,167,476,339 | |||||||||||
| $ | 52,412,716 | N/A | $ | 148,315,385 | $ | 157,925,449 | $ | 50,489,232 | $ | 200,479,174 | ||||||||||||
| 8,204,854 | N/A | 28,071,130 | 19,705,880 | 8,295,018 | 25,376,873 | |||||||||||||||||
| $ | 6.39 | N/A | $ | 5.28 | $ | 8.01 | $ | 6.09 | $ | 7.90 | ||||||||||||
| $ | 259,534,636 | $ | 86,152,734 | $ | 845,906,765 | $ | 876,612,147 | $ | 289,288,047 | $ | 966,997,165 | |||||||||||
| 21,822,259 | 18,277,472 | 82,592,090 | 68,885,806 | 31,679,400 | 95,361,666 | |||||||||||||||||
| $ | 11.89 | $ | 4.71 | $ | 10.24 | $ | 12.73 | $ | 9.13 | $ | 10.14 | |||||||||||
| $ | 366,303,646 | $ | 112,018,616 | $ | 1,317,126,985 | $ | 1,113,754,226 | $ | 416,576,322 | $ | 1,334,389,624 | |||||||||||
| 11,924,199 | 4,500,242 | 36,312,700 | 31,151,191 | 22,939,664 | 23,461,799 | |||||||||||||||||
| $ | 378,227,845 | $ | 116,518,858 | $ | 1,353,439,685 | $ | 1,144,905,417 | $ | 439,515,986 | $ | 1,357,851,423 | |||||||||||
| $ | 19,589,472 | $ | 25,100,439 | $ | 65,380,895 | $ | 92,782,069 | $ | 57,383,086 | $ | 96,965,539 | |||||||||||
| $ | — | $ | — | $ | — | $ | 2,323 | $ | 2,830 | $ | 2,071,293 | |||||||||||
| $ | — | $ | — | $ | — | $ | — | $ | — | $ | 16,434,018 | |||||||||||
| $ | — | $ | — | $ | — | $ | — | $ | (15,945 | ) | $ | — | ||||||||||
See Notes to Financial Statements.
125
Table of Contents
STATEMENTS OF OPERATIONS
For the Six Months Ended June 30, 2009 (Unaudited)
| Money Market Fund | Low-Duration Bond Fund | Medium-Duration Bond Fund | |||||||||
Investment Income | |||||||||||
Dividends | $ | — | $ | 52,500 | $ | 133,647 | |||||
Income distributions received from affiliated funds | — | 58,616 | 73,542 | ||||||||
Interest | 5,641,826 | 12,787,217 | 20,983,958 | ||||||||
Securities lending | 69,749 | 140,364 | 129,801 | ||||||||
Less foreign taxes withheld | — | — | — | ||||||||
Total Investment Income | 5,711,575 | 13,038,697 | 21,320,948 | ||||||||
Expenses | |||||||||||
Investment advisory fees | 906,288 | 1,057,385 | 1,707,300 | ||||||||
Transfer agent fees: | |||||||||||
GS2 shares | 2,021 | 1,933 | 1,969 | ||||||||
GS4 shares | 22,644 | 10,313 | 10,290 | ||||||||
GS6 shares | 2,421 | 2,409 | 2,416 | ||||||||
Custodian fees | 10,937 | 66,596 | 93,656 | ||||||||
Distribution (12b-1) fees: | |||||||||||
GS6 shares | 3,076 | 1,914 | 4,804 | ||||||||
Shareholder servicing fees: | |||||||||||
GS4 shares | 943,650 | 476,836 | 667,065 | ||||||||
GS6 shares | 9,218 | 5,741 | 14,409 | ||||||||
Accounting and administration fees | 120,553 | 109,424 | 175,080 | ||||||||
Professional fees | 25,474 | 28,870 | 28,870 | ||||||||
Blue sky fees: | |||||||||||
GS2 shares | 968 | 793 | 793 | ||||||||
GS4 shares | 17,525 | 7,816 | 9,026 | ||||||||
GS6 shares | 272 | 172 | 181 | ||||||||
Shareholder reporting fees: | |||||||||||
GS2 shares | 419 | 273 | 348 | ||||||||
GS4 shares | 21,222 | 4,094 | 6,268 | ||||||||
GS6 shares | 110 | 73 | 73 | ||||||||
Trustee fees | 5,045 | 3,524 | 5,155 | ||||||||
Line of credit facility fees | 5,515 | 3,116 | 4,310 | ||||||||
Dividend expense on securities sold short | — | — | — | ||||||||
Other expenses | 315,882 | 20,728 | 28,139 | ||||||||
Total expenses | 2,413,240 | 1,802,010 | 2,760,152 | ||||||||
Expenses waived/reimbursed net of amount recaptured(1) | 3,349 | (296,673 | ) | (421,586 | ) | ||||||
Fees paid indirectly | — | — | — | ||||||||
Net expenses | 2,416,589 | 1,505,337 | 2,338,566 | ||||||||
Net Investment Income | 3,294,986 | 11,533,360 | 18,982,382 | ||||||||
Realized and Unrealized Gain (Loss) | |||||||||||
Net realized gain (loss) from: | |||||||||||
Investment securities | 51,884 | (3,627,612 | ) | 517,390 | |||||||
Futures transactions | — | 5,875,667 | 3,513,113 | ||||||||
Swap agreements | — | 3,756,661 | 8,850,095 | ||||||||
Option contracts written | — | 3,687,541 | 2,982,869 | ||||||||
Option contracts purchased | — | (3,782,465 | ) | (3,252,783 | ) | ||||||
Foreign currency transactions | — | (2,273,269 | ) | (3,199,846 | ) | ||||||
Net realized gain (loss) | 51,884 | 3,636,523 | 9,410,838 | ||||||||
Net change in unrealized appreciation (depreciation) on: | |||||||||||
Investment securities (net of estimated capital gains taxes of ($309,815) for International Equity) | — | 26,358,047 | 30,944,576 | ||||||||
Futures | — | (5,359,768 | ) | (2,124,069 | ) | ||||||
Swap agreements | — | 10,118,654 | 6,741,777 | ||||||||
Option contracts written | — | (940,421 | ) | 7,500,693 | |||||||
Option contracts purchased | — | (4,468,062 | ) | (7,874,450 | ) | ||||||
Foreign currency translations | — | 682,973 | 2,094,769 | ||||||||
Net change in unrealized appreciation (depreciation) | — | 26,391,423 | 37,283,296 | ||||||||
Net Realized and Unrealized Gain (Loss) | 51,884 | 30,027,946 | 46,694,134 | ||||||||
Net Increase (Decrease) in Net Assets Resulting from Operations | $ | 3,346,870 | $ | 41,561,306 | $ | 65,676,516 | |||||
| (1) | See Note 3a and 3c in Notes to Financial Statements. |
See Notes to Financial Statements.
126
Table of Contents
Extended-Duration Bond Fund | Inflation Protected Bond Fund | Global Bond Fund | Equity Index Fund | Real Estate Securities Fund | Value Equity Fund | Growth Equity Fund | Small Cap Equity Fund | International Equity Fund | ||||||||||||||||||||||||||
| $ | 9,404 | $ | — | $ | 111,610 | $ | 3,476,336 | $ | 1,711,802 | $ | 13,913,914 | $ | 5,412,024 | $ | 1,507,898 | $ | 25,177,680 | |||||||||||||||||
| 19,937 | 829 | 35,460 | 26,797 | 10,840 | 93,060 | 142,101 | 55,322 | (40,964 | ) | |||||||||||||||||||||||||
| 15,490,621 | 13,796 | 6,903,796 | 1,881 | 686 | 5,017 | 11,268 | 623,192 | 1,247 | ||||||||||||||||||||||||||
| 41,664 | — | 44,112 | 184,587 | 70,154 | 515,703 | 342,658 | 271,021 | 924,085 | ||||||||||||||||||||||||||
| — | — | — | — | 2,003 | (44,473 | ) | (79,346 | ) | (3,594 | ) | (2,360,532 | ) | ||||||||||||||||||||||
| 15,561,626 | 14,625 | 7,094,978 | 3,689,601 | 1,795,485 | 14,483,221 | 5,828,705 | 2,453,839 | 23,701,516 | ||||||||||||||||||||||||||
| 919,697 | 2,384 | 392,661 | 219,339 | 342,735 | 3,024,492 | 4,173,524 | 1,456,217 | 5,057,148 | ||||||||||||||||||||||||||
| 1,922 | — | — | 1,942 | — | 1,971 | 1,928 | 1,952 | 2,039 | ||||||||||||||||||||||||||
| 11,450 | 244 | 2,029 | 12,160 | 11,238 | 14,348 | 13,118 | 13,135 | 17,580 | ||||||||||||||||||||||||||
| 2,406 | — | — | 2,399 | — | 2,425 | 2,418 | 2,411 | 2,413 | ||||||||||||||||||||||||||
| 15,703 | 166 | 38,075 | 14,045 | 12,478 | 31,717 | 41,976 | 58,796 | 637,754 | ||||||||||||||||||||||||||
| 4,978 | — | — | 219 | — | 3,388 | 2,521 | 3,362 | 4,588 | ||||||||||||||||||||||||||
| 304,391 | 1,428 | 158,652 | 222,295 | 70,277 | 745,746 | 787,448 | 246,083 | 812,866 | ||||||||||||||||||||||||||
| 14,934 | — | — | 656 | — | 10,174 | 7,567 | 10,093 | 13,778 | ||||||||||||||||||||||||||
| 55,467 | 195 | 47,861 | 41,080 | 11,181 | 104,112 | 106,224 | 59,349 | 252,867 | ||||||||||||||||||||||||||
| 26,372 | 838 | 25,910 | 31,306 | 28,255 | 31,307 | 25,758 | 25,758 | 26,082 | ||||||||||||||||||||||||||
| 793 | — | — | 793 | — | 793 | 793 | 793 | 793 | ||||||||||||||||||||||||||
| 7,645 | 515 | 4,646 | 6,404 | 3,001 | 6,377 | 6,677 | 6,319 | 6,482 | ||||||||||||||||||||||||||
| 212 | — | — | 181 | — | 199 | 193 | 243 | 209 | ||||||||||||||||||||||||||
| 255 | — | — | 273 | — | 329 | 291 | 384 | 530 | ||||||||||||||||||||||||||
| 6,451 | 904 | 1,746 | 7,710 | 5,609 | 11,582 | 9,226 | 10,979 | 18,632 | ||||||||||||||||||||||||||
| 73 | — | — | 60 | — | 109 | 97 | 85 | 97 | ||||||||||||||||||||||||||
| 2,370 | 17 | 749 | 1,931 | 501 | 6,398 | 6,563 | 2,170 | 7,030 | ||||||||||||||||||||||||||
| 2,039 | 21 | 777 | 1,462 | 364 | 4,831 | 5,007 | 1,620 | 5,291 | ||||||||||||||||||||||||||
| — | — | — | — | — | — | — | — | 349,474 | ||||||||||||||||||||||||||
| 10,698 | 36 | 13,473 | 17,277 | 6,009 | 21,629 | 22,208 | 16,078 | 87,942 | ||||||||||||||||||||||||||
| 1,387,856 | 6,748 | 686,579 | 581,532 | 491,648 | 4,021,927 | 5,213,537 | 1,915,827 | 7,303,595 | ||||||||||||||||||||||||||
| (77,579 | ) | (1,747 | ) | (11,448 | ) | (92,757 | ) | (14,501 | ) | (184,919 | ) | (524,794 | ) | (142,101 | ) | (1,262,053 | ) | |||||||||||||||||
| — | — | — | — | — | (18,141 | ) | (31,644 | ) | (9,727 | ) | (22,753 | ) | ||||||||||||||||||||||
| 1,310,277 | 5,001 | 675,131 | 488,775 | 477,147 | 3,818,867 | 4,657,099 | 1,763,999 | 6,018,789 | ||||||||||||||||||||||||||
| 14,251,349 | 9,624 | 6,419,847 | 3,200,826 | 1,318,338 | 10,664,354 | 1,171,606 | 689,840 | 17,682,727 | ||||||||||||||||||||||||||
| (14,274,815 | ) | 6,468 | (7,303,032 | ) | (2,646,894 | ) | (30,073,724 | ) | (80,151,651 | ) | (130,144,406 | ) | (61,075,923 | ) | (187,944,039 | ) | ||||||||||||||||||
| — | — | 233,133 | 619,396 | 897,029 | 4,734,204 | 2,231,185 | 5,378,777 | 2,698,327 | ||||||||||||||||||||||||||
| — | — | — | — | — | — | — | — | (19,868 | ) | |||||||||||||||||||||||||
| — | — | — | — | — | — | — | 62,196 | — | ||||||||||||||||||||||||||
| — | — | — | — | — | — | — | (6,757 | ) | — | |||||||||||||||||||||||||
| (817,821 | ) | — | (559,712 | ) | — | — | — | (125 | ) | (40,509 | ) | 365,636 | ||||||||||||||||||||||
| (15,092,636 | ) | 6,468 | (7,629,611 | ) | (2,027,498 | ) | (29,176,695 | ) | (75,417,447 | ) | (127,913,346 | ) | (55,682,216 | ) | (184,899,944 | ) | ||||||||||||||||||
| 35,069,524 | 545,357 | 30,266,777 | 8,377,075 | 23,097,500 | 56,807,660 | 229,992,963 | 68,014,401 | 268,944,796 | ||||||||||||||||||||||||||
| — | (1,076 | ) | (129,025 | ) | (472,450 | ) | (353,615 | ) | (1,273,398 | ) | (753,514 | ) | (4,395,879 | ) | (772,093 | ) | ||||||||||||||||||
| — | — | — | — | — | — | — | — | 116,543 | ||||||||||||||||||||||||||
| — | — | — | — | — | — | — | 134,552 | — | ||||||||||||||||||||||||||
| — | — | (272,678 | ) | — | — | — | — | — | — | |||||||||||||||||||||||||
| 71,785 | 40 | (1,116,153 | ) | — | — | — | (2 | ) | 22,552 | (10,460 | ) | |||||||||||||||||||||||
| 35,141,309 | 544,321 | 28,748,921 | 7,904,625 | 22,743,885 | 55,534,262 | 229,239,447 | 63,775,626 | 268,278,786 | ||||||||||||||||||||||||||
| 20,048,673 | 550,789 | 21,119,310 | 5,877,127 | (6,432,810 | ) | (19,883,185 | ) | 101,326,101 | 8,093,410 | 83,378,842 | ||||||||||||||||||||||||
| $ | 34,300,022 | $ | 560,413 | $ | 27,539,157 | $ | 9,077,953 | $ | (5,114,472 | ) | $ | (9,218,831 | ) | $ | 102,497,707 | $ | 8,783,250 | $ | 101,061,569 | |||||||||||||||
See Notes to Financial Statements.
127
Table of Contents
STATEMENTS OF CHANGES IN NET ASSETS
| Money Market Fund | ||||||||
| For the Six Months Ended 06/30/09 (Unaudited) | For the Year Ended 12/31/08 | |||||||
Operations: | ||||||||
Net investment income | $ | 3,294,986 | $ | 30,499,308 | ||||
Net realized gain (loss) on investment securities, foreign currency transactions and | ||||||||
derivative transactions | 51,884 | 87,123 | ||||||
Net change in unrealized appreciation (depreciation) on investment securities, foreign currency translations and derivative transactions | — | — | ||||||
Net increase in net assets resulting from operations | 3,346,870 | 30,586,431 | ||||||
Dividends and Distributions to Shareholders: | ||||||||
Dividends from net investment income | ||||||||
GS2 shares | (626,331 | ) | (3,742,477 | ) | ||||
GS4 shares | (2,660,757 | ) | (26,602,255 | ) | ||||
GS6 shares | (7,898 | ) | (154,576 | ) | ||||
Distributions from net realized capital gains | ||||||||
GS2 shares | — | — | ||||||
GS4 shares | — | — | ||||||
GS6 shares | — | — | ||||||
Return of Capital | ||||||||
Total dividends and distributions | (3,294,986 | ) | (30,499,308 | ) | ||||
Capital Share Transactions: | ||||||||
Proceeds from shares sold | ||||||||
GS2 shares | 63,311,251 | 174,901,124 | ||||||
GS4 shares | 1,403,200,493 | 4,070,538,346 | ||||||
GS6 shares | 1,367,352 | 3,546,544 | ||||||
Proceeds from exchange of GS6 shares for GS4 shares(1) | ||||||||
GS4 shares | 9,761,236 | — | ||||||
GS6 shares | (9,761,236 | ) | — | |||||
Reinvestment of dividends and distributions | ||||||||
GS2 shares | 507,209 | 3,367,839 | ||||||
GS4 shares | 1,881,273 | 16,558,471 | ||||||
GS6 shares | 7,898 | 154,558 | ||||||
Total proceeds from shares sold and reinvested | 1,470,275,476 | 4,269,066,882 | ||||||
Value of shares redeemed | ||||||||
GS2 shares | (67,952,180 | ) | (119,120,727 | ) | ||||
GS4 shares | (1,401,785,861 | ) | (4,056,623,451 | ) | ||||
GS6 shares | (421,134 | ) | (873,423 | ) | ||||
Total value of shares redeemed | (1,470,159,175 | ) | (4,176,617,601 | ) | ||||
Net increase (decrease) from capital share transactions(2) | 116,301 | 92,449,281 | ||||||
Total increase (decrease) in net assets | 168,185 | 92,536,404 | ||||||
Net Assets: | ||||||||
Beginning of Period | 1,150,692,271 | 1,058,155,867 | ||||||
End of Period* | $ | 1,150,860,456 | $ | 1,150,692,271 | ||||
*Including undistributed (distributions in excess of) net investment income | $ | 84,502 | $ | 84,502 | ||||
| (1) | See Note 1 in Notes to Financial Statements. |
| (2) | See Note 7 in Notes to Financial Statements. |
See Notes to Financial Statements.
128
Table of Contents
| Low-Duration Bond Fund | Medium-Duration Bond Fund | Extended-Duration Bond Fund | Inflation Protected Bond Fund | Global Bond Fund | ||||||||||||||||||||||||||||
| For the Six Months Ended 06/30/09 (Unaudited) | For the Year Ended 12/31/08 | For the Six Months Ended 06/30/09 (Unaudited) | For the Year Ended 12/31/08 | For the Six Months Ended 06/30/09 (Unaudited) | For the Year Ended 12/31/08 | For the Period 06/25/09 to 06/30/09 (Unaudited) | For the Six Months Ended 06/30/09 (Unaudited) | For the Year Ended 12/31/08 | ||||||||||||||||||||||||
| $ | 11,533,360 | $ | 30,702,495 | $ | 18,982,382 | $ | 54,680,407 | $ | 14,251,349 | $ | 32,896,917 | $ | 9,624 | $ | 6,419,847 | $ | 11,820,489 | |||||||||||||||
| 3,636,523 | 10,248,330 | 9,410,838 | 25,910,258 | (15,092,636 | ) | 3,536,736 | 6,468 | (7,629,611 | ) | (771,149 | ) | |||||||||||||||||||||
| 26,391,423 | (62,157,691 | ) | 37,283,296 | (129,485,267 | ) | 35,141,309 | (81,975,842 | ) | 544,321 | 28,748,921 | (56,189,843 | ) | ||||||||||||||||||||
| 41,561,306 | (21,206,866 | ) | 65,676,516 | (48,894,602 | ) | 34,300,022 | (45,542,189 | ) | 560,413 | 27,539,157 | (45,140,503 | ) | ||||||||||||||||||||
| (2,211,280) | (7,859,812 | ) | (3,457,014 | ) | (11,645,709 | ) | (3,274,048 | ) | (8,411,202 | ) | — | — | — | |||||||||||||||||||
| (6,990,691) | (25,918,642 | ) | (12,774,800 | ) | (44,817,988 | ) | (8,345,832 | ) | (24,338,771 | ) | — | (7,000,792 | ) | (13,354,129 | ) | |||||||||||||||||
| (101,664) | (331,598 | ) | (303,734 | ) | (1,129,043 | ) | (571,919 | ) | (1,871,633 | ) | — | — | — | |||||||||||||||||||
| — | — | (1,210,513 | ) | (5,325,358 | ) | (162,567 | ) | (1,551,879 | ) | — | — | — | ||||||||||||||||||||
| — | — | (4,560,211 | ) | (20,940,453 | ) | (426,578 | ) | (4,629,238 | ) | — | — | (1,286,826 | ) | |||||||||||||||||||
| — | — | (168,322 | ) | (605,256 | ) | (44,540 | ) | (351,828 | ) | — | — | — | ||||||||||||||||||||
| (9,303,635) | (34,110,052 | ) | (22,474,594 | ) | (84,463,807 | ) | (12,825,484 | ) | (41,154,551 | ) | — | (7,000,792 | ) | (14,640,955 | ) | |||||||||||||||||
| 8,497,140 | 13,419,447 | 5,548,838 | 26,755,295 | 3,079,066 | 12,386,781 | — | — | — | ||||||||||||||||||||||||
| 42,567,455 | 74,611,719 | 30,167,091 | 94,933,988 | 13,775,200 | 27,666,880 | 68,259,048 | 11,830,795 | 122,278,692 | ||||||||||||||||||||||||
| 254,107 | 598,495 | 144,295 | 708,473 | 49,106 | 170,965 | — | — | — | ||||||||||||||||||||||||
| 6,028,341 | — | 14,963,529 | — | 15,327,294 | — | — | — | — | ||||||||||||||||||||||||
| (6,028,341) | — | (14,963,529 | ) | — | (15,327,294 | ) | — | — | — | — | ||||||||||||||||||||||
| 2,209,235 | 7,855,439 | 4,663,558 | 16,454,325 | 3,432,330 | 9,955,235 | — | — | — | ||||||||||||||||||||||||
| 6,989,653 | 25,915,895 | 17,333,748 | 65,754,384 | 8,772,041 | 28,967,078 | 7,000,792 | 14,640,955 | |||||||||||||||||||||||||
| 101,664 | 331,598 | 472,056 | 1,734,299 | 616,459 | 2,223,461 | — | — | — | ||||||||||||||||||||||||
| 60,619,254 | 122,732,593 | 58,329,586 | 206,340,764 | 29,724,202 | 81,370,400 | 68,259,048 | 18,831,587 | 136,919,647 | ||||||||||||||||||||||||
| (20,452,878) | (38,248,100 | ) | (12,166,167 | ) | (58,514,727 | ) | (12,007,768 | ) | (17,257,194 | ) | — | — | ||||||||||||||||||||
| (99,065,816) | (206,206,149 | ) | (100,000,388 | ) | (394,054,838 | ) | (65,614,370 | ) | (132,897,070 | ) | — | (20,971,633 | ) | (35,006,076 | ) | |||||||||||||||||
| (74,922) | (311,460 | ) | (176,672 | ) | (200,010 | ) | (44,729 | ) | (165,272 | ) | — | — | ||||||||||||||||||||
| (119,593,616) | (244,765,709 | ) | (112,343,227 | ) | (452,769,575 | ) | (77,666,867 | ) | (150,319,536 | ) | — | (20,971,633 | ) | (35,006,076 | ) | |||||||||||||||||
| (58,974,362) | (122,033,116 | ) | (54,013,641 | ) | (246,428,811 | ) | (47,942,665 | ) | (68,949,136 | ) | 68,259,048 | (2,140,046 | ) | 101,913,571 | ||||||||||||||||||
| (26,716,691) | (177,350,034 | ) | (10,811,719 | ) | (379,787,220 | ) | (26,468,127 | ) | (155,645,876 | ) | 68,819,461 | 18,398,319 | 42,132,113 | |||||||||||||||||||
| 626,841,694 | 804,191,728 | 865,366,738 | 1,245,153,958 | 437,604,655 | 593,250,531 | — | 167,464,776 | 125,332,663 | ||||||||||||||||||||||||
| $ | 600,125,003 | $ | 626,841,694 | $ | 854,555,019 | $ | 865,366,738 | $ | 411,136,528 | $ | 437,604,655 | $ | 68,819,461 | $ | 185,863,095 | $ | 167,464,776 | |||||||||||||||
| $ | 4,233,878 | $ | 2,004,153 | $ | 5,702,990 | $ | 3,256,156 | $ | 2,004,075 | $ | (55,475 | ) | $ | 9,624 | $ | (596,981 | ) | $ | (16,036 | ) | ||||||||||||
See Notes to Financial Statements.
129
Table of Contents
STATEMENTS OF CHANGES IN NET ASSETS
| Equity Index Fund | Real Estate Securities Fund | |||||||||||||||
| For the Six Months Ended 06/30/09 (Unaudited) | For the Year Ended 12/31/08 | For the Six Months Ended 06/30/09 (Unaudited) | For the Year Ended 12/31/08 | |||||||||||||
Operations: | ||||||||||||||||
Net investment income | $ | 3,200,826 | $ | 8,054,465 | $ | 1,318,338 | $ | 2,328,218 | ||||||||
Net realized (loss) on investment securities, foreign currency transactions and derivative transactions | (2,027,498 | ) | (3,835,975 | ) | (29,176,695 | ) | (44,494,060 | ) | ||||||||
Net change in unrealized appreciation (depreciation) on investment securities, foreign currency translations and derivative transactions | 7,904,625 | (186,466,450 | ) | 22,743,885 | (8,562,119 | ) | ||||||||||
Net increase (decrease) in net assets resulting from operations | 9,077,953 | (182,247,960 | ) | (5,114,472 | ) | (50,727,961 | ) | |||||||||
Dividends and Distributions to Shareholders: | ||||||||||||||||
Dividends from net investment income | ||||||||||||||||
GS2 shares | (1,330,372 | ) | (1,831,863 | ) | — | — | ||||||||||
GS4 shares | (3,384,220 | ) | (4,586,589 | ) | (1,294,845 | ) | (2,388,143 | ) | ||||||||
GS6 shares | (14,301 | ) | (18,532 | ) | — | — | ||||||||||
Distributions from net realized capital gains | ||||||||||||||||
GS2 shares | — | (695,874 | ) | — | — | |||||||||||
GS4 shares | — | (1,977,420 | ) | — | — | |||||||||||
GS6 shares | — | (7,511 | ) | — | — | |||||||||||
Return of Capital | ||||||||||||||||
GS2 shares | — | — | — | — | ||||||||||||
GS4 shares | — | — | — | (99,004 | ) | |||||||||||
GS6 shares | — | — | — | — | ||||||||||||
Total dividends and distributions | (4,728,893 | ) | (9,117,789 | ) | (1,294,845 | ) | (2,487,147 | ) | ||||||||
Capital Share Transactions: | ||||||||||||||||
Proceeds from shares sold | ||||||||||||||||
GS2 shares | 2,731,452 | 7,040,123 | — | — | ||||||||||||
GS4 shares | 13,842,061 | 22,884,918 | 24,311,468 | 84,159,228 | ||||||||||||
GS6 shares | 169,604 | 524,851 | — | — | ||||||||||||
GS8 shares(1) | — | — | — | — | ||||||||||||
Proceeds from exchange of GS6 shares for GS4 shares(1) | ||||||||||||||||
GS4 shares | 752,012 | — | — | — | ||||||||||||
GS6 shares | (752,012 | ) | — | — | — | |||||||||||
Reinvestment of dividends and distributions | ||||||||||||||||
GS2 shares | 1,328,589 | 2,524,043 | — | — | ||||||||||||
GS4 shares | 3,383,934 | 6,563,344 | 1,294,845 | 2,446,782 | ||||||||||||
GS6 shares | 14,301 | 26,043 | — | — | ||||||||||||
Total proceeds from shares sold and reinvested | 21,469,941 | 39,563,322 | 25,606,313 | 86,606,010 | ||||||||||||
Value of shares redeemed | ||||||||||||||||
GS2 shares | (1,525,395 | ) | (8,877,183 | ) | — | — | ||||||||||
GS4 shares | (9,486,373 | ) | (53,088,621 | ) | (13,623,511 | ) | (49,586,856 | ) | ||||||||
GS6 shares | (53,435 | ) | (197,779 | ) | — | — | ||||||||||
Total value of shares redeemed | (11,065,203 | ) | (62,163,583 | ) | (13,623,511 | ) | (49,586,856 | ) | ||||||||
Net increase (decrease) from capital share transactions(2) | 10,404,738 | (22,600,261 | ) | 11,982,802 | 37,019,154 | |||||||||||
Total increase (decrease) in net assets | 14,753,798 | (213,966,010 | ) | 5,573,485 | (16,195,954 | ) | ||||||||||
Net Assets: | ||||||||||||||||
Beginning of Period | 297,193,554 | 511,159,564 | 80,579,249 | 96,775,203 | ||||||||||||
End of Period* | $ | 311,947,352 | $ | 297,193,554 | $ | 86,152,734 | $ | 80,579,249 | ||||||||
*Including undistributed (distributions in excess of) net investment income | $ | 94,492 | $ | 1,622,559 | $ | 23,493 | $ | — | ||||||||
| (1) | See Note 1 in Notes to Financial Statements. |
| (2) | See Note 7 in Notes to Financial Statements. |
See Notes to Financial Statements.
130
Table of Contents
| Value Equity Fund | Growth Equity Fund | Small Cap Equity Fund | International Equity Fund | ||||||||||||||||||||||||||
| For the Six Months Ended 06/30/09 (Unaudited) | For the Year Ended 12/31/08 | For the Six Months Ended 06/30/09 (Unaudited) | For the Year Ended 12/31/08 | For the Six Months Ended 06/30/09 (Unaudited) | For the Year Ended 12/31/08 | For the Six Months Ended 06/30/09 (Unaudited) | For the Year Ended 12/31/08 | ||||||||||||||||||||||
| $ | 10,664,354 | $ | 28,680,309 | $ | 1,171,606 | $ | 2,438,359 | $ | 689,840 | $ | 2,549,818 | $ | 17,682,727 | $ | 40,980,349 | ||||||||||||||
| (75,417,447) | (118,299,560 | ) | (127,913,346 | ) | (77,879,679 | ) | (55,682,216 | ) | (88,724,230 | ) | (184,899,944 | ) | (87,271,419 | ) | |||||||||||||||
| 55,534,262 | (509,658,839 | ) | 229,239,447 | (641,077,277 | ) | 63,775,626 | (113,441,348 | ) | 268,278,786 | (776,771,510 | ) | ||||||||||||||||||
| (9,218,831) | (599,278,090 | ) | 102,497,707 | (716,518,597 | ) | 8,783,250 | (199,615,760 | ) | 101,061,569 | (823,062,580 | ) | ||||||||||||||||||
| (4,550,025) | (5,427,637 | ) | (344,030 | ) | (760,505 | ) | (109,846 | ) | (614,201 | ) | (1,785,189 | ) | (9,679,437 | ) | |||||||||||||||
| (13,300,606) | (15,120,026 | ) | (889,232 | ) | (1,656,101 | ) | (312,503 | ) | (1,982,895 | ) | (6,382,581 | ) | (32,423,305 | ) | |||||||||||||||
| (275,945) | (371,566 | ) | (1,914 | ) | (2,559 | ) | (13,179 | ) | (103,815 | ) | (134,700 | ) | (701,696 | ) | |||||||||||||||
| — | (1,791,283 | ) | — | — | — | — | (2,529 | ) | (8,347,976 | ) | |||||||||||||||||||
| — | (5,776,508 | ) | — | — | — | — | (9,714 | ) | (30,093,735 | ) | |||||||||||||||||||
| — | (145,613 | ) | — | — | — | — | (219 | ) | (687,438 | ) | |||||||||||||||||||
| — | — | — | — | — | (168,554 | ) | — | — | |||||||||||||||||||||
| — | — | — | — | — | (544,164 | ) | — | — | |||||||||||||||||||||
| — | — | — | — | — | (28,490 | ) | — | — | |||||||||||||||||||||
| (18,126,576) | (28,632,633 | ) | (1,235,176 | ) | (2,419,165 | ) | (435,528 | ) | (3,442,119 | ) | (8,314,932 | ) | (81,933,587 | ) | |||||||||||||||
| 8,551,064 | 26,364,928 | 8,585,332 | 28,172,361 | 2,402,323 | 20,033,750 | 11,862,389 | 104,596,517 | ||||||||||||||||||||||
| 46,106,414 | 119,844,786 | 41,970,882 | 122,481,304 | 12,694,784 | 38,592,188 | 61,482,458 | 275,354,383 | ||||||||||||||||||||||
| 202,991 | 384,635 | 130,569 | 295,093 | 121,495 | 274,544 | 203,417 | 699,797 | ||||||||||||||||||||||
| — | — | — | 1,150,180 | — | — | — | — | ||||||||||||||||||||||
| 10,999,393 | — | 8,465,100 | — | 11,250,269 | — | 15,254,145 | — | ||||||||||||||||||||||
| (10,999,393) | — | (8,465,100 | ) | — | (11,250,269 | ) | — | (15,254,145 | ) | — | |||||||||||||||||||
| 4,544,451 | 7,209,480 | 343,662 | 759,609 | 109,693 | 781,539 | 1,783,075 | 17,999,891 | ||||||||||||||||||||||
| 13,299,539 | 20,894,776 | 889,208 | 1,656,068 | 312,456 | 2,526,659 | 6,391,937 | 62,512,863 | ||||||||||||||||||||||
| 275,945 | 517,179 | 1,914 | 2,559 | 13,179 | 132,305 | 134,919 | 1,389,134 | ||||||||||||||||||||||
| 72,980,404 | 175,215,784 | 51,921,567 | 154,517,174 | 15,653,930 | 62,340,985 | 81,858,195 | 462,552,585 | ||||||||||||||||||||||
| (2,825,094) | (28,656,106 | ) | (7,235,069 | ) | (26,886,067 | ) | (1,464,787 | ) | (16,975,850 | ) | (19,330,643 | ) | (38,548,254 | ) | |||||||||||||||
| (48,088,250) | (175,032,062 | ) | (77,713,275 | ) | (186,516,510 | ) | (14,818,577 | ) | (71,310,720 | ) | (70,211,923 | ) | (144,223,290 | ) | |||||||||||||||
| (12,385) | (127,031 | ) | (41,307 | ) | (149,108 | ) | (22,607 | ) | (74,701 | ) | (67,761 | ) | (300,712 | ) | |||||||||||||||
| (50,925,729) | (203,815,199 | ) | (84,989,651 | ) | (213,551,685 | ) | (16,305,971 | ) | (88,361,271 | ) | (89,610,327 | ) | (183,072,256 | ) | |||||||||||||||
| 22,054,675 | (28,599,415 | ) | (33,068,084 | ) | (59,034,511 | ) | (652,041 | ) | (26,020,286 | ) | (7,752,132 | ) | 279,480,329 | ||||||||||||||||
| (5,290,732) | (656,510,138 | ) | 68,194,447 | (777,972,273 | ) | 7,695,681 | (229,078,165 | ) | 84,994,505 | (625,515,838 | ) | ||||||||||||||||||
| 999,512,882 | 1,656,023,020 | 966,343,149 | 1,744,315,422 | 332,081,598 | 561,159,763 | 1,082,481,834 | 1,707,997,672 | ||||||||||||||||||||||
| $994,222,150 | $ | 999,512,882 | $ | 1,034,537,596 | $ | 966,343,149 | $ | 339,777,279 | $ | 332,081,598 | $ | 1,167,476,339 | $ | 1,082,481,834 | |||||||||||||||
| $ | 290,047 | $ | 7,752,269 | $ | (25,025 | ) | $ | 38,545 | $ | 233,038 | $ | (21,274 | ) | $ | 9,886,983 | $ | 506,726 | ||||||||||||
See Notes to Financial Statements.
131
Table of Contents
FINANCIAL HIGHLIGHTS (Unaudited)
| For a Share Outstanding For the Years Ended December 31, unless otherwise indicated | Ratios to Average Net Assets | |||||||||||||||||||||||||||||||||||||||||||||
| Net Asset Value, Beginning of Period | Net Investment Income | Realized and Unrealized Gain (Loss) on Investments | Dividends from Net Investment Income | Distributions from Net Realized Capital Gains | Net Asset Value, End of Period | Total Return | Net Assets, End of Period (000) | Expenses, Net | Expenses, Including Expense Reduction | Expenses, Before Waivers and Expense Reduction(1) | Investment Income, Net | Investment Income/ (Loss), Excluding Waivers and Expense Reduction | Portfolio Turnover Rate | |||||||||||||||||||||||||||||||||
Money Market Fund |
| |||||||||||||||||||||||||||||||||||||||||||||
GS2 Class | ||||||||||||||||||||||||||||||||||||||||||||||
2009(2) | $ | 1.00 | $ | — | † | $ | — | † | $ | — | † | $ | — | $ | 1.00 | 0.37 | % | $ | 167,613 | 0.24 | %(3) | 0.24 | %(3) | 0.24 | %(3) | 0.74 | % | 0.74 | % | N/A | ||||||||||||||||
2008 | 1.00 | 0.03 | — | † | (0.03 | ) | — | 1.00 | 2.95 | 171,739 | 0.20 | 0.20 | 0.20 | 2.86 | 2.86 | N/A | ||||||||||||||||||||||||||||||
2007 | 1.00 | 0.05 | — | † | (0.05 | ) | — | 1.00 | 5.23 | 112,581 | 0.23 | 0.23 | 0.23 | 5.11 | 5.11 | N/A | ||||||||||||||||||||||||||||||
2006 | 1.00 | 0.05 | — | † | (0.05 | ) | — | 1.00 | 4.92 | 100,559 | 0.26 | 0.26 | 0.26 | 4.82 | 4.82 | N/A | ||||||||||||||||||||||||||||||
2005 | 1.00 | 0.03 | — | † | (0.03 | ) | — | 1.00 | 3.07 | 93,103 | 0.27 | 0.27 | 0.26 | 3.03 | 3.04 | N/A | ||||||||||||||||||||||||||||||
2004 | 1.00 | 0.01 | — | † | (0.01 | ) | — | 1.00 | 1.19 | 61,374 | 0.27 | 0.27 | 0.27 | 1.17 | 1.17 | N/A | ||||||||||||||||||||||||||||||
GS4 Class | ||||||||||||||||||||||||||||||||||||||||||||||
2009(2) | $ | 1.00 | $ | — | † | $ | — | † | $ | — | † | $ | — | $ | 1.00 | 0.27 | % | $ | 983,248 | 0.44 | %(3) | 0.44 | %(3) | 0.44 | %(3) | 0.54 | % | 0.54 | % | N/A | ||||||||||||||||
2008 | 1.00 | 0.03 | — | † | (0.03 | ) | — | 1.00 | 2.75 | 970,146 | 0.40 | (3) | 0.40 | (3) | 0.40 | (3) | 2.72 | 2.72 | N/A | |||||||||||||||||||||||||||
2007 | 1.00 | 0.05 | — | † | (0.05 | ) | — | 1.00 | 5.03 | 939,596 | 0.43 | 0.43 | 0.43 | 4.92 | 4.92 | N/A | ||||||||||||||||||||||||||||||
2006 | 1.00 | 0.05 | — | † | (0.05 | ) | — | 1.00 | 4.72 | 930,582 | 0.46 | 0.46 | 0.46 | 4.64 | 4.64 | N/A | ||||||||||||||||||||||||||||||
2005 | 1.00 | 0.03 | — | † | (0.03 | ) | — | 1.00 | 2.88 | 766,322 | 0.46 | 0.46 | 0.46 | 2.84 | 2.84 | N/A | ||||||||||||||||||||||||||||||
2004 | 1.00 | 0.01 | — | † | (0.01 | ) | — | 1.00 | 0.99 | 838,087 | 0.46 | 0.46 | 0.45 | 0.98 | 0.99 | N/A | ||||||||||||||||||||||||||||||
Low-Duration Bond Fund |
| |||||||||||||||||||||||||||||||||||||||||||||
GS2 Class | ||||||||||||||||||||||||||||||||||||||||||||||
2009(2) | $ | 8.11 | $ | 0.16 | # | $ | 0.41 | $ | (0.18 | ) | $ | — | $ | 8.50 | 7.12 | % | $ | 100,275 | 0.36 | % | 0.36 | % | 0.43 | % | 3.93 | % | 3.86 | % | 201 | % | ||||||||||||||||
2008 | 8.90 | 0.36 | # | (0.60 | ) | (0.55 | ) | — | 8.11 | (2.76 | ) | 105,223 | 0.36 | 0.36 | 0.41 | 4.19 | 4.14 | 427 | ||||||||||||||||||||||||||||
2007 | 8.89 | 0.42 | # | 0.12 | (0.53 | ) | — | 8.90 | 6.22 | 133,374 | 0.42 | 0.42 | 0.45 | 4.71 | 4.68 | 248 | ||||||||||||||||||||||||||||||
2006 | 9.06 | 0.38 | # | (0.03 | ) | (0.52 | ) | — | 8.89 | 3.94 | 105,991 | 0.45 | 0.45 | 0.47 | 4.22 | 4.20 | 168 | |||||||||||||||||||||||||||||
2005 | 9.32 | 0.30 | # | (0.15 | ) | (0.41 | ) | — | † | 9.06 | 1.60 | 104,681 | 0.45 | 0.45 | 0.48 | 3.30 | 3.27 | 196 | ||||||||||||||||||||||||||||
2004 | 9.51 | 0.21 | # | (0.07 | ) | (0.28 | ) | (0.05 | ) | 9.32 | 1.47 | 59,777 | 0.45 | 0.45 | 0.49 | 2.22 | 2.18 | 289 | ||||||||||||||||||||||||||||
GS4 Class | ||||||||||||||||||||||||||||||||||||||||||||||
2009(2) | $ | 11.99 | $ | 0.23 | # | $ | 0.60 | $ | (0.17 | ) | $ | — | $ | 12.65 | 6.99 | % | $ | 499,850 | 0.52 | % | 0.52 | % | 0.62 | % | 3.77 | % | 3.67 | % | 201 | % | ||||||||||||||||
2008 | 12.88 | 0.51 | # | (0.87 | ) | (0.53 | ) | — | 11.99 | (2.84 | ) | 515,996 | 0.52 | 0.52 | 0.61 | 4.03 | 3.94 | 427 | ||||||||||||||||||||||||||||
2007 | 12.63 | 0.58 | # | 0.17 | (0.50 | ) | — | 12.88 | 6.11 | 665,292 | 0.58 | 0.58 | 0.64 | 4.54 | 4.48 | 248 | ||||||||||||||||||||||||||||||
2006 | 12.66 | 0.58 | # | (0.11 | ) | (0.50 | ) | — | 12.63 | 3.75 | 697,687 | 0.61 | 0.61 | 0.66 | 4.05 | 4.00 | 168 | |||||||||||||||||||||||||||||
2005 | 12.87 | 0.40 | # | (0.22 | ) | (0.39 | ) | — | † | 12.66 | 1.39 | 789,077 | 0.61 | 0.61 | 0.67 | 3.13 | 3.07 | 196 | ||||||||||||||||||||||||||||
2004 | 13.00 | 0.27 | # | (0.09 | ) | (0.26 | ) | (0.05 | ) | 12.87 | 1.38 | 789,866 | 0.61 | 0.61 | 0.67 | 2.06 | 2.00 | 289 | ||||||||||||||||||||||||||||
| † | Amount represents less than $0.005 per share. |
| # | Calculated using the average shares outstanding method. |
| (1) | The ratio also excludes previously recaptured fees. |
| (2) | For the six months ended June 30, 2009. All ratios for the period have been annualized. Total return and portfolio turnover for the period have not been annualized. |
| (3) | See Note 11 in Notes to Financial Statements. |
See Notes to Financial Statements.
132
Table of Contents
| Ratios to Average Net Assets | ||||||||||||||||||||||||||||||||||||||||||||||||||
| Net Asset Value, Beginning of Period | Net Investment Income | Realized and Unrealized Gain (Loss) on Investments | Dividends from Net Investment Income | Distributions from Net Realized Capital Gains | Return of Capital | Net Asset Value, End of Period | Total Return | Net Assets, End of Period (000) | Expenses, Net | Expenses, Including Expense Reduction | Expenses, Before Waivers and Expense Reduction(1) | Investment Income, Net | Investment Income/ (Loss), Excluding Waivers and Expense Reduction | Portfolio Turnover Rate | ||||||||||||||||||||||||||||||||||||
Medium-Duration Bond Fund |
| |||||||||||||||||||||||||||||||||||||||||||||||||
GS2 Class | ||||||||||||||||||||||||||||||||||||||||||||||||||
2009(2) | $ | 7.13 | $ | 0.17 | # | $ | 0.41 | $ | (0.23 | ) | $ | (0.08 | ) | $ | — | $ | 7.40 | 8.47 | % | $ | 114,303 | 0.48 | % | 0.48 | % | 0.50 | % | 4.73 | % | 4.71 | % | 254 | % | |||||||||||||||||
2008 | 8.42 | 0.40 | # | (0.72 | ) | (0.65 | ) | (0.32 | ) | — | 7.13 | (3.88 | ) | 112,240 | 0.47 | 0.47 | 0.48 | 5.07 | 5.06 | 566 | ||||||||||||||||||||||||||||||
2007 | 8.52 | 0.42 | # | 0.12 | (0.64 | ) | — | † | — | 8.42 | 6.65 | 151,466 | 0.48 | 0.48 | 0.49 | 5.02 | 5.01 | 428 | ||||||||||||||||||||||||||||||||
2006 | 8.71 | 0.39 | # | (0.01 | ) | (0.57 | ) | — | — | 8.52 | 4.50 | 113,051 | 0.50 | 0.50 | 0.50 | 4.60 | 4.60 | 440 | ||||||||||||||||||||||||||||||||
2005 | 9.06 | 0.34 | # | (0.10 | ) | (0.53 | ) | (0.06 | ) | — | 8.71 | 2.62 | 100,800 | 0.50 | 0.50 | 0.53 | 3.84 | 3.81 | 465 | |||||||||||||||||||||||||||||||
2004 | 9.24 | 0.28 | # | 0.21 | (0.45 | ) | (0.22 | ) | — | 9.06 | 5.34 | 52,865 | 0.50 | 0.50 | 0.53 | 2.97 | 2.94 | 372 | ||||||||||||||||||||||||||||||||
GS4 Class | ||||||||||||||||||||||||||||||||||||||||||||||||||
2009(2) | $ | 12.16 | $ | 0.28 | # | $ | 0.72 | $ | (0.23 | ) | $ | (0.08 | ) | $ | — | $ | 12.85 | 8.37 | % | $ | 740,252 | 0.58 | % | 0.58 | % | 0.70 | % | 4.63 | % | 4.51 | % | 254 | % | |||||||||||||||||
2008 | 13.64 | 0.65 | # | (1.18 | ) | (0.63 | ) | (0.32 | ) | — | 12.16 | (3.89 | ) | 738,610 | 0.58 | 0.58 | 0.67 | 4.96 | 4.87 | 566 | ||||||||||||||||||||||||||||||
2007 | 13.42 | 0.66 | # | 0.18 | (0.62 | ) | — | † | — | 13.64 | 6.46 | 1,079,034 | 0.61 | 0.61 | 0.68 | 4.88 | 4.81 | 428 | ||||||||||||||||||||||||||||||||
2006 | 13.40 | 0.60 | # | (0.03 | ) | (0.55 | ) | — | — | 13.42 | 4.37 | 1,108,958 | 0.62 | 0.62 | 0.69 | 4.48 | 4.41 | 440 | ||||||||||||||||||||||||||||||||
2005 | 13.63 | 0.50 | # | (0.16 | ) | (0.51 | ) | (0.06 | ) | — | 13.40 | 2.50 | 981,935 | 0.62 | 0.62 | 0.71 | 3.71 | 3.62 | 465 | |||||||||||||||||||||||||||||||
2004 | 13.58 | 0.39 | # | 0.31 | (0.43 | ) | (0.22 | ) | — | 13.63 | 5.20 | 853,377 | 0.62 | 0.62 | 0.72 | 2.85 | 2.75 | 372 | ||||||||||||||||||||||||||||||||
Extended-Duration Bond Fund |
| |||||||||||||||||||||||||||||||||||||||||||||||||
GS2 Class | ||||||||||||||||||||||||||||||||||||||||||||||||||
2009(2) | $ | 6.31 | $ | 0.23 | # | $ | 0.33 | $ | (0.34 | ) | $ | (0.02 | ) | $ | — | $ | 6.51 | 9.51 | % | $ | 61,268 | 0.54 | % | 0.54 | % | 0.54 | % | 7.47 | % | 7.47 | % | 17 | % | |||||||||||||||||
2008 | 7.95 | 0.47 | # | (1.11 | ) | (0.85 | ) | (0.15 | ) | — | 6.31 | (8.12 | ) | 64,834 | 0.52 | 0.52 | 0.52 | 6.66 | 6.66 | 40 | ||||||||||||||||||||||||||||||
2007 | 8.13 | 0.41 | # | 0.23 | (0.69 | ) | (0.13 | ) | — | 7.95 | 8.45 | 75,841 | 0.53 | 0.53 | 0.53 | 5.21 | 5.21 | 101 | ||||||||||||||||||||||||||||||||
2006 | 8.44 | 0.40 | # | (0.03 | ) | (0.65 | ) | (0.03 | ) | — | 8.13 | 4.75 | 59,916 | 0.57 | 0.57 | 0.57 | 4.91 | 4.91 | 100 | |||||||||||||||||||||||||||||||
2005 | 8.90 | 0.44 | # | 0.04 | (0.68 | ) | (0.26 | ) | — | 8.44 | 5.65 | 57,372 | 0.56 | 0.56 | 0.57 | 4.90 | 4.89 | 38 | ||||||||||||||||||||||||||||||||
2004 | 9.23 | 0.47 | # | 0.27 | (0.76 | ) | (0.31 | ) | — | 8.90 | 8.49 | 32,309 | 0.57 | 0.57 | 0.57 | 5.17 | 5.17 | 66 | ||||||||||||||||||||||||||||||||
GS4 Class | ||||||||||||||||||||||||||||||||||||||||||||||||||
2009(2) | $ | 12.97 | $ | 0.46 | # | $ | 0.72 | $ | (0.33 | ) | $ | (0.02 | ) | $ | — | $ | 13.80 | 9.40 | % | $ | 349,869 | 0.69 | % | 0.69 | % | 0.74 | % | 7.32 | % | 7.27 | % | 17 | % | |||||||||||||||||
2008 | 15.20 | 0.90 | # | (2.15 | ) | (0.83 | ) | (0.15 | ) | — | 12.97 | (8.28 | ) | 357,073 | 0.69 | 0.69 | 0.71 | 6.45 | 6.43 | 40 | ||||||||||||||||||||||||||||||
2007 | 14.81 | 0.74 | # | 0.44 | (0.66 | ) | (0.13 | ) | — | 15.20 | 8.29 | 500,252 | 0.72 | 0.72 | 0.72 | 5.02 | 5.02 | 101 | ||||||||||||||||||||||||||||||||
2006 | 14.82 | 0.69 | # | (0.04 | ) | (0.63 | ) | (0.03 | ) | — | 14.81 | 4.56 | 467,877 | 0.73 | 0.73 | 0.76 | 4.75 | 4.72 | 100 | |||||||||||||||||||||||||||||||
2005 | 14.93 | 0.71 | # | 0.10 | (0.66 | ) | (0.26 | ) | — | 14.82 | 5.54 | 393,851 | 0.73 | 0.73 | 0.76 | 4.72 | 4.69 | 38 | ||||||||||||||||||||||||||||||||
2004 | 14.78 | 0.75 | # | 0.45 | (0.74 | ) | (0.31 | ) | — | 14.93 | 8.37 | 399,459 | 0.73 | 0.73 | 0.75 | 5.01 | 4.99 | 66 | ||||||||||||||||||||||||||||||||
Inflation Protected Bond Fund |
| |||||||||||||||||||||||||||||||||||||||||||||||||
GS4 Class | ||||||||||||||||||||||||||||||||||||||||||||||||||
2009(3)(4) | $ | 10.00 | $ | — | $ | 0.08 | $ | — | $ | — | $ | — | $ | 10.08 | 0.80 | % | $ | 68,819 | 0.02 | % | 0.02 | % | 0.03 | % | 0.04 | % | 0.03 | % | 4 | % | ||||||||||||||||||||
Global Bond Fund |
| |||||||||||||||||||||||||||||||||||||||||||||||||
GS4 Class | ||||||||||||||||||||||||||||||||||||||||||||||||||
2009(2) | $ | 7.34 | $ | 0.29 | # | $ | 0.95 | $ | (0.31 | ) | $ | — | $ | — | $ | 8.27 | 17.51 | % | $ | 185,863 | 0.81 | % | 0.81 | % | 0.82 | % | 7.69 | % | 7.68 | % | 59 | % | ||||||||||||||||||
2008 | 10.14 | 0.64 | # | (2.59 | ) | (0.75 | ) | (0.10 | ) | — | 7.34 | (20.28 | ) | 167,465 | 0.78 | 0.78 | 0.80 | 7.20 | 7.18 | 176 | ||||||||||||||||||||||||||||||
2007 | 10.12 | 0.61 | 0.08 | (0.64 | ) | (0.03 | ) | — | 10.14 | 7.00 | 125,333 | 0.79 | 0.79 | 0.80 | 6.07 | 6.06 | 255 | |||||||||||||||||||||||||||||||||
2006(4)(5) | 10.12 | — | † | — | † | — | † | — | — | † | 10.12 | 0.04 | 104,635 | 1.04 | 1.04 | 1.42 | 4.32 | 3.94 | — | |||||||||||||||||||||||||||||||
| † | Amount represents less than $0.005 per share. |
| # | Calculated using the average shares outstanding method. |
| (1) | The ratio also excludes previously recaptured fees. |
| (2) | For the six months ended June 30, 2009. All ratios for the period have been annualized. Total return and portfolio turnover for the period have not been annualized. |
| (3) | Inception date was June 26, 2009. |
| (4) | Total return is not annualized. Ratios are annualized. |
| (5) | Inception date was December 29, 2006. |
See Notes to Financial Statements.
133
Table of Contents
FINANCIAL HIGHLIGHTS (Unaudited) (Continued)
| For a Share Outstanding For the Years Ended December 31, unless otherwise indicated | Ratios to Average Net Assets | |||||||||||||||||||||||||||||||||||||||||||||||||
| Net Asset Value, Beginning of Period | Net Investment Income | Realized and Unrealized Gain (Loss) on Investments | Dividends from Net Investment Income | Distributions from Net Realized Capital Gains | Excess Distribution/ Return of Capital | Net Asset Value, End of Period | Total Return | Net Assets, End of Period (000) | Expenses, Net | Expenses, Including Expense Reduction | Expenses, Before Waivers and Expense Reduction(1) | Investment Income/ (Loss), Net | Investment Income/ (Loss), Excluding Waivers and Expense Reduction | Portfolio Turnover Rate | ||||||||||||||||||||||||||||||||||||
Equity Index Fund |
| |||||||||||||||||||||||||||||||||||||||||||||||||
GS2 Class | ||||||||||||||||||||||||||||||||||||||||||||||||||
2009(2) | $ | 6.36 | $ | 0.07 | # | $ | 0.13 | $ | (0.17 | ) | $ | — | $ | — | $ | 6.39 | 3.19 | % | $ | 52,413 | 0.22 | % | 0.22 | % | 0.24 | % | 2.39 | % | 2.37 | % | 1 | % | ||||||||||||||||||
2008 | 10.57 | 0.18 | # | (4.06 | ) | (0.24 | ) | (0.09 | ) | — | 6.36 | (37.32 | ) | 49,472 | 0.21 | 0.21 | 0.22 | 2.11 | 2.10 | 5 | ||||||||||||||||||||||||||||||
2007 | 11.08 | 0.20 | # | 0.39 | (0.32 | ) | (0.78 | ) | — | 10.57 | 5.19 | 81,104 | 0.22 | 0.22 | 0.22 | 1.77 | 1.77 | 5 | ||||||||||||||||||||||||||||||||
2006 | 9.96 | 0.18 | # | 1.33 | (0.28 | ) | (0.11 | ) | — | 11.08 | 15.37 | 74,634 | 0.23 | 0.23 | 0.23 | 1.74 | 1.74 | 5 | ||||||||||||||||||||||||||||||||
2005 | 9.78 | 0.16 | # | 0.30 | (0.24 | ) | (0.04 | ) | — | 9.96 | 4.80 | 62,214 | 0.23 | 0.23 | 0.24 | 1.63 | 1.62 | 6 | ||||||||||||||||||||||||||||||||
2004 | 9.08 | 0.16 | # | 0.81 | (0.27 | ) | — | — | † | 9.78 | 10.77 | 36,148 | 0.25 | 0.25 | 0.23 | 1.75 | 1.77 | 2 | ||||||||||||||||||||||||||||||||
GS4 Class | ||||||||||||||||||||||||||||||||||||||||||||||||||
2009(2) | $ | 11.70 | $ | 0.12 | # | $ | 0.23 | $ | (0.16 | ) | $ | — | $ | — | $ | 11.89 | 3.04 | % | $ | 259,535 | 0.37 | % | 0.37 | % | 0.44 | % | 2.24 | % | 2.17 | % | 1 | % | ||||||||||||||||||
2008 | 19.07 | 0.31 | # | (7.37 | ) | (0.22 | ) | (0.09 | ) | — | 11.70 | (37.37 | ) | 247,077 | 0.37 | 0.37 | 0.42 | 1.95 | 1.90 | 5 | ||||||||||||||||||||||||||||||
2007 | 19.17 | 0.32 | # | 0.64 | (0.28 | ) | (0.78 | ) | — | 19.07 | 4.95 | 429,423 | 0.39 | 0.39 | 0.42 | 1.59 | 1.56 | 5 | ||||||||||||||||||||||||||||||||
2006 | 16.97 | 0.28 | # | 2.28 | (0.25 | ) | (0.11 | ) | — | 19.17 | 15.19 | 466,429 | 0.40 | 0.40 | 0.43 | 1.57 | 1.54 | 5 | ||||||||||||||||||||||||||||||||
2005 | 16.47 | 0.24 | # | 0.51 | (0.21 | ) | (0.04 | ) | — | 16.97 | 4.61 | 402,865 | 0.40 | 0.40 | 0.43 | 1.46 | 1.43 | 6 | ||||||||||||||||||||||||||||||||
2004 | 15.12 | 0.25 | # | 1.35 | (0.25 | ) | — | — | 16.47 | 10.60 | 417,962 | 0.40 | 0.40 | 0.41 | 1.60 | 1.59 | 2 | |||||||||||||||||||||||||||||||||
Real Estate Securities Fund |
| |||||||||||||||||||||||||||||||||||||||||||||||||
GS4 Class | ||||||||||||||||||||||||||||||||||||||||||||||||||
2009(2) | $ | 5.25 | $ | 0.08 | # | $ | (0.55 | ) | $ | (0.07 | ) | $ | — | $ | — | $ | 4.71 | (8.91 | )% | $ | 86,153 | 1.29 | % | 1.29 | % | 1.33 | % | 3.56 | % | 3.52 | % | 68 | % | |||||||||||||||||
2008 | 9.04 | 0.18 | # | (3.80 | ) | (0.16 | ) | — | (0.01 | ) | 5.25 | (40.35 | ) | 80,579 | 1.26 | 1.26 | 1.25 | 2.21 | 2.22 | 94 | ||||||||||||||||||||||||||||||
2007 | 12.55 | 0.11 | # | (2.12 | ) | (0.11 | ) | (1.39 | ) | — | 9.04 | (16.23 | ) | 96,775 | 1.20 | 1.20 | 1.22 | 0.94 | 0.92 | 119 | ||||||||||||||||||||||||||||||
2006(3)(4) | 12.50 | — | † | 0.05 | — | — | — | 12.55 | 0.40 | 107,035 | 1.33 | 1.33 | 1.88 | (1.16 | ) | (1.71 | ) | — | ||||||||||||||||||||||||||||||||
Value Equity Fund |
| |||||||||||||||||||||||||||||||||||||||||||||||||
GS2 Class | ||||||||||||||||||||||||||||||||||||||||||||||||||
2009(2) | $ | 5.52 | $ | 0.06 | # | $ | (0.13 | ) | $ | (0.17 | ) | $ | — | $ | — | $ | 5.28 | (1.17 | )% | $ | 148,315 | 0.69 | % | 0.69 | % | 0.70 | % | 2.44 | % | 2.43 | % | 20 | % | |||||||||||||||||
2008 | 9.10 | 0.17 | # | (3.46 | ) | (0.22 | ) | (0.07 | ) | — | 5.52 | (36.81 | ) | 143,506 | 0.66 | 0.65 | 0.67 | 2.29 | 2.27 | 52 | ||||||||||||||||||||||||||||||
2007 | 10.62 | 0.18 | # | (0.27 | ) | (0.28 | ) | (1.15 | ) | — | 9.10 | (1.18 | ) | 230,436 | 0.69 | 0.69 | 0.69 | 1.70 | 1.70 | 45 | ||||||||||||||||||||||||||||||
2006 | 10.75 | 0.18 | # | 1.78 | (0.28 | ) | (1.81 | ) | — | 10.62 | 18.76 | 181,940 | 0.72 | 0.71 | 0.72 | 1.70 | 1.69 | 76 | ||||||||||||||||||||||||||||||||
2005 | 11.44 | 0.20 | # | 0.65 | (0.28 | ) | (1.26 | ) | — | 10.75 | 7.40 | 156,279 | 0.73 | 0.72 | 0.73 | 1.72 | 1.71 | 54 | ||||||||||||||||||||||||||||||||
2004 | 9.94 | 0.17 | # | 1.59 | (0.26 | ) | — | † | — | 11.44 | 17.83 | 75,123 | 0.75 | 0.74 | 0.74 | 1.64 | 1.64 | 56 | ||||||||||||||||||||||||||||||||
GS4 Class | ||||||||||||||||||||||||||||||||||||||||||||||||||
2009(2) | $ | 10.53 | $ | 0.11 | # | $ | (0.24 | ) | $ | (0.16 | ) | $ | — | $ | — | $ | 10.24 | (1.16 | )% | $ | 845,907 | 0.85 | % | 0.85 | % | 0.89 | % | 2.28 | % | 2.24 | % | 20 | % | |||||||||||||||||
2008 | 17.03 | 0.30 | # | (6.54 | ) | (0.19 | ) | (0.07 | ) | — | 10.53 | (36.95 | ) | 844,459 | 0.85 | 0.84 | 0.86 | 2.09 | 2.07 | 52 | ||||||||||||||||||||||||||||||
2007 | 18.65 | 0.29 | # | (0.52 | ) | (0.24 | ) | (1.15 | ) | — | 17.03 | (1.39 | ) | 1,407,534 | 0.88 | 0.88 | 0.88 | 1.50 | 1.50 | 45 | ||||||||||||||||||||||||||||||
2006 | 17.50 | 0.28 | # | 2.93 | (0.25 | ) | (1.81 | ) | — | 18.65 | 18.64 | 1,434,773 | 0.90 | 0.89 | 0.91 | 1.52 | 1.50 | 76 | ||||||||||||||||||||||||||||||||
2005 | 17.74 | 0.28 | # | 0.99 | (0.25 | ) | (1.26 | ) | — | 17.50 | 7.13 | 1,279,940 | 0.90 | 0.89 | 0.93 | 1.53 | 1.49 | 54 | ||||||||||||||||||||||||||||||||
2004 | 15.28 | 0.24 | # | 2.45 | (0.23 | ) | — | — | 17.74 | 17.71 | 1,305,669 | 0.90 | 0.89 | 0.92 | 1.49 | 1.46 | 56 | |||||||||||||||||||||||||||||||||
| † | Amount represents less than $0.005 per share. |
| # | Calculated using the average shares outstanding method. |
| (1) | The ratio also excludes previously recaptured fees. |
| (2) | For the six months ended June 30, 2009. All ratios for the period have been annualized. Total return and portfolio turnover for the period have not been annualized. |
| (3) | Inception date was December 29, 2006. |
| (4) | Total return is not annualized. Ratios are annualized. |
See Notes to Financial Statements.
134
Table of Contents
| Ratios to Average Net Assets | ||||||||||||||||||||||||||||||||||||||||||||||||||
| Net Asset Value, Beginning of Period | Net Investment Income/ (Loss) | Realized and Unrealized Gain (Loss) on Investments | Dividends from Net Investment Income | Distri- butions from Net Realized Capital Gains | Excess Distri- bution/ Return of Capital | Net Asset Value, End of Period | Total Return | Net Assets, End of Period (000) | Expenses, Net | Expenses, Including Expense Reduction | Expenses, Before Waivers/ Reimburse- ments and Expense Reduction(1) | Invest- ment Income/ (Loss), Net | Investment Income/ (Loss), Excluding Waivers/ Reimburse- ments and Expense Reduction | Portfolio Turnover Rate | ||||||||||||||||||||||||||||||||||||
Growth Equity Fund |
| |||||||||||||||||||||||||||||||||||||||||||||||||
GS2 Class | ||||||||||||||||||||||||||||||||||||||||||||||||||
2009(2) | $ | 7.26 | $ | 0.01 | $ | 0.76 | $ | (0.02 | ) | $ | — | $ | — | $ | 8.01 | 10.58 | % | $ | 157,925 | 0.88 | % | 0.87 | % | 0.90 | % | 0.32 | % | 0.29 | % | 45 | % | |||||||||||||||||||
2008 | 12.76 | 0.03 | (5.49 | ) | (0.04 | ) | — | — | 7.26 | (42.84 | ) | 141,138 | 0.87 | 0.86 | 0.87 | 0.26 | 0.25 | 99 | ||||||||||||||||||||||||||||||||
2007 | 11.23 | 0.02 | 1.55 | (0.04 | ) | — | — | 12.76 | 13.99 | 242,557 | 0.89 | 0.89 | 0.88 | 0.24 | 0.25 | 51 | ||||||||||||||||||||||||||||||||||
2006 | 11.18 | — | † | 0.05 | — | — | — | 11.23 | 0.45 | 179,852 | 0.89 | 0.88 | 0.90 | 0.00 | (0.02 | ) | 48 | |||||||||||||||||||||||||||||||||
2005 | 10.29 | (0.03 | ) | 0.92 | — | — | — | 11.18 | 8.65 | 172,118 | 0.87 | 0.86 | 0.89 | (0.10 | ) | (0.13 | ) | 49 | ||||||||||||||||||||||||||||||||
2004 | 9.16 | — | † | 1.13 | — | — | — | 10.29 | 12.34 | 84,177 | 0.87 | 0.86 | 0.89 | 0.01 | (0.02 | ) | 56 | |||||||||||||||||||||||||||||||||
GS4 Class | ||||||||||||||||||||||||||||||||||||||||||||||||||
2009(2) | $ | 11.52 | $ | — | † | $ | 1.22 | $ | (0.01 | ) | $ | — | $ | — | $ | 12.73 | 10.62 | % | $ | 876,612 | 0.97 | % | 0.96 | % | 1.09 | % | 0.23 | % | 0.10 | % | 45 | % | ||||||||||||||||||
2008 | 20.22 | 0.02 | (8.70 | ) | (0.02 | ) | — | — | 11.52 | (42.92 | ) | 817,315 | 0.97 | 0.96 | 1.06 | 0.16 | 0.06 | 99 | ||||||||||||||||||||||||||||||||
2007 | 17.77 | 0.02 | 2.45 | (0.02 | ) | — | — | 20.22 | 13.90 | 1,488,091 | 1.00 | 1.00 | 1.07 | 0.13 | 0.06 | 51 | ||||||||||||||||||||||||||||||||||
2006 | 17.71 | (0.02 | ) | 0.08 | — | — | — | 17.77 | 0.34 | 1,343,147 | 1.01 | 1.00 | 1.09 | (0.12 | ) | (0.21 | ) | 48 | ||||||||||||||||||||||||||||||||
2005 | 16.33 | (0.04 | ) | 1.42 | — | — | — | 17.71 | 8.45 | 1,362,599 | 0.99 | 0.98 | 1.08 | (0.22 | ) | (0.32 | ) | 49 | ||||||||||||||||||||||||||||||||
2004 | 14.55 | (0.02 | ) | 1.80 | — | — | — | 16.33 | 12.23 | 1,405,754 | 0.99 | 0.98 | 1.08 | (0.11 | ) | (0.21 | ) | 56 | ||||||||||||||||||||||||||||||||
Small Cap Equity Fund |
| |||||||||||||||||||||||||||||||||||||||||||||||||
GS2 Class | ||||||||||||||||||||||||||||||||||||||||||||||||||
2009(2) | $ | 5.94 | $ | 0.01 | # | $ | 0.15 | $ | (0.01 | ) | $ | — | $ | — | $ | 6.09 | 2.76 | % | $ | 50,489 | 1.04 | % | 1.04 | % | 1.06 | % | 0.54 | % | 0.52 | % | 72 | % | ||||||||||||||||||
2008 | 9.60 | 0.05 | # | (3.61 | ) | (0.08 | ) | — | (0.02 | ) | 5.94 | (37.05 | ) | 48,159 | 1.03 | 1.02 | 1.04 | 0.66 | 0.64 | 147 | ||||||||||||||||||||||||||||||
2007 | 11.33 | 0.06 | # | 0.09 | (0.07 | ) | (1.81 | ) | — | 9.60 | 1.05 | 76,792 | 1.05 | 1.05 | 1.05 | 0.48 | 0.48 | 119 | ||||||||||||||||||||||||||||||||
2006 | 11.40 | (0.01 | )# | 1.32 | — | (1.38 | ) | — | 11.33 | 11.40 | 66,695 | 1.06 | 1.05 | 1.06 | (0.05 | ) | (0.06 | ) | 86 | |||||||||||||||||||||||||||||||
2005 | 12.51 | (0.01 | )# | 0.84 | — | (1.94 | ) | — | 11.40 | 6.48 | 62,009 | 1.10 | 1.09 | 1.07 | (0.06 | ) | (0.04 | ) | 97 | |||||||||||||||||||||||||||||||
2004 | 11.52 | (0.01 | ) | 1.74 | — | (0.74 | ) | — | 12.51 | 15.04 | 28,639 | 1.18 | 1.15 | 1.20 | (0.10 | ) | (0.15 | ) | 148 | |||||||||||||||||||||||||||||||
GS4 Class | ||||||||||||||||||||||||||||||||||||||||||||||||||
2009(2) | $ | 8.91 | $ | 0.02 | # | $ | 0.21 | $ | (0.01 | ) | $ | — | $ | — | $ | 9.13 | 2.59 | % | $ | 289,288 | 1.15 | % | 1.14 | % | 1.26 | % | 0.43 | % | 0.31 | % | 72 | % | ||||||||||||||||||
2008 | 14.31 | 0.07 | # | (5.39 | ) | (0.06 | ) | — | (0.02 | ) | 8.91 | (37.19 | ) | 272,588 | 1.15 | 1.13 | 1.24 | 0.55 | 0.44 | 147 | ||||||||||||||||||||||||||||||
2007 | 16.00 | 0.06 | # | 0.11 | (0.05 | ) | (1.81 | ) | — | 14.31 | 0.87 | 466,522 | 1.18 | 1.18 | 1.25 | 0.34 | 0.27 | 119 | ||||||||||||||||||||||||||||||||
2006 | 15.61 | (0.03 | )# | 1.80 | — | (1.38 | ) | — | 16.00 | 11.27 | 486,358 | 1.21 | 1.20 | 1.25 | (0.20 | ) | (0.25 | ) | 86 | |||||||||||||||||||||||||||||||
2005 | 16.48 | (0.03 | )# | 1.10 | — | (1.94 | ) | — | 15.61 | 6.37 | 463,367 | 1.22 | 1.21 | 1.27 | (0.19 | ) | (0.26 | ) | 97 | |||||||||||||||||||||||||||||||
2004 | 14.99 | (0.02 | ) | 2.25 | — | (0.74 | ) | — | 16.48 | 14.89 | 432,763 | 1.25 | 1.22 | 1.37 | (0.16 | ) | (0.31 | ) | 148 | |||||||||||||||||||||||||||||||
| † | Amount represents less than $0.005 per share. |
| # | Calculated using the average shares outstanding method. |
| (1) | The ratio also excludes previously recaptured fees. |
| (2) | For the six months ended June 30, 2009. All ratios for the period have been annualized. Total return and portfolio turnover for the period have not been annualized. |
See Notes to Financial Statements.
135
Table of Contents
FINANCIAL HIGHLIGHTS (Unaudited) (Continued)
| For a Share Outstanding For the Years Ended December 31, unless otherwise indicated | Ratios to Average Net Assets | ||||||||||||||||||||||||||||||||||||||||||||||||
| Net Asset Value, Beginning of Period | Net Investment Income | Realized and Unrealized Gain (Loss) on Investments | Dividends from Net Investment Income | Distributions from Net Realized Capital Gains | Return of Capital | Net Asset Value, End of Period | Total Return | Net Assets, End of Period (000) | Expenses, Net | Expenses, Including Expense Reduction | Expenses, Before Waivers and Expense Reduction(1) | Investment Income, Net | Investment Income/ (Loss), Excluding Waivers and Expense Reduction | Portfolio Turnover Rate | |||||||||||||||||||||||||||||||||||
International Equity Fund |
| ||||||||||||||||||||||||||||||||||||||||||||||||
GS2 Class | |||||||||||||||||||||||||||||||||||||||||||||||||
2009(2) | $ | 7.32 | $ | 0.12 | # | $ | 0.53 | $ | (0.07 | ) | $ | — | † | $ | — | $ | 7.90 | 9.02 | % | $ | 200,479 | 0.94 | % | 0.94 | % | 1.17 | % | 3.47 | % | 3.24 | % | 34 | % | ||||||||||||||||
2008 | 14.61 | 0.34 | # | (6.89 | ) | (0.39 | ) | (0.35 | ) | — | 7.32 | (44.72 | ) | 193,281 | 0.94 | 0.93 | 1.08 | 2.92 | 2.77 | 88 | |||||||||||||||||||||||||||||
2007 | 15.80 | 0.26 | # | 1.79 | (0.27 | ) | (2.97 | ) | — | 14.61 | 13.21 | 279,652 | 0.96 | 0.96 | 1.07 | 1.55 | 1.44 | 66 | |||||||||||||||||||||||||||||||
2006 | 14.71 | 0.25 | 3.23 | (0.35 | ) | (2.04 | ) | — | 15.80 | 23.78 | 199,989 | 0.97 | 0.96 | 1.10 | 1.60 | 1.46 | 26 | ||||||||||||||||||||||||||||||||
2005 | 12.93 | 0.29 | 1.99 | (0.30 | ) | (0.20 | ) | — | 14.71 | 17.66 | 176,819 | 0.97 | 0.95 | 1.12 | 1.59 | 1.43 | 30 | ||||||||||||||||||||||||||||||||
2004 | 11.06 | 0.16 | 1.93 | (0.22 | ) | — | — | 12.93 | 18.93 | 87,300 | 0.97 | 0.95 | 1.13 | 1.32 | 1.14 | 33 | |||||||||||||||||||||||||||||||||
GS4 Class | |||||||||||||||||||||||||||||||||||||||||||||||||
2009(2) | $ | 9.38 | $ | 0.15 | # | $ | 0.68 | $ | (0.07 | ) | $ | — | † | $ | — | $ | 10.14 | 8.90 | % | $ | 966,997 | 1.12 | % | 1.12 | % | 1.36 | % | 3.37 | % | 3.13 | % | 34 | % | ||||||||||||||||
2008 | 18.32 | 0.40 | # | (8.63 | ) | (0.36 | ) | (0.35 | ) | — | 9.38 | (44.81 | ) | 873,618 | 1.12 | 1.11 | 1.28 | 2.73 | 2.56 | 88 | |||||||||||||||||||||||||||||
2007 | 19.09 | 0.28 | # | 2.16 | (0.24 | ) | (2.97 | ) | — | 18.32 | 12.96 | 1,400,548 | 1.14 | 1.14 | 1.27 | 1.38 | 1.25 | 66 | |||||||||||||||||||||||||||||||
2006 | 17.37 | 0.26 | 3.82 | (0.32 | ) | (2.04 | ) | — | 19.09 | 23.58 | 1,254,839 | 1.15 | 1.14 | 1.29 | 1.43 | 1.28 | 26 | ||||||||||||||||||||||||||||||||
2005 | 15.20 | 0.23 | 2.41 | (0.27 | ) | (0.20 | ) | — | 17.37 | 17.39 | 1,120,234 | 1.15 | 1.13 | 1.31 | 1.42 | 1.24 | 30 | ||||||||||||||||||||||||||||||||
2004 | 12.96 | 0.17 | 2.26 | (0.19 | ) | — | — | 15.20 | 18.80 | 1,072,556 | 1.15 | 1.13 | 1.31 | 1.22 | 1.04 | 33 | |||||||||||||||||||||||||||||||||
| † | Amount represents less than $0.005 per share. |
| # | Calculated using the average shares outstanding method. |
| (1) | The ratio also excludes previously recaptured fees. |
| (2) | For the six months ended June 30, 2009. All ratios for the period have been annualized. Total return and portfolio turnover for the period have not been annualized. |
See Notes to Financial Statements.
136
Table of Contents
NOTES TO FINANCIAL STATEMENTS (Unaudited)
1. DESCRIPTION OF THE FUNDS
GuideStone Funds (the “Trust”) was organized as a Delaware statutory trust on March 2, 2000. The Trust has established twenty-five series (each, a “Fund” and together, the “Funds”). Each Fund is a diversified, open-end management investment company, registered under the Investment Company Act of 1940, as amended (the “1940 Act”). The MyDestination 2005, MyDestination 2015, MyDestination 2025, MyDestination 2035 and MyDestination 2045 Funds, are each referred to as a “Date Target Fund” and together as the “Date Target Funds,” commenced operations on December 29, 2006. The Conservative Allocation Fund, Balanced Allocation Fund, Growth Allocation Fund, Aggressive Allocation Fund, Conservative Allocation Fund I, Balanced Allocation Fund I, Growth Allocation Fund I and Aggressive Allocation Fund I, are each referred to as an “Asset Allocation Fund” and together as the “Asset Allocation Funds.” The remaining Funds are each referred to as a “Select Fund” and are together referred to as the “Select Funds.” The Low-Duration Bond Fund, Medium-Duration Bond Fund, Extended-Duration Bond Fund, Inflation Protected Bond Fund and Global Bond Fund are together referred to as the “Bond Funds.” The Equity Index Fund, Real Estate Securities Fund, Value Equity Fund, Growth Equity Fund, Small Cap Equity Fund and International Equity Fund are together referred to as the “Equity Funds.” The Money Market Fund is referred to as the “Money Market Fund.” The Inflation Protected Bond Fund commenced operations as a registered investment company on June 25, 2009.
There are two classes of shares issued by the Funds — the GS2 Class and the GS4 Class (each, a “Class” and together the “Classes”), except for the Date Target Funds, the Inflation Protected Bond Fund, the Global Bond Fund, and the Real Estate Securities Fund, which issued the GS4 Class only. The Conservative Allocation Fund I, Balanced Allocation Fund I, Growth Allocation Fund I and Aggressive Allocation Fund I issued the GS2 Class only. All Classes of shares have identical voting, dividend and liquidation rights. Income, expenses (other than class specific expenses) and realized and unrealized gains or losses on investments are allocated to each Class of shares based upon its relative net assets. The distribution fee (expense specific to the GS6 Class) ceased with the elimination of the GS6 Class.
Prior to April 30, 2009, GS6 Class shares of the Funds were also available. On April 30, 2009, shares of the GS6 Class of each Fund were exchanged at each Fund’s applicable net asset value for equivalent shares of the GS4 Class of the same Fund, and the GS6 Class was terminated effective May 1, 2009.
Each Fund is a separate mutual fund with its own investment objective, strategies and risks. The Select Funds invest directly in particular types of fixed-income obligations, stocks and other investments. The Asset Allocation and Date Target Funds primarily invest in a different mix of the Select Funds to meet a specified investment strategy. The Asset Allocation and Date Target Funds are commonly referred to as “Fund of Funds”.
2. SIGNIFICANT ACCOUNTING POLICIES
The following significant accounting policies are in conformity with generally accepted accounting principles (“GAAP”) in the United States of America which require management to make estimates and assumptions that affect the reported amounts of assets, liabilities, disclosures of contingent assets and liabilities at the date of the financial statements and the reported amounts of income and expenses during the reporting period. Actual results could differ from those estimates.
a. Valuation of Securities
The Funds (except the Money Market Fund) each value securities traded on national securities exchanges or included in national market systems at the last quoted sale price, or official close price, on the principal exchange on which they were traded, or, in the absence of any sale or official close price, at the closing bid price. Securities which are primarily traded on foreign exchanges
137
Table of Contents
are generally valued at the closing values of such securities on their respective exchanges, except that when an occurrence subsequent to the time when the foreign security is valued is likely to have changed such value, then the fair value of those securities will be determined through procedures established by or under the direction of the Board of Trustees of the Trust (the “Board of Trustees”). Non-exchange traded securities for which an over-the-counter quotation is readily available are valued at the last quoted bid price. Debt securities, excluding asset-backed and mortgage-backed securities, are valued at the mean of the last bid and asked prices available. Asset-backed and mortgage-backed securities are valued at the last bid price. Options and warrants for which the primary market is a national securities exchange are valued at the last sale price on the exchange on which they are traded, or, in the absence of any sale, at the closing bid price. Options and warrants not traded on a national securities exchange are valued at the last quoted bid price. Short-term securities maturing in more than 60 days from the valuation date are valued at the mean of the last bid and asked prices; those maturing in 60 days or less are valued at amortized cost. Futures contracts are valued at the closing settlement price on the exchange on which they are primarily traded. Forward foreign exchange contracts are valued based upon closing exchange rates from each respective foreign market. Swap agreements are valued daily based upon the terms specific to each agreement with its counterparty. To the extent available, valuations of portfolio securities are provided by independent pricing services approved by the Board of Trustees. Debt securities are valued on the basis of broker quotations or valuations provided by a pricing service which may use a matrix, formula or other objective method that takes into consideration market indices, matrices, yield curves and other specific adjustments. Certain fixed-income securities are valued by the sub-adviser using various methodologies. Due to excessive volatility in the current market, valuations developed through pricing techniques may materially vary from the actual amounts realized upon sale of the securities. Securities for which market quotations are not readily available are valued at fair value according to methods established in good faith by the Board of Trustees.
For securities that principally trade on a foreign market or exchange, a significant gap in time can exist between the time of a particular security’s last trade and the time at which a Fund calculates its net asset value. The closing prices of such securities may no longer reflect their market value at the time the Fund calculates its net asset value if an event that could materially affect the value of those securities (a “Significant Event”) has occurred between the time of the security’s last close and the time that the Fund calculates its net asset value. A Significant Event may relate to a single issuer or to an entire market sector. If a Fund becomes aware of a Significant Event that has occurred with respect to a security or group of securities after the closing of the exchange or market on which the security or securities principally trade, but before the time at which the Fund calculates its net asset value, a Valuation Committee meeting may be called. The Trust uses Interactive Data (“ID”) as a third party fair valuation vendor. ID provides a fair value for foreign equity securities held by the Trust based on certain factors and methodologies applied by ID in the event that there is movement in the U.S. market that exceeds a specific threshold established by the Valuation Committee in consultation with, and approved by, the Trustees. Such methodologies generally involve tracking valuation correlations between the U.S. market and each non-U.S. security. As part of the valuation procedures, a “confidence interval” is used, when the threshold is exceeded, to determine the level of correlation between the value of a foreign equity security and movements in the U.S. market before a particular security will be fair valued. In the event that the threshold established by the Valuation Committee is exceeded on a specific day, the Trust will typically value non-U.S. equity securities in its portfolio that exceed the applicable confidence interval based upon the fair values provided by ID.
The Money Market Fund uses the amortized cost method, which approximates market value, to determine the value of its portfolio securities.
The Asset Allocation and Date Target Funds value their investments in the underlying Select Funds daily at the closing net asset value of each respective Select Fund.
138
Table of Contents
The Funds have adopted the provisions of the Statement of Financial Accounting Standards No. 157 (“FAS 157”). FAS 157 defines fair value as the price that a fund would receive to sell an asset or pay to transfer a liability in an orderly transaction between market participants at the measurement date. It establishes and requires disclosure of a fair value hierarchy, separately for each major category of assets and liabilities, that segregates fair value measurements into levels (Levels 1, 2, and 3). Categorization of fair value measurements is determined by the nature of the inputs as follows:
| Level 1 | – | quoted prices in active markets for identical securities. | ||
| Level 2 | – | prices determined using other significant observable inputs (including quoted prices for similar securities, interest rates, prepayment speeds, credit risk, etc.). | ||
| Level 3 | – | prices determined using significant unobservable inputs (including the Fund’s own assumptions in determining the fair value of investments). | ||
Valuation levels are not necessarily an indication of the risk associated with investing in those securities. For fair valuations using significant unobservable inputs, FAS 157 requires a reconciliation of the beginning to ending balances for reported market values that presents changes attributable to total realized and unrealized gains or losses, purchases and sales, and transfers in/out of the Level 3 category during the period. In accordance with the requirements of FAS 157, a fair value hierarchy and Level 3 reconciliation have been included in the Schedules of Investments for each respective fund.
b. Repurchase Agreements
Each Fund may agree to purchase securities from financial institutions subject to the seller’s agreement to repurchase them at a mutually agreed upon date and price. It is the Fund’s policy that repurchase agreements are fully collateralized by U.S. Treasury and Government Agency securities. All collateral is held by the Fund’s custodian bank or a bank with which the custodian bank has entered into a subcustodian agreement, or is segregated in the Federal Reserve Book Entry System. In connection with transactions in repurchase agreements, if the seller defaults and the value of the collateral declines, or if the seller enters an insolvency proceeding, realization of the collateral by the Fund may be delayed or limited.
c. Derivative Financial Instruments
The Funds may engage in various portfolio strategies to seek to increase its return by hedging its portfolio against adverse movements in the equity, debt and currency markets. Losses may arise due to changes in the value of the contract if the counterparty does not perform under the contract. The Funds, in their normal course of business, may enter into contracts that contain a variety of representations and warranties, and which provide general indemnifications. The Funds’ exposure may include future claims that may be made against the Funds that have not yet occurred. However, based on experience, the Funds expect the risk of loss to be remote.
Financial Futures Contracts — The Funds (except the Money Market Fund) may purchase or sell financial futures contracts and the options on such futures contracts for the purpose of hedging risk on existing securities, demonstrating purchase of securities or gaining market exposure on cash balances. Financial futures contracts are contracts for the delivery of securities at a specified future date at an agreed upon price or yield. Upon entering into a contract, the Funds deposit and maintain as collateral such initial margin as required by the exchange on which the transaction is effected.
Pursuant to the contract, the Funds agree to pay to or receive from the broker an amount of cash equal to the daily fluctuation in the value of the contract. Such payments or receipts are known as variation margin and are recorded by the Funds as unrealized gains or losses until the contract is closed or settled.
139
Table of Contents
Risks of entering into futures contracts include the possibility that there will be an imperfect price correlation between the futures and the underlying securities. Second, it is possible that a lack of liquidity for futures contracts could exist in the secondary market, resulting in an inability to close a futures position prior to its maturity date. Third, the purchase of a futures contract involves the risk that a Fund could lose more than the original margin deposit required to initiate a futures transaction.
Options — Certain Funds are authorized to write and purchase put and call options. The risk in writing a call option is that the Funds give up the opportunity for profit if the market price of the security increases. The risk in writing a put option is that the Funds may incur a loss if the market price of the security decreases and the option is exercised. The risk in purchasing an option is that the Funds pay a premium whether or not the option is exercised. The Funds also have the additional risk of being unable to enter into a closing transaction at an acceptable price if a liquid secondary market does not exist. The Funds also may write over-the-counter options where completing the obligation depends upon the credit standing of the other party and that party’s ability to perform. Option contracts also involve the risk that they may not work as intended due to unanticipated developments in market conditions or other causes.
Options purchased are recorded as an asset, and written options are recorded as liabilities to the extent of premiums paid or received. Each Fund will realize a gain or loss when the option transaction expires or closes. When an option is exercised, the proceeds on sales for a written call option, the purchase cost for a written put option or the cost of a security for a purchased put or call option is adjusted by the amount of the premium received or paid.
Certain Funds may write swaption contracts to manage exposure to fluctuations in interest rates and to enhance portfolio yield. Swaption contracts written by the Funds represent an option that gives the purchaser the right, but not the obligation, to enter into a previously agreed upon swap contract on a future date. If a written call swaption is exercised, the writer will enter a swap and is obligated to pay the fixed-rate and receive a floating rate in exchange. If a written put swaption is exercised, the writer will enter a swap and is obligated to pay the floating rate and receive a fixed rate in exchange. Swaptions are marked-to-market daily based upon quotations from market makers. When a Fund writes a swaption, the premium received is recorded as a liability and is subsequently adjusted to the current market value of the swaption.
Entering into a swaption contract involves, to varying degrees, the elements of credit, market and interest rate risk in excess of the amounts reported in the Statement of Assets and Liabilities, associated with both option contracts and swap contracts. The Funds bear the market risk arising from any change in index values or interest rates.
Forward Foreign Exchange Contracts — Certain Funds may enter into forward foreign currency exchange contracts to hedge against adverse exchange rate fluctuation to the U.S. dollar or between different foreign currencies in connection with either specific security transactions or portfolio positions. Each contract is valued daily and the change in value is recorded as an unrealized gain or loss. When the contract is closed, a realized gain or loss is recorded equal to the difference between the opening value and the closing value of the contract. The Funds could be exposed to risk if the counterparties to the contracts are unable to meet the terms of the contract and from unanticipated movements in the value of a foreign currency relative to the U.S. dollar.
Foreign Currency Options and Futures — The International Equity Fund, Small Cap Equity Fund and the Bond Funds may also enter into futures contracts on foreign currencies and related options on transactions as a short or long hedge against possible variations in foreign exchange rates.
140
Table of Contents
TBAs — The Bond Funds and the Small Cap Equity Fund may enter into “TBA” (to be announced) purchase commitments to purchase securities for a fixed price at a future date, typically not exceeding 45 days. TBAs may be considered securities in themselves and involve a risk of loss if the value of the security to be purchased declines prior to settlement date. This risk is in addition to the risk of decline in each Fund’s other assets. Unsettled TBAs are valued at the current market value of the underlying securities, according to the procedures described in the section entitled “Valuation of Securities”.
Mortgage-Backed Securities — Investments in securities collateralized by residential real estate mortgages are subject to certain credit and liquidity risks. When market conditions result in an increase in default rates of the underlying mortgages and the foreclosure values of underlying real estate properties are materially below the outstanding amount of these underlying mortgages, collection of the full amount of accrued interest and principal on these investments may be difficult. Such market conditions may significantly impair the value of these investments resulting in a lack of correlation between their credit ratings and values.
Dollar Rolls — During the period ended June 30, 2009, the Trust entered into dollar roll transactions, pursuant to which they sell a mortgage-backed TBA or security and simultaneously purchase a similar, but not identical, TBA with the same issuer, rate and terms. The Funds may execute a “roll” to obtain better underlying mortgage securities or to increase yield. The Funds account for dollar roll transactions as purchases and sales, which has the effect of increasing their portfolio turnover rates. Risks associated with dollar rolls are that actual mortgages received by the Funds may be less favorable than those anticipated or that counterparties may fail to perform under the terms of the contracts.
Swap Agreements — Each Select Fund may enter into swap agreements. The Equity Funds may enter into equity swap contracts and the Bond Funds and the Small Cap Equity Fund may enter into interest rate and credit default swaps. The Bond Funds and International Equity Fund may enter into cross-currency swaps, and each Select Fund may enter into total return swaps.
Swap agreements are privately negotiated agreements between a Fund and a counterparty to exchange or swap investment cash flows, assets, foreign currencies or market-linked returns at specified, future intervals. A swap may be entered into in order to, among other things, change the maturity of a Fund’s portfolio, to protect a Fund’s value from changes in interest rates, to expose a Fund to a different security or market, or to help a Fund achieve a strategy relative to an index or other benchmark. By entering into a swap agreement, a Fund is exposed to the risk of unanticipated movements in interest rates or in the value of an underlying security or index (or the risk that the counterparty will not fulfill its obligation under the agreement). Credit default swaps involve the payment of amounts based on a specified rate multiplied by a notional amount as well as upon an event of default. In connection with these agreements, securities are set aside as collateral by the Fund’s custodian.
Swaps are marked-to-market daily based upon values from third party vendors or quotations from market makers to the extent available and the change in value, if any, is recorded as an unrealized gain or loss on the Statements of Assets and Liabilities. In the event that market quotations are not readily available or deemed reliable, certain swap agreements may be valued pursuant to guidelines established by the Board of Trustees. In the event that market quotes are not readily available and the swap cannot be valued pursuant to one of the valuation methods, the value of the swap will be determined in good faith by the Valuation Committee of the Board of Trustees, generally based upon recommendations provided by the Fund’s sub-adviser.
141
Table of Contents
Payments received or made at the beginning of the measurement period are reflected as such on the Statements of Assets and Liabilities and represent payments made or received upon entering into the swap agreement to compensate for differences between the stated terms of the swap agreement and prevailing market conditions (credit spreads, currency exchange rates, interest rates, and other relevant factors). These upfront payments are recorded as realized gains or losses on the Statements of Operations upon termination or maturity of the swap. A liquidation payment received or made at the termination of the swap is recorded as realized gain or loss on the Statements of Operations. Net periodic payments received or paid by a Fund are included as part of realized gains or losses on the Statements of Operations.
Certain of the Fund’s derivative agreements contain provisions that require the Fund to maintain a predetermined level of net assets, and/or provide limits regarding the decline of the Fund’s NAV over one-month, three-month and 12-month periods. If the Fund were to violate such provisions, the counterparties to the derivative instruments could request immediate payment or demand immediate collateralization on derivative instruments in net liability positions. For the period ended June 30, 2009, the Fund did maintain the required level of net assets and/or the NAV of the Fund did not decline below the limits set forth in the derivative agreements.
Entering into these agreements involves, to varying degrees, elements of credit, market and documentation risk in excess of the amounts recognized on the Statements of Assets and Liabilities. Such risks involve the possibility that there will be no liquid market for these agreements, that the counterparty to the agreements may default on its obligation to perform or disagree as to the meaning of contractual terms in the agreements and that there may be unfavorable changes in interest rates.
Credit Default Swaps — Credit default swap agreements involve one party making a stream of payments (referred to as the buyer of protection) to another party (the seller of protection) in exchange for the right to receive a specified return in the event of a default or other credit event for the referenced entity, obligation or index. As a seller of protection on credit default swap agreements, a Fund will generally receive from the buyer of protection a fixed rate of income throughout the term of the swap provided that there is no credit event. As the seller, a Fund would effectively add leverage to its portfolio because, in addition to its total net assets, a Fund would be subject to investment exposure on the notional amount of the swap.
Any upfront payments made or received upon entering a credit default swap contract is treated as part of the cost and is reflected as part of the unrealized gain (loss) on valuation. Upon termination of the swap contract, the amount included in the cost is reversed and becomes part of the swap’s realized gain (loss).
Credit default swaps are carried at their estimated fair value, as determined in good faith by the Board of Trustees. In determining fair value, the Board of Trustees considers the value provided by the counterparty as well as the use of a proprietary model. In addition to credit quality, the sub-advisors monitor a variety of factors including cash flow assumptions, market activity, market sentiment and valuation as part of its ongoing process of assessing payment and performance risk. As payment and performance risk increases, the value of a credit default swap increases, resulting in recognition of unrealized gains for long positions and unrealized losses for short positions. Conversely, as payment and performance risk decreases, unrealized gains are recognized for short positions and unrealized losses are recognized for long positions. Any current or future declines in the fair value of the swap may be partially offset by upfront payments received by the Fund as a seller of protection if applicable. The change in value is recorded within unrealized appreciation (depreciation) until the occurrence of a credit event or the termination of the swap, at which time a realized gain (loss) is recorded.
142
Table of Contents
If a Fund is a seller of protection and a credit event occurs, as defined under the terms of that particular swap agreement, a Fund will either (i) pay to the buyer of protection an amount equal to the notional amount of the swap and take delivery of the referenced obligation, other deliverable obligations or underlying securities comprising the referenced index or (ii) pay a net settlement amount in the form of cash or securities equal to the notional amount of the swap less the recovery value of the referenced obligation or underlying securities comprising the referenced index. If a Fund is a buyer of protection and a credit event occurs, as defined under the terms of that particular swap agreement, a Fund will either (i) receive from the seller of protection an amount equal to the notional amount of the swap and deliver the referenced obligation, other deliverable obligations or underlying securities comprising the referenced index or (ii) receive a net settlement amount in the form of cash or securities equal to the notional amount of the swap less the recovery value of the referenced obligation or underlying securities comprising the referenced index. Recovery values are assumed by market makers considering either industry standard recovery rates or entity specific factors and considerations until a credit event occurs. If a credit event has occurred, the recovery value is determined by a facilitated auction whereby a minimum number of allowable broker bids, together with a specified valuation method, are used to calculate the settlement value.
Credit default swap agreements on corporate issues or sovereign issues of an emerging country involve one party making a stream of payments to another party in exchange for the right to receive a specified return in the event of a default or other credit event. If a credit event occurs and cash settlement is not elected, a variety of other deliverable obligations may be delivered in lieu of the specific referenced obligation. The ability to deliver other obligations may result in a cheapest-to-deliver option (the buyer of protection’s right to choose the deliverable obligation with the lowest value following a credit event). A Fund may use credit default swaps on corporate issues or sovereign issues of an emerging country to provide a measure of protection against defaults of the issuers (i.e., to reduce risk where a Fund owns or has exposure to the referenced obligation) or to take an active long or short position with respect to the likelihood of a particular issuer’s default.
Credit default swap agreements on asset-backed securities involve one party making a stream of payments to another party in exchange for the right to receive a specified return in the event of a default or other credit event. Unlike credit default swaps on corporate issues or sovereign issues of an emerging country, deliverable obligations in most instances would be limited to the specific referenced obligation as performance for asset-backed securities can vary across deals. Prepayments, principal paydowns, and other write down or loss events on the underlying mortgage loans will reduce the outstanding principal balance of the referenced obligation. These reductions may be temporary or permanent as defined under the terms of the swap agreement and the notional amount for the swap agreement will be adjusted by corresponding amounts. A Fund may use credit default swaps on asset-backed securities to provide a measure of protection against defaults of the referenced obligation or to take an active long or short position with respect to the likelihood of a particular referenced obligation’s default.
Credit default swap agreements on credit indices involve one party making a stream of payments to another party in exchange for the right to receive a specified return in the event of a write-down, principal shortfall, interest shortfall or default of all or part of the referenced entities comprising the credit index. A credit index is a list of a basket of credit instruments or exposures designed to be representative of some part of the credit market as a whole. These indices are made up of reference credits that are judged by a poll of dealers to be the most liquid entities in the credit default swap market based on the sector of the index. Components of the indices may include, but are not limited to, investment grade securities, high yield securities, asset backed securities, emerging markets, and/or various credit ratings within each sector. Credit indices are traded using credit default swaps with standardized terms including a fixed spread and standard maturity
143
Table of Contents
dates. An index credit default swap references all the names in the index, and if there is a default, the credit event is settled based on that name’s weight in the index. The composition of the indices changes periodically, usually every six months, and for most indices, each name has an equal weight in the index. A Fund may use credit default swaps on credit indices to hedge a portfolio of credit default swaps or bonds with a credit default swap on indices which is less expensive than it would be to buy many credit default swap to achieve a similar effect. Credit-default swap on indices are benchmarks for protecting investors owning bonds against default, and traders use them to speculate on changes in credit quality.
Implied credit spreads, represented in absolute terms, utilized in determining the market value of credit default swap agreements on corporate issues or sovereign issues of an emerging country as of period end are disclosed in the footnotes to the Schedules of Investments and serve as an indicator of the current status of the payment/performance risk and represent the likelihood or risk of default for the credit derivative. The implied credit spread of a particular referenced entity reflects the cost of buying/selling protection and may include upfront payments required to be made to enter into the agreement. For credit default swap agreements on asset-backed securities and credit indices, the quoted market prices and resulting values serve as the indicator of the current status of the payment/performance risk. Wider credit spreads and increasing market values, in absolute terms when compared to the notional amount of the swap, represent a deterioration of the referenced entity’s credit soundness and a greater likelihood or risk of default or other credit event occurring as defined under the terms of the agreement.
The maximum potential amount of future payments (undiscounted) that a Fund as a seller of protection could be required to make under a credit default swap agreement would be an amount equal to the notional amount of the agreement. These potential amounts would be partially offset by any recovery values of the respective referenced obligations, upfront payments received upon entering into the agreement, or net amounts received from the settlement of buy protection credit default swap agreements entered into by a Fund for the same referenced entity or entities.
Credit default swaps involve greater risks than if the Funds had invested in the reference obligation directly. In addition to general market risks, credit default swaps are subject to liquidity risk and counterparty credit risk. The Funds enter into credit default swaps with counterparties meeting defined criteria for financial strength. A buyer also may lose its investment and recover nothing should a credit event not occur. If a credit event did occur, the value of the reference obligation received by the seller, coupled with the periodic payments previously received, may be less than the full notional value it pays to the buyer, resulting in a loss of value.
Cross-Currency Swap Agreements — Cross-currency swap agreements involve two parties exchanging two different currencies with an agreement to reverse the exchange at a later date at specified exchange rates. The exchange of currencies at the inception date of the contract takes place at the current spot rate. The re-exchange at maturity may take place at the same exchange rate, a specified rate, or the then current spot rate. Interest payments, if applicable, are made between the parties based on interest rates available in the two currencies at the inception of the contract. The terms of cross currency swap contracts may extend for many years. Cross-currency swaps are usually negotiated with commercial and investment banks. Some cross currency swaps may not provide for exchanging principal cash flows, but only for exchanging interest cash flows.
Interest Rate Swap Agreements — Interest rate swap agreements involve the exchange by a Fund with another party of their respective commitments to pay or receive interest with respect to the notional amount of principal. Certain forms of interest rate swap agreements may include: (i) interest rate caps, under which, in return for a premium, one party agrees to make payments to the other to the extent that interest rates exceed a specified rate, or “cap”, (ii) interest rate floors, under
144
Table of Contents
which, in return for a premium, one party agrees to make payments to the other to the extent that interest rates fall below a specified rate, or “floor”, (iii) interest rate collars, under which a party sells a cap and purchases a floor or vice versa in an attempt to protect itself against interest rate movements exceeding given minimum or maximum levels, (iv) callable interest rate swaps, under which the counterparty may terminate the swap transaction in whole at zero cost by a predetermined date and time prior to the maturity date, (v) spread locks, which allow the interest rate swap users to lock in the forward differential (or spread) between the interest rate swap rate and a specified benchmark, or (vi) basis swap, under which two parties can exchange variable interest rates based on different money markets.
Total Return Swap Agreements — Total return swap agreements on commodities involve commitments where exchanged cash flows based on the price of a commodity and in return receives either fixed or determined by floating price or rate. One party would receive payments based on the market value of the commodity involved and pay a fixed amount. Total return swap agreements on indices involve commitments to pay interest in exchange for a market-linked return. One counterparty pays out the total return of a specific reference asset, which may be an equity, index, or bond, and in return receives a regular stream of payments. To the extent the total return of the security or index underlying the transaction exceeds or falls short of the offsetting interest rate obligation, a Fund will receive a payment from or make a payment to the counterparty.
Financial Accounting Standards Board (“FASB”) Staff Position No. FAS 133-1 and FIN 45-4, “Disclosures about Credit Derivatives and Certain Guarantees: An Amendment of FASB Statement No. 133 and FASB Interpretation No. 45” (the “Position”). The Position amends FASB Statement No. 133 (“FAS 133”), Accounting for Derivative Instruments and Hedging Activities, and also amends FASB Interpretation No. 45 (“FIN 45”), Guarantor’s Accounting and Disclosure Requirements for Guarantees, Including Indirect Guarantees of Indebtedness of Others. The amendments to FAS 133 include required disclosure for (i) the nature and terms of the credit derivative, reasons for entering into the credit derivative, the events or circumstances that would require the seller to perform under the credit derivative, and the current status of the payment/performance risk of the credit derivative, (ii) the maximum potential amount of future payments (undiscounted) the seller could be required to make under the credit derivative, (iii) the fair value of the credit derivative, and (iv) the nature of any recourse provisions and assets held either as collateral or by third parties. The amendments to FIN 45 require additional disclosures about the current status of the payment/performance risk of a guarantee. All changes to accounting policies have been made in accordance with the Position and incorporated for the current period as part of the Notes to the Schedules of Investments and disclosures within Footnote 2(c), Swap Agreements.
145
Table of Contents
As of June 30, 2009, the Low-Duration Bond Fund and the Medium-Duration Bond Fund are the buyer (“receiving protection”) on a total notional amount of $30,606,881 and $7,670,050,400, respectively, and Medium Duration Bond Fund is the seller (“providing protection”) on a total notional amount of $10,400,000. The notional amounts of the swaps are not recorded in the financial statements; however the notional amount does approximate the maximum potential amount of future payments that the Funds could be required to make if the Funds were the seller of protection and a credit event were to occur. Those credit default swaps for which the Funds are providing protection at balance sheet date are summarized as follows:
| Single Name Credit Default Swaps | Credit Default Swap Index | Total | |||||||||||||||||
| Reference Asset | Corporate Debt | Sovereign Debt | Asset-Backed Securities | Corporate Debt | |||||||||||||||
Medium-Duration Bond | |||||||||||||||||||
Fair value of written credit derivatives | $ | (2,137,324 | ) | $ | (59,170 | ) | $ | (749,119 | ) | $ | — | $ | (2,945,613 | ) | |||||
Maximum potential amount of future payments | (8,400,000 | ) | (1,000,000 | ) | (1,000,000 | ) | — | (10,400,000 | ) | ||||||||||
Recourse provisions with third parties to recover any amounts paid under the credit derivative (including any purchased credit protection) | — | — | — | — | — | ||||||||||||||
Collateral held by the Funds or other third parties which the Funds can obtain upon occurrence of triggering event | — | — | — | — | — | ||||||||||||||
The credit spread disclosed below for each referenced obligation where the Funds are the seller of protection is a representation of the current payment/performance risk of the swap.
| Maximum Potential Amount of Futures Payments by Contract Term | ||||||||||||||||||
Current credit spread on underlying (in basis points) | 0-6 Months | 6-12 Months | 1-5 Years | 5-10 Years | More Than 10 Years | Total | ||||||||||||
Medium-Duration Bond Fund | ||||||||||||||||||
0 - 100 | $ | — | $ | — | $ | — | $ | — | $ | — | $ | — | ||||||
101 - 250 | — | — | — | 1,000,000 | — | 1,000,000 | ||||||||||||
251 - 500 | — | — | — | — | 1,000,000 | 1,000,000 | ||||||||||||
501 - 1,000 | — | — | — | 8,400,000 | — | 8,400,000 | ||||||||||||
Greater than 1,000 | — | — | — | — | — | — | ||||||||||||
Total | $ | — | $ | — | $ | — | $ | 9,400,000 | $ | 1,000,000 | $ | 10,400,000 | ||||||
Derivative Holdings Categorized by Risk Exposure
The FASB recently adopted Statement of Financial Accounting Standards No. 161, Disclosures about Derivative Instruments and Hedging Activities (“FAS 161”). The new standard requires all companies to disclose information intended to enable financial statement users to understand how and why the entity uses derivative instruments, how derivatives are accounted for under FASB Statement No. 133, Accounting for Derivative Instruments and Hedging Activities, and how derivative instruments affect the entity’s financial position, results of operations, and cash flows. The new standard is effective for financial statements issued for fiscal years and interim periods beginning after November 15, 2008. The Funds have adopted the provisions of FAS 161 as of the beginning of the current fiscal year.
146
Table of Contents
Location on the Statements of Assets and Liabilities | ||||
Derivative Type | Asset Derivatives | Liability Derivatives | ||
| Interest rate contracts | Investments in securities of unaffiliated issuers, | Options written at value | ||
| at value | ||||
| Receivables: Variation margin | Payables: Variation margin | |||
| Unrealized appreciation on swap agreements | Unrealized depreciation on swap agreements | |||
| Foreign exchange contracts | Investments in securities of unaffiliated issuers, | Options written at value | ||
| at value | ||||
| Unrealized appreciation on foreign currency | Unrealized depreciation on foreign currency | |||
| exchange contracts | exchange contracts | |||
| Credit contracts | Unrealized appreciation on swap agreements | Unrealized depreciation on swap agreements | ||
| Equity contracts | Receivables: Variation margin | Payables: Variation margin | ||
| Asset Derivative Value | ||||||||||||||||||
| Fund | Total Value at June 30, 2009 | Interest Rate Contracts | Foreign Exchange Contracts | Credit Contracts | Equity Contracts | |||||||||||||
MyDestination 2005 Fund | $ | (8,578 | ) | $ | — | $ | — | $ | — | $ | (8,578 | ) | ||||||
MyDestination 2015 Fund | (27,266 | ) | — | — | — | (27,266 | ) | |||||||||||
MyDestination 2025 Fund | (1,563 | ) | — | — | — | (1,563 | ) | |||||||||||
MyDestination 2035 Fund | 2,751 | — | — | — | 2,751 | |||||||||||||
MyDestination 2045 Fund | (7,480 | ) | — | — | — | (7,480 | ) | |||||||||||
Conservative Allocation Fund | (27,130 | ) | — | — | — | (27,130 | ) | |||||||||||
Balanced Allocation Fund | (253,292 | )�� | — | — | — | (253,292 | ) | |||||||||||
Growth Allocation Fund | (80,297 | ) | — | — | — | (80,297 | ) | |||||||||||
Aggressive Allocation Fund | (357,443 | ) | — | — | — | (357,443 | ) | |||||||||||
Conservative Allocation Fund I | (5,401 | ) | — | — | — | (5,401 | ) | |||||||||||
Balanced Allocation Fund I | (55,349 | ) | — | — | — | (55,349 | ) | |||||||||||
Growth Allocation Fund I | (10,856 | ) | — | — | — | (10,856 | ) | |||||||||||
Aggressive Allocation Fund I | (55,652 | ) | — | — | — | (55,652 | ) | |||||||||||
Low-Duration Bond Fund | 7,280,770 | 2,657,726 | 323,185 | 4,299,859 | — | |||||||||||||
Medium-Duration Bond Fund | 5,921,699 | 4,615,109 | 272,559 | 1,034,031 | — | |||||||||||||
Inflation Protected Bond Fund | (1,628 | ) | (1,628 | ) | — | — | — | |||||||||||
Global Bond Fund | 958,553 | (55,190 | ) | 1,013,743 | — | — | ||||||||||||
Equity Index Fund | (180,787 | ) | — | — | — | (180,787 | ) | |||||||||||
Real Estate Securities Fund | (115,310 | ) | — | — | — | (115,310 | ) | |||||||||||
Value Equity Fund | (785,520 | ) | — | — | — | (785,520 | ) | |||||||||||
Growth Equity Fund | 265,904 | — | — | — | 265,904 | |||||||||||||
Small Cap Equity Fund | (1,612,978 | ) | 46,175 | — | — | (1,659,153 | ) | |||||||||||
International Equity Fund | 377,318 | — | 522,825 | — | (145,507 | ) | ||||||||||||
| Liability Derivative Value | ||||||||||||||||||
Low-Duration Bond Fund | $ | 627,559 | $ | 175,518 | $ | 450,886 | $ | 1,155 | $ | — | ||||||||
Medium-Duration Bond Fund | 4,097,327 | 355,863 | 754,512 | 2,986,952 | — | |||||||||||||
Inflation Protected Bond Fund | (552 | ) | (552 | ) | — | — | — | |||||||||||
Global Bond Fund | 1,184,564 | — | 1,184,564 | — | — | |||||||||||||
Small Cap Equity Fund | 43,415 | 30,335 | 13,080 | — | — | |||||||||||||
International Equity Fund | 342,104 | — | 374,904 | — | (32,800 | ) | ||||||||||||
147
Table of Contents
Derivative Type | Location on the Statements of Operations | |
| Interest rate contracts | Net realized gain (loss) from: Futures transactions | |
| Net realized gain (loss) from: Swap agreements | ||
| Net realized gain (loss) from: Option contracts written | ||
| Net realized gain (loss) from: Option contracts purchased | ||
| Net change in unrealized appreciation (depreciation) on: Futures | ||
| Net change in unrealized appreciation (depreciation) on: Swap agreements | ||
| Net change in unrealized appreciation (depreciation) on: Option contracts written | ||
| Net change in unrealized appreciation (depreciation) on: Option contracts purchased | ||
| Foreign exchange contracts | Net realized gain (loss) from: Foreign currency transactions | |
| Net realized gain (loss) from: Option contracts purchased | ||
| Net change in unrealized appreciation (depreciation) on: Foreign currency transactions | ||
| Net change in unrealized appreciation (depreciation) on: Option contracts written | ||
| Credit contracts | Net realized gain (loss) from: Swap agreements | |
| Net change in unrealized appreciation (depreciation) on: Swap agreements | ||
| Equity contracts | Net realized gain (loss) from: Futures transactions | |
| Net change in unrealized appreciation (depreciation) on: Futures |
| Realized Gain (Loss) on Derivatives Recognized in Income | |||||||||||||||||||
| Fund | Total Value at June 30, 2009 | Interest Rate Contracts | Foreign Exchange Contracts | Credit Contracts | Equity Contracts | ||||||||||||||
MyDestination 2005 Fund | $ | (44,606 | ) | $ | — | $ | — | $ | — | $ | (44,606 | ) | |||||||
MyDestination 2015 Fund | 67,152 | — | — | — | 67,152 | ||||||||||||||
MyDestination 2025 Fund | 96,871 | — | — | — | 96,871 | ||||||||||||||
MyDestination 2035 Fund | 68,807 | — | — | — | 68,807 | ||||||||||||||
MyDestination 2045 Fund | 69,015 | — | — | — | 69,015 | ||||||||||||||
Conservative Allocation Fund | (694,060 | ) | — | — | — | (694,060 | ) | ||||||||||||
Balanced Allocation Fund | (244,764 | ) | — | — | — | (244,764 | ) | ||||||||||||
Growth Allocation Fund | (408,552 | ) | — | — | — | (408,552 | ) | ||||||||||||
Aggressive Allocation Fund | 769,240 | — | — | — | 769,240 | ||||||||||||||
Conservative Allocation Fund I | (12,377 | ) | — | — | — | (12,377 | ) | ||||||||||||
Balanced Allocation Fund I | (409,247 | ) | — | — | — | (409,247 | ) | ||||||||||||
Growth Allocation Fund I | (29,040 | ) | — | — | — | (29,040 | ) | ||||||||||||
Aggressive Allocation Fund I | 89,548 | — | — | — | 89,548 | ||||||||||||||
Low-Duration Bond Fund | 7,944,362 | 7,709,880 | (1,484,718 | ) | 1,719,200 | — | |||||||||||||
Medium-Duration Bond Fund | 11,533,917 | 7,130,076 | (268,183 | ) | 4,672,024 | — | |||||||||||||
Inflation Protected Bond Fund | — | — | — | — | — | ||||||||||||||
Global Bond Fund | 1,438,942 | 233,133 | 1,205,809 | — | — | ||||||||||||||
Equity Index Fund | 619,396 | — | — | — | 619,396 | ||||||||||||||
Real Estate Securities Fund | 897,029 | — | — | — | 897,029 | ||||||||||||||
Value Equity Fund | 4,734,204 | — | — | — | 4,734,204 | ||||||||||||||
Growth Equity Fund | 2,231,185 | — | — | — | 2,231,185 | ||||||||||||||
Small Cap Equity Fund | 5,437,045 | (79,642 | ) | 2,829 | — | 5,513,858 | |||||||||||||
International Equity Fund | 3,135,047 | — | 456,588 | — | 2,678,459 | ||||||||||||||
| Change in Unrealized Appreciation (Depreciation) on Derivatives Recognized in Income | |||||||||||||||||||
| Fund | Total Value at June 30, 2009 | Interest Rate Contracts | Foreign Exchange Contracts | Credit Contracts | Equity Contracts | ||||||||||||||
MyDestination 2005 Fund | $ | (25,126 | ) | $ | — | $ | — | $ | — | $ | (25,126 | ) | |||||||
MyDestination 2015 Fund | (61,115 | ) | — | — | — | (61,115 | ) | ||||||||||||
MyDestination 2025 Fund | (28,201 | ) | — | — | — | �� | (28,201 | ) | |||||||||||
MyDestination 2035 Fund | (13,136 | ) | — | — | — | (13,136 | ) | ||||||||||||
MyDestination 2045 Fund | (19,114 | ) | — | — | — | (19,114 | ) | ||||||||||||
148
Table of Contents
| Change in Unrealized Appreciation (Depreciation) on Derivatives Recognized in Income | ||||||||||||||||||||
| Fund | Total Value at June 30, 2009 | Interest Rate Contracts | Foreign Exchange Contracts | Credit Contracts | Equity Contracts | |||||||||||||||
Conservative Allocation Fund | $ | (53,636 | ) | $ | — | $ | — | $ | — | $ | (53,636 | ) | ||||||||
Balanced Allocation Fund | (269,089 | ) | — | — | — | (269,089 | ) | |||||||||||||
Growth Allocation Fund | (227,849 | ) | — | — | — | (227,849 | ) | |||||||||||||
Aggressive Allocation Fund | (494,872 | ) | — | — | — | (494,872 | ) | |||||||||||||
Conservative Allocation Fund I | (18,075 | ) | — | — | — | (18,075 | ) | |||||||||||||
Balanced Allocation Fund I | (99,221 | ) | — | — | — | (99,221 | ) | |||||||||||||
Growth Allocation Fund I | (57,828 | ) | — | — | — | (57,828 | ) | |||||||||||||
Aggressive Allocation Fund I | (67,892 | ) | — | — | — | (67,892 | ) | |||||||||||||
Low-Duration Bond Fund | (159,430 | ) | 1,366,486 | 490,167 | (2,016,083 | ) | — | |||||||||||||
Medium-Duration Bond Fund | 6,083,611 | 9,118,608 | 1,839,660 | (4,874,657 | ) | — | ||||||||||||||
Inflation Protected Bond Fund | (1,076 | ) | (1,076 | ) | — | — | — | |||||||||||||
Global Bond Fund | (1,499,548 | ) | (129,025 | ) | (1,370,523 | ) | — | — | ||||||||||||
Equity Index Fund | (472,450 | ) | — | — | — | (472,450 | ) | |||||||||||||
Real Estate Securities Fund | (353,615 | ) | — | — | — | (353,615 | ) | |||||||||||||
Value Equity Fund | (1,273,398 | ) | — | — | — | (1,273,398 | ) | |||||||||||||
Growth Equity Fund | (753,514 | ) | — | — | — | (753,514 | ) | |||||||||||||
Small Cap Equity Fund | (4,266,579 | ) | (115,819 | ) | (5,252 | ) | — | (4,145,508 | ) | |||||||||||
International Equity Fund | (835,928 | ) | — | (180,378 | ) | — | (655,550 | ) | ||||||||||||
d. Foreign Currency Translations
Securities and other assets and liabilities denominated in foreign currencies are translated daily into U.S. dollars. Foreign currency amounts related to the purchase or sale of securities and income and expenses are translated at the exchange rate on the transaction date. The effect of changes in foreign exchange rates on realized and unrealized security gains or losses is reflected as a component of such gains or losses. In the statement of operations, net realized gains or losses from foreign currency transactions, if any, may arise from sales of foreign currency, closed forward contracts, exchange gains or losses realized between the trade date and settlement date on securities transactions, and other translation gains or losses on dividends, interest income and foreign withholding taxes.
e. Dividends and Distributions to Shareholders
Dividends from net investment income for the Money Market Fund are declared daily and paid monthly. Dividends from net investment income for the Bond Funds are declared and paid monthly. Dividends from net investment income, if any, for the Equity Index Fund, Real Estate Securities Fund, Value Equity Fund and Growth Equity Fund are declared and paid semi-annually. Dividends from net investment income, if any, for the Small Cap Equity Fund, International Equity Fund, the Asset Allocation Funds and the Date Target Funds are declared and paid annually. Net realized capital gains, if any, will be distributed at least annually by each of the Funds. Dividends and distributions to shareholders are recorded on the ex-dividend date.
f. Security Transactions, Income and Realized Gains and Losses
Security transactions are accounted for on the date securities are purchased or sold (the trade date). Dividend income is recognized on the ex-dividend date and interest income is accrued daily, including the amortization of market premium and the accretion of market discount. Realized gains and losses from security transactions are on an identified cost basis.
g. Expenses
Expenses arising in connection with a Fund are charged directly to that Fund. Expenses common to all Funds are generally allocated to each Fund in proportion to their relative net assets. Each Class of shares bears its pro-rata portion of expenses attributable to its Class, except that each Class separately bears expenses related specifically to that Class, such as printing, registration, transfer agent, shareholder servicing and distribution fees.
149
Table of Contents
h. REITs
The Real Estate Securities Fund invests substantial assets in real estate investment trusts (“REITs”) that involve risks not associated with investing in stocks. Risks include declines in the value of real estate, general and economic conditions, changes in the value of the underlying property and defaults by borrowers. The value of assets in the real estate industry may go through cycles of relative underperformance and outperformance in comparison to equity securities markets in general.
Dividend income is recorded using management’s estimate of the income included in distributions received from REIT investments. The actual amounts of income, return of capital and capital gains are only determined by each REIT after its fiscal year-end, and may differ from the estimated amount. Estimates of income are adjusted in the Funds to the actual amounts when the amounts are determined.
i. Short Sales
A short sale is a transaction in which a Fund sells a security it does not own. The Fund’s obligation to replace the security borrowed and sold short will be fully collateralized at all times by cash equivalents deposited in an account with the Fund’s custodian. If the price of the security sold short increases between the time of the short sale and the time the Fund replaces the borrowed security, the Fund will realize a loss, and if the price declines during the period, the Fund will realize a gain. Any realized gain will be decreased, and any realized loss increased, by the amount of transaction costs.
The Equity Funds may sell short exchange-listed equity futures contracts to reduce market exposure. The Date Target Funds, Asset Allocation Funds, Bond Funds and Small Cap Equity Fund may sell short U.S. Treasury securities and exchange-listed U.S. Treasury futures contracts to reduce market exposure. The Low-Duration Bond, Medium-Duration Bond and Small Cap Equity Funds will occasionally enter into a short sale to initiate a dollar roll transaction. The International Equity Fund may establish short positions in stocks of foreign companies with a market value of up to 5% of the Fund’s assets.
At June 30, 2009, the value of securities sold short in the Low-Duration Bond Fund, the Medium-Duration Bond Fund and the International Equity Fund amounted to $40,508,433, $994,062 and $19,441,034, respectively.
j. Loan Participations
Loan participations typically represent direct participation in a loan to a corporate borrower, and generally are offered by banks or other financial institutions or lending syndicates. The Bond Funds and the Small Cap Equity Fund may participate in such syndications, or can buy part of a loan, becoming a part lender. When purchasing loan participations, a Fund assumes the credit risk associated with the corporate borrower and may assume the credit risk associated with an interposed bank or other financial intermediary.
The Bond Funds and the Small Cap Equity Fund invest in loan participations with credit quality comparable to that of issuers of its securities investments. Indebtedness of companies whose creditworthiness is poor involves substantially greater risks, and may be highly speculative.
150
Table of Contents
3. FEES AND OTHER TRANSACTIONS WITH AFFILIATES
a. Investment Advisory Fees
Pursuant to a separate investment advisory agreement, GuideStone Capital Management (“GSCM” or “Adviser”) acts as the Adviser to the Funds. As Adviser, it supervises the investments of the Funds and for such services is paid a fee. GSCM and the Trust have entered into sub-advisory agreements with various sub-advisers to manage each Select Fund’s investments. Under the general supervision of GSCM, the sub-advisers make the day-to-day investment decisions for the Select Funds, and for such services, each sub-adviser receives a fee from the Funds.
The advisory fees paid to GSCM and aggregate sub-advisory fees paid to the sub-advisers, listed at the end of this report, are computed daily based upon the net assets of each Fund. The actual advisory fees accrued and the sub-advisory fees accrued during the six months ended June 30, 2009, based upon average daily net assets, were as follows:
Fund | Advisory Fees | Sub-Adviser Fees | ||||
MyDestination 2005 | 0.10 | % | — | |||
MyDestination 2015 | 0.10 | % | — | |||
MyDestination 2025 | 0.10 | % | — | |||
MyDestination 2035 | 0.10 | % | — | |||
MyDestination 2045 | 0.10 | % | — | |||
Conservative Allocation | 0.10 | % | — | |||
Balanced Allocation | 0.10 | % | — | |||
Growth Allocation | 0.10 | % | — | |||
Aggressive Allocation | 0.10 | % | — | |||
Conservative Allocation I | 0.10 | % | — | |||
Balanced Allocation I | 0.10 | % | — | |||
Growth Allocation I | 0.10 | % | — | |||
Aggressive Allocation I | 0.10 | % | — | |||
Money Market | 0.09 | % | 0.07 | % | ||
Low-Duration Bond | 0.13 | % | 0.22 | % | ||
Medium-Duration Bond | 0.21 | % | 0.21 | % | ||
Extended-Duration Bond | 0.25 | % | 0.22 | % | ||
Inflation Protected Bond | 0.20 | % | 0.12 | % | ||
Global Bond | 0.21 | % | 0.26 | % | ||
Equity Index | 0.13 | % | 0.03 | % | ||
Real Estate Securities | 0.28 | % | 0.65 | % | ||
Value Equity | 0.40 | % | 0.25 | % | ||
Growth Equity | 0.45 | % | 0.40 | % | ||
Small Cap Equity | 0.27 | % | 0.67 | % | ||
International Equity | 0.47 | % | 0.50 | % |
For the six months ended June 30, 2009, advisory fees (excluding sub-advisory fees) and waivers for each Fund were as follows:
| Gross Advisory Fee | Waiver/ Reimbursements | Net Advisory Fee (Reimbursement) | |||||||||
MyDestination 2005 | $ | 25,496 | $ | (27,342 | ) | $ | (1,846 | ) | |||
MyDestination 2015 | 73,934 | (1,864 | ) | 72,070 | |||||||
MyDestination 2025 | 51,031 | (7,682 | ) | 43,349 | |||||||
MyDestination 2035 | 20,833 | (31,851 | ) | (11,018 | ) | ||||||
MyDestination 2045 | 11,067 | (39,941 | ) | (28,874 | ) | ||||||
Conservative Allocation | 124,674 | (51,637 | ) | 73,037 | |||||||
Balanced Allocation | 442,510 | (65,588 | ) | 376,922 | |||||||
Growth Allocation | 319,671 | (66,540 | ) | 253,131 | |||||||
Aggressive Allocation | 264,806 | (66,979 | ) | 197,827 | |||||||
151
Table of Contents
| Gross Advisory Fee | Waiver/ Reimbursements | Net Advisory Fee (Reimbursement) | |||||||||
Conservative Allocation I | $ | 26,851 | $ | (23,669 | ) | $ | 3,182 | ||||
Balanced Allocation I | 125,696 | — | 125,696 | ||||||||
Growth Allocation I | 78,131 | (5,114 | ) | 73,017 | |||||||
Aggressive Allocation I | 52,227 | (13,977 | ) | 38,250 | |||||||
Money Market | 526,232 | 3,349 | 529,581 | ||||||||
Low-Duration Bond | 394,812 | (296,673 | ) | 98,139 | |||||||
Medium-Duration Bond | 860,152 | (421,586 | ) | 438,567 | |||||||
Extended-Duration Bond | 485,857 | (77,579 | ) | 408,279 | |||||||
Inflation Protected Bond | 1,503 | (1,747 | ) | (244 | ) | ||||||
Global Bond | 175,352 | (11,448 | ) | 163,904 | |||||||
Equity Index | 183,229 | (92,757 | ) | 90,472 | |||||||
Real Estate Securities | 103,567 | (14,501 | ) | 89,066 | |||||||
Value Equity | 1,851,829 | (184,919 | ) | 1,666,909 | |||||||
Growth Equity | 2,201,729 | (524,794 | ) | 1,676,935 | |||||||
Small Cap Equity | 420,084 | (142,101 | ) | 277,982 | |||||||
International Equity | 2,451,315 | (1,262,053 | ) | 1,189,261 | |||||||
b. Distribution and Shareholder Servicing Fees
The Board of Trustees has adopted a Shareholder Service Plan for the GS4 Class of each Select Fund pursuant to Rule 12b-1 under the 1940 Act (“12b-1 Plan”).
Under this Plan, the GS4 Class of each Select Fund is authorized to pay fees to parties that provide services for and maintain shareholder accounts. The GS4 Class of each Select Fund is authorized to pay service fees of 0.19% of average daily net assets.
Under the 12b-1 Plan, the assets of each Select Fund may be used to compensate GuideStone Financial Resources, the Underwriter or others for certain expenses relating to the distribution of shares of the Funds to investors. With the merger of the GS6 Class into the GS4 Class to terminate the GS6 Class, the Plan was no longer in effect as of May 1, 2009.
c. Expense Limitation
GSCM has agreed, through April 30, 2010, to waive fees and reimburse expenses of the GS2 Class and GS4 Class of each Fund (excluding interest, taxes, brokerage commissions and extraordinary expenses) which exceed, in the aggregate, the annual percentage rate of each Class’s average daily net assets as follows:
Fund | GS2 Class | GS4 Class | ||||
MyDestination 2005 | NA | 0.20 | % | |||
MyDestination 2015 | NA | 0.20 | % | |||
MyDestination 2025 | NA | 0.20 | % | |||
MyDestination 2035 | NA | 0.20 | % | |||
MyDestination 2045 | NA | 0.20 | % | |||
Conservative Allocation | NA | 0.12 | % | |||
Balanced Allocation | NA | 0.12 | % | |||
Growth Allocation | NA | 0.12 | % | |||
Aggressive Allocation | NA | 0.12 | % | |||
Conservative Allocation I | 0.15 | % | NA | |||
Balanced Allocation I | 0.15 | % | NA | |||
Growth Allocation I | 0.15 | % | NA | |||
Aggressive Allocation I | 0.15 | % | NA | |||
Money Market | 0.20 | % | 0.39 | % | ||
Low-Duration Bond | 0.36 | % | 0.52 | % | ||
Medium-Duration Bond | 0.48 | % | 0.58 | % |
152
Table of Contents
Fund | GS2 Class | GS4 Class | ||||
Extended-Duration Bond | 0.63 | % | 0.69 | % | ||
Inflation Protected Bond | NA | 0.67 | % | |||
Global Bond | NA | 1.02 | % | |||
Equity Index | 0.23 | % | 0.37 | % | ||
Real Estate Securities | NA | 1.29 | % | |||
Value Equity | 0.74 | % | 0.85 | % | ||
Growth Equity | 0.88 | % | 0.97 | % | ||
Small Cap Equity | 1.12 | % | 1.15 | % | ||
International Equity | 0.94 | % | 1.12 | % |
Each Fund in turn agrees to reimburse GSCM for any operating expenses in excess of the expense limitation paid, waived or assumed by GSCM for that Fund during the limitation period, provided GSCM would not be entitled to reimbursement for any amount that would cause operating expenses to exceed the expense limitation during the year in which the reimbursement would be made, and provided further that no amount will be reimbursed by the Fund more than three years after the year in which it was incurred or waived by GSCM.
At June 30, 2009, the amounts subject to possible future reimbursement under the expense limitation agreement are as follows:
| GS2 Class | GS4 Class | |||||
MyDestination 2005 | NA | $ | 150,311 | |||
MyDestination 2015 | NA | NA | ||||
MyDestination 2025 | NA | 79,235 | ||||
MyDestination 2035 | NA | 187,198 | ||||
MyDestination 2045 | NA | 205,962 | ||||
Conservative Allocation | NA | 414,405 | ||||
Balanced Allocation | NA | 304,256 | ||||
Growth Allocation | NA | 313,156 | ||||
Aggressive Allocation | NA | 331,593 | ||||
Conservative Allocation I | $ | 182,395 | NA | |||
Balanced Allocation I | NA | NA | ||||
Growth Allocation I | 36,780 | NA | ||||
Aggressive Allocation I | 70,439 | NA | ||||
Money Market | NA | NA | ||||
Low-Duration Bond | 154,275 | 1,582,232 | ||||
Medium-Duration Bond | 10,015 | 2,497,771 | ||||
Extended-Duration Bond | NA | 298,809 | ||||
Inflation Protected Bond | NA | 1,747 | ||||
Global Bond | NA | NA | ||||
Equity Index | 1,732 | 475,123 | ||||
Real Estate Securities | NA | 10,293 | ||||
Value Equity | NA | 410,908 | ||||
Growth Equity | 7,348 | 3,546,334 | ||||
Small Cap Equity | NA | 987,943 | ||||
International Equity | 1,115,748 | 6,366,809 | ||||
153
Table of Contents
d. Brokerage Service and Other Arrangements
The Adviser directs the sub-advisers to place security trades with designated brokers who have agreed to pay certain custody, transfer agency or other operating expenses through the use of Brokerage Service Arrangements on behalf of the Equity Funds.
Fund | Expenses Paid Through Brokerage Service Arrangements | ||
Value Equity | $ | 18,141 | |
Growth Equity | 31,644 | ||
Small Cap Equity | 9,727 | ||
International Equity | 22,753 | ||
e. Administrator, Transfer Agent and Distributor
Certain employees of PNC Global Investment Servicing (U.S.), Inc. (“PNC”), an indirect, wholly-owned subsidiary of The PNC Financial Services Group, Inc., are officers of the Funds. PNC serves as Administrator and Transfer Agent of the Funds.
For its services as Administrator, PNC is entitled to receive fees, computed daily and paid monthly, based upon the average daily net assets of each Fund. The fees, excluding out of pocket expenses, currently range between 0.004% and 0.02% of average daily net assets. For its services as Transfer Agent, PNC receives a fee based mainly upon the number of accounts serviced. Certain minimum fees and transaction charges may apply. For the six months ended June 30, 2009, PNC received $1,270,602 in aggregate fees and expenses for services rendered under the various agreements described above.
PFPC Distributors, Inc. (“PDI”), also an indirect, wholly-owned subsidiary of The PNC Financial Services Group, Inc., serves as the Underwriter for the Funds. The Funds do not pay any fees to PDI in its capacity as Underwriter. The fees are paid by GSCM.
4. SECURITIES LENDING
Through an agreement with The Northern Trust Company (“Northern Trust”) (the Funds’ custodian) the Select Funds may lend portfolio securities to certain brokers, dealers and other financial institutions that pay the Select Funds a negotiated fee. The Select Funds receive cash or U.S. government securities as collateral against the loaned securities in an amount at least equal to the market value of the loaned securities. The Funds continue to own the loaned securities and the securities remain in the investment portfolio. However, in the event of default or bankruptcy by the other party to the agreement, realization and/or retention of the collateral may be subject to legal proceedings. Cash collateral has been invested in a short-term money market fund of Northern Trust, an affiliate of the Funds, that invests in securities that satisfy the quality requirements of Rule 2a-7 and have short maturities. At June 30, 2009, the market values of loaned securities and collateral received were as follows:
Fund | Value of Securities Loaned | Value of Cash Collateral | Value of Non-cash Collateral | Total Value of Collateral | ||||||||
Money Market | $ | 11,966,507 | $ | 12,249,000 | $ | — | $ | 12,249,000 | ||||
Low-Duration Bond | 30,458,566 | 32,032,492 | — | 32,032,492 | ||||||||
Medium-Duration Bond | 46,488,755 | 39,184,485 | 238,958 | 39,423,443 | ||||||||
Extended-Duration Bond | 14,386,908 | 15,327,188 | — | 15,327,188 | ||||||||
Global Bond | 13,960,546 | 13,075,144 | 56 | 13,075,200 | ||||||||
Equity Index | 19,589,472 | 20,248,889 | — | 20,248,889 | ||||||||
Real Estate Securities | 25,100,439 | 25,654,407 | — | 25,654,407 | ||||||||
Value Equity | 65,380,895 | 71,083,280 | 451,347 | 71,534,627 | ||||||||
Growth Equity | 92,782,069 | 93,789,900 | — | 93,789,900 | ||||||||
Small Cap Equity | 57,383,086 | 60,576,786 | 4,773 | 60,581,559 | ||||||||
International Equity | 96,965,539 | 96,658,606 | 1,344,964 | 98,003,570 | ||||||||
154
Table of Contents
5. 10% SHAREHOLDERS
The Date Target and Asset Allocation Funds do not invest in the underlying Select Funds for the purpose of exercising management or control; however, investments made by each Date Target and Asset Allocation Fund within each of its principal investment strategies may represent a significant portion of an underlying Select Fund’s net assets. At June 30, 2009, the Asset Allocation Funds were the owner of record of the following approximate percentages of the total outstanding shares of the underlying Select Funds as detailed below:
Fund | Low- Duration Bond | Medium- Duration Bond | Extended- Duration Bond | Inflation Protected Bond | Global Bond | Equity Index | Real Estate Securities | Value Equity | Growth Equity | Small Cap Equity | International Equity | ||||||||||||||||||||||
MyDestination 2005 | 1.46 | % | 0.99 | % | 0.12 | % | 11.72 | % | 0.75 | % | 0.38 | % | 2.40 | % | 0.57 | % | 0.58 | % | 0.51 | % | 0.56 | % | |||||||||||
MyDestination 2015 | 1.63 | 1.98 | 1.51 | 21.98 | 6.04 | 1.36 | 11.21 | 2.35 | 2.34 | 2.08 | 2.28 | ||||||||||||||||||||||
MyDestination 2025 | — | 0.89 | 1.75 | — | 6.55 | 1.13 | 9.55 | 2.02 | 20.34 | 2.20 | 2.02 | ||||||||||||||||||||||
MyDestination 2035 | — | 0.13 | 0.19 | — | 1.55 | 0.56 | 4.35 | 1.02 | 1.03 | 1.25 | 1.05 | ||||||||||||||||||||||
MyDestination 2045 | — | — | — | — | — | 0.39 | 3.29 | 0.59 | 0.59 | 0.77 | 0.61 | ||||||||||||||||||||||
Conservative Allocation | 22.81 | — | — | 53.92 | — | 1.09 | — | 1.57 | 1.57 | 1.22 | 1.53 | ||||||||||||||||||||||
Balanced Allocation | 21.45 | — | 17.42 | — | 36.74 | 1.09 | — | 11.80 | 11.93 | 8.49 | 12.37 | ||||||||||||||||||||||
Growth Allocation | 7.78 | 19.99 | 6.39 | — | 13.47 | 8.83 | — | 12.73 | 12.69 | 9.22 | 13.33 | ||||||||||||||||||||||
Aggressive Allocation | — | 7.19 | — | — | — | 10.12 | — | 14.06 | 14.28 | 10.67 | 14.71 | ||||||||||||||||||||||
Conservative Allocation I | 7.60 | — | — | 12.01 | — | 0.45 | — | 0.68 | 0.56 | 0.41 | 0.44 | ||||||||||||||||||||||
Balanced Allocation I | 9.14 | 9.95 | 10.58 | — | 10.53 | 4.02 | — | 6.55 | 5.43 | 3.65 | 4.55 | ||||||||||||||||||||||
Growth Allocation I | 2.85 | 3.07 | 3.33 | — | 3.31 | 4.05 | — | 6.07 | 4.96 | 3.40 | 4.21 | ||||||||||||||||||||||
Aggressive Allocation I | — | — | — | — | — | 3.62 | — | 5.39 | 4.48 | 3.17 | 3.73 |
6. INVESTMENT TRANSACTIONS
For the period ended June 30, 2009, the cost of purchases and proceeds from sales and maturities for each Fund were as follows:
| Cost of Purchases and Proceeds from Sales and Maturities of Long-Term Securities (other than U.S. Government Obligations) | Cost of Purchases and Proceeds from Sales and Maturities of Long-Term U.S. Government Obligations | |||||||||||
| Purchases | Sale and Maturity Proceeds | Purchases | Sale and Maturity Proceeds | |||||||||
MyDestination 2005 | $ | 15,778,617 | $ | 15,839,616 | $ | 3,459,787 | $ | 2,922,949 | ||||
MyDestination 2015 | 34,798,613 | 26,582,496 | 4,225,213 | 3,394,877 | ||||||||
MyDestination 2025 | 18,517,300 | 7,129,115 | 2,468,377 | 2,035,556 | ||||||||
MyDestination 2035 | 9,536,600 | 394,000 | 478,319 | 414,895 | ||||||||
MyDestination 2045 | 9,058,250 | 1,123,500 | — | — | ||||||||
Conservative Allocation | 47,700,000 | 66,400,000 | 8,676,011 | 3,341,624 | ||||||||
Balanced Allocation | 44,600,000 | 75,500,000 | 37,243,092 | 23,461,264 | ||||||||
Growth Allocation | 23,300,000 | 42,500,000 | 18,618,016 | 13,474,286 | ||||||||
Aggressive Allocation | 6,600,000 | 9,050,000 | — | — | ||||||||
Conservative Allocation I | 11,492,000 | 13,160,000 | 1,619,413 | 834,509 | ||||||||
Balanced Allocation I | 17,720,000 | 21,836,000 | 8,313,535 | 5,448,101 | ||||||||
Growth Allocation I | 9,596,000 | 10,348,000 | 3,993,995 | 3,099,512 | ||||||||
Aggressive Allocation I | 3,662,000 | 3,362,000 | — | — | ||||||||
Low-Duration Bond | 218,228,854 | 206,699,246 | 1,198,485,779 | 1,343,364,611 | ||||||||
Medium-Duration Bond | 105,379,912 | 174,297,304 | 2,518,676,240 | 2,754,676,404 | ||||||||
Extended-Duration Bond | 61,934,910 | 102,278,426 | 2,246,663 | 2,246,892 | ||||||||
Inflation Protected Bond | — | — | 61,063,382 | 2,312,556 | ||||||||
Global Bond | 18,900,792 | 19,746,076 | 76,470,015 | 83,956,868 | ||||||||
Equity Index | 14,527,497 | 3,657,576 | — | — | ||||||||
Real Estate Securities | 60,084,238 | 47,967,413 | — | — | ||||||||
Value Equity | 183,195,206 | 173,181,779 | — | — | ||||||||
Growth Equity | 420,743,722 | 412,022,615 | — | — | ||||||||
155
Table of Contents
| Cost of Purchases and Proceeds from Sales and Maturities of Long-Term Securities (other than U.S. Government Obligations) | Cost of Purchases and Proceeds from Sales and Maturities of Long-Term U.S. Government Obligations | |||||||||||
| Purchases | Sale and Maturity Proceeds | Purchases | Sale and Maturity Proceeds | |||||||||
Small Cap Equity | $ | 131,269,383 | $ | 128,601,073 | $ | 87,207,065 | $ | 84,478,910 | ||||
International Equity | 3,579,669,295 | 357,532,926 | — | — | ||||||||
Futures Contracts
Investments as of June 30, 2009, included cash and securities that were valued and pledged as collateral to cover initial margin deposits. The market value of the open futures contracts is as follows:
| Open Long (Short) Contracts | Market Value of Contracts | Net Unrealized Appreciation (Depreciation) on Futures | |||||||||
MyDestination 2005 Fund | |||||||||||
September 2009 S&P 500® E-Mini | 11 | $ | 503,525 | $ | (8,578 | ) | |||||
MyDestination 2015 Fund | |||||||||||
September 2009 S&P 500® E-Mini | 33 | $ | 1,510,575 | $ | (27,266 | ) | |||||
MyDestination 2025 Fund | |||||||||||
September 2009 S&P 500® E-Mini | 34 | $ | 1,556,350 | $ | (1,563 | ) | |||||
MyDestination 2035 Fund | |||||||||||
September 2009 S&P 500® E-Mini | 17 | $ | 778,175 | $ | 2,751 | ||||||
MyDestination 2045 Fund | |||||||||||
September 2009 S&P 500® E-Mini | 16 | $ | 732,400 | $ | (7,480 | ) | |||||
Conservative Allocation Fund | |||||||||||
September 2009 S&P 500® | 7 | $ | 1,602,125 | $ | (27,130 | ) | |||||
Balanced Allocation Fund | |||||||||||
September 2009 S&P 500® | 57 | $ | 13,045,875 | $ | (253,292 | ) | |||||
Growth Allocation Fund | |||||||||||
September 2009 S&P 500® | 64 | $ | 14,648,000 | $ | (80,297 | ) | |||||
Aggressive Allocation Fund | |||||||||||
September 2009 S&P 500® | 72 | $ | 16,479,000 | $ | (357,443 | ) | |||||
Conservative Allocation Fund I | |||||||||||
September 2009 S&P 500® E-Mini | 5 | $ | 228,875 | $ | (5,401 | ) | |||||
Balanced Allocation Fund I | |||||||||||
September 2009 S&P 500® E-Mini | 60 | $ | 2,746,500 | $ | (55,349 | ) | |||||
Growth Allocation Fund I | |||||||||||
September 2009 S&P 500® E-Mini | 56 | $ | 2,563,400 | $ | (10,856 | ) | |||||
Aggressive Allocation Fund I | |||||||||||
September 2009 S&P 500® E-Mini | 65 | $ | 2,975,375 | $ | (55,652 | ) | |||||
Low-Duration Bond Fund | |||||||||||
December 2009 90-Day Sterling | 185 | $ | 37,535,375 | $ | 1,003,718 | ||||||
June 2010 90-Day Sterling | 18 | 3,622,847 | 4,933 | ||||||||
March 2010 90-Day Euro | 253 | 62,506,812 | 1,151,425 | ||||||||
March 2010 90-Day Sterling | 55 | 11,125,233 | 25,875 | ||||||||
March 2011 90-Day Sterling | 193 | 38,285,338 | (268,591 | ) | |||||||
September 2009 2-Year U.S. Treasury Note | 298 | 64,433,188 | (96,178 | ) | |||||||
September 2009 2-Year U.S. Treasury Note | (36 | ) | (7,783,875 | ) | (47,379 | ) | |||||
September 2009 5-Year U.S. Treasury Note | (41 | ) | (4,703,469 | ) | (16,954 | ) | |||||
September 2009 90-Day Euro | 109 | 27,067,425 | 702,805 | ||||||||
September 2009 Euro-BOBL | 22 | 3,563,122 | 27,736 | ||||||||
156
Table of Contents
| Open Long (Short) Contracts | Market Value of Contracts | Net Unrealized Appreciation (Depreciation) on Futures | |||||||||
September 2009 Euro-Schatz | 36 | $ | 5,449,266 | $ | 1,942 | ||||||
September 2010 90-Day Sterling | 17 | 3,404,098 | (2,903 | ) | |||||||
| $ | 2,486,429 | ||||||||||
Medium-Duration Bond Fund | |||||||||||
September 2009 90-Day Euro | 15 | $ | 3,724,875 | $ | 51,509 | ||||||
September 2009 90-Day Euro | (11 | ) | (2,731,575 | ) | (12,842 | ) | |||||
September 2009 5-Year U.S. Treasury Note | 360 | 41,298,750 | (495,611 | ) | |||||||
September 2009 2-Year U.S. Treasury Note | 92 | 19,892,125 | (18,922 | ) | |||||||
September 2009 10-Year U.S. Treasury Note | 110 | 12,789,219 | 45,755 | ||||||||
September 2009 10-Year U.S. Treasury Note | (75 | ) | (8,719,922 | ) | 158,484 | ||||||
September 2009 U.S. Long Treasury Bond | 165 | 19,529,297 | 95,800 | ||||||||
June 2010 90-Day EURIBOR | 41 | 14,150,674 | 55,045 | ||||||||
September 2010 90-Day EURIBOR | 210 | 72,247,065 | 140,321 | ||||||||
September 2009 Euro-Bund | 36 | 6,114,894 | 126,135 | ||||||||
June 2010 90-Day Sterling | 94 | 18,919,313 | (11,191 | ) | |||||||
September 2010 90-Day Sterling | 68 | 13,616,391 | (16,365 | ) | |||||||
December 2009 90-Day Sterling | 290 | 58,839,237 | 2,225,300 | ||||||||
March 2010 90-Day Euro | 692 | 170,967,250 | 1,721,290 | ||||||||
June 2010 90-Day Euro | 44 | 10,830,050 | (15,950 | ) | |||||||
December 2009 90-Day Euro | 280 | 69,366,500 | 240,550 | ||||||||
September 2010 90-Day Euro | 13 | 3,187,600 | (5,778 | ) | |||||||
| $ | 4,283,530 | ||||||||||
Inflation Protected Bond Fund | |||||||||||
September 2009 2-Year U.S. Treasury Note | (19 | ) | $ | (4,108,156 | ) | $ | 552 | ||||
September 2009 5-Year U.S. Treasury Note | 5 | 573,594 | (597 | ) | |||||||
September 2009 10-Year U.S. Treasury Note | 5 | 581,328 | (714 | ) | |||||||
September 2009 U.S. Long Treasury Bond | 2 | 236,719 | (317 | ) | |||||||
| $ | (1,076 | ) | |||||||||
Global Bond Fund | |||||||||||
September 2009 5-Year U.S. Treasury Note | 95 | $ | 10,898,281 | $ | (67,762 | ) | |||||
September 2009 10-Year U.S. Treasury Note | 6 | 697,594 | (16,327 | ) | |||||||
September 2009 Euro-BOBL | 3 | 485,880 | 4,216 | ||||||||
September 2009 Euro-Bund | 9 | 1,528,724 | 24,683 | ||||||||
| $ | (55,190 | ) | |||||||||
Equity Index Fund | |||||||||||
September 2009 S&P 500® | 44 | $ | 10,070,500 | $ | (180,787 | ) | |||||
Real Estate Securities Fund | |||||||||||
September 2009 Russell 2000® IMM-Mini | 107 | $ | 5,427,040 | $ | (115,310 | ) | |||||
Value Equity Fund | |||||||||||
September 2009 S&P 500® | 168 | $ | 38,451,000 | $ | (749,689 | ) | |||||
September 2009 S&P 500® E-Mini | 45 | 2,059,875 | (35,831 | ) | |||||||
| $ | (785,520 | ) | |||||||||
Growth Equity Fund | |||||||||||
September 2009 S&P 500® | 164 | $ | 37,535,500 | $ | 265,904 | ||||||
Small Cap Equity Fund | |||||||||||
December 2009 90-Day Euro | 19 | $ | 4,707,013 | $ | 16,893 | ||||||
June 2010 90-Day Euro | 7 | 1,722,962 | 8,052 | ||||||||
March 2010 90-Day Euro | 30 | 7,411,875 | 27,375 | ||||||||
September 2009 2-Year U.S. Treasury Note | 1 | 216,219 | (614 | ) | |||||||
September 2009 Euro-Bund | (6 | ) | (1,019,149 | ) | (19,317 | ) | |||||
157
Table of Contents
| Open Long (Short) Contracts | Market Value of Contracts | Net Unrealized Appreciation (Depreciation) on Futures | |||||||||
September 2009 10-Year U.S. Treasury Note | 53 | $ | 6,162,078 | $ | (5,531 | ) | |||||
September 2009 5-Year U.S. Treasury Note | (1 | ) | (114,719 | ) | (1,568 | ) | |||||
September 2009 Russell 2000® EMM-Mini | 945 | 47,930,400 | (1,659,153 | ) | |||||||
| $ | (1,633,863 | ) | |||||||||
International Equity Fund | |||||||||||
July 2009 AEX Index | 28 | $ | 1,998,962 | $ | 6,794 | ||||||
July 2009 CAC40 Index | 80 | 3,519,493 | (70,350 | ) | |||||||
July 2009 Hang Seng Index | (15 | ) | (1,782,569 | ) | (52,292 | ) | |||||
July 2009 IBEX 35 Future | 36 | 272,632 | 185,335 | ||||||||
July 2009 MSCI Singapore Index | 1 | 38,525 | 1,792 | ||||||||
July 2009 OMX Index | 40 | 412,203 | 235 | ||||||||
September 2009 DAX Index | (13 | ) | (2,197,351 | ) | 35,510 | ||||||
September 2009 DJ Euro Stoxx 50® | 421 | 14,162,676 | (127,301 | ) | |||||||
September 2009 FTSE 100 Index® | 128 | 8,882,484 | (144,419 | ) | |||||||
September 2009 S&P MIB Index | 28 | 3,748,888 | (41,105 | ) | |||||||
September 2009 S&P/TSE 60 Index | (10 | ) | (1,078,279 | ) | 15,532 | ||||||
September 2009 SPI 200 Index® | (57 | ) | (4,479,393 | ) | 41,219 | ||||||
September 2009 SPI 200 Index® | 47 | 3,693,534 | 24,425 | ||||||||
September 2009 TOPIX Index® | (12 | ) | (1,151,606 | ) | 2,802 | ||||||
September 2009 TOPIX Index® | 65 | 6,237,868 | 22,650 | ||||||||
September 2009 Swiss Synthetic Future | 49 | 2,416,286 | (3,563 | ) | |||||||
September 2009 Swiss Synthetic Future | (49 | ) | (2,429,819 | ) | (9,971 | ) | |||||
| $ | (112,707 | ) | |||||||||
Forward Foreign Currency Contracts
As of June 30, 2009, the following Funds have forward foreign currency exchange contracts that obligate it to deliver currencies at specified future dates. The unrealized appreciation and/or depreciation on these contracts is included in the accompanying financial statements. The terms of the open contracts are as follows:
Fund/ Expiration Date | Currency to be Delivered | Counter- | Amount of Currency to be Delivered | Currency to be Received | Amount of Currency to be Received | Net Unrealized Appreciation (Depreciation) | ||||||||
Low-Duration Bond Fund | ||||||||||||||
07/02/09 | U.S. Dollars | DEUT | 60,000 | Japanese Yen | 5,780,000 | $ | (193 | ) | ||||||
07/02/09 | U.S. Dollars | RBS | 388,266 | United Kingdom Pounds | 236,000 | 18,198 | ||||||||
07/02/09 | U.S. Dollars | RBS | 449,138 | United Kingdom Pounds | 273,000 | 21,051 | ||||||||
07/02/09 | U.S. Dollars | GSC | 115,164 | United Kingdom Pounds | 70,000 | 2,823 | ||||||||
07/02/09 | U.S. Dollars | JPM | 1,836,037 | United Kingdom Pounds | 1,116,000 | (8,823 | ) | |||||||
07/02/09 | Japanese Yen | RBS | 5,780,000 | U.S. Dollars | 60,000 | (11 | ) | |||||||
07/02/09 | United Kingdom Pounds | MLCS | 1,231,000 | U.S. Dollars | 2,025,234 | (120,600 | ) | |||||||
07/02/09 | United Kingdom Pounds | BAR | 161,000 | U.S. Dollars | 264,876 | (9,732 | ) | |||||||
07/02/09 | United Kingdom Pounds | CS | 70,000 | U.S. Dollars | 115,164 | (3,311 | ) | |||||||
07/02/09 | United Kingdom Pounds | GSC | 79,000 | U.S. Dollars | 129,970 | (3,186 | ) | |||||||
07/02/09 | United Kingdom Pounds | BAR | 124,000 | U.S. Dollars | 204,004 | (2,147 | ) | |||||||
07/02/09 | United Kingdom Pounds | GSC | 30,000 | U.S. Dollars | 49,356 | 441 | ||||||||
07/13/09 | U.S. Dollars | MLCS | 2,687,893 | Euro | 1,916,000 | 15,034 | ||||||||
07/13/09 | Euro | CITI | 4,532,000 | U.S. Dollars | 6,357,792 | 79,053 | ||||||||
07/13/09 | Euro | MLCS | 8,769,000 | U.S. Dollars | 12,301,738 | 146,821 | ||||||||
158
Table of Contents
Fund/ Expiration Date | Currency to be Delivered | Counter- | Amount of Currency to be Delivered | Currency to be Received | Amount of Currency to be Received | Net Unrealized Appreciation (Depreciation) | ||||||||
07/15/09 | U.S. Dollars | BAR | 1,020,423 | Chinese Yuan Renminbi | 6,970,000 | $ | (4,577 | ) | ||||||
07/15/09 | U.S. Dollars | DEUT | 1,044,410 | Chinese Yuan Renminbi | 7,133,841 | (2,990 | ) | |||||||
07/15/09 | U.S. Dollars | DEUT | 742,696 | Chinese Yuan Renminbi | 5,072,989 | (1,689 | ) | |||||||
07/15/09 | U.S. Dollars | JPM | 741,635 | Chinese Yuan Renminbi | 5,065,741 | (1,578 | ) | |||||||
07/15/09 | U.S. Dollars | JPM | 3,042,237 | Chinese Yuan Renminbi | 20,780,000 | (5,578 | ) | |||||||
07/15/09 | U.S. Dollars | MLCS | 946,318 | Chinese Yuan Renminbi | 6,463,827 | (1,457 | ) | |||||||
07/15/09 | Euro | MLCS | 174,500 | U.S. Dollars | 244,800 | (7,131 | ) | |||||||
07/15/09 | Chinese Yuan Renminbi | JPM | 2,376,990 | U.S. Dollars | 347,996 | (4,996 | ) | |||||||
07/15/09 | Chinese Yuan Renminbi | JPM | 2,716,560 | U.S. Dollars | 397,710 | (5,710 | ) | |||||||
07/15/09 | Chinese Yuan Renminbi | JPM | 2,467,970 | U.S. Dollars | 361,316 | (5,316 | ) | |||||||
07/15/09 | Chinese Yuan Renminbi | JPM | 5,462,810 | U.S. Dollars | 799,767 | (11,767 | ) | |||||||
07/15/09 | Chinese Yuan Renminbi | JPM | 7,008,758 | U.S. Dollars | 1,026,097 | (15,097 | ) | |||||||
07/15/09 | Chinese Yuan Renminbi | JPM | 7,018,220 | U.S. Dollars | 1,027,483 | (15,483 | ) | |||||||
07/15/09 | Chinese Yuan Renminbi | JPM | 11,131,090 | U.S. Dollars | 1,629,616 | (32,616 | ) | |||||||
07/15/09 | Chinese Yuan Renminbi | JPM | 3,490,000 | U.S. Dollars | 510,944 | (10,944 | ) | |||||||
07/15/09 | Chinese Yuan Renminbi | JPM | 9,814,000 | U.S. Dollars | 1,436,791 | (36,791 | ) | |||||||
07/22/09 | Japanese Yen | DEUT | 5,780,000 | U.S. Dollars | 60,015 | 194 | ||||||||
07/27/09 | Euro | RBS | 999,000 | U.S. Dollars | 1,401,472 | (384 | ) | |||||||
07/27/09 | Euro | BAR | 704,000 | U.S. Dollars | 987,624 | (5,290 | ) | |||||||
08/04/09 | U.S. Dollars | JPM | 1,556,407 | Canadian Dollars | 1,810,000 | (96,395 | ) | |||||||
08/06/09 | United Kingdom Pounds | JPM | 1,116,000 | U.S. Dollars | 1,835,980 | 8,812 | ||||||||
08/26/09 | United Kingdom Pounds | DEUT | 310,000 | U.S. Dollars | 509,983 | (8,230 | ) | |||||||
09/08/09 | U.S. Dollars | CITG | 1,626,403 | Chinese Yuan Renminbi | 11,100,145 | 16,403 | ||||||||
09/08/09 | Chinese Yuan Renminbi | DEUT | 5,072,989 | U.S. Dollars | 743,299 | 3,168 | ||||||||
09/08/09 | Chinese Yuan Renminbi | JPM | 5,065,741 | U.S. Dollars | 742,237 | 2,561 | ||||||||
09/08/09 | Chinese Yuan Renminbi | CITI | 6,463,827 | U.S. Dollars | 947,085 | 2,779 | ||||||||
03/29/10 | U.S. Dollars | DEUT | 798,711 | Chinese Yuan Renminbi | 5,416,747 | (3,889 | ) | |||||||
03/29/10 | U.S. Dollars | MLCS | 1,194,682 | Chinese Yuan Renminbi | 8,102,165 | (4,750 | ) | |||||||
03/29/10 | U.S. Dollars | JPM | 168,096 | Chinese Yuan Renminbi | 1,140,000 | (618 | ) | |||||||
03/29/10 | U.S. Dollars | JPM | 10,735 | Chinese Yuan Renminbi | 72,800 | (36 | ) | |||||||
03/29/10 | U.S. Dollars | HKSB | 1,149,595 | Chinese Yuan Renminbi | 7,796,386 | (3,205 | ) | |||||||
03/29/10 | U.S. Dollars | BTAB | 1,359 | Chinese Yuan Renminbi | 9,214 | (3 | ) | |||||||
03/29/10 | Chinese Yuan Renminbi | HSBC | 7,063,666 | U.S. Dollars | 1,041,553 | 5,847 | ||||||||
06/07/10 | U.S. Dollars | MLCS | 232,675 | Chinese Yuan Renminbi | 1,574,352 | (1,325 | ) | |||||||
06/07/10 | U.S. Dollars | KKSB | 661,579 | Chinese Yuan Renminbi | 4,476,448 | (3,421 | ) | |||||||
06/07/10 | U.S. Dollars | JPM | 608,897 | Chinese Yuan Renminbi | 4,119,984 | (3,103 | ) | |||||||
06/07/10 | U.S. Dollars | DEUT | 352,310 | Chinese Yuan Renminbi | 2,383,836 | (1,690 | ) | |||||||
06/07/10 | U.S. Dollars | MLCS | 190,088 | Chinese Yuan Renminbi | 1,286,194 | (912 | ) | |||||||
06/07/10 | U.S. Dollars | BAR | 583,202 | Chinese Yuan Renminbi | 3,946,124 | (2,798 | ) | |||||||
06/07/10 | U.S. Dollars | BAR | 586,449 | Chinese Yuan Renminbi | 3,968,093 | (2,551 | ) | |||||||
06/07/10 | U.S. Dollars | JPM | 129,437 | Chinese Yuan Renminbi | 875,810 | (563 | ) | |||||||
| $ | (127,701 | ) | ||||||||||||
Medium-Duration Bond Fund |
| |||||||||||||
07/02/09 | Japanese Yen | DEUT | 3,447,000 | U.S. Dollars | 35,782 | $ | (7 | ) | ||||||
07/02/09 | U.S. Dollars | DEUT | 35,782 | Japanese Yen | 3,447,000 | (115 | ) | |||||||
07/02/09 | U.S. Dollars | DEUT | 424,460 | United Kingdom Pounds | 258,000 | 19,894 | ||||||||
07/02/09 | U.S. Dollars | JPM | 3,673,719 | United Kingdom Pounds | 2,233,000 | (17,654 | ) | |||||||
07/02/09 | United Kingdom Pounds | BAR | 2,008,000 | U.S. Dollars | 3,303,550 | (227,896 | ) | |||||||
07/02/09 | United Kingdom Pounds | CITI | 323,000 | U.S. Dollars | 531,398 | (31,644 | ) | |||||||
07/02/09 | United Kingdom Pounds | GSC | 103,000 | U.S. Dollars | 169,455 | (4,153 | ) | |||||||
07/02/09 | United Kingdom Pounds | BAR | 57,000 | U.S. Dollars | 93,776 | (987 | ) | |||||||
159
Table of Contents
Fund/ Expiration Date | Currency to be Delivered | Counter- | Amount of Currency to be Delivered | Currency to be Received | Amount of Currency to be Received | Net Unrealized Appreciation (Depreciation) | ||||||||
07/15/09 | Chinese Yuan Renminbi | JPM | 3,180,870 | U.S. Dollars | 465,686 | $ | (6,686 | ) | ||||||
07/15/09 | Chinese Yuan Renminbi | JPM | 2,785,860 | U.S. Dollars | 407,856 | (5,856 | ) | |||||||
07/15/09 | Chinese Yuan Renminbi | JPM | 2,185,690 | U.S. Dollars | 319,990 | (4,708 | ) | |||||||
07/15/09 | Chinese Yuan Renminbi | JPM | 8,208,080 | U.S. Dollars | 1,201,681 | (17,681 | ) | |||||||
07/15/09 | Chinese Yuan Renminbi | JPM | 2,883,920 | U.S. Dollars | 422,212 | (6,212 | ) | |||||||
07/15/09 | Chinese Yuan Renminbi | JPM | 8,217,975 | U.S. Dollars | 1,203,129 | (18,129 | ) | |||||||
07/15/09 | U.S. Dollars | JPM | 1,208,540 | Chinese Yuan Renminbi | 8,254,932 | (3,460 | ) | |||||||
07/15/09 | U.S. Dollars | JPM | 859,224 | Chinese Yuan Renminbi | 5,868,930 | (1,954 | ) | |||||||
07/15/09 | U.S. Dollars | JPM | 857,996 | Chinese Yuan Renminbi | 5,860,545 | (1,825 | ) | |||||||
07/15/09 | U.S. Dollars | DEUT | 1,094,794 | Chinese Yuan Renminbi | 7,477,988 | (1,686 | ) | |||||||
07/22/09 | Japanese Yen | DEUT | 3,447,000 | U.S. Dollars | 35,791 | 115 | ||||||||
07/27/09 | Euro | GSC | 235,000 | U.S. Dollars | 329,676 | (228 | ) | |||||||
07/27/09 | Euro | DEUT | 1,198,000 | U.S. Dollars | 1,680,644 | (461 | ) | |||||||
07/27/09 | Euro | BAR | 2,114,000 | U.S. Dollars | 2,965,678 | (15,886 | ) | |||||||
07/31/09 | Euro | DEUT | 245,654 | U.S. Dollars | 344,621 | 890 | ||||||||
08/04/09 | Brazilian Reals | HKSB | 2,602,870 | U.S. Dollars | 1,319,155 | (16,418 | ) | |||||||
08/04/09 | Canadian Dollars | JPM | 232,000 | U.S. Dollars | 199,495 | 12,356 | ||||||||
08/04/09 | U.S. Dollars | HSBC | 1,319,155 | Brazilian Reals | 2,602,870 | 131,986 | ||||||||
08/06/09 | United Kingdom Pounds | JPM | 2,233,000 | U.S. Dollars | 3,673,606 | 17,633 | ||||||||
08/12/09 | Malaysian Ringgits | JPM | 2,425,499 | U.S. Dollars | 688,974 | (27,354 | ) | |||||||
08/12/09 | U.S. Dollars | BAR | 401,994 | Malaysian Ringgits | 1,415,200 | 1,994 | ||||||||
08/12/09 | U.S. Dollars | BAR | 202,218 | Malaysian Ringgits | 711,900 | 2,218 | ||||||||
08/12/09 | U.S. Dollars | BAR | 87,169 | Malaysian Ringgits | 306,875 | 1,174 | ||||||||
08/19/09 | Canadian Dollars | CS | 1,842,980 | U.S. Dollars | 1,584,950 | (63,209 | ) | |||||||
08/19/09 | Euro | JPM | 1,448,485 | U.S. Dollars | 2,031,952 | (146,879 | ) | |||||||
08/19/09 | U.S. Dollars | JPM | 1,010,667 | Canadian Dollars | 1,175,203 | 48,726 | ||||||||
09/08/09 | Chinese Yuan Renminbi | DEUT | 5,868,930 | U.S. Dollars | 859,921 | 3,665 | ||||||||
09/08/09 | Chinese Yuan Renminbi | JPM | 5,860,545 | U.S. Dollars | 858,692 | 2,963 | ||||||||
09/08/09 | Chinese Yuan Renminbi | CITI | 7,477,988 | U.S. Dollars | 1,095,681 | 3,215 | ||||||||
09/08/09 | U.S. Dollars | CITG | 1,878,950 | Chinese Yuan Renminbi | 12,823,770 | 18,950 | ||||||||
11/27/09 | U.S. Dollars | JPM | 3,709 | Mexican Pesos | 49,909 | 14 | ||||||||
03/29/10 | Chinese Yuan Renminbi | JPM | 8,173,728 | U.S. Dollars | 1,205,234 | 6,766 | ||||||||
03/29/10 | U.S. Dollars | BTAB | 924,499 | Chinese Yuan Renminbi | 6,269,821 | (4,501 | ) | |||||||
03/29/10 | U.S. Dollars | CITI | 1,382,820 | Chinese Yuan Renminbi | 9,378,089 | (5,498 | ) | |||||||
03/29/10 | U.S. Dollars | DEUT | 194,593 | Chinese Yuan Renminbi | 1,319,700 | (716 | ) | |||||||
03/29/10 | U.S. Dollars | JPM | 12,430 | Chinese Yuan Renminbi | 84,300 | (42 | ) | |||||||
03/29/10 | U.S. Dollars | HSBC | 1,330,590 | Chinese Yuan Renminbi | 9,023,871 | (3,710 | ) | |||||||
03/29/10 | U.S. Dollars | BTAB | 1,577 | Chinese Yuan Renminbi | 10,697 | (4 | ) | |||||||
06/07/10 | U.S. Dollars | CITI | 284,381 | Chinese Yuan Renminbi | 1,924,208 | (1,619 | ) | |||||||
06/07/10 | U.S. Dollars | HSBC | 806,828 | Chinese Yuan Renminbi | 5,459,246 | (4,172 | ) | |||||||
06/07/10 | U.S. Dollars | JPM | 744,208 | Chinese Yuan Renminbi | 5,035,536 | (3,792 | ) | |||||||
06/07/10 | U.S. Dollars | DEUT | 429,938 | Chinese Yuan Renminbi | 2,909,088 | (2,062 | ) | |||||||
06/07/10 | U.S. Dollars | CITI | 230,892 | Chinese Yuan Renminbi | 1,562,288 | (1,108 | ) | |||||||
06/07/10 | U.S. Dollars | BAR | 712,582 | Chinese Yuan Renminbi | 4,821,544 | (3,418 | ) | |||||||
06/07/10 | U.S. Dollars | BAR | 715,886 | Chinese Yuan Renminbi | 4,843,903 | (3,114 | ) | |||||||
06/07/10 | U.S. Dollars | JPM | 248,917 | Chinese Yuan Renminbi | 1,684,250 | (1,083 | ) | |||||||
07/15/09 | U.S. Dollars | BAR | 1,008,824 | Chinese Yuan Renminbi | 6,860,000 | (4,504 | ) | |||||||
07/15/09 | Chinese Yuan Renminbi | BAR | 6,860,000 | U.S. Dollars | 982,585 | (21,734 | ) | |||||||
07/15/09 | U.S. Dollars | JPM | 2,996,480 | Chinese Yuan Renminbi | 20,430,000 | (5,484 | ) | |||||||
07/15/09 | Chinese Yuan Renminbi | JPM | 20,430,000 | U.S. Dollars | 2,990,996 | (66,863 | ) | |||||||
| $ | (481,953 | ) | ||||||||||||
160
Table of Contents
Fund/ Expiration Date | Currency to be Delivered | Counter- | Amount of Currency to be Delivered | Currency to be Received | Amount of Currency to be Received | Net Unrealized Appreciation (Depreciation) | ||||||||
Global Bond Fund | ||||||||||||||
08/19/09 | Australian Dollars | MSCS | 587,221 | U.S. Dollars | 471,376 | $ | 55,917 | |||||||
08/19/09 | Australian Dollars | CITIG | 745,608 | U.S. Dollars | 598,517 | 78,641 | ||||||||
08/19/09 | Canadian Dollars | JPM | 1,157,388 | U.S. Dollars | 995,346 | 47,987 | ||||||||
08/19/09 | Euro | DEUT | 1,000,000 | U.S. Dollars | 1,402,812 | 102,762 | ||||||||
08/19/09 | Euro | CITIG | 1,916,003 | U.S. Dollars | 2,687,792 | 163,075 | ||||||||
08/19/09 | Euro | UBS | 2,470,000 | U.S. Dollars | 3,464,945 | 252,908 | ||||||||
08/19/09 | Japanese Yen | JPM | 43,029,372 | U.S. Dollars | 446,925 | 2,925 | ||||||||
08/19/09 | Japanese Yen | DEUT | 600,226,840 | U.S. Dollars | 6,234,257 | (3,487 | ) | |||||||
08/19/09 | Japanese Yen | GSC | 1,011,467,400 | U.S. Dollars | 10,505,607 | (48,542 | ) | |||||||
08/19/09 | Mexican Pesos | GSC | 4,650,275 | U.S. Dollars | 350,503 | 24,911 | ||||||||
08/19/09 | South African Rand | GSC | 988,065 | U.S. Dollars | 126,800 | 17,167 | ||||||||
08/19/09 | Turkish Lira | CS | 1,122,047 | U.S. Dollars | 719,268 | (1,379 | ) | |||||||
08/19/09 | U.S. Dollars | CITIG | 200,681 | Australian Dollars | 250,000 | (23,443 | ) | |||||||
08/19/09 | U.S. Dollars | CS | 275,644 | Turkish Lira | 430,000 | 262 | ||||||||
08/19/09 | U.S. Dollars | GSC | 329,024 | United Kingdom Pounds | 200,000 | (38,115 | ) | |||||||
08/19/09 | U.S. Dollars | CITIG | 506,788 | Australian Dollars | 631,336 | (66,147 | ) | |||||||
08/19/09 | U.S. Dollars | CITIG | 705,157 | Turkish Lira | 1,100,034 | (39,881 | ) | |||||||
08/19/09 | U.S. Dollars | GSC | 791,861 | Euro | 564,482 | (57,194 | ) | |||||||
08/19/09 | U.S. Dollars | DEUT | 822,560 | United Kingdom Pounds | 500,000 | (92,895 | ) | |||||||
08/19/09 | U.S. Dollars | JPM | 906,412 | Euro | 646,139 | (11,412 | ) | |||||||
08/19/09 | U.S. Dollars | CITIG | 1,069,328 | United Kingdom Pounds | 650,000 | (113,568 | ) | |||||||
08/19/09 | U.S. Dollars | JPM | 1,076,708 | Euro | 767,536 | (78,566 | ) | |||||||
08/19/09 | U.S. Dollars | MSCS | 1,133,830 | Euro | 808,255 | (68,121 | ) | |||||||
08/19/09 | U.S. Dollars | CS | 1,304,615 | Euro | 930,000 | 18,198 | ||||||||
08/19/09 | U.S. Dollars | JPM | 1,314,100 | Euro | 936,761 | (14,100 | ) | |||||||
08/19/09 | U.S. Dollars | CITIG | 1,329,737 | Japanese Yen | 128,025,470 | 4,724 | ||||||||
08/19/09 | U.S. Dollars | CITIG | 7,108,519 | Euro | 5,067,336 | (513,837 | ) | |||||||
08/19/09 | U.S. Dollars | JPM | 8,266,698 | Japanese Yen | 795,907,900 | 27,465 | ||||||||
08/19/09 | United Kingdom Pounds | JPM | 1,135,170 | U.S. Dollars | 1,867,491 | 216,647 | ||||||||
08/26/09 | South Korean Won | DEUT | 700,000,000 | U.S. Dollars | 551,094 | (13,877 | ) | |||||||
08/26/09 | U.S. Dollars | JPM | 169,846 | Brazilian Reals | 336,685 | 154 | ||||||||
| $ | (170,821 | ) | ||||||||||||
Small Cap Equity Fund |
| |||||||||||||
08/19/09 | Euro | JPM | 128,994 | U.S. Dollars | 180,955 | $ | (13,080 | ) | ||||||
International Equity Fund |
| |||||||||||||
09/16/09 | Australian Dollars | BAR | 21,000 | U.S. Dollars | 16,823 | $ | 201 | |||||||
09/16/09 | Australian Dollars | BAR | 9,132,000 | U.S. Dollars | 7,315,586 | 56,650 | ||||||||
09/16/09 | Canadian Dollars | BAR | 360,000 | U.S. Dollars | 309,643 | (23,137 | ) | |||||||
09/16/09 | Canadian Dollars | BAR | 418,000 | U.S. Dollars | 359,530 | (10,100 | ) | |||||||
09/16/09 | Canadian Dollars | BAR | 633,000 | U.S. Dollars | 544,456 | (33,857 | ) | |||||||
09/16/09 | Canadian Dollars | BAR | 901,000 | U.S. Dollars | 774,968 | (36,053 | ) | |||||||
09/16/09 | Danish Kroner | BAR | 33,000 | U.S. Dollars | 6,209 | 61 | ||||||||
09/16/09 | Danish Kroner | BAR | 100,000 | U.S. Dollars | 18,815 | (124 | ) | |||||||
09/16/09 | Danish Kroner | BAR | 248,000 | U.S. Dollars | 46,662 | 501 | ||||||||
09/16/09 | Danish Kroner | BAR | 1,239,000 | U.S. Dollars | 233,120 | (2,889 | ) | |||||||
09/16/09 | Euro | BAR | 5,000 | U.S. Dollars | 7,013 | 70 | ||||||||
09/16/09 | Euro | BAR | 150,000 | U.S. Dollars | 210,397 | 1,137 | ||||||||
09/16/09 | Euro | BAR | 1,250,000 | U.S. Dollars | 1,753,312 | (10,952 | ) | |||||||
161
Table of Contents
Fund/ Expiration Date | Currency to be Delivered | Counter- | Amount of Currency to be Delivered | Currency to be Received | Amount of Currency to be Received | Net Unrealized Appreciation (Depreciation) | ||||||||
09/16/09 | Hong Kong Dollars | BAR | 111,000 | U.S. Dollars | 14,332 | $ | 1 | |||||||
09/16/09 | Hong Kong Dollars | BAR | 2,501,000 | U.S. Dollars | 322,929 | 23 | ||||||||
09/16/09 | Japanese Yen | BAR | 529,000 | U.S. Dollars | 5,496 | (18 | ) | |||||||
09/16/09 | Japanese Yen | BAR | 8,461,000 | U.S. Dollars | 87,908 | 1,606 | ||||||||
09/16/09 | Japanese Yen | BAR | 12,206,000 | U.S. Dollars | 126,818 | (1,252 | ) | |||||||
09/16/09 | Japanese Yen | BAR | 571,018,000 | U.S. Dollars | 5,932,784 | (20,687 | ) | |||||||
09/16/09 | Norwegian Krone | BAR | 32,000 | U.S. Dollars | 4,967 | (135 | ) | |||||||
09/16/09 | Norwegian Krone | BAR | 7,392,000 | U.S. Dollars | 1,147,282 | (9,621 | ) | |||||||
09/16/09 | Singapore Dollars | BAR | 9,000 | U.S. Dollars | 6,211 | 52 | ||||||||
09/16/09 | Singapore Dollars | BAR | 14,000 | U.S. Dollars | 9,661 | (69 | ) | |||||||
09/16/09 | Singapore Dollars | BAR | 139,000 | U.S. Dollars | 95,921 | 141 | ||||||||
09/16/09 | Swedish Kronor | BAR | 379,000 | U.S. Dollars | 49,120 | (119 | ) | |||||||
09/16/09 | Swedish Kronor | BAR | 626,000 | U.S. Dollars | 81,133 | 960 | ||||||||
09/16/09 | Swedish Kronor | BAR | 1,185,000 | U.S. Dollars | 153,582 | (1,763 | ) | |||||||
09/16/09 | Swedish Kronor | BAR | 6,378,000 | U.S. Dollars | 826,621 | (24,188 | ) | |||||||
09/16/09 | Switzerland Francs | BAR | 48,000 | U.S. Dollars | 44,220 | 2 | ||||||||
09/16/09 | Switzerland Francs | BAR | 406,000 | U.S. Dollars | 374,029 | (908 | ) | |||||||
09/16/09 | Switzerland Francs | BAR | 549,000 | U.S. Dollars | 505,768 | (11,887 | ) | |||||||
09/16/09 | Switzerland Francs | BAR | 1,682,000 | U.S. Dollars | 1,549,547 | (2,831 | ) | |||||||
09/16/09 | Switzerland Francs | BAR | 1,825,000 | U.S. Dollars | 1,681,286 | (29,438 | ) | |||||||
09/16/09 | U.S. Dollars | BAR | 646 | Hong Kong Dollars | 5,000 | — | ||||||||
09/16/09 | U.S. Dollars | BAR | 3,951 | Danish Kroner | 21,000 | 60 | ||||||||
09/16/09 | U.S. Dollars | BAR | 4,140 | Singapore Dollars | 6,000 | (1 | ) | |||||||
09/16/09 | U.S. Dollars | BAR | 9,661 | Singapore Dollars | 14000.00 | (72 | ) | |||||||
09/16/09 | U.S. Dollars | BAR | 11,055 | Switzerland Francs | 12,000 | 68 | ||||||||
09/16/09 | U.S. Dollars | BAR | 11,221 | Euro | 8,000 | (126 | ) | |||||||
09/16/09 | U.S. Dollars | BAR | 12,230 | Danish Kroner | 65,000 | (122 | ) | |||||||
09/16/09 | U.S. Dollars | BAR | 11,221 | Hong Kong Dollars | 97,000 | (1 | ) | |||||||
09/16/09 | U.S. Dollars | BAR | 12,817 | Australian Dollars | 16,000 | 113 | ||||||||
09/16/09 | U.S. Dollars | BAR | 15,882 | Hong Kong Dollars | 123,000 | — | ||||||||
09/16/09 | U.S. Dollars | BAR | 17,942 | Singapore Dollars | 26,000 | 26 | ||||||||
09/16/09 | U.S. Dollars | BAR | 30,104 | Danish Kroner | 160,000 | (109 | ) | |||||||
09/16/09 | U.S. Dollars | BAR | 33,814 | Singapore Dollars | 49,000 | 102 | ||||||||
09/16/09 | U.S. Dollars | BAR | 35,121 | Hong Kong Dollars | 272,000 | (5 | ) | |||||||
09/16/09 | U.S. Dollars | BAR | 95,330 | Australian Dollars | 119,000 | (2,230 | ) | |||||||
09/16/09 | U.S. Dollars | BAR | 129,507 | Hong Kong Dollars | 1,003,000 | (57 | ) | |||||||
09/16/09 | U.S. Dollars | BAR | 275,445 | New Zealand Dollars | 429,000 | (10,658 | ) | |||||||
09/16/09 | U.S. Dollars | BAR | 290,348 | Euro | 207,000 | 5,512 | ||||||||
09/16/09 | U.S. Dollars | BAR | 337,260 | Australian Dollars | 421,000 | (2,966 | ) | |||||||
09/16/09 | U.S. Dollars | BAR | 355,758 | Japanese Yen | 34,241,000 | 3,786 | ||||||||
09/16/09 | U.S. Dollars | BAR | 358,608 | United Kingdom Pounds | 218,000 | (135 | ) | |||||||
09/16/09 | U.S. Dollars | BAR | 359,078 | Euro | 256,000 | (1,943 | ) | |||||||
09/16/09 | U.S. Dollars | BAR | 414,866 | Swedish Kronor | 3,201,000 | (15,381 | ) | |||||||
09/16/09 | U.S. Dollars | BAR | 475,646 | Canadian Dollars | 553,000 | 3,154 | ||||||||
09/16/09 | U.S. Dollars | BAR | 511,591 | United Kingdom Pounds | 311,000 | (14,598 | ) | |||||||
09/16/09 | U.S. Dollars | BAR | 667,318 | Japanese Yen | 64,228,000 | 7,622 | ||||||||
162
Table of Contents
Fund/Expiration Date | Currency to be Delivered | Counterparty | Amount of Currency to be Delivered | Currency to be Received | Amount of Currency to be Received | Net Unrealized Appreciation (Depreciation) | ||||||||
09/16/09 | U.S. Dollars | BAR | 797,137 | Norweigan Krone | 5,136,000 | $ | 30,836 | |||||||
09/16/09 | U.S. Dollars | BAR | 837,250 | New Zealand Dollars | 1,304,000 | (28,079 | ) | |||||||
09/16/09 | U.S. Dollars | BAR | 904,025 | New Zealand Dollars | 1,408,000 | 10,386 | ||||||||
09/16/09 | U.S. Dollars | BAR | 1,370,824 | Switzerland Francs | 1,488,000 | 14,360 | ||||||||
09/16/09 | U.S. Dollars | BAR | 1,582,188 | Euro | 1,128,000 | (14,260 | ) | |||||||
09/16/09 | U.S. Dollars | BAR | 1,926,282 | United Kingdom Pounds | 1,171,000 | (36,446 | ) | |||||||
09/16/09 | U.S. Dollars | BAR | 2,131,111 | Japanese Yen | 205,115,000 | (24,711 | ) | |||||||
09/16/09 | U.S. Dollars | BAR | 5,352,524 | Canadian Dollars | 6,223,000 | 299,769 | ||||||||
09/16/09 | U.S. Dollars | BAR | 7,117,042 | Euro | 5,074,000 | 6,119 | ||||||||
09/16/09 | United Kingdom Pounds | BAR | 23,000 | U.S. Dollars | 37,835 | 89 | ||||||||
09/16/09 | United Kingdom Pounds | BAR | 153,000 | U.S. Dollars | 251,683 | (2,976 | ) | |||||||
09/16/09 | United Kingdom Pounds | BAR | 383,000 | U.S. Dollars | 630,031 | 5,708 | ||||||||
09/16/09 | United Kingdom Pounds | BAR | 1,156,000 | U.S. Dollars | 1,901,607 | 8,641 | ||||||||
09/16/09 | United Kingdom Pounds | BAR | 1,732,000 | U.S. Dollars | 2,849,120 | 65,069 | ||||||||
| $ | 147,921 | |||||||||||||
Options Written
Transactions in options written during the period ended June 30, 2009 were as follows:
Low-Duration Bond Fund | Number of Contracts | Notional Amount | Premiums Received | ||||||||
Options written, 12/31/08 | — | $ | 37,000,000 | $ | 3,687,541 | ||||||
Options written | 84 | 7,000,000 | 107,107 | ||||||||
Options expired | — | (37,000,000 | ) | (3,687,541 | ) | ||||||
Options closed | — | — | — | ||||||||
Options written, 06/30/09 | 84 | $ | 7,000,000 | $ | 107,107 | ||||||
Medium-Duration Bond Fund | Number of Contracts | Notional Amount | Premiums Received | ||||||||
Options written, 12/31/08 | 2 | $ | 73,200,000 | $ | 5,614,864 | ||||||
Options written | 162 | 30,000,000 | 86,936 | ||||||||
Options expired | (108 | ) | (56,600,000 | ) | (5,039,277 | ) | |||||
Options closed | — | (22,100,000 | ) | (623,220 | ) | ||||||
Options written, 06/30/09 | 56 | $ | 24,500,000 | $ | 39,303 | ||||||
Small Cap Equity Fund | Number of Contracts | Notional Amount | Premiums Received | ||||||||
Options written, 12/31/08 | 89 | $ | — | $ | 81,114 | ||||||
Options written | 126 | — | 96,702 | ||||||||
Options expired | (71 | ) | — | (69,410 | ) | ||||||
Options closed | (126 | ) | — | (92,461 | ) | ||||||
Options written, 06/30/09 | 18 | $ | — | $ | 15,945 | ||||||
163
Table of Contents
7. CAPITAL SHARE TRANSACTIONS
Transactions in shares of capital stock were as follows:
| Six Months Ended June 30, 2009 | Year Ended December 31, 2008 | |||||||||||
| GS4 | GS6 | GS4 | GS6 | |||||||||
MyDestination 2005 | ||||||||||||
Shares sold | 994,548 | 50,038 | 2,578,136 | 56,867 | ||||||||
Shares exchanged | 184,772 | (183,044 | ) | — | — | |||||||
Shares reinvested | 45,654 | 773 | 470,720 | 8,600 | ||||||||
Shares redeemed | (1,058,382 | ) | (19,104 | ) | (1,805,238 | ) | (55,337 | ) | ||||
Net increase (decrease) | 166,592 | (151,337 | ) | 1,243,618 | 10,130 | |||||||
MyDestination 2015 | ||||||||||||
Shares sold | 2,811,796 | 247,957 | 6,021,065 | 80,777 | ||||||||
Shares exchanged | 431,494 | (427,887 | ) | — | — | |||||||
Shares reinvested | 286,340 | 4,807 | 1,381,039 | 9,488 | ||||||||
Shares redeemed | (1,780,562 | ) | (6,551 | ) | (2,468,448 | ) | (56,916 | ) | ||||
Net increase (decrease) | 1,749,068 | (181,674 | ) | 4,933,656 | 33,349 | |||||||
MyDestination 2025 | ||||||||||||
Shares sold | 3,301,313 | 178,840 | 5,197,306 | 175,155 | ||||||||
Shares exchanged | 519,224 | (517,312 | ) | — | — | |||||||
Shares reinvested | 152,663 | 3,796 | 1,107,495 | 20,895 | ||||||||
Shares redeemed | (1,340,423 | ) | (1,813 | ) | (892,400 | ) | (61,065 | ) | ||||
Net increase (decrease) | 2,632,777 | (336,489 | ) | 5,412,401 | 134,985 | |||||||
MyDestination 2035 | ||||||||||||
Shares sold | 1,944,729 | 156,527 | 2,939,696 | 92,123 | ||||||||
Shares exchanged | 367,932 | (364,947 | ) | — | — | |||||||
Shares reinvested | 58,996 | 2,176 | 416,311 | 10,875 | ||||||||
Shares redeemed | (400,784 | ) | (1,335 | ) | (356,667 | ) | (31,178 | ) | ||||
Net increase (decrease) | 1,970,873 | (207,579 | ) | 2,999,340 | 71,820 | |||||||
MyDestination 2045 | ||||||||||||
Shares sold | 1,787,560 | 67,736 | 1,972,366 | 43,400 | ||||||||
Shares exchanged | 226,386 | (224,243 | ) | — | — | |||||||
Shares reinvested | 23,100 | 616 | 148,529 | 6,121 | ||||||||
Shares redeemed | (293,124 | ) | (4,681 | ) | (143,582 | ) | (10,397 | ) | ||||
Net increase (decrease) | 1,743,922 | (160,572 | ) | 1,977,313 | 39,124 | |||||||
164
Table of Contents
| Six Months Ended June 30, 2009 | Year Ended December 31, 2008 | |||||||||||
| GS4 | GS6 | GS4 | GS6 | |||||||||
Conservative Allocation Fund | ||||||||||||
Shares sold | 1,534,057 | 269,055 | 3,830,825 | 1,335,856 | ||||||||
Shares exchanged | 1,134,656 | (1,811,024 | ) | — | — | |||||||
Shares reinvested | 266,651 | 31,621 | 2,072,716 | 194,313 | ||||||||
Shares redeemed | (3,383,406 | ) | (30,545 | ) | (6,132,632 | ) | (1,625,132 | ) | ||||
Net (decrease) | (448,042 | ) | (1,540,893 | ) | (229,091 | ) | (94,963 | ) | ||||
Balanced Allocation Fund | ||||||||||||
Shares sold | 2,734,371 | 152,629 | 3,881,710 | 277,834 | ||||||||
Shares exchanged | 1,936,474 | (3,506,545 | ) | — | — | |||||||
Shares reinvested | 1,332,826 | 87,810 | 13,664,245 | 751,815 | ||||||||
Shares redeemed | (5,538,932 | ) | (20,612 | ) | (14,547,876 | ) | (250,354 | ) | ||||
Net increase (decrease) | 464,739 | (3,286,718 | ) | 2,998,079 | 779,295 | |||||||
Growth Allocation Fund | ||||||||||||
Shares sold | 2,165,033 | 237,995 | 3,068,016 | 311,761 | ||||||||
Shares exchanged | 1,254,537 | (2,246,107 | ) | — | — | |||||||
Shares reinvested | 650,082 | 33,305 | 10,412,402 | 442,625 | ||||||||
Shares redeemed | (4,319,360 | ) | (53,186 | ) | (9,482,818 | ) | (249,371 | ) | ||||
Net increase (decrease) | (249,708 | ) | (2,027,993 | ) | 3,997,600 | 505,015 | ||||||
Aggressive Allocation Fund | ||||||||||||
Shares sold | 3,048,378 | 111,653 | 3,141,389 | 134,125 | ||||||||
Shares exchanged | 1,515,794 | (2,573,184 | ) | — | — | |||||||
Shares reinvested | 582,183 | 37,558 | 10,394,753 | 571,773 | ||||||||
Shares redeemed | (2,746,814 | ) | (35,096 | ) | (7,577,349 | ) | (148,560 | ) | ||||
Net increase (decrease) | 2,399,541 | (2,459,069 | ) | 5,958,793 | 557,338 | |||||||
| GS2 | GS2 | |||||||||||
Conservative Allocation Fund I | ||||||||||||
Shares sold | 420,968 | 898,141 | ||||||||||
Shares reinvested | — | 458,199 | ||||||||||
Shares redeemed | (607,778 | ) | (1,390,576 | ) | ||||||||
Net (decrease) | (186,810 | ) | (34,236 | ) | ||||||||
Balanced Allocation Fund I | ||||||||||||
Shares sold | 1,058,692 | 2,176,193 | ||||||||||
Shares reinvested | — | 3,505,813 | ||||||||||
Shares redeemed | (1,711,225 | ) | (3,132,150 | ) | ||||||||
Net increase (decrease) | (652,533 | ) | 2,549,856 | |||||||||
Growth Allocation Fund I | ||||||||||||
Shares sold | 1,036,830 | 1,391,073 | ||||||||||
Shares reinvested | — | 2,776,308 | ||||||||||
Shares redeemed | (1,180,490 | ) | (2,236,325 | ) | ||||||||
Net increase (decrease) | (143,660 | ) | 1,931,056 | |||||||||
Aggressive Allocation Fund I | ||||||||||||
Shares sold | 729,412 | 881,962 | ||||||||||
Shares reinvested | — | 2,044,532 | ||||||||||
Shares redeemed | (605,151 | ) | (1,840,613 | ) | ||||||||
Net increase | 124,261 | 1,085,881 | ||||||||||
165
Table of Contents
| Six Months Ended June 30, 2009 | Year Ended December 31, 2008 | |||||||||||||||||
| GS2 | GS4 | GS6 | GS2 | GS4 | GS6 | |||||||||||||
Money Market Fund | ||||||||||||||||||
Shares sold | 63,311,251 | 1,403,201,931 | 1,365,914 | 174,901,124 | 4,070,538,152 | 3,546,545 | ||||||||||||
Shares exchanged | — | 9,761,236 | (9,761,137 | ) | — | — | — | |||||||||||
Shares reinvested | 507,209 | 1,881,273 | 7,898 | 3,367,839 | 16,558,522 | 154,558 | ||||||||||||
Shares redeemed | (67,952,180 | ) | (1,401,785,861 | ) | (421,233 | ) | (119,120,727 | ) | (4,056,623,451 | ) | (873,423 | ) | ||||||
Net increase (decrease) | (4,133,720 | ) | 13,058,579 | (8,808,558 | ) | 59,148,236 | 30,473,223 | 2,827,680 | ||||||||||
Low-Duration Bond Fund | ||||||||||||||||||
Shares sold | 1,013,832 | 3,428,100 | 30,894 | 1,544,065 | 5,832,714 | 68,587 | ||||||||||||
Shares exchanged | — | 489,313 | (723,673 | ) | — | — | — | |||||||||||
Shares reinvested | 268,114 | 572,220 | 12,328 | 924,880 | 2,084,429 | 38,993 | ||||||||||||
Shares redeemed | (2,456,213 | ) | (8,022,465 | ) | (9,054 | ) | (4,482,124 | ) | (16,505,332 | ) | (35,787 | ) | ||||||
Net increase (decrease) | (1,174,267 | ) | (3,532,832 | ) | (689,505 | ) | (2,013,179 | ) | (8,588,189 | ) | 71,793 | |||||||
Medium-Duration Bond Fund | ||||||||||||||||||
Shares sold | 765,332 | 2,448,901 | 20,156 | 3,207,707 | 7,021,197 | 87,296 | ||||||||||||
Shares exchanged | — | 1,213,587 | (2,078,297 | ) | — | — | — | |||||||||||
Shares reinvested | 659,016 | 1,419,329 | 66,716 | 2,156,956 | 5,171,411 | 227,556 | ||||||||||||
Shares redeemed | (1,714,048 | ) | (8,221,488 | ) | (24,765 | ) | (7,621,389 | ) | (30,536,247 | ) | (25,004 | ) | ||||||
Net increase (decrease) | (289,700 | ) | (3,139,671 | ) | (2,016,190 | ) | (2,256,726 | ) | (18,343,639 | ) | 289,848 | |||||||
Extended-Duration Bond Fund | ||||||||||||||||||
Shares sold | 507,568 | 1,094,477 | 8,130 | 1,689,108 | 1,932,832 | 24,149 | ||||||||||||
Shares exchanged | — | 1,233,982 | (2,593,714 | ) | — | — | — | |||||||||||
Shares reinvested | 569,713 | 695,864 | 104,274 | 1,461,454 | 2,130,785 | 328,365 | ||||||||||||
Shares redeemed | (1,940,709 | ) | (5,208,779 | ) | (7,292 | ) | (2,415,249 | ) | (9,446,049 | ) | (22,623 | ) | ||||||
Net increase (decrease) | (863,428 | ) | (2,184,456 | ) | (2,488,602 | ) | 735,313 | (5,382,432 | ) | 329,891 | ||||||||
Inflation Protected Bond Fund(1) | ||||||||||||||||||
Shares sold | 6,825,712 | |||||||||||||||||
Shares reinvested | — | |||||||||||||||||
Shares redeemed | — | |||||||||||||||||
Net increase | 6,825,712 | |||||||||||||||||
Global Bond Fund | ||||||||||||||||||
Shares sold | 1,539,762 | 12,869,898 | ||||||||||||||||
Shares reinvested | 939,422 | 1,740,619 | ||||||||||||||||
Shares redeemed | (2,821,101 | ) | (4,150,771 | ) | ||||||||||||||
Net increase (decrease) | (341,917 | ) | 10,459,746 | |||||||||||||||
Equity Index Fund | ||||||||||||||||||
Shares sold | 470,571 | 1,245,123 | 28,455 | 820,528 | 1,486,319 | 59,695 | ||||||||||||
Shares exchanged | — | 66,567 | (121,488 | ) | — | — | — | |||||||||||
Shares reinvested | 215,632 | 295,849 | 2,310 | 311,273 | 437,304 | 3,175 | ||||||||||||
Shares redeemed | (260,628 | ) | (908,808 | ) | (8,919 | ) | (1,027,162 | ) | (3,313,360 | ) | (22,137 | ) | ||||||
Net increase (decrease) | 425,575 | 698,731 | (99,642 | ) | 104,639 | (1,389,737 | ) | 40,733 | ||||||||||
| (1) | Inception date was June 25, 2009. |
166
Table of Contents
| Six Months Ended June 30, 2009 | Year Ended December 31, 2008 | |||||||||||||||||
| GS2 | GS4 | GS6 | GS2 | GS4 | GS6 | |||||||||||||
Real Estate Securities Fund | ||||||||||||||||||
Shares sold | 5,867,944 | 10,637,842 | ||||||||||||||||
Shares reinvested | 274,332 | 386,418 | ||||||||||||||||
Shares redeemed | (3,209,003 | ) | (6,384,635 | ) | ||||||||||||||
Net increase | 2,933,273 | 4,639,625 | ||||||||||||||||
Value Equity Fund | ||||||||||||||||||
Shares sold | 1,753,581 | 4,864,575 | 40,675 | 3,486,962 | 8,453,832 | 52,086 | ||||||||||||
Shares exchanged | — | 1,130,694 | (2,203,139 | ) | — | — | — | |||||||||||
Shares reinvested | 891,841 | 1,348,985 | 55,079 | 1,038,380 | 1,565,141 | 74,232 | ||||||||||||
Shares redeemed | (591,170 | ) | (4,967,680 | ) | (2,487 | ) | (3,826,610 | ) | (12,449,297 | ) | (16,490 | ) | ||||||
Net increase (decrease) | 2,054,252 | 2,376,574 | (2,109,872 | ) | 698,732 | (2,430,324 | ) | 109,828 | ||||||||||
Growth Equity Fund | ||||||||||||||||||
Shares sold | 1,221,111 | 3,648,747 | 18,948 | 2,871,383 | 8,033,364 | 30,730 | ||||||||||||
Shares exchanged | — | 692,725 | (1,126,367 | ) | — | — | — | |||||||||||
Shares reinvested | 43,921 | 71,463 | 255 | 89,784 | 126,685 | 372 | ||||||||||||
Shares redeemed | (1,001,484 | ) | (6,486,822 | ) | (5,975 | ) | (2,524,921 | ) | (10,808,932 | ) | (14,792 | ) | ||||||
Net increase (decrease) | 263,548 | (2,073,887 | ) | (1,113,139 | ) | 436,246 | (2,648,883 | ) | 16,310 | |||||||||
Small Cap Equity Fund | ||||||||||||||||||
Shares sold | 441,861 | 1,543,489 | 23,304 | 2,366,155 | 3,557,451 | 35,880 | ||||||||||||
Shares exchanged | — | 1,285,304 | (1,999,515 | ) | — | — | — | |||||||||||
Shares reinvested | 18,751 | 35,587 | 2,337 | 138,470 | 298,452 | 24,255 | ||||||||||||
Shares redeemed | (277,913 | ) | (1,795,562 | ) | (4,198 | ) | (2,394,207 | ) | (5,853,574 | ) | (10,548 | ) | ||||||
Net increase (decrease) | 182,699 | 1,068,818 | (1,978,072 | ) | 110,418 | (1,997,671 | ) | 49,587 | ||||||||||
International Equity Fund | ||||||||||||||||||
Shares sold | 1,841,209 | 7,392,858 | 31,617 | 8,764,143 | 19,289,876 | 62,220 | ||||||||||||
Shares exchanged | — | 1,687,592 | (2,207,195 | ) | — | — | — | |||||||||||
Shares reinvested | 256,189 | 715,782 | 19,754 | 2,467,529 | 6,721,576 | 193,967 | ||||||||||||
Shares redeemed | (3,117,785 | ) | (7,548,059 | ) | (10,746 | ) | (3,979,501 | ) | (9,340,113 | ) | (27,121 | ) | ||||||
Net increase (decrease) | (1,020,387 | ) | 2,248,173 | (2,166,570 | ) | 7,252,171 | 16,671,339 | 229,066 | ||||||||||
8. BANK BORROWINGS
On October 30, 2008, the Board of Trustees approved a credit agreement with Bank of America, N.A. dated December 3, 2008 through December 2, 2009. The agreement permits up to $50 million, collectively. Interest is charged to each Fund based on its borrowings at a rate equal to the Bank prime plus 0.60% or the Wall Street Journal LIBOR One Month Floating Rate plus 1.00%. Each Fund also pays a facility fee equal to its pro rata share of the amount of the credit facility at a rate of 0.30% per annum.
On March 4, 2009, the MyDestination 2005 Fund borrowed $250,000 at a rate of 1.49625%. The Fund repaid the loan in the amount of $250,007, which represents principal and one day of accrued interest, on March 5, 2009. On May 28, 2009, the MyDestination 2015 and MyDestination 2025 Funds borrowed a total of $3,250,000 at a rate of 1.31625%. The Funds repaid the loan in the amount of $3,250,119, which represents principal and one day of accrued interest, on May 29, 2009. No other Funds borrowed for the six months ended June 30, 2009, and there were no outstanding loans at June 30, 2009.
167
Table of Contents
9. FEDERAL INCOME TAXES
Each Fund’s policy is to comply with all sections of the Internal Revenue Code of 1986, as amended, that apply to regulated investment companies and to distribute substantially all of its taxable income to shareholders. No provision for income or excise taxes is thus required. Each Fund is treated as a separate entity for federal income tax purposes.
Net investment income (loss) and net realized gains (losses) may differ for financial statements and tax purposes primarily because of deferred losses on certain futures contracts and losses deferred due to “wash sale” transactions. The character of distributions made during the year from net investment income or net realized gains may differ from their ultimate characterization for federal income tax purposes. Also, due to the timing of dividend distributions, the fiscal year in which amounts are distributed may differ from the year that the income or realized gains (losses) were recorded by the Funds. Income dividends and capital gain distributions are determined in accordance with federal income tax regulations, which may differ from GAAP. These differences are primarily due to differing treatments for futures and options transactions, foreign currency transactions, paydowns, losses deferred due to wash sales and investments in Passive Foreign Investment Companies (“PFIC’s”). Distributions during the year ended December 31, 2008 were characterized as follows for tax purposes:
Fund | Ordinary Income | Long-Term Capital Gain | Return of Capital | ||||||
MyDestination 2005 | $ | 2,083,566 | $ | 1,504,355 | $ | — | |||
MyDestination 2015 | 4,008,790 | 5,518,766 | — | ||||||
MyDestination 2025 | 2,335,600 | 4,629,258 | — | ||||||
MyDestination 2035 | 630,615 | 1,856,236 | — | ||||||
MyDestination 2045 | 180,040 | 700,135 | — | ||||||
Conservative Allocation | 10,292,290 | 12,642,828 | — | ||||||
Balanced Allocation | 41,644,877 | 90,209,055 | — | ||||||
Growth Allocation | 21,830,650 | 73,173,462 | — | ||||||
Aggressive Allocation | 9,741,630 | 77,173,217 | — | ||||||
Conservative Allocation I | 2,530,981 | 1,163,656 | — | ||||||
Balanced Allocation I | 13,748,251 | 13,132,319 | — | ||||||
Growth Allocation I | 7,165,766 | 13,478,283 | — | ||||||
Aggressive Allocation I | 20 | 14,453,009 | — | ||||||
Money Market | 30,499,308 | — | — | ||||||
Low-Duration Bond | 34,110,052 | — | — | ||||||
Medium-Duration Bond | 81,631,018 | 2,832,789 | — | ||||||
Extended-Duration Bond | 38,263,627 | 2,890,924 | — | ||||||
Global Bond | 14,374,673 | 266,282 | — | ||||||
Equity Index | 6,439,050 | 2,678,739 | — | ||||||
Real Estate Securities | 2,388,143 | — | 99,004 | ||||||
Value Equity | 20,928,040 | 7,704,593 | — | ||||||
Growth Equity | 2,419,165 | — | — | ||||||
Small Cap Equity | 2,699,065 | 1,846 | 741,208 | ||||||
International Equity | 42,815,653 | 39,117,934 | — | ||||||
168
Table of Contents
At December 31, 2008, the components of distributable earnings on a tax basis were as follows:
Fund | Undistributed Ordinary Income | Undistributed Long-Term Capital Gain/ (Capital Loss Carryforward) | Post-October Loss Deferral | Net Unrealized Appreciation (Depreciation) on Investments | |||||||||||
MyDestination 2005 | $ | 101,730 | $ | (42,414 | ) | $ | — | $ | (19,247,610 | ) | |||||
MyDestination 2015 | 1,381,316 | (889,637 | ) | — | (70,456,057 | ) | |||||||||
MyDestination 2025 | 608,702 | (31,687 | ) | — | (56,909,902 | ) | |||||||||
MyDestination 2035 | 185,808 | 124,488 | — | (23,141,954 | ) | ||||||||||
MyDestination 2045 | 127,784 | 4,334 | — | (9,495,015 | ) | ||||||||||
Conservative Allocation | 6,254 | 1,080,889 | — | (19,698,703 | ) | ||||||||||
Balanced Allocation | — | 6,797,379 | — | (231,929,322 | ) | ||||||||||
Growth Allocation | — | 3,868,509 | — | (221,602,148 | ) | ||||||||||
Aggressive Allocation | — | 4,784,388 | — | (240,154,545 | ) | ||||||||||
Conservative Allocation I | 705,587 | (650,405 | ) | — | (13,926,014 | ) | |||||||||
Balanced Allocation I | 5,275,545 | (4,262,186 | ) | — | (110,615,628 | ) | |||||||||
Growth Allocation I | 1,465,194 | (412,556 | ) | — | (90,581,706 | ) | |||||||||
Aggressive Allocation I | 3,253,345 | (3,489,043 | ) | — | (79,815,110 | ) | |||||||||
Money Market | 84,502 | — | — | — | |||||||||||
Low-Duration Bond | 1,544,710 | (7,356,071 | ) | (1,971,733 | ) | (57,708,645 | ) | ||||||||
Medium-Duration Bond | 7,822,937 | — | (3,952,447 | ) | (124,816,470 | ) | |||||||||
Extended-Duration Bond | — | 651,104 | (324,537 | ) | (57,639,431 | ) | |||||||||
Global Bond | 1,495,654 | (705,051 | ) | (1,784,324 | ) | (58,052,503 | ) | ||||||||
Equity Index | 1,622,559 | (1,612,695 | ) | (1,178,253 | ) | (54,644,915 | ) | ||||||||
Real Estate Securities | — | (12,320,254 | ) | (23,080,864 | ) | (40,008,172 | ) | ||||||||
Value Equity | 7,752,269 | (73,270,784 | ) | (45,682,715 | ) | (359,683,765 | ) | ||||||||
Growth Equity | 49,558 | (45,483,748 | ) | (57,189,899 | ) | (285,155,634 | ) | ||||||||
Small Cap Equity | — | (69,003,843 | ) | (18,488,881 | ) | (97,580,240 | ) | ||||||||
International Equity | 1,194,012 | 5,380 | (61,018,376 | ) | (415,621,820 | ) | |||||||||
Post-October loss deferrals have been included in undistributed ordinary income and undistributed long-term capital gains, depending upon the character of the loss deferral.
For federal income tax purposes, capital loss carryovers and their expiration dates, were as follows as of December 31, 2008:
| Expiring December 31, | 2011 | 2014 | 2016 | Total | ||||||||
MyDestination 2005 | $ | — | $ | — | $ | 42,414 | $ | 42,414 | ||||
MyDestination 2015 | — | — | 889,637 | 889,637 | ||||||||
MyDestination 2025 | — | — | 31,687 | 31,687 | ||||||||
Conservative Allocation I | — | — | 650,405 | 650,405 | ||||||||
Balanced Allocation I | — | — | 4,262,186 | 4,262,186 | ||||||||
Growth Allocation I | — | — | 412,556 | 412,556 | ||||||||
Aggressive Allocation I | — | — | 3,489,043 | 3,489,043 | ||||||||
Low-Duration Bond | — | 7,356,071 | — | 7,356,071 | ||||||||
Global Bond | — | — | 705,051 | 705,051 | ||||||||
Equity Index | — | — | 1,612,695 | 1,612,695 | ||||||||
Real Estate Securities | — | — | 12,320,254 | 12,320,254 | ||||||||
Value Equity | — | — | 73,270,784 | 73,270,784 | ||||||||
Growth Equity | 45,483,748 | — | — | 45,483,748 | ||||||||
Small Cap Equity | — | — | 69,003,843 | 69,003,843 | ||||||||
169
Table of Contents
For federal income tax purposes, post-October loss deferrals, which will reverse in 2009, were as follows as of December 31, 2008:
| Capital | FX | Total | |||||||
Low-Duration Bond | $ | 1,971,733 | $ | — | $ | 1,971,733 | |||
Medium-Duration Bond | 3,641,503 | 310,944 | 3,952,447 | ||||||
Extended-Duration Bond | 269,062 | 55,475 | 324,537 | ||||||
Global Bond | 1,784,324 | — | 1,784,324 | ||||||
Equity Index | 1,178,253 | — | 1,178,253 | ||||||
Real Estate Securities | 23,080,864 | — | 23,080,864 | ||||||
Value Equity | 45,682,715 | — | 45,682,715 | ||||||
Growth Equity | 57,178,886 | 11,013 | 57,189,899 | ||||||
Small Cap Equity | 18,459,779 | 29,102 | 18,488,881 | ||||||
International Equity | 61,018,376 | — | 61,018,376 | ||||||
At June 30, 2009, the aggregate cost of investment securities for federal income tax purposes (excluding foreign currency, securities sold short and derivative related items) and the net unrealized appreciation from investments for those securities having an excess of value over cost and net unrealized depreciation from investments for those securities having an excess of cost over value (based on cost for federal income tax purposes) were as follows:
Fund | Federal Tax Cost | Net Unrealized Appreciation (Depreciation) | Appreciated Securities | Depreciated Securities | ||||||||||
MyDestination 2005 | $ | 67,506,182 | $ | (12,606,641 | ) | $ | — | $ | (12,606,641 | ) | ||||
MyDestination 2015 | 221,669,120 | (56,118,941 | ) | — | (56,118,941 | ) | ||||||||
MyDestination 2025 | 164,666,289 | (45,774,336 | ) | — | (45,774,336 | ) | ||||||||
MyDestination 2035 | 71,442,878 | (19,959,809 | ) | — | (19,959,809 | ) | ||||||||
MyDestination 2045 | 35,951,820 | (7,028,311 | ) | — | (7,028,311 | ) | ||||||||
Conservative Allocation | 269,649,301 | (14,181,987 | ) | 2,382,667 | (16,564,654 | ) | ||||||||
Balanced Allocation | 1,137,686,403 | (172,395,071 | ) | — | (172,395,071 | ) | ||||||||
Growth Allocation | 883,397,553 | (180,141,396 | ) | — | (180,141,396 | ) | ||||||||
Aggressive Allocation | 805,387,188 | (212,081,268 | ) | — | (212,081,268 | ) | ||||||||
Conservative Allocation I | 65,070,228 | (8,463,332 | ) | — | (8,463,332 | ) | ||||||||
Balanced Allocation I | 364,821,830 | (90,150,813 | ) | — | (90,150,813 | ) | ||||||||
Growth Allocation I | 251,314,399 | (79,645,254 | ) | — | (79,645,254 | ) | ||||||||
Aggressive Allocation I | 189,610,761 | (72,806,469 | ) | — | (72,806,469 | ) | ||||||||
Money Market | 1,243,562,141 | — | — | — | ||||||||||
Low-Duration Bond | 707,438,695 | (34,430,151 | ) | 9,168,883 | (43,599,034 | ) | ||||||||
Medium-Duration Bond | 1,139,632,777 | (88,252,921 | ) | 18,211,341 | (106,464,262 | ) | ||||||||
Extended-Duration Bond | 445,237,109 | (22,508,791 | ) | 15,065,485 | (37,574,276 | ) | ||||||||
Inflation Protected Bond | 65,417,206 | 545,358 | 547,268 | (1,910 | ) | |||||||||
Global Bond | 228,795,343 | (27,895,355 | ) | 3,202,240 | (31,097,595 | ) | ||||||||
Equity Index | 382,200,312 | (46,267,840 | ) | 50,650,441 | (96,918,281 | ) | ||||||||
Real Estate Securities | 128,010,445 | (16,910,672 | ) | — | (16,910,672 | ) | ||||||||
Value Equity | 1,370,114,714 | (302,876,105 | ) | 22,840,074 | (325,716,179 | ) | ||||||||
Growth Equity | 1,184,248,503 | (55,162,674 | ) | 30,409,349 | (85,572,023 | ) | ||||||||
Small Cap Equity | 442,152,678 | (29,535,809 | ) | 20,640,518 | (50,176,327 | ) | ||||||||
International Equity | 1,410,219,254 | (143,858,336 | ) | 26,957,065 | (170,815,401 | ) | ||||||||
The differences between book basis and tax-basis unrealized appreciation is attributable primarily to the tax deferral of losses on wash sales and on investments in PFIC’s.
170
Table of Contents
At December 31, 2008, capital contributions, accumulated undistributed net investment income and accumulated net realized gain (loss) from investments have been adjusted for current period permanent book/tax differences which arose principally from differing book/tax treatments of paydown gains, net operating losses and foreign currency transactions. The following amounts were reclassified within the capital accounts:
Fund | Paid in Capital | Accumulated Undistributed Income | Accumulated Net Realized Gain (Loss) on Investments, Currency Translations and Derivative Transactions | ||||||||
MyDestination 2005 | $ | — | $ | 226,191 | $ | (226,191 | ) | ||||
MyDestination 2015 | — | 509,565 | (509,565 | ) | |||||||
MyDestination 2025 | — | 259,169 | (259,169 | ) | |||||||
MyDestination 2035 | — | 26,799 | (26,799 | ) | |||||||
MyDestination 2045 | — | 47 | (47 | ) | |||||||
Conservative Allocation | — | (1,317 | ) | 1,317 | |||||||
Balanced Allocation | — | 6,029,808 | (6,029,808 | ) | |||||||
Growth Allocation | — | 2,316,162 | (2,316,162 | ) | |||||||
Aggressive Allocation | — | (1,080 | ) | 1,080 | |||||||
Conservative Allocation I | — | (590 | ) | 590 | |||||||
Balanced Allocation I | — | 2,773,325 | (2,773,325 | ) | |||||||
Growth Allocation I | — | 911,960 | (911,960 | ) | |||||||
Aggressive Allocation I | — | 380 | (380 | ) | |||||||
Money Market | — | 84,502 | (84,502 | ) | |||||||
Low-Duration Bond | — | 3,971,996 | (3,971,996 | ) | |||||||
Medium-Duration Bond | — | 5,487,420 | (5,487,420 | ) | |||||||
Extended-Duration Bond | — | 1,252,246 | (1,252,246 | ) | |||||||
Global Bond | — | 1,515,962 | (1,515,962 | ) | |||||||
Equity Index | — | (2,066 | ) | 2,066 | |||||||
Real Estate Securities | — | — | — | ||||||||
Value Equity | — | (8,811 | ) | 8,811 | |||||||
Growth Equity | — | 3,395 | (3,395 | ) | |||||||
Small Cap Equity | — | 34,447 | (34,447 | ) | |||||||
International Equity | — | 5,455,380 | (5,455,380 | ) | |||||||
Net investment income, net realized gain (loss) on investments and net assets were not affected by these reclassifications.
The Financial Accounting Standards Board (“FASB”) Interpretation No. 48, (“FIN 48”) Accounting for Uncertainty in Income Taxes, sets forth a minimum threshold for financial statement recognition of the benefit of a tax position taken or expected to be taken in a tax return. Management has analyzed the Funds’ tax positions and has concluded that no provision for income tax is required in the Funds’ financial statements. The Funds are not aware of any tax positions for which it is reasonably possible that the total amounts of unrecognized tax benefits will significantly change in the next twelve months. However, management’s conclusions regarding the adoption of FIN 48 may be subject to review and adjustment at a later date based on factors including, but not limited to, further implementation guidance from the FASB, new tax laws, regulations and administrative interpretations (including court decisions). Each of the Funds’ federal tax returns for the prior three fiscal years remains subject to examination by the Internal Revenue Service.
10. LEHMAN BROTHERS
On September 15, 2008, Lehman Brothers Holdings Inc. filed for protection under Chapter 11 of the United States Bankruptcy Code. On September 19, 2008, a proceeding under the Securities Investor Protection Act (SIPA) was commenced with respect to Lehman Brothers Inc., a broker-dealer. A trustee appointed under SIPA is administering the bankruptcy estate of Lehman Brothers Inc. Lehman Brothers International (Europe) was placed in administration under the UK Insolvency Act on September 15, 2008. Lehman Brothers Special Financing Inc. filed for protection under Chapter 11 of the United States Bankruptcy Code on October 3, 2008. In connection with these filings, the Lehman Brothers group of companies (collectively “Lehman Brothers”) will be reorganized and/or liquidated in an orderly fashion, subject to court approval. Each Lehman Brothers entity is a separate legal entity that is subject to its own bankruptcy proceeding.
171
Table of Contents
The Low-Duration Bond, Medium-Duration Bond, Global Bond and Small Cap Equity Funds had select holdings, credit default swap agreements, and securities and derivatives transactions outstanding with Lehman Brothers entities as issuer, referenced entity, counterparty or guarantor at the time the relevant Lehman Brothers entity filed for protection or was placed in administration. The security holdings, credit default swap agreements, and securities and derivatives transactions associated with Lehman Brothers have been written down to their estimated recoverable values. Anticipated losses for securities and derivatives transactions associated with Lehman Brothers have been incorporated as components of other receivables on the Statement of Assets and Liabilities and net changes in unrealized appreciation (depreciation) on the Statement of Operations. A facilitated auction occurred on October 10, 2008 comprising multiple pre-approved brokerage agencies to determine the estimated recovery rate for holdings and credit default swap agreements with Lehman Brothers Holdings Inc. as referenced entity. These recovery rates have been utilized in determining estimated recovery values. Claims against Lehman Brothers, Inc. and Lehman Brothers International (Europe) have been filed on behalf of GuideStone Funds.
The Funds’ Sub-Advisers, on behalf of GSCM, have delivered notices of default to the relevant Lehman Brothers entities in accordance with the terms of the applicable agreements. For transactions with Lehman Brothers counterparties, the Sub-Advisers have terminated the trades, have obtained quotations from brokers for replacement trades and, where deemed appropriate, have re-opened positions with new counterparties.
11. U.S. TREASURY DEPARTMENT TEMPORARY GUARANTEE PROGRAM
The Money Market Fund participates in the U.S. Department of the Treasury (the “Treasury”) Temporary Guarantee Program for Money Market Funds (the “Program”). Under the Program, the Treasury will guarantee the share price of the shares of the Fund held by shareholders as of the close of business on September 19, 2008, at $1.00 for each share of the Fund, if the Fund’s net asset value per share falls below $0.995 (a “Guarantee Event”) and the Fund liquidates. Shareholders who held shares of the Fund on September 19, 2008, are provided a guarantee for the lesser of: (a) the number of shares owned by the shareholder at the close of September 19, 2008; or (b) the number of shares owned by the shareholder on the date of a Guarantee Event. The Program does not apply to shareholders who were not shareholders of the Fund as of the close of business on September 19, 2008. The Fund will bear the expense of its participation in the program without regard to any expense limitation currently in effect. The Program is scheduled to expire on September 18, 2009.
12. NEW ACCOUNTING PRONOUNCEMENTS
In April 2009, FASB issued Statement No. 157-4, “Determining Fair Value When the Volume and Level of Activity for the Asset or Liability Have Significantly Decreased and Identifying Transactions That Are Not Orderly” (“FAS 157-4”), an amendment to FASB Statement No. 157. FAS 157-4 is intended to provide additional guidance for estimating fair value in accordance with FASB Statement No. 157, Fair Value Measurements, when the volume and level of trade activity for the asset or liability have significantly decreased. FAS 157-4 is effective for financial statements issued for fiscal years and interim periods ending after June 15, 2009. The adoption of Statement 157-4 did not have an impact on the amounts reported in the financial statements.
In May 2009, FASB issued Statement No. 165, “Subsequent Events” (“FAS 165”). FAS 165 establishes general standards of accounting for and disclosure of events that occur after the balance sheet date but before financial statements are issued or are available to be issued. It requires the disclosure of the date through which an entity has valuated subsequent events and the basis for that date — that is, whether that date represents the date the financial statements were issued or were available to be issued.
172
Table of Contents
This disclosure is intended to alert all users of financial statements that an entity has not evaluated subsequent events after that date in the set of financial statements being presented. FAS 165 is effective for interim and annual periods ending after June 15, 2009. The adoption of FAS 165 did not have a material impact on the amounts reported in the financial statements.
In June, 2009 FASB issued Statement No. 166 “Accounting for Transfers of Financial Assets” (“FAS 166”), an amendment to FASB Statement No. 140. FAS 166 is intended to improve the relevance, representational faithfulness, and comparability of the information that a reporting entity provides in its financial statements about a transfer of financial assets; the effects of a transfer on its financial position, financial performance, and cash flows; and a transferor’s continuing involvement, if any, in transferred financial assets. FAS 166 is effective for financial statements issued for fiscal years and interim periods beginning after November 15, 2009. Management is currently evaluating the implications of Statement 166. The impact on the Funds’ financial statement disclosures, if any, is currently being assessed.
13. SUBSEQUENT EVENTS
Subsequent events have been evaluated through August 27, 2009, the date that the financial statements were available to be issued. All subsequent events determined to be relevant and material to the financial statements have been appropriately recorded or disclosed.
173
Table of Contents
Information pertaining to the Trustees and officers of the Trust is set forth below. The statement of additional information (SAI) includes additional information about the Trustees and is available without charge, upon request, by calling 1-888-98-GUIDE.
Name, (DOB), Address and Position(s) | Term of Office | Principal Occupation(s) During Past 5 Years | Number of Portfolios in Fund Complex Overseen by Trustee | Other Trusteeships/Directorships Held by Trustee | ||||
| DISINTERESTED TRUSTEES | ||||||||
Michael R. Buster (1957) 2401 Cedar Springs Road Dallas, TX 75201-1407 Trustee | Since 2002 | Executive Pastor, Prestonwood Baptist Church, 1989 - present. | 25 | N/A | ||||
Peter L. Chamberlain, Ph.D. (1951) 2401 Cedar Springs Road Dallas, TX 75201-1407 Trustee | Since 2008 | Senior Financial Analyst, Summit Wealth Management, Inc., 2006 – present; President, B.R. Chamberlain & Sons, Inc., 1990 – 2006, Registered Investment Adviser. | 25 | First Baptist Church of Orlando – Board of Trustee Member and Strategy Team; Rollins College Board of Overseers/Corporate Council – Member; the B.R. Chamberlain Foundation for Public Entertainment – President. | ||||
Julie P. Fry (1956) 2401 Cedar Springs Road Dallas, TX 75201-1407 Trustee | Since 2007 | Chief Operating Officer, Salmon, Sims, Thomas & Associates, PLLC, 1996 - present | 25 | National Charity League, DFW Metroport Chapter — Past President | ||||
William Craig George (1958) 2401 Cedar Springs Road Dallas, TX 75201-1407 Trustee | Since 2004 | Regional loan administrator, SunTrust Bank, 1995 - present. | 25 | N/A | ||||
Joseph A. Mack (1939) 2401 Cedar Springs Road Dallas, TX 75201-1407 Trustee | Since 2002 | Director, Office of Public Policy, South Carolina Baptist Convention, 1999 - Present. | 25 | N/A | ||||
Franklin Raymond Morgan (1943) 2401 Cedar Springs Road Dallas, TX 75201-1407 Trustee | Since 2005 | Retired - Senior Vice President, Director of International Administration, Prudential Securities, Inc., January 1962 - May 2003. | 25 | N/A | ||||
| INTERESTED TRUSTEES2 | ||||||||
Barry Hartis (1945) 2401 Cedar Springs Road Dallas, TX 75201-1407 Trustee | Since 2005 | Certified Public Accountant, 1976 - present; Vice President of Business and Finance, Greensboro College, January 1998 - June 30, 2005. | 25 | N/A | ||||
Gerald B. Jones (1932) 2401 Cedar Springs Road Dallas, TX 75201-1407 Trustee | Since 2000 | President, Flying Investments, November 2006 - present. Owner Jones Motorcars, Inc. 1957 - October 2006. | 25 | Bank of Arkansas — Director | ||||
174
Table of Contents
FUND MANAGEMENT (Continued)
Name, (DOB), Address and Position(s) | Term of Office | Principal Occupation(s) During Past 5 Years | Number of Portfolios in Fund Complex Overseen by Trustee | Other Trusteeships/Directorships Held by Trustee | ||||
| OFFICERS WHO ARE NOT TRUSTEES3 | ||||||||
Ron W. Bass (1966) 2401 Cedar Springs Road Dallas, TX 75201-1407 Chief Compliance Officer and AML Officer | Since 2009 | Manager of Broker/Dealer and RIA Compliance, GuideStone Financial Resources of the Southern Baptist Convention, 2008 – present; Marketing Compliance Manager, GuideStone Financial Resources of the Southern Baptist Convention, 2005 – present; Compliance Specialist, GuideStone Financial Resources of the Southern Baptist Convention, 2000 – 2006. | N/A | N/A | ||||
Jeffrey P. Billinger (1946) 2401 Cedar Springs Road Dallas, TX 75201-1407 Vice President and Treasurer | Since 2000 | Executive Officer and Treasurer, GuideStone Financial Resources of the Southern Baptist Convention, 1995 - present. | N/A | N/A | ||||
Rodric E. Cummins (1957) 2401 Cedar Springs Road Dallas, TX 75201-1407 Vice President and Investment Officer | Since 2000 | Executive Officer and Chief Investment Officer, GuideStone Financial Resources of the Southern Baptist Convention, 1998 - present. | N/A | N/A | ||||
John R. Jones (1953) 2401 Cedar Springs Road Dallas, TX 75201-1407 President | Since 2000 | Executive Vice President and Chief Operating Officer, GuideStone Financial Resources of the Southern Baptist Convention, 1995 - present. | N/A | N/A | ||||
Rodney R. Miller (1953) 2401 Cedar Springs Road Dallas, TX 75201-1407 Vice President, Secretary and Chief Legal Officer | Since 2000 | General Counsel, Legal and Compliance, GuideStone Financial Resources of the Southern Baptist Convention, 1995 - present. | N/A | N/A | ||||
Patricia A. Weiland (1959) 2401 Cedar Springs Road Dallas, TX 75201-1407 Vice President — Fund Operations and Sales | Since 2000 | Executive Officer, Financial Solutions and Services, GuideStone Financial Resources of the Southern Baptist Convention, 2006 - present; Director, Mutual Funds, GuideStone Financial Resources of the Southern Baptist Convention, 2000 - 2006. | N/A | N/A | ||||
| 1 | Each Trustee serves for an indefinite term, until his/her successor is elected. Officers serve at the pleasure of the Board of Trustees. |
| 2 | Messrs. Gerald Jones and Hartis serve as trustees and are to be “interested persons” of the Trust as the term is defined in the Investment Company Act of 1940, due to their positions on the Board of Trustees of GuideStone Financial Resources of the Southern Baptist Convention. |
| 3 | The executive officers of the Trust may be deemed to be affiliates of the Adviser due to their positions with the Adviser and/or GuideStone Financial Resources. |
175
Table of Contents
PROXY VOTING
A description of the policies and procedures that GuideStone Funds uses to determine how to vote proxies relating to their portfolio securities as well as information regarding how GuideStone Funds voted proxies during the most recent 12-month period ended June 30 is available without charge by calling 1-888-98-GUIDE, by visiting our Web site at www.GuideStoneFunds.org or by visiting the SEC’s Web site at www.sec.gov.
QUARTERLY SCHEDULES OF INVESTMENTS
In addition to the semi-annual and annual reports that GuideStone Funds delivers to shareholders and makes available through its Web site, GuideStone Funds files a complete schedule of portfolio holdings with the U.S. Securities and Exchange Commission (SEC) for each Fund’s first and third fiscal quarters on Form N-Q. GuideStone Funds does not deliver the schedule for the first and third fiscal quarters to shareholders, however the schedule is posted to our Web site, www.GuideStoneFunds.org. You may also obtain the Form N-Q filings by accessing the SEC’s Web site at www.sec.gov or copy them at the SEC’s Public Reference Room in Washington, DC. Information on the operation of the SEC’s Public Reference Room may be obtained by calling the SEC at (800) 732-0330. You can also request copies of this information, upon payment of a fee for duplication, at the SEC’s email address (publicinfo@sec.gov) or by writing the Public Reference section of the SEC, Washington, DC 20549-0102.
176
Table of Contents
BOARD REVIEW OF NEW SUB-ADVISORY AGREEMENTS FOR SMALL CAP EQUITY FUND AND INTERNATIONAL EQUITY FUND
As required by the Investment Company Act of 1940, as amended (the “1940 Act”), the Board of Trustees (the “Board”) of GuideStone Funds (the “Trust”), including all of the Trustees who are not “interested persons” of the Trust, as that term is defined in the 1940 Act (the “Independent Trustees”), considered the approval of a new Sub-Advisory Agreement among: GuideStone Capital Management (“GSCM” or “Adviser”), Columbus Circle Investors (“CCI”) and the Trust on behalf of the Small Cap Equity Fund. The Board approved the new sub-advisory agreement (the “New Sub-Advisory Agreement”) for an initial two-year term at the meeting of the Board held on February 26, 2009. Also, at the Board meeting held on February 26, 2009, the Board approved an amendment to the fee schedule for the sub-advisory agreement with Mondrian Investment Partners Ltd. (“Mondrian”) (“Mondrian Amended Fee Schedule”) and the Trust on behalf of the International Equity Fund. The Board’s decision to approve the New Sub-Advisory Agreement and the Mondrian Amended Fee Schedule reflects the exercise of its business judgment to enter into new or amended sub-advisory arrangements. In approving the New Sub-Advisory Agreement and the Mondrian Amended Fee Schedule, the Board considered information provided by the Adviser, CCI and Mondrian with the assistance and advice of counsel to the Independent Trustees and counsel to the Trust.
With respect to the Small Cap Equity Fund, the Board’s consideration of various factors and its conclusions with respect to such factors formed the basis for the Board’s determination to approve the New Sub-Advisory Agreement. The factors considered by the Board included, but were not limited to: (i) the resources of CCI; (ii) the experience and expertise of CCI; (iii) the financial capability of CCI; (iv) the compliance procedures and history of CCI; (v) the performance of similarly managed funds and accounts in comparison to relevant benchmarks for the Small Cap Equity Fund; (vi) the amount of the contractual sub-advisory fee in comparison to similarly managed funds and CCI’s other similarly situated clients and the effect of any fee waiver and expense reimbursement arrangement; (vii) the total expenses of the Small Cap Equity Fund in comparison to similarly managed funds and the use of past and anticipated expense caps; (viii) the anticipated profitability of CCI with respect to the Small Cap Equity Fund and its overall business; (ix) the extent of any anticipated economies of scale and whether the fee structure reflects such economies of scale; (x) the existence of any collateral benefits to be realized by CCI; and (xi) the existence of any collateral benefits to be realized by the Small Cap Equity Fund. No one factor was determinative in the Board’s consideration of the New Sub-Advisory Agreement.
The Board undertook a review of the terms of the New Sub-Advisory Agreement and the Mondrian Amended Fee Schedule, the nature and quality of the services to be provided by CCI and the proposed fee changes to Mondrian. The Adviser provided the Board with substantial detailed information in the form of reports about CCI prior to the meeting which addressed most, if not all, of the factors listed previously. The Adviser also provided additional information about CCI in a presentation made during the meeting, discussed the comprehensive screening process used to recommend CCI and responded to questions from the Board. The Adviser also provided the Board with details regarding the proposed new fees to be charged under the Mondrian Amended Fee Schedule. In addition, the Independent Trustees met separately in executive session with counsel to the Independent Trustees to discuss and consider information presented in connection with the approval of the New Sub-Advisory Agreement and the Mondrian Amended Fee Schedule as well as the Board’s responsibilities and duties in approving each agreement.
APPROVAL OF NEW SUB-ADVISORY AGREEMENTS FOR SMALL CAP EQUITY FUND AND INTERNATIONAL EQUITY FUND
In considering the approval of the New Sub-Advisory Agreement for the Small Cap Equity Fund, the Board took into account the materials provided prior to and during the meeting, the presentations made during the meeting and the extensive discussions during the meeting, including the discussions the Independent Trustees had during their executive session with their independent legal counsel. The Board considered their responsibilities with respect to reviewing and approving the terms of the New Sub-Advisory Agreement, the investment management team at CCI, the reasonableness of the sub-advisory fees and whether the appointment would be reasonable and fair to the Small Cap Equity Fund and its shareholders. The Board reviewed the factors that they should consider in evaluating whether to approve the New Sub-Advisory Agreement and the materials provided to support each factor.
177
Table of Contents
More specifically, the Board examined the nature, extent and quality of the services to be provided by CCI. The Board evaluated CCI’s experience and noted that CCI currently provides investment advice to various clients, including the Growth Equity Fund, another series of the Trust. The Board noted the experience of key personnel at CCI in providing investment management services and systems used by such persons and the ability of the sub-adviser to attract and retain capable personnel. The Board noted the reputation, compliance history and compliance program of CCI. The Board also noted the terms of the New Sub-Advisory Agreement and the responsibilities that CCI would have as a sub-adviser to the Small Cap Equity Fund, including the responsibility of the day-to-day management of an investment portfolio of the Small Cap Equity Fund, compliance with the Small Cap Equity Fund’s policies and objective and the implementation of Board directives as they relate to the Small Cap Equity Fund. The Board concluded that the Small Cap Equity Fund is likely to benefit from the extent and quality of these services as a result of the sub-adviser’s experience, personnel, operations and resources.
The Board considered information about the potential of CCI to contribute economies of scale as the Small Cap Equity Fund grows in size. The Board noted that the Adviser had been able to negotiate fees that were favorable compared to CCI’s stated fee schedules. The Board noted that CCI’s fee schedule incorporates fee breakpoints, and given the proposed allocation of assets to CCI, one future breakpoint would be available to the Small Cap Equity Fund as assets increase in market value. The Board also noted that CCI provided an estimate of its anticipated profitability with respect to the Small Cap Equity Fund based upon overall profitability as an investment advisory firm.
The Board noted that the Small Cap Fund’s aggregate sub-advisory fee would not increase as a result of the appointment of CCI. However, the Board recognized that the Small Cap Equity Fund’s aggregate sub-advisory fee was effectively reduced on a temporary basis during the period when the Small Cap Equity Fund held a position in exchange-traded funds. The Board noted that the Small Cap Equity Fund, and not the Adviser, would pay fees to CCI directly; therefore, the appointment of CCI would not affect the profitability of the Adviser. The Board noted that the management fee for the Small Cap Equity Fund would continue to be competitive with fees paid by other mutual funds to other advisers.
The Board considered potential “fall-out” or ancillary benefits anticipated to be received by CCI and its affiliates as a result of its arrangements with the Small Cap Equity Fund. The Board concluded that any potential benefits to be derived by CCI included potential access to additional research resources, larger assets under management and reputational benefits, which were consistent with those generally derived by sub-advisers to mutual funds.
The Board considered the investment strategy proposed to be implemented by CCI with respect to approximately 12% of the Small Cap Equity Fund’s assets, and the Adviser’s assessment that the strategy would enhance the Small Cap Equity Fund’s core to high-growth oriented exposure and offers the potential for increased returns. The Board also considered the favorable past performance history of the investment strategy relative to the benchmark index and to the peer universe. The Board noted that the proposed investment strategy outperformed its benchmark, the Russell 2000® Growth Index, over each of the past four calendar year periods. The Board further noted that the proposed investment strategy was ranked in the top quartile among its peer universe during each of the one- through five-year periods ended December 31, 2008.
The Board considered the Adviser’s assessment of CCI’s financial condition. The Board noted that the Adviser, after reviewing certain financial information provided by CCI, felt comfortable that CCI was financially sound.
In considering the approval of the Mondrian Amended Fee Schedule for the International Equity Fund, the Board took into account the information provided by the Adviser at the February 26, 2009, Board meeting. The Board noted the addition of a breakpoint that could potentially lower fees payable to Mondrian, and thus benefit shareholders, if Mondrian’s assigned portion of the International Equity Fund rose above $500,000,000, and that all of the factors that the Board previously considered when renewing the contract at its September 11, 2008, meeting were still applicable.
178
Table of Contents
Based on all of the information presented to the Board and its consideration of relevant factors, the Board, in the exercise of its reasonable business judgment, determined to approve the New Sub-Advisory Agreement and the Mondrian Amended Fee Schedule.
BOARD REVIEW OF NEW INVESTMENT ADVISORY AND SUB-ADVISORY AGREEMENTS FOR INFLATION PROTECTED BOND FUND
As required by the 1940 Act, the Board, including all of the Independent Trustees, considered the approval of the advisory agreement between: GSCM and the Trust on behalf of the Inflation Protected Bond Fund (the “New Fund”) (the “New Advisory Agreement”) and the approval of the new sub-advisory agreement between: GSCM, BlackRock Financial Management, Inc. (“BFM”) and the Trust on behalf of the New Fund (the “Sub-Advisory Agreement”). At the Board meeting held on May 18 – 19, 2009, the New Advisory Agreement was approved for a one-year term and the Sub-Advisory Agreement was approved for a two-year term. The Board’s decision to approve the New Advisory Agreement and the Sub-Advisory Agreement reflects the exercise of its business judgment to enter into new advisory and sub-advisory arrangements. In approving the New Advisory Agreement and the Sub-Advisory Agreement, the Board considered information provided by the Adviser and BFM with the assistance and advice of counsel to the Independent Trustees and counsel to the Trust.
The Board’s consideration of various factors and its conclusions with respect to such factors formed the basis for the Board’s determination to approve the New Advisory Agreement and the Sub-Advisory Agreement. The factors considered by the Board included, but were not limited to: (i) the resources of the Adviser and BFM; (ii) the experience and expertise of the Adviser and BFM; (iii) the financial capability of the Adviser and BFM; (iv) the compliance procedures and history of the Adviser and BFM; (v) the performance of similarly managed funds and accounts in comparison to relevant benchmarks for the New Fund; (vi) the amount of the contractual advisory and sub-advisory fees in comparison to similarly managed funds and the Adviser’s and BFM’s other clients and the effect of any fee waiver and expense reimbursement arrangement; (vii) the total expenses of the New Fund in comparison to similarly managed funds and the use of past and anticipated expense caps; (viii) the profitability of the Adviser and anticipated profitability of BFM with respect to the New Fund and its overall business; (ix) the extent of any anticipated economies of scale and whether the fee structure reflects such economies of scale; (x) the existence of any collateral benefits to be realized by the Adviser and BFM; and (xi) the existence of any collateral benefits to be realized by the New Fund. No one factor was determinative in the Board’s consideration of the New Advisory Agreement and the Sub-Advisory Agreement.
The Board undertook a review of the terms of the New Advisory Agreement and the Sub-Advisory Agreement and the nature and quality of the services to be provided by the Adviser and BFM. The Adviser provided the Board with substantial detailed information in the form of reports about the New Fund, the Adviser and BFM prior to the meeting which addressed most, if not all, of the factors listed previously. The Adviser also provided additional information about the Adviser and BFM in a presentation made during the meeting, discussed the comprehensive screening process used to recommend BFM and responded to questions from the Board. In addition, the Independent Trustees met separately in executive session with counsel to the Independent Trustees to discuss and consider information presented in connection with the approval of the New Advisory Agreement and the Sub-Advisory Agreement as well as the Board’s responsibilities and duties in approving the New Advisory Agreement and the Sub-Advisory Agreement.
APPROVAL OF NEW INVESTMENT ADVISORY AGREEMENT FOR INFLATION PROTECTED BOND FUND
In considering the approval of the New Advisory Agreement with the Adviser on behalf of the New Fund, the Board took into account all the materials provided prior to and during the meeting, the presentations made during the meeting and the extensive discussions during the meeting, including the discussion the Independent Trustees had during their executive session with their independent legal counsel. More specifically, the Board examined the nature, extent and quality of the services to be provided by the Adviser to the New Fund. The Board evaluated the Adviser’s experience in serving as an investment adviser, including overseeing and managing the allocation of existing Fund assets among the underlying Select Funds. The Board noted the experience of key personnel in providing investment management and administrative services and the systems used by such persons and the Adviser’s ability to attract and retain capable personnel. The Board noted the reputation, compliance history, compliance program and financial condition of the Adviser. The Board noted the terms of the agreement and the responsibilities
179
Table of Contents
that the Adviser has as an investment adviser to the New Fund, including oversight of general fund compliance and compliance with social restrictions and the implementation of Board directives as they relate to the New Fund. The Board also noted that, except for the identity of the New Fund and its management fee, the New Advisory Agreement is identical in all material respects to other advisory agreements entered into by the Trust for the Funds. The Board concluded that the New Fund is likely to benefit from the extent and quality of these services as a result of the Adviser’s experience, personnel, operations and resources.
The Board also reviewed a memorandum prepared by a third-party independent consulting firm engaged by the Adviser for, among other things, supplying research on expense comparisons. The Board noted that the aggregate management fee, taking into account the proposed fee cap for the New Fund, was competitive relative to other comparable funds with similar investment objectives and policies.
Based on all of the information presented to the Board and its consideration of relevant factors, the Board, in the exercise of its reasonable business judgment, determined to approve the New Advisory Agreement.
APPROVAL OF NEW SUB-ADVISORY AGREEMENT FOR INFLATION PROTECTED BOND FUND
In considering approval of the Sub-Advisory Agreement on behalf of the New Fund, the Board took into account all the materials provided prior to and during the meeting, the presentations made during the meeting and the extensive discussions during the meeting, including the discussion the Independent Trustees had during their executive session with their independent legal counsel. More specifically, the Board examined the nature, extent and quality of the services to be provided by BFM to the New Fund. The Board considered its responsibilities with respect to reviewing and approving the terms of the Sub-Advisory Agreement, the investment management team at BFM, the reasonableness of the sub-advisory fees and whether the appointment of BFM would be reasonable and fair to the New Fund and its shareholders. The Board reviewed the factors that it should consider in evaluating whether to approve the Sub-Advisory Agreement and the materials provided to support each factor. The Board evaluated BFM’s experience in serving as a sub-adviser, including its oversight and management of the allocation of existing Fund assets among the Low-Duration Bond Fund, another series BFM services under the Trust.
The Board considered the reputation, compliance history, compliance program and financial condition of BFM. The Board also considered the experience of key personnel at BFM in providing investment management services to the New Fund, the systems and resources used by such persons to implement and manage the strategy and the ability of the sub-adviser to attract and retain capable personnel. The Board also noted the terms of the Sub-Advisory Agreement and the responsibilities that BFM has to the New Fund, including the responsibility of day-to-day management of an investment portfolio of the New Fund, compliance with the New Fund’s policies and objective and the implementation of Board directives as they relate to the New Fund. In addition, the Board noted BFM’s longstanding relationship with the Trust and its understanding of the investment philosophy and culture of the Adviser, two factors which would facilitate a seamless integration of BFM into the New Fund. The Board concluded that the New Fund is likely to benefit from the extent and quality of these services as a result of BFM’s experience, personnel, operations and resources.
The Board considered information about the potential of BFM to contribute economies of scale as the New Fund grows in size. The Board noted that the Adviser had been able to negotiate fees that were favorable compared to BFM’s stated fee schedule for accounts below $100,000,000 in assets. The Board noted that BFM’s fee schedule incorporates the availability of a future breakpoint to the New Fund as assets increase in market value.
The Board considered potential “fall-out” or ancillary benefits anticipated to be received by BFM and its affiliates as a result of its arrangements with the New Fund. The Board concluded that any potential benefits to be derived by BFM included potential access to additional research resources, larger assets under management and reputational benefits, which were consistent with those generally derived by sub-advisers to mutual funds.
The Board noted BFM’s successful history in managing comparable inflation-protected bond fund strategies for other clients, including the BlackRock Inflation Protected Bond Fund Portfolio. The Board noted that the BFM Treasury Inflation-Protected Securities (“TIPS”) Strategy outperformed the benchmark for the one-year, three-year, five-year and since inception periods
180
Table of Contents
ended March 31, 2009, but underperformed the benchmark in the first calendar quarter for 2009. The Board also noted that the BFM TIPS Strategy exceeded the median for the peer universe of comparable funds for each of the one- through five-year periods ended March 31, 2009, and resided in the top quartile of the peer universe for each of those periods. In light of BFM’s successful track record, the Board concluded that the New Fund is likely to benefit from BFM’s management of the New Fund.
The Board considered the Adviser’s assessment of BFM’s financial condition. The Board noted that the Adviser, after reviewing certain financial information provided by BFM, felt comfortable that BFM was financially sound.
Based on all of the information presented to the Board and its consideration of relevant factors, the Board, in the exercise of its reasonable business judgment, determined to approve the Sub-Advisory Agreement.
181
Table of Contents
INVESTMENT SUB-ADVISERS (Assets under management as of 06/30/09) (Unaudited)
GuideStone Funds employs a broad array of proven investment managers for the benefit of their investors. Each manager is distinctive in its investment management process and business approach.
Fund | Sub-Adviser | Firm Established | Total Assets Managed | |||||
Money Market | BlackRock Institutional Management Corporation | 1988 | $ | 1.3 | Tr | |||
Low-Duration Bond | BlackRock Financial Management, Inc. | 1988 | $ | 1.3 | Tr | |||
Payden & Rygel | 1983 | $ | 44.6 | B | ||||
PIMCO (Pacific Investment Management Company LLC) | 1971 | $ | 842 | B | ||||
Medium-Duration Bond | Goldman Sachs Asset Management, L.P. | 1984 | $ | 708.7 | B | |||
PIMCO (Pacific Investment Management Company LLC) | 1971 | $ | 842 | B | ||||
Western Asset Management Company | 1971 | $ | 485 | B | ||||
Western Asset Management Company Limited | 1971 | $ | 61.1 | B | ||||
Extended-Duration Bond | Loomis, Sayles & Company, L.P. | 1926 | $ | 124 | B | |||
STW Fixed Income Management Ltd. | 1977 | $ | 9.6 | B | ||||
Inflation Protected Bond | BlackRock Financial Management, Inc. | 1988 | $ | 1.3 | Tr | |||
Global Bond | Loomis, Sayles & Company, L.P. | 1926 | $ | 124 | B | |||
Western Asset Management Company | 1971 | $ | 485 | B | ||||
Western Asset Management Company Limited | 1971 | $ | 61.1 | B | ||||
Equity Index | Northern Trust Investments, N.A. | 1889 | $ | 559 | B | |||
Real Estate Securities | RREEF America L.L.C. | 1975 | $ | 60.2 | B | |||
Value Equity | Aronson+Johnson+Ortiz, LP | 1984 | $ | 17.4 | B | |||
Barrow, Hanley, Mewhinney & Straus, Inc. | 1979 | $ | 46.0 | B | ||||
Northern Trust Investments, N.A. | 1889 | $ | 559 | B | ||||
TCW Investment Management Company | 1971 | $ | 103.3 | B | ||||
Growth Equity | Columbus Circle Investors | 1975 | $ | 12.1 | B | |||
Marsico Capital Management, LLC | 1997 | $ | 51.1 | B | ||||
Rainier Investment Management, Inc.® | 1991 | $ | 14.1 | B | ||||
Sands Capital Management, LLC | 1992 | $ | 10.9 | B | ||||
Small Cap Equity | Aronson+Johnson+Ortiz, L.P. | 1984 | $ | 17.4 | B | |||
Columbus Circle Investors | 1975 | $ | 12.1 | B | ||||
Lord, Abbett & Company LLC | 1929 | $ | 73.9 | B | ||||
TimesSquare Capital Management, LLC | 2000 | $ | 8.8 | B | ||||
Western Asset Management Company | 1971 | $ | 485 | B | ||||
Western Asset Management Company Limited | 1971 | $ | 61.1 | B | ||||
International Equity | AllianceBernstein L.P. | 1962 | $ | 447 | B | |||
AQR Capital Management, LLC | 1998 | $ | 20.0 | B | ||||
Genesis Asset Managers, LLP | 1989 | $ | 15.9 | B | ||||
Lazard Asset Management LLC | 1970 | $ | 86.3 | B | ||||
McKinley Capital Management, LLC | 1990 | $ | 10.4 | B | ||||
MFS Institutional Advisors, Inc. | 1970 | $ | 141 | B | ||||
Mondrian Investment Partners Ltd. | 1990 | $ | 52.0 | B | ||||
Philadelphia International Advisors, L.P. | 1956 | $ | 5.7 | B | ||||
UBS Global Asset Management (Americas), Inc. | 1998 | $ | 142 | B | ||||
Custodian for GuideStone Funds Assets | The Northern Trust Company | 1889 | $ | 3.2 | Tr | |||
Cash Overlay for GuideStone Date Target, Asset Allocation, Bond and Equity Funds | Northern Trust Investments, N.A. | 1889 | $ | 559 | B | |||
You should consider the investment objectives, risks, charges and expenses of each Fund carefully before investing. To obtain a prospectus with this and other information about GuideStone Funds call 1-888-98-GUIDE (48433), visit www.GuideStoneFunds.org or write to GuideStone Funds, 2401 Cedar Springs, Dallas, TX 75201-1498. Read it carefully before you invest. Shares of GuideStone Funds are distributed by PFPC Distributors, Inc., 760 Moore Road, King of Prussia, PA 19406.
182
Table of Contents
(This page intentionally left blank)
Table of Contents
(This page intentionally left blank)
Table of Contents
 | 2401 Cedar Springs Road, Dallas, TX 75201-1498 1-888-98-GUIDE — www.GuideStonesFunds.org | Funds distributed by PFPC Distributors, Inc. 760 Moore Road, King of Prussia, PA 19406 | ||
| 15177 | 6/09 2239 | |||
Table of Contents
| Item 2. | Code of Ethics. |
Not applicable.
| Item 3. | Audit Committee Financial Expert. |
Not applicable.
| Item 4. | Principal Accountant Fees and Services. |
Not applicable.
| Item 5. | Audit Committee of Listed registrants. |
Not applicable.
| Item 6. | Investments. |
| (a) | Schedule of Investments in securities of unaffiliated issuers as of the close of the reporting period is included as part of the report to shareholders filed under Item 1 of this form. |
| (b) | Not applicable. |
| Item 7. | Disclosure of Proxy Voting Policies and Procedures for Closed-End Management Investment Companies. |
Not applicable.
| Item 8. | Portfolio Managers of Closed-End Management Investment Companies. |
Not applicable.
Table of Contents
| Item 9. | Purchases of Equity Securities by Closed-End Management Investment Company and Affiliated Purchasers. |
Not applicable.
| Item 10. | Submission of Matters to a Vote of Security Holders. |
There have been no material changes to the procedures by which the shareholders may recommend nominees to the registrant’s board of directors, where those changes were implemented after the registrant last provided disclosure in response to the requirements of Item 407(c)(2)(iv) of Regulation S-K (17 CFR 229.407) (as required by Item 22(b)(15) of Schedule 14A (17 CFR 240.14a-101)), or this Item.
| Item 11. | Controls and Procedures. |
| (a) | The registrant’s principal executive and principal financial officers, or persons performing similar functions, have concluded that the registrant’s disclosure controls and procedures (as defined in Rule 30a-3(c) under the Investment Company Act of 1940, as amended (the “1940 Act”) (17 CFR 270.30a-3(c))) are effective, as of a date within 90 days of the filing date of the report that includes the disclosure required by this paragraph, based on their evaluation of these controls and procedures required by Rule 30a-3(b) under the 1940 Act (17 CFR 270.30a-3(b)) and Rules 13a-15(b) or 15d-15(b) under the Securities Exchange Act of 1934, as amended (17 CFR 240.13a-15(b) or 240.15d-15(b)). |
| (b) | There were no changes in the registrant’s internal control over financial reporting (as defined in Rule 30a-3(d) under the 1940 Act (17 CFR 270.30a-3(d)) that occurred during the registrant’s second fiscal quarter of the period covered by this report that has materially affected, or is reasonably likely to materially affect, the registrant’s internal control over financial reporting. |
| Item 12. | Exhibits. |
| (a)(1) | Not applicable. | |
| (a)(2) | Certifications pursuant to Rule 30a-2(a) under the 1940 Act and Section 302 of the Sarbanes-Oxley Act of 2002 are attached hereto. | |
| (a)(3) | Not applicable. | |
| (b) | Certifications pursuant to Rule 30a-2(b) under the 1940 Act and Section 906 of the Sarbanes-Oxley Act of 2002 are attached hereto. | |
Table of Contents
SIGNATURES
Pursuant to the requirements of the Securities Exchange Act of 1934 and the Investment Company Act of 1940, the registrant has duly caused this report to be signed on its behalf by the undersigned, thereunto duly authorized.
| (registrant) | GuideStone Funds |
| By (Signature and Title)* | /s/ John R. Jones | |
| John R. Jones, President | ||
| (principal executive officer) | ||
| Date | August 27, 2009 | |
Pursuant to the requirements of the Securities Exchange Act of 1934 and the Investment Company Act of 1940, this report has been signed below by the following persons on behalf of the registrant and in the capacities and on the dates indicated.
| By (Signature and Title)* | /s/ John R. Jones | |
| John R. Jones, President | ||
| (principal executive officer) |
| Date | August 27, 2009 | |
| By (Signature and Title)* | /s/ Jeffrey P. Billinger | |
| Jeffrey P. Billinger, Vice President and Treasurer | ||
| (principal financial officer) |
| Date | August 27, 2009 | |
| * | Print the name and title of each signing officer under his or her signature. |