Exhibit 99.2
Chunghwa Telecom Co., Ltd. and Subsidiaries
Consolidated Financial Statements for the
Years Ended December 31, 2017 and 2016 and
Independent Auditors’ Report
REPRESENTATION LETTER
The entities that are required to be included in the consolidated financial statements of affiliates in accordance with the “Criteria Governing Preparation of Affiliation Reports, Consolidated Business Reports and Consolidated Financial Statements of Affiliated Enterprises” for the year ended December 31, 2017 are all the same as those included in the consolidated financial statements of Chunghwa Telecom Co., Ltd. and its subsidiaries prepared in conformity with the International Financial Reporting Standard 10 “Consolidated Financial Statements”. Relevant information that should be disclosed in the consolidated financial statements of affiliates is included in the consolidated financial statements of Chunghwa Telecom Co., Ltd. and its subsidiaries. Hence, we do not prepare a separate set of consolidated financial statements of affiliates.
| Very truly yours, |
| CHUNGHWA TELECOM CO., LTD. |
| By |
|
YU CHENG |
Chairman |
| March 13, 2018 |
- 1 -
INDEPENDENT AUDITORS’ REPORT
The Board of Directors and Stockholders
Chunghwa Telecom Co., Ltd.
Opinion
We have audited the accompanying consolidated financial statements of Chunghwa Telecom Co., Ltd. and its subsidiaries (the Company), which comprise the consolidated balance sheets as of December 31, 2017 and 2016, and the consolidated statements of comprehensive income, changes in equity and cash flows for the years then ended, and the notes to the consolidated financial statements, including a summary of significant accounting policies.
In our opinion, the accompanying consolidated financial statements present fairly, in all material respects, the consolidated financial position of the Company as of December 31, 2017 and 2016, and its consolidated financial performance and its consolidated cash flows for the years then ended in accordance with the Regulations Governing the Preparation of Financial Reports by Securities Issuers and International Financial Reporting Standards (IFRS), International Accounting Standards (IAS), IFRIC Interpretations (IFRIC), and SIC Interpretations (SIC) endorsed and issued into effect by the Financial Supervisory Commission of the Republic of China.
Basis for Opinion
We conducted our audits in accordance with the Regulations Governing Auditing and Attestation of Financial Statements by Certified Public Accountants and auditing standards generally accepted in the Republic of China. Our responsibilities under those standards are further described in the Auditors’ Responsibilities for the Audit of the Consolidated Financial Statements section of our report. We are independent of the Company in accordance with The Norm of Professional Ethics for Certified Public Accountant of the Republic of China, and we have fulfilled our other ethical responsibilities in accordance with these requirements. We believe that the audit evidence we have obtained is sufficient and appropriate to provide a basis for our opinion.
Key Audit Matters
Key audit matters are those matters that, in our professional judgment, were of most significance in our audit of the consolidated financial statements for the year ended December 31, 2017. These matters were addressed in the context of our audit of the consolidated financial statements as a whole, and in forming our opinion thereon, and we do not provide a separate opinion on these matters.
- 2 -
The descriptions of the key audit matters of the consolidated financial statements for the year ended December 31, 2017 are as follows:
Revenue Recognition on Mobile Services
Key audit matter:
As disclosed in Note 44 to the consolidated financial statements, mobile service revenue is the Company’s one source of main revenues and is also an important indicator for the public to evaluate competitiveness and growth potential of telecommunications companies. The calculation of the Company’s mobile services revenue highly relies on an automated computer environment in which the systems are complex due to combinations of the various mobile service price plans and process large volumes of data. Consequently, whether mobile services revenue is appropriately recognized is considered as one of the key audit matters.
Corresponding audit procedures:
We tested the information systems relevant to the mobile services revenue and the mobile services revenue process from call records, rate calculations, and billing procedures to accounting information system so as to understand the Company’s revenue recognition process and perform procedures to test the design and operating effectiveness of the related internal controls.
Moreover, we performed the following audit procedures on a sample basis: (1) inspected mobile service customers’ contracts; (2) performed live call testing andre-calculated the call records on the basis of corresponding price plans; (3) checked that the calculations of call records agreed with customers’ bills; and (4) checked that the amounts transferred from the mobile service system agreed with the accounting information system.
Revenue Recognition on Project Business
Key audit matter:
The project business mainly provides customers with combinations of one or more equipment and/or services. When the Company provides a project business, part of the obligations or service may likely be outsourced to third parties. Hence, the judgment on whether the Company is acting as a principal or an agent is required in order to determine if revenue should be reported gross as principal versus net as agent. Please refer to Notes 3 and 4 to the consolidated financial statements for the details. Due to highly customized nature of the project business, whether project revenue is recognized appropriately is considered as one of the key audit matters.
Corresponding audit procedures:
We understood and tested the Company’s design and operating effectiveness of the project revenue’s internal controls, including, but not limited to, the authorized personnel’s exercise of judgment on whether the Company is acting as a principal or an agent, and then recognize revenue gross or net accordingly.
Moreover, we performed the following audit procedures on a sample basis: (1) inspected project contracts; (2) reviewed evaluation forms prepared by authorized personnel on whether the Company is acting as a principal or an agent;(3) re-calculated the project revenue and checked that they agreed with the accounting records; (4) obtained confirmations; and (5) checked the source documents and tested the amounts received.
Other Matter
We have also audited the parent company only financial statements of Chunghwa Telecom Co., Ltd. as of and for the years ended December 31, 2017 and 2016 on which we have issued an unmodified opinion.
- 3 -
Responsibilities of Management and Those Charged with Governance for the Consolidated Financial Statements
Management is responsible for the preparation and fair presentation of the consolidated financial statements in accordance with the Regulations Governing the Preparation of Financial Reports by Securities Issuers and IFRS, IAS, IFRIC, and SIC endorsed and issued into effect by the Financial Supervisory Commission of the Republic of China, and for such internal control as management determines is necessary to enable the preparation of the consolidated financial statements that are free from material misstatement, whether due to fraud or error.
In preparing the consolidated financial statements, management is responsible for assessing the Company’s ability to continue as a going concern, disclosing, as applicable, matters related to going concern and using the going concern basis of accounting unless management either intends to liquidate the Company or to cease operations, or has no realistic alternative but to do so.
Those charged with governance, including the audit committee, are responsible for overseeing the Company’s financial reporting process.
Auditors’ Responsibilities for the Audit of the Consolidated Financial Statements
Our objectives are to obtain reasonable assurance about whether the consolidated financial statements as a whole are free from material misstatement, whether due to fraud or error, and to issue an auditors’ report that includes our opinion. Reasonable assurance is a high level of assurance, but is not a guarantee that an audit conducted in accordance with the auditing standards generally accepted in the Republic of China will always detect a material misstatement when it exists. Misstatements can arise from fraud or error and are considered material if, individually or in the aggregate, they could reasonably be expected to influence the economic decisions of users taken on the basis of these consolidated financial statements.
As part of an audit in accordance with the auditing standards generally accepted in the Republic of China, we exercise professional judgment and maintain professional skepticism throughout the audit. We also:
| 1. | Identify and assess the risks of material misstatement of the consolidated financial statements, whether due to fraud or error, design and perform audit procedures responsive to those risks, and obtain audit evidence that is sufficient and appropriate to provide a basis for our opinion. The risk of not detecting a material misstatement resulting from fraud is higher than for one resulting from error, as fraud may involve collusion, forgery, intentional omissions, misrepresentations, or the override of internal control. |
| 2. | Obtain an understanding of internal control relevant to the audit in order to design audit procedures that are appropriate in the circumstances, but not for the purpose of expressing an opinion on the effectiveness of the Company’s internal control. |
| 3. | Evaluate the appropriateness of accounting policies used and the reasonableness of accounting estimates and related disclosures made by management. |
| 4. | Conclude on the appropriateness of management’s use of the going concern basis of accounting and, based on the audit evidence obtained, whether a material uncertainty exists related to events or conditions that may cast significant doubt on the Company’s ability to continue as a going concern. If we conclude that a material uncertainty exists, we are required to draw attention in our auditors’ report to the related disclosures in the consolidated financial statements or, if such disclosures are inadequate, to modify our opinion. Our conclusions are based on the audit evidence obtained up to the date of our auditors’ report. However, future events or conditions may cause the Company to cease to continue as a going concern. |
| 5. | Evaluate the overall presentation, structure and content of the consolidated financial statements, including the disclosures, and whether the consolidated financial statements represent the underlying transactions and events in a manner that achieves fair presentation. |
- 4 -
| 6. | Obtain sufficient appropriate audit evidence regarding the financial information of the entities or business activities within the Company to express an opinion on the consolidated financial statements. We are responsible for the direction, supervision, and performance of the group audit. We remain solely responsible for our audit opinion. |
We communicate with those charged with governance regarding, among other matters, the planned scope and timing of the audit and significant audit findings, including any significant deficiencies in internal control that we identify during our audit.
We also provide those charged with governance with a statement that we have complied with relevant ethical requirements regarding independence, and to communicate with them all relationships and other matters that may reasonably be thought to bear on our independence, and where applicable, related safeguards.
From the matters communicated with those charged with governance, we determine those matters that were of most significance in the audit of the consolidated financial statements for the year ended December 31, 2017 and are therefore the key audit matters. We describe these matters in our auditors’ report unless law or regulation precludes public disclosure about the matter or when, in extremely rare circumstances, we determine that a matter should not be communicated in our report because the adverse consequences of doing so would reasonably be expected to outweigh the public interest benefits of such communication.
The engagement partners on the audit resulting in this independent auditors’ report are Mr. Hung Peng Lin and Mr. Ching Pin Shih.
/s/ Hung Peng Lin | /s/ Ching Pin Shih | |||
| Deloitte & Touche | ||||
| Taipei, Taiwan | ||||
| Republic of China | ||||
| March 13, 2018 | ||||
Notice to Readers
The accompanying consolidated financial statements are intended only to present the consolidated financial position, financial performance and cash flows in accordance with accounting principles and practices generally accepted in the Republic of China and not those of any other jurisdictions. The standards, procedures and practices to audit such consolidated financial statements are those generally applied in the Republic of China.
For the convenience of readers, the independent auditors’ report and the accompanying consolidated financial statements have been translated into English from the original Chinese version prepared and used in the Republic of China. If there is any conflict between the English version and the original Chinese version or any difference in the interpretation of the two versions, the Chinese-language independent auditors’ report and consolidated financial statements shall prevail.
- 5 -
CHUNGHWA TELECOM CO., LTD. AND SUBSIDIARIES
CONSOLIDATED BALANCE SHEETS
DECEMBER 31, 2017 and 2016
(In Thousands of New Taiwan Dollars)
| 2017 | 2016 | |||||||||||||||
ASSETS | Amount | % | Amount | % | ||||||||||||
CURRENT ASSETS | ||||||||||||||||
Cash and cash equivalents (Notes 3 and 6) | $ | 28,824,935 | 7 | $ | 31,100,342 | 7 | ||||||||||
Financial assets at fair value through profit or loss (Notes 3 and 7) | — | — | 217 | — | ||||||||||||
Held-to-maturity financial assets (Notes 3 and 9) | — | — | 2,139,892 | — | ||||||||||||
Trade notes and accounts receivable, net (Notes 3, 4 and 10) | 31,941,094 | 7 | 31,022,488 | 7 | ||||||||||||
Receivables from related parties (Note 39) | 49,367 | — | 13,799 | — | ||||||||||||
Inventories (Notes 3, 4, 11 and 40) | 8,839,615 | 2 | 7,422,774 | 2 | ||||||||||||
Prepayments (Notes 12 and 39) | 2,188,173 | — | 2,978,462 | 1 | ||||||||||||
Other current monetary assets (Notes 13 and 28) | 5,308,060 | 1 | 4,820,424 | 1 | ||||||||||||
Other current assets (Notes 20, 32 and 40) | 2,182,758 | — | 2,121,777 | — | ||||||||||||
|
|
|
|
|
|
|
| |||||||||
Total current assets | 79,334,002 | 17 | 81,620,175 | 18 | ||||||||||||
|
|
|
|
|
|
|
| |||||||||
NONCURRENT ASSETS | ||||||||||||||||
Available-for-sale financial assets (Notes 3 and 8) | 3,125,086 | 1 | 2,521,027 | 1 | ||||||||||||
Financial assets carried at cost (Notes 3 and 14) | 2,625,785 | 1 | 2,242,820 | — | ||||||||||||
Investments accounted for using equity method (Notes 3 and 16) | 2,546,374 | — | 2,602,859 | 1 | ||||||||||||
Property, plant and equipment (Notes 3, 4, 17, 39 and 40) | 288,707,910 | 64 | 291,169,760 | 65 | ||||||||||||
Investment properties (Notes 3, 4 and 18) | 8,047,793 | 2 | 8,114,533 | 2 | ||||||||||||
Intangible assets (Notes 3, 4 and 19) | 54,883,268 | 12 | 47,353,424 | 11 | ||||||||||||
Deferred income tax assets (Notes 3 and 32) | 2,730,093 | 1 | 2,322,226 | — | ||||||||||||
Net defined benefit assets (Notes 3, 4 and 28) | 12,979 | — | 918,636 | — | ||||||||||||
Prepayments (Notes 12 and 39) | 3,573,345 | 1 | 3,241,060 | 1 | ||||||||||||
Other noncurrent assets (Notes 20 and 40) | 5,536,487 | 1 | 5,025,985 | 1 | ||||||||||||
|
|
|
|
|
|
|
| |||||||||
Total noncurrent assets | 371,789,120 | 83 | 365,512,330 | 82 | ||||||||||||
|
|
|
|
|
|
|
| |||||||||
TOTAL | $ | 451,123,122 | 100 | $ | 447,132,505 | 100 | ||||||||||
|
|
|
|
|
|
|
| |||||||||
LIABILITIES AND EQUITY | ||||||||||||||||
CURRENT LIABILITIES | ||||||||||||||||
Short-term loans (Notes 22 and 40) | $ | 70,000 | — | $ | 138,000 | — | ||||||||||
Financial liabilities at fair value through profit or loss (Notes 3 and 7) | 578 | — | 1,356 | — | ||||||||||||
Hedging derivative financial liabilities (Notes 3 and 21) | 850 | — | 586 | — | ||||||||||||
Trade notes and accounts payable (Note 24) | 19,395,889 | 4 | 18,809,664 | 5 | ||||||||||||
Payables to related parties (Note 39) | 684,185 | — | 762,073 | — | ||||||||||||
Current tax liabilities (Notes 3 and 32) | 4,725,698 | 1 | 2,467,551 | 1 | ||||||||||||
Other payables (Note 25) | 25,001,401 | 6 | 26,418,336 | 6 | ||||||||||||
Provisions (Notes 3 and 26) | 188,744 | — | 118,872 | — | ||||||||||||
Advance receipts (Note 27) | 8,841,858 | 2 | 10,059,321 | 2 | ||||||||||||
Other current liabilities | 1,081,156 | — | 1,329,836 | — | ||||||||||||
|
|
|
|
|
|
|
| |||||||||
Total current liabilities | 59,990,359 | 13 | 60,105,595 | 14 | ||||||||||||
|
|
|
|
|
|
|
| |||||||||
NONCURRENT LIABILITIES | ||||||||||||||||
Long-term loans (Notes 23 and 40) | 1,600,000 | — | 1,600,000 | — | ||||||||||||
Deferred income tax liabilities (Notes 3 and 32) | 1,429,592 | — | 1,464,220 | — | ||||||||||||
Provisions (Notes 3 and 26) | 78,513 | — | 65,942 | — | ||||||||||||
Customers’ deposits (Note 39) | 4,671,441 | 1 | 4,609,580 | 1 | ||||||||||||
Net defined benefit liabilities (Notes 3, 4 and 28) | 2,703,569 | 1 | 1,536,814 | — | ||||||||||||
Deferred revenue (Note 3) | 3,612,391 | 1 | 3,546,192 | 1 | ||||||||||||
Other noncurrent liabilities | 3,457,677 | 1 | 3,004,492 | 1 | ||||||||||||
|
|
|
|
|
|
|
| |||||||||
Total noncurrent liabilities | 17,553,183 | 4 | 15,827,240 | 3 | ||||||||||||
|
|
|
|
|
|
|
| |||||||||
Total liabilities | 77,543,542 | 17 | 75,932,835 | 17 | ||||||||||||
|
|
|
|
|
|
|
| |||||||||
EQUITY ATTRIBUTABLE TO STOCKHOLDERS OF THE PARENT (Notes 15 and 29) | ||||||||||||||||
Common stocks | 77,574,465 | 17 | 77,574,465 | 17 | ||||||||||||
|
|
|
|
|
|
|
| |||||||||
Additionalpaid-in capital | 169,466,883 | 38 | 168,542,486 | 38 | ||||||||||||
|
|
|
|
|
|
|
| |||||||||
Retained earnings | ||||||||||||||||
Legal reserve | 77,574,465 | 17 | 77,574,465 | 17 | ||||||||||||
Special reserve | 2,680,823 | 1 | 2,675,419 | 1 | ||||||||||||
Unappropriated earnings | 37,202,683 | 8 | 38,342,317 | 9 | ||||||||||||
|
|
|
|
|
|
|
| |||||||||
Total retained earnings | 117,457,971 | 26 | 118,592,201 | 27 | ||||||||||||
|
|
|
|
|
|
|
| |||||||||
Other adjustments | 382,666 | — | (5,404 | ) | — | |||||||||||
|
|
|
|
|
|
|
| |||||||||
Total equity attributable to stockholders of the parent | 364,881,985 | 81 | 364,703,748 | 82 | ||||||||||||
NONCONTROLLING INTERESTS (Notes 15 and 29) | 8,697,595 | 2 | 6,495,922 | 1 | ||||||||||||
|
|
|
|
|
|
|
| |||||||||
Total equity | 373,579,580 | 83 | 371,199,670 | 83 | ||||||||||||
|
|
|
|
|
|
|
| |||||||||
TOTAL | $ | 451,123,122 | 100 | $ | 447,132,505 | 100 | ||||||||||
|
|
|
|
|
|
|
| |||||||||
The accompanying notes are an integral part of the consolidated financial statements.
- 6 -
CHUNGHWA TELECOM CO., LTD. AND SUBSIDIARIES
CONSOLIDATED STATEMENTS OF COMPREHENSIVE INCOME
YEARS ENDED DECEMBER 31, 2017 and 2016
(In Thousands of New Taiwan Dollars, Except Earnings Per Share)
| 2017 | 2016 | |||||||||||||||
| Amount | % | Amount | % | |||||||||||||
REVENUES (Notes 30, 39 and 44) | $ | 227,514,183 | 100 | $ | 229,991,428 | 100 | ||||||||||
OPERATING COSTS (Notes 11, 28, 31, 39 and 44) | 146,837,483 | 65 | 147,551,794 | 64 | ||||||||||||
|
|
|
|
|
|
|
| |||||||||
GROSS PROFIT | 80,676,700 | 35 | 82,439,634 | 36 | ||||||||||||
|
|
|
|
|
|
|
| |||||||||
OPERATING EXPENSES (Notes 28, 31, 39 and 44) | ||||||||||||||||
Marketing | 25,356,999 | 11 | 25,515,844 | 11 | ||||||||||||
General and administrative | 4,626,423 | 2 | 4,536,958 | 2 | ||||||||||||
Research and development | 3,885,920 | 2 | 3,784,905 | 2 | ||||||||||||
|
|
|
|
|
|
|
| |||||||||
Total operating expenses | 33,869,342 | 15 | 33,837,707 | 15 | ||||||||||||
|
|
|
|
|
|
|
| |||||||||
OTHER INCOME AND EXPENSES (Notes 17, 18, 19, 31 and 44) | (104,381 | ) | — | (496,649 | ) | — | ||||||||||
|
|
|
|
|
|
|
| |||||||||
INCOME FROM OPERATIONS | 46,702,977 | 20 | 48,105,278 | 21 | ||||||||||||
|
|
|
|
|
|
|
| |||||||||
NON-OPERATING INCOME AND EXPENSES | ||||||||||||||||
Interest income (Note 44) | 205,448 | — | 188,851 | — | ||||||||||||
Other income (Notes 31 and 39) | 835,465 | — | 1,072,106 | — | ||||||||||||
Other gains and losses (Notes 31 and 39) | (132,158 | ) | — | (446,540 | ) | — | ||||||||||
Interest expenses (Note 44) | (21,913 | ) | — | (19,808 | ) | — | ||||||||||
Share of profits of associates and joint ventures accounted for using equity method (Notes 16 and 44) | 407,243 | — | 482,660 | — | ||||||||||||
|
|
|
|
|
|
|
| |||||||||
Totalnon-operating income and expenses | 1,294,085 | — | 1,277,269 | — | ||||||||||||
|
|
|
|
|
|
|
| |||||||||
INCOME BEFORE INCOME TAX | 47,997,062 | 20 | 49,382,547 | 21 | ||||||||||||
INCOME TAX EXPENSE (Notes 3 and 32) | 7,954,461 | 2 | 8,152,562 | 3 | ||||||||||||
|
|
|
|
|
|
|
| |||||||||
NET INCOME | 40,042,601 | 18 | 41,229,985 | 18 | ||||||||||||
|
|
|
|
|
|
|
| |||||||||
TOTAL OTHER COMPREHENSIVE INCOME (LOSS) | ||||||||||||||||
Items that will not be reclassified to profit or loss: | ||||||||||||||||
Remeasurements of defined benefit pension plans (Note 28) | (2,023,493 | ) | (1 | ) | (2,043,414 | ) | (1 | ) | ||||||||
Share of remeasurements of defined benefit pension plans of associates and joint ventures (Note 16) | 844 | — | (43,669 | ) | — | |||||||||||
(Continued)
- 7 -
CHUNGHWA TELECOM CO., LTD. AND SUBSIDIARIES
CONSOLIDATED STATEMENTS OF COMPREHENSIVE INCOME
YEARS ENDED DECEMBER 31, 2017 and 2016
(In Thousands of New Taiwan Dollars, Except Earnings Per Share)
| 2017 | 2016 | |||||||||||||||
| Amount | % | Amount | % | |||||||||||||
Income tax benefit relating to items that will not be reclassified to profit or loss (Note 32) | $ | 343,994 | — | $ | 347,380 | — | ||||||||||
|
|
|
|
|
|
|
| |||||||||
| (1,678,655 | ) | (1 | ) | (1,739,703 | ) | (1 | ) | |||||||||
|
|
|
|
|
|
|
| |||||||||
Items that may be reclassified subsequently to profit or loss: | ||||||||||||||||
Exchange differences arising from the translation of the foreign operations | (229,009 | ) | — | (169,917 | ) | — | ||||||||||
Unrealized gain or loss onavailable-for-sale financial assets (Note 31) | 605,274 | — | (144,467 | ) | — | |||||||||||
Cash flow hedges (Notes 21 and 31) | (263 | ) | — | (1,085 | ) | — | ||||||||||
Share of exchange differences arising from the translation of the foreign operations of associates and joint ventures (Note 16) | (5,293 | ) | — | (2,737 | ) | — | ||||||||||
Income tax benefit relating to items that may be reclassified subsequently (Note 32) | 2,420 | — | 1,703 | — | ||||||||||||
|
|
|
|
|
|
|
| |||||||||
| 373,129 | — | (316,503 | ) | — | ||||||||||||
|
|
|
|
|
|
|
| |||||||||
Total other comprehensive loss, net of income tax | (1,305,526 | ) | (1 | ) | (2,056,206 | ) | (1 | ) | ||||||||
|
|
|
|
|
|
|
| |||||||||
TOTAL COMPREHENSIVE INCOME | $ | 38,737,075 | 17 | $ | 39,173,779 | 17 | ||||||||||
|
|
|
|
|
|
|
| |||||||||
NET INCOME ATTRIBUTABLE TO | ||||||||||||||||
Stockholders of the parent | $ | 38,873,905 | 17 | $ | 40,067,010 | 17 | ||||||||||
Noncontrolling interests | 1,168,696 | 1 | 1,162,975 | 1 | ||||||||||||
|
|
|
|
|
|
|
| |||||||||
| $ | 40,042,601 | 18 | $ | 41,229,985 | 18 | |||||||||||
|
|
|
|
|
|
|
| |||||||||
COMPREHENSIVE INCOME ATTRIBUTABLE TO | ||||||||||||||||
Stockholders of the parent | $ | 37,590,365 | 17 | $ | 38,068,095 | 17 | ||||||||||
Noncontrolling interests | 1,146,710 | — | 1,105,684 | — | ||||||||||||
|
|
|
|
|
|
|
| |||||||||
| $ | 38,737,075 | 17 | $ | 39,173,779 | 17 | |||||||||||
|
|
|
|
|
|
|
| |||||||||
EARNINGS PER SHARE (Note 33) | ||||||||||||||||
Basic | $ | 5.01 | $ | 5.16 | ||||||||||||
|
|
|
| |||||||||||||
Diluted | $ | 5.00 | $ | 5.16 | ||||||||||||
|
|
|
| |||||||||||||
The accompanying notes are an integral part of the consolidated financial statements. | (Concluded | ) |
- 8 -
CHUNGHWA TELECOM CO., LTD. AND SUBSIDIARIES
CONSOLIDATED STATEMENTS OF CHANGES IN EQUITY
YEARS ENDED DECEMBER 31, 2017 and 2016
(In Thousands of New Taiwan Dollars)
| Equity Attributable to Stockholders of the Parent (Notes 15, 21 and 29) | ||||||||||||||||||||||||||||||||||||||||||||
| Other Adjustments | ||||||||||||||||||||||||||||||||||||||||||||
Additional Paid-in Capital | Retained Earnings | Exchange Arising from the | Unrealized Gain Available-for-sale | Noncontrolling | ||||||||||||||||||||||||||||||||||||||||
Common Stocks | Legal Reserve | Special Reserve | Unappropriated Earnings | Translation of the Foreign Operations | Cash Flow Hedges | Total | Interests (Notes 15 | Total Equity | ||||||||||||||||||||||||||||||||||||
BALANCE, JANUARY 1, 2016 | $ | 77,574,465 | $ | 168,095,615 | $ | 77,574,465 | $ | 2,675,419 | $ | 42,551,245 | $ | 177,257 | $ | 90,964 | $ | 498 | $ | 368,739,928 | $ | 5,269,075 | $ | 374,009,003 | ||||||||||||||||||||||
Appropriation of 2015 earnings Cash dividends distributed by Chunghwa | — | — | — | — | (42,551,146 | ) | — | — | — | (42,551,146 | ) | — | (42,551,146 | ) | ||||||||||||||||||||||||||||||
Cash dividends distributed by subsidiaries | — | — | — | — | — | — | — | — | — | (709,971 | ) | (709,971 | ) | |||||||||||||||||||||||||||||||
Change in additionalpaid-in capital from investments in associates and joint ventures accounted for using equity method | — | (1,081 | ) | — | — | — | — | — | — | (1,081 | ) | (1,543 | ) | (2,624 | ) | |||||||||||||||||||||||||||||
Partial disposal of interests in subsidiaries | — | 58,206 | — | — | — | — | — | — | 58,206 | 25,422 | 83,628 | |||||||||||||||||||||||||||||||||
Change in additionalpaid-in capital for not participating in the capital increase of a subsidiary | — | 389,740 | — | — | — | — | — | — | 389,740 | 785,769 | 1,175,509 | |||||||||||||||||||||||||||||||||
Net income for the year ended December 31, 2016 | — | — | — | — | 40,067,010 | — | — | — | 40,067,010 | 1,162,975 | 41,229,985 | |||||||||||||||||||||||||||||||||
Other comprehensive loss for the year ended December 31, 2016 | — | — | — | — | (1,724,792 | ) | (131,189 | ) | (141,849 | ) | (1,085 | ) | (1,998,915 | ) | (57,291 | ) | (2,056,206 | ) | ||||||||||||||||||||||||||
|
|
|
|
|
|
|
|
|
|
|
|
|
|
|
|
|
|
|
|
|
| |||||||||||||||||||||||
Total comprehensive income for the year ended December 31, 2016 | — | — | — | — | 38,342,218 | (131,189 | ) | (141,849 | ) | (1,085 | ) | 38,068,095 | 1,105,684 | 39,173,779 | ||||||||||||||||||||||||||||||
|
|
|
|
|
|
|
|
|
|
|
|
|
|
|
|
|
|
|
|
|
| |||||||||||||||||||||||
Share-based payment transactions of subsidiaries | — | 6 | — | — | — | — | — | — | 6 | 17,189 | 17,195 | |||||||||||||||||||||||||||||||||
Net increase in noncontrolling interests | — | — | — | — | — | — | — | — | — | 4,297 | 4,297 | |||||||||||||||||||||||||||||||||
|
|
|
|
|
|
|
|
|
|
|
|
|
|
|
|
|
|
|
|
|
| |||||||||||||||||||||||
BALANCE, DECEMBER 31, 2016 | 77,574,465 | 168,542,486 | 77,574,465 | 2,675,419 | 38,342,317 | 46,068 | (50,885 | ) | (587 | ) | 364,703,748 | 6,495,922 | 371,199,670 | |||||||||||||||||||||||||||||||
Appropriation of 2016 earnings | ||||||||||||||||||||||||||||||||||||||||||||
Special Reserve | — | — | — | 5,404 | (5,404 | ) | — | — | — | — | — | — | ||||||||||||||||||||||||||||||||
Cash dividends distributed by Chunghwa | — | — | — | — | (38,336,525 | ) | — | — | — | (38,336,525 | ) | — | (38,336,525 | ) | ||||||||||||||||||||||||||||||
Cash dividends distributed by subsidiaries | — | — | — | — | — | — | — | — | — | (942,482 | ) | (942,482 | ) | |||||||||||||||||||||||||||||||
Unclaimed dividend | — | 3,023 | — | — | — | — | — | — | 3,023 | — | 3,023 | |||||||||||||||||||||||||||||||||
Change in additionalpaid-in capital from investments in associates and joint ventures accounted for using equity method | — | 13,965 | — | — | — | — | — | — | 13,965 | 1,762 | 15,727 | |||||||||||||||||||||||||||||||||
Partial disposal of interests in subsidiaries | — | 76,714 | — | — | — | — | — | — | 76,714 | 29,217 | 105,931 | |||||||||||||||||||||||||||||||||
Change in additionalpaid-in capital for not participating in the capital increase of a subsidiary | — | 801,727 | — | — | — | — | — | — | 801,727 | 1,750,326 | 2,552,053 | |||||||||||||||||||||||||||||||||
Other changes in additionalpaid-in capital of subsidiaries | — | 84 | — | — | — | — | — | — | 84 | 41 | 125 | |||||||||||||||||||||||||||||||||
Net income for the year ended December 31, 2017 | — | — | — | — | 38,873,905 | — | — | — | 38,873,905 | 1,168,696 | 40,042,601 | |||||||||||||||||||||||||||||||||
Other comprehensive income (loss) for the year ended December 31, 2017 | — | — | — | — | (1,671,610 | ) | (220,661 | ) | 608,994 | (263 | ) | (1,283,540 | ) | (21,986 | ) | (1,305,526 | ) | |||||||||||||||||||||||||||
|
|
|
|
|
|
|
|
|
|
|
|
|
|
|
|
|
|
|
|
|
| |||||||||||||||||||||||
Total comprehensive income for the year ended December 31, 2017 | — | — | — | — | 37,202,295 | (220,661 | ) | 608,994 | (263 | ) | 37,590,365 | 1,146,710 | 38,737,075 | |||||||||||||||||||||||||||||||
|
|
|
|
|
|
|
|
|
|
|
|
|
|
|
|
|
|
|
|
|
| |||||||||||||||||||||||
Share-based payment transactions of subsidiaries | — | 1,984 | — | — | — | — | — | — | 1,984 | 19,799 | 21,783 | |||||||||||||||||||||||||||||||||
Net increase in noncontrolling interests | — | 26,900 | — | — | — | — | — | — | 26,900 | 196,300 | 223,200 | |||||||||||||||||||||||||||||||||
|
|
|
|
|
|
|
|
|
|
|
|
|
|
|
|
|
|
|
|
|
| |||||||||||||||||||||||
BALANCE, DECEMBER 31, 2017 | $ | 77,574,465 | $ | 169,466,883 | $ | 77,574,465 | $ | 2,680,823 | $ | 37,202,683 | $ | (174,593 | ) | $ | 558,109 | $ | (850 | ) | $ | 364,881,985 | $ | 8,697,595 | $ | 373,579,580 | ||||||||||||||||||||
|
|
|
|
|
|
|
|
|
|
|
|
|
|
|
|
|
|
|
|
|
| |||||||||||||||||||||||
The accompanying notes are an integral part of the consolidated financial statements.
- 9 -
CHUNGHWA TELECOM CO., LTD. AND SUBSIDIARIES
CONSOLIDATED STATEMENTS OF CASH FLOWS
YEARS ENDED DECEMBER 31, 2017 and 2016
(In Thousands of New Taiwan Dollars)
| 2017 | 2016 | |||||||
CASH FLOWS FROM OPERATING ACTIVITIES | ||||||||
Income before income tax | $ | 47,997,062 | $ | 49,382,547 | ||||
Adjustments to reconcile income before income tax to net cash provided by operating activities: | ||||||||
Depreciation | 28,163,584 | 29,106,148 | ||||||
Amortization | 3,766,020 | 3,378,821 | ||||||
Provision for doubtful accounts | 643,010 | 940,991 | ||||||
Interest expenses | 21,913 | 19,808 | ||||||
Interest income | (205,448 | ) | (188,851 | ) | ||||
Dividend income | (327,861 | ) | (390,856 | ) | ||||
Compensation cost of share-based payment transactions | 21,783 | 17,195 | ||||||
Share of profits of associates and joint ventures accounted for using equity method | (407,243 | ) | (482,660 | ) | ||||
Loss on disposal of property, plant and equipment | 106,692 | 48,249 | ||||||
Property, plant and equipment transferred to expenses | 2,565 | — | ||||||
Loss on disposal of intangible assets | 46 | — | ||||||
Gain on disposal of financial instruments | (2,748 | ) | (490 | ) | ||||
Loss on disposal of investments accounted for using equity method | 223 | 409 | ||||||
Impairment loss onavailable-for-sale financial assets | — | 577,333 | ||||||
Provision for inventory and obsolescence | 52,487 | 191,846 | ||||||
Impairment loss on property, plant and equipment | — | 595,828 | ||||||
Reversal of impairment loss on investment properties | (10,979 | ) | (147,527 | ) | ||||
Impairment loss on intangible assets | 8,622 | 99 | ||||||
Valuation loss (gain) on financial assets and liabilities at fair value through profit or loss, net | (779 | ) | 1,153 | |||||
Loss (gain) on foreign exchange, net | 83,171 | (80,595 | ) | |||||
Changes in operating assets and liabilities: | ||||||||
Decrease (increase) in: | ||||||||
Financial assets held for trading | 218 | 149 | ||||||
Trade notes and accounts receivable | (1,191,428 | ) | (4,612,984 | ) | ||||
Receivables from related parties | (35,568 | ) | 28,257 | |||||
Inventories | (1,469,328 | ) | 1,165,570 | |||||
Prepayments | 458,004 | 61,317 | ||||||
Other current monetary assets | (81,035 | ) | (241,590 | ) | ||||
Other current assets | (60,981 | ) | 214,144 | |||||
Increase (decrease) in: | ||||||||
Trade notes and accounts payable | 586,940 | 2,497,437 | ||||||
Payables to related parties | (77,888 | ) | 150,973 | |||||
Other payables | (691,001 | ) | (76,619 | ) | ||||
Provisions | 82,443 | (63,090 | ) | |||||
Advance receipts | (728,007 | ) | 503,531 | |||||
Other current liabilities | (76,063 | ) | 6,784 | |||||
Deferred revenue | 66,199 | (69,410 | ) | |||||
Net defined benefit plans | 48,919 | (8,538,838 | ) | |||||
|
|
|
| |||||
Cash generated from operations | 76,743,544 | 73,995,079 | ||||||
(Continued)
- 10 -
CHUNGHWA TELECOM CO., LTD. AND SUBSIDIARIES
CONSOLIDATED STATEMENTS OF CASH FLOWS
YEARS ENDED DECEMBER 31, 2017 and 2016
(In Thousands of New Taiwan Dollars)
| 2017 | 2016 | |||||||
Interest expenses paid | $ | (21,918 | ) | $ | (19,905 | ) | ||
Income tax paid | (5,789,762 | ) | (9,023,263 | ) | ||||
|
|
|
| |||||
Net cash provided by operating activities | 70,931,864 | 64,951,911 | ||||||
|
|
|
| |||||
CASH FLOWS FROM INVESTING ACTIVITIES | ||||||||
Acquisition ofavailable-for-sale financial assets | — | (30,000 | ) | |||||
Proceeds from disposal ofavailable-for-sale financial assets | 1,258 | 29,784 | ||||||
Acquisition of time deposits and negotiable certificate of deposit with maturities of more than three months | (6,230,944 | ) | (4,119,307 | ) | ||||
Proceeds from disposal of time deposits and negotiable certificate of deposit with maturities of more than three months | 5,649,868 | 2,834,171 | ||||||
Proceeds from disposal ofheld-to-maturity financial assets | 2,140,000 | 1,875,000 | ||||||
Acquisition of financial assets carried at cost | (400,000 | ) | (22,980 | ) | ||||
Proceeds from disposal of financial assets carried at cost | 7,292 | 9,609 | ||||||
Capital reduction of financial assets carried at cost | 12,167 | 37,223 | ||||||
Acquisition of investments accounted for using equity method | — | (30,000 | ) | |||||
Proceeds from disposal of investments accounted for using equity method | — | 182,108 | ||||||
Acquisition of property, plant and equipment | (26,875,336 | ) | (23,516,783 | ) | ||||
Proceeds from disposal of property, plant and equipment | 159,636 | 44,065 | ||||||
Acquisition of intangible assets | (11,304,633 | ) | (282,809 | ) | ||||
Acquisition of investment properties | — | (52 | ) | |||||
Decrease (increase) in other noncurrent assets | (788,594 | ) | 63,915 | |||||
Interest received | 233,439 | 197,790 | ||||||
Cash dividends received | 675,321 | 1,065,520 | ||||||
|
|
|
| |||||
Net cash used in investing activities | (36,720,526 | ) | (21,662,746 | ) | ||||
|
|
|
| |||||
CASH FLOWS FROM FINANCING ACTIVITIES | ||||||||
Proceeds from short-term loans | 6,951,500 | 1,415,000 | ||||||
Repayment of short-term loans | (7,019,500 | ) | (1,387,000 | ) | ||||
Repayment of long-term loans | — | (150,000 | ) | |||||
Decrease in customers’ deposits | (110,756 | ) | (294,463 | ) | ||||
Decrease in other noncurrent liabilities | (36,271 | ) | (104,481 | ) | ||||
Cash dividends paid | (38,336,525 | ) | (42,551,146 | ) | ||||
Partial disposal of interests in subsidiaries without losing control | 105,931 | 83,628 | ||||||
Cash dividends distributed to noncontrolling interests | (942,482 | ) | (709,971 | ) | ||||
Change in other noncontrolling interests | 2,777,237 | 1,179,806 | ||||||
Unclaimed dividend | 3,023 | — | ||||||
|
|
|
| |||||
Net cash used in financing activities | (36,607,843 | ) | (42,518,627 | ) | ||||
|
|
|
| |||||
(Continued)
- 11 -
CHUNGHWA TELECOM CO., LTD. AND SUBSIDIARIES
CONSOLIDATED STATEMENTS OF CASH FLOWS
YEARS ENDED DECEMBER 31, 2017 and 2016
(In Thousands of New Taiwan Dollars)
| 2017 | 2016 | |||||||
EFFECT OF EXCHANGE RATE CHANGES ON CASH AND CASH EQUIVALENTS | $ | 121,098 | $ | 58,381 | ||||
|
|
|
| |||||
NET INCREASE (DECREASE) IN CASH AND CASH EQUIVALENTS | (2,275,407 | ) | 828,919 | |||||
CASH AND CASH EQUIVALENTS, BEGINNING OF THE YEAR | 31,100,342 | 30,271,423 | ||||||
|
|
|
| |||||
CASH AND CASH EQUIVALENTS, END OF THE YEAR | $ | 28,824,935 | $ | 31,100,342 | ||||
|
|
|
| |||||
The accompanying notes are an integral part of the consolidated financial statements. | (Concluded | ) |
- 12 -
CHUNGHWA TELECOM CO., LTD. AND SUBSIDIARIES
NOTES TO CONSOLIDATED FINANCIAL STATEMENTS
YEARS ENDED DECEMBER 31, 2017 and 2016
(In Thousands of New Taiwan Dollars, Unless Stated Otherwise)
| 1. | GENERAL |
Chunghwa Telecom Co., Ltd. (“Chunghwa”) was incorporated on July 1, 1996 in the Republic of China (“ROC”) pursuant to the Article 30 of the Telecommunications Act. Chunghwa is a company limited by shares and, prior to August 2000, was wholly owned by the Ministry of Transportation and Communications (“MOTC”). Prior to July 1, 1996, the current operations of Chunghwa were carried out under the Directorate General of Telecommunications (“DGT”). The DGT was established by the MOTC in June 1943 to take primary responsibility in the development of telecommunications infrastructure and to formulate policies related to telecommunications. On July 1, 1996, the telecom operations of the DGT werespun-off as Chunghwa which continues to carry out the business and the DGT continues to be the industry regulator.
As the dominant telecommunications service provider of domestic and international fixed-line, Global System for Mobile Communications (“GSM”), and Third Generation (“3G”) in the ROC, Chunghwa is subject to additional regulations imposed by the ROC.
Effective August 12, 2005, the MOTC completed the process of privatizing Chunghwa by reducing the government ownership to below 50% in various stages. In July 2000, Chunghwa received approval from the Securities and Futures Commission (the “SFC”) for a domestic initial public offering and its common stocks were listed and traded on the Taiwan Stock Exchange (the “TWSE”) on October 27, 2000. Certain of Chunghwa’s common stocks were sold, in connection with the foregoing privatization plan, in domestic public offerings at various dates from August 2000 to July 2003. Certain of Chunghwa’s common stocks were also sold in an international offering of securities in the form of American Depository Shares (“ADS”) on July 17, 2003 and were listed and traded on the New York Stock Exchange (the “NYSE”). The MOTC sold common stocks of Chunghwa by auction in the ROC on August 9, 2005 and completed the second international offering on August 10, 2005. Upon completion of the share transfers associated with these offerings on August 12, 2005, the MOTC owned less than 50% of the outstanding shares of Chunghwa and completed the privatization plan.
Chunghwa together with its subsidiaries are hereinafter referred to collectively as the “Company”.
The consolidated financial statements are presented in Chunghwa’s functional currency, New Taiwan dollars.
| 2. | APPROVAL OF FINANCIAL STATEMENTS |
The consolidated financial statements were approved by the Board of Directors on March 13, 2018.
| 3. | SUMMARY OF SIGNIFICANT ACCOUNTING POLICIES |
Statement of Compliance
The accompanying consolidated financial statements have been prepared in conformity with the Regulations Governing the Preparation of Financial Reports by Securities Issuers and the International Financial Reporting Standards (IFRS), International Accounting Standards (IAS), International Financial Reporting Interpretations Committee (IFRIC) and SIC Interpretations (SIC) endorsed for use by the Financial Supervisory Commission (FSC) (the “Taiwan-IFRS”).
- 13 -
Basis of Preparation
The consolidated financial statements have been prepared on the historical cost basis except for certain financial instruments that are measured at fair values and net defined benefit liabilities (assets) which are measured at the present value of the defined benefit obligation less the fair value of plan assets.
Current and Noncurrent Assets and Liabilities
Current assets include:
| a. | Assets held primarily for the purpose of trading; |
| b. | Assets expected to be realized within twelve months after the reporting period; and |
| c. | Cash and cash equivalents unless the asset is restricted from being exchanged or used to settle a liability for at least twelve months after the reporting period. |
Current liabilities include:
| a. | Liabilities held primarily for the purpose of trading; |
| b. | Liabilities due to be settled within twelve months after the reporting period; and |
| c. | Liabilities for which the Company does not have an unconditional right to defer settlement for at least twelve months after the reporting period. |
Assets and liabilities that are not classified as current are classified as noncurrent.
Light Era Development Co., Ltd. (LED) engages mainly in development of property for rent and sale. The assets and liabilities of LED related to property development within its operating cycle, which is over one year, are classified as current items.
Basis of Consolidation
| a. | Principles for preparing consolidated financial statements |
The consolidated financial statements incorporate the financial statements of Chunghwa and entities controlled by Chunghwa (its subsidiaries).
Income and expenses of subsidiaries acquired during the period are included in the consolidated statements of comprehensive income from the acquisition date.
When necessary, adjustments are made to the financial statements of subsidiaries to bring their accounting policies in line with those used by the Company.
All inter-company transactions, balances, income and expenses are eliminated in full upon consolidation.
Attribution of total comprehensive income to noncontrolling interests
Total comprehensive income of subsidiaries is attributed to the stockholders of the parent and to the noncontrolling interests even if this results in the noncontrolling interests having a deficit balance.
- 14 -
Changes in the Company’s ownership interests in subsidiaries
Changes in the Company’s ownership interests in subsidiaries that do not result in the Company losing control over the subsidiaries are accounted for as equity transactions. The carrying amounts of the Company’s interests and the noncontrolling interests are adjusted to reflect the changes in their relative interests in the subsidiaries. Any difference between the amount by which the noncontrolling interests are adjusted and the fair value of the consideration paid or received is recognized directly in equity and attributed to stockholders of the parent.
| b. | The subsidiaries in the consolidated financial statements |
The detail information of the subsidiaries at the end of reporting period was as follows:
| Percentage of Ownership | ||||||||||||||||
| December 31 | ||||||||||||||||
| Name of Investor | Name of Investee | Main Businesses and Products | 2017 | 2016 | Note | |||||||||||
Chunghwa Telecom Co., Ltd. | Senao International Co., Ltd. (“SENAO”) | Handset and peripherals retailer; sales of CHT mobile phone plans as an agent | 29 | 29 | 1 | ) | ||||||||||
Light Era Development Co., Ltd. (“LED”) | Planning and development of real estate and intelligent buildings, and property management | 100 | 100 | |||||||||||||
Donghwa Telecom Co., Ltd. (“DHT”) | International private leased circuit, IP VPN service, and IP transit services | 100 | 100 | |||||||||||||
Chunghwa Telecom Singapore Pte., Ltd. (“CHTS”) | International private leased circuit, IP VPN service, and IP transit services | 100 | 100 | |||||||||||||
Chunghwa System Integration Co., Ltd. (“CHSI”) | Providing system integration services and telecommunications equipment | 100 | 100 | |||||||||||||
Chunghwa Investment Co., Ltd. (“CHI”) | Investment | 89 | 89 | |||||||||||||
CHIEF Telecom Inc. (“CHIEF”) | Network integration, internet data center (“IDC”), communications integration and cloud application services | 67 | 69 | 2 | ) | |||||||||||
CHYP Multimedia Marketing & Communications Co., Ltd. (“CHYP”) | Digital information supply services and advertisement services | 100 | 100 | 3 | ) | |||||||||||
Prime Asia Investments Group Ltd. (B.V.I.) (“Prime Asia”) | Investment | 100 | 100 | |||||||||||||
Spring House Entertainment Tech. Inc. (“SHE”) | Digital entertainment contents production, animated character licensing and endorsement, and mobile digital platform construction | 56 | 56 | |||||||||||||
Chunghwa Telecom Global, Inc. (“CHTG”) | International private leased circuit, internet services, and transit services | 100 | 100 | |||||||||||||
Chunghwa Telecom Vietnam Co., Ltd. (“CHTV”) | Intelligent energy saving solutions, international circuit, and information and communication technology (“ICT”) services | 100 | 100 | |||||||||||||
Smartfun Digital Co., Ltd. (“SFD”) | Providing diversified family education digital services | 65 | 65 | |||||||||||||
Chunghwa Telecom Japan Co., Ltd. (“CHTJ”) | International private leased circuit, IP VPN service, and IP transit services | 100 | 100 | |||||||||||||
Chunghwa Sochamp Technology Inc. (“CHST”) | Design, development and production of Automatic License Plate Recognition software and hardware | 51 | 51 | |||||||||||||
Honghwa International Co., Ltd. (“HHI”) | Telecommunication engineering, sales agent of mobile phone plan application and other business services | 100 | 100 | |||||||||||||
Chunghwa Leading Photonics Tech Co., Ltd. (“CLPT”) | Production and sale of electronic components and finished products | 75 | 75 | 4 | ) | |||||||||||
Chunghwa Telecom (Thailand) Co., Ltd. (“CHTT”) | International private leased circuit, IP VPN service, ICT and cloud VAS services | 100 | — | 5 | ) | |||||||||||
(Continued)
- 15 -
| Percentage of Ownership | ||||||||||||||||
| December 31 | ||||||||||||||||
| Name of Investor | Name of Investee | Main Businesses and Products | 2017 | 2016 | Note | |||||||||||
CHT Security Co., Ltd. (“CHTSC”) | Computing equipment installation, wholesale of computing and business machinery equipment and software, management consulting services, data processing services, digital information supply services and internet identify services | 80 | — | 6 | ) | |||||||||||
New Prospect Investments Holdings Ltd. (B.V.I.) (“New Prospect”) | Investment | — | 100 | 7 | ) | |||||||||||
Senao International Co., Ltd. | Senao International (Samoa) Holding Ltd. (“SIS”) | International investment | 100 | 100 | ||||||||||||
Youth Co., Ltd. (“Youth”) | Sale of information and communication technologies products | 89 | 89 | |||||||||||||
Aval Technologies Co., Ltd. (“Aval”) | Sale of information and communication technologies products | 100 | 100 | |||||||||||||
SENYOUNG Insurance Agent Co., Ltd. (“SENYOUNG”) | Property and liability insurance agency | 100 | — | 8 | ) | |||||||||||
Youth Co., Ltd. | ISPOT Co., Ltd. (“ISPOT”) | Sale of information and communication technologies products | 100 | 100 | ||||||||||||
Youyi Co., Ltd. (“Youyi”) | Maintenance of information and communication technologies products | 100 | 100 | |||||||||||||
CHIEF Telecom Inc. | Unigate Telecom Inc. (“Unigate”) | Telecommunications and internet service | 100 | 100 | ||||||||||||
Chief International Corp. (“CIC”) | Telecommunications and internet service | 100 | 100 | |||||||||||||
Shanghai Chief Telecom Co., Ltd. (“SCT”) | Telecommunications and internet service | 49 | 49 | |||||||||||||
Chunghwa System Integration Co., Ltd. | Concord Technology Co., Ltd. (“Concord”) | Investment | 100 | 100 | 9 | ) | ||||||||||
Spring House Entertainment Tech. Inc. | Ceylon Innovation Co., Ltd. (“CEI”) | E-book publishing and copyright negotiation of digital music | — | — | 10 | ) | ||||||||||
Chunghwa Investment Co., Ltd. | Chunghwa Precision Test Tech. Co., Ltd. (“CHPT”) | Production and sale of semiconductor testing components and printed circuit board | 38 | 41 | 11 | ) | ||||||||||
Chunghwa Investment Holding Co., Ltd. (“CIHC”) | Investment | — | — | 12 | ) | |||||||||||
Concord Technology Co., Ltd. | Glory Network System Service (Shanghai) Co., Ltd. (“GNSS (Shanghai)”) | Design, development and production of computer and internet software, installment, maintenance and consulting services of information system integration, and sales of self-production products | — | 100 | 13 | ) | ||||||||||
Chunghwa Precision Test Tech. Co., Ltd. | Chunghwa Precision Test Tech USA Corporation (“CHPT (US)”) | Design and after-sale services of semiconductor testing components and printed circuit board | 100 | 100 | ||||||||||||
CHPT Japan Co., Ltd. (“CHPT (JP)”) | Related services of electronic parts, machinery processed products and printed circuit board | 100 | 100 | |||||||||||||
Chunghwa Precision Test Tech. International, Ltd. (“CHPT (International)”) | Wholesale and retail of electronic materials, and investment | 100 | 100 | |||||||||||||
Senao International (Samoa) Holding Ltd. | Senao International HK Limited (“SIHK”) | International investment | 100 | 100 | ||||||||||||
(Continued)
- 16 -
| Percentage of Ownership | ||||||||||||||||
| December 31 | ||||||||||||||||
| Name of Investor | Name of Investee | Main Businesses and Products | 2017 | 2016 | Note | |||||||||||
Chunghwa Investment Holding Co., Ltd. | CHI One Investment Co., Limited (“COI”) | Investment | — | — | 14 | ) | ||||||||||
Senao International HK Limited | Senao Trading (Fujian) Co., Ltd. (“STF”) | Sale of information and communication technologies products | 100 | 100 | ||||||||||||
Senao International Trading (Shanghai) Co., Ltd. (“SITS”) | Sale of information and communication technologies products | 100 | 100 | |||||||||||||
Senao International Trading (Shanghai) Co., Ltd. (“SEITS”) | Maintenance of information and communication technologies products | 100 | 100 | 15 | ) | |||||||||||
Senao International Trading (Jiangsu) Co., Ltd. (“SITJ”) | Sale of information and communication technologies products | 100 | 100 | |||||||||||||
Prime Asia Investments Group Ltd. (B.V.I.) | Chunghwa Hsingta Co., Ltd. (“CHC”) | Investment | 100 | 100 | ||||||||||||
Chunghwa Hsingta Co., Ltd. (“CHC”) | Chunghwa Telecom (China) Co., Ltd. (“CTC”) | Integrated information and communication solution services for enterprise clients, and intelligent energy network service | 100 | 100 | ||||||||||||
Jiangsu Zhenhua Information Technology Company, LLC. (“JZIT”) | Providing intelligent energy saving solution and intelligent buildings services | 75 | 75 | 16 | ) | |||||||||||
Chunghwa Precision Test Tech. International, Ltd. | Shanghai Taihua Electronic Technology Limited (“STET”) | Design of printed circuit board and related consultation service | 100 | 100 | ||||||||||||
(Concluded)
| 1) | The Company owns 28.93% equity shares of SENAO. Chunghwa had originally four out of seven seats of the Board of Directors of SENAO through the support of large beneficial stockholders. In order to comply with the local regulations, SENAO increased two seats of independent directors in June 2016; therefore, total seats of its Board of Directors increased to nine and Chunghwa continues to hold four out of nine seats of the Board of Directors. As Chunghwa remains the control over SENAO’s relevant activities, the accounts of SENAO are included in the consolidated financial statements. |
| 2) | Chunghwa and CHI disposed some shares of CHIEF in June 2017 before CHIEF traded its shares on the emerging stock market according to the local requirements. The Company’s equity ownership of CHIEF decreased to 70.43%. |
| 3) | Chunghwa International Yellow Pages Co., Ltd. changed its name to CHYP Multimedia Marketing & Communications Co., Ltd. starting from September 4, 2017. |
| 4) | Chunghwa invested 75% equity shares of Chunghwa Leading Photonics Tech Co., Ltd. (“CLPT”) in July 2016. |
| 5) | Chunghwa invested 100% equity shares of Chunghwa Telecom (Thailand) Co., Ltd. (“CHTT”) in March 2017. |
| 6) | Chunghwa invested 80% equity shares of CHT Security Co., Ltd. (“CHTSC”) in December 2017. |
| 7) | New Prospect was approved to dissolve its business in April 2017. The liquidation of New Prospect was completed in May 2017. |
| 8) | SENAO invested 100% equity shares of SENYOUNG Insurance Agent Co., Ltd. (“SENYOUNG”) in November 2017. |
- 17 -
| 9) | Concord was approved to end and dissolve its business in August 2017. The liquidation of Concord was completed in January 2018. |
| 10) | CEI’s liquidation was completed in August 2016 and SHE received the proceeds from the liquidation. |
| 11) | CHI disposed of some shares of CHPT in March 2016. Furthermore, CHI did not participate in the capital increase of CHPT in March 2016 and September 2017. Therefore, its ownership interest in CHPT decreased to 38.30%. However, considering the absolute and relative size of ownership interest, and the dispersion of shares owned by the other stockholders, the management concluded that the Company has a sufficiently dominant voting interest to direct the relevant activities; hence, CHPT is deemed as a subsidiary of the Company. |
| 12) | CIHC’s dissolution was approved in August 2016 and the liquidation was completed in September 2016. CHI received the proceeds from the liquidation. |
| 13) | GNSS (Shanghai) completed its liquidation in August 2017 and Concord received the proceeds from the liquidation. |
| 14) | COI completed its liquidation in July 2016 and CIHC received the proceeds from the liquidation. |
| 15) | SEITS was approved to end and dissolve its business in March 2017. The liquidation of SEITS is still in process. |
| 16) | JZIT was approved to end and dissolve its business in May 2016. The liquidation of JZIT is still in process. |
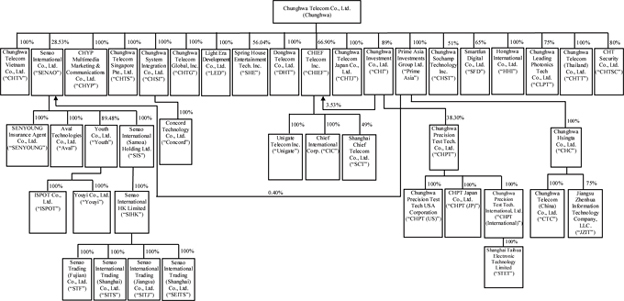
The following diagram presents information regarding the relationship and ownership percentages between Chunghwa and its subsidiaries as of December 31, 2017:
- 18 -
Foreign Currencies
In preparing the financial statements of each individual entity, transactions in currencies other than the entity’s functional currency (foreign currencies) are recognized at the rates of exchange prevailing at the dates of the transactions.
At the end of each reporting period, monetary items denominated in foreign currencies are retranslated at the rates prevailing at that date. Exchange differences on monetary items arising from settlement or translation are recognized in profit or loss in the period in which they arise.
Non-monetary items carried at fair value that are denominated in foreign currencies are retranslated at the rates prevailing at the date when the fair value was determined and related exchange differences are recognized in profit or loss. Conversely, when the fair value changes were recognized in other comprehensive income, related exchange difference shall be recognized in other comprehensive income.
Non-monetary items that are measured at historical cost in a foreign currency are not retranslated.
For the purposes of presenting consolidated financial statements, the assets and liabilities of the Company’s foreign operations (including of the subsidiaries and associates in other countries or currencies used different with Chunghwa) are translated into New Taiwan dollars using exchange rates prevailing at the end of each reporting period. Income and expense items are translated at the average exchange rates for the period. Exchange differences arising, if any, are recognized in other comprehensive income and attributed to stockholders of the parent and noncontrolling interests as appropriate.
Cash Equivalents
Cash equivalents include commercial paper, time deposits and negotiable certificate of deposit with original maturities within three months from the date of acquisition, highly liquid, readily convertible to a known amount of cash and are subject to an insignificant risk of changes in value. These cash equivalents are held for the purpose of meeting short-term cash commitments.
Inventories
Inventories are stated at the lower of cost or net realizable value item by item, except for those that may be appropriate to group items of similar or related inventories. Net realizable value is the estimated selling price of inventories less all estimated costs of completion and costs necessary to make the sale. The calculation of the cost of inventory is derived using the weighted-average method.
Buildings and Land Consigned to Construction Contractors
Inventories of LED are stated at the lower of cost or net realizable value item by item, except for those that may be appropriate to group as similar items or related inventories. Land acquired before construction is classified as land held for development, and then reclassified as land held under development after LED begins its construction project.
When using the completed-contract method for its construction projects, LED recognizes the proceeds from customers as advances from customers for land and building before the construction project is completed. After completion of the construction project and ownership is transferred to the customers, LED recognizes the relevant revenues.
- 19 -
Investments in Associates and Joint Ventures
An associate is an entity over which the Company has significant influence and that is neither a subsidiary nor an interest in a joint venture. A joint venture is a joint arrangement whereby the Company and other parties that have joint control of the arrangement have rights to the net assets of the arrangement.
Investments accounted for using the equity method include investments in associates and interests in joint ventures. Under the equity method, an investment in an associate or a joint venture is initially recognized at cost and adjusted thereafter to recognize the Company’s share of profit or loss and other comprehensive income of the associate and joint venture as well as the distribution received. The Company also recognizes its share in changes in the associates and joint ventures.
When the Company subscribes for new shares of the associate and joint venture at a percentage different from its existing ownership percentage, the resulting carrying amount of the investment differs from the amount of the Company’s proportionate interest in the associate and joint venture. The Company records such a difference as an adjustment to investments with the corresponding amount charged or credited to additionalpaid-in capital. When the adjustment should be debited to additionalpaid-in capital but the additionalpaid-in capital recognized from investments accounted for using equity method is insufficient, the shortage is debited to retained earnings.
Any excess of the cost of acquisition over the Company’s share of the fair value of the identifiable net assets and liabilities of an associate or a joint venture at the date of acquisition is recognized as goodwill, which is included within the carrying amount of the investment and shall not be amortized. Any excess of the Company’s share of the net fair value of the identifiable assets and liabilities over the cost of acquisition is recognized immediately in profit or loss.
When necessary, the entire carrying amount of the investment (including goodwill) is tested for impairment as a single asset by comparing its recoverable amount with its carrying amount. Any impairment loss recognized forms part of the carrying amount of the investment. Any reversal of that impairment loss is recognized to the extent that the recoverable amount of the investment subsequently increases.
When the Company transacts with its associate and joint venture, profits and losses resulting from the transactions with the associate and joint venture are recognized in the Company’s consolidated financial statements only to the extent of interests in the associate and joint venture that are not related to the Company.
Property, Plant and Equipment
Property, plant and equipment are initially measured at cost and subsequently measured at cost less accumulated depreciation and accumulated impairment loss.
Depreciation on property, plant and equipment is recognized using the straight-line method. Each significant part is depreciated separately. The estimated useful lives, residual values and depreciation method are reviewed at the end of each year, with the effect of any changes in estimate accounted for on a prospective basis.
On derecognition of an item of property, plant and equipment, the difference between the net disposal proceeds and the carrying amount of the asset is recognized in profit or loss in the period in which the property is derecognized.
- 20 -
Investment Properties
Investment properties are properties held to earn rentals and/or for capital appreciation. Investment properties also include land held for a currently undetermined future use.
Investment properties are measured initially at cost, including transaction costs. Subsequent to initial recognition, investment properties are measured at cost less accumulated depreciation and accumulated impairment loss. Depreciation is recognized using the straight-line method.
On derecognition of the investment properties, the difference between the net disposal proceeds and the carrying amount of the asset is recognized in profit or loss in the period in which the property is derecognized.
Goodwill
Goodwill arising from the acquisition of a business is carried at cost as established at the date of acquisition of the business less accumulated impairment loss.
For the purpose of impairment testing, goodwill is allocated to each of the Company’s cash-generating units or groups of cash-generating units (referred to as “cash-generating unit”) that are expected to benefit from the synergies of the business combination.
A cash-generating unit to which goodwill has been allocated is tested for impairment annually, or more frequently when there is an indication that the unit may be impaired, by comparing its carrying amount, including the attributable goodwill, with its recoverable amount. However, if the goodwill allocated to a cash-generating unit was acquired in a business combination during the current annual period, that unit shall be tested for impairment before the end of the current annual period. If the recoverable amount of the cash-generating unit is less than its carrying amount, the impairment loss is allocated first to reduce the carrying amount of any goodwill allocated to the unit and then to the other assets of the unit pro rata based on the carrying amount of each asset in the unit. Any impairment loss is recognized directly in profit or loss. An impairment loss recognized for goodwill is not reversed in subsequent periods.
Intangible Assets Other Than Goodwill
Intangible assets with finite useful lives that are acquired separately are initially measured at cost and subsequently measured at cost less accumulated amortization and accumulated impairment loss. Amortization is recognized on a straight-line basis. The estimated useful life, residual value, and amortization method are reviewed at the end of each reporting period, with the effect of any changes in estimate being accounted for on a prospective basis. The residual value of an intangible asset with a finite useful life shall be assumed to be zero unless the Company expects to dispose of the intangible asset before the end of its economic life. Intangible assets with indefinite useful lives that are acquired separately are measured at cost less accumulated impairment loss.
Intangible assets acquired in a business combination and recognized separately from goodwill are initially recognized at their fair value at the acquisition date (which is regarded as their cost). Subsequent to initial recognition, they are measured on the same basis as intangible assets that are acquired separately.
Gains or losses arising from derecognition of an intangible asset, measured as the difference between the net disposal proceeds and the carrying amount of the asset, are recognized in profit or loss in the period in which the asset is derecognized.
- 21 -
Impairment of Tangible and Intangible Assets Other Than Goodwill
At the end of each reporting period, the Company reviews the carrying amounts of its tangible and intangible assets, excluding goodwill, to determine whether there is any indication that those assets have suffered an impairment loss. If any such indication exists, the recoverable amount of the asset is estimated in order to determine the extent of the impairment loss. When it is not possible to estimate the recoverable amount of an individual asset, the Company estimates the recoverable amount of the cash-generating unit to which the asset belongs.
Intangible assets with indefinite useful lives and intangible assets not yet available for use are tested for impairment at least annually, and whenever there is an indication that the asset may be impaired.
Recoverable amount is the higher of fair value less costs to sell and value in use. If the recoverable amount of an asset or cash-generating unit is estimated to be less than its carrying amount, the carrying amount of the asset or cash-generating unit is reduced to its recoverable amount, with the resulting impairment loss recognized in profit or loss.
When an impairment loss is subsequently reversed, the carrying amount of the asset or cash-generating unit is increased to the revised estimate of its recoverable amount, but only to the extent of the carrying amount that would have been determined had no impairment loss been recognized for the asset or cash-generating unit in prior years. A reversal of an impairment loss is recognized in profit or loss.
Financial Instruments
Financial assets and financial liabilities are recognized when the Company becomes a party to the contractual provisions of the instruments.
Financial assets and financial liabilities are initially measured at fair value. Transaction costs that are directly attributable to the acquisition or issue of financial assets and financial liabilities (other than financial assets and financial liabilities at fair value through profit or loss) are added to or deducted from the fair value of the financial assets or financial liabilities, as appropriate, on initial recognition. Transaction costs directly attributable to the acquisition of financial assets or financial liabilities at fair value through profit or loss are recognized immediately in profit or loss.
| a. | Financial assets |
All regular way purchases or sales of financial assets are recognized and derecognized on a trade date basis.
| 1) | Measurement category |
| a) | Financial assets at fair value through profit and loss (FVTPL) |
Financial assets are classified as at FVTPL when the financial asset is held for trading.
Financial assets at FVTPL are stated at fair value, with any gains or losses arising on remeasurement recognized in profit or loss. The net gain or loss recognized in profit or loss does not incorporate any dividend or interest earned on the financial asset.
| b) | Held-to-maturity financial assets |
The Company invests in bank debentures and corporate bonds with specific credit ratings and the Company has positive intent and ability to hold to maturity, are classified asheld-to-maturity investments.
- 22 -
Subsequent to initial recognition,held-to-maturity financial assets are measured at amortized cost using the effective interest method less any impairment loss.
| c) | Available-for-sale financial assets (AFS financial assets) |
AFS financial assets arenon-derivatives that are either designated as AFS or are not classified as loans and receivables,held-to-maturity financial assets or financial assets at fair value through profit or loss.
The Company invests in listed stocks, emerging market stocks and unlisted stocks. Among these investments, those that have a quoted market price in an active market are classified as AFS and measured at fair value at the end of each reporting period; the others that do not have a quoted market price in an active market and whose fair value cannot be reliably measured are measured at cost less any identified impairment losses at the end of each reporting period by presenting in a separate line item as financial assets carried at cost. If, in a subsequent period, the fair value of the financial assets can be reliably measured, the financial assets are remeasured at fair value. The difference between the carrying amount and the fair value is recognized in other comprehensive income. Any impairment losses are recognized in profit or loss.
Changes in the carrying amount of AFS monetary financial assets relating to changes in foreign currency exchange rates, interest income calculated using the effective interest method and dividends on AFS equity investments are recognized in profit or loss. Other changes in the carrying amount of AFS financial assets are recognized in other comprehensive income and will be reclassified to profit or loss when the investment is disposed of or is determined to be impaired.
Dividends on AFS equity instruments are recognized in profit or loss when the Company’s right to receive the dividends is established.
| d) | Loans and receivables |
Loans and receivables (including cash and cash equivalents, trade notes and accounts receivable, receivables from related parties, other financial assets and refundable deposits) are measured at amortized cost using the effective interest method, less any impairment loss, except for short-term receivables as the effect of discounting is immaterial.
| 2) | Impairment of financial assets |
Financial assets, other than those at FVTPL, are assessed to determine whether there is objective evidence that an impairment loss has occurred at the end of each reporting period. Financial assets are considered to be impaired when there is objective evidence that, as a result of one or more events that occurred after the initial recognition of the financial asset, the estimated future cash flows of the investment have been affected.
For financial assets carried at amortized cost, such asheld-to-maturity financial assets and trade notes and accounts receivable, assets that are individually assessed and not impaired are, in addition, assessed for impairment on a collective basis.
For financial assets carried at amortized cost, the amount of the impairment loss recognized is mainly based on the difference between the asset’s carrying amount and the present value of estimated future cash flows, discounted at the financial asset’s original effective interest rate. However, since the discounted effect of short-term receivables is immaterial, the impairment loss is recognized on the difference between carrying amount and estimated future cash flow.
- 23 -
For financial assets measured at amortized cost, if, in a subsequent period, the amount of the impairment loss decreases and the decrease can be related objectively to an event occurring after the impairment was recognized, the previously recognized impairment loss is reversed through profit or loss to the extent that the carrying amount of the investment at the date the impairment is reversed does not exceed what the amortized cost would have been had the impairment not been recognized.
For AFS equity investments, a significant or prolonged decline in the fair value of the security below its cost is considered to be objective evidence of impairment.
When an AFS financial asset is considered to be impaired, cumulative gains or losses previously recognized in other comprehensive income are reclassified to profit or loss in the period.
In respect of AFS equity securities, impairment losses previously recognized in profit or loss are not reversed through profit or loss. Any increase in fair value subsequent to an impairment loss is recognized in other comprehensive income.
For financial assets that are carried at cost, the amount of the impairment loss is mainly measured as the difference between the asset’s carrying amount and the present value of the estimated future cash flows discounted at the current market rate of return for a similar financial asset. Such impairment loss is not reversed in subsequent periods.
The carrying amount of the financial asset is reduced by the impairment loss directly for all financial assets with the exception of trade notes and accounts receivable and other receivables, where the carrying amount is reduced through the use of an allowance account. When a trade note and accounts receivable and other receivables are considered uncollectible, it is written off against the allowance account. Subsequent recoveries of amounts previously written off are credited against the allowance account. Changes in the carrying amount of the allowance account are recognized in profit or loss except for uncollectible trade notes and accounts receivable and other receivables that are written off against the allowance account.
| 3) | Derecognition of financial assets |
The Company derecognizes a financial asset only when the contractual rights to the cash flows from the asset expire, or when it transfers the financial asset and substantially all the risks and rewards of ownership of the asset to another entity.
On derecognition of a financial asset in its entirety, the difference between the asset’s carrying amount and the sum of the consideration received and receivable and the cumulative gain or loss that had been recognized in other comprehensive income is recognized in profit or loss.
| b. | Financial liabilities |
| 1) | Subsequent measurement |
Except for financial liabilities at FVTPL, all the financial liabilities are subsequently measured at amortized cost using the effective interest method.
| 2) | Derecognition of financial liabilities |
The difference between the carrying amount of the financial liability derecognized and the consideration paid and payable, including anynon-cash assets transferred or liabilities assumed, is recognized in profit or loss.
- 24 -
| c. | Derivative financial instruments |
The Company enters into a variety of derivative financial instruments to manage its exposure to foreign exchange rate risks, including forward exchange contracts.
Derivatives are initially measured at fair value at the date the derivative contracts are entered into and are subsequently remeasured to their fair value at the end of each reporting period. The resulting gain or loss is recognized in profit or loss immediately unless the derivative is designated and effective as a hedging instrument, in which event the timing of the recognition in profit or loss depends on the nature of the hedge relationship. When the fair value of derivative financial instruments is positive, the derivative is recognized as a financial asset; when the fair value of derivative financial instruments is negative, the derivative is recognized as a financial liability.
Hedge Accounting
The Company designates some derivatives instruments as cash flow hedges. Hedges of foreign exchange risk on firm commitments are accounted for as cash flow hedges.
The effective portion of changes in the fair value of derivatives that are designated and qualify as cash flow hedges is recognized in other comprehensive income. The gain or loss relating to the ineffective portion is recognized immediately in profit or loss.
The associated gains or losses that were recognized in other comprehensive income are reclassified from equity to profit or loss as a reclassification adjustment in the line item relating to the hedged item in the same period when the hedged item affects profit or loss. If a hedge of a forecast transaction subsequently results in the recognition of anon-financial asset or anon-financial liability, the associated gains and losses that were recognized in other comprehensive income are removed from equity and are included in the initial cost of thenon-financial asset ornon-financial liability.
Hedge accounting is discontinued prospectively when the Company revokes the designated hedging relationship, or when the hedging instrument expires or is sold, terminated, or exercised, or when it no longer meets the criteria for hedge accounting. The cumulative gain or loss on the hedging instrument that has been previously recognized in other comprehensive income from the period when the hedge was effective remains separately in equity until the forecast transaction occurs. When a forecast transaction is no longer expected to occur, the gain or loss accumulated in equity is recognized immediately in profit or loss.
Provisions
Provisions are measured at the best estimate of the expenditure required to settle the Company’s obligation at the end of the reporting period, taking into account the risks and uncertainties surrounding the obligation. The provisions for warranties claims andtrade-in right are made by management according to the sales agreements which represent the management’s best estimate of the future outflow of economic benefits. The provisions of warranties claims andtrade-in right are recognized as operating cost and the reduction of revenue, respectively, in the period in which the goods are sold.
Revenue Recognition
Revenue from the sale of goods is recognized when all the following conditions are satisfied:
| a. | The Company has transferred to the buyer the significant risks and rewards of ownership of the goods; |
| b. | The Company retains neither continuing managerial involvement to the degree usually associated with ownership nor effective control over the goods sold; |
- 25 -
| c. | The amount of revenue can be measured reliably; |
| d. | It is probable that the economic benefits associated with the transaction will flow to the Company; and |
| e. | The costs incurred or to be incurred in respect of the transaction can be measured reliably. |
Revenue is measured at the fair value of the consideration received or receivable and represents amounts for goods sold in the normal course of business, net of sales discounts and volume rebates. For trade notes and accounts receivable due within one year from the balance sheet date, as the nominal value of the consideration to be received approximates its fair value and transactions are frequent, fair value of the consideration is not determined by discounting all future receipts using an imputed rate of interest.
Usage revenues from fixed-line services (including local, domestic long distance and international long distance telephone services), cellular services, Internet and data services, and interconnection and call transfer fees from other telecommunications companies and carriers are billed in arrears and are recognized based upon seconds or minutes of traffic processed when the services are provided in accordance with contract terms.
Other revenues are recognized as follows:(a) one-time subscriber connection fees (on fixed-line services) are deferred and recognized over the average expected customer service periods, (b) monthly fees (on fixed-line services, mobile, Internet and data services) are accrued every month, and (c) prepaid services (fixed-line, mobile, Internet and data services) are recognized as income based upon actual usage by customers.
Where the Company enters into transactions which involve both the provision of telecommunications service bundled with products such as handsets, total consideration received from products and telecommunications service in these arrangements are allocated and measured using units of accounting within the arrangement based on their relative fair values limited to the amount that is not contingent upon the delivery of products.
Revenue from a contract to provide services is recognized by reference to the stage of completion of the contract.
Dividend income from investments is recognized when the stockholder’s right to receive payment has been established under the premises when it is probable that the economic benefit related to the transactions will flow to the Company and that the revenue can be reasonably measured.
Interest income from a financial asset is recognized when it is probable that the economic benefits related to the transactions will flow to the Company and the amount of income can be measured reliably. Interest income is accrued on a time basis, by reference to the principal outstanding and at the effective interest rate applicable.
When another party is involved in providing goods or services to a customer, the Company is acting as a principal when it has exposure to the significant risks and rewards associated with the sale of goods or the rendering of services; otherwise, the Company is acting as an agent. When the Company is acting as a principal, gross inflows of economic benefits arising from transactions is recognized as revenue. When the Company is acting as an agent, revenue is recognized in the amount of commission.
- 26 -
Leasing
| a. | The Company as lessor |
Rental income from operating leases is recognized on a straight-line basis over the term of the relevant lease.
| b. | The Company as lessee |
Operating lease payments are recognized as an expense on a straight-line basis over the lease term.
Borrowing Costs
Borrowing costs directly attributable to the acquisition, construction or production of qualifying assets, are added to the cost of those assets, until such time as the assets are substantially ready for their intended use or sale.
Other than stated above, all other borrowing costs are recognized in profit or loss in the period in which they are incurred.
Employee Benefits
| a. | Short-term employee benefits |
Liabilities recognized in respect of short-term employee benefits are measured at the undiscounted amount of the benefits expected to be paid in exchange for the related service.
| b. | Retirement benefits |
Payments to defined contribution retirement benefit plans are recognized as an expense when employees have rendered service entitling them to the contributions.
Defined benefit costs (including service cost, net interest and remeasurement) under the defined benefit retirement benefit plans are determined using the projected unit credit method. Service cost (including current service cost and gains or losses on settlements) and net interest on the net defined benefit liability (asset) are recognized as employee benefits expense in the period they occur. Remeasurement, comprising (a) actuarial gains and losses; and (b) the return on plan assets, excluding amounts included in net interest on the net defined benefit liability (asset), is recognized in other comprehensive income in the period in which they occur. Remeasurement recognized in other comprehensive income is reflected immediately in retained earnings and will not be reclassified to profit or loss.
Net defined benefit liability (asset) represents the actual deficit (surplus) in the Company’s defined benefit plan. Any surplus resulting from this calculation is limited to the present value of any refunds from the plans or reductions in future contributions to the plans.
| c. | Other long-term employee benefits |
Other long-term employee benefits are accounted for in the same way as the accounting required for defined benefit plan except that remeasurement is recognized in profit or loss.
- 27 -
Share-based Payment Arrangements—Employee Stock Options
The fair value determined at the grant date of the employee share options is expensed on a straight-line basis over the vesting period, based on the Company’s estimate of employee share options that are expected to ultimately vest, with a corresponding increase in additionalpaid-in capital—employee stock options. If the equity instruments granted vest immediately at the grant date, expenses are recognized in full in profit or loss.
At the end of each reporting period, the Company revises its estimate of the number of employee share options expected to vest. The impact of the revision of the original estimates is recognized in profit or loss such that the cumulative expense reflects the revised estimate, with a corresponding adjustment to additionalpaid-in capital—employee stock options.
Income Tax
Income tax expense represents the sum of the tax currently payable and deferred tax.
| a. | Current tax |
According to the Income Tax Act, an additional tax at 10% of unappropriated earnings is provided for as income tax in the year the stockholders approve to retain the earnings.
Adjustments of prior years’ tax liabilities are added to or deducted from the current year’s tax provision.
| b. | Deferred tax |
Deferred tax is recognized on temporary differences between the carrying amounts of assets and liabilities in the consolidated financial statements and the corresponding tax bases used in the computation of taxable profit. If the temporary difference arises from the initial recognition (other than in a business combination) of assets and liabilities in a transaction that affects neither the taxable profit nor the accounting profit, the resulting deferred tax asset or liability is not recognized. In addition, a deferred tax liability is not recognized on taxable temporary difference arising from initial recognition of goodwill.
Deferred tax liabilities are generally recognized for all taxable temporary differences. Deferred tax assets are generally recognized for all deductible temporary differences, unused loss carry forward and unused tax credits from purchases of machinery, equipment and technology and research and development expenditures to the extent that it is probable that taxable profits will be available against which those deductible temporary differences can be utilized.
Deferred tax liabilities are recognized for taxable temporary differences associated with investments in subsidiaries and associates, and interests in joint ventures, except where the Company is able to control the reversal of the temporary difference and it is probable that the temporary difference will not reverse in the foreseeable future. Deferred tax assets arising from deductible temporary differences associated with such investments and interests are only recognized to the extent that it is probable that there will be sufficient taxable profits against which to utilize the benefits of the temporary differences and they are expected to reverse in the foreseeable future.
The carrying amount of deferred tax assets is reviewed at the end of each reporting period and reduced to the extent that it is no longer probable that sufficient taxable profits will be available to allow all or part of the asset to be recovered. A previously unrecognized deferred tax asset is also reviewed at the end of each reporting period and recognized to the to the extent that it has become probable that future taxable profit will allow the deferred tax asset to be recovered.
- 28 -
Deferred tax assets and liabilities are measured at the tax rates that are expected to apply in the period in which the liability is settled or the asset realized, based on tax rates (and tax laws) that have been enacted or substantively enacted by the end of the reporting period. The measurement of deferred tax assets and liabilities reflects the tax consequences that would follow from the manner in which the Company expects, at the end of the reporting period, to recover or settle the carrying amount of its assets and liabilities.
| c. | Current and deferred tax |
Current and deferred tax are recognized in profit or loss, except when they relate to items that are recognized in other comprehensive income, in which case, the current and deferred tax are also recognized in other comprehensive income.
Where current tax or deferred tax arises from the initial accounting for a business combination, the tax effect is included in the accounting for the business combination.
| 4. | CRITICAL ACCOUNTING JUDGMENTS AND KEY SOURCES OF ESTIMATION UNCERTAINTY AND ASSUMPTION |
In the application of the Company’s accounting policies, which are described in Note 3, the management is required to make judgments, estimates and assumptions which are based on historical experience and other factors that are not readily apparent from other sources. Actual results may differ from these estimates.
The estimates and underlying assumptions are reviewed by the management on an ongoing basis. Revisions to accounting estimates are recognized in the period in which the estimate is revised if the revision affects only that period or in the period of the revision and future periods if the revision affects both current and future periods.
The following are the key assumptions concerning the future, and other key sources of estimation uncertainty at the end of the reporting period. Actual results may differ from these estimates.
| a. | Revenue recognition |
The Company’s project agreements are mainly to provide one or more equipment or services to customers. In order to fulfill the agreements, another party may be involved in some agreements. The Company considers the following factors to determine whether the Company is a principal of the transaction: whether the Company is the primary obligation provider of the agreements, its exposures to inventory risks and the discretion in establishing prices, etc. The determination of whether the Company is a principal or an agent will affect the amount of revenue recognized by the Company. Only when the Company is acting as a principal, gross inflows of economic benefits arising from transactions is recognized as revenue.
| b. | Impairment of trade notes and accounts receivable |
When there is objective evidence showed indications of impairment, the Company considers the estimation of future cash flows. The amount of impairment will be measured at the difference between the carrying amount and the present value of estimated future cash flows discounted by the original effective interest rates of the financial assets. However, as the impact from discounting short-term receivables is not material, the impairment of short-term receivables is measured at the difference between the carrying amount and the estimated undiscounted future cash flows. Where the actual future cash flows are lower than expected, a material impairment loss may arise.
- 29 -
| c. | Provision for inventory valuation and obsolescence |
Inventories are stated at the lower of cost or net realizable value. Net realizable value is calculated as the estimated selling price less the estimated selling costs. Comparison of net realizable value and cost is determined on an item by item basis, except those similar items which could be categorized into the same groups. The Company uses the inventory holding period and turnover as the evaluation basis for inventory obsolescence losses.
| d. | Impairment of tangible and intangible assets |
When an indication of impairment is assessed with objective evidence, the Company considers whether the recoverable amount of an asset is less than its carrying amount and recognizes the impairment loss based on difference between the recoverable amount and its carrying amount. The estimate of recoverable amount would impact on the timing and the amount of impairment loss recognition.
| e. | Useful lives of property, plant and equipment |
As discussed in Note 3, “Summary of Significant Accounting Policies—Property, Plant and Equipment”, the Company reviews estimated useful lives of property, plant and equipment at the end of each year.
| f. | Recognition and measurement of defined benefit plans |
Net defined benefit liabilities and the resulting pension expense under defined benefit pension plans are calculated using the Projected Unit Credit Method. Actuarial assumptions comprise the discount rate, rate of employee turnover, and long-term average future salary increase. Changes in economic circumstances and market conditions will affect these assumptions and may have a material impact on the amount of the expense and the liability.
| g. | Control over subsidiaries |
As discussed in Note 3, some entities are subsidiaries of the Company although the Company only owns less than 50% ownership interests in these entities. After considering the Company’s absolute size of holding in the entity and the relative size of and dispersion of shares owned by the other stockholders, and the contractual arrangements between the Company and other investors, potential voting interests and the written agreement between stockholders, the management concluded that the Company has a sufficiently dominant voting interest to direct the relevant activities of the entity and therefore the Company has control over these entities.
| 5. | APPLICATION OF NEW AND REVISED STANDARDS AND INTERPRETATIONS |
| a. | Initial application of the amendments to the Regulations Governing the Preparation of Financial Reports by Securities Issuers and the IFRS, IAS, IFRIC and SIC endorsed and issued into effect by the FSC |
The application of the amendments to the Regulations Governing the Preparation of Financial Reports by Securities Issuers and the IFRS, IAS, IFRIC and SIC endorsed and issued into effect by the FSC does not have material impacts on the Company’s consolidated financial statements.
- 30 -
| b. | The Regulations Governing the Preparation of Financial Reports by Securities Issuers and IFRSs endorsed by FSC effective from January 1, 2018 |
New, Revised or Amended Standards and Interpretations | Effective Date Issued by IASB (Note 1) | |||
Amendments to IFRSs | Annual Improvements to IFRSs 2014-2016 Cycle | Note 2 | ||
Amendments to IFRS 2 | Classification and Measurement of Share-based Payment Transactions | January 1, 2018 | ||
IFRS 9 | Financial Instruments | January 1, 2018 | ||
Amendments to IFRS 9 and IFRS 7 | Mandatory Effective Date of IFRS 9 and Transition Disclosures | January 1, 2018 | ||
IFRS 15 | Revenue from Contracts with Customers | January 1, 2018 | ||
Amendments to IFRS 15 | Clarifications to IFRS 15 | January 1, 2018 | ||
Amendments to IAS 7 | Disclosure Initiative | January 1, 2017 | ||
Amendments to IAS 12 | Recognition of Deferred Tax Assets for Unrealized Losses | January 1, 2017 | ||
Amendments to IAS 40 | Transfers of Investment Property | January 1, 2018 | ||
IFRIC 22 | Foreign Currency Transactions and Advance Consideration | January 1, 2018 | ||
| Note 1: | Unless stated otherwise, the above amendments and interpretations are effective for annual periods beginning on or after their respective effective dates. |
| Note 2: | The amendment to IFRS 12 is retrospectively applied for annual periods beginning on or after January 1, 2017; the amendment to IAS 28 is retrospectively applied for annual periods beginning on or after January 1, 2018. |
Except for the following items, the application of the above new, revised or amended standards and interpretations will not have material impact on the Company’s consolidated financial statements:
| IFRS | 15 “Revenue from Contracts with Customers” and related amendments |
IFRS 15 establishes principles for recognizing revenue that apply to all contracts with customers, and will supersede IAS 18 “Revenue”, IAS 11 “Construction Contracts” and a number of revenue-related interpretations.
When applying IFRS 15, the Company shall recognize revenue by applying the following steps:
| 1) | Identify the contract with the customer; |
| 2) | Identify the performance obligations in the contract; |
| 3) | Determine the transaction price; |
| 4) | Allocate the transaction price to the performance obligations in the contracts; and |
| 5) | Recognize revenue when the entity satisfies a performance obligation. |
Upon the application of IFRS 15 and its related amendments, the Company will allocate the transaction price to each performance obligation identified in the contract on a relative stand-alone selling price basis.
- 31 -
Where the Company enters into transactions which involve both the provision of telecommunications service bundled with products such as handsets, total consideration received from products and telecommunications service in these arrangements is allocated based on each performance obligation’s relative selling price. The amount of sales revenue recognized for products is no longer limited to the amount paid by the customer for the products. This will not change the total revenue recognized, but will change the timing of revenue recognition. The Company may recognize more revenue at the beginning of the contract period (i.e., at the time of sale of products), and revenue recognized for telecommunications service in the subsequent contract periods will decrease.
Incremental costs of obtaining a contract will be recognized as an asset to the extent the Company expects to recover those costs. Such asset will be amortized on a basis that is consistent with the transfer to the customer of the goods or services to which the asset relates. Before the application of IFRS 15, the relevant expenditures were recognized as expenses.
IFRS 15 and its related amendments require that when another party is involved in providing goods or services to a customer, the Company is a principal if it controls the specified good or service before that good or service is transferred to a customer. Before the application of IFRS 15, the Company determines whether it is a principal or an agent based on its exposure to the significant risks and rewards associated with the sale of goods or the rendering of services.
Under IFRS 15, the net effect of revenue recognized, consideration received and receivable is recognized as a contract asset or a contract liability. Before the application of IFRS 15, receivable is recognized or advance receipts and deferred revenue is reduced when revenue is recognized for the contract under IAS 18.
Under IFRS 15, the Company will recognize atrade-in liability (other liability) and a right to recover a product (other asset) when recognizing revenue for the sale with atrade-in right. Before the application of IFRS 15,trade-in right provisions and inventories are recognized when recognizing revenue.
The Company elected to retrospectively apply IFRS 15 to contracts that were not completed on January 1, 2018 and recognized the cumulative effect of the change in the retained earnings on January 1, 2018. In addition, the Company will disclose the difference between the amounts that result from applying IFRS 15 and the amounts that result from applying current standards for 2018.
The anticipated significant impact on assets, liabilities and equity when retrospectively applying IFRS 15 on January 1, 2018 is showed as follows (The following table only disclosed the summary of differences arising from recognitions and measurements. The differences arising from presentations are not included.):
| Carrying Amount as of December 31, 2017 | Adjustments Arising from Initial Application of IFRS 15 | Adjusted Carrying Amount as of January 1, 2018 | ||||||||||
Contract assets—current | $ | — | $ | 6,998,445 | $ | 6,998,445 | ||||||
|
|
|
| |||||||||
Contract assets—noncurrent | $ | — | 3,916,924 | $ | 3,916,924 | |||||||
|
|
|
| |||||||||
Incremental costs to obtain a contract | $ | — | 2,466,515 | $ | 2,466,515 | |||||||
|
|
|
|
|
| |||||||
Total effect on assets | $ | 13,381,884 | ||||||||||
|
| |||||||||||
(Continued)
- 32 -
| Carrying Amount as of December 31, 2017 | Adjustments Arising from Initial Application | Adjusted Carrying Amount as of January 1, 2018 | ||||||||||
Contract liability—current | $ | — | $ | 197,345 | $ | 197,345 | ||||||
|
|
|
| |||||||||
Contract liability—noncurrent | $ | — | 86,355 | $ | 86,355 | |||||||
|
|
|
| |||||||||
Current tax liabilities | $ | 4,725,698 | 2,226,691 | $ | 6,952,389 | |||||||
|
|
|
|
|
| |||||||
Total effect on liabilities | $ | 2,510,391 | ||||||||||
|
| |||||||||||
Total effect on equity (unappropriated earnings) | $ | 37,202,683 | $ | 10,871,493 | $ | 48,074,176 | ||||||
|
|
|
|
|
| |||||||
(Concluded)
| IFRS | 9 “Financial Instruments” and related amendments |
With regard to financial assets, all recognized financial assets that are within the scope of IAS 39 “Financial Instruments: Recognition and Measurement” are subsequently measured at amortized cost or fair value.
Non-debt financial instruments held by the Company are measured at fair values. Changes in fair values are recognized in profit or loss. However, the Company may make an irrevocable election to designate equity investments that are not held for trading as financial assets at fair value through other comprehensive income with only dividend income recognized in profit or loss and subsequent changes in the fair value of an equity investment recognized in other comprehensive income. No subsequent impairment assessment is required, and the cumulative gain or loss previously recognized in other comprehensive income cannot be reclassified from equity to profit or loss.
The Company analyzed the facts and circumstances of its financial assets that exist at December 31, 2017 and performed the assessment of the impact of IFRS 9 on the classification and measurement of financial assets.
Under IFRS 9, except theavailable-for-sale financial asset listed on the TWSE will be designated as financial asset at fair value through other comprehensive income, other listedavailable-for-sale equity investment will be designated as financial asset at fair value through profit or loss. In addition, investments in unlisted shares measured at cost will be measured at fair value, and designated as financial assets at fair value through other comprehensive income at initial recognition.
IFRS 9 introduces a new expected loss impairment model to measure the impairment of financial assets and recognize loss allowance for the related expected credit losses. If the credit risk on a financial instrument has not increased significantly since initial recognition, the loss allowance for that financial instrument should be measured at an amount equal to12-month expected credit losses. If the credit risk on a financial instrument has increased significantly since initial recognition and is not deemed to be a low credit risk, the loss allowance for that financial instrument should be measured at an amount equal to the lifetime expected credit losses. A simplified approach is used for trade accounts receivables and contract assets and the loss allowance for these financial instruments could be measured at an amount equal to lifetime expected credit losses. As a result of retrospective application of expected loss impairment model, there was no material impact on the Company’s consolidated financial statements.
- 33 -
The Company elected not to restate prior reporting periods when applying the requirements for the financial assets under IFRS 9 with the cumulative effect of the initial application recognized at the date of initial application and will provide the disclosures related to the classification and the adjustment information upon the application of IFRS 9.
The anticipated significant impact on assets, liabilities and equity of retrospective application of the IFRS 9 on January 1, 2018 is set out below:
| Carrying Amount as of December 31, 2017 | Adjustments Arising from Initial Application of IFRS 9 | Adjusted Carrying Amount as of January 1, 2018 | ||||||||||
Impact on assets, liabilities and equity | ||||||||||||
Financial assets at fair value through profit or loss—noncurrent | $ | — | $ | 53,888 | $ | 53,888 | ||||||
|
|
|
| |||||||||
Financial assets at fair value through other comprehensive income—noncurrent | $ | — | 7,538,848 | $ | 7,538,848 | |||||||
|
|
|
| |||||||||
Available-for-sale financial assets—noncurrent | $ | 3,125,086 | (3,125,086 | ) | $ | — | ||||||
|
|
|
| |||||||||
Financial assets carried at cost—noncurrent | $ | 2,625,785 | (2,625,785 | ) | $ | — | ||||||
|
|
|
|
|
| |||||||
Total effect on assets | $ | 1,841,865 | ||||||||||
|
| |||||||||||
Total effect on liabilities (deferred income tax liabilities) | $ | 1,429,592 | $ | (1,175 | ) | $ | 1,428,417 | |||||
|
|
|
|
|
| |||||||
Unrealized gain or loss onavailable-for-sale financial assets | $ | 558,109 | $ | (558,109 | ) | $ | — | |||||
|
|
|
| |||||||||
Unrealized gain or loss on financial assets at fair value through other comprehensive income | $ | — | 883,420 | $ | 883,420 | |||||||
|
|
|
| |||||||||
Unappropriated earnings | $ | 37,202,683 | 1,521,674 | $ | 38,724,357 | |||||||
|
|
|
| |||||||||
Noncontrolling interests | $ | 8,697,595 | (3,945 | ) | $ | 8,693,650 | ||||||
|
|
|
|
|
| |||||||
Total effect on equity | $ | 1,843,040 | ||||||||||
|
| |||||||||||
| c. | The IFRSs issued by the International Accounting Standards Board (IASB) but not yet endorsed and issued into effect by the FSC. |
New, Revised or Amended Standards and Interpretations | Effective Date Issued by IASB (Note 1) | |||
Amendments to IFRSs | Annual Improvements to IFRSs 2015-2017 Cycle | January 1, 2019 | ||
Amendments to IFRS 9 | Prepayment Features with Negative Compensation | January 1, 2019 (Note 2) | ||
Amendments to IFRS 10 and IAS 28 | Sale or Contribution of Assets between an Investor and its Associate or Joint Venture | To be determined by IASB | ||
IFRS 16 | Leases | January 1, 2019 (Note 3) | ||
(Continued)
- 34 -
New, Revised or Amended Standards and Interpretations | Effective Date Issued by IASB (Note 1) | |||
Amendments to IAS 28 | Long-term Interests in Associates and Joint Ventures | January 1, 2019 | ||
IFRIC 23 | Uncertainty Over Income Tax Treatments | January 1, 2019 | ||
Amendments to IAS 19 | Plan Amendment, Curtailment or Settlement | January 1, 2019 (Note 4) | ||
(Concluded)
| Note 1: | Unless stated otherwise, the above amendments and interpretations are effective for annual periods beginning on or after their respective effective dates. |
| Note 2: | The FSC permits that companies may elect to early adopt the amendments starting from 2018. |
| Note 3: | On December 19, 2017, the FSC announced that IFRS 16 will take effect starting from January 1, 2019. |
| Note 4: | Companies shall apply the amendments to pension plan amendments, curtailments or settlements occurring on or after January 1, 2019. |
Except for the following items, the application of the above new, revised or amended standards and interpretations will not have material impact on the Company’s consolidated financial statements:
IFRS 16 “Leases”
IFRS 16 sets out the accounting standards for leases that will supersede IAS 17 and a number of related interpretations.
Under IFRS 16, if the Company is a lessee, it shall recognizeright-of-use assets and lease liabilities for all leases on the consolidated balance sheets except forlow-value and short-term leases. The Company may elect to apply the accounting method similar to the accounting for operating lease under IAS 17 to thelow-value and short-term leases. On the consolidated statements of comprehensive income, the Company should present the depreciation expense charged on theright-of-use asset separately from interest expense accrued on the lease liability and discloses such amounts in the footnotes; interest is computed by using effective interest method. On the consolidated financial statements of cash flows, cash payments for the principal portion of the lease liability are classified within financing activities; cash payments for interest portion are classified within operating activities.
The application of IFRS 16 is not expected to have a material impact on the accounting of the Company as lessor.
When IFRS 16 becomes effective, the Company may elect to apply this Standard either retrospectively to each prior reporting period presented or retrospectively with the cumulative effect of the initial application of this Standard recognized at the date of initial application.
Except for the abovementioned impact, as of the date the consolidated financial statements were authorized for issue, the Company is continuously assessing the possible impact that the application of other standards and interpretations will have on the Company’s financial position and operating result, and will disclose the relevant impact when the assessment is completed.
- 35 -
| 6. | CASH AND CASH EQUIVALENTS |
| December 31 | ||||||||
| 2017 | 2016 | |||||||
Cash | ||||||||
Cash on hand | $ | 382,694 | $ | 370,598 | ||||
Bank deposits | 7,877,605 | 7,239,990 | ||||||
|
|
|
| |||||
| 8,260,299 | 7,610,588 | |||||||
|
|
|
| |||||
Cash equivalents (investments with maturities of less than three months) | ||||||||
Commercial paper | 10,178,512 | 11,435,706 | ||||||
Negotiable certificate of deposit | 7,950,000 | 10,800,000 | ||||||
Time deposits | 2,436,124 | 1,254,048 | ||||||
|
|
|
| |||||
| 20,564,636 | 23,489,754 | |||||||
|
|
|
| |||||
| $ | 28,824,935 | $ | 31,100,342 | |||||
|
|
|
| |||||
The annual yield rates of bank deposits, commercial paper, negotiable certificate of deposit and time deposits as of balance sheet dates were as follows:
| December 31 | ||||||||
| 2017 | 2016 | |||||||
Bank deposits | 0.00%-0.70% | 0.00%-0.42% | ||||||
Commercial paper | 0.32%-0.40% | 0.32%-0.42% | ||||||
Negotiable certificate of deposit | 0.40%-0.50% | 0.35%-0.50% | ||||||
Time deposits | 0.52%-4.40% | 0.40%-3.30% | ||||||
| 7. | FINANCIAL INSTRUMENTS AT FAIR VALUE THROUGH PROFIT OR LOSS |
| December 31 | ||||||||
| 2017 | 2016 | |||||||
Financial assets held for trading | ||||||||
Derivatives (not designated for hedge) | ||||||||
Forward exchange contracts | $ | — | $ | 217 | ||||
|
|
|
| |||||
Financial liabilities held for trading | ||||||||
Derivatives (not designated for hedge) | ||||||||
Forward exchange contracts | $ | 578 | $ | 1,356 | ||||
|
|
|
| |||||
Outstanding forward exchange contracts not designated for hedge as of balance sheet dates were as follows:
| Currency | Maturity Period | Contract Amount (In Thousands) | ||||||||||
December 31, 2017 | ||||||||||||
Forward exchange contracts—buy | EUR/NT$ | 2018.03-06 | EUR1,942/NT$69,061 | |||||||||
Forward exchange contracts—buy | US$/NT$ | 2018.01 | US$4,190/NT$125,481 | |||||||||
(Continued)
- 36 -
| Currency | Maturity Period | Contract Amount (In Thousands) | ||||
December 31, 2016 | ||||||
Forward exchange contracts—buy | EUR/NT$ | 2017.03 | EUR4,857/NT$166,940 | |||
Forward exchange contracts—buy | US$/NT$ | 2017.01 | US$1,700/NT$54,629 | |||
(Concluded)
The Company entered into the above forward exchange contracts to manage its exposure to foreign currency risk due to fluctuations in exchange rates. However, the aforementioned derivatives did not meet the criteria for hedge accounting.
| 8. | AVAILABLE-FOR-SALE FINANCIAL ASSETS—NONCURRENT |
| December 31 | ||||||||
| 2017 | 2016 | |||||||
Equity securities | ||||||||
Listed stocks | $ | 3,125,086 | $ | 2,521,027 | ||||
|
|
|
| |||||
The Company evaluated and concluded that there was no indication thatavailable-for-sale financial assets were impaired; therefore, no impairment loss was recognized for the year ended December 31, 2017. Chunghwa evaluated and concluded itsavailable-for-sale financial assets were impaired and recorded an impairment loss of $577,333 thousand for the year ended December 31, 2016.
| 9. | HELD-TO-MATURITY FINANCIAL ASSETS—CURRENT |
| December 31 | ||||||||
| 2017 | 2016 | |||||||
Corporate bonds | $ | — | $ | 1,989,892 | ||||
Bank debentures | — | 150,000 | ||||||
|
|
|
| |||||
| $ | — | $ | 2,139,892 | |||||
|
|
|
| |||||
The related information of corporate bonds and bank debentures as of balance sheet dates was as follows:
| December 31 | ||||||||
| 2017 | 2016 | |||||||
Corporate bonds | ||||||||
Par value | $ | — | $ | 1,990,000 | ||||
|
|
|
| |||||
Nominal interest rate | — | 1.18%-1.35% | ||||||
Effective interest rate | — | 1.20%-1.35% | ||||||
Average remaining maturity life | — | 0.34 year | ||||||
(Continued)
- 37 -
| December 31 | ||||||||
| 2017 | 2016 | |||||||
Bank debentures | ||||||||
Par value | $ | — | $ | 150,000 | ||||
|
|
|
| |||||
Nominal interest rate | — | 1.25% | ||||||
Effective interest rate | — | 1.25% | ||||||
Average remaining maturity life | — | 0.41 year | ||||||
(Concluded)
| 10. | TRADE NOTES AND ACCOUNTS RECEIVABLE, NET |
| December 31 | ||||||||
| 2017 | 2016 | |||||||
Trade notes and accounts receivable | $ | 34,058,443 | $ | 32,795,513 | ||||
Less: Allowance for doubtful accounts | (2,117,349 | ) | (1,773,025 | ) | ||||
|
|
|
| |||||
| $ | 31,941,094 | $ | 31,022,488 | |||||
|
|
|
| |||||
The average credit terms range from 30 to 90 days. In determining the recoverability of trade notes and accounts receivable, the Company considers significant change in the credit quality of the trade notes and accounts receivable from the date credit was initially granted up to the end of the reporting period. In general, with few exceptional cases, it is unlikely for the notes and accounts receivable due longer than 180 days to be collected, therefore the Company recognized 100% allowance of notes and accounts receivable overdue longer than 180 days. For the notes and accounts receivable less than 180 days, the allowance for doubtful accounts was estimated based on the Company’s historical recovery experience.
The Company serves a large consumer base; therefore, the concentration of credit risk is limited.
The aging analysis for trade notes and accounts receivable as of balance sheet dates was as follows:
| December 31 | ||||||||
| 2017 | 2016 | |||||||
Non-overdue | $ | 30,031,885 | $ | 29,596,183 | ||||
Less than 30 days | 1,280,443 | 1,050,149 | ||||||
31-60 days | 484,795 | 347,796 | ||||||
61-90 days | 278,242 | 285,843 | ||||||
91-120 days | 253,318 | 198,364 | ||||||
121-180 days | 122,086 | 118,511 | ||||||
More than 181 days | 1,607,674 | 1,198,667 | ||||||
|
|
|
| |||||
| $ | 34,058,443 | $ | 32,795,513 | |||||
|
|
|
| |||||
- 38 -
The above aging analysis was based on days overdue.
At the balance sheet dates, the receivables that were past due but not impaired were considered recoverable by the management of the Company. The aging of these receivables as of balance sheet dates was as follows:
| December 31 | ||||||||
| 2017 | 2016 | |||||||
Less than 30 days | $ | 328,438 | $ | 256,298 | ||||
31-60 days | 36,253 | 46,987 | ||||||
61-90 days | 7,279 | 8,473 | ||||||
91-120 days | 69,486 | 73,890 | ||||||
121-180 days | 549 | 705 | ||||||
More than 181 days | 6,572 | 13,240 | ||||||
|
|
|
| |||||
| $ | 448,577 | $ | 399,593 | |||||
|
|
|
| |||||
The above aging analysis was based on days overdue.
Movements of the allowance for doubtful accounts were as follows:
| Individually Assessed for Impairment | Collectively Assessed for Impairment | Total | ||||||||||
Balance on January 1, 2016 | $ | 364,841 | $ | 969,636 | $ | 1,334,477 | ||||||
Add: Provision for doubtful accounts | 714,542 | 228,185 | 942,727 | |||||||||
Deduct: Amounts written off | (274,238 | ) | (229,941 | ) | (504,179 | ) | ||||||
|
|
|
|
|
| |||||||
Balance on December 31, 2016 | 805,145 | 967,880 | 1,773,025 | |||||||||
Add: Provision for doubtful accounts | 534,836 | 42,811 | 577,647 | |||||||||
Deduct: Amounts written off | (15,202 | ) | (218,121 | ) | (233,323 | ) | ||||||
|
|
|
|
|
| |||||||
Balance on December 31, 2017 | $ | 1,324,779 | $ | 792,570 | $ | 2,117,349 | ||||||
|
|
|
|
|
| |||||||
| 11. | INVENTORIES |
| December 31 | ||||||||
| 2017 | 2016 | |||||||
Merchandise | $ | 5,133,528 | $ | 4,136,246 | ||||
Project in process | 1,390,212 | 960,618 | ||||||
Work in process | 151,804 | 108,535 | ||||||
Raw materials | 88,726 | 143,554 | ||||||
|
|
|
| |||||
| 6,764,270 | 5,348,953 | |||||||
Land held under development | 1,998,733 | 1,998,733 | ||||||
Construction in progress | 76,612 | 75,088 | ||||||
|
|
|
| |||||
| $ | 8,839,615 | $ | 7,422,774 | |||||
|
|
|
| |||||
The operating costs related to inventories were $56,342,225 thousand (including the provision for inventory and obsolescence of $52,487 thousand) and $54,182,652 thousand (including the provision for inventory and obsolescence of $191,846 thousand) for the years ended December 31, 2017 and 2016, respectively.
- 39 -
As of December 31, 2017 and 2016, inventories of $2,075,345 thousand and $2,073,821 thousand, respectively, were expected to be recovered for a time period longer than twelve months. The aforementioned amount of inventories is related to property development owned by LED.
Land held under development and construction in progress on December 31, 2017 and 2016 was developed by LED for Qingshan Sec., Dayuan Dist., Taoyuan City project.
| 12. | PREPAYMENTS |
| December 31 | ||||||||
| 2017 | 2016 | |||||||
Prepaid rents | $ | 2,687,513 | $ | 2,933,899 | ||||
Others | 3,074,005 | 3,285,623 | ||||||
|
|
|
| |||||
| $ | 5,761,518 | $ | 6,219,522 | |||||
|
|
|
| |||||
Current | ||||||||
Prepaid rents | $ | 812,148 | $ | 899,270 | ||||
Others | 1,376,025 | 2,079,192 | ||||||
|
|
|
| |||||
| $ | 2,188,173 | $ | 2,978,462 | |||||
|
|
|
| |||||
Noncurrent | ||||||||
Prepaid rents | $ | 1,875,365 | $ | 2,034,629 | ||||
Others | 1,697,980 | 1,206,431 | ||||||
|
|
|
| |||||
| $ | 3,573,345 | $ | 3,241,060 | |||||
|
|
|
| |||||
| 13. | OTHER CURRENT MONETARY ASSETS |
| December 31 | ||||||||
| 2017 | 2016 | |||||||
Time deposits and negotiable certificates of deposit with maturities of more than three months | $ | 4,053,637 | $ | 3,567,928 | ||||
Others | 1,254,423 | 1,252,496 | ||||||
|
|
|
| |||||
| $ | 5,308,060 | $ | 4,820,424 | |||||
|
|
|
| |||||
The annual yield rates of time deposits and negotiable certificates of deposit with maturities of more than three months were as follows:
| December 31 | ||||||||
| 2017 | 2016 | |||||||
Time deposits and negotiable certificates of deposit with maturities of more than three months | 0.06%-4.15% | 0.11%-1.95% | ||||||
- 40 -
| 14. | FINANCIAL ASSETS CARRIED AT COST |
| December 31 | ||||||||
| 2017 | 2016 | |||||||
Non-listed stocks | ||||||||
Domestic | $ | 2,331,798 | $ | 1,948,552 | ||||
Foreign | 293,987 | 294,268 | ||||||
|
|
|
| |||||
| $ | 2,625,785 | $ | 2,242,820 | |||||
|
|
|
| |||||
The abovenon-listed stocks are classified asavailable-for-sale financial assets based on financial assets categories (see Note 38). Since the fair values of suchnon-listed stocks investments cannot be reliably measured due to the range of reasonable fair value estimates was so significant, the abovenon-listed stocks investments owned by the Company were measured at costs less any impairment losses at the balance sheet dates.
The Company invested $300,000 thousand to invest Taiwania Capital Buffalo Fund Co., Ltd. in December 2017 and owns 12.9% equity shares of Taiwania Capital Buffalo Fund Co., Ltd. Taiwania Capital Buffalo Fund Co., Ltd. engaged mainly in investment business.
The Company disposed financial assets carried at cost with carrying amount of $4,587 thousand and $8,903 thousand and recognized the disposal gain of $2,705 thousand and $706 thousand for the years ended December 31, 2017 and 2016, respectively.
The Company evaluated and concluded that there was no indication that financial assets carried at cost were impaired; therefore, no impairment loss was recognized for the years ended December 31, 2017 and 2016.
| 15. | SUBSIDIARIES |
| a. | Information on significant noncontrolling interest subsidiary |
| Subsidiaries | Principal Place of Business | Proportion of Ownership Interests and Voting Rights Held by Noncontrolling Interests | ||||||||||
| December 31 | ||||||||||||
| 2017 | 2016 | |||||||||||
SENAO | Taiwan | 71 | % | 71 | % | |||||||
CHPT | Taiwan | 62 | % | 59 | % | |||||||
| Profit Allocated to Noncontrolling Interests | Accumulated Noncontrolling Interests | |||||||||||||||
| Year Ended December 31 | December 31 | |||||||||||||||
| 2017 | 2016 | 2017 | 2016 | |||||||||||||
SENAO | $ | 578,618 | $ | 696,161 | $ | 4,257,408 | $ | 4,247,031 | ||||||||
|
|
|
| |||||||||||||
CHPT | $ | 439,123 | $ | 353,187 | 3,555,563 | 1,609,218 | ||||||||||
|
|
|
| |||||||||||||
Individually immaterial subsidiaries with noncontrolling interests | 884,624 | 639,673 | ||||||||||||||
|
|
|
| |||||||||||||
| $ | 8,697,595 | $ | 6,495,922 | |||||||||||||
|
|
|
| |||||||||||||
- 41 -
Summarized financial information in respect of SENAO and its subsidiaries that has material noncontrolling interests is set out below. The summarized financial information below represents amounts before intercompany eliminations.
| December 31 | ||||||||
| 2017 | 2016 | |||||||
Current assets | $ | 7,584,225 | $ | 7,761,962 | ||||
Noncurrent assets | 2,686,696 | 2,693,981 | ||||||
Current liabilities | (4,203,944 | ) | (4,376,279 | ) | ||||
Noncurrent liabilities | (160,366 | ) | (155,028 | ) | ||||
|
|
|
| |||||
Equity | $ | 5,906,611 | $ | 5,924,636 | ||||
|
|
|
| |||||
Equity attributable to the parent | $ | 1,649,203 | $ | 1,677,605 | ||||
Equity attributable to noncontrolling interests | 4,257,408 | 4,247,031 | ||||||
|
|
|
| |||||
| $ | 5,906,611 | $ | 5,924,636 | |||||
|
|
|
| |||||
| Year Ended December 31 | ||||||||
| 2017 | 2016 | |||||||
Revenues and income | $ | 36,034,572 | $ | 34,445,288 | ||||
Costs and expenses | 35,215,871 | 33,458,740 | ||||||
|
|
|
| |||||
Profit for the year | $ | 818,701 | $ | 986,548 | ||||
|
|
|
| |||||
Profit attributable to the parent | $ | 240,083 | $ | 290,387 | ||||
Profit attributable to noncontrolling interests | 578,618 | 696,161 | ||||||
|
|
|
| |||||
Profit for the year | $ | 818,701 | $ | 986,548 | ||||
|
|
|
| |||||
Other comprehensive income (loss) attributable to the parent | $ | 2,656 | $ | (21,404 | ) | |||
Other comprehensive loss attributable to noncontrolling interests | (16,581 | ) | (52,631 | ) | ||||
|
|
|
| |||||
| $ | (13,925 | ) | $ | (74,035 | ) | |||
|
|
|
| |||||
Total comprehensive income attributable to the parent | $ | 242,739 | $ | 268,983 | ||||
Total comprehensive income attributable to noncontrolling interests | 562,037 | 643,530 | ||||||
|
|
|
| |||||
| $ | 804,776 | $ | 912,513 | |||||
|
|
|
| |||||
Net cash flow from operating activities | $ | 1,080,947 | $ | 530,796 | ||||
Net cash flow from investing activities | (56,640 | ) | 129,848 | |||||
Net cash flow from financing activities | (896,889 | ) | (677,415 | ) | ||||
Effect of exchange rate changes on cash and cash equivalents | (2,488 | ) | (6,663 | ) | ||||
|
|
|
| |||||
Net cash inflow (outflow) | $ | 124,930 | $ | (23,434 | ) | |||
|
|
|
| |||||
Dividends paid to noncontrolling interest | $ | 703,207 | $ | 526,436 | ||||
|
|
|
| |||||
- 42 -
Summarized financial information in respect of CHPT and its subsidiaries that has material noncontrolling interests is set out below. The summarized financial information below represents amounts before intercompany eliminations.
| December 31 | ||||||||
| 2017 | 2016 | |||||||
Current assets | $ | 4,495,601 | $ | 2,116,256 | ||||
Noncurrent assets | 2,167,138 | 1,871,599 | ||||||
Current liabilities | (899,079 | ) | (1,268,736 | ) | ||||
Noncurrent liabilities | (997 | ) | (1,305 | ) | ||||
|
|
|
| |||||
Equity | $ | 5,762,663 | $ | 2,717,814 | ||||
|
|
|
| |||||
Equity attributable to CHI | $ | 2,207,100 | $ | 1,108,596 | ||||
Equity attributable to noncontrolling interests | 3,555,563 | 1,609,218 | ||||||
|
|
|
| |||||
| $ | 5,762,663 | $ | 2,717,814 | |||||
|
|
|
| |||||
| Year Ended December 31 | ||||||||
| 2017 | 2016 | |||||||
Revenues and income | $ | 3,126,669 | $ | 2,607,301 | ||||
Costs and expenses | 2,390,299 | 2,002,522 | ||||||
|
|
|
| |||||
Profit for the year | $ | 736,370 | $ | 604,779 | ||||
|
|
|
| |||||
Profit attributable to CHI | $ | 297,247 | $ | 251,592 | ||||
Profit attributable to noncontrolling interests | 439,123 | 353,187 | ||||||
|
|
|
| |||||
Profit for the year | $ | 736,370 | $ | 604,779 | ||||
|
|
|
| |||||
Other comprehensive loss attributable to CHI | $ | (1,179 | ) | $ | (194 | ) | ||
Other comprehensive loss attributable to noncontrolling interests | (1,904 | ) | (239 | ) | ||||
|
|
|
| |||||
| $ | (3,083 | ) | $ | (433 | ) | |||
|
|
|
| |||||
Total comprehensive income attributable to CHI | $ | 296,068 | $ | 251,398 | ||||
Total comprehensive income attributable to noncontrolling interests | 437,219 | 352,948 | ||||||
|
|
|
| |||||
| $ | 733,287 | $ | 604,346 | |||||
|
|
|
| |||||
Net cash flow from operating activities | $ | 1,051,989 | $ | 670,792 | ||||
Net cash flow from investing activities | (639,158 | ) | (904,100 | ) | ||||
Net cash flow from financing activities | 2,305,741 | 840,775 | ||||||
Effect of exchange rate changes on cash and cash equivalents | (3,640 | ) | (1,520 | ) | ||||
|
|
|
| |||||
Net cash inflow | $ | 2,714,932 | $ | 605,947 | ||||
|
|
|
| |||||
Dividends paid to noncontrolling interest | $ | 145,849 | $ | 109,387 | ||||
|
|
|
| |||||
- 43 -
| b. | Equity transactions with noncontrolling interests |
Chunghwa and CHI disposed some shares of CHIEF in June 2017 before CHIEF traded its shares on the emerging stock market according to the local requirements. The Company’s equity ownership of CHIEF decreased to 70.43%.
SENAO transferred its treasury stock to employees in May and November 2017 and the Company’s ownership interest in SENAO decreased to 28.93%. See Note 34(b) for details.
CHI disposed of some shares of CHPT in March 2016 and did not participate in the capital increase of CHPT in March 2016 and September 2017. Therefore, the Company’s ownership interest in CHPT decreased to 38.30%. See Note 34(d) for details.
The above transactions were accounted for as equity transactions since the Company did not cease to have control over these subsidiaries.
| Year Ended December 31 | ||||||||||||||||||||
| 2017 | 2016 | |||||||||||||||||||
| CHI Did Not Participate in the Capital Increase of CHPT | Chunghwa and CHI | SENAO Transferred its Treasury Stock | CHI Did Not Participate in the Capital Increase of CHPT | CHI Disposed Some Shares of CHPT | ||||||||||||||||
Cash consideration received from noncontrolling interests | $ | 2,552,053 | $ | 105,931 | $ | 164,200 | $ | 1,175,509 | $ | 83,628 | ||||||||||
The proportionate share of the carrying amount of the net assets of the subsidiary transferred to noncontrolling interests | (1,750,326 | ) | (29,217 | ) | (137,300 | ) | (785,769 | ) | (25,422 | ) | ||||||||||
|
|
|
|
|
|
|
|
|
| |||||||||||
Differences arising from equity transactions | $ | 801,727 | $ | 76,714 | $ | 26,900 | $ | 389,740 | $ | 58,206 | ||||||||||
|
|
|
|
|
|
|
|
|
| |||||||||||
Line items for equity | ||||||||||||||||||||
Additionalpaid-in capital—difference between consideration received or paid and the carrying amount of the subsidiaries’ net assets upon actual disposal or acquisition | $ | — | $ | 76,393 | $ | — | $ | — | $ | 58,206 | ||||||||||
|
|
|
|
|
|
|
|
|
| |||||||||||
Additionalpaid-in capital-arising from changes in equities of subsidiaries | $ | 801,727 | $ | 321 | $ | 26,900 | $ | 389,740 | $ | — | ||||||||||
|
|
|
|
|
|
|
|
|
| |||||||||||
- 44 -
| 16. | INVESTMENTS ACCOUNTED FOR USING EQUITY METHOD |
| December 31 | ||||||||
| 2017 | 2016 | |||||||
Investments in associates | $ | 2,546,374 | $ | 2,600,183 | ||||
Investments in joint ventures | — | 2,676 | ||||||
|
|
|
| |||||
| $ | 2,546,374 | $ | 2,602,859 | |||||
|
|
|
| |||||
| a. | Investments in associates |
Investments in associates were as follows:
| Carrying Amount | ||||||||
| December 31 | ||||||||
| 2017 | 2016 | |||||||
Listed | ||||||||
Senao Networks, Inc. (“SNI”) | $ | 862,116 | $ | 838,830 | ||||
Non-listed | ||||||||
ST-2 Satellite Ventures Pte., Ltd. (“STS”) | 472,505 | 466,847 | ||||||
International Integrated System, Inc. (“IISI”) | 296,333 | 312,528 | ||||||
Viettel-CHT Co., Ltd.(“Viettel-CHT”) | 256,323 | 274,814 | ||||||
Skysoft Co., Ltd. (“SKYSOFT”) | 139,741 | 145,727 | ||||||
Taiwan International Standard Electronics Co., Ltd. (“TISE”) | 136,885 | 153,104 | ||||||
KingwayTek Technology Co., Ltd. (“KWT”) | 128,269 | 122,221 | ||||||
So-net Entertainment Taiwan Limited(“So-net”) | 104,171 | 111,390 | ||||||
Taiwan International Ports Logistics Corporation (“TIPL”) | 49,631 | 56,450 | ||||||
Click Force Co., Ltd. (“CF”) | 38,175 | 37,188 | ||||||
Dian Zuan Integrating Marketing Co., Ltd. (“DZIM”) | 25,006 | 23,758 | ||||||
HopeTech Technologies Limited (“HopeTech”) | 22,731 | 23,458 | ||||||
Alliance Digital Tech Co., Ltd. (“ADT”) | 14,488 | 33,868 | ||||||
MeWorks LIMITED (HK) (“MeWorks”) | — | — | ||||||
|
|
|
| |||||
| $ | 2,546,374 | $ | 2,600,183 | |||||
|
|
|
| |||||
The percentages of ownership and voting rights in associates held by the Company as of balance sheet dates were as follows:
| % of Ownership and Voting Rights | ||||||||
| December 31 | ||||||||
| 2017 | 2016 | |||||||
Senao Networks, Inc. (“SNI”) | 34 | 34 | ||||||
ST-2 Satellite Ventures Pte., Ltd. (“STS”) | 38 | 38 | ||||||
International Integrated System, Inc. (“IISI”) | 32 | 32 | ||||||
Viettel-CHT Co., Ltd. (“Viettel-CHT”) | 30 | 30 | ||||||
Skysoft Co., Ltd. (“SKYSOFT”) | 30 | 30 | ||||||
Taiwan International Standard Electronics Co., Ltd. (“TISE”) | 40 | 40 | ||||||
(Continued)
- 45 -
| % of Ownership and Voting Rights | ||||||||
| December 31 | ||||||||
| 2017 | 2016 | |||||||
KingwayTek Technology Co., Ltd. (“KWT”) | 26 | 26 | ||||||
So-net Entertainment Taiwan Limited(“So-net”) | 30 | 30 | ||||||
Taiwan International Ports Logistics Corporation (“TIPL”) | 27 | 27 | ||||||
Click Force Co., Ltd. (“CF”) | 49 | 49 | ||||||
Dian Zuan Integrating Marketing Co., Ltd. (“DZIM”) | 22 | 26 | ||||||
HopeTech Technologies Limited (“HopeTech”) | 45 | 45 | ||||||
Alliance Digital Tech Co., Ltd. (“ADT”) | 14 | 14 | ||||||
MeWorks LIMITED (HK) (“MeWorks”) | 20 | 20 | ||||||
(Concluded)
None of the above associates is considered individually material to the Company. Summarized financial information of associates that are not individually material was as follows:
| Year Ended December 31 | ||||||||
| 2017 | 2016 | |||||||
The Company’s share of profit | $ | 408,022 | $ | 524,633 | ||||
The Company’s share of other comprehensive loss | (4,449 | ) | (46,406 | ) | ||||
|
|
|
| |||||
The Company’s share of total comprehensive income | $ | 403,573 | $ | 478,227 | ||||
|
|
|
| |||||
The Level 1 fair values based on the closing market prices of SNI as of the balance sheet dates were as follows:
| December 31 | ||||||||
| 2017 | 2016 | |||||||
SNI | $ | 2,130,406 | $ | 2,536,592 | ||||
|
|
|
| |||||
The Company did not participate in the capital increase of DZIM in April 2017 and the ownership interest of DZIM decreased from 26% to 22%. DZIM engages mainly in information technology service and general advertisement service.
The Company owns 14% equity shares of ADT. As the Company remains the seat in the Board of Directors of ADT, and considers the relative size of ownership interest and the dispersion of shares owned by the other stockholders, the Company remains significant influence over ADT. ADT engages mainly in the development of mobile payments and information processing service.
The Company’s share of profit and other comprehensive loss of associates was recognized based on the audited financial statements.
- 46 -
| b. | Investments in joint ventures |
Investments in joint ventures were as follows:
| Carrying Amount | % of Ownership and Voting Rights | |||||||||||||||
| December 31 | December 31 | |||||||||||||||
| 2017 | 2016 | 2017 | 2016 | |||||||||||||
Non-listed | ||||||||||||||||
Chunghwa Benefit One Co., Ltd. (“CBO”) | $ | — | $ | 2,676 | — | 50 | ||||||||||
Huada Digital Corporation (“HDD”) | — | — | — | 50 | ||||||||||||
|
|
|
| |||||||||||||
| $ | — | $ | 2,676 | |||||||||||||
|
|
|
| |||||||||||||
In December 2016, the stockholders of CBO approved that CBO should start its dissolution from December 31, 2016. CBO completed its liquidation in December 2017 and recognized the disposal loss of $223 thousand.
In March 2016, the stockholders of HDD approved that HDD should start its dissolution from March 31, 2016. Chunghwa received the proceeds from the liquidation in September 2016 and recognized the disposal loss of $409 thousand. HDD completed its liquidation in March 2017.
None of the above joint ventures is considered individually material to the Company. Summarized financial information of joint ventures that was not material to the Company was as follows:
| Year Ended December 31 | ||||||||
| 2017 | 2016 | |||||||
The Company’s share of loss | $ | (779 | ) | $ | (41,973 | ) | ||
The Company’s share of other comprehensive income | — | — | ||||||
|
|
|
| |||||
The Company’s share of total comprehensive loss | $ | (779 | ) | $ | (41,973 | ) | ||
|
|
|
| |||||
The Company’s share of loss of joint ventures was recorded based on the audited financial statements.
| 17. | PROPERTY, PLANT AND EQUIPMENT |
| Land | Land Improvements | Buildings | Computer Equipment | Telecommuni- cations Equipment | Transportation Equipment | Miscellaneous Equipment | Construction in Progress and equipment to be accepted | Total | ||||||||||||||||||||||||||||
Cost | ||||||||||||||||||||||||||||||||||||
Balance on January 1, 2016 | $ | 102,747,140 | $ | 1,575,270 | $ | 67,789,742 | $ | 14,995,890 | $ | 705,371,587 | $ | 3,815,372 | $ | 8,736,898 | $ | 20,402,328 | $ | 925,434,227 | ||||||||||||||||||
Additions | 791,148 | — | 36,037 | 41,912 | 170,781 | 880 | 255,602 | 23,294,912 | 24,591,272 | |||||||||||||||||||||||||||
Disposal | (1,645 | ) | (6,290 | ) | (34,887 | ) | (1,546,812 | ) | (11,541,665 | ) | (53,533 | ) | (625,417 | ) | — | (13,810,249 | ) | |||||||||||||||||||
Effect of foreign exchange differences | — | — | — | (2,664 | ) | (34,651 | ) | (15 | ) | (4,283 | ) | — | (41,613 | ) | ||||||||||||||||||||||
Others | 335,426 | 11,913 | (53,079 | ) | 806,491 | 21,726,424 | 103,697 | 580,136 | (23,556,518 | ) | (45,510 | ) | ||||||||||||||||||||||||
|
|
|
|
|
|
|
|
|
|
|
|
|
|
|
|
|
| |||||||||||||||||||
Balance on December 31, 2016 | $ | 103,872,069 | $ | 1,580,893 | $ | 67,737,813 | $ | 14,294,817 | $ | 715,692,476 | $ | 3,866,401 | $ | 8,942,936 | $ | 20,140,722 | $ | 936,128,127 | ||||||||||||||||||
|
|
|
|
|
|
|
|
|
|
|
|
|
|
|
|
|
| |||||||||||||||||||
(Continued)
- 47 -
| Land | Land Improvements | Buildings | Computer Equipment | Telecommuni- cations Equipment | Transportation Equipment | Miscellaneous Equipment | Construction in Progress and equipment to be accepted | Total | ||||||||||||||||||||||||||||
Accumulated depreciation and impairment | ||||||||||||||||||||||||||||||||||||
Balance on January 1, 2016 | $ | — | $ | (1,203,409 | ) | $ | (24,420,559 | ) | $ | (11,714,869 | ) | $ | (582,205,048 | ) | $ | (2,750,230 | ) | $ | (6,740,966 | ) | $ | — | $ | (629,035,081 | ) | |||||||||||
Depreciation expenses | — | (51,280 | ) | (1,268,974 | ) | (1,332,321 | ) | (25,279,598 | ) | (528,910 | ) | (625,946 | ) | — | (29,087,029 | ) | ||||||||||||||||||||
Disposal | — | 6,246 | 34,270 | 1,528,545 | 11,512,157 | 53,469 | 583,248 | — | 13,717,935 | |||||||||||||||||||||||||||
Impairment loss | — | — | — | (360 | ) | (595,408 | ) | (2 | ) | (58 | ) | — | (595,828 | ) | ||||||||||||||||||||||
Effect of foreign exchange differences | — | — | — | 1,506 | 6,647 | 18 | 4,002 | — | 12,173 | |||||||||||||||||||||||||||
Others | — | (171 | ) | 63,975 | (64,180 | ) | 64,070 | (11,409 | ) | (22,822 | ) | — | 29,463 | |||||||||||||||||||||||
|
|
|
|
|
|
|
|
|
|
|
|
|
|
|
|
|
| |||||||||||||||||||
Balance on December 31, 2016 | $ | — | $ | (1,248,614 | ) | $ | (25,591,288 | ) | $ | (11,581,679 | ) | $ | (596,497,180 | ) | $ | (3,237,064 | ) | $ | (6,802,542 | ) | $ | — | $ | (644,958,367 | ) | |||||||||||
|
|
|
|
|
|
|
|
|
|
|
|
|
|
|
|
|
| |||||||||||||||||||
Balance on January 1, 2016, net | $ | 102,747,140 | $ | 371,861 | $ | 43,369,183 | $ | 3,281,021 | $ | 123,166,539 | $ | 1,065,142 | $ | 1,995,932 | $ | 20,402,328 | $ | 296,399,146 | ||||||||||||||||||
|
|
|
|
|
|
|
|
|
|
|
|
|
|
|
|
|
| |||||||||||||||||||
Balance on December 31, 2016, net | $ | 103,872,069 | $ | 332,279 | $ | 42,146,525 | $ | 2,713,138 | $ | 119,195,296 | $ | 629,337 | $ | 2,140,394 | $ | 20,140,722 | $ | 291,169,760 | ||||||||||||||||||
|
|
|
|
|
|
|
|
|
|
|
|
|
|
|
|
|
| |||||||||||||||||||
Cost | ||||||||||||||||||||||||||||||||||||
Balance on January 1, 2017 | $ | 103,872,069 | $ | 1,580,893 | $ | 67,737,813 | $ | 14,294,817 | $ | 715,692,476 | $ | 3,866,401 | $ | 8,942,936 | $ | 20,140,722 | $ | 936,128,127 | ||||||||||||||||||
Additions | — | — | 29,582 | 77,643 | 193,286 | 1,048 | 193,238 | 25,574,267 | 26,069,064 | |||||||||||||||||||||||||||
Disposal | (157,928 | ) | (4,701 | ) | (108,349 | ) | (974,218 | ) | (13,739,288 | ) | (61,988 | ) | (401,624 | ) | — | (15,448,096 | ) | |||||||||||||||||||
Effect of foreign exchange differences | — | — | — | (424 | ) | (172,350 | ) | (101 | ) | (3,467 | ) | 35 | (176,307 | ) | ||||||||||||||||||||||
Others | 365,049 | 18,707 | 5,035,004 | 763,979 | 20,080,311 | 29,012 | 783,792 | (27,188,210 | ) | (112,356 | ) | |||||||||||||||||||||||||
|
|
|
|
|
|
|
|
|
|
|
|
|
|
|
|
|
| |||||||||||||||||||
Balance on December 31, 2017 | $ | 104,079,190 | $ | 1,594,899 | $ | 72,694,050 | $ | 14,161,797 | $ | 722,054,435 | $ | 3,834,372 | $ | 9,514,875 | $ | 18,526,814 | $ | 946,460,432 | ||||||||||||||||||
|
|
|
|
|
|
|
|
|
|
|
|
|
|
|
|
|
| |||||||||||||||||||
Accumulated depreciation and impairment | ||||||||||||||||||||||||||||||||||||
Balance on January 1, 2017 | $ | — | $ | (1,248,614 | ) | $ | (25,591,288 | ) | $ | (11,581,679 | ) | $ | (596,497,180 | ) | $ | (3,237,064 | ) | $ | (6,802,542 | ) | $ | — | $ | (644,958,367 | ) | |||||||||||
Depreciation expenses | — | (49,673 | ) | (1,402,180 | ) | (1,192,426 | ) | (24,492,377 | ) | (329,590 | ) | (676,507 | ) | — | (28,142,753 | ) | ||||||||||||||||||||
Disposal | — | 4,688 | 47,462 | 966,979 | 13,711,970 | 61,957 | 388,712 | — | 15,181,768 | |||||||||||||||||||||||||||
Effect of foreign exchange differences | — | — | — | 218 | 45,272 | 84 | 1,354 | — | 46,928 | |||||||||||||||||||||||||||
Others | — | 1,072 | 147,312 | 19,061 | 77,401 | (8,916 | ) | (116,028 | ) | — | 119,902 | |||||||||||||||||||||||||
|
|
|
|
|
|
|
|
|
|
|
|
|
|
|
|
|
| |||||||||||||||||||
Balance on December 31, 2017 | $ | — | $ | (1,292,527 | ) | $ | (26,798,694 | ) | $ | (11,787,847 | ) | $ | (607,154,914 | ) | $ | (3,513,529 | ) | $ | (7,205,011 | ) | $ | — | $ | (657,752,522 | ) | |||||||||||
|
|
|
|
|
|
|
|
|
|
|
|
|
|
|
|
|
| |||||||||||||||||||
Balance on January 1, 2017, net | $ | 103,872,069 | $ | 332,279 | $ | 42,146,525 | $ | 2,713,138 | $ | 119,195,296 | $ | 629,337 | $ | 2,140,394 | $ | 20,140,722 | $ | 291,169,760 | ||||||||||||||||||
|
|
|
|
|
|
|
|
|
|
|
|
|
|
|
|
|
| |||||||||||||||||||
Balance on December 31, 2017, net | $ | 104,079,190 | $ | 302,372 | $ | 45,895,356 | $ | 2,373,950 | $ | 114,899,521 | $ | 320,843 | $ | 2,309,864 | $ | 18,526,814 | $ | 288,707,910 | ||||||||||||||||||
|
|
|
|
|
|
|
|
|
|
|
|
|
|
|
|
|
| |||||||||||||||||||
(Concluded)
There was no indication that property, plant and equipment was impaired so the Company did not recognize any impairment loss for the year ended December 31, 2017. The Company determined that some telecommunications equipment was impaired in 2016 due to the expiration of 2G license in June 2017 which will lead to the termination of the related service. The Company evaluated and concluded the recoverable amount determined on the basis of value in use of aforementioned telecommunications equipment was lower than the carrying value, and recognized impairment loss of $595,408 thousand for the year ended December 31, 2016. In addition, the Company evaluated and concluded the recoverable amount of partial computer and miscellaneous equipment was nil and recognized impairment losses of $420 thousand for the year ended December 31, 2016. The impairment loss was included in other income and expenses in the statements of comprehensive income.
Depreciation expense is computed using the straight-line method over the following estimated service lives:
Land improvements | 8-30 years | |
Buildings | ||
Main buildings | 35-60 years | |
Other building facilities | 3-20 years | |
Computer equipment | 2-8 years | |
Telecommunications equipment | ||
Telecommunication circuits | 2-30 years | |
Telecommunication machinery and antennas equipment | 2-30 years | |
Transportation equipment | 3-10 years | |
Miscellaneous equipment | ||
Leasehold improvements | 1-6 years | |
Mechanical and air conditioner equipment | 3-16 years | |
Others | 1-10 years |
- 48 -
| 18. | INVESTMENT PROPERTIES |
Cost | ||||
Balance on January 1, 2016 | $ | 9,057,992 | ||
Additions | 52 | |||
Reclassification | 136,608 | |||
|
| |||
Balance on December 31, 2016 | $ | 9,194,652 | ||
|
| |||
Accumulated depreciation and impairment | ||||
Balance on January 1, 2016 | $ | (1,155,587 | ) | |
Depreciation expense | (19,119 | ) | ||
Reclassification | (52,940 | ) | ||
Reversal of impairment loss | 147,527 | |||
|
| |||
Balance on December 31, 2016 | $ | (1,080,119 | ) | |
|
| |||
Balance on January 1, 2016, net | $ | 7,902,405 | ||
|
| |||
Balance on December 31, 2016, net | $ | 8,114,533 | ||
|
| |||
Cost | ||||
Balance on January 1, 2017 | $ | 9,194,652 | ||
Reclassification | (59,835 | ) | ||
|
| |||
Balance on December 31, 2017 | $ | 9,134,817 | ||
|
| |||
Accumulated depreciation and impairment | ||||
Balance on January 1, 2017 | $ | (1,080,119 | ) | |
Depreciation expense | (20,831 | ) | ||
Reclassification | 2,947 | |||
Reversal of impairment loss | 10,979 | |||
|
| |||
Balance on December 31, 2017 | $ | (1,087,024 | ) | |
|
| |||
Balance on January 1, 2017, net | $ | 8,114,533 | ||
|
| |||
Balance on December 31, 2017, net | $ | 8,047,793 | ||
|
|
Depreciation expense is computed using the straight-line method over the following estimated service lives:
Land improvements | 8-30 years | |
Buildings | ||
Main buildings | 35-60 years | |
Other building facilities | 4-10 years |
After the evaluation of land and buildings, the Company concluded the recoverable amount which represented the fair value less costs to sell of some land and buildings was higher than the carrying amount. Therefore, the Company recognized reversal of impairment losses of $10,979 thousand and $147,527 thousand for the years ended December 31, 2017 and 2016, respectively, and the amounts were recognized only to the extent of impairment losses that had been recognized in prior years. The reversal of impairment loss was included in other income and expenses in the statements of comprehensive income.
- 49 -
The fair values of the Company’s investment properties as of December 31, 2017 and 2016 were determined by Level 3 fair value measurements inputs based on the appraisal reports conducted by independent appraisers. Those appraisal reports are based on the comparison approach, income approach or cost approach. Key assumptions and the fair values were as follows:
| December 31 | ||||||||
| 2017 | 2016 | |||||||
Fair value | $17,728,012 | $17,778,228 | ||||||
|
|
|
| |||||
Overall capital interest rate | 1.46%-2.20% | 1.46%-2.20% | ||||||
Profit margin ratio | 12%-20% | 10%-20% | ||||||
Discount rate | 1.04% | 1.04% | ||||||
Capitalization rate | 0.47%-1.69% | 0.43%-1.78% | ||||||
All of the Company’s investment properties are held under freehold interest.
| 19. | INTANGIBLE ASSETS |
| 3G and 4G Concession | Computer Software | Goodwill | Others | Total | ||||||||||||||||
Cost | ||||||||||||||||||||
Balance on January 1, 2016 | $ | 59,209,000 | $ | 3,248,628 | $ | 236,200 | $ | 408,881 | $ | 63,102,709 | ||||||||||
Additions-acquired separately | — | 277,380 | — | 5,429 | 282,809 | |||||||||||||||
Disposal | — | (120,584 | ) | — | (79 | ) | (120,663 | ) | ||||||||||||
Effect of foreign exchange difference | — | (367 | ) | — | — | (367 | ) | |||||||||||||
Others | — | 3,035 | — | — | 3,035 | |||||||||||||||
|
|
|
|
|
|
|
|
|
| |||||||||||
Balance on December 31, 2016 | $ | 59,209,000 | $ | 3,408,092 | $ | 236,200 | $ | 414,231 | $ | 63,267,523 | ||||||||||
|
|
|
|
|
|
|
|
|
| |||||||||||
Accumulated amortization and impairment | ||||||||||||||||||||
Balance on January 1, 2016 | $ | (10,607,800 | ) | $ | (1,982,992 | ) | $ | (18,055 | ) | $ | (47,084 | ) | $ | (12,655,931 | ) | |||||
Amortization expenses | (2,804,912 | ) | (550,914 | ) | — | (22,995 | ) | (3,378,821 | ) | |||||||||||
Disposal | — | 120,584 | — | 79 | 120,663 | |||||||||||||||
Impairment losses | — | (99 | ) | — | — | (99 | ) | |||||||||||||
Effect of foreign exchange difference | — | 84 | — | 5 | 89 | |||||||||||||||
|
|
|
|
|
|
|
|
|
| |||||||||||
Balance on December 31, 2016 | $ | (13,412,712 | ) | $ | (2,413,337 | ) | $ | (18,055 | ) | $ | (69,995 | ) | $ | (15,914,099 | ) | |||||
|
|
|
|
|
|
|
|
|
| |||||||||||
Balance on January 1, 2016, net | $ | 48,601,200 | $ | 1,265,636 | $ | 218,145 | $ | 361,797 | $ | 50,446,778 | ||||||||||
|
|
|
|
|
|
|
|
|
| |||||||||||
Balance on December 31, 2016, net | $ | 45,796,288 | $ | 994,755 | $ | 218,145 | $ | 344,236 | $ | 47,353,424 | ||||||||||
|
|
|
|
|
|
|
|
|
| |||||||||||
Cost | ||||||||||||||||||||
Balance on January 1, 2017 | $ | 59,209,000 | $ | 3,408,092 | $ | 236,200 | $ | 414,231 | $ | 63,267,523 | ||||||||||
Additions-acquired separately | 10,935,000 | 365,655 | — | 3,978 | 11,304,633 | |||||||||||||||
Disposal | — | (461,850 | ) | — | (18 | ) | (461,868 | ) | ||||||||||||
Effect of foreign exchange difference | — | (287 | ) | — | (41 | ) | (328 | ) | ||||||||||||
|
|
|
|
|
|
|
|
|
| |||||||||||
Balance on December 31, 2017 | $ | 70,144,000 | $ | 3,311,610 | $ | 236,200 | $ | 418,150 | $ | 74,109,960 | ||||||||||
|
|
|
|
|
|
|
|
|
| |||||||||||
(Continued)
- 50 -
| 3G and 4G Concession | Computer Software | Goodwill | Others | Total | ||||||||||||||||
Accumulated amortization and impairment | ||||||||||||||||||||
Balance on January 1, 2017 | $ | (13,412,712 | ) | $ | (2,413,337 | ) | $ | (18,055 | ) | $ | (69,995 | ) | $ | (15,914,099 | ) | |||||
Amortization expenses | (3,261,853 | ) | (480,496 | ) | — | (23,671 | ) | (3,766,020 | ) | |||||||||||
Disposal | — | 461,804 | — | 18 | 461,822 | |||||||||||||||
Impairment losses | — | — | (8,622 | ) | — | (8,622 | ) | |||||||||||||
Effect of foreign exchange difference | — | 232 | — | (5 | ) | 227 | ||||||||||||||
|
|
|
|
|
|
|
|
|
| |||||||||||
Balance on December 31, 2017 | $ | (16,674,565 | ) | $ | (2,431,797 | ) | $ | (26,677 | ) | $ | (93,653 | ) | $ | (19,226,692 | ) | |||||
|
|
|
|
|
|
|
|
|
| |||||||||||
Balance on January 1, 2017, net | $ | 45,796,288 | $ | 994,755 | $ | 218,145 | $ | 344,236 | $ | 47,353,424 | ||||||||||
|
|
|
|
|
|
|
|
|
| |||||||||||
Balance on December 31, 2017, net | $ | 53,469,435 | $ | 879,813 | $ | 209,523 | $ | 324,497 | $ | 54,883,268 | ||||||||||
|
|
|
|
|
|
|
|
|
| |||||||||||
(Concluded)
For long-term business development, Chunghwa submitted an application to NCC for 4G mobile broadband license in 1.8 and 2.1 GHz frequency bands and obtained certain spectrums. Chunghwa paid the 4G concession fee amounting to $10,935,000 thousand in November 2017.
The concessions are granted and issued by the NCC. The concession fees are amortized using the straight-line method from the date operations commence through the date the license expires. The carrying amount of 3G concession fee will be fully amortized by December 2018, and 4G concession fees will be fully amortized by December 2030 and December 2033.
The computer software is amortized using the straight-line method over the estimated useful lives of 1 to 10 years. Other intangible assets are amortized using the straight-line method over the estimated useful lives of 1 to 20 years. Goodwill is not amortized.
SENAO evaluated the goodwill that arose in the acquisition of Youth and its subsidiaries at the end of each year. SENAO determined the smallest identifiable group of assets that generates cash inflows as single cash generating units by business type, and evaluated the recoverable amount of those cash generating units by their value in use. The management of SENAO estimated the cash flow projections based on the financial budgets for the following five years. Discount rates were 14.8% and 14.6% as of December 31 2017 and 2016, respectively and were used to calculate the recoverable amount of related cash generating units by discounting aforementioned cash flows.
SENAO concluded the recoverable amount of the goodwill was lower than the carrying value and recognized impairment loss of $8,622 thousand for the year ended December 31, 2017. The impairment loss was included in other income and expenses in the statements of comprehensive income. There was no impairment loss recognized for the year ended December 31, 2016.
| 20. | OTHER ASSETS |
| December 31 | ||||||||
| 2017 | 2016 | |||||||
Spare parts | $ | 2,058,769 | $ | 1,775,715 | ||||
Refundable deposits | 1,860,364 | 2,083,753 | ||||||
Other financial assets | 1,000,000 | 1,000,000 | ||||||
Others | 2,800,112 | 2,288,294 | ||||||
|
|
|
| |||||
| $ | 7,719,245 | $ | 7,147,762 | |||||
|
|
|
| |||||
(Continued)
- 51 -
| December 31 | ||||||||
| 2017 | 2016 | |||||||
Current | ||||||||
Spare parts | $ | 2,058,769 | $ | 1,775,715 | ||||
Others | 123,989 | 346,062 | ||||||
|
|
|
| |||||
| $ | 2,182,758 | $ | 2,121,777 | |||||
|
|
|
| |||||
Noncurrent | ||||||||
Refundable deposits | $ | 1,860,364 | $ | 2,083,753 | ||||
Other financial assets | 1,000,000 | 1,000,000 | ||||||
Others | 2,676,123 | 1,942,232 | ||||||
|
|
|
| |||||
| $ | 5,536,487 | $ | 5,025,985 | |||||
|
|
|
| |||||
(Concluded)
Other financial assets—noncurrent was Piping Fund. As part of the government’s effort to upgrade the existing telecommunications infrastructure, Chunghwa and other public utility companies were required by the ROC government to contribute to a Piping Fund administered by the Taipei City Government. This fund was used to finance various telecommunications infrastructure projects. Net assets of this fund will be returned proportionately after the project is completed.
| 21. | HEDGING DERIVATIVE FINANCIAL INSTRUMENTS |
| December 31 | ||||||||
| 2017 | 2016 | |||||||
Hedging derivative financial liabilities | ||||||||
Cash flow hedge—forward exchange contracts | $ | 850 | $ | 586 | ||||
|
|
|
| |||||
Chunghwa’s hedge strategy is to enter forward exchange contracts—buy to avoid its foreign currency exposure to certain foreign currency denominated equipment payments in the following six months. In addition, Chunghwa’s management considers the market condition to determine the hedge ratio, and enters into forward exchange contracts with the banks to avoid the foreign currency risk.
Chunghwa signed equipment purchase contracts with suppliers, and entered into forward exchange contracts to avoid foreign currency risk exposure to Euro-denominated purchase commitments. Those forward exchange contracts were designated as cash flow hedges. For the years ended December 31, 2017 and 2016, losses arising from changes in fair value of the hedged items recognized in other comprehensive income were $263 thousand and $1,085 thousand, respectively. Upon the completion of the purchase transaction, the amount deferred and recognized in equity initially will be reclassified into equipment as its carrying value.
As of December 31, 2017 and 2016, Chunghwa expected part of the equipment purchase transactions will not occur and reclassified the related gain of $1,748 thousand and $696 thousand from equity to profit or loss which arising from the forward exchange contracts of the aforementioned transactions for the years ended December 31, 2017 and 2016, respectively.
- 52 -
The outstanding forward exchange contracts at the balance sheet dates were as follows:
| Contract Amount | ||||||
| Currency | Maturity Period | (Thousands) | ||||
December 31, 2017 | ||||||
Forward exchange contracts—buy | EUR/NT$ | 2018.03-06 | EUR3,963/NT$141,605 | |||
December 31, 2016 | ||||||
Forward exchange contracts—buy | EUR/NT$ | 2017.03 | EUR2,967/NT$101,743 | |||
Loss (gain) arising from the hedging derivative financial instruments that have been reclassified from equity to initial cost of the property, plant and equipment were as follows:
| Year Ended December 31 | ||||||||
| 2017 | 2016 | |||||||
Construction in progress and equipment to be accepted | $ | (2,411 | ) | $ | (15,139 | ) | ||
|
|
|
| |||||
| 22. | SHORT-TERM LOANS |
| December 31 | ||||||||
| 2017 | 2016 | |||||||
Secured loans (Note 40) | $ | — | $ | 20,000 | ||||
Unsecured loans | 70,000 | 118,000 | ||||||
|
|
|
| |||||
| $ | 70,000 | $ | 138,000 | |||||
|
|
|
| |||||
The annual interest rates of loans were as follows:
| December 31 | ||||
| 2017 | 2016 | |||
Secured loans | — | 1.98% | ||
Unsecured loans | 2.15%-2.19% | 1.95%-2.25% | ||
| 23. | LONG-TERM LOANS |
| December 31 | ||||||||
| 2017 | 2016 | |||||||
Secured loans (Note 40) | $ | 1,600,000 | $ | 1,600,000 | ||||
|
|
|
| |||||
The annual interest rates of loans were as follows:
| December 31 | ||||||||
| 2017 | 2016 | |||||||
Secured loans | 0.91 | % | 0.91 | % | ||||
- 53 -
LED obtained a secured loan from Chang Hwa Bank in September 2010. Interest is paid monthly. $300,000 thousand and $1,350,000 thousand were originally due in December 2014 and September 2015, respectively. In October 2014, the bank borrowing mentioned above was extended to September 2018 for one time repayment. LED made an early repayment of $50,000 thousand in April 2015. LED entered into a contract with Chang Hwa Bank to renew the contract upon the maturity of the aforementioned contract in December 2017 and the due date of the renew contract is extended to September 2021.
CHPT entered into a secured loan contract of $348,000 thousand with Bank of Taiwan in April 2014, interest is paid monthly, amortization of principal began in May 2016, and the loan is due in April 2029. CHPT made early repayments of $148,000 thousand, $50,000 thousand and $150,000 thousand from September to December 2014, in November 2015, and from March to April 2016, respectively.
| 24. | TRADE NOTES AND ACCOUNTS PAYABLE |
| December 31 | ||||||||
| 2017 | 2016 | |||||||
Trade notes and accounts payable | $ | 19,395,889 | $ | 18,809,664 | ||||
|
|
|
| |||||
Trade notes and accounts payable were attributable to operating activities and the trading conditions were agreed separately.
| 25. | OTHER PAYABLES |
| December 31 | ||||||||
| 2017 | 2016 | |||||||
Accrued salary and compensation | $ | 9,748,433 | $ | 9,769,858 | ||||
Payables to contractors | 2,057,651 | 2,395,881 | ||||||
Accrued compensation to employees and remuneration to directors and supervisors | 1,948,821 | 2,014,794 | ||||||
Payables to equipment suppliers | 1,689,685 | 1,623,027 | ||||||
Accrued franchise fees | 1,248,010 | 1,325,535 | ||||||
Amounts collected for others | 1,202,933 | 1,407,488 | ||||||
Accrued maintenance costs | 1,081,473 | 1,061,875 | ||||||
Others | 6,024,395 | 6,819,878 | ||||||
|
|
|
| |||||
| $ | 25,001,401 | $ | 26,418,336 | |||||
|
|
|
| |||||
| 26. | PROVISIONS |
| December 31 | ||||||||
| 2017 | 2016 | |||||||
Warranties | $ | 131,789 | $ | 110,975 | ||||
Trade-in right | 87,572 | 31,378 | ||||||
Employee benefits | 43,429 | 38,014 | ||||||
Others | 4,467 | 4,447 | ||||||
|
|
|
| |||||
| $ | 267,257 | $ | 184,814 | |||||
|
|
|
| |||||
(Continued)
- 54 -
| December 31 | ||||||||
| 2017 | 2016 | |||||||
Current | $ | 188,744 | $ | 118,872 | ||||
Noncurrent | 78,513 | 65,942 | ||||||
|
|
|
| |||||
| $ | 267,257 | $ | 184,814 | |||||
|
|
|
| |||||
(Concluded)
| Warranties | Trade-in right | Employee Benefits | Others | Total | ||||||||||||||||
Balance on January 1, 2016 | $ | 213,114 | $ | — | $ | 30,108 | $ | 4,682 | $ | 247,904 | ||||||||||
Additional provisions recognized | 80,573 | 31,378 | 9,344 | 75 | 121,370 | |||||||||||||||
Used / forfeited during the year | (182,712 | ) | — | (1,438 | ) | (310 | ) | (184,460 | ) | |||||||||||
|
|
|
|
|
|
|
|
|
| |||||||||||
Balance on December 31, 2016 | $ | 110,975 | $ | 31,378 | $ | 38,014 | $ | 4,447 | $ | 184,814 | ||||||||||
|
|
|
|
|
|
|
|
|
| |||||||||||
Balance on January 1, 2017 | $ | 110,975 | $ | 31,378 | $ | 38,014 | $ | 4,447 | $ | 184,814 | ||||||||||
Additional provisions recognized | 78,952 | 69,308 | 7,187 | 50 | 155,497 | |||||||||||||||
Used / forfeited during the year | (58,138 | ) | (13,114 | ) | (1,772 | ) | (30 | ) | (73,054 | ) | ||||||||||
|
|
|
|
|
|
|
|
|
| |||||||||||
Balance on December 31, 2017 | $ | 131,789 | $ | 87,572 | $ | 43,429 | $ | 4,467 | $ | 267,257 | ||||||||||
|
|
|
|
|
|
|
|
|
| |||||||||||
| a. | The provision for warranties claims represents the present value of the management’s best estimate of the future outflow of economic benefits that will be required under the Company’s obligation for warranties in sales agreements. The estimate has been made based on the historical warranty experience. |
| b. | The provision for employee benefits represents vested long-term service compensation accrued. |
| c. | The provision fortrade-in right is based on the management’s judgments to estimate thetrade-in right of products exercised by customers in the future. The provision is recognized as a reduction of revenue in the period in which the goods are sold. |
| 27. | ADVANCE RECEIPTS |
Advance receipts are mainly from advance telecommunication charges. In accordance with NCC’s regulation named “Mandatory and Prohibitory Provisions To Be Included In Standard Contracts for Telecommunication Goods (Services) Coupons”, the Company entered into a contract with Bank of Taiwan to provide a performance guarantee for advance receipts from selling prepaid cards amounting to $796,813 thousand as of December 31, 2017.
| 28. | RETIREMENT BENEFIT PLANS |
| a. | Defined contribution plans |
The pension plan under the Labor Pension Act of ROC (the “LPA”) is considered as a defined contribution plan. Based on the LPA, Chunghwa and its domestic subsidiaries make monthly contributions to employees’ individual pension accounts at 6% of monthly salaries and wages. Its foreign subsidiaries would make monthly contributions based on the local pension requirements.
- 55 -
| b. | Defined benefit plans |
Chunghwa completed its privatization plans on August 12, 2005. Chunghwa is required to pay all accrued pension obligations including service clearance payment, lump sum payment under civil service plan, additional separation payments, etc. upon the completion of the privatization in accordance with the Statute Governing Privatization of Stated-owned Enterprises. After paying all pension obligations for privatization, the plan assets of Chunghwa should be transferred to the Fund for Privatization of Government-owned Enterprises (the “Privatization Fund”) under the Executive Yuan. On August 7, 2006, Chunghwa transferred the remaining balance of fund to the Privatization Fund. However, according to the instructions of MOTC, Chunghwa was requested to administer the distributions to employees for pension obligations including service clearance payment, lump sum payment under civil service plan, additional separation payments, etc. upon the completion of the privatization and recognized in other current monetary assets.
Chunghwa and its subsidiaries SENAO, CHIEF, CHSI, and SHE with the pension mechanism under the Labor Standards Law are considered as defined benefit plans. These pension plans provide benefits based on an employee’s length of service and averagesix-month salary prior to retirement. Chunghwa and its subsidiaries contribute an amount no more than 15% of salaries paid each month to their respective pension funds (the Funds), which are administered by the Labor Pension Fund Supervisory Committee (the Committee) and deposited in the names of the Committees in the Bank of Taiwan. The plan assets are held in a commingled fund which is operated and managed by the government’s designated authorities; as such, the Company does not have any right to intervene in the investments of the funds. According to the Article 56 of the Labor Standards Law of the ROC revised in February 2015, entities are required to contribute the difference in one appropriation to the Funds before the end of next March when the balance of the Funds is insufficient to pay employees who will meet the retirement eligibility criteria within next year.
The amounts included in the consolidated balance sheets arising from the Company’s obligation in respect of its defined benefit plans were as follows:
| December 31 | ||||||||
| 2017 | 2016 | |||||||
Present value of funded defined benefit obligation | $ | 37,662,966 | $ | 34,572,194 | ||||
Fair value of plan assets | (34,972,376 | ) | (33,954,016 | ) | ||||
|
|
|
| |||||
Funded status—deficit | $ | 2,690,590 | $ | 618,178 | ||||
|
|
|
| |||||
Net defined benefit liabilities | $ | 2,703,569 | $ | 1,536,814 | ||||
Net defined benefit assets | (12,979 | ) | (918,636 | ) | ||||
|
|
|
| |||||
| $ | 2,690,590 | $ | 618,178 | |||||
|
|
|
| |||||
Movements in the defined benefit obligation and the fair value of plan assets were as follows:
| Present Value of Funded Defined Benefit Obligation | Fair Value of Plan Assets | Net Defined Benefit Liabilities (Assets) | ||||||||||
Balance on January 1, 2016 | $ | 30,882,113 | $ | 23,794,280 | $ | 7,087,833 | ||||||
|
|
|
|
|
| |||||||
Current service cost | 2,866,371 | — | 2,866,371 | |||||||||
Interest expense/interest income | 599,667 | 573,125 | 26,542 | |||||||||
|
|
|
|
|
| |||||||
Amounts recognized in profit or loss | 3,466,038 | 573,125 | 2,892,913 | |||||||||
|
|
|
|
|
| |||||||
(Continued)
- 56 -
| Present Value of Funded Defined Benefit Obligation | Fair Value of Plan Assets | Net Defined Benefit Liabilities (Assets) | ||||||||||
Remeasurement on the net defined benefit liability | ||||||||||||
Return on plan assets (excluding amounts included in net interest) | $ | — | $ | (352,477 | ) | $ | 352,477 | |||||
Actuarial gains recognized from changes in demographic assumptions | (124,492 | ) | — | (124,492 | ) | |||||||
Actuarial losses recognized from changes in financial assumptions | 1,715,104 | — | 1,715,104 | |||||||||
Actuarial losses recognized from experience adjustments | 100,325 | — | 100,325 | |||||||||
|
|
|
|
|
| |||||||
Amounts recognized in other comprehensive income | 1,690,937 | (352,477 | ) | 2,043,414 | ||||||||
|
|
|
|
|
| |||||||
Contributions from employer | — | 11,235,496 | (11,235,496 | ) | ||||||||
Benefits paid | (1,296,408 | ) | (1,296,408 | ) | — | |||||||
Benefits paid directly by the Company | (170,486 | ) | — | (170,486 | ) | |||||||
|
|
|
|
|
| |||||||
Balance on December 31, 2016 | 34,572,194 | 33,954,016 | 618,178 | |||||||||
|
|
|
|
|
| |||||||
Current service cost | 2,918,166 | — | 2,918,166 | |||||||||
Interest expense/interest income | 506,261 | 519,049 | (12,788 | ) | ||||||||
|
|
|
|
|
| |||||||
Amounts recognized in profit or loss | 3,424,427 | 519,049 | 2,905,378 | |||||||||
|
|
|
|
|
| |||||||
Remeasurement on the net defined benefit liability | ||||||||||||
Return on plan assets (excluding amounts included in net interest) | — | (192,650 | ) | 192,650 | ||||||||
Actuarial losses recognized from changes in demographic assumptions | 14,424 | — | 14,424 | |||||||||
Actuarial losses recognized from experience adjustments | 1,816,419 | — | 1,816,419 | |||||||||
|
|
|
|
|
| |||||||
Amounts recognized in other comprehensive income | 1,830,843 | (192,650 | ) | 2,023,493 | ||||||||
|
|
|
|
|
| |||||||
Contributions from employer | — | 2,635,225 | (2,635,225 | ) | ||||||||
Benefits paid | (1,943,264 | ) | (1,943,264 | ) | — | |||||||
Benefits paid directly by the Company | (221,234 | ) | — | (221,234 | ) | |||||||
|
|
|
|
|
| |||||||
Balance on December 31, 2017 | $ | 37,662,966 | $ | 34,972,376 | $ | 2,690,590 | ||||||
|
|
|
|
|
| |||||||
(Concluded)
Relevant pension costs recognized in profit and loss for defined benefit plans were as follows:
| Year Ended December 31 | ||||||||
| 2017 | 2016 | |||||||
Operating costs | $ | 1,733,951 | $ | 1,732,595 | ||||
Marketing expenses | 847,318 | 837,905 | ||||||
General and administrative expenses | 155,707 | 154,617 | ||||||
Research and development expenses | 96,953 | 97,336 | ||||||
|
|
|
| |||||
| $ | 2,833,929 | $ | 2,822,453 | |||||
|
|
|
| |||||
- 57 -
The Company is exposed to following risks for the defined benefits plans under the Labor Standards Law:
| a. | Investment risk |
Under the Labor Standards Law, the rate of return on assets shall not be lower than the average interest rate on atwo-year time deposit published by the local banks and the government is responsible for any shortfall in the event that the rate of return is less than the required rate of return. The plan assets are held in a commingled fund mainly invested in foreign and domestic equity and debt securities and bank deposits which is operated and managed by the government’s designated authorities; as such, the Company does not have any right to intervene in the investments of the funds.
| b. | Interest rate risk |
The decline in government bond interest rate will increase the present value of the obligation on the defined benefit plan, while the return on plan assets will increase. The net effect on the present value of the obligation on defined benefit plan is partially offset by the return on plan assets.
| c. | Salary risk |
The calculation of the present value of defined benefit obligation is referred to the plan participants’ future salary. Hence, the increase in plan participants’ salary will increase the present value of the defined benefit obligation.
The most recent actuarial valuation of plan assets and the present value of the defined benefit obligation were carried out by the independent actuary.
The principal assumptions used for the purpose of the actuarial valuations were as follows:
| Measurement Date | ||||
| December 31 | ||||
| 2017 | 2016 | |||
Discount rates | 1.50% | 1.50% | ||
Expected rates of salary increase | 1.20%-2.00% | 1.20%-2.00% | ||
If reasonably possible changes of the respective significant actuarial assumptions occur at the end of reporting periods, while holding all other assumptions constant, the present value of the defined benefit obligation would increase (decrease) as follows:
| December 31 | ||||||||
| 2017 | 2016 | |||||||
Discount rates | ||||||||
0.5% increase | $ | (1,231,822 | ) | $ | (1,219,246 | ) | ||
|
|
|
| |||||
0.5% decrease | $ | 1,309,513 | $ | 1,298,399 | ||||
|
|
|
| |||||
Expected rates of salary increase | ||||||||
0.5% increase | $ | 1,397,699 | $ | 1,379,365 | ||||
|
|
|
| |||||
0.5% decrease | $ | (1,325,710 | ) | $ | (1,305,935 | ) | ||
|
|
|
| |||||
The sensitivity analysis presented above may not be representative of the actual change in the present value of the defined benefit obligation as it is unlikely that the change in assumptions would occur in isolation of one another as some of the assumptions may be correlated. There is no change in the methods and assumptions used in preparing the sensitivity analysis from the previous period.
- 58 -
| December 31 | ||||||||
| 2017 | 2016 | |||||||
The expected contributions to the plan for the next year | $ | 4,392,763 | $ | 2,723,526 | ||||
|
|
|
| |||||
The average duration of the defined benefit obligation | 6-13 years | 7-14 years | ||||||
As of December 31, 2017, the Company’s maturity analysis of the undiscounted benefit payments was as follows:
| Year | Amount | |||
2018 | $ | 2,042,594 | ||
2019 | 4,715,736 | |||
2020 | 8,087,985 | |||
2021 | 11,201,321 | |||
2022 and thereafter | 48,309,789 | |||
|
| |||
| $ | 74,357,425 | |||
|
| |||
| 29. | EQUITY |
| a. | Share capital |
| 1) | Common stocks |
| December 31 | ||||||||
| 2017 | 2016 | |||||||
Number of authorized shares (thousand) | 12,000,000 | 12,000,000 | ||||||
|
|
|
| |||||
Authorized shares | $ | 120,000,000 | $ | 120,000,000 | ||||
|
|
|
| |||||
Number of issued and paid shares (thousand) | 7,757,447 | 7,757,447 | ||||||
|
|
|
| |||||
Issued shares | $ | 77,574,465 | $ | 77,574,465 | ||||
|
|
|
| |||||
The issued common stocks of a par value at $10 per share entitled the right to vote and receive dividends.
| 2) | Global depositary receipts |
The MOTC and some stockholders sold some common stocks of Chunghwa in an international offering of securities in the form of American Depositary Shares (“ADS”) (one ADS represents 10 common stocks) in July 2003, August 2005, and September 2006. The ADSs were traded on the New York Stock Exchange since July 17, 2003. As of December 31, 2017, the outstanding ADSs were 260,561 thousand common stocks, which equaled 26,056 thousand units and represented 3.36% of Chunghwa’s total outstanding common stocks.
The ADS holders generally have the same rights and obligations as other common stockholders, subject to the provision of relevant laws. The exercise of such rights and obligations shall comply with the related regulations and deposit agreement, which stipulate, among other things, that ADS holders are entitled to, through deposit agents:
| a) | Exercise their voting rights, |
| b) | Sell their ADSs, and |
- 59 -
| c) | Receive dividends declared and subscribe to the issuance of new shares. |
| b. | Additionalpaid-in capital |
The adjustments of additionalpaid-in capital for the years ended December 31, 2017 and 2016 were as follows:
| Share Premium | Movements of Additional Paid-in Capital for Associates and Joint Ventures Accounted for Using Equity Method | Movements of Additional Paid-in Capital Arising from Changes in Equities of Subsidiaries | Difference between Consideration Received and Carrying Amount of the Subsidiaries’ Net Assets upon Disposal | Donated Capital | Stockholders’ Contribution Due to Privatization | Total | ||||||||||||||||||||||
Balance on January 1, 2016 | $ | 147,329,386 | $ | 78,053 | $ | 284 | $ | 26,644 | $ | 13,170 | $ | 20,648,078 | $ | 168,095,615 | ||||||||||||||
Change in additionalpaid-in capital from investments in associates and joint ventures accounted for using equity method | — | (1,081 | ) | — | — | — | — | (1,081 | ) | |||||||||||||||||||
Partial disposal of interests in subsidiaries | — | — | — | 58,206 | — | — | 58,206 | |||||||||||||||||||||
Change in additionalpaid-in capital for not participating in the capital increase of a subsidiary | — | — | 389,740 | — | — | — | 389,740 | |||||||||||||||||||||
Share-based payment transactions of subsidiaries | — | — | 6 | — | — | — | 6 | |||||||||||||||||||||
|
|
|
|
|
|
|
|
|
|
|
|
|
| |||||||||||||||
Balance on December 31, 2016 | 147,329,386 | 76,972 | 390,030 | 84,850 | 13,170 | 20,648,078 | 168,542,486 | |||||||||||||||||||||
Unclaimed dividend | — | — | — | — | 3,023 | — | 3,023 | |||||||||||||||||||||
Change in additionalpaid-in capital from investments in associates and joint ventures accounted for using equity method | — | 13,965 | — | — | — | — | 13,965 | |||||||||||||||||||||
Partial disposal of interests in subsidiaries | — | — | 321 | 76,393 | — | — | 76,714 | |||||||||||||||||||||
Change in additionalpaid-in capital for not participating in the capital increase of a subsidiary | — | — | 801,727 | — | — | — | 801,727 | |||||||||||||||||||||
Other changes in additionalpaid-in capital of subsidiaries | — | — | 84 | — | — | — | 84 | |||||||||||||||||||||
Share-based payment transactions of subsidiaries | — | — | 1,984 | — | — | — | 1,984 | |||||||||||||||||||||
Treasury stock transfer of subsidiaries | — | — | 26,900 | — | — | — | 26,900 | |||||||||||||||||||||
|
|
|
|
|
|
|
|
|
|
|
|
|
| |||||||||||||||
Balance on December 31, 2017 | $ | 147,329,386 | $ | 90,937 | $ | 1,221,046 | $ | 161,243 | $ | 16,193 | $ | 20,648,078 | $ | 169,466,883 | ||||||||||||||
|
|
|
|
|
|
|
|
|
|
|
|
|
| |||||||||||||||
Additionalpaid-in capital from share premium, donated capital and the difference between consideration received and the carrying amount of the subsidiaries’ net assets upon disposal may be utilized to offset deficits. Furthermore, when Chunghwa has no deficit, it may be distributed in cash or capitalized, which however is limited to a certain percentage of Chunghwa’spaid-in capital except the additionalpaid-in capital arising from unclaimed dividend can only be utilized to offset deficits.
The additionalpaid-in capital from movements ofpaid-in capital arising from changes in equities of subsidiaries may only be utilized to offset deficits.
Among additionalpaid-in capital from movements of investments in associates and joint ventures accounted for using equity method, the portion arising from the difference between consideration received and the carrying amount of the subsidiaries’ net assets upon disposal may be utilized to offset deficits; furthermore, when the Company has no deficit, it may be distributed in cash or capitalized. However, other additionalpaid-in capital recognized in proportion of share ownership may only be utilized to offset deficits.
- 60 -
| c. | Retained earnings and dividends policy |
In accordance with the amendments to the Company Act of the ROC in May 2015, the recipients of dividends and bonuses are limited to stockholders and do not include employees. To comply with the above amendments to the Company Act of the ROC, amendments to the policy on dividend distribution and the addition of the policy on distribution of employees’ and directors’ compensation in Chunghwa’s Articles of Incorporation were approved by the stockholders in their meeting on June 24, 2016.
In accordance with the Chunghwa’s amended Articles of Incorporation, Chunghwa must pay all outstanding taxes, offset deficits in prior years and set aside a legal reserve equal to 10% of its net income before distributing a dividend or making any other distribution to stockholders, except when the accumulated amount of such legal reserve equals to Chunghwa’s total issued capital, and depending on its business needs or requirements, may also set aside or reverse special reserves. No less than 50% of the remaining earnings comprising remaining balance of net income, if any, plus cumulative undistributed earnings shall be distributed as stockholders’ dividends, of which cash dividends to be distributed shall not be less than 50% of the total amount of dividends to be distributed. If cash dividend to be distributed is less than $0.10 per share, such cash dividend shall be distributed in the form of common stocks.
For the information on compensation to the employees and remuneration to the directors accured based on the Chunghwa’s amended Articles of Incorporation, please refer to Note 31.a.7)—Employee benefit expenses.
Chunghwa should appropriate or reverse a special reserve in accordance with Rule No. 1010012865 and Rule No. 1010047490 issued by the FSC and the directive entitled “Questions and Answers on Special Reserves Appropriated Following the Adoption of Taiwan-IFRSs”. Distributions can be made out of any subsequent reversal of the debit to other equity items.
The appropriation for legal reserve shall be made until the accumulated reserve equals the aggregate par value of the outstanding capital stock of Chunghwa. This reserve can only be used to offset a deficit, or, when the legal reserve has exceeded 25% of Chunghwa’spaid-in capital, the excess may be transferred to capital or distributed in cash.
Except fornon-ROC resident stockholders, all stockholders receiving the dividends are entitled to a tax credit equal to their proportionate share of the income tax paid by the Company.
The appropriations of the 2016 and 2015 earnings of Chunghwa approved by the stockholders in their meetings on June 23, 2017 and June 24, 2016 were as follows:
| Appropriation of Earnings | Dividends Per Share (NT$) | |||||||||||||||
| For Fiscal Year 2016 | For Fiscal Year 2015 | For Fiscal Year 2016 | For Fiscal Year 2015 | |||||||||||||
Special reserve | $ | 5,404 | $ | — | ||||||||||||
Cash dividends | 38,336,525 | 42,551,146 | $ | 4.9419 | $ | 5.4852 | ||||||||||
- 61 -
The appropriations of earnings for 2017 had been proposed by Chunghwa’s Board of Directors on March 13, 2018. The appropriations and dividends per share were as follows:
| Appropriation of Earnings | Dividends Per Share (NT$) | |||||||
Reversal of special reserve | $ | 5,404 | ||||||
Cash dividends | 37,204,714 | $ | 4.796 | |||||
The appropriations of earnings for 2017 are subject to the resolution of the stockholders’ meeting planned to be held on June 15, 2018. Information of the appropriation of the Chunghwa’s earnings proposed by the Board of Directors and approved by the stockholders is available on the Market Observation Post System website.
| d. | Other equity items |
| 1) | Exchange differences arising from the translation of the foreign operations |
The exchange differences arising from the translation of the foreign operations from their functional currency to New Taiwan dollars were recognized as exchange differences arising from the translation of the foreign operations in other comprehensive income.
| 2) | Unrealized gain (loss) onavailable-for-sale financial assets |
| Year Ended December 31 | ||||||||
| 2017 | 2016 | |||||||
Beginning balance | $ | (50,885 | ) | $ | 90,964 | |||
Unrealized gain (loss) onavailable-for-sale financial assets | 606,878 | (720,914 | ) | |||||
Income tax relating to unrealized gain and loss onavailable-for-sale financial assets | 2,154 | 1,516 | ||||||
Amount reclassified from equity to profit or loss on disposal ofavailable-for-sale financial assets | (38 | ) | 216 | |||||
Amount reclassified from equity to profit or loss on impairment ofavailable-for-sale financial assets | — | 577,333 | ||||||
|
|
|
| |||||
Ending balance | $ | 558,109 | $ | (50,885 | ) | |||
|
|
|
| |||||
| e. | Noncontrolling interests |
| Year Ended December 31 | ||||||||
| 2017 | 2016 | |||||||
Beginning balance | $ | 6,495,922 | $ | 5,269,075 | ||||
Shares attributed to noncontrolling interests | ||||||||
Net income for the year | 1,168,696 | 1,162,975 | ||||||
Exchange differences arising from the translation of the net investment in foreign operations | (11,557 | ) | (40,559 | ) | ||||
Unrealized loss onavailable-for-sale financial assets | (1,566 | ) | (1,102 | ) | ||||
Income tax relating to unrealized gain and loss onavailable-for-sale financial assets | 266 | 187 | ||||||
Remeasurements of defined benefit pension plans | (8,053 | ) | (17,577 | ) | ||||
Income tax relating to remeasurements of defined benefit pension plans | 1,369 | 2,988 | ||||||
(Continued)
- 62 -
| Year Ended December 31 | ||||||||
| 2017 | 2016 | |||||||
Share of other comprehensive loss of associates accounted for using equity method | $ | (2,445 | ) | $ | (1,228 | ) | ||
Cash dividends distributed by subsidiaries | (942,482 | ) | (709,971 | ) | ||||
Changes in additionalpaid-in capital from investments in associates and joint ventures accounted for using equity method | 1,762 | (1,543 | ) | |||||
Partial disposal of interests in subsidiaries | 29,217 | 25,422 | ||||||
Change in additionalpaid-in capital for not participating in the capital increase of a subsidiary | 1,750,326 | 785,769 | ||||||
Other changes in additionalpaid-in capital of subsidiaries | 41 | — | ||||||
Share-based payment transactions of subsidiaries | 19,799 | 17,189 | ||||||
Net increase in noncontrolling interests | 196,300 | 4,297 | ||||||
|
|
|
| |||||
Ending balance | $ | 8,697,595 | $ | 6,495,922 | ||||
|
|
|
| |||||
(Concluded)
| 30. | REVENUES |
The main source of revenue of the Company includes various telecommunications services in many different streams, please refer to Note 44.
| 31. | NET INCOME AND OTHER COMPREHENSIVE INCOME (LOSS) |
| a. | Net income |
| 1) | Other income and expenses |
| Year Ended December 31 | ||||||||
| 2017 | 2016 | |||||||
Loss on disposal of property, plant and equipment | $ | (106,692 | ) | $ | (48,249 | ) | ||
Impairment loss on property, plant and equipment | — | (595,828 | ) | |||||
Reversal of impairment loss on investment properties | 10,979 | 147,527 | ||||||
Loss on disposal of intangible assets | (46 | ) | — | |||||
Impairment loss on intangible assets | (8,622 | ) | (99 | ) | ||||
|
|
|
| |||||
| $ | (104,381 | ) | $ | (496,649 | ) | |||
|
|
|
| |||||
| 2) | Other income |
| Year Ended December 31 | ||||||||
| 2017 | 2016 | |||||||
Dividend income | $ | 327,861 | $ | 390,856 | ||||
Rental income | 60,516 | 40,776 | ||||||
Income from Piping Fund | 362 | 201,648 | ||||||
Others | 446,726 | 438,826 | ||||||
|
|
|
| |||||
| $ | 835,465 | $ | 1,072,106 | |||||
|
|
|
| |||||
- 63 -
| 3) | Other gains and losses |
| Year Ended December 31 | ||||||||
| 2017 | 2016 | |||||||
Net foreign currency exchange gains (losses) | $ | (87,330 | ) | $ | 180,877 | |||
Gain on disposal of financial instruments | 2,748 | 490 | ||||||
Valuation gain (loss) on financial assets and liabilities at fair value through profit or loss, net | 779 | (1,153 | ) | |||||
Loss on disposal of investments accounted for using equity method | (223 | ) | (409 | ) | ||||
Impairment loss onavailable-for-sale financial assets | — | (577,333 | ) | |||||
Others | (48,132 | ) | (49,012 | ) | ||||
|
|
|
| |||||
| $ | (132,158 | ) | $ | (446,540 | ) | |||
|
|
|
| |||||
| 4) | Impairment loss (reversal of impairment loss) on financial instruments |
| Year Ended December 31 | ||||||||
| 2017 | 2016 | |||||||
Trade notes and accounts receivable | $ | 577,647 | $ | 942,727 | ||||
|
|
|
| |||||
Other receivables | $ | 65,363 | $ | (1,736 | ) | |||
|
|
|
| |||||
Available-for-sale financial assets | $ | — | $ | 577,333 | ||||
|
|
|
| |||||
| 5) | Impairment loss (reversal of impairment loss) onnon-financial assets |
| Year Ended December 31 | ||||||||
| 2017 | 2016 | |||||||
Inventories | $ | 52,487 | $ | 191,846 | ||||
|
|
|
| |||||
Property, plant and equipment | $ | — | $ | 595,828 | ||||
|
|
|
| |||||
Investment properties | $ | (10,979 | ) | $ | (147,527 | ) | ||
|
|
|
| |||||
Intangible assets | $ | 8,622 | $ | 99 | ||||
|
|
|
| |||||
| 6) | Depreciation and amortization expenses |
| Year Ended December 31 | ||||||||
| 2017 | 2016 | |||||||
Property, plant and equipment | $ | 28,142,753 | $ | 29,087,029 | ||||
Investment properties | 20,831 | 19,119 | ||||||
Intangible assets | 3,766,020 | 3,378,821 | ||||||
|
|
|
| |||||
Total depreciation and amortization expenses | $ | 31,929,604 | $ | 32,484,969 | ||||
|
|
|
| |||||
Depreciation expenses summarized by functions | ||||||||
Operating costs | $ | 26,401,822 | $ | 27,214,066 | ||||
Operating expenses | 1,761,762 | 1,892,082 | ||||||
|
|
|
| |||||
| $ | 28,163,584 | $ | 29,106,148 | |||||
|
|
|
| |||||
(Continued)
- 64 -
| Year Ended December 31 | ||||||||
| 2017 | 2016 | |||||||
Amortization expenses summarized by functions | ||||||||
Operating costs | $ | 3,473,233 | $ | 3,041,872 | ||||
Marketing expenses | 153,458 | 172,827 | ||||||
General and administrative expenses | 104,205 | 126,085 | ||||||
Research and development expenses | 35,124 | 38,037 | ||||||
|
|
|
| |||||
| $ | 3,766,020 | $ | 3,378,821 | |||||
|
|
|
| |||||
(Concluded)
| 7) | Employee benefit expenses |
| Year Ended December 31 | ||||||||
| 2017 | 2016 | |||||||
Post-employment benefit | ||||||||
Defined contribution plans | $ | 593,714 | $ | 543,872 | ||||
Defined benefit plans | 2,833,929 | 2,822,453 | ||||||
|
|
|
| |||||
| 3,427,643 | 3,366,325 | |||||||
|
|
|
| |||||
Share-based payment | ||||||||
Equity-settled share-based payment | 21,783 | 17,195 | ||||||
|
|
|
| |||||
Other employee benefit | ||||||||
Salaries | 25,759,742 | 25,984,961 | ||||||
Insurance | 2,748,020 | 2,651,837 | ||||||
Others | 15,449,368 | 15,729,590 | ||||||
|
|
|
| |||||
| 43,957,130 | 44,366,388 | |||||||
|
|
|
| |||||
Total employee benefit expenses | $ | 47,406,556 | $ | 47,749,908 | ||||
|
|
|
| |||||
Summary by functions | ||||||||
Operating costs | $ | 24,725,143 | $ | 25,189,832 | ||||
Operating expenses | 22,681,413 | 22,560,076 | ||||||
|
|
|
| |||||
| $ | 47,406,556 | $ | 47,749,908 | |||||
|
|
|
| |||||
According to the Company Act as amended in May 2015 and the amendments to the Chunghwa’s Articles of Incorporation approved by the Chunghwa’s stockholders in their meeting on June 24, 2016, Chunghwa shall distribute employees’ compensation at the rates from 1.7% to 4.3% and remuneration to directors not higher than 0.17%, respectively, ofpre-tax income. As of December 31, 2017, the payables of the employees’ compensation and the remuneration to directors were $1,596,012 thousand and $40,750 thousand, respectively. Such amounts have been approved by the Chunghwa’s Board of Directors on March 13, 2018 and will be reported to the stockholders in their meeting planned to be held on June 15, 2018.
If there is a change in the proposed amounts after the annual financial statements are authorized for issue, the differences are recorded as a change in accounting estimate.
- 65 -
The compensation to the employees and remuneration to the directors of 2016 and 2015 approved by the Board of Directors on March 7, 2017 and March 11, 2016, respectively, were as follows:
| 2016 | 2015 | |||||||
| Cash | Cash | |||||||
Compensation distributed to the employees | $ | 1,702,164 | $ | 1,927,518 | ||||
Remuneration paid to the directors | 42,087 | 44,852 | ||||||
There was no difference between the initial accrual amounts and the amounts proposed in the Board of Directors in 2017 and 2016 of the aforementioned compensation to employees and the remuneration to directors.
Information of the appropriation of Chunghwa’s employees compensation and remuneration to directors and those approved by the Board of Directors is available on the Market Observation Post System website.
| b. | Reclassification adjustments of other comprehensive income (loss) |
| Year Ended December 31 | ||||||||
| 2017 | 2016 | |||||||
Unrealized gain (loss) onavailable-for-sale financial assets | ||||||||
Arising during the year | $ | 605,317 | $ | (722,016 | ) | |||
Reclassification adjustments | ||||||||
Upon disposal | (43 | ) | 216 | |||||
Upon impairment | — | 577,333 | ||||||
|
|
|
| |||||
| $ | 605,274 | $ | (144,467 | ) | ||||
|
|
|
| |||||
Cash flow hedges | ||||||||
Gain arising during the year | $ | 3,896 | $ | 14,750 | ||||
Reclassification adjustments included in profit or loss | (1,748 | ) | (696 | ) | ||||
Adjusted against the carrying amount of hedged items | (2,411 | ) | (15,139 | ) | ||||
|
|
|
| |||||
| $ | (263 | ) | $ | (1,085 | ) | |||
|
|
|
| |||||
| 32. | INCOME TAX |
| a. | Income tax recognized in profit or loss |
The major components of income tax expense were as follows:
| Year Ended December 31 | ||||||||
| 2017 | 2016 | |||||||
Current tax | ||||||||
Current tax expenses recognized for the year | $ | 7,993,159 | $ | 6,735,442 | ||||
Income tax on unappropriated earnings | 48,170 | 19,244 | ||||||
Income tax adjustments on prior years | (1,997 | ) | (21,709 | ) | ||||
Others | 11,210 | 14,906 | ||||||
|
|
|
| |||||
| 8,050,542 | 6,747,883 | |||||||
|
|
|
| |||||
(Continued)
- 66 -
| Year Ended December 31 | ||||||||
| 2017 | 2016 | |||||||
Deferred tax | ||||||||
Deferred tax expenses recognized for the year | $ | (101,663 | ) | $ | 1,404,679 | |||
Income tax adjustments on prior years | 5,582 | — | ||||||
|
|
|
| |||||
| (96,081 | ) | 1,404,679 | ||||||
|
|
|
| |||||
Income tax recognized in profit or loss | $ | 7,954,461 | $ | 8,152,562 | ||||
|
|
|
| |||||
(Concluded)
Reconciliation of accounting profit and income tax expense was as follows:
| Year Ended December 31 | ||||||||
| 2017 | 2016 | |||||||
Income before income tax | $ | 47,997,062 | $ | 49,382,547 | ||||
|
|
|
| |||||
Income tax expense calculated at the statutory rate (17%) | $ | 8,159,501 | $ | 8,395,033 | ||||
Nondeductible revenues and expenses in determining taxable income | 34,300 | 5,316 | ||||||
Unrecognized deductible temporary differences | (856 | ) | (8,537 | ) | ||||
Unrecognized loss carryforwards | 9,859 | 11,605 | ||||||
Tax-exempt income | (87,476 | ) | (20,231 | ) | ||||
Income tax on unappropriated earnings | 48,170 | 19,244 | ||||||
Investment credits | (211,740 | ) | (234,101 | ) | ||||
Effect of different tax rates of group entities operating in other jurisdictions | (2,110 | ) | (8,117 | ) | ||||
Income tax adjustments on prior years | 3,585 | (21,709 | ) | |||||
Others | 1,228 | 14,059 | ||||||
|
|
|
| |||||
Income tax expense recognized in profit or loss | $ | 7,954,461 | $ | 8,152,562 | ||||
|
|
|
| |||||
The applicable tax rate used above is the corporate tax rate of 17% payable by the entities subject to the Income Tax Act of the Republic of China, while the applicable tax rate used by subsidiaries in China is 25%. Tax rates used by other entities in the Company operating in other jurisdictions are based on the tax laws in those jurisdictions.
In February 2018, it was announced by the President that the Income Tax Act in the ROC was amended and starting from 2018, the corporate income tax rate will be adjusted from 17% to 20%. In addition, the tax rate applicable to 2018 unappropriated earnings will be reduced from 10% to 5%. Deferred tax assets and deferred tax liabilities recognized as at December 31, 2017 are expected to increase by $480,440 thousand and $235,519 thousand, respectively, as a result of the aforementioned tax rate changes in 2018.
- 67 -
| b. | Income tax benefit recognized in other comprehensive income |
| Year Ended December 31 | ||||||||
| 2017 | 2016 | |||||||
Deferred tax | ||||||||
Unrealized gain or loss onavailable-for-sale financial assets | $ | (2,420 | ) | $ | (1,703 | ) | ||
Remeasurement on defined benefit plan | (343,994 | ) | (347,380 | ) | ||||
|
|
|
| |||||
Total income tax benefit recognized in other comprehensive income | $ | (346,414 | ) | $ | (349,083 | ) | ||
|
|
|
| |||||
| c. | Current tax assets and liabilities |
| December 31 | ||||||||
| 2017 | 2016 | |||||||
Current tax assets | ||||||||
Tax refund receivable (included in other current assets—other) | $ | 1,670 | $ | 5,337 | ||||
|
|
|
| |||||
Current tax liabilities | ||||||||
Income tax payable | $ | 4,725,698 | $ | 2,467,551 | ||||
|
|
|
| |||||
| d. | Deferred income tax assets and liabilities |
The movements of deferred income tax assets and liabilities were as follows:
For the year ended December 31, 2017
| January 1, 2017 | Recognized in Profit or Loss | Recognized in Other Comprehensive Income | December 31, 2017 | |||||||||||||
Deferred income tax assets | ||||||||||||||||
Temporary differences | ||||||||||||||||
Defined benefit obligation | $ | 1,373,755 | $ | 5,397 | $ | 343,978 | $ | 1,723,130 | ||||||||
Share of profits of associates and joint ventures accounted for using equity method | 329,775 | 930 | — | 330,705 | ||||||||||||
Allowance for doubtful receivables over quota | 230,017 | 59,026 | — | 289,043 | ||||||||||||
Impairment loss on property, plant and equipment | 122,805 | (10,482 | ) | — | 112,323 | |||||||||||
Deferred revenue | 117,193 | (11,451 | ) | — | 105,742 | |||||||||||
Valuation loss on inventory | 20,616 | 2,289 | — | 22,905 | ||||||||||||
Estimated warranty liabilities | 18,544 | 3,845 | — | 22,389 | ||||||||||||
Unrealized foreign exchange loss, net | 120 | 16,543 | — | 16,663 | ||||||||||||
Accrued award credits liabilities | 19,926 | (4,539 | ) | — | 15,387 | |||||||||||
Trade-in right | — | 14,887 | — | 14,887 | ||||||||||||
(Continued)
- 68 -
| January 1, 2017 | Recognized in Profit or Loss | Recognized in Other Comprehensive Income | December 31, 2017 | |||||||||||||
Property, plant and equipment | $ | 1,850 | $ | (88 | ) | $ | — | $ | 1,762 | |||||||
Others | 33,775 | (4,228 | ) | — | 29,547 | |||||||||||
|
|
|
|
|
|
|
| |||||||||
| 2,268,376 | 72,129 | 343,978 | 2,684,483 | |||||||||||||
Loss carryforwards | 53,850 | (8,240 | ) | — | 45,610 | |||||||||||
|
|
|
|
|
|
|
| |||||||||
| $ | 2,322,226 | $ | 63,889 | $ | 343,978 | $ | 2,730,093 | |||||||||
|
|
|
|
|
|
|
| |||||||||
Deferred income tax liabilities | ||||||||||||||||
Temporary differences | ||||||||||||||||
Defined benefit obligation | $ | 1,268,319 | $ | (2,923 | ) | $ | (16 | ) | $ | 1,265,380 | ||||||
Land value incremental tax | 94,986 | — | — | 94,986 | ||||||||||||
Intangible assets | 40,742 | (2,631 | ) | — | 38,111 | |||||||||||
Deferred revenue for award credits | 45,690 | (16,880 | ) | — | 28,810 | |||||||||||
Valuation gain or loss on financial instruments, net | 3,632 | (37 | ) | (2,420 | ) | 1,175 | ||||||||||
Unrealized foreign exchange gain, net | 9,545 | (9,411 | ) | — | 134 | |||||||||||
Others | 1,306 | (310 | ) | — | 996 | |||||||||||
|
|
|
|
|
|
|
| |||||||||
| $ | 1,464,220 | $ | (32,192 | ) | $ | (2,436 | ) | $ | 1,429,592 | |||||||
|
|
|
|
|
|
|
| |||||||||
(Concluded)
For the year ended December 31, 2016
| January 1, 2016 | Recognized in Profit or Loss | Recognized in Other Comprehensive Income | December 31, 2016 | |||||||||||||
Deferred income tax assets | ||||||||||||||||
Temporary differences | ||||||||||||||||
Defined benefit obligation | $ | 1,205,660 | $ | (179,240 | ) | $ | 347,335 | $ | 1,373,755 | |||||||
Share of profits of associates and joint ventures accounted for using equity method | 325,231 | 4,544 | — | 329,775 | ||||||||||||
Allowance for doubtful receivables over quota | 168,756 | 61,261 | — | 230,017 | ||||||||||||
Impairment loss on property, plant and equipment | 44,406 | 78,399 | — | 122,805 | ||||||||||||
Deferred revenue | 136,403 | (19,210 | ) | — | 117,193 | |||||||||||
Valuation loss on inventory | 33,323 | (12,707 | ) | — | 20,616 | |||||||||||
Estimated warranty liabilities | 17,584 | 960 | — | 18,544 | ||||||||||||
Unrealized foreign exchange loss, net | 18,479 | (18,359 | ) | — | 120 | |||||||||||
Accrued award credits liabilities | 21,970 | (2,044 | ) | — | 19,926 | |||||||||||
(Continued)
- 69 -
| January 1, 2016 | Recognized in Profit or Loss | Recognized in Other Comprehensive Income | December 31, 2016 | |||||||||||||
Property, plant and equipment | $ | 2,027 | $ | (177 | ) | $ | — | $ | 1,850 | |||||||
Others | 39,502 | (5,727 | ) | — | 33,775 | |||||||||||
|
|
|
|
|
|
|
| |||||||||
| 2,013,341 | (92,300 | ) | 347,335 | 2,268,376 | ||||||||||||
Loss carryforwards | 48,236 | 5,614 | — | 53,850 | ||||||||||||
|
|
|
|
|
|
|
| |||||||||
| $ | 2,061,577 | $ | (86,686 | ) | $ | 347,335 | $ | 2,322,226 | ||||||||
|
|
|
|
|
|
|
| |||||||||
Deferred income tax liabilities | ||||||||||||||||
Temporary differences | ||||||||||||||||
Defined benefit obligation | $ | 614 | $ | 1,267,750 | $ | (45 | ) | $ | 1,268,319 | |||||||
Land value incremental tax | 94,986 | — | — | 94,986 | ||||||||||||
Intangible assets | 43,373 | (2,631 | ) | — | 40,742 | |||||||||||
Deferred revenue for award credits | 1,942 | 43,748 | — | 45,690 | ||||||||||||
Valuation gain or loss on financial instruments, net | 5,326 | 9 | (1,703 | ) | 3,632 | |||||||||||
Unrealized foreign exchange gain, net | 542 | 9,003 | — | 9,545 | ||||||||||||
Others | 1,192 | 114 | — | 1,306 | ||||||||||||
|
|
|
|
|
|
|
| |||||||||
| $ | 147,975 | $ | 1,317,993 | $ | (1,748 | ) | $ | 1,464,220 | ||||||||
|
|
|
|
|
|
|
| |||||||||
(Concluded)
| e. | Deductible temporary differences and unused loss carryforwards for which no deferred tax assets have been recognized in the consolidated balance sheets |
| December 31 | ||||||||
| 2017 | 2016 | |||||||
Loss carryforwards | ||||||||
Expire in 2018 | $ | 126,429 | $ | 126,429 | ||||
Expire in 2019 | 137,604 | 137,604 | ||||||
Expire in 2020 | 41,758 | 41,858 | ||||||
Expire in 2021 | 9,347 | 12,817 | ||||||
Expire in 2022 | 10,957 | 1,446 | ||||||
Expire in 2023 | 21 | 592 | ||||||
Expire in 2024 | 20 | 20 | ||||||
Expire in 2025 | 13,122 | 13,702 | ||||||
Expire in 2026 | 23 | 23 | ||||||
Expire in 2027 | 2,575 | — | ||||||
|
|
|
| |||||
| $ | 341,856 | $ | 334,491 | |||||
|
|
|
| |||||
Deductible temporary differences | $ | 2,543 | $ | 3,431 | ||||
|
|
|
| |||||
- 70 -
| f. | Information about unused loss carryforwards |
As of December 31, 2017, information about loss carryforwards was as follows:
| Remaining Creditable Amount | Expiry Year | |||
| $126,429 | 2018 | |||
| 137,604 | 2019 | |||
| 45,130 | 2020 | |||
| 19,806 | 2021 | |||
| 12,436 | 2022 | |||
| 1,487 | 2023 | |||
| 3,580 | 2024 | |||
| 27,913 | 2025 | |||
| 9,986 | 2026 | |||
| 3,095 | 2027 | |||
|
| |||
| $387,466 | ||||
|
| |||
| g. | The related information under the Integrated Income Tax System was as follows: |
Unappropriated earnings information
As of December 31, 2017 and 2016, Chunghwa’s unappropriated earnings are generated after the adoption of Integrated Income Tax System.
Imputation credit account
| December 31, 2016 | ||||
Balance of Imputation Credit Account (“ICA”) | $ | 7,690,580 | ||
|
| |||
The creditable ratio for distribution of earnings of 2016 was 20.48%. Effective from January 1, 2015, the creditable ratio for individual stockholders residing in the Republic of China is half of the original creditable ratio according to the revised Article66-6 of the Income Tax Act of the ROC in June 2014. However, starting from January 1, 2018, the imputation tax system was abolished and imputation credit account is no longer applicable based on amended ROC Income Tax Act announced in February 2018.
| h. | Income tax examinations |
Income tax returns of Chunghwa have been examined by the tax authorities through 2014 (except 2013). Income tax returns of SENAO (except 2014), LED (except 2014), CHIEF, HHI, CHI, CHSI, CHYP, CHPT, SFD, Youth, Youyi, Aval, Unigate and SHE have been examined by the tax authorities through 2015. Income tax returns of ISPOT and CHST have been examined through 2016, and income tax returns of CEI’s 2015 current final reports on total business income to liquidation date and on income earned from liquidation have been examined by the tax authorities.
- 71 -
| 33. | EARNINGS PER SHARE (“EPS”) |
Net income and weighted average number of common stocks used in the calculation of earnings per share were as follows:
Net Income
| Year Ended December 31 | ||||||||
| 2017 | 2016 | |||||||
Net income used to compute the basic earnings per share | ||||||||
Net income attributable to the parent | $ | 38,873,905 | $ | 40,067,010 | ||||
Assumed conversion of all dilutive potential common stocks | ||||||||
Employee stock options and employee compensation of subsidiaries | (459 | ) | (524 | ) | ||||
|
|
|
| |||||
Net income used to compute the diluted earnings per share | $ | 38,873,446 | $ | 40,066,486 | ||||
|
|
|
| |||||
Weighted Average Number of Common Stocks
| (Thousand Shares) | ||||||||
| Year Ended December 31 | ||||||||
| 2017 | 2016 | |||||||
Weighted average number of common stocks used to compute the basic earnings per share | 7,757,447 | 7,757,447 | ||||||
Assumed conversion of all dilutive potential common stocks | ||||||||
Employee compensation | 10,486 | 11,922 | ||||||
|
|
|
| |||||
Weighted average number of common stocks used to compute the diluted earnings per share | 7,767,933 | 7,769,369 | ||||||
|
|
|
| |||||
Because Chunghwa may settle the employee compensation in shares or cash, Chunghwa shall presume that it will be settled in shares and takes those shares into consideration when calculating the weighted average number of outstanding shares used in the calculation of diluted EPS if the shares have a dilutive effect. The dilutive effect of the shares needs to be considered until the approval of the number of shares to be distributed to employees as compensation in the following year.
| 34. | SHARE-BASED PAYMENT ARRANGEMENT |
| a. | SENAO share-based compensation plan (“SENAO Plan”) described as follows: |
Effective Date for Plan Registration | Resolution Date by Directors | Stock Options Units (Thousand) | Exercise Price (NT$) | |||
2012.05.28 | 2013.04.29 | 10,000 | $70.70 (Original price$93.00) |
Each option is eligible to subscribe for one common share when exercisable. Under the terms of the SENAO Plan, the options are granted at an exercise price equal to the closing price of the SENAO’s common stocks listed on the TSE on the higher of closing price or par value. The SENAO Plan have exercise price adjustment formula upon the changes in common stocks equity (including cash capital increase, new share issue through capitalization of earnings and additional
- 72 -
paid-in capital, merger, spin off and new share issue for Global Depositary Shares, and so on) or distribution of cash dividends. The options of SENAO Plan are valid for six years and the graded vesting schedule for which 50% of option granted will vest two years after the grant date and another two tranches of 25%, each will vest three and four years after the grant date respectively.
The compensation costs of stock options granted on May 7, 2013 were $3,991 thousand and $13,229 thousand for the years ended December 31, 2017 and 2016, respectively.
SENAO modified the plan terms of the outstanding stock options in July 2017 and the exercise price changed from $76.10 to $70.70 per share. The modification did not cause any incremental fair value granted.
SENAO modified the plan terms of the outstanding stock options in July 2016 and the exercise price changed from $81.40 to $76.10 per share. The modification did not cause any incremental fair value granted.
Information about SENAO’s outstanding stock options for the years ended December 31, 2017 and 2016 was as follows:
| Year Ended December 31 | ||||||||||||||||
| 2017 | 2016 | |||||||||||||||
| Granted on May 7, 2013 | Granted on May 7, 2013 | |||||||||||||||
Number of Options (Thousand) | Weighted- average | Number of Options (Thousand) | Weighted- average | |||||||||||||
Employee stock options | ||||||||||||||||
Options outstanding at beginning of the year | 6,587 | $ | 76.10 | 7,787 | $ | 81.40 | ||||||||||
Options exercised | — | — | — | — | ||||||||||||
Options forfeited | (661 | ) | — | (1,200 | ) | — | ||||||||||
|
|
|
| |||||||||||||
Options outstanding at end of the year | 5,926 | 70.70 | 6,587 | 76.10 | ||||||||||||
|
|
|
| |||||||||||||
Option exercisable at end of the year | 5,926 | 70.70 | 4,947 | 76.10 | ||||||||||||
|
|
|
| |||||||||||||
As of December 31, 2017, information about employee stock options outstanding was as follows:
| Options Outstanding | Options Exercisable | |||||||||||||||||||
| Range of Exercise Price (NT$) | Number of (Thousand) | Weighted Average Remaining Contractual Life (Years) | Weighted Price (NT$) | Number of (Thousand) | Weighted Average Exercise Price (NT$) | |||||||||||||||
| $70.70 | 5,926 | 1.35 | $ | 70.70 | 5,926 | $ | 70.70 | |||||||||||||
- 73 -
As of December 31, 2016, information about employee stock options outstanding was as follows:
| Options Outstanding | Options Exercisable | |||||||||||||||||||
| Range of Exercise Price (NT$) | Number of (Thousand) | Weighted Average Remaining Contractual Life (Years) | Weighted Price (NT$) | Number of (Thousand) | Weighted Price (NT$) | |||||||||||||||
| $76.10 | 6,587 | 2.35 | $ | 76.10 | 4,947 | $ | 76.10 | |||||||||||||
SENAO used the fair value method to evaluate the options using the Black-Scholes model and the related assumptions and the fair value of the options were as follows:
| Stock Options Granted on May 7, 2013 | ||||
Grant-date share price (NT$) | $ | 93.00 | ||
Exercise price (NT$) | $ | 93.00 | ||
Dividends yield | — | |||
Risk-free interest rate | 0.91% | |||
Expected life | 4.375 years | |||
Expected volatility | 36.22% | |||
Weighted average fair value of grants (NT$) | $ | 28.72 | ||
Expected volatility was based on the historical share price volatility of SENAO over the period equal to the expected life of SENAO Plan.
| b. | SENAO transferred the treasury stock |
The Board of Directors of SENAO resolved to transfer treasury stock to specific employees in May and November 2017. The aforementioned treasury stock transferred to employees were measured at the fair value of the grant date. SENAO totally transfered 3,342 thousand shares of treasury stock and the compensation cost of $8,698 thousand was recognized for the year ended December 31, 2017.
SENAO used the fair value method to evaluate share-based payment transaction using the Black-Scholes model and the related assumptions and the fair value of the option were as follows:
| Stock Options Granted on November 17, 2017 | Stock Options Granted on May 23 , 2017 | |||||||
Grant-date share price (NT$) | $ | 51.00 | $ | 53.60 | ||||
Exercise price (NT$) | $ | 49.28 | $ | 49.28 | ||||
Dividends yield | — | — | ||||||
Risk-free interest rate | 0.59 | % | 0.59 | % | ||||
Expected life | 14 days | 9 days | ||||||
Expected volatility | 9.94 | % | 12.35 | % | ||||
Weighted average fair value of grants (NT$) | $ | 1.75 | $ | 4.33 | ||||
Expected volatility was based on the historical share price volatility of SENAO over three months before the grant date.
- 74 -
c. CHIEF share-based compensation plan (“CHIEF Plan”) described as follows:
Effective Date for Plan Registration | Resolution Date by CHIEF’s Board of Directors | Stock Options Units | Exercise Price (NT$) | |||
2017.12.18 | 2017.12.19 | 950 | $147.00 | |||
2015.10.22 | 2015.10.22 | 2,000 | 34.40 (Original price$43.00) |
Each option is eligible to subscribe for one thousand common stocks when exercisable. Under the terms of the CHIEF Plan, the options are granted at an exercise price equal to $147.00 and $43.00 , respectively. The options are granted to specific employees that meet the vesting conditions. The CHIEF Plan has exercise price adjustment formula upon the changes in common stocks or distribution of cash dividends. The options of CHIEF Plan are valid for five years and the graded vesting schedule will vest two years after the grant date.
The compensation cost recognized for stock options granted on December 19, 2017 was $96 thousand for the year ended December 31, 2017.
The compensation costs recognized for stock options granted on October 22, 2015 were $3,177 thousand and $3,950 thousand for the years ended December 31, 2017 and 2016, respectively.
CHIEF modified the plan terms of the outstanding stock options in July 2016, the exercise price changed from $43.00 to $34.40 per share. The modification did not cause any incremental fair value granted.
Information about CHIEF’s outstanding stock options for the years ended December 31, 2017 and 2016 was as follows:
| Year Ended December 31 | ||||||||||||||||||||||||
| 2017 | 2016 | |||||||||||||||||||||||
| Granted on December 19, 2017 | Granted on October 22, 2015 | Granted on October 22, 2015 | ||||||||||||||||||||||
Number of Options | Weighted Average Exercise Price (NT$) | Number of Options | Weighted Average Exercise Price (NT$) | Number of Options | Weighted Average Exercise Price (NT$) | |||||||||||||||||||
Employee stock options | ||||||||||||||||||||||||
Options outstanding at beginning of the year | — | $ | — | 1,948 | $ | 34.40 | 2,000 | $ | 43.00 | |||||||||||||||
Options granted | 950 | 147.00 | — | — | — | — | ||||||||||||||||||
Options forfeited | — | — | (12 | ) | — | (52 | ) | — | ||||||||||||||||
|
|
|
|
|
| |||||||||||||||||||
Options outstanding at end of the year | 950 | 147.00 | 1,936 | 34.40 | 1,948 | 34.40 | ||||||||||||||||||
|
|
|
|
|
| |||||||||||||||||||
Option exercisable at end of the year | — | — | 968 | 34.40 | — | — | ||||||||||||||||||
|
|
|
|
|
| |||||||||||||||||||
- 75 -
As of December 31, 2017, information about employee stock options outstanding was as follows:
| Granted on December 19, 2017 | ||||||||||||||||||||
| Options Outstanding | Options Exercisable | |||||||||||||||||||
Range of Exercise Price (NT$) | Number of Options | Weighted Average Remaining Life (Years) | Weighted Average Exercise Price (NT$) | Number of Options | Weighted Average Exercise Price (NT$) | |||||||||||||||
| $147.00 | 950 | 4.96 | $ | 147.00 | — | $ | — | |||||||||||||
| Granted on October 22, 2015 | ||||||||||||||||||||
| Options Outstanding | Options Exercisable | |||||||||||||||||||
Range of Exercise Price (NT$) | Number of Options | Weighted Average Remaining Contractual Life (Years) | Weighted Average Exercise Price (NT$) | Number of Options | Weighted Average Exercise Price (NT$) | |||||||||||||||
| $34.40 | 1,936 | 2.81 | $ | 34.40 | 968 | $ | 34.40 | |||||||||||||
As of December 31, 2016, information about employee stock options outstanding was as follows:
| Granted on October 22, 2015 | ||||||||||||||||||||
| Options Outstanding | Options Exercisable | |||||||||||||||||||
Range of Exercise Price (NT$) | Number of Options | Weighted Average Remaining Contractual Life (Years) | Weighted Average Exercise Price (NT$) | Number of Options | Weighted Average Exercise Price (NT$) | |||||||||||||||
| $34.40 | 1,948 | 3.81 | $ | 34.40 | — | $ | — | |||||||||||||
CHIEF used the fair value method to evaluate the options using the Black-Scholes model and binomial option pricing model and the related assumptions and the fair value of the options were as follows:
| Stock Options Granted on December 19, 2017 | Stock Options Granted on October 22, 2015 | |||||||
Grant-date share price (NT$) | $ | 95.92 | $ | 39.55 | ||||
Exercise price (NT$) | $ | 147.00 | $ | 43.00 | ||||
Dividends yield | — | — | ||||||
Risk-free interest rate | 0.62 | % | 0.86 | % | ||||
Expected life | 5 years | | 5 years | | ||||
Expected volatility | 17.35 | % | 21.02 | % | ||||
Weighted average fair value of grants (NT$) | $ | 2,318 | $ | 4,863 | ||||
Expected volatility was based on the average annualized historical share price volatility of CHIEF’s comparable companies before the grant date.
- 76 -
| d. | New shares reserved for subscription by employees under cash injection of CHPT |
1) Capital Increase in September 2017
On February 8, 2017, the Board of Directors of CHPT approved the cash injection to issue 2,000 thousand shares and simultaneously reserved 300 thousand shares for subscription by employees according to the Company Act of the ROC. Furthermore, when the employees subscribed some shares or discarded their rights to subscribe shares, the Board of Directors of CHPT authorized the chairman of the Board of Directors to contact specific people or group to subscribe.
The aforementioned options granted to employees are accounted for and measured at fair value. The compensation cost was $5,821 thousand for the year ended December 31, 2017.
CHPT used the fair value method to evaluate the options granted to employees on September 18, 2017 using the Black-Scholes model and the related assumptions and the fair value of the options were as follows:
| Stock Options Granted on September 18, 2017 | ||||
Grant-date share price (NT$) | $ | 1,295.00 | ||
Exercise price (NT$) | $ | 1,267.33 | ||
Dividends yield | — | |||
Risk-free interest rate | 0.35% | |||
Expected life | 4 days | |||
Expected volatility | 28.30% | |||
Weighted average fair value of grants (NT$) | $ | 31.60 | ||
Expected volatility was based on the historical share price volatility of CHPT over the period equal to the expected life.
2) Capital Increase in March 2016
On December 8, 2015, the Board of Directors of CHPT approved the cash injection to issue 2,787 thousand shares and simultaneously reserved 418 thousand shares for subscription by employees according to the Company Act of the ROC. Furthermore, when the employees subscribed some shares or discarded their rights to subscribe shares, the Board of Directors of CHPT authorized the chairman of the Board of Directors to contact specific people or group to subscribe.
The aforementioned options granted to employees are accounted for and measured at fair value. The compensation cost was $16 thousand for the year ended December 31, 2016.
- 77 -
CHPT used the fair value method to evaluate the options granted to employees on March 10, 2016 using the Black-Scholes model and the related assumptions and the fair value of the options were as follows:
| Stock Options Granted on March 10, 2016 | ||||
Grant-date share price (NT$) | $302.46 | |||
Exercise price (NT$) | $360.00 | |||
Dividends yield | — | |||
Risk-free interest rate | 0.37% | |||
Expected life | 12 days | |||
Expected volatility | 37.43% | |||
Weighted average fair value of grants (NT$) | $0.04 | |||
Expected volatility was based on the average annualized historical share price volatility of CHPT’s comparable companies before the grant date.
| 35. | NON-CASH TRANSACTIONS |
For the years ended December 31, 2017 and 2016, the Company entered into the followingnon-cash investing activities:
| Year Ended December 31 | ||||||||
| 2017 | 2016 | |||||||
Increase in property, plant and equipment | $ | 26,069,064 | $ | 24,591,272 | ||||
Changes in other payables | 806,272 | (1,074,489 | ) | |||||
|
|
|
| |||||
| $ | 26,875,336 | $ | 23,516,783 | |||||
|
|
|
| |||||
| 36. | OPERATING LEASE ARRANGEMENTS |
| a. | The Company as lessee |
Except for theST-2 satellite referred in Note 39 to the consolidated financial statements, the Company entered into several lease agreements for base stations located all over in Taiwan. The future aggregate minimum lease payments undernon-cancellable operating leases are as follows:
| December 31 | ||||||||
| 2017 | 2016 | |||||||
Within one year | $ | 2,918,651 | $ | 2,811,440 | ||||
Longer than one year but within five years | 5,796,026 | 5,449,712 | ||||||
Longer than five years | 778,808 | 960,069 | ||||||
|
|
|
| |||||
| $ | 9,493,485 | $ | 9,221,221 | |||||
|
|
|
| |||||
- 78 -
| b. | The Company as lessor |
The Company leases out some land and buildings. The future aggregate minimum lease collection undernon-cancellable operating leases are as follows:
| December 31 | ||||||||
| 2017 | 2016 | |||||||
Within one year | $ | 353,023 | $ | 427,159 | ||||
Longer than one year but within five years | 658,768 | 600,093 | ||||||
Longer than five years | 242,799 | 320,982 | ||||||
|
|
|
| |||||
| $ | 1,254,590 | $ | 1,348,234 | |||||
|
|
|
| |||||
| 37. | CAPITAL MANAGEMENT |
The Company manages its capital to ensure that entities in the Company will be able to continue as going concerns while maximizing the return to stakeholders through the optimization of the debt and equity balance.
The capital structure of the Company consists of debt of the Company and the equity attributable to the parent.
Some consolidated entities are required to maintain minimumpaid-in capital amount as prescribed by the applicable laws.
The management reviews the capital structure of the Company as needed. As part of this review, the management considers the cost of capital and the risks associated with each class of capital.
According to the management’s suggestion, the Company maintains a balanced capital structure through paying cash dividends, increasing its share capital, purchasing outstanding shares, and proceeds from new debt or repayment of debt.
| 38. | FINANCIAL INSTRUMENTS |
Fair Value Information
The fair value measurement guidance establishes a framework for measuring fair value and expands disclosure about fair value measurements. The standard describes a fair value hierarchy based on three levels of inputs that may be used to measure fair value. These levels are:
Level 1 fair value measurements: These measurements are those derived from quoted prices (unadjusted) in active markets for identical assets or liabilities.
Level 2 fair value measurements: These measurements are those derived from inputs other than quoted prices included within Level 1 that are observable for the asset or liability, either directly (i.e. as prices) or indirectly (i.e. derived from prices).
Level 3 fair value measurements: These measurements are those derived from valuation techniques that include inputs for the asset or liability that are not based on observable market data (unobservable inputs).
- 79 -
| a. | Financial instruments that are not measured at fair value but for which fair value is disclosed |
Except for what disclosed in the following table, the Company considers that the carrying amounts of financial assets and liabilities not measured at fair value approximate their fair values or the fair values cannot be reliable estimated:
December 31, 2016
Carrying Amount | Fair Value | |||||||||||||||
| Level 1 | Level 2 | Level 3 | ||||||||||||||
Held-to-maturity financial assets | ||||||||||||||||
Corporate bonds | $ | 1,989,892 | $ | — | $ | 1,995,869 | $ | — | ||||||||
Bank debentures | 150,000 | — | 150,488 | — | ||||||||||||
|
|
|
|
|
|
|
| |||||||||
| $ | 2,139,892 | $ | — | $ | 2,146,357 | $ | — | |||||||||
|
|
|
|
|
|
|
| |||||||||
The Level 2 fair values are estimated using discounted cash flow models. The models use market-based observable inputs including duration, yield rate and credit rating.
| b. | Financial instruments that are measured at fair values on a recurring basis |
December 31, 2017
| Level 1 | Level 2 | Level 3 | Total | |||||||||||||
Available-for-sale financial assets | ||||||||||||||||
Listed securities | ||||||||||||||||
Equity investments | $ | 3,125,086 | $ | — | $ | — | $ | 3,125,086 | ||||||||
|
|
|
|
|
|
|
| |||||||||
Financial liabilities at FVTPL | ||||||||||||||||
Derivatives | $ | — | $ | 578 | $ | — | $ | 578 | ||||||||
|
|
|
|
|
|
|
| |||||||||
Hedging derivative financial liabilities | $ | — | $ | 850 | $ | — | $ | 850 | ||||||||
|
|
|
|
|
|
|
| |||||||||
December 31, 2016
| Level 1 | Level 2 | Level 3 | Total | |||||||||||||
Financial assets at FVTPL | ||||||||||||||||
Derivatives | $ | — | $ | 217 | $ | — | $ | 217 | ||||||||
|
|
|
|
|
|
|
| |||||||||
Available-for-sale financial assets | ||||||||||||||||
Listed securities | ||||||||||||||||
Equity investments | $ | 2,521,027 | $ | — | $ | — | $ | 2,521,027 | ||||||||
|
|
|
|
|
|
|
| |||||||||
Financial liabilities at FVTPL | ||||||||||||||||
Derivatives | $ | — | $ | 1,356 | $ | — | $ | 1,356 | ||||||||
|
|
|
|
|
|
|
| |||||||||
Hedging derivative financial liabilities | $ | — | $ | 586 | $ | — | $ | 586 | ||||||||
|
|
|
|
|
|
|
| |||||||||
There were no transfers between Levels 1 and 2 for the years ended December 31, 2017 and 2016.
- 80 -
| The | fair values of financial assets and financial liabilities are determined as follows: |
| 1) | The fair values of financial assets and financial liabilities with standard terms and conditions and traded in active markets are determined with reference to quoted market prices. |
| 2) | For derivatives, fair values are estimated using discounted cash flow model. Future cash flows are estimated based on observable inputs including forward exchange rates at the end of the reporting periods and the forward and spot exchange rates stated in the contracts, discounted at a rate that reflects the credit risk of various counterparties. |
Categories of Financial Instruments
| December 31 | ||||||||
| 2017 | 2016 | |||||||
Financial assets | ||||||||
Measured at FVTPL | ||||||||
Held for trading | $ | — | $ | 217 | ||||
Held-to-maturity financial assets | — | 2,139,892 | ||||||
Loans and receivables (Note a) | 68,983,820 | 70,040,806 | ||||||
Available-for-sale financial assets (Note b) | 5,750,871 | 4,763,847 | ||||||
Financial liabilities | ||||||||
Measured at FVTPL | ||||||||
Held for trading | 578 | 1,356 | ||||||
Hedging derivative financial liabilities | 850 | 586 | ||||||
Measured at amortized cost (Note c) | 39,725,662 | 40,553,001 | ||||||
| Note a: | The balances included cash and cash equivalents, trade notes and accounts receivable, receivables from related parties, other current monetary assets, other financial assets and refundable deposits (classified as other noncurrent assets) which were loans and receivables. |
| Note b: | The balances included financial assets carried at cost which were classified asavailable-for-sale financial assets. |
| Note c: | The balances included short-term loans, trade notes and accounts payable, payables to related parties, partial other payables, customers’ deposits and long-term loans which were financial liabilities carried at amortized cost. |
Financial Risk Management Objectives
The main financial instruments of the Company include equity and debt investments, accounts receivable, accounts payable and loans. The Company’s Finance Department provides services to its business units,co-ordinates access to domestic and international capital markets, monitors and manages the financial risks relating to the operations of the Company through internal risk reports which analyze exposures by degree and magnitude of risks. These risks include market risk (including foreign currency risk, interest rate risk and other price risk), credit risk, and liquidity risk.
- 81 -
The Company seeks to minimize the effects of these risks by using derivative financial instruments to hedge risk exposures. The use of financial derivatives is governed by the Company’s policies approved by the Board of Directors. Those derivatives are used to hedge the risks of exchange rate fluctuation arising from operating or investment activities. Compliance with policies and risk exposure limits is reviewed by the Company’s Finance Department on a continuous basis. The Company does not enter into or trade financial instruments, including derivative financial instruments, for speculative purposes.
Chunghwa reports the significant risk exposures and related action plans timely and actively to the audit committee and to the Board of Directors if needed.
| a. | Market risk |
The Company is exposed to market risks of changes in foreign currency exchange rates and interest rates. The Company uses forward exchange contracts to hedge the exchange rate risk arising from assets and liabilities denominated in foreign currencies.
There were no changes to the Company’s exposure to market risks or the manner in which these risks are managed and measured.
| 1) | Foreign currency risk |
The carrying amounts of the Company’s foreign currency denominated monetary assets and monetary liabilities at the balance sheet dates were as follows:
| December 31 | ||||||||
| 2017 | 2016 | |||||||
Assets | ||||||||
USD | $ | 5,584,064 | $ | 5,326,692 | ||||
EUR | 28,492 | 14,004 | ||||||
SGD | 62,909 | 105,710 | ||||||
RMB | 2,986 | 29,737 | ||||||
JPY | 36,248 | 13,021 | ||||||
Liabilities | ||||||||
USD | 4,963,953 | 4,237,739 | ||||||
EUR | 1,322,803 | 967,727 | ||||||
SGD | 96,442 | 576 | ||||||
RMB | 25 | 49 | ||||||
JPY | 11,934 | 10,454 | ||||||
The carrying amounts of the Company’s derivatives with exchange rate risk exposures at the balance sheet dates were as follows:
| December 31 | ||||||||
| 2017 | 2016 | |||||||
Assets | ||||||||
USD | $ | — | $ | 217 | ||||
Liabilities | ||||||||
USD | 484 | — | ||||||
EUR | 944 | 1,942 | ||||||
- 82 -
Foreign currency sensitivity analysis
The Company is mainly exposed to the fluctuations of the currencies listed above.
The following table details the Company’s sensitivity to a 5% increase and decrease in the functional currency against the relevant foreign currencies. 5% is the sensitivity rate used when reporting foreign currency risk internally to key management personnel and represents management’s assessment of the reasonably possible changes in foreign exchange rates. The sensitivity analysis includes only outstanding foreign currency denominated monetary items and forward exchange contracts. A positive number below indicates an increase inpre-tax profit or equity where the functional currency weakens 5% against the relevant currency.
| Year Ended December 31 | ||||||||
| 2017 | 2016 | |||||||
Profit or loss | ||||||||
Monetary assets and liabilities (a) | ||||||||
USD | $ | 31,006 | $ | 54,448 | ||||
EUR | (64,716 | ) | (47,686 | ) | ||||
SGD | (1,677 | ) | 5,257 | |||||
RMB | 148 | 1,484 | ||||||
JPY | 1,216 | 128 | ||||||
Derivatives (b) | ||||||||
USD | 6,235 | 2,741 | ||||||
EUR | 3,454 | 8,233 | ||||||
Equity | ||||||||
Derivatives (c) | ||||||||
EUR | 7,048 | 5,030 | ||||||
| a) | This is mainly attributable to the exposure to foreign currency denominated receivables and payables of the Company outstanding at the balance sheet dates. |
| b) | This is mainly attributable to the forward exchange contracts. |
| c) | This is mainly attributable to the changes in the fair value of derivatives that are designated as cash flow hedges. |
For a 5% strengthening of the functional currency against the relevant currencies, it would have the equal but opposite effect on thepre-tax profit or equity for the amounts shown above.
| 2) | Interest rate risk |
The carrying amounts of the Company’s exposures to interest rates on financial assets and financial liabilities at the balance sheet dates were as follows:
| December 31 | ||||||||
| 2017 | 2016 | |||||||
Fair value interest rate risk | ||||||||
Financial assets | $ | 25,911,422 | $ | 28,302,792 | ||||
Cash flow interest rate risk | ||||||||
Financial assets | 6,714,639 | 6,581,916 | ||||||
Financial liabilities | 1,670,000 | 1,738,000 | ||||||
- 83 -
Interest rate sensitivity analysis
The sensitivity analyses below have been determined based on the exposure to interest rates fornon-derivative instruments at the end of the reporting period. A 25 basis point increase or decrease is used when reporting interest rate risk internally to key management personnel and represents management’s assessment of the reasonably possible change in interest rates.
If interest rates had been 25 basis points higher/lower and all other variables were held constant, the Company’spre-tax income would increase/decrease by $12,612 thousand and $12,110 thousand for the years ended December 31, 2017 and 2016, respectively. This is mainly attributable to the Company’s exposure to floating interest rates on its financial assets and short-term and long-term loan.
| 3) | Other price risk |
The Company is exposed to equity price risks arising from listed equity investments. Equity investments are held for strategic rather than trading purposes. The management managed the risk through holding various risk portfolios. Further, the Company assigned finance and investment departments to monitor the price risk.
Equity price sensitivity analysis
The sensitivity analyses below have been determined based on the exposure to equity price risks at the end of the reporting period.
If equity prices of listed equity securities had been 5% higher/lower, other comprehensive income would have increased/decreased by $156,254 thousand and $126,051 thousand as a result of the changes in fair value ofavailable-for-sale financial assets for the years ended December 31, 2017 and 2016, respectively.
| b. | Credit risk |
Credit risk refers to the risk that a counterparty would default on its contractual obligations resulting in financial loss to the Company. The maximum credit exposure of the aforementioned financial instruments is equal to their carrying amounts recognized in consolidated balance sheet as of the balance sheet date.
The Company has large trade receivables outstanding with its customers. A substantial majority of the Company’s outstanding trade receivables are not covered by collateral or credit insurance. The Company has implemented ongoing measures including enhancing credit assessments and strengthening overall risk management to reduce its credit risk. While the Company has procedures to monitor and limit exposure to credit risk on trade receivables, there can be no assurance such procedures will effectively limit its credit risk and avoid losses. This risk is heightened during periods when economic conditions worsen.
As the Company serves a large number of unrelated consumers, the concentration of credit risk was limited.
- 84 -
| c. | Liquidity risk |
The Company manages and maintains sufficient cash and cash equivalent position to support the operations and reduce the impact on fluctuation of cash flow.
| 1) | Liquidity and interest risk tables |
The following tables detailed the Company’s remaining contractual maturity for itsnon-derivative financial liabilities with agreed repayment periods. The tables had been drawn up based on the undiscounted cash flows of financial liabilities based on the earliest date on which the Company is required to pay.
Weighted Average Effective Interest | Less Than 1 Month | 1-3 Months | 3 Months to 1 Year | 1-5 Years | More Than 5 Years | Total | ||||||||||||||||||||||
December 31, 2017 | ||||||||||||||||||||||||||||
Non-derivative financial liabilities | ||||||||||||||||||||||||||||
Non-interest bearing | — | $ | 41,884,644 | $ | — | $ | 3,196,831 | $ | 4,671,441 | $ | — | $ | 49,752,916 | |||||||||||||||
Floating interest rate instruments | 0.97 | 50,000 | — | 20,000 | 1,600,000 | — | 1,670,000 | |||||||||||||||||||||
|
|
|
|
|
|
|
|
|
|
|
| |||||||||||||||||
| $ | 41,934,644 | $ | — | $ | 3,216,831 | $ | 6,271,441 | $ | — | $ | 51,422,916 | |||||||||||||||||
|
|
|
|
|
|
|
|
|
|
|
| |||||||||||||||||
December 31, 2016 | ||||||||||||||||||||||||||||
Non-derivative financial liabilities | ||||||||||||||||||||||||||||
Non-interest bearing | — | $ | 43,975,279 | $ | — | $ | 2,014,794 | $ | 4,609,580 | $ | — | $ | 50,599,653 | |||||||||||||||
Floating interest rate instruments | 1.00 | — | 38,000 | 100,000 | 1,600,000 | — | 1,738,000 | |||||||||||||||||||||
|
|
|
|
|
|
|
|
|
|
|
| |||||||||||||||||
| $ | 43,975,279 | $ | 38,000 | $ | 2,114,794 | $ | 6,209,580 | $ | — | $ | 52,337,653 | |||||||||||||||||
|
|
|
|
|
|
|
|
|
|
|
| |||||||||||||||||
The following table detailed the Company’s liquidity analysis for its derivative financial instruments. The table had been drawn up based on the undiscounted gross inflows and outflows on those derivatives that require gross settlement.
| Less Than 1 Month | 1-3 Months | 3 Months to 1 Year | 1-5 Years | Total | ||||||||||||||||
December 31, 2017 | ||||||||||||||||||||
Gross settled | ||||||||||||||||||||
Forward exchange contracts | ||||||||||||||||||||
Inflows | $ | 124,997 | $ | 173,068 | $ | 36,654 | $ | — | $ | 334,719 | ||||||||||
Outflows | 125,481 | 174,021 | 36,645 | — | 336,147 | |||||||||||||||
|
|
|
|
|
|
|
|
|
| |||||||||||
| $ | (484 | ) | $ | (953 | ) | $ | 9 | $ | — | $ | (1,428 | ) | ||||||||
|
|
|
|
|
|
|
|
|
| |||||||||||
December 31, 2016 | ||||||||||||||||||||
Gross settled | ||||||||||||||||||||
Forward exchange contracts | ||||||||||||||||||||
Inflows | $ | 54,846 | $ | 266,741 | $ | — | $ | — | $ | 321,587 | ||||||||||
Outflows | 54,629 | 268,683 | — | — | 323,312 | |||||||||||||||
|
|
|
|
|
|
|
|
|
| |||||||||||
| $ | 217 | $ | (1,942 | ) | $ | — | $ | — | $ | (1,725 | ) | |||||||||
|
|
|
|
|
|
|
|
|
| |||||||||||
- 85 -
| 2) | Financing facilities |
| December 31 | ||||||||
| 2017 | 2016 | |||||||
Unsecured bank loan facility | ||||||||
Amount used | $ | 90,000 | $ | 118,000 | ||||
Amount unused | 45,748,967 | 46,218,883 | ||||||
|
|
|
| |||||
| $ | 45,838,967 | $ | 46,336,883 | |||||
|
|
|
| |||||
Secured bank loan facility | ||||||||
Amount used | $ | 1,600,000 | $ | 1,620,000 | ||||
Amount unused | 1,910,000 | 200,000 | ||||||
|
|
|
| |||||
| $ | 3,510,000 | $ | 1,820,000 | |||||
|
|
|
| |||||
| 39. | RELATED PARTIES TRANSACTIONS |
The ROC Government, one of Chunghwa’s customers, has significant equity interest in Chunghwa. Chunghwa provides fixed-line services, wireless services, internet and data and other services to the various departments and institutions of the ROC Government in the normal course of business and atarm’s-length prices. The transactions with the ROC government bodies have not been disclosed because the transactions are not individually or collectively significant. However, the related revenues and operating costs have been appropriately recorded.
| a. | The Company engages in business transactions with the following related parties: |
Company | Relationship | |
Taiwan International Standard Electronics Co., Ltd. | Associate | |
So-net Entertainment Taiwan Limited | Associate | |
Skysoft Co., Ltd. | Associate | |
KingwayTek Technology Co., Ltd. | Associate | |
Dian Zuan Integrating Marketing Co., Ltd. | Associate | |
Taiwan International Ports Logistics Corporation | Associate | |
Huada Digital Corporation | Joint venture | |
Chunghwa Benefit One Co., Ltd. | Joint venture | |
International Integrated System, Inc. | Associate | |
Senao Networks, Inc. | Associate | |
EnGenius Tech. Co., Ltd. | Associate | |
HopeTech Technologies Limited | Associate | |
ST-2 Satellite Ventures Pte., Ltd. | Associate | |
Viettel-CHT Co., Ltd. | Associate | |
Click Force Co., Ltd. | Associate | |
Other related parties | ||
Chunghwa Telecom Foundation | A nonprofit organization of which the funds donated by Chunghwa exceeds one third of its total funds | |
Senao Technical and Cultural Foundation | A nonprofit organization of which the funds donated by SENAO exceeds one third of its total funds | |
Sochamp Technology Co., Ltd. | Investor of significant influence over CHST |
(Continued)
- 86 -
Company | Relationship | |
E-Life Mall Co., Ltd. | One of the directors ofE-Life Mall and a director of SENAO are members of an immediate family | |
Engenius Technologies Co., Ltd. | Chairman of Engenius Technologies Co., Ltd. is a member of SENAO’s management | |
United Daily News Co., Ltd. | Investor of significant influence over SFD | |
Shenzhen Century Communication Co., Ltd. | Investor of significant influence over SCT |
(Concluded)
| b. | Balances and transactions between Chunghwa and its subsidiaries, which are related parties of Chunghwa, have been eliminated on consolidation and are not disclosed in this note. Terms of the foregoing transactions with related parties were not significantly different from transactions withnon-related parties. When no similar transactions withnon-related parties can be referenced, terms were determined in accordance with mutual agreements. Details of transactions between the Company and other related parties are disclosed below: |
| 1) | Operating transactions |
| Revenues | ||||||||
| Year Ended December 31 | ||||||||
| 2017 | 2016 | |||||||
Associates | $ | 344,305 | $ | 292,488 | ||||
Joint ventures | 563 | 6,802 | ||||||
Others | 64,951 | 49,146 | ||||||
|
|
|
| |||||
| $ | 409,819 | $ | 348,436 | |||||
|
|
|
| |||||
| Operating Costs and Expenses | ||||||||
| Year Ended December 31 | ||||||||
| 2017 | 2016 | |||||||
Associates | $ | 1,196,636 | $ | 1,404,519 | ||||
Joint ventures | 2,247 | 17,246 | ||||||
Others | 71,596 | 73,763 | ||||||
|
|
|
| |||||
| $ | 1,270,479 | $ | 1,495,528 | |||||
|
|
|
| |||||
| 2) | Non-operating transactions |
| Non-operating Income and Expenses | ||||||||
| Year Ended December 31 | ||||||||
| 2017 | 2016 | |||||||
Associates | $ | 31,554 | $ | 37,167 | ||||
Others | 32 | 46 | ||||||
|
|
|
| |||||
| $ | 31,586 | $ | 37,213 | |||||
|
|
|
| |||||
- 87 -
| 3) | Receivables |
| December 31 | ||||||||
| 2017 | 2016 | |||||||
Associates | $ | 43,302 | $ | 8,942 | ||||
Joint ventures | — | 50 | ||||||
Others | 6,065 | 4,807 | ||||||
|
|
|
| |||||
| $ | 49,367 | $ | 13,799 | |||||
|
|
|
| |||||
| 4) | Payables |
| December 31 | ||||||||
| 2017 | 2016 | |||||||
Associates | $ | 679,845 | $ | 756,930 | ||||
Joint ventures | — | 954 | ||||||
Others | 4,340 | 4,189 | ||||||
|
|
|
| |||||
| $ | 684,185 | $ | 762,073 | |||||
|
|
|
| |||||
| 5) | Customers’ deposits |
| December 31 | ||||||||
| 2017 | 2016 | |||||||
Associates | $ | 5,700 | $ | 10,355 | ||||
Joint ventures | — | 640 | ||||||
|
|
|
| |||||
| $ | 5,700 | $ | 10,995 | |||||
|
|
|
| |||||
| 6) | Acquisition of property, plant and equipment |
| Year Ended December 31 | ||||||||
| 2017 | 2016 | |||||||
Associates | $ | 389,924 | $ | 313,202 | ||||
Joint ventures | 46 | 6,869 | ||||||
|
|
|
| |||||
| $ | 389,970 | $ | 320,071 | |||||
|
|
|
| |||||
| 7) | Prepayments |
Chunghwa entered into a contract withST-2 Satellite Ventures Pte., Ltd. on March 12, 2010 to lease capacity on theST-2 satellite. This lease term is for 15 years which should start from the official operation ofST-2 satellite and the total contract value is approximately $6,000,000 thousand (SG$260,723 thousand), including a prepayment of $3,067,711 thousand, and the rest of amount should be paid annually whenST-2 satellite starts its official operation.ST-2 satellite was launched in May 2011, and began its official operation in August 2011. The total rental expense for the year ended December 31, 2017 was $391,691 thousand, which consisted of an offsetting credit of the prepayment of $204,398 thousand and an additional accrual of $187,293 thousand. The total rental expense for the year ended December 31, 2016 was $393,701 thousand, which consisted of an offsetting credit of the prepayment of $204,398 thousand and an additional accrual of $189,303 thousand. The prepaid rents (classified as prepayments) as of December 31, 2017 and 2016, were as follows:
- 88 -
| December 31 | ||||||||
| 2017 | 2016 | |||||||
Prepaid rents—current | $ | 204,398 | $ | 204,398 | ||||
Prepaid rents—noncurrent | 1,550,021 | 1,754,419 | ||||||
|
|
|
| |||||
| $ | 1,754,419 | $ | 1,958,817 | |||||
|
|
|
| |||||
| c. | Compensation of key management personnel |
The compensation of directors and key management personnel was as follows:
| Year Ended December 31 | ||||||||
| 2017 | 2016 | |||||||
Short-term employee benefits | $ | 253,254 | $ | 251,137 | ||||
Post-employment benefits | 9,171 | 8,038 | ||||||
Share-based payment | 2,162 | 1,779 | ||||||
|
|
|
| |||||
| $ | 264,587 | $ | 260,954 | |||||
|
|
|
| |||||
The compensation of directors and key executives is mainly determined by the compensation committee having regard to the performance of individual and market trends.
| 40. | PLEDGED ASSETS |
The following assets are pledged as collaterals for bank loans and custom duties of the imported materials.
| December 31 | ||||||||
| 2017 | 2016 | |||||||
Property, plant and equipment | $ | 2,550,352 | $ | 2,579,866 | ||||
Land held under development (included in inventories) | 1,998,733 | 1,998,733 | ||||||
Restricted assets (included in other assets— others) | 2,500 | 20,633 | ||||||
|
|
|
| |||||
| $ | 4,551,585 | $ | 4,599,232 | |||||
|
|
|
| |||||
| 41. | SIGNIFICANT CONTINGENT LIABILITIES AND UNRECOGNIZED COMMITMENTS |
The Company’s significant contingent liabilities and recognized commitments, excluding those disclosed in other notes, were as follows:
| a. | As of December 31, 2017, acquisitions of land and buildings of $118,282 thousand. |
| b. | As of December 31, 2017, acquisitions of telecommunications equipment of $16,199,273 thousand. |
| c. | As of December 31, 2017, unused letters of credit amounting to $50,000 thousand. |
| d. | A commitment to contribute $2,000,000 thousand to a Piping Fund administered by the Taipei City Government, of which $1,000,000 thousand was contributed by Chunghwa on August 15, 1996 (classified as other monetary assets—noncurrent). If the fund is not sufficient, Chunghwa will contribute the remaining $1,000,000 thousand upon notification from the Taipei City Government. |
- 89 -
| e. | CHPT signed the contract for its headquarters construction amounted to $1,613,800 thousand as of July 2017. The payment is not yet paid as of December 31, 2017. |
| 42. | SIGNIFICANT ASSETS AND LIABILITIES DENOMINATED IN FOREIGN CURRENCIES |
The following information summarizes the disclosure of the currency which is other than functional currency of Chunghwa and its subsidiaries. The following exchange rates are the exchange rates used to translate to the presentation currency in the consolidated financial statements, which is NTD:
| December 31, 2017 | ||||||||||||
| Foreign Currencies (Thousands) | Exchange Rate | New Taiwan Dollars (Thousands) | ||||||||||
Assets denominated in foreign currencies | ||||||||||||
Monetary items | ||||||||||||
Cash | ||||||||||||
USD | $ | 20,224 | 29.76 | $ | 601,877 | |||||||
EUR | 757 | 35.57 | 26,941 | |||||||||
SGD | 2,752 | 22.26 | 61,270 | |||||||||
RMB | 197 | 4.565 | 898 | |||||||||
JPY | 97,684 | 0.264 | 25,789 | |||||||||
Accounts receivable | ||||||||||||
USD | 167,412 | 29.76 | 4,982,187 | |||||||||
EUR | 44 | 35.57 | 1,551 | |||||||||
SGD | 74 | 22.26 | 1,639 | |||||||||
RMB | 457 | 4.565 | 2,088 | |||||||||
JPY | 39,616 | 0.264 | 10,459 | |||||||||
Non-monetary items | ||||||||||||
Investments accounted for using equity method | ||||||||||||
USD | 762 | 29.76 | 22,731 | |||||||||
SGD | 21,227 | 22.26 | 472,505 | |||||||||
VND | 215,397,479 | 0.00119 | 256,323 | |||||||||
Liabilities denominated in foreign currencies | ||||||||||||
Monetary items | ||||||||||||
Accounts payable | ||||||||||||
USD | 166,800 | 29.76 | 4,963,953 | |||||||||
EUR | 37,189 | 35.57 | 1,322,803 | |||||||||
SGD | 4,333 | 22.26 | 96,442 | |||||||||
RMB | 5 | 4.565 | 25 | |||||||||
JPY | 45,203 | 0.264 | 11,934 | |||||||||
- 90 -
| December 31, 2016 | ||||||||||||
| Foreign Currencies (Thousands) | Exchange Rate | New Taiwan Dollars (Thousands) | ||||||||||
Assets denominated in foreign currencies | ||||||||||||
Monetary items | ||||||||||||
Cash | ||||||||||||
USD | $ | 15,992 | 32.25 | $ | 515,733 | |||||||
EUR | 413 | 33.90 | 14,004 | |||||||||
SGD | 4,701 | 22.29 | 104,784 | |||||||||
RMB | 6,441 | 4.617 | 29,737 | |||||||||
JPY | 41,821 | 0.276 | 11,543 | |||||||||
Accounts receivable | ||||||||||||
USD | 149,177 | 32.25 | 4,810,959 | |||||||||
SGD | 42 | 22.29 | 926 | |||||||||
JPY | 5,354 | 0.276 | 1,478 | |||||||||
Non-monetary items | ||||||||||||
Investments accounted for using equity method | ||||||||||||
USD | 727 | 32.25 | 23,458 | |||||||||
SGD | 20,944 | 22.29 | 466,847 | |||||||||
VND | 213,034,109 | 0.00129 | 274,814 | |||||||||
Liabilities denominated in foreign currencies | ||||||||||||
Monetary items | ||||||||||||
Accounts payable | ||||||||||||
USD | 131,403 | 32.25 | 4,237,739 | |||||||||
EUR | 28,547 | 33.90 | 967,727 | |||||||||
SGD | 26 | 22.29 | 576 | |||||||||
RMB | 11 | 4.617 | 49 | |||||||||
JPY | 37,877 | 0.276 | 10,454 | |||||||||
The unrealized foreign exchange gains and losses were loss of $67,954 thousand and gain of $62,960 thousand for the years ended December 31, 2017 and 2016, respectively. Due to the various foreign currency transactions and the functional currency of each individual entity of the Company, foreign exchange gains and losses cannot be disclosed by the respective significant foreign currency.
| 43. | ADDITIONAL DISCLOSURES |
Following are the additional disclosures required by the FSC for the Company:
| a. | Financing provided: None. |
| b. | Endorsement/guarantee provided: Please see Table 1. |
| c. | Marketable securities held (excluding investments in subsidiaries, associates and joint ventures): Please see Table 2. |
| d. | Marketable securities acquired and disposed of at costs or prices at least $300 million or 20% of thepaid-in capital: Please see Table 3. |
- 91 -
| e. | Acquisition of individual real estate at costs of at least $300 million or 20% of thepaid-in capital: None. |
| f. | Disposal of individual real estate at prices of at least $300 million or 20% of thepaid-in capital: None. |
| g. | Total purchases from or sales to related parties amounting to at least $100 million or 20% of thepaid-in capital: Please see Table 4. |
| h. | Receivables from related parties amounting to $100 million or 20% of thepaid-in capital: Please see Table 5. |
| i. | Names, locations, and other information of investees on which the Company exercises significant influence (excluding investment in Mainland China): Please see Table 6. |
| j. | Derivative instruments transactions: Please see Notes 7, 21 and 38. |
| k. | Investment in Mainland China: Please see Table 7. |
| l. | Intercompany relationships and significant intercompany transaction: Please see Table 8. |
| 44. | SEGMENT INFORMATION |
The Company has the following reportable segments that provide different products or services. The reportable segments are managed separately because each segment represents a strategic business unit that serves different markets. Segment information is provided to CEO who allocates resources and assesses segment performance. The Company’s measure of segment performance is mainly based on revenues and income before income tax. The Company’s reportable segments are as follows:
| a. | Domestic fixed communications business—the provision of local telephone services, domestic long distance telephone services, broadband access, and related services; |
| b. | Mobile communications business—the provision of mobile services, sales of mobile handsets and data cards, and related services; |
| c. | Internet business—the provision of HiNet services and related services; |
| d. | International fixed communications business—the provision of international long distance telephone services and related services; |
| e. | Others—the provision of non-telecom services and the corporate related items not allocated to reportable segments. |
Some operating segments have been aggregated into a single operating segment taking into account the following factors: (a) similar economic characteristics such as long-term gross profit margins; (b) the nature of the telecommunications products and services are similar; (c) the nature of production processes of the telecommunications products and services are similar; (d) the type or class of customer for the telecommunications products and services are similar; and (e) the methods used to provide the services to the customers are similar.
There was no material differences between the accounting policies of the operating segments and the accounting policies described in Note 3.
- 92 -
Segment Revenues and Operating Results
Analysis by reportable segment of revenue and operating results of continuing operations was as follows:
| Domestic Fixed Communications Business | Mobile Communications Business | Internet Business | International Fixed Communications Business | Others | Total | |||||||||||||||||||
Year ended December 31, 2017 | ||||||||||||||||||||||||
Revenues | ||||||||||||||||||||||||
From external customers | $ | 71,136,604 | $ | 109,376,248 | $ | 28,917,514 | $ | 13,552,343 | $ | 4,531,474 | $ | 227,514,183 | ||||||||||||
Intersegment revenues | 22,514,866 | 2,030,565 | 4,208,685 | 2,375,280 | 4,600,296 | 35,729,692 | ||||||||||||||||||
|
|
|
|
|
|
|
|
|
|
|
| |||||||||||||
Segment revenues | $ | 93,651,470 | $ | 111,406,813 | $ | 33,126,199 | $ | 15,927,623 | $ | 9,131,770 | 263,243,875 | |||||||||||||
|
|
|
|
|
|
|
|
|
| |||||||||||||||
Intersegment elimination | (35,729,692 | ) | ||||||||||||||||||||||
|
| |||||||||||||||||||||||
Consolidated revenues | $ | 227,514,183 | ||||||||||||||||||||||
|
| |||||||||||||||||||||||
Segments operating costs and expenses | $ | 62,795,150 | $ | 80,274,903 | $ | 13,288,122 | $ | 13,385,017 | $ | 10,963,633 | $ | 180,706,825 | ||||||||||||
|
|
|
|
|
|
|
|
|
|
|
| |||||||||||||
Segment income (loss) before income tax | $ | 24,888,058 | $ | 12,433,249 | $ | 11,118,327 | $ | 1,028,983 | $ | (1,471,555 | ) | $ | 47,997,062 | |||||||||||
|
|
|
|
|
|
|
|
|
|
|
| |||||||||||||
Year ended December 31, 2016 | ||||||||||||||||||||||||
Revenues | ||||||||||||||||||||||||
From external customers | $ | 72,783,774 | $ | 110,801,831 | $ | 28,100,193 | $ | 14,433,501 | $ | 3,872,129 | $ | 229,991,428 | ||||||||||||
Intersegment revenues | 22,669,037 | 2,529,544 | 4,733,529 | 2,680,822 | 4,121,847 | 36,734,779 | ||||||||||||||||||
|
|
|
|
|
|
|
|
|
|
|
| |||||||||||||
Segment revenues | $ | 95,452,811 | $ | 113,331,375 | $ | 32,833,722 | $ | 17,114,323 | $ | 7,993,976 | 266,726,207 | |||||||||||||
|
|
|
|
|
|
|
|
|
| |||||||||||||||
Intersegment elimination | (36,734,779 | ) | ||||||||||||||||||||||
|
| |||||||||||||||||||||||
Consolidated revenues | $ | 229,991,428 | ||||||||||||||||||||||
|
| |||||||||||||||||||||||
Segments operating costs and expenses | $ | 64,229,704 | $ | 79,592,777 | $ | 13,160,262 | $ | 14,313,136 | $ | 10,093,622 | $ | 181,389,501 | ||||||||||||
|
|
|
|
|
|
|
|
|
|
|
| |||||||||||||
Segment income (loss) before income tax | $ | 25,657,655 | $ | 13,925,960 | $ | 10,729,227 | $ | 1,097,771 | $ | (2,028,066 | ) | $ | 49,382,547 | |||||||||||
|
|
|
|
|
|
|
|
|
|
|
| |||||||||||||
Other Segment Information
Other information reviewed by the chief operating decision maker or regularly provided to the chief operating decision maker was as follows:
| Domestic Fixed Communications Business | Mobile Communications Business | Internet Business | International Fixed Communications Business | Others | Total | |||||||||||||||||||
Year ended December 31, 2017 | ||||||||||||||||||||||||
Share of profits of associates and joint ventures accounted for using equity method | $ | — | $ | — | $ | — | $ | — | $ | 407,243 | $ | 407,243 | ||||||||||||
|
|
|
|
|
|
|
|
|
|
|
| |||||||||||||
Interest revenue | $ | 21,282 | $ | 14,791 | $ | 8,619 | $ | 15,510 | $ | 145,246 | $ | 205,448 | ||||||||||||
|
|
|
|
|
|
|
|
|
|
|
| |||||||||||||
Interest expenses | $ | — | $ | 5,406 | $ | 195 | $ | — | $ | 16,312 | $ | 21,913 | ||||||||||||
|
|
|
|
|
|
|
|
|
|
|
| |||||||||||||
Depreciation and amortization | $ | 15,614,052 | $ | 11,000,948 | $ | 3,385,312 | $ | 1,476,658 | $ | 452,634 | $ | 31,929,604 | ||||||||||||
|
|
|
|
|
|
|
|
|
|
|
| |||||||||||||
Capital expenditure | $ | 11,647,266 | $ | 9,742,113 | $ | 2,778,821 | $ | 1,580,156 | $ | 1,126,980 | $ | 26,875,336 | ||||||||||||
|
|
|
|
|
|
|
|
|
|
|
| |||||||||||||
Impairment loss on property, plant and equipment | $ | — | $ | — | $ | — | $ | — | $ | — | $ | — | ||||||||||||
|
|
|
|
|
|
|
|
|
|
|
| |||||||||||||
Reversal of impairment loss on investment properties | $ | 10,979 | $ | — | $ | — | $ | — | $ | — | $ | 10,979 | ||||||||||||
|
|
|
|
|
|
|
|
|
|
|
| |||||||||||||
Year ended December 31, 2016 | ||||||||||||||||||||||||
Share of profits of associates and joint ventures accounted for using equity method | $ | — | $ | — | $ | — | $ | — | $ | 482,660 | $ | 482,660 | ||||||||||||
|
|
|
|
|
|
|
|
|
|
|
| |||||||||||||
Interest revenue | $ | 15,196 | $ | 10,883 | $ | 6,423 | $ | 6,153 | $ | 150,196 | $ | 188,851 | ||||||||||||
|
|
|
|
|
|
|
|
|
|
|
| |||||||||||||
Interest expenses | $ | — | $ | 1,861 | $ | 180 | $ | — | $ | 17,767 | $ | 19,808 | ||||||||||||
|
|
|
|
|
|
|
|
|
|
|
| |||||||||||||
Depreciation and amortization | $ | 16,413,696 | $ | 10,619,783 | $ | 3,625,848 | $ | 1,451,209 | $ | 374,433 | $ | 32,484,969 | ||||||||||||
|
|
|
|
|
|
|
|
|
|
|
| |||||||||||||
Capital expenditure | $ | 9,846,151 | $ | 8,980,930 | $ | 2,718,190 | $ | 1,136,016 | $ | 835,496 | $ | 23,516,783 | ||||||||||||
|
|
|
|
|
|
|
|
|
|
|
| |||||||||||||
Impairment loss on property, plant and equipment | $ | — | $ | 595,408 | $ | — | $ | — | $ | 420 | $ | 595,828 | ||||||||||||
|
|
|
|
|
|
|
|
|
|
|
| |||||||||||||
Reversal of impairment loss on investment properties | $ | 147,527 | $ | — | $ | — | $ | — | $ | — | $ | 147,527 | ||||||||||||
|
|
|
|
|
|
|
|
|
|
|
| |||||||||||||
- 93 -
Main Products and Service Revenues
| Year Ended December 31 | ||||||||
| 2017 | 2016 | |||||||
Mobile services revenue | $ | 75,822,863 | $ | 78,787,719 | ||||
Local telephone and domestic long distance telephone services revenue | 32,247,482 | 34,530,810 | ||||||
Sales of products | 37,649,313 | 35,377,556 | ||||||
Broadband access and domestic leased line services revenue | 22,949,982 | 23,314,882 | ||||||
Data Communications internet services revenue | 21,142,705 | 20,905,741 | ||||||
International network and leased telephone services revenue | 9,328,298 | 10,634,177 | ||||||
Others | 28,373,540 | 26,440,543 | ||||||
|
|
|
| |||||
| $ | 227,514,183 | $ | 229,991,428 | |||||
|
|
|
| |||||
Geographic Information
The users of the Company’s services are mainly from Taiwan, ROC. The revenues it derived outside Taiwan are mainly revenues from international long distance telephone and leased line services. The geographic information for revenues was as follows:
| Year Ended December 31 | ||||||||
| 2017 | 2016 | |||||||
Taiwan, ROC | $ | 217,567,991 | $ | 218,933,004 | ||||
Overseas | 9,946,192 | 11,058,424 | ||||||
|
|
|
| |||||
| $ | 227,514,183 | $ | 229,991,428 | |||||
|
|
|
| |||||
The Company has long-lived assets in U.S., Singapore, Hong Kong, China, Vietnam, Japan and Thailand and except for $4,444,991 thousand and $3,947,402 thousand at December 31, 2017 and 2016, respectively, in the aforementioned areas, the other long-lived assets are located in Taiwan, ROC.
Major Customers
For the years ended December 31, 2017 and 2016, the Company did not have any single customer whose revenue exceeded 10% of the total revenues.
- 94 -
TABLE 1
CHUNGHWA TELECOM CO., LTD. AND SUBSIDIARIES
ENDORSEMENTS/GUARANTEES PROVIDED
YEAR ENDED DECEMBER 31, 2017
(Amounts in Thousands of New Taiwan Dollars)
No. (Note 1) | Endorsement/ Guarantee Provider | Guaranteed Party | Limits on Endorsement/ Guarantee Amount Provided to Each Guaranteed Party | Maximum Balance for the Period | Ending Balance | Actual Borrowing Amount | Amount of Endorsement/ Guarantee Collateralized by Properties | Ratio of Accumulated Endorsement/ Guarantee to Net Equity Per Latest Financial Statements | Maximum Endorsement/ Guarantee Amount Allowable | Endorsement/ Guarantee Given by Parent on Behalf of Subsidiaries | Endorsement/ Guarantee Given by Subsidiaries on Behalf of Parent | Endorsement/ Guarantee Given on Behalf of Companies in Mainland China | Note | |||||||||||||||||||||||||||||
| Name | Nature of Relationship (Note 2) | |||||||||||||||||||||||||||||||||||||||||
1 | Senao International Co., Ltd. | Youth Co., Ltd. ISPOT Co., Ltd. Aval Technologies Co., Ltd. | b c b | $ | 590,014 590,014 590,014 | | $ | 200,000 150,000 300,000 | | $ | 200,000 150,000 300,000 | | $ | — 150,000 300,000 | | $ | — — — | | | 3.39 2.54 5.08 | | $ | 2,950,071 2,950,071 2,950,071 | | Yes Yes Yes | No No No | No No No | Notes 3 and 4 Notes 3 and 4 Notes 3 and 4 | ||||||||||||||
| Note 1: | Significant transactions between the Company and its subsidiaries or among subsidiaries are numbered as follows: |
| a. | “0” for the Company. |
| b. | Subsidiaries are numbered from “1”. |
| Note 2: | Relationships between the endorsement/guarantee provider and the guaranteed party: |
| a. | Trading partner. |
| b. | Majority owned subsidiary. |
| c. | The Company and subsidiary owns over 50% ownership of the investee company. |
| d. | A subsidiary jointly owned by the Company and the Company’s directly-owned subsidiary. |
| e. | Guaranteed by the Company according to the construction contract. |
| f. | An investee company. The guarantees were provided based on the Company’s proportionate share in the investee company. |
| Note 3: | The limits on endorsement or guarantee amount provided to each guaranteed party is up to 10% of the net assets value of the latest financial statements of Senao International Co., Ltd. |
| Note 4: | The total amount of endorsement or guarantee that the Company is allowed to provide is up to 50% of the net assets value of the latest financial statements of Senao International Co., Ltd. |
- 95 -
TABLE 2
CHUNGHWA TELECOM CO., LTD. AND SUBSIDIARIES
MARKETABLE SECURITIES HELD
DECEMBER 31, 2017
(Amounts in Thousands of New Taiwan Dollars)
Held Company Name | Marketable Securities Type and Name | Relationship with | Financial Statement Account | December 31, 2017 | Note | |||||||||||||||||||
| Shares (Thousands/ Thousand Units) | Carrying Value (Note 1) | Percentage of Ownership | Fair Value | |||||||||||||||||||||
Chunghwa Telecom Co., Ltd. | Stocks | |||||||||||||||||||||||
Taipei Financial Center Corp. | — | Financial assets carried at cost | 172,927 | $ | 1,789,530 | 12 | $ | — | — | |||||||||||||||
Innovation Works Development Fund, L.P. | — | Financial assets carried at cost | — | 242,521 | 4 | — | — | |||||||||||||||||
Industrial Bank of Taiwan II Venture Capital Co., Ltd. (IBT II) | — | Financial assets carried at cost | 5,252 | 40,853 | 17 | — | — | |||||||||||||||||
Global Mobile Corp. | — | Financial assets carried at cost | 7,617 | — | 3 | — | — | |||||||||||||||||
Innovation Works Limited | — | Financial assets carried at cost | 1,000 | 26,834 | 2 | — | — | |||||||||||||||||
RPTI Intergroup International Ltd. | — | Financial assets carried at cost | 4,765 | — | 10 | — | — | |||||||||||||||||
Taiwan mobile payment Co., Ltd. | — | Financial assets carried at cost | 1,200 | 12,000 | 2 | — | — | |||||||||||||||||
Taiwania Capital Buffalo Fund Co., Ltd. | — | Financial assets carried at cost | 300,000 | 300,000 | 13 | — | — | |||||||||||||||||
China Airlines Ltd. | — | Available-for-sale financial assets-noncurrent | 263,622 | 3,071,198 | 5 | 3,071,198 | Note 2 | |||||||||||||||||
Senao International Co., Ltd. | Stocks | |||||||||||||||||||||||
N.T.U. Innovation Incubation Corporation | — | Financial assets carried at cost | 1,200 | 12,000 | 9 | — | — | |||||||||||||||||
CHIEF Telecom Inc. | Stocks | |||||||||||||||||||||||
3 Link Information Service Co., Ltd. | — | Financial assets carried at cost | 374 | 3,450 | 10 | — | — | |||||||||||||||||
Chunghwa Investment Co., Ltd. | Stocks | |||||||||||||||||||||||
Tatung Technology Inc. | — | Financial assets carried at cost | 4,571 | 73,964 | 11 | — | — | |||||||||||||||||
iSing99 Inc. | — | Financial assets carried at cost | 10,000 | 100,000 | 7 | — | — | |||||||||||||||||
PChome Store Inc. | — | Available-for-sale financial assets-noncurrent | 279 | 13,830 | 1 | 13,830 | Note 2 | |||||||||||||||||
Tons Lightology Inc. | — | Available-for-sale financial assets-noncurrent | 1,318 | 40,058 | 3 | 40,058 | Note 2 | |||||||||||||||||
Chunghwa Hsingta Co., Ltd. | Stocks | |||||||||||||||||||||||
Cotech Engineering Fuzhou Corp. | — | Financial assets carried at cost | — | 24,633 | 5 | — | — | |||||||||||||||||
| Note 1: | Securities measured at fair values are showed at carrying amounts with adjustments for fair value and deducted accumulated impairment loss. Securities not measured at fair values are showed at their original carrying amounts on amortized cost deducted the accumulated impairment loss. |
| Note 2: | Fair value was based on the closing price on December 29, 2017. |
- 96 -
TABLE 3
CHUNGHWA TELECOM CO., LTD. AND SUBSIDIARIES
MARKETABLE SECURITIES ACQUIRED AND DISPOSED OF AT COSTS OR PRICES OF AT LEAST NT$300 MILLION OR 20% OF THEPAID-IN CAPITAL
YEAR ENDED DECEMBER 31, 2017
(Amounts in Thousands of New Taiwan Dollars)
Company Name | Marketable Securities | Financial Statement | Counter- party | Nature of Relationship | Beginning Balance | Acquisition | Disposal | Ending Balance | ||||||||||||||||||||||||||||||||||||||||||||
| Shares (Thousands/ Thousand Units) | Amount (Note 1) | Shares (Thousands/ Thousand Units) | Amount | Shares (Thousands/ Thousand Units) | Amount | Carrying Value (Note 1) | Gain (Loss) on Disposal | Shares (Thousands/ Thousand Units) | Amount (Note 1) | |||||||||||||||||||||||||||||||||||||||||||
Chunghwa Telecom Co., Ltd. | Bonds | |||||||||||||||||||||||||||||||||||||||||||||||||||
| TSMC 1st Unsecured CorporateBond-A Issue in 2012 | Held-to-maturity financial assets | — | — | — | $
| 500,000 (Note 2 | ) | — | $ | — | — | $ | — | $
| 500,000 (Note 2 | ) | $ | — | — | $ | — | |||||||||||||||||||||||||||||||
| China Development Holding Corporation 1st Unsecured CorporateBond-A Issue in 2012 | Held-to-maturity financial assets | — | — | — | | 350,000 (Note 2 | ) | — | — | — | — | | 350,000 (Note 2 | ) | — | — | — | |||||||||||||||||||||||||||||||||||
| Fubon Financial Holding Co., Ltd. 1st Unsecured CorporateBond-A Issue in 2012 | Held-to-maturity financial assets | — | — | — | | 300,000 (Note 2 | ) | — | — | — | — | | 300,000 (Note 2 | ) | — | — | — | |||||||||||||||||||||||||||||||||||
| Stocks | ||||||||||||||||||||||||||||||||||||||||||||||||||||
| Taiwania Capital Buffalo Fund Co., Ltd. | Financial assets carried at cost | — | — | — | — | 300,000 | | 300,000 (Note 2 | ) | — | — | — | — | — | | 300,000 (Note 2 | ) | |||||||||||||||||||||||||||||||||||
| Note 1: | Showing at their original investing amounts without adjustments for fair values. |
| Note 2: | Showing at their nominal amounts. |
- 97 -
TABLE 4
CHUNGHWA TELECOM CO., LTD. AND SUBSIDIARIES
TOTAL PURCHASES FROM OR SALES TO RELATED PARTIES AMOUNTING TO AT LEAST NT$100 MILLION OR 20% OF THEPAID-IN CAPITAL
YEAR ENDED DECEMBER 31, 2017
(Amounts in Thousands of New Taiwan Dollars)
Company Name | Related Party | Nature of Relationship | Transaction Details | Abnormal Transaction | Notes / Accounts Payable or Receivable | |||||||||||||||||||||||||||
| Purchase/Sales (Note 1) | Amount (Notes 2 and 5) | % to Total | Payment Terms | Units Price | Payment Terms | Ending Balance (Notes 3 and 5) | % to Total | |||||||||||||||||||||||||
Chunghwa Telecom Co., Ltd. | Senao International Co., Ltd. | Subsidiary | Sales | $ | 1,687,161 | 1 | 30 days | $ | — | — | $ | 150,035 | 1 | |||||||||||||||||||
| Purchase | 10,480,438 | 9 | 30-90 days | — | — | (1,195,243 | ) | (8 | ) | |||||||||||||||||||||||
| CHIEF Telecom Inc. | Subsidiary | Sales | 331,435 | — | 30 days | — | — | 32,617 | — | |||||||||||||||||||||||
| Purchase | 304,193 | — | 60 days | — | — | (41,563 | ) | — | ||||||||||||||||||||||||
| Chunghwa System Integration Co., Ltd. | Subsidiary | Purchase | 1,041,652 | 1 | 30 days | — | — | (553,172 | ) | (4 | ) | |||||||||||||||||||||
| Honghwa International Co., Ltd. | Subsidiary | Purchase | 5,023,414 | 4 | 30-60 days | — | — | (1,015,343 | ) | (6 | ) | |||||||||||||||||||||
| Donghwa Telecom Co., Ltd. | Subsidiary | Sales | 175,901 | — | 30 days | — | — | 87,005 | — | |||||||||||||||||||||||
| Purchase | 439,977 | — | 90 days | — | — | (118,390 | ) | (1 | ) | |||||||||||||||||||||||
| Chunghwa Telecom Global, Inc. | Subsidiary | Purchase | 365,739 | — | 90 days | — | — | (42,927 | ) | — | ||||||||||||||||||||||
| Chunghwa Telecom Singapore Pte., Ltd. | Subsidiary | Sales | 162,667 | — | 30 days | — | — | 101,570 | — | |||||||||||||||||||||||
| Purchase | 261,083 | — | 90 days | — | — | (87,294 | ) | (1 | ) | |||||||||||||||||||||||
| ST-2 Satellite Ventures Pte. Ltd. | Associate | Purchase | 391,691 | — | 30 days | — | — | (94,524 | ) | (1 | ) | |||||||||||||||||||||
| Taiwan International Standard Electronics Co., Ltd. | Associate | Purchase | 545,224 | — | 30-90 days | — | — | (338,337 | ) | (2 | ) | |||||||||||||||||||||
| So-net Entertainment Taiwan Limited | Associate | Sales | 188,934 | — | 60 days | — | — | 13,505 | — | |||||||||||||||||||||||
| International Integrated System, Inc. | Associate | Purchase | 141,482 | — | 30 days | — | — | (66,395 | ) | — | ||||||||||||||||||||||
Senao International Co., Ltd. | Chunghwa Telecom Co., Ltd. | Parent company | Sales | 10,491,376 | 29 | 30-90 days | — | — | 1,210,974 | 54 | ||||||||||||||||||||||
| Purchase | 1,420,740 | 5 | 30 days | — | — | (133,101 | ) | (5 | ) | |||||||||||||||||||||||
| Aval Technologies Co., Ltd. | Subsidiary | Purchase | 114,719 | — | 30 days | — | — | — | — | |||||||||||||||||||||||
CHIEF Telecom Inc. | Chunghwa Telecom Co., Ltd. | Parent company | Sales | 304,193 | 15 | 60 days | — | — | 41,563 | 23 | ||||||||||||||||||||||
| Purchase | 330,894 | 25 | 30 days | — | — | (31,890 | ) | (28 | ) | |||||||||||||||||||||||
Chunghwa System Integration Co., Ltd. | Chunghwa Telecom Co., Ltd. | Parent company | Sales | 1,618,818 | 78 | 30 days | — | — | 553,172 | 71 | ||||||||||||||||||||||
Honghwa International Co., Ltd. | Chunghwa Telecom Co., Ltd. | Parent company | Sales | 5,024,207 | 98 | 30-60 days | — | — | 1,015,343 | 98 | ||||||||||||||||||||||
Donghwa Telecom Co., Ltd. | Chunghwa Telecom Co., Ltd. | Parent company | Sales | 439,977 | 40 | 90 days | — | — | 118,390 | 68 | ||||||||||||||||||||||
| Purchase | 175,901 | 17 | 30 days | — | — | (87,005 | ) | (96 | ) | |||||||||||||||||||||||
Chunghwa Telecom Global, Inc. | Chunghwa Telecom Co., Ltd. | Parent company | Sales | 365,739 | 58 | 90 days | — | — | 42,927 | 57 | ||||||||||||||||||||||
Chunghwa Telecom Singapore Pte., Ltd. | Chunghwa Telecom Co., Ltd. | Parent company | Sales | 261,083 | 22 | 90 days | — | — | 87,294 | 35 | ||||||||||||||||||||||
| Purchase | 162,667 | 15 | 30 days | — | — | (101,570 | ) | (48 | ) | |||||||||||||||||||||||
| Note 1: | Purchase included acquisition of services costs. |
| Note 2: | The differences were because Chunghwa Telecom Co., Ltd. and subsidiaries classified the amount as inventories, property, plant and equipment, intangible assets, and operating expenses. |
| Note 3: | Notes and accounts receivable did not include the amounts collected for others and other receivables. |
| Note 4: | Transaction terms with the related parties were determined in accordance with mutual agreements when there were no similar transactions with third parties. Other transactions with related parties were not significantly different from those with third parties. |
| Note 5: | All inter-company transactions, balances, income and expenses are eliminated upon consolidation. |
- 98 -
TABLE 5
CHUNGHWA TELECOM CO., LTD. AND SUBSIDIARIES
RECEIVABLES FROM RELATED PARTIES AMOUNTING TO AT LEAST NT$100 MILLION OR 20% OF THEPAID-IN CAPITAL
DECEMBER 31, 2017
(Amounts in Thousands of New Taiwan Dollars)
Company Name | Related Party | Nature of Relationship | Ending Balance | Turnover Rate (Note 1) | Overdue | Amounts Received in Subsequent Period | Allowance for Bad Debts | |||||||||||||||||||||
| Amounts | Action Taken | |||||||||||||||||||||||||||
Chunghwa Telecom Co., Ltd. | Senao International Co., Ltd. | Subsidiary | $
| 630,284 (Note 2 | ) | 12.19 | $ | — | — | $ | 559,187 | $ | — | |||||||||||||||
| Chunghwa Telecom Singapore Pte., Ltd. | Subsidiary | | 101,570 (Note 2 | ) | 1.81 | — | — | 101,570 | — | |||||||||||||||||||
Senao International Co., Ltd. | Chunghwa Telecom Co., Ltd. | Parent company | | 1,541,571 (Note 2 | ) | 7.22 | — | — | 771,680 | — | ||||||||||||||||||
Chunghwa System Integration Co., Ltd. | Chunghwa Telecom Co., Ltd. | Parent company | | 552,232 (Note 2 | ) | 5.16 | — | — | 385,729 | — | ||||||||||||||||||
Honghwa International Co., Ltd. | Chunghwa Telecom Co., Ltd. | Parent company | | 1,015,252 (Note 2 | ) | 6.46 | — | — | 595,176 | — | ||||||||||||||||||
Donghwa Telecom Co., Ltd. | Chunghwa Telecom Co., Ltd. | Parent company | | 118,390 (Note 2 | ) | 6.20 | — | — | 96,670 | — | ||||||||||||||||||
| Note 1: | Payments and receipts collected in trust for others are excluded from the accounts receivable for calculating the turnover rate. |
| Note 2: | The amount was eliminated upon consolidation. |
- 99 -
TABLE 6
CHUNGHWA TELECOM CO., LTD. AND SUBSIDIARIES
NAMES, LOCATIONS, AND OTHER INFORMATION OF INVESTEES IN WHICH THE COMPANY EXERCISES SIGNIFICANT INFLUENCE (EXCLUDING INVESTMENT IN MAINLAND CHINA)
YEAR ENDED DECEMBER 31, 2017
(Amounts in Thousands of New Taiwan Dollars)
| Original Investment Amount | Balance as of December 31, 2017 | Net Income | Recognized | |||||||||||||||||||||||||||||||||
Investor Company | Investee Company | Location | Main Businesses and Products | December 31, 2017 | December 31, 2016 | Shares (Thousands) | Percentage of Ownership (%) | Carrying Value | (Loss) of the Investee | Gain (Loss) (Notes 1 and 2) | Note | |||||||||||||||||||||||||
Chunghwa Telecom Co., Ltd. | Senao International Co., Ltd. | Taiwan | Handset and peripherals retailer; sales of CHT mobile phone plans as an agent | $ | 1,065,813 | $ | 1,065,813 | 71,773 | 29 | $ | 1,678,240 | $ | 821,671 | $ | 230,883 | Subsidiary (Note 6) | ||||||||||||||||||||
Light Era Development Co., Ltd. | Taiwan | Planning and development of real estate and intelligent buildings, and property management | 3,000,000 | 3,000,000 | 300,000 | 100 | 3,855,359 | 10,651 | 10,675 | Subsidiary (Note 6) | ||||||||||||||||||||||||||
Donghwa Telecom Co., Ltd. | Hong Kong | International private leased circuit, IP VPN service, and IP transit services | 1,567,453 | 1,567,453 | 402,590 | 100 | 1,527,333 | 42,503 | 42,503 | Subsidiary (Note 6) | ||||||||||||||||||||||||||
Chunghwa Telecom Singapore Pte., Ltd. | Singapore | International private leased circuit, IP VPN service, and IP transit services | 574,112 | 574,112 | 26,383 | 100 | 848,442 | 139,924 | 139,924 | Subsidiary (Note 6) | ||||||||||||||||||||||||||
Chunghwa System Integration Co., Ltd. | Taiwan | Providing system integration services and telecommunications equipment | 838,506 | 838,506 | 60,000 | 100 | 715,610 | 11,158 | 17,595 | Subsidiary (Note 6) | ||||||||||||||||||||||||||
CHIEF Telecom Inc. | Taiwan | Network integration, internet data center (“IDC”), communications integration and cloud application services | 468,326 | 482,165 | 40,170 | 67 | 858,313 | 384,587 | 266,170 | Subsidiary (Note 6) | ||||||||||||||||||||||||||
Chunghwa Investment Co., Ltd. | Taiwan | Investment | 639,559 | 639,559 | 68,085 | 89 | 2,316,100 | 283,409 | 252,495 | Subsidiary (Note 6) | ||||||||||||||||||||||||||
Prime Asia Investments Group Ltd. (B.V.I.) | British Virgin Islands | Investment | 385,274 | 385,274 | 1 | 100 | 212,251 | (8,426 | ) | (8,426 | ) | Subsidiary (Note 6) | ||||||||||||||||||||||||
Honghwa International Co., Ltd. | Taiwan | Telecommunication engineering, sales agent of mobile phone plan application and other business services | 180,000 | 180,000 | 18,000 | 100 | 459,096 | 227,990 | 226,096 | Subsidiary (Note 6) | ||||||||||||||||||||||||||
CHYP Multimedia Marketing & Communications Co., Ltd. | Taiwan | Digital information supply services and advertisement services | 150,000 | 150,000 | 15,000 | 100 | 194,808 | 24,589 | 24,589 | Subsidiary (Note 6) | ||||||||||||||||||||||||||
Chunghwa Telecom Vietnam Co., Ltd. | Vietnam | Intelligent energy saving solutions, international circuit, and information and communication technology (“ICT”) services. | 148,275 | 148,275 | — | 100 | 106,676 | (17,111 | ) | (17,111 | ) | Subsidiary (Note 6) | ||||||||||||||||||||||||
Chunghwa Telecom Global, Inc. | United States | International private leased circuit, internet services, and transit services | 70,429 | 70,429 | 6,000 | 100 | 218,982 | 49,720 | 51,975 | Subsidiary (Note 6) | ||||||||||||||||||||||||||
CHT Security Co., Ltd. | Taiwan | Computing equipment installation, wholesale of computing and business machinery equipment and software, management consulting services, data processing services, digital information supply services and internet identify services | 240,000 | — | 24,000 | 80 | 240,007 | 7 | 7 | Subsidiary (Note 6) | ||||||||||||||||||||||||||
Chunghwa Telecom (Thailand) Co., Ltd. | Thailand | International private leased circuit, IP VPN service, ICT and cloud VAS services | 100,000 | — | 1,000 | 100 | 93,998 | (9,413 | ) | (9,413 | ) | Subsidiary (Note 6) | ||||||||||||||||||||||||
(Continued)
- 100 -
| Original Investment Amount | Balance as of December 31, 2017 | Net Income | Recognized | |||||||||||||||||||||||||||||||||
Investor Company | Investee Company | Location | Main Businesses and Products | December 31, 2017 | December 31, 2016 | Shares (Thousands) | Percentage of Ownership (%) | Carrying Value | (Loss) of the Investee | Gain (Loss) (Notes 1 and 2) | Note | |||||||||||||||||||||||||
Spring House Entertainment Tech. Inc. | Taiwan | Digital entertainment contents production, animated character licensing and endorsement, and mobile digital platform construction | 62,209 | 62,209 | 10,277 | 56 | 93,907 | 3,302 | 1,891 | Subsidiary (Note 6) | ||||||||||||||||||||||||||
Chunghwa leading Photonics Tech Co., Ltd. | Taiwan | Production and sale of electronic components and finished products | 70,500 | 70,500 | 7,050 | 75 | 98,007 | 35,110 | 32,971 | Subsidiary (Note 6) | ||||||||||||||||||||||||||
Smartfun Digital Co., Ltd. | Taiwan | Providing diversified family education digital services | 65,000 | 65,000 | 6,500 | 65 | 73,049 | 15,781 | 7,518 | Subsidiary (Note 6) | ||||||||||||||||||||||||||
Chunghwa Telecom Japan Co., Ltd. | Japan | International private leased circuit, IP VPN service, and IP transit services | 17,291 | 17,291 | 1 | 100 | 48,730 | 8,067 | 8,067 | Subsidiary (Note 6) | ||||||||||||||||||||||||||
Chunghwa Sochamp Technology Inc. | Taiwan | Design, development and production of Automatic License Plate Recognition software and hardware | 20,400 | 20,400 | 2,040 | 51 | (10,197 | ) | 3,218 | (3,414 | ) | Subsidiary (Note 6) | ||||||||||||||||||||||||
International Integrated System, Inc. | Taiwan | IT solution provider, IT application consultation, system integration and package solution | 283,500 | 283,500 | 22,498 | 32 | 296,333 | 24,561 | 6,891 | Associate | ||||||||||||||||||||||||||
Viettel-CHT Co., Ltd. | Vietnam | IDC services | $ | 288,327 | $ | 288,327 | — | 30 | $ | 256,323 | $ | 177,697 | $ | 53,310 | Associate | |||||||||||||||||||||
Taiwan International Standard Electronics Co., Ltd. | Taiwan | Manufacturing, selling, designing, and maintaining of telecommunications systems and equipment | 164,000 | 164,000 | 1,760 | 40 | 136,885 | 166,752 | 116,691 | Associate | ||||||||||||||||||||||||||
Skysoft Co., Ltd. | Taiwan | Providing of music on-line, software, electronic information, and advertisement services | 67,025 | 67,025 | 4,438 | 30 | 139,741 | 3,743 | 1,999 | Associate | ||||||||||||||||||||||||||
So-net Entertainment Taiwan Limited | Taiwan | Online service and sale of computer hardware | 120,008 | 120,008 | 9,429 | 30 | 104,171 | (23,464 | ) | (7,039 | ) | Associate | ||||||||||||||||||||||||
KingwayTek Technology Co., Ltd. | Taiwan | Publishing books, data processing and software services | 69,013 | 69,013 | 5,926 | 26 | 128,269 | 24,111 | 6,498 | Associate | ||||||||||||||||||||||||||
Taiwan International Ports Logistics Corporation | Taiwan | Import and export storage, logistic warehouse, and ocean shipping service | 80,000 | 80,000 | 8,000 | 27 | 49,631 | (25,628 | ) | (6,819 | ) | Associate | ||||||||||||||||||||||||
Dian Zuan Integrating Marketing Co., Ltd. | Taiwan | Information technology service and general advertisement service | 97,598 | 97,598 | 5,400 | 15 | 17,218 | (55,766 | ) | (8,954 | ) | Associate | ||||||||||||||||||||||||
Alliance Digital Tech Co., Ltd. | Taiwan | Development of mobile payments and information processing service | 60,000 | 60,000 | 6,000 | 14 | 14,488 | (134,582 | ) | (19,380 | ) | Associate | ||||||||||||||||||||||||
Chunghwa Benefit One Co., Ltd. | Taiwan | E-commerce of employee benefits | — | 50,000 | — | — | — | (1,558 | ) | (779 | ) | Joint venture (Note 3) | ||||||||||||||||||||||||
Senao International Co., Ltd. | Senao Networks, Inc. | Taiwan | Telecommunication facilities manufactures and sales | 202,758 | 202,758 | 16,579 | 34 | 862,116 | 471,335 | 159,339 | Associate | |||||||||||||||||||||||||
Senao International (Samoa) Holding Ltd. | Samoa Islands | International investment | 2,416,645 | 2,416,645 | 81,175 | 100 | 506,275 | (41,392 | ) | (39,607 | ) | Subsidiary (Note 6) | ||||||||||||||||||||||||
Dian Zuan Integrating Marketing Co., Ltd. | Taiwan | Information technology service and general advertisement service | 24,000 | 24,000 | 2,400 | 7 | 7,788 | (55,766 | ) | (3,850 | ) | Associate | ||||||||||||||||||||||||
(Continued)
- 101 -
| Original Investment Amount | Balance as of December 31, 2017 | Net Income | Recognized | |||||||||||||||||||||||||||||||||
Investor Company | Investee Company | Location | Main Businesses and Products | December 31, 2017 | December 31, 2016 | Shares (Thousands) | Percentage of Ownership (%) | Carrying Value | (Loss) of the Investee | Gain (Loss) (Notes 1 and 2) | Note | |||||||||||||||||||||||||
Youth Co., Ltd. | Taiwan | Sale of information and communication technologies products | 335,450 | 335,450 | 13,780 | 89 | 239,869 | (15,817 | ) | (33,883 | ) | Subsidiary (Note 6) | ||||||||||||||||||||||||
Aval Technologies Co., Ltd. | Taiwan | Sale of information and communication technologies products | 60,000 | 60,000 | 6,000 | 100 | 65,831 | 5,311 | 5,311 | Subsidiary (Note 6) | ||||||||||||||||||||||||||
SENYOUNG Insurance Agent Co., Ltd. | Taiwan | Property and liability insurance agency | 10,000 | — | 1,000 | 100 | 9,516 | (484 | ) | (484 | ) | Subsidiary (Note 6) | ||||||||||||||||||||||||
CHIEF Telecom Inc. | Unigate Telecom Inc. | Taiwan | Telecommunications and internet service | 2,000 | 2,000 | 200 | 100 | 1,003 | (149 | ) | (149 | ) | Subsidiary (Note 6) | |||||||||||||||||||||||
Chief International Corp. | Samoa Islands | Telecommunications and internet service | 6,068 | 6,068 | 200 | 100 | 51,082 | 12,793 | 12,793 | Subsidiary (Note 6) | ||||||||||||||||||||||||||
Chunghwa System Integrated Co., Ltd. | Concord Technology Co., Ltd. | Brunei | Investment | 47,321 | 47,321 | 1,500 | 100 | 18,236 | 2,318 | 2,318 | Subsidiary (Notes 4 and 6) | |||||||||||||||||||||||||
Chunghwa Telecom Singapore Pte., Ltd. | ST-2 Satellite Ventures Pte., Ltd. | Singapore | Operation ofST-2 telecommunications satellite | 409,061 | 409,061 | 18,102 | 38 | 472,505 | 281,763 | 107,070 | Associate | |||||||||||||||||||||||||
Chunghwa Investment Co., Ltd. | Chunghwa Precision Test Tech. Co., Ltd. | Taiwan | Production and sale of semiconductor testing components and printed circuit board | 199,736 | 199,736 | 12,558 | 38 | 2,207,100 | 736,370 | 297,247 | Subsidiary (Note 6) | |||||||||||||||||||||||||
CHIEF Telecom Inc. | Taiwan | Network integration, internet data center (“IDC”), communications integration and cloud application services | 19,422 | 20,000 | 2,117 | 4 | 41,862 | 384,587 | 13,768 | Associate (Note 6) | ||||||||||||||||||||||||||
Senao International Co., Ltd. | Taiwan | Selling and maintaining mobile phones and its peripheral products | 49,731 | 49,731 | 1,001 | — | 44,221 | 821,671 | 3,318 | Associate (Note 6) | ||||||||||||||||||||||||||
Chunghwa Precision Test Tech. Co., Ltd. | Chunghwa Precision Test Tech USA Corporation | United States | Design and after-sale services of semiconductor testing components and printed circuit board | 12,636 | 12,636 | 400 | 100 | 22,529 | 4,425 | 4,425 | Subsidiary (Note 6) | |||||||||||||||||||||||||
CHPT Japan Co., Ltd. | Japan | Related services of electronic parts, machinery processed products and printed circuit board | 2,008 | 2,008 | 1 | 100 | 2,124 | 281 | 281 | Subsidiary (Note 6) | ||||||||||||||||||||||||||
Chunghwa Precision Test Tech. International, Ltd. | Samoa Islands | Wholesale and retail of electronic materials, and investment | 54,450 | 54,450 | 1,700 | 100 | 47,137 | (6,521 | ) | (6,521 | ) | Subsidiary (Note 6) | ||||||||||||||||||||||||
Prime Asia Investments Group, | Chunghwa Hsingta Co., Ltd. | Hong Kong | Investment | 375,274 | 375,274 | 1 | 100 | 211,701 | (8,969 | ) | (8,969 | ) | Subsidiary (Note 6) | |||||||||||||||||||||||
Ltd. (B.V.I.) | MeWorks Limited (HK) | Hong Kong | Investment | 10,000 | 10,000 | — | 20 | — | — | — | Associate | |||||||||||||||||||||||||
Senao International (Samoa) | Senao International HK Limited | Hong Kong | International investment | $ | 2,393,646 | $ | 2,393,646 | 80,440 | 100 | $ | 468,862 | $ | (40,944 | ) | $ | (40,944 | ) | Subsidiary (Note 6) | ||||||||||||||||||
Holding Ltd. | HopeTech Technologies Limited | Hong Kong | Information technology and telecommunications products sales | 21,177 | 21,177 | 5,240 | 45 | 22,731 | (1,101 | ) | (495 | ) | Associate | |||||||||||||||||||||||
Youth Co., Ltd. | ISPOT Co., Ltd. | Taiwan | Sale of information and communication technologies products | 53,021 | 53,021 | — | 100 | 19,214 | (4,901 | ) | (5,371 | ) | Subsidiary (Note 6) | |||||||||||||||||||||||
Youyi Co., Ltd. | Taiwan | Maintenance of information and communication technologies products | 21,354 | 6,920 | — | 100 | 15,744 | (1,272 | ) | (1,475 | ) | Subsidiary (Note 6) | ||||||||||||||||||||||||
CHYP Multimedia Marketing & Communications Co., Ltd | Click Force Marketing Company | Taiwan | Advertisement services | 44,607 | 44,607 | 1,078 | 49 | 38,175 | 6,864 | 988 | Associate | |||||||||||||||||||||||||
| Note 1: | The amounts were based on audited financial statements. |
| Note 2: | Recognized gain (loss) of investees includes amortization of differences between the investment cost and net value and elimination of unrealized transactions. |
| Note 3: | Chunghwa Benefit One Co., Ltd.’s liquidation was completed in December 2017 and Chunghwa received the proceeds from liquidation. |
| Note 4: | Concord Technology Co., Ltd. was approved to end and dissolve its business in August 2017. The liquidation of Concord was completed in January 2018. |
| Note 5: | Investment in mainland China is included in Table 7. |
| Note 6: | The amount was eliminated upon consolidation. |
(Concluded)
- 102 -
TABLE 7
CHUNGHWA TELECOM CO., LTD. AND SUBSIDIARIES
INVESTMENT IN MAINLAND CHINA
YEAR ENDED DECEMBER 31, 2017
(Amounts in Thousands of New Taiwan Dollars)
Investee | Main Businesses and Products | Total Amount ofPaid-in Capital | Investment Type (Note 1) | Accumulated Outflow of Investment from Taiwan as of January 1, 2017 | Investment Flows | Accumulated Outflow of Investment from Taiwan as of December 31, 2017 | Net Income (Loss) of the Investee | % Ownership of Direct or Indirect Investment | Investment Gain (Loss) (Note 2) | Carrying Value as of December 31, 2017 | Accumulated Inward Remittance of Earnings as of December 31, 2017 | Note | ||||||||||||||||||||||||||||||||||||||
| Outflow | Inflow | |||||||||||||||||||||||||||||||||||||||||||||||||
Glory Network System Service (Shanghai) Co., Ltd. | Design, development and production of computer and internet software, installment, maintenance and consulting services of information system integration, and sales of self-production products | $ | 47,321 | 2 | $ | 47,321 | $ | — | $ | 18,891 | $ | — | $ | — | — | $ | — | $ | — | $ | — | | Notes 7 and 10 | | ||||||||||||||||||||||||||
Senao Trading (Fujian) Co., Ltd. | Sale of information and communication technologies products | 1,073,170 | 2 | 1,073,170 | — | — | 1,073,170 | 1,976 | 100 | 1,976 | 192,707 | — | Note 10 | |||||||||||||||||||||||||||||||||||||
Senao International Trading (Shanghai) Co., Ltd. | Sale of information and communication technologies products | 955,838 | 2 | 955,838 | — | — | 955,838 | (40,607 | ) | 100 | (40,607 | ) | 116,606 | — | Note 10 | |||||||||||||||||||||||||||||||||||
Senao International Trading (Shanghai) Co., Ltd. (Note 11) | Maintenance of information and communication technologies products | 87,540 | 2 | 87,540 | — | — | 87,540 | (5,026 | ) | 100 | (5,026 | ) | 67,277 | — | | Notes 8 and 10 | | |||||||||||||||||||||||||||||||||
Senao International Trading (Jiangsu) Co., Ltd. | Sale of information and communication technologies products | 263,736 | 2 | 263,736 | — | — | 263,736 | 2,852 | 100 | 2,852 | 89,389 | — | Note 10 | |||||||||||||||||||||||||||||||||||||
Chunghwa Telecom (China) Co., Ltd. | Integrated information and communication solution services for enterprise clients, and intelligent energy network service | 177,176 | 2 | 177,176 | — | — | 177,176 | (7,995 | ) | 100 | (7,995 | ) | 53,707 | — | Note 10 | |||||||||||||||||||||||||||||||||||
Jiangsu Zhenghua Information Technology Company, LLC | Providing intelligent energy saving solution and intelligent buildings services | 189,410 | 2 | 142,057 | — | — | 142,057 | (374 | ) | 75 | (281 | ) | 113,600 | — | | Notes 9 and 10 | | |||||||||||||||||||||||||||||||||
Shanghai Taihua Electronic Technology Limited | Design of printed circuit board and related consultation service | 51,233 | 2 | 51,233 | — | — | 51,233 | (6,538 | ) | 100 | (6,538 | ) | 44,121 | — | Note 10 | |||||||||||||||||||||||||||||||||||
Shanghai Chief Telecom Co., Ltd. | Telecommunications and internet service | 10,150 | 1 | 4,973 | — | — | 4,973 | 3,309 | 49 | 1,621 | 6,041 | — | Note 10 | |||||||||||||||||||||||||||||||||||||
(Continued)
- 103 -
Investee | Accumulated Investment in Mainland China as of December 31, 2017 | Investment Amounts Authorized by Investment Commission, MOEA | Upper Limit on Investment Stipulated by Investment Commission, MOEA | |||||||||
SENAO and its subsidiaries (Note 3) | $ | 2,380,284 | $ | 2,380,284 | $ | 3,553,694 | ||||||
Chunghwa Telecom (China) Co., Ltd. (Note 4) | 177,176 | 177,176 | 224,147,748 | |||||||||
Jiangsu Zhenghua Information Technology Company, LLC (Note 4) | 142,057 | 142,057 | 224,147,748 | |||||||||
Shanghai Taihua Electronic Technology Limited (Note 5) | 51,233 | 97,965 | 3,457,598 | |||||||||
Shanghai Chief Telecom Co., Ltd. (Note 6) | 4,973 | 4,973 | 715,315 | |||||||||
| Note 1: | Investments are divided into three categories as follows: |
| a. | Direct investment. |
| b. | Investments through a holding company registered in a third region. |
| c. | Others. |
| Note 2: | The amounts were calculated based on the investee’s audited financial statements. |
| Note 3: | Senao International Co., Ltd. and its subsidiaries were calculated based on the consolidated net assets value of Senao International Co., Ltd. |
| Note 4: | Chunghwa Telecom (China) Co., Ltd. and Jiangsu Zhenghua Information Technology Company, LLC were calculated based on the consolidated net assets value of Chunghwa Telecom Co., Ltd. |
| Note 5: | Shanghai Taihua Electronic Technology Limited was calculated based on the consolidated net assets value of Chunghwa Precision Test Tech. Co., Ltd. |
| Note 6: | Shanghai Chief Telecom Co., Ltd. was calculated based on the consolidated net assets value of CHIEF Telecom Inc. |
| Note 7: | Glory Network System Service (Shanghai) Co., Ltd. completed its liquidation in August 2017 and Concord Technology Co., Ltd. received the proceeds from liquidation. |
| Note 8: | Senao International Trading (Shanghai) Co., Ltd. was approved to end and dissolve its business in March 2017. The liquidation of Senao International Trading (Shanghai) Co., Ltd. is still in process. |
| Note 9: | Jiangsu Zhenhua Information Technology Company, LLC. was approved to end its business and dissolve in May 2016. The liquidation of Jiangsu Zhenhua Information Technology Company, LLC. is still in process. |
| Note 10: | The amount was eliminated upon consolidation. |
| Note 11: | The English name is the same as the above entity; however the Chinese name included in the respective Articles of Incorporations is different from the above entity. |
(Concluded)
- 104 -
TABLE 8
CHUNGHWA TELECOM CO., LTD. AND SUBSIDIARIES
INTERCOMPANY RELATIONSHIPS AND SIGNIFICANT TRANSACTIONS
YEAR ENDED DECEMBER 31, 2017
(Amounts in Thousands of New Taiwan Dollars)
Year | No. (Note 1) | Company Name | Related Party | Nature of Relationship (Note 2) | Transaction Details | |||||||||||||||||||
Financial Statement Account | Amount (Note 5) | Payment Terms (Note 3) | % to Total Sales or Assets (Note 4) | |||||||||||||||||||||
2017 | 0 | Chunghwa Telecom Co., Ltd. | Senao International Co., Ltd. | a | Accounts receivable | $ | 150,035 | — | — | |||||||||||||||
| Accrued custodial receipts | 480,249 | — | — | |||||||||||||||||||||
| Accounts payable | 1,195,243 | — | — | |||||||||||||||||||||
| Amounts collected for others | 346,559 | — | — | |||||||||||||||||||||
| Revenues | 1,687,161 | — | — | |||||||||||||||||||||
| Operating costs and expenses | 10,467,604 | — | 5 | |||||||||||||||||||||
| Inventories | 12,834 | — | — | |||||||||||||||||||||
| Property, plant and equipment | 11,122 | — | — | |||||||||||||||||||||
| CHIEF Telecom Inc. | a | Accounts receivable | 32,617 | — | — | |||||||||||||||||||
| Accounts payable | 41,563 | — | — | |||||||||||||||||||||
| Revenues | 331,435 | — | — | |||||||||||||||||||||
| Operating costs and expenses | 304,193 | — | — | |||||||||||||||||||||
| CHYP Multimedia Marketing & Communications Co., Ltd. | a | Accounts payable | 28,503 | — | — | |||||||||||||||||||
| Amounts collected for others | 56,817 | — | — | |||||||||||||||||||||
| Revenues | 28,308 | — | ||||||||||||||||||||||
| Operating costs and expenses | 97,299 | — | — | |||||||||||||||||||||
| Chunghwa System Integration Co., Ltd. | a | Accounts receivable | 18,380 | — | — | |||||||||||||||||||
| Accounts payable | 553,172 | — | — | |||||||||||||||||||||
| Revenues | 54,153 | — | — | |||||||||||||||||||||
| Operating costs and expenses | 853,746 | — | — | |||||||||||||||||||||
| Inventories | 187,906 | — | — | |||||||||||||||||||||
| Prepayments | 124,616 | — | — | |||||||||||||||||||||
| Property, plant and equipment | 383,339 | — | — | |||||||||||||||||||||
| Intangible assets | 82,029 | — | — | |||||||||||||||||||||
| Spare parts | 62,439 | — | — | |||||||||||||||||||||
| Chunghwa Telecom Global Inc. | a | Accounts receivable | 18,889 | — | — | |||||||||||||||||||
| Accounts payable | 42,927 | — | — | |||||||||||||||||||||
| Revenues | 54,028 | — | — | |||||||||||||||||||||
| Operating costs and expenses | 365,739 | — | — | |||||||||||||||||||||
| Donghwa Telecom Co., Ltd. | a | Accounts receivable | 87,005 | — | — | |||||||||||||||||||
| Accounts payable | 118,390 | — | — | |||||||||||||||||||||
| Revenues | 175,901 | — | — | |||||||||||||||||||||
| Operating costs and expenses | 439,977 | — | — | |||||||||||||||||||||
| Spring House Entertainment Tech. Inc. | a | Amounts collected for others | 11,253 | — | — | |||||||||||||||||||
| Revenues | 17,988 | — | — | |||||||||||||||||||||
(Continued)
- 105 -
Year | No. (Note 1) | Company Name | Related Party | Nature of Relationship (Note 2) | Transaction Details | |||||||||||||||||||
Financial Statement Account | Amount (Note 5) | Payment Terms (Note 3) | % to Total Sales or Assets (Note 4) | |||||||||||||||||||||
| Chunghwa Telecom Japan Co., Ltd. | a | Accounts receivable | $ | 23,406 | — | — | ||||||||||||||||||
| Accounts payable | 12,413 | — | — | |||||||||||||||||||||
| Revenues | 12,512 | — | — | |||||||||||||||||||||
| Operating costs and expenses | 94,097 | — | — | |||||||||||||||||||||
| Light Era Development Co., Ltd. | a | Inventories | 40,497 | — | — | |||||||||||||||||||
| Operating costs and expenses | 19,910 | — | — | |||||||||||||||||||||
| Chunghwa Telecom Singapore Pte., Ltd. | a | Accounts receivable | 101,570 | — | — | |||||||||||||||||||
| Accounts payable | 87,294 | — | — | |||||||||||||||||||||
| Revenues | 162,667 | — | — | |||||||||||||||||||||
| Operating costs and expenses | 261,083 | — | — | |||||||||||||||||||||
| Chunghwa Sochamp Technology Inc. | a | Accounts payable | 27,658 | — | — | |||||||||||||||||||
| Operating costs and expenses | 35,669 | — | — | |||||||||||||||||||||
| Honghwa International Co., Ltd. | a | Accounts payable | 1,015,343 | — | — | |||||||||||||||||||
| Revenues | 87,213 | — | — | |||||||||||||||||||||
| Operating costs and expenses | 5,023,414 | — | 3 | |||||||||||||||||||||
| Property, plant and equipment | 32,600 | — | — | |||||||||||||||||||||
| Smartfun Digital Co., Ltd. | a | Accounts payable | 10,104 | — | — | |||||||||||||||||||
| Operating costs and expenses | 17,089 | — | �� | — | ||||||||||||||||||||
| Aval Technologies Co., Ltd. | a | Operating costs and expenses | 27,969 | — | — | |||||||||||||||||||
| 1 | Light Era Development Co., Ltd. | CHIEF Telecom Inc. | c | Revenues | 95,038 | — | — | |||||||||||||||||
| 2 | Donghwa Telecom Co., Ltd. | Chunghwa Telecom Singapore Pte., Ltd. | c | Prepayments | 10,858 | — | — | |||||||||||||||||
| 3 | Chunghwa Telecom Singapore Pte., Ltd. | Donghwa Telecom Co., Ltd. | c | Prepayments | 19,251 | — | — | |||||||||||||||||
| Note 1: | Significant transactions between the Company and its subsidiaries or among subsidiaries are numbered as follows: |
| a. | “0” for the Company. |
| b. | Subsidiaries are numbered from “1”. |
| Note 2: | Related party transactions are divided into three categories as follows: |
| a. | The Company to subsidiaries. |
| b. | Subsidiaries to the Company. |
| c. | Subsidiaries to subsidiaries. |
| Note 3: | Transaction terms with the related parties were determined in accordance with mutual agreements when there were no similar transactions with third parties. Other transactions with related parties were not significantly different from those with third parties. |
| Note 4: | For assets and liabilities, amount is shown as a percentage to consolidated total assets as of December 31, 2017, while revenues, costs and expenses are shown as a percentage to consolidated revenues for the year ended December 31, 2017. |
| Note 5: | The amount was eliminated upon consolidation. |
(Concluded)
- 106 -