UNITED STATES
SECURITIES AND EXCHANGE COMMISSION
Washington, D.C. 20549
FORM N-CSR
CERTIFIED SHAREHOLDER REPORT OF REGISTERED MANAGEMENT INVESTMENT COMPANIES
Investment Company Act file number 811-10303
Buffalo Funds
(Exact name of registrant as specified in charter)
5420 W. 61st Place,
Shawnee Mission, KS 66025
(Address of principal executive offices) (Zip code)
Kent Gasaway
5420 W. 61st Place,
Shawnee Mission, KS 66025
(Name and address of agent for service)
913-677-7778
Registrant's telephone number, including area code
Date of fiscal year end: March 31
Date of reporting period: March 31, 2022
Item 1. Reports to Stockholders.
| (a) |


ANNUAL REPORT
March 31, 2022

MESSAGE TO OUR SHAREHOLDERS
DEAR SHAREHOLDERS,
Capital markets delivered mixed results over the Buffalo Funds fiscal year ending March 31st, 2022. Small capitalization stocks underperformed their mid and large cap peers. The Russell 2000 Growth Index, a popular small cap growth benchmark, declined -14.33% for the fiscal year, the Russell Midcap Growth Index declined -0.89% while the larger cap S&P 500 Index produced a positive return of 15.65%. The market's rotation into quality and stability accelerated throughout the year. This trend was initially driven by a more hawkish Federal Reserve but picked up steam following Russia's invasion of Ukraine. There is the possibility that the equity market could be poised for a break after one of the best three-year performance runs in history, and inflation and higher interest rates could be critical drivers of market action moving forward. The extraordinary monetary and fiscal stimulus measures taken to boost the economy amidst the COVID pandemic has increased money supply. Coupled with stubbornly persistent and well-documented supply chain challenges, inflation has increased, and production of goods (supply) has been limited relative to demand. These challenges remain, as evidenced by China recently shutting down Shanghai, the 3rd largest city in the world, because of COVID.
Russia's invasion of Ukraine has given rise to heightened economic hurdles and uncertainties. Russia supplies about one-third of Europe's natural gas, and its pre-war oil production represented about 7-8% of the roughly 100 million barrel per day worldwide demand for oil and the world cannot immediately replace that supply. In agriculture, Russia and Ukraine combined produce 12% of the world's wheat, 18% of its barley, and accounts for 52% of its sunflower oil exports. Potential lasting shortages (or withholding for retaliatory purposes) of these critical supplies further threatens to limit production of new supply and/ or inflate prices for energy, food, and other goods and services as costs are passed through globally.
Positive take-aways include the U.S. labor market, which remains strong, as are consumer balance sheets as well as pent-up demand for a range of products and services. Furthermore, inventory-to-sales ratios remain extremely depressed, suggesting eventual economic strength from replenishment as supply chain issues are resolved.
Historically, equities have acted as a good hedge against inflation as companies adjust pricing. Many companies have been generating cash and increasing buybacks,
dividends, or both. Despite higher inflation, corporate profits have remained robust, with margins holding up well. Companies within the S&P 500 Index had operating profit margins of nearly 17% collectively last year, the highest level ever with forecasts pointing to further increases for this year and next.
As the Fed continues to raise interest rates and begins quantitative tightening, inflation levels will hopefully move lower and economic growth could moderate. The Fed is trying to manage a soft landing, bringing inflation under control with as little damage to the economy as possible. The potential for near-term, inflation-induced demand destruction could limit how much the Fed needs to do compared to the economy's self-correcting mechanisms. Supply and demand imbalances will eventually be restored to the commodity markets leading to more normalized prices, though the timing is uncertain.
Growth stocks are discounting higher interest rates and valuation levels in certain parts of the market are becoming more attractive. As the supply chain disruptions ease and labor productivity and participation rates continue to improve, a rotation back into attractively-priced, well-managed growth stocks should occur. We continue to find well-managed companies with durable competitive advantages that we believe will evolve into profitable industry leaders. Thank you for your continued trust and conviction in the Buffalo Funds.
Sincerely,

Kent Gasaway
President
Buffalo Funds
The Funds' investment objectives, risks, charges and expenses must be considered carefully before investing. The summary and statutory prospectus contains this and other important information about the investment company, and it may be obtained by calling 1-800-49-BUFFALO or visiting www.buffalofunds.com. Read it carefully before investing.
Past performance does not guarantee future results. Mutual fund investing involves risk. Principal loss is possible.
Kornitzer Capital Management, Inc. is the Advisor to the Buffalo Funds which are distributed by Quasar Distributors, LLC.
Nothing contained in this communication constitutes tax, legal or investment advice. Investors must consult their tax advisors or legal counsel for advice and information concerning their particular situation.
The opinions expressed are those of the Portfolio Manager(s) and are subject to change, are not guaranteed and should not be considered recommendations to buy or sell any security.
Fund performance may be subject to substantial short-term changes.
This page intentionally left blank.
TABLE OF CONTENTS
Investment Results (unaudited) | 6 | ||||||
Portfolio Management Review (unaudited) | 12 | ||||||
Expense Example (unaudited) | 23 | ||||||
Allocation of Portfolio Holdings (unaudited) | 27 | ||||||
Schedules of Investments or Options Written | 29 | ||||||
Buffalo Discovery Fund (BUFTX) | 29 | ||||||
Buffalo Dividend Focus Fund (BUFDX) | 35 | ||||||
Buffalo Early Stage Growth Fund (BUFOX) | 43 | ||||||
Buffalo Flexible Income Fund (BUFBX) | 48 | ||||||
Buffalo Growth Fund (BUFGX) | 54 | ||||||
Buffalo High Yield Fund (BUFHX) | 58 | ||||||
Buffalo International Fund (BUFIX) | 72 | ||||||
Buffalo Large Cap Fund (BUFEX) | 81 | ||||||
Buffalo Mid Cap Fund (BUFMX) | 86 | ||||||
Buffalo Small Cap Fund (BUFSX) | 91 | ||||||
Statements of Assets and Liabilities | 96 | ||||||
Statements of Operations | 98 | ||||||
Statements of Changes in Net Assets | 100 | ||||||
Financial Highlights | 104 | ||||||
Notes to Financial Statements | 124 | ||||||
Report of Independent Registered Public Accounting Firm | 136 | ||||||
Notice to Shareholders (unaudited) | 137 | ||||||
Privacy Policy (unaudited) | 149 | ||||||
INVESTMENT RESULTS (UNAUDITED)
Total Returns as of March 31, 2022
Average Annual | |||||||||||||||||||||||||||||||
| Gross Expense Ratio**** | Six Months | One Year | Five Years | Ten Years | Investor Class Since Inception | Institutional Class Since Inception | |||||||||||||||||||||||||
| Buffalo Discovery Fund — Investor Class (inception date 4/16/01) | 1.01 | % | -8.98 | % | -4.58 | % | 13.34 | % | 13.05 | % | 9.88 | % | N/A | ||||||||||||||||||
| Buffalo Discovery Fund — Institutional Class (inception date 7/1/19)1 | 0.86 | % | -8.91 | % | -4.46 | % | 13.51 | % | 13.22 | % | N/A | 10.04 | % | ||||||||||||||||||
Russell Mid Cap Growth Index | N/A | -10.09 | % | -0.89 | % | 15.10 | % | 13.52 | % | 9.75 | % | 13.71 | % | ||||||||||||||||||
Morningstar US Mid Growth Index | N/A | -12.01 | % | -1.85 | % | 16.79 | % | 13.82 | % | 9.21 | % | 15.00 | % | ||||||||||||||||||
Lipper Multi-Cap Growth Funds Index | N/A | -8.85 | % | -0.04 | % | 17.14 | % | 14.51 | % | 8.50 | % | 17.56 | % | ||||||||||||||||||
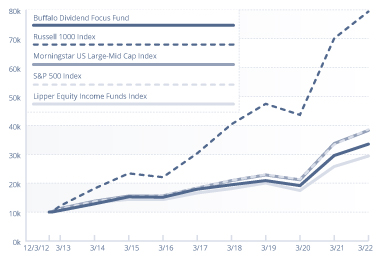
| Buffalo Dividend Focus Fund — Investor Class (inception date 12/03/12) | 0.94 | % | 5.46 | % | 13.39 | % | 13.34 | % | N/A | 13.85 | % | N/A | |||||||||||||||||||
| Buffalo Dividend Focus Fund — Institutional Class (inception date 7/1/19)1 | 0.79 | % | 5.50 | % | 13.51 | % | 13.51 | % | N/A | N/A | 16.93 | % | |||||||||||||||||||
Russell 1000 Index | N/A | 4.15 | % | 13.27 | % | 15.82 | % | N/A | 15.47 | % | 18.43 | % | |||||||||||||||||||
Morningstar US Large-Mid Cap Index | N/A | 4.07 | % | 13.47 | % | 15.90 | % | N/A | 15.48 | % | 18.44 | % | |||||||||||||||||||
S&P 500 Index | N/A | 5.92 | % | 15.65 | % | 15.99 | % | N/A | 15.58 | % | 18.64 | % | |||||||||||||||||||
Lipper Equity Income Funds Index | N/A | 8.35 | % | 14.10 | % | 11.30 | % | N/A | 11.90 | % | 13.15 | % | |||||||||||||||||||
| Buffalo Early Stage Growth Fund — Investor Class (inception date 5/21/04) | 1.51 | % | -15.79 | % | -13.32 | % | 16.06 | % | 13.64 | % | 9.90 | % | N/A | ||||||||||||||||||
| Buffalo Early Stage Growth Fund — Institutional Class (inception date 7/1/19)1 | 1.36 | % | -15.74 | % | -13.20 | % | 16.23 | % | 13.81 | % | N/A | 15.21 | % | ||||||||||||||||||
Russell 2000 Growth Index | N/A | -12.62 | % | -14.33 | % | 10.33 | % | 11.21 | % | 9.43 | % | 9.63 | % | ||||||||||||||||||
Morningstar US Small Growth Index | N/A | -13.93 | % | -13.87 | % | 11.63 | % | 11.49 | % | 9.53 | % | 9.31 | % | ||||||||||||||||||
Lipper Small-Cap Growth Funds Index | N/A | -10.09 | % | -6.60 | % | 14.61 | % | 12.55 | % | 9.77 | % | 12.95 | % | ||||||||||||||||||
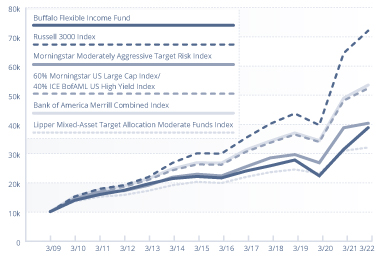
| Buffalo Flexible Income Fund — Investor Class (inception date 8/12/94) | 1.01 | % | 15.54 | % | 23.81 | % | 10.20 | % | 8.47 | % | 7.72 | % | N/A | ||||||||||||||||||
| Buffalo Flexible Income Fund — Institutional Class (inception date 7/1/19)1 | 0.86 | % | 15.63 | % | 24.00 | % | 10.37 | % | 8.64 | % | N/A | 12.91 | % | ||||||||||||||||||
Russell 3000 Index | N/A | 3.51 | % | 11.92 | % | 15.40 | % | 14.28 | % | 10.66 | % | 18.00 | % | ||||||||||||||||||
| Morningstar Moderately Aggressive Target Risk Index* | N/A | -0.84 | % | 4.01 | % | 9.73 | % | 8.96 | % | N/A | 10.46 | % | |||||||||||||||||||
| 60% Morningstar US Large Cap Index/ 40% ICE BofAML US High Yield Master II Index | N/A | 1.27 | % | 8.75 | % | 11.79 | % | 11.23 | % | 9.34 | % | 13.01 | % | ||||||||||||||||||
| Bank of America Merrill Combined Index (60% S&P 500® Index/40% ICE BofAML US High Yield Master II Index) (reflects no deduction for fees, expenses or taxes) | N/A | 1.99 | % | 9.16 | % | 11.45 | % | 11.10 | % | 9.44 | % | 12.65 | % | ||||||||||||||||||
| Lipper Mixed-Asset Target Allocation Moderate Funds Index | N/A | -0.77 | % | 3.67 | % | 7.94 | % | 7.42 | % | 7.12 | % | 8.95 | % | ||||||||||||||||||
| Buffalo Growth Fund — Investor Class (inception date 5/19/95) | 0.92 | % | -2.19 | % | 9.56 | % | 16.38 | % | 13.71 | % | 10.96 | % | N/A | ||||||||||||||||||
| Buffalo Growth Fund — Institutional Class (inception date 7/1/19)1 | 0.77 | % | -2.12 | % | 9.74 | % | 16.56 | % | 13.88 | % | N/A | 16.10 | % | ||||||||||||||||||

6
(Unaudited)
Average Annual | |||||||||||||||||||||||||||||||
| Gross Expense Ratio**** | Six Months | One Year | Five Years | Ten Years | Investor Class Since Inception | Institutional Class Since Inception | |||||||||||||||||||||||||
Russell 3000 Growth Index | N/A | 0.63 | % | 12.86 | % | 20.16 | % | 16.64 | % | 10.65 | % | 22.59 | % | ||||||||||||||||||
Morningstar US Growth Index** | N/A | -5.55 | % | 9.19 | % | 20.84 | % | 16.48 | % | N/A | 21.71 | % | |||||||||||||||||||
Lipper Large Cap Growth Funds Index | N/A | -4.93 | % | 6.79 | % | 19.03 | % | 15.26 | % | 9.57 | % | 19.58 | % | ||||||||||||||||||
| Buffalo High Yield Fund — Investor Class (inception date 5/19/95) | 1.03 | % | -1.27 | % | 1.97 | % | 5.25 | % | 5.28 | % | 6.89 | % | N/A | ||||||||||||||||||
| Buffalo High Yield Fund — Institutional Class (inception date 7/1/19)1 | 0.87 | % | -1.19 | % | 2.12 | % | 5.39 | % | 5.43 | % | N/A | 6.32 | % | ||||||||||||||||||
ICE BofAML US High Yield Master II Index | N/A | -3.89 | % | -0.29 | % | 4.56 | % | 5.70 | % | 6.87 | % | 3.78 | % | ||||||||||||||||||
Lipper High Yield Bond Funds Index | N/A | -3.24 | % | 0.31 | % | 4.36 | % | 5.23 | % | 5.73 | % | 3.72 | % | ||||||||||||||||||
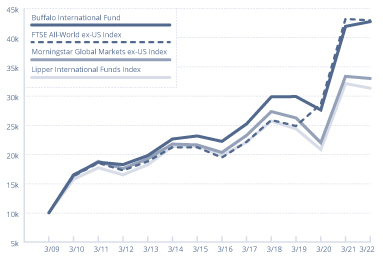
| Buffalo International Fund — Investor Class (inception date 9/28/07) | 1.04 | % | -7.49 | % | 1.94 | % | 11.11 | % | 8.87 | % | 5.88 | % | N/A | ||||||||||||||||||
| Buffalo International Fund — Institutional Class (inception date 7/1/19)1 | 0.89 | % | -7.39 | % | 2.08 | % | 11.28 | % | 9.03 | % | N/A | 11.11 | % | ||||||||||||||||||
FTSE All-World ex-US Index | N/A | -3.35 | % | -0.59 | % | 7.42 | % | 6.26 | % | 3.07 | % | 7.79 | % | ||||||||||||||||||
Morningstar Global Markets ex-US Index | N/A | -3.94 | % | -1.08 | % | 7.02 | % | 6.08 | % | 2.97 | % | 7.40 | % | ||||||||||||||||||
Lipper International Funds Index | N/A | -5.49 | % | -2.47 | % | 7.22 | % | 6.61 | % | 2.98 | % | 7.96 | % | ||||||||||||||||||
| Buffalo Large Cap Fund — Investor Class (inception date 5/19/95) | 0.95 | % | -1.78 | % | 10.23 | % | 16.83 | % | 15.18 | % | 10.65 | % | N/A | ||||||||||||||||||
| Buffalo Large Cap Fund — Institutional Class (inception date 7/1/19)1 | 0.80 | % | -1.70 | % | 10.42 | % | 17.01 | % | 15.36 | % | N/A | 18.24 | % | ||||||||||||||||||
Russell 1000 Growth Index | N/A | 1.54 | % | 14.98 | % | 20.88 | % | 17.04 | % | 10.84 | % | 23.51 | % | ||||||||||||||||||
Morningstar US Large Growth Index*** | N/A | -10.44 | % | 5.79 | % | 19.27 | % | 15.95 | % | N/A | 18.36 | % | |||||||||||||||||||
Lipper Large-Cap Growth Funds Index | N/A | -4.93 | % | 6.79 | % | 19.03 | % | 15.26 | % | 9.57 | % | 19.58 | % | ||||||||||||||||||
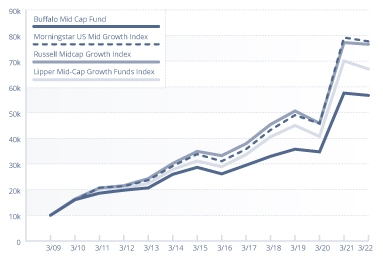
| Buffalo Mid Cap Fund — Investor Class (inception date 12/17/01) | 1.03 | % | -5.35 | % | -1.55 | % | 13.94 | % | 11.11 | % | 9.26 | % | N/A | ||||||||||||||||||
| Buffalo Mid Cap Fund — Institutional Class (inception date 7/1/19)1 | 0.88 | % | -5.27 | % | -1.34 | % | 14.12 | % | 11.28 | % | N/A | 15.32 | % | ||||||||||||||||||
Russell Mid Cap Growth Index | N/A | -10.09 | % | -0.89 | % | 15.10 | % | 13.52 | % | 9.99 | % | 13.71 | % | ||||||||||||||||||
Morningstar US Mid Growth Index | N/A | -12.01 | % | -1.85 | % | 16.79 | % | 13.82 | % | 9.83 | % | 15.00 | % | ||||||||||||||||||
Lipper Mid-Cap Growth Funds Index | N/A | -11.24 | % | -4.51 | % | 14.72 | % | 12.61 | % | 9.20 | % | 12.64 | % | ||||||||||||||||||
| Buffalo Small Cap Fund — Investor Class (inception date 4/14/98) | 1.01 | % | -18.55 | % | -16.93 | % | 17.54 | % | 13.51 | % | 12.52 | % | N/A | ||||||||||||||||||
| Buffalo Small Cap Fund — Institutional Class (inception date 7/1/19)1 | 0.86 | % | -18.48 | % | -16.79 | % | 17.72 | % | 13.68 | % | N/A | 18.54 | % | ||||||||||||||||||
Russell 2000 Growth Index | N/A | -12.62 | % | -14.33 | % | 10.33 | % | 11.21 | % | 6.58 | % | 9.63 | % | ||||||||||||||||||
Morningstar US Small Growth Index | N/A | -13.93 | % | -13.87 | % | 11.63 | % | 11.49 | % | 6.60 | % | 9.31 | % | ||||||||||||||||||
Lipper Small-Cap Growth Funds Index | N/A | -10.09 | % | -6.60 | % | 14.61 | % | 12.55 | % | 7.90 | % | 12.95 | % | ||||||||||||||||||
1 The Institutional Class commenced operations on 7/1/2019. Performance for periods prior to 7/1/2019 is based on the performance of the Investor Class adjusted for the Shareholder Services fee of the Investor Class.
* The inception date of the Morningstar Moderately Aggressive Target Risk Index is February 18, 2009. The annualized return since inception as of March 31, 2022 is 11.45%.
** The inception date of the Morningstar US Growth Index is July 3, 2002. The annualized return since inception as of March 31, 2022 is 11.82%.
*** The inception date of the Morningstar US Large Growth Index is July 3, 2002. The annualized return since inception as of March 31, 2022 is 10.89%.
**** As reported in the Funds' Prospectus dated July 29, 2021. Current period gross expense ratio for each Fund can be found on the Financial Highlights, beginning on page 106.

7
(Unaudited)
Performance data quoted represents past performance; past performance does not guarantee future results. The investment return and principal value of an investment will fluctuate so that an investor's shares, when redeemed, may be worth more or less than their original cost. Current performance of the Funds may be lower or higher than the performance quoted. Performance data current as of the most recent month-end may be obtained by calling 1-800-49-BUFFALO or by visiting the website at www.buffalofunds.com.
The Russell Midcap® Growth Index has replaced the Morningstar US Mid Growth Index as the Buffalo Discovery Fund's primary benchmark. The Russell 1000 Index has replaced the Morningstar US Large-Mid Cap Index as the Buffalo Dividend Focus Fund's primary benchmark. The Russell 2000® Growth Index has replaced the Morningstar US Small Growth Index as the Buffalo Early Stage Growth Fund's primary benchmark. The Russell 3000 Index has replaced the Morningstar Moderately Aggressive Target Risk Index as the Buffalo Flexible Income Fund's primary benchmark. The Russell 3000® Growth Index has replaced the Morningstar US Growth Index as the Buffalo Growth Fund's primary benchmark. The FTSE All-World ex-US Index has replaced the Morningstar Global Markets ex-US Index as the Buffalo International Fund's primary benchmark. The Russell 1000® Growth Index has replaced the Morningstar US Large Growth Index as the Buffalo Large Cap Fund's primary benchmark. The Russell Midcap® Growth Index has replaced the Morningstar US Mid Growth Index as the Buffalo Mid Cap Fund's primary benchmark. The Russell 2000® Growth Index has replaced the Morningstar US Small Growth Index as the Buffalo Small Cap Fund's primary benchmark. The Advisor believes that each of the new indices is more appropriate given each Fund's holdings.
The Funds' returns shown do not reflect the deduction of taxes that a shareholder would pay on distributions or the redemption of shares. The benchmark returns shown, excluding the Lipper Indices, reflect the reinvestment of dividends and capital gains but do not reflect the deduction of any investment management fees, other expenses or taxes. The performance of the Lipper Indices is presented net of fees and expenses; however, applicable sales charges are not taken into consideration. One cannot invest directly in an index.
The Russell 1000 Growth Index measures the performance of those Russell 1000 Index companies with higher price-to-book ratios and higher forecasted growth values. The Russell 2000 Growth Index is a small-cap stock market index of the bottom 2,000 stocks in the Russell 3000 Index. The Russell Mid Cap Growth Index measures the performance of those Russell Midcap companies with higher price-to-book ratios and higher forecasted growth values. The Russell 1000 Index represents the 1,000 companies by market capitalization in the USA. The Russell 3000 Index is a market-capitalization-weighted equity index that tracks the performance of the 3,000 largest US-traded stocks. The Russell 3000 Growth Index is a market-capitalization index that is comprised of companies that display signs of above-average growth. The FTSE All-World ex-US Index is part of the FTSE All-World Index, a global index covering approximately 4,000 mid cap and large cap stocks in 47 countries, excluding the USA. The Morningstar US Mid Growth Index measures the performance of US mid-cap stocks that are expected to grow at a faster pace than the rest of the market as measured by forward earnings, historical earnings, book value, cash flow and sales. The Lipper Multi-Cap Growth Funds Index is an unmanaged index that reflects the net asset value weighted return of 30 of the largest multi-cap growth funds tracked by Lipper. Its returns include net reinvested dividends. The Morningstar US Large-Mid Cap Index measures the performance of the US equity market targeting the top 90% of stocks by market capitalization. Lipper Equity Income Funds Index tracks funds that seek relatively high current income and growth of income by investing at least 65% of their portfolio in dividend-paying equity securities. These funds' gross or net yield must be at least 125% of the average gross or net yield of the U.S. diversified equity fund universe. The Morningstar US Small Growth Index measures the performance of US small-cap stocks that are expected to grow at a faster pace than the rest of the market as measured by forward earnings, historical earnings, book value, cash flows and sales. The Lipper Small-Cap Growth Funds Index is an unmanaged, equally weighted performance index of the 30 largest qualifying mutual funds (based on net assets) in the Lipper Small-Cap classification. The Morningstar US Large Cap Index measures the performance of the US equity market targeting the top 70% of stocks by market capitalization. The ICE BofAML US High Yield Master II Index tracks the performance of below investment grade U.S. dollar-denominated corporate bonds publicly issued in the U.S. domestic market. The Lipper Mixed-Asset Target Allocation Moderate Funds Index is an average of funds that, by portfolio practice, maintain a mix of between 40%-60% equity securities, with the remainder invested in bonds, cash, and cash equivalents. The total return of the Lipper Average does not include the effect of sales charges. The Morningstar US Growth Index measures the performance of US

8
(Unaudited)
stocks that are expected to grow at a faster pace than the rest of the market as measured by forward earnings, historical earnings, book value, cash flow and sales. The Lipper Large Cap Growth Funds Index is an unmanaged, equally weighted performance index of the 30 largest qualifying mutual funds (based on net assets) in the Lipper Large-Cap classification. The Lipper High Yield Bond Funds Index is a widely recognized index of the 30 largest mutual funds that invest primarily in high yield bonds. The Morningstar Global Market ex-US Index is designed to provide exposure to the top 97% market capitalization in each of two market segments, developed markets, excluding the United States, and emerging markets. The Lipper International Funds Index is an unmanaged, equally weighted performance index of the 30 largest qualifying mutual funds (based on net assets) in the Lipper International classification. The Morningstar US Large Growth Index measures the performance of US large-cap stocks that are expected to grow at a faster pace than the rest of the market as measured by forward earnings, historical earnings, book value, cash flow and sales. The Lipper Mid-Cap Growth Funds Index is an unmanaged, equally weighted performance index of the 30 largest qualifying mutual funds (based on net assets) in the Lipper Mid-Cap classification. The S&P 500 Index is a capitalization weighted index of 500 large capitalization stocks which is designed to measure broad domestic securities markets. The Morningstar Moderately Aggressive Target Risk Index is designed to meet the needs of investors who would like to maintain a target level of equity exposure through a portfolio diversified across equities, bonds and inflation-hedged instruments.
Please refer to the prospectus for special risks associated with investing in the Buffalo Funds, including, but not limited to, risks involved with investments in healthcare and information technology companies, foreign securities, debt securities, lower- or unrated securities and medium and small companies. Fund holdings and sector allocations are subject to change at any time and should not be considered a recommendation to buy or sell any security. Please refer to the Schedule of Investments for a complete list of Fund holdings.

9
INVESTMENT RESULTS (UNAUDITED) Continued
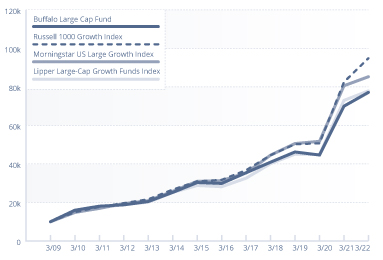
Growth of $10,000 Investment — Investor Class
BUFFALO DISCOVERY FUND

BUFFALO DIVIDEND FOCUS FUND
BUFFALO EARLY STAGE
GROWTH FUND

BUFFALO GROWTH FUND

BUFFALO HIGH YIELD FUND

BUFFALO INTERNATIONAL FUND

10
(Unaudited)
Growth of $10,000 Investment
BUFFALO FLEXIBLE INCOME FUND
BUFFALO MID CAP FUND
BUFFALO LARGE CAP FUND
BUFFALO SMALL CAP FUND


11
PORTFOLIO MANAGEMENT REVIEW (UNAUDITED)
BUFFALO DISCOVERY FUND
The Buffalo Discovery Fund declined -4.58% during the fiscal year versus a decline of -1.85% for the Morningstar US Mid Growth Index. Relative underperformance in Health Care and Telecommunication Services primarily led to the shortfall. Despite the underperformance in those areas, the fund benefited from its relative underweight to high-priced, speculative growth companies. These types of stocks often struggle when interest rates move higher, and during the period the yield of the 10-year U.S. Treasury Bond rose 60 basis points ending at 2.34%. Investors are grappling with a number of issues: inflation at a 40-year high, expectations for slower economic growth, and fallout from the war in Ukraine. It remains to be seen whether the Fed can tone down inflation without sending the economy into a recession. Yet through all this uncertainty, management of the Buffalo Discovery Fund remains focused on its core mission: to invest in disruptive growth companies that use innovation to create competitive advantage, all while maintaining a consistent discipline around valuation and risk. We believe this is a strategy that will continue to deliver attractive risk-adjusted returns over time.
Palo Alto Networks, a leading network security solutions provider, was the top contributor for the portfolio in the review period. Investors cheered better than expected billings guidance for FY'22 driven by improved enterprise spending and strong adoption of next generation security products. Security spending remains a priority following numerous high profile cyber-attacks in recent years while the work from home trend has expanded the threat landscape and coincident revenue opportunity for Palo Alto.
Tenable Holdings was another top contributor to performance. Tenable is a leader in vulnerability management software which keeps track of a company's electronic assets and looks for vulnerabilities on those devices. A heightened cyber threat landscape and explosive growth of corporate devices deployed for remote work drove a robust spending environment for vulnerability software. This led to a series of better than expected quarterly results for Tenable through the fiscal year.
Cleveland Cliffs was another strong contributor for the fiscal period. Cleveland Cliffs is a vertically integrated U.S. steel manufacturer with innovative products and manufacturing processes. Earnings expectations have steadily increased over the past six months as the company implemented new supply contracts at higher prices. In addition, the stock saw a sharp move to the upside following Russia's invasion of Ukraine. Those two countries have historically supplied approximately two-thirds of the world's pig iron, and Cleveland Cliffs captures the benefit of higher commodity prices through its mining operations.
Natera (NTRA) was the largest detractor from portfolio results during the fiscal review period. The company's proprietary molecular and bioinformatics technology is currently used for prenatal testing, cancer screening, and assessing rejection risks in organ transplant recipients. Shares moved lower after a short-selling firm published a negative report on the company. The management team hosted a call with investors to rebut the short report, and the company has not changed its expectation for 25% revenue growth in 2022. We have reviewed the short report and believe the selloff is greatly overdone.
Bandwidth (BAND) was also a significant detractor during the fiscal annual period. Bandwidth operates a cloud-based communications platform that allows enterprises to embed voice, video and messaging features into their existing business software. The company's network was overwhelmed by hackers in a coordinated attack during the fall of 2021. The company also experienced an increase in customer churn due to the attack, and management had been overly optimistic in its initial assessment of when those customers would return.
The market's rotation into quality and stability accelerated throughout the year. This move was initially driven by a more hawkish Fed but picked up steam following Russia's invasion of Ukraine. Looking ahead, economic growth will almost certainly slow in the coming quarters, yet some of the factors driving inflation remain persistent. Those include tight labor markets, COVID-related supply chains disruptions, bans on Russian commodities, and a shortage of affordable housing. The Fed simply does not have the tools to tackle many of

12
(Unaudited)
these issues. While the rate of inflation could peak in the first half of 2022, it will not be anywhere close to the Fed's official 2% target, in our view. We expect the Fed's tightening cycle to last. Against that backdrop, we continue to focus on companies with scale advantages and pricing power, as they are best positioned to maintain profit margins, reinvest in their businesses, grow earnings, and take market share.
Sentiment around equities has clearly become more pessimistic since the Fed made its "hawkish pivot" in mid-December, but these types of markets often create opportunities for long-term investors. The positive news is that consumer and corporate balance sheets are in excellent shape, unemployment is back to pre-pandemic levels, COVID vaccines are widely available, and the labor participation rate is showing sequential improvement. Valuations for growth stocks have become somewhat less frothy, as well. Many of 2021's high-flying, speculative growth stocks have fallen 50% or more over the past six months. To the extent we can find innovative, well-managed companies with durable competitive advantages that we believe will evolve into profitable industry leaders, we will certainly look to take advantage of the recent sell-off. Thank you for your continued trust and support.
BUFFALO DIVIDEND FOCUS FUND
The Buffalo Dividend Focus Fund posted a return of 13.39% during the fiscal year ending March 31, 2022, a result that was in-line with the Morningstar U.S. Large-Mid Cap Index return of 13.47%. The portfolio's Energy, Utilities, and Materials investments contributed to relative performance which was partially offset by weak results in Consumer Discretionary and Financials.
Specific securities that contributed most positively to performance during the fiscal year included Viper Energy Partners LP, Apple, and Microsoft. Viper is involved in the oil and gas industry and benefited from rising commodities prices following increased demand and supply constraints. Microsoft is a prime beneficiary of workplace digital transformation and the move from on premise IT infrastructure to the cloud. As the world economy continued to emerge from the pandemic, Microsoft was well positioned to gain share of rising IT budgets. Their commercial cloud growth reaccelerated, Azure grew 50%, and Windows also performed better than expectations. Margins surprised to the upside, as did guidance.
Apple shares rose in the review period despite a challenging global supply chain environment. The company highlighted its installed base grew to record levels across all product groups. A growing base combined with continued strong consumer affinity for the Apple ecosystem boosted forecasts for the recurring high margin services revenues. Investors cheered the positive mix shift. The general market rotation to quality companies along with an undemanding valuation also helped the stock.
Meanwhile Citigroup and Walt Disney Company were the largest detractors from fund performance results during the fiscal year. Citigroup, a diversified financial services company, declined on interest rates movement which led investors to narrow their outlook for the company's net interest margin. Disney, the entertainment and media company, declined as the number of streaming subscribers came in below Wall Street expectations.
Measures of inflation have reached levels not seen in decades as demand has bounced back while supply chain issues (bottlenecks, chip shortages, lack of workers, etc.) have restrained supplies. Businesses also lost productivity as Covid-19 continued to lead to employee absenteeism. Additionally, inflation and supply chain issues have been impacted by sanctions against Russia following their invasion of Ukraine. As a result, the Fed has adopted a more hawkish approach toward interest rates and a reduction in their balance sheet. As the Fed implements these programs, it will attempt to strike a delicate balance of curbing inflation without causing a recession. Stock market performance is likely to reflect the view of how well the Fed is managing the situation.
Despite the uncertainty, we remain focused on identifying competitively advantaged, wide-moat companies trading at reasonable valuations. We will be ready to take advantage of opportunities created by stock market volatility using market declines as attractive entry points for long-term investors.
BUFFALO EARLY STAGE GROWTH FUND
The Buffalo Early Stage Growth Fund returned -13.32% for the 12 months ending March 31, 2022. This result was modestly ahead of the Morningstar US Small Growth Index return of -13.87% and the Russell 2000 Growth Index return of -14.33%. Most of the relative performance came from the Fund's holdings in the Industrials, Information Technology, and Healthcare sectors while

13
(Unaudited)
Consumer Staples and Telecommunications were a drag on relative performance.
Small capitalization stocks underperformed their mid and large cap peers for the 12 months ended March 31, 2022. The Russell 2000 Growth Index, a popular small cap growth benchmark, declined 14.33% compared to the Russell Midcap Growth Index return of -0.89% and the larger cap S&P 500 Index return of positive 15.65%.
The underperformance of small cap stocks this annual reporting period follows the strong relative performance in the prior 12-month period ending March 31, 2021. The declines in the small cap growth index came after highs were reached in early November 2021. The realization by the Federal Reserve and market participants that "transitory" inflation was in fact persistent and growing inflation led to expectations that the Fed would begin implementing interest rates hikes along with a reduction of its balance sheet holdings to combat heightened inflation. Additionally, the Omicron variant of Covid-19 contributed to an uneven recovery of supply chains along with the war in Ukraine, which further disrupted the smooth flow of goods and economic normalization.
The Fund ended the March 31, 2022 period with 63 holdings.
The market is now pricing in fairly aggressive interest rate hikes by the Federal Reserve along with planned action in May 2022 to begin reducing the Fed's balance sheet. Equity valuations, particular small cap growth valuations, have been negatively impacted as a result. The next debate seems to be if the Fed will be able to quell heightened inflation while not pushing too hard on the brakes triggering a recession. We remain positive on the strength of personal balance sheets along with corporate balance sheets and margin profiles given years of low borrowing costs and solid economic footing. Therefore, any slowdown should be offset by the position of strength in these areas.
Regardless of the macroeconomic headwinds we face, our job remains to find attractive small cap companies that have not been fully appreciated by the market or are mispriced due to recent results or events. We believe less investor interest in our segment of the market creates opportunity to uncover value. The Fund typically invests at the smaller end of the small cap growth spectrum and the managers continue to seek companies with sustainable growth due to secular growth trends or innovative or disruptive products.
The Buffalo Early Stage Growth Fund is focused primarily on identifying innovation within U.S. companies with primarily North American revenue bases. With an active share of greater than 90%, a lower turnover strategy with 50-70 holdings, the Fund will continue to offer a distinct offering.
BUFFALO FLEXIBLE INCOME FUND
The Buffalo Flexible Income Fund returned 23.81% for the twelve months ended 3/31/22, compared to a return of 4.01% for the Morningstar Moderately Aggressive Target Risk Index. The portfolio's investments in the Energy sector drove relative performance, as well as an underweight allocation to the Consumer Discretionary area, a weak performing sector for the market overall.
The top three contributors to the Fund's performance during the fiscal year were Microsoft, ConocoPhilips, and APA Corporation. Microsoft is a prime beneficiary of workplace digital transformation and the move from on premise IT infrastructure to the cloud. As the world economy continued to emerge from the pandemic, Microsoft was well positioned to gain share of rising IT budgets. Their commercial cloud growth reaccelerated, Azure grew 50%, and Windows also performed better than expectations. Margins surprised to the upside, as did guidance. ConocoPhilips and APA are involved in the oil and gas industry and benefited from rising energy prices over the past year following increased demand and supply constraints.
The top detractors from the Fund's performance during the period were Clorox, Intel, and AT&T. Clorox experienced significant margin pressure due to higher manufacturing and logistics costs and higher commodity prices (input costs) for its goods. Intel's negative performance reflected investor concern over the sustainability of profit margins due to its product mix, competition, and minimal free cash flow generation due to capital spending plans. Meanwhile, AT&T's decline reflected concerns around the company's sustainability of growth due its mature end markets, competitive threats, balance sheet leverage, and potential tax changes.
Measures of inflation have reached levels not seen in decades as demand has bounced back while supply chain issues (bottlenecks, chip shortages, lack of workers, etc.) have restrained supplies. Businesses also lost productivity as Covid-19 continued to lead to employee absenteeism. Additionally, inflation and supply chain issues have been impacted by sanctions against Russia

14
(Unaudited)
following their invasion of Ukraine. As a result, the Fed has adopted a more hawkish approach toward interest rates and a reduction in their balance sheet. As the Fed implements these programs, it will attempt to strike a delicate balance of curbing inflation without causing a recession. Stock market performance is likely to reflect the view of how well the Fed is managing the situation.
Despite the uncertainty, we remain focused on identifying competitively advantaged, wide-moat companies trading at reasonable valuations. We will be ready to take advantage of opportunities created by stock market volatility using market declines as attractive entry points for long-term investors.
BUFFALO GROWTH FUND
The Buffalo Growth Fund's return of 9.56% during the annual reporting period outperformed the Morningstar U.S. Growth Index's return of 9.19%. The Fund's outperformance was driven by stock selection in the Information Technology, Health Care and Industrial sectors. Meanwhile, the Consumer sector was the only meaningful detractor relative to the index. Overall, our focus on quality companies and reasonably priced growth had a broadly positive impact on Fund performance during a turbulent market environment, particularly in the back half of the fiscal 12-month period.
Microsoft was the top contributor to results over the fiscal year. The company is a prime beneficiary of workplace digital transformation and the move from on premise IT infrastructure to the cloud. As the world economy continued to emerge from the pandemic, Microsoft was well positioned to gain share of rising IT budgets. Their commercial cloud growth reaccelerated, Azure grew 50%, and Windows also performed better than expectations. Margins surprised to the upside, as did guidance.
Apple shares rose in the review period despite a challenging global supply chain environment. The company highlighted its installed base grew to record levels across all product groups. A growing base combined with continued strong consumer affinity for the Apple ecosystem boosted forecasts for the recurring high margin services revenues. Investors cheered the positive mix shift. The general market rotation to quality companies along with an undemanding valuation also helped the stock.
Palo Alto Networks, a leading network security solutions provider, was among the top contributors for the portfolio in the review period. Investors cheered better than expected billings guidance for FY'22 driven by improved enterprise spending and strong adoption of next generation security products. Security spending remains a priority following numerous high profile cyber-attacks in recent years while the work from home trend has expanded the threat landscape and coincident revenue opportunity for Palo Alto.
Meta Platforms, Inc. detracted from Fund results after it disclosed that it would accelerate spending in the near term to drive monetization of short-form video content and advance its leadership status in the Metaverse, a network of virtual worlds focused on social connection and digital commerce. The accelerated investment cycle led to much lower than anticipated margin guidance with little corresponding revenue lift in 2022 given the longer-term nature of these investments. Meanwhile, Meta's advertising revenues have been pressured in the near term by Apple's recent iOS privacy changes that make it harder for advertisers to trace user behavior on iPhones. While investment cycles cause disruption and require patience, Facebook remains a highly profitable digital advertising juggernaut with a favorable history of execution during transition years. We expect the near-term investment cycle to ultimately lead to better engagement and large monetization opportunities in exciting new markets.
PayPal was also among the top detractors from performance over the fiscal year. The company reported disappointing financials, volumes on eBay were weaker than expected, and management guided lower expectations for the future citing supply chain disruptions and a slower travel recovery. We consider these headwinds to be temporary in nature and expect PayPal to be one of the prime beneficiaries of ecommerce growth going forward.
The market environment is more complex than it has been in quite some time. Geopolitical conflict, a more hawkish Federal Reserve, persistent inflation and lingering supply constraints remain challenges while tailwinds such as ultra-low interest rates, the Fed put and fiscal stimulus fade.
In its latest public messaging, the Fed strongly signaled its move from Dovish to Hawkish regarding inflation given the persistence of supply chain constraints and rising prices. As the drumbeat for interest rate normalization

15
(Unaudited)
and quantitative tightening grows more forceful, we think the market will continue to transition incrementally away from speculative stocks and rotate increasingly to growth and quality factors. It remains to be seen whether the Fed can throttle-down inflation without sending the economy into recession. In any case, we do expect the Fed to get a firmer handle on inflation through 2022 which could cause investors to become more discerning about recent gains in commodities and cyclically oriented equities.
We believe the portfolio is well positioned for an environment of moderating economic growth and higher long-term interest rates. The evolving market environment should favor companies with scale advantages and pricing power, as they are best positioned to maintain profit margins, reinvest in their businesses, grow earnings, and take market share. We will continue to invest in businesses with solid growth opportunities, durable competitive advantages, scalable business models, and good management teams, when they are trading at attractive valuations, in our opinion.
Thank you for your continued support.
BUFFALO HIGH YIELD FUND
The Buffalo High Yield Fund increased 1.97% for the fiscal year ending March 31, 2022, outperforming the ICE BofAML US High Yield Master II Index and the Lipper High Yield Bond Funds Index which generated returns of -0.29% and +0.31% respectively, for the twelve-month period.
For the first three quarters of our fiscal year, the U.S. high yield sector continued its positive return streak before suffering a significant correction in the first quarter of 2022, which is the final quarter of our fiscal year. Throughout 2021, as the world began to recover from the COVID pandemic, strong corporate earnings and a dovish Federal Reserve drove positive returns. That all changed in December beginning with the Omicron variant, followed by economic data signaling that the U.S. economy might indeed be overheating, only to be capped off by the Russian invasion of Ukraine. In fact, high yield bond yields posted record lows in June of 2021 hitting a yield-to-worst of 4.30% as investors seemed willing to believe the Fed's claim that current inflation would prove transitory. However, by March 2022 the yield-to-worst moved 200 basis points (bps) higher ending at 6.31%. The 10-year Treasury Bond returned -3.42% during the fiscal
year while the S&P 500 stock index posted a +15.63% return.
High yield mutual funds experienced relatively muted fund outflows of -$2.6 billion during the first three quarters of our fiscal year but suffered significant outflows of -$25.3 billion in the March 2022 quarter. Likewise, high yield new issuance in the first three quarters was a robust $324.3 billion only to shrink to $46.5 billion in the March 2022 quarter. This compares to $158.8 billion in new issuance in the March 2021 quarter.
During the first three quarters of the period, the 10-year Treasury Bond's yield declined 23bps from 1.74% to 1.51% before drastically reversing course and moving 83 bps higher in the March quarter to end at 2.34%. The 60 bps move in the 10-year yield was dwarfed by the 218 bps move higher in 2-year Treasury yield over the fiscal year. The majority of this flattening of the 2/10 year spread to literally zero occurred primarily in the March '22 quarter and negatively impacted higher-quality, longer duration fixed income securities that were more interest rate sensitive.
According to data from JP Morgan, the U.S. high yield market's spread to worst for the period-end was 399 bps, 7 bps tighter than the preceding March '21 quarter and 181 basis points tighter than its 20-year historical average of 580 basis points. As mentioned above, the yield-to-worst for the high yield market at fiscal year-end was 6.31%, below the 20-year average of 7.98%, but well above the yield of 4.72% at the end of the March '21 quarter.
The Fund's composition by asset class at quarter end was as follows:
3/31/2021 | 6/30/2021 | 9/30/2021 | 12/31/2021 | 3/31/2022 | |||||||||||||||||||
| Straight Corporates | 62.7 | % | 61.5 | % | 65.3 | % | 67.8 | % | 68.3 | % | |||||||||||||
Convertibles | 16.3 | % | 17.0 | % | 16.1 | % | 7.1 | % | 6.3 | % | |||||||||||||
Bank Loans | 11.2 | % | 13.7 | % | 13.5 | % | 16.7 | % | 18.5 | % | |||||||||||||
| Preferred Stocks | 2.2 | % | 2.3 | % | 2.2 | % | 2.6 | % | 2.7 | % | |||||||||||||
| Convertible Preferreds | 0.0 | % | 0.0 | % | 0.0 | % | 0.0 | % | 0.0 | % | |||||||||||||
| Common Stocks | 0.0 | % | 0.0 | % | 0.0 | % | 1.3 | % | 0.0 | % | |||||||||||||
Cash | 7.6 | % | 5.5 | % | 2.9 | % | 4.5 | % | 4.1 | % | |||||||||||||
Total | 100.0 | % | 100.0 | % | 100.0 | % | 100.0 | % | 100.0 | % | |||||||||||||

16
(Unaudited)
The approximate rate and contribution of return from the various asset classes in the Fund during the quarter is as follows:
| Approximate Contribution to Return | |||||||
Straight Corporates | 2.34 | % | |||||
Convertibles | -0.84 | % | |||||
Bank Loans | 0.43 | % | |||||
Preferred Stocks | 0.22 | % | |||||
Convertible Preferreds | 0.00 | % | |||||
Common Stocks | 0.76 | % | |||||
Total | 1.97 | % | |||||
The three top contributors for the Fund during the twelve-month period were Nuance 1.5% convertible bonds, Northern Oil & Gas 8.125% corporate bonds and Consol Energy 11% corporate bonds. In early April '21, Microsoft announced the acquisition of Nuance for a 23% premium, driving the strong performance in Nuance convertible bonds. The Northern Oil & Gas bonds, along with the entire energy sector, improved on the back of the rally in WTI crude oil during the year of 70%. In the same vein, Consol Energy is a coal mining company whose bonds performed well as coal prices soared on global supply/demand imbalances.
The Carrols Restaurant 5.875% corporate bonds, the Invacare 4.25% convertible bonds, and the Revance Therapeutics 1.75% convertible bonds were the worst performers during the year. Carrols is the largest operator of Burger King and Popeye's franchises in the U.S. and its bonds were negatively impacted by input cost and labor inflation concerns, as well as its longer duration profile. Invacare convertible bonds were negatively impacted by a disappointing earnings announcement in Q3 driven by global supply chain disruptions. Revance common stock dropped precipitously after management announced in mid-October that the U.S. Food & Drug Administration (FDA) surprisingly declined to approve its application for a highly anticipated frown-line treatment. The Revance convertible bonds declined in correlation to the underlying common stock. The Fund exited the Revance position shortly after the FDA news broke.
We are focused first and foremost on the Federal Reserve's balancing act between taming inflation while avoiding a recession. We are also monitoring the continued supply chain disruptions and the geopolitical uncertainty caused by the tragic conflict in Ukraine. We are managing the Fund cautiously yet actively, focusing
on high-quality issuers with defensive business models and manageable credit metrics. We will continue to deploy cash in opportunities that we believe offer the most appealing risk/reward tradeoff with a bias toward shorter durations and less levered credits. Additionally, we believe bank loans offer a more defensive position as they provide senior positioning in the capital structure and less interest rate sensitivity due to their floating rate structures. Finally, we continue to look for opportunities in convertible bonds and preferred stocks. We ended the fiscal year with 138 positions, down slightly from the previous year's level of 142 (excluding cash).
BUFFALO INTERNATIONAL FUND
Global markets were volatile during the Buffalo Funds fiscal year. While foreign markets grappled with some pandemic induced ups and downs in the first half of 2021, inflation and rising interest rates became concerns as 2021 came to a close and flowed into 2022. In February of 2022 the invasion of Ukraine by Russia rocked global markets and the war continued to weigh on sentiment through the end of March. With Russia and Ukraine being substantial commodity exporters, inflation and supply chain concerns that were present before the war, intensified.
Among developed markets, European stock markets as a whole rose around 6% on average in local currencies, but because of the strengthening U.S. dollar, particularly during the first three months of 2022, the performance in dollar terms was basically flat during the annual reporting period. Likewise, the Japanese market, whose performance in local currency was flat, declined in US dollar terms due to the strengthening dollar and weakening yen. Meanwhile, Hong Kong's market performance was sharply negative, as the city continued to grapple with covid restrictions and faced a full-blown wave of the omicron strain of the coronavirus. Emerging markets were mixed over the past year. Among the markets we follow, the Indian stock market was a strong performer, and Brazil market rose modestly.
The MSCI ACWI ex-USA Index in USD terms was down -5.44% for the annual reporting period and the developed country MSCI EAFE Index was down -5.91% in USD terms.
The Buffalo International Fund produced a return of 1.94% for the year ended March 31, 2022, outperforming the MSCI All-Country World Ex USA Growth Index, which posted a return of -6.16%, and the broad Morningstar

17
(Unaudited)
Global Markets ex-US Index, which posted a return of -1.08%. Compared to the Morningstar Index, the Buffalo International Fund's outperformance was almost entirely due to stock selection.
Top contributors in the period included Aon Plc, IMCD N.V., and Novo Nordisk A/S. First, Aon is a global provider of insurance and reinsurance brokerage and human resource solutions. With some of its discretionary services coming back post the pandemic, Aon experienced strong growth in 2021. Second, IMCD, a Dutch-based distributor of specialty chemicals, continued to benefit from an outsourcing trend. Companies rely on IMCD to be able to procure supply of niche specialty chemicals. Finally, Novo Nordisk, a pharmaceutical company focused on diabetes, posted continually better results of its new therapy for obesity.
Top detractors in the period were Taiwan Semiconductor Manufacturing, Infineon Technologies AG, and Siemens AG. Taiwan Semiconductor is the world's largest dedicated contract semiconductor manufacturer and although business performance and outlook continued to be strong, the stock was affected by geopolitical concerns, as investors worried about the possibility of China invading Taiwan, as well as the overall future health of the semiconductor market in the face of potentially slowing global growth. Next, Infineon Technologies, a designer of semiconductors for the automotive, power, and industrial markets, saw its stock drop due to concerns about rising inventories and weakening demand in its end markets. Finally, Siemens AG, an engineering and manufacturing company focused on automation, digitalization, and electrification, had weak stock performance in the wake of the Russian invasion of Ukraine, growing difficulty in controlling the pandemic in China, and concerns about the future health of global manufacturing.
In the wake of Russia's invasion of Ukraine, and continued covid-related restrictions in China, the outlook for global growth in 2022 has understandably weakened. Following war-related disruptions to supply chains of energy, food, and materials, inflationary pressures have intensified around the globe. Annual inflation in the Eurozone has now risen to 7.5%, 4% of which is coming from Energy. Many regions of the world will feel the effects of increased prices of raw materials and food. Furthermore, ongoing efforts to control the pandemic in China could result in continued pressure on supply chains. With these inflationary forces, and the ensuing
interest rate increases by central banks seeking to curb them, there is the risk that demand destruction will eventually ensue. A global recession is becoming a more likely event moving forward.
Despite the dark clouds there are positives to consider. Outside of China, the reduction of pandemic-related disruptions and the increasing movement of people is a force for growth and normalization. Consumers in the developed markets of Europe and Asia have pent up savings and the means to spend. In the Eurozone, while energy costs are expected to remain high through the "energy transition", European officials will seek to help lower-income consumers. The green energy revolution that was already underway in Europe will most likely be accelerated, bringing some added costs, but it may also bring new business and investment opportunities.
In times of slowing growth, as in boom times, we execute on our time-tested investment strategy. While it is difficult to predict the future macroeconomic or geopolitical environment, we try to understand current conditions and plan for the associated risks within our existing framework. Our investment process is centered on bottoms-up investing and we seek out high-quality companies with sound, sustainable business models, competitive advantages, that can benefit from secular growth drivers throughout the business cycle. We prefer businesses that have strong balance sheets and generate strong free cash flow. In an inflationary environment we also favor companies that have the means of passing along cost pressures, such as companies with high recurring revenues or those whose products make up a small cost of a larger project. We pay close attention valuation and seek out opportunities during periods of market weakness or volatility to buy high quality growth companies at attractive valuations. We believe that by continuing our disciplined strategy we should be able to post superior risk-adjusted returns over the long term.
BUFFALO LARGE CAP FUND
The Buffalo Large Cap Fund gained 10.23% in the annual review period, outperforming the Morningstar U.S. Large Growth Index's gain of 5.79%. Stock selection drove the outperformance during the period, particularly within the Information Technology sector. Stock selection with Information Technology was led by the Fund's investments in Apple and Alphabet. Meanwhile overall outperformance was partially offset by weak results in Consumer Discretionary, which was driven by a portfolio

18
(Unaudited)
underweight to Tesla. Tesla is a large benchmark position and the stock advanced 61% during the fiscal year reporting period.
Microsoft was the top contributor to results over the fiscal year. The company is a prime beneficiary of workplace digital transformation and the move from on premise IT infrastructure to the cloud. As the world economy continued to emerge from the pandemic, Microsoft was well positioned to gain share of rising IT budgets. Their commercial cloud growth reaccelerated, Azure grew 50%, and Windows also performed better than expectations. Margins surprised to the upside, as did guidance.
Apple shares rose in the review period despite a challenging global supply chain environment. The company highlighted its installed base grew to record levels across all product groups. A growing base combined with continued strong consumer affinity for the Apple ecosystem boosted forecasts for the recurring high margin services revenues. Investors cheered the positive mix shift. The general market rotation to quality companies along with an undemanding valuation also helped the stock.
Meanwhile Meta Platforms, Inc. detracted from the Fund's performance results after the company reported weaker than expected advertising revenues related to new consumer privacy restrictions with Apple's recent iOS privacy changes that make it harder for advertisers to trace user behavior on iPhones. Management also disclosed that it would accelerate spending in the near term to drive monetization of short-form video content and advance its leadership status in the Metaverse, a network of virtual worlds focused on social connection and digital commerce. The accelerated investment cycle led to much lower than anticipated margin guidance with little corresponding revenue lift in 2022 given the longer-term nature of these investments.
Overall, the Buffalo Large Cap Fund continues to have a defensive bias, as it increasingly appears the Fed may indeed be behind the curve on taming inflation, at least over the short term with the most recent March CPI data indicating inflation continues to increase, now at 8.5% on annual basis. The market is pricing in nine interest rate hikes over the course of 2022 but the delayed timing of these rate hikes may make it difficult to achieve a soft landing of continued strong employment coupled with dramatically more stable pricing. While we are bottom's up investors, we remain macro aware.
As equity valuations continue to offer more attractive entry points, with some high growth stocks down 50% or more from highs in 2021, we will selectively take advantage of strong franchises, with recurring revenue, high cash flow returns on invested capital and pristine balance sheets. The software industry is one example of this and is an area we are looking with more interest.
BUFFALO MID CAP FUND
The Buffalo Mid Cap Fund returned -1.55% for the 12-month period ending March 31, 2022, compared to a return of -1.85% for the Fund's primary benchmark, the Morningstar US Mid Growth Index. It also compares with a return of -0.89% for the Russell Midcap Growth Index. The relative outperformance compared to the primary benchmark was driven primarily by the Fund's outperformance in energy which was partially offset by underperformance in technology.
The top contributor in the fiscal year was Palo Alto Networks, Inc. The company completed an investment cycle resulting in an expanded product offering to support their Zero Trust platform sales strategy. This accelerated growth without requiring significant additional operating expenses, resulting in both increased expectations for revenue and expanding margins.
Gartner, Inc. ranked as the second leading contributor during the fiscal year as it grew its research and consulting businesses nicely as contract value growth accelerated sharply in both businesses. Additionally, its events business returned to growth as in-person events began to return. Expense growth was relatively controlled resulting in significantly increased expectations for earnings and cash flow.
Finally, energy companies EOG Resources, Inc. and Schlumberger NV were among the leading contributors as crude oil prices surged nearly 75 percent in the fiscal year. This was primarily related to increased demand as the world continued to recover from COVID. Other factors impacting energy prices included global inflation, the war in Ukraine and the related Russian sanctions, and reduced supply in certain oil producing countries.
Lyft, Inc., which was the previous fiscal year's top contributor, was the Fund's largest drag this fiscal year. The company generally performed well, modestly beating sales estimates and exceeding profit expectations throughout the year. However, the stock lagged

19
(Unaudited)
throughout the year as investors moved away from stocks that were perceived to be COVID recovery beneficiaries. Ultimately, Omicron caused a COVID resurgence which weighed further on investor sentiment and negatively impacted the company's outlook.
Similarly, TripAdvisor, Inc., which was the previous year's second largest contributor, was the Fund's second largest drag this fiscal year. The company also generally performed well, though it did effectively abandon its plan for TripAdvisor Plus after it fell short of expectations. The stock also lagged throughout the year as it was perceived to be a COVID recovery beneficiary. Omicron also weighed on investor sentiment and the company outlook.
Finally, IAC/InteractiveCorp. was also a significant detractor during the fiscal year. Angi fell short of investor expectations as its rebranding all of its brands under a unified name was slower to resonate with consumers than anticipated. The company also closed a $2.7 billion dollar acquisition of Meredith Corp, which is a portfolio of magazines with digital content. Those events combined with the spinoff of Vimeo led to IAC reporting much slower grower than it has historically.
The Federal Reserve made a hawkish pivot in mid-December with Chairman Jerome Powell highlighting the underlying strength of the U.S. economy and noting that inflation was running hotter than previously anticipated. The market is now expecting a series of interest rate hikes in the year ahead, and ultimately a reduction in the size of the Fed's balance sheet. These moves have the potential to increase both short and long-term interest rates, and this has negatively impacted equity valuations as of late, particularly in the more speculative areas of the market.
The rotation to quality and stability is well underway. Formerly hot IPO's have deflated, demand for blank-check companies has dried up, and 40% of NASDAQ listings have now declined more than 50% from their 52-week highs. Frothy valuations can still be found in places like software, biotech and e-commerce, but investors are moving quickly to discount a more hawkish Fed. We do not know how much longer high growth stocks will continue to underperform, and we are not calling a bottom. However, we are excited to see good businesses trading at more reasonable valuations and will continue looking for opportunities to purchase shares in these businesses when the risk/reward is attractive.
While we are mindful of macroeconomic fluctuations, they do not drive our investment process. We will continue to invest in businesses with solid growth opportunities, durable competitive advantages, scalable business models, and good management teams, when they are trading at attractive valuations, in our opinion.
Thank you for your continued support.
BUFFALO SMALL CAP FUND
For the fiscal year ended March 31, 2022, the Buffalo Small Cap Fund declined -16.93%, underperforming the Morningstar US Small Growth Index's return of -13.87%. Relative weakness in health care, telecommunication services, consumer discretionary, and financials was responsible for most of the underperformance, but was somewhat offset by strong relative performance in the information technology and industrial sectors. Unlike most periods where the Fund's stock selection drives all of the performance, a negative allocation effect represented greater than 30% of the relative underperformance. The Fund's underweight in energy and real estate and overweight in consumer discretionary generated most of the negative allocation effect.
Energy, while not a large part of the small cap marketplace, was the best performing sector in the index producing a return of approximately +19% versus a decline of nearly -14% for the entire benchmark. The high cyclicality, poor cash flow characteristics, combined with a lack of favorable long-term trend drivers (all features we typically avoid through our investment approach) makes most Energy companies unattractive in our view and therefore our underweight position was a drag on relative performance.
The two largest contributors to performance for the fiscal year were Tenable Holdings (TENB) and TaskUs (TASK). Tenable, a leader in risk-based vulnerability management (VM) software which keeps track of a company's electronic assets and looks for vulnerabilities on those devices, is benefitting from a heightened cyber threat environment and explosive growth of corporate devices deployed for remote work resulting in strong demand and accelerating revenue growth.
TaskUs was also a nice contributor to performance for the fiscal year. The company is a leading provider of digital outsourced services focused on serving high growth technology companies and provides three main service offerings, including Digital Customer Experience,

20
(Unaudited)
Content Security, and AI Operations. The company has executed well and is benefitting from operating in a fast growth market environment with an attractive client base and 99%+ of its revenue coming from recurring revenue contracts. The company is also experiencing a mix shift toward digital higher-margin services.
The two largest detractors from performance for the fiscal year were Bandwidth (BAND) and Hydrofarm (HYFM). Bandwidth operates a cloud-based communications platform that allows enterprises to embed voice, video and messaging features into their existing business software. The company's network was overwhelmed by hackers in a coordinated attack during the fall of 2021. The company also experienced an increase in customer churn due to the attack, and management had been overly optimistic in its initial assessment of when those customers would return.
Hydrofarm was another detractor from performance during the fiscal year. A distributor of controlled environment agricultural products such as nutrients, consumables and lighting largely used by the fast-growing cannabis industry, Hydrofarm's stock was weak due to a slowdown in the California market following an inventory correction from an earlier harvest. We believe this will prove to be a short-term event and the long-term opportunity for Hydrofarm, namely more markets approving cannabis usage along with the potential for highly accretive acquisitions by the company, remains intact.
Inflation is running at levels not seen in decades and is the Federal Reserve's primary concern. Factors fueling inflation include a tight labor market, supply chain disruptions, Russian sanctions due to the war combined with a strong demand backdrop. As the Fed continues to raise interest rates and begins quantitative tightening, inflation levels will hopefully move lower and economic growth could moderate. Furthermore, any easing in supply chain disruptions should contribute to lower inflation levels as well.
Small cap growth stocks are discounting higher interest rates and valuation levels in certain parts of the market are becoming more attractive. As the supply chain disruptions ease and labor productivity and participation rates continue to improve, a rotation back into attractively-priced, well-managed small cap growth stocks should occur.
The hawkish fed policy and geo-political uncertainty has increased investor angst, which is creating attractive
opportunities for long-term investors. While the Buffalo Small Cap Fund historically underperforms during market rotations away from growth towards value and during macro risk-off markets, as stock pickers, we find resolve in environments like these where growth has been mispriced, by our analysis. As always, we will continue to look for companies that are well-managed with scalable attractive business models that should benefit from long-term trends. We are well positioned to take advantage of the movement back into small cap growth stocks and are looking forward to moving past some of these issues caused by the pandemic. We continue to appreciate your interest in the Fund.

21
(Unaudited)
Bond ratings are grades given to bonds that indicate their credit quality as determined by a private independent rating service such as Standard & Poor's. The firm evaluates a bond issuer's financial strength, or its ability to pay a bond's principal and interest in a timely fashion. Ratings are expressed as letters ranging from 'AAA', which is the highest grade, to 'D', which is the lowest grade. In limited situations when the rating agency has not issued a formal rating, the Advisor will classify the security as nonrated.
Earnings growth is not representative of a Fund's future performance.
A basis point is one hundredth of a percentage point (0.01%) Yield is the income return on an investment.
Yield to worst is the lowest potential yield that can be received on a bond without the issuer actually defaulting. A Spread is the difference between the bid and the ask price of a security.
Spread to worst is the difference between the yield to worst of a bond and the yield to worst of a U.S. Treasury security with similar duration.
The London Interbank offered Rate (LIBOR) is a benchmark interest rate at which major global banks lead to one another in the international interbank market for short-term loans.
Duration is a commonly used measure of the potential volatility of the price of a debt security, or the aggregate market value of a portfolio of debt securities, prior to maturity. Securities with a longer duration generally have more volatile prices than securities of comparable quality with a shorter duration.
Active share is a measure of the percentage of stock holdings in a manager's portfolio that differs from the benchmark index.
Cash flow is the net amount of cash and cash-equivalents being transferred into and out of a business.
Free Cash Flow is revenue less operating expenses including interest expense and maintenance capital spending. It is the discretionary cash that a company has after all expenses and is available for purposes such as dividend payments, investing back into the business, or share repurchases.
MSCI ACWI ex-USA index is a stock market index comprising of non-U.S. stocks from 22 developed markets and 26 emerging markets including sectors in health care, industry, finance, consumer staples, and information technology.
MSCI EAFE Index captures the performance of large and mid capitalization companies in the Europe, Australasia, and the Far East regions.
MSCI All-Country World Ex USA Growth Index captures large and mid capitalization companies exhibiting overall growth style characteristics across 22 developed markets countries and 24 emerging markets countries.
NASDAQ or National Association of Securities Dealers Automated Quotations is a global electronic marketplace for buying and selling securities.

22
EXPENSE EXAMPLE (UNAUDITED)
As a shareholder of the Funds, you incur two types of costs: (1) transaction costs and (2) ongoing costs, including management fees, shareholder servicing fees (Investor Class only) and other Fund specific expenses. The examples below are intended to help you understand your ongoing costs (in dollars) of investing in the Funds and to compare these costs with the ongoing costs of investing in other mutual funds. The example is based on an investment of $1,000 invested at the beginning of the period and held for the entire period (October 1, 2021 – March 31, 2022).
ACTUAL EXPENSES
The first line of the tables below provides information about actual account values and actual expenses. You may use the information in this line, together with the amount you invested, to estimate the expenses that you paid over the period. Simply divide your account by $1,000 (for example, an $8,600 account value divided by $1,000 = 8.6), then multiply the result by the number in the first line under the heading entitled "Expenses Paid During the Period" to estimate the expenses you paid on your account during the period. Although the Funds charge no sales load or transaction fees, you will be assessed fees for outgoing wire transfers, returned checks and stop payment orders at prevailing rates charged by U.S. Bancorp Fund Services, LLC, the Funds' transfer agent. If you request that a redemption be made by wire transfer, currently a $15.00 fee is charged by the Funds' transfer agent. To the extent a Fund invests in shares of other investment companies as part of its investment strategy, you will indirectly bear your proportionate share of any fees and expenses charged by
the underlying funds in which the Fund invests in addition to the expenses of the Fund. Actual expenses of the underlying funds are expected to vary among the various underlying funds. These expenses are not included in the examples below. The examples below include management fees, registration fees and other expenses. However, the examples below do not include portfolio trading commissions and related expenses and other extraordinary expenses as determined under U.S. generally accepted accounting principles.
HYPOTHETICAL EXAMPLE FOR COMPARISON PURPOSES
The second line of each table below provides information about hypothetical account values and hypothetical expenses based on the Funds' actual expense ratios and an assumed rate of return of 5% per year before expenses, which are not the Funds' actual returns. The hypothetical account values and expenses may not be used to estimate the actual ending account balance or expenses you paid for the period. You may use this information to compare the ongoing costs of investing in our Funds and other funds. To do so, compare this 5% hypothetical example with the 5% hypothetical examples that appear in the shareholder reports of the other funds. Please note that the expenses shown in the tables are meant to highlight your ongoing costs only and do not reflect any transactional costs. Therefore, the second line of the tables is useful in comparing ongoing costs only, and will not help you determine the relative total costs of owning different funds. In addition, if these transactional costs were included, your costs would have been higher.
BUFFALO DISCOVERY FUND | Beginning Account Value October 1, 2021 | Ending Account Value March 31, 2022 | Expenses Paid During Period October 1, 2021 - March 31, 2022* | ||||||||||||
Investor Class | |||||||||||||||
Actual | $ | 1,000.00 | $ | 910.20 | $ | 4.81 | |||||||||
Hypothetical (5% return before expenses) | $ | 1,000.00 | $ | 1,019.90 | $ | 5.09 | |||||||||
Institutional Class | |||||||||||||||
Actual | $ | 1,000.00 | $ | 910.90 | $ | 4.10 | |||||||||
Hypothetical (5% return before expenses) | $ | 1,000.00 | $ | 1,020.64 | $ | 4.33 | |||||||||
* Expenses for the Investor Class are equal to the Fund's annualized expense ratio of 1.01%, multiplied by the average account value over the period, multiplied by 182/365 to reflect the one-half year period. Expenses for the Institutional Class are equal to the Fund's annualized expense ratio of 0.86%, multiplied by the average account value over the period, multiplied by 182/365 to project a one-half year period.

23
(Unaudited)
BUFFALO DIVIDEND FOCUS FUND | Beginning Account Value October 1, 2021 | Ending Account Value March 31, 2022 | Expenses Paid During Period October 1, 2021 - March 31, 2022* | ||||||||||||
Investor Class | |||||||||||||||
Actual | $ | 1,000.00 | $ | 1,054.60 | $ | 4.76 | |||||||||
Hypothetical (5% return before expenses) | $ | 1,000.00 | $ | 1,020.29 | $ | 4.68 | |||||||||
Institutional Class | |||||||||||||||
Actual | $ | 1,000.00 | $ | 1,055.00 | $ | 4.00 | |||||||||
Hypothetical (5% return before expenses) | $ | 1,000.00 | $ | 1,021.04 | $ | 3.93 | |||||||||
* Expenses for the Investor Class are equal to the Fund's annualized expense ratio of 0.93%, multiplied by the average account value over the period, multiplied by 182/365 to reflect the one-half year period. Expenses for the Institutional Class are equal to the Fund's annualized expense ratio of 0.78%, multiplied by the average account value over the period, multiplied by 182/365 to project a one-half year period.
BUFFALO EARLY STAGE GROWTH FUND | Beginning Account Value October 1, 2021 | Ending Account Value March 31, 2022 | Expenses Paid During Period October 1, 2021 - March 31, 2022* | ||||||||||||
Investor Class | |||||||||||||||
Actual | $ | 1,000.00 | $ | 842.10 | $ | 6.29 | |||||||||
Hypothetical (5% return before expenses) | $ | 1,000.00 | $ | 1,018.10 | $ | 6.89 | |||||||||
Institutional Class | |||||||||||||||
Actual | $ | 1,000.00 | $ | 842.60 | $ | 5.60 | |||||||||
Hypothetical (5% return before expenses) | $ | 1,000.00 | $ | 1,018.85 | $ | 6.14 | |||||||||
* Expenses for the Investor Class are equal to the Fund's annualized expense ratio of 1.37%, multiplied by the average account value over the period, multiplied by 182/365 to reflect the one-half year period. Expenses for the Institutional Class are equal to the Fund's annualized expense ratio of 1.22%, multiplied by the average account value over the period, multiplied by 182/365 to project a one-half year period.
BUFFALO FLEXIBLE INCOME FUND | Beginning Account Value October 1, 2021 | Ending Account Value March 31, 2022 | Expenses Paid During Period October 1, 2021 - March 31, 2022* | ||||||||||||
Investor Class | |||||||||||||||
Actual | $ | 1,000.00 | $ | 1,155.40 | $ | 5.43 | |||||||||
Hypothetical (5% return before expenses) | $ | 1,000.00 | $ | 1,019.90 | $ | 5.09 | |||||||||
Institutional Class | |||||||||||||||
Actual | $ | 1,000.00 | $ | 1,156.30 | $ | 4.62 | |||||||||
Hypothetical (5% return before expenses) | $ | 1,000.00 | $ | 1,020.64 | $ | 4.33 | |||||||||
* Expenses for the Investor Class are equal to the Fund's annualized expense ratio of 1.01%, multiplied by the average account value over the period, multiplied by 182/365 to reflect the one-half year period. Expenses for the Institutional Class are equal to the Fund's annualized expense ratio of 0.86%, multiplied by the average account value over the period, multiplied by 182/365 to project a one-half year period.
BUFFALO GROWTH FUND | Beginning Account Value October 1, 2021 | Ending Account Value March 31, 2022 | Expenses Paid During Period October 1, 2021 - March 31, 2022* | ||||||||||||
Investor Class | |||||||||||||||
Actual | $ | 1,000.00 | $ | 978.10 | $ | 4.54 | |||||||||
Hypothetical (5% return before expenses) | $ | 1,000.00 | $ | 1,020.34 | $ | 4.64 | |||||||||
Institutional Class | |||||||||||||||
Actual | $ | 1,000.00 | $ | 978.80 | $ | 3.80 | |||||||||
Hypothetical (5% return before expenses) | $ | 1,000.00 | $ | 1,017.25 | $ | 3.88 | |||||||||
* Expenses for the Investor Class are equal to the Fund's annualized expense ratio of 0.92%, multiplied by the average account value over the period, multiplied by 182/365 to reflect the one-half year period. Expenses for the Institutional Class are equal to the Fund's annualized expense ratio of 0.77%, multiplied by the average account value over the period, multiplied by 182/365 to project a one-half year period.

24
(Unaudited)
BUFFALO HIGH YIELD FUND | Beginning Account Value October 1, 2021 | Ending Account Value March 31, 2022 | Expenses Paid During Period October 1, 2021 - March 31, 2022* | ||||||||||||
Investor Class | |||||||||||||||
Actual | $ | 1,000.00 | $ | 987.30 | $ | 5.05 | |||||||||
Hypothetical (5% return before expenses) | $ | 1,000.00 | $ | 1,019.85 | $ | 5.14 | |||||||||
Institutional Class | |||||||||||||||
Actual | $ | 1,000.00 | $ | 988.10 | $ | 4.31 | |||||||||
Hypothetical (5% return before expenses) | $ | 1,000.00 | $ | 1,020.59 | $ | 4.38 | |||||||||
* Expenses for the Investor Class are equal to the Fund's annualized expense ratio of 1.02%, multiplied by the average account value over the period, multiplied by 182/365 to reflect the one-half year period. Expenses for the Institutional Class are equal to the Fund's annualized expense ratio of 0.87%, multiplied by the average account value over the period, multiplied by 182/365 to project a one-half year period.
BUFFALO INTERNATIONAL FUND | Beginning Account Value October 1, 2021 | Ending Account Value March 31, 2022 | Expenses Paid During Period October 1, 2021 - March 31, 2022* | ||||||||||||
Investor Class | |||||||||||||||
Actual | $ | 1,000.00 | $ | 925.10 | $ | 4.70 | |||||||||
Hypothetical (5% return before expenses) | $ | 1,000.00 | $ | 1,020.04 | $ | 4.94 | |||||||||
Institutional Class | |||||||||||||||
Actual | $ | 1,000.00 | $ | 926.10 | $ | 3.99 | |||||||||
Hypothetical (5% return before expenses) | $ | 1,000.00 | $ | 1,020.79 | $ | 4.18 | |||||||||
* Expenses for the Investor Class are equal to the Fund's annualized expense ratio of 0.98%, multiplied by the average account value over the period, multiplied by 182/365 to reflect the one-half year period. Expenses for the Institutional Class are equal to the Fund's annualized expense ratio of 0.83%, multiplied by the average account value over the period, multiplied by 182/365 to project a one-half year period.
BUFFALO LARGE CAP FUND | Beginning Account Value October 1, 2021 | Ending Account Value March 31, 2022 | Expenses Paid During Period October 1, 2021 - March 31, 2022* | ||||||||||||
Investor Class | |||||||||||||||
Actual | $ | 1,000.00 | $ | 982.20 | $ | 4.60 | |||||||||
Hypothetical (5% return before expenses) | $ | 1,000.00 | $ | 1,020.29 | $ | 4.68 | |||||||||
Institutional Class | |||||||||||||||
Actual | $ | 1,000.00 | $ | 983.00 | $ | 3.86 | |||||||||
Hypothetical (5% return before expenses) | $ | 1,000.00 | $ | 1,021.04 | $ | 3.93 | |||||||||
* Expenses for the Investor Class are equal to the Fund's annualized expense ratio of 0.93%, multiplied by the average account value over the period, multiplied by 182/365 to reflect the one-half year period. Expenses for the Institutional Class are equal to the Fund's annualized expense ratio of 0.78%, multiplied by the average account value over the period, multiplied by 182/365 to project a one-half year period.
BUFFALO MID CAP FUND | Beginning Account Value October 1, 2021 | Ending Account Value March 31, 2022 | Expenses Paid During Period October 1, 2021 - March 31, 2022* | ||||||||||||
Investor Class | |||||||||||||||
Actual | $ | 1,000.00 | $ | 946.50 | $ | 4.95 | |||||||||
Hypothetical (5% return before expenses) | $ | 1,000.00 | $ | 1,019.85 | $ | 5.14 | |||||||||
Institutional Class | |||||||||||||||
Actual | $ | 1,000.00 | $ | 947.30 | $ | 4.22 | |||||||||
Hypothetical (5% return before expenses) | $ | 1,000.00 | $ | 1,020.59 | $ | 4.38 | |||||||||
* Expenses for the Investor Class are equal to the Fund's annualized expense ratio of 1.02%, multiplied by the average account value over the period, multiplied by 182/365 to reflect the one-half year period. Expenses for the Institutional Class are equal to the Fund's annualized expense ratio of 0.87%, multiplied by the average account value over the period, multiplied by 182/365 to project a one-half year period.

25
(Unaudited)
BUFFALO SMALL CAP FUND | Beginning Account Value October 1, 2021 | Ending Account Value March 31, 2022 | Expenses Paid During Period October 1, 2021 - March 31, 2022* | ||||||||||||
Investor Class | |||||||||||||||
Actual | $ | 1,000.00 | $ | 814.50 | $ | 4.57 | |||||||||
Hypothetical (5% return before expenses) | $ | 1,000.00 | $ | 1,019.90 | $ | 5.09 | |||||||||
Institutional Class | |||||||||||||||
Actual | $ | 1,000.00 | $ | 815.20 | $ | 3.89 | |||||||||
Hypothetical (5% return before expenses) | $ | 1,000.00 | $ | 1,020.64 | $ | 4.33 | |||||||||
* Expenses for the Investor Class are equal to the Fund's annualized expense ratio of 1.01%, multiplied by the average account value over the period, multiplied by 182/365 to reflect the one-half year period. Expenses for the Institutional Class are equal to the Fund's annualized expense ratio of 0.86%, multiplied by the average account value over the period, multiplied by 182/365 to project a one-half year period.

26
ALLOCATION OF PORTFOLIO HOLDINGS
(UNAUDITED)
Percentages represent market value as a percentage of investments as of March 31, 2022.
BUFFALO DISCOVERY
FUND
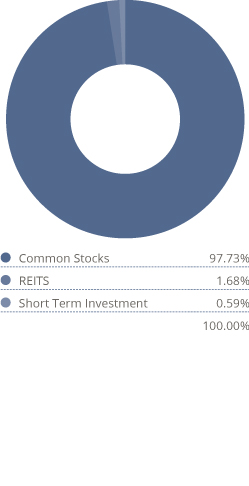
BUFFALO DIVIDEND
FOCUS FUND

BUFFALO EARLY STAGE GROWTH FUND

BUFFALO FLEXIBLE
INCOME FUND

BUFFALO GROWTH
FUND
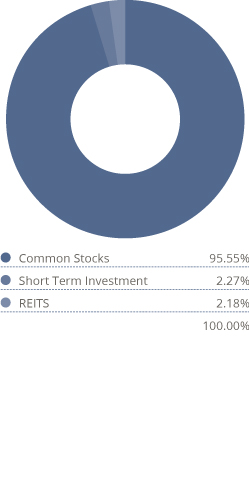
BUFFALO HIGH YIELD
FUND


27
(Unaudited)
Percentages represent market value as a percentage of investments as of March 31, 2022.
BUFFALO
INTERNATIONAL FUND

BUFFALO LARGE CAP
FUND

BUFFALO MID CAP
FUND
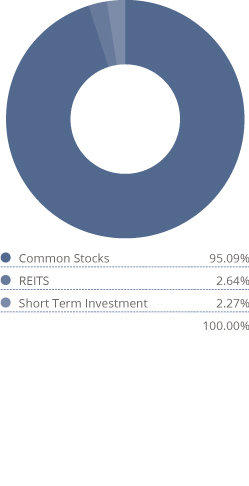
BUFFALO SMALL CAP
FUND
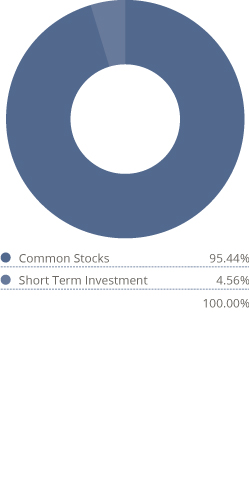

28
BUFFALO DISCOVERY FUND
SCHEDULE OF INVESTMENTS
MARCH 31, 2022
Shares or Face Amount | $ Fair Value* | ||||||||||
Common Stocks | 97.74 | % | |||||||||
Communication Services | 3.09 | % | |||||||||
Entertainment | 1.42 | % | |||||||||
134,915 | Take-Two Interactive Software, Inc.(a) | 20,741,832 | |||||||||
Interactive Media & Services | 1.67 | % | |||||||||
482,245 | Eventbrite, Inc.(a) | 7,122,759 | |||||||||
50,839 | Match Group, Inc.(a) | 5,528,233 | |||||||||
480,125 | Pinterest, Inc.(a) | 11,815,876 | |||||||||
24,466,868 | |||||||||||
| Total Communication Services (Cost $45,013,664) | 45,208,700 | ||||||||||
Consumer Discretionary | 11.75 | % | |||||||||
Auto Components | 0.89 | % | |||||||||
108,353 | Aptiv PLC — ADR(a) (b) | 12,970,938 | |||||||||
Hotels, Restaurants & Leisure | 5.27 | % | |||||||||
7,682 | Chipotle Mexican Grill, Inc.(a) | 12,153,154 | |||||||||
88,069 | Darden Restaurants, Inc. | 11,708,774 | |||||||||
623,684 | Everi Holdings Inc.(a) | 13,097,364 | |||||||||
624,840 | MGM Resorts International | 26,205,790 | |||||||||
329,120 | Penn National Gaming, Inc.(a) | 13,961,270 | |||||||||
77,126,352 | |||||||||||
Internet & Direct Marketing Retail | 1.70 | % | |||||||||
127,210 | Expedia Group, Inc.(a) | 24,891,181 | |||||||||
Leisure Products | 1.15 | % | |||||||||
714,308 | Callaway Golf Co.(a) | 16,729,093 | |||||||||
Specialty Retail | 2.01 | % | |||||||||
75,255 | Five Below, Inc.(a) | 11,918,134 | |||||||||
75,005 | Tractor Supply Co. | 17,503,917 | |||||||||
29,422,051 | |||||||||||
Textiles, Apparel & Luxury Goods | 0.73 | % | |||||||||
38,975 | Deckers Outdoor Corp.(a) | 10,670,186 | |||||||||
| Total Consumer Discretionary (Cost $140,705,548) | 171,809,801 | ||||||||||

The accompanying notes are an integral part of these financial statements
29
BUFFALO DISCOVERY FUND
SCHEDULE OF INVESTMENTS
MARCH 31, 2022 Continued
Shares or Face Amount | $ Fair Value* | ||||||||||
Financials | 8.00 | % | |||||||||
Banks | 0.92 | % | |||||||||
295,962 | Citizens Financial Group, Inc. | 13,415,958 | |||||||||
Capital Markets | 5.84 | % | |||||||||
137,551 | Intercontinental Exchange, Inc. | 18,173,238 | |||||||||
66,495 | MSCI, Inc. | 33,439,006 | |||||||||
75,052 | S&P Global, Inc. | 30,784,731 | |||||||||
100,000 | TPG, Inc.(a) | 3,014,000 | |||||||||
85,410,975 | |||||||||||
Diversified Financial Services | 1.24 | % | |||||||||
133,229 | Global Payments Inc. | 18,231,056 | |||||||||
| Total Financials (Cost $57,850,955) | 117,057,989 | ||||||||||
Health Care | 19.89 | % | |||||||||
Biotechnology | 4.17 | % | |||||||||
239,815 | Horizon Therapeutics Plc — ADR(a) (b) | 25,230,936 | |||||||||
168,835 | Ligand Pharmaceuticals, Inc.(a) | 18,992,249 | |||||||||
413,235 | Natera, Inc.(a) | 16,810,400 | |||||||||
61,033,585 | |||||||||||
Health Care Equipment & Supplies | 5.86 | % | |||||||||
188,200 | Alcon, Inc. — ADR(b) | 14,929,906 | |||||||||
528,100 | Boston Scientific Corp.(a) | 23,389,549 | |||||||||
157,987 | Edwards Lifesciences Corp.(a) | 18,598,230 | |||||||||
476,880 | Figs, Inc.(a) | 10,262,457 | |||||||||
21,408 | IDEXX Laboratories, Inc.(a) | 11,711,460 | |||||||||
53,461 | Zimmer Biomet Holdings, Inc. | 6,837,662 | |||||||||
85,729,264 | |||||||||||
Health Care Providers & Services | 1.77 | % | |||||||||
382,480 | HealthEquity, Inc.(a) | 25,794,451 | |||||||||
Health Care Technology | 0.49 | % | |||||||||
33,897 | Veeva Systems, Inc.(a) | 7,201,757 | |||||||||

The accompanying notes are an integral part of these financial statements
30
BUFFALO DISCOVERY FUND
SCHEDULE OF INVESTMENTS
MARCH 31, 2022 Continued
Shares or Face Amount | $ Fair Value* | ||||||||||
Life Sciences Tools & Services | 6.04 | % | |||||||||
92,777 | Agilent Technologies, Inc. | 12,277,181 | |||||||||
695,068 | Avantor, Inc.(a) | 23,507,200 | |||||||||
21,380 | Bio-Rad Laboratories, Inc.(a) | 12,041,857 | |||||||||
66,415 | Charles River Laboratories International, Inc.(a) | 18,859,868 | |||||||||
69,929 | ICON PLC. — ADR(a) (b) | 17,008,131 | |||||||||
227,594 | Stevanato Group SpA — ADR(a) (b) | 4,579,191 | |||||||||
88,273,428 | |||||||||||
Pharmaceuticals | 1.56 | % | |||||||||
205,860 | Catalent, Inc.(a) | 22,829,874 | |||||||||
| Total Health Care (Cost $241,056,382) | 290,862,359 | ||||||||||
Industrials | 18.95 | % | |||||||||
Building Products | 1.63 | % | |||||||||
369,273 | Builders FirstSource, Inc.(a) | 23,832,879 | |||||||||
Commercial Services & Supplies | 1.60 | % | |||||||||
186,906 | Copart, Inc.(a) | 23,451,096 | |||||||||
Construction & Engineering | 1.79 | % | |||||||||
300,765 | MasTec, Inc.(a) | 26,196,631 | |||||||||
Electrical Equipment | 4.12 | % | |||||||||
201,948 | AMETEK, Inc. | 26,895,435 | |||||||||
85,952 | Generac Holdings, Inc.(a) | 25,550,092 | |||||||||
462,585 | Shoals Technologies Group, Inc.(a) | 7,882,448 | |||||||||
60,327,975 | |||||||||||
Machinery | 1.00 | % | |||||||||
289,295 | Ingersoll Rand, Inc. | 14,566,003 | |||||||||
Professional Services | 5.32 | % | |||||||||
319,660 | CoStar Group, Inc.(a) | 21,292,553 | |||||||||
216,419 | TransUnion | 22,364,739 | |||||||||
511,765 | Upwork, Inc.(a) | 11,893,419 | |||||||||
103,359 | Verisk Analytics, Inc. | 22,183,942 | |||||||||
77,734,653 | |||||||||||
Road & Rail | 0.67 | % | |||||||||
275,000 | Uber Technologies, Inc.(a) | 9,812,000 | |||||||||

The accompanying notes are an integral part of these financial statements
31
BUFFALO DISCOVERY FUND
SCHEDULE OF INVESTMENTS
MARCH 31, 2022 Continued
Shares or Face Amount | $ Fair Value* | ||||||||||
Trading Companies & Distributors | 2.82 | % | |||||||||
337,406 | Fastenal Co. | 20,041,917 | |||||||||
162,666 | WESCO International, Inc.(a) | 21,169,353 | |||||||||
41,211,270 | |||||||||||
| Total Industrials (Cost $170,505,551) | 277,132,507 | ||||||||||
Information Technology | 32.32 | % | |||||||||
Communications Equipment | 5.30 | % | |||||||||
99,702 | Arista Networks Inc.(a) | 13,856,584 | |||||||||
392,365 | Calix, Inc.(a) | 16,836,382 | |||||||||
256,473 | Ciena Corp.(a) | 15,549,958 | |||||||||
92,885 | F5 Networks, Inc.(a) | 19,408,321 | |||||||||
121,921 | Lumentum Holdings, Inc.(a) | 11,899,489 | |||||||||
77,550,734 | |||||||||||
Electronic Equipment, Instruments & Components | 3.61 | % | |||||||||
228,101 | Amphenol Corp. — Class A | 17,187,410 | |||||||||
118,585 | Keysight Technologies, Inc.(a) | 18,732,873 | |||||||||
414,816 | National Instruments Corp. | 16,837,381 | |||||||||
52,757,664 | |||||||||||
IT Services | 5.18 | % | |||||||||
35,019 | EPAM Systems, Inc.(a) | 10,386,986 | |||||||||
62,193 | FleetCor Technologies, Inc.(a) | 15,489,789 | |||||||||
296,630 | GoDaddy, Inc. — Class A(a) | 24,827,931 | |||||||||
653,890 | TaskUS, Inc.(a) | 25,148,609 | |||||||||
75,853,315 | |||||||||||
Semiconductors & Semiconductor Equipment | 4.51 | % | |||||||||
84,337 | Azenta, Inc. | 6,989,851 | |||||||||
27,881 | KLA-Tencor Corporation | 10,206,119 | |||||||||
215,605 | Micron Technology, Inc. | 16,793,473 | |||||||||
28,861 | SolarEdge Technologies, Inc.(a) | 9,303,921 | |||||||||
135,509 | Universal Display Corp. | 22,623,227 | |||||||||
65,916,591 | |||||||||||

The accompanying notes are an integral part of these financial statements
32
BUFFALO DISCOVERY FUND
SCHEDULE OF INVESTMENTS
MARCH 31, 2022 Continued
Shares or Face Amount | $ Fair Value* | ||||||||||
Software | 13.72 | % | |||||||||
100,539 | Aspen Technology, Inc.(a) | 16,626,134 | |||||||||
62,119 | Autodesk, Inc.(a) | 13,315,208 | |||||||||
351,971 | Digital Turbine, Inc.(a) | 15,419,849 | |||||||||
603,586 | DoubleVerify Holdings, Inc.(a) | 15,192,260 | |||||||||
127,320 | Guidewire Software, Inc.(a) | 12,047,018 | |||||||||
34,988 | Palo Alto Networks, Inc.(a) | 21,780,380 | |||||||||
152,396 | Splunk, Inc.(a) | 22,647,569 | |||||||||
58,058 | Synopsys, Inc.(a) | 19,348,990 | |||||||||
534,330 | Tenable Holdings, Inc.(a) | 30,878,931 | |||||||||
19,921 | Tyler Technologies, Inc.(a) | 8,862,654 | |||||||||
516,835 | Varonis Systems, Inc.(a) | 24,570,336 | |||||||||
200,689,329 | |||||||||||
| Total Information Technology (Cost $370,469,018) | 472,767,633 | ||||||||||
Materials | 3.74 | % | |||||||||
Chemicals | 0.57 | % | |||||||||
25,985 | Linde PLC — ADR(b) | 8,300,388 | |||||||||
Construction Materials | 1.81 | % | |||||||||
68,863 | Martin Marietta Materials, Inc. | 26,504,680 | |||||||||
Metals & Mining | 1.36 | % | |||||||||
620,551 | Cleveland-Cliffs, Inc.(a) | 19,987,948 | |||||||||
| Total Materials (Cost $39,621,624) | 54,793,016 | ||||||||||
| Total Common Stocks (Cost $1,065,222,742) | 1,429,632,005 | ||||||||||
REITS | 1.68 | % | |||||||||
Real Estate | 1.68 | % | |||||||||
Equity Real Estate Investment Trusts (REITs) | 1.68 | % | |||||||||
16,389 | Equinix Inc. | 12,154,410 | |||||||||
35,894 | SBA Communications Corp. | 12,351,126 | |||||||||
| Total Real Estate (Cost $21,040,705) | 24,505,536 | ||||||||||
| Total REITS (Cost $21,040,705) | 24,505,536 | ||||||||||

The accompanying notes are an integral part of these financial statements
33
BUFFALO DISCOVERY FUND
SCHEDULE OF INVESTMENTS
MARCH 31, 2022 Continued
Shares or Face Amount | $ Fair Value* | ||||||||||
Short Term Investments | 0.59 | % | |||||||||
Investment Company | 0.59 | % | |||||||||
8,637,103 | Fidelity Investments Money Market Funds — Government Portfolio — Class I — 0.12%(c) | 8,637,103 | |||||||||
Total Investment Company | 8,637,103 | ||||||||||
| Total Short Term Investments (Cost $8,637,103) | 8,637,103 | ||||||||||
| Total Investments (Cost $1,094,900,550) | 100.01 1,462,774,644 | % | |||||||||
| Liabilities in Excess of Other Assets | (0.01 (148,416) | )% | |||||||||
| Total Net Assets | 100.00 1,462,626,228 | % | |||||||||
ADR American Depositary Receipt
PLC Public Limited Company
(a) Non Income Producing.
(b) Foreign Issued Security. The total value of these securities amounted to $83,019,490 (5.68% of net assets) at March 31, 2022.
(c) The rate quoted is the annualized seven-day effective yield as of March 31, 2022.
* See Note 1A of the accompanying Notes to Financial Statements regarding valuation of securities.
The Global Industry Classification Standard (GICS) was developed by and/or is the exclusive property of MSCI, Inc. and Standard & Poor's Financial Services LLC ("S&P"). GICS is a service mark of MSCI and S&P and has been licensed for use by U.S. Bancorp Fund Services, LLC.

The accompanying notes are an integral part of these financial statements
34
BUFFALO DIVIDEND FOCUS FUND
SCHEDULE OF INVESTMENTS
MARCH 31, 2022
Shares or Face Amount | $ Fair Value* | ||||||||||
Common Stocks | 83.35 | % | |||||||||
Communication Services | 6.64 | % | |||||||||
Diversified Telecommunication Services | 0.46 | % | |||||||||
10,625 | Verizon Communications, Inc. | 541,238 | |||||||||
Entertainment | 1.63 | % | |||||||||
10,750 | Activision Blizzard, Inc. | 861,182 | |||||||||
7,605 | The Walt Disney Co.(a) | 1,043,102 | |||||||||
1,904,284 | |||||||||||
Interactive Media & Services | 3.65 | % | |||||||||
630 | Alphabet, Inc. — Class A(a) | 1,752,251 | |||||||||
650 | Alphabet, Inc. — Class C(a) | 1,815,443 | |||||||||
3,100 | Facebook, Inc. — Class A(a) | 689,316 | |||||||||
4,257,010 | |||||||||||
Media | 0.90 | % | |||||||||
22,500 | Comcast Corp. — Class A | 1,053,450 | |||||||||
| Total Communication Services (Cost $3,286,636) | 7,755,982 | ||||||||||
Consumer Discretionary | 3.52 | % | |||||||||
Hotels, Restaurants & Leisure | 0.91 | % | |||||||||
5,000 | Las Vegas Sands Corp(a) | 194,350 | |||||||||
9,500 | Starbucks Corp. | 864,215 | |||||||||
1,058,565 | |||||||||||
Internet & Direct Marketing Retail | 1.53 | % | |||||||||
550 | Amazon.com, Inc.(a) | 1,792,973 | |||||||||
Specialty Retail | 1.08 | % | |||||||||
4,225 | The Home Depot, Inc. | 1,264,669 | |||||||||
| Total Consumer Discretionary (Cost $1,757,399) | 4,116,207 | ||||||||||
Consumer Staples | 3.78 | % | |||||||||
Beverages | 1.22 | % | |||||||||
5,550 | PepsiCo, Inc. | 928,959 | |||||||||
35,000 | Primo Water Corporation — ADR(b) | 498,750 | |||||||||
1,427,709 | |||||||||||
Food & Staples Retailing | 0.44 | % | |||||||||
3,450 | Walmart, Inc. | 513,774 | |||||||||

The accompanying notes are an integral part of these financial statements
35
BUFFALO DIVIDEND FOCUS FUND
SCHEDULE OF INVESTMENTS
MARCH 31, 2022 Continued
Shares or Face Amount | $ Fair Value* | ||||||||||
Food Products | 1.37 | % | |||||||||
9,000 | Lamb Weston Holdings, Inc. | 539,190 | |||||||||
11,900 | Tyson Foods, Inc. | 1,066,597 | |||||||||
1,605,787 | |||||||||||
Household Products | 0.75 | % | |||||||||
5,725 | The Procter & Gamble Co. | 874,780 | |||||||||
| Total Consumer Staples (Cost $3,022,908) | 4,422,050 | ||||||||||
Energy | 11.12 | % | |||||||||
Oil, Gas & Consumable Fuels | 11.12 | % | |||||||||
116,900 | Energy Transfer Equity, L.P. | 1,308,111 | |||||||||
46,650 | Enterprise Products Partners L.P. | 1,204,037 | |||||||||
17,200 | Enviva, Inc. | 1,361,380 | |||||||||
9,875 | Hess Corp. | 1,057,020 | |||||||||
12,126 | Marathon Petroleum Corp. | 1,036,773 | |||||||||
63,400 | Northern Oil and Gas, Inc. | 1,787,246 | |||||||||
7,900 | Valero Energy Corp. | 802,166 | |||||||||
150,000 | Viper Energy Partners LP | 4,435,500 | |||||||||
| Total Energy (Cost $6,390,828) | 12,992,233 | ||||||||||
Financials | 14.63 | % | |||||||||
Banks | 7.80 | % | |||||||||
56,000 | Bank of America Corp. | 2,308,320 | |||||||||
27,000 | Citigroup, Inc. | 1,441,800 | |||||||||
44,000 | Citizens Financial Group, Inc. | 1,994,520 | |||||||||
12,000 | JPMorgan Chase & Co. | 1,635,840 | |||||||||
30,500 | Truist Financial Corp. | 1,729,350 | |||||||||
9,109,830 | |||||||||||
Capital Markets | 4.04 | % | |||||||||
1,100 | BlackRock, Inc. | 840,587 | |||||||||
4,025 | CME Group, Inc. | 957,386 | |||||||||
7,137 | S&P Global, Inc. | 2,927,291 | |||||||||
4,725,264 | |||||||||||
Diversified Financial Services | 1.06 | % | |||||||||
27,000 | Compass Diversified Holdings | 641,790 | |||||||||
4,400 | Global Payments Inc. | 602,096 | |||||||||
1,243,886 | |||||||||||

The accompanying notes are an integral part of these financial statements
36
BUFFALO DIVIDEND FOCUS FUND
SCHEDULE OF INVESTMENTS
MARCH 31, 2022 Continued
Shares or Face Amount | $ Fair Value* | ||||||||||
Insurance | 1.73 | % | |||||||||
11,575 | Arthur J. Gallagher & Co. | 2,020,995 | |||||||||
| Total Financials (Cost $8,737,749) | 17,099,975 | ||||||||||
Health Care | 16.01 | % | |||||||||
Biotechnology | 2.22 | % | |||||||||
24,700 | Horizon Therapeutics Plc — ADR(a) (b) | 2,598,687 | |||||||||
Health Care Equipment & Supplies | 2.14 | % | |||||||||
11,600 | Baxter International, Inc. | 899,464 | |||||||||
7,400 | Medtronic, PLC — ADR(b) | 821,030 | |||||||||
6,000 | Zimmer Biomet Holdings, Inc. | 767,400 | |||||||||
600 | Zimvie, Inc.(a) | 13,704 | |||||||||
2,501,598 | |||||||||||
Health Care Providers & Services | 9.11 | % | |||||||||
3,375 | Anthem, Inc. | 1,657,868 | |||||||||
32,900 | CVS Health Corp. | 3,329,809 | |||||||||
8,100 | HCA Healthcare, Inc. | 2,030,022 | |||||||||
2,500 | McKesson Corp. | 765,325 | |||||||||
5,600 | UnitedHealth Group, Inc. | 2,855,832 | |||||||||
10,638,856 | |||||||||||
Pharmaceuticals | 2.54 | % | |||||||||
3,150 | Eli Lilly & Co. | 902,065 | |||||||||
7,125 | Johnson & Johnson | 1,262,764 | |||||||||
9,800 | Merck & Co., Inc. | 804,090 | |||||||||
2,968,919 | |||||||||||
| Total Health Care (Cost $9,821,096) | 18,708,060 | ||||||||||
Industrials | 4.51 | % | |||||||||
Aerospace & Defense | 0.50 | % | |||||||||
3,025 | The Boeing Co.(a) | 579,287 | |||||||||
Commercial Services & Supplies | 1.02 | % | |||||||||
2,800 | Cintas Corp. | 1,191,092 | |||||||||
Electrical Equipment | 0.29 | % | |||||||||
2,500 | AMETEK, Inc. | 332,950 | |||||||||
Industrial Conglomerates | 0.57 | % | |||||||||
3,450 | Honeywell International, Inc. | 671,301 | |||||||||

The accompanying notes are an integral part of these financial statements
37
BUFFALO DIVIDEND FOCUS FUND
SCHEDULE OF INVESTMENTS
MARCH 31, 2022 Continued
Shares or Face Amount | $ Fair Value* | ||||||||||
Machinery | 0.96 | % | |||||||||
3,950 | Parker-Hannifin Corp. | 1,120,852 | |||||||||
Professional Services | 0.65 | % | |||||||||
3,200 | Equifax, Inc. | 758,720 | |||||||||
Trading Companies & Distributors | 0.52 | % | |||||||||
10,300 | Fastenal Co. | 611,820 | |||||||||
| Total Industrials (Cost $2,943,278) | 5,266,022 | ||||||||||
Information Technology | 16.72 | % | |||||||||
Communications Equipment | 0.85 | % | |||||||||
17,750 | Cisco Systems, Inc. | 989,740 | |||||||||
IT Services | 3.80 | % | |||||||||
4,400 | MasterCard, Inc. — Class A | 1,572,472 | |||||||||
12,925 | Visa Inc. — Class A | 2,866,377 | |||||||||
4,438,849 | |||||||||||
Semiconductors & Semiconductor Equipment | 1.65 | % | |||||||||
9,075 | QUALCOMM, Inc. | 1,386,842 | |||||||||
2,950 | Texas Instruments, Inc. | 541,266 | |||||||||
1,928,108 | |||||||||||
Software | 5.78 | % | |||||||||
50,100 | Absolute Software Corp. — ADR(b) | 424,848 | |||||||||
18,650 | Microsoft Corp. | 5,749,981 | |||||||||
7,700 | SS&C Technologies Holdings, Inc. | 577,654 | |||||||||
6,752,483 | |||||||||||
Technology Hardware, Storage & Peripherals | 4.64 | % | |||||||||
31,080 | Apple Inc. | 5,426,879 | |||||||||
| Total Information Technology (Cost $5,663,134) | 19,536,059 | ||||||||||
Materials | 1.59 | % | |||||||||
Construction Materials | 0.84 | % | |||||||||
10,000 | CRH PLC — ADR(b) | 400,600 | |||||||||
1,500 | Martin Marietta Materials, Inc. | 577,335 | |||||||||
977,935 | |||||||||||

The accompanying notes are an integral part of these financial statements
38
BUFFALO DIVIDEND FOCUS FUND
SCHEDULE OF INVESTMENTS
MARCH 31, 2022 Continued
Shares or Face Amount | $ Fair Value* | ||||||||||
Containers & Packaging | 0.75 | % | |||||||||
43,700 | Graphic Packaging Holding Co. | 875,748 | |||||||||
| Total Materials (Cost $1,579,697) | 1,853,683 | ||||||||||
Utilities | 4.83 | % | |||||||||
Electric Utilities | 3.17 | % | |||||||||
15,700 | American Electric Power Co., Inc. | 1,566,389 | |||||||||
30,550 | Edison International | 2,141,555 | |||||||||
3,707,944 | |||||||||||
Independent Power and Renewable Electricity Producers | 0.78 | % | |||||||||
39,000 | Vistra Corp. | 906,750 | |||||||||
Multi-Utilities | 0.88 | % | |||||||||
6,100 | Sempra Energy | 1,025,532 | |||||||||
| Total Utilities (Cost $4,471,025) | 5,640,226 | ||||||||||
| Total Common Stocks (Cost $47,673,750) | 97,390,497 | ||||||||||
REITS | 2.69 | % | |||||||||
Real Estate | 2.69 | % | |||||||||
Equity Real Estate Investment Trusts (REITs) | 2.69 | % | |||||||||
3,200 | American Tower Corp. | 803,904 | |||||||||
19,106 | Community Healthcare Trust, Inc. | 806,464 | |||||||||
5,000 | Digital Realty Trust, Inc. | 709,000 | |||||||||
1,100 | Equinix Inc. | 815,782 | |||||||||
| Total Real Estate (Cost $2,014,133) | 3,135,150 | ||||||||||
| Total REITS (Cost $2,014,133) | 3,135,150 | ||||||||||
Convertible Preferred Stocks | 1.75 | % | |||||||||
Health Care | 1.75 | % | |||||||||
Pharmaceuticals | 1.75 | % | |||||||||
50,000 | Elanco Animal Health, Inc. 5.000%, 02/01/2023(d) | 2,037,000 | |||||||||
| Total Health Care (Cost $2,429,605) | 2,037,000 | ||||||||||
| Total Convertible Preferred Stocks (Cost $2,429,605) | 2,037,000 | ||||||||||

The accompanying notes are an integral part of these financial statements
39
BUFFALO DIVIDEND FOCUS FUND
SCHEDULE OF INVESTMENTS
MARCH 31, 2022 Continued
Shares or Face Amount | $ Fair Value* | ||||||||||
Preferred Stocks | 0.33 | % | |||||||||
Financials | 0.33 | % | |||||||||
Diversified Financial Services | 0.33 | % | |||||||||
15,000 | Compass Diversified Holdings 7.875%, 01/30/2025(f) | 388,650 | |||||||||
| Total Financials (Cost $349,499) | 388,650 | ||||||||||
| Total Preferred Stocks (Cost $349,499) | 388,650 | ||||||||||
Convertible Bonds | 4.89 | % | |||||||||
Communication Services | 0.52 | % | |||||||||
Entertainment | 0.52 | % | |||||||||
500,000 | Zynga, Inc. 0.250%, 06/01/2024 | 610,313 | |||||||||
| Total Communication Services (Cost $505,730) | 610,313 | ||||||||||
Health Care | 2.03 | % | |||||||||
Biotechnology | 2.03 | % | |||||||||
300,000 | Apellis Pharmaceuticals, Inc. 3.500%, 09/15/2026 | 476,737 | |||||||||
100,000 | Exact Sciences Corp. 0.375%, 03/15/2027 | 94,812 | |||||||||
750,000 | 0.375%, 03/01/2028 | 663,000 | |||||||||
600,000 | PTC Therapeutics, Inc. 1.500%, 09/15/2026(c) | 607,380 | |||||||||
500,000 | Travere Therapeutics, Inc. 2.250%, 03/01/2029 | 532,250 | |||||||||
| Total Health Care (Cost $2,254,068) | 2,374,179 | ||||||||||
Industrials | 0.87 | % | |||||||||
Airlines | 0.87 | % | |||||||||
750,000 | Southwest Airlines Co. 1.250%, 05/01/2025 | 1,020,563 | |||||||||
| Total Industrials (Cost $750,000) | 1,020,563 | ||||||||||

The accompanying notes are an integral part of these financial statements
40
BUFFALO DIVIDEND FOCUS FUND
SCHEDULE OF INVESTMENTS
MARCH 31, 2022 Continued
Shares or Face Amount | $ Fair Value* | ||||||||||
Information Technology | 1.47 | % | |||||||||
Communications Equipment | 0.75 | % | |||||||||
750,000 | Lumentum Holdings, Inc. 0.500%, 12/15/2026 | 872,910 | |||||||||
Software | 0.72 | % | |||||||||
250,000 | Cerence, Inc. 3.000%, 06/01/2025 | 313,906 | |||||||||
500,000 | Guidewire Software, Inc. 1.250%, 03/15/2025 | 525,400 | |||||||||
839,306 | |||||||||||
| Total Information Technology (Cost $1,492,690) | 1,712,216 | ||||||||||
| Total Convertible Bonds (Cost $5,002,488) | 5,717,271 | ||||||||||
Short Term Investments | 7.03 | % | |||||||||
Investment Company | 7.03 | % | |||||||||
8,216,998 | Fidelity Investments Money Market Funds — Government Portfolio — Class I — 0.12%(e) | 8,216,998 | |||||||||
Total Investment Company | 8,216,998 | ||||||||||
| Total Short Term Investments (Cost $8,216,998) | 8,216,998 | ||||||||||
| Total Investments (Cost ($65,686,473) | 100.04 116,885,566 | % | |||||||||
Liabilities in Excess of Other Assets | (0.04 (44,414) | )% | |||||||||
Total Net Assets | 100.00 116,841,152 | % | |||||||||

The accompanying notes are an integral part of these financial statements
41
BUFFALO DIVIDEND FOCUS FUND
SCHEDULE OF INVESTMENTS
MARCH 31, 2022 Continued
ADR American Depositary Receipt
PLC Public Limited Company
(a) Non Income Producing
(b) Foreign Issued Security. The total value of these securities amounted to $4,743,915 (4.06% of net assets) at March 31, 2022.
(c) 144A Securities. The total value of these securities is $607,380 (0.52% of net assets) at March 31, 2022.
(d) Illiquid Security. The total value of these securities amounted to $2,037,000 (1.74% of net assets) at March 31, 2022.
(e) The rate quoted is the annualized seven-day effective yield as of March 31, 2022.
(f) Callable at any dividend payment date on or after date disclosed.
* See Note 1A of the accompanying Notes to Financial Statements regarding valuation of securities.
The Global Industry Classification Standard (GICS) was developed by and/or is the exclusive property of MSCI, Inc. and Standard & Poor's Financial Services LLC ("S&P"). GICS is a service mark of MSCI and S&P and has been licensed for use by U.S. Bancorp Fund Services, LLC.

The accompanying notes are an integral part of these financial statements
42
BUFFALO EARLY STAGE GROWTH FUND
SCHEDULE OF INVESTMENTS
MARCH 31, 2022
Shares or Face Amount | $ Fair Value* | ||||||||||
Common Stocks | 88.20 | % | |||||||||
Consumer Discretionary | 16.32 | % | |||||||||
Auto Components | 1.36 | % | |||||||||
110,000 | Holley, Inc.(a) | 1,530,100 | |||||||||
Diversified Consumer Services | 1.09 | % | |||||||||
120,300 | OneSpaWorld Holdings Ltd. — ADR(a) (b) | 1,227,060 | |||||||||
Hotels, Restaurants & Leisure | 4.83 | % | |||||||||
187,800 | Accel Entertainment, Inc.(a) | 2,287,404 | |||||||||
247,200 | Playa Hotels & Resorts N.V. — ADR(a) (b) | 2,138,280 | |||||||||
140,300 | Rush Street Interactive, Inc.(a) | 1,019,981 | |||||||||
5,445,665 | |||||||||||
Household Durables | 2.79 | % | |||||||||
13,900 | LGI Homes, Inc.(a) | 1,357,752 | |||||||||
33,100 | Lovesac Co/The(a) | 1,789,386 | |||||||||
3,147,138 | |||||||||||
Internet & Direct Marketing Retail | 3.98 | % | |||||||||
93,750 | Lulu's Fashion Lounge Holdings, Inc.(a) | 635,625 | |||||||||
36,900 | Overstock.com, Inc.(a) | 1,623,785 | |||||||||
23,900 | Shutterstock, Inc. | 2,224,612 | |||||||||
4,484,022 | |||||||||||
Leisure Products | 1.37 | % | |||||||||
26,600 | Malibu Boats, Inc. — Class A(a) | 1,543,066 | |||||||||
Specialty Retail | 0.90 | % | |||||||||
20,100 | Sleep Number Corp.(a) | 1,019,271 | |||||||||
| Total Consumer Discretionary (Cost $16,406,759) | 18,396,322 | ||||||||||
Consumer Staples | 1.98 | % | |||||||||
Food Products | 1.98 | % | |||||||||
130,000 | Real Good Food Co Inc/The(a) | 1,027,000 | |||||||||
240,000 | SunOpta, Inc. — ADR(a) (b) | 1,204,800 | |||||||||
| Total Consumer Staples (Cost $4,269,392) | 2,231,800 | ||||||||||

The accompanying notes are an integral part of these financial statements
43
BUFFALO EARLY STAGE GROWTH FUND
SCHEDULE OF INVESTMENTS
MARCH 31, 2022 Continued
Shares or Face Amount | $ Fair Value* | ||||||||||
Financials | 8.98 | % | |||||||||
Capital Markets | 4.10 | % | |||||||||
21,985 | Hamilton Lane Inc. — Class A | 1,699,221 | |||||||||
120,000 | MarketWise, Inc. — Class A(a) (d) | 566,400 | |||||||||
124,600 | Open Lending Corp.(a) | 2,356,186 | |||||||||
4,621,807 | |||||||||||
Diversified Financial Services | 2.39 | % | |||||||||
113,700 | Compass Diversified Holdings | 2,702,649 | |||||||||
Insurance | 2.49 | % | |||||||||
12,300 | Kinsale Capital Group, Inc. | 2,804,646 | |||||||||
| Total Financials (Cost $5,914,085) | 10,129,102 | ||||||||||
Health Care | 15.29 | % | |||||||||
Biotechnology | 0.88 | % | |||||||||
22,100 | Castle Biosciences, Inc.(a) | 991,406 | |||||||||
Health Care Equipment & Supplies | 6.42 | % | |||||||||
28,800 | BioLife Solutions, Inc.(a) | 654,624 | |||||||||
36,700 | Establishment Labs Holdings, Inc. — ADR(a) (b) | 2,473,213 | |||||||||
133,000 | Lucid Diagnostics, Inc.(a) | 446,880 | |||||||||
28,490 | OrthoPediatrics Corp.(a) | 1,538,175 | |||||||||
33,610 | Paragon 28, Inc.(a) | 562,632 | |||||||||
164,300 | Sientra, Inc.(a) | 364,746 | |||||||||
14,875 | STAAR Surgical Co.(a) | 1,188,661 | |||||||||
7,228,931 | |||||||||||
Health Care Providers & Services | 1.90 | % | |||||||||
85,000 | AirSculpt Technologies, Inc.(a) | 1,162,800 | |||||||||
5,800 | LHC Group, Inc.(a) | 977,880 | |||||||||
2,140,680 | |||||||||||
Health Care Technology | 4.06 | % | |||||||||
67,100 | HealthStream, Inc.(a) | 1,336,632 | |||||||||
5,200 | Inspire Medical Systems, Inc.(a) | 1,334,788 | |||||||||
14,700 | Omnicell, Inc.(a) | 1,903,503 | |||||||||
4,574,923 | |||||||||||

The accompanying notes are an integral part of these financial statements
44
BUFFALO EARLY STAGE GROWTH FUND
SCHEDULE OF INVESTMENTS
MARCH 31, 2022 Continued
Shares or Face Amount | $ Fair Value* | ||||||||||
Pharmaceuticals | 2.03 | % | |||||||||
690,000 | Societal CDMO, Inc.(a) | 1,242,000 | |||||||||
129,251 | Verrica Pharmaceuticals, Inc.(a) | 1,048,225 | |||||||||
2,290,225 | |||||||||||
| Total Health Care (Cost $13,312,189) | 17,226,165 | ||||||||||
Industrials | 25.45 | % | |||||||||
Aerospace & Defense | 2.91 | % | |||||||||
100,000 | Cadre Holdings, Inc. | 2,456,000 | |||||||||
40,000 | Kratos Defense & Security Solutions, Inc.(a) | 819,200 | |||||||||
3,275,200 | |||||||||||
Air Freight & Logistics | 2.35 | % | |||||||||
79,100 | Air Transport Services Group, Inc.(a) | 2,645,895 | |||||||||
Building Products | 4.33 | % | |||||||||
13,000 | Advanced Drainage Systems, Inc. | 1,544,530 | |||||||||
29,400 | Apogee Enterprises, Inc. | 1,395,324 | |||||||||
32,100 | Patrick Industries, Inc. | 1,935,630 | |||||||||
4,875,484 | |||||||||||
Construction & Engineering | 4.60 | % | |||||||||
95,000 | Bowman Consulting Group Ltd.(a) | 1,561,800 | |||||||||
27,200 | NV5 Global, Inc.(a) | 3,625,760 | |||||||||
5,187,560 | |||||||||||
Machinery | 3.50 | % | |||||||||
60,400 | Federal Signal Corporation | 2,038,500 | |||||||||
160,000 | Hillman Solutions Corp.(a) | 1,900,800 | |||||||||
3,939,300 | |||||||||||
Professional Services | 3.92 | % | |||||||||
21,100 | ICF International, Inc. | 1,986,354 | |||||||||
79,400 | Willdan Group, Inc.(a) | 2,436,786 | |||||||||
4,423,140 | |||||||||||
Trading Companies & Distributors | 3.84 | % | |||||||||
30,600 | Transcat, Inc.(a) | 2,482,884 | |||||||||
57,510 | Univar Inc.(a) | 1,848,371 | |||||||||
4,331,255 | |||||||||||
| Total Industrials (Cost $19,760,415) | 28,677,834 | ||||||||||

The accompanying notes are an integral part of these financial statements
45
BUFFALO EARLY STAGE GROWTH FUND
SCHEDULE OF INVESTMENTS
MARCH 31, 2022 Continued
Shares or Face Amount | $ Fair Value* | ||||||||||
Information Technology | 20.18 | % | |||||||||
Communications Equipment | 1.13 | % | |||||||||
29,500 | Calix, Inc.(a) | 1,265,845 | |||||||||
Electronic Equipment, Instruments & Components | 0.66 | % | |||||||||
42,800 | nLight, Inc.(a) | 742,152 | |||||||||
IT Services | 6.77 | % | |||||||||
47,700 | BigCommerce Holdings, Inc.(a) | 1,045,107 | |||||||||
101,900 | i3 Verticals, Inc. — Class A(a) | 2,838,934 | |||||||||
348,600 | Paya Holdings, Inc.(a) | 2,042,796 | |||||||||
104,600 | Verra Mobility Corp.(a) | 1,702,888 | |||||||||
7,629,725 | |||||||||||
Semiconductors & Semiconductor Equipment | 1.81 | % | |||||||||
35,000 | MaxLinear, Inc.(a) | 2,042,250 | |||||||||
Software | 9.81 | % | |||||||||
175,900 | 8x8, Inc.(a) | 2,214,581 | |||||||||
190,100 | Absolute Software Corp. — ADR(b) | 1,612,048 | |||||||||
34,900 | Cerence, Inc.(a) | 1,259,890 | |||||||||
28,500 | CoreCard Corp.(a) | 780,900 | |||||||||
7,100 | CyberArk Software Ltd. — ADR(a) (b) | 1,198,125 | |||||||||
27,005 | Envestnet, Inc.(a) | 2,010,252 | |||||||||
41,700 | Varonis Systems, Inc.(a) | 1,982,418 | |||||||||
11,058,214 | |||||||||||
| Total Information Technology (Cost $19,649,477) | 22,738,186 | ||||||||||
| Total Common Stocks (Cost $79,312,317) | 99,399,409 | ||||||||||
REITS | 2.01 | % | |||||||||
Real Estate | 2.01 | % | |||||||||
Equity Real Estate Investment Trusts (REITs) | 2.01 | % | |||||||||
53,600 | Community Healthcare Trust, Inc. | 2,262,456 | |||||||||
| Total Real Estate (Cost $1,340,663) | 2,262,456 | ||||||||||
| Total REITS (Cost $1,340,663) | 2,262,456 | ||||||||||

The accompanying notes are an integral part of these financial statements
46
BUFFALO EARLY STAGE GROWTH FUND
SCHEDULE OF INVESTMENTS
MARCH 31, 2022 Continued
Shares or Face Amount | $ Fair Value* | ||||||||||
Warrants | 0.66 | % | |||||||||
Internet & Direct Marketing Retail | 0.66 | % | |||||||||
1,200,000 | 1847 Goedeker, Inc.(a) (c) | 742,800 | |||||||||
| Total Internet & Direct Marketing Retail (Cost $577,170) | |||||||||||
| Total Warrants (Cost $577,170) | 742,800 | ||||||||||
Short Term Investments | 8.63 | % | |||||||||
Investment Company | 8.63 | % | |||||||||
9,724,317 | Fidelity Investments Money Market Funds — Government Portfolio — Class I — 0.12%(e) | 9,724,317 | |||||||||
Total Investment Company | 9,724,317 | ||||||||||
| Total Short Term Investments (Cost $9,724,317) | 9,724,317 | ||||||||||
| Total Investments (Cost $90,954,467) | 99.50 112,128,982 | % | |||||||||
Other Assets in Excess of Liabilities | 0.50 560,375 | % | |||||||||
Total Net Assets | 100.00 112,689,357 | % | |||||||||
ADR American Depositary Receipt
(a) Non Income Producing.
(b) Foreign Issued Securities. The total value of these securities amounted to $9,853,526 (8.74% of net assets) at March 31, 2022.
(c) Illiquid Security. The total value of these securities amounted to $742,800 (0.66% of net assets) at March 31, 2022.
(d) Security is restricted from resale and considered illiquid.
(e) The rate quoted is the annualized seven-day effective yield as of March 31, 2022.
* See Note 1A of the accompanying Notes to Financial Statements regarding valuation of securities.
The Global Industry Classification Standard (GICS) was developed by and/or is the exclusive property of MSCI, Inc. and Standard & Poor's Financial Services LLC ("S&P"). GICS is a service mark of MSCI and S&P and has been licensed for use by U.S. Bancorp Fund Services, LLC.

The accompanying notes are an integral part of these financial statements
47
BUFFALO FLEXIBLE INCOME FUND
SCHEDULE OF INVESTMENTS
MARCH 31, 2022
Shares or Face Amount | $ Fair Value* | ||||||||||
Common Stocks | 94.70 | % | |||||||||
Communication Services | 4.66 | % | |||||||||
Diversified Telecommunication Services | 3.49 | % | |||||||||
400,000 | AT&T, Inc.(c) | 9,452,000 | |||||||||
150,000 | Verizon Communications, Inc. | 7,641,000 | |||||||||
17,093,000 | |||||||||||
Entertainment | 1.17 | % | |||||||||
140,000 | Lions Gate Entertainment Corp. — Class A — ADR(a) (b) | 2,275,000 | |||||||||
230,000 | Lions Gate Entertainment Corp. — Class B — ADR(a) (b) (c) | 3,456,900 | |||||||||
5,731,900 | |||||||||||
| Total Communication Services (Cost $25,529,149) | 22,824,900 | ||||||||||
Consumer Staples | 18.60 | % | |||||||||
Beverages | 4.63 | % | |||||||||
80,000 | PepsiCo, Inc. | 13,390,400 | |||||||||
150,000 | The Coca Cola Co. | 9,300,000 | |||||||||
22,690,400 | |||||||||||
Food & Staples Retailing | 3.53 | % | |||||||||
30,000 | Costco Wholesale Corp. | 17,275,500 | |||||||||
Food Products | 4.54 | % | |||||||||
150,000 | B&G Foods, Inc. | 4,047,000 | |||||||||
89,000 | ConAgra Foods, Inc. | 2,987,730 | |||||||||
150,000 | General Mills, Inc. | 10,158,000 | |||||||||
60,000 | Kellogg Co. | 3,869,400 | |||||||||
30,000 | The Kraft Heinz Co. | 1,181,700 | |||||||||
22,243,830 | |||||||||||
Household Products | 5.90 | % | |||||||||
25,000 | Colgate-Palmolive Co. | 1,895,750 | |||||||||
70,000 | Kimberly-Clark Corp. | 8,621,200 | |||||||||
50,000 | The Clorox Co. | 6,951,500 | |||||||||
75,000 | The Procter & Gamble Co. | 11,460,000 | |||||||||
28,928,450 | |||||||||||
| Total Consumer Staples (Cost $39,203,619) | 91,138,180 | ||||||||||

The accompanying notes are an integral part of these financial statements.
48
BUFFALO FLEXIBLE INCOME FUND
SCHEDULE OF INVESTMENTS
MARCH 31, 2022 Continued
Shares or Face Amount | $ Fair Value* | ||||||||||
Energy | 24.75 | % | |||||||||
Energy Equipment & Services | 1.66 | % | |||||||||
197,000 | Schlumberger Ltd. — ADR(b) (c) | 8,138,070 | |||||||||
Oil, Gas & Consumable Fuels | 23.09 | % | |||||||||
400,000 | APA Corp. | 16,532,000 | |||||||||
125,000 | Chevron Corp. | 20,353,750 | |||||||||
175,000 | ConocoPhillips | 17,500,000 | |||||||||
140,000 | Delek Logistics Partners LP | 6,158,600 | |||||||||
165,000 | Exxon Mobil Corp. | 13,627,350 | |||||||||
165,000 | Hess Corp.(c) | 17,661,600 | |||||||||
70,000 | HF Sinclair Corp. | 2,789,500 | |||||||||
560,000 | Kinder Morgan, Inc. | 10,589,600 | |||||||||
85,000 | Marathon Petroleum Corp. | 7,267,500 | |||||||||
20,000 | Suncor Energy, Inc. — ADR(b) | 651,800 | |||||||||
113,131,700 | |||||||||||
| Total Energy (Cost $69,020,349) | 121,269,770 | ||||||||||
Financials | 7.38 | % | |||||||||
Banks | 2.02 | % | |||||||||
175,000 | Truist Financial Corp. | 9,922,500 | |||||||||
Insurance | 5.36 | % | |||||||||
75,000 | Arthur J. Gallagher & Co. | 13,095,000 | |||||||||
95,000 | The Allstate Corp.(c) | 13,158,450 | |||||||||
26,253,450 | |||||||||||
| Total Financials (Cost $12,486,126) | 36,175,950 | ||||||||||
Health Care | 16.57 | % | |||||||||
Biotechnology | 0.91 | % | |||||||||
75,000 | Gilead Sciences, Inc. | 4,458,750 | |||||||||
Health Care Equipment & Supplies | 3.24 | % | |||||||||
75,000 | Abbott Laboratories | 8,877,000 | |||||||||
90,000 | Baxter International, Inc. | 6,978,600 | |||||||||
15,855,600 | |||||||||||

The accompanying notes are an integral part of these financial statements.
49
BUFFALO FLEXIBLE INCOME FUND
SCHEDULE OF INVESTMENTS
MARCH 31, 2022 Continued
Shares or Face Amount | $ Fair Value* | ||||||||||
Pharmaceuticals | 12.42 | % | |||||||||
15,000 | Bristol-Myers Squibb Co. | 1,095,450 | |||||||||
52,000 | Eli Lilly & Co.(c) | 14,891,240 | |||||||||
235,000 | GlaxoSmithKline PLC — ADR(b) (c) | 10,236,600 | |||||||||
75,000 | Johnson & Johnson | 13,292,250 | |||||||||
80,000 | Merck & Co., Inc. | 6,564,000 | |||||||||
8,000 | Organon & Co. | 279,440 | |||||||||
270,000 | Pfizer Inc. | 13,977,900 | |||||||||
50,000 | Viatris, Inc. | 544,000 | |||||||||
60,880,880 | |||||||||||
| Total Health Care (Cost $35,257,589) | 81,195,230 | ||||||||||
Industrials | 2.74 | % | |||||||||
Commercial Services & Supplies | 2.72 | % | |||||||||
429,000 | Pitney Bowes Inc. | 2,230,800 | |||||||||
70,000 | Waste Management, Inc.(c) | 11,095,000 | |||||||||
13,325,800 | |||||||||||
Electrical Equipment | 0.02 | % | |||||||||
3,300 | ABB Ltd. — ADR(b) | 106,722 | |||||||||
| Total Industrials (Cost $3,978,862) | 13,432,522 | ||||||||||
Information Technology | 16.90 | % | |||||||||
Communications Equipment | 1.99 | % | |||||||||
175,000 | Cisco Systems, Inc. | 9,758,000 | |||||||||
IT Services | 1.89 | % | |||||||||
70,000 | International Business Machines Corp. | 9,101,400 | |||||||||
12,000 | Kyndryl Holdings, Inc.(a) | 157,440 | |||||||||
9,258,840 | |||||||||||
Semiconductors & Semiconductor Equipment | 4.53 | % | |||||||||
170,000 | Intel Corp. | 8,425,200 | |||||||||
90,000 | QUALCOMM, Inc. | 13,753,800 | |||||||||
22,179,000 | |||||||||||
Software | 8.49 | % | |||||||||
135,000 | Microsoft Corp. | 41,621,850 | |||||||||
| Total Information Technology (Cost $24,137,848) | 82,817,690 | ||||||||||

The accompanying notes are an integral part of these financial statements.
50
BUFFALO FLEXIBLE INCOME FUND
SCHEDULE OF INVESTMENTS
MARCH 31, 2022 Continued
Shares or Face Amount | $ Fair Value* | ||||||||||
Materials | 3.10 | % | |||||||||
Chemicals | 1.49 | % | |||||||||
115,000 | Dow Inc.(c) | 7,327,800 | |||||||||
Metals & Mining | 1.61 | % | |||||||||
8,500 | BHP Billiton Ltd. — ADR(b) | 656,625 | |||||||||
100,000 | Cleveland-Cliffs, Inc.(a) | 3,221,000 | |||||||||
50,000 | Rio Tinto PLC — ADR(b) | 4,020,000 | |||||||||
7,897,625 | |||||||||||
| Total Materials (Cost $9,138,088) | 15,225,425 | ||||||||||
| Total Common Stocks (Cost $218,751,630) | 464,079,667 | ||||||||||
REITS | 2.47 | % | |||||||||
Real Estate | 2.47 | % | |||||||||
Equity Real Estate Investment Trusts (REITs) | 2.47 | % | |||||||||
85,300 | Digital Realty Trust, Inc. | 12,095,540 | |||||||||
| Total Real Estate (Cost $4,977,727) | 12,095,540 | ||||||||||
| Total REITS (Cost $4,977,727) | 12,095,540 | ||||||||||
Short Term Investments | 2.75 | % | |||||||||
Investment Company | 2.75 | % | |||||||||
13,456,474 | Fidelity Investments Money Market Funds — Government Portfolio — Class I — 0.12%(d) | 13,456,474 | |||||||||
Total Investment Company | 13,456,474 | ||||||||||
| Total Short Term Investments (Cost $13,456,474) | 13,456,474 | ||||||||||
| Total Investments (Cost $237,185,831) | 99.92 489,631,681 | % | |||||||||

The accompanying notes are an integral part of these financial statements.
51
BUFFALO FLEXIBLE INCOME FUND
SCHEDULE OF INVESTMENTS
MARCH 31, 2022 Continued
Shares or Face Amount | $ Fair Value* | ||||||
Other Assets in Excess of Liabilities | 0.08 393,263 | % | |||||
Total Net Assets | 100.00 | % | |||||
ADR American Depositary Receipt
PLC Public Limited Company
(a) Non Income Producing.
(b) Foreign Issued Security. The total value of these securities amounted to $29,541,717 (6.03% of net assets) at March 31, 2022.
(c) A portion of this investment is segregated as collateral for open written option contracts.
(d) The rate quoted is the annualized seven-day effective yield as of March 31, 2022.
* See Note 1A of the accompanying Notes to Financial Statements regarding valuation of securities.
The Global Industry Classification Standard (GICS) was developed by and/or is the exclusive property of MSCI, Inc. and Standard & Poor's Financial Services LLC ("S&P"). GICS is a service mark of MSCI and S&P and has been licensed for use by U.S. Bancorp Fund Services, LLC.

The accompanying notes are an integral part of these financial statements.
52
BUFFALO FLEXIBLE INCOME FUND
SCHEDULE OF OPTIONS WRITTEN
MARCH 31, 2022 Continued
Contracts | $ Notional Amount | $ Value | |||||||||||||
Call Options | |||||||||||||||
| Allstate Corp/The | ||||||||||||||
(100 | ) | Expiration: April 2022, Exercise Price: $145.00 | 1,385,100 | 5,000 | |||||||||||
| AT&T, Inc. | ||||||||||||||
(1,000 | ) | Expiration: June 2022, Exercise Price: $25.00 | 2,363,000 | 35,000 | |||||||||||
| Dow, Inc. | ||||||||||||||
(50 | ) | Expiration: June 2022, Exercise Price: $72.50 | 318,600 | 2,875 | |||||||||||
| Eli Lilly & Co. | ||||||||||||||
(70 | ) | Expiration: April 2022, Exercise Price: $300.00 | 2,004,590 | 8,470 | |||||||||||
| GlaxoSmithKline Plc | ||||||||||||||
(80 | ) | Expiration: May 2022, Exercise Price: $47.00 | 348,480 | 1,600 | |||||||||||
| Hess Corp. | ||||||||||||||
(100 | ) | Expiration: April 2022, Exercise Price: $105.00 | 1,070,400 | 44,000 | |||||||||||
| Lions Gate Entertainment Corp. | ||||||||||||||
(100 | ) | Expiration: April 2022, Exercise Price: $16.00 | 150,300 | 3,750 | |||||||||||
| Schlumberger NV | ||||||||||||||
(400 | ) | Expiration: April 2022, Exercise Price: $45.00 | 1,652,400 | 400 | |||||||||||
(200 | ) | Expiration: May 2022, Exercise Price: $50.00 | 826,200 | 10,600 | |||||||||||
| Waste Management, Inc. | ||||||||||||||
(100 | ) | Expiration: April 2022, Exercise Price: $180.00 | 1,585,000 | 9,250 | |||||||||||
| Total Written Options (Premium received $114, 845) | 120,945 | ||||||||||||||

The accompanying notes are an integral part of these financial statements.
53
BUFFALO GROWTH FUND
SCHEDULE OF INVESTMENTS
MARCH 31, 2022
Shares or Face Amount | $ Fair Value* | ||||||||||
Common Stocks | 95.67 | % | |||||||||
Communication Services | 16.16 | % | |||||||||
Entertainment | 1.51 | % | |||||||||
9,941 | Electronic Arts, Inc. | 1,257,636 | |||||||||
12,368 | The Walt Disney Co.(a) | 1,696,395 | |||||||||
2,954,031 | |||||||||||
Interactive Media & Services | 13.45 | % | |||||||||
3,195 | Alphabet, Inc. — Class A(a) | 8,886,413 | |||||||||
3,822 | Alphabet, Inc. — Class C(a) | 10,674,808 | |||||||||
21,281 | Facebook, Inc. — Class A(a) | 4,732,043 | |||||||||
18,147 | Match Group, Inc.(a) | 1,973,305 | |||||||||
26,266,569 | |||||||||||
Media | 1.20 | % | |||||||||
50,000 | Comcast Corp. — Class A | 2,341,000 | |||||||||
| Total Communication Services (Cost $9,510,681) | 31,561,600 | ||||||||||
Consumer Discretionary | 11.87 | % | |||||||||
Hotels, Restaurants & Leisure | 0.93 | % | |||||||||
19,928 | Starbucks Corp. | 1,812,850 | |||||||||
Internet & Direct Marketing Retail | 8.60 | % | |||||||||
4,125 | Amazon.com, Inc.(a) | 13,447,294 | |||||||||
1,429 | Booking Holdings, Inc.(a) | 3,355,935 | |||||||||
16,803,229 | |||||||||||
Specialty Retail | 1.06 | % | |||||||||
6,896 | The Home Depot, Inc. | 2,064,179 | |||||||||
Textiles, Apparel & Luxury Goods | 1.28 | % | |||||||||
18,639 | NIKE, Inc. — Class B | 2,508,064 | |||||||||
| Total Consumer Discretionary (Cost $7,049,625) | 23,188,322 | ||||||||||
Financials | 6.37 | % | |||||||||
Capital Markets | 4.86 | % | |||||||||
181,786 | Open Lending Corp.(a) | 3,437,573 | |||||||||
14,777 | S&P Global, Inc. | 6,061,265 | |||||||||
9,498,838 | |||||||||||

The accompanying notes are an integral part of these financial statements.
54
BUFFALO GROWTH FUND
SCHEDULE OF INVESTMENTS
MARCH 31, 2022 Continued
Shares or Face Amount | $ Fair Value* | ||||||||||
Diversified Financial Services | 1.51 | % | |||||||||
21,526 | Global Payments Inc. | 2,945,618 | |||||||||
| Total Financials (Cost $9,792,144) | 12,444,456 | ||||||||||
Health Care | 10.98 | % | |||||||||
Health Care Equipment & Supplies | 5.02 | % | |||||||||
8,870 | Danaher Corp. | 2,601,837 | |||||||||
21,475 | Edwards Lifesciences Corp.(a) | 2,528,037 | |||||||||
3,297 | IDEXX Laboratories, Inc.(a) | 1,803,657 | |||||||||
9,522 | Intuitive Surgical, Inc.(a) | 2,872,597 | |||||||||
9,806,128 | |||||||||||
Health Care Providers & Services | 1.63 | % | |||||||||
6,226 | UnitedHealth Group, Inc. | 3,175,073 | |||||||||
Health Care Technology | 1.08 | % | |||||||||
9,959 | Veeva Systems, Inc.(a) | 2,115,889 | |||||||||
Life Sciences Tools & Services | 2.49 | % | |||||||||
5,026 | Illumina, Inc.(a) | 1,756,085 | |||||||||
5,259 | Thermo Fisher Scientific, Inc. | 3,106,228 | |||||||||
4,862,313 | |||||||||||
Pharmaceuticals | 0.76 | % | |||||||||
9,600 | Jazz Pharmaceuticals Public Limited Company — ADR(a) (b) | 1,494,432 | |||||||||
| Total Health Care (Cost $12,463,562) | 21,453,835 | ||||||||||
Industrials | 6.53 | % | |||||||||
Commercial Services & Supplies | 1.26 | % | |||||||||
19,500 | Copart, Inc.(a) | 2,446,665 | |||||||||
Professional Services | 2.71 | % | |||||||||
23,414 | TransUnion | 2,419,603 | |||||||||
13,400 | Verisk Analytics, Inc. | 2,876,042 | |||||||||
5,295,645 | |||||||||||
Road & Rail | 2.56 | % | |||||||||
57,278 | Uber Technologies, Inc.(a) | 2,043,679 | |||||||||
10,822 | Union Pacific Corp. | 2,956,678 | |||||||||
5,000,357 | |||||||||||
| Total Industrials (Cost $9,308,937) | 12,742,667 | ||||||||||

The accompanying notes are an integral part of these financial statements.
55
BUFFALO GROWTH FUND
SCHEDULE OF INVESTMENTS
MARCH 31, 2022 Continued
Shares or Face Amount | $ Fair Value* | ||||||||||
Information Technology | 40.49 | % | |||||||||
IT Services | 5.93 | % | |||||||||
16,115 | MasterCard, Inc. — Class A | 5,759,179 | |||||||||
17,149 | PayPal Holdings, Inc.(a) | 1,983,282 | |||||||||
17,358 | Visa Inc. — Class A | 3,849,483 | |||||||||
11,591,944 | |||||||||||
Semiconductors & Semiconductor Equipment | 5.46 | % | |||||||||
13,332 | Analog Devices, Inc. | 2,202,180 | |||||||||
16,162 | Applied Materials, Inc. | 2,130,151 | |||||||||
4,663 | Broadcom Inc. | 2,936,198 | |||||||||
12,440 | NVIDIA Corp. | 3,394,378 | |||||||||
10,662,907 | |||||||||||
Software | 20.63 | % | |||||||||
6,845 | Adobe, Inc.(a) | 3,118,719 | |||||||||
24,536 | Digital Turbine, Inc.(a) | 1,074,922 | |||||||||
4,570 | Fair Isaac Corp.(a) | 2,131,722 | |||||||||
4,012 | Intuit, Inc. | 1,929,130 | |||||||||
79,809 | Microsoft Corp. | 24,605,913 | |||||||||
4,114 | Palo Alto Networks, Inc.(a) | 2,561,006 | |||||||||
14,222 | salesforce.com, Inc.(a) | 3,019,615 | |||||||||
3,341 | ServiceNow, Inc.(a) | 1,860,570 | |||||||||
40,301,597 | |||||||||||
Technology Hardware, Storage & Peripherals | 8.47 | % | |||||||||
94,716 | Apple Inc. | 16,538,361 | |||||||||
| Total Information Technology (Cost $31,775,849) | 79,094,809 | ||||||||||
Materials | 1.64 | % | |||||||||
Chemicals | 1.64 | % | |||||||||
10,044 | Linde PLC — ADR(b) | 3,208,355 | |||||||||
| Total Materials (Cost $1,641,742) | 3,208,355 | ||||||||||
Real Estate | 1.63 | % | |||||||||
Real Estate Management & Development | 1.63 | % | |||||||||
34,850 | CBRE Group, Inc. — Class A(a) | 3,189,472 | |||||||||
| Total Real Estate (Cost $1,427,111) | 3,189,472 | ||||||||||
| Total Common Stocks (Cost $82,969,651) | 186,883,516 | ||||||||||

The accompanying notes are an integral part of these financial statements.
56
BUFFALO GROWTH FUND
SCHEDULE OF INVESTMENTS
MARCH 31, 2022 Continued
Shares or Face Amount | $ Fair Value* | ||||||||||
REITS | 2.19 | % | |||||||||
Real Estate | 2.19 | % | |||||||||
Equity Real Estate Investment Trusts (REITs) | 2.19 | % | |||||||||
8,395 | American Tower Corp. | 2,108,992 | |||||||||
2,914 | Equinix Inc. | 2,161,081 | |||||||||
| Total Real Estate (Cost $1,775,275) | 4,270,073 | ||||||||||
| Total REITS (Cost $1,775,275) | 4,270,073 | ||||||||||
Short Term Investments | 2.27 | % | |||||||||
Investment Company | 2.27 | % | |||||||||
4,433,033 | Fidelity Investments Money Market Funds — Government Portfolio — Class I — 0.12%(c) | 4,433,033 | |||||||||
Total Investment Company | 4,433,033 | ||||||||||
| Total Short Term Investments (Cost $4,433,033) | 4,433,033 | ||||||||||
| Total Investments (Cost ($89,177,959) | 100.13 195,586,622 | % | |||||||||
| Liabilities in Excess of Other Assets | (0.13 (253,888) | )% | |||||||||
| Total Net Assets | 100.00 195,332,734 | % | |||||||||
ADR American Depositary Receipt
PLC Public Limited Company
(a) Non Income Producing.
(b) Foreign Issued Securities. The total value of these securities amounted to $4,702,787 (2.41% of net assets) at March 31, 2022.
(c) The rate quoted is the annualized seven-day effective yield as of March 31, 2022.
* See Note 1A of the accompanying Notes to Financial Statements regarding valuation of securities.
The Global Industry Classification Standard (GICS) was developed by and/or is the exclusive property of MSCI, Inc. and Standard & Poor's Financial Services LLC ("S&P"). GICS is a service mark of MSCI and S&P and has been licensed for use by U.S. Bancorp Fund Services, LLC.

The accompanying notes are an integral part of these financial statements.
57
BUFFALO HIGH YIELD FUND
SCHEDULE OF INVESTMENTS
MARCH 31, 2022
Shares or Face Amount | $ Fair Value* | ||||||||||
Preferred Stocks | 2.73 | % | |||||||||
Consumer Discretionary | 0.50 | % | |||||||||
Textiles, Apparel & Luxury Goods | 0.50 | % | |||||||||
Fossil Group, Inc.(a) | |||||||||||
60,000 | 7.000%, 11/30/2026(d) | 1,476,600 | |||||||||
| Total Consumer Discretionary (Cost $1,516,247) | 1,476,600 | ||||||||||
Energy | 1.15 | % | |||||||||
Oil, Gas & Consumable Fuels | 1.15 | % | |||||||||
NuStar Energy LP | |||||||||||
137,482 | 9.000%, (effective 12/15/2022, 3 Month LIBOR USD + 6.880%), 12/15/2022(d) (f) | 3,409,554 | |||||||||
| Total Energy (Cost $2,822,581) | 3,409,554 | ||||||||||
Financials | 1.08 | % | |||||||||
Diversified Financial Services | 1.08 | % | |||||||||
Compass Diversified Holdings | |||||||||||
25,000 | 7.250%, 07/30/2022(d) | 626,250 | |||||||||
100,000 | 7.875%, 01/30/2025(d) | 2,591,000 | |||||||||
| Total Financials (Cost $2,852,111) | 3,217,250 | ||||||||||
| Total Preferred Stocks (Cost $7,190,939) | 8,103,404 | ||||||||||
Convertible Bonds | 6.35 | % | |||||||||
Consumer Discretionary | 1.35 | % | |||||||||
Auto Components | 0.38 | % | |||||||||
Patrick Industries, Inc. | |||||||||||
1,250,000 | 1.750%, 12/01/2028(b) | 1,125,000 | |||||||||
Diversified Consumer Services | 0.67 | % | |||||||||
Stride, Inc. | |||||||||||
2,000,000 | 1.125%, 09/01/2027 | 1,994,000 | |||||||||
Internet & Direct Marketing Retail | 0.30 | % | |||||||||
Etsy, Inc. | |||||||||||
1,000,000 | 0.250%, 06/15/2028(b) | 893,500 | |||||||||
| Total Consumer Discretionary (Cost $4,189,344) | 4,012,500 | ||||||||||

The accompanying notes are an integral part of these financial statements.
58
BUFFALO HIGH YIELD FUND
SCHEDULE OF INVESTMENTS
MARCH 31, 2022 Continued
Shares or Face Amount | $ Fair Value* | ||||||||||
Financials | 0.75 | % | |||||||||
Consumer Finance | 0.75 | % | |||||||||
PRA Group, Inc. | |||||||||||
2,000,000 | 3.500%, 06/01/2023 | 2,222,500 | |||||||||
| Total Financials (Cost $2,012,242) | 2,222,500 | ||||||||||
Health Care | 0.18 | % | |||||||||
Health Care Equipment & Supplies | 0.18 | % | |||||||||
Invacare Corp. | |||||||||||
1,000,000 | 4.250%, 03/15/2026 | 530,000 | |||||||||
| Total Health Care (Cost $1,000,000) | 530,000 | ||||||||||
Industrials | 2.25 | % | |||||||||
Air Freight & Logistics | 0.76 | % | |||||||||
Air Transport Services Group, Inc. | |||||||||||
1,900,000 | 1.125%, 10/15/2024 | 2,261,094 | |||||||||
Airlines | 0.46 | % | |||||||||
Southwest Airlines Co. | |||||||||||
1,000,000 | 1.250%, 05/01/2025 | 1,360,750 | |||||||||
Electrical Equipment | 0.26 | % | |||||||||
Array Technologies, Inc. | |||||||||||
1,000,000 | 1.000%, 12/01/2028(b) | 763,500 | |||||||||
Machinery | 0.77 | % | |||||||||
Greenbrier Cos Inc/The | |||||||||||
1,000,000 | 2.875%, 04/15/2028(b) | 1,157,182 | |||||||||
The Greenbrier Companies, Inc. | |||||||||||
1,000,000 | 2.875%, 02/01/2024 | 1,120,000 | |||||||||
2,277,182 | |||||||||||
| Total Industrials (Cost $5,790,477) | 6,662,526 | ||||||||||
Information Technology | 1.82 | % | |||||||||
Communications Equipment | 0.49 | % | |||||||||
Lumentum Holdings, Inc. | |||||||||||
1,250,000 | 0.500%, 12/15/2026 | 1,454,850 | |||||||||

The accompanying notes are an integral part of these financial statements.
59
BUFFALO HIGH YIELD FUND
SCHEDULE OF INVESTMENTS
MARCH 31, 2022 Continued
Shares or Face Amount | $ Fair Value* | ||||||||||
Software | 1.33 | % | |||||||||
J2 Global, Inc. | |||||||||||
1,500,000 | 1.750%, 11/01/2026(b) | 1,698,750 | |||||||||
Mitek Systems, Inc. | |||||||||||
2,250,000 | 0.750%, 02/01/2026(b) | 2,258,438 | |||||||||
3,957,188 | |||||||||||
| Total Information Technology (Cost $4,786,966) | 5,412,038 | ||||||||||
| Total Convertible Bonds (Cost $17,779,029) | 18,839,564 | ||||||||||
Corporate Bonds | 67.31 | % | |||||||||
Administrative and Support and Waste Management and Remediation Services | 0.33 | % | |||||||||
Office Administrative Services | 0.33 | % | |||||||||
Cargo Aircraft Management, Inc. | |||||||||||
1,000,000 | 4.750%, 02/01/2028(b) | 977,975 | |||||||||
| Total Administrative and Support and Waste Management and Remediation Services (Cost $1,010,475) | 977,975 | ||||||||||
Agriculture, Forestry, Fishing and Hunting | 0.69 | % | |||||||||
Forest Nurseries and Gathering of Forest Products | 0.69 | % | |||||||||
Enviva Partners LP / Enviva Partners Finance Corp. | |||||||||||
2,000,000 | 6.500%, 01/15/2026(b) | 2,059,590 | |||||||||
| Total Agriculture, Forestry, Fishing and Hunting (Cost $2,011,123) | 2,059,590 | ||||||||||
Communication Services | 3.98 | % | |||||||||
Entertainment | 0.95 | % | |||||||||
Live Nation Entertainment, Inc. | |||||||||||
1,000,000 | 4.875%, 11/01/2024(b) | 1,005,738 | |||||||||
500,000 | 5.625%, 03/15/2026(b) | 509,970 | |||||||||
250,000 | 4.750%, 10/15/2027(b) | 244,850 | |||||||||
Netflix, Inc. | |||||||||||
1,000,000 | 5.750%, 03/01/2024 | 1,051,150 | |||||||||
2,811,708 | |||||||||||

The accompanying notes are an integral part of these financial statements.
60
BUFFALO HIGH YIELD FUND
SCHEDULE OF INVESTMENTS
MARCH 31, 2022 Continued
Shares or Face Amount | $ Fair Value* | ||||||||||
Interactive Media & Services | 1.87 | % | |||||||||
Cars.com, Inc. | |||||||||||
2,500,000 | 6.375%, 11/01/2028(b) | 2,486,937 | |||||||||
Match Group, Inc. | |||||||||||
1,000,000 | 5.000%, 12/15/2027(b) | 998,675 | |||||||||
TripAdvisor, Inc. | |||||||||||
2,000,000 | 7.000%, 07/15/2025(b) | 2,052,740 | |||||||||
5,538,352 | |||||||||||
Media | 1.16 | % | |||||||||
AMC Networks, Inc. | |||||||||||
596,000 | 5.000%, 04/01/2024 | 595,294 | |||||||||
Gray Television, Inc. | |||||||||||
2,060,000 | 5.875%, 07/15/2026(b) | 2,113,282 | |||||||||
500,000 | 4.750%, 10/15/2030(b) | 466,310 | |||||||||
Townsquare Media, Inc. | |||||||||||
250,000 | 6.875%, 02/01/2026(b) | 257,905 | |||||||||
3,432,791 | |||||||||||
| Total Communication Services (Cost $11,667,286) | 11,782,851 | ||||||||||
Consumer Staples | 1.01 | % | |||||||||
Food Products | 1.01 | % | |||||||||
Performance Food Group, Inc. | |||||||||||
3,000,000 | 5.500%, 10/15/2027(b) | 2,992,395 | |||||||||
| Total Consumer Staples (Cost $3,000,000) | 2,992,395 | ||||||||||
Consumer Discretionary | 4.57 | % | |||||||||
Auto Components | 0.87 | % | |||||||||
Patrick Industries, Inc. | |||||||||||
3,000,000 | 4.750%, 05/01/2029(b) | 2,585,475 | |||||||||

The accompanying notes are an integral part of these financial statements.
61
BUFFALO HIGH YIELD FUND
SCHEDULE OF INVESTMENTS
MARCH 31, 2022 Continued
Shares or Face Amount | $ Fair Value* | ||||||||||
Hotels, Restaurants & Leisure | 2.56 | % | |||||||||
Carrols Restaurant Group, Inc. | |||||||||||
4,000,000 | 5.875%, 07/01/2029(b) | 3,267,780 | |||||||||
Nathan's Famous, Inc. | |||||||||||
1,100,000 | 6.625%, 11/01/2025(b) | 1,099,279 | |||||||||
Royal Caribbean Cruises Ltd. | |||||||||||
1,615,000 | 7.500%, 10/15/2027(a) | 1,719,402 | |||||||||
Six Flags Entertainment Corp. | |||||||||||
1,500,000 | 5.500%, 04/15/2027(b) | 1,502,895 | |||||||||
7,589,356 | |||||||||||
Textiles, Apparel & Luxury Goods | 1.14 | % | |||||||||
PVH Corp. | |||||||||||
3,120,000 | 7.750%, 11/15/2023 | 3,357,777 | |||||||||
| Total Consumer Discretionary (Cost $13,893,305) | 13,532,608 | ||||||||||
Consumer Staples | 1.81 | % | |||||||||
Food Products | 1.46 | % | |||||||||
Lamb Weston Holdings, Inc. | |||||||||||
1,000,000 | 4.125%, 01/31/2030(b) | 935,500 | |||||||||
TreeHouse Foods, Inc. | |||||||||||
4,000,000 | 4.000%, 09/01/2028 | 3,391,200 | |||||||||
4,326,700 | |||||||||||
Personal Products | 0.35 | % | |||||||||
BellRing Brands, Inc. | |||||||||||
1,000,000 | 7.000%, 03/15/2030(b) | 1,023,980 | |||||||||
| Total Consumer Staples (Cost $6,000,000) | 5,350,680 | ||||||||||
Consumer, Cyclical | 0.66 | % | |||||||||
Motion Picture and Video Industries | 0.66 | % | |||||||||
Cinemark USA, Inc. | |||||||||||
2,000,000 | 5.875%, 03/15/2026(b) | 1,957,340 | |||||||||
| Total Consumer, Cyclical (Cost $1,982,326) | 1,957,340 | ||||||||||

The accompanying notes are an integral part of these financial statements.
62
BUFFALO HIGH YIELD FUND
SCHEDULE OF INVESTMENTS
MARCH 31, 2022 Continued
Shares or Face Amount | $ Fair Value* | ||||||||||
Energy | 18.42 | % | |||||||||
Energy Equipment & Services | 0.77 | % | |||||||||
Bristow Group, Inc. | |||||||||||
2,250,000 | 6.875%, 03/01/2028(b) | 2,281,151 | |||||||||
Oil, Gas & Consumable Fuels | 17.65 | % | |||||||||
Antero Resources Corp. | |||||||||||
658,000 | 8.375%, 07/15/2026(b) | 725,642 | |||||||||
418,000 | 7.625%, 02/01/2029(b) | 452,638 | |||||||||
1,000,000 | 5.375%, 03/01/2030(b) | 1,024,010 | |||||||||
Athabasca Oil Corp. | |||||||||||
3,000,000 | 9.750%, 11/01/2026(a) (b) | 3,198,450 | |||||||||
California Resources Corp. | |||||||||||
4,000,000 | 7.125%, 02/01/2026(b) | 4,164,940 | |||||||||
CNX Resources Corp. | |||||||||||
4,000,000 | 7.250%, 03/14/2027(b) | 4,238,740 | |||||||||
100,000 | 6.000%, 01/15/2029(b) | 101,130 | |||||||||
CONSOL Energy, Inc. | |||||||||||
6,000,000 | 11.000%, 11/15/2025(b) | 6,267,990 | |||||||||
Delek Logistics Partners LP / Delek Logistics Finance Corp. | |||||||||||
3,000,000 | 6.750%, 05/15/2025 | 3,005,250 | |||||||||
Energy Transfer LP | |||||||||||
5,500,000 | 7.125% (5 Year CMT Rate + 5.306%), 11/15/2165 | 5,403,750 | |||||||||
Matador Resources Co. | |||||||||||
5,500,000 | 5.875%, 09/15/2026 | 5,608,075 | |||||||||
| MPLX LP | |||||||||||
7,500,000 | 6.875% (3 Month LIBOR USD + 4.652%), 08/15/2023 | 7,387,500 | |||||||||
Northern Oil and Gas, Inc. | |||||||||||
8,600,000 | 8.125%, 03/01/2028(b) | 8,973,326 | |||||||||
Viper Energy Partners LP | |||||||||||
1,750,000 | 5.375%, 11/01/2027(b) | 1,784,878 | |||||||||
52,336,319 | |||||||||||
| Total Energy (Cost $53,458,814) | 54,617,470 | ||||||||||
Finance and Insurance | 0.65 | % | |||||||||
Activities Related to Credit Intermediation | 0.65 | % | |||||||||
Scripps Escrow II, Inc. | |||||||||||
2,000,000 | 5.375%, 01/15/2031(b) | 1,917,760 | |||||||||
| Total Finance and Insurance (Cost $1,995,776) | 1,917,760 | ||||||||||

The accompanying notes are an integral part of these financial statements.
63
BUFFALO HIGH YIELD FUND
SCHEDULE OF INVESTMENTS
MARCH 31, 2022 Continued
Shares or Face Amount | $ Fair Value* | ||||||||||
Financials | 0.20 | % | |||||||||
Consumer Finance | 0.20 | % | |||||||||
PRA Group, Inc. | |||||||||||
100,000 | 7.375%, 09/01/2025(b) | 104,338 | |||||||||
500,000 | 5.000%, 10/01/2029(b) | 474,808 | |||||||||
| Total Financials (Cost $600,000) | 579,146 | ||||||||||
Health Care | 2.26 | % | |||||||||
Pharmaceuticals | 2.26 | % | |||||||||
Bausch Health Americas, Inc. | |||||||||||
1,000,000 | 9.250%, 04/01/2026(a) (b) | 1,026,875 | |||||||||
Bausch Health Companies Inc. | |||||||||||
1,500,000 | 5.500%, 11/01/2025(a) (b) | 1,498,395 | |||||||||
500,000 | 9.000%, 12/15/2025(a) (b) | 518,550 | |||||||||
Horizon Therapeutics USA, Inc. | |||||||||||
1,000,000 | 5.500%, 08/01/2027(b) | 1,026,830 | |||||||||
Teva Pharmaceutical Industries Ltd. | |||||||||||
2,500,000 | 6.750%, 03/01/2028(a) | 2,630,350 | |||||||||
| Total Health Care (Cost $6,363,459) | 6,701,000 | ||||||||||
Industrials | 10.16 | % | |||||||||
Aerospace & Defense | 0.35 | % | |||||||||
TransDigm, Inc. | |||||||||||
500,000 | 6.250%, 03/15/2026(b) | 514,678 | |||||||||
500,000 | 6.375%, 06/15/2026 | 505,150 | |||||||||
1,019,828 | |||||||||||
Building Products | 1.78 | % | |||||||||
Builders FirstSource, Inc. | |||||||||||
354,000 | 6.750%, 06/01/2027(b) | 367,850 | |||||||||
4,000,000 | 5.000%, 03/01/2030(b) | 3,964,360 | |||||||||
1,000,000 | 4.250%, 02/01/2032(b) | 932,840 | |||||||||
5,265,050 | |||||||||||

The accompanying notes are an integral part of these financial statements.
64
BUFFALO HIGH YIELD FUND
SCHEDULE OF INVESTMENTS
MARCH 31, 2022 Continued
Shares or Face Amount | $ Fair Value* | ||||||||||
Commercial Services & Supplies | 4.96 | % | |||||||||
Cimpress NV | |||||||||||
2,000,000 | 7.000%, 06/15/2026(a) (b) | 1,918,600 | |||||||||
CoreCivic, Inc. | |||||||||||
5,500,000 | 8.250%, 04/15/2026 | 5,717,525 | |||||||||
Deluxe Corp. | |||||||||||
2,500,000 | 8.000%, 06/01/2029(b) | 2,542,487 | |||||||||
KAR Auction Services, Inc. | |||||||||||
2,500,000 | 5.125%, 06/01/2025(b) | 2,534,250 | |||||||||
Quad Graphics, Inc. | |||||||||||
2,000,000 | 7.000%, 05/01/2022 | 2,000,000 | |||||||||
14,712,862 | |||||||||||
Construction & Engineering | 0.96 | % | |||||||||
Tutor Perini Corp. | |||||||||||
3,000,000 | 6.875%, 05/01/2025(b) | 2,856,870 | |||||||||
Trading Companies & Distributors | 2.11 | % | |||||||||
Alta Equipment Group, Inc. | |||||||||||
1,750,000 | 5.625%, 04/15/2026(b) | 1,666,149 | |||||||||
BlueLinx Holdings, Inc. | |||||||||||
3,000,000 | 6.000%, 11/15/2029(b) | 2,795,475 | |||||||||
Fly Leasing Ltd. | |||||||||||
2,000,000 | 7.000%, 10/15/2024(a) (b) | 1,801,550 | |||||||||
6,263,174 | |||||||||||
| Total Industrials (Cost $30,733,223) | 30,117,784 | ||||||||||
Information | 4.24 | % | |||||||||
Data Processing, Hosting, and Related Services | 0.32 | % | |||||||||
VM Consolidated, Inc. | |||||||||||
1,000,000 | 5.500%, 04/15/2029(b) | 940,585 | |||||||||
Motion Picture and Video Industries | 0.65 | % | |||||||||
Lions Gate Capital Holdings LLC | |||||||||||
2,000,000 | 5.500%, 04/15/2029(b) | 1,932,560 | |||||||||
Other Telecommunications | 1.20 | % | |||||||||
Avaya, Inc. | |||||||||||
1,500,000 | 6.125%, 09/15/2028(b) | 1,481,002 | |||||||||
Consolidated Communications, Inc. | |||||||||||
2,250,000 | 6.500%, 10/01/2028(b) | 2,078,775 | |||||||||
3,559,777 | |||||||||||

The accompanying notes are an integral part of these financial statements.
65
BUFFALO HIGH YIELD FUND
SCHEDULE OF INVESTMENTS
MARCH 31, 2022 Continued
Shares or Face Amount | $ Fair Value* | ||||||||||
Radio and Television Broadcasting | 2.07 | % | |||||||||
Audacy Capital Corp. | |||||||||||
2,200,000 | 6.750%, 03/31/2029(b) | 2,058,628 | |||||||||
Gray Escrow II, Inc. | |||||||||||
1,000,000 | 5.375%, 11/15/2031(b) | 957,500 | |||||||||
iHeartCommunications, Inc. | |||||||||||
2,000,000 | 8.375%, 05/01/2027 | 2,072,500 | |||||||||
100,000 | 5.250%, 08/15/2027(b) | 99,052 | |||||||||
Nexstar Media, Inc. | |||||||||||
500,000 | 4.750%, 11/01/2028(b) | 487,435 | |||||||||
Scripps Escrow II, Inc. | |||||||||||
500,000 | 3.875%, 01/15/2029(b) | 465,643 | |||||||||
6,140,758 | |||||||||||
| Total Information (Cost $13,154,988) | 12,573,680 | ||||||||||
Information Technology | 2.72 | % | |||||||||
Software | 1.26 | % | |||||||||
Consensus Cloud Solutions, Inc. | |||||||||||
3,500,000 | 6.000%, 10/15/2026(b) | 3,477,985 | |||||||||
250,000 | 6.500%, 10/15/2028(b) | 248,896 | |||||||||
3,726,881 | |||||||||||
Technology Hardware, Storage & Peripherals | 1.46 | % | |||||||||
Diebold Nixdorf, Inc. | |||||||||||
4,000,000 | 8.500%, 04/15/2024 | 3,839,800 | |||||||||
500,000 | 9.375%, 07/15/2025(b) | 508,693 | |||||||||
4,348,493 | |||||||||||
| Total Information Technology (Cost $8,256,724) | 8,075,374 | ||||||||||
Manufacturing | 0.63 | % | |||||||||
Aerospace Product and Parts Manufacturing | 0.63 | % | |||||||||
TransDigm, Inc. | |||||||||||
1,000,000 | 4.625%, 01/15/2029 | 936,235 | |||||||||
1,000,000 | 4.875%, 05/01/2029 | 939,300 | |||||||||
| Total Manufacturing (Cost $2,000,000) | 1,875,535 | ||||||||||

The accompanying notes are an integral part of these financial statements.
66
BUFFALO HIGH YIELD FUND
SCHEDULE OF INVESTMENTS
MARCH 31, 2022 Continued
Shares or Face Amount | $ Fair Value* | ||||||||||
Materials | 2.87 | % | |||||||||
Chemicals | 0.66 | % | |||||||||
Chemours Co/The | |||||||||||
2,000,000 | 5.750%, 11/15/2028(b) | 1,952,220 | |||||||||
Metals & Mining | 1.55 | % | |||||||||
Commercial Metals Co. | |||||||||||
500,000 | 3.875%, 02/15/2031 | 455,232 | |||||||||
Taseko Mines Ltd. | |||||||||||
3,000,000 | 7.000%, 02/15/2026(a) (b) | 3,093,375 | |||||||||
Warrior Met Coal, Inc. | |||||||||||
1,000,000 | 7.875%, 12/01/2028(b) | 1,053,400 | |||||||||
4,602,007 | |||||||||||
Paper & Forest Products | 0.66 | % | |||||||||
Sylvamo Corp. | |||||||||||
2,000,000 | 7.000%, 09/01/2029(b) | 1,966,810 | |||||||||
| Total Materials (Cost $8,530,182) | 8,521,037 | ||||||||||
Mining, Quarrying, and Oil and Gas Extraction | 5.44 | % | |||||||||
Coal Mining | 0.93 | % | |||||||||
Alliance Resource Operating Partners LP / Alliance Resource Finance Corp. | |||||||||||
2,750,000 | 7.500%, 05/01/2025(b) | 2,746,562 | |||||||||
Oil and Gas Extraction | 2.32 | % | |||||||||
Penn Virginia Holdings LLC | |||||||||||
6,500,000 | 9.250%, 08/15/2026(b) | 6,864,325 | |||||||||
Support Activities for Mining | 2.19 | % | |||||||||
Talos Production, Inc. | |||||||||||
6,000,000 | 12.000%, 01/15/2026 | 6,502,410 | |||||||||
| Total Mining, Quarrying, and Oil and Gas Extraction (Cost $15,684,388) | 16,113,297 | ||||||||||
Professional, Scientific, and Technical Services | 0.85 | % | |||||||||
Advertising, Public Relations, and Related Services | 0.32 | % | |||||||||
Outfront Media Capital LLC / Outfront Media Capital Corp. | |||||||||||
1,000,000 | 4.625%, 03/15/2030(b) | 943,130 | |||||||||

The accompanying notes are an integral part of these financial statements.
67
BUFFALO HIGH YIELD FUND
SCHEDULE OF INVESTMENTS
MARCH 31, 2022 Continued
Shares or Face Amount | $ Fair Value* | ||||||||||
Other Professional, Scientific, and Technical Services | 0.53 | % | |||||||||
Sabre GLBL, Inc. | |||||||||||
1,500,000 | 7.375%, 09/01/2025(b) | 1,568,798 | |||||||||
| Total Professional, Scientific, and Technical Services (Cost $2,503,109) | 2,511,928 | ||||||||||
Real Estate and Rental and Leasing | 1.71 | % | |||||||||
Lessors of Real Estate | 1.71 | % | |||||||||
IIP Operating Partnership LP | |||||||||||
3,000,000 | 5.500%, 05/25/2026 | 3,000,910 | |||||||||
Uniti Group LP / Uniti Group Finance Inc / CSL Capital LLC | |||||||||||
1,000,000 | 4.750%, 04/15/2028(b) | 948,590 | |||||||||
1,200,000 | 6.500%, 02/15/2029(b) | 1,122,914 | |||||||||
2,071,504 | |||||||||||
| Total Real Estate and Rental and Leasing (Cost $5,186,547) | 5,072,414 | ||||||||||
Transportation and Warehousing | 1.06 | % | |||||||||
Pipeline Transportation of Crude Oil | 0.33 | % | |||||||||
Delek Logistics Partners LP / Delek Logistics Finance Corp. | |||||||||||
1,000,000 | 7.125%, 06/01/2028(b) | 982,080 | |||||||||
Pipeline Transportation of Natural Gas | 0.73 | % | |||||||||
Antero Midstream Partners LP / Antero Midstream Finance Corp. | |||||||||||
2,000,000 | 7.875%, 05/15/2026(b) | 2,167,460 | |||||||||
| Total Transportation and Warehousing (Cost $3,002,000) | 3,149,540 | ||||||||||
Utilities | 1.62 | % | |||||||||
Electric Power Generation, Transmission and Distribution | 0.63 | % | |||||||||
IEA Energy Services LLC | |||||||||||
2,000,000 | 6.625%, 08/15/2029(b) | 1,883,710 | |||||||||
Independent Power and Renewable Electricity Producers | 0.99 | % | |||||||||
Vistra Corp. | |||||||||||
3,000,000 | 7.000% (5 Year CMT Rate + 5.740%), 06/15/2027 | 2,925,915 | |||||||||
| Total Utilities (Cost $4,978,899) | 4,809,625 | ||||||||||

The accompanying notes are an integral part of these financial statements.
68
BUFFALO HIGH YIELD FUND
SCHEDULE OF INVESTMENTS
MARCH 31, 2022 Continued
Shares or Face Amount | $ Fair Value* | ||||||||||
Wholesale Trade | 1.43 | % | |||||||||
Drugs and Druggists' Sundries Merchant Wholesalers | 0.17 | % | |||||||||
Herbalife Nutrition Ltd / HLF Financing, Inc. | |||||||||||
500,000 | 7.875%, 09/01/2025(a) (b) | 513,342 | |||||||||
Grocery and Related Product Merchant Wholesalers | 0.92 | % | |||||||||
Performance Food Group, Inc. | |||||||||||
1,000,000 | 4.250%, 08/01/2029(b) | 912,500 | |||||||||
Primo Water Holdings, Inc. | |||||||||||
2,000,000 | 4.375%, 04/30/2029(b) | 1,812,790 | |||||||||
2,725,290 | |||||||||||
Machinery, Equipment, and Supplies Merchant Wholesalers | 0.34 | % | |||||||||
TransDigm, Inc. | |||||||||||
1,000,000 | 5.500%, 11/15/2027 | 993,745 | |||||||||
| Total Wholesale Trade (Cost $4,500,520) | 4,232,377 | ||||||||||
| Total Corporate Bonds (Cost $200,513,144) | 199,521,406 | ||||||||||
Bank Loans | 18.51 | % | |||||||||
Aerospace & Defense | 1.84 | % | |||||||||
3,609,671 | Maxar Technologies Ltd., Senior Secured First Lien Term Loan (1 Month LIBOR USD + 2.750%) | 3,560,995 | |||||||||
1,906,321 | TransDigm, Inc., Senior Secured First Lien Term Loan (1 Month LIBOR USD + 2.250%) | 1,882,739 | |||||||||
5,443,734 | |||||||||||
Broadcasting | 0.32 | % | |||||||||
522,816 | CBS Radio, Senior Secured First Lien Term Loan (1 Month LIBOR USD + 2.500%) | 515,169 | |||||||||
431,373 | Nexstar Media Group, Inc., Senior Secured First Lien Term Loan (1 Month LIBOR USD + 2.500%) | 430,256 | |||||||||
945,425 | |||||||||||
Construction & Engineering | 0.98 | % | |||||||||
2,956,241 | Tutor Perini Corp., Senior Secured First Lien Term Loan (3 Month LIBOR USD + 4.750%)(g) | 2,910,049 | |||||||||
Financial | 0.60 | % | |||||||||
1,763,490 | Fly Willow Funding Ltd., Senior Secured First Lien Term Loan (3 Month LIBOR USD + 6.000%)(g) | 1,767,899 | |||||||||
Healthcare | 0.66 | % | |||||||||
1,985,000 | RadNet, Inc., Senior Secured First Lien Term Loan (3 Month LIBOR USD + 3.000%) | 1,961,428 | |||||||||
Internet & Direct Marketing Retail | 1.50 | % | |||||||||
4,466,250 | Magnite, Inc., Senior Secured First Lien Term Loan (6 Month LIBOR USD + 5.000%)(g) | 4,432,753 | |||||||||
IT Services | 0.97 | % | |||||||||
2,872,500 | MoneyGram International, Inc., Senior Secured First Lien Term Loan (6 Month LIBOR USD + 4.500%) | 2,871,782 | |||||||||

The accompanying notes are an integral part of these financial statements.
69
BUFFALO HIGH YIELD FUND
SCHEDULE OF INVESTMENTS
MARCH 31, 2022 Continued
Shares or Face Amount | $ Fair Value* | ||||||||||
Media | 3.62 | % | |||||||||
8,616,982 | Directv Financing LLC., Senior Secured First Lien Term Loan (1 Month LIBOR USD + 5.000%) | 8,618,662 | |||||||||
970,125 | The E.W. Scripps Co., Senior Secured First Lien Term Loan (1 Month LIBOR USD + 2.562%) | 961,117 | |||||||||
207,813 | The E.W. Scripps Co., Senior Secured First Lien Term Loan (1 Month LIBOR USD + 3.000%) | 206,806 | |||||||||
955,000 | The E.W. Scripps Co., Senior Secured First Lien Term Loan (1 Month LIBOR USD + 2.000%) | 945,092 | |||||||||
10,731,677 | |||||||||||
Oil, Gas & Consumable Fuels | 0.91 | % | |||||||||
2,713,969 | Consolidated Energy, Inc., Senior Secured First Lien Term Loan (1 Month LIBOR USD + 3.500%)(c) | 2,686,830 | |||||||||
Pharmaceuticals | 2.34 | % | |||||||||
1,985,000 | Jazz Pharmaceuticals., Senior Secured First Lien Term Loan (1 Month LIBOR USD + 3.500%) | 1,980,167 | |||||||||
4,975,000 | PetIQ Holdings LLC, Senior Secured First Lien Term Loan (3 Month LIBOR USD + 4.250%)(g) | 4,950,125 | |||||||||
6,930,292 | |||||||||||
Retailers (other than Food/Drug) | 2.92 | % | |||||||||
2,987,494 | Jo-Ann Stores LLC., Senior Secured First Lien Term Loan (1 Month LIBOR USD + 4.750%) | 2,627,934 | |||||||||
6,038,544 | Portillo's Holdings LLC., Senior Secured First Lien Term Loan (1 Month LIBOR USD + 5.500%)(c) | 6,030,996 | |||||||||
8,658,930 | |||||||||||
Software | 0.43 | % | |||||||||
189,651 | SS&C Technologies Holdings, Inc., Senior Secured First Lien Term Loan (1 Month LIBOR USD + 1.750%) | 187,043 | |||||||||
153,954 | SS&C Technologies Holdings, Inc., Senior Secured First Lien Term Loan (1 Month LIBOR USD + 1.750%) | 151,837 | |||||||||
952,620 | SS&C Technologies Holdings, Inc., Senior Secured First Lien Term Loan (1 Month LIBOR USD + 1.750%)(c) | 939,193 | |||||||||
1,278,073 | |||||||||||
Telecommunications | 1.43 | % | |||||||||
1,500,000 | Avaya, Inc., Senior Secured First Lien Term Loan (1 Month LIBOR USD + 4.000%) | 1,485,938 | |||||||||
2,928,009 | Consolidated Communications, Inc., Senior Secured First Lien Term Loan (1 Month LIBOR USD + 3.500%) | 2,761,215 | |||||||||
4,247,153 | |||||||||||
| Total Bank Loans (Cost $55,400,441) | 54,866,025 | ||||||||||
Short Term Investments | 4.04 | % | |||||||||
Investment Company | 4.04 | % | |||||||||
11,975,841 | Fidelity Investments Money Market Funds — Government Portfolio — Class I — 0.12%(e) | 11,975,841 | |||||||||
Total Investment Company | 11,975,841 | ||||||||||
| Total Short Term Investments (Cost $11,975,841) | 11,975,841 | ||||||||||

The accompanying notes are an integral part of these financial statements.
70
BUFFALO HIGH YIELD FUND
SCHEDULE OF INVESTMENTS
MARCH 31, 2022 Continued
Shares or Face Amount | $ Fair Value* | ||||||
| Total Investments (Cost $292,859,394) | 98.94 | % | |||||
| 293,306,240 | ||||||
Other Assets in Excess of Liabilities | 1.06 3,132,349 | % | |||||
Total Net Assets | 100.00 | % | |||||
(a) Foreign Issued Securities. The total value of these securities amounted to $17,918,889 (6.04% if net assets) at March 31, 2022.
(b) 144A securities. The total value of these securities amounted to $143,379,305 (48.37% of net assets) at March 31, 2022.
(c) Illiquid Security. The total value of these securities amounted to $9,705,133 (3.25% of net assets) at March 31, 2022.
(d) Callable at any dividend payment date on or after date disclosed.
(e) The rate quoted is the annualized seven-day effective yield as of March 31, 2022.
(f) Fixed to floating rate. Effective date of change and formula disclosed. Rate disclosed as of March 31, 2022.
(g) Level 3 security. See Note 1A of the accompanying Notes to Financial Statements for information regarding Level 3 securities.
* See Note 1A of the accompanying Notes to Financial Statements regarding valuation of securities.
The Global Industry Classification Standard (GICS) was developed by and/or is the exclusive property of MSCI, Inc. and Standard & Poor's Financial Services LLC ("S&P"). GICS is a service mark of MSCI and S&P and has been licensed for use by U.S. Bancorp Fund Services, LLC.

The accompanying notes are an integral part of these financial statements.
71
BUFFALO INTERNATIONAL FUND
SCHEDULE OF INVESTMENTS
MARCH 31, 2022
Shares or Face Amount | $ Fair Value* | ||||||||||
Common Stocks | 94.15 | % | |||||||||
Belgium | 0.46 | % | |||||||||
Beverages | 0.46 | % | |||||||||
45,000 | Anheuser-Busch InBev SA/NV | 2,690,479 | |||||||||
| Total Belgium (Cost $2,291,611) | 2,690,479 | ||||||||||
Bermuda | 0.31 | % | |||||||||
Machinery | 0.31 | % | |||||||||
500,000 | AutoStore Holdings Ltd.(a) | 1,811,590 | |||||||||
| Total Bermuda (Cost $2,021,588) | 1,811,590 | ||||||||||
Canada | 3.29 | % | |||||||||
Commercial Services & Supplies | 0.56 | % | |||||||||
100,000 | GFL Environmental, Inc. — ADR | 3,254,000 | |||||||||
Road & Rail | 1.55 | % | |||||||||
67,000 | Canadian National Railway Co. — ADR | 8,987,380 | |||||||||
Software | 1.18 | % | |||||||||
4,000 | Constellation Software Inc/Canada(a) | 6,837,580 | |||||||||
| Total Canada (Cost $14,081,341) | 19,078,960 | ||||||||||
Cayman Islands | 0.27 | % | |||||||||
Diversified Telecommunication Services | 0.27 | % | |||||||||
140,000 | IHS Holding Ltd. — ADR(a) | 1,551,200 | |||||||||
| Total Cayman Islands (Cost $2,940,000) | 1,551,200 | ||||||||||
Denmark | 1.74 | % | |||||||||
Pharmaceuticals | 1.74 | % | |||||||||
15,000 | Novo Nordisk A/S | 1,663,742 | |||||||||
76,000 | Novo Nordisk A/S — ADR | 8,439,800 | |||||||||
10,103,542 | |||||||||||
| Total Denmark (Cost $5,103,075) | 10,103,542 | ||||||||||

The accompanying notes are an integral part of these financial statements.
72
BUFFALO INTERNATIONAL FUND
SCHEDULE OF INVESTMENTS
MARCH 31, 2022 Continued
Shares or Face Amount | $ Fair Value* | ||||||||||
France | 17.31 | % | |||||||||
Aerospace & Defense | 1.73 | % | |||||||||
80,000 | Thales SA | 10,018,904 | |||||||||
Beverages | 1.42 | % | |||||||||
37,500 | Pernod Ricard SA | 8,239,212 | |||||||||
Chemicals | 1.54 | % | |||||||||
51,062 | Air Liquide SA | 8,933,034 | |||||||||
Construction & Engineering | 1.52 | % | |||||||||
86,000 | Vinci SA | 8,786,897 | |||||||||
Electrical Equipment | 2.58 | % | |||||||||
89,000 | Schneider Electric SE | 14,942,321 | |||||||||
Hotels, Restaurants & Leisure | 0.34 | % | |||||||||
50,000 | La Francaise des Jeux SAEM | 1,983,642 | |||||||||
Life Sciences Tools & Services | 1.62 | % | |||||||||
23,000 | Sartorius Stedim Biotech | 9,416,587 | |||||||||
Pharmaceuticals | 0.88 | % | |||||||||
99,587 | Sanofi — ADR | 5,112,797 | |||||||||
Professional Services | 1.54 | % | |||||||||
313,000 | Bureau Veritas SA | 8,923,955 | |||||||||
Software | 1.19 | % | |||||||||
140,000 | Dassault Systemes SE | 6,878,047 | |||||||||
Textiles, Apparel & Luxury Goods | 2.95 | % | |||||||||
12,300 | Kering SA | 7,765,369 | |||||||||
13,100 | LVMH Moet Hennessy Louis Vuitton SE | 9,350,820 | |||||||||
17,116,189 | |||||||||||
| Total France (Cost $55,208,224) | 100,351,585 | ||||||||||
Germany | 17.36 | % | |||||||||
Capital Markets | 0.89 | % | |||||||||
142,000 | DWS Group GmbH & Co KGaA | 5,189,706 | |||||||||
Chemicals | 1.16 | % | |||||||||
56,000 | Symrise AG | 6,714,033 | |||||||||
Electrical Equipment | 0.25 | % | |||||||||
62,600 | Siemens Energy AG | 1,424,204 | |||||||||

The accompanying notes are an integral part of these financial statements.
73
BUFFALO INTERNATIONAL FUND
SCHEDULE OF INVESTMENTS
MARCH 31, 2022 Continued
Shares or Face Amount | $ Fair Value* | ||||||||||
Electronic Equipment, Instruments & Components | 1.01 | % | |||||||||
193,711 | Jenoptik AG | 5,828,187 | |||||||||
Health Care Equipment & Supplies | 1.54 | % | |||||||||
55,525 | Carl Zeiss Meditec AG | 8,943,855 | |||||||||
Health Care Providers & Services | 1.13 | % | |||||||||
178,900 | Fresenius SE & Co. KGaA | 6,568,612 | |||||||||
Household Products | 0.27 | % | |||||||||
23,900 | Henkel AG & Co. KGaA | 1,577,520 | |||||||||
Industrial Conglomerates | 1.87 | % | |||||||||
78,200 | Siemens A.G. — ADR | 10,828,203 | |||||||||
Insurance | 1.68 | % | |||||||||
15,000 | Hannover Rueck SE | 2,548,189 | |||||||||
26,900 | Muenchener Rueckversicherungs-Gesellschaft AG in Muenchen | 7,191,476 | |||||||||
9,739,665 | |||||||||||
Pharmaceuticals | 2.29 | % | |||||||||
63,500 | Merck KGaA | 13,261,067 | |||||||||
Semiconductors & Semiconductor Equipment | 0.61 | % | |||||||||
104,000 | Infineon Technologies AG | 3,518,343 | |||||||||
Software | 1.24 | % | |||||||||
64,800 | SAP SE — ADR | 7,190,208 | |||||||||
Textiles, Apparel & Luxury Goods | 1.85 | % | |||||||||
19,700 | adidas AG | 4,590,637 | |||||||||
72,160 | Puma SE | 6,136,659 | |||||||||
10,727,296 | |||||||||||
Trading Companies & Distributors | 1.57 | % | |||||||||
113,000 | Brenntag AG | 9,111,409 | |||||||||
| Total Germany (Cost $64,155,144) | 100,622,308 | ||||||||||
Hong Kong | 0.32 | % | |||||||||
Capital Markets | 0.32 | % | |||||||||
40,000 | Hong Kong Exchanges & Clearing Ltd. | 1,874,933 | |||||||||
| Total Hong Kong (Cost $1,935,676) | 1,874,933 | ||||||||||

The accompanying notes are an integral part of these financial statements.
74
BUFFALO INTERNATIONAL FUND
SCHEDULE OF INVESTMENTS
MARCH 31, 2022 Continued
Shares or Face Amount | $ Fair Value* | ||||||||||
India | 1.98 | % | |||||||||
Banks | 1.98 | % | |||||||||
55,000 | HDFC Bank Ltd. — ADR | 3,373,150 | |||||||||
427,480 | ICICI Bank Ltd. — ADR | 8,096,471 | |||||||||
11,469,621 | |||||||||||
| Total India (Cost $6,778,180) | 11,469,621 | ||||||||||
Ireland | 9.86 | % | |||||||||
Chemicals | 2.57 | % | |||||||||
46,760 | Linde PLC | 14,920,838 | |||||||||
Construction Materials | 1.33 | % | |||||||||
78,000 | CRH PLC — ADR | 3,124,680 | |||||||||
5,000 | CRH PLC | 199,708 | |||||||||
110,000 | CRH public limited company | 4,387,390 | |||||||||
7,711,778 | |||||||||||
Food Products | 0.52 | % | |||||||||
27,000 | Kerry Group Plc | 3,019,747 | |||||||||
Health Care Equipment & Supplies | 1.48 | % | |||||||||
77,400 | Medtronic, PLC — ADR | 8,587,530 | |||||||||
Insurance | 2.70 | % | |||||||||
48,000 | Aon Plc — ADR | 15,630,240 | |||||||||
Life Sciences Tools & Services | 1.26 | % | |||||||||
30,000 | ICON PLC. — ADR(a) | 7,296,600 | |||||||||
| Total Ireland (Cost $35,598,933) | 57,166,733 | ||||||||||
Italy | 0.24 | % | |||||||||
Life Sciences Tools & Services | 0.24 | % | |||||||||
68,050 | Stevanato Group SpA — ADR(a) | 1,369,166 | |||||||||
| Total Italy (Cost $1,429,050) | 1,369,166 | ||||||||||
Japan | 7.04 | % | |||||||||
Beverages | 0.74 | % | |||||||||
117,000 | Asahi Group Holdings Ltd. | 4,261,197 | |||||||||

The accompanying notes are an integral part of these financial statements.
75
BUFFALO INTERNATIONAL FUND
SCHEDULE OF INVESTMENTS
MARCH 31, 2022 Continued
Shares or Face Amount | $ Fair Value* | ||||||||||
Electronic Equipment, Instruments & Components | 2.65 | % | |||||||||
7,100 | KEYENCE CORP. | 3,292,289 | |||||||||
75,000 | Murata Manufacturing Co., Ltd. | 4,940,460 | |||||||||
107,000 | Omron Corp. | 7,120,697 | |||||||||
15,353,446 | |||||||||||
Entertainment | 0.91 | % | |||||||||
10,500 | Nintendo Co Ltd. | 5,300,002 | |||||||||
Machinery | 0.62 | % | |||||||||
18,500 | FANUC Corp. | 3,246,933 | |||||||||
18,000 | FANUC Corp. — ADR(a) | 315,900 | |||||||||
3,562,833 | |||||||||||
Professional Services | 0.62 | % | |||||||||
10,000 | BayCurrent Consulting, Inc. | 3,619,783 | |||||||||
Semiconductors & Semiconductor Equipment | 1.50 | % | |||||||||
750,000 | Renesas Electronics Corp.(a) | 8,690,227 | |||||||||
| Total Japan (Cost $36,784,196) | 40,787,488 | ||||||||||
Luxembourg | 2.18 | % | |||||||||
Life Sciences Tools & Services | 1.77 | % | |||||||||
104,000 | EUROFINS SCIENTIFI | 10,288,024 | |||||||||
Personal Products | 0.41 | % | |||||||||
730,750 | L'Occitane International SA | 2,352,901 | |||||||||
| Total Luxembourg (Cost $5,449,304) | 12,640,925 | ||||||||||
Netherlands | 6.86 | % | |||||||||
Beverages | 1.42 | % | |||||||||
710,000 | Davide Campari-Milano NV | 8,235,385 | |||||||||
IT Services | 1.09 | % | |||||||||
3,200 | Adyen NV(a) | 6,338,257 | |||||||||
Semiconductors & Semiconductor Equipment | 3.02 | % | |||||||||
16,741 | ASML Holding NV — NY Shares — ADR | 11,181,816 | |||||||||
65,000 | STMicroelectronics N.V. | 2,825,175 | |||||||||
80,600 | STMicroelectronics N.V. — NY Shares — ADR | 3,483,532 | |||||||||
17,490,523 | |||||||||||

The accompanying notes are an integral part of these financial statements.
76
BUFFALO INTERNATIONAL FUND
SCHEDULE OF INVESTMENTS
MARCH 31, 2022 Continued
Shares or Face Amount | $ Fair Value* | ||||||||||
Trading Companies & Distributors | 1.33 | % | |||||||||
45,000 | IMCD N.V. | 7,676,701 | |||||||||
| Total Netherlands (Cost $11,691,296) | 39,740,866 | ||||||||||
Norway | 1.94 | % | |||||||||
Commercial Services & Supplies | 1.48 | % | |||||||||
168,000 | Tomra Systems ASA | 8,570,349 | |||||||||
Semiconductors & Semiconductor Equipment | 0.46 | % | |||||||||
105,459 | Nordic Semiconductor ASA(a) | 2,686,429 | |||||||||
| Total Norway (Cost $4,048,572) | 11,256,778 | ||||||||||
Republic of Korea | 0.89 | % | |||||||||
Semiconductors & Semiconductor Equipment | 0.89 | % | |||||||||
90,000 | Samsung Electronic Co., Ltd. | 5,150,069 | |||||||||
| Total Republic of Korea (Cost $4,096,119) | 5,150,069 | ||||||||||
Sweden | 2.77 | % | |||||||||
Electronic Equipment, Instruments & Components | 2.33 | % | |||||||||
966,000 | HEXAGON AB | 13,534,433 | |||||||||
Hotels, Restaurants & Leisure | 0.44 | % | |||||||||
25,000 | Evolution AB | 2,543,358 | |||||||||
| Total Sweden (Cost $9,818,401) | 16,077,791 | ||||||||||
Switzerland | 6.49 | % | |||||||||
Capital Markets | 0.52 | % | |||||||||
51,937 | Julius Baer Group Ltd. | 3,006,867 | |||||||||
Construction Materials | 0.59 | % | |||||||||
70,000 | LafargeHolcim Ltd. | 3,404,574 | |||||||||
Electrical Equipment | 1.24 | % | |||||||||
222,500 | ABB Ltd. — ADR | 7,195,650 | |||||||||
Food Products | 0.45 | % | |||||||||
20,000 | Nestle SA | 2,600,373 | |||||||||

The accompanying notes are an integral part of these financial statements.
77
BUFFALO INTERNATIONAL FUND
SCHEDULE OF INVESTMENTS
MARCH 31, 2022 Continued
Shares or Face Amount | $ Fair Value* | ||||||||||
Health Care Equipment & Supplies | 0.63 | % | |||||||||
46,000 | Alcon, Inc. | 3,644,393 | |||||||||
Life Sciences Tools & Services | 1.87 | % | |||||||||
15,000 | Lonza Group AG | 10,869,060 | |||||||||
Pharmaceuticals | 1.19 | % | |||||||||
11,800 | Roche Holding AG | 4,668,810 | |||||||||
45,400 | Roche Holding AG — ADR | 2,243,214 | |||||||||
6,912,024 | |||||||||||
| Total Switzerland (Cost $23,093,812) | 37,632,941 | ||||||||||
Taiwan, Province of China | 2.33 | % | |||||||||
Semiconductors & Semiconductor Equipment | 2.33 | % | |||||||||
129,281 | Taiwan Semiconductor Manufacturing Co. Ltd. — ADR | 13,478,837 | |||||||||
| Total Taiwan, Province of China (Cost $1,607,687) | 13,478,837 | ||||||||||
United Kingdom | 9.28 | % | |||||||||
Aerospace & Defense | 0.71 | % | |||||||||
440,000 | BAE Systems Plc | 4,132,229 | |||||||||
Beverages | 1.41 | % | |||||||||
40,300 | Diageo PLC — ADR | 8,186,542 | |||||||||
Food Products | 0.51 | % | |||||||||
64,700 | Unilever PLC — ADR | 2,948,379 | |||||||||
Health Care Equipment & Supplies | 0.70 | % | |||||||||
127,000 | Smith & Nephew Plc — ADR | 4,051,300 | |||||||||
Hotels, Restaurants & Leisure | 0.85 | % | |||||||||
73,100 | InterContinental Hotels Group PLC | 4,944,077 | |||||||||
Oil, Gas & Consumable Fuels | 0.94 | % | |||||||||
200,000 | Shell Plc | 5,462,182 | |||||||||
Pharmaceuticals | 1.86 | % | |||||||||
144,000 | AstraZeneca PLC — ADR | 9,552,960 | |||||||||
9,000 | AstraZeneca PLC | 1,193,514 | |||||||||
10,746,474 | |||||||||||

The accompanying notes are an integral part of these financial statements.
78
BUFFALO INTERNATIONAL FUND
SCHEDULE OF INVESTMENTS
MARCH 31, 2022 Continued
Shares or Face Amount | $ Fair Value* | ||||||||||
Trading Companies & Distributors | 2.30 | % | |||||||||
212,000 | Ashtead Group Plc | 13,348,417 | |||||||||
| Total United Kingdom (Cost $35,096,628) | 53,819,600 | ||||||||||
United States | 1.23 | % | |||||||||
Internet & Direct Marketing Retail | 1.23 | % | |||||||||
6,000 | MercadoLibre, Inc.(a) | 7,136,880 | |||||||||
| Total United States (Cost $6,274,753) | 7,136,880 | ||||||||||
| Total Common Stocks (Cost $329,503,590) | 545,812,292 | ||||||||||
Short Term Investments | 5.43 | % | |||||||||
Investment Company | 5.43 | % | |||||||||
31,504,145 | Fidelity Investments Money Market Funds — Government Portfolio — Class I — 0.12%(b) | 31,504,145 | |||||||||
Total Investment Company | 31,504,145 | ||||||||||
| Total Short Term Investments (Cost $31,504,145) | 31,504,145 | ||||||||||
| Total Investments (Cost $361,007,735) | 99.58 | % | |||||||||
| 577,316,437 | ||||||||||
| Other Assets in Excess of Liabilities | 0.42 2,405,964 | % | |||||||||
| Total Net Assets | 100.00 579,722,401 | % | |||||||||
ADR American Depositary Receipt
PLC Public Limited Company
(a) Non Income Producing.
(b) The rate quoted is the annualized seven-day effective yield as of March 31, 2022.
* See Note 1A of the accompanying Notes to Financial Statements regarding valuation of securities.
The Global Industry Classification Standard (GICS) was developed by and/or is the exclusive property of MSCI, Inc. and Standard & Poor's Financial Services LLC ("S&P"). GICS is a service mark of MSCI and S&P and has been licensed for use by U.S. Bancorp Fund Services, LLC.

The accompanying notes are an integral part of these financial statements.
79
BUFFALO INTERNATIONAL FUND
SCHEDULE OF INVESTMENTS
MARCH 31, 2022 Continued
As of March 31, 2022, the industry diversification was as follows:
$ Fair Value | Percentage | ||||||||||
Common Stocks | |||||||||||
Aerospace & Defense | 14,151,133 | 2.44 | % | ||||||||
Banks | 11,469,621 | 1.98 | % | ||||||||
Beverages | 31,612,815 | 5.45 | % | ||||||||
Capital Markets | 10,071,507 | 1.74 | % | ||||||||
Chemicals | 30,567,904 | 5.27 | % | ||||||||
Commercial Services & Supplies | 11,824,349 | 2.04 | % | ||||||||
Construction & Engineering | 8,786,897 | 1.52 | % | ||||||||
Construction Materials | 11,116,353 | 1.92 | % | ||||||||
Diversified Telecommunication Services | 1,551,200 | 0.27 | % | ||||||||
Electrical Equipment | 23,562,175 | 4.06 | % | ||||||||
Electronic Equipment, Instruments & Components | 34,716,067 | 5.99 | % | ||||||||
Entertainment | 5,300,002 | 0.91 | % | ||||||||
Food Products | 8,568,499 | 1.48 | % | ||||||||
Health Care Equipment & Supplies | 25,227,078 | 4.35 | % | ||||||||
Health Care Providers & Services | 6,568,612 | 1.13 | % | ||||||||
Hotels, Restaurants & Leisure | 9,471,077 | 1.63 | % | ||||||||
Household Products | 1,577,520 | 0.27 | % | ||||||||
Industrial Conglomerates | 10,828,203 | 1.87 | % | ||||||||
Insurance | 25,369,905 | 4.38 | % | ||||||||
Internet & Direct Marketing Retail | 7,136,880 | 1.23 | % | ||||||||
IT Services | 6,338,257 | 1.09 | % | ||||||||
Life Sciences Tools & Services | 39,239,437 | 6.77 | % | ||||||||
Machinery | 5,374,424 | 0.93 | % | ||||||||
Oil, Gas & Consumable Fuels | 5,462,182 | 0.94 | % | ||||||||
Personal Products | 2,352,901 | 0.41 | % | ||||||||
Pharmaceuticals | 46,135,903 | 7.96 | % | ||||||||
Professional Services | 12,543,738 | 2.16 | % | ||||||||
Road & Rail | 8,987,380 | 1.55 | % | ||||||||
Semiconductors & Semiconductor Equipment | 51,014,426 | 8.80 | % | ||||||||
Software | 20,905,834 | 3.61 | % | ||||||||
Textiles, Apparel & Luxury Goods | 27,843,486 | 4.80 | % | ||||||||
Trading Companies & Distributors | 30,136,527 | 5.20 | % | ||||||||
Total Common Stocks | 545,812,292 | 94.15 | % | ||||||||
Short Term Investments | |||||||||||
Investment Company | 31,504,145 | 5.43 | % | ||||||||
Total Short Term Investments | 31,504,145 | 5.43 | % | ||||||||
Total Investments | 577,316,437 | 99.58 | % | ||||||||
Other Assets in Excess of Liabilities | 2,405,964 | 0.42 | % | ||||||||
TOTAL NET ASSETS | 579,722,401 | 100.00 | % | ||||||||

The accompanying notes are an integral part of these financial statements.
80
BUFFALO LARGE CAP FUND
SCHEDULE OF INVESTMENTS
MARCH 31, 2022
Shares or Face Amount | $ Fair Value* | ||||||||||
Common Stocks | 93.56 | % | |||||||||
Communication Services | 10.32 | % | |||||||||
Interactive Media & Services | 10.32 | % | |||||||||
2,845 | Alphabet, Inc. — Class A(a) | 7,912,941 | |||||||||
498 | Alphabet, Inc. — Class C(a) | 1,390,909 | |||||||||
10,800 | Facebook, Inc. — Class A(a) | 2,401,488 | |||||||||
| Total Communication Services (Cost $3,831,763) | 11,705,338 | ||||||||||
Consumer Discretionary | 17.16 | % | |||||||||
Automobiles | 2.19 | % | |||||||||
2,300 | Tesla, Inc.(a) | 2,478,480 | |||||||||
Hotels, Restaurants & Leisure | 1.99 | % | |||||||||
4,825 | Airbnb, Inc.(a) | 828,742 | |||||||||
2,950 | McDonald's Corp. | 729,476 | |||||||||
5,915 | Yum! Brands, Inc. | 701,105 | |||||||||
2,259,323 | |||||||||||
Internet & Catalog Retail | 0.37 | % | |||||||||
1,115 | Netflix Inc.(a) | 417,668 | |||||||||
Internet & Direct Marketing Retail | 7.85 | % | |||||||||
2,485 | Amazon.com, Inc.(a) | 8,100,976 | |||||||||
250 | Booking Holdings, Inc.(a) | 587,112 | |||||||||
1,800 | Etsy, Inc.(a) | 223,704 | |||||||||
8,911,792 | |||||||||||
Multiline Retail | 0.70 | % | |||||||||
3,750 | Target Corp. | 795,825 | |||||||||
Specialty Retail | 3.04 | % | |||||||||
7,425 | Lowe's Companies, Inc. | 1,501,261 | |||||||||
1,100 | O'Reilly Automotive, Inc.(a) | 753,456 | |||||||||
19,745 | The TJX Companies, Inc. | 1,196,152 | |||||||||
3,450,869 | |||||||||||
Textiles, Apparel & Luxury Goods | 1.02 | % | |||||||||
8,635 | NIKE, Inc. — Class B | 1,161,925 | |||||||||
| Total Consumer Discretionary (Cost $10,066,562) | 19,475,882 | ||||||||||

The accompanying notes are an integral part of these financial statements.
81
BUFFALO LARGE CAP FUND
SCHEDULE OF INVESTMENTS
MARCH 31, 2022 Continued
Shares or Face Amount | $ Fair Value* | ||||||||||
Consumer Staples | 4.04 | % | |||||||||
Food & Staples Retailing | 3.37 | % | |||||||||
4,750 | Costco Wholesale Corp. | 2,735,287 | |||||||||
13,350 | Sysco Corp. | 1,090,028 | |||||||||
3,825,315 | |||||||||||
Personal Products | 0.67 | % | |||||||||
2,810 | The Estee Lauder Companies Inc. — Class A | 765,219 | |||||||||
| Total Consumer Staples (Cost $3,559,561) | 4,590,534 | ||||||||||
Financials | 2.16 | % | |||||||||
Capital Markets | 1.16 | % | |||||||||
3,225 | S&P Global, Inc. | 1,322,831 | |||||||||
Insurance | 1.00 | % | |||||||||
3,475 | Aon PLC — ADR(b) | 1,131,564 | |||||||||
| Total Financials (Cost $1,242,264) | 2,454,395 | ||||||||||
Health Care | 12.50 | % | |||||||||
Biotechnology | 1.09 | % | |||||||||
3,360 | Alnylam Pharmaceuticals, Inc.(a) | 548,655 | |||||||||
2,625 | Vertex Pharmaceuticals Inc.(a) | 685,046 | |||||||||
1,233,701 | |||||||||||
Health Care Equipment & Supplies | 4.83 | % | |||||||||
4,815 | Abbott Laboratories | 569,903 | |||||||||
12,825 | Boston Scientific Corp.(a) | 568,019 | |||||||||
4,775 | Danaher Corp. | 1,400,651 | |||||||||
11,075 | Edwards Lifesciences Corp.(a) | 1,303,749 | |||||||||
2,675 | Insulet Corporation(a) | 712,593 | |||||||||
3,450 | Stryker Corp. | 922,358 | |||||||||
5,477,273 | |||||||||||
Health Care Providers & Services | 1.82 | % | |||||||||
4,050 | UnitedHealth Group, Inc. | 2,065,378 | |||||||||
Life Sciences Tools & Services | 2.33 | % | |||||||||
3,375 | ICON PLC. — ADR(a) (b) | 820,868 | |||||||||
22,615 | Stevanato Group SpA — ADR(a) (b) | 455,014 | |||||||||
2,325 | Thermo Fisher Scientific, Inc. | 1,373,261 | |||||||||
2,649,143 | |||||||||||

The accompanying notes are an integral part of these financial statements.
82
BUFFALO LARGE CAP FUND
SCHEDULE OF INVESTMENTS
MARCH 31, 2022 Continued
Shares or Face Amount | $ Fair Value* | ||||||||||
Pharmaceuticals | 2.43 | % | |||||||||
2,650 | Eli Lilly & Co. | 758,880 | |||||||||
6,625 | Johnson & Johnson | 1,174,149 | |||||||||
4,400 | Zoetis, Inc. | 829,796 | |||||||||
2,762,825 | |||||||||||
| Total Health Care (Cost $11,250,477) | 14,188,320 | ||||||||||
Industrials | 3.42 | % | |||||||||
Aerospace & Defense | 0.94 | % | |||||||||
2,375 | Northrop Grumman Corp. | 1,062,147 | |||||||||
Commercial Services & Supplies | 1.00 | % | |||||||||
7,175 | Waste Management, Inc. | 1,137,238 | |||||||||
Industrial Conglomerates | 0.79 | % | |||||||||
4,625 | Honeywell International, Inc. | 899,932 | |||||||||
Trading Companies & Distributors | 0.69 | % | |||||||||
2,200 | United Rentals, Inc.(a) | 781,462 | |||||||||
| Total Industrials (Cost $3,333,070) | 3,880,779 | ||||||||||
Information Technology | 42.42 | % | |||||||||
Communications Equipment | 1.09 | % | |||||||||
8,900 | Arista Networks Inc.(a) | 1,236,922 | |||||||||
Computers & Peripherals | 0.72 | % | |||||||||
9,875 | NetApp, Inc. | 819,625 | |||||||||
Internet Software & Services | 0.12 | % | |||||||||
888 | Okta, Inc.(a) | 134,052 | |||||||||
IT Services | 5.65 | % | |||||||||
1,875 | Accenture Plc — ADR(b) | 632,306 | |||||||||
1,700 | MasterCard, Inc. — Class A | 607,546 | |||||||||
2,175 | MongoDB, Inc.(a) | 964,808 | |||||||||
6,000 | PayPal Holdings, Inc.(a) | 693,900 | |||||||||
15,840 | Visa Inc. — Class A | 3,512,837 | |||||||||
6,411,397 | |||||||||||

The accompanying notes are an integral part of these financial statements.
83
BUFFALO LARGE CAP FUND
SCHEDULE OF INVESTMENTS
MARCH 31, 2022 Continued
Shares or Face Amount | $ Fair Value* | ||||||||||
Semiconductors & Semiconductor Equipment | 7.83 | % | |||||||||
6,150 | Advanced Micro Devices, Inc.(a) | 672,441 | |||||||||
8,325 | Applied Materials, Inc. | 1,097,235 | |||||||||
2,800 | ASML Holding NV — NY Shares — ADR(b) | 1,870,204 | |||||||||
7,475 | Entegris, Inc. | 981,169 | |||||||||
1,525 | Lam Research Corporation | 819,855 | |||||||||
10,600 | NVIDIA Corp. | 2,892,316 | |||||||||
2,950 | NXP Semiconductors NV — ADR(b) | 545,986 | |||||||||
8,879,206 | |||||||||||
Software | 19.01 | % | |||||||||
2,570 | Adobe, Inc.(a) | 1,170,943 | |||||||||
8,100 | Dassault Systemes SE — ADR(b) | 399,492 | |||||||||
2,900 | Fortinet Inc.(a) | 991,046 | |||||||||
1,325 | HubSpot, Inc.(a) | 629,296 | |||||||||
2,325 | Intuit, Inc. | 1,117,953 | |||||||||
37,200 | Microsoft Corp. | 11,469,132 | |||||||||
2,775 | Palo Alto Networks, Inc.(a) | 1,727,465 | |||||||||
6,990 | salesforce.com, Inc.(a) | 1,484,117 | |||||||||
2,870 | ServiceNow, Inc.(a) | 1,598,274 | |||||||||
4,325 | Snap Inc. — Class A(a) | 155,657 | |||||||||
3,475 | Workday, Inc.(a) | 832,124 | |||||||||
21,575,499 | |||||||||||
Technology Hardware, Storage & Peripherals | 8.00 | % | |||||||||
51,980 | Apple Inc. | 9,076,228 | |||||||||
| Total Information Technology (Cost $25,914,193) | 48,132,929 | ||||||||||
Materials | 1.54 | % | |||||||||
Chemicals | 1.02 | % | |||||||||
3,630 | Linde PLC — ADR(b) | 1,159,531 | |||||||||
Construction Materials | 0.52 | % | |||||||||
14,550 | CRH PLC — ADR(b) | 582,873 | |||||||||
| Total Materials (Cost $1,350,807) | 1,742,404 | ||||||||||
| Total Common Stocks (Cost $60,548,697) | 106,170,581 | ||||||||||

The accompanying notes are an integral part of these financial statements.
84
BUFFALO LARGE CAP FUND
SCHEDULE OF INVESTMENTS
MARCH 31, 2022 Continued
Shares or Face Amount | $ Fair Value* | ||||||||||
Exchange Traded Funds | 0.93 | % | |||||||||
Other Financial Investment Activities | 0.34 | % | |||||||||
5,625 | SPDR S&P Regional Banking ETF | 387,563 | |||||||||
Other Investment Pools and Funds | 0.59 | % | |||||||||
10,925 | SPDR S&P Metals & Mining ETF | 669,593 | |||||||||
| Total Exchange Traded Funds (Cost $1,060,544) | 1,057,156 | ||||||||||
Short Term Investments | 6.18 | % | |||||||||
Investment Company | 6.18 | % | |||||||||
7,009,473 | Fidelity Investments Money Market Funds — Government Portfolio — Class I — 0.12%(c) | 7,009,473 | |||||||||
Total Investment Company | 7,009,473 | ||||||||||
| Total Short Term Investments (Cost $7,009,473) | 7,009,473 | ||||||||||
| Total Investments (Cost ($68,618,714) | 100.67 114,237,210 | % | |||||||||
Liabilities in Excess of Other Assets | (0.67 (763,664) | )% | |||||||||
| Total Net Assets | 100.00 113,473,546 | % | |||||||||
ADR American Depositary Receipt
PLC Public Limited Company
(a) Non Income Producing.
(b) Foreign Issued Securities. The total value of these securities amounted to $7,597,838 (6.70% of net assets) at March 31, 2022.
(c) The rate quoted is the annualized seven-day effective yield as of March 31, 2022.
* See Note 1A of the accompanying Notes to Financial Statements regarding valuation of securities.
The Global Industry Classification Standard (GICS) was developed by and/or is the exclusive property of MSCI, Inc. and Standard & Poor's Financial Services LLC ("S&P"). GICS is a service mark of MSCI and S&P and has been licensed for use by U.S. Bancorp Fund Services, LLC.

The accompanying notes are an integral part of these financial statements.
85
BUFFALO MID CAP FUND
SCHEDULE OF INVESTMENTS
MARCH 31, 2022
Shares or Face Amount | $ Fair Value* | ||||||||||
Common Stocks | 95.15 | % | |||||||||
Communication Services | 5.49 | % | |||||||||
Entertainment | 2.42 | % | |||||||||
23,537 | Live Nation Entertainment, Inc.(a) | 2,768,893 | |||||||||
10,260 | Take-Two Interactive Software, Inc.(a) | 1,577,372 | |||||||||
4,346,265 | |||||||||||
Interactive Media & Services | 2.29 | % | |||||||||
101,300 | Pinterest, Inc.(a) | 2,492,993 | |||||||||
60,040 | TripAdvisor, Inc.(a) | 1,628,285 | |||||||||
4,121,278 | |||||||||||
Media | 0.78 | % | |||||||||
22,329 | Liberty Media Corp-Liberty Formula One(a) | 1,409,630 | |||||||||
| Total Communication Services (Cost $7,480,845) | 9,877,173 | ||||||||||
Consumer Discretionary | 4.76 | % | |||||||||
Hotels, Restaurants & Leisure | 0.86 | % | |||||||||
5,956 | Vail Resorts, Inc. | 1,550,168 | |||||||||
Specialty Retail | 2.56 | % | |||||||||
24,835 | CarMax, Inc.(a) | 2,396,081 | |||||||||
9,800 | Floor & Decor Holdings, Inc. — Class A(a) | 793,800 | |||||||||
4,300 | RH(a) | 1,402,187 | |||||||||
4,592,068 | |||||||||||
Textiles, Apparel & Luxury Goods | 1.34 | % | |||||||||
6,600 | lululemon athletica, Inc.(a) | 2,410,518 | |||||||||
| Total Consumer Discretionary (Cost $8,114,562) | 8,552,754 | ||||||||||
Energy | 3.68 | % | |||||||||
Energy Equipment & Services | 1.76 | % | |||||||||
76,740 | Schlumberger Ltd. — ADR(b) | 3,170,129 | |||||||||
Oil, Gas & Consumable Fuels | 1.92 | % | |||||||||
29,000 | EOG Resources, Inc. | 3,457,670 | |||||||||
| Total Energy (Cost $2,865,715) | 6,627,799 | ||||||||||

The accompanying notes are an integral part of these financial statements.
86
BUFFALO MID CAP FUND
SCHEDULE OF INVESTMENTS
MARCH 31, 2022 Continued
Shares or Face Amount | $ Fair Value* | ||||||||||
Financials | 10.47 | % | |||||||||
Capital Markets | 9.21 | % | |||||||||
6,225 | MarketAxess Holdings, Inc. | 2,117,745 | |||||||||
8,074 | Moody's Corp. | 2,724,248 | |||||||||
11,466 | MSCI, Inc. | 5,766,022 | |||||||||
134,000 | Open Lending Corp.(a) | 2,533,940 | |||||||||
8,340 | S&P Global, Inc. | 3,421,080 | |||||||||
16,563,035 | |||||||||||
Insurance | 1.26 | % | |||||||||
9,900 | Kinsale Capital Group, Inc. | 2,257,398 | |||||||||
| Total Financials (Cost $7,305,967) | 18,820,433 | ||||||||||
Health Care | 17.41 | % | |||||||||
Aerospace & Defense | 1.07 | % | |||||||||
5,400 | Teleflex, Inc. | 1,916,082 | |||||||||
Biotechnology | 0.54 | % | |||||||||
13,950 | Exact Sciences Corp.(a) | 975,384 | |||||||||
Health Care Equipment & Supplies | 5.22 | % | |||||||||
6,700 | ABIOMED, Inc.(a) | 2,219,308 | |||||||||
75,810 | Envista Holdings Corp.(a) | 3,692,705 | |||||||||
7,720 | Masimo Corp.(a) | 1,123,569 | |||||||||
5,650 | The Cooper Companies, Inc. | 2,359,383 | |||||||||
9,394,965 | |||||||||||
Health Care Providers & Services | 2.48 | % | |||||||||
5,360 | Chemed Corp. | 2,715,108 | |||||||||
24,550 | Encompass Health Corp. | 1,745,751 | |||||||||
4,460,859 | |||||||||||
Health Care Technology | 1.96 | % | |||||||||
16,550 | Veeva Systems, Inc.(a) | 3,516,213 | |||||||||
Life Sciences Tools & Services | 5.36 | % | |||||||||
4,530 | Bio-Rad Laboratories, Inc.(a) | 2,551,432 | |||||||||
11,500 | Bio-Techne Corp. | 4,979,960 | |||||||||
6,055 | Illumina, Inc.(a) | 2,115,617 | |||||||||
9,647,009 | |||||||||||

The accompanying notes are an integral part of these financial statements.
87
BUFFALO MID CAP FUND
SCHEDULE OF INVESTMENTS
MARCH 31, 2022 Continued
Shares or Face Amount | $ Fair Value* | ||||||||||
Pharmaceuticals | 0.78 | % | |||||||||
9,000 | Jazz Pharmaceuticals Public Limited Company — ADR(a) (b) | 1,401,030 | |||||||||
| Total Health Care (Cost $19,079,435) | 31,311,542 | ||||||||||
Industrials | 18.31 | % | |||||||||
Aerospace & Defense | 1.45 | % | |||||||||
4,000 | TransDigm Group, Inc.(a) | 2,606,160 | |||||||||
Building Products | 0.76 | % | |||||||||
21,002 | Trex Co., Inc.(a) | 1,372,060 | |||||||||
Commercial Services & Supplies | 2.87 | % | |||||||||
25,041 | Copart, Inc.(a) | 3,141,894 | |||||||||
52,666 | IAA Inc.(a) | 2,014,475 | |||||||||
5,156,369 | |||||||||||
Electrical Equipment | 2.61 | % | |||||||||
35,255 | AMETEK, Inc. | 4,695,261 | |||||||||
Professional Services | 8.33 | % | |||||||||
136,000 | Clarivate Plc — ADR(a) (b) | 2,279,360 | |||||||||
61,550 | CoStar Group, Inc.(a) | 4,099,846 | |||||||||
12,483 | Equifax, Inc. | 2,959,719 | |||||||||
26,303 | Verisk Analytics, Inc. | 5,645,413 | |||||||||
14,984,338 | |||||||||||
Road & Rail | 2.29 | % | |||||||||
107,000 | Lyft, Inc.(a) | 4,108,800 | |||||||||
| Total Industrials (Cost $16,477,441) | 32,922,988 | ||||||||||
Information Technology | 27.83 | % | |||||||||
Communications Equipment | 1.93 | % | |||||||||
16,570 | F5 Networks, Inc.(a) | 3,462,301 | |||||||||
IT Services | 5.63 | % | |||||||||
6,680 | EPAM Systems, Inc.(a) | 1,981,355 | |||||||||
22,600 | Euronet Worldwide, Inc.(a) | 2,941,390 | |||||||||
17,500 | Gartner, Inc.(a) | 5,205,550 | |||||||||
10,128,295 | |||||||||||

The accompanying notes are an integral part of these financial statements.
88
BUFFALO MID CAP FUND
SCHEDULE OF INVESTMENTS
MARCH 31, 2022 Continued
Shares or Face Amount | $ Fair Value* | ||||||||||
Semiconductors & Semiconductor Equipment | 5.73 | % | |||||||||
19,186 | Analog Devices, Inc. | 3,169,144 | |||||||||
37,300 | Micron Technology, Inc. | 2,905,297 | |||||||||
43,310 | ON Semiconductor Corp.(a) | 2,711,639 | |||||||||
9,140 | Universal Display Corp. | 1,525,923 | |||||||||
10,312,003 | |||||||||||
Software | 14.54 | % | |||||||||
27,335 | Aspen Technology, Inc.(a) | 4,520,389 | |||||||||
21,862 | Guidewire Software, Inc.(a) | 2,068,582 | |||||||||
8,030 | Palo Alto Networks, Inc.(a) | 4,998,755 | |||||||||
28,000 | Procore Technologies, Inc.(a) | 1,622,880 | |||||||||
19,400 | Splunk, Inc.(a) | 2,883,034 | |||||||||
34,289 | SS&C Technologies Holdings, Inc. | 2,572,361 | |||||||||
6,640 | Tyler Technologies, Inc.(a) | 2,954,070 | |||||||||
47,000 | Varonis Systems, Inc.(a) | 2,234,380 | |||||||||
9,540 | Workday, Inc.(a) | 2,284,448 | |||||||||
26,138,899 | |||||||||||
| Total Information Technology (Cost $29,824,228) | 50,041,498 | ||||||||||
Materials | 3.31 | % | |||||||||
Chemicals | 1.71 | % | |||||||||
23,310 | FMC Corp. | 3,066,897 | |||||||||
Construction Materials | 1.60 | % | |||||||||
7,500 | Martin Marietta Materials, Inc. | 2,886,675 | |||||||||
| Total Materials (Cost $1,847,509) | 5,953,572 | ||||||||||
Real Estate | 3.89 | % | |||||||||
Real Estate Management & Development | 3.89 | % | |||||||||
56,522 | CBRE Group, Inc. — Class A(a) | 5,172,893 | |||||||||
37,000 | Zillow Group, Inc.(a) | 1,823,730 | |||||||||
| Total Real Estate (Cost $4,632,590) | 6,996,623 | ||||||||||
| Total Common Stocks (Cost $97,628,292) | 171,104,382 | ||||||||||

The accompanying notes are an integral part of these financial statements.
89
BUFFALO MID CAP FUND
SCHEDULE OF INVESTMENTS
MARCH 31, 2022 Continued
Shares or Face Amount | $ Fair Value* | ||||||||||
REITS | 2.64 | % | |||||||||
Real Estate | 2.64 | % | |||||||||
Equity Real Estate Investment Trusts (REITs) | 2.64 | % | |||||||||
1,624 | Equinix Inc. | 1,204,391 | |||||||||
36,790 | Welltower, Inc. | 3,536,990 | |||||||||
| Total Real Estate (Cost $2,973,950) | 4,741,381 | ||||||||||
| Total REITS (Cost $2,973,950) | 4,741,381 | ||||||||||
Short Term Investments | 2.27 | % | |||||||||
Investment Company | 2.27 | % | |||||||||
4,076,222 | Fidelity Investments Money Market Funds — Government Portfolio — Class I — 0.12%(c) | 4,076,222 | |||||||||
Total Investment Company | 4,076,222 | ||||||||||
| Total Short Term Investments (Cost $4,076,222) | 4,076,222 | ||||||||||
| Total Investments (Cost $104,678,464) | 100.06 179,921,985 | % | |||||||||
| Liabilities in Excess of Other Assets | (0.06 (98,992) | )% | |||||||||
| Total Net Assets | 100.00 179,822,993 | % | |||||||||
ADR American Depositary Receipt
PLC Public Limited Company
(a) Non Income Producing.
(b) Foreign Issued Security. The total value of these securities amounted to $6,850,519 (3.81% of net assets) at March 31, 2022.
(c) The rate quoted is the annualized seven-day effective yield as of March 31, 2022.
* See Note 1A of the accompanying Notes to Financial Statements regarding valuation of securities.
The Global Industry Classification Standard (GICS) was developed by and/or is the exclusive property of MSCI, Inc. and Standard & Poor's Financial Services LLC ("S&P"). GICS is a service mark of MSCI and S&P and has been licensed for use by U.S. Bancorp Fund Services, LLC.

The accompanying notes are an integral part of these financial statements.
90
BUFFALO SMALL CAP FUND
SCHEDULE OF INVESTMENTS
MARCH 31, 2022
Shares or Face Amount | $ Fair Value* | ||||||||||
Common Stocks | 95.22 | % | |||||||||
Communication Services | 1.23 | % | |||||||||
Interactive Media & Services | 1.23 | % | |||||||||
811,824 | Eventbrite, Inc.(a) | 11,990,640 | |||||||||
| Total Communication Services (Cost $15,253,617) | 11,990,640 | ||||||||||
Consumer Discretionary | 13.10 | % | |||||||||
Diversified Consumer Services | 1.16 | % | |||||||||
383,065 | European Wax Center, Inc.(a) | 11,323,401 | |||||||||
Hotels, Restaurants & Leisure | 5.98 | % | |||||||||
239,340 | Bally's Corp.(a) | 7,357,312 | |||||||||
1,017,610 | Everi Holdings Inc.(a) | 21,369,810 | |||||||||
531,202 | First Watch Restaurant Group, Inc.(a) | 6,932,186 | |||||||||
1,060,075 | Rush Street Interactive, Inc.(a) | 7,706,745 | |||||||||
59,355 | Texas Roadhouse, Inc. | 4,969,794 | |||||||||
87,090 | Wingstop, Inc. | 10,220,012 | |||||||||
58,555,859 | |||||||||||
Household Durables | 1.22 | % | |||||||||
221,932 | Lovesac Co/The(a) | 11,997,644 | |||||||||
Internet & Direct Marketing Retail | 1.48 | % | |||||||||
172,285 | Overstock.com, Inc.(a) | 7,581,402 | |||||||||
628,156 | Vivid Seats, Inc. | 6,947,405 | |||||||||
14,528,807 | |||||||||||
Specialty Retail | 1.65 | % | |||||||||
738,406 | Guess?, Inc. | 16,134,171 | |||||||||
Textiles, Apparel & Luxury Goods | 1.61 | % | |||||||||
407,487 | Steven Madden Ltd. | 15,745,298 | |||||||||
| Total Consumer Discretionary (Cost $107,849,796) | 128,285,180 | ||||||||||
Consumer Staples | 1.62 | % | |||||||||
Beverages | 1.62 | % | |||||||||
185,025 | MGP Ingredients, Inc. | 15,836,290 | |||||||||
| Total Consumer Staples (Cost $7,519,455) | 15,836,290 | ||||||||||

The accompanying notes are an integral part of these financial statements.
91
BUFFALO SMALL CAP FUND
SCHEDULE OF INVESTMENTS
MARCH 31, 2022 Continued
Shares or Face Amount | $ Fair Value* | ||||||||||
Financials | 8.42 | % | |||||||||
Banks | 2.49 | % | |||||||||
445,170 | Bancorp Inc/The(a) | 12,611,666 | |||||||||
225,140 | Customers Bancorp, Inc.(a) | 11,738,800 | |||||||||
24,350,466 | |||||||||||
Capital Markets | 3.18 | % | |||||||||
151,195 | Hamilton Lane Inc. — Class A | 11,685,861 | |||||||||
856,110 | MarketWise, Inc. — Class A(a) (c) | 4,040,839 | |||||||||
817,105 | Open Lending Corp.(a) | 15,451,456 | |||||||||
31,178,156 | |||||||||||
Insurance | 3.16 | % | |||||||||
487,670 | BRP Group, Inc.(a) | 13,084,186 | |||||||||
278,588 | Palomar Holdings, Inc.(a) | 17,826,846 | |||||||||
30,911,032 | |||||||||||
| Total Financials (Cost $83,019,223) | 86,439,654 | ||||||||||
Health Care | 24.68 | % | |||||||||
Biotechnology | 8.39 | % | |||||||||
675,077 | Avid Bioservices, Inc.(a) | 13,751,319 | |||||||||
422,242 | Castle Biosciences, Inc.(a) | 18,941,776 | |||||||||
546,715 | Halozyme Therapeutics, Inc.(a) | 21,802,994 | |||||||||
133,987 | Ligand Pharmaceuticals, Inc.(a) | 15,072,198 | |||||||||
309,165 | Natera, Inc.(a) | 12,576,832 | |||||||||
82,145,119 | |||||||||||
Health Care Equipment & Supplies | 6.79 | % | |||||||||
211,315 | Establishment Labs Holdings, Inc. — ADR(a) (b) | 14,240,518 | |||||||||
199,919 | NeuroPace, Inc.(a) | 1,641,335 | |||||||||
1,303,920 | OraSure Technologies, Inc.(a) | 8,840,577 | |||||||||
342,140 | Paragon 28, Inc.(a) | 5,727,423 | |||||||||
76,710 | Quidel Corp.(a) | 8,626,807 | |||||||||
169,835 | STAAR Surgical Co.(a) | 13,571,515 | |||||||||
512,284 | TransMedics Group, Inc.(a) | 13,800,931 | |||||||||
66,449,106 | |||||||||||
Health Care Providers & Services | 3.76 | % | |||||||||
229,848 | HealthEquity, Inc.(a) | 15,500,949 | |||||||||
798,610 | Privia Health Group, Inc.(a) | 21,346,845 | |||||||||
36,847,794 | |||||||||||

The accompanying notes are an integral part of these financial statements.
92
BUFFALO SMALL CAP FUND
SCHEDULE OF INVESTMENTS
MARCH 31, 2022 Continued
Shares or Face Amount | $ Fair Value* | ||||||||||
Health Care Technology | 1.77 | % | |||||||||
536,085 | Evolent Health, Inc. — Class A(a) | 17,315,546 | |||||||||
Life Sciences Tools & Services | 3.49 | % | |||||||||
638,029 | Codexis, Inc.(a) | 13,156,158 | |||||||||
384,675 | Quanterix Corp.(a) | 11,228,663 | |||||||||
121,080 | Syneos Health, Inc.(a) | 9,801,426 | |||||||||
34,186,247 | |||||||||||
Pharmaceuticals | 0.48 | % | |||||||||
579,725 | Verrica Pharmaceuticals, Inc.(a) | 4,701,570 | |||||||||
| Total Health Care (Cost $236,976,657) | 241,645,382 | ||||||||||
Industrials | 23.09 | % | |||||||||
Air Freight & Logistics | 2.31 | % | |||||||||
675,200 | Air Transport Services Group, Inc.(a) | 22,585,440 | |||||||||
Building Products | 3.88 | % | |||||||||
142,175 | Advanced Drainage Systems, Inc. | 16,891,812 | |||||||||
747,550 | Janus International Group, Inc.(a) | 6,727,950 | |||||||||
796,425 | PGT Innovations, Inc.(a) | 14,319,721 | |||||||||
37,939,483 | |||||||||||
Construction & Engineering | 4.20 | % | |||||||||
239,580 | MasTec, Inc.(a) | 20,867,418 | |||||||||
152,260 | NV5 Global, Inc.(a) | 20,296,258 | |||||||||
41,163,676 | |||||||||||
Electrical Equipment | 2.16 | % | |||||||||
666,310 | Array Technologies, Inc.(a) | 7,509,314 | |||||||||
387,973 | Shoals Technologies Group, Inc.(a) | 6,611,060 | |||||||||
100,252 | Vicor Corp.(a) | 7,072,778 | |||||||||
21,193,152 | |||||||||||
Machinery | 2.69 | % | |||||||||
38,625 | Chart Industries, Inc.(a) | 6,634,616 | |||||||||
362,973 | Hydrofarm Holdings Group, Inc.(a) | 5,499,041 | |||||||||
119,870 | John Bean Technologies Corp. | 14,200,999 | |||||||||
26,334,656 | |||||||||||

The accompanying notes are an integral part of these financial statements.
93
BUFFALO SMALL CAP FUND
SCHEDULE OF INVESTMENTS
MARCH 31, 2022 Continued
Shares or Face Amount | $ Fair Value* | ||||||||||
Professional Services | 7.85 | % | |||||||||
413,235 | First Advantage Corp.(a) | 8,343,215 | |||||||||
124,710 | FTI Consulting, Inc.(a) | 19,606,906 | |||||||||
265,448 | ICF International, Inc. | 24,989,275 | |||||||||
510,515 | Sterling Check Corp.(a) | 13,492,912 | |||||||||
448,135 | Upwork, Inc.(a) | 10,414,657 | |||||||||
76,846,965 | |||||||||||
| Total Industrials (Cost $184,632,086) | 226,063,372 | ||||||||||
Information Technology | 20.52 | % | |||||||||
Communications Equipment | 4.40 | % | |||||||||
852,935 | ADTRAN, Inc. | 15,736,651 | |||||||||
464,070 | Calix, Inc.(a) | 19,913,243 | |||||||||
311,545 | Cambium Networks Corp. — ADR(a) (b) | 7,364,924 | |||||||||
43,014,818 | |||||||||||
IT Services | 4.45 | % | |||||||||
58,040 | Endava Plc — ADR(a) (b) | 7,721,061 | |||||||||
280,710 | Grid Dynamics Holdings, Inc.(a) | 3,952,397 | |||||||||
1,714,490 | Paya Holdings, Inc.(a) | 10,046,912 | |||||||||
566,716 | TaskUS, Inc.(a) | 21,795,897 | |||||||||
43,516,267 | |||||||||||
Semiconductors & Semiconductor Equipment | 3.70 | % | |||||||||
286,430 | MaxLinear, Inc.(a) | 16,713,190 | |||||||||
58,335 | Silicon Laboratories, Inc.(a) | 8,761,917 | |||||||||
64,545 | Universal Display Corp. | 10,775,788 | |||||||||
36,250,895 | |||||||||||
Software | 8.04 | % | |||||||||
220,200 | Airspan Networks Holdings, Inc.(a) (c) | 640,782 | |||||||||
245,875 | Digital Turbine, Inc.(a) | 10,771,784 | |||||||||
672,859 | DoubleVerify Holdings, Inc.(a) | 16,935,861 | |||||||||
352,735 | Tenable Holdings, Inc.(a) | 20,384,556 | |||||||||
303,105 | Varonis Systems, Inc.(a) | 14,409,612 | |||||||||
238,060 | Viant Technology, Inc.(a) | 1,559,293 | |||||||||
933,490 | Zuora, Inc.(a) | 13,983,680 | |||||||||
78,685,568 | |||||||||||
| Total Information Technology (Cost $168,693,122) | 201,467,548 | ||||||||||

The accompanying notes are an integral part of these financial statements.
94
BUFFALO SMALL CAP FUND
SCHEDULE OF INVESTMENTS
MARCH 31, 2022 Continued
Shares or Face Amount | $ Fair Value* | ||||||||||
Materials | 2.08 | % | |||||||||
Construction Materials | 1.47 | % | |||||||||
463,433 | Summit Materials, Inc. — Class A(a) | 14,394,229 | |||||||||
Containers & Packaging | 0.61 | % | |||||||||
302,997 | Karat Packaging, Inc.(a) | 6,014,490 | |||||||||
| Total Materials (Cost $12,354,782) | 20,408,719 | ||||||||||
| Total Common Stocks (Cost $816,298,728) | 932,136,785 | ||||||||||
Short Term Investments | 4.54 | % | |||||||||
Investment Company | 4.54 | % | |||||||||
44,458,589 | Fidelity Investments Money Market Funds — Government Portfolio — Class I — 0.12%(d) | 44,458,589 | |||||||||
Total Investment Company | 44,458,589 | ||||||||||
| Total Short Term Investments (Cost $44,458,589) | 44,458,589 | ||||||||||
| Total Investments (Cost ($860,757,317) | 99.76 976,595,374 | % | |||||||||
| Other Assets in Excess of Liabilities | 0.24 2,327,102 | % | |||||||||
| Total Net Assets | 100.00 978,922,476 | % | |||||||||
ADR American Depositary Receipt
(a) Non Income Producing.
(b) Foreign Issued Securities. The total value of these securities amounted to $29,326,503 (3.00% of net assets) at March 31, 2022.
(c) Security is restricted from resale and considered illiquid. The total value of these securities amounted to $4,681,621 (0.48% of net assets) at March 31, 2022.
(d) The rate quoted is the annualized seven-day effective yield as of March 31, 2022.
* See Note 1A of the accompanying Notes to Financial Statements regarding valuation of securities.
The Global Industry Classification Standard (GICS) was developed by and/or is the exclusive property of MSCI, Inc. and Standard & Poor's Financial Services LLC ("S&P"). GICS is a service mark of MSCI and S&P and has been licensed for use by U.S. Bancorp Fund Services, LLC.

The accompanying notes are an integral part of these financial statements.
95
STATEMENTS OF ASSETS AND
LIABILITIES
MARCH 31, 2022
| Buffalo Discovery Fund | Buffalo Dividend Focus Fund | Buffalo Early Stage Growth Fund | Buffalo Flexible Income Fund | Buffalo Growth Fund | |||||||||||||||||||
ASSETS: | |||||||||||||||||||||||
Investments in securities, at cost: | $ | 1,094,900,550 | $ | 65,686,473 | $ | 90,954,467 | $ | 237,185,831 | $ | 89,177,959 | |||||||||||||
Cash denominated in foreign currencies, at cost: | — | — | — | — | — | ||||||||||||||||||
Investments in securities, at fair value: | 1,462,774,644 | 116,885,566 | 112,128,982 | 489,631,681 | 195,586,622 | ||||||||||||||||||
Cash: | — | — | — | — | — | ||||||||||||||||||
Receivables: | |||||||||||||||||||||||
Investments sold | 2,278,102 | — | 729,647 | — | — | ||||||||||||||||||
Fund shares sold | 596,044 | 7,945 | 10,626 | 190,632 | 10,502 | ||||||||||||||||||
Dividends | 63,222 | 75,103 | 16,554 | 907,517 | 11,415 | ||||||||||||||||||
Interest | — | 9,948 | — | — | — | ||||||||||||||||||
Other assets | 41,127 | 14,430 | 13,130 | 18,646 | 14,684 | ||||||||||||||||||
Total assets | 1,465,753,139 | 116,992,992 | 112,898,939 | 490,748,476 | 195,623,223 | ||||||||||||||||||
LIABILITIES: | |||||||||||||||||||||||
Payables: | |||||||||||||||||||||||
Investments purchased | — | — | — | — | — | ||||||||||||||||||
Written options, at value(1) (Note 8) | — | — | — | 120,945 | — | ||||||||||||||||||
Fund shares purchased | 1,691,945 | 69,022 | 25,728 | 117,849 | 87,559 | ||||||||||||||||||
Management fees (Note 3) | 1,032,340 | 72,526 | 123,900 | 344,072 | 120,010 | ||||||||||||||||||
Custodian fees (Note 3) | — | — | — | — | — | ||||||||||||||||||
Accrued shareholder service fees — Investor Class (Note 7) | 401,327 | 7,645 | 51,820 | 87,116 | 65,071 | ||||||||||||||||||
Other payables | — | — | — | — | — | ||||||||||||||||||
Accrued expenses | 1,299 | 2,647 | 8,134 | 53,550 | 17,849 | ||||||||||||||||||
Total liabilities | 3,126,911 | 151,840 | 209,582 | 723,532 | 290,489 | ||||||||||||||||||
NET ASSETS | $ | 1,462,626,228 | $ | 116,841,152 | $ | 112,689,357 | $ | 490,024,944 | $ | 195,332,734 | |||||||||||||
NET ASSETS CONSIST OF: | |||||||||||||||||||||||
Capital (capital stock and paid-in capital) | $ | 1,089,705,178 | $ | 63,842,829 | $ | 92,639,579 | $ | 225,696,839 | $ | 85,002,519 | |||||||||||||
Total distributable earnings | 372,921,050 | 52,998,323 | 20,049,778 | 264,328,105 | 110,330,215 | ||||||||||||||||||
NET ASSETS APPLICABLE TO OUTSTANDING SHARES | $ | 1,462,626,228 | $ | 116,841,152 | $ | 112,689,357 | $ | 490,024,944 | $ | 195,332,734 | |||||||||||||
Net Assets — Investor Class | $ | 1,099,257,608 | $ | 30,894,744 | $ | 68,231,595 | $ | 314,134,313 | $ | 103,336,043 | |||||||||||||
Outstanding Shares — Investor Class | 43,438,831 | 1,198,131 | 3,844,758 | 16,504,947 | 3,351,492 | ||||||||||||||||||
NET ASSET VALUE PER SHARE — Investor Class | $ | 25.31 | $ | 25.79 | $ | 17.75 | $ | 19.03 | $ | 30.83 | |||||||||||||
Net Assets — Institutional Class | $ | 363,368,620 | $ | 85,946,408 | $ | 44,457,762 | $ | 175,890,631 | $ | 91,996,691 | |||||||||||||
Outstanding Shares — Institutional Class | 14,284,775 | 3,333,258 | 2,491,984 | 9,245,074 | 2,972,680 | ||||||||||||||||||
NET ASSET VALUE PER SHARE — Institutional Class | $ | 25.44 | $ | 25.78 | $ | 17.84 | $ | 19.03 | $ | 30.95 | |||||||||||||
Capital shares, $1.00 par value: | |||||||||||||||||||||||
Authorized | Unlimited | Unlimited | Unlimited | Unlimited | Unlimited | ||||||||||||||||||
| (1) Written options, premiums received | — | — | — | 114,845 | — | ||||||||||||||||||

The accompanying notes are an integral part of these financial statements.
96

| Buffalo High Yield Fund | Buffalo International Fund | Buffalo Large Cap Fund | Buffalo Mid Cap Fund | Buffalo Small Cap Fund | |||||||||||||||||||
ASSETS: | |||||||||||||||||||||||
Investments in securities, at cost: | $ | 292,859,394 | $ | 361,007,735 | $ | 68,618,714 | $ | 104,678,464 | $ | 860,757,317 | |||||||||||||
Cash denominated in foreign currencies, at cost: | — | — | — | — | — | ||||||||||||||||||
Investments in securities, at fair value: | 293,306,240 | 577,316,437 | 114,237,210 | 179,921,985 | 976,595,374 | ||||||||||||||||||
Cash: | 479,243 | 25,191 | — | — | 139,600 | ||||||||||||||||||
Receivables: | |||||||||||||||||||||||
Investments sold | 75,366 | — | 619,886 | — | 8,666,847 | ||||||||||||||||||
Fund shares sold | 244,362 | 700,527 | 10,127 | 33,652 | 1,142,463 | ||||||||||||||||||
Dividends | — | 2,585,770 | 35,438 | 42,148 | 401,058 | ||||||||||||||||||
Interest | 3,936,159 | — | — | — | — | ||||||||||||||||||
Other assets | 20,228 | 23,827 | 14,231 | 17,595 | 186,995 | ||||||||||||||||||
Total assets | 298,061,598 | 580,651,752 | 114,916,892 | 180,015,380 | 987,132,337 | ||||||||||||||||||
LIABILITIES: | |||||||||||||||||||||||
Payables: | |||||||||||||||||||||||
Investments purchased | — | — | 1,326,956 | — | 6,310,566 | ||||||||||||||||||
Written options, at value(1) (Note 8) | — | — | — | — | — | ||||||||||||||||||
Fund shares purchased | 1,407,022 | 357,429 | 27,257 | 2,008 | 485,053 | ||||||||||||||||||
Management fees (Note 3) | 213,054 | 410,497 | 69,730 | 125,885 | 687,049 | ||||||||||||||||||
Custodian fees (Note 3) | — | 17,996 | — | — | — | ||||||||||||||||||
Accrued shareholder service fees — Investor Class (Note 7) | — | 28,634 | 18,101 | 50,971 | 720,724 | ||||||||||||||||||
Other payables | — | 112,934 | — | — | — | ||||||||||||||||||
Accrued expenses | 2,933 | 1,861 | 1,302 | 13,523 | 6,469 | ||||||||||||||||||
Total liabilities | 1,623,009 | 929,351 | 1,443,346 | 192,387 | 8,209,861 | ||||||||||||||||||
NET ASSETS | $ | 296,438,589 | $ | 579,722,401 | $ | 113,473,546 | $ | 179,822,993 | $ | 978,922,476 | |||||||||||||
NET ASSETS CONSIST OF: | |||||||||||||||||||||||
Capital (capital stock and paid-in capital) | $ | 290,303,444 | $ | 355,869,119 | $ | 67,817,005 | $ | 99,881,511 | $ | 869,124,955 | |||||||||||||
Total distributable earnings | 6,135,145 | 223,853,282 | 45,656,541 | 79,941,482 | 109,797,521 | ||||||||||||||||||
NET ASSETS APPLICABLE TO OUTSTANDING SHARES | $ | 296,438,589 | $ | 579,722,401 | $ | 113,473,546 | $ | 179,822,993 | $ | 978,922,476 | |||||||||||||
Net Assets — Investor Class | $ | 50,580,946 | $ | 263,119,900 | $ | 35,391,343 | $ | 96,992,087 | $ | 697,646,649 | |||||||||||||
Outstanding Shares — Investor Class | 4,505,826 | 12,741,473 | 880,159 | 5,472,132 | 43,310,908 | ||||||||||||||||||
NET ASSET VALUE PER SHARE — Investor Class | $ | 11.23 | $ | 20.65 | $ | 40.21 | $ | 17.72 | $ | 16.11 | |||||||||||||
Net Assets — Institutional Class | $ | 245,857,643 | $ | 316,602,501 | $ | 78,082,203 | $ | 82,830,906 | $ | 281,275,827 | |||||||||||||
Outstanding Shares — Institutional Class | 21,919,168 | 15,319,011 | 1,934,299 | 4,650,875 | 17,376,370 | ||||||||||||||||||
NET ASSET VALUE PER SHARE — Institutional Class | $ | 11.22 | $ | 20.67 | $ | 40.37 | $ | 17.81 | $ | 16.19 | |||||||||||||
Capital shares, $1.00 par value: | |||||||||||||||||||||||
Authorized | Unlimited | Unlimited | Unlimited | Unlimited | Unlimited | ||||||||||||||||||
| (1) Written options, premiums received | — | — | — | — | — | ||||||||||||||||||
97
STATEMENTS OF OPERATIONS
FOR THE YEAR ENDED MARCH 31, 2022
| Buffalo Discovery Fund | Buffalo Dividend Focus Fund | Buffalo Early Stage Growth Fund | Buffalo Flexible Income Fund | Buffalo Growth Fund | |||||||||||||||||||
INVESTMENT INCOME: | |||||||||||||||||||||||
Interest | $ | — | $ | 56,242 | $ | — | $ | 104,487 | $ | — | |||||||||||||
Dividends from securities | 5,230,051 | 1,623,729 | 343,729 | 11,656,004 | 1,100,127 | ||||||||||||||||||
Foreign tax withheld | (3,098 | ) | (2,926 | ) | (7,317 | ) | — | — | |||||||||||||||
Total investment income | 5,226,953 | 1,677,045 | 336,412 | 11,760,491 | 1,100,127 | ||||||||||||||||||
EXPENSES: | |||||||||||||||||||||||
Management fees (Note 3) | 14,696,008 | 843,450 | 1,762,739 | 3,825,034 | 1,585,640 | ||||||||||||||||||
Shareholder Service Fees — Investor Class (Note 7) | 2,022,322 | 46,320 | 127,519 | 433,814 | 173,289 | ||||||||||||||||||
Registration fees | 53,319 | 32,501 | 26,288 | 35,559 | 35,037 | ||||||||||||||||||
Custody fees | — | — | — | — | — | ||||||||||||||||||
Other expenses | 23,235 | 1,298 | 1,917 | 5,293 | 2,632 | ||||||||||||||||||
Total expenses | 16,794,884 | 923,569 | 1,918,463 | 4,299,700 | 1,796,598 | ||||||||||||||||||
Net investment income (loss) | (11,567,931 | ) | 753,476 | (1,582,051 | ) | 7,460,791 | (696,471 | ) | |||||||||||||||
NET REALIZED AND UNREALIZED GAIN (LOSS): | |||||||||||||||||||||||
Net realized gain from: | |||||||||||||||||||||||
Investment transactions | 145,261,973 | 2,299,786 | 10,248,601 | 18,231,520 | 18,127,016 | ||||||||||||||||||
Options written (Note 8) | — | — | — | 884,613 | — | ||||||||||||||||||
Net unrealized appreciation/depreciation during the year on: | |||||||||||||||||||||||
Investments | (200,818,345 | ) | 10,781,502 | (26,331,028 | ) | 69,794,782 | 2,161,487 | ||||||||||||||||
Options written (Note 8) | — | — | — | (69,235 | ) | — | |||||||||||||||||
Net realized and unrealized gain (loss) | (55,556,372 | ) | 13,081,288 | (16,082,427 | ) | 88,841,680 | 20,288,503 | ||||||||||||||||
Net increase (decrease) in net assets resulting from operations | $ | (67,124,303 | ) | $ | 13,834,764 | $ | (17,664,478 | ) | $ | 96,302,471 | $ | 19,592,032 | |||||||||||

The accompanying notes are an integral part of these financial statements.
98

| Buffalo High Yield Fund | Buffalo International Fund | Buffalo Large Cap Fund | Buffalo Mid Cap Fund | Buffalo Small Cap Fund | |||||||||||||||||||
INVESTMENT INCOME: | |||||||||||||||||||||||
Interest | $ | 14,868,662 | $ | — | $ | — | $ | — | $ | — | |||||||||||||
Dividends from securities | 113,259 | 8,096,264 | 717,916 | 891,373 | 2,113,889 | ||||||||||||||||||
Foreign tax withheld | — | (956,967 | ) | (5,689 | ) | — | — | ||||||||||||||||
Total investment income | 14,981,921 | 7,139,297 | 712,227 | 891,373 | 2,113,889 | ||||||||||||||||||
EXPENSES: | |||||||||||||||||||||||
Management fees (Note 3) | 2,493,677 | 5,209,880 | 904,830 | 1,651,850 | 9,798,514 | ||||||||||||||||||
Shareholder Service Fees — Investor Class (Note 7) | 81,890 | 429,851 | 60,436 | 160,971 | 1,257,921 | ||||||||||||||||||
Registration fees | 33,510 | 48,410 | 31,916 | 31,557 | 84,623 | ||||||||||||||||||
Custody fees | — | 105,362 | — | — | — | ||||||||||||||||||
Other expenses | 22,573 | 6,972 | 1,683 | 2,598 | 15,507 | ||||||||||||||||||
Total expenses | 2,631,650 | 5,800,475 | 998,865 | 1,846,976 | 11,156,565 | ||||||||||||||||||
Net investment income (loss) | 12,350,271 | 1,338,822 | (286,638 | ) | (955,603 | ) | (9,042,676 | ) | |||||||||||||||
NET REALIZED AND UNREALIZED GAIN (LOSS): | |||||||||||||||||||||||
Net realized gain from: | |||||||||||||||||||||||
Investment transactions | 8,337,574 | 15,739,005 | 27,125,565 | 14,348,950 | 52,166,078 | ||||||||||||||||||
Options written (Note 8) | — | — | — | — | — | ||||||||||||||||||
Net unrealized appreciation/depreciation during the year on: | |||||||||||||||||||||||
Investments | (15,061,629 | ) | (9,582,271 | ) | (15,249,591 | ) | (15,622,847 | ) | (254,440,168 | ) | |||||||||||||
Options written (Note 8) | — | — | — | — | — | ||||||||||||||||||
Net realized and unrealized gain (loss) | (6,724,055 | ) | 6,156,734 | 11,875,974 | (1,273,897 | ) | (202,274,090 | ) | |||||||||||||||
Net increase (decrease) in net assets resulting from operations | $ | 5,626,216 | $ | 7,495,556 | $ | 11,589,336 | $ | (2,229,500 | ) | $ | (211,316,766 | ) | |||||||||||
99
STATEMENTS OF CHANGES IN
NET ASSETS
| Buffalo Discovery Fund | Buffalo Dividend Focus Fund | Buffalo Early Stage Growth Fund | |||||||||||||||||||||||||
| Year Ended March 31, 2022 | Year Ended March 31, 2021 | Year Ended March 31, 2022 | Year Ended March 31, 2021 | Year Ended March 31, 2022 | Year Ended March 31, 2021 | ||||||||||||||||||||||
OPERATIONS: | |||||||||||||||||||||||||||
Net investment income (loss) | $ | (11,567,931 | ) | $ | (10,326,642 | ) | $ | 753,476 | $ | 606,964 | $ | (1,582,051 | ) | $ | (1,200,578 | ) | |||||||||||
Net realized gain on investment transactions | 145,261,973 | 322,324,905 | 2,299,786 | 2,703,910 | 10,248,601 | 24,524,120 | |||||||||||||||||||||
| Net unrealized appreciation/depreciation during the year on investments and translation of assets and liabilities in foreign currencies | (200,818,345 | ) | 509,250,181 | 10,781,502 | 31,172,434 | (26,331,028 | ) | 46,689,428 | |||||||||||||||||||
Net increase (decrease) in net assets resulting from operations | (67,124,303 | ) | 821,248,444 | 13,834,764 | 34,483,308 | (17,664,478 | ) | 70,012,970 | |||||||||||||||||||
DISTRIBUTIONS TO SHAREHOLDERS: | |||||||||||||||||||||||||||
Distributable earnings | (236,211,778 | ) | (135,340,074 | ) | (2,146,892 | ) | (603,921 | ) | (18,199,094 | ) | (11,977,369 | ) | |||||||||||||||
Total distributions | (236,211,778 | ) | (135,340,074 | ) | (2,146,892 | ) | (603,921 | ) | (18,199,094 | ) | (11,977,369 | ) | |||||||||||||||
CAPITAL SHARE TRANSACTIONS: | |||||||||||||||||||||||||||
Shares sold | |||||||||||||||||||||||||||
Investor Class | 90,702,153 | 149,611,384 | 2,561,338 | 2,831,032 | 16,837,991 | 12,452,018 | |||||||||||||||||||||
Institutional Class | 112,094,624 | 96,646,218 | 9,515,807 | 17,170,546 | 7,269,326 | 6,151,289 | |||||||||||||||||||||
Reinvested dividends and distributions | |||||||||||||||||||||||||||
Investor Class | 175,336,317 | 110,352,380 | 544,419 | 161,501 | 10,901,467 | 7,394,722 | |||||||||||||||||||||
Institutional Class | 54,999,105 | 21,348,611 | 1,544,679 | 421,740 | 6,790,444 | 4,253,752 | |||||||||||||||||||||
Shares Issued | 433,132,199 | 377,958,593 | 14,166,243 | 20,584,819 | 41,799,228 | 30,251,781 | |||||||||||||||||||||
Redemptions | |||||||||||||||||||||||||||
Investor Class | (383,826,469 | ) | (530,764,960 | ) | (4,057,708 | ) | (9,627,763 | ) | (20,264,115 | ) | (17,078,266 | ) | |||||||||||||||
Institutional Class | (63,487,663 | ) | (90,624,869 | ) | (5,965,203 | ) | (8,534,071 | ) | (4,828,538 | ) | (5,097,713 | ) | |||||||||||||||
Shares repurchased | (447,314,132 | ) | (621,389,829 | ) | (10,022,911 | ) | (18,161,834 | ) | (25,092,653 | ) | (22,175,979 | ) | |||||||||||||||
Net increase (decrease) from capital share transactions | (14,181,933 | ) | (243,431,236 | ) | 4,143,332 | 2,422,985 | 16,706,575 | 8,075,802 | |||||||||||||||||||
Total increase (decrease) in net assets | (317,518,014 | ) | 442,477,134 | 15,831,204 | 36,302,372 | (19,156,997 | ) | 66,111,403 | |||||||||||||||||||
NET ASSETS: | |||||||||||||||||||||||||||
Beginning of period | 1,780,144,242 | 1,337,667,108 | 101,009,948 | 64,707,576 | 131,846,354 | 65,734,951 | |||||||||||||||||||||
End of period | $ | 1,462,626,228 | $ | 1,780,144,242 | $ | 116,841,152 | $ | 101,009,948 | $ | 112,689,357 | $ | 131,846,354 | |||||||||||||||
Fund share transactions: | |||||||||||||||||||||||||||
Shares issued | |||||||||||||||||||||||||||
Investor Class | 3,027,055 | 5,500,653 | 101,658 | 141,111 | 707,214 | 567,291 | |||||||||||||||||||||
Institutional Class | 3,495,167 | 3,308,615 | 380,489 | 832,698 | 321,214 | 273,406 | |||||||||||||||||||||
6,522,222 | 8,809,268 | 482,147 | 973,809 | 1,028,428 | 840,697 | ||||||||||||||||||||||
Reinvested dividends and distributions | |||||||||||||||||||||||||||
Investor Class | 6,501,161 | 3,704,344 | 21,770 | 7,919 | 555,914 | 341,558 | |||||||||||||||||||||
Institutional Class | 2,029,487 | 714,717 | 61,769 | 20,360 | 344,518 | 195,935 | |||||||||||||||||||||
8,530,648 | 4,419,061 | 83,539 | 28,279 | 900,432 | 537,493 | ||||||||||||||||||||||
Shares Issued | 15,052,870 | 13,228,329 | 565,686 | 1,002,088 | 1,928,860 | 1,378,190 | |||||||||||||||||||||
Shares repurchased | |||||||||||||||||||||||||||
Investor Class | (12,876,646 | ) | (19,361,212 | ) | (160,274 | ) | (491,618 | ) | (886,300 | ) | (852,378 | ) | |||||||||||||||
Institutional Class | (2,172,522 | ) | (3,408,874 | ) | (235,015 | ) | (435,000 | ) | (220,133 | ) | (269,189 | ) | |||||||||||||||
Total Shares Repurchased | (15,049,168 | ) | (22,770,086 | ) | (395,289 | ) | (926,618 | ) | (1,106,433 | ) | (1,121,567 | ) | |||||||||||||||
Net increase (decrease) in fund shares | 3,702 | (9,541,757 | ) | 170,397 | 75,470 | 822,427 | 256,623 | ||||||||||||||||||||

The accompanying notes are an integral part of these financial statements.
100

| Buffalo Flexible Income Fund | Buffalo Growth Fund | ||||||||||||||||||
| Year Ended March 31, 2022 | Year Ended March 31, 2021 | Year Ended March 31, 2022 | Year Ended March 31, 2021 | ||||||||||||||||
OPERATIONS: | |||||||||||||||||||
Net investment income (loss) | $ | 7,460,791 | $ | 8,932,524 | $ | (696,471 | ) | $ | (241,834 | ) | |||||||||
Net realized gain on investment transactions | 19,116,133 | 12,766,430 | 18,127,016 | 20,363,885 | |||||||||||||||
| Net unrealized appreciation/depreciation during the year on investments and translation of assets and liabilities in foreign currencies | 69,725,547 | 124,757,423 | 2,161,487 | 55,554,120 | |||||||||||||||
Net increase (decrease) in net assets resulting from operations | 96,302,471 | 146,456,377 | 19,592,032 | 75,676,171 | |||||||||||||||
DISTRIBUTIONS TO SHAREHOLDERS: | |||||||||||||||||||
Distributable earnings | (24,455,226 | ) | (14,924,358 | ) | (20,046,380 | ) | (9,555,575 | ) | |||||||||||
Total distributions | (24,455,226 | ) | (14,924,358 | ) | (20,046,380 | ) | (9,555,575 | ) | |||||||||||
CAPITAL SHARE TRANSACTIONS: | |||||||||||||||||||
Shares sold | |||||||||||||||||||
Investor Class | 35,446,475 | 5,998,019 | 5,085,586 | 8,115,877 | |||||||||||||||
Institutional Class | 11,411,527 | 6,056,964 | 6,760,777 | 8,440,623 | |||||||||||||||
Reinvested dividends and distributions | |||||||||||||||||||
Investor Class | 15,186,659 | 9,615,886 | 10,701,157 | 5,431,116 | |||||||||||||||
Institutional Class | 7,689,399 | 4,671,983 | 9,126,988 | 4,021,245 | |||||||||||||||
Shares Issued | 69,734,060 | 26,342,852 | 31,674,508 | 26,008,861 | |||||||||||||||
Redemptions | |||||||||||||||||||
Investor Class | (60,688,616 | ) | (98,594,572 | ) | (25,149,748 | ) | (28,516,879 | ) | |||||||||||
Institutional Class | (16,575,934 | ) | (40,830,504 | ) | (9,182,096 | ) | (11,526,887 | ) | |||||||||||
Shares repurchased | (77,264,550 | ) | (139,425,076 | ) | (34,331,844 | ) | (40,043,766 | ) | |||||||||||
Net increase (decrease) from capital share transactions | (7,530,490 | ) | (113,082,224 | ) | (2,657,336 | ) | (14,034,905 | ) | |||||||||||
Total increase (decrease) in net assets | 64,316,755 | 18,449,795 | (3,111,684 | ) | 52,085,691 | ||||||||||||||
NET ASSETS: | |||||||||||||||||||
Beginning of period | 425,708,189 | 407,258,394 | 198,444,418 | 146,358,727 | |||||||||||||||
End of period | $ | 490,024,944 | $ | 425,708,189 | $ | 195,332,734 | $ | 198,444,418 | |||||||||||
Fund share transactions: | |||||||||||||||||||
Shares issued | |||||||||||||||||||
Investor Class | 1,953,183 | 416,984 | 152,848 | 284,229 | |||||||||||||||
Institutional Class | 639,999 | 407,263 | 199,782 | 300,559 | |||||||||||||||
2,593,182 | 824,247 | 352,630 | 584,788 | ||||||||||||||||
Reinvested dividends and distributions | |||||||||||||||||||
Investor Class | 866,665 | 656,101 | 331,305 | 179,600 | |||||||||||||||
Institutional Class | 438,889 | 318,733 | 281,697 | 132,758 | |||||||||||||||
1,305,554 | 974,834 | 613,002 | 312,358 | ||||||||||||||||
Shares Issued | 3,898,736 | 1,799,081 | 965,632 | 897,146 | |||||||||||||||
Shares repurchased | |||||||||||||||||||
Investor Class | (3,423,944 | ) | (6,880,691 | ) | (750,535 | ) | (1,000,266 | ) | |||||||||||
Institutional Class | (936,487 | ) | (2,845,684 | ) | (273,115 | ) | (419,001 | ) | |||||||||||
Total Shares Repurchased | (4,360,431 | ) | (9,726,375 | ) | (1,023,650 | ) | (1,419,267 | ) | |||||||||||
Net increase (decrease) in fund shares | (461,695 | ) | (7,927,294 | ) | (58,018 | ) | (522,121 | ) | |||||||||||
101
STATEMENTS OF CHANGES IN
NET ASSETS
| Buffalo High Yield Fund | Buffalo International Fund | Buffalo Large Cap Fund | |||||||||||||||||||||||||
| Year Ended March 31, 2022 | Year Ended March 31, 2021 | Year Ended March 31, 2022 | Year Ended March 31, 2021 | Year Ended March 31, 2022 | Year Ended March 31, 2021 | ||||||||||||||||||||||
OPERATIONS: | |||||||||||||||||||||||||||
Net investment income (loss) | $ | 12,350,271 | $ | 10,724,695 | $ | 1,338,822 | $ | 1,433,999 | $ | (286,638 | ) | $ | (62,605 | ) | |||||||||||||
Net realized gain on investment transactions | 8,337,574 | 6,896,478 | 15,739,005 | 1,772,922 | 27,125,565 | 1,438,010 | |||||||||||||||||||||
| Net unrealized appreciation/depreciation during the year on investments and translation of assets and liabilities in foreign currencies | (15,061,629 | ) | 36,810,629 | (9,582,271 | ) | 185,957,714 | (15,249,591 | ) | 39,787,915 | ||||||||||||||||||
Net increase (decrease) in net assets resulting from operations | 5,626,216 | 54,431,802 | 7,495,556 | 189,164,635 | 11,589,336 | 41,163,320 | |||||||||||||||||||||
DISTRIBUTIONS TO SHAREHOLDERS: | |||||||||||||||||||||||||||
Distributable earnings | (21,107,564 | ) | (10,794,072 | ) | (8,250,348 | ) | (1,810,577 | ) | (26,204,398 | ) | (226,492 | ) | |||||||||||||||
Total distributions | (21,107,564 | ) | (10,794,072 | ) | (8,250,348 | ) | (1,810,577 | ) | (26,204,398 | ) | (226,492 | ) | |||||||||||||||
CAPITAL SHARE TRANSACTIONS: | |||||||||||||||||||||||||||
Shares sold | |||||||||||||||||||||||||||
Investor Class | 16,978,308 | 7,659,688 | 74,628,662 | 76,610,305 | 4,233,701 | 4,685,305 | |||||||||||||||||||||
Institutional Class | 37,510,763 | 58,665,709 | 65,919,686 | 68,195,319 | 8,024,389 | 9,245,163 | |||||||||||||||||||||
Reinvested dividends and distributions | |||||||||||||||||||||||||||
Investor Class | 3,835,831 | 2,076,991 | 3,539,520 | 705,246 | 8,131,619 | 46,663 | |||||||||||||||||||||
Institutional Class | 15,198,835 | 7,577,783 | 4,474,207 | 1,027,962 | 17,150,974 | 171,050 | |||||||||||||||||||||
Shares Issued | 73,523,737 | 75,980,171 | 148,562,075 | 146,538,832 | 37,540,683 | 14,148,181 | |||||||||||||||||||||
Redemptions | |||||||||||||||||||||||||||
Investor Class | (17,482,430 | ) | (15,115,408 | ) | (75,011,332 | ) | (97,166,871 | ) | (9,924,225 | ) | (10,383,103 | ) | |||||||||||||||
Institutional Class | (19,946,518 | ) | (16,448,241 | ) | (38,713,002 | ) | (51,180,047 | ) | (8,334,709 | ) | (9,011,030 | ) | |||||||||||||||
Shares repurchased | (37,428,948 | ) | (31,563,649 | ) | (113,724,334 | ) | (148,346,918 | ) | (18,258,934 | ) | (19,394,133 | ) | |||||||||||||||
Net increase (decrease) from capital share transactions | 36,094,789 | 44,416,522 | 34,837,741 | (1,808,086 | ) | 19,281,749 | (5,245,952 | ) | |||||||||||||||||||
Total increase (decrease) in net assets | 20,613,441 | 88,054,252 | 34,082,949 | 185,545,972 | 4,666,687 | 35,690,876 | |||||||||||||||||||||
NET ASSETS: | |||||||||||||||||||||||||||
Beginning of period | 275,825,148 | 187,770,896 | 545,639,452 | 360,093,480 | 108,806,859 | 73,115,983 | |||||||||||||||||||||
End of period | $ | 296,438,589 | $ | 275,825,148 | $ | 579,722,401 | $ | 545,639,452 | $ | 113,473,546 | $ | 108,806,859 | |||||||||||||||
Fund share transactions: | |||||||||||||||||||||||||||
Shares issued | |||||||||||||||||||||||||||
Investor Class | 1,444,631 | 685,046 | 3,362,322 | 4,425,494 | 87,396 | 115,539 | |||||||||||||||||||||
Institutional Class | 3,219,662 | 5,312,364 | 2,960,156 | 3,747,339 | 168,409 | 227,459 | |||||||||||||||||||||
4,664,293 | 5,997,410 | 6,322,478 | 8,172,833 | 255,805 | 342,998 | ||||||||||||||||||||||
Reinvested dividends and distributions | |||||||||||||||||||||||||||
Investor Class | 330,686 | 187,338 | 157,413 | 35,368 | 189,902 | 1,051 | |||||||||||||||||||||
Institutional Class | 1,311,808 | 680,140 | 198,604 | 51,553 | 399,138 | 3,848 | |||||||||||||||||||||
1,642,494 | 867,478 | 356,017 | 86,921 | 589,040 | 4,899 | ||||||||||||||||||||||
Shares Issued | 6,306,787 | 6,864,888 | 6,678,495 | 8,259,754 | 844,845 | 347,897 | |||||||||||||||||||||
Shares repurchased | |||||||||||||||||||||||||||
Investor Class | (1,507,734 | ) | (1,370,951 | ) | (3,455,367 | ) | (5,354,527 | ) | (206,465 | ) | (251,260 | ) | |||||||||||||||
Institutional Class | (1,717,947 | ) | (1,483,211 | ) | (1,752,736 | ) | (2,896,307 | ) | (175,089 | ) | (219,968 | ) | |||||||||||||||
Total Shares Repurchased | (3,225,681 | ) | (2,854,162 | ) | (5,208,103 | ) | (8,250,834 | ) | (381,554 | ) | (471,228 | ) | |||||||||||||||
Net increase (decrease) in fund shares | 3,081,106 | 4,010,726 | 1,470,392 | 8,920 | 463,291 | (123,331 | ) | ||||||||||||||||||||

The accompanying notes are an integral part of these financial statements.
102

| Buffalo Mid Cap Fund | Buffalo Small Cap Fund | ||||||||||||||||||
| Year Ended March 31, 2022 | Year Ended March 31, 2021 | Year Ended March 31, 2022 | Year Ended March 31, 2021 | ||||||||||||||||
OPERATIONS: | |||||||||||||||||||
Net investment income (loss) | $ | (955,603 | ) | $ | (960,256 | ) | $ | (9,042,676 | ) | $ | (5,997,480 | ) | |||||||
Net realized gain on investment transactions | 14,348,950 | 26,406,775 | 52,166,078 | 219,482,041 | |||||||||||||||
| Net unrealized appreciation/depreciation during the year on investments and translation of assets and liabilities in foreign currencies | (15,622,847 | ) | 57,028,018 | (254,440,168 | ) | 308,472,234 | |||||||||||||
Net increase (decrease) in net assets resulting from operations | (2,229,500 | ) | 82,474,537 | (211,316,766 | ) | 521,956,795 | |||||||||||||
DISTRIBUTIONS TO SHAREHOLDERS: | |||||||||||||||||||
Distributable earnings | (20,762,447 | ) | (12,015,139 | ) | (142,049,821 | ) | (76,101,843 | ) | |||||||||||
Total distributions | (20,762,447 | ) | (12,015,139 | ) | (142,049,821 | ) | (76,101,843 | ) | |||||||||||
CAPITAL SHARE TRANSACTIONS: | |||||||||||||||||||
Shares sold | |||||||||||||||||||
Investor Class | 5,257,376 | 3,660,618 | 291,257,479 | 177,161,629 | |||||||||||||||
Institutional Class | 6,656,550 | 8,501,585 | 174,193,990 | 157,633,634 | |||||||||||||||
Reinvested dividends and distributions | |||||||||||||||||||
Investor Class | 11,369,480 | 6,861,738 | 101,656,595 | 58,109,075 | |||||||||||||||
Institutional Class | 9,147,691 | 5,016,695 | 37,625,245 | 16,517,003 | |||||||||||||||
Shares Issued | 32,431,097 | 24,040,636 | 604,733,309 | 409,421,341 | |||||||||||||||
Redemptions | |||||||||||||||||||
Investor Class | (14,115,769 | ) | (31,736,812 | ) | (241,646,741 | ) | (117,827,412 | ) | |||||||||||
Institutional Class | (6,203,747 | ) | (9,413,314 | ) | (160,773,145 | ) | (40,372,895 | ) | |||||||||||
Shares repurchased | (20,319,516 | ) | (41,150,126 | ) | (402,419,886 | ) | (158,200,307 | ) | |||||||||||
Net increase (decrease) from capital share transactions | 12,111,581 | (17,109,490 | ) | 202,313,423 | 251,221,034 | ||||||||||||||
Total increase (decrease) in net assets | (10,880,366 | ) | 53,349,908 | (151,053,164 | ) | 697,075,986 | |||||||||||||
NET ASSETS: | |||||||||||||||||||
Beginning of period | 190,703,359 | 137,353,451 | 1,129,975,640 | 432,899,654 | |||||||||||||||
End of period | $ | 179,822,993 | $ | 190,703,359 | $ | 978,922,476 | $ | 1,129,975,640 | |||||||||||
Fund share transactions: | |||||||||||||||||||
Shares issued | |||||||||||||||||||
Investor Class | 263,645 | 214,506 | 13,531,321 | 8,586,112 | |||||||||||||||
Institutional Class | 336,084 | 483,763 | 8,315,660 | 7,457,256 | |||||||||||||||
599,729 | 698,269 | 21,846,981 | 16,043,368 | ||||||||||||||||
Reinvested dividends and distributions | |||||||||||||||||||
Investor Class | 612,910 | 360,385 | 5,564,127 | 2,816,727 | |||||||||||||||
Institutional Class | 491,019 | 262,792 | 2,050,422 | 798,695 | |||||||||||||||
1,103,929 | 623,177 | 7,614,549 | 3,615,422 | ||||||||||||||||
Shares Issued | 1,703,658 | 1,321,446 | 29,461,530 | 19,658,790 | |||||||||||||||
Shares repurchased | |||||||||||||||||||
Investor Class | (708,224 | ) | (1,880,452 | ) | (11,981,132 | ) | (6,078,091 | ) | |||||||||||
Institutional Class | (308,223 | ) | (553,172 | ) | (7,788,562 | ) | (2,137,290 | ) | |||||||||||
Total Shares Repurchased | (1,016,447 | ) | (2,433,624 | ) | (19,769,694 | ) | (8,215,381 | ) | |||||||||||
Net increase (decrease) in fund shares | 687,211 | (1,112,178 | ) | 9,691,836 | 11,443,409 | ||||||||||||||
103
FINANCIAL HIGHLIGHTS
BUFFALO DISCOVERY FUND INVESTOR CLASS
The following tables are intended to help you understand the Fund's financial performance for the periods shown. Certain information reflects financial results for a single Fund share. Total returns in the table represent the rate that an investor would have earned (or lost) on an investment in the Fund. Total returns assume reinvestment of all dividends and distributions. Total returns do not reflect payment of sales charges, if any, and are not annualized for periods of less than one year.
For the Years Ended March 31, | |||||||||||||||||||||||
| Condensed data for a share of capital stock outstanding throughout the period. | 2022 | 2021 | 2020 | 2019 | 2018 | ||||||||||||||||||
Net asset value, beginning of period | $ | 30.82 | $ | 19.88 | $ | 25.29 | $ | 24.52 | $ | 21.86 | |||||||||||||
Income from investment operations: | |||||||||||||||||||||||
Net investment loss | (0.21 | )(1) | (0.18 | )(1) | (0.06 | ) | (0.06 | ) | (0.04 | ) | |||||||||||||
Net gains (losses) on securities (both realized and unrealized) | (0.93 | ) | 13.51 | (1.76 | ) | 2.31 | 3.82 | ||||||||||||||||
Total from investment operations | (1.14 | ) | 13.33 | (1.82 | ) | 2.25 | 3.78 | ||||||||||||||||
Less distributions: | |||||||||||||||||||||||
Distributions from capital gains | (4.37 | ) | (2.39 | ) | (3.59 | ) | (1.48 | ) | (1.12 | ) | |||||||||||||
Total distributions | (4.37 | ) | (2.39 | ) | (3.59 | ) | (1.48 | ) | (1.12 | ) | |||||||||||||
Net asset value, end of period | $ | 25.31 | $ | 30.82 | $ | 19.88 | $ | 25.29 | $ | 24.52 | |||||||||||||
Total return | (4.58 | %) | 67.49 | % | (9.64 | %) | 10.34 | % | 17.35 | % | |||||||||||||
Ratios/Supplemental Data | |||||||||||||||||||||||
Net assets, end of period (in thousands) | $ | 1,099,258 | $ | 1,442,145 | $ | 1,132,237 | $ | 1,744,262 | $ | 1,896,950 | |||||||||||||
Ratio of expenses to average net assets | 1.00 | % | 1.01 | % | 1.01 | % | 1.01 | % | 1.01 | % | |||||||||||||
Ratio of net investment loss to average net assets | (0.70 | %) | (0.64 | %) | (0.30 | %) | (0.21 | %) | (0.20 | %) | |||||||||||||
Portfolio turnover rate | 41 | % | 84 | % | 123 | % | 77 | % | 42 | % | |||||||||||||
(1) Per share amounts have been calculated using the average shares method.

104
FINANCIAL HIGHLIGHTS
BUFFALO DISCOVERY FUND INSTITUTIONAL CLASS
The following tables are intended to help you understand the Fund's financial performance for the periods shown. Certain information reflects financial results for a single Fund share. Total returns in the table represent the rate that an investor would have earned (or lost) on an investment in the Fund. Total returns assume reinvestment of all dividends and distributions. Total returns do not reflect payment of sales charges, if any, and are not annualized for periods of less than one year.
For the Years Ended March 31, | For the period July 1, 2019* through | ||||||||||||||
| Condensed data for a share of capital stock outstanding throughout the period. | 2022 | 2021 | March 31, 2020 | ||||||||||||
Net asset value, beginning of period | $ | 30.92 | $ | 19.91 | $ | 27.10 | |||||||||
Income from investment operations: | |||||||||||||||
Net investment loss | (0.17 | )(1) | (0.14 | )(1) | (0.04 | ) | |||||||||
Net gains (losses) on securities (both realized and unrealized) | (0.94 | ) | 13.54 | (3.56 | ) | ||||||||||
Total from investment operations | (1.11 | ) | 13.40 | (3.60 | ) | ||||||||||
Less distributions: | |||||||||||||||
Distributions from capital gains | (4.37 | ) | (2.39 | ) | (3.59 | ) | |||||||||
Total distributions | (4.37 | ) | (2.39 | ) | (3.59 | ) | |||||||||
Net asset value, end of period | $ | 25.44 | $ | 30.92 | $ | 19.91 | |||||||||
Total return | (4.46 | %) | 67.75 | % | (15.55 | %)(2) | |||||||||
Ratios/Supplemental Data | |||||||||||||||
Net assets, end of period (in thousands) | $ | 363,369 | $ | 337,999 | $ | 205,430 | |||||||||
Ratio of expenses to average net assets | 0.86 | % | 0.86 | % | 0.86 | % | |||||||||
Ratio of net investment loss to average net assets | (0.55 | %) | (0.50 | %) | (0.25 | %) | |||||||||
Portfolio turnover rate** | 41 | % | 84 | % | 123 | % | |||||||||
* Inception date
** Not annualized for periods less than one year.
(1) Per share amounts have been calculated using the average shares method.
(2) The return listed is the non-annualized return for the Institutional Class since inception date.

105
FINANCIAL HIGHLIGHTS
BUFFALO DIVIDEND FOCUS FUND INVESTOR CLASS
The following tables are intended to help you understand the Fund's financial performance for the periods shown. Certain information reflects financial results for a single Fund share. Total returns in the table represent the rate that an investor would have earned (or lost) on an investment in the Fund. Total returns assume reinvestment of all dividends and distributions. Total returns do not reflect payment of sales charges, if any, and are not annualized for periods of less than one year.
For the Years Ended March 31, | |||||||||||||||||||||||
| Condensed data for a share of capital stock outstanding throughout the period. | 2022 | 2021 | 2020 | 2019 | 2018 | ||||||||||||||||||
Net asset value, beginning of period | $ | 23.16 | $ | 15.10 | $ | 16.65 | $ | 16.28 | $ | 15.32 | |||||||||||||
Income from investment operations: | |||||||||||||||||||||||
Net investment gain | 0.14 | (1) | 0.12 | (1) | 0.44 | 0.25 | 0.19 | ||||||||||||||||
Net gains (losses) on securities (both realized and unrealized) | 2.94 | 8.06 | (1.81 | ) | 0.91 | 1.11 | |||||||||||||||||
Total from investment operations | 3.08 | 8.18 | (1.37 | ) | 1.16 | 1.30 | |||||||||||||||||
Less distributions: | |||||||||||||||||||||||
Distributions from investment Income | (0.14 | ) | (0.12 | ) | (0.17 | ) | (0.25 | ) | (0.19 | ) | |||||||||||||
Distributions from capital gains | (0.31 | ) | — | — | (0.54 | ) | (0.15 | ) | |||||||||||||||
Distributions from return of capital | — | — | (0.01 | ) | — | — | |||||||||||||||||
Total distributions | (0.45 | ) | (0.12 | ) | (0.18 | ) | (0.79 | ) | (0.34 | ) | |||||||||||||
Net asset value, end of period | $ | 25.79 | $ | 23.16 | $ | 15.10 | $ | 16.65 | $ | 16.28 | |||||||||||||
Total return | 13.39 | % | 54.29 | % | (8.32 | %) | 7.48 | % | 8.51 | % | |||||||||||||
Ratios/Supplemental Data | |||||||||||||||||||||||
Net assets, end of period (in thousands) | $ | 30,895 | $ | 28,605 | $ | 23,821 | $ | 58,299 | $ | 59,364 | |||||||||||||
Ratio of expenses to average net assets | 0.93 | % | 0.94 | % | 0.95 | % | 0.94 | % | 0.94 | % | |||||||||||||
Ratio of net investment income to average net assets | 0.56 | % | 0.63 | % | 0.84 | % | 1.45 | % | 1.16 | % | |||||||||||||
Portfolio turnover rate | 4 | % | 20 | % | 31 | % | 20 | % | 21 | % | |||||||||||||
(1) Per share amounts have been calculated using the average shares method.

106
FINANCIAL HIGHLIGHTS
BUFFALO DIVIDEND FOCUS FUND INSTITUTIONAL CLASS
The following tables are intended to help you understand the Fund's financial performance for the periods shown. Certain information reflects financial results for a single Fund share. Total returns in the table represent the rate that an investor would have earned (or lost) on an investment in the Fund. Total returns assume reinvestment of all dividends and distributions. Total returns do not reflect payment of sales charges, if any, and are not annualized for periods of less than one year.
For the Years Ended March 31, | For the period July 1, 2019* through | ||||||||||||||
| Condensed data for a share of capital stock outstanding throughout the period. | 2022 | 2021 | March 31, 2020 | ||||||||||||
Net asset value, beginning of period | $ | 23.16 | $ | 15.10 | $ | 17.37 | |||||||||
Income from investment operations: | |||||||||||||||
Net investment income | 0.18 | (1) | 0.15 | (1) | 0.28 | ||||||||||
Net gains (losses) on securities (both realized and unrealized) | 2.93 | 8.06 | (2.41 | ) | |||||||||||
Total from investment operations | 3.11 | 8.21 | (2.13 | ) | |||||||||||
Less distributions: | |||||||||||||||
Distributions from investment Income | (0.18 | ) | (0.15 | ) | (0.13 | ) | |||||||||
Distributions from capital gains | (0.31 | ) | — | — | |||||||||||
Distributions from return of capital | — | — | (0.01 | ) | |||||||||||
Total distributions | (0.49 | ) | (0.15 | ) | (0.14 | ) | |||||||||
Net asset value, end of period | $ | 25.78 | $ | 23.16 | $ | 15.10 | |||||||||
Total return | 13.51 | % | 54.52 | % | (12.34 | %)(2) | |||||||||
Ratios/Supplemental Data | |||||||||||||||
Net assets, end of period (in thousands) | $ | 85,946 | $ | 72,405 | $ | 40,887 | |||||||||
Ratio of expenses to average net assets | 0.78 | % | 0.79 | % | 0.80 | % | |||||||||
Ratio of net investment income (loss) to average net assets | 0.71 | % | 0.78 | % | 1.23 | % | |||||||||
Portfolio turnover rate** | 4 | % | 20 | % | 31 | % | |||||||||
* Inception date
** Not annualized for periods less than one year.
(1) Per share amounts have been calculated using the average shares method.
(2) The return listed is the non-annualized return for the Institutional Class since inception date.

107
FINANCIAL HIGHLIGHTS
BUFFALO EARLY STAGE GROWTH FUND INVESTOR CLASS
The following tables are intended to help you understand the Fund's financial performance for the periods shown. Certain information reflects financial results for a single Fund share. Total returns in the table represent the rate that an investor would have earned (or lost) on an investment in the Fund. Total returns assume reinvestment of all dividends and distributions. Total returns do not reflect payment of sales charges, if any, and are not annualized for periods of less than one year.
For the Years Ended March 31, | |||||||||||||||||||||||
| Condensed data for a share of capital stock outstanding throughout the period. | 2022 | 2021 | 2020 | 2019 | 2018 | ||||||||||||||||||
Net asset value, beginning of period | $ | 23.88 | $ | 12.50 | $ | 15.30 | $ | 16.03 | $ | 15.78 | |||||||||||||
Income from investment operations: | |||||||||||||||||||||||
Net investment loss | (0.28 | )(1) | (0.25 | )(1) | (0.15 | ) | (0.15 | ) | (0.18 | ) | |||||||||||||
Net gains (losses) on securities (both realized and unrealized) | (2.60 | ) | 14.11 | (1.85 | ) | 1.32 | 3.55 | ||||||||||||||||
Total from investment operations | (2.88 | ) | 13.86 | (2.00 | ) | 1.17 | 3.37 | ||||||||||||||||
Less distributions: | |||||||||||||||||||||||
Distributions from capital gains | (3.25 | ) | (2.48 | ) | (0.80 | ) | (1.90 | ) | (3.12 | ) | |||||||||||||
Total distributions | (3.25 | ) | (2.48 | ) | (0.80 | ) | (0.79 | ) | (0.34 | ) | |||||||||||||
Net asset value, end of period | $ | 17.75 | $ | 23.88 | $ | 12.50 | $ | 15.30 | $ | 16.03 | |||||||||||||
Total return | (13.32 | %) | 112.86 | % | (14.38 | %) | 9.39 | % | 21.84 | % | |||||||||||||
Ratios/Supplemental Data | |||||||||||||||||||||||
Net assets, end of period (in thousands) | $ | 68,232 | $ | 82,824 | $ | 42,633 | $ | 84,032 | $ | 87,969 | |||||||||||||
Ratio of expenses to average net assets | 1.45 | % | 1.50 | % | 1.49 | % | 1.48 | % | 1.48 | % | |||||||||||||
Ratio of net investment loss to average net assets | (1.22 | %) | (1.24 | %) | (1.00 | %) | (0.94 | %) | (1.10 | %) | |||||||||||||
Portfolio turnover rate | 34 | % | 54 | % | 22 | % | 40 | % | 48 | % | |||||||||||||
(1) Per share amounts have been calculated using the average shares method.

108
FINANCIAL HIGHLIGHTS
BUFFALO EARLY STAGE GROWTH FUND INSTITUTIONAL CLASS
The following tables are intended to help you understand the Fund's financial performance for the periods shown. Certain information reflects financial results for a single Fund share. Total returns in the table represent the rate that an investor would have earned (or lost) on an investment in the Fund. Total returns assume reinvestment of all dividends and distributions. Total returns do not reflect payment of sales charges, if any, and are not annualized for periods of less than one year.
For the Years Ended March 31, | For the period July 1, 2019* through | ||||||||||||||
| Condensed data for a share of capital stock outstanding throughout the period. | 2022 | 2021 | March 31, 2020 | ||||||||||||
Net asset value, beginning of period | $ | 23.96 | $ | 12.51 | $ | 16.44 | |||||||||
Income from investment operations: | |||||||||||||||
Net investment loss | (0.24 | )(1) | (0.22 | )(1) | (0.14 | ) | |||||||||
Net gains (losses) on securities (both realized and unrealized) | (2.63 | ) | 14.15 | (2.99 | ) | ||||||||||
Total from investment operations | (2.87 | ) | 13.93 | (3.13 | ) | ||||||||||
Less distributions: | |||||||||||||||
Distributions from capital gains | (3.25 | ) | (2.48 | ) | (0.80 | ) | |||||||||
Total distributions | (3.25 | ) | (2.48 | ) | (0.80 | ) | |||||||||
Net asset value, end of period | $ | 17.84 | $ | 23.96 | $ | 12.51 | |||||||||
Total return | (13.20 | %) | 113.25 | % | (20.25 | %)(2) | |||||||||
Ratios/Supplemental Data | |||||||||||||||
Net assets, end of period (in thousands) | $ | 44,458 | $ | 49,023 | $ | 23,102 | |||||||||
Ratio of expenses to average net assets | 1.32 | % | 1.35 | % | 1.35 | % | |||||||||
Ratio of net investment loss to average net assets | (1.07 | %) | (1.09 | %) | (1.19 | %) | |||||||||
Portfolio turnover rate** | 34 | % | 54 | % | 22 | % | |||||||||
* Inception date
** Not annualized for periods less than one year.
(1) Per share amounts have been calculated using the average shares method.
(2) The return listed is the non-annualized return for the Institutional Class since inception date.

109
FINANCIAL HIGHLIGHTS
BUFFALO FLEXIBLE INCOME FUND INVESTOR CLASS
The following tables are intended to help you understand the Fund's financial performance for the periods shown. Certain information reflects financial results for a single Fund share. Total returns in the table represent the rate that an investor would have earned (or lost) on an investment in the Fund. Total returns assume reinvestment of all dividends and distributions. Total returns do not reflect payment of sales charges, if any, and are not annualized for periods of less than one year.
For the Years Ended March 31, | |||||||||||||||||||||||
| Condensed data for a share of capital stock outstanding throughout the period. | 2022 | 2021 | 2020 | 2019 | 2018 | ||||||||||||||||||
Net asset value, beginning of period | $ | 16.24 | $ | 11.93 | $ | 15.27 | $ | 15.00 | $ | 14.74 | |||||||||||||
Income from investment operations: | |||||||||||||||||||||||
Net investment income | 0.29 | (1) | 0.29 | (1) | 0.72 | 0.39 | 0.34 | ||||||||||||||||
Net gains (losses) on securities (both realized and unrealized) | 3.48 | 4.53 | (3.63 | ) | 0.71 | 0.77 | |||||||||||||||||
Total from investment operations | 3.77 | 4.82 | (2.91 | ) | 1.10 | 1.11 | |||||||||||||||||
Less distributions: | |||||||||||||||||||||||
Distributions from investment Income | (0.29 | ) | (0.30 | ) | (0.32 | ) | (0.39 | ) | (0.36 | ) | |||||||||||||
Distributions from capital gains | (0.69 | ) | (0.21 | ) | (0.11 | ) | (0.44 | ) | (0.49 | ) | |||||||||||||
Total distributions | (0.98 | ) | (0.51 | ) | (0.43 | ) | (0.83 | ) | (0.85 | ) | |||||||||||||
Net asset value, end of period | $ | 19.03 | $ | 16.24 | $ | 11.93 | $ | 15.27 | $ | 15.00 | |||||||||||||
Total return | 23.81 | % | 40.94 | % | (19.63 | %) | 7.73 | % | 7.57 | % | |||||||||||||
Ratios/Supplemental Data | |||||||||||||||||||||||
Net assets, end of period (in thousands) | $ | 314,134 | $ | 277,906 | $ | 273,416 | $ | 625,349 | $ | 698,084 | |||||||||||||
Ratio of expenses to average net assets | 1.01 | % | 1.01 | % | 1.01 | % | 1.01 | % | 1.01 | % | |||||||||||||
Ratio of net investment income to average net assets | 1.60 | % | 2.04 | % | 1.99 | % | 2.57 | % | 2.27 | % | |||||||||||||
Portfolio turnover rate | 4 | % | 1 | % | 5 | % | 6 | % | 2 | % | |||||||||||||
(1) Per share amounts have been calculated using the average shares method.

110
FINANCIAL HIGHLIGHTS
BUFFALO FLEXIBLE INCOME FUND INSTITUTIONAL CLASS
The following tables are intended to help you understand the Fund's financial performance for the periods shown. Certain information reflects financial results for a single Fund share. Total returns in the table represent the rate that an investor would have earned (or lost) on an investment in the Fund. Total returns assume reinvestment of all dividends and distributions. Total returns do not reflect payment of sales charges, if any, and are not annualized for periods of less than one year.
For the Years Ended March 31, | For the period July 1, 2019* through | ||||||||||||||
| Condensed data for a share of capital stock outstanding throughout the period. | 2022 | 2021 | March 31, 2020 | ||||||||||||
Net asset value, beginning of period | $ | 16.24 | $ | 11.93 | $ | 15.31 | |||||||||
Income from investment operations: | |||||||||||||||
Net investment income | 0.32 | (1) | 0.31 | (1) | 0.57 | ||||||||||
Net gains (losses) on securities (both realized and unrealized) | 3.48 | 4.53 | (3.60 | ) | |||||||||||
Total from investment operations | 3.80 | 4.84 | (3.03 | ) | |||||||||||
Less distributions: | |||||||||||||||
Distributions from investment Income | (0.31 | ) | (0.32 | ) | (0.25 | ) | |||||||||
Distributions from capital gains | (0.69 | ) | (0.21 | ) | (0.10 | ) | |||||||||
Total distributions | (1.01 | ) | (0.53 | ) | (0.35 | ) | |||||||||
Net asset value, end of period | $ | 19.03 | $ | 16.24 | $ | 11.93 | |||||||||
Total return | 24.00 | % | 41.15 | % | (20.20 | %)(2) | |||||||||
Ratios/Supplemental Data | |||||||||||||||
Net assets, end of period (in thousands) | $ | 175,891 | $ | 147,802 | $ | 133,843 | |||||||||
Ratio of expenses to average net assets | 0.86 | % | 0.86 | % | 0.86 | % | |||||||||
Ratio of net investment income to average net assets | 1.75 | % | 2.19 | % | 2.79 | % | |||||||||
Portfolio turnover rate** | 4 | % | 1 | % | 5 | % | |||||||||
* Inception date
** Not annualized for periods less than one year.
(1) Per share amounts have been calculated using the average shares method.
(2) The return listed is the non-annualized return for the Institutional Class since inception date.

111
FINANCIAL HIGHLIGHTS
BUFFALO GROWTH FUND INVESTOR CLASS
The following tables are intended to help you understand the Fund's financial performance for the periods shown. Certain information reflects financial results for a single Fund share. Total returns in the table represent the rate that an investor would have earned (or lost) on an investment in the Fund. Total returns assume reinvestment of all dividends and distributions. Total returns do not reflect payment of sales charges, if any, and are not annualized for periods of less than one year.
For the Years Ended March 31, | |||||||||||||||||||||||
| Condensed data for a share of capital stock outstanding throughout the period. | 2022 | 2021 | 2020 | 2019 | 2018 | ||||||||||||||||||
Net asset value, beginning of period | $ | 31.07 | $ | 21.20 | $ | 25.10 | $ | 29.83 | $ | 30.83 | |||||||||||||
Income from investment operations: | |||||||||||||||||||||||
Net investment income (loss) | (0.13 | )(1) | (0.05 | )(1) | 0.08 | 0.05 | 0.39 | ||||||||||||||||
Net gains (losses) on securities (both realized and unrealized) | 3.25 | 11.46 | (0.55 | ) | 2.76 | 4.58 | |||||||||||||||||
Total from investment operations | 3.12 | 11.41 | (0.47 | ) | 2.81 | 4.97 | |||||||||||||||||
Less distributions: | |||||||||||||||||||||||
Distributions from investment Income | — | — | (0.08 | ) | (0.01 | ) | (0.45 | ) | |||||||||||||||
Distributions from capital gains | (3.36 | ) | (1.53 | ) | (3.35 | ) | (7.53 | ) | (5.52 | ) | |||||||||||||
Total distributions | (3.36 | ) | (1.53 | ) | (3.43 | ) | (7.54 | ) | (5.97 | ) | |||||||||||||
Net asset value, end of period | $ | 30.83 | $ | 31.07 | $ | 21.20 | $ | 25.10 | $ | 29.83 | |||||||||||||
Total return | 9.56 | % | 53.98 | % | (3.90 | %) | 13.17 | % | 16.42 | % | |||||||||||||
Ratios/Supplemental Data | |||||||||||||||||||||||
Net assets, end of period (in thousands) | $ | 103,336 | $ | 112,399 | $ | 88,051 | $ | 174,570 | $ | 204,251 | |||||||||||||
Ratio of expenses to average net assets | 0.92 | % | 0.92 | % | 0.92 | % | 0.91 | % | 0.91 | % | |||||||||||||
Ratio of net investment income (loss) to average net assets | (0.40 | %) | (0.19 | %) | 0.11 | % | 0.17 | % | 0.90 | % | |||||||||||||
Portfolio turnover rate | 13 | % | 21 | % | 33 | % | 16 | % | 32 | % | |||||||||||||
(1) Per share amounts have been calculated using the average shares method.

112
FINANCIAL HIGHLIGHTS
BUFFALO GROWTH FUND INSTITUTIONAL CLASS
The following tables are intended to help you understand the Fund's financial performance for the periods shown. Certain information reflects financial results for a single Fund share. Total returns in the table represent the rate that an investor would have earned (or lost) on an investment in the Fund. Total returns assume reinvestment of all dividends and distributions. Total returns do not reflect payment of sales charges, if any, and are not annualized for periods of less than one year.
For the Years Ended March 31, | For the period July 1, 2019* through | ||||||||||||||
| Condensed data for a share of capital stock outstanding throughout the period. | 2022 | 2021 | March 31, 2020 | ||||||||||||
Net asset value, beginning of period | $ | 31.13 | $ | 21.20 | $ | 27.10 | |||||||||
Income from investment operations: | |||||||||||||||
Net investment income (loss) | (0.08 | )(1) | (0.01 | )(1) | 0.15 | ||||||||||
Net gains (losses) on securities (both realized and unrealized) | 3.28 | 11.47 | (2.59 | ) | |||||||||||
Total from investment operations | 3.18 | 11.46 | (2.44 | ) | |||||||||||
Less distributions: | |||||||||||||||
Distributions from investment Income | — | — | (0.10 | ) | |||||||||||
Distributions from capital gains | (3.36 | ) | (1.53 | ) | (3.36 | ) | |||||||||
Total distributions | (3.36 | ) | (1.53 | ) | (3.46 | ) | |||||||||
Net asset value, end of period | $ | 30.95 | $ | 31.13 | $ | 21.20 | |||||||||
Total return | 9.74 | % | 54.26 | % | (10.92 | %)(2) | |||||||||
Ratios/Supplemental Data | |||||||||||||||
Net assets, end of period (in thousands) | $ | 91,997 | $ | 86,046 | $ | 58,307 | |||||||||
Ratio of expenses to average net assets | 0.77 | % | 0.77 | % | 0.78 | % | |||||||||
Ratio of net investment income (loss) to average net assets | (0.25 | %) | (0.04 | %) | 0.28 | % | |||||||||
Portfolio turnover rate** | 13 | % | 21 | % | 33 | % | |||||||||
* Inception date
** Not annualized for periods less than one year.
(1) Per share amounts have been calculated using the average shares method.
(2) The return listed is the non-annualized return for the Institutional Class since inception date.

113
FINANCIAL HIGHLIGHTS
BUFFALO HIGH YIELD FUND INVESTOR CLASS
The following tables are intended to help you understand the Fund's financial performance for the periods shown. Certain information reflects financial results for a single Fund share. Total returns in the table represent the rate that an investor would have earned (or lost) on an investment in the Fund. Total returns assume reinvestment of all dividends and distributions. Total returns do not reflect payment of sales charges, if any, and are not annualized for periods of less than one year.
For the Years Ended March 31, | |||||||||||||||||||||||
| Condensed data for a share of capital stock outstanding throughout the period. | 2022 | 2021 | 2020 | 2019 | 2018 | ||||||||||||||||||
Net asset value, beginning of period | $ | 11.82 | $ | 9.72 | $ | 10.86 | $ | 11.04 | $ | 11.21 | |||||||||||||
Income from investment operations: | |||||||||||||||||||||||
Net investment income | 0.48 | (1) | 0.48 | (1) | 1.17 | 0.51 | 0.50 | ||||||||||||||||
Net gains (losses) on securities (both realized and unrealized) | (0.24 | ) | 2.10 | (1.85 | ) | (0.15 | ) | (0.15 | ) | ||||||||||||||
Total from investment operations | 0.24 | 2.59 | (0.68 | ) | 0.36 | 0.35 | |||||||||||||||||
Less distributions: | |||||||||||||||||||||||
Distributions from investment Income | (0.48 | ) | (0.49 | ) | (0.46 | ) | (0.51 | ) | (0.47 | ) | |||||||||||||
Distributions from capital gains | (0.34 | ) | — | (2) | — | (0.03 | ) | (0.05 | ) | ||||||||||||||
Total distributions | (0.83 | ) | (0.49 | ) | (0.46 | ) | (0.54 | ) | (0.52 | ) | |||||||||||||
Net asset value, end of period | $ | 11.23 | $ | 11.82 | $ | 9.72 | $ | 10.86 | $ | 11.04 | |||||||||||||
Total return | 1.97 | % | 27.07 | % | (6.67 | %) | 3.46 | % | 3.20 | % | |||||||||||||
Ratios/Supplemental Data | |||||||||||||||||||||||
Net assets, end of period (in thousands) | $ | 50,581 | $ | 50,110 | $ | 46,036 | $ | 191,451 | $ | 231,295 | |||||||||||||
Ratio of expenses to average net assets | 1.02 | % | 1.02 | % | 1.02 | % | 1.02 | % | 1.02 | % | |||||||||||||
Ratio of net investment income to average net assets | 4.09 | % | 4.38 | % | 3.60 | % | 4.68 | % | 4.06 | % | |||||||||||||
Portfolio turnover rate | 41 | % | 66 | % | 36 | % | 22 | % | 41 | % | |||||||||||||
(1) Per share amounts have been calculated using the average shares method.
(2) Less than $0.01 per share.

114
FINANCIAL HIGHLIGHTS
BUFFALO HIGH YIELD FUND INSTITUTIONAL CLASS
The following tables are intended to help you understand the Fund's financial performance for the periods shown. Certain information reflects financial results for a single Fund share. Total returns in the table represent the rate that an investor would have earned (or lost) on an investment in the Fund. Total returns assume reinvestment of all dividends and distributions. Total returns do not reflect payment of sales charges, if any, and are not annualized for periods of less than one year.
For the Years Ended March 31, | For the period July 1, 2019* through | ||||||||||||||
| Condensed data for a share of capital stock outstanding throughout the period. | 2022 | 2021 | March 31, 2020 | ||||||||||||
Net asset value, beginning of period | $ | 11.81 | $ | 9.71 | $ | 11.01 | |||||||||
Income from investment operations: | |||||||||||||||
Net investment income | 0.50 | (1) | 0.50 | (1) | 0.71 | ||||||||||
Net gains (losses) on securities (both realized and unrealized) | (0.24 | ) | 2.10 | (1.66 | ) | ||||||||||
Total from investment operations | 0.26 | 2.60 | (0.95 | ) | |||||||||||
Less distributions: | |||||||||||||||
Distributions from investment Income | (0.50 | ) | (0.50 | ) | (0.35 | ) | |||||||||
Distributions from capital gains | (0.35 | ) | — | (2) | — | ||||||||||
Total distributions | (0.85 | ) | (0.50 | ) | (0.35 | ) | |||||||||
Net asset value, end of period | $ | 11.22 | $ | 11.81 | $ | 9.71 | |||||||||
Total return | 2.12 | % | 27.28 | % | (8.94 | %)(3) | |||||||||
Ratios/Supplemental Data | |||||||||||||||
Net assets, end of period (in thousands) | $ | 245,858 | $ | 225,715 | $ | 141,735 | |||||||||
Ratio of expenses to average net assets | 0.87 | % | 0.86 | % | 0.88 | % | |||||||||
Ratio of net investment income to average net assets | 4.24 | % | 4.51 | % | 4.90 | % | |||||||||
Portfolio turnover rate** | 41 | % | 66 | % | 36 | % | |||||||||
* Inception date
** Not annualized for periods less than one year.
(1) Per share amounts have been calculated using the average shares method.
(2) Less than $0.01 per share.
(3) The return listed is the non-annualized return for the Institutional Class since inception date.

115
FINANCIAL HIGHLIGHTS
BUFFALO INTERNATIONAL FUND INVESTOR CLASS
The following tables are intended to help you understand the Fund's financial performance for the periods shown. Certain information reflects financial results for a single Fund share. Total returns in the table represent the rate that an investor would have earned (or lost) on an investment in the Fund. Total returns assume reinvestment of all dividends and distributions. Total returns do not reflect payment of sales charges, if any, and are not annualized for periods of less than one year.
For the Years Ended March 31, | |||||||||||||||||||||||
| Condensed data for a share of capital stock outstanding throughout the period. | 2022 | 2021 | 2020 | 2019 | 2018 | ||||||||||||||||||
Net asset value, beginning of period | $ | 20.51 | $ | 13.54 | $ | 14.76 | $ | 15.10 | $ | 12.80 | |||||||||||||
Income from investment operations: | |||||||||||||||||||||||
Net investment income | 0.03 | (1) | 0.04 | (1) | 0.19 | 0.09 | 0.06 | ||||||||||||||||
Net gains (losses) on securities (both realized and unrealized) | 0.39 | 6.98 | (1.31 | ) | (0.11 | ) | 2.29 | ||||||||||||||||
Total from investment operations | 0.42 | 7.02 | (1.12 | ) | (0.02 | ) | 2.35 | ||||||||||||||||
Less distributions: | |||||||||||||||||||||||
Distributions from investment Income | (0.02 | ) | (0.05 | ) | (0.10 | ) | (0.08 | ) | (0.04 | ) | |||||||||||||
Distributions from capital gains | (0.26 | ) | — | (2) | — | (0.24 | ) | (0.01 | ) | ||||||||||||||
Total distributions | (0.28 | ) | (0.05 | ) | (0.10 | ) | (0.32 | ) | (0.05 | ) | |||||||||||||
Net asset value, end of period | $ | 20.65 | $ | 20.51 | $ | 13.54 | $ | 14.76 | $ | 15.10 | |||||||||||||
Total return | 1.94 | % | 51.79 | % | (7.67 | %) | 0.11 | % | 18.40 | % | |||||||||||||
Ratios/Supplemental Data | |||||||||||||||||||||||
Net assets, end of period (in thousands) | $ | 263,120 | $ | 260,044 | $ | 183,809 | $ | 340,880 | $ | 277,865 | |||||||||||||
Ratio of expenses to average net assets | 1.03 | % | 1.03 | % | 1.03 | % | 1.04 | % | 1.03 | % | |||||||||||||
Ratio of net investment income to average net assets | 0.14 | % | 0.22 | % | 0.55 | % | 0.64 | % | 0.42 | % | |||||||||||||
Portfolio turnover rate | 13 | % | 14 | % | 13 | % | 16 | % | 13 | % | |||||||||||||
(1) Per share amounts have been calculated using the average shares method.
(2) Less than $0.01 per share.

116
FINANCIAL HIGHLIGHTS
BUFFALO INTERNATIONAL FUND INSTITUTIONAL CLASS
The following tables are intended to help you understand the Fund's financial performance for the periods shown. Certain information reflects financial results for a single Fund share. Total returns in the table represent the rate that an investor would have earned (or lost) on an investment in the Fund. Total returns assume reinvestment of all dividends and distributions. Total returns do not reflect payment of sales charges, if any, and are not annualized for periods of less than one year.
For the Years Ended March 31, | For the period July 1, 2019* through | ||||||||||||||
| Condensed data for a share of capital stock outstanding throughout the period. | 2022 | 2021 | March 31, 2020 | ||||||||||||
Net asset value, beginning of period | $ | 20.53 | $ | 13.55 | $ | 15.85 | |||||||||
Income from investment operations: | |||||||||||||||
Net investment income | 0.06 | (1) | 0.07 | (1) | 0.20 | ||||||||||
Net gains income (losses) on securities (both realized and unrealized) | 0.39 | 6.99 | (2.39 | ) | |||||||||||
Total from investment operations | 0.45 | 7.06 | (2.19 | ) | |||||||||||
Less distributions: | |||||||||||||||
Distributions from investment Income | (0.05 | ) | (0.08 | ) | (0.11 | ) | |||||||||
Distributions from capital gains | (0.26 | ) | — | (2) | — | ||||||||||
Total distributions | (0.31 | ) | (0.08 | ) | (0.11 | ) | |||||||||
Net asset value, end of period | $ | 20.67 | $ | 20.53 | $ | 13.55 | |||||||||
Total return | 2.08 | % | 52.12 | % | (13.95 | %)(3) | |||||||||
Ratios/Supplemental Data | |||||||||||||||
Net assets, end of period (in thousands) | $ | 316,602 | $ | 285,595 | $ | 176,285 | |||||||||
Ratio of expenses to average net assets | 0.88 | % | 0.88 | % | 0.88 | % | |||||||||
Ratio of net investment income to average net assets | 0.29 | % | 0.37 | % | 0.86 | % | |||||||||
Portfolio turnover rate** | 13 | % | 14 | % | 13 | % | |||||||||
* Inception date
** Not annualized for periods less than one year.
(1) Per share amounts have been calculated using the average shares method.
(2) Less than $0.01 per share.
(3) The return listed is the non-annualized return for the Institutional Class since inception date.

117
FINANCIAL HIGHLIGHTS
BUFFALO LARGE CAP FUND INVESTOR CLASS
The following tables are intended to help you understand the Fund's financial performance for the periods shown. Certain information reflects financial results for a single Fund share. Total returns in the table represent the rate that an investor would have earned (or lost) on an investment in the Fund. Total returns assume reinvestment of all dividends and distributions. Total returns do not reflect payment of sales charges, if any, and are not annualized for periods of less than one year.
For the Years Ended March 31, | |||||||||||||||||||||||
| Condensed data for a share of capital stock outstanding throughout the period. | 2022 | 2021 | 2020 | 2019 | 2018 | ||||||||||||||||||
Net asset value, beginning of period | $ | 46.23 | $ | 29.53 | $ | 31.01 | $ | 29.08 | $ | 26.53 | |||||||||||||
Income from investment operations: | |||||||||||||||||||||||
Net investment income (loss) | (0.16 | )(1) | (0.07 | )(1) | 0.09 | 0.09 | 0.09 | ||||||||||||||||
Net gains (losses) on securities (both realized and unrealized) | 5.59 | 16.83 | (1.07 | ) | 3.46 | 4.01 | |||||||||||||||||
Total from investment operations | 5.43 | 16.76 | (0.98 | ) | 3.55 | 4.10 | |||||||||||||||||
Less distributions: | |||||||||||||||||||||||
Distributions from investment Income | — | (0.06 | ) | (0.07 | ) | (0.11 | ) | (0.04 | ) | ||||||||||||||
Distributions from capital gains | (11.45 | ) | — | (0.43 | ) | (1.51 | ) | (1.51 | ) | ||||||||||||||
Total distributions | (11.45 | ) | (0.06 | ) | (0.50 | ) | (1.62 | ) | (1.55 | ) | |||||||||||||
Net asset value, end of period | $ | 40.21 | $ | 46.23 | $ | 29.53 | $ | 31.01 | $ | 29.08 | |||||||||||||
Total return | 10.23 | % | 56.78 | % | (3.40 | %) | 12.96 | % | 15.41 | % | |||||||||||||
Ratios/Supplemental Data | |||||||||||||||||||||||
Net assets, end of period (in thousands) | $ | 35,391 | $ | 37,413 | $ | 27,872 | $ | 69,002 | $ | 69,024 | |||||||||||||
Ratio of expenses to average net assets | 0.93 | % | 0.94 | % | 0.94 | % | 0.93 | % | 0.93 | % | |||||||||||||
Ratio of net investment income (loss) to average net assets | (0.34 | %) | (0.16 | %) | 0.21 | % | 0.27 | % | 0.33 | % | |||||||||||||
Portfolio turnover rate | 83 | % | 7 | % | 6 | % | 10 | % | 40 | % | |||||||||||||
(1) Per share amounts have been calculated using the average shares method.

118
FINANCIAL HIGHLIGHTS
BUFFALO LARGE CAP FUND INSTITUTIONAL CLASS
The following tables are intended to help you understand the Fund's financial performance for the periods shown. Certain information reflects financial results for a single Fund share. Total returns in the table represent the rate that an investor would have earned (or lost) on an investment in the Fund. Total returns assume reinvestment of all dividends and distributions. Total returns do not reflect payment of sales charges, if any, and are not annualized for periods of less than one year.
For the Years Ended March 31, | For the period July 1, 2019* through | ||||||||||||||
| Condensed data for a share of capital stock outstanding throughout the period. | 2022 | 2021 | March 31, 2020 | ||||||||||||
Net asset value, beginning of period | $ | 46.30 | $ | 29.56 | $ | 32.79 | |||||||||
Income from investment operations: | |||||||||||||||
Net investment income (loss) | (0.09 | )(1) | — | (1)(2) | 0.16 | ||||||||||
Net gains (losses) on securities (both realized and unrealized) | 5.61 | 16.85 | (2.89 | ) | |||||||||||
Total from investment operations | 5.52 | 16.85 | (2.73 | ) | |||||||||||
Less distributions: | |||||||||||||||
Distributions from investment Income | — | (0.11 | ) | (0.07 | ) | ||||||||||
Distributions from capital gains | (11.45 | ) | — | (0.43 | ) | ||||||||||
Total distributions | (11.45 | ) | (0.11 | ) | (0.50 | ) | |||||||||
Net asset value, end of period | $ | 40.37 | $ | 46.30 | $ | 29.56 | |||||||||
Total return | 10.42 | % | 57.02 | % | (8.55 | %)(3) | |||||||||
Ratios/Supplemental Data | |||||||||||||||
Net assets, end of period (in thousands) | $ | 78,082 | $ | 71,394 | $ | 45,244 | |||||||||
Ratio of expenses to average net assets | 0.78 | % | 0.79 | % | 0.80 | % | |||||||||
Ratio of net investment income (loss) to average net assets | (0.19 | %) | (0.01 | %) | 0.40 | % | |||||||||
Portfolio turnover rate** | 83 | % | 7 | % | 6 | % | |||||||||
* Inception date
** Not annualized for periods less than one year.
(1) Per share amounts have been calculated using the average shares method.
(2) Less than $0.01 per share.
(3) The return listed is the non-annualized return for the Institutional Class since inception date.

119
FINANCIAL HIGHLIGHTS
BUFFALO MID CAP FUND INVESTOR CLASS
The following tables are intended to help you understand the Fund's financial performance for the periods shown. Certain information reflects financial results for a single Fund share. Total returns in the table represent the rate that an investor would have earned (or lost) on an investment in the Fund. Total returns assume reinvestment of all dividends and distributions. Total returns do not reflect payment of sales charges, if any, and are not annualized for periods of less than one year.
For the Years Ended March 31, | |||||||||||||||||||||||
| Condensed data for a share of capital stock outstanding throughout the period. | 2022 | 2021 | 2020 | 2019 | 2018 | ||||||||||||||||||
Net asset value, beginning of period | $ | 20.19 | $ | 13.02 | $ | 14.52 | $ | 13.99 | $ | 15.68 | |||||||||||||
Income from investment operations: | |||||||||||||||||||||||
Net investment loss | (0.11 | )(1) | (0.11 | )(1) | (0.05 | ) | (0.04 | ) | (0.03 | ) | |||||||||||||
Net gains (losses) on securities (both realized and unrealized) | (0.10 | ) | 8.61 | (0.19 | ) | 1.11 | 1.77 | ||||||||||||||||
Total from investment operations | (0.21 | ) | 8.50 | (0.24 | ) | 1.07 | 1.74 | ||||||||||||||||
Less distributions: | |||||||||||||||||||||||
Distributions from capital gains | (2.26 | ) | (1.33 | ) | (1.26 | ) | (0.54 | ) | (3.43 | ) | |||||||||||||
Total distributions | (2.26 | ) | (1.33 | ) | (1.26 | ) | (0.54 | ) | (3.43 | ) | |||||||||||||
Net asset value, end of period | $ | 17.72 | $ | 20.19 | $ | 13.02 | $ | 14.52 | $ | 13.99 | |||||||||||||
Total return | (1.55 | %) | 65.92 | % | (2.89 | %) | 8.40 | % | 11.69 | % | |||||||||||||
Ratios/Supplemental Data | |||||||||||||||||||||||
Net assets, end of period (in thousands) | $ | 96,992 | $ | 107,061 | $ | 86,030 | $ | 135,262 | $ | 155,587 | |||||||||||||
Ratio of expenses to average net assets | 1.02 | % | 1.03 | % | 1.02 | % | 1.02 | % | 1.01 | % | |||||||||||||
Ratio of net investment loss to average net assets | (0.56 | %) | (0.63 | %) | (0.39 | %) | (0.27 | %) | (0.13 | %) | |||||||||||||
Portfolio turnover rate | 19 | % | 41 | % | 52 | % | 36 | % | 51 | % | |||||||||||||
(1) Per share amounts have been calculated using the average shares method.

120
FINANCIAL HIGHLIGHTS
BUFFALO MID CAP FUND INSTITUTIONAL CLASS
The following tables are intended to help you understand the Fund's financial performance for the periods shown. Certain information reflects financial results for a single Fund share. Total returns in the table represent the rate that an investor would have earned (or lost) on an investment in the Fund. Total returns assume reinvestment of all dividends and distributions. Total returns do not reflect payment of sales charges, if any, and are not annualized for periods of less than one year.
For the Years Ended March 31, | For the period July 1, 2019* through | ||||||||||||||
| Condensed data for a share of capital stock outstanding throughout the period. | 2022 | 2021 | March 31, 2020 | ||||||||||||
Net asset value, beginning of period | $ | 20.24 | $ | 13.03 | $ | 15.63 | |||||||||
Income from investment operations: | |||||||||||||||
Net investment loss | (0.08 | )(1) | (0.09 | )(1) | (0.04 | ) | |||||||||
Net gains (losses) on securities (both realized and unrealized) | (0.09 | ) | 8.63 | (1.30 | ) | ||||||||||
Total from investment operations | (0.17 | ) | 8.54 | (1.34 | ) | ||||||||||
Less distributions: | |||||||||||||||
Distributions from capital gains | (2.26 | ) | (1.33 | ) | (1.26 | ) | |||||||||
Total distributions | (2.26 | ) | (1.33 | ) | (1.26 | ) | |||||||||
Net asset value, end of period | $ | 17.81 | $ | 20.24 | $ | 13.03 | |||||||||
Total return | (1.34 | %) | 66.18 | % | (9.72 | %)(2) | |||||||||
Ratios/Supplemental Data | |||||||||||||||
Net assets, end of period (in thousands) | $ | 82,831 | $ | 83,642 | $ | 51,324 | |||||||||
Ratio of expenses to average net assets | 0.87 | % | 0.88 | % | 0.89 | % | |||||||||
Ratio of net investment loss to average net assets | (0.41 | %) | (0.48 | %) | (0.38 | %) | |||||||||
Portfolio turnover rate** | 19 | % | 41 | % | 52 | % | |||||||||
* Inception date
** Not annualized for periods less than one year.
(1) Per share amounts have been calculated using the average shares method.
(2) The return listed is the non-annualized return for the Institutional Class since inception date.

121
FINANCIAL HIGHLIGHTS
BUFFALO SMALL CAP FUND INVESTOR CLASS
The following tables are intended to help you understand the Fund's financial performance for the periods shown. Certain information reflects financial results for a single Fund share. Total returns in the table represent the rate that an investor would have earned (or lost) on an investment in the Fund. Total returns assume reinvestment of all dividends and distributions. Total returns do not reflect payment of sales charges, if any, and are not annualized for periods of less than one year.
For the Years Ended March 31, | |||||||||||||||||||||||
| Condensed data for a share of capital stock outstanding throughout the period. | 2022 | 2021 | 2020 | 2019 | 2018 | ||||||||||||||||||
Net asset value, beginning of period | $ | 22.14 | $ | 10.94 | $ | 12.89 | $ | 15.00 | $ | 16.61 | |||||||||||||
Income from investment operations: | |||||||||||||||||||||||
Net investment loss | (0.17 | )(1) | (0.15 | )(1) | (0.08 | ) | (0.08 | ) | (0.09 | ) | |||||||||||||
Net gains (losses) on securities (both realized and unrealized) | (3.27 | ) | 13.23 | (0.62 | ) | 1.25 | 2.92 | ||||||||||||||||
Total from investment operations | (3.44 | ) | 13.08 | (0.70 | ) | 1.17 | 2.83 | ||||||||||||||||
Less distributions: | |||||||||||||||||||||||
Distributions from capital gains | (2.59 | ) | (1.88 | ) | (1.25 | ) | (3.28 | ) | (4.44 | ) | |||||||||||||
Total distributions | (2.59 | ) | (1.88 | ) | (1.25 | ) | (3.28 | ) | (4.44 | ) | |||||||||||||
Net asset value, end of period | $ | 16.11 | $ | 22.14 | $ | 10.94 | $ | 12.89 | $ | 15.00 | |||||||||||||
Total return | (16.93 | %) | 120.78 | % | (7.33 | %) | 12.19 | % | 17.65 | % | |||||||||||||
Ratios/Supplemental Data | |||||||||||||||||||||||
Net assets, end of period (in thousands) | $ | 697,647 | $ | 801,388 | $ | 337,804 | $ | 510,410 | $ | 535,820 | |||||||||||||
Ratio of expenses to average net assets | 1.01 | % | 1.01 | % | 1.01 | % | 1.01 | % | 1.01 | % | |||||||||||||
Ratio of net investment loss to average net assets | (0.83 | %) | (0.81 | %) | (0.65 | %) | (0.55 | %) | (0.64 | %) | |||||||||||||
Portfolio turnover rate | 59 | % | 63 | % | 67 | % | 57 | % | 49 | % | |||||||||||||
(1) Per share amounts have been calculated using the average shares method.

122
FINANCIAL HIGHLIGHTS
BUFFALO SMALL CAP FUND INSTITUTIONAL CLASS
The following tables are intended to help you understand the Fund's financial performance for the periods shown. Certain information reflects financial results for a single Fund share. Total returns in the table represent the rate that an investor would have earned (or lost) on an investment in the Fund. Total returns assume reinvestment of all dividends and distributions. Total returns do not reflect payment of sales charges, if any, and are not annualized for periods of less than one year.
For the Years Ended March 31, | For the period July 1, 2019* through | ||||||||||||||
| Condensed data for a share of capital stock outstanding throughout the period. | 2022 | 2021 | March 31, 2020 | ||||||||||||
Net asset value, beginning of period | $ | 22.20 | $ | 10.96 | $ | 13.78 | |||||||||
Income from investment operations: | |||||||||||||||
Net investment loss | (0.14 | )(1) | (0.13 | )(1) | (0.06 | ) | |||||||||
Net gains (losses) on securities (both realized and unrealized) | (3.28 | ) | 13.24 | (1.51 | ) | ||||||||||
Total from investment operations | (3.42 | ) | 13.11 | (1.57 | ) | ||||||||||
Less distributions: | |||||||||||||||
Distributions from capital gains | (2.59 | ) | (1.88 | ) | (1.25 | ) | |||||||||
Total distributions | (2.59 | ) | (1.88 | ) | (1.25 | ) | |||||||||
Net asset value, end of period | $ | 16.19 | $ | 22.20 | $ | 10.96 | |||||||||
Total return | (16.79 | %) | 121.14 | % | (13.24 | %)(2) | |||||||||
Ratios/Supplemental Data | |||||||||||||||
Net assets, end of period (in thousands) | $ | 281,276 | $ | 328,588 | $ | 95,095 | |||||||||
Ratio of expenses to average net assets | 0.86 | % | 0.86 | % | 0.86 | % | |||||||||
Ratio of net investment loss to average net assets | (0.68 | %) | (0.67 | %) | (0.73 | %) | |||||||||
Portfolio turnover rate** | 59 | % | 63 | % | 67 | % | |||||||||
* Inception date
** Not annualized for periods less than one year.
(1) Per share amounts have been calculated using the average shares method.
(2) The return listed is the non-annualized return for the Institutional Class since inception date.

123
NOTES TO FINANCIAL STATEMENTS
March 31, 2022
1. SIGNIFICANT ACCOUNTING POLICIES:
The Buffalo Funds (comprised of the Buffalo Discovery Fund, Buffalo Dividend Focus Fund, Buffalo Early Stage Growth Fund, Buffalo Flexible Income Fund, Buffalo Growth Fund, Buffalo High Yield Fund, Buffalo International Fund, Buffalo Large Cap Fund, Buffalo Mid Cap Fund, and Buffalo Small Cap Fund) (the "Funds") are registered under the Investment Company Act of 1940, as amended (the "1940 Act"), each as a diversified open-end management investment company. The shares of the Buffalo Funds are issued in multiple series, with each series, in effect, representing a separate fund. Kornitzer Capital Management, Inc. ("Advisor" or "KCM") is the Funds' investment advisor.
Each of the Funds offers two classes of shares, Investor Class and Institutional Class. Each class of share represents an equal interest in the Fund, except the difference of class specific expenses, which reflects the difference in the range of services provided to each class. The shareholder servicing fees for the Investor Class represent the class specific expenses. See Note 7 for more information regarding shareholder servicing fees for the Investor Class. Income, expenses (other than class specific), and realized and unrealized gains and losses on investments are allocated daily to each class based on relative net assets.
The investment objective of the Buffalo Discovery Fund, Buffalo Early Stage Growth Fund, Buffalo Growth Fund, Buffalo International Fund, Buffalo Large Cap Fund, Buffalo Mid Cap Fund and Buffalo Small Cap Fund is long-term growth of capital. The investment objective of the Buffalo Flexible Income Fund is high current income, with long-term growth of capital as a secondary objective. The investment objectives of the Buffalo Dividend Focus Fund and Buffalo High Yield Fund are current income, with long-term growth of capital as a secondary objective.
Each Fund is an investment company and accordingly follows the investment company accounting and reporting guidance of the Financial Accounting Standards Board ("FASB") Accounting Standard Codification ("ASC") Topic 946 "Financial Services — Investment Companies."
The following is a summary of significant accounting policies consistently followed by the Funds in the preparation of their financial statements.
A. INVESTMENT VALUATION — In accordance with FASB ASC 820, Fair Value Measurements ("ASC 820"), fair value is defined as the price that a Fund would receive to sell an investment or pay to transfer a liability in an orderly transaction with an independent buyer in the principal market, or in the absence of a principal market, the most advantageous market for the investment or liability.
Equity securities and debt securities traded on a national securities exchange or national market, except those traded using the National Association of Securities Dealers' Automated Quotation System ("NASDAQ"), are valued at the latest sales price thereof, or if no sale was reported on that date, the mean between the most recent quoted bid and ask price is used. All equity securities that are traded using NASDAQ are valued using the NASDAQ Official Closing Price ("NOCP"), which may not necessarily represent the last sales price. If there has been no sale on such exchange or on NASDAQ on such day, the security is valued at the mean between the most recent quoted bid and ask price.
When market quotations are not readily available, any security or other asset is valued at its fair value as determined in good faith under procedures approved by the Board of Trustees (the "Board"). If events occur that will affect the value of a Fund's portfolio securities before the net asset value ("NAV") has been calculated (a "significant event"), the security will generally be priced using a fair value procedure. The Board has adopted specific procedures for valuing portfolio securities and delegated the responsibility of fair value determinations to the Valuation Committee. Some of the factors that may be considered by the Valuation Committee in determining fair value are fundamental analytical data relating to the investment; the nature and duration of any restriction on disposition; trading in similar securities of the same issuer or comparable companies; information from broker-dealers; and an evaluation of the forces that influence the market in which the securities are purchased or sold. As of March 31, 2022, none of the Funds held

124
securities valued at fair value as determined in good faith by the Valuation Committee. In addition, with respect to the valuation of securities principally traded on foreign markets, the Buffalo International Fund uses a fair value pricing service approved by the Funds' Board which employs quantitative models to adjust for "stale" prices caused by the movement of other markets and other factors occurring after the close of the foreign markets, but before the close of the New York Stock Exchange ("NYSE"). As of March 31, 2022, the Buffalo International Fund held 63 securities where a foreign fair value factor was applied, with a market value of $384,166,734 or 66.50% of total net assets.
Debt securities, including treasury bills, commercial paper, corporate and convertible bonds, bank loans, etc., with remaining maturities of 60 days or less are normally valued at the last reported sale price. If there is no trade on the valuation date, then the security will be priced at the mean between the most recent bid and ask prices.
Restricted securities include securities that have not been registered under the Securities Act of 1933, as amended, and securities that are subject to restrictions on resale. The Funds may invest in restricted securities that are consistent with the Funds' investment objectives and investment strategies. In some cases, the issuer of restricted securities has agreed to register such securities for resale, at the issuer's expense either upon demand by the Funds or in connection with another registered offering of the securities. Investments in restricted securities are valued utilizing the Funds' valuation policies.
ASC 820 establishes a three-tier hierarchy to distinguish between (1) inputs that reflect the assumptions market participants would use in pricing an asset or liability developed based on market data obtained from sources independent of the reporting entity (observable inputs) and (2) inputs that reflect the reporting entity's own assumptions about the assumptions market participants would use in pricing an asset or liability developed based on the best information available in the circumstances (unobservable inputs) and to establish classification of fair value measurements for disclosure purposes. Various inputs are used in determining the value of the Funds' investments. The inputs are summarized in the three broad levels listed below:
Level 1 — Valuations based on quoted prices for investments in active markets that a Fund has the ability to access at the measurement date. Valuation adjustments are not applied to Level 1 investments.
Level 2 — Valuations based on other significant observable inputs (including quoted prices for similar securities, interest rates, prepayment speeds, credit risks, etc.).
Level 3 — Valuations based on significant unobservable inputs (including a Fund's own assumptions and judgment in determining the fair value of investments).
Inputs that are used in determining fair value of an investment may include price information, credit data, volatility statistics, and other factors. These inputs can be either observable or unobservable. The availability of observable inputs can vary between investments, and is affected by various factors such as the type of investment, and the volume and level of activity for that investment or similar investments in the market place. The inputs will be considered by KCM, along with any other relevant factors in the calculation of an investment's fair value. The Funds use prices and inputs that are current as of the measurement date, which may include periods of market dislocations. During these periods, the availability of prices and inputs may be reduced for many investments. This condition could cause an investment to be reclassified between the various levels within the hierarchy.
Non-U.S. equity securities actively traded in foreign markets may be reflected in Level 2 despite the availability of closing prices, because the Funds evaluate and determine whether those closing prices reflect fair value at the close of the NYSE or require adjustment, as described above and in Note 9 — Foreign Investment Risk.
Investments falling into the Level 3 category are primarily supported by quoted prices from brokers and dealers participating in the market for those investments. However, these may be classified as Level 3 investments due to lack of market transparency and corroboration to support these quoted prices. Additionally, valuation models may be used as the pricing source for any remaining investments classified as Level 3. These models rely on one or more significant unobservable inputs and/or significant assumptions made by the Valuation Committee. Inputs used in valuations may include, but are not limited to, financial statement analysis, capital account balances, discount rates and estimated cash flows, and comparable company data.
The inputs or methodology used for valuing securities are not necessarily an indication of the risk associated with investing in those securities.

125
The following table provides the fair value measurement of applicable Fund assets and liabilities by level within the fair value hierarchy as of March 31, 2022. These assets are measured on a recurring basis.
BUFFALO DISCOVERY FUND
Level 1 | Level 2 | Level 3 | Total | ||||||||||||||||
Common Stocks | $ | 1,429,632,005 | — | — | $ | 1,429,632,005 | |||||||||||||
REITS | 24,505,536 | — | — | 24,505,536 | |||||||||||||||
Short Term Investments | 8,637,103 | — | — | 8,637,103 | |||||||||||||||
Total* | $ | 1,462,774,644 | $ | — | $ | — | $ | 1,462,774,644 | |||||||||||
BUFFALO DIVIDEND FOCUS FUND
Level 1 | Level 2 | Level 3 | Total | ||||||||||||||||
Common Stocks | $ | 97,390,497 | — | — | $ | 97,390,497 | |||||||||||||
REITS | 3,135,150 | — | — | 3,135,150 | |||||||||||||||
Convertible Preferred Stocks | 2,037,000 | — | — | 2,037,000 | |||||||||||||||
Preferred Stocks | 388,650 | — | — | 388,650 | |||||||||||||||
Convertible Bonds | — | 5,717,271 | — | 5,717,271 | |||||||||||||||
Short Term Investments | 8,216,998 | — | — | 8,216,998 | |||||||||||||||
Total* | $ | 111,168,295 | $ | 5,717,271 | $ | — | $ | 116,885,566 | |||||||||||
BUFFALO EARLY STAGE GROWTH FUND
Level 1 | Level 2 | Level 3 | Total | ||||||||||||||||
Common Stocks | $ | 99,399,409 | — | — | $ | 99,399,409 | |||||||||||||
REITS | 2,262,456 | — | — | 2,262,456 | |||||||||||||||
Warrants | 742,800 | — | — | 742,800 | |||||||||||||||
Short Term Investments | 9,724,317 | — | — | 9,724,317 | |||||||||||||||
Total* | $ | 112,128,982 | $ | — | $ | — | $ | 112,128,982 | |||||||||||
BUFFALO FLEXIBLE INCOME FUND
Level 1 | Level 2 | Level 3 | Total | ||||||||||||||||
Common Stocks | $ | 464,079,667 | — | — | $ | 464,079,667 | |||||||||||||
REITS | 12,095,540 | — | — | 12,095,540 | |||||||||||||||
Short Term Investments | 13,456,474 | — | — | 13,456,474 | |||||||||||||||
Total* | $ | 489,631,681 | $ | — | $ | — | $ | 489,631,681 | |||||||||||
Written Options | $ | 105,070 | $ | 15,875 | — | $ | 120,945 | ||||||||||||
BUFFALO GROWTH FUND
Level 1 | Level 2 | Level 3 | Total | ||||||||||||||||
Common Stocks | $ | 186,883,516 | — | — | $ | 186,883,516 | |||||||||||||
REITS | 4,270,073 | — | — | 4,270,073 | |||||||||||||||
Short Term Investments | 4,433,033 | — | — | 4,433,033 | |||||||||||||||
Total* | $ | 195,586,622 | $ | — | $ | — | $ | 195,586,622 | |||||||||||
BUFFALO HIGH YIELD FUND
Level 1 | Level 2 | Level 3 | Total | ||||||||||||||||
Preferred Stocks | $ | 8,103,404 | — | — | $ | 8,103,404 | |||||||||||||
Convertible Bonds | — | 18,839,564 | — | 18,839,564 | |||||||||||||||
Corporate Bonds | — | 199,521,406 | — | 199,521,406 | |||||||||||||||
Bank Loans | — | 40,805,199 | 14,060,826 | 54,866,025 | |||||||||||||||
Short Term Investments | 11,975,841 | — | — | 11,975,841 | |||||||||||||||
Total* | $ | 20,079,245 | $ | 259,166,169 | $ | 14,060,826 | $ | 293,306,240 | |||||||||||

126
BUFFALO INTERNATIONAL FUND
Level 1 | Level 2 | Level 3 | Total | ||||||||||||||||
Common Stocks | $ | 161,645,558 | $ | 384,166,734 | — | $ | 545,812,292 | ||||||||||||
Short Term Investments | 31,504,145 | — | — | 31,504,145 | |||||||||||||||
Total* | $ | 193,149,703 | $ | 384,166,734 | $ | — | $ | 577,316,437 | |||||||||||
BUFFALO LARGE CAP FUND
Level 1 | Level 2 | Level 3 | Total | ||||||||||||||||
Common Stocks | $ | 106,170,581 | — | — | $ | 106,170,581 | |||||||||||||
Exchange Traded Funds | 1,057,156 | — | — | 1,057,156 | |||||||||||||||
Short Term Investments | 7,009,473 | — | — | 7,009,473 | |||||||||||||||
Total* | $ | 114,237,210 | $ | — | $ | — | $ | 114,237,210 | |||||||||||
BUFFALO MID CAP FUND
Level 1 | Level 2 | Level 3 | Total | ||||||||||||||||
Common Stocks | $ | 171,104,382 | — | — | $ | 171,104,382 | |||||||||||||
REITS | 4,741,381 | — | — | 4,741,381 | |||||||||||||||
Short Term Investments | 4,076,222 | — | — | 4,076,222 | |||||||||||||||
Total* | $ | 179,921,985 | $ | — | $ | — | $ | 179,921,985 | |||||||||||
BUFFALO SMALL CAP FUND
Level 1 | Level 2 | Level 3 | Total | ||||||||||||||||
Common Stocks | $ | 932,136,785 | — | — | $ | 932,136,785 | |||||||||||||
Short Term Investments | 44,458,589 | — | — | 44,458,589 | |||||||||||||||
Total* | $ | 976,595,374 | $ | — | $ | — | $ | 976,595,374 | |||||||||||
* Additional information regarding the industry and/or geographical classification of these investments is disclosed in the schedule of investments.
The following is a reconciliation of the Buffalo High Yield Income Fund Level 3 assets for which significant unobservable inputs were used to determine fair value for the period ended March 31, 2022:
| Fair Value Measurement Using Significant Unobservable Inputs (Level 3) | Investments in Securities Period Ended March 31, 2022 | ||||||
Fair Value as of 3/31/2021 | $ | — | |||||
Total unrealized gain included in earnings | 24,875 | ||||||
Total unrealized losses included in earnings | (104,066 | ) | |||||
Realized gain included in earnings | 8,200 | ||||||
Realized losses included in earnings | (470 | ) | |||||
Purchases | 9,919,975 | ||||||
Sales | (301,519 | ) | |||||
Amortization/Accretion | (423 | ) | |||||
Transfer into Level 3* | 4,514,254 | ||||||
Fair Value as of 3/31/2022 | $ | 14,060,826 | |||||
* Transfers into Level 3 during the period were due to uncertainty regarding the valuation of certain securities with thinly traded markets. All Level 3 securities in the Buffalo High Yield Fund were priced by an approved pricing vendor as of March 31, 2022. The basis for recognizing and valuing transfers is as of the beginning of the period in which transfers occur.
B. FEDERAL INCOME TAXES — Each Fund complies with the requirements of Subchapter M of the Internal Revenue Code necessary to qualify as a regulated investment company and makes the requisite distributions of income and capital gains to its shareholders sufficient to relieve it from all or substantially all federal income and excise taxes. Therefore, no federal income tax provision has been provided.
At March 31, 2022, the Funds did not have any tax positions that did not meet the "more likely-than-not" threshold of being sustained by the applicable tax authority. The Funds recognize interest and penalties, if any, related to

127
unrecognized tax benefits as other expense in the Statement of Operations. During the year, the Funds did not incur any interest or penalties.
The Funds have analyzed all open tax years, as defined by the statute of limitations, for all major jurisdictions. Open tax years are those that are open for exam by taxing authorities. Open tax years include the tax years ended March 31, 2019 through March 31, 2022. The Funds have no examinations in progress.
C. INVESTMENT TRANSACTIONS AND INVESTMENT INCOME — Investment transactions are accounted for on the date the securities are purchased or sold (trade date). Dividend income is recorded on the ex-dividend date except that certain dividends for foreign securities where the ex-dividend date may have passed are recorded as soon as the Fund is informed of the dividend in the exercise of reasonable diligence. Interest income is recognized on the accrual basis. Realized gains and losses from investment transactions are reported on the identified cost basis. All discounts/premiums are accreted/amortized for financial reporting purposes and are included in interest income.
D. DISTRIBUTIONS TO SHAREHOLDERS — Distributions to shareholders are recorded on the ex-dividend date. Distributions are determined in accordance with income tax regulations, which may differ from U.S. generally accepted accounting principles ("GAAP"). These differences are primarily due to differing treatments for premium amortization on debt securities, deferral of late year and wash sale losses, and partnership investment income.
E. USE OF ESTIMATES — The preparation of financial statements in conformity with GAAP requires management to make estimates and assumptions that affect the amounts reported in the financial statements and accompanying notes. Actual results could differ from such estimates.
F. FOREIGN CURRENCY TRANSLATION — Values of investments denominated in foreign currencies are converted into U.S. dollars using a spot market rate of exchange on the day of valuation. Purchases and sales of investments and dividend and interest income are translated to U.S. dollars using a spot market rate of exchange prevailing on the respective dates of such transactions. The portion of security gains or losses resulting from changes in foreign exchange rates is included with net realized and unrealized gain or loss from investments, as appropriate, for both financial reporting and tax purposes.
G. PURCHASED AND WRITTEN OPTION CONTRACTS — Certain Funds may purchase and write call or put options on securities and indices and enter into related closing transactions. As a holder of a call option, a Fund has the right, but not the obligation, to purchase a security at the exercise price during the exercise period. As the writer of a call option, a Fund has the obligation to sell the security at the exercise price during the exercise period. The Fund's maximum payout in the case of written call option contracts cannot be determined. As a holder of a put option, a Fund has the right, but not the obligation, to sell a security at the exercise price during the exercise period. As the writer of a put option, a Fund has the obligation to buy the underlying security at the exercise price during the exercise period. The Funds did not hold any written put options as of March 31, 2022.
The premium that a Fund pays when purchasing an option or receives when writing an option will reflect, among other things, the market price of the security, the relationship of the exercise price to the market price of the security, the relationship of the exercise price to the volatility of the security, the length of the option period and supply and demand factors. The premium is the market value of an option at the time of purchase.
A purchaser (holder) of a put option pays a non-refundable premium to the seller (writer) of a put option to obtain the right to sell a specified amount of a security at a fixed price (the exercise price) during a specified period (exercise period). Conversely, the seller (writer) of a put option, upon payment by the holder of the premium, has the obligation to buy the security from the holder of the put option at the exercise price during the exercise period.
Exchange traded options are valued at the composite price, using the National Best Bid and Offer quotes ("NBBO"). NBBO consists of the highest bid prices and lowest ask prices across any of the exchanges on which an option is quoted, thus providing a view across the entire U.S. options marketplace. Specifically, composite pricing looks at the last trades on the exchanges where the options are traded. If there are no trades for the option on a given business day, composite option pricing calculates the mean of the highest bid price and lowest ask price across the exchanges where the option is traded. Non exchange traded options also will be valued at the mean between the last bid and ask quotations. For options where market quotations are not readily available, a fair value shall be determined as set forth in the Funds' fair valuation guidelines.

128
The Funds may use options with the objective to generate income as a non-principal investment strategy. Currently, the Buffalo Flexible Income Fund makes use of the options strategy to a greater extent than the other Funds because high income generation is a primary investment objective of the Buffalo Flexible Income Fund. The primary strategy used by Buffalo Flexible Income Fund to achieve income generation through the use of options is to write covered calls with the strike price above the cost basis and the value the portfolio managers believe will be achieved before the expiration of the option and also at a value that the portfolio managers are willing to sell if the option is exercised. The collected premiums generate income for the Fund, and if the option is exercised, a gain will also be achieved. A risk of using derivatives is that the counterparty to a derivative may fail to comply with their obligation to the Funds. See Note 7 for written option activity.
H. INDEMNIFICATIONS — Under the Funds' organizational documents, officers and trustees are indemnified against certain liabilities arising out of the performance of their duties to the Funds. In addition, in the normal course of business, the Funds enter into contracts that provide general indemnification to other parties. The Funds' maximum exposure under these arrangements is unknown as this would involve future claims that may be made against the Funds that have not yet occurred, and may not occur. However, the Funds have not had prior claims or losses pursuant to these contracts and expect the risk of loss to be remote.
I. RECENT ACCOUNTING PRONOUNCEMENTS — In March 2020, FASB issued Accounting Standards Update 2020-04, Reference Rate Reform: Facilitation of the Effects of Reference Rate Reform on Financial Reporting ("ASU 2020-04"). The main objective of ASU 2020-04 is to provide relief to companies that will be impacted by the expected change in benchmark interest rates at the end of 2021, when participating banks will no longer be required to submit London Inter-bank Offered Rate ("LIBOR") quotes by the UK Financial Conduct Authority. ASU 2020-04 allows companies to, provided the only change to existing contracts are a change to an approved benchmark interest rate, account for modifications as a continuance of the existing contract without additional analysis. In addition, derivative contracts that qualified for hedge accounting prior to modification, will be allowed to continue to receive such treatment, even if critical terms change due to a change in the benchmark interest rate. For new and existing contracts, the Funds may elect to apply the amendments as of March 12, 2020 through December 31, 2022. Management is currently assessing the impact of the adoption of ASU 2020-04 to the Funds' financial statements and various filings.
2. FEDERAL TAX MATTERS:
The tax character of distributions paid during the year ended March 31, 2022 and the year ended March 31, 2021 were as follows:
Year Ended March 31, 2022 | Year Ended March 31, 2021 | ||||||||||||||||||
| Ordinary Income | Long-Term Capital Gains* | Ordinary Income | Long-Term Capital Gains* | ||||||||||||||||
Buffalo Discovery Fund | $ | 112,318,729 | $ | 123,893,049 | $ | 38,071,743 | $ | 97,268,331 | |||||||||||
Buffalo Dividend Focus Fund | 986,883 | 1,160,009 | 603,921 | — | |||||||||||||||
Buffalo Early Stage Growth Fund | 5,875,169 | 12,323,925 | 3,781,350 | 8,196,019 | |||||||||||||||
Buffalo Flexible Income Fund | 8,766,704 | 15,688,522 | 10,003,773 | 4,920,585 | |||||||||||||||
Buffalo Growth Fund | 132,540 | 19,913,840 | — | 9,555,575 | |||||||||||||||
Buffalo High Yield Fund | 17,440,640 | 3,666,924 | 10,794,072 | — | |||||||||||||||
Buffalo International Fund | 1,022,952 | 7,227,396 | 1,745,735 | 64,842 | |||||||||||||||
Buffalo Large Cap Fund | 1,335,634 | 24,868,764 | 226,492 | — | |||||||||||||||
Buffalo Mid Cap Fund | 3,986,617 | 16,775,830 | 1,244,192 | 10,770,947 | |||||||||||||||
Buffalo Small Cap Fund | 52,124,491 | 89,925,330 | 40,701,261 | 35,400,582 | |||||||||||||||
* The Funds designate as long-term capital gain dividends, pursuant to Internal Revenue Code Section 852(b)(3)(C), the amounts necessary to reduce the earnings and profits of the Funds related to net capital gain to zero for the tax period ended March 31, 2022.
For tax purposes, distributions from short-term capital gain distributions are included in ordinary income distributions.

129
Additionally, GAAP requires that certain components of net assets relating to permanent differences be reclassified between financial and tax reporting. These reclassifications have no effect on net assets or net asset value per share. For the year ended March 31, 2022, the following table shows the reclassifications made:
Funds | Distributable Earnings | Paid In Capital | |||||||||
Buffalo Discovery Fund | $ | (28,498,234 | ) | $ | 28,498,234 | ||||||
Buffalo Dividend Focus Fund | (80,638 | ) | 80,638 | ||||||||
Buffalo Early Stage Growth Fund | (1,907,036 | ) | 1,907,036 | ||||||||
Buffalo Flexible Income Fund | (1,477,994 | ) | 1,477,994 | ||||||||
Buffalo Growth Fund | (1,377,738 | ) | 1,377,738 | ||||||||
Buffalo High Yield Fund | (628,998 | ) | 628,998 | ||||||||
Buffalo International Fund | (960,089 | ) | 960,089 | ||||||||
Buffalo Large Cap Fund | (1,696,615 | ) | 1,696,615 | ||||||||
Buffalo Mid Cap Fund | (162,886 | ) | 162,886 | ||||||||
Buffalo Small Cap Fund | (26,891,803 | ) | 26,891,803 | ||||||||
The permanent differences primarily relate to net operating losses and utilization of earnings and profit distributions to shareholders on redemption of shares.
As of March 31, 2022, the components of distributable earnings (losses) for income tax purposes were as follows:
| Buffalo Discovery Fund | Buffalo Dividend Focus Fund | Buffalo Early Stage Growth Fund | Buffalo Flexible Income Fund | Buffalo Growth Fund | |||||||||||||||||||
Tax cost of Investments(a) | $ | 1,097,903,658 | $ | 65,709,828 | $ | 91,181,258 | $ | 237,239,090 | $ | 89,178,884 | |||||||||||||
Unrealized Appreciation | 424,315,793 | 52,802,414 | 35,755,718 | 259,461,399 | 110,300,602 | ||||||||||||||||||
Unrealized Depreciation | (59,444,807 | ) | (1,626,676 | ) | (14,807,994 | ) | (7,074,906 | ) | (3,892,864 | ) | |||||||||||||
Net unrealized appreciation | 364,870,986 | 51,175,738 | 20,947,724 | 252,386,493 | 106,407,738 | ||||||||||||||||||
Undistributed Ordinary Income | — | — | — | — | — | ||||||||||||||||||
| Undistributed Long Term Capital Gain | 61,661,360 | 1,828,124 | 991,522 | 11,966,545 | 6,058,234 | ||||||||||||||||||
Distributable earnings | 61,661,360 | 1,828,124 | 991,522 | 11,966,545 | 6,058,234 | ||||||||||||||||||
Other accumulated gain/(loss) | (53,611,296 | ) | (5,539 | ) | (1,889,468 | ) | (24,933 | ) | (2,135,757 | ) | |||||||||||||
Total distributable earnings | 372,921,050 | 52,998,323 | 20,049,778 | 264,328,105 | 110,330,215 | ||||||||||||||||||
| Buffalo High Yield Fund | Buffalo International Fund | Buffalo Large Cap Fund | Buffalo Mid Cap Fund | Buffalo Small Cap Fund | |||||||||||||||||||
Tax cost of Investments(a) | $ | 293,543,757 | $ | 361,079,925 | $ | 68,731,116 | $ | 104,678,464 | $ | 861,016,916 | |||||||||||||
Unrealized Appreciation | 6,787,035 | 223,670,021 | 47,997,454 | 78,209,934 | 229,018,671 | ||||||||||||||||||
Unrealized Depreciation | (7,024,552 | ) | (7,471,565 | ) | (2,491,360 | ) | (2,953,057 | ) | (113,440,213 | ) | |||||||||||||
Net unrealized appreciation | (237,517 | ) | 216,198,456 | 45,506,094 | 75,256,877 | 115,578,458 | |||||||||||||||||
Undistributed Ordinary Income | 1,369,487 | 234,266 | — | — | — | ||||||||||||||||||
| Undistributed Long Term Capital Gain | 5,003,175 | 7,420,560 | 2,521,272 | 4,892,444 | — | ||||||||||||||||||
Distributable earnings | 6,372,662 | 7,654,826 | 2,521,272 | 4,892,444 | — | ||||||||||||||||||
Other accumulated gain/(loss) | — | — | (2,370,825 | ) | (207,839 | ) | (5,780,937 | ) | |||||||||||||||
Total distributable earnings | 6,135,145 | 223,853,282 | 45,656,541 | 79,941,482 | 109,797,521 | ||||||||||||||||||
The differences between book-basis and tax-basis unrealized appreciation/depreciation are attributable primarily to the tax deferral of losses on wash sales, premium amortization, and publicly traded partnership investments.
Other accumulated gain/(loss) is generally comprised of qualified late year losses and/or straddle loss deferrals.
(a) Represents cost for federal income tax purposes and may differ from the cost for financial reporting purposes.

130
As of March 31, 2022, the Buffalo Funds had no capital loss carryovers available to offset future taxable gains.
In order to meet certain excise tax distribution requirements, the Funds are required to measure and distribute annually net capital gains realized during a twelve month period ending October 31 and net investment income earned during a twelve month period ending December 31. In connection with this, the Funds are permitted for tax purposes to defer into their next fiscal year qualified late year losses. Qualified late year capital losses are any net capital losses incurred between November 1 and the end of their fiscal year, March 31, 2022. Qualified late year ordinary losses are generally losses incurred between January 1 and the end of their fiscal year, March 31, 2022.
At March 31, 2022, the following Funds deferred, on a tax basis, qualified late year losses, consisting of ordinary and capital losses, as follows:
Funds | Qualified Late Year Ordinary Losses | Qualified Late Year Capital Losses | |||||||||
Buffalo Discovery Fund | $ | — | $ | 53,611,296 | |||||||
Buffalo Dividend Focus Fund | 5,539 | — | |||||||||
Buffalo Early Stage Growth Fund | 252,011 | 1,637,457 | |||||||||
Buffalo Flexible Income Fund | — | — | |||||||||
Buffalo Growth Fund | 133,391 | 2,002,366 | |||||||||
Buffalo High Yield Fund | — | — | |||||||||
Buffalo International Fund | — | — | |||||||||
Buffalo Large Cap Fund | — | 2,370,825 | |||||||||
Buffalo Mid Cap Fund | 207,839 | — | |||||||||
Buffalo Small Cap Fund | 1,872,293 | 3,908,644 | |||||||||
For the year ended March 31, 2022, the Buffalo International Fund earned foreign source income and paid foreign taxes, as noted below, which it intends to pass through to its shareholders pursuant to Section 853 of the Internal Revenue Code.
| Gross Foreign Income | Foreign Tax Paid | ||||||||||
Buffalo International Fund | $ | 8,144,918 | $ | (956,967 | ) | ||||||
3. RELATED PARTY TRANSACTIONS:
Management fees are paid to KCM at the rate of 0.85% per annum of the average daily net asset values of the Funds, except for the Buffalo Early Stage Growth Fund, Buffalo Dividend Focus Fund, Buffalo Growth Fund and Buffalo Large Cap Fund which have a management fee rate of 1.30%, 0.75%, 0.75% and 0.75%, respectively. The management fees are for services which include the costs of all management, supervisory and administrative services required in the normal operation of the Funds. This includes investment management and supervision; fees of the custodian (except for the additional cost of maintaining custody of assets in foreign jurisdictions, when compared to domestic custody costs), independent registered public accounting firm and legal counsel; fees and expenses of officers, trustees and other personnel; rent; and other items incidental to corporate administration. Pursuant to a Master Services Agreement with U.S. Bancorp Fund Services, LLC, doing business as U.S. Bank Global Fund Services ("GFS"), KCM pays GFS a fee of 30/100 of 1% (0.30%) of each Funds' average daily net assets out of the fees KCM receives from the Funds, except for the Buffalo Dividend Focus Fund, Buffalo Growth Fund and the Buffalo Large Cap Fund, where GFS receives 25/100 of 1% (0.25%). GFS provides or obtains various operational services required by the Funds, pays various Fund expenses and acts as paying agent to compensate other Fund service providers. Some of the other Fund service providers are affiliates of GFS.
With respect to the Buffalo Small Cap Fund only, the annual management fee rate of 0.85% of the Buffalo Small Cap Fund's average daily net assets is a base fee paid to KCM that is subject to reduced fees paid on assets in excess of certain levels (breakpoints). The fee paid by KCM to GFS is also subject to breakpoints on assets in excess of certain

131
levels. The breakpoint schedules for the management fees paid by the Buffalo Small Cap Fund to KCM and the fees paid by KCM to GFS are set forth in the following table:
BUFFALO SMALL CAP FUND FEE BREAKPOINTS
(As a % Of Average Daily Net Assets) | |||||||||||
Asset Level | Management Fee | GFS Fee | |||||||||
Assets up to $6 billion | 0.85 | % | 0.300 | % | |||||||
Assets over $6 billion up to $7 billion | 0.80 | % | 0.275 | % | |||||||
Assets over $7 billion up to $8 billion | 0.75 | % | 0.250 | % | |||||||
Assets over $8 billion up to $9 billion | 0.70 | % | 0.225 | % | |||||||
Assets over $9 billion | 0.65 | % | 0.200 | % | |||||||
The management fees do not include the cost of acquiring and disposing of portfolio securities, taxes, if any, imposed directly on the Funds and their shares, insurance, certain trustee expenses and the cost of qualifying the Funds' shares for sale in any jurisdiction. Certain officers of the Funds are also officers and/or directors of KCM. With respect to each Fund's Investor Class, the management fees do not include the shareholder servicing fees.
The Buffalo International Fund incurred $105,362 in custody fees during the period ended March 31, 2022, and owed $17,996 for custody fees as of March 31, 2022.
4. AGGREGATE COMPENSATION TO TRUSTEES:
The Funds do not directly compensate any of their trustees. GFS pays trustee fees to non-interested Board members from its share of the management fee that it receives from KCM. The aggregate compensation paid to the Funds' non-interested trustees for their service on the Funds' Board for the period ended March 31, 2022 was $213,000. Interested trustees who are affiliated with KCM do not receive any compensation from the Funds, but are compensated directly by KCM in connection with their employment with KCM.
5. INVESTMENT TRANSACTIONS:
The aggregate purchases and sales of securities, excluding short-term investments and U.S. government securities, for the Funds for the year ended March 31, 2022, were as follows:
| Buffalo Discovery Fund | Buffalo Dividend Focus Fund | Buffalo Early Stage Growth Fund | Buffalo Flexible Income Fund | Buffalo Growth Fund | |||||||||||||||||||
Purchases | $ | 699,765,247 | $ | 5,263,621 | $ | 44,892,257 | $ | 18,881,172 | $ | 27,853,558 | |||||||||||||
Proceeds from Sales | 941,338,563 | 3,991,303 | 42,869,769 | 27,534,724 | 51,509,834 | ||||||||||||||||||
| Buffalo High Yield Fund | Buffalo International Fund | Buffalo Large Cap Fund | Buffalo Mid Cap Fund | Buffalo Small Cap Fund | |||||||||||||||||||
Purchases | $ | 156,584,596 | $ | 89,778,773 | $ | 94,516,098 | $ | 36,770,037 | $ | 708,839,536 | |||||||||||||
Proceeds from Sales | 112,717,346 | 72,503,298 | 104,051,800 | 47,879,933 | 655,256,592 | ||||||||||||||||||
There were no purchases or sales of long-term U.S. government securities for any Funds during the period ended March 31, 2022.
6. TRANSACTIONS WITH AFFILIATES:
Investments representing 5% or more of the outstanding voting securities of a portfolio company result in that company being considered an affiliated company, as defined in the 1940 Act. There were no affiliated companies held in any of the Funds during the period ended March 31, 2022.

132
7. SHAREHOLDER SERVICING PLAN:
The Trust, on behalf of the Funds, has adopted a Shareholder Servicing Plan, to pay a fee at an annual rate of up to 0.15% of average daily net assets of the Investor Class shares serviced by shareholder servicing agents who provide administrative and support services to their customers. No shareholder servicing fees are charged to the Institutional Class. For the period ended March 31, 2022, Investor Class shareholder servicing fees were as follows:
| Fund: | Investor Class Shareholder Servicing Fee | ||||||
Buffalo Discovery Fund | $ | 2,022,322 | |||||
Buffalo Dividend Focus Fund | 46,320 | ||||||
Buffalo Early Stage Growth Fund | 127,519 | ||||||
Buffalo Flexible Income Fund | 433,814 | ||||||
Buffalo Growth Fund | 173,289 | ||||||
Buffalo High Yield Fund | 81,890 | ||||||
Buffalo International Fund | 429,851 | ||||||
Buffalo Large Cap Fund | 60,436 | ||||||
Buffalo Mid Cap Fund | 160,971 | ||||||
Buffalo Small Cap Fund | 1,257,921 | ||||||
8. OPTIONS WRITTEN:
FASB ASC 815, Derivatives and Hedging (ASC 815) requires disclosures to enable investors to better understand how and why the Funds use derivative instruments, how these derivative instruments are accounted for and their effects on the Funds' financial position and results of operations. The Buffalo Flexible Income Fund is the only Fund that has maintained any positions in derivative instruments or engaged in hedging activities during the year ended March 31, 2022. For the year ended March 31, 2022, the quarterly average gross notional amount of derivatives held by the Fund was $11,449,871, representing holdings in written options. The Fund utilizes these written options as a substitute for a comparable market position in the respective underlying security of the written options.
As of March 31, 2022, the Buffalo Flexible Income Fund was invested in written option contracts.
The following is a summary of the location of derivative investments on the Buffalo Flexible Income Fund's Statement of Assets and Liabilities as of March 31, 2022:
Derivative Investment Type | Value | ||||||
Liability Derivatives | |||||||
Buffalo Flexible Income Fund | |||||||
Written Options — equity contracts | $ | 120,945 | |||||
The following is a summary of the effect of derivative investments on Realized Gain (loss) and Change in Unrealized Appreciation/Depreciation on Options in the Fund as of March 31, 2022:
Derivative Investment Type | Realized Gain (Loss) on Options | ||||||
Liability Derivatives | |||||||
Buffalo Flexible Income Fund | |||||||
Written Options — equity contracts | $ | 884,613 | |||||
Derivative Investment Type | Change in Unrealized Appreciation/Depreciation on Options | ||||||
Liability Derivatives | |||||||
Buffalo Flexible Income Fund | |||||||
Written Options — equity contracts | $ | (69,235 | ) | ||||

133
The following table presents derivative assets and liabilities net of amounts available for offset under Master Netting Agreements (MNA) and net of related collateral received or pledged, if any, as of March 31, 2022:
GROSS AMOUNTS NOT OFFSET IN THE STATEMENT OF ASSETS AND LIABILITIES AND SUBJECT TO MNAs
Gross | Gross Amounts Offset In The | Net Amounts Presented In | Gross Amounts Not Offset In The Statement Of Financial Position | ||||||||||||||||||||||||
Liabilities: | Amounts Of Recognized Liabilities | Statement Of Financial Position | The Statement Of Financial Position | Financial Instruments | Collateral Pledged/ (Received)* | Net Amount | |||||||||||||||||||||
Description | |||||||||||||||||||||||||||
Written Options | $ | 120,945 | $ | 120,945 | $ | 120,945 | $ | 120,945 | $ | 120,945 | $ | 120,945 | |||||||||||||||
$ | 120,945 | $ | 120,945 | $ | 120,945 | $ | 120,945 | $ | 120,945 | $ | 120,945 | ||||||||||||||||
* Any over-collateralization of total financial instruments or cash is not shown.
9. FOREIGN INVESTMENT RISK:
When the Buffalo International Fund buys or sells securities on a foreign stock exchange, the transaction is undertaken in the local currency rather than in U.S. dollars. In purchasing or selling local currency to execute transactions on foreign exchanges, the Buffalo International Fund will be exposed to the risk that the value of the foreign currency will increase or decrease, which may impact the value of the portfolio holdings. China has, and may continue to adopt, internal economic policies that affect its currency valuations in a manner that may be disadvantageous for U.S. investors or U.S. companies seeking to do business in China. In addition, a country may impose formal or informal currency exchange controls (or "capital controls"). These types of controls may restrict or prohibit the Buffalo International Fund's ability to repatriate both investment capital and income, which could undermine the value of the portfolio holdings and potentially place the Buffalo International Fund's assets at risk of total loss.
Investing in securities of foreign corporations and governments involves additional risks relating to: political, social, religious and economic developments abroad; market instability; fluctuations in foreign exchange rates; different regulatory requirements, market practices, accounting standards and practices; and less publicly available information about foreign issuers. Additionally, these investments may be less liquid, carry higher brokerage commissions and other fees, and procedures and regulations governing transactions and custody in foreign markets also may involve delays in payment, delivery or recovery of money or investments. Investments in common stocks of U.S. companies with international operations, and the purchase of sponsored or unsponsored ADRs (American Depositary Receipt) carry similar risks. In addition to risks associated with investing in foreign securities, there are special risks associated with investments in China and Hong Kong, including exposure to currency fluctuations, less liquidity, expropriation, confiscatory taxation, nationalization, exchange control regulations, differing legal standards and rapid fluctuations in inflation and interest rates. The Chinese government could, at any time, alter or discontinue economic reform programs implemented since 1978.
10. LINE OF CREDIT:
U.S. Bank, N.A. has made available to the Funds an unsecured line of credit pursuant to a Loan Agreement for the Funds which matures, unless renewed, on July 30, 2022. The line of credit is intended to provide short-term financing, if necessary, subject to certain restrictions, in connection with shareholder redemptions. The Funds may borrow up to the lesser of $50,000,000 or certain percentage amounts based on the net assets of the Funds.
The interest rate paid by the Funds on outstanding borrowings is equal to the Prime Rate. As of March 31, 2022, the Prime Rate was 3.50%. During the year ended March 31, 2022, the Buffalo Flexible Income Fund had average outstanding borrowings of $326 under the credit facility and paid a weighted average interest rate of 3.25%, totaling $11, which is included in the other expenses on the Statement of Operations. The November 3, 2021 balance of $119,000 for the Buffalo Flexible Income Fund was the maximum borrowing during the year ended March 31, 2022. None of the other Buffalo Funds had borrowings under the credit facility during the year ended March 31, 2022.

134
11. RECENT MARKET EVENTS:
U.S. and international markets have experienced significant periods of volatility in recent years and months due to a number of economic, political and global macros factors including the impact of COVID-19 as a global pandemic and related public health crisis, growth concerns in the U.S. and overseas, uncertainties regarding interest rates, rising inflation, trade tensions, and the threat of tariffs imposed by the U.S. and other countries. In particular, the global spread of COVID-19 has resulted in disruptions to business operations and supply chains, stress on the global healthcare system, growth concerns in the U.S. and overseas, staffing shortages and the inability to meet consumer demand, and widespread concern and uncertainty. The global recovery from COVID-19 is proceeding at slower than expected rates due to the emergence of variant strains and may last for an extended period of time. Health crises and related political, social and economic disruptions caused by the spread of CVID-19 may also exacerbate other pre-existing political, social and economic risks in certain countries. As a result of continuing political tensions and armed conflicts, including the war between Ukraine and Russia, the U.S. and the European Union imposed sanctions on certain Russian individual and companies, including certain financial institutions, and have limited certain exports and imports to and from Russia. The war has contributed to recent market volatility and may continue to do so. These developments, as well as other events, could result in further market volatility and negatively affect financial asset prices, the liquidity of certain securities and the normal operations of securities exchange and other markets, despite government efforts to address market disruptions. Continuing market volatility as a result of recent market conditions or other events may have adverse effects on your account.
12. LIBOR:
The London Interbank Offered Rate ("LIBOR") is an interest-rate average calculated from estimates submitted by the leading banks in London. LIBOR represents the rate which banks may obtain short-term borrowings from each other. It is the primary interest rate benchmark for short-term interest rates around the world. The regulator of the LIBOR administrator phased out the use of LIBOR on December 30, 2021 such that the one-week and 2-month USD LIBOR settings ceased to be published or will no longer be representative. The remaining USD LIBOR settings will cease to be published or will no longer be representative after June 30, 2023. Because the usefulness of LIBOR as a reference rate could deteriorate during the transition from LIBOR to an alternative reference rate, these effects could occur prior to June 30, 2023. The expected discontinuation of LIBOR could have a significant impact on the financial markets, and may present a risk for certain market participants, including the risk that the transition from LIBOR to an alternative interest rate will not be orderly, will occur over various time periods or will have unintended consequences.
13. SUBSEQUENT EVENTS:
Management has evaluated the events and transactions that have occurred after March 31, 2022 and through the date the financial statements were issued and determined that there were no significant subsequent events that would require adjustment of the financial statements or additional disclosures.

135
REPORT OF INDEPENDENT REGISTERED PUBLIC ACCOUNTING FIRM
To the Shareholders and the Board of Trustees of Buffalo Funds
Opinion on the Financial Statements
We have audited the accompanying statements of assets and liabilities of the Buffalo Funds (the "Trust") (comprising the Buffalo Discovery Fund, Buffalo Dividend Focus Fund, Buffalo Early Stage Growth Fund, Buffalo Flexible Income Fund, Buffalo Growth Fund, Buffalo High Yield Fund, Buffalo International Fund, Buffalo Large Cap Fund, Buffalo Mid Cap Fund, and Buffalo Small Cap Fund (collectively referred to as the "Funds")), including the schedules of investments, as of March 31, 2022, and the related statements of operations for the year then ended, the statements of changes in net assets for each of the two years in the period then ended, the financial highlights for each of the five years in the period then ended and the related notes (collectively referred to as the "financial statements"). In our opinion, the financial statements present fairly, in all material respects, the financial position of each of the Funds comprising the Buffalo Funds at March 31, 2022, the results of their operations for the year then ended, the changes in their net assets for each of the two years in the period then ended and their financial highlights for each of the five years in the period then ended, in conformity with U.S. generally accepted accounting principles.
Basis for Opinion
These financial statements are the responsibility of the Trust's management. Our responsibility is to express an opinion on each of the Funds' financial statements based on our audits. We are a public accounting firm registered with the Public Company Accounting Oversight Board (United States) ("PCAOB") and are required to be independent with respect to the Trust in accordance with the U.S. federal securities laws and the applicable rules and regulations of the Securities and Exchange Commission and the PCAOB.
We conducted our audits in accordance with the standards of the PCAOB. Those standards require that we plan and perform the audit to obtain reasonable assurance about whether the financial statements are free of material misstatement, whether due to error or fraud. The Trust is not required to have, nor were we engaged to perform, an audit of the Trust's internal control over financial reporting. As part of our audits, we are required to obtain an understanding of internal control over financial reporting but not for the purpose of expressing an opinion on the effectiveness of the Trust's internal control over financial reporting. Accordingly, we express no such opinion.
Our audits included performing procedures to assess the risks of material misstatement of the financial statements, whether due to error or fraud, and performing procedures that respond to those risks. Such procedures included examining, on a test basis, evidence regarding the amounts and disclosures in the financial statements. Our procedures included confirmation of securities owned as of March 31, 2022, by correspondence with the custodian, brokers, and agent banks or by other appropriate auditing procedures where replies from brokers and agent banks were not received. Our audits also included evaluating the accounting principles used and significant estimates made by management, as well as evaluating the overall presentation of the financial statements. We believe that our audits provide a reasonable basis for our opinion.

We have served as the auditor of the Buffalo Funds since 1994.
Kansas City, Missouri
May 26, 2022

136
NOTICE TO SHAREHOLDERS (UNAUDITED)
MARCH 31, 2022
TAX INFORMATION
For the fiscal year ended March 31, 2022, certain dividends paid by the Funds may be subject to a maximum tax rate of 23.8%, as provided for by the Jobs and Growth Tax Relief Reconciliation Act of 2003. The percentage of dividends declared from ordinary income designated as qualified dividend income was as follows (unaudited):
Buffalo Discovery Fund | 6.40 | % | |||||
Buffalo Dividend Focus Fund | 100.00 | % | |||||
Buffalo Early Stage Growth Fund | 5.02 | % | |||||
Buffalo Flexible Income Fund | 100.00 | % | |||||
Buffalo Growth Fund | 100.00 | % | |||||
Buffalo High Yield Fund | 1.78 | % | |||||
Buffalo International Fund | 100.00 | % | |||||
Buffalo Large Cap Fund | 89.77 | % | |||||
Buffalo Mid Cap Fund | 11.35 | % | |||||
Buffalo Small Cap Fund | 1.31 | % | |||||
For corporate shareholders, the percent of ordinary income distributions qualifying for the corporate dividends received deduction for the fiscal year ended March 31, 2022 was as follows (unaudited):
Buffalo Discovery Fund | 6.17 | % | |||||
Buffalo Dividend Focus Fund | 100.00 | % | |||||
Buffalo Early Stage Growth Fund | 4.40 | % | |||||
Buffalo Flexible Income Fund | 100.00 | % | |||||
Buffalo Growth Fund | 100.00 | % | |||||
Buffalo High Yield Fund | 1.78 | % | |||||
Buffalo International Fund | 0.00 | % | |||||
Buffalo Large Cap Fund | 89.64 | % | |||||
Buffalo Mid Cap Fund | 10.32 | % | |||||
Buffalo Small Cap Fund | 1.31 | % | |||||
FOREIGN SHAREHOLDERS: The percentage of taxable ordinary income distributions that are designated as short-term capital gain distributions under Internal Revenue Section 871(k)(2)(C) for the year ended March 31, 2022 was as follows (unaudited).
Buffalo Discovery Fund | 100.00 | % | |||||
Buffalo Dividend Focus Fund | 51.38 | % | |||||
Buffalo Early Stage Growth Fund | 100.00 | % | |||||
Buffalo Flexible Income Fund | 18.68 | % | |||||
Buffalo Growth Fund | 100.00 | % | |||||
Buffalo High Yield Fund | 28.77 | % | |||||
Buffalo International Fund | 0.00 | % | |||||
Buffalo Large Cap Fund | 100.00 | % | |||||
Buffalo Mid Cap Fund | 100.00 | % | |||||
Buffalo Small Cap Fund | 100.00 | % | |||||

137
(Unaudited)
With respect to the taxable year ended March 31, 2022, the Funds hereby designate as capital gain dividends the amounts listed below, or, if subsequently determined to be different, the net capital gains of such year:
Funds | From long-term capital gains, subject to the 15% rate gains category: | From long-term capital gains, using proceeds from shareholder redemptions: | |||||||||
Buffalo Discovery Fund | $ | 123,893,049 | $ | 28,634,043 | |||||||
Buffalo Dividend Focus Fund | 1,160,009 | 88,468 | |||||||||
Buffalo Early Stage Growth Fund | 12,323,925 | 1,907,036 | |||||||||
Buffalo Flexible Income Fund | 15,688,522 | 1,457,397 | |||||||||
Buffalo Growth Fund | 19,913,840 | 1,377,737 | |||||||||
Buffalo High Yield Fund | 3,666,924 | 628,998 | |||||||||
Buffalo International Fund | 7,227,396 | 960,089 | |||||||||
Buffalo Large Cap Fund | 24,868,764 | 1,696,615 | |||||||||
Buffalo Mid Cap Fund | 16,775,830 | 941,127 | |||||||||
Buffalo Small Cap Fund | 89,925,330 | 34,143,125 | |||||||||

138
(Unaudited)
Trustees and Officers of the Funds
The management and affairs for the Funds are supervised by the Board of Trustees ("Trustees") under the laws of the State of Delaware. The Trustees and executive officers of the Funds and their principal occupations for the last five years are set forth below. Each may have held other positions with the named companies during that period. The Funds' Statement of Additional Information includes additional information about the Trustees and is available without charge, upon request, by calling the Funds toll-free at 1-800-49-BUFFALO.
Name, Age and Address | Position(s) Held | Term of Office | Principal Occupation(s) | Number of | Other Directorships | ||||||||||||||||||
INTERESTED TRUSTEES(1) | |||||||||||||||||||||||
Robert J. Male | Trustee | Indefinite term and served since April 2020. | Portfolio Manager, Kornitzer Capital Management, Inc. (management company) 1991-present. | 10 | None | ||||||||||||||||||
INDEPENDENT TRUSTEES | |||||||||||||||||||||||
Philip J. Kennedy | Trustee | Indefinite term and served since May 1995. | Business Consultant. | 10 | None | ||||||||||||||||||
Rachel F. Lupardus | Trustee | Indefinite term and served since October 2015. | Chief Operating Officer/Chief Financial Officer, Trozzolo Communications Group (marketing communications agency), 2015-present. | 10 | None | ||||||||||||||||||
Jeffrey D. Yowell | Chairman | One year term and served since December 2017. | President and Owner, Getter Farms, LLC (agriculture and farm-related operations), 2007-present. | 10 | None | ||||||||||||||||||
OFFICERS | |||||||||||||||||||||||
Kent Gasaway | President and Treasurer | One year term and served since April 2020. | Portfolio Manager, Kornitzer Capital Management, Inc. (management company) 1991-present. | N/A | None | ||||||||||||||||||
Fred Coats | Chief Compliance Officer | Indefinite term and served since May 2015. | Chief Compliance Officer, Kornitzer Capital Management, Inc. (management company) May 2015-present; Private Practice Attorney May 1993-present. | N/A | None | ||||||||||||||||||
1 Mr. Robert J. Male is deemed to be an interested person of the Funds as that term is defined in the 1940 Act, by virtue of the fact that he is an employee and stockholder of the Advisor.

139
(Unaudited)
A NOTE ON FORWARD-LOOKING STATEMENTS
Except for historical information contained in this annual report for the Funds, the matters discussed in this report may constitute forward-looking statements made pursuant to the safe harbor provisions of the Securities Litigation Reform Act of 1995. These include any advisor and/or portfolio manager predictions, assessments, analyses or outlooks for individual securities, industries, market sectors and/or markets. These statements involve risks and uncertainties. In addition to the general risks described for the Funds in the current Prospectus, other factors bearing on these reports include the accuracy of the Advisor's or portfolio managers' forecasts and predictions, and the appropriateness of the investment programs designed by the Advisor or portfolio manager to implement their strategies efficiently and effectively. Any one or more of these factors, as well as other risks affecting the securities markets and investment instruments generally, could cause the actual results of the Funds to differ materially as compared to benchmarks associated with the Funds.
ADDITIONAL INFORMATION
The Buffalo Funds have adopted proxy voting policies and procedures that delegate to Kornitzer Capital Management, Inc., the Funds' investment advisor, the authority to vote proxies. A description of the Buffalo Funds' proxy voting policies and procedures is available without charge, upon request, by calling the Funds toll free at 1-800-49-BUFFALO. A description of these policies and procedures is also included in the Funds' Statement of Additional Information, which is available on the SEC's website at http://www.sec.gov.
The actual voting records relating to portfolio securities during the most recent twelve month period ended June 30 (as filed with the SEC on Form N-PX) are available without charge, upon request, by calling the Funds toll free at 1-800-49-BUFFALO or by accessing the SEC's website at http://www.sec.gov.
The Funds file their complete schedule of portfolio holdings with the SEC four times each fiscal year at quarter-ends. The Trust files the Schedule of Portfolio Holdings with the SEC on Form N-CSR (second and fourth quarters) and as an exhibit to its reports on Form N-PORT (first and third quarters). Shareholders may view the Funds' Forms N-CSR and N-PORT on the SEC's website at http://www.sec.gov.

140
(Unaudited)
APPROVAL OF ADVISORY AGREEMENTS (NOVEMBER 2021)
The Board of Trustees (the "Trustees") of Buffalo Funds, a Delaware statutory trust, on behalf of its series, Buffalo Flexible Income Fund, Buffalo High Yield Fund, Buffalo Large Cap Fund, Buffalo Small Cap Fund, Buffalo Growth Fund, Buffalo Discovery Fund, Buffalo Mid Cap Fund, Buffalo Early Stage Growth Fund, Buffalo International Fund and Buffalo Dividend Focus Fund (all such funds referred to collectively as the "Funds") met on November 4, 2021 to consider the renewal of the Amended and Restated Management Agreements (the "Management Agreements") between the Trust, on behalf of the Funds, and Kornitzer Capital Management, Inc., the Funds' investment adviser (the "Adviser" or "KCM"). In advance of the meeting, the Trustees requested and received materials to assist them in considering the renewal of the Management Agreements.
The materials provided contained information with respect to the factors enumerated below, including a copy of the Management Agreements, a memorandum prepared by the Trust's outside legal counsel discussing the Trustees' fiduciary obligations and the factors they should assess in considering the renewal of the Management Agreements, detailed comparative information relating to each Fund's performance, as well as the management fees and expenses of the Funds, the Adviser's Form ADV, select financial information of the Adviser, including a profitability analysis prepared by the Adviser, and other comparative performance and fee information. The Trustees also considered information periodically throughout the year that was relevant to the consideration of the Management Agreements. In addition, the Independent Trustees, as defined below, met with their independent counsel on October 26, 2021 and immediately prior to the Board meeting held on November 4, 2021, to review and discuss the information provided to them and their duties and responsibilities in connection with the renewal of the Management Agreements. Based on their evaluation of information provided by the Adviser, in conjunction with the Funds' other service providers, the Trustees, by a unanimous vote (including a separate vote of the Trustees who are not "interested persons," as that term is defined in the Investment Company Act of 1940, as amended (the "Independent Trustees")), approved the renewal of the Management Agreements for an additional term of one year ending November 30, 2022.
In considering the renewal of the Management Agreements, the Trustees reviewed and analyzed various factors that they determined were relevant, including the factors enumerated below.
1. Nature, Extent and Quality of Services Provided to the Funds
The Trustees considered the nature, extent and quality of services provided by KCM to the Funds and the amount of time devoted to the Funds' affairs by KCM's staff. The Trustees considered KCM's specific responsibilities in all aspects of day-to-day management of the Funds, including the investment strategies implemented by KCM, as well as the qualifications, experience and responsibilities of the Funds' portfolio managers and other key personnel at KCM involved in the day-to-day activities of the Funds. In executive session, the Independent Trustees reviewed information provided by KCM in response to the Board's 15(c) Request for Information, including the structure of KCM's compliance program, KCM's continuing commitment to the growth of the Funds' assets, KCM's sales and marketing strategies, KCM's addition of several new research analysts and KCM's continued investment in systems, equipment and other resources. The Trustees noted during the course of the prior year they had met with representatives of KCM to discuss the Funds' performance and outlook, along with the marketing and sales and compliance efforts made by KCM throughout the year. The Trustees also noted any services that extended beyond portfolio management, and they considered the trading capability of KCM, and the lack of both significant shareholder complaints and financial statement issues. The Trustees discussed KCM's handling of compliance matters, including the quarterly and annual reports of the Trust's chief compliance officer to the Trustees on the effectiveness of KCM's compliance program. The Trustees concluded that KCM had sufficient quality and depth of personnel, resources, investment methods and compliance policies and procedures essential to performing its duties under the Management Agreements and that the nature, overall quality and extent of the management services provided to the Funds, as well as KCM's compliance program, were satisfactory.
2. Investment Performance of the Funds and KCM
In assessing the quality of the portfolio management services delivered by KCM, the Trustees compared the short-term and long-term performance of the Investor

141
(Unaudited)
Class shares of each Fund on both an absolute basis and in comparison to a benchmark index and in comparison to a peer group as constructed using data from Morningstar, Inc. (each a "Morningstar Peer Group").
Buffalo Discovery Fund. The Trustees noted the Buffalo Discovery Fund's performance for the ten-year period ended September 30, 2021 was above the median for the Morningstar Peer Group of U.S. open-end mid cap growth funds, falling within the second quartile of the Morningstar Peer Group. The Trustees also noted the Buffalo Discovery Fund's performance for the year-to-date, one-year, three-year and five-year periods ended September 30, 2021 was below the median for the Morningstar Peer Group, falling into the fourth quartile of the Morningstar Peer Group for each period. The Trustees further noted for the since inception period ended September 30, 2021, the Buffalo Discovery Fund outperformed the Morningstar U.S. Mid Growth Total Return Index and the Lipper Multi Cap Growth Funds Index. The Trustees also noted the Buffalo Discovery Fund outperformed the Lipper Multi Cap Growth Funds Index for the one-year period ended September 30, 2021 but underperformed the Morningstar U.S. Mid Growth Total Return Index for the same period. The Trustees further noted that the Buffalo Discovery Fund underperformed each of the Morningstar U.S. Mid Growth Total Return Index and the Lipper Multi Cap Growth Funds Index for the year-to-date, three-year, five-year and ten-year periods ended September 30, 2021.
Buffalo Dividend Focus Fund. The Trustees noted the Buffalo Dividend Focus Fund's performance for the one-year period ended September 30, 2021 was equal to the median for the Morningstar Peer Group of U.S. open-end large blend category funds. The Trustees further noted the Buffalo Dividend Focus Fund's performance for the year-to-date, three-year and five-year periods ended September 30, 2021 was below the median for the Morningstar Peer Group, falling into the third quartile for each period. The Trustees further noted that for the one-year, three-year, five-year and since inception periods ended September 30, 2021, the Buffalo Dividend Focus Fund outperformed the Lipper Equity Income Funds Index. The Trustees noted that the Buffalo Dividend Focus Fund had underperformed the Morningstar U.S. Large-Mid TR Index and the S&P 500 TR Index for the year-to-date, one-year, three-year, five-year and since inception periods ended September 30, 2021.
Buffalo Early Stage Growth Fund. The Trustees noted the Buffalo Early Stage Growth Fund's performance for the year-to-date, one-year, three-year, five-year and ten-year periods ended September 30, 2021 was above the median for the Morningstar Peer Group of U.S. open-end small growth funds, falling into the first quartile for the three-year, five-year and ten-year periods and within the second quartile for the year-to-date and one-year periods. The Trustees next noted for the year-to-date, one-year, three-year, five-year, ten-year and since inception periods ended September 30, 2021, the Buffalo Early Stage Growth Fund outperformed the Lipper Small Cap Growth Funds Index and the Morningstar U.S. Small Growth TR Index.
Buffalo Flexible Income Fund. The Trustees noted the Buffalo Flexible Income Fund's performance for the year-to-date and one-year periods ended September 30, 2021 was above the median for the Morningstar Peer Group of U.S. open-end allocation 85%+ equity funds, falling within the first quartile of the Morningstar Peer Group for the year-to-date period and the second quartile for the one-year period. The Trustees then noted that the Buffalo Flexible Income Fund's performance for the three-year, five-year and ten-year periods ended September 30, 2021 was below the median for the Morningstar Peer Group, falling within the fourth quartile for each period. The Trustees next noted that the Buffalo Flexible Income Fund outperformed the Lipper Mixed-Asset Target Allocation Moderate Funds Index for the year-to-date, one-year and since inception periods ended September 30, 2021, but underperformed the Lipper Mixed-Asset Target Allocation Moderate Funds Index for the three-year, five-year and ten-year periods ended September 30, 2021. The Trustees then noted the Buffalo Flexible Income Fund outperformed the ICE BofA Merrill Lynch High Yield Master II Index for the year-to-date, one-year, five-year, and ten-year periods ended September 30, 2021, but underperformed the ICE BofA Merrill Lynch High Yield Master II Index for the three-year and since inception periods ended September 30, 2021. The Trustees also noted the Buffalo Flexible Income Fund outperformed the Morningstar Moderate Target Risk Index for the year-to-date and one-year periods ended September 30, 2021 but underperformed the Morningstar Moderate Target Risk Index for the three-year, five-year and ten-year periods ended September 30, 2021. The Trustees also noted that the Buffalo Flexible Income Fund outperformed for the year-to-date and one-year periods ended September 30, 2021 a blended

142
(Unaudited)
index of 60% Morningstar U.S. Large Cap TR Index and 40% ICE BofA Merrill Lynch U.S. High Yield Master II Index, a blended index of 60% S&P 500 Index and 40% ICE BofA Merrill Lynch U.S. High Yield Master II Index and the Morningstar U.S. Large Cap TR Index, but underperformed each index for the three-year, five-year, ten-year and since inception periods ended September 30, 2021.
Buffalo Growth Fund. The Trustees noted the Buffalo Growth Fund's performance for the year-to-date and one-year periods ended September 30, 2021 was above the median for the Morningstar Peer Group of U.S. open-end large growth funds, falling within the second quartile of the Morningstar Peer Group for each period. The Trustees also noted the Buffalo Growth Fund's performance for the three-year, five-year and ten-year periods ended September 30, 2021 was below the median for the Morningstar Peer Group of U.S. open-end large growth funds, falling within the third quartile of the Morningstar Peer Group for the three-year and five-year periods and within the fourth quartile for the ten-year period. The Trustees next noted that for the since-inception period ended September 30, 2021, the Buffalo Growth Fund outperformed the Lipper Large Cap Growth Fund Index. The Trustees further noted that for the year-to-date, one-year, three-year, five-year and ten-year periods ended September 30, 2021, the Buffalo Growth Fund underperformed the Morningstar U.S. Growth TR Index and the Lipper Large Cap Growth Fund Index.
Buffalo High Yield Fund. The Trustees noted the Buffalo High Yield Fund's performance for the year-to-date, one-year, three-year and five-year periods ended September 30, 2021, was above the median for the Morningstar Peer Group of U.S. open-end high yield bond funds, falling within the first quartile for the one-year and three-year periods and within the second quartile for the year-to-date and five-year periods. The Trustees next noted for the one-year and three-year periods ended September 30, 2021, the Buffalo High Yield Fund outperformed the Lipper High Yield Bond Funds Index and the ICE BofA Merrill Lynch High Yield Master II Index, but underperformed each Index for the ten-year period ended September 30, 2021. The Trustees then noted that the Buffalo High Yield Fund outperformed the Lipper High Yield Bond Funds Index for the five-year and since inception periods ended September 30, 2021 but underperformed the ICE BofA Merrill Lynch High Yield Master II Index for the same periods. The Trustees noted that the Buffalo High Yield Fund outperformed the
ICE BofA Merrill Lynch High Yield Master II Index for the year-to-date period ended September 30, 2021, but underperformed the Lipper High Yield Bond Funds Index for the same period.
Buffalo International Fund. The Trustees noted the Buffalo International Fund's performance for the year-to-date, one-year, three-year, five-year and ten-year periods ended September 30, 2021 was above the median for the Morningstar Peer Group of U.S. open-end foreign large growth funds, noting the Fund's performance was in the first quartile for the year-to-date, one-year, five-year and ten-year periods, and within the second quartile for the three-year period. The Trustees further noted for the year-to-date, one-year, three-year, five-year, ten-year and since-inception periods ended September 30, 2021, the Buffalo International Fund outperformed the Lipper International Fund Index and the Morningstar Global Markets ex-U.S. NR Index.
Buffalo Large Cap Fund. The Trustees noted the Buffalo Large Cap Fund's performance for the year-to-date, one-year and ten-year periods ended September 30, 2021 was above the median for the Morningstar Peer Group of U.S. open-end large growth funds, falling within the first quartile for the year-to-date period and within the second quartile for the one-year and ten-year periods. The Trustees then noted that the Buffalo Large Cap Fund's performance for the three-year and five-year periods ended September 30, 2021 was below the Morningstar Peer Group median and fell within the third quartile for each period. The Trustees next noted that for the year-to-date, one-year and since inception periods ended September 30, 2021 the Buffalo Large Cap Fund outperformed the Lipper Large Cap Growth Fund Index but underperformed the Morningstar U.S. Large Growth Total Return Index for each period. The Trustees further noted that the Buffalo Large Cap Fund underperformed the Morningstar U.S. Large Growth Total Return Index and the Lipper Large Cap Growth Fund Index for the three-year, five-year and ten-year periods ended September 30, 2021.
Buffalo Mid Cap Fund. The Trustees noted the Buffalo Mid Cap Fund's performance for the three-year period ended September 30, 2021 was above the median for the Morningstar Peer Group of U.S. open-end mid-cap growth funds, falling within the second quartile. The Trustees then noted that the Buffalo Mid Cap Fund's performance for the year-to-date, one-year, five-year and ten-year periods ended September 30, 2021 was below

143
(Unaudited)
the median for the Morningstar Peer Group of U.S. open-end mid-cap growth funds, falling within the third quartile for the one-year, and five-year periods ended September 30, 2021, and within the fourth quartile for the year-to-date and ten-year periods. The Trustees also noted the Buffalo Mid Cap Fund outperformed the Lipper Mid Cap Growth Funds Index and the Morningstar U.S. Mid Growth TR Index for the one-year ended September 30, 2021, but underperformed each Index for the year-to-date, five-year, ten-year and since-inception periods. The Trustees further noted that for the three-year period ended September 30, 2021, the Buffalo Mid Cap Fund outperformed the Lipper Mid Cap Growth Funds Index, but underperformed the Morningstar U.S. Mid Growth TR Index for the same period. The Trustees also compared the performance of the Buffalo Mid Cap Fund to that of other accounts managed by KCM using investment strategies substantially similar to that of the Fund and noted for all periods the performance of the Fund was comparable to that of the other accounts, noting that the performance for the other accounts was presented gross of fees.
Buffalo Small Cap Fund. The Trustees noted the Buffalo Small Cap Fund's performance for the one-year, three-year, five-year and ten-year periods ended September 30, 2021 was above the median of the Morningstar Peer Group of U.S. open-end small growth funds, falling within the first quartile of the Morningstar Peer Group for the three-year, five-year and ten-year periods and within the second quartile for the one-year period. The Trustees then noted that for the year-to-date period ended September 30, 2021, the Buffalo Small Cap Fund's performance was below the Morningstar Peer Group median, falling within the third quartile. The Trustees further noted that for the one-year, three-year, five-year, ten-year and since-inception periods ended September 30, 2021, the Buffalo Small Cap Fund outperformed the Lipper Small Cap Growth Funds Index and the Morningstar U.S. Small Growth TR Index. The Trustees then noted that for the year-to-date period ended September 30, 2021, the Buffalo Small Cap Fund outperformed the Morningstar U.S. Small Growth TR Index but underperformed the Lipper Small Cap Growth Funds Index. The Trustees also compared the performance of the Buffalo Small Cap Fund to that of other accounts managed by KCM using investment strategies substantially similar to that of the Fund and noted for all periods the performance of the Fund was comparable to that of the other accounts, noting that the performance for the other accounts was presented gross of fees.
After considering all of the information including specific responses regarding Fund performance, including KCM's efforts to improve performance of underperforming Funds, the Trustees concluded that the performance obtained by KCM for the Funds was satisfactory under current market conditions and in light of each Fund's investment objective, strategies and policies. Although past performance is not a guarantee or indication of future results, the Trustees determined that the Funds and their shareholders were likely to benefit from KCM's continued management.
3. Costs of Services Provided and Profits Realized by KCM
The Trustees considered the cost of services and the structure of KCM's fees, including a review of the expense analyses and other pertinent material with respect to the Funds. The Trustees reviewed related statistical information, including the comparative expenses, expense components and peer group selections. The Trustees considered the cost structure of each Fund relative to its Morningstar Peer Group.
The Trustees also considered the overall profitability of the Funds to KCM and examined the level of profits that could be expected to accrue to KCM from the fees payable under the Management Agreements, as well as the Funds' brokerage commissions and use of soft dollars by KCM. The Trustees also considered the profitability of each Fund before and after any distribution costs borne by KCM. These considerations were based on materials requested by the Trustees specifically for the Meeting, as well as the presentations made by KCM over the course of the year.
In reviewing the Morningstar 15(c) materials, the Board noted the Institutional Class shares of the Buffalo Funds operate under a unitary fee structure whereby many of the Funds' ordinary operating expenses are paid by KCM out of its advisory fee rather than paid directly by the Funds. The Board noted the difficulty of comparing the Buffalo Funds to non-unitary fee funds and observed that the advisory fee comparison in the Board materials which used the management fee excluding the fees paid by KCM to Fund Services under a master servicing agreement, and referred to below as the net management fee, was the most appropriate. The Board also noted the net expense ratio used in the Morningstar comparative data excludes any Rule 12b-1 fees imposed by other funds.

144
(Unaudited)
Buffalo Discovery Fund. The Trustees noted the Buffalo Discovery Fund's net management fee of 0.55% fell within the first quartile and was below both the Morningstar Peer Group average of 0.74% and the Morningstar Peer Group median of 0.75%. The Trustees further noted the net expense ratio of 0.86% for the Buffalo Discovery Fund fell in the second quartile, below the Morningstar Peer Group average of 0.88%, which also fell in the second quartile. Based on a profitability analysis prepared by KCM, the Trustees concluded that KCM's profit from sponsoring the Discovery Fund had not been, and currently was not, excessive and that KCM maintained adequate profit levels to support its services to the Fund.
Buffalo Dividend Focus Fund. The Trustees noted the Buffalo Dividend Focus Fund's net management fee of 0.50% fell within the first quartile and was below both the Morningstar Peer Group average of 0.68% and the Morningstar Peer Group median of 0.65%. The Trustees further noted the net expense ratio of 0.79% for the Buffalo Dividend Focus Fund fell into the second quartile, below the Morningstar Peer Group average of 0.83%, which also fell into the second quartile. Based on a profitability analysis prepared by KCM, the Trustees concluded while KCM was not realizing profits in connection with its management of the Dividend Focus Fund, KCM maintained adequate profit levels to support its services to the Fund from the revenues of its overall investment advisory business.
Buffalo Early Stage Growth Fund. The Trustees noted the Buffalo Early Stage Growth Fund's net management fee of 1.00% fell within the fourth quartile and was above the Morningstar Peer Group average of 0.81% and median of 0.85%. The Trustees further noted the net expense ratio of 1.35% for the Buffalo Early Stage Growth Fund fell within the fourth quartile, above the Morningstar Peer Group average of 1.09%, which fell into the third quartile. The Trustees noted that based on information provided by KCM, the Early Stage Growth Fund would more closely align with a micro-cap category, but Morningstar does not have such a category and is therefore included in the small growth category. Based on a profitability analysis prepared by KCM, the Trustees concluded that while KCM was not realizing profits in connection with its management of the Early Stage Growth Fund, KCM maintained adequate profit levels to support its services to the Fund from the revenues of its overall investment advisory business.
Buffalo Flexible Income Fund. The Trustees noted the Buffalo Flexible Income Fund's net management fee of
0.55% fell within the second quartile and was below the Morningstar Peer Group average of 0.58% and median of 0.60%. The Trustees further noted the net expense ratio of 0.86% for the Buffalo Flexible Income Fund fell within the second quartile, above the Morningstar Peer Group average of 0.73%, which also fell within the second quartile. Based on a profitability analysis prepared by KCM, the Trustees concluded that KCM's profits from sponsoring the Flexible Income Fund had not been, and currently were not excessive and that KCM maintained adequate profit levels to support its services to the Fund.
Buffalo Growth Fund. The Trustees noted the Buffalo Growth Fund's net management fee of 0.50% fell between the first and second quartiles, below the Morningstar Peer Group average of 0.65% and median of 0.68%. The Trustees further noted the net expense ratio of 0.77% for the Buffalo Growth Fund fell within the second quartile, below the Morningstar Peer Group average of 0.83%, which also fell in the second quartile. Based on a profitability analysis prepared by KCM, the Trustees concluded that KCM's profits from sponsoring the Growth Fund had not been, and currently were not excessive and that KCM maintained adequate profit levels to support its services to the Fund.
Buffalo High Yield Fund. The Trustees noted the Buffalo High Yield Fund's net management fee of 0.55% was equal to the Morningstar Peer Group median and below the average of 0.56%. The Trustees further noted the net expense ratio of 0.86% for the Buffalo High Yield Fund fell within the fourth quartile, above the Morningstar Peer Group average of 0.73%, which fell within the second quartile. Based on a profitability analysis prepared by KCM, the Trustees concluded that KCM's profit from sponsoring the High Yield Fund had not been, and currently was not, excessive and that KCM maintained adequate profit levels to support its services to the Fund.
Buffalo International Fund. The Trustees noted the Buffalo International Fund's net management fee of 0.55% fell in the first quartile, below the Morningstar Peer Group average of 0.76% and median of 0.79%. The Trustees further noted the net expense ratio of 0.88% for the Buffalo International Fund fell within the third quartile, below the Morningstar Peer Group average and median of 0.89%, which also fell at or within the third quartile. Based on a profitability analysis prepared by KCM, the Trustees concluded that KCM's profits, before distribution costs, were not excessive and that KCM maintained adequate profit levels to support its services to the Fund.

145
(Unaudited)
Buffalo Large Cap Fund. The Trustees noted the Buffalo Large Cap Fund's net management fee of 0.50% fell into the first quartile, below the Morningstar Peer Group average of 0.68% and the Morningstar Peer Group median of 0.70%. The Trustees further noted the net expense ratio of 0.79% for the Buffalo Large Cap Fund fell between the first and second quartiles, below the Morningstar Peer Group average of 0.89%, which fell within the second quartile, and the Morningstar Peer Group median of 0.90%. Based on a profitability analysis prepared by KCM, the Trustees concluded that KCM's profits from sponsoring the Large Cap Fund had not been, and currently were not excessive and that KCM maintained adequate profit levels to support its services to the Fund.
Buffalo Mid Cap Fund. The Trustees noted the Buffalo Mid Cap Fund's net management fee of 0.55% fell within the first quartile, below the Morningstar Peer Group average of 0.74%, which fell within the second quartile, and median of 0.75%. The Trustees further noted the net expense ratio of 0.88% for the Buffalo Mid Cap Fund fell in the third quartile, below the Morningstar Peer Group average of 0.96%, which also fell within the third quartile, and below the median of 0.94%. Based on a profitability analysis prepared by KCM, the Trustees concluded that while KCM was not realizing profits in connection with its management of the Mid Cap Fund, KCM maintained adequate profit levels to support its services to the Fund from the revenues of its overall investment advisory business.
Buffalo Small Cap Fund. The Trustees noted the Buffalo Small Cap Fund's net management fee of 0.55% fell within the first quartile and was below the Morningstar Peer Group average and median of 0.77%, which fell within the second quartile. The Trustees further noted the net expense ratio of 0.86% for the Buffalo Small Cap Fund fell within the second quartile and was below the Morningstar Peer Group average of 0.95%, which fell between the second and third quartiles, and below the Morningstar Peer Group median of 0.97%. The Trustees further noted the annual management fee is subject to reduced fees paid on assets in excess of certain levels. Based on a profitability analysis prepared by KCM, the Trustees concluded that KCM's profit from sponsoring the Small Cap Fund had not been, and currently was not, excessive and that KCM maintained adequate profit levels to support its services to the Fund.
The Trustees concluded that each Fund's expenses and the management fees paid to KCM were fair and
reasonable in light of the comparative performance, expense and management fee information. The Trustees further concluded that KCM's profit from sponsoring the Funds had not been, and currently was not, excessive and that KCM maintained adequate profit levels to support the services to the Funds.
4. Extent of Economies of Scale as the Funds Grow
The Trustees compared each Fund's expenses relative to its peer group and discussed realized and potential economies of scale. In considering the economies of scale for each Fund, the Board considered that the Buffalo Funds' Institutional Class shares operate under a unitary fee structure whereby many of the Funds' ordinary operating expenses are paid by KCM out of its advisory fee rather than being paid directly by the Funds.
Buffalo Discovery Fund. The Trustees reviewed the structure of the Buffalo Discovery Fund's management fee and total expense ratio and considered whether the Fund was large enough to generate economies of scale for shareholders or whether economies of scale would be expected to be realized as Fund assets grow (and if so, how those economies of scale were being or would be shared with shareholders). The Trustees noted the Buffalo Discovery Fund's management fee structure did not contain any breakpoint reductions as the Fund's assets grow in size, but that the feasibility of incorporating breakpoints would continue to be reviewed on a regular basis.
Buffalo Dividend Focus Fund. The Trustees reviewed the structure of the Buffalo Dividend Focus Fund's management fee and total expense ratio and considered whether the Fund was large enough to generate economies of scale for shareholders or whether economies of scale would be expected to be realized as Fund assets grow (and if so, how those economies of scale were being or would be shared with shareholders). The Trustees noted the Buffalo Dividend Focus Fund's management fee structure did not contain any breakpoint reductions as the Fund's assets grow in size, but that the feasibility of incorporating breakpoints would continue to be reviewed on a regular basis.
Buffalo Early Stage Growth Fund. The Trustees reviewed the structure of the Buffalo Early Stage Growth Fund's management fee and total expense ratio and considered whether the Fund was large enough to generate economies of scale for shareholders or whether economies of scale would be expected to be realized as

146
(Unaudited)
Fund assets grow (and if so, how those economies of scale were being or would be shared with shareholders). The Trustees noted the Buffalo Early Stage Growth Fund's management fee structure did not contain any breakpoint reductions as the Fund's assets grow in size, but that the feasibility of incorporating breakpoints would continue to be reviewed on a regular basis.
Buffalo Flexible Income Fund. The Trustees reviewed the structure of the Buffalo Flexible Income Fund's management fee and total expense ratio and considered whether the Fund was large enough to generate economies of scale for shareholders or whether economies of scale would be expected to be realized as Fund assets grow (and if so, how those economies of scale were being or would be shared with shareholders). The Trustees noted the Buffalo Flexible Income Fund's management fee structure did not contain any breakpoint reductions as the Fund's assets grow in size, but that the feasibility of incorporating breakpoints would continue to be reviewed on a regular basis.
Buffalo Growth Fund. The Trustees reviewed the structure of the Buffalo Growth Fund's management fee and total expense ratio and considered whether the Fund was large enough to generate economies of scale for shareholders or whether economies of scale would be expected to be realized as Fund assets grow (and if so, how those economies of scale were being or would be shared with shareholders). The Trustees noted the Buffalo Growth Fund's management fee structure did not contain any breakpoint reductions as the Fund's assets grow in size, but that the feasibility of incorporating breakpoints would continue to be reviewed on a regular basis.
Buffalo High Yield Fund. The Trustees reviewed the structure of the Buffalo High Yield Fund's management fee and total expense ratio and considered whether the Fund was large enough to generate economies of scale for shareholders or whether economies of scale would be expected to be realized as Fund assets grow (and if so, how those economies of scale were being or would be shared with shareholders). The Trustees noted the Buffalo High Yield Fund's management fee structure did not contain any breakpoint reductions as the Fund's assets grow in size, but that the feasibility of incorporating breakpoints would continue to be reviewed on a regular basis.
Buffalo International Fund. The Trustees reviewed the structure of the Buffalo International Fund's
management fee and total expense ratio and considered whether the Fund was large enough to generate economies of scale for shareholders or whether economies of scale would be expected to be realized as Fund assets grow (and if so, how those economies of scale were being or would be shared with shareholders). The Trustees noted the Buffalo International Fund's management fee structure did not contain any breakpoint reductions as the Fund's assets grow in size, but that the feasibility of incorporating breakpoints would continue to be reviewed on a regular basis.
Buffalo Large Cap Fund. The Trustees reviewed the structure of the Buffalo Large Cap Fund's management fee and total expense ratio and considered whether the Fund was large enough to generate economies of scale for shareholders or whether economies of scale would be expected to be realized as Fund assets grow (and if so, how those economies of scale were being or would be shared with shareholders). The Trustees noted the Buffalo Large Cap Fund's management fee structure did not contain any breakpoint reductions as the Fund's assets grow in size, but that the feasibility of incorporating breakpoints would continue to be reviewed on a regular basis.
Buffalo Mid Cap Fund. The Trustees reviewed the structure of the Buffalo Mid Cap Fund's management fee and total expense ratio and considered whether the Fund was large enough to generate economies of scale for shareholders or whether economies of scale would be expected to be realized as Fund assets grow (and if so, how those economies of scale were being or would be shared with shareholders). The Trustees noted the Buffalo Mid Cap Fund's management fee structure did not contain any breakpoint reductions as the Fund's assets grow in size, but that the feasibility of incorporating breakpoints would continue to be reviewed on a regular basis.
Buffalo Small Cap Fund. The Trustees reviewed the structure of the Buffalo Small Cap Fund's management fee and total expense ratio and considered whether the Fund was large enough to generate economies of scale for shareholders or whether economies of scale would be expected to be realized as Fund assets grow (and if so, how those economies of scale were being or would be shared with shareholders). The Trustees further noted the Buffalo Small Cap Fund's management fee structure contained breakpoint reductions as the Fund's assets grow in size.

147
(Unaudited)
The Trustees concluded that the current fee structure for each Fund was reasonable and reflected a sharing of economies of scale between KCM and each Fund at each Fund's current asset levels.
5. Benefits Derived from the Relationship with the Funds
The Trustees considered the direct and indirect benefits that could be received by KCM from its association with the Funds. The Trustees examined the brokerage and commissions of KCM with respect to the Funds. The Trustees concluded that the benefits KCM may receive, such as greater name recognition, growth in separate account management services, greater exposure to press coverage, or increased ability to obtain research or brokerage services through the use of soft dollars,
appear to be reasonable, and may benefit the Funds through growth in assets.
CONCLUSIONS
The Trustees considered all of the foregoing factors. In considering the Management Agreements, the Trustees did not identify any one factor as all-important, but rather considered these factors collectively in light of the Funds' surrounding circumstances and concluded that the Funds and their shareholders would benefit from the Adviser's continued management. Based on this review, the Trustees, including a majority of the Independent Trustees, approved the renewal of the Management Agreements with the Funds as being in the best interests of the Funds and their shareholders.

148
PRIVACY POLICY (UNAUDITED)
This Privacy Policy has been adopted by the Buffalo Funds. The Funds are each an open-end diversified management investment company registered under the Investment Company Act of 1940 (the "1940 Act").
This Privacy Policy has also been adopted by KCM, an investment advisor registered with the Securities and Exchange Commission that serves as the investment advisor and manager of the Funds.
The Funds and the Adviser are collectively referred to as the "Companies," "we," "our" or "us."
As a part of providing you services and products we collect non-public personally identifiable information ("Personal Information") about you. Some of this is information you provide and some is obtained from other sources. In some circumstances, a necessary part of providing products and services to you requires that we disclose Personal Information about you to third parties.
We want you to understand how we handle your Personal Information. Please read the Privacy Policy carefully. It has information about our policies for the collection, use, disclosure, and protection of your Personal Information. If you have any questions, you can obtain additional information from the following:
Buffalo Funds
c/o U.S. Bancorp Fund Services, LLC
P.O. Box 701
Milwaukee, Wisconsin 53201-0701
www.buffalofunds.com
1-800-492-8332
Please be aware that we periodically update or revise the Privacy Policy. As methods of doing business change, we reflect any applicable changes in our Privacy Policy. If you are our customer, we will send you an update as and when it occurs.
SALE/DISCLOSURE OF YOUR PERSONAL INFORMATION
We promise that we will not sell your Personal Information to any person.
Also, we will not disclose your Personal Information to any third person aside from the disclosures described below. These disclosures generally relate to marketing or maintaining products or services provided to you.
WHAT INFORMATION DO WE COLLECT?
Personal, Financial and Product Information
To be able to offer, provide and maintain these products and services, the Companies collect a variety of Personal Information about you. The Personal Information we collect will vary depending upon the product or service you select.
The following is a general list of the Personal Information. Not all of the Personal Information will be collected every time you do business with us.
Personal Information
• Name
• Address
• Birthdate
• Phone number
• Social Security Number
• E-mail address
• Product-Related Personal Information
• Product Activity History (things you have done with your mutual funds such as deposits, transfers, redemptions, etc.)
GENERAL PRIVACY PROCESSES
How do we collect Personal Information?
We use a variety of methods to collect Personal Information. We collect Personal Information directly from you with paper forms (for example, new account and other administrative forms), over the phone or through facsimile transmissions. We also collect Personal Information from our web site and through other electronic means. We collect some Personal Information through joint marketing programs where we offer a product or service through another financial institution. In some of these instances, you may be considered a customer of both entities.
Who has access to this Personal Information?
Generally, only the Companies' staff and certain companies working on the Companies' behalf have access to this Personal Information.

149
(Unaudited)
Those Working on Our Behalf
Depending on the product or service you select, there may be a number of third parties that will have access to your Personal Information since they are working on our behalf. This access is necessary because these third parties perform a task or provide administrative services for the product you seek or have purchased from us. If we do not share the Personal Information, we cannot provide you the product or service you requested. In certain cases, affiliates are the entities performing such services on our behalf.
When we share Personal Information with non-affiliated companies working on our behalf, we protect your Personal Information by requiring such companies to adopt our privacy policy or have a policy providing protection similar to ours.
Required Disclosures
Certain Personal Information may also be disclosed to third parties without your consent if disclosure is necessary to comply with: 1) legal processes; 2) to protect the rights, property, or personal safety of the Funds, their shareholders or the public; 3) as part of inspections or examinations conducted by our regulatory agencies; and 4) in other situations required by law.
Joint Marketing
In certain circumstances, the Companies may jointly market a product or service with another financial institution. In these circumstances, we have arranged to offer our products through these entities and their representatives or through electronic systems (for example, the Internet).
The Companies may make other disclosures authorized by law.
Requested Disclosures
We will disclose your Personal Information if you request it to those persons that you designate. Examples of this are to: members of your family; registered investment advisors, attorneys and CPAs who you have retained to advise you in a transaction; and persons whom you have designated to represent you in dealings with us.
What do we do with the Personal Information?
The Companies make use of the Personal Information to provide you with the financial products and services that we offer.
At the point that you cease being a customer, we will maintain your Personal Information and handle it just the same as our current customers.
The Companies restrict access to the Personal Information to those who need to know it for ordinary business purposes. We also maintain physical, electronic, and procedural safeguards that comply with federal standards to guard your Personal Information.
What are your options regarding corrections of Personal Information?
Generally, upon your written request, we will make available Personal Information for your review. Please note, Personal Information collected that relates to a disputed claim or legal proceeding will not be made available. If you notify us that the Personal Information is incorrect, we will review it and if we agree, correct our records. If we do not agree, you may submit a short comment, which we will include in future third party disclosures, if any occur, of Personal Information.

150
This page intentionally left blank.

151

This page intentionally left blank.
152
This page intentionally left blank.

153


1-800-49-BUFFALO
(1-800-492-8332)
Buffalo Funds
c/o U.S. Bancorp Fund Services, LLC
P.O. Box 701
Milwaukee, WI 53201-0701
www.buffalofunds.com
Buffalofundannual
| (b) | Not Applicable. |
Item 2. Code of Ethics.
The Registrant has adopted a code of ethics that applies to the Registrant’s principal executive officer and principal financial officer. The Registrant has not made any amendments to its code of ethics during the period covered by this report. The Registrant has not granted any waivers from any provisions of the code of ethics during the period covered by this report. A copy of the Registrant’s Code of Ethics is incorporated by reference to the Registrant’s Form N-CSR filed on June 3, 2011.
Item 3. Audit Committee Financial Expert.
The registrant’s Board of Trustees has determined that there is at least one audit committee financial expert serving on its audit committee The name of the audit committee financial experts are Philip J. Kennedy and Rachel F. Lupardus. Both Mr. Kennedy and Ms. Lupardus are “independent” as defined in Item 3 of Form N-CSR.
Item 4. Principal Accountant Fees and Services.
The registrant has engaged its principal accountant to perform audit services, audit-related services, tax services and other services during the past two fiscal years. “Audit services” refer to performing an audit of the registrant's annual financial statements or services that are normally provided by the accountant in connection with statutory and regulatory filings or engagements for those fiscal years. “Audit-related services” refer to the assurance and related services by the principal accountant that are reasonably related to the performance of the audit. “Tax services” refer to professional services rendered by the principal accountant for tax compliance, tax advice, and tax planning. There were no “Other services” provided by the principal accountant. The following table details the aggregate fees billed or expected to be billed for each of the last two fiscal years for audit fees, audit-related fees, tax fees and other fees by the principal accountant.
| FYE 3/31/22 | FYE 3/31/21 | |||||||
| ( a ) Audit Fees | $ | 239,700 | $ | 229,000 | ||||
| ( b ) Audit-Related Fees | $ | 8,200 | $ | 7,600 | ||||
| ( c ) Tax Fees | $ | 42,700 | $ | 38,000 | ||||
| ( d ) All Other Fees | $ | 0 | $ | 0 | ||||
(e)(1) The audit committee has adopted pre-approval policies and procedures that require the audit committee to pre-approve all audit and non-audit services of the registrant, including services provided to any entity affiliated with the registrant.
1
(e)(2) The percentage of fees billed by Ernst & Young LLP applicable to non-audit services pursuant to waiver of pre-approval requirement were as follows:
| FYE 3/31/22 | FYE 3/31/21 | |||||||
| Audit-Related Fees | 0 | % | 0 | % | ||||
| Tax Fees | 0 | % | 0 | % | ||||
| All Other Fees | 0 | % | 0 | % | ||||
(f) All of the principal accountant’s hours spent on auditing the registrant’s financial statements were attributed to work performed by full-time permanent employees of the principal accountant.
(g) The following table indicates the non-audit fees billed or expected to be billed by the registrant’s accountant for services to the registrant and to the registrant’s investment adviser (and any other controlling entity, etc.—not sub-adviser) for the last two years.
| Non-Audit Related Fees | FYE 3/31/22 | FYE 3/31/21 | ||
| Registrant | N/A | N/A | ||
| Registrant’s Investment Adviser | N/A | N/A |
(h) The audit committee of the board of trustees/directors has considered whether the provision of non-audit services that were rendered to the registrant's investment adviser is compatible with maintaining the principal accountant's independence and has concluded that the provision of such non-audit services by the accountant has not compromised the accountant’s independence.
(i) Not applicable
(j) Not applicable
Item 5. Audit Committee of Listed Registrants.
Not applicable to registrants who are not listed issuers (as defined in Rule 10A-3 under the Securities Exchange Act of 1934).
Item 6. Investments.
| (a) | Schedule of Investments is included as part of the report to shareholders filed under Item 1 of this Form. |
| (b) | Not Applicable |
Item 7. Disclosure of Proxy Voting Policies and Procedures for Closed-End Management Investment Companies.
Not applicable to open-end investment companies.
Item 8. Portfolio Managers of Closed-End Management Investment Companies.
Not applicable to open-end investment companies.
2
Item 9. Purchases of Equity Securities by Closed-End Management Investment Company and Affiliated Purchasers.
Not applicable to open-end investment companies.
Item 10. Submission of Matters to a Vote of Security Holders.
There have been no material changes to the procedures by which shareholders may recommend nominees to the registrant’s Board of Trustees.
Item 11. Controls and Procedures.
| (a) | The Registrant’s President and Treasurer has reviewed the Registrant's disclosure controls and procedures (as defined in Rule 30a-3(c) under the Investment Company Act of 1940 (the “Act”)) as of a date within 90 days of the filing of this report, as required by Rule 30a-3(b) under the Act and Rules 13a-15(b) or 15d-15(b) under the Securities Exchange Act of 1934. Based on this review, such officer has concluded that the disclosure controls and procedures are effective in ensuring that information required to be disclosed in this report is appropriately recorded, processed, summarized and reported and made known to him by others within the Registrant and by the Registrant’s service provider. |
| (b) | There were no changes in the Registrant's internal control over financial reporting (as defined in Rule 30a-3(d) under the Act) that occurred during the period covered by this report that have materially affected, or are reasonably likely to materially affect, the Registrant's internal control over financial reporting. |
Item 12. Disclosure of Securities Lending Activities for Closed-End Management Investment Companies
Not applicable to open-end investment companies.
Item 13. Exhibits.
| (a) | (1) Code of Ethics. Incorporated by reference to the Registrant’s Form N-CSR filed on June 3, 2011. |
(3) Not applicable to open-end investment companies.
(4) There was no change in the registrant’s independent public accountant for the period covered by this report.
| (b) | Certifications pursuant to Section 906 of the Sarbanes-Oxley Act of 2002. Furnished herewith. |
3
SIGNATURES
Pursuant to the requirements of the Securities Exchange Act of 1934 and the Investment Company Act of 1940, the registrant has duly caused this report to be signed on its behalf by the undersigned, thereunto duly authorized.
| Buffalo Funds | ||||
| By | /s/Kent W. Gasaway | |||
| Kent W. Gasaway | ||||
| President and Treasurer | ||||
| Date | June 6, 2022 | |||
Pursuant to the requirements of the Securities Exchange Act of 1934 and the Investment Company Act of 1940, this report has been signed below by the following person on behalf of the registrant and in the capacities and on the date indicated.
| Buffalo Funds | ||||
| By | /s/Kent W. Gasaway | |||
| Kent W. Gasaway | ||||
| President and Treasurer | ||||
| Date | June 6, 2022 | |||
4