UNITED STATES
SECURITIES AND EXCHANGE COMMISSION
Washington, D.C. 20549
FORM N-CSR
CERTIFIED SHAREHOLDER REPORT OF REGISTERED MANAGEMENT
INVESTMENT COMPANIES
Investment Company Act file number 811-10325
VANECK VECTORS ETF TRUST
(Exact name of registrant as specified in charter)
666 Third Avenue, New York, NY 10017
(Address of principal executive offices) (Zip code)
Van Eck Associates Corporation
666 Third Avenue, New York, NY 10017
(Name and address of agent for service)
Registrant’s telephone number, including area code: (212) 293-2000
Date of fiscal year end: DECEMBER 31
Date of reporting period: DECEMBER 31, 2019
| Item 1. | REPORT TO SHAREHOLDERS. |
| ANNUAL REPORT December 31, 2019 |
| VANECK VECTORS® | |
| Africa Index ETF | AFK® |
| Brazil Small-Cap ETF | BRF® |
| ChinaAMC CSI 300 ETF | PEK® |
| ChinaAMC SME-ChiNext ETF | CNXT® |
| Egypt Index ETF | EGPT® |
| India Small-Cap Index ETF | SCIF® |
| Indonesia Index ETF | IDX® |
| Israel ETF | ISRA® |
| Russia ETF | RSX® |
| Russia Small-Cap ETF | RSXJ® |
| Vietnam ETF | VNM® |
| 800.826.2333 | vaneck.com |
Certain information contained in this report represents the opinion of the investment adviser which may change at any time. This information is not intended to be a forecast of future events, a guarantee of future results or investment advice. Current market conditions may not continue. The information contained herein regarding each index has been provided by the relevant index provider. Also, unless otherwise specifically noted, any discussion of the Funds’ holdings, the Funds’ performance, and the views of the investment adviser are as of December 31, 2019.
VANECK VECTORS ETFs
December 31, 2019 (unaudited)
Dear Shareholders:
The story for 2019 was simple and familiar—slower economic growth was combated by expansive monetary policy.
But first a comment on global growth: the two engines of the global economy, the U.S. and China, continue to move forward and we now have the prospect of at least some resolution of the trade dispute between them in the phase-one agreement. The latest economic statistics from China are steady and there are signs of “green shoots.” China’s services sector is expanding robustly and manufacturing is struggling, but not collapsing. My blog,China’s Economic Growth: Continuing Despite Headlines, shows this in two charts.
The biggest event in the markets last summer was the surge in bonds in Europe with negative interest rates. At the end of September, nearly $15 trillion worth of debt globally carried a negative yield.1Despite moves by the European Central Bank to stimulate, not only is the European economy slowing down, but there are also concerns about just how effective central bank actions are. Looking forward, therefore, I think investors should assess their hedge against central bank uncertainty by considering, for example, their gold allocations. While high interest rate environments tend to be tough for gold (it does not pay any yield), against negative interest rates, gold and other hedges against central bank impotence should be strongly considered.
We encourage you to stay in touch with us through the videos, email subscriptions and research blogs available on our website, www.vaneck.com. I have started my own email subscription where I share interesting research—you can sign up on www.vaneck.com. Should you have any questions regarding fund performance, please contact us at 800.826.2333 or visit our website.
We sincerely thank you for investing in VanEck’s investment strategies. On the following pages, you will find a performance discussion and financial statements for each of the funds for the twelve month period ended December 31, 2019. As always, we value your continued confidence in us and look forward to helping you meet your investment goals in the future.

Jan F. van Eck
CEO and President
VanEck Vectors ETF Trust
January 24, 2020
Investing involves substantial risk and high volatility, including possible loss of principal. An investor should consider the investment objective, risks, charges and expenses of the Funds carefully before investing. To obtain a prospectus and summary prospectus, which contain this and other information, call 800.826.2333 or visit vaneck.com. Please read the prospectus and summary prospectus carefully before investing.
| 1 | Financial Times: September was the busiest month ever for corporate debt issuance, September 30, 2019, https://www.ft.com/content/eef8234c-e3c0-11e9-b112-9624ec9edc59 |
| 1 |
VANECK VECTORS ETFs
December 31, 2019 (unaudited)
Africa
The materials sector, followed by the financial and communication services sectors, were the three greatest contributors to the performance of VanEck Vectors Africa Index ETF, which returned 8.52% for the 12 month period. The consumer discretionary sector detracted the most from performance. Geographically, companies in Kenya, followed by those in South Africa (with the largest average country weighting during the year), were the two largest contributors to performance. A German domiciled company which derives the majority of its revenues across Africa was the largest detractor, followed by companies in Nigeria and Ghana.
Brazil
Following the swearing in of President Jair Bolsonaro on January 1, during 2019 the VanEck Vectors Brazil Small-Cap ETF benefited from not only optimism on the political front, but also a more business-friendly legislative agenda. Consequently, its performance was the reverse of that in 2018 and the Fund returned 40.81% over the 12 month period under review.
Building on a robust first six months of the year, in the third quarter, the country’s economy expanded at its fastest pace since the start of 2018. With the country appearing “to be leaving behind years of sluggish growth that followed its worst recession on record.”1
The utilities and consumer discretionary sectors, with the two largest average sector weightings during the year, were the two largest positive contributors to performance. Only a single sector, communication services, detracted from performance, and then only minimally.
China
After their negative performances in 2018, the two VanEck Vectors China-focused ETFs reported double digit gains in 2019, with VanEck Vectors ChinaAMC CSI 300 ETF and VanEck Vectors ChinaAMC SME-ChiNext ETF returning 35.40% and 42.80%, respectively. Over the course of the year, despite a slowing economy and the continuing trade war between China and the U.S., Chinese asset prices continued to rise, not least as a result of stimulative monetary policies implemented by the People’s Bank of China to address growth concerns.
VanEck Vectors ChinaAMC SME-ChiNext ETF seeks to provide exposure not only to China’s market for innovative, non-government owned companies, but also to the sectors that are increasingly underpinning the growth of China’s “New Economy”. The information technology sector, with the largest average sector weighting during the year, was the greatest contributor to performance. Only the utilities sector, comprising two companies, detracted from performance. While all sectors contributed positively to the performance of VanEck Vectors ChinaAMC CSI 300 ETF, financial companies contributed the most to returns and utilities the least.
Egypt
VanEck Vectors Egypt Index ETF gained 5.42% in 2019. The World Bank increased slightly its estimate of gross domestic product (GDP) growth for the country in its last fiscal year (which ended June 30, 2019), from 5.3% to 5.6%. Drivers of growth have been the construction, gas, real estate, tourism and wholesale and retail trade sectors.2
According to the World Bank: “Egypt is sustaining its robust growth, fiscal outturns are improving, and external accounts are stabilizing at broadly favorable levels. Inflation receded significantly, paving the way for monetary easing.”3However, according to the preliminary GDP release, economic growth in the first quarter of the new (2020) fiscal year (i.e., third quarter 2019), slowed marginally4and in November, the HIS Markit Egypt Purchasing Managers’ Index declined, for the fourth consecutive month, to 47.9. This is its lowest since September 2017.5
The top three performing sectors were financials, communication services and materials. Only the energy and industrial sectors detracted from performance. Both mid- and large-cap companies contributed positively to returns, while small-cap companies, with the largest average weighting during the period under review, detracted from performance.
| 2 |
India
The VanEck Vectors India Small-Cap Index ETF posted a negative total return for the year of 21.65%. Economic growth in India continued to fall throughout 2019. In the second quarter of the country’s new fiscal year (July-September), annual economic growth slowed (for the sixth consecutive quarter) to 4.5%, its weakest pace since 2013.6This compared to 7% growth in the same quarter of 2018 and 5% in the previous quarter.7
With the Sensex index of stocks quoted on the Bombay Stock Exchange trading at “multiples higher than the S&P 500,”8stocks were proving expensive not only to foreign investors, but also domestically. Other headwinds included both continuing concern about the liquidity of the country’s banking system and the fact that, by December, consumer confidence in India was at its lowest level since 2014.9
Two sectors contributed positively to performance: healthcare and information technology. Companies in the financial sector, together with those in the industrial and consumer discretionary sectors, were the greatest detractors from performance.
Indonesia
The VanEck Vectors Indonesia Index ETF returned 5.97% in 2019. While Indonesia’s economic growth rate in 2018 was 5.17%, at a press conference on December 19, 2019, Indonesia’s vice finance minister, Suahasil Nazara said that the country’s economic growth was seen at 5.05%–5.06% in 2019. This rate would mark the first slowdown in four years.10The country has, however, been able to avoid much of the fallout from the U.S./China trade war because the majority of its economic growth has been driven by the performance of household consumption.11
The greatest positive contributions to returns came from three sectors: financial, materials and communication services. The greatest negative contributions to returns also came from three sectors: consumer discretionary, consumer staples and energy.
Israel
The VanEck Vectors Israel ETF returned 26.64% for the 12 months period under review, a reversal from its poor performance in 2018. According to the country’s Central Bureau for Statistics, in the third quarter GDP increased at an annual rate of 4.1%, following a second quarter in which it grew at only 0.8%. At 2.1%, GDP per capita also recovered, after falling 0.9% in the previous quarter.
Unfortunately, however, the figure of 4.1% for GDP growth rested on a single parameter: new car purchases. If the influence of car purchases is “neutralized,” then ” . . . the picture that remains is not all that favorable.”12As November came to a close, however, there was some good news to be found in the country’s export figures. With goods and services exports standing at $84 billion over the first nine months of 2019 (a 4.6% increase on the figure for January–September 2018), according to government data, Israeli exports, led by high tech, were expected to hit a record of $114 billion in 2019.13
Over the period under review, the performances of three sectors, information technology, financial and real estate, produced the majority of positive contributions to returns. Only two sectors detracted from performance, and then only minimally: communication services and materials. Mid-cap companies, followed by large- then small-cap companies, made the greatest positive contribution to returns.
Russia
2019 was a good year for the VanEck Vectors Russia Small-Cap ETF and, even more so, for its peer investing in larger-cap Russian stocks, the VanEck Vectors Russia ETF. The former ETF returned 36.17% for the year, while the latter returned 40.40% over the same period.
Despite disappointing growth during 2019, unlikely to exceed 1.3%,14the good news was the fall in inflation, which was, once again, below the central bank’s target of 4%. Estimates are that 2020 will see improved economic growth of 1.6%.15
| 3 |
VANECK VECTORS ETFs
MANAGEMENT DISCUSSION (unaudited) (continued)
The energy sector was by far the most significant contributor to performance of the VanEck Vectors Russia ETF. The financial and materials sectors also contributed strongly to positive performance. While no sector detracted from performance, the utilities sector contributed the least. For the VanEck Vectors Russia Small-Cap ETF, the utilities and consumer staples sectors were the most significant contributors to positive returns. While no sector provided negative returns, the energy sector contributed the least.
Vietnam
VanEck Vectors Vietnam ETF gained 8.86% in 2019. Despite the unresolved trade tensions between the U.S. and China during the year, Vietnam’s export and industrial production performance surprised to the upside during the year.16Many companies continue to look to shift their manufacturing operations to the country not only because of favorable wage levels, but also because of labor availability.17
According to the country’s General Statistics office, economic growth over the first nine months of 2019 was driven by manufacturing, followed by services.18Up 7.31% from 2018, GDP growth in the fourth quarter beat a revised figure of 6.73% in the second quarter. For the first three quarters of the year through September, the growth figure was 6.98%.19
Large-cap companies contributed the most to performance over the reporting period, outperforming the positive returns of mid- and small-cap companies. Three sectors contributed the majority of positive returns: information technology, healthcare and real estate. The utilities and consumer staples sectors were the greatest detractors from performance.
| * | Returns based on the funds’ net asset values (NAVs). |
| The principal risks of investing in VanEck Vectors ETFs include sector, market, economic, political, foreign currency, world event, index tracking and non-diversification risks, as well as fluctuations in net asset value and the risks associated with investing in less developed capital markets. The Funds may loan their securities, which may subject them to additional credit and counterparty risk. Please see the prospectus of each Fund for more complete information regarding each Fund’s specific risks. |
| 1 | The Wall Street Journal:Brazil’s Economy Expands at Fastest Pace in Six Quarters,December 3, 2019, https://www.wsj.com/articles/brazils-economy-expands-at-fastest-pace-in-six-quarters-11575377914 |
| 2 | The World Bank:Arab Republic of Egypt,October, 2019, http://pubdocs.worldbank.org/en/471871570664047542/EN-MPO-OCT19-Egypt.pdf |
| 3 | Ibid. |
| 4 | Focus Economics:Egypt Economic Outlook,November 26, 2019, https://www.focus-economics.com/countries/egypt |
| 5 | Reuters:Egypt’s non-oil private sector shrinks to slowest in over two years: PMI,December 3, 2019, https://www.reuters.com/article/us-egypt-economy-pmi/egypts-non-oil-private-sector-shrinks-to-slowest-in-over-two-years-pmi-idUSKBN1Y70F2 |
| 6 | Reuters:India’s economic growth slows, pressure on Modi to speed up reforms,November 29, 2019, https://www.reuters.com/article/us-india-economy-gdp/indias-economic-growth-slows-pressure-on-modi-to-speed-up-reforms-idUSKBN1Y31N1 |
| 7 | Ibid. |
| 8 | Forbes:For Investors, Modi 2.0 Has Made India Too Expensive,December 9, 2019, https://www.forbes.com/sites/kenrapoza/2019/12/09/for-investors-modi-20-has-made-india-too-expensive/#44524a213b58 |
| 9 | Ibid. |
| 10 | Reuters:Indonesia on track for budget deficit of 2.2% of GDP in 2019 – finmin,December 19, 2019, https://www.reuters.com/article/indonesia-economy-budget/indonesia-on-track-for-budget-deficit-of-22-of-gdp-in-2019-finmin-idUSL4N28T1EO |
| 11 | Antara News:Indonesia’s economic growth in 2020 to reach 4.8 percent: Indef,November 26, 2019, https://en.antaranews.com/news/137248/indonesias-economic-growth-in-2020-to-reach-48-percent-indef |
| 12 | CTECH:The Israeli Economy’s Greatest Growth Generator Is Also its Biggest Enemy,November 18, 2019, https://www.calcalistech.com/ctech/articles/0,7340,L-3773930,00.html |
| 13 | Reuters:Led by high tech, Israeli exports to hit record of $114 billion in 2019,November 24, 2019, https://www.reuters.com/article/us-israel-economy-exports/led-by-high-tech-israeli-exports-to-hit-record-of-114-billion-in-2019-idUSKBN1XY0IJ |
| 4 |
| 14 | Bloomberg:Putin Promised Economic Rebound. Russians Are Still Waiting,December 17, 2019, https://www.bloomberg.com/news/articles/2019-12-18/putin-promised-economic-breakthrough-russians-are-still-waiting |
| 15 | Ibid. |
| 16 | GardaWorld:Vietnam Country Report,November 27, 2019, https://www.garda.com/crisis24/country-reports/vietnam |
| 17 | Ibid. |
| 18 | Bangkok Post:Vietnam economy expands 7.3% in Q3,September 28, 2019, https://www.bangkokpost.com/world/1760444/vietnam-economy-expands-7-3-in-q3 |
| 19 | Ibid. |
| 5 |
VANECK VECTORS AFRICA INDEX ETF
December 31, 2019 (unaudited)
| Average Annual Total Returns | Cumulative Total Returns | ||||||||||||
| Share Price | NAV | MVAFKTR1 | Share Price | NAV | MVAFKTR1 | ||||||||
| One Year | 9.76% | 8.52% | 8.76% | 9.76% | 8.52% | 8.76% | |||||||
| Five Year | (1.95)% | (1.97)% | (0.86)% | (9.37)% | (9.48)% | (4.22)% | |||||||
| Ten Year | (0.52)% | (0.35)% | 0.78% | (5.11)% | (3.42)% | 8.09% | |||||||
| 1 | MVIS®GDP Africa (MVAFKTR) Index is a rules-based, modified-capitalization-weighted, float-adjusted index and is intended to give investors a means of tracking the overall performance of the publicly traded companies in Africa. |
| Index data prior to June 21, 2013 reflects that of the Dow Jones Africa Titans 50 IndexSM. From June 21, 2013, forward, the index data reflects that of the MVIS®GDP Africa Index (MVAFKTR). All Index history reflects a blend of the performance of the aforementioned Indexes. | |
| Hypothetical Growth of $10,000 | ||
| This chart shows the value of a hypothetical $10,000 investment in the Fund at NAV and at Share Price over the past 10 years. The result is compared with the Fund’s benchmark. | 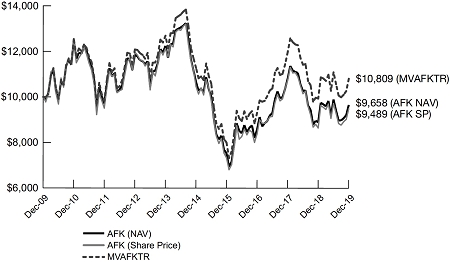 |
Past performance is no guarantee of future results. Performance results do not reflect the deduction of taxes that a shareholder would pay on fund distributions or on the redemption or sale of fund shares.
See “About Fund Performance” on page 17 for more information.
| 6 |
VANECK VECTORS BRAZIL SMALL-CAP ETF
PERFORMANCE COMPARISON
December 31, 2019 (unaudited)
| Average Annual Total Returns | Cumulative Total Returns | ||||||||||||
| Share Price | NAV | MVBRFTR1 | Share Price | NAV | MVBRFTR1 | ||||||||
| One Year | 40.95% | 40.81% | 41.43% | 40.95% | 40.81% | 41.43% | |||||||
| Five Year | 9.25% | 9.16% | 9.80% | 55.63% | 54.98% | 59.59% | |||||||
| Ten Year | (1.41)% | (1.17)% | (0.48)% | (13.23)% | (11.11)% | (4.69)% | |||||||
| 1 | MVIS®Brazil Small-Cap Index (MVBRFTR) is a rules based, modified capitalization weighted, float adjusted index intended to give investors a means of tracking the overall performance of publicly traded small-capitalization companies that are incorporated in Brazil or that are incorporated outside of Brazil but have at least 50% of their revenues/related assets in Brazil. |
| Hypothetical Growth of $10,000 | ||
| This chart shows the value of a hypothetical $10,000 investment in the Fund at NAV and at Share Price over the past 10 years. The result is compared with the Fund’s benchmark. | 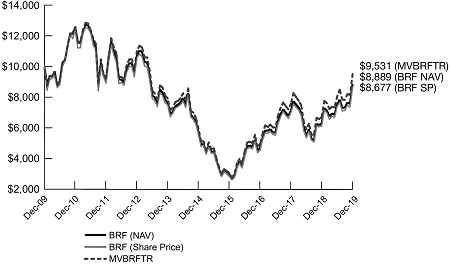 |
Past performance is no guarantee of future results. Performance results do not reflect the deduction of taxes that a shareholder would pay on fund distributions or on the redemption or sale of fund shares.
See “About Fund Performance” on page 17 for more information.
| 7 |
VANECK VECTORS CHINAAMC CSI 300 ETF
PERFORMANCE COMPARISON
December 31, 2019 (unaudited)
| Average Annual Total Returns | Cumulative Total Returns | ||||||||||||
| Share Price | NAV | CSIH07491 | Share Price | NAV | CSIH07491 | ||||||||
| One Year | 34.86% | 35.40% | 37.20% | 34.86% | 35.40% | 37.20% | |||||||
| Five Year | 1.22% | 1.33% | 2.76% | 6.23% | 6.84% | 14.58% | |||||||
| Life* | 2.51% | 2.64% | 4.28% | 25.68% | 27.11% | 47.09% | |||||||
| * | Commencement of Fund: 10/13/10; First Day of Secondary Market Trading: 10/14/10 |
| 1 | CSI 300 Index (CSIH0749) is a modified free-float market capitalization weighted index comprised of the largest and most liquid stocks in the Chinese A-share market. Constituent stocks for the CSI 300 Index must have been listed for more than three months (unless the stock’s average daily A-share market capitalization since its initial listing ranks among the top 30 of all A-shares) and must not be experiencing what the index provider believes to be obvious abnormal fluctuations or market manipulation. |
| Index data as of October 31, 2018 for all periods presented reflect the CSIH0749 stream of the Index which is denominated in USD and converted by the index provider using the “offshore” Renminbi (CNH) exchange rate. |
| Hypothetical Growth of $10,000 (Since Inception) | ||
| This chart shows the value of a hypothetical $10,000 investment in the Fund at NAV and at Share Price since inception. The result is compared with the Fund’s benchmark. | 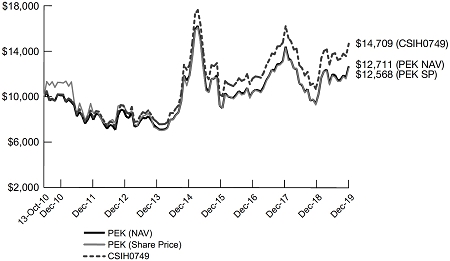 |
Past performance is no guarantee of future results. Performance results do not reflect the deduction of taxes that a shareholder would pay on fund distributions or on the redemption or sale of fund shares.
See “About Fund Performance” on page 17 for more information.
| 8 |
VANECK VECTORS CHINAAMC SME-CHINEXT ETF
PERFORMANCE COMPARISON
December 31, 2019 (unaudited)
| Average Annual Total Returns | Cumulative Total Returns | ||||||||||||
| Share Price | NAV | CNI61091 | Share Price | NAV | CNI61091 | ||||||||
| One Year | 42.68% | 42.80% | 44.18% | 42.68% | 42.80% | 44.18% | |||||||
| Five Year | 0.77% | 0.96% | 3.41% | 3.90% | 4.90% | 18.23% | |||||||
| Life* | 3.61% | 3.65% | 6.12% | 21.29% | 21.56% | 38.14% | |||||||
| * | Commencement of Fund: 7/23/14; First Day of Secondary Market Trading: 7/24/14 |
| 1 | The SME-ChiNext Index (CNI6109) is a modified, free-float adjusted index intended to track the performance of the 100 largest and most liquid stocks listed and trading on the Small and Medium Enterprise (“SME”) Board and the ChiNext Board of the Shenzhen Stock Exchange. The SME-ChiNext Index is comprised of A-shares. |
| Index data as of October 1, 2015 for all periods presented reflect the CNI6109 stream of the Index which is denominated in USD and converted by the index provider using the “offshore” Renminbi (CNH) exchange rate. |
| Hypothetical Growth of $10,000 (Since Inception) | ||
| This chart shows the value of a hypothetical $10,000 investment in the Fund at NAV and at Share Price since inception. The result is compared with the Fund’s benchmark. |
Past performance is no guarantee of future results. Performance results do not reflect the deduction of taxes that a shareholder would pay on fund distributions or on the redemption or sale of fund shares.
See “About Fund Performance” on page 17 for more information.
| 9 |
VANECK VECTORS EGYPT INDEX ETF
PERFORMANCE COMPARISON
December 31, 2019 (unaudited)
| Average Annual Total Returns | Cumulative Total Returns | ||||||||||||
| Share Price | NAV | MVEGPTTR1 | Share Price | NAV | MVEGPTTR1 | ||||||||
| One Year | 6.82% | 5.42% | 7.26% | 6.82% | 5.42% | 7.26% | |||||||
| Five Year | (11.99)% | (12.33)% | (8.33)% | (47.18)% | (48.22)% | (35.26)% | |||||||
| Life* | (7.87)% | (7.81)% | (5.69)% | (55.50)% | (55.21)% | (43.89)% | |||||||
| * | Commencement of Fund: 2/16/10; First Day of Secondary Market Trading: 2/18/10 |
| 1 | MVIS®Egypt Index (MVEGPTTR) is a rules based, modified capitalization weighted, float adjusted index intended to give investors a means of tracking the overall performance of publicly traded companies that are incorporated in Egypt or that are incorporated outside of Egypt but have at least 50% of their revenues/related assets in Egypt. |
| Hypothetical Growth of $10,000 (Since Inception) | ||
| This chart shows the value of a hypothetical $10,000 investment in the Fund at NAV and at Share Price since inception. The result is compared with the Fund’s benchmark. |  |
Past performance is no guarantee of future results. Performance results do not reflect the deduction of taxes that a shareholder would pay on fund distributions or on the redemption or sale of fund shares.
See “About Fund Performance” on page 17 for more information.
| 10 |
VANECK VECTORS INDIA SMALL-CAP INDEX ETF
PERFORMANCE COMPARISON
December 31, 2019 (unaudited)
| Average Annual Total Returns | Cumulative Total Returns | ||||||||||||
| Share Price | NAV | MVSCIFTR1 | Share Price | NAV | MVSCIFTR1 | ||||||||
| One Year | (21.60)% | (21.65)% | (22.19)% | (21.60)% | (21.65)% | (22.19)% | |||||||
| Five Year | (4.86)% | (4.83)% | (4.96)% | (22.05)% | (21.92)% | (22.46)% | |||||||
| Life* | (8.02)% | (8.04)% | (7.92)% | (54.25)% | (54.34)% | (53.76)% | |||||||
| * | Commencement of Fund: 8/24/10; First Day of Secondary Market Trading: 8/25/10 |
| 1 | MVIS®India Small-Cap Index (MVSCIFTR) is a rules based, modified capitalization weighted, float adjusted index intended to give investors a means of tracking the overall performance of publicly traded small-capitalization companies that are incorporated in India or that are incorporated outside of India but have at least 50% of their revenues/related assets in India. |
| Hypothetical Growth of $10,000 (Since Inception) | ||
| This chart shows the value of a hypothetical $10,000 investment in the Fund at NAV and at Share Price since inception. The result is compared with the Fund’s benchmark. | 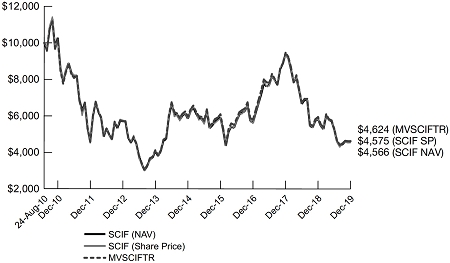 |
Past performance is no guarantee of future results. Performance results do not reflect the deduction of taxes that a shareholder would pay on fund distributions or on the redemption or sale of fund shares.
See “About Fund Performance” on page 17 for more information.
| 11 |
VANECK VECTORS INDONESIA INDEX ETF
PERFORMANCE COMPARISON
December 31, 2019 (unaudited)
| Average Annual Total Returns | Cumulative Total Returns | ||||||||||||
| Share Price | NAV | MVIDXTR1 | Share Price | NAV | MVIDXTR1 | ||||||||
| One Year | 6.13% | 5.97% | 6.36% | 6.13% | 5.97% | 6.36% | |||||||
| Five Year | 0.52% | 0.55% | 1.09% | 2.62% | 2.77% | 5.55% | |||||||
| Ten Year | 2.86% | 2.91% | 3.50% | 32.58% | 33.22% | 41.00% | |||||||
| 1 | MVIS®Indonesia Index (MVIDXTR) is a rules based, modified capitalization weighted, float adjusted index intended to give investors a means of tracking the overall performance of publicly traded companies that are incorporated in Indonesia or that are incorporated outside of Indonesia but have at least 50% of their revenues/related assets in Indonesia. |
| Hypothetical Growth of $10,000 | ||
| This chart shows the value of a hypothetical $10,000 investment in the Fund at NAV and at Share Price over the past 10 years. The result is compared with the Fund’s benchmark. | 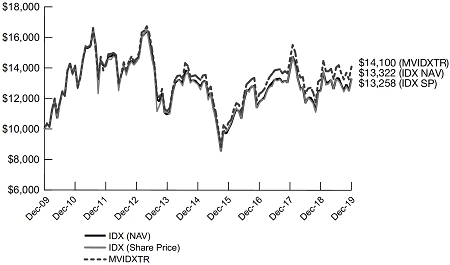 |
Past performance is no guarantee of future results. Performance results do not reflect the deduction of taxes that a shareholder would pay on fund distributions or on the redemption or sale of fund shares.
See “About Fund Performance” on page 17 for more information.
| 12 |
PERFORMANCE COMPARISON
December 31, 2019 (unaudited)
| Average Annual Total Returns | Cumulative Total Returns | ||||||||||||
| Share Price | NAV | BLSNTR1 | Share Price | NAV | BLSNTR1 | ||||||||
| One Year | 26.75% | 26.64% | 27.26% | 26.75% | 26.64% | 27.26% | |||||||
| Five Year | 4.83% | 4.83% | 5.23% | 26.60% | 26.61% | 29.03% | |||||||
| Life* | 6.69% | 6.69% | 7.16% | 52.51% | 52.48% | 56.98% | |||||||
| * | Commencement of Fund: 6/25/13; First Day of Secondary Market Trading: 6/26/13 |
| 1 | Bluestar Israel Global Index®(BLSNTR) is a rules based, modified capitalization, float adjusted weighted index comprised of equity securities, which may include depositary receipts, of publicly traded companies that are generally considered by the index provider to be Israeli companies. |
| Hypothetical Growth of $10,000 (Since Inception) | ||
| This chart shows the value of a hypothetical $10,000 investment in the Fund at NAV and at Share Price since inception. The result is compared with the Fund’s benchmark. | 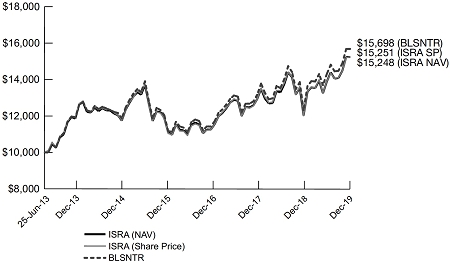 |
Past performance is no guarantee of future results. Performance results do not reflect the deduction of taxes that a shareholder would pay on fund distributions or on the redemption or sale of fund shares.
See “About Fund Performance” on page 17 for more information.
| 13 |
PERFORMANCE COMPARISON
December 31, 2019 (unaudited)
| Average Annual Total Returns | Cumulative Total Returns | ||||||||||||
| Share Price | NAV | MVRSXTR1 | Share Price | NAV | MVRSXTR1 | ||||||||
| One Year | 40.76% | 40.40% | 40.95% | 40.76% | 40.40% | 40.95% | |||||||
| Five Year | 15.87% | 15.01% | 15.60% | 108.85% | 101.23% | 106.45% | |||||||
| Ten Year | 0.99% | 1.01% | 1.14% | 10.35% | 10.54% | 11.99% | |||||||
| 1 | MVIS®Russia Index (MVRSXTR) is a rules based, modified capitalization weighted, float adjusted index intended to give investors a means of tracking the overall performance of publicly traded companies that are incorporated in Russia or that are incorporated outside of Russia but have at least 50% of their revenues/related assets in Russia. |
| Hypothetical Growth of $10,000 | ||
| This chart shows the value of a hypothetical $10,000 investment in the Fund at NAV and at Share Price over the past 10 years. The result is compared with the Fund’s benchmark. | 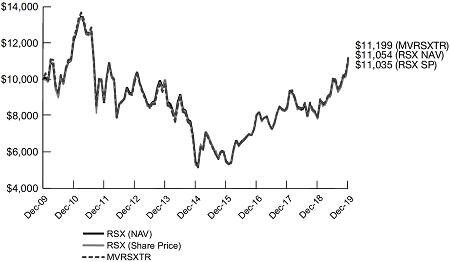 |
Past performance is no guarantee of future results. Performance results do not reflect the deduction of taxes that a shareholder would pay on fund distributions or on the redemption or sale of fund shares.
See “About Fund Performance” on page 17 for more information.
| 14 |
VANECK VECTORS RUSSIA SMALL-CAP ETF
PERFORMANCE COMPARISON
December 31, 2019 (unaudited)
| Average Annual Total Returns | Cumulative Total Returns | ||||||||||||
| Share Price | NAV | MVRSXJTR1 | Share Price | NAV | MVRSXJTR1 | ||||||||
| One Year | 38.05% | 36.17% | 36.68% | 38.05% | 36.17% | 36.68% | |||||||
| Five Year | 16.50% | 16.71% | 17.56% | 114.64% | 116.57% | 124.50% | |||||||
| Life* | (5.48)% | (5.52)% | (5.13)% | (38.79)% | (39.03)% | (36.84)% | |||||||
| * | Commencement of Fund: 4/13/11; First Day of Secondary Market Trading: 4/14/11 |
| 1 | MVIS®Russia Small-Cap Index (MVRSXJTR) is a rules based, modified capitalization weighted, float adjusted index intended to give investors a means of tracking the overall performance of publicly traded small-capitalization companies that are incorporated in Russia or that are incorporated outside of Russia but have at least 50% of their revenues/related assets in Russia. |
| Hypothetical Growth of $10,000 (Since Inception) | ||
| This chart shows the value of a hypothetical $10,000 investment in the Fund at NAV and at Share Price since inception. The result is compared with the Fund’s benchmark. | 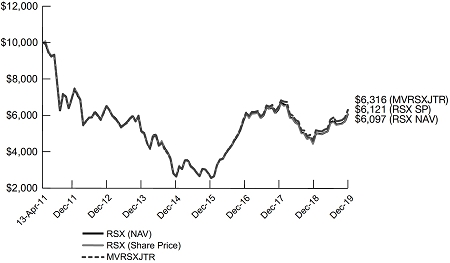 |
Past performance is no guarantee of future results. Performance results do not reflect the deduction of taxes that a shareholder would pay on fund distributions or on the redemption or sale of fund shares.
See “About Fund Performance” on page 17 for more information.
| 15 |
PERFORMANCE COMPARISON
December 31, 2019 (unaudited)
| Average Annual Total Returns | Cumulative Total Returns | ||||||||||||
| Share Price | NAV | MVVNMTR1 | Share Price | NAV | MVVNMTR1 | ||||||||
| One Year | 9.12% | 8.86% | 9.74% | 9.12% | 8.86% | 9.74% | |||||||
| Five Year | (1.93)% | (1.47)% | (0.52)% | (9.30)% | (7.13)% | (2.58)% | |||||||
| Ten Year | (2.73)% | (2.53)% | (1.93)% | (24.17)% | (22.62)% | (17.70)% | |||||||
| 1 | MVIS®Vietnam Index (MVVNMTR) is a rules based, modified capitalization weighted, float adjusted index intended to give investors a means of tracking the overall performance of publicly traded companies that are incorporated in Vietnam or that are incorporated outside of Vietnam but have at least 50% of their revenues/related assets in Vietnam. |
| Hypothetical Growth of $10,000 | ||
| This chart shows the value of a hypothetical $10,000 investment in the Fund at NAV and at Share Price over the past 10 years. The result is compared with the Fund’s benchmark. | 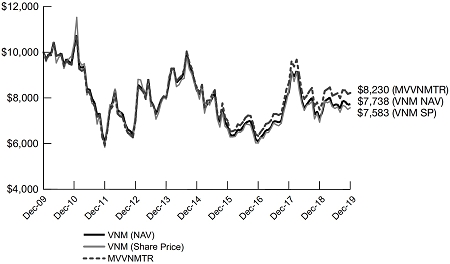 |
Past performance is no guarantee of future results. Performance results do not reflect the deduction of taxes that a shareholder would pay on fund distributions or on the redemption or sale of fund shares.
See “About Fund Performance” on page 17 for more information.
| 16 |
VANECK VECTORS ETF TRUST
(unaudited)
The price used to calculate market return (Share Price) is determined by using the closing price listed on its primary listing exchange. Since the shares of each Fund did not trade in the secondary market until after each Fund’s commencement, for the period from commencement to the first day of secondary market trading in shares of each Fund, the NAV of each Fund is used as a proxy for the secondary market trading price to calculate market returns.
The performance data quoted represents past performance. Past performance is not a guarantee of future results.Performance information for each Fund may reflect temporary waivers of expenses and/or fees. Had each Fund incurred all expenses, investment returns would have been reduced. These returns do not reflect the deduction of taxes that a shareholder would pay on Fund dividends and distributions or the sale of Fund shares.
Investment return and value of the shares of each Fund will fluctuate so that an investor’s shares, when sold, may be worth more or less than their original cost. Performance may be lower or higher than performance data quoted. Fund returns reflect reinvestment of dividends and capital gains distributions. Performance current to the most recent month-end is available by calling 800.826.2333 or by visiting vaneck.com.
Fund shares are not individually redeemable and will be issued and redeemed at their NAV only through certain authorized broker-dealers in large, specified blocks of shares called “creation units” and otherwise can be bought and sold only through exchange trading. Shares may trade at a premium or discount to their NAV in the secondary market.
The net asset value (NAV) of each VanEck Vectors exchange-traded fund (ETF) is determined at the close of each business day, and represents the dollar value of one share of each fund; it is calculated by taking the total assets of each fund, subtracting total liabilities, and dividing by the total number of shares outstanding. The NAVs are not necessarily the same as each ETF’s intraday trading value. VanEck Vectors ETF investors should not expect to buy or sell fund shares at NAV.
Index returns assume the reinvestment of all income and do not reflect any management fees or brokerage expenses associated with Fund returns. Certain indices may take into account withholding taxes. Investors cannot invest directly in the Index. Returns for actual Fund investors may differ from what is shown because of differences in timing, the amount invested and fees and expenses.
The Africa Index, Brazil Small-Cap Index, Egypt Index, India Small-Cap Index, Indonesia Index, Russia Index, Russia Small-Cap Index, and Vietnam Index are published by MV Index Solutions GmbH (MVIS®), which is a wholly owned subsidiary of the Adviser, Van Eck Associates Corporation. The CSI 300 Index is published by China Securities Index Co., Ltd. (China Securities) and the SME-ChiNext Index is published by the Shenzhen Securities Information Co., Ltd. (Shenzhen Securities), which is a subsidiary of the Shenzhen Stock Exchange. The Israel Index is published by BlueStar Global Investors, LLC (BlueStar).
BlueStar, China Securities, MVIS, and Shenzhen Securities are “Index Providers.” The Index Providers do not sponsor, endorse, or promote the Funds and bear no liability with respect to the Funds or any security.
Premium/discount information regarding how often the closing trading price of the Shares of each Fund were above (i.e., at a premium) or below (i.e., at a discount) the NAV of the Fund for each of the four previous calendar quarters and the immediately preceding five years (if applicable) can be found at vaneck.com.
| 17 |
VANECK VECTORS ETF TRUST
(unaudited)
Hypothetical $1,000 investment at beginning of period
As a shareholder of a Fund, you incur operating expenses, including management fees and other Fund expenses. This disclosure is intended to help you understand the ongoing costs (in dollars) of investing in your Fund and to compare these costs with the ongoing costs of investing in other mutual funds.
The disclosure is based on an investment of $1,000 invested at the beginning of the period and held for the entire period, July 1, 2019 to December 31, 2019.
Actual Expenses
The first line in the table below provides information about account values and actual expenses. You may use the information in this line, together with the amount you invested, to estimate the expenses that you paid over the period. Simply divide your account value by $1,000 (for example, an $8,600 account value divided by $1,000 = 8.6), then multiply the result by the number in the first line under the heading entitled “Expenses Paid During the Period.”
Hypothetical Example for Comparison Purposes
The second line in the table below provides information about hypothetical account values and hypothetical expenses based on the Fund’s actual expense ratio and an assumed rate of return of 5% per year before expenses, which is not the Fund’s actual return. The hypothetical account values and expenses may not be used to estimate the actual ending account balance or expenses you paid for the period. You may use this information to compare the ongoing costs of investing in your Fund and other funds. To do so, compare this 5% hypothetical example with the 5% hypothetical examples that appear in the shareholder reports of other funds.
Please note that the expenses shown in the table are meant to highlight your ongoing costs only and do not reflect any transactional costs, such as brokerage commissions paid on purchases and sales. Therefore, the second line of the table is useful in comparing ongoing costs only, and will not help you determine the relative costs of owning different funds. In addition, if these transactional costs were included, your costs would have been higher.
| 18 |
| Beginning Account Value July 1, 2019 | Ending Account Value December 31, 2019 | Annualized Expense Ratio During Period | Expenses Paid During the Period* July 1, 2019 — December 31, 2019 | |||||||||||||
| Africa Index ETF | ||||||||||||||||
| Actual | $ | 1,000.00 | $ | 975.80 | 0.79 | % | $ | 3.93 | ||||||||
| Hypothetical** | $ | 1,000.00 | $ | 1,021.22 | 0.79 | % | $ | 4.02 | ||||||||
| Brazil Small-Cap ETF | ||||||||||||||||
| Actual | $ | 1,000.00 | $ | 1,177.40 | 0.60 | % | $ | 3.29 | ||||||||
| Hypothetical** | $ | 1,000.00 | $ | 1,022.18 | 0.60 | % | $ | 3.06 | ||||||||
| ChinaAMC CSI 300 ETF | ||||||||||||||||
| Actual | $ | 1,000.00 | $ | 1,059.10 | 0.60 | % | $ | 3.11 | ||||||||
| Hypothetical** | $ | 1,000.00 | $ | 1,022.18 | 0.60 | % | $ | 3.06 | ||||||||
| ChinaAMC SME-ChiNext ETF | ||||||||||||||||
| Actual | $ | 1,000.00 | $ | 1,156.50 | 0.65 | % | $ | 3.53 | ||||||||
| Hypothetical** | $ | 1,000.00 | $ | 1,021.93 | 0.65 | % | $ | 3.31 | ||||||||
| Egypt Index ETF | ||||||||||||||||
| Actual | $ | 1,000.00 | $ | 948.60 | 1.02 | % | $ | 5.01 | ||||||||
| Hypothetical** | $ | 1,000.00 | $ | 1,020.06 | 1.02 | % | $ | 5.19 | ||||||||
| India Small-Cap Index ETF | ||||||||||||||||
| Actual | $ | 1,000.00 | $ | 871.10 | 0.88 | % | $ | 4.15 | ||||||||
| Hypothetical** | $ | 1,000.00 | $ | 1,020.77 | 0.88 | % | $ | 4.88 | ||||||||
| Indonesia Index ETF | ||||||||||||||||
| Actual | $ | 1,000.00 | $ | 1,001.10 | 0.57 | % | $ | 2.88 | ||||||||
| Hypothetical** | $ | 1,000.00 | $ | 1,022.33 | 0.57 | % | $ | 2.91 | ||||||||
| Israel ETF | ||||||||||||||||
| Actual | $ | 1,000.00 | $ | 1,096.40 | 0.62 | % | $ | 3.28 | ||||||||
| Hypothetical** | $ | 1,000.00 | $ | 1,022.08 | 0.62 | % | $ | 3.16 | ||||||||
| Russia ETF | ||||||||||||||||
| Actual | $ | 1,000.00 | $ | 1,111.20 | 0.62 | % | $ | 3.30 | ||||||||
| Hypothetical** | $ | 1,000.00 | $ | 1,022.08 | 0.62 | % | $ | 3.16 | ||||||||
| Russia Small-Cap ETF | ||||||||||||||||
| Actual | $ | 1,000.00 | $ | 1,088.10 | 0.75 | % | $ | 3.95 | ||||||||
| Hypothetical** | $ | 1,000.00 | $ | 1,021.42 | 0.75 | % | $ | 3.82 | ||||||||
| Vietnam ETF | ||||||||||||||||
| Actual | $ | 1,000.00 | $ | 1,002.10 | 0.68 | % | $ | 3.43 | ||||||||
| Hypothetical** | $ | 1,000.00 | $ | 1,021.78 | 0.68 | % | $ | 3.47 | ||||||||
| * | Expenses are equal to the Fund’s annualized expense ratio (for the six months ended December 31, 2019) multiplied by the average account value over the period, multiplied by the number of days in the most recent fiscal half year divided by the number of days in the fiscal year (to reflect the one-half year period). | |
| ** | Assumes annual return of 5% before expenses |
| 19 |
VANECK VECTORS AFRICA INDEX ETF
December 31, 2019
| Number of Shares | Value | |||||||
| COMMON STOCKS: 101.4% | ||||||||
| Canada: 11.5% | ||||||||
| 43,329 | B2Gold Corp. (USD) | $ | 173,749 | |||||
| 90,115 | Barrick Gold Corp. (USD) | 1,675,238 | ||||||
| 114,487 | First Quantum Minerals Ltd. | 1,162,748 | ||||||
| 338,532 | IAMGOLD Corp. (USD) * | 1,262,724 | ||||||
| 453,852 | Ivanhoe Mines Ltd. * | 1,487,466 | ||||||
| 5,761,925 | ||||||||
| China / Hong Kong: 2.6% | ||||||||
| 2,997,000 | China Molybdenum Co. Ltd. † # | 1,285,982 | ||||||
| Egypt: 4.3% | ||||||||
| 423,549 | Commercial International Bank Egypt SAE Reg S (GDR) | 2,160,100 | ||||||
| India: 1.3% | ||||||||
| 29,354 | MakeMyTrip Ltd. (USD) * | 672,207 | ||||||
| Kenya: 9.8% | ||||||||
| 362,000 | East African Breweries Ltd. # | 708,531 | ||||||
| 2,868,100 | Equity Group Holdings Plc | 1,513,995 | ||||||
| 8,650,700 | Safaricom Plc | 2,688,673 | ||||||
| 4,911,199 | ||||||||
| Morocco: 16.8% | ||||||||
| 57,110 | Attijariwafa Bank | 2,980,951 | ||||||
| 66,834 | Banque Centrale Populaire # | 1,939,691 | ||||||
| 46,609 | Banque Marocaine du Commerce Exterieur | 936,080 | ||||||
| 35,815 | Cosumar # | 820,460 | ||||||
| 111,071 | Maroc Telecom | 1,777,601 | ||||||
| 8,454,783 | ||||||||
| Nigeria: 10.7% | ||||||||
| 22,923,121 | Guaranty Trust Bank Plc | 1,875,941 | ||||||
| 5,339,306 | MTN Nigeria Communications Plc | 1,544,768 | ||||||
| 209,908 | Nestle Nigeria Plc | 850,170 | ||||||
| 21,763,926 | Zenith Bank Ltd. | 1,115,422 | ||||||
| 5,386,301 | ||||||||
| Singapore: 1.5% | ||||||||
| 4,408,200 | Golden Agri-Resources Ltd. # | 771,173 | ||||||
| South Africa: 32.1% | ||||||||
| 41,913 | Absa Group Ltd. # | 447,850 | ||||||
| 3,881 | Anglo American Platinum Ltd. | 362,838 | ||||||
| 16,114 | AngloGold Ashanti Ltd. (ADR) | 359,987 | ||||||
| 21,710 | Aspen Pharmacare Holdings Ltd. * # | 185,447 | ||||||
| 16,584 | AVI Ltd. # | 105,568 | ||||||
| 6,256 | Barloworld Ltd. | 50,434 | ||||||
| 15,953 | Bid Corp. Ltd. # | 376,801 | ||||||
| 14,264 | Bidvest Group Ltd. # | 208,861 | ||||||
| 3,980 | Capitec Bank Holdings Ltd. # | 411,553 | ||||||
| 11,481 | Clicks Group Ltd. # | 210,848 | ||||||
| 17,294 | Coronation Fund Managers Ltd. # | 49,496 | ||||||
| 24,307 | Discovery Ltd. # | 209,846 | ||||||
| 11,898 | Exxaro Resources Ltd. # | 111,400 | ||||||
| 200,104 | FirstRand Ltd. # | 899,307 | ||||||
| 60,320 | Fortress REIT Ltd. | 83,081 | ||||||
| 11,705 | Foschini Group Ltd. † # | 125,228 | ||||||
| Number of Shares | Value | |||||||
| South Africa: (continued) | ||||||||
| 34,745 | Gold Fields Ltd. (USD) | $ | 229,317 | |||||
| 164,567 | Growthpoint Properties Ltd. # | 260,386 | ||||||
| 29,187 | Harmony Gold Mining Co. Ltd. (USD) * | 105,949 | ||||||
| 12,812 | Hyprop Investments Ltd. | 51,354 | ||||||
| 43,505 | Impala Platinum Holdings Ltd. * † # | 445,221 | ||||||
| 15,368 | Investec Ltd. # | 91,267 | ||||||
| 31,365 | Investec Plc (GBP) # | 184,346 | ||||||
| 6,448 | Liberty Holdings Ltd. | 51,022 | ||||||
| 65,200 | Life Healthcare Group Holdings Ltd. | 114,934 | ||||||
| 22,608 | Mediclinic International Plc (GBP) | 123,274 | ||||||
| 55,293 | Momentum Metropolitan Holdings | 86,359 | ||||||
| 12,869 | Mr Price Group Ltd. # | 168,283 | ||||||
| 77,829 | MTN Group Ltd. # | 459,551 | ||||||
| 26,091 | MultiChoice Group Ltd. * # | 217,721 | ||||||
| 24,211 | Naspers Ltd. # | 3,968,430 | ||||||
| 23,641 | Nedbank Group Ltd. # | 362,568 | ||||||
| 86,318 | Netcare Ltd. † | 120,124 | ||||||
| 215,113 | Old Mutual Ltd. # | 302,384 | ||||||
| 19,455 | Pick n Pay Stores Ltd. | 88,889 | ||||||
| 7,914 | Pioneer Foods Ltd. # | 62,099 | ||||||
| 11,188 | PSG Group Ltd. # | 187,526 | ||||||
| 39,305 | Rand Merchant Investment Holdings Ltd. | 86,685 | ||||||
| 282,793 | Redefine Properties Ltd. | 152,888 | ||||||
| 25,834 | Remgro Ltd. # | 360,817 | ||||||
| 16,277 | Resilient REIT Ltd. | 79,200 | ||||||
| 39,757 | RMB Holdings Ltd. # | 229,039 | ||||||
| 102,657 | Sanlam Ltd. # | 580,933 | ||||||
| 20,236 | Sappi Ltd. # | 63,123 | ||||||
| 27,031 | Sasol Ltd. (ADR) † | 584,140 | ||||||
| 26,276 | Shoprite Holdings Ltd. # | 236,708 | ||||||
| 28,407 | Sibanye Gold Ltd. (USD) * | 282,081 | ||||||
| 9,884 | Spar Group Ltd. # | 139,856 | ||||||
| 68,929 | Standard Bank Group Ltd. # | 830,409 | ||||||
| 15,035 | Telkom SA SOC Ltd. # | 37,490 | ||||||
| 8,910 | Tiger Brands Ltd. † # | 134,334 | ||||||
| 23,282 | Truworths International Ltd. # | 82,065 | ||||||
| 21,830 | Vodacom Group Ltd. # | 180,120 | ||||||
| 51,184 | Woolworths Holdings Ltd. # | 178,148 | ||||||
| 16,117,585 | ||||||||
| United Kingdom: 7.9% | ||||||||
| 65,463 | Anglo American Plc # | 1,880,830 | ||||||
| 222,181 | Centamin Plc # | 372,697 | ||||||
| 1,988,535 | Tullow Oil Plc # | 1,691,590 | ||||||
| 3,945,117 | ||||||||
| United States: 2.9% | ||||||||
| 189,213 | Kosmos Energy Ltd. | 1,078,514 | ||||||
| 2,682 | Royal Caribbean Cruises Ltd. | 358,074 | ||||||
| 1,436,588 | ||||||||
| Zimbabwe: 0.0% | ||||||||
| 32,900 | Cassava Smartech Zimbabwe Ltd. * | 1,788 | ||||||
| 15,980 | Delta Corp. Ltd. | 2,080 | ||||||
| 3,868 | ||||||||
| Total Common Stocks (Cost: $43,645,648) | 50,906,828 | |||||||
See Notes to Financial Statements
| 20 |
| Number of Shares | Value | |||||||
| SHORT-TERM INVESTMENT HELD AS COLLATERAL FOR SECURITIES ON LOAN: 1.8% (Cost: $916,922) | ||||||||
| Money Market Fund: 1.8% | ||||||||
| 916,922 | State Street Navigator Securities Lending Government Money Market Portfolio | $ | 916,922 | |||||
| Total Investments: 103.2% (Cost: $44,562,570) | 51,823,750 | |||||||
| Liabilities in excess of other assets: (3.2)% | (1,600,185 | ) | ||||||
| NET ASSETS: 100.0% | $ | 50,223,565 | ||||||
| Definitions: | |
| ADR | American Depositary Receipt |
| GBP | British Pound |
| GDR | Global Depositary Receipt |
| USD | United States Dollar |
Footnotes:
| * | Non-income producing |
| † | Security fully or partially on loan. Total market value of securities on loan is $1,588,160. |
| # | Security has been valued in good faith pursuant to guidelines established by the Board of Trustees. The aggregate value of fair valued securities is $22,575,983 which represents 45.0% of net assets. |
| Reg S | Security was purchased pursuant to Regulation S under the Securities Act of 1933, which exempts from registration securities offered and sold outside of the United States. Such a security cannot be sold in the United States without either an effective registration statement filed pursuant to the Securities Act of 1933, or pursuant to an exemption from registration. |
| Summary of Investments by Sector Excluding Collateral for Securities Loaned | % of Investments | Value | ||||||
| Communication Services | 13.6 | % | $ | 6,905,924 | ||||
| Consumer Discretionary | 10.9 | 5,552,435 | ||||||
| Consumer Staples | 8.9 | 4,507,517 | ||||||
| Energy | 5.7 | 2,881,504 | ||||||
| Financials | 35.1 | 17,895,375 | ||||||
| Health Care | 1.1 | 543,779 | ||||||
| Industrials | 0.5 | 259,295 | ||||||
| Materials | 23.0 | 11,734,090 | ||||||
| Real Estate | 1.2 | 626,909 | ||||||
| 100.0 | % | $ | 50,906,828 | |||||
See Notes to Financial Statements
| 21 |
VANECK VECTORS AFRICA INDEX ETF
SCHEDULE OF INVESTMENTS
(continued)
The summary of inputs used to value the Fund’s investments as of December 31, 2019 is as follows:
| Level 1 Quoted Prices | Level 2 Significant Observable Inputs | Level 3 Significant Unobservable Inputs | Value | ||||||||||||||
| Common Stocks | |||||||||||||||||
| Canada | $ | 5,761,925 | $ | — | $ | — | $ | 5,761,925 | |||||||||
| China / Hong Kong | — | 1,285,982 | — | 1,285,982 | |||||||||||||
| Egypt | 2,160,100 | — | — | 2,160,100 | |||||||||||||
| India | 672,207 | — | — | 672,207 | |||||||||||||
| Kenya | 4,202,668 | 708,531 | — | 4,911,199 | |||||||||||||
| Morocco | 5,694,632 | 2,760,151 | — | 8,454,783 | |||||||||||||
| Nigeria | 5,386,301 | — | — | 5,386,301 | |||||||||||||
| Singapore | — | 771,173 | — | 771,173 | |||||||||||||
| South Africa | 3,012,556 | 13,105,029 | — | 16,117,585 | |||||||||||||
| United Kingdom | — | 3,945,117 | — | 3,945,117 | |||||||||||||
| United States | 1,436,588 | — | — | 1,436,588 | |||||||||||||
| Zimbabwe | 3,868 | — | — | 3,868 | |||||||||||||
| Money Market Fund | 916,922 | — | — | 916,922 | |||||||||||||
| Total | $ | 29,247,767 | $ | 22,575,983 | $ | — | $ | 51,823,750 | |||||||||
See Notes to Financial Statements
| 22 |
VANECK VECTORS BRAZIL SMALL-CAP ETF
SCHEDULE OF INVESTMENTS
December 31, 2019
| Number of Shares | Value | |||||||
| COMMON STOCKS: 92.7% | ||||||||
| Automobiles & Components: 1.2% | ||||||||
| 65,800 | Mahle-Metal Leve SA Industria e Comercio # | $ | 471,887 | |||||
| 113,300 | Tupy SA # | 714,243 | ||||||
| 1,186,130 | ||||||||
| Capital Goods: 0.9% | ||||||||
| 147,052 | Iochpe Maxion SA # | 858,014 | ||||||
| Consumer Durables & Apparel: 16.0% | ||||||||
| 68,350 | Arezzo Industria e Comercio SA # | 1,089,555 | ||||||
| 193,900 | Cia Hering SA # | 1,645,222 | ||||||
| 115,900 | Construtora Tenda SA # | 873,008 | ||||||
| 484,950 | Cyrela Brazil Realty SA Empreendimentos e Participacoes # | 3,605,934 | ||||||
| 196,500 | Even Construtora e Incorporadora SA * # | 764,342 | ||||||
| 259,902 | EZ Tec Empreendimentos e Participacoes SA # | 3,375,028 | ||||||
| 370,000 | Grendene SA # | 1,132,717 | ||||||
| 145,050 | Guararapes Confeccoes SA # | 875,411 | ||||||
| 425,000 | MRV Engenharia e Participacoes SA # | 2,285,685 | ||||||
| 15,646,902 | ||||||||
| Consumer Services: 5.9% | ||||||||
| 38,596 | Afya Ltd. (USD) * † | 1,046,724 | ||||||
| 16,428 | Arco Platform Ltd. (USD) * | 726,118 | ||||||
| 233,900 | BK Brasil Operacao E Assessoria # | 1,037,089 | ||||||
| 229,250 | CVC Brasil Operadora e Agencia de Viagens SA # | 2,505,245 | ||||||
| 70,425 | Ser Educacional SA Reg S 144A # | 488,184 | ||||||
| 5,803,360 | ||||||||
| Energy: 2.3% | ||||||||
| 136,250 | Enauta Participacoes SA # | 544,703 | ||||||
| 33,700 | Modec, Inc. # | 813,227 | ||||||
| 112,500 | Petro Rio SA * # | 931,146 | ||||||
| 2,289,076 | ||||||||
| Food, Beverage & Tobacco: 5.3% | ||||||||
| 90,334 | Adecoagro SA (USD) * | 756,096 | ||||||
| 189,700 | Camil Alimentos SA # | 425,588 | ||||||
| 329,050 | Marfrig Alimentos SA * # | 816,441 | ||||||
| 245,500 | Minerva SA * # | 785,077 | ||||||
| 278,250 | Sao Martinho SA # | 1,643,845 | ||||||
| 120,500 | SLC Agricola SA # | 745,030 | ||||||
| 5,172,077 | ||||||||
| Health Care Equipment & Services: 8.8% | ||||||||
| 78,800 | Centro de Imagem Diagnosticos SA # | 356,356 | ||||||
| 378,800 | Fleury SA # | 2,886,286 | ||||||
| 55,950 | Instituto Hermes Pardini SA # | 379,963 | ||||||
| 408,500 | Odontoprev SA # | 1,718,573 | ||||||
| 349,400 | Qualicorp SA # | 3,234,247 | ||||||
| 8,575,425 | ||||||||
| Insurance: 0.4% | ||||||||
| 112,050 | Wiz Solucoes e Corretagem de Seguros SA # | 393,965 | ||||||
| Number of Shares | Value | |||||||
| Materials: 7.6% | ||||||||
| 520,125 | Duratex SA # | $ | 2,169,682 | |||||
| 102,352 | ERO Copper Corp. * † | 1,860,945 | ||||||
| 418,072 | Largo Resources Ltd. * | 318,733 | ||||||
| 59,539 | Rhi Magnesita NV (GBP) # | 3,041,124 | ||||||
| 7,390,484 | ||||||||
| Media & Entertainment: 1.0% | ||||||||
| 99,700 | Smiles Fidelidade SA # | 975,789 | ||||||
| Real Estate: 6.5% | ||||||||
| 213,388 | Aliansce Sonae Shopping Centers SA # | 2,666,209 | ||||||
| 251,950 | BR Properties SA * # | 910,546 | ||||||
| 28,250 | FII BTG Pactual Corporate Office Fund # | 827,111 | ||||||
| 147,900 | Iguatemi Empresa de Shopping Centers SA # | 1,952,554 | ||||||
| 6,356,420 | ||||||||
| Retailing: 0.9% | ||||||||
| 104,100 | Grupo SBF SA * # | 914,370 | ||||||
| Semiconductor: 0.7% | ||||||||
| 18,665 | SMART Global Holdings, Inc. * | 708,150 | ||||||
| Software & Services: 6.9% | ||||||||
| 239,491 | Linx SA (ADR) * † | 2,097,941 | ||||||
| 729,289 | Sonda SA # | 629,095 | ||||||
| 250,150 | Totvs SA # | 4,021,699 | ||||||
| 6,748,735 | ||||||||
| Technology Hardware & Equipment: 0.6% | ||||||||
| 22,061 | Ituran Location and Control Ltd. (USD) | 554,393 | ||||||
| Telecommunication Services: 1.2% | ||||||||
| 1,247,933 | Oi SA (ADR) * † | 1,162,574 | ||||||
| Transportation: 6.3% | ||||||||
| 397,800 | Cia de Locacao das Americas # | 2,253,349 | ||||||
| 295,890 | EcoRodovias Infraestrutura e Logistica SA # | 1,203,827 | ||||||
| 229,850 | Movida Participacoes SA # | 1,098,675 | ||||||
| 763,800 | Santos Brasil Participacoes SA # | 1,556,673 | ||||||
| 6,112,524 | ||||||||
| Utilities: 20.2% | ||||||||
| 354,640 | AES Tiete Energia SA # | 1,419,921 | ||||||
| 345,137 | Alupar Investimento SA # | 2,369,939 | ||||||
| 108,296 | Cia de Saneamento de Minas Gerais SA # | 1,836,896 | ||||||
| 153,200 | Cia de Saneamento do Parana # | 3,876,391 | ||||||
| 237,200 | Eneva SA * # | 2,582,802 | ||||||
| 368,700 | Light SA # | 2,186,106 | ||||||
| 93,000 | Omega Geracao SA * # | 846,060 | ||||||
| 588,650 | Transmissora Alianca de Energia Eletrica SA # | 4,574,300 | ||||||
| 19,692,415 | ||||||||
| Total Common Stocks (Cost: $64,179,564) | 90,540,803 | |||||||
| PREFERRED STOCKS: 7.2% | ||||||||
| Banks: 0.7% | ||||||||
| 130,250 | Banco ABC Brasil SA, 5.42% # | 655,514 | ||||||
See Notes to Financial Statements
| 23 |
VANECK VECTORS BRAZIL SMALL-CAP ETF
SCHEDULE OF INVESTMENTS
(continued)
| Number of Shares | Value | |||||||
| Capital Goods: 1.9% | ||||||||
| 806,709 | Marcopolo SA, 1.33% # | $ | 905,059 | |||||
| 274,200 | Randon Implementos e Participacoes SA, 2.68% # | 916,666 | ||||||
| 1,821,725 | ||||||||
| Materials: 3.3% | ||||||||
| 1,122,850 | Metalurgica Gerdau SA, 1.62% # | 2,604,020 | ||||||
| 76,127 | Unipar Carbocloro SA, 0.73% # | 678,163 | ||||||
| 3,282,183 | ||||||||
| Utilities: 1.3% | ||||||||
| 155,000 | Cia Energetica de Sao Paulo, 2.78% # | 1,234,147 | ||||||
| Total Preferred Stocks (Cost: $3,254,251) | 6,993,569 | |||||||
| Total Investments Before Collateral for Securities Loaned: 99.9% (Cost: $67,433,815) | 97,534,372 | |||||||
| Number of Shares | Value | |||||||
| SHORT-TERM INVESTMENT HELD AS COLLATERAL FOR SECURITIES ON LOAN: 1.3% (Cost: $1,306,142) | ||||||||
| Money Market Fund: 1.3% | ||||||||
| 1,306,142 | State Street Navigator Securities Lending Government Money Market Portfolio | $ | 1,306,142 | |||||
| Total Investments: 101.2% (Cost: $68,739,957) | 98,840,514 | |||||||
| Liabilities in excess of other assets: (1.2)% | (1,216,481 | ) | ||||||
| NET ASSETS: 100.0% | $ | 97,624,033 | ||||||
Definitions:
| ADR | American Depositary Receipt |
| GBP | British Pound |
| USD | United States Dollar |
Footnotes:
| * | Non-income producing |
| † | Security fully or partially on loan. Total market value of securities on loan is $1,811,608. |
| # | Security has been valued in good faith pursuant to guidelines established by the Board of Trustees. The aggregate value of fair valued securities is $88,302,698 which represents 90.5% of net assets. |
| Reg S | Security was purchased pursuant to Regulation S under the Securities Act of 1933, which exempts from registration securities offered and sold outside of the United States. Such a security cannot be sold in the United States without either an effective registration statement filed pursuant to the Securities Act of 1933, or pursuant to an exemption from registration. |
| 144A | Security exempt from registration under Rule 144A of the Securities Act of 1933, as amended, or otherwise restricted. These securities may be resold in transactions exempt from registration, unless otherwise noted, and the value amounted to $488,184, or 0.5% of net assets. |
| Summary of Investments by Sector Excluding Collateral for Securities Loaned | % of Investments | Value | ||||||
| Communication Services | 2.2 | % | $ | 2,138,363 | ||||
| Consumer Discretionary | 24.1 | 23,550,762 | ||||||
| Consumer Staples | 5.3 | 5,172,077 | ||||||
| Energy | 2.4 | 2,289,076 | ||||||
| Financials | 1.9 | 1,876,590 | ||||||
| Health Care | 8.8 | 8,575,425 | ||||||
| Industrials | 9.0 | 8,792,263 | ||||||
| Information Technology | 8.2 | 8,011,278 | ||||||
| Materials | 10.9 | 10,672,667 | ||||||
| Real Estate | 5.7 | 5,529,309 | ||||||
| Utilities | 21.5 | 20,926,562 | ||||||
| 100.0 | % | $ | 97,534,372 | |||||
See Notes to Financial Statements
| 24 |
The summary of inputs used to value the Fund’s investments as of December 31, 2019 is as follows:
| Level 1 Quoted Prices | Level 2 Significant Observable Inputs | Level 3 Significant Unobservable Inputs | Value | ||||||||||||||
| Common Stocks | |||||||||||||||||
| Automobiles & Components | $ | — | $ | 1,186,130 | $ | — | $ | 1,186,130 | |||||||||
| Capital Goods | — | 858,014 | — | 858,014 | |||||||||||||
| Consumer Durables & Apparel | — | 15,646,902 | — | 15,646,902 | |||||||||||||
| Consumer Services | 1,772,842 | 4,030,518 | — | 5,803,360 | |||||||||||||
| Energy | — | 2,289,076 | — | 2,289,076 | |||||||||||||
| Food, Beverage & Tobacco | 756,096 | 4,415,981 | — | 5,172,077 | |||||||||||||
| Health Care Equipment & Services | — | 8,575,425 | — | 8,575,425 | |||||||||||||
| Insurance | — | 393,965 | — | 393,965 | |||||||||||||
| Materials | 2,179,678 | 5,210,806 | — | 7,390,484 | |||||||||||||
| Media & Entertainment | — | 975,789 | — | 975,789 | |||||||||||||
| Real Estate | — | 6,356,420 | — | 6,356,420 | |||||||||||||
| Retailing | — | 914,370 | — | 914,370 | |||||||||||||
| Semiconductor | 708,150 | — | — | 708,150 | |||||||||||||
| Software & Services | 2,097,941 | 4,650,794 | — | 6,748,735 | |||||||||||||
| Technology Hardware & Equipment | 554,393 | — | — | 554,393 | |||||||||||||
| Telecommunication Services | 1,162,574 | — | — | 1,162,574 | |||||||||||||
| Transportation | — | 6,112,524 | — | 6,112,524 | |||||||||||||
| Utilities | — | 19,692,415 | — | 19,692,415 | |||||||||||||
| Preferred Stock* | — | 6,993,569 | — | 6,993,569 | |||||||||||||
| Money Market Fund | 1,306,142 | — | — | 1,306,142 | |||||||||||||
| Total | $ | 10,537,816 | $ | 88,302,698 | $ | — | $ | 98,840,514 | |||||||||
| * | See Schedule of Investments for industry sector breakouts. |
See Notes to Financial Statements
| 25 |
VANECK VECTORS CHINAAMC CSI 300 ETF
SCHEDULE OF INVESTMENTS
December 31, 2019
| Number of Shares | Value | |||||||
| COMMON STOCKS: 100.0% | ||||||||
| Automobiles & Components: 2.1% | ||||||||
| 47,500 | BAIC BluePark New Energy Technology Co. Ltd. * # | $ | 39,789 | |||||
| 30,781 | Byd Co. Ltd. # | 210,866 | ||||||
| 23,009 | China Shipbuilding Industry Group Power Co. Ltd. * # | 66,145 | ||||||
| 66,285 | Chongqing Changan Automobile Co. Ltd. # | 95,514 | ||||||
| 47,700 | Fuyao Glass Industry Group Co. Ltd. # | 164,362 | ||||||
| 40,974 | Great Wall Motor Co. Ltd. # | 52,153 | ||||||
| 31,580 | Guangzhou Automobile Group Co. Ltd. # | 53,046 | ||||||
| 53,573 | Huayu Automotive Systems Co. Ltd. # | 200,082 | ||||||
| 119,163 | SAIC Motor Corp. Ltd. # | 408,379 | ||||||
| 80,980 | Zhejiang Century Huatong Group Co. Ltd. # | 133,078 | ||||||
| 1,423,414 | ||||||||
| Banks: 16.3% | ||||||||
| 1,302,200 | Agricultural Bank of China Ltd. # | 690,239 | ||||||
| 503,015 | Bank of Beijing Co. Ltd. # | 410,551 | ||||||
| 34,900 | Bank of Changsha Co. Ltd. # | 45,510 | ||||||
| 61,400 | Bank of Chengdu Co. Ltd. # | 80,076 | ||||||
| 716,400 | Bank of China Ltd. # | 379,771 | ||||||
| 933,916 | Bank of Communications Co. Ltd. # | 755,460 | ||||||
| 87,460 | Bank of Guiyang Co. Ltd. # | 120,176 | ||||||
| 69,760 | Bank of Hangzhou Co. Ltd. # | 91,829 | ||||||
| 313,900 | Bank of Jiangsu Co. Ltd. # | 326,695 | ||||||
| 201,771 | Bank of Nanjing Co. Ltd. # | 254,330 | ||||||
| 95,635 | Bank of Ningbo Co. Ltd. # | 387,228 | ||||||
| 241,454 | Bank of Shanghai Co. Ltd. # | 329,376 | ||||||
| 16,600 | Bank of Xi’an Co. Ltd. | 18,548 | ||||||
| 104,200 | China CITIC Bank Corp. Ltd. # | 92,374 | ||||||
| 228,300 | China Construction Bank Corp. # | 237,207 | ||||||
| 541,300 | China Everbright Bank Co. Ltd. # | 343,019 | ||||||
| 350,589 | China Merchants Bank Co. Ltd. # | 1,894,873 | ||||||
| 843,717 | China Minsheng Banking Corp. Ltd. # | 764,842 | ||||||
| 209,256 | Huaxia Bank Co. Ltd. # | 230,565 | ||||||
| 733,104 | Industrial & Commercial Bank of China Ltd. # | 619,410 | ||||||
| 494,291 | Industrial Bank Co. Ltd. # | 1,406,236 | ||||||
| 329,809 | Ping An Bank Co. Ltd. # | 780,415 | ||||||
| 20,800 | Qingdao Rural Commercial Bank Corp. | 19,318 | ||||||
| 399,118 | Shanghai Pudong Development Bank Co. Ltd. # | 709,464 | ||||||
| 10,987,512 | ||||||||
| Capital Goods: 8.3% | ||||||||
| 47,100 | AVIC Aircraft Co. Ltd. # | 110,903 | ||||||
| 30,600 | AVIC Aviation Engine Corp. Plc # | 95,376 | ||||||
| 10,000 | AVIC Helicopter Co. Ltd. # | 68,563 | ||||||
| 14,300 | AVIC Shenyang Aircraft Co. Ltd. * # | 64,932 | ||||||
| 28,700 | Beijing New Building Materials Plc # | 104,923 | ||||||
| 17,899 | China Avionics Systems Co. Ltd. # | 36,625 | ||||||
| 79,824 | China Communications Construction Co. Ltd. # | 105,124 | ||||||
| 93,900 | China Gezhouba Group Co. Ltd. # | 90,096 | ||||||
| Number of Shares | Value | |||||||
| Capital Goods: (continued) | ||||||||
| 83,800 | China National Chemical Engineering Co. Ltd. # | $ | 77,552 | |||||
| 156,400 | China Railway Construction Corp. Ltd. # | 227,879 | ||||||
| 276,908 | China Railway Group Ltd. # | 236,436 | ||||||
| 311,100 | China Shipbuilding Industry Co. Ltd. # | 234,383 | ||||||
| 20,100 | China Spacesat Co. Ltd. # | 61,728 | ||||||
| 713,408 | China State Construction Engineering Corp. Ltd. # | 576,149 | ||||||
| 330,815 | CRRC Corp. Ltd. # | 339,578 | ||||||
| 55,458 | Fangda Carbon New Material Co. Ltd. * # | 96,993 | ||||||
| 29,000 | Han’s Laser Technology Co. Ltd. # | 166,948 | ||||||
| 83,400 | Jiangsu Zhongtian Technology Co. Ltd. # | 99,575 | ||||||
| 242,700 | Metallurgical Corp. of China Ltd. # | 97,663 | ||||||
| 78,511 | NARI Technology Co. Ltd. # | 239,063 | ||||||
| 260,000 | Power Construction Corp. of China Ltd. # | 162,193 | ||||||
| 200,400 | Sany Heavy Industry Co. Ltd. # | 491,711 | ||||||
| 151,348 | Shanghai Construction Group Co. Ltd. # | 76,982 | ||||||
| 124,200 | Shanghai Electric Group Co. Ltd. # | 88,933 | ||||||
| 35,349 | Shenzhen Inovance Technology Co. Ltd. # | 155,752 | ||||||
| 37,089 | Siasun Robot & Automation Co. Ltd. * # | 74,658 | ||||||
| 54,561 | Suzhou Gold Mantis Construction Decoration Co. Ltd. # | 69,139 | ||||||
| 126,207 | TBEA Co. Ltd. # | 120,649 | ||||||
| 162,900 | Weichai Power Co. Ltd. # | 372,170 | ||||||
| 159,800 | XCMG Construction Machinery Co. Ltd. # | 125,780 | ||||||
| 48,200 | Xiamen C & D, Inc. # | 62,319 | ||||||
| 93,900 | Xinjiang Goldwind Science and Technology Co. Ltd. # | 161,282 | ||||||
| 36,600 | Zhejiang Chint Electrics Co. Ltd. # | 140,975 | ||||||
| 46,982 | Zhejiang Sanhua Intelligent Controls Co. Ltd. # | 117,056 | ||||||
| 45,153 | Zhengzhou Yutong Bus Co. Ltd. # | 92,478 | ||||||
| 176,200 | Zoomlion Heavy Industry Science and Technology Co. Ltd. # | 169,357 | ||||||
| 5,611,923 | ||||||||
| Commercial & Professional Services: 0.3% | ||||||||
| 64,541 | Beijing Originwater Technology Co. Ltd. # | 70,548 | ||||||
| 12,500 | Shanghai M&G Stationery, Inc. # | 87,571 | ||||||
| 52,800 | Shanghai Yuyuan Tourist Mart Group Co. Ltd. | 59,432 | ||||||
| 217,551 | ||||||||
| Consumer Durables & Apparel: 5.6% | ||||||||
| 163,628 | Gree Electric Appliances, Inc. # | 1,543,256 | ||||||
| 16,172 | Hangzhou Robam Appliances Co. Ltd. # | 78,641 | ||||||
| 165,095 | Midea Group Co. Ltd. # | 1,384,302 | ||||||
| 4,300 | Oppein Home Group, Inc. # | 72,242 | ||||||
| 125,300 | Qingdao Haier Co. Ltd. # | 351,401 | ||||||
See Notes to Financial Statements
| 26 |
| Number of Shares | Value | |||||||
| Consumer Durables & Apparel: (continued) | ||||||||
| 459,800 | TCL Corp. # | $ | 295,636 | |||||
| 5,600 | Zhejiang Supor Co. Ltd. # | 61,835 | ||||||
| 3,787,313 | ||||||||
| Consumer Services: 1.2% | ||||||||
| 33,200 | China International Travel Service Corp. Ltd. # | 424,612 | ||||||
| 45,094 | Heilan Home Co. Ltd. # | 49,766 | ||||||
| 23,100 | Offcn Education Technology Co. Ltd. # | 59,406 | ||||||
| 139,420 | Shenzhen Overseas Chinese Town Co. Ltd. # | 156,127 | ||||||
| 29,600 | Songcheng Performance Development Co. Ltd. # | 131,510 | ||||||
| 821,421 | ||||||||
| Diversified Financials: 6.9% | ||||||||
| 74,336 | Anxin Trust Co. Ltd. * # | 47,436 | ||||||
| 183,086 | AVIC Capital Co. Ltd. # | 127,697 | ||||||
| 63,100 | Bohai Capital Holding Co. Ltd. * # | 34,494 | ||||||
| 85,400 | Caitong Securities Co. Ltd. # | 139,473 | ||||||
| 43,800 | China Galaxy Securities Co. Ltd. # | 73,215 | ||||||
| 11,600 | China Great Wall Securities Co. Ltd. # | 23,148 | ||||||
| 97,200 | China Merchants Securities Co. Ltd. # | 255,803 | ||||||
| 9,200 | Chinalin Securities Co. Ltd. # | 19,787 | ||||||
| 267,500 | CITIC Securities Co. Ltd. # | 973,755 | ||||||
| 15,200 | CSC Financial Co. Ltd. # | 66,702 | ||||||
| 46,900 | Dongxing Securities Co. Ltd. # | 88,704 | ||||||
| 182,620 | East Money Information Co. Ltd. # | 414,392 | ||||||
| 66,371 | Everbright Securities Co. Ltd. # | 125,166 | ||||||
| 139,950 | Founder Securities Co. Ltd. # | 174,579 | ||||||
| 153,250 | Guotai Junan Securities Co. Ltd. # | 407,664 | ||||||
| 83,630 | Guoyuan Securities Co. Ltd. # | 151,092 | ||||||
| 275,036 | Haitong Securities Co. Ltd. # | 611,953 | ||||||
| 7,300 | Hithink RoyalFlush Information Network Co. Ltd. # | 114,857 | ||||||
| 13,600 | Hongta Securities Co. Ltd. * | 32,745 | ||||||
| 16,860 | Minmetals Capital Co. Ltd. # | 20,052 | ||||||
| 121,700 | Orient Securities Co. Ltd. # | 188,445 | ||||||
| 57,500 | SDIC Capital Co. Ltd. # | 125,386 | ||||||
| 306,438 | Shenwan Hongyuan Group Co. Ltd. # | 225,595 | ||||||
| 82,200 | Sinolink Securities Co. Ltd. # | 110,032 | ||||||
| 17,600 | Tianfeng Securities Co. Ltd. # | 18,623 | ||||||
| 45,300 | Zheshang Securities Co. Ltd. # | 72,598 | ||||||
| 4,643,393 | ||||||||
| Energy: 2.1% | ||||||||
| 62,200 | China Coal Energy Co. Ltd. # | 44,871 | ||||||
| 20,100 | China Oilfield Services Ltd. # | 55,556 | ||||||
| 454,700 | China Petroleum and Chemical Corp. # | 334,327 | ||||||
| 112,110 | China Shenhua Energy Co. Ltd. # | 294,030 | ||||||
| 69,100 | CNOOC Energy Technology & Services Ltd. * | 29,110 | ||||||
| 75,180 | Offshore Oil Engineering Co. Ltd. # | 79,798 | ||||||
| 330,200 | PetroChina Co. Ltd. # | 276,734 | ||||||
| 136,007 | Shaanxi Coal Industry Co. Ltd. # | 175,749 | ||||||
| 41,800 | Shanxi Meijin Energy Co. Ltd. * # | 56,854 | ||||||
| 30,200 | Yanzhou Coal Mining Co. Ltd. # | 45,823 | ||||||
| 1,392,852 | ||||||||
| Number of Shares | Value | |||||||
| Financials: 2.0% | ||||||||
| 131,600 | Changjiang Securities Co. Ltd. # | $ | 135,158 | |||||
| 100,556 | GF Securities Co. Ltd. # | 219,406 | ||||||
| 68,650 | Guoyuan Securities Co. Ltd. # | 91,511 | ||||||
| 150,004 | Huatai Securities Co. Ltd. # | 438,165 | ||||||
| 159,350 | Industrial Securities Co. Ltd. # | 162,357 | ||||||
| 81,600 | SooChow Securities Co. Ltd. # | 117,378 | ||||||
| 95,928 | Southwest Securities Co. Ltd. # | 71,586 | ||||||
| 59,514 | Western Securities Co. Ltd. # | 83,977 | ||||||
| 1,319,538 | ||||||||
| Food, Beverage & Tobacco: 12.1% | ||||||||
| 3,900 | Anhui Gujing Distillery Co. Ltd. # | 76,149 | ||||||
| 27,500 | Foshan Haitian Flavouring and Food Co. Ltd. # | 425,212 | ||||||
| 26,900 | Guangdong Haid Group Co. Ltd. # | 139,130 | ||||||
| 14,325 | Hebei Yangyuan Zhihui Beverage Co. Ltd. # | 59,778 | ||||||
| 33,867 | Henan Shuanghui Investment and Development Co. Ltd. # | 141,254 | ||||||
| 207,244 | Inner Mongolia Yili Industrial Group Co. Ltd. # | 922,076 | ||||||
| 20,499 | Jiangsu Yanghe Brewery Joint-Stock Co. Ltd. # | 325,852 | ||||||
| 17,126 | Kweichow Moutai Co. Ltd. # | 2,914,686 | ||||||
| 24,893 | Luzhou Laojiao Co. Ltd. # | 310,347 | ||||||
| 29,400 | Muyuan Foodstuff Co. Ltd. # | 374,799 | ||||||
| 71,700 | New Hope Liuhe Co. Ltd. # | 205,700 | ||||||
| 8,860 | Shanxi Xinghuacun Fen Wine Factory Co. Ltd. # | 114,217 | ||||||
| 66,000 | Tongwei Co. Ltd. # | 124,489 | ||||||
| 126,385 | Wens Foodstuffs Group Co. Ltd. # | 610,071 | ||||||
| 66,000 | Wuliangye Yibin Co. Ltd. # | 1,263,173 | ||||||
| 130,156 | Yonghui Superstores Co. Ltd. # | 141,029 | ||||||
| 8,147,962 | ||||||||
| Health Care Equipment & Services: 1.5% | ||||||||
| 42,162 | Aier Eye Hospital Group Co. Ltd. # | 239,847 | ||||||
| 17,800 | Hangzhou Tigermed Consulting Co. Ltd. # | 161,582 | ||||||
| 29,781 | Huadong Medicine Co. Ltd. # | 104,425 | ||||||
| 19,100 | Jointown Pharmaceutical Group Co. Ltd. # | 38,838 | ||||||
| 36,300 | Lepu Medical Technology Beijing Co. Ltd. # | 172,716 | ||||||
| 93,274 | Meinian Onehealth Healthcare Holdings Co. Ltd. # | 199,636 | ||||||
| 39,173 | Shanghai Pharmaceuticals Holding Co. Ltd. # | 103,406 | ||||||
| 1,020,450 | ||||||||
| Insurance: 8.5% | ||||||||
| 56,611 | China Life Insurance Co. Ltd. # | 284,084 | ||||||
| 106,817 | China Pacific Insurance Group Co. Ltd. # | 581,338 | ||||||
| 67,200 | Hubei Biocause Pharmaceutical Co. Ltd. # | 67,971 | ||||||
| 28,376 | New China Life Insurance Co. Ltd. # | 200,667 | ||||||
See Notes to Financial Statements
| 27 |
VANECK VECTORS CHINAAMC CSI 300 ETF
SCHEDULE OF INVESTMENTS
(continued)
| Number of Shares | Value | |||||||
| Insurance: (continued) | ||||||||
| 36,200 | People’s Insurance Co. Group of China Ltd. # | $ | 39,527 | |||||
| 368,220 | Ping An Insurance Group Co. of China Ltd. # | 4,525,424 | ||||||
| 5,699,011 | ||||||||
| Materials: 6.2% | ||||||||
| 222,300 | Aluminum Corporation of China Ltd. * # | 113,140 | ||||||
| 81,530 | Angang Steel Co. Ltd. # | 39,258 | ||||||
| 68,000 | Anhui Conch Cement Co. Ltd. # | 535,439 | ||||||
| 50,300 | Baiyin Nonferrous Group Co. Ltd. * # | 26,553 | ||||||
| 302,828 | Baoshan Iron and Steel Co. Ltd. # | 249,873 | ||||||
| 113,400 | BBMG Corp. # | 60,778 | ||||||
| 30,352 | Beijing Oriental Yuhong Waterproof Technology Co. Ltd. # | 114,754 | ||||||
| 10,000 | Bluestar Adisseo Co. # | 15,907 | ||||||
| 71,400 | China Jushi Co. Ltd. # | 111,864 | ||||||
| 240,200 | China Molybdenum Co. Ltd. # | 150,688 | ||||||
| 74,070 | China Northern Rare Earth Group High-Tech Co. Ltd. # | 114,993 | ||||||
| 144,400 | Hebei Iron & Steel Co. Ltd. # | 53,533 | ||||||
| 71,740 | Hengli Petrochemical Co. Ltd. # | 166,000 | ||||||
| 38,600 | Hengyi Petrochemical Co. Ltd. # | 77,339 | ||||||
| 4,780 | Hoshine Silicon Industry Co. Ltd. # | 20,230 | ||||||
| 114,716 | Inner Mongolia Junzheng Energy and Chemical Industry Co. Ltd. * # | 51,628 | ||||||
| 774,760 | Inner Mongolian Baotou Steel Union Co. Ltd. # | 146,992 | ||||||
| 35,300 | Jiangxi Copper Co. Ltd. # | 85,934 | ||||||
| 26,000 | Jiangxi Ganfeng Lithium Co. Ltd. # | 130,378 | ||||||
| 34,500 | Lomon Billions Group Co. Ltd. # | 76,340 | ||||||
| 27,400 | Ningxia Baofeng Energy Group Co. Ltd. | 37,457 | ||||||
| 146,000 | Pangang Group Vanadium Titanium & Resources Co. Ltd. * # | 61,274 | ||||||
| 64,200 | Rongsheng Petro Chemical Co. Ltd. # | 114,363 | ||||||
| 35,300 | Shandong Gold Mining Co. Ltd. # | 163,940 | ||||||
| 243,740 | Shandong Nanshan Aluminum Co. Ltd. # | 78,482 | ||||||
| 30,634 | Tianqi Lithium Industries, Inc. # | 132,975 | ||||||
| 214,700 | Tongling Nonferrous Metals Group Co. Ltd. # | 71,906 | ||||||
| 44,300 | Transfar Zhilian Co. Ltd. # | 44,470 | ||||||
| 53,370 | Wanhua Chemical Group Co. Ltd. # | 431,639 | ||||||
| 20,836 | YanAn Bicon Pharmaceutical Listed Co. * # | 46,762 | ||||||
| 22,033 | Zhejiang Huayou Cobalt Co. Ltd. # | 124,113 | ||||||
| 88,500 | Zhejiang Longsheng Group Co. Ltd. # | 184,201 | ||||||
| 58,646 | Zhongjin Gold Corp. Ltd. # | 71,029 | ||||||
| 467,300 | Zijin Mining Group Co. Ltd. # | 306,888 | ||||||
| 4,211,120 | ||||||||
| Media & Entertainment: 1.4% | ||||||||
| 25,429 | China Film Co. Ltd. # | 55,655 | ||||||
| 13,600 | China Satellite Communications Co. Ltd. * | 22,124 | ||||||
| 349,212 | Focus Media Information Technology Co. Ltd. # | 314,439 | ||||||
| 20,600 | Giant Network Group Co. Ltd. # | 53,462 | ||||||
| 18,160 | Mango Excellent Media Co. Ltd. * # | 91,136 | ||||||
| Number of Shares | Value | |||||||
| Media & Entertainment: (continued) | ||||||||
| 17,600 | Perfect World Co. Ltd. # | $ | 111,810 | |||||
| 69,967 | Shanghai Oriental Pearl Media Co. Ltd. # | 94,146 | ||||||
| 28,300 | Wanda Film Holding Co. Ltd. * # | 73,869 | ||||||
| 35,900 | Wuhu Shunrong Sanqi Interactive Entertainment Network Technology Co. Ltd. # | 139,002 | ||||||
| 955,643 | ||||||||
| Pharmaceuticals / Biotechnology: 5.6% | ||||||||
| 18,600 | Beijing Tongrentang Co. Ltd. # | 75,300 | ||||||
| 4,800 | Changchun High & New Technology Industry Group, Inc. # | 308,351 | ||||||
| 8,945 | Chengdu Kanghong Pharmaceutical Group Co. Ltd. # | 47,446 | ||||||
| 16,300 | Chongqing Zhifei Biological Products Co. Ltd. # | 116,349 | ||||||
| 19,161 | Guangzhou Baiyunshan Pharmaceutical Holdings Co. Ltd. # | 98,130 | ||||||
| 28,640 | Hualan Biological Engineering, Inc. # | 144,765 | ||||||
| 11,100 | Hubei Jumpcan Pharmaceutical Co. Ltd. # | 38,592 | ||||||
| 105,249 | Jiangsu Hengrui Medicine Co. Ltd. # | 1,324,213 | ||||||
| 15,600 | Shandong Dong-E E-Jiao Co. Ltd. # | 79,276 | ||||||
| 34,200 | Shanghai Fosun Pharmaceutical Group Co. Ltd. # | 130,906 | ||||||
| 67,660 | Shanghai RAAS Blood Products Co. Ltd. * # | 72,180 | ||||||
| 14,186 | Shenzhen Salubris Pharmaceuticals Co. Ltd. # | 40,636 | ||||||
| 29,391 | Sichuan Kelun Pharmaceutical Co. Ltd. # | 99,175 | ||||||
| 30,870 | Tasly Pharmaceutical Group Co. Ltd. # | 68,382 | ||||||
| 48,439 | Tonghua Dongbao Pharmaceutical Co. Ltd. # | 88,111 | ||||||
| 41,800 | Walvax Biotechnology Co. Ltd. # | 194,842 | ||||||
| 24,920 | WuXi AppTec Co. Ltd. # | 329,842 | ||||||
| 17,401 | Yunnan Baiyao Group Co. Ltd. # | 223,783 | ||||||
| 10,291 | Zhangzhou Pientzehuang Pharmaceutical Co. Ltd. # | 162,564 | ||||||
| 43,800 | Zhejiang NHU Co. Ltd. # | 146,429 | ||||||
| 3,789,272 | ||||||||
| Real Estate: 4.6% | ||||||||
| 40,974 | China Fortune Land Development Co. Ltd. # | 169,082 | ||||||
| 107,559 | China Merchants Shekou Industrial Zone Co. Ltd. # | 306,969 | ||||||
| 198,367 | China Vanke Co. Ltd. # | 918,105 | ||||||
| 76,701 | Gemdale Corp. # | 159,754 | ||||||
| 124,100 | Greenland Holdings Corp. Ltd. # | 123,863 | ||||||
| 63,000 | Jiangsu Zhongnan Construction Group Co. Ltd. # | 95,616 | ||||||
| 72,600 | Jinke Properties Group Co. Ltd. # | 80,039 | ||||||
| 243,304 | Poly Real Estate Group Co. Ltd. # | 565,664 | ||||||
| 13,700 | Red Star Macalline Group Corp. Ltd. # | 22,291 | ||||||
| 59,100 | RiseSun Real Estate Development Co. Ltd. # | 83,487 | ||||||
See Notes to Financial Statements
| 28 |
| Number of Shares | Value | |||||||
| Real Estate: (continued) | ||||||||
| 30,700 | Seazen Holdings Co. Ltd. # | $ | 170,654 | |||||
| 13,600 | Shanghai Lingang Holdings Corp. Ltd. # | 47,927 | ||||||
| 29,917 | Shanghai Lujiazui Finance and Trade Zone Development Co. Ltd. # | 58,075 | ||||||
| 55,100 | Sunshine City Group Co. Ltd. # | 67,360 | ||||||
| 146,181 | Xinhu Zhongbao Co. Ltd. # | 79,455 | ||||||
| 119,323 | Youngor Group Co. Ltd. # | 119,528 | ||||||
| 3,067,869 | ||||||||
| Retailing: 0.3% | ||||||||
| 110,920 | China Grand Automotive Services Co. Ltd. # | 51,938 | ||||||
| 126,600 | Suning Commerce Group Co. Ltd. # | 183,959 | ||||||
| 235,897 | ||||||||
| Semiconductor: 1.5% | ||||||||
| 6,567 | Gigadevice Semiconductor Beijing, Inc. # | 193,073 | ||||||
| 89,778 | LONGi Green Energy Technology Co. Ltd. # | 320,432 | ||||||
| 83,223 | Sanan Optoelectronics Co. Ltd. # | 219,673 | ||||||
| 4,600 | Shenzhen Goodix Technology Co. Ltd. # | 136,473 | ||||||
| 5,900 | Will Semiconductor Ltd. # | 121,853 | ||||||
| 991,504 | ||||||||
| Software & Services: 1.7% | ||||||||
| 13,800 | 360 Security Technology, Inc. # | 46,659 | ||||||
| 38,000 | Aisino Co. Ltd. # | 126,569 | ||||||
| 52,330 | Anhui USTC iFlytek Co. Ltd. # | 259,635 | ||||||
| 10,906 | Beijing Shiji Information Technology Co. Ltd. # | 61,175 | ||||||
| 23,000 | Glodon Co. Ltd. # | 112,368 | ||||||
| 21,790 | Hundsun Technologies, Inc. # | 243,760 | ||||||
| 66,131 | Wangsu Science and Technology Co. Ltd. # | 90,703 | ||||||
| 42,515 | Yonyou Network Technology Co. Ltd. # | 173,816 | ||||||
| 1,114,685 | ||||||||
| Technology Hardware & Equipment: 6.1% | ||||||||
| 8,600 | Avary Holding Shenzhen Co. Ltd. # | 55,575 | ||||||
| 18,173 | AVIC Jonhon OptronicTechnology Co. Ltd. # | 101,960 | ||||||
| 805,733 | BOE Technology Group Co. Ltd. # | 526,648 | ||||||
| 35,600 | Chaozhou Three-Circle Group Co. Ltd. # | 113,976 | ||||||
| 21,400 | Dawning Information Industry Co. Ltd. # | 106,459 | ||||||
| 149,000 | Dongxu Optoelectronic Technology Co. Ltd. # | 71,980 | ||||||
| 23,922 | Fiberhome Telecommunication Technologies Co. Ltd. # | 94,428 | ||||||
| 60,700 | Foxconn Industrial Internet Co. Ltd. # | 159,794 | ||||||
| 77,200 | GoerTek, Inc. # | 221,454 | ||||||
| 2,500 | Guangzhou Shiyuan Electronic Technology Co. Ltd. # | 30,786 | ||||||
| 127,064 | Hangzhou Hikvision Digital Technology Co. Ltd. # | 599,030 | ||||||
| 45,280 | Hengtong Optic-electric Co. Ltd. # | 105,944 | ||||||
| Number of Shares | Value | |||||||
| Technology Hardware & Equipment: (continued) | ||||||||
| 26,649 | Lens Technology Co. Ltd. # | $ | 53,012 | |||||
| 109,062 | Luxshare Precision Industry Co. Ltd. # | 573,252 | ||||||
| 64,550 | OFILM Group Co. Ltd. * # | 144,891 | ||||||
| 38,700 | Shengyi Technology Co. Ltd. # | 116,409 | ||||||
| 3,500 | Shennan Circuits Co. Ltd. # | 71,471 | ||||||
| 26,300 | Shenzhen Sunway Communication Co. Ltd. * # | 171,564 | ||||||
| 80,600 | Tsinghua Tongfang Co. Ltd. * # | 101,617 | ||||||
| 27,800 | Tsinghua Unisplendour Co. Ltd. # | 126,281 | ||||||
| 61,395 | Zhejiang Dahua Technology Co. Ltd. # | 175,779 | ||||||
| 80,820 | ZTE Corp. * # | 411,831 | ||||||
| 4,134,141 | ||||||||
| Telecommunication Services: 0.4% | ||||||||
| 316,478 | China United Network Communications Ltd. # | 268,032 | ||||||
| Transportation: 2.9% | ||||||||
| 101,600 | Air China Ltd. # | 141,646 | ||||||
| 131,600 | China COSCO Holdings Co. Ltd. * # | 99,739 | ||||||
| 152,300 | China Eastern Airlines Corp. Ltd. * # | 127,300 | ||||||
| 146,200 | China Southern Airlines Co. Ltd. # | 151,041 | ||||||
| 202,091 | Daqin Railway Co. Ltd. # | 238,337 | ||||||
| 35,200 | Guangzhou Baiyun International Airport Co. Ltd. # | 88,389 | ||||||
| 391,100 | Hainan Airlines Co. Ltd. * # | 97,191 | ||||||
| 134,367 | Ningbo Port Co. Ltd. # | 73,403 | ||||||
| 16,500 | Qingdao Port International Co. Ltd. # | 16,309 | ||||||
| 30,000 | SF Holding Co. Ltd. # | 160,379 | ||||||
| 32,700 | Shanghai International Airport Co. Ltd. # | 370,474 | ||||||
| 157,500 | Shanghai International Port Group Co. Ltd. # | 130,818 | ||||||
| 12,500 | Spring Airlines Co. Ltd. # | 78,882 | ||||||
| 10,400 | STO Express Co. Ltd. # | 29,131 | ||||||
| 19,300 | YTO Express Group Co. Ltd. # | 35,118 | ||||||
| 22,740 | Yunda Holding Co. Ltd. # | 108,952 | ||||||
| 1,947,109 | ||||||||
| Utilities: 2.4% | ||||||||
| 211,599 | China National Nuclear Power Co. Ltd. # | 152,021 | ||||||
| 299,100 | China Yangtze Power Co. Ltd. # | 790,004 | ||||||
| 400,800 | GD Power Development Co. Ltd. # | 134,762 | ||||||
| 110,800 | Huadian Power International Corp. Ltd. # | 58,411 | ||||||
| 61,200 | Huaneng Lancang River Hydropower, Inc. # | 37,123 | ||||||
| 149,557 | Huaneng Power International, Inc. # | 119,917 | ||||||
| 115,300 | SDIC Power Holdings Co. Ltd. # | 152,031 | ||||||
| 59,900 | Sichuan Chuantou Energy Co. Ltd. # | 84,715 | ||||||
| 138,710 | Zhejiang Zheneng Electric Power Co. Ltd. # | 78,926 | ||||||
| 1,607,910 | ||||||||
| Total Common Stocks (Cost: $49,818,798) | 67,395,522 | |||||||
| Other assets less liabilities: 0.0% | 25,305 | |||||||
| NET ASSETS: 100.0% | $ | 67,420,827 | ||||||
See Notes to Financial Statements
| 29 |
VANECK VECTORS CHINAAMC CSI 300 ETF
SCHEDULE OF INVESTMENTS
(continued)
Footnotes:
| * | Non-income producing |
| # | Security has been valued in good faith pursuant to guidelines established by the Board of Trustees. The aggregate value of fair valued securities is $67,176,788 which represents 99.6% of net assets. |
| Summary of Investments by Sector | % of Investments | Value | ||||||
| Communication Services | 1.8 | % | $ | 1,223,675 | ||||
| Consumer Discretionary | 9.4 | 6,327,477 | ||||||
| Consumer Staples | 12.1 | 8,147,962 | ||||||
| Energy | 2.1 | 1,392,852 | ||||||
| Financials | 33.6 | 22,649,454 | ||||||
| Health Care | 7.1 | 4,809,722 | ||||||
| Industrials | 11.4 | 7,717,151 | ||||||
| Information Technology | 9.3 | 6,240,330 | ||||||
| Materials | 6.2 | 4,211,120 | ||||||
| Real Estate | 4.6 | 3,067,869 | ||||||
| Utilities | 2.4 | 1,607,910 | ||||||
| 100.0 | % | $ | 67,395,522 | |||||
The summary of inputs used to value the Fund’s investments as of December 31, 2019 is as follows:
| Level 1 Quoted Prices | Level 2 Significant Observable Inputs | Level 3 Significant Unobservable Inputs | Value | ||||||||||||||||
| Common Stocks | |||||||||||||||||||
| Automobiles & Components | $ | — | $ | 1,423,414 | $ | — | $ | 1,423,414 | |||||||||||
| Banks | — | 10,987,512 | — | 10,987,512 | |||||||||||||||
| Capital Goods | — | 5,611,923 | — | 5,611,923 | |||||||||||||||
| Commercial & Professional Services | 59,432 | 158,119 | — | 217,551 | |||||||||||||||
| Consumer Durables & Apparel | — | 3,787,313 | — | 3,787,313 | |||||||||||||||
| Consumer Services | — | 821,421 | — | 821,421 | |||||||||||||||
| Diversified Financials | 32,745 | 4,610,648 | — | 4,643,393 | |||||||||||||||
| Energy | — | 1,392,852 | — | 1,392,852 | |||||||||||||||
| Financials | — | 1,319,538 | — | 1,319,538 | |||||||||||||||
| Food, Beverage & Tobacco | — | 8,147,962 | — | 8,147,962 | |||||||||||||||
| Health Care Equipment & Services | — | 1,020,450 | — | 1,020,450 | |||||||||||||||
| Insurance | — | 5,699,011 | — | 5,699,011 | |||||||||||||||
| Materials | — | 4,211,120 | — | 4,211,120 | |||||||||||||||
| Media & Entertainment | — | 955,643 | — | 955,643 | |||||||||||||||
| Pharmaceuticals / Biotechnology | — | 3,789,272 | — | 3,789,272 | |||||||||||||||
| Real Estate | — | 3,067,869 | — | 3,067,869 | |||||||||||||||
| Retailing | — | 235,897 | — | 235,897 | |||||||||||||||
| Semiconductor | — | 991,504 | — | 991,504 | |||||||||||||||
| Software & Services | — | 1,114,685 | — | 1,114,685 | |||||||||||||||
| Technology Hardware & Equipment | — | 4,134,141 | — | 4,134,141 | |||||||||||||||
| Telecommunication Services | — | 268,032 | — | 268,032 | |||||||||||||||
| Transportation | — | 1,947,109 | — | 1,947,109 | |||||||||||||||
| Utilities | — | 1,607,910 | — | 1,607,910 | |||||||||||||||
| Total | $ | 92,177 | $ | 67,303,345 | $ | — | $ | 67,395,522 | |||||||||||
See Notes to Financial Statements
| 30 |
VANECK VECTORS CHINAAMC SME-CHINEXT ETF
SCHEDULE OF INVESTMENTS
December 31, 2019
| Number of Shares | Value | |||||||
| COMMON STOCKS: 100.0% | ||||||||
| Automobiles & Components: 2.0% | ||||||||
| 62,622 | Byd Co. Ltd. # | $ | 428,993 | |||||
| 95,500 | Zhejiang Century Huatong Group Co. Ltd. # | 156,939 | ||||||
| 585,932 | ||||||||
| Banks: 2.9% | ||||||||
| 203,532 | Bank of Ningbo Co. Ltd. # | 824,106 | ||||||
| 45,300 | Qingdao Rural Commercial Bank Corp. # | 42,184 | ||||||
| 866,290 | ||||||||
| Capital Goods: 10.0% | ||||||||
| 136,100 | AVIC Electromechanical Systems Co. Ltd. # | 135,742 | ||||||
| 62,200 | Contemporary Amperex Technology Co. Ltd. * # | 951,483 | ||||||
| 39,205 | Eve Energy Co. Ltd. * # | 283,136 | ||||||
| 65,800 | Han’s Laser Technology Co. Ltd. # | 378,799 | ||||||
| 83,290 | Shenzhen Inovance Technology Co. Ltd. # | 366,985 | ||||||
| 91,222 | Siasun Robot & Automation Co. Ltd. * # | 183,625 | ||||||
| 105,449 | Suzhou Gold Mantis Construction Decoration Co. Ltd. # | 133,623 | ||||||
| 192,330 | Xinjiang Goldwind Science and Technology Co. Ltd. # | 330,345 | ||||||
| 90,426 | Zhejiang Sanhua Intelligent Controls Co. Ltd. # | 225,296 | ||||||
| 2,989,034 | ||||||||
| Commercial & Professional Services: 0.5% | ||||||||
| 132,663 | Beijing Originwater Technology Co. Ltd. # | 145,010 | ||||||
| Consumer Durables & Apparel: 2.0% | ||||||||
| 35,980 | Hangzhou Robam Appliances Co. Ltd. # | 174,962 | ||||||
| 98,176 | NavInfo Co. Ltd. # | 227,295 | ||||||
| 44,500 | Zhejiang Semir Garment Co. Ltd. # | 63,118 | ||||||
| 12,223 | Zhejiang Supor Co. Ltd. # | 134,966 | ||||||
| 600,341 | ||||||||
| Consumer Services: 1.2% | ||||||||
| 41,900 | Offcn Education Technology Co. Ltd. # | 107,754 | ||||||
| 54,821 | Songcheng Performance Development Co. Ltd. # | 243,565 | ||||||
| 351,319 | ||||||||
| Diversified Financials: 7.0% | ||||||||
| 72,300 | China Great Wall Securities Co. Ltd. # | 144,316 | ||||||
| 384,575 | East Money Information Co. Ltd. # | 872,658 | ||||||
| 177,880 | First Capital Securities Co. Ltd. # | 212,145 | ||||||
| 164,143 | Guoyuan Securities Co. Ltd. # | 296,553 | ||||||
| 15,300 | Hithink RoyalFlush Information Network Co. Ltd. # | 240,727 | ||||||
| 120,700 | Shanxi Securities Co. Ltd. # | 143,958 | ||||||
| 136,054 | Western Securities Co. Ltd. # | 191,979 | ||||||
| 2,102,336 | ||||||||
| Food, Beverage & Tobacco: 11.6% | ||||||||
| 28,800 | Fujian Sunner Development Co. Ltd. # | 99,637 | ||||||
| 52,400 | Guangdong Haid Group Co. Ltd. # | 271,019 | ||||||
| 311,400 | Guangdong Wens Foodstuffs Group Co. Ltd. # | 1,503,154 | ||||||
| Number of Shares | Value | |||||||
| Food, Beverage & Tobacco: (continued) | ||||||||
| 41,938 | Jiangsu Yanghe Brewery Joint-Stock Co. Ltd. # | $ | 666,646 | |||||
| 98,100 | Jiangxi Zhengbang Technology Co. Ltd. | 228,167 | ||||||
| 54,900 | Muyuan Foodstuff Co. Ltd. # | 699,880 | ||||||
| 3,468,503 | ||||||||
| Health Care Equipment & Services: 8.4% | ||||||||
| 98,255 | Aier Eye Hospital Group Co. Ltd. # | 558,952 | ||||||
| 45,320 | Jiangsu Yuyue Medical Equipment & Supply Co. Ltd. # | 132,327 | ||||||
| 86,598 | Lepu Medical Technology Beijing Co. Ltd. # | 412,034 | ||||||
| 192,916 | Meinian Onehealth Healthcare Holdings Co. Ltd. # | 412,902 | ||||||
| 30,400 | Shenzhen Mindray Bio-Medical Electronics Co. Ltd. # | 794,876 | ||||||
| 95,551 | Winning Health Technology Group Co. Ltd. # | 206,033 | ||||||
| 2,517,124 | ||||||||
| Household & Personal Products: 0.4% | ||||||||
| 57,400 | By-health Co. Ltd. # | 134,546 | ||||||
| Materials: 4.9% | ||||||||
| 63,269 | Beijing Oriental Yuhong Waterproof Technology Co. Ltd. # | 239,207 | ||||||
| 57,700 | Jiangxi Ganfeng Lithium Co. Ltd. # | 289,339 | ||||||
| 77,600 | Lomon Billions Group Co. Ltd. # | 171,709 | ||||||
| 126,000 | Rongsheng Petrochemical Co. Ltd. # | 224,450 | ||||||
| 87,750 | Sansteel Minguang Co. Ltd., Fujian # | 118,069 | ||||||
| 71,136 | Tianqi Lithium Industries, Inc. # | 308,785 | ||||||
| 95,200 | Zhejiang Transfar Co. Ltd. # | 95,566 | ||||||
| 1,447,125 | ||||||||
| Media & Entertainment: 6.5% | ||||||||
| 71,610 | Beijing Enlight Media Co. Ltd. # | 121,488 | ||||||
| 833,760 | Focus Media Information Technology Co. Ltd. # | 750,738 | ||||||
| 34,180 | Giant Network Group Co. Ltd. # | 88,706 | ||||||
| 42,670 | Mango Excellent Media Co. Ltd. * # | 214,139 | ||||||
| 42,600 | Perfect World Co. Ltd. # | 270,631 | ||||||
| 56,150 | Wanda Film Holding Co. Ltd. * # | 146,564 | ||||||
| 88,400 | Wuhu Shunrong Sanqi Interactive Entertainment Network Technology Co. Ltd. # | 342,278 | ||||||
| 1,934,544 | ||||||||
| Pharmaceuticals / Biotechnology: 8.9% | ||||||||
| 12,900 | BGI Genomics Co. Ltd. # | 127,418 | ||||||
| 20,600 | Chengdu Kanghong Pharmaceutical Group Co. Ltd. # | 109,266 | ||||||
| 38,600 | Chongqing Zhifei Biological Products Co. Ltd. # | 275,526 | ||||||
| 38,600 | Hangzhou Tigermed Consulting Co. Ltd. # | 350,396 | ||||||
| 60,790 | Hualan Biological Engineering, Inc. # | 307,271 | ||||||
| 146,463 | Shanghai RAAS Blood Products Co. Ltd. * # | 156,247 | ||||||
| 21,300 | Shenzhen Kangtai Biological Products Co. Ltd. # | 268,724 | ||||||
See Notes to Financial Statements
| 31 |
VANECK VECTORS CHINAAMC SME-CHINEXT ETF
SCHEDULE OF INVESTMENTS
(continued)
| Number of Shares | Value | |||||||
| Pharmaceuticals / Biotechnology: (continued) | ||||||||
| 27,340 | Shenzhen Salubris Pharmaceuticals Co. Ltd. # | $ | 78,316 | |||||
| 71,598 | Sichuan Kelun Pharmaceutical Co. Ltd. # | 241,596 | ||||||
| 95,500 | Walvax Biotechnology Co. Ltd. * # | 445,153 | ||||||
| 87,870 | Zhejiang NHU Co. Ltd. # | 293,760 | ||||||
| 2,653,673 | ||||||||
| Real Estate: 0.6% | ||||||||
| 130,700 | RiseSun Real Estate Development Co. Ltd. # | 184,633 | ||||||
| Retailing: 1.3% | ||||||||
| 259,338 | Suning Commerce Group Co. Ltd. # | 376,836 | ||||||
| Semiconductor: 0.8% | ||||||||
| 135,720 | Tianjin Zhonghuan Semiconductor Joint-Stock Co. Ltd. # | 230,213 | ||||||
| Software & Services: 7.5% | ||||||||
| 118,850 | Anhui USTC iFlytek Co. Ltd. # | 589,673 | ||||||
| 24,490 | Beijing Shiji Information Technology Co. Ltd. # | 137,371 | ||||||
| 80,700 | Beijing Sinnet Technology Co. Ltd. # | 232,769 | ||||||
| 146,358 | DHC Software Co. Ltd. # | 217,079 | ||||||
| 55,575 | Glodon Software Co. Ltd. # | 271,515 | ||||||
| 11,700 | Sangfor Technologies, Inc. | 192,151 | ||||||
| 340,163 | Shanghai 2345 Network Holding Group Co. Ltd. # | 157,974 | ||||||
| 46,800 | Venustech Group, Inc. # | 227,389 | ||||||
| 143,650 | Wangsu Science and Technology Co. Ltd. # | 197,026 | ||||||
| 2,222,947 | ||||||||
| Technology Hardware & Equipment: 21.0% | ||||||||
| 18,800 | Avary Holding Shenzhen Co. Ltd. # | 121,450 | ||||||
| 42,161 | AVIC Jonhon Optronic Technology Co. Ltd. # | 236,545 | ||||||
| 80,900 | Chaozhou Three-Circle Group Co. Ltd. # | 259,007 | ||||||
| 165,616 | GoerTek, Inc. # | 475,081 | ||||||
| 134,500 | Guangdong LY Intelligent Manufacturing Co. Ltd. * # | 210,465 | ||||||
| Number of Shares | Value | |||||||
| Technology Hardware & Equipment: (continued) | ||||||||
| 127,400 | Guangzhou Haige Communications Group, Inc. Co. # | $ | 198,324 | |||||
| 5,700 | Guangzhou Shiyuan Electronic Technology Co. Ltd. # | 70,193 | ||||||
| 266,295 | Hangzhou Hikvision Digital Technology Co. Ltd. # | 1,255,420 | ||||||
| 62,268 | Lens Technology Co. Ltd. # | 123,868 | ||||||
| 238,877 | Luxshare Precision Industry Co. Ltd. # | 1,255,587 | ||||||
| 16,500 | NAURA Technology Group Co. Ltd. # | 208,753 | ||||||
| 148,962 | OFILM Group Co. Ltd. * # | 334,365 | ||||||
| 8,000 | Shennan Circuits Co. Ltd. # | 163,326 | ||||||
| 62,101 | Shenzhen Sunway Communication Co. Ltd. * # | 405,105 | ||||||
| 30,400 | Unigroup Guoxin Microelectronics Co. Ltd. # | 222,096 | ||||||
| 90,500 | WUS Printed Circuit Kunshan Co. Ltd. # | 288,833 | ||||||
| 8,100 | Yealink Network Technology Corp. Ltd. # | 84,325 | ||||||
| 122,405 | Zhejiang Dahua Technology Co. Ltd. # | 350,456 | ||||||
| 6,263,199 | ||||||||
| Transportation: 2.0% | ||||||||
| 69,900 | SF Holding Co. Ltd. # | 373,684 | ||||||
| 20,100 | STO Express Co. Ltd. # | 56,302 | ||||||
| 36,088 | Yunda Holding Co. Ltd. # | 172,905 | ||||||
| 602,891 | ||||||||
| Utilities: 0.5% | ||||||||
| 166,800 | CGN Power Co. Ltd. * # | 85,740 | ||||||
| 49,500 | Jiangsu Guoxin Corp. Ltd. * # | 54,881 | ||||||
| 140,621 | ||||||||
| Total Common Stocks (Cost: $21,526,891) | 29,817,117 | |||||||
| Liabilities in excess of other assets: 0.0% | (10,782 | ) | ||||||
| NET ASSETS: 100.0% | $ | 29,806,335 | ||||||
Footnotes:
| * | Non-income producing |
| # | Security has been valued in good faith pursuant to guidelines established by the Board of Trustees. The aggregate value of fair valued securities is $29,396,779 which represents 98.6% of net assets. |
See Notes to Financial Statements
| 32 |
| Summary of Investments by Sector | % of Investments | Value | ||||||
| Communication Services | 6.5 | % | $ | 1,934,544 | ||||
| Consumer Discretionary | 6.4 | 1,914,428 | ||||||
| Consumer Staples | 12.1 | 3,603,049 | ||||||
| Financials | 10.0 | 2,968,626 | ||||||
| Health Care | 17.3 | 5,170,797 | ||||||
| Industrials | 12.5 | 3,736,935 | ||||||
| Information Technology | 29.2 | 8,716,359 | ||||||
| Materials | 4.9 | 1,447,125 | ||||||
| Real Estate | 0.6 | 184,633 | ||||||
| Utilities | 0.5 | 140,621 | ||||||
| 100.0 | % | $ | 29,817,117 | |||||
The summary of inputs used to value the Fund’s investments as of December 31, 2019 is as follows:
| Level 1 Quoted Prices | Level 2 Significant Observable Inputs | Level 3 Significant Unobservable Inputs | Value | ||||||||||||||||
| Common Stocks | |||||||||||||||||||
| Automobiles & Components | $ | — | $ | 585,932 | $ | — | $ | 585,932 | |||||||||||
| Banks | — | 866,290 | — | 866,290 | |||||||||||||||
| Capital Goods | — | 2,989,034 | — | 2,989,034 | |||||||||||||||
| Commercial & Professional Services | — | 145,010 | — | 145,010 | |||||||||||||||
| Consumer Durables & Apparel | — | 600,341 | — | 600,341 | |||||||||||||||
| Consumer Services | — | 351,319 | — | 351,319 | |||||||||||||||
| Diversified Financials | — | 2,102,336 | — | 2,102,336 | |||||||||||||||
| Food, Beverage & Tobacco | 228,167 | 3,240,336 | — | 3,468,503 | |||||||||||||||
| Health Care Equipment & Services | — | 2,517,124 | — | 2,517,124 | |||||||||||||||
| Household & Personal Products | — | 134,546 | — | 134,546 | |||||||||||||||
| Materials | — | 1,447,125 | — | 1,447,125 | |||||||||||||||
| Media & Entertainment | — | 1,934,544 | — | 1,934,544 | |||||||||||||||
| Pharmaceuticals / Biotechnology | — | 2,653,673 | — | 2,653,673 | |||||||||||||||
| Real Estate | — | 184,633 | — | 184,633 | |||||||||||||||
| Retailing | — | 376,836 | — | 376,836 | |||||||||||||||
| Semiconductor | — | 230,213 | — | 230,213 | |||||||||||||||
| Software & Services | 192,151 | 2,030,796 | — | 2,222,947 | |||||||||||||||
| Technology Hardware & Equipment | — | 6,263,199 | — | 6,263,199 | |||||||||||||||
| Transportation | — | 602,891 | — | 602,891 | |||||||||||||||
| Utilities | — | 140,621 | — | 140,621 | |||||||||||||||
| Total | $ | 420,318 | $ | 29,396,779 | $ | — | $ | 29,817,117 | |||||||||||
See Notes to Financial Statements
| 33 |
VANECK VECTORS EGYPT INDEX ETF
SCHEDULE OF INVESTMENTS
December 31, 2019
| Number of Shares | Value | |||||||
| COMMON STOCKS: 97.8% | ||||||||
| Banks: 8.4% | ||||||||
| 515,556 | Commercial International Bank Egypt SAE Reg S (GDR) | $ | 2,629,336 | |||||
| Capital Goods: 5.4% | ||||||||
| 2,361,122 | El Sewedy Electric Co. | 1,691,770 | ||||||
| Consumer Durables & Apparel: 2.8% | ||||||||
| 1,319,716 | Oriental Weavers | 868,299 | ||||||
| Consumer Services: 1.7% | ||||||||
| 628,167 | Cairo Investment & Real Estate Development Co. SAE | 543,237 | ||||||
| Diversified Financials: 13.6% | ||||||||
| 3,158,573 | CI Capital Holding for Financial Investments * | 905,261 | ||||||
| 476,232 | Egyptian Financial Group-Hermes Holding Co. Reg S (GDR) | 1,047,710 | ||||||
| 905,899 | Egyptian Financial Group-Hermes Holding SAE # | 957,733 | ||||||
| 2,429,749 | Pioneers Holding * | 793,264 | ||||||
| 3,839,727 | Qalaa Holdings SAE * | 583,734 | ||||||
| 4,287,702 | ||||||||
| Food, Beverage & Tobacco: 11.1% | ||||||||
| 2,301,665 | Eastern Co. SAE | 2,234,264 | ||||||
| 2,336,318 | Juhayna Food Industries | 1,256,226 | ||||||
| 3,490,490 | ||||||||
| Health Care Equipment & Services: 10.4% | ||||||||
| 4,806,419 | Cleopatra Hospital * | 1,805,776 | ||||||
| 2,395,381 | Ibnsina Pharma SAE # | 1,459,412 | ||||||
| 3,265,188 | ||||||||
| Materials: 17.5% | ||||||||
| 2,185,338 | Alexandria Mineral Oils Co. # | 494,712 | ||||||
| 851,809 | Centamin Plc # | 1,428,864 | ||||||
| 1,836,253 | Egyptian Kuwaiti Holding Co. (USD) | 2,425,690 | ||||||
| 1,041,822 | Ezz Steel Co. SAE * | 675,724 | ||||||
| 829,125 | Sidi Kerir Petrochemcials Co. | 463,897 | ||||||
| 5,488,887 | ||||||||
| Number of Shares | Value | |||||||
| Real Estate: 21.5% | ||||||||
| 3,321,092 | Emaar Misr for Development SAE * # | $ | 604,923 | |||||
| 702,827 | Heliopolis Housing # | 1,035,673 | ||||||
| 4,629,565 | Medinet Nasr Housing * | 1,390,312 | ||||||
| 8,440,427 | Palm Hills Developments SAE * | 919,244 | ||||||
| 1,161,991 | Six of October Development & Investment Co. # | 959,620 | ||||||
| 3,591,609 | Talaat Moustafa Group | 1,828,252 | ||||||
| 6,738,024 | ||||||||
| Telecommunication Services: 5.4% | ||||||||
| 14,201,909 | Orascom Telecom Media and Technology Holding SAE * # | 482,781 | ||||||
| 1,925,682 | Telecom Egypt # | 1,206,510 | ||||||
| 1,689,291 | ||||||||
| Total Common Stocks (Cost: $28,413,440) | 30,692,224 | |||||||
| Other assets less liabilities: 2.2% | 701,889 | |||||||
| NET ASSETS: 100.0% | $ | 31,394,113 | ||||||
Definitions:
| GDR | Global Depositary Receipt |
| USD | United States Dollar |
Footnotes:
| * | Non-income producing |
| # | Security has been valued in good faith pursuant to guidelines established by the Board of Trustees. The aggregate value of fair valued securities is $8,630,228 which represents 27.5% of net assets. |
| Reg S | Security was purchased pursuant to Regulation S under the Securities Act of 1933, which exempts from registration securities offered and sold outside of the United States. Such a security cannot be sold in the United States without either an effective registration statement filed pursuant to the Securities Act of 1933, or pursuant to an exemption from registration. |
See Notes to Financial Statements
| 34 |
| Summary of Investments by Sector | % of Investments | Value | ||||||
| Communication Services | 5.5 | % | $ | 1,689,291 | ||||
| Consumer Discretionary | 4.6 | 1,411,536 | ||||||
| Consumer Staples | 11.4 | 3,490,490 | ||||||
| Financials | 22.5 | 6,917,038 | ||||||
| Health Care | 10.6 | 3,265,188 | ||||||
| Industrials | 5.5 | 1,691,770 | ||||||
| Materials | 17.9 | 5,488,887 | ||||||
| Real Estate | 22.0 | 6,738,024 | ||||||
| 100.0 | % | $ | 30,692,224 | |||||
The summary of inputs used to value the Fund’s investments as of December 31, 2019 is as follows:
| Level 1 Quoted Prices | Level 2 Significant Observable Inputs | Level 3 Significant Unobservable Inputs | Value | ||||||||||||||||
| Common Stock | |||||||||||||||||||
| Banks | $ | 2,629,336 | $ | — | $ | — | $ | 2,629,336 | |||||||||||
| Capital Goods | 1,691,770 | — | — | 1,691,770 | |||||||||||||||
| Consumer Durables & Apparel | 868,299 | — | — | 868,299 | |||||||||||||||
| Consumer Services | 543,237 | — | — | 543,237 | |||||||||||||||
| Diversified Financials | 3,329,969 | 957,733 | — | 4,287,702 | |||||||||||||||
| Food, Beverage & Tobacco | 3,490,490 | — | — | 3,490,490 | |||||||||||||||
| Health Care Equipment & Services | 1,805,776 | 1,459,412 | — | 3,265,188 | |||||||||||||||
| Materials | 3,565,311 | 1,923,576 | — | 5,488,887 | |||||||||||||||
| Real Estate | 4,137,808 | 2,600,216 | — | 6,738,024 | |||||||||||||||
| Telecommunication Services | — | 1,689,291 | — | 1,689,291 | |||||||||||||||
| Total | $ | 22,061,996 | $ | 8,630,228 | $ | — | $ | 30,692,224 | |||||||||||
See Notes to Financial Statements
| 35 |
VANECK VECTORS INDIA SMALL-CAP INDEX ETF
SCHEDULE OF INVESTMENTS(a)
December 31, 2019
| Number of Shares | Value | |||||||
| COMMON STOCKS: 99.9% | ||||||||
| Automobiles & Components: 1.3% | ||||||||
| 69,046 | Ceat Ltd. # | $ | 956,653 | |||||
| 466,396 | Jamna Auto Industries Ltd. # | 304,819 | ||||||
| 288,210 | JK Tyre & Industries Ltd. # | 302,547 | ||||||
| 1,564,019 | ||||||||
| Banks: 6.6% | ||||||||
| 1,746,649 | Andhra Bank * | 408,655 | ||||||
| 155,854 | Can Fin Homes Ltd. # | 858,877 | ||||||
| 771,487 | Development Credit Bank Ltd. # | 1,858,214 | ||||||
| 918,313 | Dewan Housing Finance Corp. Ltd. * | 216,140 | ||||||
| 63,032 | GIC Housing Finance Ltd. # | 138,106 | ||||||
| 1,086,324 | Jammu & Kashmir Bank Ltd. * # | 454,494 | ||||||
| 675,359 | Karnataka Bank Ltd. # | 682,158 | ||||||
| 1,559,024 | Karur Vysya Bank Ltd. # | 1,316,507 | ||||||
| 328,432 | Lakshmi Vilas Bank Ltd. * | 79,372 | ||||||
| 801,905 | Oriental Bank of Commerce * # | 585,096 | ||||||
| 4,324,765 | South Indian Bank Ltd. # | 612,291 | ||||||
| 2,094,172 | Syndicate Bank * # | 816,157 | ||||||
| 8,026,067 | ||||||||
| Capital Goods: 17.2% | ||||||||
| 48,744 | BEML Ltd. # | 672,400 | ||||||
| 160,087 | Dilip Buildcon Ltd. Reg S 144A # | 903,604 | ||||||
| 739,642 | Engineers India Ltd. # | 1,026,048 | ||||||
| 304,883 | Escorts Ltd. # | 2,691,833 | ||||||
| 228,684 | Graphite India Ltd. # | 972,432 | ||||||
| 285,840 | Greaves Cotton Ltd. # | 536,317 | ||||||
| 58,465 | HEG Ltd. # | 874,042 | ||||||
| 3,615,744 | Hindustan Construction Co. Ltd. * | 509,095 | ||||||
| 33,851 | IndiaMart InterMesh Ltd. Reg S 144A * # | 978,921 | ||||||
| 719,892 | IRB Infrastructure Developers Ltd. * # | 751,648 | ||||||
| 1,452,472 | Jain Irrigation Systems Ltd. | 161,774 | ||||||
| 310,082 | Kajaria Ceramics Ltd. # | 2,282,380 | ||||||
| 300,918 | KEC International Ltd. # | 1,274,010 | ||||||
| 186,117 | KEI Industries Ltd. | 1,194,877 | ||||||
| 731,553 | MMTC Ltd. # | 192,297 | ||||||
| 1,816,206 | Nagarjuna Construction Co. Ltd. # | 1,425,466 | ||||||
| 429,707 | Nava Bharat Ventures Ltd. # | 448,987 | ||||||
| 2,106,872 | NBCC India Ltd. # | 1,028,895 | ||||||
| 40,500 | Nissei ASB Machine Co. Ltd. # | 1,758,125 | ||||||
| 214,112 | Praj Industries Ltd. # | 307,868 | ||||||
| 1,220,242 | Rail Vikas Nigam Ltd. Reg S # | 392,398 | ||||||
| 12,712,876 | Suzlon Energy Ltd. * # | 330,107 | ||||||
| 263,194 | Texmaco Rail & Engineering Ltd. # | 122,388 | ||||||
| 173,329 | Welspun Enterprises Ltd. | 185,281 | ||||||
| 21,021,193 | ||||||||
| Commercial & Professional Services: 1.7% | ||||||||
| 208,442 | Quess Corp. Ltd. Reg S 144A * | 1,415,299 | ||||||
| 158,503 | RITES Ltd. # | 643,669 | ||||||
| 2,058,968 | ||||||||
| Consumer Durables & Apparel: 6.5% | ||||||||
| 36,808 | Amber Enterprises India Ltd. # | 576,352 | ||||||
| 618,386 | Arvind Ltd. # | 346,224 | ||||||
| 119,924 | Bajaj Electricals Ltd. # | 601,783 | ||||||
| 241,746 | Bombay Dyeing & Manufacturing Co. Ltd. # | 268,861 | ||||||
| 13,537 | Dixon Technologies India Ltd. Reg S # | 720,874 | ||||||
| Number of Shares | Value | |||||||
| Consumer Durables & Apparel: (continued) | ||||||||
| 115,243 | Himatsingka Seide Ltd. | $ | 200,365 | |||||
| 234,706 | Jindal Worldwide Ltd. | 208,143 | ||||||
| 29,558 | LUX Industries Ltd. | 531,979 | ||||||
| 71,846 | Raymond Ltd. # | 673,570 | ||||||
| 285,899 | Swan Energy Ltd. # | 433,468 | ||||||
| 71,948 | TCNS Clothing Co. Ltd. Reg S 144A * | 625,857 | ||||||
| 5,716,208 | Trident Ltd. | 536,559 | ||||||
| 14,873 | TTK Prestige Ltd. | 1,190,423 | ||||||
| 165,410 | VIP Industries Ltd. # | 1,000,836 | ||||||
| 7,915,294 | ||||||||
| Consumer Services: 1.5% | ||||||||
| 1,298,085 | Chennai Super Kings Cricket Ltd. * #∞ ø | 164,038 | ||||||
| 317,129 | Delta Corp. Ltd. | 879,925 | ||||||
| 927,313 | Lemon Tree Hotels Ltd. Reg S 144A * | 831,459 | ||||||
| 1,875,422 | ||||||||
| Diversified Financials: 5.4% | ||||||||
| 52,700 | BSE Ltd. # | 370,286 | ||||||
| 170,827 | Capri Global Capital Ltd. # | 485,402 | ||||||
| 99,141 | Care Ratings Ltd. # | 887,805 | ||||||
| 122,316 | Central Depository Services India Ltd. Reg S # | 381,663 | ||||||
| 3,737,027 | IDFC Ltd. | 2,054,947 | ||||||
| 3,639,413 | IFCI Ltd. * # | 336,524 | ||||||
| 84,564 | Multi Commodity Exchange of India Ltd. # | 1,384,655 | ||||||
| 614,621 | Reliance Capital Ltd. * | 127,009 | ||||||
| 115,943 | Repco Home Finance Ltd. # | 515,620 | ||||||
| 6,543,911 | ||||||||
| Energy: 0.4% | ||||||||
| 174,298 | Chennai Petroleum Corp. Ltd. * # | 301,557 | ||||||
| 154,789 | Hindustan Oil Exploration Co. Ltd. * # | 196,922 | ||||||
| 498,479 | ||||||||
| Food, Beverage & Tobacco: 6.7% | ||||||||
| 159,474 | Avanti Feeds Ltd. # | 1,305,591 | ||||||
| 633,037 | Balrampur Chini Mills Ltd. # | 1,627,515 | ||||||
| 81,667 | Bombay Burmah Trading Co. # | 1,189,105 | ||||||
| 50,715 | Godfrey Phillips India Ltd. # | 904,208 | ||||||
| 138,547 | Kaveri Seed Co. Ltd. # | 987,622 | ||||||
| 164,092 | Parag Milk Foods Ltd. Reg S 144A # | 308,044 | ||||||
| 260,256 | Radico Khaitan Ltd. # | 1,143,688 | ||||||
| 290,216 | Triveni Engineering & Industries Ltd. | 289,288 | ||||||
| 16,489 | Venky’s India Ltd. # | 406,971 | ||||||
| 8,162,032 | ||||||||
| Health Care Equipment & Services: 0.9% | ||||||||
| 314,469 | Max India Ltd. * | 359,944 | ||||||
| 173,155 | Take Solutions Ltd. # | 242,005 | ||||||
| 61,800 | Thyrocare Technologies Ltd. Reg S 144A | 475,460 | ||||||
| 1,077,409 | ||||||||
| Materials: 15.4% | ||||||||
| 130,716 | Advanced Enzyme Technologies Ltd. Reg S | 303,083 | ||||||
| 34,719 | Atul Ltd. | 1,970,347 | ||||||
| 194,190 | Bhansali Engineering Polymers Ltd. | 141,470 | ||||||
| 260,050 | Century Plyboards India Ltd. | 585,109 | ||||||
See Notes to Financial Statements
| 36 |
| Number of Shares | Value | |||||||
| Materials: (continued) | ||||||||
| 487,163 | Chambal Fertilizers & Chemicals Ltd. # $ | 1,039,586 | ||||||
| 182,528 | DCM Shriram Ltd. # | 1,009,471 | ||||||
| 207,170 | EID Parry India Ltd. # | 585,014 | ||||||
| 114,958 | GHCL Ltd. # | 296,915 | ||||||
| 181,915 | Gujarat Narmada Valley Fertilizers Co. Ltd. # | 417,408 | ||||||
| 490,086 | Himadri Speciality Chemical Ltd. | 416,426 | ||||||
| 541,477 | Hindustan Copper Ltd. # | 297,867 | ||||||
| 604,550 | India Cements Ltd. # | 604,644 | ||||||
| 46,550 | International Paper APPM Ltd. * # | 187,400 | ||||||
| 234,981 | Jai Corp. Ltd. # | 300,141 | ||||||
| 576,995 | Jindal Saw Ltd. # | 590,883 | ||||||
| 276,158 | Jindal Stainless Hisar Ltd. * # | 292,945 | ||||||
| 137,731 | JK Lakshmi Cement Ltd. # | 540,287 | ||||||
| 208,631 | JK Paper Ltd. # | 363,140 | ||||||
| 39,353 | Kiri Industries Ltd. # | 221,430 | ||||||
| 297,671 | Meghmani Organics Ltd. # | 238,662 | ||||||
| 173,596 | Mishra Dhatu Nigam Ltd. Reg S 144A | 380,374 | ||||||
| 301,527 | MOIL Ltd. | 618,869 | ||||||
| 2,183,677 | National Aluminium Co. Ltd. # | 1,336,154 | ||||||
| 334,958 | National Fertilizers Ltd. # | 122,210 | ||||||
| 17,467 | Nilkamal Ltd. | 319,078 | ||||||
| 193,829 | NOCIL Ltd. # | 275,679 | ||||||
| 201,718 | Phillips Carbon Black Ltd. # | 334,773 | ||||||
| 589,171 | Prism Johnson Ltd. # | 518,733 | ||||||
| 393,687 | Rain Industries Ltd. # | 544,338 | ||||||
| 227,623 | Rallis India Ltd. | 536,385 | ||||||
| 645,742 | Rashtriya Chemicals & Fertilizers Ltd. | 422,484 | ||||||
| 151,629 | SH Kelkar & Co. Ltd. Reg S 144A * # | 234,336 | ||||||
| 81,029 | Sudarshan Chemical Industries # | 462,424 | ||||||
| 63,685 | Surya Roshni Ltd. # | 141,676 | ||||||
| 81,010 | Tamil Nadu Newsprint & Papers Ltd. # | 191,336 | ||||||
| 32,873 | Tata Metaliks Ltd. | 282,062 | ||||||
| 122,512 | Tinplate Co. of India Ltd. # | 244,721 | ||||||
| 84,522 | Uflex Ltd. | 239,256 | ||||||
| 559,797 | Welspun Corp. Ltd. # | 1,131,969 | ||||||
| 18,739,085 | ||||||||
| Media & Entertainment: 5.7% | ||||||||
| 116,372 | DEN Networks Ltd. * | 78,909 | ||||||
| 2,155,159 | Dish TV India Ltd. * # | 395,809 | ||||||
| 407,228 | Eros International Plc (USD) * | 1,380,503 | ||||||
| 113,897 | Just Dial Ltd. * | 911,694 | ||||||
| 125,074 | PVR Ltd. # | 3,328,275 | ||||||
| 69,833 | TV Today Network Ltd. # | 236,166 | ||||||
| 2,173,852 | TV18 Broadcast Ltd. * # | 644,887 | ||||||
| 6,976,243 | ||||||||
| Pharmaceuticals / Biotechnology: 10.3% | ||||||||
| 120,732 | Bliss Gvs Pharma Ltd. # | 254,842 | ||||||
| 607,586 | Granules India Ltd. | 1,047,853 | ||||||
| 215,678 | Ipca Laboratories Ltd. # | 3,434,396 | ||||||
| 93,916 | JB Chemicals & Pharmaceuticals Ltd. | 560,050 | ||||||
| 349,568 | Jubilant Life Sciences Ltd. | 2,629,909 | ||||||
| 19,430 | Procter & Gamble Health Ltd. | 1,188,669 | ||||||
| 200,905 | Strides Pharma Science Ltd. # | 1,019,538 | ||||||
| 408,929 | Sun Pharma Advanced Research Co. Ltd. * # | 895,966 | ||||||
| 248,304 | Suven Life Sciences Ltd. # | 1,068,818 | ||||||
| Number of Shares | Value | |||||||
| Pharmaceuticals / Biotechnology: (continued) | ||||||||
| 140,404 | Wockhardt Ltd. * # | $ | 460,856 | |||||
| 12,560,897 | ||||||||
| Real Estate: 3.1% | ||||||||
| 532,501 | Anant Raj Industries Ltd. | 253,650 | ||||||
| 1,552,183 | Indiabulls Real Estate Ltd. * | 1,421,095 | ||||||
| 214,082 | OMAXE Ltd. # | 465,120 | ||||||
| 111,016 | Sobha Developers Ltd. # | 624,540 | ||||||
| 171,295 | Sunteck Realty Ltd. # | 999,105 | ||||||
| 3,763,510 | ||||||||
| Retailing: 0.9% | ||||||||
| 776,845 | Infibeam Avenues Ltd. # | 598,284 | ||||||
| 943,954 | PC Jeweller Ltd. * # | 322,259 | ||||||
| 61,950 | Yatra Online, Inc. (USD) * | 195,143 | ||||||
| 1,115,686 | ||||||||
| Software & Services: 11.2% | ||||||||
| 796,089 | Birlasoft Ltd. | 788,526 | ||||||
| 811,567 | Firstsource Solutions Ltd. # | 467,457 | ||||||
| 154,794 | Intellect Design Arena Ltd. * # | 300,137 | ||||||
| 33,394 | Majesco Ltd. # | 178,059 | ||||||
| 57,623 | Mastek Ltd. | 337,690 | ||||||
| 81,449 | Newgen Software Technologies Ltd. | 222,456 | ||||||
| 402,213 | NIIT Ltd. | 528,277 | ||||||
| 91,312 | NIIT Technologies Ltd. # | 2,033,916 | ||||||
| 182,636 | Persistent Systems Ltd. | 1,724,954 | ||||||
| 153,859 | Sonata Software Ltd. | 666,495 | ||||||
| 72,839 | Tata Elxsi Ltd. # | 843,217 | ||||||
| 2,531,704 | Vakrangee Software Ltd. # | 1,694,397 | ||||||
| 85,874 | Virtusa Corp. * | 3,892,668 | ||||||
| 13,678,249 | ||||||||
| Technology Hardware & Equipment: 1.8% | ||||||||
| 872,876 | Redington India Ltd. | 1,440,564 | ||||||
| 472,736 | Sterlite Technologies Ltd. # | 785,957 | ||||||
| 2,226,521 | ||||||||
| Telecommunication Services: 0.6% | ||||||||
| 3,069,327 | Himachal Futuristic Communications Ltd. | 754,666 | ||||||
| Transportation: 1.5% | ||||||||
| 32,773 | Dredging Corp. of India Ltd. # | 152,978 | ||||||
| 212,108 | Gateway Distriparks Ltd. | 363,279 | ||||||
| 83,671 | Mahindra Logistics Ltd. Reg S 144A # | 471,503 | ||||||
| 545,211 | Shipping Corp. of India Ltd. * # | 473,671 | ||||||
| 105,746 | VRL Logistics Ltd. # | 407,333 | ||||||
| 1,868,764 | ||||||||
| Utilities: 1.2% | ||||||||
| 866,183 | PTC India Ltd. # | 686,420 | ||||||
| 626,833 | Reliance Infrastructure Ltd. * | 258,187 | ||||||
| 3,283,358 | Reliance Power Ltd. * | 160,998 | ||||||
| 130,696 | VA Tech Wabag Ltd. * | 334,164 | ||||||
| 1,439,769 | ||||||||
| Total Common Stocks (Cost: $129,945,612) | 121,866,184 | |||||||
| Other assets less liabilities: 0.1% | 171,331 | |||||||
| NET ASSETS: 100.0% | $ | 122,037,515 | ||||||
See Notes to Financial Statements
| 37 |
VANECK VECTORS INDIA SMALL-CAP INDEX ETF
SCHEDULE OF INVESTMENTS(a)
(continued)
Definitions:
| USD | United States Dollar |
Footnotes:
| (a) | Represents Consolidated Schedule of Investments. |
| * | Non-income producing |
| # | Security has been valued in good faith pursuant to guidelines established by the Board of Trustees. The aggregate value of fair valued securities is $82,028,991 which represents 67.2% of net assets. |
| ø | Restricted Security – the aggregate value of restricted securities is $164,038, or 0.1% of net assets |
| ∞ | Security is valued using significant unobservable inputs and is classified as Level 3 in the fair value hierarchy. |
| Reg S | Security was purchased pursuant to Regulation S under the Securities Act of 1933, which exempts from registration securities offered and sold outside of the United States. Such a security cannot be sold in the United States without either an effective registration statement filed pursuant to the Securities Act of 1933, or pursuant to an exemption from registration. |
| 144A | Security exempt from registration under Rule 144A of the Securities Act of 1933, as amended, or otherwise restricted. These securities may be resold in transactions exempt from registration, unless otherwise noted, and the value amounted to $6,624,857, or 5.4% of net assets. |
Restricted securities held by the Fund as of December 31, 2019 are as follows:
| Security | Acquisition Date | Number of Shares | Acquisition Cost | Value | % of Net Assets | ||||||||||||||
| Chennai Super Kings Cricket Ltd. | 10/08/15 | 1,298,085 | $ | 35,108 | $ | 164,038 | 0.1 | % | |||||||||||
| Summary of Investments by Sector Excluding Collateral for Securities Loaned | % of Investments | Value | ||||||
| Communication Services | 6.3 | % | $ | 7,730,909 | ||||
| Consumer Discretionary | 10.2 | 12,470,421 | ||||||
| Consumer Staples | 6.7 | 8,162,032 | ||||||
| Energy | 0.4 | 498,479 | ||||||
| Financials | 12.0 | 14,569,978 | ||||||
| Health Care | 11.2 | 13,638,306 | ||||||
| Industrials | 20.5 | 24,948,925 | ||||||
| Information Technology | 13.0 | 15,904,770 | ||||||
| Materials | 15.4 | 18,739,085 | ||||||
| Real Estate | 3.1 | 3,763,510 | ||||||
| Utilities | 1.2 | 1,439,769 | ||||||
| 100.0 | % | $ | 121,866,184 | |||||
See Notes to Financial Statements
| 38 |
The summary of inputs used to value the Fund’s investments as of December 31, 2019 is as follows:
| Level 1 Quoted Prices | Level 2 Significant Observable Inputs | Level 3 Significant Unobservable Inputs | Value | ||||||||||||||
| Common Stocks | |||||||||||||||||
| Automobiles & Components | $ | — | $ | 1,564,019 | $ | — | $ | 1,564,019 | |||||||||
| Banks | 704,167 | 7,321,900 | — | 8,026,067 | |||||||||||||
| Capital Goods | 2,051,027 | 18,970,166 | — | 21,021,193 | |||||||||||||
| Commercial & Professional Services | 1,415,299 | 643,669 | — | 2,058,968 | |||||||||||||
| Consumer Durables & Apparel | 3,293,326 | 4,621,968 | — | 7,915,294 | |||||||||||||
| Consumer Services | 1,711,384 | — | 164,038 | 1,875,422 | |||||||||||||
| Diversified Financials | 2,181,956 | 4,361,955 | — | 6,543,911 | |||||||||||||
| Energy | — | 498,479 | — | 498,479 | |||||||||||||
| Food, Beverage & Tobacco | 289,288 | 7,872,744 | — | 8,162,032 | |||||||||||||
| Health Care Equipment & Services | 835,404 | 242,005 | — | 1,077,409 | |||||||||||||
| Materials | 6,214,943 | 12,524,142 | — | 18,739,085 | |||||||||||||
| Media & Entertainment | 2,371,106 | 4,605,137 | — | 6,976,243 | |||||||||||||
| Pharmaceuticals / Biotechnology | 5,426,481 | 7,134,416 | — | 12,560,897 | |||||||||||||
| Real Estate | 1,674,745 | 2,088,765 | — | 3,763,510 | |||||||||||||
| Retailing | 195,143 | 920,543 | — | 1,115,686 | |||||||||||||
| Software & Services | 8,161,066 | 5,517,183 | — | 13,678,249 | |||||||||||||
| Technology Hardware & Equipment | 1,440,564 | 785,957 | — | 2,226,521 | |||||||||||||
| Telecommunication Services | 754,666 | — | — | 754,666 | |||||||||||||
| Transportation | 363,279 | 1,505,485 | — | 1,868,764 | |||||||||||||
| Utilities | 753,349 | 686,420 | — | 1,439,769 | |||||||||||||
| Total | $ | 39,837,193 | $ | 81,864,953 | $ | 164,038 | $ | 121,866,184 | |||||||||
See Notes to Financial Statements
| 39 |
VANECK VECTORS INDONESIA INDEX ETF
SCHEDULE OF INVESTMENTS
December 31, 2019
| Number of Shares | Value | |||||||
| COMMON STOCKS: 100.0% | ||||||||
| Automobiles & Components: 6.2% | ||||||||
| 5,101,800 | Astra International Tbk PT # | $ | 2,541,169 | |||||
| Banks: 28.9% | ||||||||
| 1,396,700 | Bank Central Asia Tbk PT # | 3,359,072 | ||||||
| 4,925,302 | Bank Mandiri Persero Tbk PT # | 2,721,542 | ||||||
| 3,627,132 | Bank Negara Indonesia Persero Tbk PT # | 2,047,575 | ||||||
| 10,583,200 | Bank Rakyat Indonesia Tbk PT # | 3,349,856 | ||||||
| 2,059,700 | Bank Tabungan Negara Tbk PT # | 314,008 | ||||||
| 11,792,053 | ||||||||
| Capital Goods: 0.6% | ||||||||
| 2,244,088 | Waskita Karya Persero Tbk PT # | 239,536 | ||||||
| Diversified Financials: 1.2% | ||||||||
| 909,250 | First Pacific Company Ltd. # | 309,163 | ||||||
| 5,577,900 | Kresna Graha Investama Tbk PT * # | 200,819 | ||||||
| 509,982 | ||||||||
| Energy: 7.9% | ||||||||
| 7,776,500 | Adaro Energy Tbk PT # | 869,034 | ||||||
| 2,171,397 | Banpu PCL (NVDR) # | 861,334 | ||||||
| 1,904,600 | Tambang Batubara Bukit Asam Tbk PT # | 364,295 | ||||||
| 725,469 | United Tractors Tbk PT # | 1,123,243 | ||||||
| 3,217,906 | ||||||||
| Food, Beverage & Tobacco: 12.1% | ||||||||
| 3,508,300 | Charoen Pokphand Indonesia Tbk PT # | 1,640,741 | ||||||
| 1,981,500 | Golden Agri-Resources Ltd. # | 346,645 | ||||||
| 224,500 | Gudang Garam Tbk PT # | 856,388 | ||||||
| 1,077,400 | Indofood Cbp Sukses Makmur Tbk PT # | 865,180 | ||||||
| 2,134,700 | Indofood Sukses Makmur Tbk PT # | 1,217,173 | ||||||
| 4,926,127 | ||||||||
| Health Care Equipment & Services: 1.3% | ||||||||
| 2,701,597 | Mitra Keluarga Karyasehat Tbk PT Reg S # | 519,182 | ||||||
| Household & Personal Products: 4.1% | ||||||||
| 556,500 | Unilever Indonesia Tbk PT # | 1,682,257 | ||||||
| Number of Shares | Value | |||||||
| Materials: 14.1% | ||||||||
| 12,551,900 | Barito Pacific Tbk PT # | $ | 1,363,752 | |||||
| 1,127,300 | Chandra Asri Petrochemical Tbk PT # | 841,485 | ||||||
| 1,250,300 | Indah Kiat Pulp and Paper Corp. Tbk PT # | 691,959 | ||||||
| 877,100 | Indocement Tunggal Prakarsa Tbk PT # | 1,199,634 | ||||||
| 605,500 | Pabrik Kertas Tjiwi Kimia Tbk PT # | 447,502 | ||||||
| 1,413,200 | Semen Gresik Persero Tbk PT # | 1,218,661 | ||||||
| 5,762,993 | ||||||||
| Media & Entertainment: 0.7% | ||||||||
| 2,800,700 | Surya Citra Media Tbk PT # | 284,151 | ||||||
| Pharmaceuticals / Biotechnology: 2.8% | ||||||||
| 9,800,900 | Kalbe Farma Tbk PT # | 1,142,703 | ||||||
| Real Estate: 4.2% | ||||||||
| 4,492,100 | Bumi Serpong Damai Tbk PT * # | 404,844 | ||||||
| 4,783,195 | Ciputra Development Tbk PT # | 357,696 | ||||||
| 18,960,600 | Lippo Karawaci Tbk PT * # | 330,222 | ||||||
| 7,961,900 | Pakuwon Jati Tbk PT # | 325,903 | ||||||
| 3,928,400 | Summarecon Agung Tbk PT # | 283,756 | ||||||
| 1,702,421 | ||||||||
| Retailing: 4.2% | ||||||||
| 3,335,600 | Ace Hardware Indonesia Tbk PT # | 359,221 | ||||||
| 48,088 | Jardine Cycle & Carriage Ltd. # | 1,075,620 | ||||||
| 913,800 | Matahari Department Store Tbk PT # | 277,123 | ||||||
| 1,711,964 | ||||||||
| Telecommunication Services: 8.8% | ||||||||
| 96,989 | Telekomunikasi Indonesia Persero Tbk PT (ADR) | 2,764,186 | ||||||
| 4,957,600 | Tower Bersama Infrastructure Tbk PT # | 438,915 | ||||||
| 1,766,975 | XL Axiata Tbk PT * # | 400,558 | ||||||
| 3,603,659 | ||||||||
| Transportation: 1.0% | ||||||||
| 1,058,750 | Jasa Marga Persero Tbk PT # | 394,141 | ||||||
| Utilities: 1.9% | ||||||||
| 5,068,500 | Perusahaan Gas Negara Tbk PT # | 790,283 | ||||||
| Total Common Stocks (Cost: $48,670,937) | 40,820,527 | |||||||
| Other assets less liabilities: 0.0% | 5,215 | |||||||
| NET ASSETS: 100.0% | $ | 40,825,742 | ||||||
Definitions:
| ADR | American Depositary Receipt |
| NVDR | Non-Voting Depositary Receipt |
Footnotes:
| * | Non-income producing |
| # | Security has been valued in good faith pursuant to guidelines established by the Board of Trustees. The aggregate value of fair valued securities is $38,056,341 which represents 93.2% of net assets. |
| Reg S | Security was purchased pursuant to Regulation S under the Securities Act of 1933, which exempts from registration securities offered and sold outside of the United States. Such a security cannot be sold in the United States without either an effective registration statement filed pursuant to the Securities Act of 1933, or pursuant to an exemption from registration. |
See Notes to Financial Statements
| 40 |
| Summary of Investments by Sector Excluding Collateral for Securities Loaned | % of Investments | Value | ||||||
| Communication Services | 9.5 | % | $ | 3,887,810 | ||||
| Consumer Discretionary | 10.4 | 4,253,133 | ||||||
| Consumer Staples | 16.2 | 6,608,384 | ||||||
| Energy | 7.9 | 3,217,906 | ||||||
| Financials | 30.1 | 12,302,035 | ||||||
| Health Care | 4.1 | 1,661,885 | ||||||
| Industrials | 1.6 | 633,677 | ||||||
| Materials | 14.1 | 5,762,993 | ||||||
| Real Estate | 4.2 | 1,702,421 | ||||||
| Utilities | 1.9 | 790,283 | ||||||
| 100.0 | % | $ | 40,820,527 | |||||
The summary of inputs used to value the Fund’s investments as of December 31, 2019 is as follows:
| Level 1 Quoted Prices | Level 2 Significant Observable Inputs | Level 3 Significant Unobservable Inputs | Value | ||||||||||||||
| Common Stocks | |||||||||||||||||
| Automobiles & Components | $ | — | $ | 2,541,169 | $ | — | $ | 2,541,169 | |||||||||
| Banks | — | 11,792,053 | — | 11,792,053 | |||||||||||||
| Capital Goods | — | 239,536 | — | 239,536 | |||||||||||||
| Diversified Financials | — | 509,982 | — | 509,982 | |||||||||||||
| Energy | — | 3,217,906 | — | 3,217,906 | |||||||||||||
| Food, Beverage & Tobacco | — | 4,926,127 | — | 4,926,127 | |||||||||||||
| Health Care Equipment & Services | — | 519,182 | — | 519,182 | |||||||||||||
| Household & Personal Products | — | 1,682,257 | — | 1,682,257 | |||||||||||||
| Materials | — | 5,762,993 | — | 5,762,993 | |||||||||||||
| Media & Entertainment | — | 284,151 | — | 284,151 | |||||||||||||
| Pharmaceuticals / Biotechnology | — | 1,142,703 | — | 1,142,703 | |||||||||||||
| Real Estate | — | 1,702,421 | — | 1,702,421 | |||||||||||||
| Retailing | — | 1,711,964 | — | 1,711,964 | |||||||||||||
| Telecommunication Services | 2,764,186 | 839,473 | — | 3,603,659 | |||||||||||||
| Transportation | — | 394,141 | — | 394,141 | |||||||||||||
| Utilities | — | 790,283 | — | 790,283 | |||||||||||||
| Total | $ | 2,764,186 | $ | 38,056,341 | $ | — | $ | 40,820,527 | |||||||||
See Notes to Financial Statements
| 41 |
SCHEDULE OF INVESTMENTS
December 31, 2019
| Number of Shares | Value | |||||||
| COMMON STOCKS: 99.9% | ||||||||
| Banks: 16.9% | ||||||||
| 364,126 | Bank Hapoalim BM # | $ | 3,023,375 | |||||
| 464,970 | Bank Leumi Le-Israel BM # | 3,390,306 | ||||||
| 16,645 | First International Bank of Israel Ltd. # | 481,994 | ||||||
| 376,539 | Israel Discount Bank Ltd. # | 1,748,373 | ||||||
| 41,717 | Mizrahi Tefahot Bank Ltd. # | 1,112,554 | ||||||
| 5,729 | Union Bank of Israel * # | 37,998 | ||||||
| 9,794,600 | ||||||||
| Capital Goods: 5.5% | ||||||||
| 7,865 | Ashtrom Group Ltd. # | 117,820 | ||||||
| 1,595 | Bet Shemesh Engines Holdings 1997 Ltd. # | 62,602 | ||||||
| 7,427 | Caesarstone Ltd. (USD) | 111,925 | ||||||
| 7,989 | Elbit Systems Ltd. # | 1,244,541 | ||||||
| 2,965 | Elco Holdings Ltd. # | 105,959 | ||||||
| 540 | Electra Ltd. # | 240,153 | ||||||
| 1,710 | Ham-Let Israel-Canada Ltd. * # | 32,940 | ||||||
| 35,316 | Inrom Construction Industries Ltd. # | 153,350 | ||||||
| 13,274 | Kornit Digital Ltd. (USD) * | 454,369 | ||||||
| 918 | Plasson Industries Ltd. # | 41,099 | ||||||
| 10,165 | RADA Electronic Industries Ltd. (USD) * † | 52,756 | ||||||
| 1,932 | Scope Metals Group Ltd. # | 44,211 | ||||||
| 37,204 | Shapir Engineering and Industry Ltd. # | 227,566 | ||||||
| 64,896 | Shikun & Binui Ltd. # | 298,723 | ||||||
| 3,188,014 | ||||||||
| Commercial & Professional Services: 0.3% | ||||||||
| 1,553 | Danel Adir Yeoshua Ltd. # | 144,622 | ||||||
| Consumer Durables & Apparel: 0.6% | ||||||||
| 2,970 | Delta-Galil Industries Ltd. # | 81,025 | ||||||
| 3,141 | Electra Consumer Products Ltd. # | 58,116 | ||||||
| 2,255 | Fox Wizel Ltd. # | 102,775 | ||||||
| 13,422 | Maytronics Ltd. # | 112,317 | ||||||
| 354,233 | ||||||||
| Consumer Services: 0.8% | ||||||||
| 110,086 | 888 Holdings Plc | 240,630 | ||||||
| 1,314 | Fattal Holdings Ltd. # | 214,182 | ||||||
| 454,812 | ||||||||
| Diversified Financials: 1.3% | ||||||||
| 15,647 | Altshuler Shaham Provident Funds & Pension Ltd. | 48,427 | ||||||
| 43,153 | Isracard Ltd. * # | 161,416 | ||||||
| 6,794 | Nawi Brothers Ltd. * # | 49,014 | ||||||
| 31,638 | Plus500 Ltd. (GBP) | 371,344 | ||||||
| 32,242 | Tel Aviv Stock Exchange Ltd. * # | 109,546 | ||||||
| 739,747 | ||||||||
| Energy: 2.4% | ||||||||
| 1,414 | Delek Group Ltd. # | 215,325 | ||||||
| 26,112 | Energean Oil & Gas Plc * | 321,705 | ||||||
| 11,435 | Naphtha Israel Petroleum Corp. Ltd. # | 68,422 | ||||||
| 533,182 | Oil Refineries Ltd. # | 268,035 | ||||||
| 3,210 | Paz Oil Co. Ltd. # | 455,129 | ||||||
| 21,817 | Tamar Petroleum Ltd. Reg S 144A # | 50,632 | ||||||
| 1,379,248 | ||||||||
| Number of Shares | Value | |||||||
| Food & Staples Retailing: 0.9% | ||||||||
| 2,396 | Rami Levi Chain Stores Hashikma Marketing Ltd. # | $ | 137,834 | |||||
| 56,966 | Shufersal Ltd. # | 363,071 | ||||||
| 500,905 | ||||||||
| Food, Beverage & Tobacco: 0.9% | ||||||||
| 1 | Mehadrin Ltd. * # | 27 | ||||||
| 606 | Neto ME Holdings Ltd. # | 37,454 | ||||||
| 15,990 | Strauss Group Ltd. # | 490,812 | ||||||
| 528,293 | ||||||||
| Health Care Equipment & Services: 4.4% | ||||||||
| 5,323 | Brainsway Ltd. * # | 25,920 | ||||||
| 3,799 | Inmode Ltd. (USD) * † | 148,921 | ||||||
| 14,260 | Intercure Ltd. * # | 15,471 | ||||||
| 27,984 | Mediterranean Towers Ltd. # | 81,332 | ||||||
| 26,920 | Novocure Ltd. (USD) * | 2,268,548 | ||||||
| 2,540,192 | ||||||||
| Insurance: 1.8% | ||||||||
| 13,342 | Clal Insurance Enterprises Holdings Ltd. * # | 200,757 | ||||||
| 35,175 | Harel Insurance Investments & Financial Services Ltd. # | 274,987 | ||||||
| 2,383 | IDI Insurance Co. Ltd. # | 86,948 | ||||||
| 7,165 | Menorah Mivtachim Holdings Ltd. # | 104,827 | ||||||
| 108,962 | Migdal Insurance & Financial Holdings Ltd. # | 103,026 | ||||||
| 46,450 | Phoenix Holdings Ltd. # | 281,020 | ||||||
| 1,051,565 | ||||||||
| Materials: 2.3% | ||||||||
| 756 | Hadera Paper Ltd. # | 30,213 | ||||||
| 222,964 | Israel Chemicals Ltd. # | 1,052,737 | ||||||
| 1,176 | Israel Corp. Ltd. * # | 244,824 | ||||||
| 1,327,774 | ||||||||
| Media & Entertainment: 0.1% | ||||||||
| 26,001 | Taptica international Ltd. (GBP) * | 55,112 | ||||||
| 53,700 | XLMedia Plc | 31,301 | ||||||
| 86,413 | ||||||||
| Pharmaceuticals / Biotechnology: 7.6% | ||||||||
| 20,351 | Compugen Ltd. (USD) * † | 121,292 | ||||||
| 19,760 | Foamix Pharmaceuticals Ltd. (USD) * † | 65,801 | ||||||
| 4,264 | Galmed Pharmaceuticals Ltd. (USD) * | 24,646 | ||||||
| 9,303 | Intec Pharma Ltd. (USD) * | 4,651 | ||||||
| 7,608 | Kamada Ltd. * # | 52,296 | ||||||
| 4,638 | Pluristem Therapeutics, Inc. (USD) * | 18,320 | ||||||
| 10,667 | Redhill Biopharma Ltd. (ADR) * † | 64,749 | ||||||
| 2,956 | Taro Pharmaceutical Industries Ltd. (USD) * | 259,921 | ||||||
| 367,208 | Teva Pharmaceutical Industries Ltd. * # | 3,579,085 | ||||||
| 5,616 | UroGen Pharma Ltd. * † | 187,406 | ||||||
| 4,378,167 | ||||||||
| Real Estate: 8.1% | ||||||||
| 5,881 | Africa Israel Properties Ltd. * # | 244,470 | ||||||
| 23,285 | Airport City Ltd. * # | 437,590 | ||||||
| 36,642 | Alony Hetz Properties & Investments Ltd. # | 579,749 | ||||||
See Notes to Financial Statements
| 42 |
| Number of Shares | Value | |||||||
| Real Estate: (continued) | ||||||||
| 1,716 | Alrov Properties and Lodgings Ltd. | $ | 78,497 | |||||
| 53,305 | Amot Investments Ltd. # | 387,202 | ||||||
| 10,581 | Ashtrom Properties Ltd. # | 67,642 | ||||||
| 11,918 | Azrieli Group Ltd. # | 872,844 | ||||||
| 325 | Bayside Land Corp. # | 249,935 | ||||||
| 1,892 | Big Shopping Centers Ltd. # | 183,905 | ||||||
| 1,575 | Blue Square Real Estate Ltd. # | 111,437 | ||||||
| 1,573 | Brack Capital Properties NV (ILS) * | 161,217 | ||||||
| 24,191 | Gazit-Globe Ltd. # | 268,083 | ||||||
| 83,862 | Industrial Buildings Corp. * # | 229,109 | ||||||
| 531 | Isras Investment Co. Ltd. # | 116,896 | ||||||
| 6,497 | Mega Or Holdings Ltd. # | 160,424 | ||||||
| 5,196 | Melisron Ltd. # | 332,100 | ||||||
| 695 | Property & Building Corp. | 74,027 | ||||||
| 10,237 | Summit Real Estate Holdings Ltd. # | 136,793 | ||||||
| 4,691,920 | ||||||||
| Retailing: 0.3% | ||||||||
| 11,749 | Delek Automotive Systems Ltd. # | 75,551 | ||||||
| 3,244 | Fiverr International Ltd. (USD) * | 76,234 | ||||||
| 151,785 | ||||||||
| Semiconductor: 8.5% | ||||||||
| 7,048 | Camtek Ltd. | 76,330 | ||||||
| 6,957 | Ceva, Inc. * | 187,561 | ||||||
| 6,999 | DSP Group, Inc. (USD) * | 110,164 | ||||||
| 17,032 | Mellanox Technologies Ltd. (USD) * | 1,995,810 | ||||||
| 7,963 | Nova Measuring Instruments Ltd. * # | 303,567 | ||||||
| 15,651 | SolarEdge Technologies, Inc. (USD) * | 1,488,254 | ||||||
| 30,686 | Tower Semiconductor Ltd. (USD) * | 738,305 | ||||||
| 4,899,991 | ||||||||
| Software & Services: 30.5% | ||||||||
| 10,336 | Allot Communications Ltd. (USD) * | 87,856 | ||||||
| 44,024 | Amdocs Ltd. (USD) | 3,178,093 | ||||||
| 38,988 | Check Point Software Technologies Ltd. (USD) * | 4,326,108 | ||||||
| 12,090 | CyberArk Software Ltd. (USD) * | 1,409,452 | ||||||
| 11,893 | ForeScout Technologies, Inc. * | 390,090 | ||||||
| 2,257 | Formula Systems Ltd. # | 153,620 | ||||||
| 4,664 | Hilan Ltd. # | 187,948 | ||||||
| 19,498 | LivePerson, Inc. * † | 721,426 | ||||||
| 7,704 | Magic Software Enterprises Ltd. (USD) | 75,037 | ||||||
| 10,082 | Matrix IT Ltd. # | 203,153 | ||||||
| 18,638 | NICE Systems Ltd. * # | 2,889,409 | ||||||
| 8,176 | Sapiens International Corp. NV (USD) | 188,048 | ||||||
| 61,514 | Splitit Payments Ltd. * # | 28,606 | ||||||
| 4,077 | Tufin Software Technologies Ltd. (USD) * † | 71,714 | ||||||
| 9,458 | Varonis Systems, Inc. * † | 734,981 | ||||||
| 19,773 | Verint Systems, Inc. * | 1,094,633 | ||||||
| 15,355 | Wix.com Ltd. (USD) * | 1,879,145 | ||||||
| 17,619,319 | ||||||||
| Number of Shares | Value | |||||||
| Technology Hardware & Equipment: 2.2% | ||||||||
| 6,903 | AudioCodes Ltd. (USD) † | $ | 177,338 | |||||
| 108,895 | BATM Advanced Communications (GBP) * # | 53,875 | ||||||
| 19,703 | Ceragon Networks Ltd. (USD) * † | 41,376 | ||||||
| 8,451 | Gilat Satellite Networks Ltd. # | 66,862 | ||||||
| 6,378 | Ituran Location and Control Ltd. (USD) | 160,279 | ||||||
| 9,156 | Powerfleet, Inc. * | 59,606 | ||||||
| 13,088 | Radware Ltd. (USD) * | 337,409 | ||||||
| 2,025 | Silicom Ltd. (USD) * | 67,351 | ||||||
| 16,524 | Stratasys Ltd. * | 334,198 | ||||||
| 1,298,294 | ||||||||
| Telecommunication Services: 1.4% | ||||||||
| 651,710 | Bezeq The Israeli Telecommunication Corp. Ltd. * # | 524,756 | ||||||
| 19,647 | Cellcom Israel Ltd. * # | 62,596 | ||||||
| 46,871 | Partner Communications Co. Ltd. * # | 208,964 | ||||||
| 796,316 | ||||||||
| Transportation: 0.0% | ||||||||
| 90,804 | El Al Israel Airlines * # | 25,357 | ||||||
| Utilities: 3.1% | ||||||||
| 51,610 | Energix-Renewable Energies Ltd. * # | 154,321 | ||||||
| 201,467 | Enlight Renewable Energy Ltd. * # | 253,582 | ||||||
| 8,980 | Kenon Holdings Ltd. (ILS) # | 191,971 | ||||||
| 13,248 | OPC Energy Ltd. # | 112,732 | ||||||
| 14,788 | Ormat Technologies, Inc. | 1,102,002 | ||||||
| 1,814,608 | ||||||||
| Total Common Stocks (Cost: $44,942,647) | 57,766,175 | |||||||
| SHORT-TERM INVESTMENT HELD ASCOLLATERAL FOR SECURITIES ON LOAN: 0.5% (Cost: $282,011) | ||||||||
| Money Market Fund: 0.5% | ||||||||
| 282,011 | State Street Navigator Securities Lending Government Money Market Portfolio | 282,011 | ||||||
| Total Investments: 100.4% (Cost: $45,224,658) | 58,048,186 | |||||||
| Liabilities in excess of other assets: (0.4)% | (240,450 | ) | ||||||
| NET ASSETS: 100.0% | $ | 57,807,736 | ||||||
See Notes to Financial Statements
| 43 |
VANECK VECTORS ISRAEL ETF
SCHEDULE OF INVESTMENTS
(continued)
Definitions:
| ADR | American Depositary Receipt |
| GBP | British Pound |
| ILS | New Israeli Shekel |
| USD | United States Dollar |
Footnotes:
| * | Non-income producing |
| † | Security fully or partially on loan. Total market value of securities on loan is $2,013,664. |
| # | Security has been valued in good faith pursuant to guidelines established by the Board of Trustees. The aggregate value of fair valued securities is $31,491,810 which represents 54.5% of net assets. |
| Reg S | Security was purchased pursuant to Regulation S under the Securities Act of 1933, which exempts from registration securities offered and sold outside of the United States. Such a security cannot be sold in the United States without either an effective registration statement filed pursuant to the Securities Act of 1933, or pursuant to an exemption from registration. |
| 144A | Security exempt from registration under Rule 144A of the Securities Act of 1933, as amended, or otherwise restricted. These securities may be resold in transactions exempt from registration, unless otherwise noted, and the value amounted to $50,632, or 0.1% of net assets. |
| Summary of Investments by Sector Excluding Collateral for Securities Loaned | % of Investments | Value | ||||||
| Communication Services | 1.5 | % | $ | 882,729 | ||||
| Consumer Discretionary | 1.7 | 960,830 | ||||||
| Consumer Staples | 1.8 | 1,029,198 | ||||||
| Energy | 2.4 | 1,379,248 | ||||||
| Financials | 20.1 | 11,585,912 | ||||||
| Health Care | 12.0 | 6,918,359 | ||||||
| Industrials | 5.8 | 3,357,993 | ||||||
| Information Technology | 41.2 | 23,817,604 | ||||||
| Materials | 2.3 | 1,327,774 | ||||||
| Real Estate | 8.1 | 4,691,920 | ||||||
| Utilities | 3.1 | 1,814,608 | ||||||
| 100.0 | % | $ | 57,766,175 | |||||
See Notes to Financial Statements
| 44 |
The summary of inputs used to value the Fund’s investments as of December 31, 2019 is as follows:
| Level 1 Quoted Prices | Level 2 Significant Observable Inputs | Level 3 Significant Unobservable Inputs | Value | ||||||||||||||
| Common Stocks | |||||||||||||||||
| Banks | $ | — | $ | 9,794,600 | $ | — | $ | 9,794,600 | |||||||||
| Capital Goods | 619,050 | 2,568,964 | — | 3,188,014 | |||||||||||||
| Commercial & Professional Services | — | 144,622 | — | 144,622 | |||||||||||||
| Consumer Durables & Apparel | — | 354,233 | — | 354,233 | |||||||||||||
| Consumer Services | 240,630 | 214,182 | — | 454,812 | |||||||||||||
| Diversified Financials | 419,771 | 319,976 | — | 739,747 | |||||||||||||
| Energy | 321,705 | 1,057,543 | — | 1,379,248 | |||||||||||||
| Food & Staples Retailing | — | 500,905 | — | 500,905 | |||||||||||||
| Food, Beverage & Tobacco | — | 528,293 | — | 528,293 | |||||||||||||
| Health Care Equipment & Services | 2,417,469 | 122,723 | — | 2,540,192 | |||||||||||||
| Insurance | — | 1,051,565 | — | 1,051,565 | |||||||||||||
| Materials | — | 1,327,774 | — | 1,327,774 | |||||||||||||
| Media & Entertainment | 86,413 | — | — | 86,413 | |||||||||||||
| Pharmaceuticals / Biotechnology | 746,786 | 3,631,381 | — | 4,378,167 | |||||||||||||
| Real Estate | 313,741 | 4,378,179 | — | 4,691,920 | |||||||||||||
| Retailing | 76,234 | 75,551 | — | 151,785 | |||||||||||||
| Semiconductor | 4,596,424 | 303,567 | — | 4,899,991 | |||||||||||||
| Software & Services | 14,156,583 | 3,462,736 | — | 17,619,319 | |||||||||||||
| Technology Hardware & Equipment | 1,177,557 | 120,737 | — | 1,298,294 | |||||||||||||
| Telecommunication Services | — | 796,316 | — | 796,316 | |||||||||||||
| Transportation | — | 25,357 | — | 25,357 | |||||||||||||
| Utilities | 1,102,002 | 712,606 | — | 1,814,608 | |||||||||||||
| Money Market Fund | 282,011 | — | — | 282,011 | |||||||||||||
| Total | $ | 26,556,376 | $ | 31,491,810 | $ | — | $ | 58,048,186 | |||||||||
See Notes to Financial Statements
| 45 |
SCHEDULE OF INVESTMENTS
December 31, 2019
| Number of Shares | Value | |||||||
| COMMON STOCKS: 95.8% | ||||||||
| Banks: 9.2% | ||||||||
| 5,552,167 | Sberbank of Russia PJSC (ADR) # | $ | 91,468,942 | |||||
| 18,386,281 | VTB Bank PJSC Reg S (GDR) # | 26,921,395 | ||||||
| 118,390,337 | ||||||||
| Diversified Financials: 2.1% | ||||||||
| 15,877,801 | Moscow Exchange MICEX-RTS PJSC # | 27,546,502 | ||||||
| Energy: 37.4% | ||||||||
| 12,611,655 | Gazprom PJSC (ADR) # † | 104,090,585 | ||||||
| 1,011,893 | Lukoil PJSC (ADR) # | 100,791,194 | ||||||
| 338,113 | Novatek PJSC Reg S (GDR) | 68,636,939 | ||||||
| 8,607,223 | Rosneft Oil Co. PJSC Reg S (GDR) # | 62,487,613 | ||||||
| 7,782,597 | Surgutneftegas PJSC (ADR) # † | 63,000,636 | ||||||
| 1,094,399 | Tatneft PJSC (ADR) | 80,832,310 | ||||||
| 479,839,277 | ||||||||
| Food & Staples Retailing: 7.3% | ||||||||
| 3,975,465 | Magnit OJSC Reg S (GDR) # | 47,990,410 | ||||||
| 1,316,315 | X5 Retail Group NV Reg S (GDR) # | 45,430,986 | ||||||
| 93,421,396 | ||||||||
| Materials: 23.7% | ||||||||
| 29,603,227 | Alrosa PJSC | 40,188,277 | ||||||
| 6,179,178 | Evraz Plc (GBP) # | 33,092,143 | ||||||
| 2,466,417 | MMC Norilsk Nickel PJSC (ADR) # | 75,426,120 | ||||||
| 1,132,405 | Novolipetsk Steel PJSC Reg S (GDR) # | 26,104,099 | ||||||
| 1,423,918 | PhosAgro PJSC Reg S (GDR) | 18,083,759 | ||||||
| 2,501,323 | Polymetal International Plc (GBP) # | 39,563,102 | ||||||
| 663,164 | Polyus PJSC Reg S (GDR) # | 37,568,272 | ||||||
| 2,277,802 | Severstal PJSC Reg S (GDR) # | 34,471,333 | ||||||
| 304,497,105 | ||||||||
| Media & Entertainment: 6.6% | ||||||||
| 1,232,923 | Mail.ru Group Ltd. Reg S (GDR) * | 27,494,183 | ||||||
| 1,313,539 | Yandex NV (USD) * | 57,125,811 | ||||||
| 84,619,994 | ||||||||
| Telecommunication Services: 6.8% | ||||||||
| 5,197,458 | Mobile TeleSystems PJSC (ADR) | 52,754,199 | ||||||
| 2,080,111 | Rostelecom PJSC (ADR) # | 15,716,740 | ||||||
| 7,268,804 | VEON Ltd. (ADR) | 18,390,074 | ||||||
| 86,861,013 | ||||||||
| Number of Shares | Value | |||||||
| Utilities: 2.7% | ||||||||
| 419,632,410 | Inter Rao Ues PJSC # | $ | 34,105,679 | |||||
| 7,410,870 | Irkutsk Electronetwork Co. JSC (USD) * # ∞ | 58,642 | ||||||
| 34,164,321 | ||||||||
| Total Common Stocks (Cost: $1,232,075,087) | 1,229,339,945 | |||||||
| PREFERRED STOCK: 4.1% (Cost: $51,057,935) | ||||||||
| Energy: 4.1% | ||||||||
| 18,378 | AK Transneft OAO, 6.06% | 52,298,279 | ||||||
| Total Investments Before Collateral for Securities Loaned: 99.9% (Cost: $1,283,133,022) | 1,281,638,224 | |||||||
| SHORT-TERM INVESTMENT HELD AS COLLATERAL FOR SECURITIES ON LOAN: 0.0% (Cost: $27,004) | ||||||||
| Money Market Fund: 0.0% | ||||||||
| 27,004 | State Street Navigator Securities Lending Government Money Market Portfolio | 27,004 | ||||||
| Total Investments: 99.9% (Cost: $1,283,160,026) | 1,281,665,228 | |||||||
| Other assets less liabilities: 0.1% | 261,514 | |||||||
| NET ASSETS: 100.0% | $ | 1,281,926,742 | ||||||
Definitions:
| ADR | American Depositary Receipt |
| GBP | British Pound |
| GDR | Global Depositary Receipt |
| USD | United States Dollar |
Footnotes:
| * | Non-income producing |
| † | Security fully or partially on loan. Total market value of securities on loan is $2,136,185. |
| # | Security has been valued in good faith pursuant to guidelines established by the Board of Trustees. The aggregate value of fair valued securities is $865,834,393 which represents 67.5% of net assets. |
| ∞ | Security is valued using significant unobservable inputs and is classified as Level 3 in the fair value hierarchy. |
| Reg S | Security was purchased pursuant to Regulation S under the Securities Act of 1933, which exempts from registration securities offered and sold outside of the United States. Such a security cannot be sold in the United States without either an effective registration statement filed pursuant to the Securities Act of 1933, or pursuant to an exemption from registration. |
See Notes to Financial Statements
| 46 |
| Summary of Investments by Sector Excluding Collateral for Securities Loaned | % of Investments | Value | ||||||
| Communication Services | 13.4 | % | $ | 171,481,007 | ||||
| Consumer Staples | 7.3 | 93,421,396 | ||||||
| Energy | 41.5 | 532,137,556 | ||||||
| Financials | 11.4 | 145,936,839 | ||||||
| Materials | 23.7 | 304,497,105 | ||||||
| Utilities | 2.7 | 34,164,321 | ||||||
| 100.0 | % | $ | 1,281,638,224 | |||||
The summary of inputs used to value the Fund’s investments as of December 31, 2019 is as follows:
| Level 1 Quoted Prices | Level 2 Significant Observable Inputs | Level 3 Significant Unobservable Inputs | Value | ||||||||||||||
| Common Stocks | |||||||||||||||||
| Banks | $ | — | $ | 118,390,337 | $ | — | $ | 118,390,337 | |||||||||
| Diversified Financials | — | 27,546,502 | — | 27,546,502 | |||||||||||||
| Energy | 149,469,249 | 330,370,028 | — | 479,839,277 | |||||||||||||
| Food & Staples Retailing | — | 93,421,396 | — | 93,421,396 | |||||||||||||
| Materials | 58,272,036 | 246,225,069 | — | 304,497,105 | |||||||||||||
| Media & Entertainment | 84,619,994 | — | — | 84,619,994 | |||||||||||||
| Telecommunication Services | 71,144,273 | 15,716,740 | — | 86,861,013 | |||||||||||||
| Utilities | — | 34,105,679 | 58,642 | 34,164,321 | |||||||||||||
| Preferred Stock* | 52,298,279 | — | — | 52,298,279 | |||||||||||||
| Money Market Fund | 27,004 | — | — | 27,004 | |||||||||||||
| Total | $ | 415,830,835 | $ | 865,775,751 | $ | 58,642 | $ | 1,281,665,228 | |||||||||
* See Schedule of Investments for industry sector breakouts.
See Notes to Financial Statements
| 47 |
VANECK VECTORS RUSSIA SMALL-CAP ETF
SCHEDULE OF INVESTMENTS
December 31, 2019
| Number of Shares | Value | |||||||
| COMMON STOCKS: 98.6% | ||||||||
| Banks: 6.9% | ||||||||
| 25,596,100 | Credit Bank of Moscow PJSC # | $ | 2,422,179 | |||||
| Capital Goods: 1.2% | ||||||||
| 82,826 | United Wagon Co. PJSC * | 417,789 | ||||||
| Commercial & Professional Services: 3.7% | ||||||||
| 60,867 | HeadHunter Group Plc (ADR) † | 1,305,597 | ||||||
| Diversified Financials: 5.4% | ||||||||
| 162,006 | Safmar Financial Investment | 1,340,676 | ||||||
| 82,327 | Vostok New Ventures Ltd. (SDR) # | 553,949 | ||||||
| 1,894,625 | ||||||||
| Energy: 3.0% | ||||||||
| 1,143,352 | TMK PJSC | 1,067,672 | ||||||
| Food & Staples Retailing: 3.1% | ||||||||
| 377,988 | Lenta Ltd. Reg S (GDR) * # | 1,107,335 | ||||||
| Materials: 12.1% | ||||||||
| 645,301 | Highland Gold Mining Ltd. (GBP) # | 1,667,864 | ||||||
| 752,442 | Mechel PJSC * # | 765,003 | ||||||
| 6,716,138 | Petropavlovsk Plc (GBP) * † | 1,133,504 | ||||||
| 415,092 | Raspadskaya OJSC # | 712,739 | ||||||
| 4,279,110 | ||||||||
| Media & Entertainment: 5.2% | ||||||||
| 1,364,136 | ITE Group Plc (GBP) | 1,843,283 | ||||||
| Real Estate: 10.3% | ||||||||
| 696,372 | Etalon Group Plc Reg S (GDR) | 1,213,080 | ||||||
| 966,633 | LSR Group Reg S (GDR) | 2,411,749 | ||||||
| 3,624,829 | ||||||||
| Retailing: 7.4% | ||||||||
| 926,882 | Detsky Mir PJSC Reg S 144A | 1,492,293 | ||||||
| 132,631 | M.Video PJSC # | 1,106,232 | ||||||
| 2,598,525 | ||||||||
| Software & Services: 4.2% | ||||||||
| 75,964 | QIWI Plc (ADR) † | 1,470,663 | ||||||
| Telecommunication Services: 8.0% | ||||||||
| 582,989 | Sistema PJSFC Reg S (GDR) | 2,841,488 | ||||||
| Transportation: 12.5% | ||||||||
| 1,680,747 | Aeroflot PJSC # | 2,803,001 | ||||||
| 183,160 | Globaltrans Investment Plc Reg S (GDR) | 1,620,966 | ||||||
| 4,423,967 | ||||||||
| Number of Shares | Value | |||||||
| Utilities: 15.6% | ||||||||
| 29,326,800 | Mosenergo PJSC # | $ | 1,069,458 | |||||
| 110,000,600 | OGK-2 PJSC # | 997,468 | ||||||
| 80,681,000 | Rosseti PJSC # | 1,796,800 | ||||||
| 37,213,000 | Unipro PJSC # | 1,667,681 | ||||||
| 5,531,407 | ||||||||
| Total Common Stocks (Cost: $36,386,950) | 34,828,469 | |||||||
| PREFERRED STOCK: 1.4% (Cost: $525,338) | ||||||||
| Utilities: 1.4% | ||||||||
| 261,475 | Lenenergo PJSC, 9.11% | 514,857 | ||||||
| Total Investments Before Collateral for Securities Loaned: 100.0% (Cost: $36,912,288) | 35,343,326 | |||||||
| SHORT-TERM INVESTMENT HELD AS COLLATERAL FOR SECURITIES ON LOAN: 3.4% (Cost: $1,210,410) | ||||||||
| Money Market Fund: 3.4% | ||||||||
| 1,210,410 | State Street Navigator Securities Lending Government Money Market Portfolio | 1,210,410 | ||||||
| Total Investments: 103.4% (Cost: $38,122,698) | 36,553,736 | |||||||
| Liabilities in excess of other assets: (3.4)% | (1,217,522 | ) | ||||||
| NET ASSETS: 100.0% | $ | 35,336,214 | ||||||
See Notes to Financial Statements
| 48 |
Definitions:
| ADR | American Depositary Receipt |
| GBP | British Pound |
| GDR | Global Depositary Receipt |
| SDR | Swedish Depositary Receipt |
Footnotes:
| * | Non-income producing |
| † | Security fully or partially on loan. Total market value of securities on loan is $2,942,477. |
| # | Security has been valued in good faith pursuant to guidelines established by the Board of Trustees. The aggregate value of fair valued securities is $16,669,709 which represents 47.2% of net assets. |
| Reg S | Security was purchased pursuant to Regulation S under the Securities Act of 1933, which exempts from registration securities offered and sold outside of the United States. Such a security cannot be sold in the United States without either an effective registration statement filed pursuant to the Securities Act of 1933, or pursuant to an exemption from registration. |
| 144A | Security exempt from registration under Rule 144A of the Securities Act of 1933, as amended, or otherwise restricted. These securities may be resold in transactions exempt from registration, unless otherwise noted, and the value amounted to $1,492,293, or 4.2% of net assets. |
| Summary of Investments by Sector Excluding Collateral for Securities Loaned | % of Investments | Value | ||||||
| Communication Services | 13.3 | % | $ | 4,684,771 | ||||
| Consumer Discretionary | 7.3 | 2,598,525 | ||||||
| Consumer Staples | 3.1 | 1,107,335 | ||||||
| Energy | 3.0 | 1,067,672 | ||||||
| Financials | 12.2 | 4,316,804 | ||||||
| Industrials | 17.4 | 6,147,353 | ||||||
| Information Technology | 4.2 | 1,470,663 | ||||||
| Materials | 12.1 | 4,279,110 | ||||||
| Real Estate | 10.3 | 3,624,829 | ||||||
| Utilities | 17.1 | 6,046,264 | ||||||
| 100.0 | % | $ | 35,343,326 | |||||
The summary of inputs used to value the Fund’s investments as of December 31, 2019 is as follows:
| Level 1 Quoted Prices | Level 2 Significant Observable Inputs | Level 3 Significant Unobservable Inputs | Value | ||||||||||||||
| Common Stocks | |||||||||||||||||
| Banks | $ | — | $ | 2,422,179 | $ | — | $ | 2,422,179 | |||||||||
| Capital Goods | 417,789 | — | — | 417,789 | |||||||||||||
| Commercial & Professional Services | 1,305,597 | — | — | 1,305,597 | |||||||||||||
| Diversified Financials | 1,340,676 | 553,949 | — | 1,894,625 | |||||||||||||
| Energy | 1,067,672 | — | — | 1,067,672 | |||||||||||||
| Food & Staples Retailing | — | 1,107,335 | — | 1,107,335 | |||||||||||||
| Materials | 1,133,504 | 3,145,606 | — | 4,279,110 | |||||||||||||
| Media & Entertainment | 1,843,283 | — | — | 1,843,283 | |||||||||||||
| Real Estate | 3,624,829 | — | — | 3,624,829 | |||||||||||||
| Retailing | 1,492,293 | 1,106,232 | — | 2,598,525 | |||||||||||||
| Software & Services | 1,470,663 | — | — | 1,470,663 | |||||||||||||
| Telecommunication Services | 2,841,488 | — | — | 2,841,488 | |||||||||||||
| Transportation | 1,620,966 | 2,803,001 | — | 4,423,967 | |||||||||||||
| Utilities | — | 5,531,407 | — | 5,531,407 | |||||||||||||
| Preferred Stock* | 514,857 | — | — | 514,857 | |||||||||||||
| Money Market Funds | 1,210,410 | — | — | 1,210,410 | |||||||||||||
| Total | $ | 19,884,027 | $ | 16,669,709 | $ | — | $ | 36,553,736 | |||||||||
* See Schedule of Investments for industry sector breakouts.
See Notes to Financial Statements
| 49 |
SCHEDULE OF INVESTMENTS
December 31, 2019
| Number of Shares | Value | |||||||
| COMMON STOCKS: 99.8% | ||||||||
| Banks: 6.7% | ||||||||
| 7,626,542 | Bank for Foreign Trade of Vietnam JSC # | $ | 29,717,176 | |||||
| Capital Goods: 6.2% | ||||||||
| 12,138,141 | FLC Faros Construction JSC * | 9,062,028 | ||||||
| 7,932,480 | Hoang Huy Investment Financial Services JSC # | 11,177,651 | ||||||
| 8,613,945 | Vietnam Electrical Equipment * # | 7,198,181 | ||||||
| 27,437,860 | ||||||||
| Consumer Durables & Apparel: 6.7% | ||||||||
| 1,502,160 | Eclat Textile Co. Ltd. # | 20,221,216 | ||||||
| 641,553 | Hansae Co. Ltd. † # | 9,584,221 | ||||||
| 29,805,437 | ||||||||
| Diversified Financials: 2.1% | ||||||||
| 11,951,271 | Saigon Securities, Inc. # | 9,323,322 | ||||||
| Energy: 2.2% | ||||||||
| 14,239,022 | Soco International Plc | 9,846,567 | ||||||
| Food, Beverage & Tobacco: 12.9% | ||||||||
| 5,624,560 | Masan Group Corp. * # | 13,722,460 | ||||||
| 16,939,121 | Thanh Thanh Cong Tay Ninh JSC | 13,523,519 | ||||||
| 5,948,686 | Vietnam Dairy Products JSC # | 29,928,169 | ||||||
| 57,174,148 | ||||||||
| Health Care Equipment & Services: 4.8% | ||||||||
| 734,300 | MANI, Inc. # | 20,987,724 | ||||||
| Number of Shares | Value | |||||||
| Insurance: 3.5% | ||||||||
| 5,245,986 | Bao Viet Holdings # | $ | 15,545,901 | |||||
| Materials: 3.7% | ||||||||
| 16,237,599 | Hoa Phat Group JSC * # | 16,487,737 | ||||||
| Real Estate: 26.7% | ||||||||
| 10,798,676 | No Va Land Investment Group Corp. * | 27,727,747 | ||||||
| 15,838,062 | Vincom Retail JSC # | 23,262,481 | ||||||
| 6,956,872 | Vingroup JSC * # | 34,535,846 | ||||||
| 8,850,732 | Vinhomes JSC Reg S 144A * # | 32,445,377 | ||||||
| 117,971,451 | ||||||||
| Technology Hardware & Equipment: 17.5% | ||||||||
| 1,157,390 | BH Co. Ltd. * # | 21,876,126 | ||||||
| 639,870 | Mcnex Co. Ltd. † # | 20,764,941 | ||||||
| 658,043 | Seojin System Co. Ltd. † # | 16,310,012 | ||||||
| 3,568,971 | Synopex, Inc. * # | 8,426,227 | ||||||
| 636,135 | UTI, Inc. † # | 10,147,600 | ||||||
| 77,524,906 | ||||||||
| Transportation: 4.0% | ||||||||
| 2,800,580 | Vietjet Aviation JSC # | 17,677,661 | ||||||
| Utilities: 2.8% | ||||||||
| 25,040,570 | PetroVietnam Power Corp. * # | 12,390,225 | ||||||
| Total Common Stocks (Cost: $384,967,788) | 441,890,115 | |||||||
| Other assets less liabilities: 0.2% | 1,070,123 | |||||||
| NET ASSETS: 100.0% | $ | 442,960,238 | ||||||
Footnotes:
| * | Non-income producing |
| † | Security fully or partially on loan. Total market value of securities on loan is $1,927,656. |
| # | Security has been valued in good faith pursuant to guidelines established by the Board of Trustees. The aggregate value of fair valued securities is $381,730,254 which represents 86.2% of net assets. |
| Reg S | Security was purchased pursuant to Regulation S under the Securities Act of 1933, which exempts from registration securities offered and sold outside of the United States. Such a security cannot be sold in the United States without either an effective registration statement filed pursuant to the Securities Act of 1933, or pursuant to an exemption from registration. |
| 144A | Security exempt from registration under Rule 144A of the Securities Act of 1933, as amended, or otherwise restricted. These securities may be resold in transactions exempt from registration, unless otherwise noted, and the value amounted to $32,445,377, or 7.3% of net assets. |
| Summary of Investments by Sector | % of Investments | Value | ||||||
| Consumer Discretionary | 6.8 | % | $ | 29,805,437 | ||||
| Consumer Staples | 12.9 | 57,174,148 | ||||||
| Energy | 2.2 | 9,846,567 | ||||||
| Financials | 12.4 | 54,586,399 | ||||||
| Health Care | 4.8 | 20,987,724 | ||||||
| Industrials | 10.2 | 45,115,521 | ||||||
| Information Technology | 17.5 | 77,524,906 | ||||||
| Materials | 3.7 | 16,487,737 | ||||||
| Real Estate | 26.7 | 117,971,451 | ||||||
| Utilities | 2.8 | 12,390,225 | ||||||
| 100.0 | % | $ | 441,890,115 | |||||
See Notes to Financial Statements
| 50 |
The summary of inputs used to value the Fund’s investments as of December 31, 2019 is as follows:
| Level 1 Quoted Prices | Level 2 Significant Observable Inputs | Level 3 Significant Unobservable Inputs | Value | ||||||||||||||
| Common Stocks | |||||||||||||||||
| Banks | $ | — | $ | 29,717,176 | $ | — | $ | 29,717,176 | |||||||||
| Capital Goods | 9,062,028 | 18,375,832 | — | 27,437,860 | |||||||||||||
| Consumer Durables & Apparel | — | 29,805,437 | — | 29,805,437 | |||||||||||||
| Diversified Financials | — | 9,323,322 | — | 9,323,322 | |||||||||||||
| Energy | 9,846,567 | — | — | 9,846,567 | |||||||||||||
| Food, Beverage & Tobacco | 13,523,519 | 43,650,629 | — | 57,174,148 | |||||||||||||
| Health Care Equipment & Services | — | 20,987,724 | — | 20,987,724 | |||||||||||||
| Insurance | — | 15,545,901 | — | 15,545,901 | |||||||||||||
| Materials | — | 16,487,737 | — | 16,487,737 | |||||||||||||
| Real Estate | 27,727,747 | 90,243,704 | — | 117,971,451 | |||||||||||||
| Technology Hardware & Equipment | — | 77,524,906 | — | 77,524,906 | |||||||||||||
| Transportation | — | 17,677,661 | — | 17,677,661 | |||||||||||||
| Utilities | — | 12,390,225 | — | 12,390,225 | |||||||||||||
| Total | $ | 60,159,861 | $ | 381,730,254 | $ | — | $ | 441,890,115 | |||||||||
See Notes to Financial Statements
| 51 |
VANECK VECTORS ETF TRUST
STATEMENTS OF ASSETS AND LIABILITIES
December 31, 2019
| Africa Index ETF | Brazil Small-Cap ETF | ChinaAMC CSI 300 ETF | ChinaAMC SME-ChiNext ETF | Egypt Index ETF | |||||||||||||||||||||
| Assets: | |||||||||||||||||||||||||
| Investments, at value (1) (2) | $ | 50,906,828 | $ | 97,534,372 | $ | 67,395,522 | $ | 29,817,117 | $ | 30,692,224 | |||||||||||||||
| Short-term investments held as collateral for securities loaned (3) | 916,922 | 1,306,142 | — | — | — | ||||||||||||||||||||
| Cash | — | 1,956,346 | 232,916 | 112,654 | (b) | 564,511 | |||||||||||||||||||
| Cash denominated in foreign currency, at value (4) | 1,740 | 59,964 | — | — | 140,969 | ||||||||||||||||||||
| Receivables: | |||||||||||||||||||||||||
| Investment securities sold | — | 5,872 | — | — | 44,743 | ||||||||||||||||||||
| Shares of beneficial interest sold | — | — | — | — | — | ||||||||||||||||||||
| Due from Adviser | — | — | — | — | — | ||||||||||||||||||||
| Dividends and interest | 29,439 | 226,863 | 1,474 | — | 72,606 | ||||||||||||||||||||
| Prepaid expenses | 1,846 | 2,007 | 1,921 | 904 | 1,749 | ||||||||||||||||||||
| Total assets | 51,856,775 | $ | 101,091,566 | 67,631,833 | 29,930,675 | 31,516,802 | |||||||||||||||||||
| Liabilities: | |||||||||||||||||||||||||
| Payables: | |||||||||||||||||||||||||
| Investment securities purchased | — | 5,876 | — | — | 9,806 | ||||||||||||||||||||
| Collateral for securities loaned | 916,922 | 1,306,142 | — | — | — | ||||||||||||||||||||
| Line of credit | 467,385 | 2,000,930 | — | — | — | ||||||||||||||||||||
| Shares redeemed | — | — | — | — | — | ||||||||||||||||||||
| Due to Adviser | 13,879 | 37,377 | 12,942 | 11,247 | 13,333 | ||||||||||||||||||||
| Due to custodian | 114,136 | — | 3,782 | 6,359 | — | ||||||||||||||||||||
| Distribution to shareholders | — | — | — | — | — | ||||||||||||||||||||
| Deferred Trustee fees | 11,317 | 34,983 | 4,678 | 569 | 5,137 | ||||||||||||||||||||
| Accrued expenses | 109,571 | 82,225 | 189,604 | 106,165 | 94,413 | ||||||||||||||||||||
| Total liabilities | 1,633,210 | 3,467,533 | 211,006 | 124,340 | 122,689 | ||||||||||||||||||||
| NET ASSETS | $ | 50,223,565 | $ | 97,624,033 | $ | 67,420,827 | $ | 29,806,335 | $ | 31,394,113 | |||||||||||||||
| Shares outstanding | 2,450,000 | 3,550,000 | 1,600,000 | 1,000,000 | 1,074,974 | ||||||||||||||||||||
| Net asset value, redemption and offering price per share | $ | 20.50 | $ | 27.50 | $ | 42.14 | $ | 29.81 | $ | 29.20 | |||||||||||||||
| Net Assets consist of: | |||||||||||||||||||||||||
| Aggregate paid in capital | $ | 104,064,950 | $ | 229,302,877 | $ | 56,999,221 | $ | 37,084,344 | $ | 62,712,624 | |||||||||||||||
| Total distributable earnings (loss) | (53,841,385 | ) | (131,678,844 | ) | 10,421,606 | (7,278,009 | ) | (31,318,511 | ) | ||||||||||||||||
| NET ASSETS | $ | 50,223,565 | $ | 97,624,033 | $ | 67,420,827 | $ | 29,806,335 | $ | 31,394,113 | |||||||||||||||
| (1) Value of securities on loan | $ | 1,588,160 | $ | 1,811,608 | $ | — | $ | — | $ | — | |||||||||||||||
| (2) Cost of investments | $ | 43,645,648 | $ | 67,433,815 | $ | 49,818,798 | $ | 21,526,891 | $ | 28,413,440 | |||||||||||||||
| (3) Cost of short-term investments held as collateral for securities loaned | $ | 916,922 | $ | 1,306,142 | $ | — | $ | — | $ | — | |||||||||||||||
| (4) Cost of cash denominated in foreign currency | $ | 1,567 | $ | 59,423 | $ | — | $ | — | $ | 141,057 | |||||||||||||||
| (a) | Represents Consolidated Statement of Assets and Liabilities. |
| (b) | Includes $8,600 on foreign investor minimum settlement reserve funds (See Note 2H). |
See Notes to Financial Statements
| 52 |
| India Small-Cap Index ETF (a) | Indonesia Index ETF | Israel ETF | Russia ETF | Russia Small-Cap ETF | Vietnam ETF | ||||||||||||||||||||||||
| $ | 121,866,184 | $ | 40,820,527 | $ | 57,766,175 | $ | 1,281,638,224 | $ | 35,343,326 | $ | 441,890,115 | ||||||||||||||||||
| — | — | 282,011 | 27,004 | 1,210,410 | — | ||||||||||||||||||||||||
| 433,763 | 145,815 | 172,332 | 23,458 | 22,465 | — | ||||||||||||||||||||||||
| 40,284 | — | 21,159 | 785,658 | — | 1,403,487 | ||||||||||||||||||||||||
| 1,616,234 | 15,133 | — | 4,994,152 | 238,177 | — | ||||||||||||||||||||||||
| — | — | — | 601,197 | — | — | ||||||||||||||||||||||||
| — | — | — | — | 71,474 | — | ||||||||||||||||||||||||
| 32,798 | 931 | 19,836 | 7,310,017 | 38,927 | 1,031,456 | ||||||||||||||||||||||||
| 3,297 | 1,033 | 1,800 | 15,741 | 971 | 6,074 | ||||||||||||||||||||||||
| 123,992,560 | 40,983,439 | 58,263,313 | 1,295,395,451 | 36,925,750 | 444,331,132 | ||||||||||||||||||||||||
| — | 7,567 | 68,552 | 2,458,301 | 231,262 | — | ||||||||||||||||||||||||
| — | — | 282,011 | 27,004 | 1,210,410 | — | ||||||||||||||||||||||||
| — | — | — | 4,886,486 | — | 475,303 | ||||||||||||||||||||||||
| 1,614,401 | — | — | 4,992,846 | — | — | ||||||||||||||||||||||||
| 52,215 | 12,728 | 8,940 | 556,291 | — | 187,723 | ||||||||||||||||||||||||
| — | — | — | — | 148 | 2,904 | ||||||||||||||||||||||||
| — | — | — | — | — | 436,080 | ||||||||||||||||||||||||
| 13,134 | 29,160 | 3,023 | 163,317 | 2,800 | 42,380 | ||||||||||||||||||||||||
| 275,295 | 108,242 | 93,051 | 384,464 | 144,916 | 226,504 | ||||||||||||||||||||||||
| 1,955,045 | 157,697 | 455,577 | 13,468,709 | 1,589,536 | 1,370,894 | ||||||||||||||||||||||||
| $ | 122,037,515 | $ | 40,825,742 | $ | 57,807,736 | $ | 1,281,926,742 | $ | 35,336,214 | $ | 442,960,238 | ||||||||||||||||||
| 3,724,967 | 1,800,000 | 1,650,000 | 51,350,000 | 983,318 | 27,600,000 | ||||||||||||||||||||||||
| $ | 32.76 | $ | 22.68 | $ | 35.03 | $ | 24.96 | $ | 35.94 | $ | 16.05 | ||||||||||||||||||
| $ | 191,111,665 | $ | 151,074,684 | $ | 55,186,327 | $ | 2,715,188,556 | $ | 47,107,443 | $ | 674,773,797 | ||||||||||||||||||
| (69,074,150 | ) | (110,248,942 | ) | 2,621,409 | (1,433,261,814 | ) | (11,771,229 | ) | (231,813,559 | ) | |||||||||||||||||||
| $ | 122,037,515 | $ | 40,825,742 | $ | 57,807,736 | $ | 1,281,926,742 | $ | 35,336,214 | $ | 442,960,238 | ||||||||||||||||||
| $ | — | $ | — | $ | 2,013,664 | $ | 2,136,185 | $ | 2,942,477 | $ | 1,927,656 | ||||||||||||||||||
| $ | 129,945,612 | $ | 48,670,937 | $ | 44,942,647 | $ | 1,283,133,022 | $ | 36,912,288 | $ | 384,967,788 | ||||||||||||||||||
| $ | — | $ | — | $ | 282,011 | $ | 27,004 | $ | 1,210,410 | $ | — | ||||||||||||||||||
| $ | 40,423 | $ | — | $ | 20,946 | $ | 768,785 | $ | — | $ | 1,402,853 | ||||||||||||||||||
See Notes to Financial Statements
| 53 |
VANECK VECTORS ETF TRUST
For the Year Ended December 31, 2019
| Africa Index ETF | Brazil Small-Cap ETF | ChinaAMC CSI 300 ETF | ChinaAMC SME-ChiNext ETF | Egypt Index ETF | |||||||||||||||||||||
| Income: | |||||||||||||||||||||||||
| Dividends | $ | 3,355,946 | $ | 2,915,330 | $ | 1,744,686 | $ | 314,741 | $ | 1,255,879 | |||||||||||||||
| Interest | 2,008 | 1,450 | 751 | 662 | 4,698 | ||||||||||||||||||||
| Securities lending income | 190,602 | 18,589 | — | — | 1,887 | ||||||||||||||||||||
| Foreign taxes withheld | (240,644 | ) | (115,436 | ) | (174,919 | ) | (32,068 | ) | (126,851 | ) | |||||||||||||||
| Total income | 3,307,912 | 2,819,933 | 1,570,518 | 283,335 | 1,135,613 | ||||||||||||||||||||
| Expenses: | |||||||||||||||||||||||||
| Management fees | 279,894 | 447,572 | 356,650 | 136,485 | 196,464 | ||||||||||||||||||||
| Professional fees | 69,059 | 70,060 | 74,472 | 65,086 | 64,430 | ||||||||||||||||||||
| Custodian fees | 98,049 | 52,201 | 125,787 | 38,300 | 104,496 | ||||||||||||||||||||
| Fund accounting fees | 21,965 | 12,099 | 89,810 | 28,452 | 11,209 | ||||||||||||||||||||
| Reports to shareholders | 12,171 | 12,373 | 11,016 | 13,146 | 11,839 | ||||||||||||||||||||
| IOPV fees | 5,828 | 2,525 | 5,827 | 4,254 | 5,039 | ||||||||||||||||||||
| Trustees’ fees and expenses | 5,100 | 8,372 | 3,222 | 1,086 | 2,528 | ||||||||||||||||||||
| Registration fees | 5,058 | 5,042 | 5,042 | 5,199 | 5,042 | ||||||||||||||||||||
| Transfer agent fees | 2,420 | 2,419 | 2,420 | 2,420 | 2,420 | ||||||||||||||||||||
| Insurance | 1,889 | 2,059 | 1,896 | 889 | 1,892 | ||||||||||||||||||||
| Interest | 3,276 | 36,689 | 88,236 | 156 | 28,024 | ||||||||||||||||||||
| Other | 767 | 994 | 814 | 590 | 2,020 | ||||||||||||||||||||
| Total expenses | 505,476 | 652,405 | 765,192 | 296,063 | 435,403 | ||||||||||||||||||||
| Waiver of management fees | (65,774 | ) | (89,704 | ) | (333,269 | ) | (118,619 | ) | (39,809 | ) | |||||||||||||||
| Net Expenses | 439,702 | 562,701 | 431,923 | 177,444 | 395,594 | ||||||||||||||||||||
| Net investment income | 2,868,210 | 2,257,232 | 1,138,595 | 105,891 | 740,019 | ||||||||||||||||||||
| Net realized gain (loss) on: | |||||||||||||||||||||||||
| Investments | (3,556,385 | ) | 9,220,953 | (3,353,719 | ) | (3,201,335 | ) | (2,662,604 | ) | ||||||||||||||||
| Increase from payment from Adviser (See Note 3) | — | 372,975 | — | — | — | ||||||||||||||||||||
| In-kind redemptions | 1,155,739 | 621,744 | — | — | 189,234 | ||||||||||||||||||||
| Foreign currency transactions and foreign denominated assets and liabilities | (33,112 | ) | 48,213 | (146,378 | ) | (23,017 | ) | (172,402 | ) | ||||||||||||||||
| Net realized loss | (2,433,758 | ) | 10,263,885 | (3,500,097 | ) | (3,224,352 | ) | (2,645,772 | ) | ||||||||||||||||
| Net change in unrealized appreciation (depreciation) on: | |||||||||||||||||||||||||
| Investments | 3,994,837 | 18,150,348 | 19,455,036 | 9,178,497 | 1,576,887 | ||||||||||||||||||||
| Foreign currency transactions and foreign denominated assets and liabilities | 664 | (14,290 | ) | (904 | ) | (356 | ) | 276 | |||||||||||||||||
| Net change in unrealized appreciation (depreciation) | 3,995,501 | 18,136,058 | 19,454,132 | 9,178,141 | 1,577,163 | ||||||||||||||||||||
| Net Increase (decrease) in Net Assets Resulting from Operations | $ | 4,429,953 | $ | 30,657,175 | $ | 17,092,630 | $ | 6,059,680 | $ | (328,590 | ) | ||||||||||||||
| (a) | Represents Consolidated Statement of Operations. |
See Notes to Financial Statements
| 54 |
| India Small-Cap Index ETF (a) | Indonesia Index ETF | Israel ETF | Russia ETF | Russia Small-Cap ETF | Vietnam ETF | ||||||||||||||||||||||||
| $ | 3,351,880 | $ | 1,164,330 | $ | 812,863 | $ | 91,112,423 | $ | 2,048,719 | $ | 6,777,460 | ||||||||||||||||||
| 9,987 | 3,156 | 143 | 30,343 | 1,469 | 23,960 | ||||||||||||||||||||||||
| — | 1,040 | 17,722 | 9,799 | 2,959 | 93,268 | ||||||||||||||||||||||||
| (4,231 | ) | (159,086 | ) | (175,586 | ) | (10,949,069 | ) | (135,710 | ) | (253,188 | ) | ||||||||||||||||||
| 3,357,636 | 1,009,440 | 655,142 | 80,203,496 | 1,917,437 | 6,641,500 | ||||||||||||||||||||||||
| 760,484 | 215,052 | 268,083 | 6,614,532 | 176,212 | 2,142,303 | ||||||||||||||||||||||||
| 144,279 | 64,702 | 68,370 | 64,633 | 62,716 | 67,208 | ||||||||||||||||||||||||
| 163,224 | 15,656 | 91,422 | 1,661,792 | 127,244 | 401,621 | ||||||||||||||||||||||||
| 79,356 | 18,462 | 25,673 | 88,194 | 13,175 | 34,075 | ||||||||||||||||||||||||
| 15,140 | 10,584 | 11,610 | 38,751 | 18,721 | 13,361 | ||||||||||||||||||||||||
| 5,827 | 5,828 | 5,040 | 1,523 | 5,794 | 5,872 | ||||||||||||||||||||||||
| 33,243 | 4,656 | 2,999 | 84,619 | 2,093 | 27,209 | ||||||||||||||||||||||||
| 5,042 | 5,042 | 5,359 | 9,819 | 5,042 | 5,022 | ||||||||||||||||||||||||
| 4,840 | 2,420 | 2,421 | 1,108 | 2,420 | 2,420 | ||||||||||||||||||||||||
| 3,887 | 1,080 | 1,744 | 17,245 | 1,029 | 5,913 | ||||||||||||||||||||||||
| 48,581 | 157 | 18,232 | 178,150 | 6,429 | 126,345 | ||||||||||||||||||||||||
| 39,654 | 445 | 487 | 44,243 | 551 | 5,620 | ||||||||||||||||||||||||
| 1,303,557 | 344,084 | 501,440 | 8,804,609 | 421,426 | 2,836,969 | ||||||||||||||||||||||||
| — | (98,777 | ) | (166,870 | ) | — | (150,684 | ) | — | |||||||||||||||||||||
| 1,303,557 | 245,307 | 334,570 | 8,804,609 | 270,742 | 2,836,969 | ||||||||||||||||||||||||
| 2,054,079 | 764,133 | 320,572 | 71,398,887 | 1,646,695 | 3,804,531 | ||||||||||||||||||||||||
| (39,121,222 | ) | (1,427,291 | ) | 119,826 | (33,276,159 | ) | (2,561,339 | ) | (21,760,973 | ) | |||||||||||||||||||
| — | — | — | — | — | — | ||||||||||||||||||||||||
| (43,490 | ) | 811,253 | — | 112,008,019 | 672,752 | 958,990 | |||||||||||||||||||||||
| (170,934 | ) | (1,634 | ) | (1,357 | ) | (200,344 | ) | (2,205 | ) | (460,092 | ) | ||||||||||||||||||
| (39,335,646 | ) | (617,672 | ) | 118,469 | 78,531,516 | (1,890,792 | ) | (21,262,075 | ) | ||||||||||||||||||||
| (581,309 | ) | 2,358,098 | 11,887,134 | 300,166,156 | 11,022,748 | 44,578,555 | |||||||||||||||||||||||
| (4,323 | ) | (223 | ) | (3,346 | ) | (9,599 | ) | 2,257 | (22,347 | ) | |||||||||||||||||||
| (585,632 | ) | 2,357,875 | 11,883,788 | 300,156,557 | 11,025,005 | 44,556,208 | |||||||||||||||||||||||
| $ | (37,867,199 | ) | $ | 2,504,336 | $ | 12,322,829 | $ | 450,086,960 | $ | 10,780,908 | $ | 27,098,664 | |||||||||||||||||
See Notes to Financial Statements
| 55 |
VANECK VECTORS ETF TRUST
STATEMENTS OF CHANGES IN NET ASSETS
| Africa Index ETF | Brazil Small-Cap ETF | |||||||||||||||||||
| Year Ended December 31, 2019 | Year Ended December 31, 2018 | Year Ended December 31, 2019 | Year Ended December 31, 2018 | |||||||||||||||||
| Operations: | ||||||||||||||||||||
| Net investment income | $ | 2,868,210 | $ | 1,667,874 | $ | 2,257,232 | $ | 3,012,348 | ||||||||||||
| Net realized gain (loss) | (2,433,758 | ) | (27,757 | ) | 9,890,910 | 4,482,111 | ||||||||||||||
| Increase from payment from Adviser (See Note 3) | — | — | 372,975 | — | ||||||||||||||||
| Net change in unrealized appreciation (depreciation) | 3,995,501 | (14,097,436 | ) | 18,136,058 | (19,288,050 | ) | ||||||||||||||
| Net increase (decrease) in net assets resulting from operations | 4,429,953 | (12,457,319 | ) | 30,657,175 | (11,793,591 | ) | ||||||||||||||
| Dividends to shareholders: | ||||||||||||||||||||
| Dividends and Distributions | (3,150,210 | ) | (924,000 | ) | (2,475,060 | ) | (2,547,600 | ) | ||||||||||||
| Share transactions*: | ||||||||||||||||||||
| Proceeds from sale of shares | — | — | — | 5,522,935 | ||||||||||||||||
| Cost of shares redeemed | (6,279,035 | ) | (7,073,702 | ) | (18,955,215 | ) | (11,268,857 | ) | ||||||||||||
| Increase (decrease) in net assets resulting from share transactions | (6,279,035 | ) | (7,073,702 | ) | (18,955,215 | ) | (5,745,922 | ) | ||||||||||||
| Total increase (decrease) in net assets | (4,999,292 | ) | (20,455,021 | ) | 9,226,900 | (20,087,113 | ) | |||||||||||||
| Net Assets, beginning of year | 55,222,857 | 75,677,878 | 88,397,133 | 108,484,246 | ||||||||||||||||
| Net Assets, end of year | $ | 50,223,565 | $ | 55,222,857 | $ | 97,624,033 | $ | 88,397,133 | ||||||||||||
| ** Shares of Common Stock Issued (no par value) | ||||||||||||||||||||
| Shares sold | — | — | — | 250,000 | ||||||||||||||||
| Shares redeemed | (300,000 | ) | (300,000 | ) | (850,000 | ) | (500,000 | ) | ||||||||||||
| Net increase (decrease) | (300,000 | ) | (300,000 | ) | (850,000 | ) | (250,000 | ) | ||||||||||||
See Notes to Financial Statements
| 56 |
| ChinaAMC CSI 300 ETF | ChinaAMC SME-ChiNext ETF | Egypt Index ETF | ||||||||||||||||||||||||||
| Year Ended December 31, 2019 | Year Ended December 31, 2018 | Year Ended December 31, 2019 | Year Ended December 31, 2018 | Year Ended December 31, 2019 | Year Ended December 31, 2018 | |||||||||||||||||||||||
| $ | 1,138,595 | $ | 608,763 | $ | 105,891 | $ | 19,785 | $ | 740,019 | $ | 1,018,244 | |||||||||||||||||
| (3,500,097 | ) | 4,930,507 | (3,224,352 | ) | (3,576,086 | ) | (2,645,772 | ) | 6,230,153 | |||||||||||||||||||
| — | — | — | — | — | — | |||||||||||||||||||||||
| 19,454,132 | (26,428,940 | ) | 9,178,141 | (7,066,926 | ) | 1,577,163 | (11,591,246 | ) | ||||||||||||||||||||
| 17,092,630 | (20,889,670 | ) | 6,059,680 | (10,623,227 | ) | (328,590 | ) | (4,342,849 | ) | |||||||||||||||||||
| (985,120 | ) | (4,841,600 | ) | (135,000 | ) | — | (650,037 | ) | (560,463 | ) | ||||||||||||||||||
| 20,798,155 | 14,985,222 | 14,409,463 | 7,672,886 | 23,237,784 | 15,041,752 | |||||||||||||||||||||||
| (23,178,285 | ) | (29,881,468 | ) | (6,258,128 | ) | (3,932,406 | ) | (24,088,922 | ) | (53,373,990 | ) | |||||||||||||||||
| (2,380,130 | ) | (14,896,246 | ) | 8,151,335 | 3,740,480 | (851,138 | ) | (38,332,238 | ) | |||||||||||||||||||
| 13,727,380 | (40,627,516 | ) | 14,076,015 | (6,882,747 | ) | (1,829,765 | ) | (43,235,550 | ) | |||||||||||||||||||
| 53,693,447 | 94,320,963 | 15,730,320 | 22,613,067 | 33,223,878 | 76,459,428 | |||||||||||||||||||||||
| $ | 67,420,827 | $ | 53,693,447 | $ | 29,806,335 | $ | 15,730,320 | $ | 31,394,113 | $ | 33,223,878 | |||||||||||||||||
| 500,000 | 400,000 | 500,000 | 250,000 | 700,000 | 400,000 | |||||||||||||||||||||||
| (600,000 | ) | (650,000 | ) | (250,000 | ) | (150,000 | ) | (800,000 | ) | (1,550,000 | ) | |||||||||||||||||
| (100,000 | ) | (250,000 | ) | 250,000 | 100,000 | (100,000 | ) | (1,150,000 | ) | |||||||||||||||||||
See Notes to Financial Statements
| 57 |
VANECK VECTORS ETF TRUST
STATEMENTS OF CHANGES IN NET ASSETS
(continued)
| India Small-Cap Index ETF (a) | Indonesia Index ETF | |||||||||||||||||||
| Year Ended December 31, 2019 | Year Ended December 31, 2018 | Year Ended December 31, 2019 | Year Ended December 31, 2018 | |||||||||||||||||
| Operations: | ||||||||||||||||||||
| Net investment income (loss) | $ | 2,054,079 | $ | (77,616 | ) | $ | 764,133 | $ | 876,448 | |||||||||||
| Net realized gain (loss) | (39,335,646 | ) | 4,126,517 | (617,672 | ) | (4,134,430 | ) | |||||||||||||
| Net change in unrealized appreciation (depreciation) | (585,632 | ) | (131,817,510 | ) | 2,357,875 | (3,716,594 | ) | |||||||||||||
| Net increase (decrease) in net assets resulting from operations | (37,867,199 | ) | (127,768,609 | ) | 2,504,336 | (6,974,576 | ) | |||||||||||||
| Dividends to shareholders: | ||||||||||||||||||||
| Dividends and Distributions | (1,600,209 | ) | (216,823 | ) | (850,140 | ) | (975,800 | ) | ||||||||||||
| Share transactions*: | ||||||||||||||||||||
| Proceeds from sale of shares | 9,562,351 | 6,506,209 | 1,105,121 | 8,643,814 | ||||||||||||||||
| Cost of shares redeemed | (35,496,590 | ) | (96,327,507 | ) | (6,734,141 | ) | (17,756,773 | ) | ||||||||||||
| Increase (decrease) in net assets resulting from share transactions | (25,934,239 | ) | (89,821,298 | ) | (5,629,020 | ) | (9,112,959 | ) | ||||||||||||
| Total increase (decrease) in net assets | (65,401,647 | ) | (217,806,730 | ) | (3,974,824 | ) | (17,063,335 | ) | ||||||||||||
| Net Assets, beginning of year | 187,439,162 | 405,245,892 | 44,800,566 | 61,863,901 | ||||||||||||||||
| Net Assets, end of year | $ | 122,037,515 | $ | 187,439,162 | $ | 40,825,742 | $ | 44,800,566 | ||||||||||||
| ** Shares of Common Stock Issued (no par value) | ||||||||||||||||||||
| Shares sold | 250,000 | 150,000 | 50,000 | 350,000 | ||||||||||||||||
| Shares redeemed | (950,000 | ) | (1,650,000 | ) | (300,000 | ) | (800,000 | ) | ||||||||||||
| Net increase (decrease) | (700,000 | ) | (1,500,000 | ) | (250,000 | ) | (450,000 | ) | ||||||||||||
| (a) | Represents Consolidated Statement of Changes in Net Assets. |
See Notes to Financial Statements
| 58 |
| Israel ETF | Russia ETF | Russia Small-Cap ETF | ||||||||||||||||||||||||||
| Year Ended December 31, 2019 | Year Ended December 31, 2018 | Year Ended December 31, 2019 | Year Ended December 31, 2018 | Year Ended December 31, 2019 | Year Ended December 31, 2018 | |||||||||||||||||||||||
| $ | 320,572 | $ | 401,669 | $ | 71,398,887 | $ | 70,096,608 | $ | 1,646,695 | $ | 1,469,550 | |||||||||||||||||
| 118,469 | (5,005,061 | ) | 78,531,516 | 66,675,505 | (1,890,792 | ) | (2,827,712 | ) | ||||||||||||||||||||
| 11,883,788 | 911,146 | 300,156,557 | (226,285,860 | ) | 11,025,005 | (12,433,777 | ) | |||||||||||||||||||||
| 12,322,829 | (3,692,246 | ) | 450,086,960 | (89,513,747 | ) | 10,780,908 | (13,791,939 | ) | ||||||||||||||||||||
| (800,085 | ) | (349,800 | ) | (73,500,780 | ) | (68,511,950 | ) | (1,625,031 | ) | (1,440,098 | ) | |||||||||||||||||
| — | 9,336,069 | 373,210,325 | 898,492,169 | — | 3,757,271 | |||||||||||||||||||||||
| — | (1,529,591 | ) | (793,491,106 | ) | (1,221,552,842 | ) | (6,496,725 | ) | (14,160,540 | ) | ||||||||||||||||||
| — | 7,806,478 | (420,280,781 | ) | (323,060,673 | ) | (6,496,725 | ) | (10,403,269 | ) | |||||||||||||||||||
| 11,522,744 | 3,764,432 | (43,694,601 | ) | (481,086,370 | ) | 2,659,152 | (25,635,306 | ) | ||||||||||||||||||||
| 46,284,992 | 42,520,560 | 1,325,621,343 | 1,806,707,713 | 32,677,062 | 58,312,368 | |||||||||||||||||||||||
| $ | 57,807,736 | $ | 46,284,992 | $ | 1,281,926,742 | $ | 1,325,621,343 | $ | 35,336,214 | $ | 32,677,062 | |||||||||||||||||
| — | 300,000 | 17,000,000 | 42,350,000 | — | 100,000 | |||||||||||||||||||||||
| — | (50,000 | ) | (36,200,000 | ) | (57,250,000 | ) | (200,000 | ) | (350,000 | ) | ||||||||||||||||||
| — | 250,000 | (19,200,000 | ) | (14,900,000 | ) | (200,000 | ) | (250,000 | ) | |||||||||||||||||||
See Notes to Financial Statements
| 59 |
VANECK VECTORS ETF TRUST
STATEMENTS OF CHANGES IN NET ASSETS
(continued)
| Vietnam ETF | ||||||||||
| Year Ended December 31, 2019 | Year Ended December 31, 2018 | |||||||||
| Operations: | ||||||||||
| Net investment income. | $ | 3,804,531 | $ | 3,720,819 | ||||||
| Net realized loss | (21,262,075 | ) | (1,687,406 | ) | ||||||
| Net change in unrealized appreciation (depreciation) | 44,556,208 | (63,106,038 | ) | |||||||
| Net increase (decrease) in net assets resulting from operations | 27,098,664 | (61,072,625 | ) | |||||||
| Dividends to shareholders: | ||||||||||
| Dividends and Distributions | (3,336,840 | ) | (2,610,800 | ) | ||||||
| Share transactions*: | ||||||||||
| Proceeds from sale of shares | 133,626,985 | 96,453,951 | ||||||||
| Cost of shares redeemed | (32,097,680 | ) | (64,130,429 | ) | ||||||
| Increase in net assets resulting from share transactions | 101,529,305 | 32,323,522 | ||||||||
| Total increase (decrease) in net assets | 125,291,129 | (31,359,903 | ) | |||||||
| Net Assets, beginning of year | 317,669,109 | 349,029,012 | ||||||||
| Net Assets, end of year | $ | 442,960,238 | $ | 317,669,109 | ||||||
| ** Shares of Common Stock Issued (no par value) | ||||||||||
| Shares sold | 8,200,000 | 5,200,000 | ||||||||
| Shares redeemed | (2,000,000 | ) | (3,800,000 | ) | ||||||
| Net increase | 6,200,000 | 1,400,000 | ||||||||
See Notes to Financial Statements
| 60 |
VANECK VECTORS ETF TRUST
For a share outstanding throughout each year:
| (a) | Calculated based upon average shares outstanding |
| (b) | Total return is calculated assuming an initial investment made at the net asset value at the beginning of year, reinvestment of any dividends and distributions at net asset value on the dividend/distributions payment date and a redemption at the net asset value on the last day of the year. The return does not reflect the deduction of taxes that a shareholder would pay on Fund dividends/distributions or the redemption of Fund shares. |
| (c) | Portfolio turnover rates exclude securities received or delivered as a result of processing in-kind capital share transactions. |
| (d) | Excludes reimbursement from prior year custodial charge of 0.01%. |
| (e) | For the year ended December 31, 2019, 0.55% of total return, representing $0.11 per share, consisted of a payment from the Adviser in connection with a reimbursement for an investment loss (See Note 3). |
See Notes to Financial Statements
| 61 |
VANECK VECTORS ETF TRUST
FINANCIAL HIGHLIGHTS
For a share outstanding throughout each year:
| (a) | Calculated based upon average shares outstanding |
| (b) | Total return is calculated assuming an initial investment made at the net asset value at the beginning of year, reinvestment of any dividends and distributions at net asset value on the dividend/distributions payment date and a redemption at the net asset value on the last day of the year. The return does not reflect the deduction of taxes that a shareholder would pay on Fund dividends/distributions or the redemption of Fund shares. |
| (c) | Portfolio turnover rates exclude securities received or delivered as a result of processing in-kind capital share transactions. |
| (d) | Excludes reimbursement from prior year custodial charge of 0.02%. |
| (e) | Effective January 10, 2019, the Fund includes interest expense in the calculation of the expense limitation. The ratio only excludes interest expense accrued prior to January 10, 2019 and not waived under the expense limit agreement. |
See Notes to Financial Statements
| 62 |
FINANCIAL HIGHLIGHTS
For a share outstanding throughout each year:
| (a) | Calculated based upon average shares outstanding |
| (b) | Total return is calculated assuming an initial investment made at the net asset value at the beginning of year, reinvestment of any dividends and distributions at net asset value on the dividend/distributions payment date and a redemption at the net asset value on the last day of the year. The return does not reflect the deduction of taxes that a shareholder would pay on Fund dividends/distributions or the redemption of Fund shares. |
| (c) | Portfolio turnover rates exclude securities received or delivered as a result of processing in-kind capital share transactions. |
| (d) | Represents consolidated Financial Highlights |
| (e) | Excludes reimbursement from prior year custodial charge of 0.01%. |
| (f) | The amount shown for a share outstanding does not correspond with the aggregate net gain (loss) on investments for the period due to the timing of sales and repurchases of shares in relation to fluctuating market values of the investments of the Fund. |
See Notes to Financial Statements
| 63 |
VANECK VECTORS ETF TRUST
FINANCIAL HIGHLIGHTS
For a share outstanding throughout each year:
| (a) | Calculated based upon average shares outstanding |
| (b) | Total return is calculated assuming an initial investment made at the net asset value at the beginning of year, reinvestment of any dividends and distributions at net asset value on the dividend/distributions payment date and a redemption at the net asset value on the last day of the year. The return does not reflect the deduction of taxes that a shareholder would pay on Fund dividends/distributions or the redemption of Fund shares. |
| (c) | Portfolio turnover rates exclude securities received or delivered as a result of processing in-kind capital share transactions. |
See Notes to Financial Statements
| 64 |
FINANCIAL HIGHLIGHTS
For a share outstanding throughout each year:
| (a) | Calculated based upon average shares outstanding |
| (b) | Total return is calculated assuming an initial investment made at the net asset value at the beginning of year, reinvestment of any dividends and distributions at net asset value on the dividend/distributions payment date and a redemption at the net asset value on the last day of the year. The return does not reflect the deduction of taxes that a shareholder would pay on Fund dividends/distributions or the redemption of Fund shares. |
| (c) | Portfolio turnover rates exclude securities received or delivered as a result of processing in-kind capital share transactions. |
| (d) | Effective May 1, 2016, the ratio excludes depositary receipt fees in excess of 0.10% of average daily net assets (See Note 3). |
| (e) | Effective May 1, 2016, the ratio excludes depositary receipt fees in excess of 0.08% of average daily net assets (See Note 3). |
See Notes to Financial Statements
| 65 |
VANECK VECTORS ETF TRUST
FINANCIAL HIGHLIGHTS
For a share outstanding throughout each year:
| (a) | Calculated based upon average shares outstanding |
| (b) | Total return is calculated assuming an initial investment made at the net asset value at the beginning of year, reinvestment of any dividends and distributions at net asset value on the dividend/distributions payment date and a redemption at the net asset value on the last day of the year. The return does not reflect the deduction of taxes that a shareholder would pay on Fund dividends/distributions or the redemption of Fund shares. |
| (c) | Portfolio turnover rates exclude securities received or delivered as a result of processing in-kind capital share transactions. |
| (d) | Amount represents less than $0.005 per share. |
See Notes to Financial Statements
| 66 |
VANECK VECTORS ETF TRUST
December 31, 2019
Note 1—Fund Organization—VanEck Vectors ETF Trust (the “Trust”) is registered under the Investment Company Act of 1940, as amended, as an open-end management investment company. The Trust was incorporated in Delaware as a statutory trust on March 15, 2001. The Trust operates as a series fund, and offers multiple investment portfolios, each of which represents a separate series of the Trust. These financial statements relate only to the investment portfolios listed in the diversification table below (each a “Fund” and, collectively, the “Funds”).
Each Fund was created to provide investors with the opportunity to purchase a security representing a proportionate undivided interest in a portfolio of securities consisting of substantially all of the common stocks in substantially the same weighting as their index.
| Fund | Diversification Classification |
| Africa Index ETF | Diversified |
| Brazil Small-Cap ETF | Diversified |
| ChinaAMC CSI 300 ETF | Diversified |
| ChinaAMC SME-ChiNext ETF | Diversified |
| Egypt Index ETF | Non-Diversified |
| India Small-Cap Index ETF | Diversified |
| Indonesia Index ETF | Non-Diversified |
| Israel ETF | Non-Diversified |
| Russia ETF | Non-Diversified |
| Russia Small-Cap ETF | Non-Diversified |
| Vietnam ETF | Non-Diversified |
China Asset Management (Hong Kong) Limited (the “Sub-Adviser”) is the sub-adviser to ChinaAMC CSI 300 ETF and ChinaAMC SME-ChiNext ETF. ChinaAMC CSI 300 ETF and ChinaAMC SME-ChiNext ETF seek to achieve their investment objectives by primarily investing directly in A-shares through the Hong Kong-Shanghai Stock Connect program and via the A-share quota granted to the Sub-Adviser. India Small-Cap Index ETF makes its investments through the MV SCIF Mauritius (the “Subsidiary”), a wholly owned subsidiary organized in the Republic of Mauritius.
Note 2—Significant Accounting Policies—The preparation of financial statements in conformity with U.S. generally accepted accounting principles (“GAAP”) requires management to make estimates and assumptions that affect the reported amounts and disclosures in the financial statements. Actual results could differ from those estimates.
The Funds are investment companies and follow accounting and reporting requirements of Accounting Standards Codification (“ASC”) 946Financial Services—Investment Companies.
The following summarizes the Funds’ significant accounting policies.
| A. | Security Valuation—The Funds value their investments in securities and other assets and liabilities at fair value daily. Fair value is the price that would be received to sell an asset or paid to transfer a liability in an orderly transaction between market participants on the measurement date. Securities traded on the NASDAQ Stock Market LLC (“NASDAQ”) are valued at the NASDAQ official closing price. Securities traded on national exchanges are valued at the closing price on the markets in which the securities trade. Over-the-counter securities not included on NASDAQ and listed securities for which no sale was reported are valued at the mean of the bid and ask prices. To the extent these securities are actively traded they are categorized as Level 1 in the fair value hierarchy (described below). Certain foreign securities, whose values may be affected by market direction or events occurring before the Funds’ pricing time (4:00 p.m. Eastern Standard Time) but after the last close of the securities’ primary market, are fair valued using a pricing service and are categorized as Level 2 in the fair value hierarchy. The pricing service, using methods approved by the Board of Trustees, considers the correlation of the trading patterns of the foreign security to intraday trading in the U.S. markets, based on indices of domestic securities and other appropriate indicators such as prices of relevant ADR’s and futures contracts. The Funds may also fair value securities in other situations, such as, when a particular foreign market is closed but the Fund is open. Short-term debt securities with sixty days or less to maturity are valued at amortized cost, which with accrued interest approximates fair value. Money market fund investments are valued at net asset value and are considered to be Level 1 in the fair value hierarchy. The Pricing Committee of Van Eck Associates Corporation (the “Adviser”) provides oversight of the Funds’ valuation policies and procedures, which are approved by the Funds’ Board of Trustees. Among other things, these |
| 67 |
VANECK VECTORS ETF TRUST
NOTES TO FINANCIAL STATEMENTS
(continued)
| procedures allow the Funds to utilize independent pricing services, quotations from securities dealers, and other market sources to determine fair value. The Pricing Committee convenes regularly to review the fair value of financial instruments or other assets. If market quotations for a security or other asset are not readily available, or if the Adviser believes they do not otherwise reflect the fair value of a security or asset, the security or asset will be fair valued by the Pricing Committee in accordance with the Funds’ valuation policies and procedures. The Pricing Committee employs various methods for calibrating the valuation approaches utilized to determine fair value, including a regular review of key inputs and assumptions, periodic comparisons to valuations provided by other independent pricing services, transactional back-testing and disposition analysis. | |
| Certain factors such as economic conditions, political events, market trends, the nature of and duration of any restrictions on disposition, trading in similar securities of the issuer or comparable issuers and other security specific information are used to determine the fair value of these securities. Depending on the relative significance of valuation inputs, these securities may be classified either as Level 2 or Level 3 in the fair value hierarchy. The price which the Funds may realize upon sale of an investment may differ materially from the value presented in the Schedules of Investments. | |
| The Funds utilize various methods to measure the fair value of their investments on a recurring basis, which includes a hierarchy that prioritizes inputs to valuation methods used to measure fair value. The fair value hierarchy gives highest priority to unadjusted quoted prices in active markets for identical assets and liabilities (Level 1 measurements) and the lowest priority to unobservable inputs (Level 3 measurements). The inputs or methodologies used for valuing securities are not necessarily an indication of the risk associated with investing in those securities. The three levels of the fair value hierarchy are described below: | |
| Level 1 — Quoted prices in active markets for identical securities. | |
| Level 2 — Significant observable inputs (including quoted prices for similar securities, interest rates, prepayment speeds, credit risk, etc.). | |
| Level 3 — Significant unobservable inputs (including each Fund’s own assumptions in determining the fair value of investments). | |
| A summary of the inputs and the levels used to value the Funds’ investments, are located in the Schedules of Investments. Additionally, tables that reconcile the valuation of the Funds’ Level 3 investments and that present additional information about valuation methodologies and unobservable inputs, if applicable, are located in the Schedules of Investments. |
| B. | Basis for Consolidation—The Subsidiary, an Indian exempted company, was incorporated on February 25, 2010 and acts as an investment vehicle for the India Small-Cap Index ETF (“SCIF”) in order to effect certain investments on behalf of the SCIF. The SCIF is the sole shareholder of the Subsidiary, and it is intended that the SCIF will remain the sole shareholder and will continue to control the Subsidiary. The consolidated financial statements of SCIF include the financial results of its wholly owned subsidiary. All interfund account balances and transactions have been eliminated in consolidation. |
| C. | Federal Income Taxes—It is each Fund’s policy to comply with the provisions of the Internal Revenue Code applicable to regulated investment companies and to distribute all of its taxable income to its shareholders. Therefore, no federal income tax provision is required. |
| D. | Dividends and Distributions to Shareholders—Dividends to shareholders from net investment income and distributions from net realized capital gains, if any, are declared and paid annually by each Fund. Income dividends and capital gain distributions are determined in accordance with U.S. income tax regulations, which may differ from such amounts determined in accordance with GAAP. |
| E. | Currency Translation—Assets and liabilities denominated in foreign currencies and commitments under foreign currency contracts are translated into U.S. dollars at the closing prices of such currencies each business day as quoted by one or more sources. Purchases and sales of investments are translated at the exchange rates prevailing when such investments are acquired or sold. Foreign denominated income and expenses are translated at the exchange rates prevailing when accrued. The portion of realized and unrealized gains and losses on investments that result from fluctuations in foreign currency exchange rates is not separately disclosed in the financial |
| 68 |
| statements. Such amounts are included with the net realized and unrealized gains and losses on investment securities in the Statement of Operations. Recognized gains or losses attributable to foreign currency fluctuations on foreign currency denominated assets, other than investments, and liabilities are recorded as net realized gain (loss) on foreign currency transactions and foreign denominated assets and liabilities in the Statements of Operations. | |
| F. | Restricted Securities—The Funds may invest in securities that are subject to legal or contractual restrictions on resale. These securities generally may be resold in transactions exempt from registration or to the public if the securities are registered. Disposal of these securities may involve time-consuming negotiations and expense, and prompt sale at an acceptable price may be difficult. Information regarding restricted securities, if any, is included at the end of each Fund’s Schedule of Investments. |
| G. | Offsetting Assets and Liabilities—In the ordinary course of business, the Funds enter into transactions subject to enforceable master netting or other similar agreements. Generally, the right of offset in those agreements allows the Funds to offset any exposure to a specific counterparty with any collateral received or delivered to that counterparty based on the terms of the agreements. The Funds may pledge or receive cash and/or securities as collateral for derivative instruments and securities lending. For financial reporting purposes, the Funds present securities lending assets and liabilities on a gross basis in the Statements of Assets and Liabilities. Cash collateral held in the form of money market investments, if any, at December 31, 2019 is presented in the Schedules of Investments and in the Statement of Assets and Liabilities. Non-cash collateral is disclosed in Note 9 (Securities Lending). |
| H. | Other—Security transactions are accounted for on trade date. Realized gains and losses are determined based on the specific identification method. Dividend income is recorded on the ex-dividend date except that certain dividends from foreign securities are recognized upon notification of the ex-dividend date. Interest income, including amortization of premiums and discounts, is accrued as earned. |
| In the normal course of business, the Funds enter into contracts that contain a variety of general indemnifications. The Funds’ maximum exposure under these agreements is unknown as this would involve future claims that may be made against the Funds that have not yet occurred. However, the Adviser believes the risk of loss under these arrangements to be remote. | |
| At December 31, 2019, ChinaAMC SME-ChiNext included $8,600 in cash, at value on the Statements of Assets and Liabilities, which represents foreign investor minimum settlement reserve funds required by China Securities Depository and Clearing Corporation Limited. |
Note 3—Investment Management and Other Agreements—The Adviser is the investment adviser to the Funds. The Adviser receives a management fee, calculated daily and payable monthly based on an annual rate of 0.50% of each Fund’s average daily net assets. The Adviser has agreed, until at least May 1, 2020, to waive management fees and assume expenses to prevent each Fund’s total annual operating expenses (excluding acquired fund fees and expenses, interest expense, trading expenses, taxes and extraordinary expenses; and for Russia ETF and Russia Small-Cap ETF, depositary receipt fees up to 0.10% and 0.08% of average daily net assets, respectively) from exceeding the expense limitations as listed in the following table. Effective January 10, 2019, ChinaAMC CSI 300 ETF and ChinaAMC SME-ChiNext ETF no longer exclude interest expense from their expense limitations. Refer to the Statements of Operations for the amounts waived/assumed by the Advisor for the year ended December 31, 2019.
| 69 |
VANECK VECTORS ETF TRUST
NOTES TO FINANCIAL STATEMENTS
(continued)
| Fund | Expense Limitations | |||
| Africa Index ETF | 0.78 | % | ||
| Brazil Small-Cap ETF | 0.59 | |||
| ChinaAMC CSI 300 ETF*(a) | 0.60 | |||
| ChinaAMC SME-ChiNext ETF*(b) | 0.65 | |||
| Egypt Index ETF | 0.94 | |||
| India Small-Cap Index ETF | 0.85 | |||
| Indonesia Index ETF | 0.57 | |||
| Israel ETF | 0.59 | |||
| Russia ETF | 0.62 | |||
| Russia Small-Cap ETF | 0.67 | |||
| Vietnam ETF | 0.76 | |||
| * | The Adviser paid sub-advisory fees directly to the Sub-Adviser |
| (a) | Prior to January 10, 2019 the expense limitation was 0.72%. |
| (b) | Prior to January 10, 2019 the expense limitation was 0.78% |
During the year ended December 31, 2019, the Adviser reimbursed the Brazil Small-Cap ETF $372,975 for an investment loss. This reimbursement is reflected in the Statements of Operations and the Statements of Changes in Net Assets as a net increase from payment from Adviser. The per share and total return impact to the Fund is reflected in the Financial Highlights.
In addition, Van Eck Securities Corporation (the “Distributor”), an affiliate of the Adviser, acts as the Funds’ distributor. Certain officers and a Trustee of the Trust are officers, directors or stockholders of the Adviser and Distributor.
Effective November 4, 2019, State Street Bank and Trust Company is the Funds’ custodian, securities lending agent and transfer agent. Prior to November 4, 2019, Bank of New York Mellon provided these services to the Funds.
For the year ended December 31, 2019, there were offsets to custodian fees under an expense offset agreement and these amounts are reflected in custody expense in the Statement of Operations.
Note 4—Capital Share Transactions—As of December 31, 2019, there were an unlimited number of capital shares of beneficial interest authorized by the Trust with no par value. Fund shares are not individually redeemable and are issued and redeemed at their net asset value per share only through certain authorized broker-dealers (“Authorized Participants”) in blocks of shares (“Creation Units”), consisting of 50,000 shares or multiples thereof.
The consideration for the purchase or redemption of Creation Units of the Funds generally consists of the in-kind contribution or distribution of securities constituting the Funds’ underlying index (“Deposit Securities”) plus a balancing cash component to equate the transaction to the net asset value per share of the Fund on the transaction date. Cash may also be substituted in an amount equivalent to the value of certain Deposit Securities, generally as a result of market circumstances, or when the securities are not available in sufficient quantity for delivery, or are not eligible for trading by the Authorized Participant. The Funds may issue Creation Units in advance of receipt of Deposit Securities subject to various conditions, including, for the benefit of the Funds, a requirement to maintain cash collateral on deposit at the custodian equal to at least 115% of the daily marked to market value of the missing Deposit Securities.
Authorized Participants purchasing and redeeming Creation Units may pay transaction fees directly to the transfer agent. In addition, the Funds may impose certain variable fees for creations and redemptions with respect to transactions in Creation Units for cash, or on transactions effected outside the clearing process, which are treated as increases in capital. These variable fees, if any, are reflected in share transactions in the Statements of Changes in Net Assets.
| 70 |
Note 5—Investments—For the year ended December 31, 2019, purchases and sales of investments (excluding short-term investments and in-kind capital share transactions) and the purchases and sales of investments resulting from in-kind capital share transactions (excluding short-term investments) were as follows:
| In-kind Capital Share Transactions | ||||||||||||||||
| Fund | Purchases | Sales | Purchases | Sales | ||||||||||||
| Africa Index ETF | $ | 25,518,641 | $ | 27,607,576 | $ | — | $ | 3,831,997 | ||||||||
| Brazil Small-Cap ETF | 34,413,698 | 48,591,617 | — | 3,534,476 | ||||||||||||
| ChinaAMC CSI 300 ETF | 27,633,558 | 30,302,820 | — | — | ||||||||||||
| ChinaAMC SME-ChiNext ETF | 19,489,028 | 11,389,144 | — | — | ||||||||||||
| Egypt Index ETF | 28,700,838 | 30,426,914 | 4,250,209 | 4,228,709 | ||||||||||||
| India Small-Cap Index ETF | 78,014,163 | 102,920,785 | 261,512 | 869,595 | ||||||||||||
| Indonesia Index ETF | 4,221,041 | 4,275,241 | 1,104,653 | 6,736,042 | ||||||||||||
| Israel ETF | 7,648,299 | 8,180,993 | — | — | ||||||||||||
| Russia ETF | 201,203,237 | 206,399,320 | 409,966,329 | 830,001,819 | ||||||||||||
| Russia Small-Cap ETF | 10,789,286 | 11,333,971 | 2,374,902 | 8,871,778 | ||||||||||||
| Vietnam ETF | 228,371,623 | 138,674,838 | 13,794,957 | 3,014,471 | ||||||||||||
Note 6—Income Taxes—As of December 31, 2019, for Federal income tax purposes, the identified cost, gross unrealized appreciation, gross unrealized depreciation, and net unrealized appreciation (depreciation) of investments owned were as follows:
| Fund | Tax Cost of Investments | Gross Unrealized Appreciation | Gross Unrealized (Depreciation) | Net Unrealized Appreciation (Depreciation) | ||||||||||||
| Africa Index ETF | $ | 45,800,795 | $ | 11,131,020 | $ | (5,108,067 | ) | $ | 6,022,953 | |||||||
| Brazil Small-Cap ETF | 74,460,980 | 31,925,568 | (7,546,034 | ) | 24,379,534 | |||||||||||
| ChinaAMC CSI 300 ETF | 50,954,467 | 22,978,725 | (6,537,671 | ) | 16,441,054 | |||||||||||
| ChinaAMC SME-ChiNext ETF | 22,837,326 | 9,187,200 | (2,207,410 | ) | 6,979,790 | |||||||||||
| Egypt Index ETF | 31,701,472 | 4,547,643 | (5,556,890 | ) | (1,009,247 | ) | ||||||||||
| India Small-Cap Index ETF | 137,279,878 | 21,605,478 | (37,019,173 | ) | (15,413,695 | ) | ||||||||||
| Indonesia Index ETF | 48,730,933 | 6,867,939 | (14,778,345 | ) | (7,910,406 | ) | ||||||||||
| Israel ETF | 46,555,808 | 19,619,036 | (8,126,657 | ) | 11,492,379 | |||||||||||
| Russia ETF | 1,303,228,316 | 174,809,490 | (196,372,547 | ) | (21,563,057 | ) | ||||||||||
| Russia Small-Cap ETF | 38,480,760 | 4,927,297 | (6,854,321 | ) | (1,927,024 | ) | ||||||||||
| Vietnam ETF | 406,365,334 | 106,192,866 | (70,668,085 | ) | 35,524,781 | |||||||||||
At December 31, 2019, the components of total distributable earnings on a tax basis, for each Fund, were as follows:
| Fund | Undistributed Ordinary Income | Accumulated Capital Losses | Qualified Late-Year Losses* | Other Temporary Differences | Unrealized Appreciation (Depreciation) | Total Distributable Earnings | ||||||||||||||||||
| Africa Index ETF | $ | 437,644 | $ | (60,290,824 | ) | $ | — | $ | (11,318 | ) | $ | 6,023,114 | $ | (53,841,384 | ) | |||||||||
| Brazil Small-Cap ETF | 148,404 | (156,176,312 | ) | — | (34,983 | ) | 24,384,047 | (131,678,844 | ) | |||||||||||||||
| ChinaAMC CSI 300 ETF | 23,393 | (6,046,313 | ) | — | (4,678 | ) | 16,449,203 | 10,421,605 | ||||||||||||||||
| ChinaAMC SME-ChiNext ETF | — | (14,252,433 | ) | (4,290 | ) | (569 | ) | 6,979,282 | (7,278,010 | ) | ||||||||||||||
| Egypt Index ETF | — | (30,248,113 | ) | (56,338 | ) | (5,136 | ) | (1,008,924 | ) | (31,318,511 | ) | |||||||||||||
| India Small-Cap Index ETF | 178,050 | (53,823,933 | ) | — | (13,134 | ) | (15,415,133 | ) | (69,074,150 | ) | ||||||||||||||
| Indonesia Index ETF | — | (102,308,622 | ) | (762 | ) | (29,160 | ) | (7,910,398 | ) | (110,248,942 | ) | |||||||||||||
| Israel ETF | 92,479 | (8,960,659 | ) | — | (3,023 | ) | 11,492,612 | 2,621,409 | ||||||||||||||||
| Russia ETF | 13,155,992 | (1,424,696,275 | ) | — | (163,318 | ) | (21,558,213 | ) | (1,433,261,814 | ) | ||||||||||||||
| Russia Small-Cap ETF | 19,704 | (9,861,660 | ) | — | (2,799 | ) | (1,926,474 | ) | (11,771,229 | ) | ||||||||||||||
| Vietnam ETF | 39,215 | (267,338,121 | ) | — | (42,378 | ) | 35,527,725 | (231,813,559 | ) | |||||||||||||||
| * | Qualified late year losses incurred after October 31, 2019 are deemed to arise on January 1, 2020. |
| 71 |
VANECK VECTORS ETF TRUST
NOTES TO FINANCIAL STATEMENTS
(continued)
The tax character of dividends paid to shareholders were as follows:
| 2019 Dividends | 2018 Dividends | |||||||||||
| Fund | Ordinary Income** | Ordinary Income** | Long-Term Capital Gains | |||||||||
| Africa Index ETF | $ | 3,150,210 | $ | 924,000 | $ | — | ||||||
| Brazil Small-Cap ETF | 2,475,060 | 2,547,600 | — | |||||||||
| ChinaAMC CSI 300 ETF | 985,120 | 525,300 | 4,316,300 | |||||||||
| ChinaAMC SME-ChiNext ETF | 135,000 | — | — | |||||||||
| Egypt Index ETF | 650,037 | 560,463 | — | |||||||||
| India Small-Cap Index ETF | 1,600,209 | 216,823 | — | |||||||||
| Indonesia Index ETF | 850,140 | 975,800 | — | |||||||||
| Israel ETF | 800,085 | 349,800 | — | |||||||||
| Russia ETF | 73,500,780 | 68,511,950 | — | |||||||||
| Russia Small-Cap ETF | 1,625,031 | 1,440,098 | — | |||||||||
| Vietnam ETF | 3,336,840 | 2,610,800 | — | |||||||||
| ** | Includes short-term capital gains (if any) |
At December 31, 2019, the Funds had capital loss carryforwards available to offset future capital gains, as follow:
| Fund | Short-Term Capital Losses with No Expiration | Long-Term Capital Losses with No Expiration | Total | |||||||||
| Africa Index ETF | $ | (10,482,431 | ) | $ | (49,808,393 | ) | $ | (60,290,824 | ) | |||
| Brazil Small-Cap ETF | (22,088,693 | ) | (134,087,619 | ) | (156,176,312 | ) | ||||||
| ChinaAMC CSI 300 ETF | (1,492,992 | ) | (4,553,321 | ) | (6,046,313 | ) | ||||||
| ChinaAMC SME-ChiNext ETF | (8,882,601 | ) | (5,369,832 | ) | (14,252,433 | ) | ||||||
| Egypt Index ETF | (12,397,949 | ) | (17,850,164 | ) | (30,248,113 | ) | ||||||
| India Small-Cap Index ETF | (19,174,916 | ) | (34,649,017 | ) | (53,823,933 | ) | ||||||
| Indonesia Index ETF | (37,157,756 | ) | (65,150,866 | ) | (102,308,622 | ) | ||||||
| Israel ETF | (868,022 | ) | (8,092,637 | ) | (8,960,659 | ) | ||||||
| Russia ETF | (220,099,845 | ) | (1,204,596,430 | ) | (1,424,696,275 | ) | ||||||
| Russia Small-Cap ETF | (3,271,269 | ) | (6,590,391 | ) | (9,861,660 | ) | ||||||
| Vietnam ETF | (66,849,395 | ) | (200,488,726 | ) | (267,338,121 | ) | ||||||
During the year ended December 31, 2019, Brazil Small-Cap ETF and Israel ETF utilized $8,189,563 and $40,045 of their capital loss carryovers available from prior years.
During the year ended December 31, 2019, as a result of permanent book to tax differences, primarily due to the tax treatment of gains/losses from securities redeemed in-kind, the Funds incurred differences that affected distributable earnings and aggregate paid in capital by the amounts in the table below. Net assets were not affected by these reclassifications.
| Fund | Increase (Decrease) in Distributable Earnings | Increase (Decrease) in Aggregate Paid in Capital | ||||||
| Africa Index ETF | $ | (1,058,432 | ) | $ | 1,058,432 | |||
| Brazil Small-Cap ETF | (476,505 | ) | 476,505 | |||||
| ChinaAMC CSI 300 ETF | — | — | ||||||
| ChinaAMC SME-ChiNext ETF | 9,242 | (9,242 | ) | |||||
| Egypt Index ETF | (189,234 | ) | 189,234 | |||||
| India Small-Cap Index ETF | 171,849 | (171,849 | ) | |||||
| Indonesia Index ETF | (404,280 | ) | 404,280 | |||||
| Israel ETF | — | — | ||||||
| Russia ETF | (89,239,018 | ) | 89,239,018 | |||||
| Russia Small-Cap ETF | (132,802 | ) | 132,802 | |||||
| Vietnam ETF | (950,984 | ) | 950,984 | |||||
| 72 |
The Funds recognize the tax benefits of uncertain tax positions only where the position is “more-likely-than-not” to be sustained assuming examination by applicable tax authorities. Management has analyzed the Funds’ tax positions, and has concluded that no liability for unrecognized tax benefits should be recorded related to uncertain tax positions taken on return filings for all open tax years. The Funds do not have exposure for additional years that might still be open in certain foreign jurisdictions. Therefore, no provision for income tax is required in the Funds’ financial statements. However, the Funds are subject to foreign taxes on the appreciation in value of certain investments. The Funds provide for such taxes on both realized and unrealized appreciation.
The Funds recognize interest and penalties, if any, related to uncertain tax positions as income tax expense in the Statements of Operations. During the year ended December 31, 2019, the Funds did not incur any interest or penalties.
Investments in China:Uncertainties in the Chinese tax rules governing taxation of income and gains from investments in A-Shares could result in unexpected tax liabilities for the ChinaAMC CSI 300 ETF and ChinaAMC SME-ChiNext ETF (the “Funds”). China generally imposes withholding income tax (“WHT”) at a rate of 10% on dividends and interest (excluding government bond interest) derived by non-People’s Republic of China (“PRC”) resident enterprises (including a Qualified Foreign Institutional Investor (“QFII”) and a Renminbi Qualified Foreign Institutional Investor (“RQFII”)) from issuers residing in China. However, on November 7, 2018, the PRC Ministry of Finance (“MOF”) and PRC State Administration of Taxation (“SAT”) jointly issued Caishui [2018] 108 (Circular 108) to clarify the temporary three-year tax exemption on bond interest derived by foreign institutional investors (“FIIs”). Pursuant to Circular 108, FIIs are temporarily exempt from withholding income tax and value added tax with respect to bond interest income derived in the domestic bond market (via QFII, RQFII, CIBM and Hong Kong Bond Connect) from November 7, 2018 to November 6, 2021. China also imposes WHT at a rate of 10% on capital gains derived by non-PRC resident enterprises from the disposal in shares of PRC enterprises. Effective November 17, 2014, investments through the Hong Kong-Shanghai Stock Connect program, QFIIs and RQFIIs, which includes these Funds, were exempted temporarily from WHT with respect to gains derived from the trading of equity investments (including A-shares). However, uncertainties remain regarding the taxation of capital gains in China. PRC rules for taxation of RQFIIs (and QFIIs) and the PRC tax regulations to be issued by the PRC State Administration of Taxation and/or PRC MOF to clarify the subject matter may apply retrospectively, even if such rules are adverse to the nonresident investors. If the PRC tax authorities were to issue differing formal guidance or tax rules regarding the taxation of capital gains derived by QFIIs, RQFIIs and other nonresident investors WHT on gains from such investments the Funds could be subject to additional tax liabilities.
Investments in India:The Finance Act, 2012 introduced a general anti-avoidance rule (“GAAR”), which became effective from April 1, 2017. GAAR is applicable where the main purpose of an arrangement is tax avoidance and empowers Indian tax authorities to declare such an arrangement as an impermissible avoidance arrangement. Additionally, on May 10, 2016, the Governments of India and Mauritius signed the Protocol for amending the tax treaty between India and Mauritius. The renegotiation of the treaty clarified the applicability of GAAR to a Mauritius subsidiary deemed a tax resident of Mauritius. As per the Protocol, India commenced taxation on capital gains arising from disposition of shares acquired on or after April 1, 2017 in a company resident in India, with shares acquired on or before March 31, 2017 being grandfathered as exempt from capital gains taxation. Additionally, the Finance Act (2018) provided that long-term capital gains from listed equity shares sold after April 1, 2018 which were previously exempt from capital gains tax are now subject to a tax of 10% (plus applicable surcharge and education cess). Taxpayers received a cost step-up to the fair market value of shares held on January 31, 2018 provided the shares had unrealized gains as of that date. In summary, capital gains on shares purchased after April 1, 2018 for India Small-Cap Index Fund will now be subject to a capital gains tax of 15% on short-term capital gains and 10% on long-term capital gains (plus applicable surcharges and cess). Existing Indian capital loss carryforwards may be utilized to offset capital gains realized on securities acquired after April 1, 2017. These changes may reduce the return to the India Small-Cap Index ETF on its investments made after April 1, 2017 and the return received by Fund shareholders.
Note 7—Principal Risks—The investment objective of each Fund is to seek investment results that correspond generally to the price and yield performance, before fees and expenses, of its underlying index, as indicated in the name of each Fund. The Adviser uses a “passive” or index approach to achieve each Fund’s investment objective by investing in a portfolio of securities that generally replicates the Fund’s index. Each of the Funds (except Africa Index ETF, Brazil Small-Cap ETF, ChinaAMC CSI 300 ETF, ChinaAMC SME-ChiNext ETF and India Small-Cap Index ETF) is classified as a non-diversified fund under the 1940 Act. Non-diversified funds generally hold securities of fewer issuers than diversified funds and may be more susceptible to the risks associated with these particular issuers, or to a single
| 73 |
VANECK VECTORS ETF TRUST
NOTES TO FINANCIAL STATEMENTS
(continued)
economic, political or regulatory occurrence affecting these issuers. The Funds may purchase securities on foreign exchanges. Securities of foreign issuers involve special risks and considerations not typically associated with investing in U.S. issuers. These risks include devaluation of currencies, currency controls, less reliable information about issuers, different securities transaction clearance and settlement practices, future adverse political and economic developments and local/regional conflicts or natural or other disasters, such as the recent coronavirus outbreak. These risks are heightened for investments in emerging market countries. Moreover, securities of many foreign issuers and their markets may be less liquid and their prices more volatile than those of comparable U.S. issuers. In addition, for Africa Index ETF and Egypt Index ETF there may be limitations or delays in the convertibility or repatriation of certain African currencies, which would adversely affect the U.S. dollar value and/or liquidity of the Fund’s investments denominated in such African currencies, may impair the Fund’s ability to achieve its investment objective and/or may impede the Fund’s ability to satisfy redemption requests in timely manner.
As a result of certain events, the United States and the European Union (“EU”) have imposed sanctions on certain Russian individuals and companies. These sanctions do not currently impact the Funds. Additional economic sanctions may be imposed or other actions may be taken that may adversely affect the value and liquidity of the Russian-related issuers’ held by the Funds.
Should the Chinese government impose restrictions on the ability of ChinaAMC CSI 300 ETF and ChinaAMC SME-ChiNext ETF to repatriate funds associated with direct investment in A-Shares, the Funds may be unable to satisfy distribution requirements applicable to regulated investment companies (“RICs”) under the Internal Revenue Code of 1986, as amended, and the Funds may therefore be subject to Fund-level U.S. federal taxes.
A more complete description of risks is included in each Fund’s Prospectus and Statement of Additional Information.
Note 8—Trustee Deferred Compensation Plan—The Trust has a Deferred Compensation Plan (the “Plan”) for Trustees under which the Trustees can elect to defer receipt of their trustee fees until retirement, disability or termination from the Board of Trustees. The fees otherwise payable to the participating Trustees are deemed invested in shares of the Funds as directed by the Trustees.
The expense for the Plan is included in “Trustees’ fees and expenses” in the Statements of Operations. The liability for the Plan is shown as “Deferred Trustee fees” in the Statements of Assets and Liabilities.
Note 9—Securities Lending—To generate additional income, each of the Funds may lend its securities pursuant to a securities lending agreement with the securities lending agent. Each Fund may lend up to 33% of its investments requiring that the loan be continuously collateralized by cash, cash equivalents, U.S. government securities, or any combination of cash and such securities at all times equal to at least 102% (105% for foreign securities) of the market value plus accrued interest on the securities loaned. Daily market fluctuations could cause the value of loaned securities to be more or less than the value of the collateral received. When this occurs, the collateral is adjusted and settled on the next business day. During the term of the loan, the Funds will continue to receive any dividends, interest or amounts equivalent thereto, on the securities loaned while receiving a fee from the borrower and/or earning interest on the investment of the cash collateral. Such fees and interest are shared with the securities lending agent under the terms of the securities lending agreement. Securities lending income is disclosed as such in the Statements of Operations. The cash collateral is maintained on the Funds’ behalf by the lending agent and is invested in the State Street Navigator Securities Lending Government Money Market Portfolio. Non-cash collateral consists of U.S. Treasuries and U.S. Government Agency securities, and is not disclosed in the Funds’ Schedules of Investments or Statements of Assets and Liabilities as it is held by the agent on behalf of the Funds, and the Funds do not have the ability to re-hypothecate those securities. Loans are subject to termination at the option of the borrower or the Funds. Upon termination of the loan, the borrower will return to the Fund securities identical to the securities loaned. The Funds bear the risk of delay in recovery of, or even loss of rights in, the securities loaned should the borrower of the securities fail financially. The value of loaned securities and related collateral outstanding at December 31, 2019 is presented on a gross basis in the Schedules of Investments and Statements of Assets and Liabilities. The following is a summary of the Funds’ securities on loan and related collateral as of December 31, 2019:
| 74 |
| Fund | Market Value of Securities on Loan | Cash Collateral | Non-Cash Collateral | Total Collateral | ||||||||||||
| Africa Index ETF | $ | 1,588,160 | $ | 916,922 | $ | 803,218 | $ | 1,720,140 | ||||||||
| Brazil Small-Cap ETF | 1,811,608 | 1,306,142 | 588,675 | 1,894,817 | ||||||||||||
| Israel ETF | 2,013,664 | 282,011 | 1,771,493 | 2,053,504 | ||||||||||||
| Russia ETF | 2,136,185 | 27,004 | 2,131,867 | 2,158,871 | ||||||||||||
| Russia Small-Cap ETF | 2,942,477 | 1,210,410 | 1,894,316 | 3,104,726 | ||||||||||||
| Vietnam ETF | 1,927,656 | — | 2,061,166 | 2,061,166 | ||||||||||||
The following table presents money market fund investments held as collateral by type of security on loan as of December 31, 2019:
| Gross Amount of Recognized Liabilities for Securities Loaned in the Statements of Assets and Liabilities* | ||||
| Fund | Equity Securities | |||
| Africa Index ETF | $ | 916,922 | ||
| Brazil Small-Cap ETF | 1,306,142 | |||
| Israel ETF | 282,011 | |||
| Russia ETF | 27,004 | |||
| Russia Small-Cap ETF | 1,210,410 | |||
| * | Remaining contractual maturity of the agreements: overnight and continuous |
Note 10—Bank Line of Credit—The Funds may participate in a $200 million committed credit facility (the “Facility”) to be utilized for temporary financing until the settlement of sales or purchases of portfolio securities, the repurchase or redemption of shares of the Funds at the request of the shareholders and other temporary or emergency purposes. The Funds have agreed to pay commitment fees, pro rata, based on the unused but available balance. Interest is charged to the Funds at rates based on prevailing market rates in effect at the time of borrowings. During the year ended December 31, 2019, the following Funds borrowed under this Facility:
| Fund | Days Outstanding | Average Daily Loan Balance | Average Interest Rate | Outstanding Loan Balance as of December 31, 2019 | ||||||||||||
| Africa Index ETF | 92 | $ | 346,353 | 3.74 | % | $ | 467,385 | |||||||||
| Brazil Small-Cap ETF | 310 | 1,064,324 | 3.70 | 2,000,930 | ||||||||||||
| ChinaAMC CSI 300 ETF | 343 | 2,431,753 | 3.64 | — | ||||||||||||
| ChinaAMC SME-ChiNext ETF | 1 | 1,478,981 | 3.80 | — | ||||||||||||
| Egypt Index ETF | 219 | 827,168 | 3.67 | — | ||||||||||||
| India Small-Cap Index ETF | 306 | 1,532,041 | 3.59 | — | ||||||||||||
| Indonesia Index ETF | 2 | 446,915 | 3.65 | — | ||||||||||||
| Israel ETF | 130 | 528,403 | 3.65 | — | ||||||||||||
| Russia ETF | 242 | 6,727,015 | 3.63 | 4,886,486 | ||||||||||||
| Russia Small-Cap ETF | 148 | 393,690 | 3.83 | — | ||||||||||||
| Vietnam ETF | 321 | 3,812,842 | 3.61 | 475,303 | ||||||||||||
Note 11—Recent Accounting Pronouncements—The Funds early adopted certain provisions of Accounting Standards Update No. 2018-13Disclosure Framework—Changes to the Disclosure Requirements for Fair Value Measurement(“ASU 2018-13”) that eliminate and modify certain disclosure requirements for fair value measurements. The adoption of certain provisions of the ASU 2018-13 had no material effect on financial statements and related disclosures. Management is currently evaluating the potential impact of additional requirements, not yet adopted, of the ASU 2018-13 to financial statements. Public companies will be required to disclose the range and weighted average used to develop significant unobservable inputs for Level 3 fair value measurements. ASU 2018-13 is effective for fiscal years beginning after December 15, 2019 and for interim periods within those fiscal years.
Note 12—Subsequent Event Review—The Funds have evaluated subsequent events and transactions for potential recognition or disclosure through the date the financial statements were issued.
| 75 |
REPORT OF INDEPENDENT REGISTERED PUBLIC ACCOUNTING FIRM
To the Shareholders of VanEck Vectors Africa Index ETF, VanEck Vectors Brazil Small-Cap ETF, VanEck Vectors ChinaAMC CSI 300 ETF, VanEck Vectors ChinaAMC SME-ChiNext ETF, VanEck Vectors Egypt Index ETF, VanEck Vectors India Small-Cap Index ETF, VanEck Vectors Indonesia Index ETF, VanEck Vectors Israel ETF, VanEck Vectors Russia ETF, VanEck Vectors Russia Small-Cap ETF and VanEck Vectors Vietnam ETF and the Board of Trustees of VanEck Vectors ETF Trust.
Opinion on the Financial Statements
We have audited the accompanying statements of assets and liabilities (consolidated as it relates to VanEck Vectors India Small-Cap Index ETF) of VanEck Vectors Africa Index ETF, VanEck Vectors Brazil Small-Cap ETF, VanEck Vectors ChinaAMC CSI 300 ETF, VanEck Vectors ChinaAMC SME-ChiNext ETF, VanEck Vectors Egypt Index ETF, VanEck Vectors India Small-Cap Index ETF, VanEck Vectors Indonesia Index ETF, VanEck Vectors Israel ETF, VanEck Vectors Russia ETF, VanEck Vectors Russia Small-Cap ETF and VanEck Vectors Vietnam ETF (collectively referred to as the “Funds”) (eleven of the series constituting VanEck Vectors ETF Trust (the “Trust”)), including the schedules of investments (consolidated as it relates to VanEck Vectors India Small-Cap Index ETF), as of December 31, 2019, and the related statements of operations (consolidated as it relates to VanEck Vectors India Small-Cap Index ETF) for the year then ended, the statements of changes in net assets (consolidated as it relates to VanEck Vectors India Small-Cap Index ETF) for each of the two years in the period then ended, the financial highlights (consolidated as it relates to VanEck Vectors India Small-Cap Index ETF) for each of the five years in the period then ended and the related notes (collectively referred to as the “financial statements”). In our opinion, the financial statements present fairly, in all material respects, the financial position (consolidated as it relates to VanEck Vectors India Small-Cap Index ETF) of each of the Funds (eleven of the series constituting VanEck Vectors ETF Trust) at December 31, 2019, and the results of their operations for the year then ended (consolidated as it relates to VanEck Vectors India Small-Cap Index ETF), the changes in net assets (consolidated as it relates to VanEck Vectors India Small-Cap Index ETF) for each of the two years in the period then ended and financial highlights (consolidated as it relates to VanEck Vectors India Small-Cap Index ETF) for each of the five years in the period then ended, in conformity with U.S. generally accepted accounting principles.
Basis for Opinion
These financial statements are the responsibility of the Trust’s management. Our responsibility is to express an opinion on each of the Funds’ financial statements based on our audits. We are a public accounting firm registered with the Public Company Accounting Oversight Board (United States) (“PCAOB”) and are required to be independent with respect to the Trust in accordance with the U.S. federal securities laws and the applicable rules and regulations of the Securities and Exchange Commission and the PCAOB.
We conducted our audits in accordance with the standards of the PCAOB. Those standards require that we plan and perform the audit to obtain reasonable assurance about whether the financial statements are free of material misstatement, whether due to error or fraud. The Trust is not required to have, nor were we engaged to perform, an audit of the Trust’s internal control over financial reporting. As part of our audits, we are required to obtain an understanding of internal control over financial reporting, but not for the purpose of expressing an opinion on the effectiveness of the Trust’s internal control over financial reporting. Accordingly, we express no such opinion.
Our audits included performing procedures to assess the risks of material misstatement of the financial statements, whether due to error or fraud, and performing procedures that respond to those risks. Such procedures included examining, on a test basis, evidence regarding the amounts and disclosures in the financial statements. Our procedures included confirmation of securities owned as of December 31, 2019, by correspondence with the custodian and brokers or by other appropriate auditing procedures where replies from broker were not received. Our audits also included evaluating the accounting principles used and significant estimates made by management, as well as evaluating the overall presentation of the financial statements. We believe that our audits provide a reasonable basis for our opinion.

We have served as the auditor of one or more of the VanEck investment companies since 1999.
New York, New York
February 27, 2020
| 76 |
VANECK VECTORS ETF TRUST
(unaudited)
The following information is provided with respect to the distributions paid during the taxable year ended December 31, 2019
| Africa Index ETF | Brazil Small-Cap ETF | ChinaAMC CSI 300 ETF | ChinaAMC SME-ChiNext ETF | Egypt Index ETF | India Small-Cap Index ETF | |||||||||||||||||||||||||
| Record Date | 12/24/2019 | 12/24/2019 | 12/24/2019 | 12/24/2019 | 12/24/2019 | 12/24/2019 | ||||||||||||||||||||||||
| Ex Date | 12/23/2019 | 12/23/2019 | 12/23/2019 | 12/23/2019 | 12/23/2019 | 12/23/2019 | ||||||||||||||||||||||||
| Payable Date | 12/30/2019 | 12/30/2019 | 12/30/2019 | 12/30/2019 | 12/30/2019 | 12/30/2019 | ||||||||||||||||||||||||
| Ordinary Income Per Share | $ | 1.285800 | $ | 0.697200 | $ | 0.615700 | $ | 0.135000 | $ | 0.604700 | $ | 0.423900 | ||||||||||||||||||
| Ordinary Income: | ||||||||||||||||||||||||||||||
| Qualified Dividend Income for Individuals | 30.07 | %* | 6.97 | %* | 100.00 | %* | 100.00 | %* | 100.00 | %* | 100.00 | %* | ||||||||||||||||||
| Dividends Qualifying for the Dividends Received Deduction for Corporations | — | — | — | — | — | — | ||||||||||||||||||||||||
| Foreign Source Income | 81.73 | %* | 92.64 | %* | 100.00 | %* | 88.94 | %* | 100.00 | %* | 100.00 | %* | ||||||||||||||||||
| Foreign Taxes Paid Per Share | $ | 0.081936 | ** | $ | 0.032093 | ** | $ | 0.109324 | ** | $ | 0.032068 | ** | $ | 0.116700 | ** | $ | 0.010165 | ** | ||||||||||||
| Indonesia Index ETF | Israel ETF | Russia ETF | Russia Small-Cap ETF | Vietnam ETF | ||||||||||||||||||||||||||
| Record Date | 12/24/2019 | 12/24/2019 | 12/24/2019 | 12/24/2019 | 12/24/2019 | 12/31/2019 | ||||||||||||||||||||||||
| Ex Date | 12/23/2019 | 12/23/2019 | 12/23/2019 | 12/23/2019 | 12/23/2019 | 12/30/2019 | ||||||||||||||||||||||||
| Payable Date | 12/30/2019 | 12/30/2019 | 12/30/2019 | 12/30/2019 | 12/30/2019 | 1/6/2020 | ||||||||||||||||||||||||
| Ordinary Income Per Share | $ | 0.472300 | $ | 0.484900 | $ | 1.416200 | $ | 1.652600 | $ | 0.105100 | $ | 0.015800 | ||||||||||||||||||
| Ordinary Income: | ||||||||||||||||||||||||||||||
| Qualified Dividend Income for Individuals | 100.00 | %* | 74.28 | %* | 25.04 | %* | 32.13 | %* | 47.77 | %* | 47.73 | %* | ||||||||||||||||||
| Dividends Qualifying for the Dividends Received Deduction for Corporations | — | 0.71 | %* | — | — | — | — | |||||||||||||||||||||||
| Foreign Source Income | 99.28 | %* | 61.90 | %* | 97.11 | %* | 99.16 | %* | 100.00 | %* | 100.00 | %* | ||||||||||||||||||
| Foreign Taxes Paid Per Share | $ | 0.086796 | ** | $ | 0.105617 | ** | $ | 0.210841 | $ | 0.138012 | ** | $ | 0.007716 | ** | $ | 0.001160 | ** | |||||||||||||
| * | Expressed as a percentage of the ordinary income distribution grossed up for foreign taxes. |
| ** | The foreign taxes paid represent taxes incurred by the Fund on income received by the Fund from foreign sources. Foreign taxes paid may be included in taxable income with an offsetting deduction from gross income or may be taken as a credit for taxes paid to foreign governments. You should consult your tax adviser regarding the appropriate treatment of foreign taxes paid. |
Please consult your tax advisor for proper treatment of this information.
| 77 |
VANECK VECTORS ETF TRUST
BOARD OF TRUSTEES AND OFFICERS
December 31, 2019 (unaudited)
| Name, Address1 and Year of Birth | Position(s) Held with the Trust | Term of Office2and Length of Time Served | Principal Occupation(s) During Past Five Years | Number of Portfolios in Fund Complex3 Overseen | Other Directorships Held By Trustee During Past Five Years | |||||
| Independent Trustees | ||||||||||
| David H. Chow, 1957*† | Chairman Trustee | Since 2008 Since 2006 | Founder and CEO, DanCourt Management LLC (financial/strategy consulting firm and Registered Investment Adviser), March 1999 to present. | 55 | Director, Forward Management LLC and Audit Committee Chairman, May 2008 to June 2015; Trustee, Berea College of Kentucky, May 2009 to present and currently Chairman of the Investment Committee; Member of the Governing Council of the Independent Directors Council, October 2012 to present; President, July 2013 to June 2015, and Board Member of the CFA Society of Stamford, July 2009 to present; Trustee, MainStay Fund Complex4, January 2016 to present and currently Chairman of the Risk and Compliance Committee. | |||||
| Laurie A. Hesslein, 1959*† | Trustee | Since 2019 | Citigroup, Managing Director and Business Head, Local Consumer Lending North America, CEO and President, CitiFinancial Servicing LLC (2013 - 2017). | 55 | Trustee, Eagle Growth and Income Opportunities Fund; Trustee, THL Credit Senior Loan Fund. | |||||
| R. Alastair Short, 1953*† | Trustee | Since 2006 | President, Apex Capital Corporation (personal investment vehicle). | 66 | Chairman and Independent Director, EULAV Asset Management; Trustee, Kenyon Review; Trustee, Children’s Village. Formerly, Independent Director, Tremont offshore funds. | |||||
| Peter J. Sidebottom, 1962*† | Trustee | Since 2012 | Lead Partner, North America Banking and Capital Markets Strategy, Accenture, May 2017 to present; Partner, PWC/Strategy & Financial Services Advisory, February 2015 to March 2017; Founder and Board Member, AspenWoods Risk Solutions, September 2013 to February 2016; Independent consultant, June 2013 to February 2015; Partner, Bain & Company (management consulting firm), April 2012 to December 2013; Executive Vice President and Senior Operating Committee Member, TD Ameritrade (on-line brokerage firm), February 2009 to January 2012. | 55 | Board Member, Special Olympics, New Jersey, November 2011 to September 2013; Director, The Charlotte Research Institute, December 2000 to 2009; Board Member, Social Capital Institute, University of North Carolina Charlotte, November 2004 to January 2012; Board Member, NJ-CAN, July 2014 to 2016. | |||||
| Richard D. Stamberger, 1959*† | Trustee | Since 2006 | President and CEO, SmartBrief, LLC (business media company). | 66 | Director, Food and Friends, Inc. | |||||
| Interested Trustee | ||||||||||
| Jan F. van Eck, 19635 | Trustee, Chief Executive Officer and President | Trustee (Since 2006); Chief Executive Officer and President (Since 2009) | Director, President and Chief Executive Officer of Van Eck Associates Corporation (VEAC), Van Eck Absolute Return Advisers Corporation (VEARA) and Van Eck Securities Corporation (VESC); Officer and/or Director of other companies affiliated with VEAC and/or the Trust | 55 | Director, National Committee on US-China Relations. | |||||
| 1 | The address for each Trustee and officer is 666 Third Avenue, 9th Floor, New York, New York 10017. |
| 2 | Each Trustee serves until resignation, death, retirement or removal. Officers are elected yearly by the Trustees. |
| 3 | The Fund Complex consists of the VanEck Funds, VanEck VIP Trust and the Trust. |
| 4 | The MainStay Fund Complex consists of MainStay Funds, MainStay Funds Trust, MainStay VP Funds Trust and MainStay MacKay Defined Term Municipal Opportunities Fund. |
| 5 | “Interested person” of the Trust within the meaning of the 1940 Act. Mr. van Eck is an officer of VEAC, VEARA and VESC. |
| * | Member of the Audit Committee. |
| † | Member of the Nominating and Corporate Governance Committee. |
| 78 |
| Officer’s Name, Address1and Year of Birth | Position(s) Held with the Trust | Term of Office2 and Length of Time Served | Principal Occupation(s) During Past Five Years | |||
| Officer Information | ||||||
| Matthew A. Babinsky, 1983 | Assistant Vice President and Assistant Secretary | Since 2016 | Assistant Vice President, Assistant General Counsel and Assistant Secretary of VEAC, VEARA and VESC; Officer of other investment companies advised by VEAC and VEARA. Formerly, Associate, Clifford Chance US LLP. | |||
| Russell G. Brennan, 1964 | Assistant Vice President and Assistant Treasurer | Since 2008 | Assistant Vice President of VEAC; Officer of other investment companies advised by VEAC and VEARA. | |||
| Charles T. Cameron, 1960 | Vice President | Since 2006 | Portfolio Manager of VEAC; Officer and/or Portfolio Manager of other investment companies advised by VEAC and VEARA. Formerly, Director of Trading of VEAC. | |||
| John J. Crimmins, 1957 | Vice President, Treasurer, Chief Financial Officer and Principal Accounting Officer | Vice President, Chief Financial Officer and Principal Accounting Officer (Since 2012); Treasurer (Since 2009) | Vice President of VEAC and VEARA; Officer of other investment companies advised by VEAC and VEARA. Formerly, Vice President of VESC. | |||
| Eduardo Escario, 1975 | Vice President | Since 2012 | Regional Director, Business Development/Sales for Southern Europe and South America of VEAC. | |||
| Henry Glynn, 1983 | Assistant Vice President | Since 2018 | Head of ETF Capital Markets Europe of Van Eck Switzerland AG. Formerly, Member of the Capital Markets team at Vanguard Group. | |||
| F. Michael Gozzillo, 1965 | Chief Compliance Officer | Since 2018 | Vice President and Chief Compliance Officer of VEAC and VEARA; Chief Compliance Officer of VESC; Officer of other investment companies advised by VEAC and VEARA. Formerly, Chief Compliance Officer of City National Rochdale, LLC and City National Rochdale Funds. | |||
| Laura Hamilton, 1977 | Vice President | Since 2019 | Assistant Vice President of VEAC and VESC; Officer of other investment companies advised by VEAC and VEARA. Formerly, Operations Manager of Royce & Associates. | |||
| Nicholas Jackson, 1974 | Assistant Vice President | Since 2018 | Vice President, Business Development of VanEck Australia Pty Ltd. | |||
| Laura I. Martínez, 1980 | Vice President and Assistant Secretary | Vice President (Since 2016); Assistant Secretary (Since 2008) | Vice President, Associate General Counsel and Assistant Secretary of VEAC, VEARA and VESC; Officer of other investment companies advised by VEAC and VEARA. Formerly, Assistant Vice President of VEAC, VEARA and VESC. | |||
| Matthew McKinnon, 1970 | Assistant Vice President | Since 2018 | Head of Business Development of Asia Pacific of VanEck Australia Pty Ltd. Formerly, Director, Intermediaries and Institutions of VanEck Australia Pty Ltd. | |||
| Arian Neiron, 1979 | Vice President | Since 2018 | Managing Director and Head of Asia Pacific of VanEck Australia Pty Ltd.; Officer and/or Director of other companies affiliated with VEAC and/or the Trust. | |||
| James Parker, 1969 | Assistant Treasurer | Since 2014 | Assistant Vice President of VEAC; Manager, Portfolio Administration of VEAC and VEARA. Officer of other investment companies advised by VEAC and VEARA. | |||
| Adam Phillips, 1970 | Vice President | Since 2018 | ETF Chief Operating Officer of VEAC; Director of other companies affiliated with VEAC. | |||
| Philipp Schlegel, 1974 | Vice President | Since 2016 | Managing Director of Van Eck Switzerland AG. | |||
| Jonathan R. Simon, 1974 | Senior Vice President, Secretary and Chief Legal Officer | Senior Vice President (Since 2016); Secretary and Chief Legal Officer (Since 2014) | Senior Vice President, General Counsel and Secretary of VEAC, VEARA and VESC; Officer and/or Director of other companies affiliated with VEAC and/or the Trust. Formerly, Vice President of VEAC, VEARA and VESC. |
| 1 | The address for each Officer is 666 Third Avenue, 9th Floor, New York, New York 10017. |
| 2 | Officers are elected yearly by the Trustees. |
| 79 |
This report is intended for the Funds’ shareholders. It may not be distributed to prospective investors unless it is preceded or accompanied by a VanEck Vectors ETF Trust (the “Trust”) prospectus and summary prospectus, which includes more complete information. Investing involves substantial risk and high volatility, including possible loss of principal. An investor should consider the investment objective, risks, charges and expenses of the Fund carefully before investing. To obtain a prospectus and summary prospectus, which contains this and other information, call 800.826.2333 or visit vaneck.com. Please read the prospectus and summary prospectus carefully before investing.
Additional information about the Trust’s Board of Trustees/Officers and a description of the policies and procedures the Trust uses to determine how to vote proxies relating to portfolio securities are provided in the Statement of Additional Information. The Statement of Additional Information and information regarding how the Trust voted proxies relating to portfolio securities during the most recent twelve month period ending June 30 is available, without charge, by calling 800.826.2333, or by visiting vaneck.com, or on the Securities and Exchange Commission’s website at http://www.sec.gov.
The Trust files its complete schedule of portfolio holdings with the Securities and Exchange Commission for the first and third quarters of each fiscal year on Form N-PORT. The Trust’s Form N-PORT filings are available on the Commission’s website at http://www.sec.gov and may be reviewed and copied at the Commission’s Public Reference Room in Washington, D.C. Information on the operation of the Public Reference Room may be obtained by calling 202.942.8090. The Funds’ complete schedules of portfolio holdings are also available by calling 800.826.2333 or by visiting vaneck.com.

| Investment Adviser: | Van Eck Associates Corporation | |
| Distributor: | Van Eck Securities Corporation 666 Third Avenue, New York, NY 10017 vaneck.com | |
| Account Assistance: | 800.826.2333 | INTLAR |
| ANNUAL REPORT December 31, 2019 |
VANECK VECTORS®
| Agribusiness ETF | MOO® |
| Coal ETF | KOL® |
| Gold Miners ETF | GDX® |
| Junior Gold Miners ETF | GDXJ® |
| Low Carbon Energy ETF | SMOG® |
| Natural Resources ETF | HAP® |
| Oil Refiners ETF | CRAK® |
| Oil Services ETF | OIH® |
| Rare Earth/Strategic Metals ETF | REMX® |
| Steel ETF | SLX® |
| Unconventional Oil & Gas ETF | FRAK® |
| Uranium+Nuclear Energy ETF | NLR® |
| 800.826.2333 | vaneck.com |
Certain information contained in this report represents the opinion of the investment adviser which may change at any time. This information is not intended to be a forecast of future events, a guarantee of future results or investment advice. Current market conditions may not continue. The information contained herein regarding each index has been provided by the relevant index provider. Also, unless otherwise specifically noted, any discussion of the Funds’ holdings, the Funds’ performance, and the views of the investment adviser are as of December 31, 2019.
VANECK VECTORS ETFs
December 31, 2019 (unaudited)
Dear Shareholders:
The story for 2019 was simple and familiar—slower economic growth was combated by expansive monetary policy.
But first a comment on global growth: the two engines of the global economy, the U.S. and China, continue to move forward and we now have the prospect of at least some resolution of the trade dispute between them in the phase-one agreement. The latest economic statistics from China are steady and there are signs of “green shoots.” China’s services sector is expanding robustly and manufacturing is struggling, but not collapsing. My blog,China’s Economic Growth: Continuing Despite Headlines, shows this in two charts.
The biggest event in the markets last summer was the surge in bonds in Europe with negative interest rates. At the end of September, nearly $15 trillion worth of debt globally carried a negative yield.1 Despite moves by the European Central Bank to stimulate, not only is the European economy slowing down, but there are also concerns about just how effective central bank actions are. Looking forward, therefore, I think investors should assess their hedge against central bank uncertainty by considering, for example, their gold allocations. While high interest rate environments tend to be tough for gold (it does not pay any yield), against negative interest rates, gold and other hedges against central bank impotence should be strongly considered.
We encourage you to stay in touch with us through the videos, email subscriptions and research blogs available on our website, www.vaneck.com. I have started my own email subscription where I share interesting research—you can sign up on www.vaneck.com. Should you have any questions regarding fund performance, please contact us at 800.826.2333 or visit ourwebsite.
We sincerely thank you for investing in VanEck’s investment strategies. On the following pages, you will find a performance discussion and financial statements for each of the funds for the twelve month period ended December 31, 2019. As always, we value your continued confidence in us and look forward to helping you meet your investment goals in the future.

Jan F. van Eck
CEO and President
VanEck Vectors ETF Trust
January 24, 2020
Investing involves substantial risk and high volatility, including possible loss of principal. An investor should consider the investment objective, risks, charges and expenses of the Funds carefully before investing. To obtain a prospectus and summary prospectus, which contain this and other information, call 800.826.2333 or visit vaneck.com. Please read the prospectus and summary prospectus carefully before investing.
| 1 | Financial Times: September was the busiest month ever for corporate debt issuance, September 30, 2019, https://www.ft.com/content/eef8234c-e3c0-11e9-b112-9624ec9edc59 |
| 1 |
VANECK VECTORS ETFs
December 31, 2019 (unaudited)
Agribusiness
From a low at the very start of the year, and following one dip at the end of May, agribusiness stocks essentially moved sideways and upward during 2019 without any other major ups or downs. The Fund finished the year returning 21.70% for the 12 month period. The primary drivers of positive performance were companies in the healthcare and consumer staples sectors. In the former, they were, in particular, those in the pharmaceuticals segment. In the latter, they were those in the food products segment. All sectors contributed positively to returns, with only a single segment, food and staples retailing (in the consumer staples sector), detracting from performance. By far the greatest positive returns came from companies in the U.S., while the greatest negative returns came from those in Australia and Chile.
Coal
Following a lackluster first six months in 2019, after the end of June, except for a single significant up-tick in mid-September, coal stocks declined through December, with a slight up-tick at the very end of the year. The Fund lost 13.77% for the 12 month period under review.
In mid-December the U.S. Energy Information Administration (EIA) expected U.S. coal production would total 697 MMst1in 2019 (down 8% from 2018) and 601 MMst in 2020 (down 14% from 2019).2U.S. coal exports were expected to total 93 million MMst in 2019 (down nearly 20% on 2018).3According to the EIA: “U.S. coking coal currently faces challenges from a global oversupply of steel, particularly in the fourth quarter of 2019. Steam coal exports have been dampened by high stockpiles in Europe and India, a top destination for U.S. shipments.”
The long-term benefits of any of the current U.S. Administration’s initiatives to provide support for the domestic coal industry continue to remain debatable. Over 2019, demonstrable benefits for coal companies, not least in the U.S., appeared even fewer. However, coal accounts for 27% of all energy used globally and for 38% of electricity generation, in addition to playing a crucial role in industries such as iron and steel.4While South Africa was the largest positive contributor to returns, its contribution was offset significantly by the negative contributions of the U.S., the single largest negative country contributor to returns, followed by those of Poland and Canada.
Gold Miners
Until the end of May 2019, the stocks of both major gold miners and their junior peers remained in the doldrums. Thereafter, on the back of falling U.S. interest rates and a rise in the price of gold, they appreciated significantly with the larger gold miners (VanEck Vectors Gold Miners ETF) posting a positive return of 40.15% and junior gold miners (VanEck Vectors Junior Gold Miners ETF) posting a positive return of 41.31% for the 12 month period.
Among the larger mining stocks, Canadian companies, with the largest average country weighting, contributed by far the most to performance. Only companies in Peru detracted from performance.
The situation was similar among the juniors, with Canada the strongest contributor, followed by South Africa. Mexico detracted the most from performance.
Low Carbon Energy
The performance of low carbon energy stocks during the 12 month period was encouraging, with the Fund recording a positive return of 37.38%. Companies in the industrial and information technology sectors contributed by far the most to performance. No sector detracted from performance. The U.S. was by far the best performing country. Only a single country, France, detracted from performance and then only minimally.
Natural Resources
The Fund returned 18.34% over the 12 months period under review. All sectors, except two, contributed positively to returns. While the materials and consumer staples sectors were the two largest contributors, the two detracting sectors, healthcare and financial, did so only minimally. Companies in the U.S. contributed by far the most to performance, while those in Chile detracted the most from performance.
| 2 |
Oil Refiners
Following weakness in the middle of the year, refining stocks picked up over the final four months of 2019, ending the 12 month period showing a gain of 9.19%. Refiners performed well with an improving crack spread and widening of the high/light sulfur fuel oil spread heading into the implementation of IMO 2020 (regulations mandating a maximum sulfur content of 0.5% in marine fuels globally) on January 1. There were also some seasonality impacts in November and December, with increased refinery utilization and products build.
Exposure to refiners in the U.S. contributed the majority of the Fund’s total positive return. Other significant contributors were: India, Finland, Austria and Australia. Poland, Japan and South Korea detracted the most from performance.
Oil Services
Having had a relatively strong first four months of 2019, oil services stocks declined into mid-August and demonstrated neither any very stable nor significant recovery thereafter. The result was that the Fund lost 3.35% over the full 12 month period.
During the year, drilling activity slowed substantially. While the Baker Hughes U.S. rig count stood at 1,083 at the end of 2018, by the end of 2019 it had dropped over 25% to 805. The count still remains considerably lower than its peak in the U.S. of over 1,900 prior to the oil glut and consequent price crash of 2015.5
The oil service stocks in the U.S., with the largest average country weighting, detracted the most from performance. Companies in the U.K. and Netherlands contributed positively, but only minimally, to performance.
Rare Earth and Strategic Metals
The Fund had another difficult year, gaining just 0.91%. Having hit highs at the end of February and early in April, stocks in the Fund’s portfolio declined (with only a little respite in the last week or so), through the end of the year. A number of companies contributed positively to returns, the largest such contribution coming from a company involved in the mining of cobalt, followed by others involved in either rare earths or titanium. The greatest detractors from performance were companies with mining operations and/or production involving vanadium and lithium. Mid-cap companies performed better than either their large- or small-cap peers (these last actually detracting from performance) during the period under review.
Steel
In 2019, steel stocks continued to experience a number of quite violent ups and downs, with the Fund’s NAV reaching highs above $42 and a low of approximately $31 over the course of the year. However, the Fund ended the year under review recording a gain of 11.02%. The continuing trade dispute between the U.S. and both China and its ostensible allies did little to help the volatility not only of steel prices, but also those of steel stocks. Perhaps surprisingly, companies in the U.S., with the largest average country weighting, were the greatest contributors to performance. The country was followed by Brazil, with the second largest average weighting during the period under review, and then Australia. India was the greatest detractor from performance.
Unconventional Oil & Gas
Having hit a high toward the end of April, with an NAV of a little over $14, the Fund took a roller coaster ride down through November and into December, but still ended the period under review having gained 4.32%. Having ended 2018 at $45.41 a barrel, and reached a high of $66.30 on April 23, by the end of the year the front month West Texas Intermediate (WTI) crude oil price6had dropped nearly 8% to $61.06. Unconventional oil and gas, particularly shale oil, companies consequently had a challenging year. However, both U.S. companies (on average approximately 81% of the Fund by weight during the period under review) and Canadian contributed positively to performance.
| 3 |
VANECK VECTORS ETFs
MANAGEMENT DISCUSSION
(unaudited) (continued)
Uranium+Nuclear Energy
The Fund also had an unsettled year in 2019, ending the 12 month period slightly up with a gain of 0.44%. Industrial companies were the largest contributors to the Fund’s positive total return, with only the energy sector substantially offsetting and detracting from performance. Geographically, companies in the U.S. contributed the most to performance, while Japan was the greatest detractor from performance. According to the World Nuclear Association, in December 2019, there were some 444 operable nuclear power reactors in 30 countries and 54 power reactors currently under construction in 18 countries, notably China, Russia, India, South Korea, the UAE and the U.S.7
| * | Returns based on the funds’ net asset values (NAVs). |
| The principal risks of investing in VanEck Vectors ETFs include sector, market, economic, political, foreign currency, world event, index tracking and non-diversification risks, as well as fluctuations in net asset value and the risks associated with investing in less developed capital markets. The Funds may loan their securities, which may subject them to additional credit and counterparty risk. Please see the prospectus of each Fund for more complete information regarding each Fund’s specific risks. |
| 1 | One short ton = 2,000 lbs (907.19 kg). |
| 2 | EIA:Short-Term Energy Outlook(Dated: December 10, 2018), https://www.eia.gov/outlooks/steo/report/coal.cfm |
| 3 | Ibid. |
| 4 | International Energy Agency: Coal 2018, December 2018, https://www.iea.org/reports/coal-2018 |
| 5 | Baker Hughes:Baker Hughes Rig Count,http://phx.corporate-ir.net/phoenix.zhtml?c=79687&p=irol-rigcountsoverview |
| 6 | Front month: “Used in the context of options and futures, the term Front Month means the month closest to delivery (futures) or expiration (options)—which is often in the same month.” www.wikinvest.com/wiki/Front_Month |
| 7 | World Nuclear Association: World Nuclear Power Reactors & Uranium Requirements, December 2019, https://www.world-nuclear.org/information-library/facts-and-figures/world-nuclear-power-reactors-archive/reactor-archive-december-2019.aspx |
| 4 |
VANECK VECTORS AGRIBUSINESS ETF
December 31, 2019 (unaudited)
| Average Annual Total Returns | Cumulative Total Returns | ||||||||||||
| Share Price | NAV | MVMOOTR1 | Share Price | NAV | MVMOOTR1 | ||||||||
| One Year | 22.36% | 21.70% | 22.00% | 22.36% | 21.70% | 22.00% | |||||||
| Five Year | 7.52% | 7.45% | 7.34% | 43.71% | 43.24% | 42.52% | |||||||
| Ten Year | 6.46% | 6.46% | 6.57% | 86.96% | 86.98% | 88.98% | |||||||
| 1 | MVIS®Global Agribusiness Index (MVMOOTR) is a rules based index intended to give investors a means of tracking the overall performance of the companies in the global agribusiness industry. |
| Index data prior to March 18, 2013 reflects that of the DAXglobal Agribusiness Index (DXAG). From March 18, 2013, forward, the index data reflects that of the MVIS®Global Agribusiness Index (MVMOOTR). All Index history reflects a blend of the performance of the aforementioned Indexes. | |
| Hypothetical Growth of $10,000 | ||
| This chart shows the value of a hypothetical $10,000 investment in the Fund at NAV and at Share Price over the past 10 years. The result is compared with the Fund’s benchmark. | 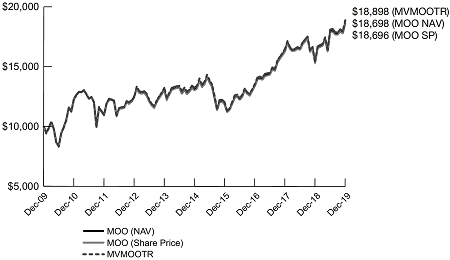 |
Past performance is no guarantee of future results. Performance results do not reflect the deduction of taxes that a shareholder would pay on fund distributions or on the redemption or sale of fund shares.
See “About Fund Performance” on page 17 for more information.
| 5 |
PERFORMANCE COMPARISON
December 31, 2019 (unaudited)
| Average Annual Total Returns | Cumulative Total Returns | ||||||||||||
| Share Price | NAV | MVKOLTR1 | Share Price | NAV | MVKOLTR1 | ||||||||
| One Year | (12.86)% | (13.77)% | (13.66)% | (12.86)% | (13.77)% | (13.66)% | |||||||
| Five Year | (2.74)% | (2.75)% | (2.49)% | (12.96)% | (13.01)% | (11.87)% | |||||||
| Ten Year | (9.13)% | (9.11)% | (8.78)% | (61.60)% | (61.51)% | (60.11)% | |||||||
| 1 | MVIS®Global Coal Index (MVKOLTR) is a rules based index intended to give investors a means of tracking the overall performance of companies in the global coal industry. |
| Index data prior to September 24, 2012 reflects that of the Stowe Coal IndexSM(TCOAL). From September 24, 2012 forward, the index data reflects that of the MVIS®Global Coal Index (MVKOLTR). All Index history reflects a blend of the performance of the aforementioned Indexes. | |
| Hypothetical Growth of $10,000 | ||
| This chart shows the value of a hypothetical $10,000 investment in the Fund at NAV and at Share Price over the past 10 years. The result is compared with the Fund’s benchmark. | 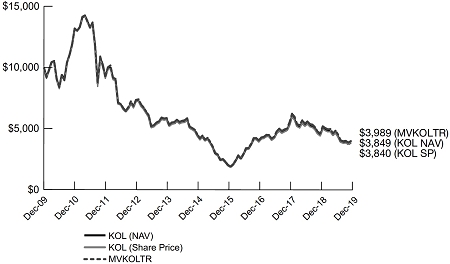 |
Past performance is no guarantee of future results. Performance results do not reflect the deduction of taxes that a shareholder would pay on fund distributions or on the redemption or sale of fund shares.
See “About Fund Performance” on page 17 for more information.
| 6 |
VANECK VECTORS GOLD MINERS ETF
PERFORMANCE COMPARISON
December 31, 2019 (unaudited)
| Average Annual Total Returns | Cumulative Total Returns | ||||||||||||
| Share Price | NAV | GDMNTR1 | Share Price | NAV | GDMNTR1 | ||||||||
| One Year | 39.73% | 40.15% | 40.89% | 39.73% | 40.15% | 40.89% | |||||||
| Five Year | 10.43% | 10.41% | 10.84% | 64.21% | 64.09% | 67.31% | |||||||
| Ten Year | (3.83)% | (3.80)% | (3.35)% | (32.34)% | (32.11)% | (28.85)% | |||||||
| 1 | NYSE Arca Gold Miners Index (GDMNTR) is a modified market capitalization weighted index primarily comprised of publicly traded companies involved in the mining for gold and silver. |
| Hypothetical Growth of $10,000 | ||
| This chart shows the value of a hypothetical $10,000 investment in the Fund at NAV and at Share Price over the past 10 years. The result is compared with the Fund’s benchmark. | 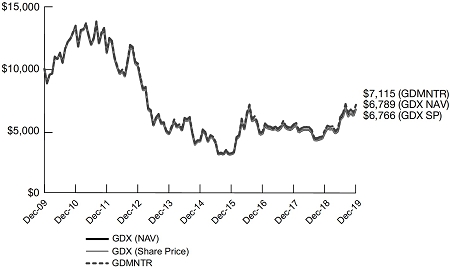 |
Past performance is no guarantee of future results. Performance results do not reflect the deduction of taxes that a shareholder would pay on fund distributions or on the redemption or sale of fund shares.
See “About Fund Performance” on page 17 for more information.
| 7 |
VANECK VECTORS JUNIOR GOLD MINERS ETF
PERFORMANCE COMPARISON
December 31, 2019 (unaudited)
| Average Annual Total Returns | Cumulative Total Returns | ||||||||||||
| Share Price | NAV | MVGDXJTR1 | Share Price | NAV | MVGDXJTR1 | ||||||||
| One Year | 40.38% | 41.31% | 42.18% | 40.38% | 41.31% | 42.18% | |||||||
| Five Year | 13.56% | 13.53% | 13.66% | 88.87% | 88.58% | 89.68% | |||||||
| Ten Year | (6.24)% | (6.23)% | (5.78)% | (47.49)% | (47.45)% | (44.84)% | |||||||
| 1 | MVIS®Global Junior Gold Miners Index (MVGDXJTR) is a rules based, modified capitalization weighted, float adjusted index intended to give investors a means of tracking the overall performance of small-capitalization companies that are involved primarily in the mining for gold and/or silver. |
| Hypothetical Growth of $10,000 | ||
| This chart shows the value of a hypothetical $10,000 investment in the Fund at NAV and at Share Price over the past 10 years. The result is compared with the Fund’s benchmark. | 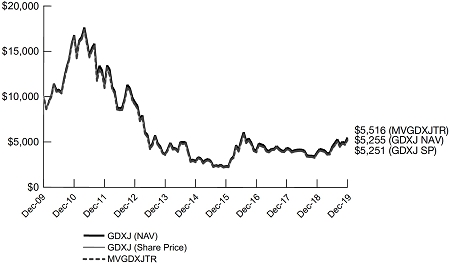 |
Past performance is no guarantee of future results. Performance results do not reflect the deduction of taxes that a shareholder would pay on fund distributions or on the redemption or sale of fund shares.
See “About Fund Performance” on page 17 for more information.
| 8 |
VANECK VECTORS LOW CARBON ENERGY ETF
PERFORMANCE COMPARISON
December 31, 2019 (unaudited)
| Average Annual Total Returns | Cumulative Total Returns | ||||||||||||
| Share Price | NAV | AGIXLT1 | Share Price | NAV | AGIXLT1 | ||||||||
| One Year | 38.86% | 37.38% | 38.40% | 38.86% | 37.38% | 38.40% | |||||||
| Five Year | 8.01% | 7.93% | 8.10% | 46.98% | 46.43% | 47.58% | |||||||
| Ten Year | 1.28% | 1.20% | 0.98% | 13.61% | 12.63% | 10.26% | |||||||
| 1 | Ardour Global IndexSM(Extra Liquid) (AGIXLT) is a rules based, modified capitalization weighted, float adjusted index intended to give investors a means of tracking the overall performance of a global universe of listed companies engaged in the alternative energy industry. |
| Hypothetical Growth of $10,000 | ||
| This chart shows the value of a hypothetical $10,000 investment in the Fund at NAV and at Share Price over the past 10 years. The result is compared with the Fund’s benchmark. |
Past performance is no guarantee of future results. Performance results do not reflect the deduction of taxes that a shareholder would pay on fund distributions or on the redemption or sale of fund shares.
See “About Fund Performance” on page 17 for more information.
| 9 |
VANECK VECTORS NATURAL RESOURCES ETF
PERFORMANCE COMPARISON
December 31, 2019 (unaudited)
| Average Annual Total Returns | Cumulative Total Returns | ||||||||||||
| Share Price | NAV | RVEIT1 | Share Price | NAV | RVEIT1 | ||||||||
| One Year | 18.44% | 18.34% | 18.54% | 18.44% | 18.34% | 18.54% | |||||||
| Five Year | 4.43% | 4.49% | 4.65% | 24.20% | 24.55% | 25.52% | |||||||
| Ten Year | 3.25% | 3.27% | 3.45% | 37.67% | 37.93% | 40.43% | |||||||
| 1 | VanEck®Natural Resources Index (RVEIT) is a rules based, modified capitalization weighted, float adjusted index intended to give investors a means of tracking the overall performance of a global universe of listed companies engaged in the production and distribution of commodities and commodity-related products and services. |
| Hypothetical Growth of $10,000 | ||
| This chart shows the value of a hypothetical $10,000 investment in the Fund at NAV and at Share Price over the past 10 years. The result is compared with the Fund’s benchmark. | 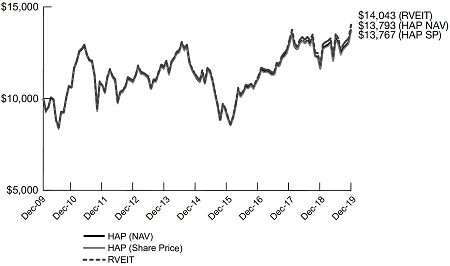 |
Past performance is no guarantee of future results. Performance results do not reflect the deduction of taxes that a shareholder would pay on fund distributions or on the redemption or sale of fund shares.
See “About Fund Performance” on page 17 for more information.
| 10 |
VANECK VECTORS OIL REFINERS ETF
PERFORMANCE COMPARISON
December 31, 2019 (unaudited)
| Average Annual Total Returns | Cumulative Total Returns | ||||||||||||
| Share Price | NAV | MVCRAKTR1 | Share Price | NAV | MVCRAKTR1 | ||||||||
| One Year | 9.11% | 9.19% | 9.45% | 9.11% | 9.19% | 9.45% | |||||||
| Life* | 11.37% | 11.49% | 11.60% | 60.10% | 60.87% | 61.54% | |||||||
| * | Commencement of Fund: 8/18/15; First Day of Secondary Market Trading: 8/19/15 |
| 1 | MVIS®Global Oil Refiners Index (MVCRAKTR) is a rules based, modified capitalization weighted, float adjusted index intended to give investors a means of tracking the overall performance of companies involved in crude oil refining which may include: gasoline, diesel, jet fuel, fuel oil, naphtha, and other petrochemicals. |
| Hypothetical Growth of $10,000 (Since Inception) | ||
| This chart shows the value of a hypothetical $10,000 investment in the Fund at NAV and at Share Price since inception. The result is compared with the Fund’s benchmark. | 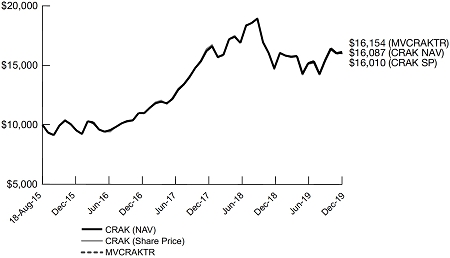 |
Past performance is no guarantee of future results. Performance results do not reflect the deduction of taxes that a shareholder would pay on fund distributions or on the redemption or sale of fund shares.
See “About Fund Performance” on page 17 for more information.
| 11 |
VANECK VECTORS OIL SERVICES ETF
PERFORMANCE COMPARISON
December 31, 2019 (unaudited)
| Average Annual Total Returns | Cumulative Total Returns | ||||||||||||
| Share Price | NAV | MVOIHTR1 | Share Price | NAV | MVOIHTR1 | ||||||||
| One Year | (3.52)% | (3.35)% | (3.21)% | (3.52)% | (3.35)% | (3.21)% | |||||||
| Five Year | (16.33)% | (16.29)% | (16.42)% | (58.99)% | (58.89)% | (59.22)% | |||||||
| Life* | (10.56)% | (10.63)% | (10.70)% | (59.18)% | (59.45)% | (59.71)% | |||||||
| * | Commencement of Fund: 12/20/11; First Day of Secondary Market Trading: 12/21/11 |
| 1 | MVIS®US Listed Oil Services 25 Index (MVOIHTR) is a rules based, modified capitalization weighted, float adjusted index intended to give investors a means of tracking the overall performance of the largest and the most liquid common stocks and depositary receipts of U.S. exchange-listed companies involved in oil services to the upstream oil sector. |
| Hypothetical Growth of $10,000 (Since Inception) | ||
| This chart shows the value of a hypothetical $10,000 investment in the Fund at NAV and at Share Price since inception. The result is compared with the Fund’s benchmark. | 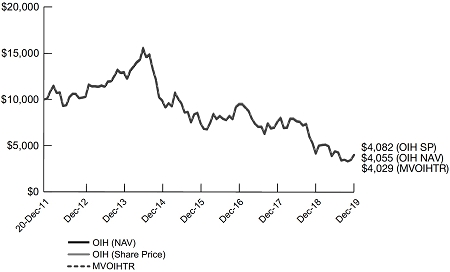 |
Past performance is no guarantee of future results. Performance results do not reflect the deduction of taxes that a shareholder would pay on fund distributions or on the redemption or sale of fund shares.
See “About Fund Performance” on page 17 for more information.
| 12 |
VANECK VECTORS RARE EARTH/STRATEGIC METALS ETF
PERFORMANCE COMPARISON
December 31, 2019 (unaudited)
| Average Annual Total Returns | Cumulative Total Returns | ||||||||||||
| Share Price | NAV | MVREMXTR1 | Share Price | NAV | MVREMXTR1 | ||||||||
| One Year | 0.62% | 0.91% | (0.75)% | 0.62% | 0.91% | (0.75)% | |||||||
| Five Year | (7.62)% | (7.77)% | (8.46)% | (32.71)% | (33.26)% | (35.72)% | |||||||
| Life* | (14.55)% | (14.52)% | (15.08)% | (76.38)% | (76.32)% | (77.69)% | |||||||
| * | Commencement of Fund: 10/27/10; First Day of Secondary Market Trading: 10/28/10 |
| 1 | MVIS®Global Rare Earth/Strategic Metals Index (MVREMXTR) is a rules based, modified capitalization weighted, float adjusted index intended to give investors a means of tracking the overall performance of companies involved in the rare earth and strategic metals segment. |
| Hypothetical Growth of $10,000 (Since Inception) | ||
| This chart shows the value of a hypothetical $10,000 investment in the Fund at NAV and at Share Price since inception. The result is compared with the Fund’s benchmark. |  |
Past performance is no guarantee of future results. Performance results do not reflect the deduction of taxes that a shareholder would pay on fund distributions or on the redemption or sale of fund shares.
See “About Fund Performance” on page 17 for more information.
| 13 |
PERFORMANCE COMPARISON
December 31, 2019 (unaudited)
| Average Annual Total Returns | Cumulative Total Returns | ||||||||||||
| Share Price | NAV | STEEL1 | Share Price | NAV | STEEL1 | ||||||||
| One Year | 11.03% | 11.02% | 11.60% | 11.03% | 11.02% | 11.60% | |||||||
| Five Year | 4.79% | 4.82% | 4.98% | 26.33% | 26.51% | 27.51% | |||||||
| Ten Year | (2.03)% | (2.04)% | (1.80)% | (18.58)% | (18.58)% | (16.57)% | |||||||
| 1 | NYSE Arca Steel Index (STEEL) is a modified market capitalization weighted index comprised of common stocks and ADRs of selected companies that are primarily involved in a variety of activities that are related to steel production. |
| Hypothetical Growth of $10,000 | ||
| This chart shows the value of a hypothetical $10,000 investment in the Fund at NAV and at Share Price over the past 10 years. The result is compared with the Fund’s benchmark. | 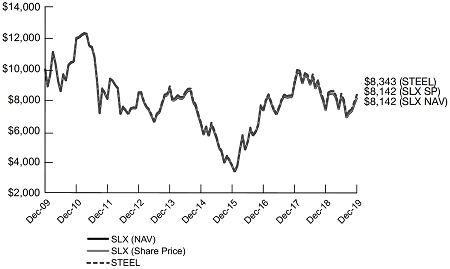 |
Past performance is no guarantee of future results. Performance results do not reflect the deduction of taxes that a shareholder would pay on fund distributions or on the redemption or sale of fund shares.
See “About Fund Performance” on page 17 for more information.
| 14 |
VANECK VECTORS UNCONVENTIONAL OIL & GAS ETF
PERFORMANCE COMPARISON
December 31, 2019 (unaudited)
| Average Annual Total Returns | Cumulative Total Returns | ||||||||||||
| Share Price | NAV | MVFRAKTR1 | Share Price | NAV | MVFRAKTR1 | ||||||||
| One Year | 4.14% | 4.32% | 4.43% | 4.14% | 4.32% | 4.43% | |||||||
| Five Year | (11.63)% | (11.64)% | (11.48)% | (46.10)% | (46.13)% | (45.66)% | |||||||
| Life* | (8.70)% | (8.67)% | (8.51)% | (51.17)% | (51.04)% | (50.36)% | |||||||
| * | Commencement of Fund: 2/14/12; First Day of Secondary Market Trading: 2/15/12 |
| 1 | MVIS®Global Unconventional Oil & Gas Index (MVFRAKTR) is a rules based, modified capitalization weighted, float adjusted index intended to give investors a means of tracking the overall performance of companies involved in the exploration, development, extraction and/or production of unconventional oil and natural gas. |
| Hypothetical Growth of $10,000 (Since Inception) | ||
| This chart shows the value of a hypothetical $10,000 investment in the Fund at NAV and at Share Price since inception. The result is compared with the Fund’s benchmark. | 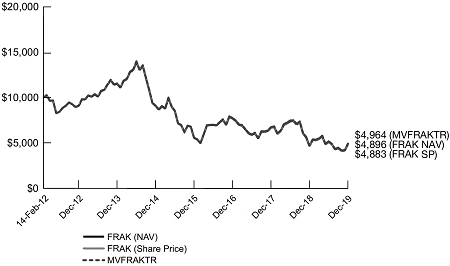 |
Past performance is no guarantee of future results. Performance results do not reflect the deduction of taxes that a shareholder would pay on fund distributions or on the redemption or sale of fund shares.
See “About Fund Performance” on page 17 for more information.
| 15 |
VANECK VECTORS URANIUM+NUCLEAR ENERGY ETF
PERFORMANCE COMPARISON
December 31, 2019 (unaudited)
| Average Annual Total Returns | Cumulative Total Returns | ||||||||||||
| Share Price | NAV | MVNLRTR1 | Share Price | NAV | MVNLRTR1 | ||||||||
| One Year | 0.43% | 0.44% | 0.57% | 0.43% | 0.44% | 0.57% | |||||||
| Five Year | 2.45% | 2.47% | 2.01% | 12.89% | 12.96% | 10.45% | |||||||
| Ten Year | 0.82% | 0.83% | 0.48% | 8.47% | 8.65% | 4.95% | |||||||
| 1 | MVIS®Global Uranium & Nuclear Energy Index (MVNLRTR) is a rules based, modified capitalization weighted, float adjusted index intended to give investors a means of tracking the overall performance of companies involved in uranium and nuclear energy. |
| Index data prior to March 24, 2014 reflects that of the DAXglobal®Nuclear Energy Index (DXNE). From March 24, 2014, forward, the index data reflects that of the MVIS®Global Uranium & Nuclear Energy Index (MVNLRTR). All index history reflects a blend of the performance of the aforementioned Indexes. | |
| Hypothetical Growth of $10,000 | ||
| This chart shows the value of a hypothetical $10,000 investment in the Fund at NAV and at Share Price over the past 10 years. The result is compared with the Fund’s benchmark. | 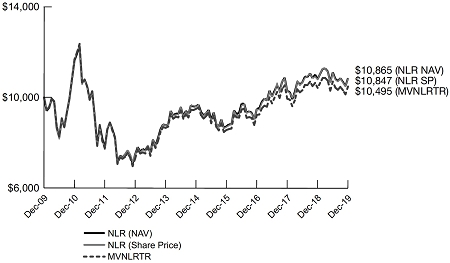 |
Past performance is no guarantee of future results. Performance results do not reflect the deduction of taxes that a shareholder would pay on fund distributions or on the redemption or sale of fund shares.
See “About Fund Performance” on page 17 for more information.
| 16 |
ABOUT FUND PERFORMANCE
(unaudited)
The price used to calculate market return (Share Price) is determined by using the closing price listed on its primary listing exchange. Since the shares of each Fund did not trade in the secondary market until after each Fund’s commencement, for the period from commencement to the first day of secondary market trading in shares of each Fund, the NAV of each Fund is used as a proxy for the secondary market trading price to calculate market returns.
The performance data quoted represents past performance. Past performance is not a guarantee of future results.Performance information for certain Funds reflect temporary waivers of expenses and/or fees. Had these Funds incurred all expenses, investment returns would have been reduced. These returns do not reflect the deduction of taxes that a shareholder would pay on Fund dividends and distributions or the sale of Fund shares.
Investment return and value of the shares of each Fund will fluctuate so that an investor’s shares, when sold, may be worth more or less than their original cost. Performance may be lower or higher than performance data quoted. Fund returns reflect reinvestment of dividends and capital gains distributions. Performance current to the most recent month-end is available by calling 800.826.2333 or by visiting vaneck.com.
Fund shares are not individually redeemable and will be issued and redeemed at their NAV only through certain authorized broker-dealers in large, specified blocks of shares called “creation units” and otherwise can be bought and sold only through exchange trading. Shares may trade at a premium or discount to their NAV in the secondary market.
The net asset value (NAV) of each VanEck Vectors exchange-traded fund (ETF) is determined at the close of each business day, and represents the dollar value of one share of each fund; it is calculated by taking the total assets of each fund, subtracting total liabilities, and dividing by the total number of shares outstanding. The NAVs are not necessarily the same as each ETF’s intraday trading value. VanEck Vectors ETF investors should not expect to buy or sell fund shares at NAV.
All indices are unmanaged and include the reinvestment of all dividends, but do not reflect the payment of transaction costs, advisory fees or expenses that are associated with an investment in the Fund. Certain indices may take into account withholding taxes. An index’s performance is not illustrative of the Fund’s performance. Indices are not securities in which investments can be made.
The Gold Miners Index and Steel Index are published by ICE Data Indices, LLC (ICE Data). The Agribusiness Index, Coal Index, Junior Gold Miners Index, Oil & Gas Index, Oil Refiners Index, Oil Services Index, Rare Earth/Strategic Metals Index and Uranium & Nuclear Energy Index are published by MV Index Solutions GmbH (MVIS®), which is a wholly owned subsidiary of the Adviser, Van Eck Associates Corporation. The Natural Resources Index and the Ardour Global Index are published by S-Network Global Indexes, LLC (S-Network).
ICE Data, MVIS, S-Network, and Ardour are referred to herein as the “Index Providers”. The Index Providers do not sponsor, endorse, or promote the Funds and bear no liability with respect to the Funds or any security.
Premium/discount information regarding how often the closing trading price of the Shares of each Fund were above (i.e., at a premium) or below (i.e., at a discount) the NAV of the Fund for each of the four previous calendar quarters and the immediately preceding five years (if applicable) can be found at vaneck.com.
| 17 |
VANECK VECTORS ETF TRUST
(unaudited)
Hypothetical $1,000 investment at beginning of period
As a shareholder of a Fund, you incur operating expenses, including management fees and other Fund expenses. This disclosure is intended to help you understand the ongoing costs (in dollars) of investing in your Fund and to compare these costs with the ongoing costs of investing in other mutual funds.
The disclosure is based on an investment of $1,000 invested at the beginning of the period and held for the entire period, July 1, 2019 to December 31, 2019.
Actual Expenses
The first line in the table below provides information about account values and actual expenses. You may use the information in this line, together with the amount you invested, to estimate the expenses that you paid over the period. Simply divide your account value by $1,000 (for example, an $8,600 account value divided by $1,000 = 8.6), then multiply the result by the number in the first line under the heading entitled “Expenses Paid During the Period.”
Hypothetical Example for Comparison Purposes
The second line in the table below provides information about hypothetical account values and hypothetical expenses based on the Fund’s actual expense ratio and an assumed rate of return of 5% per year before expenses, which is not the Fund’s actual return. The hypothetical account values and expenses may not be used to estimate the actual ending account balance or expenses you paid for the period. You may use this information to compare the ongoing costs of investing in your Fund and other funds. To do so, compare this 5% hypothetical example with the 5% hypothetical examples that appear in the shareholder reports of other funds.
Please note that the expenses shown in the table are meant to highlight your ongoing costs only and do not reflect any transactional costs, such as brokerage commissions paid on purchases and sales. Therefore, the second line of the table is useful in comparing ongoing costs only, and will not help you determine the relative costs of owning different funds. In addition, if these transactional costs were included, your costs would have been higher.
| 18 |
| Beginning | Ending | Annualized | Expenses Paid | |||||||||||||
| Account | Account | Expense | During the Period* | |||||||||||||
| Value | Value | Ratio | July 1, 2019- | |||||||||||||
| July 1, 2019 | December 31, 2019 | During Period | December 31, 2019 | |||||||||||||
| Agribusiness ETF | ||||||||||||||||
| Actual | $ | 1,000.00 | $ | 1,039.80 | 0.57 | % | $ | 2.93 | ||||||||
| Hypothetical** | $ | 1,000.00 | $ | 1,022.33 | 0.57 | % | $ | 2.91 | ||||||||
| Coal ETF | ||||||||||||||||
| Actual | $ | 1,000.00 | $ | 820.80 | 0.60 | % | $ | 2.75 | ||||||||
| Hypothetical** | $ | 1,000.00 | $ | 1,022.18 | 0.60 | % | $ | 3.06 | ||||||||
| Gold Miners ETF | ||||||||||||||||
| Actual | $ | 1,000.00 | $ | 1,152.10 | 0.52 | % | $ | 2.82 | ||||||||
| Hypothetical** | $ | 1,000.00 | $ | 1,022.58 | 0.52 | % | $ | 2.65 | ||||||||
| Junior Gold Miners ETF | ||||||||||||||||
| Actual | $ | 1,000.00 | $ | 1,214.00 | 0.53 | % | $ | 2.96 | ||||||||
| Hypothetical** | $ | 1,000.00 | $ | 1,022.53 | 0.53 | % | $ | 2.70 | ||||||||
| Low Carbon Energy ETF | ||||||||||||||||
| Actual | $ | 1,000.00 | $ | 1,163.80 | 0.62 | % | $ | 3.38 | ||||||||
| Hypothetical** | $ | 1,000.00 | $ | 1,022.08 | 0.62 | % | $ | 3.16 | ||||||||
| Natural Resources ETF | ||||||||||||||||
| Actual | $ | 1,000.00 | $ | 1,037.20 | 0.50 | % | $ | 2.57 | ||||||||
| Hypothetical** | $ | 1,000.00 | $ | 1,022.68 | 0.50 | % | $ | 2.55 | ||||||||
| Oil Refiners ETF | ||||||||||||||||
| Actual | $ | 1,000.00 | $ | 1,058.50 | 0.60 | % | $ | 3.11 | ||||||||
| Hypothetical** | $ | 1,000.00 | $ | 1,022.18 | 0.60 | % | $ | 3.06 | ||||||||
| Oil Services ETF | ||||||||||||||||
| Actual | $ | 1,000.00 | $ | 915.60 | 0.35 | % | $ | 1.69 | ||||||||
| Hypothetical** | $ | 1,000.00 | $ | 1,023.44 | 0.35 | % | $ | 1.79 | ||||||||
| Rare Earth/Strategic Metals ETF | ||||||||||||||||
| Actual | $ | 1,000.00 | $ | 906.20 | 0.60 | % | $ | 2.88 | ||||||||
| Hypothetical** | $ | 1,000.00 | $ | 1,022.18 | 0.60 | % | $ | 3.06 | ||||||||
| Steel ETF | ||||||||||||||||
| Actual | $ | 1,000.00 | $ | 988.30 | 0.55 | % | $ | 2.76 | ||||||||
| Hypothetical** | $ | 1,000.00 | $ | 1,022.43 | 0.55 | % | $ | 2.80 | ||||||||
| Unconventional Oil & Gas ETF | ||||||||||||||||
| Actual | $ | 1,000.00 | $ | 951.80 | 0.54 | % | $ | 2.66 | ||||||||
| Hypothetical** | $ | 1,000.00 | $ | 1,022.48 | 0.54 | % | $ | 2.75 | ||||||||
| Uranium+Nuclear Energy ETF | ||||||||||||||||
| Actual | $ | 1,000.00 | $ | 977.10 | 0.60 | % | $ | 2.99 | ||||||||
| Hypothetical** | $ | 1,000.00 | $ | 1,022.18 | 0.60 | % | $ | 3.06 | ||||||||
| * | Expenses are equal to the Fund’s annualized expense ratio (for the six months ended December 31, 2019) multiplied by the average account value over the period, multiplied by the number of days in the most recent fiscal half year divided by the number of days in the fiscal year (to reflect the one-half year period). |
| ** | Assumes annual return of 5% before expenses |
| 19 |
VANECK VECTORS AGRIBUSINESS ETF
December 31, 2019
| Number of Shares | Value | |||||||
| COMMON STOCKS: 99.9% | ||||||||
| Australia: 2.5% | ||||||||
| 2,155,299 | Incitec Pivot Ltd. # | $ | 4,823,354 | |||||
| 1,156,653 | Treasury Wine Estates Ltd. † # | 13,197,671 | ||||||
| 18,021,025 | ||||||||
| Brazil: 1.9% | ||||||||
| 2,092,500 | Rumo SA * # | 13,620,843 | ||||||
| Canada: 6.4% | ||||||||
| 964,762 | Nutrien Ltd. (USD) | 46,221,747 | ||||||
| Chile: 0.9% | ||||||||
| 244,805 | Sociedad Quimica y Minera de Chile SA (ADR) † | 6,533,845 | ||||||
| China / Hong Kong: 1.5% | ||||||||
| 2,641,000 | China Mengniu Dairy Co. Ltd. # | 10,683,773 | ||||||
| Denmark: 1.2% | ||||||||
| 86,510 | Bakkafrost P/F (NOK) # | 6,407,222 | ||||||
| 25,929 | Schouw & Co. AB | 2,181,199 | ||||||
| 8,588,421 | ||||||||
| Germany: 8.8% | ||||||||
| 718,787 | Bayer AG # | 58,476,586 | ||||||
| 365,886 | K+S AG # | 4,559,693 | ||||||
| 63,036,279 | ||||||||
| Indonesia: 1.0% | ||||||||
| 14,673,000 | Charoen Pokphand Indonesia Tbk PT # | 6,862,182 | ||||||
| Israel: 0.9% | ||||||||
| 1,406,045 | Israel Chemicals Ltd. (USD) † | 6,734,956 | ||||||
| Japan: 5.4% | ||||||||
| 1,812,030 | Kubota Corp. # | 28,449,506 | ||||||
| 73,900 | Maruha Nichiro Corp. # | 1,891,556 | ||||||
| 144,500 | Nippon Meat Packers, Inc. # | 5,984,584 | ||||||
| 400,300 | Nippon Suisan Kaisha Ltd. # | 2,390,117 | ||||||
| 38,715,763 | ||||||||
| Malaysia: 3.0% | ||||||||
| 5,112,355 | IOI Corp. Bhd # | 5,764,259 | ||||||
| 714,670 | Kuala Lumpur Kepong Bhd # | 4,336,310 | ||||||
| 1,070,480 | PPB Group Bhd # | 4,933,078 | ||||||
| 5,040,300 | Sime Darby Plantation Bhd # | 6,717,761 | ||||||
| 21,751,408 | ||||||||
| Netherlands: 0.4% | ||||||||
| 128,307 | OCI NV * # | 2,718,415 | ||||||
| Norway: 5.9% | ||||||||
| 484,638 | Leroy Seafood Group ASA # | 3,223,303 | ||||||
| 820,266 | Mowi ASA # | 21,308,249 | ||||||
| 96,773 | Salmar ASA # | 4,954,732 | ||||||
| 315,764 | Yara International ASA # | 13,143,945 | ||||||
| 42,630,229 | ||||||||
| Russia: 0.4% | ||||||||
| 244,947 | PhosAgro PJSC Reg S (GDR) | 3,110,827 | ||||||
| Number of Shares | Value | |||||||
| Singapore: 2.7% | ||||||||
| 8,287,345 | Golden Agri-Resources Ltd. # | $ | 1,449,794 | |||||
| 5,802,051 | Wilmar International Ltd. # | 17,779,691 | ||||||
| 19,229,485 | ||||||||
| Switzerland: 0.6% | ||||||||
| 12,299 | Bucher Indistries AG # | 4,313,987 | ||||||
| Taiwan: 0.4% | ||||||||
| 1,515,000 | Taiwan Fertilizer Co. Ltd. # | 2,505,309 | ||||||
| Thailand: 1.3% | ||||||||
| 9,806,836 | Charoen Pokphand Foods (NVDR) # | 8,990,281 | ||||||
| United Kingdom: 3.3% | ||||||||
| 1,758,809 | CNH Industrial NV (USD) † | 19,346,899 | ||||||
| 101,898 | Genus Plc # | 4,292,491 | ||||||
| 23,639,390 | ||||||||
| United States: 51.4% | ||||||||
| 104,439 | AGCO Corp. | 8,067,913 | ||||||
| 690,584 | Archer-Daniels-Midland Co. | 32,008,568 | ||||||
| 40,561 | Balchem Corp. | 4,122,214 | ||||||
| 213,188 | Bunge Ltd. | 12,268,969 | ||||||
| 265,308 | CF Industries Holdings, Inc. | 12,665,804 | ||||||
| 1,065,980 | Corteva, Inc. | 31,510,369 | ||||||
| 283,896 | Deere & Co. | 49,187,821 | ||||||
| 455,136 | Elanco Animal Health, Inc. * | 13,403,755 | ||||||
| 168,699 | FMC Corp. | 16,839,534 | ||||||
| 134,328 | IDEXX Laboratories, Inc. * | 35,077,071 | ||||||
| 67,164 | Neogen Corp. * | 4,383,123 | ||||||
| 111,659 | Pilgrim’s Pride Corp. * | 3,652,924 | ||||||
| 27,932 | Sanderson Farms, Inc. | 4,922,177 | ||||||
| 531,487 | The Mosaic Co. | 11,501,379 | ||||||
| 156,090 | Toro Co. | 12,435,690 | ||||||
| 197,420 | Tractor Supply Co. | 18,446,925 | ||||||
| 426,214 | Tyson Foods, Inc. | 38,802,523 | ||||||
| 445,611 | Zoetis, Inc. | 58,976,616 | ||||||
| 368,273,375 | ||||||||
| Total Common Stocks (Cost: $637,545,722) | 716,181,540 | |||||||
| SHORT-TERM INVESTMENT HELD ASCOLLATERAL FOR SECURITIES ON LOAN: 0.1% (Cost: $827,598) | ||||||||
| Money Market Fund: 0.1% | ||||||||
| 827,598 | State Street Navigator Securities Lending Government Money Market Portfolio | 827,598 | ||||||
| Total Investments: 100.0% (Cost: $638,373,320) | 717,009,138 | |||||||
| Liabilities in excess of other assets: (0.0)% | (249,496 | ) | ||||||
| NET ASSETS: 100.0% | $ | 716,759,642 | ||||||
See Notes to Financial Statements
| 20 |
Definitions:
| ADR | American Depositary Receipt |
| GDR | Global Depositary Receipt |
| NOK | Norwegian Krone |
| NVDR | Non-Voting Depositary Receipt |
| USD | United States Dollar |
Footnotes:
| * | Non-income producing |
| † | Security fully or partially on loan. Total market value of securities on loan is $7,510,630. |
| # | Security has been valued in good faith pursuant to guidelines established by the Board of Trustees. The aggregate value of fair valued securities is $263,778,692 which represents 36.8% of net assets. |
| Reg S | Security was purchased pursuant to Regulation S under the Securities Act of 1933, which exempts from registration securities offered and sold outside of the United States. Such a security cannot be sold in the United States without either an effective registration statement filed pursuant to the Securities Act of 1933, or pursuant to an exemption from registration. |
| Summary of Investments by Sector Excluding Collateral for Securities Loaned | % of Investments | Value | ||||||
| Consumer Discretionary | 2.6 | % | $ | 18,446,925 | ||||
| Consumer Staples | 30.8 | 220,710,923 | ||||||
| Health Care | 24.4 | 174,609,642 | ||||||
| Industrials | 18.9 | 135,422,659 | ||||||
| Materials | 23.3 | 166,991,391 | ||||||
| 100.0 | % | $ | 716,181,540 | |||||
The summary of inputs used to value the Fund’s investments as of December 31, 2019 is as follows:
| Level 1 Quoted Prices | Level 2 Significant Observable Inputs | Level 3 Significant Unobservable Inputs | Value | ||||||||||||||
| Common Stocks | |||||||||||||||||
| Australia | $ | — | $ | 18,021,025 | $ | — | $ | 18,021,025 | |||||||||
| Brazil | — | 13,620,843 | — | 13,620,843 | |||||||||||||
| Canada | 46,221,747 | — | — | 46,221,747 | |||||||||||||
| Chile | 6,533,845 | — | — | 6,533,845 | |||||||||||||
| China / Hong Kong | — | 10,683,773 | — | 10,683,773 | |||||||||||||
| Denmark | 2,181,199 | 6,407,222 | — | 8,588,421 | |||||||||||||
| Germany | — | 63,036,279 | — | 63,036,279 | |||||||||||||
| Indonesia | — | 6,862,182 | — | 6,862,182 | |||||||||||||
| Israel | 6,734,956 | — | — | 6,734,956 | |||||||||||||
| Japan | — | 38,715,763 | — | 38,715,763 | |||||||||||||
| Malaysia | — | 21,751,408 | — | 21,751,408 | |||||||||||||
| Netherlands | — | 2,718,415 | — | 2,718,415 | |||||||||||||
| Norway | — | 42,630,229 | — | 42,630,229 | |||||||||||||
| Russia | 3,110,827 | — | — | 3,110,827 | |||||||||||||
| Singapore | — | 19,229,485 | — | 19,229,485 | |||||||||||||
| Switzerland | — | 4,313,987 | — | 4,313,987 | |||||||||||||
| Taiwan | — | 2,505,309 | — | 2,505,309 | |||||||||||||
| Thailand | — | 8,990,281 | — | 8,990,281 | |||||||||||||
| United Kingdom | 19,346,899 | 4,292,491 | — | 23,639,390 | |||||||||||||
| United States | 368,273,375 | — | — | 368,273,375 | |||||||||||||
| Money Market Fund | 827,598 | — | — | 827,598 | |||||||||||||
| Total | $ | 453,230,446 | $ | 263,778,692 | $ | — | $ | 717,009,138 | |||||||||
See Notes to Financial Statements
| 21 |
SCHEDULE OF INVESTMENTS
December 31, 2019
| Number of Shares | Value | |||||||
| COMMON STOCKS: 100.1% | ||||||||
| Australia: 20.7% | ||||||||
| 548,140 | Aurizon Holdings Ltd. # | $ | 2,015,073 | |||||
| 301,976 | Coronado Global Resources, Inc. Reg S 144A # | 469,453 | ||||||
| 506,721 | New Hope Corp. Ltd. † # | 734,873 | ||||||
| 79,341 | Washington H Soul Pattinson & Co. Ltd. # | 1,198,987 | ||||||
| 639,412 | Whitehaven Coal Ltd. # | 1,187,839 | ||||||
| 5,606,225 | ||||||||
| Canada: 11.5% | ||||||||
| 130,628 | Teck Resources Ltd. (USD) | 2,269,008 | ||||||
| 57,306 | Westshore Terminals Investment Corp. † | 837,439 | ||||||
| 3,106,447 | ||||||||
| China / Hong Kong: 22.9% | ||||||||
| 4,380,000 | Agritrade Resources Ltd. † | 326,035 | ||||||
| 3,123,095 | China Coal Energy Co. Ltd. # | 1,239,485 | ||||||
| 942,908 | China Shenhua Energy Co. Ltd. # | 1,971,655 | ||||||
| 29,780,000 | National United Resources Holdings Ltd. * # ∞ | 4 | ||||||
| 1,550,000 | Sany Heavy Equipment International Holdings Co. Ltd. # | 848,212 | ||||||
| 2,898,067 | Shougang Fushan Resources Group Ltd. # | 625,916 | ||||||
| 1,336,000 | Yanzhou Coal Mining Co. Ltd. # | 1,200,396 | ||||||
| 6,211,703 | ||||||||
| Indonesia: 19.8% | ||||||||
| 13,670,215 | Adaro Energy Tbk PT # | 1,527,665 | ||||||
| 78,761,100 | Bumi Resources Tbk PT * # | 373,818 | ||||||
| 617,852 | Indo Tambangraya Megah Tbk PT # | 510,046 | ||||||
| 6,119,100 | Tambang Batubara Bukit Asam Tbk PT # | 1,170,407 | ||||||
| 1,157,300 | United Tractors Tbk PT # | 1,791,847 | ||||||
| 5,373,783 | ||||||||
| Philippines: 3.2% | ||||||||
| 1,992,030 | Semirara Mining and Power Corp. # | 864,953 | ||||||
| Poland: 1.7% | ||||||||
| 82,539 | Jastrzebska Spolka Weglowa SA # | 466,541 | ||||||
| South Africa: 5.8% | ||||||||
| 167,718 | Exxaro Resources Ltd. # | 1,570,335 | ||||||
| Thailand: 5.1% | ||||||||
| 3,505,789 | Banpu PCL (NVDR) # | 1,390,651 | ||||||
| United States: 9.4% | ||||||||
| 10,339 | Arch Coal, Inc. † | 741,720 | ||||||
| 68,049 | Peabody Energy Corp. | 620,607 | ||||||
| 56,646 | Warrior Met Coal, Inc. | 1,196,930 | ||||||
| 2,559,257 | ||||||||
| Total Common Stocks (Cost: $41,093,496) | 27,149,895 | |||||||
| Number of Shares | Value | |||||||
| SHORT-TERM INVESTMENT HELD ASCOLLATERAL FOR SECURITIES ON LOAN: 2.6% (Cost: $697,091) | ||||||||
| Money Market Fund: 2.6% | ||||||||
| 697,091 | State Street Navigator Securities Lending Government Money Market Portfolio | $ | 697,091 | |||||
| Total Investments: 102.7% (Cost: $41,790,587) | 27,846,986 | |||||||
| Liabilities in excess of other assets: (2.7)% | (715,959 | ) | ||||||
| NET ASSETS: 100.0% | $ | 27,131,027 | ||||||
See Notes to Financial Statements
| 22 |
Definitions:
| NVDR | Non-Voting Depositary Receipt |
| USD | United States Dollar |
Footnotes:
| * | Non-income producing |
| † | Security fully or partially on loan. Total market value of securities on loan is $1,709,344. |
| # | Security has been valued in good faith pursuant to guidelines established by the Board of Trustees. The aggregate value of fair valued securities is $21,158,156 which represents 78.0% of net assets. |
| ∞ | Security is valued using significant unobservable inputs and is classified as Level 3 in the fair value hierarchy. |
| Reg S | Security was purchased pursuant to Regulation S under the Securities Act of 1933, which exempts from registration securities offered and sold outside of the United States. Such a security cannot be sold in the United States without either an effective registration statement filed pursuant to the Securities Act of 1933, or pursuant to an exemption from registration. |
| 144A | Security exempt from registration under Rule 144A of the Securities Act of 1933, as amended, or otherwise restricted. These securities may be resold in transactions exempt from registration, unless otherwise noted, and the value amounted to $469,453, or 1.7% of net assets. |
| Summary of Investments by Sector Excluding Collateral for Securities Loaned | % of Investments | Value | ||||||
| Energy | 67.9 | % | $ | 18,421,319 | ||||
| Industrials | 13.6 | 3,700,728 | ||||||
| Materials | 18.5 | 5,027,848 | ||||||
| 100.0 | % | $ | 27,149,895 | |||||
The summary of inputs used to value the Fund’s investments as of December 31, 2019 is as follows:
| Level 1 Quoted Prices | Level 2 Significant Observable Inputs | Level 3 Significant Unobservable Inputs | Value | ||||||||||||||
| Common Stocks | |||||||||||||||||
| Australia | $ | — | $ | 5,606,225 | $ | — | $ | 5,606,225 | |||||||||
| Canada | 3,106,447 | — | — | 3,106,447 | |||||||||||||
| China / Hong Kong | 326,035 | 5,885,664 | 4 | 6,211,703 | |||||||||||||
| Indonesia | — | 5,373,783 | — | 5,373,783 | |||||||||||||
| Philippines | — | 864,953 | — | 864,953 | |||||||||||||
| Poland | — | 466,541 | — | 466,541 | |||||||||||||
| South Africa | — | 1,570,335 | — | 1,570,335 | |||||||||||||
| Thailand | — | 1,390,651 | — | 1,390,651 | |||||||||||||
| United States | 2,559,257 | — | — | 2,559,257 | |||||||||||||
| Money Market Fund | 697,091 | — | — | 697,091 | |||||||||||||
| Total | $ | 6,688,830 | $ | 21,158,152 | $ | 4 | $ | 27,846,986 | |||||||||
See Notes to Financial Statements
| 23 |
VANECK VECTORS GOLD MINERS ETF
December 31, 2019
| Number of Shares | Value | |||||||
| COMMON STOCKS: 100.0% | ||||||||
| Australia: 14.1% | ||||||||
| 107,063,462 | Evolution Mining Ltd. ‡ # | $ | 285,107,900 | |||||
| 33,065,013 | Newcrest Mining Ltd. # | 699,493,388 | ||||||
| 40,832,345 | Northern Star Resources Ltd. ‡ # | 322,344,397 | ||||||
| 39,158,224 | OceanaGold Corp. (CAD) ‡ | 77,002,870 | ||||||
| 73,191,044 | Perseus Mining Ltd. ‡ * # | 59,258,632 | ||||||
| 31,977,616 | Regis Resources Ltd. ‡ # | 96,922,314 | ||||||
| 56,830,902 | Resolute Mining Ltd. ‡ * # | 50,094,493 | ||||||
| 69,367,323 | Saracen Mineral Holdings Ltd. ‡ * # | 161,141,752 | ||||||
| 43,994,374 | St. Barbara Ltd. ‡ # | 83,729,671 | ||||||
| 1,835,095,417 | ||||||||
| Canada: 53.4% | ||||||||
| 10,316,793 | Agnico-Eagle Mines Ltd. (USD) | 635,617,617 | ||||||
| 24,615,240 | Alamos Gold, Inc. (USD) ‡ | 148,183,745 | ||||||
| 64,542,840 | B2Gold Corp. (USD) ‡ † | 258,816,788 | ||||||
| 76,455,534 | Barrick Gold Corp. (USD) | 1,421,308,376 | ||||||
| 18,472,841 | Centerra Gold, Inc. ‡ * | 147,155,926 | ||||||
| 11,163,152 | Detour Gold Corp. ‡ * | 216,419,234 | ||||||
| 11,248,720 | Dundee Precious Metals, Inc. ‡ * | 48,403,977 | ||||||
| 9,971,362 | Eldorado Gold Corp. (USD) ‡ * | 80,070,037 | ||||||
| 12,886,242 | First Majestic Silver Corp. (USD) ‡ * † | 157,985,327 | ||||||
| 8,109,881 | Franco-Nevada Corp. (USD) | 837,750,707 | ||||||
| 29,449,200 | IAMGOLD Corp. (USD) ‡ * | 109,845,516 | ||||||
| 78,874,926 | Kinross Gold Corp. (USD) ‡ * | 373,867,149 | ||||||
| 12,757,844 | Kirkland Lake Gold Ltd. ‡ † | 563,145,549 | ||||||
| 42,342,629 | New Gold, Inc. (USD) ‡ * | 37,261,514 | ||||||
| 9,905,011 | Osisko Gold Royalties Ltd. (USD) ‡ | 96,177,657 | ||||||
| 13,189,789 | Pan American Silver Corp. (USD) ‡ † | 312,466,101 | ||||||
| 11,662,595 | Pretium Resources, Inc. (USD) ‡ * † | 129,804,682 | ||||||
| 10,999,433 | Sandstorm Gold Ltd. (USD) ‡ * † | 81,945,776 | ||||||
| 21,045,803 | Semafo, Inc. ‡ * | 43,820,064 | ||||||
| 10,803,271 | Silvercorp Metals, Inc. (USD) ‡ | 61,254,547 | ||||||
| 7,742,708 | SSR Mining, Inc. (USD) ‡ * | 149,124,556 | ||||||
| 5,365,877 | Torex Gold Resources, Inc. ‡ * | 84,910,581 | ||||||
| 8,605,391 | Wesdome Gold Mines Ltd. ‡ * | 67,489,359 | ||||||
| 21,584,038 | Wheaton Precious Metals Corp. (USD) | 642,125,130 | ||||||
| 59,806,309 | Yamana Gold, Inc. (USD) ‡ | 236,234,921 | ||||||
| 6,941,184,836 | ||||||||
| China / Hong Kong: 1.9% | ||||||||
| 66,038,000 | Zhaojin Mining Industry Co. Ltd. ‡ # | 72,449,148 | ||||||
| 360,798,000 | Zijin Mining Group Ltd. ‡ # | 179,209,244 | ||||||
| 251,658,392 | ||||||||
| Monaco: 1.0% | ||||||||
| 6,916,628 | Endeavour Mining Corp. (CAD) ‡ * | 130,838,546 | ||||||
| Peru: 1.9% | ||||||||
| 15,970,754 | Cia de Minas Buenaventura SAA (USD) ‡ | 241,158,385 | ||||||
| South Africa: 8.1% | ||||||||
| 26,132,217 | AngloGold Ashanti Ltd. (ADR) ‡ | 583,793,728 | ||||||
| 52,142,224 | Gold Fields Ltd. (USD) ‡ | 344,138,678 | ||||||
| 34,122,650 | Harmony Gold Mining Co. Ltd. (USD) ‡ * | 123,865,219 | ||||||
| 1,051,797,625 | ||||||||
| Number of Shares | Value | |||||||
| United Kingdom: 1.4% | ||||||||
| 72,739,222 | Centamin Plc ‡ # | $ | 122,016,193 | |||||
| 22,898,417 | Highland Gold Mining Ltd. ‡ # | 59,183,929 | ||||||
| 181,200,122 | ||||||||
| United States: 18.2% | ||||||||
| 18,543,185 | Alacer Gold Corp. (CAD) ‡ * † | 98,668,191 | ||||||
| 15,130,283 | Coeur Mining, Inc. ‡ * | 122,252,687 | ||||||
| 31,180,828 | Hecla Mining Co. ‡ | 105,703,007 | ||||||
| 35,258,275 | Newmont Mining Corp. | 1,531,972,049 | ||||||
| 4,127,457 | Royal Gold, Inc. ‡ | 504,581,618 | ||||||
| 2,363,177,552 | ||||||||
| Total Common Stocks (Cost: $10,751,009,939) | 12,996,110,875 | |||||||
| SHORT-TERM INVESTMENT HELD ASCOLLATERAL FOR SECURITIES ON LOAN: 0.2% (Cost: $27,585,223) | ||||||||
| Money Market Fund: 0.2% | ||||||||
| 27,585,223 | State Street Navigator Securities Lending Government Money Market Portfolio | 27,585,223 | ||||||
| Total Investments: 100.2% (Cost: $10,778,595,162) | 13,023,696,098 | |||||||
| Liabilities in excess of other assets: (0.2)% | (24,969,623 | ) | ||||||
| NET ASSETS: 100.0% | $ | 12,998,726,475 | ||||||
See Notes to Financial Statements
| 24 |
Definitions:
| ADR | American Depositary Receipt |
| CAD | Canadian Dollar |
| USD | United States Dollar |
Footnotes:
| ‡ | Affiliated issuer – as defined under the Investment Company Act of 1940. |
| * | Non-income producing |
| † | Security fully or partially on loan. Total market value of securities on loan is $86,418,103. |
| # | Security has been valued in good faith pursuant to guidelines established by the Board of Trustees. The aggregate value of fair valued securities is $2,190,951,061 which represents 16.9% of net assets. |
| Summary of Investments by Sector Excluding Collateral for Securities Loaned | % of Investments | Value | ||||||
| Gold | 90.2 | % | $ | 11,716,576,763 | ||||
| Silver | 9.8 | 1,279,534,112 | ||||||
| 100.0 | % | $ | 12,996,110,875 | |||||
A summary of the Fund’s transactions in securities of affiliates for the year ended December 31, 2019 is set forth below:
| Affiliates | Value 12/31/18 | Purchases | Sales Proceeds | Realized Gain (Loss) | Dividend Income | Net Change in Unrealized Appreciation (Depreciation) | Value 12/31/19 | |||||||||||||||||||||
| Agnico-Eagle Mines Ltd. | $ | 520,137,718 | $ | 162,321,253 | $ | (269,685,839 | ) | $ | 43,548,549 | $ | 5,993,767 | $ | 179,295,936 | $ | — | (a) | ||||||||||||
| Alacer Gold Corp. | — | 79,267,657 | (25,426,456 | ) | 3,724,616 | — | 41,102,374 | 98,668,191 | ||||||||||||||||||||
| Alamos Gold, Inc. | 99,464,864 | 47,991,715 | (59,616,813 | ) | 15,318,194 | 1,000,835 | 45,025,785 | 148,183,745 | ||||||||||||||||||||
| AngloGold Ashanti Ltd. | 366,913,231 | 165,866,605 | (196,849,189 | ) | 70,713,124 | 1,860,235 | 177,149,957 | 583,793,728 | ||||||||||||||||||||
| B2Gold Corp. | 204,816,687 | 75,199,155 | (86,360,068 | ) | 12,420,377 | — | 52,740,637 | 258,816,788 | ||||||||||||||||||||
| Barrick Gold Corp. | 808,713,532 | 875,240,834 | (576,177,872 | ) | 29,779,965 | 9,397,604 | 283,751,917 | — | (a) | |||||||||||||||||||
| Centamin Plc | 113,792,339 | 36,882,137 | (47,954,200 | ) | (1,536,053 | ) | 4,956,007 | 20,831,970 | 122,016,193 | |||||||||||||||||||
| Centerra Gold, Inc. | 88,781,167 | 47,177,379 | (55,538,915 | ) | 14,434,950 | — | 52,301,345 | 147,155,926 | ||||||||||||||||||||
| Cia de Minas Buenaventura SAA | 316,030,237 | 89,431,520 | (142,149,530 | ) | 13,261,718 | 1,546,645 | (35,415,560 | ) | 241,158,385 | |||||||||||||||||||
| Coeur Mining, Inc. | 64,403,009 | 31,783,589 | (24,022,138 | ) | 972,241 | — | 49,115,986 | 122,252,687 | ||||||||||||||||||||
| Detour Gold Corp. | 104,674,993 | 54,007,416 | (62,884,739 | ) | 17,637,075 | — | 102,984,489 | 216,419,234 | ||||||||||||||||||||
| Dundee Precious Metals, Inc. | — | 48,019,069 | (221,067 | ) | 3,401 | — | 602,574 | 48,403,977 | ||||||||||||||||||||
| Eldorado Gold Corp. | 32,416,577 | 24,381,162 | (26,701,914 | ) | (9,714,860 | ) | — | 59,689,072 | 80,070,037 | |||||||||||||||||||
| Endeavour Mining Corp. | 124,894,732 | 40,609,749 | (50,551,904 | ) | 3,616,952 | — | 12,269,017 | 130,838,546 | ||||||||||||||||||||
| Evolution Mining Ltd. | 312,760,951 | 107,019,391 | (136,667,276 | ) | 38,255,481 | 6,968,312 | (36,260,647 | ) | 285,107,900 | |||||||||||||||||||
| First Majestic Silver Corp. | 80,812,220 | 42,176,410 | (43,041,705 | ) | 9,018,462 | — | 69,019,940 | 157,985,327 | ||||||||||||||||||||
| Fortuna Silver Mines, Inc. | 41,480,198 | 1,910,383 | (35,051,997 | ) | (26,914,481 | ) | — | 18,575,897 | — | |||||||||||||||||||
| Franco-Nevada Corp. | 668,954,538 | 204,388,892 | (293,491,978 | ) | 49,273,281 | 7,969,406 | 208,625,974 | — | (a) | |||||||||||||||||||
| Gold Fields Ltd. | 204,968,051 | 93,127,539 | (114,752,721 | ) | 26,513,556 | 2,832,431 | 134,282,253 | 344,138,678 | ||||||||||||||||||||
| Goldcorp, Inc. | 482,050,171 | 36,549,181 | (587,592,400 | ) | (192,897,372 | ) | 918,382 | 261,890,420 | — | |||||||||||||||||||
| Harmony Gold Mining Co. Ltd. | 67,526,656 | 33,710,076 | (37,483,005 | ) | 7,595,865 | — | 52,515,627 | 123,865,219 | ||||||||||||||||||||
| Hecla Mining Co. | 80,325,184 | 22,973,290 | (29,504,399 | ) | (4,694,060 | ) | 308,188 | 36,602,992 | 105,703,007 | |||||||||||||||||||
| Highland Gold Mining Ltd. | — | 75,675,674 | (20,399,756 | ) | (89,617 | ) | 3,633,943 | 3,997,628 | 59,183,929 | |||||||||||||||||||
| IAMGOLD Corp. | 121,697,254 | 35,041,436 | (44,885,057 | ) | (6,143,619 | ) | — | 4,135,502 | 109,845,516 | |||||||||||||||||||
| Kinross Gold Corp. | 285,843,557 | 114,513,763 | (139,339,184 | ) | 18,418,031 | — | 94,430,982 | 373,867,149 | ||||||||||||||||||||
| Kirkland Lake Gold Ltd. | 387,709,075 | 171,225,853 | (221,849,861 | ) | 148,139,193 | 2,081,447 | 77,921,289 | 563,145,549 | ||||||||||||||||||||
| McEwen Mining, Inc. | 43,509,870 | 14,358,056 | (39,675,274 | ) | (35,000,800 | ) | — | 16,808,148 | — | |||||||||||||||||||
| New Gold, Inc. | 30,868,670 | 56,420,043 | (37,137,558 | ) | (86,711,056 | ) | — | 73,821,415 | 37,261,514 | |||||||||||||||||||
| Newcrest Mining Ltd. | 603,699,623 | 194,932,753 | (295,989,670 | ) | 68,159,970 | 7,078,428 | 128,690,712 | — | (a) | |||||||||||||||||||
| Newmont Mining Corp. | 944,143,269 | 864,018,277 | (582,580,194 | ) | 35,366,902 | 38,547,584 | 271,023,795 | — | (a) | |||||||||||||||||||
| Northern Star Resources Ltd. | 295,708,750 | 99,685,363 | (126,771,084 | ) | 52,275,099 | 3,834,941 | 1,446,269 | 322,344,397 | ||||||||||||||||||||
| OceanaGold Corp. | 159,840,290 | 34,489,065 | (48,459,320 | ) | (682,271 | ) | 406,838 | (68,184,894 | ) | 77,002,870 | ||||||||||||||||||
| Osisko Gold Royalties Ltd. | 97,337,468 | 38,110,271 | (51,599,362 | ) | 6,947,471 | 1,469,642 | 5,381,809 | 96,177,657 | ||||||||||||||||||||
| Pan American Silver Corp. | 158,659,602 | 120,245,837 | (88,579,247 | ) | 8,430,436 | 1,712,795 | 113,709,473 | 312,466,101 | ||||||||||||||||||||
| Perseus Mining Ltd. | — | 50,671,321 | (232,106 | ) | 2,447 | — | 8,816,970 | 59,258,632 | ||||||||||||||||||||
| Pretium Resources, Inc. | 109,881,257 | 41,072,890 | (50,272,707 | ) | 6,206,093 | — | 22,917,149 | 129,804,682 | ||||||||||||||||||||
See Notes to Financial Statements
| 25 |
VANECK VECTORS GOLD MINERS ETF
SCHEDULE OF INVESTMENTS
(continued)
| Affiliates (continued) | Value 12/31/18 | Purchases | Sales Proceeds | Realized Gain (Loss) | Dividend Income | Net Change in Unrealized Appreciation (Depreciation) | Value 12/31/19 | |||||||||||||||||||||
| Randgold Resources Ltd. | $ | 498,159,398 | $ | — | $ | (511,609,270 | ) | $ | — | $ | 15,559,502 | $ | 13,449,872 | $ | — | |||||||||||||
| Regis Resources Ltd. | 122,392,528 | 36,988,956 | (49,755,976 | ) | 12,950,919 | 3,546,830 | (25,654,113 | ) | 96,922,314 | |||||||||||||||||||
| Resolute Mining Ltd. | 43,706,450 | 24,875,939 | (19,116,109 | ) | (717,082 | ) | — | 1,345,295 | 50,094,493 | |||||||||||||||||||
| Royal Gold, Inc. | 397,694,277 | 155,471,658 | (194,923,048 | ) | 37,532,909 | 4,519,548 | 108,805,822 | 504,581,618 | ||||||||||||||||||||
| Sandstorm Gold Ltd. | 59,675,136 | 21,621,840 | (31,200,706 | ) | 5,299,312 | — | 26,550,194 | 81,945,776 | ||||||||||||||||||||
| Saracen Mineral Holdings Ltd. | 120,142,275 | 72,413,766 | (47,068,100 | ) | 24,288,113 | — | (8,634,302 | ) | 161,141,752 | |||||||||||||||||||
| Semafo, Inc. | 49,849,492 | 23,763,890 | (27,024,264 | ) | 3,425,953 | — | (6,195,007 | ) | 43,820,064 | |||||||||||||||||||
| Silvercorp Metals, Inc. | — | 58,618,276 | (269,781 | ) | 3,760 | — | 2,902,292 | 61,254,547 | ||||||||||||||||||||
| SSR Mining, Inc. | 103,045,923 | 38,206,270 | (46,183,849 | ) | 9,868,705 | — | 44,187,507 | 149,124,556 | ||||||||||||||||||||
| St. Barbara Ltd. | 123,029,927 | 51,894,942 | (41,250,492 | ) | 936,337 | 2,038,018 | (50,881,043 | ) | 83,729,671 | |||||||||||||||||||
| Tahoe Resources, Inc. | 81,058,653 | 659,261 | (82,846,460 | ) | (97,134,218 | ) | — | 98,262,764 | — | |||||||||||||||||||
| Torex Gold Resources, Inc. | 53,530,337 | 26,745,493 | (27,182,989 | ) | 4,491,834 | — | 27,325,906 | 84,910,581 | ||||||||||||||||||||
| Wesdome Gold Mines Ltd. | — | 61,692,459 | (291,029 | ) | 11,232 | — | 6,076,697 | 67,489,359 | ||||||||||||||||||||
| Wheaton Precious Metals Corp. | 515,099,961 | 160,945,542 | (256,263,508 | ) | 27,989,624 | 7,800,820 | 194,353,511 | — | (a) | |||||||||||||||||||
| Yamana Gold, Inc. | 158,725,755 | 62,853,039 | (77,833,576 | ) | 2,601,772 | 1,800,301 | 89,887,931 | 236,234,921 | ||||||||||||||||||||
| Zhaojin Mining Industry Co. Ltd. | 75,479,429 | 25,003,261 | (32,532,622 | ) | 6,280,036 | 371,170 | (1,780,956 | ) | 72,449,148 | |||||||||||||||||||
| Zijin Mining Group Ltd. | 154,103,290 | 46,713,257 | (64,743,569 | ) | 6,043,098 | 5,194,402 | 37,093,168 | 179,209,244 | ||||||||||||||||||||
| $ | 10,578,508,571 | $ | 5,098,962,853 | $ | (6,159,591,853 | ) | $ | 379,521,564 | $ | 143,348,021 | $ | 3,098,709,740 | $ | 7,227,843,608 | ||||||||||||||
| (a) | Security held by the Fund, however not classified as an affiliate at the end of the reporting period. |
The summary of inputs used to value the Fund’s investments as of December 31, 2019 is as follows:
| Level 1 Quoted Prices | Level 2 Significant Observable Inputs | Level 3 Significant Unobservable Inputs | Value | ||||||||||||||
| Common Stocks | |||||||||||||||||
| Australia | $ | 77,002,870 | $ | 1,758,092,547 | $ | — | $ | 1,835,095,417 | |||||||||
| Canada | 6,941,184,836 | — | — | 6,941,184,836 | |||||||||||||
| China / Hong Kong | — | 251,658,392 | — | 251,658,392 | |||||||||||||
| Monaco | 130,838,546 | — | — | 130,838,546 | |||||||||||||
| Peru | 241,158,385 | — | — | 241,158,385 | |||||||||||||
| South Africa | 1,051,797,625 | — | — | 1,051,797,625 | |||||||||||||
| United Kingdom | — | 181,200,122 | — | 181,200,122 | |||||||||||||
| United States | 2,363,177,552 | — | — | 2,363,177,552 | |||||||||||||
| Money Market Fund | 27,585,223 | — | — | 27,585,223 | |||||||||||||
| Total | $ | 10,832,745,037 | $ | 2,190,951,061 | $ | — | $ | 13,023,696,098 | |||||||||
See Notes to Financial Statements
| 26 |
VANECK VECTORS JUNIOR GOLD MINERS ETF
SCHEDULE OF INVESTMENTS
December 31, 2019
| Number of Shares | Value | |||||||
| COMMON STOCKS: 99.9% | ||||||||
| Australia: 20.2% | ||||||||
| 42,210,066 | Aurelia Metals Ltd. # | $ | 12,914,107 | |||||
| 4,027,098 | Castile Resources Pty Ltd. * #∞ | 56,617 | ||||||
| 11,730,509 | Dacian Gold Ltd. ‡ * † # | 13,018,355 | ||||||
| 78,936,482 | Evolution Mining Ltd. # | 210,206,304 | ||||||
| 43,040,408 | Gold Road Resources Ltd. * † # | 40,366,236 | ||||||
| 32,197,701 | Northern Star Resources Ltd. † # | 254,179,585 | ||||||
| 27,667,853 | OceanaGold Corp. (CAD) | 54,407,577 | ||||||
| 64,723,972 | Perseus Mining Ltd. ‡ * † # | 52,403,324 | ||||||
| 36,065,027 | Ramelius Resources Ltd. ‡ # | 31,267,811 | ||||||
| 26,851,159 | Regis Resources Ltd. ‡ # | 81,384,318 | ||||||
| 37,245,400 | Resolute Mining Ltd. * † # | 32,830,544 | ||||||
| 54,508,007 | Saracen Mineral Holdings Ltd. * # | 126,623,248 | ||||||
| 44,646,125 | Silver Lake Resources Ltd. ‡ * † # | 41,916,219 | ||||||
| 37,392,658 | St. Barbara Ltd. ‡ # | 71,165,348 | ||||||
| 19,562,689 | Westgold Resources Ltd. * # | 31,405,205 | ||||||
| 1,054,144,798 | ||||||||
| Canada: 51.7% | ||||||||
| 16,132,388 | Alamos Gold, Inc. (USD) | 97,116,976 | ||||||
| 42,962,194 | B2Gold Corp. (USD) | 172,278,398 | ||||||
| 10,025,730 | Centerra Gold, Inc. * | 79,865,657 | ||||||
| 15,581,511 | China Gold International Resources Corp. Ltd. * † | 14,178,664 | ||||||
| 8,900,451 | Continental Gold, Inc. * | 36,720,581 | ||||||
| 9,374,053 | Detour Gold Corp. ‡ * | 181,734,099 | ||||||
| 7,738,260 | Dundee Precious Metals, Inc. * | 33,298,238 | ||||||
| 9,109,221 | Eldorado Gold Corp. (USD) ‡ * | 73,147,045 | ||||||
| 8,474,263 | Endeavour Silver Corp. (USD) ‡ * † | 20,422,974 | ||||||
| 10,178,888 | First Majestic Silver Corp. (USD) ‡ * † | 124,793,167 | ||||||
| 8,572,732 | Fortuna Silver Mines, Inc. (USD) ‡ * † | 34,976,747 | ||||||
| 9,835,576 | Gold Standard Ventures Corp. (USD) * | 8,419,253 | ||||||
| 3,998,535 | Golden Star Resources Ltd. (USD) * † | 15,234,418 | ||||||
| 18,860,161 | Great Panther Silver Ltd. (USD) ‡ * | 9,618,682 | ||||||
| 24,124,104 | IAMGOLD Corp. (USD) ‡ * | 89,982,908 | ||||||
| 58,957,956 | Kinross Gold Corp. (USD) * | 279,460,711 | ||||||
| 3,512,102 | MAG Silver Corp. (USD) * † | 41,583,288 | ||||||
| 17,280,980 | McEwen Mining, Inc. (USD) * † | 21,946,845 | ||||||
| 31,359,804 | New Gold, Inc. (USD) * | 27,596,627 | ||||||
| 12,634,222 | NovaGold Resources, Inc. (USD) * | 113,202,629 | ||||||
| 8,061,248 | Novo Resources Corp. * † | 23,684,870 | ||||||
| 5,783,651 | Osisko Gold Royalties Ltd. (USD) † | 56,159,251 | ||||||
| 9,700,745 | Osisko Mining, Inc. * † | 30,297,295 | ||||||
| 11,885,728 | Pan American Silver Corp. (USD) ‡ † | 281,572,897 | ||||||
| 16,729,842 | Pan American Silver Corp. (USD) * # (a)∞ | 10,066,982 | ||||||
| 8,814,860 | Premier Gold Mines Ltd. * † | 13,391,382 | ||||||
| 8,001,691 | Pretium Resources, Inc. (USD) * † | 89,058,821 | ||||||
| 19,391,823 | Roxgold, Inc. ‡ * † | 15,552,339 | ||||||
| 32,427,307 | Royal Nickel Corp. ‡ * † | 12,503,299 | ||||||
| 9,383,118 | Sandstorm Gold Ltd. (USD) ‡ * † | 69,904,229 | ||||||
| 3,017,345 | Seabridge Gold, Inc. (USD) * † | 41,699,708 | ||||||
| 14,439,228 | Semafo, Inc. * | 30,064,327 | ||||||
| 10,435,349 | Silvercorp Metals, Inc. ‡ † | 58,986,781 | ||||||
| 6,973,917 | SSR Mining, Inc. (USD) ‡ * † | 134,317,641 | ||||||
| 1,694,754 | Sulliden Mining Capital, Inc. * | 65,346 | ||||||
| 4,644,775 | Teranga Gold Corp. * | 25,144,647 | ||||||
| 3,296,774 | Torex Gold Resources, Inc. * | 52,168,731 | ||||||
| 8,317,788 | Wesdome Gold Mines Ltd. ‡ * † | 65,233,780 | ||||||
| Number of Shares | Value | |||||||
| Canada: (continued) | ||||||||
| 53,893,479 | Yamana Gold, Inc. (USD) ‡ | $ | 212,879,242 | |||||
| 2,698,329,475 | ||||||||
| China / Hong Kong: 0.9% | ||||||||
| 11,294,000 | Hengxing Gold Holding Co. Ltd. Reg S | 5,189,112 | ||||||
| 19,287,400 | Real Gold Mining Ltd. * #�� | 2 | ||||||
| 37,177,000 | Zhaojin Mining Industry Co. Ltd. # | 40,786,244 | ||||||
| 45,975,358 | ||||||||
| Mexico: 1.6% | ||||||||
| 7,939,612 | Industrias Penoles, SAB de CV † | 83,335,654 | ||||||
| Monaco: 1.2% | ||||||||
| 3,329,084 | Endeavour Mining Corp. (CAD) * | 62,974,691 | ||||||
| Peru: 4.1% | ||||||||
| 11,513,382 | Cia de Minas Buenaventura SAA (USD) | 173,852,068 | ||||||
| 16,120,131 | Hochschild Mining Plc (GBP) # | 39,084,269 | ||||||
| 212,936,337 | ||||||||
| South Africa: 12.1% | ||||||||
| 35,774,055 | Gold Fields Ltd. (USD) | 236,108,763 | ||||||
| 30,051,424 | Harmony Gold Mining Co. Ltd. (USD) ‡ * | 109,086,669 | ||||||
| 29,247,977 | Sibanye Gold Ltd. (USD) * † | 290,432,412 | ||||||
| 635,627,844 | ||||||||
| Turkey: 0.7% | ||||||||
| 2,947,967 | Koza Altin Isletmeleri AS * # | 36,661,086 | ||||||
| United Kingdom: 2.2% | ||||||||
| 46,181,049 | Centamin Plc # | 77,466,264 | ||||||
| 14,068,914 | Highland Gold Mining Ltd. # | 36,362,933 | ||||||
| 113,829,197 | ||||||||
| United States: 5.2% | ||||||||
| 14,431,126 | Alacer Gold Corp. (CAD) * | 76,787,946 | ||||||
| 9,599,703 | Argonaut Gold, Inc. (CAD) ‡ * | 14,435,644 | ||||||
| 10,848,922 | Coeur Mining, Inc. * | 87,659,290 | ||||||
| 3,513,324 | Gold Resource Corp. ‡ | 19,463,815 | ||||||
| 21,393,667 | Hecla Mining Co. | 72,524,531 | ||||||
| 2,799,497 | Patagonia Gold Corp. (CAD) * | 129,531 | ||||||
| 271,000,757 | ||||||||
| Total Common Stocks (Cost: $4,410,149,674) | 5,214,815,197 | |||||||
| SHORT-TERM INVESTMENT HELD ASCOLLATERAL FOR SECURITIES ON LOAN: 1.2% (Cost: $60,229,115) | ||||||||
| Money Market Fund: 1.2% | ||||||||
| 60,229,115 | State Street Navigator Securities Lending Government Money Market Portfolio | 60,229,115 | ||||||
| Total Investments: 101.1% (Cost: $4,470,378,789) | 5,275,044,312 | |||||||
| Liabilities in excess of other assets: (1.1)% | (55,824,058 | ) | ||||||
| NET ASSETS: 100.0% | $ | 5,219,220,254 | ||||||
See Notes to Financial Statements
| 27 |
VANECK VECTORS JUNIOR GOLD MINERS ETF
SCHEDULE OF INVESTMENTS
(continued)
Definitions:
| CAD | Canadian Dollar |
| GBP | British Pound |
| USD | United States Dollar |
Footnotes:
| (a) | Contingent Value Right |
| ‡ | Affiliated issuer – as defined under the Investment Company Act of 1940. |
| * | Non-income producing |
| † | Security fully or partially on loan. Total market value of securities on loan is $196,868,095. |
| # | Security has been valued in good faith pursuant to guidelines established by the Board of Trustees. The aggregate value of fair valued securities is $1,240,165,001 which represents 23.8% of net assets. |
| ∞ | Security is valued using pricing models and significant unobservable inputs that factor in discount for lack of marketability |
| Reg S | Security was purchased pursuant to Regulation S under the Securities Act of 1933, which exempts from registration securities offered and sold outside of the United States. Such a security cannot be sold in the United States without either an effective registration statement filed pursuant to the Securities Act of 1933, or pursuant to an exemption from registration. |
| Summary of Investments by Sector Excluding Collateral for Securities Loaned | % of Investments | Value | ||||||
| Diversified Metals & Mining | 0.5 | % | $ | 25,474,023 | ||||
| Gold | 84.2 | 4,391,631,243 | ||||||
| Precious Metals & Minerals | 2.2 | 113,698,295 | ||||||
| Silver | 13.1 | 684,011,636 | ||||||
| 100.0 | % | $ | 5,214,815,197 | |||||
A summary of the Fund’s transactions in securities of affiliates for the period ended December 31, 2019 is set forth below:
| Affiliates | Value 12/31/18 | Purchases | Sales Proceeds | Realized Gain (Loss) | Dividend Income | Net Change in Unrealized Appreciation (Depreciation) | Value 12/31/19 | |||||||||||||||||||||
| Alacer Gold Corp. | $ | 34,982,152 | $ | 28,127,937 | $ | (42,760,939 | ) | $ | 12,821,342 | $ | — | $ | 43,617,454 | $ | — | (b) | ||||||||||||
| AngloGold Ashanti Ltd. | 282,998,522 | 5,835,830 | (312,202,250 | ) | 121,052,961 | — | (97,685,063 | ) | — | |||||||||||||||||||
| Argonaut Gold, Inc. | 12,949,447 | 6,382,283 | (8,939,982 | ) | (980,605 | ) | — | 5,024,501 | 14,435,644 | |||||||||||||||||||
| Centamin Plc | 80,309,456 | 31,633,430 | (49,685,680 | ) | (7,177,506 | ) | 3,426,347 | 22,386,564 | — | (b) | ||||||||||||||||||
| Cia de Minas Buenaventura SAA | 234,294,396 | 77,442,145 | (125,819,878 | ) | (423,792 | ) | 1,091,177 | (11,640,803 | ) | — | (b) | |||||||||||||||||
| Coeur Mining, Inc. | 45,523,338 | 30,482,985 | (24,680,523 | ) | (3,004,910 | ) | — | 39,338,400 | — | (b) | ||||||||||||||||||
| Dacian Gold Ltd. | — | 12,461,615 | (885,693 | ) | 37,778 | — | 1,404,655 | 13,018,355 | ||||||||||||||||||||
| Detour Gold Corp. | 88,749,098 | 62,333,538 | (72,661,288 | ) | 11,100,423 | — | 92,212,328 | 181,734,099 | ||||||||||||||||||||
| Eldorado Gold Corp. | 25,343,959 | 29,282,145 | (23,309,709 | ) | 1,330,896 | — | 40,499,754 | 73,147,045 | ||||||||||||||||||||
| Endeavour Silver Corp. | 19,602,819 | 9,136,403 | (10,278,882 | ) | (1,147,089 | ) | — | 3,109,723 | 20,422,974 | |||||||||||||||||||
| Evolution Mining Ltd. | 231,124,387 | 100,527,859 | (130,077,560 | ) | 37,871,883 | 5,082,843 | (29,240,265 | ) | — | (b) | ||||||||||||||||||
| First Majestic Silver Corp. | 65,808,888 | 42,834,854 | (48,906,439 | ) | 4,274,878 | — | 60,780,986 | 124,793,167 | ||||||||||||||||||||
| First Mining Gold Corp. | 7,062,340 | 1,633,504 | (8,092,517 | ) | (16,153,544 | ) | — | 15,550,217 | — | |||||||||||||||||||
| Fortuna Silver Mines, Inc. | 35,792,404 | 12,942,551 | (17,198,543 | ) | (2,549,153 | ) | — | 5,989,488 | 34,976,747 | |||||||||||||||||||
| Gold Fields Ltd. | 169,028,988 | 85,758,731 | (151,169,671 | ) | 33,370,085 | 2,074,036 | 99,120,630 | — | (b) | |||||||||||||||||||
| Gold Resource Corp. | 13,319,704 | 9,256,661 | (8,918,698 | ) | 970,322 | 82,851 | 4,835,826 | 19,463,815 | ||||||||||||||||||||
| Great Panther Silver Ltd. | 8,385,985 | 15,663,567 | (7,579,518 | ) | (2,741,720 | ) | — | (4,109,632 | ) | 9,618,682 | ||||||||||||||||||
| Harmony Gold Mining Co. Ltd. | 52,794,763 | 43,005,070 | (38,147,661 | ) | 7,063,841 | — | 44,370,656 | 109,086,669 | ||||||||||||||||||||
| Hecla Mining Co. | 60,219,126 | 17,807,007 | (25,988,310 | ) | (8,909,609 | ) | 220,887 | 29,396,317 | — | (b) | ||||||||||||||||||
| IAMGOLD Corp. | 102,965,609 | 38,282,805 | (50,626,589 | ) | (4,666,377 | ) | — | 4,027,460 | 89,982,908 | |||||||||||||||||||
| Kinross Gold Corp. | 264,445,346 | 117,185,725 | (201,558,488 | ) | 29,421,421 | — | 69,966,707 | — | (b) | |||||||||||||||||||
| New Gold, Inc. | 28,593,826 | 12,760,287 | (17,826,478 | ) | (18,218,871 | ) | — | 22,287,863 | — | (b) | ||||||||||||||||||
| Northern Star Resources Ltd. | 237,525,086 | 98,755,904 | (129,209,792 | ) | 52,018,061 | 2,829,103 | (4,909,674 | ) | — | (b) | ||||||||||||||||||
| OceanaGold Corp. | 119,830,727 | 34,608,873 | (49,573,072 | ) | (3,035,391 | ) | 295,764 | (47,423,560 | ) | — | (b) | |||||||||||||||||
| Pan American Silver Corp. | 139,336,545 | 199,430,921 | (113,870,133 | ) | (29,096,338 | ) | 1,783,457 | 85,771,902 | 281,572,897 | |||||||||||||||||||
| Perseus Mining Ltd. | 16,515,673 | 19,044,756 | (14,348,200 | ) | 4,909,929 | — | 26,281,166 | 52,403,324 | ||||||||||||||||||||
| Premier Gold Mines Ltd. | 12,902,867 | 6,338,268 | (9,578,035 | ) | (1,955,551 | ) | — | 5,683,833 | — | (b) | ||||||||||||||||||
| Pretium Resources, Inc. | 89,438,248 | 30,630,897 | (55,441,985 | ) | 7,533,661 | — | 16,898,000 | — | (b) | |||||||||||||||||||
| Ramelius Resources Ltd. | 9,807,806 | 17,845,435 | (14,450,112 | ) | 4,537,450 | 227,730 | 13,527,232 | 31,267,811 | ||||||||||||||||||||
| Regis Resources Ltd. | 111,422,986 | 48,074,362 | (67,746,447 | ) | 21,588,567 | 3,186,817 | (31,955,150 | ) | 81,384,318 | |||||||||||||||||||
See Notes to Financial Statements
| 28 |
| Affiliates (continued) | Value 12/31/18 | Purchases | Sales Proceeds | Realized Gain (Loss) | Dividend Income | Net Change in Unrealized Appreciation (Depreciation) | Value 12/31/19 | |||||||||||||||||||||
| Roxgold, Inc. | $ | — | $ | 18,089,944 | $ | (839,545 | ) | $ | 76,217 | $ | — | $ | (1,774,277 | ) | $ | 15,552,339 | ||||||||||||
| Royal Nickel Corp. | — | 21,102,766 | (3,835,793 | ) | (2,097,099 | ) | — | (2,666,575 | ) | 12,503,299 | ||||||||||||||||||
| Sandstorm Gold Ltd. | 51,768,258 | 22,409,429 | (31,984,252 | ) | 8,773,422 | — | 18,937,372 | 69,904,229 | ||||||||||||||||||||
| Saracen Mineral Holdings Ltd. | 97,789,867 | 73,665,771 | (61,617,009 | ) | 41,527,652 | — | (24,743,033 | ) | — | (b) | ||||||||||||||||||
| Silver Lake Resources Ltd. | 11,913,423 | 30,275,278 | (16,906,498 | ) | 3,957,879 | — | 12,676,137 | 41,916,219 | ||||||||||||||||||||
| Silvercorp Metals, Inc. | 24,544,468 | 16,815,249 | (20,242,503 | ) | 3,746,220 | 277,792 | 34,123,347 | 58,986,781 | ||||||||||||||||||||
| SSR Mining, Inc. | 94,896,804 | 43,267,246 | (55,821,656 | ) | 24,457,213 | — | 27,518,034 | 134,317,641 | ||||||||||||||||||||
| St. Barbara Ltd. | 107,983,269 | 64,578,577 | (55,355,913 | ) | (972,714 | ) | 1,870,343 | (45,067,871 | ) | 71,165,348 | ||||||||||||||||||
| Tahoe Resources, Inc. | 65,108,273 | 784,105 | (114,775,367 | ) | 695,506 | — | 48,187,483 | — | ||||||||||||||||||||
| Teranga Gold Corp. | 17,350,543 | 24,120,226 | (28,552,594 | ) | 857,877 | — | 11,368,595 | — | (b) | |||||||||||||||||||
| Torex Gold Resources,Inc. | 42,916,086 | 22,117,013 | (36,238,829 | ) | 3,692,730 | — | 19,681,731 | — | (b) | |||||||||||||||||||
| Wesdome Gold Mines Ltd. | — | (a) | 25,614,737 | (14,597,089 | ) | 7,351,595 | — | 25,298,805 | 65,233,780 | |||||||||||||||||||
| Yamana Gold, Inc. | 147,920,842 | 71,148,134 | (93,261,715 | ) | 10,315,396 | 1,609,091 | 76,756,585 | 212,879,242 | ||||||||||||||||||||
| $ | 3,263,266,324 | $ | 1,679,494,823 | $ | (2,365,561,835 | ) | $ | 352,224,936 | $ | 24,058,238 | $ | 725,413,848 | $ | 1,819,767,333 | ||||||||||||||
| (a) | Security held by the Fund, however not classified as an affiliate at the beginning of the reporting period. |
| (b) | Security held by the Fund, however not classified as an affiliate at the end of the reporting period |
The summary of inputs used to value the Fund’s investments as of December 31, 2019 is as follows:
| Level 1 Quoted Prices | Level 2 Significant Observable Inputs | Level 3 Significant Unobservable Inputs | Value | ||||||||||||||
| Common Stocks | |||||||||||||||||
| Australia | $ | 54,407,577 | $ | 999,680,604 | $ | 56,617 | $ | 1,054,144,798 | |||||||||
| Canada | 2,688,262,493 | — | 10,066,982 | 2,698,329,475 | |||||||||||||
| China / Hong Kong | 5,189,112 | 40,786,244 | 2 | 45,975,358 | |||||||||||||
| Mexico | 83,335,654 | — | — | 83,335,654 | |||||||||||||
| Monaco | 62,974,691 | — | — | 62,974,691 | |||||||||||||
| Peru | 173,852,068 | 39,084,269 | — | 212,936,337 | |||||||||||||
| South Africa | 635,627,844 | — | — | 635,627,844 | |||||||||||||
| Turkey | — | 36,661,086 | — | 36,661,086 | |||||||||||||
| United Kingdom | — | 113,829,197 | — | 113,829,197 | |||||||||||||
| United States | 271,000,757 | — | — | 271,000,757 | |||||||||||||
| Money Market Fund | 60,229,115 | — | — | 60,229,115 | |||||||||||||
| Total | $ | 4,034,879,311 | $ | 1,230,041,400 | $ | 10,123,601 | $ | 5,275,044,312 | |||||||||
See Notes to Financial Statements
| 29 |
VANECK VECTORS LOW CARBON ENERGY ETF
SCHEDULE OF INVESTMENTS
December 31, 2019
| Number of Shares | Value | |||||||
| COMMON STOCKS: 99.9% | ||||||||
| Austria: 2.9% | ||||||||
| 60,521 | Verbund-Oesterreichische Elektrizis AG # | $ | 3,040,299 | |||||
| Brazil: 2.0% | ||||||||
| 93,564 | Cosan Ltd. (USD) * | 2,137,002 | ||||||
| Canada: 3.7% | ||||||||
| 40,549 | Canadian Solar, Inc. (USD) * † | 896,133 | ||||||
| 140,299 | Northland Power, Inc. | 2,942,844 | ||||||
| 3,838,977 | ||||||||
| China / Hong Kong: 3.2% | ||||||||
| 2,763,000 | China Longyuan Power Group Corp. Ltd. # | 1,747,409 | ||||||
| 36,642 | JinkoSolar Holding Co. Ltd. (ADR) * † | 824,078 | ||||||
| 639,580 | Xinjiang Goldwind Science & Technology Co. Ltd. # | 743,274 | ||||||
| 3,314,761 | ||||||||
| Denmark: 8.1% | ||||||||
| 84,038 | Vestas Wind Systems A/S # | 8,494,562 | ||||||
| Germany: 0.7% | ||||||||
| 55,939 | Nordex SE * # | 749,618 | ||||||
| Spain: 3.3% | ||||||||
| 199,771 | Siemens Gamesa Renewable Energy SA # | 3,520,608 | ||||||
| Sweden: 4.4% | ||||||||
| 263,827 | Nibe Industrier AB # | 4,579,826 | ||||||
| United States: 71.6% | ||||||||
| 32,683 | Acuity Brands, Inc. | 4,510,254 | ||||||
| 85,909 | AMETEK, Inc. | 8,568,564 | ||||||
| 25,872 | Badger Meter, Inc. | 1,679,869 | ||||||
| 109,790 | Covanta Holding Corp. | 1,629,284 | ||||||
| 94,464 | Cree, Inc. * | 4,359,513 | ||||||
| 90,320 | Eaton Corp. Plc | 8,555,110 | ||||||
| 37,751 | EnerSys, Inc. | 2,824,907 | ||||||
| 70,454 | Enphase Energy, Inc. * † | 1,840,963 | ||||||
| 67,433 | First Solar, Inc. * | 3,773,551 | ||||||
| 34,177 | Franklin Electric Co. Inc. | 1,959,026 | ||||||
| 31,207 | Itron, Inc. * | 2,619,828 | ||||||
| 82,694 | Microchip Technology, Inc. | 8,659,716 | ||||||
| 45,199 | Ormat Technologies, Inc. | 3,368,229 | ||||||
| 26,064 | Power Integrations, Inc. | 2,577,990 | ||||||
| 34,620 | Renewable Energy Group, Inc. * † | 933,009 | ||||||
| 79,067 | SunPower Corp. * † | 616,723 | ||||||
| 88,833 | Sunrun, Inc. * | 1,226,784 | ||||||
| 23,718 | Tesla, Inc. * | 9,921,951 | ||||||
| 25,878 | Universal Display Corp. | 5,332,679 | ||||||
| 74,957,950 | ||||||||
| Total Common Stocks (Cost: $71,944,708) | 104,633,603 | |||||||
| Number of Shares | Value | |||||||
| SHORT-TERM INVESTMENT HELD AS COLLATERAL FOR SECURITIES ON LOAN: 1.2% (Cost: $1,193,707) | ||||||||
| Money Market Fund: 1.2% | ||||||||
| 1,193,707 | State Street Navigator Securities Lending Government Money Market Portfolio | $ | 1,193,707 | |||||
| Total Investments: 101.1% (Cost: $73,138,415) | 105,827,310 | |||||||
| Liabilities in excess of other assets: (1.1)% | (1,117,256 | ) | ||||||
| NET ASSETS: 100.0% | $ | 104,710,054 | ||||||
See Notes to Financial Statements
| 30 |
Definitions:
| ADR | American Depositary Receipt |
| USD | United States Dollar |
Footnotes:
| * | Non-income producing |
| † | Security fully or partially on loan. Total market value of securities on loan is $4,691,228. |
| # | Security has been valued in good faith pursuant to guidelines established by the Board of Trustees. The aggregate value of fair valued securities is $22,875,596 which represents 21.8% of net assets. |
| Summary of Investments by Sector | % of Investments | Value | ||||||
| Consumer Discretionary | 9.5 | % | $ | 9,921,951 | ||||
| Energy | 2.9 | 3,070,011 | ||||||
| Industrials | 45.3 | 47,361,817 | ||||||
| Information Technology | 31.7 | 33,181,043 | ||||||
| Utilities | 10.6 | 11,098,781 | ||||||
| 100.0 | % | $ | 104,633,603 | |||||
The summary of inputs used to value the Fund’s investments as of December 31, 2019 is as follows:
| Level 1 Quoted Prices | Level 2 Significant Observable Inputs | Level 3 Significant Unobservable Inputs | Value | ||||||||||||||
| Common Stocks | |||||||||||||||||
| Austria | $ | — | $ | 3,040,299 | $ | — | $ | 3,040,299 | |||||||||
| Brazil | 2,137,002 | — | — | 2,137,002 | |||||||||||||
| Canada | 3,838,977 | — | — | 3,838,977 | |||||||||||||
| China / Hong Kong | 824,078 | 2,490,683 | — | 3,314,761 | |||||||||||||
| Denmark | — | 8,494,562 | — | 8,494,562 | |||||||||||||
| Germany | — | 749,618 | — | 749,618 | |||||||||||||
| Spain | — | 3,520,608 | — | 3,520,608 | |||||||||||||
| Sweden | — | 4,579,826 | — | 4,579,826 | |||||||||||||
| United States | 74,957,950 | — | — | 74,957,950 | |||||||||||||
| Money Market Fund | 1,193,707 | — | — | 1,193,707 | |||||||||||||
| Total | $ | 82,951,714 | $ | 22,875,596 | $ | — | $ | 105,827,310 | |||||||||
See Notes to Financial Statements
| 31 |
VANECK VECTORS NATURAL RESOURCES ETF
SCHEDULE OF INVESTMENTS
December 31, 2019
| Number of Shares | Value | |||||||
| COMMON STOCKS: 100.1% | ||||||||
| Argentina: 0.1% | ||||||||
| 8,224 | Adecoagro SA (USD) * | $ | 68,835 | |||||
| 1,525 | YPF SA (ADR) † | 17,660 | ||||||
| 86,495 | ||||||||
| Australia: 5.0% | ||||||||
| 5,799 | AGL Energy Ltd. # | 83,611 | ||||||
| 43,484 | Alumina Ltd. # | 70,356 | ||||||
| 17,464 | Bega Cheese Ltd. † # | 53,057 | ||||||
| 54,198 | BHP Group Ltd. # | 1,486,604 | ||||||
| 9,618 | BlueScope Steel Ltd. # | 102,044 | ||||||
| 2,299 | Caltex Australia Ltd. # | 54,912 | ||||||
| 1,609 | CIMIC Group Ltd. # | 37,473 | ||||||
| 11,486 | Elders Ltd. # | 52,184 | ||||||
| 31,120 | Evolution Mining Ltd. # | 82,872 | ||||||
| 31,183 | Fortescue Metals Group Ltd. † # | 235,470 | ||||||
| 19,263 | GrainCorp. Ltd. * # | 102,691 | ||||||
| 7,781 | Iluka Resources Ltd. # | 51,035 | ||||||
| 15,625 | Newcrest Mining Ltd. # | 330,548 | ||||||
| 23,546 | Nufarm Ltd. * # | 95,980 | ||||||
| 11,692 | Oil Search Ltd. # | 59,720 | ||||||
| 15,493 | Origin Energy Ltd. # | 92,019 | ||||||
| 15,606 | Santos Ltd. # | 89,934 | ||||||
| 22,019 | Saracen Mineral Holdings Ltd. * # | 51,151 | ||||||
| 90,746 | South32 Ltd. # | 171,632 | ||||||
| 8,250 | Woodside Petroleum Ltd. # | 199,815 | ||||||
| 3,503,108 | ||||||||
| Austria: 0.3% | ||||||||
| 152 | Mayr-Melnhof Karton AG | 20,406 | ||||||
| 1,269 | OMV AG # | 71,146 | ||||||
| 1,220 | Verbund-Oesterreichische Elektrizis AG # | 61,287 | ||||||
| 2,301 | Voestalpine AG # | 63,865 | ||||||
| 216,704 | ||||||||
| Brazil: 2.2% | ||||||||
| 6,122 | Cia de Saneamento Basico do Estado de Sao Paulo (ADR) | 92,136 | ||||||
| 11,753 | Cia Siderurgica Nacional SA (ADR) † | 40,548 | ||||||
| 19,415 | Gerdau SA (ADR) † | 95,134 | ||||||
| 19,150 | Klabin SA # | 87,928 | ||||||
| 16,399 | Petroleo Brasileiro S.A. (ADR) | 261,400 | ||||||
| 7,550 | SLC Agricola SA # | 46,680 | ||||||
| 9,400 | Suzano SA # | 93,062 | ||||||
| 62,277 | Vale SA (ADR) | 822,056 | ||||||
| 1,538,944 | ||||||||
| Canada: 11.0% | ||||||||
| 4,843 | Agnico-Eagle Mines Ltd. (USD) † | 298,377 | ||||||
| 7,950 | Alamos Gold, Inc. | 48,003 | ||||||
| 9,389 | Algonquin Power & Utilities Corp. † | 133,006 | ||||||
| 20,598 | B2Gold Corp. | 82,757 | ||||||
| 36,109 | Barrick Gold Corp. (USD) | 671,266 | ||||||
| 10,475 | Canadian Natural Resources Ltd. (USD) | 338,866 | ||||||
| 8,989 | Cenovus Energy, Inc. | 91,502 | ||||||
| 4,346 | Centerra Gold, Inc. * | 34,621 | ||||||
| 17,838 | Enbridge, Inc. (USD) | 709,417 | ||||||
| Number of Shares | Value | |||||||
| Canada: (continued) | ||||||||
| 11,449 | Encana Corp. (USD) † | $ | 53,696 | |||||
| 3,622 | First Majestic Silver Corp. * † | 44,495 | ||||||
| 10,282 | First Quantum Minerals Ltd. | 104,426 | ||||||
| 3,805 | Franco-Nevada Corp. | 393,455 | ||||||
| 2,658 | Husky Energy, Inc. | 21,358 | ||||||
| 9,511 | IAMGOLD Corp. * † | 35,572 | ||||||
| 1,882 | Imperial Oil Ltd. (USD) † | 49,817 | ||||||
| 25,454 | Kinross Gold Corp. (USD) * | 120,652 | ||||||
| 3,887 | Kirkland Lake Gold Ltd. | 171,577 | ||||||
| 11,784 | Lundin Mining Corp. † | 70,518 | ||||||
| 4,841 | NovaGold Resources, Inc. (USD) * | 43,375 | ||||||
| 50,758 | Nutrien Ltd. (USD) † | 2,431,816 | ||||||
| 2,888 | Osisko Gold Royalties Ltd. | 28,106 | ||||||
| 4,257 | Pan American Silver Corp. (USD) | 100,848 | ||||||
| 4,505 | Pembina Pipeline Corp. † | 167,207 | ||||||
| 3,676 | Pretium Resources, Inc. * | 40,963 | ||||||
| 2,468 | SSR Mining, Inc. (USD) * | 47,534 | ||||||
| 13,711 | Suncor Energy, Inc. (USD) | 449,721 | ||||||
| 8,221 | TC Energy Corp. (USD) | 438,262 | ||||||
| 9,012 | Teck Resources Ltd. (USD) | 156,538 | ||||||
| 891 | West Fraser Timber Co. Ltd. † | 39,357 | ||||||
| 9,070 | Wheaton Precious Metals Corp. (USD) | 269,833 | ||||||
| 19,315 | Yamana Gold, Inc. (USD) | 76,294 | ||||||
| 7,763,235 | ||||||||
| Chile: 0.6% | ||||||||
| 48,921 | Aguas Andinas SA # | 20,765 | ||||||
| 6,354 | Antofagasta Plc (GBP) # | 76,941 | ||||||
| 19,880 | Empresas CMPC SA # | 48,724 | ||||||
| 9,813 | Sociedad Quimica y Minera de Chile SA (ADR) † | 261,909 | ||||||
| 408,339 | ||||||||
| China / Hong Kong: 1.8% | ||||||||
| 69,900 | Aluminum Corp. of China Ltd. * # | 23,956 | ||||||
| 26,340 | Angang Steel Co. Ltd. † # | 10,961 | ||||||
| 195,614 | China Agri-Industries Holdings Ltd. # | 103,621 | ||||||
| 144,175 | China BlueChemical Ltd. # | 35,523 | ||||||
| 18,300 | China Coal Energy Co. Ltd. # | 7,263 | ||||||
| 17,400 | China Gas Holdings Ltd. # | 65,153 | ||||||
| 31,700 | China Hongqiao Group Ltd. # | 19,119 | ||||||
| 55,429 | China Longyuan Power Group Corp. Ltd. # | 35,055 | ||||||
| 66,000 | China Molybdenum Co. Ltd. # | 28,320 | ||||||
| 16,100 | China Oilfield Services Ltd. (Class H) # | 25,279 | ||||||
| 225,627 | China Petroleum & Chemical Corp. # | 135,866 | ||||||
| 29,991 | China Shenhua Energy Co. Ltd. # | 62,712 | ||||||
| 142,079 | CNOOC Ltd. # | 236,268 | ||||||
| 45,400 | Fosun International Ltd. # | 66,228 | ||||||
| 18,800 | Health and Happiness H&H International Holdings Ltd. † # | 77,875 | ||||||
| 32,500 | Huaneng Power International, Inc. # | 16,435 | ||||||
| 90,000 | Huaneng Renewables Corp. Ltd. # | 35,000 | ||||||
| 21,400 | Jiangxi Copper Co. Ltd. (Class H) # | 29,435 | ||||||
| 35,900 | Kunlun Energy Co. Ltd. # | 31,718 | ||||||
| 21,200 | Lee & Man Paper Manufacturing Ltd. # | 16,060 | ||||||
| 15,700 | Maanshan Iron and Steel Co. Ltd. (Class H) † # | 6,366 | ||||||
| 29,657 | Nine Dragons Paper Holdings Ltd. # | 30,843 | ||||||
See Notes to Financial Statements
| 32 |
| Number of Shares | Value | |||||||
| China / Hong Kong: (continued) | ||||||||
| 186,140 | PetroChina Co. Ltd. (Class-H) # | $ | 93,708 | |||||
| 14,000 | Yanzhou Coal Mining Co. Ltd. † # | 12,579 | ||||||
| 20,600 | Zhaojin Mining Industry Co. Ltd. # | 22,600 | ||||||
| 117,461 | Zijin Mining Group Ltd. # | 58,343 | ||||||
| 1,286,286 | ||||||||
| Denmark: 1.0% | ||||||||
| 4,182 | Bakkafrost P/F (NOK) # | 309,733 | ||||||
| 3,563 | Vestas Wind Systems A/S # | 360,148 | ||||||
| 669,881 | ||||||||
| Finland: 0.4% | ||||||||
| 3,797 | Neste Oil Oyj | 132,211 | ||||||
| 10,821 | Stora Enso Oyj (R Shares) # | 157,566 | ||||||
| 289,777 | ||||||||
| France: 2.3% | ||||||||
| 7,593 | Suez # | 115,141 | ||||||
| 22,260 | Total SA # | 1,236,099 | ||||||
| 10,072 | Veolia Environnement SA # | 268,190 | ||||||
| 1,619,430 | ||||||||
| Germany: 0.9% | ||||||||
| 39,268 | E.ON SE # | 419,951 | ||||||
| 5,789 | Suedzucker AG # | 106,119 | ||||||
| 9,056 | ThyssenKrupp AG # | 121,773 | ||||||
| 647,843 | ||||||||
| Hungary: 0.1% | ||||||||
| 4,261 | MOL Hungarian Oil & Gas Plc # | 42,537 | ||||||
| India: 0.8% | ||||||||
| 13,676 | Reliance Industries Ltd. 144A (GDR) | 581,914 | ||||||
| Indonesia: 0.1% | ||||||||
| 45,400 | Indah Kiat Pulp and Paper Corp. Tbk PT # | 25,126 | ||||||
| 22,000 | Pabrik Kertas Tjiwi Kimia Tbk PT # | 16,259 | ||||||
| 247,900 | Perusahaan Perkebunan London Sumatra Indonesia Tbk PT # | 26,510 | ||||||
| 67,895 | ||||||||
| Ireland: 0.3% | ||||||||
| 11,128 | Origin Enterprises Plc # | 46,134 | ||||||
| 4,204 | Smurfit Kappa Group Plc (GBP) # | 162,373 | ||||||
| 208,507 | ||||||||
| Italy: 0.5% | ||||||||
| 22,422 | ENI S.p.A. # | 348,489 | ||||||
| Japan: 5.6% | ||||||||
| 7,700 | Calbee, Inc. # | 250,830 | ||||||
| 2,100 | Daio Paper Corp. # | 28,622 | ||||||
| 3,717 | Hitachi Metals Ltd. # | 54,703 | ||||||
| 2,200 | Hokuto Corp. # | 39,936 | ||||||
| 2,000 | Idemitsu Kosan Co. Ltd. # | 55,253 | ||||||
| 9,500 | Inpex Corp. # | 98,399 | ||||||
| Number of Shares | Value | |||||||
| Japan: (continued) | ||||||||
| 10,664 | JFE Holdings, Inc. # | $ | 136,809 | |||||
| 29,400 | JXTG Holdings, Inc. # | 133,410 | ||||||
| 103,700 | Kubota Corp. † # | 1,628,126 | ||||||
| 8,700 | Kumiai Chemical Industry Co. Ltd. # | 79,585 | ||||||
| 1,965 | Kurita Water Industries Ltd. # | 58,301 | ||||||
| 2,400 | Mitsubishi Materials Corp. # | 65,123 | ||||||
| 1,800 | Nippon Paper Industries Co. Ltd. # | 30,372 | ||||||
| 17,500 | Nippon Steel Corp. # | 263,728 | ||||||
| 27,714 | Nippon Suisan Kaisha Ltd. # | 165,475 | ||||||
| 22,350 | Nisshin Seifun Group, Inc. # | 389,879 | ||||||
| 16,876 | Oji Holdings Corp. # | 91,248 | ||||||
| 4,370 | Rengo Co. Ltd. # | 33,287 | ||||||
| 3,200 | Sakata Seed Corp. # | 107,284 | ||||||
| 3,083 | Sumitomo Forestry Co. Ltd. # | 45,392 | ||||||
| 5,000 | Sumitomo Metal Mining Ltd. # | 160,970 | ||||||
| 3,916,732 | ||||||||
| Luxembourg: 0.4% | ||||||||
| 11,783 | Arcelormittal # | 207,761 | ||||||
| 2,081 | Tenaris SA (ADR) | 47,114 | ||||||
| 976 | Ternium SA (ADR) | 21,472 | ||||||
| 276,347 | ||||||||
| Malaysia: 1.4% | ||||||||
| 135,739 | Felda Global Ventures Holdings Bhd * # | 50,472 | ||||||
| 30,251 | Genting Plantation Bhd # | 78,352 | ||||||
| 172,594 | IOI Corp. Bhd # | 194,602 | ||||||
| 29,278 | Kuala Lumpur Kepong Bhd # | 177,646 | ||||||
| 91,400 | Malyan Banking Bhd # | 193,144 | ||||||
| 1,600 | Petronas Dagangan Bhd | 9,036 | ||||||
| 47,900 | PPB Group Bhd # | 220,737 | ||||||
| 28,800 | Press Metal Aluminium Holdings Bhd # | 32,790 | ||||||
| 956,779 | ||||||||
| Mexico: 0.6% | ||||||||
| 3,744 | Fresnillo Plc (GBP) # | 31,760 | ||||||
| 19,510 | Gruma, SAB de CV | 200,565 | ||||||
| 58,764 | Grupo Mexico, SAB de CV | 161,380 | ||||||
| 2,502 | Industrias Penoles, SAB de CV | 26,261 | ||||||
| 419,966 | ||||||||
| Monaco: 0.0% | ||||||||
| 1,541 | Endeavour Mining Corp. (CAD) * | 29,150 | ||||||
| Netherlands: 1.6% | ||||||||
| 7,468 | OCI NV * # | 158,223 | ||||||
| 33,012 | Royal Dutch Shell Plc (GBP) # | 980,029 | ||||||
| 1,138,252 | ||||||||
| Norway: 2.8% | ||||||||
| 9,711 | Equinor ASA # | 193,483 | ||||||
| 39,779 | Mowi ASA # | 1,033,349 | ||||||
| 25,145 | Norsk Hydro ASA # | 93,419 | ||||||
| 1,660 | Norway Royal Salmon ASA | 45,187 | ||||||
| 15,447 | Yara International ASA # | 642,995 | ||||||
| 2,008,433 | ||||||||
See Notes to Financial Statements
| 33 |
VANECK VECTORS NATURAL RESOURCES ETF
SCHEDULE OF INVESTMENTS
(continued)
| Number of Shares | Value | |||||||
| Peru: 0.2% | ||||||||
| 4,581 | Cia de Minas Buenaventura SAA (USD) | $ | 69,173 | |||||
| 1,566 | Southern Copper Corp. (USD) † | 66,524 | ||||||
| 135,697 | ||||||||
| Poland: 0.2% | ||||||||
| 4,131 | Grupa Azoty SA * | 31,937 | ||||||
| 2,504 | KGHM Polska Miedz SA * # | 63,273 | ||||||
| 2,563 | Polski Koncern Naftowy Orlen SA # | 58,075 | ||||||
| 14,260 | Polskie Gornictwo Naftowe I Gazownictwo SA # | 16,293 | ||||||
| 169,578 | ||||||||
| Portugal: 0.1% | ||||||||
| 3,806 | Galp Energia, SGPS, SA # | 63,941 | ||||||
| 3,930 | Navigator Co. SA # | 15,867 | ||||||
| 79,808 | ||||||||
| Russia: 3.1% | ||||||||
| 9,625 | Evraz Plc (GBP) # | 51,546 | ||||||
| 53,207 | Gazprom PJSC (ADR) † # | 439,145 | ||||||
| 3,718 | LUKOIL PJSC (ADR) # | 370,337 | ||||||
| 11,073 | MMC Norilsk Nickel PJSC (ADR) # | 338,626 | ||||||
| 876 | Novatek PJSC Reg S (GDR) | 177,828 | ||||||
| 2,097 | Novolipetsk Steel PJSC Reg S (GDR) # | 48,340 | ||||||
| 12,049 | PhosAgro PJSC Reg S (GDR) | 153,022 | ||||||
| 5,628 | Polymetal International Plc (GBP) # | 89,017 | ||||||
| 10,275 | Rosneft Oil Co. PJSC Reg S (GDR) # | 74,596 | ||||||
| 3,461 | Severstal PJSC Reg S (GDR) # | 52,377 | ||||||
| 31,488 | Surgutneftegas PJSC (ADR) † # | 254,897 | ||||||
| 2,272 | Tatneft PJSC (ADR) | 167,810 | ||||||
| 2,217,541 | ||||||||
| Singapore: 1.1% | ||||||||
| 586,719 | Golden Agri-Resources Ltd. # | 102,641 | ||||||
| 229,864 | Wilmar International Ltd. # | 704,391 | ||||||
| 807,032 | ||||||||
| South Africa: 1.5% | ||||||||
| 1,261 | Anglo American Platinum Ltd. | 117,892 | ||||||
| 8,383 | AngloGold Ashanti Ltd. (ADR) | 187,276 | ||||||
| 617 | Assore Ltd. # | 11,993 | ||||||
| 3,371 | Astral Foods Ltd. | 52,348 | ||||||
| 16,696 | Gold Fields Ltd. (USD) | 110,194 | ||||||
| 9,422 | Harmony Gold Mining Co. Ltd. (USD) * | 34,202 | ||||||
| 16,238 | Impala Platinum Holdings Ltd. * † # | 166,176 | ||||||
| 1,008 | Kumba Iron Ore Ltd. # | 30,039 | ||||||
| 9,324 | Northam Platinum Ltd. * | 82,428 | ||||||
| 9,685 | Sappi Ltd. # | 30,211 | ||||||
| 5,053 | Sasol Ltd. # | 109,804 | ||||||
| 43,275 | Sibanye Gold Ltd. * # | 110,752 | ||||||
| 1,043,315 | ||||||||
| South Korea: 1.0% | ||||||||
| 1,573 | Hyundai Steel Co. # | 42,647 | ||||||
| 233 | Korea Zinc Co. Ltd. # | 85,622 | ||||||
| 1,413 | POSCO # | 287,211 | ||||||
| 497 | SK Energy Co. Ltd. # | 64,320 | ||||||
| Number of Shares | Value | |||||||
| South Korea: (continued) | ||||||||
| 409 | SK Holdings Co. Ltd. # | $ | 92,270 | |||||
| 357 | S-Oil Corp. # | 29,321 | ||||||
| 912 | Woongjin Coway Co. Ltd. | 73,421 | ||||||
| 674,812 | ||||||||
| Spain: 0.5% | ||||||||
| 2,790 | Acerinox SA # | 31,549 | ||||||
| 2,656 | EDP Renovaveis SA # | 31,384 | ||||||
| 13,357 | Repsol YPF SA # | 209,990 | ||||||
| 4,026 | Siemens Gamesa Renewable Energy SA # | 70,951 | ||||||
| 343,874 | ||||||||
| Sweden: 0.6% | ||||||||
| 3,128 | Billerudkorsnas AB † # | 36,983 | ||||||
| 5,036 | Boliden AB # | 133,825 | ||||||
| 1,757 | Holmen AB # | 53,521 | ||||||
| 1,663 | Lundin Petroleum AB # | 56,498 | ||||||
| 11,625 | SSAB AB (B Shares) # | 38,009 | ||||||
| 10,704 | Svenska Cellulosa AB # | 108,606 | ||||||
| 427,442 | ||||||||
| Switzerland: 0.4% | ||||||||
| 96,299 | Glencore Plc (GBP) # | 299,882 | ||||||
| Taiwan: 0.5% | ||||||||
| 231,472 | China Steel Corp. # | 184,688 | ||||||
| 14,920 | Formosa Petrochemical Corp. # | 48,527 | ||||||
| 66,000 | Taiwan Fertilizer Co. Ltd. # | 109,142 | ||||||
| 342,357 | ||||||||
| Thailand: 0.3% | ||||||||
| 30,700 | Energy Absolute PCL (NVDR) # | 44,720 | ||||||
| 12,200 | PTT Exploration & Production PCL (NVDR) # | 50,634 | ||||||
| 75,500 | PTT PCL (NVDR) # | 110,781 | ||||||
| 206,135 | ||||||||
| Turkey: 0.1% | ||||||||
| 25,135 | Eregli Demir ve Celik Fabrikalari TAS # | 38,160 | ||||||
| 1,082 | Tupras-Turkiye Petrol Rafinerileri AS # | 23,047 | ||||||
| 61,207 | ||||||||
| United Kingdom: 6.7% | ||||||||
| 22,930 | Anglo American Plc # | 658,806 | ||||||
| 167,928 | BP Plc # | 1,056,522 | ||||||
| 23,492 | Centamin Plc # | 39,407 | ||||||
| 51,381 | Centrica Plc | 60,784 | ||||||
| 88,037 | CNH Industrial NV (USD) | 968,407 | ||||||
| 24,252 | DS Smith Plc # | 123,363 | ||||||
| 4,176 | KAZ Minerals Plc # | 29,375 | ||||||
| 8,580 | Mondi Plc # | 201,217 | ||||||
| 7,540 | Pennon Group Plc # | 102,282 | ||||||
| 18,331 | Rio Tinto Plc # | 1,085,227 | ||||||
| 4,262 | Severn Trent Plc | 141,999 | ||||||
| 3,699 | TechnipFMC Plc (USD) | 79,307 | ||||||
| 12,214 | United Utilities Group Plc # | 152,862 | ||||||
| 4,699,558 | ||||||||
See Notes to Financial Statements
| 34 |
| Number of Shares | Value | |||||||
| United States: 44.0% | ||||||||
| 5,607 | AGCO Corp. | $ | 433,141 | |||||
| 3,417 | Alcoa Corp. * | 73,500 | ||||||
| 660 | American States Water Co. | 57,182 | ||||||
| 3,314 | Apache Corp. | 84,805 | ||||||
| 3,865 | Aqua America, Inc. | 181,423 | ||||||
| 49,350 | Archer-Daniels-Midland Co. | 2,287,372 | ||||||
| 7,619 | Arconic, Inc. | 234,437 | ||||||
| 5,728 | Baker Hughes Co. | 146,809 | ||||||
| 12,542 | Bunge Ltd. | 721,792 | ||||||
| 3,688 | Cabot Oil & Gas Corp. | 64,208 | ||||||
| 862 | California Water Service Group | 44,445 | ||||||
| 2,683 | Cal-Maine Foods, Inc. | 114,698 | ||||||
| 19,344 | CF Industries Holdings, Inc. | 923,483 | ||||||
| 2,254 | Chefs’ Warehouse, Inc. * | 85,900 | ||||||
| 2,218 | Cheniere Energy, Inc. * | 135,453 | ||||||
| 16,732 | Chevron Corp. | 2,016,373 | ||||||
| 894 | Cimarex Energy Co. | 46,926 | ||||||
| 1,313 | Clearway Energy, Inc. | 26,194 | ||||||
| 1,772 | Concho Resources, Inc. | 155,174 | ||||||
| 9,785 | ConocoPhillips | 636,319 | ||||||
| 759 | Continental Resources, Inc. | 26,034 | ||||||
| 1,916 | Cree, Inc. * | 88,423 | ||||||
| 14,597 | Darling International, Inc. * | 409,884 | ||||||
| 27,899 | Deere & Co. | 4,833,781 | ||||||
| 3,563 | Devon Energy Corp. | 92,531 | ||||||
| 1,437 | Diamondback Energy, Inc. | 133,440 | ||||||
| 1,012 | Domtar Corp. | 38,699 | ||||||
| 5,115 | EOG Resources, Inc. | 428,432 | ||||||
| 37,292 | Exxon Mobil Corp. | 2,602,236 | ||||||
| 1,359 | First Solar, Inc. * | 76,050 | ||||||
| 11,557 | FMC Corp. | 1,153,620 | ||||||
| 26,716 | Freeport-McMoRan Copper and Gold, Inc. | 350,514 | ||||||
| 5,195 | Graphic Packaging Holding Co. | 86,497 | ||||||
| 7,720 | Halliburton Co. | 188,908 | ||||||
| 956 | Helmerich & Payne, Inc. | 43,431 | ||||||
| 2,281 | Hess Corp. | 152,394 | ||||||
| 1,335 | HollyFrontier Corp. | 67,698 | ||||||
| 5,912 | Ingredion, Inc. | 549,520 | ||||||
| 6,942 | International Paper Co. | 319,679 | ||||||
| 629 | Itron, Inc. * | 52,805 | ||||||
| 17,159 | Kinder Morgan, Inc. | 363,256 | ||||||
| 956 | Lindsay Corp. | 91,766 | ||||||
| 2,184 | Louisiana-Pacific Corp. | 64,799 | ||||||
| 7,087 | Marathon Oil Corp. | 96,241 | ||||||
| 5,802 | Marathon Petroleum Corp. | 349,571 | ||||||
| 3,401 | National Oilwell Varco, Inc. | 85,195 | ||||||
| 16,663 | Newmont Mining Corp. | 724,007 | ||||||
| 4,215 | Noble Energy, Inc. | 104,701 | ||||||
| 5,582 | Nucor Corp. | 314,155 | ||||||
| 7,884 | Occidental Petroleum Corp. | 324,900 | ||||||
| 3,640 | ONEOK, Inc. | 275,439 | ||||||
| 911 | Ormat Technologies, Inc. | 67,888 | ||||||
| 1,673 | Packaging Corp. of America | 187,359 | ||||||
| 3,953 | Phillips 66 | 440,404 | ||||||
| 4,639 | Pilgrim’s Pride Corp. * | 151,765 | ||||||
| 1,473 | Pioneer Natural Resources Co. | 222,968 | ||||||
| 1,227 | Reliance Steel & Aluminum Co. | 146,946 | ||||||
| 1,207 | Royal Gold, Inc. | 147,556 | ||||||
| Number of Shares | Value | |||||||
| United States: (continued) | ||||||||
| 12,190 | Schlumberger Ltd. | $ | 490,038 | |||||
| 23 | Seaboard Corp. | 97,763 | ||||||
| 9,212 | Southern Co./The | 586,804 | ||||||
| 3,680 | Steel Dynamics, Inc. | 125,267 | ||||||
| 2,052 | Targa Resources Corp. | 83,783 | ||||||
| 2,831 | The Andersons, Inc. | 71,568 | ||||||
| 31,112 | The Mosaic Co. | 673,264 | ||||||
| 10,567 | Tractor Supply Co. | 987,380 | ||||||
| 26,109 | Tyson Foods, Inc. | 2,376,963 | ||||||
| 3,144 | United States Steel Corp. † | 35,873 | ||||||
| 3,652 | Valero Energy Corp. | 342,010 | ||||||
| 4,557 | Westrock Co. | 195,541 | ||||||
| 13,164 | Weyerhaeuser Co. | 397,553 | ||||||
| 10,683 | Williams Cos, Inc./The | 253,401 | ||||||
| 31,040,334 | ||||||||
| Total Common Stocks (Cost: $65,717,778) | 70,573,615 | |||||||
| SHORT-TERM INVESTMENT HELD AS COLLATERAL FOR SECURITIES ON LOAN: 4.0% (Cost: $2,838,207) | ||||||||
| Money Market Fund: 4.0% | ||||||||
| 2,838,207 | State Street Navigator Securities Lending Government Money Market Portfolio | 2,838,207 | ||||||
| Total Investments: 104.1% (Cost: $68,555,985) | 73,411,822 | |||||||
| Liabilities in excess of other assets: (4.1)% | (2,917,873 | ) | ||||||
| NET ASSETS: 100.0% | $ | 70,493,949 | ||||||
See Notes to Financial Statements
| 35 |
VANECK VECTORS NATURAL RESOURCES ETF
SCHEDULE OF INVESTMENTS
(continued)
Definitions:
| ADR | American Depositary Receipt |
| CAD | Canadian Dollar |
| GBP | British Pound |
| GDR | Global Depositary Receipt |
| NOK | Norwegian Krone |
| NVDR | Non-Voting Depositary Receipt |
| USD | United States Dollar |
| Footnotes: | |
| * | Non-income producing |
| † | Security fully or partially on loan. Total market value of securities on loan is $5,755,656. |
| # | Security has been valued in good faith pursuant to guidelines established by the Board of Trustees. The aggregate value of fair valued securities is $26,261,120 which represents 37.3% of net assets. |
| Reg S | Security was purchased pursuant to Regulation S under the Securities Act of 1933, which exempts from registration securities offered and sold outside of the United States. Such a security cannot be sold in the United States without either an effective registration statement filed pursuant to the Securities Act of 1933, or pursuant to an exemption from registration. |
| 144A | Security exempt from registration under Rule 144A of the Securities Act of 1933, as amended, or otherwise restricted. These securities may be resold in transactions exempt from registration, unless otherwise noted, and the value amounted to $581,914, or 0.8% of net assets. |
| Summary of Investments by Sector Excluding Collateral for Securities Loaned | % of Investments | Value | ||||||
| Consumer Discretionary | 1.6 | % | $ | 1,106,193 | ||||
| Consumer Staples | 16.5 | 11,674,358 | ||||||
| Energy | 30.3 | 21,403,048 | ||||||
| Financials | 0.3 | 193,144 | ||||||
| Industrials | 12.6 | 8,875,029 | ||||||
| Information Technology | 0.3 | 217,278 | ||||||
| Materials | 33.8 | 23,831,597 | ||||||
| Real Estate | 0.5 | 397,553 | ||||||
| Utilities | 4.1 | 2,875,415 | ||||||
| 100.0 | % | $ | 70,573,615 | |||||
See Notes to Financial Statements
| 36 |
The summary of inputs used to value the Fund’s investments as of December 31, 2019 is as follows:
| Level 1 Quoted Prices | Level 2 Significant Observable Inputs | Level 3 Significant Unobservable Inputs | Value | ||||||||||||||
| Common Stocks | |||||||||||||||||
| Argentina | $ | 86,495 | $ | — | $ | — | $ | 86,495 | |||||||||
| Australia | — | 3,503,108 | — | 3,503,108 | |||||||||||||
| Austria | 20,406 | 196,298 | — | 216,704 | |||||||||||||
| Brazil | 1,311,274 | 227,670 | — | 1,538,944 | |||||||||||||
| Canada | 7,763,235 | — | — | 7,763,235 | |||||||||||||
| Chile | 261,909 | 146,430 | — | 408,339 | |||||||||||||
| China / Hong Kong | — | 1,286,286 | — | 1,286,286 | |||||||||||||
| Denmark | — | 669,881 | — | 669,881 | |||||||||||||
| Finland | 132,211 | 157,566 | — | 289,777 | |||||||||||||
| France | — | 1,619,430 | — | 1,619,430 | |||||||||||||
| Germany | — | 647,843 | — | 647,843 | |||||||||||||
| Hungary | — | 42,537 | — | 42,537 | |||||||||||||
| India | 581,914 | — | — | 581,914 | |||||||||||||
| Indonesia | — | 67,895 | — | 67,895 | |||||||||||||
| Ireland | — | 208,507 | — | 208,507 | |||||||||||||
| Italy | — | 348,489 | — | 348,489 | |||||||||||||
| Japan | — | 3,916,732 | — | 3,916,732 | |||||||||||||
| Luxembourg | 68,586 | 207,761 | — | 276,347 | |||||||||||||
| Malaysia | 9,036 | 947,743 | — | 956,779 | |||||||||||||
| Mexico | 388,206 | 31,760 | — | 419,966 | |||||||||||||
| Monaco | 29,150 | — | — | 29,150 | |||||||||||||
| Netherlands | — | 1,138,252 | — | 1,138,252 | |||||||||||||
| Norway | 45,187 | 1,963,246 | — | 2,008,433 | |||||||||||||
| Peru | 135,697 | — | — | 135,697 | |||||||||||||
| Poland | 31,937 | 137,641 | — | 169,578 | |||||||||||||
| Portugal | — | 79,808 | — | 79,808 | |||||||||||||
| Russia | 498,660 | 1,718,881 | — | 2,217,541 | |||||||||||||
| Singapore | — | 807,032 | — | 807,032 | |||||||||||||
| South Africa | 584,340 | 458,975 | — | 1,043,315 | |||||||||||||
| South Korea | 73,421 | 601,391 | — | 674,812 | |||||||||||||
| Spain | — | 343,874 | — | 343,874 | |||||||||||||
| Sweden | — | 427,442 | — | 427,442 | |||||||||||||
| Switzerland | — | 299,882 | — | 299,882 | |||||||||||||
| Taiwan | — | 342,357 | — | 342,357 | |||||||||||||
| Thailand | — | 206,135 | — | 206,135 | |||||||||||||
| Turkey | — | 61,207 | — | 61,207 | |||||||||||||
| United Kingdom | 1,250,497 | 3,449,061 | — | 4,699,558 | |||||||||||||
| United States | 31,040,334 | — | — | 31,040,334 | |||||||||||||
| Money Market Fund | 2,838,207 | — | — | 2,838,207 | |||||||||||||
| Total | $ | 47,150,702 | $ | 26,261,120 | $ | — | $ | 73,411,822 | |||||||||
See Notes to Financial Statements
| 37 |
VANECK VECTORS OIL REFINERS ETF
SCHEDULE OF INVESTMENTS
December 31, 2019
| Number of Shares | Value | |||||||
| COMMON STOCKS: 99.9% | ||||||||
| Australia: 4.4% | ||||||||
| 64,084 | Caltex Australia Ltd. # | $ | 1,530,653 | |||||
| Austria: 4.9% | ||||||||
| 30,720 | OMV AG # | 1,722,309 | ||||||
| Finland: 6.5% | ||||||||
| 64,976 | Neste Oil Oyj | 2,262,460 | ||||||
| Greece: 1.3% | ||||||||
| 19,683 | Motor Oil Hellas Corinth Refineries SA # | 455,886 | ||||||
| Hungary: 4.1% | ||||||||
| 142,893 | MOL Hungarian Oil & Gas Plc # | 1,426,489 | ||||||
| India: 7.5% | ||||||||
| 61,005 | Reliance Industries Ltd. 144A (GDR) | 2,595,763 | ||||||
| Japan: 11.0% | ||||||||
| 19,000 | Cosmo Energy Holdings Co. Ltd. # | 434,906 | ||||||
| 55,468 | Idemitsu Kosan Co. Ltd. # | 1,532,394 | ||||||
| 407,400 | JXTG Holdings, Inc. # | 1,848,676 | ||||||
| 3,815,976 | ||||||||
| Poland: 6.3% | ||||||||
| 25,548 | Grupa Lotos SA # | 564,537 | ||||||
| 72,005 | Polski Koncern Naftowy Orlen SA # | 1,631,559 | ||||||
| 2,196,096 | ||||||||
| Portugal: 4.6% | ||||||||
| 96,065 | Galp Energia, SGPS, SA # | 1,613,894 | ||||||
| Number of Shares | Value | |||||||
| South Korea: 10.1% | ||||||||
| 2,626 | Hyundai Heavy Industries Holdings Co. Ltd. # | $ | 766,395 | |||||
| 12,439 | SK Energy Co. Ltd. # | 1,609,823 | ||||||
| 13,706 | S-Oil Corp. # | 1,125,698 | ||||||
| 3,501,916 | ||||||||
| Taiwan: 4.5% | ||||||||
| 485,000 | Formosa Petrochemical Corp. # | 1,577,442 | ||||||
| Thailand: 3.6% | ||||||||
| 3,496,200 | IRPC PCL (NVDR) # | 428,649 | ||||||
| 349,000 | Thai Oil PCL (NVDR) # | 811,232 | ||||||
| 1,239,881 | ||||||||
| Turkey: 2.2% | ||||||||
| 36,253 | Tupras-Turkiye Petrol Rafinerileri AS # | 772,190 | ||||||
| United States: 28.9% | ||||||||
| 13,922 | Delek US Holdings, Inc. | 466,805 | ||||||
| 30,343 | HollyFrontier Corp. | 1,538,694 | ||||||
| 41,406 | Marathon Petroleum Corp. | 2,494,711 | ||||||
| 21,688 | PBF Energy, Inc. | 680,353 | ||||||
| 24,085 | Phillips 66 | 2,683,310 | ||||||
| 23,639 | Valero Energy Corp. | 2,213,792 | ||||||
| 10,077,665 | ||||||||
| Total Common Stocks: 99.9% (Cost: $37,777,533) | 34,788,620 | |||||||
| Other assets less liabilities: 0.1% | 25,879 | |||||||
| NET ASSETS: 100.0% | $ | 34,814,499 | ||||||
Definitions:
| GDR | Global Depositary Receipt |
| NVDR | Non-Voting Depositary Receipt |
| Footnotes: | |
| # | Security has been valued in good faith pursuant to guidelines established by the Board of Trustees. The aggregate value of fair valued securities is $19,852,732 which represents 57.0% of net assets. |
| 144A | Security exempt from registration under Rule 144A of the Securities Act of 1933, as amended, or otherwise restricted. These securities may be resold in transactions exempt from registration, unless otherwise noted, and the value amounted to $2,595,763, or 7.5% of net assets. |
| Summary of Investments by Sector | % of Investments | Value | ||||||
| Energy | 97.8 | % | $ | 34,022,225 | ||||
| Industrials | 2.2 | 766,395 | ||||||
| 100.0 | % | $ | 34,788,620 | |||||
See Notes to Financial Statements
| 38 |
The summary of inputs used to value the Fund’s investments as of December 31, 2019 is as follows:
| Level 1 Quoted Prices | Level 2 Significant Observable Inputs | Level 3 Significant Unobservable Inputs | Value | ||||||||||||||
| Common Stocks | |||||||||||||||||
| Australia | $ | — | $ | 1,530,653 | $ | — | $ | 1,530,653 | |||||||||
| Austria | — | 1,722,309 | — | 1,722,309 | |||||||||||||
| Finland | 2,262,460 | — | — | 2,262,460 | |||||||||||||
| Greece | — | 455,886 | — | 455,886 | |||||||||||||
| Hungary | — | 1,426,489 | — | 1,426,489 | |||||||||||||
| India | 2,595,763 | — | — | 2,595,763 | |||||||||||||
| Japan | — | 3,815,976 | — | 3,815,976 | |||||||||||||
| Poland | — | 2,196,096 | — | 2,196,096 | |||||||||||||
| Portugal | — | 1,613,894 | — | 1,613,894 | |||||||||||||
| South Korea | — | 3,501,916 | — | 3,501,916 | |||||||||||||
| Taiwan | — | 1,577,442 | — | 1,577,442 | |||||||||||||
| Thailand | — | 1,239,881 | — | 1,239,881 | |||||||||||||
| Turkey | — | 772,190 | — | 772,190 | |||||||||||||
| United States | 10,077,665 | — | — | 10,077,665 | |||||||||||||
| Total | $ | 14,935,888 | $ | 19,852,732 | $ | — | $ | 34,788,620 | |||||||||
See Notes to Financial Statements
| 39 |
VANECK VECTORS OIL SERVICES ETF
SCHEDULE OF INVESTMENTS
December 31, 2019
| Number of Shares | Value | |||||||
| COMMON STOCKS: 100.1% | ||||||||
| Luxembourg: 4.7% | ||||||||
| 1,604,012 | Tenaris SA (ADR) | $ | 36,314,832 | |||||
| Netherlands: 3.5% | ||||||||
| 727,417 | Core Laboratories NV (USD) | 27,401,798 | ||||||
| Switzerland: 0.7% | ||||||||
| 4,366,891 | Noble Corp. Plc (USD) * | 5,327,607 | ||||||
| United Kingdom: 7.8% | ||||||||
| 1,852,853 | TechnipFMC Plc (USD) | 39,725,168 | ||||||
| 3,187,906 | Valaris Plc (USD) † | 20,912,663 | ||||||
| 60,637,831 | ||||||||
| United States: 83.4% | ||||||||
| 1,153,026 | Apergy Corp. * | 38,949,218 | ||||||
| 1,579,953 | Baker Hughes Co. | 40,494,195 | ||||||
| 1,017,319 | Cactus, Inc. | 34,914,388 | ||||||
| 933,945 | Diamond Offshore Drilling, Inc. * † | 6,715,065 | ||||||
| 449,905 | Dril-Quip, Inc. * | 21,105,044 | ||||||
| 3,065,341 | Halliburton Co. | 75,008,894 | ||||||
| 2,481,470 | Helix Energy Solutions Group, Inc. * | 23,896,556 | ||||||
| 775,354 | Helmerich & Payne, Inc. | 35,224,332 | ||||||
| 4,111,236 | McDermott International, Inc. * † | 2,781,662 | ||||||
| 6,162,936 | Nabors Industries Ltd. | 17,749,256 | ||||||
| 1,515,144 | National Oilwell Varco, Inc. | 37,954,357 | ||||||
| 2,436,168 | NexTier Oilfield Solutions, Inc. * | 16,322,326 | ||||||
| 1,649,741 | Oceaneering International, Inc. * | 24,597,638 | ||||||
| 735,312 | Oil States International, Inc. * | 11,992,939 | ||||||
| Number of Shares | Value | |||||||
| United States: (continued) | ||||||||
| 3,199,457 | Patterson-UTI Energy, Inc. | $ | 33,594,299 | |||||
| 1,592,572 | ProPetro Holding Corp. * | 17,916,435 | ||||||
| 2,061,236 | RPC, Inc. † | 10,800,877 | ||||||
| 3,732,696 | Schlumberger Ltd. | 150,054,379 | ||||||
| 5,708,059 | Transocean Ltd. * † | 39,271,446 | ||||||
| 852,498 | US Silica Holdings, Inc. † | 5,242,863 | ||||||
| 644,586,169 | ||||||||
| Total Common Stocks (Cost: $1,340,492,634) | 774,268,237 | |||||||
| SHORT-TERM INVESTMENT HELD AS COLLATERAL FOR SECURITIES ON LOAN: 2.6% (Cost: $19,877,420) | ||||||||
| Money Market Fund: 2.6% | ||||||||
| 19,877,420 | State Street Navigator Securities Lending Government Money Market Portfolio | 19,877,420 | ||||||
| Total Investments: 102.7% (Cost: $1,360,370,054) | 794,145,657 | |||||||
| Liabilities in excess of other assets: (2.7)% | (20,822,094 | ) | ||||||
| NET ASSETS: 100.0% | $ | 773,323,563 | ||||||
Definitions:
| ADR | American Depositary Receipt |
| USD | United States Dollar |
Footnotes:
| * | Non-income producing |
| † | Security fully or partially on loan. Total market value of securities on loan is $59,407,365. |
| Summary of Investments by Sector Excluding Collateral for Securities Loaned | % of Investments | Value | ||||||
| Oil & Gas Drilling | 20.5 | % | $ | 158,794,668 | ||||
| Oil & Gas Equipment & Services | 79.5 | 615,473,569 | ||||||
| 100.0 | % | $ | 774,268,237 | |||||
The summary of inputs used to value the Fund’s investments as of December 31, 2019 is as follows:
| Level 1 Quoted Prices | Level 2 Significant Observable Inputs | Level 3 Significant Unobservable Inputs | Value | ||||||||||||||
| Common Stocks* | $ | 774,268,237 | $ | — | $ | — | $ | 774,268,237 | |||||||||
| Money Market Fund | 19,877,420 | — | — | 19,877,420 | |||||||||||||
| Total | $ | 794,145,657 | $ | — | $ | — | $ | 794,145,657 | |||||||||
| * | See Schedule of Investments for geographic sector breakouts. |
See Notes to Financial Statements
| 40 |
VANECK VECTORS RARE EARTH/STRATEGIC METALS ETF
SCHEDULE OF INVESTMENTS
December 31, 2019
| Number of Shares | Value | |||||||
| COMMON STOCKS: 100.0% | ||||||||
| Australia: 22.2% | ||||||||
| 9,225,207 | Galaxy Resources Ltd. * † # | $ | 6,023,372 | |||||
| 1,763,635 | Iluka Resources Ltd. # | 11,567,630 | ||||||
| 42,193,732 | Jupiter Mines Ltd. † # | 8,325,528 | ||||||
| 4,566,639 | Orocobre Ltd. * † # | 8,526,848 | ||||||
| 42,390,640 | Pilbara Minerals Ltd. * † # | 8,375,049 | ||||||
| 42,818,427 | ||||||||
| Canada: 2.4% | ||||||||
| 6,057,566 | Largo Resources Ltd. * | 4,624,631 | ||||||
| China / Hong Kong: 41.7% | ||||||||
| 26,785,980 | China Molybdenum Co. Ltd. # | 16,804,035 | ||||||
| 9,839,024 | China Northern Rare Earth Group High-Tech Co. Ltd. # | 15,274,981 | ||||||
| 8,496,670 | Jinduicheng Molybdenum Co. Ltd. # | 9,778,427 | ||||||
| 8,915,261 | Shenghe Resources Holding Co. Ltd. # | 11,609,313 | ||||||
| 5,613,800 | Xiamen Tungsten Co. Ltd. # | 10,514,552 | ||||||
| 2,912,201 | Zhejiang Huayou Cobalt Co. Ltd. # | 16,404,574 | ||||||
| 80,385,882 | ||||||||
| France: 4.6% | ||||||||
| 171,042 | Eramet SA † # | 8,854,717 | ||||||
| Japan: 7.3% | ||||||||
| 473,892 | OSAKA Titanium Technologies Co. # | 6,623,685 | ||||||
| 876,347 | Toho Titanium Co. Ltd. # | 7,475,765 | ||||||
| 14,099,450 | ||||||||
| Malaysia: 4.5% | ||||||||
| 5,370,027 | Lynas Corp. Ltd. (AUD) * # | 8,783,709 | ||||||
| Number of Shares | Value | |||||||
| Netherlands: 4.5% | ||||||||
| 353,032 | AMG Advanced Metallurgical † # | $ | 8,672,005 | |||||
| South Africa: 4.4% | ||||||||
| 438,351 | Assore Ltd. # | 8,520,546 | ||||||
| United Kingdom: 4.3% | ||||||||
| 720,618 | Tronox Holdings PLC (USD) | 8,229,458 | ||||||
| United States: 4.1% | ||||||||
| 924,238 | Livent Corp. * † | 7,902,235 | ||||||
| Total Common Stocks (Cost: $214,277,026) | 192,891,060 | |||||||
| SHORT-TERM INVESTMENT HELD AS COLLATERAL FOR SECURITIES ON LOAN: 1.1% (Cost: $2,126,040) | ||||||||
| Money Market Fund: 1.1% | ||||||||
| 2,126,040 | State Street Navigator Securities Lending Government Money Market Portfolio | 2,126,040 | ||||||
| Total Investments: 101.1% (Cost: $216,403,066) | 195,017,100 | |||||||
| Liabilities in excess of other assets: (1.1)% | (2,080,265 | ) | ||||||
| NET ASSETS: 100.0% | $ | 192,936,835 | ||||||
Definitions:
| AUD | Australian Dollar |
| USD | United States Dollar |
| Footnotes: | |
| * | Non-income producing |
| † | Security fully or partially on loan. Total market value of securities on loan is $30,938,789. |
| # | Security has been valued in good faith pursuant to guidelines established by the Board of Trustees. The aggregate value of fair valued securities is $172,134,736 which represents 89.2% of net assets. |
| Summary of Investments by Sector Excluding Collateral for Securities Loaned | % of Investments | Value | ||||||
| Diversified Metals & Mining | 26.9 | % | $ | 51,826,052 | ||||
| Materials | 73.1 | 141,065,008 | ||||||
| 100.0 | % | $ | 192,891,060 | |||||
See Notes to Financial Statements
| 41 |
VANECK VECTORS RARE EARTH/STRATEGIC METALS ETF
SCHEDULE OF INVESTMENTS
(continued)
The summary of inputs used to value the Fund’s investments as of December 31, 2019 is as follows:
| Level 1 Quoted Prices | Level 2 Significant Observable Inputs | Level 3 Significant Unobservable Inputs | Value | ||||||||||||||
| Common Stocks | |||||||||||||||||
| Australia | $ | — | $ | 42,818,427 | $ | — | $ | 42,818,427 | |||||||||
| Canada | 4,624,631 | — | — | 4,624,631 | |||||||||||||
| China / Hong Kong | — | 80,385,882 | — | 80,385,882 | |||||||||||||
| France | — | 8,854,717 | — | 8,854,717 | |||||||||||||
| Japan | — | 14,099,450 | — | 14,099,450 | |||||||||||||
| Malaysia | — | 8,783,709 | — | 8,783,709 | |||||||||||||
| Netherlands | — | 8,672,005 | — | 8,672,005 | |||||||||||||
| South Africa | — | 8,520,546 | — | 8,520,546 | |||||||||||||
| United Kingdom | 8,229,458 | — | — | 8,229,458 | |||||||||||||
| United States | 7,902,235 | — | — | 7,902,235 | |||||||||||||
| Money Market Fund | 2,126,040 | — | — | 2,126,040 | |||||||||||||
| Total | $ | 22,882,364 | $ | 172,134,736 | $ | — | $ | 195,017,100 | |||||||||
See Notes to Financial Statements
| 42 |
SCHEDULE OF INVESTMENTS
December 31, 2019
| Number of Shares | Value | |||||||
| COMMON STOCKS: 100.2% | ||||||||
| Brazil: 20.1% | ||||||||
| 846,163 | Cia Siderurgica Nacional SA (ADR) † | $ | 2,919,262 | |||||
| 635,523 | Gerdau SA (ADR) † | 3,114,063 | ||||||
| 549,128 | Vale SA (ADR) | 7,248,490 | ||||||
| 13,281,815 | ||||||||
| India: 5.6% | ||||||||
| 427,989 | Vedanta Ltd. (ADR) † | 3,693,545 | ||||||
| Luxembourg: 17.5% | ||||||||
| 186,138 | ArcelorMittal SA (USD) † | 3,264,860 | ||||||
| 145,499 | Tenaris SA (ADR) | 3,294,097 | ||||||
| 225,975 | Ternium SA (ADR) | 4,971,450 | ||||||
| 11,530,407 | ||||||||
| South Korea: 4.4% | ||||||||
| 57,287 | POSCO (ADR) | 2,899,868 | ||||||
| United Kingdom: 11.1% | ||||||||
| 123,849 | Rio Tinto Plc (ADR) | 7,351,677 | ||||||
| United States: 41.5% | ||||||||
| 196,132 | AK Steel Holding Corp. * † | 645,274 | ||||||
| 141,294 | Allegheny Technologies, Inc. * | 2,919,134 | ||||||
| 59,183 | Carpenter Technology Corp. | 2,946,130 | ||||||
| 363,819 | Cleveland-Cliffs, Inc. † | 3,056,080 | ||||||
| 134,669 | Commercial Metals Co. | 2,999,079 | ||||||
| 20,442 | Gibraltar Industries, Inc. * | 1,031,094 | ||||||
| 58,461 | Nucor Corp. | 3,290,185 | ||||||
| 6,842 | Olympic Steel, Inc. | 122,609 | ||||||
| Number of Shares | Value | |||||||
| United States: (continued) | ||||||||
| 24,720 | Reliance Steel & Aluminum Co. | $ | 2,960,467 | |||||
| 23,275 | Ryerson Holding Corp. * | 275,343 | ||||||
| 16,574 | Schnitzer Steel Industries, Inc. | 359,324 | ||||||
| 86,830 | Steel Dynamics, Inc. | 2,955,693 | ||||||
| 40,251 | SunCoke Energy, Inc. | 250,764 | ||||||
| 27,723 | TimkenSteel Corp. * | 217,903 | ||||||
| 108,485 | United States Steel Corp. † | 1,237,814 | ||||||
| 32,088 | Warrior Met Coal, Inc. | 678,019 | ||||||
| 34,478 | Worthington Industries, Inc. | 1,454,282 | ||||||
| 27,399,194 | ||||||||
| Total Common Stocks (Cost: $74,008,511) | 66,156,506 | |||||||
| SHORT-TERM INVESTMENT HELD AS COLLATERAL FOR SECURITIES ON LOAN: 5.1% (Cost: $3,391,650) | ||||||||
| Money Market Fund: 5.1% | ||||||||
| 3,391,650 | State Street Navigator Securities Lending Government Money Market Portfolio | 3,391,650 | ||||||
| Total Investments: 105.3% (Cost: $77,400,161) | 69,548,156 | |||||||
| Liabilities in excess of other assets: (5.3)% | (3,506,389 | ) | ||||||
| NET ASSETS: 100.0% | $ | 66,041,767 | ||||||
Definitions:
| ADR | American Depositary Receipt |
| USD | United States Dollar |
Footnotes:
| * | Non-income producing |
| † | Security fully or partially on loan. Total market value of securities on loan is $10,794,738. |
| Summary of Investments by Sector Excluding Collateral for Securities Loaned | % of Investments | Value | ||||||
| Energy | 5.0 | % | $ | 3,294,097 | ||||
| Industrials | 1.5 | 1,031,094 | ||||||
| Materials | 93.5 | 61,831,315 | ||||||
| 100.0 | % | $ | 66,156,506 | |||||
The summary of inputs used to value the Fund’s investments as of December 31, 2019 is as follows:
| Level 1 Quoted Prices | Level 2 Significant Observable Inputs | Level 3 Significant Unobservable Inputs | Value | ||||||||||||||
| Common Stocks* | $ | 66,156,506 | $ | — | $ | — | $ | 66,156,506 | |||||||||
| Money Market Fund | 3,391,650 | — | — | 3,391,650 | |||||||||||||
| Total | $ | 69,548,156 | $ | — | $ | — | $ | 69,548,156 | |||||||||
| * | See Schedule of Investments for geographic sector breakouts. |
See Notes to Financial Statements
| 43 |
VANECK VECTORS UNCONVENTIONAL OIL & GAS ETF
SCHEDULE OF INVESTMENTS
December 31, 2019
| Number of Shares | Value | |||||||
| COMMON STOCKS: 100.0% | ||||||||
| Canada: 17.6% | ||||||||
| 40,570 | ARC Resources Ltd. † | $ | 255,919 | |||||
| 93,488 | Cenovus Energy, Inc. (USD) | 948,903 | ||||||
| 65,520 | Crescent Point Energy Corp. (USD) | 292,874 | ||||||
| 117,403 | Encana Corp. (USD) † | 550,620 | ||||||
| 28,290 | Enerplus Corp. (USD) † | 201,708 | ||||||
| 38,381 | Husky Energy, Inc. | 308,409 | ||||||
| 19,003 | PrairieSky Royalty Ltd. † | 223,185 | ||||||
| 28,173 | Seven Generations Energy Ltd. * | 184,018 | ||||||
| 26,317 | Tourmaline Oil Corp. | 308,883 | ||||||
| 42,745 | Whitecap Resources, Inc. † | 182,946 | ||||||
| 3,457,465 | ||||||||
| United States: 82.4% | ||||||||
| 25,948 | Antero Resources Corp. * † | 73,952 | ||||||
| 22,017 | Apache Corp. | 563,415 | ||||||
| 35,307 | Cabot Oil & Gas Corp. | 614,695 | ||||||
| 94,519 | Chesapeake Energy Corp. * † | 78,035 | ||||||
| 8,164 | Cimarex Energy Co. | 428,528 | ||||||
| 8,550 | CNX Resources Corp. * | 75,667 | ||||||
| 12,440 | Concho Resources, Inc. | 1,089,371 | ||||||
| 22,820 | ConocoPhillips | 1,483,985 | ||||||
| 10,873 | Continental Resources, Inc. | 372,944 | ||||||
| 33,734 | Devon Energy Corp. | 876,072 | ||||||
| 9,445 | Diamondback Energy, Inc. | 877,063 | ||||||
| 18,850 | EOG Resources, Inc. | 1,578,876 | ||||||
| 23,103 | EQT Corp. | 251,823 | ||||||
| 17,137 | Hess Corp. | 1,144,923 | ||||||
| 62,109 | Marathon Oil Corp. | 843,440 | ||||||
| 11,877 | Matador Resources Co. * | 213,430 | ||||||
| Number of Shares | Value | |||||||
| United States: (continued) | ||||||||
| 9,806 | Murphy Oil Corp. † | $ | 262,801 | |||||
| 7,472 | National Fuel Gas Co. | 347,747 | ||||||
| 34,093 | Noble Energy, Inc. | 846,870 | ||||||
| 20,858 | Oasis Petroleum, Inc. * | 67,997 | ||||||
| 32,808 | Occidental Petroleum Corp. | 1,352,018 | ||||||
| 27,922 | Parsley Energy, Inc. | 528,005 | ||||||
| 3,921 | PDC Energy, Inc. * | 102,612 | ||||||
| 8,397 | Pioneer Natural Resources Co. | 1,271,054 | ||||||
| 16,950 | QEP Resources, Inc. | 76,275 | ||||||
| 17,281 | Range Resources Corp. † | 83,813 | ||||||
| 6,895 | SM Energy Co. | 77,500 | ||||||
| 40,844 | WPX Energy, Inc. * | 561,196 | ||||||
| 16,144,107 | ||||||||
| Total Common Stocks (Cost: $31,901,196) | 19,601,572 | |||||||
| SHORT-TERM INVESTMENT HELD AS COLLATERAL FOR SECURITIES ON LOAN: 2.7% (Cost: $525,900) | ||||||||
| Money Market Fund: 2.7% | ||||||||
| 525,900 | State Street Navigator Securities Lending Government Money Market Portfolio | 525,900 | ||||||
| Total Investments: 102.7% (Cost: $32,427,096) | 20,127,472 | |||||||
| Liabilities in excess of other assets: (2.7)% | (526,816 | ) | ||||||
| NET ASSETS: 100.0% | $ | 19,600,656 | ||||||
Definitions:
| USD | United States Dollar |
Footnotes:
| * | Non-income producing |
| † | Security fully or partially on loan. Total market value of securities on loan is $1,671,202. |
| Summary of Investments by Sector Excluding Collateral for Securities Loaned | % of Investments | Value | ||||||
| Gas Utilities | 1.8 | % | $ | 347,747 | ||||
| Integrated Oil & Gas | 13.3 | 2,609,330 | ||||||
| Oil & Gas Exploration & Production | 84.9 | 16,644,495 | ||||||
| 100.0 | % | $ | 19,601,572 | |||||
The summary of inputs used to value the Fund’s investments as of December 31, 2019 is as follows:
| Level 1 Quoted Prices | Level 2 Significant Observable Inputs | Level 3 Significant Unobservable Inputs | Value | ||||||||||||||
| Common Stocks* | $ | 19,601,572 | $ | — | $ | — | $ | 19,601,572 | |||||||||
| Money Market Fund | 525,900 | — | — | 525,900 | |||||||||||||
| Total | $ | 20,127,472 | $ | — | $ | — | $ | 20,127,472 | |||||||||
| * | See Schedule of Investments for geographic sector breakouts. |
See Notes to Financial Statements
| 44 |
VANECK VECTORS URANIUM+NUCLEAR ENERGY ETF
SCHEDULE OF INVESTMENTS
December 31, 2019
| Number of Shares | Value | |||||||
| COMMON STOCKS: 100.1% | ||||||||
| Canada: 4.9% | ||||||||
| 103,020 | Cameco Corp. (USD) | $ | 916,878 | |||||
| 87,686 | NexGen Energy Ltd. * | 112,925 | ||||||
| 26,618 | Uranium Participation Corp. * | 83,749 | ||||||
| 1,113,552 | ||||||||
| China / Hong Kong: 2.9% | ||||||||
| 2,442,000 | CGN Power Co. Ltd. Reg S 144A # | 652,182 | ||||||
| Czech Republic: 4.4% | ||||||||
| 44,691 | CEZ AS | 1,005,720 | ||||||
| Finland: 5.7% | ||||||||
| 52,512 | Fortum Oyj # | 1,297,100 | ||||||
| France: 4.8% | ||||||||
| 96,681 | Electricite de France SA # | 1,079,562 | ||||||
| Japan: 15.3% | ||||||||
| 50,700 | Hokuriku Electric Power Co. * # | 369,899 | ||||||
| 98,000 | Kansai Electric Power Co., Inc. † # | 1,135,102 | ||||||
| 112,900 | Kyushu Electric Power Co., Inc. # | 979,338 | ||||||
| 228,900 | Tokyo Electric Power Co., Inc. * # | 979,638 | ||||||
| 3,463,977 | ||||||||
| Korea: 0.6% | ||||||||
| 4,237 | KEPCO Plant Service & Engineering Co. Ltd. # | 143,444 | ||||||
| South Korea: 4.4% | ||||||||
| 84,787 | Korea Electric Power Corp. (ADR) * † | 1,003,030 | ||||||
| Spain: 4.4% | ||||||||
| 37,534 | Endesa SA † # | 1,003,049 | ||||||
| Number of Shares | Value | |||||||
| United States: 52.7% | ||||||||
| 10,022 | BWX Technologies, Inc. | $ | 622,166 | |||||
| 22,209 | Dominion Energy, Inc. | 1,839,349 | ||||||
| 20,188 | Duke Energy Corp. | 1,841,348 | ||||||
| 7,332 | El Paso Electric Co. | 497,770 | ||||||
| 27,357 | Energy Fuels, Inc./Canada * † | 52,252 | ||||||
| 11,403 | Entergy Corp. | 1,366,079 | ||||||
| 35,573 | Exelon Corp. | 1,621,773 | ||||||
| 83,251 | PG&E Corp. * | 904,938 | ||||||
| 11,829 | Pinnacle West Capital Corp. | 1,063,782 | ||||||
| 13,675 | PNM Resources, Inc. | 693,459 | ||||||
| 25,053 | Public Service Enterprise Group, Inc. | 1,479,380 | ||||||
| 11,982,296 | ||||||||
| Total Common Stocks (Cost: $22,382,301) | 22,743,912 | |||||||
| SHORT-TERM INVESTMENT HELD AS COLLATERAL FOR SECURITIES ON LOAN: 6.3% (Cost: $1,448,283) | ||||||||
| Money Market Fund: 6.3% | ||||||||
| 1,448,283 | State Street Navigator Securities Lending Government Money Market Portfolio | 1,448,283 | ||||||
| Total Investments: 106.4% (Cost: $23,830,584) | 24,192,195 | |||||||
| Liabilities in excess of other assets: (6.4)% | (1,461,790 | ) | ||||||
| NET ASSETS: 100.0% | $ | 22,730,405 | ||||||
Definitions:
| ADR | American Depositary Receipt |
| USD | United States Dollar |
Footnotes:
| * | Non-income producing |
| † | Security fully or partially on loan. Total market value of securities on loan is $1,562,020. |
| # | Security has been valued in good faith pursuant to guidelines established by the Board of Trustees. The aggregate value of fair valued securities is $7,639,314 which represents 33.6% of net assets. |
| Reg S | Security was purchased pursuant to Regulation S under the Securities Act of 1933, which exempts from registration securities offered and sold outside of the United States. Such a security cannot be sold in the United States without either an effective registration statement filed pursuant to the Securities Act of 1933, or pursuant to an exemption from registration. |
| 144A | Security exempt from registration under Rule 144A of the Securities Act of 1933, as amended, or otherwise restricted. These securities may be resold in transactions exempt from registration, unless otherwise noted, and the value amounted to $652,182, or 2.9% of net assets. |
See Notes to Financial Statements
| 45 |
VANECK VECTORS URANIUM+NUCLEAR ENERGY ETF
SCHEDULE OF INVESTMENTS
(continued)
| Summary of Investments by Sector Excluding Collateral for Securities Loaned | % of Investments | Value | ||||||
| Energy | 4.7 | % | $ | 1,082,055 | ||||
| Financials | 0.4 | 83,749 | ||||||
| Industrials | 3.4 | 765,610 | ||||||
| Utilities | 91.5 | 20,812,498 | ||||||
| 100.0 | % | $ | 22,743,912 | |||||
The summary of inputs used to value the Fund’s investments as of December 31, 2019 is as follows:
| Level 1 Quoted Prices | Level 2 Significant Observable Inputs | Level 3 Significant Unobservable Inputs | Value | ||||||||||||||
| Common Stocks | |||||||||||||||||
| Canada | $ | 1,113,552 | $ | — | $ | — | $ | 1,113,552 | |||||||||
| China / Hong Kong | — | 652,182 | — | 652,182 | |||||||||||||
| Czech Republic | 1,005,720 | — | — | 1,005,720 | |||||||||||||
| Finland | — | 1,297,100 | — | 1,297,100 | |||||||||||||
| France | — | 1,079,562 | — | 1,079,562 | |||||||||||||
| Japan | — | 3,463,977 | — | 3,463,977 | |||||||||||||
| Korea | — | 143,444 | — | 143,444 | |||||||||||||
| South Korea | 1,003,030 | — | — | 1,003,030 | |||||||||||||
| Spain | — | 1,003,049 | — | 1,003,049 | |||||||||||||
| United States | 11,982,296 | — | — | 11,982,296 | |||||||||||||
| Money Market Fund | 1,448,283 | — | — | 1,448,283 | |||||||||||||
| Total | $ | 16,552,881 | $ | 7,639,314 | $ | — | $ | 24,192,195 | |||||||||
See Notes to Financial Statements
| 46 |
[This Page Intentionally Left Blank.]
| 47 |
VANECK VECTORS ETF TRUST
STATEMENTS OF ASSETS AND LIABILITIES
December 31, 2019
| Agribusiness ETF | Coal ETF | Gold Miners ETF | Junior Gold Miners ETF | Low Carbon Energy ETF | |||||||||||||||||||||
| Assets: | |||||||||||||||||||||||||
| Investments, at value (1) | |||||||||||||||||||||||||
| Unaffiliated issuers (2) | $ | 716,181,540 | $ | 27,149,895 | $ | 5,768,267,267 | $ | 3,395,047,864 | $ | 104,633,603 | |||||||||||||||
| Affiliated issuers (3) | — | — | 7,227,843,608 | 1,819,767,333 | — | ||||||||||||||||||||
| Short-term investments held as collateral for securities loaned (4) | 827,598 | 697,091 | 27,585,223 | 60,229,115 | 1,193,707 | ||||||||||||||||||||
| Cash | 211,774 | 77,638 | 5,785,862 | 13,481,087 | 54,183 | ||||||||||||||||||||
| Cash denominated in foreign currency, at value (5) | 212,808 | 13 | 882 | — | — | ||||||||||||||||||||
| Receivables: | |||||||||||||||||||||||||
| Investment securities sold | — | — | — | — | 59,234 | ||||||||||||||||||||
| Shares of beneficial interest sold | — | — | 170,403,245 | 44,504,429 | — | ||||||||||||||||||||
| Dividends and interest | 1,179,874 | 11,948 | 3,152,010 | 1,763,506 | 116,938 | ||||||||||||||||||||
| Prepaid expenses | 8,280 | 1,840 | 77,563 | 35,862 | 2,012 | ||||||||||||||||||||
| Other assets | — | — | — | 216,253 | — | ||||||||||||||||||||
| Total assets | 718,621,874 | 27,938,425 | 13,203,115,660 | 5,335,045,449 | 106,059,677 | ||||||||||||||||||||
| Liabilities: | |||||||||||||||||||||||||
| Payables: | |||||||||||||||||||||||||
| Investment securities purchased | — | — | 170,357,076 | 52,916,465 | — | ||||||||||||||||||||
| Collateral for securities loaned | 827,598 | 697,091 | 27,585,223 | 60,229,115 | 1,193,707 | ||||||||||||||||||||
| Line of credit | — | — | — | — | — | ||||||||||||||||||||
| Shares redeemed | — | — | 476 | — | — | ||||||||||||||||||||
| Due to Adviser | 304,072 | 7,406 | 5,138,567 | 2,060,386 | 42,972 | ||||||||||||||||||||
| Due to custodian | — | — | — | 209,160 | 59,234 | ||||||||||||||||||||
| Distribution to shareholders | — | — | — | — | — | ||||||||||||||||||||
| Deferred Trustee fees | 484,842 | 21,987 | 972,330 | 236,762 | 12,090 | ||||||||||||||||||||
| Accrued expenses | 245,720 | 80,914 | 335,513 | 173,307 | 41,620 | ||||||||||||||||||||
| Total liabilities | 1,862,232 | 807,398 | 204,389,185 | 115,825,195 | 1,349,623 | ||||||||||||||||||||
| NET ASSETS | $ | 716,759,642 | $ | 27,131,027 | $ | 12,998,726,475 | $ | 5,219,220,254 | $ | 104,710,054 | |||||||||||||||
| Shares outstanding | 10,450,000 | 2,750,000 | 443,052,500 | 123,137,446 | 1,383,298 | ||||||||||||||||||||
| Net asset value, redemption and offering price per share | $ | 68.59 | $ | 9.87 | $ | 29.34 | $ | 42.39 | $ | 75.70 | |||||||||||||||
| Net Assets consist of: | |||||||||||||||||||||||||
| Aggregate paid in capital | $ | 1,356,378,381 | $ | 353,629,076 | $ | 21,137,815,637 | $ | 8,993,903,204 | $ | 168,092,157 | |||||||||||||||
| Total distributable earnings (loss) | (639,618,739 | ) | (326,498,049 | ) | (8,139,089,162 | ) | (3,774,682,950 | ) | (63,382,103 | ) | |||||||||||||||
| $ | 716,759,642 | $ | 27,131,027 | $ | 12,998,726,475 | $ | 5,219,220,254 | $ | 104,710,054 | ||||||||||||||||
| (1) Value of securities on loan | $ | 7,510,630 | $ | 1,709,344 | $ | 86,418,103 | $ | 196,868,095 | $ | 4,691,228 | |||||||||||||||
| (2) Cost of investments – Unaffiliated issuers | $ | 637,545,722 | $ | 41,093,496 | $ | 4,703,226,911 | $ | 2,962,500,702 | $ | 71,944,708 | |||||||||||||||
| (3) Cost of investments – Affiliated issuers | $ | — | $ | — | $ | 6,047,783,028 | $ | 1,447,648,972 | $ | — | |||||||||||||||
| (4) Cost of short-term investments held as collateral for securities loaned | $ | 827,598 | $ | 697,091 | $ | 27,585,223 | $ | 60,229,115 | $ | 1,193,707 | |||||||||||||||
| (5) Cost of cash denominated in foreign currency | $ | 209,456 | $ | 13 | $ | 868 | $ | — | $ | — | |||||||||||||||
See Notes to Financial Statements
| 48 |
| Natural Resources ETF | Oil Refiners ETF | Oil Services ETF | Rare Earth/ Strategic Metals ETF | Steel ETF | Unconventional Oil & Gas ETF | Uranium+Nuclear Energy ETF | |||||||||||||||||||||||||||
| $ | 70,573,615 | $ | 34,788,620 | $ | 774,268,237 | $ | 192,891,060 | $ | 66,156,506 | $ | 19,601,572 | $ | 22,743,912 | ||||||||||||||||||||
| — | — | — | — | — | — | — | |||||||||||||||||||||||||||
| 2,838,207 | — | 19,877,420 | 2,126,040 | 3,391,650 | 525,900 | 1,448,283 | |||||||||||||||||||||||||||
| 1,167 | 21,508 | 1,397,736 | 831,519 | 157,223 | 39,307 | 39,205 | |||||||||||||||||||||||||||
| 16,573 | — | — | 1,082,662 | — | 2,089 | — | |||||||||||||||||||||||||||
| 6,620 | 85,536 | 38,631,663 | — | 2,545,925 | 2,081 | — | |||||||||||||||||||||||||||
| — | — | — | 241,409 | — | — | — | |||||||||||||||||||||||||||
| 181,593 | 57,613 | 2,348,177 | 133,312 | 217,336 | 44,283 | 28,326 | |||||||||||||||||||||||||||
| 1,974 | 985 | 9,689 | 2,410 | 1,926 | 1,004 | 909 | |||||||||||||||||||||||||||
| — | — | — | 42,940 | — | — | — | |||||||||||||||||||||||||||
| 73,619,749 | 34,954,262 | 836,532,922 | 197,351,352 | 72,470,566 | 20,216,236 | 24,260,635 | |||||||||||||||||||||||||||
| 353 | — | 1,398,729 | 241,409 | 2,779,131 | 2,085 | — | |||||||||||||||||||||||||||
| 2,838,207 | — | 19,877,420 | 2,126,040 | 3,391,650 | 525,900 | 1,448,283 | |||||||||||||||||||||||||||
| 147,703 | — | 2,826,895 | 943,932 | — | — | — | |||||||||||||||||||||||||||
| — | — | 38,632,002 | 916,858 | — | — | — | |||||||||||||||||||||||||||
| 13,243 | 10,393 | 206,375 | 71,691 | 31,054 | 1,143 | 5,488 | |||||||||||||||||||||||||||
| — | 64,582 | — | — | — | — | — | |||||||||||||||||||||||||||
| — | — | — | — | 130,140 | — | — | |||||||||||||||||||||||||||
| 12,573 | 558 | 164,794 | 15,491 | 16,774 | 3,867 | 11,022 | |||||||||||||||||||||||||||
| 113,721 | 64,230 | 103,144 | 99,096 | 80,050 | 82,585 | 65,437 | |||||||||||||||||||||||||||
| 3,125,800 | 139,763 | 63,209,359 | 4,414,517 | 6,428,799 | 615,580 | 1,530,230 | |||||||||||||||||||||||||||
| $ | 70,493,949 | $ | 34,814,499 | $ | 773,323,563 | $ | 192,936,835 | $ | 66,041,767 | $ | 19,600,656 | $ | 22,730,405 | ||||||||||||||||||||
| 1,900,000 | 1,200,000 | 58,260,863 | 14,324,962 | 1,750,000 | 1,750,000 | 466,632 | |||||||||||||||||||||||||||
| $ | 37.10 | $ | 29.01 | $ | 13.27 | $ | 13.47 | $ | 37.74 | $ | 11.20 | $ | 48.71 | ||||||||||||||||||||
| $ | 106,882,214 | $ | 40,847,623 | $ | 2,280,040,359 | $ | 522,370,775 | $ | 213,500,434 | $ | 77,661,596 | $ | 104,521,699 | ||||||||||||||||||||
| (36,388,265 | ) | (6,033,124 | ) | (1,506,716,796 | ) | (329,433,940 | ) | (147,458,667 | ) | (58,060,940 | ) | (81,791,294 | ) | ||||||||||||||||||||
| $ | 70,493,949 | $ | 34,814,499 | $ | 773,323,563 | $ | 192,936,835 | $ | 66,041,767 | $ | 19,600,656 | $ | 22,730,405 | ||||||||||||||||||||
| $ | 5,755,656 | $ | — | $ | 59,407,365 | $ | 30,938,789 | $ | 10,794,738 | $ | 1,671,202 | $ | 1,562,020 | ||||||||||||||||||||
| $ | 65,717,778 | $ | 37,777,533 | $ | 1,340,492,634 | $ | 214,277,026 | $ | 74,008,511 | $ | 31,901,196 | $ | 22,382,301 | ||||||||||||||||||||
| $ | — | $ | — | $ | — | $ | — | $ | — | $ | — | $ | — | ||||||||||||||||||||
| $ | 2,838,207 | $ | — | $ | 19,877,420 | $ | 2,126,040 | $ | 3,391,650 | $ | 525,900 | $ | 1,448,283 | ||||||||||||||||||||
| $ | 16,313 | $ | — | $ | — | $ | 1,079,401 | $ | — | $ | 2,075 | $ | — | ||||||||||||||||||||
See Notes to Financial Statements
| 49 |
VANECK VECTORS ETF TRUST
For the Year Ended December 31, 2019
| Agribusiness ETF | Coal ETF | Gold Miners ETF | Junior Gold Miners ETF | Low Carbon Energy ETF | |||||||||||||||||||||
| Income: | |||||||||||||||||||||||||
| Dividends – Unaffiliated issuers | $ | 13,522,689 | $ | 3,403,914 | $ | 665,307 | $ | 7,377,870 | $ | 634,354 | |||||||||||||||
| Dividends – Affiliated issuers | — | — | 143,348,021 | 24,058,238 | — | ||||||||||||||||||||
| Interest | 6,389 | 1,750 | 89,924 | 172,278 | 765 | ||||||||||||||||||||
| Securities lending income | 945,042 | 47,075 | 1,215,535 | 2,454,622 | 53,184 | ||||||||||||||||||||
| Foreign taxes withheld | (1,082,755 | ) | (323,205 | ) | (7,569,564 | ) | (1,276,728 | ) | (54,566 | ) | |||||||||||||||
| Total income | 13,391,365 | 3,129,534 | 137,749,223 | 32,786,280 | 633,737 | ||||||||||||||||||||
| Expenses: | |||||||||||||||||||||||||
| Management fees | 3,615,501 | 228,229 | 53,842,504 | 21,262,348 | 453,986 | ||||||||||||||||||||
| Professional fees | 61,261 | 62,480 | 102,647 | 156,758 | 62,642 | ||||||||||||||||||||
| Custodian fees | 75,029 | 6,408 | 450,637 | 202,339 | 12,428 | ||||||||||||||||||||
| Fund accounting fees | 56,536 | 14,365 | — | 235,418 | 10,308 | ||||||||||||||||||||
| Reports to shareholders | 42,611 | 21,390 | 321,263 | 140,103 | 27,852 | ||||||||||||||||||||
| IOPV fees | 3,062 | 5,036 | — | 5,039 | 5,050 | ||||||||||||||||||||
| Trustees’ fees and expenses | 141,619 | 1,972 | 664,837 | 201,108 | 2,772 | ||||||||||||||||||||
| Registration fees | 5,043 | 5,043 | 51,377 | 27,201 | 5,044 | ||||||||||||||||||||
| Transfer agent fees | 2,420 | 2,420 | 2,420 | 2,420 | 2,420 | ||||||||||||||||||||
| Insurance | 8,311 | 2,004 | 60,309 | 34,470 | 1,979 | ||||||||||||||||||||
| Interest | 41,538 | 3,786 | 121,770 | 40,440 | 3,359 | ||||||||||||||||||||
| Other | 13,352 | 907 | 312,675 | 339,944 | 737 | ||||||||||||||||||||
| Total expenses | 4,066,283 | 354,040 | 55,930,439 | 22,647,588 | 588,577 | ||||||||||||||||||||
| Waiver of management fees | — | (81,052 | ) | — | — | (25,109 | ) | ||||||||||||||||||
| Net expenses | 4,066,283 | 272,988 | 55,930,439 | 22,647,588 | 563,468 | ||||||||||||||||||||
| Net investment income | 9,325,082 | 2,856,546 | 81,818,784 | 10,138,692 | 70,269 | ||||||||||||||||||||
| Net realized gain (loss) on: | |||||||||||||||||||||||||
| Investments – unaffiliated issuers | (23,209,279 | ) | (5,949,389 | ) | — | (52,634,762 | ) | 1,262,569 | |||||||||||||||||
| Investments – affiliated issuers | — | — | (603,201,819 | ) | 21,634,015 | — | |||||||||||||||||||
| In-kind redemptions – unaffiliated issuers | 68,286,682 | (1,752,239 | ) | — | 90,539,484 | 2,705,670 | |||||||||||||||||||
| In-kind redemptions – affiliated issuers | — | — | 982,723,383 | 330,590,921 | — | ||||||||||||||||||||
| Foreign currency transactions and foreign denominated assets and liabilities | (280,087 | ) | 5,633 | (207,453 | ) | (777,877 | ) | (10,903 | ) | ||||||||||||||||
| Net realized gain | 44,797,316 | (7,695,995 | ) | 379,314,111 | 389,351,781 | 3,957,336 | |||||||||||||||||||
| Net change in unrealized appreciation (depreciation) on: | |||||||||||||||||||||||||
| Investments – unaffiliated issuers | 90,481,083 | (1,102,411 | ) | — | 433,933,175 | 24,995,376 | |||||||||||||||||||
| Investments – affiliated issuers | — | — | 3,098,709,740 | 725,413,848 | — | ||||||||||||||||||||
| Foreign currency transactions and foreign denominated assets and liabilities | 13,871 | (7,964 | ) | 29,126 | 2,405 | 236 | |||||||||||||||||||
| Net change in unrealized appreciation (depreciation) | 90,494,954 | (1,110,375 | ) | 3,098,738,866 | 1,159,349,428 | 24,995,612 | |||||||||||||||||||
| Net Increase in Net Assets Resulting from Operations | $ | 144,617,352 | $ | (5,949,824 | ) | $ | 3,559,871,761 | $ | 1,558,839,901 | $ | 29,023,217 | ||||||||||||||
See Notes to Financial Statements
| 50 |
| Natural Resources ETF | Oil Refiners ETF | Oil Services ETF | Rare Earth/ Strategic Metals ETF | Steel ETF | Unconventional Oil & Gas ETF | Uranium+Nuclear Energy ETF | ||||||||||||||||||||||||||||||||||
| $ | 2,382,675 | $ | 654,506 | $ | 20,086,649 | $ | 2,605,121 | $ | 2,151,470 | $ | 419,445 | $ | 684,000 | |||||||||||||||||||||||||||
| — | — | — | — | — | — | — | ||||||||||||||||||||||||||||||||||
| 807 | 230 | 7,236 | 4,520 | 1,627 | 1,421 | 488 | ||||||||||||||||||||||||||||||||||
| 37,518 | 880 | 589,816 | 2,272,611 | 41,637 | 2,699 | 11,600 | ||||||||||||||||||||||||||||||||||
| (158,940 | ) | (38,037 | ) | (197,602 | ) | (232,410 | ) | (48,469 | ) | (13,558 | ) | (32,440 | ) | |||||||||||||||||||||||||||
| 2,262,060 | 617,579 | 20,486,099 | 4,649,842 | 2,146,265 | 410,007 | 663,648 | ||||||||||||||||||||||||||||||||||
| 353,318 | 119,831 | 2,719,707 | 847,063 | 292,623 | 113,950 | 121,444 | ||||||||||||||||||||||||||||||||||
| 69,630 | 61,563 | 63,946 | 62,283 | 62,089 | 61,192 | 51,795 | ||||||||||||||||||||||||||||||||||
| 42,648 | 17,686 | 18,393 | 16,104 | 17,759 | 4,816 | 11,804 | ||||||||||||||||||||||||||||||||||
| 46,134 | 12,077 | 40,061 | 17,375 | 8,833 | 8,219 | 10,836 | ||||||||||||||||||||||||||||||||||
| 18,925 | 13,272 | 69,807 | 35,184 | 15,489 | 17,406 | 12,390 | ||||||||||||||||||||||||||||||||||
| 5,853 | 4,989 | 5,039 | 8,604 | 302 | 1,241 | 5,893 | ||||||||||||||||||||||||||||||||||
| 4,935 | 387 | 69,997 | 7,005 | 3,860 | 1,860 | 1,153 | ||||||||||||||||||||||||||||||||||
| 5,056 | 10,226 | 12,729 | 4,921 | 4,675 | 5,658 | 5,056 | ||||||||||||||||||||||||||||||||||
| 2,608 | 2,656 | 2,420 | 2,419 | 2,420 | 2,420 | 2,420 | ||||||||||||||||||||||||||||||||||
| 2,041 | 911 | 12,242 | 2,645 | 2,293 | 1,140 | 902 | ||||||||||||||||||||||||||||||||||
| 8,485 | 3,124 | 33,788 | 53,309 | 4,335 | 370 | 1,501 | ||||||||||||||||||||||||||||||||||
| 1,585 | 414 | 10,063 | 26,039 | 1,298 | 883 | 484 | ||||||||||||||||||||||||||||||||||
| 561,218 | 247,136 | 3,058,192 | 1,082,951 | 415,976 | 219,155 | 225,678 | ||||||||||||||||||||||||||||||||||
| (206,461 | ) | (102,490 | ) | (305,084 | ) | (60,775 | ) | (89,706 | ) | (95,707 | ) | (78,447 | ) | |||||||||||||||||||||||||||
| 354,757 | 144,646 | 2,753,108 | 1,022,176 | 326,270 | 123,448 | 147,231 | ||||||||||||||||||||||||||||||||||
| 1,907,303 | 472,933 | 17,732,991 | 3,627,666 | 1,819,995 | 286,559 | 516,417 | ||||||||||||||||||||||||||||||||||
| (1,009,828 | ) | (1,539,296 | ) | (745,520,370 | ) | (39,327,786 | ) | (7,472,207 | ) | (3,707,711 | ) | (575,902 | ) | |||||||||||||||||||||||||||
| — | — | — | — | — | — | — | ||||||||||||||||||||||||||||||||||
| 2,880,887 | (2,568,840 | ) | 13,236,601 | 5,006,938 | 2,735,630 | (2,687,476 | ) | 453,441 | ||||||||||||||||||||||||||||||||
| — | — | — | — | — | — | — | ||||||||||||||||||||||||||||||||||
| (9,369 | ) | 6,107 | — | (123,387 | ) | — | 181 | (663 | ) | |||||||||||||||||||||||||||||||
| 1,861,690 | (4,102,029 | ) | (732,283,769 | ) | (34,444,235 | ) | (4,736,577 | ) | (6,395,006 | ) | (123,124 | ) | ||||||||||||||||||||||||||||
| 8,602,328 | 6,240,639 | 792,379,286 | 20,065,075 | 9,706,290 | 8,706,635 | (269,238 | ) | |||||||||||||||||||||||||||||||||
| — | — | — | — | — | — | — | ||||||||||||||||||||||||||||||||||
| 2,361 | 89 | — | (489 | ) | — | 392 | (672 | ) | ||||||||||||||||||||||||||||||||
| 8,604,689 | 6,240,728 | 792,379,286 | 20,064,586 | 9,706,290 | 8,707,027 | (269,910 | ) | |||||||||||||||||||||||||||||||||
| $ | 12,373,682 | $ | 2,611,632 | $ | 77,828,508 | $ | (10,751,983 | ) | $ | 6,789,708 | $ | 2,598,580 | $ | 123,383 | ||||||||||||||||||||||||||
See Notes to Financial Statements
| 51 |
VANECK VECTORS ETF TRUST
STATEMENTS OF CHANGES IN NET ASSETS
| Agribusiness ETF | Coal ETF | |||||||||||||||||||
| Year Ended December 31, 2019 | Year Ended December 31, 2018 | Year Ended December 31, 2019 | Year Ended December 31, 2018 | |||||||||||||||||
| Operations: | ||||||||||||||||||||
| Net investment income | $ | 9,325,082 | $ | 11,247,175 | $ | 2,856,546 | $ | 3,658,960 | ||||||||||||
| Net realized gain (loss) | 44,797,316 | 26,425,991 | (7,695,995 | ) | 5,152,067 | |||||||||||||||
| Net change in unrealized appreciation (depreciation) | 90,494,954 | (78,237,487 | ) | (1,110,375 | ) | (23,299,853 | ) | |||||||||||||
| Net increase (decrease) in net assets resulting from operations | 144,617,352 | (40,564,321 | ) | (5,949,824 | ) | (14,488,826 | ) | |||||||||||||
| Distributions to shareholders: | ||||||||||||||||||||
| Dividends and Distributions | (9,500,095 | ) | (12,001,800 | ) | (2,900,150 | ) | (3,625,600 | ) | ||||||||||||
| Share transactions:** | ||||||||||||||||||||
| Proceeds from sale of shares | 105,326,430 | 253,505,524 | 1,187,794 | 37,840,160 | ||||||||||||||||
| Cost of shares redeemed | (280,400,157 | ) | (297,801,280 | ) | (20,290,433 | ) | (65,842,648 | ) | ||||||||||||
| Increase (decrease) in net assets resulting from share transactions | (175,073,727 | ) | (44,295,756 | ) | (19,102,639 | ) | (28,002,488 | ) | ||||||||||||
| Total increase (decrease) in net assets | (39,956,470 | ) | (96,861,877 | ) | (27,952,613 | ) | (46,116,914 | ) | ||||||||||||
| Net Assets, beginning of year | 756,716,112 | 853,577,989 | 55,083,640 | 101,200,554 | ||||||||||||||||
| Net Assets, end of year | $ | 716,759,642 | $ | 756,716,112 | $ | 27,131,027 | $ | 55,083,640 | ||||||||||||
| ** Shares of Common Stock Issued (no par value) | ||||||||||||||||||||
| Shares sold | 1,600,000 | 4,100,000 | 100,000 | 2,200,000 | ||||||||||||||||
| Shares redeemed | (4,400,000 | ) | (4,700,000 | ) | (1,700,000 | ) | (4,150,000 | ) | ||||||||||||
| Net increase (decrease) | (2,800,000 | ) | (600,000 | ) | (1,600,000 | ) | (1,950,000 | ) | ||||||||||||
See Notes to Financial Statements
| 52 |
| Gold Miners ETF | Junior Gold Miners ETF | Low Carbon Energy ETF | ||||||||||||||||||||||||||
| Year Ended December 31, 2019 | Year Ended December 31, 2018 | Year Ended December 31, 2019 | Year Ended December 31, 2018 | Year Ended December 31, 2019 | Year Ended December 31, 2018 | |||||||||||||||||||||||
| $ | 81,818,784 | $ | 54,277,346 | $ | 10,138,692 | $ | 20,158,325 | $ | 70,269 | $ | 388,213 | |||||||||||||||||
| 379,314,111 | (601,102,816 | ) | 389,351,781 | (27,214,893 | ) | 3,957,336 | (6,719,605 | ) | ||||||||||||||||||||
| 3,098,738,866 | (18,619,340 | ) | 1,159,349,428 | (619,710,123 | ) | 24,995,612 | (1,788,978 | ) | ||||||||||||||||||||
| 3,559,871,761 | (565,444,810 | ) | 1,558,839,901 | (626,766,691 | ) | 29,023,217 | (8,120,370 | ) | ||||||||||||||||||||
| (83,020,376 | ) | (51,959,513 | ) | (19,760,414 | ) | (19,534,693 | ) | — | (499,871 | ) | ||||||||||||||||||
| 3,041,614,263 | 5,960,338,004 | 1,571,000,381 | 1,806,805,925 | 3,279,996 | 2,944,806 | |||||||||||||||||||||||
| (4,095,425,966 | ) | (2,341,832,008 | ) | (2,164,254,798 | ) | (1,521,604,784 | ) | (6,568,905 | ) | (2,699,948 | ) | |||||||||||||||||
| (1,053,811,703 | ) | 3,618,505,996 | (593,254,417 | ) | 285,201,141 | (3,288,909 | ) | 244,858 | ||||||||||||||||||||
| 2,423,039,682 | 3,001,101,673 | 945,825,070 | (361,100,243 | ) | 25,734,308 | (8,375,383 | ) | |||||||||||||||||||||
| 10,575,686,793 | 7,574,585,120 | 4,273,395,184 | 4,634,495,427 | 78,975,746 | 87,351,129 | |||||||||||||||||||||||
| $ | 12,998,726,475 | $ | 10,575,686,793 | $ | 5,219,220,254 | $ | 4,273,395,184 | $ | 104,710,054 | $ | 78,975,746 | |||||||||||||||||
| 110,700,000 | 284,350,000 | 44,500,000 | 57,450,000 | 50,000 | 50,000 | |||||||||||||||||||||||
| (169,500,000 | ) | (108,250,000 | ) | (63,300,000 | ) | (51,000,000 | ) | (100,000 | ) | (50,000 | ) | |||||||||||||||||
| (58,800,000 | ) | 176,100,000 | (18,800,000 | ) | 6,450,000 | (50,000 | ) | — | ||||||||||||||||||||
See Notes to Financial Statements
| 53 |
VANECK VECTORS ETF TRUST
STATEMENTS OF CHANGES IN NET ASSETS
(continued)
| Natural Resources ETF | Oil Refiners ETF | |||||||||||||||||||
| Year Ended December 31, 2019 | Year Ended December 31, 2018 | Year Ended December 31, 2019 | Year Ended December 31, 2018 | |||||||||||||||||
| Operations: | ||||||||||||||||||||
| Net investment income | $ | 1,907,303 | $ | 2,177,109 | $ | 472,933 | $ | 1,074,205 | ||||||||||||
| Net realized gain (loss) | 1,861,690 | 2,307,544 | (4,102,029 | ) | 2,132,774 | |||||||||||||||
| Net change in unrealized appreciation (depreciation) | 8,604,689 | (14,165,407 | ) | 6,240,728 | (11,639,881 | ) | ||||||||||||||
| Net increase (decrease) in net assets resulting from operations | 12,373,682 | (9,680,754 | ) | 2,611,632 | (8,432,902 | ) | ||||||||||||||
| Distributions to shareholders: | ||||||||||||||||||||
| Dividends and Distributions | (1,900,000 | ) | (2,159,650 | ) | (496,080 | ) | (1,170,000 | ) | ||||||||||||
| Share transactions:** | ||||||||||||||||||||
| Proceeds from sale of shares | 3,749,265 | 20,587,991 | 21,310,441 | 71,379,067 | ||||||||||||||||
| Cost of shares redeemed | (21,011,129 | ) | (35,327,984 | ) | (37,120,710 | ) | (23,907,520 | ) | ||||||||||||
| Increase (decrease) in net assets resulting from share transactions | (17,261,864 | ) | (14,739,993 | ) | (15,810,269 | ) | 47,471,547 | |||||||||||||
| Total increase (decrease) in net assets | (6,788,182 | ) | (26,580,397 | ) | (13,694,717 | ) | 37,868,645 | |||||||||||||
| Net Assets, beginning of year | 77,282,131 | 103,862,528 | 48,509,216 | 10,640,571 | ||||||||||||||||
| Net Assets, end of year | $ | 70,493,949 | $ | 77,282,131 | $ | 34,814,499 | $ | 48,509,216 | ||||||||||||
| ** Shares of Common Stock Issued (no par value) | ||||||||||||||||||||
| Shares sold | 100,000 | 550,000 | 700,000 | 2,200,000 | ||||||||||||||||
| Shares redeemed | (600,000 | ) | (950,000 | ) | (1,300,000 | ) | (750,000 | ) | ||||||||||||
| Net increase (decrease) | (500,000 | ) | (400,000 | ) | (600,000 | ) | 1,450,000 | |||||||||||||
See Notes to Financial Statements
| 54 |
| Oil Services ETF | Rare Earth/Strategic Metals ETF | Steel ETF | ||||||||||||||||||||||||||
| Year Ended December 31, 2019 | Year Ended December 31, 2018 | Year Ended December 31, 2019 | Year Ended December 31, 2018 | Year Ended December 31, 2019 | Year Ended December 31, 2018 | |||||||||||||||||||||||
| $ | 17,732,991 | $ | 20,914,787 | $ | 3,627,666 | $ | 4,738,473 | $ | 1,819,995 | $ | 3,613,616 | |||||||||||||||||
| (732,283,769 | ) | (21,009,960 | ) | (34,444,235 | ) | (29,449,479 | ) | (4,736,577 | ) | 13,351,999 | ||||||||||||||||||
| 792,379,286 | (653,349,446 | ) | 20,064,586 | (83,243,311 | ) | 9,706,290 | (35,609,871 | ) | ||||||||||||||||||||
| 77,828,508 | (653,444,619 | ) | (10,751,983 | ) | (107,954,317 | ) | 6,789,708 | (18,644,256 | ) | |||||||||||||||||||
| (17,651,031 | ) | (21,321,948 | ) | (3,000,424 | ) | (11,500,061 | ) | (1,830,265 | ) | (3,600,300 | ) | |||||||||||||||||
| 1,831,589,993 | 3,576,434,472 | 179,145,791 | 92,876,673 | 22,421,304 | 69,668,571 | |||||||||||||||||||||||
| (2,163,278,689 | ) | (3,508,098,084 | ) | (64,994,094 | ) | (63,091,508 | ) | (18,873,013 | ) | (140,826,609 | ) | |||||||||||||||||
| (331,688,696 | ) | 68,336,388 | 114,151,697 | 29,785,165 | 3,548,291 | (71,158,038 | ) | |||||||||||||||||||||
| (271,511,219 | ) | (606,430,179 | ) | 100,399,290 | (89,669,213 | ) | 8,507,734 | (93,402,594 | ) | |||||||||||||||||||
| 1,044,834,782 | 1,651,264,961 | 92,537,545 | 182,206,758 | 57,534,033 | 150,936,627 | |||||||||||||||||||||||
| $ | 773,323,563 | $ | 1,044,834,782 | $ | 192,936,835 | $ | 92,537,545 | $ | 66,041,767 | $ | 57,534,033 | |||||||||||||||||
| 131,400,000 | 156,300,000 | 12,100,000 | 3,300,000 | 600,000 | 1,450,000 | |||||||||||||||||||||||
| (147,600,000 | ) | (145,300,000 | ) | (4,600,000 | ) | (2,600,000 | ) | (500,000 | ) | (3,100,000 | ) | |||||||||||||||||
| (16,200,000 | ) | 11,000,000 | 7,500,000 | 700,000 | 100,000 | (1,650,000 | ) | |||||||||||||||||||||
See Notes to Financial Statements
| 55 |
VANECK VECTORS ETF TRUST
STATEMENTS OF CHANGES IN NET ASSETS
(continued)
| Unconventional Oil & Gas ETF | Uranium+Nuclear Energy ETF | |||||||||||||||||||
| Year Ended December 31, 2019 | Year Ended December 31, 2018 | Year Ended December 31, 2019 | Year Ended December 31, 2018 | |||||||||||||||||
| Operations: | ||||||||||||||||||||
| Net investment income | $ | 286,559 | $ | 508,185 | $ | 516,417 | $ | 716,050 | ||||||||||||
| Net realized gain (loss) | (6,395,006 | ) | (10,939,902 | ) | (123,124 | ) | 502,306 | |||||||||||||
| Net change in unrealized appreciation (depreciation) | 8,707,027 | (12,940,297 | ) | (269,910 | ) | 234,878 | ||||||||||||||
| Net increase (decrease) in net assets resulting from operations | 2,598,580 | (23,372,014 | ) | 123,383 | 1,453,234 | |||||||||||||||
| Distributions to shareholders: | ||||||||||||||||||||
| Dividends and Distributions | (350,000 | ) | (426,800 | ) | (550,019 | ) | (1,000,199 | ) | ||||||||||||
| Share transactions:** | ||||||||||||||||||||
| Proceeds from sale of shares | 1,675,305 | 19,198,826 | — | — | ||||||||||||||||
| Cost of shares redeemed | (14,385,844 | ) | (34,540,419 | ) | (2,503,957 | ) | (2,606,938 | ) | ||||||||||||
| Decrease in net assets resulting from share transactions | (12,710,539 | ) | (15,341,593 | ) | (2,503,957 | ) | (2,606,938 | ) | ||||||||||||
| Total decrease in net assets | (10,461,959 | ) | (39,140,407 | ) | (2,930,593 | ) | (2,153,903 | ) | ||||||||||||
| Net Assets, beginning of year | 30,062,615 | 69,203,022 | 25,660,998 | 27,814,901 | ||||||||||||||||
| Net Assets, end of year | $ | 19,600,656 | $ | 30,062,615 | $ | 22,730,405 | $ | 25,660,998 | ||||||||||||
| ** Shares of Common Stock Issued (no par value) | ||||||||||||||||||||
| Shares sold | 150,000 | 1,200,000 | — | — | ||||||||||||||||
| Shares redeemed | (1,150,000 | ) | (2,850,000 | ) | (50,000 | ) | (50,000 | ) | ||||||||||||
| Net decrease | (1,000,000 | ) | (1,650,000 | ) | (50,000 | ) | (50,000 | ) | ||||||||||||
See Notes to Financial Statements
| 56 |
VANECK VECTORS ETF TRUST
For a share outstanding throughout each year:
| (a) | Calculated based upon average shares outstanding |
| (b) | Total return is calculated assuming an initial investment made at the net asset value at the beginning of year, reinvestment of any dividends and distributions at net asset value on the dividend/distributions payment date and a redemption at the net asset value on the last day of the year. The return does not reflect the deduction of taxes that a shareholder would pay on Fund dividends/distributions or the redemption of Fund shares. |
| (c) | Portfolio turnover rates exclude securities received or delivered as a result of processing in-kind capital share transactions. |
| (d) | Includes expense offset arrangements of 0.01%. |
See Notes to Financial Statements
| 57 |
VANECK VECTORS ETF TRUST
FINANCIAL HIGHLIGHTS
For a share outstanding throughout each year:
| (a) | Calculated based upon average shares outstanding |
| (b) | Total return is calculated assuming an initial investment made at the net asset value at the beginning of year, reinvestment of any dividends and distributions at net asset value on the dividend/distributions payment date and a redemption at the net asset value on the last day of the year. The return does not reflect the deduction of taxes that a shareholder would pay on Fund dividends/distributions or the redemption of Fund shares. |
| (c) | Portfolio turnover rates exclude securities received or delivered as a result of processing in-kind capital share transactions. |
| (d) | The ratios presented do not reflect the Fund’s proportionate share of income and expenses form the Fund’s investment in underlying funds. |
See Notes to Financial Statements
| 58 |
FINANCIAL HIGHLIGHTS
For a share outstanding throughout each year:
| (a) | Calculated based upon average shares outstanding |
| (b) | Total return is calculated assuming an initial investment made at the net asset value at the beginning of year, reinvestment of any dividends and distributions at net asset value on the dividend/distributions payment date and a redemption at the net asset value on the last day of the year. The return does not reflect the deduction of taxes that a shareholder would pay on Fund dividends/distributions or the redemption of Fund shares. |
| (c) | Portfolio turnover rates exclude securities received or delivered as a result of processing in-kind capital share transactions. |
See Notes to Financial Statements
| 59 |
VANECK VECTORS ETF TRUST
FINANCIAL HIGHLIGHTS
For a share outstanding throughout each period:
| (a) | Commencement of operations |
| (b) | Calculated based upon average shares outstanding |
| (c) | Total return is calculated assuming an initial investment made at the net asset value at the beginning of period, reinvestment of any dividends and distributions at net asset value on the dividend/distributions payment date and a redemption at the net asset value on the last day of the period. The return does not reflect the deduction of taxes that a shareholder would pay on Fund dividends/distributions or the redemption of Fund shares. |
| (d) | Not Annualized |
| (e) | Annualized |
| (f) | Portfolio turnover rates exclude securities received or delivered as a result of processing in-kind capital share transactions. |
| (g) | The amount shown for a share outstanding does not correspond with the aggregate net gain (loss) on investments for the period due to the timing of sales and repurchases of shares in relation to fluctuating market values of the investments of the Fund. |
See Notes to Financial Statements
| 60 |
FINANCIAL HIGHLIGHTS
For a share outstanding throughout each year:
| (a) | Calculated based upon average shares outstanding |
| (b) | Total return is calculated assuming an initial investment made at the net asset value at the beginning of year, reinvestment of any dividends and distributions at net asset value on the dividend/distributions payment date and a redemption at the net asset value on the last day of the year. The return does not reflect the deduction of taxes that a shareholder would pay on Fund dividends/distributions or the redemption of Fund shares. |
| (c) | Portfolio turnover rates exclude securities received or delivered as a result of processing in-kind capital share transactions. |
| (d) | The amount shown for a share outstanding does not correspond with the aggregate net gain (loss) on investments for the period due to the timing of sales and repurchaes of shares in relation to fluctuating market values of the investments of the Fund. |
See Notes to Financial Statements
| 61 |
VANECK VECTORS ETF TRUST
FINANCIAL HIGHLIGHTS
For a share outstanding throughout each year:
| (a) | Calculated based upon average shares outstanding |
| (b) | Total return is calculated assuming an initial investment made at the net asset value at the beginning of year, reinvestment of any dividends and distributions at net asset value on the dividend/distributions payment date and a redemption at the net asset value on the last day of the year. The return does not reflect the deduction of taxes that a shareholder would pay on Fund dividends/distributions or the redemption of Fund shares. |
| (c) | Portfolio turnover rates exclude securities received or delivered as a result of processing in-kind capital share transactions. |
See Notes to Financial Statements
| 62 |
NOTES TO FINANCIAL STATEMENTS
December 31, 2019
Note 1—Fund Organization—VanEck Vectors ETF Trust (the “Trust”) is registered under the Investment Company Act of 1940, as amended, as an open-end management investment company. The Trust was incorporated in Delaware as a statutory trust on March 15, 2001. The Trust operates as a series fund, and offers multiple investment portfolios, each of which represents a separate series of the Trust. These financial statements relate only to the investment portfolios listed in the diversification table below (each a “Fund” and, collectively, the “Funds”).
Each Fund was created to provide investors with the opportunity to purchase a security representing a proportionate undivided interest in a portfolio of securities consisting of substantially all of the common stocks in substantially the same weighting as their index.
| Fund | Diversification Classification | ||
| Agribusiness ETF | Non-Diversified | ||
| Coal ETF | Non-Diversified | ||
| Gold Miners ETF | Non-Diversified | ||
| Junior Gold Miners ETF | Non-Diversified | ||
| Low Carbon Energy ETF* | Non-Diversified | ||
| Natural Resources ETF | Diversified | ||
| Oil Refiners ETF | Non-Diversified | ||
| Oil Services ETF | Non-Diversified | ||
| Rare Earth/Strategic Metals ETF | Non-Diversified | ||
| Steel ETF | Non-Diversified | ||
| Unconventional Oil & Gas ETF | Non-Diversified | ||
| Uranium+Nuclear Energy ETF | Non-Diversified |
| * | Formerly known as Global Alternative Energy ETF |
Note 2—Significant Accounting Policies—The preparation of financial statements in conformity with U.S. generally accepted accounting principles (“GAAP”) requires management to make estimates and assumptions that affect the reported amounts and disclosures in the financial statements. Actual results could differ from those estimates.
The Funds are investment companies and follow accounting and reporting requirements of Accounting Standards Codification (“ASC”) 946Financial Services-Investment Companies.
The following summarizes the Funds’ significant accounting policies.
| A. | Security Valuation—The Funds value their investments in securities and other assets and liabilities at fair value daily. Fair value is the price that would be received to sell an asset or paid to transfer a liability in an orderly transaction between market participants on the measurement date. Securities traded on the NASDAQ Stock Market LLC (“NASDAQ”) are valued at the NASDAQ official closing price. Securities traded on national exchanges are valued at the closing price on the markets in which the securities trade. Over-the-counter securities not included in the NASDAQ and listed securities for which no sale was reported are valued at the mean of the bid and ask prices. To the extent these securities are actively traded they are categorized as Level 1 in the fair value hierarchy (described below). Certain foreign securities, whose values may be affected by market direction or events occurring before the Funds’ pricing time (4:00 p.m. Eastern Standard Time) but after the last close of the securities’ primary market, are fair valued using a pricing service and are categorized as Level 2 in the fair value hierarchy. The pricing service, using methods approved by the Board of Trustees, considers the correlation of the trading patterns of the foreign security to intraday trading in the U.S. markets, based on indices of domestic securities and other appropriate indicators such as prices of relevant ADR’s and futures contracts. The Funds may also fair value securities in other situations, such as, when a particular foreign market is closed but the Fund is open. Short-term debt securities with sixty days or less to maturity are valued at amortized cost, which with accrued interest approximates fair value. Money market fund investments are valued at net asset value and are categorized as Level 1 in the fair value hierarchy. The Pricing Committee of Van Eck Associates Corporation (the “Adviser”) provides oversight of the Funds’ valuation policies and procedures, which are approved by the Funds’ Board of Trustees. Among other things, these procedures allow the Funds to utilize independent pricing services, quotations from securities dealers, and other market sources to determine fair value. The Pricing Committee convenes regularly to review the fair value of financial instruments or other assets. If market quotations for a security or other asset are not readily available, or if the Adviser believes they do not otherwise reflect the fair value of a security or asset, the |
| 63 |
VANECK VECTORS ETF TRUST
NOTES TO FINANCIAL STATEMENTS
(continued)
| security or asset will be fair valued by the Pricing Committee in accordance with the Funds’ valuation policies and procedures. The Pricing Committee employs various methods for calibrating the valuation approaches utilized to determine fair value, including a regular review of key inputs and assumptions, periodic comparisons to valuations provided by other independent pricing services, transactional back-testing and disposition analysis. | |
| Certain factors such as economic conditions, political events, market trends, the nature of and duration of any restrictions on disposition, trading in similar securities of the issuer or comparable issuers and other security specific information are used to determine the fair value of these securities. Depending on the relative significance of valuation inputs, these securities may be classified either as Level 2 or Level 3 in the fair value hierarchy. The price which the Funds may realize upon sale of an investment may differ materially from the value presented in the Schedules of Investments. | |
| The Funds utilize various methods to measure the fair value of their investments on a recurring basis, which includes a hierarchy that prioritizes inputs to valuation methods used to measure fair value. The fair value hierarchy gives highest priority to unadjusted quoted prices in active markets for identical assets and liabilities (Level 1 measurements) and the lowest priority to unobservable inputs (Level 3 measurements). The inputs or methodologies used for valuing securities are not necessarily an indication of the risk associated with investing in those securities. The three levels of the fair value hierarchy are described below: | |
| Level 1 — Quoted prices in active markets for identical securities. | |
| Level 2 — Significant observable inputs (including quoted prices for similar securities, interest rates, prepayment speeds, credit risk, etc.). | |
| Level 3 — Significant unobservable inputs (including each Fund’s own assumptions in determining the fair value of investments). | |
| A summary of the inputs and the levels used to value the Funds’ investments, are located in the Schedules of Investments. Additionally, tables that reconcile the valuation of the Funds’ Level 3 investments and that present additional information about valuation methodologies and unobservable inputs, if applicable, are located in the Schedules of Investments. | |
| B. | Federal Income Taxes—It is each Fund’s policy to comply with the provisions of the Internal Revenue Code applicable to regulated investment companies and to distribute all of its taxable income to its shareholders. Therefore, no federal income tax provision is required. |
| C. | Dividends and Distributions to Shareholders—Dividends to shareholders from net investment income and distributions from net realized capital gains, if any, are declared and paid annually by each Fund. Income dividends and capital gain distributions are determined in accordance with U.S. income tax regulations, which may differ from such amounts determined in accordance with GAAP. |
| D. | Currency Translation—Assets and liabilities denominated in foreign currencies and commitments under foreign currency contracts are translated into U.S. dollars at the closing prices of such currencies each business day as quoted by one or more sources. Purchases and sales of investments are translated at the exchange rates prevailing when such investments are acquired or sold. Foreign denominated income and expenses are translated at the exchange rates prevailing when accrued. The portion of realized and unrealized gains and losses on investments that result from fluctuations in foreign currency exchange rates is not separately disclosed in the financial statements. Such amounts are included with the net realized and unrealized gains and losses on investment securities in the Statement of Operations. Recognized gains or losses attributable to foreign currency fluctuations on foreign currency denominated assets, other than investments, and liabilities are recorded as net realized gain (loss) on foreign currency transactions and foreign denominated assets and liabilities in the Statements of Operations. |
| E. | Restricted Securities—The Funds may invest in securities that are subject to legal or contractual restrictions on resale. These securities generally may be resold in transactions exempt from registration or to the public if the securities are registered. Disposal of these securities may involve time-consuming negotiations and expense, and prompt sale at an acceptable price may be difficult. Information regarding restricted securities, if any, is included at the end of each Fund’s Schedule of Investments. |
| 64 |
| F. | Offsetting Assets and Liabilities—In the ordinary course of business, the Funds enter into transactions subject to enforceable master netting or other similar agreements. Generally, the right of offset in those agreements allows the Funds to offset any exposure to a specific counterparty with any collateral received or delivered to that counterparty based on the terms of the agreements. The Funds may pledge or receive cash and or securities as collateral for derivative instruments and securities lending. For financial reporting purposes, the Funds present securities lending assets and liabilities on a gross basis in the Statements of Assets and Liabilities. Cash collateral held in the form of money market investments, if any, at December 31, 2019 is presented in the Schedules of Investments and in the Statement of Assets and Liabilities. Non-cash collateral is disclosed in Note 9 (Securities Lending). |
| G. | Other—Security transactions are accounted for on trade date. Realized gains and losses are determined based on the specific identification method. Dividend income is recorded on the ex-dividend date except that certain dividends from foreign securities are recognized upon notification of the ex-dividend date. Interest income, including amortization of premiums and discounts, is accrued as earned. |
| In the normal course of business, the Funds enter into contracts that contain a variety of general indemnifications. The Funds’ maximum exposure under these agreements is unknown as this would involve future claims that may be made against the Funds that have not yet occurred. However, the Adviser believes the risk of loss under these arrangements to be remote. |
Note 3—Investment Management and Other Agreements—The Adviser is the investment adviser to the Funds. The Adviser receives a management fee, calculated daily and payable monthly based on an annual rate of 0.50% of each Fund’s average daily net assets (except for Oil Services ETF). The management fee rate for Oil Services ETF is 0.35%. The Adviser has agreed, until at least May 1, 2020 to waive management fees and assume expenses to prevent each Fund’s total annual operating expenses (excluding acquired fund fees and expenses, interest expense, trading expenses, taxes and extraordinary expenses) from exceeding expense limitations listed in the table below.
The current expense limitations for the year ended December 31, 2019, are as follows:
| Fund | Expense Limitations | |||
| Agribusiness ETF | 0.56 | % | ||
| Coal ETF | 0.59 | |||
| Gold Miners ETF | 0.53 | |||
| Junior Gold Miners ETF | 0.56 | |||
| Low Carbon Energy ETF | 0.62 | |||
| Natural Resources ETF | 0.49 | |||
| Oil Refiners ETF | 0.59 | |||
| Oil Services ETF | 0.35 | |||
| Rare Earth/Strategic Metals ETF | 0.57 | |||
| Steel ETF | 0.55 | |||
| Unconventional Oil & Gas ETF | 0.54 | |||
| Uranium+Nuclear Energy ETF | 0.60 | |||
Refer to Statement of Operations for the amounts waived/assumed by the Adviser.
In addition, Van Eck Securities Corporation, an affiliate of the Adviser, acts as the Funds’ distributor (the “Distributor”). Certain officers and a Trustee of the Trust are officers, directors or stockholders of the Adviser and Distributor.
At December 31, 2019, the Adviser owned 2,500 shares of Gold Miners ETF.
Effective November 4, 2019, State Street Bank and Trust Company is the Funds’ custodian, securities lending agent and transfer agent. Prior to November 4, 2019, Bank of New York Mellon provided these services to the Funds.
For the year ended December 31, 2019, there were offsets to custodian fees under an expense offset agreement and these amounts are reflected in custody expense in the Statements of Operations.
Note 4—Capital Share Transactions—As of December 31, 2019, there were an unlimited number of capital shares of beneficial interest authorized by the Trust with no par value. Fund shares are not individually redeemable and are
| 65 |
VANECK VECTORS ETF TRUST
NOTES TO FINANCIAL STATEMENTS
(continued)
issued and redeemed at their net asset value per share only through certain authorized broker-dealers (“Authorized Participants”) in blocks of shares (“Creation Units”), consisting of 50,000 shares, or multiples thereof.
The consideration for the purchase or redemption of Creation Units of the Funds generally consists of the in-kind contribution or distribution of securities constituting the Funds’ underlying index (“Deposit Securities”) plus a balancing cash component to equate the transaction to the net asset value per share of the Fund on the transaction date. Cash may also be substituted in an amount equivalent to the value of certain Deposit Securities, generally as a result of market circumstances, or when the securities are not available in sufficient quantity for delivery, or are not eligible for trading by the Authorized Participant. The Funds may issue Creation Units in advance of receipt of Deposit Securities subject to various conditions, including, for the benefit of the Funds, a requirement to maintain cash collateral on deposit at the custodian equal to at least 115% of the daily marked to market value of the missing Deposit Securities.
Authorized Participants purchasing and redeeming Creation Units may pay transaction fees directly to transfer agent. In addition, the Funds may impose certain variable fees for creations and redemptions with respect to transactions in Creation Units for cash, or on transactions effected outside the clearing process, which are treated as increases in capital. These variable fees, if any, are reflected in share transactions in the Statements of Changes in Net Assets.
Note 5—Investments—For the year ended December 31, 2019, purchases and sales of investments (excluding short-term investments and in-kind capital share transactions) and the purchases and sales of investments resulting from in-kind capital share transactions (excluding short-term investments) were as follows:
| In-kind Capital Share Transactions | ||||||||||||||||
| Fund | Purchases | Sales | Purchases | Sales | ||||||||||||
| Agribusiness ETF | $ | 149,185,204 | $ | 159,506,389 | $ | 99,346,982 | $ | 264,601,680 | ||||||||
| Coal ETF | 10,792,100 | 11,816,980 | 1,184,959 | 19,111,882 | ||||||||||||
| Gold Miners ETF | 1,702,048,953 | 1,554,067,790 | 2,886,580,464 | 4,095,190,627 | ||||||||||||
| Junior Gold Miners ETF | 963,332,970 | 829,365,379 | 1,433,973,693 | 2,164,458,809 | ||||||||||||
| Low Carbon Energy ETF | 36,878,056 | 36,653,676 | 3,280,701 | 6,568,020 | ||||||||||||
| Natural Resources ETF | 17,119,815 | 17,604,019 | 3,699,120 | 20,410,754 | ||||||||||||
| Oil Refiners ETF | 7,475,585 | 8,739,214 | 18,160,803 | 32,642,629 | ||||||||||||
| Oil Services ETF | 242,659,383 | 225,059,890 | 1,709,977,726 | 2,058,183,776 | ||||||||||||
| Rare Earth/Strategic Metals ETF | 144,824,390 | 108,494,166 | 122,494,595 | 44,101,860 | ||||||||||||
| Steel ETF | 10,834,708 | 12,995,607 | 22,421,687 | 16,577,955 | ||||||||||||
| Unconventional Oil & Gas ETF | 6,683,927 | 6,734,940 | 1,675,287 | 14,386,144 | ||||||||||||
| Uranium+Nuclear Energy ETF | 3,723,138 | 3,697,757 | — | 2,490,447 | ||||||||||||
Note 6—Income Taxes—As of December 31, 2019, for Federal income tax purposes, the identified cost, gross unrealized appreciation, gross unrealized depreciation and net unrealized appreciation (depreciation) of investments owned were as follows:
| Fund | Tax Cost of Investments | Gross Unrealized Appreciation | Gross Unrealized (Depreciation) | Net Unrealized Appreciation (Depreciation) | ||||||||||||
| Agribusiness ETF | $ | 649,326,703 | $ | 145,332,445 | $ | (77,650,010 | ) | $ | 67,682,435 | |||||||
| Coal ETF | 42,823,384 | 118,938 | (15,095,336 | ) | (14,976,398 | ) | ||||||||||
| Gold Miners ETF | 10,811,251,411 | 2,586,778,200 | (374,333,512 | ) | 2,212,444,688 | |||||||||||
| Junior Gold Miners ETF | 4,543,261,377 | 1,162,647,623 | (430,864,688 | ) | 731,782,935 | |||||||||||
| Low Carbon Energy ETF | 72,913,903 | 35,376,175 | (2,462,768 | ) | 32,913,407 | |||||||||||
| Natural Resources ETF | 68,954,860 | 9,512,687 | (5,055,725 | ) | 4,456,962 | |||||||||||
| Oil Refiners ETF | 37,919,143 | 1,093,509 | (4,224,032 | ) | (3,130,523 | ) | ||||||||||
| Oil Services ETF | 1,364,134,817 | 18,004,067 | (587,993,227 | ) | (569,989,160 | ) | ||||||||||
| Rare Earth/Strategic Materials ETF | 229,013,022 | 13,336,772 | (47,332,693 | ) | (33,995,921 | ) | ||||||||||
| Steel ETF | 78,212,893 | 3,018,573 | (11,683,310 | ) | (8,664,737 | ) | ||||||||||
| Unconventional Oil & Gas ETF | 32,647,722 | 378,220 | (12,898,470 | ) | (12,520,250 | ) | ||||||||||
| Uranium+Nuclear Energy ETF | 23,928,343 | 3,479,361 | (3,215,509 | ) | 263,852 | |||||||||||
| 66 |
At December 31, 2019, the components of distributable earnings (loss) on a tax basis, for each Fund, were as follows:
| Fund | Undistributed Ordinary Income | Accumulated Capital Losses | Qualified Late Year Losses* | Other Temporary Differences | Unrealized Appreciation (Depreciation) | Total Distributable Earnings (Loss) | ||||||||||||||||||
| Agribusiness ETF | $ | 676,222 | $ | (707,502,202 | ) | $ | — | $ | (484,842 | ) | $ | 67,692,083 | $ | (639,618,739 | ) | |||||||||
| Coal ETF | — | (311,498,315 | ) | (1,480 | ) | (21,987 | ) | (14,976,267 | ) | (326,498,049 | ) | |||||||||||||
| Gold Miners ETF | 3,307,534 | (10,353,896,984 | ) | — | (972,330 | ) | 2,212,472,618 | (8,139,089,162 | ) | |||||||||||||||
| Junior Gold Miners ETF | 20,198,595 | (4,526,433,128 | ) | — | (236,762 | ) | 731,788,345 | (3,774,682,950 | ) | |||||||||||||||
| Low Carbon Energy ETF | 39,561 | (96,324,516 | ) | — | (12,090 | ) | 32,914,942 | (63,382,103 | ) | |||||||||||||||
| Natural Resources ETF | 111,942 | (40,945,959 | ) | — | (12,573 | ) | 4,458,325 | (36,388,265 | ) | |||||||||||||||
| Oil Refiners ETF | — | (2,902,724 | ) | — | (559 | ) | (3,129,841 | ) | (6,033,124 | ) | ||||||||||||||
| Oil Services ETF | 221,445 | (936,747,781 | ) | — | (201,299 | ) | (569,989,160 | ) | (1,506,716,795 | ) | ||||||||||||||
| Rare Earth/Strategic Materials ETF | 2,019,606 | (297,445,357 | ) | — | (15,491 | ) | (33,992,698 | ) | (329,433,940 | ) | ||||||||||||||
| Steel ETF | 74,606 | (138,851,761 | ) | — | (16,775 | ) | (8,664,737 | ) | (147,458,667 | ) | ||||||||||||||
| Unconventional Oil & Gas ETF | 286 | (45,537,289 | ) | — | (3,867 | ) | (12,520,070 | ) | (58,060,940 | ) | ||||||||||||||
| Uranium+Nuclear Energy ETF | 456,917 | (82,501,101 | ) | — | (11,022 | ) | 263,912 | (81,791,294 | ) | |||||||||||||||
| * | Qualified late year losses incurred after October 31, 2019 are deemed to arise on the January 1, 2020. |
The tax character of dividends paid to shareholders during the years ended December 31, 2019 and December 31, 2018 were as follows:
| 2019 Dividends | 2018 Dividends | |||||||
| Fund | Ordinary Income * | Ordinary Income * | ||||||
| Agribusiness ETF | $ | 9,500,095 | $ | 12,001,800 | ||||
| Coal ETF | 2,900,150 | 3,625,600 | ||||||
| Gold Miners ETF | 83,020,376 | 51,959,513 | ||||||
| Junior Gold Miners ETF | 19,760,414 | 19,534,693 | ||||||
| Low Carbon Energy ETF | — | 499,871 | ||||||
| Natural Resources ETF | 1,900,000 | 2,159,650 | ||||||
| Oil Refiners ETF | 496,080 | 1,170,000 | ||||||
| Oil Services ETF | 17,651,031 | 21,321,948 | ||||||
| Rare Earth/Strategic Materials ETF | 3,000,424 | 11,500,061 | ||||||
| Steel ETF | 1,830,265 | 3,600,300 | ||||||
| Unconventional Oil & Gas ETF | 350,000 | 426,800 | ||||||
| Uranium+Nuclear Energy ETF | 550,019 | 1,000,200 | ||||||
| * | Includes short-term capital gains (if any) |
At December 31, 2019, the Funds had capital loss carryforwards available to offset future capital gains, as follow:
| Fund | Short-Term Capital Losses with No Expiration | Long-Term Capital Losses with No Expiration | Total | |||||||||
| Agribusiness ETF | $ | (176,695,262 | ) | $ | (530,806,940 | ) | $ | (707,502,202 | ) | |||
| Coal ETF | (25,686,329 | ) | (285,811,986 | ) | (311,498,315 | ) | ||||||
| Gold Miners ETF | (1,400,615,888 | ) | (8,953,281,096 | ) | (10,353,896,984 | ) | ||||||
| Junior Gold Miners ETF | (1,526,966,259 | ) | (2,999,466,869 | ) | (4,526,433,128 | ) | ||||||
| Low Carbon Energy ETF | (2,682,903 | ) | (93,641,613 | ) | (96,324,516 | ) | ||||||
| Natural Resources ETF | (2,837,843 | ) | (38,108,116 | ) | (40,945,959 | ) | ||||||
| Oil Refiners ETF | (2,508,048 | ) | (394,676 | ) | (2,902,724 | ) | ||||||
| Oil Services ETF | (76,248,000 | ) | (860,499,781 | ) | (936,747,781 | ) | ||||||
| Rare Earth/Strategic Materials ETF | (84,095,383 | ) | (213,349,974 | ) | (297,445,357 | ) | ||||||
| Steel ETF | (7,461,174 | ) | (131,390,587 | ) | (138,851,761 | ) | ||||||
| Unconventional Oil & Gas ETF | (7,056,729 | ) | (38,480,560 | ) | (45,537,289 | ) | ||||||
| Uranium+Nuclear Energy ETF | (13,905,560 | ) | (68,595,541 | ) | (82,501,101 | ) | ||||||
During the year ended December 31, 2019, Low Carbon Energy ETF, utilized $1,285,485 of its capital loss carryovers available from prior years.
| 67 |
VANECK VECTORS ETF TRUST
NOTES TO FINANCIAL STATEMENTS
(continued)
During the year ended December 31, 2019, as a result of permanent book to tax differences, primarily due to the tax treatment of gains/losses from securities redeemed in-kind, the Funds incurred differences that affected distributable earnings and aggregate paid in capital by the amounts in the table below. Net assets were not affected by these reclassifications.
| Fund | Increase (Decrease) in Distributable Earnings | Increase (Decrease) in Aggregate Paid in Capital | ||||||
| Agribusiness ETF | $ | (66,723,217 | ) | $ | 66,723,217 | |||
| Coal ETF | 2,170,584 | (2,170,584 | ) | |||||
| Gold Miners ETF | (982,720,367 | ) | 982,720,367 | |||||
| Junior Gold Miners ETF | (397,784,270 | ) | 397,784,270 | |||||
| Low Carbon Energy ETF | (2,727,420 | ) | 2,727,420 | |||||
| Natural Resources ETF | (2,693,886 | ) | 2,693,886 | |||||
| Oil Refiners ETF | 2,797,067 | (2,797,067 | ) | |||||
| Oil Services ETF | 7,029,165 | (7,029,165 | ) | |||||
| Rare Earth/Strategic Materials ETF | (1,311,747 | ) | 1,311,747 | |||||
| Steel ETF | (2,066,666 | ) | 2,066,666 | |||||
| Unconventional Oil & Gas ETF | 3,270,108 | (3,270,108 | ) | |||||
| Uranium+Nuclear Energy ETF | (431,106 | ) | 431,106 | |||||
The Funds recognize the tax benefits of uncertain tax positions only where the position is “more-likely-than-not” to be sustained assuming examination by applicable tax authorities. Management has analyzed the Funds’ tax positions, and has concluded that no liability for unrecognized tax benefits should be recorded related to uncertain tax positions taken on return filings for all open tax years. The Funds do not have exposure for additional years that might still be open in certain foreign jurisdictions. Therefore, no provision for income tax is required in the Funds’ financial statements. However, the Funds are subject to foreign taxes on the appreciation in value of certain investments. The Funds provide for such taxes on both realized and unrealized appreciation.
The Funds recognize interest and penalties, if any, related to uncertain tax positions as income tax expense in the Statements of Operations. During the year ended December 31, 2019, the Funds did not incur any interest or penalties.
Note 7—Principal Risks—The investment objective of each Fund is to seek investment results that correspond generally to the price and yield performance, before fees and expenses, of its underlying index, as indicated in the name of each Fund. The Adviser uses a “passive” or index approach to achieve each Fund’s investment objective by investing in a portfolio of securities that generally replicates the Fund’s index. Non-diversified funds generally hold securities of fewer issuers than diversified funds (see Note 1) and may be more susceptible to the risks associated with these particular issuers, or to a single economic, political or regulatory occurrence affecting these issuers. The Funds may purchase securities on foreign exchanges. Securities of foreign issuers involve special risks and considerations not typically associated with investing in U.S. issuers. These risks include devaluation of currencies, currency controls, less reliable information about issuers, different securities transaction clearance and settlement practices, future adverse political and economic developments and local/regional conflicts or natural or other disasters, such as the recent coronavirus outbreak. These risks are heightened for investments in emerging market countries. Moreover, securities of many foreign issuers and their markets may be less liquid and their prices more volatile than those of comparable U.S. issuers.
As a result of events involving Ukraine and the Russian Federation, the United States and the European Union have imposed sanctions on certain Russian individuals and companies. These sanctions do not currently impact the Funds. Additional economic sanctions may be imposed or other actions may be taken that may adversely affect the value and liquidity of the Russian-related issuers held by the Funds.
A more complete description of risks is included in each Fund’s Prospectus and Statement of Additional Information.
Note 8—Trustee Deferred Compensation Plan—The Trust has a Deferred Compensation Plan (the “Plan”) for Trustees under which the Trustees can elect to defer receipt of their trustee fees until retirement, disability or termination from the Board of Trustees. The fees otherwise payable to the participating Trustees are deemed invested in shares of the Funds as directed by the Trustees.
| 68 |
The expense for the Plan is included in “Trustees’ fees and expenses” in the Statements of Operations. The liability for the Plan is shown as “Deferred Trustee fees” in the Statements of Assets and Liabilities.
Note 9—Securities Lending—To generate additional income, each of the Funds may lend its securities pursuant to a securities lending agreement with the securities lending agent. Each Fund may lend up to 33% of its investments requiring that the loan be continuously collateralized by cash, cash equivalents, U.S. government securities, or any combination of cash and such securities at all times equal to at least 102% (105% for foreign securities) of the market value plus accrued interest on the securities loaned. Daily market fluctuations could cause the value of loaned securities to be more or less than the value of the collateral received. When this occurs, the collateral is adjusted and settled on the next business day. During the term of the loan, the Funds will continue to receive any dividends, interest or amounts equivalent thereto, on the securities loaned while receiving a fee from the borrower and/or earning interest on the investment of the cash collateral. Such fees and interest are shared with the securities lending agent under the terms of the securities lending agreement. Securities lending income is disclosed as such in the Statements of Operations. The cash collateral is maintained on the Funds’ behalf by the lending agent and is invested in the State Street Navigator Securities Lending Government Money Market Portfolio. Non-cash collateral consists of U.S. Treasuries and U.S. Government Agency securities, and is not disclosed in the Funds’ Schedules of Investments or Statements of Assets and Liabilities as it is held by the agent on behalf of the Funds, and the Funds do not have the ability to re-hypothecate those securities. Loans are subject to termination at the option of the borrower or the Funds. Upon termination of the loan, the borrower will return to the Fund securities identical to the securities loaned. The Funds bear the risk of delay in recovery of, or even loss of rights in, the securities loaned should the borrower of the securities fail financially. The value of loaned securities and related cash collateral, if any, at December 31, 2019 is presented on a gross basis in the Schedules of Investments and Statements of Assets and Liabilities. The following is a summary of the Funds’ securities on loan and related collateral as of December 31, 2019:
| Fund | Market Value of Securities on Loan | Cash Collateral | Non-Cash Collateral | Total Collateral | ||||||||||||
| Agribusiness ETF | $ | 7,510,630 | $ | 827,598 | $ | 6,821,610 | $ | 7,649,208 | ||||||||
| Coal ETF | 1,709,344 | 697,091 | 1,070,707 | 1,767,798 | ||||||||||||
| Gold Miners ETF | 86,418,103 | 27,585,223 | 63,060,722 | 90,645,945 | ||||||||||||
| Junior Gold Miners ETF | 196,868,095 | 60,229,115 | 144,696,174 | 204,925,289 | ||||||||||||
| Low Carbon Energy ETF | 4,691,228 | 1,193,707 | 3,536,958 | 4,730,665 | ||||||||||||
| Natural Resources ETF | 5,755,656 | 2,838,207 | 3,142,022 | 5,980,229 | ||||||||||||
| Oil Services ETF | 59,407,365 | 19,877,420 | 41,561,156 | 61,438,576 | ||||||||||||
| Rare Earth/Strategic Metals ETF | 30,938,789 | 2,126,040 | 30,307,181 | 32,433,221 | ||||||||||||
| Steel ETF | 10,794,738 | 3,391,650 | 7,632,710 | 11,024,360 | ||||||||||||
| Unconventional Oil & Gas ETF | 1,671,202 | 525,900 | 1,194,145 | 1,720,045 | ||||||||||||
| Uranium+Nuclear Energy ETF | 1,562,020 | 1,448,283 | 217,964 | 1,666,247 | ||||||||||||
| 69 |
VANECK VECTORS ETF TRUST
NOTES TO FINANCIAL STATEMENTS
(continued)
The following table presents money market fund investments held as collateral by type of security on loan as of December 31, 2019:
| Gross Amount of Recognized Liabilities for Securities Loaned in the Statements of Assets and Liabilities* | ||||
| Fund | Equity Securities | |||
| Agribusiness ETF | $ | 827,598 | ||
| Coal ETF | 697,091 | |||
| Gold Miners ETF | 27,585,223 | |||
| Junior Gold Miners ETF | 60,229,115 | |||
| Low Carbon Energy ETF | 1,193,707 | |||
| Natural Resources ETF | 2,838,207 | |||
| Oil Services ETF | 19,877,420 | |||
| Rare Earth/Strategic Metals ETF | 2,126,040 | |||
| Steel ETF | 3,391,650 | |||
| Unconventional Oil & Gas ETF | 525,900 | |||
| Uranium+Nuclear Energy ETF | 1,448,283 | |||
| * | Remaining contractual maturity of the agreements: overnight and continuous |
Note 10—Bank Line of Credit—The Funds may participate in a $200 million committed credit facility (the “Facility”) to be utilized for temporary financing until the settlement of sales or purchases of portfolio securities, the repurchase or redemption of shares of the Funds at the request of the shareholders and other temporary or emergency purposes. The Funds have agreed to pay commitment fees, pro rata, based on the unused but available balance. Interest is charged to the Funds at rates based on prevailing market rates in effect at the time of borrowings. The Funds earn interest income on uninvested cash balances held at the custodian bank, such amounts, if any, are presented as interest income in the Statements of Operations. During the year ended December 31, 2019, the following Funds borrowed under this Facility:
| Fund | Days Outstanding | Average Daily Loan Balance | Average Interest Rate | Outstanding Loan Balance as of December 31, 2019 | ||||||||||||
| Agribusiness ETF | 287 | $1,397,857 | 3.67 | % | $ | — | ||||||||||
| Coal ETF | 186 | 197,599 | 3.62 | — | ||||||||||||
| Gold Miners ETF | 157 | 7,701,048 | 3.61 | — | ||||||||||||
| Junior Gold Miners ETF | 85 | 5,005,298 | 3.50 | — | ||||||||||||
| Low Carbon Energy ETF | 206 | 158,140 | 3.49 | — | ||||||||||||
| Natural Resources ETF | 285 | 275,365 | 3.68 | 147,703 | ||||||||||||
| Oil Refiners ETF | 162 | 139,396 | 3.70 | — | ||||||||||||
| Oil Services ETF | 219 | 1,550,682 | 3.58 | 2,826,895 | ||||||||||||
| Rare Earth/Strategic Metals ETF | 307 | 1,439,376 | 3.63 | 943,932 | ||||||||||||
| Steel ETF | 112 | 278,754 | 3.77 | — | ||||||||||||
| Uranium+Nuclear Energy ETF | 10 | 100,145 | 3.80 | — | ||||||||||||
Note 11—Recent Accounting Pronouncements—The Funds early adopted certain provisions of Accounting Standards Update No. 2018-13,Disclosure Framework-Changes to the Disclosure Requirements for Fair Value Measurement(“ASU 2018-13”) that eliminate and modify certain disclosure requirements for fair value measurements. The adoption of certain provisions of ASU 2018-13 had no material effect on the financial statements and related disclosures. Management evaluated the additional requirements, not yet adopted, and they are not expected to have a material impact to the financial statements. Public companies will be required to disclose the range and weighted average of significant unobservable inputs for Level 3 fair value measurements. ASU 2018-13 is effective for fiscal years beginning after December 15, 2019 and for interim periods within those fiscal years.
Note 12—Subsequent Event Review—The Funds have evaluated subsequent events and transactions for potential recognition or disclosure through the date the financial statements were issued.
| 70 |
VANECK VECTORS ETF TRUST
REPORT OF INDEPENDENT REGISTERED PUBLIC ACCOUNTING FIRM
To the Shareholders of VanEck Vectors Agribusiness ETF, VanEck Vectors Coal ETF, VanEck Vectors Gold Miners ETF, VanEck Vectors Junior Gold Miners ETF, VanEck Vectors Low Carbon Energy ETF, VanEck Vectors Natural Resources ETF, VanEck Vectors Oil Refiners ETF, VanEck Vectors Oil Services ETF, VanEck Vectors Rare Earth/Strategic Metals ETF, VanEck Vectors Steel ETF, VanEck Vectors Unconventional Oil & Gas ETF and VanEck Vectors Uranium+Nuclear Energy ETF and the Board of Trustees of VanEck Vectors ETF Trust
Opinion on the Financial Statements
We have audited the accompanying statements of assets and liabilities of VanEck Vectors Agribusiness ETF, VanEck Vectors Coal ETF, VanEck Vectors Gold Miners ETF, VanEck Vectors Junior Gold Miners ETF, VanEck Vectors Low Carbon Energy ETF, VanEck Vectors Natural Resources ETF, VanEck Vectors Oil Refiners ETF, VanEck Vectors Oil Services ETF, VanEck Vectors Rare Earth/Strategic Metals ETF, VanEck Vectors Steel ETF, VanEck Vectors Unconventional Oil & Gas ETF and VanEck Vectors Uranium+Nuclear Energy ETF (collectively referred to as the “Funds”) (twelve of the series constituting VanEck Vectors ETF Trust (the “Trust”)), including the schedules of investments, as of December 31, 2019, and the related statements of operations, changes in net assets, and the financial highlights for each of the periods indicated in the table below and the related notes (collectively referred to as the “financial statements”). In our opinion, the financial statements present fairly, in all material respects, the financial position of each of the Funds (twelve of the series constituting VanEck Vectors ETF Trust) at December 31, 2019, and the results of their operations, changes in net assets and financial highlights for each of the periods indicated in the table below, in conformity with U.S. generally accepted accounting principles.
| Individual fund constituting the VanEck Vectors ETF Trust | Statement of operations | Statements of changes in net assets | Financial highlights | |||
| VanEck Vectors Agribusiness ETF | For the year ended December 31, 2019 | For each of the two years in the period ended December 31, 2019 | For each of the five years in the period ended December 31, 2019 | |||
| VanEck Vectors Coal ETF | ||||||
| VanEck Vectors Gold Miners ETF | ||||||
| VanEck Vectors Junior Gold Miners ETF | ||||||
| VanEck Vectors Low Carbon Energy ETF | ||||||
| VanEck Vectors Natural Resources ETF | ||||||
| VanEck Vectors Oil Services ETF | ||||||
| VanEck Vectors Rare Earth/Strategic Metals ETF | ||||||
| VanEck Vectors Steel ETF | ||||||
| VanEck Vectors Unconventional Oil & Gas ETF | ||||||
| VanEck Vectors Uranium+Nuclear Energy ETF | ||||||
| VanEck Vectors Oil Refiners ETF | For the year ended December 31, 2019 | For each of the two years in the period ended December 31, 2019 | For each of the four years in the period ended December 31, 2019 and the period from August 18, 2015 (commencement of operations) through December 31, 2015 |
| 71 |
VANECK VECTORS ETF TRUST
REPORT OF INDEPENDENT REGISTERED PUBLIC ACCOUNTING FIRM
(continued)
Basis for Opinion
These financial statements are the responsibility of the Trust’s management. Our responsibility is to express an opinion on each of the Funds�� financial statements based on our audits. We are a public accounting firm registered with the Public Company Accounting Oversight Board (United States) (“PCAOB”) and are required to be independent with respect to the Trust in accordance with the U.S. federal securities laws and the applicable rules and regulations of the Securities and Exchange Commission and the PCAOB.
We conducted our audits in accordance with the standards of the PCAOB. Those standards require that we plan and perform the audits to obtain reasonable assurance about whether the financial statements are free of material misstatement, whether due to error or fraud. The Trust is not required to have, nor were we engaged to perform, an audit of the Trust’s internal control over financial reporting. As part of our audits, we are required to obtain an understanding of internal control over financial reporting, but not for the purpose of expressing an opinion on the effectiveness of the Trust’s internal control over financial reporting. Accordingly, we express no such opinion.
Our audits included performing procedures to assess the risks of material misstatement of the financial statements, whether due to error or fraud, and performing procedures that respond to those risks. Such procedures included examining, on a test basis, evidence regarding the amounts and disclosures in the financial statements. Our procedures included confirmation of securities owned as of December 31, 2019, by correspondence with the custodian and brokers or by other appropriate auditing procedures where replies from broker were not received. Our audits also included evaluating the accounting principles used and significant estimates made by management, as well as evaluating the overall presentation of the financial statements. We believe that our audits provide a reasonable basis for our opinion.

We have served as the auditor of one or more of the VanEck investment companies since 1999.
New York, New York
February 27, 2020
| 72 |
VANECK VECTORS ETF TRUST
(unaudited)
The following information is provided with respect to the distributions paid during the taxable year ended December 31, 2019:
| Agribusiness ETF | Coal ETF | Gold Miners ETF | Junior Gold Miners ETF | Natural Resources ETF | Oil Refiners ETF | |||||||||||||||||||||||||
| Record Date | 12/24/2019 | 12/24/2019 | 12/24/2019 | 12/24/2019 | 12/24/2019 | 12/24/2019 | ||||||||||||||||||||||||
| Ex Date | 12/23/2109 | 12/23/2109 | 12/23/2109 | 12/23/2109 | 12/23/2109 | 12/23/2109 | ||||||||||||||||||||||||
| Payable Date | 12/30/2019 | 12/30/2019 | 12/30/2019 | 12/30/2019 | 12/30/2019 | 12/30/2019 | ||||||||||||||||||||||||
| Ordinary Income Per Share | $ | 0.909100 | $ | 1.054600 | $ | 0.190500 | $ | 0.163800 | $ | 1.000000 | $ | 0.413400 | ||||||||||||||||||
| Ordinary Income: | ||||||||||||||||||||||||||||||
| Qualified Dividend Income for Individuals | 96.31 | % | 91.14 | %* | 100.00 | %* | 84.37 | %* | 97.74 | %* | 99.90 | %* | ||||||||||||||||||
| Dividends Qualifying for the Dividends Received Deduction for Corporations | 50.13 | % | 25.58 | %* | 47.20 | %* | 17.64 | %* | 36.81 | %* | 54.76 | %* | ||||||||||||||||||
| Foreign Source Income | — | 64.89 | %* | 69.13 | %* | 45.21 | %* | 63.92 | %* | 51.12 | %* | |||||||||||||||||||
| Foreign Taxes Paid Per Share | — | $ | 0.100765 | ** | 0.016692 | ** | $ | 0.010363 | ** | $ | 0.072903 | ** | $ | 0.028073 | ** | |||||||||||||||
| Oil Services ETF | Rare Earth / Strategic Metals ETF | Steel ETF | Unconventional Oil & Gas ETF | Uranium+ Nuclear Energy ETF | ||||||||||||||||||||||||||
| Record Date | 12/24/2019 | 12/24/2019 | 12/24/2019 | 12/31/2019 | 12/24/2019 | 12/24/2019 | ||||||||||||||||||||||||
| Ex Date | 12/23/2109 | 12/23/2109 | 12/23/2109 | 12/30/2019 | 12/23/2109 | 12/23/2109 | ||||||||||||||||||||||||
| Payable Date | 12/30/2019 | 12/30/2019 | 12/30/2019 | 01/06/2020 | 12/30/2019 | 12/30/2019 | ||||||||||||||||||||||||
| Ordinary Income Per Share | $ | 0.290500 | $ | 0.214700 | $ | 0.097150 | $ | 0.072300 | $ | 0.200000 | $ | 1.178700 | ||||||||||||||||||
| Ordinary Income: | ||||||||||||||||||||||||||||||
| Qualified Dividend Income for Individuals | 53.51 | % | 49.92 | %* | 89.28 | %* | 89.53 | %* | 100.00 | % | 100.00 | % | ||||||||||||||||||
| Dividends Qualifying for the Dividends Received Deduction for Corporations | 43.28 | % | — | 20.19 | % | 20.39 | %* | 100.00 | % | 73.92 | % | |||||||||||||||||||
| Foreign Source Income | — | 51.07 | %* | 75.99 | %* | 76.96 | %* | — | — | |||||||||||||||||||||
| Foreign Taxes Paid Per Share | $ | — | $ | 0.008948 | ** | $ | 0.020792 | ** | 0.001547 | ** | — | — | ||||||||||||||||||
| * | Expressed as a percentage of the ordinary income distribution grossed up for foreign taxes. |
| ** | The foreign taxes paid represent taxes incurred by the Fund on income received by the Fund from foreign sources. Foreign taxes paid may be included in taxable income with an offsetting deduction from gross income or may be taken as a credit for taxes paid to foreign governments. |
Please consult your tax advisor for proper treatment of this information.
| 73 |
VANECK VECTORS ETF TRUST
BOARD OF TRUSTEES AND OFFICERS
December 31, 2019 (unaudited)
| Name, Address1 and Year of Birth | Position(s) Held with the Trust | Term of Office2and Length of Time Served | Principal Occupation(s) During Past Five Years | Number of Portfolios in Fund Complex3 Overseen | Other Directorships Held By Trustee During Past Five Years | |||||
| Independent Trustees | ||||||||||
| David H. Chow, 1957*† | Chairman Trustee | Since 2008 Since 2006 | Founder and CEO, DanCourt Management LLC (financial/strategy consulting firm and Registered Investment Adviser), March 1999 to present. | 55 | Director, Forward Management LLC and Audit Committee Chairman, May 2008 to June 2015; Trustee, Berea College of Kentucky, May 2009 to present and currently Chairman of the Investment Committee; Member of the Governing Council of the Independent Directors Council, October 2012 to present; President, July 2013 to June 2015, and Board Member of the CFA Society of Stamford, July 2009 to present; Trustee, MainStay Fund Complex4, January 2016 to present and currently Chairman of the Risk and Compliance Committee. | |||||
| Laurie A. Hesslein, 1959*† | Trustee | Since 2019 | Citigroup, Managing Director, and Business Head, Local Consumer Lending North America, CEO and President, CitiFinancial Servicing LLC (2013 - 2017). | 55 | Trustee, Eagle Growth and Income Opportunities Fund; Trustee, THL Credit Senior Loan Fund. | |||||
| R. Alastair Short, 1953*† | Trustee | Since 2006 | President, Apex Capital Corporation (personal investment vehicle). | 66 | Chairman and Independent Director, EULAV Asset Management; Trustee, Kenyon Review; Trustee, Children’s Village. Formerly, Independent Director, Tremont offshore funds. | |||||
| Peter J. Sidebottom, 1962*† | Trustee | Since 2012 | Lead Partner, North America Banking and Capital Markets Strategy, Accenture, May 2017 to present; Partner, PWC/Strategy & Financial Services Advisory, February 2015 to March 2017; Founder and Board Member, AspenWoods Risk Solutions, September 2013 to February 2016; Independent consultant, June 2013 to February 2015; Partner, Bain & Company (management consulting firm), April 2012 to December 2013; Executive Vice President and Senior Operating Committee Member, TD Ameritrade (on-line brokerage firm), February 2009 to January 2012. | 55 | Board Member, Special Olympics, New Jersey, November 2011 to September 2013; Director, The Charlotte Research Institute, December 2000 to 2009; Board Member, Social Capital Institute, University of North Carolina Charlotte, November 2004 to January 2012; Board Member, NJ-CAN, July 2014 to 2016. | |||||
| Richard D. Stamberger, 1959*† | Trustee | Since 2006 | President and CEO, SmartBrief, LLC (business media company). | 66 | Director, Food and Friends, Inc. | |||||
| Interested Trustee | ||||||||||
| Jan F. van Eck, 19635 | Trustee, Chief Executive Officer and President | Trustee (Since 2006); Chief Executive Officer and President (Since 2009) | Director, President and Chief Executive Officer of Van Eck Associates Corporation (VEAC), Van Eck Absolute Return Advisers Corporation (VEARA) and Van Eck Securities Corporation (VESC); Officer and/or Director of other companies affiliated with VEAC and/or the Trust | 55 | Director, National Committee on US-China Relations. | |||||
| 1 | The address for each Trustee and officer is 666 Third Avenue, 9th Floor, New York, New York 10017. |
| 2 | Each Trustee serves until resignation, death, retirement or removal. Officers are elected yearly by the Trustees. |
| 3 | The Fund Complex consists of the VanEck Funds, VanEck VIP Trust and the Trust. |
| 4 | The MainStay Fund Complex consists of MainStay Funds, MainStay Funds Trust, MainStay VP Funds Trust and MainStay MacKay Defined Term Municipal Opportunities Fund. |
| 5 | “Interested person” of the Trust within the meaning of the 1940 Act. Mr. van Eck is an officer of VEAC, VEARA and VESC. |
| * | Member of the Audit Committee. |
| † | Member of the Nominating and Corporate Governance Committee. |
| 74 |
| Officer’s Name, Address1and Year of Birth | Position(s) Held with the Trust | Term of Office2 and Length of Time Served | Principal Occupation(s) During Past Five Years | |||
| Officer Information | ||||||
| Matthew A. Babinsky, 1983 | Assistant Vice President and Assistant Secretary | Since 2016 | Assistant Vice President, Assistant General Counsel and Assistant Secretary of VEAC, VEARA and VESC; Officer of other investment companies advised by VEAC and VEARA. Formerly, Associate, Clifford Chance US LLP. | |||
| Russell G. Brennan, 1964 | Assistant Vice President and Assistant Treasurer | Since 2008 | Assistant Vice President of VEAC; Officer of other investment companies advised by VEAC and VEARA. | |||
| Charles T. Cameron, 1960 | Vice President | Since 2006 | Portfolio Manager of VEAC; Officer and/or Portfolio Manager of other investment companies advised by VEAC and VEARA. Formerly, Director of Trading of VEAC. | |||
| John J. Crimmins, 1957 | Vice President, Treasurer, Chief Financial Officer and Principal Accounting Officer | Vice President, Chief Financial Officer and Principal Accounting Officer (Since 2012); Treasurer (Since 2009) | Vice President of VEAC and VEARA; Officer of other investment companies advised by VEAC and VEARA. Formerly, Vice President of VESC. | |||
| Eduardo Escario, 1975 | Vice President | Since 2012 | Regional Director, Business Development/Sales for Southern Europe and South America of VEAC. | |||
| Henry Glynn, 1983 | Assistant Vice President | Since 2018 | Head of ETF Capital Markets Europe of Van Eck Switzerland AG. Formerly, Member of the Capital Markets team at Vanguard Group. | |||
| F. Michael Gozzillo, 1965 | Chief Compliance Officer | Since 2018 | Vice President and Chief Compliance Officer of VEAC and VEARA; Chief Compliance Officer of VESC; Officer of other investment companies advised by VEAC and VEARA. Formerly, Chief Compliance Officer of City National Rochdale, LLC and City National Rochdale Funds. | |||
| Laura Hamilton, 1977 | Vice President | Since 2019 | Assistant Vice President of VEAC and VESC; Officer of other investment companies advised by VEAC and VEARA. Formerly, Operations Manager of Royce & Associates. | |||
| Nicholas Jackson, 1974 | Assistant Vice President | Since 2018 | Vice President, Business Development of VanEck Australia Pty Ltd. | |||
| Laura I. Martínez, 1980 | Vice President and Assistant Secretary | Vice President (Since 2016); Assistant Secretary (Since 2008) | Vice President, Associate General Counsel and Assistant Secretary of VEAC, VEARA and VESC; Officer of other investment companies advised by VEAC and VEARA. Formerly, Assistant Vice President of VEAC, VEARA and VESC. | |||
| Matthew McKinnon, 1970 | Assistant Vice President | Since 2018 | Head of Business Development of Asia Pacific of VanEck Australia Pty Ltd. Formerly, Director, Intermediaries and Institutions of VanEck Australia Pty Ltd. | |||
| Arian Neiron, 1979 | Vice President | Since 2018 | Managing Director and Head of Asia Pacific of VanEck Australia Pty Ltd.; Officer and/or Director of other companies affiliated with VEAC and/or the Trust. | |||
| James Parker, 1969 | Assistant Treasurer | Since 2014 | Assistant Vice President of VEAC; Manager, Portfolio Administration of VEAC and VEARA. Officer of other investment companies advised by VEAC and VEARA. | |||
| Adam Phillips, 1970 | Vice President | Since 2018 | ETF Chief Operating Officer of VEAC; Director of other companies affiliated with VEAC. | |||
| Philipp Schlegel, 1974 | Vice President | Since 2016 | Managing Director of Van Eck Switzerland AG. | |||
| Jonathan R. Simon, 1974 | Senior Vice President, Secretary and Chief Legal Officer | Senior Vice President (Since 2016); Secretary and Chief Legal Officer (Since 2014) | Senior Vice President, General Counsel and Secretary of VEAC, VEARA and VESC; Officer and/or Director of other companies affiliated with VEAC and/or the Trust. Formerly, Vice President of VEAC, VEARA and VESC. |
| 1 | The address for each Officer is 666 Third Avenue, 9th Floor, New York, New York 10017. |
| 2 | Officers are elected yearly by the Trustees. |
| 75 |
This report is intended for the Funds’ shareholders. It may not be distributed to prospective investors unless it is preceded or accompanied by a VanEck Vectors ETF Trust (the “Trust”) prospectus and summary prospectus, which includes more complete information. Investing involves substantial risk and high volatility, including possible loss of principal. An investor should consider the investment objective, risks, charges and expenses of the Fund carefully before investing. To obtain a prospectus and summary prospectus, which contains this and other information, call 800.826.2333 or visit vaneck.com. Please read the prospectus and summary prospectus carefully before investing.
Additional information about the Trust’s Board of Trustees/Officers and a description of the policies and procedures the Trust uses to determine how to vote proxies relating to portfolio securities are provided in the Statement of Additional Information. The Statement of Additional Information and information regarding how the Trust voted proxies relating to portfolio securities during the most recent twelve month period ending June 30 is available, without charge, by calling 800.826.2333, or by visiting vaneck.com, or on the Securities and Exchange Commission’s website at http://www.sec.gov.
The Trust files its complete schedule of portfolio holdings with the Securities and Exchange Commission for the first and third quarters of each fiscal year on Form N-PORT. The Trust’s Form N-PORT Filings are available on the Commission’s website at http://www.sec.gov and may be reviewed and copied at the Commission’s Public Reference Room in Washington, D.C. Information on the operation of the Public Reference Room may be obtained by calling 202.942.8090. The Funds’ complete schedules of portfolio holdings are also available by calling 800.826.2333 or by visiting vaneck.com.

| Investment Adviser: | Van Eck Associates Corporation | |
| Distributor: | Van Eck Securities Corporation 666 Third Avenue, New York, NY 10017 vaneck.com | |
| Account Assistance: | 800.826.2333 | HAAR |
| Item 2. | CODE OF ETHICS. |
| (a) | The Registrant has adopted a code of ethics (the “Code of Ethics”) that applies to the principal executive officer, principal financial officer, principal accounting officer or controller, or persons performing similar functions. |
| (b) | The Registrant’s code of ethics is reasonably described in this Form N-CSR. |
| (c) | The Registrant has not amended its Code of Ethics during the period covered by the shareholder report presented in Item 1 hereto. |
| (d) | The Registrant has not granted a waiver or an implicit waiver from a provision of its Code of Ethics during the period covered by the shareholder report presented in Item 1 hereto. |
| (e) | Not applicable. |
| (f) | The Registrant’s Code of Ethics is attached as an Exhibit hereto. |
| Item 3. | AUDIT COMMITTEE FINANCIAL EXPERT. |
| The Registrant’s Board of Trustees has determined that David Chow, Laurie A. Hesslein, R. Alastair Short, Peter Sidebottom and Richard Stamberger, members of the Audit and Governance Committees, are “audit committee financial experts” and “independent” as such terms are defined in the instructions to Form N-CSR Item 3(a)(2). | |
| Item 4. | PRINCIPAL ACCOUNTANT FEES AND SERVICES. |
| The principal accountant fees disclosed in Item 4(a), 4(b), 4(c), 4(d) and 4(g) are for the Funds of the Registrant for which the fiscal year end is December 31. | |
| (a) | Audit Fees. The aggregate Audit Fees of Ernst & Young for professional services billed for the audits of the financial statements, or services that are normally provided in connection with statutory and regulatory filings or engagements for the fiscal years ended December 31, 2019 and December 31, 2018, were $655,550 and $683,610, respectively. |
| (b) | Audit-Related Fees. Not applicable. |
| (c) | Tax Fees. The aggregate Tax Fees of Ernst & Young for professional services billed for the review of Federal, state and excise tax returns and other tax compliance consultations for the fiscal years ended December 31, 2019 and December 31, 2018, were $604,585 and $835,807, respectively. |
| (d) | All Other Fees |
| None. | |
| (e) | The Audit Committee will pre-approve all audit and non-audit services, to be provided to the Funds, by the independent accountants as required by Section 10A of the Securities Exchange Act of 1934. The Audit Committee has authorized the Chairman of the Audit Committee to approve, between meeting dates, appropriate non-audit services. |
| The Audit Committee after considering all factors, including a review of independence issues, will recommend to the Board of Trustees the independent auditors to be selected to audit the financial statements of the Funds. |
| (f) | Not applicable. |
| (g) | Not applicable. |
| (h) | Not applicable. |
| Item 5. | AUDIT COMMITTEE OF LISTED REGISTRANTS. |
| The Registrant’s Board has an Audit Committee established in accordance with Section 3(a)(58)(A) of the Exchange Act (15 U.S.C. 78c(a)(58)(A)) consisting of five Independent Trustees. Messrs. Chow, Hesslein, Short, Sidebottom and Stamberger currently serve as members of the Audit Committee. Mr. Short is the Chairman of the Audit Committee. | |
| Item 6. | SCHEDULE OF INVESTMENTS. |
| Information included in Item 1. | |
| Item 7. | DISCLOSURE OF PROXY VOTING POLICIES AND PROCEDURES FOR CLOSED-END MANAGEMENT INVESTMENT COMPANIES. |
| Not applicable. | |
| Item 8. | PORTFOLIO MANAGER OF CLOSED-END MANAGEMENT INVESTMENT COMPANIES. |
| Not applicable. | |
| Item 9. | PURCHASE OF EQUITY SECURITIES BY CLOSED-END MANAGEMENT INVESTMENT COMPANY AND AFFILIATED PURCHASERS. |
| Not applicable. | |
| Item 10. | SUBMISSION OF MATTERS TO A VOTE OF SECURITY HOLDERS. |
| None. | |
| Item 11. | CONTROLS AND PROCEDURES. |
| (a) | The registrant’s principal executive and principal financial officers, or persons performing similar functions, have concluded that the registrant’s disclosure controls and procedures (as defined in Rule 30a-3(c) under the Investment Company Act of 1940, as amended (the “1940 Act”) (17 CFR 270.30a-3 (c)) are effective, as of a date within 90 days of the filing date of the report that includes the disclosure required by this paragraph, based on their evaluation of these controls and procedures required by Rule 30a-3(b) under the 1940 Act (17 CFR 270.30a-3(b)) and Rules 13a-15(b) or 15d-15(b) under the Securities Exchange Act of 1934, as amended (17 CFR 240.13a-15(b) or 240.15d-15 (b)). |
| (b) | There were no changes in the registrant’s internal control over financial reporting (as defined in Rule 30a-3(d) under the 1940 Act (17 CFR 270.30a(d)) that occurred during the period covered by this report that has materially affected, or is reasonably likely to materially affect, the registrant’s internal control over financial reporting. |
| Item 12. | DISCLOSURE OF SECURITIES LENDING ACTIVITIES FOR CLOSED-END MANAGEMENT INVESTMENT COMPANIES. |
| (a) | Not applicable. |
| (b) | Not applicable. |
| Item 13. | EXHIBITS. |
| (b) | Certification pursuant to Section 906 of the Sarbanes-Oxley Act of 2002 is furnished as Exhibit 99.906CERT. |
SIGNATURES
Pursuant to the requirements of the Securities Exchange Act of 1934 and the Investment Company Act of 1940, the registrant has duly caused this report to be signed on its behalf by the undersigned, thereunto duly authorized.
(Registrant) VANECK VECTORS ETF TRUST
| By (Signature and Title) | /s/ John J. Crimmins, Treasurer and CFO |
| Date | March 9, 2020 |
Pursuant to the requirements of the Securities Exchange Act of 1934 and the Investment Company Act of 1940, this report has been signed below by the following persons on behalf of the registrant and in the capacities and on the dates indicated.
| By (Signature and Title) | /s/ Jan F. van Eck, CEO |
| Date | March 9, 2020 |
| By (Signature and Title) | /s/ John J. Crimmins, Treasurer and CFO |
| Date | March 9, 2020 |