Table of Contents
UNITED STATES
SECURITIES AND EXCHANGE COMMISSION
WASHINGTON, D.C. 20541
FORM 10-K
x | | ANNUAL REPORT UNDER SECTION 13 OR 15(d) OF THE SECURITIES EXCHANGE ACT OF 1934 |
For the fiscal year ended October 31, 2008
o | | TRANSITION REPORT UNDER SECTION 13 OR 15(d) OF THE SECURITIES EXCHANGE ACT OF 1934 |
For the transition period from to
Commission file number: 000-32531
NOVA BIOSOURCE FUELS, INC.
(Exact name of registrant in its charter)
Nevada
(State or other jurisdiction
of incorporation or organization) | | 91-2028450
(I.R.S. Employer
Identification No.) |
| | |
109 North Post Oak Lane, Suite 422, Houston, Texas
(Address of principal executive offices) | | 77024
(Zip Code) |
(713) 869-6682
(Registrant’s Telephone Number, Including Area Code)
Securities registered under Section 12(b) of the Exchange Act:
Title of Each Class | | Name of Each Exchange On Which Registered |
Common Stock, $0.001 par value | | American Stock Exchange |
Securities registered under Section 12(g) of the Exchange Act:
Indicate by check mark if the registrant is a well-known seasoned issuer, as defined in Rule 405 of the Securities Act.
Yes o No x
Indicate by check mark if the registrant is not required to file reports pursuant to Section 13 or Section 15(d) of the Act.
Yes o No x
Indicate by check mark whether the registrant (1) has filed all reports required to be filed by Section 13 or 15(d) of the Securities Exchange Act of 1934 during the preceding 12 months (or for such shorter period that the registrant was required to file such reports), and (2) has been subject to such filing requirements for the past 90 days. Yes x No o
Indicate by check mark if disclosure of delinquent filers pursuant to Item 405 of Regulation S-K (§ 229.405 of this chapter) is not contained herein, and will not be contained, to the best of registrant’s knowledge, in definitive proxy or information statements incorporated by reference in Part III of this Form 10-K or any amendment to this Form 10-K. o
Indicate by check mark whether the registrant is a large accelerated filer, an accelerated filer, a non-accelerated filer or a smaller reporting company. See definitions of large accelerated filer, accelerated filer and smaller reporting company in Rule 12b-2 of the Exchange Act. (Check one):
Large accelerated filer o | | Accelerated filer x |
Non-accelerated filer o (do not check if a smaller reporting company) | | Smaller reporting company o |
Indicate by check mark whether the registrant is a shell company (as defined in Rule 12b-2 of the Exchange Act).
Yes o No x
As of April 30, 2008, the aggregate market value of the voting and non-voting common equity held by non-affiliates was approximately $93,388,000 based on the closing price as reported on the American Stock Exchange.
As of January 15, 2009, there were 110,047,996 shares of the registrant’s common stock outstanding.
DOCUMENTS INCORPORATED BY REFERENCE
Portions of the registrant’s definitive proxy statement for the 2009 annual meeting of stockholders are incorporated herein by reference in Part III.
Table of Contents
Nova Biosource Fuels, Inc. and Subsidiaries
Annual Report on Form 10-K for the Year Ended October 31, 2008
Table of Contents
i
Table of Contents
Basis of Presentation
In this Annual Report on Form 10-K, the terms “Nova,” “the Company,” “we,” “our” and “us” refer to Nova Biosource Fuels, Inc., a Nevada corporation, and its subsidiaries on a consolidated basis. The term “Nova Biosource Fuels” refers to Nova Biosource Fuels, Inc. on a stand alone basis only, and not its subsidiaries. The term “Nova Oil” refers to Nova Oil, Inc. prior to the share exchange with Biosource America, Inc. on March 31, 2006. Nova Oil, Inc. changed its name to Nova Biosource Fuels, Inc. on September 12, 2006.
Market and Industry Data and Forecasts
This document includes industry data and forecasts that the Company has prepared based, in part, upon information obtained from industry publications and surveys and internal company surveys. Third-party industry publications and surveys and forecasts generally state that the information contained therein has been obtained from sources believed to be reliable, but do not guarantee the accuracy and completeness of such information. In particular, we have based much of our discussion of the biodiesel industry, including government regulation relevant to the industry and forecasted growth in demand, on information published by the National Biodiesel Board, the national trade association for the U.S. biodiesel industry. Because the National Biodiesel Board is a trade organization for the U.S. biodiesel industry, it may present information in a manner that is more favorable to the industry than would be presented by an independent source. Forecasts are particularly likely to be inaccurate, especially over long periods of time.
The industry standard ASTM D6751 refers to the product specifications and quality standards published by the American Society of Testing and Materials, or ASTM, for biodiesel (B100) fuel blend stock for middle distillate fuels. It is used to control pure biodiesel (B100) quality prior to blending with conventional diesel type fuels. ASTM D6751 is mandated in the Energy Independence and Security Act of 2007. The U.S. Environmental Protection Agency also requires that all biodiesel intended for use as a fuel meet the ASTM D6751 standard.
Forward-Looking Statements
This report contains forward-looking statements. These forward-looking statements relate to our outlook or expectations for earnings, revenues, expenses, future financial or business performance, plans, goals, strategies, intent, beliefs or current expectations. Specifically, forward looking statements may include statements preceded by, followed by or that include the words: “believe,” “plan,” “intend,” “anticipate,” “target,” “estimate,” “expect,” “project,” “forecast” and the like, or future-tense or conditional constructions (“will,” “may,” “could,” “should,” etc.). Statements contemplating or making assumptions about actual or potential future sales, economic performance, financial condition, business prospects, feedstock costs, product sales prices, revenue, income, market size, refinery construction, testing, completion and production schedules, collaborations, and trends or operating results also constitute forward-looking statements.
Although these forward-looking statements reflect the good faith judgment of management based on currently available information, forward-looking statements involve a number of risks and uncertainties that may cause actual results to be materially different from those discussed in these forward-looking statements. Some of the factors, risks and uncertainties that could cause actual results to differ include general economic conditions, availability of financing on economic terms, cost and availability of feedstocks, engineering and construction delays, adverse weather conditions, wholesale and retail prices of petroleum-based diesel fuels, consumer acceptance of biodiesel derived from animal fats, competitive rate fluctuations, continued government mandates and incentives for the use of alternative fuels and audits or tax assessments of various federal, state or local taxing authorities, including the Internal Revenue Service, the risk factors listed under “Part I, Item 1A. Risk Factors” and other risks referenced from time to time in our SEC filings.
The forward looking statements are made pursuant to safe harbor provisions of the Private Securities Litigation Reform Act of 1995. You are urged not to place undue reliance on these forward-looking statements, which speak only as of the date of this report. We assume no obligation to update any forward-looking statements in order to reflect any event or circumstance that may arise after the date of this report, other than as may be required by applicable law or regulation. You are urged to carefully review and consider the various disclosures that we make in our reports filed with the SEC which attempt to advise interested parties of the risks and factors that may affect our business, financial condition, results of operations and cash flows. If one or more of these risks or uncertainties materialize, or if the underlying assumptions prove incorrect, our actual results may vary materially from those expected or projected.
1
Table of Contents
ITEM 1. BUSINESS
Overview
We are an energy company that refines and markets ASTM D6751 biodiesel and related co-products from a variety of feedstocks, such as animal-derived fats, vegetable-based oils and greases. Our strategy is to profitably use our patented, proprietary biodiesel technology and become the industry leader in the production of biodiesel. Biodiesel is a clean burning, biodegradable and renewable fuel made from a variety of feedstocks, such as animal-derived fats, oils and greases and vegetable-based oils. Biodiesel is typically blended with petroleum diesel to create a biodiesel blend that is nearly indistinguishable from, and in some respects superior to, 100% petroleum diesel.
We currently own three fully continuous flow biodiesel refineries. Our largest full scale refinery is located in Seneca, Illinois and has an annual biodiesel production capacity of 60,000,000 gallons per year. Our second full scale refinery is located in Clinton County, Iowa and has an annual biodiesel production capacity of 10,000,000 gallons per year. Our third is a smaller scale biodiesel refinery in Butte, Montana, which we use primarily for research, development and technology demonstration purposes.
We believe our technology allows us to process over 25 different animal-derived fats, oils and greases and vegetable-based oils with free fatty acid levels in excess of 20% to produce our two primary marketable products: ASTM D6751 quality biodiesel and technical grade glycerin. Our ability to process a wide range of feedstocks, including single feedstock or blends of feedstocks, such as animal-derived feedstocks with higher free fatty acid content, gives us a significant cost advantage because many of these feedstocks are residual by-products that have limited alternative uses. Many of our competitors are limited to a more narrow range of feedstocks and, in many instances, their feedstock options are limited to vegetable-based oils, and they have little or no ability to economically process meaningful amounts of lower cost animal-based feedstocks.
Our Seneca, Illinois refinery is designed to have production capacity of 60,000,000 gallons per year. It began start-up operations in March 2008. We have entered into feedstock supply and biodiesel sale agreements for the requirements of this refinery. The Clinton County, Iowa refinery is designed to have a production capacity of 10,000,000 gallons per year. It began start-up operations in May 2006, and we purchased the refinery in September 2007. It suffered a casualty in late September 2008, although repairs have been completed with re-start expected to commence in late January or early February 2009.
We are also in the process of developing two additional biodiesel refineries for our own use. We are evaluating potential sites for these additional refineries, engineering and permitting process and have purchased and fabricated certain long-lead time process equipment, which are ready to be installed upon completion of site selection and preparation subject to obtaining sufficient debt and equity financing to support construction, start-up and working capital requirements. The equipment would be the primary equipment for additional capacity of 120,000,000 gallons per year.
Our initial focus was to design and build biodiesel refineries for third parties while we transitioned to our primary business plan of building and operating our own refineries. We have finished this initial phase of our business plan with the completion of the design, construction and startup of three full scale biodiesel refineries for third parties. The first refinery was the Clinton County refinery (which we purchased from the owner in September 2007). The second refinery was completed near DeForest, Wisconsin for Sanimax Energy, Inc. in October 2007 and has a production capacity of 20,000,000 gallons per year. The last such refinery was built in Greenville, Mississippi for Scott Petroleum Corporation and has a production capacity of 20,000,000 gallons per year. Biodiesel production was achieved at the refinery’s full rated capacity in February 2008. We had previously executed an agreement with Scott for the right to buy 50% of this facility’s production over an initial ten year period at approximately the production cost, excluding plant depreciation. We were required to pay a tolling fee and other costs to secure the right to purchase this production capacity. The agreement commenced in September 2008, and, as of October 31, 2008, we had paid approximately $3,390,000 in tolling fees and other costs and had purchased approximately 221,000 gallons of biodiesel related to this agreement. However, in October 2008, we disputed the calculation of the purchase price of the biodiesel and ultimately refused to take delivery of any additional product. As a result, Scott exercised their right to request a termination of the agreement, and we accepted the request, which relieved us of any further obligations related to the agreement.
The financial information set forth in Item 6 Selected Financial Data and Item 8 Financial Statements and Supplementary Data are incorporated by reference into this Item 1 Business.
2
Table of Contents
Biodiesel Industry Overview
Biodiesel is a clean burning, biodegradable and renewable, natural fuel composed of mono-alkyl esters of long chain fatty acids derived from vegetable oils, animal fats and recycled cooking oils. If produced from soybean oil, it may be referred to as soy methyl esters, or SME. If produced from animal fats, oils or greases, it may be referred to as fatty acid methyl esters, or FAME. Biodiesel is typically blended with petroleum diesel to create a biodiesel blend that is nearly indistinguishable from, and in some respects superior to, 100% petroleum diesel. In addition, 100% biodiesel fuel, or B100, can be used in all compression-ignition (diesel) engines without modifications, which some end users use in environmentally sensitive areas and for large fleets of diesel powered vehicles.
In Illinois, the principal market for our flagship refinery, the majority of the consumption will likely be a blend of 11% biodiesel and 89% petroleum diesel, or B11, due to state tax incentives, although a B5 blend of 5% biodiesel and 95% petroleum diesel is also common in the U.S. and is the most common blend in Europe and Australia. Currently, the key markets in the U.S. for biodiesel and biodiesel blends are diesel blending facilities and distributors, government fleets, mass transit vehicles, commercial fleets and marine fleets, as well as for general use in environmentally sensitive areas. One example of government fleet use is the Portland Water Bureau, which, since 2006, uses a B99 blend (99% biodiesel, 1% petroleum diesel) in its city-owned, diesel-powered vehicles and equipment from spring through fall and a B50 blend (50% biodiesel, 50% petroleum diesel) in the winter.
The biodiesel market has grown significantly over the past several years with most consumption concentrated in the federal, state and local government. According to the National Biodiesel Board, U.S. biodiesel production was approximately 15,000,000 gallons in 2002 and U.S. production has grown to an estimated 690,000,000 gallons in 2008. By comparison, the European biodiesel market is more mature than the U.S. market, having consumed approximately 1 billion gallons of biodiesel in 2005.

Drivers of the biodiesel market include:
· Beneficial government initiatives and incentives. Initiatives and incentives at the federal, state and local government levels enhance the economics and market demand for biodiesel production. These initiatives include tax credits as well as mandates for increased use of biodiesel and biodiesel blends.
· Environmental benefits. Biodiesel is biodegradable, nontoxic and essentially free of sulfur and aromatics. Additionally, biodiesel reduces tailpipe exhaust emissions, greenhouse gas emissions and sulfur dioxide emissions (acid rain) and minimizes black smoke and smog-causing particulate matter.
· Easy integration into existing infrastructure. As discussed above, biodiesel can be used in diesel engines with no modifications as B100 or mixed with petroleum diesel, such as the B11 and B5 blends. A blended biodiesel may enhance petroleum diesel because it has the ability to extend engine life and decrease operating expenses due to the increase in engine lubricity.
· Increased energy security. U.S. domestic oil production has continuously declined while demand has grown since the mid-1980s, increasing dramatically our nation’s import requirements. Use of biodiesel, which can be produced with a variety of feedstocks from both domestic and worldwide sources, can help reduce dependence on imported oil. Many of these feedstocks are normally unfit for human consumption.
3
Table of Contents
· Imbalance of supply and demand. We believe that the biodiesel industry lacks sufficient capacity for production of high quality B100 to meet current and anticipated demand for biodiesel. The United States consumes over 60 billion gallons per year of petrodiesel based on 2006 volumes reported by the Energy Information Administration for No. 1 and No. 2 diesel and fuel oils. Therefore, a mandated blend as low as B5 would require 3 billion gallons of biodiesel production per year. The National Biodiesel Board reports that only 690,000,000 gallons of biodiesel were produced in the United States in 2008 (see chart above), even though 176 biodiesel refineries were operational as of September 29, 2008 with a reported capacity of approximately 2.61 billion gallons per year.
Biodiesel Refining Process, Quality Standards and Feedstocks
Refining Process.
Biodiesel is produced through a process called transesterification, which was first conducted using vegetable oil in 1853. Transesterification involves reacting organically-derived fats, oils and greases with an alcohol, typically methanol, in the presence of a base catalyst, typically sodium or potassium hydroxide (common caustic potash), to form methyl esters, or biodiesel, and glycerin.
Traditional Process. The traditional process typically requires feedstock (frequently soybean oil) with a free fatty acid content of less than 2% because the presence of higher free fatty acid content during the transesterification process can produce soap, which can prevent the separation of the biodiesel from the glycerin resulting in yield losses and higher production costs.
For this reason, using high free fatty acid feedstocks in the traditional process requires a pretreatment step, consisting of either a steam stripping process to remove the free fatty acids or an acid esterification process to reduce the feedstock’s free fatty acids through a chemical reaction that uses acids, such as sulphuric or hydrochloric acid, which are later removed after transesterification using a water wash process.
The traditional process then incorporates a settling or centrifugation process or desiccant drying media to reduce the water content of the biodiesel, while the glycerin mixture undergoes a separate process to remove methanol and to produce a crude glycerin of less than 90% purity. While the normal feedstock to biodiesel input-output ratio is approximately 8 to 9 pounds of feedstock for every one gallon of biodiesel produced, the use of greater than 2% free fatty acid feedstocks in the traditional method reduces the amount of biodiesel yield considerably due to the increased need for the acid esterification or steam stripping processes and the subsequent acid neutralization and co-product removal process. The entire process typically takes approximately 40 hours per batch produced.
Innovation. Nova’s technology and continuous refining processes are fundamentally different from the traditional batch processes.
Quality Standards.
In the U.S., biodiesel quality is measured by ASTM Standard D6751, which specifies the required properties of B100 biodiesel for use as a blend component with petroleum diesel fuel oils. This standard specifies, among other qualities, maximum amounts of free glycerin, total glycerin, water and sediment content, monoglycerides, sulfated ash, total sulfur, copper corrosivity, carbon residue and, magnesium, calcium, sodium and phosphorous. The standard also specifies minimum flash point and cetane numbers. The ASTM recently revised the standard to include cold soak filtration specifications. The cold soak filtration test subjects the biodiesel to a soak period at cold temperatures, re-warms the fuel, and then filters the biodiesel through 0.7 micron filter. The test is a qualitative evaluation meant to replicate performance of the biodiesel in cold climates. Compliance with these standards requires a process that provides for complete transesterification and efficient and thorough separation and purification processes.
In October 2008, ASTM International, published the biodiesel blend specifications for general use. The new blend specifications included:
· ASTM D975-08a, Specification for Diesel Fuel Oils — used for on- and off-road diesel applications; revised to include requirements for up to 5 percent biodiesel.
4
Table of Contents
· ASTM D396-08b, Specification for Fuel Oils — used for home heating and boiler applications; revised to include requirements for up to 5 percent biodiesel.
· ASTM D7467-08, Specification for Diesel Fuel Oil, Biodiesel Blend (B6 to 20) — a completely new specification that covers finished fuel blends of between 6 (B6) and 20 (B20) percent biodiesel for on- and off-road diesel engine use.
The majority of Original Equipment Manufacturers (OEMs) viewed the adoption of the ASTM blended fuel specification as a key component for full, universal acceptance of B20. Several OEMs had requested this specification for years, and having it in place makes way for increased usage. Even before the recent revisions, hundreds of major fleets are using B20 biodiesel, including all branches of the U.S. military for administrative uses and more than 200 school districts. The blended fuel specification Biodiesel blends are available to the public at more than 1,250 retail filling stations nationwide.
Coupled with the ASTM quality requirements, the U.S. biodiesel industry’s BQ-9000 program ensures organizations have sound quality management systems in place. Nova’s Seneca refinery recently obtained its BQ-9000 Producer accreditation.
Biodiesel
The price of refined ASTM D6751 biodiesel is primarily related to the price of petroleum diesel. As a result, the profitability of biodiesel production is largely determined by the difference between the cost of feedstocks, which are agricultural commodities not correlated to the price of petroleum diesel, and the price for refined ASTM D6751 biodiesel, which typically sells at a premium to petroleum diesel due to governmental mandates and incentives for use of biodiesel, as well as environmental factors and other market drivers, although during winter months higher cloud point biodiesel typically sells at a greater discount to low cloud point biodiesel and may in some cases even sell at a slight discount to petroleum diesel. We believe that implementation of the cold soak filtration specification, increasing interest by customers to have low levels of mono-glycerides in biodiesel, and increased customer consumer use of and experience with Nova-quality, distilled biodiesel will help reduce the price disparity.
2008 B100 versus Diesel Price
Source: Jacobsen Commentary and Market News Bulletin January 2009
B100 Midwest vs Diesel
Weekly Average Wholesale Prices

Feedstocks
Biodiesel production costs are highly dependent on feedstock costs. Typically, the costs of fats, oils or greases used to make biodiesel are approximately 70% to 80% of the finished product cost. To produce biodiesel profitability, a biodiesel refiner must have a process that can efficiently convert low-cost feedstock into high quality B100. Suitable feedstocks for
5
Table of Contents
biodiesel production include vegetable oils, animal fats and recycled cooking oils and greases. According to U.S. Department of Agricultural statistics, in 2007, 23.2 billion pounds of vegetable oils, 6.9 billion pounds of edible and inedible tallow, pork and poultry fat and 2.6 billion pounds of yellow and other greases were produced in the U.S. These are the most commonly available feedstocks that are produced in the U.S. and economically available for biodiesel production. Therefore, we estimate that the total available feedstock supply in the U.S. is 32.7 billion pounds, although most of the edible feedstocks would be used for human and animal consumption and could not be used economically for biodiesel production.
Animal Fats. Animal fats used for biodiesel production include edible fats, such as tallow and choice white grease with a free fatty acid content of up to 0.8%, inedible fats with a free fatty acid content of up to 10%, and fish oil, poultry fats and other fats and lards with higher free fatty acid content. Our business plan is to focus on the use of as high an amount of inedible animal fats as possible in order to lower the average cost of our feedstocks and seek to avoid competition with feedstocks suitable for human consumption. Biodiesel produced from animal fats tends to have a higher cloud point than biodiesel produced from soybean oil or corn oil.
Vegetable Oils. Vegetable oils used for biodiesel production include soybean (the most commonly used biodiesel feedstock in the U.S.), palm, rapeseed or canola (the most commonly used biodiesel feedstock in Europe), corn, camelina, cottonseed, groundnut, sunflower, coconut, olive, castor, sesame and linseed oils. Soybean oil is the primary feedstock for over 95% of biodiesel produced by traditional processes in the U.S. Soybean oil can be obtained in various grades with a free fatty acid content of approximately 1% or less. Corn oil extracted from dried distiller’s grains, a byproduct of the ethanol production process, can have a free fatty acid content of between 1% to 10%.
Second Use Oils and Greases. Second use oils and greases used for biodiesel production include yellow grease with a free fatty acid content of up to 15% and brown grease with a free fatty acid content of greater than 15%, although these feedstocks tend to be in more limited supply than animal fats and vegetable oils. Recent changes to the biodiesel blenders excise tax credit have eliminated the disparity in government incentives between second use feedstocks and virgin feedstocks.
Feedstock Costs. The costs of the various feedstocks depend largely on whether the feedstock may be used in the food market. The graph below shows a higher price associated with a vegetable oil used in the food market vs other inedible fats and greases. Similar to several other commodities, animal fats and vegetable oil pricing experienced significant volatility over the last twelve months. Soybean oil (RBD) ranged in pricing from over $0.72/lb to $0.33/lb, versus a prior 15 year average price of approximately $0.22/lb. Similarly, inedible tallow ranged in pricing from over $0.50/lb to $0.11/lb versus a historical average price of approximately $0.16 per pound. We believe that there are a variety of market factors responsible for the volatility, which are unrelated to the production of biodiesel.
2008 Feedstock Prices
Source: Jacobsen Commentary and Market News Bulletin January 2009 and Energy Information Administration
SBO (RBD), BFT, CWG, SPF and YG
Weekly Average Wholesale Prices
6
Table of Contents
Government Incentives
In the interest of environmental protection and energy security, federal, state and local governments have enacted a variety of incentives and mandates to promote the production and use of biodiesel. These incentives and mandates generally have three approaches:
· To lower the effective cost of biodiesel in order to make it more price competitive with petroleum diesel, primarily through tax credits, rebates and deductions;
· To increase the use of biodiesel through mandates, such as requirements for use of a biodiesel blend for certain government fleets or requiring a certain percentage of sales to consist of a biodiesel blend; and
· To encourage investments in production and distribution capacity, as well as technology to promote end use of biodiesel, through tax credits, rebates and deductions, grants for construction or purchase of new equipment or government loan guarantees.
Tax Incentives. The primary federal government incentive intended to lower the effective cost of biodiesel is the biodiesel blenders excise tax credit, which is available to registered blenders of biodiesel and petroleum diesel. As an independent biodiesel producer, we do not currently have blending operations and, accordingly, are not a direct recipient of the tax credit, but only receive the benefits of the tax credit indirectly through improved pricing of biodiesel. The tax credit is currently set to expire on December 31, 2009. Due to recent Congressional action signed into law in October 2008, all biodiesel fuel, regardless of feedstock source, now qualifies for the $1.00 per gallon biodiesel incentive as of January 1, 2009. Under the past legislation, biodiesel produced from second use, or non-virgin, feedstocks, such as yellow grease collected from restaurants, was only eligible for a $0.50 per gallon tax incentive. Additionally, the new legislation closes the so-called “splash and dash” loophole, which allowed foreign-produced biodiesel to be sent to the U.S., splash blended to claim the tax incentive, and then shipped to a third country for final use. In December 2007, the Energy Independence and Security Act of 2007 established a renewable fuels standard for biodiesel use in the United States of one billion gallons by 2012.
In addition to the federal biodiesel blenders tax credit, various states, such as Arkansas, Illinois, Iowa, Idaho, Kansas, Kentucky, Maryland, Montana, North Dakota, Oklahoma, Rhode Island, South Carolina, South Dakota and Washington, also provide for tax credits, rebates, deductions or reduced state, excise or other taxes for the blending or sale of biodiesel within their states.
Use Mandates. A number of federal and state regulations mandate the use of biodiesel blends. The Energy Independence and Security Act of 2007 requires a 36 billion gallons per year renewable fuels standard (RFS) by 2022, to be administered by the U.S. Environmental Protection Agency. The new RFS begins in 2008 and requires 9 billion gallons of biofuels to be used in 2008 and 11 billion gallons in the following year. The RFS contains three sub-levels:
· 21 billion gallons of the overall 36 billion gallons mandate are to be “advanced biofuels” (defined as cellulosic ethanol, ethanol derived from sugar or starch, biogas, biomass-based diesel, butanol or other alcohols and other fuel derived from cellulosic biomass) by 2022;
· 16 billion gallons of that amount, under the same timeframe, are to come from cellulosic biofuel; and
· 1 billion gallons by 2012 are required to be from biomass-based diesel.
In addition to the federal government, a number of states have mandated state-owned vehicles to reduce petroleum diesel usage through the use of biodiesel blends. For example:
· Illinois has required all state- or city-owned diesel-powered vehicles to use a biodiesel blend containing at least 2% biodiesel (B2);
· Minnesota is targeting a 10% and 25% reduction in petroleum diesel use by 2010 and 2015, respectively, through the purchase of vehicles that use B20 to B100 blends; and
· New Mexico has mandated all cabinet-level agencies, public schools and institutions of higher learning to obtain 15% of their transportation fuel requirements from renewable fuels, including biodiesel, by 2010.
7
Table of Contents
Capital Investment Incentives. Federal and state governments have also passed laws encouraging capital investments to support production, distribution and use of biodiesel and other renewable fuels. For example, through 2010, fueling stations are eligible for a 30% federal tax credit for the cost of installing clean-fuel refueling equipment, including any B20 or greater biodiesel blend. In Louisiana, property and equipment used in the manufacture, production or extraction of biodiesel, as well as biodiesel used as fuel by a registered manufacturer are exempt from state sales and use taxes. Louisiana has also established an income tax credit equal to 20% of the cost of constructing an alternative fuel refueling station, as well as 20% of the cost of converting a vehicle to run on alternative fuels, or of the incremental cost to purchase a new alternative fuel vehicle.
Our Competitive Strengths
We believe that our patented, proprietary technology, clearly defined growth plan and experienced management team will combine to provide us with the following competitive strengths:
· Patented, proprietary technology consistently produces high quality biodiesel with minimal waste in a continuous process. Our patented, proprietary technology produces biodiesel that consistently exceeds current ASTM D6751 specifications. In addition, our process does not generate significant amounts of toxic or hazardous byproducts that are often found in alternative processes. The principal byproduct generated in our production process is technical grade glycerin with additional byproducts consisting of crude glycerin, a biodiesel “bottoms,” which can be used as a burner fuel, and a “sweetwater” product, which can be used as fertilizer for crop irrigation. Each of the co-products can be sold to reduce our net biodiesel processing costs. Based upon our experiences to date, the minimal environmental impact of our facilities has resulted in faster facility permitting.
· True multi-feedstock technology gives us the ability to use lower-cost feedstock. Our production process is able to use over 25 different feedstocks with free fatty acid levels in excess of 20%, thereby allowing us to use the lowest cost feedstock available at any given time in any given market. Our process can use at any one time a single feedstock, a blend of feedstocks or multiple feedstocks without modification to the process equipment. Because feedstock represents 70 to 80% of biodiesel production costs, the ability to use a variety of potentially cheaper sources, animal fats in particular, dramatically increases our potential profitability and ability to grow.
· Clearly defined growth plan based on proven technology. Based on data from the small scale refinery in Butte, Montana, from two years of operation and production from the full scale, 10,000,000 gallons per year Clinton County, Iowa refinery, from nearly two years of operation and production from the 20,000,000 gallons per year Sanimax refinery in DeForest, Wisconsin, from nearly a year of operation and production from the 20,000,000 gallons per year Scott refinery in Greenville, Mississippi, and, most importantly, from the start-up and operation of our 60,000,000 gallons per year flagship refinery in Seneca, Illinois, our technology has been shown to be operationally viable, which has laid the framework for future expansion.
· Our decision to construct future refineries using three parallel 20,000,000 gallons per year “trains” producing side-by-side has been very effective. By standardizing and modularizing the production units, we dramatically reduced construction and design risk and compressed construction schedules as evidenced by our completion of the Seneca refinery from ground breaking to mechanical completion in nine months. We intend to employ this same strategy for future potential sites, which we believe will not require significant reengineering or changes in construction methods.
· Strategic relationships with high quality equipment, feedstock and distribution partners. We have positioned ourselves to take advantage of the rapidly growing biodiesel market through agreements with business partners throughout the production process. We have entered into feedstock supply and biodiesel fuel sale agreements with affiliates of Kaluzny Brothers, Inc. (Lipid Logistics, LLC) and Gavilon, LLC as well as strategic relationships with equipment vendors, construction subcontractors, instrumentation and controls equipment providers, rail and transport companies and a variety of consumable product suppliers for methanol and other chemical commodities.
· Experienced management team. Our management team has extensive operating and finance experience in the energy industry. Our Chairman and CEO, Kenneth T. Hern, served as President of Texaco Saudi, Vice Chairman and Managing Director of Texaco Nigeria and President of Texaco Brazil. Our Chief Financial Officer, Jay Fillman, was a founder and vice president of Illinois River Energy, LLC, a 50,000,000 gallons per year ethanol refinery located in Rochelle, Illinois. He was responsible for all financial aspects of the
8
Table of Contents
development, capital raising, construction and initial operation of the refinery. Our operations executives and senior managers have extensive experience in petrochemical facility construction and refinery operations and have successfully overseen the construction of four full-scale biodiesel refineries in the last two years months. Our Chief Operating Officer, Dick Talley, has led Nova’s research and development, process development, design, construction and startup teams for the past eight years and has overseen similar projects throughout the U.S. during his career. Our Vice President of Marketing, Rusty Sammons, most recently worked for ExxonMobil Refining & Supply, where he supervised planning and controls of refinery system turnarounds and large refinery maintenance projects at ExxonMobil’s largest U.S. refinery.
· In-house development expertise. Our staff engineers began developing our biodiesel technology in 2000 when Charlie Vignieri, the founder of Kenosha Beef International, sponsored the research and development effort to discover a commercially viable process to produce quality biodiesel in a continuous process from high free fatty acid feedstocks, such as animal tallow. This engineering team further developed and demonstrated the process through the construction and operation of the small scale refinery in Butte, Montana. They continue to develop and refine the process. In the process of continually optimizing our proprietary technology and scaling up our production capacity, we have developed significant in-house engineering competence. The Nova technology and in-house engineering and project delivery teams have built and commissioned four refineries in the last two years, bringing the total production capacity of biodiesel refineries using Nova’s process technology to 110,000,000 gallons per year.
Nova Process Technology.
Our biodiesel production technology differs from the traditional biodiesel production process in several important respects. Our technology allows for consistent high quality production of ASTM D6751 standard biodiesel and technical grade glycerin that is 97% pure, the use of lower cost feedstocks, continuous processing and energy recovery, and reduced processing time and reduced environmental discharges. The Nova process incorporates two components: a seamless conversion of high free fatty acid feedstocks, which is incorporated into the Sanimax, Scott and Seneca refineries, and a distillation-based purification and refining process, which is incorporated into all Nova-built biodiesel refineries, including Clinton County. In lieu of the acid esterification or steam stripping pretreatment, the Nova process incorporates a patented, heterogeneous catalytic conversion process that seamlessly and simultaneously reacts free fatty acids and pure triglycerides. After transesterification, we employ a continuous separation process to separate the biodiesel from the glycerin.
The biodiesel then undergoes a purification and refining process to remove excess moisture, glycerin, glycerides and other impurities without using a water wash or dry wash system, while the glycerin is similarly purified and refined to remove methanol, excess moisture and other impurities. A methanol recovery step then purifies the excess methanol for reuse in the transesterification process. The biodiesel purification and refining step also produces a heavy oil, which may be used to supply a portion of the energy needs of the plant as both the biodiesel and glycerin purification and refining processes employ a waste heat recovery system for use in other parts of the process. The entire Nova biodiesel refining process takes approximately twelve hours to complete, compared to forty hours using the traditional process.
Nova Biodiesel Quality.
The Nova process results in consistent high quality production of ASTM D6751 standard biodiesel by replacing the traditional water wash system with a distillation system. In testing our small scale refinery in Butte and in commercial operations at all refineries, we have consistently produced biodiesel that exceeds ASTM D6751 specifications. We believe our consistent biodiesel quality will have a positive effect in marketing our biodiesel as our product gains wider recognition and distribution and as the ASTM D6751 standard is strengthened. As a result of our process, our Seneca refinery obtained BQ-9000 certification in January 2009 from the National Biodiesel Accreditation Commission, an independent committee of the National Biodiesel Board, for our quality assurance program. The BQ-9000 Quality Assurance Program for the Biodiesel Industry seeks to promote the commercial success and public acceptance of biodiesel by helping to assure that biodiesel fuel is produced to and maintained at the ASTM D6751 standard on a consistent basis. We believe that our Clinton County refinery will also obtain BQ-9000 certification in due course.
Nova Cost Advantage.
As discussed above, feedstock cost is the primary driver for profitable biodiesel production. Feedstock markets makes up 70% to 80% of the production cost. The ability to use lower cost feedstocks, i.e., feedstocks with high free fatty acid content typically animal-based, without a loss of yield, gives us a competitive advantage over biodiesel refiners that use the traditional process.
9
Table of Contents
The production of technical grade glycerin (refined and 97% pure) also provides an additional pricing advantage when compared to the traditional process that can only produce and sell a crude, or splitter’s grade, glycerin, which is typically only 80% to 90% pure. Recently, the market prices for crude glycerin have ranged from $0.03 to $0.08 per pound while the market prices for technical grade glycerin have ranged from $0.18 to $0.25 per pound. These higher selling prices for this portion of the production enables us to potentially reduce our net biodiesel production costs. Our cost advantage is also enhanced by the waste heat recovery process incorporated into the Nova production system.
Environmental Factors
The Nova process is a completely closed loop system, allowing for the recovery and treatment of vapors and condensable products to provide for odor control and limits on emissions to comply with air quality standards and permit limits. By eliminating the “water wash” step used in traditional processes, the Nova process substantially reduces the amount of waste water and the related water disposal challenges. For example, for a 20,000,000 gallons per year refinery, the traditional process would generate approximately 8,000,000 gallons of waste water. In contrast, the Nova process generates only approximately 140,000 gallons of waste water: a 98.25% reduction in waste water discharge.
Business Strategy
Operation of Biodiesel Refineries.
We have designed our biodiesel refineries, after the first refinery in Clinton County, Iowa, to have a nameplate capacity of 20, 40 or 60,000,000 gallons per year through the construction of either one, two or three 20,000,000 gallons per year “trains” designed to operate in parallel. We believe this design permits us to standardize the engineering of the various vessels, tanks, piping, valves, pumps and motors that comprise a refinery in order to facilitate procurement of the raw materials, equipment and supplies and to provide for modular construction off-site. This approach significantly reduces the construction time of our refineries, and enables standardization of our operating procedures, equipment and spare parts inventories, and permits production from any one train to continue independently of the operational status of an adjacent train.
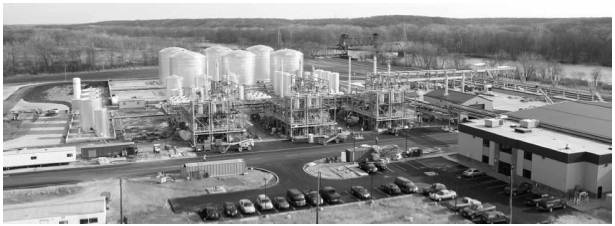
Nova’s Flagship, BQ-9000 Certified 60,000,000 Gallons Per Year Biodiesel Refinery in Seneca, Illinois
In June 2006, we purchased 54 acres of land in the Shipyard Industrial Park of Seneca, Illinois for a purchase price of $3,650,000 and began construction of 60,000,000 gallons per year biodiesel refinery on the property in April of 2007. The Seneca Shipyard Industrial Park, located southwest of Chicago, Illinois, has ready truck, barge and rail access and we have entered into a Redevelopment Agreement with the Village of Seneca with respect to a tax incentive financing district that will provide a $7,000,000 property tax abatement for the construction of infrastructure improvements and related matters. The refinery began start-up operations in March 2008 and was certified as substantially complete in September 2008.
10
Table of Contents

Nova’s 10,000,000 Gallons Per Year Biodiesel Refinery in Clinton, Iowa
In September 2007, we acquired the Clinton County facility and as a result now own and operate this 10,000,000 gallons per year biodiesel refinery. Nova designed and built this biodiesel refinery for its former owners who used soybean oil as the principal feedstock.
As soon as practicable after our refineries are operating profitably with sufficient capital, our objective is to build additional biodiesel refineries in the twelve to eighteen month period thereafter that will have an additional 120,000,000 to 140,000,000 gallons of annual biodiesel production capacity. We currently own certain long-lead time process equipment for such capacity, which are ready to be installed upon completion of site selection, permitting and final plant layout and design efforts. Upon completion of such biodiesel refineries, we will have 190,000,000 to 210,000,000 gallons of annual biodiesel production capacity. Until our two refineries are operating profitably with sufficient capital, however, implementation of our long-term business strategy will consist mostly of planning and financing activities only.
Obtaining Commitments for the Sale of Biodiesel. Because biodiesel can be substituted for petroleum-based diesel or blended with petroleum-based diesel, the market for biodiesel is substantially the same as that of petroleum-based diesel. Both pure biodiesel and the blended product can be sold as a commodity through standard diesel distribution channels or it can be sold directly to large fleet buyers seeking to reduce emissions or dependence on foreign sources of oil. For example, large transportation companies using heavy trucks represent an opportunity for immediate biodiesel sales due to increased government regulations on emissions, established distribution channels and the lack of U.S. biodiesel production.
Also, the U.S. armed forces are currently the nation’s single largest consumer of diesel fuel. We believe there is an opportunity to provide fuel to the military’s existing vehicles, as well as future opportunities because it is expected that new government regulations will require that a high percentage of the Department of Defense’s new vehicles be able to use alternative fuels. The United States Post Office, as well as other government agencies, such as the National Parks Service, are expected in the future to be large consumers of biodiesel blends in their vehicles. In addition, the States of Minnesota and Texas have both passed legislation to increase the use of biodiesel in government vehicles.
We have entered into agreements with Gavilon, LLC to sell and market all of our biodiesel production from our Seneca refinery. We are currently engaged in discussions with various distribution channels and large fleet buyers with respect to selling biodiesel production from our Clinton County refinery and our future refineries.
Securing Feedstock Supply. Because feedstock represents approximately 70% to 80% of biodiesel’s production cost, it is imperative that we are able to acquire raw materials at a reasonable cost in order to be competitive in the marketplace. We have a feedstock supply agreement with Lipid Logistics, LLC for 100% of the Seneca refinery’s requirements. We are currently engaged in negotiations with other large food processing and rendering companies in an effort to obtain commitments for the supply of lower cost feedstock, which we believe would consist largely of feedstocks that are not normally fit for human consumption.
Logistics. The supply of feedstock and the distribution of biodiesel production will require management of a multi-faceted logistical system. Ideal prospective sites for biodiesel refineries include ready truck, rail and barge access near feedstock sources, such as rendering operations, and biodiesel consumption facilities, such as blending facilities or large fleet refueling stations. Biodiesel can be transported by pipeline and locating a refinery near existing refined products pipelines can also facilitate access to distant markets.
11
Table of Contents
We have entered into agreements with Lipid Logistics, LLC to manage the logistics and supply of feedstock and with Gavilon to manage the logistics for the offtake of biodiesel for the Seneca refinery. We have also entered into railcar leases for 125 insulated tank cars to ship biodiesel from the refineries. The leases are for 60 months beginning upon delivery and will be treated as operating leases for accounting purposes. The average rent for each car is approximately $680 per month. The railcars are used as necessary for the logistics requirements for our Clinton County refinery and our Seneca refinery.
Business Partners. In addition to building refineries for our own account, we intend to seek out business partners who are strategically situated to help us with respect to the engineering, construction and operation of biodiesel refineries for our mutual benefit. An example of such a strategic partner might be a supplier of feedstock or consumables or a distributor of diesel fuel who can also provide a portion of the equity or debt financing necessary to obtain project financing for the joint venture’s engineering and construction of a biodiesel refinery, as well as any working capital financing requirements.
Earlier Focus. Since the formation of our engineering and construction subsidiary, Biosource America, Inc., we initially focused on the completion of the construction of three biodiesel refineries for third parties in Clinton County, Iowa, DeForest, Wisconsin and Greenville, Mississippi while validating the technology on a commercial scale and planning for the financing and construction of biodiesel refineries for our own account. We purchased the Clinton County refinery in September 2007. All refineries are now fully operational.
International Expansion. Our long term business strategy includes expanding into international markets. In Europe, concerns over bovine spongiform encephalopathy, or Mad Cow Disease, have led to restrictions on the use of animal tallow in animal feed, resulting in a marked decline in the market prices for tallow. Brazil has long been a world leader in the development and production of alternative fuels, such as ethanol, and there appears to be significant government interest in building a biodiesel infrastructure as well. Accordingly, we are actively seeking business partners for the construction of biodiesel refineries in the U.K., South America and Europe. Further, the Nova process allows for the use of high free fatty acid palm oils that are currently a waste product for palm oil producers in Southeast Asia and Latin America. When coupled with government incentives for the construction of biodiesel refineries in developing countries, we believe there are excellent opportunities for expansion into foreign markets. We intend to continue to evaluate several other international markets and opportunities.
Long-term Strategy and Public Policy. As a nation, the United States has been reluctant to utilize its vast potential resources for the development of domestic sources of oil and gas, in part due to well-considered environmental concerns. Nonetheless, the United States is quickly depleting its petroleum resources to economically satisfy its energy needs, resulting in greater dependence on foreign sources of energy and increasing export of U.S. currency, sometimes known as petrodollars. Looking beyond the domestic energy situation, global oil and gas resources are being consumed at a rate greater than new oil and gas resources are being discovered and developed. For every two barrels being consumed worldwide, one replacement barrel is being developed. To put this in perspective, over 40,000 gallons of oil are being consumed every second and the probability of maintaining this massive demand over the long term is minimal at best.
We, as a company, are committed to earning a healthy return for our shareholders, providing a safe, friendly place to work for our employees and being a good neighbor and citizen. To do this, we will seek to produce large volumes of high quality biodiesel in an ecologically friendly manner.
We will press for school districts and major cities to adopt the use of B100 biodiesel to promote the health and safety of our children and to raise the quality of air in our urban areas. We will press for the use of this clean, biodegradable, nontoxic fuel in diesel powered boats in inland waterways and on ocean liners. And, to the extent available in sufficient quantities on economically viable terms, we will also seek to obtain feedstock not normally fit for human consumption in order to reduce the competition between food and fuel for our agricultural resources. Finally, as our refineries come online, we intend to invest in research to process feedstocks that have a minimal impact on human and animal food sources, such as algae and jatropha, which we hope will help meet the energy demands of future generations who will no longer have easy access to crude oil.
Competition
The National Biodiesel Board reports that, as of September 2008, there were approximately 176 commercial biodiesel refineries in the U.S. with an annual production capacity of approximately 2.61 billion gallons per year. In addition, the National Biodiesel Board reports that, as of September 2008, there were 39 commercial biodiesel refineries under construction and one existing commercial biodiesel refinery undergoing expansion in the U.S. The total additional anticipated annual production capacity of these plants under construction or expansion is approximately 850 million gallons per year.
12
Table of Contents
The biodiesel production market is very dynamic as there are a number of new entrants that may have greater access to capital or low cost feedstock. For example, large international agricultural companies, such as Archer Daniels Midland Corporation, or ADM, and Bunge Limited have begun to build or sponsor biodiesel refineries to take advantage of their access to agricultural feedstock. ADM is already the largest ethanol producer in the United States and has publicly stated an intention to build biodiesel refineries in the United States to complement its ethanol production and to take advantage of its vertically integrated agricultural supply chain. ADM estimates that, as of August 11, 2007, it had 1,600,000 metric tons of biodiesel production capacity worldwide. In addition, major energy companies have expressed an interest in investing in renewable energy projects, including biodiesel. Chevron Corporation, for example, reports that it has spent over $1.5 billion on renewable energy projects since 2000.
While the market for biodiesel may not be constrained by demand given the large volume of consumption of diesel in the United States and worldwide, we may face significant competition for feedstock and capital from these large, vertically integrated competitors, in addition to the other independent entrants into the market.
Intellectual Property
Our main competitive strength derives from the expertise, know-how, production process and refinery technology developed by the engineers we currently employ. We intend to continue research and development into improvements in the Nova process and into the use of alternative feedstocks for the production of biodiesel, such as jatropha and algae. We estimate that since inception on December 1, 2005 we have spent less than $50,000 on research and development. We do not expect our research and development expenses to be borne by potential customers as the price of our biodiesel will be determined primarily by commodity prices at the time of sale.
We protect the intellectual property comprising the Nova process technology through a combination of patents, patent applications, common law copyrights and trade secrets. The first of our patents does not expire until 2023. All of our technical employees enter into confidentiality and invention assignment agreements and, in some cases, non-competition agreements. We also require contractors, vendors, construction customers and others to enter into confidentiality agreements of varying duration prior to being given access to our proprietary information regarding our technology. There can be no assurance, however, that such measures will be adequate to protect our technology.
Employees
As of October 31, 2008, we had approximately 90 full-time equivalent employees. We believe our relations with our employees are good.
Company History
Nova Biosource Fuels, Inc. was originally incorporated under the name Nova Oil, Inc. on February 25, 2000 under the laws of the State of Nevada and was organized primarily for the purpose of acquiring, either alone or with others, interests in developed producing oil and gas leases, with the objective of establishing steady cash flows from operations. As of October 19, 2005, Nova Oil completed the sale of all of its oil and gas well interests. As a result, Nova Oil became a “shell company,” as the term is defined under the Securities Exchange Act of 1934, as amended, because it ceased conventional oil and gas exploration and production operations and shifted its primary activity to seeking merger or acquisition candidates with whom it could either merge or acquire.
Our engineering and construction subsidiary, Biosource America, Inc., was incorporated in Texas on December 1, 2005, which is the date that we use as our date of inception for accounting purposes. On February 10, 2006, Biosource America completed the acquisition of substantially all of the assets of Biosource Fuels, LLC (an independent and non-affiliated company), which had been in the business of engineering, construction and licensing of processes and technologies for the refining of biodiesel and related co-products from animal-derived fats, oils and greases and vegetable-based oils.
On March 31, 2006, Nova Oil completed a share exchange and issued 40,000,000 shares of its common stock in exchange for all of the shares of common stock of Biosource America. As a result of the share exchange, Biosource America became a wholly-owned subsidiary of Nova Oil. A change of control of Nova Oil occurred because the former Biosource America shareholders acquired approximately 86% of the issued and outstanding shares of Nova Oil’s common stock. At that point, Nova Oil ceased being a “shell company” and became an energy company with long-term plans to refine and market standard biodiesel. An additional 23,462,523 shares of common stock were issued on April 24, 2006 as a result of a three for two forward stock split.
13
Table of Contents
For accounting purposes, this transaction was treated as an acquisition of Nova Oil by Biosource America coincident with a recapitalization of Biosource America. The historical financial statements and other information prior to March 31, 2006, unless expressly stated otherwise, are those of Biosource America. In connection with the share exchange, Nova Oil changed its fiscal year end from December 31 to October 31 to conform to the fiscal year end of Biosource America. On September 12, 2006, Nova Oil changed its name to Nova Biosource Fuels, Inc.
Originally, our common stock was quoted on the Over-The-Counter Bulletin Board System under the symbol “NVBF.” On May 9, 2007, the American Stock Exchange approved our listing application to trade our common stock on that exchange. Our common stock started trading on the American Stock Exchange under the symbol “NBF” on May 14, 2007.
In July 2008, we relocated our principal administrative offices from Houston, Texas to Butte, Montana and consolidated our accounting functions. Our Chief Executive Officer and other senior executive officers maintain an executive office in Houston, Texas. Our Chief Financial Officer relocated to our flagship biodiesel refinery in Seneca, Illinois to improve efficiency and reduce administrative costs. The corporate accounting offices were also consolidated in Butte, Montana.
Available Information
Our website address is www.novabiosource.com. We make available, free of charge through the Investor Relations portion of the website, annual reports on Form 10-K, quarterly reports on Form 10-Q, current reports on Form 8-K and amendments to those reports filed or furnished pursuant to Section 13(a) or 15(d) of the 1934 Act as soon as reasonably practicable after we electronically file such material with, or furnish it to, the SEC. Reports of beneficial ownership filed pursuant to Section 16(a) of the 1934 Act are also available on our website. Information contained on our website is not part of this report.
14
Table of Contents
ITEM 1A. RISK FACTORS
The following summarizes the material risks of purchasing or owning our securities. Additional unknown risks may also impair our financial performance and business operations. Our business, financial condition and/or results of operation may be materially adversely affected by the nature and impact of these risks. In such case, the market value of our securities could be detrimentally affected, and investors may lose part or all of the value of their investment. You should carefully consider the risks and uncertainties described below before purchasing our securities.
Risks Related To Our Business
We are engaged in a business focused on designing, building and operating biodiesel refineries, as well as producing biodiesel fuel through proprietary process technologies. The business is inherently risky and we face numerous and varied risks, both known and unknown. Despite the knowledge and experience of management, careful evaluation and strategic planning, we may not be able to overcome the risks associated with our business, which may prevent us from achieving our goals.
We are in an early stage with limited operating history and may never attain profitability.
We are currently in an early stage of our current business plan. We have limited operating history with respect to the construction and operation of biodiesel refineries for our own use. Our limited operating history makes it difficult for potential investors to evaluate our business. Therefore, our proposed operations are subject to all of the risks inherent in the initial expenses, challenges, complications and delays frequently encountered in connection with the formation of any new business, as well as those risks that are specific to the biodiesel industry in general. Investors should evaluate an investment in our company in light of the problems and uncertainties frequently encountered by companies attempting to develop markets for new products, services and technologies. Despite best efforts, we may never overcome these obstacles to achieve financial success.
Our business is speculative and dependent upon the implementation of our business plan, as well as our ability to enter into agreements with third parties for necessary financing, the provision of necessary feedstock sources, engineering, procurement and construction services and the sale and distribution of our biodiesel fuel on terms that will be commercially viable for us. There can be no assurance that our efforts will be successful or result in revenue or profit. There is no assurance that we will earn significant revenues or that our investors will not lose their entire investment.
We may be unable to obtain the additional capital required to implement our business plan.
We currently do not have sufficient cash reserves to meet all of our anticipated expenditure obligations for operating and capital purposes for the remainder of fiscal year 2009. As a result, we are in the process of seeking additional capital, particularly with respect to procuring working capital sufficient for operation of our Seneca refinery at full capacity, modifications and operations of our Clinton County refinery and corporate overhead. The revenues generated from designing and building biodiesel refineries for third parties were insufficient to cover the anticipated final costs of construction, and the proceeds from our most recently completed private placements of securities are not sufficient to fund operations as currently contemplated. We must secure additional financing of approximately $20,000,000 to fund additional working capital requirements as the Seneca refinery reaches full production, to cover general and administrative expenses, and to pay operating expenses that are expected to be incurred before the refining operations at Seneca become profitable. The additional capital may be provided by common or preferred equity or equity-linked securities, debt, tolling arrangements with industry participants, project financing, joint venture projects, a strategic business combination, particularly with a strategic partner with access to low-cost feedstocks such as corn oil extracted from dried distillers grains, or a combination of these. We will require additional capital to continue to expand our business beyond the initial phase. Limitations on the anti-dilution adjustments of our outstanding convertible notes implemented to comply with the American Stock Exchange listing rules, and related covenants, significantly constrain the amount of equity capital we can raise until such time as we can obtain stockholder approval to remove such anti-dilution adjustment limitations. There is no assurance that we will be able to obtain the capital required in a timely fashion, on favorable terms or at all. If we are unable to obtain required additional financing, we may be forced to restrain our growth plans or cut back existing operations.
Future construction and operation of biodiesel refineries, capital expenditures to build and operate our refineries, hiring qualified management and key employees, complying with licensing, registration and other requirements, maintaining compliance with applicable laws, production and marketing activities, administrative requirements, such as salaries, insurance expenses and general overhead expenses, legal compliance costs and accounting expenses will all require a substantial amount of additional capital and cash flow.
15
Table of Contents
We will be required to pursue sources of additional capital through various means, including joint venture projects, tolling arrangements, which may include a profit sharing component, debt financing, equity financing or other means. There is no assurance that we will be successful in locating a suitable financing or strategic business combination transaction in a timely fashion or at all. In addition, there is no assurance that we will be successful in obtaining the capital we require by any other means. Future financings through equity investments are likely, and these are likely to be dilutive to the existing shareholders as we issue additional shares of common stock to investors in future financing transactions and as these financings trigger anti-dilution adjustments in existing equity-linked securities. Also, the terms of securities we issue in future capital transactions may be more favorable for our new investors. Newly issued securities may include preferences, superior voting rights, the issuance of warrants or other derivative securities, and the issuances of incentive awards under employee equity incentive plans, which may have additional dilutive effects. Further, we may incur substantial costs in pursuing future capital or financing, including investment banking fees, legal fees, accounting fees, securities law compliance fees, printing and distribution expenses and other costs. We may also be required to recognize non-cash expenses in connection with certain securities we may issue, such as convertible notes and warrants, which may adversely affect our financial results.
Our ability to obtain needed financing may be impaired by such factors as the capital markets, both generally and specifically in the biodiesel industry, the fact that we are a new enterprise without a proven operating history, the location of our biodiesel refineries in the United States instead of Europe or other regions where biodiesel is more widely accepted, and the price of biodiesel and oil on the commodities market. Furthermore, if petroleum or biodiesel prices on the commodities markets decrease, then our revenues will likely decrease and decreased revenues may increase our requirements for capital. Some of the contractual arrangements governing our operations may require us to maintain minimum capital, and we may lose our contract rights if we do not have the required minimum capital. If the amount of capital we are able to raise from financing activities, together with our revenues from operations, are not sufficient to satisfy our capital needs, even to the extent that we reduce our operations accordingly, we may be required to cease operations.
Unanticipated problems or delays in operating biodiesel refineries to the proper specifications may harm our business and viability.
Our current operating cash flow depends on our ability to timely and economically operate our Seneca biodiesel refinery. Refinery operations require significant amounts of capital to procure feedstock before account receivables are paid for finished biodiesel. If our biodiesel refining operations are disrupted or the economic integrity of these projects is threatened for unexpected reasons, our business may experience a substantial setback. Prolonged problems may threaten the commercial viability of our refineries. Moreover, the occurrence of significant unforeseen conditions or events in connection with these refineries may require us to reexamine the thoroughness of our due diligence and planning processes. Any change to our business model or management’s evaluation of the viability of these projects may adversely affect our business.
Our construction costs for additional biodiesel refineries may also increase to a level that would make a new facility too expensive to complete or unprofitable to operate. Contractors, engineering firms, construction firms and equipment suppliers also receive requests and orders from other companies and, therefore, we may not be able to secure their services or products on a timely basis or on acceptable financial terms. We may suffer significant delays or cost overruns as a result of a variety of factors, such as increases in the prices of raw materials, shortages of workers or materials, transportation constraints, adverse weather, equipment failures, fires, damage to or destruction of property and equipment, environmental damage, unforeseen difficulties or labor issues, any of which could prevent us from commencing operations as expected at our facilities.
Our results of operations, financial condition and business outlook will be highly dependent on commodity prices, which are subject to significant volatility and uncertainty, and the availability of supplies, so our results could fluctuate substantially.
Our results are substantially dependent on many different commodity prices, especially prices for biodiesel, petroleum diesel, feedstock and materials used in the construction of our refineries. From 2006 to the fall of 2008, prices for all varieties of feedstock increased to record levels, which were approximately twice the level from when construction began on our refineries. The price of petroleum diesel and biodiesel increased at approximately a similar pace. Since the fall of 2008, the global economic downturn has resulted in significant declines in prices for petroleum diesel and biodiesel. During periods when feedstock and diesel prices are rising, in the absence of any commodity price risk mitigation strategies, the sale of finished biodiesel would generally result in higher margins due to the time difference between when feedstocks are procured and paid for and when the resulting biodiesel is delivered and paid for. Conversely, during periods when feedstock and diesel prices are declining, in the absence of any commodity price risk mitigation strategies, the sale of finished biodiesel
16
Table of Contents
would generally result in lower or negative margins due to the same time differences. This effect becomes especially pronounced in periods of extreme and rapid commodity price changes. We currently do not have sufficient working capital to purchase commodity forwards, futures, options or puts to fully implement a robust commodity price risk mitigation strategy.
Further, the market efficiency for animal-derived fats, oils and greases has been limited when compared to the market efficiency for vegetable-based oils, resulting in increased price volatility. As a result of the volatility of the prices for these items, our results may fluctuate substantially, and we may experience periods of declining prices for our products and increasing costs for our raw materials, which could result in operating losses. Although we may attempt to offset a portion of the effects of fluctuations in prices by entering into forward contracts to supply biodiesel or purchase feedstock or other items or by engaging in transactions involving exchange-traded futures contracts, the amount and duration of these hedging and other risk mitigation activities may vary substantially over time and these activities also involve substantial risks.
Biodiesel fuel is a commodity whose price is determined based on the price of petroleum diesel, world demand, supply and other factors, all of which are beyond our control. Prices for biodiesel fuel in the regions in which we sell have fluctuated widely in recent years. We expect that prices will continue to fluctuate in the future. Price fluctuations will have a significant impact upon our revenue, the return on our investment in biodiesel refineries and on our general financial condition. Price fluctuations for biodiesel fuel, regionally and globally, may also affect the investment market, and our ability to raise additional capital. Future decreases in the prices of biodiesel or petroleum diesel fuel may have a material adverse effect on our financial condition and future results of operations.
The price of feedstock is influenced by market demand, weather conditions, animal processing and rendering plant decisions, the level of feedstock use as feed for livestock, factors affecting crop yields, farmer planting decisions, foreign demand for feedstock and general economic, market and regulatory factors. These factors include government policies and subsidies with respect to agriculture and international trade, and global and local demand and supply. The significance and relative effect of these factors on the price of feedstock is difficult to predict. The prices for most commonly available biodiesel feedstocks were at or near record high levels until the fall of 2008 and then fell dramatically. Any event that tends to negatively affect the supply of feedstock, such as increased demand, adverse weather or crop disease, could increase feedstock prices and potentially harm our business. In addition, we may also have difficulty, from time to time, in physically sourcing feedstock on economical terms due to supply shortages or quality control issues of feedstock providers. For example, some animal rendering operations produce feedstock with unacceptable levels of polyethylene, which must be rejected before the feedstock enters the refinery. Such a shortage or quality control issues could require us to suspend operations until sufficient feedstock of acceptable quality is available at economical terms, which would have a material adverse effect on our business, results of operations and financial position. The price we pay for feedstock at a refinery could increase if an additional multi-feedstock biodiesel production facility is built in the same general vicinity or if alternative uses are found for lower cost feedstocks.
We are a holding company, and there are significant limitations on our ability to receive distributions from our subsidiaries.
We conduct substantially all of our operations through subsidiaries and are dependent on dividends or other intercompany transfers of funds from our subsidiaries to meet our obligations. Our subsidiaries may not have funds legally available for dividends or distributions, and we may enter into credit or other agreements that would contractually restrict our subsidiaries from paying dividends, making distributions or making intracompany loans to our parent company or to any other subsidiary. In particular, our credit agreement for the Seneca refinery sweeps a significant portion of its cash flow—100% of its cash flow unless and until various required reserve accounts are filled and the federal biodiesel excise tax credit is extended past December 31, 2009—into a number of reserve escrow accounts until repayment of the loan. Until such time as our Seneca refinery generates sufficient revenue to fill the various required reserve accounts, such revenue will not be available to fund ongoing working capital and corporate overhead requirements for the other Nova entities. We do not have similar restrictions with respect to revenues generated by our Clinton County biodiesel refinery or by our offtake arrangement from the Scott biodiesel refinery. If the amount of capital we are able to raise from financing activities, together with our revenues from operations that are available for distribution, are not sufficient to satisfy our ongoing working capital and corporate overhead requirements needs, even to the extent that we reduce our operations accordingly, we may be required to cease operations.
17
Table of Contents
Cold weather can cause biodiesel, particularly biodiesel produced from animal fats, oils and greases, to gel sooner than petroleum-based diesel, which has resulted in price discounts for biodiesel produced from animal fats, oils and greases.
The cloud point for a fuel is the temperature at which the liquid becomes cloudy due to formation of crystals and solidification of saturates. With decreasing temperature, more solids form and the material approaches the pour point, the lowest temperature at which the material will pour. A lower cloud point means the fuel will flow more readily in cold weather. No. 2 diesel and No. 1 diesel are used extensively for automotive transportation. Although the cloud points for these products vary depending on the origin refinery and the time of the year, an indicative range observed for No.2 diesel is –14°C to -23°C. In contrast, the cloud points of soybean-based, yellow grease-based and animal tallow-based pure biodiesel, or B100, are approximately 0°C, 5°C and 10°C, respectively. Testing conducted in 2005 by the Biodiesel Cold Flow Consortium established by the National Biodiesel Board demonstrated that the cloud points of soybean-based, yellow grease-based and animal tallow-based 2% blended biodiesel, or B2, varied only a few degrees from the cloud point of No. 2 diesel. However, there exists a discount in the marketplace for B100 biodiesel with high cloud points. This discount may range from $0.50 to $1.15 per gallon depending on the season, with a lower discount during warmer months and a higher discount in the summer months.
In addition to the decline in price differential between biodiesel and petroleum-derived diesel expected during the colder months, it is likely that the discount for biodiesel produced from animal fats, oils and greases will increase during colder weather. This may also require us to use particular feedstocks that customers believe are better suited for their climate, which could require us to purchase more expensive feedstocks and increase our cost of sales. In addition, the testing conducted by the Biodiesel Cold Flow Consortium showed that successful blending of biodiesel with petroleum-based diesel would require the biodiesel to be heated to approximately 10°C above its cloud point. This would necessitate the use of heated facilities in order to produce a blended product, which may increase blending costs and the resulting cost of biodiesel sold to the public. Further, at low temperatures, biodiesel may need to be stored in a heated building or heated storage tanks, which would increase storage costs. Any reduction in the demand for or pricing of, or increased costs of, our biodiesel will reduce our revenue and have an adverse effect on our financial condition and results of operations.
The U.S. biodiesel industry is highly dependent upon a myriad of federal and state legislation and regulation and any changes in legislation or regulation could materially and adversely affect our results of operations and financial position.
The production of biodiesel is made significantly more competitive by federal and state tax incentives. The federal excise tax incentive program for biodiesel was originally enacted as part of the American Jobs Creation Act of 2004, but is scheduled to expire on December 31, 2009. Since January 1, 2009, this program provides fuel blenders, generally distributors, with a one-cent tax credit for each percentage point of biodiesel blended with petroleum diesel. As a producer, we do not directly receive the biodiesel tax credit. For example, distributors that blend biodiesel with petroleum diesel into a B20 blend would receive a twenty cent per gallon excise tax credit. These tax credits generally allow for B100 biodiesel to sell at a premium over wholesale petroleum diesel, although the wholesale price paid by a blender to a producer may not reflect the full amount of the tax credit and the amount of the premium, if any, is generally less during colder months.
In addition, approximately thirty-one states provide mandates, programs and other incentives to increase biodiesel production and use, such as mandates for fleet use or for overall use within the state, tax credits, financial grants, tax deductions, financial assistance, tax exemptions and fuel rebate programs. For example, Illinois exempts biodiesel blends of B10 and higher from its state sales tax. These incentives are meant to lower the cost of biodiesel in comparison to petroleum diesel. The elimination or significant reduction in the federal excise tax incentive program or state incentive programs benefiting biodiesel production may have a material and adverse effect on our results of operations and financial condition. For example, unless and until the federal biodiesel excise tax incentive is extended past December 31, 2009, 100% of the cash flow of our Seneca refinery will be swept into an escrow account to secure repayment of the project financing loan and will not be available for distribution to our parent company.
Adverse public opinions concerning the biodiesel industry in general or biodiesel produced from animal-derived fats, oils and greases could harm our business.
The biodiesel industry is new, and general public acceptance of biodiesel is uncertain, particularly with respect to biodiesel produced from animal-derived fats, oil and greases. For example, in many markets animal-derived biodiesel sells at a discount compared to soy-derived biodiesel. Public acceptance of biodiesel produced by the Nova process as a reliable, high-quality alternative to diesel may be limited or slower than anticipated due to several factors, including:
· public perception that biodiesel produced from animal-derived fats, oil and greases or waste vegetable oils does not consistently comply with ASTM D6751 or other applicable standards;
18
Table of Contents
· public perception that the use of biodiesel will require excessive engine modifications, or that engines running biodiesel will not reliably start in cold conditions;
· actual or perceived problems with biodiesel quality or performance; and
· concern that using biodiesel will void engine warranties.
Even if the Nova process consistently produces biodiesel that complies with ASTM D6751 and other applicable standards, actual or perceived problems with quality control in the industry generally may lead to a lack of consumer confidence in biodiesel and harm our ability to successfully market biodiesel. For example, the State of Minnesota temporarily suspended its 2% biodiesel, or B2, mandate on at least two occasions due to concerns about biodiesel quality. Similar quality control issues in biodiesel that is produced by other industry participants could result in a decrease in demand or mandates for biodiesel, with a resulting decrease in our revenue. Such public perceptions or concerns, whether substantiated or not, may adversely affect the demand for our biodiesel, which in turn could decrease our sales, harm our business and adversely affect our financial condition.
Strategic relationships on which we may rely are subject to change.
Our ability to identify and enter into commercial arrangements with feedstock suppliers, construction contractors, equipment fabricators, transportation, logistics and marketing services providers and biodiesel customers will depend on developing and maintaining close working relationships with industry participants. Our success in this area will also depend on our ability to select and evaluate suitable projects as well as to consummate transactions in a highly competitive environment. These relationships are subject to change and may impair our ability to grow.
To develop our business, we will use the business relationships of management in order to form strategic relationships. These relationships may take the form of joint ventures with other private parties or local government bodies, contractual arrangements with other companies, including those that supply feedstock that we will use in our business, or minority investments from third parties. There can be no assurances that we will be able to establish these strategic relationships, or, if established, that the relationships will be maintained, particularly if members of the management team leave our company. In addition, the dynamics of our relationships with strategic partners may require us to incur expenses or undertake activities we would not otherwise be inclined to incur or undertake in order to fulfill our obligations to these partners or maintain these relationships. If we do not successfully establish or maintain strategic relationships, our business may be negatively affected.
Our business may suffer if we are unable to attract or retain talented personnel.
As of October 31, 2008, we had approximately 90 full-time equivalent employees. Our success will depend in large measure on the abilities, expertise, judgment, discretion, integrity, and good faith of our management, as well as other personnel. We have a relatively small but very effective management team, and the loss of a key individual or inability to attract suitably qualified replacements or additional staff could adversely affect our business. We may also experience difficulties in certain jurisdictions in our efforts to obtain and/or retain suitably qualified staff willing to work in such jurisdictions. Our success depends on the ability of management and employees to interpret market and technical data correctly, as well as respond to economic, market and other conditions. No assurance can be given that our key personnel will continue their association or employment with us or that replacement personnel with comparable skills will be found. If we are unable to attract and retain key personnel and additional employees, our business may be adversely affected.
We may be unable to locate suitable properties and obtain the development rights needed to build and expand our business.
Our long-term business plan focuses on designing, building and operating biodiesel refineries for our own account. Although we were able to successfully enter into agreements to purchase land in Seneca, Illinois, our ability to acquire quality properties in the future is uncertain and we may be required to delay construction of our facilities, which may create unanticipated costs and delays. In the event that we are not successful in identifying and obtaining development rights on suitable properties for building and operating biodiesel refineries, our future prospects for profitability will likely be substantially limited, and our financial condition and resulting operations may be adversely affected.
19
Table of Contents
The production, sale and distribution of biodiesel is dependent on sufficient and necessary infrastructure which may not occur on a timely basis, if at all, and our operations could be adversely affected by infrastructure disruptions.
Substantial development of infrastructure will be required by persons and entities outside our control for our operations, and the biodiesel industry generally, to grow. Areas requiring expansion include, but are not limited to:
· adequate rail capacity, including sufficient numbers of dedicated tanker cars;
· sufficient storage facilities for feedstock and biodiesel;
· increases in truck fleets capable of transporting biodiesel within localized markets; and
· expansion of refining and blending facilities to handle biodiesel.
Substantial investments required for these infrastructure changes and expansions may not be made or they may not be made on a timely basis. Any delay or failure in making the changes to or expansion of infrastructure could hurt the demand or prices for our products, impede our delivery of products, impose additional costs on us or otherwise have a material adverse effect on our results of operations or financial condition.
Our commercial success will depend in part on our ability to obtain and maintain protection of our intellectual property.
Our success will depend in part on our ability to maintain or obtain and enforce patent and other intellectual property protection for our technologies, to preserve our trade secrets and to operate without infringing upon the proprietary rights of third parties. We have obtained or developed rights to patents and patent applications in the United States and internationally, and may, in the future, seek rights from third parties to other patent applications or patented technology. Significant aspects of our technology are currently protected as trade secrets, for which we intend to file patent applications when appropriate. The description of the processes currently protected as trade secrets is likely to be published at some point in the patent application process with no assurance that the related patents will be issued. Further, certain confidentiality agreements may expire prior to the issuance of the relevant patent. There can be no assurance that patents will issue from the patent applications filed or to be filed or that the scope of any claims granted in any patent will provide us with proprietary protection or a competitive advantage. We cannot be certain that the creators of our technology were the first inventors of inventions covered by our patents and patent applications or that they were the first to file. Accordingly, there can be no assurance that our patents will be valid or will afford us with protection against competitors with similar technology.
The failure to obtain or maintain patent or other intellectual property protection on the technologies underlying our biodiesel refining process may have a material adverse effect on our competitive position and business prospects. It is also possible that our technologies may infringe on patents or other intellectual property rights owned by others. We may have to alter our products or processes, pay licensing fees, defend an infringement action or challenge the validity of the patents in court, or cease activities altogether because of patent rights of third parties, thereby causing additional unexpected costs and delays to us. There can be no assurance that a license will be available to us, if at all, upon terms and conditions acceptable to us or that we will prevail in any intellectual property litigation.
Intellectual property litigation is costly and time consuming, and there can be no assurance that we will have sufficient resources to pursue such litigation. If we do not obtain a license under such intellectual property rights, are found liable for infringement or are not able to have such patents declared invalid, we may be liable for significant money damages and may encounter significant delays in bringing products and services to market. There can be no assurance that we have identified all United States and foreign patents that pose a risk of infringement.
Competition may impair our success.
We face competition from other producers of biodiesel with respect to the procurement of feedstock, obtaining suitable properties for the construction of biodiesel refineries and selling biodiesel and related products. Such competition could intensify, thus driving up the cost of feedstock and driving down the price for our products. Competition will likely increase as the commodities market prices of hydrocarbon-based energy, including petroleum and biodiesel, rise as they have in recent years. Additionally, new companies are constantly entering the market, thus increasing the competition.
Larger foreign owned and domestic companies who have been engaged in this business for substantially longer periods of time, such as vertically integrated agricultural and food supply companies such as ADM and Bunge, or who decide to enter into our industry, such as Tyson and ConocoPhillips, may have access to greater resources. These companies may
20
Table of Contents
have greater success in the recruitment and retention of qualified employees, as well as in conducting their own refining and fuel marketing operations, and may have greater access to feedstocks, market presence, economies of scale, financial resources and engineering, technical and marketing capabilities, which may give them a competitive advantage. In addition, actual or potential competitors may be strengthened through the acquisition of additional assets and interests. If we are unable to compete effectively or adequately respond to competitive pressures, this may materially adversely affect our results of operation and financial condition and could also have a negative impact on our ability to obtain additional capital from investors.
Competition due to advances in alternative fuels may lessen the demand for biodiesel and negatively impact our profitability.
Alternative fuels, gasoline oxygenates, ethanol and biodiesel production methods are continually under development. A number of automotive, industrial and power generation manufacturers are developing alternative clean power systems using fuel cells or clean-burning gaseous fuels that, like biodiesel, may address increasing worldwide energy costs, the long-term availability of petroleum reserves and environmental concerns. Additionally, there is significant research and development being undertaken regarding the production of ethanol from cellulosic biomass, the production of methane from anaerobic digesters and the production of electricity from wind and tidal energy systems, among other potential sources of renewable energy. If these alternative fuels continue to expand and gain broad acceptance such that the overall demand for diesel is reduced, we may not be able to compete effectively.
Our business is subject to local legal, political, and economic factors which are beyond our control.
We believe that the current political environment for construction of biodiesel refineries is sufficiently supportive to enable us to plan and implement our operations. However, there are risks that conditions will change in an adverse manner. These risks include, but are not limited to, laws or policies affecting mandates or incentives to promote the use of biodiesel, environmental issues, land use, air emissions, water use, zoning, workplace safety, restrictions imposed on the biodiesel fuel industry such as restrictions on production, substantial changes in product quality standards, restrictions on feedstock supply, price controls and export controls. Any changes in biodiesel fuel, financial incentives, investment regulations, policies or a shift in political attitudes are beyond our control and may adversely affect our business and future financial results.
Changes in industry specification standards for biodiesel may increase production costs or require additional capital expenditures to upgrade or modify our biodiesel production facilities. Such upgrades or modifications may entail delays in construction or stoppages of production.
The American Society of Testing and Materials, or ASTM, is the recognized standard-setting body for fuels and additives in the United States. ASTM’s specification for biodiesel as a blend stock, D6751, has been adopted by the EPA, and compliance with such specification is required in order for our biodiesel to qualify as a legal motor fuel for sale and distribution. In Europe, the biodiesel standard is EN 14214, which has been modified to a more stringent standard in Germany. ASTM and the European standard-setting bodies have modified the biodiesel specifications in the past, and are expected to continue to modify specifications in the future as the use of biodiesel expands. There is no guarantee that our production facilities will be able to produce ASTM-compliant biodiesel in the event of changes to the specifications. We may need to invest significant capital resources to upgrade or modify our production facilities, which might cause delays in construction or stoppages of production and the resultant loss of revenue, or which might not be economically feasible at all. Any modifications to our production facilities or to the biodiesel specification set by ASTM or other specification with which we attempt to comply may entail increased construction or production costs or reduced production capacity. These consequences could result in a negative impact on our financial performance.
Environmental risks and regulations may adversely affect our business.
All phases of designing, constructing and operating biodiesel refineries present environmental risks and hazards. We are subject to environmental regulation implemented or imposed by a variety of federal, state and municipal laws and regulations as well as international conventions. Among other things, environmental legislation provides for restrictions and prohibitions on spills and discharges, as well as emissions of various substances produced in association with biodiesel fuel operations. Legislation also requires that facility sites be operated, maintained, abandoned and reclaimed in such a way that would satisfy applicable regulatory authorities. Compliance with such legislation can require significant expenditures and a breach may result in the imposition of fines and penalties, some of which may be material. Environmental legislation is evolving in a manner we expect may result in stricter standards and enforcement, larger fines and liability, as well as potentially increased capital expenditures and operating costs.
21
Table of Contents
The presence or discharge of pollutants in or into the air, soil or water may give rise to liabilities to governments and third parties and may require us to incur costs to remedy such presence or discharge. If we are unable to remediate such conditions economically or obtain reimbursement or indemnification from third parties, our financial condition and results of operations could be adversely affected.
In addition, environmental regulatory standards for emissions into the air may adversely affect the market for biodiesel. For example, while biodiesel is generally believed to reduce emissions of hydrocarbons, sulfur, carbon monoxide and particulate pollutants, its effect on the emissions of nitrogen oxide in comparison to petroleum diesel are not, at this time, clearly established. We cannot give assurance that the application of environmental laws to our business will not cause us to limit our production, to significantly increase the costs of our operations and activities, to reduce the market for our products or to otherwise adversely affect our financial condition, results of operations or prospects.
Penalties we may incur could impair our business.
Failure to comply with government regulations could subject us to civil and criminal penalties require us to forfeit property rights and may affect the value of our assets or our ability to conduct our business. We may also be required to take corrective actions, including, but not limited to, installing additional equipment, which could require us to make substantial capital expenditures. We could also be required to indemnify our employees in connection with any expenses or liabilities that they may incur individually in connection with regulatory action against them. These could result in a material adverse effect on our prospects, business, financial condition and our results of operations.
Our business will suffer if we cannot obtain or maintain necessary permits or licenses.
Our operations will require licenses, permits and in some cases renewals of these licenses and permits from various governmental authorities. Our ability to obtain, sustain, or renew such licenses and permits on acceptable, commercially viable terms are subject to change, as, among other things, the regulations and policies of applicable governmental authorities may change. Our inability to obtain or extend a license or a loss of any of these licenses or permits may have a material adverse effect on our operations and financial condition.
Our insurance may be inadequate to cover liabilities we may incur.
Our involvement in the design, construction and operation of biodiesel refineries may result in our becoming subject to liability for pollution, property damage, personal injury, or other hazards. Although we will obtain insurance in accordance with industry standards to address those risks, insurance has limitations on liability that may not be sufficient to cover the full extent of our liabilities. In addition, some risks may not be insurable or, in certain circumstances, we may choose not to obtain insurance to manage specific risks due to the high premiums associated with the insurance, or for other reasons. The payment of uninsured liabilities could reduce the funds available for operations or capital needs. If we suffer a significant event or occurrence that is not fully covered by insurance, or if the insurer of a particular incident is not solvent, this could result in a material adverse effect on our results of operations or financial condition.
Increases in our energy costs will affect operating results and financial condition.
Our biodiesel production costs will be dependent on the costs of the energy sources used to run our refineries. These costs are subject to fluctuations and variations in different locations where we intend to operate, and we may not be able to predict or control these costs. If these costs exceed our expectations, this may adversely affect our results of operations.
We may not be able to effectively manage our growth.
Our strategy includes expanding our business operations. If we fail to effectively manage the growth, our financial results could be adversely affected. Growth may place a strain on our management systems and resources. We must continue to refine and expand our business development capabilities, our systems and processes and our access to financing sources. As we grow, we must continue to hire, train, supervise and manage new employees. We cannot assure that we will be able to:
· meet our capital needs;
· expand our systems effectively, efficiently or in a timely manner;
· allocate our human resources optimally;
22
Table of Contents
· identify and hire qualified employees or retain valued employees; or
· effectively incorporate the components of any business that we may acquire in the future.
If we are unable to manage our growth and operations, then our financial results could be adversely affected.
Lack of diversification may increase the risk.
Larger companies have the ability to manage their risk through diversification. However, we lack diversification, in terms of both the nature and geographic scope of our business. As a result, we could potentially be impacted more by factors affecting the biodiesel industry or the regions in which we operate than we would if our business were more diversified.
We will rely on technology to conduct our business and our technology could become ineffective or obsolete.
We will be required to continually enhance and update our technology to maintain its efficacy and to avoid obsolescence. The costs of doing so may be substantial and may be higher than the costs that we anticipate for technology maintenance and development. If we are unable to maintain the efficacy of our technology, our ability to manage our business and to compete may be impaired. Even if we are able to maintain technical effectiveness, our technology may not be the most efficient means of reaching our objectives, in which case we may incur higher operating costs than we would if our technology was more effective. The impact of technical shortcomings could have a material adverse effect on our prospects, business, financial condition, and results of operations.
Litigation or other proceedings relating to intellectual property rights could result in substantial costs and liabilities and prevent us from selling our biodiesel.
We must operate in a way that does not infringe the intellectual property rights of others in the U.S. and foreign countries. Third parties may claim that our production process or related technologies infringe their patents or other intellectual property rights. Competitors may have filed patent applications or have issued patents and may obtain additional patents and proprietary rights related to production processes that are similar to ours. We may not be aware of all of the patents potentially adverse to our interests. We may need to participate in interference proceedings in the U.S. Patent and Trademark Office or in similar agencies of foreign governments to determine the priority of invention involving issued patents and pending applications of another entity.
The cost to us of any litigation or other proceeding relating to intellectual property rights, even if resolved in our favor, may cause us to incur significant expenses, divert the attention of our management and key personnel from other business concerns and, in certain cases, result in substantial additional expenses to license technologies from third parties. Some of our competitors may be able to sustain the costs of complex patent litigation more effectively than we can because they have substantially greater resources or engage legal counsel willing to advance the litigation costs. An unfavorable outcome in an interference proceeding or patent infringement suit could require us to pay substantial damages, cease using the technology or to license rights, potentially at a substantial cost, from prevailing third parties. There is no assurance that any prevailing party would offer us a license or that we could acquire any license made available to us on commercially acceptable terms. Even if we are able to obtain rights to a third party’s intellectual property, those rights may be non-exclusive and therefore our competitors may obtain access to the same intellectual property. Ultimately, we may be unable to produce and sell our biodiesel or may have to cease some of our business operations as a result of infringement claims, which could severely harm our business. We cannot give assurances that our biodiesel technologies will not conflict with the intellectual property rights of others. Additionally, any involvement in litigation in which we are accused of infringement may result in negative publicity about us and injure our relations with any then-current or prospective customers or vendors.
Decommissioning costs are unknown and may be substantial.
We may become responsible for costs associated with abandoning facilities that we use for production of biodiesel, which we anticipate will have a useful life of twenty years in the absence of a major overhaul. Abandonment and reclamation of these facilities and the associated costs are often referred to as “decommissioning.” We have not yet determined if we will establish a reserve account for these potential costs for any of our biodiesel refineries or if we will be able to pay for the costs of decommissioning from the proceeds of future sales. The use of other funds to pay for decommissioning costs could have a material adverse effect on our financial condition and future results of operations.
23
Table of Contents
We are subject to financial reporting and other requirements for which our accounting, internal audit and other management systems and resources may not be adequately prepared.
We are subject to reporting and other obligations under the Securities Exchange Act of 1934, including the requirements of Section 404 of the Sarbanes-Oxley Act of 2002. Section 404 requires us to conduct an annual management assessment of the effectiveness of our internal controls over financial reporting, provide a report on our assessment and obtain a report by our independent auditors addressing our assessments. These reporting and other obligations will place significant demands on our management, administrative, operational and accounting and financial resources.
Risks related to our prior business may adversely affect our business.
Prior to the share exchange and the resulting change in control of our company, our business involved oil and natural gas exploration, with an emphasis on the development and production of oil and natural gas assets. This included ownership of non-operating, working interests in two wells in Texas and the exploration of this property. We have determined not to pursue this line of business. However, claims arising from our former business may be made against us. These claims may arise from these former activities (including employee and labor matters), financing and credit arrangements or other commercial transactions. While no claims are pending and we have no actual knowledge of any threatened claims, it is possible that third parties may seek to make claims against us related to the activities and liabilities of our company prior to the share exchange. Even if asserted claims are without merit and we have no liability, defense costs and the distraction of management’s attention may adversely affect our business. If any potential claims are made, our business could suffer, particularly if any such claims are material in terms of their magnitude or complexity. Therefore, claims arising from our business prior to the share exchange may have a material adverse effect on our business in the future.
There can be no assurance that we will be able economically operate the Clinton County refinery or to implement capital improvement projects necessary to achieve profitability.
In evaluating the terms of the acquisition of the Clinton County refinery, we made certain assumptions concerning future operations and future capital improvement projects. A principal assumption was that the acquisition will produce operating results better than those historically experienced and that we could implement capital improvements to achieve profitability. There can be no assurance, however, that this assumption is correct or that the business of the Clinton County refinery will be economically operated or that we can implement capital improvement projects necessary to use high free fatty acid feedstocks or to enhance reliability and operating efficiency.
The gross margins our biodiesel refineries are and will be principally dependent on the spread between feedstock prices and biodiesel prices. If the cost of feedstock increases and the cost of biodiesel does not similarly increase or if the cost of biodiesel decreases and the cost of feedstock does not similarly decrease, our margins will decrease, and our results of operations will be adversely affected.
Biodiesel is marketed primarily as an additive or alternative to petroleum-based diesel fuel, and as a result biodiesel prices are primarily influenced by the supply and demand for petroleum-based diesel fuel, rather than biodiesel production costs. The very low correlation between production costs and product prices means that we are generally unable to pass increased feedstock costs on to our customers. Any decrease in the spread between biodiesel prices and feedstock prices, whether as a result of a reduction in biodiesel prices or an increase in feedstock prices, would adversely affect our financial performance and cash flow.
The gross margins of our refineries depend on the spread between biodiesel and feedstock prices. At present, our Clinton County refinery cannot process lower cost, high free fatty acid feedstocks. Until we are able to make capital improvements to the Clinton County refinery to fully allow use of less expensive feedstocks, the Clinton County refinery will be limited to soybean oil, choice white grease and other low free fatty acid feedstocks. The spread between biodiesel prices, especially with respect to animal fat-derived biodiesel, and feedstock prices has narrowed significantly in recent periods. Our principal feedstocks do not necessarily have a direct price relationship to the price of biodiesel. The price of these feedstocks is influenced by general economic, market and regulatory factors and has been extremely volatile recently. Any conditions that negatively impact the supply of these feedstocks, such as decreased soybean acres planted by farmers, increased costs of corn for animal feed, severe weather or crop disease, or factors that increase demand for these feedstocks, such as increasing biodiesel production or changes in governmental policies or subsidies, will tend to increase feedstock prices.
Farmer planting decisions are a key driver of the price of crop-based feedstocks. In the past two decades, soybean acreage in the U.S. has ranged from approximately 58,000,000 acres to approximately 75,000,000 acres. Planting decisions for 2009 and beyond are likely to be based on relative government supports and anticipated crop prices. If there is a general
24
Table of Contents
decrease in planted acres of soybeans and other oilseed crops, the price for these feedstocks may increase, which may cause our multi-feedstock capable competitors to switch to low free fatty acid animal-derived fats as a feedstock. The expected ripple effect of this switch may likely be a corresponding increase in the cost of high free fatty acid feedstocks, which would increase our costs of producing biodiesel.
Assumption of unknown liabilities in the acquisition of the Clinton County biodiesel refinery may harm our financial condition and operating results.
Acquisitions may be structured in such a manner that would result in the assumption of unknown liabilities not disclosed by the seller or uncovered during pre-acquisition due diligence. For example, our acquisition of the Clinton County refinery was structured as an asset purchase in which we effectively assumed all of the liabilities of the plant from and after the closing date, including liabilities that may be unknown. Such unknown obligations and liabilities, should they arise, could harm our financial condition and operating results.
Risks Related To Our Securities
There is not a well-established trading market for our common stock.
Our common stock is currently quoted on the American Stock Exchange under the symbol “NBF.” While our common stock is now listed on a national securities exchange, the average trading volume has not changed significantly from the recent historical average daily trading volume experienced by our common stock when it was quoted on the OTC Bulletin Board system and the sales prices for our common stock have fluctuated widely since the share exchange in March 2006 depending on the trading volume. The limited public trading market and price volatility may impair your ability to sell your shares of our common stock at the time you wish to sell them or at a price that you consider reasonable, reduce the fair market value of our common stock and impair our ability to raise capital by selling additional shares of capital stock and may impair our ability to acquire other companies or technologies by using common stock as consideration.
Other factors could cause the market price of our common stock to continue to be highly volatile and subject to wide fluctuations.
In addition to the limited trading market, the market price of our common stock is likely to be highly volatile and could be subject to wide fluctuations in response to a number of factors, many of which are beyond our control, including:
· dilution caused by our issuance of additional shares of common stock and other forms of equity securities, which we expect to make in connection with future capital financings to fund our operations and growth, to attract and retain valuable personnel and in connection with future strategic partnerships with other companies, and the further dilution caused by anti-dilution adjustments made to our outstanding equity-linked securities as a result of such issuances;
· announcements of new financings, refinery startups, acquisitions and other business initiatives by our competitors;
· fluctuations in revenue from our biodiesel refineries;
· volatility in the market for biodiesel fuel commodities and/or generally in the capital markets;
· changes in the availability of feedstock on commercially economic terms;
· changes in the availability of the rail transportation equipment or access to the rail transportation system;
· changes in the demand for biodiesel fuel, including changes resulting from the expansion of other alternative fuels;
· changes in the social, political and/or legal climate in the regions in which we will operate;
· quarterly variations in our revenues and operating expenses;
· changes in the valuation of similarly situated companies, both in our industry and in other industries;
25
Table of Contents
· changes in analysts’ estimates affecting us, our competitors or our industry;
· changes in the accounting methods used in or otherwise affecting our industry;
· additions and departures of key personnel;
· announcements of technological innovations or new products available to the biodiesel refineries industry;
· announcements by relevant governments pertaining to incentives for alternative energy development programs;
· fluctuations in interest rates, exchange rates and the availability of capital in the capital markets; or
· significant sales of our common stock, including sales by shareholders holding shares of common stock issued in the share exchange and future investors in future offerings from which we expect to raise additional capital as well as short sales and other hedging transactions facilitated by the securities loan agreement described in our consolidated financial statements filed with our most recent quarterly report, which was implemented to facilitate the offering and sale of our convertible notes.
These and other factors are largely beyond our control, and the impact of these risks, singly or in the aggregate, may result in material adverse changes to the market price of the common stock and/or our results of operation and financial condition.
Shares of our common stock that previously could not be traded without restriction are currently eligible for trading upon compliance with Rule 144.
As of December 31, 2008, 110,047,996 shares of our common stock were outstanding. Substantially all such shares have satisfied the initial holding period of Rule 144. As a result, substantially all shares held by non-affiliates are eligible for trading. No prediction can be made as to the effect, if any, that the availability of these shares for sale, or the sale of these shares, will have on the market price for our common stock. If the number of shares offered for sale is greater than the number of shares sought to be purchased, then the price of our common stock would decline. The market price of our securities could be adversely affected by future sales of these securities.
A large number of shares of our common stock underlying warrants, options and convertible notes may be available for future sale and the sale of these shares may depress the market price of our common stock.
The issuance of shares of common stock upon the exercise of our outstanding options and warrants will result in dilution to the interests of our shareholders and you as an investor, and may have an adverse effect on the trading price and market for our common stock. As of October 31, 2008, we had options, warrants and convertible notes outstanding that may be exercised or converted at various times to acquire approximately 40.1 million shares, or approximately 26.7% of our common stock on a fully diluted basis. The future sale of these shares may adversely affect the market price of our common stock. Shares issued upon exercise of our outstanding options, warrants and convertible notes will also cause immediate and potentially substantial dilution to our existing shareholders. In addition, as long as these options, warrants and convertible notes remain outstanding, our ability to obtain additional capital through the sale of our securities might be adversely affected.
Our existing shareholders can exert significant influence over us. Their interests may not coincide with yours and they may make decisions with which you may disagree.
As of December 31, 2008, Kenneth T. Hern, our Chairman and Chief Executive Officer, owned approximately 12.7% of our outstanding common stock. Further, J.D. McGraw, our former Vice-Chairman, also owned a significant number of our shares of outstanding common stock, and Michael McGowan, one of the original founders of Biosource America, owned approximately 11.2% of our outstanding common stock. As a result, these shareholders, acting individually, together or with others, could exert significant influence over substantially all matters requiring shareholder approval, including the election of directors and the approval of significant corporate transactions. In addition, this concentration of ownership may delay or prevent a change in control of our company and make some transactions more difficult or impossible without the support of these shareholders. The interests of these shareholders may not always coincide with our interests as a company or the interest of other shareholders. Accordingly, these shareholders could cause us to enter into transactions or
26
Table of Contents
agreements that you would not approve or make decisions with which you may disagree.
We do not expect to pay dividends in the foreseeable future.
We do not intend to declare dividends for the foreseeable future, as we anticipate that we will reinvest any future earnings into the development and growth of our business. Therefore, investors will not receive any funds unless they sell their common stock, and shareholders may be unable to sell their shares on favorable terms or at all. Investors cannot be assured of a positive return on investment or that they will not lose the entire amount of their investment in the common stock.
If we are or become a “United States real property holding corporation,” non-U.S. investors may be subject to U.S. federal income tax, including withholding tax, in connection with the disposition of our shares, and U.S. investors selling our shares may be required to certify as to their status in order to avoid withholding.
A non-U.S. holder of our common stock will generally be subject to withholding of U.S. federal income tax with respect to distributions made by us that are treated as dividends for U.S. federal income tax purposes. Moreover, a non-U.S. holder of our common stock not otherwise subject to U.S. federal income tax on gain from the sale or other disposition of our common stock may nevertheless be subject to U.S. federal income tax with respect to such sale or other disposition if we are, or have been, a United States real property holding corporation at any time within the five-year period preceding the disposition, or the non-U.S. holder’s holding period if shorter. Generally, a corporation is a “United States real property holding corporation” at any time the fair market value of its U.S. real property interests, as defined in the Internal Revenue Code of 1986, as amended, and applicable regulations, equals or exceeds 50% of the aggregate fair market value of its worldwide real property interests and its other assets used or held for use in a trade or business. Although we believe that we are not currently a United States real property holding corporation, and do not expect to become a United States real property holding corporation, no assurances can be made in this regard.
Certain non-U.S. holders of our common stock may be eligible for an exception to the general rule described above if our common stock is regularly traded on an established securities market during the calendar year in which the sale or disposition occurs and the non-U.S. holder holds no more than 5% of our outstanding common stock, directly or indirectly, during the relevant period, or the “5% exception.” If we are a United States real property holding corporation during the relevant time period, and the 5% exception does not apply, the purchaser or other transferee of our common stock will generally be required to withhold tax at the rate of 10% on the sales price or other amount realized, unless the transferor furnishes an affidavit certifying that it is not a foreign person in the manner and form specified in the applicable U.S. Treasury regulations.
Our management will have broad discretion over the use of the proceeds to us from any offering and might not apply the proceeds of an offering in ways that increase the value of your investment.
Our management will have broad discretion to use the net proceeds from any offering, and you will have to rely on the judgment of our management regarding the application of these proceeds. Our management might not apply the net proceeds of an offering in ways that you believe will increase the value of your investment.
We may incur additional indebtedness in the future. Our current indebtedness and any future indebtedness could adversely affect our business and may restrict our operating flexibility.
As of October 31, 2008, we had approximately $96,664,000 in total long-term debt. Our ability to incur additional debt could adversely affect our business and restrict our operating flexibility.
We face several risks relating to our need to complete additional financings in the future. We must secure additional working capital financing for our Seneca biodiesel refinery of approximately $15,000,000. If we build additional refineries, financing for the additional biodiesel refineries are likely to be at a level likely to be higher than that for our Seneca refinery. We anticipate that a 60,000,000 gallon per year biodiesel refinery built by third party contractors will cost approximately $75,000,000 to $120,000,000 to build, exclusive of any capitalized interest costs, land acquisition costs, the costs of related or ancillary infrastructure and working capital costs. However, there can be no assurances that costs may not be greater depending on site conditions, costs of materials, labor costs, engineering and design changes and other potential cost overruns. The financing may consist of debt but may also consist of common or preferred equity, project financing or a combination of these financing techniques. Additional debt will increase our leverage and interest expense and will likely be secured by certain of our assets; additional equity or equity-linked financings may have a dilutive effect on our equity and equity-linked securities holders and may trigger anti-dilution adjustments under our outstanding equity-linked securities. It is
27
Table of Contents
likely that the terms of any project financing would include customary financial and other covenants on our project subsidiaries, including restrictions on the ability to make distributions to the parent company, to guarantee the debts of the parent company and to incur liens on the refineries of such project subsidiaries, among others.
If our cash flow proves inadequate to service our debt and provide for our other obligations, we may be required to refinance all or a portion of our existing and future debt on terms unfavorable to us or cease operations.
Our ability to make payments on and refinance our debt, and to fund our operations and capital expenditures will depend on our ability to generate substantial operating cash flow. If our future cash flows prove inadequate to meet our future debt service obligations, we may be required to refinance all or a portion of our existing or future debt, to sell assets, to obtain additional financing or to cease operations. We cannot assure you that any such refinancing or that any such sale of assets or additional financing would be possible on favorable terms, or at all. If we raise additional equity or equity-related securities in the future, it may be dilutive to holders of our common stock.
Future sales of shares of our common stock or the issuance of securities senior to our common stock could adversely affect the trading price of our common stock, the value of our debt securities and our ability to raise funds in new equity offerings.
We may issue additional common stock, preferred stock or securities convertible into or exchangeable for common stock. Future sales of substantial amounts of our common stock or equity-related securities in the public market or privately, or the perception that such sales could occur, could adversely affect prevailing trading prices of our common stock and the value of our debt securities and could impair our ability to raise capital through future offerings of equity or equity-related securities. No prediction can be made as to the effect, if any, that future sales of shares of common stock or the availability of shares of common stock for future sale, will have on the trading price of our common stock or the value of our debt securities.
Anti-takeover provisions in our charter documents and Nevada law could prevent or delay a change in control of our company.
Provisions of our articles of incorporation and bylaws may discourage, delay or prevent a merger, acquisition or change of control. These provisions could also discourage proxy contests and make it more difficult for stockholders to elect directors and take other corporate actions. The existence of these provisions could limit the price that investors might be willing to pay in the future for shares of our common stock.
You should consider the U.S. federal income tax consequences of owning our securities.
There are risks associated with the U.S. federal income tax consequences of owning our securities. Because the tax consequences of owning our securities are complex and certain tax consequences may differ depending on the holder’s particular tax circumstances, each potential investor should consult with and rely on its tax advisor about the tax consequences. In addition, there can be no assurance that the U.S. federal income tax treatment currently applicable to owning our securities will not be modified by legislative, administrative, or judicial action that may have a retroactive effect. No representation or warranty of any kind is made with respect to the acceptance by the Internal Revenue Service or any court of law regarding the treatment of any item of income, deduction, gain, loss or credit by an investor on its tax return.
The effect of the lending of our shares of common stock pursuant to a share lending agreement, including sales of our common stock in short sale transactions, may lower the market price of our common stock.
As described in the notes to our consolidated financial statements included in this report, two stockholders entered into a securities loan agreement to facilitate the offering and sale of our convertible notes. We expect that these shares are being used to facilitate transactions by which investors in our convertible notes may hedge their interests in the convertible notes. The effect of these transactions could have a negative effect on the market price of our common stock. The market price of our common stock also could be negatively affected by short sales or other derivative trades of our common stock by the purchasers of the convertible notes to hedge their investment in the convertible notes.
ITEM 1B. UNRESOLVED STAFF COMMENTS
None.
28
Table of Contents
ITEM 2. PROPERTIES
Our principal executive offices are located at 109 North Post Oak Lane, Suite 422, Houston, Texas 77024, which our chief executive officer and other senior executive officers use without charge. We also lease 3,000 square feet of office space in Butte, Montana and lease a 3,200 square foot building in Butte, Montana for our small scale refinery. We own 54 acres of land in the Shipyard Industrial Park of Seneca, Illinois where our 60,000,000 gallons per year biodiesel refinery is located. The Seneca Shipyard Industrial Park, located southwest of Chicago, Illinois, has ready truck, barge and rail access. We have entered into a redevelopment agreement with the Village of Seneca with respect to a tax increment financing district that will provide a property tax abatement of up to $7,000,000 for the construction of infrastructure improvements and related matters. We have obtained debt financing for the refinery, which includes grants of security interests in the property, plant and equipment.
We own a 10,000,000 gallons per year biodiesel refinery in Clinton, Iowa, which is situated on about 10 acres of land and is subject to a mortgage in favor of our convertible note holders.
We believe the condition of each of our properties is good for its current intended use.
ITEM 3. LEGAL PROCEEDINGS
We are currently not subject to any material legal proceedings.
ITEM 4. SUBMISSION OF MATTERS TO A VOTE OF SECURITY HOLDERS
None.
29
Table of Contents
PART II
ITEM 5. MARKET FOR REGISTRANT’S COMMON EQUITY AND RELATED STOCKHOLDER MATTERS AND ISSUER PURCHASES OF EQUITY SECURITIES
Our common stock is listed on the American Stock Exchange under the symbol “NBF.”
Prior to May 14, 2007, our common stock was traded over-the-counter and quoted on the OTC Bulletin Board on a limited and sporadic basis under the symbol “NVBF.” Our common stock was originally approved for quotation on the OTC Bulletin Board system on April 5, 2005 under the symbol “NVAO.” Our symbol was changed to “NVBF” on November 1, 2006 in connection with the change of our corporate name to Nova Biosource Fuels, Inc.
The reported high and low sales prices for our common stock from and after May 14, 2007, as reported by the American Stock Exchange, are shown below for the periods indicated. The reported high and low bid prices for our common stock prior to May 14, 2007, as reported by the OTC Bulletin Board system, are shown below for the periods indicated, adjusted for the three-for-two forward stock split made on April 24, 2006. These over-the-counter market quotations reflect inter-dealer prices, without retail mark-up, mark-down or commission, and may not represent actual transactions.
Common Stock
| | Bid Price | |
| | Low | | High | |
2007 | | | | | |
Quarter ended January 31, 2007 | | $ | 2.05 | | $ | 3.13 | |
Quarter ended April 30, 2007 | | $ | 2.35 | | $ | 4.05 | |
Quarter ended July 31, 2007(1) | | $ | 2.80 | | $ | 3.17 | |
| | Sale Price | |
| | Low | | High | |
Quarter ended July 31, 2007(1) | | $ | 2.12 | | $ | 3.10 | |
Quarter ended October 31, 2007 | | $ | 2.46 | | $ | 3.10 | |
| | | | | |
2008 | | | | | |
Quarter ended January 31, 2008 | | $ | 1.53 | | $ | 3.00 | |
Quarter ended April 30, 2008 | | $ | 1.07 | | $ | 2.25 | |
Quarter ended July 31, 2008 | | $ | 0.30 | | $ | 1.33 | |
Quarter ended October 31, 2008 | | $ | 0.12 | | $ | 0.43 | |
(1) Reflects the listing of our common stock on the American Stock Exchange on May 14, 2007 and the transition from high and low reported bid prices on the OTC Bulletin Board System to high and low reported sales prices on the American Stock Exchange.
Our registrar and transfer agent is American Stock Transfer & Trust Company, 59 Maiden Lane, New York, New York 10038. As of December 31, 2008, there were approximately 277 holders of record of our common stock and 110,047,996 shares of common stock outstanding.
We have not paid any dividends on our common stock and do not expect to do so in the foreseeable future. We anticipate that any earnings generated from our operations will be used to finance our ongoing operations and growth or repay present debt obligations. Terms and conditions of our convertible notes outstanding have restrictions that presently affect our ability to pay dividends. At October 31, 2008, under the covenants contained in the convertible notes indenture, we would not have been permitted to pay any dividends.
The information required by this item with respect to equity compensation plans is set forth under Item 12 of this report and incorporated herein by reference.
All sales of unregistered securities we made during the period covered by this report have been reported on Current Reports on Form 8-K filed with the SEC.
30
Table of Contents
We made no repurchases of common stock during fiscal 2008.
Stock Performance Graph
The following graph illustrates the cumulative total stockholder return of our common stock since our common stock began trading on the OTC Bulletin Board on April 13, 2005, compared to the cumulative total stockholder returns of the Russell 2000 Index (^RUT) and the Ardour Global Index (North America) (AGINA), a capitalization-weighted, float-adjusted index of alternative energy stocks in North America published by Ardour Global Indexes, LLC. The comparison assumes a hypothetical investment in our common stock and each of the foregoing indices of $100 at the adjusted closing price of Nova common stock on April 13, 2005 of $0.03 per share, which reflects the 3 for 2 stock split of April 24, 2006. The graph assumes all cash dividends were reinvested. Shareholder returns over the indicated period are based on historical data and should not be considered indicative of future shareholder returns. The graph and associated table should be read in conjunction with Item 1 Business—Company History, which contains a description of the changes in Nova’s business since it was organized in September 2000. The graph and related disclosure in no way reflect our forecast of future financial performance.

| | 4/13/2005 | | 10/31/2005 | | 10/31/2006 | | 10/31/2007 | | 10/31/2008 | |
Nova Biosource Fuels (NBF) | | $ | 100.00 | | $ | 500.00 | | $ | 8,000.00 | | $ | 9,133.33 | | $ | 733.33 | |
Ardour Global Index Fund North America (AGINA) | | $ | 100.00 | | $ | 98.85 | | $ | 107.88 | | $ | 134.57 | | $ | 67.46 | |
Russell 2000 Index (^RUT) | | $ | 100.00 | | $ | 107.31 | | $ | 127.27 | | $ | 137.42 | | $ | 89.21 | |
31
Table of Contents
ITEM 6. SELECTED FINANCIAL DATA
The following selected financial data has been derived from our consolidated financial statements. This data should be read together with Item 7 – Management’s Discussion and Analysis of Financial Condition and Results of Operations of this report, and the consolidated financial statements and related notes thereto included elsewhere herein. The financial information below is not necessarily indicative of results to be expected for any future period. Future results could differ materially from historical results due to many factors, including those discussed in Item 1A – Risk Factors of this report.
| | | | | | Period from inception | |
| | Year Ended October 31, | | (December 1, 2005) – | |
| | 2008 | | 2007 | | October 31, 2006 | |
Statement of Operations Data: | | | | | | | |
Revenues | | $ | 67,427,000 | | $ | 24,938,000 | | $ | 16,211,000 | |
Cost of goods sold | | $ | 74,117,000 | | $ | 30,989,000 | | $ | 21,912,000 | |
Operating expenses | | $ | 31,830,000 | | $ | 15,003,000 | | $ | 21,712,000 | |
Operating loss | | $ | 38,520,000 | | $ | 21,054,000 | | $ | 27,413,000 | |
Other income (expense) | | $ | (3,778,000 | ) | $ | 1,638,000 | | $ | (1,102.000 | ) |
Net loss | | $ | 42,298,000 | | $ | 19,416,000 | | $ | 28,515,000 | |
| | | | | | | |
Basic and diluted net loss per share: | | $ | (.38 | ) | $ | (.18 | ) | $ | (.38 | ) |
| | As of October 31, | |
| | 2008 | | 2007 | | 2006 | |
Balance Sheet Data: | | | | | | | |
Cash and equivalents | | $ | 1,625,000 | | $ | 26,165,000 | | $ | 21,826,000 | |
Current assets | | $ | 15,110,000 | | $ | 34,256,000 | | $ | 23,793,000 | |
Restricted cash and investments | | $ | 12,312,000 | | $ | 11,125,000 | | $ | — | |
Total assets | | $ | 120,208,000 | | $ | 125,544,000 | | $ | 40,491,000 | |
Current liabilities | | $ | 18,083,000 | | $ | 17,378,000 | | $ | 20,733,000 | |
Long-term debt | | $ | 89,664,000 | | $ | 57,778,000 | | $ | — | |
Total liabilities | | $ | 107,747,000 | | $ | 75,156,000 | | $ | 20,733,000 | |
Stockholder’s equity | | $ | 9,887,000 | | $ | 46,408,000 | | $ | 15,756,000 | |
32
Table of Contents
ITEM 7. MANAGEMENT’S DISCUSSION AND ANALYSIS OF FINANCIAL CONDITION AND RESULTS OF OPERATIONS
GENERAL
Our Business
We are an energy company that refines and markets ASTM D6751 quality biodiesel and related co-products from a variety of feedstocks, such as animal-derived fats, vegetable-based oils and greases. Our strategy is to profitably use our patented, proprietary biodiesel technology and become the industry leader in the production of biodiesel. Biodiesel is a clean burning, non-toxic, biodegradable and renewable fuel. Biodiesel is typically blended with petroleum diesel to create a biodiesel blend that is nearly indistinguishable from, and in some respects superior to, 100% petroleum diesel.
100% biodiesel fuel, or B100, can be used in all compression-ignition (diesel) engines without modifications. In the U.S., the majority of the current consumption is a blend of 5% biodiesel and 95% petroleum diesel, or B5, although as industry production increases, blends of B10 and B20 are becoming more common in the U.S., Europe, Latin America, Indonesia and Australia. Currently, the key markets in the U.S. for biodiesel and biodiesel blends are diesel blending facilities and distributors, truck stops, government fleets, mass transit vehicles, commercial fleets and marine fleets, as well as for general use in environmentally sensitive areas.
Our patented, proprietary technology enables us to refine biodiesel that meets and exceeds the industry’s product specifications and quality standards published by the American Society of Testing and Materials or ASTM. We believe our technology allows us to process over 25 different animal-derived fats, vegetable-based oils and greases with free fatty acid levels in excess of 20% and produce our two principal products: ASTM D6751 quality biodiesel and technical grade glycerin.
Our ability to process a wide range of feedstocks, including single feedstock or blends of feedstocks, such as non-food animal-derived feedstocks, corn oil extracted from dried distillers grains, which are a co-product from the ethanol production process, and non-food based oils and greases which usually have higher free fatty acid content, gives us a significant cost advantage because many of these feedstocks are residual by-products that have limited alternative uses and are typically not otherwise fit for human consumption or use in personal care products. Many of our competitors are limited to a more narrow range of feedstocks and, in many instances, their feedstock options are limited to vegetable-based oils only, and they have little or no ability to process meaningful amounts of lower cost, high free fatty acid animal-based feedstocks.
Our main competitive strength derives from the expertise, production process and plant technology developed by the engineers and staff we currently employ. We will continue to develop and refine our technology to improve the effectiveness, efficiency and reliability of our proprietary process technology. We may conduct additional research and development activities into improvements in the Nova process and into the use of additional non-food based feedstocks for the production of biodiesel, such as jatropha and algae.
We protect the intellectual property comprising the Nova process technology through a combination of patents, patent applications, common law copyrights and trade secrets. The first of our patents does not expire until 2023. All of our technical employees enter into confidentiality and invention assignment agreements and, in some cases, non-competition agreements. We also require contractors, vendors, construction customers and others to enter into confidentiality agreements prior to being given access to proprietary information regarding our technology. There can be no assurance, however, that such measures will be adequate to protect our technology.
We currently own and operate two full scale biodiesel refineries with an aggregate production capacity of 70,000,000 gallons per year. Our flagship full scale refinery is fully operational in Seneca, Illinois with an annual biodiesel production capacity of 60,000,000 gallons. Our other full scale refinery is fully operational in Clinton County, Iowa with an annual biodiesel production capacity of 10,000,000 gallons. We also own a smaller scale biodiesel refinery in Butte, Montana, which we use primarily for research, development and technology demonstration purposes.
As soon as practicable after our refineries are operating profitably with sufficient capital, our objective is to build additional biodiesel refineries in the twelve to eighteen month period thereafter that will have an additional 120,000,000 to 140,000,000 gallons of annual biodiesel production capacity. We currently own certain long-lead time process equipment for such capacity, which are ready to be installed upon completion of site selection, permitting and final plant layout and design efforts. Upon completion of such biodiesel refineries, we will have 190,000,000 to 210,000,000 gallons of annual biodiesel production capacity. Until our two refineries are operating profitably with sufficient capital, however, implementation of our long-term business strategy will consist mostly of planning and financing activities only.
33
Table of Contents
Current Plan of Operations
Prior to September 2007, our results of operations generally reflect those of a biodiesel refinery engineering and construction company. The last of three biodiesel refineries that were designed and constructed for others was completed in February 2008. The Clinton County refinery discussed above was one of the three built for others under a construction contract.
A second biodiesel refinery built for others is located near DeForest, Wisconsin and is owned by Sanimax Energy, Inc. This refinery has a production capacity of 20,000,000 gallons per year, was completed in October 2007 and has been producing ASTM D6751 biodiesel from animal-based feedstocks with a free fatty-acid content of between 7 and 15% and technical grade glycerin in excess of 95% purity levels.
The last plant built for a third party is located in Greenville, Mississippi and is owned by Scott Petroleum Corporation. The Scott refinery has a production capacity of 20,000,000 gallons per year. Biodiesel production was achieved at the refinery’s full rated capacity in February 2008. We had previously executed a tolling agreement with Scott for the right to buy 50% of this facility’s production over an initial ten year period at approximately the production cost, excluding plant depreciation, plus a mark-up. We were required to pay a tolling fee and other costs to purchase this production capacity. The agreement commenced in September 2008, and as of October 31, 2008 we had paid approximately $3,390,000 in tolling fees and other costs and had purchased approximately 221,000 gallons of biodiesel related to this agreement. However, in October 2008, we disputed the calculation of the purchase price of the biodiesel and ultimately refused to take delivery of any additional product. As a result, Scott exercised its right to request a termination of the agreement, and we accepted the request. Under the terms of the tolling agreement, as amended, we believe we have no further obligations to Scott under the tolling agreement.
More recent results of operations reflect our transition from engineering and construction activities to biodiesel production and operations. Beginning in September 2007, our operations began to reflect the costs of completing, starting up, testing and operating our own refineries. Our first revenue from biodiesel and related co-product sales occurred in September 2007 with the acquisition of the Clinton County refinery, which we had previously designed and built for a third party. On March 31, 2008, we commissioned our Seneca refinery and began the start up, testing and transition to commercial operations. Our Seneca refinery was certified as substantially complete in September 2008, although additional work and testing must be completed prior to certification of final completion.
As noted above, our current business focus is to operate our biodiesel refineries profitably with sufficient capital. To achieve this objective, we must accomplish the measures described below for each of our refineries.
Seneca Refinery
As noted above, our Seneca refinery is designed to have production capacity of 60,000,000 gallons per year. The refinery consists of three independent production systems or trains, each capable of producing and refining 2,400 gallons per hour or 20 million gallons per year of biodiesel, which would require approximately 3,500,000 pounds of feedstock per week per train. Due to the recent volatility of the economic environment and the seasonality of biodiesel usage and sales, it would not be profitable to operate the refinery at this level. The current relative prices of biodiesel and feedstock do not provide for acceptable profit margins as production increases. In addition, we currently do not have sufficient working capital at the Seneca project subsidiary in order to operate the refinery at full capacity, should the markets allow. We are seeking additional debt or equity financing, such as through expansion of our working capital credit facility from $5,000,000 to $20,000,000 through syndication of the facility with additional lenders or through tolling arrangements with market participants, to obtain the desired working capital. Until such time, our plan is to operate the Seneca refinery at 50% to 70% capacity, which we believe can be supported by our current levels of working capital and would result in breakeven to slightly profitable results at the refinery level depending on feedstock costs, biodiesel sales prices and operational efficiency.
Our Seneca refinery is supported by two business partners: Lipid Logistics, LLC, (“Lipid”), an affiliate of Kaluzny Bros., Inc., which supplies the Seneca refinery’s feedstock requirements and Gavilon, LLC (“Gavilon”), formerly ConAgra Trade Group, which purchases the biodiesel fuel produced and manages the truck, rail and barge transportation logistics for the refinery.
All three production trains have been operated at rated capacity, processing feedstock with free fatty acid levels in excess of 10%, including a test run using only high free fatty acid corn oil extracted from dried distillers grains, to produce ASTM D6751 quality biodiesel. To date, the Seneca refinery has produced approximately 18,000,000 gallons of biodiesel. As noted above, the refinery achieved substantial completion in September 2008. Substantial completion is defined as a
34
Table of Contents
milestone in which the refinery has achieved minimum performance requirements for product quality, throughput and yield at 80% of the overall rated capacity of the refinery. This milestone indicates that the technology functions as designed, the construction is complete, and commissioning, startup and training of operations staff have reached a point in which the refinery is considered self sufficient.
Clinton County Refinery.
Our Clinton County, Iowa refinery is fully operational and has a production capacity of 10,000,000 gallons per year. We designed and constructed this refinery for a third party, and it became operational in August 2006. In September 2007, we acquired the refinery from the original owners. Currently, our Clinton County refinery can only process feedstocks with a composite free fatty acid content of up to 2%. After acquiring the refinery, we implemented certain capital improvements designed to enhance reliability and stability and began to operate the refinery using a blend of low free fatty acid feedstocks, such as choice white grease and tallows, to develop operator experience and to take advantage of the summer season when biodiesel sales prices tend to be higher. We plan capital expenditures of between $3,500,000 and $6,500,000 over the next year to enable the refinery to process feedstock with higher free fatty acid content, and we may make additional capital expenditures to improve reliability and operating efficiency. The additional equipment that we intend to add will enable the plant to continue to produce the same superior quality biodiesel but from a much wider range of lower cost feedstocks that include animal-derived fats, oils and greases and high free fatty acid corn oil extracted from dried distiller grains. This plant suffered a minor fire in October of 2008 and all repairs were completed in December of 2008. Production is scheduled to resume in the first calendar quarter of 2009 should market conditions remain favorable.
Process Economics
Biodiesel production costs are highly dependent on feedstock prices, with feedstock representing approximately 75% to 85% of the finished product cost. Our biodiesel refineries have a design yield standard of between 8.0 and 8.7 pounds per gallon depending upon feedstock impurities. Processing costs, including depreciation, capital costs and interest, net of co-product revenue are approximately $0.90 to $1.00 per gallon when operating at full capacity. Sales prices for B100 produced from animal-derived fats typically range from approximately $0.20 under to $0.20 over the wholesale (rack) prices for #2 petroleum diesel. The variability in the price of this B100 when compared to petroleum diesel is due, in part, to the federal biodiesel excise tax credit received by petroleum blenders, state tax incentives and biodiesel use mandates. Sales price for B100 produced from soybean oil, canola oil or corn oil typically range from approximately $0.80 to $1.10 over the wholesale (rack) prices for #2 petroleum diesel. The higher spreads for these types of B100 are due, in part, to the perceived advantages of a lower cloud point of the finished product, a difference we believe becomes negligible when blended to a level at or below B20. We have noted that there appears to be no price differential for B20 and lower blends based on the source of B100 used as a blendstock. B100 sales prices actually received may vary from these ranges due to forward sales commitments, disruptions in supply and demand, seasonal variations with higher cloud point B100 receiving a lower spread during colder months, geographic region of the country, industry and fleet acceptance of biodiesel blends and other factors. Our plan is to take advantage of our multi-feedstock technology to use the lowest cost feedstock available in the requisite quantities to generate the highest margin possible based on prevailing prices for B100. This dramatic drop in retail diesel fuel prices has contributed greatly to the instability of the B100 market.
Execution of Current Plan
Execution of our business plan for the next twelve months will require the ability to generate cash flow to satisfy planned operating and capital expenditure requirements for our refining and marketing business. We currently do not have sufficient cash reserves to meet all of our anticipated expenditure obligations for operating and capital purposes for fiscal year 2009. As a result, we are in the process of seeking additional capital, particularly with respect to procuring working capital sufficient for operation of our Seneca refinery at full capacity, completing our planned modifications and operation of our Clinton County refinery and corporate overhead.
We must secure additional financing of approximately $20,000,000 to fund additional working capital requirements as the Seneca refinery reaches full production to cover general and administrative expenses and to pay operating expenses that are expected to be incurred before our refining operations become profitable. The additional capital may be provided by common or preferred equity or equity-linked securities, debt, tolling arrangements with industry participants, project financing, joint venture projects, a strategic business combination, particularly with a strategic partner with access to low-cost feedstocks such as corn oil extracted from dried distillers grains, or a combination of these.
We must successfully bring the Seneca refinery through demonstration of final completion standards to the satisfaction of the project lender. Biodiesel produced must meet or exceed the industry’s product specifications and quality
35
Table of Contents
standards. In addition, production volume must be taken to the rated capacity. We intend to make capital improvements intended to allow the Clinton County refinery to process lower cost, high free fatty acid feedstocks and potentially to improve reliability and operating efficiency.
There has been a recent deterioration in the debt and equity capital markets for alternative energy companies. Accordingly, there can be no assurance that we will be successful in raising additional capital in fiscal year 2009. Any such funds will supplement cash generated from operations at our refineries.
Long-Term Plan of Operations
As soon as practicable after both of our refineries are operating profitably with sufficient capital, our objective is to build additional biodiesel refineries in the twelve to eighteen month period thereafter that will have an additional 120,000,000 to 140,000,000 gallons of annual biodiesel production capacity. We currently own certain long-lead time process equipment for such capacity, which is ready to be installed upon completion of site selection, permitting and preparation. Upon completion of such biodiesel refineries, we will have 190,000,000 to 210,000,000 gallons of annual biodiesel production capacity. Until our refineries are operating profitably with sufficient capital, however, implementation of our long-term business strategy will consist mostly of planning and financing activities only.
We have been evaluating potential sites for additional refineries, which we anticipate would incorporate our 20,000,000 gallon process train configuration successfully employed at our Seneca refinery. We will evaluate a number of factors when selecting a site for development of future refineries, including the terms and conditions of the land purchase or lease, economic incentives provided by the seller or lessor, the nature of legislation or policies in the site’s jurisdiction promoting the production of biodiesel, existing storage, production and distribution infrastructure, availability of feedstock, market appetite for our finished products, jurisdictional permitting requirements, available labor markets, and existing site logistics and utility support infrastructure. Site selection would also depend on whether business or joint venture partners that can provide us strategic benefits in terms of long-term feedstock supply contracts, long-term commitments to buy biodiesel and capital commitments necessary to engineer, construct and operate biodiesel plants domestically and internationally are present and will avail themselves. We have had discussions with third parties regarding the terms for acquisition or lease of future sites and expect that we will likely continue to seek additional sites. No assurances can be given as to if or when these discussions will result in a definitive agreement.
Additional refineries will require us to seek qualified, experienced and effective professionals to enhance our management team. Qualified refinery operators, technicians, managers and engineers are in short supply; however, we believe that we will be in a position to offer attractive professional opportunities for these individuals. Each biodiesel refinery is expected to require approximately 30 to 40 full-time employees to operate. Consequently, if we are successful in bringing on-line three or more biodiesel refineries in fiscal years 2009 and 2010, we would need to hire approximately 90 to 120 additional full-time employees to operate our facilities.
Company History
Nova Biosource Fuels, Inc. was originally incorporated under the name Nova Oil, Inc. on February 25, 2000 under the laws of the State of Nevada and was organized primarily for the purpose of acquiring, either alone or with others, interests in developed producing oil and gas leases, with the objective of establishing steady cash flows from operations. As of October 19, 2005, Nova Oil completed the sale of all of its oil and gas well interests. As a result, Nova Oil became a “shell company,” as the term is defined under the Securities Exchange Act of 1934, as amended, because it ceased conventional oil and gas exploration and production operations and shifted its primary activity to seeking merger or acquisition candidates with whom it could either merge or acquire.
Our engineering and construction subsidiary, Biosource America, Inc., was incorporated in Texas on December 1, 2005, which is the date that we use as our date of inception for accounting purposes. On February 10, 2006, Biosource America completed the acquisition of substantially all of the assets of Biosource Fuels, LLC (an independent and non-affiliated company), which had been in the business of engineering, construction and licensing of processes and technologies for the refining of biodiesel and related co-products from animal-derived fats, oils and greases and vegetable-based oils.
On March 31, 2006, Nova Oil completed a share exchange and issued 40,000,000 shares of its common stock in exchange for all of the shares of common stock of Biosource America. As a result of the share exchange, Biosource America became a wholly-owned subsidiary of Nova Oil. A change of control of Nova Oil occurred because the former Biosource America shareholders acquired approximately 86% of the issued and outstanding shares of Nova Oil’s common stock. At that point, Nova Oil ceased being a “shell company” and became an energy company with long-term plans to refine and market
36
Table of Contents
standard biodiesel. An additional 23,462,523 shares of common stock were issued on April 24, 2006 as a result of a three for two forward stock split.
For accounting purposes, this transaction was treated as an acquisition of Nova Oil by Biosource America coincident with a recapitalization of Biosource America. The historical financial statements and other information prior to March 31, 2006, unless expressly stated otherwise, are those of Biosource America. In connection with the share exchange, Nova Oil changed its fiscal year end from December 31 to October 31 to conform to the fiscal year end of Biosource America. On September 12, 2006, Nova Oil changed its name to Nova Biosource Fuels, Inc.
Originally, our common stock was quoted on the Over-The-Counter Bulletin Board System under the symbol “NVBF.” On May 9, 2007, the American Stock Exchange approved our listing application to trade our common stock on that exchange. Our common stock started trading on the American Stock Exchange under the symbol “NBF” on May 14, 2007.
In July 2008, we relocated our principal administrative offices from Houston, Texas to Butte, Montana and consolidated our accounting functions. Our Chief Executive Officer and other senior executive officers maintain an executive office in Houston, Texas. Our Chief Financial Officer relocated to our flagship biodiesel refinery in Seneca, Illinois to improve efficiency and reduce administrative costs. The corporate accounting offices were also consolidated in Butte, Montana.
LIQUIDITY AND CAPITAL RESOURCES
Consolidated Cash Balances
As of October 31, 2008, we had a cash balance of $1,625,000 down from a balance of $26,165,000 at October 31, 2007. Summarized immediately below and discussed in more detail in the subsequent sub-sections are the main elements of the $24,540,000 net decrease in cash during the year ended October 31, 2008:
o | Financing activities: | | $37,361,000 of net cash provided by financing activities, primarily from fundings under the $41,000,000 senior secured credit facility obtained in December 2007, which is discussed in Note 9 to the Consolidated Financial Statements. |
| | | |
o | Investing activities: | | $27,243,000 of net cash used in investing activities, primarily to build our own refineries and fund restricted cash accounts required by certain of our debt agreements. The majority of the construction expenditures relate to the Seneca refinery, which is discussed in Note 4 to the Consolidated Financial Statements. The restricted cash and investment accounts are discussed in Note 6 to the Consolidated Financial Statements. |
| | | |
o | Operating activities: | | $34,658,000 of net cash used in operating activities, primarily for operation of the Clinton County refinery and start-up and operation of the Seneca refinery, and to cover general and administrative expenses. |
As of October 31, 2008, we had a restricted cash balance of $12,312,000, up from a balance of $11,125,000 at October 31, 2007 which is discussed in a subsequent sub-section and in Note 6 to the Consolidated Financial Statements.
37
Table of Contents
Cash Flows from Financing Activities
Current Activity
In December 2007, we entered into a credit agreement with WestLB AG, New York Branch for a $41,000,000 senior secured credit facility. The facility includes a $36,000,000 construction loan that will convert to a 60-month term loan upon final completion of the Seneca, Illinois refinery and a $5,000,000 working capital and letter of credit facility. As of October 31, 2008, $36,000,000 had been received under the construction loan and $5,000,000 had been received under the working capital loan. We incurred and paid $2,253,000 of costs associated with this debt. We are seeking to expand our working capital credit facility from $5,000,000 to $20,000,000 through syndication of the facility with additional lenders to obtain the desired working capital. On September 11, 2008, we amended the credit facility, which is described in Note 9 to the Consolidated Financial Statements, to provide that as soon as reasonably practicable $3,000,000 held by Sterling Bank in the sponsor support account, which is a restricted cash account described in Note 6 to the Consolidated Financial Statements, will be released to Nova Seneca for payment of feedstocks utilized for commissioning, performance tests, and operation of the Seneca biodiesel refinery. These funds were released and utilized in October 2008. The credit agreement requires the Seneca refinery to sweep a significant portion of its cash flow – 100% of its cash flow unless and until various required reserve accounts are filled and the federal biodiesel excise tax credit is extended past December 31, 2009 – into a number of reserve escrow accounts until repayment of the loan. Until such time as our Seneca refinery generates sufficient revenue to fill the various required reserve accounts, such revenue will not be available to fund ongoing working capital and corporate overhead requirements for the other Nova entities. The credit agreement does provide, however, for a services agreement between Nova Seneca and a Nova services subsidiary with respect to management, administrative, engineering and technical services provided by Nova employees to the refinery. The services agreement was effective in February 2008 and provides for payment of fixed monthly fees of $158,000, plus compensation for services necessary to address matters outside of the ordinary course of constructing, operating and owning the refinery at a rate of $200 per hour, plus reimbursement of third party costs and expenses. During the commissioning and start-up period for the Seneca refinery, such fees were not paid due, in part, to the limited working capital available to the refinery.
We repaid our note payable of $2,520,000 to Centrue Bank in February 2008 and borrowed $1,189,000 from the same bank. The new debt is secured by a mortgage on the land held by our project subsidiary, Nova Biofuels Seneca SIP, LLC.
Prior Years Activity.
The $96,849,000 of net cash provided by financing activities during the year ended October 31, 2007 was primarily related to issuing equity securities in a private placement during December 2006 ($43,795,000 of net proceeds), the issuance of a promissory note payable to a bank in January 2007 for $2,520,000 for the purchase of land being used for the site of the Seneca refinery, and an offering of $55,000,000 of convertible senior secured notes used for the purchase of the Clinton County refinery which netted $50,958,000 after paying issuance costs.
The $23,085,000 of net cash raised from financing activities during the period from inception (December 1, 2005) through October 31, 2006 was primarily related to issuing equity securities in a private placement during July 2006 ($18,939,000) and the sale of a minority interest in a subsidiary that owns and will operate our refinery in Seneca, Illinois ($4,000,000).
Planned Activity
We will need to enter into additional debt and equity financing arrangements to meet our projected financial needs for operations and for construction of additional biodiesel refineries that we will own and operate for ourselves. The financing may consist of debt, tolling arrangements with industry participants, common or preferred stock, project financing, joint venture projects, a strategic alliance or business combination or a combination of these financing techniques. Additional debt will increase our leverage and interest costs and will likely be secured by certain of our assets (other than the Clinton County refinery). Additional equity or equity-linked financings will likely have a dilutive effect on our existing equity and equity-linked securities holders. It is likely that the terms of any project financing would include customary financial and other covenants on our project subsidiaries, including restrictions on the ability to make distributions, to guarantee indebtedness, and to incur liens on the refineries of such project subsidiaries.
We have an effective universal shelf registration statement for the offer and sale from time to time on a delayed or continuous basis in one or more offerings of up to $200,000,000 of securities which may consist of common stock, preferred stock, depositary shares, debt securities which may include guarantees of the debt securities by some or all of our
38
Table of Contents
subsidiaries, warrants to acquire common stock, preferred stock or debt securities, or units comprising one or more classes of these types of securities. So long as our market capitalization held by non-affiliates is less than $75,000,000, our use of the shelf registration statement is limited to one-third of our market capitalization held by non-affiliates in any 12 month period. No securities have yet been offered or sold under this registration statement.
We intend to use the net proceeds of any offering under the shelf registration statement for general corporate purposes, reducing or repaying existing or future indebtedness, providing additional working capital, acquiring and developing sites for future biodiesel refineries, capital expenditures and construction costs for existing biodiesel refinery projects and future biodiesel refineries, procuring equipment and supplies for biodiesel refineries, providing credit support for project financing and acquiring interests or companies in biodiesel and related businesses.
Cash Flows from Investing Activities
Current Activity
During the year ended October 31, 2008, we spent approximately $26,012,000 for equipment and construction costs at our plant sites, primarily for the Seneca refinery. Included in this amount was $337,000 that we paid for new construction at the Clinton County refinery.
During the year ended October 31, 2008, we deposited cash into restricted cash and investment accounts in accordance with requirements of certain of our debt agreements. We deposited $5,000,000 in an escrow account with WestLB as security for any construction cost overruns at the Seneca refinery. We also deposited $5,000,000 with Chicago Title and Trust Company as security for possible construction liens against our Seneca refinery. Interest payments of $5,500,000 on our convertible notes were paid from the restricted cash account, established upon issuance of the notes, to pay interest on the notes through September 2009. At October 31, 2008, our restricted cash and investments were $12,312,000.
Prior Years Activity.
The $70,244,000 of net cash used in investing activities during the year ended October 31, 2007 was primarily related to the acquisition of 54 acres of land for our Seneca refinery ($3,650,000), equipment and construction expenditures for the Seneca refinery ($39,142,000), long-lead time processing equipment for future refineries ($5,402,000), and certain liabilities assumed in the acquisition of the Clinton County refinery ($10,688,000).
There was $1,000,000 of cash investing activity in the prior year period from inception (December 1, 2005) through October 31, 2006 that was related to the purchase price of approximately $6,000,000 for the assets and working capital of Biosource Fuels, LLC (an independent and non-affiliated company). The balance of $5,000,000 of the purchase price for the assets was paid by issuing a note payable. The note payable was subsequently repaid by issuing common stock. A premium of $1,413,000 in the value of common stock issued in exchange for the note payable was charged as a non-cash interest expense as a result of the exchange of the note for stock. In addition, expenditures of $4,289,000 were made for equipment and construction costs at our plant sites.
Planned Activity
As of October 31, 2008, Chicago Title and Trust Company (“Chicago Title”) released the final amount of the $5 million of restricted cash and investments, which had been held by Chicago Title as security for possible construction liens against our Seneca refinery.
The costs to build additional refineries with an estimated production capacity of 120,000,000 gallons per year are estimated to be between $170,000,000 and $190,000,000. These cost estimates include land acquisition costs, costs of related or ancillary infrastructure and working capital costs but not interest costs capitalized during construction.
At October 31, 2008, we had recorded cumulative construction expenditures of $11,772,000, with respect to our additional refineries, excluding Seneca, which was transferred to operating assets prior to October 31, 2008. Continued construction of our second and third refineries will depend on finalization of site selection and is subject to securing additional financing.
The Clinton County refinery already produces biodiesel of a much higher quality than biodiesel produced from traditional, water-intensive processes used by most other biodiesel producers who primarily rely on high-cost vegetable-based
39
Table of Contents
oils. We plan capital expenditures of between $3,500,000 and $6,500,000 over the next year to enable the refinery to process feedstock with higher free fatty acid content. The additional equipment that we intend to add will enable the plant to continue to produce the same superior quality biodiesel but from a much wider range of lower cost feedstocks that include animal-derived fats, oils and greases. We may also make additional capital expenditures to improve reliability and operating efficiency of the refinery.
After installing the additional equipment, we intend to work with the Clinton Regional Development Corporation to procure additional acreage and railroad access for the site to permit expansion of the refinery’s capacity by up to 20,000,000 gallons per year. Such expansion would likely require us to obtain additional debt or equity financing, and there can be no assurance that the Clinton Regional Development Corporation will be able to procure the additional acreage and rail access for the site on terms and conditions acceptable to us.
Cash Flows from Operating Activities
Current Activity
During the year ended October 31, 2008, cash used in operations was $34,658,000. The primary use of cash was to support refinery operations at Clinton County and for the start-up and support of operations at the Seneca refinery.
Biodiesel and related co-product sales at Clinton County began on September 1, 2007 following acquisition of the refinery. Average monthly sales at Clinton County have been $845,000 during the year ended October 31, 2008. During this period, cost of sales has exceeded revenue, with monthly cost of sales averaging $1,162,000. Selling, general and administrative expenses at Clinton County were $205,000 during the year ended October 31, 2008.
Revenue from the Seneca refinery began in April 2008 during start-up and operational testing of the refinery. Average monthly sales at Seneca have been $7,760,000 during the period from the date of start-up through October 31, 2008. During this period, cost of sales has exceeded revenue, with monthly cost of sales averaging $8,415,000. Selling, general and administrative expenses at Seneca were $5,311,000 during the period from the date of start-up though October 31, 2008.
Prior Years Activity
Cash used in operations during the year ended October 31, 2007 was $22,266,000. The primary net use of cash in operations was completing construction of biodiesel refineries for third parties. Cash used for general corporate purposes was approximately $8,306,000 for the period and included periodic payments for the additional process equipment as discussed above, general corporate expense such as facility leases, utilities, insurance, G&A, legal and accounting expense required for SEC compliance, patent and intellectual property expenses and board member and senior management payroll and reimbursements.
Cash provided by operations during the period from inception (December 1, 2005) through October 31, 2006 was $10,311,000. The primary funding of operations was received as cash advances from customers related to biodiesel refinery design-build agreements.
Planned Activity
Operating results at our Clinton County refinery are expected to be breakeven to slightly profitable because we have already discontinued using, where possible, soybean oil and other high cost vegetable-based feedstocks and started using lower cost feedstock such as non-edible tallow with no more than a 2% free fatty acid content. Later in the year, we plan to add equipment to the refinery to enable us to process even less expensive animal-derived feedstock with free fatty acid content of up to 20%, which we expect will allow the refinery to operate profitably.
All three production trains at the Seneca refinery are capable of being operated at the full rated capacity, subject to obtaining additional working capital. Since the end of the fiscal year, we have used a mix of feedstock that incorporates more low cost, higher free fatty acid content feedstocks, which should improve the operating margin at the Seneca refinery.
40
Table of Contents
Contractual Commitments
Our material contractual obligations are composed of repayment of amounts borrowed through our convertible notes, credit facility and other notes payable and obligations under our operating lease agreements.
Contractual obligations at October 31, 2008 are as follows:
| | Payments Due by Period | |
Contractual Obligations | | Less Than 1 Year | | 1-3 Years | | 3-5 Years | | Over 5 Years | | Total | |
Convertible senior secured notes | | $ | 5,500,000 | | $ | 11,000,000 | | $ | 60,500,000 | | $ | — | | $ | 77,000,000 | |
Senior secured credit facility- construction loans | | $ | 11,234,000 | | $ | 10,680,000 | | $ | 34,045,000 | | $ | — | | $ | 55,959,000 | |
Other notes payable | | $ | 184,000 | | $ | 1,514,000 | | $ | — | | $ | — | | $ | 1,698,000 | |
Operating lease obligations | | $ | 1,049,000 | | $ | 2,029,000 | | $ | 660,000 | | $ | — | | $ | 3,738,000 | |
| | $ | 17,967,000 | | $ | 25,223,000 | | $ | 95,205,000 | | $ | — | | $ | 138,395,000 | |
In connection with the Seneca refinery, we agreed to buy 100% of the feedstock requirements for the refinery from Lipid Logistics for a ten year period at a benchmark price that will be adjusted according to the market price of the feedstock. Additionally, we will pay a service fee of one-quarter cent for every pound of feedstock purchased and we agreed to purchase a minimum of 25,000,000 gallons of feedstock per year commencing on the date of initial production of biodiesel at the refinery.
RESULTS OF OPERATIONS
Consolidated Results of Operations for the Years Ended October 31, 2008 and 2007 and the Period from Inception (December 1, 2005) through October 31, 2006
Revenue for biodiesel and related co-product sales is recognized when the products are shipped or delivered and the title and risk of loss passes to the customer. Biodiesel and related co-product revenues were $65,234,000 and costs of these sales were $74,117,000 during the year ended October 31, 2008. This produced a gross margin loss of $8,883,000 during the period. Revenue was generated throughout the period at the Clinton County refinery as well as at the Seneca refinery during the start-up and operational testing periods. Revenue was lower than projected during the year ended October 31, 2008 as we continue to bring our marketing, mechanical, technical and training processes up to full capacity at a methodical pace. In addition, the unprecedented rise in the feedstock market was not anticipated by us when we entered into forward sales commitments for B100 with no effective means to place a corresponding position for feedstock prior to start up of production. The majority of these contracts were settled as of July 31, 2008.
Our first biodiesel refining and operating costs began at the start of September 2007 with the acquisition of the Clinton County refinery. Biodiesel and related co-product revenues were $3,179,000 and costs of these sales were $3,914,000 during the year ended October 31, 2007. This produced a gross margin loss of $735,000 for the two months of operation.
Contracting revenues are recognized on the percentage-of-completion method, measured by the percentage of costs incurred to date compared to estimated total costs for each contract. Provisions for estimated losses on uncompleted contracts are made in the period in which such losses are determined. We earned contracting revenues of $2,193,000 during the year ended October 31, 2008 and incurred contracting expenses on contracts in progress of $0 for the same period. We have shifted our business plan to building refineries for our own account and away from building refineries for third parties. Due to this shift in our business, we do not anticipate recognizing contracting revenue in the future.
We earned contracting revenues of $21,759,000 during the year ended October 31, 2007 and incurred contracting expenses on contracts in progress of $27,075,000 for the same period. Contracting expenses include provisions for estimated
41
Table of Contents
contract losses of $5,316,000 which were recorded during the year ended October 31, 2007.
During the period from inception (December 1, 2005) through October 31, 2006, contracting revenues were $16,086,000 and contracting expenses were $21,912,000.
We incurred selling, general and administrative expenses of $16,464,000 during the year ended October 31, 2008. Included in this amount are non-cash, share-based compensation expense of $5,776,000 for options granted to certain key employees.
We incurred selling, general and administrative expenses of $15,003,000 during the year ended October 31, 2007. Included in this amount are non-cash, share-based compensation expense of $6,482,000 for options granted to certain key employees and $215,000 for options granted to certain key consultants under our 2006 Equity Incentive Plan.
Selling, general and administrative expenses were $21,712,000 during the period from inception (December 1, 2005) through October 31, 2006 and included $18,523,000 of non-cash, share-based compensation expense.
Interest and other income was $651,000 during the year ended October 31, 2008. We earned interest primarily on the unspent proceeds from the sale of our convertible senior secured notes in September 2007 and from investments held in restricted cash accounts. There was $1,722,000 of interest and other income during the year ended October 31, 2007. We earned this interest primarily on the unspent proceeds from the sale of our equity securities in a private placement in December 2006. There was $326,000 of interest income during the period from inception (December 1, 2005) through October 31, 2006.
Interest costs during the year ended October 31, 2008 were $9,004,000, of which $3,169,000 was capitalized as a cost of constructing our refineries. Interest costs were $599,000 during the year ended October 31, 2007, all of which were capitalized during the period. During the period from inception (December 1, 2005) through October 31, 2006, we recorded a non-cash interest expense of $1,413,000 as a result of issuing 1,333,333 shares of common stock to Biosource Fuels, LLC in exchange for the cancellation of our debt obligation that arose from the acquisition of the business of Biosource Fuels.
The net loss for the year ended October 31, 2008 was $42,298,000 or $0.38 per common share. The net loss for the year ended October 31, 2007 was $19,416,000 or $0.18 per common share. The net loss for the period from inception (December 1, 2005) through October 31, 2006 was $28,515,000 or $0.38 per common share.
CRITICAL ACCOUNTING POLICIES
Revenue Recognition
Revenues from biodiesel and related co-products are recognized when the customer has taken title and has assumed the risks and rewards of ownership, prices are fixed or determinable, and collectability is reasonably assured.
Revenues from construction contracts are recognized on the percentage-of-completion method, measured by the percentage of costs incurred to date to estimated total costs of each contract at completion. This method is used because we consider total costs to be the best available measure of progress on the contracts. Contract costs include all direct material and labor costs and indirect costs related to contract performance, such as supplies, equipment repairs, employee travel and supervisor time. Selling, general and administrative costs are charged to expense as incurred.
Provisions for estimated losses (if any) on uncompleted contracts are made in the period in which such losses are identified. Changes in job conditions, job performance and total contract values may result in revisions to costs and income and are recognized in the period in which the revisions are determined.
The asset, “Costs and estimated earnings in excess of billings on uncompleted contracts,” represents revenues recognized in excess of amounts billed.
42
Table of Contents
Impairment of Long-Lived Assets
General
In the event that facts and circumstances indicate that the cost of the long-lived assets used in our operations might be impaired, an evaluation of recoverability would be performed. If an evaluation were required, the estimated undiscounted cash flow estimated to be generated by those assets would be compared to their carrying amounts to determine if a write-down to either market value or a discounted cash flow value is required.
Intangible assets acquired in connection with the acquisition of Biosource Fuels, LLC included intellectual property and proprietary technology related to the processes developed by the acquired entity with respect to the synthesis of biodiesel and other biofuels from animal and vegetable based fats, oils and greases. The value of intellectual property and proprietary technologies and accordingly the life of the intangible assets are dependent on such factors as the cost of different sources of energy, the cost of feedstocks and other processing costs for the subject technology as well as other economic factors. We have assessed these factors and determined that these intangible assets have an indefinite life. However, in accordance with SFAS No. 142 and SFAS No. 144, these assets will be evaluated for impairment at least on an annual basis.
The amount of any impairment considered necessary would be determined by comparing the net book value of the assets in the applicable line of business to fair value determined by using methods such as the present-value of estimated future cash flows, market value or other valuation methodologies appropriate at the time, depending on the stage of development of the line of business and our intentions as to the use of the assets at the time an impairment adjustment was considered necessary.
Patent
Intangible assets with definite lives are subject to amortization. Such intangible assets consist of a purchased patent which is being amortized on a straight-line basis over the patent life of 17 years. Intangible assets with definite lives are tested for impairment if conditions exist that indicates the net carrying value may not be recoverable. These conditions may include an economic downturn, regulations relating to alternative fuels, or a change in the assessment of future operations.
Intellectual Property
Intangible assets with indefinite lives are not subject to amortization. Such intangible assets consist of intellectual property and proprietary technology. Tests for impairment are performed at least annually, or more frequently if events or circumstances indicate that the asset might be impaired. Impairment tests include a comparison of estimated undiscounted cash flows associated with the asset to the asset’s carrying amount. If the fair value is less than the carrying value of the asset, an impairment charge is recorded to reduce the value of the asset to fair value.
Business Combinations
We allocate the purchase price of acquired companies and assets to the tangible and intangible assets acquired and liabilities assumed based on their estimated fair values at the time of acquisition. We engage independent third-party appraisal firms to assist us in determining the fair value of assets acquired and liabilities assumed. This valuation requires significant estimates and judgments, especially with respect to long-lived and intangible assets.
Share Based Compensation Expense
We measure all share-based payments, including grants of employee stock options, using a fair-value based method. We use the Black-Scholes model, a standard option-pricing model, to measure the fair value of stock options granted. Determining the appropriate fair value model and calculating the value of share-based awards, which includes estimates of stock-price volatility and expected lives, requires judgment.
OFF-BALANCE SHEET ARRANGEMENTS
We do not have any off-balance sheet arrangements or commitments that have, or are reasonably likely to have, a current or future effect on our financial condition, changes in financial condition, revenues or expenses, results of operations, liquidity, capital expenditures or capital resources that is material to investors.
RECENT ACCOUNTING PRONOUNCEMENTS
We do not expect that adoption of recently issued accounting pronouncements will have a material impact on our financial position, results of operations or cash flows.
43
Table of Contents
ITEM 7A. QUANTITATIVE AND QUALITATIVE DISCLOSURES ABOUT MARKET RISK
We are exposed to various market risks, including changes in commodity prices and interest rates. Market risk is the potential loss arising from adverse changes in market rates and prices. We have not historically entered into various types of transactions involving financial instruments to manage and reduce the impact of changes in commodity prices and interest rates, although we may do so in the future in the ordinary course of business.
Commodity Price Risks
We are subject to market risk with respect to the price and availability of animal fats, the principal feedstock we use to produce biodiesel, and to a lesser extent corn oil and soybean oil. In general, rising feedstock prices result in lower profit margins and, therefore, represent unfavorable market conditions. This is especially true when market conditions do not allow us to pass along increased feedstock costs to our customers or if we have entered into fixed price forward biodiesel sales contracts as described below. The availability and price of feedstock is subject to wide fluctuations due to unpredictable factors such as chemical and soap industry demands, cattle, pork and poultry producer feeding decisions, governmental policies with respect to agriculture and international trade, weather conditions and local and global demand and supply. Assuming that the price of biodiesel and related co-products and other consumables remained constant, for the year ended October 31, 2008, a $0.10 per pound increase in the weighted-average price of animal fats and other feedstocks would have resulted in an increase of approximately $12,750,000 of our net losses based on 15 million gallons produced in the fiscal year at our Clinton County and Seneca refineries.
We are also subject to market risk with respect to biodiesel pricing. Our biodiesel sales are priced using contracts that can either be fixed; based upon the price of wholesale petroleum diesel or heating oil plus or minus a fixed amount; or based upon a market price at the time of shipment. In the case of forward biodiesel sales contracts where the price is determined at a point in the future based upon an index plus or minus a fixed amount, we assume the risk of a price decrease in the market price of biodiesel. In the case of forward biodiesel sales contracts where the price is fixed, we assume the risk of a price increase in the market price of our feedstocks. In all cases, we assume the risk of the market prices of the feedstocks and on biodiesel not being correlated such that feedstock prices could increase while biodiesel market prices decrease.
We may also be subject to market risk with respect to our supply of natural gas and other consumables, such as caustic potash or methanol, which are consumed during the production of biodiesel and its co-products and has historically been subject to volatile market conditions. Natural gas prices and availability are affected by weather conditions, overall economic conditions and foreign and domestic governmental regulation. Assuming that the price of feedstock, biodiesel and related co-products and other consumables remained constant, for the year ended October 31, 2008, a $0.10 per million cubic feet increase in the weighted-average price of natural gas would have resulted in an increase of approximately $132,000 of our net losses based on 15 million gallons produced in the fiscal year at our Clinton County and Seneca refineries. Assuming that the price of feedstock, biodiesel and related co-products and other consumables remained constant, for the year ended October 31, 2008, a $0.10 per gallon increase in the weighted-average price of methanol would have resulted in an increase of approximately $187,500 of our net losses based on 15 million gallons produced in the fiscal year at our Clinton County and Seneca refineries. Assuming that the price of feedstock, biodiesel and related co-products and other consumables remained constant, for the year ended October 31, 2008, a $0.10 per pound increase in the weighted-average price of caustic potash would have resulted in an increase of approximately $165,000 of our net losses based on 15 million gallons produced in the fiscal year at our Clinton County and Seneca refineries.
During the twelve months ended October 31, 2008, we did not have any derivative instruments that were designated and accounted for as hedges.
Interest Rate Risk
As of October 31, 2008, $41.0 million of our outstanding floating rate debt was at a weighted-average rate of 10% per annum. An increase in WestLB’s base rate of 1% would increase our interest expense by $410,000 million per year. We have not entered into any interest rate swaps or other instruments to mitigate interest rate risk but may do so in the future.
44
Table of Contents
ITEM 8. FINANCIAL STATEMENTS AND SUPPLEMENTARY DATA
Index to Consolidated Financial Statements
| Page |
Report of Independent Registered Public Accounting Firm | 46 |
| |
Report of Independent Registered Public Accounting Firm on Internal Control over Financial Reporting | 47 |
| |
Consolidated Balance Sheets as of October 31, 2008 and 2007 | 49 |
| |
Consolidated Statements of Operations for the years ended October 31, 2008 and 2007 and the Period from Inception (December 1, 2005) through October 31, 2006 | 50 |
| |
Consolidated Statements of Changes in Stockholders’ Equity for the years ended October 31, 2008 and 2007 and the Period from Inception (December 1, 2005) through October 31, 2006 | 51 |
| |
Consolidated Statements of Cash Flows for the years ended October 31, 2008 and 2007 and the Period from Inception (December 1, 2005) through October 31, 2006 | 52 |
| |
Notes to Consolidated Financial Statements | 53 |
45
Table of Contents
REPORT OF INDEPENDENT REGISTERED PUBLIC ACCOUNTING FIRM
To the Board of Directors
Nova Biosource Fuels, Inc.
Houston, Texas
We have audited the accompanying consolidated balance sheets of Nova Biosource Fuels, Inc. and its subsidiaries as of October 31, 2008 and 2007, and the related consolidated statements of operations, changes in stockholders’ equity and cash flows for the years ended October 31, 2008, 2007 and the period from inception (December 1, 2005) through October 31, 2006. These financial statements are the responsibility of Nova’s management. Our responsibility is to express an opinion on these financial statements based on our audits.
We conducted our audits in accordance with standards of the Public Company Accounting Oversight Board (United States). Those standards require that we plan and perform the audit to obtain reasonable assurance about whether the financial statements are free of material misstatement. An audit includes examining, on a test basis, evidence supporting the amounts and disclosures in the financial statements. An audit also includes assessing the accounting principles used and significant estimates made by management, as well as evaluating the overall financial statement presentation. We believe that our audits provide a reasonable basis for our opinion.
In our opinion, the consolidated financial statements referred to above present fairly, in all material respects, the financial position of Nova Biosource Fuels, Inc. and its subsidiaries as of October 31, 2008 and 2007, and the results of their operations and their cash flows for the periods described in conformity with accounting principles generally accepted in the United States of America.
The accompanying financial statements have been prepared assuming that Nova will continue as a going concern. As discussed in Note 1 to the financial statements, Nova has a working capital deficit, an accumulated deficit and continues to use cash in operations, which raises substantial doubt about its ability to continue as a going concern. Management’s plans regarding those matters also are described in Note 1. The financial statements do not include any adjustments that might result from the outcome of this uncertainty.
/s/ Malone & Bailey, PC
www.malone-bailey.com
Houston, Texas
January 28, 2009
46
Table of Contents
REPORT OF INDEPENDENT REGISTERED PUBLIC ACCOUNTING FIRM ON INTERNAL CONTROL OVER FINANCIAL REPORTING
To the Board of Directors and Shareholders
Nova Biosource Fuels, Inc.
Houston, Texas
We have audited Nova Biosource Fuels, Inc.’s internal control over financial reporting as of October 31, 2008, based on criteria established in Internal Control—Integrated Framework issued by the Committee of Sponsoring Organizations of the Treadway Commission (the COSO criteria). Nova Biosource Fuels, Inc.’s management is responsible for maintaining effective internal control over financial reporting and for its assessment of the effectiveness of internal control over financial reporting. Our responsibility is to express an opinion on the Company’s internal control over financial reporting based on our audit.
We conducted our audit in accordance with the standards of the Public Company Accounting Oversight Board (United States). Those standards require that we plan and perform the audit to obtain reasonable assurance about whether effective internal control over financial reporting was maintained in all material respects. Our audit included obtaining an understanding of internal control over financial reporting, assessing the risk that a material weakness exists, and testing and evaluating the design and operating effectiveness of internal control based on the assessed risk. Our audit also included performing such other procedures as we considered necessary in the circumstances. We believe that our audit provides a reasonable basis for our opinion.
A company’s internal control over financial reporting is a process designed to provide reasonable assurance regarding the reliability of financial reporting and the preparation of financial statements for external purposes in accordance with generally accepted accounting principles. A company’s internal control over financial reporting includes those policies and procedures that (1) pertain to the maintenance of records that, in reasonable detail, accurately and fairly reflect the transactions and dispositions of the assets of the company; (2) provide reasonable assurance that transactions are recorded as necessary to permit preparation of financial statements in accordance with generally accepted accounting principles, and that receipts and expenditures of the company are being made only in accordance with authorizations of management and directors of the company; and (3) provide reasonable assurance regarding prevention or timely detection of unauthorized acquisition, use, or disposition of the company’s assets that could have a material effect on the financial statements.
Because of its inherent limitations, internal control over financial reporting may not prevent or detect misstatements. Also, projections of any evaluation of effectiveness to future periods are subject to the risk that controls may become inadequate because of changes in conditions, or that the degree of compliance with the policies or procedures may deteriorate.
A material weakness is a deficiency, or combination of deficiencies, in internal control over financial reporting, such that there is a reasonable possibility that a material misstatement of the company’s annual or interim financial statements will not be prevented or detected on a timely basis. The following material weaknesses have been identified and included in management’s assessment:
· Management has determined that the Company did not maintain effective controls over the accuracy of share based compensation. Accordingly, there was a material weakness in internal controls over the Company’s share based compensation process.
· Management has determined that the Company did not maintain effective controls over the accuracy of revenue recognition. Accordingly, there was a material weakness in internal controls over the Company’s revenue recognition process.
· Management determined that the Company lacked sufficient qualified personnel to monitor the operating effectiveness of internal controls and the effective completion of its financial reporting processes. This inadequate level of skilled resources resulted in ineffective oversight of the Company’s financial reporting process. Accordingly, there was a material weakness in internal controls over monitoring the Company’s financial reporting processes.
These material weaknesses were considered in determining the nature, timing and extent of audit tests applied in our audit of the fiscal year 2008 consolidated financial statements and this report does not affect our report dated January 28, 2009 on those financial statements.
47
Table of Contents
In our opinion, because of the effect of the material weaknesses described above on the achievement of the objectives of the control criteria, Nova Biosource Fuels, Inc. and subsidiaries has not maintained effective internal control over financial reporting as of October 31, 2008, based on the COSO criteria.
We also have audited, in accordance with the standards of the Public Company Accounting Oversight Board (United States), the consolidated balance sheets of Nova Biosource Fuels, Inc. as of October 31, 2008 and 2007, and the related consolidated statements of income, stockholders’ equity, and cash flows for the years ended October 31, 2008, 2007 and the period from inception (December 1, 2005) through October 31, 2006 and our report dated January 28, 2009 expressed an unqualified opinion thereon.
/s/ Malone & Bailey, PC
www.malone-bailey.com
Houston, Texas
January 28, 2009
48
Table of Contents
Nova Biosource Fuels, Inc. and Subsidiaries
Consolidated Balance Sheets
| | October 31, 2008 | | October 31, 2007 | |
ASSETS | | | | | |
Current Assets | | | | | |
Cash and cash equivalents | | $ | 1,625,000 | | $ | 26,165,000 | |
Accounts receivable | | 5,136,000 | | 4,578,000 | |
Inventories | | 8,054,000 | | 659,000 | |
Costs and estimated earnings in excess of billings on uncompleted contracts | | — | | 2,500,000 | |
Prepaid expenses and other current assets | | 295,000 | | 354,000 | |
Deferred debt issuance costs, short-term | | 1,113,000 | | 795,000 | |
Total current assets | | 16,223,000 | | 35,051,000 | |
Property and Equipment | | | | | |
Land | | 3,784,000 | | 3,784,000 | |
Plant and equipment, net of accumulated depreciation of $2,916,000 and $496,000, respectively | | 77,602,000 | | 11,262,000 | |
Assets being developed for our own use | | 1,000,000 | | 55,119,000 | |
Total property, plant and equipment | | 82,386,000 | | 70,165,000 | |
Intangible assets | | | | | |
Patent, net of accumulated amortization of $33,000 and $18,000, respectively | | 217,000 | | 232,000 | |
Intellectual property and proprietary technology | | 4,945,000 | | 4,945,000 | |
Purchased production capacity rights | | — | | 846,000 | |
Total intangible assets | | 5,162,000 | | 6,023,000 | |
Other Assets | | | | | |
Restricted cash and investments | | 12,312,000 | | 11,125,000 | |
Deferred debt issuance costs, net of short-term and accumulated amortization of $1,090,000 and $0, respectively | | 4,125,000 | | 3,180,000 | |
Total other assets | | 16,437,000 | | 14,305,000 | |
| | | | | |
Total Assets | | $ | 120,208,000 | | $ | 125,544,000 | |
LIABILITIES AND STOCKHOLDERS’ EQUITY | | | | | |
Current Liabilities | | | | | |
Accounts payable | | $ | 7,790,000 | | $ | 7,442,000 | |
Accrued expenses | | 2,493,000 | | 9,864,000 | |
Current portion of long-term debt | | 7,800,000 | | 72,000 | |
Total current liabilities | | 18,083,000 | | 17,378,000 | |
Long-Term Debt, less current maturities | | 89,664,000 | | 57,778,000 | |
Total liabilities | | 107,747,000 | | 75,156,000 | |
Minority interest | | 2,574,000 | | 3,980,000 | |
Stockholders’ equity | | | | | |
Preferred stock, $0.0001 par value, 5,000,000 shares authorized; no shares issued and outstanding | | — | | — | |
Common stock, $0.001 par value, 500,000,000 shares authorized; 110,199,966 shares issued | | 110,000 | | 110,000 | |
Additional paid-in capital | | 100,430,000 | | 94,653,000 | |
Accumulated deficit | | (90,229,000 | ) | (47,931,000 | ) |
Treasury stock, 152,000 shares | | (424,000 | ) | (424,000 | ) |
Total stockholders’ equity | | 9,887,000 | | 46,408,000 | |
| | | | | |
Total Liabilities and Stockholders’ Equity | | $ | 120,208,000 | | $ | 125,544,000 | |
See accompanying notes to consolidated financial statements
49
Table of Contents
Nova Biosource Fuels, Inc. and Subsidiaries
Consolidated Statement of Operations
| | | | Period from Inception
(December 1, 2005) | |
| | Year Ended | | through October 31, | |
| | October 31, 2008 | | October 31, 2007 | | 2006 | |
Revenues: | | | | | | | |
Biodiesel and related co-product sales | | $ | 65,234,000 | | $ | 3,179,000 | | $ | — | |
Contracting revenues | | 2,193,000 | | 21,759,000 | | 16,086,000 | |
Services revenues | | — | | — | | 125,000 | |
Total revenues | | 67,427,000 | | 24,938,000 | | 16,211,000 | |
Costs and expenses: | | | | | | | |
Cost of biodiesel and related co-product sales | | 74,117,000 | | 3,914,000 | | — | |
Contracting expenses | | — | | 27,075,000 | | 21,912,000 | |
Long-lived asset impairment | | 15,167,000 | | — | | — | |
Selling, general and administrative | | 16,663,000 | | 15,003,000 | | 21,712,000 | |
Total costs and expense | | 105,947,000 | | 45,992,000 | | 43,624,000 | |
Loss from operations | | (38,520,000 | ) | (21,054,000 | ) | (27,413,000 | ) |
Other income (expense): | | | | | | | |
Interest and other income | | 651,000 | | 1,722,000 | | 326,000 | |
Interest expense | | (5,835,000 | ) | (106,000 | ) | (1,426,000 | ) |
Minority interest in loss (earnings) of subsidiary | | 1,406,000 | | 22,000 | | (2,000 | ) |
Net Loss | | $ | (42,298,000 | ) | $ | (19,416,000 | ) | $ | (28,515,000 | ) |
| | | | | | | |
Basic and diluted net loss per share | | (0.38 | ) | (0.18 | ) | $ | (0.38 | ) |
Weighted-average number of shares outstanding | | 110,199,966 | | 106,542,410 | | 75,735,751 | |
See accompanying notes to consolidated financial statements
50
Table of Contents
Nova Biosource Fuels, Inc. and Subsidiaries
Consolidated Statements of Changes in Stockholders’ Equity
| | Common Stock | | | | | | | | Total | |
| | Shares | | | | Additional | | Accumulated | | Treasury | | Stockholders | |
| | Issued | | (at Par Value) | | Paid-in Capital | | Deficit | | Stock | | Equity | |
Opening balances | | 6,925,000 | | $ | 7,000 | | $ | (7,000 | ) | $ | — | | $ | — | | $ | — | |
Share exchange with Biosource America | | 40,000,000 | | 40,000 | | 356,000 | | — | | — | | 396,000 | |
Three-for-two forward stock split | | 23,462,523 | | 24,000 | | (24,000 | ) | — | | — | | — | |
Sale of common stock in private placement, net of placement fee | | 12,847,641 | | 13,000 | | 18,926,000 | | — | | — | | 18,939,000 | |
Issuance of common stock in exchange for note payable | | 1,333,333 | | 1,000 | | 6,412,000 | | — | | — | | 6,413,000 | |
Issuance of stock options to employees | | — | | — | | 12,041,000 | | — | | — | | 12,041,000 | |
Issuance of stock options for services to consultants | | — | | — | | 2,114,000 | | — | | — | | 2,114,000 | |
Stock issued for services | | 17,811 | | — | | 34,000 | | — | | — | | 34,000 | |
Issuance of restricted stock to employee | | 1,000,000 | | 1,000 | | 4,299,000 | | — | | — | | 4,300,000 | |
Issuance of restricted stock to directors for director’s fees | | 50,000 | | — | | 10,000 | | — | | — | | 10,000 | |
Issuance of stock to directors in lieu of director’s fees | | 10,050 | | — | | 24,000 | | — | | — | | 24,000 | |
Net loss | | — | | — | | — | | (28,515,000 | ) | — | | (28,515,000 | ) |
Balance at October 31, 2006 | | 85,646,358 | | $ | 86,000 | | $ | 44,185,000 | | $ | (28,515,000 | ) | $ | — | | $ | 15,756,000 | |
Sale of common stock in private placement, net of placement fee | | 24,352,334 | | 24,000 | | 43,771,000 | | — | | — | | 43,795,000 | |
Issuance of stock options to employees | | — | | — | | 6,403,000 | | — | | — | | 6,403,000 | |
Issuance of stock options for services to consultants | | — | | — | | 215,000 | | — | | — | | 215,000 | |
Issuance of restricted stock to directors for director’s fees | | 95,460 | | — | | 64,000 | | — | | — | | 64,000 | |
Issuance of stock to directors in lieu of director’s fees | | 5,456 | | — | | 15,000 | | — | | — | | 15,000 | |
Exercise of warrants, net issuance | | 100,358 | | — | | — | | — | | — | | — | |
Repurchase of common stock for treasury (152,000 shares) | | — | | — | | — | | — | | (424,000 | ) | (424,000 | ) |
Net loss | | — | | — | | — | | (19,416,000 | ) | — | | (19,416,000 | ) |
Balances at October 31, 2007 | | 110,199,966 | | 110,000 | | 94,653,000 | | (47,931,000 | ) | (424,000 | ) | 46,408,000 | |
Issuance of stock options to employees | | — | | — | | 5,667,000 | | — | | — | | 5,667,000 | |
Issuance of restricted stock to directors for director’s fees | | — | | — | | 110,000 | | — | | — | | 110,000 | |
Net loss | | — | | — | | — | | (42,298,000 | ) | — | | (42,298,000 | ) |
Balances at October 31, 2008 | | 110,199,966 | | $ | 110,000 | | $ | 100,430,000 | | $ | (90,229,000 | ) | $ | (424,000 | ) | $ | 9,887,000 | |
See accompanying notes to consolidated financial statements
51
Table of Contents
Nova Biosource Fuels, Inc. and Subsidiaries
Consolidated Statements of Cash Flows
| | | | | | Period from | |
| | | | | | Inception | |
| | | | | | (December 1, 2005) | |
| | Year Ended | | through October 31, | |
| | October 31, 2008 | | October 31, 2007 | | 2006 | |
Cash Flows from Operating Activities | | | | | | | |
Net loss | | $ | (42,298,000 | ) | $ | (19,416,000 | ) | $ | (28,515,000 | ) |
Adjustments to reconcile net loss to net cash used in operating activities: | | | | | | | |
Depreciation and amortization | | 3,019,000 | | 403,000 | | 122,000 | |
Impairment loss on long-lived assets | | 15,167,000 | | — | | — | |
Minority interest in (loss) earnings of subsidiary | | (1,406,000 | ) | (22,000 | ) | 2,000 | |
Interest expense upon exchange of note for common stock | | — | | — | | 1,413,000 | |
Share-based compensation for employees and directors | | 5,777,000 | | 6,482,000 | | 16,375,000 | |
Share-based compensation for consultants and agents | | — | | 215,000 | | 2,148,000 | |
Decrease in estimated losses on construction contracts | | (1,545,000 | ) | — | | | |
Changes in assets and liabilities | | | | | | | |
Accounts receivable | | (558,000 | ) | (3,966,000 | ) | — | |
Inventories | | (7,395,000 | ) | (344,000 | ) | — | |
Costs and estimated earnings in excess of billings on uncompleted contracts | | — | | (1,543,000 | ) | (1,803,000 | ) |
Prepaid expenses and other current assets | | 59,000 | | (190,000 | ) | (164,000 | ) |
Accounts payable | | 348,000 | | 2,326,000 | | 4,658,000 | |
Accrued expenses | | (5,826,000 | ) | 5,730,000 | | 4,134,000 | |
Billings in excess of costs and estimated earnings on uncompleted contracts | | — | | (11,941,000 | ) | 11,941,000 | |
Net cash (used) in operating activities | | (34,658,000 | ) | (22,266,000 | ) | 10,311,000 | |
Cash Flows from Investing Activities | | | | | | | |
Purchase of land | | — | | (3,650,000 | ) | — | |
Assets being developed for our own use | | (25,898,000 | ) | (44,544,000 | ) | (10,519,000 | ) |
Purchase of net assets in business combination | | — | | (10,688,000 | ) | (1,000,000 | ) |
Purchases of property and equipment | | (114,000 | ) | (237,000 | ) | (51,000 | ) |
Purchase of intangible assets | | (44,000 | ) | — | | — | |
Change in restricted cash and investments | | (1,187,000 | ) | (11,125,000 | ) | | |
Net cash used in investing activities | | (27,243,000 | ) | (70,244,000 | ) | (11,570,000 | ) |
Cash Flows from Financing Activities | | | | | | | |
Proceeds from private placement of stock | | — | | 47,000,000 | | 20,310,000 | |
Costs associated with sale of stock | | — | | (3,205,000 | ) | (975,000 | ) |
Sale of minority interest | | — | | — | | 4,000,000 | |
Proceeds from issuance of debt | | 42,188,000 | | 2,520,000 | | — | |
Proceeds from issuance of convertible notes | | — | | 55,000,000 | | — | |
Costs associated with issuance of debt | | (2,253,000 | ) | (4,042,000 | ) | — | |
Payments on notes payable and long-term debt | | (2,574,000 | ) | — | | (250,000 | ) |
Repurchase of common stock for treasury | | — | | (424,000 | ) | — | |
Net cash provided by financing activities | | 37,361,000 | | 96,849,000 | | 23,085,000 | |
Net Increase (Decrease) in Cash and Equivalents | | (24,540,000 | ) | 4,339,000 | | 21,826,000 | |
Cash and Equivalents – Beginning of Period | | 26,165,000 | | 21,826,000 | | — | |
Cash and Equivalents – End of Period | | $ | 1,625,000 | | $ | 26,165,000 | | $ | 21,826,000 | |
Non-cash financing and investing activities | | | | | | | |
Purchase of fixed assets and intangible assets in exchange for note payable | | $ | — | | $ | — | | $ | 5,000,000 | |
Repayment of note payable in exchange for issuance of common stock | | $ | — | | $ | — | | $ | 5,000,000 | |
Purchase of patent in exchange for issuance of note payable | | $ | — | | $ | — | | $ | 250,000 | |
Amortization of debt issuance costs added to plant and equipment | | $ | 273,000 | | $ | — | | $ | — | |
Purchase of production capacity rights in exchange for project underbilling | | $ | 2,500,000 | | $ | 846,000 | | $ | — | |
Reclassification of construction in process to property & equipment | | $ | 69,749,000 | | $ | — | | $ | — | |
See accompanying notes to consolidated financial statements
52
Table of Contents
Nova Biosource Fuels, Inc. and Subsidiaries
Notes to Consolidated Financial Statements
As of October 31, 2008
NOTE 1 – ORGANIZATION AND NATURE OF OPERATIONS
Nova Biosource Fuels, Inc. (“Nova”) is an energy company in the business of refining and marketing renewable diesel fuel products and related co-products. Nova has developed technology for the production of biodiesel fuel from animal and vegetable fats, oils and greases. It also designs and constructs facilities for the production of biodiesel fuels.
Nova’s initial focus has been to design and build biodiesel refineries for third parties while it transitions to its intended primary business of building and operating its own biodiesel refineries. At October 31, 2008, Nova had completed the construction of three biodiesel refineries planned for third parties (see Note 8), had completed construction of one biodiesel refinery for its own use and was in the process of building two other biodiesel refineries for its own use (see Note 4). All of Nova’s refineries will use its proprietary, patented process technology, which enables the use of a broad range of lower cost feedstocks.
Current Plan of Operations and Ability to Operate as a Going Concern
Execution of Nova’s business plan for the next twelve months requires the ability to generate cash flow to satisfy planned operating and capital expenditure requirements for the refining and marketing business. Nova currently does not have sufficient cash reserves to meet all of its anticipated expenditure obligations for operating and capital purposes for the next twelve months. As a result, Nova is in the process of seeking additional capital, particularly with respect to procuring working capital sufficient for operation of its Seneca and Clinton County refineries, and corporate overhead.
Nova must secure additional financing of approximately $20,000,000 to fund additional working capital requirements as the Seneca refinery reaches full production and the Clinton County refinery resumes production, to cover general and administrative expenses, and to pay operating expenses that are expected to be incurred before the refining operations at Seneca and Clinton County become profitable. The additional capital may be provided by common or preferred equity or equity-linked securities, debt, tolling arrangements with industry participants, project financing, joint venture projects, a strategic alliance or business combination, particularly with a strategic partner with access to low-cost feedstocks such as corn oil extracted from dried distillers grains, or a combination of these.
Nova must successfully bring the Seneca refinery through demonstration of final completion standards to the satisfaction of the project lender. Biodiesel produced must meet or exceed the industry’s product specifications and quality standards. In addition, production volume must be taken to the rated capacity. Nova intends to make capital improvements intended to allow Clinton County refinery to process lower cost, high free fatty acid feedstocks and potentially improve reliability and operating efficiency.
If Nova is unable to accomplish the objectives noted above with respect to entering into additional financing arrangements and potentially identifying a strategic partner, this raises substantial doubt about Nova’s ability to continue to operate as going concern. No adjustments have been made to these financial statements based upon any potential lack of ability to continue operating as a going concern.
NOTE 2 – SUMMARY OF SIGNIFICANT ACCOUNTING POLICIES
Principles of Consolidation
Nova’s consolidated financial statements include the accounts of Nova and its wholly and majority owned subsidiaries. All significant intercompany accounts and transactions have been eliminated in consolidation.
At October 31, 2008, other than Nova Holding Seneca LLC, which is subject to an 8.25% minority interest as described in Note 10, and Nova Biofuels Seneca LLC, which is a wholly-owned subsidiary of Nova Holding Seneca LLC, all of Nova’s subsidiaries are wholly-owned.
53
Table of Contents
Use of Estimates
The preparation of consolidated financial statements in conformity with accounting principles generally accepted in the United States of America requires management to make estimates and assumptions that affect the reported amounts of assets and liabilities and disclosure of contingent assets and liabilities at the date of the financial statements and the reported amounts of revenues and expenses during the reporting period. Actual results could differ from those estimates.
Cash Equivalents
Cash equivalents include highly liquid investments purchased with original maturities of three months or less. Cash equivalents of approximately $1,184,000 and $25,835,000 at October 31, 2008 and 2007, respectively, consist of certificates of deposit, money market funds, and short-term government backed investments.
Inventories
Inventories are stated at the lower of cost or market. Cost is determined using the first-in, first-out (FIFO) method using actual production costs incurred.
Inventories are reviewed for salability and obsolescence, and an allowance is provided for any inventory unlikely to be sold.
Property, Plant and Equipment
Property, plant and equipment are carried at cost. Depreciation of plant and equipment is provided using the straight-line method for financial reporting purposes at rates based on estimated useful lives as follows:
| | Estimated Useful Lives | |
Buildings and improvements | | 15-25 years | |
Tank farm | | 15-20 years | |
Plant process equipment | | 10-15 years | |
Lab equipment | | 5-7 years | |
Office equipment, furniture and fixtures | | 5 years | |
Computer equipment and software | | 5 years | |
The cost of asset additions and improvements that extend the useful lives of plant and equipment are capitalized. Routine maintenance and repair items are charged to current operations. The original cost and accumulated depreciation of asset dispositions are removed from the accounts and any gain or loss is reflected in the statement of operations in the period of disposition.
When events or changes in circumstances indicate that the carrying amount of property, plant and equipment may not be recoverable, an evaluation of the recoverability of currently recorded costs is performed. When an evaluation is performed, the estimated value of undiscounted future net cash flows associated with the asset is compared to the asset’s carrying value to determine if a write-down to fair value is required. If such assets are considered to be impaired, the impairment to be recognized is measured by the amount by which the carrying amount of the assets exceeds the fair value of the assets.
Assets Being Developed for Our Own Use
Assets being developed for our own use are stated at cost, which includes the cost of construction and other direct costs attributable to the construction, less any impairment charges. No provision for depreciation is made on assets developed for our own use until such time as the relevant assets are completed and put into service.
Nova capitalizes interest cost on borrowings incurred during the new construction or upgrade of qualifying assets. Capitalized interest is added to the cost of the underlying assets and amortized over the estimated useful lives of the assets. During the years ended October 31, 2008 and 2007, $2,652,000 and $599,000, respectively, of interest was capitalized.
54
Table of Contents
Intangible Assets
Intangible assets with definite lives are subject to amortization. At October 31, 2008 and 2007, such intangible assets consist of a purchased patent which is being amortized on a straight-line basis over the patent life of 17 years. Intangible assets with definite lives are tested for impairment whenever events or changes in circumstances indicate the carrying value may not be recoverable. These conditions may include an economic downturn, regulations relating to alternative fuels, or a change in the assessment of future operations.
Intangible assets with indefinite lives are not subject to amortization. At October 31, 2008 and 2007, such intangible assets consist of intellectual property and proprietary technology. Tests for impairment are performed at least annually, or more frequently if events or circumstances indicate that the asset might be impaired. Impairment tests include a comparison of estimated discounted cash flows associated with the asset to the asset’s carrying amount. If the fair value is less than the carrying value of the asset, an impairment charge is recorded to reduce the value of the asset to fair value.
Purchased Production Capacity Rights
Fees and other costs paid to secure the right to purchase biodiesel production capacity from refineries in which Nova has no ownership in the plant’s fixed assets and no ownership interest in the production company are capitalized. Capitalized amounts will be amortized using the straight-line method over the estimated useful life or legal term of the off-take agreement after commercial production begins. These rights are reviewed for possible impairment whenever events or circumstances indicate the carrying amount may be impaired. Subsequent to year end, the Company terminated the agreement related to the purchased production capacity rights and consequently found the intangible asset to be impaired, as described in Note 5.
Restricted Cash and Investments
Restricted cash and investments are held in trust and represent debt service reserves for payment of semi-annual interest on Nova’s convertible notes through September 30, 2009, revenue funds, funds reserved for capital expenditures, and a sponsor support escrow. At October 31, 2008, restricted cash and investments consist primarily of money market funds.
Deferred Debt Issuance Costs
Costs incurred in connection with borrowing are capitalized and amortized as an adjustment to interest expense over the term of the borrowing using the interest method. As of October 31, 2008 and 2007, $1,090,118 and $0 was included in interest expense related to these costs.
Fair Value of Financial Instruments
Various methods and assumptions are used to estimate the fair value of financial instruments. Due to their short-term nature, the carrying value of cash and cash equivalents, accounts receivable, accounts payable and accrued expenses approximate fair value. The fair value of the convertible notes and other debt is estimated based on the current rates offered to Nova for debt of similar maturities.
Biodiesel and Related Co-Product Sales Revenue Recognition
Revenue from biodiesel and related co-product sales is recognized when the products are shipped or delivered and the title and risk of loss passes to the customer. Biodiesel and related co-product sales include amounts related to the federal excise tax incentive program for blending biodiesel fuel with petroleum diesel fuel. Provisions for any product returns or discounts given to customers are accounted for as reductions in revenues in the same period revenues are recorded.
Construction Contract Revenue and Cost Recognition
Revenues from construction contracts are recognized on the percentage-of-completion method, measured by the percentage of costs incurred to date for each contract to estimated total costs of each contract at completion. This method is used because management considers total costs to be the best available measure of progress on the contracts. Contract costs include all direct material and labor costs, and those indirect costs related to contract performance, such as supplies, equipment repairs, employee travel and supervisor time. Selling, general and administrative costs are charged to expense as
55
Table of Contents
incurred. Provisions for estimated losses (if any) on uncompleted construction contracts are made in the period in which such losses are identified. Changes in job conditions, job performance and total contract values may result in revisions to costs and income and are recognized in the period in which the revisions are determined.
The asset, “Costs and estimated earnings in excess of billings on uncompleted contracts,” represents revenues recognized in excess of amounts billed. The liability, “Billings in excess of costs and estimated earnings on uncompleted contracts,” represents billings in excess of revenues recognized.
Services Revenues
Services revenues primarily consist of engineering fees. These revenues are recognized as services are performed.
Income Taxes
Nova and its subsidiaries file a consolidated federal tax return.
Nova uses the liability method in accounting for income taxes. Deferred tax assets and liabilities are recognized for temporary differences between financial statement carrying amounts and the tax bases of assets and liabilities, and are measured using the tax rates expected to be in effect when the differences reverse. Deferred tax assets are also recognized for operating loss and tax credit carry forwards. The effect on deferred tax assets and liabilities of a change in tax rates is recognized in the results of operations in the period that includes the enactment date. A valuation allowance is used to reduce deferred tax assets when uncertainty exists regarding their realization.
Net Loss per Common Share
Basic net loss per common share is calculated by dividing the net loss applicable to common shares by the weighted- average number of common and common equivalent shares outstanding during the period. For the years ended October 31, 2008 and 2007, there were no potential common equivalent shares used in the calculation of weighted-average common shares outstanding as the effect would be anti-dilutive because of the net loss.
| | | | | | Period from
Inception | |
| | Year Ended
October 31, 2008 | | Year Ended
October 31, 2007 | | (December 1, 2005)
to October 31, 2006 | |
Weighted-average shares used to compute basic and diluted net loss per common share: | | 110,199,966 | | 106,542,410 | | 75,735,751 | |
| | October 31, 2008 | | October 31, 2007 | | October 31, 2006 | |
Securities convertible into shares of common stock, not used because the effect would be anti-dilutive: | | | | | | | |
Stock options under the 2006 Equity Incentive Plan | | 8,542,365 | | 6,162,365 | | 5,698,991 | |
Stock warrants related to private party equity placements | | 15,059,326 | | 15,525,845 | | 6,872,916 | |
Common stock issuable upon conversion of convertible notes | | 15,027,322 | | 15,027,322 | | — | |
| | 38,629,013 | | 36,715,532 | | 12,676,157 | |
Stock-Based Compensation
Nova measures all share-based payments, including grants of employee stock options, using a fair-value based method in accordance with Statement of Financial Accounting Standards No. 123R, “Share-Based Payments.” The cost of services received in exchange for awards of equity instruments is recognized in the statement of operations based on the grant
56
Table of Contents
date fair value of those awards amortized over the requisite service period. Nova utilizes a standard option pricing model, the Black-Scholes model, to measure the fair value of stock options granted.
Common Stock Split
On March 31, 2006, Nova declared a three-for-two stock split effected in the form of a 50% stock dividend distributable April 24, 2006 to stockholders of record on April 10, 2006. The total number of authorized shares of common stock and par value were unchanged by the split. Nova reclassified $24,000 from additional paid-in capital to common stock, representing the par value of additional shares issued. All share and per share amounts presented in the consolidated financial statements have been adjusted to reflect the stock split.
Treasury Stock
Treasury stock is stated at cost.
Credit Risk
Financial instruments that potentially subject Nova to concentration of credit risk consist primarily of cash and cash equivalents and accounts receivable. Nova invests its excess cash in bank certificates of deposit, money market funds and short-term government obligations. These investments are generally insured or guaranteed by the U.S. Government or the Federal Deposit Insurance Corporation. There have been no credit risk losses related to these investments.
Nova performs ongoing credit evaluations of its customers’ financial condition and maintains an appropriate allowance for uncollectible accounts receivable based on the expected collectability of all accounts receivable. Nova’s accounts receivable are generally unsecured.
Risks and Uncertainties
Nova is subject to risks common to companies in the renewable fuel refining and petroleum refining industries. These risks, which could have a material and negative impact on Nova’s business, financial condition and results of operations, include, but are not limited to, loss of any significant customer, dependence on key feedstock suppliers, obtaining regulatory clearances and approvals for refineries, and changes in refined petroleum product prices.
Demand and the corresponding prices for biodiesel products can vary significantly over time and decreases in price levels could adversely affect Nova’s profitability and viability. The price for biodiesel correlates with the price for petroleum-based diesel fuel and other energy commodities. Any lowering of diesel prices may also lead to lower sales prices for biodiesel and adversely affect Nova’s operating results.
Nova’s business may depend on continuation of certain federal and state subsidies and regulatory support. Certain subsidies to the biodiesel industry may not continue beyond their scheduled expiration date or, if they continue, the incentives may not be at the same level. The revocation or amendment of any one or more of those laws, regulations or programs could adversely affect the future use of biodiesel in a material way.
Statement of Cash Flows Information
During the years ended October 31, 2008 and 2007 and the period from inception (December 1, 2005) through October 31, 2006, $4,434,000, $201,000 and $13,000, respectively, was paid in cash for interest and no cash was paid for taxes.
Reclassifications
Certain prior period amounts have been reclassified to conform with the current year presentation. These reclassifications had no effect on previously reported results of operations.
Recent Accounting Pronouncements
Nova does not expect that adoption of recently issued accounting pronouncements will have a material impact on its
57
Table of Contents
financial position, results of operations or cash flows.
NOTE 3 - - INVENTORIES
Inventories are as follows:
| | October 31, 2008 | | October 31, 2007 | |
Raw materials (feedstock and chemicals) | | $ | 3,643,000 | | $ | 415,000 | |
Work in process | | 282,000 | | 37,000 | |
Finished goods (biodiesel and related co-products) | | 4,129,000 | | 207,000 | |
Total inventories | | $ | 8,054,000 | | $ | 659,000 | |
NOTE 4 – PROPERTY, PLANT AND EQUIPMENT
Property, plant and equipment are as follows:
| | October 31, 2008 | | October 31, 2007 | |
Land | | $ | 3,784,000 | | $ | 3,784,000 | |
Land improvements | | 5,870,000 | | — | |
Plant and equipment: | | | | | |
Plant process equipment | | 66,989,000 | | 8,588,000 | |
Building and improvements | | 5,986,000 | | 1,479,000 | |
Tank farm | | 1,257,000 | | 1,257,000 | |
Lab equipment | | 191,000 | | 191,000 | |
Office equipment, furniture and fixtures | | 99,000 | | 120,000 | |
Computer equipment and software | | 126,000 | | 123,000 | |
| | 84,302,000 | | 15,542,000 | |
Less accumulated depreciation | | (2,916,000 | ) | (496,000 | ) |
| | 81,386,000 | | 15,046,000 | |
Assets being developed for our own use | | 1,000,000 | | 55,119,000 | |
Net property, plant and equipment | | 82,386,000 | | $ | 70,165,000 | |
| | | | | | | |
Depreciation expense during the years ended October 31, 2008 and 2007 and the period from inception (December 1, 2005) through October 31, 2006 was $2,420,000, $378,000 and $118,000, respectively.
Assets Being Developed for Our Own Use
Assets being developed for our own use consist of two biodiesel refineries. Construction of the two refineries will continue through fiscal year 2009, subject to available financing.
Total estimated costs to be incurred for construction of the two refineries are between $170,000,000 and $190,000,000. At October 31, 2008, construction expenditures of $12,777,000 have been recognized subject to the impairment charge discussed below. In May 2008, the Company placed the Seneca plant into service and began depreciating the plant at that time. The Company reclassified approximately $69,749,000 from construction in progress to the various long-lived assets.
In accordance with Statement of Financial Accounting Standards No. 144, “Accounting for the Impairment or Disposal of Long-Lived Assets” (“SFAS 144”), Nova performs an impairment evaluation of long-lived assets if triggering events occur.
Upon completion of the annual impairment evaluations for long-lived assets, Nova determined that the fair value of Nova’s assets being developed for their own use were impaired to their liquidation value of $1,000,000. Consequently,
58
Table of Contents
during the year ended October 31, 2008, Nova recorded an impairment charge of approximately $11,772,000, which was recorded in the statement of operations as “Long-lived asset impairment”.
NOTE 5 – INTANGIBLE ASSETS
Intangible assets are as follows:
| | October 31, 2008 | | October 31, 2007 | |
Amortizable intangible assets: | | | | | |
Patent | | $ | 250,000 | | $ | 250,000 | |
Purchased production capacity rights | | — | | 846,000 | |
Less accumulated amortization of patent | | (33,000 | ) | (18,000 | ) |
Net amortizable intangible assets | | 217,000 | | 1,078,000 | |
Indefinite lived intangible asset-intellectual property and proprietary technology | | 4,945,000 | | 4,945,000 | |
Net intangible assets | | $ | 5,162,000 | | $ | 6,023,000 | |
Amortization expense for intangible assets subject to amortization during the years ended October 31, 2008 and 2007 and the period from inception (December 1, 2005) through October 31, 2006 was $15,000, $14,000 and $4,000, respectively.
In accordance with Statement of Financial Accounting Standards No. 142, “Goodwill and Other Intangible Assets” (“SFAS 142”), Nova performs an annual impairment evaluation as of November 1st or performs an interim evaluation if triggering events have occurred.
Upon completion of the annual impairment evaluations for the other intangible assets, Nova determined that the fair value of Nova’s intellectual property and proprietary technology exceeds it carrying value of $4,945,000. Therefore, no impairment was recorded. In evaluating the purchased production capacity rights, Nova found the asset to be completely impaired due to the termination of the tolling agreement in December 2008. Consequently, during the year ended October 31, 2008, Nova recorded an impairment charge of approximately $3,390,000, which was recorded in the statements of operations as “Long-lived asset impairment”.
Intellectual Property and Proprietary Technology
Intangible assets acquired in connection with the acquisition of the assets of Biosource Fuels, LLC in February 2006 (see Note 7) relate to the processes developed by Biosource Fuels, LLC with respect to the synthesis of biodiesel and other biofuels from animal and vegetable based fats, oils and greases. The value of intellectual property and proprietary technology and the life of the intangible asset depend on factors such as the cost of different sources of energy, the costs of feedstocks and other processing costs for the subject technology, as well as other economic factors. Management has made an assessment of these factors and determined that this intangible asset has an indefinite life.
Patent
In April 2006, Nova acquired a patent closely related to its technologies for the synthesis of biodiesel and other biofuels for $250,000.
Purchased Production Capacity Rights
In March 2007, Nova entered into a biofuel tolling and off-take agreement with Scott Petroleum Corporation (“Scott”). Under the agreement, Nova agreed to purchase and Scott agreed to sell 50% of the production of Scott’s biodiesel refinery in Greenville, Mississippi at approximately the production cost, excluding plant depreciation, plus a mark-up. The annual production capacity of the plant is 20,000,000 gallons and Nova’s right to 50% of the production equaled 10,000,000 gallons annually. The agreement had a ten year term that began in August 2008 when Scott met the production requirements in order for the term of the agreement to commence. Nova would have been entitled to any tax credits available for blending biodiesel and for selling the products that it purchased pursuant to the agreement.
59
Table of Contents
Nova was required to pay a tolling fee and other costs to purchase this production capacity. Nova has no ownership in the plant’s fixed assets or responsibilities for any of the plant’s liabilities, and will have no ownership interest in the production company.
Subsequent to October 31, 2008, Nova accepted an offer to terminate the biofuel tolling and off-take agreement. Pursuant to the tolling agreement, in the event of a material breach by either party of its obligation to deliver or obligation to purchase and receive the minimum purchase amount, other than in the event of a force majeure, the non-defaulting party shall not be entitled to an award of monetary or liquidated damages and shall be entitled to injunctive relief only. Therefore, the Company believes it has no further obligations under the tolling agreement and has removed the ending inventory related to the tolling agreement and the related liability from the financial statements as of October 31, 2008. Because the inventory had been recorded at the lower of cost or market value, removing the inventory and the related liability resulted in a decrease of the existing net loss of approximately $1,318,000.
NOTE 6 – RESTRICTED CASH AND INVESTMENTS
In accordance with requirements of certain debt agreements, cash has been placed in restricted cash and investment accounts. Amounts are generally invested in short-term government backed investments and money market funds.
Restricted cash and investments are as follows:
Purpose: | | October 31, 2008 | | October 31, 2007 | |
| | | | | |
Funds held for payment of semi-annual interest on convertible secured notes | | $ | 5,572,000 | | $ | 11,072,000 | |
Revenue escrow – Seneca | | 3,786,000 | | — | |
Construction escrow – Seneca | | 871,000 | | — | |
Operating escrow – Seneca | | 1,000 | | — | |
Sponsor support escrow – Seneca | | 2,082,000 | | — | |
Centrue Bank Account | | — | | 53,000 | |
| | 12,312,000 | | $ | 11,125,000 | |
| | | | | | | |
NOTE 7 – BUSINESS COMBINATIONS
Effective September 1, 2007, Nova acquired substantially all of the assets and assumed certain liabilities of Clinton County Bio Energy, L.L.C. (“CCBE”). CCBE owned and operated a 10,000,000 gallons per year biodiesel refinery in Clinton County, Iowa, which Nova had previously constructed for CCBE pursuant to a design-build agreement.
The aggregate purchase price was $10,688,000. The fair value of assets acquired and liabilities assumed was as follows:
| | At September 1, 2007 | |
Working capital acquired: | | | |
Accounts receivable | | $ | 612,000 | |
Inventories | | 314,000 | |
Accounts payable | | (457,000 | ) |
Net working capital | | 469,000 | |
| | | |
Long-term assets and liabilities: | | | |
Land | | 135,000 | |
Plant and equipment | | 10,414,000 | |
Long-term debt | | (330,000 | ) |
Net assets acquired | | $ | 10,668,000 | |
Unaudited pro forma information, as though the companies had been combined at the beginning of the year ended October 31, 2007 is as follows:
60
Table of Contents
| | Year Ended October 31, 2007 | |
| | As Reported | | Pro forma | |
Revenues | | $ | 24,938,000 | | $ | 37,297,000 | |
Net loss | | (19,416,000 | ) | (22,548,000 | ) |
Net loss per share | | (0.18 | ) | (0.21 | ) |
| | | | | | | |
The pro forma data may not be indicative of the results that would have been obtained had this transaction actually occurred at the beginning of the period presented, nor does it intend to be a projection of future results.
NOTE 8 – CONSTRUCTION CONTRACTS
At October 31, 2008, Nova had completed construction of biodiesel refineries for CCBE in Clinton County, Iowa and for Sanimax Energy, Inc. in DeForest, Wisconsin. The biodiesel refinery for Scott Petroleum Corporation in Greenville, Mississippi was substantially complete in August 2008. In March 2008, while undergoing start-up and operational testing, a mechanical pump failure resulted in minor damage to the refinery. The owner completed repairs to the refinery. These three customers accounted for all of the contracting revenues recognized during each of the periods presented.
Effective September 1, 2007, Nova acquired the Clinton County refinery, which it had designed and built.
The percentage of completion on construction contracts is estimated based on total costs incurred to date compared to estimated total costs for each contract at completion. At October 31, 2008, total amounts of construction contracts and the estimated percentage of completion are as follows:
Contract | | Contract Amount | | Percentage of
Completion | |
| | | | | |
CCBE | | $ | 5,924,000 | | 100 | % |
Sanimax Energy, Inc. | | 17,426,000 | | 100 | % |
Scott Petroleum Corporation | | 14,834,000 | | 100 | % |
| | $ | 38,184,000 | | | |
Nova does not expect to recognize future contract revenue from these projects.
Cumulative costs and estimated earnings (losses) on contracts and related amounts billed October 31, 2008 and 2007 are as follows:
| | October 31, 2008 | | October 31, 2007 | |
| | | | | |
Cumulative costs incurred on construction contracts, including estimated losses | | $ | 47,712,000 | | $ | 48,987,000 | |
Estimated cumulative losses on construction contracts | | (9,866,000 | ) | (11,142,000 | ) |
Net costs to be billed on construction contracts | | 37,846,000 | | 37,845,000 | |
Less cumulative billings to date | | (37,846,000 | ) | (35,345,000 | ) |
Costs and estimated earnings in excess of billings on uncompleted contracts | | $ | — | | $ | 2,500,000 | |
These amounts are reflected in the accompanying consolidated balance sheets at October 31 2008 and 2007 under the following captions:
| | October 31, 2008 | | October 31, 2007 | |
| | | | | |
Costs and estimated earnings in excess of billings on uncompleted contracts | | $ | — | | $ | 2,500,000 | |
Billings in excess of costs and estimated earnings on uncompleted contracts | | — | | — | |
| | $ | — | | $ | 2,500,000 | |
61
Table of Contents
During the year ended October 31, 2008, a gain of $433,000 was recognized as a result of a change in estimate for the construction contracts. During the year ended October 31, 2007 and the period from inception (December 1, 2005) through October 31, 2006, losses of $5,316,000 and $5,826,000, respectively, were recognized. Cumulative losses on all three contracts are estimated to be $9,866,000.
NOTE 9 – LONG-TERM DEBT
Long-term debt is as follows:
| | October 31, 2008 | | October 31, 2007 | |
10% convertible senior secured notes | | $ | 55,000,000 | | $ | 55,000,000 | |
Senior secured credit facility – construction loan | | 36,000,000 | | — | |
Line of credit | | 5,000,000 | | — | |
8.25% note payable to bank | | — | | 2,520,000 | |
7.25% note payable to bank | | 1,184,000 | | — | |
Non interest-bearing note payable to government authority | | 280,000 | | 330,000 | |
Total | | 97,464,000 | | 57,850,000 | |
Less current portion | | (7,800,000 | ) | (72,000 | ) |
Long-term portion of debt | | $ | 89,664,000 | | $ | 57,778,000 | |
Scheduled maturities of long-term debt at October 31, 2008 are as follows:
Years Ending October 31: | | | |
2009 | | $ | 7,800,000 | |
2010 | | 2,251,000 | |
2011 | | 3,433,000 | |
2012 | | 57,160,000 | |
2013 | | 26,820,000 | |
| | $ | 97,464,000 | |
Convertible Senior Secured Notes
On September 28, 2007, Nova sold 10% convertible senior secured notes, at par, in the aggregate principal amount of $55,000,000. Interest is payable semi-annually on March 31 and September 30 through maturity on September 30, 2012. Interest is payable in cash or, after September 30, 2009 if certain conditions are satisfied, Nova may elect to add interest to the principal amount of the notes at a 12% annual rate.
Holders may convert their notes into shares of common stock at an initial conversion price of $3.66 per share, subject to adjustment under certain circumstances. If holders elect to convert the notes prior to September 30, 2009, such holders will also receive a make-whole payment equal to the remaining scheduled interest payments due on or before September 30, 2009. Effective September 30, 2009, the conversion price will be reset to equal the lower of the then current conversion price and the weighted average price of Nova’s common stock for the immediately preceding 30 trading days, provided that the conversion price cannot be reset below $3.24 per share.
The notes may be redeemed by Nova on or after September 30, 2009 if the closing price of Nova’s common stock exceeds $6.00 per share for twenty days in any thirty consecutive trading day period (the “Pricing Condition”). If the Pricing Condition is met, the notes may be redeemed prior to September 30, 2010 at 100% of the principal amount, plus a make-whole payment equal to the remaining scheduled interest payments due on or before September 30, 2010. After September 30, 2010, the notes may be redeemed at 100% of the principal amount if the Pricing Condition is met. If the Pricing Condition is not met, Nova may redeem the notes at 105% of the principal amount during the year ending September 30, 2011 and at 102.5% of the principal amount during the year ending September 30, 2012.
The notes are guaranteed by Nova’s wholly-owned holding and project subsidiaries for the Clinton County biodiesel refinery (Nova Holding Clinton County, LLC and Nova Biofuels Clinton County, LLC). The notes are secured by a first priority security interest in the Clinton County biodiesel refinery and its assets, and by a pledge of the equity interests in the holding and project subsidiaries for the Clinton County biodiesel refinery.
62
Table of Contents
Nova has procured a bank letter of credit, using cash proceeds from the convertible note issuance, to guarantee payment of the semi-annual interest payments through September 30, 2009. At October 31, 2008 and October 31, 2007, $5,572,000 and $11,125,000, respectively, of prefunded interest payments and accrued interest income are reported as restricted cash and investments in the consolidated balance sheets.
The terms of the notes restrict the ability of Nova and the guarantor subsidiaries, among other things, to pay dividends, repurchase equity securities, make certain investments or engage in other businesses, incur debt or liens, or merge or sell substantially all of the assets.
Nova evaluated the notes for derivative accounting consideration under Statement of Financial Accounting Standards No. 133 and EITF 00-19 and determined that the conversion features contained in the notes do not constitute embedded derivatives as the conversion price cannot be reset below a minimum share price of $3.24 per share and Nova maintains sufficient authorized shares to provide for a potential conversion.
Securities Loan Agreement
In connection with the offering of the convertible notes, on September 28, 2007, the Chairman and CEO and the then-President of Nova entered into a master securities loan agreement with Jefferies & Company, Inc. (“Jefferies”) under which these officers may loan, in the aggregate, up to 8,000,000 shares of Nova’s common stock which they own to Jefferies during a period of five years, unless all of the notes are converted into common stock prior to such date. Nova expects that the borrowed shares may be used for lending to investors in the convertible notes to facilitate transactions by which such note holders may hedge their investments in the convertible notes. Nova’s Board of Directors has determined that the entry into the shares lending agreement was in the best interests of Nova’s stockholders as it was a means to facilitate the offer and sale of the convertible notes on terms more favorable to Nova than it could have otherwise obtained.
Senior Secured Credit Facility
On December 26, 2007, Nova Biofuels Seneca, LLC (“Nova Seneca”), a subsidiary of Nova, entered into a credit agreement with WestLB AG, New York Branch (“WestLB”) for a $41,000,000 senior secured credit facility. The facility includes a $36,000,000 construction loan that will convert to a 60-month term loan upon demonstration of final completion standards to the satisfaction of WestLB relative to the Seneca, Illinois biodiesel refinery. The financing also includes a $5,000,000 working capital and letter of credit facility.
This credit facility provides debt financing for construction, start-up and operation of Nova Seneca’s 60,000,000 gallon per year biodiesel refinery. As of October 31, 2008, $36,000,000 had been received under the construction loan. Nova has also borrowed $5,000,000 under the working capital provisions of the credit facility for the start-up and operation of the Seneca refinery. After taking into account these borrowings, Nova has no remaining capacity under construction and term notes but may repay and re-borrow amounts under the working capital facility. In connection with the initial funding of the loan, Nova entered into a completion guaranty under which it guarantees completion of construction of the refinery.
On September 11, 2008, Nova Seneca entered into an amendment to the credit agreement which provides for the release of $3,000,000 currently held by Sterling Bank in the Sponsor Support Account, as described in Note 6, to Nova Seneca for payment of feedstocks utilized for commissioning, performance tests for, and operation of, the Seneca biodiesel refinery, as soon as reasonably practicable after September 5, 2008. These funds were released in October 2008. Additionally, the amendment modifies certain procedural matters related to drawdowns on the construction loan and other miscellaneous matters.
Nova Seneca has the option to select floating or periodic fixed-rate Eurodollar loans with interest at LIBOR plus 4% or Base Rate loans at WestLB’s prime rate plus 3%. At October 31, 2008, the construction borrowings of $36,000,000 and the working capital loan of $5,000,000 were base rate loans at a floating rate of 10.0% per annum.
The term loan will require quarterly principal reductions of 1.5% of the amount converted from the construction loan, with the balance due at maturity. The principal payments began November 30, 2008. Borrowings under the credit facility are secured by substantially all the assets of Nova Seneca.
63
Table of Contents
Other Long-Term Debt
In January 2007, Nova Seneca purchased approximately 54 acres of land in Seneca, Illinois for $3,650,000. Nova paid $1,130,000 in cash and issued a note payable to a bank for the balance of $2,520,000. The note payable bore interest at 8.25% per annum and was secured by a mortgage on the land. This note was paid on February 19, 2008.
Nova Seneca subdivided its real property and conveyed a portion of the real property to its affiliate Nova Biofuels Seneca SIP, LLC (“Nova Biofuels Seneca SIP”), which Nova plans to use for the future construction of a feedstock receiving and processing facility. Nova Biofuels Seneca SIP borrowed $1,189,000 from a bank on February 19, 2008. The new bank loan bears interest at 7.25% per annum and is secured by a mortgage on the land held by Nova Biofuels Seneca SIP. The loan provides for monthly interest-only payments through August 2008 followed by monthly principal and interest payments of $10,000 until maturity in August 2011. A final principal payment is due at maturity.
The note payable to government authority is payable to the Iowa Department of Economic Development under a master contract dated August 18, 2005. The loan is secured and is non interest-bearing. Interest is not imputed for this liability because amounts are not material. Payments are due in monthly installments of $5,000, with a final payment due on March 1, 2011. The note balance includes a forgivable amount of $100,000 which may be realized at maturity if certain economic development criteria specified in the master agreement are met.
NOTE 10 – MINORITY INTEREST
KBI Energy, LLC (“KBI”) purchased an 8% equity interest in Nova Holding Seneca LLC (“Nova Holdings”) for $4,000,000 in July 2006. Nova Holdings owns Nova Biofuels Seneca LLC which is the operating entity for the Seneca biodiesel refinery. KBI’s interest is recorded as a minority interest in a consolidated subsidiary. KBI’s share of (loss) earnings of Nova Holdings was $(1,406,000), $(22,000) and $(2,000) for the years ended October 31, 2008 and 2007 and the period from inception (December 1, 2005) through October 31, 2006, respectively. Nova has an agreement with an affiliate of KBI to purchase feedstock for the Seneca biodiesel refinery (see Note 16).
Jay Fillman, CFO of Nova since May 2008, acquired a ..25% interest in Nova Holding Seneca LLC in August 2006, as part of a consulting agreement.
NOTE 11 – INCOME TAXES
Nova did not incur any income tax expense during any of the periods presented due to operating losses and the related increase in the valuation allowance.
The reconciliation of income taxes at the statutory rate of 35% applied to the loss before taxes for the periods presented is as follows:
| | Year ended
October 31, 2008 | | Year ended
October 31, 2007 | | Period from
Inception
(December 31,
2005) to
October 31, 2006 | |
Computed “expected” tax recovery | | $ | (10,746,000 | ) | $ | (6,796,000 | ) | $ | (9,980,000 | ) |
Effect of permanent differences: | | | | | | | |
Non-deductible interest expense | | | | | | 495,000 | |
Other non-deductible expenses | | 510,000 | | 33,000 | | 49,000 | |
Increase in valuation allowance | | 10,236,000 | | 6,763,000 | | 9,436,000 | |
Tax expense | | $ | — | | $ | — | | $ | — | |
The tax effects of the temporary differences that give rise to deferred tax assets and liabilities are as follows:
| | October 31, 2008 | | October 31, 2007 | |
Deferred tax assets | | | | | |
Loss carryforwards | | $ | 19,211,000 | | $ | 8,371,000 | |
Stock-based compensation | | 9,678,000 | | 7,884,000 | |
Other | | (2,125,000 | ) | 152,000 | |
Deferred tax liability – intangible assets | | (329,000 | ) | (208,000 | ) |
| | 26,435,000 | | 16,199,000 | |
Less valuation allowance | | (26,435,000 | ) | (16,199,000 | ) |
Net deferred tax assets | | $ | — | | $ | — | |
64
Table of Contents
Nova has recorded a valuation allowance for the full amount of the deferred tax assets as management does not currently believe that it is more likely than not that these assets will be recovered in the foreseeable future. At October 31, 2008 and 2007, Nova had net operating loss carryforwards for federal income tax purposes of approximately $54,890,000 and $23,915,000, respectively that may be offset against future taxable income. To the extent not utilized, the net operating loss carryforwards will expire in 2027 and 2028.
NOTE 12 – PRIVATE PLACEMENTS OF STOCK AND WARRANTS
In December 2006, Nova issued and sold units of securities consisting of common stock and warrants to purchase additional shares of common stock in a private placement. Aggregate gross proceeds of $47,000,000 were received for 24,352,334 shares of common stock and warrants to purchase an additional 7,772,217 shares of common stock. The relative fair value of the common stock was $33,474,000 and the relative fair value of the warrants was $13,526,000. The warrants have an exercise price of $2.72 per share and expire in five years.
The fair value of the stock was estimated using current market rates and the fair value of the warrants granted with this private placement was computed using the Black-Scholes option-pricing model. Variables used in the option-pricing model include (1) risk-free interest rate at the date of grant (4.5%), (2) expected warrant life of 5 years, (3) expected volatility of 123%, and (4) zero expected dividends. In connection with the private placement, Nova paid the placement agents a fee of $3,055,000 and incurred other expenses of $150,000. In addition, Nova issued to one of the placement agents warrants to purchase 466,519 shares of common stock. The warrants have an exercise price of $2.72 per share and expire in five years.
Nova has registered for resale from time to time all of the shares of common stock and shares of common stock that are issuable if the warrants are exercised.
Nova has an effective universal shelf registration statement, for the offer and sale from time to time on a delayed or continuous basis in one or more offerings of up to $200,000,000 of securities which may consist of common stock, preferred stock, depositary shares, debt securities, which may include guarantees of the debt securities by some or all of its subsidiaries, warrants to acquire common stock, preferred stock or debt securities, or units comprising one or more classes of these types of securities. So long as Nova’s market capitalization held by non-affiliates is less than $75,000,000, Nova’s use of the shelf registration statement is limited to one-third of its market capitalization held by non-affiliates in any 12 month period. No securities have yet been offered or sold under this registration statement.
NOTE 13 – WARRANTS
Warrants outstanding at October 31, 2008 are as follows:
Warrants: | | Number of
Warrants | | Weighted-Average
Exercise Price | |
Private placement, July 2006 | | 6,890,337 | | $ | 2.40 | |
Anti-dilutive provisions, July 2006 placement | | 396,772 | | $ | 2.40 | |
Private placement, December 2006 | | 7,772,217 | | $ | 2.72 | |
Outstanding at October 31, 2008 | | 15,059,326 | | $ | 2.58 | |
As a result of the December 2006 issuance of securities in the private placement, the exercise price and number of shares obtainable pursuant to warrants issued to investors and the placement agent in connection with the July 2006 private placement were adjusted according to the anti-dilution provisions described in the warrants. The adjustments were based on a weighted-average difference between the purchase price of the securities issued in the December 2006 private placement and the exercise price of the original warrants. The adjustments were as follows:
65
Table of Contents
Original Exercise
Price | | Original
Warrants | | Adjusted Exercise Price | | Adjusted Warrants | |
$ | 2.60 | | 1,088,062 | | $ | 2.45 | | 1,154,678 | |
$ | 2.54 | | 5,335,756 | | $ | 2.40 | | 5,647,008 | |
$ | 2.40 | | 69,916 | | $ | 2.30 | | 72,956 | |
$ | 2.34 | | 396,603 | | $ | 2.25 | | 412,467 | |
Nova considers the adjustments in warrants triggered by the anti-dilution clause to be an adjustment of the original relative fair values allocated to common stock and to warrants. Nova has not recorded a charge to operations for the application of the anti-dilution provisions described in the warrants.
In June 2007, warrants were exercised to purchase 104,250 shares of common stock at an exercise price of $0.09 per share. Payment in the form of 3,892 shares was received under the net issuance right of the warrant. These warrants were originally issued on February 27, 2004 and no measurable cost was associated with the warrants as management had determined at that time that their fair value was zero.
Changes in warrants during the year ended October 31, 2008 and warrants outstanding at October 31, 2008 are as follows:
Grant Date | | Expiration
Date | | Exercise Price | | Outstanding
10/31/07 | | New Grants | | Exercises | | Outstanding
10/31/08 | |
7/6/06 | | 7/6/11 | | $ | 2.40 | | 5,647,008 | | — | | — | | 5,647,008 | |
7/10/06 | | 7/10/11 | | 2.45 | | 1,154,678 | | — | | — | | 1,154,678 | |
7/26/06 | | 7/26/11 | | 2.30 | | 72,956 | | — | | — | | 72,956 | |
7/26/06 | | 7/26/11 | | 2.25 | | 412,467 | | — | | — | | 412,467 | |
12/19/06 | | 12/19/11 | | 2.72 | | 7,305,698 | | — | | — | | 7,305,698 | |
12/19/06 | | 12/19/11 | | 2.72 | | 466,519 | | — | | — | | 466,519 | |
| | | | | | | | | | | | | |
| | Totals | | | | 15,059,326 | | — | | — | | 15,059,326 | |
| | | | | | | | | | | | | | |
NOTE 14 – EQUITY INCENTIVE PLAN
Nova 2006 Equity Incentive Plan
On April 24, 2006, Nova adopted its 2006 Equity Incentive Plan (the “2006 Plan”), which was amended on September 14, 2007. The 2006 Plan provides for equity incentives to be granted to employees, officers or directors of Nova, or key advisers or consultants. Equity incentives may be in the form of stock options with an exercise price not less than the market value of the underlying shares on the date of grant, stock appreciation rights, restricted stock awards, stock bonus awards, other stock-based awards, or any combination of the foregoing. The 2006 Plan is administered by the Compensation Committee of the Board of Directors. The stockholders have ratified and approved the 2006 Plan.
A maximum of 13,000,000 shares of common stock were authorized for issuance under the 2006 Plan. At October 31, 2008, Nova had 3,278,858 shares remaining for future awards under the 2006 Plan.
All options granted during the years ended October 31, 2008 and 2007 and the period from inception (December 1, 2005) through October 31, 2006 were granted at the market value of the underlying shares on the date of grant.
During the year ended October 31, 2008, the Compensation Committee approved the grant of non-qualified stock options to employees to purchase, in the aggregate, 2,380,000 shares of common stock. The options expire ten years from the date of the grant, and generally vest over four years. All options were granted at the market value of the underlying shares on the date of the grant. These options have an exercise price ranging between $0.32 and $2.36 per share.
The fair value of the stock options granted was computed using the Black-Sholes option-pricing model. Variables used in the Black-Sholes option-pricing model include (1) risk-free interest rate at the date of grant, (2) expected option life based on using the simplified method determined as the average of the option term and the vesting period, (3) expected volatility, and (4) zero expected dividends. For options granted during the year ended October 31, 2008, risk-free interest rates ranged between 3.5% and 4.25% and expected volatility ranged between 124% and 401%.
66
Table of Contents
During the year ended October 31, 2007, the Compensation Committee approved the grant of non-qualified stock options to employees to purchase, in the aggregate, 461,500 shares of common stock. The options expire ten years from the date of grant, and generally vest over four years. These options have an exercise price ranging between $2.53 and $3.22 per share.
During the year ended October 31, 2007, consultants were issued non-qualified stock options to purchase, in the aggregate, 75,000 shares of common stock. The options expire ten years from the date of grant. These options have an exercise price ranging between $2.25 and $2.79 per share.
During the period from inception (December 1, 2005) through October 31, 2006, the Compensation Committee approved the grant of non-qualified stock options to employees to purchase, in the aggregate, 5,098,991 shares of common stock. The options expire ten years from the date of grant, and generally vest over two years. These options have an exercise price ranging between $2.62 and $3.88 per share.
During the period from inception (December 1, 2005) through October 31, 2006, consultants were issued non-qualified stock options to purchase, in the aggregate, 600,000 shares of common stock. The options expire ten years from the dates of grant. These options have an exercise price ranging between $2.62 and $3.79 per share
On August 31, 2006, an employee of Nova was granted a restricted stock award for 1,000,000 shares of common stock. The shares vested in equal annual installments over a four year period as long as the employee remained employed by Nova. Nova recorded non-cash share-based compensation expense related to this stock grant. On October 10, 2007, the Compensation Committee accelerated the vesting of the remaining shares of the restricted stock award. The Company erroneously revalued the stock award, which reduced the share-based compensation expense for the year ended October 31, 2007 by $1,245,000. During 2008, the Company received additional information related to the revision and reversed the prior year entry, resulting in an increase of share-based compensation for the year ended October 31, 2008 by $1,245,000.
Stock option activity from adoption of the 2006 Plan in April 2006 through October 31, 2008 is as follows:
Options under 2006 Equity Incentive Plan: | | Number of
Options | | Weighted-Average
Exercise Price | |
| | | | | |
Opening balance | | — | | — | |
Option grants | | 5,698,991 | | $ | 3.00 | |
Outstanding at October 31, 2006 | | 5,698,991 | | $ | 3.00 | |
Option grants | | 536,500 | | $ | 2.61 | |
Forfeited options | | (73,126 | ) | $ | 3.07 | |
Outstanding at October 31, 2007 | | 6,162,365 | | $ | 2.99 | |
Option grants | | 2,380,000 | | $ | 1.82 | |
Outstanding at October 31, 2008 | | 8,542,365 | | $ | 2.66 | |
Exercisable at October 31, 2008 | | 6,672,522 | | $ | 2.82 | |
Non-cash share-based compensation expense related to stock options and stock grants during the years ended October 31, 2008 and 2007 and the period from inception (December 1, 2005) through October 31, 2006 was $5,776,000, $6,482,000, and $16,375,000, respectively, for employees and directors and was $25,000, $215,000 and $2,148,000, respectively, for the consultants and agents.
It is anticipated that unvested options at October 31, 2008 will result in compensation expense being recognized in future years as follows:
Years ending October 31: | | | |
2009 | | $ | 1,423,000 | |
2010 | | 1,288,000 | |
2011 | | 706,000 | |
| | $ | 3,417,000 | |
67
Table of Contents
Non-Employee Director Compensation Program
On July 31, 2006, the Board of Directors approved a director compensation program for non-employee directors. Pursuant to this program, the Compensation Committee approved the grant of 95,460 and 50,000 shares of restricted stock to non-employee directors during the year ended October 31, 2007 and the period from inception (December 31, 2005) through October 31, 2006, respectively. These shares vest in one installment on the third anniversary of the date of grant. The Compensation Committee also approved the grant of 5,456 shares to non-employee directors in lieu of cash retainer fees during the year ended October 31, 2007. Shares granted under the director compensation program are included in the 2006 Equity Incentive Plan.
NOTE 15 – FAIR VALUE OF FINANCIAL INSTRUMENTS
The carrying values of cash and cash equivalents, accounts receivable, accounts payable and accrued expenses at October 31, 2008 and 2007 approximate their fair values because of the short-term maturities of these items. Restricted cash and investments at October 31, 2008 and 2007 consist primarily of money market funds and represent debt service reserves for payment of semi-annual interest on the convertible notes through September 30, 2009, funds reserved for capital expenditures, and a sponsor support escrow. The carrying value of these financial instruments approximates its fair value.
The fair value of long-term debt is estimated based on current interest rates available to Nova for debt with similar terms and remaining maturities. Nova’s convertible notes were issued in September 2007, and at October 31, 2008 and 2007, the carrying value of long-term debt approximates its fair value.
NOTE 16 – COMMITMENTS
Lease Commitments
Nova leases the building where it operates its small scale refinery located in Butte, Montana and leases office space in Butte, Montana. The lease for office space in Houston, Texas was canceled in July 2008. A subsidiary of Nova also leased land in Oklahoma on which it intended to build a biodiesel refinery. This lease began November 1, 2006 and provided for a ten year term, with three ten year renewal options so long as construction of the refinery commenced before March 1, 2008. Nova has recently decided not to build a refinery on the site and the lease has lapsed.
Nova has executed rail car leases for 125 insulated tank cars to ship biodiesel. Sixty-five of the rail cars are leased for a term of 60 months commencing upon delivery with a monthly rent of $760. The remaining sixty rail cars have a lease term of 36 months commencing upon delivery and a monthly rent of $585. Twenty rail cars were delivered during the year ended October 31, 2007 and the remaining 105 rail cars were delivered during the year ended October 31, 2008. The rail car leases are treated as operating leases.
Future minimum lease commitments under these operating leases at October 31, 2008 are as follows:
Years Ending October 31: | | | |
2009 | | $ | 1,049,400 | |
2010 | | 1,049,400 | |
2011 | | 979,200 | |
2012 | | 522,700 | |
2013 | | 136,800 | |
Total minimum payments | | $ | 3,737,500 | |
Rent expense during the years ended October 31, 2008 and 2007 and the period from inception (December 1, 2005) through October 31, 2006 was approximately $125,000, $155,000 and $80,000, respectively.
Feedstock Purchase Agreement
On June 26, 2006, Nova Biofuels Seneca, LLC (“Nova Seneca”) agreed to buy 100% of the feedstock requirements for the Seneca biodiesel refinery from Lipid Logistics, LLC (“Lipid”) for a ten year period at a benchmark price that will be adjusted according to the market price of the feedstock. Additionally, Nova Seneca will pay a service fee of one quarter cent for every pound of feedstock purchased and Nova Seneca agreed to purchase a minimum of 25,000,000 gallons of feedstock per year from Lipid commencing on the date of initial production of biodiesel at the refinery.
68
Table of Contents
Biodiesel Sale and Purchase Agreement
On August 8, 2007, Nova entered into a biodiesel sale and purchase agreement with Gavilon, LLC (formerly ConAgra Trade Group, Inc.) (“Gavilon”). Under the agreement, Gavilon would have purchased and taken delivery from Nova of approximately 10,000,000 gallons per year of biodiesel produced at the Greenville, Mississippi refinery owned and operated by Scott and to be sold to Nova pursuant to a tolling and off-take agreement with Scott (see Note 5). The biodiesel sale price would have been the price per gallon invoiced by Gavilon to its customers or otherwise payable by Gavilon if it is the principal buyer less Gavilon’s transportation costs, plus a fee. The price was subject to adjustment for quantity, price and tax incentive if the biodiesel is blended prior to its sale to Gavilon. The initial term of the agreement provided for termination upon the later of ten years from the first day of the calendar month in which the Company sells and delivers biodiesel to Gavilon pursuant to the agreement or on May 1, 2018, unless terminated earlier. The agreement may be subsequently extended for successive five year terms. Subsequent to October 31, 2008, Nova terminated the biodiesel sale and purchase agreement with Gavilon, LLC in connection with its termination of the tolling and off-take agreement with Scott (see Note 5).
On September 13, 2006, Nova Seneca entered into an agreement with Gavilon for biodiesel sales at the Seneca biodiesel refinery. The ten-year agreement provides that Gavilon will purchase and sell all of the biodiesel fuel produced by, and manage the logistics for, the facility at market based prices. The biodiesel sale price is the price per gallon invoiced by Gavilon to its customers or otherwise payable by Gavilon if it is the principal buyer less Gavilon’s transportation costs, plus a fee. The price is subject to adjustment for quantity, price and tax incentive if the biodiesel is blended prior to its sale to Gavilon. The agreement may be extended for successive five year terms.
Defined Contribution Plans
Nova sponsors defined contribution plans for its employees. These plans include a SIMPLE IRA and a 401(k) plan. Employees may elect to make annual contributions and Nova matches an employee’s elective deferral dollar for dollar up to 3% of the employee’s compensation. Expense recorded for the matching contributions during the years ended October 31, 2008 and 2007 and the period from inception (December 1, 2005) through October 31, 2006 was $100,000, $43,000 and $7,000, respectively.
NOTE 17 – CONCENTRATIONS OF CREDIT RISK
Financial instruments that subject Nova to credit risk consist of cash balances maintained in excess of federal depository insurance limits and accounts receivable, which have no collateral or security. The accounts maintained by Nova at banks are insured by the Federal Deposit Insurance Corporation up to $250,000 per depository institution. The uninsured balance was $11,812,000 at October 31, 2008. Nova has not experienced any credit losses in such accounts and believes it is not exposed to any significant risk of loss based on this exposure.
During the year ended October 31, 2008, approximately 89% of Nova’s biodiesel and related co-product sales and receivables were to Gavilon.
NOTE 18 – CONTINGENCIES
In the normal course of business, Nova may become subject to lawsuits and other claims and proceedings. These matters are subject to uncertainty and outcomes are not predictable with assurance. Management is not aware of any pending or threatened lawsuits or proceedings which would have a material effect on Nova’s financial position, results of operations or liquidity.
NOTE 19 – SUPPLEMENTAL GUARANTOR INFORMATION
Nova’s payment obligations under its convertible senior secured notes (see Note 9) are fully and unconditionally guaranteed, on a joint and several basis, by each of its current and future restricted subsidiaries (“Guarantor Subsidiaries”). At October 31, 2008, the Guarantor Subsidiaries are Nova Holding Clinton County, LLC and Nova Biofuels Clinton County, LLC. The Guarantor Subsidiaries were formed in August 2007 and had no assets or liabilities or operations prior to that date. Each Guarantor Subsidiary is 100% owned by the parent company. The following unaudited condensed consolidating financial information presents the financial condition, results of operations and cash flows of Nova Biosource Fuels, Inc., the Guarantor Subsidiaries and the
69
Table of Contents
remaining subsidiaries that do not guarantee the notes (the “Non-Guarantor Subsidiaries”), together with consolidating adjustments necessary to present Nova’s results on a consolidated basis.
70
Table of Contents
Condensed Consolidating Balance Sheet Information
October 31, 2008
(in thousands)
| | Nova Biosource
Fuels, Inc. | | Guarantor
Subsidiaries | | Non-Guarantor
Subsidiaries | | Eliminations | | Consolidated
Total | |
ASSETS | | | | | | | | | | | |
Current Assets: | | | | | | | | | | | |
Cash and cash equivalents | | $ | 1,298 | | $ | 25 | | $ | 302 | | $ | — | | $ | 1,625 | |
Accounts receivable | | — | | 178 | | 4,958 | | — | | 5,136 | |
Inventories | | — | | 448 | | 7,606 | | — | | 8,054 | |
Other current assets | | 302 | | (9 | ) | 2 | | — | | 295 | |
Total current assets | | 1,600 | | 642 | | 12,868 | | — | | 15,110 | |
Receivables-related party | | 108,572 | | 16,496 | | 89,771 | | (214,839 | ) | — | |
Property, plant and equipment | | — | | 9,394 | | 72,992 | | — | | 82,386 | |
Other assets | | 8,738 | | — | | 13,974 | | — | | 22,712 | |
Total Assets | | $ | 118,910 | | $ | 26,532 | | $ | 189,605 | | $ | (214,839 | ) | $ | 120,208 | |
LIABILITIES AND STOCKHOLDERS’ EQUITY | | | | | | | | | | | |
Current Liabilities: | | | | | | | | | | | |
Current portion of long-term debt | | $ | — | | $ | 70 | | $ | 7,730 | | $ | — | | $ | 7,800 | |
Accounts payable | | 554 | | 702 | | 6,534 | | — | | 7,790 | |
Accrued expenses | | 778 | | 56 | | 1,659 | | — | | 2,493 | |
Total current liabilities | | 1,332 | | 828 | | 15,923 | | — | | 18,083 | |
Payables-related party | | 8,274 | | 30,788 | | 175,777 | | (214,839 | ) | — | |
Long-term debt | | 55,000 | | 210 | | 34,454 | | — | | 89,664 | |
Total liabilities | | 64,606 | | 31,826 | | 226,154 | | (214,839 | ) | 107,747 | |
Investment deficiency in subsidiaries | | 44,417 | | — | | — | | (44,417 | ) | — | |
Minority interest | | — | | — | | 2,574 | | — | | 2,574 | |
Stockholders’ equity | | 9,887 | | (5,294 | ) | (39,123 | ) | 44,417 | | 9,887 | |
Total Liabilities and Stockholders’ Equity | | $ | 118,910 | | $ | 26,532 | | $ | 189,605 | | $ | (214,839 | ) | $ | 120,208 | |
71
Table of Contents
Condensed Consolidating Balance Sheet Information
October 31, 2007
(in thousands)
| | Nova Biosource
Fuels, Inc. | | Guarantor
Subsidiaries | | Non-Guarantor
Subsidiaries | | Eliminations | | Consolidated
Total | |
ASSETS | | | | | | | | | | | |
Current Assets: | | | | | | | | | | | |
Cash and cash equivalents | | $ | 25,537 | | $ | 532 | | $ | 96 | | $ | — | | $ | 26,165 | |
Accounts receivable | | — | | 493 | | 4,085 | | — | | 4,578 | |
Inventories | | — | | 659 | | — | | — | | 659 | |
Other current assets | | 345 | | 3 | | 2,506 | | — | | 2,854 | |
Total current assets | | 25,882 | | 1,687 | | 6,687 | | — | | 34,256 | |
Receivables-related party | | 79,672 | | 1,000 | | 61,540 | | (142,212 | ) | — | |
Property, plant and equipment | | 67 | | 10,383 | | 59,715 | | — | | 70,165 | |
Other assets | | 15,047 | | — | | 53 | | — | | 15,100 | |
Total Assets | | $ | 120,668 | | $ | 13,070 | | $ | 134,018 | | $ | (142,212 | ) | $ | 125,544 | |
LIABILITIES AND STOCKHOLDERS’ EQUITY | | | | | | | | | | | |
Current Liabilities: | | | | | | | | | | | |
Current portion of long-term debt | | $ | — | | $ | 60 | | $ | 12 | | $ | — | | $ | 72 | |
Accounts payable | | 1,569 | | 1,115 | | 4,758 | | — | | 7,442 | |
Accrued expenses | | 1,209 | | 251 | | 8,404 | | — | | 9,864 | |
Total current liabilities | | 2,778 | | 1,426 | | 13,174 | | — | | 17,378 | |
Payables-related party | | 1,798 | | 12,335 | | 128,079 | | (142,212 | ) | — | |
Long-term debt | | 55,000 | | 270 | | 2,508 | | — | | 57,778 | |
Total liabilities | | 59,576 | | 14,031 | | 143,761 | | (142,212 | ) | 75,156 | |
Investment deficiency in subsidiaries | | 14,684 | | — | | — | | (14,684 | ) | — | |
Minority interest | | — | | — | | 3,980 | | — | | 3,980 | |
Stockholders’ equity | | 46,408 | | (961 | ) | (13,723 | ) | 14,684 | | 46,408 | |
Total Liabilities and Stockholders’ Equity | | $ | 120,668 | | $ | 13,070 | | $ | 134,018 | | $ | (142,212 | ) | $ | 125,544 | |
72
Table of Contents
Condensed Consolidating Operations Information
Year Ended October 31, 2008
(in thousands)
| | Nova Biosource
Fuels, Inc. | | Guarantor
Subsidiaries | | Non-Guarantor
Subsidiaries | | Eliminations | | Consolidated
Total | |
Revenues: | | | | | | | | | | | |
Biodiesel and related co-product sales | | $ | — | | $ | 10,143 | | $ | 55,091 | | $ | — | | $ | 65,234 | |
Contracting revenues | | — | | — | | 2,193 | | — | | 2,193 | |
Total revenues | | — | | 10,143 | | 57,284 | | — | | 67,427 | |
Costs and expenses: | | | | | | | | | | | |
Cost of biodiesel & related co-product sales | | — | | 13,949 | | 60,168 | | — | | 74,117 | |
Long-lived asset impairment | | — | | 337 | | 14,830 | | — | | 15,167 | |
Selling, general and administrative | | 8,974 | | 205 | | 7,484 | | — | | 16,663 | |
Total costs and expense | | 8,974 | | 14,491 | | 82,482 | | — | | 105,947 | |
Loss from operations | | (8,974 | ) | (4,348 | ) | (25,198 | ) | — | | (38,520 | ) |
Equity in losses of subsidiaries | | (30,085 | ) | — | | — | | 30,085 | | — | |
Other income (expense): | | | | | | | | | | | |
Interest and other income | | 429 | | 14 | | 208 | | — | | 651 | |
Interest expense | | (3,668 | ) | — | | (2,167 | ) | — | | (5,835 | ) |
Minority interest in loss of subsidiary | | — | | — | | 1,406 | | — | | 1,406 | |
Net loss | | $ | (42,298 | ) | $ | (4,334 | ) | $ | (25,751 | ) | $ | 30,085 | | $ | (42,298 | ) |
73
Table of Contents
Condensed Consolidating Operations Information
Year Ended October 31, 2007
(in thousands)
| | Nova Biosource
Fuels, Inc. | | Guarantor
Subsidiaries | | Non-Guarantor
Subsidiaries | | Eliminations | | Consolidated
Total | |
Revenues: | | | | | | | | | | | |
Biodiesel and related co-product sales | | $ | — | | $ | 3,179 | | $ | — | | $ | — | | $ | 3,179 | |
Contracting revenues | | — | | — | | 21,759 | | — | | 21,759 | |
Total revenues | | — | | 3,179 | | 21,759 | | — | | 24,938 | |
Costs and expenses: | | | | | | | | | | | |
Cost of biodiesel & related co-product sales | | — | | 3,914 | | — | | — | | 3,914 | |
Contracting expenses | | — | | — | | 27,075 | | — | | 27,075 | |
Selling, general and administrative | | 12,651 | | 215 | | 2,137 | | — | | 15,003 | |
Total costs and expense | | 12,651 | | 4,129 | | 29,212 | | — | | 45,992 | |
Loss from operations | | (12,651 | ) | (950 | ) | (7,453 | ) | — | | (21,054 | ) |
Equity in losses of subsidiaries | | (8,311 | ) | — | | — | | 8,311 | | — | |
Other income (expense): | | | | | | | | | | | |
Interest and other income | | 1,636 | | 5 | | 81 | | — | | 1,722 | |
Interest expense | | (90 | ) | (16 | ) | — | | — | | (106 | ) |
Minority interest in loss of subsidiary | | — | | — | | 22 | | — | | 22 | |
Net loss | | $ | (19,416 | ) | $ | (961 | ) | $ | (7,350 | ) | $ | 8,311 | | $ | (19,416 | ) |
74
Table of Contents
Condensed Consolidating Cash Flow Information
Year Ended October 31, 2008
(in thousands)
| | Nova Biosource
Fuels, Inc. | | Guarantor
Subsidiaries | | Non-Guarantor
Subsidiaries | | Eliminations | | Consolidated
Total | |
Cash flows from operating activities: | | | | | | | | | | | |
Net loss | | $ | (12,213 | ) | $ | (4,333 | ) | $ | (25,752 | ) | $ | — | | $ | (42,298 | ) |
Non-cash expenses | | 4,645 | | 1,334 | | 15,033 | | — | | 21,012 | |
Net changes in working capital and other | | 142 | | (67 | ) | (13,447 | ) | — | | (13,372 | ) |
| | (7,426 | ) | (3,066 | ) | (24,166 | ) | — | | (34,658 | ) |
Cash flows from investing activities: | | | | | | | | | | | |
Additions to fixed assets | | 481 | | (345 | ) | (26,192 | ) | — | | (26,056 | ) |
Additions to restricted cash and investments | | 5,553 | | — | | (6,740 | ) | — | | (1,187 | ) |
| | 6,034 | | (345 | ) | (32,932 | ) | — | | (27,243 | ) |
Cash flows from financing activities: | | | | | | | | | | | |
Net change in intercompany receivables/ payables | | (22,775 | ) | 2,954 | | 19,821 | | — | | — | |
Payment of long-term debt | | — | | (50 | ) | (2,524 | ) | — | | (2,574 | ) |
Proceeds from issuance of debt, net | | — | | — | | 42,188 | | — | | 42,188 | |
Costs associated with issuance of debt | | (72 | ) | — | | (2,181 | ) | — | | (2,253 | ) |
| | (22,847 | ) | 2,904 | | 57,304 | | — | | 37,361 | |
Net (decrease) increase in cash and cash equivalents | | (24,239 | ) | (507 | ) | 206 | | — | | (24,540 | ) |
Cash and cash equivalents | | | | | | | | | | | |
Beginning of year | | 25,537 | | 532 | | 96 | | — | | 26,165 | |
End of year | | $ | 1,298 | | $ | 25 | | $ | 302 | | $ | — | | $ | 1,625 | |
75
Table of Contents
Condensed Consolidating Cash Flow Information
Year Ended October 31, 2007
(in thousands)
| | Nova Biosource
Fuels, Inc. | | Guarantor
Subsidiaries | | Non-Guarantor
Subsidiaries | | Eliminations | | Consolidated
Total | |
Cash flows from operating activities: | | | | | | | | | | | |
Net loss | | $ | (19,416 | ) | $ | (961 | ) | $ | (7,350 | ) | $ | 8,311 | | $ | (19,416 | ) |
Non-cash expenses | | 6,709 | | 166 | | 203 | | — | | 7,078 | |
Net changes in working capital and other | | 8,102 | | 680 | | (10,399 | ) | (8,311 | ) | (9,928 | ) |
| | (4,605 | ) | (115 | ) | (17,546 | ) | — | | (22,266 | ) |
Cash flows from investing activities: | | | | | | | | | | | |
Additions to fixed assets | | (73 | ) | — | | (48,358 | ) | — | | (48,431 | ) |
Additions to restricted cash and investments | | (11,072 | ) | — | | (53 | ) | — | | (11,125 | ) |
Purchase of net assets in business combination | | — | | (10,688 | ) | — | | — | | (10,688 | ) |
| | (11,145 | ) | (10,688 | ) | (48,411 | ) | — | | (70,244 | ) |
Cash flows from financing activities: | | | | | | | | | | | |
Net change in intercompany receivables/ payables | | (69,635 | ) | 11,335 | | 58,300 | | — | | — | |
Proceeds from private placement of stock, net | | 43,795 | | — | | — | | — | | 43,795 | |
Proceeds from issuance of debt, net | | 53,478 | | — | | — | | — | | 53,478 | |
Repurchase of common stock for treasury | | (424 | ) | — | | — | | — | | (424 | ) |
| | 27,214 | | 11,335 | | 58,300 | | — | | 96,849 | |
Net (decrease) increase in cash and cash equivalents | | 11,464 | | 532 | | (7,657 | ) | — | | 4,339 | |
Cash and cash equivalents | | | | | | | | | | | |
Beginning of year | | 14,073 | | — | | 7,753 | | — | | 21,826 | |
End of year | | $ | 25,537 | | $ | 532 | | $ | 96 | | $ | — | | $ | 26,165 | |
76
Table of Contents
ITEM 9 | CHANGES IN AND DISAGREEMENTS WITH ACCOUNTANTS ON ACCOUNTING AND FINANCIAL DISCLOSURE |
None.
ITEM 9A. | CONTROLS AND PROCEDURES |
Evaluation of Disclosure Controls and Procedures.
Management, under the general direction of the principal executive officer and the principal financial officer, has performed an evaluation of the effectiveness of our disclosure controls and procedures (as defined in Rule 13a-15(e) promulgated under the Securities Exchange Act of 1934) as of the end of the period covered by this report. This evaluation included consideration of the controls and procedures that are designed to ensure that information required to be disclosed by us in reports that we file or submit under the Securities Exchange Act is recorded, processed, summarized and reported within the time periods specified in Securities and Exchange Commission rules and forms, and that information required to be disclosed in reports filed by us under the Securities Exchange Act is accumulated and communicated to management, including the principal executive officer and the principal financial officer, in such a manner as to allow timely decisions regarding the required disclosure. Based on this evaluation, the principal executive officer and the principal financial officer concluded that our disclosure controls and procedures are not effective to allow timely decisions regarding the required disclosure, as discussed below.
Changes in Internal Control over Financial Reporting.
There have been no changes in our system of internal control over financial reporting during the quarter ended October 31, 2008, that have materially affected, or are reasonably likely to materially affect, our internal control over financial reporting, although management is evaluating its controls and procedures to remediate the deficiencies discussed below.
Management’s Report on Internal Control over Financial Reporting.
Our management is responsible for establishing and maintaining adequate internal control over financial reporting, as such term is defined in Rule 13a-15(f) under the Securities Exchange Act of 1934, as amended. Internal control over financial reporting is a process to provide reasonable assurance regarding the reliability of our financial reporting and the preparation of financial statements for external purposes in accordance with U.S. generally accepted accounting principles. Because of its inherent limitations, internal control over financial reporting may not prevent or detect misstatements. Also, projections of any evaluation of effectiveness to future periods are subject to the risk that controls may become inadequate because of changes in conditions, or that the degree of compliance with the policies or procedures may deteriorate.
Management conducted an evaluation of the effectiveness of our internal control over financial reporting based on the framework in Internal Control — Integrated Framework issued by the Committee of Sponsoring Organizations of the Treadway Commission. Based on this evaluation, management concluded that the Company’s internal control over financial reporting was not effective as of October 31, 2008.
A material weakness is a deficiency, or combination of deficiencies, in internal control over financial reporting, such that there is a reasonable possibility that a material misstatement of the company’s annual or interim financial statements will not be prevented or detected on a timely basis. The following material weaknesses have been identified and included in management’s assessment:
· | | Management has determined that the Company did not maintain effective controls over the accuracy of share-based compensation. Accordingly, there was a material weakness in internal controls over the Company’s share-based compensation process. |
| | |
· | | Management has determined that the Company did not maintain effective controls over the accuracy of revenue recognition. Accordingly, there was a material weakness in internal controls over the Company’s revenue recognition process. |
| | |
· | | Management determined that the Company lacked sufficient qualified personnel to monitor the operating effectiveness of internal controls and the effective completion of its financial reporting processes. This inadequate |
77
Table of Contents
level of skilled resources resulted in ineffective oversight of the Company’s financial reporting process. Accordingly, there was a material weakness in internal controls over monitoring the Company’s financial reporting processes.
Malone & Bailey, P.C., an independent registered public accounting firm, has audited the effectiveness of our internal control over financial reporting as of October 31, 2008, as stated in their report included herein.
ITEM 9B. OTHER INFORMATION
None.
78
Table of Contents
PART III
ITEM 10. DIRECTORS, EXECUTIVE OFFICERS AND CORPORATE GOVERNANCE
The name, age, positions and biographical information of our directors and executive officers are set forth below:
Name | | Age | | Position and Business Experience |
Kenneth T. Hern | | 71 | | Chairman of the Board and Chief Executive Officer. Mr. Hern has been Chairman and Chief Executive Officer since March 31, 2006 and was a founder and Chairman and Chief Executive Officer of Biosource America since December 2005. He served as President of Texaco Saudi, Inc., between 1981 through 1984, as Vice Chairman and Managing Director of Texaco Nigeria Limited from 1984 through 1989, and as President of Texaco Brazil from 1989 through 1994, when he retired. From 1994 to 2006, he has served as an independent consultant and served as Chairman of Fibrominn L.L.C., a company formed to generate electricity from biowaste material. Mr. Hern earned a Bachelor of Arts in Chemistry from Austin College in 1960 and a Master of Science in Organic Chemistry from North Texas State University in 1962. He has also received Associate Degrees from the Wharton School of Business and Carnegie Mellon University. |
| | | | |
C. Robert Black | | 73 | | Director. Mr. Black has been a director since July 17, 2006. He was formerly Senior Vice President in the Office of the Chairman of Texaco, Inc., an international oil and gas exploration, production, distribution and marketing company, until 1999 when he retired. He spent nearly forty years in various roles with Texaco before his retirement, including key assignments in engineering, supply and distribution, crude oil (international) and Middle Eastern Operations. Elected Vice President of Texaco, Inc. in 1983, Mr. Black was appointed Senior Vice President of Texaco Middle East/Far East that same year, and later named President of the same division. In 1992 he was elected Senior Vice President, and in 1997 was appointed President of Texaco’s Worldwide Exploration and Production. In his last and most recent role with Texaco, Mr. Black was responsible for developing and managing the company’s relationships with the industry on a worldwide basis, along with oversight responsibility for Texaco’s Technology Division and Corporate Reserves Audit Group. He also served as Corporate Compliance Officer, and as a member of Texaco’s Executive Council, which set corporate strategies and priorities. Mr. Black is a member of the Board of Trustees of the United States-Azerbaijan Chamber of Commerce, the University of Texas Engineering Advisory Council, and the Committee of Economic Development. He is a distinguished alumnus of Texas Tech University, graduating with a bachelor’s degree in petroleum engineering in 1958 and was appointed to the Texas Tech University System Board of Regents by Governor Rick Perry in 2001. He also serves on the Board of Directors of Coastal Energy Company and Madagascar Oil Limited. |
| | | | |
John S. Reiland | | 59 | | Director. Mr. Reiland has been a director since July 31, 2006. He is currently the Chief Financial Officer of SingerLewak LLP, an accounting services firm headquartered in Los Angeles, a position he has held since January 2008. From August 2007 through January 2008, Mr. Reiland was the Chief Financial Officer of StarVox Communications, Inc., a telecommunications services provider. From March 2006 to 2007, Mr. Reiland was CEO/Chief Restructuring Officer of RONCO, a company engaged in the manufacture, marketing and distribution of consumer products. From March 2003 until March 2006, he served as the Chief Financial Officer of US Dataworks, a developer of payment processing software focused on the financial services market, federal, state and local governments, billers and retailers. From March 2002 until December 2002, Mr. Reiland was the Interim Chief Executive Officer of New England Pantry, Inc., a convenience store chain. From November 2000 to February 2002, he was Chief Executive Officer of ServiceIQ, a privately held developmental stage company developing wireless communications devices for the field service industry.. Mr. Reiland is a certified public accountant and began his career at PriceWaterhouse & Co. from 1973 to 1978. He received his Bachelor of Business Administration degree from the University of Houston in 1973. |
79
Table of Contents
Name | | Age | | Position and Business Experience |
Robert White | | 73 | | Director. Mr. White has been a director since July 17, 2006. He was the last President of Mobil Exploration and Producing U.S. Inc., a division of Mobil Oil Company focusing on domestic oil and gas exploration and production, prior to that company’s merger with Exxon in 1996, when he retired. Mr. White’s career with Mobil spanned over 40 years, including 15 years spent outside the United States. He joined the company in 1964 as a production engineer in Hobbs, New Mexico, following his honorable discharge from the U.S. Army Corps of Engineers at the rank of Captain. Since that time he has served as Manager of Economics and Planning for Natural Gas in North America, Planning Advisor for Exploration and Producing in North America, Chairman and President of Mobil Producing Netherlands, Mobil Producing Nigeria, and Mobil North Sea Limited in London. While in the UK, Mr. White also served as Chairman of the Petroleum Science and Technology Institute, a scientific and development organization made up of oil industry representatives and Scottish universities. Mr. White is a graduate of the University of Texas at Austin with a Bachelor of Science in Petroleum Engineering. |
| | | | |
Fred S. Zeidman | | 62 | | Director. Mr. Zeidman has been a director since June 26, 2007. He has served as a Managing Director of the law firm Greenberg Traurig, LLP since July 2003. Mr. Zeidman has served as Chairman of the Board of Corporate Strategies, Inc., a consulting firm, since July 2004, and he served as Chairman of the Board of Seitel Inc., an oil field services company, from June 2002 to February 2007. Mr. Zeidman serves as the Chairman of the Board of the United States Holocaust Memorial Museum. He received a Bachelor of Science in Business Administration from Washington University in 1968, and an MBA from New York University in 1970. |
| | | | |
Jay Fillman | | 54 | | Vice President, Chief Financial Officer, Secretary and Treasurer. Mr. Fillman has been Chief Financial Officer since May 2008. Prior to becoming our Chief Financial Officer, he served as a consultant to the company, assisting with corporate development. Mr. Fillman was one of the founders of Illinois River Energy, a publicly traded green field ethanol producer, and served as the company’s Vice President and a Manager with responsibility for accounting and financial matters from 2001 to 2004. In 1992 and 1978, respectively, Mr. Fillman founded Fillman Insurance and Fillman Tax Services. Mr. Fillman currently manages Fillman Insurance and the daily operations of a corn and soybean farm. He also served as a manager of the Illinois Soybean Operating Board and American Soybean Development Foundation. He holds a Bachelor of Science degree in Agricultural Economics from the University of Illinois. |
| | | | | | | |
80
Table of Contents
Name | | Age | | Position and Business Experience |
Richard Talley | | 44 | | Chief Operating Officer. Mr. Talley has been our Chief Operating Officer since October 2008 and was our Vice President of Technology and Projects and President of Biosource America, Inc. from April 2006 until then. He has over 21 years of experience in process development and design. During the last eight years, he has led the effort with Biosource Fuels, LLC and one of the members of Biosource Fuels, LLC to develop the unique biodiesel production technology now owned by the Company. Mr. Talley has been requested to speak at the National Biodiesel Board (NBB) Annual Conference and the Fat and Proteins Research Foundation (FPRF) Annual Meeting, where he led presentations on biodiesel production technologies. In addition, Mr. Talley has authored an article regarding biodiesel production from animal fats and greases for the National Render Association’s Magazine (Render February 2004 “Biodiesel: A Compelling Business for The Rendering Industry”). Before joining biodiesel production technology development efforts in the fall of 2000, Mr. Talley served as the Western Regional Manager for HKM Engineering. HKM was a regional civil, structural and environmental engineering firm that specialized in large scale industrial and public works projects, including process and chemical refineries, structures, dams, highways and bridges, airports and large water supply, treatment and distributions systems. Mr. Talley began work with HKM in 1990 and served as a project engineer, project manager, and technical division director prior to his promotion and transfer to the Western Regional Manager position in Butte, Montana. Mr. Talley received his B.S. in Civil Engineering from the University of Wyoming in 1986, and is currently registered as a professional engineer in the states of Wyoming, Montana, and Idaho. |
| | | | |
Russell D. Sammons | | 35 | | Vice President of Marketing. Mr. Sammons has been our Vice President of Marketing since October 2008 and was our Vice President of Refinery Operations from June 2006 until then. He was previously employed as a Turnaround and Majors Planning Section Supervisor with ExxonMobil Refining & Supply, a division of ExxonMobil focusing on refining crude oil into refined fuel products, from 2002 until 2006, where he oversaw planning and controls of turnarounds and large maintenance jobs in ExxonMobil’s largest United States Refinery. From 2000 until 2002, Mr. Sammons was employed with ExxonMobil as a Maintenance Section Supervisor. Mr. Sammons earned a master’s degree in business administration from the University of Houston and a bachelor’s degree in mechanical engineering from the Colorado School of Mines. |
The remaining information required by this item is incorporated by reference to our definitive proxy statement or an amendment to this Form 10-K to be filed not later than 120 days after the end of the fiscal year covered by this report.
81
Table of Contents
ITEM 11. EXECUTIVE COMPENSATION
The information required by this item is incorporated by reference to our definitive proxy statement or an amendment to this Form 10-K to be filed not later than 120 days after the end of the fiscal year covered by this report.
ITEM 12. SECURITY OWNERSHIP OF CERTAIN BENEFICIAL OWNERS AND MANAGEMENT AND RELATED STOCKHOLDER MATTERS
Securities Authorized for Issuance under Equity Compensation Plans
The following table sets forth, as of October 31, 2008, certain information related to our compensation plans under which shares of our common stock are authorized for issuance:
Plan category | | Number of securities to be
issued upon exercise of
outstanding options,
warrants and rights
(a) | | Weighted-average
exercise price of
outstanding options,
warrants and rights
(b) | | Number of securities
remaining available for
future issuance under
equity compensation
plans (excluding securities
reflected in column (a))
(c) | |
Equity compensation plans approved by security holders | | 8,542,365 | | $ | 2.66 | | 3,278,858 | |
Equity compensation plans not approved by security holders | | — | | — | | — | |
Total | | 8,542,365 | | $ | 2.66 | | 3,278,858 | |
Material Features of Plan Approved by Shareholders
On April 24, 2006, we adopted our 2006 Equity Incentive Plan. The 2006 Equity Incentive Plan provides for equity incentives to be granted to our employees, officers or directors or to key advisers or consultants. Equity incentives may be in the form of stock options with an exercise price not less than the fair market value of the underlying shares as determined pursuant to the 2006 Equity Incentive Plan, stock appreciation rights, restricted stock awards, stock bonus awards, other stock-based awards, or any combination of the foregoing. The 2006 Equity Incentive Plan is administered by the Compensation Committee of the Board of Directors. The 2006 Equity Incentive Plan was approved by our stockholders at our annual meeting on October 30, 2007.
Material Features of Individual Arrangements Not Approved by Shareholders
As of October 31, 2008, we do not have any individual equity compensation arrangements outside of our 2006 Equity Incentive Plan.
The remaining information required by this item is incorporated by reference to our definitive proxy statement or an amendment to this Form 10-K to be filed not later than 120 days after the end of the fiscal year covered by this report.
ITEM 13. CERTAIN RELATIONSHIPS AND RELATED TRANSACTIONS, AND DIRECTOR INDEPENDENCE
The information required by this item is incorporated by reference to our definitive proxy statement or an amendment to this Form 10-K to be filed not later than 120 days after the end of the fiscal year covered by this report.
ITEM 14. PRINCIPAL ACCOUNTING FEES AND SERVICES
The information required by this item is incorporated by reference to our definitive proxy statement or an amendment to this Form 10-K to be filed not later than 120 days after the end of the fiscal year covered by this report.
82
Table of Contents
PART IV
ITEM 15. EXHIBITS AND FINANCIAL STATEMENT SCHEDULES
(a) The following documents are filed as part of this report:
(1) Financial Statements: See Item 8 above.
(2) Financial Statement Schedules: Schedules for which provision is made in the applicable accounting regulations of the Securities and Exchange Commission are omitted because they are not required under the related instructions or are not applicable, or because the required information is shown in the consolidated financial statements or notes thereto.
(3)&(b) Exhibits: The exhibits listed in the accompanying Exhibit Index are filed as part of this Annual Report on Form 10-K. Management contracts or compensatory plans or arrangements are identified in such Exhibit Index by the symbol “*”.
83
Table of Contents
SIGNATURES
In accordance with Section 13 or 15(d) of the Securities Exchange Act, the registrant caused this report to be signed on its behalf by the undersigned, thereunto duly authorized.
| NOVA BIOSOURCE FUELS, INC. |
Dated: January 28, 2009 | /s/ KENNETH T. HERN |
| Kenneth T. Hern |
| Chairman and Chief Executive Officer |
| (Principal Executive Officer) |
In accordance with Exchange Act, this report has been signed below by the following persons on behalf of the registrant and in the capacities and on the dates indicated.
Name | | Title | | Date |
| | | | |
/s/ KENNETH T. HERN | | Chairman and Chief Executive Officer | | January 28, 2009 |
Kenneth T. Hern | | (Principal Executive Officer) | | |
| | | | |
/s/ JAY FILLMAN | | Vice President, Chief Financial Officer, Secretary and | | January 28, 2009 |
Jay Fillman | | Treasurer (Principal Financial and Accounting Officer) | | |
| | | | |
/s/ C. ROBERT BLACK | | Director | | January 28, 2009 |
C. Robert Black | | | | |
| | | | |
/s/ JOHN S. REILAND | | Director | | January 28, 2009 |
John S. Reiland | | | | |
| | | | |
/s/ ROBERT W. WHITE | | Director | | January 28, 2009 |
Robert W. White | | | | |
| | | | |
/s/ FRED S. ZEIDMAN | | Director and Interim President | | January 28, 2009 |
Fred S. Zeidman | | | | |
Table of Contents
EXHIBIT INDEX
Exhibit
No. | | Title |
2.1 | | Share Exchange Agreement, dated March 30, 2006, among Nova Oil, Inc., Biosource America, Inc. and the shareholders of Biosource America, Inc. (incorporated by reference to Exhibit 2.1 of the Company’s Current Report on Form 8-K dated March 30, 2006 and filed with the SEC on April 3, 2006). |
| | |
2.2 | | Asset Purchase Agreement, dated February 7, 2006, between Biosource Fuels, LLC and Biosource America, Inc. (incorporated by reference to Exhibit 2.2 of the Company’s Current Report on Form 8-K dated March 30, 2006 and filed with the SEC on April 3, 2006). |
| | |
2.3 | | Omnibus Amendment to Asset Purchase Agreement and operative documents, dated as of April 28, 2006, among Biosource Fuels, LLC, the members and assignees of Biosource Fuels, LLC, Nova Oil, Inc. and Biosource America, Inc. (incorporated by reference to Exhibit 2.3 of the Company’s Quarterly Report on Form 10-QSB for the Quarter ended April 30, 2006 and filed with the SEC on June 15, 2006). |
| | |
2.4 | | Asset Purchase Agreement between Nova Biofuels Clinton County, LLC, Clinton County Bio Energy, L.L.C. and the Members of Clinton County Bio Energy, L.L.C. (incorporated by reference to Exhibit 2.1 of the Company’s Current Report on Form 8-K dated August 15, 2007 and filed with the SEC on August 16, 2007). |
| | |
3.1 | | Amended and Restated Articles of Incorporation of Nova Biosource Fuels, Inc. (incorporated by reference to Exhibit 3.1 of the Company’s Annual Report on Form 10-KSB for the year ended October 31, 2006 and filed with the SEC on January 16, 2007). |
| | |
3.2 | | Bylaws of Nova Biosource Fuels, Inc. (composite as amended as of February 3, 2008) (incorporated by reference to Exhibit 3.1 of the Company’s Annual Report on Form 10-KSB for the year ended October 31, 2007 and filed with the SEC on February 8, 2008). |
| | |
4.1 | | See Exhibits 3.1 and 3.2 |
| | |
4.2 | | Specimen common stock certificate (incorporated by reference to Exhibit 3.1 of the Company’s Annual Report on Form 10-KSB for the year ended October 31, 2006 and filed with the SEC on January 16, 2007). |
| | |
4.3 | | Form of Warrant, dated as of July 6, 2006, between the Company and the holder thereof (incorporated by reference to Exhibit 10.8 of the Company’s Quarterly Report on Form 10-QSB for the quarter ended July 31, 2006 and filed with the SEC on September 14, 2006). |
| | |
4.4 | | Form of Warrant, dated as of July 10, 2006, between the Company and the holder thereof (incorporated by reference to Exhibit 10.11 of the Company’s Quarterly Report on Form 10-QSB for the quarter ended July 31, 2006 and filed with the SEC on September 14, 2006). |
| | |
4.5 | | Form of Warrant, dated as of July 11, 2006, between the Company and the holder thereof (incorporated by reference to Exhibit 10.14 of the Company’s Quarterly Report on Form 10-QSB for the quarter ended July 31, 2006 and filed with the SEC on September 14, 2006). |
| | |
4.6 | | Form of Warrant, dated as of December 21, 2006, between the Company and the holder thereof (incorporated by reference to Exhibit 99.3 of the Company’s Current Report on Form 8-K dated December 19, 2006 and filed with the SEC on December 20, 2006). |
| | |
4.7 | | Registration Rights Agreement, dated as of February 17, 2006, between Biosource Fuels, LLC and Biosource America, Inc. (incorporated by reference to Exhibit 10.4 of the Company’s Current Report on Form 8-K dated March 30, 2006 and filed with the SEC on April 3, 2006). |
| | |
4.8 | | Registration Rights Agreement, dated as of July 6, 2006, between the Company and the purchasers party thereto (incorporated by reference to Exhibit 10.9 of the Company’s Quarterly Report on Form 10-QSB for the quarter ended July 31, 2006 and filed with the SEC on September 14, 2006). |
| | |
4.9 | | Registration Rights Agreement, dated as of July 10, 2006, between the Company and the purchasers party thereto (incorporated by reference to Exhibit 10.12 of the Company’s Quarterly Report on Form 10-QSB for the quarter ended July 31, 2006 and filed with the SEC on September 14, 2006). |
| | |
4.10 | | Registration Rights Agreement, dated as of July 11, 2006, between the Company and the purchasers party thereto (incorporated by reference to Exhibit 10.15 of the Company’s Quarterly Report on Form 10-QSB for the quarter ended July 31, 2006 and filed with the SEC on September 14, 2006). |
Table of Contents
Exhibit
No. | | Title |
4.11 | | Registration Rights Agreement, dated as of December 19, 2006, between the Company and the purchasers party thereto (incorporated by reference to Exhibit 99.2 of the Company’s Current Report on Form 8-K dated December 19, 2006 and filed with the SEC on December 20, 2006). |
| | |
4.12 | | Securities Purchase Agreement, dated as of July 6, 2006, between the Company and the purchasers party thereto (incorporated by reference to Exhibit 10.7 of the Company’s Quarterly Report on Form 10-QSB for the quarter ended July 31, 2006 and filed with the SEC on September 14, 2006). |
| | |
4.13 | | Securities Purchase Agreement, dated as of July 10, 2006, between the Company and the purchasers party thereto (incorporated by reference to Exhibit 10.10 of the Company’s Quarterly Report on Form 10-QSB for the quarter ended July 31, 2006 and filed with the SEC on September 14, 2006). |
| | |
4.14 | | Securities Purchase Agreement, dated as of July 11, 2006, between the Company and the purchasers party thereto (incorporated by reference to Exhibit 10.13 of the Company’s Quarterly Report on Form 10-QSB for the quarter ended July 31, 2006 and filed with the SEC on September 14, 2006). |
| | |
4.15 | | Securities Purchase Agreement, dated as of December 19, 2006, between the Company and the purchasers party thereto (incorporated by reference to Exhibit 99.1 of the Company’s Current Report on Form 8-K dated December 19, 2006 and filed with the SEC on December 20, 2006). |
| | |
4.16 | | Securities Purchase Agreement, dated as of September 27, 2007, between the Company and the purchasers named therein (incorporated by reference to Exhibit 4.1 of the Company’s Current Report on Form 8-K dated September 28, 2007 and filed with the SEC on October 4, 2007). |
| | |
4.17 | | Indenture, dated as of September 28, 2007, among the Company, the Guarantors set forth therein, Nova Holding Seneca LLC, a wholly-owned subsidiary of the Company, the Bank of New York Trust Company, N.A., a national banking association, as trustee (including the note and guarantee attached thereto) (incorporated by reference to Exhibit 4.2 of the Company’s Current Report on Form 8-K dated September 28, 2007 and filed with the SEC on October 4, 2007). |
| | |
4.18 | | Supplemental Indenture, dated as of March 27, 2008, to the Indenture, dated as of September 28, 2007, among the Company, the Guarantors set forth therein, Nova Holding Seneca LLC, a wholly-owned subsidiary of the Company, and the Bank of New York Trust Company, N.A., a national banking association, as trustee (including the note and guarantee attached thereto) (incorporated by reference to Exhibit 4.2 of the Company’s Quarterly Report on Form 10-Q dated July 31, 2008 and filed with the SEC on June 9, 2008). |
| | |
4.19 | | Registration Rights Agreement, dated as of September 27, 2007, between the Company and the purchasers named therein (incorporated by reference to Exhibit 4.3 of the Company’s Current Report on Form 8-K dated September 28, 2007 and filed with the SEC on October 4, 2007). |
| | |
4.20 | | Share Loan Registration Rights Agreement, dated as of September 28, 2007, among the Company, Kenneth T. Hern, J.D. McGraw and Jefferies & Company, Inc. (incorporated by reference to Exhibit 4.4 of the Company’s Current Report on Form 8-K dated September 28, 2007 filed with the SEC on October 4, 2007). |
| | |
10.1 | | Confidentiality and Non-Competition Agreement, dated as of February 17, 2006, between Biosource America, Inc. and Resodyn Corporation (incorporated by reference to Exhibit 10.5 of the Company’s Current Report on Form 8-K dated March 30, 2006 and filed with the SEC on April 3, 2006). |
| | |
10.2 | | Agreement, dated as of March 31, 2006, between Biosource America, Inc. and Scott Petroleum Corporation (incorporated by reference to Exhibit 10.10 of the Company’s Quarterly Report on Form 10-QSB for the Quarter ended April 30, 2006 and filed with the SEC on June 15, 2006). |
| | |
10.3 | | Biofuel Tolling and Off-Take Agreement, dated March 7, 2007, between Nova Biofuels Trade Group, LLC and Scott Petroleum Corporation (incorporated by reference to Exhibit 10.1 of the Company’s Quarterly Report on Form 10-QSB for the quarter ended April 30, 2007 and filed with the SEC on June 14, 2007). |
| | |
10.4 | | Change Order One, dated June 28, 2007, to the agreement dated March 31, 2006 between Biosource America, Inc. and Scott Petroleum Corporation (incorporated by reference to Exhibit 10.1 of the Company’s Quarterly Report on Form 10-QSB for the quarter ended July 31, 2007 and filed with the SEC on September 13, 2007). |
| | |
10.5 | | Change Order Two, dated July 2, 2007, to the agreement dated March 31, 2006 between Biosource America, Inc. and Scott Petroleum Corporation (incorporated by reference to Exhibit 10.2 of the Company’s Quarterly Report on Form 10-QSB for the quarter ended July 31, 2007 and filed with the SEC on September 13, 2007). |
Table of Contents
Exhibit
No. | | Title |
10.6 | | Amendment, dated July 2, 2007, to Agreement between Scott Petroleum Corporation and Biosource America, Inc. and Biofuel Tolling and Off-Take Agreement between Nova Biofuels Trade Group, LLC and Scott Petroleum Corporation (incorporated by reference to Exhibit 10.15 of the Company’s Annual Report on Form 10-KSB for the year ended October 31, 2007 and filed with the SEC on February 8, 2008). |
| | |
10.7 | | Second Amendment to the Biofuel Tolling and Off-Take Agreement, executed and delivered on September 3, 2008 (incorporated by reference to Exhibit 10.1 of the Company’s Current Report on Form 8-K filed with the SEC on September 5, 2008). |
| | |
10.8 | | Purchase and Sale Agreement by and between Nova Biofuels Seneca, LLC and L&L Properties LLC and Shipyard Industrial Park, Inc., dated as of June 23, 2006 (incorporated by reference to Exhibit 10.4 of the Company’s Quarterly Report on Form 10-QSB for the quarter ended July 31, 2006 and filed with the SEC on September 14, 2006). |
| | |
10.9 | | Biodiesel Sale and Purchase Agreement, dated as of July 30, 2007, between Nova Biofuels Trade Group, LLC and Gavilon, LLC, formerly known as ConAgra Trade Group (incorporated by reference to Exhibit 10.1 of the Company’s Current Report on Form 8-K dated August 8, 2007 and filed with the SEC on August 13, 2007). |
| | |
10.10 | | Credit Agreement, dated as of December 26, 2007, among Nova Biofuels Seneca, LLC, the Lenders party thereto, WestLB AG, New York Branch, as administrative agent for the Lenders, WestLB AG, New York Branch, as issuing bank with respect to the letters of credit, WestLB AG, New York Branch, as collateral agent for the senior secured parties, WestLB AG, New York Branch, as lead arranger and sole bookrunner, and Sterling Bank, a Texas banking corporation, as accounts bank (incorporated by reference to Exhibit 10.1 on the Company’s Current Report on Form 8-K dated December 26, 2007 and filed with the SEC on January 2, 2008). |
| | |
10.11 | | First Amendment to Credit Agreement, dated February 22, 2008, by and among Nova Biofuels Seneca, LLC, the Lenders party thereto, WestLB AG, New York Branch, as administrative agent for the Lenders, WestLB AG, New York Branch, as issuing bank with respect to the letters of credit, WestLB AG, New York Branch, as collateral agent for the senior secured parties, WestLB AG, New York Branch, as lead arranger and sole bookrunner, and Sterling Bank, a Texas banking corporation, as accounts bank (incorporated by reference to Exhibit 10.1 of the Company’s Quarterly Report on Form 10-Q dated July 31, 2008 and filed with the SEC on June 9, 2008). |
| | |
10.12 | | Second Amendment to Credit Agreement, dated as of April 17, 2008, by and among Nova Biofuels Seneca, LLC, the Lenders party thereto, WestLB AG, New York Branch, as administrative agent for the Lenders, WestLB AG, New York Branch, as issuing bank with respect to the letters of credit, WestLB AG, New York Branch, as collateral agent for the senior secured parties, WestLB AG, New York Branch, as lead arranger and sole bookrunner, and Sterling Bank, a Texas banking corporation, as accounts bank (incorporated by reference to Exhibit 10.2 of the Company’s Quarterly Report on Form 10-Q dated July 31, 2008 and filed with the SEC on June 9, 2008). |
| | |
10.13† | | Third Amendment to Credit Agreement, dated as of September 5, 2008, by and among Nova Biofuels Seneca, LLC, the Lenders party thereto, WestLB AG, New York Branch, as administrative agent for the Lenders, WestLB AG, New York Branch, as issuing bank with respect to the letters of credit, WestLB AG, New York Branch, as collateral agent for the senior secured parties, WestLB AG, New York Branch, as lead arranger and sole bookrunner, and Sterling Bank, a Texas banking corporation, as accounts bank. |
| | |
10.14† | | Fourth Amendment to Credit Agreement, dated as of September 29, 2008, by and among Nova Biofuels Seneca, LLC, the Lenders party thereto, WestLB AG, New York Branch, as administrative agent for the Lenders, WestLB AG, New York Branch, as issuing bank with respect to the letters of credit, WestLB AG, New York Branch, as collateral agent for the senior secured parties, WestLB AG, New York Branch, as lead arranger and sole bookrunner, and Sterling Bank, a Texas banking corporation, as accounts bank. |
| | |
10.15† | | Fifth Amendment to Credit Agreement and First Amendment to Completion Guaranty, dated as of October 31, 2008, by and among Nova Biofuels Seneca, LLC, the Lenders party thereto, WestLB AG, New York Branch, as administrative agent for the Lenders, WestLB AG, New York Branch, as issuing bank with respect to the letters of credit, WestLB AG, New York Branch, as collateral agent for the senior secured parties, WestLB AG, New York Branch, as lead arranger and sole bookrunner, and Sterling Bank, a Texas banking corporation, as accounts bank. |
| | |
10.16† | | Sixth Amendment to Credit Agreement, dated as of December 29, 2008, by and among Nova Biofuels Seneca, LLC, the Lenders party thereto, WestLB AG, New York Branch, as administrative agent for the Lenders, WestLB AG, New York Branch, as issuing bank with respect to the letters of credit, WestLB AG, New York Branch, as collateral agent for the senior secured parties, WestLB AG, New York Branch, as lead arranger and sole bookrunner, and Sterling Bank, a Texas banking corporation, as accounts bank. |
Table of Contents
Exhibit
No. | | Title |
10.17 | | Subscription Agreement, dated as of June 23, 2006, between KBI Energy, LLC and Nova Holdings Seneca LLC (incorporated by reference to Exhibit 10.6 of the Company’s Quarterly Report on Form 10-QSB for the quarter ended July 31, 2006 and filed with the SEC on September 14, 2006). |
| | |
10.18 | | Feedstock Agreement between Nova Biofuels Seneca, LLC and Lipid Logistics, LLC, dated as of June 26, 2006 (incorporated by reference to Exhibit 10.5 of the Company’s Quarterly Report on Form 10-QSB for the quarter ended July 31, 2006 and filed with the SEC on September 14, 2006). |
| | |
10.19 | | Biodiesel Sale and Purchase Agreement, dated as of September 13, 2006, between Nova Biofuels Seneca, LLC and Gavilon, LLC, as successor to ConAgra Trade Group, Inc., (incorporated by reference to Exhibit 10.40 of the Company’s Annual Report on Form 10-KSB for the year ended October 31, 2006 and filed with the SEC on January 16, 2007). |
| | |
10.20* | | Nova Biosource Fuels, Inc. 2006 Equity Incentive Plan (incorporated by reference to Exhibit 10.11 of the Company’s Quarterly Report on Form 10-QSB for the Quarter ended April 30, 2006 and filed with the SEC on June 15, 2006). |
| | |
10.21* | | Form of Non-Qualified Stock Option Agreement for 2006 Equity Incentive Plan (incorporated by reference to Exhibit 10.12 of the Company’s Quarterly Report on Form 10-QSB for the Quarter ended April 30, 2006 and filed with the SEC on June 15, 2006). |
| | |
10.22* | | Form of Stock Bonus Agreement for Consultants and Advisors under the Company’s 2006 Equity Incentive Plan. (incorporated by reference to Exhibit 99.2 of the Company’s Current Report on Form 8-K dated July 31, 2006, filed with the Commission on August 4, 2006) |
| | |
10.23* | | Form of Restricted Stock Award Agreement for Non-Employee Directors under the Company’s 2006 Equity Incentive Plan (incorporated by reference to Exhibit 99.3 of the Company’s Current Report on Form 8-K dated July 31, 2006, filed with the Commission on August 4, 2006). |
| | |
10.24* | | Employment Agreement, dated as of May 1, 2006, between Biosource America, Inc. and Richard H. Talley (incorporated by reference to Exhibit 10.13 of the Company’s Amended Quarterly Report on Form 10-QSB for the Quarter ended April 30, 2006 and filed with the SEC on June 30, 2006). |
| | |
10.25* | | Employment Agreement, dated as of June 13, 2006, between the Company and Russell D. Sammons (incorporated by reference to Exhibit 10.1 of the Company’s Quarterly Report on Form 10-QSB for the quarter ended July 31, 2006 and filed with the SEC on September 14, 2006). |
| | |
10.26* | | Employment Agreement, dated as of May 1, 2006, between the Company and Leon van Kraayenburg (incorporated by reference to Exhibit 10.3 of the Company’s Quarterly Report on Form 10-QSB for the quarter ended July 31, 2006 and filed with the SEC on September 14, 2006). |
| | |
10.27* | | Executive Services Agreement between the Company and Tatum, LLC dated December 29, 2006 (incorporated by reference to Exhibit 10.4 of the Company’s Quarterly Report on Form 10-QSB for the quarter ended January 31, 2007 and filed with the SEC on March 19, 2007). |
| | |
10.28* | | Project Agreement between the Company and Tatum, LLC, dated December 28, 2006 (incorporated by reference to Exhibit 10.5 of the Company’s Quarterly Report on Form 10-QSB for the quarter ended January 31, 2007 and filed with the SEC on March 19, 2007). |
| | |
10.29*† | | Summary of Non-Equity Compensation of Certain Named Executive Officers. |
| | |
10.30* | | Nova Director Compensation Program (2008) (incorporated by reference to Exhibit 10.42 of the Company’s Annual Report on Form 10-KSB for the year ended October 31, 2007 and filed with the SEC on February 8, 2008). |
| | |
10.31 | | Master Securities Loan Agreement between Jefferies & Company, Inc. and Kenneth T. Hern and J.D. McGraw (incorporated by reference to Exhibit 10.1 of the Company’s Current Report on Form 8-K dated September 28, 2007 and filed with the SEC on October 4, 2007). |
| | |
10.32 | | Letter Agreement among the Company, Kenneth T. Hern and J.D. McGraw (incorporated by reference to Exhibit 10.2 of the Company’s Current Report on Form 8-K dated September 28, 2007 and filed with the SEC on October 4, 2007). |
Table of Contents
Exhibit
No. | | Title |
10.33 | | Letter Agreement among Jefferies & Company, Inc., Kenneth T. Hern and J.D. McGraw (incorporated by reference to Exhibit 10.2 of the Company’s Current Report on Form 8-K dated September 28, 2007 and filed with the SEC on October 4, 2007). |
| | |
14.1 | | Nova Biosource Fuels, Inc. Code of Ethics and Business Conduct (incorporated by reference to Exhibit 14.1 of the Company’s Annual Report on Form 10-KSB for the year ended October 31, 2006 and filed with the SEC on January 16, 2007). |
| | |
16.1 | | Letter Regarding Change in Certifying Accountant (incorporated by reference to Exhibit 16.1 of the Company’s Current Report on Form 8-K dated March 31, 2006 and filed with the SEC on April 3, 2006). |
| | |
21.1 | | Subsidiaries of Nova Biosource Fuels, Inc. (incorporated by reference to Exhibit 21.1 of the Company’s Annual Report on Form 10-KSB for the year ended October 31, 2007 and filed with the SEC on February 8, 2008). |
| | |
23.1† | | Consent of Malone & Bailey, P.C. |
| | |
31.1† | | Certifications of the Chief Executive Officer. |
| | |
31.2† | | Certifications of the Chief Financial Officer. |
| | |
32.1† | | Certifications of the Chief Executive Officer provided pursuant to 18 U.S.C. Section 1350 as adopted pursuant to Section 906 of the Sarbanes-Oxley Act of 2002. |
| | |
32.2† | | Certifications of the Chief Financial Officer provided pursuant to 18 U.S.C. Section 1350 as adopted pursuant to Section 906 of the Sarbanes-Oxley Act of 2002. |
† Filed with this report.
* Indicates a management contract or compensatory plan or arrangement.