UNITED STATES
SECURITIES AND EXCHANGE COMMISSION
Washington, D.C. 20549
FORM N-CSR
CERTIFIED SHAREHOLDER REPORT OF REGISTERED MANAGEMENT
INVESTMENT COMPANIES
Investment Company Act file number: 811-10385
Pacific Funds
(Exact name of registrant as specified in charter)
700 Newport Center Drive, P.O. Box 7500, Newport Beach, CA 92660
(Address of principal executive offices)
Robin S. Yonis
Assistant Vice President and Investment Counsel of
Pacific Life Insurance Company
700 Newport Center Drive
Post Office Box 9000
Newport Beach, CA 92660
(Name and address of agent for service)
Copies to:
Jeffrey S. Puretz, Esq.
Dechert LLP
1775 Eye Street, N.W.
Washington, D.C. 20006-2401
Registrant’s telephone number, including area code: (949) 219-6767
Date of fiscal year end: March 31, 2003
Date of reporting period: April 1, 2002–March 31, 2003
Form N-CSR is to be used by management investment companies to file reports with the Commission not later than 10 days after the transmission to stockholders of any report that is required to be transmitted to stockholders under Rule 30e-1 under the Investment Company Act of 1940 (17 CFR 270.30e-1). The Commission may use the information provided on Form N-CSR in its regulatory, disclosure review, inspection, and policymaking roles.
A registrant is required to disclose the information specified by Form N-CSR, and the Commission will make this information public. A registrant is not required to respond to the collection of information contained in Form N-CSR unless the Form displays a currently valid Office of Management and Budget (“OMB”) control number. Please direct comments concerning the accuracy of the information collection burden estimate and any suggestions for reducing the burden to Secretary, Securities and Exchange Commission, 450 Fifth Street, NW, Washington, DC 20549-0609. The OMB has reviewed this collection of information under the clearance requirements of 44 U.S.C. § 3507. ANNUAL REPORT TABLE OF CONTENTS PACIFIC FUNDS To Our Pacific Funds Shareholders: We’ve prepared the enclosed investment results for each of the funds for the past 12 months. Each of the fund managers has prepared a discussion regarding the performance of the funds they manage, including commentary discussing positive and negative factors affecting performance. Thank you for investing in Pacific Funds. We appreciate your confidence and look forward to serving your financial needs in the years to come. Thomas C. Sutton A-1 PACIFIC FUNDS PERFORMANCE DISCUSSION PF Aim Blue Chip Fund Q. How did the fund perform for the year ended March 31, 2003? A. For the year ended March 31, 2003, the fund’s Class A returned –26.55%* compared to a –24.75%** return for its benchmark, the Standard & Poor’s 500 Composite Stock Price Index (S&P 500 Index). Complete performance information for all classes is included in the following table. Performance Comparison The following graph shows the value as of March 31, 2003 of a $10,000 investment made in Class A shares when the fund began operations. For comparison purposes, the performance of the fund’s benchmark (the S&P 500 Index) is also shown. Performance data for Class B and C shares will vary due to differences in fees and sales charges. Performance data shown represents past performance. Investment return and principal value will fluctuate so that shares of the fund when redeemed may be worth more or less than their original cost. Past performance is not predictive of future performance. The table does not reflect the deduction of taxes that a shareholder would pay on fund distributions or redemption of fund shares. Q. Discuss both positive and negative factors that materially affected the fund’s performance during the year, including relevant market conditions, investment strategies and techniques, and particular sectors or securities. A. During the year ending March 31, 2003, the financial markets declined significantly, while the economy continued to make its way through a somewhat choppy recovery. All of the major indices posted disappointing returns. The NASDAQ Composite Stock Index (NASDAQ) was down 26.97%**, the S&P 500 Index declined by 24.75%**, and the Dow Jones Industrial Average posted a return of –21.45%** for the period. Some of the negative influences on the markets included repeated reports of scandalous activity in corporate America, fear of terrorism, and increased uncertainty over the war in Iraq. During the first three quarters of this period, the positive news related mostly to the economy, with average Gross Domestic Product (GDP) growth recorded at a healthy 2.2%, productivity rates at levels not seen in 50 years, relatively nonexistent inflation, a low interest rate environment that fueled consumer spending, and a booming housing market. However, during the first quarter of 2003, reports on the economy turned more negative after the start of the war. Preliminary estimates for first quarter GDP growth have been scaled back significantly since the beginning of the year. Employment statistics have also been worrisome as unemployment claims and payrolls were weaker than expected. The unemployment rate held steady at 5.8% by the end of the first quarter of 2003, suggesting little expansion in hiring, at least until a resolution of the Iraqi conflict. Consumer confidence also deteriorated amid war tensions and rising oil prices, falling to a nine-year low in March. As consumer confidence waned, spending data also declined. Burdened by higher energy prices, consumers scaled back their purchases. The housing market, until recently, had largely offset weak economic data; however, reports released in March also showed some signs of deceleration. During this period, all of the sectors within the S&P 500 Index posted large declines, with utilities and telecommunication services performing the worst. The health care sector had the best performance, but it was still down over 18% for the period. Growth stocks remained out of favor, as value stocks strongly outperformed during 2002; however, the growth style of investing has outperformed value since the beginning of 2003. Small-capitalization growth stocks suffered the greatest losses during the period, while mid-capitalization value-oriented stocks had the best performance. The fund seeks long-term growth of capital. Current income is of secondary importance. It invests mainly in equity securities of “blue chip” companies, which are typically large companies that are well established in their respective industries. The fund seeks to invest only in market leaders and is diversified across all sectors of its benchmark. In managing the fund in the uncertain market environment of the last fiscal year, we at AIM _____________________ PACIFIC FUNDS PERFORMANCE DISCUSSION (Continued) continued to focus on diversification, both within sectors and across industries, while targeting high quality, market-leading companies with strong fundamentals. On average, the fund held an overweight position relative to the benchmark in the health care sector, and held underweight positions in consumer staples, industrials, telecommunication services, materials, and utilities during the period. The fund’s underperformance relative to its benchmark was largely due to its holdings in the information technology sector, as market-leading companies remained under pressure. The semiconductor industry within this sector performed the worst during the period. Good stock selection in the industrials sector helped the fund’s performance when compared to the benchmark, as did stock selection and an underweight position relative to the benchmark in consumer staples. The fund’s underweight position relative to the benchmark in telecommunication services also made a positive contribution, while holdings in the consumer discretionary sector detracted from performance as the war had a negative short-term impact on media related companies during the first quarter of 2003. The performance of the fund was also affected by its heavy exposure to very large capitalization stocks relative to its benchmark, which were out of favor in comparison to small-and mid-capitalization stocks during the first part of 2003. The top five contributors for the period were Forest Laboratories Inc., Zimmer Holdings Inc., Amgen Inc., SLM Corp., and St. Jude Medical Inc. The bottom five contributors were Home Depot Inc., General Electric Co., Citigroup Inc., Applied Materials Inc., and American International Group Inc. PF AIM Aggressive Growth Fund Q. How did the fund perform for the year ended March 31, 2003? A. For the year ended March 31, 2003, the fund’s Class A returned –26.14%* compared to a –24.00%** return for the Russell 2500 Index and –29.28%** for the Russell 2500 Growth Index. The fund’s benchmark was changed to the Russell 2500 Growth Index due to the fund’s growth style of investing. Complete performance information for all classes is included in the following table. Performance Comparison The following graph shows the value as of March 31, 2003 of a $10,000 investment made in Class A shares when the fund began operations. For comparison purposes, the performance of the fund’s benchmarks is also shown. Performance data for Class B and C shares will vary due to differences in fees and sales charges. Performance data shown represents past performance. Investment return and principal value will fluctuate so that shares of the fund when redeemed may be worth more or less than their original cost. Past performance is not predictive of future performance. The table does not reflect the deduction of taxes that a shareholder would pay on fund distributions or redemption of fund shares. Q. Discuss both positive and negative factors that materially affected the fund’s performance during the year, including relevant market conditions, investment strategies and techniques, and particular sectors or securities. A. During the year ending March 31, 2003, the financial markets declined significantly, while the economy continued to make its way through a somewhat choppy recovery. All of the major indices posted disappointing returns. The NASDAQ was down 26.97%**, the S&P 500 Index declined by 24.75%**, and the Dow Jones Industrial Average posted a return of –21.45%** for the period. Some of the negative influences on the markets included repeated reports of scandalous activity in corporate America, fear of terrorism, and increased uncertainty _____________________ PACIFIC FUNDS PERFORMANCE DISCUSSION (Continued) over the war in Iraq. During the first three quarters of this period, the positive news related mostly to the economy, with average GDP growth recorded at a healthy 2.2%, productivity rates at levels not seen in 50 years, relatively nonexistent inflation, a low interest rate environment that fueled consumer spending, and a booming housing market. However, during the first quarter of 2003, reports on the economy turned more negative after the start of the war. Preliminary estimates for first quarter GDP growth have been scaled back significantly since the beginning of the year. Employment statistics have also been worrisome as unemployment claims and payrolls were weaker than expected. The unemployment rate held steady at 5.8% by the end of the first quarter of 2003, suggesting little expansion in hiring, at least until a resolution of the Iraqi conflict. Consumer confidence also deteriorated amid war tensions and rising oil prices, falling to a nine-year low in March. As consumer confidence waned, spending data also declined. Burdened by higher energy prices, consumers scaled back their purchases. The housing market, until recently, had largely offset weak economic data; however, reports released in March also showed some signs of deceleration. During this period, all of the sectors within the S&P 500 Index posted large declines, with utilities and telecommunication services performing the worst. The health care sector had the best performance, but it was still down over 18% for the period. Growth stocks remained out of favor, as value stocks strongly outperformed during 2002; however, the growth style of investing has outperformed value since the beginning of 2003. Small-capitalization growth stocks suffered the greatest losses during the period, while mid-capitalization value-oriented stocks had the best performance. The fund seeks long-term growth of capital, and invests mainly in equity securities of small and medium sized growth companies. It offers an earnings momentum investment strategy, and seeks to optimize full growth potential by typically holding stocks for longer durations. In the uncertain market environment of the past year, we took on a slightly defensive position for the fund by emphasizing a mix of core growth holdings and earnings momentum stocks. They reduced the fund’s holdings from 138 as of March 31, 2002 to 80 as of March 31, 2003 in order to focus on core names to help minimize risk and volatility. During the year, we increased the fund’s weight in more defensive sectors like health care and industrials, while decreasing positions in information technology due to the continued deterioration of the fundamentals in this sector. On average, the fund held overweight positions in the consumer discretionary and energy sectors, while holding underweight positions in consumer staples, financials, information technology, and telecommunication services relative to the Russell 2500 Growth Index. As the year came to an end, fund holdings emphasized stocks of high-quality companies with solid earnings growth prospects, as many of these companies reported strong earnings for their most recent fiscal quarters despite a struggling economy. The fund out-performed its benchmark, the Russell 2500 Growth Index, for the period. The fund’s out-performance was largely due to superior stock selection in the health care sector. Specifically, a lack of exposure to biotechnology stocks within this sector made the largest positive contribution to the fund’s out-performance. An underweight position in consumer staples stocks also made a positive contribution to performance when compared to the Russell 2500 Growth Index. Stock selection in the materials sector was the largest detractor from relative performance during the period, followed by stock selection in financials. In absolute terms, information technology had the largest negative impact for the year, but the fund had strong stock selection within this sector relative to the Russell 2500 Growth Index. The top five contributors for the year were Jacobs Engineering Group Inc., Medicis Pharmaceutical Corp. ‘A’, Pacific Sunwear of California Inc., Doral Financial Corp., and Apollo Group Inc. ‘A’. The bottom five contributors were OM Group Inc., Robert Half International Inc., Concord EFS Inc., DST Systems Inc., and SunGard Data Systems Inc. PF INVESCO Health Sciences Fund Q. How did the fund perform for the year ended March 31, 2003? A. With a positive first quarter 2003 return of 2.13%* for the fund’s Class A versus –3.15%** for its benchmark, the S&P 500 Index, the fund returned –17.49%* compared to a –24.75%** return for its benchmark for the year ended March 31, 2003. Complete performance information for all classes is included in the following table. _____________________ PACIFIC FUNDS PERFORMANCE DISCUSSION (Continued) Performance Comparison The following graph shows the value as of March 31, 2003 of a $10,000 investment made in Class A shares when the fund began operations. For comparison purposes, the performance of the fund’s benchmark (the S&P 500 Index) is also shown. Performance data for Class B and C shares will vary due to differences in fees and sales charges. PF INVESCO Health Sciences Fund Class A with maximum front-end sales charge Performance data shown represents past performance. Investment return and principal value will fluctuate so that shares of the fund when redeemed may be worth more or less than their original cost. Past performance is not predictive of future performance. The table does not reflect the deduction of taxes that a shareholder would pay on fund distributions or redemption of fund shares. Q. Discuss both positive and negative factors that materially affected the fund’s performance during the year, including relevant market conditions, investment strategies and techniques, and particular sectors or securities. A. For the year ended March 31, 2003, the PF INVESCO Health Sciences Fund declined sharply, falling essentially in line with the Standard & Poor’s Healthcare Index. However, the fund outperformed the broader S&P 500 Index’s return over the same time period. Through the majority of the period, the fund’s health services holdings (those health care companies that provide services, such as hospitals and HMOs, rather than offering products) performed extremely well — particularly during the second and third quarters of 2002. Then, at the end of October, 2002, Tenet Healthcare Corporation (no longer a fund holding) fell under scrutiny for its Medicare pricing tactics — news that quickly clouded the entire health services area. Following this development, the fund’s exposure to Tenet and other services leaders proved detrimental, hampering performance for the period. In response, we at INVESCO significantly cut back the fund’s exposure to hospitals and HMOs. This decision stemmed not only from the regulatory problems dogging hospitals, but also from our growing concern over the possibility that we could see cuts in Medicare going forward as the U.S. government attends to the current budget deficit. In restructuring the fund, we shifted a significant portion of assets from health services holdings into the large-capitalization pharmaceuticals group. A wave of new pharmaceutical products is expected in late 2003 or early 2004, which should bolster the industry. Furthermore, research we conducted during the period showed that for the first time in 40 years, the dividend yields on drug stocks had surpassed those of short-term Treasuries. We also increased the fund’s weighting in biotechnology stocks heading into 2003. It’s important to note, however, that we sought only profitable companies in this space — firms with strong earnings, positive cash flows, and proven biological products that have already been introduced to the market. Meanwhile, throughout the period, the fund maintained a substantial weighting in medical device companies, and many of the fund’s holdings representing this sub-sector outperformed its benchmark index. Specifically, we targeted those names poised to dominate the promising drug-coated stent market, which we believe will be the largest new therapeutic market in all of health care over the next two-to five-years. (Drug-coated stents are devices used to prop open arteries, and contain drugs to keep them unclogged.) PF INVESCO Technology Fund Q. How did the fund perform for the year ended March 31, 2003? A. For the year ended March 31, 2003, the fund’s Class A returned –44.83%* compared to a –24.75%** return for its benchmark, the S&P 500 Index. Complete performance information for all classes is included in the following table. _____________________ PACIFIC FUNDS PERFORMANCE DISCUSSION (Continued) Performance Comparison The following graph shows the value as of March 31, 2003 of a $10,000 investment made in Class A shares when the fund began operations. For comparison purposes, the performance of the fund’s benchmark (the S&P 500 Index) is also shown. Performance data for Class B and C shares will vary due to differences in fees and sales charges. Performance data shown represents past performance. Investment return and principal value will fluctuate so that shares of the fund when redeemed may be worth more or less than their original cost. Past performance is not predictive of future performance. The table does not reflect the deduction of taxes that a shareholder would pay on fund distributions or redemption of fund shares. Q. Discuss both positive and negative factors that materially affected the fund’s performance during the year, including relevant market conditions, investment strategies and techniques, and particular sectors or securities. A. Investors remained risk averse throughout the past year, which translated into a rough period for technology stocks. During the summer, several high-profile accounting scandals and rising tensions on the West Bank unnerved investors. With the fall came concerns about another conflict with Iraq and worries that consumer spending could weaken. Underlying all of these headline developments was continued economic weakness, which meant that demand for technology products remained weak. The fourth quarter of 2002 and first quarter of 2003 saw performance improve somewhat, as the sector bounced sharply off the market lows seen during October, 2002. The sector’s strength could be attributed to the market’s anticipation of rising holiday consumer demand and corporate year-end spending on technology upgrades. Although technology stocks lost some of their momentum in January, 2003, the sector managed to finish the fiscal year on a positive note. While most market sectors declined in the face of the war, slipping consumer confidence and rising unemployment claims and energy prices, the technology sector managed to outperform the broader market during the first quarter of 2003. The late gains enjoyed by the technology sector could not offset losses endured earlier in the period. As such, the value of the fund’s shares declined for the one-year period ended March 31, 2003, and underperformed the S&P 500 Index. Frankly, the selling was so severe throughout the technology sector that there weren’t many industries that advanced. Information technology, consulting, software, communications equipment, computers, electronic equipment and semiconductors all declined sharply. Even more conservative technology stocks, such as those in the aerospace and defense industry and commercial services companies, declined. The fund’s lone bright spot was in Internet-related stocks. A handful of companies also made positive relative contributions to performance by declining less than the broader market. Included in this group were several technology “blue chips”. Wireless telecommunications services stocks also performed well. PF Janus Strategic Value Fund Q. How did the fund perform for the year ended March 31, 2003? A. For the year ended March 31, 2003, the fund’s Class A returned –28.26%* compared to a –24.75%** return for its benchmark, the S&P 500 Index. Complete performance information for all classes is included in the following table. _____________________ PACIFIC FUNDS PERFORMANCE DISCUSSION (Continued) Performance Comparison The following graph shows the value as of March 31, 2003 of a $10,000 investment made in Class A shares when the fund began operations. For comparison purposes, the performance of the fund’s benchmark (the S&P 500 Index) is also shown. Performance data for Class B and C shares will vary due to differences in fees and sales charges. Performance data shown represents past performance. Investment return and principal value will fluctuate so that shares of the fund when redeemed may be worth more or less than their original cost. Past performance is not predictive of future performance. The table does not reflect the deduction of taxes that a shareholder would pay on fund distributions or redemption of fund shares. Q. Discuss both positive and negative factors that materially affected the fund’s performance during the year, including relevant market conditions, investment strategies and techniques, and particular sectors or securities. A. Before regaining traction in October, stocks generally fell during the first six months of the fund’s fiscal year. The modest fourth quarter rally proved to be too little, too late, however, and the S&P 500 Index resumed its slide during the opening months of 2003, ultimately finishing the period down more than 24%. The Dow Jones Industrial Average, which lost 21.45%** during the period, fared slightly better. However, the higher-growth-tilted NASDAQ turned in the worst performance of all three benchmarks, giving back more than 26.97%** for the period. Despite the NASDAQ’s difficult performance, growth stocks modestly outperformed their value-oriented peers, with the S&P/Barra Growth Index losing 23.61%** of its value versus the 26.19%** drop of the S&P/Barra Value Index. Exposure to information technology stocks, in which the fund was underweight relative to the benchmark index, worked against the fund during this period. Additionally, stocks in the industrial sector, in which the fund was overweight relative to the benchmark, were also negative detractors. On the other hand, the consumer discretionary and financial sectors, in which the fund was overweight and underweight, respectively, relative to the benchmark, represented the top-two performing sectors in the fund. The biggest disappointment was utilities company El Paso Corp., followed by industrial conglomerate Tyco International Ltd. both of which declined, detracting from results. Cadence Design Systems Inc., which provides design software to the semiconductor industry, was the fund’s third biggest detractor from performance. Rounding out the list of negative contributors were HR data outsourcing firm Ceridian Corp., and toy retailer Toys “R” Us Inc., which also declined. Digital Broadcast Services provider EchoStar Communications Corp ‘A’, better known as Dish Network, was the fund’s strongest gainer. Elsewhere, Station Casinos Inc., which targets local resident gamblers in Las Vegas, contributed to performance. Meanwhile, credit rating service Moody’s Corp. and natural gas firm Kinder Morgan Management LLC also gained ground, offering modest gains, as did financial concern SLM Corp., commonly known as Sallie Mae. PF Janus Growth LT Fund Q. How did the fund perform for the year ended March 31, 2003? A. For the year ended March 31, 2003, the fund’s Class A returned –26.16%* compared to a –24.75%** return for its benchmark, the S&P 500 Index. These results were earned under the tenure of Warren B. Lammert, Fund Manager. Mr. Lammert departed Janus on March 31, 2003, and turned over all portfolio management responsibilities to David Corkins on that date. Mr. Corkins co-managed the fund during the entire month of March, 2003. Complete performance information for all classes is included in the following table. _____________________ PACIFIC FUNDS PERFORMANCE DISCUSSION (Continued) Performance Comparison The following graph shows the value as of March 31, 2003 of a $10,000 investment made in Class A shares when the fund began operations. For comparison purposes, the performance of the fund’s benchmark (the S&P 500 Index) is also shown. Performance data for Class B and C shares will vary due to differences in fees and sales charges. Performance data shown represents past performance. Investment return and principal value will fluctuate so that shares of the fund when redeemed may be worth more or less than their original cost. Past performance is not predictive of future performance. The table does not reflect the deduction of taxes that a shareholder would pay on fund distributions or redemption of fund shares. Q. Discuss both positive and negative factors that materially affected the fund’s performance during the year, including relevant market conditions, investment strategies and techniques, and particular sectors or securities. A. Stocks generally fell during the first six months of the fund’s fiscal year before regaining traction in October. The modest fourth quarter, 2002 rally proved to be too little, too late, however, and the S&P 500 Index resumed its slide during the opening months of 2003, ultimately finishing the year ended March 31, 2003 down more than 24%**. The Dow Jones Industrial Average, which lost 21.45%**, fared slightly better. However, the higher-growth NASDAQ turned in the worst performance of all three indices, giving back more than 26.97%** during the year. Despite the NASDAQ’s difficult performance, growth stocks modestly outperformed their value-oriented peers, with the S&P/Barra Growth Index losing 23.61%** of its value versus the 26.19%** drop of the S&P/Barra Value Index. The fund’s exposure to information technology stocks, an area where it carried a modest overweighting relative to the benchmark, was the biggest detractor from performance as stock selection in the sector worked against the fund. The fund’s underweighting relative to the benchmark in industrial stocks – where we carried roughly half the exposure of the benchmark – was the second biggest detractor from results. Together, these two sectors accounted for the fund’s total underperformance. Top contributors to performance included the health care sector, an area where we had carefully built a sizable exposure relative to the benchmark. Meanwhile, the fund’s lack of exposure to telecommunications services stocks, a poorly performing sector we largely avoided, also worked to the fund’s advantage. The biggest disappointment was cellular handset and wireless infrastructure company Nokia OYJ, which cost the fund in performance. Diversified financial services firm Citigroup Inc. also declined, detracting from results. Flextronics International Ltd., which manufactures electronics for other firms on a contract basis, was our third biggest disappointment. Rounding out the list of negative contributors to fund performance were laboratory services provider Laboratory Corp. of America Holdings, which detracted from results, and Celestica Inc., a company that, like Flextronics International Ltd., competes in the electronics manufacturing industry. Internet-based retailer Amazon.com Inc. was the fund’s top performer during the period. The company added to fund results. The second best performer was Yahoo! Inc., the Internet search site. Yahoo! Inc., together with pharmaceutical maker Forest Laboratories Inc. and medical device maker Medtronic Inc. contributed to the fund’s performance. Satellite television provider EchoStar Communications Corp. ‘A’, rounded out the list of top performers, also adding to fund performance. _____________________ PACIFIC FUNDS PERFORMANCE DISCUSSION (Continued) PF Lazard International Value Fund Q. How did the fund perform for the year ended March 31, 2003? A. For the year ended March 31, 2003, the fund’s Class A returned –20.50%* compared to a –23.59%**** return for its benchmark, the Morgan Stanley Capital International Europe, Australasia and Far East (MSCI EAFE) Index. Complete performance information for all classes is included in the following table. Performance Comparison The following graph shows the value as of March 31, 2003 of a $10,000 investment made in Class A shares when the fund began operations. For comparison purposes, the performance of the fund’s benchmark (the MSCI EAFE Index) is also shown. Performance data for Class B and C shares will vary due to differences in fees and sales charges. Performance data shown represents past performance. Investment return and principal value will fluctuate so that shares of the fund when redeemed may be worth more or less than their original cost. Past performance is not predictive of future performance. The table does not reflect the deduction of taxes that a shareholder would pay on fund distributions or redemption of fund shares. Q. Discuss both positive and negative factors that materially affected the fund’s performance during the year, including relevant market conditions, investment strategies and techniques, and particular sectors or securities. A. Confounding the expectations of most market participants, stocks continued their decline in the twelve months ending March 31, 2003, with the MSCI EAFE Index falling approximately 24%****. The fund defended well in the decline, falling less than the overall market, although unable to avoid weakness entirely. Concerns over terrorism, impending war, and fall-out from U.S. accounting scandals weighed heavily on the markets. Adding to market anxiety was slower-than-expected economic growth worldwide and continued weakness in corporate spending and investment. The fund’s consumer staples holdings, whose earnings have been relatively unaffected by the economic doldrums, performed well. While this defensive sector has outperformed throughout this bear market, valuations remain attractive: the group’s earnings have been resilient while in most other sectors earnings have declined dramatically. The fund’s European energy holdings also performed well due to both their defensive characteristics, and attractive valuations relative to their peers. Technology holdings experienced weakness, as there has yet to be a significant rebound in demand for IT products. PF MFS Mid-Cap Growth Fund Q. How did the fund perform for the year ended March 31, 2003? A. For the year ended March 31, 2003, the fund’s Class A returned –40.51%* compared to a –26.11%** return for its benchmark, the Russell Midcap Growth Index. Complete performance information for all classes is included in the following table. _____________________ PACIFIC FUNDS PERFORMANCE DISCUSSION (Continued) Performance Comparison The following graph shows the value as of March 31, 2003 of a $10,000 investment made in Class A shares when the fund began operations. For comparison purposes, the performance of the fund’s benchmark (the Russell Midcap Growth Index) is also shown. Performance data for Class B and C shares will vary due to differences in fees and sales charges. Performance data shown represents past performance. Investment return and principal value will fluctuate so that shares of the fund when redeemed may be worth more or less than their original cost. Past performance is not predictive of future performance. The table does not reflect the deduction of taxes that a shareholder would pay on fund distributions or redemption of fund shares. Q. Discuss both positive and negative factors that materially affected the fund’s performance during the year, including relevant market conditions, investment strategies and techniques, and particular sectors or securities. A. Despite a rally in the fourth quarter of 2002 and a war-related rally in late March 2003, the past year has been a challenging year for stock investors, with most equity indices posting double-digit declines. Most industries and sectors showed few signs of improving business fundamentals such as earnings and cash flow growth. The one exception was media companies, including television and radio broadcasters, which benefited from an uptick in advertising spending. In the equity market, the fund experienced extreme volatility. A sharp market plunge that began in August 2002 continued in September. In October and November the fund enjoyed a brief rally that, in our view, was fueled largely by investor sentiment that stock valuations had simply fallen too far — and not by much real improvement in company fundamentals. The fund also experienced a brief rally in late March 2003, which, we at MFS believe, was driven by the certainty of action in Iraq and the belief that the fighting would be short. Most of the fund’s underperformance versus its benchmark index occurred early in the period, when the fund held a number of very large positions in stocks that fell dramatically. Until late in 2001, a strategy of holding large positions in stocks in which we had long-term confidence had worked well for the fund; in the first half of 2002, however, that strategy worked against us. The prices of many key holdings collapsed, including stocks in the technology, business services, telecommunications, and health care sectors. The management team and the strategy of the fund were changed in June. We began a transition to a more diversified and less concentrated fund, with more companies represented in the portfolio and smaller positions in individual companies. By the end of 2002, the transition had been completed, and we believe investors have begun to see results from this new strategy. In the latter half of the period, we began to see benefits from diversifying into some relatively new areas for the fund. In property and casualty insurance for example, we invested in what our research indicated were upturns in the business cycle. Insurance firms benefited from price increases, after many years in which competition had cut pricing to unprofitable levels. PF MFS Global Growth Fund Q. How did the fund perform for the year ended March 31, 2003? A. For the year ended March 31, 2003, the fund’s Class A returned –24.11%* compared to a –24.19%**** return for its benchmark, the Morgan Stanley Capital International (MSCI) All Country World Index Free. Complete performance information for all classes is included in the following table. _____________________ PACIFIC FUNDS PERFORMANCE DISCUSSION (Continued) Performance Comparison The following graph shows the value as of March 31, 2003 of a $10,000 investment made in Class A shares when the fund began operations. For comparison purposes, the performance of the fund’s benchmark (the MSCI All Country World Index Free) is also shown. Performance data for Class B and C shares will vary due to differences in fees and sales charges. MSCI All Country World Index Free Performance data shown represents past performance. Investment return and principal value will fluctuate so that shares of the fund when redeemed may be worth more or less than their original cost. Past performance is not predictive of future performance. The table does not reflect the deduction of taxes that a shareholder would pay on fund distributions or redemption of fund shares. Q. Discuss both positive and negative factors that materially affected the fund’s performance during the year, including relevant market conditions, investment strategies and techniques, and particular sectors or securities. A. The period was dominated by uncertainty and volatility, two conditions unfavorable for equity markets and especially for growth stocks. Beginning in early spring of 2002, markets around the world experienced a strong downdraft that lasted into early October. The major factor, in our view, was an expected recovery that didn’t happen. We at MFS think that going into 2002, investors anticipated a global economic recovery in the second half of the year. When it became clear that was not happening, stock prices fell around the world as expectations of a recovery were pushed out further and further. In the fourth quarter of 2002, stock markets reversed direction again, rising on news that third quarter earnings, while not robust, were at least not disappointing. In a tough period for most of the developed world, the fund’s overweight position in emerging market securities, relative to its benchmark index, helped performance. We think emerging markets did well largely because developing nations such as China and South Korea had a large amount of internal demand that continued to grow over the period. In addition, our research helped us avoid much of the turmoil in Latin American equities caused by presidential elections in Brazil. Relatively defensive positioning in international developed markets also helped fund performance. We tried to avoid some of the global volatility by investing in companies whose businesses we thought would be able to grow despite the ups and downs of the economy. The health care sector, which has historically tended to perform relatively well in a tough economy, suffered over the period. Large pharmaceutical firms found their drug patents challenged by generic drug companies, while investors worried that the challenges, if successful, might impair future earnings. PF PIMCO Inflation Managed Fund Q. How did the fund perform for the period since inception ending March 31, 2003? A. For the period ending March 31, 2003, the fund’s Class A returned 3.30%* compared to a 2.83%** return for its benchmark, the Lehman Brothers Global Real: U.S. TIPs Index. Complete performance information for all classes is included in the following table. _____________________ PACIFIC FUNDS PERFORMANCE DISCUSSION (Continued) Performance Comparison The following graph shows the value as of March 31, 2003 of a $10,000 investment made in Class A shares when the fund began operations. For comparison purposes, the performance of the fund’s benchmark (the Lehman Brothers Global Real: U.S. TIPs Index) is also shown. Performance data for Class B and C shares will vary due to differences in fees and sales charges. Lehman Brothers Global Real: U.S. TIPs Index Performance data shown represents past performance. Investment return and principal value will fluctuate so that shares of the fund when redeemed may be worth more or less than their original cost. Past performance is not predictive of future performance. The table does not reflect the deduction of taxes that a shareholder would pay on fund distributions or redemption of fund shares. Q. Discuss both positive and negative factors that materially affected the fund’s performance during the period, including relevant market conditions, investment strategies and techniques, and particular sectors or securities. A. The flight to safer assets such as Treasuries that characterized financial markets for much of 2002 transitioned into a move toward higher yielding fixed income securities. Despite this movement away from safer assets, Treasury Inflation Protected Securities (“TIPs”) performed well, outpacing both the S&P 500 Index and the broad bond market for the first quarter of 2003. For the period since the fund’s inception on December 31, 2002 to March 31, 2003 the fund outperformed its benchmark. Interest rate strategies helped performance overall, as the fund emphasized intermediate TIPs where inflation protected yields fell the most. In managing the fund, we at PIMCO will emphasize shorter maturity TIPs which are attractive due to the recent spike in oil prices and associated short-term inflation. We will also emphasize longer maturity TIPs, since increased fiscal deficits will likely drive long run inflation rates up. Finally, we will continue to modestly use higher yielding sectors such as corporate bonds and emerging markets to add to returns. PF PIMCO Managed Bond Fund Q. How did the fund perform for the year ended March 31, 2003? A. For the year ended March 31, 2003, the fund’s Class A returned 12.80%* compared to a 13.40%** return for its benchmark, the Lehman Brothers Government/Credit Index. Complete performance information for all classes is included in the following table. Performance Comparison The following graph shows the value as of March 31, 2003 of a $10,000 investment made in Class A shares when the fund began operations. For comparison purposes, the performance of the fund’s benchmark (the Lehman Brothers Government/Credit Index) is also shown. Performance data for Class B and C shares will vary due to differences in fees and sales charges. Performance data shown represents past performance. Investment return and principal value will fluctuate so that shares of the fund when redeemed may be worth more or less than their original cost. Past performance is not predictive of future performance. The table does not reflect the deduction of taxes that a shareholder would pay on fund distributions or redemption of fund shares. ____________________ PACIFIC FUNDS PERFORMANCE DISCUSSION (Continued) Q. Discuss both positive and negative factors that materially affected the fund’s performance during the year, including relevant market conditions, investment strategies and techniques, and particular sectors or securities. A. The year ended March 31, 2003 marked an especially volatile time for financial markets. For much of this period, geopolitical uncertainty encouraged investors’ flight to safer assets. This trend abated somewhat in the later part of the 12-month period as market participants moved toward higher yielding fixed income securities. As a result, at the end of the period, capital flocked to U.S. corporate and emerging market bonds that offered substantial yield premiums relative to the safest asset classes. The fund modestly underperformed its benchmark for the year ended March 31, 2003. A variety of strategies contributed to this performance. The fund’s general level of interest rate sensitivity was a modest drag on returns for the year. However, the fund’s emphasis on intermediate maturity securities, especially over the first half of the year, proved to be notably positive as yields dropped the most for these maturities. Overall, the fund benefited from its sector strategies. An emphasis in mortgage-backed securities was positive for performance as these higher yielding securities provided attractive returns. A lower than benchmark exposure to corporate securities helped returns over the course of the year as corporate issues underperformed. However, an emphasis in telecommunications and utilities issues hurt returns as these sectors suffered amid a general flight to quality over the last year. Finally, exposure to emerging market debt was modestly positive for returns. This sector benefited from improving economic fundamentals in many developing countries over the last twelve months. PF Pacific Life Money Market Fund Q. How did the fund perform for the year ended March 31, 2003? A. For the year ended March 31, 2003, the fund’s Class A returned 0.58%* compared to a 1.65%** return for its benchmark, the Merrill Lynch 3-Month U.S. T-Bill Index.The current yield for Class A measured during the seven-day period ending March 31, 2003 was 0.33%*. Q. Discuss both positive and negative factors that materially affected the fund’s performance during the year, including relevant market conditions, investment strategies and techniques, and particular sectors or securities. A. For the twelve months ending March 31, 2003, short-term interest rates remained at historically low levels. From April, 2002 through October, 2002, three-month Treasury bill yields were in the 1.60% to 1.70% range. In November, 2002, rates dropped noticeably, ultimately yielding around 1.20%. 90-day commercial paper yields closely followed the pattern that three-month Treasury bills took. Yields were generally about .10% above Treasury bills. The fourth quarter, 2002 drop in rates was precipitated by the Federal Reserve Board’s (Fed) decrease of their target interest rate from 1.75% to its current level of 1.25%. Continued economic weakness has kept the Federal Open Market Committee busy trying to determine if the current environment is directly related to the war in Iraq. Until economic fundamentals become clearer, the Federal Open Market Committee appears to be on hold. The shape of the short-term yield curve was generally flat, although at times we saw an inverted yield curve. This represents the view that rates will continue to be low, with the prospect that yields could decrease even further. Consequently, the view on where to hold the fund’s average maturity has been ambiguous. With three-to six-month yields at or below one-to three-month yields, there was little incentive to extend the fund’s average maturity. However, with the prospect for lower rates likely, shortening the fund’s average maturity didn’t seem to be the answer either. Ultimately, our strategy was to find yield at various points on the yield curve, placing less weight on maturity and more weight on credit quality. For much of the year, the availability of high quality commercial paper was in short supply. The current, prolonged low interest rate environment has allowed many top tier issuers to issue longer-term debt, thus reducing their dependence on the commercial paper market. Consequently, we were required to invest in higher quality, lower yielding assets. These generally were U.S. Treasury bills or agency discount notes. The commercial paper market as a whole has been relatively tricky. Anticipating future issuance proved difficult. Consequently, the sector could not be counted on to provide consistent yield. We were able to find steady issuance, and relatively attractive yields, in the pharmaceutical and telecommunications sectors. Callable agency securities were plentiful, thus providing a safe place to invest cash flow. While these securities contain very little credit risk, the built-in call option allows for a substantial yield pickup over commercial paper and traditional agency discount notes. ____________________ PACIFIC FUNDS PERFORMANCE DISCUSSION (Continued) PF Putnam Equity Income Fund Q. How did the fund perform for the year ended March 31, 2003? A. For the year ended March 31, 2003, the fund’s Class A returned –23.59%* compared to a –22.79%** return for its benchmark, the Russell 1000 Value Index. Complete performance information for all classes is included in the following table. Performance Comparison The following graph shows the value as of March 31, 2003 of a $10,000 investment made in Class A shares when the fund began operations. For comparison purposes, the performance of the fund’s benchmark (the Russell 1000 Value Index) is also shown. Performance data for Class B and C shares will vary due to differences in fees and sales charges. Performance data shown represents past performance. Investment return and principal value will fluctuate so that shares of the fund when redeemed may be worth more or less than their original cost. Past performance is not predictive of future performance. The table does not reflect the deduction of taxes that a shareholder would pay on fund distributions or redemption of fund shares. Q. Discuss both positive and negative factors that materially affected the fund’s performance during the year, including relevant market conditions, investment strategies and techniques, and particular sectors or securities. A. For the year ended March 31, 2003, the PF Putnam Equity Income Fund slightly underperformed its benchmark index. A favorable overweight position versus the benchmark in the consumer cyclicals sector and strong stock selection (Ford Motor Company Capital Trust II, J.C. Penney Co. Inc., Liberty Media Corp. ‘A’) in this sector contributed positively to performance. Selected stocks in the transportation sector (Union Pacific Corp.) and technology sector (Lexmark International Inc., PeopleSoft Inc., BMC Software Inc.) also proved beneficial. Weaker stock selection in the financial (ACE Ltd., The Bank of New York Co. Inc., Comerica Inc.) and energy (BP PLC ADR, Royal Dutch Petroleum Co. ‘NY’, TotalFinaElf SA ADR) sectors detracted from performance. Compared to the benchmark, an overweight position in Charter One Financial Inc. (savings and loans, financials) was a primary contributor to results for the period as solid performance lifted shares above those of other companies in the financial sector. Underweighting WorldCom Inc. (competitive local exchange carriers, communications services) also aided relative performance as investigations into fraudulent accounting procedures and the company’s subsequent bankruptcy filing forced share prices lower. Strong pricing and enrollment trends translated into robust performance for Anthem Inc. (HMOs/managed care), a significant contributor in the health care sector. Anthem Inc. was also added to the S&P 500 Index during the fund’s fiscal year. Holdings adversely affecting fund performance included an overweight position versus the benchmark in Tyco International Ltd. (conglomerates), which fell first on allegations of accounting irregularities and again on reduced earnings forecasts due to expenses related to accounting issues within its security division. In the health care sector, an overweight to CIGNA Corp. (HMOs/managed care) had a negative impact after the company announced lower earnings estimates due to higher costs. Accounting irregularities in Dynegy Inc.’s energy trading unit and reduced financial forecasts made it a negative contributor. PF Putnam Research Fund Q. How did the fund perform for the year ended March 31, 2003? A. For the year ended March 31, 2003, the fund’s Class A returned –26.30%* compared to a –24.75%** return for its benchmark, the S&P 500 Index. Complete performance information for all classes is included in the following table. ____________________ PACIFIC FUNDS PERFORMANCE DISCUSSION (Continued) Performance Comparison The following graph shows the value as of March 31, 2003 of a $10,000 investment made in Class A shares when the fund began operations. For comparison purposes, the performance of the fund’s benchmark (the S&P 500 Index) is also shown. Performance data for Class B and C shares will vary due to differences in fees and sales charges. Performance data shown represents past performance. Investment return and principal value will fluctuate so that shares of the fund when redeemed may be worth more or less than their original cost. Past performance is not predictive of future performance. The table does not reflect the deduction of taxes that a shareholder would pay on fund distributions or redemption of fund shares. Q. Discuss both positive and negative factors that materially affected the fund’s performance during the year, including relevant market conditions, investment strategies and techniques, and particular sectors or securities. A. For the year ended March 31, 2003, the PF Putnam Research Fund modestly trailed its benchmark index, primarily due to unrewarded stock selection in the financial and conglomerates sectors, while the fund benefited from effective stock selection in the consumer cyclicals and health care sectors. Holdings in the financial sector were the greatest detractor from relative results, particularly in the consumer finance industry. Rising loan-loss numbers heightened investor concern about consumer finance companies including fund holdings Capital One Financial Corp., Household International Inc., and MBNA Corp. Even holdings of companies that the fund’s management team believes have effective risk management programs, were hurt. The fund also lost ground in conglomerate stocks. An overweight position versus the benchmark to Tyco International Ltd. detracted from performance as the company continued to suffer setbacks from decisions made by its old management team, even as the new management worked to improve corporate governance and business practices. In the consumer cyclicals sector, stock selection in retail cyclicals was the greatest contributor to relative results. Overweight positions versus the benchmark in J.C. Penney Co. Inc. and The TJX Cos. Inc. proved beneficial as these discount department stores profited from consumers’ added attention to how they spend their dollar in this difficult economic time. Not holding Home Depot Inc. in the fund’s portfolio proved beneficial to relative performance as its stock suffered due to increasing competition from Lowe’s Cos. Inc. and efforts by new management to reenergize the company. Holdings in the health care sector contributed to results primarily due to effective stock selection in health care services. Overweights versus the benchmark to AmerisourceBergen Corp., HCA Inc., and WellPoint Health Networks Inc. were particularly beneficial. Health-care services companies fared well in this time period because of the favorable environment for this industry: pricing power was strong and costs were down, resulting in improved margins. The fund also benefited from effective stock selection in the technology sector, particularly computers. An overweight position versus the benchmark to Hewlett-Packard Co. was a relative contributor. Hewlett-Packard Co. fared well due to their merger with Compaq Computer Corp., which many investors believed would create profit-generating synergies, and particularly well relative to other technology companies which generally suffered during the period due to stagnant capital spending. PF Salomon Brothers Large-Cap Value Fund Q. How did the fund perform for the year ended March 31, 2003? A. For the year ended March 31, 2003, the fund’s Class A returned –27.69%* compared to a –24.75%** return for its benchmark, the S&P 500 Index. Complete performance information for all classes is included in the following table. ____________________ PACIFIC FUNDS PERFORMANCE DISCUSSION (Continued) Performance Comparison The following graph shows the value as of March 31, 2003 of a $10,000 investment made in Class A shares when the fund began operations. For comparison purposes, the performance of the fund’s benchmark (the S&P 500 Index) is also shown. Performance data for Class B and C shares will vary due to differences in fees and sales charges. Performance data shown represents past performance. Investment return and principal value will fluctuate so that shares of the fund when redeemed may be worth more or less than their original cost. Past performance is not predictive of future performance. The table does not reflect the deduction of taxes that a shareholder would pay on fund distributions or redemption of fund shares. Q. Discuss both positive and negative factors that materially affected the fund’s performance during the year, including relevant market conditions, investment strategies and techniques, and particular sectors or securities. A. The year ended March 31, 2003 proved to be another challenging year for the U.S. equity markets. The major U.S. equity market indices were negative for the third year in a row. Early in the period, investor concerns on numerous fronts, particularly regarding corporate governance and accounting issues, weighed on the major equity market indices. Subsequent allegations of corporate fraud and insider trading further shook the market. As we moved into the second half of the period, corporate governance and accounting issues took a back seat to more fundamental concerns, including the strength of the economy and corporate earnings. The prospect of a war with Iraq and possible terrorist activities also affected investor sentiment. During the period, utilities, telecommunication services, and information technology stocks led the equity market’s decline. Although technology and telecommunications stocks rallied sharply in the quarter ending December 31, 2002, both sectors ended the period down. All sectors of the S&P 500 Index posted negative absolute returns for the period, but health care, consumer staples, energy, materials, and financials outperformed the other sectors of the S&P®500 Index on a relative basis. U.S. Treasury securities were the major beneficiary of the continued equity market fallout. The yield on the 10-year U.S. Treasury note fell from 5.40% at the beginning of the period to 3.80% on March 31, 2003. In early March of 2003, the U.S. Treasury note’s yield reached 3.56%, its lowest level in more than 40 years. The Fed also reduced the federal funds rate by half a percentage point in November of 2002 to 1.25%, also a 40-year low. Although the fund avoided many of the high-profile “blowups,” several companies that the fund did hold were dragged down in sympathy. The fund’s underperformance relative to its benchmark was primarily due to security selection in the utilities sector. In the utilities sector, the fund’s exposure to El Paso Corp. and Williams Cos. Inc. penalized its performance. Both companies have merchant energy operations, which came under a great deal of scrutiny from regulatory authorities, politicians, and rating agencies in the post-Enron environment. The fund’s Williams Cos. Inc. position was sold in the early summer of 2002 but the fund continued to hold El Paso Corp. due to its stronger balance sheet and more attractive asset profile. In the fall of 2002, however, El Paso Corp. came under further pressure due to an administrative ruling that the company withheld capacity on its natural gas pipeline during the California energy crisis. Therefore, despite El Paso Corp.’s favorable valuation, we decided to exit the fund’s position due to the heightened risk profile. The health care sector proved to be a bright spot in the fund’s portfolio this year. Four of the fund’s top ten positive contributors to performance came from the pharmaceutical industry, including Pharmacia Corp., Eli Lilly & Co., Wyeth and Novartis AG. Pharmacia Corp. benefited from a takeover offer from Pfizer Inc., which the fund also held. We believe that the prospects of this merger are positive and continue to hold shares in both companies. In the summer, we added to the ____________________ PACIFIC FUNDS PERFORMANCE DISCUSSION (Continued) fund’s health care exposure as some of the drug stocks reached multi-year valuation lows. As those valuations recovered in the fall of 2002, we took profits in Novartis AG and Eli Lilly & Co. We still favor the health care sector and remain overweight versus the benchmark. The fund’s overweight position in technology stocks relative to its benchmark penalized performance in the first half of the period, but paid off in the December quarter. Throughout the spring and summer of 2002, we continued to add modestly to the fund’s technology positions. In addition to valuation, we focused on companies with a market leadership position and a strong balance sheet. We recognized that these stocks could see further downside, but we wanted to position the fund to outperform relative to its benchmark, as these stocks recovered. We reduced the fund’s technology holdings in the last quarter of the period due to their increased valuations, but the fund remains overweight in the sector relative to the benchmark. A-17 [THIS PAGE INTENTIONALLY LEFT BLANK] PACIFIC FUNDS See Notes to Financial Statements See explanation of symbols on B-28 B-1 PACIFIC FUNDS Note to Schedule of Investments (a) Securities with an approximate aggregate market value of $811,079 were segregated with the custodian to cover margin requirements for the following open futures contracts at March 31, 2003: See Notes to Financial Statements See explanation of symbols on B-28 B-2 PACIFIC FUNDS See Notes to Financial Statements See explanation of symbols on B-28 B-3 PACIFIC FUNDS See Notes to Financial Statements See explanation of symbols on B-28 B-4 PACIFIC FUNDS See Notes to Financial Statements See explanation of symbols on B-28 B-5 PACIFIC FUNDS Notes to Schedule of Investments (a) Transactions in written options for the year ended March 31, 2003, were as follows: (b) Premiums received on and value of written options outstanding at March 31, 2003: See Notes to Financial Statements See explanation of symbols on B-28 B-6 PACIFIC FUNDS See Notes to Financial Statements See explanation of symbols on B-28 B-7 PACIFIC FUNDS See Notes to Financial Statements See explanation of symbols on B-28 B-8 PACIFIC FUNDS Notes to Schedule of Investments (a) Forward foreign currency contracts outstanding at March 31, 2003, are summarized as follows: See Notes to Financial Statements B-9 PACIFIC FUNDS Note to Schedule of Investments (a) At March 31, 2003, the Fund's investments were diversified as a percentage of net assets as follows: See Notes to Financial Statements B-10 PACIFIC FUNDS See Notes to Financial Statements See explanation of symbols on B-28 B-11 PACIFIC FUNDS See Notes to Financial Statements See explanation of symbols on B-28 B-12 PACIFIC FUNDS See Notes to Financial Statements See explanation of symbols on B-28 B-13 PACIFIC FUNDS See Notes to Financial Statements See explanation of symbols on B-28 B-14 PACIFIC FUNDS See Notes to Financial Statements See explanation of symbols on B-28 B-15 PACIFIC FUNDS Note to Schedule of Investments (a) At March 31, 2003, the Fund's investments were diversified as a percentage of net assets as follows: See Notes to Financial Statements See explanation of symbols on B-28 B-16 PACIFIC FUNDS See Notes to Financial Statements See explanation of symbols on B-28 B-17 PACIFIC FUNDS See Notes to Financial Statements See explanation of symbols on B-28 B-18 PACIFIC FUNDS See Notes to Financial Statements See explanation of symbols on B-28 B-19 PACIFIC FUNDS Notes to Schedule of Investments (a) Securities with an approximate aggregate market value of $299,664 were segregated with the custodian to cover margin requirements for the following open futures contracts at March 31, 2003: (b) Transactions in written options for the year ended March 31, 2003, were as follows: (c) Premiums received on and value of written options outstanding at March 31, 2003: (d) Forward foreign currency contracts outstanding at March 31, 2003, are summarized as follows: (e) Interest rate swap agreements outstanding at March 31, 2003: See Notes to Financial Statements See explanation of symbols on B-28 B-20 PACIFIC FUNDS See Notes to Financial Statements See explanation of symbols on B-28 B-21 PACIFIC FUNDS See Notes to Financial Statements See explanation of symbols on B-28 B-22 PACIFIC FUNDS See Notes to Financial Statements See explanation of symbols on B-28 B-23 PACIFIC FUNDS See Notes to Financial Statements See explanation of symbols on B-28 B-24 PACIFIC FUNDS See Notes to Financial Statements See explanation of symbols on B-28 B-25 PACIFIC FUNDS Notes to Schedule of Investments (a) Forward foreign currency contracts outstanding at March 31, 2003, are summarized as follows: See Notes to Financial Statements See explanation of symbols on B-28 B-26 PACIFIC FUNDS See Notes to Financial Statements See explanation of symbols on B-28 B-27 PACIFIC FUNDS See Notes to Financial Statements B-28 PACIFIC FUNDS See Notes to Financial Statements C-1 PACIFIC FUNDS * Redemption price per share is equal to the Net Asset Value per share less any applicable contingent deferred sales charges. See Notes to Financial Statements C-2 PACIFIC FUNDS (1) Foreign currency held at cost is $195,676. See Notes to Financial Statements C-3 PACIFIC FUNDS * Redemption price per share is equal to the Net Asset Value per share less any applicable contingent deferred sales charges. See Notes to Financial Statements C-4 PACIFIC FUNDS (1) Net of $341, $75, $1,260, $512, $952, $22,675 and $36 foreign witholding taxes, respectively. See Notes to Financial Statements C-5 PACIFIC FUNDS (1) Operations commenced on December 31, 2002. (2) Net of $8, 236, $0, $1,423 $1,813 and $4,248 foreign witholding taxes, respectively. See Notes to Financial Statements C-6 PACIFIC FUNDS (1) Operations commenced on September 28, 2001. See Notes to Financial Statements C-7 PACIFIC FUNDS (1) Operations commenced on September 28, 2001. See Notes to Financial Statements C-8 PACIFIC FUNDS (1) Operations commenced on September 28, 2001. See Notes to Financial Statements C-9 PACIFIC FUNDS (1) Operations commenced on December 31, 2002. (2) Operations commenced on September 28, 2001. See Notes to Financial Statements C-10 PACIFIC FUNDS (1) Operations commenced on December 31, 2002. (2) Operations commenced on September 28, 2001. See Notes to Financial Statements C-11 [THIS PAGE INTENTIONALLY LEFT BLANK]![]()


Chairman of the Board
Glenn S. Schafer
President PF AIM Blue Chip Fund Class A without front-end sales charge PF AIM Blue Chip Fund Class A with maximum front-end sales charge - - - - - - - - - - - S&P 500 Index 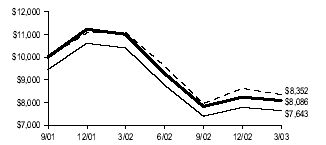
Average Annual Total Returns for the Periods Ended March 31, 2003 PF AIM Blue Chip Fund Class A Class B Class C 1 Year Total Return: Without sales charge* -26.55% -27.06% -26.99% With maximum sales charge*** -30.60% -30.70% -28.44% S&P 500 Index** -24.75% Since Inception: Without sales charge* -13.22% -13.77% -13.75% With maximum sales charge*** -16.42% -16.08% -14.32% S&P 500 Index** -11.32% * The total return for each fund includes reinvestment of all dividends and capital gain distributions, if any, and does not include deductions of any applicable sales charges. Past performance is not predictive of future performance. ** This index is unmanaged and does not reflect any fees or expenses. Results include reinvested dividends. *** Performance figures for each class reflect the deduction of any applicable maximum front-end sales charge at the time of investment, and reflect any applicable contingent deferred sales charge that would be deducted upon redemption at the end of the period presented.
A-2 PF AIM Aggressive Growth Fund Class A without front-end sales charge PF AIM Aggressive Growth Fund Class A with maximum front-end sales charge – – – – – – – – – Russell 2500 Index –– –– –– –– Russell 2500 Growth Index 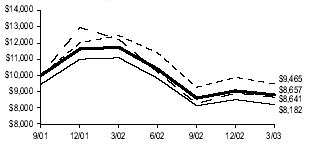
Average Annual Total Returns for the Periods Ended March 31, 2003 PF AIM Aggressive Growth Fund Class A Class B Class C 1 Year Total Return: Without sales charge* -26.14% -26.44% -26.36% With maximum sales charge*** -30.22% -30.12% -27.84% Russell 2500 Index** -24.00% Russell 2500 Growth Index** -29.28% Since Inception: Without sales charge* -9.18% -9.61% -9.51% With maximum sales charge*** -12.53% -12.02% -10.11% Russell 2500 Index** -3.60% Russell 2500 Growth Index** -9.28% * The total return for each fund includes reinvestment of all dividends and capital gain distributions, if any, and does not include deductions of any applicable sales charges. Past performance is not predictive of future performance. ** This index is unmanaged and does not reflect any fees or expenses. Results include reinvested dividends. *** Performance figures for each class reflect the deduction of any applicable maximum front-end sales charge at the time of investment, and reflect any applicable contingent deferred sales charge that would be deducted upon redemption at the end of the period presented.
A-3* The total return for each fund includes reinvestment of all dividends and capital gain distributions, if any, and does not include deductions of any applicable sales charges. Past performance is not predictive of future performance. ** This index is unmanaged and does not reflect any fees or expenses. Results include reinvested dividends. *** Performance figures for each class reflect the deduction of any applicable maximum front-end sales charge at the time of investment, and reflect any applicable contingent deferred sales charge that would be deducted upon redemption at the end of the period presented. PF INVESCO Health Sciences Fund Class A without front-end sales charge - - - - - - - - - - - S&P 500 Index 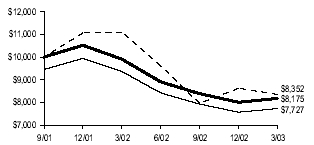
Average Annual Total Returns for the Periods Ended March 31, 2003 PF INVESCO Health Sciences Fund Class A Class B Class C 1 Year Total Return: Without sales charge* -17.49% -17.95% -17.85% With maximum sales charge*** -22.06% -22.05% -19.49% S&P 500 Index** -24.75% Since Inception: Without sales charge* -12.58% -13.08% -13.01% With maximum sales charge*** -15.81% -15.41% -13.59% S&P 500 Index** -11.32% * The total return for each fund includes reinvestment of all dividends and capital gain distributions, if any, and does not include deductions of any applicable sales charges. Past performance is not predictive of future performance. ** This index is unmanaged and does not reflect any fees or expenses. Results include reinvested dividends. *** Performance figures for each class reflect the deduction of any applicable maximum front-end sales charge at the time of investment, and reflect any applicable contingent deferred sales charge that would be deducted upon redemption at the end of the period presented. PF INVESCO Technology Fund Class A without front-end sales charge PF INVESCO Technology Fund Class A with maximum front-end sales charge - - - - - - - - - - - S&P 500 Index 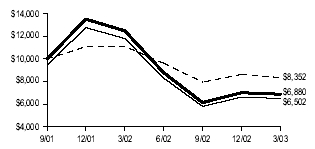
Average Annual Total Returns for the Periods Ended March 31, 2003 PF INVESCO Technology Fund Class A Class B Class C 1 Year Total Return: Without sales charge* -44.83% -45.10% -45.10% With maximum sales charge*** -47.88% -47.84% -46.21% S&P 500 Index** -24.75% Since Inception: Without sales charge* -22.08% -22.46% -22.46% With maximum sales charge*** -24.96% -24.55% -22.98% S&P 500 Index** -11.32% * The total return for each fund includes reinvestment of all dividends and capital gain distributions, if any, and does not include deductions of any applicable sales charges. Past performance is not predictive of future performance. ** This index is unmanaged and does not reflect any fees or expenses. Results include reinvested dividends. *** Performance figures for each class reflect the deduction of any applicable maximum front-end sales charge at the time of investment, and reflect any applicable contingent deferred sales charge that would be deducted upon redemption at the end of the period presented. PF Janus Strategic Value Fund Class A without front-end sales charge PF Janus Strategic Value Fund Class A with maximum front-end sales charge - - - - - - - - - - - S&P 500 Index ![]()
Average Annual Total Returns for the Periods Ended March 31, 2003 PF Janus Strategic Value Fund Class A Class B Class C 1 Year Total Return: Without sales charge* -28.26% -28.66% -28.57% With maximum sales charge*** -32.23% -32.21% -30.02% S&P 500 Index** -24.75% Since Inception: Without sales charge* -12.08% -12.52% -12.47% With maximum sales charge*** -15.32% -14.85% -13.05% S&P 500 Index** -11.32% * The total return for each fund includes reinvestment of all dividends and capital gain distributions, if any, and does not include deductions of any applicable sales charges. Past performance is not predictive of future performance. ** This index is unmanaged and does not reflect any fees or expenses. Results include reinvested dividends. *** Performance figures for each class reflect the deduction of any applicable maximum front-end sales charge at the time of investment, and reflect any applicable contingent deferred sales charge that would be deducted upon redemption at the end of the period presented. PF Janus Growth LT Fund Class A without front-end sales charge PF Janus Growth LT Fund Class A with maximum front-end sales charge - - - - - - - - - - - S&P 500 Index 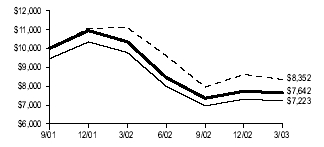
Average Annual Total Returns for the Periods Ended March 31, 2003 PF Janus Growth LT Fund Class A Class B Class C 1 Year Total Return: Without sales charge* -26.16% -26.31% -26.58% With maximum sales charge*** -30.22% -30.00% -28.01% S&P 500 Index** -24.75% Since Inception: Without sales charge* -16.43% -16.66% -16.83% With maximum sales charge*** -19.51% -18.90% -17.38% S&P 500 Index** -11.32% * The total return for each fund includes reinvestment of all dividends and capital gain distributions, if any, and does not include deductions of any applicable sales charges. Past performance is not predictive of future performance. ** This index is unmanaged and does not reflect any fees or expenses. Results include reinvested dividends. *** Performance figures for each class reflect the deduction of any applicable maximum front-end sales charge at the time of investment, and reflect any applicable contingent deferred sales charge that would be deducted upon redemption at the end of the period presented. PF Lazard International Value Fund Class A without front-end sales charge PF Lazard International Value Fund Class A with maximum front-end sales charge - - - - - - - - - - - MSCI EAFE Index 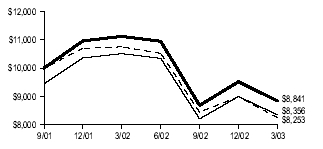
Average Annual Total Returns for the Periods Ended March 31, 2003 PF Lazard International Value Fund Class A Class B Class C 1 Year Total Return: Without sales charge* -20.50% -20.93% -20.93% With maximum sales charge*** -24.91% -24.84% -22.48% MSCI EAFE Index**** -23.59% Since Inception: Without sales charge* -7.89% -8.36% -8.39% With maximum sales charge*** -11.29% -10.79% -8.99% MSCI EAFE Index**** -12.01% * The total return for each fund includes reinvestment of all dividends and capital gain distributions, if any, and does not include deductions of any applicable sales charges. Past performance is not predictive of future performance. ** This index is unmanaged and does not reflect any fees or expenses. Results include reinvested dividends. *** Performance figures for each class reflect the deduction of any applicable maximum front-end sales charge at the time of investment, and reflect any applicable contingent deferred sales charge that would be deducted upon redemption at the end of the period presented. **** This index is unmanaged and includes reinvested dividends after deducting withholding taxes. PF MFS Mid-Cap Growth Fund Class A without front-end sales charge PF MFS Mid-Cap Growth Fund Class A with maximum front-end sales charge - - - - - - - - - - - Russell Midcap Growth Index 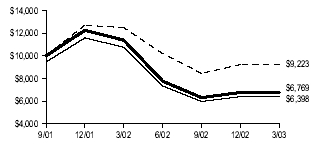
Average Annual Total Returns for the Periods Ended March 31, 2003 PF MFS Mid-Cap Growth Fund Class A Class B Class C 1 Year Total Return: Without sales charge* -40.51% -40.84% -40.78% With maximum sales charge*** -43.78% -43.47% -41.88% Russell Midcap Growth Index** -26.11% Since Inception: Without sales charge* -22.92% -23.33% -23.27% With maximum sales charge*** -25.77% -25.13% -23.78% Russell Midcap Growth Index** -5.25% * The total return for each fund includes reinvestment of all dividends and capital gain distributions, if any, and does not include deductions of any applicable sales charges. Past performance is not predictive of future performance. ** This index is unmanaged and does not reflect any fees or expenses. Results include reinvested dividends. *** Performance figures for each class reflect the deduction of any applicable maximum front-end sales charge at the time of investment, and reflect any applicable contingent deferred sales charge that would be deducted upon redemption at the end of the period presented. **** This index is unmanaged and includes reinvested dividends after deducting withholding taxes. PF MFS Global Growth Fund Class A without front-end sales charge PF MFS Global Growth Fund Class A with maximum front-end sales charge - - - - - - - - - - - 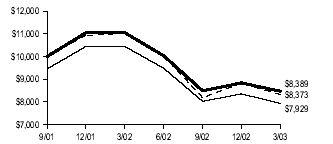
Average Annual Total Returns for the Periods Ended March 31, 2003 PF MFS Global Growth Fund Class A Class B Class C 1 Year Total Return: Without sales charge* -24.11% -24.52% -24.43% With maximum sales charge*** -28.27% -28.22% -25.91% MSCI All Country World Index Free**** -24.19% Since Inception: Without sales charge* -11.06% -11.54% -11.47% With maximum sales charge*** -14.34% -13.87% -12.06% MSCI All Country World Index Free**** -11.16% * The total return for each fund includes reinvestment of all dividends and capital gain distributions, if any, and does not include deductions of any applicable sales charges. Past performance is not predictive of future performance. ** This index is unmanaged and does not reflect any fees or expenses. Results include reinvested dividends. *** Performance figures for each class reflect the deduction of any applicable maximum front-end sales charge at the time of investment, and reflect any applicable contingent deferred sales charge that would be deducted upon redemption at the end of the period presented. **** This index is unmanaged and includes reinvested dividends after deducting withholding taxes. PF PIMCO Inflation Managed Fund Class A without front-end sales charge PF PIMCO Inflation Managed Fund Class A with maximum front-end sales charge - - - - - - - - - - - 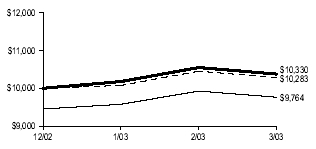
Total Returns (Non-Annualized) for the Period Ended March 31, 2003 PF PIMCO Inflation Managed Fund Class A Class B Class C Since Inception: Without sales charge* 3.30% 3.16% 3.11% With maximum sales charge*** -2.36% -1.84% 1.10% Lehman Brothers Global Real: U.S. TIPs Index** 2.83% PF PIMCO Managed Bond Fund Class A without front-end sales charge PF PIMCO Managed Bond Fund Class A with maximum front-end sales charge - - - - - - - - - - - Lehman Brothers Government/CreditIndex 
Average Annual Total Returns for the Periods Ended March 31, 2003 PF PIMCO Managed Bond Fund Class A Class B Class C 1 Year Total Return: Without sales charge* 12.80% 12.27% 12.28% With maximum sales charge*** 6.63% 7.27% 10.16% Lehman Brothers Government/Credit Index** 13.40% Since Inception: Without sales charge* 8.17% 7.63% 7.63% With maximum sales charge*** 4.17% 5.04% 6.92% Lehman Brothers Government/Credit Index** 8.44% * The total return for each fund includes reinvestment of all dividends and capital gain distributions, if any, and does not include deductions of any applicable sales charges. Past performance is not predictive of future performance. ** This index is unmanaged and does not reflect any fees or expenses. Results include reinvested dividends. *** Performance figures for each class reflect the deduction of any applicable maximum front-end sales charge at the time of investment, and reflect any applicable contingent deferred sales charge that would be deducted upon redemption at the end of the period presented. * The total return and 7-day yield for PF Pacific Life Money Market Fund includes reinvestment of all dividends and capital gain distributions, if any, and does not include deductions of any applicable sales charges. Past performance is not predictive of future performance. ** This index is unmanaged and does not reflect any fees or expenses. Results include reinvested dividends. *** Performance figures for each class reflect the deduction of any applicable maximum front-end sales charge at the time of investment, and reflect any applicable contingent deferred sales charge that would be deducted upon redemption at the end of the period presented. PF Putnam Equity Income Fund Class A without front-end sales charge PF Putnam Equity Income Fund Class A with maximum front-end sales charge - - - - - - - - - - - Russell 1000 Value Index 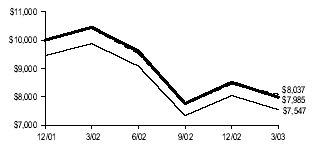
Average Annual Total Returns for the Periods Ended March 31, 2003 PF Putnam Equity Income Fund Class A Class B Class C 1 Year Total Return: Without sales charge* -23.59% -23.92% -23.83% With maximum sales charge*** -27.80% -27.69% -25.37% Russell 1000 Value Index** -22.79% Since Inception: Without sales charge* -16.51% -16.94% -16.86% With maximum sales charge*** -20.21% -19.58% -17.52% Russell 1000 Value Index** -16.04% * The total return for each fund includes reinvestment of all dividends and capital gain distributions, if any, and does not include deductions of any applicable sales charges. Past performance is not predictive of future performance. ** This index is unmanaged and does not reflect any fees or expenses. Results include reinvested dividends. *** Performance figures for each class reflect the deduction of any applicable maximum front-end sales charge at the time of investment, and reflect any applicable contingent deferred sales charge that would be deducted upon redemption at the end of the period presented. PF Putnam Research Fund Class A without front-end sales charge PF Putnam Research Fund Class A with maximum front-end sales charge - - - - - - - - - - - S&P 500 Index 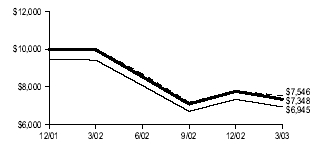
Average Annual Total Returns for the Periods Ended March 31, 2003 PF Putnam Research Fund Class A Class B Class C 1 Year Total Return: Without sales charge* -26.30% -26.61% -26.64% With maximum sales charge*** -30.35% -30.28% -28.10% S&P 500 Index** -24.75% Since Inception: Without sales charge* -21.90% -22.29% -22.32% With maximum sales charge*** -25.36% -24.79% -22.94% S&P 500 Index** -20.17% * The total return for each fund includes reinvestment of all dividends and capital gain distributions, if any, and does not include deductions of any applicable sales charges. Past performance is not predictive of future performance. ** This index is unmanaged and does not reflect any fees or expenses. Results include reinvested dividends. *** Performance figures for each class reflect the deduction of any applicable maximum front-end sales charge at the time of investment, and reflect any applicable contingent deferred sales charge that would be deducted upon redemption at the end of the period presented. PF Salomon Brothers Large-Cap Value Fund Class A without front-end sales charge PF Salomon Brothers Large-Cap Value Fund Class A with maximum front-end sales charge - - - - - - - - - - - S&P 500 Index 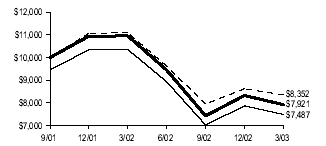
Average Annual Total Returns for the Periods Ended March 31, 2003 PF Salomon Brothers Class A Class B Class C 1 Year Total Return: Without sales charge* -27.69% -28.02% -28.08% With maximum sales charge*** -31.69% -31.59% -29.50% S&P 500 Index** -24.75% Since Inception: Without sales charge* -14.40% -14.75% -14.83% With maximum sales charge*** -17.56% -17.02% -15.39% S&P 500 Index** -11.32% * The total return for each fund includes reinvestment of all dividends and capital gain distributions, if any, and does not include deductions of any applicable sales charges. Past performance is not predictive of future performance. ** This index is unmanaged and does not reflect any fees or expenses. Results include reinvested dividends. *** Performance figures for each class reflect the deduction of any applicable maximum front-end sales charge at the time of investment, and reflect any applicable contingent deferred sales charge that would be deducted upon redemption at the end of the period presented.
PF AIM BLUE CHIP FUND
Schedule of Investments
March 31, 2003 Shares Value U.S. COMMON STOCKS - 90.22% Autos & Transportation - 0.31% Harley-Davidson Inc 800 $ 31,768 Consumer Discretionary - 12.26% Bed Bath & Beyond Inc * 2,900 100,166 Carnival Corp 2,600 62,686 Clear Channel Communications Inc * 2,700 91,584 Home Depot Inc 6,300 153,468 Kohl's Corp * 1,800 101,844 Omnicom Group Inc 1,700 92,089 Target Corp 2,700 79,002 The Gap Inc 5,000 72,450 Viacom Inc 'B' * 4,450 162,514 Wal-Mart Stores Inc 6,300 327,789 1,243,592 Consumer Staples - 6.74% Anheuser-Busch Cos Inc 1,800 83,898 Colgate-Palmolive Co 2,500 136,100 PepsiCo Inc 1,400 56,000 Procter & Gamble Co 2,250 200,362 Sysco Corp 4,800 122,112 The Coca-Cola Co 2,100 85,008 683,480 Diversified - 3.89% General Electric Co ** 12,200 311,100 Schlumberger Ltd 2,200 83,622 394,722 Energy - 0.58% ENSCO International Inc 2,300 58,673 Financial Services - 20.90% American Express Co 3,200 106,336 American International Group Inc 3,200 158,240 Bank of America Corp 3,200 213,888 Citigroup Inc ** 9,000 310,050 Fannie Mae 2,600 169,910 Fifth Third Bancorp 2,200 110,308 First Data Corp 3,600 133,236 Fiserv Inc * 2,500 78,700 Freddie Mac 2,000 106,200 Goldman Sachs Group Inc 1,800 122,544 J.P. Morgan Chase & Co 3,200 75,872 Merrill Lynch & Co Inc 2,700 95,580 Morgan Stanley 3,200 122,720 Prudential Financial Inc 2,100 61,425 SLM Corp 800 88,736 Wells Fargo & Co 3,700 166,463 2,120,208 Health Care - 19.93% Allergan Inc 1,500 102,315 Amgen Inc * 3,200 184,160 Boston Scientific Corp * 2,500 101,900 Cardinal Health Inc 2,000 113,940 Forest Laboratories Inc * 2,200 118,734 HCA Inc 3,000 124,080 Johnson & Johnson 5,200 300,924 Medtronic Inc 3,600 162,432 Shares Value Pfizer Inc ** 12,600 $ 392,616 St. Jude Medical Inc * 1,400 68,250 UnitedHealth Group Inc 1,600 146,672 Wyeth 3,000 113,460 Zimmer Holdings Inc * 1,900 92,397 2,021,880 Integrated Oils - 3.13% Exxon Mobil Corp 9,100 318,045 Materials & Processing - 1.83% Air Products & Chemicals Inc 1,500 62,145 Alcoa Inc 2,300 44,574 E.I. du Pont de Nemours & Co 700 27,202 Masco Corp 2,800 52,136 186,057 Producer Durables - 3.97% Applied Materials Inc * 9,000 113,220 KLA-Tencor Corp * 1,500 53,913 Lockheed Martin Corp 1,600 76,080 Novellus Systems Inc * 1,400 38,178 United Technologies Corp 2,100 121,338 402,729 Technology - 14.27% Analog Devices Inc * 2,600 71,500 Cisco Systems Inc * 15,600 202,488 Dell Computer Corp * 6,400 174,784 Hewlett-Packard Co 3,000 46,650 Intel Corp 5,700 92,796 International Business Machines Corp 1,500 117,645 Linear Technology Corp 1,700 52,479 Maxim Integrated Products Inc 1,100 39,732 Microchip Technology Inc 3,100 61,690 Microsoft Corp 14,700 355,887 Oracle Corp * 10,000 108,490 Texas Instruments Inc 1,400 22,918 VERITAS Software Corp * 2,550 44,829 Xilinx Inc * 2,400 56,184 1,448,072 Utilities - 2.41% BellSouth Corp 1,300 28,171 Duke Energy Corp 2,300 33,442 FPLGroup Inc 900 53,037 SBC Communications Inc 3,500 70,210 The Southern Co 2,100 59,724 244,584 Total U.S. Common Stocks (Cost $10,545,520) 9,153,810 FOREIGN COMMON STOCKS - 2.33% Barbados - 0.71% Nabors Industries Ltd * 1,800 71,766 Canada - 0.59% Canadian National Railway Co 1,400 59,920
PF AIM BLUE CHIP FUND
Schedule of Investments (Continued)
March 31, 2003 Shares Value Finland - 0.39% Nokia OYJ ADR 2,800 $ 39,228 United Kingdom - 0.64% Vodafone Group PLC ADR 3,600 65,592 Total Foreign Common Stocks (Cost $257,804) 236,506 Principal Amount SHORT-TERM INVESTMENTS - 7.16% Commercial Paper - 6.67% Federal Home Loan Bank 1.200% due 04/01/03 $ 676,000 676,000 U.S. Treasury Bill - 0.49% 1.125% due 06/19/03 ** 50,000 49,881 Total Short-Term Investments (Cost $725,877) 725,881 TOTAL INVESTMENTS - 99.71% (Cost $11,529,201) 10,116,197 OTHER ASSETS AND LIABILITIES, NET - 0.29% 29,672 NET ASSETS - 100.00% $10,145,869 Number of Unrealized Type Contracts (Depreciation) S&P EMINI Futures (06/03) 10 ($2,030)
PF AIM AGGRESSIVE GROWTH FUND
Schedule of Investments
March 31, 2003 Shares Value U.S. COMMON STOCKS - 93.48% Autos & Transportation - 3.73% C.H. Robinson Worldwide Inc 1,000 $ 32,700 Expeditors International of Washington Inc 880 31,636 Gentex Corp * 2,560 65,126 Lear Corp * 750 26,512 Superior Industries International Inc 1,050 38,252 194,226 Consumer Discretionary - 24.19% Abercrombie & Fitch Co 'A' * 1,400 42,042 Apollo Group Inc 'A' * 625 31,187 Bed Bath & Beyond Inc * 2,600 89,804 Best Buy Co Inc * 950 25,622 Brinker International Inc * 900 27,450 CBRL Group Inc 1,230 33,764 CDW Computer Centers Inc * 3,240 132,192 ChoicePoint Inc * 800 27,120 Cintas Corp 1,320 43,428 Dollar Tree Stores Inc * 1,360 27,064 eBay Inc * 300 25,587 Fastenal Co 2,580 72,730 Fisher Scientific International Inc * 3,250 90,870 Hispanic Broadcasting Corp * 2,230 46,072 Iron Mountain Inc * 905 34,616 Kohl's Corp * 790 44,698 Pacific Sunwear of California Inc * 4,325 88,014 Regis Corp 1,900 47,329 Robert Half International Inc * 7,070 94,102 Sonic Corp * 1,635 41,627 Starbucks Corp * 1,040 26,790 The Cheesecake Factory Inc * 800 25,816 The TJX Cos Inc 3,200 56,320 Westwood One Inc * 850 26,554 Williams-Sonoma Inc * 2,720 59,296 1,260,094 Energy - 8.82% Cal Dive International Inc * 2,550 45,925 Cooper Cameron Corp * 720 35,647 ENSCO International Inc 1,950 49,745 National-Oilwell Inc * 2,550 57,095 Newfield Exploration Co * 1,320 44,735 Patterson-UTI Energy Inc * 3,140 101,610 Pride International Inc * 5,860 79,051 Varco International Inc * 2,480 45,409 459,217 Financial Services - 18.69% Affiliated Computer Services Inc 'A' * 3,200 141,632 Brown & Brown Inc 1,890 59,176 Doral Financial Corp 1,015 35,880 DST Systems Inc * 2,050 55,760 Fiserv Inc * 3,370 106,088 HCC Insurance Holdings Inc 1,970 50,353 Investors Financial Services Corp 4,580 111,523 Legg Mason Inc 1,180 57,513 Lehman Brothers Holdings Inc 1,400 80,850 Paychex Inc 3,850 105,759 Southwest Bancorp of Texas Inc * 750 22,523 SunGard Data Systems Inc * 5,100 108,630 TCF Financial Corp 950 38,038 973,725 Shares Value Health Care - 22.25% AmerisourceBergen Corp 2,040 $ 107,100 Biomet Inc 1,000 30,650 Caremark Rx Inc * 6,740 122,331 Community Health Systems Inc * 4,360 89,336 Cytyc Corp * 1,800 23,490 Express Scripts Inc * 2,550 141,984 First Health Group Corp * 3,330 84,715 Health Management Associates Inc 'A' 6,610 125,590 Lincare Holdings Inc * 1,940 59,539 Medicis Pharmaceutical Corp 'A' * 2,560 142,310 Omnicare Inc 2,500 68,025 Patterson Dental Co * 1,020 46,849 ResMed Inc * 2,600 83,148 Varian Medical Systems Inc * 630 33,976 1,159,043 Materials & Processing - 3.78% Jacobs Engineering Group Inc * 3,760 157,958 The Valspar Corp 950 38,883 196,841 Producer Durables - 4.15% Alliant Techsystems Inc * 1,250 67,513 Danaher Corp 1,950 128,232 Molex Inc 'A' 1,100 20,229 215,974 Technology - 7.87% CACI International Inc 'A' * 800 26,688 Intuit Inc * 1,600 59,520 L-3 Communications Holdings Inc * 1,300 52,221 Linear Technology Corp 1,550 47,848 Microchip Technology Inc 1,925 38,308 National Instruments Corp * 1,180 41,619 QLogic Corp * 650 24,141 Symantec Corp * 600 23,508 The Reynolds & Reynolds Co 'A' 750 18,975 UTStarcom Inc * 3,870 77,361 410,189 Total U.S. Common Stocks (Cost $4,878,545) 4,869,309 Principal Amount SHORT-TERM INVESTMENT - 5.66% Commercial Paper - 5.66% Federal Home Loan Bank 1.200% due 04/01/03 $ 295,000 295,000 Total Short-Term Investment (Cost $295,000) 295,000 TOTAL INVESTMENTS - 99.14% (Cost $5,173,545) 5,164,309 OTHER ASSETS AND LIABILITIES, NET - 0.86% 44,732 NET ASSETS - 100.00% $ 5,209,041
PF INVESCO HEALTH SCIENCES FUND
Schedule of Investments
March 31, 2003 Shares Value U.S. COMMON STOCKS - 86.28% Consumer Staples - 1.36% Procter & Gamble Co 900 $ 80,145 Health Care - 81.42% Abbott Laboratories 5,260 197,828 AmerisourceBergen Corp 1,240 65,100 Amgen Inc * 4,900 281,995 Barr Laboratories Inc * 1,500 85,500 Biomet Inc 2,600 79,690 Boston Scientific Corp * 3,900 158,964 Bristol-Myers Squibb Co 9,100 192,283 C.R. Bard Inc 2,000 126,120 Chiron Corp * 1,400 52,500 Edwards Lifesciences Corp * 2,000 54,800 Eli Lilly & Co 3,200 182,880 First Health Group Corp * 3,140 79,881 Forest Laboratories Inc * 5,720 308,708 Genentech Inc * 1,800 63,018 Genzyme Corp-General Division * 1,600 58,320 Gilead Sciences Inc * 5,880 246,901 Guidant Corp * 3,900 141,180 HCA Inc 1,160 47,978 Health Management Associates Inc 'A' 2,800 53,200 IDEC Pharmaceuticals Corp * 1,200 41,303 Johnson & Johnson 4,140 239,582 McKesson Corp 2,500 62,325 MedImmune Inc * 1,600 52,528 Medtronic Inc 3,600 162,432 Merck & Co Inc 3,700 202,686 Pfizer Inc 4,900 152,684 Pharmaceutical HOLDRs Trust 4,200 311,430 Pharmaceutical Resources Inc * 1,800 76,464 Pharmacia Corp 3,500 151,550 Stryker Corp 1,700 116,705 Triad Hospitals Inc * 900 24,210 UnitedHealth Group Inc 800 73,336 Varian Medical Systems Inc * 3,320 179,048 Wyeth 5,400 204,228 Zimmer Holdings Inc * 5,160 250,931 4,778,288 Technology - 3.50% Biotech HOLDRs Trust 2,200 205,150 Total U.S. Common Stocks (Cost $4,694,975) 5,063,583 FOREIGN COMMON STOCKS - 11.85% Israel - 3.85% Teva Pharmaceutical Industries Ltd ADR 5,420 225,743 Switzerland - 5.19% Alcon Inc * 3,900 159,978 Novartis AG ADR 3,900 144,534 304,512 Shares Value United Kingdom - 2.81% GlaxoSmithKline PLC ADR 4,100 $ 144,279 Smith & Nephew PLC 3,400 20,796 165,075 Total Foreign Common Stocks (Cost $631,042) 695,330 SHORT-TERM INVESTMENT - 0.69% Cash Equivalent - 0.69% BlackRock Provident Institutional TempFund 40,375 40,375 Total Short-Term Investment (Cost $40,375) 40,375 TOTAL INVESTMENTS - 98.82% (Cost $5,366,392) 5,799,288 OTHER ASSETS AND LIABILITIES, NET - 1.18% 69,259 NET ASSETS - 100.00% $ 5,868,547
PF INVESCO TECHNOLOGY FUND
Schedule of Investments
March 31, 2003 Shares Value U.S. COMMON STOCKS - 82.73% Consumer Discretionary - 5.31% Amazon.com Inc * 1,200 $ 31,236 AOL Time Warner Inc * 1,900 20,634 eBay Inc * 1,400 119,406 Hotels.com 'A' * 200 11,535 VeriSign Inc * 900 7,866 Yahoo! Inc * 900 21,618 212,295 Financial Services - 7.08% Affiliated Computer Services Inc 'A' * 1,200 53,112 CheckFree Corp * 1,900 42,712 First Data Corp 1,900 70,319 Fiserv Inc * 1,700 53,516 Paychex Inc 1,600 43,952 The BISYS Group Inc * 1,200 19,584 283,195 Producer Durables - 6.05% Applied Materials Inc * 4,700 59,126 Cymer Inc * 100 2,365 KLA-Tencor Corp * 1,100 39,536 Lam Research Corp * 1,900 21,639 Lexmark International Inc * 500 33,475 Lockheed Martin Corp 600 28,530 MKS Instruments Inc * 200 2,500 Novellus Systems Inc * 2,000 54,540 241,711 Technology - 63.00% ADC Telecommunications Inc * 5,100 10,506 Adobe Systems Inc 2,100 64,743 Altera Corp * 3,100 41,974 Analog Devices Inc * 900 24,750 Apple Computer Inc * 3,600 50,904 BEA Systems Inc * 7,400 75,406 BMC Software Inc * 3,100 46,779 Broadcom Corp 'A' * 800 9,880 Cadence Design Systems Inc * 2,200 22,000 CIENA Corp * 1,600 6,992 Cisco Systems Inc * 11,000 142,780 Cognizant Technology Solutions Corp * 200 13,470 Corning Inc * 1,000 5,840 Cypress Semiconductor Corp * 600 4,140 Dell Computer Corp * 4,000 109,240 EMC Corp MA * 9,100 65,793 Emulex Corp * 2,100 40,215 Fairchild Semiconductor International Inc 'A' * 1,500 15,690 GlobespanVirata Inc * 1,300 5,850 Hewlett-Packard Co 3,400 52,870 Intel Corp 9,400 153,032 International Business Machines Corp 1,000 78,430 Internet Security Systems Inc * 500 4,965 Intersil Corp 'A' * 700 10,892 Intuit Inc * 1,500 55,800 Jabil Circuit Inc * 4,300 75,250 Juniper Networks Inc * 1,700 13,889 Linear Technology Corp 2,800 86,436 Lucent Technologies Inc * 6,200 9,114 Maxim Integrated Products Inc 1,800 65,016 McDATA Corp 'A' * 2,500 21,475 Mercury Interactive Corp * 1,900 56,392 Microchip Technology Inc 3,000 59,700 Micromuse Inc * 1,500 7,800 Shares Value Microsoft Corp 11,100 $ 268,731 National Semiconductor Corp * 1,300 22,152 NetScreen Technologies Inc * 1,000 16,780 Network Appliance Inc * 5,000 55,950 Networks Associates Inc * 2,350 32,454 Oracle Corp * 9,200 99,811 PeopleSoft Inc * 2,700 41,310 PMC-Sierra Inc * 600 3,570 QLogic Corp * 600 22,284 QUALCOMM Inc 1,800 64,908 RF Micro Devices Inc * 2,700 16,278 Siebel Systems Inc * 3,400 27,234 Skyworks Solutions Inc * 1,700 10,591 Software HOLDRs Trust 2,200 55,902 Sun Microsystems Inc * 3,400 11,084 Symantec Corp * 3,100 121,458 Texas Instruments Inc 2,400 39,288 UTStarcom Inc * 700 13,993 VERITAS Software Corp * 1,800 31,644 Vitesse Semiconductor Corp * 1,700 3,638 Xilinx Inc * 2,200 51,502 2,518,575 Utilities - 1.29% Comcast Corp 'A' * 700 20,013 Nextel Communications Inc 'A' * 1,300 17,407 Verizon Communications Inc 400 14,140 51,560 Total U.S. Common Stocks (Cost $3,395,757) 3,307,336 FOREIGN COMMON STOCKS - 9.99% Canada - 1.31% Celestica Inc * 3,400 38,862 Nortel Networks Corp * 6,600 13,728 52,590 Finland - 1.44% Nokia OYJ ADR 4,100 57,441 France - 0.43% Alcatel SAADR 2,500 17,225 Germany - 0.14% SAP AG ADR 300 5,688 India - 0.14% Wipro Ltd ADR 200 5,620 Israel - 0.87% Check Point Software Technologies Ltd * 2,400 34,728 Netherlands - 0.16% ASMLHolding NV 'NY' * 1,000 6,570
PF INVESCO TECHNOLOGY FUND
Schedule of Investments (Continued)
March 31, 2003 Shares Value Singapore - 1.53% Flextronics International Ltd * 7,000 $ 61,040 South Korea - 0.85% Samsung Electronics Co Ltd GDR ~ 300 33,959 Taiwan - 1.15% Taiwan Semiconductor Manufacturing Co Ltd ADR * 5,010 34,269 United Microelectronics Corp ADR * 3,835 11,543 45,812 United Kingdom - 1.97% Amdocs Ltd * 3,200 42,496 Vodafone Group PLC ADR 2,000 36,440 78,936 Total Foreign Common Stocks (Cost $561,620) 399,609 SHORT-TERM INVESTMENTS - 5.14% Cash Equivalents - 5.14% BlackRock Provident Institutional TempCash 17,479 17,479 BlackRock Provident Institutional TempFund 188,101 188,101 205,580 Total Short-Term Investments (Cost $205,580) 205,580 TOTAL INVESTMENTS - 97.86% (Cost $4,162,957) 3,912,525 OTHER ASSETS AND LIABILITIES, NET - 2.14% 85,400 NET ASSETS - 100.00% $ 3,997,925 Number of Contracts Premium Outstanding, March 31, 2002 83 $33,384 Options Written 345 80,957 Options Expired 60 16,675 Options Repurchased 352 95,394 Outstanding, March 31, 2003 16 $2,272 Number of Type Contracts Premium Value Call - CBOE Xilinx Inc Strike @ 27.50 Exp 04/19/03 16 $ 2,272 $ 320
PF JANUS STRATEGIC VALUE FUND
Schedule of Investments
March 31, 2003 Shares Value U.S. CONVERTIBLE PREFERRED STOCK - 1.98% Autos & Transportation - 1.98% General Motors Corp 4,900 $ 111,230 Total U.S. Convertible Preferred Stock (Cost $133,334) 111,230 U.S. COMMON STOCKS - 83.81% Autos & Transportation - 4.10% Lear Corp * 6,505 229,952 Consumer Discretionary - 34.81% Allied Waste Industries Inc * 20,585 164,474 Arbitron Inc * 1,855 58,803 Bally Total Fitness Holding Corp * 10,005 50,725 Blockbuster Inc 'A' 4,205 71,906 EchoStar Communications Corp 'A' * 5,825 168,226 Liberty Media Corp 'A' * 41,611 404,875 Liz Claiborne Inc 5,310 164,185 Mattel Inc 6,455 145,238 Mohawk Industries Inc * 1,720 82,457 Six Flags Inc * 9,120 51,072 Station Casinos Inc * 7,690 162,336 The Interpublic Group of Cos Inc 13,600 126,480 The McGraw-Hill Cos Inc 1,260 70,043 The New York Times Co 'A' 745 32,147 Toys "R" Us Inc * 12,875 107,764 USA Interactive * 3,390 90,818 1,951,549 Consumer Staples - 0.89% Vector Group Ltd 4,521 49,731 Diversified - 2.07% SPX Corp * 3,405 116,315 Energy - 1.58% Apache Corp 1,430 88,288 Financial Services - 16.32% American Express Co 3,630 120,625 Berkshire Hathaway Inc 'B' * 135 288,495 Fannie Mae 1,845 120,571 Freddie Mac 2,515 133,546 Moody's Corp 2,475 114,419 SLM Corp 1,240 137,541 915,197 Health Care - 0.46% IMS Health Inc 1,650 25,756 Materials & Processing - 1.90% Packaging Corp of America * 5,920 106,619 Shares Value Producer Durables - 0.63% Alliant Techsystems Inc * 652 $ 35,215 Technology - 14.44% Apple Computer Inc * 12,490 176,609 Cadence Design Systems Inc * 17,375 173,750 Ceridian Corp * 20,565 287,499 Computer Associates International Inc 12,555 171,501 809,359 Utilities - 6.61% Kinder Morgan Management LLC * 11,461 370,763 Total U.S. Common Stocks (Cost $5,248,598) 4,698,744 FOREIGN COMMON STOCKS - 10.41% Bermuda - 2.18% Tyco International Ltd 9,480 121,913 Japan - 2.62% Nissan Motor Co Ltd 22,000 147,138 Mexico - 5.61% Cemex SAde CV ADR 12,955 225,935 Grupo TMM SA de CV 'A' ADR * 22,580 88,740 314,675 Total Foreign Common Stocks (Cost $739,116) 583,726 Principal Amount SHORT-TERM INVESTMENTS - 4.77% Commercial Paper - 3.57% Fannie Mae 1.300% due 04/01/03 $ 200,000 200,000 Shares Cash Equivalents - 1.20% BlackRock Provident Institutional TempCash 33,547 33,547 BlackRock Provident Institutional TempFund 33,547 33,547 67,094 Total Short-Term Investments (Cost $267,094) 267,094 TOTAL INVESTMENTS - 100.97% (Cost $6,388,142) 5,660,794 OTHER ASSETS AND LIABILITIES, NET - (0.97)% (54,432) NET ASSETS - 100.00% $5,606,362
PF JANUS GROWTH LT FUND
Schedule of Investments
March 31, 2003 Shares Value U.S. COMMON STOCKS - 77.34% Consumer Discretionary - 21.24% Amazon.com Inc * 4,410 $ 114,792 AOL Time Warner Inc * 11,035 119,840 Avon Products Inc 1,785 101,834 Dollar Tree Stores Inc * 4,075 81,092 EchoStar Communications Corp 'A' * 3,065 88,517 Electronic Arts Inc * 725 42,514 International Game Technology * 755 61,835 Kohl's Corp * 720 40,738 Liberty Media Corp 'A' * 56,191 546,738 The TJX Cos Inc 2,080 36,608 USA Interactive * 4,390 117,608 Wendy's International Inc 1,390 38,239 Yahoo! Inc * 7,410 177,988 Yum! Brands Inc * 3,250 79,073 1,647,416 Energy - 2.78% BJ Services Co * 2,930 100,763 Patterson-UTI Energy Inc * 1,195 38,670 Smith International Inc * 2,160 76,097 215,530 Financial Services - 14.86% AFLAC Inc 3,395 108,810 Berkshire Hathaway Inc 'B' * 149 318,413 Citigroup Inc 1,595 54,948 E*TRADE Group Inc * 5,790 24,376 Fannie Mae 1,160 75,806 Fifth Third Bancorp 1,985 99,528 Franklin Financial Corp 125 3,640 Freddie Mac 2,040 108,324 Goldman Sachs Group Inc 2,745 186,879 The Allstate Corp 5,190 172,152 1,152,876 Health Care - 14.32% Anthem Inc * 2,015 133,494 Cardinal Health Inc 1,315 74,915 Eli Lilly & Co 625 35,719 Forest Laboratories Inc * 4,980 268,771 Guidant Corp 3,375 122,175 MedImmune Inc * 1,265 41,530 Medtronic Inc 3,310 149,347 Pfizer Inc 4,730 147,387 UnitedHealth Group Inc 1,505 137,963 1,111,301 Integrated Oils - 1.54% Murphy Oil Corp 2,700 119,259 Producer Durables - 5.04% Applied Materials Inc * 3,045 38,306 KLA-Tencor Corp * 1,070 38,458 Lockheed Martin Corp 2,895 137,657 Northrop Grumman Corp 1,655 141,999 Novellus Systems Inc * 1,260 34,360 390,780 Shares Value Technology - 11.96% Apple Computer Inc * 8,470 $ 119,766 CIENACorp * 5,560 24,297 Cisco Systems Inc * 13,880 180,163 Computer Associates International Inc 16,690 227,985 Intuit Inc * 525 19,530 Microsoft Corp 7,000 169,470 Symantec Corp * 1,670 65,431 Synopsys Inc * 1,770 75,331 Texas Instruments Inc 2,800 45,836 927,809 Utilities - 5.60% Cablevision Systems Corp 'A' * 11,958 227,082 Comcast Corp Special 'A' * 3,920 107,761 Cox Communications Inc 'A' * 3,195 99,397 434,240 Total U.S. Common Stocks (Cost $6,154,009) 5,999,211 FOREIGN PREFERRED STOCK - 0.11% Germany - 0.11% Porsche AG 31 8,661 Total Foreign Preferred Stock (Cost $9,175) 8,661 FOREIGN COMMON STOCKS - 10.03% Bermuda - 0.94% Accenture Ltd 'A' * 4,705 72,928 Canada - 2.85% Biovail Corp * 1,075 42,860 Canadian National Railway Co 2,370 101,436 EnCana Corp (TSX) 2,362 76,762 221,058 Finland - 3.09% Nokia OYJ 1,037 14,306 Nokia OYJ ADR 16,085 225,351 239,657 South Korea - 2.22% Samsung Electronics Co Ltd GDR ~ 1,525 172,625 United Kingdom - 0.93% Willis Group Holdings Ltd 2,600 72,020 Total Foreign Common Stocks (Cost $886,896) 778,288
PF JANUS GROWTH LT FUND
Schedule of Investments (Continued)
March 31, 2003 Principal Amount Value SHORT-TERM INVESTMENTS - 11.87% Commercial Paper - 11.61% Fannie Mae 1.300% due 04/01/03 $ 900,000 $ 900,000 Cash Equivalents - 0.26% BlackRock Provident Institutional TempCash 10,149 10,149 BlackRock Provident Institutional TempFund 10,149 10,149 20,298 Total Short-Term Investments (Cost $920,298) 920,298 TOTAL INVESTMENTS - 99.35% (Cost $7,970,378) 7,706,458 OTHER ASSETS AND LIABILITIES, NET - 0.65% 50,512 NET ASSETS - 100.00% $ 7,756,970 Principal Contracts Amount to Buy Covered by Expiration Unrealized or to Sell Currency Contracts Month (Depreciation) Sell EUR 125,000 9/03 ($4,524) (b) Principal amount denoted in the indicated currency: EUR – Eurodollar
PF LAZARD INTERNATIONAL VALUE FUND
Schedule of Investments
March 31, 2003 Shares Value COMMON STOCKS - 92.45% Denmark - 1.92% Danske Bank AS 11,100 $ 184,848 Finland - 2.57% Nokia OYJ 18,000 248,321 France - 11.48% Aventis SA 5,100 223,577 AXA 22,000 259,392 Societe Generale 'A' 5,000 257,823 TotalFinaElf SA 2,900 366,575 1,107,367 Germany - 1.58% Siemens AG 3,700 152,405 Ireland - 2.89% Allied Irish Banks PLC 20,200 278,451 Italy - 5.61% ENI SPA 25,900 345,453 Sanpaolo IMI SPA 28,900 196,197 541,650 Japan - 5.78% Canon Inc 7,800 273,383 Kao Corp 14,000 283,864 557,247 Netherlands - 9.81% ABN Amro Holding NV 19,700 287,659 Heineken NV 10,100 374,093 Royal Dutch Petroleum Co 7,000 284,597 946,349 Spain - 3.35% Endesa SA 26,600 323,194 Switzerland - 13.04% Compagnie Financiere Richemont AG 'A' 11,000 149,901 Nestle SA 1,800 355,639 Novartis AG 10,700 395,550 UBS AG 8,400 356,747 1,257,837 United Kingdom - 34.42% AstraZeneca PLC 9,300 317,050 Barclays PLC 62,600 361,128 BP PLC 47,500 301,233 Cadbury Schweppes PLC 68,400 362,156 Diageo PLC 37,200 381,577 GlaxoSmithKline PLC 21,800 383,483 HSBC Holdings PLC 34,400 352,856 Tesco PLC 67,000 188,755 Shares Value Unilever PLC 42,600 $ 394,550 Vodafone Group PLC 155,000 276,825 3,319,613 Total Common Stocks (Cost $9,852,269) 8,917,282 SHORT-TERM INVESTMENTS - 5.94% Cash Equivalents - 5.94% BlackRock Provident Institutional TempCash 286,359 286,359 BlackRock Provident Institutional TempFund 286,359 286,359 572,718 Total Short-Term Investments (Cost $572,718) 572,718 TOTAL INVESTMENTS - 98.39% (Cost $10,424,987) 9,490,000 OTHER ASSETS AND LIABILITIES, NET - 1.61% 155,482 NET ASSETS - 100.00% $ 9,645,482 Financial Services 27.85% Consumer Staples 21.32% Health Care 13.68% Energy 7.38% Utilities 6.22% Integrated Oils 6.07% Short-Term Investments 5.94% Technology 5.41% Materials & Processing 2.94% Other 1.61% Producer Durables 1.58% Total 100.00%
PF MFS MID-CAP GROWTH FUND
Schedule of Investments
March 31, 2003 Shares Value U.S. COMMON STOCKS - 91.03% Autos & Transportation - 1.49% Expeditors International of Washington Inc 2,080 $ 74,776 Swift Transportation Co Inc * 1,480 23,680 Werner Enterprises Inc 1,000 19,260 117,716 Consumer Discretionary - 32.45% Apollo Group Inc 'A' * 1,130 56,387 ARAMARK Corp 'B' * 950 21,755 ChoicePoint Inc * 2,530 85,767 EchoStar Communications Corp 'A' * 7,550 218,044 Entercom Communications Corp * 700 30,737 Expedia Inc 'A' * 2,300 118,818 Family Dollar Stores Inc 2,630 81,214 Hearst-Argyle Television Inc * 2,320 48,001 Hilton Hotels Corp 4,800 55,728 Linens 'n Things Inc * 1,470 29,870 Manpower Inc 2,510 74,999 Mattel Inc 2,170 48,825 Meredith Corp 1,640 62,615 Nordstrom Inc 2,080 33,696 Office Depot Inc * 6,900 81,627 Outback Steakhouse Inc 3,740 132,321 PETsMART Inc * 5,590 70,434 Robert Half International Inc * 2,280 30,347 Starbucks Corp * 1,340 34,518 Starwood Hotels & Resorts Worldwide Inc 3,070 73,035 Talbots Inc 4,240 109,138 The Cheesecake Factory Inc * 640 20,653 The E.W. Scripps Co 'A' 1,130 85,586 The McGraw-Hill Cos Inc 1,710 95,059 The New York Times Co 'A' 870 37,541 The TJX Cos Inc 3,950 69,520 Tiffany & Co 4,310 107,750 Tribune Co 2,400 108,024 Univision Communications Inc 'A' * 4,530 111,030 USA Interactive * 3,930 105,285 Weight Watchers International Inc * 2,540 116,967 Westwood One Inc * 3,790 118,400 Williams-Sonoma Inc * 900 19,620 Yahoo! Inc * 3,150 75,663 2,568,974 Consumer Staples - 1.02% Hershey Foods Corp 1,290 80,831 Diversified - 0.97% ITT Industries Inc 1,440 76,910 Energy - 3.85% Baker Hughes Inc 2,600 77,818 BJ Services Co * 3,320 114,175 Cooper Cameron Corp * 1,420 70,304 Smith International Inc * 1,200 42,276 304,573 Financial Services - 8.95% Arthur J. Gallagher & Co 2,320 56,956 Concord EFS Inc * 3,120 29,328 DST Systems Inc * 2,420 65,824 Shares Value Investors Financial Services Corp 4,520 $ 110,062 Legg Mason Inc 620 30,219 Lehman Brothers Holdings Inc 1,440 83,160 Paychex Inc 1,140 31,316 SunGard Data Systems Inc * 6,920 147,396 T. Rowe Price Group Inc 740 20,068 The BISYS Group Inc * 8,220 134,150 708,479 Health Care - 21.73% AmerisourceBergen Corp 1,060 55,650 Biogen Inc * 1,310 39,248 Caremark Rx Inc * 9,490 172,243 Celgene Corp * 2,790 72,763 Cytyc Corp * 10,190 132,979 DENTSPLY International Inc 3,510 122,113 Genentech Inc * 600 21,006 Genzyme Corp-General Division * 3,660 133,407 Gilead Sciences Inc * 1,130 47,449 Guidant Corp 3,310 119,822 Health Management Associates Inc 'A' 2,970 56,430 ICOS Corp * 850 15,903 IDEC Pharmaceuticals Corp * 2,800 96,373 IMS Health Inc 2,750 42,928 InterMune Inc * 240 5,148 Invitrogen Corp * 2,220 67,999 MedImmune Inc * 4,350 142,811 Millipore Corp * 4,150 135,705 Mylan Laboratories Inc 6,635 190,756 Varian Medical Systems Inc * 930 50,155 1,720,888 Integrated Oils - 0.64% GlobalSantaFe Corp 1,300 26,845 Noble Corp * 750 23,565 50,410 Materials & Processing - 0.60% Energizer Holdings Inc * 740 18,862 Smurfit-Stone Container Corp * 2,180 29,123 47,985 Producer Durables - 5.62% Alliant Techsystems Inc * 840 45,369 American Tower Corp 'A' * 13,400 73,968 Crown Castle International Corp * 17,560 96,580 Danaher Corp 300 19,728 Novellus Systems Inc * 3,740 101,990 Waters Corp * 5,090 107,704 445,339 Technology - 13.71% Advanced Fibre Communications Inc * 3,630 54,958 Altera Corp * 3,300 44,682 Analog Devices Inc * 4,780 131,450 BEA Systems Inc * 5,670 57,777 Intuit Inc * 1,270 47,244 LSI Logic Corp * 4,020 18,171 Maxim Integrated Products Inc 1,970 71,156 Mercury Interactive Corp * 1,150 34,132 Microchip Technology Inc 2,520 50,148 Networks Associates Inc * 7,050 97,361 PeopleSoft Inc * 7,940 121,482 RF Micro Devices Inc * 4,560 27,492 Rockwell Automation Inc 3,900 80,730
PF MFS MID-CAP GROWTH FUND
Schedule of Investments (Continued)
March 31, 2003 Shares Value Symantec Corp * 1,410 $ 55,244 VERITAS Software Corp * 8,970 157,693 Xilinx Inc * 1,520 35,583 1,085,303 Total U.S. Common Stocks (Cost $7,194,733) 7,207,408 FOREIGN COMMON STOCKS - 1.91% Canada - 0.25% Four Seasons Hotels Inc 740 20,106 Israel - 0.57% Teva Pharmaceutical Industries Ltd ADR 1,080 44,982 Netherlands - 0.57% ASMLHolding NV 'NY' * 6,830 44,873 United Kingdom - 0.52% Willis Group Holdings Ltd 1,480 40,996 Total Foreign Common Stocks (Cost $151,533) 150,957 Principal Amount SHORT-TERM INVESTMENTS - 6.80% Commercial Paper - 6.79% Fannie Mae 1.300% due 04/01/03 $ 538,000 538,000 Shares Cash Equivalent - 0.01% BlackRock Provident Institutional TempCash 454 454 Total Short-Term Investments (Cost $538,454) 538,454 TOTAL INVESTMENTS - 99.74% (Cost $7,884,720) 7,896,819 OTHER ASSETS AND LIABILITIES, NET - 0.26% 20,609 NET ASSETS - 100.00% $ 7,917,428
PF MFS GLOBAL GROWTH FUND
Schedule of Investments
March 31, 2003 Shares Value PREFERRED STOCKS - 0.93% Germany - 0.86% Fresenius Medical Care AG 590 $ 22,181 Porsche AG 63 17,602 39,783 Thailand - 0.07% Siam Commercial Bank PCL ~ 4,000 3,082 Total Preferred Stocks (Cost $51,646) 42,865 COMMON STOCK RIGHT - 0.02% Spain - 0.02% Telefonica SA 78 728 Total Common Stock Right (Cost $762) 728 COMMON STOCKS - 92.09% Australia - 0.94% Australia & New Zealand Banking Group Ltd 2,020 21,860 John Fairfax Holdings Ltd 4,780 8,828 The News Corp Ltd 1,985 12,903 43,591 Austria - 0.14% Erste Bank Oesterreichischen Sparkassen AG 90 6,414 Belgium - 0.36% Fortis 1,300 16,758 Bermuda - 0.98% Accenture Ltd 'A' * 480 7,440 ACE Ltd 300 8,685 Tyco International Ltd 1,000 12,860 XLCapital Ltd 'A' 230 16,279 45,264 Brazil - 0.87% Aracruz Celulose SA ADR 390 7,804 Brasil Telecom Participacoes SA ADR 200 5,590 Cia Siderurgica Nacional SA ADR 100 1,920 Petroleo Brasileiro SA ADR 1,030 15,604 Tele Norte Leste Participacoes SA ADR 600 4,950 Unibanco - Uniao de Bancos Brasileiros SA ADR 300 4,341 40,209 Canada - 1.15% Bank of Nova Scotia 270 9,537 EnCana Corp (NYSE) 570 18,445 EnCana Corp (TSX) 620 20,149 Manitoba Telecom Services Inc 215 5,356 53,487 Shares China - 0.94% Beijing Datang Power Generation Co Ltd 'H' 10,000 $ 3,494 China Oilfield Services Ltd 'H' 44,300 10,053 China Telecom Corp Ltd 'H' * 42,000 7,539 Huaneng Power International Inc 'H' 24,000 22,617 43,703 Croatia - 0.07% Pliva DD GDR 280 3,226 Denmark - 0.68% Danske Bank AS 1,890 31,474 Egypt - 0.04% MobiNil - Egyptian Mobile Netork 300 1,842 France - 4.48% Air Liquide SA 200 26,480 Aventis SA 410 17,974 Carrefour SA 530 20,046 France Telecom SA 1,000 20,367 Generale de Sante 850 7,855 Sanofi-Synthelabo SA 785 39,443 Schneider Electric SA 348 16,268 Societe Television Francaise 1 282 6,416 TotalFinaElf SA 420 53,090 207,939 Germany - 1.60% Bayerische Motoren Werke AG 970 26,890 Celanese AG 508 8,741 Linde AG 660 20,965 SAP AG 100 7,568 Schering AG 130 5,277 Stada Arzneimittel AG 100 4,718 74,159 Greece - 0.18% Coca-Cola Hellenic Bottling Co SA 655 8,322 Hong Kong - 1.39% China Mobile Ltd 12,000 23,771 China Mobile Ltd ADR 400 3,960 Citic Pacific Ltd 2,000 4,052 CNOOC Ltd 13,000 17,334 Hong Kong Electric Holdings Ltd 2,000 7,975 SmarTone Telecommunications Holdings Ltd 4,000 4,821 TCL International Holdings Ltd 11,400 2,616 64,529 Hungary - 0.30% Gedeon Richter RT GDR 65 4,102 OTP Bank RT GDR 510 9,996 14,098 India - 0.39% ICICI Bank Ltd ADR * 1,237 7,793 Infosys Technologies Ltd ADR 170 10,430 18,223
PF MFS GLOBAL GROWTH FUND
Schedule of Investments (Continued)
March 31, 2003 Shares Indonesia - 0.30% P.T. Astra International Tbk * 7,500 $ 2,106 P.T. Bank Central Asia Tbk 7,000 1,730 P.T. Hanjaya Mandala Sampoerna Tbk 6,000 1,989 P.T. Telekomunikasi Indonesia 20,030 8,157 13,982 Ireland - 1.07% Anglo Irish Bank Corp PLC 770 5,495 Bank of Ireland 3,220 34,351 Irish Life & Permanent PLC 930 9,628 49,474 Israel - 0.26% Bank Leumi Le-Israel BM * 4,460 4,424 Taro Pharmaceutical Industries Ltd * 200 7,656 12,080 Japan - 9.36% Aeon Credit Service Co Ltd 300 8,483 Brother Industries Ltd 6,000 38,097 Canon Inc 1,000 35,049 Credit Saison Co Ltd 1,000 17,313 Fanuc Ltd 400 17,406 Fast Retailing Co Ltd 700 17,304 Fujikura Ltd 4,000 9,583 Honda Motor Co Ltd 1,100 36,785 Namco Ltd 900 12,968 Nippon Electric Glass Co Ltd 2,000 21,487 Nissan Motor Co Ltd 3,100 20,733 Shiseido Co Ltd 4,000 39,350 Sompo Japan Insurance Inc 3,000 14,070 Sony Corp 200 7,111 Sony Corp ADR 290 10,188 Stanley Electric Co Ltd 3,000 38,021 Tokyo Gas Co Ltd 17,640 54,957 Uni-Charm Corp 900 35,506 434,411 Luxembourg - 0.09% Tenaris SA ADR * 200 4,408 Malaysia - 0.37% Resorts World Bhd 1,910 4,272 Sime Darby Bhd 9,570 13,096 17,368 Mexico - 1.77% Alfa SA de CV 'A' 1,400 2,010 America Movil SA de CV 'L' ADR 1,360 18,183 Apasco SA de CV 700 4,163 Coca-Cola Femsa SA ADR 830 14,226 Corporacion Geo SA de CV 'B' * 2,000 4,312 Fomento Economico SA de CV ADR 220 7,320 Grupo Continental SA 3,100 4,120 Grupo Financiero Banorte SA de CV 'O' 2,070 4,810 Grupo Modelo SA de CV 'C' 1,850 3,757 Kimberly-Clark de Mexico SA de CV 'A' 2,670 5,978 TV Azteca SA de CV ADR 800 3,744 Wal-Mart de Mexico SA de CV 'V' 3,840 9,379 82,002 Shares Value Netherlands - 3.26% Fugro NV 320 $ 12,079 Koninklijke KPN NV * 4,485 28,737 Koninklijke Philips Electronics NV 1,370 21,483 STMicroelectronics NV 'NY' 600 11,340 Unilever NV CVA 860 51,121 Unilever NV 'NY' 100 5,944 VNU NV 822 20,853 151,557 Norway - 0.10% DnB Holding ASA 1,160 4,570 Philippines - 0.06% Philippine Long Distance Telephone Co * 480 2,825 Russia - 1.70% Golden Telecom Inc * 290 4,321 JSC MMC Norilsk Nickel ADR 440 10,560 LUKOIL ADR (FTSE) 325 17,940 LUKOIL ADR (OTC) ~ 80 4,416 Sibneft ADR 400 8,260 Surgutneftegaz SP ADR 770 11,261 YUKOS ADR 150 22,118 78,876 Singapore - 1.42% DBS Group Holdings Ltd 2,000 10,429 MobilOne Ltd 7,000 4,999 Singapore Telecommunications Ltd 36,000 27,342 United Overseas Bank Ltd 4,000 23,351 66,121 South Africa - 2.20% ABSA Group Ltd 1,990 7,414 Anglo American Platinum Corp Ltd 355 10,482 AngloGold Ltd 200 5,997 FirstRand Ltd 4,600 3,789 Gold Fields Ltd 2,220 23,687 Impala Platinum Holdings Ltd 410 20,834 Nedcor Ltd 350 3,903 Sanlam Ltd 4,400 3,390 Sasol Ltd 1,350 14,884 Standard Bank Group Ltd 2,200 7,569 101,949 South Korea - 3.23% Hana Bank 300 1,966 Hyundai Motor Co Ltd 260 4,988 Kia Motors Corp 600 3,401 Koram Bank 580 2,921 Korea Electric Power Corp 490 7,011 Korea Tobacco & Ginseng Corp 560 8,147 Korea Tobacco & Ginseng Corp GDR ~ 1,890 13,710 KT Freetel Co Ltd * 300 5,719 LG Chemical Ltd 220 6,771 LG Electronics Inc 140 4,488 POSCO ADR 480 9,456 Samsung Electronics Co Ltd 310 70,376 Samsung Fire & Marine Insurance Co Ltd 150 5,947 Samsung SDI Co Ltd 80 4,988 149,889
PF MFS GLOBAL GROWTH FUND
Schedule of Investments (Continued)
March 31, 2003 Shares Value Spain - 1.55% Altadis SA 680 $ 16,554 Iberdrola SA 1,160 18,872 Telefonica SA 3,929 36,692 72,118 Sweden - 0.27% Alfa Laval AB 1,560 12,718 Switzerland - 5.43% Alcon Inc * 100 4,102 Converium Holding AG * 590 24,839 Givaudan SA 21 8,004 Nestle SA 185 36,552 Novartis AG 2,710 100,181 Syngenta AG 555 25,252 Synthes-Stratec Inc 38 21,078 UBS AG 759 32,235 252,243 Taiwan - 0.07% Taiwan Semiconductor Manufacturing Co Ltd ADR * 500 3,420 Thailand - 0.48% Bangkok Bank PCL * 3,930 5,872 BEC World PCL 1,340 6,507 PTT Exploration & Production PCL 1,440 4,336 PTT PCL 5,160 5,481 22,196 Turkey - 0.17% Akbank TAS 2,960,700 7,766 United Kingdom - 12.98% Anglo American PLC 3,220 45,752 AstraZeneca PLC 1,720 58,637 BG Group PLC 5,400 20,505 BHP Billiton PLC 5,260 26,354 BP PLC ADR 1,775 68,497 British Sky Broadcasting PLC * 1,850 18,318 CGNU PLC 3,000 16,690 Diageo PLC 3,580 36,722 easyJet PLC * 2,100 7,368 Intertek Testing Services PLC 2,640 14,604 Johnston Press PLC 2,837 15,021 Kingfisher PLC 9,040 32,862 Lonmin PLC 1,590 16,975 Marks & Spencer Group PLC 3,180 14,173 NEXT PLC 1,950 26,166 Reckitt Benckiser PLC 1,294 21,208 Reed Elsevier PLC 4,445 31,755 Royal Bank of Scotland Group PLC 2,622 59,053 Standard Chartered PLC 1,835 19,533 Vodafone Group PLC 18,200 32,505 Vodafone Group PLC ADR 1,096 19,969 602,667 United States - 31.44% 3M Co 140 18,204 Abbott Laboratories 580 21,814 Affiliated Computer Services Inc 'A' * 90 3,983 Shares Value American Express Co 350 $ 11,630 AmerisourceBergen Corp 100 5,250 Amgen Inc * 700 40,285 Analog Devices Inc * 1,000 27,500 AOL Time Warner Inc * 2,170 23,566 Apollo Group Inc 'A' * 190 9,481 Archer-Daniels-Midland Co 290 3,132 Avon Products Inc 390 22,250 Baker Hughes Inc 300 8,979 BJ Services Co * 200 6,878 Brinker International Inc * 310 9,455 Caremark Rx Inc * 200 3,630 Cendant Corp * 1,120 14,224 Cisco Systems Inc * 2,930 38,031 Citigroup Inc 1,000 34,450 Clear Channel Communications Inc * 600 20,352 Comcast Corp 'A' * 1,060 30,305 CVS Corp 500 11,925 Danaher Corp 310 20,386 Dell Computer Corp * 840 22,940 DST Systems Inc * 300 8,160 EchoStar Communications Corp 'A' * 670 19,350 Eli Lilly & Co 430 24,575 Express Scripts Inc * 310 17,261 Family Dollar Stores Inc 330 10,190 Fannie Mae 400 26,140 FedEx Corp 200 11,014 First Data Corp 460 17,025 Forest Laboratories Inc * 120 6,476 Fox Entertainment Group Inc 'A' * 200 5,334 Freddie Mac 290 15,399 Freeport-McMoRan Copper & Gold Inc 'B' * 200 3,410 Gannett Co Inc 110 7,747 General Electric Co 1,410 35,955 Gilead Sciences Inc * 100 4,199 Goldman Sachs Group Inc 410 27,913 Harley-Davidson Inc 470 18,664 Health Management Associates Inc 'A' 290 5,510 Home Depot Inc 1,330 32,399 IDEC Pharmaceuticals Corp * 200 6,884 International Business Machines Corp 380 29,803 International Paper Co 310 10,478 Johnson & Johnson 490 28,356 Kellogg Co 430 13,180 Kimberly-Clark Corp 200 9,092 Kohl's Corp * 420 23,764 Lamar Advertising Co * 290 8,512 Liberty Media Corp 'A' * 900 8,757 Linear Technology Corp 330 10,187 Lockheed Martin Corp 100 4,755 Manpower Inc 390 11,653 Maxim Integrated Products Inc 320 11,558 MBNA Corp 200 3,010 MedImmune Inc * 90 2,955 Medtronic Inc 380 17,146 Mellon Financial Corp 700 14,882 Mercury Interactive Corp * 160 4,749 Merrill Lynch & Co Inc 450 15,930 MetLife Inc 530 13,981 Microchip Technology Inc 100 1,990 Microsoft Corp 2,440 59,072 Mylan Laboratories Inc 100 2,875 Networks Associates Inc * 500 6,905 Northrop Grumman Corp 200 17,160 Novellus Systems Inc * 100 2,727 Oracle Corp * 2,670 28,967 PeopleSoft Inc * 950 14,535 PepsiCo Inc 680 27,200 Pfizer Inc 1,810 56,400
PF MFS GLOBAL GROWTH FUND
Schedule of Investments (Continued)
March 31, 2003 Shares Value Praxair Inc 300 $ 16,905 Procter & Gamble Co 200 17,810 Schering-Plough Corp 500 8,915 Schlumberger Ltd 200 7,602 Starwood Hotels & Resorts Worldwide Inc 270 6,423 SunGard Data Systems Inc * 760 16,188 Sysco Corp 200 5,088 Target Corp 800 23,408 The BISYS Group Inc * 740 12,077 The E.W. Scripps Co 'A' 100 7,574 The Gillette Co 530 16,398 The New York Times Co 'A' 190 8,199 Travelers Property Casualty Corp 'A' 1,535 21,628 Tribune Co 300 13,503 United Parcel Service Inc 'B' 140 7,980 USAInteractive * 400 10,716 VERITAS Software Corp * 1,460 25,667 Viacom Inc 'B' * 870 31,772 Wal-Mart Stores Inc 410 21,332 Yahoo! Inc * 300 7,206 1,459,225 Total Common Stocks (Cost $4,547,915) 4,275,103 Principal Amount GOVERNMENT BOND - 0.23% Brazil - 0.23% Republic of Brazil 12.250% due 03/06/30 $ 13,000 10,790 Total Government Bond (Cost $9,297) 10,790 SHORT-TERM INVESTMENTS - 4.30% Commercial Paper - 4.29% Fannie Mae 1.300% due 04/01/03 199,000 199,000 Shares Cash Equivalent - 0.01% BlackRock Provident Institutional TempCash 460 460 Total Short-Term Investments (Cost $199,460) 199,460 TOTAL INVESTMENTS - 97.57% (Cost $4,809,080) 4,528,946 OTHER ASSETS AND LIABILITIES, NET - 2.43% 112,981 NET ASSETS - 100.00% $ 4,641,927 Consumer Discretionary 15.99% Financial Services 15.51% Health Care 11.83% Technology 9.21% Utilities 8.91% Materials & Processing 6.87% Consumer Staples 6.57% Short-Term Investments 4.30% Diversified 4.14% Integrated Oils 3.81% Producer Durables 3.55% Autos & Transportation 3.39% Energy 3.26% Other 2.43% Government Bond 0.23% Total 100.00%
PF PIMCO INFLATION MANAGED FUND
Schedule of Investments
March 31, 2003 Principal Amount Value U.S. CORPORATE BONDS & NOTES - 5.70% Financial Services - 5.70% CITGroup Inc 2.630% due 01/09/04 + $ 100,000 $ 100,364 Ford Motor Credit Co 3.228% due 10/25/04 + 100,000 95,511 General Motors Acceptance Corp 2.040% due 05/17/04 + 100,000 98,997 Travelers Property Casualty Corp 3.750% due 03/15/08 ~ 100,000 100,029 394,901 Total U.S. Corporate Bonds & Notes (Cost $396,306) 394,901 U.S. TREASURY INFLATION-INDEX BONDS - 97.33% 3.000% due 07/15/12 378,908 412,417 3.875% due 04/15/29 1,547,168 1,902,534 4.250% due 01/15/10 3,788,880 4,431,808 Total U.S. Treasury Inflation-Index Bonds (Cost $6,668,466) 6,746,759 SHORT-TERM INVESTMENTS - 11.04% Commercial Paper - 8.64% HBOS Treasury Services PLC 1.250% due 04/30/03 300,000 299,698 Svenska Handelsbank Inc 1.240% due 06/26/03 300,000 299,133 598,831 Shares Cash Equivalents - 2.40% BlackRock Provident Institutional TempCash 83,166 83,166 BlackRock Provident Institutional TempFund 83,166 83,166 166,332 Total Short-Term Investments (Cost $765,141) 765,163 TOTAL INVESTMENTS - 114.07% (Cost $7,829,913) 7,906,823 INVESTMENT SOLD SHORT - (1.46)% U.S. Treasury Note 4.000% due 11/15/12 (101,477) Total Investment Sold Short (Proceeds $102,737) (101,477) OTHER ASSETS AND LIABILITIES, NET - (12.61)% (873,990) NET ASSETS - 100.00% $ 6,931,356
PF PIMCO MANAGED BOND FUND
Schedule of Investments
March 31, 2003 Principal Amount Value U.S. CORPORATE BONDS & NOTES - 13.83% Autos & Transportation - 1.09% Amercian Airlines Inc 7.377% due 05/23/19 $ 90,709 $ 16,837 Ford Motor Co 6.625% due 02/15/28 250,000 175,688 7.450% due 07/16/31 100,000 76,726 269,251 Consumer Discretionary - 1.92% Allied Waste North America 7.875% due 01/01/09 100,000 102,375 AOL Time Warner Inc 7.625% due 04/15/31 300,000 319,491 Waste Management Inc 6.375% due 11/15/12 50,000 53,442 475,308 Diversified - 0.41% General Electric Co 5.000% due 02/01/13 100,000 102,464 Energy - 0.14% Dynegy Holdings Inc 8.750% due 02/15/12 50,000 35,250 Financial Services - 5.49% Bank of America Corp 4.875% due 01/15/13 100,000 101,976 CIT Group Inc 7.750% due 04/02/12 100,000 112,067 Citigroup Inc 5.625% due 08/27/12 50,000 53,717 General Electric Capital Corp 5.450% due 01/15/13 150,000 157,363 General Motors Acceptance Corp 6.875% due 08/28/12 200,000 197,674 8.000% due 11/01/31 200,000 195,269 Morgan Stanley 5.300% due 03/01/13 100,000 102,079 Pemex Project Funding Master Trust 7.375% due 12/15/14 ~ 100,000 102,875 Qwest Capital Funding Inc 7.250% due 02/15/11 100,000 76,500 Sprint Capital Corp 7.625% due 01/30/11 200,000 206,000 Unilever Capital Corp 6.875% due 11/01/05 50,000 55,933 1,361,453 Integrated Oils - 1.58% Occidental Petroleum Corp 8.450% due 02/15/29 300,000 390,398 Materials & Processing - 0.65% Weyerhaeuser Co 6.750% due 03/15/12 100,000 109,816 6.875% due 12/15/33 50,000 51,558 161,374 Principal Amount Value Utilities - 2.55% AT&TBroadband Corp 8.375% due 03/15/13 $ 150,000 $ 178,095 Oncor Electric Delivery Inc 7.250% due 01/15/33 ~ 150,000 169,794 Progress Energy Inc 6.850% due 04/15/12 50,000 55,798 Qwest Corp 6.875% due 09/15/33 150,000 127,500 TXU Energy Co 7.000% due 03/15/13 ~ 100,000 102,199 633,386 Total U.S. Corporate Bonds & Notes (Cost $3,358,214) 3,428,884 MORTGAGE-BACKED SECURITIES - 41.96% Collateralized Mortgage Obligations - 29.40% Credit-Based Asset Servicing & Securitization LLC 1.625% due 06/25/32 " + 238,407 238,318 CS First Boston Mortgage Securities Corp 1.666% due 03/25/32 ~ " + 268,019 265,098 2.081% due 03/25/32 ~ " + 251,108 247,467 7.500% due 02/25/31 " 141,339 146,293 Fannie Mae 5.500% due 03/25/09 " 1,000,000 1,017,416 6.000% due 01/25/22 " 760,558 766,602 6.250% due 10/25/22 " 435,511 450,873 6.250% due 08/25/28 " 139,439 141,405 6.500% due 12/25/42 " 97,858 104,066 Freddie Mac 6.000% due 09/15/22 " 24,494 24,475 6.000% due 02/15/24 " 184,797 186,439 6.000% due 06/15/25 " 977,539 987,621 6.250% due 04/15/23 " 470,792 496,285 6.250% due 02/15/27 " 96,797 98,193 Government National Mortgage Association 5.500% due 11/20/31 " 953,888 985,163 MLCC Mortgage Investors Inc 1.660% due 03/15/25 " + 140,558 140,713 Residential Funding Mortgage Securities Inc 5.655% due 09/25/32 " + 302,131 307,250 Washington Mutual 5.216% due 10/25/32 " + 374,127 383,487 6.500% due 10/19/29 " 105,569 108,280 Washington Mutual Mortgage Securities Corp 6.010% due 01/25/31 " + 33,326 33,592 Wells Fargo Mortgage-Backed Securities Trust 4.944% due 09/25/32 " + 158,103 159,631 7,288,667 Fannie Mae - 7.42% 5.000% due 05/15/18 " 500,000 511,719 5.000% due 06/15/18 " 500,000 509,844 6.500% due 03/01/17 " 772,619 818,190 1,839,753 Freddie Mac - 5.14% 5.500% due 08/01/07 " 413,418 429,478 5.500% due 05/15/33 " 500,000 509,375 5.944% due 11/01/31 " + 322,864 336,786 1,275,639 Total Mortgage-Backed Securities (Cost $10,435,012) 10,404,059
PF PIMCO MANAGED BOND FUND
Schedule of Investments (Continued)
March 31, 2003 Principal Amount Value ASSET-BACKED SECURITIES - 0.77% Conseco Private Label Master Note Trust 1.560% due 12/15/08 " + $ 21,224 $ 20,358 Morgan Stanley Dean Witter Capital I Inc Trust 1.635% due 07/25/32 " + 169,831 169,744 Total Asset-Backed Securities (Cost $190,958) 190,102 U.S. GOVERNMENT AGENCY ISSUE - 0.40% Freddie Mac 4.500% due 04/15/05 100,000 100,121 Total U.S. Government Agency Issue (Cost $100,116) 100,121 U.S. TREASURY BONDS - 22.18% 5.500% due 08/15/28 350,000 377,385 7.500% due 11/15/16 3,400,000 4,466,617 8.750% due 05/15/17 200,000 290,063 8.875% due 08/15/17 250,000 366,494 Total U.S. Treasury Bonds (Cost $5,449,237) 5,500,559 U.S. TREASURY INFLATION-INDEX BONDS - 7.91% 3.375% due 01/15/07 1,146,680 1,262,066 3.625% due 01/15/08 281,135 314,740 3.625% due 04/15/28 112,325 132,052 4.250% due 01/15/10 215,964 252,610 Total U.S. Treasury Inflation-Index Bonds (Cost $1,927,601) 1,961,468 U.S. TREASURY STRIPS (PO) - 1.25% 0.000% due 02/15/27 1,100,000 309,733 Total U.S. Treasury Strips (PO) (Cost $323,302) 309,733 FOREIGN CORPORATE BONDS - 0.81% Bermuda - 0.42% Tyco International Group SA 4.375% due 11/19/04 (Principal in Euro) 100,000 104,658 Germany - 0.39% Deutsche Telekom International Finance BV 8.750% due 06/15/30 80,000 95,261 Total Foreign Corporate Bonds (Cost $191,254) 199,919 Principal Amount Value FOREIGN GOVERNMENT BONDS - 6.78% Brazil - 1.46% Republic of Brazil 11.000% due 01/11/12 $ 100,000 $ 85,250 11.500% due 03/12/08 300,000 276,750 362,000 Germany - 1.92% Bundesrepublik Deutschland 5.250% due 01/04/11 (Principal in Euro) 400,000 476,417 Mexico - 2.12% United Mexican States 8.000% due 09/24/22 500,000 524,500 Notional Amount United Mexican States Value Recovery Rights 0.000% due 06/30/04 250,000 175 0.000% due 06/30/05 250,000 525 0.000% due 06/30/06 250,000 325 0.000% due 06/30/07 250,000 37 525,562 Principal Amount Peru - 1.28% Republic of Peru 9.125% due 02/21/12 $ 300,000 317,250 Total Foreign Government Bonds (Cost $1,574,525) 1,681,229 MUNICIPAL BONDS - 1.85% California State 5.250% due 02/01/33 50,000 50,764 Energy Northwest Washington Electric Revenue 'A' 5.500% due 07/01/12 100,000 112,312 Florida State Board of Education 'A' 5.000% due 06/01/32 100,000 101,748 Golden State Tobacco Securitization Corp 6.750% due 06/01/39 100,000 92,897 Las Vegas VY Nevada Water District 5.000% due 06/01/32 100,000 101,448 Total Municipal Bonds (Cost $459,206) 459,169 SHORT-TERM INVESTMENTS - 7.49% Commercial Paper - 4.03% Danske Corp 1.250% due 04/30/03 400,000 399,597 KFW International Finance Corp 1.240% due 06/12/03 500,000 498,820 UBS Finance (DE) LLC 1.250% due 04/24/03 100,000 99,920 998,337
PF PIMCO MANAGED BOND FUND
Schedule of Investments (Continued)
March 31, 2003 Shares Value BlackRock Provident Institutional TempCash 279,402 $ 279,402 BlackRock Provident Institutional TempFund 279,402 279,402 558,804 Principal Amount U.S. Treasury Bills - 1.21% 1.145% due 05/08/03 ** $ 260,000 259,711 1.153% due 05/08/03 ** 30,000 29,966 1.155% due 05/15/03 ** 10,000 9,987 299,664 Total Short-Term Investments (Cost $1,856,726) 1,856,805 TOTAL INVESTMENTS - 105.23% (Cost $25,866,151) 26,092,048 OTHER ASSETS AND LIABILITIES, NET - (5.23)% (1,297,427) NET ASSETS - 100.00% $ 24,794,621 Unrealized Number of Appreciation Contracts (Depreciation) Euribor Lif (12/03) 11 $ 15,174 Euribor Lif (03/04) 3 (981) Eurodollar Futures (09/04) 13 12,538 Eurodollar Futures (12/04) 5 1,350 EUX 10-Year Euro-Bond Futures (06/03) 1 (1,395) 90-Day GBP LIBOR Futures (03/04) 5 (138) 90-Day GBP LIBOR Futures (06/04) 5 (553) U.S. Treasury 10-Year Notes (06/03) 9 14,781 $ 40,776 Number of Contracts Premium Outstanding, March 31, 2002 20 $6,425 Options Written 7,500,023 180,492 Options Expired 25 10,619 Options Repurchased 7 2,339 Outstanding, March 31, 2003 7,500,011 $ 173,959 Number of Type Contracts Premium Value Call – CBOT U.S. Treasury Note June Futures Strike @ 116.00 Exp 05/24/2003 3 $ 1,898 $ 2,531 Put – CBOT U.S. Treasury Note June Futures Strike @ 110.00 Exp 05/24/2003 2 992 344 Call – CME Eurodollar December Futures Strike @ 98.75 Exp 12/15/2003 6 1,721 3,413 Call – OTC Swaption (3 month LIBOR vs 3.000%) Strike @ 3.00 Exp 11/12/2003 1,900,000 15,008 13,334 Call – OTC Swaption (3 month LIBOR vs 4.000%) Strike @ 4.00 Exp 09/23/2003 1,100,000 29,370 18,097 Call – OTC Swaption (3 month LIBOR vs 4.000%) Strike @ 4.00 Exp 10/07/2004 700,000 17,570 10,368 Call – OTC Swaption (3 month LIBOR vs 5.000%) Strike @ 5.00 Exp 01/07/2005 1,000,000 27,150 48,057 Put – OTC Swaption (3 month LIBOR vs 6.000%) Strike @ 6.00 Exp 10/07/2004 700,000 22,260 16,537 Put – OTC Swaption (3 month LIBOR vs 6.000%) Strike @ 6.00 Exp 09/23/2005 1,100,000 37,290 30,572 Put – OTC Swaption (3 month LIBOR vs 7.000%) Strike @ 7.00 Exp 01/07/2005 1,000,000 20,700 9,766 $ 173,959 $ 153,019 Principal Contracts Amount Unrealized to Buy Covered by Expiration Appreciation or to Sell Currency Contracts Month (Depreciation) Buy EUR 30,000 04/03 $1,172 Sell EUR 565,000 04/03 5,745 Sell EUR 128,000 04/03 (1,588) Buy GBP 96,000 04/03 967 Sell GBP 145,000 04/03 340 Buy MXP 1,164,300 09/03 8,156 $14,792 Notional Market Type Amount Cost Value Receive floating rate based on 6-month GBP-LIBOR and pay fixed rate equal to 4.000%. Broker: Morgan Stanley Dean Witter Exp. 03/17/05 GBP 300,000 $1,532 $727 Receive floating rate based on 3-month CHF-LIBOR and pay fixed rate equal to 1.500% Broker: Merrill Lynch Exp. 03/29/05 CHF 900,000 670 1,018 Receive floating rate based on 3-month USD-LIBOR and pay fixed rate equal to 6.000%. Broker: Merrill Lynch Exp. 06/18/23 $1,200,000 (89,502) (141,990) ($87,300) ($140,245) (f) Notional and principal amount denoted in the indicated currency:
CHF – Swiss Franc
EUR – Eurodollar
GBP – British Pound
MXP – Mexican Peso
PF PACIFIC LIFE MONEY MARKET FUND
Schedule of Investments
March 31, 2003 Principal Amount Value SHORT-TERM INVESTMENTS - 99.57% Commercial Paper - 91.56% Alcoa Inc 1.260% due 04/04/03 $ 500,000 $ 499,947 Bemis Co 1.230% due 04/07/03 300,000 299,939 Coca-Cola Enterprises Inc 1.240% due 04/08/03 ~ 700,000 699,831 E.I. du Pont de Nemours & Co 1.220% due 05/02/03 700,000 699,265 Federal Home Loan Bank System 1.199% due 05/15/03 + 1,000,000 1,000,000 1.410% due 03/30/04 400,000 400,000 1.550% due 01/13/04 1,000,000 1,000,000 General Dynamics Corp 1.230% due 04/10/03 ~ 645,000 644,802 Harley-Davidson Funding Corp 1.240% due 04/15/03 ~ 250,000 249,879 Merck & Co Inc 1.230% due 05/07/03 640,000 639,213 Pfizer Inc 1.230% due 04/30/03 ~ 700,000 699,306 Procter & Gamble Co 1.190% due 04/16/03 ~ 700,000 699,653 Sallie Mae 1.224% due 06/19/03 + 1,000,000 1,000,000 SBC International Inc 1.220% due 05/08/03 ~ 650,000 649,185 Sharp Electronics Corp 1.250% due 04/29/03 500,000 499,514 The E.W. Scripps Co 1.230% due 04/30/03 ~ 700,000 699,306 The Gillette Co 1.220% due 04/04/03 ~ 700,000 699,929 The Sherwin-Williams Co 1.250% due 04/02/03 ~ 705,000 704,976 The Southern Co 1.260% due 04/03/03 ~ 610,000 609,957 Verizon Network Funding Corp 1.240% due 04/11/03 700,000 699,759 Washington Gas Light Co 1.380% due 04/01/03 590,000 590,000 13,684,461 Asset-Backed Securities - 8.01% Honda Auto Receivables Owner Trust 1.380% due 12/15/03 " 405,216 405,216 Nissan Auto Lease Trust 1.400% due 11/17/03 " ~ 350,433 350,433 Nissan Auto Receivables Owner Trust 1.704% due 09/08/03 " 123,182 123,182 Volkswagen Auto Lease Trust 1.385% due 11/20/03 " 318,276 318,276 1,197,107 Shares Cash Equivalent - 0.00% BlackRock Provident Institutional TempFund 270 $ 270 Total Short-Term Investments (Cost $14,881,838) 14,881,838 TOTAL INVESTMENTS - 99.57% (Cost $14,881,838) 14,881,838 OTHER ASSETS AND LIABILITIES, NET - 0.43% 65,008 NET ASSETS - 100.00% $ 14,946,846
PF PUTNAM EQUITY INCOME FUND
Schedule of Investments
March 31, 2003 Shares Value U.S. CONVERTIBLE PREFERRED STOCKS - 1.77% Autos & Transportation - 0.32% Ford Motor Co Capital Trust II 856 $ 30,508 Financial Services - 0.32% The Hartford Financial Services Group Inc 742 30,882 Health Care - 0.43% Anthem Inc 510 41,718 Materials & Processing - 0.21% Boise Cascade Corp 422 16,243 Hercules Trust II 7 4,249 20,492 Producer Durables - 0.08% Northrop Grumman Corp 77 7,642 Technology - 0.20% Raytheon Co 300 15,378 Solectron Corp 391 4,086 19,464 Utilities - 0.21% Dominion Resources Inc VA 367 19,734 Total U.S. Convertible Preferred Stocks (Cost $176,962) 170,440 U.S. COMMON STOCKS - 80.01% Autos & Transportation - 1.85% Southwest Airlines Co 800 11,488 Union Pacific Corp 3,023 166,265 177,753 Consumer Discretionary - 9.86% AOLTime Warner Inc * 1,500 16,290 BearingPoint Inc * 2,375 15,129 Federated Department Stores Inc * 1,089 30,514 J.C. Penney Co Inc 4,044 79,424 Kimberly-Clark Corp 1,633 74,236 Knight-Ridder Inc 395 23,107 Liberty Media Corp 'A' * 13,735 133,642 Limited Brands Inc 3,172 40,824 Marriott International Inc 'A' 1,134 36,072 McDonald's Corp 1,649 23,844 Office Depot Inc * 3,655 43,239 Republic Services Inc * 4,633 91,919 Royal Caribbean Cruises Ltd 3,075 46,217 The TJX Cos Inc 2,565 45,144 The Walt Disney Co 5,345 90,972 USAInteractive * 2,076 55,616 Waste Management Inc 1,923 40,729 Shares Value Whirlpool Corp 791 $ 38,783 Yum! Brands Inc * 889 21,629 947,330 Consumer Staples - 4.12% Altria Group Inc 4,359 130,596 Coca-Cola Enterprises Inc 1,184 22,129 Colgate-Palmolive Co 739 40,231 CVS Corp 900 21,465 H.J. Heinz Co 1,961 57,261 Kraft Foods Inc 'A' 1,283 36,181 Pepsi Bottling Group Inc 2,268 40,665 Sara Lee Corp 2,564 47,947 396,475 Diversified - 1.14% Fortune Brands Inc 1,477 63,319 Honeywell International Inc 2,173 46,415 109,734 Energy - 0.96% Apache Corp 520 32,105 BJ Services Co * 736 25,311 Burlington Resources Inc 739 35,258 92,674 Financial Services - 27.87% AMBAC Financial Group Inc 96 4,850 American International Group Inc 1,805 89,257 Aon Corp 987 20,411 Archstone-Smith Trust 1,681 36,915 Bank of America Corp 3,118 208,407 BB&T Corp 1,772 55,694 Berkshire Hathaway Inc 'B' * 30 64,110 Charter One Financial Inc 1,629 45,058 CIGNA Corp 798 36,485 CIT Group Inc 1,571 26,487 Citigroup Inc 11,177 385,048 Comerica Inc 2,636 99,852 Compass Bancshares Inc 1,133 35,429 Equity Office Properties Trust 3,341 85,028 Equity Residential 560 13,479 Fannie Mae 1,451 94,823 Freddie Mac 1,845 97,970 GreenPoint Financial Corp 1,088 48,753 J.P. Morgan Chase & Co 5,199 123,268 Lehman Brothers Holdings Inc 396 22,869 M&T Bank Corp 317 24,910 MBIA Inc 987 38,138 MBNA Corp 1,283 19,309 Mellon Financial Corp 1,569 33,357 Merrill Lynch & Co Inc 2,516 89,066 Radian Group Inc 1,971 65,792 SouthTrust Corp 293 7,480 TCF Financial Corp 605 24,224 The Bank of New York Co Inc 5,142 105,411 The PMI Group Inc 1,283 32,781 Travelers Property Casualty Corp 'B' 3,153 44,489 U.S. Bancorp 10,407 197,525 Wachovia Corp 3,891 132,566 Washington Mutual Inc 4,154 146,512 Wells Fargo & Co 1,156 52,008 Zions Bancorp 1,661 71,058 2,678,819
PF PUTNAM EQUITY INCOME FUND
Schedule of Investments (Continued)
March 31, 2003 Shares Value Health Care - 3.79% Abbott Laboratories 2,415 $ 90,828 AmerisourceBergen Corp 913 47,932 HCA Inc 1,083 44,793 King Pharmaceuticals Inc * 3,276 39,083 Pharmacia Corp 3,279 141,981 364,617 Integrated Oils - 7.28% ConocoPhillips 2,941 157,638 Exxon Mobil Corp 11,134 389,133 GlobalSantaFe Corp 2,160 44,604 Noble Corp * 661 20,769 Unocal Corp 3,340 87,875 700,019 Materials & Processing - 3.74% Alcoa Inc 127 2,461 Boise Cascade Corp 1,085 23,707 Engelhard Corp 2,368 50,723 PPG Industries Inc 556 25,064 Rohm & Haas Co 793 23,616 Smurfit-Stone Container Corp * 3,945 52,701 Sonoco Products Co 2,763 57,830 The Dow Chemical Co 3,436 94,868 Weyerhaeuser Co 592 28,315 359,285 Producer Durables - 3.47% Agilent Technologies Inc * 2,171 28,549 Dover Corp 1,657 40,132 Emerson Electric Co 1,109 50,293 Lexmark International Inc * 562 37,626 Northrop Grumman Corp 809 69,412 Parker Hannifin Corp 977 37,849 Rockwell Collins Inc 888 16,313 The Boeing Co 1,434 35,936 W.W. Grainger Inc 413 17,718 333,828 Technology - 3.90% BMC Software Inc * 1,559 23,525 Computer Associates International Inc 5,043 68,887 Hewlett-Packard Co 10,067 156,542 International Business Machines Corp 691 54,195 Motorola Inc 3,000 24,780 Raytheon Co 850 24,115 Sun Microsystems Inc * 6,868 22,390 374,434 Utilities - 12.03% AT&T Wireless Services Inc * 2,861 18,883 BellSouth Corp 4,616 100,029 CenterPoint Energy Inc 5,600 39,480 Cinergy Corp 776 26,112 Comcast Corp 'A' * 319 9,120 Comcast Corp Special 'A' * 5,539 152,267 Constellation Energy Group Inc 691 19,161 Dominion Resources Inc VA 987 54,650 DPL Inc 3,182 39,648 DTE Energy Co 444 17,161 Edison International * 2,323 31,802 Entergy Corp 1,038 49,980 FirstEnergy Corp 989 31,153 Shares NiSource Inc 381 $ 6,934 Northeast Utilities Inc 1,973 27,464 PG&E Corp * 2,000 26,900 PPL Corp 395 14,066 Progress Energy Inc 1,808 70,783 Qwest Communication International Inc * 5,821 20,315 SBC Communications Inc 9,227 185,094 Sprint Corp-FON Group 1,973 23,183 Verizon Communications Inc 5,429 191,915 1,156,100 Total U.S. Common Stocks (Cost $8,970,052) 7,691,068 FOREIGN COMMON STOCKS - 7.68% Bermuda - 3.68% ACE Ltd 3,975 115,076 Ingersoll-Rand Co 'A' 1,975 76,215 Tyco International Ltd 5,753 73,984 XLCapital Ltd 'A' 1,251 88,546 353,821 Canada - 0.80% Abitibi-Consolidated Inc 1,600 11,120 Canadian National Railway Co 789 33,769 Celestica Inc * 2,800 32,004 76,893 France - 0.85% TotalFinaElf SA ADR 1,283 81,175 Netherlands - 0.66% Royal Dutch Petroleum Co 'NY' 1,565 63,774 Singapore - 0.47% Flextronics International Ltd * 5,169 45,074 United Kingdom - 1.22% BP PLCADR 3,043 117,429 Total Foreign Common Stocks (Cost $914,761) 738,166 Principal Amount U. S. CONVERTIBLE CORPORATE BONDS - 1.31% Consumer Discretionary - 0.63% J.C. Penney Co Inc 5.000% due 10/15/08 $ 15,000 15,225 Service Corp International 6.750% due 06/22/08 50,000 45,500 60,725
PF PUTNAM EQUITY INCOME FUND
Schedule of Investments (Continued)
March 31, 2003 Principal Amount Value Consumer Staples - 0.28% Rite Aid Corp 4.750% due 12/01/06 $ 32,000 $ 27,120 Materials & Processing - 0.35% Freeport-McMoRan Copper & Gold Inc 8.250% due 01/31/06 10,000 14,075 8.250% due 01/31/06 14,000 19,705 33,780 Utilities - 0.05% CenterPoint Energy Corp 2.000% due 09/15/2029 + 200 4,747 Total U.S. Convertible Corporate Bonds (Cost $125,447) 126,372 U.S. GOVERNMENT AGENCY ISSUE - 0.22% Fannie Mae 7.250% due 01/15/10 17,000 20,668 Total U.S. Government Agency Issue (Cost $20,401) 20,668 U.S. TREASURY BOND - 0.26% 6.250% due 05/15/30 21,000 25,067 Total U.S. Treasury Bond (Cost $24,813) 25,067 U.S. TREASURY NOTES - 4.96% 1.750% due 12/31/04 244,000 245,477 3.000% due 11/15/07 150,000 152,109 6.500% due 02/15/10 66,000 78,770 Total U.S. Treasury Notes (Cost $473,219) 476,356 FOREIGN CONVERTIBLE CORPORATE BOND - 0.03% Bermuda - 0.03% Tyco International Group 2.750% due 01/15/18 ~ 3,000 2,790 Total Foreign Convertible Corporate Bond (Cost $2,929) 2,790 Shares Value SHORT-TERM INVESTMENT - 2.22% Cash Equivalent - 2.22% BlackRock Provident Institutional TempFund 213,866 $ 213,866 Total Short-Term Investment (Cost $213,866) 213,866 TOTAL INVESTMENTS - 98.46% (Cost $10,922,450) 9,464,793 OTHER ASSETS AND LIABILITIES, NET - 1.54% 147,986 NET ASSETS - 100.00% $ 9,612,779
PF PUTNAM RESEARCH FUND
Schedule of Investments
March 31, 2003 Shares Value U.S. COMMON STOCKS - 90.83% Autos & Transportation - 2.61% Southwest Airlines Co 9,500 $ 136,420 Union Pacific Corp 2,820 155,100 291,520 Consumer Discretionary - 13.13% AOL Time Warner Inc * 7,600 82,536 AutoZone Inc * 1,750 120,242 EchoStar Communications Corp 'A' * 1,100 31,768 J.C. Penney Co Inc 1,500 29,460 Kimberly-Clark Corp 1,100 50,006 Kohl's Corp * 2,400 135,792 Liberty Media Corp 'A' * 15,260 148,480 Lowe's Cos Inc 3,600 146,952 Marriott International Inc 'A' 1,500 47,715 Office Depot Inc * 3,200 37,856 Royal Caribbean Cruises Ltd 5,750 86,422 Target Corp 1,800 52,668 The TJX Cos Inc 2,500 44,000 The Walt Disney Co 2,900 49,358 Wal-Mart Stores Inc 6,200 322,586 Whirlpool Corp 900 44,127 Yum! Brands Inc * 1,420 34,549 1,464,517 Consumer Staples - 7.57% Altria Group Inc 8,050 241,178 Colgate-Palmolive Co 900 48,996 CVS Corp 1,300 31,005 General Mills Inc 2,200 100,210 Kraft Foods Inc 'A' 2,000 56,400 Pepsi Bottling Group Inc 1,200 21,516 PepsiCo Inc 5,100 204,000 The Coca-Cola Co 3,500 141,680 844,985 Diversified - 0.61% Honeywell International Inc 3,160 67,498 Energy - 0.64% BJ Services Co * 1,200 41,268 Burlington Resources Inc 620 29,580 70,848 Financial Services - 20.16% American International Group Inc 7,419 366,870 Automatic Data Processing Inc 900 27,711 Bank of America Corp 2,000 133,680 Capital One Financial Corp 1,330 39,913 Citigroup Inc 10,000 344,500 Comerica Inc 775 29,357 Commerce Bancorp Inc 800 31,792 Equity Office Properties Trust 1,400 35,630 Fannie Mae 2,150 140,502 Fifth Third Bancorp 3,950 198,053 Freddie Mac 2,217 117,723 MBNA Corp 7,500 112,875 Paychex Inc 1,300 35,711 Radian Group Inc 2,000 66,760 Standard & Poor's Depositary Receipts Trust Series I 1,255 106,349 TCF Financial Corp 800 32,032 The Bank of New York Co Inc 6,150 126,075 Shares Value U.S. Bancorp 4,550 $ 86,359 Wells Fargo & Co 2,500 112,475 Zions Bancorp 2,460 105,239 2,249,606 Health Care - 14.86% Abbott Laboratories 2,260 84,999 AmerisourceBergen Corp 1,200 63,000 Amgen Inc * 1,820 104,741 Baxter International Inc 1,060 19,759 Cardinal Health Inc 3,260 185,722 Forest Laboratories Inc * 1,620 87,431 Johnson & Johnson 5,150 298,031 Medtronic Inc 1,870 84,374 Pfizer Inc 8,640 269,222 Pharmacia Corp 6,340 274,522 WellPoint Health Networks Inc * 1,444 110,827 Wyeth 2,000 75,640 1,658,268 Integrated Oils - 4.25% Exxon Mobil Corp 12,519 437,539 GlobalSantaFe Corp 1,780 36,757 474,296 Materials & Processing - 2.04% Alcoa Inc 4,800 93,024 PPG Industries Inc 700 31,556 Rohm & Haas Co 1,100 32,758 Smurfit-Stone Container Corp * 2,700 36,070 Weyerhaeuser Co 710 33,959 227,367 Producer Durables - 5.41% Dover Corp 4,300 104,146 Emerson Electric Co 3,290 149,201 KLA-Tencor Corp * 1,000 35,942 Lexmark International Inc * 2,090 139,926 Lockheed Martin Corp 2,400 114,120 Parker Hannifin Corp 1,550 60,047 603,382 Technology - 11.42% BMC Software Inc * 2,200 33,198 Computer Associates International Inc 9,650 131,819 Dell Computer Corp * 7,840 214,111 Electronic Data Systems Corp 2,000 35,200 Hewlett-Packard Co 15,580 242,269 Intel Corp 16,800 273,504 Motorola Inc 3,990 32,957 NCR Corp * 1,500 27,510 Oracle Corp * 14,800 160,565 QUALCOMM Inc 2,300 82,938 Raytheon Co 1,400 39,718 1,273,789 Utilities - 8.13% AT&T Wireless Services Inc * 7,600 50,160 BellSouth Corp 9,690 209,982 CenterPoint Energy Inc 6,300 44,415 CenturyTel Inc 2,100 57,960 Comcast Corp 'A' * 5,697 162,877 Edison International * 4,430 60,647 Entergy Corp 1,800 86,670 FirstEnergy Corp 1,200 37,800 NiSource Inc 2,000 36,400
PF PUTNAM RESEARCH FUND
Schedule of Investments (Continued)
March 31, 2003 Shares Value PG&E Corp * 2,400 $ 32,280 Progress Energy Inc 900 35,235 SBC Communications Inc 4,600 92,276 906,702 Total U.S. Common Stocks (Cost $11,113,792) 10,132,778 FOREIGN COMMON STOCKS - 8.27% Australia - 0.33% BHPBilliton Ltd 6,550 36,686 Bermuda - 3.64% ACE Ltd 2,600 75,270 Ingersoll-Rand Co 'A' 3,370 130,048 Tyco International Ltd 13,010 167,308 XLCapital Ltd 'A' 470 33,267 405,893 Canada - 0.30% Canadian Natural Resources Ltd 1,000 34,132 Finland - 0.99% Nokia OYJ ADR 7,900 110,679 France - 0.31% TotalFinaElf SA ADR 546 34,545 Germany - 0.27% SAP AG 400 30,272 Italy - 0.75% Eni SPAADR 1,250 83,463 Japan - 0.24% Advantest Corp ADR 3,000 26,700 Singapore - 0.33% Flextronics International Ltd * 4,200 36,624 Switzerland - 1.11% CibaSpecialty Chemicals AG * 700 45,731 Novartis AG 2,110 78,001 Novartis AG ADR 3 111 123,843 Total Foreign Common Stocks (Cost $1,245,779) 922,837 Shares Value SHORT-TERM INVESTMENT - 0.92% Cash Equivalent - 0.92% BlackRock Provident Institutional TempFund 102,621 $ 102,621 Total Short-Term Investment (Cost $102,621) 102,621 TOTAL INVESTMENTS - 100.02% (Cost $12,462,192) 11,158,236 OTHER ASSETS AND LIABILITIES, NET - (0.02)% (2,000) NET ASSETS - 100.00% $ 11,156,236 Principal Contracts Amount Unrealized to Buy Covered by Expiration Appreciation or to Sell Currency Contracts Month (Depreciation) Sell AUD 51,000 06/03 $90 Buy CAD 11,000 06/03 84 Sell CAD 52,000 06/03 (414) Buy CHF 10,000 06/03 (149) Sell CHF 159,000 06/03 657 Buy EUR 142,000 06/03 743 Sell EUR 395,600 06/03 (7,505) Sell JPY 3,099,000 06/03 121 Sell SGD 55,000 06/03 566 ($5,807) (b) Principal amount denoted in the indicated currency:
AUD – Australian Dollar
CAD – Canadian Dollar
CHF – Swiss Franc
EUR – Euro Dollar
JPY – Japanese Yen
SGD – Singapore Dollar
PF SALOMON BROTHERS LARGE-CAP VALUE FUND
Schedule of Investments
March 31, 2003 Shares Value U.S. COMMON STOCKS - 86.12% Consumer Discretionary - 12.91% Costco Wholesale Corp * 5,500 $ 165,165 Federated Department Stores Inc * 5,800 162,516 Home Depot Inc 10,100 246,036 Kimberly-Clark Corp 6,300 286,398 Liberty Media Corp 'A' * 26,541 258,244 McDonald's Corp 15,700 227,022 MGM MIRAGE * 3,836 112,203 Target Corp 8,000 234,080 The Gap Inc 14,300 207,207 1,898,871 Consumer Staples - 5.24% Altria Group Inc 9,400 281,624 General Mills Inc 2,080 94,744 R.J. Reynolds Tobacco Holdings Inc 5,000 161,300 Safeway Inc * 12,300 232,839 770,507 Diversified - 2.59% Fortune Brands Inc 4,200 180,054 Honeywell International Inc 9,400 200,784 380,838 Financial Services - 24.08% American Express Co 6,000 199,380 American International Group Inc 5,400 267,030 Bank of America Corp 2,500 167,100 Equity Office Properties Trust 9,500 241,775 FleetBoston Financial Corp 7,900 188,652 Freddie Mac 3,100 164,610 Goldman Sachs Group Inc 2,600 177,008 J.P. Morgan Chase & Co 7,000 165,970 MBNA Corp 9,750 146,737 Merrill Lynch & Co Inc 5,900 208,860 Morgan Stanley 4,900 187,915 The Bank of New York Co Inc 10,500 215,250 The Hartford Financial Services Group Inc 2,400 84,696 The St. Paul Cos Inc 5,300 168,540 U.S. Bancorp 10,700 203,086 Wachovia Corp 5,600 190,792 Waddell & Reed Financial Inc 'A' 9,500 166,915 Washington Mutual Inc 5,500 193,985 Wells Fargo & Co 4,500 202,455 3,540,756 Health Care - 8.83% HCA Inc 5,100 210,936 Pfizer Inc 6,400 199,424 Pharmacia Corp 5,500 238,150 Schering-Plough Corp 13,200 235,356 Tenet Healthcare Corp * 12,200 203,740 Wyeth 5,600 211,792 1,299,398 Integrated Oils - 5.12% ChevronTexaco Corp 3,600 232,740 ConocoPhillips 3,560 190,816 Marathon Oil Corp 5,700 136,629 Transocean Inc 9,400 192,230 752,415 Shares Value Materials & Processing - 3.70% Alcoa Inc 13,200 $ 255,816 International Paper Co 4,200 141,960 The Dow Chemical Co 5,300 146,333 544,109 Producer Durables - 1.41% United Technologies Corp 3,600 208,008 Technology - 11.06% 3Com Corp * 18,500 91,205 Agere Systems Inc 'B' * 16,614 24,921 Comverse Technology Inc * 19,600 221,676 Hewlett-Packard Co 19,700 306,335 Intel Corp 1,800 29,304 International Business Machines Corp 1,400 109,802 Lucent Technologies Inc * 165,000 242,550 Micron Technology Inc * 6,500 52,910 Motorola Inc 19,100 157,766 Solectron Corp * 53,100 160,362 Sun Microsystems Inc * 70,400 229,504 1,626,335 Utilities - 11.18% AT&TCorp 4,000 64,800 AT&TWireless Services Inc * 43,000 283,800 Comcast Corp 'A' * 6,470 184,977 Comcast Corp Special 'A' * 5,000 137,450 NiSource Inc 8,700 158,340 Progress Energy Inc 5,000 195,750 SBC Communications Inc 11,600 232,696 Verizon Communications Inc 9,700 342,895 Xcel Energy Inc 3,400 43,554 1,644,262 Total U.S. Common Stocks (Cost $15,819,454) 12,665,499 FOREIGN PREFERRED STOCK - 1.63% Australia - 1.63% The News Corp Ltd ADR 11,200 239,568 Total Foreign Preferred Stock (Cost $270,461) 239,568 FOREIGN COMMON STOCKS - 7.51% Bermuda - 1.11% XLCapital Ltd 'A' 2,300 162,794 Finland - 1.96% Nokia OYJ ADR 20,600 288,606 France - 1.38% TotalFinaElf SA ADR 3,200 202,464
PF SALOMON BROTHERS LARGE-CAP VALUE FUND
Schedule of Investments (Continued)
March 31, 2003 Shares Value Netherlands - 1.38% Royal Dutch Petroleum Co 'NY' 5,000 $ 203,750 United Kingdom - 1.68% BP PLCADR 6,400 246,976 Total Foreign Common Stocks (Cost $1,265,436) 1,104,590 Principal Amount U. S. CONVERTIBLE CORPORATE BOND - 0.28% Consumer Discretionary - 0.28% Charter Communications Inc 5.750% due 10/15/05 $ 193,000 41,495 Total U.S. Convertible Corporate Bond (Cost $109,793) 41,495 Shares SHORT-TERM INVESTMENT - 4.13% Cash Equivalent - 4.13% BlackRock Provident Institutional TempFund 606,871 606,871 Total Short-Term Investment (Cost $606,871) 606,871 TOTAL INVESTMENTS - 99.67% (Cost $18,072,015) 14,658,023 OTHER ASSETS AND LIABILITIES, NET - 0.33% 47,942 NET ASSETS - 100.00% $ 14,705,965 Explanation of Symbols for Schedules of Investments ~ Securities purchased in private placement transaction; resale to the public may require registration. * Non-income producing securities. ** Securities were fully/partially segregated with the custodian to cover margin requirements for open futures contracts as of March 31, 2003. " Pass-through security backed by a pool of mortgages or other loans on which principal payments are periodically made. Therefore, the effective maturity is shorter than the stated maturity. ^ Securities with their principal amount adjusted for inflation. + Variable rate securities. The rate listed is as of March 31, 2003.
STATEMENTS OF ASSETS AND LIABILITIES
MARCH 31, 2003 PF AIM Blue Chip Fund PF AIM Aggressive Growth Fund PF Janus Strategic Value Fund PF Lazard International Value Fund PF MFS Mid-Cap Growth Fund PF INVESCO Health Sciences Fund PF INVESCO Technology Fund PF Janus Growth LT Fund ASSETS Investments, at cost $ 11,529,201 $ 5,173,545 $ 5,366,392 $ 4,162,957 $ 6,388,142 $ 7,970,378 $ 10,424,987 $ 7,884,720 Investments, at value $ 10,116,197 $ 5,164,309 $ 5,799,288 $ 3,912,525 $ 5,660,794 $ 7,706,458 $ 9,490,000 $ 7,896,819 Cash 149 948 — — — — — — Receivables: Dividends and interest 5,934 639 6,593 1,579 1,839 6,625 70,634 3,212 Fund shares sold 52,967 11,091 43,526 — 238 26,227 69,383 43,930 Securities sold 52,635 47,580 — 66,459 7,732 22,332 — 121,661 Due from adviser 98,620 67,461 71,972 64,747 70,705 91,337 93,282 100,855 Forward foreign currency contracts appreciation — — — — — 39 — — Prepaid expenses and other assets 4,133 2,395 2,395 1,816 2,974 3,554 4,133 2,395 Total Assets 10,330,635 5,294,423 5,923,774 4,047,126 5,744,282 7,856,572 9,727,432 8,168,872 LIABILITIES Payables: Fund shares redeemed 21,670 — 7,867 — 23,504 7,372 — 6,010 Securities purchased 67,891 37,023 — 7,386 63,007 20,091 — 182,308 Accrued advisory fees 8,079 4,362 5,352 3,849 4,557 4,871 6,800 5,931 Accrued administration fees 2,977 1,527 1,703 1,224 1,679 2,273 2,800 2,306 Accrued trustees fees 1,508 837 870 739 1,024 1,239 1,457 967 Accrued deferred trustee compensation 4,215 2,637 2,676 2,399 3,065 3,574 3,977 3,498 Accrued distribution and service (12b-1) fees 5,135 2,252 2,521 1,799 2,514 3,621 4,966 3,982 Accrued other 65,341 36,744 34,238 31,485 38,570 52,037 61,950 46,442 Forward foreign currency contracts depreciation — — — — — 4,524 — — Outstanding options written, at value — — — 320 — — — — Variation margin on futures contracts 7,950 — — — — — — — Total Liabilities 184,766 85,382 55,227 49,201 137,920 99,602 81,950 251,444 NET ASSETS $ 10,145,869 $ 5,209,041 $ 5,868,547 $ 3,997,925 $ 5,606,362 $ 7,756,970 $ 9,645,482 $ 7,917,428
STATEMENTS OF ASSETS AND LIABILITIES (Continued)
MARCH 31, 2003 PF AIM Aggressive Growth Fund PF INVESCO Health Sciences Fund PF Janus Strategic Value Fund PF Lazard International Value Fund PF MFS Mid-Cap Growth Fund PF AIM Blue Chip Fund PF INVESCO Technology Fund PF Janus Growth LT Fund NET ASSETS CONSIST OF: Paid-in capital $ 12,584,235 $ 6,151,733 $ 7,364,401 $ 6,057,804 $ 7,070,101 $ 10,185,368 $ 10,956,317 $ 12,822,214 Accumulated undistributed net investment income (loss) (5,256 ) (3,526 ) (3,312 ) (3,035 ) (4,055 ) (16,023 ) 25,933 (4,438 ) Accumulated undistributed net realized loss (1,018,076 ) (929,930 ) (1,925,493 ) (1,808,364 ) (732,363 ) (2,143,931 ) (403,618 ) (4,912,447 ) Net unrealized appreciation (depreciation) on investments and assets and liabilities in foreign currencies (1,415,034 ) (9,236 ) 432,951 (248,480 ) (727,321 ) (268,444 ) (933,150 ) 12,099 NET ASSETS $ 10,145,869 $ 5,209,041 $ 5,868,547 $ 3,997,925 $ 5,606,362 $ 7,756,970 $ 9,645,482 $ 7,917,428 Class A Shares: Net Assets $ 7,922,492 $ 5,030,940 $ 5,643,470 $ 3,884,841 $ 5,331,111 $ 6,831,782 $ 7,217,649 $ 6,190,534 Shares of beneficial interest outstanding 983,915 585,399 691,406 564,549 652,997 896,084 826,623 1,046,112 NET ASSET VALUE * $ 8.05 $ 8.59 $ 8.16 $ 6.88 $ 8.16 $ 7.62 $ 8.73 $ 5.92 Sales Charge - 5.50% of offering price 0.47 0.50 0.47 0.40 0.47 0.44 0.51 0.34 Maximum offering price per share $ 8.52 $ 9.09 $ 8.63 $ 7.28 $ 8.63 $ 8.06 $ 9.24 $ 6.26 Class B Shares: Net Assets $ 756,820 $ 62,715 $ 108,318 $ 35,002 $ 200,783 $ 301,422 $ 771,443 $ 585,776 Shares of beneficial interest outstanding 94,800 7,353 13,381 5,123 24,782 39,741 89,093 99,558 NET ASSET VALUE and offering price per share * $ 7.98 $ 8.53 $ 8.09 $ 6.83 $ 8.10 $ 7.58 $ 8.66 $ 5.88 Class C Shares: Net Assets $ 1,466,557 $ 115,386 $ 116,759 $ 78,082 $ 74,468 $ 623,766 $ 1,656,390 $ 1,141,118 Shares of beneficial interest outstanding 183,681 13,495 14,423 11,430 9,186 82,377 191,224 194,145 NET ASSET VALUE * $ 7.98 $ 8.55 $ 8.10 $ 6.83 $ 8.11 $ 7.57 $ 8.66 $ 5.88 Sales Charge - 1.00% of offering price 0.08 0.09 0.08 0.07 0.08 0.08 0.09 0.06 Maximum offering price per share $ 8.06 $ 8.64 $ 8.18 $ 6.90 $ 8.19 $ 7.65 $ 8.75 $ 5.94
STATEMENTS OF ASSETS AND LIABILITIES (Continued)
MARCH 31, 2003 PF Salomon Brothers Large-Cap Value Fund PF PIMCO Inflation Managed Fund PF MFS Global Growth Fund PF PIMCO Managed Bond Fund PF Pacific Life Money Market Fund PF Putnam Equity Income Fund PF Putnam Research Fund ASSETS Investments, at cost $ 4,809,080 $ 7,829,913 $ 25,866,151 $ 14,881,838 $ 10,922,450 $ 12,462,192 $ 18,072,015 Investments, at value $ 4,528,946 $ 7,906,823 $ 26,092,048 $ 14,881,838 $ 9,464,793 $ 11,158,236 $ 14,658,023 Foreign currency held, at value (1) — — 193,955 — — — — Receivables: Dividends and interest 18,804 71,475 242,631 10,644 23,468 16,425 41,819 Fund shares sold 4,450 205,467 103,079 11,011 43,635 198 65,682 Securities sold 18,376 — 107,026 — 43,032 4,101 4,552 Securities sold short — 102,737 — — — — — Due from adviser 208,032 — 185,997 172,529 139,561 101,493 100,541 Forward foreign currency contracts appreciation — — 16,380 — — 2,261 — Variation margin on futures contracts — — 21,080 — — — — Prepaid expenses and other assets 2,395 37,226 9,347 7,029 4,712 4,133 5,292 Total Assets 4,781,003 8,323,728 26,971,543 15,083,051 9,719,201 11,286,847 14,875,909 LIABILITIES Payables: Fund shares redeemed — — 57,273 21,020 — — 24,275 Securities purchased 47,317 1,260,320 1,626,736 — 5,968 51,575 46,034 Securities sold short, at value (proceeds $102,737) — 101,477 — — — — — Income and capital gains distributions — 158 12,678 42 — — — Accrued advisory fees 4,332 3,323 12,608 5,095 7,699 9,465 10,496 Accrued administration fees 1,378 1,939 7,355 4,458 2,836 3,313 4,322 Accrued trustees fees 809 566 3,417 2,126 1,680 1,349 1,748 Accrued deferred trustee compensation 2,018 182 9,408 6,516 5,026 4,139 4,721 Accrued distribution and service (12b-1) fees 2,025 2,921 13,169 6,890 4,377 4,783 7,359 Accrued other 81,197 21,486 138,734 90,058 78,836 47,919 70,989 Forward foreign currency contracts depreciation — — 1,588 — — 8,068 — Outstanding interest rate swaps, at value — — 140,245 — — — — Outstanding options written, at value — — 153,019 — — — — Variation margin on futures contracts — — 692 — — — — Total Liabilities 139,076 1,392,372 2,176,922 136,205 106,422 130,611 169,944 NET ASSETS $ 4,641,927 $ 6,931,356 $ 24,794,621 $ 14,946,846 $ 9,612,779 $ 11,156,236 $ 14,705,965
STATEMENTS OF ASSETS AND LIABILITIES (Continued)
MARCH 31, 2003 PF PIMCO Inflation Managed Fund PFSalomon Brothers Large-Cap Value Fund PF MFS Global Growth Fund PF PIMCO Managed Bond Fund PF Pacific Life Money Market Fund PF Putnam Equity Income Fund PF Putnam Research Fund NET ASSETS CONSIST OF: Paid-in capital $ 5,737,494 $ 6,774,926 $ 24,442,074 $14,899,549 $ 11,863,838 $ 15,075,010 $ 19,465,786 Accumulated undistributed net investment income (loss) (3,824 ) 7,915 163,662 47,347 12,362 (29,857 ) 17,913 Accumulated undistributed net realized gain (loss) (811,721 ) 70,345 (58,929) (50) (805,764 ) (2,579,150 ) (1,363,742 ) Net unrealized appreciation (depreciation) on investments and assets and liabilities in foreign currencies (280,022 ) 78,170 247,814 — (1,457,657 ) (1,309,767 ) (3,413,992 ) NET ASSETS $ 4,641,927 $ 6,931,356 $ 24,794,621 $ 14,946,846 $ 9,612,779 $ 11,156,236 $ 14,705,965 Class A Shares: Net Assets $ 4,505,415 $ 6,289,976 $ 18,236,254 $ 13,091,885 $ 8,812,118 $ 11,035,127 $ 11,736,321 Shares of beneficial interest outstanding 549,549 611,735 1,795,231 13,089,685 1,114,198 1,505,477 1,499,384 NET ASSET VALUE * $ 8.20 $ 10.28 $ 10.16 $ 1.00 $ 7.91 $ 7.33 $ 7.83 Sales Charge - 5.50% of offering price 0.48 0.60 0.59 — 0.46 0.43 0.46 Maximum offering price per share $ 8.68 $ 10.88 $ 10.75 $ 1.00 $ 8.37 $ 7.76 $ 8.29 Class B Shares: Net Assets $ 57,603 $ 160,962 $ 1,985,756 $ 781,810 $ 264,729 $ 28,784 $ 954,618 Shares of beneficial interest outstanding 7,073 15,668 195,812 781,809 33,716 3,950 122,759 NET ASSET VALUE and offering price per share * $ 8.14 $ 10.27 $ 10.14 $ 1.00 $ 7.85 $ 7.29 $ 7.78 Class C Shares: Net Assets $ 78,909 $ 480,418 $ 4,572,611 $ 1,073,151 $ 535,932 $ 92,325 $ 2,015,026 Shares of beneficial interest outstanding 9,692 46,773 450,834 1,073,151 68,200 12,680 259,334 NET ASSET VALUE * $ 8.14 $ 10.27 $ 10.14 $ 1.00 $ 7.86 $ 7.28 $ 7.77 Sales Charge - 1.00% of offering price 0.08 0.10 0.10 — 0.08 0.07 0.08 Maximum offering price per share $ 8.22 $ 10.37 $ 10.24 $ 1.00 $ 7.94 $ 7.35 $ 7.85
STATEMENTS OF OPERATIONS
FOR THE YEAR ENDED MARCH 31, 2003 PF AIM Aggressive Growth Fund PF Janus Strategic Value Fund PF Lazard International Value Fund PF MFS Mid-Cap Growth Fund PF AIM Blue Chip Fund PF INVESCO Health Sciences Fund PF INVESCO Technology Fund PF Janus Growth LT Fund INVESTMENT INCOME Dividends, net of foreign taxes withheld (1) $ 108,028 $ 13,114 $ 39,396 $ 8,392 $ 55,939 $ 45,420 $ 205,378 $ 29,259 Interest 8,390 3,787 4,694 4,599 2,840 13,588 8,238 7,094 Total Investment Income 116,418 16,901 44,090 12,991 58,779 59,008 213,616 36,353 EXPENSES Advisory fees 89,824 59,122 71,203 52,735 64,958 58,785 71,029 70,649 Administration fees 33,093 20,693 22,656 16,779 23,932 27,433 29,247 27,474 Support services expenses 23,072 12,807 14,132 12,438 15,705 19,112 21,768 17,581 Custodian fees and expenses 20,731 25,381 18,719 24,427 12,897 38,076 10,637 51,819 Shareholder reports 7,789 2,019 2,723 2,461 2,601 4,601 6,602 5,716 Distribution and service (12b-1) fees Class A 42,536 29,083 31,684 23,658 33,173 36,982 36,405 35,576 Class B 2,526 308 598 258 1,314 1,253 2,667 2,084 Class C 6,954 648 765 367 716 3,163 8,086 5,262 Transfer agency out-of-pocket expenses 66,174 36,874 41,030 39,298 40,662 50,167 60,063 56,401 Registration fees 26,177 24,718 24,714 24,715 24,731 25,538 27,151 25,712 Legal and audit fees 23,253 12,854 14,379 12,740 16,419 18,965 22,149 17,254 Trustees' fees and expenses 7,052 3,514 5,127 4,349 4,143 5,256 6,749 5,200 Offering expenses 18,529 13,897 6,176 6,176 16,985 18,529 16,985 15,442 Other 9,376 10,925 8,010 9,990 7,249 8,706 10,678 5,796 Total Expenses 377,086 252,843 261,916 230,391 265,485 316,566 330,216 341,966 Adviser Expense Reimbursement (192,697 ) (137,076 ) (128,537 ) (131,800 ) (134,554 ) (181,111 ) (174,426 ) (193,070 ) Net Expenses 184,389 115,767 133,379 98,591 130,931 135,455 155,790 148,896 NET INVESTMENT INCOME (LOSS) (67,971 ) (98,866 ) (89,289 ) (85,600 ) (72,152 ) (76,447 ) 57,826 (112,543 ) NET REALIZED AND UNREALIZED GAIN (LOSS) ON INVESTMENTS AND FOREIGN CURRENCY TRANSACTIONS Net realized gain (loss) on: Investment security transactions (959,307 ) (777,769 ) (1,537,522 ) (1,648,225 ) (692,130 ) (1,925,847 ) (408,325 ) (4,844,623 ) Futures contracts and written option transactions (17,256 ) — — — — — — — Foreign currency transactions — — — — 30 4 (463 ) — Net Realized Loss on Investments and Foreign Currency Transactions (976,563 ) (777,769 ) (1,537,522 ) (1,648,225 ) (692,100 ) (1,925,843 ) (408,788 ) (4,844,623 ) Net change in unrealized appreciation (depreciation) on: Investment security transactions (1,976,959 ) (1,115,746 ) 223,928 (1,638,731 ) (1,751,601 ) (602,281 ) (1,537,314 ) 241,624 Futures contracts and written options 2,973 — — (6,432 ) — — — — Foreign currency transactions — — 55 — 27 (4,523 ) 1,906 — Net Change in Unrealized Appreciation (Depreciation) on Investments and Foreign Currency Transactions (1,973,986 ) (1,115,746 ) 223,983 (1,645,163 ) (1,751,574 ) (606,804 ) (1,535,408 ) 241,624 NET REALIZED AND UNREALIZED LOSS ON INVESTMENTS AND FOREIGN CURRENCY TRANSACTIONS (2,950,549 ) (1,893,515 ) (1,313,539 ) (3,293,388 ) (2,443,674 ) (2,532,647 ) (1,944,196 ) (4,602,999 ) NET DECREASE IN NET ASSETS RESULTING FROM OPERATIONS ($3,018,520 ) ($1,992,381 ) ($1,402,828 ) ($3,378,988 ) ($2,515,826 ) ($2,609,094 ) ($1,886,370 ) ($4,715,542 )
STATEMENTS OF OPERATIONS (Continued)
FOR THE YEAR ENDED MARCH 31, 2003 PF PIMCO Inflation Managed Fund (1) PF Salomon Brothers Large-Cap Value Fund PF MFS Global Growth Fund PF PIMCO Managed Bond Fund PF Pacific Life Money Market Fund PF Putnam Equity Income Fund PF Putnam Research Fund �� INVESTMENT INCOME Dividends, net of foreign taxes withheld (2) $ 88,774 $ — $ — $ — $ 231,299 $ 181,292 $ 330,931 Interest 3,099 54,236 1,015,916 341,885 10,913 1,261 29,498 Total Investment Income 91,873 54,236 1,015,916 341,885 242,212 182,553 360,429 EXPENSES Advisory fees 61,260 8,709 170,595 81,879 92,299 122,209 138,868 Administration fees 19,492 5,080 99,514 71,644 34,005 42,773 57,181 Support services expenses 11,019 3,389 55,161 35,700 28,313 21,260 26,452 Custodian fees and expenses 273,102 2,250 28,576 13,672 24,474 25,088 6,663 Shareholder reports 1,774 660 17,406 8,353 2,838 — 7,539 Distribution and service (12b-1) fees Class A 27,584 7,007 126,543 98,040 46,823 60,856 74,630 Class B 302 156 7,537 3,198 907 183 3,704 Class C 221 345 23,702 5,420 2,602 315 10,410 Transfer agency out-of-pocket expenses 29,865 7,787 154,779 91,882 79,447 65,503 75,382 Registration fees 24,714 83 27,768 30,727 25,376 25,285 25,920 Legal and audit fees 12,718 7,376 56,890 37,607 25,306 21,857 27,540 Trustees' fees and expenses 3,593 1,558 21,788 13,592 11,260 8,704 9,105 Offering expenses 7,721 9,375 9,264 10,809 37,500 37,500 13,897 Other 32,428 4,487 17,604 14,015 16,357 10,604 10,854 Total Expenses 505,793 58,262 817,127 516,538 427,507 442,137 488,145 Adviser Expense Reimbursement/Distributor Waiver (391,365 ) (35,513 ) (360,805 ) (292,361 ) (241,155 ) (203,580 ) (187,014 ) Net Expenses 114,428 22,749 456,322 224,177 186,352 238,557 301,131 NET INVESTMENT INCOME (LOSS) (22,555 ) 31,487 559,594 117,708 55,860 (56,004 ) 59,298 NET REALIZED AND UNREALIZED GAIN (LOSS) ON INVESTMENTS AND FOREIGN CURRENCY TRANSACTIONS Net realized gain (loss) on: Investment security transactions (795,447 ) 70,345 940,420 (50 ) (782,021 ) (2,481,076 ) (1,227,554 ) Futures contracts and written option transactions — — 1,306,349 — — — — Foreign currency transactions (323 ) — 89 — — (93 ) — Net Realized Gain (Loss) on Investments and Foreign Currency Transactions (795,770 ) 70,345 2,246,858 (50 ) (782,021 ) (2,481,169 ) (1,227,554 ) Net change in unrealized appreciation (depreciation) on: Investment security transactions (736,070 ) 78,170 468,045 — (1,942,233 ) (1,401,295 ) (4,356,079 ) Futures contracts and written options — — 162,885 — — — — Foreign currency transactions (121 ) — 13,146 — — (5,811 ) — Net Change in Unrealized Appreciation (Depreciation) on Investments and Foreign Currency Transactions (736,191 ) 78,170 644,076 — (1,942,233 ) (1,407,106 ) (4,356,079 ) NET REALIZED AND UNREALIZED GAIN (LOSS) ON INVESTMENTS AND FOREIGN CURRENCY TRANSACTIONS (1,531,961 ) 148,515 2,890,934 (50 ) (2,724,254 ) (3,888,275 ) (5,583,633 ) NET INCREASE (DECREASE) IN NET ASSETS RESULTING FROM OPERATIONS ($1,554,516 ) $ 180,002 $ 3,450,528 $ 117,658 ($ 2,668,394 ) ($3,944,279 ) ($5,524,335 )
STATEMENTS OF CHANGES IN NET ASSETS PF AIM Blue Chip Fund PF AIM Aggressive Growth Fund PF INVESCO Health Sciences Fund Year Ended March 31, 2003 Period Ended March 31, 2002 (1) Year Ended March 31, 2003 Period Ended March 31, 2002 (1) Year Ended March 31, 2003 Period Ended March 31, 2002 (1) OPERATIONS Net investment loss ($67,971 ) ($43,189 ) ($98,866 ) ($56,401 ) ($89,289 ) ($52,913 ) Net realized loss on investments and foreign currency transactions (976,563 ) (31,111 ) (777,769 ) (115,648 ) (1,537,522 ) (380,204 ) Net change in unrealized appreciation (depreciation) on investments and foreign currency transactions (1,973,986 ) 558,952 (1,115,746 ) 1,106,510 223,983 208,968 Net Increase (Decrease) in Net Assets Resulting from Operations (3,018,520 ) 484,652 (1,992,381 ) 934,461 (1,402,828 ) (224,149 ) DISTRIBUTIONS TO SHAREHOLDERS Net investment income Class A — (28,717 ) — (12,159 ) — — Class B — (40 ) — (4 ) — — Class C — (112 ) — (19 ) — — Net realized gains Class A — (9,307 ) — (32,769 ) — — Class B — (19 ) — (66 ) — — Class C — (19 ) — (66 ) — — Return of Capital Class A — — — — — (9,567 ) Class B — — — — — (19 ) Class C — — — — — (19 ) Net Decrease in Net Assets Resulting from Distributions to Shareholders — (38,214 ) — (45,083 ) — (9,605 ) CAPITAL SHARE TRANSACTIONS Proceeds from sale of shares Class A 1,900,875 10,899,593 193,336 6,969,193 805,954 8,317,467 Class B 800,289 43,334 60,918 19,579 91,991 152,313 Class C 1,473,852 164,424 114,733 22,878 96,992 40,690 Dividends reinvestments Class A — 38,024 — 44,899 — 9,567 Class B — 59 — 70 — 19 Class C — 131 — 85 — 19 Cost of shares repurchased Class A (1,996,697 ) (516,404 ) (847,697 ) (245,825 ) (1,634,258 ) (243,096 ) Class B (40,980 ) (888 ) (2,348 ) (9,693 ) (11,115 ) (114,165 ) Class C (37,479 ) (10,182 ) (8,084 ) — (5,082 ) (2,167 ) Net Increase (Decrease) in Net Assets Derived from Capital Share Transactions 2,099,860 10,618,091 (489,142 ) 6,801,186 (655,518 ) 8,160,647 NET INCREASE (DECREASE) IN NET ASSETS (918,660 ) 11,064,529 (2,481,523 ) 7,690,564 (2,058,346 ) 7,926,893 NET ASSETS Beginning of Year/Period 11,064,529 — 7,690,564 — 7,926,893 — End of Year/Period $10,145,869 $11,064,529 $5,209,041 $7,690,564 $5,868,547 $7,926,893 Undistributed net investment loss at end of year/period ($5,256 ) ($1,041 ) ($3,526 ) ($889 ) ($3,312 ) ($2,385 )
STATEMENTS OF CHANGES IN NET ASSETS (Continued) PF INVESCOTechnology Fund PF Janus Strategic Value Fund PF Janus Growth LT Fund Year Ended Period Ended Year Ended Period Ended Year Ended Period Ended March 31, March 31, March 31, March 31, March 31, March 31, 2003 2002 (1) 2003 2002 (1) 2003 2002 (1) OPERATIONS Net investment loss ($85,600 ) ($70,094 ) ($72,152 ) ($32,649 ) ($76,447 ) ($34,447 ) Net realized gain (loss) on investments and foreign currency transactions (1,648,225 ) (158,816 ) (692,100 ) 33,239 (1,925,843 ) (229,493 ) Net change in unrealized appreciation (depreciation) on investments and foreign currency transactions (1,645,163 ) 1,396,683 (1,751,574 ) 1,024,253 (606,804 ) 338,360 Net Increase (Decrease) in Net Assets Resulting from Operations (3,378,988 ) 1,167,773 (2,515,826 ) 1,024,843 (2,609,094 ) 74,420 DISTRIBUTIONS TO SHAREHOLDERS Net investment income Class A — — — (32,036 ) — (28,272 ) Class B — — — (80 ) — (62 ) Class C — — — (64 ) — (79 ) Net realized gains Class A — — (49,164 ) — — — Class B — — (784 ) — — — Class C — — (632 ) — — — Net Decrease in Net Assets Resulting from Distributions to Shareholders — — (50,580 ) (32,180 ) — (28,413 ) CAPITAL SHARE TRANSACTIONS Proceeds from sale of shares Class A 30,769 6,962,964 515,634 8,326,013 835,684 10,018,920 Class B 24,496 50,000 157,848 96,658 275,409 57,376 Class C 78,233 10,502 106,658 18,908 615,901 88,070 Dividends reinvestments Class A — — 48,385 31,796 — 27,060 Class B — — 378 62 — 62 Class C — — 631 64 — 78 Cost of shares repurchased Class A (601,001 ) (330,130 ) (1,735,118 ) (337,648 ) (1,286,073 ) (273,854 ) Class B (15,949 ) — (19,927 ) — (7,630 ) (13 ) Class C (744 ) — (30,237 ) — (27,389 ) (3,544 ) Net Increase (Decrease) in Net Assets Derived from Capital Share Transactions (484,196 ) 6,693,336 (955,748 ) 8,135,853 405,902 9,914,155 NET INCREASE (DECREASE) IN NET ASSETS (3,863,184 ) 7,861,109 (3,522,154 ) 9,128,516 (2,203,192 ) 9,960,162 NET ASSETS Beginning of Year/Period 7,861,109 — 9,128,516 — 9,960,162 — End of Year/Period $3,997,925 $7,861,109 $5,606,362 $9,128,516 $7,756,970 $9,960,162 Undistributed net investment loss at end of year/period ($3,035 ) ($28,189 ) ($4,055 ) ($990 ) ($16,023 ) ($1,041 )
STATEMENTS OF CHANGES IN NET ASSETS (Continued) PF Lazard International Value Fund PF MFS Mid-Cap Growth Fund PF MFS Global Growth Fund Year Ended Period Ended Year Ended Period Ended Year Ended Period Ended March 31, March 31, March 31, March 31, March 31, March 31, 2003 2002 (1) 2003 2002 (1) 2003 2002 (1) OPERATIONS Net investment income (loss) $ 57,826 ($12,130 ) ($112,543 ) ($68,364 ) ($22,555 ) ($29,041 ) Net realized gain (loss) on investments and foreign currency transactions (408,788 ) 47,796 (4,844,623 ) 979,520 (795,770 ) 126,613 Net change in unrealized appreciation (depreciation) on investments and foreign currency transactions (1,535,408 ) 602,258 241,624 (229,525 ) (736,191 ) 456,169 Net Increase (Decrease) in Net Assets Resulting from Operations (1,886,370 ) 637,924 (4,715,542 ) 681,631 (1,554,516 ) 553,741 DISTRIBUTIONS TO SHAREHOLDERS Net investment income Class A (28,445 ) (20,005 ) — (18,870 ) — (6,200 ) Class B (1,913 ) (15 ) — (4 ) — — Class C (4,078 ) (29 ) — (41 ) — — Net realized gains Class A (45,705 ) — (843,858 ) (85,907 ) (124,390 ) (6,537 ) Class B (389 ) — (7,367 ) (173 ) (418 ) (13 ) Class C (2,132 ) — (22,315 ) (173 ) (212 ) (13 ) Net Decrease in Net Assets Resulting from Distributions to Shareholders (82,662 ) (20,049 ) (873,540 ) (105,168 ) (125,020 ) (12,763 ) CAPITAL SHARE TRANSACTIONS Proceeds from sale of shares Class A 6,682,746 7,395,576 1,670,491 11,535,542 4,191,604 6,275,672 Class B 845,346 24,469 562,549 81,551 43,068 21,097 Class C 1,759,737 150,940 1,166,586 123,241 74,289 10,000 Dividends reinvestments Class A 72,436 19,760 823,409 104,380 113,748 12,201 Class B 2,207 15 7,319 177 418 13 Class C 6,305 29 22,315 214 212 13 Cost of shares repurchased Class A (5,618,470 ) (210,093 ) (2,274,920 ) (832,471 ) (4,942,110 ) (18,287 ) Class B (42,393 ) (309 ) (13,861 ) — (222 ) — Class C (79,744 ) (11,918 ) (38,785 ) (7,690 ) (1,231 ) — Net Increase (Decrease) in Net Assets Derived from Capital Share Transactions 3,628,170 7,368,469 1,925,103 11,004,944 (520,224 ) 6,300,709 NET INCREASE (DECREASE) IN NET ASSETS 1,659,138 7,986,344 (3,663,979 ) 11,581,407 (2,199,760 ) 6,841,687 NET ASSETS Beginning of Year/Period 7,986,344 — 11,581,407 — 6,841,687 — End of Year/Period $ 9,645,482 $7,986,344 $7,917,428 $11,581,407 $4,641,927 $6,841,687 Undistributed net investment income (loss) at end of year/period $ 25,933 $7,714 ($4,438 ) ($940 ) ($3,824 ) ($637 )
STATEMENTS OF CHANGES IN NET ASSETS (Continued) PF PIMCO Inflation Managed Fund PF PIMCO Managed Bond Fund PF Pacific Life Money Market Fund Period Ended Year Ended Period Ended Year Ended Period Ended March 31, March 31, March 31, March 31, March 31, 2003 (1) 2003 2002 (2) 2003 2002 (2) OPERATIONS Net investment income $ 31,487 $ 559,594 $ 163,364 $ 117,708 $ 63,863 Net realized gain (loss) on investments and foreign currency transactions 70,345 2,246,858 (459,527 ) (50 ) 2,251 Net change in unrealized appreciation (depreciation) on investments and foreign currency transactions 78,170 644,076 (396,262 ) — — Net Increase (Decrease) in Net Assets Resulting from Operations 180,002 3,450,528 (692,425 ) 117,658 66,114 DISTRIBUTIONS TO SHAREHOLDERS Net investment income Class A (29,246 ) (822,096 ) (198,884 ) (117,028 ) (63,834 ) Class B (562 ) (32,967 ) (377 ) (245 ) (10 ) Class C (1,373 ) (96,396 ) (963 ) (435 ) (19 ) Net realized gains Class A — (1,013,640 ) (26,223 ) — — Class B — (61,509 ) (53 ) — — Class C — (197,240 ) (53 ) — — Net Decrease in Net Assets Resulting from Distributions to Shareholders (31,181 ) (2,223,848 ) (226,553 ) (117,708 ) (63,863 ) CAPITAL SHARE TRANSACTIONS Proceeds from sale of shares Class A 6,347,968 12,479,148 38,543,576 7,721,450 38,214,595 Class B 159,771 1,858,665 177,468 821,580 125,511 Class C 504,905 4,246,502 392,197 1,497,246 487,642 Dividends reinvestments Class A 29,246 1,530,194 179,170 109,308 60,436 Class B 473 92,878 408 247 10 Class C 1,304 255,022 783 435 12 Cost of shares repurchased Class A (232,743 ) (30,122,684 ) (4,756,476 ) (21,795,052 ) (11,221,052 ) Class B — (121,135 ) (2,287 ) (127,876 ) (37,663 ) Class C (28,389 ) (249,008 ) (17,502 ) (499,191 ) (412,993 ) Net Increase (Decrease) in Net Assets Derived from Capital Share Transactions 6,782,535 (10,030,418 ) 34,517,337 (12,271,853 ) 27,216,498 NET INCREASE (DECREASE) IN NET ASSETS 6,931,356 (8,803,738 ) 33,598,359 (12,271,903 ) 27,218,749 . NET ASSETS Beginning of Year/Period — 33,598,359 — 27,218,749 — End of Year/Period $ 6,931,356 $ 24,794,621 $ 33,598,359 $ 14,946,846 $ 27,218,749 Undistributed net investment income at end of year/period $ 7,915 $ 163,662 $ 7,984 $ 47,347 $ 45,422
STATEMENTS OF CHANGES IN NET ASSETS (Continued) PF Putnam Equity Income Fund PF Putnam Research Fund PF Salomon Brothers
Large-Cap Value Fund Year Ended Period Ended Year Ended Period Ended Year Ended Period Ended March 31, March 31, March 31, March 31, March 31, March 31, 2003 2002 (1) 2003 2002 (1) 2003 2002 (2) OPERATIONS Net investment income (loss) $ 55,860 $ 5,102 ($56,004 ) ($21,340 ) $ 59,298 ($11,460 ) Net realized loss on investments and foreign currency transactions (782,021 ) (24,546 ) (2,481,169 ) (127,287 ) (1,227,554 ) (19,381 ) Net change in unrealized appreciation (depreciation) on investments and foreign currency transactions (1,942,233 ) 484,576 (1,407,106 ) 97,339 (4,356,079 ) 942,087 Net Increase (Decrease) in Net Assets Resulting from Operations (2,668,394 ) 465,132 (3,944,279 ) (51,288 ) (5,524,335 ) 911,246 DISTRIBUTIONS TO SHAREHOLDERS Net investment income Class A (90,783 ) — (31,398 ) — (34,071 ) (41,033 ) Class B (959 ) — (18 ) — (1,682 ) (66 ) Class C (2,562 ) — (50 ) — (4,576 ) (182 ) Net realized gains Class A — — — — (98,565 ) (4,303 ) Class B — — — — (965 ) (9 ) Class C — — — — (2,918 ) (9 ) Net Decrease in Net Assets Resulting from Distributions to Shareholders (94,304 ) — (31,466 ) — (142,777 ) (45,602 ) CAPITAL SHARE TRANSACTIONS Proceeds from sale of shares Class A 727,291 10,417,665 47,749 15,019,575 3,046,380 19,940,332 Class B 279,145 12,549 38,404 10,010 941,383 144,338 Class C 573,829 44,011 89,783 10,010 2,064,546 251,002 Dividends reinvestments Class A 90,410 — 31,398 — 130,473 44,875 Class B 959 — 18 — 2,185 75 Class C 2,562 — 50 — 7,437 153 Cost of shares repurchased Class A (197,143 ) (4,138 ) (49,736 ) (166 ) (5,848,309 ) (1,092,458 ) Class B (9,527 ) — (13,785 ) — (43,395 ) (552 ) Class C (23,159 ) (4,109 ) (41 ) — (70,164 ) (10,868 ) Net Increase in Net Assets Derived from Capital Share Transactions 1,444,367 10,465,978 143,840 15,039,429 230,536 19,276,897 NET INCREASE (DECREASE) IN NET ASSETS (1,318,331 ) 10,931,110 (3,831,905 ) 14,988,141 (5,436,576 ) 20,142,541 NET ASSETS Beginning of Year/Period 10,931,110 — 14,988,141 — 20,142,541 — End of Year/Period $ 9,612,779 $ 10,931,110 $11,156,236 $14,988,141 $ 14,705,965 $ 20,142,541 Undistributed net investment income (loss) at end of year/period $ 12,362 $ 51,609 ($29,857 ) $30,076 $ 17,913 ($1,063 )
PACIFIC FUNDS
FINANCIAL HIGHLIGHTS
Selected per share, ratios and supplemental data for each year or period ended March 31, were as follows:
| Investment Activities | Distributions | Ratios/Supplemental Data | |||||||||||||||||||||||||||||||||||
Net Asset Value, Beginning of Year or Period | Net Asset Investment (Loss) | Net Realized and Unrealized Gain (Loss) on Securities | Total from Investment Operations | Dividends from Net Investment Income | Distributions from Capital Gains | Return of Capital | Total Distri- butions | Net Asset Value, End of Year or Period | Total Returns(1) | Net Assets, End of Year or Period (in thousands) | Ratios of Net Expenses to Average Net Assets (2), (3) | Ratios of Gross Expenses to Average Net Assets(3) | Ratios of Net Investment (Loss) After Expense Reductions to Average Net Assets (3) | Ratios of Net Investment (Loss) Before Expense Reductions to Average Net Assets (2),(3) | Portfolio Turnover Rates | ||||||||||||||||||||||
| PF AIM Blue Chip Fund | |||||||||||||||||||||||||||||||||||||
| Class A: 2003 (4) | $ | 10.96 | ($0.06 | ) | ($2.85 | ) | ($2.91 | ) | $ — | $— | $— | $ — | $8.05 | (26.55 | %) | $7,922 | 1.90 | % | 3.94 | % | (0.67 | %) | (2.71 | %) | 35.58 | % | |||||||||||
| 9/28/2001 - 3/31/2002 (4) | 10.00 | (0.05 | ) | 1.06 | 1.01 | (0.03 | ) | (0.02 | ) | — | (0.05 | ) | 10.96 | 10.09 | % | 10,867 | 1.90 | % | 5.99 | % | (0.92 | %) | (5.01 | %) | 12.63 | % | |||||||||||
| Class B: 2003 (4) | $ | 10.94 | ($0.10 | ) | ($2.86 | ) | ($2.96 | ) | $ — | $— | $— | $ — | $7.98 | (27.06 | %) | $757 | 2.40 | % | 4.44 | % | (1.17 | %) | (3.21 | %) | 35.58 | % | |||||||||||
| 9/28/2001 - 3/31/2002 (4) | 10.00 | (0.08 | ) | 1.06 | 0.98 | (0.02 | ) | (0.02 | ) | — | (0.04 | ) | 10.94 | 9.79 | % | 43 | 2.40 | % | 6.49 | % | (1.42 | %) | (5.51 | %) | 12.63 | % | |||||||||||
| Class C: 2003 (4) | $ | 10.93 | ($0.10 | ) | ($2.85 | ) | ($2.95 | ) | $ — | $— | $— | $ — | $7.98 | (26.99 | %) | $1,467 | 2.40 | % | 4.44 | % | (1.17 | %) | (3.21 | %) | 35.58 | % | |||||||||||
| 9/28/2001 - 3/31/2002 (4) | 10.00 | (0.08 | ) | 1.06 | 0.98 | (0.03 | ) | (0.02 | ) | — | (0.05 | ) | 10.93 | 9.74 | % | 154 | 2.40 | % | 6.49 | % | (1.42 | %) | (5.51 | %) | 12.63 | % | |||||||||||
| PF AIM Aggressive Growth Fund | |||||||||||||||||||||||||||||||||||||
| Class A: 2003 (4) | $ | 11.63 | ($0.16 | ) | ($2.88 | ) | ($3.04 | ) | $ — | $— | $— | $ — | $8.59 | (26.14 | %) | $5,031 | 1.95 | % | 4.27 | % | (1.66 | %) | (3.98 | %) | 71.87 | % | |||||||||||
| 9/28/2001 - 3/31/2002 (4) | 10.00 | (0.09 | ) | 1.81 | 1.72 | (0.02 | ) | (0.07 | ) | — | (0.09 | ) | 11.63 | 17.21 | % | 7,654 | 1.95 | % | 6.84 | % | (1.67 | %) | (6.56 | %) | 44.75 | % | |||||||||||
| Class B: 2003 (4) | $ | 11.61 | ($0.19 | ) | ($2.89 | ) | ($3.08 | ) | $ — | $— | $— | $ — | $8.53 | (26.44 | %) | $63 | 2.45 | % | 4.77 | % | (2.16 | %) | (4.48 | %) | 71.87 | % | |||||||||||
| 9/28/2001 - 3/31/2002 (4) | 10.00 | (0.12 | ) | 1.80 | 1.68 | — | (0.07 | ) | — | (0.07 | ) | 11.61 | 16.84 | % | 12 | 2.45 | % | 7.34 | % | (2.17 | %) | (7.06 | %) | 44.75 | % | ||||||||||||
| Class C: 2003 (4) | $ | 11.61 | ($0.19 | ) | ($2.87 | ) | ($3.06 | ) | $ — | $— | $— | $ — | $8.55 | (26.36 | %) | $115 | 2.45 | % | 4.77 | % | (2.16 | %) | (4.48 | %) | 71.87 | % | |||||||||||
| 9/28/2001 - 3/31/2002 (4) | 10.00 | (0.12 | ) | 1.81 | 1.69 | (0.01 | ) | (0.07 | ) | — | (0.08 | ) | 11.61 | 16.91 | % | 25 | 2.45 | % | 7.34 | % | (2.17 | %) | (7.06 | %) | 44.75 | % | |||||||||||
| PF INVESCO Health Sciences Fund | |||||||||||||||||||||||||||||||||||||
| Class A: 2003 (4) | $ | 9.89 | ($0.12 | ) | ($1.61 | ) | ($1.73 | ) | $ — | $— | $— | $ — | $8.16 | (17.49 | %) | $5,643 | 2.05 | % | 4.04 | % | (1.37 | %) | (3.36 | %) | 139.83 | % | |||||||||||
| 9/28/2001 - 3/31/2002 (4) | 10.00 | (0.07) | (0.02) | (0.09 | ) | — | — | (0.02 | ) | (0.02 | ) | 9.89 | (0.92 | %) | 7,854 | 2.05 | % | 4.82 | % | (1.43 | %) | (4.20 | %) | 22.74 | % | ||||||||||||
| Class B: 2003 (4) | $ | 9.86 | ($0.15 | ) | ($1.62 | ) | ($1.77 | ) | $ — | $— | $— | $ — | $8.09 | (17.95 | %) | $108 | 2.55 | % | 4.54 | % | (1.87 | %) | (3.86 | %) | 139.83 | % | |||||||||||
| 9/28/2001 - 3/31/2002 (4) | 10.00 | (0.10) | (0.02) | (0.12 | ) | — | — | (0.02 | ) | (0.02 | ) | 9.86 | (1.22 | %) | 37 | 2.55 | % | 5.32 | % | (1.93 | %) | (4.70 | %) | 22.74 | % | ||||||||||||
| Class C: 2003 (4) | $ | 9.86 | ($0.15 | ) | ($1.61 | ) | ($1.76 | ) | $ — | $— | $— | $ — | $8.10 | (17.85 | %) | $117 | 2.55 | % | 4.54 | % | (1.87 | %) | (3.86 | %) | 139.83 | % | |||||||||||
| 9/28/2001 - 3/31/2002 (4) | 10.00 | (0.10) | (0.02) | (0.12 | ) | — | — | (0.02 | ) | (0.02 | ) | 9.86 | (1.22 | %) | 37 | 2.55 | % | 5.32 | % | (1.93 | %) | (4.70 | %) | 22.74 | % | ||||||||||||
| PF INVESCO Technology Fund | |||||||||||||||||||||||||||||||||||||
| Class A: 2003 (4) | $ | 12.47 | ($0.14 | ) | ($5.45 | ) | ($5.59 | ) | $ — | $ — | $— | $ — | $6.88 | (44.83 | %) | $3,885 | 2.05 | % | 4.80 | % | (1.78 | %) | (4.53 | %) | 96.29 | % | |||||||||||
| 9/28/2001 - 3/31/2002 (4) | 10.00 | (0.12 | ) | 2.59 | 2.47 | — | — | — | — | 12.47 | 24.70 | % | 7,801 | 2.05 | % | 4.81 | % | (1.82 | %) | (4.58 | %) | 32.50 | % | ||||||||||||||
| Class B: 2003 (4) | $ | 12.44 | ($0.19 | ) | ($5.42 | ) | ($5.61 | ) | $ — | $— | $— | $ — | $6.83 | (45.10 | %) | $35 | 2.55 | % | 5.30 | % | (2.28 | %) | (5.03 | %) | 96.29 | % | |||||||||||
| 9/28/2001 - 3/31/2002 (4) | 10.00 | (0.15 | ) | 2.59 | 2.44 | — | — | — | — | 12.44 | 24.40 | % | 47 | 2.55 | % | 5.31 | % | (2.32 | %) | (5.08 | %) | 32.50 | % | ||||||||||||||
| Class C: 2003 (4) | $ | 12.44 | ($0.17 | ) | ($5.44 | ) | ($5.61 | ) | $ — | $— | $— | $ — | $6.83 | (45.10 | %) | $78 | 2.55 | % | 5.30 | % | (2.28 | %) | (5.03 | %) | 96.29 | % | |||||||||||
| 9/28/2001 - 3/31/2002 (4) | 10.00 | (0.15 | ) | 2.59 | 2.44 | — | — | — | — | 12.44 | 24.40 | % | 13 | 2.55 | % | 5.31 | % | (2.32 | %) | (5.08 | %) | 32.50 | % | ||||||||||||||
See Notes to Financial Statements
See explanation of symbols on D-4
D-1
PACIFIC FUNDS
FINANCIAL HIGHLIGHTS (Continued)
Selected per share, ratios and supplemental data for each year or period ended March 31, were as follows:
| Investment Activities | Distributions | Ratios/Supplemental Data | |||||||||||||||||||||||||||||||||
| Net Asset Value, Beginning of Year or Period | Net Asset Investment (Loss) | Net Realized and Unrealized Gain (Loss) on Securities | Total from Investment Operations | Dividends from Net Investment Income | Distributions from Capital Gains | Return of Capital | Total Distri-butions | Net Asset Value, End of Year or Period | Total Returns(1) | Net Assets, End of Year or Period (in thousands) | Ratios of Net Expenses to Average Net Assets (2), (3) | Ratios of Gross Expenses to Average Net Assets(3) | Ratios of Net Investment (Loss) After Expense Reductions to Average Net Assets (3) | Ratios of Net Investment (Loss) Before Expense Reductions to Average Net Assets (2),(3) | Portfolio Turnover Rates | ||||||||||||||||||||
| PF Janus Strategic Value Fund | |||||||||||||||||||||||||||||||||||
| Class A: 2003 | $ | 11.45 | ($0.11 | ) | ($3.12) | ($3.23 | ) | $ — | ($0.06 | ) | $— | ($0.06 | ) | $8.16 | (28.26 | %) | $5,331 | 1.90 | % | 3.87 | % | (1.04 | %) | (3.01 | %) | 37.78 | % | ||||||||
| 9/28/2001 - 3/31/2002 (4) | 10.00 | (0.05 | ) | 1.54 | 1.49 | (0.04 | ) | — | — | (0.04 | ) | 11.45 | 14.94 | % | 9,002 | 1.90 | % | 6.26 | % | (0.84 | %) | (5.20 | %) | 18.71 | % | ||||||||||
| Class B: 2003 | $ | 11.43 | ($0.11 | ) | ($3.16) | ($3.27 | ) | $ — | ($0.06 | ) | $— | ($0.06 | ) | $8.10 | (28.66 | %) | $201 | 2.40 | % | 4.37 | % | (1.54 | %) | (3.51 | %) | 37.78 | % | ||||||||
| 9/28/2001 - 3/31/2002 (4) | 10.00 | (0.07 | ) | 1.54 | 1.47 | (0.04 | ) | — | — | (0.04 | ) | 11.43 | 14.71 | % | 105 | 2.40 | % | 6.76 | % | (1.34 | %) | (5.70 | %) | 18.71 | % | ||||||||||
| Class C: 2003 | $ | 11.43 | ($0.11 | ) | ($3.15) | ($3.26 | ) | $ — | ($0.06 | ) | $— | ($0.06 | ) | $8.11 | (28.57 | %) | $74 | 2.40 | % | 4.37 | % | (1.54 | %) | (3.51 | %) | 37.78 | % | ||||||||
| 9/28/2001 - 3/31/2002 (4) | 10.00 | (0.07 | ) | 1.53 | 1.46 | (0.03 | ) | — | — | (0.03 | ) | 11.43 | 14.67 | % | 21 | 2.40 | % | 6.76 | % | (1.34 | %) | (5.70 | %) | 18.71 | % | ||||||||||
| PF Janus Growth LT Fund | |||||||||||||||||||||||||||||||||||
| Class A: 2003 | $ | 10.32 | ($0.08 | ) | ($2.62) | ($2.70 | ) | $ — | $— | $— | $— | $7.62 | (26.16 | %) | $6,832 | 1.70 | % | 4.01 | % | (0.95 | %) | (3.26 | %) | 124.73 | % | ||||||||||
| 9/28/2001 - 3/31/2002 (4) | 10.00 | (0.04 | ) | 0.39 | 0.35 | (0.03 | ) | — | — | (0.03 | ) | 10.32 | 3.50 | % | 9,819 | 1.70 | % | 6.29 | % | (0.78 | %) | (5.37 | %) | 64.33 | % | ||||||||||
| Class B: 2003 | $ | 10.30 | ($0.06 | ) | ($2.66) | ($2.72 | ) | $ — | $— | $— | $— | $7.58 | (26.31 | %) | $301 | 2.20 | % | 4.51 | % | (1.45 | %) | (3.76 | %) | 124.73 | % | ||||||||||
| 9/28/2001 - 3/31/2002 (4) | 10.00 | (0.07 | ) | 0.40 | 0.33 | (0.03 | ) | — | — | (0.03 | ) | 10.30 | 3.27 | % | 57 | 2.20 | % | 6.79 | % | (1.28 | %) | (5.87 | %) | 64.33 | % | ||||||||||
| Class C: 2003 | $ | 10.31 | ($0.08 | ) | ($2.66) | ($2.74 | ) | $ — | $— | $— | $— | $7.57 | (26.58 | %) | $624 | 2.20 | % | 4.51 | % | (1.45 | %) | (3.76 | %) | 124.73 | % | ||||||||||
| 9/28/2001 - 3/31/2002 (4) | 10.00 | (0.07 | ) | 0.40 | 0.33 | (0.02 | ) | — | — | (0.02 | ) | 10.31 | 3.33 | % | 84 | 2.20 | % | 6.79 | % | (1.28 | %) | (5.87 | %) | 64.33 | % | ||||||||||
| PF Lazard International Value Fund | |||||||||||||||||||||||||||||||||||
| Class A: 2003(4) | $ | 11.09 | $ 0.07 | ($2.33) | ($2.26 | ) | ($0.04 | ) | ($0.06 | ) | $— | ($0.10 | ) | $8.73 | (20.50 | %) | $7,218 | 1.80 | % | 3.89 | % | 0.76 | % | (1.33 | %) | 19.60 | % | ||||||||
| 9/28/2001 - 3/31/2002 (4) | 10.00 | (0.02 | ) | 1.14 | 1.12 | (0.03 | ) | — | — | (0.03 | ) | 11.09 | 11.21 | % | 7,817 | 1.80 | % | 7.07 | % | (0.35 | %) | (5.62 | %) | 7.11 | % | ||||||||||
| Class B: 2003(4) | $ | 11.08 | $ 0.02 | ($2.33) | ($2.31 | ) | ($0.05 | ) | ($0.06 | ) | $— | ($0.11 | ) | $8.66 | (20.93 | %) | $771 | 2.30 | % | 4.39 | % | 0.26 | % | (1.83 | %) | 19.60 | % | ||||||||
| 9/28/2001 - 3/31/2002 (4) | 10.00 | (0.05 | ) | 1.14 | 1.09 | (0.01 | ) | — | — | (0.01 | ) | 11.08 | 10.95 | % | 26 | 2.30 | % | 7.57 | % | (0.85 | %) | (6.12 | %) | 7.11 | % | ||||||||||
| Class C: 2003(4) | $ | 11.07 | $ 0.02 | ($2.32) | ($2.30 | ) | ($0.05 | ) | ($0.06 | ) | $— | ($0.11 | ) | $8.66 | (20.93 | %) | $1,656 | 2.30 | % | 4.39 | % | 0.26 | % | (1.83 | %) | 19.60 | % | ||||||||
| 9/28/2001 - 3/31/2002 (4) | 10.00 | (0.05 | ) | 1.14 | 1.09 | (0.02 | ) | — | — | (0.02 | ) | 11.07 | 10.91 | % | 143 | 2.30 | % | 7.57 | % | (0.85 | %) | (6.12 | %) | 7.11 | % | ||||||||||
| PF MFS Mid-Cap Growth Fund | |||||||||||||||||||||||||||||||||||
| Class A: 2003 | $ | 11.18 | ($0.09 | ) | ($4.33) | ($4.42 | ) | $ — | ($0.84 | ) | $— | ($0.84 | ) | $5.92 | (40.51 | %) | $6,191 | 1.85 | % | 4.31 | % | (1.39 | %) | (3.85 | %) | 158.16 | % | ||||||||
| 9/28/2001 - 3/31/2002 (4) | 10.00 | (0.08 | ) | 1.45 | 1.37 | (0.02 | ) | (0.17 | ) | — | (0.19 | ) | 11.18 | 13.79 | % | 11,383 | 1.85 | % | 5.33 | % | (1.44 | %) | (4.92 | %) | 70.54 | % | |||||||||
| Class B: 2003 | $ | 11.17 | ($0.08 | ) | ($4.37) | ($4.45 | ) | $ — | ($0.84 | ) | $— | ($0.84 | ) | $5.88 | (40.84 | %) | $586 | 2.35 | % | 4.81 | % | (1.89 | %) | (4.35 | %) | 158.16 | % | ||||||||
| 9/28/2001 - 3/31/2002 (4) | 10.00 | (0.11 | ) | 1.45 | 1.34 | — | (0.17 | ) | — | (0.17 | ) | 11.17 | 13.52 | % | 82 | 2.35 | % | 5.83 | % | (1.94 | %) | (5.42 | %) | 70.54 | % | ||||||||||
| Class C: 2003 | $ | 11.16 | ($0.09 | ) | ($4.35) | ($4.44 | ) | $ — | ($0.84 | ) | $— | ($0.84 | ) | $5.88 | (40.78 | %) | $1,141 | 2.35 | % | 4.81 | % | (1.89 | %) | (4.35 | %) | 158.16 | % | ||||||||
| 9/28/2001 - 3/31/2002 (4) | 10.00 | (0.11 | ) | 1.46 | 1.35 | (0.02 | ) | (0.17 | ) | — | (0.19 | ) | 11.16 | 13.53 | % | 116 | 2.35 | % | 5.83 | % | (1.94 | %) | (5.42 | %) | 70.54 | % | |||||||||
See Notes to Financial Statements
See explanation of symbols on D-4
D-2
PACIFIC FUNDS
FINANCIAL HIGHLIGHTS (Continued)
Selected per share, ratios and supplemental data for each year or period ended March 31, were as follows:
Investment Activities | Distributions | Ratios/Supplemental Data | |||||||||||||||||||||||||||||||||||||||||||||
| Net Asset Value, Beginning of Year or Period | Net Asset Investment (Loss) | Net Realized and Unrealized Gain (Loss) on Securities | Total from Investment Operations | Dividends from Net Investment Income | Distributions from Capital Gains | Return of Capital | Total Distributions | Net Asset Value, End of Year or Period | Total Returns(1) | Net Assets, End of Year or Period (in thousands) | Ratios of Net Expenses to Average Net Assets (2), (3) | Ratios of Gross Expenses to Average Net Assets(3) | Ratios of Net Investment (Loss) After Expense Reductions to Average Net Assets (3) | Ratios of Net Investment (Loss) Before Expense Reductions to Average Net Assets (2),(3) | Portfolio Turnover Rates | ||||||||||||||||||||||||||||||||
| PF MFS Global Growth Fund | |||||||||||||||||||||||||||||||||||||||||||||||
| Class A: 2003 (4) | $11.03 | ($0.04 | ) | ($2.59 | ) | ($2.63 | ) | $— | ($0.20 | ) | $ | — | ($0.20 | ) | $8.20 | (24.11 | %) | $4,505 | 2.05 | % | 9.08 | % | (0.40 | %) | (7.43 | %) | 137.37 | % | |||||||||||||||||||
| 9/28/2001 - 3/31/2002 (4) | 10.00 | (0.05) | 1.10 | 1.05 | (0.01 | ) | (0.01 | ) | — | (0.02 | ) | 11.03 | 10.54 | % | 6,808 | 2.05 | % | 9.38 | % | (0.92 | %) | (8.25 | %) | 77.66 | % | ||||||||||||||||||||||
| Class B: 2003 (4) | $11.01 | ($0.08 | ) | ($2.59 | ) | ($2.67 | ) | $— | ($0.20 | ) | $ | — | ($0.20 | ) | $8.14 | (24.52 | %) | $58 | 2.55 | % | 9.58 | % | (0.90 | %) | (7.93 | %) | 137.37 | % | |||||||||||||||||||
| 9/28/2001 - 3/31/2002 (4) | 10.00 | (0.08) | 1.10 | 1.02 | — | (0.01 | ) | — | (0.01 | ) | 11.01 | 10.24 | % | 22 | 2.55 | % | 9.88 | % | (1.42 | %) | (8.75 | %) | 77.66 | % | |||||||||||||||||||||||
| Class C: 2003 (4) | $11.01 | ($0.08 | ) | ($2.59 | ) | ($2.67 | ) | $— | ($0.20 | ) | $ | — | ($0.20 | ) | $8.14 | (24.43 | %) | $79 | 2.55 | % | 9.58 | % | (0.90 | %) | (7.93 | %) | 137.37 | % | |||||||||||||||||||
| 9/28/2001 - 3/31/2002 (4) | 10.00 | (0.08) | 1.10 | 1.02 | — | (0.01 | ) | — | (0.01 | ) | 11.01 | 10.24 | % | 11 | 2.55 | % | 9.88 | % | (1.42 | %) | (8.75 | %) | 77.66 | % | |||||||||||||||||||||||
| PF PIMCO Inflation Managed Fund | |||||||||||||||||||||||||||||||||||||||||||||||
| Class A: | 12/31/2002 - 3/31/2003 (4) | $10.00 | $0.06 | $0.27 | $ 0.33 | ($0.05 | ) | $— | $ | — | ($0.05 | ) | $10.28 | 3.30 | % | $6,290 | 1.55 | % | 4.00 | % | 2.19 | % | (0.26 | %) | 199.92 | % | |||||||||||||||||||||
| Class B: | 12/31/2002 - 3/31/2003 (4) | $10.00 | $0.04 | $0.28 | $ 0.32 | ($0.05 | ) | $— | $ | — | ($0.05 | ) | $10.27 | 3.16 | % | $161 | 2.05 | % | 4.50 | % | 1.69 | % | (0.76 | %) | 199.92 | % | |||||||||||||||||||||
| Class C: | 12/31/2002 - 3/31/2003 (4) | $10.00 | $0.04 | $0.28 | $ 0.32 | ($0.05 | ) | $— | $ | — | ($0.05 | ) | $10.27 | 3.11 | % | $480 | 2.05 | % | 4.50 | % | 1.69 | % | (0.76 | %) | 199.92 | % | |||||||||||||||||||||
| PF PIMCO Managed Bond Fund | |||||||||||||||||||||||||||||||||||||||||||||||
| Class A: 2003 (4) | $9.85 | $0.21 | $1.02 | $ 1.23 | ($0.36 | ) | ($0.56 | ) | $ | — | ($0.92 | ) | $10.16 | 12.80 | % | $18,236 | 1.55 | % | 2.82 | % | 2.02 | % | 0.75 | % | 445.26 | % | |||||||||||||||||||||
| 9/28/2001 - 3/31/2002 | 10.00 | 0.06 | (0.09 | ) | (0.03 | ) | (0.07 | ) | (0.05 | ) | — | (0.12 | ) | 9.85 | (0.28 | %) | 33,055 | 1.55 | % | 2.54 | % | 1.16 | % | 0.17 | % | 522.25 | % | ||||||||||||||||||||
| Class B: 2003 (4) | $9.84 | $0.15 | $1.03 | $ 1.18 | ($0.32 | ) | ($0.56 | ) | $ | — | ($0.88 | ) | $10.14 | 12.27 | % | $1,986 | 2.05 | % | 3.32 | % | 1.52 | % | 0.25 | % | 445.26 | % | |||||||||||||||||||||
| 9/28/2001 - 3/31/2002 | 10.00 | 0.04 | (0.10 | ) | (0.06 | ) | (0.05 | ) | (0.05 | ) | — | (0.10 | ) | 9.84 | (0.55 | %) | 173 | 2.05 | % | 3.04 | % | 0.66 | % | (0.33 | %) | 522.25 | % | ||||||||||||||||||||
| Class C: 2003 (4) | $9.84 | $0.15 | $1.03 | $ 1.18 | ($0.32 | ) | ($0.56 | ) | $ | — | ($0.88 | ) | $10.14 | 12.28 | % | $4,573 | 2.05 | % | 3.32 | % | 1.52 | % | 0.25 | % | 445.26 | % | |||||||||||||||||||||
| 9/28/2001 - 3/31/2002 | 10.00 | 0.04 | (0.10 | ) | (0.06 | ) | (0.05 | ) | (0.05 | ) | — | (0.10 | ) | 9.84 | (0.57 | %) | 370 | 2.05 | % | 3.04 | % | 0.66 | % | (0.33 | %) | 522.25 | % | ||||||||||||||||||||
| PF Pacific Life Money Market Fund | |||||||||||||||||||||||||||||||||||||||||||||||
| Class A: 2003 | $1.00 | $0.01 | $— | $ 0.01 | ($0.01 | ) | $— | $ | — | ($0.01 | ) | $1.00 | 0.58 | % | $13,092 | 1.08 | %(6) | 2.50 | % | 0.59 | % | (0.83 | %) | N/A | |||||||||||||||||||||||
| 9/28/2001 - 3/31/2002 | 1.00 | — | (5) | — | — | — | (5) | — | — | — | 1.00 | 0.33 | % | 27,056 | 1.35 | % | 2.59 | % | 0.57 | % | (0.67 | %) | N/A | ||||||||||||||||||||||||
| Class B: 2003 | $1.00 | $— | (5) | $— | $— | $— | (5) | $— | $ | — | $— | $1.00 | 0.12 | % | $782 | 1.49 | %(6) | 3.00 | % | 0.18 | % | (1.33 | %)(6) | N/A | |||||||||||||||||||||||
| 9/28/2001 - 3/31/2002 | 1.00 | — | (5) | — | — | — | (5) | — | — | — | 1.00 | 0.09 | % | 88 | 1.85 | % | 3.09 | % | 0.07 | % | (1.17 | %) | N/A | ||||||||||||||||||||||||
| Class C: 2003 | $1.00 | $— | (5) | $— | $— | $— | (5) | $— | $ | — | $— | $1.00 | 0.12 | % | $1,073 | 1.49 | %(6) | 3.00 | % | 0.18 | % | (1.33 | %)(6) | N/A | |||||||||||||||||||||||
| 9/28/2001 - 3/31/2002 | 1.00 | — | (5) | — | — | — | (5) | — | — | — | 1.00 | 0.09 | % | 75 | 1.85 | % | 3.09 | % | 0.07 | % | (1.17 | %) | N/A | ||||||||||||||||||||||||
See Notes to Financial Statements
See explanation of symbols on D-4
D-3
PACIFIC FUNDS
FINANCIAL HIGHLIGHTS (Continued)
Selected per share, ratios and supplemental data for each year or period ended March 31, were as follows:
Investment Activities | Distributions | Ratios/Supplemental Data | |||||||||||||||||||||||||||||||||||||||||
| Net Asset Value, Beginning of Year or Period | Net Asset Investment (Loss) | Net Realized and Unrealized Gain (Loss) on Securities | Total from Investment Operations | Dividends from Net Investment Income | Distributions from Capital Gains | Return of Capita | Total Distri-butions | Net Asset Value, End of Year or Period | Total Returns(1) | Net Assets, End of Year or Period (in thousands) | Ratios of Net Expenses to Average Net Assets (2), (3) | Ratios of Gross Expenses to Average Net Assets(3) | Ratios of Net Investment (Loss) After Expense Reductions to Average Net Assets (3) | Ratios of Net Investment (Loss) Before Expense Reductions to Average Net Assets (2),(3) | Portfolio Turnover Rates | ||||||||||||||||||||||||||||
| PF Putnam Equity Income Fund | |||||||||||||||||||||||||||||||||||||||||||
| Class A: 2003 | $ | 10.45 | $ 0.06 | ($2.51 | ) | ($2.45 | ) | ($0.09 | ) | $— | $— | ($0.09 | ) | $7.91 | (23.59 | %) | $8,812 | 1.90 | % | 4.38 | % | 0.59 | % | (1.89 | %) | 45.60 | % | ||||||||||||||||
| 12/31/2001 - 3/31/2002 (4) | 10.00 | 0.01 | 0.44 | 0.45 | — | — | — | — | 10.45 | 4.50 | % | 10,877 | 1.90 | % | 5.97 | % | 0.20 | % | (3.87 | %) | 10.27 | % | |||||||||||||||||||||
| Class B: 2003 | $ | 10.43 | $ 0.04 | ($2.52 | ) | ($2.48 | ) | ($0.10 | ) | $— | $— | ($0.10 | ) | $7.85 | (23.92 | %) | $265 | 2.40 | % | 4.88 | % | 0.09 | % | (2.39 | %) | 45.60 | % | ||||||||||||||||
| 12/31/2001 - 3/31/2002 (4) | 10.00 | (0.01 | ) | 0.44 | 0.43 | — | — | — | — | 10.43 | 4.30 | % | 13 | 2.40 | % | 6.47 | % | (0.30 | %) | (4.37 | %) | 10.27 | % | ||||||||||||||||||||
| Class C: 2003 | $ | 10.43 | $ 0.03 | ($2.50 | ) | ($2.47 | ) | ($0.10 | ) | $— | $— | ($0.10 | ) | $7.86 | (23.83 | %) | $536 | 2.40 | % | 4.88 | % | 0.09 | % | (2.39 | %) | 45.60 | % | ||||||||||||||||
| 12/31/2001 - 3/31/2002 (4) | 10.00 | (0.01 | ) | 0.44 | 0.43 | — | — | — | — | 10.43 | 4.30 | % | 41 | 2.40 | % | 6.47 | % | (0.30 | %) | (4.37 | %) | 10.27 | % | ||||||||||||||||||||
| PF Putnam Research Fund | |||||||||||||||||||||||||||||||||||||||||||
| Class A: 2003(4) | $ | 9.97 | ($ 0.04 | ) | ($2.58 | ) | ($2.62 | ) | ($0.02 | ) | $— | $— | ($0.02 | ) | $7.33 | (26.30 | %) | $11,035 | 1.95 | % | 3.62 | % | (0.46 | %) | (2.13 | %) | 160.76 | % | |||||||||||||||
| 12/31/2001 - 3/31/2002 | 10.00 | (0.01 | ) | (0.02 | ) | (0.03 | ) | — | — | — | — | 9.97 | (0.30 | %) | 14,968 | 1.95 | % | 5.29 | % | (0.59 | %) | (3.93 | %) | 56.30 | % | ||||||||||||||||||
| Class B: 2003(4) | $ | 9.95 | ($0.08 | ) | ($2.57 | ) | ($2.65 | ) | ($0.01 | ) | $— | $— | ($0.01 | ) | $7.29 | (26.61 | %) | $29 | 2.45 | % | 4.12 | % | (0.96 | %) | (2.63 | %) | 160.76 | % | |||||||||||||||
| 12/31/2001 - 3/31/2002 | 10.00 | (0.03 | ) | (0.02 | ) | (0.05 | ) | — | — | — | — | 9.95 | (0.50 | %) | 10 | 2.45 | % | 5.79 | % | (1.09 | %) | (4.43 | %) | 56.30 | % | ||||||||||||||||||
| Class C: 2003(4) | $ | 9.95 | ($0.07 | ) | ($2.58 | ) | ($2.65 | ) | ($0.02 | ) | $— | $— | ($0.02 | ) | $7.28 | (26.64 | %) | $92 | 2.45 | % | 4.12 | % | (0.96 | %) | (2.63 | %) | 160.76 | % | |||||||||||||||
| 12/31/2001 - 3/31/2002 | 10.00 | (0.03 | ) | (0.02 | ) | (0.05 | ) | — | — | — | — | 9.95 | (0.50 | %) | 10 | 2.45 | % | 5.79 | % | (1.09 | %) | (4.43 | %) | 56.30 | % | ||||||||||||||||||
| PF Salomon Brothers Large-Cap Value Fund | |||||||||||||||||||||||||||||||||||||||||||
| Class A: 2003(4) | $ | 10.92 | $0.04 | ($3.05 | ) | ($3.01 | ) | ($0.02 | ) | ($0.06 | ) | $— | ($0.08 | ) | $7.83 | (27.69 | %) | 11,736 | 1.80 | % | 2.94 | % | 0.41 | % | (0.73 | %) | 49.00 | % | |||||||||||||||
| 9/28/2001 - 3/31/2002 (4) | 10.00 | (0.01 | ) | 0.96 | 0.95 | (0.02 | ) | (0.01 | ) | — | (0.03 | ) | 10.92 | 9.54 | % | 19,748 | 1.80 | % | 3.93 | % | (0.14 | %) | (2.27 | %) | 27.37 | % | |||||||||||||||||
| Class B: 2003(4) | $ | 10.91 | ($0.01 | ) | ($3.03 | ) | ($3.04 | ) | (0.03 | ) | ($0.06 | ) | $— | ($0.09 | ) | $7.78 | (28.02 | %) | $955 | 2.30 | % | 3.44 | % | (0.09 | %) | (1.23 | %) | 49.00 | % | ||||||||||||||
| 9/28/2001 - 3/31/2002 (4) | 10.00 | (0.03 | ) | 0.97 | 0.94 | (0.02 | ) | (0.01 | ) | — | (0.03 | ) | 10.91 | 9.38 | % | 151 | 2.30 | % | 4.43 | % | (0.64 | %) | (2.77 | %) | 27.37 | % | |||||||||||||||||
| Class C: 2003(4) | $ | 10.90 | ($0.01 | ) | ($3.04 | ) | ($3.05 | ) | (0.02 | ) | ($0.06 | ) | $— | ($0.08 | ) | $7.77 | (28.08 | %) | $2,015 | 2.30 | % | 3.44 | % | (0.09 | %) | (1.23 | %) | 49.00 | % | ||||||||||||||
| 9/28/2001 - 3/31/2002 (4) | 10.00 | (0.03 | ) | 0.96 | 0.93 | (0.02 | ) | (0.01 | ) | — | (0.03 | ) | 10.90 | 9.30 | % | 243 | 2.30 | % | 4.43 | % | (0.64 | %) | (2.77 | %) | 27.37 | % | |||||||||||||||||
| (1) | Total returns are not annualized for periods less than one full year. Calculation does not include the effect of any sales charges for Classes A, B and C. |
| (2) | The ratios of net expenses to average daily net assets are after adviser expense reimbursements, if any, as discussed in Note 6 to the Financial Statements. The ratios of net investment income (loss) before expense reductions to average daily net assets are grossed up by the adviser expense reimbursements, if any. |
| (3) | The ratios are annualized for periods of less than one full year. |
| (4) | Per share investment income has been calculated using the monthly average shares method. |
| (5) | Amount represents less than $0.01 per share. |
| (6) | The expense cap for the PF Pacific Life Money Market Fund is 0.05% for the period 7/1/02 - 6/30/03 and 0.45% thereafter through 6/30/05. The effect of the 12b-1 waiver by the Distributor on the ratios of net expenses and net investment income (loss) after expense reductions to average daily net assets for PF Pacific Life Money Market Class B and C were 0.09% and 0.09%, respectively. |
| See Notes to Financial Statements | |
D-4 | |
PACIFIC FUNDS
NOTES TO FINANCIAL STATEMENTS
MARCH 31, 2003
1. ORGANIZATION
Pacific Funds is a Delaware statutory trust, which was formed on May 21, 2001, and is registered under the Investment Company Act of 1940, as amended, as an open-end management investment company, and as of March 31, 2003, is comprised of fifteen separate funds (each individually a “Fund”, and collectively, the “Funds”): PF AIM Blue Chip, PF AIMAggressive Growth, PF INVESCO Health Sciences, PF INVESCO Technology, PF Janus Strategic Value, PF Janus Growth LT, PF Lazard International Value, PF MFS Mid-Cap Growth, PF MFS Global Growth, PF PIMCO Inflation Managed, PF PIMCO Managed Bond, PF Pacific Life Money Market, PF Putnam Equity Income, PF Putnam Research and PF Salomon Brothers Large-Cap Value Funds. Each Fund has three separate classes of shares: Class A, B and C. Each class is distinguished by the level of distribution services provided and is substantially the same except that (i) Class A shares are subject to a maximum 5.50% front-end sales charge, except that for an investment of $1 million or more there is no front-end sales charge; however a 1% contingent deferred sales charge (“CDSC”) is imposed upon the redemption of Class A shares within one year of their purchase if the purchase was part of an investment of $1 million or more (when there was no initial sales charge), (ii) Class B shares are subject to a maximum 5.00% CDSC, and (iii) Class C shares are subject to a maximum 1.00% front-end sales charge, except for shares of the PF Pacific Life Money Market Fund, which are sold at the net asset value (“NAV”) per share without an initial sales charge, and a maximum 1.00% CDSC is imposed upon the sale of Class C shares within one year of their purchase.
All of the Funds except the PF Putnam Equity Income Fund, PF Putnam Research Fund, and PF PIMCO Inflation Managed Fund commenced operations on September 28, 2001. The PF Putnam Equity Income and PF Putnam Research Funds commenced operations on December 31, 2001 and the PF PIMCO Inflation Managed Fund commenced operations on December 31, 2002.
2. SIGNIFICANT ACCOUNTING POLICIES
The financial statements have been prepared in conformity with accounting principles generally accepted in the United States of America (“U.S. GAAP”) for investment companies. These principles require management to make estimates and assumptions that affect the reported amounts and disclosures in the financial statements. Actual results could differ from those estimates. The following is a summary of the significant accounting policies followed by the Funds in the preparation of the financial statements.
A. Fund Valuation
Equity securities are generally valued at the last reported sale price for securities traded on a principal exchange (U.S. or foreign) and on the NASDAQ National Market as reported by a pricing source approved by the Funds’ Board of Trustees (the “Board”). Securities traded on over-the-counter markets and listed securities for which no sales are reported are generally valued at the mean between the most recent bid and asked quotes obtained from a quotation reporting system, from established market makers, brokers or dealers. Fixed income securities are generally valued at prices obtained from pricing services or brokers and dealers. Certain bonds are valued by a benchmarking process approved by the Board. Securities for which market quotations are not readily available, or are deemed to be unreliable or inaccurate, are valued at their fair value as determined in good faith pursuant to procedures established by the Board. If events occur that materially affect NAV (including non-U.S. securities) between the close of trading in those securities affected and the close of regular trading on the New York Stock Exchange (generally 4:00 p.m. Eastern time), the securities may be valued at fair value under procedures approved by the Board. Money market instruments and short-term securities maturing within 60 days are valued at amortized cost, which approximate market value.
B. Securities Transactions and Investment Income
Securities transactions are recorded on a trade date basis. Dividend income is recorded on the ex-dividend date. Interest income is recorded on the accrual basis. Discounts and premiums are recorded on a daily basis using the effective yield method except for short-term securities and PF Pacific Life Money Market Fund, which recognize discounts and premiums on a straight line basis. Realized gains and losses from securities transactions are recorded on the basis of identified cost.
Each class of shares has equal rights as to assets and earnings, except that each class separately bears certain class-specific expenses related to distribution and service (12b-1) fees (included in Note 3). Income, other non-class specific expenses, and realized and unrealized gains and losses on investments are allocated to each class of shares based on its relative net assets.
C. Foreign Currency Translation
Assets and liabilities initially expressed in non-U.S. currencies are translated into U.S. dollars based on the applicable exchange rates at the end of the reporting period. Purchases and sales of securities, income and dividends received, and expenses denominated in foreign currencies are translated into U.S. dollars at the exchange rates in effect on the transaction date.
Net realized foreign exchange gains and losses arise from sales of foreign securities, sales and maturities of short-term securities, sales of foreign currencies, currency gains or losses realized between the trade and settlement dates on securities transactions, the difference between the amounts of dividends, interest, and foreign withholding taxes recorded on each Fund’s books, and the U.S. dollar equivalent of the amounts actually received or paid. Net unrealized foreign exchange gains and losses arise from changes in the value of assets and liabilities, including investments in securities at the period-end, resulting from changes in the exchange rate.
E-1
PACIFIC FUNDS
NOTES TO FINANCIAL STATEMENTS (Continued)
MARCH 31, 2003
D. Expense Allocation
General expenses of the Funds (including legal and audit fees, transfer agency out-of-pocket expenses and fees and expenses of the Independent Trustees) are allocated to each Fund in proportion to its relative average daily net assets. Expenses directly attributable to a particular Fund (including advisory, administration, custody, registration and distribution and service (12b-1) fees) are charged to that Fund.
E. Offering Costs
The Funds bear all costs associated with offering expenses including legal, printing and internal services support. All such costs are amortized to expense on a straight-line basis over twelve months from commencement of operations.
F. Futures Contracts
Certain Funds may use futures contracts to manage their exposure to the stock markets, to fluctuations in interest rates, and foreign currency values. Initial margin deposits are made upon entering into futures contracts and can be either cash or securities. During the period a futures contract is open, changes in the value of the contract are recognized as unrealized gains or losses by “marking-to-market” on a daily basis to reflect the market value of the contract at the end of each day’s trading. Variation margin receivables or payables represent the difference between the unrealized appreciation and depreciation on the open contracts and the cash deposits made on the margin accounts. When the contract is closed, a Fund records a realized gain or loss equal to the difference between the proceeds from the closing transaction and the Fund’s cost of the contract. The primary risks associated with the use of futures contracts are the possibility of illiquid markets or imperfect correlation between the value of the instruments and the underlying securities, or that the counterparty will fail to perform its obligations. Futures contracts are valued at the settlement price established each day by the board of trade or exchange on which they are traded.
G. Options and Options on Futures Contracts
Certain Funds may write options on interest rate futures and purchase put and call options and write secured put and covered call options. When a Fund writes (sells) an option, an amount equal to the premium received is recorded as an asset with an equal liability that is "marked-to-market" based on the option’s quoted daily settlement price. Any fluctuation in the value of such an instrument is recorded as unrealized appreciation or depreciation until terminated, at which time realized gains and losses are recognized. The purposes of using options or options on futures contracts include hedging exposure to rising interest rates while retaining capital gain potential from falling rates and capitalizing on anticipated changes in market volatility or to earn additional income. These options may relate to particular securities, stock indexes, options on swaps, or foreign currencies. These investments involve, to varying degrees, elements of market risk and risks in excess of the amount recognized in the Statements of Assets and Liabilities. Risks may include an imperfect correlation between the changes in the market values of the securities held by a Fund and the prices of options or options on future contracts, an illiquid secondary market for the instruments, or the inability of a counterparty to perform.
H. Forward Foreign Currency Contracts
Certain Funds may enter into forward foreign currency contracts (“forward contracts”) for the purpose of hedging against foreign exchange risk arising from a Fund’s investment in foreign securities. These contracts are “marked-to-market” daily at the applicable translation rates and any result of unrealized appreciation or depreciation is recorded in a Fund’s financial statements. A Fund records realized gains or losses at the time the forward contract is closed. A forward contract is extinguished through a closing transaction or upon delivery of the currency or entering an offsetting contract. Risks may arise upon entering these contracts from the potential inability of a counterparty to meet the terms of their contracts and from unanticipated movements in the value of a foreign currency relative to the U.S. dollar or other currencies.
I. Swaps
Certain Funds may enter into interest rate, total return, and currency exchange swap agreements in order to obtain a desired return at a lower cost than if a Fund had invested directly in the asset that yielded the desired return. Swaps involve commitments to exchange components of income (generally interest or returns) pegged to the underlying assets based on a notional principal amount. Swaps are “marked-to-market” daily based upon quotations from market makers and the change, if any, is recorded as unrealized gains or losses in a Fund. A Fund bears the risk of loss of the amount expected to be received under a swap agreement in the event of the default or bankruptcy of a counterparty.
J. Inflation-Indexed Bonds
Inflation-Indexed bonds are fixed income securities whose principal value is periodically adjusted to the rate of inflation. The interest rate on these bonds is generally fixed at issuance at a rate lower than typical bonds. Over the life of an inflation-indexed bond, however, interest will be paid based on a principal value, which is adjusted for inflation. Any increase or decrease in the principal amount of an inflation-indexed bond will result in an adjustment of interest income, even though investors do not receive their principal until maturity.
K. Stripped Mortgage-Backed Securities
Stripped Mortgage-Backed Securities (“SMBS”) represent a participation in, or are secured by and payable from, mortgage loans on real property, and may be structured in classes with rights to receive varying proportions of principal and interest. SMBS include interest-only securities (“IOs” ), which receive all of the interest, and principal-only securities (“POs“), which receive the entire principal. If the underlying mortgage assets experience
E-2
PACIFIC FUNDS
NOTES TO FINANCIAL STATEMENTS (Continued)
MARCH 31, 2003
greater than anticipated prepayments of principal, a Fund may fail to recoup some or all of its initial investment in these securities. The market value of these securities is highly sensitive to changes in interest rates.
L. When-Issued Securities and Delayed-Delivery Transactions
Certain Funds may purchase or sell securities on a when-issued or delayed-delivery basis. Payment and delivery may take place after the customary settlement period for that security. The price or yield of the underlying securities is fixed at the time the transaction is negotiated. The market values of the securities purchased on a when-issued or delayed-delivery basis are identified as such in each applicable Fund’s Schedule of Investments. When delayed-delivery purchases are outstanding, a Fund will set aside and maintain until the settlement date in a segregated account, liquid assets in an amount sufficient to meet the purchase price. When purchasing a security on a delayed-delivery basis, a Fund assumes the rights and risks of ownership of the security, including the risk of price and yield fluctuations, and takes such fluctuations into account when determining its NAV. A Fund may dispose of or renegotiate a delayed-delivery transaction after it is entered into, and may sell when-issued securities before they are delivered, which may result in a capital gain or loss. When a Fund has sold a security on a delayed-delivery basis, it does not participate in future gains and losses with respect to the security. Risks may arise upon entering these contracts from the potential inability of a counterparty to meet the terms of their contracts, or if the issuer does not issue the securities due to political, economic, or other factors.
M. Short Sales
Certain Funds may enter into short sales. A short sale is a transaction in which a Fund sells securities it does not own in anticipation of a decline in the market price of the securities. A Fund is obligated to deliver securities at the market price at the time the short position is closed. Possible losses from short sales may be unlimited, whereas losses from purchases cannot exceed the total amount invested.
N. Repurchase Agreements
Certain Funds may invest in repurchase agreements. Repurchase agreements permit the investor to maintain liquidity and earn income over periods of time as short as overnight. Repurchase agreements held by a Fund are fully collateralized by U.S. Government securities and such collateral is in the possession of the Funds’ custodian or a designated broker-dealer. The collateral is evaluated daily to ensure its market value equals or exceeds the current market value of the repurchase agreements including accrued interest. In the event of default on the obligation to repurchase, a Fund has the right to liquidate the collateral and apply the proceeds in satisfaction of the obligation.
O. Investment Risk
Fixed income securities are affected primarily by the financial condition of the companies that have issued them, and by changes in interest rates.
There are certain additional risks involved in investing in foreign securities that are not inherent in investments in domestic securities. These risks may involve adverse political and economic developments and the possible imposition of currency exchange blockages or other foreign governmental laws or restrictions. In addition, the securities of some foreign companies and securities markets are less liquid and at times more volatile than securities of comparable U.S. companies and U.S. securities markets.
3. INVESTMENT ADVISORY, ADMINISTRATION AND SHAREHOLDER SERVICES, AND DISTRIBUTION AGREEMENTS
Pursuant to an Investment Advisory Agreement, Pacific Life Insurance Company (“Pacific Life”) serves as Investment Adviser to the Funds, and receives from the Funds the following advisory fee rates based on an annual percentage of the average daily net assets of each Fund and the fees are accrued daily by the Funds:
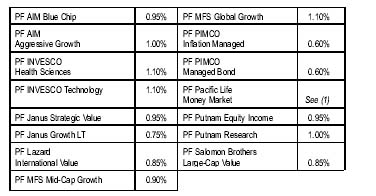
(1) An annual rate of 0.40% of the first $250 million of the average daily net assets, 0.35% of the next $250 million, and 0.30% in excess of $500 million.
Pursuant to Fund Management Agreements, the Funds and Pacific Life engage managers, under Pacific Life’s supervision, for fourteen of the fifteen Funds. The following firms serve as sub-advisors for their respective Funds: AIM Capital Management, Inc INVESCO Funds Group, Inc., Janus Capital Management LLC, Lazard Asset Management, MFS Investment Management, Pacific Investment Management Company LLC, Putnam Investment Management, LLC, and Salomon Brothers Asset Management Inc Pacific Life pays each sub-adviser a fee as compensation for advisory services provided to each of their Funds.
Pursuant to the Administration and Shareholder Services Agreement, Pacific Life serves as Administrator (the “Administrator”) to the Funds. Under the Agreement, the Funds compensate the Administrator at an annual rate of 0.35% of average daily net assets for procuring the administrative, transfer agency and shareholder services. In addition, the Funds compensate the Administrator for support services based on an internal billing rate at cost for the time spent by the legal, accounting, tax and compliance personnel for providing assistance, coordination and supervision to the Funds.
Pacific Select Distributors, Inc. (the “Distributor”), a wholly-owned subsidiary of Pacific Life, serves as distributor of the
E-3
PACIFIC FUNDS
NOTES TO FINANCIAL STATEMENTS (Continued)
MARCH 31, 2003
Funds’ shares. Under the distribution and service (12b-1) plans, each Fund pays to the Distributor fees at annual rates expressed as a percentage of average daily net assets. Each Fund pays a distribution fee as compensation for services rendered and expenses borne by the Distributor in connection with the distribution of shares of the Funds (at an annual rate of 0.25% of average daily net assets for Class A shares and 0.75% for Class B and C shares). Additionally, each Fund pays a servicing fee as compensation in connection with services rendered to shareholders of the Funds and/or maintenance of shareholder accounts (at an annual rate of 0.25% of average daily net assets for Class A, B and C shares). The fees are accrued daily.
The Funds have incurred $1,214,124 of investment advisory fees, $530,996 of administration fees and $317,909 of support services expenses, payable to Pacific Life, for the year ended March 31, 2003. At March 31, 2003, $96,819 $42,090, and $73,070, respectively, remained payable. For the year ended March 31, 2003, the Funds also incurred $805,819 of distribution expenses payable to Pacific Select Distributors, Inc. under the distribution and service (12b-1) plans. At March 31, 2003, $68,314 remained payable.
For the year ended March 31, 2003, the Distributor, acting as underwriter, received net commissions of $545,694 from the sale of Class A and Class C shares. In addition, the Distributor received $5,682 in CDSC from redemptions of Class B and Class C shares for the year ended March 31, 2003.
4. TRUSTEE DEFERRED COMPENSATION PLAN
Each Independent Trustee is eligible to participate in the Deferred Compensation Plan (the “Plan”). The Plan allows each Independent Trustee to voluntarily defer receipt of all or a percentage of fees which otherwise would be payable for services performed. Amounts in the deferral account are obligations of the Fund that are payable in accordance with the agreement. A trustee who defers compensation has the option to select credit rate options that tracks the performance of the Class A shares of the corresponding series of the Pacific Funds without a sales load. Accordingly, the market value appreciation/ depreciation of the Trustee’s deferred compensation accounts will cause the expenses of each Fund to increase or decrease due to the market fluctuation.
5. DISTRIBUTIONS TO SHAREHOLDERS
The Funds intend to declare and pay dividends on net investment income at least annually, except for the PF PIMCO Inflation Managed Fund, the PF PIMCO Managed Bond Fund, and the PF Pacific Life Money Market Fund. Dividends are generally declared and paid monthly for the PF PIMCO Inflation Managed Fund and the PF PIMCO Managed Bond Fund and are generally declared daily and paid monthly for the PF Pacific Life Money Market Fund. Dividends may be declared less frequently if it is advantageous to the Funds, but in no event less frequently than annually. All realized capital gains are distributed at least annually for all Funds.
Dividends on net investment income and capital gain distributions are determined in accordance with income tax regulations, which may differ from U.S. GAAP. These differences are primarily due to differing treatments for futures and options, foreign currency transactions, post-October losses, passive foreign investment companies (“PFIC”), capital loss carryforwards, and losses deferred due to wash sales. Permanent book and tax differences relating to shareholder distributions will result in reclassifications of paid-in capital. Dividends and distributions paid to shareholders are recorded on the ex-dividend date.
The tax character of distributions paid during the year ended March 31, 2003 was as follows:
| Distributions paid from | |||||||||
| Ordinary Income | Long-Term Capital Gain | Return of Capital | |||||||
| Funds | |||||||||
| PF Janus Strategic Value | $ | 50,580 | $ | — | $ | — | |||
| PF Lazard International | |||||||||
| Value | 82,662 | — | — | ||||||
| PF MFS Mid-Cap Growth | 873,540 | — | — | ||||||
| PF MFS Global Growth | 125,020 | — | — | ||||||
| PF PIMCO Inflation Managed | 31,181 | — | — | ||||||
| PF PIMCO Managed Bond | 1,575,720 | 648,128 | — | ||||||
| PF Pacific Life Money | |||||||||
| Market | 117,708 | — | — | ||||||
| PF Putnam Equity Income | 94,304 | — | — | ||||||
| PF Putnam Research | 31,466 | — | — | ||||||
| PF Salomon Brothers | |||||||||
| Large-Cap Value | 142,777 | — | — | ||||||
The tax character of distributions paid during the six-month period ended March 31, 2002 was as follows:
| Distributions paid from | |||||||||
| Ordinary Income | Long-Term Capital Gain | Return of Capital | |||||||
| Funds | |||||||||
| PF AIM Blue Chip | $ | 38,214 | $ | — | $ | — | |||
| PF AIM Aggressive Growth | 45,083 | — | — | ||||||
| PF INVESCO Health | |||||||||
| Sciences | — | — | 9,605 | ||||||
| PF Janus Strategic Value | 32,180 | — | — | ||||||
| PF Janus Growth LT | 28,413 | — | — | ||||||
| PF Lazard International | |||||||||
| Value | 20,049 | — | — | ||||||
| PF MFS Mid-Cap Growth | 105,168 | — | — | ||||||
| PF MFS Global Growth | 12,763 | — | — | ||||||
| PF PIMCO Managed Bond | 226,553 | — | — | ||||||
| PF Pacific Life Money | |||||||||
| Market | 63,863 | — | — | ||||||
| PF Salomon Brothers | |||||||||
| Large-Cap Value | 45,602 | — | — | ||||||
E-4
PACIFIC FUNDS
NOTES TO FINANCIAL STATEMENTS (Continued)
MARCH 31, 2003
As of March 31, 2003, the components of distributable earnings on a tax basis were as follows:
| Accumulated | Undistributed | Unrealized | ||||||
| Capital and | Ordinary | Appreciation | ||||||
| Funds | Other Losses | Income | (Depreciation) | |||||
| PF AIM Blue Chip | ($923,553) | $— | ($1,509,557) | |||||
| PF AIM Aggressive Growth | (921,178) | — | (17,988) | |||||
| PF INVESCO Health | ||||||||
| Sciences | (1,806,924) | — | 314,382 | |||||
| PF INVESCO Technology | (1,649,234) | — | (374,387) | |||||
| PF Janus Strategic Value | (574,125) | — | (885,559) | |||||
| PF Janus Growth LT | (1,936,534) | — | (487,288) | |||||
| PF Lazard International | ||||||||
| Value | (382,792) | 32,940 | (956,016) | |||||
| PF MFS Mid-Cap Growth | (4,655,744) | — | (244,604) | |||||
| PF MFS Global Growth | (690,163) | — | (402,815) | |||||
| PF PIMCO Inflation | ||||||||
| Managed | — | 88,734 | 66,776 | |||||
| PF PIMCO Managed Bond | — | 201,885 | 226,443 | |||||
| PF Pacific Life Money | ||||||||
| Market | (50) | 55,040 | — | |||||
| PF Putnam Equity Income | (717,750) | 18,430 | (1,545,711) | |||||
| PF Putnam Research | (2,123,101) | — | (1,790,145) | |||||
| PF Salomon Brothers | ||||||||
| Large-Cap Value | (1,223,358) | 23,697 | (3,554,376) | |||||
There were no funds that had undistributed long-term capital gains at March 31, 2003. The components of the accumulated capital and other losses as of March 31, 2003 are summarized in Note 8.
6. EXPENSE REDUCTIONS
Pacific Life has contractually agreed to waive all or part of its investment advisory fees, administration fees or otherwise reimburse each Fund for operating expenses (including organizational expenses, but, not including investment advisory fees, distribution and service (12b-1) fees, foreign taxes on dividends, interest or gains, interest, taxes, brokerage commissions and other transactional expenses and extraordinary expenses such as litigation and other expenses not incurred in the ordinary course of each Fund’s business) that exceed an annual rate of 0.45% of it’s average daily net assets for all Funds through June 30, 2005, except for the PF Pacific Life Money Market Fund. The expense cap for the PF Pacific Life Money Market Fund has been reduced to 0.05% for the period July 1, 2002 through June 30, 2004 and 0.45% thereafter through June 30, 2005. Such waiver or reimbursement is subject to repayment to Pacific Life, for a period of time as permitted under regulatory and/or accounting standards (currently 3 years), to the extent such expenses fall below the expense cap. Any amounts repaid to Pacific Life will have the effect of increasing such expenses of the Funds, but not above the expense cap. There is no guarantee that Pacific Life will continue to cap the expenses after June 30, 2005. The Distributor has also agreed to waive part of the 12b-1 fees. The total amount waived by the Distributor for PF Pacific Life Money Market Fund for the year ended March 31, 2003 was $732.
The cumulative reimbursement amounts at March 31, 2003 that is subject to repayment for each fund is as follows:
| Funds | Amounts | |
| PF AIM Blue Chip | $384,382 | |
| PF AIM Aggressive Growth | 302,004 | |
| PF INVESCO Health Sciences | 230,242 | |
| PF INVESCO Technology | 237,765 | |
| PF Janus Strategic Value | 302,527 | |
| PF Janus Growth LT | 382,540 | |
| PF Lazard International Value | 355,435 | |
| PF MFS Mid-Cap Growth | 357,553 | |
| PF MFS Global Growth | 622,634 | |
| PF PIMCO Inflation Managed | 35,513 | |
| PF PIMCO Managed Bond | 500,604 | |
| PF Pacific Life Money Market | 431,333 | |
| PF Putnam Equity Income | 343,535 | |
| PF Putnam Research | 323,644 | |
| PF Salomon Brothers Large-Cap Value | 353,371 |
The adviser’s expense reimbursement is presented in the accompanying Statements of Operations.
7. PURCHASES AND SALES OF SECURITIES
Purchases and sales of securities (excluding short-term investments and the PF Pacific Life Money Market Fund since it trades exclusively in short-term debt securities) for the year ended March 31, 2003 are summarized in the following tables:
| U.S. Government Securities | ||||||
| Funds | Purchases | Sales | ||||
| PF PIMCO Inflation Managed | $ | 14,201,386 | $ | 9,373,405 | ||
| PF PIMCO Managed Bond | 105,194,491 | 105,422,026 | ||||
| Other Securities | ||||||
| Funds | Purchases | Sales | ||||
| PF AIM Blue Chip | $ | 5,327,290 | $ | 3,174,055 | ||
| PF AIM Aggressive Growth | 4,067,063 | 4,421,112 | ||||
| PF INVESCO Health Sciences | 8,682,014 | 9,290,590 | ||||
| PF INVESCO Technology | 4,329,480 | 4,736,986 | ||||
| PF Janus Strategic Value | 2,539,676 | 3,708,497 | ||||
| PF Janus Growth LT | 9,029,431 | 8,807,370 | ||||
| PF Lazard International Value | 5,286,364 | 1,538,669 | ||||
| PF MFS Mid-Cap Growth | 13,493,696 | 11,913,617 | ||||
| PF MFS Global Growth | 7,249,797 | 7,656,450 | ||||
| PF PIMCO Inflation Managed | 396,187 | — | ||||
| PF PIMCO Managed Bond | 7,613,767 | 5,046,753 | ||||
| PF Putnam Equity Income | 5,255,805 | 4,343,705 | ||||
| PF Putnam Research | 20,105,951 | 19,558,472 | ||||
| PF Salomon Brothers | ||||||
| Large-Cap Value | 9,082,709 | 7,804,418 | ||||
E-5
PACIFIC FUNDS
NOTES TO FINANCIAL STATEMENTS (Continued)
MARCH 31, 2003
8. FEDERAL INCOME TAX
Each Fund declared and paid sufficient dividends on net investment income and capital gains distributions during the fiscal year ended March 31, 2003 to qualify as a regulated investment company and is not required to pay Federal income tax under Regulation M of the Internal Revenue Code. Each Fund intends to continue to qualify as a regulated investment company and distribute substantially all its taxable income and capital gains to its shareholders. Accordingly, no provision for Federal income taxes is required in the financial statements. Required distributions are based on net investment income and net realized gains determined on a tax basis and may differ from such amounts for financial reporting purposes. In addition, the year in which amounts are distributed may differ from the year in which the net investment income is earned and the net gains are realized by each Fund.
Net capital loss carryovers and post-October capital losses, if any, at March 31, 2003, are available to offset future realized capital gains and thereby reduce future capital gains distributions. Post-October foreign currency losses, if any, will offset future net investment income and thereby reduce future ordinary income distributions. The estimated net capital loss carryovers, the post-October capital losses and foreign currency losses deferred, the composition of unrealized appreciation and depreciation of investment securities, the accumulated capital and other losses and the aggregate cost of investments for Federal income tax purposes as of March 31, 2003, were as follows:
| Post-October Foreign Currency Loss Deferral | ||||||||||||||||||||||
| Net Capital Loss Carryover | Post-October Capital Loss Deferral | Accumulated Capital and Other Losses | Total Cost on Tax Basis | Gross Unrealized Appreciation | Gross Unrealized Depreciation | Net Unrealized Appreciation/ (Depreciation) | ||||||||||||||||
| Funds | Expiration | |||||||||||||||||||||
| PF AIM Blue Chip | ($739,723) | 2011 | ($183,830) | $ —- | ($923,553) | $11,625,754 | $192,344 | ($1,701,901) | ($1,509,557) | |||||||||||||
| PF AIM Aggressive Growth | (840,112) | 2011 | (81,066) | —- | (921,178) | 5,182,297 | 346,968 | (364,956) | (17,988) | |||||||||||||
| PF INVESCO Health Sciences | (1,444,769) | 2011 | (362,155) | —- | (1,806,924) | 5,484,961 | 560,603 | (246,276) | 314,327 | |||||||||||||
| PF INVESCO Technology | (1,210,742) | 2010-2011 | (438,492) | —- | (1,649,234) | 4,286,912 | 231,892 | (606,279) | (374,387) | |||||||||||||
| PF Janus Strategic Value | (495,603) | 2011 | (78,522) | —- | (574,125) | 6,546,380 | 400,752 | (1,286,338) | (885,586) | |||||||||||||
| PF Janus Growth LT | (1,657,020) | 2010-2011 | (263,582) | (15,932) | (1,936,534) | 8,193,707 | 328,395 | (815,644) | (487,249) | |||||||||||||
| PF Lazard International Value | (335,022) | 2011 | (45,730) | (2,040) | (382,792) | 10,447,853 | 107,090 | (1,064,943) | (957,853) | |||||||||||||
| PF MFS Mid-Cap Growth | (4,216,302) | 2011 | (439,442) | —- | (4,655,744) | 8,141,423 | 183,219 | (427,823) | (244,604) | |||||||||||||
| PF MFS Global Growth | (381,584) | 2011 | (307,373) | (1,206) | (690,163) | 4,931,844 | 131,236 | (534,134) | (402,898) | |||||||||||||
| PF PIMCO Inflation Managed | —- | —- | —- | —- | —- | 7,840,047 | 79,543 | (12,767) | 66,776 | |||||||||||||
| PF PIMCO Managed Bond | —- | —- | —- | —- | —- | 25,898,225 | 355,090 | (161,267) | 193,823 | |||||||||||||
| PF Pacific Life Money Market | (37) | 2011 | (13) | —- | (50) | 14,881,838 | —- | —- | —- | |||||||||||||
| PF Putnam Equity Income | (327,599) | 2011 | (390,151) | —- | (717,750) | 11,010,504 | 143,794 | (1,689,505) | (1,545,711) | |||||||||||||
| PF Putnam Research | (1,040,026) | 2011 | (1,052,939) | (30,136) | (2,123,101) | 12,948,377 | 190,829 | (1,980,970) | (1,790,141) | |||||||||||||
| PF Salomon Brothers Large-Cap Value | (498,187) | 2011 | (725,171) | —- | (1,223,358) | 18,212,399 | 266,042 | (3,820,418) | (3,554,376) | |||||||||||||
E-6
PACIFIC FUNDS
NOTES TO FINANCIAL STATEMENTS (Continued)
MARCH 31, 2003
9. RECLASSIFICATION OF ACCOUNTS
During the year ended March 31, 2003, reclassifications have been made in each Fund’s capital accounts to report these balances on a tax basis, excluding certain temporary differences, as of March 31, 2003. Additional adjustments may be needed in subsequent reporting periods. These reclassifications, which have no impact on the NAV of the Funds, are primarily attributable to the reclassification of foreign currency transactions, non-deductible expenses, treatment of net operating losses, and certain differences in the computation of distributable income and capital gains under Federal tax rules versus U.S. GAAP. The calculation of net investment income per share in the financial highlights excludes these adjustments.
| Accumulated | ||||||||||
| Undistributed | Net | |||||||||
| Paid-In | Net Investment | Realized | ||||||||
| Funds | Capital | Income (Loss) | Gain (Loss) | |||||||
| PF AIM Blue Chip | ($63,756) | $ | 63,756 | $ | — | |||||
| PF AIM Aggressive Growth | (96,229) | 96,229 | — | |||||||
| PF INVESCO Health Sciences | (88,363) | 88,363 | — | |||||||
| PF INVESCO Technology | (110,754) | 110,754 | — | |||||||
| PF Janus Strategic Value | (68,902) | 69,087 | (185) | |||||||
| PF Janus Growth LT | (72,870) | 61,465 | 11,405 | |||||||
| PF Lazard International Value | _ | (5,171) | 5,171 | |||||||
| PF MFS Mid-Cap Growth | (109,046) | 109,046 | — | |||||||
| PF MFS Global Growth | (20,744) | 19,368 | 1,376 | |||||||
| PF PIMCO Inflation Managed | (7,609) | 7,609 | — | |||||||
| PF PIMCO Managed Bond | — | 547,543 | (547,543) | |||||||
| PF Pacific Life Money Market | (1,925) | 1,925 | — | |||||||
| PF Putnam Equity Income | — | (803) | 803 | |||||||
| PF Putnam Research | (56,843) | 27,537 | 29,306 | |||||||
| PF Salomon Brothers | ||||||||||
| Large-Cap Value | — | 7 | (7) | |||||||
10. SHARES OF BENEFICIAL INTEREST
Transactions in shares of each Fund for the year ended March 31, 2003 and for the period ended March 31, 2002 were as follows:
| PF AIM Blue Chip Fund(1) | PF AIM Aggressive Growth Fund(1) | PF INVESCO Health Sciences Fund(1) | PF INVESCO Technology Fund(1) | |||||||||||||
| Year Ended | Period Ended | Year Ended | Period Ended | Year Ended | Period Ended | Year Ended | Period Ended | |||||||||
| 3/31/03 | 3/31/02 | 3/31/03 | 3/31/02 | 3/31/03 | 3/31/02 | 3/31/03 | 3/31/02 | |||||||||
| Class A | ||||||||||||||||
| Beginning Balances | 991,619 | — | 658,211 | — | 794,141 | — | 625,516 | — | ||||||||
| Shares sold | 222,273 | 1,034,665 | 20,830 | 675,918 | 91,480 | 816,411 | 4,005 | 650,129 | ||||||||
| Distributions reinvested | — | 3,457 | — | 4,090 | — | 916 | — | — | ||||||||
| Shares redeemed | (229,977) | (46,503) | (93,642) | (21,797) | (194,215) | (23,186) | (64,972) | (24,613) | ||||||||
| Ending Balances | 983,915 | 991,619 | 585,399 | 658,211 | 691,406 | 794,141 | 564,549 | 625,516 | ||||||||
| Class B | ||||||||||||||||
| Beginning Balances | 3,971 | — | 1,006 | — | 3,721 | — | 3,812 | — | ||||||||
| Shares sold | 95,912 | 4,048 | 6,620 | 1,832 | 11,001 | 15,346 | 3,413 | 3,812 | ||||||||
| Distributions reinvested | — | 5 | — | 6 | — | 2 | — | — | ||||||||
| Shares redeemed | (5,083) | (82) | (273) | (832) | (1,341) | (11,627) | (2,102) | — | ||||||||
| Ending Balances | 94,800 | 3,971 | 7,353 | 1,006 | 13,381 | 3,721 | 5,123 | 3,812 | ||||||||
| Class C | ||||||||||||||||
| Beginning Balances | 14,112 | — | 2,168 | — | 3,715 | — | 1,040 | — | ||||||||
| Shares sold | 174,163 | 15,044 | 12,247 | 2,160 | 11,254 | 3,933 | 10,478 | 1,040 | ||||||||
| Distributions reinvested | — | 12 | — | 8 | — | 2 | — | — | ||||||||
| Shares redeemed | (4,594) | (944) | (920) | — | (546) | (220) | (88) | — | ||||||||
| Ending Balances | 183,681 | 14,112 | 13,495 | 2,168 | 14,423 | 3,715 | 11,430 | 1,040 | ||||||||
(1) Operations commenced on September 28, 2001.
E-7
PACIFIC FUNDS
NOTES TO FINANCIAL STATEMENTS (Continued)
MARCH 31, 2003
| PF Janus Strategic Value Fund (1) | PF Janus Growth LT Fund (1) | PF Lazard International Value Fund (1) | PF MFS Mid-Cap Growth Fund (1) | |||||||||||||
| Year Ended | Period Ended | Year Ended | Period Ended | Year Ended | Period Ended | Year Ended | Period Ended | |||||||||
| 3/31/03 | 3/31/02 | 3/31/03 | 3/31/02 | 3/31/03 | 3/31/02 | 3/31/03 | 3/31/02 | |||||||||
| Class A | ||||||||||||||||
| Beginning Balances | 786,021 | — | 951,073 | — | 704,668 | — | 1,018,038 | — | ||||||||
| Shares sold | 48,543 | 814,050 | 102,538 | 974,177 | 729,553 | 722,362 | 261,651 | 1,087,421 | ||||||||
| Distributions reinvested | 4,947 | 2,972 | — | 2,541 | 7,015 | 1,861 | 121,267 | 9,521 | ||||||||
| Shares redeemed | (186,514) | (31,001) | (157,527) | (25,645) | (614,613) | (19,555) | (354,844) | (78,904) | ||||||||
| Ending Balances | 652,997 | 786,021 | 896,084 | 951,073 | 826,623 | 704,668 | 1,046,112 | 1,018,038 | ||||||||
| Class B | ||||||||||||||||
| Beginning Balances | 9,208 | — | 5,550 | — | 2,327 | — | 7,378 | — | ||||||||
| Shares sold | 17,823 | 9,202 | 35,152 | 5,545 | 91,248 | 2,355 | 93,422 | 7,362 | ||||||||
| Distributions reinvested | 39 | 6 | — | 6 | 233 | 1 | 1,081 | 16 | ||||||||
| Shares redeemed | (2,288) | — | (961) | (1) | (4,715) | (29) | (2,323) | — | ||||||||
| Ending Balances | 24,782 | 9,208 | 39,741 | 5,550 | 89,093 | 2,327 | 99,558 | 7,378 | ||||||||
| Class C | ||||||||||||||||
| Beginning Balances | 1,846 | — | 8,107 | — | 12,922 | — | 10,382 | — | ||||||||
| Shares sold | 10,745 | 1,840 | 77,927 | 8,452 | 186,266 | 14,039 | 187,003 | 11,074 | ||||||||
| Distributions reinvested | 64 | 6 | — | 7 | 643 | 3 | 3,296 | 20 | ||||||||
| Shares redeemed | (3,469) | — | (3,657) | (352) | (8,607) | (1,120) | (6,536) | (712) | ||||||||
| Ending Balances | 9,186 | 1,846 | 82,377 | 8,107 | 191,224 | 12,922 | 194,145 | 10,382 | ||||||||
| PF PIMCO Inflation Managed Fund (2) | ||||||||||||||
| PF MFS Global Growth Fund (1) | PF PIMCO Managed Bond Fund (1) | PF Pacific Life Money Market Fund (1) | ||||||||||||
| Year Ended | Period Ended | Period Ended | Year Ended | Period Ended | Year Ended | Period Ended | ||||||||
| 3/31/03 | 3/31/02 | 3/31/03 | 3/31/03 | 3/31/02 | 3/31/03 | 3/31/02 | ||||||||
| Class A | ||||||||||||||
| Beginning Balances | 617,508 | — | — | 3,357,105 | — | 27,053,979 | — | |||||||
| Shares sold | 494,408 | 618,042 | 631,493 | 1,205,919 | 3,817,401 | 7,721,450 | 38,214,595 | |||||||
| Distributions reinvested | 11,595 | 1,144 | 2,854 | 150,859 | 17,992 | 109,308 | 60,436 | |||||||
| Shares redeemed | (573,962) | (1,678) | (22,612) | (2,918,652) | (478,288) | (21,795,052) | (11,221,052) | |||||||
| Ending Balances | 549,549 | 617,508 | 611,735 | 1,795,231 | 3,357,105 | 13,089,685 | 27,053,979 | |||||||
| Class B | ||||||||||||||
| Beginning Balances | 2,043 | — | — | 17,592 | — | 87,858 | — | |||||||
| Shares sold | 5,014 | 2,042 | 15,622 | 180,739 | 17,779 | 821,580 | 125,511 | |||||||
| Distributions reinvested | 43 | 1 | 46 | 9,191 | 41 | 247 | 10 | |||||||
| Shares redeemed | (27) | — | — | (11,710) | (228) | (127,876) | (37,663) | |||||||
| Ending Balances | 7,073 | 2,043 | 15,668 | 195,812 | 17,592 | 781,809 | 87,858 | |||||||
| Class C | ||||||||||||||
| Beginning Balances | 1,001 | — | — | 37,632 | — | 74,661 | — | |||||||
| Shares sold | 8,802 | 1,000 | 49,393 | 412,387 | 39,300 | 1,497,246 | 487,642 | |||||||
| Distributions reinvested | 22 | 1 | 127 | 25,244 | 79 | 435 | 12 | |||||||
| Shares redeemed | (133) | — | (2,747) | (24,429) | (1,747) | (499,191) | (412,993) | |||||||
| Ending Balances | 9,692 | 1,001 | 46,773 | 450,834 | 37,632 | 1,073,151 | 74,661 | |||||||
| (1) | Operations commenced on September 28, 2001. |
| (2) | Operations commenced on December 31, 2002. |
E-8
PACIFIC FUNDS
NOTES TO FINANCIAL STATEMENTS (Continued)
MARCH 31, 2003
| PF Putnam Equity Income Fund (1) | PF Putnam Research Fund (1) | PF Salomon Brothers Large-Cap Value Fund (2) | ||||||||||
| Year Ended | Period Ended | Year Ended | Period Ended | Year Ended | Period Ended | |||||||
| 3/31/03 | 3/31/02 | 3/31/03 | 3/31/02 | 3/31/03 | 3/31/02 | |||||||
| Class A | ||||||||||||
| Beginning Balances | 1,041,437 | — | 1,501,874 | — | 1,807,799 | — | ||||||
| Shares sold | 86,086 | 1,041,852 | 6,409 | 1,501,891 | 357,374 | 1,905,188 | ||||||
| Distributions reinvested | 9,997 | — | 3,685 | — | 14,406 | 4,206 | ||||||
| Shares redeemed | (23,322) | (415) | (6,491) | (17) | (680,195) | (101,595) | ||||||
| Ending Balances | 1,114,198 | 1,041,437 | 1,505,477 | 1,501,874 | 1,499,384 | 1,807,799 | ||||||
| Class B | ||||||||||||
| Beginning Balances | 1,255 | — | 1,001 | — | 13,840 | — | ||||||
| Shares sold | 33,524 | 1,255 | 4,860 | 1,001 | 114,122 | 13,884 | ||||||
| Distributions reinvested | 113 | — | 2 | — | 256 | 7 | ||||||
| Shares redeemed | (1,176) | — | (1,913) | — | (5,459) | (51) | ||||||
| Ending Balances | 33,716 | 1,255 | 3,950 | 1,001 | 122,759 | 13,840 | ||||||
| Class C | ||||||||||||
| Beginning Balances | 3,885 | — | 1,001 | — | 22,297 | — | ||||||
| Shares sold | 66,711 | 4,288 | 11,678 | 1,001 | 244,853 | 23,307 | ||||||
| Distributions reinvested | 298 | — | 6 | — | 864 | 14 | ||||||
| Shares redeemed | (2,694) | (403) | (5) | — | (8,680) | (1,024) | ||||||
| Ending Balances | 68,200 | 3,885 | 12,680 | 1,001 | 259,334 | 22,297 | ||||||
| (1) | Operations commenced on December 31, 2001. |
| (2) | Operations commenced on September 28, 2001. |
At March 31, 2003, Pacific Asset Management LLC, a wholly-owned subsidiary of Pacific Life, owned the following percentage of shares outstanding of each of the Funds:
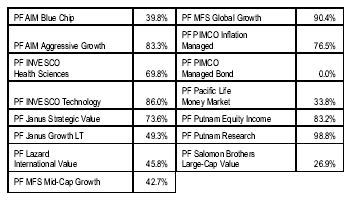
11. TAX INFORMATION (UNAUDITED)
For corporate shareholders, the percentage of investment income (dividend income plus short-term gains, if any) that qualifies for the dividends-received deductions is as follows:
| Funds | Percentage | |
| PF Janus Strategic Value | 60.10% | |
| PF MFS Mid-Cap Growth | 6.20% | |
| PF MFS Global Growth | 46.20% | |
| PF Putnam Equity Income | 44.17% | |
| PF Salomon Brothers Large-Cap Value | 100.00% |
The PF PIMCO Managed Bond Fund designated $648,128 as long-term capital gain dividend during the fiscal year ended March 31, 2003.
E-9
[THIS PAGE INTENTIONALLY LEFT BLANK]
INDEPENDENT AUDITORS’ REPORT
To The Board of Trustees and Shareholders of Pacific Funds
We have audited the accompanying statements of assets and liabilities, including the schedules of investments, of Pacific Funds comprising the PF AIM Blue Chip Fund, PF AIM
Aggressive Growth Fund, PF INVESCO Health Sciences Fund, PF INVESCO Technology Fund, PF Janus Strategic Value Fund, PF Janus Growth LT Fund, PF Lazard International Value Fund, PF MFS Mid-Cap Growth Fund, PF MFS Global Growth Fund, PF PIMCO Inflation Managed Fund, PF PIMCO Managed Bond Fund, PF Pacific Life Money Market Fund, PF Putnam Equity Income Fund, PF Putnam Research Fund, and PF Salomon Brothers Large-Cap Value Fund (collectively the "Funds") as of March 31, 2003, and the related statements of operations, changes in net assets and the financial highlights for the respective periods indicated therein. These financial statements and financial highlights are the responsibility of the Funds’ management. Our responsibility is to express an opinion on these financial statements and financial highlights based on our audits.
We conducted our audits in accordance with auditing standards generally accepted in the United States. Those standards require that we plan and perform the audit to obtain reasonable assurance about whether the financial statements and financial highlights are free of material misstatement. An audit includes
examining, on a test basis, evidence supporting the amounts and disclosures in the financial statements. Our procedures included confirmation of securities owned as of March 31, 2003, by correspondence with the custodians and brokers. An audit also includes assessing the accounting principles used and significant estimates made by management, as well as evaluating the overall financial statement presentation. We believe that our audits provide a reasonable basis for our opinion.
In our opinion, the financial statements and financial highlights referred to above present fairly, in all material respects, the financial position of each of the respective funds constituting Pacific Funds as of March 31, 2003, the results of their operations, changes in their net assets and their financial highlights for the periods indicated therein, in conformity with accounting principles generally accepted in the United States.

Los Angeles, California
May 2, 2003
F-1
PACIFIC FUNDS
TRUSTEES AND OFFICERS INFORMATION
The business and affairs of the Funds are managed under the direction of the Board of Trustees under the Pacific Funds’ Declaration of Trust. Information pertaining to the trustees and officers of the Funds is set forth below. Trustees who are not deemed to be “interested persons” of the Funds, as defined in the Investment Company Act of 1940 (“1940 Act”), are referred to as “Independent Trustees.” Trustees who are deemed to be “interested persons” of the Funds are referred to as “Interested Trustees”. The Funds’ Statement of Additional Information (SAI) includes additional information about the trustees and is available without charge, upon request, by calling the Funds toll-free at 1-800-722-2333.
The address of each Independent Trustee, Interested Trustees, and officers, is c/o Pacific Funds, 700 Newport Center Drive, Newport Beach, CA 92660.
| Principal Occupation(s) | Number of | ||
| (and certain additional | Portfolios in | ||
| Position(s) with the Fund | occupation information) | Fund Complex | |
Name and Age | and Term of Office | During Past 5 Years | Overseen (1) |
INDEPENDENT TRUSTEES | |||
| Lucie H. Moore, 46 | Trustee since 6/13/01 | Trustee of Pacific Select Fund; Former | 48 |
| partner (1994) with Gibson, Dunn & | |||
| Crutcher (Law). | |||
| Richard L. Nelson, 73 | Trustee since 6/13/01 | Trustee of Pacific Select Fund; Former | 93 |
| Trustee (2001) and Trustee Emeritus (2003) | |||
| PIMCO Funds, Multi-Manager Series; Former | |||
| Director (2000) of Wynn’s International, Inc. | |||
| (Industrial); Retired Partner (1983) with | |||
| Ernst & Young LLP (Accounting). | |||
| Lyman W. Porter, 73 | Trustee since 6/13/01 | Trustee of Pacific Select Fund; Professor | 93 |
| Emeritus of Management in the Graduate | |||
| School of Management at the University of | |||
| California, Irvine; Member of the Board of | |||
| Trustees of the American University of Armenia; | |||
| Former Trustee (2001) and Trustee Emeritus | |||
| (2003) PIMCO Funds; Multi-Manager Series; | |||
| Former Member (1995) of the Academic Advisory | |||
| Board of the Czechoslovak Management | |||
| Center; Former Dean (1983) of the Graduate | |||
| School of Management, University of | |||
| California, Irvine. | |||
| Alan Richards, 73 | Trustee since 6/13/01 | Trustee of Pacific Select Fund; Chairman | 93 |
| of the Board and Director, NETirement.com, Inc. | |||
| (retirement planning software); Chairman of | |||
| of IBIS Capital, LLC (Financial); Former Trustee | |||
| (2001) and Trustee Emeritus (2003) PIMCO | |||
| Funds; Multi-Manager Series; Former Director | |||
| (1998) of Western National Corporation | |||
| (Insurance Holding Company); Retired | |||
| Chairman (1986) of E.F. Hutton Insurance | |||
| Group; Former Director (1986) of E.F. Hutton | |||
| and Company, Inc. (Financial). |
F-2
PACIFIC FUNDS
TRUSTEES AND OFFICERS INFORMATION (Continued)
| Principal Occupation(s) | Number of | ||
| (and certain additional | Portfolios in | ||
| Position(s) with the Fund | occupation information) | Fund Complex | |
Name and Age | and Term of Office | During Past 5 Years | Overseen(1) |
INTERESTED TRUSTEES & OFFICERS | |||
| Thomas C. Sutton, 60 (2) | Chairman of the | Chairman of the Board, Director and Chief | 48 |
| Board and Trustee | Executive Officer of Pacific Life, Pacific Mutual | ||
| since 6/13/01 | Holding Company and Pacific LifeCorp; and | ||
| similar positions with other subsidiaries and | |||
| affiliates of Pacific Life; Director of Newhall | |||
| Land & Farming; Director of The Irvine Company | |||
| (Real Estate); Director of Edison International | |||
| (Utilities); Chairman of the Board and Trustee of | |||
| Pacific Select Fund; Former Management Board | |||
| Member of PIMCO Advisors L.P. (1997); Former | |||
| Equity Board Member of PIMCO Advisors L.P. (1997). | |||
| Glenn S. Schafer, 53 (2) | President | President and Director of Pacific Life, Pacific | 15 |
| and Trustee | Mutual Holding Company and Pacific LifeCorp | ||
| since 6/13/01 | and similar positions with other subsidiaries and | ||
| affiliates of Pacific Life; President of Pacific Select | |||
| Fund; Former Management Board Member of | |||
| PIMCO Advisors L.P. (2000); Former Equity | |||
| Board Member of PIMCO Advisors L.P. (1997). | |||
| Brian D. Klemens, 46 | Vice President | Vice President and Treasurer (12/98 to | N/A |
| and Treasurer | present); Assistant Vice President and | ||
| since 6/13/01 | Assistant Controller (4/94 to 12/98) of Pacific | ||
| Life, Pacific Mutual Holding Company, Pacific | |||
| LifeCorp and similar positions with other | |||
| subsidiaries and affiliates of Pacific Life; Vice | |||
| President and Treasurer of Pacific Select Fund. | |||
| Diane N. Ledger, 63 | Vice President | Vice President, Variable Regulatory | N/A |
| and Assistant | Compliance, of Pacific Life and Pacific Life & Annuity | ||
| Secretary | and Vice President and Assistant Secretary of | ||
| since 6/13/01 | Pacific Select Fund. | ||
| Robin S. Yonis, 48 | Vice President | Assistant Vice President and Investment | N/A |
| and General | Counsel of Pacific Life. | ||
| Counsel | |||
| since 6/13/01 | |||
| Audrey L. Milfs, 57 | Secretary | Vice President, Director and Corporate | N/A |
| since 6/13/01 | Secretary of Pacific Life , Pacific Mutual Holding | ||
| Company, Pacific LifeCorp and similar positions | |||
| with other subsidiaries of Pacific Life; Secretary | |||
| of Pacific Select Fund. | |||
| —————————— | |
| (1) | In addition to Pacific Funds (15 Funds), each trustee (except Mr. Schafer) also serves as a trustee of the Pacific Select Fund (33 Portfolios) and Messrs. Nelson, Porter, and Richards formerly served as trustees of the PIMCO Funds: Multi-Manager Series (45 Funds) and for which they provided advisory and consulting services through March 31, 2003. (collectively “Fund Complex”). |
| (2) | Mr. Sutton and Mr. Schafer are interested persons of the Funds (as that term defined in the 1940 Act) because of their positions with Pacific Life as shown above. |
F-3
PACIFIC FUNDS
ANNUAL REPORT
as of March 31, 2003
INDEPENDENT ACCOUNTANTS
Ernst & Young LLP
725 South Figueroa Street
Los Angeles, CA 90017
COUNSEL
Dechert LLP
1775 Eye Street, N.W.
Washington, D.C. 20006-2401
PACIFIC FUNDS
P.O. Box 9768
Providence, RI 02940-9768
ADDRESS SERVICE REQUESTED
3012-3A
| Item 2. | Code of Ethics - not applicable
| |
| Item 3. | Audit Committee Financial Expert - not applicable
| |
| Items 4-8. | (Reserved)
| |
| Item 9. | Controls and Procedures - not applicable
| |
| Item 10. | Exhibits
| |
| (a) | Not applicable | |
| (b) | Exhibit 99.CERT - Certification required by Item 10(b) of Form N-CSR - filed herewith
| |
| Exhibit 99.1350 CERT - Certification required by Section 906 of the Sarbanes-Oxley Act - filed herewith | ||
SIGNATURES
Pursuant to the requirements of the Securities Exchange Act of 1934 and the Investment Company Act of 1940, the registrant has duly caused this report to be signed on its behalf by the undersigned, thereunto duly authorized.
PACIFIC FUNDS
/s/ GLENN S. SCHAFER
________________________
By: Glenn S. Schafer
Title: President, Pacific Funds
Date: May 27, 2003
Pursuant to the requirements of the Securities Exchange Act of 1934 and the Investment Company Act of 1940, this report has been signed below by the following persons on behalf of the registrant and in the capacities and on the dates indicated.
/s/ THOMAS C. SUTTON
________________________
Thomas C. Sutton
Chairman of the Board of Trustees, Pacific Funds
Date: May 27, 2003
/s/ GLENN S. SCHAFER
________________________
Glenn S. Schafer
President, Pacific Funds
Date: May 27, 2003
/s/ BRIAN D. KLEMENS
________________________
Brian D. Klemens
Treasurer (Principal Financial and Accounting
Officer), Pacific Funds
Date: May 27, 2003