UNITED STATES
SECURITIES AND EXCHANGE COMMISSION
SECURITIES AND EXCHANGE COMMISSION
Washington, D.C. 20549
FORM N-CSR
CERTIFIED SHAREHOLDER REPORT OF REGISTERED MANAGEMENT
INVESTMENT COMPANIES
INVESTMENT COMPANIES
Investment Company Act file number 811-10385
Pacific Life Funds
(Exact name of registrant as specified in charter)
700 Newport Center Drive, P.O. Box 7500
Newport Beach, CA 92660
Newport Beach, CA 92660
(Address of principal executive offices) (Zip code)
Robin S. Yonis
Vice President and General Counsel of Pacific Life Funds
Pacific Life Fund Advisors LLC
700 Newport Center Drive, P.O. Box 9000
Newport Beach, CA 92660
Vice President and General Counsel of Pacific Life Funds
Pacific Life Fund Advisors LLC
700 Newport Center Drive, P.O. Box 9000
Newport Beach, CA 92660
(Name and address of agent for service)
Copies to:
Anthony H. Zacharski, Esq.
Dechert LLP
90 State House Square
Hartford, CT 06103
Anthony H. Zacharski, Esq.
Dechert LLP
90 State House Square
Hartford, CT 06103
Registrant’s telephone number, including area code: 949-219-6767
Date of fiscal year end: March 31
Date of reporting period: April 1, 2010 — March 31, 2011
Form N-CSR is to be used by management investment companies to file reports with the Commission not later than 10 days after the transmission to stockholders of any report that is required to be transmitted to stockholders under Rule 30e-1 under the Investment Company Act of 1940 (17 CFR 270.30e-1). The Commission may use the information provided on Form N-CSR in its regulatory, disclosure review, inspection, and policymaking roles.
A registrant is required to disclose the information specified by Form N-CSR, and the Commission will make this information public. A registrant is not required to respond to the collection of information contained in Form N-CSR unless the Form displays a currently valid Office of Management and Budget (“OMB”) control number. Please direct comments concerning the accuracy of the information collection burden estimate and any suggestions for reducing the burden to Secretary, Securities and Exchange Commission, 100 F Street, NE, Washington, DC 20549. The OMB has reviewed this collection of information under the clearance requirements of 44 U.S.C. § 3507.
Item 1. Reports to Stockholders.
The following is a copy of the report transmitted to stockholders pursuant to Rule 30e-1 under the Act (17 CFR 270.30e-1).
TABLE OF CONTENTS
PACIFIC LIFE FUNDS | ||
| Letter to Shareholders | A-1 | |
| Performance Discussion | A-2 | |
| Schedules of Investments | B-1 | |
| Financial Statements: | ||
| Statements of Assets and Liabilities | C-1 | |
| Statements of Operations | C-3 | |
| Statements of Changes in Net Assets | C-4 | |
| Financial Highlights | C-6 | |
| Notes to Financial Statements | D-1 | |
| Report of Independent Registered Public Accounting Firm | E-1 | |
| Disclosure of Fund Expenses | F-1 | |
| Trustees and Officers Information | F-3 | |
| Approval of Investment Advisory Agreement and Fund Management Agreements | F-7 | |
| Where to Go for More Information | F-13 |
PACIFIC LIFE FUNDS
Dear Shareholders:
| We are pleased to share with you the Pacific Life Funds Annual Report dated March 31, 2011. |
Pacific Life Funds is comprised of twenty-four separate funds, seven of which are presented in this report (each individually a “fund” and collectively, the “funds”), and are available for direct investment. Pacific Life Fund Advisors LLC (PLFA), as adviser to the funds, manages seven of the funds directly and supervises the management of the underlying funds (“Underlying Funds”) which are only available for investment by the five Portfolio Optimization Funds and are included in a separate Annual Report. Please see “Where to Go for More Information” for instructions on how to obtain the Underlying Funds’ Annual Report. PLFA also does business under the name “Pacific Asset Management” and manages the PL Money Market Fund and PL Income Fund under that name. For the Underlying Funds, Pacific Life Funds and PLFA have retained other firms to serve as fund managers under PLFA’s supervision. The funds and the fund managers as of March 31, 2011 are listed below:
| Fund | Fund Manager | |
| PL Portfolio Optimization Conservative Fund | ||
| PL Portfolio Optimization Moderate-Conservative Fund | ||
| PL Portfolio Optimization Moderate Fund | Pacific Life Fund Advisors LLC (PLFA) | |
| PL Portfolio Optimization Moderate-Aggressive Fund | ||
| PL Portfolio Optimization Aggressive Fund | ||
| PL Money Market Fund | Pacific Asset Management | |
| PL Income Fund |
We appreciate your confidence in the Pacific Life Funds and look forward to serving your financial needs in the years to come.
| Sincerely, | ||
 |  | |
| James T. Morris | Mary Ann Brown | |
| Chairman of the Board | Chief Executive Officer | |
| Pacific Life Funds | Pacific Life Funds |
A-1
PACIFIC LIFE FUNDS PERFORMANCE DISCUSSION
This annual report is provided for the general information of investors with beneficial interests in Pacific Life Funds. This report is not authorized for distribution to prospective investors unless preceded or accompanied by a current Pacific Life Funds’ prospectus which contains information about Pacific Life Funds and each of its funds, including their investment objectives, risks, charges and expenses. You should read the prospectus carefully before investing. There is no assurance that a fund will achieve its investment objective. Each fund is subject to market risk. The value of a fund changes as its asset values go up or down. The value of a fund’s shares will fluctuate, and when redeemed, may be worth more or less than their original cost.
The total return for each fund (including the 7-day yield for the PL Money Market Fund) includes reinvestment of all dividends and capital gain distributions, if any, and does not include deductions of any applicable sales charges. Past performance is not predictive of future performance. Performance figures for each class reflect the deduction of any applicable maximum front-end sales charge at the time of investment and reflect any applicable contingent deferred sales charge that would be deducted upon redemption at the end of the period presented.
The composite benchmarks are composed using the four broad-based indices for the PL Portfolio Optimization Funds. The percentage amounts of each broad-based index within each composite benchmark are based on each fund’s target asset class allocations in effect during the applicable period. The percentages attributed to a broad-based index within a composite benchmark will change if a fund’s target asset class allocations change.
This report shows you the performance of the funds compared to benchmark indices. Index performance is provided for illustrative and comparative purposes only and does not predict or depict the performance of the funds. Indices are unmanaged, do not incur transaction costs and cannot be purchased directly by investors. Index returns on equity securities include reinvested dividends.
PLFA supervises the management of all of the Underlying Funds (subject to the review of the Pacific Life Funds’ Board) and directly manages the PL Money Market and PL Income Funds (under the name Pacific Asset Management) and the PL Portfolio Optimization Conservative, PL Portfolio Optimization Moderate-Conservative, PL Portfolio Optimization Moderate, PL Portfolio Optimization Moderate-Aggressive and PL Portfolio Optimization Aggressive Funds. PLFA has written the general market conditions commentary which expresses PLFA’s opinions and view on how the market generally performed for the twelve-month period ended March 31, 2011.
All views are subject to change at any time based upon market or other conditions, and Pacific Life Funds, its adviser and the fund managers disclaim any responsibility to update such views. Any references to “we,” “I,” or “ours” are references to the adviser or fund manager. The adviser and fund managers may include statements that constitute “forward-looking statements” under the United States (U.S.) securities laws. Forward-looking statements include information concerning possible or assumed future results of the Pacific Life Funds’ investment operations, asset levels, earnings, expenses, industry or market conditions, regulatory developments and other aspects of the Pacific Life Funds’ operations or general economic conditions. In addition, when used in this report, predictive verbs such as “believes,” “expects,” “anticipates,” “intends,” “plans,” “estimates,” “projects” and future or conditional verbs such as “will,” “may,” “could,” “should” and “would,” or any other statement that necessarily depends on future events, are intended to identify forward-looking statements. Forward-looking statements are not guarantees of performance or economic results. They involve risks, uncertainties and assumptions. Although such statements are based on expectations that the adviser or fund manager believes to be reasonable, actual results may differ materially from expectations. Investors must not rely on any forward-looking statements.
In connection with any forward-looking statements and any investment in the Pacific Life Funds, investors should carefully consider the investment objectives, policies and risks described in the Pacific Life Funds’ current Prospectus, as supplemented and Statement of Additional Information, as supplemented as filed with the Securities and Exchange Commission (SEC), which may be obtained from the SEC’s website at www.sec.gov or Pacific Life’s website at www.pacificlife.com/pacificlifefunds.htm.
Market Conditions (for the twelve-month period ended March 31, 2011)
Executive Summary
Global markets faced various challenges throughout the summer of 2010 and the first quarter of 2011. Nevertheless, riskier asset classes and styles generally fared better than their more conservative counterparts over the reporting period. Bullish sentiments plowed through adverse events, which included the Deepwater Horizon oil spill and the “Flash Crash” during the second quarter of 2010, as well as the turmoil in the Middle East/North Africa region and the earthquake/tsunami that rattled Japan over the first quarter of 2011. While these events had some repercussions, the effects on the United States’ financial markets were generally temporary.
During the reporting period, investors relied on government support (i.e. Quantitative Easing 2 (QE2)) to ease their nerves and responded to any positive economic and business reports to fuel the upward momentum. Various surveys1 indicated that U.S. executives’ optimism levels improved over the reporting period. U.S. corporate profits reached near their all-time highs, and mergers and acquisitions (M&A) activity continued to remain healthy. These factors have created opportunities for several companies.
| 1 | The Business Roundtable’s CEO Economic Outlook Survey and The Duke/CFO Magazine Global Business Outlook Survey |
See benchmark definitions on page A-14
A-2
PACIFIC LIFE FUNDS PERFORMANCE DISCUSSION (Continued)
While there were some positive developments at the corporate level, the lackluster job growth continued to be a drag on the economic recovery. The unemployment rate in the U.S. hovered in the mid-to-upper 9% range without any solid evidence of a strong improvement. Job creation remained low due partly to an overly conservative lending standard as well as a blurred outlook on the economy.
Concerns over inflation also became a growing topic of interest over the period. Such pressures may encourage central bankers to raise rates, which could hinder the recovery process. The creeping inflationary pressures from rising commodity and food prices around the globe have already forced several countries to take action. During the first quarter of 2011, a number of the central banks in emerging countries (particularly in those of Latin America and Asia) have addressed these inflationary concerns by raising their interest rates.
The following sections highlight how specific segments of the financial market responded to the events that unfolded over the reporting period.
Fixed Income
The Barclays Capital U.S. Aggregate Bond Index gained 5.12% over the reporting period. From a credit risk perspective, lower rated issues generally outperformed those of higher quality. Excluding the second quarter of 2010, high yield bonds generally led the fixed income market. The market experienced a temporary “flight-to-safety” (shift toward U.S. Treasuries) over the second quarter of 2010 as sovereign debt problems began to surface and uncertainty heightened. However, the accommodating Federal Reserve (Fed) policies combined with improving business sentiments helped risk tolerances grow for the remainder of the reporting period.
Strong corporate balance sheets and an improving outlook led to substantial spread compression, which was evident in the narrowing difference between corporate and U.S. Treasury yields. The growing confidence displayed by the bond market continued to benefit the corporate sectors. Consistent with the financial market’s increasing risk appetite, the Barclays Capital U.S. Corporate High-Yield Index gained 14.31% compared to a 7.46% rise for the Barclays Capital U.S. Corporate Investment Grade Index during the reporting period.
U.S. Treasuries generally lagged behind the corporate sector with the Barclays Capital U.S. Treasury Index gaining 4.53% over the reporting period. The Barclays Capital U.S. Treasury Inflation-Protected Securities (TIPS) Index rose 7.91% as inflation became a growing concern for some investors. While inflation has been relatively tame in recent years, concerns over future inflation has led to a widening disagreement between the “doves” who continue to make a case for maintaining stimulus support and the “hawks” who argue for a preemptive action to tame inflation by reversing the easy monetary policy. A tighter monetary policy would likely cause interest rates and yields (which move inversely to prices) to rise.
The mortgage sector was mixed. On one hand, the Barclays Capital U.S. Mortgage-Backed Securities Index returned 4.37% as the U.S. housing market continued to remain relatively stagnant. Nonetheless, the commercial mortgage side of the securitized market continued to experience a robust recovery. Over the period, the Barclays Capital Commercial Mortgage-Backed Securities (CMBS) High Yield Index and the Barclays Capital CMBS Investment-Grade Index rose 53.92% and 13.53%, respectively.
Short-term credit returns barely budged as the Fed continued to hold the Federal Funds (Fed Funds) rate near 0%. Additionally, the low interest rate environment encouraged companies to shift toward fixed and long-term borrowing to lock in the low rates. Low cash yields and the Fed’s ongoing message of maintaining “exceptionally low levels for the Fed Funds rate for an extended period” has kept the short end of the yield curve relatively flat over the period.
Domestic Equity
After adverse market conditions in the second quarter of 2010, the domestic equity market experienced three consecutive quarters of solid gains. The extended monetary support from the Fed’s second round of quantitative easing and fiscal assistance from President Obama’s push to extend Bush-era tax cuts helped the S&P 500 Index increase 15.65% over the period with the riskier styles (e.g. higher beta stocks) leading the charge.
The equity market faced some headwinds in the first quarter of 2011 but maintained its cautiously bullish sentiment to finish off the period. Although the employment picture improved slightly, the U.S. unemployment rate still remains high. Additionally, the downward spiral of the housing market may have ended, but new construction and sales activity have yet to show signs of a sustained recovery.
Without a vibrant consumer market, some businesses have turned to M&A for growth. In these conditions, large-capitalization companies flush with cash tend to acquire smaller but established companies with solid growth potential. In general, small- and mid-capitalization growth stocks tend to be the beneficiaries of increased M&A activity as bidders tend to raise valuations of such companies. Over the reporting period, the Russell 2000 Index (a small-capitalization benchmark) and the Russell Midcap Index (a mid-capitalization benchmark) surged 25.79% and 24.27%, respectively. The Russell 1000 Index (a benchmark for large-capitalization stocks) rose 16.69% for the reporting period.
See benchmark definitions on page A-14
A-3
PACIFIC LIFE FUNDS PERFORMANCE DISCUSSION (Continued)
With respect to style, the higher tolerance for risk may have helped growth stocks outpace their respective value counterparts. The risk-taking sentiment was also reflected in the performances of the sector classifications. Market participants continued to shift toward cyclical sectors (e.g. consumer discretionary, industrials, materials and energy) that tend to have a high correlation to the overall economy. Defensive sectors (e.g. health care and utilities) that generally are less volatile during economic downturns lagged behind the overall market.
The real estate investment trust (REIT) market also continued to deliver solid returns over the reporting period. Market participants had previously expected significant declines in commercial property values but began to demonstrate less pessimism as the year progressed. This less gloomy outlook helped lift the Financial Times Stock Exchange National Association of Real Estate Investment Trust (FTSE NAREIT) Equity REITs Index 23.68% higher over the reporting period. Residential apartments represented the top performing property sector, which may have been a result of the continued lackluster residential housing sales and an increased demand for rental property. On the other hand, office REITs were among the weakest performing properties. The lack of employment growth kept office vacancy rates relatively high, thereby delaying the stabilization of office properties.
International Equity
Foreign markets dealt with various challenges throughout the reporting period, which affected developed regions more than emerging markets. Although the sovereign debt problems have been concentrated in several peripheral European countries (i.e. Portugal, Ireland, Italy, Greece and Spain), the interconnectivity of the European Union’s financial system heightened fears of another series of contagion throughout the region during the earlier part of the reporting period. Despite this setback in Europe, certain developed countries benefited from the strong and sustained growth in developing economies such as China and India. For instance, exporters of commodities (e.g. Australia and New Zealand) and capital goods (e.g. Germany) benefited from the growth in these emerging countries.
Other difficulties surfaced toward the end of this reporting period. Mounting tension in the Middle East/North Africa fed to the uncertain outlook on the global recovery. Furthermore, Japan, which represents approximately 20% of the Morgan Stanley Capital International (MSCI) Europe, Australasia, and Far East (EAFE) Index, was a drag on benchmark performance after the devastating earthquake/tsunami. The developed international equity market trailed the U.S. stock market, as the MSCI EAFE Index gained 10.42% over the reporting period. Additionally, emerging markets outperformed developed foreign markets with the MSCI Emerging Markets Index rising 18.46% for the reporting period. However, high inflation in emerging regions has pushed some of these countries to tighten policies and restrict some of its heated growth.
Concluding Remarks
Global markets showed some resilience to additional challenges that surfaced in the first quarter of 2011. On the domestic front, the positive momentum of business sentiment supported a brighter outlook. A recent poll of economists2 showed positive revisions to growth and employment projections. Anticipation for a slightly higher headline inflation (which includes food and energy) accompanied the improved outlook in the U.S. Nevertheless, long-term expectation for core inflation (which excludes food and energy) remains generally unchanged at a modest level. While attention to inflation has grown, inflationary concerns in the U.S. have been milder than those for the emerging markets.
The International Monetary Fund (IMF) projects world growth to slightly decelerate to 4.5% in 2011 from 4.7% in 20103. Much of the global growth is expected to primarily stem from emerging markets. The intergovernmental organization projects advanced economies to grow 2.4% in 2011, while developing economies are expected to expand by 6.5%.
Weak balance sheets of certain advanced economies, lifeless real estate markets, and the dismal job growth will continue to present hurdles. Additionally, new risks that recently surfaced such as high oil prices and geopolitical uncertainty as well as overheating in various emerging market countries could place extra burden on the recovery. While some countries have raised interest rates to contain inflationary pressures, the Fed Chairman (Ben Bernanke) believes that inflation expectations are well anchored in the U.S. With wage pressure and core inflation relatively subdued, the Fed has been able to maintain its accommodative monetary policy despite the noise surrounding elevated prices of certain goods.
Much focus has been placed on the Fed’s balancing act of trying to improve the employment picture and maintain a subdued inflationary environment. At this point, Mr. Bernanke’s concerns over potential inflationary threat appear to have taken a backseat to efforts of lowering the unemployment rate. The Fed Chairman’s views may be consistent with those who continue to question the strength of the recovery. With the “advance estimate” of real gross domestic product (GDP) indicating that the U.S. economy grew at an annualized rate of 1.8% in the first quarter of 2011, some economists have begun to lower their growth outlook. Although the Fed helped ease fears in the market, uncertainty may still create a fickle market until the recovery process develops solid traction. Until further clarity is established, financial markets may continue to be driven by economic and business reports in the near future.
| 2 | Federal Reserve Bank of Philadelphia: Survey of Professional Forecasters – First Quarter 2011 | |
| 3 | International Monetary Fund: World Economic Outlook – April 2011 |
See benchmark definitions on page A-14
A-4
PACIFIC LIFE FUNDS PERFORMANCE DISCUSSION (Continued)
PL Portfolio Optimization Funds
The Portfolio Optimization Funds are five, risk-based funds (PL Portfolio Optimization Funds) that commenced operations on December 31, 2003. Each of the PL Portfolio Optimization Funds invests a specified target amount in various funds (Underlying Funds) of the Pacific Life Funds to accomplish the risk/return profile that corresponds to the respective PL Portfolio Optimization Fund. Each PL Portfolio Optimization Fund seeks to optimize returns for a given level of risk (or minimize risk for a given level of return).
Performance
Since the performance of each PL Portfolio Optimization Fund is a composite of the performance of each of the Underlying Funds in which each invests (which may include bonds, domestic and/or international equities), there is no one, broad-based industry index to use as a comparison to a PL Portfolio Optimization Fund’s performance. Therefore, we at PLFA have provided information regarding four broad-based indices to use as a comparison to each fund’s performance.
In addition, to assist in performance comparisons, composite benchmarks were constructed for each PL Portfolio Optimization Fund; each is comprised of the four broad-based indices shown below. The composite benchmarks were constructed with allocations to each asset class that correspond to the target allocations for the PL Portfolio Optimization Funds. However, the actual allocation of any PL Portfolio Optimization Fund will naturally vary from these targets as a result of market performance over time. The one-year performance for these broad-based indices is shown in the following table. The Underlying Funds’ performance listed is net of fund expenses.
| 1-Year | ||||
| Performance | ||||
| Broad-Based Indices | as of 3-31-11 | |||
| S&P 500 Index (U.S. Stocks) | 15.65 | % | ||
| Morgan Stanley Capital International (MSCI) EAFE Index (International Stocks) | 10.42 | % | ||
| Barclays Capital U.S. Aggregate Bond Index (Fixed Income) | 5.12 | % | ||
| BofA Merrill Lynch U.S. 3-Month T-Bill (Cash) | 0.16 | % | ||
It should be noted that the indices for the Underlying Funds may differ from the PL Portfolio Optimization Funds’ broad-based indices.
The PL Portfolio Optimization Funds had investments in the following Underlying Funds, which were some of the primary contributors to performance relative to the broad-based indices. Not all of the Underlying Funds were represented in each PL Portfolio Optimization Fund, and the allocation of each Underlying Fund within the PL Portfolio Optimization Funds did vary:
| 1-Year | ||||
| Performance | ||||
| Underlying Funds | as of 3-31-11 | |||
| PL Managed Bond ‘P’ (Fixed Income) | 6.31 | % | ||
| PL Inflation-Managed ‘P’ (Fixed Income) | 8.56 | % | ||
| PL Mid-Cap Equity ‘P’ (U.S. Stocks) | 21.70 | % | ||
| PL Mid-Cap Growth ‘P’ (U.S. Stocks) | 35.16 | % | ||
| PL Small-Cap Value ‘P’ (U.S. Stocks) | 25.11 | % | ||
The PL Portfolio Optimization Funds had investments in the following Underlying Funds, which were some of the primary detractors to performance relative to the broad-based indices. Not all of the Underlying Funds were represented in each PL Portfolio Optimization Fund, and the allocation of each Underlying Fund within the PL Portfolio Optimization Funds did vary:
| 1-Year | ||||
| Performance | ||||
| Underlying Funds | as of 3-31-11 | |||
| PL Short Duration Bond ‘P’ (Fixed Income) | 1.57 | % | ||
| PL International Value ‘P’ (International Stocks) | 5.99 | % | ||
| PL Growth LT ‘P’ (U.S. Stocks) | 10.79 | % | ||
| PL Large-Cap Value ‘P’ (U.S. Stocks) | 12.69 | % | ||
| PL Main Street Core ‘P’ (U.S. Stocks) | 13.28 | % | ||
See benchmark definitions on page A-14
A-5
PACIFIC LIFE FUNDS PERFORMANCE DISCUSSION (Continued)
PL Portfolio Optimization Conservative Fund (managed by Pacific Life Fund Advisors LLC)
Q. How did the fund perform over the year ended March 31, 2011?
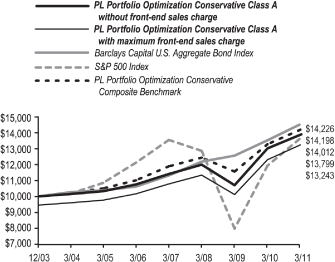
A. For the year ended March 31, 2011, the fund’s Class A returned 7.60%, compared to a 5.12% return for the Barclays Capital U.S. Aggregate Bond Index, a 15.65% return for the S&P 500 Index, a 10.42% return for the MSCI EAFE Index, and a 6.87% return for the PL Portfolio Optimization Conservative Composite Benchmark.
The following graph shows the value as of March 31, 2011 of a $10,000 investment made in Class A shares since the fund began operations. For comparison purposes, the performance of the fund’s fixed income and domestic equity benchmarks is also shown. Performance data for Class B, C, and R shares will vary due to differences in fees and sales charges.
Performance Comparison
Average Annual Total Returns for the Periods Ended March 31, 2011
| PL Portfolio Optimization | ||||||||||||||||
| Conservative | Class A | Class B | Class C | Class R | ||||||||||||
1 Year Total Return: | ||||||||||||||||
Without sales charge | 7.60 | % | 6.80 | % | 6.81 | % | 7.25 | % | ||||||||
With maximum sales charge | 1.65 | % | 1.80 | % | 5.81 | % | N/A | |||||||||
Barclays Capital U.S. Aggregate | ||||||||||||||||
Bond Index | 5.12 | % | ||||||||||||||
S&P 500 Index | 15.65 | % | ||||||||||||||
PL Portfolio Optimization | ||||||||||||||||
Conservative Composite | ||||||||||||||||
Benchmark | 6.87 | % | ||||||||||||||
5 Years Total Return: | ||||||||||||||||
Without sales charge | 5.44 | % | 4.74 | % | 4.74 | % | 5.23 | % | ||||||||
With maximum sales charge | 4.26 | % | 4.41 | % | 4.74 | % | N/A | |||||||||
Barclays Capital U.S. Aggregate | ||||||||||||||||
Bond Index | 6.03 | % | ||||||||||||||
S&P 500 Index | 2.62 | % | ||||||||||||||
PL Portfolio Optimization | ||||||||||||||||
Conservative Composite | ||||||||||||||||
Benchmark | 5.20 | % | ||||||||||||||
Since Inception (December 31, 2003): | ||||||||||||||||
Without sales charge | 4.76 | % | 4.12 | % | 4.11 | % | 5.11 | % | ||||||||
With maximum sales charge | 3.95 | % | 4.12 | % | 4.11 | % | N/A | |||||||||
Barclays Capital U.S. Aggregate | ||||||||||||||||
Bond Index | 4.98 | % | ||||||||||||||
S&P 500 Index | 4.54 | % | ||||||||||||||
PL Portfolio Optimization | ||||||||||||||||
Conservative Composite | ||||||||||||||||
Benchmark | 4.95 | % | ||||||||||||||
Performance data shown represents past performance. Investment return and principal value will fluctuate so that shares of the fund when redeemed may be worth more or less than their original cost. Past performance is not predictive of future performance. The table does not reflect the deduction of taxes that a shareholder would pay on fund distributions or redemption of fund shares.
Q. Discuss both positive and negative factors that materially affected the fund’s performance during the year, including relevant market conditions, investment strategies and techniques, and particular sectors or securities.
A. The PL Portfolio Optimization Conservative Fund is comprised primarily of a diverse group of fixed income funds with an additional minor allocation to domestic and international equity funds. The fund outperformed its composite benchmark over the trailing twelve-month period.
Outperformance was driven by the fixed income allocation within the fund. The domestic equity allocation also slightly contributed to outperformance while international equity exposure modestly detracted from performance over the reporting period.
The fixed income segment of the fund was a strong contributor to performance. A large weighting in PL Managed Bond Fund helped drive relative performance, as it outperformed the fixed income component of the composite benchmark (Barclays Capital U.S. Aggregate Bond Index). Relative underperformance from PL Short Duration Bond Fund was more than offset by gains from PL Floating Rate Loan Fund and PL Inflation Managed Fund allocations.
See benchmark definitions on page A-14
A-6
PACIFIC LIFE FUNDS PERFORMANCE DISCUSSION (Continued)
Relative outperformance from domestic equity allocations outweighed the modest underperformance from international counterparts. U.S. focused strategies like PL Large-Cap Growth and PL Mid-Cap Equity Funds generated solid outperformance relative to the S&P 500 Index while PL International Value and PL International Large-Cap Funds collectively trailed the MSCI EAFE Index.
PL Portfolio Optimization Moderate-Conservative Fund (managed by Pacific Life Fund Advisors LLC)
Q. How did the fund perform over the year ended March 31, 2011?
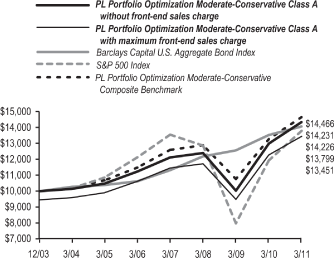
A. For the year ended March 31, 2011, the fund’s Class A returned 9.53%, compared to a 5.12% return for the Barclays Capital U.S. Aggregate Bond Index, a 15.65% return for the S&P 500 Index, a 10.42% return for the MSCI EAFE Index, and an 8.97% return for the PL Portfolio Optimization Moderate-Conservative Composite Benchmark.
The following graph shows the value as of March 31, 2011 of a $10,000 investment made in Class A shares since the fund began operations. For comparison purposes, the performance of the fundís fixed income and domestic equity benchmarks is also shown. Performance data for Class B, C, and R shares will vary due to differences in fees and sales charges.
Performance Comparison
Average Annual Total Returns for the Periods Ended March 31, 2011
| PL Portfolio Optimization | ||||||||||||||||
| Moderate-Conservative | Class A | Class B | Class C | Class R | ||||||||||||
1 Year Total Return: | ||||||||||||||||
Without sales charge | 9.53 | % | 8.78 | % | 8.71 | % | 9.32 | % | ||||||||
With maximum sales charge | 3.54 | % | 3.78 | % | 7.71 | % | N/A | |||||||||
Barclays Capital U.S. Aggregate | ||||||||||||||||
Bond Index | 5.12 | % | ||||||||||||||
S&P 500 Index | 15.65 | % | ||||||||||||||
PL Portfolio Optimization Moderate-Conservative Composite Benchmark | 8.97 | % | ||||||||||||||
5 Years Total Return: | ||||||||||||||||
Without sales charge | 4.85 | % | 4.14 | % | 4.13 | % | 4.64 | % | ||||||||
With maximum sales charge | 3.68 | % | 3.80 | % | 4.13 | % | N/A | |||||||||
Barclays Capital U.S. Aggregate | ||||||||||||||||
Bond Index | 6.03 | % | ||||||||||||||
S&P 500 Index | 2.62 | % | ||||||||||||||
PL Portfolio Optimization Moderate-Conservative Composite Benchmark | 4.71 | % | ||||||||||||||
Since Inception (December 31, 2003): | ||||||||||||||||
Without sales charge | 4.99 | % | 4.33 | % | 4.33 | % | 4.89 | % | ||||||||
With maximum sales charge | 4.17 | % | 4.33 | % | 4.33 | % | N/A | |||||||||
Barclays Capital U.S. Aggregate | ||||||||||||||||
Bond Index | 4.98 | % | ||||||||||||||
S&P 500 Index | 4.54 | % | ||||||||||||||
PL Portfolio Optimization Moderate-Conservative Composite Benchmark | 5.22 | % | ||||||||||||||
Performance data shown represents past performance. Investment return and principal value will fluctuate so that shares of the fund when redeemed may be worth more or less than their original cost. Past performance is not predictive of future performance. The table does not reflect the deduction of taxes that a shareholder would pay on fund distributions or redemption of fund shares.
Q. Discuss both positive and negative factors that materially affected the fund’s performance during the year, including relevant market conditions, investment strategies and techniques, and particular sectors or securities.
A. The PL Portfolio Optimization Moderate-Conservative Fund has just over half of its allocation in a diverse mix of fixed income funds with the remainder in several domestic and international equity funds. The fund outperformed its composite benchmark over the trailing twelve-month period.
Outperformance was driven by fixed income and domestic equity allocations while the international equity exposure slightly detracted from performance over the reporting period.
The fixed income segment of the fund was a strong contributor to its performance. A large weighting in PL Managed Bond Fund helped drive relative performance, as it outperformed the Barclays Capital U.S. Aggregate Bond Index. Relative outperformance from
See benchmark definitions on page A-14
A-7
PACIFIC LIFE FUNDS PERFORMANCE DISCUSSION (Continued)
PL Floating Rate Loan and PL Inflation Managed Funds also contributed positively to results. PL Short Duration Bond Fund trailed the Barclays Capital U.S. Aggregate Bond Index and detracted from its results.
Within domestic equity, the fund’s allocation to U.S. companies with mid-sized market capitalizations helped boost performance versus the S&P 500 Index. Specifically, PL Mid-Cap Equity and PL Mid-Cap Growth Funds both generated strong relative returns. The fund’s larger market capitalization exposure generally detracted from its relative performance, except for PL Large-Cap Growth Fund which outperformed the S&P 500 Index and other domestic large-capitalization strategies in the fund.
International equity was a slight detractor to performance relative to the composite benchmark. PL International Value Fund significantly trailed the benchmark while PL International Large-Cap Fund outperformed.
PL Portfolio Optimization Moderate Fund (managed by Pacific Life Fund Advisors LLC)
Q. How did the fund perform over the year ended March 31, 2011?
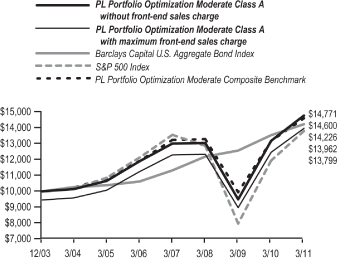
A. For the year ended March 31, 2011, the fund’s Class A returned 12.10%, compared to a 5.12% return for the Barclays Capital U.S. Aggregate Bond Index, a 15.65% return for the S&P 500 Index, a 10.42% return for the MSCI EAFE Index, and a 10.94% return for the PL Portfolio Optimization Moderate Composite Benchmark.
The following graph shows the value as of March 31, 2011 of a $10,000 investment made in Class A shares since the fund began operations. For comparison purposes, the performance of the fund’s fixed income and domestic equity benchmarks is also shown. Performance data for Class B, C, and R shares will vary due to differences in fees and sales charges.
Performance Comparison
Average Annual Total Returns for the Periods Ended March 31, 2011
| PL Portfolio Optimization | ||||||||||||||||
| Moderate | Class A | Class B | Class C | Class R | ||||||||||||
1 Year Total Return: | ||||||||||||||||
Without sales charge | 12.10 | % | 11.33 | % | 11.26 | % | 11.82 | % | ||||||||
With maximum sales charge | 5.93 | % | 6.33 | % | 10.26 | % | N/A | |||||||||
Barclays Capital U.S. Aggregate | ||||||||||||||||
Bond Index | 5.12 | % | ||||||||||||||
S&P 500 Index | 15.65 | % | ||||||||||||||
PL Portfolio Optimization Moderate Composite Benchmark | 10.94 | % | ||||||||||||||
5 Years Total Return: | ||||||||||||||||
Without sales charge | 4.44 | % | 3.72 | % | 3.72 | % | 4.20 | % | ||||||||
With maximum sales charge | 3.27 | % | 3.38 | % | 3.72 | % | N/A | |||||||||
Barclays Capital U.S. Aggregate | ||||||||||||||||
Bond Index | 6.03 | % | ||||||||||||||
S&P 500 Index | 2.62 | % | ||||||||||||||
PL Portfolio Optimization Moderate Composite Benchmark | 4.15 | % | ||||||||||||||
Since Inception (December 31, 2003): | ||||||||||||||||
Without sales charge | 5.53 | % | 4.88 | % | 4.86 | % | 4.95 | % | ||||||||
With maximum sales charge | 4.71 | % | 4.88 | % | 4.86 | % | N/A | |||||||||
Barclays Capital U.S. Aggregate | ||||||||||||||||
Bond Index | 4.98 | % | ||||||||||||||
S&P 500 Index | 4.54 | % | ||||||||||||||
PL Portfolio Optimization Moderate Composite Benchmark | 5.35 | % | ||||||||||||||
Performance data shown represents past performance. Investment return and principal value will fluctuate so that shares of the fund when redeemed may be worth more or less than their original cost. Past performance is not predictive of future performance. The table does not reflect the deduction of taxes that a shareholder would pay on fund distributions or redemption of fund shares.
See benchmark definitions on page A-14
A-8
PACIFIC LIFE FUNDS PERFORMANCE DISCUSSION (Continued)
Q. Discuss both positive and negative factors that materially affected the fund’s performance during the year, including relevant market conditions, investment strategies and techniques, and particular sectors or securities.
A. The PL Portfolio Optimization Moderate Fund has just over half of its allocation in a diverse mix of domestic and international equity funds, with the remainder in several fixed income funds. The fund outperformed its composite benchmark over the trailing twelve-month period.
Outperformance was driven by domestic equity and fixed income allocations while the international equity exposure slightly detracted from performance over the reporting period.
Within the fund’s domestic equity allocation, small- and mid-sized companies helped boost relative performance. Specifically, PL Mid-Cap Equity, PL Mid-Cap Growth, and PL Small-Cap Growth Funds all generated strong returns relative to the S&P 500 Index. Except for PL Large-Cap Growth Fund, the fund’s larger market capitalization exposure generally detracted from relative performance. An allocation to real estate also positively contributed to performance as PL Real Estate Fund returned more than 25% for the trailing twelve-month period. Overall, solid performance from the domestic equity segment of the fund drove relative performance.
International equity was a slight detractor from relative performance. Though a small emerging markets (PL Emerging Markets Fund) allocation contributed positively to performance, it was not enough to offset underperformance from PL International Value Fund versus the MSCI EAFE Index.
The fixed income segment of the fund was a strong contributor to performance. A large weighting in PL Managed Bond Fund helped drive relative performance, as the fund outperformed the Barclays Capital U.S. Aggregate Bond Index. Relative outperformance from PL Floating Rate Loan Fund and PL Inflation Managed Fund also contributed positively to results. PL Short Duration Bond Fund trailed the Barclays Capital U.S. Aggregate Bond Index and detracted from results.
PL Portfolio Optimization Moderate-Aggressive Fund (managed by Pacific Life Fund Advisors LLC)
Q. How did the fund perform over the year ended March 31, 2011?
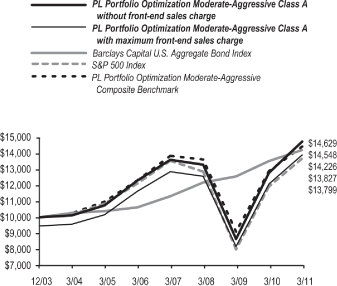
A. For the year ended March 31, 2011, the fund’s Class A returned 14.36%, compared to a 5.12% return for the Barclays Capital U.S. Aggregate Bond Index, a 15.65% return for the S&P 500 Index, a 10.42% return for the MSCI EAFE Index, and a 12.73% return for the PL Portfolio Optimization Moderate-Aggressive Composite Benchmark.
See benchmark definitions on page A-14
A-9
PACIFIC LIFE FUNDS PERFORMANCE DISCUSSION (Continued)
The following graph shows the value as of March 31, 2011 of a $10,000 investment made in Class A shares since the fund began operations. For comparison purposes, the performance of the fund’s fixed income and domestic equity benchmarks is also shown. Performance data for Class B, C, and R shares will vary due to differences in fees and sales charges.
Performance Comparison
Average Annual Total Returns for the Periods Ended March 31, 2011
| PL Portfolio Optimization | ||||||||||||||||
| Moderate-Aggressive | Class A | Class B | Class C | Class R | ||||||||||||
1 Year Total Return: | ||||||||||||||||
Without sales charge | 14.36 | % | 13.59 | % | 13.64 | % | 14.00 | % | ||||||||
With maximum sales charge | 8.08 | % | 8.59 | % | 12.64 | % | N/A | |||||||||
Barclays Capital U.S. Aggregate | ||||||||||||||||
Bond Index | 5.12 | % | ||||||||||||||
S&P 500 Index | 15.65 | % | ||||||||||||||
PL Portfolio Optimization Moderate-Aggressive Composite Benchmark | 12.73 | % | ||||||||||||||
5 Years Total Return: | ||||||||||||||||
Without sales charge | 3.51 | % | 2.80 | % | 2.81 | % | 3.32 | % | ||||||||
With maximum sales charge | 2.35 | % | 2.44 | % | 2.81 | % | N/A | |||||||||
Barclays Capital U.S. Aggregate | ||||||||||||||||
Bond Index | 6.03 | % | ||||||||||||||
S&P 500 Index | 2.62 | % | ||||||||||||||
PL Portfolio Optimization Moderate-Aggressive Composite Benchmark | 3.39 | % | ||||||||||||||
Since Inception (December 31, 2003): | ||||||||||||||||
Without sales charge | 5.39 | % | 4.74 | % | 4.73 | % | 4.45 | % | ||||||||
With maximum sales charge | 4.57 | % | 4.74 | % | 4.73 | % | N/A | |||||||||
Barclays Capital U.S. Aggregate | ||||||||||||||||
Bond Index | 4.98 | % | ||||||||||||||
S&P 500 Index | 4.54 | % | ||||||||||||||
PL Portfolio Optimization Moderate-Aggressive Composite Benchmark | 5.32 | % | ||||||||||||||
Performance data shown represents past performance. Investment return and principal value will fluctuate so that shares of the fund when redeemed may be worth more or less than their original cost. Past performance is not predictive of future performance. The table does not reflect the deduction of taxes that a shareholder would pay on fund distributions or redemption of fund shares.
Q. Discuss both positive and negative factors that materially affected the fund’s performance during the year, including relevant market conditions, investment strategies and techniques, and particular sectors or securities.
A. The PL Portfolio Optimization Moderate-Aggressive Fund primarily allocates to a diverse group of domestic and international equity funds and has a moderate exposure to fixed income funds. The fund outperformed its composite benchmark over the trailing twelve-month period.
Outperformance was driven by domestic equity and fixed income allocations while the international equity exposure slightly detracted from performance over the reporting period.
Within the fund’s domestic equity allocation, small- and mid-sized companies helped boost relative performance. Specifically, PL Mid-Cap Equity, PL Mid-Cap Growth, PL Small-Cap Value and PL Small-Cap Growth Funds all generated strong returns relative to the S&P 500 Index. Except for PL Large-Cap Growth Fund, the fund’s larger domestic market capitalization equity exposure generally detracted from relative performance. An allocation to real estate positively contributed to performance as PL Real Estate Fund returned more than 25% for the trailing twelve-month period. Overall, solid performance from the domestic equity segment of the fund drove relative performance.
International equity slightly detracted from performance relative to the MSCI EAFE Index. PL International Large-Cap Fund outperformed while PL International Value Fund detracted from results. PL Emerging Markets Fund outperformed and contributed positively to overall results.
The fund’s allocation to fixed income was a modest positive contributor to performance. PL Managed Bond Fund helped drive relative performance, as the fund outperformed the fixed income component of the composite benchmark (Barclays Capital U.S. Aggregate Bond Index). Underperformance from PL Short Duration Bond Fund was minimized by strong relative performance from PL Inflation Managed Fund.
See benchmark definitions on page A-14
A-10
PACIFIC LIFE FUNDS PERFORMANCE DISCUSSION (Continued)
PL Portfolio Optimization Aggressive Fund (managed by Pacific Life Fund Advisors LLC)
Q. How did the fund perform over the year ended March 31, 2011?
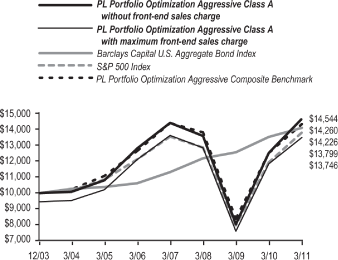
A. For the year ended March 31, 2011, the fund’s Class A returned 16.11%, compared to a 5.12% return for the Barclays Capital U.S. Aggregate Bond Index, a 15.65% return for the S&P 500 Index, a 10.42% return for the MSCI EAFE Index, and a 13.87% return for the PL Portfolio Optimization Aggressive Composite Benchmark.
The following graph shows the value as of March 31, 2011 of a $10,000 investment made in Class A shares since the fund began operations. For comparison purposes, the performance of the fund’s fixed income and domestic equity benchmarks is also shown. Performance data for Class B, C, and R shares will vary due to differences in fees and sales charges.
Performance Comparison
Average Annual Total Returns for the Periods Ended March 31, 2011
| PL Portfolio Optimization | ||||||||||||||||
| Aggressive | Class A | Class B | Class C | Class R | ||||||||||||
1 Year Total Return: | ||||||||||||||||
Without sales charge | 16.11 | % | 15.62 | % | 15.61 | % | 16.02 | % | ||||||||
With maximum sales charge | 9.73 | % | 10.62 | % | 14.61 | % | N/A | |||||||||
Barclays Capital U.S. Aggregate | ||||||||||||||||
Bond Index | 5.12 | % | ||||||||||||||
S&P 500 Index | 15.65 | % | ||||||||||||||
PL Portfolio Optimization Aggressive Composite Benchmark | 13.87 | % | ||||||||||||||
5 Years Total Return: | ||||||||||||||||
Without sales charge | 2.57 | % | 1.86 | % | 1.87 | % | 2.39 | % | ||||||||
With maximum sales charge | 1.42 | % | 1.50 | % | 1.87 | % | N/A | |||||||||
Barclays Capital U.S. Aggregate | ||||||||||||||||
Bond Index | 6.03 | % | ||||||||||||||
S&P 500 Index | 2.62 | % | ||||||||||||||
PL Portfolio Optimization Aggressive Composite Benchmark | 2.44 | % | ||||||||||||||
Since Inception (December 31, 2003): | ||||||||||||||||
Without sales charge | 5.30 | % | 4.67 | % | 4.66 | % | 4.04 | % | ||||||||
With maximum sales charge | 4.49 | % | 4.67 | % | 4.66 | % | N/A | |||||||||
Barclays Capital U.S. Aggregate | ||||||||||||||||
Bond Index | 4.98 | % | ||||||||||||||
S&P 500 Index | 4.54 | % | ||||||||||||||
PL Portfolio Optimization Aggressive Composite Benchmark | 5.03 | % | ||||||||||||||
Performance data shown represents past performance. Investment return and principal value will fluctuate so that shares of the fund when redeemed may be worth more or less than their original cost. Past performance is not predictive of future performance. The table does not reflect the deduction of taxes that a shareholder would pay on fund distributions or redemption of fund shares.
Q. Discuss both positive and negative factors that materially affected the fund’s performance during the year, including relevant market conditions, investment strategies and techniques, and particular sectors or securities.
A. The PL Portfolio Optimization Aggressive Fund allocates primarily to a diverse group of domestic and international equity funds. The fund also maintains a small allocation to fixed income. The fund outperformed its composite benchmark over the trailing twelve-month period.
Outperformance was driven by an allocation to domestic equity and a small allocation to fixed income. International equity exposure slightly detracted from fund performance over the reporting period.
Within the fund’s domestic equity allocation, small- and mid-sized companies helped boost relative performance. Specifically, PL Mid-Cap Equity, PL Mid-Cap Growth, PL Small-Cap Value and PL Small-Cap Growth Funds all generated strong returns relative to the S&P 500 Index. Except for PL Large-Cap Growth Fund, the fund’s larger domestic market capitalization equity exposure generally detracted from relative performance. An allocation to real estate also positively contributed to performance as PL Real Estate Fund returned more than 25% for the trailing twelve-month period. Overall, solid performance from the domestic equity segment of the fund drove relative performance.
International equity slightly detracted from performance relative to the MSCI EAFE Index. PL International Large-Cap Fund outperformed while PL International Value Fund detracted from results. PL Emerging Markets Fund outperformed and contributed positively to overall results.
See benchmark definitions on page A-14
A-11
PACIFIC LIFE FUNDS PERFORMANCE DISCUSSION (Continued)
The fixed income segment modestly contributed to the fund’s outperformance, as PL Managed Bond Fund generated strong returns relative to the fixed income component of the composite benchmark (Barclays Capital U.S. Aggregate Bond Index).
PL Money Market Fund (managed by Pacific Asset Management)
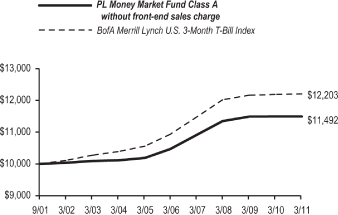
Q. How did the fund perform over the year ended March 31, 2011?
A. For the year ended March 31, 2011, the fund’s Class A returned 0.00%, compared to a 0.16% return for the BofA Merrill Lynch U.S. 3-Month T-bill Index. The current yield measured during the seven-day period ended March 31, 2011 was 0.00%.
The following graph shows the value as of March 31, 2011 of a $10,000 investment made in Class A shares since the fund began operations. For comparison purposes, the performance of the fund’s benchmark is also shown.
Performance Comparison
Average Annual Total Returns for the Periods Ended March 31, 2011
| PL Money Market Fund | Class A | |||
1 Year Total Return: | ||||
Without sales charge | 0.00 | % | ||
BofA Merrill Lynch U.S. 3-Month T-Bill Index | 0.16 | % | ||
5 Years Total Return: | ||||
Without sales charge | 1.89 | % | ||
BofA Merrill Lynch U.S. 3-Month T-Bill Index | 2.23 | % | ||
Since Inception (September 28, 2001): | ||||
Without sales charge | 1.47 | % | ||
BofA Merrill Lynch U.S. 3-Month T-Bill Index | 2.12 | % | ||
Performance data shown represents past performance. Investment return and principal value will fluctuate so that shares of the fund when redeemed may be worth more or less than their original cost. Past performance is not predictive of future performance. The table does not reflect the deduction of taxes that a shareholder would pay on fund distributions or redemption of fund shares.
Q. Discuss both positive and negative factors that materially affected the fund’s performance during the year, including relevant market conditions, investment strategies and techniques, and particular sectors or securities.
A. The U.S. economy showed signs of life during the year, although the pace of the recovery was slow. Economic data improved with strong industrial production and improved consumer spending numbers. After trimming costs through the recession, companies expanded margins and strengthened their balance sheets as the year progressed. Despite these improvements, the rebound was not experienced by all segments of the market. Residential housing continued to struggle despite stimulus efforts taken by the U.S. government. Foreclosures remained a large overhang, which pressured home prices, while the prevalence of underwater mortgages limited the turnover of the housing stock. Regarding employment, the recovery remained weak but did start to gain traction late in the year. The unemployment rate dropped from 9.8% at the end of November to 8.8% in March.
A low Fed Funds target rate and a shrinking supply of commercial paper constrained the absolute return environment for the fund. The interest rate curve remains upwardly sloping and relatively steep. This environment has generated relative outperformance by the longer duration assets in the fund. Citing the slack in the economy and the weakness in the labor force, the Fed remained accommodative throughout the year. The Fed Funds’ target rate was unchanged, remaining at the range of 0.00% to 0.25%. The three-month London Interbank Offered Rate (LIBOR) was very stable starting at 0.292% on March 31, 2010 and moving to 0.285% by March 31, 2011. Fewer companies utilized the commercial paper market during the year which reduced supply and further lowered available yields. From the peak of the market in August of 2007 through the end of the year, total commercial paper supply was lower by more than 50%. Money market accounts continued to experience outflows as investors deployed cash into higher risk asset classes.
The strength of the global recovery was tested on several fronts during the first calendar quarter of 2011. The quarter saw devastating natural disasters in Japan, unrest in northern Africa, and further European sovereign default concerns. However, the most meaningful near term impact on U.S. GDP may come from increased commodity prices, most importantly higher oil prices, in part, due to
See benchmark definitions on page A-14
A-12
PACIFIC LIFE FUNDS PERFORMANCE DISCUSSION (Continued)
the instability in northern Africa. Meaningfully higher prices at the pump are likely to slow consumer spending. Increasing input prices have also raised concerns about the potential for global inflation. In the U.S., the Fed has stated it will continue to focus on core inflation which excludes food and energy. Although, they have commented that they are keeping a close eye on inflation expectations. The Federal Open Market Committee (FOMC) members who tend to be more hawkish have started to become more vocal about possibly tightening monetary policy in order to avoid inflationary pressures. We expect this push and pull to continue over the course of the next several quarters.
Although the employment picture has started to improve and the economy is strengthening, we at Pacific Asset Management believe the Fed is going to remain cautious throughout the year and will want to ensure the recovery is on very solid footing before any tightening of monetary policy. We expect any tightening to be well forecasted to the market and would expect to shorten the fund’s weighted average maturity heading into a rate increase. We continue to manage the fund with a focus on stability, liquidity, and current income through a consistent, disciplined investment approach emphasizing industry and asset type diversification.
PL Income Fund (managed by Pacific Asset Management)
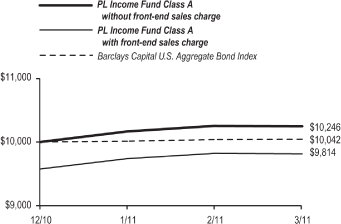
Q. How did the fund perform over the period ended March 31, 2011?
A. This fund commenced operations on December 31, 2010. For the three-month period ended March 31, 2011, the fund’s Class A returned 2.46%, compared to a 0.42% return for its benchmark, the Barclays Capital U.S. Aggregate Bond Index.
The following graph shows the value as of March 31, 2011 of a $10,000 investment made in Class A shares since the fund began operations. For comparison purposes, the performance of the fund’s benchmark is also shown. Performance date for Class I shares will vary due to differences in fees and sales charges.
Performance Comparison
Total Returns (Non-Annualized) for the Period Ended March 31, 2011
| PL Income Fund | Class A | Class I | ||||||
Since Inception (December 31, 2010): | ||||||||
Without sales charge | 2.46 | % | 2.48 | % | ||||
With maximum sales charge | -1.86 | % | N/A | |||||
Barclays Capital U.S. Aggregate | ||||||||
Bond Index | 0.42 | % | ||||||
Performance data shown represents past performance. Investment return and principal value will fluctuate so that shares of the fund when redeemed may be worth more or less than their original cost. Past performance is not predictive of future performance. The table does not reflect the deduction of taxes that a shareholder would pay on fund distributions or redemption of fund shares.
Q. Discuss both positive and negative factors that materially affected the fund’s performance during the period, including relevant market conditions, investment strategies and techniques, and particular sectors or securities.
A. The fund is a core bond fund that will generally invest in investment grade corporate bonds and has the flexibility to invest up to 40% in non-investment grade securities. As a result, we at Pacific Asset Management expect the fund to be structurally overweight corporate securities and generally underweight government securities such as U.S. Treasuries, agencies, and mortgage-backed securities (MBS) relative to the benchmark. Additionally, the fund must maintain an overall portfolio credit quality of investment grade and must have a duration position within two years of its benchmark.
During the reporting period, the fund’s duration was roughly one year less than that of the benchmark. This underweight in duration, achieved primarily through an underweight in U.S. Treasuries, was neutral to the fund’s relative performance as rates, although volatile during the reporting period, ended only slightly higher than where they had been.
See benchmark definitions on page A-14
A-13
PACIFIC LIFE FUNDS PERFORMANCE DISCUSSION (Continued)
Sector allocation was the most significant contributor to the fund’s positive relative performance. Within investment grade sectors, the overweight to corporate debt coupled with the underweight to U.S. Treasuries was a material driver contributing to the fund’s performance results. Additionally, high yield bonds and floating rate loans positively impacted the fund’s performance, posting strong returns relative to the benchmark during the reporting period. With approximately one third of the fund allocated to these sectors, relative fund performance was enhanced greatly. The fund’s security selection was also a positive contributor to the fund’s relative performance. In particular, names held in the metals and mining, technology, and electric utility sectors contributed to the fund’s performance. However, names held in the building materials, airlines, and banking sectors detracted from the fund’s performance results.
The fund utilized derivatives, specifically the loan credit default swap index (LCDX), during the reporting period. The LCDX is a specialized index of loan-only credit default swaps covering 100 individual companies that have unsecured debt trading in the broad secondary markets. During early January, the fund purchased LCDX to specifically gain exposure to the broad floating rate loan market. As the fund purchased individual loan securities, the percentage allocated to this derivative declined. By the end of the reporting period, this position had been completely unwound. This transaction achieved the desired goal in gaining broad exposure to an area of the fixed income market and benefiting the fund’s performance as floating rate loans outperformed the benchmark during the period in which it was held.
Pacific Asset Management continues to manage the fund with a focus on providing high levels of current income, diversification, and liquidity, primarily through corporate debt instruments.
Benchmark Definitions
Barclays Capital U.S. Aggregate Bond Index covers the U.S. dollar-denominated, investment-grade, fixed-rate, taxable bond market of SEC-registered securities. The index includes bonds from the Treasury, government-related, corporate, MBS, asset-backed securities, and corporate mortgage-backed securities sectors. The total return is equal to the change in price plus the coupon return.
BofA Merrill Lynch U.S. 3-Month Treasury Bill (T-Bill) Index is an index comprised of a single Treasury bill issue purchased at the beginning of the month and held for a full month, then sold and rolled into a newly selected Treasury bill issue. Results include the reinvestment of all distributions.
Morgan Stanley Capital International (MSCI) Europe, Australasia and Far East (EAFE) Index is an index of stocks from 21 countries/regions in Europe, Australia, New Zealand and Asia. Results include reinvested dividends after deducting withholding taxes.
PL Portfolio Optimization Conservative Composite Benchmark is 15% S&P 500; 73% Barclays Capital U.S. Aggregate Bond; 5% MSCI EAFE (Net), and 7% The BofA Merrill Lynch US 3-Month Treasury Bill Indices.
PL Portfolio Optimization Moderate-Conservative Composite Benchmark is 30% S&P 500; 55% Barclays Capital U.S. Aggregate Bond; 10% MSCI EAFE (Net), and 5% The BofA Merrill Lynch US 3-Month Treasury Bill Indices.
PL Portfolio Optimization Moderate Composite Benchmark is 44% S&P 500; 38% Barclays Capital U.S. Aggregate Bond; 16% MSCI EAFE (Net), and 2% The BofA Merrill Lynch US 3-Month Treasury Bill Indices.
PL Portfolio Optimization Moderate-Aggressive Composite Benchmark is 58% S&P 500; 20% Barclays Capital U.S. Aggregate Bond; and 22% MSCI EAFE (Net) Indices.
PL Portfolio Optimization Aggressive Composite Benchmark is 68% S&P 500; 5% Barclays Capital U.S. Aggregate Bond; and 27% MSCI EAFE (Net) Indices.
S&P 500 Index is an index of the stocks of approximately 500 large-capitalization companies traded in U.S. stock markets. Results include reinvested dividends.
A-14
PACIFIC LIFE FUNDS | ||
PL PORTFOLIO OPTIMIZATION CONSERVATIVE FUND | ||
Schedule of Investments | ||
March 31, 2011 |
| Shares | Value | |||||||
AFFILIATED MUTUAL FUNDS - 99.8% | ||||||||
| PL Floating Rate Loan Fund ‘P’ | 2,397,284 | $ | 24,260,513 | |||||
| PL Inflation Managed Fund ‘P’ | 4,630,670 | 48,760,953 | ||||||
| PL Managed Bond Fund ‘P’ | 9,544,191 | 102,504,610 | ||||||
| PL Short Duration Bond Fund ‘P’ | 3,858,846 | 38,742,817 | ||||||
| PL Comstock Fund ‘P’ | 823,009 | 9,983,099 | ||||||
| PL Growth LT Fund ‘P’ * | 429,776 | 5,337,813 | ||||||
| PL Large-Cap Growth Fund ‘P’ * | 533,965 | 4,928,497 | ||||||
| PL Large-Cap Value Fund ‘P’ | 1,364,715 | 15,817,051 | ||||||
| PL Main Street Core Fund ‘P’ | 599,181 | 6,069,708 | ||||||
| PL Mid-Cap Equity Fund ‘P’ | 916,400 | 9,585,544 | ||||||
| PL International Large-Cap Fund ‘P’ | 401,191 | 6,166,303 | ||||||
| PL International Value Fund ‘P’ | 648,090 | 6,163,334 | ||||||
| Total Affiliated Mutual Funds (Cost $258,384,822) | 278,320,242 | |||||||
SHORT-TERM INVESTMENT - 0.0% | ||||||||
Money Market Fund - 0.0% | ||||||||
| BlackRock Liquidity Funds Treasury Trust Fund Portfolio | 7,516 | 7,516 | ||||||
| Total Short-Term Investment (Cost $7,516) | 7,516 | |||||||
TOTAL INVESTMENTS - 99.8% (Cost $258,392,338) | 278,327,758 | |||||||
OTHER ASSETS & LIABILITIES, NET - 0.2% | 542,536 | |||||||
NET ASSETS - 100.0% | $ | 278,870,294 | ||||||
| Notes to Schedule of Investments | ||
| (a) | As of March 31, 2011, the fund was diversified as a percentage of net assets as follows: | |
| Affiliated Fixed Income Funds | 76.8 | % | ||
| Affiliated Equity Funds | 23.0 | % | ||
| 99.8 | % | |||
| Other Assets & Liabilities, Net | 0.2 | % | ||
| 100.0 | % | |||
PACIFIC LIFE FUNDS
PL PORTFOLIO OPTIMIZATION MODERATE-CONSERVATIVE FUND
Schedule of Investments
March 31, 2011
PL PORTFOLIO OPTIMIZATION MODERATE-CONSERVATIVE FUND
Schedule of Investments
March 31, 2011
| Shares | Value | |||||||
AFFILIATED MUTUAL FUNDS - 99.7% | ||||||||
| PL Floating Rate Loan Fund ‘P’ | 2,081,719 | $ | 21,066,994 | |||||
| PL Inflation Managed Fund ‘P’ | 3,781,957 | 39,824,008 | ||||||
| PL Managed Bond Fund ‘P’ | 7,489,230 | 80,434,335 | ||||||
| PL Short Duration Bond Fund ‘P’ | 2,886,340 | 28,978,853 | ||||||
| PL Comstock Fund ‘P’ | 1,341,937 | 16,277,697 | ||||||
| PL Growth LT Fund ‘P’ * | 668,054 | 8,297,223 | ||||||
| PL Large-Cap Growth Fund ‘P’ * | 1,189,360 | 10,977,797 | ||||||
| PL Large-Cap Value Fund ‘P’ | 1,911,806 | 22,157,836 | ||||||
| PL Main Street Core Fund ‘P’ | 1,338,340 | 13,557,385 | ||||||
| PL Mid-Cap Equity Fund ‘P’ | 1,044,969 | 10,930,378 | ||||||
| PL Mid-Cap Growth Fund ‘P’ | 627,199 | 6,447,601 | ||||||
| PL Small-Cap Value Fund ‘P’ | 265,738 | 2,816,817 | ||||||
| PL International Large-Cap Fund ‘P’ | 889,138 | 13,666,052 | ||||||
| PL International Value Fund ‘P’ | 824,149 | 7,837,656 | ||||||
| Total Affiliated Mutual Funds (Cost $257,455,948) | 283,270,632 | |||||||
SHORT-TERM INVESTMENT - 0.1% | ||||||||
Money Market Fund - 0.1% | ||||||||
| BlackRock Liquidity Funds Treasury Trust Fund Portfolio | 236,094 | 236,094 | ||||||
| Total Short-Term Investment (Cost $236,094) | 236,094 | |||||||
TOTAL INVESTMENTS - 99.8% (Cost $257,692,042) | 283,506,726 | |||||||
OTHER ASSETS & LIABILITIES, NET - 0.2% | 470,101 | |||||||
NET ASSETS - 100.0% | $ | 283,976,827 | ||||||
| Notes to Schedule of Investments | ||
| (a) | As of March 31, 2011, the fund was diversified as a percentage of net assets as follows: | |
| Affiliated Fixed Income Funds | 59.9 | % | ||
| Affiliated Equity Funds | 39.8 | % | ||
| Short-Term Investment | 0.1 | % | ||
| 99.8 | % | |||
| Other Assets & Liabilities, Net | 0.2 | % | ||
| 100.0 | % | |||
| (b) | Fair Value Measurements | |
| The following is a summary of the funds’ investments as categorized under the three-tier hierarchy of inputs used in valuing the funds’ assets and liabilities (See Note 10 in Notes to Financial Statements) as of March 31, 2011: |
| Level 2 | Level 3 | |||||||||||||||
| Total Value at | Level 1 | Significant | Significant | |||||||||||||
| March 31, 2011 | Quoted Price | Observable Inputs | Unobservable Inputs | |||||||||||||
PL Portfolio Optimization Conservative Fund | ||||||||||||||||
| Assets Affiliated Mutual Funds | $ | 278,320,242 | $ | 278,320,242 | $ | — | $ | — | ||||||||
| Short-Term Investment | 7,516 | 7,516 | — | — | ||||||||||||
| Total | $ | 278,327,758 | $ | 278,327,758 | $ | — | $ | — | ||||||||
PL Portfolio Optimization Moderate-Conservative Fund | ||||||||||||||||
| Assets Affiliated Mutual Funds | $ | 283,270,632 | $ | 283,270,632 | $ | — | $ | — | ||||||||
| Short-Term Investment | 236,094 | 236,094 | — | — | ||||||||||||
| Total | $ | 283,506,726 | $ | 283,506,726 | $ | — | $ | — | ||||||||
| See Notes to Financial Statements | See explanation of symbols and term, if any, on page B-8 |
B-1
PACIFIC LIFE FUNDS | ||
PL PORTFOLIO OPTIMIZATION MODERATE FUND | ||
Schedule of Investments | ||
March 31, 2011 |
| Shares | Value | |||||||
AFFILIATED MUTUAL FUNDS - 99.6% | ||||||||
| PL Floating Rate Loan Fund ‘P’ | 4,021,323 | $ | 40,695,802 | |||||
| PL Inflation Managed Fund ‘P’ | 8,485,196 | 89,349,110 | ||||||
| PL Managed Bond Fund ‘P’ | 12,821,675 | 137,704,785 | ||||||
| PL Short Duration Bond Fund ‘P’ | 4,038,646 | 40,548,010 | ||||||
| PL Comstock Fund ‘P’ | 5,188,979 | 62,942,312 | ||||||
| PL Growth LT Fund ‘P’ * | 3,279,108 | 40,726,523 | ||||||
| PL Large-Cap Growth Fund ‘P’ * | 4,354,557 | 40,192,558 | ||||||
| PL Large-Cap Value Fund ‘P’ | 7,607,857 | 88,175,057 | ||||||
| PL Main Street Core Fund ‘P’ | 5,567,867 | 56,402,491 | ||||||
| PL Mid-Cap Equity Fund ‘P’ | 4,513,090 | 47,206,923 | ||||||
| PL Mid-Cap Growth Fund ‘P’ | 1,692,901 | 17,403,026 | ||||||
| PL Small-Cap Growth Fund ‘P’ * | 677,321 | 8,060,122 | ||||||
| PL Small-Cap Value Fund ‘P’ | 2,335,169 | 24,752,795 | ||||||
| PL Real Estate Fund ‘P’ | 1,337,729 | 15,330,373 | ||||||
| PL Emerging Markets Fund ‘P’ | 1,704,086 | 25,015,984 | ||||||
| PL International Large-Cap Fund ‘P’ | 3,095,716 | 47,581,150 | ||||||
| PL International Value Fund ‘P’ | 2,496,110 | 23,738,005 | ||||||
| Total Affiliated Mutual Funds (Cost $724,545,061) | 805,825,026 | |||||||
SHORT-TERM INVESTMENT - 0.2% | ||||||||
Money Market Fund - 0.2% | ||||||||
| BlackRock Liquidity Funds Treasury Trust Fund Portfolio | 1,331,903 | 1,331,903 | ||||||
| Total Short-Term Investment (Cost $1,331,903) | 1,331,903 | |||||||
TOTAL INVESTMENTS - 99.8% (Cost $725,876,964) | 807,156,929 | |||||||
OTHER ASSETS & LIABILITIES, NET - 0.2% | 2,012,784 | |||||||
NET ASSETS - 100.0% | $ | 809,169,713 | ||||||
| Notes to Schedule of Investments | ||
| (a) | As of March 31, 2011, the fund was diversified as a percentage of net assets as follows: | |
| Affiliated Equity Funds | 61.6 | % | ||
| Affiliated Fixed Income Funds | 38.0 | % | ||
| Short-Term Investment | 0.2 | % | ||
| 99.8 | % | |||
| Other Assets & Liabilities, Net | 0.2 | % | ||
| 100.0 | % | |||
PACIFIC LIFE FUNDS
PL PORTFOLIO OPTIMIZATION MODERATE-AGGRESSIVE FUND
Schedule of Investments
March 31, 2011
PL PORTFOLIO OPTIMIZATION MODERATE-AGGRESSIVE FUND
Schedule of Investments
March 31, 2011
| Shares | Value | |||||||
AFFILIATED MUTUAL FUNDS - 100.0% | ||||||||
| PL Inflation Managed Fund ‘P’ | 4,880,851 | $ | 51,395,357 | |||||
| PL Managed Bond Fund ‘P’ | 4,794,408 | 51,491,942 | ||||||
| PL Short Duration Bond Fund ‘P’ | 1,287,235 | 12,923,837 | ||||||
| PL Comstock Fund ‘P’ | 4,689,107 | 56,878,863 | ||||||
| PL Growth LT Fund ‘P’ * | 3,503,518 | 43,513,697 | ||||||
| PL Large-Cap Growth Fund ‘P’ * | 3,450,264 | 31,845,940 | ||||||
| PL Large-Cap Value Fund ‘P’ | 6,515,778 | 75,517,862 | ||||||
| PL Main Street Core Fund ‘P’ | 5,599,745 | 56,725,420 | ||||||
| PL Mid-Cap Equity Fund ‘P’ | 4,772,364 | 49,918,924 | ||||||
| PL Mid-Cap Growth Fund ‘P’ | 2,541,912 | 26,130,860 | ||||||
| PL Small-Cap Growth Fund ‘P’ * | 1,123,057 | 13,364,373 | ||||||
| PL Small-Cap Value Fund ‘P’ | 3,065,524 | 32,494,550 | ||||||
| PL Real Estate Fund ‘P’ | 1,593,145 | 18,257,445 | ||||||
| PL Emerging Markets Fund ‘P’ | 1,845,770 | 27,095,906 | ||||||
| PL International Large-Cap Fund ‘P’ | 3,248,902 | 49,935,619 | ||||||
| PL International Value Fund ‘P’ | 3,739,167 | 35,559,482 | ||||||
| Total Affiliated Mutual Funds (Cost $560,430,808) | 633,050,077 | |||||||
SHORT-TERM INVESTMENT - 0.1% | ||||||||
Money Market Fund - 0.1% | ||||||||
| BlackRock Liquidity Funds Treasury Trust Fund Portfolio | 862,022 | 862,022 | ||||||
| Total Short-Term Investment (Cost $862,022) | 862,022 | |||||||
TOTAL INVESTMENTS - 100.1% (Cost $561,292,830) | 633,912,099 | |||||||
OTHER ASSETS & LIABILITIES, NET — (0.1%) | (638,008 | ) | ||||||
NET ASSETS - 100.0% | $ | 633,274,091 | ||||||
| Notes to Schedule of Investments | ||
| (a) | As of March 31, 2011, the fund was diversified as a percentage of net assets as follows: | |
| Affiliated Equity Funds | 81.7 | % | ||
| Affiliated Fixed Income Funds | 18.3 | % | ||
| Short-Term Investment | 0.1 | % | ||
| 100.1 | % | |||
| Other Assets & Liabilities, Net | (0.1 | %) | ||
| 100.0 | % | |||
| (b) | Fair Value Measurements | |
| The following is a summary of the fund’s investments as categorized under the three-tier hierarchy of inputs used in valuing the fund’s assets and liabilities (See Note 10 in Notes to Financial Statements) as of March 31, 2011: |
| Level 2 | Level 3 | |||||||||||||||
| Total Value at | Level 1 | Significant | Significant | |||||||||||||
| March 31, 2011 | Quoted Price | Observable Inputs | Unobservable Inputs | |||||||||||||
PL Portfolio Optimization Moderate Fund | ||||||||||||||||
| Assets Affiliated Mutual Funds | $ | 805,825,026 | $ | 805,825,026 | $ | — | $ | — | ||||||||
| Short-Term Investment | 1,331,903 | 1,331,903 | — | — | ||||||||||||
| Total | $ | 807,156,929 | $ | 807,156,929 | $ | — | $ | — | ||||||||
PL Portfolio Optimization Moderate-Aggressive Fund | ||||||||||||||||
| Assets Affiliated Mutual Funds | $ | 633,050,077 | $ | 633,050,077 | $ | — | $ | — | ||||||||
| Short-Term Investment | 862,022 | 862,022 | — | — | ||||||||||||
| Total | $ | 633,912,099 | $ | 633,912,099 | $ | — | $ | — | ||||||||
| See Notes to Financial Statements | See explanation of symbols and term, if any, on page B-8 |
B-2
PACIFIC LIFE FUNDS
PL PORTFOLIO OPTIMIZATION AGGRESSIVE FUND
Schedule of Investments
March 31, 2011
PL PORTFOLIO OPTIMIZATION AGGRESSIVE FUND
Schedule of Investments
March 31, 2011
| Shares | Value | |||||||
AFFILIATED MUTUAL FUNDS - 99.8% | ||||||||
| PL Managed Bond Fund ‘P’ | 612,687 | $ | 6,580,263 | |||||
| PL Comstock Fund ‘P’ | 1,684,473 | 20,432,657 | ||||||
| PL Growth LT Fund ‘P’ * | 1,421,721 | 17,657,777 | ||||||
| PL Large-Cap Growth Fund ‘P’ * | 1,207,555 | 11,145,737 | ||||||
| PL Large-Cap Value Fund ‘P’ | 2,311,945 | 26,795,440 | ||||||
| PL Main Street Core Fund ‘P’ | 2,480,907 | 25,131,584 | ||||||
| PL Mid-Cap Equity Fund ‘P’ | 1,737,756 | 18,176,927 | ||||||
| PL Mid-Cap Growth Fund ‘P’ | 1,408,099 | 14,475,253 | ||||||
| PL Small-Cap Growth Fund ‘P’ * | 918,972 | 10,935,764 | ||||||
| PL Small-Cap Value Fund ‘P’ | 1,523,647 | 16,150,663 | ||||||
| PL Real Estate Fund ‘P’ | 721,797 | 8,271,792 | ||||||
| PL Emerging Markets Fund ‘P’ | 828,750 | 12,166,048 | ||||||
| PL International Large-Cap Fund ‘P’ | 1,343,916 | 20,655,991 | ||||||
| PL International Value Fund ‘P’ | 1,784,049 | 16,966,308 | ||||||
| Total Affiliated Mutual Funds (Cost $186,688,228) | 225,542,204 | |||||||
TOTAL INVESTMENTS - 99.8% (Cost $186,688,228) | 225,542,204 | |||||||
OTHER ASSETS & LIABILITIES, NET - 0.2% | 557,631 | |||||||
NET ASSETS - 100.0% | $ | 226,099,835 | ||||||
Notes to Schedule of Investments
| (a) | As of March 31, 2011, the fund was diversified as a percentage of net assets as follows: |
| Affiliated Equity Funds | 96.9 | % | ||
| Affiliated Fixed Income Funds | 2.9 | % | ||
| 99.8 | % | |||
| Other Assets & Liabilities, Net | 0.2 | % | ||
| 100.0 | % | |||
| (b) | Fair Value Measurements | |
| The following is a summary of the fund’s investments as categorized under the three-tier hierarchy of inputs used in valuing the fund’s assets and liabilities (See Note 10 in Notes to Financial Statements) as of March 31, 2011: |
| Level 2 | Level 3 | |||||||||||||||
| Total Value at | Level 1 | Significant | Significant | |||||||||||||
| March 31, 2011 | Quoted Price | Observable Inputs | Unobservable Inputs | |||||||||||||
| Assets Affiliated Mutual Funds | $ | 225,542,204 | $ | 225,542,204 | $ | — | $ | — | ||||||||
| See Notes to Financial Statements | See explanation of symbols and term, if any, on page B-8 |
B-3
PACIFIC LIFE FUNDS
PL MONEY MARKET FUND
Schedule of Investments
March 31, 2011
PL MONEY MARKET FUND
Schedule of Investments
March 31, 2011
| Principal | ||||||||
| Amount | Value | |||||||
SHORT-TERM INVESTMENTS - 100.9% | ||||||||
Commercial Paper - 83.8% | ||||||||
| Abbott Laboratories | ||||||||
| 0.170% due 06/20/11 | $ | 1,200,000 | $ | 1,199,546 | ||||
| 0.200% due 05/09/11 | 500,000 | 499,893 | ||||||
| Archer-Daniels-Midland Co | ||||||||
| 0.280% due 04/06/11 | 500,000 | 499,980 | ||||||
| Bank of America Corp | ||||||||
| 0.140% due 04/04/11 | 1,100,000 | 1,099,987 | ||||||
| Bank of Montreal (Canada) | ||||||||
| 0.200% due 05/17/11 | 1,700,000 | 1,699,566 | ||||||
| Bank of Nova Scotia NY | ||||||||
| 0.090% due 04/06/11 | 1,700,000 | 1,699,979 | ||||||
| Caterpillar Financial Services Corp | ||||||||
| 0.050% due 04/01/11 | 1,700,000 | 1,700,000 | ||||||
| Commonwealth Bank of Australia (Australia) | ||||||||
| 0.255% due 05/25/11 | 800,000 | 799,694 | ||||||
| ConocoPhillips Qatar Funding Ltd (Cayman) | ||||||||
| 0.220% due 05/27/11 | 400,000 | 399,863 | ||||||
| 0.240% due 04/12/11 | 500,000 | 499,963 | ||||||
| Electricite de France SA (France) | ||||||||
| 0.230% due 04/15/11 | 1,600,000 | 1,599,857 | ||||||
| General Electric Capital Corp | ||||||||
| 0.200% due 05/10/11 | 1,100,000 | 1,099,762 | ||||||
| Google Inc | ||||||||
| 0.160% due 05/13/11 | 1,700,000 | 1,699,683 | ||||||
| Hewlett-Packard Co | ||||||||
| 0.150% due 04/11/11 | 1,000,000 | 999,958 | ||||||
| John Deere Credit Ltd (Australia) | ||||||||
| 0.180% due 04/18/11 | 1,200,000 | 1,199,898 | ||||||
| Kreditanstalt fuer Wiederaufbau (Germany) | ||||||||
| 0.210% due 05/19/11 | 900,000 | 899,748 | ||||||
| Nestle Capital Corp | ||||||||
| 0.170% due 06/30/11 | 700,000 | 699,703 | ||||||
| 0.200% due 05/09/11 | 1,000,000 | 999,789 | ||||||
| NetJets Inc | ||||||||
| 0.150% due 04/01/11 | 1,000,000 | 1,000,000 | ||||||
| Novartis Securities Investment Ltd (Bermuda) | ||||||||
| 0.220% due 06/13/11 | 1,400,000 | 1,399,375 | ||||||
| Roche Holdings Inc | ||||||||
| 0.160% due 04/14/11 | 900,000 | 899,948 | ||||||
| Royal Bank of Canada (Canada) | ||||||||
| 0.270% due 05/16/11 | 1,000,000 | 999,663 | ||||||
| Schlumberger Technology Corp | ||||||||
| 0.240% due 06/01/11 | 1,700,000 | 1,699,309 | ||||||
| The Coca-Cola Co | ||||||||
| 0.210% due 06/08/11 | 400,000 | 399,841 | ||||||
| 0.230% due 04/08/11 | 1,300,000 | 1,299,942 | ||||||
| The Procter & Gamble Co | ||||||||
| 0.190% due 05/04/11 | 1,300,000 | 1,299,774 | ||||||
| The Walt Disney Co | ||||||||
| 0.130% due 05/02/11 | 1,200,000 | 1,199,866 | ||||||
| Toronto-Dominion Holdings USA Inc | ||||||||
| 0.230% due 06/16/11 | 1,000,000 | 999,514 | ||||||
| Toyota Motor Credit Corp | ||||||||
| 0.160% due 04/05/11 | 700,000 | 699,988 | ||||||
| 0.340% due 08/08/11 | 1,000,000 | 998,782 | ||||||
| 32,192,871 | ||||||||
Corporate Notes - 1.3% | ||||||||
| International Business Machines Corp | ||||||||
| 0.884% due 07/28/11 § | 500,000 | 501,019 | ||||||
U.S. Treasury Bills - 15.6% | ||||||||
| 0.098% due 06/30/11 | 2,000,000 | 1,999,513 | ||||||
| 0.102% due 05/19/11 | 1,500,000 | 1,499,796 | ||||||
| 0.120% due 05/26/11 | 1,000,000 | 999,817 | ||||||
| 0.147% due 04/14/11 | 1,500,000 | 1,499,920 | ||||||
| 5,999,046 | ||||||||
| Shares | ||||||||
Money Market Fund - 0.2% | ||||||||
| BlackRock Liquidity Funds Treasury | ||||||||
| Trust Fund Portfolio | 79,079 | 79,079 | ||||||
| Total Short-Term Investments | ||||||||
| (Amortized Cost $38,772,015) | 38,772,015 | |||||||
TOTAL INVESTMENTS - 100.9% | ||||||||
(Amortized Cost $38,772,015) | 38,772,015 | |||||||
OTHER ASSETS & LIABILITIES, NET - (0.9%) | (329,494 | ) | ||||||
NET ASSETS - 100.0% | $ | 38,442,521 | ||||||
Notes to Schedule of Investments
| (a) | As of March 31, 2011 the fund was diversified as a percentage of net assets as follows: |
| Commercial Paper | 83.8 | % | ||
| U.S. Treasury Bills | 15.6 | % | ||
| Corporate Notes | 1.3 | % | ||
| Money Market Fund | 0.2 | % | ||
| 100.9 | % | |||
| Other Assets & Liabilities, Net | (0.9 | %) | ||
| 100.0 | % | |||
| (b) | As of March 31, 2011, the fund’s Standard & Poor’s quality ratings as a percentage of total fixed income investments were as follows: |
| AAA / U.S. Government & Agency Issues | 15.5 | % | ||
| A-1 (Short-term Debt Only) | 83.2 | % | ||
| A | 1.3 | % | ||
| 100.0 | % | |||
| (c) | Short-term investments reflect either the stated coupon rate or the annualized effective yield on the date of purchase for discounted investments. | |
| (d) | Fair Value Measurements | |
| The following is a summary of the fund’s investments as categorized under the three-tier hierarchy of inputs used in valuing the fund’s assets and liabilities (See Note 10 in Notes to Financial Statements) as of March 31, 2011: |
| Level 2 | Level 3 | |||||||||||||||||||
| Total Value at | Level 1 | Significant | Significant | |||||||||||||||||
| March 31, 2011 | Quoted Price | Observable Inputs | Unobservable Inputs | |||||||||||||||||
| Assets | Short-Term Investments | $ | 38,772,015 | $ | 79,079 | $ | 38,692,936 | $ | — | |||||||||||
| See Notes to Financial Statements | See explanation of symbols and term, if any, on page B-8 |
B-4
PACIFIC LIFE FUNDS
PL INCOME FUND
Schedule of Investments
March 31, 2011
PL INCOME FUND
Schedule of Investments
March 31, 2011
| Principal | ||||||||
| Amount | Value | |||||||
CORPORATE BONDS & NOTES - 74.4% | ||||||||
Consumer Discretionary - 12.3% | ||||||||
| Ameristar Casinos Inc | ||||||||
| 7.500% due 04/15/21 ~ | $ | 500,000 | $ | 495,625 | ||||
| CityCenter Holdings LLC | ||||||||
| 7.625% due 01/15/16 ~ | 500,000 | 518,750 | ||||||
| Comcast Corp | ||||||||
| 4.950% due 06/15/16 | 1,000,000 | 1,069,010 | ||||||
| DIRECTV Holdings LLC | ||||||||
| 3.125% due 02/15/16 | 1,000,000 | 985,322 | ||||||
| Hyatt Hotels Corp | ||||||||
| 6.875% due 08/15/19 ~ | 750,000 | 803,007 | ||||||
| Kabel BW Erste Beteiligungs GmbH (Germany) | ||||||||
| 7.500% due 03/15/19 ~ | 250,000 | 257,500 | ||||||
| Toll Brothers Finance Corp | ||||||||
| 6.750% due 11/01/19 | 750,000 | 774,800 | ||||||
| Toys R Us Property Co II LLC | ||||||||
| 8.500% due 12/01/17 | 500,000 | 540,000 | ||||||
| Viacom Inc | ||||||||
| 3.500% due 04/01/17 | 1,000,000 | 984,325 | ||||||
| Wyndham Worldwide Corp | ||||||||
| 5.750% due 02/01/18 | 500,000 | 517,976 | ||||||
| 6,946,315 | ||||||||
Consumer Staples - 4.6% | ||||||||
| Blue Merger Sub Inc | ||||||||
| 7.625% due 02/15/19 ~ | 500,000 | 509,375 | ||||||
| Cencosud SA (Chile) | ||||||||
| 5.500% due 01/20/21 ~ | 500,000 | 494,372 | ||||||
| PepsiAmericas Inc | ||||||||
| 4.375% due 02/15/14 | 1,000,000 | 1,072,396 | ||||||
| Reynolds Group Issuer Inc | ||||||||
| 7.750% due 10/15/16 ~ | 500,000 | 531,250 | ||||||
| 2,607,393 | ||||||||
Energy - 6.4% | ||||||||
| Forest Oil Corp | ||||||||
| 7.250% due 06/15/19 | 250,000 | 262,500 | ||||||
| Gazprom OAO Via Gaz Capital SA (Luxembourg) | ||||||||
| 5.092% due 11/29/15 ~ | 500,000 | 524,350 | ||||||
| Lukoil International Finance BV (Netherlands) | ||||||||
| 6.356% due 06/07/17 ~ | 500,000 | 539,350 | ||||||
| Marathon Petroleum Corp | ||||||||
| 3.500% due 03/01/16 ~ | 500,000 | 500,975 | ||||||
| Petrobras International Finance Co (Cayman) | ||||||||
| 5.375% due 01/27/21 | 500,000 | 503,403 | ||||||
| TNK-BP Finance SA (Luxembourg) | ||||||||
| 6.250% due 02/02/15 ~ | 500,000 | 539,500 | ||||||
| Weatherford International Ltd (Bermuda) | ||||||||
| 5.125% due 09/15/20 | 750,000 | 746,096 | ||||||
| 3,616,174 | ||||||||
Financials - 25.8% | ||||||||
| AMB Property LP | ||||||||
| 4.000% due 01/15/18 | 500,000 | 483,743 | ||||||
| American International Group Inc | ||||||||
| 6.400% due 12/15/20 | 500,000 | 533,996 | ||||||
| Australia & New Zealand Banking Group Ltd (Australia) | ||||||||
| 2.125% due 01/10/14 ~ | 500,000 | 500,086 | ||||||
| Bank of America Corp | ||||||||
| 5.875% due 01/05/21 | 1,000,000 | 1,044,565 | ||||||
| BRE Properties Inc REIT | ||||||||
| 5.500% due 03/15/17 | 500,000 | 535,595 | ||||||
| Citigroup Inc | ||||||||
| 4.587% due 12/15/15 | 500,000 | 516,698 | ||||||
| 4.750% due 05/19/15 | 500,000 | 523,808 | ||||||
| Developers Diversified Realty Corp REIT | ||||||||
| 4.750% due 04/15/18 | 500,000 | 486,573 | ||||||
| Dexus Diversified Trust (Australia) | ||||||||
| 5.600% due 03/15/21 ~ | 500,000 | 493,802 | ||||||
| General Electric Capital Corp | ||||||||
| 2.100% due 01/07/14 | 500,000 | 500,704 | ||||||
| 5.300% due 02/11/21 | 500,000 | 508,028 | ||||||
| Health Care REIT Inc | ||||||||
| 5.250% due 01/15/22 | 500,000 | 488,030 | ||||||
| Hyundai Capital Services Inc (South Korea) | ||||||||
| 4.375% due 07/27/16 ~ | 500,000 | 502,563 | ||||||
| JPMorgan Chase & Co | ||||||||
| 4.250% due 10/15/20 | 500,000 | 478,040 | ||||||
| JPMorgan Chase Bank NA | ||||||||
| 6.000% due 10/01/17 | 500,000 | 546,882 | ||||||
| KeyCorp | ||||||||
| 5.100% due 03/24/21 | 500,000 | 497,106 | ||||||
| Korea Development Bank (South Korea) | ||||||||
| 4.000% due 09/09/16 | 500,000 | 505,831 | ||||||
| Macquarie Group Ltd (Australia) | ||||||||
| 6.250% due 01/14/21 ~ | 500,000 | 505,587 | ||||||
| Marsh & McLennan Cos Inc | ||||||||
| 5.750% due 09/15/15 | 500,000 | 542,814 | ||||||
| Merrill Lynch & Co Inc | ||||||||
| 6.875% due 04/25/18 | 750,000 | 832,817 | ||||||
| Morgan Stanley | ||||||||
| 3.450% due 11/02/15 | 500,000 | 491,185 | ||||||
| 5.500% due 01/26/20 | 500,000 | 502,349 | ||||||
| Nationwide Financial Services | ||||||||
| 5.375% due 03/25/21 ~ | 500,000 | 495,437 | ||||||
| The Goldman Sachs Group Inc | ||||||||
| 5.350% due 01/15/16 | 500,000 | 533,302 | ||||||
| 5.375% due 03/15/20 | 1,000,000 | 1,015,693 | ||||||
| Wells Operating Partnership II LP REIT | ||||||||
| 5.875% due 04/01/18 ~ | 500,000 | 496,470 | ||||||
| 14,561,704 | ||||||||
Health Care - 0.9% | ||||||||
| Valeant Pharmaceuticals International Inc | ||||||||
| 6.500% due 07/15/16 ~ | 500,000 | 496,250 | ||||||
Industrials - 9.5% | ||||||||
| Air Canada (Canada) | ||||||||
| 9.250% due 08/01/15 ~ | 250,000 | 261,875 | ||||||
| Asciano Finance Ltd (Australia) | ||||||||
| 5.000% due 04/07/18 ~ | 500,000 | 497,290 | ||||||
| AWAS Aviation Capital Ltd (Ireland) | ||||||||
| 7.000% due 10/15/16 ~ | 500,000 | 502,500 | ||||||
| Continental Airlines 2010-1 Class A Pass | ||||||||
| Through Trust | ||||||||
| 4.750% due 01/12/21 | 750,000 | 735,000 | ||||||
| Delta Air Lines 2010-1 Class A Pass | ||||||||
| Through Trust | ||||||||
| 6.200% due 07/02/18 | 741,219 | 769,015 | ||||||
| Florida East Coast Railway Corp | ||||||||
| 8.125% due 02/01/17 ~ | 200,000 | 209,750 | ||||||
| International Lease Finance Corp | ||||||||
| 5.650% due 06/01/14 | 250,000 | 252,500 | ||||||
| 6.750% due 09/01/16 ~ | 500,000 | 537,500 | ||||||
| 8.875% due 09/15/15 ~ | 250,000 | 275,625 | ||||||
| JMC Steel Group | ||||||||
| 8.250% due 03/15/18 ~ | 500,000 | 513,750 | ||||||
| Owens Corning | ||||||||
| 6.500% due 12/01/16 | 500,000 | 544,360 | ||||||
| Spirit Aerosystems Inc | ||||||||
| 7.500% due 10/01/17 | 250,000 | 270,000 | ||||||
| 5,369,165 | ||||||||
| See Notes to Financial Statements | See explanation of symbols and term, if any, on page B-8 |
B-5
PACIFIC LIFE FUNDS
PL INCOME FUND
Schedule of Investments (Continued)
March 31, 2011
PL INCOME FUND
Schedule of Investments (Continued)
March 31, 2011
| Principal | ||||||||
| Amount | Value | |||||||
Materials - 7.1% | ||||||||
| Allegheny Technologies Inc | ||||||||
| 5.950% due 01/15/21 | $ | 500,000 | $ | 526,640 | ||||
| APERAM (Luxembourg) | ||||||||
| 7.375% due 04/01/16 ~ | 500,000 | 511,250 | ||||||
| ArcelorMittal (Luxembourg) | ||||||||
| 5.250% due 08/05/20 | �� | 750,000 | 734,843 | |||||
| Berry Plastics Corp | ||||||||
| 5.053% due 02/15/15 § | 500,000 | 498,125 | ||||||
| Cemex SAB de CV (Mexico) | ||||||||
| 5.299% due 09/30/15 ~ § | 500,000 | 495,005 | ||||||
| FMG Resources August 2006 Pty Ltd (Australia) | ||||||||
| 6.375% due 02/01/16 ~ | 250,000 | 253,125 | ||||||
| International Paper Co | ||||||||
| 5.250% due 04/01/16 | 500,000 | 532,739 | ||||||
| Inversiones CMPC SA (Chile) | ||||||||
| 4.750% due 01/19/18 ~ | 500,000 | 492,561 | ||||||
| 4,044,288 | ||||||||
Telecommunication Services - 6.4% | ||||||||
| American Tower Corp | ||||||||
| 4.500% due 01/15/18 | 750,000 | 736,438 | ||||||
| Avaya Inc | ||||||||
| 7.000% due 04/01/19 ~ | 500,000 | 490,000 | ||||||
| Frontier Communications Corp | ||||||||
| 7.875% due 04/15/15 | 500,000 | 541,250 | ||||||
| Intelsat Jackson Holdings SA (Luxembourg) | ||||||||
| 9.500% due 06/15/16 | 500,000 | 530,000 | ||||||
| Qwest Communications International Inc | ||||||||
| 8.000% due 10/01/15 | 500,000 | 554,375 | ||||||
| Qwest Corp | ||||||||
| 7.500% due 06/15/23 | 750,000 | 755,625 | ||||||
| 3,607,688 | ||||||||
Utilities - 1.4% | ||||||||
| Eskom Holdings Ltd (South Africa) | ||||||||
| 5.750% due 01/26/21 ~ | 250,000 | 254,688 | ||||||
| NRG Energy Inc | ||||||||
| 7.625% due 01/15/18 ~ | 500,000 | 519,375 | ||||||
| 774,063 | ||||||||
| Total Corporate Bonds & Notes (Cost $41,961,828) | 42,023,040 | |||||||
SENIOR LOAN NOTES - 14.0% | ||||||||
Consumer Discretionary - 7.1% | ||||||||
| Acosta Inc Term B | ||||||||
| 4.750% due 01/27/18 § | 500,000 | 501,667 | ||||||
| Burger King Corp Tranche B | ||||||||
| 4.500% due 10/30/16 § | 498,750 | 498,704 | ||||||
| Capital Automotive LP Tranche B | ||||||||
| 5.000% due 02/15/17 § | 499,431 | 495,685 | ||||||
| DineEquity Inc Term B-1 | ||||||||
| 4.250% due 10/31/17 § | 494,609 | 498,628 | ||||||
| Jo-Ann Stores Inc | ||||||||
| 4.750% due 12/23/17 § | 500,000 | 496,687 | ||||||
| Petco Animal Supplies Inc (New Loan) | ||||||||
| 4.500% due 11/24/17 § | 495,000 | 496,987 | ||||||
| Savers Inc (New Term Loan) | ||||||||
| 4.250% due 02/04/17 § | 500,000 | 503,750 | ||||||
| UCI International Inc | ||||||||
| 5.500% due 07/04/17 § | 498,750 | 502,257 | ||||||
| 3,994,365 | ||||||||
Consumer Staples - 0.9% | ||||||||
| U.S. Foodservice | ||||||||
| 2.753% due 07/03/14 § | 498,705 | 484,540 | ||||||
Financials - 1.7% | ||||||||
| First Data Corp (Initial Tranche B-1) | ||||||||
| 3.012% due 09/24/14 § | 500,000 | 479,844 | ||||||
| Nuveen Investments Inc (Extended 1st Lien Term Loan) | ||||||||
| 5.806% due 05/31/17 § | 500,000 | 501,326 | ||||||
| 981,170 | ||||||||
Health Care - 1.7% | ||||||||
| Axcan Intermediate Holdings Inc | ||||||||
| 5.500% due 01/25/17 § | 498,750 | 498,360 | ||||||
| Onex Carestream Finance LP | ||||||||
| 5.000% due 02/08/17 § | 500,000 | 490,078 | ||||||
| 988,438 | ||||||||
Information Technology - 0.8% | ||||||||
| CDW LLC (Extended Term Loan) | ||||||||
| 5.006% due 07/15/17 § | 460,538 | 459,444 | ||||||
Materials - 0.9% | ||||||||
| Rock-Tenn Co Term Loan B | ||||||||
| due 01/24/17 ∞ | 500,000 | 503,616 | ||||||
Utilities - 0.9% | ||||||||
| EquiPower Resources Holdings LLC (Term B Facility) | �� | |||||||
| 5.750% due 01/04/18 § | 500,000 | 506,250 | ||||||
| Total Senior Loan Notes (Cost $7,851,345) | 7,917,823 | |||||||
U.S. TREASURY OBLIGATIONS - 7.8% | ||||||||
U.S. Treasury Notes - 7.8% | ||||||||
| 2.125% due 12/31/15 | 1,500,000 | 1,498,359 | ||||||
| 2.750% due 12/31/17 | 1,505,000 | 1,496,300 | ||||||
| 2.625% due 11/15/20 | 1,500,000 | 1,397,929 | ||||||
| 4,392,588 | ||||||||
| Total U.S. Treasury Obligations (Cost $4,400,854) | 4,392,588 | |||||||
| See Notes to Financial Statements | See explanation of symbols and term, if any, on page B-8 |
B-6
PACIFIC LIFE FUNDS
PL INCOME FUND
Schedule of Investments (Continued)
March 31, 2011
PL INCOME FUND
Schedule of Investments (Continued)
March 31, 2011
| Shares | Value | |||||||
SHORT-TERM INVESTMENT - 3.1% | ||||||||
Money Market Fund - 3.1% | ||||||||
| BlackRock Liquidity Funds Treasury Trust Fund Portfolio | 1,773,041 | $ | 1,773,041 | |||||
| Total Short-Term Investment (Cost $1,773,041) | 1,773,041 | |||||||
TOTAL INVESTMENTS - 99.3% (Cost $55,987,068) | 56,106,492 | |||||||
OTHER ASSETS & LIABILITIES, NET - 0.7% | 423,963 | |||||||
NET ASSETS - 100.0% | $ | 56,530,455 | ||||||
Notes to Schedule of Investments
| (a) | As of March 31, 2011, the fund was diversified as a percentage of net assets as follows: |
| Corporate Bonds & Notes | 74.4 | % | ||
| Senior Loan Notes | 14.0 | % | ||
| U.S. Treasury Obligations | 7.8 | % | ||
| Short-Term Investment | 3.1 | % | ||
| 99.3 | % | |||
| Other Assets & Liabilities, Net | 0.7 | % | ||
| 100.0 | % | |||
| (b) | As of March 31, 2011, the fund’s Standard & Poor’s quality ratings as a percentage of total fixed income investments were as follows: |
| AAA / U.S. Government & Agency Issues | 8.1 | % | ||
| AA | 2.8 | % | ||
| A | 19.5 | % | ||
| BBB | 35.7 | % | ||
| BB | 13.7 | % | ||
| B | 18.4 | % | ||
| Not Rated | 1.8 | % | ||
| 100.0 | % | |||
| (c) | Fair Value Measurements | |
| The following is a summary of the fund’s investments as categorized under the three-tier hierarchy of inputs used in valuing the fund’s assets and liabilities (See Note 10 in Notes to Financial Statements) as of March 31, 2011: |
| Level 2 | Level 3 | |||||||||||||||||||
| Total Value at | Level 1 | Significant | Significant | |||||||||||||||||
| March 31, 2011 | Quoted Price | Observable Inputs | Unobservable Inputs | |||||||||||||||||
| Assets | Corporate Bonds & Notes | $ | 42,023,040 | $ | — | $ | 40,519,025 | $ | 1,504,015 | |||||||||||
| Senior Loan Notes | 7,917,823 | — | 7,917,823 | — | ||||||||||||||||
| U.S. Treasury Obligations | 4,392,588 | — | 4,392,588 | — | ||||||||||||||||
| Short-Term Investment | 1,773,041 | 1,773,041 | — | — | ||||||||||||||||
| Total | $ | 56,106,492 | $ | 1,773,041 | $ | 52,829,436 | $ | 1,504,015 | ||||||||||||
The following is a reconciliation of investments for significant unobservable inputs (Level 3) used in valuing the fund’s assets and liabilities (See Note 10 in Notes to Financial Statements) for the period ended March 31, 2011:
| Change in Net | ||||||||||||||||||||||||||||||||
| Unrealized | ||||||||||||||||||||||||||||||||
| Depreciation | ||||||||||||||||||||||||||||||||
| Total Change | Transfers | on Level 3 | ||||||||||||||||||||||||||||||
| Value, | Net | Accrued | Total Net | in Net | In and/ | Investments Held at | ||||||||||||||||||||||||||
| Beginning | Purchases | Discounts | Realized Gains | Unrealized | or Out of | Value, | the End of Period, | |||||||||||||||||||||||||
| of Period | (Sales) | (Premiums) | (Losses) | Depreciation | Level 3 | End of Period | if Applicable | |||||||||||||||||||||||||
| Corporate Bonds & Notes | $ | — | $ | 1,538,505 | ($1,226 | ) | $ | — | ($33,264 | ) | $ | — | $ | 1,504,015 | ($33,264 | ) | ||||||||||||||||
| See Notes to Financial Statements | See explanation of symbols and term, if any, on page B-8 |
B-7
PACIFIC LIFE FUNDS
Schedule of Investments (Continued)
Explanation of Symbols and Term
March 31, 2011
Schedule of Investments (Continued)
Explanation of Symbols and Term
March 31, 2011
Explanation of Symbols:
| * | Non-income producing investments. | |
| ~ | Securities are not registered under the Securities Act of 1933 (1933 Act). These securities are either (1) exempt from registration pursuant to Rule 144A of the 1933 Act and may only be sold to “qualified institutional buyers”, or (2) the securities comply with Regulation S rules governing offers and sales made outside the United States without registration under the 1933 Act and contain certain restrictions as to public resale. | |
| § | Variable rate investments. The rate shown is based on the latest available information as of March 31, 2011. For Senior Loan Notes, the rate shown may represent a weighted average interest rate. | |
| ∞ | Unsettled position. Contract rates do not take effect until settlement date. |
Abbreviation:
REIT Real Estate Investment Trust
Note: The descriptions and Standard & Poor’s quality ratings of the companies shown in the schedules of investments were obtained from published reports and other sources believed to be reliable, and are not audited by the Independent Registered Public Accounting Firm.
| See Notes to Financial Statements | B-8 |
PACIFIC LIFE FUNDS
STATEMENTS OF ASSETS AND LIABILITIES
MARCH 31, 2011
STATEMENTS OF ASSETS AND LIABILITIES
MARCH 31, 2011
| PL Portfolio Optimization Funds | PL Money | |||||||||||||||||||||||||||
| Moderate- | Moderate- | Market | PL Income | |||||||||||||||||||||||||
| Conservative Fund | Conservative Fund | Moderate Fund | Aggressive Fund | Aggressive Fund | Fund | Fund | ||||||||||||||||||||||
ASSETS | ||||||||||||||||||||||||||||
| Investments, at cost | $ | 258,392,338 | $ | 257,692,042 | $ | 725,876,964 | $ | 561,292,830 | $ | 186,688,228 | $ | 38,772,015 | $ | 55,987,068 | ||||||||||||||
| Investments in affiliated mutual funds, at value | $ | 278,320,242 | $ | 283,270,632 | $ | 805,825,026 | $ | 633,050,077 | $ | 225,542,204 | $ | — | $ | — | ||||||||||||||
| Investments, at value | 7,516 | 236,094 | 1,331,903 | 862,022 | — | 38,772,015 | 56,106,492 | |||||||||||||||||||||
| Receivables: | ||||||||||||||||||||||||||||
| Dividends and interest | — | — | — | — | — | 774 | 580,145 | |||||||||||||||||||||
| Fund shares sold | 1,370,780 | 1,329,595 | 5,320,179 | 3,036,704 | 990,183 | 20,296 | 243,774 | |||||||||||||||||||||
| Securities sold | — | — | — | — | 57,279 | — | 4,533,970 | |||||||||||||||||||||
| Due from adviser | 36,440 | 29,256 | 77,408 | 56,245 | 17,891 | 15,459 | 43,630 | |||||||||||||||||||||
| Prepaid expenses and other assets | 22,282 | 23,492 | 39,963 | 38,649 | 24,292 | 6,510 | 111,251 | |||||||||||||||||||||
| Total Assets | 279,757,260 | 284,889,069 | 812,594,479 | 637,043,697 | 226,631,849 | 38,815,054 | 61,619,262 | |||||||||||||||||||||
LIABILITIES | ||||||||||||||||||||||||||||
| Payables: | ||||||||||||||||||||||||||||
| Fund shares redeemed | 683,349 | 484,067 | 1,549,664 | 2,467,786 | 313,825 | 347,484 | 3,020 | |||||||||||||||||||||
| Securities purchased | 7,516 | 236,094 | 1,331,903 | 862,022 | — | — | 4,991,084 | |||||||||||||||||||||
| Due to custodian | — | — | — | — | 57,279 | — | — | |||||||||||||||||||||
| Income distributions | — | — | — | — | — | — | 4,577 | |||||||||||||||||||||
| Accrued advisory fees | 46,498 | 46,870 | 133,458 | 104,744 | 37,144 | — | 23,176 | |||||||||||||||||||||
| Accrued administration fees | 34,874 | 35,152 | 100,094 | 78,558 | 27,858 | — | 6,953 | |||||||||||||||||||||
| Accrued support service expenses | 12,382 | 11,430 | 32,385 | 26,479 | 9,906 | 2,095 | 3,619 | |||||||||||||||||||||
| Accrued custodian fees and expenses | 2,890 | 2,890 | 2,890 | 2,890 | 2,890 | 5,135 | 5,345 | |||||||||||||||||||||
| Accrued legal, audit and tax service fees | 38,160 | 35,224 | 99,844 | 81,685 | 30,594 | 6,460 | 10,939 | |||||||||||||||||||||
| Accrued trustees’ fees and expenses and deferred compensation | 1,504 | 2,056 | 6,501 | 6,009 | 2,321 | 3,697 | 53 | |||||||||||||||||||||
| Accrued distribution and/or service fees | 19,401 | 19,221 | 55,164 | 43,341 | 14,831 | 798 | 141 | |||||||||||||||||||||
| Accrued transfer agency out-of-pocket expenses | 17,210 | 17,218 | 51,163 | 45,373 | 16,455 | 2,153 | 3,479 | |||||||||||||||||||||
| Accrued other | 23,182 | 22,020 | 61,700 | 50,719 | 18,911 | 4,711 | 36,421 | |||||||||||||||||||||
| Total Liabilities | 886,966 | 912,242 | 3,424,766 | 3,769,606 | 532,014 | 372,533 | 5,088,807 | |||||||||||||||||||||
| NET ASSETS | $ | 278,870,294 | $ | 283,976,827 | $ | 809,169,713 | $ | 633,274,091 | $ | 226,099,835 | $ | 38,442,521 | $ | 56,530,455 | ||||||||||||||
See Notes to Financial Statements
C-1
PACIFIC LIFE FUNDS
STATEMENTS OF ASSETS AND LIABILITIES (Continued)
MARCH 31, 2011
STATEMENTS OF ASSETS AND LIABILITIES (Continued)
MARCH 31, 2011
| PL Portfolio Optimization Funds | PL Money | |||||||||||||||||||||||||||
| Moderate | Moderate- | Market | PL Income | |||||||||||||||||||||||||
| Conservative Fund | Conservative Fund | Moderate Fund | Aggressive Fund | Aggressive Fund | Fund | Fund | ||||||||||||||||||||||
NET ASSETS CONSIST OF: | ||||||||||||||||||||||||||||
| Paid-in capital | $ | 262,284,251 | $ | 267,651,532 | $ | 760,775,722 | $ | 608,455,536 | $ | 226,065,503 | $ | 38,446,186 | $ | 55,910,355 | ||||||||||||||
| Undistributed/accumulated net investment income (loss) | (1,541 | ) | 481,698 | 2,129,617 | 1,749,205 | 573,483 | (3,699 | ) | 6,275 | |||||||||||||||||||
| Undistributed/accumulated net realized gain (loss) | (3,347,836 | ) | (9,971,087 | ) | (35,015,591 | ) | (49,549,919 | ) | (39,393,127 | ) | 34 | 494,401 | ||||||||||||||||
| Net unrealized appreciation (depreciation) on investments | 19,935,420 | 25,814,684 | 81,279,965 | 72,619,269 | 38,853,976 | — | 119,424 | |||||||||||||||||||||
| NET ASSETS | $ | 278,870,294 | $ | 283,976,827 | $ | 809,169,713 | $ | 633,274,091 | $ | 226,099,835 | $ | 38,442,521 | $ | 56,530,455 | ||||||||||||||
Class A Shares: | ||||||||||||||||||||||||||||
| Net Assets | $ | 130,248,986 | $ | 132,918,638 | $ | 384,999,174 | $ | 301,232,152 | $ | 114,246,062 | $ | 38,442,521 | $ | 5,299,889 | ||||||||||||||
| Shares of beneficial interest outstanding | 11,983,618 | 11,815,219 | 32,420,483 | 25,004,207 | 9,296,213 | 38,453,326 | 521,832 | |||||||||||||||||||||
| Net Asset Value per share* | $ | 10.87 | $ | 11.25 | $ | 11.88 | $ | 12.05 | $ | 12.29 | $ | 1.00 | $ | 10.16 | ||||||||||||||
| Sales Charge (1) | 0.63 | 0.65 | 0.69 | 0.70 | 0.72 | — | 0.45 | |||||||||||||||||||||
| Maximum offering price per share | $ | 11.50 | $ | 11.90 | $ | 12.57 | $ | 12.75 | $ | 13.01 | $ | 1.00 | $ | 10.61 | ||||||||||||||
Class B Shares: | ||||||||||||||||||||||||||||
| Net Assets | $ | 22,282,190 | $ | 28,411,338 | $ | 92,063,577 | $ | 83,812,474 | $ | 30,693,498 | — | — | ||||||||||||||||
| Shares of beneficial interest outstanding | 2,067,260 | 2,543,566 | 7,804,830 | 7,022,886 | 2,550,471 | — | — | |||||||||||||||||||||
| Net Asset Value and offering price per share* | $ | 10.78 | $ | 11.17 | $ | 11.80 | $ | 11.93 | $ | 12.03 | — | — | ||||||||||||||||
Class C Shares: | ||||||||||||||||||||||||||||
| Net Assets | $ | 117,457,955 | $ | 107,411,317 | $ | 308,448,920 | $ | 230,964,198 | $ | 75,607,418 | — | — | ||||||||||||||||
| Shares of beneficial interest outstanding | 10,905,548 | 9,620,440 | 26,185,201 | 19,396,943 | 6,282,882 | — | — | |||||||||||||||||||||
| Net Asset Value and offering price per share* | $ | 10.77 | $ | 11.16 | $ | 11.78 | $ | 11.91 | $ | 12.03 | — | — | ||||||||||||||||
Class R Shares: | ||||||||||||||||||||||||||||
| Net Assets | $ | 8,881,163 | $ | 15,235,534 | $ | 23,658,042 | $ | 17,265,267 | $ | 5,552,857 | — | — | ||||||||||||||||
| Shares of beneficial interest outstanding | 819,689 | 1,357,946 | 1,998,222 | 1,435,029 | 454,534 | — | — | |||||||||||||||||||||
| Net Asset Value per share | $ | 10.83 | $ | 11.22 | $ | 11.84 | $ | 12.03 | $ | 12.22 | — | — | ||||||||||||||||
Class I Shares: | ||||||||||||||||||||||||||||
| Net Assets | — | — | — | — | — | — | $ | 51,230,566 | ||||||||||||||||||||
| Shares of beneficial interest outstanding | — | — | — | — | — | — | 5,044,009 | |||||||||||||||||||||
| Net Asset Value per share | — | — | — | — | — | — | $ | 10.16 | ||||||||||||||||||||
| * | Redemption price per share is equal to the Net Asset Value per share less any applicable contingent deferred sales charge. | |
| (1) | The PL Portfolio Optimization Funds are subject to a maximum 5.50% front-end sales charge, the PL Money Market Fund is not subject to a front-end sales charge, and the PL Income Fund is subject to a maximum 4.25% front-end sales charge. |
See Notes to Financial Statements
C-2
PACIFIC LIFE FUNDS
STATEMENTS OF OPERATIONS
FOR THE YEAR OR PERIOD ENDED MARCH 31, 2011
STATEMENTS OF OPERATIONS
FOR THE YEAR OR PERIOD ENDED MARCH 31, 2011
| PL Portfolio Optimization Funds | PL Money | |||||||||||||||||||||||||||
| Moderate- | Moderate- | Market | PL Income | |||||||||||||||||||||||||
| Conservative Fund | Conservative Fund | Moderate Fund | Aggressive Fund | Aggressive Fund | Fund | Fund(1) | ||||||||||||||||||||||
INVESTMENT INCOME | ||||||||||||||||||||||||||||
| Dividends from affiliated mutual fund investments | $ | 4,521,836 | $ | 3,733,104 | $ | 9,276,269 | $ | 6,093,504 | $ | 1,933,631 | $ | — | $ | — | ||||||||||||||
| Dividends from mutual fund investments | 128 | 21 | 931 | 26 | 1 | 5 | — | |||||||||||||||||||||
| Interest | — | — | — | — | — | 108,182 | 537,450 | |||||||||||||||||||||
| Total Investment Income | 4,521,964 | 3,733,125 | 9,277,200 | 6,093,530 | 1,933,632 | 108,187 | 537,450 | |||||||||||||||||||||
EXPENSES | ||||||||||||||||||||||||||||
| Advisory fees | 462,520 | 445,358 | 1,299,201 | 1,078,087 | 410,482 | 88,994 | 59,424 | |||||||||||||||||||||
| Administration fees | 412,818 | 402,075 | 1,184,806 | 993,374 | 381,475 | 133,492 | 18,423 | |||||||||||||||||||||
| Support services expenses | 39,074 | 38,336 | 113,814 | 96,743 | 38,322 | 15,301 | 3,619 | |||||||||||||||||||||
| Custodian fees and expenses | 9,563 | 9,563 | 9,676 | 9,563 | 9,563 | 18,238 | 5,345 | |||||||||||||||||||||
| Shareholder report expenses | 37,554 | 36,697 | 109,213 | 93,166 | 36,891 | 7,213 | 3,182 | |||||||||||||||||||||
| Distribution and/or service fees | ||||||||||||||||||||||||||||
| Class A | 269,773 | 258,055 | 750,948 | 627,117 | 259,393 | 111,243 | 992 | |||||||||||||||||||||
| Class B (2) | 182,099 | 231,916 | 751,050 | 722,367 | 287,777 | — | — | |||||||||||||||||||||
| Class C (2) | 967,650 | 842,001 | 2,497,958 | 2,025,298 | 679,640 | — | — | |||||||||||||||||||||
| Class R (2) | 41,879 | 60,327 | 121,603 | 67,153 | 23,711 | — | — | |||||||||||||||||||||
| Transfer agency out-of-pocket expenses | 84,182 | 86,212 | 264,935 | 239,090 | 91,365 | 11,981 | 5,236 | |||||||||||||||||||||
| Registration fees | 92,136 | 71,509 | 117,485 | 96,726 | 68,135 | 26,493 | 2,398 | |||||||||||||||||||||
| Legal, audit and tax service fees | 61,011 | 58,000 | 168,376 | 140,982 | 54,293 | 21,469 | 11,492 | |||||||||||||||||||||
| Trustees’ fees and expenses | 11,153 | 10,792 | 31,746 | 26,951 | 10,551 | 2,040 | 1,218 | |||||||||||||||||||||
| Offering expenses | — | — | — | — | — | — | 47,358 | |||||||||||||||||||||
| Other | 19,983 | 20,245 | 58,257 | 51,856 | 21,315 | 10,023 | 5,319 | |||||||||||||||||||||
| Total Expenses | 2,691,395 | 2,571,086 | 7,479,068 | 6,268,473 | 2,372,913 | 446,487 | 164,006 | |||||||||||||||||||||
| Advisory Fee Waiver | — | — | — | — | — | (88,994 | ) | — | ||||||||||||||||||||
| Adviser Reimbursement and/or Administrator Fee Reduction (3) | (486,514 | ) | (467,467 | ) | (1,294,312 | ) | (1,124,694 | ) | (477,661 | ) | (241,090 | ) | (85,763 | ) | ||||||||||||||
| Distribution and/or Service Fees Waiver | (109,880 | ) | (113,427 | ) | (350,675 | ) | (308,014 | ) | (122,688 | ) | (8,182 | ) | — | |||||||||||||||
| Net Expenses | 2,095,001 | 1,990,192 | 5,834,081 | 4,835,765 | 1,772,564 | 108,221 | 78,243 | |||||||||||||||||||||
| NET INVESTMENT INCOME (LOSS) | 2,426,963 | 1,742,933 | 3,443,119 | 1,257,765 | 161,068 | (34 | ) | 459,207 | ||||||||||||||||||||
NET REALIZED AND UNREALIZED GAIN (LOSS) | ||||||||||||||||||||||||||||
| Net Realized Gain (Loss) On: | ||||||||||||||||||||||||||||
| Investment security transactions in affiliated mutual funds | 1,463,882 | (2,204,762 | ) | (11,368,450 | ) | (11,538,765 | ) | (7,217,637 | ) | — | — | |||||||||||||||||
| Investment security transactions | 163 | 158 | 469 | 401 | 158 | 34 | 450,228 | |||||||||||||||||||||
| Swap transactions | — | — | — | — | — | — | 51,639 | |||||||||||||||||||||
| Capital gain distributions from affiliated mutual fund investments | 4,150,463 | 3,381,812 | 6,645,431 | 4,476,334 | 1,352,204 | — | — | |||||||||||||||||||||
| Net Realized Gain (Loss) | 5,614,508 | 1,177,208 | (4,722,550 | ) | (7,062,030 | ) | (5,865,275 | ) | 34 | 501,867 | ||||||||||||||||||
| Change In Net Unrealized Appreciation (Depreciation) On: | ||||||||||||||||||||||||||||
| Investment securities in affiliated mutual funds | 9,101,884 | 18,241,955 | 77,730,242 | 79,657,093 | 36,869,932 | — | — | |||||||||||||||||||||
| Investment securities | — | — | — | — | — | — | 119,424 | |||||||||||||||||||||
| Change in Net Unrealized Appreciation (Depreciation) | 9,101,884 | 18,241,955 | 77,730,242 | 79,657,093 | 36,869,932 | — | 119,424 | |||||||||||||||||||||
| NET GAIN | 14,716,392 | 19,419,163 | 73,007,692 | 72,595,063 | 31,004,657 | 34 | 621,291 | |||||||||||||||||||||
| NET INCREASE (DECREASE) IN NET ASSETS RESULTING FROM | ||||||||||||||||||||||||||||
| OPERATIONS | $ | 17,143,355 | $ | 21,162,096 | $ | 76,450,811 | $ | 73,852,828 | $ | 31,165,725 | $ | — | $ | 1,080,498 | ||||||||||||||
| (1) | Operations commenced on December 31, 2010. | |
| (2) | Class B, C and R shares are offered to the PL Portfolio Optimization Funds only. | |
| (3) | See Note 5 in Notes to Financial Statements. |
See Notes to Financial Statements
C-3
PACIFIC LIFE FUNDS
STATEMENTS OF CHANGES IN NET ASSETS
STATEMENTS OF CHANGES IN NET ASSETS
| PL Portfolio Optimization | PL Portfolio Optimization | PL Portfolio Optimization | PL Portfolio Optimization | |||||||||||||||||||||||||||||
| Conservative Fund | Moderate-Conservative Fund | Moderate Fund | Moderate-Aggressive Fund | |||||||||||||||||||||||||||||
| Year Ended | Year Ended | Year Ended | Year Ended | Year Ended, | Year Ended | Year Ended, | Year Ended | |||||||||||||||||||||||||
| March 31, 2011 | March 31, 2010 | March 31, 2011 | March 31, 2010 | March 31, 2011 | March 31, 2010 | March 31, 2011 | March 31, 2010 | |||||||||||||||||||||||||
OPERATIONS | ||||||||||||||||||||||||||||||||
| Net investment income | $ | 2,426,963 | $ | 3,277,105 | $ | 1,742,933 | $ | 2,947,406 | $ | 3,443,119 | $ | 6,898,619 | $ | 1,257,765 | $ | 3,841,042 | ||||||||||||||||
| Net realized gain (loss) | 5,614,508 | (2,367,128 | ) | 1,177,208 | (4,826,492 | ) | (4,722,550 | ) | (16,496,114 | ) | (7,062,030 | ) | (30,603,203 | ) | ||||||||||||||||||
| Change in net unrealized appreciation | 9,101,884 | 19,660,083 | 18,241,955 | 33,278,746 | 77,730,242 | 138,905,984 | 79,657,093 | 175,714,887 | ||||||||||||||||||||||||
| Net Increase in Net Assets Resulting from Operations | 17,143,355 | 20,570,060 | 21,162,096 | 31,399,660 | 76,450,811 | 129,308,489 | 73,852,828 | 148,952,726 | ||||||||||||||||||||||||
DISTRIBUTIONS TO SHAREHOLDERS | ||||||||||||||||||||||||||||||||
| Net investment income | ||||||||||||||||||||||||||||||||
| Class A | (3,593,206 | ) | (1,710,474 | ) | (2,708,809 | ) | (1,614,143 | ) | (5,861,904 | ) | (4,160,973 | ) | (3,198,720 | ) | (2,602,301 | ) | ||||||||||||||||
| Class B | (479,073 | ) | (279,755 | ) | (453,971 | ) | (339,598 | ) | (947,544 | ) | (831,429 | ) | (413,315 | ) | (446,128 | ) | ||||||||||||||||
| Class C | (2,524,717 | ) | (1,401,774 | ) | (1,680,826 | ) | (1,145,058 | ) | (3,190,968 | ) | (2,524,685 | ) | (1,199,785 | ) | (1,189,157 | ) | ||||||||||||||||
| Class R | (227,648 | ) | (191,258 | ) | (297,015 | ) | (225,209 | ) | (392,225 | ) | (401,521 | ) | (140,419 | ) | (138,865 | ) | ||||||||||||||||
| Net realized gains | ||||||||||||||||||||||||||||||||
| Class A | — | (106,162 | ) | — | — | — | — | — | — | |||||||||||||||||||||||
| Class B | — | (23,898 | ) | — | — | — | — | — | — | |||||||||||||||||||||||
| Class C | — | (117,264 | ) | — | — | — | — | — | — | |||||||||||||||||||||||
| Class R | — | (12,184 | ) | — | — | — | — | — | — | |||||||||||||||||||||||
| Net Decrease in Net Assets Resulting from Dividends and Distributions to Shareholders | (6,824,644 | ) | (3,842,769 | ) | (5,140,621 | ) | (3,324,008 | ) | (10,392,641 | ) | (7,918,608 | ) | (4,952,239 | ) | (4,376,451 | ) | ||||||||||||||||
CAPITAL SHARE TRANSACTIONS | ||||||||||||||||||||||||||||||||
| Proceeds from sale of shares | ||||||||||||||||||||||||||||||||
| Class A | 104,781,421 | 50,752,914 | 80,784,715 | 40,790,178 | 185,986,071 | 93,246,975 | 121,425,845 | 65,603,064 | ||||||||||||||||||||||||
| Class B | 12,759,957 | 5,817,970 | 12,279,576 | 6,690,345 | 33,183,939 | 16,242,994 | 22,860,115 | 11,566,216 | ||||||||||||||||||||||||
| Class C | 88,154,402 | 45,745,410 | 55,590,836 | 25,952,657 | 123,838,803 | 75,334,134 | 65,553,149 | 44,834,816 | ||||||||||||||||||||||||
| Class R | 4,081,989 | 5,594,582 | 7,703,990 | 6,560,716 | 11,894,550 | 13,380,310 | 7,156,992 | 10,113,346 | ||||||||||||||||||||||||
| Dividends and distribution reinvestments | ||||||||||||||||||||||||||||||||
| Class A | 2,892,117 | 1,558,693 | 2,437,411 | 1,498,188 | 5,379,578 | 3,842,035 | 2,983,736 | 2,456,310 | ||||||||||||||||||||||||
| Class B | 427,599 | 280,171 | 424,066 | 318,466 | 899,819 | 790,075 | 398,886 | 430,112 | ||||||||||||||||||||||||
| Class C | 2,127,507 | 1,341,548 | 1,479,706 | 1,045,210 | 2,904,360 | 2,369,247 | 1,118,086 | 1,134,414 | ||||||||||||||||||||||||
| Class R | 227,284 | 202,846 | 297,015 | 225,209 | 391,387 | 400,842 | 140,419 | 138,865 | ||||||||||||||||||||||||
| Cost of shares repurchased | ||||||||||||||||||||||||||||||||
| Class A | (51,195,607 | ) | (23,064,174 | ) | (36,084,313 | ) | (15,266,919 | ) | (84,457,616 | ) | (40,358,953 | ) | (80,660,446 | ) | (35,242,574 | ) | ||||||||||||||||
| Class B | (5,031,808 | ) | (2,677,685 | ) | (5,109,134 | ) | (3,115,431 | ) | (14,909,440 | ) | (7,808,728 | ) | (17,358,312 | ) | (7,692,928 | ) | ||||||||||||||||
| Class C | (44,764,772 | ) | (24,597,878 | ) | (20,738,361 | ) | (14,008,363 | ) | (54,487,355 | ) | (37,125,941 | ) | (51,398,155 | ) | (30,185,514 | ) | ||||||||||||||||
| Class R | (3,774,101 | ) | (1,796,648 | ) | (4,035,851 | ) | (2,898,487 | ) | (15,183,105 | ) | (7,339,654 | ) | (3,961,554 | ) | (7,037,738 | ) | ||||||||||||||||
| Net Increase in Net Assets from Capital Share Transactions | 110,685,988 | 59,157,749 | 95,029,656 | 47,791,769 | 195,440,991 | 112,973,336 | 68,258,761 | 56,118,389 | ||||||||||||||||||||||||
| NET INCREASE IN NET ASSETS | 121,004,699 | 75,885,040 | 111,051,131 | 75,867,421 | 261,499,161 | 234,363,217 | 137,159,350 | 200,694,664 | ||||||||||||||||||||||||
NET ASSETS | ||||||||||||||||||||||||||||||||
| Beginning of Year | 157,865,595 | 81,980,555 | 172,925,696 | 97,058,275 | 547,670,552 | 313,307,335 | 496,114,741 | 295,420,077 | ||||||||||||||||||||||||
| End of Year | $ | 278,870,294 | $ | 157,865,595 | $ | 283,976,827 | $ | 172,925,696 | $ | 809,169,713 | $ | 547,670,552 | $ | 633,274,091 | $ | 496,114,741 | ||||||||||||||||
| Undistributed/Accumulated Net Investment Income (Loss) | $ | (1,541 | ) | $ | 778,905 | $ | 481,698 | $ | 1,497,808 | $ | 2,129,617 | $ | 4,542,909 | $ | 1,749,205 | $ | 3,042,265 | |||||||||||||||
See Notes to Financial Statements
C-4
PACIFIC LIFE FUNDS
STATEMENTS OF CHANGES IN NET ASSETS (Continued)
STATEMENTS OF CHANGES IN NET ASSETS (Continued)
| PL Portfolio Optimization | PL Money Market | PL Income | ||||||||||||||||||
| Aggressive Fund | Fund | Fund (1) | ||||||||||||||||||
| Year Ended | Year Ended | Year Ended | Year Ended | Period Ended | ||||||||||||||||
| March 31, 2011 | March 31, 2010 | March 31, 2011 | March 31, 2010 | March 31, 2011 | ||||||||||||||||
OPERATIONS | ||||||||||||||||||||
| Net investment income (loss) | $ | 161,068 | $ | 982,773 | $ | (34 | ) | $ | (173 | ) | $ | 459,207 | ||||||||
| Net realized gain (loss) | (5,865,275 | ) | (24,928,333 | ) | 34 | 201 | 501,867 | |||||||||||||
| Change in net unrealized appreciation (depreciation) | 36,869,932 | 94,510,444 | — | — | 119,424 | |||||||||||||||
| Net Increase (Decrease) in Net Assets Resulting from Operations | 31,165,725 | 70,564,884 | — | 28 | 1,080,498 | |||||||||||||||
DISTRIBUTIONS TO SHAREHOLDERS | ||||||||||||||||||||
| Net investment income | ||||||||||||||||||||
| Class A | (653,565 | ) | (843,794 | ) | — | (10,057 | ) | (23,783 | ) | |||||||||||
| Class B | (139,088 | ) | (69,556 | ) | — | — | — | |||||||||||||
| Class C | (314,226 | ) | (153,091 | ) | — | — | — | |||||||||||||
| Class R | (27,172 | ) | (40,677 | ) | — | — | — | |||||||||||||
| Class I | — | — | — | — | (437,607 | ) | ||||||||||||||
| Net Decrease in Net Assets Resulting from Dividends and Distributions to Shareholders | (1,134,051 | ) | (1,107,118 | ) | — | (10,057 | ) | (461,390 | ) | |||||||||||
CAPITAL SHARE TRANSACTIONS | ||||||||||||||||||||
| Proceeds from sale of shares | ||||||||||||||||||||
| Class A | 38,968,570 | 27,309,375 | 88,260,849 | 52,775,972 | 5,581,764 | |||||||||||||||
| Class B | 6,508,358 | 4,468,034 | — | — | — | |||||||||||||||
| Class C | 30,970,677 | 19,255,411 | — | — | — | |||||||||||||||
| Class R | 2,314,952 | 3,407,327 | — | — | — | |||||||||||||||
| Class I | — | — | — | — | 50,161,102 | |||||||||||||||
| Dividends and distribution reinvestments | ||||||||||||||||||||
| Class A | 628,094 | 807,649 | — | 9,957 | 16,590 | |||||||||||||||
| Class B | 133,256 | 66,789 | — | — | — | |||||||||||||||
| Class C | 294,024 | 147,013 | — | — | — | |||||||||||||||
| Class R | 27,172 | 40,677 | — | — | — | |||||||||||||||
| Class I | — | — | — | — | 437,607 | |||||||||||||||
| Cost of shares repurchased | ||||||||||||||||||||
| Class A | (39,713,135 | ) | (22,695,126 | ) | (84,487,252 | ) | (73,530,933 | ) | (285,716 | ) | ||||||||||
| Class B | (8,809,245 | ) | (3,834,070 | ) | — | — | — | |||||||||||||
| Class C | (33,444,485 | ) | (19,134,707 | ) | — | — | — | |||||||||||||
| Class R | (1,932,830 | ) | (2,846,769 | ) | — | — | — | |||||||||||||
| Net Increase (Decrease) in Net Assets from Capital Share Transactions | (4,054,592 | ) | 6,991,603 | 3,773,597 | (20,745,004 | ) | 55,911,347 | |||||||||||||
| NET INCREASE (DECREASE) IN NET ASSETS | 25,977,082 | 76,449,369 | 3,773,597 | (20,755,033 | ) | 56,530,455 | ||||||||||||||
NET ASSETS | ||||||||||||||||||||
| Beginning of Year or Period | 200,122,753 | 123,673,384 | 34,668,924 | 55,423,957 | — | |||||||||||||||
| End of Year or Period | $ | 226,099,835 | $ | 200,122,753 | $ | 38,442,521 | $ | 34,668,924 | $ | 56,530,455 | ||||||||||
| Undistributed/Accumulated Net Investment Income (Loss) | $ | 573,483 | $ | 1,132,279 | $ | (3,699 | ) | $ | (3,665 | ) | $ | 6,275 | ||||||||
| (1) | Operations commenced on December 31, 2010. |
See Notes to Financial Statements
C-5
PACIFIC LIFE FUNDS
FINANCIAL HIGHLIGHTS
Selected per share, ratios and supplemental data for each year or period ended March 31 were as follows:
FINANCIAL HIGHLIGHTS
Selected per share, ratios and supplemental data for each year or period ended March 31 were as follows:
| Investment Activities | Distributions | Ratios/Supplemental Data | ||||||||||||||||||||||||||||||||||||||||||||||||||||||||||
| For the Year or Period Ended | Net Asset Value, Beginning of Year or Period | Net Investment Income (1) | Net Realized and Unrealized Gain (Loss) | Total from Investment Activities | Distributions from Net Investment Income | Distributions from Capital Gains | Total Distributions | Net Asset Value, End of Year or Period | Total Returns (2) | Net Assets, End of Year or Period (in thousands) | Ratios of Expenses After Expense Reductions to Average Net Assets (3), (4) | Ratios of Expenses Before Expense Reductions to Average Net Assets (4) | Ratios of Net Investment Income to Average Net Assets (4) | Portfolio Turnover Rates | ||||||||||||||||||||||||||||||||||||||||||||||
| PL Portfolio Optimization Conservative Fund | ||||||||||||||||||||||||||||||||||||||||||||||||||||||||||||
| Class A: | 4/1/2010 - 3/31/2011 | $ | 10.41 | $ | 0.15 | $ | 0.63 | $ | 0.78 | $ | ( 0.32 | ) | $ | — | $ | ( 0.32 | ) | $ | 10.87 | 7.60 | % | $ | 130,249 | 0.53 | % | 0.78 | % | 1.43 | % | 18.42 | % | |||||||||||||||||||||||||||||
| 4/1/2009 - 3/31/2010 | 8.84 | 0.32 | 1.59 | 1.91 | (0.31 | ) | (0.03 | ) | (0.34 | ) | 10.41 | 21.67 | % | 68,938 | 0.20 | % | 0.95 | % | 3.20 | % | 20.50 | % | ||||||||||||||||||||||||||||||||||||||
| 4/1/2008 - 3/31/2009 | 10.55 | 0.37 | (1.50 | ) | (1.13 | ) | (0.55 | ) | (0.03 | ) | (0.58 | ) | 8.84 | (10.78 | %) | 32,817 | 0.16 | % | 0.95 | % | 3.91 | % | 26.41 | % | ||||||||||||||||||||||||||||||||||||
| 4/1/2007 - 3/31/2008 | 10.51 | 0.34 | 0.19 | 0.53 | (0.35 | ) | (0.14 | ) | (0.49 | ) | 10.55 | 5.15 | % | 24,003 | 0.00 | % | 0.94 | % | 3.20 | % | 43.30 | % | ||||||||||||||||||||||||||||||||||||||
| 4/1/2006 - 3/31/2007 | 10.34 | 0.29 | 0.33 | 0.62 | (0.28 | ) | (0.17 | ) | (0.45 | ) | 10.51 | 6.12 | % | 11,730 | 0.02 | % | 1.37 | % | 2.77 | % | 35.84 | % | ||||||||||||||||||||||||||||||||||||||
| Class B: | 4/1/2010 - 3/31/2011 | $ | 10.34 | $ | 0.07 | $ | 0.63 | $ | 0.70 | $ | ( 0.26 | ) | $ | — | $ | ( 0.26 | ) | $ | 10.78 | 6.80 | % | $ | 22,282 | 1.27 | % | 1.53 | % | 0.68 | % | 18.42 | % | |||||||||||||||||||||||||||||
| 4/1/2009 - 3/31/2010 | 8.77 | 0.24 | 1.60 | 1.84 | (0.24 | ) | (0.03 | ) | (0.27 | ) | 10.34 | 21.07 | % | 13,336 | 0.95 | % | 1.70 | % | 2.45 | % | 20.50 | % | ||||||||||||||||||||||||||||||||||||||
| 4/1/2008 - 3/31/2009 | 10.49 | 0.30 | (1.50 | ) | (1.20 | ) | (0.49 | ) | (0.03 | ) | (0.52 | ) | 8.77 | (11.51 | %) | 8,306 | 0.91 | % | 1.70 | % | 3.16 | % | 26.41 | % | ||||||||||||||||||||||||||||||||||||
| 4/1/2007 - 3/31/2008 | 10.46 | 0.26 | 0.19 | 0.45 | (0.28 | ) | (0.14 | ) | (0.42 | ) | 10.49 | 4.42 | % | 4,895 | 0.75 | % | 1.69 | % | 2.45 | % | 43.30 | % | ||||||||||||||||||||||||||||||||||||||
| 4/1/2006 - 3/31/2007 | 10.30 | 0.23 | 0.33 | 0.56 | (0.23 | ) | (0.17 | ) | (0.40 | ) | 10.46 | 5.52 | % | 2,822 | 0.58 | % | 1.93 | % | 2.20 | % | 35.84 | % | ||||||||||||||||||||||||||||||||||||||
| Class C: | 4/1/2010 - 3/31/2011 | $ | 10.33 | $ | 0.07 | $ | 0.63 | $ | 0.70 | $ | ( 0.26 | ) | $ | — | $ | ( 0.26 | ) | $ | 10.77 | 6.81 | % | $ | 117,458 | 1.27 | % | 1.53 | % | 0.68 | % | 18.42 | % | |||||||||||||||||||||||||||||
| 4/1/2009 - 3/31/2010 | 8.76 | 0.24 | 1.61 | 1.85 | (0.25 | ) | (0.03 | ) | (0.28 | ) | 10.33 | 21.14 | % | 67,620 | 0.95 | % | 1.70 | % | 2.45 | % | 20.50 | % | ||||||||||||||||||||||||||||||||||||||
| 4/1/2008 - 3/31/2009 | 10.49 | 0.30 | (1.51 | ) | (1.21 | ) | (0.49 | ) | (0.03 | ) | (0.52 | ) | 8.76 | (11.63 | %) | 37,659 | 0.91 | % | 1.70 | % | 3.16 | % | 26.41 | % | ||||||||||||||||||||||||||||||||||||
| 4/1/2007 - 3/31/2008 | 10.45 | 0.26 | 0.20 | 0.46 | (0.28 | ) | (0.14 | ) | (0.42 | ) | 10.49 | 4.48 | % | 25,841 | 0.75 | % | 1.69 | % | 2.45 | % | 43.30 | % | ||||||||||||||||||||||||||||||||||||||
| 4/1/2006 - 3/31/2007 | 10.29 | 0.23 | 0.33 | 0.56 | (0.23 | ) | (0.17 | ) | (0.40 | ) | 10.45 | 5.55 | % | 16,322 | 0.58 | % | 1.93 | % | 2.20 | % | 35.84 | % | ||||||||||||||||||||||||||||||||||||||
| Class R: | 4/1/2010 - 3/31/2011 | $ | 10.38 | $ | 0.13 | $ | 0.61 | $ | 0.74 | $ | ( 0.29 | ) | $ | — | $ | ( 0.29 | ) | $ | 10.83 | 7.25 | % | $ | 8,881 | 0.75 | % | 1.03 | % | 1.20 | % | 18.42 | % | |||||||||||||||||||||||||||||
| 4/1/2009 - 3/31/2010 | 8.81 | 0.29 | 1.60 | 1.89 | (0.29 | ) | (0.03 | ) | (0.32 | ) | 10.38 | 21.53 | % | 7,972 | 0.45 | % | 1.20 | % | 2.95 | % | 20.50 | % | ||||||||||||||||||||||||||||||||||||||
| 4/1/2008 - 3/31/2009 | 10.53 | 0.34 | (1.50 | ) | (1.16 | ) | (0.53 | ) | (0.03 | ) | (0.56 | ) | 8.81 | (11.07 | %) | 3,197 | 0.41 | % | 1.20 | % | 3.66 | % | 26.41 | % | ||||||||||||||||||||||||||||||||||||
| 4/1/2007 - 3/31/2008 | 10.50 | 0.31 | 0.19 | 0.50 | (0.33 | ) | (0.14 | ) | (0.47 | ) | 10.53 | 4.90 | % | 1,629 | 0.25 | % | 1.19 | % | 2.95 | % | 43.30 | % | ||||||||||||||||||||||||||||||||||||||
| 4/1/2006 - 3/31/2007 | 10.33 | 0.28 | 0.34 | 0.62 | (0.28 | ) | (0.17 | ) | (0.45 | ) | 10.50 | 6.13 | % | 216 | 0.10 | % | 1.43 | % | 2.68 | % | 35.84 | % | ||||||||||||||||||||||||||||||||||||||
| PL Portfolio Optimization Moderate-Conservative Fund | ||||||||||||||||||||||||||||||||||||||||||||||||||||||||||||
| Class A: | 4/1/2010 - 3/31/2011 | $ | 10.54 | $ | 0.12 | $ | 0.87 | $ | 0.99 | $ | ( 0.28 | ) | $ | — | $ | ( 0.28 | ) | $ | 11.25 | 9.53 | % | $ | 132,919 | 0.52 | % | 0.78 | % | 1.16 | % | 9.61 | % | |||||||||||||||||||||||||||||
| 4/1/2009 - 3/31/2010 | 8.36 | 0.26 | 2.19 | 2.45 | (0.27 | ) | — | (0.27 | ) | 10.54 | 29.60 | % | 78,160 | 0.20 | % | 0.95 | % | 2.58 | % | 10.42 | % | |||||||||||||||||||||||||||||||||||||||
| 4/1/2008 - 3/31/2009 | 10.96 | 0.30 | (2.36 | ) | (2.06 | ) | (0.44 | ) | (0.10 | ) | (0.54 | ) | 8.36 | (19.15 | %) | 39,518 | 0.14 | % | 0.92 | % | 3.10 | % | 31.68 | % | ||||||||||||||||||||||||||||||||||||
| 4/1/2007 - 3/31/2008 | 11.21 | 0.28 | (0.01 | ) | 0.27 | (0.34 | ) | (0.18 | ) | (0.52 | ) | 10.96 | 2.31 | % | 50,389 | 0.00 | % | 0.82 | % | 2.50 | % | 10.38 | % | |||||||||||||||||||||||||||||||||||||
| 4/1/2006 - 3/31/2007 | 10.87 | 0.23 | 0.61 | 0.84 | (0.25 | ) | (0.25 | ) | (0.50 | ) | 11.21 | 7.93 | % | 36,345 | 0.01 | % | 1.18 | % | 2.13 | % | 18.25 | % | ||||||||||||||||||||||||||||||||||||||
| Class B: | 4/1/2010 - 3/31/2011 | $ | 10.47 | $ | 0.04 | $ | 0.87 | $ | 0.91 | $ | ( 0.21 | ) | $ | — | $ | ( 0.21 | ) | $ | 11.17 | 8.78 | % | $ | 28,411 | 1.27 | % | 1.53 | % | 0.41 | % | 9.61 | % | |||||||||||||||||||||||||||||
| 4/1/2009 - 3/31/2010 | 8.30 | 0.18 | 2.20 | 2.38 | (0.21 | ) | — | (0.21 | ) | 10.47 | 28.87 | % | 19,202 | 0.95 | % | 1.70 | % | 1.83 | % | 10.42 | % | |||||||||||||||||||||||||||||||||||||||
| 4/1/2008 - 3/31/2009 | 10.89 | 0.23 | (2.36 | ) | (2.13 | ) | (0.36 | ) | (0.10 | ) | (0.46 | ) | 8.30 | (19.85 | %) | 11,943 | 0.89 | % | 1.67 | % | 2.35 | % | 31.68 | % | ||||||||||||||||||||||||||||||||||||
| 4/1/2007 - 3/31/2008 | 11.15 | 0.20 | (0.02 | ) | 0.18 | (0.26 | ) | (0.18 | ) | (0.44 | ) | 10.89 | 1.53 | % | 15,092 | 0.75 | % | 1.57 | % | 1.75 | % | 10.38 | % | |||||||||||||||||||||||||||||||||||||
| 4/1/2006 - 3/31/2007 | 10.82 | 0.17 | 0.61 | 0.78 | (0.20 | ) | (0.25 | ) | (0.45 | ) | 11.15 | 7.39 | % | 12,098 | 0.58 | % | 1.75 | % | 1.56 | % | 18.25 | % | ||||||||||||||||||||||||||||||||||||||
| Class C: | 4/1/2010 - 3/31/2011 | $ | 10.47 | $ | 0.04 | $ | 0.86 | $ | 0.90 | $ | ( 0.21 | ) | $ | — | $ | ( 0.21 | ) | $ | 11.16 | 8.71 | % | $ | 107,411 | 1.27 | % | 1.53 | % | 0.41 | % | 9.61 | % | |||||||||||||||||||||||||||||
| 4/1/2009 - 3/31/2010 | 8.30 | 0.18 | 2.20 | 2.38 | (0.21 | ) | — | (0.21 | ) | 10.47 | 28.87 | % | 65,086 | 0.95 | % | 1.70 | % | 1.83 | % | 10.42 | % | |||||||||||||||||||||||||||||||||||||||
| 4/1/2008 - 3/31/2009 | 10.89 | 0.22 | (2.35 | ) | (2.13 | ) | (0.36 | ) | (0.10 | ) | (0.46 | ) | 8.30 | (19.84 | %) | 40,640 | 0.89 | % | 1.67 | % | 2.35 | % | 31.68 | % | ||||||||||||||||||||||||||||||||||||
| 4/1/2007 - 3/31/2008 | 11.16 | 0.20 | (0.02 | ) | 0.18 | (0.27 | ) | (0.18 | ) | (0.45 | ) | 10.89 | 1.51 | % | 48,205 | 0.75 | % | 1.57 | % | 1.75 | % | 10.38 | % | |||||||||||||||||||||||||||||||||||||
| 4/1/2006 - 3/31/2007 | 10.83 | 0.17 | 0.61 | 0.78 | (0.20 | ) | (0.25 | ) | (0.45 | ) | 11.16 | 7.38 | % | 30,464 | 0.58 | % | 1.75 | % | 1.56 | % | 18.25 | % | ||||||||||||||||||||||||||||||||||||||
| Class R: | 4/1/2010 - 3/31/2011 | $ | 10.51 | $ | 0.10 | $ | 0.86 | $ | 0.96 | $ | ( 0.25 | ) | $ | — | $ | ( 0.25 | ) | $ | 11.22 | 9.32 | % | $ | 15,236 | 0.76 | % | 1.03 | % | 0.91 | % | 9.61 | % | |||||||||||||||||||||||||||||
| 4/1/2009 - 3/31/2010 | 8.34 | 0.23 | 2.20 | 2.43 | (0.26 | ) | — | (0.26 | ) | 10.51 | 29.32 | % | 10,478 | 0.45 | % | 1.20 | % | 2.33 | % | 10.42 | % | |||||||||||||||||||||||||||||||||||||||
| 4/1/2008 - 3/31/2009 | 10.94 | 0.27 | (2.36 | ) | (2.09 | ) | (0.41 | ) | (0.10 | ) | (0.51 | ) | 8.34 | (19.36 | %) | 4,957 | 0.39 | % | 1.17 | % | 2.85 | % | 31.68 | % | ||||||||||||||||||||||||||||||||||||
| 4/1/2007 - 3/31/2008 | 11.20 | 0.25 | (0.01 | ) | 0.24 | (0.32 | ) | (0.18 | ) | (0.50 | ) | 10.94 | 2.03 | % | 3,031 | 0.25 | % | 1.07 | % | 2.25 | % | 10.38 | % | |||||||||||||||||||||||||||||||||||||
| 4/1/2006 - 3/31/2007 | 10.87 | 0.22 | 0.61 | 0.83 | (0.25 | ) | (0.25 | ) | (0.50 | ) | 11.20 | 7.84 | % | 1,373 | 0.10 | % | 1.25 | % | 2.04 | % | 18.25 | % | ||||||||||||||||||||||||||||||||||||||
| See Notes to Financial Statements | See explanation of references on C-8 |
C-6
PACIFIC LIFE FUNDS
FINANCIAL HIGHLIGHTS (Continued)
Selected per share, ratios and supplemental data for each year or period ended March 31 were as follows:
FINANCIAL HIGHLIGHTS (Continued)
Selected per share, ratios and supplemental data for each year or period ended March 31 were as follows:
| Ratios/Supplemental Data | ||||||||||||||||||||||||||||||||||||||||||||||||||||||||||
| Ratios of Expenses | Ratios of Expenses | |||||||||||||||||||||||||||||||||||||||||||||||||||||||||
| Investment Activities | Distributions | After Expense | Before Expense | Ratios of Net | ||||||||||||||||||||||||||||||||||||||||||||||||||||||
| Net Asset Value, | Net Realized and | Total from | Distributions from | Net Asset Value, | Net Assets, End of | Reductions to | Reductions to | Investment Income | Portfolio | |||||||||||||||||||||||||||||||||||||||||||||||||
| Beginning of Year | Net Investment | Unrealized Gain | Investment | Net | Distributions from | Total | End of Year or | Total | Year or Period | Average Net Assets | Average Net Assets | (Loss) to Average | Turnover | |||||||||||||||||||||||||||||||||||||||||||||
| For the Year or Period Ended | or Period | Income (Loss) (1) | (Loss) | Activities | Investment Income | Capital Gains | Distributions | Period | Returns(2) | (in thousands) | (3),(4) | (4) | Net Assets(4) | Rates | ||||||||||||||||||||||||||||||||||||||||||||
| PL Portfolio Optimization Moderate Fund | ||||||||||||||||||||||||||||||||||||||||||||||||||||||||||
| Class A: | 4/1/2010 - 3/31/2011 | $ | 10.81 | $ | 0.10 | $ | 1.19 | $ | 1.29 | $ | (0.22 | ) | $ | — | $ | (0.22 | ) | $ | 11.88 | 12.10 | % | $ | 384,999 | 0.52 | % | 0.77 | % | 0.91 | % | 9.36 | % | |||||||||||||||||||||||||||
| 4/1/2009 - 3/31/2010 | 7.96 | 0.20 | 2.87 | 3.07 | (0.22 | ) | — | (0.22 | ) | 10.81 | 38.85 | % | 247,213 | 0.20 | % | 0.92 | % | 1.99 | % | 9.43 | % | |||||||||||||||||||||||||||||||||||||
| 4/1/2008 - 3/31/2009 | 11.51 | 0.23 | (3.30 | ) | (3.07 | ) | (0.31 | ) | (0.17 | ) | (0.48 | ) | 7.96 | (27.25 | %) | 137,205 | 0.14 | % | 0.89 | % | 2.35 | % | 25.95 | % | ||||||||||||||||||||||||||||||||||
| 4/1/2007 - 3/31/2008 | 12.08 | 0.23 | (0.17 | ) | 0.06 | (0.35 | ) | (0.28 | ) | (0.63 | ) | 11.51 | 0.28 | % | 192,707 | 0.00 | % | 0.78 | % | 1.90 | % | 5.01 | % | |||||||||||||||||||||||||||||||||||
| 4/1/2006 - 3/31/2007 | 11.56 | 0.18 | 0.88 | 1.06 | (0.22 | ) | (0.32 | ) | (0.54 | ) | 12.08 | 9.41 | % | 149,905 | 0.00 | % | 1.06 | % | 1.51 | % | 8.24 | % | ||||||||||||||||||||||||||||||||||||
| Class B: | 4/1/2010 - 3/31/2011 | $ | 10.74 | $ | 0.02 | $ | 1.18 | $ | 1.20 | $ | (0.14 | ) | $ | — | $ | (0.14 | ) | $ | 11.80 | 11.33 | % | $ | 92,064 | 1.26 | % | 1.52 | % | 0.17 | % | 9.36 | % | |||||||||||||||||||||||||||
| 4/1/2009 - 3/31/2010 | 7.90 | 0.12 | 2.87 | 2.99 | (0.15 | ) | — | (0.15 | ) | 10.74 | 38.14 | % | 65,336 | 0.95 | % | 1.67 | % | 1.24 | % | 9.43 | % | |||||||||||||||||||||||||||||||||||||
| 4/1/2008 - 3/31/2009 | 11.44 | 0.16 | (3.30 | ) | (3.14 | ) | (0.23 | ) | (0.17 | ) | (0.40 | ) | 7.90 | (27.95 | %) | 40,658 | 0.89 | % | 1.64 | % | 1.60 | % | 25.95 | % | ||||||||||||||||||||||||||||||||||
| 4/1/2007 - 3/31/2008 | 12.02 | 0.14 | (0.17 | ) | (0.03 | ) | (0.27 | ) | (0.28 | ) | (0.55 | ) | 11.44 | (0.48 | %) | 56,387 | 0.75 | % | 1.53 | % | 1.15 | % | 5.01 | % | ||||||||||||||||||||||||||||||||||
| 4/1/2006 - 3/31/2007 | 11.51 | 0.11 | 0.89 | 1.00 | (0.17 | ) | (0.32 | ) | (0.49 | ) | 12.02 | 8.88 | % | 43,774 | 0.57 | % | 1.63 | % | 0.94 | % | 8.24 | % | ||||||||||||||||||||||||||||||||||||
| Class C: | 4/1/2010 - 3/31/2011 | $ | 10.73 | $ | 0.02 | $ | 1.17 | $ | 1.19 | $ | (0.14 | ) | $ | — | $ | (0.14 | ) | $ | 11.78 | 11.26 | % | $ | 308,449 | 1.26 | % | 1.52 | % | 0.17 | % | 9.36 | % | |||||||||||||||||||||||||||
| 4/1/2009 - 3/31/2010 | 7.88 | 0.12 | 2.88 | 3.00 | (0.15 | ) | — | (0.15 | ) | 10.73 | 38.36 | % | 210,889 | 0.95 | % | 1.67 | % | 1.24 | % | 9.43 | % | |||||||||||||||||||||||||||||||||||||
| 4/1/2008 - 3/31/2009 | 11.42 | 0.16 | (3.30 | ) | (3.14 | ) | (0.23 | ) | (0.17 | ) | (0.40 | ) | 7.88 | (28.02 | %) | 123,122 | 0.89 | % | 1.64 | % | 1.60 | % | 25.95 | % | ||||||||||||||||||||||||||||||||||
| 4/1/2007 - 3/31/2008 | 12.00 | 0.14 | (0.17 | ) | (0.03 | ) | (0.27 | ) | (0.28 | ) | (0.55 | ) | 11.42 | (0.46 | %) | 180,421 | 0.75 | % | 1.53 | % | 1.15 | % | 5.01 | % | ||||||||||||||||||||||||||||||||||
| 4/1/2006 - 3/31/2007 | 11.50 | 0.11 | 0.88 | 0.99 | (0.17 | ) | (0.32 | ) | (0.49 | ) | 12.00 | 8.82 | % | 134,695 | 0.57 | % | 1.63 | % | 0.94 | % | 8.24 | % | ||||||||||||||||||||||||||||||||||||
| Class R: | 4/1/2010 - 3/31/2011 | $ | 10.77 | $ | 0.07 | $ | 1.18 | $ | 1.25 | $ | (0.18 | ) | $ | — | $ | (0.18 | ) | $ | 11.84 | 11.82 | % | $ | 23,658 | 0.75 | % | 1.02 | % | 0.68 | % | 9.36 | % | |||||||||||||||||||||||||||
| 4/1/2009 - 3/31/2010 | 7.93 | 0.17 | 2.87 | 3.04 | (0.20 | ) | — | (0.20 | ) | 10.77 | 38.61 | % | 24,232 | 0.45 | % | 1.17 | % | 1.74 | % | 9.43 | % | |||||||||||||||||||||||||||||||||||||
| 4/1/2008 - 3/31/2009 | 11.48 | 0.20 | (3.29 | ) | (3.09 | ) | (0.29 | ) | (0.17 | ) | (0.46 | ) | 7.93 | (27.48 | %) | 12,323 | 0.39 | % | 1.14 | % | 2.10 | % | 25.95 | % | ||||||||||||||||||||||||||||||||||
| 4/1/2007 - 3/31/2008 | 12.06 | 0.20 | (0.17 | ) | 0.03 | (0.33 | ) | (0.28 | ) | (0.61 | ) | 11.48 | 0.05 | % | 7,754 | 0.25 | % | 1.03 | % | 1.65 | % | 5.01 | % | |||||||||||||||||||||||||||||||||||
| 4/1/2006 - 3/31/2007 | 11.56 | 0.16 | 0.88 | 1.04 | (0.22 | ) | (0.32 | ) | (0.54 | ) | 12.06 | 9.24 | % | 2,332 | 0.11 | % | 1.13 | % | 1.40 | % | 8.24 | % | ||||||||||||||||||||||||||||||||||||
| PL Portfolio Optimization Moderate-Aggressive Fund | ||||||||||||||||||||||||||||||||||||||||||||||||||||||||||
| Class A: | 4/1/2010 - 3/31/2011 | $ | 10.68 | $ | 0.07 | $ | 1.44 | $ | 1.51 | $ | (0.14 | ) | $ | — | $ | (0.14 | ) | $ | 12.05 | 14.36 | % | $ | 301,232 | 0.51 | % | 0.77 | % | 0.62 | % | 13.33 | % | |||||||||||||||||||||||||||
| 4/1/2009 - 3/31/2010 | 7.31 | 0.13 | 3.38 | 3.51 | (0.14 | ) | — | (0.14 | ) | 10.68 | 48.26 | % | 225,236 | 0.20 | % | 0.92 | % | 1.33 | % | 13.96 | % | |||||||||||||||||||||||||||||||||||||
| 4/1/2008 - 3/31/2009 | 11.79 | 0.16 | (4.21 | ) | (4.05 | ) | (0.19 | ) | (0.24 | ) | (0.43 | ) | 7.31 | (35.15 | %) | 128,976 | 0.14 | % | 0.89 | % | 1.63 | % | 22.98 | % | ||||||||||||||||||||||||||||||||||
| 4/1/2007 - 3/31/2008 | 12.74 | 0.17 | (0.41 | ) | (0.24 | ) | (0.33 | ) | (0.38 | ) | (0.71 | ) | 11.79 | (2.25 | %) | 203,091 | 0.00 | % | 0.78 | % | 1.30 | % | 5.05 | % | ||||||||||||||||||||||||||||||||||
| 4/1/2006 - 3/31/2007 | 12.02 | 0.12 | 1.12 | 1.24 | (0.20 | ) | (0.32 | ) | (0.52 | ) | 12.74 | 10.57 | % | 158,754 | 0.00 | % | 1.05 | % | 1.02 | % | 6.96 | % | ||||||||||||||||||||||||||||||||||||
| Class B: | 4/1/2010 - 3/31/2011 | $ | 10.57 | $ | (0.01 | ) | $ | 1.43 | $ | 1.42 | $ | (0.06 | ) | $ | — | $ | (0.06 | ) | $ | 11.93 | 13.59 | % | $ | 83,812 | 1.26 | % | 1.52 | % | (0.13 | %) | 13.33 | % | ||||||||||||||||||||||||||
| 4/1/2009 - 3/31/2010 | 7.21 | 0.05 | 3.38 | 3.43 | (0.07 | ) | — | (0.07 | ) | 10.57 | 47.84 | % | 68,751 | 0.95 | % | 1.67 | % | 0.58 | % | 13.96 | % | |||||||||||||||||||||||||||||||||||||
| 4/1/2008 - 3/31/2009 | 11.69 | 0.08 | (4.19 | ) | (4.11 | ) | (0.13 | ) | (0.24 | ) | (0.37 | ) | 7.21 | (35.97 | %) | 43,587 | 0.89 | % | 1.64 | % | 0.88 | % | 22.98 | % | ||||||||||||||||||||||||||||||||||
| 4/1/2007 - 3/31/2008 | 12.67 | 0.07 | (0.41 | ) | (0.34 | ) | (0.26 | ) | (0.38 | ) | (0.64 | ) | 11.69 | (3.04 | %) | 68,162 | 0.75 | % | 1.53 | % | 0.55 | % | 5.05 | % | ||||||||||||||||||||||||||||||||||
| 4/1/2006 - 3/31/2007 | 11.97 | 0.05 | 1.13 | 1.18 | (0.16 | ) | (0.32 | ) | (0.48 | ) | 12.67 | 10.11 | % | 56,938 | 0.57 | % | 1.62 | % | 0.44 | % | 6.96 | % | ||||||||||||||||||||||||||||||||||||
| Class C: | 4/1/2010 - 3/31/2011 | $ | 10.55 | $ | (0.01 | ) | $ | 1.43 | $ | 1.42 | $ | (0.06 | ) | $ | — | $ | (0.06 | ) | $ | 11.91 | 13.64 | % | $ | 230,964 | 1.26 | % | 1.52 | % | (0.13 | %) | 13.33 | % | ||||||||||||||||||||||||||
| 4/1/2009 - 3/31/2010 | 7.18 | 0.05 | 3.39 | 3.44 | (0.07 | ) | — | (0.07 | ) | 10.55 | 48.18 | % | 189,917 | 0.95 | % | 1.67 | % | 0.58 | % | 13.96 | % | |||||||||||||||||||||||||||||||||||||
| 4/1/2008 - 3/31/2009 | 11.67 | 0.08 | (4.20 | ) | (4.12 | ) | (0.13 | ) | (0.24 | ) | (0.37 | ) | 7.18 | (36.12 | %) | 117,549 | 0.89 | % | 1.64 | % | 0.88 | % | 22.98 | % | ||||||||||||||||||||||||||||||||||
| 4/1/2007 - 3/31/2008 | 12.65 | 0.07 | (0.41 | ) | (0.34 | ) | (0.26 | ) | (0.38 | ) | (0.64 | ) | 11.67 | (3.03 | %) | 184,634 | 0.75 | % | 1.53 | % | 0.55 | % | 5.05 | % | ||||||||||||||||||||||||||||||||||
| 4/1/2006 - 3/31/2007 | 11.95 | 0.05 | 1.13 | 1.18 | (0.16 | ) | (0.32 | ) | (0.48 | ) | 12.65 | 10.12 | % | 143,281 | 0.57 | % | 1.62 | % | 0.44 | % | 6.96 | % | ||||||||||||||||||||||||||||||||||||
| Class R: | 4/1/2010 - 3/31/2011 | $ | 10.67 | $ | 0.04 | $ | 1.44 | $ | 1.48 | $ | (0.12 | ) | $ | — | $ | (0.12 | ) | $ | 12.03 | 14.00 | % | $ | 17,265 | 0.76 | % | 1.02 | % | 0.37 | % | 13.33 | % | |||||||||||||||||||||||||||
| 4/1/2009 - 3/31/2010 | 7.30 | 0.10 | 3.39 | 3.49 | (0.12 | ) | — | (0.12 | ) | 10.67 | 48.07 | % | 12,211 | 0.45 | % | 1.17 | % | 1.08 | % | 13.96 | % | |||||||||||||||||||||||||||||||||||||
| 4/1/2008 - 3/31/2009 | 11.79 | 0.13 | (4.21 | ) | (4.08 | ) | (0.17 | ) | (0.24 | ) | (0.41 | ) | 7.30 | (35.38 | %) | 5,307 | 0.39 | % | 1.14 | % | 1.38 | % | 22.98 | % | ||||||||||||||||||||||||||||||||||
| 4/1/2007 - 3/31/2008 | 12.74 | 0.13 | (0.39 | ) | (0.26 | ) | (0.31 | ) | (0.38 | ) | (0.69 | ) | 11.79 | (2.39 | %) | 3,147 | 0.25 | % | 1.03 | % | 1.05 | % | 5.05 | % | ||||||||||||||||||||||||||||||||||
| 4/1/2006 - 3/31/2007 | 12.02 | 0.11 | 1.13 | 1.24 | (0.20 | ) | (0.32 | ) | (0.52 | ) | 12.74 | 10.57 | % | 971 | 0.10 | % | 1.12 | % | 0.92 | % | 6.96 | % | ||||||||||||||||||||||||||||||||||||
| See Notes to Financial Statements | See explanation of references on C-8 |
C-7
PACIFIC LIFE FUNDS
FINANCIAL HIGHLIGHTS (Continued)
Selected per share, ratios and supplemental data for each year or period ended March 31 were as follows:
FINANCIAL HIGHLIGHTS (Continued)
Selected per share, ratios and supplemental data for each year or period ended March 31 were as follows:
| Ratios/Supplemental Data | ||||||||||||||||||||||||||||||||||||||||||||||||||||||||||
| Ratios of Expenses | Ratios of Expenses | |||||||||||||||||||||||||||||||||||||||||||||||||||||||||
| Investment Activities | Distributions | After Expense | Before Expense | Ratios of Net | ||||||||||||||||||||||||||||||||||||||||||||||||||||||
| Net Asset Value, | Net Realized and | Total from | Distributions from | Net Asset Value, | Net Assets, End of | Reductions to | Reductions to | Investment Income | Portfolio | |||||||||||||||||||||||||||||||||||||||||||||||||
| Beginning of Year | Net Investment | Unrealized Gain | Investment | Net | Distributions from | Total | End of Year or | Total | Year or Period | Average Net Assets | Average Net Assets | (Loss) to Average | Turnover | |||||||||||||||||||||||||||||||||||||||||||||
| For the Year or Period Ended | or Period | Income (Loss) (1) | (Loss) | Activities | Investment Income | Capital Gains | Distributions | Period | Returns(2) | (in thousands) | (3),(4) | (4) | Net Assets(4) | Rates | ||||||||||||||||||||||||||||||||||||||||||||
| PL Portfolio Optimization Aggressive Fund | ||||||||||||||||||||||||||||||||||||||||||||||||||||||||||
| Class A: | 4/1/2010 — 3/31/2011 | $ | 10.66 | $ | 0.05 | $ | 1.65 | $ | 1.70 | $ | (0.07 | ) | $ | — | $ | (0.07 | ) | $ | 12.29 | 16.11 | % | $ | 114,246 | 0.51 | % | 0.80 | % | 0.44 | % | 26.22 | % | |||||||||||||||||||||||||||
| 4/1/2009 — 3/31/2010 | 6.92 | 0.09 | 3.75 | 3.84 | (0.10 | ) | — | (0.10 | ) | 10.66 | 55.84 | % | 98,669 | 0.20 | % | 0.94 | % | 0.94 | % | 25.89 | % | |||||||||||||||||||||||||||||||||||||
| 4/1/2008 — 3/31/2009 | 12.04 | 0.09 | (4.88 | ) | (4.79 | ) | — | (0.33 | ) | (0.33 | ) | 6.92 | (40.88 | %) | 59,937 | 0.14 | % | 0.92 | % | 0.97 | % | 18.16 | % | |||||||||||||||||||||||||||||||||||
| 4/1/2007 — 3/31/2008 | 13.49 | 0.08 | (0.77 | ) | (0.69 | ) | (0.33 | ) | (0.43 | ) | (0.76 | ) | 12.04 | (5.70 | %) | 96,230 | 0.00 | % | 0.80 | % | 0.62 | % | 9.66 | % | ||||||||||||||||||||||||||||||||||
| 4/1/2006 — 3/31/2007 | 12.57 | 0.07 | 1.46 | 1.53 | (0.19 | ) | (0.42 | ) | (0.61 | ) | 13.49 | 12.53 | % | 75,546 | 0.00 | % | 1.09 | % | 0.54 | % | 10.14 | % | ||||||||||||||||||||||||||||||||||||
| Class B: | 4/1/2010 — 3/31/2011 | $ | 10.46 | $ | (0.03 | ) | $ | 1.65 | $ | 1.62 | $ | (0.05 | ) | $ | — | $ | (0.05 | ) | $ | 12.03 | 15.62 | % | $ | 30,693 | 1.25 | % | 1.55 | % | (0.31 | %) | 26.22 | % | ||||||||||||||||||||||||||
| 4/1/2009 — 3/31/2010 | 6.72 | 0.02 | 3.75 | 3.77 | (0.03 | ) | — | (0.03 | ) | 10.46 | 56.15 | % | 28,776 | 0.95 | % | 1.69 | % | 0.19 | % | 25.89 | % | |||||||||||||||||||||||||||||||||||||
| 4/1/2008 — 3/31/2009 | 11.93 | 0.02 | (4.90 | ) | (4.88 | ) | — | (0.33 | ) | (0.33 | ) | 6.72 | (42.04 | %) | 18,042 | 0.89 | % | 1.67 | % | 0.22 | % | 18.16 | % | |||||||||||||||||||||||||||||||||||
| 4/1/2007 — 3/31/2008 | 13.41 | (0.02 | ) | (0.78 | ) | (0.80 | ) | (0.25 | ) | (0.43 | ) | (0.68 | ) | 11.93 | (6.46 | %) | 30,059 | 0.75 | % | 1.55 | % | (0.13 | %) | 9.66 | % | |||||||||||||||||||||||||||||||||
| 4/1/2006 — 3/31/2007 | 12.52 | (0.00 | )(5) | 1.46 | 1.46 | (0.15 | ) | (0.42 | ) | (0.57 | ) | 13.41 | 12.00 | % | 23,716 | 0.58 | % | 1.67 | % | (0.04 | %) | 10.14 | % | |||||||||||||||||||||||||||||||||||
| Class C: | 4/1/2010 — 3/31/2011 | $ | 10.46 | $ | (0.03 | ) | $ | 1.65 | $ | 1.62 | $ | (0.05 | ) | $ | — | $ | (0.05 | ) | $ | 12.03 | 15.61 | % | $ | 75,607 | 1.25 | % | 1.55 | % | (0.31 | %) | 26.22 | % | ||||||||||||||||||||||||||
| 4/1/2009 — 3/31/2010 | 6.71 | 0.02 | 3.75 | 3.77 | (0.02 | ) | — | (0.02 | ) | 10.46 | 56.11 | % | 68,230 | 0.95 | % | 1.69 | % | 0.19 | % | 25.89 | % | |||||||||||||||||||||||||||||||||||||
| 4/1/2008 — 3/31/2009 | 11.92 | 0.02 | (4.90 | ) | (4.88 | ) | — | (0.33 | ) | (0.33 | ) | 6.71 | (41.99 | %) | 43,588 | 0.89 | % | 1.67 | % | 0.22 | % | 18.16 | % | |||||||||||||||||||||||||||||||||||
| 4/1/2007 — 3/31/2008 | 13.40 | (0.02 | ) | (0.77 | ) | (0.79 | ) | (0.26 | ) | (0.43 | ) | (0.69 | ) | 11.92 | (6.44 | %) | 75,389 | 0.75 | % | 1.55 | % | (0.13 | %) | 9.66 | % | |||||||||||||||||||||||||||||||||
| 4/1/2006 — 3/31/2007 | 12.51 | (0.00 | )(5) | 1.46 | 1.46 | (0.15 | ) | (0.42 | ) | (0.57 | ) | 13.40 | 12.01 | % | 55,389 | 0.58 | % | 1.67 | % | (0.04 | %) | 10.14 | % | |||||||||||||||||||||||||||||||||||
| Class R: | 4/1/2010 — 3/31/2011 | $ | 10.61 | $ | 0.02 | $ | 1.65 | $ | 1.67 | $ | (0.06 | ) | $ | — | $ | (0.06 | ) | $ | 12.22 | 16.02 | % | $ | 5,553 | 0.76 | % | 1.05 | % | 0.19 | % | 26.22 | % | |||||||||||||||||||||||||||
| 4/1/2009 — 3/31/2010 | 6.88 | 0.06 | 3.76 | 3.82 | (0.09 | ) | — | (0.09 | ) | 10.61 | 55.70 | % | 4,448 | 0.45 | % | 1.19 | % | 0.69 | % | 25.89 | % | |||||||||||||||||||||||||||||||||||||
| 4/1/2008 — 3/31/2009 | 12.03 | 0.06 | (4.88 | ) | (4.82 | ) | — | (0.33 | ) | (0.33 | ) | 6.88 | (41.17 | %) | 2,106 | 0.39 | % | 1.17 | % | 0.72 | % | 18.16 | % | |||||||||||||||||||||||||||||||||||
| 4/1/2007 — 3/31/2008 | 13.49 | 0.05 | (0.77 | ) | (0.72 | ) | (0.31 | ) | (0.43 | ) | (0.74 | ) | 12.03 | (5.88 | %) | 1,236 | 0.25 | % | 1.05 | % | 0.37 | % | 9.66 | % | ||||||||||||||||||||||||||||||||||
| 4/1/2006 — 3/31/2007 | 12.57 | 0.05 | 1.48 | 1.53 | (0.19 | ) | (0.42 | ) | (0.61 | ) | 13.49 | 12.53 | % | 382 | 0.14 | % | 1.17 | % | 0.40 | % | 10.14 | % | ||||||||||||||||||||||||||||||||||||
| PL Money Market Fund | ||||||||||||||||||||||||||||||||||||||||||||||||||||||||||
| Class A: | 4/1/2010 — 3/31/2011 | $ | 1.00 | $ | (0.00 | )(5) | $ | 0.00 | (5) | $ | 0.00 | $ | — | $ | — | $ | — | $ | 1.00 | 0.00 | % | $ | 38,443 | 0.24 | % | 1.00 | % | (0.00% | )(5) | N/A | ||||||||||||||||||||||||||||
| 4/1/2009 — 3/31/2010 | 1.00 | (0.00 | )(5) | 0.00 | (5) | 0.00 | (0.00 | )(5) | — | (0.00 | )(5) | 1.00 | 0.03 | % | 34,669 | 0.36 | % | 1.09 | % | (0.00% | )(5) | N/A | ||||||||||||||||||||||||||||||||||||
| 4/1/2008 — 3/31/2009 | 1.00 | 0.01 | — | 0.01 | (0.01 | ) | — | (0.01 | ) | 1.00 | 1.27 | % | 55,424 | 0.78 | % | 1.18 | % | 1.22 | % | N/A | ||||||||||||||||||||||||||||||||||||||
| 4/1/2007 — 3/31/2008 | 1.00 | 0.04 | — | 0.04 | (0.04 | ) | — | (0.04 | ) | 1.00 | 3.90 | % | 42,636 | 0.95 | % | 1.28 | % | 3.68 | % | N/A | ||||||||||||||||||||||||||||||||||||||
| 4/1/2006 — 3/31/2007 | 1.00 | 0.04 | — | 0.04 | (0.04 | ) | — | (0.04 | ) | 1.00 | 4.31 | % | 21,098 | 1.02 | % | 1.58 | % | 4.20 | % | N/A | ||||||||||||||||||||||||||||||||||||||
| PL Income Fund (6) | ||||||||||||||||||||||||||||||||||||||||||||||||||||||||||
| Class A: | 12/31/2010 — 3/31/2011 | $ | 10.00 | $ | 0.09 | $ | 0.16 | $ | 0.25 | $ | (0.09 | ) | $ | — | $ | (0.09 | ) | $ | 10.16 | 2.46 | % | $ | 5,300 | 0.90 | % | 1.77 | % | 3.62 | % | 142.25 | % | |||||||||||||||||||||||||||
| Class I: | 12/31/2010 — 3/31/2011 | $ | 10.00 | $ | 0.10 | $ | 0.15 | $ | 0.25 | $ | (0.09 | ) | $ | — | $ | (0.09 | ) | $ | 10.16 | 2.48 | % | $ | 51,231 | 0.65 | % | 1.37 | % | 3.87 | % | 142.25 | % | |||||||||||||||||||||||||||
| (1) | Net investment income (loss) per share has been calculated using the average shares method except for the PL Money Market Fund. | |
| (2) | The total returns include reinvestment of all dividends and capital gain distributions, if any, and do not include deductions of any applicable sales charges. Total returns are not annualized for periods less than one full year. | |
| (3) | The ratios of expenses after expense reductions to average net assets are after any advisory fee waivers, adviser expense reimbursements, administrator fee reductions, and distributor fee waivers, as discussed in Note 5 in Notes to Financial Statements. The expense ratios for all the PL Portfolio Optimization Funds do not include expenses of the Underlying Funds (see Note 1 in Notes to Financial Statements) in which the PL Portfolio Optimization Funds invest. | |
| (4) | The ratios are annualized for periods of less than one full year. | |
| (5) | Amount represents less than $0.005 per share or less than 0.005%. | |
| (6) | Operations commenced on December 31, 2010. |
See Notes to Financial Statements
C-8
PACIFIC LIFE FUNDS
NOTES TO FINANCIAL STATEMENTS
NOTES TO FINANCIAL STATEMENTS
1. ORGANIZATION
Pacific Life Funds (the “Trust”) is a Delaware statutory trust, which was formed on May 21, 2001, and is registered under the Investment Company Act of 1940 (“1940 Act”), as amended, as an open-end management investment company. Pacific Life Fund Advisors LLC (“PLFA” or “Adviser”) serves as an Adviser to the Trust. As of March 31, 2011, the Trust was comprised of twenty-four separate funds, seven of which are presented in this report (each individually, a “Fund”, and collectively the “Funds”): PL Portfolio Optimization Conservative Fund, PL Portfolio Optimization Moderate-Conservative Fund, PL Portfolio Optimization Moderate Fund, PL Portfolio Optimization Moderate-Aggressive Fund, PL Portfolio Optimization Aggressive Fund (collectively, the “Portfolio Optimization Funds”), PL Money Market Fund and PL Income Fund.
The Portfolio Optimization Funds offer Class A, Class B, Class C and Class R shares. Each class is distinguished by its level of distribution and/or service fees and in general: (i) Class A shares are subject to a maximum 5.50% front-end sales charge; (ii) Class B shares are subject to a maximum 5.00% contingent deferred sales charge (“CDSC”); (iii) Class C shares are subject to a maximum 1.00% CDSC; and (iv) Class R shares are sold at net asset value (“NAV”) without an initial sales charge. The sales charge for Class A shares is reduced for purchases of $50,000 or more and may be waived in certain circumstances. There is no sales charge for Class A shares for purchases of $1 million or more, although there is a CDSC of 1% on redemptions of such Class A shares within one year of purchase.
The PL Money Market Fund offers Class A shares only, which are sold at NAV without an initial sales charge.
The PL Income Fund offers Class A and Class I shares. Class A shares are subject to a maximum 4.25% front-end sales charge. Class I shares are sold at NAV without an initial sales charge.
The Portfolio Optimization Funds invest substantially all of their assets in Class P shares of other funds of the Trust (collectively, the “Underlying Funds”).
The annual report for the Underlying Funds is not included in this report; there is a separate annual report for the Underlying Funds, which is available without charge. For information on how to obtain the shareholder report for the Underlying Funds, see the Where to Go for More Information section of this report on page F-13.
2. SIGNIFICANT ACCOUNTING POLICIES
The financial statements have been prepared in conformity with accounting principles generally accepted in the United States of America (“U.S. GAAP”) for investment companies. In preparing the financial statements, management is required to make estimates and assumptions that affect the reported amounts of assets and liabilities and disclosure of contingent assets and liabilities at the date of the financial statements and the reported increases and decreases in net assets from operations during the reporting period. Actual results could differ from those estimates. The following is a summary of the significant accounting policies followed by the Trust in the preparation of the financial statements.
A. DETERMINATION OF NET ASSET VALUE
Each Fund is divided into shares. The price of a Fund’s shares is called NAV per share. The NAV forms the basis for all transactions involving buying, selling, exchanging or reinvesting shares. Each Fund’s NAV per share is calculated by taking the total value of a Fund’s assets (the value of the securities and other investments a Fund holds), subtracting a Fund’s liabilities, and dividing by the total number of shares outstanding. The value of each security or other investment is the amount which a Fund might reasonably expect to receive for the investment upon its current sale in the ordinary course. The valuation of investments held by the Funds is discussed in further detail below.
Each Fund’s NAV per share is calculated once a day, every day the New York Stock Exchange (“NYSE”) is open, including days when foreign markets are closed. For purposes of calculating the NAV, all investments are generally calculated as of the time of the close of the NYSE, which is usually 4:00 p.m. Eastern Time. Information that becomes known to the Trust or its agents after the NAV has been calculated on a particular day will not normally be used to retroactively adjust the price of an investment or the NAV determined earlier that day.
Each Fund’s NAV will not be calculated on days when the NYSE is closed. There may be a delay in calculating the NAV if: (i) the NYSE is closed on a day other than a regular holiday or weekend, (ii) trading on the NYSE is restricted, (iii) an emergency exists (as determined by the Securities and Exchange Commission (“SEC”)), making the sale of securities or other instruments or determinations of NAV not practicable, or (iv) the SEC permits a delay for the protection of shareholders.
B. INVESTMENT VALUATION
For purposes of calculating the NAV, the value of investments held by each Fund is based primarily on pricing data obtained from various sources approved by the Trust’s Board of Trustees (the “Board”).
Portfolio Optimization Funds. The investments of each Portfolio Optimization Fund consist primarily of shares of the Underlying Funds, which are valued at their respective NAV’s at the time of computation.
Money Market Instruments and Short-Term Investments. The investments of the PL Money Market Fund and money market and short-term investments in other Funds maturing within 60 days are valued at amortized cost in accordance with the 1940 Act. Amortized cost involves valuing an investment at cost on the date of acquisition and thereafter assuming a constant accretion of a discount or amortization of a premium to maturity, regardless of the impact of fluctuating interest rates on the market value of the instrument. While this method provides consistency in valuation (and may only be used if it approximates market value), it may result in periods during which value, as determined by
D-1
PACIFIC LIFE FUNDS
NOTES TO FINANCIAL STATEMENTS (Continued)
NOTES TO FINANCIAL STATEMENTS (Continued)
amortized cost, is higher or lower than the price that would be received if the Fund sold the investment. Fund investments of other mutual funds for temporary cash purposes are valued at their respective NAVs.
Domestic and Foreign Fixed Income Investments. Fixed income investments in the PL Income Fund are generally valued using the mean between the bid and ask prices provided by approved pricing and quotation services which are based upon evaluated prices determined from various observable market and other factors. Certain bonds are valued by benchmark, matrix, or other pricing processes approved by the Board.
Investment Values Determined by a Trustee Valuation Committee or a Valuation Committee Approved by the Board. The Board has adopted procedures (“Trust Procedures”) that include methodologies approved for valuing investments in circumstances where market quotations are not readily available. In such circumstances, a Trustee Valuation Committee or other valuation committee will determine the value of such investments in accordance with alternative valuation methodologies under the Trust Procedures which may include, among others, the use of broker quotes, the use of a purchase price for initial public offerings, proration rates, and benchmark and matrix pricing. In the event market quotations or Board approved alternate valuation methodologies are not readily available or reliable, the value of the investments will be determined in good faith by a Trustee Valuation Committee or determined by a valuation committee approved by the Board or a delegate of the Board. Valuations determined by a Trustee Valuation Committee or other valuation committee may require subjective inputs about the value of such investments. While these valuations are intended to estimate the value a Fund might reasonably expect to receive upon the current sale of the investments in the ordinary course, such values may differ from the value that a Fund would actually realize if the investments were sold.
Market quotes are considered not readily available if: (1) the market quotations received are deemed unreliable or inaccurate, (2) approved pricing services do not provide a valuation for a particular investment, or (3) material events occur after the close of the principal market for a particular investment but prior to the close of the NYSE.
C. INVESTMENT TRANSACTIONS AND INCOME
Investment transactions are recorded on a trade date basis. Dividend income is recorded on the ex-dividend date. Interest income, adjusted for amortization of premium and accretion of discount, is recorded daily on an accrual basis. Facility fees and other fees (such as origination fees) received from senior loans purchased (see Note 2G) by a Fund are amortized over the expected term of each applicable senior loan. Commitment fees received by a Fund relating to unfunded senior loan commitments are deferred and amortized to income over the period of the commitment. Consent fees, which are compensation for agreeing to changes in the terms of debt instruments, are included in interest income on the Statements of Operations when received. Realized gains and losses from securities transactions are recorded on the basis of identified cost, which is also used for Federal income tax purposes. Each class of shares has equal rights as to assets and earnings, except that each class separately bears certain class-specific expenses related to distribution and/or service fees (see Note 3). Income, other non-class specific expenses, and realized and unrealized gains and losses on investments are allocated to each class of shares based on its relative daily net assets.
D. DISTRIBUTIONS TO SHAREHOLDERS
The Funds currently declare and pay dividends on net investment income at least annually, except for the PL Money Market Fund and PL Income Fund. Dividends, if any, are generally declared daily and paid monthly for the PL Money Market Fund and declared and paid monthly for the PL Income Fund. Dividends may be declared more or less frequently if advantageous to the specific Fund and its shareholders. All realized capital gains are distributed at least annually for each Fund.
Dividends on net investment income and capital gain distributions are determined in accordance with income tax regulations, which may differ from U.S. GAAP. These differences are primarily due to differing treatments for foreign currency transactions, passive foreign investment companies, post-October losses, capital loss carryforwards, and losses deferred due to wash sales. Permanent book and tax differences relating to shareholder distributions will result in reclassifications of paid-in capital. Dividends and distributions paid to shareholders are recorded on the ex-dividend date.
E. EXPENSE ALLOCATION
General expenses of the Trust are allocated to each Fund in proportion to its relative average daily net assets. Expenses directly attributable to a particular Fund are charged directly to that Fund. Class-specific fees are charged directly to the respective share class within each Fund.
F. OFFERING COSTS
A new Fund bears all costs (or the applicable pro-rata share if there is more than one new Fund) associated with the offering expenses of the Fund including legal, printing and support services (see Note 3). All such costs are amortized to expense of the new Fund on a straight-line basis over twelve months from commencement of operations.
G. INVESTMENTS AND RISKS
General Investment Risks
An investment in each Fund represents an indirect investment in the assets owned by that Fund. As with any mutual fund, the value of these investments may move up or down and as a result, an investment in a Fund at any point in time may be worth more or less than the original investment. Events in the financial markets have the potential to cause increased volatility and uncertainty, which may impact the
D-2
PACIFIC LIFE FUNDS
NOTES TO FINANCIAL STATEMENTS (Continued)
NOTES TO FINANCIAL STATEMENTS (Continued)
value of each Fund’s investments. Due to interdependencies between markets, events in one market may adversely impact other markets or issuers in unforeseen ways. As a result, the value of a Fund’s investments may be adversely affected by events in the markets, either directly or indirectly, and each Fund is exposed to potential decreases in the value of those investments. In addition, traditionally liquid investments may experience periods of diminished liquidity. Governmental and regulatory responses to market events may impair the Adviser’s ability to pursue certain investment techniques or strategies and may have unexpected consequences on particular markets, strategies, or investments. Future events may impact a Fund in unforeseen ways, leading a Fund to alter its existing strategies or, potentially, to liquidate and close.
The price of equity investments changes in response to many factors, including a company’s historical and prospective earnings, the value of its assets, and many of the factors noted above.
The Portfolio Optimization Funds are exposed to the same risks as the Underlying Funds in direct proportion to the allocation of assets among those funds. The Annual Report for the Underlying Funds contains information about the risks associated with investing in the Underlying Funds. Allocations among the Underlying Funds are determined using an asset allocation process, which seeks to optimize returns by allocating among different asset classes given various levels of risk tolerance. The allocations of the Portfolio Optimization Funds may not effectively decrease risk or increase returns for investors, and the selection and weighting of allocations to asset classes and/or Underlying Funds may cause them to underperform other mutual funds with a similar investment objective. The Portfolio Optimization Funds may invest a significant portion of its assets in any Underlying Fund (See Note 6).
Fixed income (debt) investments are affected primarily by the financial condition of the companies that have issued them and by changes in interest rates, although the factors noted above may also have a significant impact on fixed income (debt) investments. There is a risk that an issuer of a Fund’s fixed income (debt) investment (including borrowers) may not be able to meet its financial obligations (e.g., may not be able to make principal and/or interest payments when they are due or otherwise default on other financial terms) and/or go bankrupt. Securities such as high yield/high-risk bonds, i.e. bonds with low credit ratings by Moody’s (Ba or lower) or Standard & Poor’s (BB and lower) or no rating, are especially subject to credit risk during periods of economic uncertainty or during economic downturns and are more likely to default on their interest and/or principal payments than higher rated securities. Certain asset-backed instruments, such as collateralized debt obligations, collateralized mortgage obligations and other mortgage related securities, structured investment vehicles and other debt investments may have exposure to subprime loans or subprime mortgages, which are loans to persons with lower credit ratings. These instruments may present credit risk that is not transparent and that is greater than indicated by their ratings. The value of these instruments may be more acutely affected by downturns in the credit markets or the real estate market than certain other investments, and it may be difficult to value these instruments because of a thin secondary market.
There are certain additional risks involved in investing in foreign securities that are generally not inherent in investments in domestic securities. These risks may involve foreign currency fluctuations, adverse political, social and economic developments and the possible imposition of currency exchange blockages or other foreign governmental laws or restrictions. In addition, the securities of some foreign companies and securities markets are less liquid and at times more volatile than securities of comparable U.S. companies and U.S. securities markets. The markets in emerging markets countries can be extremely volatile. The foreign investments of the PL Money Market Fund and the PL Income Fund must be denominated in U.S. dollars.
Illiquid Investments
The Funds may not invest in illiquid securities and illiquid bank loans (collectively, “Illiquid Investments”) if as a result of such investment, more than 15% of its net assets (5% of total assets for the PL Money Market Fund), taken at market value at the time of such investment, would be invested in Illiquid Investments. The term “Illiquid Investments” for this purpose means investments that cannot be disposed of within seven days in the ordinary course of business at approximately the amount at which a Fund has valued the investments. Illiquid Investments may be difficult to value and difficult to sell, which means a Fund may not be able to sell such investments quickly for its full value. The value of Illiquid Investments held by each Fund as of March 31, 2011 was less than 15% of its net assets (5% of total assets for the PL Money Market Fund).
Senior Loan Participations and Assignments
Certain Funds may invest in floating rate senior loans (“Senior Loans”), the interest rates of which float or adjust periodically based upon a specified adjustment schedule, benchmark indicator, or prevailing interest rates of domestic or foreign corporations, partnerships and other entities (“Borrowers”). Senior Loans generally pay interest at rates which are periodically redetermined by reference to a base lending rate plus a premium. These base lending rates generally include prime rates of one or more major U.S. banks, LIBOR rates or certificates of deposit rates. Senior Loans often require prepayments from excess cash flow or permit the borrower to repay at its election. The degree to which borrowers repay cannot be predicted with accuracy. As a result, the actual maturity may be substantially less than the stated maturities. Senior Loans are exempt from registration under the Securities Act of 1933, may contain certain restrictions on resale, and cannot be sold publicly. A Fund’s investments in Senior Loans may be in the form of participations in loans or assignments of all or a portion of loans from third parties.
When a Fund purchases assignments, it acquires all the rights and obligations under the loan agreement of the assigning lender. Assignments may, however, be arranged through private negotiations between potential assignees and potential assignors, and the rights and obligations acquired by the purchaser of an assignment may differ from, and be more limited than those held by the assigning lender.
D-3
PACIFIC LIFE FUNDS
NOTES TO FINANCIAL STATEMENTS (Continued)
NOTES TO FINANCIAL STATEMENTS (Continued)
When a Fund purchases a participation of a Senior Loan interest, the Fund typically enters into a contractual agreement with the lender or other third party selling the participation. A participation interest in Senior Loans includes the right to receive payments of principal, interest and any fees to which it is entitled from the lender and only upon receipt by the lender of payments from the Borrower, but not from the Borrower directly. When holding a participation interest, if a Borrower is unable to meet its obligations under a loan agreement, a Fund generally has no right to enforce compliance of the terms of the loan agreement. As a result, the Fund assumes the credit risk of the Borrower, the selling participant, and any other persons that are interpositioned between the Fund and the Borrower. If the lead lender in a typical lending syndicate becomes insolvent, enters FDIC receivership or, if not FDIC insured, enters into bankruptcy, the Fund may incur certain costs and delays in receiving payment or may suffer a loss of principal and/or interest. As of March 31, 2011, no participation interest in Senior Loans was held by any of the Funds.
U.S. Government Agencies or Government-Sponsored Enterprises
Certain Funds may invest in U.S. Government agencies or government-sponsored enterprises. U.S. Government securities are obligations of and, in certain cases, guaranteed by, the U.S. Government, its agencies or instrumentalities. The U.S. Government does not guarantee the net asset value of the Funds’ shares. Some U.S. Government securities, such as Treasury bills, notes and bonds, and securities guaranteed by the Government National Mortgage Association (“GNMA” or “Ginnie Mae”), are supported by the full faith and credit of the United States Government; others, such as those of the Federal Home Loan Bank, are supported by the right of the issuer to borrow from the U.S. Department of the Treasury (the “U.S. Treasury”); others, such as those of the Federal National Mortgage Association (“FNMA” or “Fannie Mae”), are supported by the discretionary authority of the U.S. Government to purchase the agency’s obligations. U.S. Government securities may include zero coupon securities, which do not distribute interest on a current basis and tend to be subject to greater risk than interest-paying securities of similar maturities.
Government-related guarantors (i.e., not backed by the full faith and credit of the United States Government) include FNMA and the Federal Home Loan Mortgage Corporation (“FHLMC” or “Freddie Mac”). FNMA is a government-sponsored corporation, the common stock of which is owned entirely by private stockholders. FNMA purchases conventional (i.e., not insured or guaranteed by any government agency) residential mortgages from a list of approved seller/servicers which include state and federally chartered savings and loan associations, mutual savings banks, commercial banks and credit unions and mortgage bankers. Pass-through securities issued by FNMA are guaranteed as to timely payment of principal and interest by FNMA, but are not backed by the full faith and credit of the United States Government. FHLMC issues Participation Certificates (“PCs”), which are pass-through securities, each representing an undivided interest in a pool of residential mortgages. FHLMC guarantees the timely payment of interest and ultimate collection of principal, but PCs are not backed by the full faith and credit of the United States Government.
On September 6, 2008, the Federal Housing Finance Agency (“FHFA”) placed FNMA and FHMLC into conservatorship. As the conservator, FHFA succeeded to all rights, titles, powers and privileges of FNMA and FHLMC and of any stockholder, officer or director of FNMA and FHLMC with respect to FNMA and FHLMC and the assets of FNMA and FHLMC. FHFA selected a new chief executive officer and chairman of the board of directors for each of FNMA and FHLMC. In connection with the conservatorship, the U.S. Treasury entered into a Senior Preferred Stock Purchase Agreement with each of FNMA and FHLMC pursuant to which the U.S. Treasury will purchase up to an aggregate of $100 billion of each of FNMA and FHLMC to maintain a positive net worth in each enterprise. This agreement contains various covenants that severely limit each enterprise’s operations. In exchange for entering into these agreements, the U.S. Treasury received $1 billion of each enterprise’s senior preferred stock and warrants to purchase 79.9% of each enterprise’s common stock. On February 18, 2009, the U.S. Treasury announced that it was doubling the size of its commitment to each enterprise under the Senior Preferred Stock Program to $200 billion. The U.S. Treasury’s obligations under the Senior Preferred Stock Program are for an indefinite period of time for a maximum amount of $200 billion per enterprise. FNMA and FHLMC are continuing to operate as going concerns while in conservatorship and each remain liable for all of its obligations, including its guaranty obligations, associated with its mortgage-backed securities. The Senior Preferred Stock Purchase Agreement is intended to enhance each of FNMA’s and FHLMC’s ability to meet its obligations. The FHFA has indicated that the conservatorship of each enterprise will end when the director of FHFA determines that FHFA’s plan to restore the enterprise to a safe and solvent condition has been completed.
Derivative Investments
Certain Funds may invest in derivative investments, including, but not limited to swaps (see Note 11 for a detailed discussion on derivative investments).
H. RECENT ACCOUNTING PRONOUNCEMENT
In January 2010, the Financial Accounting Standards Board (“FASB”) issued Accounting Standards Update No. 2010-06, Improving Disclosures about Fair Value Measurements, (“ASU”). This ASU amends FASB Accounting Standards Codification (“ASC”) Topic 820, Fair Value Measurements and Disclosures, and requires entities to disclose the amounts and reasons for significant transfers between Levels 1 and 2 in the fair value hierarchy and inputs and valuation techniques used to determine Level 2 and Level 3 fair value measurements (see Note 10), and to separately present purchases, sales, issuances, and settlements in their reconciliation of Level 3 fair value measurements (i.e., to present such items on a gross basis rather than on a net basis). This ASU is effective for interim and annual periods beginning after December 15, 2009, except for the disclosures about purchases, sales issuances, and settlements in the roll forward of activity in Level 3 fair value measurements (which are effective for interim and annual periods beginning after December 15, 2010). The Trust implemented the
D-4
PACIFIC LIFE FUNDS NOTES TO FINANCIAL STATEMENTS (Continued)
disclosures required for interim and annual periods beginning after December 15, 2009 (see the Notes to Schedules of Investments section of each Fund’s Schedule of Investments and Note 10). Management is currently evaluating the impact of additional implementation that this ASU will have on the Trust’s financial statement disclosures.
3. INVESTMENT ADVISORY, ADMINISTRATION AND SHAREHOLDER SERVICES, AND DISTRIBUTION AGREEMENTS
Pursuant to an Investment Advisory Agreement, PLFA, a wholly-owned subsidiary of Pacific Life Insurance Company (“Pacific Life”), serves as investment adviser to the Trust and manages the Portfolio Optimization Funds. PLFA also does business under the name Pacific Asset Management. Pacific Asset Management manages the PL Money Market Fund and PL Income Fund. PLFA receives advisory fees from each Fund based on the following advisory fee rates, which are based on an annual percentage of average daily net assets of each Fund:
| PL Portfolio Optimization Conservative | 0.20 | % | PL Portfolio Optimization Aggressive | 0.20 | % | |||||
| PL Portfolio Optimization Moderate-Conservative | 0.20 | % | PL Money Market | See | (1) | |||||
| PL Portfolio Optimization Moderate | 0.20 | % | PL Income Fund | 0.50 | % | |||||
| PL Portfolio Optimization Moderate-Aggressive | 0.20 | % | ||||||||
| (1) | An annual rate of 0.20% of the first $250 million of the average daily net assets, 0.15% of the next $250 million, and 0.10% in excess of $500 million. |
Pursuant to an Administration and Shareholder Services Agreement (the “Agreement”), Pacific Life serves as administrator (the “Administrator”) to the Trust. Effective July 1, 2010, the Trust compensated the Administrator for its administrative fee at an annual rate of 0.15% for each of the Portfolio Optimization Funds (which invest in the Underlying Funds that each have an administrative fee of 0.15%) and 0.30% for the PL Money Market Fund. From April 1, 2010 to June 30, 2010, the Trust compensated the Administrator at an annual rate of 0.30% of average daily net assets for each of these Funds. The Trust also compensated the Administrator at a rate of 0.30% for Class A shares and 0.15% for Class I shares for the PL Income Fund. The Administration fee is for procuring or providing administrative, transfer agency, and shareholder services. In addition, Pacific Life and PLFA provide support services to the Trust that are outside the scope of the Administrator’s and Adviser’s responsibilities under the respective agreements. Under the support services agreement, the Trust compensated Pacific Life and PLFA for their expenses in providing support services to the Trust in connection with various matters, some of which include the time spent by legal, accounting, and compliance personnel of PLFA (including individuals who may be officers or Trustees of the Trust), to attend meetings of the Board and to provide assistance with the coordination and supervision in connection with the services procured for the Trust under the Administration Agreement. Support services do not include any services for which PLFA is responsible pursuant to the Investment Advisory Agreement. The Trust reimbursed Pacific Life and PLFA for these support services on an approximate cost basis.
Pursuant to a Distribution Agreement, Pacific Select Distributors, Inc. (the “Distributor”), a wholly owned subsidiary of Pacific Life, serves as distributor of the Trust’s shares. The Distributor bears all expenses of providing services, including costs of sales presentations, mailings, advertisements, and other marketing efforts by the Distributor in connection with the distribution or sale of the Trust’s shares and makes distribution and/or service payments to selling groups in connection with the sale of certain of the Trust’s shares and subsequent servicing needs of shareholders provided by selling groups. The Distributor received distribution and service fees pursuant to class-specific distribution and service plans, each adopted in accordance with Rule 12b-1 under the 1940 Act (together the “12b-1 Plans”) for Class B, C and R shares. The Distributor also received service fees pursuant to a Class A Service Plan (non 12b-1). Under the 12b-1 Plans, each Fund paid to the Distributor both distribution and service fees at an annual rate expressed as a percentage of average daily net assets. The distribution fee was 0.75% for Class B and C shares and 0.25% for R shares. The service fee was 0.25% for Class A, B, C, and R shares. There is no service fee for Class I shares. For the period April 1, 2010 through July 1, 2010, the 0.25% service fee for each class of the Portfolio Optimization Funds was waived to avoid duplication of service fees, since the service fees were being charged by both the Portfolio Optimization Funds and the Underlying Funds in which they invest. Effective July 2, 2010, the service fee waiver for each class of the Portfolio Optimization Funds was discontinued in light of changes to the Underlying Funds expense structure, which, among other expenses, eliminated the Underlying Funds’ service fee. The service fees were accrued daily. For the year ended March 31, 2011, the Distributor, acting as underwriter, received net commissions (upfront sales charges) of $17,832,738 from the sale of Class A shares and received $810,858 in CDSC from redemptions of Class B and C shares.
4. TRUSTEE COMPENSATION
The Trust pays each independent trustee of the Board retainer fees and specified amounts for various Board and committee services and for chairing the committees.
Each independent trustee of the Board is eligible to participate in the Trust’s Deferred Compensation Plan (the “Deferred Compensation Plan”). The Deferred Compensation Plan allows each independent trustee to voluntarily defer receipt of all or a percentage of fees which
D-5
PACIFIC LIFE FUNDS
NOTES TO FINANCIAL STATEMENTS (Continued)
NOTES TO FINANCIAL STATEMENTS (Continued)
otherwise would be payable for services performed. Amounts in the deferral account are obligations of each Fund at the time of such deferral and are payable in accordance with the Deferred Compensation Plan. Deferral amounts are treated as though equivalent dollar amounts had been invested in shares of certain Funds. An independent trustee who defers compensation has the option to select credit rate options that track the performance of Class A of the corresponding Portfolio Optimization Funds without a sales load, PL Money Market Fund and PL Income Fund, and/or Class P of the corresponding Underlying Funds. The obligation of each Fund under the Deferred Compensation Plan (the “DCP Liability”) is included in “Accrued trustees’ fees and expenses and deferred compensation” in the Statements of Assets and Liabilities. Accordingly, the market value appreciation or depreciation on a Fund’s DCP Liability account will cause the expenses of that Fund to increase or decrease due to market fluctuation. The change in net unrealized appreciation or deprecation on a Fund’s DCP Liability account is included in “Trustees’ fees and expenses” in the Statements of Operations. For the year ended March 31, 2011, such expenses were increased by $5,194 for all applicable Funds covered in this report as a result of the market value appreciation on such accounts. As of March 31, 2011, the total amount in the DCP Liability accounts was $22,381 for all applicable Funds covered in this report.
5. EXPENSE REDUCTIONS
To help limit the Trust’s expenses, PLFA, pursuant to an expense limitation agreement dated July 1, 2010, has contractually agreed to reduce its fees or otherwise reimburse each Fund for its operating expenses (including administration fees and organizational expenses, but not including investment advisory fees; distribution and service (12b-1) fees; non 12b-1 service fees; acquired fund fees and expenses; taxes (including foreign taxes on dividends, interest or gains); interest; brokerage commissions and other transactional expenses; extraordinary expenses such as litigation and other expenses not incurred in the ordinary course of each Fund’s business) that exceed an annual rate based on a percentage of a Fund’s average daily net assets. The current expense cap for the Portfolio Optimization Funds is 0.15% through June 30, 2013 and 0.30% from July 1, 2013 through June 30, 2020. The current expense cap for the PL Money Market Fund is 0.30% through June 30, 2012. The current expense cap for the PL Income Fund is 0.15% through December 31, 2013.
From April 1, 2010 to July 1, 2010, pursuant to an expense limitation agreement dated July 1, 2008, PLFA reimbursed each Fund for its operational expenses and Pacific Life reduced its administration fee, to the extent that the expense cap was lower than the administration fee. The expense cap from July 1, 2008 to July 1, 2010 was 0.00% for the Portfolio Optimization Funds and 0.30% for the PL Money Market Fund.
For the PL Money Market Fund, in addition to the above expense cap, PLFA has agreed, temporarily, to reimburse expenses or waive a portion of its fees, to the extent necessary to prevent the Fund’s expenses from exceeding earnings, although there can be no assurance that a negative yield will not occur.
There is no guarantee that PLFA will continue to cap/reimburse expenses and/or waive a portion of its fees upon the expiration of the applicable expense caps.
Any expense reimbursements and fee reductions, except for the administration fee reduction of $128,332 to the PL Money Market Fund, is subject to repayment to PLFA and/or Pacific Life, for a period of time as permitted under regulatory and/or accounting guidance (currently 3 years from the end of the fiscal year in which the reimbursement or reduction took place), to the extent such expenses fall below the expense cap in future years. Any amounts repaid to PLFA and/or Pacific Life will have the effect of increasing such expenses of the Fund, but not above the expense cap. The investment adviser expense reimbursement and administrator fee reduction for the year ended March 31, 2011 for each Fund covered in this report were as follows:
| Investment | Total | |||||||||||
| Adviser | Administrator | Reimbursements | ||||||||||
| Expense | Fee | and | ||||||||||
| Fund | Reimbursements | Reductions | Reductions | |||||||||
| PL Portfolio Optimization Conservative | $ | 354,657 | $ | 131,857 | $ | 486,514 | ||||||
| PL Portfolio Optimization Moderate-Conservative | 331,354 | 136,113 | 467,467 | |||||||||
| PL Portfolio Optimization Moderate | 873,502 | 420,810 | 1,294,312 | |||||||||
| PL Portfolio Optimization Moderate-Aggressive | 755,077 | 369,617 | 1,124,694 | |||||||||
| PL Portfolio Optimization Aggressive | 330,435 | 147,226 | 477,661 | |||||||||
| PL Money Market | 112,758 | 128,332 | 241,090 | |||||||||
| PL Income | 85,167 | 596 | 85,763 | |||||||||
| Total | $ | 2,842,950 | $ | 1,334,551 | $ | 4,177,501 | ||||||
The cumulative reimbursement and reduction amounts, if any, as of March 31, 2011 that are subject to repayment for each Fund covered in this report are as follows:
| Expiration Date | ||||||||||||
| Fund | 3/31/2012 | 3/31/2013 | 3/31/2014 | |||||||||
| PL Portfolio Optimization Conservative | $ | 366,006 | $ | 592,826 | $ | 486,514 | ||||||
| PL Portfolio Optimization Moderate-Conservative | 577,457 | 678,602 | 467,467 | |||||||||
| PL Portfolio Optimization Moderate | 1,939,507 | 2,044,114 | 1,294,312 | |||||||||
| PL Portfolio Optimization Moderate-Aggressive | 1,999,277 | 1,951,672 | 1,124,694 | |||||||||
| PL Portfolio Optimization Aggressive | 906,385 | 851,173 | 477,661 | |||||||||
| PL Money Market | 165,706 | 147,762 | 112,758 | |||||||||
| PL Income | — | — | 85,763 | |||||||||
| Total | $ | 5,954,338 | $ | 6,266,149 | $ | 4,049,169 | ||||||
D-6
PACIFIC LIFE FUNDS
NOTES TO FINANCIAL STATEMENTS (Continued)
NOTES TO FINANCIAL STATEMENTS (Continued)
Due to the current regulatory and/or accounting guidance, all expense reimbursements made by the investment adviser for the period September 28, 2001 (the Pacific Life Funds’ commencement date of operations) to March 31, 2008 expired for future recoupment as of March 31, 2011. Based on the Trust’s experience, the likelihood of repayment by a Fund for the amounts presented in the table above prior to the expiration is considered remote and no liabilities for such repayments were recorded by any Fund as of March 31, 2011. The adviser expense reimbursement and administrator fee reduction are presented in the Statements of Operations.
6. TRANSACTIONS WITH AFFILIATES
The Funds covered in this report have incurred $3,755,072 of investment advisory fees (after $88,994 advisory fee waivers for the PL Money Market Fund), $2,191,912 of administration fees (after $1,334,551 administrator fee reduction), and $345,209 of expenses for support services provided by Pacific Life and PLFA (at approximate cost, see Note 3), for the year ended March 31, 2011. As of March 31, 2011, $391,890, $283,489, and $98,296, respectively, remained payable.
For the year ended March 31, 2011, the Funds covered in this report also incurred $10,767,084 of distribution and/or service fees (after $1,012,866 distribution and/or service fee waivers), payable to the Distributor under the 12b-1 Plans and non 12b-1 service plan. As of March 31, 2011, $152,897 remained payable.
As of March 31, 2011, each of the Portfolio Optimization Funds (aggregate of Classes A, B, C and R) owned shares in each of the affiliated applicable Underlying Funds. A summary of transactions for the year ended March 31, 2011 and total investments by each of the Portfolio Optimization Funds in each Underlying Fund as of March 31, 2011 is as follows:
| As of March 31, 2011 | ||||||||||||||||||||||||||||||||||||
| Change in | ||||||||||||||||||||||||||||||||||||
| Distributions | Net | Unrealized | ||||||||||||||||||||||||||||||||||
| Value as of | Purchase | Received and | Sales | Realized | Appreciation | Shares | Ownership | |||||||||||||||||||||||||||||
| Fund/Underlying Fund | April 1, 2010 | Cost (1) | Reinvested (2) | Proceeds | Gain (Loss)(3) | (Depreciation) | Value | Balance | Percentage | |||||||||||||||||||||||||||
| PL Portfolio Optimization Conservative Fund | ||||||||||||||||||||||||||||||||||||
| PL Floating Rate Loan | $ | 13,948,940 | $ | 10,210,419 | $ | 622,837 | $ | 1,202,244 | ( $20,143 | ) | $ | 700,704 | $ | 24,260,513 | 2,397,284 | 28.20 | % | |||||||||||||||||||
| PL Inflation Managed | 27,399,176 | 24,880,946 | 738,636 | 6,433,273 | 815,499 | 1,359,969 | 48,760,953 | 4,630,670 | 21.26 | % | ||||||||||||||||||||||||||
| PL Managed Bond | 57,821,043 | 45,065,491 | 2,376,582 | 5,131,611 | 2,973,621 | (600,516 | ) | 102,504,610 | 9,544,191 | 27.06 | % | |||||||||||||||||||||||||
| PL Short Duration Bond | 21,195,054 | 23,581,633 | 258,278 | 6,467,937 | 137,436 | 38,353 | 38,742,817 | 3,858,846 | 31.98 | % | ||||||||||||||||||||||||||
| PL Comstock | 5,249,495 | 6,588,292 | 75,689 | 3,329,317 | 359,981 | 1,038,959 | 9,983,099 | 823,009 | 6.00 | % | ||||||||||||||||||||||||||
| PL Growth LT | 3,334,336 | 2,298,767 | — | 1,001,005 | 48,225 | 657,490 | 5,337,813 | 429,776 | 4.62 | % | ||||||||||||||||||||||||||
| PL Large-Cap Growth | 3,615,993 | 2,212,616 | — | 2,001,338 | 252,885 | 848,341 | 4,928,497 | 533,965 | 4.98 | % | ||||||||||||||||||||||||||
| PL Large-Cap Value | 8,513,338 | 10,655,756 | 172,078 | 5,578,851 | 418,036 | 1,636,694 | 15,817,051 | 1,364,715 | 6.92 | % | ||||||||||||||||||||||||||
| PL Main Street Core | 3,306,392 | 3,845,375 | 35,461 | 1,956,417 | 85,708 | 753,189 | 6,069,708 | 599,181 | 3.84 | % | ||||||||||||||||||||||||||
| PL Mid-Cap Equity | 5,218,666 | 5,855,184 | 63,452 | 3,339,353 | 374,029 | 1,413,566 | 9,585,544 | 916,400 | 7.05 | % | ||||||||||||||||||||||||||
| PL International Large-Cap | 3,287,070 | 4,663,929 | 50,883 | 2,685,622 | 83,856 | 766,187 | 6,166,303 | 401,191 | 4.48 | % | ||||||||||||||||||||||||||
| PL International Value | 3,553,342 | 4,943,986 | 127,940 | 3,036,094 | 85,212 | 488,948 | 6,163,334 | 648,090 | 6.82 | % | ||||||||||||||||||||||||||
| $ | 156,442,845 | $ | 144,802,394 | $ | 4,521,836 | $ | 42,163,062 | $ | 5,614,345 | $ | 9,101,884 | $ | 278,320,242 | |||||||||||||||||||||||
| PL Portfolio Optimization Moderate-Conservative Fund | ||||||||||||||||||||||||||||||||||||
| PL Floating Rate Loan | $ | 12,427,676 | $ | 8,508,145 | $ | 458,798 | $ | 772,218 | ( $3,520 | ) | $ | 448,113 | $ | 21,066,994 | 2,081,719 | 24.50 | % | |||||||||||||||||||
| PL Inflation Managed | 23,688,489 | 15,528,461 | 570,145 | 1,729,221 | 614,901 | 1,151,233 | 39,824,008 | 3,781,957 | 17.36 | % | ||||||||||||||||||||||||||
| PL Managed Bond | 45,254,807 | 35,094,772 | 1,669,629 | 3,236,932 | 2,069,744 | (417,685 | ) | 80,434,335 | 7,489,230 | 21.24 | % | |||||||||||||||||||||||||
| PL Short Duration Bond | 18,728,389 | 13,318,964 | 178,576 | 3,392,711 | 92,179 | 53,456 | 28,978,853 | 2,886,340 | 23.90 | % | ||||||||||||||||||||||||||
| PL Comstock | 10,675,296 | 4,147,589 | 136,852 | 885,035 | (133,435 | ) | 2,336,430 | 16,277,697 | 1,341,937 | 9.77 | % | |||||||||||||||||||||||||
| PL Growth LT | 5,282,950 | 2,579,339 | — | 434,236 | (22,761 | ) | 891,931 | 8,297,223 | 668,054 | 7.19 | % | |||||||||||||||||||||||||
| PL Large-Cap Growth | 5,502,715 | 4,046,378 | — | 684,189 | (55,751 | ) | 2,168,644 | 10,977,797 | 1,189,360 | 11.08 | % | |||||||||||||||||||||||||
| PL Large-Cap Value | 12,277,896 | 8,109,534 | 239,582 | 1,136,813 | (251,352 | ) | 2,918,989 | 22,157,836 | 1,911,806 | 9.70 | % | |||||||||||||||||||||||||
| PL Main Street Core | 12,667,594 | 4,275,471 | 83,104 | 4,962,281 | (1,048,342 | ) | 2,541,839 | 13,557,385 | 1,338,340 | 8.59 | % | |||||||||||||||||||||||||
| PL Mid-Cap Equity | 6,643,164 | 3,030,703 | 76,709 | 793,964 | (54,804 | ) | 2,028,570 | 10,930,378 | 1,044,969 | 8.05 | % | |||||||||||||||||||||||||
| PL Mid-Cap Growth | 3,301,373 | 2,041,656 | 9,824 | 378,457 | 490,329 | 982,876 | 6,447,601 | 627,199 | 10.00 | % | ||||||||||||||||||||||||||
| PL Small-Cap Value | 1,558,992 | 977,568 | 28,660 | 299,170 | (4,098 | ) | 554,865 | 2,816,817 | 265,738 | 3.71 | % | |||||||||||||||||||||||||
| PL International Large-Cap | 9,271,422 | 4,454,137 | 111,981 | 1,737,706 | (210,211 | ) | 1,776,429 | 13,666,052 | 889,138 | 9.90 | % | |||||||||||||||||||||||||
| PL International Value | 5,592,955 | 2,468,210 | 169,244 | 893,189 | (305,829 | ) | 806,265 | 7,837,656 | 824,149 | 8.68 | % | |||||||||||||||||||||||||
| $ | 172,873,718 | $ | 108,580,927 | $ | 3,733,104 | $ | 21,336,122 | $ | 1,177,050 | $ | 18,241,955 | $ | 283,270,632 | |||||||||||||||||||||||
D-7
PACIFIC LIFE FUNDS
NOTES TO FINANCIAL STATEMENTS (Continued)
NOTES TO FINANCIAL STATEMENTS (Continued)
| As of March 31, 2011 | ||||||||||||||||||||||||||||||||||||
| Change in | ||||||||||||||||||||||||||||||||||||
| Distributions | Net | Unrealized | ||||||||||||||||||||||||||||||||||
| Value as of | Purchase | Received and | Sales | Realized | Appreciation | Shares | Ownership | |||||||||||||||||||||||||||||
| Fund/Underlying Fund | April 1, 2010 | Cost (1) | Reinvested (2) | Proceeds | Gain (Loss) (3) | (Depreciation) | Value | Balance | Percentage | |||||||||||||||||||||||||||
| PL Portfolio Optimization Moderate Fund | ||||||||||||||||||||||||||||||||||||
| PL Floating Rate Loan | $ | 26,756,141 | $ | 13,554,407 | $ | 958,138 | $ | 1,422,242 | ( $894 | ) | $ | 850,252 | $ | 40,695,802 | 4,021,323 | 47.30 | % | |||||||||||||||||||
| PL Inflation Managed | 57,412,437 | 31,994,056 | 1,338,933 | 5,536,315 | 1,307,840 | 2,832,159 | 89,349,110 | 8,485,196 | 38.97 | % | ||||||||||||||||||||||||||
| PL Managed Bond | 88,899,450 | 51,117,556 | 2,961,883 | 8,389,951 | 3,614,172 | (498,325 | ) | 137,704,785 | 12,821,675 | 36.35 | % | |||||||||||||||||||||||||
| PL Short Duration Bond | 26,096,259 | 15,987,695 | 254,798 | 1,993,723 | 124,775 | 78,206 | 40,548,010 | 4,038,646 | 33.46 | % | ||||||||||||||||||||||||||
| PL Comstock | 44,744,877 | 12,051,208 | 519,919 | 2,154,000 | (568,127 | ) | 8,348,435 | 62,942,312 | 5,188,979 | 37.80 | % | |||||||||||||||||||||||||
| PL Growth LT | 27,729,279 | 10,921,226 | — | 1,833,575 | (73,824 | ) | 3,983,417 | 40,726,523 | 3,279,108 | 35.25 | % | |||||||||||||||||||||||||
| PL Large-Cap Growth | 22,555,165 | 13,537,376 | — | 2,941,631 | (604,745 | ) | 7,646,393 | 40,192,558 | 4,354,557 | 40.56 | % | |||||||||||||||||||||||||
| PL Large-Cap Value | 54,988,140 | 25,482,879 | 947,868 | 2,961,750 | (725,716 | ) | 10,443,636 | 88,175,057 | 7,607,857 | 38.60 | % | |||||||||||||||||||||||||
| PL Main Street Core | 50,578,147 | 12,973,384 | 323,366 | 12,973,447 | (4,318,942 | ) | 9,819,983 | 56,402,491 | 5,567,867 | 35.72 | % | |||||||||||||||||||||||||
| PL Mid-Cap Equity | 32,887,850 | 8,193,721 | 318,557 | 2,285,271 | (581,171 | ) | 8,673,237 | 47,206,923 | 4,513,090 | 34.76 | % | |||||||||||||||||||||||||
| PL Mid-Cap Growth | 11,127,446 | 3,163,280 | 27,045 | 1,060,854 | 1,458,249 | 2,687,860 | 17,403,026 | 1,692,901 | 27.00 | % | ||||||||||||||||||||||||||
| PL Small-Cap Growth | 5,725,947 | 1,294,301 | — | 724,878 | (4,467 | ) | 1,769,219 | 8,060,122 | 677,321 | 24.90 | % | |||||||||||||||||||||||||
| PL Small-Cap Value | 11,191,274 | 9,610,870 | 223,429 | 1,017,998 | (18,069 | ) | 4,763,289 | 24,752,795 | 2,335,169 | 32.47 | % | |||||||||||||||||||||||||
| PL Real Estate | 11,653,763 | 2,272,719 | 121,411 | 1,554,304 | (192,360 | ) | 3,029,144 | 15,330,373 | 1,337,729 | 36.61 | % | |||||||||||||||||||||||||
| PL Emerging Markets | 17,229,262 | 6,257,017 | 374,217 | 2,529,560 | 43,544 | 3,641,504 | 25,015,984 | 1,704,086 | 38.91 | % | ||||||||||||||||||||||||||
| PL International Large-Cap | 34,217,226 | 11,993,969 | 384,192 | 3,917,989 | (809,389 | ) | 5,713,141 | 47,581,150 | 3,095,716 | 34.48 | % | |||||||||||||||||||||||||
| PL International Value | 22,828,900 | 7,178,434 | 522,513 | 7,366,639 | (3,373,895 | ) | 3,948,692 | 23,738,005 | 2,496,110 | 26.30 | % | |||||||||||||||||||||||||
| $ | 546,621,563 | $ | 237,584,098 | $ | 9,276,269 | $ | 60,664,127 | ( $4,723,019 | ) | $ | 77,730,242 | $ | 805,825,026 | |||||||||||||||||||||||
| PL Portfolio Optimization Moderate-Aggressive Fund | ||||||||||||||||||||||||||||||||||||
| PL Inflation Managed | $ | 37,772,773 | $ | 17,407,085 | $ | 820,247 | $ | 7,083,129 | $ | 766,842 | $ | 1,711,539 | $ | 51,395,357 | 4,880,851 | 22.41 | % | |||||||||||||||||||
| PL Managed Bond | 33,146,636 | 20,517,769 | 1,095,796 | 4,454,746 | 1,343,630 | (157,143 | ) | 51,491,942 | 4,794,408 | 13.60 | % | |||||||||||||||||||||||||
| PL Short Duration Bond | 9,410,825 | 4,680,893 | 83,044 | 1,323,350 | 39,081 | 33,344 | 12,923,837 | 1,287,235 | 10.66 | % | ||||||||||||||||||||||||||
| PL Comstock | 45,255,401 | 7,667,016 | 468,188 | 3,335,047 | (924,195 | ) | 7,747,500 | 56,878,863 | 4,689,107 | 34.16 | % | |||||||||||||||||||||||||
| PL Growth LT | 34,822,202 | 7,036,927 | — | 2,514,434 | (83,743 | ) | 4,252,745 | 43,513,697 | 3,503,518 | 37.66 | % | |||||||||||||||||||||||||
| PL Large-Cap Growth | 20,044,255 | 8,288,147 | — | 2,147,186 | (307,469 | ) | 5,968,193 | 31,845,940 | 3,450,264 | 32.13 | % | |||||||||||||||||||||||||
| PL Large-Cap Value | 59,254,893 | 11,912,243 | 849,838 | 4,332,662 | (1,058,236 | ) | 8,891,786 | 75,517,862 | 6,515,778 | 33.05 | % | |||||||||||||||||||||||||
| PL Main Street Core | 55,172,436 | 8,046,577 | 330,109 | 12,426,386 | (3,936,777 | ) | 9,539,461 | 56,725,420 | 5,599,745 | 35.93 | % | |||||||||||||||||||||||||
| PL Mid-Cap Equity | 40,531,478 | 4,105,214 | 341,451 | 3,787,528 | (958,104 | ) | 9,686,413 | 49,918,924 | 4,772,364 | 36.76 | % | |||||||||||||||||||||||||
| PL Mid-Cap Growth | 25,488,101 | 1,437,140 | 44,515 | 7,694,677 | 2,868,640 | 3,987,141 | 26,130,860 | 2,541,912 | 40.54 | % | ||||||||||||||||||||||||||
| PL Small-Cap Growth | 10,493,002 | 1,492,205 | — | 1,440,796 | (64,764 | ) | 2,884,726 | 13,364,373 | 1,123,057 | 41.30 | % | |||||||||||||||||||||||||
| PL Small-Cap Value | 15,488,739 | 12,707,818 | 300,340 | 2,487,998 | 75,716 | 6,409,935 | 32,494,550 | 3,065,524 | 42.63 | % | ||||||||||||||||||||||||||
| PL Real Estate | 16,023,035 | 2,441,217 | 145,929 | 3,857,270 | (276,715 | ) | 3,781,249 | 18,257,445 | 1,593,145 | 43.62 | % | |||||||||||||||||||||||||
| PL Emerging Markets | 20,253,709 | 5,236,112 | 391,795 | 2,963,812 | 380,240 | 3,797,862 | 27,095,906 | 1,845,770 | 42.16 | % | ||||||||||||||||||||||||||
| PL International Large-Cap | 39,891,136 | 8,960,540 | 424,226 | 4,413,818 | (678,396 | ) | 5,751,931 | 49,935,619 | 3,248,902 | 36.18 | % | |||||||||||||||||||||||||
| PL International Value | 34,935,717 | 6,181,501 | 798,026 | 7,477,992 | (4,248,181 | ) | 5,370,411 | 35,559,482 | 3,739,167 | 39.40 | % | |||||||||||||||||||||||||
| $ | 497,984,338 | $ | 128,118,404 | $ | 6,093,504 | $ | 71,740,831 | ( $7,062,431 | ) | $ | 79,657,093 | $ | 633,050,077 | |||||||||||||||||||||||
| PL Portfolio Optimization Aggressive Fund | ||||||||||||||||||||||||||||||||||||
| PL Managed Bond | $ | 5,575,991 | $ | 4,276,088 | $ | 158,573 | $ | 3,626,437 | $ | 215,798 | ( $19,750 | ) | $ | 6,580,263 | 612,687 | 1.75 | % | |||||||||||||||||||
| PL Comstock | 20,322,078 | 1,912,177 | 174,408 | 4,358,622 | (1,236,761 | ) | 3,619,377 | 20,432,657 | 1,684,473 | 12.27 | % | |||||||||||||||||||||||||
| PL Growth LT | 16,191,792 | 2,884,220 | — | 3,177,397 | (165,276 | ) | 1,924,438 | 17,657,777 | 1,421,721 | 15.28 | % | |||||||||||||||||||||||||
| PL Large-Cap Growth | 8,103,722 | 2,859,585 | — | 1,923,954 | (25,793 | ) | 2,132,177 | 11,145,737 | 1,207,555 | 11.25 | % | |||||||||||||||||||||||||
| PL Large-Cap Value | 24,030,520 | 2,814,360 | 310,508 | 3,167,901 | (797,266 | ) | 3,605,219 | 26,795,440 | 2,311,945 | 11.73 | % | |||||||||||||||||||||||||
| PL Main Street Core | 24,276,726 | 3,982,529 | 142,865 | 5,967,794 | (1,655,785 | ) | 4,353,043 | 25,131,584 | 2,480,907 | 15.92 | % | |||||||||||||||||||||||||
| PL Mid-Cap Equity | 16,162,199 | 3,794,404 | 124,195 | 5,084,271 | (894,068 | ) | 4,074,468 | 18,176,927 | 1,737,756 | 13.38 | % | |||||||||||||||||||||||||
| PL Mid-Cap Growth | 12,099,420 | 2,464,483 | 23,697 | 3,888,988 | 1,693,411 | 2,083,230 | 14,475,253 | 1,408,099 | 22.46 | % | ||||||||||||||||||||||||||
| PL Small-Cap Growth | 8,353,605 | 4,413,320 | — | 4,473,540 | 62,941 | 2,579,438 | 10,935,764 | 918,972 | 33.80 | % | ||||||||||||||||||||||||||
| PL Small-Cap Value | 9,928,335 | 5,526,794 | 155,297 | 2,804,997 | 133,636 | 3,211,598 | 16,150,663 | 1,523,647 | 21.19 | % | ||||||||||||||||||||||||||
| PL Real Estate | 8,312,172 | 2,537,478 | 71,091 | 4,320,597 | 46,957 | 1,624,691 | 8,271,792 | 721,797 | 19.77 | % | ||||||||||||||||||||||||||
| PL Emerging Markets | 10,221,959 | 3,915,252 | 174,696 | 4,048,995 | 471,675 | 1,431,461 | 12,166,048 | 828,750 | 18.93 | % | ||||||||||||||||||||||||||
| PL International Large-Cap | 20,032,406 | 4,892,028 | 209,168 | 6,490,020 | (288,059 | ) | 2,300,468 | 20,655,991 | 1,343,916 | 14.96 | % | |||||||||||||||||||||||||
| PL International Value | 18,012,668 | 4,111,233 | 389,133 | 6,069,957 | (3,426,843 | ) | 3,950,074 | 16,966,308 | 1,784,049 | 18.80 | % | |||||||||||||||||||||||||
| $ | 201,623,593 | $ | 50,383,951 | $ | 1,933,631 | $ | 59,403,470 | ( $5,865,433 | ) | $ | 36,869,932 | $ | 225,542,204 | |||||||||||||||||||||||
| (1) | Purchased cost excludes distributions received and reinvested. | |
| (2) | Distributions received includes distributions from net investment income from the Underlying Funds. | |
| (3) | Net realized gain (loss) includes distribution from capital gains from the Underlying Funds. |
As of March 31, 2011, Pacific Life owned 90.34% of the total (aggregate of Class A and I) shares outstanding of the PL Income Fund.
D-8
PACIFIC LIFE FUNDS
NOTES TO FINANCIAL STATEMENTS (Continued)
NOTES TO FINANCIAL STATEMENTS (Continued)
7. TAX CHARACTER OF DISTRIBUTIONS AND COMPONENTS OF DISTRIBUTABLE EARNINGS
The tax character of distributions paid during the year ended March 31, 2011, is as follows:
| Distributions Paid From | ||||||||||||
| Ordinary | Long-Term | Total | ||||||||||
| Fund | Income | Capital Gains | Distributions | |||||||||
| | | | | ||||||||||||
| PL Portfolio Optimization Conservative | $ | 6,824,644 | $ | — | $ | 6,824,644 | ||||||
| PL Portfolio Optimization Moderate-Conservative | 5,140,621 | — | 5,140,621 | |||||||||
| PL Portfolio Optimization Moderate | 10,392,641 | — | 10,392,641 | |||||||||
| PL Portfolio Optimization Moderate-Aggressive | 4,952,239 | — | 4,952,239 | |||||||||
| PL Portfolio Optimization Aggressive | 1,134,051 | — | 1,134,051 | |||||||||
| PL Income | 461,390 | — | 461,390 | |||||||||
The tax character of distributions paid during the year ended March 31, 2010, were as follows:
| Distributions Paid From | ||||||||||||
| Ordinary | Long-Term | Total | ||||||||||
| Fund | Income | Capital Gains | Distributions | |||||||||
| PL Portfolio Optimization Conservative | $ | 3,842,769 | $ | — | $ | 3,842,769 | ||||||
| PL Portfolio Optimization Moderate-Conservative | 3,324,008 | — | 3,324,008 | |||||||||
| PL Portfolio Optimization Moderate | 7,918,608 | — | 7,918,608 | |||||||||
| PL Portfolio Optimization Moderate-Aggressive | 4,376,451 | — | 4,376,451 | |||||||||
| PL Portfolio Optimization Aggressive | 1,107,118 | — | 1,107,118 | |||||||||
| PL Money Market | 10,032 | 25 | 10,057 | |||||||||
As of March 31, 2011, the components of distributable earnings on a tax basis were as follows:
| Net | ||||||||||||||||
| Accumulated | Undistributed | Undistributed | Unrealized | |||||||||||||
| Capital and | Ordinary | Long-Term | Appreciation | |||||||||||||
| Fund | Other Losses | Income | Capital Gains | (Depreciation) | ||||||||||||
| PL Portfolio Optimization Conservative | $ | — | $ | — | $ | 199,772 | $ | 16,387,812 | ||||||||
| PL Portfolio Optimization Moderate-Conservative | (5,806,370 | ) | 483,789 | — | 21,649,967 | |||||||||||
| PL Portfolio Optimization Moderate | (24,373,382 | ) | 2,136,218 | — | 70,637,756 | |||||||||||
| PL Portfolio Optimization Moderate-Aggressive | (37,802,003 | ) | 1,755,297 | — | 60,871,353 | |||||||||||
| PL Portfolio Optimization Aggressive | (28,045,850 | ) | 575,805 | — | 27,506,699 | |||||||||||
| PL Money Market | — | 37 | — | — | ||||||||||||
| PL Income | — | 526,794 | — | 97,883 | ||||||||||||
The components of the accumulated capital and other losses as of March 31, 2011, are summarized in Note 8.
8. FEDERAL INCOME TAX INFORMATION
Each Fund intends to continue to qualify as a regulated investment company (“RIC”) under Subchapter M of the Internal Revenue Code and distribute substantially all its taxable income and capital gains to its shareholders. Each Fund presented in the first table below declared and paid sufficient dividends on net investment income and capital gains distributions during the year ended March 31, 2011, to qualify as a RIC and is not required to pay Federal income tax. Accordingly, no provision for Federal income taxes is required in the financial statements. Required distributions are based on net investment income and net realized gains determined on a tax basis and may differ from such amounts for financial reporting purposes (see Note 2D). In addition, the year in which amounts are distributed may differ from the year in which the net investment income is earned and the net gains are realized by each Fund.
Net capital loss carryovers and post-October capital losses, if any, as of March 31, 2011, are available to offset future realized capital gains and thereby reduce future capital gains distributions. The net capital loss carryovers and the post-October capital losses deferred as of March 31, 2011, were as follows:
| Post | Accumulated | |||||||||||||||||||||||
| Net Capital | Net Capital Loss Carryover | October | Capital and | |||||||||||||||||||||
| Loss | Expiring on March 31, | Capital Loss | Other | |||||||||||||||||||||
| Fund | Carryover | 2017 | 2018 | 2019 | Deferral | Losses | ||||||||||||||||||
| PL Portfolio Optimization Moderate-Conservative | $ | (5,806,370 | ) | $ | ( 1,054,093 | ) | $ | ( 4,752,277 | ) | $ | — | $ | — | $ | (5,806,370 | ) | ||||||||
| PL Portfolio Optimization Moderate | (24,373,382 | ) | (3,967,837 | ) | (16,532,849 | ) | (3,872,696 | ) | — | (24,373,382 | ) | |||||||||||||
| PL Portfolio Optimization Moderate-Aggressive | (37,802,003 | ) | (3,214,516 | ) | (30,478,382 | ) | (4,109,105 | ) | — | (37,802,003 | ) | |||||||||||||
| PL Portfolio Optimization Aggressive | (27,970,730 | ) | (2,128,707 | ) | (22,811,627 | ) | (3,030,396 | ) | (75,120 | ) | (28,045,850 | ) | ||||||||||||
D-9
PACIFIC LIFE FUNDS
NOTES TO FINANCIAL STATEMENTS (Continued)
NOTES TO FINANCIAL STATEMENTS (Continued)
The aggregate Federal tax cost of investments and the composition of unrealized appreciation and depreciation on investments as of March 31, 2011, were as follows:
| Gross | Gross | Net Unrealized | ||||||||||||||
| Total Cost of | Unrealized | Unrealized | Appreciation | |||||||||||||
| Investments | Appreciation | Depreciation | (Depreciation) | |||||||||||||
| Fund | on Tax Basis | on Investments | on Investments | on Investments | ||||||||||||
| PL Portfolio Optimization Conservative | $ | 261,939,946 | $ | 16,387,812 | $ | — | $ | 16,387,812 | ||||||||
| PL Portfolio Optimization Moderate-Conservative | 261,856,759 | 21,649,967 | — | 21,649,967 | ||||||||||||
| PL Portfolio Optimization Moderate | 736,519,173 | 70,637,756 | — | 70,637,756 | ||||||||||||
| PL Portfolio Optimization Moderate-Aggressive | 573,040,746 | 61,757,713 | (886,360 | ) | 60,871,353 | |||||||||||
| PL Portfolio Optimization Aggressive | 198,035,505 | 27,506,699 | — | 27,506,699 | ||||||||||||
| PL Money Market | 38,772,015 | — | — | — | ||||||||||||
| PL Income | 56,008,609 | 375,960 | (278,077 | ) | 97,883 | |||||||||||
As of and during the year ended March 31, 2011, none of the Funds had liabilities for any unrecognized tax benefits. During the year ended March 31, 2011, none of the Funds incurred any interest or penalties.
Each Fund’s tax returns remain subject to examination by Federal and State tax authorities (principal state jurisdictions include California and Delaware) for the tax years ended March 31, 2009 through March 31, 2011 for Federal purposes and March 31, 2008 through March 31, 2011 for State purposes.
On December 22, 2010, The Regulated Investment Company Modernization Act of 2010 (the “Modernization Act”) was signed into law. The Modernization Act modifies several of the Federal income and excise tax provisions related to RICs. Under the Modernization Act, new capital losses may now be carried forward indefinitely, and retain the character of the original loss as compared with pre-enactment law where capital losses could be carried forward for eight years, and carried forward as short-term capital losses, irrespective of the character of the original loss.
The Modernization Act contains simplification provisions aimed at preventing disqualification of a RIC for “inadvertent” failures of the asset diversification and/or qualifying income tests, exempts RICs from the preferential dividend rule, and repeals the 60-day designation requirement for certain types of pay-through income and gains. The Modernization Act also contains several provisions aimed at preserving the character of distributions made by a fiscal year RIC during the portion of its taxable year ending after October 31 or December 31, reducing the circumstances under which a RIC might be required to file amended Forms 1099 to restate previously reported distributions. Except for the simplification provisions related to RIC qualification, the Modernization Act is effective for taxable years beginning after December 22, 2010. The provisions related to RIC qualification are effective for taxable years for which the extended due date of the tax return is after December 22, 2010.
9. PURCHASES AND SALES OF SECURITIES
The cost of purchases and proceeds from sales of securities (excluding short-term investments and the PL Money Market Fund since it trades exclusively in short-term debt securities) for the year ended March 31, 2011, is as follows:
| U.S. Government Securities | Other Securities | |||||||||||||||
| Fund | Purchases | Sales | Purchases | Sales | ||||||||||||
| PL Portfolio Optimization Conservative | $ | — | $ | — | $ | 153,474,693 | $ | 42,163,062 | ||||||||
| PL Portfolio Optimization Moderate-Conservative | — | — | 115,695,843 | 21,336,122 | ||||||||||||
| PL Portfolio Optimization Moderate | — | — | 253,505,798 | 60,664,127 | ||||||||||||
| PL Portfolio Optimization Moderate-Aggressive | — | — | 138,688,242 | 71,740,831 | ||||||||||||
| PL Portfolio Optimization Aggressive | — | — | 53,669,786 | 59,403,470 | ||||||||||||
| PL Income | 9,450,497 | 5,036,409 | 100,004,418 | 50,617,931 | ||||||||||||
10. FAIR VALUE MEASUREMENTS AND DISCLOSURES
The Trust characterizes its investments as Level 1, Level 2 or Level 3 based upon the various inputs or methodologies used to value the investments. The three-tier hierarchy of inputs is summarized in the three broad levels listed below:
| • Level 1 — | Quoted prices (unadjusted) in active markets for identical investments | ||
| • Level 2 — | Significant observable market-based inputs, other than Level 1 quoted prices, or unobservable inputs that are corroborated by market data | ||
| • Level 3 — | Significant unobservable inputs that are not corroborated by observable market data |
The inputs or methodologies used for valuing each Fund’s investments are not necessarily an indication of the risks associated with investing in those investments. For example, the PL Money Market Fund’s investments are valued using amortized cost in accordance with the rules under the 1940 Act. Generally, amortized cost approximates the current fair value of an investment, but since the value is not obtained from a quoted price in an active market, such investments are reflected as Level 2. For fair valuations using significant unobservable inputs, the Trust provides a reconciliation of the beginning to ending balances for reported market values that presents
D-10
PACIFIC LIFE FUNDS
NOTES TO FINANCIAL STATEMENTS (Continued)
NOTES TO FINANCIAL STATEMENTS (Continued)
changes attributable to total realized and unrealized gains or losses, purchase and sales, and transfers in and out of Level 3 during the period. Transfers in and out of Level 3 are based on values at the end of the period. The Trust also provides the amounts and reasons for significant transfers, if any, between Level 1 and Level 2 in the fair value hierarchy (see Note 2H). For the year ended March 31, 2011, there were no transfers between Level 1, Level 2, and Level 3 for any of the Funds. A summary of each Fund’s investments as of March 31, 2011 as categorized under the three-tier hierarchy of inputs can be found in the Notes to Schedule of Investments section of each Fund’s Schedule of Investments.
The following is a description of valuation inputs and techniques that the Trust currently utilizes to fair value each major category of assets and liabilities:
Mutual Funds
Investments in mutual funds, including affiliated mutual funds, are valued at their respective NAV and are categorized as Level 1.
U.S. Treasury Obligations
U.S. Treasuries are fair valued based on pricing models that evaluate the mean between the most recently published bid and ask price. The models also take into consideration data received from active market makers and inter-broker-dealer brokers, yield curves, and the spread over comparable U.S. Treasury issues. The spreads change daily in response to market conditions and are generally obtained from the new issue market and broker-dealer sources. To the extent that these inputs are observable and timely, the fair values of U.S. Treasury obligations would be categorized as Level 2; otherwise the fair values would be categorized as Level 3.
Corporate Bonds and Notes and U.S. Government Agency Issues
Corporate bonds held by a Fund are generally comprised of two main categories: investment grade bonds and high yield bonds. Investment grade bonds are reported at fair value using various inputs and techniques, which include broker-dealer quotations, live trading levels, recently executed transactions in securities of the issuer or comparable issuers, and options adjusted spread models that include base curve and spread curve inputs. Adjustments to individual bonds can be applied to recognize trading differences compared to other bonds issued by the same issuer. Fair values for high yield bonds are based primarily on broker-dealer quotations from relevant market makers and recently executed transactions in securities of the issuer or comparable issuers. The broker-dealer quotations received are supported by credit analysis of the issuer that takes into consideration credit quality assessments, daily trading activity, and the activity of the underlying equities, listed bonds and sector-specific trends. To the extent that these inputs are observable and timely, the fair values of corporate bonds would be categorized as Level 2; otherwise the fair values would be categorized as Level 3.
Senior Loan Notes
Senior Loans are fair valued based on a quoted price received from a single broker-dealer or an average of quoted prices received from multiple dealers or valued relative to other benchmark securities when broker-dealer quotes are unavailable. To the extent that these inputs are observable, the fair values of Senior Loans would be categorized as Level 2; otherwise the fair values would be categorized as Level 3.
Short-Term Investments
Short-term investments maturing within 60 days are valued using amortized cost, which is used if it approximates market value, such investments are reflected as Level 2.
Credit Default Swaps
Credit default swaps are fair valued using pricing models that take into account, among other factors, information received from market makers and broker-dealers, default probabilities from index specific credit spread curves, recovery rates, and cash flows. To the extent that these inputs are observable and timely, the fair values of credit default swaps would be categorized as Level 2; otherwise the fair values would be categorized as Level 3.
11. DERIVATIVE INVESTMENTS CATEGORIZED BY RISK EXPOSURE
Derivative instruments are investments whose values are tied to the value of an underlying security or asset, a group of assets, interest rates, exchange rates, currency or an index. Certain Funds are permitted to invest in derivative instruments, including, but not limited to, futures contracts, options contracts, forward foreign currency contracts, interest rate swaps, and credit default swaps. Derivatives may have little or no initial cash investment value relative to their market value exposure and therefore can produce significant gains or losses in excess of their cost. This is sometimes referred to as leverage. Leverage can magnify a Fund’s gains and losses and therefore increase its volatility. A Fund’s investments in derivatives may increase, decrease or change the level or types of exposure to certain risk factors. The primary risks a Fund may attempt to manage through investing in derivative instruments include, but are not limited to, interest rate, foreign investments and currency, price volatility and credit (including counterparty) risks.
Market Risks Managed By Investing In Derivatives
Interest rate risk — A Fund may be exposed to interest rate risk through investments in fixed income securities. Interest rate risk is the risk that fixed income securities will decline in value as a result of changes in interest rates. For example, the value of bonds, fixed rate loans and short-term money market instruments may decline in value when interest rates rise. Fixed income securities with longer durations tend to be more sensitive to changes in interest rates, making them more volatile than fixed income securities with shorter durations or money market instruments. Therefore, duration is a potentially useful tool to measure the sensitivity of a fixed income security’s yield (market price to interest rate movement). To manage these risks, certain Funds may invest in derivative instruments tied to interest rates.
D-11
PACIFIC LIFE FUNDS
NOTES TO FINANCIAL STATEMENTS (Continued)
NOTES TO FINANCIAL STATEMENTS (Continued)
Foreign investments and currency risk— A Fund may be exposed to foreign investments and/or currency risk through direct investment in securities or through options, futures or currency transactions. The prices of foreign securities that are denominated in foreign currencies are affected by the value of the U.S. dollar. With respect to securities denominated in foreign currencies, in general, as the value of the U.S. dollar rises, the U.S. dollar price of a foreign security will fall. As the value of the U.S. dollar falls, the U.S. dollar value of the foreign security will rise. Currency rates in foreign countries may fluctuate significantly over short periods of time for a number of reasons. Foreign investments may be riskier than U.S. investments for many reasons, including changes in currency exchange rates, unstable political and economic conditions, a lack of adequate and timely company information, differences in the way securities markets operate, relatively lower market liquidity, less stringent financial reporting and accounting guidance and controls, less secure foreign banks or securities depositories than those in the U.S., foreign taxation issues and foreign controls on investments. As a result, a Fund’s investments in foreign currency denominated securities and other foreign investments may reduce the returns of the Fund. To manage these risks, certain Funds may invest in derivative instruments tied to foreign investments and currencies.
Price volatility risk— Derivatives tied to equity and fixed income securities are exposed to potential price volatility. Fixed income securities are affected by many factors, including prevailing interest rates, market conditions and market liquidity. Volatility of below investment grade fixed income securities (including loans) may be relatively greater than for investment grade fixed income securities. Equity securities tend to go up or down in value, sometimes rapidly and unpredictably. The prices of equity securities change in response to many factors, including a company’s historical and prospective earnings, the value of its assets, general economic conditions, interest rates, investor perceptions and market liquidity. Due to the complexities of markets, events in one market or sector may adversely impact other markets or sectors. To manage these risks, certain Funds may invest in various derivative instruments. Derivative instruments may be used to manage a Fund’s exposure to price volatility risk but may also be subject to greater price volatility than investments in traditional securities. The value of commodity-linked derivative instruments may be affected by changes in overall market movements, commodity index volatility, changes in interest rates, or factors affecting a particular industry or commodity, such as drought, floods, weather, livestock disease, embargoes, tariffs and international economic, political and regulatory developments.
Credit and Counterparty risk — Credit risk is the risk that a fixed income security’s issuer (or borrower or counterparty) will be unable or unwilling to meet its financial obligations (e.g. may not be able to make principal and/or interest payments when they are due or otherwise default on other financial terms) and/or may go bankrupt. This is also sometimes described as counterparty risk. A Fund may lose money if the issuer or guarantor of fixed income security, or counterparty of a derivative contract, repurchase or reverse repurchase agreement, or a loan of Fund securities, is unable or unwilling to make timely principal and/or interest payments, or to otherwise honor its obligations. A Fund may attempt to minimize concentrations of credit risk by undertaking transactions with a large number of borrowers or counterparties on recognized and reputable exchanges. A Fund’s investments in fixed income (debt) investments may range in quality from those rated in the lowest category in which it is permitted to invest to those rated in the highest category by a rating agency, or if unrated, determined by the manager to be of comparable quality. Similar to credit risk, a Fund may be exposed to counterparty risk, or the risk that an institution or other entity with which a Fund has unsettled or open transactions will default.
Financial assets of counterparties, which potentially expose a portfolio to counterparty risk, consists mainly of cash due from counterparties and investments. Certain managers may attempt to minimize credit and counterparty risks to a Fund by performing extensive reviews of each counterparty, entering into transactions with counterparties that the manager believes to be creditworthy at the time of the transaction and requiring the posting of collateral in applicable transactions. To manage these risks, certain Funds may invest in derivative instruments tied to a security issuers’ financial strength.
A Fund’s transactions in listed securities are settled/paid for upon delivery with their counterparties. Therefore, the risk of counterparty default for listed securities is considered minimal, as delivery of securities sold is only made once a Fund has received payment. Payment is made on a purchase once the securities have been delivered by the counterparty. The trade will fail if either party fails to meet its obligations.
Derivative Investments
In addition to managing the market risks described above, certain Funds, if permitted by their investment objectives, may also invest in derivatives for purposes of hedging, duration management, as a substitute for securities, to increase returns, or to otherwise help achieve a Fund’s investment goal. Each derivative instrument and the reasons a Fund invested in derivatives during the year are discussed in further detail below.
Swaps
Swaps are privately negotiated agreements between the Funds and its counterparties to exchange cash flows, assets, foreign currencies or market-linked returns at specified intervals. In connection with these agreements, securities may be identified as collateral in accordance with the terms of the respective swap agreements to provide assets of value and recourse in the event of default or bankruptcy/insolvency. Swaps are marked-to-market daily based upon values received from third party vendors or quotations from market makers. Unrealized appreciation is recorded as an asset and unrealized depreciation is recorded as a liability on the Statements of Assets and Liabilities. The change in value of swaps, including accruals of periodic amounts of interest to be paid or received on swaps, is recorded as unrealized appreciation or depreciation in the Statements of Operations. Payments received or made at the beginning of the measurement period are reflected as such in the Statements of Assets and Liabilities and represent payments made or received upon entering into the swap agreement to compensate for differences between the stated terms of the swap agreement and prevailing market conditions (credit spreads, currency exchange rates,
D-12
PACIFIC LIFE FUNDS
NOTES TO FINANCIAL STATEMENTS (Continued)
NOTES TO FINANCIAL STATEMENTS (Continued)
interest rates, and other relevant factors). These upfront payments are included in the calculation of realized gain or loss in the Statements of Operations, when the swap is closed. A liquidation payment received or made at the termination of the swap is recorded as realized gain or loss in the Statements of Operations. Net periodic payments received by the Funds are included as part of realized gain or loss in the Statements of Operations.
Credit Default Swaps
Credit default swap agreements involve one party making a stream of payments (referred to as the buyer of protection) to another party (the seller of protection) in exchange for the right to receive a specified return in the event of a default or other credit event for the referenced entity, obligation or index. As a seller of protection, a Fund generally receives an upfront payment or a fixed rate of income throughout the term of the swap provided there is no credit event. As the seller, a Fund would effectively add leverage to its Fund because, in addition to its total net assets, a Fund would be subject to investment exposure on the notional amount of the swap.
A Fund investing in credit default swaps is subject to the risk that there is no liquid market for these agreements, that the counterparties may default on their obligations to perform or disagree as to the meaning of the contractual terms in the agreements, or that there may be unfavorable changes in interest rates.
If a Fund is a seller of protection and a credit event occurs, as defined under the terms of that particular swap agreement, a Fund will either (i) pay to the buyer of protection an amount equal to the notional amount of the swap and take delivery of the referenced obligation, other deliverable obligations or underlying securities comprising the referenced index or (ii) pay a net settlement amount in the form of cash or securities equal to the notional amount of the swap less the recovery value of the referenced obligation or underlying securities comprising the referenced index. If a Fund is a buyer of protection and a credit event occurs, as defined under the terms of that particular swap agreement, a Fund will either (i) receive from the seller of protection an amount equal to the notional amount of the swap and deliver the referenced obligation, other deliverable obligations or underlying securities comprising the referenced index or (ii) receive a net settlement amount in the form of cash or securities equal to the notional amount of the swap less the recovery value of the referenced obligation or underlying securities comprising the referenced index. Recovery values are assumed by market makers considering either industry standard recovery rates or entity specific factors and considerations until a credit event occurs. If a credit event has occurred, the recovery value is determined by a facilitated auction whereby a minimum number of allowable broker bids, together with a specified valuation method, are used to calculate the settlement value.
Credit default swap agreements on corporate and sovereign issues of an emerging country involve one party making a stream of payments to another party in exchange for the right to receive a specified return in the event of a default or other credit event. If a credit event occurs and cash settlement is not elected, a variety of other deliverable obligations may be delivered in lieu of the specific referenced obligation. The ability to deliver other obligations may result in a cheapest-to-deliver option (the buyer of protection’s right to choose the deliverable obligation with the lowest value following a credit event). A Fund may use credit default swaps on corporate and sovereign issues of an emerging country to provide a measure of protection against defaults of the issuers (i.e., to reduce risk where a Fund owns or has exposure to the referenced obligation) or to take an active long or short position with respect to the likelihood of a particular issuer’s default.
Credit default swap agreements on asset-backed securities involve one party making a stream of payments to another party in exchange for the right to receive a specified return in the event of a default or other credit event. Unlike credit default swaps on corporate and sovereign issues of an emerging country, deliverable obligations in most instances would be limited to the specific referenced obligation as performance for asset-backed securities can vary across deals. Prepayments, principal paydowns, and other writedowns or loss events on the underlying mortgage loans will reduce the outstanding principal balance of the referenced obligation. These reductions may be temporary or permanent as defined under the terms of the swap agreement and the notional amount for the swap agreement will be adjusted by corresponding amounts. A Fund may use credit default swaps on asset-backed securities to provide a measure of protection against defaults of the referenced obligation or to take an active long or short position with respect to the likelihood of a particular referenced obligation’s default.
Credit default swap agreements on credit indices involve one party making a stream of payments to another party in exchange for the right to receive a specified return in the event of a write-down, principal shortfall, interest shortfall or default of all or part of the referenced entities comprising the credit index. Credit default swap on indices are benchmarks for protecting investors owning bonds against default. A credit index is a list of a basket of credit instruments or exposures designed to be representative of some part of the credit market as a whole. These indices are made up of reference credits that are judged by a poll of dealers to be the most liquid entities in the credit default swap market based on the sector of the index. Components of the indices may include, but are not limited to, investment grade securities, high yield securities, asset-backed securities, emerging markets, and/or various credit ratings within each sector. Credit indices are traded using credit default swaps with standardized terms including a fixed spread and standard maturity dates. An index credit default swap references all the names in the index, and if there is a default, the credit event is settled based on that name’s weight in the index. The composition of the indices changes periodically, usually every six months, and for most indices, each name has an equal weight in the index. A Fund may use credit default swaps on credit indices to hedge a Fund of credit default swaps or bonds with a credit default swap on indices which is less expensive than it would be to buy many credit default swaps to achieve a similar effect.
D-13
PACIFIC LIFE FUNDS
NOTES TO FINANCIAL STATEMENTS (Continued)
NOTES TO FINANCIAL STATEMENTS (Continued)
An implied credit spread is the spread in yield between a U.S. Treasury security and the referenced obligation or underlying investment that are identical in all respects except for the quality rating. Wider credit spreads, in absolute terms when compared to the notional amount of the swap, represent a deterioration of the referenced entity’s credit soundness and a greater likelihood or risk of default or other credit event occurring as defined under the terms of the agreement. Implied credit spreads, represented in absolute terms, utilized in determining the market value of credit default swap agreements on corporate and sovereign issues of an emerging country as of period end are disclosed in the Notes to Schedules of Investments and serve as an indicator of the current status of the payment/performance risk and represent the likelihood or risk of default for the credit derivative. The implied credit spread of a particular referenced entity reflects the cost of buying/selling protection and may include upfront payments required to be made to enter into the agreement. For credit default swap agreements on asset-backed securities and credit indices, the quoted market prices and resulting values serve as the indicator of the current status of the payment/performance risk.
A Fund’s maximum risk of loss from counterparty credit risk related to credit default swaps, either as the buyer or seller of protection, is the fair value of the contract. The risk may be mitigated to some extent if a master netting arrangement between a Fund and the counterparty is in place and to the extent a Fund obtains collateral to cover the Fund’s exposure to the counterparty.
The aggregate fair value of credit default swaps in a net liability position, if any, is reflected as unrealized depreciation and is disclosed in the Notes to Schedules of Investments. The collateral posted, net of assets received as collateral, for swap contracts, if any, is also disclosed in the Notes to Schedules of Investments. The maximum potential amount of future payments (undiscounted) that a Fund as a seller of protection could be required to make under a credit default swap agreement is an amount equal to the notional amount of the agreement. Notional amounts of all credit default swap agreements outstanding, if any, as of March 31, 2011 for which a Fund is the seller of protection are disclosed in the Notes to Schedules of Investments. These potential amounts are partially offset by any recovery values of the respective referenced obligations, upfront payments received upon entering into the agreement, or net amounts received from the settlement of buy protection credit default swap agreements entered into by a Fund for the same referenced entity or entities.
During the reporting period, the PL Income Fund entered into index based credit default swaps as a substitute for securities in order to gain a broad exposure to the bank loan markets and all swap agreements were terminated prior to March 31, 2011.
The amounts of realized gains and losses on derivative investments during the year ended March 31, 2011 as disclosed in the Statements of Operations serve as indicators of the volume of derivative activity for the PL Income Fund. None of the other Funds covered in this report invest in derivative instruments.
The Trust records its derivatives, if any, at fair value. The Trust does not use hedge accounting under U.S. GAAP. Although a Fund’s investments in derivatives may represent economic hedges as part of its investment objectives, they are considered to be non-hedge transactions for purposes of U.S. GAAP. None of the Funds covered in this report held derivative instruments as of March 31, 2011.
PL Income Fund’s realized gain on derivative credit investments of $51,639 for the period ended March 31, 2011, is recognized in the Statement of Operations as net realized gain on swap transactions.
12. SHARES OF BENEFICIAL INTEREST
Each Fund is authorized to issue an unlimited number of shares of beneficial interest with no par value. Changes in shares of beneficial interest of each Fund for the years or periods ended March 31, 2011 and 2010 were as follows:
D-14
PACIFIC LIFE FUNDS
NOTES TO FINANCIAL STATEMENTS (Continued)
NOTES TO FINANCIAL STATEMENTS (Continued)
| PL Portfolio Optimization | PL Portfolio Optimization | PL Portfolio Optimization | PL Portfolio Optimization | |||||||||||||||||||||||||||||
| Conservative Fund | Moderate-Conservative Fund | Moderate Fund | Moderate-Aggressive Fund | |||||||||||||||||||||||||||||
| Year ended | Year ended | Year ended | Year ended | Year ended | Year ended | Year ended | Year ended | |||||||||||||||||||||||||
| 3/31/2011 | 3/31/2010 | 3/31/2011 | 3/31/2010 | 3/31/2011 | 3/31/2010 | 3/31/2011 | 3/31/2010 | |||||||||||||||||||||||||
Class A | ||||||||||||||||||||||||||||||||
| Shares sold | 9,883,219 | 5,095,105 | 7,499,767 | 4,079,611 | 16,639,175 | 9,322,499 | 10,900,181 | 6,825,323 | ||||||||||||||||||||||||
| Dividends and distribution reinvested | 273,222 | 154,810 | 228,388 | 151,488 | 494,777 | 395,409 | 282,851 | 265,252 | ||||||||||||||||||||||||
| Shares repurchased | (4,793,123 | ) | (2,343,715 | ) | (3,327,441 | ) | (1,540,865 | ) | (7,572,182 | ) | (4,091,285 | ) | (7,258,951 | ) | (3,652,598 | ) | ||||||||||||||||
| Net increase | 5,363,318 | 2,906,200 | 4,400,714 | 2,690,234 | 9,561,770 | 5,626,623 | 3,924,081 | 3,437,977 | ||||||||||||||||||||||||
| Beginning shares outstanding | 6,620,300 | 3,714,100 | 7,414,505 | 4,724,271 | 22,858,713 | 17,232,090 | 21,080,126 | 17,642,149 | ||||||||||||||||||||||||
| Ending shares outstanding | 11,983,618 | 6,620,300 | 11,815,219 | 7,414,505 | 32,420,483 | 22,858,713 | 25,004,207 | 21,080,126 | ||||||||||||||||||||||||
Class B | ||||||||||||||||||||||||||||||||
| Shares sold | 1,209,958 | 585,682 | 1,147,366 | 682,096 | 2,989,542 | 1,643,306 | 2,076,087 | 1,225,743 | ||||||||||||||||||||||||
| Dividends and distribution reinvested | 40,641 | 27,986 | 40,051 | 32,703 | 84,489 | 83,625 | 40,570 | 49,996 | ||||||||||||||||||||||||
| Shares repurchased | (473,616 | ) | (270,707 | ) | (477,945 | ) | (319,317 | ) | (1,351,393 | ) | (793,232 | ) | (1,595,557 | ) | (823,019 | ) | ||||||||||||||||
| Net increase | 776,983 | 342,961 | 709,472 | 395,482 | 1,722,638 | 933,699 | 521,100 | 452,720 | ||||||||||||||||||||||||
| Beginning shares outstanding | 1,290,277 | 947,316 | 1,834,094 | 1,438,612 | 6,082,192 | 5,148,493 | 6,501,786 | 6,049,066 | ||||||||||||||||||||||||
| Ending shares outstanding | 2,067,260 | 1,290,277 | 2,543,566 | 1,834,094 | 7,804,830 | 6,082,192 | 7,022,886 | 6,501,786 | ||||||||||||||||||||||||
Class C | ||||||||||||||||||||||||||||||||
| Shares sold | 8,387,689 | 4,616,051 | 5,199,896 | 2,637,348 | 11,224,010 | 7,600,515 | 5,999,834 | 4,735,118 | ||||||||||||||||||||||||
| Dividends and distribution reinvested | 202,508 | 134,198 | 139,873 | 107,346 | 272,946 | 250,879 | 113,765 | 132,149 | ||||||||||||||||||||||||
| Shares repurchased | (4,231,977 | ) | (2,499,753 | ) | (1,937,194 | ) | (1,423,572 | ) | (4,970,189 | ) | (3,815,913 | ) | (4,720,942 | ) | (3,234,418 | ) | ||||||||||||||||
| Net increase | 4,358,220 | 2,250,496 | 3,402,575 | 1,321,122 | 6,526,767 | 4,035,481 | 1,392,657 | 1,632,849 | ||||||||||||||||||||||||
| Beginning shares outstanding | 6,547,328 | 4,296,832 | 6,217,865 | 4,896,743 | 19,658,434 | 15,622,953 | 18,004,286 | 16,371,437 | ||||||||||||||||||||||||
| Ending shares outstanding | 10,905,548 | 6,547,328 | 9,620,440 | 6,217,865 | 26,185,201 | 19,658,434 | 19,396,943 | 18,004,286 | ||||||||||||||||||||||||
Class R | ||||||||||||||||||||||||||||||||
| Shares sold | 383,168 | 573,385 | 711,711 | 666,896 | 1,078,079 | 1,380,156 | 640,197 | 1,099,903 | ||||||||||||||||||||||||
| Dividends and distribution reinvested | 21,554 | 20,183 | 27,930 | 22,829 | 36,679 | 41,583 | 13,461 | 15,130 | ||||||||||||||||||||||||
| Shares repurchased | (353,249 | ) | (188,408 | ) | (378,253 | ) | (287,268 | ) | (1,365,474 | ) | (727,441 | ) | (362,686 | ) | (697,823 | ) | ||||||||||||||||
| Net increase (decrease) | 51,473 | 405,160 | 361,388 | 402,457 | (250,716 | ) | 694,298 | 290,972 | 417,210 | |||||||||||||||||||||||
| Beginning shares outstanding | 768,216 | 363,056 | 996,558 | 594,101 | 2,248,938 | 1,554,640 | 1,144,057 | 726,847 | ||||||||||||||||||||||||
| Ending shares outstanding | 819,689 | 768,216 | 1,357,946 | 996,558 | 1,998,222 | 2,248,938 | 1,435,029 | 1,144,057 | ||||||||||||||||||||||||
| PL Portfolio Optimization | PL Money | PL Income | ||||||||||||||||||
| Aggressive Fund | Market Fund | Fund (1) | ||||||||||||||||||
| Year ended | Year ended | Year ended | Year ended | Period ended | ||||||||||||||||
| 3/31/2011 | 3/31/2010 | 3/31/2011 | 3/31/2010 | 3/31/2011 | ||||||||||||||||
Class A | ||||||||||||||||||||
| Shares sold | 3,514,980 | 2,980,430 | 88,260,849 | 52,775,972 | 548,189 | |||||||||||||||
| Dividends and distribution reinvested | 66,115 | 97,909 | — | 9,957 | 1,632 | |||||||||||||||
| Shares repurchased | (3,543,645 | ) | (2,484,648 | ) | (84,487,252 | ) | (73,530,933 | ) | (27,989 | ) | ||||||||||
| Net increase (decrease) | 37,450 | 593,691 | 3,773,597 | (20,745,004 | ) | 521,832 | ||||||||||||||
| Beginning shares outstanding | 9,258,763 | 8,665,072 | 34,679,729 | 55,424,733 | — | |||||||||||||||
| Ending shares outstanding | 9,296,213 | 9,258,763 | 38,453,326 | 34,679,729 | 521,832 | |||||||||||||||
Class B | ||||||||||||||||||||
| Shares sold | 594,910 | 487,134 | — | — | — | |||||||||||||||
| Dividends and distribution reinvested | 14,313 | 8,236 | — | — | — | |||||||||||||||
| Shares repurchased | (808,725 | ) | (429,310 | ) | — | — | — | |||||||||||||
| Net increase (decrease) | (199,502 | ) | 66,060 | — | — | — | ||||||||||||||
| Beginning shares outstanding | 2,749,973 | 2,683,913 | — | — | — | |||||||||||||||
| Ending shares outstanding | 2,550,471 | 2,749,973 | ||||||||||||||||||
D-15
PACIFIC LIFE FUNDS
NOTES TO FINANCIAL STATEMENTS (Continued)
NOTES TO FINANCIAL STATEMENTS (Continued)
| PL Portfolio Optimization | PL Money | PL Income | ||||||||||||||||||
| Aggressive Fund | Market Fund | Fund (1) | ||||||||||||||||||
| Year ended | Year ended | Year ended | Year ended | Period ended | ||||||||||||||||
| 3/31/2011 | 3/31/2010 | 3/31/2011 | 3/31/2010 | 3/31/2011 | ||||||||||||||||
Class C | ||||||||||||||||||||
| Shares sold | 2,856,844 | 2,128,529 | — | — | — | |||||||||||||||
| Dividends and distribution reinvested | 31,582 | 18,127 | — | — | — | |||||||||||||||
| Shares repurchased | (3,126,313 | ) | (2,117,305 | ) | — | — | — | |||||||||||||
| Net increase (decrease) | (237,887 | ) | 29,351 | — | — | — | ||||||||||||||
| Beginning shares outstanding | 6,520,769 | 6,491,418 | — | — | — | |||||||||||||||
| Ending shares outstanding | 6,282,882 | 6,520,769 | ||||||||||||||||||
Class R | ||||||||||||||||||||
| Shares sold | 210,892 | 389,684 | — | — | — | |||||||||||||||
| Dividends and distribution reinvested | 2,875 | 4,954 | — | — | — | |||||||||||||||
| Shares repurchased | (178,354 | ) | (281,783 | ) | — | — | — | |||||||||||||
| Net increase | 35,413 | 112,855 | — | — | — | |||||||||||||||
| Beginning shares outstanding | 419,121 | 306,266 | — | — | — | |||||||||||||||
| Ending shares outstanding | 454,534 | 419,121 | ||||||||||||||||||
Class I | ||||||||||||||||||||
| Shares sold | — | — | — | — | 5,000,965 | |||||||||||||||
| Dividends and distribution reinvested | — | — | — | — | 43,044 | |||||||||||||||
| Shares repurchased | — | — | — | — | — | |||||||||||||||
| Net increase | — | — | — | — | 5,044,009 | |||||||||||||||
| Beginning shares outstanding | — | — | — | — | — | |||||||||||||||
| Ending shares outstanding | 5,044,009 | |||||||||||||||||||
| (1) | Operations commenced on December 31, 2010. |
13. INDEMNIFICATIONS
Under the Trust’s organizational documents, its officers and trustees are indemnified against certain liabilities arising out of performance of their duties to the Trust. In addition, the Trust entered into an agreement with each of the trustees which provides that the Trust will indemnify and hold harmless each trustee against any expenses actually and reasonably incurred by any trustee in any proceeding arising out of or in connection with the trustee’s services to the Trust, to the fullest extent permitted by the Trust’s Declaration of Trust and By-Laws, the general trust law of the State of Delaware, the Securities Act of 1933, and the 1940 Act, each as now or hereinafter in force. In the normal course of business, the Trust enters into contracts with service providers and others that contain general indemnification clauses. The Trust’s maximum exposure under these arrangements and agreements is dependent on future claims that may be made against the Trust and/or the trustees and, therefore, cannot be estimated; however, based on experience, the risk of loss from such claims is considered remote.
14. RECLASSIFICATION OF ACCOUNTS
During the year ended March 31, 2011, reclassifications as shown in the following table have been made in each Fund’s capital accounts to report these balances on a tax basis, excluding certain temporary differences, as of March 31, 2011. Additional adjustments may be required in subsequent reporting periods. These reclassifications, which have no impact on the NAV of the Funds, are primarily attributable to reclassifications of foreign currency transactions, non-deductible expenses, treatment of net operating losses, expiration of capital loss carryforwards, use of tax equalization, and certain differences in the computation of distributable income and capital gains under Federal tax rules versus U.S. GAAP. The calculation of net investment income per share in the financial highlights excludes these adjustments.
| Undistributed/ | ||||||||||||
| Accumulated | Accumulated | |||||||||||
| Paid-In | Net Investment | Net Realized | ||||||||||
| Fund | Capital | Income (Loss) | Loss | |||||||||
| PL Portfolio Optimization Conservative | ( $388,983 | ) | $ | 3,617,235 | ( $3,228,252 | ) | ||||||
| PL Portfolio Optimization Moderate-Conservative | — | 2,381,578 | (2,381,578 | ) | ||||||||
| PL Portfolio Optimization Moderate | — | 4,536,230 | (4,536,230 | ) | ||||||||
| PL Portfolio Optimization Moderate-Aggressive | — | 2,401,414 | (2,401,414 | ) | ||||||||
| PL Portfolio Optimization Aggressive | — | 414,187 | (414,187 | ) | ||||||||
| PL Money Market | 148 | — | (148 | ) | ||||||||
| PL Income | (992 | ) | 8,458 | (7,466 | ) | |||||||
D-16
PACIFIC LIFE FUNDS
NOTES TO FINANCIAL STATEMENTS (Continued)
NOTES TO FINANCIAL STATEMENTS (Continued)
15. OTHER TAX INFORMATION (Unaudited)
For corporate shareholders, the percentage of investment income (dividend income and short-term gains, if any) for each of the Funds that qualify for the dividends-received deductions for the year ended March 31, 2011 is as follows:
| Fund | Percentage | |||
| PL Portfolio Optimization Conservative | 7.89 | % | ||
| PL Portfolio Optimization Moderate-Conservative | 14.66 | % | ||
| PL Portfolio Optimization Moderate | 27.73 | % | ||
| PL Portfolio Optimization Moderate-Aggressive | 56.12 | % | ||
| PL Portfolio Optimization Aggressive | 89.37 | % | ||
For the year ended March 31, 2011, certain dividends paid by the Funds may be subject to a maximum tax rate of 15%, as provided by the Jobs and Growth Tax Relief Reconciliation Act of 2003. Of the distributions made by the following Funds, the corresponding percentages represent the amount of each distribution which may qualify for the 15% dividend income tax rate.
| Fund | Percentage | |||
| PL Portfolio Optimization Conservative | 12.25 | % | ||
| PL Portfolio Optimization Moderate-Conservative | 21.12 | % | ||
| PL Portfolio Optimization Moderate | 41.37 | % | ||
| PL Portfolio Optimization Moderate-Aggressive | 85.55 | % | ||
| PL Portfolio Optimization Aggressive | 100.00 | % | ||
Shareholders should not use the above tax information to prepare their tax returns. The information will be included with your Form 1099 DIV which will be sent to you separately in January 2012.
The following Funds designated the listed amounts as long-term capital gain dividends during the year ended March 31, 2011. Distributable long-term gains are based on net realized long-term gains determined on a tax basis and may differ from such amounts for financial reporting purposes.
| Fund | Amount | |||
| PL Portfolio Optimization Conservative | $ | 199,772 | ||
D-17
REPORT OF INDEPENDENT REGISTERED PUBLIC ACCOUNTING FIRM
To The Board of Trustees and Shareholders of
Pacific Life Funds
Pacific Life Funds
We have audited the accompanying statements of assets and liabilities, including the schedules of investments, of PL Portfolio Optimization Conservative Fund, PL Portfolio Optimization Moderate-Conservative Fund, PL Portfolio Optimization Moderate Fund, PL Portfolio Optimization Moderate-Aggressive Fund, PL Portfolio Optimization Aggressive Fund, PL Money Market Fund, and PL Income Fund (collectively the “Funds”) (seven of the twenty-four funds comprising the Pacific Life Funds) as of March 31, 2011, and related statements of operations for the year then ended (as to the PL Income Fund, for the period from December 31, 2010 (commencement of operations) through March 31, 2011), the statements of changes in net assets for each of the two years in the period then ended (as to the PL Income Fund, for the period from December 31, 2010 (commencement of operations) through March 31, 2011), and the financial highlights for each of the periods presented. These financial statements and financial highlights are the responsibility of the Funds’ management. Our responsibility is to express an opinion on these financial statements and financial highlights based on our audits.
We conducted our audits in accordance with the standards of the Public Company Accounting Oversight Board (United States). Those standards require that we plan and perform the audit to obtain reasonable assurance about whether the financial statements and financial highlights are free of material misstatement. The Funds are not required to have, nor were we engaged to perform, an audit of their internal control over financial reporting. Our audits included consideration of internal control over financial reporting as a basis for designing audit procedures that are appropriate in the circumstances, but not for the purpose of expressing an opinion on the effectiveness of the Funds’ internal control over financial reporting. Accordingly, we express no such opinion. An audit also includes examining, on a test basis, evidence supporting the amounts and disclosures in the financial statements, assessing the accounting principles used and significant estimates made by management, as well as evaluating the overall financial statement presentation. Our procedures included confirmation of securities owned as of March 31, 2011, by correspondence with the custodian, transfer agent and brokers; where replies were not received from brokers, we performed other auditing procedures. We believe that our audits provide a reasonable basis for our opinion.
In our opinion, the financial statements and financial highlights referred to above present fairly, in all material respects, the financial position of PL Portfolio Optimization Conservative Fund, PL Portfolio Optimization Moderate-Conservative Fund, PL Portfolio Optimization Moderate Fund, PL Portfolio Optimization Moderate-Aggressive Fund, PL Portfolio Optimization Aggressive Fund, PL Money Market Fund, and PL Income Fund as of March 31, 2011, the results of their operations for the year then ended (as to the PL Income Fund, for the period from December 31, 2010 (commencement of operations) through March 31, 2011), the changes in their net assets for each of the two years in the period then ended (as to the PL Income Fund, for the period from December 31, 2010 (commencement of operations) through March 31, 2011), and the financial highlights for each of the periods presented, in conformity with accounting principles generally accepted in the United States of America.

Costa Mesa, California
May 26, 2011
E-1
PACIFIC LIFE FUNDS
DISCLOSURE OF FUND EXPENSES
(Unaudited)
DISCLOSURE OF FUND EXPENSES
(Unaudited)
We believe it is important for you to understand the impact of fees and expenses regarding your investment. All mutual funds have operating expenses. As a shareholder of a mutual fund, you incur two types of costs: (1) transactions costs such as initial sales charges (loads) on purchase payments and/or contingent deferred sales charges on redemptions; and (2) ongoing costs, which include advisory fees, administration fees, distribution and/or service fees, and other fund expenses. The following example is intended to help you understand your ongoing costs (in dollars) of investing in each fund and to compare these costs with those of other mutual funds. The example is based on an investment of $1,000.00 made at the beginning of the period and held for the entire six-month period from October 1, 2010 to March 31, 2011.
ACTUAL EXPENSES
The first section of the table for each fund entitled “Actual Fund Return”, provides information about actual account values and actual expenses based on each fund’s actual performance and each fund’s actual expenses, after any applicable adviser expense reimbursement, administrator fee reductions, advisory fee, and distribution and/or service fee waivers. The “Ending Account Value at 03/31/11” column shown is derived from the fund’s actual performance; the “Annualized Expense Ratio” column shows the fund’s actual annualized expense ratio; and the “Expenses Paid During the Period 10/01/10-03/31/11” column shows the dollar amount that would have been paid by you. All the information illustrated in the following table is based on the past six-month period from October 1, 2010 to March 31, 2011.
You may use the information in this section, together with the amount you invested, to estimate the expenses that you paid over the period. To do so, for each fund in your account, simply divide that fund’s value by $1,000.00 (for example, an $8,600.00 fund value divided by $1,000.00 = 8.6), then multiply the result by the number given for your fund(s) in the “Expenses Paid During the Period 10/01/10-03/31/11.”
HYPOTHETICAL EXAMPLE FOR COMPARISON PURPOSES
The second section of the table for each fund, entitled “Hypothetical”, provides information about hypothetical account values and hypothetical expenses based on a 5% per year hypothetical rate of return and actual fund’s expenses, after any applicable adviser expense reimbursement, administrator fee reductions, and distributor fee waivers. It assumes that the fund had an annual 5% rate of return before expenses, but that the expense ratio is unchanged. The hypothetical account values and expenses may not be used to estimate the actual ending account values or expenses you paid for the period.
You may use the hypothetical example information to compare the ongoing costs of investing in the fund compared to other mutual funds. To do so, compare this 5% hypothetical example with the 5% hypothetical examples that appear in the shareholder reports of other mutual funds.
Please note that the expenses shown in the table are meant to highlight your ongoing costs only and do not reflect any transactional costs, such as initial sales charges (loads) or contingent deferred sales charges. Therefore, the second section of the table is useful in comparing ongoing costs only, and will not help you determine the relative total costs of owning different mutual funds. In addition, if these other costs were included, your costs would have been higher.
| Expenses | ||||||||||||||||
| Beginning | Ending | Paid During | ||||||||||||||
| Account | Account | Annualized | the Period(1) | |||||||||||||
| Value at | Value at | Expense | 10/01/10 — | |||||||||||||
| 10/01/10 | 03/31/11 | Ratio | 03/31/11 | |||||||||||||
| PL Portfolio Optimization Conservative Fund (2) | ||||||||||||||||
| Actual Fund Return | ||||||||||||||||
| Class A | $ | 1,000.00 | $ | 1,036.40 | 0.60 | % | $ | 3.05 | ||||||||
| Class B | 1,000.00 | 1,032.80 | 1.35 | % | 6.84 | |||||||||||
| Class C | 1,000.00 | 1,032.70 | 1.35 | % | 6.84 | |||||||||||
| Class R | 1,000.00 | 1,034.40 | 0.85 | % | 4.31 | |||||||||||
Hypothetical | ||||||||||||||||
| Class A | $ | 1,000.00 | $ | 1,021.94 | 0.60 | % | $ | 3.02 | ||||||||
| Class B | 1,000.00 | 1,018.20 | 1.35 | % | 6.79 | |||||||||||
| Class C | 1,000.00 | 1,018.20 | 1.35 | % | 6.79 | |||||||||||
| Class R | 1,000.00 | 1,020.69 | 0.85 | % | 4.28 | |||||||||||
| PL Portfolio Optimization Moderate-Conservative Fund (2) | ||||||||||||||||
| Actual Fund Return | ||||||||||||||||
| Class A | $ | 1,000.00 | $ | 1,064.60 | 0.60 | % | $ | 3.09 | ||||||||
| Class B | 1,000.00 | 1,060.90 | 1.35 | % | 6.94 | |||||||||||
| Class C | 1,000.00 | 1,060.10 | 1.35 | % | 6.93 | |||||||||||
| Class R | 1,000.00 | 1,063.10 | 0.85 | % | 4.37 | |||||||||||
Hypothetical | ||||||||||||||||
| Class A | $ | 1,000.00 | $ | 1,021.94 | 0.60 | % | $ | 3.02 | ||||||||
| Class B | 1,000.00 | 1,018.20 | 1.35 | % | 6.79 | |||||||||||
| Class C | 1,000.00 | 1,018.20 | 1.35 | % | 6.79 | |||||||||||
| Class R | 1,000.00 | 1,020.69 | 0.85 | % | 4.28 | |||||||||||
| PL Portfolio Optimization Moderate Fund (2) | ||||||||||||||||
Actual Fund Return | ||||||||||||||||
| Class A | $ | 1,000.00 | $ | 1,093.70 | 0.60 | % | $ | 3.13 | ||||||||
| Class B | 1,000.00 | 1,090.90 | 1.35 | % | 7.04 | |||||||||||
| Class C | 1,000.00 | 1,090.10 | 1.35 | % | 7.03 | |||||||||||
| Class R | 1,000.00 | 1,092.50 | 0.85 | % | 4.43 | |||||||||||
Hypothetical | ||||||||||||||||
| Class A | $ | 1,000.00 | $ | 1,021.94 | 0.60 | % | $ | 3.02 | ||||||||
| Class B | 1,000.00 | 1,018.20 | 1.35 | % | 6.79 | |||||||||||
| Class C | 1,000.00 | 1,018.20 | 1.35 | % | 6.79 | |||||||||||
| Class R | 1,000.00 | 1,020.69 | 0.85 | % | 4.28 | |||||||||||
| PL Portfolio Optimization Moderate-Aggressive Fund (2) | ||||||||||||||||
| Actual Fund Return | ||||||||||||||||
| Class A | $ | 1,000.00 | $ | 1,121.40 | 0.60 | % | $ | 3.17 | ||||||||
| Class B | 1,000.00 | 1,117.90 | 1.35 | % | 7.13 | |||||||||||
| Class C | 1,000.00 | 1,119.30 | 1.35 | % | 7.13 | |||||||||||
| Class R | 1,000.00 | 1,119.80 | 0.85 | % | 4.49 | |||||||||||
Hypothetical | ||||||||||||||||
| Class A | $ | 1,000.00 | $ | 1,021.94 | 0.60 | % | $ | 3.02 | ||||||||
| Class B | 1,000.00 | 1,018.20 | 1.35 | % | 6.79 | |||||||||||
| Class C | 1,000.00 | 1,018.20 | 1.35 | % | 6.79 | |||||||||||
| Class R | 1,000.00 | 1,020.69 | 0.85 | % | 4.28 | |||||||||||
See explanation of references on page F-2
F-1
PACIFIC LIFE FUNDS
DISCLOSURE OF FUND EXPENSES (Continued)
(Unaudited)
DISCLOSURE OF FUND EXPENSES (Continued)
(Unaudited)
| Expenses | ||||||||||||||||
| Beginning | Ending | Paid During | ||||||||||||||
| Account | Account | Annualized | the Period(1) | |||||||||||||
| Value at | Value at | Expense | 10/01/10 - | |||||||||||||
| 10/01/10 | 03/31/11 | Ratio | 03/31/11 | |||||||||||||
| PL Portfolio Optimization Aggressive Fund (2) | ||||||||||||||||
| Actual Fund Return | ||||||||||||||||
| Class A | $ | 1,000.00 | $ | 1,145.40 | 0.60 | % | $ | 3.21 | ||||||||
| Class B | 1,000.00 | 1,143.50 | 1.35 | % | 7.21 | |||||||||||
| Class C | 1,000.00 | 1,143.50 | 1.35 | % | 7.21 | |||||||||||
| Class R | 1,000.00 | 1,145.30 | 0.85 | % | 4.55 | |||||||||||
Hypothetical | ||||||||||||||||
| Class A | $ | 1,000.00 | $ | 1,021.94 | 0.60 | % | $ | 3.02 | ||||||||
| Class B | 1,000.00 | 1,018.20 | 1.35 | % | 6.79 | |||||||||||
| Class C | 1,000.00 | 1,018.20 | 1.35 | % | 6.79 | |||||||||||
| Class R | 1,000.00 | 1,020.69 | 0.85 | % | 4.28 | |||||||||||
| PL Money Market Fund | ||||||||||||||||
| Actual Fund Return | ||||||||||||||||
| Class A | $ | 1,000.00 | $ | 1,000.00 | 0.22 | % | $ | 1.10 | ||||||||
Hypothetical | ||||||||||||||||
| Class A | $ | 1,000.00 | $ | 1,023.83 | 0.22 | % | $ | 1.11 | ||||||||
PL Income Fund | ||||||||||||||||
| Actual Fund Return | ||||||||||||||||
| Class A (3) | $ | 1,000.00 | $ | 1,024.60 | 0.90 | % | $ | 2.27 | ||||||||
| Class I (3) | 1,000.00 | 1,024.80 | 0.65 | % | 1.64 | |||||||||||
Hypothetical | ||||||||||||||||
| Class A | $ | 1,000.00 | $ | 1,020.44 | 0.90 | % | $ | 4.53 | ||||||||
| Class I | 1,000.00 | 1,021.69 | 0.65 | % | 3.28 | |||||||||||
| (1) | Expenses paid during the period are equal to the fund’s annualized expense ratio (shown in table above), multiplied by the average account value over the period, multiplied by the number of days in the most recent fiscal half-year or applicable period, then divided by 365 days. | |
| (2) | The annualized expense ratios for the Portfolio Optimization Funds do not include expenses of the Underlying Funds (See Note 1 in Notes to Financial Statements) in which the Portfolio Optimization Funds invest. | |
| (3) | PL Income Fund commenced operations on December 31, 2010. The actual fund return and expenses paid during the period for this fund were for the period from December 31, 2010 to March 31, 2011 instead of the entire 6-month period. The hypothetical return is based on the entire 6-month period for comparison purposes. |
F-2
PACIFIC LIFE FUNDS
TRUSTEES AND OFFICERS INFORMATION
(Unaudited)
TRUSTEES AND OFFICERS INFORMATION
(Unaudited)
The business and affairs of the Pacific Life Funds (the “Trust”) are managed under the direction of the Board of Trustees under the Pacific Life Funds’ Declaration of Trust. Information pertaining to the trustees and officers of the Trust is set forth below, effective April 1, 2011. Trustees who are not deemed to be “interested persons” of the Trust, as defined in the 1940 Act, are referred to as “Independent Trustees.” Certain trustees and officers are deemed to be “interested persons” of the Trust and thus are referred to as “Interested Persons”, because of their positions with Pacific Life Insurance Company (“Pacific Life”) and Pacific Life Fund Advisors LLC, a wholly-owned subsidiary of Pacific Life. The Trust’s Statement of Additional Information includes additional information about the trustees. For information on availability of the Trust’s Statement of Additional Information, refer to the WHERE TO GO FOR MORE INFORMATION section of this report.
The address of each trustee and officer is c/o Pacific Life Funds, 700 Newport Center Drive, Newport Beach, CA 92660.
| Number of | ||||||||
| Position(s) with | Current Directorship(s) Held and Principal Occupation(s) | Portfolios in | ||||||
| the Fund and | (and certain additional occupation information) | Fund Complex | ||||||
| Name and Age | Length of Time Served* | During Past 5 Years | Overseen** | |||||
INDEPENDENT TRUSTEES | ||||||||
| Frederick L. Blackmon Year of birth 1952 | Trustee since 9/13/05 | Trustee (1/05 to present) of Pacific Select Fund; Director (2005 to present) of Trustmark Mutual Holding Company; Former Executive Vice President and Chief Financial Officer (1995 to 2003) of Zurich Life and has been retired since that time; Executive Vice President and Chief Financial Officer (1989 to 1995) of Alexander Hamilton Life Insurance Company (subsidiary of Household International); Member of Board of Trustees (2010 to present) of Cranbrook Educational Community; Former Member of Board of Governors (1994 to 1999) of Cranbrook Schools; and Former Member, Board of Regents (1993 to 1996), Eastern Michigan University. | 68 | |||||
| Gale K. Caruso Year of birth 1957 | Trustee since 1/01/06 | Trustee (1/06 to present) of Pacific Select Fund; Former Member of the Board of Directors (2005 to 2009) of LandAmerica Financial Group, Inc.; Former President and Chief Executive Officer (1999 to 2003) of Zurich Life; Former Chairman, President and Chief Executive Officer of Scudder Canada Investor Services, Ltd. and Managing Director of Scudder Kemper the Advisory Investments; Former Member of Council of the Trust for Public Land in Maine; Member of the Board of Directors of Make-A-Wish of Maine; and Former Member, Board of Directors of the Illinois Life Insurance Council. | 68 | |||||
| Lucie H. Moore Year of birth 1956 | Trustee since 6/13/01 | Trustee (10/98 to present) of Pacific Select Fund; Former Partner (1984 to 1994) with Gibson, Dunn & Crutcher (Law); Member of the Board of Trustees (2007 to present) of Sage Hill School; Former Member (2000 to 2009) of the Board of Trustees of The Pegasus School; Member of the Board of Directors (2005 to present) of HomeWord; and Former Member of the Advisory Board (1993 to 2004) of Court Appointed Special Advocates (CASA) of Orange County. | 68 | |||||
| Nooruddin (Rudy) S. Veerjee Year of birth 1958 | Trustee since 9/13/05 | Trustee (1/05 to present) of Pacific Select Fund; Former President (1997 to 2000) of Transamerica Insurance and Investment Group and has been retired since that time; Former President (1994 to 1997) of Transamerica Asset Management; Former Chairman and Chief Executive Officer (1995 to 2000) of Transamerica Premier Funds (Mutual Fund); and Former Director (1994 to 2000) of various Transamerica Life Companies. | 68 | |||||
| G. Thomas Willis Year of birth 1942 | Trustee since 2/24/04 | Trustee (11/03 to present) of Pacific Select Fund; Certified Public Accountant in California (1967 to present); Audit Partner (1976 to 2002) of PricewaterhouseCoopers LLP, (Accounting and Auditing) and has been retired since that time. | 68 | |||||
See explanation of symbols on page F-6
F-3
PACIFIC LIFE FUNDS
TRUSTEES AND OFFICERS INFORMATION (Continued)
(Unaudited)
TRUSTEES AND OFFICERS INFORMATION (Continued)
(Unaudited)
| Number of | ||||||||
| Position(s) with | Current Directorship(s) Held and Principal Occupation(s) | Portfolios in | ||||||
| the Fund and | (and certain additional occupation information) | Fund Complex | ||||||
| Name and Age | Length of Time Served* | During Past 5 Years | Overseen** | |||||
| INTERESTED PERSONS | ||||||||
| James T. Morris Year of birth 1960 | Chairman of the Board and Trustee since 1/11/07, (Chief Executive Officer 1/11/07 to 12/31/09, President 11/14/05 to 1/10/07 and Executive Vice President 6/05 to 11/05) | Director (4/07 to present), Chairman (5/08 to present), President and Chief Executive Officer (4/07 to present), Chief Operating Officer (1/06 to 4/07), Executive Vice President and Chief Insurance Officer (7/05 to 1/06) of Pacific Mutual Holding Company and Pacific LifeCorp; Director (4/07 to present), Chairman (5/08 to present), President and Chief Executive Officer (4/07 to present), Chief Operating Officer (1/06 to 4/07), Chief Insurance Officer (4/05 to 1/06), Executive Vice President (1/02 to 1/06), Senior Vice President (4/96 to 1/02), and Vice President (4/90 to 4/96) of Pacific Life; President and Chief Executive Officer (5/07 to present) of Pacific Life Fund Advisors LLC; Director (4/06 to present), Chairman (5/08 to present), President and Chief Executive Officer (4/07 to present), Chief Operating Officer (1/06 to 4/07), Chief Insurance Officer (4/05 to 1/06), Executive Vice President (1/02 to 1/06), and Senior Vice President (8/99 to 1/02) of Pacific Life & Annuity Company; and similar positions with other subsidiaries and affiliates of Pacific Life; and Chairman of the Board and Trustee (1/07 to present), Chief Executive Officer (1/07 to 12/09),President (11/05 to 1/07) and Executive Vice President (6/05 to 11/05) of Pacific Select Fund. | 68 | |||||
| Mary Ann Brown Year of birth 1951 | Chief Executive Officer since 1/01/10, (President 1/11/07 to 12/31/09, Executive Vice President 6/20/06 to 1/10/07) | Executive Vice President (4/10 to present) and Senior Vice President (5/06 to 4/10) of Pacific LifeCorp; Executive Vice President (4/10 to present) and Senior Vice President (3/05 to 4/10) of Pacific Life; Trustee (9/05 to present), Pacific Life Employees Retirement Plan; Executive Vice President (4/10 to present) and Senior Vice President (5/07 to 4/10) of Pacific Life Fund Advisors LLC; Executive Vice President (4/10 to present) and Senior Vice President (6/08 to 4/10) of Pacific Life Re Holdings LLC; Director (6/08 to present) Executive Vice President (4/10 to present) and Senior Vice President (6/08 to 4/10) of Pacific Life Re Holdings Limited; current and prior Board Member and Vice Chairman (8/01 to present) and Chairman (7/04 to 10/05) of National Association of Variable Annuities; Senior Vice President (7/03 to 11/03), of Finance, New York Life Insurance Company; MetLife, Inc. (12/98 to 6/03), Senior Vice President and Head of Individual Business Product Management (12/98 to 7/02) responsibilities included: President of New England Products and Services; Chairman, Security First Group (later MetLife Investors); Chairman, Chief Executive Officer and President, New England Pension and Annuity Company; Board Member, New England Zenith Funds; Board Member, Reinsurance Group of America, Chairman and Chief Executive Officer of Exeter Reinsurance Company, Ltd.; Chairman and Chief Executive Officer of Missouri Reinsurance Company, Ltd; Chairman of Underwriting Policy and Rate Setting Committees; Senior Vice President and Chief Actuary (7/02 to 6/03), of MetLife, Inc.; Director (12/05 to present), Executive Vice President (4/10 to present) and Senior Vice President (12/05 to 4/10) of Pacific Alliance Reinsurance Ltd; Director (10/07 to present), Executive Vice President (6/10 to present) and Senior Vice President (10/07 to 6/10) of Pacific Alliance Reinsurance Company of Vermont; and Chief Executive Officer (1/10 to present), President (1/07 to 12/09) and Executive Vice President (6/06 to 1/07) of Pacific Select Fund. | 68 | |||||
See explanation of symbols on page F-6
F-4
PACIFIC LIFE FUNDS
TRUSTEES AND OFFICERS INFORMATION (Continued)
(Unaudited)
TRUSTEES AND OFFICERS INFORMATION (Continued)
(Unaudited)
| Number of | ||||||||
| Position(s) with | Current Directorship(s) Held and Principal Occupation(s) | Portfolios in | ||||||
| the Fund and | (and certain additional occupation information) | Fund Complex | ||||||
| Name and Age | Length of Time Served* | During Past 5 Years | Overseen** | |||||
| INTERESTED PERSONS (Continued) | ||||||||
| Robin S. Yonis Year of birth 1954 | Vice President and General Counsel since 6/13/01 | Vice President, Fund Advisor General Counsel, and Assistant Secretary (5/07 to present) of Pacific Life Fund Advisors LLC; Vice President and Counsel (4/04 to present), Assistant Vice President and Investment Counsel (11/93 to 4/04) of Pacific Life; Vice President and Investment Counsel (4/04 to 9/09), Assistant Vice President and Investment Counsel (8/99 to 4/04) of Pacific Life & Annuity Company; and Vice President and General Counsel (4/05 to present) of Pacific Select Fund. | 68 | |||||
| Brian D. Klemens Year of birth 1956 | Vice President and Treasurer since 6/13/01 | Vice President and Controller (10/07 to present) and Vice President and Treasurer (6/99 to 10/07) of Pacific Mutual Holding Company and Pacific LifeCorp; Vice President and Controller (10/07 to present) and Vice President and Treasurer (12/98 to 10/07) of Pacific Life; Vice President and Controller (10/07 to present) and Vice President and Treasurer (5/07 to 10/07) of Pacific Life Fund Advisors LLC; and similar positions with other subsidiaries and affiliates of Pacific Life; and Vice President and Treasurer (4/96 to present) of Pacific Select Fund. | 68 | |||||
| Sharon E. Pacheco Year of birth 1957 | Vice President and Chief Compliance Officer since 6/04/04 | Vice President and Chief Compliance Officer (11/03 to present) of Pacific Mutual Holding Company and Pacific LifeCorp; Vice President (2/00 to present) and Chief Compliance Officer (1/03 to present) and Assistant Vice President (11/97 to 2/00) of Pacific Life; Vice President (4/00 to present), Chief Compliance Officer (1/03 to present), and Assistant Vice President (8/99 to 4/00) of Pacific Life & Annuity Company; Vice President and Chief Compliance Officer (5/07 to present) of Pacific Life Fund Advisors LLC; and Vice President and Chief Compliance Officer (6/04 to present) of Pacific Select Fund | 68 | |||||
| Eddie Tung Year of birth 1957 | Vice President and Assistant Treasurer since 11/14/05 | Assistant Vice President (4/03 to present) and Director (Variable Products Accounting) (4/00 to 4/03) of Pacific Life; Assistant Vice President (4/10 to present) of Pacific Life & Annuity Company; Assistant Vice President (5/07 to present) of Pacific Life Fund Advisors LLC; and Assistant Vice President and Assistant Treasurer (11/05 to present) of Pacific Select Fund. | 68 | |||||
| Howard T. Hirakawa Year of birth 1962 | Vice President since 6/20/06 | Vice President (5/07 to present) of Pacific Life Fund Advisors LLC; Vice President (4/05 to present), Assistant Vice President (4/00 to 4/05) and Director (Annuities & Mutual Funds) (5/98 to 4/00) of Pacific Life; Vice President (4/05 to 9/09) of Pacific Life & Annuity Company; and Vice President (6/06 to present) of Pacific Select Fund. | 68 | |||||
| Jane M. Guon Year of birth 1964 | Vice President since 1/01/11 and Secretary since 1/01/11 | Vice President and Secretary (1/11 to present) and Assistant Vice President (4/06 to 12/10) and Assistant Secretary (6/98 to 12/10) of Pacific Mutual Holding Company and Pacific LifeCorp; Director, Vice President, and Secretary (1/11 to present) and Assistant Vice President (4/06 to 12/10) and Assistant Secretary (2/95 to 12/10) of Pacific Life, Vice President and Secretary (1/11 to present) and Assistant Vice President and Assistant Secretary (05/07 to 12/10) of Pacific Life Fund Advisors LLC ; and similar positions with other subsidiaries of Pacific Life; and Vice President (1/11 to present) and Secretary (1/11 to present) of Pacific Select Fund. | 68 | |||||
See explanation of symbols on page F-6
F-5
PACIFIC LIFE FUNDS
TRUSTEES AND OFFICERS INFORMATION (Continued)
(Unaudited)
TRUSTEES AND OFFICERS INFORMATION (Continued)
(Unaudited)
| Number of | ||||||||
| Position(s) with | Current Directorship(s) Held and Principal Occupation(s) | Portfolios in | ||||||
| the Fund and | (and certain additional occupation information) | Fund Complex | ||||||
| Name and Age | Length of Time Served* | During Past 5 Years | Overseen** | |||||
| INTERESTED PERSONS (Continued) | ||||||||
| Laurene E. MacElwee Year of birth 1966 | Vice President since 4/04/05 and Assistant Secretary since 6/13/01 | Vice President (4/11 to present), Assistant Secretary (5/07 to present), and Assistant Vice President (5/07 to 3/11) of Pacific Life Fund Advisors LLC; Vice President (4/11 to present); Assistant Vice President (4/02 to 3/11) and Director (Variable Products & Fund Compliance) (4/00 to 4/02) of Pacific Life; and Assistant Vice President and Assistant Secretary (4/05 to present) of Pacific Select Fund. | 68 | |||||
| Carleton J. Muench Year of birth 1973 | Assistant Vice President since 11/30/06 | Assistant Vice President (5/07 to present) of Pacific Life Fund Advisors LLC; Assistant Vice President (10/06 to present) of Pacific Life; Director of Research (5/05 to 9/06) and Senior Investment Analyst (10/03 to 4/05) of Mason Investment Advisory Services, Inc.; Investment Analyst (2/01 to 9/02), Due Diligence Analyst (1/00 to 1/01) and Performance Analyst (10/98 to 12/99) of Manulife Financial; and Vice President (11/06 to present) of Pacific Select Fund. | 68 | |||||
| * | A trustee serves until he or she resigns, retires, or his or her successor is elected and qualified. | |
| ** | As of March 31, 2011, the “Fund Complex” consisted of Pacific Life Funds (24 funds) and Pacific Select Fund (44 portfolios) |
F-6
PACIFIC LIFE FUNDS
APPROVAL OF INVESTMENT ADVISORY AGREEMENT
AND FUND MANAGEMENT AGREEMENTS
(Unaudited)
APPROVAL OF INVESTMENT ADVISORY AGREEMENT
AND FUND MANAGEMENT AGREEMENTS
(Unaudited)
The Board of Trustees (the “Trustees” or “Board”) of Pacific Life Funds (the “Trust”) oversees the management of each of the separate funds of the Trust (each a “Fund” and collectively, the “Funds”), and, as required by Section 15(c) of the Investment Company Act of 1940, as amended (the “1940 Act”), initially approves, and determines annually whether to renew, the investment advisory agreement (the “Advisory Agreement”) with Pacific Life Fund Advisors LLC (“PLFA”) and each Fund management agreement (the “Fund Management Agreements,” together with the Advisory Agreement, the “Agreements”) with the various sub-advisers (“Fund Managers”). PLFA serves as the investment adviser for all of the Funds and directly manages the five Portfolio Optimization Funds, and also directly manages the PL Money Market Fund under the name “Pacific Asset Management.” Hereinafter, all references to PLFA with respect to the PL Money Market Fund shall mean Pacific Asset Management. For all other Funds (other than the PL Income Fund discussed below), PLFA has retained other firms to serve as Fund Managers under PLFA’s supervision. The Board, including all of the Trustees who are not “interested persons,” as that term is defined in the 1940 Act (“Independent Trustees”), last renewed the Agreements at an in-person meeting of the Trustees held on December 7, 2010. The discussion of the Board’s approval or renewal of the Agreements with respect to the Funds only available for investment by the Portfolio Optimization Funds is included in a separate Annual Report dated March 31, 2011.
Also, as discussed below, at an in-person meeting on September 14-15, 2010, the Board, including all of the Independent Trustees, approved the establishment of the PL Income Fund and the Advisory Agreement with respect to the PL Income Fund effective December 31, 2010.
At the December 7, 2010 meeting and other meetings, the Trustees considered information (both written and oral) provided to assist them in their review of the Agreements and made assessments with respect to each Agreement. The Board also requested, received and reviewed written materials from PLFA and each Fund Manager submitted in response to requests from the Independent Trustees and supporting materials relating to those questions and responses. In addition, the Board received in-person presentations about the Funds throughout the year, and the Independent Trustees were advised by independent legal counsel with respect to these and other relevant matters. The Board reviewed a variety of factors and considered a significant amount of information, including information received on an ongoing basis at Board and committee meetings, including reports on Fund performance, expenses, fee comparisons, investment advisory, compliance, and other services provided to the Funds by PLFA and the Fund Managers. The Board also reviewed financial and profitability information regarding PLFA and the Fund Managers, and information regarding the organization and operations of each entity, such as their compliance monitoring, portfolio trading and brokerage practices and the personnel providing investment management and administrative services to each Fund. The Board reviewed data provided by PLFA that was gathered from various independent providers of investment company data, to provide the Board with information concerning the Funds’ investment performance, management fees and expense information. Additionally, the Independent Trustees retained an independent consultant (“Independent Consultant”) to assist the Trustees with their analysis and to provide other relevant information. In connection with their analysis, the Independent Consultant utilized and provided the Independent Trustees with data obtained from independent sources.
The Trustees’ determinations were made on the basis of each Trustee’s business judgment after consideration of all the information presented. In reviewing the materials presented and in considering the information in the management presentations, the Trustees did not identify any single issue or particular information that, in isolation, would be a controlling factor in making a final decision regarding the proposed Agreements. Individual Trustees may have given different weights to certain factors and assigned various degrees of materiality to information received in connection with the approval process. The following summary describes the most important, but not all, of the factors considered by the Trustees in approving the Agreements, and in the case of the Independent Trustees, certain factors were considered in light of the legal advice furnished to them by independent legal counsel and information from the Independent Consultant they retained. In reviewing these matters, the Trustees considered each Fund separately. This discussion is not intended to be all-inclusive.
Annual Consideration and Approval of Investment Advisory and Fund Management Agreements
In evaluating the Advisory Agreement and each Fund Management Agreement, the Board, including the Independent Trustees, considered the following factors, among others:
1. Nature, Extent and Quality of Services
PLFA, its personnel and its resources. The Trustees considered the depth and quality of PLFA’s investment management process, including its monitoring and oversight of the Fund Managers; the experience, capability and integrity of its senior management and other personnel; the low turnover rates of its key personnel; and the overall financial strength and stability of its organization. The Trustees considered the high quality of the products and services provided by PLFA and its affiliates, such as the many educational services and tools to assist intermediaries in effectively understanding and meeting shareholder needs.
The Trustees also considered that PLFA’s investment, legal and compliance professionals have access to and utilize a variety of resources and systems relating to investment management, compliance, trading, performance and fund accounting. The Trustees further considered PLFA’s continuing need to attract and retain qualified personnel and to maintain and enhance its resources and systems.
The Trustees considered PLFA’s continued development and use of analytical tools for assessing performance of the Fund Managers, conducting an attribution analysis on performance and reporting on performance to the Trustees. The Trustees noted that PLFA appeared to have implemented effective controls and monitoring of investment style consistency by Fund Managers and for analyzing the use of
F-7
PACIFIC LIFE FUNDS
APPROVAL OF INVESTMENT ADVISORY AGREEMENT
AND FUND MANAGEMENT AGREEMENTS (Continued)
(Unaudited)
APPROVAL OF INVESTMENT ADVISORY AGREEMENT
AND FUND MANAGEMENT AGREEMENTS (Continued)
(Unaudited)
derivatives by Fund Managers. With respect to the PL Money Market Fund (the “Directly Managed Fund”), the Board considered that PLFA employed the same level of oversight, diligence and reporting with regard to its PAM unit as it employs with regard to the Fund Managers.
The Trustees considered PLFA’s policies, procedures and systems to ensure compliance with applicable laws and regulations with respect to the Directly Managed Fund, its compliance monitoring of the Fund Managers, and its commitment to those programs; PLFA’s efforts to keep the Trustees informed about the Fund Managers; PLFA’s oversight of other service providers to the Funds; and its attention to matters that may involve conflicts of interest with each Fund. In this regard, the Trustees reviewed information throughout the year on PLFA’s compliance policies and procedures, its compliance history, and reports from the Trust’s Chief Compliance Officer (“CCO”) on compliance by PLFA, the Fund Managers, and the Funds with applicable laws and regulations. The Trustees additionally reviewed information on any responses by PLFA to regulatory and compliance developments throughout the year.
Fund Management — PLFA and the Fund Managers. The Trustees considered various materials relating to PLFA, including PAM, and the Fund Managers, including copies of each existing Advisory Agreement and Fund Management Agreement; copies of the Form ADV for each Fund Manager; financial information relating to PLFA and each Fund Manager; and other information deemed relevant to the Trustees’ evaluation of PLFA and each Fund Manager, including qualitative assessments from senior management of PLFA.
The Trustees considered the benefits to shareholders of retaining PLFA and each Fund Manager and continuing the Advisory Agreement and Fund Management Agreements, particularly in light of the nature, extent, and quality of the services that have been provided by the Fund Managers. The Trustees considered the quality of the management services which have benefited and should continue to benefit the Funds and their shareholders, the organizational depth and resources of PLFA and the Fund Managers, including the background and experience of PLFA and each of the Fund Manager’s management and the expertise of PLFA and each Fund Manager’s fund management team, as well as the investment methodology used by PLFA and the Fund Manager. The Trustees also considered that the CCO had in place a systematic process for periodically reviewing PLFA’s and each Fund Manager’s written compliance policies and procedures, including the assessment of PLFA and each Fund Manager’s compliance program as required under Rule 38a-1 of the 1940 Act and PLFA’s and each Fund Manager’s code of ethics. The Trustees also considered that PLFA and each Fund Manager agreed to cooperate with the CCO in reviewing its compliance operations.
In making their assessments, the Trustees considered that PLFA has historically exercised diligence in monitoring the performance of the Fund Managers and PAM, and has recommended and taken measures to attempt to remedy relative underperformance by a Fund when PLFA and the Trustees believed it to be appropriate.
The Board concluded that it was satisfied with the nature, extent and quality of the investment management services provided by PLFA and the Fund Managers.
2. Investment Results
The Trustees considered the investment results of each Fund in light of its objective and market conditions over the past year. The Trustees compared each Fund’s total returns with both the total returns of appropriate groups of peer funds, based on information provided by PLFA using data from independent sources, and with one or more relevant benchmark indices. The Independent Trustees also considered information provided by the Independent Consultant who provided a presentation and analysis to the Trustees regarding peer group performance utilizing data from independent sources. The information provided to the Trustees included each Fund’s performance record for the prior five calendar years and three-month, year-to-date, one-, three-, five-year and since inception periods, as applicable. In reviewing the performance data drawn from independent sources, as well as the performance of the respective benchmark indices, the Trustees noted that some Funds had outperformed their peer groups over certain periods and/or exceeded their respective benchmark indices while other Funds had underperformed their peer groups over certain periods and/or trailed their respective benchmark indices. The Trustees discussed with PLFA the fact that certain periods of underperformance may be transitory while other periods of underperformance may be reflective of broader issues which may warrant consideration of corrective action. The Trustees discussed these Funds with representatives of PLFA, including an assessment of the approach used by the Fund Managers as well as oversight and monitoring by PLFA as the investment adviser, to gain an understanding of underperformance and to assess whether any actions would be appropriate.
The Trustees also reviewed the monitoring of the Fund Managers’ (including PAM’s) investment results by PLFA, including PLFA’s historical practice of recommending to the Trustees the use of a new manager if performance lagged and could not be improved within a reasonable timeframe. The Trustees noted that many of the best independent investment advisers consistently compete to be considered to provide fund management services for the Funds. Generally, the Trustees noted that there continues to be a good record of well-managed Funds that work well in the Portfolio Optimization Funds, which are asset allocation funds. The Trustees also noted that the Funds continue to deliver the investment styles as disclosed to shareholders. The Trustees further noted that only the Portfolio Optimization Funds and the PL Money Market Fund are open to new investors.
The Board concluded that PLFA continues to have a strong record of effectively managing a multi-manager fund group designed to give shareholders a reasonable array of choices through which to implement their investment programs. The Board further concluded that PLFA was implementing each Fund’s investment objective either directly or through the selection of Fund Managers and that PLFA’s record in
F-8
PACIFIC LIFE FUNDS
APPROVAL OF INVESTMENT ADVISORY AGREEMENT
AND FUND MANAGEMENT AGREEMENTS (Continued)
(Unaudited)
APPROVAL OF INVESTMENT ADVISORY AGREEMENT
AND FUND MANAGEMENT AGREEMENTS (Continued)
(Unaudited)
managing each Fund indicates that its continued management as well as the continuation of the respective Fund Management Agreements will benefit each Fund and its shareholders.
3. Advisory Fees and Total Expense Ratios
The Trustees requested, received and reviewed information from PLFA relating to the advisory fees and the sub-advisory fees and total operating expense ratios for each of the Funds. The Independent Trustees also requested and reviewed information from the Independent Consultant along with their analysis of advisory fees and certain other expenses. The Trustees reviewed the advisory fees and total operating expense ratios of each Fund and compared such amounts with the average fee and expense levels of other funds in applicable peer fund groups. During their review, the Trustees noted that all of the Funds were subject to expense limits agreed to by PLFA. The Trustees also reviewed written materials prepared by PLFA based on peer fund group information retrieved from the independent sources.
The Trustees also considered information from the Fund Managers regarding the comparative sub-advisory fees charged under other investment advisory contracts, such as contracts of each Fund Manager with other registered investment companies or other types of clients. The Trustees noted that in many cases there were differences in the level of services provided to the Funds by the Fund Managers and that the level of services provided by these Fund Managers on these other accounts were due to the different nature of the accounts or because there were other reasons to support the difference in fees, such as an affiliation between the Fund Manager and the account. These differences often explained variations in fee schedules. The Trustees were mindful that, with regard to the sub-advised Funds, the fee rates were the result of arms’-length negotiations between PLFA and the Fund Managers, and that any sub-advisory fees are paid by PLFA and are not paid directly by a Fund.
The Trustees observed that certain of the Funds’ contractual advisory fees were higher than the average of their respective Morningstar category while others were either lower or approximately equal to these averages.
The Board concluded that the advisory fees and total expenses of each Fund were fair and reasonable.
4. Costs, Level of Profits and Economies of Scale
The Trustees reviewed information provided by PLFA and the Fund Managers regarding PLFA’s costs of sponsoring the Funds and information regarding the profitability of PLFA and the Fund Managers.
PLFA’s and the Fund Managers’ Costs and Profitability. The Trustees noted that, based on the data available, PLFA appears to be providing products that are competitively priced with other funds, especially multi-manager funds. The Board considered the costs of the services to be provided and the overall financial results for PLFA and its affiliates from the management of the Trust, both including and excluding distribution costs. The Board noted that the Funds are projected to produce some profits for PLFA for the first time for the year ended December 31, 2010, and considered that the Funds have not been profitable to PLFA and its affiliates in the past, due in part to the relatively low level of assets. The Board also noted the projected profitability of the Funds to PLFA in the near-term and noted that PLFA and its affiliates continue to subsidize and reimburse expenses for many of the Funds.
The Trustees considered that the Funds are well managed, and provide shareholders with a wide choice of premier Fund Managers and asset allocation services at reasonable fee levels. The Board noted that PLFA had taken steps to ensure that shareholders benefit by negotiating favorable terms with service providers.
The Trustees also reviewed information provided regarding the structure and manner in which PLFA’s and the Fund Managers’ investment professionals were compensated and their respective views of the relationship of such compensation to the attraction and retention of quality personnel. The Trustees considered PLFA’s willingness to invest in technology, infrastructure, and staff to reinforce and offer new services and to accommodate changing regulatory requirements.
With respect to the Fund Managers, the Trustees noted that it was difficult to accurately determine or evaluate the profitability of the Fund Management Agreements to the Fund Managers because of, among other things, the differences in the types of information provided by the Fund Managers, the fact that many Fund Managers manage substantial assets other than the Funds and, further, that any such assessment would involve assumptions regarding the Fund Managers’ expense allocation policies, capital structure, cost of capital, business mix and other factors.
Accordingly, in the case of the Fund Managers, the Trustees gave less weight to profitability considerations and did not view that this data was as important as other data given the arms’-length nature of the relationship (for the Funds that are sub-advised) between PLFA and such Fund Managers with respect to the negotiation of fund management fees.
Economies of Scale. The Trustees noted and considered the extent to which economies of scale are increasingly realized as each Fund grows and whether advisory fee levels reflect economies of scale if the Funds grow in size. The Trustees noted the Funds have relatively small asset levels that do not currently produce significant economies of scale. The Trustees noted, however, PLFA’s commitment to competitive total expenses of the Funds through expense limitation agreements, its consistent reinvestment in the business in the form of improvements in technology, product innovations, and customer service, and the various expense caps the Funds have been subject to since their inception.
The Board concluded that the Funds’ cost structures were reasonable in light of the Trust’s size.
F-9
PACIFIC LIFE FUNDS
APPROVAL OF INVESTMENT ADVISORY AGREEMENT
AND FUND MANAGEMENT AGREEMENTS (Continued)
(Unaudited)
APPROVAL OF INVESTMENT ADVISORY AGREEMENT
AND FUND MANAGEMENT AGREEMENTS (Continued)
(Unaudited)
5. Ancillary Benefits
The Trustees requested and received from PLFA and the Fund Managers information concerning other benefits received by PLFA, the Fund Managers, and their affiliates as a result of their respective relationship with the Funds, including information on various service agreements with PLFA and an affiliate and reimbursement at an approximate cost basis for support services in the case of PLFA and an affiliate, as well as commissions paid to broker-dealers affiliated with certain Fund Managers and the use of soft-dollars by certain of the Fund Managers for research. The Trustees also considered information concerning other significant economic relations between the Fund Managers and their affiliates with PLFA and its affiliates and noted PLFA’s processes and procedures to identify and disclose such relationships to the Board. The Trustees also considered information provided to them as to how conflicts of interest that may arise from these relationships are managed.
The Board concluded that such benefits were consistent with those generally derived by investment advisers to mutual funds or were otherwise not unusual.
6. Conclusion
Based on their review, including their consideration of each of the factors referred to above, and assisted by the advice of the Independent Consultant and independent counsel to the Independent Trustees, the Board, including the Independent Trustees, concluded that the Advisory Agreement and each applicable Fund Management Agreement are fair and reasonable with respect to each Fund and its shareholders, and that the renewal of the Advisory Agreement and each applicable Fund Management Agreement would be in the best interests of the Funds and their shareholders. No single factor was determinative of the Board’s decision to approve the Advisory Agreement and each applicable Fund Management Agreement, but rather the Board based its determination on the total mix of information available to it.
Approval of Advisory Agreement for PL Income Fund
At an in-person meeting on September 14-15, 2010, the Board, including all of the Independent Trustees, approved the establishment and designation, effective December 31, 2010, of a newly organized Fund of the Trust, the PL Income Fund. PLFA will directly manage the PL Income Fund under the name Pacific Asset Management. In connection with the approval of the PL Income Fund, the Board also approved, effective December 31, 2010, the Advisory Agreement with PLFA with respect to the PL Income Fund.
In evaluating the Advisory Agreement with respect to the PL Income Fund, the Board, including the Independent Trustees, considered the following factors, among others:
1. Nature, Extent and Quality of Services to be Provided
The Trustees considered the depth and quality of PLFA’s investment management process, including its sophisticated monitoring and oversight of the other series of the Trust; its direct management of certain series of the Trust; the experience, capability and integrity of its senior management and other personnel; the low turnover rates of its key personnel; and the overall financial strength and stability of its organization. The Trustees considered the high quality of the products and services provided by PLFA and its affiliates, such as the many educational services and tools to assist intermediaries in effectively understanding and meeting shareholder needs.
The Trustees also considered that PLFA’s investment, legal and compliance professionals have access to and utilize a variety of resources and systems relating to investment management, compliance, trading, performance and fund accounting. The Trustees further considered PLFA’s continuing need to attract and retain qualified personnel and to maintain and enhance its resources and systems.
The Trustees considered the benefits to shareholders of retaining PLFA to serve as the adviser to the PL Income Fund and directly manage the Fund within its Pacific Asset Management (“PAM”) business unit in light of the nature, extent, and quality of services expected to be provided. The Trustees considered the ability of PLFA (including PAM) to provide an appropriate level of support and resources to the Fund and whether PLFA and PAM have sufficiently qualified personnel. The Trustees based this review on information and materials provided to them by PLFA (including PAM). The Trustees also considered the background and experience of PLFA’s senior management and the significant amount of attention expected to be given to the PL Income Fund by PAM’s investment management personnel and staff. The Trustees also considered various materials relating to PLFA (including PAM), including copies of PLFA’s Form ADV; financial information; and other information deemed relevant to the Trustees’ evaluation.
The Trustees considered that under the Advisory Agreement, PLFA (through PAM ) would be responsible for providing the investment management services for the PL Income Fund’s assets, including investment research, advice and supervision, and determining which securities would be purchased or sold by the PL Income Fund. The Trustees considered the quality of the advisory services expected to be provided to the PL Income Fund over both the short- and long-term, the organizational depth and resources of PLFA (including PAM), including the background, experience and expertise of PAM’s investment management team, as well as the investment strategies, processes and philosophy to be used with respect to the investment strategies, including the allocations to various asset classes. In making these assessments, the Trustees were aided by the in-person presentation and materials provided by PLFA and PAM. The Trustees noted that PLFA serves as adviser to each Fund of the Trust and directly manages, within its PAM business unit, the PL Money Market Fund, a series of
F-10
PACIFIC LIFE FUNDS
APPROVAL OF INVESTMENT ADVISORY AGREEMENT
AND FUND MANAGEMENT AGREEMENTS (Continued)
(Unaudited)
APPROVAL OF INVESTMENT ADVISORY AGREEMENT
AND FUND MANAGEMENT AGREEMENTS (Continued)
(Unaudited)
the Trust, and the Cash Management and High Yield Bond Portfolios, each a series of Pacific Select Fund. In addition, the Trustees considered that they had previously reviewed and approved PLFA’s written compliance policies and procedures and that the Trust’s Chief Compliance Officer (“CCO”) had previously provided an assessment of PLFA’s compliance programs as required under Rule 38a-1 of the 1940 Act and its code of ethics.
The Trustees also considered that the investment oversight group within PLFA will monitor PAM’s performance.
The Board concluded that it was satisfied with the nature, extent and quality of the investment management services anticipated to be provided by PLFA to the PL Income Fund under the Advisory Agreement.
2. Performance
The Trustees considered PLFA’s experience managing funds directly within PAM and its qualifications to manage the PL Income Fund. Because this consideration related to a newly organized fund, no actual performance records were available. However, the Trustees considered the investment process and techniques to be used by PAM for the PL Income Fund and PAM’s experience directly managing another Fund of the Trust, two portfolios of Pacific Select Fund, and Pacific Life Insurance Company’s general account, as well as the factors concerning performance in connection with its consideration of this matter, as described below.
The Trustees considered information about the historical performance of accounts managed according to the strategies expected to be used in the PL Income Fund by the same fund management team that would manage the PL Income Fund (the “Comparable Performance”). The Trustees considered the Comparable Performance for each strategy against a pertinent benchmark index and Morningstar peer group for the year-to-date, one-, and three-year periods and, where available, five- and ten-year periods as of June 30, 2010. The Trustees also considered certain simulated performance, which combined the strategies based on the Fund’s target allocations, against a relevant benchmark and against a simulated peer group for the year-to-date, one, and three-year periods as of June 30, 2010 and the Trustees reviewed certain annual returns. The Trustees noted that the simulated performance results were hypothetical.
The Board determined that the performance record of PAM’s investment team was acceptable.
3. Advisory Fees
The Trustees requested, received and reviewed information from PLFA relating to the proposed advisory fee and total operating expenses for the PL Income Fund. The Trustees reviewed the advisory fees and total operating expense ratios for the PL Income Fund and compared such amounts with the average fee and expense levels of other funds in applicable peer fund groups. The Trustees also noted that the Fund was subject to expense limits agreed to by PLFA. The Trustees considered that the proposed advisory fee rate would be in line with industry averages for similar funds based on the data presented to the Board.
The Board concluded that the compensation payable under the Advisory Agreement is fair and reasonable.
4. Costs, Level of Profits and Economies of Scale
The Trustees reviewed information regarding PLFA’s projected costs of sponsoring the PL Income Fund and information regarding the anticipated potential profitability of the proposed PL Income Fund to PLFA.
Costs and Profitability. The Trustees considered the cost of services to be provided and projected profits to be realized by PLFA from the relationship with the PL Income Fund based on the projected assets, income and expenses of PLFA in its relationship with the Fund. The Trustees noted that this information contains estimates because there is no actual operating history for the PL Income Fund. The Trustees considered the overall financial soundness of PLFA. The Trustees reviewed projected profitability information with respect to the profit or loss to PLFA from the Advisory Agreement. The Trustees reviewed the revenues and other benefits that are expected to be derived by PLFA from the PL Income Fund.
Economies of Scale. The Trustees considered the extent to which economies of scale may be realized by the PL Income Fund and the Trust as assets grow. Because the PL Income Fund does not have any operating history and no assets, no economies of scale exist at this time with respect to the PL Income Fund. The Trustees also noted that the Fund’s advisory schedule does not contain breakpoints, but there is an expense limitation agreement in place for the PL Income Fund and that PLFA had stated it would consider the implementation of breakpoints in the future, as warranted.
The Board concluded that the fee structure of the PL Income Fund reflected in the Advisory Agreement was fair and reasonable.
5. Ancillary Benefits
The Trustees received from PLFA information concerning other benefits that may be received by PLFA and its affiliates as a result of its relationship with the PL Income Fund, including fees for administrative services and reimbursement at an approximate cost basis for certain support services. The Trustees considered that PAM represented that it does not anticipate utilizing soft dollars or an affiliated broker dealer for trades. The Trustees considered that the potential benefits that could be derived by PLFA and PAM from their relationships with the PL Income Fund may include larger assets under management and reputational benefits, which are consistent with those generally derived by investment advisers to mutual funds.
F-11
PACIFIC LIFE FUNDS
APPROVAL OF INVESTMENT ADVISORY AGREEMENT
AND FUND MANAGEMENT AGREEMENTS (Continued)
(Unaudited)
APPROVAL OF INVESTMENT ADVISORY AGREEMENT
AND FUND MANAGEMENT AGREEMENTS (Continued)
(Unaudited)
6. Conclusion
Based on its review, including the consideration of each of the factors referred to above, the Board found that: (i) the compensation payable under the Advisory Agreement is fair and reasonable; and (ii) the Advisory Agreement is in the best interests of the PL Income Fund and its shareholders. No single factor was determinative of the Board’s findings, but rather the Trustees based their determination on the total mix of information available to them.
F-12
PACIFIC LIFE FUNDS
WHERE TO GO FOR MORE INFORMATION
(Unaudited)
WHERE TO GO FOR MORE INFORMATION
(Unaudited)
Availability of Quarterly Holdings
The Trust files Form N-Q (complete schedules of fund holdings) with the Securities and Exchange Commission (the “SEC”) for the first and third quarters of each fiscal year not later than 60 days after the close of the applicable quarter end. The Trust’s Form N-Q, (when required) is filed pursuant to applicable regulation and is available after filing (i) on the SEC’s Web site at www.sec.gov; (ii) for review and copying at the SEC’s Public Reference Room in Washington, D.C. (Information on the operation of the Public Reference Room may be obtained by calling the SEC at 1-800-SEC-0330); and (iii) on the Trust’s Webpage at www.pacificlife.com/pacificlifefunds.htm. The SEC may charge you a fee for this information.
Availability of Proxy Voting Record
By August 31 of each year, the Trust files information regarding how portfolio managers voted proxies relating to fund securities during the most recent twelve-month period ended June 30. Such information is available after filing on the Trust’s’ Website and on the SEC’s Website noted below.
Information Relating to Investments Held by the Pacific Life Funds
For complete descriptions of the various securities and other instruments held by the Trust and their risks, please see the Trust’s prospectus and Statement of Additional Information (“SAI”). For a description of bond ratings, please see the Trust’s SAI. The prospectus and SAI are available as noted below.
Availability of Proxy Voting Policies
A description of the Proxy Voting Policies and Procedures that the Trust uses to determine how to vote proxies relating to fund securities is described in the Trust’s SAI.
How to obtain Information
The Trust’s prospectus, SAI (including Proxy Voting Policies) and the Underlying Funds’ annual report are available:
| • | On the Trust’s Website at www.pacificlife.com/pacificlifefunds.htm | ||
| • | On the SEC’s Website at www.sec.gov | ||
| • | Upon request by calling, without charge, 1-800-722-2333, 7 a.m. through 5 p.m. Pacific Time |
F-13
[THIS PAGE INTENTIONALLY LEFT BLANK]
[THIS PAGE INTENTIONALLY LEFT BLANK]
PACIFIC LIFE FUNDS ANNUAL REPORT
as of March 31, 2011
as of March 31, 2011
PACIFIC LIFE FUNDS
P.O. Box 9768
Providence, RI 02940-9768
P.O. Box 9768
Providence, RI 02940-9768
3012-11A

Underlying Funds
Annual Report
As of March 31, 2011
Annual Report
As of March 31, 2011
TABLE OF CONTENTS
PACIFIC LIFE FUNDS
| Performance Discussion | A-1 | |||
| Schedules of Investments | B-1 | |||
| Financial Statements: | ||||
| Statements of Assets and Liabilities | C-1 | |||
| Statements of Operations | C-7 | |||
| Statements of Changes in Net Assets | C-10 | |||
| Financial Highlights | C-15 | |||
| Notes to Financial Statements | D-1 | |||
| Report of Independent Registered Public Accounting Firm | E-1 | |||
| Disclosure of Fund Expenses | F-1 | |||
| Trustees and Officers Information | F-3 | |||
| Approval of Investment Advisory Agreement and Fund Management Agreements | F-7 | |||
| Where to Go for More Information | F-13 |
PACIFIC LIFE FUNDS PERFORMANCE DISCUSSION
| Fund | Fund Manager | |
| PL Floating Rate Loan Fund | Eaton Vance Management (Eaton Vance) | |
| PL Inflation Managed Fund PL Managed Bond Fund | Pacific Investment Management Company LLC (PIMCO) | |
| PL Short Duration Bond Fund | Goldman Sachs Asset Management, L.P. (Goldman Sachs) | |
| PL Comstock Fund | Invesco Advisers, Inc. (Invesco) | |
| PL Growth LT Fund | Janus Capital Management LLC (Janus) | |
| PL Large-Cap Growth Fund | UBS Global Asset Management (Americas) Inc. (UBS) | |
| PL Large-Cap Value Fund | ClearBridge Advisors, LLC (ClearBridge) | |
PL Main Street® Core Fund | OppenheimerFunds, Inc. (Oppenheimer) | |
| PL Mid-Cap Equity Fund | Lazard Asset Management LLC (Lazard) | |
| PL Mid-Cap Growth Fund | Morgan Stanley Investment Management Inc. (Morgan Stanley) | |
| PL Small-Cap Growth Fund | Fred Alger Management, Inc. (Alger) | |
| PL Small-Cap Value Fund | NFJ Investment Group LLC (NFJ) | |
| PL Real Estate Fund | Morgan Stanley Investment Management Inc. (Morgan Stanley) | |
| PL Emerging Markets Fund | OppenheimerFunds, Inc. (Oppenheimer) | |
| PL International Large-Cap Fund | MFS Investment Management (MFS) | |
| PL International Value Fund | J.P. Morgan Investment Management Inc. (JPMorgan) |
This annual report is provided for the general information of investors with beneficial interests in Pacific Life Funds. This report is not authorized for distribution to prospective investors unless preceded or accompanied by a current Pacific Life Funds’ prospectus which contains information about Pacific Life Funds and each of its funds, including their investment objectives, risks, charges and expenses. You should read the prospectus carefully before investing. There is no assurance that a fund will achieve its investment objective. Each fund is subject to market risk. The value of a fund changes as its asset values go up or down. The value of a fund’s shares will fluctuate, and when redeemed, may be worth more or less than their original cost.
The total return for each fund includes reinvestment of all dividends and capital gain distributions, if any, and does not include deductions of any applicable sales charges. Past performance is not predictive of future performance. Performance figures for each class reflect the deduction of any applicable maximum front-end sales charge at the time of investment and reflect any applicable contingent deferred sales charge that would be deducted upon redemption at the end of the period presented.
This report shows you the performance of the funds compared to benchmark indices. Index performance is provided for illustrative and comparative purposes only and does not predict or depict the performance of the funds. Indices are unmanaged, do not incur transaction costs and cannot be purchased directly by investors. Index returns on equity securities include reinvested dividends.
PLFA supervises the management of all of the Underlying Funds (subject to the review of the Pacific Life Funds’ Board). PLFA has written the general market conditions commentary which expresses PLFA’s opinions and view on how the market generally performed for the twelve-month period ended March 31, 2011.
All views are subject to change at any time based upon market or other conditions, and Pacific Life Funds, its adviser and the fund managers disclaim any responsibility to update such views. Any references to “we,” “I,” or “ours” are references to the adviser or fund manager. The adviser and fund managers may include statements that constitute “forward-looking statements” under the United States (U.S.) securities laws. Forward-looking statements include information concerning possible or assumed future results of the Pacific Life Funds’ investment operations, asset levels, earnings, expenses, industry or market conditions, regulatory developments and other aspects of the Pacific Life Funds’ operations or general economic conditions. In addition, when used in this report, predictive verbs such as “believes,” “expects,” “anticipates,” “intends,” “plans,” “estimates,” “projects” and future or conditional verbs such as “will,” “may,” “could,” “should” and “would,” or any other statement that necessarily depends on future events, are intended to identify forward-looking statements. Forward-looking statements are not guarantees of performance or economic results. They involve risks, uncertainties and assumptions. Although such statements are based on expectations that the adviser or fund manager believes to be reasonable, actual results may differ materially from expectations. Investors must not rely on any forward-looking statements.
In connection with any forward-looking statements and any investment in the Pacific Life Funds, investors should carefully consider the investment objectives, policies and risks described in the Pacific Life Funds’ current Prospectus, as supplemented and Statement of Additional Information, as supplemented as filed with the Securities and Exchange Commission (SEC), which may be obtained from the SEC’s website at www.sec.gov or Pacific Life’s website at www.pacificlife.com/pacificlifefunds.htm.
A-1
PACIFIC LIFE FUNDS PERFORMANCE DISCUSSION (Continued)
Market Conditions (for the twelve-month period ended March 31, 2011)
Executive Summary
Global markets faced various challenges throughout the summer of 2010 and the first quarter of 2011. Nevertheless, riskier asset classes and styles generally fared better than their more conservative counterparts over the reporting period. Bullish sentiments plowed through adverse events, which included the Deepwater Horizon oil spill and the “Flash Crash” during the second quarter of 2010, as well as the turmoil in the Middle East/North Africa region and the earthquake/tsunami that rattled Japan over the first quarter of 2011. While these events had some repercussions, the effects on the United States’ financial markets were generally temporary.
During the reporting period, investors relied on government support (i.e. Quantitative Easing 2 (QE2)) to ease their nerves and responded to any positive economic and business reports to fuel the upward momentum. Various surveys1 indicated that U.S. executives’ optimism levels improved over the reporting period. U.S. corporate profits reached near their all-time highs, and mergers and acquisitions (M&A) activity continued to remain healthy. These factors have created opportunities for several companies.
While there were some positive developments at the corporate level, the lackluster job growth continued to be a drag on the economic recovery. The unemployment rate in the U.S. hovered in the mid-to-upper 9% range without any solid evidence of a strong improvement. Job creation remained low due partly to an overly conservative lending standard as well as a blurred outlook on the economy.
Concerns over inflation also became a growing topic of interest over the period. Such pressures may encourage central bankers to raise rates, which could hinder the recovery process. The creeping inflationary pressures from rising commodity and food prices around the globe have already forced several countries to take action. During the first quarter of 2011, a number of the central banks in emerging countries (particularly in those of Latin America and Asia) have addressed these inflationary concerns by raising their interest rates.
The following sections highlight how specific segments of the financial market responded to the events that unfolded over the reporting period.
Fixed Income
The Barclays Capital U.S. Aggregate Bond Index gained 5.12% over the reporting period. From a credit risk perspective, lower rated issues generally outperformed those of higher quality. Excluding the second quarter of 2010, high yield bonds generally led the fixed income market. The market experienced a temporary “flight-to-safety” (shift toward U.S. Treasuries) over the second quarter of 2010 as sovereign debt problems began to surface and uncertainty heightened. However, the accommodating Federal Reserve (Fed) policies combined with improving business sentiments helped risk tolerances grow for the remainder of the reporting period.
Strong corporate balance sheets and an improving outlook led to substantial spread compression, which was evident in the narrowing difference between corporate and U.S. Treasury yields. The growing confidence displayed by the bond market continued to benefit the corporate sectors. Consistent with the financial market’s increasing risk appetite, the Barclays Capital U.S. Corporate High-Yield Index gained 14.31% compared to a 7.46% rise for the Barclays Capital U.S. Corporate Investment Grade Index during the reporting period.
U.S. Treasuries generally lagged behind the corporate sector with the Barclays Capital U.S. Treasury Index gaining 4.53% over the reporting period. The Barclays Capital U.S. Treasury Inflation-Protected Securities (TIPS) Index rose 7.91% as inflation became a growing concern for some investors. While inflation has been relatively tame in recent years, concerns over future inflation has led to a widening disagreement between the “doves” who continue to make a case for maintaining stimulus support and the “hawks” who argue for a preemptive action to tame inflation by reversing the easy monetary policy. A tighter monetary policy would likely cause interest rates and yields (which move inversely to prices) to rise.
The mortgage sector was mixed. On one hand, the Barclays Capital U.S. Mortgage-Backed Securities Index returned 4.37% as the U.S. housing market continued to remain relatively stagnant. Nonetheless, the commercial mortgage side of the securitized market continued to experience a robust recovery. Over the period, the Barclays Capital Commercial Mortgage-Backed Securities (CMBS) High Yield Index and the Barclays Capital CMBS Investment-Grade Index rose 53.92% and 13.53%, respectively.
Short-term credit returns barely budged as the Fed continued to hold the Federal Funds (Fed Funds) rate near 0%. Additionally, the low interest rate environment encouraged companies to shift toward fixed and long-term borrowing to lock in the low rates. Low cash yields and the Fed’s ongoing message of maintaining “exceptionally low levels for the Fed Funds rate for an extended period” has kept the short end of the yield curve relatively flat over the period.
Domestic Equity
After adverse market conditions in the second quarter of 2010, the domestic equity market experienced three consecutive quarters of solid gains. The extended monetary support from the Fed’s second round of quantitative easing and fiscal assistance from President
| 1 | The Business Roundtable’s CEO Economic Outlook Survey and The Duke/CFO Magazine Global Business Outlook Survey. |
See benchmark definitions on page A-23 and A-24
A-2
PACIFIC LIFE FUNDS PERFORMANCE DISCUSSION (Continued)
Obama’s push to extend Bush-era tax cuts helped the S&P 500 Index increase 15.65% over the period with the riskier styles (e.g. higher beta stocks) leading the charge.
The equity market faced some headwinds in the first quarter of 2011 but maintained its cautiously bullish sentiment to finish off the period. Although the employment picture improved slightly, the U.S. unemployment rate still remains high. Additionally, the downward spiral of the housing market may have ended, but new construction and sales activity have yet to show signs of a sustained recovery.
Without a vibrant consumer market, some businesses have turned to M&A for growth. In these conditions, large-capitalization companies flush with cash tend to acquire smaller but established companies with solid growth potential. In general, small- and mid-capitalization growth stocks tend to be the beneficiaries of increased M&A activity as bidders tend to raise valuations of such companies. Over the reporting period, the Russell 2000 Index (a small-capitalization benchmark) and the Russell Midcap Index (a mid-capitalization benchmark) surged 25.79% and 24.27%, respectively. The Russell 1000 Index (a benchmark for large-capitalization stocks) rose 16.69% for the reporting period.
With respect to style, the higher tolerance for risk may have helped growth stocks outpace their respective value counterparts. The risk-taking sentiment was also reflected in the performances of the sector classifications. Market participants continued to shift toward cyclical sectors (e.g. consumer discretionary, industrials, materials and energy) that tend to have a high correlation to the overall economy. Defensive sectors (e.g. health care and utilities) that generally are less volatile during economic downturns lagged behind the overall market.
The real estate investment trust (REIT) market also continued to deliver solid returns over the reporting period. Market participants had previously expected significant declines in commercial property values but began to demonstrate less pessimism as the year progressed. This less gloomy outlook helped lift the Financial Times Stock Exchange National Association of Real Estate Investment Trust (FTSE NAREIT) Equity REITs Index 23.68% higher over the reporting period. Residential apartments represented the top performing property sector, which may have been a result of the continued lackluster residential housing sales and an increased demand for rental property. On the other hand, office REITs were among the weakest performing properties. The lack of employment growth kept office vacancy rates relatively high, thereby delaying the stabilization of office properties.
International Equity
Foreign markets dealt with various challenges throughout the reporting period, which affected developed regions more than emerging markets. Although the sovereign debt problems have been concentrated in several peripheral European countries (i.e. Portugal, Ireland, Italy, Greece and Spain), the interconnectivity of the European Union’s financial system heightened fears of another series of contagion throughout the region during the earlier part of the reporting period. Despite this setback in Europe, certain developed countries benefited from the strong and sustained growth in developing economies such as China and India. For instance, exporters of commodities (e.g. Australia and New Zealand) and capital goods (e.g. Germany) benefited from the growth in these emerging countries.
Other difficulties surfaced toward the end of this reporting period. Mounting tension in the Middle East/North Africa fed to the uncertain outlook on the global recovery. Furthermore, Japan, which represents approximately 20% of the Morgan Stanley Capital International (MSCI) Europe, Australasia, and Far East (EAFE) Index, was a drag on benchmark performance after the devastating earthquake/tsunami. The developed international equity market trailed the U.S. stock market, as the MSCI EAFE Index gained 10.42% over the reporting period. Additionally, emerging markets outperformed developed foreign markets with the MSCI Emerging Markets Index rising 18.46% for the reporting period. However, high inflation in emerging regions has pushed some of these countries to tighten policies and restrict some of its heated growth.
Concluding Remarks
Global markets showed some resilience to additional challenges that surfaced in the first quarter of 2011. On the domestic front, the positive momentum of business sentiment supported a brighter outlook. A recent poll of economists2 showed positive revisions to growth and employment projections. Anticipation for a slightly higher headline inflation (which includes food and energy) accompanied the improved outlook in the U.S. Nevertheless, long-term expectation for core inflation (which excludes food and energy) remains generally unchanged at a modest level. While attention to inflation has grown, inflationary concerns in the U.S. have been milder than those for the emerging markets.
The International Monetary Fund (IMF) projects world growth to slightly decelerate to 4.5% in 2011 from 4.7% in 20103. Much of the global growth is expected to primarily stem from emerging markets. The intergovernmental organization projects advanced economies to grow 2.4% in 2011, while developing economies are expected to expand by 6.5%.
Weak balance sheets of certain advanced economies, lifeless real estate markets, and the dismal job growth will continue to present hurdles. Additionally, new risks that recently surfaced such as high oil prices and geopolitical uncertainty as well as overheating in various
| 2 | Federal Reserve Bank of Philadelphia: Survey of Professional Forecasters — First Quarter 2011. | |
| 3 | International Monetary Fund: World Economic Outlook — April 2011. |
See benchmark definitions on page A-23 and A-24
A-3
PACIFIC LIFE FUNDS PERFORMANCE DISCUSSION (Continued)
emerging market countries could place extra burden on the recovery. While some countries have raised interest rates to contain inflationary pressures, the Fed Chairman (Ben Bernanke) believes that inflation expectations are well anchored in the U.S. With wage pressure and core inflation relatively subdued, the Fed has been able to maintain its accommodative monetary policy despite the noise surrounding elevated prices of certain goods.
Much focus has been placed on the Fed’s balancing act of trying to improve the employment picture and maintain a subdued inflationary environment. At this point, Mr. Bernanke’s concerns over potential inflationary threat appear to have taken a backseat to efforts of lowering the unemployment rate. The Fed Chairman’s views may be consistent with those who continue to question the strength of the recovery. With the “advance estimate” of real gross domestic product (GDP) indicating that the U.S. economy grew at an annualized rate of 1.8% in the first quarter of 2011, some economists have begun to lower their growth outlook. Although the Fed helped ease fears in the market, uncertainty may still create a fickle market until the recovery process develops solid traction. Until further clarity is established, financial markets may continue to be driven by economic and business reports in the near future.
PL Floating Rate Loan Fund (managed by Eaton Vance Management)
Q. How did the fund perform over the year ended March 31, 2011?
A. For the year ended March 31, 2011, the fund’s Class P returned 5.51%, compared to a 7.80% return for its benchmark, S&P/LSTA Leveraged Loan Index and a 8.19% return for the Credit Suisse Leveraged Loan Index. Class A shares were converted to Class P shares on July 2, 2010.
The following graph shows the value as of March 31, 2011 of a $10,000 investment made in Class P(1) shares since the fund began operations. For comparison purposes, the performance of the fund’s benchmarks is also shown.
Performance Comparison
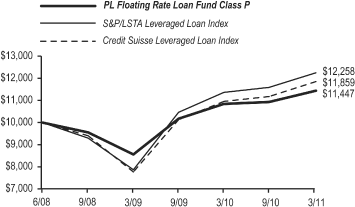
Average Annual Total Returns for the Periods Ended March 31, 2011(2)
| PL Floating Rate Loan Fund | Class P | |||
1 Year Total Return | 5.51 | % | ||
S&P/LSTA Leveraged Loan Index | 7.80 | % | ||
Credit Suisse Leveraged Loan Index | 8.19 | % | ||
Since Inception (June 30, 2008) | 5.04 | % | ||
S&P/LSTA Leveraged Loan Index | 7.69 | % | ||
Credit Suisse Leveraged Loan Index | 6.40 | % | ||
| (1) | Class A Shares were converted to Class P Shares on July 2, 2010. | |
| (2) | Eaton Vance Management began managing the fund on July 1, 2010, and some investment policies changed at that time. Another firm managed the fund before that date. |
Performance data shown represents past performance. Investment return and principal value will fluctuate so that shares of the fund when redeemed may be worth more or less than their original cost. Past performance is not predictive of future performance.
Q. Discuss both positive and negative factors that materially affected the fund’s performance during the year, including relevant market conditions, investment strategies and techniques, and particular sectors or securities.
A. Eaton Vance Management assumed management of the fund on July 1, 2010. Relative to the benchmark, the fund maintains a greater focus on higher quality loans. The fund’s higher quality positioning was a headwind to the fund’s relative performance during the nine-month reporting period where the lower quality loan categories outperformed the higher quality loan categories by a wide margin. Specifically, the strongest-performing loan segment was CCC rated loans, which delivered a 16.7% gain over the period. The fund’s underweight to this riskier loan group detracted from its relative performance. The fund’s significant overweight to higher quality BB loans also hurt its relative performance as BB rated loans failed to keep pace with the broader leveraged loan market, posting a return of 6.7% over the reporting period. Not owning any loans in default helped to partially offset the fund’s relative underperformance, as the defaulted loan segment registered a relatively modest 4.6% return over the reporting period.
The fund employs a rigorous, bottom-up credit research process where loan selection drives fund performance. With that said, analyzing performance results through the lens of industry exposures, underweight exposure to select strong-performing industry segments including financial intermediaries, utilities, and radio & television was a drag on relative performance. Contributing to the fund’s performance was a sizeable underweight exposure to the publishing industry, which trailed the broader leveraged loan market with a 6.0%
See benchmark definitions on page A-23 and A-24
A-4
PACIFIC LIFE FUNDS PERFORMANCE DISCUSSION (Continued)
return. The fund’s overweight exposure to the automotive industry also helped relative results, as the industry advanced 10.3% over the period.
Following the volatile market environment of the last few years, we at Eaton Vance anticipate volatility will become relatively muted as we expect the leveraged loan market will generate returns closer to the expected income or yield from the assets. We believe our diversified approach to portfolio construction and our bias towards the higher quality loans in the market have the fund well-positioned to generate attractive income with minimal interest rate risk, while seeking lower volatility than the overall market.
PL Inflation Managed Fund (managed by Pacific Investment Management Company LLC)
Q. How did the fund perform over the year ended March 31, 2011?
A. For the year ended March 31, 2011, the fund’s Class P returned 8.56%, compared to a 7.91% return for its benchmark, the Barclays Capital U.S.TIPS Index. Class A shares were converted to Class P shares on July 2, 2010.
The following graph shows the value as of March 31, 2011 of a $10,000 investment made in Class P(1) shares since the fund began operations. For comparison purposes, the performance of the funds benchmark is also shown.
Performance Comparison
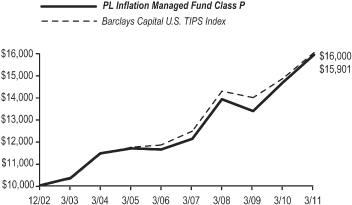
Average Annual Total Returns for the Periods Ended March 31, 2011
| PL Inflation Managed Fund | Class P | |||
1 Year Total Return | 8.56 | % | ||
Barclays Capital U.S. TIPS Index | 7.91 | % | ||
5 Years Total Return | 6.48 | % | ||
Barclays Capital U.S. TIPS Index | 6.25 | % | ||
Since Inception (December 31, 2002) | 5.78 | % | ||
Barclays Capital U.S. TIPS Index | 5.86 | % | ||
| (1) | Class A Shares were converted to Class P Shares on July 2, 2010. |
Performance data shown represents past performance. Investment return and principal value will fluctuate so that shares of the fund when redeemed may be worth more or less than their original cost. Past performance is not predictive of future performance.
Q. Discuss both positive and negative factors that materially affected the fund’s performance during the year, including relevant market conditions, investment strategies and techniques, and particular sectors or securities.
A. The fund outperformed its benchmark during the reporting period. Investment strategies were implemented by investing in bonds and derivative instruments including futures, options, credit default swaps and interest rate swaps. A yield curve steepening bias, implemented via money market futures added to the fund’s performance as most Eurodollar contracts rallied during the reporting period. An emphasis on nominal duration versus real duration, through the use of cash bonds and interest rate swaps, detracted from fund performance, as breakeven inflation levels widened during the reporting period.
On the spread sector front, modest exposure to non-agency mortgage-backed securities and CMBS added to the fund’s performance, as spreads in these sectors tightened. Modest exposure to the investment grade corporate sector, particularly financials, a subsector within the investment grade corporate sector, was positive for the fund’s performance as financials outperformed the overall corporate market. Additionally, modest exposure to high yield bonds added to the fund’s performance amid increased risk appetite during the year. Modest exposure to emerging market local interest rates in Brazil, implemented via Brazilian zero coupon swaps, detracted from the fund’s performance as interest rates rose in this country; however, exposure to emerging markets external debt added to the fund’s performance as the sector outpaced U.S. Treasuries. Exposure to a variety of foreign currencies, with an emphasis on the Brazilian Real and a basket of Asian currencies, added to the fund’s performance as these appreciated relative to the U.S. dollar.
We at PIMCO expect the U.S. economy to grow between 3.0% and 3.5% over the rest of 2011, bolstered by last year’s fiscal stimulus package and the Fed’s QE2 program. Europe and the United Kingdom (U.K.) will expand more slowly owing to their more austere fiscal policies. Japan’s economy is likely to contract in the aftermath of the terrible earthquake, which will be a drag on global growth, but should
See benchmark definitions on page A-23 and A-24
A-5
PACIFIC LIFE FUNDS PERFORMANCE DISCUSSION (Continued)
rebound later this year amid massive reconstruction spending. Emerging economies should continue their relatively rapid growth and move closer over the secular horizon toward closing wealth and income gaps with the developed world. We at PIMCO believe that inflation is likely to rise as central banks err on the side of reflation and emerging markets approach capacity limits.
We have recently focused on high quality, income producing strategies that were positively levered to the cyclical upswing we foresaw for 2011. While this approach has produced favorable results, we expect to broaden its sources of return and reduce overall risk exposure in light of highly uncertain market conditions.
With regard to portfolio strategy, we seek to balance dual goals of capturing incremental real return potential while limiting U.S. interest rate risk. We plan to underweight U.S. TIPS given low real yields coupled with an anticipated unwinding of QE2. Within TIPS, we will likely overweight short maturity TIPS to capture the potential returns as elevated commodity prices support near-term consumer price index (CPI) levels. Additionally, we will target modest exposure to countries with strong growth prospects and higher real yields such as Australia, which carry higher real yields and have strong sovereign balance sheets. On the spread sector front, we seek to continue to hold non-agency mortgage-backed securities and CMBS that have senior positions in the capital structure as these securities are another source of attractive yield. We anticipate targeting a conservative credit risk profile in the corporate sector. Within this sector, we look to retain our exposure to banking/financial credits, which are attractively valued versus the broader market.
On the emerging markets front, we plan to continue owning corporate and quasi-sovereign bonds in high quality emerging markets countries and we also plan to take exposure to relatively high nominal and real local interest rates in Brazil. Finally, we plan to take long positions in relatively high yielding, high quality emerging market currencies as well as commodity-based, fiscally sound currencies such as Canada and Norway. Additionally, we look to take positions that may gain from the depreciation of currencies of slower growing and debt-laden countries and regions such as Japan, the Eurozone and the U.K.
PL Managed Bond Fund (managed by Pacific Investment Management Company LLC)
Q. How did the fund perform over the year ended March 31, 2011?
A. For the year ended March 31, 2011, the fund’s Class P returned 6.31%, compared to a 5.12% return for its benchmark, the Barclays Capital U.S. Aggregate Bond Index. Class A shares were converted to Class P shares on July 2, 2010.
The following graph shows the value as of March 31, 2011 of a $10,000 investment made in Class P(1) shares since the fund began operations. For comparison purposes, the performance of the fund’s benchmark is also shown.
Performance Comparison
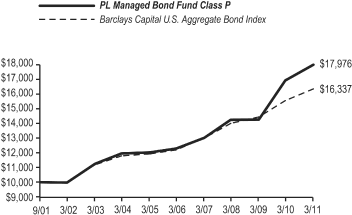
Average Annual Total Returns for the Periods Ended March 31, 2011
| PL Managed Bond Fund | Class P | |||
1 Year Total Return | 6.31 | % | ||
Barclays Capital U.S. | ||||
Aggregate Bond Index | 5.12 | % | ||
5 Years Total Return | 7.91 | % | ||
Barclays Capital U.S. | ||||
Aggregate Bond Index | 6.03 | % | ||
Since Inception (September 28, 2001) | 6.37 | % | ||
Barclays Capital U.S. | ||||
Aggregate Bond Index | 5.30 | % | ||
| (1) | Class A Shares were converted to Class P Shares on July 2, 2010. |
Performance data shown represents past performance. Investment return and principal value will fluctuate so that shares of the fund when redeemed may be worth more or less than their original cost. Past performance is not predictive of future performance.
Q. Discuss both positive and negative factors that materially affected the fund’s performance during the year, including relevant market conditions, investment strategies and techniques, and particular sectors or securities.
A. The fund outperformed its benchmark during the reporting period. Investment strategies were implemented by investing in bonds and derivative instruments including futures, options, credit default swaps and interest rate swaps. Tactical duration positioning in the U.S., through the use of cash bonds and interest rate swaps, was neutral for the fund’s performance, as rates fell after a volatile year in yields.
See benchmark definitions on page A-23 and A-24
A-6
PACIFIC LIFE FUNDS PERFORMANCE DISCUSSION (Continued)
A yield curve steepening bias, implemented via money market futures added to the fund’s performance as most Eurodollar contracts rallied during the reporting period. Additionally, tactical duration positioning in core Europe added to fund performance, as the ten-year bund (the German government’s high quality, federal bond issued to the public as a way for the German government to finance its spending) yield rose 26 basis points to end the year at 3.54%.
On the spread sector front, tactical positioning in agency mortgage-backed securities, particularly an overweight to this sector during the fourth quarter of 2010, added to the fund’s performance as the sector outpaced U.S. Treasuries. Near-index exposure to the investment grade corporate sector, partially implemented via credit default swaps on a basket of credit entities, was neutral for fund performance. However, a focus on financials, a subsector within the investment grade corporate sector, was positive for fund performance as financials outperformed the overall investment grade corporate market during the reporting period.
Beyond core sectors, modest exposure to high yield bonds added to fund performance amid an appetite for increased risk during the reporting period. Modest exposure to emerging local rates in Brazil, implemented via Brazilian zero coupon swaps, detracted from the fund’s returns as local rates rose; however, an overweight to emerging markets external debt added to the fund’s performance as the sector outpaced U.S. Treasuries. Exposure to a variety of foreign currencies, with an emphasis on the Brazilian real and a basket of Asian currencies, contributed to the fund’s performance as these appreciated relative to the U.S. dollar. Finally, modest exposure to Build America Bonds detracted from the fund’s performance for the reporting period as performance of the asset class was choppy, though the municipal market recovered slightly in the first quarter of 2011.
We at PIMCO expect the U.S. economy to grow between 3.0% and 3.5% over the rest of 2011, bolstered by last year’s fiscal stimulus package and the Fed’s QE2 program. Europe and the U.K. will expand more slowly owing to their more austere fiscal policies. Japan’s economy is likely to contract in the aftermath of the terrible earthquake, which will be a drag on global growth, but should rebound later this year amid massive reconstruction spending. Emerging economies should continue their relatively rapid growth and move closer over the secular horizon toward closing wealth and income gaps with the developed world.
We have recently focused on high quality, income producing strategies that were positively levered to the cyclical upswing we foresaw in 2011. While this approach has produced favorable results, we expect to broaden its sources of return and reduce overall risk exposure in light of highly uncertain market conditions. This will likely involve a greater focus on yield curve and currency positions and lower exposures to mortgage and credit related sectors going forward.
With regard to portfolio strategy, we look to maintain an underweight to duration overall. Additionally, we plan to focus on the short end of the yield curve, where markets are pricing in more and faster Fed tightening than we foresee. This offers potential to gain from “roll down”, or the maturing of bonds along the relatively steep short maturity curve. On the spread sector front, we plan to retain agency mortgages as an important source of high quality income, though likely at modestly reduced levels. We will continue to take advantage of relative value opportunities across mortgage coupons. Furthermore, we seek to continue to hold non-agency mortgage-backed securities and CMBS that have senior positions in the capital structure as these securities are another source of attractive yield. We will target a conservative credit risk profile in the corporate sector. Within this sector, we look to retain an overweight to banking/financial credits, which we believe are attractively valued vs. the broader market.
We plan to continue to favor Build America Bonds in order to capture their attractive valuations relative to corporates. On the emerging markets front, we plan on continuing to own corporate and quasi-sovereign bonds in high quality emerging market countries, and we also plan to take exposure to relatively high nominal and real local interest rates in Brazil. Finally, we plan to take long positions in relatively high yielding, high quality emerging market currencies as well as commodity-based, fiscally sound currencies such as those of Norway and Canada. Additionally, we look to take positions that may gain from the depreciation of slower growing and debt-laden currencies in, for example, the Eurozone, the U.K. and Japan.
PL Short Duration Bond Fund (managed by Goldman Sachs Asset Management, L.P.)
Q. How did the fund perform over the year ended March 31, 2011?
A. For the year ended March 31, 2011, the fund’s Class P returned 1.57%, compared to a 1.67% return for its benchmark, the BofA Merrill Lynch 1-3 Year U.S. Treasury Index. Class A shares were converted to Class P shares on July 2, 2010.
See benchmark definitions on page A-23 and A-24
A-7
PACIFIC LIFE FUNDS PERFORMANCE DISCUSSION (Continued)
The following graph shows the value as of March 31, 2011 of a $10,000 investment made in Class P(1) shares since the fund began operations. For comparison purposes, the performance of the fund’s benchmark is also shown.
Performance Comparison
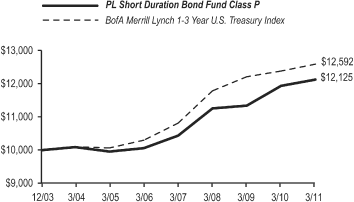
Average Annual Total Returns for the Periods Ended March 31, 2011
| PL Short Duration Bond Fund | Class P | |||
1 Year Total Return | 1.57 | % | ||
BofA Merrill Lynch 1-3 Year | ||||
U.S. Treasury Index | 1.67 | % | ||
5 Years Total Return | 3.81 | % | ||
BofA Merrill Lynch 1-3 Year | ||||
U.S. Treasury Index | 4.10 | % | ||
Since Inception (December 31, 2003) | 2.69 | % | ||
BofA Merrill Lynch 1-3 Year | ||||
U.S. Treasury Index | 3.23 | % | ||
| (1) | Class A Shares were converted to Class P Shares on July 2, 2010. |
Performance data shown represents past performance. Investment return and principal value will fluctuate so that shares of the fund when redeemed may be worth more or less than their original cost. Past performance is not predictive of future performance.
Q. Discuss both positive and negative factors that materially affected the fund’s performance during the year, including relevant market conditions, investment strategies and techniques, and particular sectors or securities.
A. The fund underperformed its benchmark during the reporting period. A combination of top-down and bottom-up strategies impacted the fund’s performance. Tactical management of the fund’s duration and term structure detracted from the fund’s performance returns during the year. The fund’s short positions in the intermediate portion of the yield curve detracted from performance over the year as rates continued to fall precipitously in the first half of the reporting period. The fund’s cross-sector positioning significantly contributed to its performance. For example, relative to the benchmark, an overweight to investment grade corporate bonds was a primary contributor to the fund’s performance, as well as an overweight to non-agency mortgage-backed securities. Liquidity returned to the corporate credit markets and spreads tightened significantly over the reporting period. The non-agency mortgage-backed securities market performed very well, rallying approximately 50% from its lows in early 2009. The sector was supported by the Public-Private Investment Program (PPIP) and a variety of housing market indicators suggesting overall activity appeared to be stabilizing. Within the fund’s bottom-up strategies, selection of super-senior non-agency mortgages was the key driver of fund performance, as these securities held significant credit enhancement. Non-agency residential mortgage-backed securities benefited from the continued stabilization of fundamentals and increased demand throughout the reporting period. Selection of specific supranational and government guaranteed corporate securities also outperformed during the reporting period and boosted the fund’s performance results. Elsewhere, selection of TIPS enhanced the fund’s performance results as breakeven spreads continued to widen. The fund also benefited from having exposure to various spread sectors, specifically in the front-end of the yield curve. Selection of short-dated corporate names also positively contributed to the fund’s performance results, as these securities outperformed their longer-maturity counterparts. We at Goldman Sachs analyze all positions in the fund on a daily basis in order to avoid inadvertent portfolio concentration. We do not employ derivatives in order to gain leverage but to gain access to markets in the most efficient manner. In the fund, derivatives are used as a tool to efficiently manage interest rate risk. We believe that the use of derivatives provides the fund the ability to participate in a broad array of security selection trades.
PL Comstock Fund (managed by Invesco Advisers, Inc.)
Q. How did the fund perform over the year ended March 31, 2011?
A. For the year ended March 31, 2011, the fund’s Class P returned 14.55%, compared to a 15.15% return for its benchmark, the Russell 1000 Value Index. Class A shares were converted to Class P shares on July 2, 2010.
See benchmark definitions on page A-23 and A-24
A-8
PACIFIC LIFE FUNDS PERFORMANCE DISCUSSION (Continued)
The following graph shows the value as of March 31, 2011 of a $10,000 investment made in Class P(1) shares since the fund began operations. For comparison purposes, the performance of the fund’s benchmark is also shown.
Performance Comparison
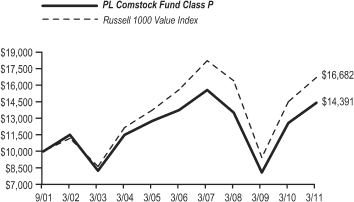
Average Annual Total Returns for the Periods Ended March 31, 2011(2)
| PL Comstock Fund | Class P | |||
1 Year Total Return | 14.55 | % | ||
Russell 1000 Value Index | 15.15 | % | ||
5 Years Total Return | 0.94 | % | ||
Russell 1000 Value Index | 1.38 | % | ||
Since Inception (September 28, 2001) | 3.90 | % | ||
Russell 1000 Value Index | 5.54 | % | ||
| (1) | Class A Shares were converted to Class P Shares on July 2, 2010. | |
| (2) | Invesco Advisers, Inc. began managing the fund on June 1, 2010. Another firm managed the fund before that date. |
Performance data shown represents past performance. Investment return and principal value will fluctuate so that shares of the fund when redeemed may be worth more or less than their original cost. Past performance is not predictive of future performance.
Q. Discuss both positive and negative factors that materially affected the fund’s performance during the year, including relevant market conditions, investment strategies and techniques, and particular sectors or securities.
A. Invesco Advisers, Inc. assumed management of the fund on June 1, 2010. Our investment philosophy appreciates that, as financial markets tend to focus on short-term factors, stock prices often fail to reflect the intrinsic value of companies. We at Invesco believe that longer-term investors can take advantage of pricing anomalies in financial markets by purchasing stocks of companies that are currently underpriced. The fund aims to exploit these market inefficiencies by investing in companies that appear undervalued relative to the market in general. Ultimately, we believe that the market will recognize the value in these companies, and we sell them as their stock price begins to reflect their intrinsic value.
The fund’s consumer discretionary sector exposure acted as the largest contributor to relative and absolute returns. The fund’s notable overweight position combined with strong stock selection positively impacted its performance. Specifically, the fund’s holdings in media companies Comcast Corp. and Viacom, Inc. made significant contributions to the fund’s performance results as both stocks posted strong double-digit returns during the reporting period.
The fund’s position in the financials sector acted as another primary driver of the fund’s relative performance when measured against the benchmark. Specifically, the fund’s material overweight position in the property and casualty insurance industry enhanced its performance returns. The Chubb Corp., a property and casualty insurance company was one of the largest holdings in the fund for much of the reporting period. The company’s strong performance is reflective of a strong balance sheet and a well diversified, conservative underwriting platform. Chubb has done an admirable job of returning cash to shareholders through buybacks and dividends, while operating in a difficult pricing environment. Stock selection within the health care, industrials and materials sectors were also positive drivers of fund performance for the reporting period.
The technology sector was the largest detractor from relative fund performance. Among technology stocks, the fund’s overweight exposure relative to the benchmark combined with unfavorable stock selection among hardware and select internet related companies dampened the fund’s performance returns. More specifically, the unexpected departure of Hewlett Packard Co.’s CEO temporarily weighed heavily on the fund’s performance returns. Shares of Cisco Systems, Inc. also were a drag on fund performance due to the reporting of declining revenues toward the end of the reporting period and the weak guidance they provided for 2011. Other than cash, stock selection and an underweight position in both the energy and utilities sectors also detracted from the fund’s performance results relative to the benchmark.
Toward the end of the reporting period, the management team reduced exposure to select media holdings and used the proceeds to increase exposure to technology, credit exposed financials and utilities stocks through opportunistic purchases.
See benchmark definitions on page A-23 and A-24
A-9
PACIFIC LIFE FUNDS PERFORMANCE DISCUSSION (Continued)
We believe that market volatility and the market correction that began in the second quarter of 2010 have created opportunities to invest in companies with attractive valuations. Our contrarian philosophy and deep value approach of buying extremely undervalued companies capitalize on market volatility and periods of down markets as value is created for new investment opportunities.
PL Growth LT Fund (managed by Janus Capital Management LLC)
Q. How did the fund perform over the year ended March 31, 2011?
A. For the year ended March 31, 2011, the fund’s Class P returned 10.79% compared to a 18.26% return for its benchmark, the Russell 1000 Growth Index. Class A shares were converted to Class P shares on July 2, 2010.
The following graph shows the value as of March 31, 2011 of a $10,000 investment made in Class P(1) shares since the fund began operations. For comparison purposes, the performance of the fund’s benchmark is also shown.
Performance Comparison
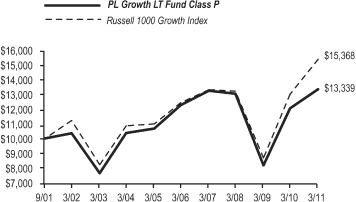
Average Annual Total Returns for the Periods Ended March 31, 2011
| PL Growth LT Fund | Class P | |||
1 Year Total Return | 10.79 | % | ||
Russell 1000 Growth Index | 18.26 | % | ||
5 Years Total Return | 1.69 | % | ||
Russell 1000 Growth Index | 4.34 | % | ||
Since Inception (September 28, 2001) | 3.08 | % | ||
Russell 1000 Growth Index | 4.63 | % | ||
| (1) | Class A Shares were converted to Class P Shares on July 2, 2010. |
Performance data shown represents past performance. Investment return and principal value will fluctuate so that shares of the fund when redeemed may be worth more or less than their original cost. Past performance is not predictive of future performance.
Q. Discuss both positive and negative factors that materially affected the fund’s performance during the year, including relevant market conditions, investment strategies and techniques, and particular sectors or securities.
A. We at Janus seek to deliver strong risk-adjusted returns over an entire market cycle by managing a diversified, moderately positioned, classic large-capitalization growth portfolio. We look for durable franchises with consistent free cash flow growth, high and improving returns, diversified revenue streams and properly incentivized management teams.
During the reporting period, stock selection drove much of the fund’s underperformance, particularly within the health care, materials and financials sectors. The fund’s underweight in the consumer discretionary sector also detracted from its relative results. On a positive note, stock selections within the consumer staples sector aided relative fund performance.
Cisco Systems, Inc. was the top detractor from fund performance during the reporting period. The networking giant has since reported disappointing gross margins, raising concerns over its competitive position. While we continue to analyze the deterioration in margins, we have maintained a position as we believe the market is pricing in an overly negative scenario for top line growth and margin compression. Despite the downbeat near-term outlook, we believe the company is well-positioned to benefit from surging bandwidth usage, driven by real-time communication and entertainment, which will likely force major changes in network architecture.
Microsoft Corp. also detracted from the fund’s performance. We like the software giant based on its attractive valuation and an improvement in its consumer business, notably the success of its Xbox video game console and Windows 7-based phone. We also like its investments in its Bing search engine and launch of Windows 8 in 2012. In addition, we think the company is well positioned to benefit from the transition to “cloud computing”. In the traditional model of computing, both data and software are fully contained on the user’s computer; in cloud computing, the user’s computer may contain almost no software or data (perhaps a minimal operating system and web browser only), serving as little more than a display terminal for processes occurring on a network of computers far away. The most attractive element to the fund is the downside protection afforded by the company’s incredibly stable corporate franchises.
See benchmark definitions on page A-23 and A-24
A-10
PACIFIC LIFE FUNDS PERFORMANCE DISCUSSION (Continued)
Another detractor from the fund’s performance was Petroleo Brasileiro S.A. The Brazilian development and production company (also known as Petrobras) retreated amid concerns over potential dilution related to a large capital raise. The complexity of the deal makes the near-term prospects for Petrobras less compelling, in our view; therefore, the fund’s position was sold.
Apple, Inc. continued to perform well and contributed to the fund’s relative performance results. It remained a top holding at the close of the reporting period. We believe the company’s growth is in the early stages internationally. We like Apple’s durable franchise, long-term growth prospects and demonstrated ability to win in various economic environments. The company has strong free cash flows and a large sum of cash on its balance sheet, and it has continued to gain market share in the personal computer and Smartphone markets.
Occidental Petroleum Corp. also contributed to the fund’s relative performance results. We believe Occidental is one of the best capital allocators among exploration-and-production companies. Occidental has a unique asset base in safe, low-cost basins such as the U.S., including a long-term opportunity in California. The firm has produced the vast majority of the industry’s free cash flow in certain periods, attesting to its capital allocation in an industry that consistently reinvests for future growth at the expense of investors.
CBS Corp. was another strong performer adding to the fund’s relative performance results during the reporting period. The fund holds shares in CBS based on management’s ability to execute on several meaningful, high-margin growth revenue opportunities. We believe the mass-media company also offers good exposure to the ongoing recovery in advertising, which should continue as long as the economy maintains stable growth. We are seeing strong demand for television content in syndication prices, new distribution platforms and global outlets, and we think CBS will benefit from secular growth beyond the current ad recovery.
Near-term, concerns about growth in Europe, inflation in emerging markets and higher oil prices may continue to weigh on sentiment. The situation in Japan raises a host of issues and may result in slower Japanese end-market demand and disruption in the global supply chain. Cost input pressures are also building globally, and we worry that companies can’t or won’t pass through price increases. Corporate profit margins have been running near peak levels and margins may compress as input costs rise and companies reinvest some of the excess cash built up on balance sheets. Reinvesting can produce long-term growth, but it may also depress free cash flow yields and returns on capital. Our caution on margins has kept us wary of many cyclical industrials which trade at high valuations on high margins. We have avoided consumer companies unless we believe they are world-class businesses that have pricing power and don’t use a lot of commodity inputs. The fund’s exposure to agriculture, gold and energy is designed partially to offset these pressures.
U.S. economic indicators have generally strengthened over the past six months, improving our confidence in the recovery. Reports on manufacturing indicate an expansive recovery, with the February Institute for Supply Management (ISM) Index at 61.4%, its highest level since May 2004. Employment figures have also strengthened, with unemployment declining not because of lower labor-force participation but because of job creation. Monetary stimulus and liquidity in the system, while potentially inflationary long-term, have improved confidence and encouraged businesses to hire and spend. Our chief concerns center around weakness in the U.S. housing market and the impact of higher oil prices on input costs and consumer spending. We are also concerned about lack of wage growth and uncertainty around the budget battles in Washington. Overall, however, we think the economy has become more self-sustaining and should continue to support investor sentiment and demand for risk assets.
Valuations for large- and mega-capitalization stocks remain attractive on a variety of historical metrics. The price-earnings ratio (P/E) spread between growth and value stocks continues to be relatively narrow, and large-capitalization companies are trading at substantial discounts to small-capitalization companies, based on historical multiples. We continue to focus on companies paying attractive dividends, which we believe imposes discipline on management teams to return cash to investors and may reduce the risk of a high-priced merger or potentially poor capital allocation decision. We remain confident in the fund’s holdings, moreover, because we believe many of its top names trade at a discount to the market with the potential to generate faster growth at higher returns. These characteristics create a very attractive risk-reward profile. Given their discounted valuations, we believe the fund’s stocks have the potential to appreciate in a variety of macro-economic climates. The fund’s holdings thus continue to represent what we think are the best risk-reward opportunities in the large-capitalization growth universe.
PL Large-Cap Growth Fund (managed by UBS Global Asset Management (Americas) Inc.)
Q. How did the fund perform over the year ended March 31, 2011?
A. For the year ended March 31, 2011, the fund’s Class P returned 19.72%, compared to a 18.26% return for its benchmark, the Russell 1000 Growth Index. Class A shares were converted to Class P shares on July 2, 2010.
See benchmark definitions on page A-23 and A-24
A-11
PACIFIC LIFE FUNDS PERFORMANCE DISCUSSION (Continued)
The following graph shows the value as of March 31, 2011 of a $10,000 investment made in Class P(1) shares since the fund began operations. For comparison purposes, the performance of the fund’s benchmark is also shown.
Performance Comparison
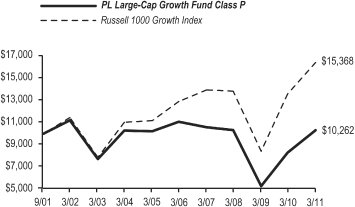
Average Annual Total Returns for the Periods Ended March 31, 2011(2)
| PL Large-Cap Growth Fund | Class P | |||
1 Year Total Return | 19.72 | % | ||
Russell 1000 Growth Index | 18.26 | % | ||
5 Years Total Return | -1.20 | % | ||
Russell 1000 Growth Index | 4.34 | % | ||
Since Inception (September 28, 2001) | 0.27 | % | ||
Russell 1000 Growth Index | 4.63 | % | ||
| (1) | Class A Shares were converted to Class P Shares on July 2, 2010. | |
| (2) | UBS Global Asset Management (Americas) Inc. began managing the fund on July 1, 2009, and some investment policies changed at that time. Other firms managed the fund before that date. |
Performance data shown represents past performance. Investment return and principal value will fluctuate so that shares of the fund when redeemed may be worth more or less than their original cost. Past performance is not predictive of future performance.
Q. Discuss both positive and negative factors that materially affected the fund’s performance during the year, including relevant market conditions, investment strategies and techniques, and particular sectors or securities.
A. The fund outperformed the benchmark during the reporting period. While sector allocations detracted modestly from fund performance during the period, a very strong positive contribution from stock selection more than offset the drag of sector allocation. During the period, our Large-Cap Growth team focused on adhering to our investment discipline, seeking to identify and invest in three diverse sources of growth and emphasizing the management of our risk budget.
Stock selection was the primary contributor to the fund’s performance during the year. In particular, the fund’s positioning within the information technology and consumer discretionary sectors contributed the most to its performance. Within the information technology sector, shares of Apple, Inc. advanced as the success of the iPad and the iPhone fueled strong earnings growth. While Apple has been able to reinvent itself with a continuous refresh of in demand products, Microsoft Corp. and Hewlett-Packard Co. have not. Investors are continuously looking for the next leg of growth for these companies and have yet to find it. As a result, shares of Microsoft and Hewlett-Packard declined during the period but contributed positively to relative performance as the fund did not have exposure to them. Within the consumer discretionary sector, e-commerce was growing twice as fast as traditional retail as consumers spent more money online than they have in the past, and the fund benefited from holdings in Amazon.com, Inc. and priceline.com, Inc. which are taking advantage of a secular shift in consumer spending habits.
While stock selection as a whole contributed to the fund’s performance during the period, there were a few areas of weakness, specifically within the financials and health care sectors. Within the financials sector, shares of BlackRock, Inc. traded down earlier in the year following disappointing earnings, where several product categories had challenged fund flow results. Shares moved higher in the second half of the period, and the fund’s position was sold. In addition, CME Group, Inc. underperformed as fears that government regulation of investment banking activities would dampen volume growth over time. We at UBS believe these fears are unfounded, and that both the CME’s high barriers to entry and outlook for volume growth remain intact. Within the health care sector, our position in Covidien P.L.C. came under pressure due to macroeconomic factors and growing concerns over management’s capital allocation strategy.
From a sector standpoint, the fund’s underweight to the health care and energy sectors and overweight to the telecommunication services and information technology sectors detracted from the fund’s performance. Throughout the year, one of the fund’s largest overweights from a sector standpoint was consumer discretionary. This proved to be beneficial to the fund’s performance as it was one of the best performing sectors during the period.
See benchmark definitions on page A-23 and A-24
A-12
PACIFIC LIFE FUNDS PERFORMANCE DISCUSSION (Continued)
PL Large-Cap Value Fund (managed by ClearBridge Advisors, LLC)
Q. How did the fund perform over the year ended March 31, 2011?
A. For the year ended March 31, 2011, the fund’s Class P returned 12.69%, compared to a 15.15% return for its benchmark, the Russell 1000 Value Index. Class A shares were converted to Class P shares on July 2, 2010.
The following graph shows the value as of March 31, 2011 of a $10,000 investment made in Class P(1) shares since the fund began operations. For comparison purposes, the performance of the fund’s benchmark is also shown.
Performance Comparison
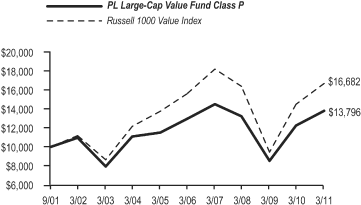
Average Annual Total Returns for the Periods Ended March 31, 2011(2)
| PL Large-Cap Value Fund | Class P | |||
1 Year Total Return | 12.69 | % | ||
Russell 1000 Value Index | 15.15 | % | ||
5 Years Total Return | 1.30 | % | ||
Russell 1000 Value Index | 1.38 | % | ||
Since Inception (September 28, 2001) | 3.44 | % | ||
Russell 1000 Value Index | 5.54 | % | ||
| (1) | Class A Shares were converted to Class P Shares on July 2, 2010. | |
| (2) | ClearBridge Advisors, LLC assumed management of the fund on October 1, 2006. Salomon Brothers Asset Management Inc, an affiliate of ClearBridge, managed the fund before that date. |
Performance data shown represents past performance. Investment return and principal value will fluctuate so that shares of the fund when redeemed may be worth more or less than their original cost. Past performance is not predictive of future performance.
Q. Discuss both positive and negative factors that materially affected the fund’s performance during the year, including relevant market conditions, investment strategies and techniques, and particular sectors or securities.
A. We at ClearBridge utilize an interactive, research-driven approach to identify companies with strong business franchises and attractive valuations. We look for companies with proven business models that we can understand; companies with sustainable competitive advantages and stocks capable of generating superior returns across a range of potential scenarios. We place a heavy emphasis on higher certainty of near and medium term cash flows, while heavily discounting earnings from emerging business models or products. We consider valuations relative to normalized earnings power.
The fund underperformed its benchmark during the reporting period. On an absolute basis, the fund had positive returns in all ten economic sectors in which it was invested during the reporting period. The greatest contributions to its returns came from the energy, consumer discretionary and consumer staples sectors. Relative to the benchmark, the fund’s overall sector allocation contributed to performance for the period. In particular, the fund’s underweight in financials and its overweight to the consumer discretionary and energy sectors contributed to relative performance for the reporting period, as did security selection in the consumer staples and telecommunications services sectors. In terms of individual fund holdings, the leading contributors to fund performance included positions in El Paso Corp., Philip Morris International, Inc., Time Warner Cable, Inc., Halliburton Co. and Honeywell International, Inc.
On an absolute basis, holdings in the health care sector slightly detracted from fund performance for the reporting period. Relative to the benchmark, overall security selection negatively impacted the fund’s performance. In particular, stock selection in the energy, information technology and health care sectors detracted from relative performance. In terms of sector allocation, the fund’s underweight in the telecommunication services sector and overweight positions in information technology and consumer staples sectors modestly hurt relative fund performance for the reporting period. On an individual holding basis, the leading detractors from fund performance for the reporting period included positions in Bank of America Corp., Hewlett-Packard Co., Raytheon Co., Microsoft Corp. and Johnson & Johnson.
During the reporting period, we identified multiple opportunities to establish the fund’s positions in what we considered to be strong franchises trading at very attractive valuations. New fund positions were established in Honeywell International, Inc., Apache Corp., Crown Holdings, Inc., Illinois Tool Works, Inc., Johnson Controls, Inc., Motorola Solutions, Inc., Charles Schwab Corp., U.S. Bancorp, MetLife, Inc.
See benchmark definitions on page A-23 and A-24
A-13
PACIFIC LIFE FUNDS PERFORMANCE DISCUSSION (Continued)
and Xerox Corp. At the same time, the fund’s positions in the following securities were sold and the proceeds were reinvested in areas where we believed there to be better risk adjusted return opportunities. The fund’s existing positions were closed in The Procter & Gamble Co., Devon Energy Corp., Capital One Financial Corp., Morgan Stanley, UnitedHealth Group, Inc., Abbott Laboratories, Scripps Networks Interactive, Inc. and Roche Holding A.G.
We continue to believe that large-capitalization companies with sustainable competitive advantages and solid balance sheets will be able to navigate the challenging economic environment and generate strong returns over time.
PL Main Street Core Fund (managed by OppenheimerFunds, Inc.)
Q. How did the fund perform over the year ended March 31, 2011?
A. For the year ended March 31, 2011, the fund’s Class P returned 13.28%, compared to a 15.65% return for its benchmark, the S&P 500 Index. Class A shares were converted to Class P shares on July 2, 2010.
The following graph shows the value as of March 31, 2011 of a $10,000 investment made in Class P(1) shares since the fund began operations. For comparison purposes, the performance of the fund’s benchmark is also shown.
Performance Comparison
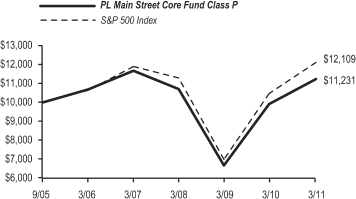
Average Annual Total Returns for the Periods Ended March 31, 2011
| PL Main Street Core Fund | Class P | |||
1 Year Total Return | 13.28 | % | ||
S&P500 Index | 15.65 | % | ||
5 Years Total Return | 1.00 | % | ||
S&P500 Index | 2.62 | % | ||
Since Inception (September 30, 2005) | 2.13 | % | ||
S&P500 Index | 3.54 | % | ||
| (1) | Class A Shares were converted to Class P Shares on July 2, 2010. |
Performance data shown represents past performance. Investment return and principal value will fluctuate so that shares of the fund when redeemed may be worth more or less than their original cost. Past performance is not predictive of future performance.
Q. Discuss both positive and negative factors that materially affected the fund’s performance during the year, including relevant market conditions, investment strategies and techniques, and particular sectors or securities.
A. The fund underperformed its benchmark during the reporting period primarily as a result of weaker relative stock selection within the health care and industrials sectors. The strongest performing sectors on a relative basis for the fund were information technology and consumer staples. During much of the reporting period, the market environment tended to be more favorable for cyclical stocks as opposed to the type of high-quality, consistent performers that our investment approach seeks to identify.
The top individual contributors to the fund’s performance during the period were information technology stocks, Apple, Inc. and QUALCOMM, Inc., energy holdings, Chevron Corp. and Occidental Petroleum Corp., and consumer staples stock, Philip Morris International, Inc. QUALCOMM performed well as high demand for its Code Division Multiple Access (CDMA) based technology among Smartphones and mobile devices boosted the stock’s performance. Apple continued to demonstrate its competitive advantage in the tablet computer and Smartphone categories and performed well for the fund. Both Chevron and Occidental Petroleum performed particularly well over the first quarter of 2011 amid rising oil prices. Philip Morris stock performed well during the reporting period. The company announced an increase in profit over the fourth quarter largely as a result of strong growth in Asian markets.
The most substantial detractors from the fund’s performance during the period were Best Buy Co., Inc., Medtronic, Inc., Microsoft Corp., Teva Pharmaceutical Industries Ltd. and Monsanto Co. By period end, the fund exited its positions in Best Buy, Medtronic and Monsanto. Each of these holdings experienced declines while held by the fund. Microsoft underperformed the market primarily over the second and third quarters of 2010 due to enthusiasm surrounding Apple’s iPad, which heightened Microsoft’s lack of a competing product.
See benchmark definitions on page A-23 and A-24
A-14
PACIFIC LIFE FUNDS PERFORMANCE DISCUSSION (Continued)
At period end, relative to the benchmark, the fund had its most substantial overweight position in the financials sector, with its largest underweight positions in the industrials, materials and energy sectors. We at Oppenheimer believe the economy will continue to improve at a gradual and perhaps uneven fashion. The slow-growth environment could create a bifurcated stock market in which well-run companies with solid business models outperform. We also believe that while cyclical stocks and companies with cyclical earnings have generally performed well as of late, this trend will eventually shift to the benefit of consistent, longer-term performers. If our expectations are correct, the current market environment could potentially favor our investment style and process, which focuses on companies with sustainable competitive advantages. We view such firms as well-positioned to generate stronger profit margins and take market share from weaker players. We seek to buy such companies when their valuations are attractive, and believe that this disciplined investment process is the key to generating solid long-term performance for the fund.
PL Mid-Cap Equity Fund (managed by Lazard Asset Management LLC)
Q. How did the fund perform over the year ended March 31, 2011?
A. For the year ended March 31, 2011, the fund’s Class P returned 21.70%, compared to a 24.27% return for its benchmark, the Russell Midcap Index. Class A shares were converted to Class P shares on July 2, 2010.
The following graph shows the value as of March 31, 2011 of a $10,000 investment made in Class P(1) shares since the fund began operations. For comparison purposes, the performance of the fund’s benchmark is also shown.
Performance Comparison
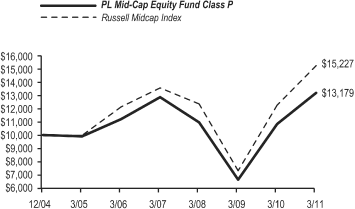
Average Annual Total Returns for the Periods Ended March 31, 2011
| PL Mid-Cap Equity Fund | Class P | |||
1 Year Total Return | 21.70 | % | ||
Russell Midcap Index | 24.27 | % | ||
5 Years Total Return | 3.31 | % | ||
Russell Midcap Index | 4.67 | % | ||
Since Inception (December 31, 2004) | 4.52 | % | ||
Russell Midcap Index | 6.96 | % | ||
| (1) | Class A Shares were converted to Class P Shares on July 2, 2010. |
Performance data shown represents past performance. Investment return and principal value will fluctuate so that shares of the fund when redeemed may be worth more or less than their original cost. Past performance is not predictive of future performance.
Q. Discuss both positive and negative factors that materially affected the fund’s performance during the year, including relevant market conditions, investment strategies and techniques, and particular sectors or securities.
A. The fund underperformed its benchmark during the reporting period. Some of the best performing sectors in the benchmark during the reporting period were the energy, materials, and industrials sectors, a move largely driven by booming prices in commodities. The consumer staples and telecommunication services sectors, generally considered defensive sectors, posted some of the lowest returns in the benchmark.
Stock selection in the industrials sector contributed to the fund’s performance. Shares of Dover Corp., a diversified manufacturer of industrial products, increased as the company reported strong earnings throughout the year. The company has seen stronger sales in each of its business segments, better margin performance, and robust free cash flow generation. Stock selection in the materials sector also helped the fund’s performance returns. Shares of Ball Corp., a provider of metal packaging, performed well, contributing to the fund’s performance returns, as it realized strong synergies from its 2009 acquisition of beverage can assets. The company also had solid core sales growth in all regions. We at Lazard believe that Ball is a strong free cash flow provider, and its shareholder-friendly policies were appreciated by the market.
In contrast, stock selection in the consumer staples sector detracted from the fund’s performance returns. Shares of Ralcorp Holdings, Inc., the largest private label food company in the U.S., lagged other consumer staples names on market worries about input cost inflation and the heavier-than-expected discounting of branded labels. However, we believe that Ralcorp’s profitability will improve as
See benchmark definitions on page A-23 and A-24
A-15
PACIFIC LIFE FUNDS PERFORMANCE DISCUSSION (Continued)
the structural growth of private label industry and pricing trends increase. Stock selection in the health care sector also hurt returns. Shares of Zimmer Holdings, Inc., one of the leading players in the orthopedic space, fell on softening demand. However, Zimmer has a strong product portfolio with well known brands in an industry with high barriers to entry.
We continue to see reason for optimism for U.S. equities. If we consider equities, versus fixed income instruments, the risk/reward remains asymmetric for much of the fixed income universe, especially considering the degree to which the Fed and other central banks are arguably distorting yields downward. If quantitative easing is effective, the legitimate expectation should be for economic growth to put downward pressure on bond prices and upward pressure on yields. If quantitative easing fails, one could argue that credit quality concerns will resurface in a significant way as investors question what will lead to economic growth.
Regarding the equity universe, we believe the U.S. is in a positive position as it is already enjoying meaningful real economic growth and seeing the early signs of job growth. To the extent this economic growth gains traction, we believe that there will likely be further legs to the upside story as demand recovers from newly re-employed workers. To the extent the bet on growth in GDP works, deleveraging can proceed, as the debt outstanding is divided by a bigger and bigger denominator of economic output.
Our strategy is to identify undervalued securities using traditional measures of value, including, but not limited to, low price to earnings ratio, high levels of free cash flow, high dividend yield, unrecognized assets, potential for management change and the potential to improve profitability. Our global investment specialists apply both quantitative and qualitative analysis to securities selection and focuses on individual stock selection rather than on forecasting stock market trends.
PL Mid-Cap Growth Fund (managed by Morgan Stanley Investment Management Inc.)
Q. How did the fund perform over the year ended March 31, 2011?
A. For the year ended March 31, 2011, the fund’s Class P returned 35.16%, compared to a 26.60% return for its benchmark, the Russell Midcap Growth Index. Class A shares were converted to Class P shares on July 2, 2010.
The following graph shows the value as of March 31, 2011 of a $10,000 investment made in Class P(1) shares since the fund began operations. For comparison purposes, the performance of the fund’s benchmark is also shown.
Performance Comparison
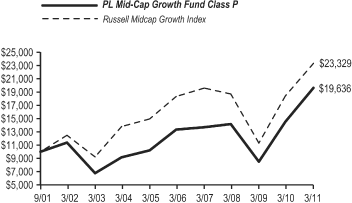
Average Annual Total Returns for the Periods Ended March 31, 2011(2)
| PL Mid-Cap Growth Fund | Class P | |||
1 Year Total Return | 35.16 | % | ||
Russell Midcap Growth Index | 26.60 | % | ||
5 Years Total Return | 8.03 | % | ||
Russell Midcap Growth Index | 4.93 | % | ||
Since Inception (September 28, 2001) | 7.36 | % | ||
Russell Midcap Growth Index | 9.33 | % | ||
| (1) | Class A Shares were converted to Class P Shares on July 2, 2010. | |
| (2) | Morgan Stanley Investment Management Inc. manages the fund and formerly did business in certain instances under the name Van Kampen, and managed the PL Mid-Cap Growth Fund under the Van Kampen name from May 1, 2003 to May 31, 2010. Another firm managed the fund before May 1, 2003. |
Performance data shown represents past performance. Investment return and principal value will fluctuate so that shares of the fund when redeemed may be worth more or less than their original cost. Past performance is not predictive of future performance.
Q. Discuss both positive and negative factors that materially affected the fund’s performance during the year, including relevant market conditions, investment strategies and techniques, and particular sectors or securities.
A. Stock selection drove the fund’s outperformance relative to its benchmark during the reporting period. The technology and consumer discretionary sectors were the largest areas of outperformance by a wide margin, benefiting the fund’s performance results. Computer systems and software holdings companies, salesforce.com, inc., Teradata Corp., Baidu, Inc. and Akamai Technologies, Inc., contributed the most within the technology sector, benefiting the fund’s performance. Holdings in semiconductors and components company, ARM Holdings P.L.C., and telecommunications equipment company, Motorola Solutions, Inc., were advantageous to the fund’s performance as well. In the consumer discretionary sector, holdings in leisure time companies, priceline.com, Inc., Ctrip.com International Ltd.; and casinos
See benchmark definitions on page A-23 and A-24
A-16
PACIFIC LIFE FUNDS PERFORMANCE DISCUSSION (Continued)
and gambling company, Las Vegas Sands Corp., were the most additive to fund performance, followed by positions in hotel/motel company, Wynn Resorts Ltd. and specialty retail company, Netflix, Inc. Stock selection in health care and materials sectors also contributed.
Energy and financial services were the main underperforming sectors. Petrohawk Energy Corp., a crude oil producer, was the sole negative performing energy holding in the fund and detracted from its results. A holding in financial data and systems company, Redecard S.A., which was eliminated, was the largest detractor from the fund’s performance within the financials services sector.
Concerns about the U.S. economy, sovereign debt levels in Europe, political turmoil in the Middle East and natural disaster in Japan led to increased volatility in the marketplace during the reporting period. But we, as fund managers at Morgan Stanley, remained confident in the long-term prospects of the fund’s positions, given these companies’ attractive valuations and strong balance sheets. Our focus on free cash flow yield and rising return on capital led us to invest in high-quality names which outperformed for the year overall despite the volatility in the marketplace.
While events in places such as the Middle East and Japan may have a short-term effect on specific companies in the fund, none of these events changed our thesis for any of these names, and none of the fund’s positions were eliminated in response. We have had very little turnover in the fund in 2011 to date, as our ongoing work reaffirms our assessment of quality and competitive advantage in the names the fund holds.
PL Small-Cap Growth Fund (managed by Fred Alger Management, Inc.)
Q. How did the fund perform over the year ended March 31, 2011?
A. For the year ended March 31, 2011, the fund’s Class P returned 26.46%, compared to a 31.04% return for its benchmark, the Russell 2000 Growth Index. Class A shares were converted to Class P shares on July 2, 2010.
The following graph shows the value as of March 31, 2011 of a $10,000 investment made in Class P(1) shares since the fund began operations. For comparison purposes, the performance of the fund’s benchmark is also shown.
Performance Comparison
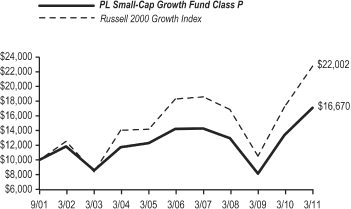
Average Annual Total Returns for the Periods Ended March 31, 2011(2)
| PL Small-Cap Growth Fund | Class P | |||
1 Year Total Return | 26.46 | % | ||
Russell 2000 Growth Index | 31.04 | % | ||
5 Years Total Return | 3.60 | % | ||
Russell 2000 Growth Index | 4.34 | % | ||
Since Inception (September 28, 2001) | 5.52 | % | ||
Russell 2000 Growth Index | 8.65 | % | ||
| (1) | Class A Shares were converted to Class P Shares on July 2, 2010. | |
| (2) | Fred Alger Management, Inc. began managing the fund on July 1, 2007, and some investment policies changed at that time. Other firms managed the fund before that date. |
Performance data shown represents past performance. Investment return and principal value will fluctuate so that shares of the fund when redeemed may be worth more or less than their original cost. Past performance is not predictive of future performance.
Q. Discuss both positive and negative factors that materially affected the fund’s performance during the year, including relevant market conditions, investment strategies and techniques, and particular sectors or securities.
A. The fund underperformed its benchmark during the reporting period. During the reporting period, the fund’s largest weightings were in the information technology, health care and consumer discretionary sectors. Generally speaking, the technology and utilities sectors were slightly overweighted versus the benchmark while the health care sector was, on average, underweight. Subpar stock selection was the most important reason for the fund’s unfavorable performance. On a relative basis, the sectors that contributed to fund performance included the consumer discretionary and energy sectors while the sectors that most detracted from fund performance included health care
See benchmark definitions on page A-23 and A-24
A-17
PACIFIC LIFE FUNDS PERFORMANCE DISCUSSION (Continued)
and financials. Among the most important contributors to fund performance were OpenTable, Inc., Riverbed Technology, Inc. and Shutterfly, Inc. Conversely, detracting from the fund’s overall performance were NuVasive, Inc., MedAssets, Inc. and Pegasystems, Inc.
At the end of the reporting period, the fund remained well diversified. During the reporting period, our investment philosophy and process remained unchanged: a research intensive, bottom-up, fundamental approach focused on discovering the fastest growing companies undergoing “Positive Dynamic Change”. Our experienced research team continues to identify many small-capitalization companies undergoing “Positive Dynamic Change” where our forward looking assessment of their fundamentals exceeded Wall Street’s consensus. We at Alger believe that market resilience in the first quarter of 2011 signals investors’ understanding of a vital fact: the U.S. economic recovery is strengthening. This has and will continue to support, we believe, a continuing rally in U.S. equity markets. We believe our philosophy of “Investing in Positive Dynamic Change” has never been more appropriate than today. Change, whether from political events such as the uprisings in the Middle East or from the continuing impact of growing emerging societies across Asia and South America, has never been more evident. While change is almost always unsettling for some investors, we believe that it generates opportunities to buy strong companies with superior potential for growth that are trading at attractive valuations. We continue to believe that research is the cornerstone of superior portfolio management, regardless of economic conditions, and that our proven and disciplined process for identifying companies experiencing “Positive Dynamic Change” will continue to produce superior long-term performance results for the fund.
PL Small-Cap Value Fund (managed by NFJ Investment Group LLC)
Q. How did the fund perform over the year ended March 31, 2011?
A. For the year ended March 31, 2011, the fund’s Class P returned 25.11%, compared to a 20.63% return for its benchmark, the Russell 2000 Value Index. Class A shares were converted to Class P shares on July 2, 2010.
The following graph shows the value as of March 31, 2011 of a $10,000 investment made in Class P(1) shares since the fund began operations. For comparison purposes, the performance of the fund’s benchmark is also shown.
Performance Comparison
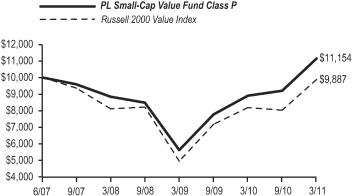
| Average Annual Total Returns for the Periods Ended March 31, 2011 | ||||
| PL Small-Cap Value Fund | Class P | |||
1 Year Total Return | 25.11 | % | ||
Russell 2000 Value Index | 20.63 | % | ||
3 Years Total Return | 8.00 | % | ||
Russell 2000 Value Index | 6.76 | % | ||
Since Inception (June 29, 2007) | 2.95 | % | ||
Russell 2000 Value Index | -0.30 | % | ||
| (1) | Class A Shares were converted to Class P Shares on July 2, 2010. |
Performance data shown represents past performance. Investment return and principal value will fluctuate so that shares of the fund when redeemed may be worth more or less than their original cost. Past performance is not predictive of future performance.
Q. Discuss both positive and negative factors that materially affected the fund’s performance during the year, including relevant market conditions, investment strategies and techniques, and particular sectors or securities.
A. The fund outperformed its benchmark during the reporting period driven by favorable sector weightings. The energy and materials sectors widely outpaced the benchmark, and the fund held an overweight position in each sector. As a reminder, the NFJ investment process employs a bottom-up approach to stock selection. We have witnessed a rotation into materials and energy stocks over the last couple of years. These stocks have generally been strong performers, which is likely a function of the market environment. During the period, investors seemed concerned about the U.S.’s deteriorating fiscal condition, which can result in the investor favoring those companies with tangible assets.
The fund’s top performer in the energy sector was Holly Corp. (HOC), which appreciated 121.6% during the reporting period. Holly is a Dallas, Texas-based refiner and marketer of petroleum products, and has been a long-time fund holding. Its earnings have risen due to higher refinery gross margins and sales volumes. More recently, the stock rose after announcing a merger with Frontier Oil Corp. The
See benchmark definitions on page A-23 and A-24
A-18
PACIFIC LIFE FUNDS PERFORMANCE DISCUSSION (Continued)
fund’s notable underweight in the financials sector contributed positively to the fund’s performance, particularly within the commercial bank industry. The underweight has been a result of the hefty benchmark weight in the sector (nearly 40%), combined with high P/E ratios and low yields relative to the rest of the market, which in our view, makes financials unattractive.
Relative fund performance was hindered by stock selection in the materials and health care sectors. Within the materials sector, stock selections in the metals & mining industry lagged the benchmark’s strong return detracting from the fund’s performance. The fund was hindered by lack of exposure to the managed health care industry, which was due to the absence of dividend payers in that industry. An overweight in the consumer staples sector was also a detractor from the fund’s performance.
The fund’s worst performing stock was in the consumer discretionary sector, within the computer and electronics retail industry category. RadioShack Corp. (RSH) declined 32.8% over the reporting period. We believe the shares of the retailer have reflected in part how investors feel about economic conditions in the U.S. The company guided below consensus during the first quarter as well. We at NFJ focus on investing in undervalued companies, relative to the market, across a broad range of industry groups. We normally invest significantly in securities of companies that we expect will generate income (for example, by paying dividends).
PL Real Estate Fund (managed by Morgan Stanley Investment Management Inc.)
Q. How did the fund perform over the year ended March 31, 2011?
A. For the year ended March 31, 2011, the fund’s Class P returned 25.16%, compared to a 23.68% return for its benchmark, the FTSE NAREIT Equity REITs Index. Class A shares were converted to Class P shares on July 2, 2010.
The following graph shows the value as of March 31, 2011 of a $10,000 investment made in Class P(1) shares since the fund began operations. For comparison purposes, the performance of the fund’s benchmark is also shown.
Performance Comparison
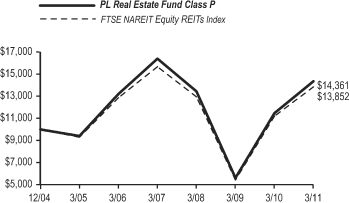
Average Annual Total Returns for the Periods Ended March 31, 2011(2)
| PL Real Estate Fund | Class P | |||
1 Year Total Return | 25.16 | % | ||
FTSE NAREIT Equity REITs Index | 23.68 | % | ||
5 Years Total Return | 1.69 | % | ||
FTSE NAREIT Equity REITs Index | 1.48 | % | ||
Since Inception (December 31, 2004) | 5.96 | % | ||
FTSE NAREIT Equity REITs Index | 5.35 | % | ||
| (1) | Class A Shares were converted to Class P Shares on July 2, 2010. | |
| (2) | Morgan Stanley Investment Management Inc. manages the fund and formerly did business in certain instances under the name Van Kampen, and managed the PL Real Estate Fund under the Van Kampen name from the fund’s inception until May 31, 2010. |
Performance data shown represents past performance. Investment return and principal value will fluctuate so that shares of the fund when redeemed may be worth more or less than their original cost. Past performance is not predictive of future performance.
Q. Discuss both positive and negative factors that materially affected the fund’s performance during the year, including relevant market conditions, investment strategies and techniques, and particular sectors or securities.
A. The fund outperformed its benchmark during the reporting period. Stock selection was especially strong in the hotel, apartment, diversified and office sectors; this benefit was partially offset by stock selection in the health care and storage sectors which detracted from the fund’s performance. From a top-down perspective, the fund benefited from an overweight to the apartment sector and an underweight to the health care sector; this benefit was partially offset by the overweight to the diversified sector, which dampened the fund’s relative performance. Cash held in the portfolio detracted from the fund’s relative performance.
We, as fund managers at Morgan Stanley, have maintained our core investment philosophy as a real estate value investor. This results in the ownership of stocks whose share prices provide real estate exposure at the best valuation relative to their underlying asset values. We continue to focus on relative implied valuations as a key metric. Our company-specific research leads us to an overweighting in the fund to a group of companies that are focused in the ownership of upscale urban hotels and a number of out-of-favor companies and an underweighting to companies concentrated in the ownership of industrial, suburban office and health care assets.
See benchmark definitions on page A-23 and A-24
A-19
PACIFIC LIFE FUNDS PERFORMANCE DISCUSSION (Continued)
PL Emerging Markets Fund (managed by OppenheimerFunds, Inc.)
Q. How did the fund perform over the year ended March 31, 2011?
A. For the year ended March 31, 2011, the fund’s Class P returned 22.53%, compared to a 18.46% return for its benchmark, the MSCI Emerging Markets Index. Class A shares were converted to Class P shares on July 2, 2010.
The following graph shows the value as of March 31, 2011 of a $10,000 investment made in Class P(1) shares since the fund began operations. For comparison purposes, the performance of the fund’s benchmark is also shown.
Performance Comparison

Average Annual Total Returns for the Periods Ended March 31, 2011
| PL Emerging Markets Fund | Class P | |||
1 Year Total Return | 22.53 | % | ||
MSCI Emerging Markets Index | 18.46 | % | ||
5 Years Total Return | 12.20 | % | ||
MSCI Emerging Markets Index | 10.70 | % | ||
Since Inception (September 30, 2005) | 14.94 | % | ||
MSCI Emerging Markets Index | 13.38 | % | ||
| (1) | Class A Shares were converted to Class P Shares on July 2, 2010. |
Performance data shown represents past performance. Investment return and principal value will fluctuate so that shares of the fund when redeemed may be worth more or less than their original cost. Past performance is not predictive of future performance.
Q. Discuss both positive and negative factors that materially affected the fund’s performance during the year, including relevant market conditions, investment strategies and techniques, and particular sectors or securities.
A. The fund outperformed its benchmark during the reporting period. The fund outperformed the benchmark in seven out of ten sectors during the reporting period, led by stronger relative stock selection within the information technology, consumer staples and financials sectors. The most substantial detractors from the fund’s relative performance were the consumer discretionary and materials sectors, as a result of weaker relative stock selection.
The fund’s top five individual contributors to its performance during the period were in the information technology and energy sectors. In information technology, HTC Corp. and Infosys Technologies Ltd. produced strong results, benefiting the fund’s performance. Taiwan-based HTC performed well during the reporting period amid high demand for Smartphones. Indian business software and outsourcing giant Infosys Technologies Ltd. was another major contributor to fund performance during the reporting period, and performed particularly well over the second half of the reporting period. Within the energy sector, Russian-based, NovaTek O.A.O. as well as Hong Kong-based CNOOC Ltd. produced strong performance results for the fund.
During the reporting period, information technology holding MediaTek, Inc., a Taiwan-based semiconductor company for wireless communications and digital multimedia solutions, was the most significant detractor from the fund’s performance. MediaTek had a volatile period and experienced its most significant declines over the first quarter of 2011 as it reported a drop in net income over its fiscal fourth quarter. In the consumer discretionary sector, Brazil-based retailer, B2W Cia Global do Varejo, and Chinese athletic company, Li Ning Co. Ltd., detracted from fund performance. Energy holdings Petroleo Brasileiro S.A., based in Brazil, and Niko Resources Ltd., based in Canada, were also among the most significant detractors from fund performance during the period. The fund exited its position in Niko Resources during the reporting period.
At the end of the reporting period, relative to the benchmark, the fund had a significant overweight position in the consumer staples sector and also had overweight positions in the information technology, consumer discretionary and health care sectors. The fund had its most significant underweight positions within the financials and materials sectors, and was underweight to a lesser degree within the utilities, industrials and energy sectors. On a country basis, the fund had significant overweight positions in India, Mexico and the U.K., with substantial underweight positions in Korea, China and Taiwan.
See benchmark definitions on page A-23 and A-24
A-20
PACIFIC LIFE FUNDS PERFORMANCE DISCUSSION (Continued)
While we at Oppenheimer believe emerging market equities are likely to encounter some challenges in the near term, we remain optimistic over the long term. We are long term investors in developing markets, and see a wide variety of unique companies which we believe are massively advantaged by bigger structural trends driving growth across these geographies. We are not particularly shaken by cyclical turns. In fact, our structurally positive thesis on the emerging markets is unchanged. We believe that new investment opportunities over our investment horizon, which is the next 3 to 5 years, continue to look promising.
PL International Large-Cap Fund (managed by MFS Investment Management)
Q. How did the fund perform over the year ended March 31, 2011?
A. For the year ended March 31, 2011, the fund’s Class P returned 12.36%, compared to a 10.42% return for its benchmark, the MSCI EAFE Index. Class A shares were converted to Class P shares on July 2, 2010.
The following graph shows the value as of March 31, 2011 of a $10,000 investment made in Class P(1) shares since the fund began operations. For comparison purposes, the performance of the fund’s benchmark is also shown.
Performance Comparison
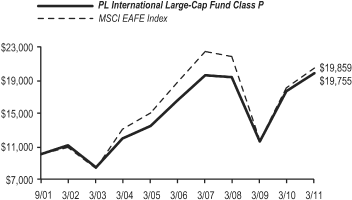
Average Annual Total Returns for the Periods Ended March 31, 2011
| PL International Large-Cap Fund | Class P | |||
1 Year Total Return | 12.36 | % | ||
MSCI EAFE Index | 10.42 | % | ||
5 Years Total Return | 3.75 | % | ||
MSCI EAFE Index | 1.30 | % | ||
Since Inception (September 28, 2001) | 7.43 | % | ||
MSCI EAFE Index | 7.49 | % | ||
| (1) | Class A Shares were converted to Class P Shares on July 2, 2010. |
Performance data shown represents past performance. Investment return and principal value will fluctuate so that shares of the fund when redeemed may be worth more or less than their original cost. Past performance is not predictive of future performance.
Q. Discuss both positive and negative factors that materially affected the fund’s performance during the year, including relevant market conditions, investment strategies and techniques, and particular sectors or securities.
A. The fund outperformed its benchmark during the reporting period. Stock selection, and to a lesser extent, an underweight position in the financials sector aided the fund’s relative performance. European bank ING Groep N.V. (Netherlands) was a top relative contributor to the fund’s performance within this sector. Stock selection in the retail sector also boosted the fund’s relative performance results. Top relative contributors within this sector included luxury retailer Moet Hennessy Louis Vuitton S.A. (LVMH) (France), jewelry manufacturer Cie Financiere Richemont S.A. (Switzerland), and British luxury goods retailer Burberry Group P.L.C. In the industrial goods & services sector, stock selection was another contributor to relative performance. Electrical distribution equipment manufacturer Schneider Electric S.A. (France) was the top relative contributor within this sector. Stocks in other sectors that benefited relative performance included medical gas producer Linde A.G. (Germany) and railroad company Canadian National Railway Co. Not owning shares of poor-performing integrated oil company BP P.L.C. (U.K.), mobile phone maker Nokia O.Y.J. (Finland), and Japanese utilities company Tokyo Electric Power Co., Inc. also contributed to relative performance.
An underweight position in the automobile and retail sectors detracted from the fund’s relative performance as this sector outperformed the broad market during the reporting period. No individual stocks within this sector were among the fund’s top relative detractors. Stock selection in the health care sector also weakened the fund’s relative performance results. Within this sector, an overweight allocation to poor-performing Swiss pharmaceutical and diagnostic company Roche Holding A.G. negatively impacted the fund’s relative performance results. Elsewhere, the fund’s overweight allocation to Hong Kong-headquartered retailer Espirit Holdings Ltd., Japanese optical eyeglasses maker HOYA Corp., Japanese specialty chemicals manufacturer Shin-Etsu Chemical Co. Ltd., and household and consumer products maker Reckitt Benckiser Group P.L.C. (U.K.) weakened the fund’s relative performance results. In addition, the strategy’s avoidance of strong-performing voice and data communications services company Vodafone Group P.L.C. (U.K.) and electronics and electrical engineering company Siemens A.G. (Germany) held back the fund’s relative performance. Copy machine manufacturer
See benchmark definitions on page A-23 and A-24
A-21
PACIFIC LIFE FUNDS PERFORMANCE DISCUSSION (Continued)
Konica Minolta Holdings, Inc. (Japan) and French insurance and financial services provider AXA S.A. were also among the fund’s top relative detractors from fund performance.
During the reporting period, currency exposure held back relative fund performance. All of MFS’ investment decisions are driven by the fundamentals of each individual opportunity and, as such, it is common for the fund to have different currency exposure than the benchmark.
The fund’s cash position also detracted from its relative performance. The fund holds cash to buy new holdings and to provide liquidity. In a period when equity markets rose, as measured by the fund’s benchmark, holding cash hurt performance versus the benchmark, which has no cash position. We at MFS use a bottom-up investment style, involving the research of the fundamentals of each individual opportunity and analyzing certain aspects of a company such as earnings, cash flows, growth potential and management abilities.
PL International Value Fund (managed by J.P. Morgan Investment Management Inc.)
Q. How did the fund perform over the year ended March 31, 2011?
A. For the year ended March 31, 2011, the fund’s Class P returned 5.99%, compared to a 10.42% return for its benchmark, the MSCI EAFE Index. Class A shares were converted to Class P shares on July 2, 2010.
The following graph shows the value as of March 31, 2011 of a $10,000 investment made in Class P(1) shares since the fund began operations. For comparison purposes, the performance of the fund’s benchmark is also shown.
Performance Comparison
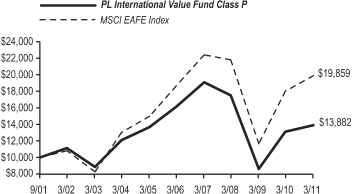
Average Annual Total Returns for the Periods Ended March 31, 2011(2)
| PL International Value Fund | Class P | |||
1 Year Total Return | 5.99 | % | ||
MSCI EAFE Index | 10.42 | % | ||
5 Years Total Return | -2.92 | % | ||
MSCI EAFE Index | 1.30 | % | ||
Since Inception (September 28, 2001) | 3.51 | % | ||
MSCI EAFE Index | 7.49 | % | ||
| (1) | Class A Shares were converted to Class P Shares on July 2, 2010. | |
| (2) | J.P. Morgan Investment Management Inc. began managing the fund on January 1, 2011, and some investment policies changed at that time. AllianceBernstein L.P. managed the PL International Value Fund from May 1, 2006 to December 31, 2010. Another firm managed the fund prior to May 1, 2006. |
Performance data shown represents past performance. Investment return and principal value will fluctuate so that shares of the fund when redeemed may be worth more or less than their original cost. Past performance is not predictive of future performance.
Q. Discuss both positive and negative factors that materially affected the fund’s performance during the year, including relevant market conditions, investment strategies and techniques, and particular sectors or securities.
A. J.P. Morgan Investment Management Inc. assumed management of the fund on January 1, 2011. The fund underperformed the benchmark during the three-month reporting period. From a sector perspective, being overweight in the technology hardware and automobile sectors, while being underweight in the energy sector hurt the fund’s performance. Stock selection in utilities, industrial cyclicals and health care sectors contributed to fund performance. Regionally, stock selection in the U.K. and Continental Europe was disappointing and hurt the fund’s relative performance results, while exposure to the emerging markets sector also detracted from fund performance. Value was added to the fund’s positions in Canada and Asia — including Japan and the rest of the Pacific Basin.
Within the technology hardware sector, the fund’s performance was undermined by Japanese holdings, whose shares fell in the wake of the March 11 earthquake and resulting tsunami. Even before these disasters, some of the fund’s Japanese holdings were struggling and negatively impacted the fund’s performance. Ricoh Co. Ltd., the Japanese office equipment maker, reported lower-than-expected net income for the fiscal third quarter that ended in December, prompting its management to say that achieving full-year results may be a “stretch.” Sales growth for multi-function printers in the fiscal third quarter was disappointing despite the launch of new products. Management announced plans to cut costs. FUJIFILM Holdings Corp., the Japanese imaging company, also detracted from fund performance. The company swung back to profitability for the nine months ending in December; however, management reduced its
See benchmark definitions on page A-23 and A-24
A-22
PACIFIC LIFE FUNDS PERFORMANCE DISCUSSION (Continued)
forecast for the full year ending in March. In the automobile sector, Nissan Motor Co. Ltd., the Japanese automaker, fell in the wake of the March 11 disasters, forcing the company to suspend production at some of its Japanese plants for a time, and detracting from the fund’s performance results. The company gradually resumed operations at all but one factory, which manufactures engines. In the energy sector, BP P.L.C. lagged relative to the benchmark detracting from the fund’s performance. The company reported lower-than-expected earnings for the fourth quarter and posted a full-year loss on the back of charges related to the Gulf oil spill. The company reinstated its dividend and replaced more gas and oil than it produced for the 18th-consecutive year.
In the utilities sector, being underweight in Japanese names and in favor of European ones, contributed to the fund’s performance. During the reporting period, not owning Tokyo Electric Power Co., Inc. benefited the fund’s performance, as shares plunged after the massive earthquake and subsequent tsunami damaged one its nuclear power plants, wiping out part of the company’s generating capacity. In contrast, shares of Snam Rete Gas S.P.A., the Italian natural gas distributor, rose on a higher-than-expected increase in net income for 2010, boosting its dividend and benefiting the fund’s performance. Revenues were up sharply as Snam Rete Gas benefited from the consolidation of Italgas S.P.A. and Stogit S.P.A., which it acquired from ENI S.P.A. in 2009. In the health care sector, Sanofi-Aventis S.A., the French drug company, added to the fund’s performance results. The stock bounced back following a dismal showing in 2010. In addition to concerns about generic competition and major changes in health care regulation, the stock had been hamstrung by the company’s efforts to acquire Genzyme Corp. Ultimately, Sanofi-Aventis S.A. proved its much disciplined approach to the acquisition. In February of 2011, the two companies came to terms, with Sanofi-Aventis agreeing to pay $74 a share for Genzyme Corp. — slightly more than its original offer of $69 a share. The deal should enable Sanofi to replace some of the revenue that it has lost. In the industrials sector, Mitsubishi Electric Corp., the Japanese maker of machinery and consumer electronics, also boosted the fund’s performance results. Net income for the fiscal third quarter, which ended in December, significantly exceeded Wall Street estimates as sales of factory automation equipment surged on strong demand from car makers and flat panel display producers. Schneider Electric S.A., the French maker of low- and medium-voltage equipment, also did well, benefiting fund performance. Its net income surged in 2010 from the year before, fuelled by a jump in sales.
Our baseline outlook remains unchanged. We at JPMorgan expect the global economy to continue recovering at a sub-trend rate, though downside risks have increased in recent months. Presently, there seems to be enough growth drivers to keep the recovery going. The U.S. economy has picked up faster than anticipated, with the private sector starting to hire again. Corporate profits continue to surprise on the upside, and merger-and-acquisition activity should remain brisk. European sovereign debt fears have eased and, we believe, though the peripheral countries will continue to struggle, core Europe (most notably Germany) remains strong. Growth in the emerging markets will likely decelerate as policymakers take steps to cool inflationary pressures but they should continue to expand at a healthy clip. There are, however, a number of “wildcards”. The European Union has yet to institute a permanent mechanism for dealing with its fiscally challenged members. Sentiment remains guarded. Recent events in Japan and the Middle East have also added to the risks. Oil prices have risen sharply in recent months as widespread political unrest in the Middle East raised questions about the stability of oil supplies. Thus far, larger producers (e.g., Saudi Arabia) have contained the situation but any major disruption could cause prices to spike, potentially derailing global growth.
The Japanese economy will likely slip into recession due to the aftermath of the recent tragic events that occurred in March. Activity should bounce back strongly in the second half once rebuilding efforts are underway but, in the near term, economic activity has been disrupted, likely impacting short term corporate earnings for a number of Japanese firms. Because Japan is a major source of key products and components in the global supply chain, the events in that country could reverberate in other parts of the world.
In such an environment, we continue to focus on stock selection, utilizing our proprietary research to identify the most attractive ‘value’ names within each sector.
Benchmark Definitions
Barclays Capital U.S. Aggregate Bond Index covers the U.S. dollar-denominated, investment-grade, fixed-rate, taxable bond market of SEC-registered securities. The index includes bonds from the Treasury, government-related, corporate, mortgage-backed securities, asset-backed securities, and corporate mortgage-backed securities sectors. The total return is equal to the change in price plus the coupon return.
Barclays Capital U.S. Treasury Inflation Protected Securities (TIPS) Index is an index of all outstanding treasury inflation protected securities issued by the U.S. government. The total return is equal to the change in price plus the coupon return.
BofA Merrill Lynch 1-3 Year U.S. Treasury Index is an index of U.S. Treasury issues that has maturities from one to three years. The total return is equal to the change in price plus the coupon return.
Credit Suisse Leveraged Loan Index is an index of U.S. dollar-denominated leveraged loan market securities. The total return is equal to the change in price plus the coupon return.
FTSE National Association of Real Estate Investment Trusts (NAREIT) Equity Real Estate Investment Trusts (REITs) Index is one index of a series of indexes represented in the FTSE NAREIT U.S. Real Estate Index Series and represents tax-qualified REITs listed on the New York Stock Exchange (NYSE), American Stock Exchange and National Association of Securities Dealers Automated
A-23
PACIFIC LIFE FUNDS PERFORMANCE DISCUSSION (Continued)
Quotations (NASDAQ). Results include reinvested dividends. Effective December 20, 2010, the FTSE NAREIT Equity REITs Index no longer includes Timber REITs.
Morgan Stanley Capital International (MSCI) Europe, Australasia and Far East (EAFE) Index is an index of stocks from 21 countries/regions in Europe, Australia, New Zealand and Asia. Results include reinvested dividends after deducting withholding taxes.
MSCI Emerging Markets Index is an index typically made up of stocks from approximately 26 emerging market countries. Results include reinvested dividends.
Russell 1000 Growth Index is an index of large companies that have higher price-to-book ratios and forecasted growth values than the Russell 1000 Value Index. Results include reinvested dividends.
Russell 1000 Value Index measures the performance of the large-capitalization value segment of the U.S. equity universe. It is an index of companies with a less-than average growth orientation. Companies in this index have lower price-to book and price-earnings ratios, higher dividend yields and lower forecasted growth rates than companies in the Russell 1000 Growth Index. Results include reinvested dividends.
Russell 2000 Growth Index measures the performance of the small-capitalization growth segment of the U.S. equity universe. It is an index of approximately 1,200 small companies with higher price-to-book ratios and forecasted growth values than companies in the Russell 2000 Value Index. Results include reinvested dividends.
Russell 2000 Value Index measures the performance of the small-capitalization value segment of the U.S. equity universe. It is an index of companies that have lower price-to-book ratios and lower forecasted growth values than companies in the Russell 2000 Growth Index. Results include reinvested dividends.
Russell Midcap Growth Index is an index that measures the performance of the mid-capitalization growth segment of the U.S. equity universe. It includes those companies within the Russell Midcap Index with higher price-to-book ratios and higher forecasted growth values. Results include reinvested dividends.
Russell Midcap Index is an index of approximately 800 of the smallest companies in the Russell 1000 Index. Results include reinvested dividends.
S&P 500 Index is an index of the stocks of approximately 500 large-capitalization companies traded in U.S. stock markets. Results include reinvested dividends.
S&P/LSTA Leveraged Loan Index is a daily total return index that uses Loan Syndications & Trading Association/Loan Pricing Corp. (LSTA/LPC) mark-to-market pricing to calculate market value change. On a real-time basis, the leveraged loan index (LLI) tracks the current outstanding balance and spread over London Interbank Offered Rate (LIBOR) for fully funded term loans. The facilities included in the LLI represent a broad cross section of leveraged loans syndicated in the U.S., including dollar-denominated loans to overseas issuers.
A-24
PACIFIC LIFE FUNDS
PL FLOATING RATE LOAN FUND
Schedule of Investments
March 31, 2011
PL FLOATING RATE LOAN FUND
Schedule of Investments
March 31, 2011
| Shares | Value | |||||||
COMMON STOCKS - 0.7% | ||||||||
Consumer Discretionary - 0.7% | ||||||||
| Metro-Goldwyn-Mayer Studios Inc ‘A’ | 27,061 | $ | 620,149 | |||||
| Total Common Stocks (Cost $671,651) | 620,149 | |||||||
| Principal | ||||||||
| Amount | ||||||||
SENIOR LOAN NOTES - 95.5% | ||||||||
Consumer Discretionary - 37.7% | ||||||||
| Advantage Sales & Marketing Inc | ||||||||
| (1st Lien) | ||||||||
| 5.250% due 12/17/17 § | $ | 174,563 | 175,598 | |||||
| Affinion Group Inc Tranche B | ||||||||
| 5.000% due 10/09/16 § | 1,092,234 | 1,094,965 | ||||||
| Allison Transmission Inc | ||||||||
| due 08/07/14 ∞ | 500,000 | 496,875 | ||||||
| 3.010% due 08/07/14 § | 492,571 | 489,493 | ||||||
| ARAMARK Corp | ||||||||
| (Non-Extending) | ||||||||
| 0.094% due 01/26/14 § | 67,524 | 67,059 | ||||||
| 2.182% due 01/26/14 § | 838,203 | 832,436 | ||||||
| Asurion Corp (1st Lien) | ||||||||
| 3.267% due 07/03/14 § | 988,722 | 983,425 | ||||||
| Burger King Corp Term B | ||||||||
| 4.500% due 10/19/16 § | 498,750 | 498,704 | ||||||
| Catalina Marketing Corp (Initial Term Loan) | ||||||||
| 3.012% due 10/26/14 § | 946,993 | 943,441 | ||||||
| Cequel Communications LLC | ||||||||
| 2.260% due 05/05/13 § | 997,403 | 992,649 | ||||||
| Charter Communications Operating LLC | ||||||||
| Term B-1 | ||||||||
| 2.250% due 09/06/13 § | 401,487 | 401,291 | ||||||
| Term C | ||||||||
| 3.560% due 09/06/16 § | 498,737 | 500,745 | ||||||
| Cumulus Media Inc | ||||||||
| (Replacement Term Loan) | ||||||||
| 3.996% due 06/11/14 § | 498,155 | 494,241 | ||||||
| DineEquity Inc Term B-1 | ||||||||
| 4.250% due 10/25/17 § | 123,652 | 124,657 | ||||||
| Dollar General Corp | ||||||||
| Tranche B-1 | ||||||||
| 3.021% due 07/06/14 § | 426,848 | 427,284 | ||||||
| Tranche B-2 | ||||||||
| 3.001% due 07/06/13 § | 500,000 | 500,426 | ||||||
| Dunkin Brands Inc Term B-1 | ||||||||
| 4.250% due 11/23/17 § | 997,500 | 1,003,646 | ||||||
| Education Management LLC Tranche C-2 | ||||||||
| 4.313% due 06/01/16 § | 994,686 | 974,870 | ||||||
| Entercom Radio LLC Term A | ||||||||
| 1.434% due 06/18/12 § | 366,889 | 361,386 | ||||||
| Federal-Mogul Corp | ||||||||
| Tranche B | ||||||||
| 2.196% due 12/27/14 § | 652,053 | 637,265 | ||||||
| Tranche C | ||||||||
| 2.189% due 12/27/15 § | 332,680 | 325,135 | ||||||
| Ford Motor Co Tranche B-1 | ||||||||
| 3.010% due 12/15/13 § | 761,940 | 762,472 | ||||||
| General Nutrition Centers Inc Tranche B | ||||||||
| 4.250% due 03/02/18 § | 500,000 | 500,700 | ||||||
| Getty Images Inc | ||||||||
| 5.250% due 11/03/16 § | 497,500 | 502,553 | ||||||
| Harrah’s Operating Co Inc Term B-1 | ||||||||
| 3.303% due 01/28/15 § | 1,000,000 | 927,969 | ||||||
| Interactive Data Corp Term B | ||||||||
| due 02/08/18 ∞ | 300,000 | 301,713 | ||||||
| 4.750% due 02/08/18 § | 200,000 | 201,142 | ||||||
| Jo-Ann Stores Inc | ||||||||
| 4.750% due 03/18/18 § | 175,000 | 173,841 | ||||||
| Language Line LLC Tranche B | ||||||||
| 6.250% due 06/15/16 § | 199,500 | 201,412 | ||||||
| Las Vegas Sands LLC | ||||||||
| (Extended Delayed Draw I Term Loan) | ||||||||
| 3.000% due 05/23/16 § | 108,343 | 105,815 | ||||||
| Tranche B (Extended) | ||||||||
| 3.000% due 11/23/16 § | 536,188 | 523,521 | ||||||
| MCC Iowa LLC Tranche E | ||||||||
| 4.500% due 11/03/17 § | 992,500 | 977,613 | ||||||
| Michaels Stores Inc | ||||||||
| Term B-1 | ||||||||
| 2.584% due 10/31/13 § | 463,828 | 460,092 | ||||||
| Term B-2 | ||||||||
| 4.834% due 07/31/16 § | 688,114 | 691,245 | ||||||
| National Bedding Co LLC (Extended) | ||||||||
| 3.813% due 12/17/13 § | 497,269 | 496,647 | ||||||
| Orbitz Worldwide Inc | ||||||||
| 3.286% due 07/25/14 § | 479,871 | 452,878 | ||||||
| OSI Restaurant Partners LLC | ||||||||
| 2.563% due 06/14/14 § | 428,653 | 416,954 | ||||||
| (Pre-Funded Revolving Credit Loan) | ||||||||
| 3.542% due 06/14/14 § | 41,547 | 40,413 | ||||||
| Penn National Gaming Inc Term B | ||||||||
| 2.028% due 10/03/12 § | 1,000,000 | 997,219 | ||||||
| Petco Animal Supplies Inc Term B | ||||||||
| 4.500% due 10/28/17 § | 495,000 | 496,987 | ||||||
| Pilot Travel Centers LLC Tranche B | ||||||||
| (Initial Term Loan) | ||||||||
| 4.250% due 03/23/18 § | 425,000 | 427,125 | ||||||
| Protection One Alarm Monitoring Inc | ||||||||
| 6.000% due 06/04/16 § | 466,763 | 469,875 | ||||||
| Regal Cinemas Corp | ||||||||
| 3.557% due 08/23/17 § | 847,875 | 850,345 | ||||||
| Sabre Inc (Initial Term Loan) | ||||||||
| 2.267% due 09/21/14 § | 971,124 | 916,768 | ||||||
| SeaWorld Parks & Entertainment Inc | ||||||||
| Term A | ||||||||
| 2.996% due 02/16/16 § | 254,249 | 253,614 | ||||||
| Term B | ||||||||
| 4.000% due 02/16/16 § | 241,926 | 243,741 | ||||||
| The Goodyear Tire & Rubber Co | ||||||||
| (2nd Lien) | ||||||||
| 1.960% due 04/30/14 § | 1,000,000 | 982,083 | ||||||
| The Neiman Marcus Group Inc Tranche B-2 | ||||||||
| 4.310% due 04/06/16 § | 953,264 | 954,257 | ||||||
| The Pep Boys — Manny, Moe and Jack | ||||||||
| 2.310% due 10/25/13 § | 232,987 | 232,696 | ||||||
| The Weather Channel Holding Corp | ||||||||
| 4.250% due 02/04/17 § | 249,375 | 251,505 | ||||||
| Travelport LLC | ||||||||
| (Extended Delayed Draw Term Loan) | ||||||||
| 4.963% due 08/23/15 § | 992,268 | 982,811 | ||||||
| Universal City Development Partners Ltd | ||||||||
| 5.500% due 11/03/14 § | 894,472 | 903,231 | ||||||
| Univision Communications Inc | ||||||||
| (Extended 1st Lien Term Loan) | ||||||||
| 4.496% due 03/29/17 § | 766,960 | 748,608 | ||||||
| (Initial Term Loan) | ||||||||
| 2.246% due 09/29/14 § | 766,960 | 747,992 | ||||||
| Visant Corp Tranche B | ||||||||
| 5.250% due 12/22/16 § | 149,625 | 149,681 | ||||||
| See Notes to Financial Statements | See explanation of symbols and terms, if any, on page B-61 | |||
B-1
PACIFIC LIFE FUNDS
PL FLOATING RATE LOAN FUND
Schedule of Investments (Continued)
March 31, 2011
PL FLOATING RATE LOAN FUND
Schedule of Investments (Continued)
March 31, 2011
| Principal | ||||||||
| Amount | Value | |||||||
| VML US Finance LLC Term B | ||||||||
| (Delayed Draw Project Loan) | ||||||||
| 4.790% due 05/25/12 § | $ | 150,825 | $ | 151,024 | ||||
| (Funded Project Loan) | ||||||||
| 4.790% due 04/11/13 § | 673,062 | 673,950 | ||||||
| Zuffa LLC (Initial Term Loan) | ||||||||
| 2.313% due 06/01/15 § | 994,832 | 978,666 | ||||||
| 32,474,749 | ||||||||
Consumer Staples - 10.9% | ||||||||
| Dean Foods Co Tranche B | ||||||||
| (Non-Extending) | ||||||||
| 1.810% due 04/02/14 § | 497,409 | 484,228 | ||||||
| Del Mont Foods Co | ||||||||
| (Initial Term Loan) | ||||||||
| 4.500% due 02/15/18 § | 1,000,000 | 1,001,953 | ||||||
| DSW Holdings Inc | ||||||||
| 4.311% due 03/02/12 § | 500,000 | 485,000 | ||||||
| Green Mountain Coffee Roasters Inc | ||||||||
| (Facility Term B Loan) | ||||||||
| 5.500% due 12/17/16 § | 997,500 | 1,004,150 | ||||||
| KIK Custom Products Inc | ||||||||
| (2nd Lien) | ||||||||
| 5.246% due 11/24/14 § | 500,000 | 336,667 | ||||||
| NBTY Inc Term B-1 | ||||||||
| 4.250% due 10/01/17 § | 997,500 | 1,000,929 | ||||||
| Pierre Foods Inc (1st Lien) | ||||||||
| 7.000% due 09/15/16 § | 498,747 | 501,968 | ||||||
| Pinnacle Foods Finance LLC | ||||||||
| 2.761% due 04/02/14 § | 500,000 | 498,854 | ||||||
| Reynolds Group Holdings Inc | ||||||||
| (US Term Loan) | ||||||||
| 4.250% due 02/10/18 § | 1,000,000 | 1,005,805 | ||||||
| Rite Aid Corp | ||||||||
| Tranche 2 | ||||||||
| 2.007% due 06/04/14 § | 1,446,717 | 1,394,274 | ||||||
| Tranche 5 | ||||||||
| 4.500% due 03/01/18 § | 194,383 | 192,763 | ||||||
| Roundy’s Supermarkets Inc | ||||||||
| Tranche B (Extended) | ||||||||
| 3.755% due 11/03/13 § | 994,805 | 999,002 | ||||||
| U.S. Foodservice | ||||||||
| 2.753% due 07/03/14 § | 498,705 | 484,540 | ||||||
| 9,390,133 | ||||||||
Energy - 0.2% | ||||||||
| Citgo Petroleum Corp Term B | ||||||||
| 8.000% due 06/25/15 § | 195,536 | 203,944 | ||||||
Financials - 3.4% | ||||||||
| First Data Corp Tranche B-1 (Initial Term Loan) | ||||||||
| 3.002% due 09/24/14 § | 527,211 | 505,958 | ||||||
| HUB International Ltd | ||||||||
| (Delayed Draw Term Loan) | ||||||||
| 2.807% due 04/02/14 § | 177,755 | 176,377 | ||||||
| (Initial Term Loan) | ||||||||
| 2.807% due 04/02/14 § | 790,776 | 784,644 | ||||||
| Nuveen Investments Inc (1st Lien) | ||||||||
| (Non-Extended) | ||||||||
| 3.306% due 11/13/14 § | 691,740 | 665,943 | ||||||
| (Extended) | ||||||||
| 5.806% due 05/13/17 § | 808,260 | 810,404 | ||||||
| 2,943,326 | ||||||||
Health Care - 11.9% | ||||||||
| Aveta Inc | ||||||||
| (MMM Term Loan) | ||||||||
| 8.500% due 04/14/16 § | 237,405 | 239,284 | ||||||
| (NAMM Term Loan) | ||||||||
| 8.500% due 04/14/16 § | 237,405 | 239,284 | ||||||
| Axcan Intermediate Holdings Inc | ||||||||
| 5.500% due 02/11/17 § | 498,750 | 498,360 | ||||||
| Bausch & Lomb Inc | ||||||||
| (Delayed Draw Term Loan) | ||||||||
| 3.496% due 04/26/15 § | 97,102 | 97,102 | ||||||
| (Parent Term Loan) | ||||||||
| 3.543% due 04/26/15 § | 399,415 | 399,415 | ||||||
| Biomet Inc (Dollar Term Loan) | ||||||||
| 3.292% due 03/25/15 § | 992,288 | 992,012 | ||||||
| CHS/Community Health Systems Inc | ||||||||
| (Extended Term Loan) | ||||||||
| 3.811% due 01/25/17 § | 320,556 | 320,335 | ||||||
| (Non-Extended Delayed Draw Term Loan) | ||||||||
| 2.561% due 07/25/14 § | 32,824 | 32,513 | ||||||
| (Non-Extended Funded Term Loan) | ||||||||
| 2.561% due 07/25/14 § | 637,987 | 631,954 | ||||||
| DaVita Inc Tranche B | ||||||||
| 4.500% due 10/20/16 § | 224,438 | 225,759 | ||||||
| DJO Finance LLC | ||||||||
| 3.246% due 11/20/13 § | 454,143 | 452,062 | ||||||
| Grifols SA Tranche B | ||||||||
| due 11/09/16 ∞ | 675,000 | 680,763 | ||||||
| HCA Inc Tranche B-1 | ||||||||
| 2.557% due 11/17/13 § | 1,581,924 | 1,576,858 | ||||||
| Health Management Associates Inc Term B | ||||||||
| 2.057% due 02/28/14 § | 991,734 | 979,276 | ||||||
| IMS Health Inc Tranche B | ||||||||
| (Dollar Term Loan) | ||||||||
| 4.500% due 03/10/16 § | 495,005 | 497,738 | ||||||
| InVentiv Health Inc Term B | ||||||||
| (Replacement) | ||||||||
| 4.750% due 08/04/16 § | 496,256 | 498,427 | ||||||
| Kindred Healthcare Inc | ||||||||
| due 02/09/18 ∞ | 175,000 | 174,508 | ||||||
| MultiPlan Merger Corp | ||||||||
| 4.750% due 08/12/17 § | 673,077 | 676,358 | ||||||
| Warner Chilcott Co LLC | ||||||||
| Term B-1 | ||||||||
| 4.250% due 03/17/18 § | 457,143 | 459,809 | ||||||
| Term B-2 | ||||||||
| 4.250% due 03/17/18 § | 228,571 | 229,905 | ||||||
| WC Luxco SARL | ||||||||
| Term B-3 | ||||||||
| 4.250% due 03/17/18 § | 314,286 | 316,119 | ||||||
| 10,217,841 | ||||||||
Industrials - 5.7% | ||||||||
| Bombardier Recreational Products Inc | ||||||||
| 2.810% due 06/07/13 § | 500,000 | 494,125 | ||||||
| Goodman Global Inc (1st Lien Initial Term Loan) | ||||||||
| 5.750% due 10/21/16 § | 149,250 | 150,357 | ||||||
| Nielsen Finance LLC Term A (Dollar Term Loan) | ||||||||
| 2.259% due 08/09/13 § | 976,089 | 971,819 | ||||||
| Novelis Inc | ||||||||
| 4.000% due 03/10/17 § | 997,500 | 1,001,329 | ||||||
| Pinafore LLC Term B-1 | ||||||||
| 4.250% due 09/28/16 § | 565,889 | 568,860 | ||||||
| Sensata Technologies BV (US Term Loan) | ||||||||
| 2.054% due 04/27/13 § | 496,094 | 492,745 | ||||||
| See Notes to Financial Statements | See explanation of symbols and terms, if any, on page B-61 | |||
B-2
PACIFIC LIFE FUNDS
PL FLOATING RATE LOAN FUND
Schedule of Investments (Continued)
March 31, 2011
PL FLOATING RATE LOAN FUND
Schedule of Investments (Continued)
March 31, 2011
| Principal | ||||||||
| Amount | Value | |||||||
| Swift Transportation Co | ||||||||
| 6.000% due 12/21/16 § | $ | 943,354 | $ | 949,132 | ||||
| Transdigm Inc Term B | ||||||||
| (New Term Loan) | ||||||||
| 4.000% due 02/15/17 § | 249,375 | 251,596 | ||||||
| 4,879,963 | ||||||||
Information Technology - 5.3% | ||||||||
| Brocade Communication Systems Inc (Borrowing) | ||||||||
| 7.000% due 10/07/13 § | 151,805 | 152,754 | ||||||
| Fidelity National Information Services Inc Term B | ||||||||
| 5.250% due 07/15/16 § | 199,000 | 200,430 | ||||||
| Freescale Semiconductor Inc | ||||||||
| (Extended Maturity Term Loan) | ||||||||
| 4.511% due 12/01/16 § | 990,347 | 986,243 | ||||||
| Infor Enterprise Solutions Holdings Ltd | ||||||||
| (Extended Delayed Draw 1st Lien) | ||||||||
| 6.000% due 07/29/15 § | 345,065 | 341,614 | ||||||
| (Extended Initial US Term Loan 1st Lien) | ||||||||
| 6.000% due 07/29/15 § | 649,727 | 643,027 | ||||||
| Kronos Inc (2nd Lien) | ||||||||
| 6.057% due 12/31/15 § | 500,000 | 494,375 | ||||||
| Skillsoft Corp Term B | ||||||||
| 6.500% due 05/20/17 § | 496,251 | 503,384 | ||||||
| Spansion LLC | ||||||||
| 6.500% due 02/09/15 § | 279,719 | 282,166 | ||||||
| SunGard Data Systems Inc | ||||||||
| Tranche A | ||||||||
| 2.008% due 02/28/14 § | 244,500 | 243,200 | ||||||
| Tranche B | ||||||||
| 3.933% due 02/28/16 § | 717,155 | 719,972 | ||||||
| 4,567,165 | ||||||||
Materials - 9.5% | ||||||||
| Fairmount Minerals Ltd Tranche B | ||||||||
| 5.250% due 03/10/17 § | 300,000 | 300,703 | ||||||
| Georgia-Pacific LLC | ||||||||
| Term B (Additional Term Loan) | ||||||||
| 2.307% due 12/29/13 § | 726,417 | 726,993 | ||||||
| Graphic Packaging International Inc Term B | ||||||||
| 2.303% due 05/16/14 § | 940,554 | 935,656 | ||||||
| Hexion Specialty Chemicals Inc | ||||||||
| Tranche C-1B | ||||||||
| 4.063% due 05/05/15 § | 700,286 | 694,013 | ||||||
| Tranche C-2B | ||||||||
| 4.063% due 05/05/15 § | 294,593 | 291,954 | ||||||
| Huntsman International LLC Term B | ||||||||
| (Dollar Term Loan) | ||||||||
| 1.786% due 04/19/14 § | 268,345 | 265,326 | ||||||
| (Extended Dollar Term Loan) | ||||||||
| 2.786% due 03/07/17 § | 731,655 | 727,692 | ||||||
| Ineos US Finance LLC | ||||||||
| Term B-2 | ||||||||
| 7.500% due 12/11/13 § | 458,252 | 472,429 | ||||||
| Term C-2 | ||||||||
| 8.001% due 12/11/14 § | 486,309 | 501,355 | ||||||
| Nalco Co Tranche B-1 | ||||||||
| 4.500% due 10/07/17 § | 995,000 | 1,005,053 | ||||||
| Smurfit-Stone Container Enterprises Inc | ||||||||
| (Exit Term Loan) | ||||||||
| 6.750% due 02/22/16 § | 486,708 | 489,065 | ||||||
| Solutia Inc Term B | ||||||||
| (New Term Loan) | ||||||||
| 3.500% due 08/16/17 § | 203,309 | 204,707 | ||||||
| Styron SARL LLC Term B | ||||||||
| 6.000% due 01/28/17 § | 498,750 | 502,231 | ||||||
| Univar Inc Term B | ||||||||
| due 02/28/17 ∞ | 349,125 | 350,933 | ||||||
| 5.000% due 02/28/17 § | 498,750 | 501,333 | ||||||
| Walter Energy Inc Term B | ||||||||
| due 03/04/18 ∞ | 225,000 | 226,744 | ||||||
| 8,196,187 | ||||||||
Telecommunication Services - 5.5% | ||||||||
| Digicel International Finance Ltd | ||||||||
| Tranche A | ||||||||
| 2.813% due 04/25/12 § | 366,736 | 363,986 | ||||||
| 2.813% due 04/25/12 § | 200,036 | 198,536 | ||||||
| Intelsat Jackson Holdings SA Tranche B | ||||||||
| 5.250% due 04/03/18 § | 1,950,000 | 1,965,382 | ||||||
| MetroPCS Wireless Inc Term B | ||||||||
| 4.060% due 03/17/17 § | 174,563 | 175,135 | ||||||
| Syniverse Holdings Inc Term B | ||||||||
| 5.250% due 12/21/17 § | 498,750 | 503,270 | ||||||
| Telesat Canada | ||||||||
| Term I (US Term Loan) | ||||||||
| 3.250% due 06/06/14 § | 456,908 | 456,527 | ||||||
| Term II (US Term Loan) | ||||||||
| 3.250% due 06/06/14 § | 39,247 | 39,214 | ||||||
| UPC Financing Partnership Facility X | ||||||||
| 3.761% due 04/16/17 § | 1,000,000 | 1,002,083 | ||||||
| 4,704,133 | ||||||||
Utilities - 5.4% | ||||||||
| Calpine Corp | ||||||||
| 4.500% due 03/09/18 § | 1,050,000 | 1,056,052 | ||||||
| Dynegy Holdings Inc | ||||||||
| (Facility Term Loan) | ||||||||
| 4.000% due 04/24/13 § | 1,388,246 | 1,380,113 | ||||||
| (Tranche B) | ||||||||
| 4.000% due 03/27/13 § | 110,325 | 109,678 | ||||||
| NRG Energy Inc (Extended Maturity Term Loan) | ||||||||
| 3.502% due 08/31/15 § | 992,500 | 998,781 | ||||||
| Texas Competitive Electric Holdings Co LLC | ||||||||
| Tranche B2 (Initial Term Loan) | ||||||||
| 3.783% due 10/10/14 § | 1,263,980 | 1,066,934 | ||||||
| 4,611,558 | ||||||||
| Total Senior Loan Notes (Cost $80,340,832) | 82,188,999 | |||||||
| Shares | ||||||||
SHORT-TERM INVESTMENT - 5.8% | ||||||||
Money Market Fund - 5.8% | ||||||||
| BlackRock Liquidity Funds Treasury Trust Fund Portfolio | 4,995,491 | 4,995,491 | ||||||
| Total Short-Term Investment (Cost $4,995,491) | 4,995,491 | |||||||
TOTAL INVESTMENTS - 102.0% (Cost $86,007,974) | 87,804,639 | |||||||
OTHER ASSETS & LIABILITIES, NET — (2.0%) | (1,739,039 | ) | ||||||
NET ASSETS - 100.0% | $ | 86,065,600 | ||||||
| See Notes to Financial Statements | See explanation of symbols and terms, if any, on page B-61 | |||
B-3
PACIFIC LIFE FUNDS
PL FLOATING RATE LOAN FUND
Schedule of Investments (Continued)
March 31, 2011
PL FLOATING RATE LOAN FUND
Schedule of Investments (Continued)
March 31, 2011
Notes to Schedule of Investments
| (a) | As of March 31, 2011, the fund was diversified as a percentage of net assets as follows: |
| Consumer Discretionary | 38.4 | % | ||
| Health Care | 11.9 | % | ||
| Consumer Staples | 10.9 | % | ||
| Materials | 9.5 | % | ||
| Short-Term Investment | 5.8 | % | ||
| Industrials | 5.7 | % | ||
| Telecommunication Services | 5.5 | % | ||
| Utilities | 5.4 | % | ||
| Information Technology | 5.3 | % | ||
| Financials | 3.4 | % | ||
| Energy | 0.2 | % | ||
| 102.0 | % | |||
| Other Assets & Liabilities, Net | (2.0 | %) | ||
| 100.0 | % | |||
| (b) | As of March 31, 2011, the fund’s Standard & Poor’s quality ratings as a percentage of total fixed income investments were as follows: |
| BBB | 2.1 | % | ||
| BB | 52.1 | % | ||
| B | 42.1 | % | ||
| CCC | 1.6 | % | ||
| Not Rated | 2.1 | % | ||
| 100.0 | % | |||
| (c) | Fair Value Measurements | |
| The following is a summary of the fund’s investments as categorized under the three-tier hierarchy of inputs used in valuing the fund’s assets and liabilities (See Note 11 in Notes to Financial Statements) as of March 31, 2011: |
| Level 2 | Level 3 | |||||||||||||||||||
| Total Value at | Level 1 | Significant | Significant | |||||||||||||||||
| March 31, 2011 | Quoted Price | Observable Inputs | Unobservable Inputs | |||||||||||||||||
| Assets | Common Stocks (1) | $ | 620,149 | $ | — | $ | 620,149 | $ | — | |||||||||||
| Senior Loan Notes | 82,188,999 | — | 82,188,999 | — | ||||||||||||||||
| Short-Term Investment | 4,995,491 | 4,995,491 | — | — | ||||||||||||||||
| Total | $ | 87,804,639 | $ | 4,995,491 | $ | 82,809,148 | $ | — | ||||||||||||
| (1) | For equity investments categorized in a single level, refer to the schedule of investments for further industry breakout. |
| See Notes to Financial Statements | See explanation of symbols and terms, if any, on page B-61 | |||
B-4
PACIFIC LIFE FUNDS
PL INFLATION MANAGED FUND
Schedule of Investments
March 31, 2011
PL INFLATION MANAGED FUND
Schedule of Investments
March 31, 2011
| Shares | Value | |||||||
CONVERTIBLE PREFERRED STOCKS - 0.0% | ||||||||
Financials - 0.0% | ||||||||
| Wells Fargo & Co 7.500% | 100 | $ | 103,520 | |||||
| Total Convertible Preferred Stocks (Cost $100,000) | 103,520 | |||||||
| Principal | ||||||||
| Amount | ||||||||
CORPORATE BONDS & NOTES - 23.7% | ||||||||
Consumer Discretionary - 0.2% | ||||||||
| Starwood Hotels & Resorts Worldwide Inc | ||||||||
| 6.250% due 02/15/13 | $ | 300,000 | 322,125 | |||||
Energy — 0.9% | ||||||||
| EOG Resources Inc | ||||||||
| 1.061% due 02/03/14 § | 1,000,000 | 1,009,477 | ||||||
| Petrobras International Finance Co (Cayman) | ||||||||
| 3.875% due 01/27/16 | 1,000,000 | 1,010,414 | ||||||
| Petroleos Mexicanos (Mexico) | ||||||||
| 5.500% due 01/21/21 | 100,000 | 102,000 | ||||||
| 2,121,891 | ||||||||
Financials - 21.2% | ||||||||
| ABN AMRO Bank NV (Netherlands) | ||||||||
| 2.071% due 01/30/14 § ~ | 1,000,000 | 1,001,364 | ||||||
| Ally Financial Inc | ||||||||
| 3.512% due 02/11/14 § | 700,000 | 702,272 | ||||||
| 8.300% due 02/12/15 | 100,000 | 109,875 | ||||||
| American Express Bank FSB | ||||||||
| 0.378% due 05/29/12 § | 300,000 | 299,347 | ||||||
| 0.406% due 06/12/12 § | 500,000 | 498,700 | ||||||
| American International Group Inc | ||||||||
| 8.175% due 05/15/58 § | 200,000 | 216,750 | ||||||
| Banco Santander Brazil SA (Brazil) | ||||||||
| 2.409% due 03/18/14 § ~ | 1,600,000 | 1,604,832 | ||||||
| 4.250% due 01/14/16 ~ | 400,000 | 400,760 | ||||||
| Banco Santander (Chile) | ||||||||
| 1.553% due 04/20/12 § ~ | 300,000 | 300,004 | ||||||
| Bank of America Corp | ||||||||
| 0.908% due 06/11/12 § | GBP | 900,000 | 1,431,113 | |||||
| Commonwealth Bank of Australia (Australia) | ||||||||
| 1.039% due 03/17/14 § ~Δ | $ | 1,500,000 | 1,501,891 | |||||
| Countrywide Financial Corp | ||||||||
| 5.800% due 06/07/12 | 400,000 | 420,792 | ||||||
| Dexia Credit Local NY SA (France) | ||||||||
| 0.710% due 03/05/13 § ~ | 4,400,000 | 4,372,768 | ||||||
| Ford Motor Credit Co LLC | ||||||||
| 7.250% due 10/25/11 | 500,000 | 514,610 | ||||||
| 7.500% due 08/01/12 | 600,000 | 639,743 | ||||||
| General Electric Capital Corp | ||||||||
| 0.429% due 12/20/13 § | 200,000 | 197,986 | ||||||
| General Motors Acceptance Corp | ||||||||
| 6.000% due 12/15/11 | 400,000 | 410,000 | ||||||
| 7.000% due 02/01/12 | 600,000 | 620,250 | ||||||
| HBOS PLC (United Kingdom) | ||||||||
| 6.750% due 05/21/18 ~ | 300,000 | 293,763 | ||||||
| HSBC Finance Corp | ||||||||
| 0.553% due 01/15/14 § | 4,600,000 | 4,535,513 | ||||||
| ICICI Bank Ltd (India) | ||||||||
| 2.063% due 02/24/14 § ~ | 300,000 | 298,289 | ||||||
| ING Bank NV (Netherlands) | ||||||||
| 1.360% due 03/15/13 § ~ Δ | 900,000 | 902,426 | ||||||
| Merrill Lynch & Co Inc | ||||||||
| 1.387% due 08/25/14 § | EUR | 1,000,000 | 1,368,717 | |||||
| 1.947% due 09/27/12 § | 1,000,000 | 1,384,500 | ||||||
| 5.450% due 07/15/14 | $ | 300,000 | 320,954 | |||||
| Metlife Institutional Funding II | ||||||||
| 1.201% due 04/04/14 § ~ Δ | 2,100,000 | 2,099,676 | ||||||
| Metropolitan Life Global Funding I | ||||||||
| 5.125% due 04/10/13 ~ | 100,000 | 106,705 | ||||||
| Morgan Stanley | ||||||||
| 1.388% due 11/29/13 § | EUR | 200,000 | 275,633 | |||||
| 1.395% due 04/13/16 § | 1,000,000 | 1,321,860 | ||||||
| 2.812% due 05/14/13 § | $ | 1,000,000 | 1,035,880 | |||||
| Nordea Eiendomskreditt AS (Norway) | ||||||||
| 0.723% due 04/07/14 § ~ Δ | 2,200,000 | 2,199,661 | ||||||
| SLM Corp | ||||||||
| 3.125% due 09/17/12 | EUR | 700,000 | 964,879 | |||||
| 6.250% due 01/25/16 | $ | 3,100,000 | 3,235,098 | |||||
| Sun Life Financial Global Funding LP | ||||||||
| 0.547% due 10/06/13 § ~ | 1,500,000 | 1,487,946 | ||||||
| The Goldman Sachs Group Inc | ||||||||
| 1.383% due 02/04/13 § | EUR | 1,500,000 | 2,106,365 | |||||
| 5.375% due 02/15/13 | 500,000 | 734,565 | ||||||
| The Royal Bank of Scotland Group PLC (United Kingdom) | ||||||||
| 2.733% due 08/23/13 § | $ | 700,000 | 719,495 | |||||
| 3.000% due 12/09/11 ~ | 200,000 | 203,616 | ||||||
| 4.875% due 03/16/15 | 400,000 | 415,690 | ||||||
| UBS AG (Switzerland) | ||||||||
| 1.413% due 02/23/12 § | 1,100,000 | 1,109,079 | ||||||
| Volkswagen International Finance NV (Netherlands) | ||||||||
| 0.757% due 10/01/12 § ~ | 1,900,000 | 1,901,433 | ||||||
| Wachovia Corp | ||||||||
| 1.244% due 02/13/14 § | EUR | 500,000 | 693,756 | |||||
| 5.143% due 05/25/12 § | AUD | 1,400,000 | 1,433,367 | |||||
| Westpac Banking Corp (Australia) | ||||||||
| 1.037% due 03/31/14 § ~ Δ | $ | 2,300,000 | 2,298,643 | |||||
| 48,690,566 | ||||||||
Health Care - 0.3% | ||||||||
| HCA Inc | ||||||||
| 7.250% due 09/15/20 | 600,000 | 645,000 | ||||||
Industrials - 0.8% | ||||||||
| International Lease Finance Corp | ||||||||
| 5.350% due 03/01/12 | 500,000 | 510,625 | ||||||
| 6.375% due 03/25/13 | 900,000 | 936,000 | ||||||
| 6.500% due 09/01/14 ~ | 100,000 | 107,250 | ||||||
| 6.750% due 09/01/16 ~ | 100,000 | 107,500 | ||||||
| 7.125% due 09/01/18 ~ | 200,000 | 215,900 | ||||||
| 1,877,275 | ||||||||
Materials - 0.3% | ||||||||
| Cemex SAB de CV (Mexico) | ||||||||
| 5.303% due 09/30/15 § ~ Δ | 700,000 | 693,007 | ||||||
| Total Corporate Bonds & Notes (Cost $53,344,316) | 54,349,864 | |||||||
MORTGAGE-BACKED SECURITIES - 9.8% | ||||||||
Collateralized Mortgage Obligations — Commercial - 1.8% | ||||||||
| Banc of America Large Loan Inc | ||||||||
| 2.005% due 11/15/15 “ § ~ | 984,277 | 931,411 | ||||||
| BCRR Trust | ||||||||
| 4.230% due 12/22/28 “ ~ | 1,250,227 | 1,253,300 | ||||||
| See Notes to Financial Statements | See explanation of symbols and terms, if any, on page B-61 |
B-5
PACIFIC LIFE FUNDS
PL INFLATION MANAGED FUND
Schedule of Investments (Continued)
March 31, 2011
PL INFLATION MANAGED FUND
Schedule of Investments (Continued)
March 31, 2011
| Principal | ||||||||
| Amount | Value | |||||||
| European Loan Conduit (Ireland) | ||||||||
| 1.243% due 05/15/19 “ § | EUR 686,266 | $ | 868,185 | |||||
| JPMorgan Chase Commercial Mortgage Securities Corp | ||||||||
| 5.336% due 05/15/47 “ | $ | 110,000 | 115,157 | |||||
| Morgan Stanley Capital I | ||||||||
| 5.877% due 06/11/49 “ § | 100,000 | 106,533 | ||||||
| UBS Commercial Mortgage Trust | ||||||||
| 1.155% due 07/15/24 “ ~ § | 607,685 | 586,752 | ||||||
| Wachovia Bank Commercial Mortgage Trust | ||||||||
| 5.418% due 01/15/45 “ § | 210,000 | 225,452 | ||||||
| 4,086,790 | ||||||||
Collateralized Mortgage Obligations — Residential - 8.0% | ||||||||
| Arkle Master Issuer PLC (United Kingdom) | ||||||||
| 1.464% due 05/17/60 “ § ~ | 500,000 | 500,468 | ||||||
| Bear Stearns Adjustable Rate Mortgage Trust | ||||||||
| 2.290% due 08/25/35 “ § | 31,909 | 30,820 | ||||||
| 2.400% due 08/25/35 “ § | 56,155 | 54,225 | ||||||
| 2.710% due 03/25/35 “ § | 107,951 | 103,975 | ||||||
| 2.934% due 03/25/35 “ § | 33,790 | 32,621 | ||||||
| 3.121% due 01/25/35 “ § | 3,197,303 | 2,963,799 | ||||||
| Citigroup Mortgage Loan Trust Inc | ||||||||
| 2.510% due 08/25/35 “ § | 50,947 | 48,474 | ||||||
| 2.560% due 08/25/35 “ § | 41,830 | 37,283 | ||||||
| Countrywide Home Loan Mortgage Pass-Through Trust | ||||||||
| 0.590% due 06/25/35 “ § ~ | 32,992 | 28,100 | ||||||
| 4.440% due 01/19/34 “ § | 168,494 | 164,486 | ||||||
| Driver One GmbH (Denmark) | ||||||||
| 1.787% due 09/21/14 “ § | EUR 399,851 | 567,386 | ||||||
| Fannie Mae | ||||||||
| 0.600% due 07/25/37 “ § | $ | 850,714 | 850,553 | |||||
| 0.630% due 07/25/37 “ § | 808,982 | 809,375 | ||||||
| 0.690% due 05/25/36 “ § | 578,790 | 580,300 | ||||||
| 0.695% due 02/25/37 “ § | 176,961 | 177,089 | ||||||
| 0.930% due 02/25/41 “ § | 963,578 | 969,030 | ||||||
| Freddie Mac | ||||||||
| 0.855% due 12/15/37 “ § | 2,826,424 | 2,840,473 | ||||||
| GSR Mortgage Loan Trust | ||||||||
| 2.796% due 09/25/35 “ § | 85,164 | 83,473 | ||||||
| Holmes Master Issuer (United Kingdom) | ||||||||
| 1.106% due 07/15/40 “ § | EUR 1,400,000 | 1,983,036 | ||||||
| 2.340% due 10/01/54 “ § ~ | 1,200,000 | 1,700,510 | ||||||
| MLCC Mortgage Investors Inc | ||||||||
| 2.238% due 12/25/34 “ § | $ | 239,876 | 233,652 | |||||
| New York Mortgage Trust Inc | ||||||||
| 2.786% due 05/25/36 “ § | 700,000 | 581,048 | ||||||
| RBSSP Resecuritization Trust | ||||||||
| 2.703% due 07/26/45 “ § ~ | 1,049,996 | 1,034,067 | ||||||
| Residential Accredit Loans Inc | ||||||||
| 0.430% due 06/25/46 “ § | 168,376 | 68,480 | ||||||
| Structured Asset Mortgage Investments Inc | ||||||||
| 0.460% due 05/25/46 “ § | 154,669 | 88,146 | ||||||
| Wells Fargo Mortgage Backed Securities Trust | ||||||||
| 2.864% due 10/25/35 “ § | 559,358 | 524,964 | ||||||
| 2.888% due 10/25/35 “ § | 1,400,000 | 1,257,540 | ||||||
| 18,313,373 | ||||||||
| Total Mortgage-Backed Securities (Cost $21,894,769) | 22,400,163 | |||||||
ASSET-BACKED SECURITIES - 5.0% | ||||||||
| Aames Mortgage Investment Trust | ||||||||
| 0.830% due 10/25/35 “ § | 180,372 | 179,402 | ||||||
| Ally Auto Receivables Trust | ||||||||
1.320% due 03/15/12 ” ~ | 162,741 | 162,858 | ||||||
| AMMC CLO (Cayman) | ||||||||
| 0.544% due 08/08/17 “ § ~ | 199,203 | 187,015 | ||||||
| ARES CLO Funds (Cayman) | ||||||||
| 0.537% due 03/12/18 “ § ~ | 494,669 | 463,613 | ||||||
| Asset Backed Funding Certificates | ||||||||
| 0.730% due 06/25/35 “ § | 1,128,349 | 1,111,130 | ||||||
| First Franklin Mortgage Loan Asset-Backed Certificates | ||||||||
| 0.300% due 11/25/36 “ § | 33,396 | 33,143 | ||||||
| Freddie Mac Structured Pass-Through Securities | ||||||||
| 0.530% due 09/25/31 “ § | 2,677 | 2,540 | ||||||
| Harvest CLO (Luxembourg) | ||||||||
| 2.003% due 03/29/17 “ ~ § | EUR 303,386 | 396,380 | ||||||
| Hillmark Funding CDO (Cayman) | ||||||||
| 0.563% due 05/21/21 “ § ~ ∆ | $ | 1,100,000 | 1,023,361 | |||||
| Pacifica CDO Ltd (Cayman) | ||||||||
| 0.663% due 02/15/17 “ § | 870,495 | 845,312 | ||||||
| Park Place Securities Inc | ||||||||
| 0.930% due 12/25/34 “ § | 359,904 | 343,736 | ||||||
| Plymouth Rock CLO Ltd Inc | ||||||||
| 1.920% due 02/16/19 “ § ~ | 1,000,000 | 998,459 | ||||||
| Race Point CLO (Cayman) | ||||||||
| 0.863% due 05/15/15 “ § ~ | 615,654 | 580,487 | ||||||
| SLM Student Loan Trust | ||||||||
| 1.433% due 12/15/23 “ § | EUR 2,182,329 | 2,972,326 | ||||||
| 1.443% due 09/15/21 “ § | 1,227,903 | 1,692,003 | ||||||
| Structured Asset Securities Corp | ||||||||
| 0.340% due 02/25/37 “ § | $ | 233,868 | 231,229 | |||||
| Wood Street CLO BV (Netherlands) | ||||||||
| 1.763% due 03/29/21 “ § ~ | EUR 246,374 | 322,113 | ||||||
| Total Asset-Backed Securities (Cost $11,469,011) | 11,545,107 | |||||||
U.S. TREASURY OBLIGATIONS — 83.9% | ||||||||
| U.S. Treasury Inflation Protected Securities — 83.9% | ||||||||
| 0.500% due 04/15/15 ^ | $ | 406,416 | 421,911 | |||||
| 0.625% due 04/15/13 ^ | 1,979,306 | 2,072,240 | ||||||
| 1.125% due 01/15/21 ^ | 201,314 | 204,224 | ||||||
| 1.250% due 04/15/14 ^ | 1,976,817 | 2,113,032 | ||||||
| 1.250% due 07/15/20 ^ | 5,452,110 | 5,629,304 | ||||||
| 1.625% due 01/15/15 ^ ‡ | 8,879,255 | 9,626,364 | ||||||
| 1.625% due 01/15/18 ^ | 1,576,560 | 1,706,626 | ||||||
| 1.750% due 01/15/28 ^ | 2,627,600 | 2,680,562 | ||||||
| 1.875% due 07/15/13 ^ | 5,035,254 | 5,447,123 | ||||||
| 1.875% due 07/15/15 ^ | 9,961,776 | 10,960,285 | ||||||
| 1.875% due 07/15/19 ^ | 5,774,944 | 6,334,842 | ||||||
| 2.000% due 01/15/14 ^ | 13,545,557 | 14,754,949 | ||||||
| 2.000% due 01/15/16 ^ | 3,106,292 | 3,430,511 | ||||||
| 2.000% due 01/15/26 ^ | 4,659,438 | 4,977,226 | ||||||
| 2.000% due 04/15/12 ^ | 1,193,610 | 1,248,442 | ||||||
| 2.000% due 07/15/14 ^ | 1,869,008 | 2,051,382 | ||||||
| 2.125% due 01/15/19 ^ | 4,102,280 | 4,576,926 | ||||||
| 2.375% due 04/15/11 ^ ‡ | 1,331,208 | 1,335,889 | ||||||
| 2.375% due 01/15/17 ^ | 3,057,208 | 3,446,764 | ||||||
| 2.375% due 01/15/25 ^ | 6,693,385 | 7,521,691 | ||||||
| 2.375% due 01/15/27 ^ ‡ | 11,273,366 | 12,534,678 | ||||||
| 2.500% due 01/15/29 ^ | 7,794,332 | 8,838,648 | ||||||
| 2.500% due 07/15/16 ^ | 12,898,810 | 14,596,375 | ||||||
| 2.625% due 07/15/17 ^ | 10,417,160 | 11,956,731 | ||||||
| 3.000% due 07/15/12 ^ | 16,781,803 | 17,936,527 | ||||||
| 3.375% due 01/15/12 ^ | 11,811,015 | 12,335,811 | ||||||
| 3.375% due 04/15/32 ^ | 186,075 | 239,833 | ||||||
| 3.625% due 04/15/28 ^ | 4,996,265 | 6,450,258 | ||||||
| 3.875% due 04/15/29 ^ ‡ | 12,677,685 | 16,943,084 | ||||||
| 192,372,238 | ||||||||
| Total U.S. Treasury Obligations (Cost $188,758,315) | 192,372,238 | |||||||
| See Notes to Financial Statements | See explanation of symbols and terms, if any, on page B-61 |
B-6
PACIFIC LIFE FUNDS
PL INFLATION MANAGED FUND
Schedule of Investments (Continued)
March 31, 2011
PL INFLATION MANAGED FUND
Schedule of Investments (Continued)
March 31, 2011
| Principal | |||||||||
| Amount | Value | ||||||||
FOREIGN GOVERNMENT BONDS & NOTES - 2.8% | |||||||||
| Australian Government Bond (Australia) | |||||||||
| 2.500% due 09/20/30 | AUD 200,000 | $ | 204,289 | ||||||
| 3.000% due 09/20/25 | 1,100,000 | 1,237,138 | |||||||
| 4.000% due 08/20/20 | 300,000 | 509,075 | |||||||
| Canada Housing Trust No.1 (Canada) | |||||||||
| 2.450% due 12/15/15 ~ | CAD 1,200,000 | 1,214,110 | |||||||
| Instituto de Credito Oficial (Spain) | |||||||||
| 2.941% due 03/25/14 § ~ Δ | EUR 1,600,000 | 2,261,770 | |||||||
| Italy Buoni Poliennali del Tesoro (Italy) | |||||||||
| 2.100% due 09/15/16 | 301,827 | 436,279 | |||||||
| New South Wales Treasury Corp (Australia) | |||||||||
| 2.750% due 11/20/25 | AUD 500,000 | 543,799 | |||||||
| Total Foreign Government Bonds & Notes (Cost $5,992,441) | 6,406,460 | ||||||||
MUNICIPAL BONDS - 0.1% | |||||||||
| Tobacco Settlement Finance Authority of WV ‘A’ | |||||||||
| 7.467% due 06/01/47 | $ | 95,000 | 66,377 | ||||||
| Tobacco Settlement Financing Corp of RI ‘A’ | |||||||||
| 6.000% due 06/01/23 | 65,000 | 65,979 | |||||||
| Total Municipal Bonds (Cost $148,566) | 132,356 | ||||||||
SHORT-TERM INVESTMENTS - 0.7% | |||||||||
Commercial Paper - 0.3% | |||||||||
| Itau Unibanco Holdings SA (Brazil) | |||||||||
| 1.200% due 04/20/11 | 600,000 | 599,621 | |||||||
Shares | |||||||||
Money Market Fund - 0.4% | |||||||||
| BlackRock Liquidity Funds Treasury Trust Fund Portfolio | 990,176 | 990,176 | |||||||
| Total Short-Term Investments (Cost $1,589,797) | 1,589,797 | ||||||||
TOTAL INVESTMENTS - 126.0% (Cost $283,297,215) | 288,899,505 | ||||||||
OTHER ASSETS & LIABILITIES, NET — (26.0%) | (59,543,104 | ) | |||||||
NET ASSETS - 100.0% | $ | 229,356,401 | |||||||
Notes to Schedule of Investments
(a) As of March 31, 2011, the fund was diversified net assets as as a percentage of follows:
| U.S. Treasury Obligations | 83.9 | % | ||
| Corporate Bonds & Notes | 23.7 | % | ||
| Mortgage-Backed Securities | 9.8 | % | ||
| Asset-Backed Securities | 5.0 | % | ||
| Foreign Government Bonds & Notes | 2.8 | % | ||
| Short-Term Investments | 0.7 | % | ||
| Municipal Bonds | 0.1 | % | ||
| 126.0 | % | |||
| Other Assets & Liabilities, Net | (26.0 | %) | ||
| 100.0 | % | |||
| (b) | As of March 31, 2011, the fund’s Standard & Poor’s quality ratings as a percentage of total fixed income investments were as follows: |
| AAA / U.S. Government & Agency Issues | 71.8 | % | ||
| A-1 | 0.2 | % | ||
| AA | 6.2 | % | ||
| A | 7.8 | % | ||
| BBB | 3.9 | % | ||
| BB | 1.3 | % | ||
| B | 0.9 | % | ||
| Not Rated | 7.9 | % | ||
| 100.0 | % | |||
| (c) | Short-term investments reflect either the stated coupon rate or the annualized effective yield on the date of purchase for discounted investments. | |
| (d) | As of March 31, 2011, 5.7% of the fund’s net assets were reported illiquid by the portfolio manager under the Trust’s policy. | |
| (e) | Open futures contracts outstanding as of March 31, 2011 were as follows: |
| Unrealized | ||||||||||||
| Number of | Notional | Appreciation | ||||||||||
| Long Futures Outstanding | Contracts | Amount | (Depreciation) | |||||||||
| Eurodollar (09/11) | 32 | $ | 32,000,000 | $ | 6,112 | |||||||
| Eurodollar (12/11) | 22 | 22,000,000 | (2,188 | ) | ||||||||
| Eurodollar (03/12) | 55 | 55,000,000 | (13,337 | ) | ||||||||
| Eurodollar (06/12) | 15 | 15,000,000 | (8,250 | ) | ||||||||
| Total Futures Contracts | ($17,663 | ) | ||||||||||
| (f) | A reverse repurchase agreement outstanding as of March 31, 2011 was as follows: |
| Interest | Settlement | Maturity | Repurchase | Principal | ||||||||||||
| Counterparty | Rate | Date | Date | Amount | Amount | |||||||||||
| DUB | 0.210 | % | 03/24/11 | 04/15/11 | $ | 1,272,163 | $ | 1,272,000 | ||||||||
| (g) | The average amount of borrowings by the fund on reverse repurchase agreements while outstanding during the year ended March 31, 2011 was $993,270 at a weighted average interest rate of 0.227%. | |
| (h) | Forward foreign currency contracts outstanding as of March 31, 2011 were as follows: |
| Contracts | Principal Amount | Unrealized | ||||||||||||||||||
| to Buy or | Covered by | Appreciation | ||||||||||||||||||
| to Sell | Currency | Contracts | Expiration | Counterparty | (Depreciation) | |||||||||||||||
| Sell | AUD | 290,000 | 04/11 | DUB | ( $15,382 | ) | ||||||||||||||
| Sell | AUD | 1,373,000 | 04/11 | RBS | (36,147 | ) | ||||||||||||||
| Buy | BRL | 1,531,244 | 04/11 | BRC | 34,636 | |||||||||||||||
| Sell | BRL | 1,531,244 | 04/11 | CIT | (20,809 | ) | ||||||||||||||
| Buy | BRL | 1,531,244 | 06/11 | CIT | 21,178 | |||||||||||||||
| See Notes to Financial Statements | See explanation of symbols and terms, if any, on page B-61 |
B-7
PACIFIC LIFE FUNDS
PL INFLATION MANAGED FUND
Schedule of Investments (Continued)
March 31, 2011
PL INFLATION MANAGED FUND
Schedule of Investments (Continued)
March 31, 2011
| Contracts | Principal Amount | Unrealized | ||||||||||||||||||
| to Buy or | Covered by | Appreciation | ||||||||||||||||||
| to Sell | Currency | Contracts | Expiration | Counterparty | (Depreciation) | |||||||||||||||
| Buy | CAD | 575,000 | 06/11 | CIT | $ | 3,599 | ||||||||||||||
| Buy | CNY | 237,000 | 11/11 | BRC | (276 | ) | ||||||||||||||
| Buy | CNY | 1,424,792 | 11/11 | CIT | 781 | |||||||||||||||
| Buy | CNY | 887,138 | 11/11 | JPM | (995 | ) | ||||||||||||||
| Buy | CNY | 2,318,616 | 02/12 | DUB | 1,845 | |||||||||||||||
| Sell | EUR | 1,755,000 | 04/11 | CIT | (69,322 | ) | ||||||||||||||
| Sell | EUR | 260,000 | 04/11 | DUB | (9,866 | ) | ||||||||||||||
| Sell | EUR | 589,000 | 04/11 | HSB | (22,354 | ) | ||||||||||||||
| Sell | EUR | 1,195,000 | 04/11 | JPM | (74,107 | ) | ||||||||||||||
| Sell | EUR | 1,598,000 | 04/11 | MSC | (5,269 | ) | ||||||||||||||
| Sell | EUR | 11,754,000 | 04/11 | UBS | (529,759 | ) | ||||||||||||||
| Sell | GBP | 444,000 | 06/11 | CIT | 581 | |||||||||||||||
| Sell | GBP | 443,000 | 06/11 | CSF | 805 | |||||||||||||||
| Buy | IDR | 1,781,400,000 | 04/11 | BRC | 4,090 | |||||||||||||||
| Sell | IDR | 1,781,400,000 | 04/11 | CIT | 199 | |||||||||||||||
| Buy | IDR | 3,209,200,000 | 10/11 | CIT | 7,972 | |||||||||||||||
| Buy | IDR | 1,480,000,000 | 10/11 | GSC | 3,704 | |||||||||||||||
| Buy | IDR | 1,781,400,000 | 01/12 | CIT | (2,531 | ) | ||||||||||||||
| Buy | INR | 77,061,700 | 08/11 | BRC | 42,560 | |||||||||||||||
| Buy | INR | 10,400,000 | 08/11 | DUB | 4,938 | |||||||||||||||
| Sell | JPY | 24,203,000 | 04/11 | CIT | 15,636 | |||||||||||||||
| Sell | JPY | 32,232,000 | 04/11 | DUB | 10,630 | |||||||||||||||
| Buy | KRW | 433,930,000 | 05/11 | BRC | 9,015 | |||||||||||||||
| Buy | KRW | 641,355,000 | 05/11 | CIT | 14,926 | |||||||||||||||
| Buy | KRW | 260,030,000 | 05/11 | DUB | 6,469 | |||||||||||||||
| Buy | KRW | 24,505,000 | 05/11 | GSC | 691 | |||||||||||||||
| Buy | KRW | 57,000,000 | 05/11 | HSB | 1,060 | |||||||||||||||
| Buy | KRW | 982,720,000 | 05/11 | JPM | 42,769 | |||||||||||||||
| Buy | KRW | 114,000,000 | 05/11 | RBS | 2,906 | |||||||||||||||
| Buy | MXN | 3,992,035 | 07/11 | HSB | 2,607 | |||||||||||||||
| Buy | MXN | 3,626,450 | 07/11 | MSC | 2,147 | |||||||||||||||
| Buy | MYR | 283,084 | 05/11 | CIT | 1,200 | |||||||||||||||
| Buy | MYR | 764,070 | 08/11 | BRC | 2,854 | |||||||||||||||
| Buy | MYR | 950,000 | 08/11 | CIT | 2,759 | |||||||||||||||
| Buy | MYR | 243,325 | 08/11 | HSB | 533 | |||||||||||||||
| Buy | MYR | 100,000 | 08/11 | JPM | 261 | |||||||||||||||
| Buy | PHP | 16,758,400 | 06/11 | CIT | 3,107 | |||||||||||||||
| Buy | PHP | 11,788,600 | 06/11 | DUB | 2,072 | |||||||||||||||
| Buy | PHP | 2,235,000 | 06/11 | JPM | 354 | |||||||||||||||
| Buy | PHP | 16,651,010 | 11/11 | BRC | 4,624 | |||||||||||||||
| Buy | PHP | 5,300,000 | 11/11 | CIT | 1,352 | |||||||||||||||
| Buy | SGD | 653,214 | 06/11 | GSC | 8,383 | |||||||||||||||
| Buy | SGD | 260,815 | 09/11 | BRC | 3,006 | |||||||||||||||
| Buy | SGD | 100,000 | 09/11 | CIT | 1,233 | |||||||||||||||
| Buy | SGD | 100,000 | 09/11 | RBS | 1,588 | |||||||||||||||
| Total Forward Foreign Currency Contracts: | $ | (517,747 | ) | |||||||||||||||||
| (i) | Transactions in written options for the year ended March 31, 2011 were as follows: |
| Notional | Notional | |||||||||||||||
| Number of | Amount | Amount | ||||||||||||||
| Contracts | in EUR | in $ | Premium | |||||||||||||
| Outstanding, March 31, 2010 | 18 | — | 59,100,000 | $ | 445,261 | |||||||||||
| Call Options Written | 183 | — | 62,600,000 | 306,326 | ||||||||||||
| Put Options Written | 116 | 700,000 | 74,400,000 | 485,225 | ||||||||||||
| Call Options Closed | (62 | ) | — | (27,600,000 | ) | (92,041 | ) | |||||||||
| Put Options Closed | (53 | ) | — | (24,900,000 | ) | (164,340 | ) | |||||||||
| Call Options Expired | (67 | ) | — | (47,700,000 | ) | (251,243 | ) | |||||||||
| Put Options Expired | (48 | ) | (700,000 | ) | (61,100,000 | ) | (378,118 | ) | ||||||||
| Outstanding, March 31, 2011 | 87 | — | 34,800,000 | $ | 351,070 | |||||||||||
| See Notes to Financial Statements | See explanation of symbols and terms, if any, on page B-61 |
B-8
PACIFIC LIFE FUNDS
PL INFLATION MANAGED FUND
Schedule of Investments (Continued)
March 31, 2011
PL INFLATION MANAGED FUND
Schedule of Investments (Continued)
March 31, 2011
(j) Premiums received and value of written options outstanding as of March 31, 2011 were as follows:
Credit Default Swaptions-Buy Protection (1)
| Exercise | Expiration | Counter- | Notional | |||||||||||||||||||||
| Description | Rate | Date | party | Amount | Premium | Value | ||||||||||||||||||
| Call — OTC Dow Jones CDX IG15 Index | 0.800 | % | 06/15/11 | BRC | $ | 100,000 | $ | 315 | $ | (174 | ) | |||||||||||||
| Call — OTC Dow Jones CDX IG15 Index | 0.800 | % | 06/15/11 | MSC | 200,000 | 620 | (348 | ) | ||||||||||||||||
| 935 | (522 | ) | ||||||||||||||||||||||
Credit Default Swaptions-Sell Protection (2)
| Put — OTC Dow Jones CDX IG15 Index | 1.200 | % | 06/15/11 | BRC | 100,000 | $ | 310 | $ | (102 | ) | ||||||||||||||
| Put — OTC Dow Jones CDX IG15 Index | 1.200 | % | 06/15/11 | MSC | 400,000 | 1,600 | (407 | ) | ||||||||||||||||
| Put — OTC Dow Jones CDX IG15 Index | 1.200 | % | 09/21/11 | UBS | 100,000 | 540 | (290 | ) | ||||||||||||||||
| Put — OTC Dow Jones CDX IG15 Index | 1.300 | % | 09/21/11 | MSC | 400,000 | 1,800 | (1,591 | ) | ||||||||||||||||
| 4,250 | (2,390 | ) | ||||||||||||||||||||||
| $ | 5,185 | $ | (2,912 | ) | ||||||||||||||||||||
| (1) | If the fund is a buyer of protection and a credit event occurs, as defined under the terms of that particular swap agreement, the fund will either (i) receive from the seller of protection an amount equal to the notional amount of the swap and deliver the referenced obligation or underlying investments comprising the referenced index or (ii) receive a net settlement amount in the form of cash or investments equal to the notional amount of the swap less the recovery value of the referenced obligation or underlying investments comprising the referenced index. The seller is only obligated if the swaption is exercised. | |
| (2) | If the fund is a seller of protection and a credit event occurs, as defined under the terms of that particular swap agreement, the fund will either (i) pay to the buyer of protection an amount equal to the notional amount of the swap and take delivery of the referenced obligation or underlying investments comprising the referenced index or (ii) pay a net settlement amount in the form of cash or investments equal to the notional amount of the swap less the recovery value of the referenced obligation or underlying investments comprising the referenced index. The fund is only obligated if the swaption is exercised. |
Inflation Floor/Cap Options
| Strike | Exercise | Expiration | Counter- | Notional | ||||||||||||||||||||||||
| Description | Index | Index | Date | party | Amount | Premium | Value | |||||||||||||||||||||
| Floor — OTC U.S. CPI Urban Consumers NSA | 215.95 | Maximum of ((-1.00%)10 - Inflation Adjustment) or $0 | 03/12/20 | CIT | $ | 1,200,000 | $ | 10,320 | $ | (6,679 | ) | |||||||||||||||||
| Floor — OTC U.S. CPI Urban Consumers NSA | 216.69 | Maximum of ((-1.00%)10 - Inflation Adjustment) or $0 | 04/07/20 | CIT | 2,000,000 | 17,720 | (11,446 | ) | ||||||||||||||||||||
| Floor — OTC U.S. CPI Urban Consumers NSA | 217.97 | Maximum of ((-1.00%)10 - Inflation Adjustment) or $0 | 09/29/20 | CIT | 300,000 | 3,870 | (1,838 | ) | ||||||||||||||||||||
| Floor — OTC U.S. CPI Urban Consumers NSA | 218.01 | Maximum of ((-1.00%)10 - Inflation Adjustment) or $0 | 10/13/20 | DUB | 700,000 | 6,860 | (5,497 | ) | ||||||||||||||||||||
| $ | 38,770 | $ | (25,460 | ) | ||||||||||||||||||||||||
Interest Rate Swaptions
| Pay/Receive | ||||||||||||||||||||||||||||
| Floating Rate | ||||||||||||||||||||||||||||
| Based on 3-Month | Exercise | Expiration | Counter- | Notional | ||||||||||||||||||||||||
| Description | USD-LIBOR | Rate | Date | party | Amount | Premium | Value | |||||||||||||||||||||
| Put — OTC 3-Year Interest Rate Swap | Pay | 3.000 | % | 06/18/12 | BRC | $ | 3,800,000 | $ | 34,352 | $ | (45,963 | ) | ||||||||||||||||
| Put — OTC 3-Year Interest Rate Swap | Pay | 3.000 | % | 06/18/12 | CIT | 1,400,000 | 15,688 | (16,934 | ) | |||||||||||||||||||
| Put — OTC 3-Year Interest Rate Swap | Pay | 3.000 | % | 06/18/12 | DUB | 1,000,000 | 11,177 | (12,096 | ) | |||||||||||||||||||
| Put — OTC 3-Year Interest Rate Swap | Pay | 3.000 | % | 06/18/12 | RBS | 2,200,000 | 24,378 | (26,610 | ) | |||||||||||||||||||
| Put — OTC 10-Year Interest Rate Swap | Pay | 10.000 | % | 07/10/12 | MSC | 200,000 | 1,320 | (21 | ) | |||||||||||||||||||
| Put — OTC 10-Year Interest Rate Swap | Pay | 10.000 | % | 07/10/12 | RBS | 500,000 | 3,400 | (52 | ) | |||||||||||||||||||
| Put — OTC 2-Year Interest Rate Swap | Pay | 2.250 | % | 09/24/12 | CIT | 600,000 | 4,087 | (8,359 | ) | |||||||||||||||||||
| Put — OTC 2-Year Interest Rate Swap | Pay | 2.250 | % | 09/24/12 | MSC | 300,000 | 1,920 | (4,179 | ) | |||||||||||||||||||
| Put — OTC 2-Year Interest Rate Swap | Pay | 2.250 | % | 09/24/12 | RBS | 12,600,000 | 101,115 | (175,530 | ) | |||||||||||||||||||
| $ | 197,437 | $ | (289,744 | ) | ||||||||||||||||||||||||
| See Notes to Financial Statements | See explanation of symbols and terms, if any, on page B-61 |
B-9
PACIFIC LIFE FUNDS
PL INFLATION MANAGED FUND
Schedule of Investments (Continued)
March 31, 2011
PL INFLATION MANAGED FUND
Schedule of Investments (Continued)
March 31, 2011
Options on Exchange-Traded Futures Contracts
| Exercise | Expiration | Counter- | Number of | |||||||||||||||||||||
| Description | Price | Date | party | Contracts | Premium | Value | ||||||||||||||||||
| Call — CBOT 10-Year U.S. Treasury Note Futures (06/11) | $ | 122.00 | 05/20/11 | MER | 54 | $ | 26,819 | $ | (14,344 | ) | ||||||||||||||
| Call — CME Eurodollar Futures (09/11) | 99.38 | 09/19/11 | MER | 9 | 4,140 | (5,287 | ) | |||||||||||||||||
| 30,959 | (19,631 | ) | ||||||||||||||||||||||
| Put — CBOT 10-Year U.S. Treasury Note Futures (06/11) | 117.00 | 05/20/11 | MER | 15 | 6,525 | (7,500 | ) | |||||||||||||||||
| Put — CME Eurodollar Futures (09/11) | 99.38 | 09/19/11 | MER | 9 | 5,715 | (1,575 | ) | |||||||||||||||||
| 12,240 | (9,075 | ) | ||||||||||||||||||||||
| $ | 43,199 | $ | (28,706 | ) | ||||||||||||||||||||
Straddle Options
| Exercise | Expiration | Counter- | Notional | |||||||||||||||||||||
| Description | Price (1) | Date | party | Amount | Premium | Value | ||||||||||||||||||
| Call & Put — OTC 1-Year vs. 1 Year Forward Volatility Agreement ∆ | $ | — | 10/11/11 | JPM | $ | 1,200,000 | $ | 6,096 | $ | (10,059 | ) | |||||||||||||
| Call & Put — OTC 1-Year vs. 2 Year Forward Volatility Agreement ∆ | — | 10/11/11 | MSC | 2,600,000 | 28,849 | (45,969 | ) | |||||||||||||||||
| Call & Put — OTC 1-Year vs. 2 Year Forward Volatility Agreement ∆ | — | 11/14/11 | MSC | 2,900,000 | 31,534 | (51,146 | ) | |||||||||||||||||
| $ | 66,479 | $ | (107,174 | ) | ||||||||||||||||||||
| (1) Exercise price and final cost determined on a future date based upon implied volatility parameters. | ||||||||||||||||||||||||
| Total Written Options | $ | 351,070 | $ | (453,996 | ) | |||||||||||||||||||
(k) Swap agreements outstanding as of March 31, 2011 were as follows:
Credit Default Swaps on Corporate and Sovereign Issues — Buy Protection (1)
| Fixed Deal | Implied Credit | Upfront | ||||||||||||||||||||||||||||||
| Pay | Expiration | Counter- | Spread at | Notional | Premiums Paid | Unrealized | ||||||||||||||||||||||||||
| Referenced Obligation | Rate | Date | party | 03/31/11 (3) | Amount (4) | Value (5) | (Received) | Depreciation | ||||||||||||||||||||||||
| Pulte Homes Inc 5.250% due 01/15/14 | (1.000 | %) | 09/20/11 | DUB | 0.924 | % | $ | 500,000 | $ | (335 | ) | $ | 1,858 | $ | (2,193 | ) | ||||||||||||||||
| Starwood Hotels & Resorts Worldwide Inc 6.750% due 05/15/18 | (1.000 | %) | 03/20/13 | DUB | 0.585 | % | 300,000 | (2,544 | ) | 5,065 | (7,609 | ) | ||||||||||||||||||||
| American International Group Inc 5.875% due 05/01/13 | (5.000 | %) | 03/20/13 | GSC | 2.240 | % | 900,000 | (48,985 | ) | (41,360 | ) | (7,625 | ) | |||||||||||||||||||
| $ | (51,864 | ) | $ | (34,437 | ) | $ | (17,427 | ) | ||||||||||||||||||||||||
Credit Default Swaps on Corporate and Sovereign Issues — Sell Protection (2)
| Fixed Deal | Implied Credit | Upfront | Unrealized | |||||||||||||||||||||||||||||
| Receive | Expiration | Counter- | Spread at | Notional | Premiums Paid | Appreciation | ||||||||||||||||||||||||||
| Referenced Obligation | Rate | Date | party | 03/31/11 (3) | Amount (4) | Value (5) | (Received) | (Depreciation) | ||||||||||||||||||||||||
| ING Verzekeringen NV 4.000% due 09/18/13∆ | 1.400 | % | 06/20/11 | DUB | 1.034 | % | EUR 300,000 | $ | 529 | $ | — | $ | 529 | |||||||||||||||||||
| Petrobras International 8.375% due 12/10/18 | 1.000 | % | 09/20/12 | DUB | 0.776 | % | $ | 100,000 | 362 | (1,241 | ) | 1,603 | ||||||||||||||||||||
| American International Group Inc 6.250% due 05/01/36 | 1.950 | % | 03/20/13 | DUB | 0.767 | % | 1,200,000 | 28,596 | — | 28,596 | ||||||||||||||||||||||
| France Government Bond OAT 4.250% due 04/25/19 | 0.250 | % | 06/20/15 | CIT | 0.620 | % | 800,000 | (12,042 | ) | (16,897 | ) | 4,855 | ||||||||||||||||||||
| Republic of Brazil 12.250% due 03/06/30 | 1.000 | % | 06/20/15 | BRC | 0.966 | % | 800,000 | 1,352 | (6,842 | ) | 8,194 | |||||||||||||||||||||
| United Kingdom GILT 4.250% due 06/07/32 ∆ | 1.000 | % | 06/20/15 | GSC | 0.450 | % | 1,600,000 | 36,604 | 17,606 | 18,998 | ||||||||||||||||||||||
| Republic of Brazil 12.250% due 03/06/30 | 1.000 | % | 06/20/15 | HSB | 0.966 | % | 700,000 | 1,183 | (7,024 | ) | 8,207 | |||||||||||||||||||||
| France Government Bond OAT 4.250% due 04/25/19 | 0.250 | % | 12/20/15 | BRC | 0.693 | % | 800,000 | (15,981 | ) | (15,888 | ) | (93 | ) | |||||||||||||||||||
| Japanese Government Bond 2.000% due 03/21/22 ∆ | 1.000 | % | 12/20/15 | GSC | 0.928 | % | 1,000,000 | 3,526 | 22,098 | (18,572 | ) | |||||||||||||||||||||
| Japanese Government Bond 2.000% due 03/21/22 ∆ | 1.000 | % | 06/20/16 | HSB | 0.999 | % | 1,300,000 | 290 | (635 | ) | 925 | |||||||||||||||||||||
| $ | 44,419 | $ | (8,823 | ) | $ | 53,242 | ||||||||||||||||||||||||||
| See Notes to Financial Statements | See explanation of symbols and terms, if any, on page B-61 |
B-10
PACIFIC LIFE FUNDS
PL INFLATION MANAGED FUND
Schedule of Investments (Continued)
March 31, 2011
PL INFLATION MANAGED FUND
Schedule of Investments (Continued)
March 31, 2011
Credit Default Swaps on Credit Indices — Sell Protection (2)
| Fixed Deal | Upfront | Unrealized | ||||||||||||||||||||||||||
| Receive | Expiration | Counter- | Notional | Premiums Paid | Appreciation | |||||||||||||||||||||||
| Referenced Obligation | Rate | Date | party | Amount (4) | Value (5) | (Received) | (Depreciation) | |||||||||||||||||||||
| Dow Jones CDX NA IG-16 5Y ∆ | 1.000 | % | 06/20/16 | GSC | $ | 5,800,000 | $ | 12,854 | $ | 11,596 | $ | 1,258 | ||||||||||||||||
| Dow Jones CDX NA EM14 5Y | 5.000 | % | 12/20/15 | CIT | 1,900,000 | 250,037 | 244,835 | 5,202 | ||||||||||||||||||||
| Dow Jones CDX NA EM14 5Y | 5.000 | % | 12/20/15 | DUB | 200,000 | 26,320 | 30,200 | (3,880 | ) | |||||||||||||||||||
| Dow Jones CDX NA EM14 5Y | 5.000 | % | 12/20/15 | MSC | 1,200,000 | 157,918 | 168,000 | (10,082 | ) | |||||||||||||||||||
| Dow Jones CDX NA EM14 5Y | 5.000 | % | 12/20/15 | UBS | 300,000 | 39,480 | 42,300 | (2,820 | ) | |||||||||||||||||||
| Dow Jones CDX NA EM15 5Y ∆ | 5.000 | % | 06/20/16 | BRC | 200,000 | 28,012 | 27,000 | 1,012 | ||||||||||||||||||||
| $ | 514,621 | $ | 523,931 | $ | (9,310 | ) | ||||||||||||||||||||||
| Total Credit Default Swaps | $ | 507,176 | $ | 480,671 | $ | 26,505 | ||||||||||||||||||||||
| (1) | If the fund is a buyer of protection and a credit event occurs, as defined under the terms of that particular swap agreement, the fund will either (i) receive from the seller ofprotection an amount equal to the notional amount of the swap and deliver the referenced obligation or underlying investments comprising the referenced index or (ii) receive a net settlement amount in the form of cash or investments equal to the notional amount of the swap less the recovery value of the referenced obligation or underlying investments comprising the referenced index. | |
| (2) | If the fund is a seller of protection and a credit event occurs, as defined under the terms of that particular swap agreement, the fund will either (i) pay to the buyer of protection an amount equal to the notional amount of the swap and take delivery of the referenced obligation or underlying investments comprising the referenced index or (ii) pay net settlement amount in the form of cash or investments equal to the notional amount of the swap less the recovery value of the referenced obligation or underlying investments comprising the referenced index. | |
| (3) | An implied credit spread is the spread in yield between a U.S. Treasury security and the referenced obligation or underlying investment that are identical in all respects except for the quality rating. Implied credit spreads, represented in absolute terms, utilized in determining the value of credit default swap agreements on corporate issues or sovereign issues of an emerging country as of year end serve as an indicator of the current status of the payment/performance risk and represent the likelihood of risk of default for the credit derivative. The implied credit spread of a particular referenced entity reflects the cost of buying/selling protection and may include upfront payments required to be made to enter into the agreement. Wider credit spreads, in comparison to narrower credit spreads, represent a deterioration of the referenced entity’s credit soundness and a greater likelihood of risk default or other credit event occurring as defined under the terms of the agreement. A credit spread identified as “Defaulted” indicates a credit event has occurred for the referenced entity or obligation. | |
| (4) | The maximum potential amount the fund could be required to make as a seller of credit protection or receive as a buyer of protection if a credit event occurs as defined under the terms of that particular swap agreement. | |
| (5) | The quoted market prices and resulting values for credit default swap agreements on credit indices serve as an indicator of the current status of the payment/performance risk and represent the likelihood of an expected liability (or profit) for the credit derivative should the notional amount of the swap agreement be closed/sold as of the year end. Increasing values in absolute terms when compared to the notional amount of the swap, represent a deterioration of the referenced entity’s credit soundness and a greater likelihood of risk of default or other credit event occurring as defined under the terms of the agreement. |
Interest Rate Swaps
| Upfront | ||||||||||||||||||||||||||||||||
| Premiums | Unrealized | |||||||||||||||||||||||||||||||
| Counter- | Pay/Receive | Fixed | Expiration | Notional | Paid | Appreciation | ||||||||||||||||||||||||||
| Floating Rate Index | party | Floating Rate | Rate | Date | Amount | Value | (Received) | (Depreciation) | ||||||||||||||||||||||||
| France CPI Excluding Tobacco | JPM | Pay | 2.261 | % | 07/14/11 | EUR 500,000 | $ | 28,728 | $ | — | $ | 28,728 | ||||||||||||||||||||
| France CPI Excluding Tobacco | JPM | Pay | 2.028 | % | 10/15/11 | 200,000 | 7,666 | — | 7,666 | |||||||||||||||||||||||
| BRL — CDI Compounded | MSC | Pay | 10.115 | % | 01/02/12 | BRL 1,300,000 | (28,649 | ) | (18,939 | ) | (9,710 | ) | ||||||||||||||||||||
| BRL — CDI Compounded | BRC | Pay | 10.680 | % | 01/02/12 | 800,000 | (5,987 | ) | (6,967 | ) | 980 | |||||||||||||||||||||
| BRL — CDI Compounded | HSB | Pay | 11.140 | % | 01/02/12 | 500,000 | 5,298 | 1,918 | 3,380 | |||||||||||||||||||||||
| BRL — CDI Compounded | MSC | Pay | 11.290 | % | 01/02/12 | 200,000 | (356 | ) | (212 | ) | (144 | ) | ||||||||||||||||||||
| BRL — CDI Compounded | HSB | Pay | 11.360 | % | 01/02/12 | 6,500,000 | 60,207 | 3,554 | 56,653 | |||||||||||||||||||||||
| BRL — CDI Compounded | GSC | Pay | 11.670 | % | 01/02/12 | 200,000 | 3,554 | 1,620 | 1,934 | |||||||||||||||||||||||
| BRL — CDI Compounded | HSB | Pay | 14.765 | % | 01/02/12 | 2,300,000 | 144,207 | 15,333 | 128,874 | |||||||||||||||||||||||
| BRL — CDI Compounded | MER | Pay | 14.765 | % | 01/02/12 | 100,000 | 6,270 | 191 | 6,079 | |||||||||||||||||||||||
| BRL — CDI Compounded | GSC | Pay | 11.890 | % | 01/02/13 | 3,500,000 | 11,490 | 2,159 | 9,331 | |||||||||||||||||||||||
| BRL — CDI Compounded | HSB | Pay | 11.890 | % | 01/02/13 | 1,400,000 | 4,596 | 1,943 | 2,653 | |||||||||||||||||||||||
| BRL — CDI Compounded | MSC | Pay | 11.980 | % | 01/02/13 | 900,000 | 3,825 | — | 3,825 | |||||||||||||||||||||||
| BRL — CDI Compounded | UBS | Pay | 12.070 | % | 01/02/13 | 1,900,000 | 10,933 | (6,688 | ) | 17,621 | ||||||||||||||||||||||
| BRL — CDI Compounded | BRC | Pay | 12.285 | % | 01/02/13 | 800,000 | 7,040 | 2,511 | 4,529 | |||||||||||||||||||||||
| Total Interest Rate Swaps | $ | 258,822 | $ | (3,577 | ) | $ | 262,399 | |||||||||||||||||||||||||
| Total Swap Agreements | $ | 765,998 | $ | 477,094 | $ | 288,904 | ||||||||||||||||||||||||||
| (l) | As of March 31, 2011, investments with total aggregate values of $160,160 and $1,253,038 were fully or partially segregated with the broker(s)/custodian as collateral for open futures contracts and a reverse repurchase agreement, respectively. Additionally, $14,700 in cash was segregated as collateral for open futures contracts. |
| See Notes to Financial Statements | See explanation of symbols and terms, if any, on page B-61 |
B-11
PACIFIC LIFE FUNDS
PL INFLATION MANAGED FUND
Schedule of Investments (Continued)
March 31, 2011
PL INFLATION MANAGED FUND
Schedule of Investments (Continued)
March 31, 2011
| (m) | Fair Value Measurements | |
| The following is a summary of the fund’s investments as categorized under the three-tier hierarchy of inputs used in valuing the fund’s assets and liabilities (See Note 11 in Notes to Financial Statements) as of March 31, 2011: |
| Level 2 | Level 3 | |||||||||||||||||||
| Total Value at | Level 1 | Significant | Significant | |||||||||||||||||
| March 31, 2011 | Quoted Price | Observable Inputs | Unobservable Inputs | |||||||||||||||||
| Assets | Convertible Preferred Stocks (1) | $ | 103,520 | $ | 103,520 | $ | — | $ | — | |||||||||||
| Corporate Bonds & Notes | 54,349,864 | — | 49,752,238 | 4,597,626 | ||||||||||||||||
| Mortgage-Backed Securities | 22,400,163 | — | 22,400,163 | — | ||||||||||||||||
| Asset-Backed Securities | 11,545,107 | — | 7,124,747 | 4,420,360 | ||||||||||||||||
| U.S. Treasury Obligations | 192,372,238 | — | 192,372,238 | — | ||||||||||||||||
| Foreign Government Bonds & Notes | 6,406,460 | — | 4,144,690 | 2,261,770 | ||||||||||||||||
| Municipal Bonds | 132,356 | — | 132,356 | — | ||||||||||||||||
| Short-Term Investments | 1,589,797 | 990,176 | 599,621 | — | ||||||||||||||||
| Derivatives: | ||||||||||||||||||||
| Credit Contracts | ||||||||||||||||||||
| Swaps | 587,063 | — | 587,063 | — | ||||||||||||||||
| Foreign Currency Contracts | ||||||||||||||||||||
| Forward Foreign Currency Contracts | 269,070 | — | 269,070 | — | ||||||||||||||||
| Interest Rate Contracts | ||||||||||||||||||||
| Futures | 6,112 | 6,112 | — | — | ||||||||||||||||
| Swaps | 293,814 | 293,814 | — | |||||||||||||||||
| Total Interest Rate Contracts | 299,926 | 6,112 | 293,814 | — | ||||||||||||||||
| Total Assets — Derivatives | 1,156,059 | 6,112 | 1,149,947 | — | ||||||||||||||||
| Total Assets | 290,055,564 | 1,099,808 | 277,676,000 | 11,279,756 | ||||||||||||||||
| Liabilities | Derivatives: | |||||||||||||||||||
| Credit Contracts | ||||||||||||||||||||
| Written Options | (2,912 | ) | — | (2,912 | ) | — | ||||||||||||||
| Swaps | (79,887 | ) | — | (79,887 | ) | — | ||||||||||||||
| Total Credit Contracts | (82,799 | ) | — | (82,799 | ) | — | ||||||||||||||
| Foreign Currency Contracts | ||||||||||||||||||||
| Forward Foreign Currency Contracts | (786,817 | ) | — | (786,817 | ) | — | ||||||||||||||
| Interest Rate Contracts | ||||||||||||||||||||
| Futures | (23,775 | ) | (23,775 | ) | — | — | ||||||||||||||
| Written Options | (451,084 | ) | (28,706 | ) | (289,744 | ) | (132,634 | ) | ||||||||||||
| Swaps | (34,992 | ) | — | (34,992 | ) | — | ||||||||||||||
| Total Interest Rate Contracts | (509,851 | ) | (52,481 | ) | (324,736 | ) | (132,634 | ) | ||||||||||||
| Total Liabilities — Derivatives | (1,379,467 | ) | (52,481 | ) | (1,194,352 | ) | (132,634 | ) | ||||||||||||
| Total Liabilities | (1,379,467 | ) | (52,481 | ) | (1,194,352 | ) | (132,634 | ) | ||||||||||||
| Total | $ | 288,676,097 | $ | 1,047,327 | $ | 276,481,648 | $ | 11,147,122 | ||||||||||||
The following is a reconciliation of investments for significant unobservable inputs (Level 3) used in valuing the fund’s assets and liabilities (See Note 11 in Notes to Financial Statements) for the year ended March 31, 2011:
| Change in Net | ||||||||||||||||||||||||||||||||
| Unrealized | ||||||||||||||||||||||||||||||||
| Appreciation | ||||||||||||||||||||||||||||||||
| Total Change | (Depreciation) | |||||||||||||||||||||||||||||||
| in Net | Transfers | on Level 3 | ||||||||||||||||||||||||||||||
| Value, | Net | Accrued | Total Net | Unrealized | In and/ | Investments Held at | ||||||||||||||||||||||||||
| Beginning | Purchases | Discounts | Realized Gains | Appreciation | or Out of | Value, | the End of Year, | |||||||||||||||||||||||||
| Of Year | (Sales) | (Premiums) | (Losses) | (Depreciation) | Level 3 | End of Year | If Applicable | |||||||||||||||||||||||||
| Corporate Bonds & Notes | $ | — | $ | 4,600,000 | $ | — | $ | — | $ | (2,374 | ) | $ | — | $ | 4,597,626 | $ | (2,374 | ) | ||||||||||||||
| Asset-Backed Securities | 1,763,241 | 2,604,793 | — | 28,095 | 24,231 | — | 4,420,360 | 24,231 | ||||||||||||||||||||||||
| Foreign Government Bonds & Notes | — | 2,261,745 | — | — | 25 | — | 2,261,770 | 25 | ||||||||||||||||||||||||
| Derivatives: | ||||||||||||||||||||||||||||||||
| Interest Rate Contracts Written Options | (12,183 | ) | (94,928 | ) | — | — | (25,523 | ) | — | (132,634 | ) | (27,833 | ) | |||||||||||||||||||
| $ | 1,751,058 | $ | 9,371,610 | $ | — | $ | 28,095 | $ | (3,641 | ) | $ | — | $ | 11,147,122 | $ | (5,951 | ) | |||||||||||||||
| (1) | For equity investments categorized in a single level, refer to the schedule of investments for further industry breakout. |
| See Notes to Financial Statements | See explanation of symbols and terms, if any, on page B-61 |
B-12
PACIFIC LIFE FUNDS
PL MANAGED BOND FUND
Schedule of Investments
March 31, 2011
PL MANAGED BOND FUND
Schedule of Investments
March 31, 2011
| Shares | Value | |||||||
CONVERTIBLE PREFERRED STOCKS - 0.8% | ||||||||
Financials - 0.8% | ||||||||
| American International Group Inc 8.500% | 8,300 | $ | 37,267 | |||||
| Lehman Brothers Holdings Inc 8.750% Ω | 1,500 | 1,350 | ||||||
| Wells Fargo & Co 7.500% | 3,000 | 3,105,600 | ||||||
| 3,144,217 | ||||||||
| Total Convertible Preferred Stocks (Cost $3,649,385) | 3,144,217 | |||||||
PREFERRED STOCKS - 0.0% | ||||||||
Financials - 0.0% | ||||||||
| Fannie Mae * | 8,000 | 13,600 | ||||||
| Total Preferred Stocks (Cost $200,000) | 13,600 | |||||||
COMMON STOCKS - 0.0% | ||||||||
Financials - 0.0% | ||||||||
| American International Group Inc * | 345 | 12,121 | ||||||
| Total Common Stocks (Cost $12,519) | 12,121 | |||||||
| Principal | ||||||||
| Amount | ||||||||
CORPORATE BONDS & NOTES - 30.5% | ||||||||
Consumer Discretionary - 0.0% | ||||||||
| General Motors Corp 8.375% due 07/05/33 Ω | EUR | 200,000 | 80,071 | |||||
Consumer Staples - 0.8% | ||||||||
| Anheuser-Busch InBev Worldwide Inc 0.854% due 01/27/14 § | $ | 1,700,000 | 1,714,691 | |||||
| Kraft Foods Inc | ||||||||
| 6.125% due 02/01/18 | 700,000 | 782,351 | ||||||
| 6.875% due 02/01/38 | 100,000 | 111,226 | ||||||
| Reynolds American Inc 7.625% due 06/01/16 | 100,000 | 118,786 | ||||||
| Wal-Mart Stores Inc | ||||||||
| 5.800% due 02/15/18 | 200,000 | 227,714 | ||||||
| 6.500% due 08/15/37 | 100,000 | 114,205 | ||||||
| 3,068,973 | ||||||||
Energy — 1.4% | ||||||||
| Colorado Interstate Gas Co 6.800% due 11/15/15 | 200,000 | 230,614 | ||||||
| Gaz Capital SA (Russia) | ||||||||
| 8.146% due 04/11/18 ~ | 500,000 | 591,850 | ||||||
| 9.250% due 04/23/19 ~ | 500,000 | 624,350 | ||||||
| NGPL PipeCo LLC 7.119% due 12/15/17 ~ | 500,000 | 558,546 | ||||||
| Novatek Finance Ltd (Ireland) 5.326% due 02/03/16 ~ | 200,000 | 206,425 | ||||||
| Odebrecht Drilling Norbe VIII/IX Ltd (Cayman) 6.350% due 06/30/21 ~ | 100,000 | 105,875 | ||||||
| Petrobras International Finance Co (Cayman) | ||||||||
| 5.375% due 01/27/21 | 900,000 | 906,125 | ||||||
| 5.875% due 03/01/18 | 400,000 | 425,315 | ||||||
| Petroleos Mexicanos (Mexico) 5.500% due 01/21/21 | 600,000 | 612,000 | ||||||
| Ras Laffan Liquefied Natural Gas Co Ltd III (Qatar) 4.500% due 09/30/12 ∆ ~ | 400,000 | 415,300 | ||||||
| Shell International Finance BV (Netherlands) 5.500% due 03/25/40 | 100,000 | 101,617 | ||||||
| TNK-BP Finance SA (Luxembourg) 7.250% due 02/02/20 ~ | 200,000 | 221,000 | ||||||
| TransCapitalInvest Ltd for OJSC AK Transneft (Ireland) 8.700% due 08/07/18 ~ | 100,000 | 124,125 | ||||||
| 5,123,142 | ||||||||
Financials - 24.4% | ||||||||
| Ally Financial Inc | ||||||||
| 6.250% due 12/01/17 ~ | 300,000 | 306,000 | ||||||
| 7.500% due 09/15/20 ~ | 200,000 | 214,250 | ||||||
| 8.300% due 02/12/15 | 600,000 | 659,250 | ||||||
| American Express Bank FSB 5.500% due 04/16/13 | 600,000 | 643,461 | ||||||
| American Express Centurion Bank 6.000% due 09/13/17 | 1,200,000 | 1,336,852 | ||||||
| American Express Co 4.875% due 07/15/13 | 200,000 | 213,185 | ||||||
| American General Finance Corp 4.125% due 11/29/13 | EUR | 1,000,000 | 1,298,981 | |||||
| American International Group Inc | ||||||||
| 5.450% due 05/18/17 | $ | 100,000 | 102,766 | |||||
| 5.850% due 01/16/18 | 800,000 | 834,891 | ||||||
| 6.250% due 03/15/37 | 200,000 | 184,000 | ||||||
| ANZ National International Ltd (New Zealand) 6.200% due 07/19/13 ~ | 300,000 | 327,216 | ||||||
| Banco Santander Brasil SA (Brazil) 4.250% due 01/14/16 ~ | 300,000 | 300,570 | ||||||
| Banco Santander Brazil SA (Brazil) 2.409% due 03/18/14 § ~ | 600,000 | 601,812 | ||||||
| Banco Santander Chile (Chile) | ||||||||
| 1.553% due 04/20/12 § ~ | 400,000 | 400,005 | ||||||
| 1.903% due 01/19/16 § ~ | 1,000,000 | 1,005,030 | ||||||
| Bank of America Corp | ||||||||
| 1.723% due 01/30/14 § | 1,200,000 | 1,220,624 | ||||||
| 4.500% due 04/01/15 | 1,900,000 | 1,971,900 | ||||||
| 4.875% due 01/15/13 | 100,000 | 105,127 | ||||||
| 5.650% due 05/01/18 | 700,000 | 731,381 | ||||||
| Bank of China Hong Kong Ltd (Hong Kong) 5.550% due 02/11/20 ~ | 100,000 | 102,700 | ||||||
| Bank of Montreal (Canada) 2.850% due 06/09/15 ~ | 100,000 | 100,843 | ||||||
| Bank of Nova Scotia (Canada) 1.650% due 10/29/15 ~ | 200,000 | 191,825 | ||||||
| Banque PSA Finance (France) 2.203% due 04/04/14 § ~ | 600,000 | 598,786 | ||||||
| Barclays Bank PLC (United Kingdom) | ||||||||
| 5.000% due 09/22/16 | 100,000 | 105,991 | ||||||
| 5.450% due 09/12/12 | 800,000 | 848,796 | ||||||
| 6.050% due 12/04/17 ~ | 2,700,000 | 2,812,782 | ||||||
| 10.179% due 06/12/21 ~ | 720,000 | 918,079 | ||||||
| BM&FBovespa SA (Brazil) 5.500% due 07/16/20 ~ | 100,000 | 102,678 | ||||||
| BPCE SA (France) | ||||||||
| 2.375% due 10/04/13 ~ | 100,000 | 99,997 | ||||||
| 9.000% § ± | EUR | 300,000 | 437,955 | |||||
| CIT Group Inc | ||||||||
| 5.250% due 04/01/14 ~ | $ | 100,000 | 100,613 | |||||
| 7.000% due 05/01/15 | 600,000 | 606,750 | ||||||
| See Notes to Financial Statements | See explanation of symbols and terms, if any, on page B-61 |
B-13
PACIFIC LIFE FUNDS
PL MANAGED BOND FUND
Schedule of Investments (Continued)
March 31, 2011
PL MANAGED BOND FUND
Schedule of Investments (Continued)
March 31, 2011
| Principal | |||||||||
| Amount | Value | ||||||||
| Citigroup Capital XXI | |||||||||
| 8.300% due 12/21/77 § | $ | 2,000,000 | $ | 2,090,000 | |||||
| Citigroup Inc | |||||||||
| 2.312% due 08/13/13 § | 200,000 | 206,019 | |||||||
| 3.625% due 11/30/17 § | EUR 500,000 | 667,930 | |||||||
| 5.500% due 04/11/13 | $ | 700,000 | 748,940 | ||||||
| 5.500% due 10/15/14 | 1,000,000 | 1,078,397 | |||||||
| 5.625% due 08/27/12 | 50,000 | 52,555 | |||||||
| 5.875% due 05/29/37 | 200,000 | 195,799 | |||||||
| 8.500% due 05/22/19 | 200,000 | 246,851 | |||||||
| Commonwealth Bank of Australia (Australia) | |||||||||
| 0.723% due 07/12/13 § ~ | 1,600,000 | 1,603,667 | |||||||
| Credit Agricole SA (France) | |||||||||
| 5.136% § ± ~ | GBP 300,000 | 419,974 | |||||||
| Credit Suisse NY (Switzerland) | |||||||||
| 2.200% due 01/14/14 | $ | 300,000 | 301,347 | ||||||
| Danske Bank AS (Denmark) | |||||||||
| 2.500% due 05/10/12 ~ | 200,000 | 203,000 | |||||||
| Deutsche Bank AG (Germany) | |||||||||
| 6.000% due 09/01/17 | 900,000 | 997,803 | |||||||
| Dexia Credit Local SA (France) | |||||||||
| 0.784% due 04/29/14 § ~ | 800,000 | 796,143 | |||||||
| 0.959% due 09/23/11 § ~ | 500,000 | 500,911 | |||||||
| Ford Motor Credit Co LLC | |||||||||
| 3.053% due 01/13/12 § | 2,900,000 | 2,929,029 | |||||||
| 7.250% due 10/25/11 | 100,000 | 102,922 | |||||||
| 7.800% due 06/01/12 | 900,000 | 954,406 | |||||||
| General Electric Capital Corp | |||||||||
| 5.875% due 01/14/38 | 900,000 | 891,515 | |||||||
| 6.875% due 01/10/39 | 200,000 | 223,931 | |||||||
| General Motors Acceptance Corp | |||||||||
| 6.625% due 05/15/12 | 300,000 | 309,219 | |||||||
| 6.875% due 09/15/11 | 1,500,000 | 1,531,875 | |||||||
| 7.000% due 02/01/12 | 600,000 | 619,094 | |||||||
| HBOS PLC (United Kingdom) | |||||||||
| 0.510% due 09/06/17 § | 8,100,000 | 7,022,214 | |||||||
| HCP Inc | |||||||||
| 5.950% due 09/15/11 | 700,000 | 715,508 | |||||||
| HSBC Bank PLC (United Kingdom) | |||||||||
| 2.000% due 01/19/14 ~ | 200,000 | 199,490 | |||||||
| ICICI Bank Ltd (India) | |||||||||
| 5.500% due 03/25/15 ~ | 600,000 | 625,470 | |||||||
| ING Bank NV (Netherlands) | |||||||||
| 1.107% due 03/30/12 § ~ | 700,000 | 702,292 | |||||||
| 2.500% due 01/14/16 ~ | 100,000 | 96,036 | |||||||
| Intesa Sanpaolo SPA (Italy) | |||||||||
| 2.375% due 12/21/12 | 1,400,000 | 1,409,674 | |||||||
| 2.713% due 02/24/14 § ~ | 500,000 | 506,836 | |||||||
| JPMorgan Chase & Co | |||||||||
| 1.057% due 09/30/13 § | 900,000 | 904,393 | |||||||
| 4.250% due 10/15/20 | 1,600,000 | 1,529,728 | |||||||
| 7.900% § ± | 300,000 | 329,371 | |||||||
| LeasePlan Corp NV (Netherlands) | |||||||||
| 3.125% due 02/10/12 | EUR 300,000 | 430,189 | |||||||
| Lehman Brothers Holdings Inc | |||||||||
| 2.851% due 12/23/19 Ω § | $ | 500,000 | 129,375 | ||||||
| 5.625% due 01/24/13 Ω | 1,200,000 | 318,000 | |||||||
| 6.750% due 12/28/17 Ω | 500,000 | 400 | |||||||
| 6.875% due 05/02/18 Ω | 100,000 | 26,750 | |||||||
| Lloyds TSB Bank PLC (United Kingdom) | |||||||||
| 4.875% due 01/21/16 | 200,000 | 205,771 | |||||||
| 12.000% § ~ ± | 1,100,000 | 1,290,626 | |||||||
| Macquarie Bank Ltd (Australia) | |||||||||
| 3.300% due 07/17/14 ~ | 5,300,000 | 5,525,012 | |||||||
| Merrill Lynch & Co Inc | |||||||||
| 6.875% due 04/25/18 | 900,000 | 999,380 | |||||||
| MetLife Institutional Funding II | |||||||||
| 1.201% due 04/04/14 § ~ ∆ | 1,800,000 | 1,799,722 | |||||||
| Metropolitan Life Global Funding I | |||||||||
| 5.125% due 04/10/13 ~ | 300,000 | 320,117 | |||||||
| Morgan Stanley | |||||||||
| 0.510% due 04/19/12 § | 100,000 | 100,057 | |||||||
| 5.950% due 12/28/17 | 1,900,000 | 2,040,583 | |||||||
| Nationwide Building Society (United Kingdom) | |||||||||
| 6.250% due 02/25/20 ~ | 300,000 | 312,315 | |||||||
| Nordea Bank AB (Sweden) | |||||||||
| 2.125% due 01/14/14 ~ | 100,000 | 99,750 | |||||||
| Nordea Eiendomskreditt AS (Norway) | |||||||||
| 0.714% due 04/07/14 § ~ ∆ | 900,000 | 899,861 | |||||||
| Nykredit Realkredit AS (Denmark) | |||||||||
| 2.359% due 04/01/38 § | DKK 731,116 | 132,655 | |||||||
| 2.359% due 10/01/38 § | 896,280 | 160,220 | |||||||
| Principal Life Income Funding Trusts | |||||||||
| 5.300% due 04/24/13 | $ | 100,000 | 107,585 | ||||||
| Qatari Diar Finance QSC (Qatar) | |||||||||
| 5.000% due 07/21/20 ~ | 200,000 | 198,478 | |||||||
| Realkredit Danmark AS (Denmark) | |||||||||
| 2.340% due 01/01/38 § | DKK 3,183,974 | 572,221 | |||||||
| Regions Bank/Birmingham AL | |||||||||
| 7.500% due 05/15/18 | $ | 300,000 | 317,273 | ||||||
| Regions Financial Corp | |||||||||
| 0.479% due 06/26/12 § | 900,000 | 869,185 | |||||||
| RZD Capital Ltd (Ireland) | |||||||||
| 5.739% due 04/03/17 | 500,000 | 522,975 | |||||||
| Santander Issuances SA Unipersonal (Spain) | |||||||||
| 7.300% due 07/27/19 § | GBP 3,000,000 | 4,940,768 | |||||||
| Santander U.S. Debt SA Unipersonal (Spain) | |||||||||
| 1.107% due 03/30/12 § ~ | $ | 1,500,000 | 1,486,475 | ||||||
| SLM Corp | |||||||||
| 0.533% due 10/25/11 § | 900,000 | 890,420 | |||||||
| 2.244% due 10/01/14 § | 100,000 | 94,536 | |||||||
| 5.000% due 10/01/13 | 3,200,000 | 3,311,360 | |||||||
| 6.250% due 01/25/16 | 100,000 | 104,358 | |||||||
| 8.000% due 03/25/20 | 400,000 | 436,706 | |||||||
| State Bank of India/London (India) | |||||||||
| 4.500% due 07/27/15 ~ | 1,000,000 | 1,020,164 | |||||||
| Stone Street Trust | |||||||||
| 5.902% due 12/15/15 ~ | 700,000 | 730,082 | |||||||
| Temasek Financial I Ltd (Singapore) | |||||||||
| 4.300% due 10/25/19 ~ | 300,000 | 304,937 | |||||||
| The Bear Stearns Cos LLC | |||||||||
| 6.400% due 10/02/17 | 400,000 | 449,351 | |||||||
| The Dai-ichi Life Insurance Co Ltd (Japan) | |||||||||
| 7.250% § ~ ± Δ | 300,000 | 296,930 | |||||||
| The Goldman Sachs Group Inc | |||||||||
| 0.491% due 02/06/12 § | 200,000 | 199,953 | |||||||
| 6.250% due 09/01/17 | 1,100,000 | 1,204,468 | |||||||
| 6.750% due 10/01/37 | 1,200,000 | 1,214,092 | |||||||
| The Royal Bank of Scotland Group PLC | |||||||||
| (United Kingdom) | |||||||||
| 0.707% due 04/08/11 § ~ | 400,000 | 400,016 | |||||||
| 2.625% due 05/11/12 ~ | 100,000 | 102,198 | |||||||
| 3.000% due 12/09/11 ~ | 800,000 | 814,463 | |||||||
| 3.950% due 09/21/15 | 400,000 | 400,238 | |||||||
| 7.640% ± | 500,000 | 400,000 | |||||||
| UBS AG (Switzerland) | |||||||||
| 1.413% due 02/23/12 § | 300,000 | 302,476 | |||||||
| 5.875% due 12/20/17 | 700,000 | 764,275 | |||||||
| Vnesheconombank Via VEB Finance Ltd (Ireland) | |||||||||
| 5.450% due 11/22/17 ~ | 100,000 | 102,000 | |||||||
| Wachovia Corp | |||||||||
| 0.433% due 10/15/11 § | 800,000 | 800,785 | |||||||
| 0.494% due 08/01/13 § | 300,000 | 298,416 | |||||||
| Wells Fargo & Co | |||||||||
| 7.980% § ± | 1,700,000 | 1,870,000 | |||||||
| Westpac Banking Corp (Australia) | |||||||||
| 1.037% due 03/31/14 § ~ Δ | 1,000,000 | 999,410 | |||||||
| 92,514,812 | |||||||||
| See Notes to Financial Statements | See explanation of symbols and terms, if any, on page B-61 |
B-14
PACIFIC LIFE FUNDS
PL MANAGED BOND FUND
Schedule of Investments (Continued)
March 31, 2011
PL MANAGED BOND FUND
Schedule of Investments (Continued)
March 31, 2011
| Principal | ||||||||
| Amount | Value | |||||||
Health Care — 0.3% | ||||||||
| Roche Holdings Inc | ||||||||
| 7.000% due 03/01/39 ~ | $ | 400,000 | $ | 488,694 | ||||
| UnitedHealth Group Inc | ||||||||
| 6.000% due 02/15/18 | 400,000 | 444,800 | ||||||
| 6.875% due 02/15/38 | 100,000 | 112,536 | ||||||
| 1,046,030 | ||||||||
Industrials — 1.1% | ||||||||
| International Lease Finance Corp | ||||||||
| 0.653% due 07/13/12 § | 2,682,000 | 2,627,622 | ||||||
| 1.468% due 08/15/11 § | EUR | 400,000 | 561,892 | |||||
| 5.300% due 05/01/12 | $ | 300,000 | 306,750 | |||||
| 5.400% due 02/15/12 | 300,000 | 306,375 | ||||||
| 5.625% due 09/20/13 | 255,000 | 260,419 | ||||||
| Noble Group Ltd (Bermuda) | ||||||||
| 6.750% due 01/29/20 ~ | 200,000 | 214,716 | ||||||
| 4,277,774 | ||||||||
Materials — 0.8% | ||||||||
| Codelco Inc (Chile) | ||||||||
| 6.150% due 10/24/36 ~ | 200,000 | 220,829 | ||||||
| CSN Islands XI Corp (Cayman) | ||||||||
| 6.875% due 09/21/19 ~ | 700,000 | 780,500 | ||||||
| CSN Resources SA (Luxembourg) | ||||||||
| 6.500% due 07/21/20 ~ | 600,000 | 642,000 | ||||||
| Gerdau Holdings Inc | ||||||||
| 7.000% due 01/20/20 ~ | 400,000 | 445,000 | ||||||
| GTL Trade Finance Inc (United Kingdom) | ||||||||
| 7.250% due 10/20/17 ~ | 600,000 | 678,000 | ||||||
| Vale Overseas Ltd (Cayman) | ||||||||
| 6.250% due 01/23/17 | 200,000 | 222,809 | ||||||
| 6.875% due 11/10/39 | 100,000 | 107,348 | ||||||
| 3,096,486 | ||||||||
Telecommunication Services — 1.1% | ||||||||
| AT&T Inc | ||||||||
| 6.300% due 01/15/38 | 200,000 | 202,076 | ||||||
| Deutsche Telekom International Finance BV | ||||||||
| (Netherlands) | ||||||||
| 6.500% due 04/08/22 | GBP | 900,000 | 1,592,861 | |||||
| Verizon Communications Inc | ||||||||
| 0.919% due 03/28/14 § | $ | 900,000 | 905,580 | |||||
| Verizon Wireless Capital LLC | ||||||||
| 5.250% due 02/01/12 | 1,300,000 | 1,347,749 | ||||||
| 4,048,266 | ||||||||
Utilities — 0.6% | ||||||||
| CMS Energy Corp | ||||||||
| 5.050% due 02/15/18 | 1,000,000 | 999,502 | ||||||
| Electricite de France (France) | ||||||||
| 5.500% due 01/26/14 ~ | 200,000 | 219,087 | ||||||
| 6.500% due 01/26/19 ~ | 200,000 | 229,407 | ||||||
| 6.950% due 01/26/39 ~ | 200,000 | 233,119 | ||||||
| Entergy Corp | ||||||||
| 3.625% due 09/15/15 | 500,000 | 494,732 | ||||||
| 2,175,847 | ||||||||
| Total Corporate Bonds & Notes | ||||||||
| (Cost $111,768,430) | 115,431,401 | |||||||
CONVERTIBLE CORPORATE BONDS — 0.4% | ||||||||
Energy — 0.4% | ||||||||
| Chesapeake Energy Corp | ||||||||
| 2.250% due 12/15/38 | 100,000 | 92,375 | ||||||
| Transocean Inc (Cayman) | ||||||||
| 1.500% due 12/15/37 | 1,400,000 | 1,384,250 | ||||||
| 1,476,625 | ||||||||
| Total Convertible Corporate Bonds (Cost $1,378,471) | 1,476,625 | |||||||
SENIOR LOAN NOTES — 0.5% | ||||||||
Financials — 0.5% | ||||||||
| Spring Leaf Financial Funding Co | ||||||||
| 7.250% due 04/21/15 § | 2,100,000 | 2,105,907 | ||||||
| Total Senior Loan Notes (Cost $2,135,319) | 2,105,907 | |||||||
MORTGAGE-BACKED SECURITIES — 25.8% | ||||||||
Collateralized Mortgage Obligations — Commercial — 1.9% | ||||||||
| Bear Stearns Commercial Mortgage Securities | ||||||||
| 5.471% due 01/12/45 “ § | 100,000 | 107,327 | ||||||
| 5.700% due 06/13/50 “ | 200,000 | 213,200 | ||||||
| Commercial Mortgage Pass-Through Certificates | ||||||||
| 5.306% due 12/10/46 “ | 200,000 | 210,843 | ||||||
| Credit Suisse Mortgage Capital Certificates | ||||||||
| 5.467% due 09/15/39 “ | 900,000 | 952,700 | ||||||
| 5.847% due 03/15/39 “ § | 100,000 | 107,506 | ||||||
| European Loan Conduit (Ireland) | ||||||||
| 1.243% due 05/15/19 “ § ~ | EUR | 85,783 | 108,523 | |||||
| Greenwich Capital Commercial Funding Corp | ||||||||
| 5.444% due 03/10/39 “ | $ | 400,000 | 423,352 | |||||
| JPMorgan Chase Commercial Mortgage | ||||||||
| Securities Corp | ||||||||
| 4.070% due 11/15/43 “ ~ | 500,000 | 481,005 | ||||||
| LB-UBS Commercial Mortgage Trust | ||||||||
| 5.866% due 09/15/45 “ § | 600,000 | 642,273 | ||||||
| Merrill Lynch-Floating Trust | ||||||||
| 0.797% due 07/09/21 “ § ~ | 499,897 | 475,621 | ||||||
| Merrill Lynch/Countrywide Commercial | ||||||||
| Mortgage Trust | ||||||||
| 5.700% due 09/12/49 “ | 500,000 | 523,926 | ||||||
| Morgan Stanley Capital I | ||||||||
| 5.731% due 07/12/44 “ § | 1,700,000 | 1,858,240 | ||||||
| Wachovia Bank Commercial Mortgage Trust | ||||||||
| 0.345% due 09/15/21 “ § ~ | 305,896 | 303,251 | ||||||
| 5.342% due 12/15/43 “ | 600,000 | 621,308 | ||||||
| 7,029,075 | ||||||||
Collateralized Mortgage Obligations — Residential — 4.6% | ||||||||
| Adjustable Rate Mortgage Trust | ||||||||
| 2.784% due 05/25/35 “ § | 19,603 | 19,830 | ||||||
| Arran Residential Mortgages Funding PLC | ||||||||
| (United Kingdom) | ||||||||
| 2.491% due 05/16/47 “ § ~ | EUR | 1,000,000 | 1,419,852 | |||||
| Banc of America Funding Corp | ||||||||
| 2.813% due 05/25/35 “ § | $ | 161,797 | 158,826 | |||||
| Banc of America Mortgage Securities Inc | ||||||||
| 2.929% due 07/25/33 “ § | 65,814 | 65,000 | ||||||
| 5.000% due 05/25/34 “ | 16,774 | 16,855 | ||||||
| See Notes to Financial Statements | See explanation of symbols and terms, if any, on page B-61 |
B-15
PACIFIC LIFE FUNDS
PL MANAGED BOND FUND
Schedule of Investments (Continued)
March 31, 2011
PL MANAGED BOND FUND
Schedule of Investments (Continued)
March 31, 2011
| Principal | ||||||||
| Amount | Value | |||||||
| Bear Stearns Adjustable Rate Mortgage Trust | ||||||||
| 2.400% due 08/25/35 “ § | $ | 71,994 | $ | 69,519 | ||||
| 2.560% due 10/25/35 “ § | 434,520 | 397,937 | ||||||
| 2.731% due 03/25/35 “ § | 149,073 | 143,916 | ||||||
| 2.749% due 08/25/33 “ § | 180,146 | 180,274 | ||||||
| 3.086% due 01/25/35 “ § | 1,767,947 | 1,612,543 | ||||||
| Bear Stearns Alt-A Trust | ||||||||
| 2.629% due 05/25/35 “ § | 64,492 | 54,419 | ||||||
| 2.935% due 09/25/35 “ § | 78,037 | 61,094 | ||||||
| 5.068% due 11/25/36 “ § | 103,638 | 64,910 | ||||||
| Chase Mortgage Finance Corp | ||||||||
| 5.996% due 09/25/36 “ § | 447,886 | 431,506 | ||||||
| Chevy Chase Mortgage Funding Corp | ||||||||
| 0.500% due 08/25/35 “ § ~ | 82,825 | 59,692 | ||||||
| Citigroup Mortgage Loan Trust Inc | ||||||||
| 2.560% due 08/25/35 “ § | 83,660 | 74,567 | ||||||
| 2.670% due 12/25/35 “ § | 144,437 | 140,724 | ||||||
| Countrywide Alternative Loan Trust | ||||||||
| 3.456% due 06/25/37 “ § | 410,793 | 299,610 | ||||||
| Countrywide Home Loan Mortgage | ||||||||
| Pass-Through Trust | ||||||||
| 0.570% due 03/25/35 “ § | 38,068 | 25,704 | ||||||
| 0.590% due 06/25/35 “ § ~ | 164,960 | 140,498 | ||||||
| Credit Suisse First Boston Mortgage | ||||||||
| Securities Corp | ||||||||
| 0.884% due 03/25/32 “ § ~ | 6,300 | 5,449 | ||||||
| 6.000% due 11/25/35 “ | 140,830 | 105,544 | ||||||
| Downey Saving and Loan Association Mortgage | ||||||||
| Loan Trust | ||||||||
| 0.434% due 04/19/48 “ § | 581,621 | 237,158 | ||||||
| Fannie Mae | ||||||||
| 0.450% due 10/27/37 “ § | 3,400,000 | 3,378,119 | ||||||
| 0.560% due 04/25/37 “ § | 200,535 | 200,036 | ||||||
| 0.700% due 09/25/35 “ § | 366,626 | 366,946 | ||||||
| 1.625% due 11/25/23 “ § | 322,929 | 323,686 | ||||||
| 4.250% due 07/25/17 “ | 110,182 | 113,691 | ||||||
| 4.500% due 04/25/17 “ | 47,410 | 47,973 | ||||||
| 4.500% due 10/25/17 “ | 118,467 | 123,129 | ||||||
| 5.000% due 01/25/17 “ | 19,264 | 19,327 | ||||||
| 6.000% due 03/25/31 “ | 711,410 | 726,370 | ||||||
| Freddie Mac | ||||||||
| 1.504% due 10/25/44 “ § | 55,843 | 55,099 | ||||||
| 1.712% due 07/25/44 “ § | 296,886 | 294,674 | ||||||
| 4.500% due 06/15/17 “ | 69,933 | 70,986 | ||||||
| 4.500% due 10/15/19 “ | 13,257 | 13,274 | ||||||
| 5.000% due 04/15/18 “ | 229,236 | 234,645 | ||||||
| 5.000% due 04/15/30 “ | 6,959 | 6,958 | ||||||
| 5.500% due 03/15/17 “ | 13,161 | 13,389 | ||||||
| 8.000% due 04/15/30 “ | 304,934 | 347,260 | ||||||
| Granite Master Issuer PLC | ||||||||
| 0.997% due 12/20/54 “ § ~ | EUR | 888,767 | 1,192,798 | |||||
| Granite Mortgages PLC (United Kingdom) | ||||||||
| 0.996% due 09/20/44 “ § ~ | GBP | 278,146 | 428,021 | |||||
| 1.156% due 01/20/44 “ § ~ | 51,376 | 79,224 | ||||||
| 1.392% due 01/20/44 “ § ~ | EUR | 50,769 | 69,161 | |||||
| Harborview Mortgage Loan Trust | ||||||||
| 0.424% due 12/19/36 “ § | $ | 763,310 | 509,678 | |||||
| 0.444% due 01/19/38 “ § | 239,661 | 158,525 | ||||||
| 0.474% due 05/19/35 “ § | 41,701 | 28,684 | ||||||
| JPMorgan Mortgage Trust | ||||||||
| 5.035% due 02/25/35 “ § | 53,594 | 54,648 | ||||||
| 5.387% due 07/25/35 “ § | 548,916 | 550,763 | ||||||
| 5.750% due 01/25/36 “ | 89,253 | 83,950 | ||||||
| Mellon Residential Funding Corp | ||||||||
| 0.735% due 06/15/30 “ § | 12,354 | 12,219 | ||||||
| Merrill Lynch Mortgage Investors Inc | ||||||||
| 0.460% due 02/25/36 “ § | 54,142 | 41,661 | ||||||
| Morgan Stanley Mortgage Loan Trust | ||||||||
| 5.500% due 08/25/35 “ | 517,949 | 509,320 | ||||||
| Residential Accredit Loans Inc | ||||||||
| 0.430% due 06/25/46 “ § | 112,251 | 45,653 | ||||||
| 6.000% due 06/25/36 “ | 332,810 | 228,791 | ||||||
| Residential Asset Securitization Trust | ||||||||
| 0.650% due 05/25/33 “ § | 17,464 | 16,798 | ||||||
| Structured Asset Mortgage Investments Inc | ||||||||
| 0.470% due 05/25/36 “ § | 246,116 | 146,841 | ||||||
| Structured Asset Securities Corp | ||||||||
| 2.573% due 08/25/32 “ § | 29,197 | 28,726 | ||||||
| 2.768% due 10/25/35 “ § ~ | 89,713 | 73,757 | ||||||
| Washington Mutual Mortgage Pass-Through Certificates | ||||||||
| 0.560% due 01/25/45 “ § | 32,081 | 27,214 | ||||||
| 0.570% due 01/25/45 “ § | 32,557 | 27,598 | ||||||
| 1.712% due 08/25/42 “ § | 5,529 | 5,032 | ||||||
| 2.734% due 02/27/34 “ § | 10,716 | 11,016 | ||||||
| 2.984% due 09/25/46 “ § | 114,776 | 94,106 | ||||||
| 5.707% due 02/25/37 “ § | 600,000 | 517,970 | ||||||
| Wells Fargo Mortgage-Backed Securities Trust | ||||||||
| 2.845% due 12/25/34 “ § | 148,789 | 146,054 | ||||||
| 2.901% due 04/25/36 “ § | 142,357 | 129,600 | ||||||
| 4.500% due 11/25/18 “ | 66,367 | 67,361 | ||||||
| 5.211% due 08/25/36 “ § | 15,871 | 15,903 | ||||||
| 17,422,061 | ||||||||
Fannie Mae — 16.5% | ||||||||
| 1.518% due 10/01/44 “ § | 54,448 | 54,400 | ||||||
| 2.411% due 09/01/35 “ § | 217,989 | 228,725 | ||||||
| 2.487% due 12/01/35 “ § | 63,448 | 66,584 | ||||||
| 2.686% due 11/01/34 “ § | 194,709 | 205,592 | ||||||
| 2.832% due 11/01/32 “ § | 206,211 | 217,259 | ||||||
| 4.000% due 04/01/24 - 12/01/25 “ | 959,118 | 986,534 | ||||||
| 4.500% due 01/01/23 - 04/13/41 “ | 26,500,972 | 26,992,099 | ||||||
| 4.578% due 12/01/36 “ § | 22,966 | 24,010 | ||||||
| 5.000% due 03/01/34 - 05/15/38 “ | 10,583,881 | 11,053,968 | ||||||
| 5.500% due 12/01/20 - 12/01/39 “ | 13,741,326 | 14,756,143 | ||||||
| 6.000% due 09/01/22 - 01/01/39 “ | 6,470,154 | 7,058,041 | ||||||
| 6.500% due 03/01/17 - 05/15/37 “ | 948,704 | 1,059,568 | ||||||
| 62,702,923 | ||||||||
Freddie Mac — 2.8% | ||||||||
| 2.505% due 11/01/31 “ § | 8,286 | 8,711 | ||||||
| 2.520% due 09/01/35 “ § | 26,036 | 27,142 | ||||||
| 2.615% due 04/01/32 “ § | 26,590 | 27,675 | ||||||
| 2.624% due 06/01/35 “ § | 334,403 | 348,785 | ||||||
| 3.060% due 09/01/35 “ § | 207,530 | 218,418 | ||||||
| 4.500% due 04/13/41 “ | 1,000,000 | 1,014,531 | ||||||
| 5.500% due 03/01/23 - 05/01/40 “ | 8,104,735 | 8,660,327 | ||||||
| 6.000% due 12/01/22 - 03/01/23 “ | 143,841 | 158,099 | ||||||
| 10,463,688 | ||||||||
| Total Mortgage-Backed Securities (Cost $97,010,337) | 97,617,747 | |||||||
ASSET-BACKED SECURITIES — 5.6% | ||||||||
| Ally Auto Receivables Trust | ||||||||
| 1.320% due 03/15/12 “ ~ | 29,589 | 29,610 | ||||||
| Asset Backed Funding Certificates | ||||||||
| 0.600% due 06/25/34 “ § | 136,876 | 112,072 | ||||||
| Auto ABS SRL (Italy) | ||||||||
| 1.165% due 10/25/20 “ § ~ | EUR | 973,074 | 1,362,276 | |||||
| Bear Stearns Asset Backed Securities Trust | ||||||||
| 3.165% due 10/25/36 “ § | $ | 187,501 | 136,905 | |||||
| Citibank Omni Master Trust | ||||||||
| 2.355% due 05/16/16 “ § ~ | 7,400,000 | 7,513,870 | ||||||
| 3.005% due 08/15/18 “ § ~ | 3,200,000 | 3,391,825 | ||||||
| Duane Street CLO (Cayman) | ||||||||
| 0.562% due 11/08/17 “ § ~ | 3,784,464 | 3,632,244 | ||||||
| See Notes to Financial Statements | See explanation of symbols and terms, if any, on page B-61 |
B-16
PACIFIC LIFE FUNDS
PL MANAGED BOND FUND
Schedule of Investments (Continued)
March 31, 2011
PL MANAGED BOND FUND
Schedule of Investments (Continued)
March 31, 2011
| Principal | ||||||||
| Amount | Value | |||||||
| Galaxy CLO Ltd (Cayman) | ||||||||
| 0.583% due 04/17/17 “ § ~ ∆ | $ | 986,155 | $ | 949,326 | ||||
| Hillmark Funding CLO (Cayman) | ||||||||
| 0.563% due 05/21/21 “ § ~ ∆ | 1,100,000 | 1,023,361 | ||||||
| HSBC Home Equity Loan Trust | ||||||||
| 0.404% due 03/20/36 “ § | 606,856 | 572,007 | ||||||
| Long Beach Mortgage Loan Trust | ||||||||
| 0.530% due 10/25/34 “ § | 18,554 | 15,526 | ||||||
| Park Place Securities Inc | ||||||||
| 0.510% due 09/25/35 “ § | 138,718 | 126,234 | ||||||
| Securitized Asset-Backed Receivables LLC Trust | ||||||||
| 0.380% due 05/25/37 “ § | 190,946 | 152,335 | ||||||
| SLM Student Loan Trust | ||||||||
| 0.303% due 10/25/16 “ § | 24,441 | 24,438 | ||||||
| 4.500% due 11/16/43 “ § ~ | 287,805 | 279,766 | ||||||
| 6.255% due 07/15/42 “ § ~ | 496,268 | 479,607 | ||||||
| Small Business Administration | ||||||||
| 4.754% due 08/10/14 “ | 45,616 | 48,109 | ||||||
| Structured Asset Securities Corp | ||||||||
| 0.300% due 10/25/36 “ § | 8,807 | 8,772 | ||||||
| Wind River CLO Ltd (Cayman) | ||||||||
| 0.639% due 12/19/16 “ § ~ | 1,248,651 | 1,214,424 | ||||||
| Total Asset-Backed Securities (Cost $21,155,693) | 21,072,707 | |||||||
U.S. GOVERNMENT AGENCY ISSUES — 0.8% | ||||||||
| Fannie Mae | ||||||||
| 1.000% due 12/27/12 | 3,000,000 | 3,012,804 | ||||||
| Total U.S. Government Agency Issues (Cost $3,023,773) | 3,012,804 | |||||||
U.S. TREASURY OBLIGATIONS - 0.9% | ||||||||
U.S. Treasury Inflation Protected Securities — 0.9% | ||||||||
| 2.000% due 01/15/26 ^ | 2,107,841 | 2,251,602 | ||||||
| 2.375% due 01/15/25 ^ | 1,168,130 | 1,312,686 | ||||||
| 3,564,288 | ||||||||
| Total U.S. Treasury Obligations (Cost $3,630,423) | 3,564,288 | |||||||
FOREIGN GOVERNMENT BONDS & NOTES — 2.9% | ||||||||
| Banco Nacional Desenvolvimento Economico e Social (Brazil) | ||||||||
| 4.125% due 09/15/17 ~ | EUR | 100,000 | 135,980 | |||||
| Canada Housing Trust No 1 (Canada) | ||||||||
| 3.350% due 12/15/20 | CAD | 700,000 | 702,975 | |||||
| 3.950% due 12/15/11 ~ ∆ | 100,000 | 105,083 | ||||||
| 4.000% due 06/15/12 | 700,000 | 743,249 | ||||||
| 4.550% due 12/15/12 | 200,000 | 215,800 | ||||||
| 4.800% due 06/15/12 | 200,000 | 214,255 | ||||||
| Canadian Government Bond (Canada) | ||||||||
| 1.500% due 12/01/12 | 300,000 | 308,407 | ||||||
| 1.750% due 03/01/13 | 1,000,000 | 1,030,428 | ||||||
| 2.000% due 12/01/14 | 500,000 | 508,448 | ||||||
| 2.500% due 09/01/13 | 600,000 | 626,315 | ||||||
| 3.000% due 12/01/15 | 200,000 | 209,357 | ||||||
| Export-Import Bank of Korea (South Korea) | ||||||||
| 0.523% due 10/04/11 § ~ | $ | 800,000 | 800,457 | |||||
| 4.000% due 01/29/21 | 100,000 | 91,436 | ||||||
| 5.125% due 06/29/20 | 100,000 | 101,129 | ||||||
| Instituto de Credito Oficial (Spain) | ||||||||
| 2.941% due 03/25/14 § ~ ∆ | EUR | 600,000 | 848,164 | |||||
| Province of Ontario Canada (Canada) | ||||||||
| 1.375% due 01/27/14 | $ | 500,000 | 498,584 | |||||
| 4.300% due 03/08/17 | CAD | 300,000 | 325,173 | |||||
| 4.400% due 06/02/19 | 300,000 | 321,422 | ||||||
| 4.600% due 06/02/39 | 100,000 | 104,366 | ||||||
| 4.700% due 06/02/37 | 400,000 | 422,614 | ||||||
| 5.500% due 06/02/18 | 100,000 | 115,007 | ||||||
| Republic of Panama (Panama) | ||||||||
| 9.375% due 04/01/29 | $ | 40,000 | 56,600 | |||||
| Russia Foreign Bond (Russia) | ||||||||
| 3.625% due 04/29/15 ~ | 100,000 | 101,625 | ||||||
| 7.500% due 03/31/30 ~ | 1,384,000 | 1,616,692 | ||||||
| Societe de Financement de l’Economie | ||||||||
| Francaise (France) | ||||||||
| 2.125% due 05/20/12 | EUR | 300,000 | 427,433 | |||||
| 3.375% due 05/05/14 ~ | $ | 200,000 | 209,970 | |||||
| United Mexican States (Mexico) | ||||||||
| 6.050% due 01/11/40 | 100,000 | 103,500 | ||||||
| Total Foreign Government Bonds & Notes (Cost $10,686,894) | 10,944,469 | |||||||
MUNICIPAL BONDS — 2.6% | ||||||||
| American Municipal Power Inc OH | ||||||||
| 8.084% due 02/15/50 | 1,000,000 | 1,139,910 | ||||||
| Buckeye Tobacco Settlement Financing | ||||||||
| Authority OH ‘A2’ | ||||||||
| 5.875% due 06/01/47 | 1,100,000 | 732,105 | ||||||
| City of North Las Vegas NV | ||||||||
| 6.572% due 06/01/40 | 900,000 | 921,042 | ||||||
| Clark County NV Airport ‘C’ | ||||||||
| 6.820% due 07/01/45 | 200,000 | 198,184 | ||||||
| Los Angeles Unified School District CA ‘A1’ | ||||||||
| 4.500% due 01/01/28 | 400,000 | 350,344 | ||||||
| North Carolina Turnpike Authority ‘B’ | ||||||||
| 6.700% due 01/01/39 | 100,000 | 103,645 | ||||||
| Southern California Public Power Authority | ||||||||
| 5.943% due 07/01/40 | 1,600,000 | 1,497,920 | ||||||
| State of California | ||||||||
| 5.650% due 04/01/39 § | 100,000 | 105,138 | ||||||
| 7.500% due 04/01/34 | 100,000 | 107,714 | ||||||
| 7.550% due 04/01/39 | 100,000 | 108,799 | ||||||
| State of Illinois | ||||||||
| 4.071% due 01/01/14 | 200,000 | 200,252 | ||||||
| Tobacco Securitization Authority of Southern California ‘A1’ | ||||||||
| 5.000% due 06/01/37 | 800,000 | 523,408 | ||||||
| Tobacco Settlement Finance Authority WV ‘A’ | ||||||||
| 7.467% due 06/01/47 | 850,000 | 593,903 | ||||||
| University of Arizona | ||||||||
| 6.423% due 08/01/35 | 2,700,000 | 2,726,622 | ||||||
| University of California | ||||||||
| 6.270% due 05/15/31 | 500,000 | 505,015 | ||||||
| Total Municipal Bonds (Cost $10,397,744) | 9,814,001 | |||||||
| See Notes to Financial Statements | See explanation of symbols and terms, if any, on page B-61 |
B-17
PACIFIC LIFE FUNDS
PL MANAGED BOND FUND
Schedule of Investments (Continued)
March 31, 2011
PL MANAGED BOND FUND
Schedule of Investments (Continued)
March 31, 2011
| Principal | ||||||||
| Amount | Value | |||||||
SHORT-TERM INVESTMENTS — 39.1% | ||||||||
Commercial Paper — 5.0% | ||||||||
| Comcast Corp | ||||||||
| 0.480% due 05/25/11 | $ | 300,000 | $ | 299,918 | ||||
| Kells Fund LLC | ||||||||
| 0.280% due 06/10/11 | 600,000 | 599,691 | ||||||
| 0.280% due 07/08/11 | 1,600,000 | 1,598,715 | ||||||
| 0.280% due 07/13/11 | 500,000 | 499,568 | ||||||
| 0.280% due 07/18/11 | 600,000 | 599,446 | ||||||
| 0.310% due 05/12/11 | 4,200,000 | 4,198,683 | ||||||
| 0.330% due 05/11/11 | 2,200,000 | 2,199,329 | ||||||
| 0.360% due 09/07/11 | 1,000,000 | 998,400 | ||||||
| Straight-A Funding LLC | ||||||||
| 0.240% due 06/06/11 | 600,000 | 599,696 | ||||||
| 0.250% due 05/02/11 | 3,500,000 | 3,499,197 | ||||||
| 0.250% due 05/09/11 | 3,200,000 | 3,199,103 | ||||||
| 0.250% due 05/11/11 | 500,000 | 499,848 | ||||||
| 18,791,594 | ||||||||
U.S. Treasury Bills — 24.9% | ||||||||
| 0.140% due 09/08/11 | 5,800,000 | 5,796,392 | ||||||
| 0.156% due 08/25/11 | 3,700,000 | 3,698,050 | ||||||
| 0.164% due 09/01/11 | 9,700,000 | 9,694,442 | ||||||
| 0.170% due 08/04/11 ‡ | 34,500,000 | 34,488,029 | ||||||
| 0.175% due 08/11/11 | 7,500,000 | 7,496,842 | ||||||
| 0.175% due 08/18/11 | 21,900,000 | 21,889,444 | ||||||
| 0.180% due 07/14/11 ‡ | 2,280,000 | 2,279,387 | ||||||
| 0.186% due 06/23/11 | 1,400,000 | 1,399,751 | ||||||
| 0.186% due 06/16/11 | 4,200,000 | 4,199,425 | ||||||
| 0.254% due 08/25/11 | 3,600,000 | 3,598,103 | ||||||
| 94,539,865 | ||||||||
Repurchase Agreements — 8.8% | ||||||||
| Barclays PLC | ||||||||
| 0.130% due 04/11/11 (Dated 03/10/11, repurchase price of $6,800,786; collateralized by Freddie Mac: | ||||||||
| 4.375% due 07/17/15 and value $6,965,052) ∆ | 6,800,000 | 6,800,000 | ||||||
| Deutsche Bank | ||||||||
| 0.100% due 04/01/11 (Dated 03/31/11, repurchase price of $4,000,011; collateralized by a U.S. Treasury Bond: | ||||||||
| 4.750% due 02/15/41 and value $4,089,409) | 4,000,000 | 4,000,000 | ||||||
| Morgan Stanley | ||||||||
| 0.140% due 04/01/11 (Dated 03/31/11, repurchase price of $22,700,088; collateralized by a U.S. Treasury Note: | ||||||||
| 2.750% due 02/15/19 and value $23,205,882) | 22,700,000 | 22,700,000 | ||||||
| 33,500,000 | ||||||||
| Shares | ||||||||
Money Market Fund — 0.4% | ||||||||
| BlackRock Liquidity Funds Treasury Trust Fund Portfolio | 1,336,925 | 1,336,925 | ||||||
| Total Short-Term Investments (Cost $148,152,700) | 148,168,384 | |||||||
TOTAL INVESTMENTS — 109.9% (Cost $413,201,688) | 416,378,271 | |||||||
TOTAL SECURITIES SOLD SHORT — (0.7%) (See Note (f) to Notes to Schedule of Investments) (Proceeds $2,552,850) | (2,540,376 | ) | ||||||
OTHER ASSETS & LIABILITIES, NET — (9.2%) | (34,855,425 | ) | ||||||
NET ASSETS — 100.0% | $ | 378,982,470 | ||||||
Notes to Schedule of Investments
| (a) | As of March 31, 2011, the fund was diversified as a percentage of net assets as follows: |
| Short-Term Investments | 39.1 | % | ||
| Corporate Bonds & Notes | 30.5 | % | ||
| Mortgage-Backed Securities | 25.8 | % | ||
| Asset-Backed Securities | 5.6 | % | ||
| Foreign Government Bonds & Notes | 2.9 | % | ||
| Municipal Bonds | 2.6 | % | ||
| U.S. Treasury Obligations | 0.9 | % | ||
| Convertible Preferred Stocks | 0.8 | % | ||
| U.S. Government Agency Issues | 0.8 | % | ||
| Senior Loan Notes | 0.5 | % | ||
| Convertible Corporate Bonds | 0.4 | % | ||
| 109.9 | % | |||
| Securities Sold Short | (0.7 | %) | ||
| Other Assets & Liabilities, Net | (9.2 | %) | ||
| 100.0 | % | |||
| (b) | As of March 31, 2011, the fund’s Standard & Poor’s quality ratings as a percentage of total fixed income investments were as follows: |
| AAA / U.S. Government & Agency Issues | 51.8 | % | ||
| A-1 (Short-term debt only) | 12.7 | % | ||
| AA | 8.1 | % | ||
| A | 9.9 | % | ||
| BBB | 7.3 | % | ||
| BB | 3.7 | % | ||
| B | 1.5 | % | ||
| CCC | 0.5 | % | ||
| C | 0.1 | % | ||
| D | 0.1 | % | ||
| Not Rated | 4.3 | % | ||
| 100.0 | % | |||
| (c) | Short-term investments reflect either the stated coupon rate or the annualized effective yield on the date of purchase for discounted investments. | |
| (d) | Investments with a total aggregate value of $555,946 or 0.1% of the net assets were in default as of March 31, 2011. |
| See Notes to Financial Statements | See explanation of symbols and terms, if any, on page B-61 |
B-18
PACIFIC LIFE FUNDS
PL MANAGED BOND FUND
Schedule of Investments (Continued)
March 31, 2011
PL MANAGED BOND FUND
Schedule of Investments (Continued)
March 31, 2011
| (e) | As of March 31, 2011, 3.7% of the fund’s net assets were reported illiquid by the portfolio manager under the Trust’s policy. | |
| (f) | Securities sold short outstanding as of March 31, 2011 were as follows: |
| Principal | ||||||||
| Description | Amount | Value | ||||||
| Fannie Mae | ||||||||
| 5.500% due 04/13/41 | $ | 1,000,000 | $ | (1,069,532 | ) | |||
| U.S. Treasury Notes | ||||||||
| 2.625% due 11/15/20 | 600,000 | (559,172 | ) | |||||
| 3.625% due 02/15/21 | 900,000 | (911,672 | ) | |||||
| Total Securities sold short | ||||||||
| (Proceeds $2,552,850) | $ | (2,540,376 | ) | |||||
| (g) | The average amount of borrowings by the fund on reverse repurchase agreements while outstanding during the year ended March 31, 2011 was $2,484,000 at a weighted average interest rate of 0.180%. As of March 31, 2011, there were no open reverse repurchase agreements. | |
| (h) | Open futures contracts outstanding as of March 31, 2011 were as follows: |
| Unrealized | ||||||||||||
| Number of | Notional | Appreciation | ||||||||||
| Long Futures Outstanding | Contracts | Amount | (Depreciation) | |||||||||
| Eurodollar (09/11) | 316 | $ | 316,000,000 | $ | 85,625 | |||||||
| Eurodollar (12/11) | 702 | 702,000,000 | 326,213 | |||||||||
| Eurodollar (03/12) | 856 | 856,000,000 | 36,050 | |||||||||
| Eurodollar (06/12) | 333 | 333,000,000 | (18,188 | ) | ||||||||
| Eurodollar (09/12) | 10 | 10,000,000 | (8,850 | ) | ||||||||
| Eurodollar (12/12) | 25 | 25,000,000 | (43,550 | ) | ||||||||
| U.S. Treasury 2-Year Notes (06/11) | 50 | 10,000,000 | (781 | ) | ||||||||
| 376,519 | ||||||||||||
Short Futures Outstanding | ||||||||||||
| U.S. Treasury 10-Year Notes (06/11) | 80 | 8,000,000 | (32,844 | ) | ||||||||
| Total Futures Contracts | $ | 343,675 | ||||||||||
| (i) | Forward foreign currency contracts outstanding as of March 31, 2011 were as follows: |
| Contracts | Principal Amount | Unrealized | ||||||||||||||||||
| to Buy or | Covered by | Appreciation | ||||||||||||||||||
| to Sell | Currency | Contracts | Expiration | Counterparty | (Depreciation) | |||||||||||||||
| Buy | AUD | 1,255,000 | 04/11 | WPC | $ | 66,689 | ||||||||||||||
| Buy | BRL | 10,415,027 | 04/11 | BRC | 229,008 | |||||||||||||||
| Buy | BRL | 1,676,800 | 04/11 | UBS | 26,258 | |||||||||||||||
| Sell | BRL | 12,091,827 | 04/11 | CIT | (164,326 | ) | ||||||||||||||
| Buy | BRL | 12,091,827 | 06/11 | CIT | 167,236 | |||||||||||||||
| Buy | BRL | 92,975 | 09/11 | MSC | 4,987 | |||||||||||||||
| Buy | CAD | 5,824,000 | 06/11 | CIT | 36,456 | |||||||||||||||
| Buy | CAD | 396,000 | 06/11 | CSF | 7,272 | |||||||||||||||
| Buy | CHF | 92,000 | 05/11 | BRC | 1,686 | |||||||||||||||
| Buy | CNY | 4,516,754 | 04/11 | BRC | 7,996 | |||||||||||||||
| Buy | CNY | 2,732,816 | 04/11 | DUB | 10,443 | |||||||||||||||
| Buy | CNY | 1,972,760 | 04/11 | HSB | 3,366 | |||||||||||||||
| Buy | CNY | 1,000,375 | 04/11 | MSC | 1,821 | |||||||||||||||
| Sell | CNY | 10,222,705 | 04/11 | DUB | (8,058 | ) | ||||||||||||||
| Buy | CNY | 159,000 | 11/11 | BRC | (185 | ) | ||||||||||||||
| Buy | CNY | 958,897 | 11/11 | CIT | 526 | |||||||||||||||
| Buy | CNY | 596,638 | 11/11 | JPM | (669 | ) | ||||||||||||||
| Buy | CNY | 10,222,705 | 02/13 | DUB | 8,320 | |||||||||||||||
| Sell | DKK | 4,607,000 | 05/11 | DUB | (23,130 | ) | ||||||||||||||
| Buy | EUR | 300,000 | 04/11 | UBS | 2,781 | |||||||||||||||
| Sell | EUR | 868,000 | 04/11 | BRC | (45,442 | ) | ||||||||||||||
| Sell | EUR | 339,000 | 04/11 | CIT | (10,442 | ) | ||||||||||||||
| Sell | EUR | 60,000 | 04/11 | HSB | (2,277 | ) | ||||||||||||||
| Sell | EUR | 49,000 | 04/11 | JPM | (3,039 | ) | ||||||||||||||
| Sell | EUR | 542,000 | 04/11 | MSC | (2,069 | ) | ||||||||||||||
| See Notes to Financial Statements | See explanation of symbols and terms, if any, on page B-61 |
B-19
PACIFIC LIFE FUNDS
PL MANAGED BOND FUND
Schedule of Investments (Continued)
March 31, 2011
PL MANAGED BOND FUND
Schedule of Investments (Continued)
March 31, 2011
| Contracts | Principal Amount | Unrealized | ||||||||||||||||||
| to Buy or | Covered by | Appreciation | ||||||||||||||||||
| to Sell | Currency | Contracts | Expiration | Counterparty | (Depreciation) | |||||||||||||||
| Sell | EUR | 939,000 | 04/11 | RBS | ( $45,088 | ) | ||||||||||||||
| Sell | EUR | 5,351,000 | 04/11 | UBS | (367,193 | ) | ||||||||||||||
| Sell | GBP | 865,000 | 06/11 | CIT | 1,131 | |||||||||||||||
| Sell | GBP | 864,000 | 06/11 | CSF | 1,569 | |||||||||||||||
| Sell | GBP | 3,155,000 | 06/11 | UBS | (5,237 | ) | ||||||||||||||
| Buy | IDR | 1,765,000,000 | 04/11 | BRC | 2,211 | |||||||||||||||
| Buy | IDR | 367,720,000 | 04/11 | CIT | 2,129 | |||||||||||||||
| Buy | IDR | 2,644,400,000 | 04/11 | JPM | 2,962 | |||||||||||||||
| Buy | IDR | 1,818,000,000 | 04/11 | MSC | 8,283 | |||||||||||||||
| Sell | IDR | 6,595,120,000 | 04/11 | CIT | 737 | |||||||||||||||
| Buy | IDR | 976,805,000 | 07/11 | BRC | 4,472 | |||||||||||||||
| Buy | IDR | 1,191,100,000 | 07/11 | CIT | 7,193 | |||||||||||||||
| Buy | IDR | 2,135,550,000 | 07/11 | HSB | 12,419 | |||||||||||||||
| Buy | IDR | 2,983,200,000 | 07/11 | JPM | 11,499 | |||||||||||||||
| Buy | IDR | 189,000,000 | 07/11 | RBS | 1,265 | |||||||||||||||
| Buy | IDR | 6,595,120,000 | 01/12 | CIT | (9,371 | ) | ||||||||||||||
| Buy | INR | 13,716,000 | 05/11 | BRC | 5,298 | |||||||||||||||
| Buy | INR | 13,758,000 | 05/11 | JPM | 6,233 | |||||||||||||||
| Buy | INR | 40,393,500 | 08/11 | BRC | 22,309 | |||||||||||||||
| Buy | INR | 5,500,000 | 08/11 | DUB | 2,611 | |||||||||||||||
| Sell | JPY | 97,080,000 | 04/11 | CIT | 43,382 | |||||||||||||||
| Buy | KRW | 20,700,000 | 05/11 | BRC | 397 | |||||||||||||||
| Buy | KRW | 426,600,000 | 05/11 | CIT | 9,452 | |||||||||||||||
| Buy | KRW | 16,605,250 | 05/11 | GSC | 468 | |||||||||||||||
| Buy | KRW | 153,750,000 | 05/11 | HSB | 5,079 | |||||||||||||||
| Buy | KRW | 1,906,584,181 | 05/11 | JPM | 71,008 | |||||||||||||||
| Buy | KRW | 1,123,825,000 | 05/11 | MSC | 22,000 | |||||||||||||||
| Buy | KRW | 78,000,000 | 05/11 | RBS | 1,988 | |||||||||||||||
| Buy | KRW | 338,190,000 | 08/11 | GSC | 5,746 | |||||||||||||||
| Buy | KRW | 49,740,000 | 08/11 | MSC | 725 | |||||||||||||||
| Buy | KRW | 63,000,000 | 08/11 | RBS | 530 | |||||||||||||||
| Buy | MXN | 2,473,700 | 07/11 | DUB | 6,102 | |||||||||||||||
| Buy | MXN | 55,660,048 | 07/11 | HSB | 143,270 | |||||||||||||||
| Buy | MXN | 1,226,200 | 07/11 | MSC | 2,164 | |||||||||||||||
| Buy | MXN | 1,225,770 | 07/11 | UBS | 2,128 | |||||||||||||||
| Buy | MYR | 500,000 | 08/11 | BRC | 1,594 | |||||||||||||||
| Buy | MYR | 760,000 | 08/11 | CIT | 2,301 | |||||||||||||||
| Buy | MYR | 300,405 | 08/11 | HSB | 658 | |||||||||||||||
| Buy | MYR | 100,000 | 08/11 | JPM | 261 | |||||||||||||||
| Buy | PHP | 4,361,000 | 04/11 | CIT | 406 | |||||||||||||||
| Buy | PHP | 4,375,000 | 04/11 | JPM | 728 | |||||||||||||||
| Sell | PHP | 8,736,000 | 04/11 | MSC | 64 | |||||||||||||||
| Buy | PHP | 4,437,000 | 06/11 | BRC | 1,888 | |||||||||||||||
| Buy | PHP | 5,200,000 | 06/11 | CIT | 1,076 | |||||||||||||||
| Buy | PHP | 12,555,000 | 06/11 | DUB | 2,052 | |||||||||||||||
| Buy | PHP | 4,321,000 | 06/11 | DUB | (776 | ) | ||||||||||||||
| Buy | PHP | 15,906,000 | 06/11 | JPM | 6,553 | |||||||||||||||
| Buy | PHP | 6,719,377 | 11/11 | BRC | 1,855 | |||||||||||||||
| Buy | PHP | 4,310,000 | 11/11 | CIT | (1,675 | ) | ||||||||||||||
| Buy | PHP | 6,521,000 | 11/11 | CIT | 1,393 | |||||||||||||||
| Buy | PHP | 4,392,000 | 11/11 | GSC | 195 | |||||||||||||||
| Buy | PHP | 4,310,000 | 11/11 | JPM | (1,675 | ) | ||||||||||||||
| Buy | PHP | 4,410,000 | 11/11 | JPM | 606 | |||||||||||||||
| Buy | PHP | 8,736,000 | 03/12 | MSC | (2,434 | ) | ||||||||||||||
| Buy | RUB | 2,897,000 | 04/11 | BRC | 1,884 | |||||||||||||||
| Sell | RUB | 2,897,000 | 04/11 | BRC | 285 | |||||||||||||||
| Buy | RUB | 2,897,000 | 07/11 | BRC | (268 | ) | ||||||||||||||
| Buy | SGD | 380,292 | 05/11 | CIT | 1,717 | |||||||||||||||
| Buy | SGD | 128,640 | 06/11 | CIT | 2,069 | |||||||||||||||
| Buy | SGD | 131,144 | 06/11 | DUB | 3,427 | |||||||||||||||
| Buy | SGD | 1,100,227 | 06/11 | GSC | 15,669 | |||||||||||||||
| Buy | SGD | 195,295 | 06/11 | JPM | 4,957 | |||||||||||||||
| Buy | SGD | 131,279 | 06/11 | RBS | 4,428 | |||||||||||||||
| Buy | SGD | 381,700 | 09/11 | BRC | 4,399 | |||||||||||||||
| Buy | SGD | 200,000 | 09/11 | CIT | 2,324 | |||||||||||||||
| Buy | SGD | 127,757 | 09/11 | DUB | 1,220 | |||||||||||||||
| Buy | SGD | 100,000 | 09/11 | JPM | 1,186 | |||||||||||||||
| Buy | SGD | 227,707 | 09/11 | RBS | 2,638 | |||||||||||||||
| Buy | TRY | 1,199,333 | 07/11 | HSB | 6,506 | |||||||||||||||
| See Notes to Financial Statements | See explanation of symbols and terms, if any, on page B-61 |
B-20
PACIFIC LIFE FUNDS
PL MANAGED BOND FUND
Schedule of Investments (Continued)
March 31, 2011
PL MANAGED BOND FUND
Schedule of Investments (Continued)
March 31, 2011
| Contracts | Principal Amount | Unrealized | ||||||||||||||||||
| to Buy or | Covered by | Appreciation | ||||||||||||||||||
| to Sell | Currency | Contracts | Expiration | Counterparty | (Depreciation) | |||||||||||||||
| Buy | TWD | 7,244,185 | 04/11 | BRC | $ | 544 | ||||||||||||||
| Buy | TWD | 2,874,455 | 04/11 | DUB | 2,593 | |||||||||||||||
| Buy | TWD | 4,369,730 | 04/11 | JPM | 4,209 | |||||||||||||||
| Sell | TWD | 7,244,185 | 04/11 | BRC | (352 | ) | ||||||||||||||
| Sell | TWD | 2,874,455 | 04/11 | DUB | (216 | ) | ||||||||||||||
| Sell | TWD | 4,369,730 | 04/11 | JPM | (328 | ) | ||||||||||||||
| Buy | TWD | 7,244,185 | 01/12 | BRC | (4,170 | ) | ||||||||||||||
| Buy | ZAR | 1,393,900 | 04/11 | JPM | 5,228 | |||||||||||||||
| Buy | ZAR | 697,650 | 04/11 | MSC | 2,717 | |||||||||||||||
| Buy | ZAR | 696,750 | 07/11 | HSB | 1,189 | |||||||||||||||
| Buy | ZAR | 5,071,209 | 07/11 | JPM | (4,805 | ) | ||||||||||||||
| Buy | ZAR | 760,150 | 09/11 | BRC | 9,626 | |||||||||||||||
| Total Forward Foreign Currency Contracts | $ | 378,825 | ||||||||||||||||||
| (j) | Transactions in written options for the year ended March 31, 2011 were as follows: |
| Number of | Notional Amount | |||||||||||
| Contracts | in $ | Premium | ||||||||||
| Outstanding, March 31, 2010 | 401 | 86,200,000 | $ | 836,411 | ||||||||
| Call Options Written | 93 | 56,200,000 | 324,972 | |||||||||
| Put Options Written | 86 | 102,600,000 | 828,519 | |||||||||
| Call Options Closed | (30 | ) | (6,600,000 | ) | (42,314 | ) | ||||||
| Call Options Expired | (112 | ) | (65,400,000 | ) | (340,144 | ) | ||||||
| Put Options Expired | (371 | ) | (85,700,000 | ) | (797,345 | ) | ||||||
| Outstanding, March 31, 2011 | 67 | 87,300,000 | $ | 810,099 | ||||||||
| (k) | Premiums received and value of written options outstanding as of March 31, 2011 were as follows: |
Inflation Floor/Cap Options
| Strike | Exercise | Expiration | Counter- | Notional | ||||||||||||||||||||||||
| Description | Index | Index | Date | party | Amount | Premium | Value | |||||||||||||||||||||
| Floor — OTC U.S. CPI Urban Consumers NSA | 215.95 | Maximum of ((1+0.00%)10 - Inflation Adjustment) or $0 | 03/12/20 | CIT | $ | 1,200,000 | $10,320 | ($6,679 | ) | |||||||||||||||||||
| Floor — OTC U.S. CPI Urban Consumers NSA | 217.97 | Maximum of ((1+0.00%)10 - Inflation Adjustment) or $0 | 09/29/20 | CIT | 600,000 | 7,740 | (3,676 | ) | ||||||||||||||||||||
| $ | 18,060 | ( $10,355 | ) | |||||||||||||||||||||||||
Interest Rate Swaptions
| Pay/Receive | ||||||||||||||||||||||||||||
| Floating Rate | ||||||||||||||||||||||||||||
| Based on 3-Month | Exercise | Expiration | Counter- | Notional | ||||||||||||||||||||||||
| Description | USD-LIBOR | Rate | Date | party | Amount | Premium | Value | |||||||||||||||||||||
| Call — OTC 10-Year Interest Rate Swap | Receive | 3.100 | % | 04/25/11 | RBS | $ | 6,600,000 | $ | 26,070 | ( $2,607 | ) | |||||||||||||||||
| Put — OTC 10-Year Interest Rate Swap | Pay | 3.700 | % | 04/25/11 | RBS | 6,600,000 | 26,400 | (36,707 | ) | |||||||||||||||||||
| Put — OTC 10-Year Interest Rate Swap | Pay | 4.000 | % | 06/13/11 | BRC | 400,000 | 5,620 | (2,446 | ) | |||||||||||||||||||
| Put — OTC 10-Year Interest Rate Swap | Pay | 4.000 | % | 06/13/11 | DUB | 1,600,000 | 21,840 | (9,782 | ) | |||||||||||||||||||
| Put — OTC 10-Year Interest Rate Swap | Pay | 4.000 | % | 06/13/11 | RBS | 900,000 | 12,721 | (5,503 | ) | |||||||||||||||||||
| Put — OTC 3-Year Interest Rate Swap | Pay | 2.750 | % | 06/18/12 | DUB | 6,200,000 | 64,360 | (91,715 | ) | |||||||||||||||||||
| Put — OTC 3-Year Interest Rate Swap | Pay | 2.750 | % | 06/18/12 | RBS | 4,400,000 | 43,120 | (65,088 | ) | |||||||||||||||||||
| Put — OTC 3-Year Interest Rate Swap | Pay | 3.000 | % | 06/18/12 | BRC | 4,300,000 | 38,951 | (52,011 | ) | |||||||||||||||||||
| Put — OTC 3-Year Interest Rate Swap | Pay | 3.000 | % | 06/18/12 | CIT | 3,100,000 | 34,590 | (37,496 | ) | |||||||||||||||||||
| Put — OTC 3-Year Interest Rate Swap | Pay | 3.000 | % | 06/18/12 | DUB | 1,900,000 | 21,236 | (22,982 | ) | |||||||||||||||||||
| Put — OTC 3-Year Interest Rate Swap | Pay | 3.000 | % | 06/18/12 | RBS | 6,600,000 | 55,422 | (79,831 | ) | |||||||||||||||||||
| Put — OTC 10-Year Interest Rate Swap | Pay | 10.000 | % | 07/10/12 | MSC | 1,200,000 | 7,230 | (124 | ) | |||||||||||||||||||
| Put — OTC 5-Year Interest Rate Swap | Pay | 3.250 | % | 07/16/12 | CIT | 3,800,000 | 93,949 | (111,573 | ) | |||||||||||||||||||
| Put — OTC 5-Year Interest Rate Swap | Pay | 3.250 | % | 07/16/12 | RBS | 1,200,000 | 30,132 | (35,234 | ) | |||||||||||||||||||
| Put — OTC 2-Year Interest Rate Swap | Pay | 2.250 | % | 09/24/12 | CIT | 700,000 | 4,769 | (9,752 | ) | |||||||||||||||||||
| Put — OTC 2-Year Interest Rate Swap | Pay | 2.250 | % | 09/24/12 | MSC | 4,800,000 | 29,501 | (66,869 | ) | |||||||||||||||||||
| Put — OTC 2-Year Interest Rate Swap | Pay | 2.250 | % | 09/24/12 | RBS | 15,000,000 | 117,839 | (208,965 | ) | |||||||||||||||||||
| Put — OTC 1-Year Interest Rate Swap | Pay | 1.750 | % | 11/19/12 | RBS | 5,400,000 | 20,385 | (44,202 | ) | |||||||||||||||||||
| 628,065 | (880,280 | ) | ||||||||||||||||||||||||||
| $ | 654,135 | ( $882,887 | ) | |||||||||||||||||||||||||
| See Notes to Financial Statements | See explanation of symbols and terms, if any, on page B-61 |
B-21
PACIFIC LIFE FUNDS
PL MANAGED BOND FUND
Schedule of Investments(Continued)
March 31, 2011
PL MANAGED BOND FUND
Schedule of Investments(Continued)
March 31, 2011
Options on Exchange-Traded Futures Contracts
| Exercise | Expiration | Counter- | Number of | |||||||||||||||||||||
| Description | Price | Date | party | Contracts | Premium | Value | ||||||||||||||||||
| Call — CBOT 10-Year U.S. Treasury Note Futures (05/11) | $ | 123.00 | 04/21/11 | MER | 1 | $ | 451 | $ | (31 | ) | ||||||||||||||
| Call — CBOT 10-Year U.S. Treasury Note Futures (06/11) | 122.00 | 05/20/11 | MER | 35 | 15,928 | (9,297 | ) | |||||||||||||||||
| 16,379 | (9,328 | ) | ||||||||||||||||||||||
| Put — CBOT 10-Year U.S. Treasury Note Futures (05/11) | 118.50 | 04/21/11 | MER | 1 | 388 | (562 | ) | |||||||||||||||||
| Put — CBOT 10-Year U.S. Treasury Note Futures (06/11) | 117.00 | 05/20/11 | MER | 30 | 13,519 | (15,000 | ) | |||||||||||||||||
| 13,907 | (15,562 | ) | ||||||||||||||||||||||
| $ | 30,286 | $ | (24,890 | ) | ||||||||||||||||||||
Straddle Options
| Exercise | Expiration | Counter- | Notional | |||||||||||||||||||||
| Description | Price (1) | Date | party | Amount | Premium | Value | ||||||||||||||||||
| Call & Put — OTC 1-Year vs. 1-Year Forward Volatility Agreement Δ | $ | — | 10/11/11 | GSC | $ | 2,000,000 | $ | 10,560 | $ | (16,765 | ) | |||||||||||||
| Call & Put — OTC 1-Year vs. 2-Year Forward Volatility Agreement Δ | — | 10/11/11 | MSC | 6,000,000 | 66,685 | (106,082 | ) | |||||||||||||||||
| Call & Put — OTC 1-Year vs. 2-Year Forward Volatility Agreement Δ | — | 11/14/11 | MSC | 2,800,000 | 30,373 | (49,382 | ) | |||||||||||||||||
| $ | 107,618 | $ | (172,229 | ) | ||||||||||||||||||||
| (1) Exercise price and final cost determined on a future date based upon implied volatility parameters. | ||||||||||||||||||||||||
| Total Written Options | $ | 810,099 | $ | (1,090,361 | ) | |||||||||||||||||||
(l) Swap agreements outstanding as of March 31, 2011 were as follows:
Credit Default Swaps on Corporate and Sovereign Issues — Buy Protection (1)
| Fixed Deal | Implied Credit | Upfront | Unrealized | |||||||||||||||||||||||||||||
| Pay | Expiration | Counter- | Spread at | Notional | Premiums Paid | Appreciation | ||||||||||||||||||||||||||
| Referenced Obligation | Rate | Date | party | 03/31/11 (3) | Amount (4) | Value (5) | (Received) | (Depreciation) | ||||||||||||||||||||||||
| Health Care Properties | ||||||||||||||||||||||||||||||||
| 5.950% due 09/15/11 | (0.460 | %) | 09/20/11 | JPM | 0.001 | % | $ | 700,000 | $ | (1,197 | ) | $ | — | $ | (1,197 | ) | ||||||||||||||||
Credit Default Swaps on Corporate and Sovereign Issues — Sell Protection (2)
| Fixed Deal | Implied Credit | Upfront | Unrealized | |||||||||||||||||||||||||||||
| Receive | Expiration | Counter- | Spread at | Notional | Premiums Paid | Appreciation | ||||||||||||||||||||||||||
| Referenced Obligation | Rate | Date | party | 03/31/11 (3) | Amount (4) | Value (5) | (Received) | (Depreciation) | ||||||||||||||||||||||||
| General Electric Capital Corp | ||||||||||||||||||||||||||||||||
| 6.000% due 06/15/12 | 1.500 | % | 09/20/11 | DUB | 0.330 | % | $ | 100,000 | $ | 609 | $ | — | $ | 609 | ||||||||||||||||||
| MBIA Insurance Corp Debt | 5.000 | % | 09/20/11 | GSC | 9.800 | % | 3,000,000 | (61,973 | ) | (30,000 | ) | (31,973 | ) | |||||||||||||||||||
| General Electric Capital Corp | ||||||||||||||||||||||||||||||||
| 5.625% due 09/15/17 | 4.000 | % | 12/20/13 | CIT | 0.740 | % | 200,000 | 17,790 | — | 17,790 | ||||||||||||||||||||||
| General Electric Capital Corp | ||||||||||||||||||||||||||||||||
| 5.625% due 09/15/17 | 4.230 | % | 12/20/13 | DUB | 0.740 | % | 200,000 | 19,043 | — | 19,043 | ||||||||||||||||||||||
| General Electric Capital Corp | ||||||||||||||||||||||||||||||||
| 5.625% due 09/15/17 | 4.325 | % | 12/20/13 | CIT | 0.740 | % | 200,000 | 19,560 | — | 19,560 | ||||||||||||||||||||||
| General Electric Capital Corp | ||||||||||||||||||||||||||||||||
| 6.000% due 06/15/12 | 4.400 | % | 12/20/13 | BRC | 0.740 | % | 200,000 | 19,987 | — | 19,987 | ||||||||||||||||||||||
| General Electric Capital Corp | ||||||||||||||||||||||||||||||||
| 6.000% due 06/15/12 | 4.500 | % | 12/20/13 | BRC | 0.740 | % | 300,000 | 30,770 | — | 30,770 | ||||||||||||||||||||||
| General Electric Capital Corp | ||||||||||||||||||||||||||||||||
| 6.000% due 06/15/12 | 4.700 | % | 12/20/13 | BRC | 0.740 | % | 400,000 | 43,205 | — | 43,205 | ||||||||||||||||||||||
| General Electric Capital Corp | ||||||||||||||||||||||||||||||||
| 5.625% due 09/15/17 | 4.750 | % | 12/20/13 | DUB | 0.740 | % | 400,000 | 43,750 | — | 43,750 | ||||||||||||||||||||||
| United Mexican States | ||||||||||||||||||||||||||||||||
| 7.500% due 04/08/33 | 1.000 | % | 03/20/15 | BRC | 0.890 | % | 400,000 | 1,814 | (8,999 | ) | 10,813 | |||||||||||||||||||||
| United Mexican States | ||||||||||||||||||||||||||||||||
| 7.500% due 04/08/33 | 1.000 | % | 03/20/15 | CIT | 0.890 | % | 400,000 | 1,814 | (9,184 | ) | 10,998 | |||||||||||||||||||||
| Japanese Government Bond Δ | ||||||||||||||||||||||||||||||||
| 2.000% due 03/21/22 | 1.000 | % | 03/20/15 | DUB | 0.810 | % | 1,000,000 | 7,663 | 11,615 | (3,952 | ) | |||||||||||||||||||||
| United Mexican States | ||||||||||||||||||||||||||||||||
| 7.500% due 04/08/33 | 1.000 | % | 03/20/15 | DUB | 0.890 | % | 200,000 | 907 | (4,592 | ) | 5,499 | |||||||||||||||||||||
| Brazil Government | ||||||||||||||||||||||||||||||||
| 12.250% due 03/06/30 | 1.000 | % | 06/20/15 | DUB | 0.970 | % | 1,000,000 | 1,659 | (10,975 | ) | 12,634 | |||||||||||||||||||||
| United Kingdom Gilt | ||||||||||||||||||||||||||||||||
| 4.250% due 06/07/32 Δ | 1.000 | % | 06/20/15 | GSC | 0.450 | % | 1,100,000 | 25,166 | 10,164 | 15,002 | ||||||||||||||||||||||
| See Notes to Financial Statements | See explanation of symbols and terms, if any, on page B-61 |
B-22
PACIFIC LIFE FUNDS
PL MANAGED BOND FUND
Schedule of Investments (Continued)
March 31, 2011
PL MANAGED BOND FUND
Schedule of Investments (Continued)
March 31, 2011
| Fixed Deal | Implied Credit | Upfront | Unrealized | |||||||||||||||||||||||||||||
| Receive | Expiration | Counter- | Spread at | Notional | Premiums Paid | Appreciation | ||||||||||||||||||||||||||
| Referenced Obligation | Rate | Date | party | 03/31/11 (3) | Amount (4) | Value (5) | (Received) | (Depreciation) | ||||||||||||||||||||||||
| Brazil Government 12.250% due 03/06/30 | 1.000 | % | 06/20/15 | HSB | 0.970 | % | $ | 1,000,000 | $ | 1,660 | ($10,975 | ) | $ | 12,635 | ||||||||||||||||||
| Brazil Government 12.250% due 03/06/30 | 1.000 | % | 09/20/15 | BRC | 1.010 | % | 1,000,000 | (73 | ) | (7,735 | ) | 7,662 | ||||||||||||||||||||
| United Mexican States 7.500% due 04/08/33 | 1.000 | % | 09/20/15 | BRC | 0.960 | % | 1,000,000 | 2,179 | (7,735 | ) | 9,914 | |||||||||||||||||||||
| Brazil Government 12.250% due 03/06/30 | 1.000 | % | 09/20/15 | HSB | 1.010 | % | 600,000 | (44 | ) | (5,962 | ) | 5,918 | ||||||||||||||||||||
| Brazil Government 12.250% due 03/06/30 | 1.000 | % | 09/20/15 | UBS | 1.010 | % | 500,000 | (36 | ) | (4,731 | ) | 4,695 | ||||||||||||||||||||
| France Government Bond OAT 4.250% due 04/25/19 | 0.250 | % | 12/20/15 | GSC | 0.690 | % | 300,000 | (5,993 | ) | (5,883 | ) | (110 | ) | |||||||||||||||||||
| France Government Bond OAT 4.250% due 04/25/19 | 0.250 | % | 12/20/15 | RBS | 0.690 | % | 700,000 | (13,984 | ) | (13,898 | ) | (86 | ) | |||||||||||||||||||
| MetLife Inc 5.000% due 06/15/15 | 1.000 | % | 12/20/15 | CIT | 1.430 | % | 800,000 | (15,078 | ) | (29,082 | ) | 14,004 | ||||||||||||||||||||
| United Kingdom Gilt 4.250% due 06/07/32 Δ | 1.000 | % | 12/20/15 | GSC | 0.510 | % | 1,200,000 | 26,985 | 27,797 | (812 | ) | |||||||||||||||||||||
| General Electric Capital Corp 5.625% due 09/15/17 | 1.000 | % | 12/20/15 | MSC | 1.080 | % | 500,000 | (1,627 | ) | (9,796 | ) | 8,169 | ||||||||||||||||||||
| France Government 4.250% due 04/25/19 | 0.250 | % | 03/20/16 | RBS | 0.720 | % | 2,900,000 | (64,876 | ) | (89,270 | ) | 24,394 | ||||||||||||||||||||
| China Government 4.750% due 10/29/13 Δ | 1.000 | % | 03/20/16 | BRC | 0.680 | % | 1,000,000 | 15,630 | 11,950 | 3,680 | ||||||||||||||||||||||
| Italy Republic 6.875% due 09/27/23 | 1.000 | % | 03/20/16 | BRC | 1.460 | % | 1,100,000 | (22,781 | ) | (40,967 | ) | 18,186 | ||||||||||||||||||||
| United Mexican States 7.500% due 04/08/33 | 1.000 | % | 03/20/16 | BRC | 1.020 | % | 100,000 | (68 | ) | (768 | ) | 700 | ||||||||||||||||||||
| Brazil Government 12.250% due 03/06/30 | 1.000 | % | 03/20/16 | CIT | 1.080 | % | 2,300,000 | (8,071 | ) | (16,240 | ) | 8,169 | ||||||||||||||||||||
| Republic of Kazakhstan Debt | 1.000 | % | 03/20/16 | CIT | 136.740 | % | 300,000 | (5,063 | ) | (8,658 | ) | 3,595 | ||||||||||||||||||||
| Spain Government 5.500% due 07/30/17 | 1.000 | % | 03/20/16 | CIT | 2.310 | % | 900,000 | (52,127 | ) | (54,475 | ) | 2,348 | ||||||||||||||||||||
| United Mexican States 7.500% due 04/08/33 | 1.000 | % | 03/20/16 | CIT | 1.020 | % | 1,100,000 | (753 | ) | (8,978 | ) | 8,225 | ||||||||||||||||||||
| Republic of Kazakhstan Debt | 1.000 | % | 03/20/16 | DUB | 136.740 | % | 300,000 | (5,063 | ) | (9,075 | ) | 4,012 | ||||||||||||||||||||
| United Mexican States 7.500% due 04/08/33 | 1.000 | % | 03/20/16 | DUB | 1.020 | % | 700,000 | (479 | ) | (5,135 | ) | 4,656 | ||||||||||||||||||||
| Italy Republic 6.875% due 09/27/23 | 1.000 | % | 03/20/16 | GSC | 1.460 | % | 4,000,000 | (82,835 | ) | (128,942 | ) | 46,107 | ||||||||||||||||||||
| Spain Government 5.500% due 07/30/17 | 1.000 | % | 03/20/16 | GSC | 2.310 | % | 1,100,000 | (63,712 | ) | (68,499 | ) | 4,787 | ||||||||||||||||||||
| Republic of Kazakhstan Debt | 1.000 | % | 03/20/16 | HSB | 136.740 | % | 400,000 | (6,751 | ) | (11,729 | ) | 4,978 | ||||||||||||||||||||
| Reynolds American Inc 7.625% due 06/01/16 | 1.280 | % | 06/20/17 | DUB | 1.420 | % | 200,000 | (1,485 | ) | — | (1,485 | ) | ||||||||||||||||||||
| MetLife Inc 5.000% due 06/15/15 | 1.000 | % | 03/20/18 | DUB | 1.690 | % | 1,200,000 | (49,632 | ) | (68,165 | ) | 18,533 | ||||||||||||||||||||
| United Mexican States 7.500% due 04/08/33 | 1.000 | % | 03/20/21 | CIT | 1.400 | % | 100,000 | (3,252 | ) | (4,247 | ) | 995 | ||||||||||||||||||||
| $ | (185,565 | ) | $ | (613,169 | ) | $ | 427,604 | |||||||||||||||||||||||||
Credit Default Swaps on Credit Indices — Sell Protection (2)
| �� | Upfront | |||||||||||||||||||||||||||
| Fixed Deal | Premiums | Unrealized | ||||||||||||||||||||||||||
| Receive | Expiration | Notional | Paid | Appreciation | ||||||||||||||||||||||||
| Referenced Obligation | Rate | Date | Counterparty | Amount (4) | Value (5) | (Received) | (Depreciation) | |||||||||||||||||||||
Dow Jones CDX NA HY-8 5Y D | 0.483 | % | 06/20/12 | BRC | $ | 770,352 | $ | 4,343 | $ | — | $ | 4,343 | ||||||||||||||||
Dow Jones CDX NA HY-9 5Y D | 2.080 | % | 12/20/12 | MER | 1,444,065 | 50,291 | — | 50,291 | ||||||||||||||||||||
| Dow Jones CDX NA EM13 5Y | 5.000 | % | 06/20/15 | BRC | 400,000 | 48,342 | 45,500 | 2,842 | ||||||||||||||||||||
| Dow Jones CDX NA EM13 5Y | 5.000 | % | 06/20/15 | DUB | 900,000 | 108,769 | 117,500 | (8,731 | ) | |||||||||||||||||||
| Dow Jones CDX NA EM13 5Y | 5.000 | % | 06/20/15 | HSB | 1,200,000 | 145,026 | 135,550 | 9,476 | ||||||||||||||||||||
| Dow Jones CDX NA EM13 5Y | 5.000 | % | 06/20/15 | MSC | 900,000 | 108,769 | 101,250 | 7,519 | ||||||||||||||||||||
Dow Jones CDX NA IG-15 5Y D | 1.000 | % | 12/20/15 | DUB | 1,800,000 | 13,516 | 3,875 | 9,641 | ||||||||||||||||||||
| Dow Jones CDX NA EM14 5Y | 5.000 | % | 12/20/15 | BRC | 900,000 | 118,438 | 115,050 | 3,388 | ||||||||||||||||||||
| Dow Jones CDX NA EM14 5Y | 5.000 | % | 12/20/15 | CIT | 200,000 | 26,320 | 27,650 | (1,330 | ) | |||||||||||||||||||
| Dow Jones CDX NA EM14 5Y | 5.000 | % | 12/20/15 | DUB | 600,000 | 78,959 | 74,750 | 4,209 | ||||||||||||||||||||
| Dow Jones CDX NA EM14 5Y | 5.000 | % | 12/20/15 | HSB | 200,000 | 26,320 | 26,100 | 220 | ||||||||||||||||||||
| Dow Jones CDX NA EM14 5Y | 5.000 | % | 12/20/15 | MSC | 400,000 | 52,639 | 52,000 | 639 | ||||||||||||||||||||
| Dow Jones CDX NA HY-15 5Y | 5.000 | % | 12/20/15 | MSC | 2,400,000 | 83,284 | 26,125 | 57,159 | ||||||||||||||||||||
| Dow Jones CDX NA EM14 5Y | 5.000 | % | 12/20/15 | UBS | 100,000 | 13,160 | 13,850 | (690 | ) | |||||||||||||||||||
| See Notes to Financial Statements | See explanation of symbols and terms, if any, on page B-61 |
B-23
PACIFIC LIFE FUNDS
PL MANAGED BOND FUND
Schedule of Investments (Continued)
March 31, 2011
PL MANAGED BOND FUND
Schedule of Investments (Continued)
March 31, 2011
| Upfront | ||||||||||||||||||||||||||||
| Fixed Deal | Premiums | Unrealized | ||||||||||||||||||||||||||
| Receive | Expiration | Notional | Paid | Appreciation | ||||||||||||||||||||||||
| Referenced Obligation | Rate | Date | Counterparty | Amount (4) | Value (5) | (Received) | (Depreciation) | |||||||||||||||||||||
| Dow Jones CDX NA EM15 5Y Δ | 5.000 | % | 06/20/16 | DUB | $ | 100,000 | $ | 14,006 | $ | 13,550 | $ | 456 | ||||||||||||||||
| Dow Jones CDX NA IG-9 10Y | 0.548 | % | 12/20/17 | GSC | 96,450 | 1,044 | — | 1,044 | ||||||||||||||||||||
| $ | 893,226 | $ | 752,750 | $ | 140,476 | |||||||||||||||||||||||
| Total Credit Default Swaps | $ | 706,464 | $ | 139,581 | $ | 566,883 | ||||||||||||||||||||||
| (1) | If the fund is a buyer of protection and a credit event occurs, as defined under the terms of that particular swap agreement, the fund will either (i) receive from the seller of protection an amount equal to the notional amount of the swap and deliver the referenced obligation or underlying investments comprising the referenced index or (ii) receive a net settlement amount in the form of cash or investments equal to the notional amount of the swap less the recovery value of the referenced obligation or underlying investments comprising the referenced index. | |
| (2) | If the fund is a seller of protection and a credit event occurs, as defined under the terms of that particular swap agreement, the fund will either (i) pay to the buyer of protection an amount equal to the notional amount of the swap and take delivery of the referenced obligation or underlying investments comprising the referenced index or (ii) pay a net settlement amount in the form of cash or investments equal to the notional amount of the swap less the recovery value of the referenced obligation or underlying investments comprising the referenced index. | |
| (3) | An implied credit spread is the spread in yield between a U.S. Treasury security and the referenced obligation or underlying investment that are identical in all respects except for the quality rating. Implied credit spreads, represented in absolute terms, utilized in determining the value of credit default swap agreements on corporate issues or sovereign issues of an emerging country as of year end serve as an indicator of the current status of the payment/performance risk and represent the likelihood of risk of default for the credit derivative. The implied credit spread of a particular referenced entity reflects the cost of buying/selling protection and may include upfront payments required to be made to enter into the agreement. Wider credit spreads, in comparison to narrower credit spreads, represent a deterioration of the referenced entity’s credit soundness and a greater likelihood of risk of default or other credit event occurring as defined under the terms of the agreement. A credit spread identified as “Defaulted” indicates a credit event has occurred for the referenced entity or obligation. | |
| (4) | The maximum potential amount the fund could be required to make as a seller of credit protection or receive as a buyer of protection if a credit event occurs as defined under the terms of that particular swap agreement. | |
| (5) | The quoted market prices and resulting values for credit default swap agreements on credit indices serve as an indicator of the current status of the payment/performance risk and represent the likelihood of an expected liability (or profit) for the credit derivative should the notional amount of the swap agreement be closed/sold as of the year end. Increasing values in absolute terms when compared to the notional amount of the swap, represent a deterioration of the referenced entity’s credit soundness and a greater likelihood of risk of default or other credit event occurring as defined under the terms of the agreement. |
Interest Rate Swaps
| Upfront | ||||||||||||||||||||||||||||||||
| Premiums | Unrealized | |||||||||||||||||||||||||||||||
| Counter- | Pay/Receive | Fixed | Expiration | Notional | Paid | Appreciation | ||||||||||||||||||||||||||
| Floating Rate Index | party | Floating Rate | Rate | Date | Amount | Value | (Received) | (Depreciation) | ||||||||||||||||||||||||
| 3-Month Australian Bank Bill | CIT | Pay | 4.500 | % | 06/15/11 | AUD 100,000 | ($114 | ) | $ | 115 | ($229 | ) | ||||||||||||||||||||
| 3-Month Australian Bank Bill | DUB | Pay | 4.500 | % | 06/15/11 | 4,720,000 | (5,396 | ) | 4,828 | (10,224 | ) | |||||||||||||||||||||
| 3-Month Australian Bank Bill | MSC | Pay | 4.500 | % | 06/15/11 | 3,600,000 | (4,115 | ) | 3,423 | (7,538 | ) | |||||||||||||||||||||
| 6-Month Australian Bank Bill | CSF | Pay | 6.250 | % | 09/15/11 | 1,200,000 | 7,241 | 129 | 7,112 | |||||||||||||||||||||||
| BRL — CDI Compounded | MSC | Pay | 10.115 | % | 01/02/12 | BRL 8,900,000 | (196,134 | ) | (199,363 | ) | 3,229 | |||||||||||||||||||||
| BRL — CDI Compounded | GSC | Pay | 10.150 | % | 01/02/12 | 6,100,000 | (129,203 | ) | (23,780 | ) | (105,423 | ) | ||||||||||||||||||||
| BRL — CDI Compounded | UBS | Pay | 10.575 | % | 01/02/12 | 1,200,000 | (11,839 | ) | (31,680 | ) | 19,841 | |||||||||||||||||||||
| BRL — CDI Compounded | BRC | Pay | 10.600 | % | 01/02/12 | 1,500,000 | 4,616 | — | 4,616 | |||||||||||||||||||||||
| BRL — CDI Compounded | HSB | Pay | 10.610 | % | 01/02/12 | 1,400,000 | 4,507 | — | 4,507 | |||||||||||||||||||||||
| BRL — CDI Compounded | BRC | Pay | 10.680 | % | 01/02/12 | 5,600,000 | (41,909 | ) | (65,566 | ) | 23,657 | |||||||||||||||||||||
| BRL — CDI Compounded | BRC | Pay | 10.835 | % | 01/02/12 | 600,000 | 3,928 | 1,014 | 2,914 | |||||||||||||||||||||||
| BRL — CDI Compounded | GSC | Pay | 10.990 | % | 01/02/12 | 600,000 | 3,781 | 840 | 2,941 | |||||||||||||||||||||||
| BRL — CDI Compounded | HSB | Pay | 11.140 | % | 01/02/12 | 900,000 | 9,536 | 4,636 | 4,900 | |||||||||||||||||||||||
| BRL — CDI Compounded | HSB | Pay | 11.360 | % | 01/02/12 | 800,000 | 7,410 | 3,212 | 4,198 | |||||||||||||||||||||||
| BRL — CDI Compounded | MSC | Pay | 11.630 | % | 01/02/12 | 4,200,000 | 18,335 | (1,547 | ) | 19,882 | ||||||||||||||||||||||
| BRL — CDI Compounded | RBS | Pay | 12.080 | % | 01/02/12 | 400,000 | 2,952 | 748 | 2,204 | |||||||||||||||||||||||
| BRL — CDI Compounded | MER | Pay | 12.540 | % | 01/02/12 | 4,000,000 | 124,415 | (20,439 | ) | 144,854 | ||||||||||||||||||||||
| BRL — CDI Compounded | MSC | Pay | 12.540 | % | 01/02/12 | 900,000 | 27,993 | (6,048 | ) | 34,041 | ||||||||||||||||||||||
| BRL — CDI Compounded | UBS | Pay | 12.540 | % | 01/02/12 | 3,000,000 | 93,311 | (14,783 | ) | 108,094 | ||||||||||||||||||||||
| BRL — CDI Compounded | HSB | Pay | 14.765 | % | 01/02/12 | 100,000 | 6,270 | 667 | 5,603 | |||||||||||||||||||||||
| BRL — CDI Compounded | MER | Pay | 14.765 | % | 01/02/12 | 200,000 | 12,540 | 1,029 | 11,511 | |||||||||||||||||||||||
| BRL — CDI Compounded | HSB | Pay | 11.880 | % | 01/02/13 | 1,300,000 | 2,213 | (989 | ) | 3,202 | ||||||||||||||||||||||
| BRL — CDI Compounded | GSC | Pay | 11.890 | % | 01/02/13 | 200,000 | 656 | 314 | 342 | |||||||||||||||||||||||
| BRL — CDI Compounded | HSB | Pay | 11.890 | % | 01/02/13 | 2,000,000 | 6,566 | 4,283 | 2,283 | |||||||||||||||||||||||
| BRL — CDI Compounded | BRC | Pay | 11.910 | % | 01/02/13 | 1,000,000 | 2,601 | 2,348 | 253 | |||||||||||||||||||||||
| BRL — CDI Compounded | GSC | Pay | 11.930 | % | 01/02/13 | 900,000 | 3,148 | (1,293 | ) | 4,441 | ||||||||||||||||||||||
| BRL — CDI Compounded | MSC | Pay | 11.980 | % | 01/02/13 | 600,000 | 2,550 | 935 | 1,615 | |||||||||||||||||||||||
| BRL — CDI Compounded | HSB | Pay | 12.300 | % | 01/02/13 | 1,300,000 | 11,856 | 3,928 | 7,928 | |||||||||||||||||||||||
| BRL — CDI Compounded | MSC | Pay | 12.590 | % | 01/02/13 | 2,400,000 | 19,129 | 9,023 | 10,106 | |||||||||||||||||||||||
| 28-Day Mexico Interbank TIIE Banxico | MSC | Pay | 6.500 | % | 03/05/13 | MXN 1,400,000 | (86 | ) | (54 | ) | (32 | ) | ||||||||||||||||||||
| 6-Month EUR-LIBOR | MSC | Pay | 2.500 | % | 09/21/13 | EUR 1,100,000 | (7,347 | ) | (6,424 | ) | (923 | ) | ||||||||||||||||||||
| BRL — CDI Compounded | MSC | Pay | 11.890 | % | 01/02/14 | BRL 3,500,000 | (17,068 | ) | (21 | ) | (17,047 | ) | ||||||||||||||||||||
| BRL — CDI Compounded | UBS | Pay | 12.250 | % | 01/02/14 | 600,000 | 2,751 | 1,667 | 1,084 | |||||||||||||||||||||||
| BRL — CDI Compounded | MSC | Pay | 12.510 | % | 01/02/14 | 200,000 | 1,773 | 919 | 854 | |||||||||||||||||||||||
| See Notes to Financial Statements | See explanation of symbols and terms, if any, on page B-61 |
B-24
PACIFIC LIFE FUNDS
PL MANAGED BOND FUND
Schedule of Investments (Continued)
March 31, 2011
PL MANAGED BOND FUND
Schedule of Investments (Continued)
March 31, 2011
| Upfront | ||||||||||||||||||||||||||||||||
| Premiums | Unrealized | |||||||||||||||||||||||||||||||
| Counter- | Pay/Receive | Fixed | Expiration | Notional | Paid | Appreciation | ||||||||||||||||||||||||||
| Floating Rate Index | party | Floating Rate | Rate | Date | Amount | Value | (Received) | (Depreciation) | ||||||||||||||||||||||||
| BRL — CDI Compounded | HSB | Pay | 12.540 | % | 01/02/14 | BRL 100,000 | $ | 932 | $ | 648 | $ | 284 | ||||||||||||||||||||
| BRL — CDI Compounded | GSC | Pay | 12.650 | % | 01/02/14 | 1,200,000 | 13,237 | 9,626 | 3,611 | |||||||||||||||||||||||
| 28-Day Mexico Interbank TIIE Banxico | HSB | Pay | 7.330 | % | 01/28/15 | MXN 3,200,000 | 5,742 | 1,414 | 4,328 | |||||||||||||||||||||||
| 28-Day Mexico Interbank TIIE Banxico | GSC | Pay | 8.170 | % | 11/04/16 | 1,200,000 | 4,128 | 1,757 | 2,371 | |||||||||||||||||||||||
| 3-Month USD-LIBOR | DUB | Receive | 3.500 | % | 06/15/21 | $ | 1,600,000 | 21,558 | 51,050 | (29,492 | ) | |||||||||||||||||||||
| 3-Month Canadian Bank Bill | RBS | Pay | 5.700 | % | 12/18/24 | CAD 2,100,000 | 21,617 | (1,439 | ) | 23,056 | ||||||||||||||||||||||
| 3-Month USD-LIBOR | BRC | Receive | 4.250 | % | 06/15/41 | $ | 300,000 | 4,175 | 6,750 | (2,575 | ) | |||||||||||||||||||||
| 3-Month USD-LIBOR | CIT | Receive | 4.250 | % | 06/15/41 | 300,000 | 4,175 | 14,040 | (9,865 | ) | ||||||||||||||||||||||
| 3-Month USD-LIBOR | GSC | Receive | 4.250 | % | 06/15/41 | 300,000 | 4,175 | 6,000 | (1,825 | ) | ||||||||||||||||||||||
| 3-Month USD-LIBOR | MSC | Receive | 4.250 | % | 06/15/41 | 1,500,000 | 3,434 | 6,300 | (2,866 | ) | ||||||||||||||||||||||
| 3-Month USD-LIBOR | RBS | Receive | 4.250 | % | 06/15/41 | 600,000 | 8,349 | 18,620 | (10,271 | ) | ||||||||||||||||||||||
| 3-Month USD-LIBOR | UBS | Receive | 4.250 | % | 06/15/41 | 100,000 | 1,392 | 3,775 | (2,383 | ) | ||||||||||||||||||||||
| Total Interest Rate Swaps | $ | 59,781 | $ | (209,388 | ) | $ | 269,169 | |||||||||||||||||||||||||
| Total Swap Agreements | $ | 766,245 | $ | (69,807 | ) | $ | 836,052 | |||||||||||||||||||||||||
| (m) | As of March 31, 2011, investments with total aggregate values of $1,599,445 and $79,978 were fully or partially segregated with the broker(s)/custodian as collateral for open futures and swap contracts, respectively. | |
| (n) | Fair Value Measurements |
The following is a summary of the fund’s investments as categorized under the three-tier hierarchy of inputs used in valuing the fund’s assets and liabilities (See Note 11 in Notes to Financial Statements) as of March 31, 2011:
| Level 2 | Level 3 | |||||||||||||||||||
| Total Value at | Level 1 | Significant | Significant | |||||||||||||||||
| March 31, 2011 | Quoted Price | Observable Inputs | Unobservable Inputs | |||||||||||||||||
| Assets | Convertible Preferred Stocks (1) | $ | 3,144,217 | $ | 3,144,217 | $ | — | $ | — | |||||||||||
| Preferred Stocks (1) | 13,600 | 13,600 | — | — | ||||||||||||||||
| Common Stocks (1) | 12,121 | 12,121 | — | — | ||||||||||||||||
| Corporate Bonds & Notes | 115,431,401 | — | 115,431,401 | — | ||||||||||||||||
| Convertible Corporate Bonds | 1,476,625 | — | 1,476,625 | — | ||||||||||||||||
| Senior Loan Notes | 2,105,907 | — | 2,105,907 | — | ||||||||||||||||
| Mortgage-Backed Securities | 97,617,747 | — | 97,617,747 | — | ||||||||||||||||
| Asset-Backed Securities | 21,072,707 | — | 14,253,352 | 6,819,355 | ||||||||||||||||
| U.S. Government Agency Issues | 3,012,804 | — | 3,012,804 | — | ||||||||||||||||
| U.S. Treasury Obligations | 3,564,288 | — | 3,564,288 | — | ||||||||||||||||
| Foreign Government Bonds & Notes | 10,944,469 | — | 10,096,305 | 848,164 | ||||||||||||||||
| Municipal Bonds | 9,814,001 | — | 9,814,001 | — | ||||||||||||||||
| Short-Term Investments | 148,168,384 | 1,336,925 | 146,831,459 | — | ||||||||||||||||
| Derivatives: | ||||||||||||||||||||
| Credit Contracts | ||||||||||||||||||||
| Swaps | 1,173,417 | — | 1,173,417 | — | ||||||||||||||||
| Foreign Currency Contracts | ||||||||||||||||||||
| Forward Foreign Currency Contracts | 1,082,050 | — | 1,082,050 | — | ||||||||||||||||
| Interest Rate Contracts | ||||||||||||||||||||
| Futures | 447,888 | 447,888 | — | — | ||||||||||||||||
| Swaps | 472,992 | — | 472,992 | — | ||||||||||||||||
| Total Interest Rate Contracts | 920,880 | 447,888 | 472,992 | — | ||||||||||||||||
| Total Assets — Derivatives | 3,176,347 | 447,888 | 2,728,459 | — | ||||||||||||||||
| Total Assets | 419,554,618 | 4,954,751 | 406,932,348 | 7,667,519 | ||||||||||||||||
| Liabilities | Securities Sold Short | (2,540,376 | ) | — | (2,540,376 | ) | — | |||||||||||||
| Derivatives: | ||||||||||||||||||||
| Credit Contracts | ||||||||||||||||||||
| Swaps | (466,953 | ) | — | (466,953 | ) | — | ||||||||||||||
| Foreign Currency Contracts | ||||||||||||||||||||
| Forward Foreign Currency Contracts | (703,225 | ) | — | (703,225 | ) | — | ||||||||||||||
| Interest Rate Contracts | ||||||||||||||||||||
| Futures | (104,213 | ) | (104,213 | ) | — | — | ||||||||||||||
| Written Options | (1,090,361 | ) | (24,890 | ) | (882,887 | ) | (182,584 | ) | ||||||||||||
| Swaps | (413,211 | ) | — | (413,211 | ) | — | ||||||||||||||
| Total Interest Rate Contracts | (1,607,785 | ) | (129,103 | ) | (1,296,098 | ) | (182,584 | ) | ||||||||||||
| Total Liabilities — Derivatives | (2,777,963 | ) | (129,103 | ) | (2,466,276 | ) | (182,584 | ) | ||||||||||||
| Total Liabilities | (5,318,339 | ) | (129,103 | ) | (5,006,652 | ) | (182,584 | ) | ||||||||||||
| Total | $ | 414,236,279 | $ | 4,825,648 | $ | 401,925,696 | $ | 7,484,935 | ||||||||||||
| (1) | For equity investments categorized in a single level, refer to the schedule of investments for further industry breakout. |
| See Notes to Financial Statements | See explanation of symbols and terms, if any, on page B-61 |
B-25
PACIFIC LIFE FUNDS
PL MANAGED BOND FUND
Schedule of Investments (Continued)
March 31, 2011
PL MANAGED BOND FUND
Schedule of Investments (Continued)
March 31, 2011
| The following is a reconciliation of investments for significant unobservable inputs (Level 3) used in valuing the fund’s assets and liabilities (See Note 11 in Notes to Financial Statements) for the year ended March 31, 2011: |
| Change in Net | |||||||||||||||||||||||||||||||||
| Unrealized | |||||||||||||||||||||||||||||||||
| Appreciation | |||||||||||||||||||||||||||||||||
| Total Change | (Depreciation) | ||||||||||||||||||||||||||||||||
| in Net | Transfers | on Level 3 | |||||||||||||||||||||||||||||||
| Value, | Net | Accrued | Total Net | Unrealized | In and/ | Investments Held at | |||||||||||||||||||||||||||
| Beginning | Purchases | Discounts | Realized Gains | Appreciation | or Out of | Value, | the End of Year, | ||||||||||||||||||||||||||
| of Year | (Sales) | (Premiums) | (Losses) | (Depreciation) | Level 3 | End of Year | if Applicable | ||||||||||||||||||||||||||
| Asset-Backed Securities | $ | — | $ | 6,813,009 | $ | — | $ | 2,324 | $ | 4,022 | $ | — | $ | 6,819,355 | $ | 4,022 | |||||||||||||||||
| Foreign Government Bonds & Notes | — | 849,867 | — | — | (1,703 | ) | — | 848,164 | (1,703 | ) | |||||||||||||||||||||||
| Derivatives: | |||||||||||||||||||||||||||||||||
| Credit Contracts | |||||||||||||||||||||||||||||||||
| Written Options | (7,024 | ) | — | — | 8,972 | (1,948 | ) | — | — | — | |||||||||||||||||||||||
| Interest Rate Contracts | |||||||||||||||||||||||||||||||||
| Written Options | (9,872 | ) | (115,358 | ) | — | — | (57,354 | ) | — | (182,584 | ) | (57,354 | ) | ||||||||||||||||||||
| $ | ( 16,896 | ) | $ | 7,547,518 | $ | — | $ | 11,296 | $ | ( 56,983 | ) | $ | — | $ | 7,484,935 | $ | ( 55,035 | ) | |||||||||||||||
| See Notes to Financial Statements | See explanation of symbols and terms,if any, on page B-61 |
B-26
PACIFIC LIFE FUNDS
PL SHORT DURATION BOND FUND
Schedule of Investments
March 31, 2011
PL SHORT DURATION BOND FUND
Schedule of Investments
March 31, 2011
| Principal | ||||||||
| Amount | Value | |||||||
CORPORATE BONDS & NOTES — 33.7% | ||||||||
Consumer Discretionary — 2.5% | ||||||||
| Comcast Cable Communications Holdings Inc | ||||||||
| 8.375% due 03/15/13 | $ | 650,000 | $ | 732,402 | ||||
| Cox Communications Inc | ||||||||
| 7.125% due 10/01/12 | 325,000 | 352,734 | ||||||
| Johnson Controls Inc | ||||||||
| 1.750% due 03/01/14 | 475,000 | 472,930 | ||||||
| NBC Universal Inc | ||||||||
| 2.100% due 04/01/14 ~ | 250,000 | 248,803 | ||||||
| Reed Elsevier Capital Inc | ||||||||
| 4.625% due 06/15/12 | 500,000 | 518,297 | ||||||
| Thomson Reuters Corp (Canada) | ||||||||
| 5.700% due 10/01/14 | 250,000 | 279,355 | ||||||
| Time Warner Cable Inc | ||||||||
| 5.400% due 07/02/12 | 381,000 | 400,573 | ||||||
| 3,005,094 | ||||||||
Consumer Staples — 3.0% | ||||||||
| Anheuser-Busch InBev Worldwide Inc | ||||||||
| 3.000% due 10/15/12 | 375,000 | 385,660 | ||||||
| 5.375% due 11/15/14 | 75,000 | 82,628 | ||||||
| 7.200% due 01/15/14 | 475,000 | 539,562 | ||||||
| BAT International Finance PLC (United Kingdom) | ||||||||
| 8.125% due 11/15/13 ~ | 150,000 | 173,839 | ||||||
| Cargill Inc | ||||||||
| 5.200% due 01/22/13 ~ | 525,000 | 560,673 | ||||||
| General Mills Inc | ||||||||
| 5.250% due 08/15/13 | 200,000 | 217,304 | ||||||
| 6.000% due 02/15/12 | 200,000 | 209,336 | ||||||
| Kellogg Co | ||||||||
| 5.125% due 12/03/12 | 300,000 | 319,983 | ||||||
| Kraft Foods Inc | ||||||||
| 2.625% due 05/08/13 | 275,000 | 281,419 | ||||||
| 6.000% due 02/11/13 | 75,000 | 81,137 | ||||||
| Philip Morris International Inc | ||||||||
| 6.875% due 03/17/14 | 325,000 | 372,961 | ||||||
| The Kroger Co | ||||||||
| 6.750% due 04/15/12 | 100,000 | 105,989 | ||||||
| Wal-Mart Stores Inc | ||||||||
| 3.200% due 05/15/14 | 250,000 | 261,843 | ||||||
| 3,592,334 | ||||||||
Energy — 1.6% | ||||||||
| Apache Corp | ||||||||
| 6.000% due 09/15/13 | 400,000 | 442,434 | ||||||
| BP Capital Markets PLC (United Kingdom) | ||||||||
| 3.125% due 10/01/15 | 225,000 | 226,494 | ||||||
| Enterprise Products Operating LLC | ||||||||
| 4.600% due 08/01/12 | 150,000 | 156,091 | ||||||
| 6.375% due 02/01/13 | 100,000 | 108,100 | ||||||
| 7.625% due 02/15/12 | 100,000 | 105,639 | ||||||
| PC Financial Partnership | ||||||||
| 5.000% due 11/15/14 | 250,000 | 269,579 | ||||||
| Williams Partners LP | ||||||||
| 3.800% due 02/15/15 | 325,000 | 336,385 | ||||||
| XTO Energy Inc | ||||||||
| 7.500% due 04/15/12 | 300,000 | 320,972 | ||||||
| 1,965,694 | ||||||||
Financials — 16.9% | ||||||||
| Banco Bilbao Vizcaya Argentaria SA | ||||||||
| 2.450% due 06/22/12 | 2,400,000 | 2,434,265 | ||||||
| Bank of America Corp | ||||||||
| 0.509% due 06/22/12 § | 1,200,000 | 1,204,325 | ||||||
| 1.723% due 01/30/14 § | 150,000 | 152,578 | ||||||
| 4.500% due 04/01/15 | 75,000 | 77,838 | ||||||
| Bank of Scotland PLC (United Kingdom) | ||||||||
| 5.000% due 11/21/11 ~ | 300,000 | 306,884 | ||||||
| 5.250% due 02/21/17 ~ Δ | 100,000 | 102,735 | ||||||
| Bank of Tokyo-Mitsubishi UFJ Ltd (Japan) | ||||||||
| 2.600% due 01/22/13 ~ | 125,000 | 127,055 | ||||||
| BB&T Corp | ||||||||
| 3.850% due 07/27/12 | 250,000 | 258,825 | ||||||
| BRFkredit AS (Denmark) | ||||||||
| 2.050% due 04/15/13 ~ | 1,100,000 | 1,120,519 | ||||||
| Capital One Financial Corp | ||||||||
| 7.375% due 05/23/14 | 275,000 | 315,598 | ||||||
| Citigroup Inc | ||||||||
| 6.375% due 08/12/14 | 175,000 | 193,422 | ||||||
| Commonwealth Bank of Australia (Australia) | ||||||||
| 2.500% due 12/10/12 ~ | 100,000 | 102,581 | ||||||
| Fifth Third Bank | ||||||||
| 0.424% due 05/17/13 § | 250,000 | 245,889 | ||||||
| FIH Erhvervsbank AS (Denmark) | ||||||||
| 2.000% due 06/12/13 ~ | 1,200,000 | 1,219,679 | ||||||
| General Electric Capital Corp | ||||||||
| 2.000% due 09/28/12 | 800,000 | 816,290 | ||||||
| 2.125% due 12/21/12 | 3,300,000 | 3,377,365 | ||||||
| General Motors Acceptance Corp LLC | ||||||||
| 2.200% due 12/19/12 | 500,000 | 512,151 | ||||||
| HCP Inc | ||||||||
| 2.700% due 02/01/14 | 150,000 | 150,429 | ||||||
| HSBC Finance Corp | ||||||||
| 0.522% due 08/09/11 § | 100,000 | 100,037 | ||||||
| 0.553% due 01/15/14 § | 100,000 | 98,598 | ||||||
| 0.573% due 04/24/12 § | 250,000 | 249,711 | ||||||
| Intesa Sanpaolo SPA (Italy) | ||||||||
| 2.375% due 12/21/12 | 275,000 | 276,900 | ||||||
| JPMorgan Chase & Co | ||||||||
| 1.103% due 01/24/14 § | 500,000 | 503,180 | ||||||
| Kreditanstalt fuer Wiederaufbau (Germany) | ||||||||
| 3.750% due 06/27/11 | 800,000 | 806,316 | ||||||
| Lloyds TSB Bank PLC (United Kingdom) | ||||||||
| 4.375% due 01/12/15 ~ | 150,000 | 152,757 | ||||||
| MassMutual Global Funding II | ||||||||
| 0.809% due 09/27/13 ~ § | 450,000 | 449,765 | ||||||
| MetLife Inc | ||||||||
| 2.375% due 02/06/14 | 125,000 | 125,152 | ||||||
| Metropolitan Life Global Funding I | ||||||||
| 2.500% due 01/11/13 ~ | 525,000 | 533,937 | ||||||
| 5.125% due 06/10/14 ~ | 250,000 | 270,908 | ||||||
| Prudential Financial Inc | ||||||||
| 2.750% due 01/14/13 | 325,000 | 331,307 | ||||||
| 5.100% due 09/20/14 | 100,000 | 107,461 | ||||||
| Rabobank Nederland NV (Netherlands) | ||||||||
| 4.200% due 05/13/14 ~ | 150,000 | 158,779 | ||||||
| Reinsurance Group of America Inc | ||||||||
| 6.750% due 12/15/11 | 175,000 | 181,355 | ||||||
| Simon Property Group LP | ||||||||
| 4.200% due 02/01/15 | 275,000 | 289,166 | ||||||
| Sovereign Bank | ||||||||
| 5.125% due 03/15/13 | 350,000 | 360,747 | ||||||
| Standard Chartered PLC (United Kingdom) | ||||||||
| 3.850% due 04/27/15 ~ | 175,000 | 179,062 | ||||||
| Sun Life Financial Global Funding LP | ||||||||
| 0.553% due 10/06/13 § ~ | 375,000 | 371,986 | ||||||
| Suncorp-Metway Ltd (Australia) | ||||||||
| 1.553% due 04/15/11 § ~ | 900,000 | 900,352 | ||||||
| The Royal Bank of Scotland PLC (United Kingdom) | ||||||||
| 3.400% due 08/23/13 | 225,000 | 230,283 | ||||||
| Wachovia Corp | ||||||||
| 5.500% due 05/01/13 | 475,000 | 511,845 | ||||||
| See Notes to Financial Statements | See explanation of symbols and terms, if any, on page B-61 |
B-27
PACIFIC LIFE FUNDS
PL SHORT DURATION BOND FUND
Schedule of Investments (Continued)
March 31, 2011
PL SHORT DURATION BOND FUND
Schedule of Investments (Continued)
March 31, 2011
| Principal | ||||||||
| Amount | Value | |||||||
| WEA Finance LLC | ||||||||
| 5.400% due 10/01/12 ~ | $ | 375,000 | $ | 396,699 | ||||
| Western Corporate Federal Credit Union | ||||||||
| 1.750% due 11/02/12 | 200,000 | 203,209 | ||||||
| 20,507,940 | ||||||||
Health Care — 2.0% | ||||||||
| Covidien International Finance SA (Luxembourg) | ||||||||
| 1.875% due 06/15/13 | 500,000 | 504,710 | ||||||
| Express Scripts Inc | ||||||||
| 5.250% due 06/15/12 | 225,000 | 235,771 | ||||||
| 6.250% due 06/15/14 | 100,000 | 111,079 | ||||||
| Life Technologies Corp | ||||||||
| 4.400% due 03/01/15 | 250,000 | 260,754 | ||||||
| Medco Health Solutions Inc | ||||||||
| 7.250% due 08/15/13 | 150,000 | 167,973 | ||||||
| Merck & Co Inc | ||||||||
| 1.875% due 06/30/11 | 125,000 | 125,487 | ||||||
| Novartis Capital Corp | ||||||||
| 1.900% due 04/24/13 | 400,000 | 406,665 | ||||||
| Roche Holdings Inc | ||||||||
| 5.000% due 03/01/14 ~ | 144,000 | 156,959 | ||||||
| St Jude Medical Inc | ||||||||
| 2.200% due 09/15/13 | 350,000 | 355,692 | ||||||
| 3.750% due 07/15/14 | 100,000 | 105,039 | ||||||
| 2,430,129 | ||||||||
Industrials — 0.8% | ||||||||
| CSX Corp | ||||||||
| 5.750% due 03/15/13 | 225,000 | 242,431 | ||||||
| Tyco International Finance SA (Luxembourg) | ||||||||
| 6.000% due 11/15/13 | 300,000 | 332,316 | ||||||
| Waste Management Inc | ||||||||
| 5.000% due 03/15/14 | 150,000 | 161,805 | ||||||
| 6.375% due 11/15/12 | 250,000 | 270,947 | ||||||
| 1,007,499 | ||||||||
Information Technology — 1.2% | ||||||||
| Dell Inc | ||||||||
| 1.400% due 09/10/13 | 275,000 | 273,732 | ||||||
| Fiserv Inc | ||||||||
| 6.125% due 11/20/12 | 350,000 | 375,712 | ||||||
| Hewlett-Packard Co | ||||||||
| 2.250% due 05/27/11 | 350,000 | 351,164 | ||||||
| HP Enterprise Services LLC | ||||||||
| 6.000% due 08/01/13 | 375,000 | 412,997 | ||||||
| 1,413,605 | ||||||||
Telecommunication Services — 2.4% | ||||||||
| Rogers Communications Inc (Canada) | ||||||||
| 5.500% due 03/15/14 | 50,000 | 54,877 | ||||||
| 6.250% due 06/15/13 | 300,000 | 330,524 | ||||||
| 6.375% due 03/01/14 | 125,000 | 140,179 | ||||||
| Telecom Italia Capital SA (Luxembourg) | ||||||||
| 5.250% due 11/15/13 | 375,000 | 395,862 | ||||||
| Telefonica Emisiones SAU (Spain) | �� | |||||||
| 5.855% due 02/04/13 | 450,000 | 479,612 | ||||||
| Verizon Wireless Capital LLC | ||||||||
| 3.750% due 05/20/11 | 775,000 | 778,296 | ||||||
| 7.375% due 11/15/13 | 100,000 | 114,108 | ||||||
| Vodafone Group PLC (United Kingdom) | ||||||||
| 5.350% due 02/27/12 | 550,000 | 573,373 | ||||||
| 2,866,831 | ||||||||
Utilities — 3.3% | ||||||||
| Arizona Public Service Co | ||||||||
| 6.500% due 03/01/12 | 250,000 | 262,293 | ||||||
| CenterPoint Energy Resources Corp | ||||||||
| 7.875% due 04/01/13 | 75,000 | 83,914 | ||||||
| Commonwealth Edison Co | ||||||||
| 1.625% due 01/15/14 | 450,000 | 447,049 | ||||||
| Dominion Resources Inc/VA | ||||||||
| 1.800% due 03/15/14 | 325,000 | 324,368 | ||||||
| Duke Energy Corp | ||||||||
| 6.300% due 02/01/14 | 525,000 | 585,127 | ||||||
| Enel Finance International SA (Luxembourg) | ||||||||
| 5.700% due 01/15/13 ~ Δ | 250,000 | 264,637 | ||||||
| FirstEnergy Corp | ||||||||
| 6.450% due 11/15/11 | 5,000 | 5,149 | ||||||
| Georgia Power Co | ||||||||
| 1.300% due 09/15/13 | 325,000 | 324,867 | ||||||
| MidAmerican Energy Holdings Co | ||||||||
| 3.150% due 07/15/12 | 525,000 | 538,160 | ||||||
| 5.000% due 02/15/14 | 250,000 | 268,450 | ||||||
| PacifiCorp | ||||||||
| 5.450% due 09/15/13 | 200,000 | 218,551 | ||||||
| Progress Energy Inc | ||||||||
| 6.050% due 03/15/14 | 150,000 | 165,842 | ||||||
| Southern Co | ||||||||
| 0.703% due 10/21/11 § | 125,000 | 125,325 | ||||||
| Wisconsin Electric Power Co | ||||||||
| 6.000% due 04/01/14 | 375,000 | 419,259 | ||||||
| 4,032,991 | ||||||||
| Total Corporate Bonds & Notes (Cost $40,440,817) | 40,822,117 | |||||||
MORTGAGE-BACKED SECURITIES — 7.2% | ||||||||
Collateralized Mortgage Obligations — Residential — 2.0% | ||||||||
| Citimortgage Alternative Loan Trust | ||||||||
| 6.000% due 12/25/36 “ | 481,969 | 360,113 | ||||||
| Fannie Mae | ||||||||
| 5.000% due 08/25/19 “ | 791,049 | 844,931 | ||||||
| NCUA Guaranteed Notes | ||||||||
| 0.620% due 03/06/20 “ § | 500,000 | 500,000 | ||||||
| 0.672% due 03/11/20 “ § | 500,000 | 500,000 | ||||||
| Structured Adjustable Rate Mortgage Loan Trust | ||||||||
| 2.713% due 11/25/34 “ § | 306,230 | 268,982 | ||||||
| 2,474,026 | ||||||||
Fannie Mae — 5.0% | ||||||||
| 2.107% due 01/01/35 “ § | 1,303,000 | 1,357,611 | ||||||
| 2.535% due 09/01/34 “ § | 1,028,326 | 1,080,625 | ||||||
| 2.686% due 11/01/34 “ § | 803,177 | 848,067 | ||||||
| 2.787% due 09/01/35 “ § | 1,273,046 | 1,340,642 | ||||||
| 5.000% due 01/01/20 “ | 7,471 | 7,987 | ||||||
| 6.000% due 10/01/21 “ | 1,238,774 | 1,354,328 | ||||||
| 5,989,260 | ||||||||
Freddie Mac — 0.2% | ||||||||
| 5.000% due 11/01/16 “ | 228,406 | 244,340 | ||||||
| 5.500% due 01/01/20 “ | 42,629 | 46,469 | ||||||
| 290,809 | ||||||||
| Total Mortgage-Backed Securities (Cost $8,761,712) | 8,754,095 | |||||||
| See Notes to Financial Statements | See explanation of symbols and terms, if any, on page B-61 |
B-28
PACIFIC LIFE FUNDS
PL SHORT DURATION BOND FUND
Schedule of Investments (Continued)
March 31, 2011
PL SHORT DURATION BOND FUND
Schedule of Investments (Continued)
March 31, 2011
| Principal | ||||||||
| Amount | Value | |||||||
ASSET-BACKED SECURITIES — 7.2% | ||||||||
| Bank of America Auto Trust | ||||||||
| 1.670% due 12/15/13 “ ~ Δ | $ | 456,338 | $ | 459,368 | ||||
| College Loan Corp Trust | ||||||||
| 0.403% due 07/25/24 “ § | 1,000,000 | 992,842 | ||||||
| 0.463% due 04/25/21 “ § | 839,987 | 839,383 | ||||||
| Collegiate Funding Services Education Loan Trust I | ||||||||
| 0.399% due 12/28/21 “ § | 398,830 | 393,431 | ||||||
| Ford Credit Auto Owner Trust | ||||||||
| 1.510% due 01/15/14 “ | 600,000 | 604,137 | ||||||
| Nelnet Education Loan Funding Inc | ||||||||
| 0.412% due 11/25/15 “ § | 150,864 | 150,786 | ||||||
| Northstar Education Finance Inc | ||||||||
| 0.424% due 04/28/16 “ § | 648,051 | 628,532 | ||||||
| 0.474% due 04/28/17 “ § | 272,500 | 272,127 | ||||||
| SLM Student Loan Trust | ||||||||
| 0.303% due 07/25/17 “ § | 409,334 | 406,434 | ||||||
| 0.333% due 07/25/18 “ § | 1,500,000 | 1,495,159 | ||||||
| 0.703% due 10/27/14 “ § | 96,467 | 96,524 | ||||||
| Student Loan Consolidation Center | ||||||||
| 1.470% due 10/25/27 “ ~ § Δ | 299,330 | 299,330 | ||||||
| Suntrust Student Loan Trust | ||||||||
| 0.404% due 07/28/20 “ ~ § | 561,439 | 559,533 | ||||||
| World Financial Network Credit Card Master Trust | ||||||||
| 0.385% due 02/15/17 “ ~ § | 1,100,000 | 1,082,160 | ||||||
| 3.790% due 05/15/16 “ | 400,000 | 413,052 | ||||||
| Total Asset-Backed Securities (Cost $8,679,554) | 8,692,798 | |||||||
U.S. GOVERNMENT AGENCY ISSUES — 2.6% | ||||||||
| Fannie Mae | ||||||||
| 2.050% due 04/26/13 | 1,500,000 | 1,501,669 | ||||||
| Federal Home Loan Bank | ||||||||
| 3.125% due 06/10/11 ‡ | 700,000 | 703,723 | ||||||
| Freddie Mac | ||||||||
| 2.750% due 04/29/14 | 700,000 | 701,360 | ||||||
| 4.500% due 01/15/13 | 300,000 | 319,899 | ||||||
| Total U.S. Government Agency Issues (Cost $3,220,011) | 3,226,651 | |||||||
U.S. TREASURY OBLIGATIONS — 33.7% | ||||||||
U.S. Treasury Bonds — 0.2% | ||||||||
| 4.250% due 11/15/40 | 100,000 | 95,563 | ||||||
| 4.375% due 11/15/39 | 100,000 | 97,766 | ||||||
| 4.750% due 02/15/41 | 100,000 | 103,891 | ||||||
| 297,220 | ||||||||
U.S. Treasury Inflation Protected Securities — 0.6% | ||||||||
| 2.375% due 04/15/11 ^ | 665,604 | 667,944 | ||||||
U.S. Treasury Notes — 32.9% | ||||||||
| 2.625% due 11/15/20 | 600,000 | 559,172 | ||||||
| 0.375% due 10/31/12 | 900,000 | 896,625 | ||||||
| 0.625% due 06/30/12 | 9,800,000 | 9,822,609 | ||||||
| 0.625% due 07/31/12 | 900,000 | 901,833 | ||||||
| 0.625% due 01/31/13 | 200,000 | 199,547 | ||||||
| 0.750% due 05/31/12 | 4,600,000 | 4,619,026 | ||||||
| 0.750% due 03/31/13 | 600,000 | 599,206 | ||||||
| 1.000% due 03/31/12 | 3,500,000 | 3,523,510 | ||||||
| 1.000% due 04/30/12 | 6,800,000 | 6,847,852 | ||||||
| 1.250% due 03/15/14 | 2,400,000 | 2,397,374 | ||||||
| 1.375% due 03/15/13 | 900,000 | 909,951 | ||||||
| 1.500% due 12/31/13 | 2,200,000 | 2,219,078 | ||||||
| 2.125% due 02/29/16 | 300,000 | 298,641 | ||||||
| 2.250% due 03/31/16 | 2,175,000 | 2,174,665 | ||||||
| 3.625% due 02/15/21 | 3,800,000 | 3,849,282 | ||||||
| 39,818,371 | ||||||||
| Total U.S. Treasury Obligations (Cost $40,699,567) | 40,783,535 | |||||||
SHORT-TERM INVESTMENTS — 15.0% | ||||||||
Repurchase Agreement — 14.5% | ||||||||
| Bank of America Corp 0.150% due 04/01/11 (Dated 03/31/11, repurchase price of $17,600,073, collateralized by Freddie Mac 4.000% due 03/01/25 and value $17,952,000) | 17,600,000 | 17,600,000 | ||||||
| Shares | ||||||||
Money Market Fund — 0.5% | ||||||||
| BlackRock Liquidity Funds Treasury Trust Fund Portfolio | 550,476 | 550,476 | ||||||
| Total Short-Term Investments (Cost $18,150,476) | 18,150,476 | |||||||
TOTAL INVESTMENTS — 99.4% (Cost $119,952,137) | 120,429,672 | |||||||
OTHER ASSETS & LIABILITIES, NET — 0.6% | 703,551 | |||||||
NET ASSETS — 100.0% | $ | 121,133,223 | ||||||
Notes to Schedule of Investments
| (a) | As of March 31, 2011, the fund was diversified as a percentage of net assets as follows: |
| Corporate Bonds & Notes | 33.7 | % | ||||||
| U.S. Treasury Obligations | 33.7 | % | ||||||
| Short-term Investments | 15.0 | % | ||||||
| Mortgage-Backed Securities | 7.2 | % | ||||||
| Asset-Backed Securities | 7.2 | % | ||||||
| U.S. Government Agency Issues | 2.6 | % | ||||||
| 99.4 | % | |||||||
| Other Assets & Liabilities, Net | 0.6 | % | ||||||
| 100.0 | % | |||||||
| (b) | As of March 31, 2011, the fund’s Standard & Poor’s quality ratings as a percentage of total fixed income investments were as follows: |
| AAA / U.S. Government & Agency Issues | 60.5 | % | ||||||
| A-1 (Short-term debt only) | 14.7 | % | ||||||
| AA | 2.6 | % | ||||||
| A | 10.6 | % | ||||||
| BBB | 9.8 | % | ||||||
| Not Rated | 1.8 | % | ||||||
| 100.0 | % | |||||||
| See Notes to Financial Statements | See explanation of symbols and terms, if any, on page B-61 |
B-29
PACIFIC LIFE FUNDS
PL SHORT DURATION BOND FUND
Schedule of Investments (Continued)
March 31, 2011
PL SHORT DURATION BOND FUND
Schedule of Investments (Continued)
March 31, 2011
| (c) | Short-term investments reflect either the stated coupon rate or the annualized effective yield on the date of purchase for discounted investments. | |
| (d) | Open futures contracts outstanding as of March 31, 2011 were as follows: |
| Unrealized | ||||||||||||
| Number of | Notional | Appreciation | ||||||||||
| Long Futures Outstanding | Contracts | Amount | (Depreciation) | |||||||||
| Eurodollar (06/11) | 5 | $ | 5,000,000 | $ | 864 | |||||||
| U.S. Treasury 2-Year Notes (06/11) | 94 | 18,800,000 | (9,579 | ) | ||||||||
| U.S. Treasury 2-Year Notes (06/11) | 134 | 26,800,000 | 30,159 | |||||||||
| U.S. Treasury Ultra Long Bond (06/11) | 6 | 600,000 | 3,555 | |||||||||
| 24,999 | ||||||||||||
| Short Futures Outstanding | ||||||||||||
| Eurodollar (09/11) | 4 | 4,000,000 | (14,960 | ) | ||||||||
| Eurodollar (12/11) | 4 | 4,000,000 | (17,010 | ) | ||||||||
| U.S. Treasury 5-Year Notes (06/11) | 11 | 1,100,000 | 462 | |||||||||
| U.S. Treasury 5-Year Notes (06/11) | 11 | 1,100,000 | (6,037 | ) | ||||||||
| U.S. Treasury 10-Year Notes (06/11) | 21 | 2,100,000 | (2,835 | ) | ||||||||
| U.S. Treasury 30-Year Bonds (06/11) | 14 | 1,400,000 | 884 | |||||||||
| U.S. Treasury 30-Year Bonds (06/11) | 15 | 1,500,000 | (12,269 | ) | ||||||||
| (51,765 | ) | |||||||||||
| Total Futures Contracts | $ | (26,766 | ) | |||||||||
| (e) | As of March 31, 2011, investments with a total aggregate value of $331,755 were fully or partially segregated with the broker(s)/custodian as collateral for open futures contracts. | |
| (f) | As of March 31, 2011, 0.9% of the fund’s net assets were reported illiquid by the portfolio manager under the Trust’s policy. | |
| (g) | Fair Value Measurements |
| The following is a summary of the fund’s investments as categorized under the three-tier hierarchy of inputs used in valuing the fund’s assets and liabilities (See Note 11 in Notes to Financial Statements) as of March 31, 2011: |
| Level 2 | Level 3 | |||||||||||||||||||
| Total Value at | Level 1 | Significant | Significant | |||||||||||||||||
| March 31, 2011 | Quoted Price | Observable Inputs | Unobservable Inputs | |||||||||||||||||
| Assets | Corporate Bonds & Notes | $ | 40,822,117 | $ | — | $ | 40,822,117 | $ | — | |||||||||||
| Mortgage-Backed Securities | 8,754,095 | — | 7,754,095 | 1,000,000 | ||||||||||||||||
| Asset-Backed Securities | 8,692,798 | — | 8,393,468 | 299,330 | ||||||||||||||||
| U.S. Government Agency Issues | 3,226,651 | — | 3,226,651 | — | ||||||||||||||||
| U.S. Treasury Obligations | 40,783,535 | — | 40,783,535 | — | ||||||||||||||||
| Short-Term Investments | 18,150,476 | 550,476 | 17,600,000 | — | ||||||||||||||||
| Derivatives: | ||||||||||||||||||||
| Interest Rate Contracts | ||||||||||||||||||||
| Futures | 35,924 | 35,924 | — | — | ||||||||||||||||
| Total Assets | 120,465,596 | 586,400 | 118,579,866 | 1,299,330 | ||||||||||||||||
| Liabilities | Derivatives: | |||||||||||||||||||
| Interest Rate Contracts | ||||||||||||||||||||
| Futures | (62,690 | ) | (62,690 | ) | ||||||||||||||||
| Total Liabilities | (62,690 | ) | (62,690 | ) | — | — | ||||||||||||||
| Total | $ | 120,402,906 | $ | 523,710 | $ | 118,579,866 | $ | 1,299,330 | ||||||||||||
The following is a reconciliation of investments for significant unobservable inputs (Level 3) used in valuing the fund’s assets and liabilities (See Note 11 in Notes to Financial Statements) for the year ended March 31, 2011:
| Change in Net | ||||||||||||||||||||||||||||||||
| Unrealized | ||||||||||||||||||||||||||||||||
| Appreciation | ||||||||||||||||||||||||||||||||
| Total Change | (Depreciation) | |||||||||||||||||||||||||||||||
| in Net | Transfers | on Level 3 | ||||||||||||||||||||||||||||||
| Value, | Net | Accrued | Total Net | Unrealized | In and/ | Investments Held at | ||||||||||||||||||||||||||
| Beginning | Purchases | Discounts | Realized Gains | Appreciation | or Out of | Value, | the End of Year, | |||||||||||||||||||||||||
| of Year | (Sales) | (Premiums) | (Losses) | (Depreciation) | Level 3 | End of Year | if Applicable | |||||||||||||||||||||||||
| Mortgage-Backed Securities | $ | — | $ | 1,000,000 | $ | — | $ | — | $ | — | $ | — | $ | 1,000,000 | $ | — | ||||||||||||||||
| Asset-Backed Securities | — | 299,330 | — | — | — | — | 299,330 | — | ||||||||||||||||||||||||
| $ | — | $ | 1,299,330 | $ | — | $ | — | $ | — | $ | — | $ | 1,299,330 | $ | — | |||||||||||||||||
| See Notes to Financial Statements | See explanation of symbols and terms, if any, on page B-61 |
B-30
PACIFIC LIFE FUNDS
PL COMSTOCK FUND
Schedule of Investments
March 31, 2011
PL COMSTOCK FUND
Schedule of Investments
March 31, 2011
| Shares | Value | |||||||
COMMON STOCKS — 94.6% | ||||||||
Consumer Discretionary — 14.7% | ||||||||
| Comcast Corp ‘A’ | 249,205 | $ | 6,160,348 | |||||
| DIRECTV ‘A’ * | 22,000 | 1,029,600 | ||||||
| General Motors Co * | 37,634 | 1,167,783 | ||||||
| Lowe’s Cos Inc | 64,496 | 1,704,629 | ||||||
| Macy’s Inc | 19,880 | 482,289 | ||||||
| News Corp ‘B’ | 126,788 | 2,360,792 | ||||||
| Staples Inc | 55,619 | 1,080,121 | ||||||
| Target Corp | 20,202 | 1,010,302 | ||||||
| The Home Depot Inc | 43,540 | 1,613,592 | ||||||
| Time Warner Cable Inc | 40,999 | 2,924,869 | ||||||
| Time Warner Inc | 42,372 | 1,512,680 | ||||||
| Viacom Inc ‘B’ | 73,881 | 3,436,944 | ||||||
| 24,483,949 | ||||||||
Consumer Staples — 8.2% | ||||||||
| Avon Products Inc | 27,355 | 739,679 | ||||||
| CVS Caremark Corp | 71,703 | 2,460,847 | ||||||
| Kraft Foods Inc ‘A’ | 113,083 | 3,546,283 | ||||||
| PepsiCo Inc | 9,717 | 625,872 | ||||||
| The Coca-Cola Co | 16,415 | 1,089,135 | ||||||
| The Procter & Gamble Co | 8,819 | 543,250 | ||||||
| Unilever NV ‘NY’ (Netherlands) | 91,586 | 2,872,137 | ||||||
| Wal-Mart Stores Inc | 34,857 | 1,814,307 | ||||||
| 13,691,510 | ||||||||
Energy — 11.4% | ||||||||
| BP PLC ADR (United Kingdom) | 41,129 | 1,815,434 | ||||||
| Chevron Corp | 37,884 | 4,069,878 | ||||||
| ConocoPhillips | 10,087 | 805,548 | ||||||
| Halliburton Co | 91,411 | 4,555,924 | ||||||
| Noble Corp (Switzerland) | 21,597 | 985,255 | ||||||
| Royal Dutch Shell PLC ADR ‘A’ (United Kingdom) | 41,502 | 3,023,836 | ||||||
| Total SA ADR (France) | 20,825 | 1,269,700 | ||||||
| Weatherford International Ltd (Switzerland) * | 105,402 | 2,382,085 | ||||||
| 18,907,660 | ||||||||
Financials — 20.3% | ||||||||
| Aflac Inc | 12,377 | 653,258 | ||||||
| Bank of America Corp | 228,676 | 3,048,251 | ||||||
| Citigroup Inc * | 528,833 | 2,337,442 | ||||||
| JPMorgan Chase & Co | 115,298 | 5,315,238 | ||||||
| MetLife Inc | 54,502 | 2,437,875 | ||||||
| Morgan Stanley | 70,370 | 1,922,508 | ||||||
| State Street Corp | 16,968 | 762,542 | ||||||
| The Allstate Corp | 10,431 | 331,497 | ||||||
| The Bank of New York Mellon Corp | 109,747 | 3,278,143 | ||||||
| The Chubb Corp | 50,243 | 3,080,398 | ||||||
| The Goldman Sachs Group Inc | 11,523 | 1,826,050 | ||||||
| The PNC Financial Services Group Inc | 36,424 | 2,294,348 | ||||||
| The Travelers Cos Inc | 33,389 | 1,985,978 | ||||||
| Torchmark Corp | 20,336 | 1,351,937 | ||||||
| U.S. Bancorp | 46,832 | 1,237,770 | ||||||
| Wells Fargo & Co | 60,475 | 1,917,058 | ||||||
| 33,780,293 | ||||||||
Health Care — 12.5% | ||||||||
| Abbott Laboratories | 23,714 | 1,163,172 | ||||||
| Bristol-Myers Squibb Co | 121,550 | 3,212,567 | ||||||
| Cardinal Health Inc | 51,915 | 2,135,264 | ||||||
| GlaxoSmithKline PLC ADR (United Kingdom) | 38,805 | 1,490,500 | ||||||
| Merck & Co Inc | 59,493 | 1,963,864 | ||||||
| Pfizer Inc | 246,799 | 5,012,488 | ||||||
| Roche Holding AG ADR (Switzerland) | 31,559 | 1,134,546 | ||||||
| UnitedHealth Group Inc | 72,346 | 3,270,039 | ||||||
| WellPoint Inc | 19,640 | 1,370,676 | ||||||
| 20,753,116 | ||||||||
Industrials — 6.2% | ||||||||
| Emerson Electric Co | 19,056 | 1,113,442 | ||||||
| General Electric Co | 128,296 | 2,572,335 | ||||||
| Honeywell International Inc | 35,088 | 2,095,104 | ||||||
| Ingersoll-Rand PLC (Ireland) | 55,348 | 2,673,862 | ||||||
| Textron Inc | 39,448 | 1,080,481 | ||||||
| Tyco International Ltd (Switzerland) | 19,614 | 878,119 | ||||||
| 10,413,343 | ||||||||
Information Technology — 11.2% | ||||||||
| Accenture PLC ‘A’ (Ireland) | 12,507 | 687,510 | ||||||
| Cisco Systems Inc | 71,955 | 1,234,028 | ||||||
| Dell Inc * | 134,735 | 1,955,005 | ||||||
| eBay Inc * | 94,277 | 2,926,358 | ||||||
| Hewlett-Packard Co | �� | 88,432 | 3,623,059 | |||||
| Intel Corp | 44,867 | 904,967 | ||||||
| KLA-Tencor Corp | 21,442 | 1,015,707 | ||||||
| Microsoft Corp | 128,560 | 3,260,282 | ||||||
| The Western Union Co | 23,663 | 491,480 | ||||||
| Yahoo! Inc * | 156,205 | 2,600,813 | ||||||
| 18,699,209 | ||||||||
Materials — 4.7% | ||||||||
| Alcoa Inc | 148,838 | 2,626,991 | ||||||
| International Paper Co | 171,020 | 5,161,384 | ||||||
| 7,788,375 | ||||||||
Telecommunication Services — 3.2% | ||||||||
| AT&T Inc | 52,254 | 1,598,972 | ||||||
| Verizon Communications Inc | 55,016 | 2,120,317 | ||||||
| Vodafone Group PLC ADR (United Kingdom) | 56,827 | 1,633,776 | ||||||
| 5,353,065 | ||||||||
Utilities — 2.2% | ||||||||
| American Electric Power Co Inc | 19,292 | 677,921 | ||||||
| FirstEnergy Corp | 31,342 | 1,162,475 | ||||||
| PPL Corp | 51,396 | 1,300,319 | ||||||
| Sempra Energy | 9,530 | 509,855 | ||||||
| 3,650,570 | ||||||||
| Total Common Stocks (Cost $124,087,219) | 157,521,090 | |||||||
SHORT-TERM INVESTMENT — 5.1% | ||||||||
Money Market Fund — 5.1% | ||||||||
| BlackRock Liquidity Funds Treasury Trust Fund Portfolio | 8,526,551 | 8,526,551 | ||||||
| Total Short-Term Investment (Cost $8,526,551) | 8,526,551 | |||||||
TOTAL INVESTMENTS — 99.7% (Cost $132,613,770) | 166,047,641 | |||||||
OTHER ASSETS & LIABILITIES, NET — 0.3% | 417,624 | |||||||
NET ASSETS — 100.0% | $ | 166,465,265 | ||||||
| See Notes to Financial Statements | See explanation of symbols and terms, if any, on page B-61 |
B-31
PACIFIC LIFE FUNDS
PL COMSTOCK FUND
Schedule of Investments (Continued)
March 31, 2011
PL COMSTOCK FUND
Schedule of Investments (Continued)
March 31, 2011
Notes to Schedule of Investments
| (a) | As of March 31, 2011, the fund was diversified as a percentage of net assets as follows: |
| Financials | 20.3 | % | ||
| Consumer Discretionary | 14.7 | % | ||
| Health Care | 12.5 | % | ||
| Energy | 11.4 | % | ||
| Information Technology | 11.2 | % | ||
| Consumer Staples | 8.2 | % | ||
| Industrials | 6.2 | % | ||
| Short-Term Investment | 5.1 | % | ||
| Materials | 4.7 | % | ||
| Telecommunication Services | 3.2 | % | ||
| Utilities | 2.2 | % | ||
| 99.7 | % | |||
| Other Assets & Liabilities, Net | 0.3 | % | ||
| 100.0 | % | |||
| (b) | Fair Value Measurements | |
| The following is a summary of the fund’s investments as categorized under the three-tier hierarchy of inputs used in valuing the fund’s assets and liabilities (See Note 11 in Notes to Financial Statements) as of March 31, 2011: |
| Level 2 | Level 3 | |||||||||||||||||||
| Total Value at | Level 1 | Significant | Significant | |||||||||||||||||
| March 31, 2011 | Quoted Price | Observable Inputs | Unobservable Inputs | |||||||||||||||||
| Assets | Common Stocks (1) | $ | 157,521,090 | $ | 157,521,090 | $ | — | $ | — | |||||||||||
| Short-Term Investment | 8,526,551 | 8,526,551 | — | — | ||||||||||||||||
| Total | $ | 166,047,641 | $ | 166,047,641 | $ | — | $ | — | ||||||||||||
| (1) | For equity investments categorized in a single level, refer to the schedule of investments for further industry breakout. |
| See Notes to Financial Statements | See explanation of symbols and terms, if any, on page B-61 |
B-32
PACIFIC LIFE FUNDS
PL GROWTH LT FUND
Schedule of Investments
March 31, 2011
PL GROWTH LT FUND
Schedule of Investments
March 31, 2011
| Shares | Value | |||||||||||
COMMON STOCKS — 94.5% | ||||||||||||
Consumer Discretionary — 10.9% | ||||||||||||
| CBS Corp ‘B’ | 104,625 | $ | 2,619,810 | |||||||||
| Cie Financiere Richemont SA ‘A’ (Switzerland) | 17,251 | 994,693 | ||||||||||
| Crown Ltd (Australia) | 111,734 | 941,202 | ||||||||||
| International Game Technology | 55,365 | 898,574 | ||||||||||
| Lamar Advertising Co ‘A’ * | 9,645 | 356,286 | ||||||||||
| Limited Brands Inc | 38,210 | 1,256,345 | ||||||||||
| Mattel Inc | 33,395 | 832,537 | ||||||||||
| Netflix Inc * | 3,855 | 914,907 | ||||||||||
| Nike Inc ‘B’ | 5,860 | 443,602 | ||||||||||
| Nordstrom Inc | 16,570 | 743,662 | ||||||||||
| Polo Ralph Lauren Corp | 7,450 | 921,193 | ||||||||||
| The Walt Disney Co | 38,450 | 1,656,811 | ||||||||||
| 12,579,622 | ||||||||||||
Consumer Staples — 7.2% | ||||||||||||
| Anheuser-Busch InBev NV (Belgium) | 38,149 | 2,174,935 | ||||||||||
| Anheuser-Busch InBev NV Strip VVPR (Belgium) * | 110,992 | 786 | ||||||||||
| Coca-Cola Enterprises Inc | 25,570 | 698,061 | ||||||||||
| Colgate-Palmolive Co | 13,605 | 1,098,740 | ||||||||||
| Philip Morris International Inc | 34,635 | 2,273,095 | ||||||||||
| SABMiller PLC (United Kingdom) | 16,962 | 600,271 | ||||||||||
| Walgreen Co | 36,795 | 1,476,951 | ||||||||||
| 8,322,839 | ||||||||||||
Energy — 11.0% | ||||||||||||
| Apache Corp | 13,610 | 1,781,821 | ||||||||||
| Canadian Natural Resources Ltd (Canada) | 26,480 | 1,308,906 | ||||||||||
| EOG Resources Inc | 13,285 | 1,574,405 | ||||||||||
| Halliburton Co | 34,050 | 1,697,052 | ||||||||||
| Hess Corp | 18,240 | 1,554,230 | ||||||||||
| Occidental Petroleum Corp | 40,000 | 4,179,600 | ||||||||||
| OGX Petroleo e Gas Participacoes SA ADR (Brazil) * | 53,700 | 660,510 | ||||||||||
| 12,756,524 | ||||||||||||
Financials — 7.8% | ||||||||||||
| Aflac Inc | 18,640 | 983,819 | ||||||||||
| Citigroup Inc * | 370,940 | 1,639,555 | ||||||||||
| JPMorgan Chase & Co | 27,593 | 1,272,037 | ||||||||||
| Mizuho Financial Group Inc (Japan) | 463,300 | 764,487 | ||||||||||
| Morgan Stanley | 49,170 | 1,343,324 | ||||||||||
| Prudential PLC (United Kingdom) | 78,945 | 894,032 | ||||||||||
| T. Rowe Price Group Inc | 22,430 | 1,489,801 | ||||||||||
| The Charles Schwab Corp | 35,560 | 641,147 | ||||||||||
| 9,028,202 | ||||||||||||
Health Care — 16.4% | ||||||||||||
| AmerisourceBergen Corp | 24,010 | 949,836 | ||||||||||
| Bristol-Myers Squibb Co | 45,825 | 1,211,155 | ||||||||||
| Celgene Corp * | 45,275 | 2,604,671 | ||||||||||
| Covidien PLC (Ireland) | 50,040 | 2,599,078 | ||||||||||
| DaVita Inc * | 9,235 | 789,685 | ||||||||||
| Endo Pharmaceuticals Holdings Inc* | 34,630 | 1,321,481 | ||||||||||
| Medco Health Solutions Inc * | 53,570 | 3,008,491 | ||||||||||
| Mylan Inc * | 40,515 | 918,475 | ||||||||||
| Pfizer Inc | 162,985 | 3,310,225 | ||||||||||
| UnitedHealth Group Inc | 30,745 | 1,389,674 | ||||||||||
| Vertex Pharmaceuticals Inc * | 18,596 | 891,306 | ||||||||||
| 18,994,077 | ||||||||||||
Industrials — 7.6% | ||||||||||||
| C.H. Robinson Worldwide Inc | 15,730 | 1,166,065 | ||||||||||
| Emerson Electric Co | 14,315 | 836,425 | ||||||||||
| Expeditors International of Washington Inc | 19,865 | 996,031 | ||||||||||
| FANUC Corp (Japan) | 4,800 | 725,553 | ||||||||||
| Precision Castparts Corp | 9,385 | 1,381,284 | ||||||||||
| Sensata Technologies Holding Inc (Netherlands) * | 17,031 | 591,487 | ||||||||||
| Tyco International Ltd (Switzerland) | 20,660 | 924,948 | ||||||||||
| Union Pacific Corp | 15,985 | 1,571,805 | ||||||||||
| Verisk Analytics Inc ‘A’ * | 16,085 | 526,945 | ||||||||||
| 8,720,543 | ||||||||||||
Information Technology — 26.7% | ||||||||||||
| Amphenol Corp ‘A’ | 23,563 | 1,281,592 | ||||||||||
| Apple Inc * | 12,640 | 4,404,408 | ||||||||||
| Cisco Systems Inc | 107,795 | 1,848,684 | ||||||||||
| eBay Inc * | 150,940 | 4,685,178 | ||||||||||
| Google Inc ‘A’ * | 6,485 | 3,801,572 | ||||||||||
| International Business Machines Corp | 14,420 | 2,351,469 | ||||||||||
| Microsoft Corp | 214,155 | 5,430,971 | ||||||||||
| ON Semiconductor Corp * | 109,317 | 1,078,959 | ||||||||||
| Oracle Corp | 52,895 | 1,765,106 | ||||||||||
| Taiwan Semiconductor Manufacturing Co Ltd (Taiwan) | 382,453 | 916,459 | ||||||||||
| TE Connectivity Ltd (Switzerland) | 42,655 | 1,485,247 | ||||||||||
| Teradata Corp * | 25,095 | 1,272,317 | ||||||||||
| The Western Union Co | 27,410 | 569,306 | ||||||||||
| 30,891,268 | ||||||||||||
Materials — 3.9% | ||||||||||||
| E.I. Du Pont de Nemours & Co | 24,285 | 1,334,946 | ||||||||||
| K+S AG (Germany) | 23,371 | 1,762,305 | ||||||||||
| Nucor Corp | 29,565 | 1,360,581 | ||||||||||
| 4,457,832 | ||||||||||||
Telecommunication Services — 3.0% | ||||||||||||
| Crown Castle International Corp * | 81,700 | 3,476,335 | ||||||||||
| Total Common Stocks (Cost $88,344,719) | 109,227,242 | |||||||||||
EXCHANGE-TRADED FUND — 0.6% | ||||||||||||
| SPDR Gold Shares * | 4,840 | 676,729 | ||||||||||
| Total Exchange-Traded Fund (Cost $672,966) | 676,729 | |||||||||||
| Principal | ||||||||
| Amount | ||||||||
SHORT-TERM INVESTMENTS — 4.8% | ||||||||
U.S. Government Agency Issues — 3.9% | ||||||||
| Federal Home Loan Bank 0.001% due 04/01/11 | $ | 4,500,000 | 4,500,000 | |||||
| See Notes to Financial Statements | See explanation of symbols and terms, if any, on page B-61 |
B-33
PACIFIC LIFE FUNDS
PL GROWTH LT FUND
Schedule of Investments (Continued)
March 31, 2011
PL GROWTH LT FUND
Schedule of Investments (Continued)
March 31, 2011
| Shares | Value | |||||||
Money Market Fund — 0.9% | ||||||||
| BlackRock Liquidity Funds Treasury Trust Fund Portfolio | 1,051,976 | $ | 1,051,976 | |||||
| Total Short-Term Investments (Cost $5,551,976) | 5,551,976 | |||||||
TOTAL INVESTMENTS — 99.9% (Cost $94,569,661) | 115,455,947 | |||||||
OTHER ASSETS & LIABILITIES, NET — 0.1% | 119,880 | |||||||
NET ASSETS — 100.0% | $ | 115,575,827 | ||||||
Notes to Schedule of Investments
| (a) | As of March 31, 2011, the fund was diversified as a percentage of net assets as follows: |
| Information Technology | 26.7 | % | ||
| Health Care | 16.4 | % | ||
| Energy | 11.0 | % | ||
| Consumer Discretionary | 10.9 | % | ||
| Financials | 7.8 | % | ||
| Industrials | 7.6 | % | ||
| Consumer Staples | 7.2 | % | ||
| Short-Term Investments | 4.8 | % | ||
| Materials | 3.9 | % | ||
| Telecommunication Services | 3.0 | % | ||
| Exchange-Traded Fund | 0.6 | % | ||
| 99.9 | % | |||
| Other Assets & Liabilities, Net | 0.1 | % | ||
| 100.0 | % | |||
| (b) | Short-term investments reflect either the stated coupon rate or the annualized effective yield on the date of purchase for discounted investments. |
| (c) | Forward foreign currency contracts outstanding as of March 31, 2011 were as follows: |
| Contracts | Principal Amount | Unrealized | ||||||||||||||||||
| to Buy or | Covered by | Appreciation | ||||||||||||||||||
| to Sell | Currency | Contracts | Expiration | Counterparty | (Depreciation) | |||||||||||||||
| Sell | EUR | 350,000 | 04/11 | JPM | $ | (15,905 | ) | |||||||||||||
| Sell | EUR | 870,000 | 05/11 | CSF | (29,225 | ) | ||||||||||||||
| Sell | EUR | 210,000 | 05/11 | HSB | (239 | ) | ||||||||||||||
| Buy | GBP | 60,000 | 04/11 | JPM | (929 | ) | ||||||||||||||
| Sell | GBP | 295,000 | 04/11 | JPM | 5,385 | |||||||||||||||
| Sell | GBP | 65,000 | 04/11 | JPM | (126 | ) | ||||||||||||||
| Buy | GBP | 165,000 | 05/11 | CSF | (4,399 | ) | ||||||||||||||
| Sell | GBP | 325,000 | 05/11 | CSF | 5,849 | |||||||||||||||
| $ | (39,589 | ) | ||||||||||||||||||
| (d) | Fair Value Measurements | |
| The following is a summary of the fund’s investments as categorized under the three-tier hierarchy of inputs used in valuing the fund’s assets and liabilities (See Note 11 in Notes to Financial Statements) as of March 31, 2011: |
| Level 2 | Level 3 | |||||||||||||||||||
| Total Value at | Level 1 | Significant | Significant | |||||||||||||||||
| March 31, 2011 | Quoted Price | Observable Inputs | Unobservable Inputs | |||||||||||||||||
| Assets | Common Stocks | |||||||||||||||||||
| Consumer Discretionary | $ | 12,579,622 | $ | 10,643,727 | $ | 1,935,895 | $ | — | ||||||||||||
| Consumer Staples | 8,322,839 | 5,547,633 | 2,775,206 | — | ||||||||||||||||
| Energy | 12,756,524 | 12,756,524 | — | — | ||||||||||||||||
| Financials | 9,028,202 | 7,369,683 | 1,658,519 | — | ||||||||||||||||
| Health Care | 18,994,077 | 18,994,077 | — | — | ||||||||||||||||
| Industrials | 8,720,543 | 7,994,990 | 725,553 | — | ||||||||||||||||
| Information Technology | 30,891,268 | 29,974,809 | 916,459 | — | ||||||||||||||||
| �� | Materials | 4,457,832 | 2,695,527 | 1,762,305 | — | |||||||||||||||
| Telecommunication Services | 3,476,335 | 3,476,335 | — | — | ||||||||||||||||
| 109,227,242 | 99,453,305 | 9,773,937 | — | |||||||||||||||||
| Exchange-Traded Fund | 676,729 | 676,729 | — | — | ||||||||||||||||
| Short-Term Investments | 5,551,976 | 1,051,976 | 4,500,000 | — | ||||||||||||||||
| Derivatives: | ||||||||||||||||||||
| Foreign Currency Contracts | ||||||||||||||||||||
| Forward Foreign Currency Contracts | 11,234 | — | 11,234 | — | ||||||||||||||||
| Total Assets | 115,467,181 | 101,182,010 | 14,285,171 | — | ||||||||||||||||
| Liabilities | Derivatives: | |||||||||||||||||||
| Foreign Currency Contracts | ||||||||||||||||||||
| Forward Foreign Currency Contracts | (50,823 | ) | — | (50,823 | ) | — | ||||||||||||||
| Total Liabilities | (50,823 | ) | — | (50,823 | ) | — | ||||||||||||||
| Total | $ | 115,416,358 | $ | 101,182,010 | $ | 14,234,348 | $ | — | ||||||||||||
| See Notes to Financial Statements | See explanation of symbols and terms, if any, on page B-61 |
B-34
PACIFIC LIFE FUNDS
PL LARGE-CAP GROWTH FUND
Schedule of Investments
March 31, 2011
PL LARGE-CAP GROWTH FUND
Schedule of Investments
March 31, 2011
| Shares | Value | |||||||
COMMON STOCKS — 98.5% | ||||||||
Consumer Discretionary — 18.7% | ||||||||
| Amazon.com Inc * | 20,600 | $ | 3,710,678 | |||||
| Discovery Communications Inc ‘A’ * | 39,400 | 1,572,060 | ||||||
| Focus Media Holding Ltd ADR (Cayman) * | 57,600 | 1,766,592 | ||||||
| International Game Technology | 86,700 | 1,407,141 | ||||||
| Las Vegas Sands Corp * | 52,200 | 2,203,884 | ||||||
| McDonald’s Corp | 43,800 | 3,332,742 | ||||||
| Nike Inc ‘B’ | 22,500 | 1,703,250 | ||||||
| priceline.com Inc * | 5,500 | 2,785,420 | ||||||
| 18,481,767 | ||||||||
Consumer Staples — 4.0% | ||||||||
| CVS Caremark Corp | 54,700 | 1,877,304 | ||||||
| Kellogg Co | 38,900 | 2,099,822 | ||||||
| 3,977,126 | ||||||||
Energy — 9.6% | ||||||||
| Anadarko Petroleum Corp | 19,600 | 1,605,632 | ||||||
| Cimarex Energy Co | 9,100 | 1,048,684 | ||||||
| Concho Resources Inc * | 18,100 | 1,942,130 | ||||||
| CONSOL Energy Inc | 28,400 | 1,523,092 | ||||||
| FMC Technologies Inc * | 14,800 | 1,398,304 | ||||||
| Schlumberger Ltd (Netherlands) | 10,900 | 1,016,534 | ||||||
| Suncor Energy Inc (Canada) | 21,400 | 959,576 | ||||||
| 9,493,952 | ||||||||
Financials — 3.8% | ||||||||
| CME Group Inc ‘A’ | 8,300 | 2,502,865 | ||||||
| The Goldman Sachs Group Inc | 7,900 | 1,251,913 | ||||||
| 3,754,778 | ||||||||
Health Care — 8.3% | ||||||||
| Agilent Technologies Inc * | 47,200 | 2,113,616 | ||||||
| Allergan Inc | 40,800 | 2,897,616 | ||||||
| Express Scripts Inc * | 27,900 | 1,551,519 | ||||||
| Watson Pharmaceuticals Inc * | 30,300 | 1,697,103 | ||||||
| 8,259,854 | ||||||||
Industrials — 11.9% | ||||||||
| C.H. Robinson Worldwide Inc | 27,200 | 2,016,336 | ||||||
| Danaher Corp | 35,300 | 1,832,070 | ||||||
| Parker-Hannifin Corp | 13,800 | 1,306,584 | ||||||
| Precision Castparts Corp | 14,200 | 2,089,956 | ||||||
| Roper Industries Inc | 15,600 | 1,348,776 | ||||||
| Union Pacific Corp | 11,200 | 1,101,296 | ||||||
| United Technologies Corp | 25,200 | 2,133,180 | ||||||
| 11,828,198 | ||||||||
Information Technology — 34.0% | ||||||||
| Apple Inc * | 19,800 | 6,899,310 | ||||||
| Baidu Inc ADR (Cayman) * | 13,800 | 1,901,778 | ||||||
| EMC Corp * | 142,200 | 3,775,410 | ||||||
| Google Inc ‘A’ * | 8,500 | 4,982,785 | ||||||
| Juniper Networks Inc * | 29,200 | 1,228,736 | ||||||
| MasterCard Inc ‘A’ | 4,400 | 1,107,568 | ||||||
| MercadoLibre Inc | 5,500 | 448,965 | ||||||
| Oracle Corp | 86,400 | 2,883,168 | ||||||
| QUALCOMM Inc | 57,800 | 3,169,174 | ||||||
| Red Hat Inc * | 22,100 | 1,003,119 | ||||||
| Riverbed Technology Inc * | 43,200 | 1,626,480 | ||||||
| salesforce.com inc * | 6,400 | 854,912 | ||||||
| SINA Corp (Cayman) * | 14,200 | 1,519,968 | ||||||
| Teradata Corp * | 44,800 | 2,271,360 | ||||||
| 33,672,733 | ||||||||
Materials — 5.9% | ||||||||
| Freeport-McMoRan Copper & Gold Inc | 28,600 | 1,588,730 | ||||||
| Potash Corp of Saskatchewan Inc (Canada) | 23,100 | 1,361,283 | ||||||
| Praxair Inc | 9,700 | 985,520 | ||||||
| The Sherwin-Williams Co | 22,000 | 1,847,780 | ||||||
| 5,783,313 | ||||||||
Telecommunication Services — 2.3% | ||||||||
| Crown Castle International Corp * | 54,100 | 2,301,955 | ||||||
| Total Common Stocks (Cost $74,457,608) | 97,553,676 | |||||||
EXCHANGE-TRADED FUND — 0.3% | ||||||||
| iShares Russell 1000 Growth Index Fund | 5,300 | 320,491 | ||||||
| Total Exchange-Traded Fund (Cost $299,253) | 320,491 | |||||||
SHORT-TERM INVESTMENT — 0.9% | ||||||||
Money Market Fund — 0.9% | ||||||||
| BlackRock Liquidity Funds Treasury Trust Fund Portfolio | 909,297 | 909,297 | ||||||
| Total Short-Term Investment (Cost $909,297) | 909,297 | |||||||
TOTAL INVESTMENTS — 99.7% (Cost $75,666,158) | 98,783,464 | |||||||
OTHER ASSETS & LIABILITIES, NET — 0.3% | 317,422 | |||||||
NET ASSETS — 100.0% | $ | 99,100,886 | ||||||
Notes to Schedule of Investments
| (a) | As of March 31, 2011, the fund was diversified as a percentage of net assets as follows: |
| Information Technology | 34.0 | % | ||
| Consumer Discretionary | 18.7 | % | ||
| Industrials | 11.9 | % | ||
| Energy | 9.6 | % | ||
| Health Care | 8.3 | % | ||
| Materials | 5.9 | % | ||
| Consumer Staples | 4.0 | % | ||
| Financials | 3.8 | % | ||
| Telecommunication Services | 2.3 | % | ||
| Short-Term Investment | 0.9 | % | ||
| Exchange-Traded Fund | 0.3 | % | ||
| 99.7 | % | |||
| Other Assets & Liabilities, Net | 0.3 | % | ||
| 100.0 | % | |||
| See Notes to Financial Statements | See explanation of symbols and terms, if any, on page B-61 |
B-35
PACIFIC LIFE FUNDS
PL LARGE-CAP GROWTH FUND FUND
Schedule of Investments (Continued)
March 31, 2011
PL LARGE-CAP GROWTH FUND FUND
Schedule of Investments (Continued)
March 31, 2011
| (b) | Fair Value Measurements | |
| The following is a summary of the fund’s investments as categorized under the three-tier hierarchy of inputs used in valuing the fund’s assets and liabilities (See Note 11 in Notes to Financial Statements) as of March 31, 2011: |
| Level 2 | Level 3 | |||||||||||||||||||
| Total Value at | Level 1 | Significant | Significant | |||||||||||||||||
| March 31, 2011 | Quoted Price | Observable Inputs | Unobservable Inputs | |||||||||||||||||
| Assets | Common Stocks (1) | $ | 97,553,676 | $ | 97,553,676 | $ | — | $ | — | |||||||||||
| Exchange-Traded Fund | 320,491 | 320,491 | — | — | ||||||||||||||||
| Short-Term Investment | 909,297 | 909,297 | — | — | ||||||||||||||||
| Total | $ | 98,783,464 | $ | 98,783,464 | $ | — | $ | — | ||||||||||||
| (1) | For equity investments categorized in a single level, refer to the schedule of investments for further industry breakout. |
| See Notes to Financial Statements | See explanation of symbols and terms, if any, on page B-61 |
B-36
PACIFIC LIFE FUNDS
PL LARGE-CAP VALUE FUND
Schedule of Investments
March 31, 2011
PL LARGE-CAP VALUE FUND
Schedule of Investments
March 31, 2011
| Shares | Value | |||||||
COMMON STOCKS - 97.7% | ||||||||
Consumer Discretionary - 16.8% | ||||||||
| DISH Network Corp ‘A’ * | 188,681 | $ | 4,596,269 | |||||
| Johnson Controls Inc | 59,372 | 2,468,094 | ||||||
| McDonald’s Corp | 31,672 | 2,409,922 | ||||||
| News Corp ‘A’ | 420,987 | 7,392,532 | ||||||
| SES SA FDR (Luxembourg) | 156,732 | 4,035,320 | ||||||
| Target Corp | 39,975 | 1,999,150 | ||||||
| The Home Depot Inc | 82,006 | 3,039,142 | ||||||
| Time Warner Cable Inc | 81,011 | 5,779,325 | ||||||
| Time Warner Inc | 189,334 | 6,759,224 | ||||||
| 38,478,978 | ||||||||
Consumer Staples - 11.0% | ||||||||
| Altria Group Inc | 84,980 | 2,212,029 | ||||||
| CVS Caremark Corp | 71,261 | 2,445,678 | ||||||
| Kimberly-Clark Corp | 90,661 | 5,917,444 | ||||||
| Lorillard Inc | 26,796 | 2,545,888 | ||||||
| Philip Morris International Inc | 113,454 | 7,445,986 | ||||||
| Unilever PLC ADR (United Kingdom) | 77,205 | 2,364,017 | ||||||
| Wal-Mart Stores Inc | 41,666 | 2,168,715 | ||||||
| 25,099,757 | ||||||||
Energy - 14.9% | ||||||||
| Apache Corp | 20,035 | 2,622,982 | ||||||
| El Paso Corp | 369,565 | 6,652,170 | ||||||
| Exxon Mobil Corp | 69,004 | 5,805,307 | ||||||
| Halliburton Co | 78,767 | 3,925,747 | ||||||
| Royal Dutch Shell PLC ADR ‘A’ (United Kingdom) | 43,358 | 3,159,064 | ||||||
| Suncor Energy Inc (Canada) | 88,114 | 3,951,032 | ||||||
| Total SA ADR (France) | 86,554 | 5,277,197 | ||||||
| Transocean Ltd (Switzerland) * | 33,813 | 2,635,723 | ||||||
| 34,029,222 | ||||||||
Financials - 21.5% | ||||||||
| American Express Co | 82,914 | 3,747,713 | ||||||
| Bank of America Corp | 286,267 | 3,815,939 | ||||||
| JPMorgan Chase & Co | 165,497 | 7,629,412 | ||||||
| Loews Corp | 78,583 | 3,386,142 | ||||||
| Marsh & McLennan Cos Inc | 121,505 | 3,622,064 | ||||||
| MetLife Inc | 49,389 | 2,209,170 | ||||||
| State Street Corp | 58,264 | 2,618,384 | ||||||
| The Bank of New York Mellon Corp | 69,839 | 2,086,091 | ||||||
| The Charles Schwab Corp | 141,535 | 2,551,876 | ||||||
| The Chubb Corp | 35,400 | 2,170,374 | ||||||
| The Progressive Corp | 106,871 | 2,258,184 | ||||||
| The Travelers Cos Inc | 55,359 | 3,292,753 | ||||||
| U.S. Bancorp | 81,908 | 2,164,828 | ||||||
| Wells Fargo & Co | 242,811 | 7,697,109 | ||||||
| 49,250,039 | ||||||||
Health Care - 6.2% | ||||||||
| Johnson & Johnson | 60,773 | 3,600,800 | ||||||
| Merck & Co Inc | 65,550 | 2,163,806 | ||||||
| Novartis AG ADR (Switzerland) | 61,981 | 3,368,667 | ||||||
| Pfizer Inc | 119,590 | 2,428,873 | ||||||
| WellPoint Inc | 36,695 | 2,560,944 | ||||||
| 14,123,090 | ||||||||
Industrials - 10.2% | ||||||||
| General Electric Co | 261,876 | 5,250,614 | ||||||
| Honeywell International Inc | 91,592 | 5,468,958 | ||||||
| Illinois Tool Works Inc | 56,698 | 3,045,817 | ||||||
| Raytheon Co | 69,691 | 3,545,181 | ||||||
| United Technologies Corp | 69,884 | 5,915,681 | ||||||
| 23,226,251 | ||||||||
Information Technology - 7.8% | ||||||||
| Hewlett-Packard Co | 72,525 | 2,971,349 | ||||||
| International Business Machines Corp | 33,156 | 5,406,749 | ||||||
| Microsoft Corp | 127,729 | 3,239,207 | ||||||
| Motorola Solutions Inc * | 61,590 | 2,752,457 | ||||||
| Xerox Corp | 328,986 | 3,503,701 | ||||||
| 17,873,463 | ||||||||
Materials - 3.1% | ||||||||
| Air Products & Chemicals Inc | 49,198 | 4,436,676 | ||||||
| Crown Holdings Inc * | 67,792 | 2,615,415 | ||||||
| 7,052,091 | ||||||||
Telecommunication Services - 4.4% | ||||||||
| AT&T Inc | 103,219 | 3,158,501 | ||||||
| CenturyLink Inc | 106,558 | 4,427,485 | ||||||
| Verizon Communications Inc | 64,070 | 2,469,258 | ||||||
| 10,055,244 | ||||||||
Utilities - 1.8% | ||||||||
| Sempra Energy | 76,598 | 4,097,993 | ||||||
| Total Common Stocks (Cost $178,252,013) | 223,286,128 | |||||||
SHORT-TERM INVESTMENT - 3.4% | ||||||||
Money Market Fund - 3.4% | ||||||||
| BlackRock Liquidity Funds Treasury | ||||||||
| Trust Fund Portfolio | 7,708,826 | 7,708,826 | ||||||
| Total Short-Term Investment (Cost $7,708,826) | 7,708,826 | |||||||
TOTAL INVESTMENTS - 101.1% (Cost $185,960,839) | 230,994,954 | |||||||
OTHER ASSETS & LIABILITIES, NET - (1.1%) | (2,559,365 | ) | ||||||
NET ASSETS - 100.0% | $ | 228,435,589 | ||||||
Notes to Schedule of Investments
| (a) | As of March 31, 2011, the fund was diversified as a percentage of net assets as follows: |
| Financials | 21.5 | % | ||
| Consumer Discretionary | 16.8 | % | ||
| Energy | 14.9 | % | ||
| Consumer Staples | 11.0 | % | ||
| Industrials | 10.2 | % | ||
| Information Technology | 7.8 | % | ||
| Health Care | 6.2 | % | ||
| Telecommunication Services | 4.4 | % | ||
| Short-Term Investment | 3.4 | % | ||
| Materials | 3.1 | % | ||
| Utilities | 1.8 | % | ||
| 101.1 | % | |||
| Other Assets & Liabilities, Net | (1.1 | %) | ||
| 100.0 | % | |||
| See Notes to Financial Statements | See explanation of symbols and terms, if any, on page B-61 |
B-37
PACIFIC LIFE FUNDS
PL LARGE-CAP VALUE FUND
Schedule of Investments (Continued)
March 31, 2011
PL LARGE-CAP VALUE FUND
Schedule of Investments (Continued)
March 31, 2011
| (b) | Fair Value Measurements | |
| The following is a summary of the fund’s investments as categorized under the three-tier hierarchy of inputs used in valuing the fund’s assets and liabilities (See Note 11 in Notes to Financial Statements) as of March 31, 2011: |
| Level 2 | Level 3 | |||||||||||||||||||
| Total Value at | Level 1 | Significant | Significant | |||||||||||||||||
| March 31, 2011 | Quoted Price | Observable Inputs | Unobservable Inputs | |||||||||||||||||
| Assets | Common Stocks | |||||||||||||||||||
| Consumer Discretionary | $ | 38,478,978 | $ | 34,443,658 | $ | 4,035,320 | $ | — | ||||||||||||
| Consumer Staples | 25,099,757 | 25,099,757 | — | — | ||||||||||||||||
| Energy | 34,029,222 | 34,029,222 | — | — | ||||||||||||||||
| Financials | 49,250,039 | 49,250,039 | — | — | ||||||||||||||||
| Health Care | 14,123,090 | 14,123,090 | — | — | ||||||||||||||||
| Industrials | 23,226,251 | 23,226,251 | — | — | ||||||||||||||||
| Information Technology | 17,873,463 | 17,873,463 | — | — | ||||||||||||||||
| Materials | 7,052,091 | 7,052,091 | — | — | ||||||||||||||||
| Telecommunication Services | 10,055,244 | 10,055,244 | — | — | ||||||||||||||||
| Utilities | 4,097,993 | 4,097,993 | — | — | ||||||||||||||||
| 223,286,128 | 219,250,808 | 4,035,320 | — | |||||||||||||||||
| Short-Term Investment | 7,708,826 | 7,708,826 | — | — | ||||||||||||||||
| Total | $ | 230,994,954 | $ | 226,959,634 | $ | 4,035,320 | $ | — | ||||||||||||
| See Notes to Financial Statements | See explanation of symbols and terms, if any, on page B-61 |
B-38
PACIFIC LIFE FUNDS
PL MAIN STREET®CORE FUND
Schedule of Investments
March 31, 2011
PL MAIN STREET®CORE FUND
Schedule of Investments
March 31, 2011
| Shares | Value | |||||||
COMMON STOCKS — 95.9% | ||||||||
Consumer Discretionary — 10.7% | ||||||||
| AutoZone Inc * | 8,280 | $ | 2,265,077 | |||||
| Ford Motor Co * | 323,132 | 4,817,898 | ||||||
| Hyatt Hotels Corp ‘A’ * | 51,768 | 2,228,095 | ||||||
| McDonald’s Corp | 16,282 | 1,238,897 | ||||||
| The McGraw-Hill Cos Inc | 93,688 | 3,691,307 | ||||||
| The TJX Cos Inc | 32,680 | 1,625,176 | ||||||
| The Washington Post Co ‘B’ | 2,262 | 989,761 | ||||||
| 16,856,211 | ||||||||
Consumer Staples - 10.3% | ||||||||
| Dr Pepper Snapple Group Inc | 84,000 | 3,121,440 | ||||||
| General Mills Inc | 81,470 | 2,977,729 | ||||||
| Mead Johnson Nutrition Co | 41,280 | 2,391,350 | ||||||
| Philip Morris International Inc | 92,130 | 6,046,492 | ||||||
| Sara Lee Corp | 98,570 | 1,741,732 | ||||||
| 16,278,743 | ||||||||
Energy — 12.0% | ||||||||
| Chevron Corp | 67,294 | 7,229,394 | ||||||
| Enterprise Products Partners LP | 42,706 | 1,838,920 | ||||||
| Kinder Morgan Inc * | 23,570 | 698,615 | ||||||
| Noble Energy Inc | 21,568 | 2,084,547 | ||||||
| Occidental Petroleum Corp | 62,868 | 6,569,077 | ||||||
| Plains All American Pipeline LP | 9,072 | 578,159 | ||||||
| 18,998,712 | ||||||||
Financials — 18.5% | ||||||||
| Aflac Inc | 54,568 | 2,880,099 | ||||||
| Bank of America Corp | 265,500 | 3,539,115 | ||||||
| CIT Group Inc * | 129,340 | 5,503,417 | ||||||
| Citigroup Inc * | 825,884 | 3,650,407 | ||||||
| State Street Corp | 69,562 | 3,126,116 | ||||||
| The Goldman Sachs Group Inc | 14,242 | 2,256,930 | ||||||
| The Progressive Corp | 151,738 | 3,206,224 | ||||||
| Wells Fargo & Co | 158,670 | 5,029,839 | ||||||
| 29,192,147 | ||||||||
Health Care — 10.8% | ||||||||
| Abbott Laboratories | 74,870 | 3,672,373 | ||||||
| Celgene Corp * | 44,032 | 2,533,161 | ||||||
| Express Scripts Inc * | 31,586 | 1,756,498 | ||||||
| Human Genome Sciences Inc * | 28,432 | 780,458 | ||||||
| Intuitive Surgical Inc * | 670 | 223,418 | ||||||
| Merck & Co Inc | 59,420 | 1,961,454 | ||||||
| Teva Pharmaceutical Industries Ltd ADR (Israel) | 46,818 | 2,348,859 | ||||||
| Waters Corp * | 5,070 | 440,583 | ||||||
| WellPoint Inc | 48,440 | 3,380,628 | ||||||
| 17,097,432 | ||||||||
Industrials — 8.5% | ||||||||
| KBR Inc | 23,340 | 881,552 | ||||||
| Norfolk Southern Corp | 9,020 | 624,815 | ||||||
| Precision Castparts Corp | 9,834 | 1,447,368 | ||||||
| The Boeing Co | 20,928 | 1,547,207 | ||||||
| Tyco International Ltd (Switzerland) | 94,245 | 4,219,349 | ||||||
| United Parcel Service Inc ‘B’ | 62,406 | 4,638,014 | ||||||
| 13,358,305 | ||||||||
Information Technology — 17.9% | ||||||||
| Apple Inc * | 20,892 | 7,279,818 | ||||||
| Check Point Software Technologies Ltd (Israel) * | 25,954 | 1,324,952 | ||||||
| eBay Inc * | 161,470 | 5,012,029 | ||||||
| Google Inc ‘A’ * | 6,906 | 4,048,366 | ||||||
| Marvell Technology Group Ltd (Bermuda) * | 136,620 | 2,124,441 | ||||||
| Microsoft Corp | 140,382 | 3,560,088 | ||||||
| QUALCOMM Inc | 75,632 | 4,146,903 | ||||||
| Western Digital Corp * | 19,090 | 711,866 | ||||||
| 28,208,463 | ||||||||
Materials — 1.7% | ||||||||
| Praxair Inc | 26,312 | 2,673,299 | ||||||
Telecommunication Services — 2.3% | ||||||||
| America Movil SAB de CV ‘L’ ADR (Mexico) | 63,610 | 3,695,741 | ||||||
Utilities — 3.2% | ||||||||
| The AES Corp * | 390,208 | 5,072,704 | ||||||
| Total Common Stocks (Cost $121,503,418) | 151,431,757 | |||||||
SHORT-TERM INVESTMENT — 3.9% | ||||||||
Money Market Fund — 3.9% | ||||||||
| BlackRock Liquidity Funds Treasury | ||||||||
| Trust Fund Portfolio | 6,204,498 | 6,204,498 | ||||||
| Total Short-Term Investment (Cost $6,204,498) | 6,204,498 | |||||||
TOTAL INVESTMENTS — 99.8% (Cost $127,707,916) | 157,636,255 | |||||||
OTHER ASSETS & LIABILITIES, NET — 0.2% | 253,347 | |||||||
NET ASSETS — 100.0% | $ | 157,889,602 | ||||||
Notes to Schedule of Investments
| (a) | As of March 31, 2011, the fund was diversified as a percentage of net assets as follows: |
| Financials | 18.5 | % | ||
| Information Technology | 17.9 | % | ||
| Energy | 12.0 | % | ||
| Health Care | 10.8 | % | ||
| Consumer Discretionary | 10.7 | % | ||
| Consumer Staples | 10.3 | % | ||
| Industrials | 8.5 | % | ||
| Short-Term Investment | 3.9 | % | ||
| Utilities | 3.2 | % | ||
| Telecommunication Services | 2.3 | % | ||
| Materials | 1.7 | % | ||
| 99.8 | % | |||
| Other Assets & Liabilities, Net | 0.2 | % | ||
| 100.0 | % | |||
| See Notes to Financial Statements | See explanation of symbols and terms, if any, on page B-61 |
B-39
PACIFIC LIFE FUNDS
PL MAIN STREET CORE FUND
Schedule of Investments (Continued)
March 31, 2011
PL MAIN STREET CORE FUND
Schedule of Investments (Continued)
March 31, 2011
| (b) | Fair Value Measurements | |
| The following is a summary of the fund’s investments as categorized under the three-tier hierarchy of inputs used in valuing the fund’s assets and liabilities (See Note 11 in Notes to Financial Statements) as of March 31, 2011: |
| Level 2 | Level 3 | |||||||||||||||||||
| Total Value at | Level 1 | Significant | Significant | |||||||||||||||||
| March 31, 2011 | Quoted Price | Observable Inputs | Unobservable Inputs | |||||||||||||||||
| Assets | Common Stocks (1) | $ | 151,431,757 | $ | 151,431,757 | $ | — | $ | — | |||||||||||
| Short-Term Investment | 6,204,498 | 6,204,498 | — | — | ||||||||||||||||
| Total | $ | 157,636,255 | $ | 157,636,255 | $ | — | $ | — | ||||||||||||
| (1) | For equity investments categorized in a single level, refer to the schedule of investments for further industry breakout. |
| See Notes to Financial Statements | See explanation of symbols and terms, if any, on page B-61 |
B-40
PACIFIC LIFE FUNDS
PL MID-CAP EQUITY FUND
Schedule of Investments
March 31, 2011
PL MID-CAP EQUITY FUND
Schedule of Investments
March 31, 2011
| Shares | Value | |||||||
CONVERTIBLE PREFERRED STOCKS — 0.4% | ||||||||
Industrials — 0.4% | ||||||||
Better Place LLC ‘B’ 8.000% * Δ + | 191,233 | $ | 573,700 | |||||
| Total Convertible Preferred Stocks (Cost $573,700) | 573,700 | |||||||
COMMON STOCKS — 96.7% | ||||||||
Consumer Discretionary — 16.8% | ||||||||
| AutoZone Inc * | 8,660 | 2,369,029 | ||||||
| Cablevision Systems Corp ‘A’ | 44,160 | 1,528,377 | ||||||
| Darden Restaurants Inc | 41,090 | 2,018,752 | ||||||
| DeVry Inc | 41,300 | 2,274,391 | ||||||
| DreamWorks Animation SKG Inc ‘A’ * | 36,600 | 1,022,238 | ||||||
| International Game Technology | 122,300 | 1,984,929 | ||||||
| Lear Corp | 39,200 | 1,915,704 | ||||||
| Mattel Inc | 65,340 | 1,628,926 | ||||||
| Newell Rubbermaid Inc | 173,430 | 3,317,716 | ||||||
| Ross Stores Inc | 13,700 | 974,344 | ||||||
| Sirius XM Radio Inc * | 323,800 | 537,508 | ||||||
| Stanley Black & Decker Inc | 20,000 | 1,532,000 | ||||||
| The Interpublic Group of Cos Inc | 62,600 | 786,882 | ||||||
| The TJX Cos Inc | 19,070 | 948,351 | ||||||
| 22,839,147 | ||||||||
Consumer Staples — 6.7% | ||||||||
| Avon Products Inc | 36,130 | 976,955 | ||||||
| Campbell Soup Co | 47,600 | 1,576,036 | ||||||
| Energizer Holdings Inc * | 600 | 42,696 | ||||||
| Molson Coors Brewing Co ‘B’ | 76,140 | 3,570,205 | ||||||
| Ralcorp Holdings Inc * | 42,950 | 2,939,069 | ||||||
| 9,104,961 | ||||||||
Energy — 8.7% | ||||||||
| Arch Coal Inc | 35,220 | 1,269,329 | ||||||
| EQT Corp | 49,540 | 2,472,046 | ||||||
| Noble Energy Inc | 13,210 | 1,276,747 | ||||||
| Rowan Cos Inc * | 53,940 | 2,383,069 | ||||||
| The Williams Cos Inc | 73,150 | 2,280,817 | ||||||
| Tidewater Inc | 36,400 | 2,178,540 | ||||||
| 11,860,548 | ||||||||
Financials — 13.4% | ||||||||
| Ameriprise Financial Inc | 55,300 | 3,377,724 | ||||||
| City National Corp | 33,390 | 1,904,899 | ||||||
| Fifth Third Bancorp | 105,900 | 1,469,892 | ||||||
| Invesco Ltd (Bermuda) | 104,100 | 2,660,796 | ||||||
| KeyCorp | 104,910 | 931,601 | ||||||
| NYSE Euronext | 19,060 | 670,340 | ||||||
| PartnerRe Ltd (Bermuda) | 22,990 | 1,821,728 | ||||||
| Principal Financial Group Inc | 60,830 | 1,953,251 | ||||||
| The Macerich Co REIT | 30,700 | 1,520,571 | ||||||
| Weingarten Realty Investors REIT | 76,000 | 1,904,560 | ||||||
| 18,215,362 | ||||||||
Health Care — 9.1% | ||||||||
| CareFusion Corp * | 62,220 | 1,754,604 | ||||||
| DENTSPLY International Inc | 25,400 | 939,546 | ||||||
| HealthSouth Corp * | 36,000 | 899,280 | ||||||
| Hospira Inc * | 27,950 | 1,542,840 | ||||||
| Laboratory Corp of America Holdings * | 12,500 | 1,151,625 | ||||||
| Life Technologies Corp * | 33,337 | 1,747,526 | ||||||
| Medicis Pharmaceutical Corp ‘A’ | 20,700 | 663,228 | ||||||
| Warner Chilcott PLC ‘A’ (Ireland) | 76,000 | 1,769,280 | ||||||
| Zimmer Holdings Inc * | 30,880 | 1,869,166 | ||||||
| 12,337,095 | ||||||||
Industrials — 14.6% | ||||||||
| Corrections Corp of America * | 76,190 | 1,859,036 | ||||||
| Dover Corp | 73,240 | 4,814,797 | ||||||
| Equifax Inc | 71,100 | 2,762,235 | ||||||
| Foster Wheeler AG (Switzerland) * | 34,460 | 1,296,385 | ||||||
| Joy Global Inc | 13,090 | 1,293,423 | ||||||
| Parker-Hannifin Corp | 31,500 | 2,982,420 | ||||||
| Rockwell Collins Inc | 51,390 | 3,331,614 | ||||||
| Thomas & Betts Corp * | 25,700 | 1,528,379 | ||||||
| 19,868,289 | ||||||||
Information Technology — 15.1% | ||||||||
| Amdocs Ltd (United Kingdom) * | 55,100 | 1,589,635 | ||||||
| Analog Devices Inc | 42,220 | 1,662,624 | ||||||
| AOL Inc * | 33,300 | 650,349 | ||||||
| BMC Software Inc * | 49,540 | 2,464,119 | ||||||
| Ingram Micro Inc ‘A’ * | 132,610 | 2,788,788 | ||||||
| Intuit Inc * | 27,150 | 1,441,665 | ||||||
| Lender Processing Services Inc | 29,600 | 952,824 | ||||||
| Motorola Mobility Holdings Inc * | 35,510 | 866,444 | ||||||
| Quest Software Inc * | 43,200 | 1,096,848 | ||||||
| Symantec Corp * | 106,490 | 1,974,325 | ||||||
| Teradata Corp * | 28,100 | 1,424,670 | ||||||
| Teradyne Inc * | 91,100 | 1,622,491 | ||||||
| Xilinx Inc | 57,400 | 1,882,720 | ||||||
| 20,417,502 | ||||||||
Materials — 8.2% | ||||||||
| Ball Corp | 85,720 | 3,073,062 | ||||||
| Cliffs Natural Resources Inc | 17,550 | 1,724,814 | ||||||
| Compass Minerals International Inc | 22,640 | 2,117,519 | ||||||
| Eastman Chemical Co | 13,710 | 1,361,677 | ||||||
| Rock-Tenn Co ‘A’ | 23,300 | 1,615,855 | ||||||
| United States Steel Corp | 23,200 | 1,251,408 | ||||||
| 11,144,335 | ||||||||
Utilities — 4.1% | ||||||||
| CMS Energy Corp | 70,900 | 1,392,476 | ||||||
| Energen Corp | 43,850 | 2,767,812 | ||||||
| Wisconsin Energy Corp | 45,100 | 1,375,550 | ||||||
| 5,535,838 | ||||||||
| Total Common Stocks (Cost $104,019,613) | 131,323,077 | |||||||
SHORT-TERM INVESTMENT — 2.9% | ||||||||
Money Market Fund — 2.9% | ||||||||
| BlackRock Liquidity Funds Treasury | ||||||||
| Trust Fund Portfolio | 3,889,021 | 3,889,021 | ||||||
| Total Short-Term Investment (Cost $3,889,021) | 3,889,021 | |||||||
TOTAL INVESTMENTS — 100.0% (Cost $108,482,334) | 135,785,798 | |||||||
OTHER ASSETS & LIABILITIES, NET — (0.0%) | (30,411 | ) | ||||||
NET ASSETS — 100.0% | $ | 135,755,387 | ||||||
| See Notes to Financial Statements | See explanation of symbols and terms, if any, on page B-61 |
B-41
PACIFIC LIFE FUNDS
PL MID-CAP EQUITY FUND
Schedule of Investments (Continued)
March 31, 2011
PL MID-CAP EQUITY FUND
Schedule of Investments (Continued)
March 31, 2011
Notes to Schedule of Investments
(a) As of March 31, 2011, the fund was diversified as a percentage of net assets as follows:
| Consumer Discretionary | 16.8 | % | ||
| Information Technology | 15.1 | % | ||
| Industrials | 15.0 | % | ||
| Financials | 13.4 | % | ||
| Health Care | 9.1 | % | ||
| Energy | 8.7 | % | ||
| Materials | 8.2 | % | ||
| Consumer Staples | 6.7 | % | ||
| Utilities | 4.1 | % | ||
| Short-Term Investment | 2.9 | % | ||
| 100.0 | % | |||
| Other Assets & Liabilities, Net | (0.0 | %) | ||
| 100.0 | % | |||
| (b) | An investment with a total aggregate value of $573,700 or 0.4% of the net assets was valued by a Trustee Valuation Committee or determined by a Board approved valuation committee or a delegate of the Board and then approved by the Board. | |
| (c) | As of March 31, 2011, 0.4% of the fund’s net assets were reported illiquid by the portfolio manager under the Trust’s policy. | |
| (d) | Fair Value Measurements | |
| The following is a summary of the fund’s investments as categorized under the three-tier hierarchy of inputs used in valuing the fund’s assets and liabilities (See Note 11 in Notes to Financial Statements) as of March 31, 2011: |
| Level 2 | Level 3 | |||||||||||||||||||
| Total Value at | Level 1 | Significant | Significant | |||||||||||||||||
| March 31, 2011 | Quoted Price | Observable Inputs | Unobservable Inputs | |||||||||||||||||
| Assets | Convertible Preferred Stocks (1) | $ | 573,700 | $ | — | $ | — | $ | 573,700 | |||||||||||
| Common Stocks (1) | 131,323,077 | 131,323,077 | — | — | ||||||||||||||||
| Short-Term Investment | 3,889,021 | 3,889,021 | — | — | ||||||||||||||||
| Total | $ | 135,785,798 | $ | 135,212,098 | $ | — | $ | 573,700 | ||||||||||||
The following is a reconciliation of investments for significant unobservable inputs (Level 3) used in valuing the fund’s assets and liabilities (See Note 11 in Notes to Financial Statements) for the year ended March 31, 2011:
| Change in Net | |||||||||||||||||||||||||||||||
| Unrealized | |||||||||||||||||||||||||||||||
| Appreciation | |||||||||||||||||||||||||||||||
| Total Change | (Depreciation) | ||||||||||||||||||||||||||||||
| in Net | Transfers | on Level 3 | |||||||||||||||||||||||||||||
| Value, | Net | Total Net | Unrealized | In and/ | Investments Held at | ||||||||||||||||||||||||||
| Beginning | Purchases | Realized | Appreciation | or Out of | Value, | the End of Year, | |||||||||||||||||||||||||
| of Year | (Sales) | Gains (Losses) | (Depreciation) | Level 3 | End of Year | if Applicable | |||||||||||||||||||||||||
| Convertible Preferred Stocks (1) | $ | 573,700 | $ | — | $ | — | $ | — | $ | — | $ | 573,700 | $ | — | |||||||||||||||||
| (1) | For equity investments categorized in a single level, refer to the schedule of investments for further industry breakout. |
| See Notes to Financial Statements | See explanation of symbols and terms, if any, on page B-61 |
B-42
PACIFIC LIFE FUNDS
PL MID-CAP GROWTH FUND
Schedule of Investments
March 31, 2011
PL MID-CAP GROWTH FUND
Schedule of Investments
March 31, 2011
| Shares | Value | |||||||
CONVERTIBLE PREFERRED STOCKS — 0.4% | ||||||||
Industrials - 0.4% | ||||||||
| Better Place LLC ‘B’ 8.000% * Δ + | 98,662 | $ | 295,986 | |||||
| Total Convertible Preferred Stocks (Cost $295,986) | 295,986 | |||||||
COMMON STOCKS — 90.8% | ||||||||
Consumer Discretionary — 19.9% | ||||||||
| Betfair Group PLC (United Kingdom) * | 11,499 | 179,856 | ||||||
| Chipotle Mexican Grill Inc * | 4,279 | 1,165,471 | ||||||
| Ctrip.com International Ltd ADR (Cayman) * | 30,598 | 1,269,511 | ||||||
| Dollar Tree Inc * | 15,346 | 852,010 | ||||||
| Gafisa SA ADR (Brazil) | 29,345 | 376,790 | ||||||
| Groupe Aeroplan Inc (Canada) | 39,136 | 530,021 | ||||||
| Lululemon Athletica Inc * | 10,517 | 936,539 | ||||||
| Morningstar Inc | 13,826 | 807,162 | ||||||
| Naspers Ltd ‘N’ (South Africa) | 18,728 | 1,007,411 | ||||||
| Netflix Inc * | 7,692 | 1,825,542 | ||||||
| New Oriental Education & Technology Group ADR (Cayman) * | 7,216 | 722,105 | ||||||
| NVR Inc * | 747 | 564,732 | ||||||
| priceline.com Inc * | 3,263 | 1,652,514 | ||||||
| Wynn Resorts Ltd | 7,348 | 935,033 | ||||||
| 12,824,697 | ||||||||
Consumer Staples — 3.0% | ||||||||
| Mead Johnson Nutrition Co | 19,343 | 1,120,540 | ||||||
| Natura Cosmeticos SA (Brazil) | 28,106 | 791,716 | ||||||
| 1,912,256 | ||||||||
Energy — 3.5% | ||||||||
| Range Resources Corp | 17,236 | 1,007,617 | ||||||
| Ultra Petroleum Corp (Canada) * | 25,229 | 1,242,528 | ||||||
| 2,250,145 | ||||||||
Financials — 6.1% | ||||||||
| Greenhill & Co Inc | 9,624 | 633,163 | ||||||
| IntercontinentalExchange Inc * | 6,504 | 803,504 | ||||||
| Leucadia National Corp | 28,501 | 1,069,928 | ||||||
| Moody’s Corp | 8,227 | 278,978 | ||||||
| MSCI Inc ‘A’ * | 30,652 | 1,128,607 | ||||||
| 3,914,180 | ||||||||
Health Care — 10.7% | ||||||||
| Gen-Probe Inc * | 14,522 | 963,535 | ||||||
| IDEXX Laboratories Inc * | 10,199 | 787,567 | ||||||
| Illumina Inc * | 26,356 | 1,846,765 | ||||||
| Intuitive Surgical Inc * | 4,255 | 1,418,872 | ||||||
| Ironwood Pharmaceuticals Inc ‘A’ * | 31,306 | 438,284 | ||||||
| Techne Corp | 10,598 | 758,817 | ||||||
| Valeant Pharmaceuticals International Inc (Canada) | 14,051 | 699,880 | ||||||
| 6,913,720 | ||||||||
Industrials — 16.9% | ||||||||
| C.H. Robinson Worldwide Inc | 9,970 | 739,076 | ||||||
| Covanta Holding Corp | 40,901 | 698,589 | ||||||
| Edenred (France) * | 74,346 | 2,243,698 | ||||||
| Expeditors International of Washington Inc | 20,723 | 1,039,051 | ||||||
| Fastenal Co | 12,757 | 827,036 | ||||||
| IHS Inc ‘A’ * | 10,447 | 927,171 | ||||||
| Intertek Group PLC (United Kingdom) | 38,476 | 1,255,764 | ||||||
| Schindler Holding AG (Switzerland) | 9,223 | 1,108,358 | ||||||
| Stericycle Inc * | 10,329 | 915,872 | ||||||
| Verisk Analytics Inc ‘A’ * | 34,704 | 1,136,903 | ||||||
| 10,891,518 | ||||||||
Information Technology — 21.7% | ||||||||
| Akamai Technologies Inc * | 16,395 | 623,010 | ||||||
| Alibaba.com Ltd (Cayman) | 282,100 | 483,555 | ||||||
| ARM Holdings PLC ADR (United Kingdom) | 32,793 | 923,779 | ||||||
| Autodesk Inc * | 18,181 | 801,964 | ||||||
| Citrix Systems Inc * | 7,025 | 516,057 | ||||||
| FactSet Research Systems Inc | 9,219 | 965,506 | ||||||
| First Solar Inc * | 3,450 | 554,898 | ||||||
| Gartner Inc * | 23,063 | 961,035 | ||||||
| Motorola Solutions Inc * | 49,697 | 2,220,959 | ||||||
| NVIDIA Corp * | 11,592 | 213,988 | ||||||
| Red Hat Inc * | 21,167 | 960,770 | ||||||
| Rovi Corp * | 9,922 | 532,315 | ||||||
| salesforce.com inc * | 8,789 | 1,174,035 | ||||||
| Solera Holdings Inc | 23,022 | 1,176,424 | ||||||
| Teradata Corp * | 25,543 | 1,295,030 | ||||||
| Youku.com Inc ADR (Cayman) * | 12,583 | 597,818 | ||||||
| 14,001,143 | ||||||||
Materials — 7.9% | ||||||||
| Intrepid Potash Inc * | 27,952 | 973,289 | ||||||
| Lynas Corp Ltd (Australia) * | 208,447 | 485,551 | ||||||
| Martin Marietta Materials Inc | 7,491 | 671,718 | ||||||
| Molycorp Inc * | 22,847 | 1,371,277 | ||||||
| Nalco Holding Co | 24,192 | 660,684 | ||||||
| Rockwood Holdings Inc * | 18,442 | 907,715 | ||||||
| 5,070,234 | ||||||||
Telecommunication Services — 1.1% | ||||||||
| Millicom International Cellular SA (Luxembourg) | 7,789 | 749,068 | ||||||
| Total Common Stocks (Cost $38,476,576) | 58,526,961 | |||||||
SHORT-TERM INVESTMENT — 8.6% | ||||||||
Money Market Fund — 8.6% | ||||||||
| BlackRock Liquidity Funds Treasury Trust Fund Portfolio | 5,525,427 | 5,525,427 | ||||||
| Total Short-Term Investment (Cost $5,525,427) | 5,525,427 | |||||||
TOTAL INVESTMENTS — 99.8% (Cost $44,297,989) | 64,348,374 | |||||||
OTHER ASSETS & LIABILITIES, NET — 0.2% | 127,203 | |||||||
NET ASSETS — 100.0% | $ | 64,475,577 | ||||||
| See Notes to Financial Statements | B-43 | See explanation of symbols and terms, if any, on page B-61 |
PACIFIC LIFE FUNDS
PL MID-CAP GROWTH FUND
Schedule of Investments (Continued)
March 31, 2011
PL MID-CAP GROWTH FUND
Schedule of Investments (Continued)
March 31, 2011
Notes to Schedule of Investments
| (a) | As of March 31, 2011, the fund was diversified as a percentage of net assets as follows: |
| Information Technology | 21.7 | % | ||
| Consumer Discretionary | 19.9 | % | ||
| Industrials | 17.3 | % | ||
| Health Care | 10.7 | % | ||
| Short-Term Investment | 8.6 | % | ||
| Materials | 7.9 | % | ||
| Financials | 6.1 | % | ||
| Energy | 3.5 | % | ||
| Consumer Staples | 3.0 | % | ||
| Telecommunication Services | 1.1 | % | ||
| 99.8 | % | |||
| Other Assets & Liabilities, Net | 0.2 | % | ||
| 100.0 | % | |||
| (b) | An investment with a total aggregate value of $295,986 or 0.4% of the net assets was valued by a Trustee Valuation Committee or determined by a Board approved valuation committee or a delegate of the Board and then approved by the Board. | |
| (c) | As of March 31, 2011, 0.4% of the fund’s net assets were reported illiquid by the portfolio manager under the Trust’s policy | |
| (d) | Fair Value Measurements | |
| The following is a summary of the fund’s investments as categorized under the three-tier hierarchy of inputs used in valuing the fund’s assets and liabilities (See Note 11 in Notes to Financial Statements) as of March 31, 2011: |
| Level 2 | Level 3 | |||||||||||||||||||
| Total Value at | Level 1 | Significant | Significant | |||||||||||||||||
| March 31, 2011 | Quoted Price | Observable Inputs | Unobservable Inputs | |||||||||||||||||
| Assets | Convertible Preferred Stocks (1) | $ | 295,986 | $ | — | $ | — | $ | 295,986 | |||||||||||
| Common Stocks | ||||||||||||||||||||
| Consumer Discretionary | 12,824,697 | 11,817,286 | 1,007,411 | — | ||||||||||||||||
| Consumer Staples | 1,912,256 | 1,912,256 | — | — | ||||||||||||||||
| Energy | 2,250,145 | 2,250,145 | — | — | ||||||||||||||||
| Financials | 3,914,180 | 3,914,180 | — | — | ||||||||||||||||
| Health Care | 6,913,720 | 6,913,720 | — | — | ||||||||||||||||
| Industrials | 10,891,518 | 8,527,396 | 2,364,122 | — | ||||||||||||||||
| Information Technology | 14,001,143 | 13,517,588 | 483,555 | — | ||||||||||||||||
| Materials | 5,070,234 | 4,584,683 | 485,551 | — | ||||||||||||||||
| Telecommunication Services | 749,068 | 749,068 | — | — | ||||||||||||||||
| 58,526,961 | 54,186,322 | 4,340,639 | — | |||||||||||||||||
| Short-Term Investment | 5,525,427 | 5,525,427 | — | — | ||||||||||||||||
| Total | $ | 64,348,374 | $ | 59,711,749 | $ | 4,340,639 | $ | 295,986 | ||||||||||||
The following is a reconciliation of investments for significant unobservable inputs (Level 3) used in valuing the fund’s assets and liabilities (See Note 11 in Notes to Financial Statements) for the year ended March 31, 2011:
| Change in Net | ||||||||||||||||||||||||||||
| Unrealized | ||||||||||||||||||||||||||||
| Appreciation | ||||||||||||||||||||||||||||
| (Depreciation) | ||||||||||||||||||||||||||||
| Total Change | Transfers | on Level 3 | ||||||||||||||||||||||||||
| Value, | Net | Total Net | in Net | In and/ | Investments Held at | |||||||||||||||||||||||
| Beginning | Purchases | Realized | Unrealized | or Out of | Value, | the End of Year, | ||||||||||||||||||||||
| of Year | (Sales) | Losses | Appreciation | Level 3 | End of Year | if Applicable | ||||||||||||||||||||||
| Convertible Preferred Stocks (1) | $ | 816,515 | $ | (112,215 | ) | $ | (9,876 | ) | $ | 39,846 | $ | (438,284 | ) | $ | 295,986 | $ | — | |||||||||||
| (1) | For equity investments categorized in a single level, refer to the schedule of investments for further industry breakout. |
| See Notes to Financial Statements | B-44 | See explanation of symbols and terms, if any, on page B-61 |
PACIFIC LIFE FUNDS
PL SMALL-CAP GROWTH FUND
Schedule of Investments
March 31, 2011
PL SMALL-CAP GROWTH FUND
Schedule of Investments
March 31, 2011
| Shares | Value | |||||||
COMMON STOCKS - 98.2% | ||||||||
Consumer Discretionary - 18.7% | ||||||||
| American Axle & Manufacturing Holdings Inc * | 9,550 | $ | 120,234 | |||||
| American Public Education Inc * | 3,900 | 157,755 | ||||||
| ANN Inc * | 12,600 | 366,786 | ||||||
| Brunswick Corp | 12,050 | 306,431 | ||||||
| Dana Holding Corp * | 21,050 | 366,059 | ||||||
| Gaylord Entertainment Co * | 9,050 | 313,854 | ||||||
| Interval Leisure Group Inc * | 17,615 | 288,005 | ||||||
| Life Time Fitness Inc * | 4,270 | 159,314 | ||||||
| LKQ Corp * | 11,350 | 273,535 | ||||||
| McCormick & Schmick’s Seafood Restaurants Inc * | 11,025 | 79,601 | ||||||
| OfficeMax Inc * | 14,200 | 183,748 | ||||||
| Shutterfly Inc * | 7,875 | 412,335 | ||||||
| Six Flags Entertainment Corp | 3,000 | 216,000 | ||||||
| Sonic Corp * | 20,600 | 186,430 | ||||||
| Sotheby’s | 6,000 | 315,600 | ||||||
| The Cheesecake Factory Inc * | 9,350 | 281,341 | ||||||
| The Children’s Place Retail Stores Inc * | 5,030 | 250,645 | ||||||
| The Warnaco Group Inc * | 5,000 | 285,950 | ||||||
| Tupperware Brands Corp | 6,375 | 380,651 | ||||||
| Ulta Salon Cosmetics & Fragrance Inc * | 8,300 | 399,479 | ||||||
| Vera Bradley Inc * | 3,700 | 156,177 | ||||||
| Vitamin Shoppe Inc * | 8,300 | 280,789 | ||||||
| Williams-Sonoma Inc | 6,800 | 275,400 | ||||||
| 6,056,119 | ||||||||
Consumer Staples - 2.1% | ||||||||
| The Fresh Market Inc * | 3,050 | 115,107 | ||||||
| The Hain Celestial Group Inc * | 7,535 | 243,230 | ||||||
| United Natural Foods Inc * | 7,300 | 327,186 | ||||||
| 685,523 | ||||||||
Energy - 5.9% | ||||||||
| Brigham Exploration Co * | 8,950 | 332,761 | ||||||
| Cal Dive International Inc * | 23,300 | 162,634 | ||||||
| Complete Production Services Inc * | 7,300 | 232,213 | ||||||
| Dril-Quip Inc * | 2,965 | 234,324 | ||||||
| Energy XXI Ltd (Bermuda) * | 5,700 | 194,370 | ||||||
| Lufkin Industries Inc | 1,250 | 116,838 | ||||||
| Patriot Coal Corp * | 8,070 | 208,448 | ||||||
| Quicksilver Resources Inc * | 13,695 | 195,975 | ||||||
| Rosetta Resources Inc * | 4,800 | 228,192 | ||||||
| 1,905,755 | ||||||||
Financials - 4.1% | ||||||||
| Fortress Investment Group LLC ‘A’ * | 55,900 | 317,512 | ||||||
| Greenhill & Co Inc | 4,500 | 296,055 | ||||||
| Northwest Bancshares Inc | 21,750 | 272,745 | ||||||
| Signature Bank * | 4,950 | 279,180 | ||||||
| Texas Capital Bancshares Inc * | 6,250 | 162,438 | ||||||
| 1,327,930 | ||||||||
Health Care - 16.8% | ||||||||
| Align Technology Inc * | 11,550 | 236,544 | ||||||
| AMERIGROUP Corp * | 5,540 | 355,945 | ||||||
| ArthroCare Corp * | 5,150 | 171,701 | ||||||
| Auxilium Pharmaceuticals Inc * | 9,855 | 211,587 | ||||||
| Bruker Corp * | 16,540 | 344,859 | ||||||
| Catalyst Health Solutions Inc * | 5,750 | 321,597 | ||||||
| Cubist Pharmaceuticals Inc * | 5,500 | 138,820 | ||||||
| Gentiva Health Services Inc * | 8,430 | 236,293 | ||||||
| HealthSouth Corp * | 9,550 | 238,559 | ||||||
| HealthSpring Inc * | 5,150 | 192,455 | ||||||
| HMS Holdings Corp * | 2,000 | 163,700 | ||||||
| Incyte Corp Ltd * | 7,500 | 118,875 | ||||||
| Insulet Corp * | 14,270 | 294,247 | ||||||
| InterMune Inc * | 6,150 | 290,218 | ||||||
| LifePoint Hospitals Inc * | 5,150 | 206,927 | ||||||
| MedAssets Inc * | 10,400 | 158,808 | ||||||
| Medicis Pharmaceutical Corp ‘A’ | 10,180 | 326,167 | ||||||
| Medidata Solutions Inc * | 12,400 | 317,068 | ||||||
| Onyx Pharmaceuticals Inc * | 2,500 | 87,950 | ||||||
| Optimer Pharmaceuticals Inc * | 19,960 | 236,127 | ||||||
| PAREXEL International Corp * | 11,725 | 291,953 | ||||||
| Salix Pharmaceuticals Ltd * | 1,850 | 64,806 | ||||||
| Sirona Dental Systems Inc * | 3,750 | 188,100 | ||||||
| Thoratec Corp * | 5,920 | 153,506 | ||||||
| ViroPharma Inc * | 4,100 | 81,590 | ||||||
| 5,428,402 | ||||||||
Industrials - 15.7% | ||||||||
| AAR Corp * | 11,771 | 326,292 | ||||||
| Actuant Corp ‘A’ | 13,095 | 379,755 | ||||||
| Aecom Technology Corp * | 8,235 | 228,357 | ||||||
| Barnes Group Inc | 14,600 | 304,848 | ||||||
| CLARCOR Inc | 4,740 | 212,968 | ||||||
| Clean Harbors Inc * | 3,600 | 355,176 | ||||||
| Esterline Technologies Corp * | 5,380 | 380,474 | ||||||
| Genesee & Wyoming Inc ‘A’ * | 5,720 | 332,904 | ||||||
| GrafTech International Ltd * | 15,700 | 323,891 | ||||||
| RBC Bearings Inc * | 9,365 | 358,024 | ||||||
| Resources Connection Inc | 13,175 | 255,463 | ||||||
| Tetra Tech Inc * | 11,550 | 285,170 | ||||||
| The Geo Group Inc * | 12,980 | 332,807 | ||||||
| Towers Watson & Co ‘A’ | 3,300 | 183,018 | ||||||
| US Airways Group Inc * | 17,550 | 152,861 | ||||||
| Waste Connections Inc | 11,860 | 341,449 | ||||||
| Woodward Inc | 9,180 | 317,261 | ||||||
| 5,070,718 | ||||||||
Information Technology - 28.0% | ||||||||
| Acme Packet Inc * | 3,150 | 223,524 | ||||||
| Aeroflex Holding Corp * | 8,950 | 162,979 | ||||||
| Ancestry.com Inc * | 8,410 | 298,134 | ||||||
| Applied Micro Circuits Corp * | 21,800 | 226,284 | ||||||
| Aruba Networks Inc * | 7,550 | 255,492 | ||||||
| BroadSoft Inc * | 5,650 | 269,448 | ||||||
| Cadence Design Systems Inc * | 32,550 | 317,362 | ||||||
| Ciena Corp * | 9,500 | 246,620 | ||||||
| comScore Inc * | 8,250 | 243,457 | ||||||
| Concur Technologies Inc * | 4,600 | 255,070 | ||||||
| Fabrinet (Cayman) * | 7,300 | 147,168 | ||||||
| Finisar Corp * | 8,550 | 210,330 | ||||||
| Fortinet Inc * | 5,850 | 257,400 | ||||||
| GSI Commerce Inc * | 11,340 | 331,922 | ||||||
| Informatica Corp * | 6,447 | 336,727 | ||||||
| Jack Henry & Associates Inc | 8,250 | 279,592 | ||||||
| LogMeIn Inc * | 8,565 | 361,100 | ||||||
| Mellanox Technologies Ltd (Israel) * | 8,440 | 212,941 | ||||||
| Monolithic Power Systems Inc * | 10,495 | 148,924 | ||||||
| Netlogic Microsystems Inc * | 8,330 | 350,027 | ||||||
| NICE Systems Ltd ADR (Israel) * | 9,495 | 350,745 | ||||||
| Novellus Systems Inc * | 9,350 | 347,166 | ||||||
| OpenTable Inc * | 3,340 | 355,209 | ||||||
| QLIK Technologies Inc * | 11,300 | 293,800 | ||||||
| RealPage Inc * | 8,950 | 248,184 | ||||||
| RF Micro Devices Inc * | 37,700 | 241,657 | ||||||
| Riverbed Technology Inc * | 6,900 | 259,785 | ||||||
| Solera Holdings Inc | 5,815 | 297,147 | ||||||
| Taleo Corp ‘A’ * | 8,624 | 307,446 | ||||||
| The Ultimate Software Group Inc * | 5,000 | 293,750 | ||||||
| VanceInfo Technologies Inc ADR | ||||||||
| (Cayman) * | 7,181 | 225,555 | ||||||
| See Notes to Financial Statements | B-45 | See explanation of symbols and terms, if any, on page B-61 |
PACIFIC LIFE FUNDS
PL SMALL-CAP GROWTH FUND
Schedule of Investments (Continued)
March 31, 2011
PL SMALL-CAP GROWTH FUND
Schedule of Investments (Continued)
March 31, 2011
| Shares | Value | |||||||
| VistaPrint NV (Netherlands) * | 6,475 | $ | 336,053 | |||||
| Wright Express Corp * | 7,015 | 363,658 | ||||||
| 9,054,656 | ||||||||
Materials - 5.0% | ||||||||
| Gammon Gold Inc (Canada) * | 20,650 | 215,793 | ||||||
| Kraton Performance Polymers Inc * | 7,000 | 267,750 | ||||||
| Rockwood Holdings Inc * | 7,500 | 369,150 | ||||||
| Silgan Holdings Inc | 7,290 | 278,041 | ||||||
| Solutia Inc * | 12,850 | 326,390 | ||||||
| Stillwater Mining Co * | 7,700 | 176,561 | ||||||
| 1,633,685 | ||||||||
Telecommunication Services - 0.8% | ||||||||
| SBA Communications Corp ‘A’ * | 7,000 | 277,760 | ||||||
Utilities - 1.1% | ||||||||
| ITC Holdings Corp | 4,930 | 344,607 | ||||||
| Total Common Stocks (Cost $22,009,834) | 31,785,155 | |||||||
SHORT-TERM INVESTMENT - 2.0% | ||||||||
Money Market Fund - 2.0% | ||||||||
| BlackRock Liquidity Funds Treasury Trust Fund Portfolio | 629,015 | 629,015 | ||||||
| Total Short-Term Investment (Cost $629,015) | 629,015 | |||||||
TOTAL INVESTMENTS - 100.2% (Cost $22,638,849) | 32,414,170 | |||||||
OTHER ASSETS & LIABILITIES, NET — (0.2%) | (59,013 | ) | ||||||
NET ASSETS - 100.0% | $ | 32,355,157 | ||||||
Notes to Schedule of Investments
(a) As of March 31, 2011, the fund was diversified as a percentage of net assets as follows:
| Information Technology | 28.0 | % | ||
| Consumer Discretionary | 18.7 | % | ||
| Health Care | 16.8 | % | ||
| Industrials | 15.7 | % | ||
| Energy | 5.9 | % | ||
| Materials | 5.0 | % | ||
| Financials | 4.1 | % | ||
| Consumer Staples | 2.1 | % | ||
| Short-Term Investment | 2.0 | % | ||
| Utilities | 1.1 | % | ||
| Telecommunication Services | 0.8 | % | ||
| 100.2 | % | |||
| Other Assets & Liabilities, Net | (0.2 | %) | ||
| 100.0 | % | |||
| (b) | Fair Value Measurements | |
| The following is a summary of the fund’s investments as categorized under the three-tier hierarchy of inputs used in valuing the fund’s assets and liabilities (See Note 11 in Notes to Financial Statements) as of March 31, 2011: |
| Level 2 | Level 3 | |||||||||||||||||||
| Total Value at | Level 1 | Significant | Significant | |||||||||||||||||
| March 31, 2011 | Quoted Price | Observable Inputs | Unobservable Inputs | |||||||||||||||||
| Assets | Common Stocks (1) | $ | 31,785,155 | $ | 31,785,155 | $ | — | $ | — | |||||||||||
| Short-Term Investment | 629,015 | 629,015 | — | — | ||||||||||||||||
| Total | $ | 32,414,170 | $ | 32,414,170 | $ | — | $ | — | ||||||||||||
| (1) | For equity investments categorized in a single level, refer to the schedule of investments for further industry breakout. |
| See Notes to Financial Statements | See explanation of symbols and terms, if any, on page B-61 |
B-46
PACIFIC LIFE FUNDS
PL SMALL-CAP VALUE FUND
Schedule of Investments
March 31, 2011
PL SMALL-CAP VALUE FUND
Schedule of Investments
March 31, 2011
| Shares | Value | |||||||
COMMON STOCKS — 94.1% | ||||||||
Consumer Discretionary — 10.3% | ||||||||
| Aaron’s Inc | 32,900 | $ | 834,344 | |||||
| Bob Evans Farms Inc | 8,100 | 264,060 | ||||||
| Brown Shoe Co Inc | 5,361 | 65,511 | ||||||
| Cinemark Holdings Inc | 32,600 | 630,810 | ||||||
| Cooper Tire & Rubber Co | 26,200 | 674,650 | ||||||
| Dover Downs Gaming & Entertainment Inc | 6,200 | 22,258 | ||||||
| Group 1 Automotive Inc | 16,000 | 684,800 | ||||||
| Hillenbrand Inc | 12,300 | 264,450 | ||||||
| International Speedway Corp ‘A’ | 14,100 | 420,180 | ||||||
| Meredith Corp | 21,700 | 736,064 | ||||||
| Oxford Industries Inc | 3,700 | 126,503 | ||||||
| PetMed Express Inc | 11,700 | 185,562 | ||||||
| RadioShack Corp | 38,400 | 576,384 | ||||||
| Sturm Ruger & Co Inc | 11,600 | 266,452 | ||||||
| The Buckle Inc | 22,600 | 913,040 | ||||||
| The Jones Group Inc | 25,900 | 356,125 | ||||||
| Wolverine World Wide Inc | 22,500 | 838,800 | ||||||
| 7,859,993 | ||||||||
Consumer Staples — 6.2% | ||||||||
| Cal-Maine Foods Inc | 11,000 | 324,500 | ||||||
| Casey’s General Stores Inc | 17,200 | 670,800 | ||||||
| Cia Cervecerias Unidas SA ADR (Chile) | 4,800 | 283,680 | ||||||
| Corn Products International Inc | 20,000 | 1,036,400 | ||||||
| Embotelladora Andina SA ‘B’ ADR (Chile) | 8,400 | 245,784 | ||||||
| Fresh Del Monte Produce Inc (Cayman) | 6,100 | 159,271 | ||||||
| Ruddick Corp | 16,400 | 632,876 | ||||||
| The Andersons Inc | 8,809 | 429,175 | ||||||
| Universal Corp | 14,200 | 618,268 | ||||||
| WD-40 Co | 5,700 | 241,338 | ||||||
| Weis Markets Inc | 2,800 | 113,288 | ||||||
| 4,755,380 | ||||||||
Energy — 15.9% | ||||||||
| Alliance Resource Partners LP | 4,300 | 350,149 | ||||||
| Berry Petroleum Co ‘A’ | 21,200 | 1,069,540 | ||||||
| Buckeye Partners LP | 9,100 | 578,214 | ||||||
| Cimarex Energy Co | 9,600 | 1,106,304 | ||||||
| El Paso Pipeline Partners LP | 11,000 | 398,530 | ||||||
| EXCO Resources Inc | 41,400 | 855,324 | ||||||
| Frontline Ltd (Bermuda) | 24,200 | 599,434 | ||||||
| Holly Corp | 18,100 | 1,099,756 | ||||||
| Knightsbridge Tankers Ltd (Bermuda) | 3,900 | 97,656 | ||||||
| Linn Energy LLC | 25,200 | 981,036 | ||||||
| Magellan Midstream Partners LP | 13,100 | 784,166 | ||||||
| Ship Finance International Ltd (Bermuda) | 16,300 | 337,899 | ||||||
| Southern Union Co | 27,200 | 778,464 | ||||||
| Sunoco Logistics Partners LP | 4,200 | 364,476 | ||||||
| TC Pipelines LP | 3,800 | 197,638 | ||||||
| Tidewater Inc | 15,100 | 903,735 | ||||||
| TransMontaigne Partners LP | 4,000 | 145,320 | ||||||
| W&T Offshore Inc | 17,200 | 391,988 | ||||||
| World Fuel Services Corp | 25,600 | 1,039,616 | ||||||
| 12,079,245 | ||||||||
Financials — 13.4% | ||||||||
| Advance America Cash Advance Centers Inc | 23,700 | 125,610 | ||||||
| American Equity Investment Life Holding Co | 15,800 | 207,296 | ||||||
| American Financial Group Inc | 22,300 | 780,946 | ||||||
| Bank of Hawaii Corp | 15,000 | 717,300 | ||||||
| Cash America International Inc | 15,900 | 732,195 | ||||||
| CommonWealth REIT | 11,950 | 310,342 | ||||||
| CreXus Investment Corp REIT | 8,000 | 91,360 | ||||||
| Cullen/Frost Bankers Inc | 12,500 | 737,750 | ||||||
| Delphi Financial Group Inc ‘A’ | 22,000 | 675,620 | ||||||
| Equity One Inc REIT | 19,200 | 360,384 | ||||||
| Federated Investors Inc ‘B’ | 26,300 | 703,525 | ||||||
| Franklin Street Properties Corp REIT | 27,500 | 386,925 | ||||||
| Healthcare Realty Trust Inc REIT | 21,900 | 497,130 | ||||||
| Infinity Property & Casualty Corp | 4,300 | 255,807 | ||||||
| Life Partners Holdings Inc | 3,260 | 26,210 | ||||||
| Montpelier Re Holdings Ltd (Bermuda) | 4,000 | 70,680 | ||||||
| Omega Healthcare Investors Inc REIT | 31,100 | 694,774 | ||||||
| Prosperity Bancshares Inc | 14,700 | 628,719 | ||||||
| PS Business Parks Inc REIT | 6,900 | 399,786 | ||||||
| Raymond James Financial Inc | 19,700 | 753,328 | ||||||
| RLI Corp | 7,000 | 403,550 | ||||||
| Sovran Self Storage Inc REIT | 8,800 | 348,040 | ||||||
| Trustmark Corp | 13,500 | 316,170 | ||||||
| 10,223,447 | ||||||||
Health Care — 6.6% | ||||||||
| Invacare Corp | 13,100 | 407,672 | ||||||
| Owens & Minor Inc | 22,400 | 727,552 | ||||||
| PerkinElmer Inc | 29,450 | 773,652 | ||||||
| STERIS Corp | 20,000 | 690,800 | ||||||
| Teleflex Inc | 13,200 | 765,336 | ||||||
| The Cooper Cos Inc | 15,700 | 1,090,365 | ||||||
| West Pharmaceutical Services Inc | 13,200 | 590,964 | ||||||
| 5,046,341 | ||||||||
Industrials — 11.6% | ||||||||
| Albany International Corp ‘A’ | 3,780 | 94,122 | ||||||
| Alliant Techsystems Inc | 10,700 | 756,169 | ||||||
| AZZ Inc | 500 | 22,800 | ||||||
| Baltic Trading Ltd | 10,200 | 93,024 | ||||||
| Barnes Group Inc | 21,200 | 442,656 | ||||||
| Belden Inc | 17,800 | 668,390 | ||||||
| Crane Co | 18,100 | 876,583 | ||||||
| Cubic Corp | 4,800 | 276,000 | ||||||
| Curtiss-Wright Corp | 16,400 | 576,296 | ||||||
| Elbit Systems Ltd (Israel) | 2,200 | 121,374 | ||||||
| Ennis Inc | 12,100 | 206,063 | ||||||
| Great Lakes Dredge & Dock Co | 14,600 | 111,398 | ||||||
| Harsco Corp | 18,900 | 666,981 | ||||||
| KBR Inc | 26,500 | 1,000,905 | ||||||
| SkyWest Inc | 19,800 | 335,016 | ||||||
| Standex International Corp | 1,567 | 59,374 | ||||||
| The Brink’s Co | 20,500 | 678,755 | ||||||
| Triumph Group Inc | 8,500 | 751,825 | ||||||
| UniFirst Corp | 3,700 | 196,137 | ||||||
| Valmont Industries Inc | 8,300 | 866,271 | ||||||
| 8,800,139 | ||||||||
Information Technology — 2.8% | ||||||||
| AVX Corp | 13,200 | 196,812 | ||||||
| Diebold Inc | 21,200 | 751,752 | ||||||
| Himax Technologies Inc ADR (Cayman) | 23,500 | 55,695 | ||||||
| Jabil Circuit Inc | 40,500 | 827,415 | ||||||
| Micrel Inc | 23,800 | 320,824 | ||||||
| 2,152,498 | ||||||||
Materials — 16.6% | ||||||||
| A. Schulman Inc | 8,300 | 205,176 | ||||||
| AMCOL International Corp | 7,800 | 280,644 | ||||||
| Bemis Co Inc | 22,400 | 734,944 | ||||||
| Cabot Corp | 15,400 | 712,866 | ||||||
| Compass Minerals International Inc | 9,700 | 907,241 | ||||||
| Gold Resource Corp | 13,120 | 349,254 | ||||||
| HudBay Minerals Inc (Canada) | 45,030 | 733,392 | ||||||
| IAMGOLD Corp (Canada) | 42,800 | 942,456 | ||||||
| Innophos Holdings Inc | 9,200 | 424,212 | ||||||
| See Notes to Financial Statements | See explanation of symbols and terms, if any, on page B-61 |
B-47
PACIFIC LIFE FUNDS
PL SMALL-CAP VALUE FUND
Schedule of Investments (Continued)
March 31, 2011
PL SMALL-CAP VALUE FUND
Schedule of Investments (Continued)
March 31, 2011
| Shares | Value | |||||||
| International Flavors & Fragrances Inc | 15,200 | $ | 946,960 | |||||
| Methanex Corp (Canada) | 18,300 | 571,509 | ||||||
| Neenah Paper Inc | 3,700 | 81,289 | ||||||
| NewMarket Corp | 2,400 | 379,728 | ||||||
| Quaker Chemical Corp | 3,794 | 152,405 | ||||||
| Rock-Tenn Co ‘A’ | 12,700 | 880,745 | ||||||
| Royal Gold Inc | 19,800 | 1,037,520 | ||||||
| RPM International Inc | 28,700 | 681,051 | ||||||
| Sensient Technologies Corp | 19,200 | 688,128 | ||||||
| Sonoco Products Co | 21,000 | 760,830 | ||||||
| Stepan Co | 1,658 | 120,205 | ||||||
| The Lubrizol Corp | 8,000 | 1,071,680 | ||||||
| 12,662,235 | ||||||||
Telecommunication Services — 0.2% | ||||||||
| Partner Communications Co Ltd ADR (Israel) | 8,100 | 153,981 | ||||||
Utilities - 10.5% | ||||||||
| AGL Resources Inc | 16,000 | 637,440 | ||||||
| AmeriGas Partners LP | 3,400 | 163,404 | ||||||
| Atmos Energy Corp | 19,900 | 678,590 | ||||||
| Avista Corp | 15,800 | 365,454 | ||||||
| Cleco Corp | 20,400 | 699,516 | ||||||
| Energen Corp | 13,700 | 864,744 | ||||||
| Great Plains Energy Inc | 18,100 | 362,362 | ||||||
| OGE Energy Corp | 15,800 | 798,848 | ||||||
| Southwest Gas Corp | 12,000 | 467,640 | ||||||
| Suburban Propane Partners LP | 7,100 | 400,653 | ||||||
| UGI Corp | 22,300 | 733,670 | ||||||
| Vectren Corp | 21,600 | 587,520 | ||||||
| Westar Energy Inc | 23,400 | 618,228 | ||||||
| WGL Holdings Inc | 16,400 | 639,600 | ||||||
| 8,017,669 | ||||||||
| Total Common Stocks (Cost $54,145,697) | 71,750,928 | |||||||
SHORT-TERM INVESTMENT — 5.9% | ||||||||
Money Market Fund — 5.9% | ||||||||
| BlackRock Liquidity Funds Treasury Trust Fund Portfolio | 4,468,166 | 4,468,166 | ||||||
| Total Short-Term Investment (Cost $4,468,166) | 4,468,166 | |||||||
TOTAL INVESTMENTS — 100.0% (Cost $58,613,863) | 76,219,094 | |||||||
OTHER ASSETS & LIABILITIES, NET — 0.0% | 28,002 | |||||||
NET ASSETS - 100.0% | $ | 76,247,096 | ||||||
| Notes to Schedule of Investments | ||
| (a) | As of March 31, 2011, the fund was diversified as a percentage of net assets as follows: |
| Materials | 16.6 | % | ||||||
| Energy | 15.9 | % | ||||||
| Financials | 13.4 | % | ||||||
| Industrials | 11.6 | % | ||||||
| Utilities | 10.5 | % | ||||||
| Consumer Discretionary | 10.3 | % | ||||||
| Health Care | 6.6 | % | ||||||
| Consumer Staples | 6.2 | % | ||||||
| Short-Term Investment | 5.9 | % | ||||||
| Information Technology | 2.8 | % | ||||||
| Telecommunication Services | 0.2 | % | ||||||
| 100.0 | % | |||||||
| Other Assets & Liabilities, Net | 0.0 | % | ||||||
| 100.0 | % | |||||||
| (b) | Fair Value Measurements |
| The following is a summary of the fund’s investments as categorized under the three-tier hierarchy of inputs used in valuing the fund’s assets and liabilities (See Note 11 in Notes to Financial Statements) as of March 31, 2011: |
| Level 2 | Level 3 | |||||||||||||||||||
| Total Value at | Level 1 | Significant | Significant | |||||||||||||||||
| March 31, 2011 | Quoted Price | Observable Inputs | Unobservable Inputs | |||||||||||||||||
| Assets | Common Stocks (1) | $ | 71,750,928 | $ | 71,750,928 | $ | — | $ | — | |||||||||||
| Short-Term Investment | 4,468,166 | 4,468,166 | — | — | ||||||||||||||||
| Total | $ | 76,219,094 | $ | 76,219,094 | $ | — | $ | — | ||||||||||||
| (1) | For equity investments categorized in a single level, refer to the schedule of investments for further industry breakout. |
| See Notes to Financial Statements | See explanation of symbols and terms, if any, on page B-61 |
B-48
PACIFIC LIFE FUNDS
PL REAL ESTATE FUND
Schedule of Investments
March 31, 2011
PL REAL ESTATE FUND
Schedule of Investments
March 31, 2011
| Shares | Value | |||||||
COMMON STOCKS — 97.2% | ||||||||
Consumer Discretionary — 4.2% | ||||||||
| Starwood Hotels & Resorts Worldwide Inc | 30,117 | $ | 1,750,400 | |||||
Financials — 91.6% | ||||||||
| Acadia Realty Trust REIT | 22,673 | 428,973 | ||||||
| AMB Property Corp REIT | 22,736 | 817,814 | ||||||
| American Campus Communities Inc REIT | 2,320 | 76,560 | ||||||
| Apartment Investment & Management Co ‘A’ REIT | 4,540 | 115,634 | ||||||
| Ashford Hospitality Trust Inc REIT | 18,850 | 207,727 | ||||||
| AvalonBay Communities Inc REIT | 12,829 | 1,540,506 | ||||||
| BioMed Realty Trust Inc REIT | 4,435 | 84,354 | ||||||
| Boston Properties Inc REIT | 20,099 | 1,906,390 | ||||||
| Brookfield Properties Corp (Canada) | 53,174 | 942,243 | ||||||
| Camden Property Trust REIT | 17,266 | 981,054 | ||||||
| CommonWealth REIT | 4,857 | 126,136 | ||||||
| Coresite Realty Corp REIT | 11,480 | 181,843 | ||||||
| Cousins Properties Inc REIT | 74,931 | 625,674 | ||||||
| CreXus Investment Corp REIT | 6,780 | 77,428 | ||||||
| DCT Industrial Trust Inc REIT | 46,120 | 255,966 | ||||||
| Digital Realty Trust Inc REIT | 8,140 | 473,260 | ||||||
| Douglas Emmett Inc REIT | 9,860 | 184,875 | ||||||
| Duke Realty Corp REIT | 8,340 | 116,843 | ||||||
| Equity Lifestyle Properties Inc REIT | 12,264 | 707,020 | ||||||
| Equity One Inc REIT | 281 | 5,274 | ||||||
| Equity Residential REIT | 72,395 | 4,083,802 | ||||||
| Federal Realty Investment Trust REIT | 6,408 | 522,636 | ||||||
| Forest City Enterprises Inc ‘A’ * | 58,793 | 1,107,072 | ||||||
| General Growth Properties Inc REIT * | 107,483 | 1,663,837 | ||||||
| HCP Inc REIT | 53,840 | 2,042,690 | ||||||
| Healthcare Realty Trust Inc REIT | 44,949 | 1,020,342 | ||||||
| Host Hotels & Resorts Inc REIT | 156,062 | 2,748,252 | ||||||
| Hudson Pacific Properties Inc REIT | 9,690 | 142,443 | ||||||
| Kite Realty Group Trust REIT | 10,500 | 55,755 | ||||||
| Lexington Realty Trust REIT | 2,680 | 25,058 | ||||||
| Liberty Property Trust REIT | 3,824 | 125,810 | ||||||
| LTC Properties Inc REIT | 2,490 | 70,567 | ||||||
| Mack-Cali Realty Corp REIT | 30,859 | 1,046,120 | ||||||
| Nationwide Health Properties Inc REIT | 4,520 | 192,236 | ||||||
| Parkway Properties Inc REIT | 1,280 | 21,760 | ||||||
| Plum Creek Timber Co Inc REIT | 3,669 | 160,005 | ||||||
| Post Properties Inc REIT | 3,510 | 137,768 | ||||||
| PS Business Parks Inc REIT | 3,681 | 213,277 | ||||||
| Public Storage REIT | 15,737 | 1,745,391 | ||||||
| Regency Centers Corp REIT | 48,601 | 2,113,171 | ||||||
| Retail Opportunity Investments Corp REIT | 29,993 | 328,123 | ||||||
| Senior Housing Properties Trust REIT | 31,443 | 724,447 | ||||||
| Simon Property Group Inc REIT | 45,627 | 4,889,389 | ||||||
| Sovran Self Storage Inc REIT | 2,922 | 115,565 | ||||||
| Starwood Property Trust Inc REIT | 19,990 | 445,777 | ||||||
| The Macerich Co REIT | 612 | 30,312 | ||||||
| Ventas Inc REIT | 7,260 | 394,218 | ||||||
| Vornado Realty Trust REIT | 24,911 | 2,179,713 | ||||||
| Winthrop Realty Trust REIT | 10,711 | 131,208 | ||||||
| 38,332,318 | ||||||||
Health Care — 1.4% | ||||||||
| Assisted Living Concepts Inc ‘A’ * | 12,240 | 479,074 | ||||||
| Capital Senior Living Corp * | 12,030 | 127,759 | ||||||
| 606,833 | ||||||||
| Total Common Stocks (Cost $25,254,038) | 40,689,551 | |||||||
SHORT-TERM INVESTMENT — 1.9% | ||||||||
Money Market Fund — 1.9% | ||||||||
| BlackRock Liquidity Funds Treasury Trust Fund Portfolio | 814,268 | 814,268 | ||||||
| Total Short-Term Investment (Cost $814,268) | 814,268 | |||||||
TOTAL INVESTMENTS — 99.1% (Cost $26,068,306) | 41,503,819 | |||||||
OTHER ASSETS & LIABILITIES, NET — 0.9% | 356,076 | |||||||
NET ASSETS - 100.0% | $ | 41,859,895 | ||||||
| Notes to Schedule of Investments | ||
| (a) | As of March 31, 2011, the fund was diversified by property sector as a percentage of net assets as follows: | |
| Retail | 23.2 | % | ||||||
| Specialized | 22.0 | % | ||||||
| Residential | 18.3 | % | ||||||
| Office | 9.5 | % | ||||||
| Diversified | 9.0 | % | ||||||
| Real Estate Operating Companies | 5.2 | % | ||||||
| Hotels, Resort & Cruise Lines | 4.7 | % | ||||||
| Industrial | 2.6 | % | ||||||
| Health Care Facilities | 1.4 | % | ||||||
| Mortgage | 1.3 | % | ||||||
| 97.2 | % | |||||||
| Short-Term Investment | 1.9 | % | ||||||
| Other Assets & Liabilities, Net | 0.9 | % | ||||||
| 100.0 | % | |||||||
| See Notes to Financial Statements | See explanation of symbols and terms, if any, on page B-61 |
B-49
PACIFIC LIFE FUNDS
PL REAL ESTATE FUND
Schedule of Investments (Continued)
March 31, 2011
PL REAL ESTATE FUND
Schedule of Investments (Continued)
March 31, 2011
| (b) | Fair Value Measurements |
| The following is a summary of the fund’s investments as categorized under the three-tier hierarchy of inputs used in valuing the fund’s assets and liabilities (See Note 11 in Notes to Financial Statements) as of March 31, 2011: |
| Level 2 | Level 3 | |||||||||||||||||||
| Total Value at | Level 1 | Significant | Significant | |||||||||||||||||
| March 31, 2011 | Quoted Price | Observable Inputs | Unobservable Inputs | |||||||||||||||||
| Assets | Common Stocks (1) | $ | 40,689,551 | $ | 40,689,551 | $ | — | $ | — | |||||||||||
| Short-Term Investment | 814,268 | 814,268 | — | — | ||||||||||||||||
| Total | $ | 41,503,819 | $ | 41,503,819 | $ | — | $ | — | ||||||||||||
| (1) | For equity investments categorized in a single level, refer to the schedule of investments for further industry breakout. |
| See Notes to Financial Statements | See explanation of symbols and terms, if any, on page B-61 |
B-50
PACIFIC LIFE FUNDS
PL EMERGING MARKETS FUND
Schedule of Investments
March 31, 2011
PL EMERGING MARKETS FUND
Schedule of Investments
March 31, 2011
| Shares | Value | |||||||
RIGHTS — 0.0% | ||||||||
Brazil - 0.0% | ||||||||
| B2W Cia Global Do Varejo Exp. 04/26/11 * | 11,324 | $ | 7,630 | |||||
| Total Rights (Cost $0) | 7,630 | |||||||
PREFERRED STOCKS — 7.7% | ||||||||
Brazil — 7.1% | ||||||||
| Cia Brasileira de Distribuicao Grupo Pao de Acucar ADR | 17,460 | 732,098 | ||||||
| Cia de Bebidas das Americas ADR | 18,100 | 512,411 | ||||||
| Lojas Americanas SA | 55,740 | 464,998 | ||||||
| Petroleo Brasileiro SA ADR | 53,600 | 1,904,944 | ||||||
| Vale SA ADR | 32,890 | 970,913 | ||||||
| 4,585,364 | ||||||||
Colombia — 0.6% | ||||||||
| Banco Davivienda SA | 2,320 | 25,487 | ||||||
| BanColombia SA ADR | 5,700 | 357,162 | ||||||
| 382,649 | ||||||||
| Total Preferred Stocks (Cost $3,336,372) | 4,968,013 | |||||||
COMMON STOCKS — 88.1% | ||||||||
Bermuda — 1.6% | ||||||||
| Credicorp Ltd | 3,290 | 345,220 | ||||||
| Dairy Farm International Holdings Ltd | 18,100 | �� | 150,592 | |||||
| VimpelCom Ltd ADR | 39,050 | 551,386 | ||||||
| 1,047,198 | ||||||||
Brazil — 6.9% | ||||||||
| Anhanguera Educacional Participacoes SA | 14,800 | 358,612 | ||||||
| B2W Cia Global do Varejo | 27,000 | 370,441 | ||||||
| BM&F BOVESPA SA | 103,616 | 752,059 | ||||||
| Cyrela Brazil Realty SA Empreendimentos e Participacoes | 38,200 | 361,492 | ||||||
| Diagnosticos da America SA | 27,900 | 357,155 | ||||||
| Embraer SA ADR | 24,410 | 822,617 | ||||||
| Estacio Participacoes SA | 23,800 | 390,095 | ||||||
| Multiplan Empreendimentos Imobiliarios SA | 12,300 | 251,251 | ||||||
| Natura Cosmeticos SA | 26,200 | 738,026 | ||||||
| 4,401,748 | ||||||||
Cayman — 3.7% | ||||||||
| Ambow Education Holding Ltd ADR * | 7,280 | 57,876 | ||||||
| Baidu Inc ADR * | 1,320 | 181,909 | ||||||
| Ctrip.com International Ltd ADR * | 6,020 | 249,770 | ||||||
| Eurasia Drilling Co Ltd GDR A ~ ∆ | 500 | 17,000 | ||||||
| Eurasia Drilling Co Ltd GDR B | 510 | 17,340 | ||||||
| Li Ning Co Ltd | 141,500 | 238,004 | ||||||
| NetEase.com Inc ADR * | 5,660 | 280,227 | ||||||
| New Oriental Education & Technology Group ADR * | 1,610 | 161,113 | ||||||
| Tencent Holdings Ltd | 26,000 | 633,178 | ||||||
| Tingyi Holding Corp | 186,000 | 454,652 | ||||||
| Want Want China Holdings Ltd | 116,000 | 91,153 | ||||||
| 2,382,222 | ||||||||
Chile — 0.8% | ||||||||
| Banco Santander Chile SA | 2,428,150 | 203,850 | ||||||
| Cencosud SA | 42,740 | 306,468 | ||||||
| 510,318 | ||||||||
China — 2.4% | ||||||||
| China Shenhua Energy Co Ltd ‘H’ | 155,000 | 729,548 | ||||||
| PetroChina Co Ltd ‘H’ | 478,000 | 727,126 | ||||||
| Shanghai Zhenhua Heavy Industries Co Ltd ‘B’ * | 117,390 | 79,346 | ||||||
| 1,536,020 | ||||||||
Colombia — 0.3% | ||||||||
| Almacenes Exito SA | 4,551 | 66,386 | ||||||
| Almacenes Exito SA GDR ~ | 9,200 | 133,612 | ||||||
| 199,998 | ||||||||
Denmark — 1.7% | ||||||||
| Carlsberg AS ‘B’ | 10,011 | 1,076,519 | ||||||
Egypt — 0.7% | ||||||||
| Commercial International Bank SAE * | 43,894 | 240,151 | ||||||
| Eastern Co SAE | 2,562 | 45,439 | ||||||
| Egyptian Financial Group-Hermes Holding | 44,712 | 164,780 | ||||||
| 450,370 | ||||||||
France — 0.6% | ||||||||
| CFAO SA | 10,740 | 402,636 | ||||||
Hong Kong — 5.8% | ||||||||
| AIA Group Ltd * | 160,400 | 493,755 | ||||||
| China Resources Enterprise Ltd | 121,000 | 491,601 | ||||||
| CNOOC Ltd | 536,000 | 1,354,484 | ||||||
| Hang Lung Group Ltd | 48,000 | 297,484 | ||||||
| Hang Lung Properties Ltd | 120,000 | 526,317 | ||||||
| Hong Kong Exchanges & Clearing Ltd | 24,800 | 538,119 | ||||||
| 3,701,760 | ||||||||
India — 13.5% | ||||||||
| Asian Paints Ltd | 2,925 | 165,835 | ||||||
| Cipla Ltd | 32,162 | 232,051 | ||||||
| Colgate-Palmolive India Ltd | 19,024 | 347,291 | ||||||
| Dabur India Ltd | 67,433 | 145,268 | ||||||
| Divi’s Laboratories Ltd | 10,735 | 162,450 | ||||||
| Godrej Consumer Products Ltd | 7,597 | 62,122 | ||||||
| HDFC Bank Ltd ADR | 3,370 | 572,698 | ||||||
| Hindustan Unilever Ltd | 129,511 | 833,784 | ||||||
| Housing Development Finance Corp Ltd | 62,365 | 981,110 | ||||||
| IBN18 Broadcast Ltd * | 14,431 | 30,120 | ||||||
| ICICI Bank Ltd ADR | 14,010 | 698,118 | ||||||
| Infosys Technologies Ltd | 34,775 | 2,525,134 | ||||||
| Jain Irrigation Systems Ltd | 15,503 | 62,178 | ||||||
| Marico Ltd | 75,877 | 237,105 | ||||||
| Network 18 Media & Investments Ltd * | 1,103 | 3,309 | ||||||
| Sun Pharmaceutical Industries Ltd | 34,723 | 344,811 | ||||||
| Tata Consultancy Services Ltd | 25,544 | 678,180 | ||||||
| Television Eighteen India Ltd * | 18,769 | 32,682 | ||||||
| Zee Entertainment Enterprises Ltd | 195,709 | 543,087 | ||||||
| Zee Learn Ltd * | 15,223 | 7,937 | ||||||
| 8,665,270 | ||||||||
Indonesia — 2.0% | ||||||||
| P.T. Astra International Tbk | 70,400 | 460,441 | ||||||
| P.T. Bank Central Asia Tbk | 200,000 | 159,377 | ||||||
| See Notes to Financial Statements | See explanation of symbols and terms, if any, on page B-61 |
B-51
PACIFIC LIFE FUNDS
PL EMERGING MARKETS FUND
Schedule of Investments (Continued)
March 31, 2011
PL EMERGING MARKETS FUND
Schedule of Investments (Continued)
March 31, 2011
| Shares | Value | |||||||
| P.T. Kalbe Farma Tbk | 65,500 | $ | 25,547 | |||||
| P.T. Telekomunikasi Indonesia Tbk | 425,400 | 358,106 | ||||||
| P.T. Unilever Indonesia Tbk | 164,000 | 287,947 | ||||||
| 1,291,418 | ||||||||
Kenya — 0.1% | ||||||||
| East African Breweries Ltd | 17,305 | 37,760 | ||||||
Luxembourg — 1.8% | ||||||||
| Oriflame Cosmetics SA SDR | 2,627 | 135,825 | ||||||
| Tenaris SA ADR | 20,920 | 1,034,703 | ||||||
| 1,170,528 | ||||||||
Mexico — 10.6% | ||||||||
| America Movil SAB de CV ‘L’ ADR | 37,950 | 2,204,895 | ||||||
| Fomento Economico Mexicano SAB de CV | 146,268 | 859,203 | ||||||
| Fomento Economico Mexicano SAB de CV ADR | 21,000 | 1,232,700 | ||||||
| Grupo Financiero Inbursa SAB de CV ‘O’ | 68,419 | 315,047 | ||||||
| Grupo Modelo SAB de CV ‘C’ | 92,290 | 554,774 | ||||||
| Grupo Televisa SAB ADR * | 25,450 | 624,288 | ||||||
| Wal-Mart de Mexico SAB de CV ‘V’ | 338,226 | 1,015,151 | ||||||
| 6,806,058 | ||||||||
Nigeria — 0.2% | ||||||||
| Nigerian Breweries PLC | 264,485 | 131,543 | ||||||
Norway — 0.4% | ||||||||
| DNO International ASA * | 143,068 | 233,515 | ||||||
Philippines — 2.6% | ||||||||
| Jollibee Foods Corp | 115,660 | 232,353 | ||||||
| Philippine Long Distance Telephone Co | 5,120 | 273,004 | ||||||
| SM Investments Corp | 26,380 | 315,328 | ||||||
| SM Prime Holdings Inc | 3,330,056 | 859,484 | ||||||
| 1,680,169 | ||||||||
Russia — 4.3% | ||||||||
| Magnit OJSC | 9,679 | 1,352,708 | ||||||
| NovaTek OAO GDR (LI) | 6,900 | 957,988 | ||||||
| NovaTek OAO GDR (OTC) ~ ∆ | 3,400 | 472,052 | ||||||
| 2,782,748 | ||||||||
South Africa — 6.2% | ||||||||
| Anglo Platinum Ltd | 8,756 | 900,086 | ||||||
| Impala Platinum Holdings Ltd | 47,023 | 1,358,641 | ||||||
| JSE Ltd | 3,233 | 33,453 | ||||||
| MTN Group Ltd | 48,330 | 974,800 | ||||||
| Standard Bank Group Ltd | 46,148 | 708,406 | ||||||
| 3,975,386 | ||||||||
South Korea — 4.5% | ||||||||
| MegaStudy Co Ltd | 1,315 | 202,276 | ||||||
| NHN Corp * | 9,943 | 1,734,793 | ||||||
| Shinsegae Co Ltd | 4,110 | 977,859 | ||||||
| 2,914,928 | ||||||||
Taiwan — 6.5% | ||||||||
| Epistar Corp | 220,000 | 807,737 | ||||||
| HTC Corp | 53,772 | 2,100,325 | ||||||
| MediaTek Inc | 28,684 | 329,563 | ||||||
| Synnex Technology International Corp | 134,118 | 312,832 | ||||||
| Taiwan Semiconductor Manufacturing Co Ltd | 264,993 | 634,993 | ||||||
| 4,185,450 | ||||||||
Thailand — 0.6% | ||||||||
| CP ALL PCL | 24,000 | 31,768 | ||||||
| Siam Commercial Bank PCL | 94,900 | 338,872 | ||||||
| 370,640 | ||||||||
Turkey — 3.4% | ||||||||
| Anadolu Efes Biracilik Ve Malt Sanayii AS | 13,954 | 197,697 | ||||||
| BIM Birlesik Magazalar AS | 13,451 | 452,762 | ||||||
| Enka Insaat ve Sanayi AS | 169,023 | 650,639 | ||||||
| Haci Omer Sabanci Holding AS | 122,206 | 567,280 | ||||||
| Turkiye Garanti Bankasi AS | 61,315 | 286,088 | ||||||
| 2,154,466 | ||||||||
United Arab Emirates — 0.8% | ||||||||
| DP World Ltd * | 875,683 | 520,515 | ||||||
United Kingdom — 5.6% | ||||||||
| Anglo American PLC | 16,327 | 838,970 | ||||||
| Antofagasta PLC | 6,680 | 145,618 | ||||||
| Cairn Energy PLC * | 92,880 | 688,189 | ||||||
| SABMiller PLC | 29,900 | 1,058,136 | ||||||
| Tullow Oil PLC | 38,670 | 897,330 | ||||||
| 3,628,243 | ||||||||
United States — 0.5% | ||||||||
| Sohu.com Inc * | 3,620 | 323,483 | ||||||
| Total Common Stocks (Cost $37,090,970) | 56,580,909 | |||||||
EQUITY-LINKED STRUCTURED SECURITIES — 0.1% | ||||||||
Vietnam — 0.1% | ||||||||
| UBS AG (for Vietnam Dairy Products) Exp. 02/12/12 *∆ | 11,700 | 51,532 | ||||||
| Total Equity-Linked Structured Securities (Cost $54,618) | 51,532 | |||||||
SHORT-TERM INVESTMENT — 3.3% | ||||||||
Money Market Fund — 3.3% | ||||||||
| BlackRock Liquidity Funds Treasury | ||||||||
| Trust Fund Portfolio | 2,139,296 | 2,139,296 | ||||||
| Total Short-Term Investment (Cost $2,139,296) | 2,139,296 | |||||||
TOTAL INVESTMENTS — 99.2% (Cost $42,621,256) | 63,747,380 | |||||||
OTHER ASSETS & LIABILITIES, NET — 0.8% | 522,886 | |||||||
NET ASSETS — 100.0% | $ | 64,270,266 | ||||||
| See Notes to Financial Statements | See explanation of symbols and terms, if any, on page B-61 |
B-52
PACIFIC LIFE FUNDS
PL EMERGING MARKETS FUND
Schedule of Investments (Continued)
March 31, 2011
PL EMERGING MARKETS FUND
Schedule of Investments (Continued)
March 31, 2011
Notes to Schedule of Investments
| (a) | As of March 31, 2011, the fund was diversified as a percentage of net assets as follows: |
| Consumer Staples | 22.9 | % | ||
| Information Technology | 16.4 | % | ||
| Financials | 15.2 | % | ||
| Energy | 14.1 | % | ||
| Consumer Discretionary | 8.2 | % | ||
| Materials | 6.8 | % | ||
| Telecommunication Services | 6.8 | % | ||
| Industrials | 3.8 | % | ||
| Short-Term Investment | 3.3 | % | ||
| Health Care | 1.7 | % | ||
| 99.2 | % | |||
| Other Assets & Liabilities, Net | 0.8 | % | ||
| 100.0 | % | |||
| (b) | As of March 31, 2011, the fund was diversified by geographical region as a percentage of net assets as follows: |
| Brazil | 14.0 | % | ||
| India | 13.5 | % | ||
| Mexico | 10.6 | % | ||
| Taiwan | 6.5 | % | ||
| South Africa | 6.2 | % | ||
| Hong Kong | 5.8 | % | ||
| United Kingdom | 5.6 | % | ||
| South Korea | 4.5 | % | ||
| Russia | 4.3 | % | ||
| United States | 3.8 | % | ||
| Cayman | 3.7 | % | ||
| Turkey | 3.4 | % | ||
| Philippines | 2.6 | % | ||
| China | 2.4 | % | ||
| Indonesia | 2.0 | % | ||
| Luxembourg | 1.8 | % | ||
| Denmark | 1.7 | % | ||
| Bermuda | 1.6 | % | ||
| Others (each less than 1.0%) | 5.2 | % | ||
| 99.2 | % | |||
| Other Assets & Liabilities, Net | 0.8 | % | ||
| 100.0 | % | |||
| (c) | As of March 31, 2011, 0.8% of the fund’s net assets were reported illiquid by the portfolio manager under the Trust’s policy. | |
| (d) | Fair Value Measurements | |
| The following is a summary of the fund’s investments as categorized under the three-tier hierarchy of inputs used in valuing the fund’s assets and liabilities (See Note 11 in Notes to Financial Statements) as of March 31, 2011: |
| Level 2 | Level 3 | |||||||||||||||||||
| Total Value at | Level 1 | Significant | Significant | |||||||||||||||||
| March 31, 2011 | Quoted Price | Observable Inputs | Unobservable Inputs | |||||||||||||||||
| Assets | Rights (1) | $ | 7,630 | $ | 7,630 | $ | — | $ | — | |||||||||||
| Preferred Stocks (1) | 4,968,013 | 4,968,013 | — | — | ||||||||||||||||
| Common Stocks | ||||||||||||||||||||
| Bermuda | 1,047,198 | 1,047,198 | — | — | ||||||||||||||||
| Brazil | 4,401,748 | 4,401,748 | — | — | ||||||||||||||||
| Cayman | 2,382,222 | 948,235 | 1,433,987 | — | ||||||||||||||||
| Chile | 510,318 | 510,318 | — | — | ||||||||||||||||
| China | 1,536,020 | — | 1,536,020 | — | ||||||||||||||||
| Colombia | 199,998 | 199,998 | — | — | ||||||||||||||||
| Denmark | 1,076,519 | — | 1,076,519 | — | ||||||||||||||||
| Egypt | 450,370 | — | 450,370 | — | ||||||||||||||||
| France | 402,636 | — | 402,636 | — | ||||||||||||||||
| Hong Kong | 3,701,760 | — | 3,701,760 | — | ||||||||||||||||
| India | 8,665,270 | 2,463,137 | 6,202,133 | — | ||||||||||||||||
| Indonesia | 1,291,418 | — | 1,291,418 | — | ||||||||||||||||
| Kenya | 37,760 | 37,760 | — | — | ||||||||||||||||
| Luxembourg | 1,170,528 | 1,034,703 | 135,825 | — | ||||||||||||||||
| Mexico | 6,806,058 | 6,806,058 | — | — | ||||||||||||||||
| Nigeria | 131,543 | 131,543 | — | — | ||||||||||||||||
| Norway | 233,515 | — | 233,515 | — | ||||||||||||||||
| Philippines | 1,680,169 | — | 1,680,169 | — | ||||||||||||||||
| Russia | 2,782,748 | — | 2,782,748 | — | ||||||||||||||||
| South Africa | 3,975,386 | 33,453 | 3,941,933 | — | ||||||||||||||||
| South Korea | 2,914,928 | — | 2,914,928 | — | ||||||||||||||||
| Taiwan | 4,185,450 | — | 4,185,450 | — | ||||||||||||||||
| Thailand | 370,640 | 370,640 | — | — | ||||||||||||||||
| Turkey | 2,154,466 | — | 2,154,466 | — | ||||||||||||||||
| United Arab Emirates | 520,515 | — | 520,515 | — | ||||||||||||||||
| United Kingdom | 3,628,243 | — | 3,628,243 | — | ||||||||||||||||
| United States | 323,483 | 323,483 | — | — | ||||||||||||||||
| 56,580,909 | 18,308,274 | 38,272,635 | — | |||||||||||||||||
| Equity-Linked Structured Securities | 51,532 | — | 51,532 | — | ||||||||||||||||
| Short-Term Investment | 2,139,296 | 2,139,296 | — | — | ||||||||||||||||
| Total | $ | 63,747,380 | $ | 25,423,213 | $ | 38,324,167 | $ | — | ||||||||||||
| (1) | For equity investments categorized in a single level, refer to the schedule of investments for further geographical region breakout. |
| See Notes to Financial Statements | See explanation of symbols and terms, if any, on page B-61 |
B-53
PACIFIC LIFE FUNDS
PL INTERNATIONAL LARGE-CAP FUND
Schedule of Investments
March 31, 2011
PL INTERNATIONAL LARGE-CAP FUND
Schedule of Investments
March 31, 2011
| Shares | Value | |||||||
COMMON STOCKS — 98.0% | ||||||||
Australia — 2.4% | ||||||||
| QBE Insurance Group Ltd | 61,819 | $ | 1,130,737 | |||||
| Westpac Banking Corp | 83,880 | 2,110,536 | ||||||
| 3,241,273 | ||||||||
Austria — 0.6% | ||||||||
| Erste Group Bank AG | 16,153 | 815,704 | ||||||
Bermuda — 1.6% | ||||||||
| Esprit Holdings Ltd | 236,500 | 1,084,353 | ||||||
| Li & Fung Ltd | 219,200 | 1,120,987 | ||||||
| 2,205,340 | ||||||||
Brazil — 0.7% | ||||||||
| Banco Santander Brasil SA ADR | 74,560 | 914,106 | ||||||
Canada — 2.9% | ||||||||
| Canadian National Railway Co | 53,550 | 4,030,709 | ||||||
Czech Republic — 0.7% | ||||||||
| Komercni Banka AS | 3,893 | 981,431 | ||||||
France — 12.4% | ||||||||
| Air Liquide SA | 21,267 | 2,828,214 | ||||||
| Danone SA | 34,252 | 2,235,414 | ||||||
| Legrand SA | 20,185 | 839,645 | ||||||
| LVMH Moet Hennessy Louis Vuitton SA | 21,062 | 3,334,915 | ||||||
| Pernod-Ricard SA | 22,704 | 2,119,857 | ||||||
| Schneider Electric SA | 27,078 | 4,624,676 | ||||||
| Total SA | 18,589 | 1,132,689 | ||||||
| 17,115,410 | ||||||||
Germany — 11.1% | ||||||||
| Bayer AG | 21,556 | 1,665,472 | ||||||
| Beiersdorf AG | 36,960 | 2,255,722 | ||||||
| Deutsche Boerse AG | 26,308 | 1,991,638 | ||||||
| Linde AG | 35,064 | 5,535,953 | ||||||
| MAN SE | 10,150 | 1,262,887 | ||||||
| Merck KGaA | 11,425 | 1,030,415 | ||||||
| SAP AG | 24,608 | 1,505,028 | ||||||
| 15,247,115 | ||||||||
Hong Kong — 2.4% | ||||||||
| AIA Group Ltd * | 351,400 | 1,081,705 | ||||||
| China Unicom Ltd | 806,000 | 1,342,108 | ||||||
| CNOOC Ltd | 349,000 | 881,931 | ||||||
| 3,305,744 | ||||||||
India — 3.1% | ||||||||
| ICICI Bank Ltd ADR | 47,930 | 2,388,352 | ||||||
| Infosys Technologies Ltd ADR | 26,370 | 1,890,729 | ||||||
| 4,279,081 | ||||||||
Japan — 11.1% | ||||||||
| Aeon Credit Service Co Ltd | 10,000 | 137,915 | ||||||
| Canon Inc | 31,750 | 1,365,560 | ||||||
| Denso Corp | 43,800 | 1,456,565 | ||||||
| FANUC Corp | 10,400 | 1,572,032 | ||||||
| Honda Motor Co Ltd | 30,100 | 1,118,324 | ||||||
| HOYA Corp | 93,000 | 2,122,350 | ||||||
| INPEX Corp | 354 | 2,678,220 | ||||||
| Lawson Inc | 36,300 | 1,749,660 | ||||||
| Nomura Holdings Inc | 132,700 | 685,925 | ||||||
| Shin-Etsu Chemical Co Ltd | 49,000 | 2,438,748 | ||||||
| 15,325,299 | ||||||||
Netherlands — 9.4% | ||||||||
| Akzo Nobel NV | 40,709 | 2,801,299 | ||||||
| Heineken NV | 75,335 | 4,113,765 | ||||||
| ING Groep NV CVA * | 230,123 | 2,921,126 | ||||||
| Randstad Holding NV * | 35,126 | 1,955,332 | ||||||
| Wolters Kluwer NV | 53,112 | 1,242,072 | ||||||
| 13,033,594 | ||||||||
Singapore — 1.0% | ||||||||
| Keppel Corp Ltd | 48,000 | 468,253 | ||||||
| Singapore Telecommunications Ltd | 405,380 | 970,632 | ||||||
| 1,438,885 | ||||||||
South Africa — 1.0% | ||||||||
| MTN Group Ltd | 64,929 | 1,309,596 | ||||||
South Korea — 1.6% | ||||||||
| Samsung Electronics Co Ltd | 2,578 | 2,186,055 | ||||||
Spain — 1.3% | ||||||||
| Banco Santander SA | 104,970 | 1,224,366 | ||||||
| Red Electrica Corp SA | 10,558 | 600,879 | ||||||
| 1,825,245 | ||||||||
Sweden — 1.4% | ||||||||
| Hennes & Mauritz AB ‘B’ | 25,360 | 841,894 | ||||||
| Svenska Cellulosa AB ‘B’ | 69,491 | 1,118,265 | ||||||
| 1,960,159 | ||||||||
Switzerland — 10.7% | ||||||||
| Cie Financiere Richemont SA ‘A’ | 20,670 | 1,191,832 | ||||||
| Givaudan SA | 1,081 | 1,087,066 | ||||||
| Julius Baer Group Ltd | 62,681 | 2,713,679 | ||||||
| Nestle SA | 71,319 | 4,084,092 | ||||||
| Roche Holding AG | 14,352 | 2,048,969 | ||||||
| Sonova Holding AG | 6,093 | 542,964 | ||||||
| Swiss Reinsurance Co Ltd | 17,800 | 1,014,374 | ||||||
| UBS AG (XVTX) * | 117,680 | 2,117,072 | ||||||
| 14,800,048 | ||||||||
Taiwan — 1.7% | ||||||||
| Hon Hai Precision Industry Co Ltd | 107,000 | 374,392 | ||||||
| Taiwan Semiconductor Manufacturing Co Ltd ADR | 163,930 | 1,996,667 | ||||||
| 2,371,059 | ||||||||
United Kingdom — 19.0% | ||||||||
| Barclays PLC | 162,262 | 728,554 | ||||||
| BG Group PLC | 55,690 | 1,382,539 | ||||||
| Burberry Group PLC | 32,938 | 620,391 | ||||||
| Compass Group PLC | 160,640 | 1,443,975 | ||||||
| Diageo PLC | 156,360 | 2,972,155 | ||||||
| Hays PLC | 385,306 | 718,199 | ||||||
| HSBC Holdings PLC (LI) | 385,422 | 3,981,089 | ||||||
| Reckitt Benckiser Group PLC | 74,123 | 3,804,789 | ||||||
| Royal Dutch Shell PLC ‘A’ (LI) | 63,396 | 2,299,603 | ||||||
| Smiths Group PLC | 77,044 | 1,601,157 | ||||||
| Standard Chartered PLC | 91,555 | 2,374,848 | ||||||
| See Notes to Financial Statements | See explanation of symbols and terms, if any, on page B-61 |
B-54
PACIFIC LIFE FUNDS
PL INTERNATIONAL LARGE-CAP FUND
Schedule of Investments (Continued)
March 31, 2011
PL INTERNATIONAL LARGE-CAP FUND
Schedule of Investments (Continued)
March 31, 2011
| Shares | Value | |||||||
| Tesco PLC | 350,110 | $ | 2,138,715 | |||||
| WPP PLC | 175,023 | 2,156,965 | ||||||
| 26,222,979 | ||||||||
United States — 1.9% | ||||||||
| Synthes Inc | 19,239 | 2,598,427 | ||||||
| Total Common Stocks (Cost $105,613,007) | 135,207,259 | |||||||
| Principal | ||||||||
| Amount | ||||||||
SHORT-TERM INVESTMENTS — 1.9% | ||||||||
Commercial Paper — 1.9% | ||||||||
| JPMorgan Chase 0.010% due 04/01/11 | $ | 2,591,000 | 2,591,000 | |||||
| Shares | ||||||||
Money Market Fund — 0.0% | ||||||||
| BlackRock Liquidity Funds Treasury | ||||||||
| Trust Fund Portfolio | 41,092 | 41,092 | ||||||
| Total Short-Term Investments (Cost $2,632,092) | 2,632,092 | |||||||
TOTAL INVESTMENTS — 99.9% (Cost $108,245,099) | 137,839,351 | |||||||
OTHER ASSETS & LIABILITIES, NET — 0.1% | 193,655 | |||||||
NET ASSETS — 100.0% | $ | 138,033,006 | ||||||
Notes to Schedule of Investments
| (a) | As of March 31, 2011, the fund was diversified as a percentage of net assets as follows: |
| Financials | 21.2 | % | ||
| Consumer Staples | 18.5 | % | ||
| Industrials | 12.4 | % | ||
| Materials | 11.5 | % | ||
| Consumer Discretionary | 11.3 | % | ||
| Information Technology | 8.3 | % | ||
| Energy | 6.1 | % | ||
| Health Care | 5.7 | % | ||
| Telecommunication Services | 2.6 | % | ||
| Short-Term Investments | 1.9 | % | ||
| Utilities | 0.4 | % | ||
| 99.9 | % | |||
| Other Assets & Liabilities, Net | 0.1 | % | ||
| 100.0 | % | |||
| (b) | As of March 31, 2011, the fund was diversified by geographical region as a percentage of net assets as follows: |
| United Kingdom | 19.0 | % | ||
| France | 12.4 | % | ||
| Japan | 11.1 | % | ||
| Germany | 11.1 | % | ||
| Switzerland | 10.7 | % | ||
| Netherlands | 9.4 | % | ||
| United States | 3.8 | % | ||
| India | 3.1 | % | ||
| Canada | 2.9 | % | ||
| Hong Kong | 2.4 | % | ||
| Australia | 2.4 | % | ||
| Taiwan | 1.7 | % | ||
| Bermuda | 1.6 | % | ||
| South Korea | 1.6 | % | ||
| Sweden | 1.4 | % | ||
| Spain | 1.3 | % | ||
| Singapore | 1.0 | % | ||
| South Africa | 1.0 | % | ||
| Others (each less than 1.0%) | 2.0 | % | ||
| 99.9 | % | |||
| Other Assets & Liabilities, Net | 0.1 | % | ||
| 100.0 | % | |||
| (c) | Short-term investments reflect either the stated coupon rate or the annualized effective yield on the date of purchase for discounted investments. |
| See Notes to Financial Statements | See explanation of symbols and terms, if any, on page B-61 |
B-55
PACIFIC LIFE FUNDS
PL INTERNATIONAL LARGE-CAP FUND
Schedule of Investments (Continued)
March 31, 2011
PL INTERNATIONAL LARGE-CAP FUND
Schedule of Investments (Continued)
March 31, 2011
| (d) | Fair Value Measurements | |
| The following is a summary of the fund’s investments as categorized under the three-tier hierarchy of inputs used in valuing the fund’s assets and liabilities (See Note 11 in Notes to Financial Statements) as of March 31, 2011: |
| Level 2 | Level 3 | |||||||||||||||||||
| Total Value at | Level 1 | Significant | Significant | |||||||||||||||||
| March 31, 2011 | Quoted Price | Observable Inputs | Unobservable Inputs | |||||||||||||||||
| Assets | Common Stocks | |||||||||||||||||||
| Australia | $ | 3,241,273 | $ | — | $ | 3,241,273 | $ | — | ||||||||||||
| Austria | 815,704 | — | 815,704 | — | ||||||||||||||||
| Bermuda | 2,205,340 | — | 2,205,340 | — | ||||||||||||||||
| Brazil | 914,106 | 914,106 | — | — | ||||||||||||||||
| Canada | 4,030,709 | 4,030,709 | — | — | ||||||||||||||||
| Czech Republic | 981,431 | — | 981,431 | — | ||||||||||||||||
| France | 17,115,410 | — | 17,115,410 | — | ||||||||||||||||
| Germany | 15,247,115 | 2,255,722 | 12,991,393 | — | ||||||||||||||||
| Hong Kong | 3,305,744 | — | 3,305,744 | — | ||||||||||||||||
| India | 4,279,081 | 4,279,081 | — | — | ||||||||||||||||
| Japan | 15,325,299 | — | 15,325,299 | — | ||||||||||||||||
| Netherlands | 13,033,594 | — | 13,033,594 | — | ||||||||||||||||
| Singapore | 1,438,885 | — | 1,438,885 | — | ||||||||||||||||
| South Africa | 1,309,596 | — | 1,309,596 | — | ||||||||||||||||
| South Korea | 2,186,055 | — | 2,186,055 | — | ||||||||||||||||
| Spain | 1,825,245 | — | 1,825,245 | — | ||||||||||||||||
| Sweden | 1,960,159 | — | 1,960,159 | — | ||||||||||||||||
| Switzerland | 14,800,048 | — | 14,800,048 | |||||||||||||||||
| Taiwan | 2,371,059 | 1,996,667 | 374,392 | — | ||||||||||||||||
| United Kingdom | 26,222,979 | — | 26,222,979 | — | ||||||||||||||||
| United States | 2,598,427 | — | 2,598,427 | — | ||||||||||||||||
| 135,207,259 | 13,476,285 | 121,730,974 | — | |||||||||||||||||
| Short-Term Investments | 2,632,092 | 41,092 | 2,591,000 | — | ||||||||||||||||
| Total | $ | 137,839,351 | $ | 13,517,377 | $ | 124,321,974 | $ | — | ||||||||||||
| See Notes to Financial Statements | See explanation of symbols and terms, if any, on page B-61 |
B-56
PACIFIC LIFE FUNDS
PL INTERNATIONAL VALUE FUND
Schedule of Investments
March 31, 2011
PL INTERNATIONAL VALUE FUND
Schedule of Investments
March 31, 2011
| Shares | Value | |||||||
PREFERRED STOCKS — 1.7% | ||||||||
Germany — 1.7% | ||||||||
| Volkswagen AG | 9,797 | $ | 1,583,414 | |||||
| Total Preferred Stocks (Cost $1,626,114) | 1,583,414 | |||||||
COMMON STOCKS — 96.0% | ||||||||
Australia — 0.7% | ||||||||
| QBE Insurance Group Ltd | 31,582 | 577,669 | ||||||
Austria — 1.1% | ||||||||
| Erste Group Bank AG | 19,833 | 1,001,538 | ||||||
Belgium — 1.0% | ||||||||
| KBC Groep NV * | 24,723 | 930,273 | ||||||
Canada — 1.4% | ||||||||
| First Quantum Minerals Ltd | 9,951 | 1,287,318 | ||||||
China — 1.4% | ||||||||
| China Merchants Bank Co Ltd ‘H’ | 295,500 | 816,874 | ||||||
| China Shenhua Energy Co Ltd ‘H’ | 102,000 | 480,089 | ||||||
| 1,296,963 | ||||||||
Finland — 1.3% | ||||||||
| UPM-Kymmene OYJ * | 54,293 | 1,147,941 | ||||||
France — 11.8% | ||||||||
| BNP Paribas | 15,115 | 1,104,972 | ||||||
| GDF Suez | 55,580 | 2,266,628 | ||||||
| PPR | 6,709 | 1,027,539 | ||||||
| Sanofi-Aventis SA | 30,505 | 2,137,617 | ||||||
| Schneider Electric SA | 9,211 | 1,573,155 | ||||||
| Societe Generale | 19,117 | 1,241,726 | ||||||
| Sodexo | 11,920 | 870,938 | ||||||
| Vivendi SA | 15,876 | 452,899 | ||||||
| 10,675,474 | ||||||||
Germany — 10.7% | ||||||||
| Allianz SE | 11,724 | 1,641,653 | ||||||
| BASF SE | 21,541 | 1,859,305 | ||||||
| Bayer AG | 22,260 | 1,719,865 | ||||||
| Daimler AG * | 22,014 | 1,551,155 | ||||||
| Hamburger Hafen und Logistik AG | 9,903 | 459,532 | ||||||
| Lanxess AG | 9,264 | 694,316 | ||||||
| Siemens AG | 12,287 | 1,680,713 | ||||||
| 9,606,539 | ||||||||
Hong Kong — 1.9% | ||||||||
| Hutchison Whampoa Ltd | 76,000 | 899,411 | ||||||
| Sun Hung Kai Properties Ltd | 52,000 | 823,473 | ||||||
| 1,722,884 | ||||||||
Italy — 4.1% | ||||||||
| Enel SPA | 206,790 | 1,302,722 | ||||||
| Snam Rete Gas SPA | 223,163 | 1,253,626 | ||||||
| UniCredit SPA | 456,215 | 1,124,495 | ||||||
| 3,680,843 | ||||||||
Japan — 19.0% | ||||||||
| Amada Co Ltd | 76,000 | 634,667 | ||||||
| Bridgestone Corp | 34,300 | 717,241 | ||||||
| East Japan Railway Co | 13,900 | 771,853 | ||||||
| FUJIFILM Holdings Corp | 29,800 | 923,659 | ||||||
| Fujitsu Ltd | 134,000 | 757,241 | ||||||
| Japan Tobacco Inc | 287 | 1,037,615 | ||||||
| JX Holdings Inc | 176,860 | 1,188,249 | ||||||
| KDDI Corp | 238 | 1,471,478 | ||||||
| Marubeni Corp | 100,000 | 718,679 | ||||||
| Mitsubishi Electric Corp | 87,000 | 1,023,866 | ||||||
| Mitsui & Co Ltd | 73,800 | 1,321,306 | ||||||
| Nintendo Co Ltd | 1,900 | 516,629 | ||||||
| Nippon Telegraph & Telephone Corp | 20,800 | 929,031 | ||||||
| Nissan Motor Co Ltd | 108,000 | 959,367 | ||||||
| Ricoh Co Ltd | 35,000 | 412,090 | ||||||
| Shiseido Co Ltd | 5,300 | 91,802 | ||||||
| Sumitomo Corp | 80,100 | 1,144,727 | ||||||
| Sumitomo Mitsui Financial Group Inc | 55,400 | 1,718,802 | ||||||
| Toyota Motor Corp | 20,400 | 809,559 | ||||||
| 17,147,861 | ||||||||
Netherlands — 5.7% | ||||||||
| ING Groep NV CVA * | 159,008 | 2,018,409 | ||||||
| Koninklijke KPN NV | 75,047 | 1,279,707 | ||||||
| Koninklijke Philips Electronics NV * | 19,849 | 635,819 | ||||||
| Unilever NV CVA | 39,264 | 1,230,238 | ||||||
| 5,164,173 | ||||||||
Norway — 1.1% | ||||||||
| DnB NOR ASA | 66,393 | 1,017,990 | ||||||
Singapore — 0.7% | ||||||||
| Singapore Telecommunications Ltd | 250,000 | 598,594 | ||||||
South Africa — 0.7% | ||||||||
| African Bank Investments Ltd | 114,100 | 638,272 | ||||||
South Korea — 1.3% | ||||||||
| Samsung Electronics Co Ltd | 1,408 | 1,193,936 | ||||||
Spain — 2.8% | ||||||||
| Banco Bilbao Vizcaya Argentaria SA | 111,366 | 1,351,158 | ||||||
| Telefonica SA | 47,150 | 1,182,738 | ||||||
| 2,533,896 | ||||||||
Sweden — 0.8% | ||||||||
| Swedbank AB ‘A’ | 40,231 | 687,916 | ||||||
Switzerland — 3.3% | ||||||||
| Holcim Ltd | 13,729 | 1,031,862 | ||||||
| UBS AG * | 43,260 | 778,251 | ||||||
| Zurich Financial Services AG | 4,267 | 1,192,784 | ||||||
| 3,002,897 | ||||||||
| See Notes to Financial Statements | See explanation of symbols and terms, if any, on page B-61 |
B-57
PACIFIC LIFE FUNDS
PL INTERNATIONAL VALUE FUND
Schedule of Investments (Continued)
March 31, 2011
PL INTERNATIONAL VALUE FUND
Schedule of Investments (Continued)
March 31, 2011
| Shares | Value | |||||||
Taiwan - 0.6% | ||||||||
| Hon Hai Precision Industry Co Ltd GDR | 78,480 | $ | 549,776 | |||||
United Kingdom - 24.6% | ||||||||
| Barclays PLC | 268,895 | 1,207,334 | ||||||
| BP PLC | 258,397 | 1,898,476 | ||||||
| British American Tobacco PLC | 25,104 | 1,006,616 | ||||||
| BT Group PLC | 234,292 | 696,181 | ||||||
| Cairn Energy PLC * | 106,111 | 786,223 | ||||||
| Centrica PLC | 218,818 | 1,141,101 | ||||||
| Experian PLC | 62,720 | 776,536 | ||||||
| GlaxoSmithKline PLC | 80,538 | 1,534,634 | ||||||
| HSBC Holdings PLC | 85,539 | 883,547 | ||||||
| InterContinental Hotels Group PLC | 49,477 | 1,013,928 | ||||||
| International Power PLC | 130,232 | 643,285 | ||||||
| Lloyds Banking Group PLC * | 788,886 | 733,040 | ||||||
| Man Group PLC | 137,535 | 541,948 | ||||||
| Petropavlovsk PLC | 28,112 | 449,907 | ||||||
| Prudential PLC | 120,749 | 1,367,452 | ||||||
| Royal Dutch Shell PLC ‘A’ | 105,478 | 3,826,069 | ||||||
| Standard Chartered PLC | 25,684 | 666,218 | ||||||
| Tullow Oil PLC | 20,211 | 468,992 | ||||||
| Vodafone Group PLC | 891,463 | 2,540,516 | ||||||
| 22,182,003 | ||||||||
| Total Common Stocks (Cost $81,536,938) | 86,644,756 | |||||||
SHORT-TERM INVESTMENT - 1.3% | ||||||||
Money Market Fund - 1.3% | ||||||||
| BlackRock Liquidity Funds Treasury Trust Fund Portfolio | 1,145,067 | 1,145,067 | ||||||
| Total Short-Term Investment (Cost $1,145,067) | 1,145,067 | |||||||
TOTAL INVESTMENTS - 99.0% (Cost $84,308,119) | 89,373,237 | |||||||
OTHER ASSETS & LIABILITIES, NET - 1.0% | 869,044 | |||||||
NET ASSETS - 100.0% | $ | 90,242,281 | ||||||
Notes to Schedule of Investments
(a) As of March 31, 2011, the fund was diversified as a percentage of net assets as follows:
| Financials | 26.6 | % | ||
| Industrials | 12.9 | % | ||
| Consumer Discretionary | 9.9 | % | ||
| Telecommunication Services | 9.6 | % | ||
| Energy | 9.6 | % | ||
| Utilities | 7.3 | % | ||
| Materials | 7.2 | % | ||
| Health Care | 6.0 | % | ||
| Information Technology | 4.9 | % | ||
| Consumer Staples | 3.7 | % | ||
| Short-Term Investment | 1.3 | % | ||
| 99.0 | % | |||
| Other Assets & Liabilities, Net | 1.0 | % | ||
| 100.0 | % | |||
(b) As of March 31, 2011, the fund was diversified by geographical region as a percentage of net assets as follows:
| United Kingdom | 24.6 | % | ||
| Japan | 19.0 | % | ||
| Germany | 12.4 | % | ||
| France | 11.8 | % | ||
| Netherlands | 5.7 | % | ||
| Italy | 4.1 | % | ||
| Switzerland | 3.3 | % | ||
| Spain | 2.8 | % | ||
| Hong Kong | 1.9 | % | ||
| China | 1.4 | % | ||
| Canada | 1.4 | % | ||
| South Korea | 1.3 | % | ||
| Finland | 1.3 | % | ||
| United States | 1.3 | % | ||
| Norway | 1.1 | % | ||
| Austria | 1.1 | % | ||
| Belgium | 1.0 | % | ||
| Others (each less than 1.0%) | 3.5 | % | ||
| 99.0 | % | |||
| Other Assets & Liabilities, Net | 1.0 | % | ||
| 100.0 | % | |||
(c) Open futures contracts outstanding as of March 31, 2010 were as follows:
| Net | ||||||||||||
| Number of | Notional | Unrealized | ||||||||||
| Long Futures Outstanding | Contracts | Amount | Depreciation | |||||||||
| Dow Jones EURO | ||||||||||||
| STOXX 50 (06/11) | 12 | EUR 341,400 | $ | ( 170 | ) | |||||||
| FTSE 100 Index (06/11) | 4 | GBP235,880 | (802 | ) | ||||||||
| $ | (972 | ) | ||||||||||
| See Notes to Financial Statements | See explanation of symbols and terms, if any, on page B-61 |
B-58
PACIFIC LIFE FUNDS
PL INTERNATIONAL VALUE FUND
Schedule of Investments (Continued)
March 31, 2011
PL INTERNATIONAL VALUE FUND
Schedule of Investments (Continued)
March 31, 2011
(d) Forward foreign currency contracts as of March 31, 2011 were as follows:
| Contracts | Principal Amount | Unrealized | ||||||||||||
| to Buy or | Covered by | Appreciation | ||||||||||||
| to Sell | Currency | Contracts | Expiration | Counterparty | (Depreciation) | |||||||||
| Buy | AUD | 277,533 | 05/11 | BRC | $ | 6,736 | ||||||||
| Buy | AUD | 450,000 | 05/11 | UBS | 11,365 | |||||||||
| Buy | AUD | 6,527,719 | 05/11 | WPC | 311,210 | |||||||||
| Sell | AUD | 475,399 | 05/11 | WPC | (13,116 | ) | ||||||||
| Sell | CAD | 1,022,059 | 05/11 | WPC | (33,015 | ) | ||||||||
| Buy | CHF | 4,087,217 | 05/11 | CIT | 117,402 | |||||||||
| Sell | CHF | 450,000 | 05/11 | WPC | (10,799 | ) | ||||||||
| Buy | EUR | 1,030,763 | 05/11 | RBC | 22,975 | |||||||||
| Buy | EUR | 363,097 | 05/11 | TDB | 963 | |||||||||
| Buy | EUR | 934,948 | 05/11 | WPC | 22,099 | |||||||||
| Sell | EUR | 203,072 | 05/11 | BRC | (8,494 | ) | ||||||||
| Sell | EUR | 6,381,143 | 05/11 | HSB | (322,476 | ) | ||||||||
| Sell | EUR | 261,618 | 05/11 | MER | 496 | |||||||||
| Sell | EUR | 620,584 | 05/11 | SGG | (30,497 | ) | ||||||||
| Sell | EUR | 387,212 | 05/11 | SSB | (13,289 | ) | ||||||||
| Sell | EUR | 409,134 | 05/11 | UBS | (15,612 | ) | ||||||||
| Buy | GBP | 221,920 | 05/11 | BRC | (2,850 | ) | ||||||||
| Buy | GBP | 210,895 | 05/11 | HSB | 4,231 | |||||||||
| Buy | GBP | 506,062 | 05/11 | RBS | 1,709 | |||||||||
| Sell | GBP | 213,558 | 05/11 | BRC | 4,526 | |||||||||
| Sell | GBP | 125,387 | 05/11 | CIT | 3,203 | |||||||||
| Sell | GBP | 610,000 | 05/11 | CIT | (10,062 | ) | ||||||||
| Sell | GBP | 1,177,884 | 05/11 | CSF | (18,628 | ) | ||||||||
| Sell | GBP | 371,131 | 05/11 | MER | 2,111 | |||||||||
| Sell | GBP | 179,903 | 05/11 | RBC | 3,820 | |||||||||
| Sell | GBP | 141,358 | 05/11 | SSB | 2,841 | |||||||||
| Buy | HKD | 2,891,350 | 05/11 | MER | 794 | |||||||||
| Buy | HKD | 2,376,548 | 05/11 | SSB | 727 | |||||||||
| Sell | HKD | 2,021,818 | 05/11 | BRC | (295 | ) | ||||||||
| Sell | HKD | 3,411,049 | 05/11 | SGG | (1,087 | ) | ||||||||
| Buy | JPY | 56,060,741 | 05/11 | CSF | (8,476 | ) | ||||||||
| Buy | JPY | 49,259,088 | 05/11 | MER | (4,902 | ) | ||||||||
| Sell | JPY | 19,055,644 | 05/11 | BRC | 980 | |||||||||
| Sell | JPY | 58,458,405 | 05/11 | BRC | (4,755 | ) | ||||||||
| Sell | JPY | 56,167,155 | 05/11 | HSB | 16,756 | |||||||||
| Buy | NOK | 4,043,342 | 05/11 | CIT | 26,492 | |||||||||
| Buy | NOK | 3,916,107 | 05/11 | HSB | 28,693 | |||||||||
| Sell | NOK | 8,960,000 | 05/11 | SSB | (80,507 | ) | ||||||||
| Buy | SEK | 15,719,142 | 05/11 | SSB | 72,072 | |||||||||
| Sell | SEK | 2,833,493 | 05/11 | RBC | (9,852 | ) | ||||||||
| Buy | SGD | 1,224,215 | 05/11 | CIT | 14,460 | |||||||||
| $ | 87,949 | |||||||||||||
| See Notes to Financial Statements | See explanation of symbols and terms, if any, on page B-61 |
B-59
PACIFIC LIFE FUNDS
PL INTERNATIONAL VALUE FUND
Schedule of Investments (Continued)
March 31, 2011
PL INTERNATIONAL VALUE FUND
Schedule of Investments (Continued)
March 31, 2011
(e) Fair Value Measurements
| The following is a summary of the fund’s investments as categorized under the three-tier hierarchy of inputs used in valuing the fund’s assets and liabilities (See Note 11 in Notes to Financial Statements) as of March 31, 2011: |
| Level 2 | Level 3 | |||||||||||||||||
| Total Value at | Level 1 | Significant | Significant | |||||||||||||||
| March 31, 2011 | Quoted Price | Observable Inputs | Unobservable Inputs | |||||||||||||||
| Assets | Preferred Stocks (1) | $ | 1,583,414 | $ | — | $ | 1,583,414 | $ | — | |||||||||
| Common Stocks | ||||||||||||||||||
| Australia | 577,669 | — | 577,669 | — | ||||||||||||||
| Austria | 1,001,538 | — | 1,001,538 | — | ||||||||||||||
| Belgium | 930,273 | — | 930,273 | — | ||||||||||||||
| Canada | 1,287,318 | 1,287,318 | — | — | ||||||||||||||
| China | 1,296,963 | — | 1,296,963 | — | ||||||||||||||
| Finland | 1,147,941 | — | 1,147,941 | — | ||||||||||||||
| France | 10,675,474 | — | 10,675,474 | — | ||||||||||||||
| Germany | 9,606,539 | — | 9,606,539 | — | ||||||||||||||
| Hong Kong | 1,722,884 | — | 1,722,884 | — | ||||||||||||||
| Italy | 3,680,843 | — | 3,680,843 | — | ||||||||||||||
| Japan | 17,147,861 | — | 17,147,861 | — | ||||||||||||||
| Netherlands | 5,164,173 | — | 5,164,173 | — | ||||||||||||||
| Norway | 1,017,990 | — | 1,017,990 | — | ||||||||||||||
| Singapore | 598,594 | — | 598,594 | — | ||||||||||||||
| South Africa | 638,272 | — | 638,272 | — | ||||||||||||||
| South Korea | 1,193,936 | — | 1,193,936 | — | ||||||||||||||
| Spain | 2,533,896 | — | 2,533,896 | — | ||||||||||||||
| Sweden | 687,916 | — | 687,916 | — | ||||||||||||||
| Switzerland | 3,002,897 | — | 3,002,897 | — | ||||||||||||||
| Taiwan | 549,776 | 549,776 | — | — | ||||||||||||||
| United Kingdom | 22,182,003 | — | 22,182,003 | — | ||||||||||||||
| 86,644,756 | 1,837,094 | 84,807,662 | — | |||||||||||||||
| Short-Term Investment | 1,145,067 | 1,145,067 | — | — | ||||||||||||||
| Derivatives: | ||||||||||||||||||
| Foreign Currency Contracts | ||||||||||||||||||
| Forward Foreign Currency Contracts | 676,661 | — | 676,661 | — | ||||||||||||||
| Total Assets | 90,049,898 | 2,982,161 | 87,067,737 | — | ||||||||||||||
| Liabilities | Derivatives: | |||||||||||||||||
| Equity Contracts | ||||||||||||||||||
| Futures | (972 | ) | (972 | ) | — | — | ||||||||||||
| Foreign Currency Contracts | ||||||||||||||||||
| Forward Foreign Currency Contracts | (588,712 | ) | — | (588,712 | ) | — | ||||||||||||
| Total Liabilities | (589,684 | ) | (972 | ) | (588,712 | ) | — | |||||||||||
| Total | $ | 89,460,214 | $ | 2,981,189 | $ | 86,479,025 | $ | — | ||||||||||
| (1) | For equity investments categorized in a single level, refer to the schedule of investments for further geographical region breakout. |
| See Notes to Financial Statements | See explanation of symbols and terms, if any, on page B-61 |
B-60
PACIFIC LIFE FUNDS
Schedule of Investments (Continued)
Explanation of Symbols and Terms
March 31, 2011
Schedule of Investments (Continued)
Explanation of Symbols and Terms
March 31, 2011
Explanation of Symbols:
| * | Non-income producing investments. | |
| " | Pass-through securities backed by a pool of mortgages or other loans on which principal payments are periodically made. Therefore, the effective maturity is shorter than the stated maturity. | |
| ^ | Investments with their principal amount adjusted for inflation. | |
| § | Variable rate investments. The rate shown is based on the latest available information as of March 31, 2011. For Senior Loan Notes, the rate shown may represent a weighted average interest rate. | |
| Ώ | Investments were in default as of March 31, 2011. | |
| ± | The security is a perpetual bond and has no definite maturity date. | |
| ∞ | Unsettled position. Contract rates do not take effect until settlement date. | |
| ~ | Securities are not registered under the Securities Act of 1933 (1933 Act). These securities are either (1) exempt from registration pursuant to Rule 144A of the 1933 Act and may only be sold to “qualified institutional buyers”, or (2) the securities comply with Regulation S rules governing offers and sales made outside the United States without registration under the 1933 Act and contain certain restrictions as to public resale. | |
| ‡ | Investments were fully or partially segregated with the broker(s)/custodian as collateral for securities sold short, futures contracts, written option contracts, swap contracts and/or reverse repurchase agreements, if any, as of March 31, 2011. | |
| Δ | Illiquid Investments. Investments were reported as illiquid by the portfolio manager pursuant to the Trust’s policy and procedures (See Note 2G in Notes to Financial Statements). | |
| + | The values of these investments were determined by a Trustee Valuation Committee or determined by a Board of Trustees (“Board”) approved valuation committee, or a delegate of the Board and then approved by the Board. Each determination was made in good faith in accordance with the procedures established by the Board and the provisions of the Investment Company Act of 1940 ( See Note 2B in Notes to Financial Statements). |
Counterparty Abbreviations:
| BRC | Barclays | |
| CIT | Citigroup | |
| CSF | Credit Suisse | |
| DUB | Deutsche Bank | |
| GSC | Goldman Sachs | |
| HSB | HSBC | |
| JPM | JPMorgan Chase | |
| MER | Merrill Lynch | |
| MSC | Morgan Stanley | |
| RBC | Royal Bank of Canada | |
| RBS | Royal Bank of Scotland | |
| SGG | Societe Generale Group | |
| SSB | State Street Bank | |
| TDB | Toronto Dominion Bank | |
| UBS | UBS | |
| WPC | Westpac Group | |
| Currency Abbreviations: | ||
| AUD | Australian Dollar | |
| BRL | Brazilian Real | |
| CAD | Canadian Dollar | |
| CHF | Swiss Franc | |
| CNY | Chinese Renminbi | |
| DKK | Danish Krone | |
| EUR | Euro | |
| GBP | British Pound | |
| HKD | Hong Kong Dollar | |
| IDR | Indonesian Rupiah | |
| INR | Indian Rupee | |
| JPY | Japanese Yen | |
| KRW | Korean Won | |
| MXN | Mexican Peso | |
| MYR | Malaysian Ringitt | |
| NOK | Norwegian Krone | |
| PHP | Philippine Peso | |
| RUB | Russian Ruble | |
| SGD | Singapore Dollar | |
| TRY | Turkish Lira | |
| TWD | Taiwan Dollar | |
| USD | United States Dollar | |
| ZAR | South African Rand | |
| Other Abbreviations: | ||
| ADR | American Depositary Receipt | |
| CBOT | Chicago Board of Trade | |
| CDO | Collateralized Debt Obligation | |
| CLO | Collateralized Loan Obligation | |
| CME | Chicago Mercantile Exchange | |
| CPI | Consumer Price Index | |
| CVA | Certificaten Van Aandelen (Dutch Certificate) | |
| FDR | Fiduciary Depositary Receipt | |
| GDR | Global Depositary Receipt | |
| LI | London Stock Exchange | |
| LIBOR | London Interbank Offered Rate | |
| ‘NY’ | New York Shares | |
| OTC | Over the Counter | |
| REIT | Real Estate Investment Trust | |
| SDR | Swedish Depositary Receipt | |
| VVPR | Verminderde Voorheffing Precompte Reduit (Belgium dividend coupon) | |
| XVTX | Virt-X Pan European Stock Exchange | |
Note: The descriptions, Standard & Poor’s quality ratings and credit spreads of the companies shown in the schedules of investments were obtained from published reports and other sources believed to be reliable, and are not audited by the Independent Registered Public Accounting Firm.
| See Notes to Financial Statements |
B-61
PACIFIC LIFE FUNDS
STATEMENTS OF ASSETS AND LIABILITIES
MARCH 31, 2011
| PL Floating | PL Inflation | PL Managed | PL Short Duration | PL Large-Cap | ||||||||||||||||||||||||
| Rate Loan | Managed | Bond | Bond | PL Comstock | PL Growth LT | Growth | ||||||||||||||||||||||
| Fund | Fund | Fund | Fund | Fund | Fund | Fund | ||||||||||||||||||||||
ASSETS | ||||||||||||||||||||||||||||
| Investments and repurchase agreements, at cost | $ | 86,007,974 | $ | 283,297,215 | $ | 413,201,688 | $ | 119,952,137 | $ | 132,613,770 | $ | 94,569,661 | $ | 75,666,158 | ||||||||||||||
| Investments, at value | $ | 87,804,639 | $ | 288,899,505 | $ | 382,878,271 | $ | 102,829,672 | $ | 166,047,641 | $ | 115,455,947 | $ | 98,783,464 | ||||||||||||||
| Repurchase agreements, at value | — | — | 33,500,000 | 17,600,000 | — | — | — | |||||||||||||||||||||
| Cash (1) | — | 14,700 | — | — | — | — | — | |||||||||||||||||||||
| Foreign currency held, at value (2) | — | 21,520 | 111,416 | — | — | 31,878 | — | |||||||||||||||||||||
| Receivables: | ||||||||||||||||||||||||||||
| Dividends and interest | 267,259 | 1,346,335 | 1,864,351 | 514,539 | 289,556 | 182,609 | 37,083 | |||||||||||||||||||||
| Foreign tax reclaim | — | — | — | — | — | 7,085 | — | |||||||||||||||||||||
| Fund shares sold | 192,778 | 397,166 | 661,207 | 230,998 | 126,311 | 186,189 | — | |||||||||||||||||||||
| Securities sold | 84,728 | 2,959,434 | 31,383,374 | 5,072,031 | 1,064,469 | — | 465,995 | |||||||||||||||||||||
| Variation margin | — | 13,650 | 250,704 | 16,091 | — | — | — | |||||||||||||||||||||
| Securities sold short | — | — | 2,552,892 | — | — | — | — | |||||||||||||||||||||
| Due from adviser | 29,101 | 23,596 | 63,796 | 18,353 | 22,504 | 14,768 | 11,062 | |||||||||||||||||||||
| Forward foreign currency contracts appreciation | — | 269,070 | 1,082,050 | — | — | 11,234 | — | |||||||||||||||||||||
| Prepaid expenses and other assets | 2,236 | 5,775 | 9,661 | 3,180 | 4,244 | 2,948 | 2,585 | |||||||||||||||||||||
| Swap contracts, at value | — | 880,877 | 1,646,409 | — | — | — | — | |||||||||||||||||||||
| Total Assets | 88,380,741 | 294,831,628 | 456,004,131 | 126,284,864 | 167,554,725 | 115,892,658 | 99,300,189 | |||||||||||||||||||||
LIABILITIES | ||||||||||||||||||||||||||||
| Payables: | ||||||||||||||||||||||||||||
| Due to brokers (3) | — | 260,000 | 1,410,000 | — | — | — | — | |||||||||||||||||||||
| Fund shares redeemed | — | — | 4,968 | — | — | — | — | |||||||||||||||||||||
| Securities purchased | 2,223,888 | 62,398,448 | 70,053,199 | 5,051,604 | 911,573 | 151,290 | 87,243 | |||||||||||||||||||||
| Reverse repurchase agreement | — | 1,272,000 | — | — | — | — | — | |||||||||||||||||||||
| Securities sold short, at value (proceeds $2,552,850) | — | — | 2,540,376 | — | — | — | — | |||||||||||||||||||||
| Accrued advisory fees | 45,783 | 76,624 | 126,072 | 39,960 | 100,403 | 52,283 | 59,916 | |||||||||||||||||||||
| Accrued administration fees | 10,565 | 28,734 | 47,277 | 14,985 | 20,490 | 14,259 | 12,396 | |||||||||||||||||||||
| Accrued support service expenses | 3,619 | 9,334 | 15,621 | 5,143 | 6,858 | 4,762 | 4,191 | |||||||||||||||||||||
| Accrued custodian fees and expenses | 7,631 | 13,391 | 40,426 | 6,995 | 8,806 | 12,718 | 6,309 | |||||||||||||||||||||
| Accrued legal, audit and tax service fees | 11,146 | 28,788 | 48,166 | 15,844 | 21,152 | 14,693 | 12,919 | |||||||||||||||||||||
| Accrued trustees’ fees and expenses and deferred compensation | 240 | 2,854 | 8,945 | 1,427 | 3,545 | 3,411 | 6,368 | |||||||||||||||||||||
| Accrued transfer agency out-of-pocket expenses | 3,279 | 8,455 | 14,150 | 4,659 | 6,212 | 4,314 | 3,796 | |||||||||||||||||||||
| Accrued interest | — | 57 | — | — | — | — | — | |||||||||||||||||||||
| Accrued other | 8,990 | 20,850 | 38,711 | 11,024 | 10,421 | 8,278 | 6,165 | |||||||||||||||||||||
| Forward foreign currency contracts depreciation | — | 786,817 | 703,225 | — | — | 50,823 | — | |||||||||||||||||||||
| Outstanding options written, at value (premiums received $351,070 and $810,099) | — | 453,996 | 1,090,361 | — | — | — | — | |||||||||||||||||||||
| Swap contracts, at value | — | 114,879 | 880,164 | — | — | — | — | |||||||||||||||||||||
| Total Liabilities | 2,315,141 | 65,475,227 | 77,021,661 | 5,151,641 | 1,089,460 | 316,831 | 199,303 | |||||||||||||||||||||
| NET ASSETS | $ | 86,065,600 | $ | 229,356,401 | $ | 378,982,470 | $ | 121,133,223 | $ | 166,465,265 | $ | 115,575,827 | $ | 99,100,886 | ||||||||||||||
| (1) | Includes margin deposits of $14,700 segregated for futures contracts in the PL Inflation Managed Fund. | |
| (2) | The cost of foreign currency for the PL Inflation Managed, PL Managed Bond and PL Growth LT Funds were $20,935, $108,615 and $31,187, respectively. | |
| (3) | The PL Inflation Managed and PL Managed Bond Funds received cash collateral to mitigate risk of loss to certain counterparties, which will be repaid based on master netting arrangements between the Funds and the counterparty. The Funds invest such cash collateral in investment securities (See Note 12 in Notes to Financial Statements). |
See Notes to Financial Statements
C-1
PACIFIC LIFE FUNDS
STATEMENTS OF ASSETS AND LIABILITIES (Continued)
MARCH 31, 2011
STATEMENTS OF ASSETS AND LIABILITIES (Continued)
MARCH 31, 2011
| PL Floating | PL Inflation | PL Managed | PL Short Duration | PL Large-Cap | ||||||||||||||||||||||||
| Rate Loan | Managed | Bond | Bond | PL Comstock | PL Growth LT | Growth | ||||||||||||||||||||||
| Fund | Fund | Fund | Fund | Fund | Fund | Fund | ||||||||||||||||||||||
NET ASSETS CONSIST OF: | ||||||||||||||||||||||||||||
| Paid-in capital | $ | 83,899,910 | $ | 224,898,923 | $ | 374,627,443 | $ | 120,474,444 | $ | 167,769,700 | $ | 114,262,005 | $ | 76,200,560 | ||||||||||||||
| Undistributed/accumulated net investment income (loss) | 890,890 | 1,571,041 | 2,525,457 | 267,511 | 491,193 | 399,303 | (6,382 | ) | ||||||||||||||||||||
| Accumulated net realized loss | (521,865 | ) | (2,369,492 | ) | (2,642,025 | ) | (59,501 | ) | (35,229,499 | ) | (19,933,235 | ) | (210,599 | ) | ||||||||||||||
| Net unrealized appreciation on investments and assets and liabilities in foreign currencies | 1,796,665 | 5,255,929 | 4,471,595 | 450,769 | 33,433,871 | 20,847,754 | 23,117,307 | |||||||||||||||||||||
| NET ASSETS | $ | 86,065,600 | $ | 229,356,401 | $ | 378,982,470 | $ | 121,133,223 | $ | 166,465,265 | $ | 115,575,827 | $ | 99,100,886 | ||||||||||||||
| Shares of beneficial interest outstanding | 8,500,327 | 21,778,673 | 35,262,191 | 12,071,067 | 13,727,504 | 9,302,177 | 10,735,702 | |||||||||||||||||||||
| Net Asset Value Per Share | $ | 10.12 | $ | 10.53 | $ | 10.75 | $ | 10.04 | $ | 12.13 | $ | 12.42 | $ | 9.23 | ||||||||||||||
See Notes to Financial Statements
C-2
PACIFIC LIFE FUNDS
STATEMENTS OF ASSETS AND LIABILITIES (Continued)
MARCH 31, 2011
STATEMENTS OF ASSETS AND LIABILITIES (Continued)
MARCH 31, 2011
| PL Large-Cap | PL Main Street | PL Mid-Cap | PL Mid-Cap | PL Small-Cap | PL Small-Cap | |||||||||||||||||||||||
| Value | Core | Equity | Growth | Growth | Value | PL Real Estate | ||||||||||||||||||||||
| Fund | Fund | Fund | Fund | Fund | Fund | Fund | ||||||||||||||||||||||
ASSETS | ||||||||||||||||||||||||||||
| Investments, at cost | $ | 185,960,839 | $ | 127,707,916 | $ | 108,482,334 | $ | 44,297,989 | $ | 22,638,849 | $ | 58,613,863 | $ | 26,068,306 | ||||||||||||||
| Investments, at value | $ | 230,994,954 | $ | 157,636,255 | $ | 135,785,798 | $ | 64,348,374 | $ | 32,414,170 | $ | 76,219,094 | $ | 41,503,819 | ||||||||||||||
| Foreign currency held, at value (1) | — | — | — | 1,008 | — | — | — | |||||||||||||||||||||
| Receivables: | ||||||||||||||||||||||||||||
| Dividends and interest | 537,715 | 161,535 | 24,186 | 28,871 | 3,115 | 57,411 | 92,119 | |||||||||||||||||||||
| Foreign tax reclaim | 12,242 | — | — | 6,025 | — | — | — | |||||||||||||||||||||
| Fund shares sold | 170,367 | 213,766 | 1,246 | 128,823 | — | — | — | |||||||||||||||||||||
| Securities sold | — | — | 109,412 | 149,432 | 352,384 | 49,853 | 352,936 | |||||||||||||||||||||
| Due from adviser | 21,888 | 1,256 | 12,786 | 15,262 | 7,644 | 16,230 | 5,602 | |||||||||||||||||||||
| Prepaid expenses and other assets | 5,886 | 4,021 | 3,534 | 1,655 | 825 | 1,992 | 1,178 | |||||||||||||||||||||
| Total Assets | 231,743,052 | 158,016,833 | 135,936,962 | 64,679,450 | 32,778,138 | 76,344,580 | 41,955,654 | |||||||||||||||||||||
LIABILITIES | ||||||||||||||||||||||||||||
| Payables: | ||||||||||||||||||||||||||||
| Fund shares redeemed | — | — | — | — | 22,814 | — | 17,632 | |||||||||||||||||||||
| Securities purchased | 3,084,093 | — | 46,335 | 123,565 | 358,223 | 10,072 | 21,459 | |||||||||||||||||||||
| Accrued advisory fees | 122,240 | 58,253 | 72,655 | 35,326 | 16,124 | 46,939 | 31,728 | |||||||||||||||||||||
| Accrued administration fees | 28,209 | 19,418 | 16,766 | 7,570 | 4,031 | 9,388 | 5,288 | |||||||||||||||||||||
| Accrued support service expenses | 9,525 | 6,477 | 5,715 | 2,667 | 1,333 | 3,238 | 1,905 | |||||||||||||||||||||
| Accrued custodian fees and expenses | 6,498 | 5,586 | 7,468 | 16,223 | 10,319 | 9,537 | 6,525 | |||||||||||||||||||||
| Accrued legal, audit and tax service fees | 29,374 | 19,977 | 17,629 | 8,221 | 4,111 | 9,983 | 5,873 | |||||||||||||||||||||
| Accrued trustees’ fees and expenses and deferred compensation | 4,888 | 1,661 | 1,149 | 3,324 | 2,017 | 33 | 527 | |||||||||||||||||||||
| Accrued transfer agency out-of-pocket expenses | 8,628 | 5,867 | 5,177 | 2,416 | 1,208 | 2,934 | 1,726 | |||||||||||||||||||||
| Accrued other | 14,008 | 9,992 | 8,681 | 4,561 | 2,801 | 5,360 | 3,096 | |||||||||||||||||||||
| Total Liabilities | 3,307,463 | 127,231 | 181,575 | 203,873 | 422,981 | 97,484 | 95,759 | |||||||||||||||||||||
| NET ASSETS | $ | 228,435,589 | $ | 157,889,602 | $ | 135,755,387 | $ | 64,475,577 | $ | 32,355,157 | $ | 76,247,096 | $ | 41,859,895 | ||||||||||||||
| (1) | The cost of foreign currency for the PL Mid-Cap Growth Fund was $ 972. |
See Notes to Financial Statements
C-3
PACIFIC LIFE FUNDS
STATEMENTS OF ASSETS AND LIABILITIES (Continued)
MARCH 31, 2011
STATEMENTS OF ASSETS AND LIABILITIES (Continued)
MARCH 31, 2011
| PL Large-Cap | PL Main Street | PL Mid-Cap | PL Mid-Cap | PL Small-Cap | PL Small-Cap | |||||||||||||||||||||||
| Value | Core | Equity | Growth | Growth | Value | PL Real Estate | ||||||||||||||||||||||
| Fund | Fund | Fund | Fund | Fund | Fund | Fund | ||||||||||||||||||||||
NET ASSETS CONSIST OF: | ||||||||||||||||||||||||||||
| Paid-in capital | $ | 201,188,740 | $ | 158,109,933 | $ | 123,623,428 | $ | 41,932,517 | $ | 30,721,977 | $ | 65,115,356 | $ | 38,201,822 | ||||||||||||||
| Undistributed/accumulated net investment income (loss) | 877,748 | 398,039 | 124,898 | 9,435 | (2,021 | ) | 253,449 | (534 | ) | |||||||||||||||||||
| Undistributed/accumulated net realized gain (loss) | (18,666,828 | ) | (30,546,709 | ) | (15,296,403 | ) | 2,483,041 | (8,140,120 | ) | (6,726,940 | ) | (11,776,906 | ) | |||||||||||||||
| Net unrealized appreciation on investments and assets and liabilities in foreign currencies | 45,035,929 | 29,928,339 | 27,303,464 | 20,050,584 | 9,775,321 | 17,605,231 | 15,435,513 | |||||||||||||||||||||
| NET ASSETS | $ | 228,435,589 | $ | 157,889,602 | $ | 135,755,387 | $ | 64,475,577 | $ | 32,355,157 | $ | 76,247,096 | $ | 41,859,895 | ||||||||||||||
| Shares of beneficial interest outstanding | 19,712,101 | 15,586,040 | 12,984,579 | 6,270,111 | 2,719,349 | 7,190,078 | 3,652,671 | |||||||||||||||||||||
| Net Asset Value Per Share | $ | 11.59 | $ | 10.13 | $ | 10.46 | $ | 10.28 | $ | 11.90 | $ | 10.60 | $ | 11.46 | ||||||||||||||
See Notes to Financial Statements
C-4
PACIFIC LIFE FUNDS
STATEMENTS OF ASSETS AND LIABILITIES (Continued)
MARCH 31, 2011
STATEMENTS OF ASSETS AND LIABILITIES (Continued)
MARCH 31, 2011
| PL Emerging | PL International | PL International | ||||||||||
| Markets | Large-Cap | Value | ||||||||||
| Fund | Fund | Fund | ||||||||||
ASSETS | ||||||||||||
| Investments, at cost | $ | 42,621,256 | $ | 108,245,099 | $ | 84,308,119 | ||||||
| Investments, at value | $ | 63,747,380 | $ | 137,839,351 | $ | 89,373,237 | ||||||
| Foreign currency held, at value (1) | 376,680 | 11,740 | 8,365 | |||||||||
| Receivables: | ||||||||||||
| Dividends and interest | 106,175 | 501,362 | 339,072 | |||||||||
| Foreign tax reclaim | 1,701 | 154,374 | 82,193 | |||||||||
| Fund shares sold | — | 127,906 | 778 | |||||||||
| Securities sold | 350,814 | 47,379 | 1,159,227 | |||||||||
| Due from adviser | 27,513 | 22,743 | 25,032 | |||||||||
| Forward foreign currency contracts appreciation | — | — | 676,661 | |||||||||
| Prepaid expenses and other assets | 1,533 | 3,418 | 2,362 | |||||||||
| Total Assets | 64,611,796 | 138,708,273 | 91,666,927 | |||||||||
LIABILITIES | ||||||||||||
| Payables: | ||||||||||||
| Fund shares redeemed | — | — | 11,869 | |||||||||
| Securities purchased | 194,879 | 491,063 | 706,188 | |||||||||
| Variation margin | — | — | 1,002 | |||||||||
| Deferred foreign capital gains tax | 14,792 | — | — | |||||||||
| Accrued advisory fees | 41,671 | 96,351 | 49,454 | |||||||||
| Accrued administration fees | 7,813 | 17,003 | 11,413 | |||||||||
| Accrued support service expenses | 2,477 | 5,525 | 3,810 | |||||||||
| Accrued custodian fees and expenses | 58,901 | 30,492 | 25,174 | |||||||||
| Accrued legal, audit and tax service fees | 7,646 | 17,053 | 11,768 | |||||||||
| Accrued trustees’ fees and expenses and deferred compensation | 853 | 2,808 | 3,976 | |||||||||
| Accrued transfer agency out-of-pocket expenses | 2,243 | 5,004 | 3,451 | |||||||||
| Accrued other | 10,255 | 9,968 | 7,829 | |||||||||
| Forward foreign currency contracts depreciation | — | — | 588,712 | |||||||||
| Total Liabilities | 341,530 | 675,267 | 1,424,646 | |||||||||
| NET ASSETS | $ | 64,270,266 | $ | 138,033,006 | $ | 90,242,281 | ||||||
| (1) | The cost of foreign currency for the PL Emerging Markets, PL International Large-Cap and the PL International Value Funds were $378,478, $11,755 and $8,304 respectively. |
See Notes to Financial Statements
C-5
PACIFIC LIFE FUNDS
STATEMENTS OF ASSETS AND LIABILITIES (Continued)
MARCH 31, 2011
STATEMENTS OF ASSETS AND LIABILITIES (Continued)
MARCH 31, 2011
| PL Emerging | PL International | PL International | ||||||||||
| Markets | Large-Cap | Value | ||||||||||
| Fund | Fund | Fund | ||||||||||
NET ASSETS CONSIST OF: | ||||||||||||
| Paid-in capital | $ | 45,289,262 | $ | 123,424,342 | $ | 131,272,604 | ||||||
| Undistributed/accumulated net investment income (loss) | (409,632 | ) | 1,065,721 | 378,185 | ||||||||
| Accumulated net realized loss | (1,720,260 | ) | (16,065,965 | ) | (46,565,732 | ) | ||||||
| Net unrealized appreciation on investments and assets and liabilities in foreign currencies | 21,110,896 | 29,608,908 | 5,157,224 | |||||||||
| NET ASSETS | $ | 64,270,266 | $ | 138,033,006 | $ | 90,242,281 | ||||||
| Shares of beneficial interest outstanding | 4,378,606 | 8,978,862 | 9,491,565 | |||||||||
| Net Asset Value Per Share | $ | 14.68 | $ | 15.37 | $ | 9.51 | ||||||
See Notes to Financial Statements
C-6
PACIFIC LIFE FUNDS
STATEMENTS OF OPERATIONS
FOR THE YEAR ENDED MARCH 31, 2011
| PL Floating | PL Inflation | PL Managed | PL Short Duration | PL Large-Cap | ||||||||||||||||||||||||
| Rate Loan | Managed | Bond | Bond | PL Comstock | PL Growth LT | Growth | ||||||||||||||||||||||
| Fund | Fund | Fund | Fund | Fund | Fund | Fund | ||||||||||||||||||||||
INVESTMENT INCOME | ||||||||||||||||||||||||||||
| Dividends, net of foreign taxes withheld | $ | — | $ | 7,500 | $ | 278,832 | $ | — | $ | 3,018,234 | $ | 1,340,153 | $ | 657,872 | ||||||||||||||
| Dividends from mutual fund investments | 554 | 51 | 100 | 118 | 330 | — | 17,008 | |||||||||||||||||||||
| Interest, net of foreign taxes withheld | 3,541,620 | 5,462,276 | 8,238,297 | 1,588,002 | 1,632 | 5,187 | — | |||||||||||||||||||||
| Total Investment Income | 3,542,174 | 5,469,827 | 8,517,229 | 1,588,120 | 3,020,196 | 1,345,340 | 674,880 | |||||||||||||||||||||
EXPENSES | ||||||||||||||||||||||||||||
| Advisory fees | 511,431 | 741,908 | 1,218,929 | 389,015 | 1,054,519 | 539,788 | 599,593 | |||||||||||||||||||||
| Administration fees | 123,507 | 338,991 | 553,848 | 177,303 | 258,010 | 180,319 | 142,330 | |||||||||||||||||||||
| Support services expenses | 22,823 | 50,966 | 79,832 | 27,771 | 43,531 | 26,339 | 18,478 | |||||||||||||||||||||
| Custodian fees and expenses | 23,477 | 52,467 | 111,553 | 23,183 | 26,347 | 36,182 | 19,829 | |||||||||||||||||||||
| Shareholder report expenses | 5,031 | 14,074 | 23,043 | 7,451 | 10,592 | 7,457 | 8,808 | |||||||||||||||||||||
| Service fees (see Note 3 in Notes to Financial Statements) | 35,367 | 101,347 | 161,350 | 52,373 | 78,546 | 55,205 | 37,381 | |||||||||||||||||||||
| Transfer agency out-of-pocket expenses | 19,503 | 53,873 | 88,099 | 28,185 | 40,872 | 28,897 | 21,730 | |||||||||||||||||||||
| Registration fees | 2,054 | 12,792 | 16,356 | 10,549 | 11,739 | 10,197 | 9,865 | |||||||||||||||||||||
| Legal, audit and tax service fees | 60,672 | 48,704 | 80,684 | 27,630 | 38,927 | 25,475 | 20,691 | |||||||||||||||||||||
| Trustees’ fees and expenses | 3,354 | 9,222 | 15,149 | 4,901 | 6,910 | 4,875 | 3,836 | |||||||||||||||||||||
| Interest expense | — | 409 | 261 | — | — | — | — | |||||||||||||||||||||
| Other | 24,268 | 87,465 | 143,497 | 34,785 | 15,788 | 15,553 | 8,891 | |||||||||||||||||||||
| Total Expenses | 831,487 | 1,512,218 | 2,492,601 | 783,146 | 1,585,781 | 930,287 | 891,432 | |||||||||||||||||||||
| Advisory Fee Waiver | (54,044 | ) | — | — | — | (5,907 | ) | — | (19,986 | ) | ||||||||||||||||||
| Adviser Reimbursement | (161,181 | ) | (329,563 | ) | (558,213 | ) | (164,455 | ) | (194,706 | ) | (154,975 | ) | (112,128 | ) | ||||||||||||||
| Net Expenses | 616,262 | 1,182,655 | 1,934,388 | 618,691 | 1,385,168 | 775,312 | 759,318 | |||||||||||||||||||||
| NET INVESTMENT INCOME (LOSS) | 2,925,912 | 4,287,172 | 6,582,841 | 969,429 | 1,635,028 | 570,028 | (84,438 | ) | ||||||||||||||||||||
NET REALIZED AND UNREALIZED GAIN (LOSS) | ||||||||||||||||||||||||||||
| Net Realized Gain (Loss) On: | ||||||||||||||||||||||||||||
| Investment security transactions | 625,495 | 8,527,065 | 2,739,264 | 332,599 | 3,283,482 | 8,312,974 | 6,298,659 | |||||||||||||||||||||
| Closed short positions | — | 1,489 | (171,953 | ) | 42,409 | — | — | — | ||||||||||||||||||||
| Futures contracts and swap transactions | — | (9,257 | ) | 5,152,185 | 164,450 | — | — | — | ||||||||||||||||||||
| Written option transactions | — | 465,555 | 1,011,560 | — | — | — | — | |||||||||||||||||||||
| Foreign currency transactions | — | 75,701 | 762,425 | — | — | (46,997 | ) | — | ||||||||||||||||||||
| Net Realized Gain | 625,495 | 9,060,553 | 9,493,481 | 539,458 | 3,283,482 | 8,265,977 | 6,298,659 | |||||||||||||||||||||
| Change In Net Unrealized Appreciation (Depreciation) On: | ||||||||||||||||||||||||||||
| Investment securities | 516,066 | 2,110,305 | 3,187,395 | (130,621 | ) | 16,761,825 | 2,621,788 | 11,649,279 | ||||||||||||||||||||
| Short positions | — | — | 12,474 | — | — | — | — | |||||||||||||||||||||
| Futures contracts and swaps | — | (35,205 | ) | (1,609,942 | ) | (43,700 | ) | — | — | — | ||||||||||||||||||
| Written options | — | (414,566 | ) | (775,343 | ) | — | — | — | — | |||||||||||||||||||
| Foreign currencies | — | (826,299 | ) | 240,329 | — | — | (160,649 | ) | — | |||||||||||||||||||
| Change in Net Unrealized Appreciation (Depreciation) | 516,066 | 834,235 | 1,054,913 | (174,321 | ) | 16,761,825 | 2,461,139 | 11,649,279 | ||||||||||||||||||||
| NET GAIN | 1,141,561 | 9,894,788 | 10,548,394 | 365,137 | 20,045,307 | 10,727,116 | 17,947,938 | |||||||||||||||||||||
| NET INCREASE IN NET ASSETS RESULTING FROM OPERATIONS | $ | 4,067,473 | $ | 14,181,960 | $ | 17,131,235 | $ | 1,334,566 | $ | 21,680,335 | $ | 11,297,144 | $ | 17,863,500 | ||||||||||||||
| Foreign taxes withheld on dividends and interest | $ | — | $ | 2,670 | $ | 4,034 | $ | — | $ | 45,109 | $ | 27,603 | $ | 554 | ||||||||||||||
See Notes to Financial Statements
C-7
PACIFIC LIFE FUNDS
STATEMENTS OF OPERATIONS (Continued)
FOR THE YEAR ENDED MARCH 31, 2011
STATEMENTS OF OPERATIONS (Continued)
FOR THE YEAR ENDED MARCH 31, 2011
| PL Large-Cap | PL Main Street | PL Mid-Cap | PL Mid-Cap | PL Small-Cap | PL Small-Cap | |||||||||||||||||||||||
| Value | Core | Equity | Growth | Growth | Value | PL Real Estate | ||||||||||||||||||||||
| Fund | Fund | Fund | Fund | Fund | Fund | Fund | ||||||||||||||||||||||
INVESTMENT INCOME | ||||||||||||||||||||||||||||
| Dividends, net of foreign taxes withheld | $ | 4,610,540 | $ | 2,290,510 | $ | 2,020,332 | $ | 646,550 | $ | 58,544 | $ | 1,540,842 | $ | 713,529 | ||||||||||||||
| Dividends from mutual fund investments | 382 | 224 | 278 | 60 | 44 | 197 | — | |||||||||||||||||||||
| Total Investment Income | 4,610,922 | 2,290,734 | 2,020,610 | 646,610 | 58,588 | 1,541,039 | 713,529 | |||||||||||||||||||||
EXPENSES | ||||||||||||||||||||||||||||
| Advisory fees | 1,225,118 | 631,523 | 745,223 | 378,744 | 164,706 | 431,612 | 336,152 | |||||||||||||||||||||
| Administration fees | 343,098 | 264,196 | 209,570 | 101,662 | 50,399 | 100,392 | 69,265 | |||||||||||||||||||||
| Support services expenses | 50,275 | 37,138 | 28,942 | 14,973 | 11,240 | 16,995 | 10,126 | |||||||||||||||||||||
| Custodian fees and expenses | 19,492 | 23,202 | 23,561 | 43,830 | 27,927 | 25,528 | 21,690 | |||||||||||||||||||||
| Shareholder report expenses | 13,627 | 11,393 | 8,420 | 4,497 | 1,975 | 3,534 | 2,821 | |||||||||||||||||||||
| Service fees (see Note 3 in Notes to Financial Statements) | 100,687 | 89,480 | 62,664 | 34,231 | 15,398 | 23,449 | 22,072 | |||||||||||||||||||||
| Transfer agency out-of-pocket expenses | 54,174 | 42,612 | 33,431 | 16,985 | 7,925 | 15,397 | 11,159 | |||||||||||||||||||||
| Registration fees | 12,903 | 3,697 | 10,436 | 9,007 | 8,245 | 1,835 | 8,271 | |||||||||||||||||||||
| Legal, audit and tax service fees | 49,254 | 36,167 | 30,034 | 15,144 | 7,051 | 15,816 | 10,550 | |||||||||||||||||||||
| Trustees’ fees and expenses | 9,279 | 7,022 | 5,695 | 2,853 | 1,337 | 2,734 | 1,904 | |||||||||||||||||||||
| Other | 19,243 | 15,364 | 13,445 | 9,300 | 8,029 | 10,452 | 5,984 | |||||||||||||||||||||
| Total Expenses | 1,897,150 | 1,161,794 | 1,171,421 | 631,226 | 304,232 | 647,744 | 499,994 | |||||||||||||||||||||
| Adviser Reimbursement | (228,247 | ) | (176,595 | ) | (153,964 | ) | (116,589 | ) | (73,729 | ) | (92,291 | ) | (72,505 | ) | ||||||||||||||
| Net Expenses | 1,668,903 | 985,199 | 1,017,457 | 514,637 | 230,503 | 555,453 | 427,489 | |||||||||||||||||||||
| NET INVESTMENT INCOME (LOSS) | 2,942,019 | 1,305,535 | 1,003,153 | 131,973 | (171,915 | ) | 985,586 | 286,040 | ||||||||||||||||||||
NET REALIZED AND UNREALIZED GAIN (LOSS) | ||||||||||||||||||||||||||||
| Net Realized Gain (Loss) On: | ||||||||||||||||||||||||||||
| Investment security transactions | (1,817,558 | ) | 7,391,931 | 13,268,146 | 7,361,212 | 3,696,262 | 3,289,234 | 3,407,040 | ||||||||||||||||||||
| Foreign currency transactions | (1,669 | ) | — | — | (10,948 | ) | — | (2,323 | ) | (63 | ) | |||||||||||||||||
| Net Realized Gain (Loss) | (1,819,227 | ) | 7,391,931 | 13,268,146 | 7,350,264 | 3,696,262 | 3,286,911 | 3,406,977 | ||||||||||||||||||||
| Change In Net Unrealized Appreciation (Depreciation) On: | ||||||||||||||||||||||||||||
| Investment securities | 26,048,991 | 8,326,713 | 10,335,351 | 8,770,531 | 3,595,499 | 11,588,543 | 4,637,930 | |||||||||||||||||||||
| Foreign currencies | 988 | — | — | 198 | — | — | — | |||||||||||||||||||||
| Change in Net Unrealized Appreciation | 26,049,979 | 8,326,713 | 10,335,351 | 8,770,729 | 3,595,499 | 11,588,543 | 4,637,930 | |||||||||||||||||||||
| NET GAIN | 24,230,752 | 15,718,644 | 23,603,497 | 16,120,993 | 7,291,761 | 14,875,454 | 8,044,907 | |||||||||||||||||||||
| NET INCREASE IN NET ASSETS RESULTING FROM OPERATIONS | $ | 27,172,771 | $ | 17,024,179 | $ | 24,606,650 | $ | 16,252,966 | $ | 7,119,846 | $ | 15,861,040 | $ | 8,330,947 | ||||||||||||||
| Foreign taxes withheld on dividends | $ | 97,141 | $ | 2,859 | $ | — | $ | 25,789 | $ | — | $ | 9,811 | $ | 4,849 | ||||||||||||||
See Notes to Financial Statements
C-8
PACIFIC LIFE FUNDS
STATEMENTS OF OPERATIONS (Continued)
FOR THE YEAR ENDED MARCH 31, 2011
STATEMENTS OF OPERATIONS (Continued)
FOR THE YEAR ENDED MARCH 31, 2011
| PL Emerging | PL International | PL International | ||||||||||
| Markets | Large-Cap | Value | ||||||||||
| Fund | Fund | Fund | ||||||||||
INVESTMENT INCOME | ||||||||||||
| Dividends, net of foreign taxes withheld | $ | 941,567 | $ | 2,643,981 | $ | 2,434,414 | ||||||
| Dividends from mutual fund investments | 71 | 7 | 96 | |||||||||
| Interest, net of foreign taxes withheld | 5,088 | 4,083 | — | |||||||||
| Total Investment Income | 946,726 | 2,648,071 | 2,434,510 | |||||||||
EXPENSES | ||||||||||||
| Advisory fees | 412,457 | 1,001,880 | 544,234 | |||||||||
| Administration fees | 94,830 | 215,884 | 156,305 | |||||||||
| Support services expenses | 18,502 | 38,293 | 30,778 | |||||||||
| Custodian fees and expenses | 172,911 | 107,626 | 70,125 | |||||||||
| Shareholder report expenses | 3,903 | 8,381 | 6,577 | |||||||||
| Service fees (see Note 3 in Notes to Financial Statements) | 29,158 | 65,158 | 51,214 | |||||||||
| Transfer agency out-of-pocket expenses | 14,987 | 33,273 | 25,141 | |||||||||
| Registration fees | 1,411 | 10,632 | 9,660 | |||||||||
| Legal, audit and tax service fees | 13,210 | 29,400 | 23,576 | |||||||||
| Trustees’ fees and expenses | 2,526 | 5,645 | 4,226 | |||||||||
| Other | 42,893 | 21,772 | 30,223 | |||||||||
| Total Expenses | 806,788 | 1,537,944 | 952,059 | |||||||||
| Adviser Reimbursement | (270,343 | ) | (255,021 | ) | (200,306 | ) | ||||||
| Net Expenses | 536,445 | 1,282,923 | 751,753 | |||||||||
| NET INVESTMENT INCOME | 410,281 | 1,365,148 | 1,682,757 | |||||||||
NET REALIZED AND UNREALIZED GAIN (LOSS) | ||||||||||||
| Net Realized Gain (Loss) On: | ||||||||||||
| Investment security transactions (1) | 5,100,492 | (2,088,270 | ) | 2,372,352 | ||||||||
| Futures contract transactions | — | — | 64,480 | |||||||||
| Foreign currency transactions | (36,035 | ) | (36,135 | ) | (190,899 | ) | ||||||
| Net Realized Gain (Loss) | 5,064,457 | (2,124,405 | ) | 2,245,933 | ||||||||
| Change In Net Unrealized Appreciation (Depreciation) On: | ||||||||||||
| Investment securities (1) | 5,217,818 | 16,232,593 | 1,075,788 | |||||||||
| Futures contracts | — | — | (7,588 | ) | ||||||||
| Foreign currencies | (1,925 | ) | 10,158 | 89,227 | ||||||||
| Change in Net Unrealized Appreciation | 5,215,893 | 16,242,751 | 1,157,427 | |||||||||
| NET GAIN | 10,280,350 | 14,118,346 | 3,403,360 | |||||||||
| NET INCREASE IN NET ASSETS RESULTING FROM OPERATIONS | $ | 10,690,631 | $ | 15,483,494 | $ | 5,086,117 | ||||||
| Foreign taxes withheld on dividends and interest | $ | 89,977 | $ | 319,937 | $ | 293,164 | ||||||
| (1) | Realized gain on investment security transactions for the PL Emerging Markets Fund is net of foreign capital gains taxes withheld of $41. Change in unrealized appreciation (depreciation) on investment securities for the PL Emerging Markets Fund is net of increase in deferred foreign capital gains tax of $2,704. No foreign tax was withheld on realized and change in unrealized capital gain for all other funds. |
See Notes to Financial Statements
C-9
PACIFIC LIFE FUNDS
STATEMENTS OF CHANGES IN NET ASSETS
| PL Floating Rate | PL Inflation | PL Managed | PL Short Duration | |||||||||||||||||||||||||||||
| Loan Fund(1) | Managed Fund (1) | Bond Fund(1) | Bond Fund (1) | |||||||||||||||||||||||||||||
| Year Ended | Year Ended | Year Ended | Year Ended | Year Ended | Year Ended | Year Ended | Year Ended | |||||||||||||||||||||||||
| March 31, 2011 | March 31, 2010 | March 31, 2011 | March 31, 2010 | March 31, 2011 | March 31, 2010 | March 31,2011 | March 31, 2010 | |||||||||||||||||||||||||
| OPERATIONS | ||||||||||||||||||||||||||||||||
| Net investment income | $ | 2,925,912 | $ | 1,954,305 | $ | 4,287,172 | $ | 3,385,754 | $ | 6,582,841 | $ | 5,411,682 | $ | 969,429 | $ | 1,123,333 | ||||||||||||||||
| Net realized gain | 625,495 | 955,953 | 9,060,553 | 5,658,554 | 9,493,481 | 10,759,370 | 539,458 | 1,036,747 | ||||||||||||||||||||||||
| Change in net unrealized appreciation (depreciation) | 516,066 | 5,926,475 | 834,235 | 1,561,622 | 1,054,913 | 13,386,144 | (174,321 | ) | 714,924 | |||||||||||||||||||||||
| Net Increase in Net Assets Resulting from Operations | 4,067,473 | 8,836,733 | 14,181,960 | 10,605,930 | 17,131,235 | 29,557,196 | 1,334,566 | 2,875,004 | ||||||||||||||||||||||||
| DISTRIBUTIONS TO SHAREHOLDERS | ||||||||||||||||||||||||||||||||
| Net investment income | ||||||||||||||||||||||||||||||||
| Class A | (576,673 | ) | (1,975,960 | ) | (1,981,141 | ) | (4,584,817 | ) | (2,619,779 | ) | (9,085,139 | ) | (226,394 | ) | (1,199,020 | ) | ||||||||||||||||
| Class P | (1,463,098 | ) | — | (1,520,135 | ) | — | (5,686,622 | ) | — | (548,974 | ) | — | ||||||||||||||||||||
| Net realized gains | ||||||||||||||||||||||||||||||||
| Class A | — | — | — | — | (2,540,364 | ) | (4,569,759 | ) | — | — | ||||||||||||||||||||||
| Class P | — | — | (3,913,597 | ) | — | (8,056,500 | ) | — | (403,149 | ) | — | |||||||||||||||||||||
| Net Decrease in Net Assets Resulting from Dividends and Distributions to Shareholders | (2,039,771 | ) | (1,975,960 | ) | (7,414,873 | ) | (4,584,817 | ) | (18,903,265 | ) | (13,654,898 | ) | (1,178,517 | ) | (1,199,020 | ) | ||||||||||||||||
| CAPITAL SHARE TRANSACTIONS | ||||||||||||||||||||||||||||||||
| Proceeds from sale of shares | ||||||||||||||||||||||||||||||||
| Class A | 7,659,141 | 21,175,293 | 20,082,422 | 62,656,627 | 33,695,419 | 76,725,391 | 14,306,748 | 35,040,145 | ||||||||||||||||||||||||
| Class P | 24,589,520 | — | 69,727,535 | — | 122,376,254 | — | 43,262,438 | — | ||||||||||||||||||||||||
| Dividends and distribution reinvestments | ||||||||||||||||||||||||||||||||
| Class A | 576,673 | 1,975,960 | 1,978,436 | 4,569,314 | 5,154,057 | 13,624,292 | 226,240 | 1,198,965 | ||||||||||||||||||||||||
| Class P | 1,463,098 | — | 5,433,732 | — | 13,743,122 | — | 952,123 | — | ||||||||||||||||||||||||
| Cost of shares repurchased | ||||||||||||||||||||||||||||||||
| Class A | (232,057 | ) | (4,701,222 | ) | (4,960,351 | ) | (5,059,940 | ) | (7,768,096 | ) | (8,018,991 | ) | (952,151 | ) | (9,596,640 | ) | ||||||||||||||||
| Class P | (3,140,337 | ) | — | (19,125,619 | ) | — | (22,403,735 | ) | — | (12,491,880 | ) | — | ||||||||||||||||||||
| Share class conversions | ||||||||||||||||||||||||||||||||
| Class A (1) | (59,055,247 | ) | — | (169,787,788 | ) | — | (268,664,284 | ) | — | (89,594,322 | ) | — | ||||||||||||||||||||
| Class P(1) | 59,055,247 | — | 169,787,788 | — | 268,664,284 | — | 89,594,322 | — | ||||||||||||||||||||||||
| Net Increase in Net Assets from Capital Share Transactions | 30,916,038 | 18,450,031 | 73,136,155 | 62,166,001 | 144,797,021 | 82,330,692 | 45,303,518 | 26,642,470 | ||||||||||||||||||||||||
| NET INCREASE IN NET ASSETS | 32,943,740 | 25,310,804 | 79,903,242 | 68,187,114 | 143,024,991 | 98,232,990 | 45,459,567 | 28,318,454 | ||||||||||||||||||||||||
| NET ASSETS | ||||||||||||||||||||||||||||||||
| Beginning of Year | 53,121,860 | 27,811,056 | 149,453,159 | 81,266,045 | 235,957,479 | 137,724,489 | 75,673,656 | 47,355,202 | ||||||||||||||||||||||||
| End of Year | $ | 86,065,600 | $ | 53,121,860 | $ | 229,356,401 | $ | 149,453,159 | $ | 378,982,470 | $ | 235,957,479 | $ | 121,133,223 | $ | 75,673,656 | ||||||||||||||||
| Undistributed Net Investment Income | $ | 890,890 | $ | 4,749 | $ | 1,571,041 | $ | 607,209 | $ | 2,525,457 | $ | 543,826 | $ | 267,511 | $ | 10,068 | ||||||||||||||||
| (1) | Class A shares were converted to Class P shares on July 2, 2010 (see Note 1 in Notes to Financial Statements). |
See Notes to Financial Statements
C-10
PACIFIC LIFE FUNDS
STATEMENTS OF CHANGES IN NET ASSETS (Continued)
STATEMENTS OF CHANGES IN NET ASSETS (Continued)
| PL Comstock | PL Growth LT | PL Large-Cap Growth | PL Large-Cap Value | |||||||||||||||||||||||||||||
| Fund(1) | Fund(1) | Fund(1) | Fund(1) | |||||||||||||||||||||||||||||
| Year Ended | Year Ended | Year Ended | Year Ended | Year Ended | Year Ended | Year Ended | Year Ended | |||||||||||||||||||||||||
| March 31, 2011 | March 31, 2010 | March 31, 2011 | March 31, 2010 | March 31, 2011 | March 31, 2010 | March 31, 2011 | March 31, 2010 | |||||||||||||||||||||||||
| OPERATIONS | ||||||||||||||||||||||||||||||||
| Net investment income (loss) | $ | 1,635,028 | $ | 961,704 | $ | 570,028 | $ | 153,170 | $ | ( 84,438 | ) | $ | ( 162,469 | ) | $ | 2,942,019 | $ | 1,848,996 | ||||||||||||||
| Net realized gain (loss) | 3,283,482 | (6,318,818 | ) | 8,265,977 | (4,637,879 | ) | 6,298,659 | 3,605,421 | (1,819,227 | ) | (3,573,288 | ) | ||||||||||||||||||||
| Change in net unrealized appreciation | 16,761,825 | 47,994,902 | 2,461,139 | 34,435,525 | 11,649,279 | 10,919,592 | 26,049,979 | 40,575,133 | ||||||||||||||||||||||||
| Net Increase in Net Assets Resulting from Operations | 21,680,335 | 42,637,788 | 11,297,144 | 29,950,816 | 17,863,500 | 14,362,544 | 27,172,771 | 38,850,841 | ||||||||||||||||||||||||
| DISTRIBUTIONS TO SHAREHOLDERS | ||||||||||||||||||||||||||||||||
| Net investment income | ||||||||||||||||||||||||||||||||
| Class A | (236,849 | ) | (1,052,848 | ) | — | (1,426,742 | ) | — | — | (467,480 | ) | (1,750,061 | ) | |||||||||||||||||||
| Class P | (1,140,637 | ) | — | — | — | — | — | (2,058,011 | ) | — | ||||||||||||||||||||||
| Net Decrease in Net Assets Resulting from Dividends and Distributions to Shareholders | (1,377,486 | ) | (1,052,848 | ) | — | (1,426,742 | ) | — | — | (2,525,491 | ) | (1,750,061 | ) | |||||||||||||||||||
| CAPITAL SHARE TRANSACTIONS | ||||||||||||||||||||||||||||||||
| Proceeds from sale of shares | ||||||||||||||||||||||||||||||||
| Class A | 8,415,520 | 17,633,612 | 5,457,542 | 12,826,646 | 4,037,967 | 32,510,333 | 14,633,209 | 62,793,290 | ||||||||||||||||||||||||
| Class P | 23,950,764 | — | 20,262,936 | — | 26,906,134 | — | 44,341,564 | — | ||||||||||||||||||||||||
| Dividends and distribution reinvestments | ||||||||||||||||||||||||||||||||
| Class A | 236,711 | 1,052,607 | — | 1,426,397 | — | — | 467,255 | 1,748,702 | ||||||||||||||||||||||||
| Class P | 1,140,637 | — | — | — | — | — | 2,058,011 | — | ||||||||||||||||||||||||
| Cost of shares repurchased | ||||||||||||||||||||||||||||||||
| Class A | (1,921,221 | ) | (6,963,843 | ) | (1,796,334 | ) | (27,715,411 | ) | (1,396,630 | ) | (2,281,361 | ) | (3,090,654 | ) | (2,262,396 | ) | ||||||||||||||||
| Class P | (13,829,114 | ) | — | (8,864,918 | ) | — | (9,416,192 | ) | — | (16,932,785 | ) | — | ||||||||||||||||||||
| Share class conversions | ||||||||||||||||||||||||||||||||
| Class A (1) | (119,192,019 | ) | — | (82,580,720 | ) | — | (56,182,987 | ) | — | (153,219,431 | ) | — | ||||||||||||||||||||
| Class P (1) | 119,192,019 | — | 82,580,720 | — | 56,182,987 | — | 153,219,431 | — | ||||||||||||||||||||||||
| Net Increase (Decrease) in Net Assets from Capital Share Transactions | 17,993,297 | 11,722,376 | 15,059,226 | (13,462,368 | ) | 20,131,279 | 30,228,972 | 41,476,600 | 62,279,596 | |||||||||||||||||||||||
| NET INCREASE IN NET ASSETS | 38,296,146 | 53,307,316 | 26,356,370 | 15,061,706 | 37,994,779 | 44,591,516 | 66,123,880 | 99,380,376 | ||||||||||||||||||||||||
| NET ASSETS | ||||||||||||||||||||||||||||||||
| Beginning of Year | 128,169,119 | 74,861,803 | 89,219,457 | 74,157,751 | 61,106,107 | 16,514,591 | 162,311,709 | 62,931,333 | ||||||||||||||||||||||||
| End of Year | $ | 166,465,265 | $ | 128,169,119 | $ | 115,575,827 | $ | 89,219,457 | $ | 99,100,886 | $ | 61,106,107 | $ | 228,435,589 | $ | 162,311,709 | ||||||||||||||||
| Undistributed/Accumulated Net Investment Income (Loss) | $ | 491,193 | $ | 233,651 | $ | 399,303 | $ | ( 123,728 | ) | $ | ( 6,382 | ) | $ | ( 6,156 | ) | $ | 877,748 | $ | 462,889 | |||||||||||||
| (1) | Class A shares were converted to Class P shares on July 2, 2010 (see Note 1 in Notes to Financial Statements). |
See Notes to Financial Statements
C-11
PACIFIC LIFE FUNDS
STATEMENTS OF CHANGES IN NET ASSETS (Continued)
STATEMENTS OF CHANGES IN NET ASSETS (Continued)
| PL Main Street Core | PL Mid-Cap Equity | PL Mid-Cap Growth | PL Small-Cap Growth | |||||||||||||||||||||||||||||
| Fund(1) | Fund(1) | Fund(1) | Fund(1) | |||||||||||||||||||||||||||||
| Year Ended | Year Ended | Year Ended | Year Ended | Year Ended | Year Ended | Year Ended | Year Ended | |||||||||||||||||||||||||
| March 31, 2011 | March 31, 2010 | March 31, 2011 | March 31, 2010 | March 31, 2011 | March 31, 2010 | March 31, 2011 | March 31, 2010 | |||||||||||||||||||||||||
| OPERATIONS | ||||||||||||||||||||||||||||||||
| Net investment income (loss) | $ | 1,305,535 | $ | 1,046,278 | $ | 1,003,153 | $ | 367,394 | $ | 131,973 | $ | (175,601 | ) | $ | (171,915 | ) | $ | (190,619 | ) | |||||||||||||
| Net realized gain (loss) | 7,391,931 | (14,377,544 | ) | 13,268,146 | 2,654,681 | 7,350,264 | 2,074,733 | 3,696,262 | 64,515 | |||||||||||||||||||||||
| Change in net unrealized appreciation | 8,326,713 | 56,194,577 | 10,335,351 | 35,083,900 | 8,770,729 | 17,555,720 | 3,595,499 | 11,316,545 | ||||||||||||||||||||||||
| Net Increase in Net Assets Resulting from Operations | 17,024,179 | 42,863,311 | 24,606,650 | 38,105,975 | 16,252,966 | 19,454,852 | 7,119,846 | 11,190,441 | ||||||||||||||||||||||||
| DISTRIBUTIONS TO SHAREHOLDERS | ||||||||||||||||||||||||||||||||
| Net investment income | ||||||||||||||||||||||||||||||||
| Class A | (95,654 | ) | (1,045,156 | ) | (47,048 | ) | (432,366 | ) | — | — | — | — | ||||||||||||||||||||
| Class P | (819,251 | ) | — | (877,377 | ) | — | (105,080 | ) | — | — | — | |||||||||||||||||||||
| Net realized gains | ||||||||||||||||||||||||||||||||
| Class A | — | — | — | — | (524,490 | ) | (614,615 | ) | — | — | ||||||||||||||||||||||
| Class P | — | — | — | — | (4,624,405 | ) | — | — | — | |||||||||||||||||||||||
| Net Decrease in Net Assets Resulting from Dividends and Distributions to Shareholders | (914,905 | ) | (1,045,156 | ) | (924,425 | ) | (432,366 | ) | (5,253,975 | ) | (614,615 | ) | — | — | ||||||||||||||||||
| CAPITAL SHARE TRANSACTIONS | ||||||||||||||||||||||||||||||||
| Proceeds from sale of shares | ||||||||||||||||||||||||||||||||
| Class A | 8,538,755 | 25,816,890 | 7,987,693 | 8,843,524 | 997,962 | 20,304,644 | 241,073 | 3,883,828 | ||||||||||||||||||||||||
| Class P | 24,547,598 | — | 16,991,531 | — | 8,108,597 | — | 6,958,753 | — | ||||||||||||||||||||||||
| Dividends and distribution reinvestments | ||||||||||||||||||||||||||||||||
| Class A | 95,654 | 1,045,156 | 47,047 | 432,363 | 523,636 | 613,939 | — | — | ||||||||||||||||||||||||
| Class P | 819,251 | — | 877,377 | — | 4,729,485 | — | — | — | ||||||||||||||||||||||||
| Cost of shares repurchased | ||||||||||||||||||||||||||||||||
| Class A | (125,274 | ) | (7,912,859 | ) | (3,190,726 | ) | (4,434,390 | ) | (5,043,424 | ) | (3,637,248 | ) | (2,114,592 | ) | (13,429,355 | ) | ||||||||||||||||
| Class P | (38,124,068 | ) | — | (12,289,913 | ) | — | (10,833,939 | ) | — | (5,541,320 | ) | — | ||||||||||||||||||||
| Share class conversions | ||||||||||||||||||||||||||||||||
| Class A (1) | (136,507,682 | ) | — | (96,440,538 | ) | — | (48,202,865 | ) | — | (21,274,966 | ) | — | ||||||||||||||||||||
| Class P (1) | 136,507,682 | — | 96,440,538 | — | 48,202,865 | — | 21,274,966 | — | ||||||||||||||||||||||||
| Net Increase (Decrease) in Net Assets from Capital Share Transactions | (4,248,084 | ) | 18,949,187 | 10,423,009 | 4,841,497 | (1,517,683 | ) | 17,281,335 | (456,086 | ) | (9,545,527 | ) | ||||||||||||||||||||
| NET INCREASE IN NET ASSETS | 11,861,190 | 60,767,342 | 34,105,234 | 42,515,106 | 9,481,308 | 36,121,572 | 6,663,760 | 1,644,914 | ||||||||||||||||||||||||
| NET ASSETS | ||||||||||||||||||||||||||||||||
| Beginning of Year | 146,028,412 | 85,261,070 | 101,650,153 | 59,135,047 | 54,994,269 | 18,872,697 | 25,691,397 | 24,046,483 | ||||||||||||||||||||||||
| End of Year | $ | 157,889,602 | $ | 146,028,412 | $ | 135,755,387 | $ | 101,650,153 | $ | 64,475,577 | $ | 54,994,269 | $ | 32,355,157 | $ | 25,691,397 | ||||||||||||||||
| Undistributed/Accumulated Net Investment Income (Loss) | $ | 398,039 | $ | 94,313 | $ | 124,898 | $ | 46,170 | $ | 9,435 | $ | (8,296 | ) | $ | (2,021 | ) | $ | (1,955 | ) | |||||||||||||
| (1) | Class A shares were converted to Class P shares on July 2, 2010 (see Note 1 in Notes to Financial Statements). |
See Notes to Financial Statements
C-12
PACIFIC LIFE FUNDS
STATEMENTS OF CHANGES IN NET ASSETS (Continued)
STATEMENTS OF CHANGES IN NET ASSETS (Continued)
| PL Small-Cap Value | PL Real Estate | PL Emerging Markets | PL International Large-Cap | |||||||||||||||||||||||||||||
| Fund(1) | Fund(1) | Fund(1) | Fund(1) | |||||||||||||||||||||||||||||
| Year Ended | Year Ended | Year Ended | Year Ended | Year Ended | Year Ended | Year Ended | Year Ended | |||||||||||||||||||||||||
| March 31, 2011 | March 31, 2010 | March 31, 2011 | March 31, 2010 | March 31, 2011 | March 31, 2010 | March 31, 2011 | March 31, 2010 | |||||||||||||||||||||||||
| OPERATIONS | ||||||||||||||||||||||||||||||||
| Net investment income | $ | 985,586 | $ | 600,102 | $ | 286,040 | $ | 513,836 | $ | 410,281 | $ | 229,192 | $ | 1,365,148 | $ | 1,115,334 | ||||||||||||||||
| Net realized gain (loss) | 3,286,911 | (4,303,623 | ) | 3,406,977 | (6,918,840 | ) | 5,064,457 | (711,695 | ) | (2,124,405 | ) | (6,136,387 | ) | |||||||||||||||||||
| Change in net unrealized appreciation | 11,588,543 | 18,077,190 | 4,637,930 | 26,784,376 | 5,215,893 | 23,987,304 | 16,242,751 | 39,313,505 | ||||||||||||||||||||||||
| Net Increase in Net Assets Resulting from Operations | 15,861,040 | 14,373,669 | 8,330,947 | 20,379,372 | 10,690,631 | 23,504,801 | 15,483,494 | 34,292,452 | ||||||||||||||||||||||||
| DISTRIBUTIONS TO SHAREHOLDERS | ||||||||||||||||||||||||||||||||
| Net investment income | ||||||||||||||||||||||||||||||||
| Class A | (68,741 | ) | (491,572 | ) | (68,821 | ) | (485,508 | ) | — | (243,918 | ) | (926,192 | ) | (975,278 | ) | |||||||||||||||||
| Class P | (638,985 | ) | — | (270,054 | ) | — | (940,708 | ) | — | (261,079 | ) | — | ||||||||||||||||||||
| Net Decrease in Net Assets Resulting from Dividends and Distributions to Shareholders | (707,726 | ) | (491,572 | ) | (338,875 | ) | (485,508 | ) | (940,708 | ) | (243,918 | ) | (1,187,271 | ) | (975,278 | ) | ||||||||||||||||
| CAPITAL SHARE TRANSACTIONS | ||||||||||||||||||||||||||||||||
| Proceeds from sale of shares | ||||||||||||||||||||||||||||||||
| Class A | 1,360,677 | 4,741,243 | 179,622 | 5,319,973 | 763,496 | 5,677,562 | 11,388,585 | 20,864,545 | ||||||||||||||||||||||||
| Class P | 27,468,646 | — | 7,071,793 | — | 14,652,817 | — | 23,576,016 | — | ||||||||||||||||||||||||
| Dividends and distribution reinvestments | ||||||||||||||||||||||||||||||||
| Class A | 68,740 | 491,572 | 68,818 | 485,465 | — | 243,918 | 925,856 | 975,153 | ||||||||||||||||||||||||
| Class P | 638,985 | — | 270,054 | — | 940,708 | — | 261,079 | — | ||||||||||||||||||||||||
| Cost of shares repurchased | ||||||||||||||||||||||||||||||||
| Class A | (1,398,444 | ) | (7,959,638 | ) | (3,964,447 | ) | (10,121,953 | ) | (95,644 | ) | (12,289,022 | ) | (1,280,976 | ) | (12,278,526 | ) | ||||||||||||||||
| Class P | (5,217,990 | ) | — | (6,110,043 | ) | — | (9,454,654 | ) | — | (19,135,979 | ) | — | ||||||||||||||||||||
| Share class conversions | ||||||||||||||||||||||||||||||||
| Class A (1) | (35,260,361 | ) | — | (31,360,853 | ) | — | (45,487,862 | ) | — | (105,495,716 | ) | — | ||||||||||||||||||||
| Class P(1) | 35,260,361 | — | 31,360,853 | — | 45,487,862 | — | 105,495,716 | — | ||||||||||||||||||||||||
| Net Increase (Decrease) in Net Assets from Capital Share Transactions | 22,920,614 | (2,726,823 | ) | (2,484,203 | ) | (4,316,515 | ) | 6,806,723 | (6,367,542 | ) | 15,734,581 | 9,561,172 | ||||||||||||||||||||
| NET INCREASE IN NET ASSETS | 38,073,928 | 11,155,274 | 5,507,869 | 15,577,349 | 16,556,646 | 16,893,341 | 30,030,804 | 42,878,346 | ||||||||||||||||||||||||
| NET ASSETS | ||||||||||||||||||||||||||||||||
| Beginning of Year | 38,173,168 | 27,017,894 | 36,352,026 | 20,774,677 | 47,713,620 | 30,820,279 | 108,002,202 | 65,123,856 | ||||||||||||||||||||||||
| End of Year | $ | 76,247,096 | $ | 38,173,168 | $ | 41,859,895 | $ | 36,352,026 | $ | 64,270,266 | $ | 47,713,620 | $ | 138,033,006 | $ | 108,002,202 | ||||||||||||||||
| Undistributed/Accumulated Net Investment Income (Loss) | $ | 253,449 | $ | 78,140 | $ | (534 | ) | $ | 23,386 | $ | (409,632 | ) | $ | (7,231 | ) | $ | 1,065,721 | $ | 923,664 | |||||||||||||
| (1) | Class A shares were converted to Class P shares on July 2, 2010 (see Note 1 in Notes to Financial Statements). |
See Notes to Financial Statements
C-13
PACIFIC LIFE FUNDS
STATEMENTS OF CHANGES IN NET ASSETS (Continued)
STATEMENTS OF CHANGES IN NET ASSETS (Continued)
| PL International Value | ||||||||
| Fund(1) | ||||||||
| Year Ended | Year Ended | |||||||
| March 31, 2011 | March 31, 2010 | |||||||
| OPERATIONS | ||||||||
| Net investment income | $ | 1,682,757 | $ | 1,848,094 | ||||
| Net realized gain (loss) | 2,245,933 | (25,094,512 | ) | |||||
| Change in net unrealized appreciation | 1,157,427 | 57,686,947 | ||||||
| Net Increase in Net Assets Resulting from Operations | 5,086,117 | 34,440,529 | ||||||
| DISTRIBUTIONS TO SHAREHOLDERS | ||||||||
| Net investment income | ||||||||
| Class A | (468,259 | ) | (1,330,371 | ) | ||||
| Class P | (1,543,617 | ) | — | |||||
| Net Decrease in Net Assets Resulting from Dividends and Distributions to Shareholders | (2,011,876 | ) | (1,330,371 | ) | ||||
| CAPITAL SHARE TRANSACTIONS | ||||||||
| Proceeds from sale of shares | ||||||||
| Class A | 10,276,598 | 17,693,878 | ||||||
| Class P | 14,606,762 | — | ||||||
| Dividends and distribution reinvestments | ||||||||
| Class A | 468,104 | 1,329,963 | ||||||
| Class P | 1,543,617 | — | ||||||
| Cost of shares repurchased | ||||||||
| Class A | (1,331,608 | ) | (44,454,169 | ) | ||||
| Class P | (24,679,366 | ) | — | |||||
| Share class conversions | ||||||||
| Class A(1) | (80,620,211 | ) | — | |||||
| Class P(1) | 80,620,211 | — | ||||||
| Net Increase (Decrease) in Net Assets from Capital Share Transactions | 884,107 | (25,430,328 | ) | |||||
| NET INCREASE IN NET ASSETS | 3,958,348 | 7,679,830 | ||||||
| NET ASSETS | ||||||||
| Beginning of Year | 86,283,933 | 78,604,103 | ||||||
| End of Year | $ | 90,242,281 | $ | 86,283,933 | ||||
| Undistributed Net Investment Income | $ | 378,185 | $ | 302,691 | ||||
| (1) | Class A shares were converted to Class P shares on July 2, 2010 (see Note 1 in Notes to Financial Statements). |
See Notes to Financial Statements
C-14
PACIFIC LIFE FUNDS
FINANCIAL HIGHLIGHTS (1)
Selected per share, ratios and supplemental data for each year or period ended March 31 were as follows:
| Investment Activities | Distributions | Ratios/Supplemental Data | ||||||||||||||||||||||||||||||||||||||||||||||||||||||||||
| Ratios of | Ratios of | |||||||||||||||||||||||||||||||||||||||||||||||||||||||||||
| Expenses | Expenses | |||||||||||||||||||||||||||||||||||||||||||||||||||||||||||
| Net | Net | Net | After | Before | Ratios of | |||||||||||||||||||||||||||||||||||||||||||||||||||||||
| Net Asset | Realized | Asset | Assets, | Expense | Expense | Net | ||||||||||||||||||||||||||||||||||||||||||||||||||||||
| Value, | Net | and | Total | Distributions | Value, | End of | Reductions | Reductions | Investment Income | |||||||||||||||||||||||||||||||||||||||||||||||||||
| Beginning of | Investment | Unrealized | from | from Net | Distributions | End of | Year or | to Average | to Average | (Loss) to Average | Portfolio | |||||||||||||||||||||||||||||||||||||||||||||||||
| Year or | Income | Gain | Investment | Investment | from | Total | Year or | Total | Period | Net | Net | Net | Turnover | |||||||||||||||||||||||||||||||||||||||||||||||
| For the Year or Period Ended | Period | (Loss) (2) | (Loss) | Activities | Income | Capital Gains | Distributions | Period | Returns (3) | (in thousands) | Assets (4), (5) | Assets (5) | Assets (5) | Rates | ||||||||||||||||||||||||||||||||||||||||||||||
| PL Floating Rate Loan Fund | ||||||||||||||||||||||||||||||||||||||||||||||||||||||||||||
| 4/1/2010 - 3/31/2011 | $ | 9.88 | $ | 0.34 | $ | 0.19 | $ | 0.53 | $ | (0.29 | ) | $ | — | $ | (0.29 | ) | $ | 10.12 | 5.51 | % | $ | 86,066 | 0.90 | % | 1.22 | % | 4.29 | % | 92.44 | % | ||||||||||||||||||||||||||||||
| 4/1/2009 - 3/31/2010 | 8.18 | 0.45 | 1.70 | 2.15 | (0.45 | ) | — | (0.45 | ) | 9.88 | 26.70 | % | 53,122 | 1.30 | % | 1.54 | % | 4.78 | % | 118.03 | % | |||||||||||||||||||||||||||||||||||||||
| 6/30/2008 - 3/31/2009 | 10.00 | 0.39 | (1.82 | ) | (1.43 | ) | (0.39 | ) | — | (0.39 | ) | 8.18 | (14.37 | %) | 27,811 | 1.30 | % | 1.53 | % | 5.90 | % | 56.30 | % | |||||||||||||||||||||||||||||||||||||
| PL Inflation Managed Fund | ||||||||||||||||||||||||||||||||||||||||||||||||||||||||||||
| 4/1/2010 - 3/31/2011 | $ | 10.10 | $ | 0.24 | $ | 0.61 | $ | 0.85 | $ | (0.21 | ) | $ | (0.21 | ) | $ | (0.42 | ) | $ | 10.53 | 8.56 | % | $ | 229,356 | 0.64 | % | 0.82 | % | 2.31 | % | 322.90 | % | |||||||||||||||||||||||||||||
| 4/1/2009 - 3/31/2010 | 9.59 | 0.29 | 0.62 | 0.91 | (0.40 | ) | — | (0.40 | ) | 10.10 | 9.68 | % | 149,453 | 0.95 | % | 1.21 | % | 2.90 | % | 299.61 | % | |||||||||||||||||||||||||||||||||||||||
| 4/1/2008 - 3/31/2009 | 11.08 | 0.39 | (0.80 | ) | (0.41 | ) | (0.41 | ) | (0.67 | ) | (1.08 | ) | 9.59 | (3.85 | %) | 81,266 | 1.01 | % | 1.35 | % | 3.94 | % | 745.76 | % | ||||||||||||||||||||||||||||||||||||
| 4/1/2007 - 3/31/2008 | 10.13 | 0.49 | 0.95 | 1.44 | (0.49 | ) | — | (0.49 | ) | 11.08 | 14.80 | % | 122,386 | 1.15 | % | 1.49 | % | 4.77 | % | 474.46 | % | |||||||||||||||||||||||||||||||||||||||
| 4/1/2006 - 3/31/2007 | 10.00 | 0.26 | 0.14 | 0.40 | (0.27 | ) | — | (0.27 | ) | 10.13 | 4.15 | % | 82,340 | 1.39 | % | 1.78 | % | 2.60 | % | 356.40 | % | |||||||||||||||||||||||||||||||||||||||
| PL Managed Bond Fund | ||||||||||||||||||||||||||||||||||||||||||||||||||||||||||||
| 4/1/2010 - 3/31/2011 | $ | 10.75 | $ | 0.24 | $ | 0.43 | $ | 0.67 | $ | (0.30 | ) | $ | (0.37 | ) | $ | (0.67 | ) | $ | 10.75 | 6.31 | % | $ | 378,982 | 0.63 | % | 0.82 | % | 2.16 | % | 501.72 | % | |||||||||||||||||||||||||||||
| 4/1/2009 - 3/31/2010 | 9.70 | 0.30 | 1.48 | 1.78 | (0.50 | ) | (0.23 | ) | (0.73 | ) | 10.75 | 18.68 | % | 235,957 | 0.95 | % | 1.22 | % | 2.86 | % | 351.53 | % | ||||||||||||||||||||||||||||||||||||||
| 4/1/2008 - 3/31/2009 | 10.73 | 0.43 | (0.45 | ) | (0.02 | ) | (0.55 | ) | (0.46 | ) | (1.01 | ) | 9.70 | 0.07 | % | 137,724 | 1.01 | % | 1.30 | % | 4.36 | % | 441.01 | % | ||||||||||||||||||||||||||||||||||||
| 4/1/2007 - 3/31/2008 | 10.16 | 0.42 | 0.53 | 0.95 | (0.37 | ) | (0.01 | ) | (0.38 | ) | 10.73 | 9.44 | % | 175,800 | 1.15 | % | 1.50 | % | 4.05 | % | 424.71 | % | ||||||||||||||||||||||||||||||||||||||
| 4/1/2006 - 3/31/2007 | 9.98 | 0.35 | 0.22 | 0.57 | (0.39 | ) | — | (0.39 | ) | 10.16 | 5.90 | % | 101,940 | 1.39 | % | 1.82 | % | 3.49 | % | 477.64 | % | |||||||||||||||||||||||||||||||||||||||
| PL Short Duration Bond Fund | ||||||||||||||||||||||||||||||||||||||||||||||||||||||||||||
| 4/1/2010 - 3/31/2011 | $ | 10.00 | $ | 0.10 | $ | 0.06 | $ | 0.16 | $ | (0.08 | ) | $ | (0.04 | ) | $ | (0.12 | ) | $ | 10.04 | 1.57 | % | $ | 121,133 | 0.64 | % | 0.81 | % | 1.00 | % | 195.72 | % | |||||||||||||||||||||||||||||
| 4/1/2009 - 3/31/2010 | 9.69 | 0.18 | 0.33 | 0.51 | (0.20 | ) | — | (0.20 | ) | 10.00 | 5.27 | % | 75,674 | 0.95 | % | 1.22 | % | 1.84 | % | 167.12 | % | |||||||||||||||||||||||||||||||||||||||
| 4/1/2008 - 3/31/2009 | 10.22 | 0.32 | (0.25 | ) | 0.07 | (0.31 | ) | (0.29 | ) | (0.60 | ) | 9.69 | 0.75 | % | 47,355 | 1.02 | % | 1.26 | % | 3.20 | % | 146.36 | % | |||||||||||||||||||||||||||||||||||||
| 4/1/2007 - 3/31/2008 | 9.81 | 0.35 | 0.41 | 0.76 | (0.35 | ) | — | (0.35 | ) | 10.22 | 7.86 | % | 83,683 | 1.15 | % | 1.42 | % | 3.48 | % | 41.74 | % | |||||||||||||||||||||||||||||||||||||||
| 4/1/2006 - 3/31/2007 | 9.76 | 0.32 | 0.04 | 0.36 | (0.31 | ) | — | (0.31 | ) | 9.81 | 3.76 | % | 66,823 | 1.39 | % | 1.75 | % | 3.28 | % | 77.84 | % | |||||||||||||||||||||||||||||||||||||||
| PL Comstock Fund | ||||||||||||||||||||||||||||||||||||||||||||||||||||||||||||
| 4/1/2010 - 3/31/2011 | $ | 10.69 | $ | 0.13 | $ | 1.41 | $ | 1.54 | $ | (0.10 | ) | $ | — | $ | (0.10 | ) | $ | 12.13 | 14.55 | % | $ | 166,465 | 0.99 | % | 1.13 | % | 1.16 | % | 30.58 | % | ||||||||||||||||||||||||||||||
| 4/1/2009 - 3/31/2010 | 6.95 | 0.09 | 3.74 | 3.83 | (0.09 | ) | — | (0.09 | ) | 10.69 | 55.34 | % | 128,169 | 1.30 | % | 1.51 | % | 0.93 | % | 27.65 | % | |||||||||||||||||||||||||||||||||||||||
| 4/1/2008 - 3/31/2009 | 11.84 | 0.16 | (4.89 | ) | (4.73 | ) | (0.16 | ) | — | (0.16 | ) | 6.95 | (40.11 | %) | 74,862 | 1.37 | % | 1.58 | % | 1.68 | % | 59.96 | % | |||||||||||||||||||||||||||||||||||||
| 4/1/2007 - 3/31/2008 | 14.11 | 0.15 | (1.95 | ) | (1.80 | ) | (0.12 | ) | (0.35 | ) | (0.47 | ) | 11.84 | (13.16 | %) | 124,271 | 1.50 | % | 1.77 | % | 1.09 | % | 23.28 | % | ||||||||||||||||||||||||||||||||||||
| 4/1/2006 - 3/31/2007 | 12.92 | 0.12 | 1.55 | 1.67 | (0.11 | ) | (0.37 | ) | (0.48 | ) | 14.11 | 13.21 | % | 83,788 | 1.74 | % | 2.11 | % | 0.92 | % | 40.11 | % | ||||||||||||||||||||||||||||||||||||||
| PL Growth LT Fund | ||||||||||||||||||||||||||||||||||||||||||||||||||||||||||||
| 4/1/2010 - 3/31/2011 | $ | 11.21 | $ | 0.07 | $ | 1.14 | $ | 1.21 | $ | — | $ | — | $ | — | $ | 12.42 | 10.79 | % | $ | 115,576 | 0.79 | % | 0.95 | % | 0.58 | % | 82.71 | % | ||||||||||||||||||||||||||||||||
| 4/1/2009 - 3/31/2010 | 7.74 | 0.02 | 3.60 | 3.62 | (0.15 | ) | — | (0.15 | ) | 11.21 | 47.26 | % | 89,219 | 1.10 | % | 1.37 | % | 0.19 | % | 60.31 | % | |||||||||||||||||||||||||||||||||||||||
| 4/1/2008 - 3/31/2009 | 12.63 | 0.03 | (4.63 | ) | (4.60 | ) | — | (0.29 | ) | (0.29 | ) | 7.74 | (37.27 | %) | 74,158 | 1.15 | % | 1.42 | % | 0.32 | % | 80.89 | % | |||||||||||||||||||||||||||||||||||||
| 4/1/2007 - 3/31/2008 | 13.10 | 0.05 | (0.22 | ) | (0.17 | ) | (0.05 | ) | (0.25 | ) | (0.30 | ) | 12.63 | (1.55 | %) | 77,196 | 1.30 | % | 1.66 | % | 0.36 | % | 81.50 | % | ||||||||||||||||||||||||||||||||||||
| 4/1/2006 - 3/31/2007 | 12.23 | (0.01 | ) | 0.98 | 0.97 | — | (0.10 | ) | (0.10 | ) | 13.10 | 7.95 | % | 61,954 | 1.54 | % | 1.95 | % | (0.08 | %) | 37.99 | % | ||||||||||||||||||||||||||||||||||||||
| See Notes to Financial Statements | See explanation of references on C-17 |
C-15
PACIFIC LIFE FUNDS
FINANCIAL HIGHLIGHTS (Continued) (1)
Selected per share, ratios and supplemental data for each year or period ended March 31 were as follows:
FINANCIAL HIGHLIGHTS (Continued) (1)
Selected per share, ratios and supplemental data for each year or period ended March 31 were as follows:
| Investment Activities | Distributions | Ratios/Supplemental Data | ||||||||||||||||||||||||||||||||||||||||||||||||||||||||||
| �� | Ratios of | Ratios of | ||||||||||||||||||||||||||||||||||||||||||||||||||||||||||
| Expenses | Expenses | |||||||||||||||||||||||||||||||||||||||||||||||||||||||||||
| Net | Net | Net | After | Before | Ratios of | |||||||||||||||||||||||||||||||||||||||||||||||||||||||
| Net Asset | Realized | Asset | Assets, | Expense | Expense | Net | ||||||||||||||||||||||||||||||||||||||||||||||||||||||
| Value, | Net | and | Total | Distributions | Value, | End of | Reductions | Reductions | Investment Income | |||||||||||||||||||||||||||||||||||||||||||||||||||
| Beginning of | Investment | Unrealized | from | from Net | Distributions | End of | Year or | to Average | to Average | (Loss) to Average | Portfolio | |||||||||||||||||||||||||||||||||||||||||||||||||
| Year or | Income | Gain | Investment | Investment | from | Total | Year or | Total | Period | Net | Net | Net | Turnover | |||||||||||||||||||||||||||||||||||||||||||||||
| For the Year or Period Ended | Period | (Loss) (2) | (Loss) | Activities | Income | Capital Gains | Distributions | Period | Returns (3) | (in thousands) | Assets (4), (5) | Assets (5) | Assets (5) | Rates | ||||||||||||||||||||||||||||||||||||||||||||||
| PL Large-Cap Growth Fund | ||||||||||||||||||||||||||||||||||||||||||||||||||||||||||||
| 4/1/2010 - 3/31/2011 | $ | 7.71 | $ | (0.01 | ) | $ | 1.53 | $ | 1.52 | $ | — | $ | — | $ | — | $ | 9.23 | 19.72 | % | $ | 99,101 | 0.95 | % | 1.12 | % | (0.11 | %) | 101.69 | % | |||||||||||||||||||||||||||||||
| 4/1/2009 - 3/31/2010 | 5.44 | (0.03 | ) | 2.30 | 2.27 | — | — | — | 7.71 | 41.73 | % | 61,106 | 1.28 | % | 1.59 | % | (0.38 | %) | 115.83 | % | ||||||||||||||||||||||||||||||||||||||||
| 4/1/2008 - 3/31/2009 | 9.24 | (0.05 | ) | (3.75 | ) | (3.80 | ) | — | — | — | 5.44 | (41.13 | %) | 16,515 | 1.37 | % | 1.81 | % | (0.61 | %) | 179.61 | % | ||||||||||||||||||||||||||||||||||||||
| 4/1/2007 - 3/31/2008 | 9.43 | (0.08 | ) | (0.11 | ) | (0.19 | ) | — | — | — | 9.24 | (2.01 | %) | 26,235 | 1.50 | % | 1.92 | % | (0.79 | %) | 178.83 | % | ||||||||||||||||||||||||||||||||||||||
| 4/1/2006 - 3/31/2007 | 10.85 | (0.09 | ) | (0.40 | ) | (0.49 | ) | — | (0.93 | ) | (0.93 | ) | 9.43 | (3.80 | %) | 29,713 | 1.73 | % | 2.43 | % | (0.93 | %) | 147.66 | % | ||||||||||||||||||||||||||||||||||||
| PL Large-Cap Value Fund | ||||||||||||||||||||||||||||||||||||||||||||||||||||||||||||
| 4/1/2010 - 3/31/2011 | $ | 10.42 | $ | 0.16 | $ | 1.15 | $ | 1.31 | $ | (0.14 | ) | $ | — | $ | (0.14 | ) | $ | 11.59 | 12.69 | % | $ | 228,436 | 0.89 | % | 1.01 | % | 1.56 | % | 18.76 | % | ||||||||||||||||||||||||||||||
| 4/1/2009 - 3/31/2010 | 7.35 | 0.14 | 3.07 | 3.21 | (0.14 | ) | — | (0.14 | ) | 10.42 | 43.79 | % | 162,312 | 1.20 | % | 1.38 | % | 1.52 | % | 16.28 | % | |||||||||||||||||||||||||||||||||||||||
| 4/1/2008 - 3/31/2009 | 11.59 | 0.16 | (4.27 | ) | (4.11 | ) | (0.12 | ) | (0.01 | ) | (0.13 | ) | 7.35 | (35.61 | %) | 62,931 | 1.25 | % | 1.48 | % | 1.63 | % | 38.49 | % | ||||||||||||||||||||||||||||||||||||
| 4/1/2007 - 3/31/2008 | 13.03 | 0.10 | (1.21 | ) | (1.11 | ) | (0.08 | ) | (0.25 | ) | (0.33 | ) | 11.59 | (8.80 | %) | 68,901 | 1.40 | % | 1.69 | % | 0.79 | % | 24.35 | % | ||||||||||||||||||||||||||||||||||||
| 4/1/2006 - 3/31/2007 | 12.67 | 0.06 | 1.37 | 1.43 | (0.04 | ) | (1.03 | ) | (1.07 | ) | 13.03 | 12.09 | % | 56,601 | 1.63 | % | 2.05 | % | 0.50 | % | 19.58 | % | ||||||||||||||||||||||||||||||||||||||
| PL Main Street Core Fund | ||||||||||||||||||||||||||||||||||||||||||||||||||||||||||||
| 4/1/2010 - 3/31/2011 | $ | 9.00 | $ | 0.09 | $ | 1.10 | $ | 1.19 | $ | (0.06 | ) | $ | — | $ | (0.06 | ) | $ | 10.13 | 13.28 | % | $ | 157,890 | 0.70 | % | 0.83 | % | 0.93 | % | 58.13 | % | ||||||||||||||||||||||||||||||
| 4/1/2009 - 3/31/2010 | 6.11 | 0.07 | 2.89 | 2.96 | (0.07 | ) | — | (0.07 | ) | 9.00 | 48.57 | % | 146,028 | 1.00 | % | 1.23 | % | 0.89 | % | 130.37 | % | |||||||||||||||||||||||||||||||||||||||
| 4/1/2008 - 3/31/2009 | 9.91 | 0.09 | (3.81 | ) | (3.72 | ) | (0.08 | ) | — | (0.08 | ) | 6.11 | (37.66 | %) | 85,261 | 1.06 | % | 1.41 | % | 1.07 | % | 101.22 | % | |||||||||||||||||||||||||||||||||||||
| 4/1/2007 - 3/31/2008 | 11.46 | 0.08 | (0.94 | ) | (0.86 | ) | (0.08 | ) | (0.61 | ) | (0.69 | ) | 9.91 | (8.29 | %) | 111,936 | 1.20 | % | 1.50 | % | 0.69 | % | 126.84 | % | ||||||||||||||||||||||||||||||||||||
| 4/1/2006 - 3/31/2007 | 10.67 | 0.05 | 0.92 | 0.97 | (0.03 | ) | (0.15 | ) | (0.18 | ) | 11.46 | 9.23 | % | 87,136 | 1.43 | % | 1.88 | % | 0.54 | % | 107.36 | % | ||||||||||||||||||||||||||||||||||||||
| PL Mid-Cap Equity Fund (6) | ||||||||||||||||||||||||||||||||||||||||||||||||||||||||||||
| 4/1/2010 - 3/31/2011 | $ | 8.66 | $ | 0.08 | $ | 1.79 | $ | 1.87 | $ | (0.07 | ) | $ | — | $ | (0.07 | ) | $ | 10.46 | 21.70 | % | $ | 135,755 | 0.89 | % | 1.02 | % | 0.87 | % | 87.04 | % | ||||||||||||||||||||||||||||||
| 4/1/2009 - 3/31/2010 | 5.33 | 0.03 | 3.34 | 3.37 | (0.04 | ) | — | (0.04 | ) | 8.66 | 63.29 | % | 101,650 | 1.20 | % | 1.41 | % | 0.44 | % | 74.00 | % | |||||||||||||||||||||||||||||||||||||||
| 4/1/2008 - 3/31/2009 | 8.92 | 0.07 | (3.58 | ) | (3.51 | ) | (0.08 | ) | (0.00 | )(7) | (0.08 | ) | 5.33 | (39.44 | %) | 59,135 | 1.26 | % | 1.52 | % | 1.01 | % | 82.26 | % | ||||||||||||||||||||||||||||||||||||
| 4/1/2007 - 3/31/2008 | 11.62 | 0.06 | (1.61 | ) | (1.55 | ) | (0.03 | ) | (1.12 | ) | (1.15 | ) | 8.92 | (14.81 | %) | 85,208 | 1.40 | % | 1.69 | % | 0.55 | % | 70.09 | % | ||||||||||||||||||||||||||||||||||||
| 4/1/2006 - 3/31/2007 | 10.54 | (0.00 | )(7) | 1.51 | 1.51 | — | (0.43 | ) | (0.43 | ) | 11.62 | 14.80 | % | 71,181 | 1.60 | % | 2.01 | % | (0.00% | )(7) | 74.07 | % | ||||||||||||||||||||||||||||||||||||||
| PL Mid-Cap Growth Fund | ||||||||||||||||||||||||||||||||||||||||||||||||||||||||||||
| 4/1/2010 - 3/31/2011 | $ | 8.41 | $ | 0.02 | $ | 2.83 | $ | 2.85 | $ | (0.02 | ) | $ | (0.96 | ) | $ | (0.98 | ) | $ | 10.28 | 35.16 | % | $ | 64,476 | 0.95 | % | 1.17 | % | 0.24 | % | 44.37 | % | |||||||||||||||||||||||||||||
| 4/1/2009 - 3/31/2010 | 4.98 | (0.03 | ) | 3.56 | 3.53 | — | (0.10 | ) | (0.10 | ) | 8.41 | 70.89 | % | 54,994 | 1.25 | % | 1.53 | % | (0.42 | %) | 31.79 | % | ||||||||||||||||||||||||||||||||||||||
| 4/1/2008 - 3/31/2009 | 9.31 | (0.05 | ) | (3.57 | ) | (3.62 | ) | — | (0.71 | ) | (0.71 | ) | 4.98 | (40.02 | %) | 18,873 | 1.34 | % | 1.80 | % | (0.60 | %) | 47.92 | % | ||||||||||||||||||||||||||||||||||||
| 4/1/2007 - 3/31/2008 | 10.93 | (0.02 | ) | 0.66 | 0.64 | — | (2.26 | ) | (2.26 | ) | 9.31 | 3.48 | % | 50,189 | 1.45 | % | 1.80 | % | (0.19 | %) | 77.63 | % | ||||||||||||||||||||||||||||||||||||||
| 4/1/2006 - 3/31/2007 | 11.67 | (0.07 | ) | 0.31 | 0.24 | — | (0.98 | ) | (0.98 | ) | 10.93 | 2.64 | % | 63,462 | 1.68 | % | 2.08 | % | (0.64 | %) | 60.08 | % | ||||||||||||||||||||||||||||||||||||||
| PL Small-Cap Growth Fund | ||||||||||||||||||||||||||||||||||||||||||||||||||||||||||||
| 4/1/2010 - 3/31/2011 | $ | 9.41 | $ | (0.06 | ) | $ | 2.55 | $ | 2.49 | $ | — | $ | — | $ | — | $ | 11.90 | 26.46 | % | $ | 32,355 | 0.84 | % | 1.11 | % | (0.63 | %) | 85.58 | % | |||||||||||||||||||||||||||||||
| 4/1/2009 - 3/31/2010 | 5.88 | (0.06 | ) | 3.59 | 3.53 | — | — | — | 9.41 | 60.03 | % | 25,691 | 1.15 | % | 1.56 | % | (0.81 | %) | 87.50 | % | ||||||||||||||||||||||||||||||||||||||||
| 4/1/2008 - 3/31/2009 | 9.12 | (0.07 | ) | (3.17 | ) | (3.24 | ) | — | — | — | 5.88 | (35.53 | %) | 24,046 | 1.28 | % | 1.71 | % | (0.96 | %) | 72.93 | % | ||||||||||||||||||||||||||||||||||||||
| 4/1/2007 - 3/31/2008 | 11.24 | (0.12 | ) | (0.62 | ) | (0.74 | ) | — | (1.38 | ) | (1.38 | ) | 9.12 | (8.81 | %) | 37,258 | 1.55 | % | 1.90 | % | (1.07 | %) | 163.56 | % | ||||||||||||||||||||||||||||||||||||
| 4/1/2006 - 3/31/2007 | 11.22 | (0.08 | ) | 0.11 | 0.03 | — | (0.01 | ) | (0.01 | ) | 11.24 | 0.28 | % | 41,378 | 1.78 | % | 2.24 | % | (0.74 | %) | 52.87 | % | ||||||||||||||||||||||||||||||||||||||
| See Notes to Financial Statements | See explanation of references on C-17 |
C-16
PACIFIC LIFE FUNDS
FINANCIAL HIGHLIGHTS (Continued)(1)
Selected per share, ratios and supplemental data for each year or period ended March 31 were as follows:
FINANCIAL HIGHLIGHTS (Continued)(1)
Selected per share, ratios and supplemental data for each year or period ended March 31 were as follows:
| Investment Activities | Distributions | Ratios/Supplemental Data | ||||||||||||||||||||||||||||||||||||||||||||||||||||||||||
| Ratios of | Ratios of | |||||||||||||||||||||||||||||||||||||||||||||||||||||||||||
| Expenses | Expenses | |||||||||||||||||||||||||||||||||||||||||||||||||||||||||||
| Net | Net | Net | After | Before | Ratios of | |||||||||||||||||||||||||||||||||||||||||||||||||||||||
| Net Asset | Realized | Asset | Assets, | Expense | Expense | Net | ||||||||||||||||||||||||||||||||||||||||||||||||||||||
| Value, | Net | and | Total | Distributions | Value, | End of | Reductions | Reductions | Investment Income | |||||||||||||||||||||||||||||||||||||||||||||||||||
| Beginning of | Investment | Unrealized | from | from Net | Distributions | End of | Year or | to Average | to Average | to Average | Portfolio | |||||||||||||||||||||||||||||||||||||||||||||||||
| Year or | Income | Gain | Investment | Investment | from | Total | Year or | Total | Period | Net | Net | Net | Turnover | |||||||||||||||||||||||||||||||||||||||||||||||
| For the Year or Period Ended | Period | (2) | (Loss) | Activities | Income | Capital Gains | Distributions | Period | Returns (3) | (in thousands) | Assets (4), (5) | Assets (5) | Assets (5) | Rates | ||||||||||||||||||||||||||||||||||||||||||||||
| PL Small-Cap Value Fund | ||||||||||||||||||||||||||||||||||||||||||||||||||||||||||||
| 4/1/2010 - 3/31/2011 | $ | 8.57 | $ | 0.16 | $ | 1.98 | $ | 2.14 | $ | (0.11 | ) | $ | — | $ | (0.11 | ) | $ | 10.60 | 25.11 | % | $ | 76,247 | 0.97 | % | 1.13 | % | 1.71 | % | 31.06 | % | ||||||||||||||||||||||||||||||
| 4/1/2009 - 3/31/2010 | 5.49 | 0.13 | 3.06 | 3.19 | (0.11 | ) | — | (0.11 | ) | 8.57 | 58.28 | % | 38,173 | 1.30 | % | 1.58 | % | 1.82 | % | 31.57 | % | |||||||||||||||||||||||||||||||||||||||
| 4/1/2008 - 3/31/2009 | 8.80 | 0.16 | (3.34 | ) | (3.18 | ) | (0.13 | ) | — | (0.13 | ) | 5.49 | (36.39 | %) | 27,018 | 1.34 | % | 1.73 | % | 2.21 | % | 47.41 | % | |||||||||||||||||||||||||||||||||||||
| 6/29/2007 - 3/31/2008 | 10.00 | 0.10 | (1.24 | ) | (1.14 | ) | (0.06 | ) | — | (0.06 | ) | 8.80 | (11.47 | %) | 19,112 | 1.50 | % | 2.07 | % | 1.46 | % | 17.98 | % | |||||||||||||||||||||||||||||||||||||
| PL Real Estate Fund | ||||||||||||||||||||||||||||||||||||||||||||||||||||||||||||
| 4/1/2010 - 3/31/2011 | $ | 9.24 | $ | 0.08 | $ | 2.23 | $ | 2.31 | $ | (0.09 | ) | $ | — | $ | (0.09 | ) | $ | 11.46 | 25.16 | % | $ | 41,860 | 1.14 | % | 1.34 | % | 0.77 | % | 32.30 | % | ||||||||||||||||||||||||||||||
| 4/1/2009 - 3/31/2010 | 4.60 | 0.12 | 4.64 | 4.76 | (0.12 | ) | — | (0.12 | ) | 9.24 | 104.32 | % | 36,352 | 1.45 | % | 1.76 | % | 1.68 | % | 26.55 | % | |||||||||||||||||||||||||||||||||||||||
| 4/1/2008 - 3/31/2009 | 11.25 | 0.15 | (6.65 | ) | (6.50 | ) | (0.15 | )(8) | — | (0.15 | ) | 4.60 | (58.24 | %) | 20,775 | 1.51 | % | 1.89 | % | 1.79 | % | 42.37 | % | |||||||||||||||||||||||||||||||||||||
| 4/1/2007 - 3/31/2008 | 14.94 | 0.13 | (2.77 | ) | (2.64 | ) | (0.18 | ) | (0.87 | ) | (1.05 | ) | 11.25 | (18.03 | %) | 37,872 | 1.65 | % | 2.03 | % | 1.02 | % | 34.98 | % | ||||||||||||||||||||||||||||||||||||
| 4/1/2006 - 3/31/2007 | 12.89 | 0.04 | 3.01 | 3.05 | (0.05 | ) | (0.95 | ) | (1.00 | ) | 14.94 | 24.19 | % | 31,504 | 1.89 | % | 2.42 | % | 0.27 | % | 36.83 | % | ||||||||||||||||||||||||||||||||||||||
| PL Emerging Markets Fund | ||||||||||||||||||||||||||||||||||||||||||||||||||||||||||||
| 4/1/2010 - 3/31/2011 | $ | 12.19 | $ | 0.11 | $ | 2.64 | $ | 2.75 | $ | (0.26 | ) | $ | — | $ | (0.26 | ) | $ | 14.68 | 22.53 | % | $ | 64,270 | 1.04 | % | 1.56 | % | 0.80 | % | 45.98 | % | ||||||||||||||||||||||||||||||
| 4/1/2009 - 3/31/2010 | 6.54 | 0.06 | 5.66 | 5.72 | (0.07 | ) | — | (0.07 | ) | 12.19 | 87.45 | % | 47,714 | 1.35 | % | 2.15 | % | 0.57 | % | 55.24 | % | |||||||||||||||||||||||||||||||||||||||
| 4/1/2008 - 3/31/2009 | 13.58 | 0.11 | (5.39 | ) | (5.28 | ) | (0.07 | ) | (1.69 | ) | (1.76 | ) | 6.54 | (42.31 | %) | 30,820 | 1.42 | % | 2.34 | % | 1.18 | % | 61.50 | % | ||||||||||||||||||||||||||||||||||||
| 4/1/2007 - 3/31/2008 | 13.01 | 0.07 | 2.32 | 2.39 | (0.05 | ) | (1.77 | ) | (1.82 | ) | 13.58 | 17.21 | % | 47,633 | 1.55 | % | 2.38 | % | 0.46 | % | 60.20 | % | ||||||||||||||||||||||||||||||||||||||
| 4/1/2006 - 3/31/2007 | 12.00 | 0.06 | 1.56 | 1.62 | (0.05 | ) | (0.56 | ) | (0.61 | ) | 13.01 | 14.49 | % | 51,376 | 1.78 | % | 2.81 | % | 0.49 | % | 58.31 | % | ||||||||||||||||||||||||||||||||||||||
| PL International Large-Cap Fund | ||||||||||||||||||||||||||||||||||||||||||||||||||||||||||||
| 4/1/2010 - 3/31/2011 | $ | 13.83 | $ | 0.16 | $ | 1.52 | $ | 1.68 | $ | (0.14 | ) | $ | — | $ | (0.14 | ) | $ | 15.37 | 12.36 | % | $ | 138,033 | 1.09 | % | 1.30 | % | 1.16 | % | 33.73 | % | ||||||||||||||||||||||||||||||
| 4/1/2009 - 3/31/2010 | 9.17 | 0.16 | 4.64 | 4.80 | (0.14 | ) | — | (0.14 | ) | 13.83 | 52.64 | % | 108,002 | 1.40 | % | 1.72 | % | 1.26 | % | 24.61 | % | |||||||||||||||||||||||||||||||||||||||
| 4/1/2008 - 3/31/2009 | 15.55 | 0.17 | (6.37 | ) | (6.20 | ) | (0.06 | ) | (0.12 | ) | (0.18 | ) | 9.17 | (40.24 | %) | 65,124 | 1.46 | % | 1.82 | % | 1.39 | % | 25.95 | % | ||||||||||||||||||||||||||||||||||||
| 4/1/2007 - 3/31/2008 | 16.64 | 0.19 | (0.34 | ) | (0.15 | ) | (0.15 | ) | (0.79 | ) | (0.94 | ) | 15.55 | (1.17 | %) | 96,049 | 1.60 | % | 1.99 | % | 1.18 | % | 28.23 | % | ||||||||||||||||||||||||||||||||||||
| 4/1/2006 - 3/31/2007 | 15.45 | 0.28 | 2.49 | 2.77 | (0.30 | ) | (1.28 | ) | (1.58 | ) | 16.64 | 18.70 | % | 76,806 | 1.84 | % | 2.38 | % | 1.77 | % | 47.87 | % | ||||||||||||||||||||||||||||||||||||||
| PL International Value Fund (9) | ||||||||||||||||||||||||||||||||||||||||||||||||||||||||||||
| 4/1/2010 - 3/31/2011 | $ | 9.19 | $ | 0.18 | $ | 0.35 | $ | 0.53 | $ | (0.21 | ) | $ | — | $ | (0.21 | ) | $ | 9.51 | 5.99 | % | $ | 90,242 | 0.90 | % | 1.14 | % | 2.01 | % | 149.95 | % | ||||||||||||||||||||||||||||||
| 4/1/2009 - 3/31/2010 | 6.14 | 0.19 | 3.00 | 3.19 | (0.14 | ) | — | (0.14 | ) | 9.19 | 52.10 | % | 86,284 | 1.20 | % | 1.56 | % | 2.28 | % | 59.92 | % | |||||||||||||||||||||||||||||||||||||||
| 4/1/2008 - 3/31/2009 | 12.82 | 0.26 | (6.72 | ) | (6.46 | ) | (0.22 | ) | (0.00 | )(7) | (0.22 | ) | 6.14 | (50.74 | %) | 78,604 | 1.27 | % | 1.58 | % | 2.82 | % | 31.43 | % | ||||||||||||||||||||||||||||||||||||
| 4/1/2007 - 3/31/2008 | 14.39 | 0.22 | (1.38 | ) | (1.16 | ) | (0.13 | ) | (0.28 | ) | (0.41 | ) | 12.82 | (8.27 | %) | 124,055 | 1.40 | % | 1.72 | % | 1.50 | % | 17.40 | % | ||||||||||||||||||||||||||||||||||||
| 4/1/2006 - 3/31/2007 | 15.30 | 0.16 | 2.48 | 2.64 | (0.14 | ) | (3.41 | ) | (3.55 | ) | 14.39 | 18.40 | % | 77,127 | 1.64 | % | 2.08 | % | 1.04 | % | 108.86 | % | ||||||||||||||||||||||||||||||||||||||
| (1) | The Underlying Funds currently offer Class P shares only. Effective July 2, 2010, all Class A Shares of the Underlying Funds were converted to Class P Shares. Performance information prior to the conversion pertains to Class A shares and reflects the fees and expenses associated with that share class. | |
| (2) | Net investment income (loss) per share has been calculated using the average shares method with the exception of the PL Main Street Core and PL Emerging Markets Funds for the fiscal year ended March 31, 2007. | |
| (3) | The total returns include reinvestment of all dividends and capital gain distributions, if any, and do not include deductions of any applicable sales charges. Total returns are not annualized for periods less than one full year. | |
| (4) | The ratios of expenses after expense reductions to average net assets are after any advisory fee waivers and adviser expense reimbursements as discussed in Note 3 and Note 5, respectively, in Notes to the Financial Statements. | |
| (5) | The ratios are annualized for periods of less than one full year. | |
| (6) | Prior to July 1, 2008, the PL Mid-Cap Equity Fund was named PL Mid-Cap Value Fund. | |
| (7) | Amount represents less than $0.005 per share or less than 0.005%. | |
| (8) | Includes return of capital distribution of $0.01 per share. | |
| (9) | Prior to May 1, 2006, the PL International Value Fund was named PF Lazard International Value Fund. |
See Notes to Financial Statements
C-17
PACIFIC LIFE FUNDS
NOTES TO FINANCIAL STATEMENTS
1. ORGANIZATION
Pacific Life Funds (the “Trust”) is a Delaware statutory trust, which was formed on May 21, 2001, and is registered under the Investment Company Act of 1940 (“1940 Act”), as amended, as an open-end management investment company, and as of March 31, 2011, was comprised of twenty-four separate funds, seventeen of which are covered by this report (each individually, a “Fund”, and collectively the “Funds” or “Underlying Funds”): PL Floating Rate Loan Fund, PL Inflation Managed Fund, PL Managed Bond Fund, PL Short Duration Bond Fund, PL Comstock Fund, PL Growth LT Fund, PL Large-Cap Growth Fund, PL Large-Cap Value Fund, PL Main Street® Core Fund (Main Street is a registered trademark of OppenheimerFunds, Inc.), PL Mid-Cap Equity Fund, PL Mid-Cap Growth Fund, PL Small-Cap Growth Fund, PL Small-Cap Value Fund, PL Real Estate Fund, PL Emerging Markets Fund, PL International Large-Cap Fund, and PL International Value Fund.
Effective July 2, 2010, all Class A shares of the Underlying Funds were converted to Class P shares within the Trust. The Underlying Funds offer Class P shares only, which are offered at Net Asset Value (“NAV”). Presently, only the PL Portfolio Optimization Conservative Fund, PL Portfolio Optimization Moderate-Conservative Fund, PL Portfolio Optimization Moderate Fund, PL Portfolio Optimization Moderate-Aggressive Fund, and PL Portfolio Optimization Aggressive Fund (collectively, the “Portfolio Optimization Funds”), and the investment adviser and certain of its affiliates can invest in the Underlying Funds.
The annual report for the Portfolio Optimization Funds is not included in this report; there is a separate annual report for the Portfolio Optimization Funds, which is available without charge. For information on how to obtain the shareholder report for the Portfolio Optimization Funds, see the Where to Go for More Information section of this report on page F-13.
2. SIGNIFICANT ACCOUNTING POLICIES
The financial statements have been prepared in conformity with accounting principles generally accepted in the United States of America (“U.S. GAAP”) for investment companies. In preparing the financial statements, management is required to make estimates and assumptions that affect the reported amounts of assets and liabilities and disclosure of contingent assets and liabilities at the date of the financial statements and the reported amounts of increases and decreases in net assets from operations during the reporting period. Actual results could differ from those estimates. The following is a summary of the significant accounting policies followed by the Trust in the preparation of the financial statements.
A. DETERMINATION OF NET ASSET VALUE
Each Fund is divided into shares. The price of a Fund’s shares is called NAV per share. The NAV forms the basis for all transactions involving buying, selling, exchanging or reinvesting shares. Each Fund’s NAV per share is calculated by taking the total value of a Fund’s assets (the value of the securities and other investments a Fund holds), subtracting a Fund’s liabilities, and dividing by the total number of shares outstanding. The value of each security or other investment is the amount which a Fund might reasonably expect to receive for the investment upon its current sale in the ordinary course. The valuation of investments held by the Trust is discussed in further detail below.
Each Fund’s NAV per share is calculated once a day, every day the New York Stock Exchange (“NYSE”) is open, including days when foreign markets are closed. For purposes of calculating the NAV, all investments are generally calculated as of the time of the close of the NYSE, which is usually 4:00 p.m. Eastern Time. Information that becomes known to the Trust or its agents after the NAV has been calculated on a particular day will not normally be used to retroactively adjust the price of an investment or the NAV determined earlier that day.
Each Fund’s NAV will not be calculated on days when the NYSE is closed. There may be a delay in calculating the NAV if: (i) the NYSE is closed on a day other than a regular holiday or weekend, (ii) trading on the NYSE is restricted, (iii) an emergency exists (as determined by the Securities and Exchange Commission (“SEC”)), making the sale of securities or other instruments or determinations of NAV not practicable, or (iv) the SEC permits a delay for the protection of shareholders.
B. INVESTMENT VALUATION
For purposes of calculating the NAV, the value of investments held by each Fund is based primarily on pricing data obtained from various sources approved by the Trust’s Board of Trustees (the “Board”):
Money Market Instruments and Short-Term Investments. Money market instruments and short-term investments maturing within 60 days are valued at amortized cost, in accordance with the 1940 Act. Amortized cost involves valuing an investment at cost on the date of acquisition and thereafter assuming a constant accretion of a discount or amortization of a premium to maturity, regardless of the impact of fluctuating interest rates on the market value of the instrument. While this method provides consistency in valuation, (and may only be used if it approximates market value), it may result in periods during which value, as determined by amortized cost, is higher or lower than the price that would be received if the Fund sold the investment. Fund investments in other mutual funds for temporary cash purposes are valued at their respective NAVs.
Domestic Equity Investments. For domestic equity investments, the Trust uses the last reported sale price received shortly after the NYSE close and does not normally take into account trading, clearances or settlements that take place after the NYSE close.
Foreign Equity Investments. Foreign equity investments are normally priced based on data reflecting the closing of the principal markets or market participants for those investments, which may be earlier than the NYSE close. The Trust then may adjust for market events, that occur between the close of certain foreign exchanges and the NYSE. The Trust has retained an independent statistical service approved by the Board to assist in determining the value of certain foreign equity securities. This service utilizes proprietary computer models based on
D-1
PACIFIC LIFE FUNDS
NOTES TO FINANCIAL STATEMENTS (Continued)
NOTES TO FINANCIAL STATEMENTS (Continued)
historical performance of markets and other considerations to determine the appropriate adjustments for market events. Quotations of foreign investments in foreign currencies and those valued using foreign currency rates are converted into U.S. dollar equivalents using a foreign exchange quotation from an approved source.
Over the Counter (“OTC”) Investments and Certain Equity Investments. OTC investments, including options contracts and listed investments for which no sales are reported, are generally valued at the mean between the most recent bid and ask prices obtained from a quotation and valuation reporting system, from established market makers, or from broker-dealers. OTC swap contracts are generally valued by approved pricing and quotation services, which are based on evaluated prices determined from various observable market and other factors. Certain OTC swap contracts are valued by other pricing processes approved by the Board.
Domestic and Foreign Fixed Income Investments. Fixed income investments are generally valued using the mean between bid and ask prices provided by approved pricing and quotation services which are based on evaluated prices determined from various observable market and other factors. Certain bonds are valued by a benchmark, matrix, or other pricing processes approved by the Board.
Investment Values Determined by a Trustee Valuation Committee or a Valuation Committee Approved by the Board. The Board has adopted procedures (“Trust Procedures”) that include methodologies approved for valuing investments in circumstances where market quotations are not readily available. In such circumstances, a Trustee Valuation Committee or other valuation committee will determine the value of such investments in accordance with alternative valuation methodologies under the Trust Procedures which may include, among others, the use of broker quotes, the use of a purchase price for initial public offerings, proration rates, and benchmark and matrix pricing. In the event market quotations or Board approved alternate valuation methodologies are not readily available or reliable, the value of the investments will be determined in good faith by a Trustee Valuation Committee or determined by a valuation committee approved by the Board or a delegate of the Board. Valuations determined by a Trustee Valuation Committee or other valuation committee may require subjective inputs about the value of such investments. While these valuations are intended to estimate the value a Fund might reasonably expect to receive upon the current sale of the investments in the ordinary course, such values may differ from the value that a Fund would actually realize if the investments were sold.
Market quotes are considered not readily available if: (1) the market quotations received are deemed unreliable or inaccurate, (2) approved pricing services do not provide a valuation for a particular investment, or (3) material events occur after the close of the principal market for a particular investment but prior to the close of the NYSE.
C. INVESTMENT TRANSACTIONS AND INCOME
Investment transactions are recorded on a trade date basis. Securities purchased or sold on a when-issued or delayed-delivery basis as well as certain loan transactions and mortgage securities (such as Government National Mortgage Association (“GNMA”) securities) may be settled a month or more after the trade date. Dividend income is recorded on the ex-dividend date, except certain dividends from foreign securities are recorded as soon as a Fund is informed of the ex-dividend date or upon receipt of the dividend. A Fund’s estimated components of distributions received from real estate investment trusts may be considered return of capital distributions or capital gain distributions. Return of capital distributions are recorded as a reduction of cost of the related investments. Interest income, adjusted for amortization of premium and accretion of discount, is recorded daily on an accrual basis. Investment income is recorded net of foreign taxes withheld, if any. A Fund may be subject to foreign taxes on income, gains on investments or currency repatriation, a portion of which may be recoverable. A Fund will accrue such taxes and reclaims as applicable, based upon their current interpretation of tax rules and regulations that exist in the markets in which a Fund invests. Facility fees and other fees (such as origination fees) received from senior loans purchased (see Note 2G) by a Fund are amortized over the expected term of each applicable senior loan. Commitment fees received by a Fund relating to unfunded senior loan commitments are deferred and amortized to income over the period of the commitment. Consent fees, which are compensation for agreeing to changes in the terms of debt instruments, are included in interest income on the Statements of Operations when received. Realized gains and losses from securities transactions are recorded on the basis of identified cost, which is also used for Federal income tax purposes. Gains and losses realized on principal paydowns from mortgage- and asset-backed securities are recorded as interest income in the Statements of Operations.
D. DISTRIBUTIONS TO SHAREHOLDERS
Each Fund currently intends to distribute substantially all of its net investment income and realized capital gains, if any, at least annually, although distribution could occur more frequently if it is advantageous to the specific Fund and to its shareholders.
Dividends on net investment income and capital gain distributions are determined in accordance with income tax regulations, which may differ from U.S. GAAP. These differences are primarily due to differing treatments for futures and options, foreign currency transactions, passive foreign investment companies, post-October losses, capital loss carryforwards, and losses deferred due to wash sales. Permanent book and tax differences relating to shareholder distributions will result in reclassifications of paid-in capital. Dividends and distributions paid to shareholders are recorded on the ex-dividend date.
E. FOREIGN CURRENCY TRANSLATION
Assets and liabilities initially expressed in non-U.S. currencies are translated into U.S. dollars based on the applicable exchange rates at the date of the last business day of the financial statement period. Purchases and sales of securities, interest income, dividends, and variation margin, and expenses denominated in foreign currencies are translated into U.S. dollars at the exchange rates in effect on the transaction date.
D-2
PACIFIC LIFE FUNDS
NOTES TO FINANCIAL STATEMENTS (Continued)
NOTES TO FINANCIAL STATEMENTS (Continued)
None of the Funds separately report the effect of changes in foreign exchange rates from changes in market prices of securities held. Such changes are included with the net realized gain or loss and change in unrealized appreciation or depreciation on investment securities in the Statements of Operations. Other foreign currency transactions resulting in realized and unrealized gain or loss, if any, are reported separately as net realized gain or loss and change in unrealized appreciation or depreciation on foreign currencies in the Statements of Operations.
F. EXPENSE ALLOCATION
General expenses of the Trust are allocated to each Fund in proportion to its relative average daily net assets. Expenses directly attributable to a particular Fund are charged directly to that Fund.
G. INVESTMENTS AND RISKS
General Investment Risks
An investment in each Fund represents an indirect investment in the assets owned by that Fund. As with any mutual fund, the value of these investments may move up or down, and as a result, an investment in a Fund at any point in time may be worth more or less than the original investment. Events in the financial markets have the potential to cause increased volatility and uncertainty, which may impact the value of each Fund’s investments. Due to interdependencies between markets, events in one market may adversely impact other markets or issuers in unforeseen ways. As a result, the value of a Fund’s investments may be adversely affected by events in the markets, either directly or indirectly, and each Fund is exposed to potential decreases in the value of those investments. In addition, traditionally liquid investments may experience periods of diminished liquidity. Governmental and regulatory responses to market events may impair a manager’s ability to pursue certain investment techniques or strategies and may have unexpected consequences on particular markets, strategies, or investments. Future events may impact a Fund in unforeseen ways, leading a Fund to alter its existing strategies or, potentially, to liquidate and close.
The price of equity investments changes in response to many factors, including a company’s historical and prospective earnings, the value of its assets, and many of the factors noted above.
Fixed income (debt) investments are affected primarily by the financial condition of the companies that have issued them and by changes in interest rates, although the factors noted above may also have a significant impact on fixed income (debt) investments. There is a risk that an issuer of a Fund’s fixed income (debt) investment (including borrowers) may not be able to meet its financial obligations (e.g., may not be able to make principal and/or interest payments when they are due or otherwise default on other financial terms) and/or go bankrupt. Securities such as high yield/high-risk bonds, i.e. bonds with low credit ratings by Moody’s (Ba or lower) or Standard & Poor’s (BB and lower) or no rating, are especially subject to credit risk during periods of economic uncertainty or during economic downturns and are more likely to default on their interest and/or principal payments than higher rated securities. Certain asset-backed instruments, such as collateralized debt obligations, collateralized mortgage obligations and other mortgage related securities, structured investment vehicles and other debt investments may have exposure to subprime loans or subprime mortgages, which are loans to persons with lower credit ratings. These instruments may present credit risk that is not transparent and that is greater than indicated by their ratings. The value of these instruments may be more acutely affected by downturns in the credit markets or the real estate market than certain other investments, and it may be difficult to value these instruments because of a thin secondary market.
There are certain additional risks involved in investing in foreign securities that are generally not inherent in investments in domestic securities. These risks may involve foreign currency fluctuations, adverse political, social and economic developments and the possible imposition of currency exchange blockages or other foreign governmental laws or restrictions. In addition, the securities of some foreign companies and securities markets are less liquid and at times more volatile than securities of comparable U.S. companies and U.S. securities markets. The markets in emerging markets countries can be extremely volatile.
Illiquid Investments
The Funds may not invest in illiquid securities and illiquid bank loans (collectively, “Illiquid Investments”) if as a result of such investment, more than 15% of its net assets, taken at market value at the time of such investment, would be invested in Illiquid Investments. The term “Illiquid Investments” for this purpose means investments that cannot be disposed of within seven days in the ordinary course of business at approximately the amount at which a Fund has valued the investments. Illiquid Investments may be difficult to value and difficult to sell, which means a Fund may not be able to sell such investments quickly for its full value. The value of Illiquid Investments held by each Fund as of March 31, 2011 was less than 15% of its net assets.
Senior Loan Participations and Assignments
Certain Funds may invest in floating rate senior loans (“Senior Loans”), the interest rates of which float or adjust periodically based upon a specified adjustment schedule, benchmark indicator, or prevailing interest rates of domestic or foreign corporations, partnerships and other entities (“Borrowers”). Senior Loans generally pay interest at rates which are periodically redetermined by reference to a base lending rate plus a premium. These base lending rates generally include prime rates of one or more major U.S. banks, LIBOR rates or certificates of deposit rates. Senior Loans often require prepayments from excess cash flow or permit the borrower to repay at its election. The degree to which borrowers repay cannot be predicted with accuracy. As a result, the actual maturity may be substantially less than the stated maturities. Senior Loans are exempt from registration under the Securities Act of 1933, may contain certain restrictions on resale, and cannot be sold publicly. A Fund’s investments in Senior Loans may be in the form of participations in loans or assignments of all or a portion of loans from third parties.
D-3
PACIFIC LIFE FUNDS
NOTES TO FINANCIAL STATEMENTS (Continued)
NOTES TO FINANCIAL STATEMENTS (Continued)
When a Fund purchases assignments, it acquires all the rights and obligations under the loan agreement of the assigning lender. Assignments may, however, be arranged through private negotiations between potential assignees and potential assignors, and the rights and obligations acquired by the purchaser of an assignment may differ from, and be more limited than those held by the assigning lender.
When a Fund purchases a participation of a Senior Loan interest, the Fund typically enters into a contractual agreement with the lender or other third party selling the participation. A participation interest in Senior Loans includes the right to receive payments of principal, interest and any fees to which it is entitled from the lender and only upon receipt by the lender of payments from the Borrower, but not from the Borrower directly. When holding a participation interest, if a Borrower is unable to meet its obligations under a loan agreement, a Fund generally has no right to enforce compliance of the terms of the loan agreement. As a result, the Fund assumes the credit risk of the Borrower, the selling participant, and any other persons that are interpositioned between the Fund and the Borrower. If the lead lender in a typical lending syndicate becomes insolvent, enters FDIC receivership or, if not FDIC insured, enters into bankruptcy, the Fund may incur certain costs and delays in receiving payment or may suffer a loss of principal and/or interest. As of March 31, 2011, no participation interest in Senior Loans was held by any of the Funds.
Inflation-Indexed Bonds
Certain Funds may invest in inflation-indexed bonds. Inflation-indexed bonds are fixed income (debt) securities whose principal value is periodically adjusted to the rate of inflation. The interest rate on these bonds is generally fixed at issuance at a rate lower than typical bonds. Over the life of an inflation indexed bond, however, interest will be paid based on a principal value, which is adjusted for inflation. Any increase or decrease in the principal amount of an inflation-indexed bond will result in an adjustment of interest income in the Statements of Operations.
Mortgage-Related and Other Asset-Backed Securities
Certain Funds may invest in mortgage-related and other asset-backed securities. These securities include mortgage pass-through securities, collateralized mortgage obligations (“CMOs”), collateralized loan obligations (“CLOs”), mortgage dollar rolls, CMO residuals, stripped mortgage-backed securities (“SMBS”), and other securities that directly or indirectly represent a participation in, or are secured by and payable from, mortgage loans secured by real property. Mortgage-related and other asset-backed securities are debt securities issued by a corporation, trust or custodian, or by a U.S. Government agency or instrumentality, that are collateralized by a portfolio or pool of mortgages, mortgage pass-through securities, U.S. Government securities or other assets. The value of some mortgage-related and asset-backed securities may be particularly sensitive to changes in prevailing interest rates. Early repayment of principal on some mortgage-related securities may expose a Fund to a lower rate of return upon reinvestment of principal. The value of these securities may fluctuate in response to the market’s perception of the creditworthiness of the issuers. Additionally, although mortgage and mortgage-related securities are generally supported by some form of government or private guarantee and/or insurance, there is no assurance that private guarantors or issuers will meet their obligations.
Mortgage dollar rolls, principally on a forward commitment basis, involve a Fund selling mortgage-backed securities for delivery in the current month and simultaneously contracting to repurchase similar, but not identical securities at an agreed-upon price on a fixed date in the future. A Fund accounts for such dollar rolls as purchases and sales and receives compensation as consideration for entering into the commitment to repurchase. A Fund must maintain liquid securities having a value not less than the repurchase price (including accrued interest) for such dollar rolls. The market value of the securities that a Fund is required to purchase may decline below the agreed upon repurchase price of those securities.
SMBS represent a participation in, or are secured by and payable from, mortgage loans on real property, and may be structured in classes with rights to receive varying proportions of principal and interest. SMBS include interest-only securities (“IOs”), which receive all of the interest, and principal-only securities (“POs”), which receive the entire principal. The cash flows and yields on IOs are extremely sensitive to the rate of principal payments (including prepayments) on the underlying mortgage loans. If the underlying mortgages experience higher than anticipated prepayments, an investor in IOs of SMBS may fail to recoup fully its initial investment, even if the IOs are highly rated or are derived from securities guaranteed by the U.S. Government. Unlike other fixed-income and other mortgage-backed securities, the market value of IOs tends to move in the same direction as interest rates. As prepayments on the underlying mortgages of POs increase, the yields on POs increase. Payments received from IOs are included in interest income in the Statements of Operations. Because principal will not be received at the maturity of an IO, adjustments are made to the book value of the security on the coupon date until maturity. These adjustments are included in interest income in the Statements of Operations. Payments received from POs are treated as reductions to the cost and par value of the securities. Any excess principal paydown gains or losses associated with the payments received are reported as interest income in the Statements of Operations.
U.S. Government Agencies or Government-Sponsored Enterprises
Certain Funds may invest in U.S. Government agencies or government-sponsored enterprises. U.S. Government securities are obligations of and, in certain cases, guaranteed by, the U.S. Government, its agencies or instrumentalities. The U.S. Government does not guarantee the net asset value of the Funds’ shares. Some U.S. Government securities, such as Treasury bills, notes and bonds, and securities guaranteed by the Government National Mortgage Association (“GNMA” or “Ginnie Mae”), are supported by the full faith and credit of the United States Government; others, such as those of the Federal Home Loan Bank, are supported by the right of the issuer to borrow from the U.S. Department of the Treasury (the “U.S. Treasury”); others, such as those of the Federal National Mortgage Association (“FNMA” or “Fannie
D-4
PACIFIC LIFE FUNDS
NOTES TO FINANCIAL STATEMENTS (Continued)
NOTES TO FINANCIAL STATEMENTS (Continued)
Mae”), are supported by the discretionary authority of the U.S. Government to purchase the agency’s obligations. U.S. Government securities may include zero coupon securities, which do not distribute interest on a current basis and tend to be subject to greater risk than interest-paying securities of similar maturities.
Government-related guarantors (i.e., not backed by the full faith and credit of the United States Government) include FNMA and the Federal Home Loan Mortgage Corporation (“FHLMC” or “Freddie Mac”). FNMA is a government-sponsored corporation, the common stock of which is owned entirely by private stockholders. FNMA purchases conventional (i.e., not insured or guaranteed by any government agency) residential mortgages from a list of approved seller/servicers which include state and federally chartered savings and loan associations, mutual savings banks, commercial banks and credit unions and mortgage bankers. Pass-through securities issued by FNMA are guaranteed as to timely payment of principal and interest by FNMA, but are not backed by the full faith and credit of the United States Government. FHLMC issues Participation Certificates (“PCs”), which are pass-through securities, each representing an undivided interest in a pool of residential mortgages. FHLMC guarantees the timely payment of interest and ultimate collection of principal, but PCs are not backed by the full faith and credit of the United States Government.
On September 6, 2008, the Federal Housing Finance Agency (“FHFA”) placed FNMA and FHMLC into conservatorship. As the conservator, FHFA succeeded to all rights, titles, powers and privileges of FNMA and FHLMC and of any stockholder, officer or director of FNMA and FHLMC with respect to FNMA and FHLMC and the assets of FNMA and FHLMC. FHFA selected a new chief executive officer and chairman of the board of directors for each of FNMA and FHLMC. In connection with the conservatorship, the U.S. Treasury entered into a Senior Preferred Stock Purchase Agreement with each of FNMA and FHLMC pursuant to which the U.S. Treasury will purchase up to an aggregate of $100 billion of each of FNMA and FHLMC to maintain a positive net worth in each enterprise. This agreement contains various covenants that severely limit each enterprise’s operations. In exchange for entering into these agreements, the U.S. Treasury received $1 billion of each enterprise’s senior preferred stock and warrants to purchase 79.9% of each enterprise’s common stock. On February 18, 2009, the U.S. Treasury announced that it was doubling the size of its commitment to each enterprise under the Senior Preferred Stock Program to $200 billion. The U.S. Treasury’s obligations under the Senior Preferred Stock Program are for an indefinite period of time for a maximum amount of $200 billion per enterprise. FNMA and FHLMC are continuing to operate as going concerns while in conservatorship and each remain liable for all of its obligations, including its guaranty obligations, associated with its mortgage-backed securities. The Senior Preferred Stock Purchase Agreement is intended to enhance each of FNMA’s and FHLMC’s ability to meet its obligations. The FHFA has indicated that the conservatorship of each enterprise will end when the director of FHFA determines that FHFA’s plan to restore the enterprise to a safe and solvent condition has been completed.
When-Issued Securities
Certain Funds may purchase and sell securities on a when-issued basis. These transactions are made conditionally because a security, although authorized, has not yet been issued in the market. A commitment by a Fund is made regarding these transactions to purchase or sell securities for a predetermined price or yield, with payment and delivery taking place beyond the customary settlement period. A Fund may sell when-issued securities before they are delivered, which may result in a capital gain or loss. Risk may arise upon entering these contracts from the potential inability of a counterparty to meet the terms of their contracts, or if the issuer does not issue the securities due to political, economic, or other factors.
Delayed-Delivery Transactions
Certain Funds may purchase or sell securities on a delayed-delivery basis. Payment and delivery may take place after the customary settlement period for that security. The price or yield of the underlying securities is fixed at the time the transaction is negotiated. When delayed-delivery purchases are outstanding, a Fund will set aside, and maintain until the settlement date in a segregated account, liquid assets in an amount sufficient to meet the purchase price. When purchasing a security on a delayed-delivery basis, a Fund assumes the rights and risks of ownership of the security, including the risk of price and yield fluctuations, and takes such fluctuations into account when determining its NAV. A Fund may dispose of or renegotiate a delayed-delivery transaction after it is entered into, and may sell delayed-delivery securities before they are delivered, which may result in a capital gain or loss. When a Fund has sold a security on a delayed-delivery basis, the Fund does not participate in future gains and losses with respect to the security.
Short Sales
Certain Funds may enter into short sales. A short sale is a transaction in which a Fund sells securities it does not own. A Fund’s use of short sales involves the risk that the price of the security in the open market may be higher when purchased to close out the Fund’s short position, resulting in a loss to the Fund. Such a loss is theoretically unlimited because there is no limit on the potential increase in the price of a security or guarantee as to the price at which the manager would be able to purchase the security in the open market.
When a Fund sells securities short, it must borrow those securities to make delivery to the buyer. The Fund incurs an expense for such borrowing. The Fund may not be able to purchase a security that it needs to deliver to close out a short position at an acceptable price. This may result in losses and/or require the Fund to sell long positions before the manager had intended. A Fund may not be able to successfully implement its short sale strategy, which may limit its ability to achieve its investment goal, due to limited availability of desired or eligible securities, the cost of borrowing securities, regulatory changes limiting or barring short sales, or for other reasons. Securities sold in short sale transactions and the interest and dividends payable on such securities, if any, are reflected as a liability in the Statements of Assets and Liabilities.
D-5
PACIFIC LIFE FUNDS
NOTES TO FINANCIAL STATEMENTS (Continued)
NOTES TO FINANCIAL STATEMENTS (Continued)
The use of proceeds received from selling short to purchase additional securities (long positions), results in leverage which may increase a Fund’s exposure to long positions. Leverage could magnify gains and losses and, therefore, increases a Fund’s volatility.
Repurchase Agreements
Certain Funds may invest in repurchase agreements. Repurchase agreements permit the investor to maintain liquidity and earn income over periods of time as short as overnight. Repurchase agreements held by a Fund are fully collateralized by U.S. Government securities, or securities issued by U.S. Government agencies, or securities that are within the three highest credit categories assigned by established rating agencies (Aaa, Aa, or A by Moody’s or AAA, AA or A by Standard & Poor’s) or, if not rated by Moody’s or Standard & Poor’s, are of equivalent investment quality as determined by the investment adviser or the applicable portfolio manager. Such collateral is in the possession of the Trust’s custodian or a designated broker-dealer. The collateral is evaluated daily to ensure its market value equals or exceeds the current market value of the repurchase agreements including accrued interest. In the event of default on the obligation to repurchase, a Fund has the right to liquidate the collateral and apply the proceeds in satisfaction of the obligation.
Reverse Repurchase Agreements
Certain Funds may enter into reverse repurchase agreements. In a reverse repurchase agreement, a Fund sells to a financial institution a security that it holds with an agreement to repurchase the same security at the agreed-upon price and date. Securities sold under reverse repurchase agreements are reflected as a liability on the Statements of Assets and Liabilities. Interest payments made are recorded as a component of interest expense on the Statements of Operations. In periods of increased demand for the security, a Fund may receive a fee for use of the security by the counterparty, which may result in interest income to the Fund. A reverse repurchase agreement involves the risk that the market value of the security sold by a Fund may decline below the repurchase price of the security. A Fund will segregate assets determined to be liquid by the investment adviser or otherwise cover its obligations under reverse repurchase agreements.
Derivative Investments
Certain Funds are permitted to invest in derivative investments, including, but not limited to futures contracts, options contracts, forward foreign currency contracts, interest rate swaps and credit default swaps (see Note 12 for a detailed discussion on derivative investments).
H. RECENT ACCOUNTING PRONOUNCEMENT
In January 2010, the Financial Accounting Standards Board (“FASB”) issued Accounting Standards Update No. 2010-06, Improving Disclosures about Fair Value Measurements, (“ASU”). This ASU amends FASB Accounting Standards Codification (“ASC”) Topic 820, Fair Value Measurements and Disclosures, and requires entities to disclose the amounts and reasons for significant transfers between Levels 1 and 2 in the fair value hierarchy and inputs and valuation techniques used to determine Level 2 and Level 3 fair value measurements (see Note 11), and to separately present purchases, sales, issuances, and settlements in their reconciliation of Level 3 fair value measurements (i.e., to present such items on a gross basis rather than on a net basis). This ASU is effective for interim and annual period beginning after December 15, 2009, except for the disclosures about purchases, sales issuances, and settlements in the roll forward of activity in Level 3 fair value measurements (which are effective for interim and annual periods beginning after December 15, 2010). The Trust implemented the disclosures required for interim and annual periods beginning after December 15, 2009 (see the Notes to Schedules of Investments section of each Fund’s Schedule of Investments and Note 11). Management is currently evaluating the impact of additional implementation that this ASU will have on the Trust’s financial statement disclosures.
3. INVESTMENT ADVISORY, ADMINISTRATION AND SHAREHOLDER SERVICES, AND DISTRIBUTION AGREEMENTS
Pursuant to an Investment Advisory Agreement, Pacific Life Fund Advisors LLC (“PLFA”), a wholly owned subsidiary of Pacific Life Insurance Company (“Pacific Life”), serves as investment adviser to the Trust. For each Fund, PLFA has retained other management firms to sub-advise each Fund, as discussed later in this section. PLFA receives advisory fees from each Fund based on the following advisory fee rates, which are based on an annual percentage of average daily net assets of each Fund:
| PL Floating Rate Loan (1) | 0.75 | % | ||
| PL Inflation Managed | 0.40 | % | ||
| PL Managed Bond | 0.40 | % | ||
| PL Short Duration Bond | 0.40 | % | ||
| PL Comstock (2) | 0.75 | % | ||
| PL Growth LT | 0.55 | % | ||
| PL Large-Cap Growth (3) | 0.75 | % | ||
| PL Large-Cap Value | 0.65 | % | ||
| PL Main Street Core | 0.45 | % | ||
| PL Mid-Cap Equity | 0.65 | % | ||
| PL Mid-Cap Growth | 0.70 | % | ||
| PL Small-Cap Growth | 0.60 | % | ||
| PL Small-Cap Value | 0.75 | % | ||
| PL Real Estate | 0.90 | % | ||
| PL Emerging Markets | 0.80 | % | ||
| PL International Large-Cap | 0.85 | % | ||
| PL International Value | 0.65 | % |
| (1) | Effective July 1, 2010, PLFA has contractually agreed to waive 0.10% of its advisory fees through June 30, 2012 as long as Eaton Vance Management remains manager of the Fund. There is no guarantee that PLFA will continue such waiver after that date. |
D-6
PACIFIC LIFE FUNDS
NOTES TO FINANCIAL STATEMENTS (Continued)
NOTES TO FINANCIAL STATEMENTS (Continued)
| (2) | Effective January 1, 2011, PLFA has contractually agreed to waive 0.015% of its advisory fees through June 30, 2012 as long as Invesco Advisers, Inc. remains manager of the Fund. There is no guarantee that PLFA will continue such waiver after that date. | |
| (3) | PLFA has contractually agreed to waive 0.025% of its advisory fees through June 30, 2012 as long as UBS Global Asset Management (Americas) Inc. remains manager of the Fund. There is no guarantee that PLFA will continue such waiver after that date. |
Pursuant to Fund Management Agreements, the Trust and PLFA engage various management firms under PLFA’s supervision for the Underlying Funds. As of March 31, 2011, the following firms serve as sub-advisers for their respective Fund: Eaton Vance Management for the PL Floating Rate Loan Fund; Pacific Investment Management Company LLC for the PL Inflation Managed and PL Managed Bond Funds; Goldman Sachs Asset Management, L.P. for the PL Short Duration Bond Fund; Invesco Advisers, Inc. for the PL Comstock Fund; Janus Capital Management LLC for the PL Growth LT Fund; UBS Global Asset Management (Americas) Inc. for the PL Large-Cap Growth Fund; ClearBridge Advisors, LLC for the PL Large-Cap Value Fund; OppenheimerFunds, Inc. for the PL Main Street Core and PL Emerging Markets Funds; Lazard Asset Management LLC for the PL Mid-Cap Equity Fund; Morgan Stanley Investment Management Inc. for the PL Mid-Cap Growth and PL Real Estate Funds; Fred Alger Management, Inc. for the PL Small-Cap Growth Fund; NFJ Investment Group LLC for the PL Small-Cap Value Fund; MFS Investment Management for the PL International Large-Cap Fund; and J.P. Morgan Investment Management Inc. for the PL International Value Fund; PLFA, as investment adviser to the Trust, pays the related management fees to these sub-advisers as compensation for advisory services provided to their respective Fund.
Pursuant to an Administration and Shareholder Services Agreement (the “Agreement”), Pacific Life serves as administrator (the “Administrator”) to the Trust. Effective July 1, 2010, the Trust compensates the Administrator at an annual rate of 0.15% of average daily net assets. From April 1, 2010 to June 30, 2010, the Trust compensated the Administrator at an annual rate of 0.30% of average daily net assets for each of these Funds. The Administration fee is for procuring or providing administrative, transfer agency, and shareholder services. In addition, Pacific Life and PLFA provide support services to the Trust that are outside the scope of the Administrator’s and investment adviser’s responsibilities under the respective agreements. Under the support services agreement, the Trust compensated Pacific Life and PLFA for their expenses in providing support services to the Trust in connection with various matters, some of which include the time spent by legal, accounting, and compliance personnel of PLFA (including individuals who may be officers or Trustees of the Trust), to attend meetings of the Board and to provide assistance with the coordination and supervision in connection with the services procured for the Trust under the Administration Agreement support services do not include any services for which PLFA is responsible pursuant to the Investment Advisory Agreement. The Trust reimbursed Pacific Life and PLFA for these support services on an approximate cost basis.
Pursuant to a Distribution Agreement, Pacific Select Distributors, Inc. (the “Distributor”), a wholly owned subsidiary of Pacific Life, serves as distributor of the Trust’s shares. The Distributor bears all expenses of providing services, including costs of sales presentations, mailings, advertisements, and other marketing efforts by the Distributor in connection with the distribution or sale of the Trust’s shares and makes distribution and/or service payments to selling groups in connection with the sale of certain of the Trust’s shares and subsequent servicing needs of shareholders provided by selling groups. For the period April 1, 2010 through July 1, 2010, the Distributor received service fees from the Underlying Funds pursuant to a Class A Service Plan (non 12b-1) for shareholder servicing activities. The service fee was 0.25% for Class A. The Class A shares did not pay a distribution fee. The fees were accrued daily. Effective July 2, 2010, the Class A shares were converted to Class P, which do not incur a service fee.
4. TRUSTEE COMPENSATION
The Trust pays each independent trustee of the Board retainer fees and specified amounts for various Board and committee services and for chairing the committees.
Each independent trustee of the Board is eligible to participate in the Trust’s Deferred Compensation Plan (the “Deferred Compensation Plan”). The Deferred Compensation Plan allows each independent trustee to voluntarily defer receipt of all or a percentage of fees which otherwise would be payable for services performed. Amounts in the deferral account are obligations of each Fund at the time of such deferral and are payable in accordance with the Deferred Compensation Plan. Deferral amounts are treated as though equivalent dollar amounts had been invested in shares of certain Funds. An independent trustee who defers compensation has the option to select credit rate options that track the performance of Class A of the corresponding Portfolio Optimization Funds without a sales load, PL Money Market Fund and PL Income Fund, and/or Class P of the corresponding Underlying Funds. The obligation of each Fund under the Deferred Compensation Plan (the “DCP Liability”) is included in “Accrued trustees’ fees and expenses and deferred compensation” in the Statements of Assets and Liabilities. Accordingly, the market value appreciation or depreciation on a Fund’s DCP liability will cause the expenses of that Fund to increase or decrease due to market fluctuation. The change in net unrealized appreciation or depreciation on a Fund’s DCP Liability account is included in “Trustees’ fees and expenses” in the Statements of Operations. For the year ended March 31, 2011, such expenses were increased by $5,121 for all applicable Funds covered in this report as a result of the market value appreciation on such accounts. As of March 31, 2011, the total amount in the DCP Liability accounts was $48,312 for all applicable Funds covered in this report.
5. EXPENSE REDUCTIONS
To help limit the Trust’s expenses, PLFA, pursuant to an expense limitation agreement dated July 1, 2010, has contractually agreed to reduce its fees or otherwise reimburse each Fund for its operating expenses (including the administration fee and organizational expenses, but not including investment advisory fees; distribution and service (12b-1) fees; non 12b-1 service fees; acquired fund fees and expenses; taxes (including foreign taxes on dividends, interest or gains); interest; brokerage commissions and other transactional expenses;
D-7
PACIFIC LIFE FUNDS
NOTES TO FINANCIAL STATEMENTS (Continued)
NOTES TO FINANCIAL STATEMENTS (Continued)
extraordinary expenses such as litigation and other expenses not incurred in the ordinary course of each Fund’s business) that exceed an annual rate based on a percentage of a Fund’s average daily net assets. The current expense cap is 0.15% through June 30, 2013, and 0.30% from July 1, 2013 through June 30, 2020.
From April 1, 2010 to July 1, 2010, pursuant to an expense limitation agreement dated July 1, 2008, PLFA reimbursed each Fund for its operational expenses above the cap. The expense cap during this time was 0.30%. The investment adviser expense reimbursement for the year ended March 31, 2011 for each Fund covered in this report was as follows:
| Investment | ||||
| Adviser | ||||
| Expense | ||||
| Fund | Reimbursements | |||
| PL Floating Rate Loan | $ | 161,181 | ||
| PL Inflation Managed | 329,563 | |||
| PL Managed Bond | 558,213 | |||
| PL Short Duration Bond | 164,455 | |||
| PL Comstock | 194,706 | |||
| PL Growth LT | 154,975 | |||
| PL Large-Cap Growth | 112,128 | |||
| PL Large-Cap Value | 228,247 | |||
| PL Main Street Core | 176,595 | |||
| PL Mid-Cap Equity | 153,964 | |||
| PL Mid-Cap Growth | 116,589 | |||
| PL Small-Cap Growth | 73,729 | |||
| PL Small-Cap Value | 92,291 | |||
| PL Real Estate | 72,505 | |||
| PL Emerging Markets | 270,343 | |||
| PL International Large-Cap | 255,021 | |||
| PL International Value | 200,306 | |||
| Total | $ | 3,314,811 | ||
There is no guarantee that PLFA will continue to cap expenses after June 30, 2020. Any reimbursement is subject to repayment to PLFA for a period of time as permitted under regulatory and/or accounting guidance (currently 3 years from the end of the fiscal year in which the reimbursement or reduction took place), to the extent such expenses fall below the expense cap in future years. Any amounts repaid to PLFA will have the effect of increasing such expenses of the Fund, but not above the expense cap.
The cumulative reimbursement and reduction amounts, if any, as of March 31, 2011 that are subject to repayment for each Fund covered in this report are as follows:
| Expiration Date | ||||||||||||
| Fund | 3/31/2012 | 3/31/2013 | 3/31/2014 | |||||||||
| PL Floating Rate Loan | $ | 55,422 | $ | 98,235 | $ | 161,181 | ||||||
| PL Inflation Managed | 341,417 | 308,763 | 329,563 | |||||||||
| PL Managed Bond | 472,001 | 502,729 | 558,213 | |||||||||
| PL Short Duration Bond | 150,950 | 164,724 | 164,455 | |||||||||
| PL Comstock | 214,389 | 214,415 | 194,706 | |||||||||
| PL Growth LT | 229,867 | 216,805 | 154,975 | |||||||||
| PL Large-Cap Growth | 94,718 | 120,503 | 112,128 | |||||||||
| PL Large-Cap Value | 175,460 | 216,004 | 228,247 | |||||||||
| PL Main Street Core | 370,309 | 266,417 | 176,595 | |||||||||
| PL Mid-Cap Equity | 195,175 | 177,580 | 153,964 | |||||||||
| PL Mid-Cap Growth | 138,724 | 115,208 | 116,589 | |||||||||
| PL Small-Cap Growth | 131,007 | 96,729 | 73,729 | |||||||||
| PL Small-Cap Value | 120,502 | 92,384 | 92,291 | |||||||||
| PL Real Estate | 118,370 | 94,439 | 72,505 | |||||||||
| PL Emerging Markets | 347,289 | 319,937 | 270,343 | |||||||||
| PL International Large-Cap | 296,673 | 286,639 | 255,021 | |||||||||
| PL International Value | 325,469 | 289,342 | 200,306 | |||||||||
| Total | $ | 3,777,742 | $ | 3,580,853 | $ | 3,314,811 | ||||||
Due to the current regulatory and/or accounting guidance, all expense reimbursements made by the investment adviser for the period September 28, 2001 (the Pacific Life Funds’ commencement date of operations) to March 31, 2008 expired for future recoupment as of March 31, 2011. Based on the Trust’s experience, the likelihood of repayment by a Fund for the amounts presented in the table above prior to the expiration is considered remote and no liabilities for such repayments were recorded by any Fund as of March 31, 2011. The adviser expense reimbursement is presented in the Statements of Operations.
D-8
PACIFIC LIFE FUNDS
NOTES TO FINANCIAL STATEMENTS (Continued)
NOTES TO FINANCIAL STATEMENTS (Continued)
6. TRANSACTIONS WITH AFFILIATES
The Funds covered in this report have incurred $10,846,895 of investment advisory fees (after advisory fee waivers of $79,937, see Note 3), $3,379,909 of administration fees, and $527,002 of expenses for support services provided by Pacific Life and PLFA (at approximate cost, see Note 3), for the year ended March 31, 2011. As of March 31, 2011, $1,071,782, $275,605 and $92,200, respectively, remained payable.
For the year ended March 31, 2011, the Funds covered in this report also incurred $1,015,082 of service fees for Class A shares, payable to the Distributor under the non 12b-1 service plan. Effective July 2, 2010, the Class A shares were converted to Class P, which do not incur a service fee (See Note 3). As of March 31, 2011, no fees remained payable.
7. TAX CHARACTER OF DISTRIBUTIONS AND COMPONENTS OF DISTRIBUTABLE EARNINGS
| The tax character of distributions paid during the year ended March 31, 2011, were as follows: |
| Distributions Paid From | ||||||||||||
| Ordinary | Long-Term | Total | ||||||||||
| Fund | Income | Capital Gains | Distributions | |||||||||
| PL Floating Rate Loan | $ | 2,039,771 | $ | — | $ | 2,039,771 | ||||||
| PL Inflation Managed | 7,414,873 | — | 7,414,873 | |||||||||
| PL Managed Bond | 16,002,758 | 2,900,507 | 18,903,265 | |||||||||
| PL Short Duration Bond | 939,371 | 239,146 | 1,178,517 | |||||||||
| PL Comstock | 1,377,486 | — | 1,377,486 | |||||||||
| PL Large-Cap Value | 2,525,491 | — | 2,525,491 | |||||||||
| PL Main Street Core | 914,905 | — | 914,905 | |||||||||
| PL Mid-Cap Equity | 924,425 | — | 924,425 | |||||||||
| PL Mid-Cap Growth | 1,329,323 | 3,924,652 | 5,253,975 | |||||||||
| PL Small-Cap Value | 707,726 | — | 707,726 | |||||||||
| PL Real Estate | 338,875 | — | 338,875 | |||||||||
| PL Emerging Markets | 940,708 | — | 940,708 | |||||||||
| PL International Large-Cap | 1,187,271 | — | 1,187,271 | |||||||||
| PL International Value | 2,011,876 | — | 2,011,876 | |||||||||
The tax character of distributions paid during the year ended March 31, 2010, were as follows:
| Distributions Paid From | ||||||||||||
| Ordinary | Long-Term | Total | ||||||||||
| Fund | Income | Capital Gains | Distributions | |||||||||
| PL Floating Rate Loan | $ | 1,975,960 | $ | — | $ | 1,975,960 | ||||||
| PL Inflation Managed | 4,584,817 | — | 4,584,817 | |||||||||
| PL Managed Bond | 12,379,527 | 1,275,371 | 13,654,898 | |||||||||
| PL Short Duration Bond | 1,199,020 | — | 1,199,020 | |||||||||
| PL Comstock | 1,052,848 | — | 1,052,848 | |||||||||
| PL Growth LT | 1,426,742 | — | 1,426,742 | |||||||||
| PL Large-Cap Value | 1,750,061 | — | 1,750,061 | |||||||||
| PL Main Street Core | 1,045,156 | — | 1,045,156 | |||||||||
| PL Mid-Cap Equity | 432,366 | — | 432,366 | |||||||||
| PL Mid-Cap Growth | 316,397 | 298,218 | 614,615 | |||||||||
| PL Small-Cap Value | 491,572 | — | 491,572 | |||||||||
| PL Real Estate | 485,508 | — | 485,508 | |||||||||
| PL Emerging Markets | 243,918 | — | 243,918 | |||||||||
| PL International Large-Cap | 975,278 | — | 975,278 | |||||||||
| PL International Value | 1,330,371 | — | 1,330,371 | |||||||||
As of March 31, 2011, the components of distributable earnings on a tax basis were as follows:
| Accumulated | Undistributed | Undistributed | Net | |||||||||||||
| Capital and | Ordinary | Long-Term | Unrealized | |||||||||||||
| Fund | Other Losses | Income | Capital Gains | Appreciation | ||||||||||||
| PL Floating Rate Loan | $ | (516,636 | ) | $ | 891,140 | $ | — | $ | 1,791,436 | |||||||
| PL Inflation Managed | (382,597 | ) | 2,277,307 | — | 1,958,679 | |||||||||||
| PL Managed Bond | (2,240,453 | ) | 2,813,425 | — | 4,419,093 | |||||||||||
| PL Short Duration Bond | (68,841 | ) | 268,953 | — | 433,343 | |||||||||||
| PL Comstock | (29,683,301 | ) | 494,759 | — | 27,887,673 | |||||||||||
| PL Growth LT | (19,071,774 | ) | 536,158 | — | 19,813,274 | |||||||||||
| PL Large-Cap Growth | — | — | 43,089 | 22,863,618 | ||||||||||||
| PL Large-Cap Value | (16,713,668 | ) | 882,666 | — | 43,082,769 | |||||||||||
| PL Main Street Core | (29,547,120 | ) | 399,720 | — | 28,928,750 | |||||||||||
| PL Mid-Cap Equity | (14,498,290 | ) | 126,064 | — | 26,505,351 | |||||||||||
D-9
PACIFIC LIFE FUNDS
NOTES TO FINANCIAL STATEMENTS (Continued)
NOTES TO FINANCIAL STATEMENTS (Continued)
| Accumulated | Undistributed | Undistributed | Net | |||||||||||||
| Capital and | Ordinary | Long-Term | Unrealized | |||||||||||||
| Fund | Other Losses | Income | Capital Gains | Appreciation | ||||||||||||
| PL Mid-Cap Growth | $ | — | $ | 510,442 | $ | 2,483,401 | $ | 19,552,549 | ||||||||
| PL Small Cap Growth | (7,701,433 | ) | — | — | 9,336,634 | |||||||||||
| PL Small-Cap Value | (6,682,763 | ) | 253,578 | — | 17,560,968 | |||||||||||
| PL Real Estate | (9,963,672 | ) | — | — | 13,622,278 | |||||||||||
| PL Emerging Markets | (137,695 | ) | 79,552 | — | 19,040,008 | |||||||||||
| PL International Large-Cap | (13,107,754 | ) | 1,107,327 | — | 26,611,916 | |||||||||||
| PL International Value | (45,889,495 | ) | 559,041 | — | 4,377,469 | |||||||||||
The components of the accumulated capital and other losses as of March 31, 2011, are summarized in Note 8.
8. FEDERAL INCOME TAX INFORMATION
Each Fund intends to continue to qualify as a regulated investment company (“RIC”) under Subchapter M of the Internal Revenue Code and distribute substantially all its taxable income and capital gains to its shareholders. Each Fund presented in the first table below declared and paid sufficient dividends on net investment income and capital gains distributions during the year ended March 31, 2011, to qualify as a RIC and is not required to pay Federal income tax. Accordingly, no provision for Federal income taxes is required in the financial statements. Required distributions are based on net investment income and net realized gains determined on a tax basis and may differ from such amounts for financial reporting purposes (see Note 2D). In addition, the year in which amounts are distributed may differ from the year in which the net investment income is earned and the net gains are realized by each Fund.
Net capital loss carryovers and post-October capital losses, if any, as of March 31, 2011, are available to offset future realized capital gains and thereby reduce future capital gains distributions. Post-October foreign currency losses, if any, will offset future net investment income and thereby reduce future ordinary income distributions. The net capital loss carryovers and the post-October capital and foreign currency losses deferred as of March 31, 2011, were as follows:
| Post- | Post-October | Accumulated | ||||||||||||||||||||||||||
| Net Capital | October | Foreign | Capital and | |||||||||||||||||||||||||
| Loss | Net Capital Loss Carryover Expiring on March 31 | Capital Loss | Currency | Other | ||||||||||||||||||||||||
| Fund | Carryover | 2017 | 2018 | 2019 | Deferral | Loss Deferral | Losses | |||||||||||||||||||||
| PL Floating Rate Loan | $ | ( 386,480 | ) | $ | — | $ | (386,480 | ) | $ | — | $ | (130,156 | ) | $ | — | $ | (516,636 | ) | ||||||||||
| PL Inflation Managed | — | — | — | — | — | (382,597 | ) | (382,597 | ) | |||||||||||||||||||
| PL Managed Bond | — | — | — | — | (2,240,453 | ) | — | (2,240,453 | ) | |||||||||||||||||||
| PL Short Duration Bond | — | — | — | — | (68,841 | ) | — | (68,841 | ) | |||||||||||||||||||
| PL Comstock | (29,683,301 | ) | (9,468,854 | ) | (20,214,447 | ) | — | — | — | (29,683,301 | ) | |||||||||||||||||
| PL Growth LT | (18,995,216 | ) | — | (18,995,216 | ) | — | — | (76,558 | ) | (19,071,774 | ) | |||||||||||||||||
| PL Large-Cap Value | (16,713,668 | ) | (5,885,797 | ) | (10,501,973 | ) | (325,898 | ) | — | — | (16,713,668 | ) | ||||||||||||||||
| PL Main Street Core | (29,547,120 | ) | (7,632,949 | ) | (21,914,171 | ) | — | — | — | (29,547,120 | ) | |||||||||||||||||
| PL Mid-Cap Equity | (14,498,290 | ) | (3,028,634 | ) | (11,469,656 | ) | — | — | — | (14,498,290 | ) | |||||||||||||||||
| PL Small-Cap Growth | (7,701,433 | ) | (1,817,790 | ) | (5,883,643 | ) | — | — | — | (7,701,433 | ) | |||||||||||||||||
| PL Small-Cap Value | (6,682,677 | ) | — | (6,682,677 | ) | — | — | (86 | ) | (6,682,763 | ) | |||||||||||||||||
| PL Real Estate | (9,963,671 | ) | — | (9,963,671 | ) | — | — | (1 | ) | (9,963,672 | ) | |||||||||||||||||
| PL Emerging Markets | (117,646 | ) | — | (117,646 | ) | — | — | (20,049 | ) | (137,695 | ) | |||||||||||||||||
| PL International Large-Cap | (13,101,020 | ) | (2,153,723 | ) | (8,295,134 | ) | (2,652,163 | ) | — | (6,734 | ) | (13,107,754 | ) | |||||||||||||||
| PL International Value | (45,785,977 | ) | (7,035,726 | ) | (38,750,251 | ) | — | — | (103,518 | ) | (45,889,495 | ) | ||||||||||||||||
The aggregate Federal tax cost of investments and the composition of unrealized appreciation and depreciation on investments and net unrealized appreciation and/or depreciation on derivatives and assets and liabilities in foreign currencies as of March 31, 2011, were as follows:
| Gross | Gross | Net Unrealized | ||||||||||||||||||||||
| Total Cost of | Unrealized | Unrealized | Net Unrealized | Appreciation | ||||||||||||||||||||
| Investments | Appreciation | Depreciation | Appreciation | (Depreciation) | Net Unrealized | |||||||||||||||||||
| Fund | on Tax Basis | on Investments | on Investments | on Investments | on Other(1) | Appreciation | ||||||||||||||||||
| PL Floating Rate Loan | $ | 86,013,203 | $ | 2,035,476 | $ | (244,040 | ) | $ | 1,791,436 | $ | — | $ | 1,791,436 | |||||||||||
| PL Inflation Managed | 286,594,465 | 3,581,110 | (1,276,070 | ) | 2,305,040 | (346,361 | ) | 1,958,679 | ||||||||||||||||
| PL Managed Bond | 413,254,190 | 9,069,302 | (5,945,221 | ) | 3,124,081 | 1,295,012 | 4,419,093 | |||||||||||||||||
| PL Short Duration Bond | 119,969,563 | 694,637 | (234,528 | ) | 460,109 | (26,766 | ) | 433,343 | ||||||||||||||||
| PL Comstock | 138,159,968 | 34,918,244 | (7,030,571 | ) | 27,887,673 | — | 27,887,673 | |||||||||||||||||
| PL Growth LT | 95,604,141 | 22,610,197 | (2,758,391 | ) | 19,851,806 | (38,532 | ) | 19,813,274 | ||||||||||||||||
| PL Large-Cap Growth | 75,919,846 | 23,190,326 | (326,708 | ) | 22,863,618 | — | 22,863,618 | |||||||||||||||||
| PL Large-Cap Value | 187,913,999 | 46,047,444 | (2,966,489 | ) | 43,080,955 | 1,814 | 43,082,769 | |||||||||||||||||
| PL Main Street Core | 128,707,505 | 29,439,892 | (511,142 | ) | 28,928,750 | — | 28,928,750 | |||||||||||||||||
D-10
PACIFIC LIFE FUNDS
NOTES TO FINANCIAL STATEMENTS (Continued)
NOTES TO FINANCIAL STATEMENTS (Continued)
| �� | ||||||||||||||||||||||||
| Gross | Gross | Net Unrealized | ||||||||||||||||||||||
| Total Cost of | Unrealized | Unrealized | Net Unrealized | Appreciation | ||||||||||||||||||||
| Investments | Appreciation | Depreciation | Appreciation | (Depreciation) | Net Unrealized | |||||||||||||||||||
| Fund | on Tax Basis | on Investments | on Investments | on Investments | on Other(1) | Appreciation | ||||||||||||||||||
| PL Mid-Cap Equity | $ | 109,280,447 | $ | 27,952,529 | $ | (1,447,178 | ) | $ | 26,505,351 | $ | — | $ | 26,505,351 | |||||||||||
| PL Mid-Cap Growth | 44,796,024 | 19,812,350 | (260,000 | ) | 19,552,350 | 199 | 19,552,549 | |||||||||||||||||
| PL Small-Cap Growth | 23,077,536 | 9,621,308 | (284,674 | ) | 9,336,634 | — | 9,336,634 | |||||||||||||||||
| PL Small-Cap Value | 58,658,126 | 18,424,542 | (863,574 | ) | 17,560,968 | — | 17,560,968 | |||||||||||||||||
| PL Real Estate | 27,881,541 | 13,718,488 | (96,210 | ) | 13,622,278 | — | 13,622,278 | |||||||||||||||||
| PL Emerging Markets | 44,692,144 | 19,274,281 | (219,045 | ) | 19,055,236 | (15,228 | ) | 19,040,008 | ||||||||||||||||
| PL International Large-Cap | 111,242,091 | 28,279,182 | (1,681,922 | ) | 26,597,260 | 14,656 | 26,611,916 | |||||||||||||||||
| PL International Value | 85,087,874 | 6,917,221 | (2,631,858 | ) | 4,285,363 | 92,106 | 4,377,469 | |||||||||||||||||
| (1) | Other includes net appreciation or depreciation on derivatives, securities sold short, and assets and liabilities in foreign currencies, if any. |
As of and during the year ended March 31, 2011, none of the Funds had liabilities for any unrecognized tax benefits. During the year ended March 31, 2011, none of the Funds incurred any interest or penalties.
Each Fund’s tax returns remain subject to examination by Federal and State tax authorities (principal state jurisdictions include California and Delaware) for the tax years ended March 31, 2009 through March 31, 2011 for Federal purposes and March 31, 2008 through March 31, 2011 for State purposes.
On December 22, 2010, The Regulated Investment Company Modernization Act of 2010 (the “Modernization Act”) was signed into law. The Modernization Act modifies several of the Federal income and excise tax provisions related to RICs. Under the Modernization Act, new capital losses may now be carried forward indefinitely, and retain the character of the original loss as compared with pre-enactment law where capital losses could be carried forward for eight years, and carried forward as short-term capital losses, irrespective of the character of the original loss.
The Modernization Act contains simplification provisions aimed at preventing disqualification of a RIC for “inadvertent” failures of the asset diversification and/or qualifying income tests, exempts RICs from the preferential dividend rule, and repeals the 60-day designation requirement for certain types of pay-through income and gains. The Modernization Act also contains several provisions aimed at preserving the character of distributions made by a fiscal year RIC during the portion of its taxable year ending after October 31 or December 31, reducing the circumstances under which a RIC might be required to file amended Forms 1099 to restate previously reported distributions. Except for the simplification provisions related to RIC qualification, the Modernization Act is effective for taxable years beginning after December 22, 2010. The provisions related to RIC qualification are effective for taxable years for which the extended due date of the tax return is after December 22, 2010.
9. UNFUNDED SENIOR LOAN COMMITMENTS
Unfunded loan commitments on senior loan participations and assignments (Note 2G), if any, are marked to market daily and valued according to the Trust’s valuation policies and procedures. Any outstanding unfunded loan commitments are presented in the Notes to Schedules of Investments section of each applicable Fund’s Schedule of Investments. Any applicable net unrealized appreciation or depreciation at the end of the reporting period and change in net unrealized appreciation or depreciation on unfunded loan commitments for the reporting period is reflected on the Statements of Assets and Liabilities and the Statements of Operations, respectively. As of March 31, 2011, no unfunded loan commitments were held by any Fund.
10. PURCHASES AND SALES OF SECURITIES
The cost of purchases and proceeds from sales of securities (excluding short-term investments) for the year ended March 31, 2011, were as follows:
| U.S. Government Securities | Other Securities | |||||||||||||||
| Fund | Purchases | Sales | Purchases | Sales | ||||||||||||
| PL Floating Rate Loan | $ | — | $ | — | $ | 93,568,716 | $ | 60,177,644 | ||||||||
| PL Inflation Managed | 744,870,349 | 682,937,748 | 75,207,823 | 28,693,176 | ||||||||||||
| PL Managed Bond | 1,408,978,576 | 1,382,299,230 | 107,709,356 | 24,792,343 | ||||||||||||
| PL Short Duration Bond | 180,264,612 | 159,493,363 | 30,443,141 | 12,758,641 | ||||||||||||
| PL Comstock | — | — | 56,495,094 | 40,860,278 | ||||||||||||
| PL Growth LT | — | — | 91,392,805 | 76,443,415 | ||||||||||||
| PL Large-Cap Growth | — | — | 99,272,162 | 79,962,095 | ||||||||||||
| PL Large-Cap Value | — | — | 75,044,005 | 34,059,533 | ||||||||||||
| PL Main Street Core | — | — | 79,361,154 | 87,247,928 | ||||||||||||
| PL Mid-Cap Equity | — | — | 104,279,959 | 95,828,531 | ||||||||||||
D-11
PACIFIC LIFE FUNDS
NOTES TO FINANCIAL STATEMENTS (Continued)
NOTES TO FINANCIAL STATEMENTS (Continued)
| U.S. Government Securities | Other Securities | |||||||||||
| Fund | Purchases | Sales | Purchases | Sales | ||||||||
| PL Mid-Cap Growth | $ | — | $ | — | $ | 23,508,932 | $ | 35,479,937 | ||||
| PL Small-Cap Growth | — | — | 22,732,597 | 23,221,610 | ||||||||
| PL Small-Cap Value | — | — | 37,022,969 | 16,840,234 | ||||||||
| PL Real Estate | — | — | 11,677,599 | 13,171,903 | ||||||||
| PL Emerging Markets | — | — | 28,554,224 | 22,980,574 | ||||||||
| PL International Large-Cap | — | — | 55,846,769 | 38,920,734 | ||||||||
| PL International Value | — | — | 122,307,156 | 120,907,539 | ||||||||
11. FAIR VALUE MEASUREMENTS AND DISCLOSURES
The Trust characterizes its investments as Level 1, Level 2 or Level 3 based upon the various inputs or methodologies used to value the investments. The three-tier hierarchy of inputs is summarized in the three broad levels listed below:
| • | Level 1 — Quoted prices in active markets for identical investments | ||
| • | Level 2 — Significant observable market-based inputs, other than Level 1 quoted prices, or unobservable inputs that are corroborated by market data | ||
| • | Level 3 — Significant unobservable inputs that are not corroborated by observable market data |
The inputs or methodologies used for valuing each Fund’s investments are not necessarily an indication of the risks associated with investing in those investments. For example, investments of money market instruments are valued using amortized cost in accordance with the rules under the 1940 Act. Generally, amortized cost approximates the current fair value of an investment, but since the value is not obtained from a quoted price in an active market, such Investments are reflected as Level 2. Foreign investments that are valued with the assistance of a statistical research service approved by the Board, and based on significant observable inputs (as described in Note 2B) are reflected as Level 2. For fair valuations using significant unobservable inputs, the Trust provides a reconciliation of the beginning to ending balances for reported market values that presents changes attributable to total realized and unrealized gains or losses, purchase and sales, and transfers in and out of Level 3 during the period. Transfers in and out of Level 3 are based on values at end of period. The Trust also provides the amounts and reasons for significant transfers, if any, between Level 1 and Level 2 in the fair value hierarchy (see Note 2H). For the year ended March 31, 2011, there were no significant transfers between Level 1, Level 2, and Level 3. A summary of each Fund’s investments as of March 31, 2011 as categorized under the three-tier hierarchy of inputs can be found in the Notes to Schedule of Investments section of each Fund’s Schedule of Investments.
The following is a description of valuation inputs and techniques that the Trust currently utilizes to fair value each major category of assets and liabilities.
Equity Securities (Common and Preferred Stock) and Mutual Funds
Equity securities (foreign or domestic) that are actively traded on a securities exchange are fair valued based on quoted prices from the applicable exchange, and to the extent valuation adjustments are not applied to these securities, they are categorized as Level 1. Equity securities traded on inactive markets and certain foreign equity securities are fair valued using significant other observable inputs which include broker-dealer quotes, recently executed transactions adjusted for changes in the benchmark index, or evaluated price quotes received from pricing vendors that take into account the integrity of the market sector and issuer, the individual characteristics of the security, and information received from broker-dealers and other market sources pertaining to the issuer or security. To the extent that these inputs are observable and timely, the fair values of these securities would be categorized as Level 2; otherwise the fair values would be categorized as Level 3.
Investments in mutual funds are valued at their respective NAV and are categorized as Level 1.
U.S. Treasury Obligations
U.S. Treasuries are fair valued based on pricing models that evaluate the mean between the most recently published bid and ask price. The models also take into consideration data received from active market makers and inter-broker-dealer brokers, yield curves, and the spread over comparable U.S. Treasury issues. The spreads change daily in response to market conditions and are generally obtained from the new issue market and broker-dealer sources. To the extent that these inputs are observable and timely, the fair values of U.S. Treasury obligations would be categorized as Level 2; otherwise the fair values would be categorized as Level 3.
Mortgage-Backed Securities and Asset-Backed Securities
Mortgage-backed securities, including government sponsored enterprises, are fair valued using pricing models based on inputs that include issuer type, coupon, and cash flows, mortgage prepayment projection tables and Adjustable Rate Mortgage evaluations that incorporate index data, periodic and life caps, and the next coupon reset date, and the convertibility of the bond. To the extent that these inputs are observable and timely, the fair values of mortgage-backed securities would be categorized as Level 2; otherwise the fair value would be categorized as Level 3.
D-12
PACIFIC LIFE FUNDS
NOTES TO FINANCIAL STATEMENTS (Continued)
NOTES TO FINANCIAL STATEMENTS (Continued)
Asset-backed securities and collateralized mortgage obligations are fair valued using pricing models based on a security’s average life volatility. The models also take into account tranche characteristics such as coupon average life, collateral types, ratings, the issuer and tranche type, underlying collateral and performance of the collateral, and discount margin for certain floating rate issues. To the extent that these inputs are observable and timely, the fair values of asset-backed securities and collateralized mortgage obligations would be categorized as Level 2; otherwise the fair values would be categorized as Level 3.
Municipal Bonds
Municipal bonds are fair valued based on pricing models that takes into account, among other factors, information received from market makers and broker-dealers, current trades, bid-want lists, offerings, market movements, the callability of the bond, state of issuance, benchmark yield curves, and bond insurance. To the extent that these inputs are observable and timely, the fair values of municipal bonds would be categorized as Level 2; otherwise the fair values would be categorized as Level 3.
Foreign Government Bonds and Notes
Foreign government bonds and notes are fair valued based on discounted cash flow models that incorporate option adjusted spreads along with benchmark curves and credit spreads. In addition, international bond markets are monitored regularly for information pertaining to the issuer and/or the specific issue. To the extent that these inputs are observable and timely, the fair values of foreign government bonds and notes would be categorized as Level 2; otherwise the fair values would be categorized as Level 3.
Corporate Bonds and Notes and U.S. Government Agency Issues
Corporate bonds held by a Fund generally comprise two main categories: investment grade bonds and high yield bonds. Investment grade bonds are reported at fair value using various inputs and techniques, which include broker-dealer quotations, live trading levels, recently executed transactions in securities of the issuer or comparable issuers, and options adjusted spread models that include base curve and spread curve inputs. Adjustments to individual bonds can be applied to recognize trading differences compared to other bonds issued by the same issuer. Fair values for high yield bonds are based primarily on broker-dealer quotations from relevant market makers and recently executed transactions in securities of the issuer or comparable issuers. The broker-dealer quotations received are supported by credit analysis of the issuer that takes into consideration credit quality assessments, daily trading activity, and the activity of the underlying equities, listed bonds and sector-specific trends. To the extent that these inputs are observable and timely, the fair values of corporate bonds would be categorized as Level 2; otherwise the fair values would be categorized as Level 3.
Futures Contracts
Futures contracts and options on futures contracts are traded on commodity exchanges and are fair valued based on quoted prices from the applicable exchange, and to the extent valuation adjustments are not applied to futures contracts, they are categorized as Level 1. To the extent that valuation adjustments are observable and timely, the fair values of futures contracts would be categorized as Level 2; otherwise the fair values would be categorized as Level 3.
Options Contracts
Exchange listed options contracts are traded on securities exchanges and are fair valued based on quoted prices from the applicable exchange, and to the extent valuation adjustments are not applied or mean variation to exchange listed options contracts, they are categorized as Level 1. If valuation adjustments are applied and such adjustments are observable and timely, the fair values of exchange listed options contracts would be categorized as Level 2; otherwise the fair values would be categorized as Level 3. Options contracts traded over the counter (“OTC”) are fair valued based on pricing models that incorporates various inputs such as interest rates, credit spreads, currency exchange rates and volatility measurements for in-the-money, at-the-money, and out-of-the-money contracts based on a given strike price. To the extent that these inputs are observable and timely, the fair values of OTC options contracts would be categorized as Level 2; otherwise the fair values would be categorized as Level 3.
Forward Foreign Currency Contracts
Forward foreign currency contracts are fair valued using various inputs and techniques, which include broker-dealer quotations, actual trading information, and foreign currency exchange rates gathered from leading market makers and foreign currency exchange trading centers throughout the world. To the extent that these inputs are observable and timely, the fair values of forward foreign currency contracts would be categorized as Level 2; otherwise the fair values would be categorized as Level 3.
Swaps
Interest Rate Swaps - Interest rate swaps are fair valued using pricing models that are based on real-time intraday snap shots of relevant interest rate curves that are built using the most actively traded securities for a given maturity. The pricing models also incorporate cash and money market rates. In addition, market data pertaining to interest rate swaps are monitored regularly to ensure that interest rates are properly depicting the current market rate. To the extent that these inputs are observable and timely, the fair values of interest rate swaps would be categorized as Level 2; otherwise the fair values would be categorized as Level 3.
Credit Default Swaps - Credit default swaps are fair valued using pricing models that take into account, among other factors, information received from market makers and broker-dealers, default probabilities from index specific credit spread curves, recovery rates, and cash flows. To the extent that these inputs are observable and timely, the fair values of credit default swaps would be categorized as Level 2; otherwise the fair values would be categorized as Level 3.
D-13
PACIFIC LIFE FUNDS
NOTES TO FINANCIAL STATEMENTS (Continued)
NOTES TO FINANCIAL STATEMENTS (Continued)
Total Return Swaps - Total Return swaps are fair valued using pricing models that take into account among other factors, index spread curves, nominal values, modified duration values and cash flows. To the extent that these inputs are observable and timely, the fair values of total return swaps would be categorized as Level 2; otherwise the fair values would be categorized as Level 3.
Senior Loan Notes
Senior Loans are fair valued based on a quoted price received from a single broker-dealer or an average of quoted prices received from multiple dealers or valued relative to other benchmark securities when broker-dealer quotes are unavailable. To the extent that these inputs are observable, the fair values of Senior Loans would be categorized as Level 2; otherwise the fair values would be categorized as Level 3.
Short-Term Investments
Short-term investments maturing within 60 days are valued using amortized cost, which is used if it approximates market value, such investments are reflected as Level 2. Repurchase agreements are fully collateralized. The collateral is evaluated daily to ensure its market value equals or exceeds the current market value of the repurchase agreements including accrued interest.
12. DERIVATIVE INVESTMENT INVESTMENTS CATEGORIZED BY RISK EXPOSURE
Derivative instruments are investments whose values are tied to the value of an underlying security or asset, a group of assets, interest rates, exchange rates, currency or an index. Certain Funds are permitted to invest in derivative instruments, including, but not limited to, futures contracts, options contracts, forward foreign currency contracts, interest rate swaps, and credit default swaps. Derivatives may have little or no initial cash investment value relative to their market value exposure and therefore can produce significant gains or losses in excess of their cost. This is sometimes referred to as leverage. Leverage can magnify a Fund’s gains and losses and therefore increase its volatility. A Fund’s investments in derivatives may increase, decrease or change the level or types of exposure to certain risk factors. The primary risks a Fund may attempt to manage through investing in derivative instruments include, but are not limited to, interest rate, foreign investments and currency, price volatility, and credit (including counterparty) risks.
Market Risks Managed By Investing in Derivatives
Interest rate risk - A Fund may be exposed to interest rate risk through investments in fixed income securities. Interest rate risk is the risk that fixed income securities will decline in value as a result of changes in interest rates. For example, the value of bonds, fixed rate loans and short-term money market instruments may decline in value when interest rates rise. Fixed income securities with longer durations tend to be more sensitive to changes in interest rates, making them more volatile than fixed income securities with shorter durations or money market instruments. Therefore, duration is a potentially useful tool to measure the sensitivity of a fixed income security’s yield (market price to interest rate movement). To manage these risks, certain Funds may invest in derivative instruments tied to interest rates.
Foreign investments and currency risk - A Fund may be exposed to foreign investments and/or currency risk through direct investment in securities or through options, futures or currency transactions. The prices of foreign securities that are denominated in foreign currencies are affected by the value of the U.S. dollar. With respect to securities denominated in foreign currencies, in general, as the value of the U.S. dollar rises, the U.S. dollar price of a foreign security will fall. As the value of the U.S. dollar falls, the U.S. dollar value of the foreign security will rise. Currency rates in foreign countries may fluctuate significantly over short periods of time for a number of reasons. Foreign investments may be riskier than U.S. investments for many reasons, including changes in currency exchange rates, unstable political and economic conditions, a lack of adequate and timely company information, differences in the way securities markets operate, relatively lower market liquidity, less stringent financial reporting and accounting guidance and controls, less secure foreign banks or securities depositories than those in the U.S., foreign taxation issues and foreign controls on investments. As a result, a Fund’s investments in foreign currency denominated securities and other foreign investments may reduce the returns of the Fund. To manage these risks, certain Funds may invest in derivative instruments tied to foreign investments and currencies.
Price volatility risk - Derivatives tied to equity and fixed income securities are exposed to potential price volatility. Fixed income securities are affected by many factors, including prevailing interest rates, market conditions and market liquidity. Volatility of below investment grade fixed income securities (including loans) may be relatively greater than for investment grade fixed income securities. Equity securities tend to go up or down in value, sometimes rapidly and unpredictably. The prices of equity securities change in response to many factors, including a company’s historical and prospective earnings, the value of its assets, general economic conditions, interest rates, investor perceptions and market liquidity. Due to the complexities of markets, events in one market or sector may adversely impact other markets or sectors. To manage these risks, certain Funds may invest in various derivative instruments. Derivative instruments may be used to manage a Fund’s exposure to price volatility risk but may also be subject to greater price volatility than investments in traditional securities. The value of commodity-linked derivative instruments may be affected by changes in overall market movements, commodity index volatility, changes in interest rates, or factors affecting a particular industry or commodity, such as drought, floods, weather, livestock disease, embargoes, tariffs and international economic, political and regulatory developments.
Credit and Counterparty risk - Credit risk is the risk that a fixed income security’s issuer (or borrower or counterparty) will be unable or unwilling to meet its financial obligations (e.g. may not be able to make principal and/or interest payments when they are due or otherwise default on other financial terms) and/or may go bankrupt. This is also sometimes described as counterparty risk. A Fund may lose money if the issuer or guarantor of fixed income security, or counterparty of a derivative contract, repurchase or reverse repurchase agreement, or a loan of Fund securities, is unable or unwilling to make timely principal and/or interest payments, or to otherwise honor its obligations. A Fund
D-14
PACIFIC LIFE FUNDS
NOTES TO FINANCIAL STATEMENTS (Continued)
NOTES TO FINANCIAL STATEMENTS (Continued)
may attempt to minimize concentrations of credit risk by undertaking transactions with a large number of borrowers or counterparties on recognized and reputable exchanges. A Fund’s investments in fixed income (debt) investments may range in quality from those rated in the lowest category in which it is permitted to invest to those rated in the highest category by a rating agency, or if unrated, determined by the manager to be of comparable quality. Similar to credit risk, a Fund may be exposed to counterparty risk, or the risk that an institution or other entity with which a Fund has unsettled or open transactions with default.
Financial assets of counterparties, which potentially expose a Fund to counterparty risk, consists mainly of cash due from counterparties and investments. Certain managers may attempt to minimize credit risks to a Fund by performing extensive reviews of each counterparty, entering into transactions with counterparties that the manager believes to be creditworthy at the time of the transaction and requiring the posting of collateral in applicable transactions. To manage these risks, certain Funds may invest in derivative instruments tied to a security issuers’ financial strength.
A Fund’s transactions in listed securities are settled/paid for upon delivery with their counterparties. Therefore, the risk of counterparty default for listed securities is considered minimal, as delivery of securities sold is only made once a Fund has received payment. Payment is made on a purchase once the securities have been delivered by the counterparty. The trade will fail if either party fails to meet its obligations.
Credit Related Contingent Features
Certain Funds are parties to various agreements, including by not limited to International Swaps and Derivatives Agreements, Master Repurchase Agreements, and Master Securities Forward Transactions Agreements (collectively “Master Agreements”), which govern the terms of certain transactions with select counterparties. These Master Agreements generally include provisions for general obligations, representations, agreements, collateral and certain events of default or termination, such as credit related contingent features. These provisions reduce the counterparty risk associated with relevant transactions by allowing a Fund or its counterparties to elect to terminate early and cause settlement of all outstanding transactions if a triggering event occurs under the applicable Master Agreement. These triggering events include, but are not limited to, bankruptcy, failure to make timely payments, restructuring, obligation acceleration, obligation default, a material decline in net assets, decline in credit rating or repudiation/moratorium. Thus, if a credit related contingent feature is triggered, it would allow a Fund or its counterparty to close out all transactions under the agreement and demand payment or additional collateral to cover their exposure to the other counterparty. Any election made by a counterparty to early terminate a transaction could be material to a Fund’s financial statements. To reduce credit and counterparty risk associated with transactions, a Fund may enter into master netting arrangements to the extent that if an event of default occurs, all amounts with the counterparty are terminated and settled on a net basis. A Fund’s overall exposure to credit risk, subject to master netting arrangements, can change substantially within a short period, as it is affected by each transaction subject to the arrangement.
Derivative Investments
In addition to managing the market risks described above, certain Funds, if permitted by their investment objectives, may also invest in derivatives for purposes of hedging, duration management, as a substitute for securities, to increase returns, or to otherwise help achieve a Fund’s investment goal. Each derivative instrument and the reasons the Funds invested in derivatives during the period are discussed in further detail below.
Futures Contracts
A futures contract is a commitment to buy or sell a specific amount of a financial instrument or commodity at a negotiated price on a specified future date. Futures contracts are subject to the possibility of illiquid markets, and the possibility of an imperfect correlation between the value of the instruments and the underlying securities. Initial margin deposits are made upon entering into futures contracts and can be funded with either cash or securities. During the period a futures contract is open, changes in the value of the contract are recognized as unrealized appreciation or depreciation by marking-to-market on a daily basis to reflect the market value of the contract at the end of each day’s trading. Variation margin receivables or payables represent the difference between the change in unrealized appreciation and depreciation on the open contracts and the cash deposits made on the margin accounts. When the contract is closed, a Fund records a realized gain or loss equal to the difference between the proceeds from (or cost of) the closing transaction and the Fund’s cost of the contract. Futures contracts are valued at the settlement price established each day by the board of trade or exchange on which they are traded. During the reporting period, the Funds entered into futures contracts for the following reasons: The PL Inflation Managed and PL Managed Bond Funds used financial and money market futures to manage exposure to securities markets and/or to manage interest rate risk. The PL Short Duration Bond Fund used Treasury and Eurodollar futures contracts to manage interest rate risk. The PL International Value Fund used futures contracts to maintain full exposure to the equity markets.
Options Contracts
An options contract is a commitment that gives the purchaser of the contract the right, but not the obligation, to buy or sell an underlying asset at a specific price on or before a specified future date. In turn, the writer of an options contract is obligated, upon the exercise of the option, to buy or sell an underlying asset at a specific price on or before a specified future date. A swaption is an option contract granting the owner the right to enter into an underlying swap. Writing put options or purchasing call options tends to increase a Fund’s exposure to the underlying instrument. Writing call options or purchasing put options tends to decrease a Fund’s exposure to the underlying instrument. When a Fund writes or purchases a call or put option, an amount equal to the premium received or paid by the Fund is included in a Fund’s
D-15
PACIFIC LIFE FUNDS
NOTES TO FINANCIAL STATEMENTS (Continued)
NOTES TO FINANCIAL STATEMENTS (Continued)
Statement of Assets and Liabilities as a liability or an investment, respectively, and subsequently adjusted to the current market value, based on the quoted daily settlement price of the option written or purchased. Certain options may be written or purchased with premiums to be determined on a future date. The premiums for these options are based upon implied volatility parameters at specified terms. Premiums received or paid from writing or purchasing options, which expire unexercised, are treated by a Fund on the expiration date as realized gains or losses. The difference between the premium and the amount paid or received on a closing purchase or sale transaction, including brokerage commissions, is also treated as a realized gain or loss. If an option is exercised, the premium paid or realized is added to the cost of the purchase or proceeds from the sale in determining whether the Fund has realized a gain or loss on investment transactions. A Fund, as a writer of an option, may have no control over whether the underlying instrument may be sold (call) or purchased (put) and as a result bears the market risk of an unfavorable change in the price of the underlying written option. In addition, an illiquid market may make it difficult for a Fund to close out an option contract.
The maximum risk of loss associated with writing put options is limited to the exercised fair value of the option contract. The maximum risk of loss associated with writing call options is potentially unlimited. Listed options contracts present minimal counterparty credit risk since they are exchange traded and the exchange’s clearinghouse, as counterparty to all exchange traded options, guarantees the options against default. A Fund’s maximum risk of loss from counterparty credit risk related to OTC options contracts is limited to the premium paid.
During the reporting period, the Funds entered into options contracts for the following reasons: The PL Inflation Managed and PL Managed Bond Funds purchased or wrote options and swaptions on futures, currencies, and swaps, as a means of capitalizing on anticipated changes in market volatility and to generate income. Both Funds also purchased or wrote inflation floors to manage duration.
Forward Foreign Currency Contracts
A forward foreign currency contract (“Forward Contract”) is a commitment to buy or sell a specific amount of a foreign currency at a negotiated price on a specified future date. Forward Contracts can help a Fund manage the risk of changes in currency exchange rates. These contracts are marked-to-market daily at the applicable forward currency translation rates. A Fund records realized gains or losses at the time the Forward Contract is closed. A Forward Contract is extinguished through a closing transaction or upon delivery of the currency or entering an offsetting contract. A Fund’s maximum risk of loss from counterparty credit risk related to Forward Contracts is the fair value of the contract. The risk may be mitigated to some extent if a master netting arrangement between a Fund and the counterparty is in place and to the extent a Fund obtains collateral to cover the Fund’s exposure to the counterparty.
During the reporting period, the Funds entered into forward foreign currency contracts for the following reasons: The PL Inflation Managed and PL Managed Bond Funds used forward foreign currency contracts in connection with settling planned purchases or sales of investments, to hedge against currency exposure associated with some or all of each Fund’s investments and as a part of each Fund’s investment strategy. The PL Growth LT Fund entered into forward foreign currency contracts to manage currency risk. The PL International Value Fund used forward foreign currency contracts to manage currency risk and for hedging purposes to insulate the Fund’s returns against adverse currency movements.
Swaps
Swaps are privately negotiated agreements between the Funds and their counterparties to exchange cash flows, assets, foreign currencies or market-linked returns at specified intervals. In connection with these agreements, securities may be identified as collateral in accordance with the terms of the respective swap agreements to provide assets of value and recourse in the event of default or bankruptcy/insolvency. Swaps are marked-to-market daily based upon values received from third party vendors or quotations from market makers. Unrealized appreciation is recorded as an asset and unrealized depreciation is recorded as a liability on the Statements of Assets and Liabilities. The change in value of swaps, including accruals of periodic amounts of interest to be paid or received on swaps, is recorded as unrealized appreciation or depreciation in the Statements of Operations. Payments received or made at the beginning of the measurement period are reflected as such in the Statements of Assets and Liabilities and represent payments made or received upon entering into the swap agreement to compensate for differences between the stated terms of the swap agreement and prevailing market conditions (credit spreads, currency exchange rates, interest rates, and other relevant factors). These upfront payments are included in the calculation of realized gain or loss in the Statements of Operations, when the swap is closed. A liquidation payment received or made at the termination of the swap is recorded as realized gain or loss in the Statements of Operations. Net periodic payments received by a Fund are included as part of realized gain or loss in the Statements of Operations.
Interest Rate Swaps
Interest rate swap agreements involve the exchange by a Fund with another party of their respective commitments to pay or receive interest with respect to the notional amount of principal. Certain forms of interest rate swap agreements may include: (i) interest rate caps, under which, in return for a premium, one party agrees to make payments to the other to the extent that interest rates exceed a specified rate, or “cap”, (ii) interest rate floors, under which, in return for a premium, one party agrees to make payments to the other to the extent that interest rates fall below a specified rate, or “floor”, (iii) interest rate collars, under which a party sells a cap and purchases a floor or vice versa in an attempt to protect itself against interest rate movements exceeding given minimum or maximum levels, (iv) callable interest rate swaps, under which the counterparty may terminate the swap transaction in whole at zero cost by a predetermined date and time prior to the maturity date, (v) spreadlocks, which allow the interest rate swap users to lock in the forward differential (or spread) between the interest rate
D-16
PACIFIC LIFE FUNDS
NOTES TO FINANCIAL STATEMENTS (Continued)
NOTES TO FINANCIAL STATEMENTS (Continued)
swap rate and a specified benchmark, or (vi) basis swaps, under which two parties can exchange variable interest rates based on different money markets.
Certain Funds hold fixed rate bonds whose value may decrease if interest rates rise. To help hedge against this risk and to maintain the ability to generate income at prevailing market rates, certain Funds enter into interest rate swap agreements.
A Fund investing in interest rate swaps is subject to the risk that there is no liquid market for these agreements, that the counterparties may default on their obligations to perform or disagree as to the meaning of the contractual terms in the agreements, or that there may be unfavorable changes in interest rates. A Fund’s maximum risk of loss from counterparty credit risk related to interest rate swaps is the discounted net value of the cash flows to be received from/paid to the counterparty over the contract’s remaining life, to the extent that the amount is positive. The risk may be mitigated to some extent if a master netting arrangement between a Fund and the counterparty is in place and to the extent a Fund obtains collateral to cover the Fund’s exposure to the counterparty.
During the reporting period, the Funds entered into interest rate swap contracts for the following reasons: The PL Inflation Managed and PL Managed Bond Funds entered into interest rate swaps to manage nominal or real interest rate risk in various global markets and as a substitute for cash bond exposure.
Credit Default Swaps
Credit default swap agreements involve one party making a stream of payments (referred to as the buyer of protection) to another party (the seller of protection) in exchange for the right to receive a specified return in the event of a default or other credit event for the referenced entity, obligation or index. As a seller of protection, a Fund generally receives an upfront payment or a fixed rate of income throughout the term of the swap provided there is no credit event. As the seller, a Fund would effectively add leverage to its Fund because, in addition to its total net assets, a Fund would be subject to investment exposure on the notional amount of the swap.
A Fund investing in credit default swaps is subject to the risk that there is no liquid market for these agreements, that the counterparties may default on their obligations to perform or disagree as to the meaning of the contractual terms in the agreements, or that there may be unfavorable changes in interest rates.
If a Fund is a seller of protection and a credit event occurs, as defined under the terms of that particular swap agreement, a Fund will either (i) pay to the buyer of protection an amount equal to the notional amount of the swap and take delivery of the referenced obligation, other deliverable obligations or underlying securities comprising the referenced index or (ii) pay a net settlement amount in the form of cash or securities equal to the notional amount of the swap less the recovery value of the referenced obligation or underlying securities comprising the referenced index. If a Fund is a buyer of protection and a credit event occurs, as defined under the terms of that particular swap agreement, a Fund will either (i) receive from the seller of protection an amount equal to the notional amount of the swap and deliver the referenced obligation, other deliverable obligations or underlying securities comprising the referenced index or (ii) receive a net settlement amount in the form of cash or securities equal to the notional amount of the swap less the recovery value of the referenced obligation or underlying securities comprising the referenced index. Recovery values are assumed by market makers considering either industry standard recovery rates or entity specific factors and considerations until a credit event occurs. If a credit event has occurred, the recovery value is determined by a facilitated auction whereby a minimum number of allowable broker bids, together with a specified valuation method, are used to calculate the settlement value.
Credit default swap agreements on corporate issues or sovereign issues of an emerging country involve one party making a stream of payments to another party in exchange for the right to receive a specified return in the event of a default or other credit event. If a credit event occurs and cash settlement is not elected, a variety of other deliverable obligations may be delivered in lieu of the specific referenced obligation. The ability to deliver other obligations may result in a cheapest-to-deliver option (the buyer of protection’s right to choose the deliverable obligation with the lowest value following a credit event). A Fund may use credit default swaps on corporate issues or sovereign issues of an emerging country to provide a measure of protection against defaults of the issuers (i.e., to reduce risk where a Fund owns or has exposure to the referenced obligation) or to take an active long or short position with respect to the likelihood of a particular issuer’s default.
Credit default swap agreements on asset-backed securities involve one party making a stream of payments to another party in exchange for the right to receive a specified return in the event of a default or other credit event. Unlike credit default swaps on corporate and sovereign issues of an emerging country, deliverable obligations in most instances would be limited to the specific referenced obligation as performance for asset-backed securities can vary across deals. Prepayments, principal paydowns, and other writedowns or loss events on the underlying mortgage loans will reduce the outstanding principal balance of the referenced obligation. These reductions may be temporary or permanent as defined under the terms of the swap agreement and the notional amount for the swap agreement will be adjusted by corresponding amounts. A Fund may use credit default swaps on asset-backed securities to provide a measure of protection against defaults of the referenced obligation or to take an active long or short position with respect to the likelihood of a particular referenced obligation’s default.
Credit default swap agreements on credit indices involve one party making a stream of payments to another party in exchange for the right to receive a specified return in the event of a write-down, principal shortfall, interest shortfall or default of all or part of the referenced entities comprising the credit index. Credit default swap on indices are benchmarks for protecting investors owning bonds against default. A credit index is a list of a basket of credit instruments or exposures designed to be representative of some part of the credit market as a whole.
D-17
PACIFIC LIFE FUNDS
NOTES TO FINANCIAL STATEMENTS (Continued)
NOTES TO FINANCIAL STATEMENTS (Continued)
These indices are made up of reference credits that are judged by a poll of dealers to be the most liquid entities in the credit default swap market based on the sector of the index. Components of the indices may include, but are not limited to, investment grade securities, high yield securities, asset-backed securities, emerging markets, and/or various credit ratings within each sector. Credit indices are traded using credit default swaps with standardized terms including a fixed spread and standard maturity dates. An index credit default swap references all the names in the index, and if there is a default, the credit event is settled based on that name’s weight in the index. The composition of the indices changes periodically, usually every six months, and for most indices, each name has an equal weight in the index. A Fund may use credit default swaps on credit indices to hedge a Fund of credit default swaps or bonds with a credit default swap on indices which is less expensive than it would be to buy many credit default swaps to achieve a similar effect.
An implied credit spread is the spread in yield between a U.S. Treasury security and the referenced obligation or underlying investment that are identical in all respects except for the quality rating. Wider credit spreads, in absolute terms when compared to the notional amount of the swap, represent a deterioration of the referenced entity’s credit soundness and a greater likelihood or risk of default or other credit event occurring as defined under the terms of the agreement. Implied credit spreads, represented in absolute terms, utilized in determining the market value of credit default swap agreements on corporate issues or sovereign issues of an emerging country as of period end, are disclosed in the Notes to Schedules of Investments and serve as an indicator of the current status of the payment/performance risk and represent the likelihood or risk of default for the credit derivative. The implied credit spread of a particular referenced entity reflects the cost of buying/selling protection and may include upfront payments required to be made to enter into the agreement. For credit default swap agreements on asset-backed securities and credit indices, the quoted market prices and resulting values serve as the indicator of the current status of the payment/performance risk.
A Fund may use pair trades of credit default swaps. Pair trades attempt to match a long position with a short position of two securities in the same market sector for hedging purposes. Pair trades of credit default swaps attempt to gain exposure to credit risk while hedging or offsetting the effects of overall market movements. For example, a Fund may purchase protection through a credit default swap referenced to the debt of an issuer, and simultaneously selling protection through a credit default swap referenced to the debt of a different issuer with the intent to realize gains from the pricing differences of the two issuers who are expected to have similar market risks.
A Fund may use spread curve trades by simultaneously purchasing and selling protection through credit default swaps referenced to the same issuer but with different maturities. Spread curves attempt to gain exposure to credit risk on a forward basis by realizing gains on the expected differences in spreads.
A Fund’s maximum risk of loss from counterparty credit risk related to credit default swaps, either as the buyer or seller of protection, is the fair value of the contract. The risk may be mitigated to some extent if a master netting arrangement between a Fund and the counterparty is in place and to the extent a Fund obtains collateral to cover the Fund’s exposure to the counterparty.
The aggregate fair value of credit default swaps in a net liability position is reflected as unrealized depreciation and is disclosed in the Notes to Schedules of Investments. The collateral posted, net of assets received as collateral, for swap contracts is also disclosed in the Notes to Schedules of Investments. The maximum potential amount of future payments (undiscounted) that a Fund as a seller of protection could be required to make under a credit default swap agreement is an amount equal to the notional amount of the agreement. Notional amounts of all credit default swap agreements outstanding as of March 31, 2011 for which a Fund is the seller of protection are disclosed in the Notes to Schedules of Investments. These potential amounts are partially offset by any recovery values of the respective referenced obligations, upfront payments received upon entering into the agreement, or net amounts received from the settlement of buy protection credit default swap agreements entered into by a Fund for the same referenced entity or entities.
During the reporting period, the Funds entered into credit default swap contracts for the following reasons: The PL Inflation Managed and PL Managed Bond Funds sold credit protection through credit default swaps to increase exposure to the credit risk of individual securities or to the broader investment grade, high yield, or emerging market through the use of credit default swaps on credit indices. Both Funds also purchased credit protection to reduce credit exposure to individual issuers, reduce broader credit risk, or to take advantage of the basis between the credit default swap and cash bond market.
For financial reporting purposes, the Trust does not offset fair value amounts recognized for derivative instruments and fair value amounts recognized for the right to reclaim cash collateral (receivables) or the obligation to return cash collateral (payables) arising from derivative instruments recognized at fair value executed with the same counterparty under a master netting arrangement. The derivative investments held as of March 31, 2011 as disclosed in the Notes to Schedules of Investments and the amounts of realized gains and losses and changes in unrealized appreciation and depreciation on derivative investments during the year ended March 31, 2011 as disclosed in the Statements of Operations serve as indicators of the volume of derivative activity for the Funds.
D-18
PACIFIC LIFE FUNDS
NOTES TO FINANCIAL STATEMENTS (Continued)
NOTES TO FINANCIAL STATEMENTS (Continued)
The following is a summary of the location of fair value amounts of derivative investments on the Trust’s Statements of Assets and Liabilities:
| Location on the Statements of Assets and Liabilities | ||||
| Derivative Investments Type | Asset Derivative Investments | Liability Derivative Investments | ||
| Interest rate contracts | Investments, at value | Outstanding options written, at value | ||
| Receivable: Variation margin | Payable: Variation margin | |||
| Swap contracts, at value | Swap contracts, at value | |||
| Foreign currency contracts | Investments, at value | Outstanding options written, at value | ||
| Receivable: Variation margin | Payable: Variation margin | |||
| Forward foreign currency contracts appreciation | Forward foreign currency contracts depreciation | |||
| Credit contracts | Swap contracts, at value | Swap contracts, at value | ||
| Equity contracts | Investments, at value | Outstanding options written, at value | ||
| Receivable: Variation margin | Payable: Variation margin | |||
The Trust records its derivatives at fair value. The Trust does not use hedge accounting under U.S. GAAP. Although a Fund’s investments in derivatives may represent economic hedges as part of its investment objectives, they are considered to be non-hedge transactions for purposes of U.S. GAAP. The following is a summary of each Fund’s derivative investments not accounted for as hedging investments under U.S. GAAP, categorized by primary risk exposure as of March 31, 2011:
| Asset Derivative Investments Value | ||||||||||||||||||||
| Foreign | Interest | |||||||||||||||||||
| Total Value at | Credit | Equity | Currency | Rate | ||||||||||||||||
| Fund | March 31, 2011 | Contracts | Contracts | Contracts | Contracts | |||||||||||||||
| PL Inflation Managed | $ | 1,156,059 | $ | 587,063 | $ | — | $ | 269,070 | $ | 299,926 | * | |||||||||
| PL Managed Bond | 3,176,347 | 1,173,417 | — | 1,082,050 | 920,880 | * | ||||||||||||||
| PL Short Duration Bond | 35,924 | — | — | — | 35,924 | * | ||||||||||||||
| PL Growth LT | 11,234 | — | — | 11,234 | — | |||||||||||||||
| PL International Value | 676,661 | — | — | 676,661 | — | |||||||||||||||
| Liability Derivative Investments Value | ||||||||||||||||||||
| Foreign | Interest | |||||||||||||||||||
| Total Value at | Credit | Equity | Currency | Rate | ||||||||||||||||
| Fund | March 31, 2011 | Contracts | Contracts | Contracts | Contracts | |||||||||||||||
| PL Inflation Managed | $ | (1,379,467 | ) | $ | (82,799 | ) | $ | — | $ | (786,817 | ) | $ | (509,851) | * | ||||||
| PL Managed Bond | (2,777,963 | ) | (466,953 | ) | — | (703,225 | ) | (1,607,785) | * | |||||||||||
| PL Short Duration Bond | (62,690 | ) | — | — | — | (62,690) | * | |||||||||||||
| PL Growth LT | (50,823 | ) | — | — | (50,823 | ) | — | |||||||||||||
| PL International Value | (589,684 | ) | — | (972) | * | (588,712 | ) | — | ||||||||||||
| * | Includes cumulative appreciation (depreciation) of futures contracts as reported in the Schedules of Investments and their notes. Only current day’s variation margin is reported within the Statements of Assets & Liabilities. |
The following is a summary of the location of realized gains and losses and changes in net unrealized appreciation and depreciation of derivative investments on the Trust’s Statements of Operations:
| Derivative Investments Type | Location of Gain (Loss) on Derivative Investments Recognized in the Statements of Operations | |
| Interest rate contracts | Net realized gain (loss) on investment security transactions | |
| Equity contracts | Net realized gain (loss) on futures contracts and swap transactions | |
| Net realized gain (loss) on written option transactions | ||
| Change in net unrealized appreciation (depreciation) on investment securities | ||
| Change in net unrealized appreciation (depreciation) on futures contracts and swaps | ||
| Change in net unrealized appreciation (depreciation) on written options | ||
| Foreign currency contracts | Net realized gain (loss) on investment security transactions | |
| Net realized gain (loss) on futures contracts and swap transactions | ||
| Net realized gain (loss) on written option transactions | ||
| Net realized gain (loss) on foreign currency transactions | ||
| Change in net unrealized appreciation (depreciation) on investment securities | ||
| Change in net unrealized appreciation (depreciation) on futures contracts and swaps | ||
| Change in net unrealized appreciation (depreciation) on written options | ||
| Change in net unrealized appreciation (depreciation) on foreign currencies | ||
| Credit contracts | Net realized gain (loss) on futures contracts and swap transactions | |
| Change in net unrealized appreciation (depreciation) on futures contracts and swaps |
19
PACIFIC LIFE FUNDS
NOTES TO FINANCIAL STATEMENTS (Continued)
NOTES TO FINANCIAL STATEMENTS (Continued)
The following is a summary of each Fund’s realized gain and/or loss and change in net unrealized appreciation and/or depreciation on derivative investments recognized in the Statements of Operations categorized by primary risk exposure for the year ended March 31, 2011:
| Realized Gain (Loss) on Derivative Investments Recognized in the Statements of Operations | ||||||||||||||||||||
| Foreign | Interest | |||||||||||||||||||
| Credit | Equity | Currency | Rate | |||||||||||||||||
| Fund | Total | Contracts | Contracts | Contracts | Contracts | |||||||||||||||
| PL Inflation Managed | $ | 639,426 | $ | 158,913 | $ | — | $ | 202,973 | $ | 277,540 | ||||||||||
| PL Managed Bond | 7,063,857 | 1,161,081 | — | 930,541 | 4,972,235 | |||||||||||||||
| PL Short Duration Bond | 164,450 | — | — | — | 164,450 | |||||||||||||||
| PL Growth LT | (42,357 | ) | — | — | (42,357 | ) | — | |||||||||||||
| PL International Value | (87,992 | ) | — | (50,474 | ) | (152,472 | ) | 114,954 | ||||||||||||
| Change in Net Unrealized Appreciation (Depreciation) on | ||||||||||||||||||||
| Derivative Investments Recognized in the Statements of Operations | ||||||||||||||||||||
| Foreign | Interest | |||||||||||||||||||
| Credit | Equity | Currency | Rate | |||||||||||||||||
| Fund | Total | Contracts | Contracts | Contracts | Contracts | |||||||||||||||
| PL Inflation Managed | $ | (1,291,508 | ) | $ | 22,120 | $ | — | $ | (831,339 | ) | $ | (482,289 | ) | |||||||
| PL Managed Bond | (2,158,328 | ) | 95,870 | — | 242,900 | (2,497,098 | ) | |||||||||||||
| PL Short Duration Bond | (43,700 | ) | — | — | — | (43,700 | ) | |||||||||||||
| PL Growth LT | (160,154 | ) | — | — | (160,154 | ) | — | |||||||||||||
| PL International Value | 80,361 | — | (7,588 | ) | 87,949 | — | ||||||||||||||
13. SHARES OF BENEFICIAL INTEREST
Each Fund is authorized to issue an unlimited number of shares of beneficial interest with no par value. Changes in shares of beneficial interest of each Fund for the years ended March 31, 2011 and 2010 were as follows:
| PL Floating Rate | PL Inflation | PL Managed | PL Short Duration | |||||||||||||||||||||||||||||
| Loan Fund (1) | Managed Fund(1) | Bond Fund (1) | Bond Fund (1) | |||||||||||||||||||||||||||||
| Year ended | Year ended | Year ended | Year ended | Year ended | Year ended | Year ended | Year ended | |||||||||||||||||||||||||
| 3/31/2011 | 3/31/2010 | 3/31/2011 | 3/31/2010 | 3/31/2011 | 3/31/2010 | 3/31/2011 | 3/31/2010 | |||||||||||||||||||||||||
Class A | ||||||||||||||||||||||||||||||||
| Shares sold | 783,698 | 2,282,633 | 1,956,632 | 6,378,988 | 3,125,323 | 7,234,283 | 1,426,601 | 3,533,144 | ||||||||||||||||||||||||
| Dividends and distribution reinvested | 59,430 | 210,756 | 192,834 | 462,500 | 476,813 | 1,283,200 | 22,578 | 120,785 | ||||||||||||||||||||||||
| Shares repurchased | (26,716 | ) | (515,930 | ) | (481,900 | ) | (518,710 | ) | (717,827 | ) | (765,659 | ) | (94,972 | ) | (973,595 | ) | ||||||||||||||||
| Converted to Class P shares | (6,194,222 | ) | — | (16,468,262 | ) | — | (24,830,341 | ) | — | (8,923,737 | ) | — | ||||||||||||||||||||
| Net increase (decrease) | (5,377,810 | ) | 1,977,459 | (14,800,696 | ) | 6,322,778 | (21,946,032 | ) | 7,751,824 | (7,569,530 | ) | 2,680,334 | ||||||||||||||||||||
| Beginning shares outstanding | 5,377,810 | 3,400,351 | 14,800,696 | 8,477,918 | 21,946,032 | 14,194,208 | 7,569,530 | 4,889,196 | ||||||||||||||||||||||||
| Ending shares outstanding | — | 5,377,810 | — | 14,800,696 | — | 21,946,032 | — | 7,569,530 | ||||||||||||||||||||||||
Class P | ||||||||||||||||||||||||||||||||
| Shares sold | 2,473,194 | 6,605,011 | 11,171,594 | 4,291,769 | ||||||||||||||||||||||||||||
| Dividends and distributions reinvested | 147,193 | 529,088 | 1,296,521 | 95,117 | ||||||||||||||||||||||||||||
| Shares repurchased | (314,282 | ) | (1,823,688 | ) | (2,036,265 | ) | (1,239,556 | ) | ||||||||||||||||||||||||
| Converted from Class A Shares | 6,194,222 | 16,468,262 | 24,830,341 | 8,923,737 | ||||||||||||||||||||||||||||
| Net increase | 8,500,327 | 21,778,673 | 35,262,191 | 12,071,067 | ||||||||||||||||||||||||||||
| Beginning shares outstanding | — | — | — | — | ||||||||||||||||||||||||||||
| Ending shares outstanding | 8,500,327 | 21,778,673 | 35,262,191 | 12,071,067 | ||||||||||||||||||||||||||||
| PL Comstock | PL Growth | PL Large-Cap | PL Large-Cap | |||||||||||||||||||||||||||||
| Fund (1) | LT Fund (1) | Growth Fund (1) | Value Fund (1) | |||||||||||||||||||||||||||||
| Year ended | Year ended | Year ended | Year ended | Year ended | Year ended | Year ended | Year ended | |||||||||||||||||||||||||
| 3/31/2011 | 3/31/2010 | 3/31/2011 | 3/31/2010 | 3/31/2011 | 3/31/2010 | 3/31/2011 | 3/31/2010 | |||||||||||||||||||||||||
Class A | ||||||||||||||||||||||||||||||||
| Shares sold | 840,641 | 1,887,392 | 515,246 | 1,279,195 | 565,551 | 5,211,526 | 1,490,054 | 7,070,227 | ||||||||||||||||||||||||
| Dividends and distribution reinvested | 25,075 | 111,723 | — | 161,723 | — | — | 51,066 | 179,933 | ||||||||||||||||||||||||
| Shares repurchased | (199,075 | ) | (787,611 | ) | (175,781 | ) | (3,057,754 | ) | (200,745 | ) | (323,434 | ) | (329,474 | ) | (242,469 | ) | ||||||||||||||||
| Converted to Class P shares | (12,653,081 | ) | — | (8,299,570 | ) | — | (8,286,576 | ) | — | (16,781,975 | ) | — | ||||||||||||||||||||
| Net increase (decrease) | (11,986,440 | ) | 1,211,504 | (7,960,105 | ) | (1,616,836 | ) | (7,921,770 | ) | 4,888,092 | (15,570,329 | ) | 7,007,691 | |||||||||||||||||||
| Beginning shares outstanding | 11,986,440 | 10,774,936 | 7,960,105 | 9,576,941 | 7,921,770 | 3,033,678 | 15,570,329 | 8,562,638 | ||||||||||||||||||||||||
| Ending shares outstanding | — | 11,986,440 | — | 7,960,105 | — | 7,921,770 | — | 15,570,329 | ||||||||||||||||||||||||
20
PACIFIC LIFE FUNDS
NOTES TO FINANCIAL STATEMENTS (Continued)
NOTES TO FINANCIAL STATEMENTS (Continued)
| PL Comstock | PL Growth | PL Large-Cap | PL Large-Cap | |||||||||||||||||||||||||||||
| Fund (1) | LT Fund (1) | Growth Fund (1) | Value Fund (1) | |||||||||||||||||||||||||||||
| Year ended | Year ended | Year ended | Year ended | Year ended | Year ended | Year ended | Year ended | |||||||||||||||||||||||||
| 3/31/2011 | 3/31/2010 | 3/31/2011 | 3/31/2010 | 3/31/2011 | 3/31/2010 | 3/31/2011 | 3/31/2010 | |||||||||||||||||||||||||
Class P | ||||||||||||||||||||||||||||||||
| Shares sold | 2,223,407 | 1,755,602 | 3,571,915 | 4,330,848 | ||||||||||||||||||||||||||||
| Dividends and distributions reinvested | 99,619 | — | — | 190,557 | ||||||||||||||||||||||||||||
| Shares repurchased | (1,248,603 | ) | (752,995 | ) | (1,122,789 | ) | (1,591,279 | ) | ||||||||||||||||||||||||
| Converted from Class A Shares | 12,653,081 | 8,299,570 | 8,286,576 | 16,781,975 | ||||||||||||||||||||||||||||
| Net increase | 13,727,504 | 9,302,177 | 10,735,702 | 19,712,101 | ||||||||||||||||||||||||||||
| Beginning shares outstanding | — | — | — | — | ||||||||||||||||||||||||||||
| Ending shares outstanding | 13,727,504 | 9,302,177 | 10,735,702 | 19,712,101 | ||||||||||||||||||||||||||||
| PL Main Street | PL Mid-Cap | PL Mid-Cap | PL Small-Cap | |||||||||||||||||||||||||||||
| Core Fund (1) | Equity Fund (1) | Growth Fund(1) | Growth Fund (1) | |||||||||||||||||||||||||||||
| Year ended | Year ended | Year ended | Year ended | Year ended | Year ended | Year ended | Year ended | |||||||||||||||||||||||||
| 3/31/2011 | 3/31/2010 | 3/31/2011 | 3/31/2010 | 3/31/2011 | 3/31/2010 | 3/31/2011 | 3/31/2010 | |||||||||||||||||||||||||
Class A | ||||||||||||||||||||||||||||||||
| Shares sold | 1,015,605 | 3,174,195 | 949,982 | 1,214,393 | 117,550 | 3,175,797 | 27,664 | 501,380 | ||||||||||||||||||||||||
| Dividends and distribution reinvested | 12,032 | 127,649 | 5,986 | 56,832 | 66,283 | 76,838 | — | — | ||||||||||||||||||||||||
| Shares repurchased | (18,854 | ) | (1,035,627 | ) | (377,103 | ) | (631,044 | ) | (620,970 | ) | (507,051 | ) | (234,932 | ) | (1,862,567 | ) | ||||||||||||||||
| Converted to Class P shares | (17,231,149 | ) | — | (12,316,799 | ) | — | (6,101,628 | ) | — | (2,523,721 | ) | — | ||||||||||||||||||||
| Net increase (decrease) | (16,222,366 | ) | 2,266,217 | (11,737,934 | ) | 640,181 | (6,538,765 | ) | 2,745,584 | (2,730,989 | ) | (1,361,187 | ) | |||||||||||||||||||
| Beginning shares outstanding | 16,222,366 | 13,956,149 | 11,737,934 | 11,097,753 | 6,538,765 | 3,793,181 | 2,730,989 | 4,092,176 | ||||||||||||||||||||||||
| Ending shares outstanding | — | 16,222,366 | — | 11,737,934 | — | 6,538,765 | — | 2,730,989 | ||||||||||||||||||||||||
Class P | ||||||||||||||||||||||||||||||||
| Shares sold | 2,582,319 | 1,862,192 | 860,631 | 717,380 | ||||||||||||||||||||||||||||
| Dividends and distributions reinvested | 82,836 | 89,164 | 495,234 | — | ||||||||||||||||||||||||||||
| Shares repurchased | (4,310,264 | ) | (1,283,576 | ) | (1,187,382 | ) | (521,752 | ) | ||||||||||||||||||||||||
| Converted from Class A Shares | 17,231,149 | 12,316,799 | 6,101,628 | 2,523,721 | ||||||||||||||||||||||||||||
| Net increase | 15,586,040 | 12,984,579 | 6,270,111 | 2,719,349 | ||||||||||||||||||||||||||||
| Beginning shares outstanding | — | — | — | — | ||||||||||||||||||||||||||||
| Ending shares outstanding | 15,586,040 | 12,984,579 | 6,270,111 | 2,719,349 | ||||||||||||||||||||||||||||
| PL Small-Cap | PL Real Estate | PL Emerging | PL International | |||||||||||||||||||||||||||||
| Value Fund (1) | Fund (1) | Markets Fund (1) | Large-Cap Fund (1) | |||||||||||||||||||||||||||||
| Year ended | Year ended | Year ended | Year ended | Year ended | Year ended | Year ended | Year ended | |||||||||||||||||||||||||
| 3/31/2011 | 3/31/2010 | 3/31/2011 | 3/31/2010 | 3/31/2011 | 3/31/2010 | 3/31/2011 | 3/31/2010 | |||||||||||||||||||||||||
Class A | ||||||||||||||||||||||||||||||||
| Shares sold | 157,009 | 681,735 | 18,349 | 865,460 | 64,136 | 543,076 | 899,940 | 1,665,396 | ||||||||||||||||||||||||
| Dividends and distribution reinvested | 8,614 | 63,819 | 7,759 | 63,259 | — | 20,636 | 76,898 | 86,240 | ||||||||||||||||||||||||
| Shares repurchased | (160,735 | ) | (1,213,361 | ) | (423,437 | ) | (1,515,147 | ) | (7,619 | ) | (1,365,816 | ) | (104,013 | ) | (1,045,692 | ) | ||||||||||||||||
| Converted to Class P shares | (4,458,487 | ) | — | (3,535,609 | ) | — | (3,969,965 | ) | — | (8,682,775 | ) | — | ||||||||||||||||||||
| Net increase (decrease) | (4,453,599 | ) | (467,807 | ) | (3,932,938 | ) | (586,428 | ) | (3,913,448 | ) | (802,104 | ) | (7,809,950 | ) | 705,944 | |||||||||||||||||
| Beginning shares outstanding | 4,453,599 | 4,921,406 | 3,932,938 | 4,519,366 | 3,913,448 | 4,715,552 | 7,809,950 | 7,104,006 | ||||||||||||||||||||||||
| Ending shares outstanding | — | 4,453,599 | — | 3,932,938 | — | 3,913,448 | — | 7,809,950 | ||||||||||||||||||||||||
Class P | ||||||||||||||||||||||||||||||||
| Shares sold | 3,207,574 | 688,375 | 1,054,854 | 1,645,551 | ||||||||||||||||||||||||||||
| Dividends and distributions reinvested | 65,004 | 24,982 | 64,256 | 17,428 | ||||||||||||||||||||||||||||
| Shares repurchased | (540,987 | ) | (596,295 | ) | (710,469 | ) | (1,366,892 | ) | ||||||||||||||||||||||||
| Converted from Class A Shares | 4,458,487 | 3,535,609 | 3,969,965 | 8,682,775 | ||||||||||||||||||||||||||||
| Net increase | 7,190,078 | 3,652,671 | 4,378,606 | 8,978,862 | ||||||||||||||||||||||||||||
| Beginning shares outstanding | — | — | — | — | ||||||||||||||||||||||||||||
| Ending shares outstanding | 7,190,078 | 3,652,671 | 4,378,606 | 8,978,862 | ||||||||||||||||||||||||||||
D-21
PACIFIC LIFE FUNDS
NOTES TO FINANCIAL STATEMENTS (Continued)
NOTES TO FINANCIAL STATEMENTS (Continued)
| PL International | ||||||||
| Value Fund (1) | ||||||||
| Year ended | Year ended | |||||||
| 3/31/2011 | 3/31/2010 | |||||||
Class A | ||||||||
| Shares sold | 1,269,450 | 2,094,735 | ||||||
| Dividends and distribution reinvested | 61,755 | 153,540 | ||||||
| Shares repurchased | (170,122 | ) | (5,667,580 | ) | ||||
| Converted to Class P shares | (10,552,384 | ) | — | |||||
| Net decrease | (9,391,301 | ) | (3,419,305 | ) | ||||
| Beginning shares outstanding | 9,391,301 | 12,810,606 | ||||||
| Ending shares outstanding | — | 9,391,301 | ||||||
Class P | ||||||||
| Shares sold | 1,627,362 | |||||||
| Dividends and distributions reinvested | 167,784 | |||||||
| Shares repurchased | (2,855,965 | ) | ||||||
| Converted from Class A Shares | 10,552,384 | |||||||
| Net increase | 9,491,565 | |||||||
| Beginning shares outstanding | — | |||||||
| Ending shares outstanding | 9,491,565 | |||||||
| (1) | Class A shares were converted to Class P shares on July 2, 2010 (see Note 1 to Financial Statements). |
14. INDEMNIFICATIONS
Under the Trust’s organizational documents, its officers and trustees are indemnified against certain liabilities arising out of performance of their duties to the Trust. In addition, the Trust entered into an agreement with each of the trustees which provides that the Trust will indemnify and hold harmless each trustee against any expenses actually and reasonably incurred by any trustee in any proceeding arising out of or in connection with the trustee’s services to the Trust, to the fullest extent permitted by the Trust’s Declaration of Trust and By-Laws, the general trust law of the State of Delaware, the Securities Act of 1933, and the 1940 Act, each as now or hereinafter in force. In the normal course of business, the Trust enters into contracts with service providers and others that contain general indemnification clauses. The Trust’s maximum exposure under these arrangements and agreements is dependent on future claims that may be made against the Trust and/or the trustees and, therefore, cannot be estimated; however, based on experience, the risk of loss from such claims is considered remote.
15. RECLASSIFICATION OF ACCOUNTS
During the year ended March 31, 2011, reclassifications as shown in the following table have been made in each Fund’s capital accounts to report these balances on a tax basis, excluding certain temporary differences, as of March 31, 2011. Additional adjustments may be required in subsequent reporting periods. These reclassifications, which have no impact on the NAV of the Funds, are primarily attributable to reclassifications of foreign currency transactions, non-deductible expenses, treatment of net operating losses, expiration of capital loss carryforwards, use of tax equalization, paydown gains and losses, and other differences in the computation of distributable income and capital gains under Federal tax rules versus U.S. GAAP. The calculation of net investment income per share in the financial highlights excludes these adjustments.
| Undistributed/ | Undistributed/ | |||||||||||
| Accumulated | Accumulated | |||||||||||
| Paid-In | Net Investment | Net Realized | ||||||||||
| Fund | Capital | Income (Loss) | Gain (Loss) | |||||||||
| PL Inflation Managed | $ | — | $ | 177,936 | $ | (177,936 | ) | |||||
| PL Managed Bond | — | 3,705,191 | (3,705,191 | ) | ||||||||
| PL Short Duration Bond | — | 63,382 | (63,382 | ) | ||||||||
| PL Growth LT | — | (46,997 | ) | 46,997 | ||||||||
| PL Large-Cap Growth | (84,212 | ) | 84,212 | — | ||||||||
| PL Large-Cap Value | — | (1,669 | ) | 1,669 | ||||||||
| PL Main Street Core | — | (86,904 | ) | 86,904 | ||||||||
| PL Mid-Cap Growth | — | (9,162 | ) | 9,162 | ||||||||
| PL Small-Cap Growth | (170,500 | ) | 171,849 | (1,349 | ) | |||||||
| PL Small-Cap Value | — | (102,551 | ) | 102,551 | ||||||||
| PL Real Estate | (28,978 | ) | 28,915 | 63 | ||||||||
| PL Emerging Markets | — | 128,026 | (128,026 | ) | ||||||||
| PL International Large-Cap | — | (35,820 | ) | 35,820 | ||||||||
| PL International Value | — | 404,613 | (404,613 | ) | ||||||||
D-22
PACIFIC LIFE FUNDS
NOTES TO FINANCIAL STATEMENTS (Continued)
NOTES TO FINANCIAL STATEMENTS (Continued)
16. OTHER TAX INFORMATION (Unaudited)
For corporate shareholders, the percentage of investment income (dividend income and short-term gains, if any) for each of the Funds that qualify for the dividends-received deductions for the year ended March 31, 2011 is as follows:
| Fund | Percentage | |||
| PL Inflation Managed | 0.10 | % | ||
| PL Managed Bond | 1.49 | % | ||
| PL Comstock | 100.00 | % | ||
| PL Large-Cap Value | 100.00 | % | ||
| PL Main Street Core | 100.00 | % | ||
| PL Mid-Cap Equity | 100.00 | % | ||
| PL Mid-Cap Growth | 27.84 | % | ||
| PL Small-Cap Value | 100.00 | % | ||
| PL Real Estate | 2.26 | % | ||
| PL International Large-Cap | 0.59 | % | ||
For the year ended March 31, 2011, certain dividends paid by the Funds may be subject to a maximum tax rate of 15%, as provided by the Jobs and Growth Tax Relief Reconciliation Act of 2003. Of the distributions made by the following Funds, the corresponding percentages represent the amount of each distribution which may qualify for the 15% dividend income tax rate.
| Fund | Percentage | |||
| PL Inflation Managed | 0.10 | % | ||
| PL Managed Bond | 1.49 | % | ||
| PL Comstock | 100.00 | % | ||
| PL Large-Cap Value | 100.00 | % | ||
| PL Main Street Core | 100.00 | % | ||
| PL Mid-Cap Equity | 100.00 | % | ||
| PL Mid-Cap Growth | 35.81 | % | ||
| PL Small-Cap Value | 100.00 | % | ||
| PL Real Estate | 12.85 | % | ||
| PL Emerging Markets | 62.89 | % | ||
| PL International Large-Cap | 100.00 | % | ||
| PL International Value | 100.00 | % | ||
Shareholders should not use the above tax information to prepare their tax returns. The information will be included with your Form 1099 DIV which will be sent to you separately in January 2012.
The following Funds designated the listed amounts as long-term capital gain dividends during the year ended March 31, 2011. Distributable long-term gains are based on net realized long-term gains determined on a tax basis and may differ from such amounts for financial reporting purposes.
| Fund | Amount | |||
| PL Managed Bond | $ | 2,900,507 | ||
| PL Short Duration Bond | 239,146 | |||
| PL Large-Cap Growth | 43,089 | |||
| PL Mid-Cap Growth | 6,222,354 | |||
D-23
REPORT OF INDEPENDENT REGISTERED PUBLIC ACCOUNTING FIRM
To The Board of Trustees and Shareholders of
Pacific Life Funds
Pacific Life Funds
We have audited the accompanying statements of assets and liabilities, including the schedules of investments, of the PL Floating Rate Loan Fund, PL Inflation Managed Fund, PL Managed Bond Fund, PL Short Duration Bond Fund, PL Comstock Fund, PL Growth LT Fund, PL Large-Cap Growth Fund, PL Large-Cap Value Fund, PL Main Street® Core Fund, PL Mid-Cap Equity Fund, PL Mid-Cap Growth Fund, PL Small-Cap Growth Fund, PL Small-Cap Value Fund, PL Real Estate Fund, PL Emerging Markets Fund, PL International Large-Cap Fund, and PL International Value Fund (collectively the “Funds”) (seventeen of the twenty-four funds comprising the Pacific Life Funds) as of March 31, 2011, and the related statements of operations for the year then ended, the statements of changes in net assets for each of the two years in the period then ended, and the financial highlights for each of the periods presented. These financial statements and financial highlights are the responsibility of the Funds’ management. Our responsibility is to express an opinion on these financial statements and financial highlights based on our audits.
We conducted our audits in accordance with the standards of the Public Company Accounting Oversight Board (United States). Those standards require that we plan and perform the audit to obtain reasonable assurance about whether the financial statements and financial highlights are free of material misstatement. The Funds are not required to have, nor were we engaged to perform, an audit of their internal control over financial reporting. Our audits included consideration of internal control over financial reporting as a basis for designing audit procedures that are appropriate in the circumstances, but not for the purpose of expressing an opinion on the effectiveness of the Funds’ internal control over financial reporting. Accordingly, we express no such opinion. An audit also includes examining, on a test basis, evidence supporting the amounts and disclosures in the financial statements, assessing the accounting principles used and significant estimates made by management, as well as evaluating the overall financial statement presentation. Our procedures included confirmation of securities owned as of March 31, 2011, by correspondence with the custodian and brokers; where replies were not received from brokers, we performed other auditing procedures. We believe that our audits provide a reasonable basis for our opinion.
In our opinion, the financial statements and financial highlights referred to above present fairly, in all material respects, the financial position of PL Floating Rate Loan Fund, PL Inflation Managed Fund, PL Managed Bond Fund, PL Short Duration Bond Fund, PL Comstock Fund, PL Growth LT Fund, PL Large-Cap Growth Fund, PL Large-Cap Value Fund, PL Main Street® Core Fund, PL Mid-Cap Equity Fund, PL Mid-Cap Growth Fund, PL Small-Cap Growth Fund, PL Small-Cap Value Fund, PL Real Estate Fund, PL Emerging Markets Fund, PL International Large-Cap Fund, and PL International Value Fund as of March 31, 2011, the results of their operations for the year then ended, the changes in their net assets for each of the two years in the period then ended, and the financial highlights for each of the periods presented, in conformity with accounting principles generally accepted in the United States of America.

Costa Mesa, California
May 26, 2011
May 26, 2011
E-1
We believe it is important for you to understand the impact of fees and expenses regarding your investment. All mutual funds have operating expenses. As a shareholder of a mutual fund, you incur two types of costs: (1) transactions costs such as initial sales charges (loads) on purchase payments and/or contingent deferred sales charges on redemptions; and (2) ongoing costs, which include advisory fees, administration fees, distribution and/or service fees, and other fund expenses. The following example is intended to help you understand your ongoing costs (in dollars) of investing in each fund and to compare these costs with those of other mutual funds. The example is based on an investment of $1,000.00 made at the beginning of the period and held for the entire six-month period from October 1, 2010 to March 31, 2011.
ACTUAL EXPENSES
The first section of the table for each fund entitled “Actual Fund Return”, provides information about actual account values and actual expenses based on each fund’s actual performance and each fund’s actual expenses, after any applicable adviser expense reimbursement, administrator fee reductions, advisory fee, and distribution and/or service fee waivers. The “Ending Account Value at 03/31/11” column shown is derived from the fund’s actual performance; the “Annualized Expense Ratio” column shows the fund’s actual annualized expense ratio; and the “Expenses Paid During the Period 10/01/10-03/31/11” column shows the dollar amount that would have been paid by you. All the information illustrated in the following table is based on the past six-month period from October 1, 2010 to March 31, 2011.
You may use the information in this section, together with the amount you invested, to estimate the expenses that you paid over the period. To do so, for each fund in your account, simply divide that fund’s value by $1,000.00 (for example, an $8,600.00 fund value divided by $1,000.00 = 8.6), then multiply the result by the number given for your fund(s) in the “Expenses Paid During the Period 10/01/10-03/31/11.”
HYPOTHETICAL EXAMPLE FOR COMPARISON PURPOSES
The second section of the table for each fund, entitled “Hypothetical”, provides information about hypothetical account values and hypothetical expenses based on a 5% per year hypothetical rate of return and actual fund’s expenses, after any applicable adviser expense reimbursement, administrator fee reductions, and distributor fee waivers. It assumes that the fund had an annual 5% rate of return before expenses, but that the expense ratio is unchanged. The hypothetical account values and expenses may not be used to estimate the actual ending account values or expenses you paid for the period.
You may use the hypothetical example information to compare the ongoing costs of investing in the fund compared to other mutual funds. To do so, compare this 5% hypothetical example with the 5% hypothetical examples that appear in the shareholder reports of other mutual funds.
Please note that the expenses shown in the table are meant to highlight your ongoing costs only and do not reflect any transactional costs, such as initial sales charges (loads) or contingent deferred sales charges. Therefore, the second section of the table is useful in comparing ongoing costs only, and will not help you determine the relative total costs of owning different mutual funds. In addition, if these other costs were included, your costs would have been higher.
| Expenses | ||||||||||||||||
| Beginning | Ending | Paid During | ||||||||||||||
| Account | Account | Annualized | the Period(1) | |||||||||||||
| Value at | Value at | Expense | 10/01/10 - | |||||||||||||
| 10/01/10 | 03/31/11 | Ratio | 03/31/11 | |||||||||||||
| PL Floating Rate Loan Fund | ||||||||||||||||
Actual Fund Return | ||||||||||||||||
| Class P | $ | 1,000.00 | $ | 1,046.80 | 0.80 | % | $ | 4.08 | ||||||||
Hypothetical | ||||||||||||||||
| Class P | $ | 1,000.00 | $ | 1,020.94 | 0.80 | % | $ | 4.03 | ||||||||
| PL Inflation Managed Fund | ||||||||||||||||
Actual Fund Return | ||||||||||||||||
| Class P | $ | 1,000.00 | $ | 1,008.70 | 0.55 | % | $ | 2.75 | ||||||||
Hypothetical | ||||||||||||||||
| Class P | $ | 1,000.00 | $ | 1,022.19 | 0.55 | % | $ | 2.77 | ||||||||
| PL Managed Bond Fund | ||||||||||||||||
Actual Fund Return | ||||||||||||||||
| Class P | $ | 1,000.00 | $ | 999.20 | 0.55 | % | $ | 2.74 | ||||||||
Hypothetical | ||||||||||||||||
| Class P | $ | 1,000.00 | $ | 1,022.19 | 0.55 | % | $ | 2.77 | ||||||||
| PL Short Duration Bond Fund | ||||||||||||||||
Actual Fund Return | ||||||||||||||||
| Class P | $ | 1,000.00 | $ | 1,002.00 | 0.55 | % | $ | 2.75 | ||||||||
Hypothetical | ||||||||||||||||
| Class P | $ | 1,000.00 | $ | 1,022.19 | 0.55 | % | $ | 2.77 | ||||||||
| PL Comstock Fund | ||||||||||||||||
Actual Fund Return | ||||||||||||||||
| Class P | $ | 1,000.00 | $ | 1,174.00 | 0.89 | % | $ | 4.82 | ||||||||
Hypothetical | ||||||||||||||||
| Class P | $ | 1,000.00 | $ | 1,020.49 | 0.89 | % | $ | 4.48 | ||||||||
| PL Growth LT Fund | ||||||||||||||||
Actual Fund Return | ||||||||||||||||
| Class P | $ | 1,000.00 | $ | 1,120.90 | 0.70 | % | $ | 3.70 | ||||||||
Hypothetical | ||||||||||||||||
| Class P | $ | 1,000.00 | $ | 1,021.44 | 0.70 | % | $ | 3.53 | ||||||||
| PL Large-Cap Growth Fund | ||||||||||||||||
Actual Fund Return | ||||||||||||||||
| Class P | $ | 1,000.00 | $ | 1,183.30 | 0.88 | % | $ | 4.79 | ||||||||
Hypothetical | ||||||||||||||||
| Class P | $ | 1,000.00 | $ | 1,020.54 | 0.88 | % | $ | 4.43 | ||||||||
| PL Large-Cap Value Fund | ||||||||||||||||
Actual Fund Return | ||||||||||||||||
| Class P | $ | 1,000.00 | $ | 1,166.00 | 0.80 | % | $ | 4.32 | ||||||||
Hypothetical | ||||||||||||||||
| Class P | $ | 1,000.00 | $ | 1,020.94 | 0.80 | % | $ | 4.03 | ||||||||
See explanation of references on page F-2
F-1
PACIFIC LIFE FUNDS
DISCLOSURE OF FUND EXPENSES (Continued)
(Unaudited)
DISCLOSURE OF FUND EXPENSES (Continued)
(Unaudited)
| Expenses | ||||||||||||||||
| Beginning | Ending | Paid During | ||||||||||||||
| Account | Account | Annualized | the Period(1) | |||||||||||||
| Value at | Value at | Expense | 10/01/10 - | |||||||||||||
| 10/01/10 | 03/31/11 | Ratio | 03/31/11 | |||||||||||||
| PL Main Street Core Fund | ||||||||||||||||
Actual Fund Return | ||||||||||||||||
| Class P | $ | 1,000.00 | $ | 1,138.40 | 0.60 | % | $ | 3.20 | ||||||||
Hypothetical | ||||||||||||||||
| Class P | $ | 1,000.00 | $ | 1,021.94 | 0.60 | % | $ | 3.02 | ||||||||
| PL Mid-Cap Equity Fund | ||||||||||||||||
Actual Fund Return | ||||||||||||||||
| Class P | $ | 1,000.00 | $ | 1,185.00 | 0.80 | % | $ | 4.36 | ||||||||
Hypothetical | ||||||||||||||||
| Class P | $ | 1,000.00 | $ | 1,020.94 | 0.80 | % | $ | 4.03 | ||||||||
| PL Mid-Cap Growth Fund | ||||||||||||||||
Actual Fund Return | ||||||||||||||||
| Class P | $ | 1,000.00 | $ | 1,209.60 | 0.85 | % | $ | 4.68 | ||||||||
Hypothetical | ||||||||||||||||
| Class P | $ | 1,000.00 | $ | 1,020.69 | 0.85 | % | $ | 4.28 | ||||||||
| PL Small-Cap Growth Fund | ||||||||||||||||
Actual Fund Return | ||||||||||||||||
| Class P | $ | 1,000.00 | $ | 1,240.90 | 0.75 | % | $ | 4.19 | ||||||||
Hypothetical | ||||||||||||||||
| Class P | $ | 1,000.00 | $ | 1,021.19 | 0.75 | % | $ | 3.78 | ||||||||
| PL Small-Cap Value Fund | ||||||||||||||||
Actual Fund Return | ||||||||||||||||
| Class P | $ | 1,000.00 | $ | 1,210.50 | 0.90 | % | $ | 4.96 | ||||||||
Hypothetical | ||||||||||||||||
| Class P | $ | 1,000.00 | $ | 1,020.44 | 0.90 | % | $ | 4.53 | ||||||||
| PL Real Estate Fund | ||||||||||||||||
Actual Fund Return | ||||||||||||||||
| Class P | $ | 1,000.00 | $ | 1,146.00 | 1.05 | % | $ | 5.62 | ||||||||
Hypothetical | ||||||||||||||||
| Class P | $ | 1,000.00 | $ | 1,019.70 | 1.05 | % | $ | 5.29 | ||||||||
| PL Emerging Markets Fund | ||||||||||||||||
Actual Fund Return | ||||||||||||||||
| Class P | $ | 1,000.00 | $ | 1,082.30 | 0.95 | % | $ | 4.93 | ||||||||
Hypothetical | ||||||||||||||||
| Class P | $ | 1,000.00 | $ | 1,020.19 | 0.95 | % | $ | 4.78 | ||||||||
| PL International Large-Cap Fund | ||||||||||||||||
Actual Fund Return | ||||||||||||||||
| Class P | $ | 1,000.00 | $ | 1,106.40 | 1.00 | % | $ | 5.25 | ||||||||
Hypothetical | ||||||||||||||||
| Class P | $ | 1,000.00 | $ | 1,019.95 | 1.00 | % | $ | 5.04 | ||||||||
| PL International Value Fund | ||||||||||||||||
Actual Fund Return | ||||||||||||||||
| Class P | $ | 1,000.00 | $ | 1,088.10 | 0.80 | % | $ | 4.16 | ||||||||
Hypothetical | ||||||||||||||||
| Class P | $ | 1,000.00 | $ | 1,020.94 | 0.80 | % | $ | 4.03 | ||||||||
| (1) | Expenses paid during the period are equal to the fund’s annualized expense ratio (shown in table above), multiplied by the average account value over the period, multiplied by the number of days in the most recent fiscal half-year or applicable period, then divided by 365 days. |
F-2
The business and affairs of the Pacific Life Funds (the “Trust”) are managed under the direction of the Board of Trustees under the Pacific Life Funds’ Declaration of Trust. Information pertaining to the trustees and officers of the Trust is set forth below, effective April 1, 2011. Trustees who are not deemed to be “interested persons” of the Trust, as defined in the 1940 Act, are referred to as “Independent Trustees.” Certain trustees and officers are deemed to be “interested persons” of the Trust and thus are referred to as “Interested Persons”, because of their positions with Pacific Life Insurance Company (“Pacific Life”) and Pacific Life Fund Advisors LLC, a wholly-owned subsidiary of Pacific Life. The Trust’s Statement of Additional Information includes additional information about the trustees. For information on availability of the Trust’s Statement of Additional Information, refer to the WHERE TO GO FOR MORE INFORMATION section of this report.
The address of each trustee and officer is c/o Pacific Life Funds, 700 Newport Center Drive, Newport Beach, CA 92660.
| Number of | ||||||||
| Position(s) with | Current Directorship(s) Held and Principal Occupation(s) | Portfolios in | ||||||
| the Fund and | (and certain additional occupation information) | Fund Complex | ||||||
| Name and Age | Length of Time Served* | During Past 5 Years | Overseen** | |||||
INDEPENDENT TRUSTEES | ||||||||
| Frederick L. Blackmon Year of birth 1952 | Trustee since 9/13/05 | Trustee (1/05 to present) of Pacific Select Fund; Director (2005 to present) of Trustmark Mutual Holding Company; Former Executive Vice President and Chief Financial Officer (1995 to 2003) of Zurich Life and has been retired since that time; Executive Vice President and Chief Financial Officer (1989 to 1995) of Alexander Hamilton Life Insurance Company (subsidiary of Household International); Member of Board of Trustees (2010 to present) of Cranbrook Educational Community; Former Member of Board of Governors (1994 to 1999) of Cranbrook Schools; and Former Member, Board of Regents (1993 to 1996), Eastern Michigan University. | 68 | |||||
| Gale K. Caruso Year of birth 1957 | Trustee since 1/01/06 | Trustee (1/06 to present) of Pacific Select Fund; Former Member of the Board of Directors (2005 to 2009) of LandAmerica Financial Group, Inc.; Former President and Chief Executive Officer (1999 to 2003) of Zurich Life; Former Chairman, President and Chief Executive Officer of Scudder Canada Investor Services, Ltd. and Managing Director of Scudder Kemper Investments; Former Member of the Advisory Council of the Trust for Public Land in Maine; Member of the Board of Directors of Make-A-Wish of Maine; and Former Member, Board of Directors of the Illinois Life Insurance Council. | 68 | |||||
| Lucie H. Moore Year of birth 1956 | Trustee since 6/13/01 | Trustee (10/98 to present) of Pacific Select Fund; Former Partner (1984 to 1994) with Gibson, Dunn & Crutcher (Law); Member of the Board of Trustees (2007 to present) of Sage Hill School; Former Member (2000 to 2009) of the Board of Trustees of The Pegasus School; Member of the Board of Directors (2005 to present) of HomeWord; and Former Member of the Advisory Board (1993 to 2004) of Court Appointed Special Advocates (CASA) of Orange County. | 68 | |||||
| Nooruddin (Rudy) S. Veerjee Year of birth 1958 | Trustee since 9/13/05 | Trustee (1/05 to present) of Pacific Select Fund; Former President (1997 to 2000) of Transamerica Insurance and Investment Group and has been retired since that time; Former President (1994 to 1997) of Transamerica Asset Management; Former Chairman and Chief Executive Officer (1995 to 2000) of Transamerica Premier Funds (Mutual Fund); and Former Director (1994 to 2000) of various Transamerica Life Companies. | 68 | |||||
| G. Thomas Willis Year of birth 1942 | Trustee since 2/24/04 | Trustee (11/03 to present) of Pacific Select Fund; Certified Public Accountant in California (1967 to present); Audit Partner (1976 to 2002) of PricewaterhouseCoopers LLP, (Accounting and Auditing) and has been retired since that time. | 68 | |||||
See explanation of symbols on page F-6
F-3
PACIFIC LIFE FUNDS
TRUSTEES AND OFFICERS INFORMATION (Continued)
(Unaudited)
TRUSTEES AND OFFICERS INFORMATION (Continued)
(Unaudited)
| Number of | ||||||||
| Position(s) with | Current Directorship(s) Held and Principal Occupation(s) | Portfolios in | ||||||
| the Fund and | (and certain additional occupation information) | Fund Complex | ||||||
| Name and Age | Length of Time Served* | During Past 5 Years | Overseen** | |||||
INTERESTED PERSONS | ||||||||
| James T. Morris Year of birth 1960 | Chairman of the Board and Trustee since 1/11/07, (Chief Executive Officer 1/11/07 to 12/31/09, President 11/14/05 to 1/10/07 and Executive Vice President 6/05 to 11/05) | Director (4/07 to present), Chairman (5/08 to present), President and Chief Executive Officer (4/07 to present), Chief Operating Officer (1/06 to 4/07), Executive Vice President and Chief Insurance Officer (7/05 to 1/06) of Pacific Mutual Holding Company and Pacific LifeCorp; Director (4/07 to present), Chairman (5/08 to present), President and Chief Executive Officer (4/07 to present), Chief Operating Officer (1/06 to 4/07), Chief Insurance Officer (4/05 to 1/06), Executive Vice President (1/02 to 1/06), Senior Vice President (4/96 to 1/02), and Vice President (4/90 to 4/96) of Pacific Life; President and Chief Executive Officer (5/07 to present) of Pacific Life Fund Advisors LLC; Director (4/06 to present), Chairman (5/08 to present), President and Chief Executive Officer (4/07 to present), Chief Operating Officer (1/06 to 4/07), Chief Insurance Officer (4/05 to 1/06), Executive Vice President (1/02 to 1/06), and Senior Vice President (8/99 to 1/02) of Pacific Life & Annuity Company; and similar positions with other subsidiaries and affiliates of Pacific Life; and Chairman of the Board and Trustee (1/07 to present), Chief Executive Officer (1/07 to 12/09),President (11/05 to 1/07) and Executive Vice President (6/05 to 11/05) of Pacific Select Fund. | 68 | |||||
| Mary Ann Brown Year of birth 1951 | Chief Executive Officer since 1/01/10, (President 1/11/07 to 12/31/09, Executive Vice President 6/20/06 to 1/10/07) | Executive Vice President (4/10 to present) and Senior Vice President (5/06 to 4/10) of Pacific LifeCorp; Executive Vice President (4/10 to present) and Senior Vice President (3/05 to 4/10) of Pacific Life; Trustee (9/05 to present), Pacific Life Employees Retirement Plan; Executive Vice President (4/10 to present) and Senior Vice President (5/07 to 4/10) of Pacific Life Fund Advisors LLC; Executive Vice President (4/10 to present) and Senior Vice President (6/08 to 4/10) of Pacific Life Re Holdings LLC; Director (6/08 to present) Executive Vice President (4/10 to present) and Senior Vice President (6/08 to 4/10) of Pacific Life Re Holdings Limited; current and prior Board Member and Vice Chairman (8/01 to present) and Chairman (7/04 to 10/05) of National Association of Variable Annuities; Senior Vice President (7/03 to 11/03), of Finance, New York Life Insurance Company; MetLife, Inc. (12/98 to 6/03), Senior Vice President and Head of Individual Business Product Management (12/98 to 7/02) responsibilities included: President of New England Products and Services; Chairman, Security First Group (later MetLife Investors); Chairman, Chief Executive Officer and President, New England Pension and Annuity Company; Board Member, New England Zenith Funds; Board Member, Reinsurance Group of America, Chairman and Chief Executive Officer of Exeter Reinsurance Company, Ltd.; Chairman and Chief Executive Officer of Missouri Reinsurance Company, Ltd; Chairman of Underwriting Policy and Rate Setting Committees; Senior Vice President and Chief Actuary (7/02 to 6/03), of MetLife, Inc.; Director (12/05 to present), Executive Vice President (4/10 to present) and Senior Vice President (12/05 to 4/10) of Pacific Alliance Reinsurance Ltd; Director (10/07 to present), Executive Vice President (6/10 to present) and Senior Vice President (10/07 to 6/10) of Pacific Alliance Reinsurance Company of Vermont; and Chief Executive Officer (1/10 to present), President (1/07 to 12/09) and Executive Vice President (6/06 to 1/07) of Pacific Select Fund. | 68 | |||||
See explanation of symbols on page F-6
F-4
PACIFIC LIFE FUNDS
TRUSTEES AND OFFICERS INFORMATION (Continued)
(Unaudited)
TRUSTEES AND OFFICERS INFORMATION (Continued)
(Unaudited)
| Number of | ||||||||
| Position(s) with | Current Directorship(s) Held and Principal Occupation(s) | Portfolios in | ||||||
| the Fund and | (and certain additional occupation information) | Fund Complex | ||||||
| Name and Age | Length of Time Served* | During Past 5 Years | Overseen** | |||||
| INTERESTED PERSONS (Continued) | ||||||||
| Robin S. Yonis Year of birth 1954 | Vice President and General Counsel since 6/13/01 | Vice President, Fund Advisor General Counsel, and Assistant Secretary (5/07 to present) of Pacific Life Fund Advisors LLC; Vice President and Counsel (4/04 to present), Assistant Vice President and Investment Counsel (11/93 to 4/04) of Pacific Life; Vice President and Investment Counsel (4/04 to 9/09), Assistant Vice President and Investment Counsel (8/99 to 4/04) of Pacific Life & Annuity Company; and Vice President and General Counsel (4/05 to present) of Pacific Select Fund. | 68 | |||||
| Brian D. Klemens Year of birth 1956 | Vice President and Treasurer since 6/13/01 | Vice President and Controller (10/07 to present) and Vice President and Treasurer (6/99 to 10/07) of Pacific Mutual Holding Company and Pacific LifeCorp; Vice President and Controller (10/07 to present) and Vice President and Treasurer (12/98 to 10/07) of Pacific Life; Vice President and Controller (10/07 to present) and Vice President and Treasurer (5/07 to 10/07) of Pacific Life Fund Advisors LLC; and similar positions with other subsidiaries and affiliates of Pacific Life; and Vice President and Treasurer (4/96 to present) of Pacific Select Fund. | 68 | |||||
| Sharon E. Pacheco Year of birth 1957 | Vice President and Chief Compliance Officer since 6/04/04 | Vice President and Chief Compliance Officer (11/03 to present) of Pacific Mutual Holding Company and Pacific LifeCorp; Vice President (2/00 to present) and Chief Compliance Officer (1/03 to present) and Assistant Vice President (11/97 to 2/00) of Pacific Life; Vice President (4/00 to present), Chief Compliance Officer (1/03 to present), and Assistant Vice President (8/99 to 4/00) of Pacific Life & Annuity Company; Vice President and Chief Compliance Officer (5/07 to present) of Pacific Life Fund Advisors LLC; and Vice President and Chief Compliance Officer (6/04 to present) of Pacific Select Fund | 68 | |||||
| Eddie Tung Year of birth 1957 | Vice President and Assistant Treasurer since 11/14/05 | Assistant Vice President (4/03 to present) and Director (Variable Products Accounting) (4/00 to 4/03) of Pacific Life; Assistant Vice President (4/10 to present) of Pacific Life & Annuity Company; Assistant Vice President (5/07 to present) of Pacific Life Fund Advisors LLC; and Assistant Vice President and Assistant Treasurer (11/05 to present) of Pacific Select Fund. | 68 | |||||
| Howard T. Hirakawa Year of birth 1962 | Vice President since 6/20/06 | Vice President (5/07 to present) of Pacific Life Fund Advisors LLC; Vice President (4/05 to present), Assistant Vice President (4/00 to 4/05) and Director (Annuities & Mutual Funds) (5/98 to 4/00) of Pacific Life; Vice President (4/05 to 9/09) of Pacific Life & Annuity Company; and Vice President (6/06 to present) of Pacific Select Fund. | 68 | |||||
| Jane M. Guon Year of birth 1964 | Vice President since 1/01/11 and Secretary since 1/01/11 | Vice President and Secretary (1/11 to present) and Assistant Vice President (4/06 to 12/10) and Assistant Secretary (6/98 to 12/10) of Pacific Mutual Holding Company and Pacific LifeCorp; Director, Vice President, and Secretary (1/11 to present) and Assistant Vice President (4/06 to 12/10) and Assistant Secretary (2/95 to 12/10) of Pacific Life, Vice President and Secretary (1/11 to present) and Assistant Vice President and Assistant Secretary (05/07 to 12/10) of Pacific Life Fund Advisors LLC ; and similar positions with other subsidiaries of Pacific Life; and Vice President (1/11 to present) and Secretary (1/11 to present) of Pacific Select Fund. | 68 | |||||
See explanation of symbols on page F-6
F-5
PACIFIC LIFE FUNDS
TRUSTEES AND OFFICERS INFORMATION (Continued)
(Unaudited)
TRUSTEES AND OFFICERS INFORMATION (Continued)
(Unaudited)
| Number of | ||||||
| Position(s) with | Current Directorship(s) Held and Principal Occupation(s) | Portfolios in | ||||
| the Fund and | (and certain additional occupation information) | Fund Complex | ||||
| Name and Age | Length of Time Served* | During Past 5 Years | Overseen** | |||
| INTERESTED PERSONS (Continued) | ||||||
| Laurene E. MacElwee | Vice President since 4/04/05 | Vice President (4/11 to present), Assistant | 68 | |||
| Year of birth 1966 | and Assistant Secretary | Secretary (5/07 to present), and Assistant | ||||
| since 6/13/01 | Vice President (5/07 to 3/11) of Pacific Life | |||||
| Fund Advisors LLC; Vice President (4/11 to | ||||||
| present); Assistant Vice President (4/02 to | ||||||
| 3/11) and Director (Variable Products & Fund | ||||||
| Compliance) (4/00 to 4/02) of Pacific Life; | ||||||
| and Assistant Vice President and Assistant | ||||||
| Secretary (4/05 to present) of Pacific Select | ||||||
| Fund. | ||||||
| Carleton J. Muench | Assistant Vice President | Assistant Vice President (5/07 to present) of | 68 | |||
| Year of birth 1973 | since 11/30/06 | Pacific Life Fund Advisors LLC; Assistant Vice | ||||
| President (10/06 to present) of Pacific Life; | ||||||
| Director of Research (5/05 to 9/06) and Senior | ||||||
| Investment Analyst (10/03 to 4/05) of Mason | ||||||
| Investment Advisory Services, Inc.; Investment | ||||||
| Analyst (2/01 to 9/02), Due Diligence Analyst | ||||||
| (1/00 to 1/01) and Performance Analyst (10/98 | ||||||
| to 12/99) of Manulife Financial; and Vice | ||||||
| President (11/06 to present) of Pacific Select | ||||||
| Fund. | ||||||
| * | A trustee serves until he or she resigns, retires, or his or her successor is elected and qualified. | |
| ** | As of March 31, 2011, the “Fund Complex” consisted of Pacific Life Funds (24 funds) and Pacific Select Fund (44 portfolios) |
F-6
PACIFIC LIFE FUNDS
APPROVAL OF INVESTMENT ADVISORY AGREEMENT
AND FUND MANAGEMENT AGREEMENTS
(Unaudited)
AND FUND MANAGEMENT AGREEMENTS
(Unaudited)
The Board of Trustees (the “Trustees” or “Board”) of Pacific Life Funds (the “Trust”) oversees the management of each of the separate funds of the Trust (each a “Fund” and collectively, the “Funds”), and, as required by Section 15(c) of the Investment Company Act of 1940, as amended (the “1940 Act”), initially approves, and determines annually whether to renew, the investment advisory agreement (the “Advisory Agreement”) with Pacific Life Fund Advisors LLC (“PLFA”) and each Fund management agreement (the “Fund Management Agreements,” together with the Advisory Agreement, the “Agreements”) with the various sub-advisers (“Fund Managers”). PLFA serves as the investment adviser for all of the Funds and directly manages the five Portfolio Optimization Funds, and also directly manages the PL Money Market Fund and PL Income Fund, which commenced operations on December 31, 2010, under the name “Pacific Asset Management.” For all other Funds, PLFA has retained other firms to serve as Fund Managers under PLFA’s supervision. The Board, including all of the Trustees who are not “interested persons,” as that term is defined in the 1940 Act (“Independent Trustees”), last renewed the Agreements at an in-person meeting of the Trustees held on December 7, 2010.* The discussion of the Board’s approval or renewal of the Agreements with respect to the Portfolio Optimization Funds, the PL Money Market Fund and the PL Income Fund is included in a separate Annual Report dated March 31, 2011.
Also, as discussed below, at an in-person meeting on January 11, 2011, the Board, including all of the Independent Trustees, approved a new Fund Management Agreement effective approximately June 1, 2011 with respect to the PL Short Duration Bond Fund.
At the December 7, 2010 meeting and other meetings, the Trustees considered information (both written and oral) provided to assist them in their review of the Agreements and made assessments with respect to each Agreement. The Board also requested, received and reviewed written materials from PLFA and each Fund Manager submitted in response to requests from the Independent Trustees and supporting materials relating to those questions and responses. In addition, the Board received in-person presentations about the Funds throughout the year, and the Independent Trustees were advised by independent legal counsel with respect to these and other relevant matters. The Board reviewed a variety of factors and considered a significant amount of information, including information received on an ongoing basis at Board and committee meetings, including reports on Fund performance, expenses, fee comparisons, investment advisory, compliance, and other services provided to the Funds by PLFA and the Fund Managers. The Board also reviewed financial and profitability information regarding PLFA and the Fund Managers, and information regarding the organization and operations of each entity, such as their compliance monitoring, portfolio trading and brokerage practices and the personnel providing investment management and administrative services to each Fund. The Board reviewed data provided by PLFA that was gathered from various independent providers of investment company data, to provide the Board with information concerning the Funds’ investment performance, management fees and expense information. Additionally, the Independent Trustees retained an independent consultant (“Independent Consultant”) to assist the Trustees with their analysis and to provide other relevant information. In connection with their analysis, the Independent Consultant utilized and provided the Independent Trustees with data obtained from independent sources.
The Trustees’ determinations were made on the basis of each Trustee’s business judgment after consideration of all the information presented. In reviewing the materials presented and in considering the information in the management presentations, the Trustees did not identify any single issue or particular information that, in isolation, would be a controlling factor in making a final decision regarding the proposed Agreements. Individual Trustees may have given different weights to certain factors and assigned various degrees of materiality to information received in connection with the approval process. The following summary describes the most important, but not all, of the factors considered by the Trustees in approving the Agreements, and in the case of the Independent Trustees, certain factors were considered in light of the legal advice furnished to them by independent legal counsel and information from the Independent Consultant they retained. In reviewing these matters, the Trustees considered each Fund separately. This discussion is not intended to be all-inclusive.
Annual Consideration and Approval of Investment Advisory and Fund Management Agreements
In evaluating the Advisory Agreement and each Fund Management Agreement, the Board, including the Independent Trustees, considered the following factors, among others:
1. Nature, Extent and Quality of Services
PLFA, its personnel and its resources. The Trustees considered the depth and quality of PLFA’s investment management process, including its monitoring and oversight of the Fund Managers; the experience, capability and integrity of its senior management and other personnel; the low turnover rates of its key personnel; and the overall financial strength and stability of its organization. The Trustees considered the high quality of the products and services provided by PLFA and its affiliates, such as the many educational services and tools to assist intermediaries in effectively understanding and meeting shareholder needs.
The Trustees also considered that PLFA’s investment, legal and compliance professionals have access to and utilize a variety of resources and systems relating to investment management, compliance, trading, performance and fund accounting. The Trustees further considered PLFA’s continuing need to attract and retain qualified personnel and to maintain and enhance its resources and systems.
The Trustees considered PLFA’s continued development and use of analytical tools for assessing performance of the Fund Managers, conducting an attribution analysis on performance and reporting on performance to the Trustees. The Trustees noted that PLFA appeared to have implemented effective controls and monitoring of investment style consistency by Fund Managers and for analyzing the use of derivatives by Fund Managers.
| * | At the December 7, 2010 meeting, the Board did not consider the continuance of the Fund Management Agreements relating to the PL International Value, PL Floating Rate Loan and PL Comstock Funds, as those agreement were not up for renewal at that time. |
F-7
PACIFIC LIFE FUNDS
APPROVAL OF INVESTMENT ADVISORY AGREEMENT
AND FUND MANAGEMENT AGREEMENTS (Continued)
(Unaudited)
APPROVAL OF INVESTMENT ADVISORY AGREEMENT
AND FUND MANAGEMENT AGREEMENTS (Continued)
(Unaudited)
The Trustees considered PLFA’s compliance monitoring of the Fund Managers, and its commitment to those programs; PLFA’s efforts to keep the Trustees informed about the Fund Managers; PLFA’s oversight of other service providers to the Funds; and its attention to matters that may involve conflicts of interest with each Fund. In this regard, the Trustees reviewed information throughout the year on PLFA’s compliance policies and procedures, its compliance history, and reports from the Trust’s Chief Compliance Officer (“CCO”) on compliance by PLFA, the Fund Managers, and the Funds with applicable laws and regulations. The Trustees additionally reviewed information on any responses by PLFA to regulatory and compliance developments throughout the year.
Fund Management — PLFA and the Fund Managers. The Trustees considered various materials relating to PLFA and the Fund Managers, including copies of each existing Advisory Agreement and Fund Management Agreement; copies of the Form ADV for each Fund Manager; financial information relating to PLFA and each Fund Manager; and other information deemed relevant to the Trustees’ evaluation of PLFA and each Fund Manager, including qualitative assessments from senior management of PLFA.
The Trustees considered the benefits to shareholders of retaining PLFA and each Fund Manager and continuing the Advisory Agreement and Fund Management Agreements, particularly in light of the nature, extent, and quality of the services that have been provided by the Fund Managers. The Trustees considered the quality of the management services which have benefited and should continue to benefit the Funds and their shareholders, the organizational depth and resources of PLFA and the Fund Managers, including the background and experience of PLFA and each of the Fund Manager’s management and the expertise of PLFA and each Fund Manager’s fund management team, as well as the investment methodology used by PLFA and the Fund Manager. The Trustees also considered that the CCO had in place a systematic process for periodically reviewing PLFA’s and each Fund Manager’s written compliance policies and procedures, including the assessment of PLFA and each Fund Manager’s compliance program as required under Rule 38a-1 of the 1940 Act and PLFA’s and each Fund Manager’s code of ethics. The Trustees also considered that PLFA and each Fund Manager agreed to cooperate with the CCO in reviewing its compliance operations.
In making their assessments, the Trustees considered that PLFA has historically exercised diligence in monitoring the performance of the Fund Managers and has recommended and taken measures to attempt to remedy relative underperformance by a Fund when PLFA and the Trustees believed it to be appropriate.
The Board concluded that it was satisfied with the nature, extent and quality of the investment management services provided by PLFA and the Fund Managers.
2. Investment Results
The Trustees considered the investment results of each Fund in light of its objective and market conditions over the past year. The Trustees compared each Fund’s total returns with both the total returns of appropriate groups of peer funds, based on information provided by PLFA using data from independent sources, and with one or more relevant benchmark indices. The Independent Trustees also considered information provided by the Independent Consultant who provided a presentation and analysis to the Trustees regarding peer group performance utilizing data from independent sources. The information provided to the Trustees included each Fund’s performance record for the prior five calendar years and three-month, year-to-date, one-, three-, five-year and since inception periods, as applicable. In reviewing the performance data drawn from independent sources, as well as the performance of the respective benchmark indices, the Trustees noted that some Funds had outperformed their peer groups over certain periods and/or exceeded their respective benchmark indices while other Funds had underperformed their peer groups over certain periods and/or trailed their respective benchmark indices. The Trustees discussed with PLFA the fact that certain periods of underperformance may be transitory while other periods of underperformance may be reflective of broader issues which may warrant consideration of corrective action. The Trustees discussed these Funds with representatives of PLFA, including an assessment of the approach used by the Fund Managers as well as oversight and monitoring by PLFA as the investment adviser, to gain an understanding of underperformance and to assess whether any actions would be appropriate.
The Trustees also reviewed the monitoring of the Fund Managers’ investment results by PLFA, including PLFA’s historical practice of recommending to the Trustees the use of a new manager if performance lagged and could not be improved within a reasonable timeframe. The Trustees noted that many of the best independent investment advisers consistently compete to be considered to provide fund management services for the Funds. Generally, the Trustees noted that there continues to be a good record of well-managed Funds that work well in the Portfolio Optimization Funds, which are asset allocation funds. The Trustees also noted that the Funds continue to deliver the investment styles as disclosed to shareholders. The Trustees further noted that only the Portfolio Optimization Funds and the PL Money Market Fund are open to new investors.
The Board concluded that PLFA continues to have a strong record of effectively managing a multi-manager fund group designed to give shareholders a reasonable array of choices through which to implement their investment programs. The Board further concluded that PLFA was implementing each Fund’s investment objective through the selection of Fund Managers and that PLFA’s record in managing each Fund indicates that its continued management as well as the continuation of the respective Fund Management Agreements will benefit each Fund and its shareholders.
F-8
PACIFIC LIFE FUNDS
APPROVAL OF INVESTMENT ADVISORY AGREEMENT
AND FUND MANAGEMENT AGREEMENTS (Continued)
(Unaudited)
APPROVAL OF INVESTMENT ADVISORY AGREEMENT
AND FUND MANAGEMENT AGREEMENTS (Continued)
(Unaudited)
3. Advisory Fees and Total Expense Ratios
The Trustees requested, received and reviewed information from PLFA relating to the advisory fees and the sub-advisory fees and total operating expense ratios for each of the Funds. The Independent Trustees also requested and reviewed information from the Independent Consultant along with their analysis of advisory fees and certain other expenses. The Trustees reviewed the advisory fees and total operating expense ratios of each Fund and compared such amounts with the average fee and expense levels of other funds in applicable peer fund groups. During their review, the Trustees noted that all of the Funds were subject to expense limits agreed to by PLFA. The Trustees also reviewed written materials prepared by PLFA based on peer fund group information retrieved from the independent sources.
The Trustees also considered information from the Fund Managers regarding the comparative sub-advisory fees charged under other investment advisory contracts, such as contracts of each Fund Manager with other registered investment companies or other types of clients. The Trustees noted that in many cases there were differences in the level of services provided to the Funds by the Fund Managers and that the level of services provided by these Fund Managers on these other accounts were due to the different nature of the accounts or because there were other reasons to support the difference in fees, such as an affiliation between the Fund Manager and the account. These differences often explained variations in fee schedules. The Trustees were mindful that, with regard to the sub-advised Funds, the fee rates were the result of arms’-length negotiations between PLFA and the Fund Managers, and that any sub-advisory fees are paid by PLFA and are not paid directly by a Fund.
The Trustees observed that certain of the Funds’ contractual advisory fees were higher than the average of their respective Morningstar category while others were either lower or approximately equal to these averages.
The Board concluded that the advisory fees and total expenses of each Fund were fair and reasonable.
4. Costs, Level of Profits and Economies of Scale
The Trustees reviewed information provided by PLFA and the Fund Managers regarding PLFA’s costs of sponsoring the Funds and information regarding the profitability of PLFA and the Fund Managers.
PLFA’s and the Fund Managers’ Costs and Profitability. The Trustees noted that, based on the data available, PLFA appears to be providing products that are competitively priced with other funds, especially multi-manager funds. The Board considered the costs of the services to be provided and the overall financial results for PLFA and its affiliates from the management of the Trust, both including and excluding distribution costs. The Board noted that the Funds are projected to produce some profits for PLFA for the first time for the year ended December 31, 2010, and considered that the Funds have not been profitable to PLFA and its affiliates in the past, due in part to the relatively low level of assets. The Board also noted the projected profitability of the Funds to PLFA in the near-term and noted that PLFA and its affiliates continue to subsidize and reimburse expenses for many of the Funds.
The Trustees considered that the Funds are well managed, and provide shareholders with a wide choice of premier Fund Managers and asset allocation services at reasonable fee levels. The Board noted that PLFA had taken steps to ensure that shareholders benefit by negotiating favorable terms with service providers.
The Trustees also reviewed information provided regarding the structure and manner in which PLFA’s and the Fund Managers’ investment professionals were compensated and their respective views of the relationship of such compensation to the attraction and retention of quality personnel. The Trustees considered PLFA’s willingness to invest in technology, infrastructure, and staff to reinforce and offer new services and to accommodate changing regulatory requirements.
With respect to the Fund Managers, the Trustees noted that it was difficult to accurately determine or evaluate the profitability of the Fund Management Agreements to the Fund Managers because of, among other things, the differences in the types of information provided by the Fund Managers, the fact that many Fund Managers manage substantial assets other than the Funds and, further, that any such assessment would involve assumptions regarding the Fund Managers’ expense allocation policies, capital structure, cost of capital, business mix and other factors.
Accordingly, in the case of the Fund Managers, the Trustees gave less weight to profitability considerations and did not view that this data was as important as other data given the arms’-length nature of the relationship between PLFA and such Fund Managers with respect to the negotiation of fund management fees.
Economies of Scale. The Trustees noted and considered the extent to which economies of scale are increasingly realized as each Fund grows and whether advisory fee levels reflect economies of scale if the Funds grow in size. The Trustees noted the Funds have relatively small asset levels that do not currently produce significant economies of scale. The Trustees noted, however, PLFA’s commitment to competitive total expenses of the Funds through expense limitation agreements, its consistent reinvestment in the business in the form of improvements in technology, product innovations, and customer service, and the various expense caps the Funds have been subject to since their inception.
The Board concluded that the Funds’ cost structures were reasonable in light of the Trust’s size.
F-9
PACIFIC LIFE FUNDS
APPROVAL OF INVESTMENT ADVISORY AGREEMENT
AND FUND MANAGEMENT AGREEMENTS (Continued)
(Unaudited)
APPROVAL OF INVESTMENT ADVISORY AGREEMENT
AND FUND MANAGEMENT AGREEMENTS (Continued)
(Unaudited)
5. Ancillary Benefits
The Trustees requested and received from PLFA and the Fund Managers information concerning other benefits received by PLFA, the Fund Managers, and their affiliates as a result of their respective relationship with the Funds, including information on various service agreements with PLFA and an affiliate and reimbursement at an approximate cost basis for support services in the case of PLFA and an affiliate, as well as commissions paid to broker-dealers affiliated with certain Fund Managers and the use of soft-dollars by certain of the Fund Managers for research. The Trustees also considered information concerning other significant economic relations between the Fund Managers and their affiliates with PLFA and its affiliates and noted PLFA’s processes and procedures to identify and disclose such relationships to the Board. The Trustees also considered information provided to them as to how conflicts of interest that may arise from these relationships are managed.
The Board concluded that such benefits were consistent with those generally derived by investment advisers to mutual funds or were otherwise not unusual.
6. Conclusion
Based on their review, including their consideration of each of the factors referred to above, and assisted by the advice of the Independent Consultant and independent counsel to the Independent Trustees, the Board, including the Independent Trustees, concluded that the Advisory Agreement and each applicable Fund Management Agreement are fair and reasonable with respect to each Fund and its shareholders, and that the renewal of the Advisory Agreement and each applicable Fund Management Agreement would be in the best interests of the Funds and their shareholders. No single factor was determinative of the Board’s decision to approve the Advisory Agreement and each applicable Fund Management Agreement, but rather the Board based its determination on the total mix of information available to it.
Other Fund Management Agreement Approval
Additionally, at an in-person meeting on January 11, 2011, the Board, including all of the Independent Trustees, appointed T. Rowe Price Associates, Inc. (“T. Rowe Price”) as the new Fund Manager and approved, effective July 1, 2011, a new Fund Management Agreement with T. Rowe Price with respect to the PL Short Duration Bond Fund (the “T. Rowe Price Fund Management Agreement”). In connection with this matter, also at the January 11, 2011, meeting, the Board terminated the Fund Management Agreement for the Fund with the prior fund manager upon the effectiveness of the T. Rowe Price Fund Management Agreement.
In evaluating the T. Rowe Price Fund Management Agreement, the Board, including the Independent Trustees, considered the factors described below. Additionally, the Board considered the various screening processes that PLFA utilizes in identifying a proposed new fund manager, including screening for qualified firms through the use of quantitative data and information gathered from independent third-party databases, as well as the use of due diligence conducted by PLFA on the investment resources and personnel of a fund manager and an assessment of the investment strategies used by a fund manager. In addition, the Board reviewed the specific criteria and information evaluated by PLFA during the selection process of T. Rowe Price, including information about other firms considered by PLFA, and PLFA’s analysis in reaching its conclusion to recommend T. Rowe Price as the new Fund Manager.
In evaluating the T. Rowe Price Fund Management Agreement, the Board, including the Independent Trustees, considered the following factors, among others:
1. Nature, Extent and Quality of Services to be Provided
The Trustees considered the benefits to shareholders of retaining T. Rowe Price as the Fund Manager, particularly in light of the nature, extent, and quality of the services expected to be provided by T. Rowe Price. In this regard, the Trustees considered various materials relating to the proposed Fund Manager, including copies of the proposed T. Rowe Price Fund Management Agreement; copies of the Form ADV for T. Rowe Price; financial information relating to T. Rowe Price; and other information deemed relevant to the Trustees’ evaluation of T. Rowe Price, including qualitative assessments from senior management of PLFA.
The Trustees considered that under the T. Rowe Price Fund Management Agreement, T. Rowe Price would be responsible for providing the investment management services for the Fund’s assets, including investment research, advice and supervision and determining which securities would be purchased or sold by the Fund. The Trustees considered the quality of the management services expected to be provided to the PL Short Duration Bond Fund over both the short- and long-term, the organizational depth and resources of T. Rowe Price, including the background and experience of T. Rowe Price’s management and the expertise of the portfolio management team, as well as the investment strategies, processes and philosophy to be used for the investment strategy.
In addition, the Trustees considered that the Trust’s Chief Compliance Officer (“CCO”) had reviewed the written compliance policies and procedures of T. Rowe Price, including the assessment of its compliance programs as required under Rule 38a-1 of the 1940 Act and its code of ethics, prior to the effectiveness of the new T. Rowe Price Fund Management Agreement.
In making these assessments, the Trustees took note of the extensive due diligence PLFA conducted on T. Rowe Price and were aided by the assessments and recommendations of PLFA and the in-person presentation and materials provided by T. Rowe Price. The Trustees
F-10
PACIFIC LIFE FUNDS
APPROVAL OF INVESTMENT ADVISORY AGREEMENT
AND FUND MANAGEMENT AGREEMENTS (Continued)
(Unaudited)
APPROVAL OF INVESTMENT ADVISORY AGREEMENT
AND FUND MANAGEMENT AGREEMENTS (Continued)
(Unaudited)
considered PLFA’s efforts and process to search for and screen advisory firms that are qualified to manage a short duration bond portfolio, and the identification by PLFA of T. Rowe Price to serve as Fund Manager with regard to the day-to-day investment activities of the PL Short Duration Bond Fund. In this regard, the Trustees considered that the search criteria employed by PLFA included identification of a firm with sufficient size, market presence and resources to properly manage the Fund, the ability to manage a large pool of assets, competitive peer ranking, manager tenure and competitive sub-advisory fees.
The Trustees also considered that PLFA has historically exercised diligence in monitoring the performance of the fund managers, and has recommended and taken measures to attempt to remedy relative underperformance by a fund when PLFA and the Board believed appropriate.
The Board concluded it was satisfied with the nature, extent and quality of the investment management services anticipated to be provided to the PL Short Duration Bond Fund by T. Rowe Price under the T. Rowe Price Fund Management Agreement.
2. Performance
The Trustees considered information about the historical performance of other mutual funds (the “Comparable Performance”) advised by the same T. Rowe Price portfolio management team that would manage the PL Short Duration Bond Fund. The Trustees considered the Comparable Performance against a pertinent benchmark and against the applicable peer group for the year-to-date, one-, three-, five-, and ten-year and since inception periods as of September 30, 2010, as available. The Trustees also considered the historical performance of a mutual fund advised by the same T. Rowe Price portfolio management team against a pertinent benchmark and an applicable peer group for the previous ten calendar years as of September 30, 2010. Additionally, the Trustees considered performance information presented by PLFA for another potential fund manager. The Trustees also considered the need for T. Rowe Price to adhere to the Fund’s general investment mandate in order to function appropriately as an investment option for the PL Portfolio Optimization Funds.
The Board determined that T. Rowe Price’s performance record was acceptable.
3. Advisory and Fund Management Fees
The Trustees considered information regarding the comparative advisory fees charged under investment advisory fee contracts with regard to other mutual funds (“Accounts”) with substantially similar investment strategies. The Trustees noted that the fees to be paid to T. Rowe Price for the management of the PL Short Duration Bond Fund were different from the fees charged to other Accounts or that there were differences in the levels of services provided by T. Rowe Price to the other Accounts and that these differences were due to the nature of the Accounts or an affiliation between T. Rowe Price and the Accounts. These differences often explained the variations in fee schedules. The Trustees noted that the fee rates were the result of arms’-length negotiations between PLFA and T. Rowe Price, and that the PL Short Duration Bond Fund’s sub-advisory management fees are paid by PLFA and are not paid directly by the Fund. The Trustees also considered that the proposed sub-advisory management fee rate payable to T. Rowe Price under the T. Rowe Price Fund Management Agreement contains breakpoints and has similar effective rates at different asset levels as the sub-advisory fee schedule for the current fund manager. The Trustees considered that the advisory fee schedule would remain unchanged from the current fee schedule for the Fund. Additionally, the Trustees considered that there are certain costs associated with a manager change, but that the advisory fee rates and ongoing operating expenses paid by shareholders were not expected to increase as a result of this fund manager change. The Board concluded that the compensation payable under the T. Rowe Price Fund Management Agreement is fair and reasonable.
4. Costs, Level of Profits and Economies of Scale
The Trustees reviewed information regarding the estimated costs to T. Rowe Price of managing the PL Short Duration Bond Fund and the projected profitability of the T. Rowe Price Fund Management Agreement to T. Rowe Price to the extent practicable based on the financial information provided by T. Rowe Price. This information is only estimated because there is no actual operating history for T. Rowe Price as the Fund Manager of the PL Short Duration Bond Fund. The Trustees gave less weight to projected profitability considerations than other information provided in connection with this matter, given the arms’-length nature of the relationship between PLFA and T. Rowe Price with respect to the negotiation of sub-advisory fees, the fact that such fees are paid by PLFA and the fact that they are projections. The Board concluded that the PL Short Duration Bond Fund’s fee structure reflected in the T. Rowe Price Fund Management Agreement with respect to the PL Short Duration Bond Fund is fair and reasonable.
5. Ancillary Benefits
The Trustees received information from PLFA and T. Rowe Price concerning other benefits that may be received by T. Rowe Price and its affiliates as a result of their relationship with the PL Short Duration Bond Fund, including commissions that may be paid to broker-dealers affiliated with the Fund Manager and the anticipated use of soft dollars by the Fund Manager. In this regard, the Trustees noted that T. Rowe Price represented that it does not anticipate utilizing an affiliated broker-dealer for trades and that its fixed income client accounts generally do not participate in generating soft dollar commissions. The Trustees considered potential benefits to be derived by T. Rowe Price from its relationship with the PL Short Duration Bond Fund and that such benefits were consistent with those generally derived by sub-advisers to mutual funds or were otherwise not unusual.
F-11
PACIFIC LIFE FUNDS
APPROVAL OF INVESTMENT ADVISORY AGREEMENT
AND FUND MANAGEMENT AGREEMENTS (Continued)
(Unaudited)
APPROVAL OF INVESTMENT ADVISORY AGREEMENT
AND FUND MANAGEMENT AGREEMENTS (Continued)
(Unaudited)
6. Conclusion
Based on its review, including the consideration of each of the factors referred to above, the Board found that: (i) the compensation payable under the T. Rowe Price Fund Management Agreement is fair and reasonable; and (ii) the T. Rowe Price Fund Management Agreement is in the best interests of the PL Short Duration Bond Fund and its shareholders. No single fact was determinative of the Board’s findings, but rather the Trustees based their determination on the total mix of information available to them.
F-12
Availability of Quarterly Holdings
The Trust files Form N-Q (complete schedules of fund holdings) with the Securities and Exchange Commission (the “SEC”) for the first and third quarters of each fiscal year not later than 60 days after the close of the applicable quarter end. The Trust’s Form N-Q, (when required) is filed pursuant to applicable regulation and is available after filing (i) on the SEC’s Web site at www.sec.gov; (ii) for review and copying at the SEC’s Public Reference Room in Washington, D.C. (Information on the operation of the Public Reference Room may be obtained by calling the SEC at 1-800-SEC-0330); and (iii) on the Trust’s Webpage at www.pacificlife.com/pacificlifefunds.htm. The SEC may charge you a fee for this information.
Availability of Proxy Voting Record
By August 31 of each year, the Trust files information regarding how portfolio managers voted proxies relating to fund securities during the most recent twelve-month period ended June 30. Such information is available after filing on the Trust’s’ Website and on the SEC’s Website noted below.
Information Relating to Investments Held by the Pacific Life Funds
For complete descriptions of the various securities and other instruments held by the Trust and their risks, please see the Trust’s prospectus and Statement of Additional Information (“SAI”). For a description of bond ratings, please see the Trust’s SAI. The prospectus and SAI are available as noted below.
Availability of Proxy Voting Policies
A description of the Proxy Voting Policies and Procedures that the Trust uses to determine how to vote proxies relating to fund securities is described in the Trust’s SAI.
How to obtain Information
The Trust’s prospectus, SAI (including Proxy Voting Policies) and the Portfolio Optimization Funds’ annual report are available:
| • | On the Trust’s Website at www.pacificlife.com/pacificlifefunds.htm | ||
| • | On the SEC’s Website at www.sec.gov | ||
| • | Upon request by calling, without charge, 1-800-722-2333, 7 a.m. through 5 p.m. Pacific Time |
F-13
[THIS PAGE INTENTIONALLY LEFT BLANK]
[THIS PAGE INTENTIONALLY LEFT BLANK]
Item 2. Code of Ethics.
As of the end of the period covered by this report, the Registrant has adopted a code of ethics that applies to the Registrant’s principal executive officer, principal financial officer, principal accounting officer or controller, or persons performing similar functions. There were no substantive amendments or waivers to the Code of Ethics during the period covered by this report.
A copy of this Code of Ethics is filed as Exhibit 99 to this Form N-CSR.
Item 3. Audit Committee Financial Expert.
The Registrant’s Board has determined that G. Thomas Willis, a member of the Registrant’s Audit Committee, is an “audit committee financial expert” and “independent,” as such terms are defined in this Item. This designation does not increase the designee’s duties, obligations or liability as compared to his duties, obligations and liability as a member of the Audit Committee and of the Board; nor does it reduce the responsibility of the other Audit Committee members. There may be other individuals who, through education or experience, would qualify as “audit committee financial experts” if the Board had designated them as such. Most importantly, the Board believes each member of the Audit Committee contributes significantly to the effective oversight of the Registrant’s financial statements and condition. Mr. Willis is a retired partner of PricewaterhouseCoopers LLP.
Item 4. Principal Accountant Fees and Services.
Audit Fees
| (a) | The aggregate fees billed for the fiscal years ended March 31, 2011 and 2010 for professional services rendered by the principal accountant for the audit of the registrant’s annual financial statements or services that are normally provided by the accountant in connection with statutory and regulatory filings or engagements for those fiscal years are $378,437 and $364,450, respectively. |
Audit-Related Fees
| (b) | There were no aggregate fees billed for the fiscal years ended March 31, 2011 and 2010 for assurance and related services by the principal accountant that are reasonably related to the performance of the audit of the registrant’s financial statements and are not reported under paragraph (a) of this Item. |
Tax Fees
| (c) | The aggregate fees billed for the fiscal years ended March 31, 2011 and 2010 for professional services rendered by the principal accountant for tax compliance, tax advice, and tax planning are $79,350 and $79,350, respectively. The nature of the services comprising the fees was the review of income tax returns and excise tax. |
All Other Fees
| (d) | There were no aggregate fees billed for the fiscal years ended March 31, 2011 and 2010 for products and services provided by the principal accountant, other than the services reported in paragraphs (a) through (c) of this Item. | ||
| (e)(1) | The Audit Committee is required to pre-approve audit and non-audit services performed for the Registrant by the independent auditor as outlined below in order to assure that the provision of such services does not impair the auditor’s independence: | ||
| Pre-Approval Requirements for Services to Registrant. Before the Auditor is engaged by the Registrant to render audit related or permissible non-audit services, either: | |||
| (i) The Audit Committee shall pre-approve such engagement; or | |||
| (ii) Such engagement shall be entered into pursuant to pre-approval policies and procedures established by the Audit committee. Any such policies and procedures must (1) be detailed as to the particular service and (2) not involve any delegation of the Audit Committee’s responsibilities to the Adviser. The Audit Committee may delegate to one or more of its members the authority to grant pre-approvals. The pre-approval policies and procedures shall include the requirement that the decisions of any member to whom authority is delegated under this Section shall be presented to the full Audit Committee at its next scheduled meeting. | |||
| (iii) De Minimis Exceptions to Pre-Approval Requirements. Pre-approval for a service provided to the Registrant other than audit, review or attest services is not required if: (1) the aggregate amount of all such non-audit services provided to the Registrant constitutes not more than 5 percent of the total amount of revenues paid by the Registrant to the Auditor during the fiscal year in which the non-audit services are provided; (2) such services were not recognized by the Registrant at the time of the engagement to be non-audit services; and (3) such services are promptly brought to the attention of the Audit Committee and are approved by the Audit Committee or by one or more members of the Audit Committee to whom authority to grant such approvals has been delegated by the Audit Committee. | |||
| Pre-Approval of Non-Audit Services Provided to the Adviser and Others. The Audit Committee shall pre-approve any non-audit services proposed to be provided by the Auditor to (i) the Adviser and (ii) any entity in the investment company complex (see note 4), if the nature of the services provided relate directly to the operations or financial reporting of the Registrant. | |||
| Application of De Minimis Exception: The De Minimis exceptions set forth above apply to pre-approvals under this Section as well, except that the “total amount of revenues” calculation for this Section’s services is based on the total amount of revenues paid to the Auditor by the Registrant and any other entity that has its services approved under this Section (i.e., the Adviser or any control person). |
| (e)(2) | No services included in (b)-(d) above were approved pursuant to paragraph (c)(7)(i)(C) of Rule 2-01 of Regulation S-X. | ||
| (f) | Not applicable. | ||
| (g) | The aggregate fees billed for the years ended March 31, 2011 and 2010 by the Registrant’s principal accountant for non-audit services rendered to the Registrant, its investment adviser, and any entity controlling, controlled by, or under common control with the investment adviser that provides ongoing services to the Registrant were $84,350 and $85,765, respectively. | ||
| (h) | The Registrant’s Audit Committee has considered whether the provision of non-audit services that were rendered to the Registrant’s investment adviser, and any entity controlling, controlled by, or under common control with the investment adviser that provides ongoing services to the Registrant which were not pre-approved (not requiring pre-approval) is compatible with maintaining the principal accountant’s independence. |
Item 5. Audit Committee of Listed registrants.
Not applicable.
Item 6. Investments.
| (a) | Schedule of Investments in securities of unaffiliated issuers as of the close of the reporting period is included as part of the report to shareholders filed under Item 1 of this form. | |
| (b) | Not applicable. |
| Item 7. | Disclosure of Proxy Voting Policies and Procedures for Closed-End Management Investment Companies. |
Not applicable.
Item 8. Portfolio Managers of Closed-End Management Investment Companies.
Not applicable.
| Item 9. | Purchases of Equity Securities by Closed-End Management Investment Company and Affiliated Purchasers. |
Not applicable.
Item 10. Submission of Matters to a Vote of Security Holders.
There have been no material changes to the procedures by which shareholders may recommend nominees to the Registrant’s Board of Directors.
Item 11. Controls and Procedures.
| (a) | The Chief Executive Officer and Treasurer have concluded that Registrant’s disclosure controls and procedures (as defined in Rule 30a-3(c) under the Investment Company Act) and internal controls over financial reporting (as defined in Rule 30a-3(d) under the Investment Company Act) provide reasonable assurances that material information relating to Registrant is made known to them by the appropriate persons, based on their evaluation of these controls and procedures as of a date within 90 days of the filing of this report. | ||
| (b) | There were no changes in Registrant’s internal control over financial reporting that occurred during the second fiscal quarter of the period covered by this report that have materially affected, or are reasonably likely to materially affect, the Registrant’s internal control over financial reporting. |
Item 12. Exhibits.
| (a)(1) | Code of Ethics, subject to the disclosure of Item 2 hereof- attached hereto as Exhibit 99. | ||
| (a)(2) | Separate certifications pursuant to Rule 30a-2(a) under the Investment Company Act of 1940 (17 CFR 270.30a-2(a)) is attached hereto as Exhibit 99 CERT. | ||
| (a)(3) | Not applicable. | ||
| (b) | Certification pursuant to Rule 30a-2(b) under the Investment Company Act of 1940 (17 CFR 270.30a-2(b)) is attached hereto as Exhibit 99.906 CERT pursuant to Section 906 of the Sarbanes Oxley Act of 2002. |
Signatures
Pursuant to the requirements of the Securities Exchange Act of 1934 and the Investment Company Act of 1940, the registrant has duly caused this report to be signed on its behalf by the undersigned, thereunto duly authorized.
| Pacific Life Funds | ||||
| By: | /s/ Mary Ann Brown | |||
| Mary Ann Brown | ||||
| Chief Executive Officer | ||||
| Date: 6/6/11 | ||||
Pursuant to the requirements of the Securities Exchange Act of 1934 and the Investment Company Act of 1940, this report has been signed below by the following persons on behalf of the registrant and in the capacities and on the dates indicated.
| By: | /s/ Mary Ann Brown | |||
| Mary Ann Brown | ||||
| Chief Executive Officer | ||||
| Date: 6/6/11 | ||||
| By: | /s/ Brian D. Klemens | |||
| Brian D. Klemens | ||||
| Treasurer (Principal Financial and Accounting Officer) | ||||
| Date: 6/6/11 | ||||