UNITED STATES
SECURITIES AND EXCHANGE COMMISSION
Washington, D.C. 20549
FORM N-CSR
CERTIFIED SHAREHOLDER REPORT OF REGISTERED MANAGEMENT
INVESTMENT COMPANIES
Investment Company Act file number 811-10385
Pacific Funds
(Exact name of registrant as specified in charter)
700 Newport Center Drive, P.O. Box 7500, Newport Beach, CA 92660
(Address of principal executive offices)
Robin S. Yonis
Vice President and Investment Counsel of
Pacific Life Insurance Company
700 Newport Center Drive
Post Office Box 9000
Newport Beach, CA 92660
(Name and address of agent for service)
Copies to:
Jeffrey S. Puretz, Esq.
Dechert LLP
1775 I Street, N.W.
Washington D.C. 20006-2401
Registrant's telephone number, including area code: (949) 219-6767
Date of fiscal year end: March 31
Date of reporting period: April 1, 2004 – March 31, 2005
Form N-CSR is to be used by management investment companies to file reports with the Commission not later than 10 days after the transmission to stockholders of any report that is required to be transmitted to stockholders under Rule 30e-1 under the Investment Company Act of 1940 (17 CFR 270.30e-1). The Commission may use the information provided on Form N-CSR in its regulatory, disclosure review, inspection, and policymaking roles.
A registrant is required to disclose the information specified by Form N-CSR, and the Commission will make this information public. A registrant is not required to respond to the collection of information contained in Form N-CSR unless the Form displays a currently valid Office of Management and Budget ("OMB") control number. Please direct comments concerning the accuracy of the information collection burden estimate and any suggestions for reducing the burden to Secretary, Securities and Exchange Commission, 450 Fifth Street, NW, Washington, DC 20549-0609. The OMB has reviewed this collection of information under the clearance requirements of 44 U.S.C. § 3507.
Item 1. Annual Report to Shareholders of the Pacific Funds for the fiscal year ended March 31, 2005. |
|
TABLE OF CONTENTS | |
PACIFIC FUNDS | |
A-1 | |
A-2 | |
B-1 | |
C-1 | |
Financial Statements: | |
D-1 | |
D-7 | |
D-10 | |
E-1 | |
F-1 | |
G-1 | |
H-1 | |
Approval of Investment Advisory Agreement and Management Agreements | H-3 |
H-6 | |
 |  |
| Thomas C. Sutton Chairman of the Board | Glenn S. Schafer President |
A-1 |
| Broad-Based Indices | 1-Year Performance as of 3-31-05 | ||||
| Standard & Poor’s 500 Composite Stock Price Index | |||||
| (S&P 500 Index)** (U.S. Stocks) | 6.69 | % | |||
| Morgan Stanley Capital International Europe | |||||
| Australasia Far East Index (MSCI EAFE | |||||
| Index)** (International Stocks) | 15.06 | % | |||
| Lehman Brothers Government/Credit Index** | |||||
| (Fixed Income) | 0.40 | % | |||
| Merrill Lynch 3-Month U.S. T-Bill Index** (Cash) | 1.67 | % | |||
It should be noted that the benchmark indices for the underlying Pacific Funds may differ from the Portfolio Optimization broad-based indices. The Portfolio Optimization funds had investments in the following underlying funds, which helped performance as compared to the broad-based indices above. |
| Underlying Funds | 1-Year Performance as of 3-31-05 | ||||
| PF Van Kampen Mid-Cap Growth Class A* | |||||
| (U.S. Stocks) | 11.49 | % | |||
| PF Van Kampen Comstock Class A* | |||||
| (U.S. Stocks) | 11.08 | % | |||
| PF PIMCO Inflation Managed Class A* | |||||
| (Fixed Income) | 1.99 | % | |||
| PF PIMCO Managed Bond Class A* | |||||
| (Fixed Income) | 0.56 | % | |||
The Portfolio Optimization funds had investments in the following underlying funds, which hurt performance as compared to the broad-based indices above. |
| Underlying Funds | 1-Year Performance as of 3-31-05 | ||||
| PF Goldman Sachs Short Duration Bond | |||||
| Class A* (Fixed Income) | -1.34 | % | |||
| PF AIM Blue Chip Class A* (U.S. Stocks) | -0.49 | % | |||
| PF Salomon Brothers Large-Cap Value | |||||
| Class A* (U.S. Stocks) | 3.78 | % | |||
| PF MFS International Large-Cap Class A* | |||||
| (International Stocks) | 12.73 | % | |||
| A-2 | See explanation of symbols and references on A-21 |
| PACIFIC FUNDS PERFORMANCE DISCUSSION (Continued) |
PF Portfolio Optimization Model A Q. How did the fund perform over the year ended March 31, 2005? A. For the year ended March 31, 2005, the fund’s Class A returned 1.74%* compared to a 6.69%** return for the S&P 500 Index, a 0.40%** return for the Lehman Brothers Government/Credit Index, and a 2.38%(1) return for the Model A Composite Benchmark Index. Complete performance information for all classes is included in the following table. Performance Comparison The following graph shows the value as of March 31, 2005 of a $10,000 investment made in Class A shares since the fund began operations. For comparison purposes, the performance of the fund’s benchmarks is also shown. Performance data for Class B and C shares will vary due to differences in fees and sales charges |
 |
| Average Annual Total Returns for the Periods Ended March 31, 2005 | |||||||||||
| PF Portfolio Optimization Model A | Class A | Class B | Class C | ||||||||
| 1 Year Total Return: | |||||||||||
| Without sales charge* | 1.74 | % | 1.25 | % | 1.18 | % | |||||
| With maximum sales charge*** | -3.85 | % | -3.75 | % | 0.18 | % | |||||
| Lehman Brothers | |||||||||||
| Government/Credit Index** | 0.40 | % | |||||||||
| S&P 500 Index** | 6.69 | % | |||||||||
| Model A Composite Benchmark(1) | 2.38 | % | |||||||||
| Since Inception: | |||||||||||
| Without sales charge* | 2.61 | % | 2.13 | % | 1.99 | % | |||||
| With maximum sales charge*** | -1.92 | % | -1.07 | % | 1.99 | % | |||||
| Lehman Brothers | |||||||||||
| Government/Credit Index** | 2.78 | % | |||||||||
| S&P 500 Index** | 6.74 | % | |||||||||
| Model A Composite Benchmark(1) | 3.85 | % | |||||||||
| Performance data shown represents past performance. Investment return and principal value will fluctuate so that shares of the fund when redeemed may be worth more or less than their original cost. Past performance is not predictive of future performance. The table does not reflect the deduction of taxes that a shareholder would pay on fund distributions or redemption of fund shares. |
| Q. Discuss both positive and negative factors that materially affected the fund’s performance during the year, including relevant market conditions, investment strategies and techniques, and particular sectors or securities. A. PF Portfolio Optimization Model A invests primarily in a diverse group of four fixed income funds, with small allocations to domestic and international equity funds. Since its launch on December 31, 2003, the fund’s net assets have grown to over $18 million. The fund’s allocations to the money market and fixed income funds, which represent a combined target allocation of 79% of the overall fund, held back fund performance. Generally, longer maturity issues outperformed shorter maturities over the period. The fund’s significant allocation to the PF Goldman Sachs Short Duration Bond Fund underperformed the Lehman Brothers Government/Credit Index while longer-term investments in the PF PIMCO Inflation Managed Fund helped performance. Overall, the fund’s limited domestic equity allocations, although positive, underperformed when compared to the S&P 500 Index. PF Portfolio Optimization Model B Q. How did the fund perform over the year ended March 31, 2005? A. For the year ended March 31, 2005, the fund’s Class A returned 3.28%* compared to a 6.69%** return for the S&P 500 Index, a 0.40%** return for the Lehman Brothers Government/Credit Index, and a 4.12%(2) return for the Model B Composite Benchmark Index. Complete performance information for all classes is included in the following table. Performance Comparison The following graph shows the value as of March 31, 2005 of a $10,000 investment made in Class A shares since the fund began operations. For comparison purposes, the performance of the fund’s benchmarks is also shown. Performance data for Class B and C shares will vary due to differences in fees and sales charges. |
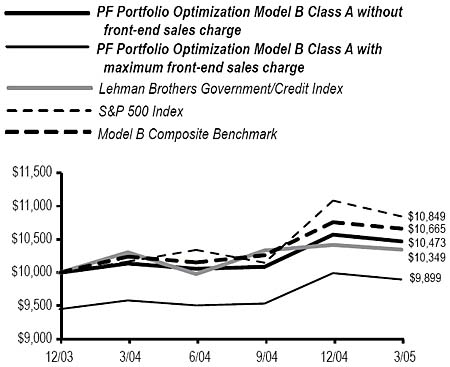 |
| A-3 | See explanation of symbols and references on A-21 |
| PACIFIC FUNDS PERFORMANCE DISCUSSION (Continued) |
| Average Annual Total Returns for the Periods Ended March 31, 2005 |
| PF Portfolio Optimization Model B | Class A | Class B | Class C | ||||||
| 1 Year Total Return: | |||||||||
| Without sales charge* | 3.28 | % | 2.69 | % | 2.70 | % | |||
| With maximum sales charge*** | -2.40 | % | -2.31 | % | 1.70 | % | |||
| Lehman Brothers | |||||||||
| Government/Credit Index** | 0.40 | % | |||||||
| S&P 500 Index** | 6.69 | % | |||||||
| Model B Composite Benchmark(2) | 4.12 | % | |||||||
| Since Inception: | |||||||||
| Without sales charge* | 3.77 | % | 3.21 | % | 3.22 | % | |||
| With maximum sales charge*** | -0.81 | % | 0.02 | % | 3.22 | % | |||
| Lehman Brothers | |||||||||
| Government/Credit Index** | 2.78 | % | |||||||
| S&P 500 Index** | 6.74 | % | |||||||
| Model B Composite Benchmark(2) | 5.29 | % | |||||||
Performance data shown represents past performance. Investment return and principal value will fluctuate so that shares of the fund when redeemed may be worth more or less than their original cost. Past performance is not predictive of future performance. The table does not reflect the deduction of taxes that a shareholder would pay on fund distributions or redemption of fund shares. Q. Discuss both positive and negative factors that materially affected the fund’s performance during the year, including relevant market conditions, investment strategies and techniques, and particular sectors or securities. A. PF Portfolio Optimization Model B invests the majority of its assets in a diverse group of four fixed income funds, with the remaining allocations invested in domestic and international equity funds. Since its launch on December 31, 2003, the fund’s net assets have grown to over $41 million. The fund’s allocations to money market and fixed income funds, which represent a combined target allocation of 56% of the overall fund, held back fund performance. Generally, longer maturity issues outperformed shorter maturities during the quarter. The fund’s investment in the PF Goldman Sachs Short Duration Bond Fund underperformed the Lehman Brothers Government/Credit Index, while longer-term investments in the PF PIMCO Inflation Managed Fund and the PF PIMCO Managed Bond Fund helped performance. Overall, the fund’s limited domestic equity allocations, although positive, underperformed when compared to the S&P 500 Index. PF Portfolio Optimization Model C Q. How did the fund perform over the year ended March 31, 2005? A. For the year ended March 31, 2005, the fund’s Class A returned 5.09%* compared to a 6.69%** return for the S&P 500 Index, a 0.40%** return for the Lehman Brothers Government/Credit Index, and a 5.50%(3) return for the Model C Composite Benchmark Index. Complete performance information for all classes is included in the following table. |
| Performance Comparison |
| The following graph shows the value as of March 31, 2005 of a $10,000 investment made in Class A shares since the fund began operations. For comparison purposes, the performance of the fund’s benchmarks is also shown. Performance data for Class B and C shares will vary due to differences in fees and sales charges. |
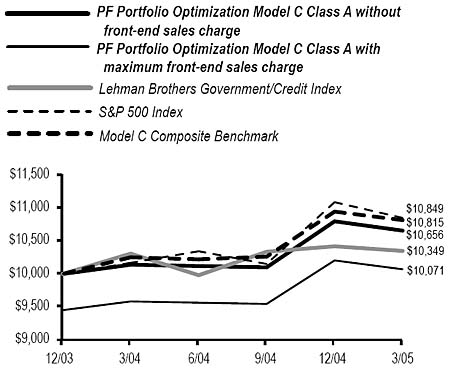 |
| Average Annual Total Returns for the Periods Ended March 31, 2005 | |||||||||
| PF Portfolio Optimization Model C | Class A | Class B | Class C | ||||||
| 1 Year Total Return: | |||||||||
| Without sales charge* | 5.09 | % | 4.55 | % | 4.53 | % | |||
| With maximum sales charge*** | -0.69 | % | -0.45 | % | 3.53 | % | |||
| Lehman Brothers | |||||||||
| Government/Credit Index** | 0.40 | % | |||||||
| S&P 500 Index** | 6.69 | % | |||||||
| Model C Composite Benchmark(3) | 5.50 | % | |||||||
| Since Inception: | |||||||||
| Without sales charge* | 5.21 | % | 4.70 | % | 4.60 | % | |||
| With maximum sales charge*** | 0.57 | % | 1.52 | % | 4.60 | % | |||
| Lehman Brothers | |||||||||
| Government/Credit Index** | 2.78 | % | |||||||
| S&P 500 Index** | 6.74 | % | |||||||
| Model C Composite Benchmark(3) | 6.47 | % | |||||||
| Performance data shown represents past performance. Investment return and principal value will fluctuate so that shares of the fund when redeemed may be worth more or less than their original cost. Past performance is not predictive of future performance. The table does not reflect the deduction of taxes that a shareholder would pay on fund distributions or redemption of fund shares. |
Q. Discuss both positive and negative factors that materially affected the fund’s performance during the year, including relevant market conditions, investment strategies and techniques, and particular sectors or securities. A. PF Portfolio Optimization Model C invests in a diverse group of eight domestic and international equity funds, with smaller allocations to fixed income and money market funds. Since its launch on December 31, 2003, the fund’s net assets have grown to over $125 million. The fund’s domestic equity allocations, representing 45% of the fund’s target allocations, although positive, detracted from fund performance compared to the S&P 500 Index. Generally, value-oriented stocks drove performance during the past year. The fund’s investments in the PF Van Kampen Comstock Fund |
| A-4 | See explanation of symbols and references on A-21 |
| PACIFIC FUNDS PERFORMANCE DISCUSSION (Continued) |
| and the PF Van Kampen Mid-Cap Growth Fund outperformed relative to the S&P 500 Index. The fund’s allocations to the international equity funds, which represent a combined target allocation of 18% of the overall fund, held back fund performance. In particular, the fund’s investment in the PF MFS International Large-Cap Fund underperformed relative to the MSCI EAFE Index. PF Portfolio Optimization Model D Q. How did the fund perform over the year ended March 31, 2005? A. For the year ended March 31, 2005, the fund’s Class A returned 6.26%* compared to a 6.69%** return for the S&P 500 Index, a 0.40%** return for the Lehman Brothers Government/Credit Index, and a 7.14%(4) return for the Model D Composite Benchmark Index. Complete performance information for all classes is included in the following table. Performance Comparison The following graph shows the value as of March 31, 2005 of a $10,000 investment made in Class A shares since the fund began operations. For comparison purposes, the performance of the fund’s benchmarks is also shown. Performance data for Class B and C shares will vary due to differences in fees and sales charges. |
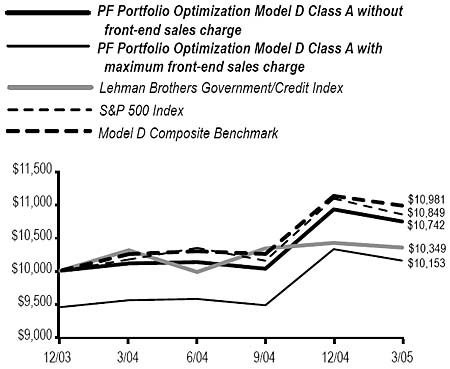 |
| Average Annual Total Returns for the Periods Ended March 31, 2005 | |||||||||
| PF Portfolio Optimization Model D | Class A | Class B | Class C | ||||||
| 1 Year Total Return: | |||||||||
| Without sales charge* | 6.26 | % | 5.79 | % | 5.72 | % | |||
| With maximum sales charge*** | 0.40 | % | 0.79 | % | 4.72 | % | |||
| Lehman Brothers | |||||||||
| Government/Credit Index** | 0.40 | % | |||||||
| S&P 500 Index** | 6.69 | % | |||||||
| Model D Composite Benchmark(4) | 7.14 | % | |||||||
| Since Inception: | |||||||||
| Without sales charge* | 5.90 | % | 5.44 | % | 5.31 | % | |||
| With maximum sales charge*** | 1.23 | % | 2.27 | % | 5.31 | % | |||
| Lehman Brothers | |||||||||
| Government/Credit Index** | 2.78 | % | |||||||
| S&P 500 Index** | 6.74 | % | |||||||
| Model D Composite Benchmark(4) | 7.77 | % | |||||||
| Performance data shown represents past performance. Investment return and principal value will fluctuate so that shares of the fund when redeemed may be worth more or less than their original cost. Past performance is not predictive of future performance. The table does not reflect the deduction of taxes that a shareholder would pay on fund distributions or redemption of fund shares. |
Q. Discuss both positive and negative factors that materially affected the fund’s performance during the year, including relevant market conditions, investment strategies and techniques, and particular sectors or securities. A. PF Portfolio Optimization Model D invests primarily in a diverse group of nine domestic and international equity funds, with small allocations to three fixed income funds. Since its launch on December 31, 2003, the fund’s net assets have grown to over $111 million. The fund’s domestic equity allocations, representing 57% of the fund’s target allocations, although positive, detracted from fund performance compared to the S&P 500 Index. Generally, value-oriented stocks drove performance during the past year. The fund’s investments in the PF Van Kampen Comstock Fund and the PF Van Kampen Mid-Cap Growth Fund outperformed relative to the S&P 500 Index. The fund’s investments in the PF AIM Blue Chip Fund held back performance relative to the S&P 500 Index. The fund’s international equity allocations, representing 25% of the fund’s target allocation, also held back portfolio performance. The fund’s investment in the PF MFS International Large-Cap Fund trailed the MSCI EAFE Index. The fund’s target allocations to fixed income funds, representing 18% of the fund’s target allocations, contributed positively to fund performance relative to the Lehman Brothers Government/Credit Index. |
| A-5 | See explanation of symbols and references on A-21 |
| PACIFIC FUNDS PERFORMANCE DISCUSSION (Continued) |
| PF Portfolio Optimization Model E Q. How did the fund perform over the year ended March 31, 2005? A. For the year ended March 31, 2005, the fund’s Class A returned 7.17%* compared to a 6.69%** return for the S&P 500 Index, a 0.40%** return for the Lehman Brothers Government/Credit Index, and a 8.28%(5) return for the Model E Composite Benchmark Index. Complete performance information for all classes is included in the following table. Performance Comparison The following graph shows the value as of March 31, 2005 of a $10,000 investment made in Class A shares since the fund began operations. For comparison purposes, the performance of the fund’s benchmarks is also shown. Performance data for Class B and C shares will vary due to differences in fees and sales charges. |
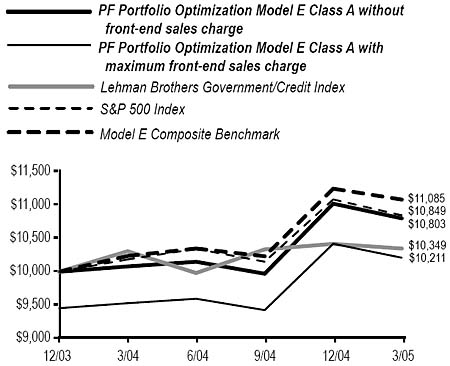 |
| Average Annual Total Returns for the Periods Ended March 31, 2005 | |||||||||
| PF Portfolio Optimization Model E | Class A | Class B | Class C | ||||||
| 1 Year Total Return: | |||||||||
| Without sales charge* | 7.17 | % | 6.75 | % | 6.75 | % | |||
| With maximum sales charge*** | 1.25 | % | 1.75 | % | 5.75 | % | |||
| Lehman Brothers | |||||||||
| Government/Credit Index** | 0.40 | % | |||||||
| S&P 500 Index** | 6.69 | % | |||||||
| Model E Composite Benchmark(5) | 8.28 | % | |||||||
| Since Inception: | |||||||||
| Without sales charge* | 6.38 | % | 5.95 | % | 5.95 | % | |||
| With maximum sales charge*** | 1.69 | % | 2.79 | % | 5.95 | % | |||
| Lehman Brothers | |||||||||
| Government/Credit Index** | 2.78 | % | |||||||
| S&P 500 Index** | 6.74 | % | |||||||
| Model E Composite Benchmark(5) | 8.59 | % | |||||||
| Performance data shown represents past performance. Investment return and principal value will fluctuate so that shares of the fund when redeemed may be worth more or less than their original cost. Past performance is not predictive of future performance. The table does not reflect the deduction of taxes that a shareholder would pay on fund distributions or redemption of fund shares. Q. Discuss both positive and negative factors that materially affected the fund’s performance during the year, including relevant market conditions, investment strategies and techniques, and particular sectors or securities. A. PF Portfolio Optimization Model E invests primarily in a diverse group of nine domestic and international equity funds. Since its launch on December 31, 2003, the fund’s net assets have grown to over $41 million. The fund’s domestic equity allocations, representing 68% of the fund’s target allocations, although positive, detracted from fund performance compared to the S&P 500 Index. Generally, value-oriented stocks drove performance during the period. The fund’s investments in the PF Van Kampen Comstock Fund and the PF Van Kampen Mid-Cap Growth Fund outperformed relative to the S&P 500 Index, while the fund’s investments in the PF AIM Blue Chip Fund held back performance relative to the S&P 500 Index. The fund’s international equity allocations, representing 29% of the fund’s target allocation, held back portfolio performance. The fund’s investment in the PF MFS International Large-Cap Fund trailed the MSCI EAFE Index. |
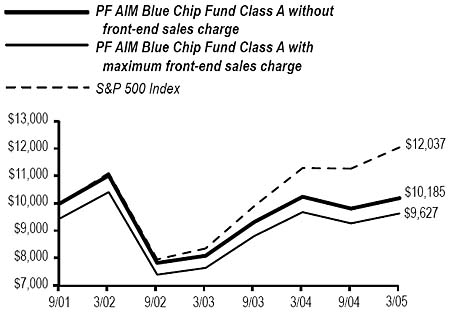
| PF AIM Blue Chip Fund Q. How did the fund perform over the year ended March 31, 2005? A. For the year ended March 31, 2005, the fund’s Class A returned –0.49%* compared to a 6.69%** return for its benchmark, the S&P 500 Index. Complete performance information for all classes is included in the following table. Performance Comparison The following graph shows the value as of March 31, 2005 of a $10,000 investment made in Class A shares since the fund began operations. For comparison purposes, the performance of the fund’s benchmark (the S&P 500 Index) is also shown. Performance data for Class B and C shares will vary due to differences in fees and sales charges. |
 |
| A-6 | See explanation of symbols and references on A-21 |
| PACIFIC FUNDS PERFORMANCE DISCUSSION (Continued) |
| Average Annual Total Returns for the Periods Ended March 31, 2005 |
| PF AIM Blue Chip Fund | Class A | Class B | Class C | ||||||||
| 1 Year Total Return: | |||||||||||
| Without sales charge* | -0.49 | % | -0.89 | % | -0.89 | % | |||||
| With maximum sales charge*** | -5.94 | % | -5.85 | % | -1.89 | % | |||||
| S&P 500 Index** | 6.69 | % | |||||||||
| 3 Year Total Return: | |||||||||||
| Without sales charge* | -2.56 | % | -3.01 | % | -3.02 | % | |||||
| With maximum sales charge*** | -4.38 | % | -4.33 | % | -3.02 | % | |||||
| S&P 500 Index** | 2.74 | % | |||||||||
| Since Inception: | |||||||||||
| Without sales charge* | 0.53 | % | 0.04 | % | 0.03 | % | |||||
| With maximum sales charge*** | -1.08 | % | -0.82 | % | 0.03 | % | |||||
| S&P 500 Index** | 5.44 | % |
| Performance data shown represents past performance. Investment return and principal value will fluctuate so that shares of the fund when redeemed may be worth more or less than their original cost. Past performance is not predictive of future performance. The table does not reflect the deduction of taxes that a shareholder would pay on fund distributions or redemption of fund shares. |
| Q. Discuss both positive and negative factors that materially affected the fund’s performance during the year, including relevant market conditions, investment strategies and techniques, and particular sectors or securities. |
| A. During the one-year period ending March 31, 2005, investors started out by focusing on election year politics and the instability in Iraq, and later shifted their attention to the rise in oil prices and fears of inflation. The equity markets posted modest gains, and the U.S. economy grew at a healthy pace. The NASDAQ Composite Stock Index (NASDAQ) posted a slight gain of 0.25%**, the Dow Jones Industrial Average (DJIA) returned 3.79%**, and the S&P 500 Index increased by 6.69%**. The final reading of fourth quarter 2004 GDP growth was unrevised at 3.8%, and early estimates for the first quarter of 2005 predict a growth rate between 3% and 4%. |
| Manufacturing activity was robust as the widely recognized Institute for Supply Management (ISM) index, a measure of manufacturing activity, remained above 50 during the entire one-year period, finishing the month of March at 55.2. Any reading above 50 indicates growth in the sector and March marks the twenty-second consecutive month of growth. Within this most recent report, however, prices paid spiked higher due to rising energy prices. Higher prices were evident in the core finished goods producer price index (Core PPI), which rose in January and February, and increased the twelve-month core finished goods inflation rate to 2.8%, its highest level since May 1992. |
| The overall employment picture improved throughout the year as the unemployment rate fell to 5.2% by the end of March. Job creation improved during this period, although the payroll figures were volatile, ranging dramatically from month to month. |
| Consumer confidence got a boost from the improving employment situation, hitting its highest level since 2002. The Conference Board’s Index of Consumer Confidence finished the period at 102.4 in March, off its July peak, but still quite strong due to a positive consumer outlook. Consumer spending also remained healthy, despite rising energy costs and creeping inflation. |
During the period, the fund’s investment strategy blended two complimentary investment disciplines with a focus on quality market leaders. We at A I M Capital Management, Inc. (AIM) seek companies with attractive growth profiles, focusing on sustainable, long-term earnings growth for the fund. We also seek companies that are trading at attractive valuations relative to their earnings fundamentals and growth prospects. Finally, we focus on high-quality companies that are well-established market leaders, with solid financial positions and strong business franchises. On average, the fund held overweight positions in the information technology and industrials sectors, and held underweight positions in the consumer staples, energy, financials, telecommunication services, and utilities sectors relative to the benchmark during the one-year period. Holdings in information technology stocks were detractors to fund performance, as this was the worst performing sector for this period. Energy stocks performed very well during the one-year period due to the increasing price of oil, but the fund’s underweight position in this sector detracted significantly from relative performance. Stock picks in consumer staples and industrials also detracted from the fund’s return when compared to the benchmark during the period. Although these sectors detracted from relative performance, energy and industrials stocks made the largest positive contributions to the fund’s overall return. |
| Over the past year, the value style of investing continued to significantly outperform the growth style and mid-capitalization stocks continued to outperform large-capitalization stocks. This environment also worked against the fund, as it maintains a consistent, disciplined approach of seeking out high-quality, large-capitalization growth companies that are reasonably priced. |
| The top five contributors to the fund’s return for the one-year period were Exxon Mobil Corp., UnitedHealth Group Inc., Johnson & Johnson, General Electric Co., and Canadian National Railway Co. The top five detractors to fund performance were Pfizer Inc., Cisco Systems, Inc., American International Group, Inc., Wal-Mart Stores, Inc., and Citigroup Inc. |
| A-7 | See explanation of symbols and references on A-21 |
| PACIFIC FUNDS PERFORMANCE DISCUSSION (Continued) |
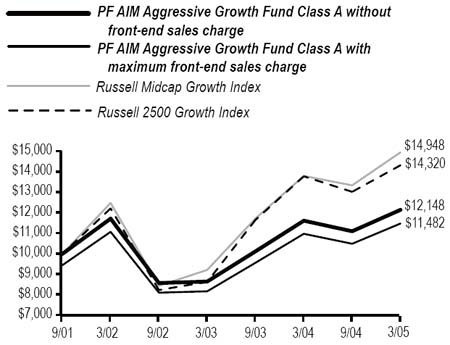
| PF AIM Aggressive Growth Fund |
| Q. How did the fund perform over the year ended March 31, 2005? |
| A. For the year ended March 31, 2005, the fund’s Class A returned 4.54%* compared to a 8.31%** return for its benchmarks, the Russell Midcap Growth Index and a 3.91%** return for the Russell 2500 Growth Index. The fund’s benchmark was changed to the Russell Midcap Growth Index due to the fund’s style of investing in mid-capitalization growth-oriented companies. Complete performance information for all classes is included in the following table. |
| Performance Comparison |
| The following graph shows the value as of March 31, 2005 of a $10,000 investment made in Class A shares since the fund began operations. For comparison purposes, the performance of the fund’s benchmarks is also shown. Performance data for Class B and C shares will vary due to differences in fees and sales charges. |
 |
| Average Annual Total Returns for the Periods Ended March 31, 2005 |
| PF AIM Aggressive Growth Fund | Class A | Class B | Class C | ||||||||
| 1 Year Total Return: | |||||||||||
| Without sales charge* | 4.54 | % | 3.97 | % | 4.06 | % | |||||
| With maximum sales charge*** | -1.20 | % | -1.03 | % | 3.06 | % | |||||
| Russell Midcap Growth Index** | 8.31 | % | |||||||||
| Russell 2500 Growth Index** | 3.91 | % | |||||||||
| 3 Year Total Return: | |||||||||||
| Without sales charge* | 1.20 | % | 0.72 | % | 0.78 | % | |||||
| With maximum sales charge*** | -0.70 | % | -0.61 | % | 0.78 | % | |||||
| Russell Midcap Growth Index** | 6.19 | % | |||||||||
| Russell 2500 Growth Index** | 5.43 | % | |||||||||
| Since Inception: | |||||||||||
| Without sales charge* | 5.72 | % | 5.20 | % | 5.26 | % | |||||
| With maximum sales charge*** | 4.03 | % | 4.44 | % | 5.26 | % | |||||
| Russell Midcap Growth Index** | 12.17 | % | |||||||||
| Russell 2500 Growth Index** | 10.80 | % |
| Performance data shown represents past performance. Investment return and principal value will fluctuate so that shares of the fund when redeemed may be worth more or less than their original cost. Past performance is not predictive of future performance. The table does not reflect the deduction of taxes that a shareholder would pay on fund distributions or redemption of fund shares. |
| Q. Discuss both positive and negative factors that materially affected the fund’s performance during the year, including relevant market conditions, investment strategies and techniques, and particular sectors or securities. |
| A. During the one-year period ending March 31, 2005, investors started out by focusing on election year politics and the instability in Iraq, and later shifted their attention to the rise in oil prices and fears of inflation. The equity markets posted modest gains, and the U.S. economy grew at a healthy pace. The NASDAQ posted a slight gain of 0.25%**, the DJIA returned 3.79%**, and the S&P 500 Index increased by 6.69%**. Mid-capitalization stocks outperformed large- and small-capitalization stocks, and the value style of investing outperformed the growth style of investing for the one-year period. The final reading of fourth quarter 2004 GDP growth was unrevised at 3.8%, and early estimates for the first quarter of 2005 predict a growth rate between 3% and 4%. |
| Manufacturing activity was robust as the widely recognized ISM index remained above 50 during the entire one-year period, finishing the month of March at 55.2. Any reading above 50 indicates growth in the sector and March marks the twenty-second consecutive month of growth. Within this most recent report, however, prices paid spiked higher due to rising energy prices. Higher prices were evident in the Core PPI, which rose in January and February, and increased the twelve-month core finished goods inflation rate to 2.8%, its highest level since May 1992. |
| The overall employment picture improved throughout the year as the unemployment rate fell to 5.2% by the end of March. Job creation improved during this period, although the payroll figures were volatile, ranging dramatically from month to month. |
| Consumer confidence got a boost from the improving employment situation, hitting its highest level since 2002. The Conference Board’s Index of Consumer Confidence finished the period at 102.4 in March, off its July peak, but still quite strong due to a positive consumer outlook. Consumer spending also remained healthy, despite rising energy costs and creeping inflation. |
| Stock selection in the health care and consumer discretionary sectors were detractors to fund performance during the period. Within the health care sector, stock picks in biotechnology detracted the most from performance when compared to the benchmark, while holdings in hotels, restaurants, and leisure companies detracted the most from performance within the consumer discretionary sector. The fund’s underweight position relative to the benchmark in the energy sector also hurt relative performance, as this sector performed very well during the year. In contrast, the information technology sector contributed significantly to the fund’s return when compared to the benchmark. Within this sector, semiconductors and semiconductor equipment stocks added the most value relative to the benchmark. On an absolute basis, the information technology, financials, and consumer |
| A-8 | See explanation of symbols and references on A-21 |
| PACIFIC FUNDS PERFORMANCE DISCUSSION (Continued) |
discretionary sectors made the largest contributions to fund performance during the year. |
Sector exposure in the fund is a result of AIM’s bottom-up stock selection process in the context of prudent risk management. During the period, the fund’s holdings in health care and materials stocks were significantly increased, and the number of holdings in consumer discretionary and information technology stocks were decreased. |
The top five contributors to fund performance for the year were Textron Inc., Alliance Data Systems Corp., CB Richard Ellis Group, Inc., Investors Financial Services Corp., and Staples, Inc. The top five detractors to fund performance were Sirva Inc., Corinthian Colleges, Inc., Taro Pharmaceutical Industries Ltd., Omnicare, Inc., and New York Community Bancorp, Inc. |
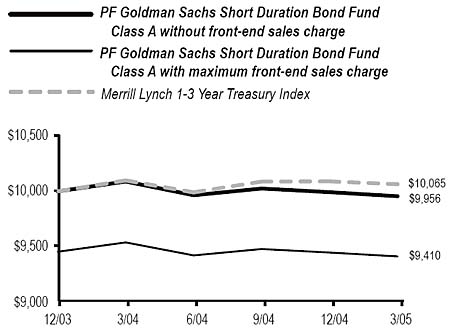
PF Goldman Sachs Short Duration Bond Fund |
Q. How did the fund perform over the year ended March 31, 2005? |
A. For the year ended March 31, 2005, the fund’s Class A returned –1.34%* compared to a –0.35%** return for its benchmark, the Merrill Lynch 1-3 Year Treasury Index. Complete performance information for all classes is included in the following table. |
Performance Comparison |
The following graph shows the value as of March 31, 2005 of a $10,000 investment made in Class A shares since the fund began operations. For comparison purposes, the performance of the fund’s benchmark (the Merrill Lynch 1-3 Year Treasury Index) is also shown. Performance data for Class B and C shares will vary due to differences in fees and sales charges. |
 |
| Average Annual Total Returns for the Periods Ended March 31, 2005 |
| PF Goldman Sachs Short Duration Bond Fund | Class A | Class B | Class C | ||||||||
| 1 Year Total Return: | |||||||||||
| Without sales charge* | -1.34 | % | -1.77 | % | -1.81 | % | |||||
| With maximum sales charge*** | -6.78 | % | -6.65 | % | -2.78 | % | |||||
| Merrill Lynch 1-3 Year | |||||||||||
| Treasury Index** | -0.35 | % | |||||||||
| Since Inception: | |||||||||||
| Without sales charge* | -0.36 | % | -0.79 | % | -0.82 | % | |||||
| With maximum sales charge*** | -4.75 | % | -3.96 | % | -0.82 | % | |||||
| Merrill Lynch 1-3 Year | |||||||||||
| Treasury Index** | 0.52 | % |
| Performance data shown represents past performance. Investment return and principal value will fluctuate so that shares of the fund when redeemed may be worth more or less than their original cost. Past performance is not predictive of future performance. The table does not reflect the deduction of taxes that a shareholder would pay on fund distributions or redemption of fund shares. |
| Q. Discuss both positive and negative factors that materially affected the fund’s performance during the year, including relevant market conditions, investment strategies and techniques, and particular sectors or securities. |
A. The Treasury yield curve flattened dramatically over the reporting period with shorter to intermediate term yields rising more than long-term yields. Consequently, the long end of the curve (ten years and longer) significantly outperformed the short to intermediate portion of the curve. Short-term interest rates rose in response to the Fed’s cumulative 175 basis point increase in the Federal Funds rate and longer-term interest rates rose less, due to mixed economic data, rising oil prices, and continued geopolitical uncertainty. The Federal Funds rate began the reporting period at 1.00% and closed at 2.75%. |
At the beginning of the period, a series of unexpectedly strong monthly non-farm payroll data releases and evidence of inflationary pressures sparked increased optimism of economic growth and drove a sell-off across the broader fixed income market. In response to these indications of economic strength, at its June 30, 2004 meeting, the Fed raised the overnight lending rate by 25 basis points to 1.25%, its first rate hike since April 2000. The markets then turned to rising oil prices as a general theme during the summer months leading into fall, interpreting rising energy prices as a check on growth rather than inflationary. Rising oil prices stemmed from supply uncertainty, hurricane weather, and continued violence in Iraq. Increased concerns over inflationary pressures and expectations of continued (and possibly accelerated) Fed tightening drove interest rates higher at the end of the reporting period. The Fed raised rates a total of seven times over the one-year period. |
A combination of top-down and bottom-up strategies were the primary drivers of fund performance over the period. Top-down strategies for the fund included active sector rotation, duration, and yield curve management. Over the period, the fund was positioned defensively. In particular, a modestly shorter duration was maintained relative to the benchmark, based on Goldman Sachs Asset Management L.P.’s belief that interest rates would move higher. Despite detracting from fund performance in the months that yields rallied on the back of |
| A-9 | See explanation of symbols and references on A-21 |
| PACIFIC FUNDS PERFORMANCE DISCUSSION (Continued) |
mixed economic data, our short duration strategy was an overall contributor to returns as interest rates ended the period higher. Our sector strategy, which concentrated on the high quality segments of the fixed income market, namely Treasuries and agency debentures, also positively impacted fund returns. The largest weighting in the fund during the period was in the Agency sector where we continue to find attractive values relative to Treasuries. |
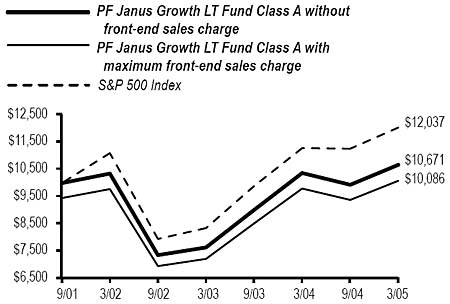
PF Janus Growth LT Fund |
Q. How did the fund perform over the year ended March 31, 2005? |
A. For the year ended March 31, 2005, the fund’s Class A returned 2.90%* compared to a 6.69%** return for its benchmark, the S&P 500 Index. Complete performance information for all classes is included in the following table. |
Performance Comparison |
The following graph shows the value as of March 31, 2005 of a $10,000 investment made in Class A shares since the fund began operations. For comparison purposes, the performance of the fund’s benchmark (the S&P 500 Index) is also shown. Performance data for Class B and C shares will vary due to differences in fees and sales charges. |
 |
| Average Annual Total Returns for the Periods Ended March 31, 2005 |
| PF Janus Growth LT Fund | Class A | Class B | Class C | ||||||||
| 1 Year Total Return: | |||||||||||
| Without sales charge* | 2.90 | % | 2.44 | % | 2.45 | % | |||||
| With maximum sales charge*** | -2.74 | % | -2.56 | % | 1.45 | % | |||||
| S&P 500 Index** | 6.69 | % | |||||||||
| 3 Year Total Return: | |||||||||||
| Without sales charge* | 1.02 | % | 0.61 | % | 0.48 | % | |||||
| With maximum sales charge*** | -0.86 | % | -0.72 | % | 0.48 | % | |||||
| S&P 500 Index** | 2.74 | % | |||||||||
| Since Inception: | |||||||||||
| Without sales charge* | 1.87 | % | 1.45 | % | 1.36 | % | |||||
| With maximum sales charge*** | 0.24 | % | 0.62 | % | 1.36 | % | |||||
| S&P 500 Index** | 5.44 | % |
| Performance data shown represents past performance. Investment return and principal value will fluctuate so that shares of the fund when redeemed may be worth more or less than their original cost. Past performance is not predictive of future performance. The table does not reflect the deduction of taxes that a shareholder would pay on fund distributions or redemption of fund shares. |
| Q. Discuss both positive and negative factors that materially affected the fund’s performance during the year, including relevant market conditions, investment strategies and techniques, and particular sectors or securities. |
A. We at Janus Capital Management LLC continue to manage the fund for shareholders who want more aggressive long-term exposure to the equity markets. We tend to gravitate to companies that we believe have good growth trends and sustainable competitive advantages within the large- and mid-capitalization areas of the market. During this somewhat volatile period, we made a conscious effort to better balance the fund’s exposure across an assortment of sectors, with the intention of reducing the risk tied to the market’s frequent sector rotations. During the period, the investment team sought out more steady-growth businesses for the fund, as the yield curve on federal debt issues suggested a slow down in the economy. |
|
Detractors to fund performance during the period were a smaller position than the benchmark in the energy sector, which enjoyed increased profits as oil prices spiked to record highs. Weak performances by select holdings in information technology also held back fund performance. Technology leader Cisco Systems, Inc. fell short during the period as a result of sluggish enterprise spending. On the positive side, Cisco continues to aggressively repurchase its own stock, thereby shrinking the number of outstanding shares. This tactic typically helps companies succeed over time. Furthermore, we believe Cisco will be the beneficiary of both a recovery in corporate networking spending where it has leading market share and increasing market share in telecommunications network spending. With this in mind, we are willing to exercise patience with regards to Cisco. |
|
Another weak performer for the twelve-month period was Samsung Electronics Co. Ltd., South Korea’s top electronics and semiconductor chip maker. Though investors have recently shied away from such high-growth and presumably high-risk names, we believe the semiconductor industry has sizable growth potential due to lower inventories and the chance for a rebound in capital spending. As such, during the first quarter of 2005, Samsung posted an impressive gain, rewarding our confidence in semiconductor makers and bouncing past its U.S. counterparts, Texas Instruments Inc. and Intel Corp. While these two companies also had a solid quarter, they did not outperform to the extent that Samsung did. |
|
Meanwhile, a number of the fund’s investments in media stocks, as well as consumer discretionary stocks, contributed to fund performance. The fund’s “fallen-growth” names (former growth companies that currently are either restructuring or refocusing their businesses) by definition require considerable patience. In that group is Liberty Media Corp. “A”. Earlier in 2004, Chief Executive Officer John Malone took steps to simplify the media conglomerate’s complex structure by spinning off its growing stable of international holdings into a new enterprise, Liberty Media International, Inc. “A”. For years, investors had avoided Liberty Media’s stock because it proved too difficult to calculate the value of the company’s myriad |
| A-10 | See explanation of symbols and references on A-21 |
| PACIFIC FUNDS PERFORMANCE DISCUSSION (Continued) |
assets, which include QVC, the Discovery Channel and News Corp., as well as European and Japanese cable operations. Separating Liberty’s fast-growing, capital-intensive international properties from its mature, cash-generating U.S. businesses has unlocked the upside of each, doubly rewarding the fund. |
Meanwhile, Starwood Hotels & Resorts Worldwide, Inc. moved ahead as interest in another leisure activity - travel - finally started to pick up three years after the September 11 terrorist attacks. With the discretionary income that a stronger economy affords them, Americans are flocking to foreign destinations as near as Canada and as far as India. At the same time, a weak dollar is attracting foreigners eager to visit big-draw East Coast cities like New York, Boston and Orlando. We are pleased to see that Starwood’s 700-plus hotels, operated under several brand names including St. Regis, Sheraton and Westin, are benefiting from this pent-up demand and the increasingly higher room rates that demand is driving. |
As always, the investment team will comb every corner of the market for companies that can further enhance diversification as they help achieve an optimal balance between risk and reward. |
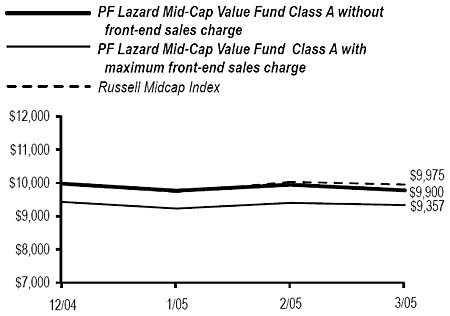
PF Lazard Mid-Cap Value Fund |
Q. How did the fund perform for the period ended March 31, 2005? |
A. The fund commenced operations on December 31, 2004. For the period since inception through March 31, 2005, the fund’s Class A returned –1.00%* compared to a –0.25%** return for its benchmark, the Russell Midcap Index. Complete performance information for all classes is included in the following table. |
Performance Comparison |
The following graph shows the value as of March 31, 2005 of a $10,000 investment made in Class A shares since the fund began operations. For comparison purposes, the performance of the fund’s benchmark (the Russell Midcap Index) is also shown. Performance data for Class B and C shares will vary due to differences in fees and sales charges. |
 |
| Total Returns (Non-Annualized) for the Period Ended March 31, 2005 |
| PF Lazard Mid-Cap Value Fund | Class A | Class B | Class C | ||||||||
| Since Inception: | |||||||||||
| Without sales charge* | -1.00 | % | -1.10 | % | -1.10 | % | |||||
| With maximum sales charge*** | -6.43 | % | -6.05 | % | -2.09 | % | |||||
| Russell Midcap Index** | -0.25 | % |
| Performance data shown represents past performance. Investment return and principal value will fluctuate so that shares of the fund when redeemed may be worth more or less than their original cost. Past performance is not predictive of future performance. The table does not reflect the deduction of taxes that a shareholder would pay on fund distributions or redemption of fund shares. |
| Q. Discuss both positive and negative factors that materially affected the fund’s performance during the period, including relevant market conditions, investment strategies and techniques, and particular sectors or securities. |
A. U.S. markets whipsawed during the quarter, as declines in January 2005 were erased by gains in February, finally ending the quarter modestly negative. During the March Federal Open Market Committee (FOMC) meeting, the Fed cited increasing inflation pressures and evidence of pricing power, which led investors to believe that more aggressive monetary tightening might lie ahead. This renewed fear of inflation caused the market to decline in March, impacting more cyclical stocks, especially commodity producers. Large-capitalization stocks handily outperformed small-capitalization stocks during the quarter. However, mid-capitalization stocks continued to outperform both large- and small-capitalization stocks. Merger activity during the quarter was strong, with about thirty-four mergers greater than $1 billion occurring, totaling over $200 billion combined. From a sector perspective, defensive stocks, such as consumer staples and utilities, held up while pharmaceutical stocks did not. Overall, technology stocks lagged, but semiconductor stocks were stronger as the outlook for demand improved. A profit warning from General Motors Corp. weighed heavily on consumer durables, causing stocks within the auto sector to decline. Once again, energy was the best performing sector as the price of oil rebounded, ending the first quarter of 2005 slightly off its 2004 peak. |
During the period, the fund benefited from stock selection in the telecommunication services sector, as two of the fund’s holdings were takeover targets. Verizon Communications Inc. made a bid for MCI Inc., and Alltel Corp. agreed to purchase Western Wireless Corp. “A”. Conversely, stock selection in the consumer discretionary sector detracted from fund performance as one of the fund’s largest holdings, Westwood One, Inc. declined after reporting disappointing earnings. We at Lazard Asset Management LLC (Lazard) remain positive on the stock’s long-term ability to generate strong returns, and believe that the consensus expectation for long-term growth in radio is too low. Stock selection in the consumer durables sector also hurt fund performance, as Lear Corp. shares declined due to slowing production at General Motors Corp. However, we believe that this situation should improve later in the year as new sport utility vehicle production begins. |
| A-11 | See explanation of symbols and references on A-21 |
| PACIFIC FUNDS PERFORMANCE DISCUSSION (Continued) |
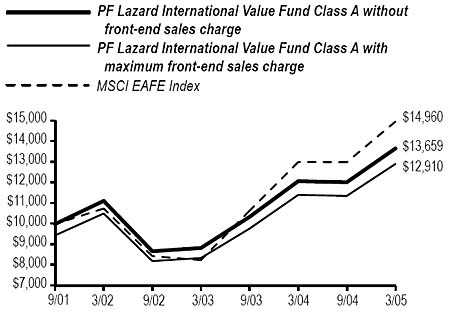
PF Lazard International Value Fund |
Q. How did the fund perform over the year ended March 31, 2005? A. For the year ended March 31, 2005, the fund’s Class A returned 13.13%* compared to a 15.06%** return for its benchmark, the MSCI EAFE Index. Complete performance information for all classes is included in the following table. Performance Comparison The following graph shows the value as of March 31, 2005 of a $10,000 investment made in Class A shares since the fund began operations. For comparison purposes, the performance of the fund’s benchmark (the MSCI EAFE Index) is also shown. Performance data for Class B and C shares will vary due to differences in fees and sales charges. |
 |
| Average Annual Total Returns for the Periods Ended March 31, 2005 |
| PF Lazard International Value Fund | Class A | Class B | Class C | ||||||||
| 1 Year Total Return: | |||||||||||
| Without sales charge* | 13.13 | % | 12.59 | % | 12.59 | % | |||||
| With maximum sales charge*** | 6.93 | % | 7.59 | % | 11.59 | % | |||||
| MSCI EAFE Index** | 15.06 | % | |||||||||
| 3 Year Total Return: | |||||||||||
| Without sales charge* | 7.09 | % | 6.53 | % | 6.53 | % | |||||
| With maximum sales charge*** | 5.08 | % | 5.34 | % | 6.53 | % | |||||
| MSCI EAFE Index** | 11.47 | % | |||||||||
| Since Inception: | |||||||||||
| Without sales charge* | 9.32 | % | 8.75 | % | 8.74 | % | |||||
| With maximum sales charge*** | 7.57 | % | 8.05 | % | 8.74 | % | |||||
| MSCI EAFE Index** | 12.20 | % |
| Performance data shown represents past performance. Investment return and principal value will fluctuate so that shares of the fund when redeemed may be worth more or less than their original cost. Past performance is not predictive of future performance. The table does not reflect the deduction of taxes that a shareholder would pay on fund distributions or redemption of fund shares. |
Q. Discuss both positive and negative factors that materially affected the fund’s performance during the year, including relevant market conditions, investment strategies and techniques, and particular sectors or securities. A. Over the last twelve months, ending March 31, 2005, the major influences on international stocks were the tightening monetary policy in the U.S., which engendered concerns about rising inflation, uncertainty over the outcome of the U.S. presidential election, rising crude oil prices, and concerns over the sustainability of growth in China. The impact on international markets, regarding the U.S. monetary policy, has been a gradual global reduction in investors’ risk tolerance. International stocks ended flat and slightly negative in the first six months of the period, rallying strongly in the third quarter, before ending the period modestly positive, in local currency terms. Europe managed to generate modest gains in the first six months of the period. In the next six months, the twelve-country euro region was among the benchmark’s best performers, although United Kingdom (U.K.) stocks trailed the other European regions. This rally started right after the U.S. presidential election, as uncertainty over the election’s outcome, as well as its definitiveness, was lifted. Japan’s economic recovery appeared to stall, as Japanese stocks were weak for the first three months of the period, fell sharply during the next three months, and then lagged for the remainder of the year, even as the yen reached a four-year high. Throughout the period, small- and mid-capitalization stocks outperformed larger-capitalization stocks, with small-capitalization stocks continuing their almost five-year run of outperformance. The energy sector was the best performer for the period, although it lagged the broad market in October, November, and December of 2004 when oil prices had crested. During the twelve-month period ending March 31, 2005, the fund benefited from stock selection, particularly in the health care and financials sectors. In health care, GlaxoSmithKline PLC shares rose due to the company’s strong pipeline of new drugs. It also reported a rise in fourth quarter 2004 profits, as an asset sale and reduced spending countered declining Paxil revenues. The company forecast low double-digit earnings growth, thanks to rising sales of drugs such as Avandia and Advair. In financials stocks, Allied Irish Banks PLC (AIB) shares rose as the company benefited from strong loan demand in 2004. The bank’s performance in the second half of 2004 more than doubled, aided by higher lending in Ireland and the U.K., and lower costs. A pick-up in AIB’s Polish unit also helped to counter the impact of the weaker dollar on U.S. earnings. From a sector weight perspective, the fund benefited from an overweight position versus the benchmark in energy stocks and an underweight position in consumer discretionary stocks. In the energy sector, ENI SPA experienced a gradual but steady upward re-rating versus larger European oil companies. A successful shift of capital employed and profit mix from the domestic gas transportation business to a global upstream business has underpinned the re-rating, coupled with capable management guidance, growing reserves and production, attention to unit costs, and a generous dividend. Conversely, lack of exposure to materials and an underweight position in utilities hurt performance. In the past two years, investors have aggressively embraced risk in many forms, emboldened by the extremely accommodative monetary policy in most major economies. This embrace of risk can be seen in the dramatic outperformance of smaller, less profitable, more leveraged companies globally. This environment has been challenging for Lazard’s investment process, which focuses on identifying high quality, financially productive companies trading at attractive valuations. However, as interest rates rise, we believe that investors’ risk tolerance should moderate. We believe that the rebound, during the first quarter of 2005, in larger stocks in the U.S. may spread |
| A-12 | See explanation of symbols and references on A-21 |
| PACIFIC FUNDS PERFORMANCE DISCUSSION (Continued) |
globally, and lead to an environment where individual company fundamentals drive stock returns. |
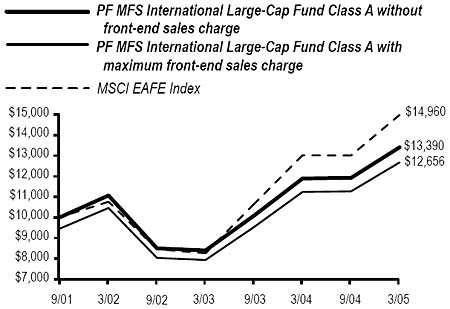
PF MFS International Large-Cap Fund |
Q. How did the fund perform over the year ended March 31, 2005? A. For the year ended March 31, 2005, the fund’s Class A returned 12.73%* compared to a 15.06%** return for its benchmark, the MSCI EAFE Index. Complete performance information for all classes is included in the following table. Performance Comparison The following graph shows the value as of March 31, 2005 of a $10,000 investment made in Class A shares since the fund began operations. For comparison purposes, the performance of the fund’s benchmark (the MSCI EAFE Index) is also shown. Performance data for Class B and C shares will vary due to differences in fees and sales charges. |
 |
| Average Annual Total Returns for the Periods Ended March 31, 2005 |
| PF MFS International Large-Cap Fund | Class A | Class B | Class C | ||||||||
| 1 Year Total Return: | |||||||||||
| Without sales charge* | 12.73 | % | 12.18 | % | 12.16 | % | |||||
| With maximum sales charge*** | 6.49 | % | 7.18 | % | 11.16 | % | |||||
| MSCI EAFE Index** | 15.06 | % | |||||||||
| 3 Year Total Return: | |||||||||||
| Without sales charge* | 6.60 | % | 6.03 | % | 6.09 | % | |||||
| With maximum sales charge*** | 4.61 | % | 4.83 | % | 6.09 | % | |||||
| MSCI EAFE Index** | 11.47 | % | |||||||||
| Since Inception: | |||||||||||
| Without sales charge* | 8.70 | % | 8.12 | % | 8.17 | % | |||||
| With maximum sales charge*** | 6.96 | % | 7.41 | % | 8.17 | % | |||||
| MSCI EAFE Index** | 12.20 | % | |||||||||
Performance data shown represents past performance. Investment return and principal value will fluctuate so that shares of the fund when redeemed may be worth more or less than their original cost. Past performance is not predictive of future performance. The table does not reflect the deduction of taxes that a shareholder would pay on fund distributions or redemption of fund shares. |
Q. Discuss both positive and negative factors that materially affected the fund’s performance during the year, including relevant market conditions, investment strategies and techniques, and particular sectors or securities. A. Stocks experienced considerable volatility during the twelve months ended March 31, 2005. Investors endured skyrocketing oil prices, a volatile and retreating U.S. dollar, record U.S. budget and trade deficits, and war in Iraq. Fundamental economic factors, however, such as corporate spending and earnings, continued to improve around the globe. By the second half of the period, investors seemed to conclude that the global economic recovery, although modest, was still intact. In the end, fundamental economic factors triumphed and most equity markets delivered positive results for the period as a whole. Relative to the fund’s benchmark, leisure, special products and services, and utilities and communications were the sectors that detracted most significantly from fund performance. In all three sectors, stock selection was the key factor that held back results over the period. In the leisure sector, the fund’s position in U.K. satellite television broadcaster British Sky Broadcasting Group PLC declined in price after management said it would boost capital spending to spur growth. We at MFS Investment Management sold the stock because we believed that the change in the company’s business plan would reduce its long-term profitability. Elsewhere in the sector, the fund’s holding in Japanese video game maker Nintendo Co. Ltd. also lost value over the period. Within the special products and services sector, the primary detractor from performance was the fund’s position in NOK Corp., a Japanese producer of auto parts and electrical components. Japanese wireless telecommunications firm KDDI Corp. was the major detractor from results in the utilities and communications area. The stock declined on worries that increased competition would lead to weaker profits and cash flow growth. Fund holdings in other sectors that lost ground during the period and hurt relative fund performance included Samsung SDI Co., Ltd., a Korean maker of digital display screens and rechargeable batteries, U.K.-headquartered financial services company AMVESCAP PLC, and Japanese electronic component firm Murata Manufacturing Co., Ltd. The fund’s cash position also detracted from relative performance. As with nearly all mutual funds, this fund holds some cash to buy new holdings and to provide liquidity. In a period when international equity markets rose sharply, holding any cash hurt performance against the fund’s benchmark, which has no cash position. Relative to the fund’s benchmark, technology and consumer staples were the fund’s strongest-performing sectors over the period. Taken as a group, the fund’s positions in technology stocks delivered slightly positive performance, while the benchmark’s holdings in the sector declined significantly. Stock selection was the key factor in the fund’s strong relative performance in the consumer staples area. U.K.-headquartered Reckitt Benckiser PLC, one of the world’s largest makers of household cleaning products, was the strongest relative contributor in the sector. Fund positions in other sectors that aided relative results included OTP Bank RT in Hungary and Erste Bank der Oesterreichischen Sparkassen AG in Austria, two larger regional banks with exposure to eastern European customers. Holdings in Companhia Vale do Rio Doce (CVRD) in Brazil, the world’s largest miner of iron ore, rose sharply as a result of |
| A-13 | See explanation of symbols and references on A-21 |
| PACIFIC FUNDS PERFORMANCE DISCUSSION (Continued) |
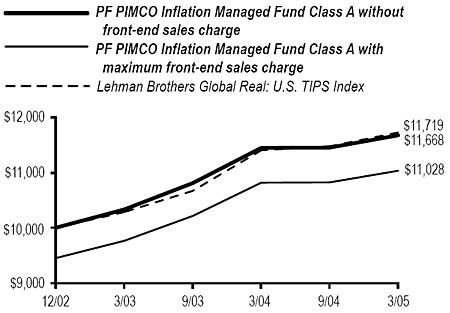
increasing global demand and higher prices for its product. The fund’s position in Canadian National Railway Co. also increased in price. Holding Canadian firm EnCana Corp., one of North America’s largest independent oil and gas producers, proved beneficial to returns as rising energy prices helped the stock perform strongly. Avoiding cellular equipment manufacturer Nokia OYJ, whose stock price sank over the period, contributed to relative returns as well. During the reporting period, shifts in currency valuations were also a significant contributor to performance relative to the benchmark. The base currency of the fund is U.S. dollars and the performance of the fund and its benchmark are presented in terms of this currency. Nevertheless, specific holdings of the fund and the benchmark may be denominated in different currencies and, therefore, present the possibility of currency depreciation or appreciation. Because the exposures of the fund and the benchmark to foreign currency movements may differ from time to time, these movements may have a material impact on relative performance. PF PIMCO Inflation Managed Fund Q. How did the fund perform over the year ended March 31, 2005? A. For the year ended March 31, 2005, the fund’s Class A returned 1.99%* compared to a 2.82%** return for its benchmark, the Lehman Brothers Global Real: U.S. TIPS Index. Complete performance information for all classes is included in the following table. Performance Comparison The following graph shows the value as of March 31, 2005 of a $10,000 investment made in Class A shares since the fund began operations. For comparison purposes, the performance of the fund’s benchmark (the Lehman Brothers Global Real: U.S. TIPS Index) is also shown. Performance data for Class B and C shares will vary due to differences in fees and sales charges. |
 |
| Average Annual Total Returns for the Periods Ended March 31, 2005 |
| PF PIMCO Inflation Managed Fund | Class A | Class B | Class C | ||||||||
| 1 Year Total Return: | |||||||||||
| Without sales charge* | 1.99 | % | 1.43 | % | 1.44 | % | |||||
| With maximum sales charge*** | -3.66 | % | -3.37 | % | 0.48 | % | |||||
| Lehman Brothers Global Real: | |||||||||||
| U.S. TIPS Index** | 2.82 | % | |||||||||
| Since Inception: | |||||||||||
| Without sales charge* | 7.11 | % | 6.55 | % | 6.56 | % | |||||
| With maximum sales charge*** | 4.45 | % | 4.89 | % | 6.56 | % | |||||
| Lehman Brothers Global Real: | |||||||||||
| U.S. TIPS Index** | 7.30 | % |
Performance data shown represents past performance. Investment return and principal value will fluctuate so that shares of the fund when redeemed may be worth more or less than their original cost. Past performance is not predictive of future performance. The table does not reflect the deduction of taxes that a shareholder would pay on fund distributions or redemption of fund shares. |
Q. Discuss both positive and negative factors that materially affected the fund’s performance during the year, including relevant market conditions, investment strategies and techniques, and particular sectors or securities. A. After concerns about the durability of the U.S. economy pushed low interest rates lower in the first quarter of 2004, market optimism was revived during the second quarter after a series of robust non-farm payroll growth and inflation releases suggested to investors that the economy indeed was on track. Short-term interest rates increased during the second quarter and fixed income markets sold off, giving back all the gains of the first quarter. The third quarter was essentially a reversal of the previous three months. Economic data releases suggested moderate economic growth, as job numbers, inflation and consumer confidence fell short of analyst expectations, again throwing doubts on the strength of the recovery. Bonds subsequently rallied as the weak employment growth and lower than expected rate of inflation prompted a fall in interest rates. The rally of the third quarter continued into the last three months of 2004 where all major fixed income sectors posted gains, capping a year in which bonds showed unexpected strength. Bonds lost ground during the first quarter of 2005 as volatile interest rates and weakness in credit markets related to concerns about auto issues weighed on fixed income securities. Higher oil prices also fuelled a rise in inflation expectations, which led to nominal yields rising more than real yields. A below benchmark duration from Treasury Inflation Protected Securities (TIPS) during the first six months of the period contributed to fund performance as real yields rose. During the final six months, the fund shifted to slightly longer-than-benchmark duration from TIPS, which was neutral for performance as real yields were essentially unchanged during this period. An overweight position to shorter maturity TIPS during the period was negative for performance as the real yield curve flattened. Exposure to Eurozone nominal interest rates, primarily via German Bund futures, was positive as Eurozone yields fell during the period in contrast to U.S. yields, which rose. An allocation to emerging market bonds was also positive for fund performance as spreads on emerging market debt narrowed during the twelve-month period. |
| A-14 | See explanation of symbols and references on A-21 |
| PACIFIC FUNDS PERFORMANCE DISCUSSION (Continued) |
With regards to strategy, Pacific Investment Management Co. LLC (PIMCO) will likely employ defensive strategies that enhance yield but protect investors’ capital should global stability erode. Key strategies we expect to employ include: an above benchmark duration from TIPS as real rates in the U.S. are expected to remain lower than historic norms due to excess leverage and other headwinds to economic growth; a below benchmark duration through net short exposure to nominal bonds to limit risk from higher interest rates; exposure to nominal bonds in Europe, where growth and rate pressures will be more muted; an emphasis on short/intermediate maturities, which offer structural advantages given a steep yield curve; forward settled bonds, which can gain even if rates rise as long as the increase is not more than markets expect; and emerging market bonds, which offer relatively high yields and continue to display improving credit fundamentals. PF PIMCO Managed Bond Fund Q. How did the fund perform over the year ended March 31, 2005? A. For the year ended March 31, 2005, the fund’s Class A returned 0.56%* compared to a 0.40%** return for its benchmark, the Lehman Brothers Government/Credit Index. Complete performance information for all classes is included in the following table. Performance Comparison The following graph shows the value as of March 31, 2005 of a $10,000 investment made in Class A shares since the fund began operations. For comparison purposes, the performance of the fund’s benchmark (the Lehman Brothers Government/Credit Index) is also shown. Performance data for Class B and C shares will vary due to differences in fees and sales charges. |
 |
| Average Annual Total Returns for the Periods Ended March 31, 2005 |
| PF PIMCO Managed Bond Fund | Class A | Class B | Class C | ||||||||
| 1 Year Total Return: | |||||||||||
| Without sales charge* | 0.56 | % | -0.05 | % | 0.04 | % | |||||
| With maximum sales charge*** | -4.99 | % | -4.84 | % | -0.92 | % | |||||
| Lehman Brothers | |||||||||||
| Government/Credit Index** | 0.40 | % | |||||||||
| 3 Year Total Return: | |||||||||||
| Without sales charge* | 6.43 | % | 5.91 | % | 5.94 | % | |||||
| With maximum sales charge*** | 4.45 | % | 4.70 | % | 5.94 | % | |||||
| Lehman Brothers | |||||||||||
| Government/Credit Index** | 6.52 | % | |||||||||
| Since Inception: | |||||||||||
| Without sales charge* | 5.40 | % | 4.88 | % | 4.90 | % | |||||
| With maximum sales charge*** | 3.72 | % | 4.11 | % | 4.90 | % | |||||
| Lehman Brothers | |||||||||||
| Government/Credit Index** | 5.44 | % |
Performance data shown represents past performance. Investment return and principal value will fluctuate so that shares of the fund when redeemed may be worth more or less than their original cost. Past performance is not predictive of future performance. The table does not reflect the deduction of taxes that a shareholder would pay on fund distributions or redemption of fund shares. |
Q. Discuss both positive and negative factors that materially affected the fund’s performance during the year, including relevant market conditions, investment strategies and techniques, and particular sectors or securities. A. After concerns about the durability of the U.S. economy pushed low interest rates lower in the first quarter of 2004, market optimism was revived during the second quarter after a series of robust non-farm payroll growth and inflation releases suggested to investors that the economy indeed was on track. Short-term interest rates increased during the second quarter and fixed income markets sold off, giving back all the gains of the first quarter. The third quarter was essentially a reversal of the previous three months. Economic data releases suggested moderate economic growth, as job numbers, inflation and consumer confidence fell short of analyst expectations, again throwing doubts on the strength of the recovery. Bonds subsequently rallied as the weak employment growth and lower than expected rate of inflation prompted a fall in interest rates. The rally of the third quarter continued into the last three months of 2004 where all major fixed income sectors posted gains, capping a year in which bonds showed unexpected strength. Bonds lost ground during the first quarter of 2005 as volatile interest rates and weakness in credit markets related to concerns about auto issues weighed on fixed income securities. The U.S. yield curve continued to flatten as the Fed tightened interest rates and strong demand from speculative investors and Asian central banks supported longer maturity bonds. A below benchmark duration helped fund returns as interest rates, while volatile, generally trended upwards over the twelve-month period. An underweight position versus the benchmark to longer maturities detracted from fund returns. Longer maturities rallied as demand increased despite the Fed tightening cycle. A mortgage emphasis helped fund performance as spreads versus U.S. Treasuries tightened and the sector outperformed. Underweighting corporate bonds versus the benchmark detracted from returns as the low return environment drove |
| A-15 | See explanation of symbols and references on A-21 |
| PACIFIC FUNDS PERFORMANCE DISCUSSION (Continued) |
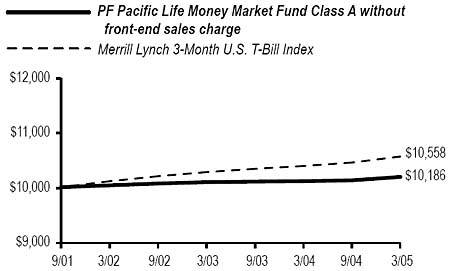
investors to seek yield in the asset class, causing historically tight credit premiums in the sector to tighten even further. A tactical allocation to real return bonds was positive as real yields fell over the period driven by higher energy prices and, thus, higher inflation expectations. Municipal bonds also helped fund returns in the volatile market as a stable base of retail demand supported municipal returns. Diversifying outside the U.S. via exposure to Eurozone issues was positive as rate movements were milder outside the U.S. Emerging markets bonds also added to fund performance as improving credit fundamentals remained and attractive yield premiums drove investor demand. With regards to strategy, PIMCO will likely employ defensive strategies that enhance yield but protect investors’ capital should global stability erode. Key strategies we expect to employ include: a target U.S. duration of neutral to 0.50 year below the benchmark, to limit risk from higher rates, with the flexibility to tactically adjust within these limits as rates near the top or bottom of our forecast range; yield curve exposure near the index, avoiding longer U.S. maturities that have been volatile this year while emphasizing longer maturity Eurozone bonds, which should benefit from demand by pension funds to lengthen their asset duration; and exposure to short-term rates via forward contracts, which offers the potential for gains if interest rates rise less than the market expects. We also expect to cautiously add to the fund’s mortgage holdings to enhance yield and add value via coupon and security selection. We will also plan to look for similar opportunities in corporates, though reduction in corporate underweight versus the benchmark will most likely be smaller than what occurred during the period. We expect to hold TIPS, which should benefit from low and stable real yields, as well as higher inflation expectations; longer maturity municipal securities, another attractive source of income given their high yield ratios versus Treasuries; and emerging market bonds, which offer currently high yields and continue to display improving credit fundamentals. PF Pacific Life Money Market Fund Q. How did the fund perform over the year ended March 31, 2005? A. For the year ended March 31, 2005, the fund’s Class A returned 0.77%* compared to a 1.67%** return for its benchmark, the Merrill Lynch 3-Month U.S. T-Bill Index. Complete performance information for all classes is included in the following table. The current yield measured during the seven-day period ending March 31, 2005 was 1.73%.* Performance Comparison The following graph shows the value as of March 31, 2005 of a $10,000 investment made in Class A shares since the fund began operations. For comparison purposes, the performance of the fund’s benchmark (the Merrill Lynch 3-Month U.S. T-Bill Index) is also shown. Performance data for Class B and C shares will vary due to differences in fees and sales charges. |
 |
| Average Annual Total Returns for the Periods Ended March 31, 2005 |
| PF Pacific Life Money Market Fund | Class A | Class B | Class C | ||||||||
| 1 Year Total Return: | |||||||||||
| Without sales charge* | 0.77 | % | 0.35 | % | 0.39 | % | |||||
| Merrill Lynch 3-Month U.S. T-Bill | |||||||||||
| Index** | 1.67 | % | |||||||||
| 3 Year Total Return: | |||||||||||
| Without sales charge* | 0.51 | % | 0.18 | % | 0.19 | % | |||||
| Merrill Lynch 3-Month U.S. T-Bill | |||||||||||
| Index** | 1.47 | % | |||||||||
| Since Inception: | |||||||||||
| Without sales charge* | 0.53 | % | 0.18 | % | 0.19 | % | |||||
| Merrill Lynch 3-Month U.S. T-Bill | |||||||||||
| Index** | 1.56 | % | |||||||||
Performance data shown represents past performance. Investment return and principal value will fluctuate so that shares of the fund when redeemed may be worth more or less than their original cost. Past performance is not predictive of future performance. The table does not reflect the deduction of taxes that a shareholder would pay on fund distributions or redemption of fund shares. |
Q. Discuss both positive and negative factors that materially affected the fund’s performance during the year, including relevant market conditions, investment strategies and techniques, and particular sectors or securities. A. Corresponding with the Fed’s mid-year tightening, the short-term yield environment changed course. Beginning with the June 30, 2004 FOMC meeting, the Fed tightened the Federal Funds target rate by 0.25% at each meeting, leaving the current rate at 2.75%. More rate increases are expected, with the Federal Funds futures predicting a 3.75% rate by year-end. Consequently, the commercial paper (CP), U.S. Treasury Bill and short-term agency markets all followed suit. CP rates have steadily increased, with 30-day CP now trading near 2.8%, 60-day CP near 2.9% and 90-day CP just above 3.0%. Additionally, the CP curve has steepened somewhat, enabling the fund to opportunistically invest in longer maturity instruments in an effort to pick up yield. With the trend for interest rates moving higher, the fund employed a number of strategies to enhance overall yield during the period ended March 31, 2005. Generally, the average maturity was kept short, thus taking advantage of the |
| A-16 | See explanation of symbols and references on A-21 |
| PACIFIC FUNDS PERFORMANCE DISCUSSION (Continued) |
steady rise in rates. However, as opportunities arose, yield was added with the purchase of callable agencies, asset-backed securities, and floating rate notes. Callable agency and asset-backed securities lengthened the fund’s average maturity, while the floating rate notes shortened the average maturity. The net effect of this barbell strategy is a temporary extension of the fund’s average maturity, but this slight negative was more than offset by the yield enhancement. We at Pacific Life were also able to periodically add yield with certificates of deposit from highly rated European and domestic banks. PF Salomon Brothers Large-Cap Value Fund Q. How did the fund perform over the year ended March 31, 2005? A. For the year ended March 31, 2005, the fund’s Class A returned 3.78%* compared to a 6.69%** return for its benchmark, the S&P 500 Index. Complete performance information for all classes is included in the following table. Performance Comparison The following graph shows the value as of March 31, 2005 of a $10,000 investment made in Class A shares since the fund began operations. For comparison purposes, the performance of the fund’s benchmark (the S&P 500 Index) is also shown. Performance data for Class B and C shares will vary due to differences in fees and sales charges. |
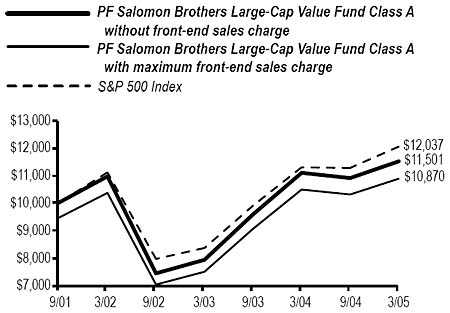 |
| Average Annual Total Returns for the Periods Ended March 31, 2005 |
| PF Salomon Brothers Large-Cap Value Fund | Class A | Class B | Class C | ||||||||
| 1 Year Total Return: | |||||||||||
| Without sales charge* | 3.78 | % | 3.32 | % | 3.33 | % | |||||
| With maximum sales charge*** | -1.96 | % | -1.68 | % | 2.33 | % | |||||
| S&P 500 Index** | 6.69 | % | |||||||||
| 3 Year Total Return: | |||||||||||
| Without sales charge* | 1.64 | % | 1.20 | % | 1.15 | % | |||||
| With maximum sales charge*** | -0.27 | % | -0.12 | % | 1.15 | % | |||||
| S&P 500 Index** | 2.74 | % | |||||||||
| Since Inception: | |||||||||||
| Without sales charge* | 4.08 | % | 3.65 | % | 3.59 | % | |||||
| With maximum sales charge*** | 2.41 | % | 2.86 | % | 3.59 | % | |||||
| S&P 500 Index** | 5.44 | % |
Performance data shown represents past performance. Investment return and principal value will fluctuate so that shares of the fund when redeemed may be worth more or less than their original cost. Past performance is not predictive of future performance. The table does not reflect the deduction of taxes that a shareholder would pay on fund distributions or redemption of fund shares. |
Q. Discuss both positive and negative factors that materially affected the fund’s performance during the year, including relevant market conditions, investment strategies and techniques, and particular sectors or securities. A. During the twelve-month period ended March 31, 2005, the U.S. stock market generated positive results, with the S&P 500 Index returning 6.69%**. During the first half of the period, stocks traded in a fairly narrow range, as rising interest rates, high oil prices, geopolitical concerns, and uncertainties surrounding the U.S. presidential election caused many investors to remain on the sidelines. However, from late October 2004 through the end of the year, equities in both the U.S. and abroad rallied sharply. Investors were drawn to the market as the presidential election ended without incident and oil prices fell from their record highs. Thus far in 2005, the equity markets have been volatile. Equities were weak in January, but subsequently rallied in February and early March. However, toward the end of the period the market fell sharply, as oil prices reached new record highs and investors were concerned that the Fed may become more aggressive in terms of raising interest rates. Looking at the one-year period as a whole, the trend of value-oriented stocks outperforming their growth counterparts continued, as the Russell 1000 Value Index and the Russell 1000 Growth Index returned 13.17%** and 1.16%**, respectively. Within the S&P 500 Index, the energy sector led the way gaining 46.9%, followed by utilities, industrials and materials posting double-digit gains of 24.9%, 17.3% and 17.3%, respectively for the twelve-month period. Most sectors of the S&P 500 Index posted positive returns with the exception of the information technology and financials sectors, which declined by 2.5% and 1.0%, respectively. The sectors that contributed most to the fund’s performance for the year included the energy, industrials and consumer discretionary sectors. Three of the fund’s sectors that detracted from fund performance included the information technology, health care, and materials sectors. Stocks that contributed to fund performance included Altria Group, Inc., Total S.A., The Boeing Co., MCI Inc. and ChevronTexaco Corp. During the period, the fund’s positions in Altria Group, Total S.A. and Boeing were increased and positions in MCI and ChevronTexaco were sold. Stocks that detracted from fund performance came from a number of different sectors and included Nortel Networks Corp., Pfizer Inc., American International Group Inc., Merck & Co., Inc. and Solectron Corp. Nortel Networks Corp. declined during the period after reducing its gross margin forecast for this year. We at Salomon Brothers Asset Management Inc. took advantage of the weakness to add modestly to the fund’s position. American International Group’s share price has been under pressure recently due to regulatory, accounting and rating agency reviews. Although the long-term financial health of the company does not appear at risk, the depth and breadth of the current investigation is larger than first anticipated. Earlier in the period, we increased the fund’s positions in Merck and Pfizer then sold |
| A-17 | See explanation of symbols and references on A-21 |
| PACIFIC FUNDS PERFORMANCE DISCUSSION (Continued) |
shares of Merck after the announcement of the Vioxx recall and reduced Pfizer holdings after the disclosure of increased cardiovascular risks from its cox-2 inhibitor class of drugs. We continue to monitor these situations closely. PF Van Kampen Comstock Fund Q. How did the fund perform over the year ended March 31, 2005? A. For the year ended March 31, 2005, the fund’s Class A returned 11.08%* compared to a 6.69%** return for its benchmark, the S&P 500 Index. Complete performance information for all classes is included in the following table. Performance Comparison The following graph shows the value as of March 31, 2005 of a $10,000 investment made in Class A shares since the fund began operations. For comparison purposes, the performance of the fund’s benchmark (the S&P 500 Index) is also shown. Performance data for Class B and C shares will vary due to differences in fees and sales charges. |
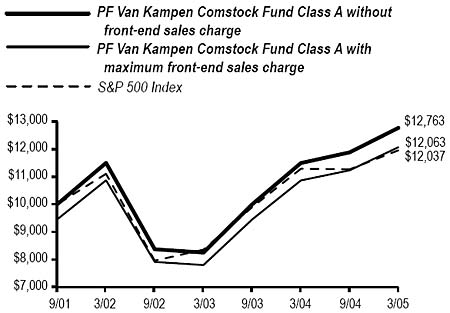 |
| Average Annual Total Returns for the Periods Ended March 31, 2005 |
| PF Van Kampen Comstock Fund | Class A | Class B | Class C | ||||||||
| 1 Year Total Return: | |||||||||||
| Without sales charge* | 11.08 | % | 10.50 | % | 10.50 | % | |||||
| With maximum sales charge*** | 4.99 | % | 5.50 | % | 9.50 | % | |||||
| S&P 500 Index** | 6.69 | % | |||||||||
| 3 Year Total Return: | |||||||||||
| Without sales charge* | 3.55 | % | 3.03 | % | 3.04 | % | |||||
| With maximum sales charge*** | 1.61 | % | 1.76 | % | 3.04 | % | |||||
| S&P 500 Index** | 2.74 | % | |||||||||
| Since Inception: | |||||||||||
| Without sales charge* | 7.22 | % | 6.70 | % | 6.69 | % | |||||
| With maximum sales charge*** | 5.51 | % | 5.97 | % | 6.69 | % | |||||
| S&P 500 Index** | 5.44 | % |
Performance data shown represents past performance. Investment return and principal value will fluctuate so that shares of the fund when redeemed may be worth more or less than their original cost. Past performance is not predictive of future performance. The table does not reflect the deduction of taxes that a shareholder would pay on fund distributions or redemption of fund shares. |
Q. Discuss both positive and negative factors that materially affected the fund’s performance during the year, including relevant market conditions, investment strategies and techniques, and particular sectors or securities. A. The equity market performed solidly overall for the period, exhibiting significant gains. The period was marked by rising interest rates, although these rate changes were implemented at a measured pace and were generally anticipated by investors. While the market made great strides in the first half of the period, supported for much of the year by robust manufacturing activity and impressive corporate earnings, a number of geopolitical concerns weighed on stocks in the third quarter and contributed to weakening performance. Investors experienced anxiety relating to events in Iraq and domestic-based terrorism, and worried further about the possibility of another protracted outcome to the U.S. presidential election. In addition, shifting energy prices contributed further to market volatility during the twelve months. A number of these concerns were alleviated once oil prices fell from their highs at the end of October of 2004 and the presidential election came to a quick and decisive conclusion. These events set the stage for an equities rally in November and December. A pickup in initial public offerings and a number of high-profile mergers and acquisitions also helped boost stocks during this time. Although the successful election in Iraq and the upward revision of fourth-quarter GDP numbers supported the market in early 2005, the period ended on a less positive note as oil prices continued to rise in the final month of the period and rising interest rates finally began to weigh on market performance. In addition, slowing profit growth also became a concern for investors late in the period. Both stock selection and sector weightings contributed favorably to fund returns during the period. As rising rates took a toll on many financial services companies, the fund’s relative performance benefited from a slight underweighting versus its benchmark. Additionally, the fund’s financial stocks were well diversified. A higher-than-benchmark weighting in utility stocks also helped fund returns. Within this sector, electric utility stocks contributed particularly notable gains. During a period of rising oil prices, a significantly higher-than-benchmark weighting in energy stocks also proved helpful. Moreover, within the sector, the fund’s exposure was tilted toward oil services and drilling companies, which performed particularly well during the fourth quarter of the fund’s fiscal year. On the downside, very limited exposure to industrial stocks, due to Van Kampen’s management team’s valuation discipline, detracted from relative returns. As the economy began to improve, the industrial sector performed briskly. A higher-than-benchmark weighting in materials stocks also hurt relative fund performance. In particular, the fund’s holdings in paper company stocks lagged, as did many companies within the industry group. Turnover remained relatively low during the twelve months. The fund management team seeks stocks that are undervalued by the market, based on an evaluation of a company’s true value and long-term potential. During the period, the team found few stocks that met their investment criteria. |
| A-18 | See explanation of symbols and references on A-21 |
| PACIFIC FUNDS PERFORMANCE DISCUSSION (Continued) |
PF Van Kampen Real Estate Fund Q. How did the fund perform for the period ended March 31, 2005? A. The PF Van Kampen Real Estate Fund commenced operations on December 31, 2004. For the period since inception through March 31, 2005, the fund’s Class A returned –5.95%* compared to a –7.05%** return for its benchmark, the NAREIT Equity Index. Complete performance information for all classes is included in the following table. Performance Comparison The following graph shows the value as of March 31, 2005 of a $10,000 investment made in Class A shares since the fund began operations. For comparison purposes, the performance of the fund’s benchmark (the NAREIT Equity Index) is also shown. Performance data for Class B and C shares will vary due to differences in fees and sales charges. |
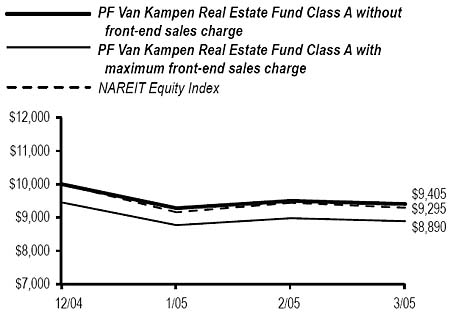 |
| Total Returns (Non-Annualized) for the Period Ended March 31, 2005 |
| PF Van Kampen Real Estate Fund | Class A | Class B | Class C | ||||||||
| Since Inception: | |||||||||||
| Without sales charge* | -5.95 | % | -6.05 | % | -6.06 | % | |||||
| With maximum sales charge*** | -11.10 | % | -10.74 | % | -7.00 | % | |||||
| NAREIT Equity Index** | -7.05 | % | |||||||||
Performance data shown represents past performance. Investment return and principal value will fluctuate so that shares of the fund when redeemed may be worth more or less than their original cost. Past performance is not predictive of future performance. The table does not reflect the deduction of taxes that a shareholder would pay on fund distributions or redemption of fund shares. |
Q. Discuss both positive and negative factors that materially affected the fund’s performance during the period, including relevant market conditions, investment strategies and techniques, and particular sectors or securities. A. Real estate investment trusts (REITs) experienced declines in the first three months of 2005, falling 7.1% as measured by the NAREIT Equity Index. The sector began the year poorly with losses in January due largely to profit-taking and rebalancing by portfolio managers as well as short selling by large hedge funds. Although the market experienced somewhat of a recovery in February of 2005, these gains were partially offset by another decline in March. Various factors, including the rise in Treasury yields, weakness in the broader equity market, and investor concerns over the five-year outperformance of REITs, hampered the market for the remainder of the quarter. Among the major sectors, the office stocks generally outperformed, the retail stocks performed in-line and the apartment stocks underperformed. The outperformance of the office companies appeared to be due to investor optimism for a recovery in this sector as fundamentals have stopped deteriorating. The apartment sector underperformed as these stocks were particularly affected by profit-taking. Many of the apartment stocks that posted the strongest performance in 2004 experienced the largest declines in the first quarter of 2005. Moreover, in contrast to the positive sentiment in the office sector, investors appeared to be more concerned about the slow pace of recovery within the apartment sector. Storage REITs were the best performing sector during the quarter, helped by favorable operating results and confidence in the sector’s recovery. In contrast, health care REITs were the weakest performers during the quarter due to investor concerns about a lack of external growth opportunities. Hotel REITs performed generally in-line with the benchmark, despite providing earnings guidance for continued strong results for 2005. Fund performance during the period was driven largely by stock selection, with a number of sector allocations supporting gains. In the hotel sector, the fund benefited from its focus on owners of upscale urban assets that had exposure to the major urban hotel markets, which are experiencing a strong recovery with the return of corporate travel. In the mall sector, the fund benefited from its preference for high-quality mall assets in dominant trade areas. From a top-down perspective, an overweighted allocation to the storage sector relative to the benchmark added to gains for the fund due to the sector’s outperformance, while an underweight position in the health care sector helped as these stocks suffered during the period. Detractors from fund performance during the period included stock selection in the apartment sector. Here, the fund maintained a significant exposure to owners of coastal assets. While these companies experienced particularly strong performance in 2004, many of them suffered a pullback that hurt the fund’s returns. In addition, the fund’s overweighted position in apartment companies relative to the benchmark detracted from performance during the first quarter of 2005, as profit-taking and investor concern over the pace of the sector’s recovery hampered apartment REITs. |
| A-19 | See explanation of symbols and references on A-21 |
| PACIFIC FUNDS PERFORMANCE DISCUSSION (Continued) |
PF Van Kampen Mid-Cap Growth Fund Q. How did the fund perform over the year ended March 31, 2005? A. For the year ended March 31, 2005, the fund’s Class A returned 11.49%* compared to a 8.31%** return for its benchmark, the Russell Midcap Growth Index. Complete performance information for all classes is included in the following table. Performance Comparison The following graph shows the value as of March 31, 2005 of a $10,000 investment made in Class A shares since the fund began operations. For comparison purposes, the performance of the fund’s benchmark (the Russell Midcap Growth Index) is also shown. Performance data for Class B and C shares will vary due to differences in fees and sales charges. |
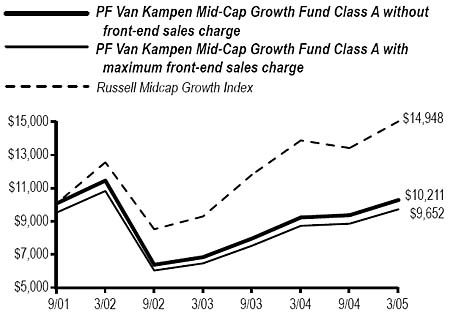 |
| Average Annual Total Returns for the Periods Ended March 31, 2005 |
| PF Van Kampen Mid-Cap Growth Fund | Class A | Class B | Class C | ||||||||
| 1 Year Total Return: | |||||||||||
| Without sales charge* | 11.49 | % | 10.97 | % | 10.99 | % | |||||
| With maximum sales charge*** | 5.31 | % | 5.97 | % | 9.99 | % | |||||
| Russell Midcap Growth Index** | 8.31 | % | |||||||||
| 3 Year Total Return: | |||||||||||
| Without sales charge* | -3.54 | % | -3.97 | % | -3.98 | % | |||||
| With maximum sales charge*** | -5.34 | % | -5.13 | % | -3.98 | % | |||||
| Russell Midcap Growth Index** | 6.19 | % | |||||||||
| Since Inception: | |||||||||||
| Without sales charge* | 0.60 | % | 0.15 | % | 0.14 | % | |||||
| With maximum sales charge*** | -1.01 | % | -0.61 | % | 0.14 | % | |||||
| Russell Midcap Growth Index** | 12.17 | % | |||||||||
Performance data shown represents past performance. Investment return and principal value will fluctuate so that shares of the fund when redeemed may be worth more or less than their original cost. Past performance is not predictive of future performance. The table does not reflect the deduction of taxes that a shareholder would pay on fund distributions or redemption of fund shares. |
Q. Discuss both positive and negative factors that materially affected the fund’s performance during the year, including relevant market conditions, investment strategies and techniques, and particular sectors or securities. A. Equity markets posted solid gains for the twelve-month period, despite some ups and downs along the way. Value stocks generally outperformed growth stocks. Consumer confidence and spending remained strong, bolstered by job growth and lower interest rates. While the FOMC raised the Federal Funds target rate several times during the period, it did so at a measured pace, and surges were widely anticipated by investors. In the third quarter of 2004, the market slowed its pace. Geopolitical concerns weighed on stocks. Investors were apprehensive about events in Iraq, as well as the possibilities of terrorist attacks and another protracted outcome to the U.S. presidential election. In addition, shifting energy prices also concerned investors. Equities rallied in November and December of 2004, as several of these concerns were alleviated. Oil prices fell from their October highs, and the presidential election came to a quick and decisive conclusion. A pickup in initial public offerings and a number of high-profile mergers and acquisitions also helped boost stock performance during this time. Although the well-received outcome of the Iraqi election and upward revision of fourth quarter GDP numbers further supported the market in early 2005, the period ended on a less positive note. To add to this environment, rising oil prices and interest rates finally began to take a noticeable toll on investor sentiment. The fund’s performance over the period was driven primarily by stock selection, with a number of sector allocations also contributing positively. The three largest sectors in the portfolio were consumer discretionary, where the fund had its largest overweighted position relative to the benchmark; health care, where the fund maintained a modestly underweighted position; and technology, where the fund had its largest underweighted position. The fund benefited from stock selection within the technology sector, with a diverse group of large-capitalization technology stocks contributing to returns. Generally, the technology sector posted disappointing results for the period and the fund’s considerably underweighted position versus the benchmark in the technology sector as a whole helped relative returns. Within technology industries, limited exposure to the semiconductor industry was also favorable for relative performance. Stock selection within the energy sector further supported the fund’s returns, and an overweighted position in energy stocks was also positive. Within the financial services sector, the fund made gains from its holdings of a number of financial services companies in different industries. While these positions drove the fund’s performance for the period, others were less positive for the fund. Despite the favorable returns seen by some of the portfolio’s health care equipment and supply companies, stock selection within the health care sector hampered the fund’s overall relative performance. Stock selection within the consumer discretionary sector was another significant detractor from overall performance, despite the gains made by several casino companies. |
| A-20 | See explanation of symbols and references on A-21 |
| PACIFIC FUNDS PERFORMANCE DISCUSSION (Continued) |
| Explanation of Symbols and References |
| * | The total return for each fund (including the 7-day yield for PF Pacific Life Money Market Fund) includes reinvestment of all dividends and capital gain distributions, if any, and does not include deductions of any applicable sales charges. Past performance is not predictive of future performance. |
| ** | This index is unmanaged and does not reflect any fees or expenses. Results include reinvested dividends. |
| *** | Performance figures for each class reflect the deduction of any applicable maximum front-end sales charge at the time of investment, and reflect any applicable contingent deferred sales charge that would be deducted upon redemption at the end of the period presented. |
| (1) | The index is comprised of 19% Merrill Lynch 3-Month U.S. T-Bill Index, 61% Lehman Brothers Government/Credit Index, 15% S&P 500 Index, and 5% MSCI EAFE Index during the period 12/31/03 through 12/31/04 and 20% Merrill 3-Month U.S. T-Bill Index, 60% Lehman Brothers Government/Credit Index, 15% S&P 500 Index, and 5% MSCI EAFE Index during the period 01/01/05 through 03/31/05. |
| (2) | The index is comprised of 12% Merrill Lynch 3-Month U.S. T-Bill Index, 46% Lehman Brothers Government/Credit Index, 32% S&P 500 Index, and 10% MSCI EAFE Index during the period 12/31/03 through 12/31/04 and 12% Merrill Lynch 3-Month U.S. T-Bill Index, 46% Lehman Brothers Government/Credit Index, 31% S&P 500 Index, and 11% MSCI EAFE Index during the period 01/01/05 through 03/31/05. |
| (3) | The index is comprised of 4% Merrill Lynch 3-Month U.S. T-Bill Index, 36% Lehman Brothers Government/Credit Index, 46% S&P 500 Index, and 14% MSCI EAFE Index during the period 12/31/03 through 12/31/04 and 4% Merrill Lynch 3-Month U.S. T-Bill Index, 35% Lehman Brothers Government/Credit Index, 45% S&P 500 Index, and 16% MSCI EAFE Index during the period 01/01/05 through 03/31/05. |
| (4) | The index is comprised of 2% Merrill Lynch 3-Month U.S. T-Bill Index, 20% Lehman Brothers Government/Credit Index, 58% S&P 500 Index, and 20% MSCI EAFE Index during the period 12/31/03 through 12/31/04 and 2% Merrill Lynch 3-Month U.S. T-Bill Index, 21% Lehman Brothers Government/Credit Index, 55% S&P 500 Index, and 22% MSCI EAFE Index during the period 01/01/05 through 03/31/05. |
| (5) | The index is comprised of 2% Merrill Lynch 3-Month U.S. T-Bill Index, 6% Lehman Brothers Government/Credit Index, 69% S&P 500 Index, and 23% MSCI EAFE Index during the period 12/31/03 through 12/31/04 and 2% Merrill Lynch 3-Month U.S. T-Bill Index, 8% Lehman Brothers Government/Credit Index, 65% S&P 500 Index, and 25% MSCI EAFE Index during the period 01/01/05 through 03/31/05. |
| A-21 | |
| [THIS PAGE INTENTIONALLY LEFT BLANK] |
| Beginning Account Value at 10/01/04 | Ending Account Value at 03/31/05 | Annualized Expense Ratio | Expenses Paid During the Period* 10/01/04 - 03/31/05 | |||||||||||
| PF Portfolio Optimization Model A | ||||||||||||||
| Actual Fund Return | ||||||||||||||
| Class A | $ | 1,000.00 | $ | 1,019.40 | 0.00% | $ | 0.00 | |||||||
| Class B | 1,000.00 | 1,016.50 | 0.50% | 2.51 | ||||||||||
| Class C | 1,000.00 | 1,015.80 | 0.50% | 2.51 | ||||||||||
| Hypothetical | ||||||||||||||
| Class A | $ | 1,000.00 | $ | 1,024.93 | 0.00% | $ | 0.00 | |||||||
| Class B | 1,000.00 | 1,022.44 | 0.50% | 2.52 | ||||||||||
| Class C | 1,000.00 | 1,022.44 | 0.50% | 2.52 | ||||||||||
| PF Portfolio Optimization Model B | ||||||||||||||
| Actual Fund Return | ||||||||||||||
| Class A | $ | 1,000.00 | $ | 1,037.90 | 0.00% | $ | 0.00 | |||||||
| Class B | 1,000.00 | 1,035.10 | 0.50% | 2.54 | ||||||||||
| Class C | 1,000.00 | 1,034.20 | 0.50% | 2.54 | ||||||||||
| Hypothetical | ||||||||||||||
| Class A | $ | 1,000.00 | $ | 1,024.93 | 0.00% | $ | 0.00 | |||||||
| Class B | 1,000.00 | 1,022.44 | 0.50% | 2.52 | ||||||||||
| Class C | 1,000.00 | 1,022.44 | 0.50% | 2.52 | ||||||||||
| PF Portfolio Optimization Model C | ||||||||||||||
| Actual Fund Return | ||||||||||||||
| Class A | $ | 1,000.00 | $ | 1,055.00 | 0.00% | $ | 0.00 | |||||||
| Class B | 1,000.00 | 1,052.70 | 0.50% | 2.56 | ||||||||||
| Class C | 1,000.00 | 1,052.60 | 0.50% | 2.56 | ||||||||||
| Hypothetical | ||||||||||||||
| Class A | $ | 1,000.00 | $ | 1,024.93 | 0.00% | $ | 0.00 | |||||||
| Class B | 1,000.00 | 1,022.44 | 0.50% | 2.52 | ||||||||||
| Class C | 1,000.00 | 1,022.44 | 0.50% | 2.52 | ||||||||||
| PF Portfolio Optimization Model D | ||||||||||||||
| Actual Fund Return | ||||||||||||||
| Class A | $ | 1,000.00 | $ | 1,071.00 | 0.00% | $ | 0.00 | |||||||
| Class B | 1,000.00 | 1,069.50 | 0.50% | 2.58 | ||||||||||
| Class C | 1,000.00 | 1,068.90 | 0.50% | 2.58 | ||||||||||
| Hypothetical | ||||||||||||||
| Class A | $ | 1,000.00 | $ | 1,024.93 | 0.00% | $ | 0.00 | |||||||
| Class B | 1,000.00 | 1,022.44 | 0.50% | 2.52 | ||||||||||
| Class C | 1,000.00 | 1,022.44 | 0.50% | 2.52 | ||||||||||
| PF Portfolio Optimization Model E | ||||||||||||||
| Actual Fund Return | ||||||||||||||
| Class A | $ | 1,000.00 | $ | 1,083.60 | 0.00% | $ | 0.00 | |||||||
| Class B | 1,000.00 | 1,080.40 | 0.50% | 2.59 | ||||||||||
| Class C | 1,000.00 | 1,081.40 | 0.50% | 2.59 | ||||||||||
| Hypothetical | ||||||||||||||
| Class A | $ | 1,000.00 | $ | 1,024.93 | 0.00% | $ | 0.00 | |||||||
| Class B | 1,000.00 | 1,022.44 | 0.50% | 2.52 | ||||||||||
| Class C | 1,000.00 | 1,022.44 | 0.50% | 2.52 | ||||||||||
| B-1 |
| PACIFIC FUNDS DISCLOSURE OF FUND EXPENSES (Continued) (Unaudited) |
| Beginning Account Value at 10/01/04 | Ending Account Value at 03/31/05 | Annualized Expense Ratio | Expenses Paid During the Period* 10/01/04 - 03/31/05 | |||||||||||
| PF AIM Blue Chip Fund | ||||||||||||||
| Actual Fund Return | ||||||||||||||
| Class A | $ | 1,000.00 | $ | 1,038.90 | 1.90% | $ | 9.66 | |||||||
| Class B | 1,000.00 | 1,037.40 | 2.40% | 12.19 | ||||||||||
| Class C | 1,000.00 | 1,037.50 | 2.40% | 12.19 | ||||||||||
| Hypothetical | ||||||||||||||
| Class A | $ | 1,000.00 | $ | 1,015.46 | 1.90% | $ | 9.55 | |||||||
| Class B | 1,000.00 | 1,012.96 | 2.40% | 12.04 | ||||||||||
| Class C | 1,000.00 | 1,012.96 | 2.40% | 12.04 | ||||||||||
| PF AIM Aggressive Growth Fund | ||||||||||||||
| Actual Fund Return | ||||||||||||||
| Class A | $ | 1,000.00 | $ | 1,093.80 | 1.95% | $ | 10.18 | |||||||
| Class B | 1,000.00 | 1,090.40 | 2.45% | 12.77 | ||||||||||
| Class C | 1,000.00 | 1,091.30 | 2.45% | 12.77 | ||||||||||
| Hypothetical | ||||||||||||||
| Class A | $ | 1,000.00 | $ | 1,015.21 | 1.95% | $ | 9.80 | |||||||
| Class B | 1,000.00 | 1,012.72 | 2.45% | 12.29 | ||||||||||
| Class C | 1,000.00 | 1,012.72 | 2.45% | 12.29 | ||||||||||
| PF Goldman Sachs Short Duration Bond Fund | ||||||||||||||
| Actual Fund Return | ||||||||||||||
| Class A | $ | 1,000.00 | $ | 992.90 | 1.55% | $ | 7.70 | |||||||
| Class B | 1,000.00 | 991.30 | 2.05% | 10.18 | ||||||||||
| Class C | 1,000.00 | 991.10 | 2.05% | 10.18 | ||||||||||
| Hypothetical | ||||||||||||||
| Class A | $ | 1,000.00 | $ | 1,017.20 | 1.55% | $ | 7.80 | |||||||
| Class B | 1,000.00 | 1,014.71 | 2.05% | 10.30 | ||||||||||
| Class C | 1,000.00 | 1,014.71 | 2.05% | 10.30 | ||||||||||
| PF Janus Growth LT Fund | ||||||||||||||
| Actual Fund Return | ||||||||||||||
| Class A | $ | 1,000.00 | $ | 1,073.70 | 1.70% | $ | 8.79 | |||||||
| Class B | 1,000.00 | 1,070.40 | 2.20% | 11.36 | ||||||||||
| Class C | 1,000.00 | 1,071.70 | 2.20% | 11.36 | ||||||||||
| Hypothetical | ||||||||||||||
| Class A | $ | 1,000.00 | $ | 1,016.45 | 1.70% | $ | 8.55 | |||||||
| Class B | 1,000.00 | 1,013.96 | 2.20% | 11.05 | ||||||||||
| Class C | 1,000.00 | 1,013.96 | 2.20% | 11.05 | ||||||||||
| PF Lazard Mid-Cap Value Fund** | ||||||||||||||
| Actual Fund Return** | ||||||||||||||
| Class A | $ | 1,000.00 | $ | 990.00 | 1.80% | $ | 4.47 | |||||||
| Class B | 1,000.00 | 989.00 | 2.30% | 5.70 | ||||||||||
| Class C | 1,000.00 | 989.00 | 2.30% | 5.70 | ||||||||||
| Hypothetical | ||||||||||||||
| Class A | $ | 1,000.00 | $ | 1,007.98 | 1.80% | $ | 4.51 | |||||||
| Class B | 1,000.00 | 1,006.73 | 2.30% | 5.75 | ||||||||||
| Class C | 1,000.00 | 1,006.73 | 2.30% | 5.75 | ||||||||||
| Beginning Account Value at 10/01/04 | Ending Account Value at 03/31/05 | Annualized Expense Ratio | Expenses Paid During the Period* 10/01/04 - 03/31/05 | |||||||||||
| PF Lazard International Value Fund | ||||||||||||||
| Actual Fund Return | ||||||||||||||
| Class A | $ | 1,000.00 | $ | 1,136.00 | 1.80% | $ | 9.59 | |||||||
| Class B | 1,000.00 | 1,133.40 | 2.30% | 12.23 | ||||||||||
| Class C | 1,000.00 | 1,133.40 | 2.30% | 12.23 | ||||||||||
| Hypothetical | ||||||||||||||
| Class A | $ | 1,000.00 | $ | 1,015.96 | 1.80% | $ | 9.05 | |||||||
| Class B | 1,000.00 | 1,013.46 | 2.30% | 11.55 | ||||||||||
| Class C | 1,000.00 | 1,013.46 | 2.30% | 11.55 | ||||||||||
| PF MFS International Large-Cap Fund | ||||||||||||||
| Actual Fund Return | ||||||||||||||
| Class A | $ | 1,000.00 | $ | 1,124.50 | 2.00% | $ | 10.59 | |||||||
| Class B | 1,000.00 | 1,121.00 | 2.50% | 13.22 | ||||||||||
| Class C | 1,000.00 | 1,121.80 | 2.50% | 13.22 | ||||||||||
| Hypothetical | ||||||||||||||
| Class A | $ | 1,000.00 | $ | 1,014.96 | 2.00% | $ | 10.05 | |||||||
| Class B | 1,000.00 | 1,012.47 | 2.50% | 12.54 | ||||||||||
| Class C | 1,000.00 | 1,012.47 | 2.50% | 12.54 | ||||||||||
| PF PIMCO Inflation Managed Fund | ||||||||||||||
| Actual Fund Return | ||||||||||||||
| Class A | $ | 1,000.00 | $ | 1,019.40 | 1.55% | $ | 7.80 | |||||||
| Class B | 1,000.00 | 1,017.00 | 2.05% | 10.31 | ||||||||||
| Class C | 1,000.00 | 1,016.90 | 2.05% | 10.31 | ||||||||||
| Hypothetical | ||||||||||||||
| Class A | $ | 1,000.00 | $ | 1,017.20 | 1.55% | $ | 7.80 | |||||||
| Class B | 1,000.00 | 1,014.71 | 2.05% | 10.30 | ||||||||||
| Class C | 1,000.00 | 1,014.71 | 2.05% | 10.30 | ||||||||||
| PF PIMCO Managed Bond Fund | ||||||||||||||
| Actual Fund Return | ||||||||||||||
| Class A | $ | 1,000.00 | $ | 1,002.30 | 1.55% | $ | 7.74 | |||||||
| Class B | 1,000.00 | 999.80 | 2.05% | 10.22 | ||||||||||
| Class C | 1,000.00 | 999.70 | 2.05% | 10.22 | ||||||||||
| Hypothetical | ||||||||||||||
| Class A | $ | 1,000.00 | $ | 1,017.20 | 1.55% | $ | 7.80 | |||||||
| Class B | 1,000.00 | 1,014.71 | 2.05% | 10.30 | ||||||||||
| Class C | 1,000.00 | 1,014.71 | 2.05% | 10.30 | ||||||||||
| PF Pacific Life Money Market Fund | ||||||||||||||
| Actual Fund Return | ||||||||||||||
| Class A | $ | 1,000.00 | $ | 1,006.10 | 0.95% | $ | 4.75 | |||||||
| Class B | 1,000.00 | 1,003.30 | 1.28% | 6.39 | ||||||||||
| Class C | 1,000.00 | 1,003.70 | 1.34% | 6.69 | ||||||||||
| Hypothetical | ||||||||||||||
| Class A | $ | 1,000.00 | $ | 1,020.19 | 0.95% | $ | 4.78 | |||||||
| Class B | 1,000.00 | 1,018.55 | 1.28% | 6.44 | ||||||||||
| Class C | 1,000.00 | 1,018.25 | 1.34% | 6.74 | ||||||||||
| B-2 |
| PACIFIC FUNDS DISCLOSURE OF FUND EXPENSES (Continued) (Unaudited) |
| Beginning Account Value at 10/01/04 | Ending Account Value at 03/31/05 | Annualized Expense Ratio | Expenses Paid During the Period* 10/01/04 - 03/31/05 | |||||||||||
| PF Salomon Brothers Large-Cap Value Fund | ||||||||||||||
| Actual Fund Return | ||||||||||||||
| Class A | $ | 1,000.00 | $ | 1,055.80 | 1.80% | $ | 9.23 | |||||||
| Class B | 1,000.00 | 1,054.70 | 2.30% | 11.78 | ||||||||||
| Class C | 1,000.00 | 1,054.80 | 2.30% | 11.78 | ||||||||||
| Hypothetical | ||||||||||||||
| Class A | $ | 1,000.00 | $ | 1,015.96 | 1.80% | $ | 9.05 | |||||||
| Class B | 1,000.00 | 1,013.46 | 2.30% | 11.55 | ||||||||||
| Class C | 1,000.00 | 1,013.46 | 2.30% | 11.55 | ||||||||||
| PF Van Kampen Comstock Fund | ||||||||||||||
| Actual Fund Return | ||||||||||||||
| Class A | $ | 1,000.00 | $ | 1,074.60 | 1.90% | $ | 9.83 | |||||||
| Class B | 1,000.00 | 1,072.50 | 2.40% | 12.40 | ||||||||||
| Class C | 1,000.00 | 1,072.60 | 2.40% | 12.40 | ||||||||||
| Hypothetical | ||||||||||||||
| Class A | $ | 1,000.00 | $ | 1,015.46 | 1.90% | $ | 9.55 | |||||||
| Class B | 1,000.00 | 1,012.96 | 2.40% | 12.04 | ||||||||||
| Class C | 1,000.00 | 1,012.96 | 2.40% | 12.04 | ||||||||||
| PF Van Kampen Real Estate Fund** | ||||||||||||||
| Actual Fund Return** | ||||||||||||||
| Class A | $ | 1,000.00 | $ | 940.50 | 2.05% | $ | 4.96 | |||||||
| Class B | 1,000.00 | 939.50 | 2.55% | 6.17 | ||||||||||
| Class C | 1,000.00 | 939.40 | 2.55% | 6.16 | ||||||||||
| Hypothetical | ||||||||||||||
| Class A | $ | 1,000.00 | $ | 1,007.35 | 2.05% | $ | 5.13 | |||||||
| Class B | 1,000.00 | 1,006.11 | 2.55% | 6.38 | ||||||||||
| Class C | 1,000.00 | 1,006.11 | 2.55% | 6.38 | ||||||||||
| PF Van Kampen Mid-Cap Growth Fund | ||||||||||||||
| Actual Fund Return | ||||||||||||||
| Class A | $ | 1,000.00 | $ | 1,098.40 | 1.85% | $ | 9.68 | |||||||
| Class B | 1,000.00 | 1,095.90 | 2.35% | 12.28 | ||||||||||
| Class C | 1,000.00 | 1,096.00 | 2.35% | 12.28 | ||||||||||
| Hypothetical | ||||||||||||||
| Class A | $ | 1,000.00 | $ | 1,015.71 | 1.85% | $ | 9.30 | |||||||
| Class B | 1,000.00 | 1,013.21 | 2.35% | 11.80 | ||||||||||
| Class C | 1,000.00 | 1,013.21 | 2.35% | 11.80 | ||||||||||
| ———————— | |
| * | Expenses paid during the period are equal to the fund’s annualized expense ratio (shown in table above), multiplied by the average account value over the period, multiplied by the number of days in the most recent fiscal half-year, then divided by 365 days. |
| * * | PF Lazard Mid-Cap Value and PF Van Kampen Real Estate Funds commenced operations on December 31, 2004. The actual fund return and expenses paid during the period for these funds were for the period from December 31, 2004 through March 31, 2005 instead of for the entire 6-month period. |
| B-3 |
| [THIS PAGE INTENTIONALLY LEFT BLANK] |
| PACIFIC FUNDS PF PORTFOLIO OPTIMIZATION MODEL A Schedule of Investments March 31, 2005 |
| Shares | Value | |||||||
| MUTUAL FUNDS - 98.51% | ||||||||
| PF AIM Blue Chip Fund ‘A’ | 71,191 | $ | 721,875 | |||||
| PF Goldman Sachs Short Duration Bond Fund ‘A’ | 522,615 | 5,147,755 | ||||||
| PF Lazard Mid-Cap Value Fund ‘A’ | 37,166 | 367,946 | ||||||
| PF Lazard International Value Fund ‘A’ | 55,501 | 733,723 | ||||||
| PF MFS International Large-Cap Fund ‘A’ | 28,219 | 362,044 | ||||||
| PF PIMCO Inflation Managed Fund ‘A’ | 192,666 | 2,024,920 | ||||||
| PF PIMCO Managed Bond Fund ‘A’ | 383,189 | 3,843,389 | ||||||
| PF Pacific Life Money Market Fund ‘A’ | 3,501,091 | 3,501,091 | ||||||
| PF Salomon Brothers Large-Cap Value Fund ‘A’ | 96,377 | 1,089,064 | ||||||
| PF Van Kampen Comstock Fund ‘A’ | 43,735 | 550,190 | ||||||
| Total Mutual Funds | ||||||||
| (Cost $18,245,945) | 18,341,997 | |||||||
| TOTAL INVESTMENTS - 98.51% | ||||||||
| (Cost $18,245,945) | 18,341,997 | |||||||
| OTHER ASSETS & LIABILITIES, NET - 1.49% | 277,738 | |||||||
| NET ASSETS - 100.00% | $ | 18,619,735 | ||||||
| Note to Schedule of Investments (a) As of March 31, 2005, the Fund was diversified as a percentage of net assets as follows: |
| Affiliated Fixed Income Funds | 59.17 | % | |||
| Affiliated Equity Funds | 20.54 | % | |||
| Affiliated Money Market Fund | 18.80 | % | |||
| 98.51 | % | ||||
| Other Assets & Liabilities, Net | 1.49 | % | |||
| 100.00 | % | ||||
| PACIFIC FUNDS PF PORTFOLIO OPTIMIZATION MODEL B Schedule of Investments March 31, 2005 |
| Shares | Value | |||||||
| MUTUAL FUNDS - 99.27% | ||||||||
| PF AIM Blue Chip Fund ‘A’ | 361,822 | $ | 3,668,879 | |||||
| PF Goldman Sachs Short Duration Bond Fund ‘A’ | 686,197 | 6,759,036 | ||||||
| PF Lazard Mid-Cap Value Fund ‘A’ | 122,734 | 1,215,069 | ||||||
| PF Lazard International Value Fund ‘A’ | 268,684 | 3,551,999 | ||||||
| PF MFS International Large-Cap Fund ‘A’ | 148,220 | 1,901,665 | ||||||
| PF PIMCO Inflation Managed Fund ‘A’ | 425,119 | 4,468,000 | ||||||
| PF PIMCO Managed Bond Fund ‘A’ | 684,460 | 6,865,130 | ||||||
| PF Pacific Life Money Market Fund ‘A’ | 4,593,909 | 4,593,909 | ||||||
| PF Salomon Brothers Large-Cap Value Fund ‘A’ | 436,742 | 4,935,186 | ||||||
| PF Van Kampen Comstock Fund ‘A’ | 129,156 | 1,624,777 | ||||||
| PF Van Kampen Mid-Cap Growth Fund ‘A’ | 206,993 | 1,848,445 | ||||||
| Total Mutual Funds | ||||||||
| (Cost $40,614,845) | 41,432,095 | |||||||
| TOTAL INVESTMENTS - 99.27% | ||||||||
| (Cost $40,614,845) | 41,432,095 | |||||||
| OTHER ASSETS & LIABILITIES, NET - 0.73% | 305,313 | |||||||
| NET ASSETS - 100.00% | $ | 41,737,408 | ||||||
| Note to Schedule of Investments (a) As of March 31, 2005, the Fund was diversified as a percentage of net assets as follows: |
| Affiliated Equity Funds | 44.91 | % |
| Affiliated Fixed Income Funds | 43.35 | % |
| Affiliated Money Market Fund | 11.01 | % |
| 99.27 | % | |
| Other Assets & Liabilities, Net | 0.73 | % |
| 100.00 | % | |
| See Notes to Financial Statements | |
C-1 | |
| PACIFIC FUNDS PF PORTFOLIO OPTIMIZATION MODEL C Schedule of Investments March 31, 2005 |
| Shares | Value | |||||||
| MUTUAL FUNDS - 99.36% | ||||||||
| PF AIM Blue Chip Fund ‘A’ | 1,180,288 | $ | 11,968,118 | |||||
| PF Goldman Sachs Short Duration Bond Fund ‘A’ | 1,377,551 | 13,568,874 | ||||||
| PF Janus Growth LT Fund ‘A’ | 344,963 | 3,670,410 | ||||||
| PF Lazard Mid-Cap Value Fund ‘A’ | 649,408 | 6,429,142 | ||||||
| PF Lazard International Value Fund ‘A’ | 1,114,636 | 14,735,488 | ||||||
| PF MFS International Large-Cap Fund ‘A’ | 758,529 | 9,731,921 | ||||||
| PF PIMCO Inflation Managed Fund ‘A’ | 1,174,408 | 12,343,025 | ||||||
| PF PIMCO Managed Bond Fund ‘A’ | 1,457,089 | 14,614,605 | ||||||
| PF Pacific Life Money Market Fund ‘A’ | 3,705,618 | 3,705,618 | ||||||
| PF Salomon Brothers Large-Cap Value Fund ‘A’ | 1,277,984 | 14,441,222 | ||||||
| PF Van Kampen Comstock Fund ‘A’ | 389,028 | 4,893,978 | ||||||
| PF Van Kampen Real Estate Fund ‘A’ | 411,863 | 3,867,390 | ||||||
| PF Van Kampen Mid-Cap Growth Fund ‘A’ | 1,224,381 | 10,933,721 | ||||||
| Total Mutual Funds | ||||||||
| (Cost $121,504,556) | 124,903,512 | |||||||
| TOTAL INVESTMENTS - 99.36% | ||||||||
| (Cost $121,504,556) | 124,903,512 | |||||||
| OTHER ASSETS & LIABILITIES, NET - 0.64% | 803,165 | |||||||
| NET ASSETS - 100.00% | $ | 125,706,677 | ||||||
| Note to Schedule of Investments (a) As of March 31, 2005, the Fund was diversified as a percentage of net assets as follows: |
| Affiliated Equity Funds | 64.17 | % | |||
| Affiliated Fixed Income Funds | 32.24 | % | |||
| Affiliated Money Market Fund | 2.95 | % | |||
| 99.36 | % | ||||
| Other Assets & Liabilities, Net | 0.64 | % | |||
| 100.00 | % | ||||
| PACIFIC FUNDS PF PORTFOLIO OPTIMIZATION MODEL D Schedule of Investments March 31, 2005 |
| Shares | Value | |||||||
| MUTUAL FUNDS - 99.58% | ||||||||
| PF AIM Blue Chip Fund ‘A’ | 1,325,455 | $ | 13,440,118 | |||||
| PF Goldman Sachs Short Duration Bond Fund ‘A’ | 545,099 | 5,369,226 | ||||||
| PF Janus Growth LT Fund ‘A’ | 501,571 | 5,336,715 | ||||||
| PF Lazard Mid-Cap Value Fund ‘A’ | 866,760 | 8,580,923 | ||||||
| PF Lazard International Value Fund ‘A’ | 1,288,973 | 17,040,227 | ||||||
| PF MFS International Large-Cap Fund ‘A’ | 984,173 | 12,626,942 | ||||||
| PF PIMCO Inflation Managed Fund ‘A’ | 511,901 | 5,380,084 | ||||||
| PF PIMCO Managed Bond Fund ‘A’ | 853,767 | 8,563,280 | ||||||
| PF Salomon Brothers Large-Cap Value Fund ‘A’ | 1,217,790 | 13,761,027 | ||||||
| PF Van Kampen Comstock Fund ‘A’ | 424,589 | 5,341,326 | ||||||
| PF Van Kampen Real Estate Fund ‘A’ | 455,890 | 4,280,811 | ||||||
| PF Van Kampen Mid-Cap Growth Fund ‘A’ | 1,221,433 | 10,907,397 | ||||||
| Total Mutual Funds | ||||||||
| (Cost $106,672,377) | 110,628,076 | |||||||
| TOTAL INVESTMENTS - 99.58% | ||||||||
| (Cost $106,672,377) | 110,628,076 | |||||||
| OTHER ASSETS & LIABILITIES, NET - 0.42% | 470,799 | |||||||
| NET ASSETS - 100.00% | $ | 111,098,875 | ||||||
| Note to Schedule of Investments (a) As of March 31, 2005, the Fund was diversified as a percentage of net assets as follows: |
| Affiliated Equity Funds | 82.19 | % | |||
| Affiliated Fixed Income Funds | 17.39 | % | |||
| 99.58 | % | ||||
| Other Assets & Liabilities, Net | 0.42 | % | |||
| 100.00 | % | ||||
| See Notes to Financial Statements | |
C-2 | |
PACIFIC FUNDS |
| Shares | Value | |||||||
| MUTUAL FUNDS - 99.69% | ||||||||
| PF AIM Blue Chip Fund ‘A’ | 598,262 | $ | 6,066,374 | |||||
| PF Janus Growth LT Fund ‘A’ | 288,892 | 3,073,815 | ||||||
| PF Lazard Mid-Cap Value Fund ‘A’ | 492,832 | 4,879,038 | ||||||
| PF Lazard International Value Fund ‘A’ | 474,311 | 6,270,398 | ||||||
| PF MFS International Large-Cap Fund ‘A’ | 437,886 | 5,618,080 | ||||||
| PF PIMCO Managed Bond Fund ‘A’ | 115,262 | 1,156,079 | ||||||
| PF Salomon Brothers Large-Cap Value Fund ‘A’ | 444,350 | 5,021,152 | ||||||
| PF Van Kampen Comstock Fund ‘A’ | 154,686 | 1,945,951 | ||||||
| PF Van Kampen Real Estate Fund ‘A’ | 204,135 | 1,916,828 | ||||||
| PF Van Kampen Mid-Cap Growth Fund ‘A’ | 647,985 | 5,786,507 | ||||||
| Total Mutual Funds (Cost $39,678,737) | 41,734,222 | |||||||
| TOTAL INVESTMENTS - 99.69% | ||||||||
| (Cost $39,678,737) | 41,734,222 | |||||||
| OTHER ASSETS & LIABILITIES, NET - 0.31% | 128,780 | |||||||
| NET ASSETS - 100.00% | $ | 41,863,002 | ||||||
| Note to Schedule of Investments (a) As of March 31, 2005, the Fund was diversified as a percentage of net assets as follows: |
| Affiliated Equity Funds | 96.93 | % | |||
| Affiliated Fixed Income Fund | 2.76 | % | |||
| 99.69 | % | ||||
| Other Assets & Liabilities, Net | 0.31 | % | |||
| 100.00 | % | ||||
| See Notes to Financial Statements | |
C-3 | |
PACIFIC FUNDS |
| Shares | Value | |||||
|---|---|---|---|---|---|---|
| COMMON STOCKS - 96.64% | ||||||
| Autos & Transportation - 2.12% | ||||||
| Burlington Northern Santa Fe Corp | 4,000 | $ | 215,720 | |||
| Canadian National Railway Co (Canada) | 5,700 | 360,867 | ||||
| FedEx Corp | 4,500 | 422,775 | ||||
| 999,362 | ||||||
| Consumer Discretionary - 17.79% | ||||||
| Bed Bath & Beyond Inc * | 6,900 | 252,126 | ||||
| Best Buy Co Inc | 6,900 | 372,669 | ||||
| Carnival Corp | 6,200 | 321,222 | ||||
| Cendant Corp | 15,300 | 314,262 | ||||
| Cooper Industries Ltd ‘A’ | 2,700 | 193,104 | ||||
| Costco Wholesale Corp | 11,700 | 516,906 | ||||
| eBay Inc * | 6,000 | 223,560 | ||||
| J.C. Penney Co Inc | 7,200 | 373,824 | ||||
| McDonald’s Corp | 20,600 | 641,484 | ||||
| Nike Inc ‘B’ | 6,400 | 533,184 | ||||
| Nordstrom Inc | 6,400 | 354,432 | ||||
| Staples Inc | 5,300 | 166,579 | ||||
| Starbucks Corp * | 5,700 | 294,462 | ||||
| Starwood Hotels & Resorts Worldwide Inc | 4,500 | 270,135 | ||||
| The Gillette Co | 11,200 | 565,376 | ||||
| The Home Depot Inc | 22,800 | 871,872 | ||||
| The Walt Disney Co | 17,300 | 497,029 | ||||
| VeriSign Inc * | 8,600 | 246,820 | ||||
| Wal-Mart Stores Inc | 21,300 | 1,067,343 | ||||
| Yahoo! Inc * | 8,600 | 291,540 | ||||
| 8,367,929 | ||||||
| Consumer Staples - 2.70% | ||||||
| PepsiCo Inc | 5,800 | 307,574 | ||||
| The Procter & Gamble Co | 18,200 | 964,600 | ||||
| 1,272,174 | ||||||
| Energy - 2.38% | ||||||
| BJ Services Co ² | 8,600 | 446,168 | ||||
| ENSCO International Inc | 8,100 | 305,046 | ||||
| Valero Energy Corp | 5,000 | 366,350 | ||||
| 1,117,564 | ||||||
| Financial Services - 16.15% | ||||||
| American Express Co | 12,100 | 621,577 | ||||
| American International Group Inc | 5,600 | 310,296 | ||||
| Automatic Data Processing Inc | 9,400 | 422,530 | ||||
| Bank of America Corp | 14,900 | 657,090 | ||||
| Citigroup Inc | 25,700 | 1,154,958 | ||||
| Franklin Resources Inc | 4,400 | 302,060 | ||||
| Genworth Financial Inc ‘A’ | 12,200 | 335,744 | ||||
| JPMorgan Chase & Co | 19,400 | 671,240 | ||||
| Merrill Lynch & Co Inc | 11,900 | 673,540 | ||||
| SLM Corp | 9,400 | 468,496 | ||||
| The Allstate Corp | 8,800 | 475,728 | ||||
| The Goldman Sachs Group Inc | 7,400 | 813,926 | ||||
| U.S. Bancorp | 9,600 | 276,672 | ||||
| Wells Fargo & Co | 6,900 | 412,620 | ||||
| 7,596,477 | ||||||
| Health Care - 14.58% | ||||||
| Allergan Inc | 3,800 | 263,986 | ||||
| Amgen Inc * | 9,400 | 547,174 | ||||
| Becton Dickinson & Co | 4,300 | 251,206 | ||||
| C.R. Bard Inc | 3,400 | 231,472 | ||||
| Forest Laboratories Inc * | 5,700 | 210,615 | ||||
| Genentech Inc * | 5,400 | 305,694 | ||||
| Johnson & Johnson | 22,900 | 1,537,964 | ||||
| Medtronic Inc | 9,400 | 478,930 | ||||
| Pfizer Inc | 27,800 | 730,306 | ||||
| UnitedHealth Group Inc | 9,300 | 887,034 | ||||
| Varian Medical Systems Inc * | 6,700 | 229,676 | ||||
| WellPoint Inc * | 4,000 | 501,400 | ||||
| Wyeth | 10,500 | 442,890 | ||||
| Zimmer Holdings Inc * ² | 3,100 | 241,211 | ||||
| 6,859,558 | ||||||
| Integrated Oils - 5.43% | ||||||
| Exxon Mobil Corp | 30,700 | 1,829,720 | ||||
| GlobalSantaFe Corp | 5,700 | 211,128 | ||||
| Schlumberger Ltd | 7,300 | 514,504 | ||||
| 2,555,352 | ||||||
| Materials & Processing - 2.84% | ||||||
| Air Products & Chemicals Inc | 4,000 | 253,160 | ||||
| Alcoa Inc | 7,500 | 227,925 | ||||
| Masco Corp | 6,900 | 239,223 | ||||
| The Dow Chemical Co | 9,000 | 448,650 | ||||
| United States Steel Corp | 3,300 | 167,805 | ||||
| 1,336,763 | ||||||
| Multi-Industry - 6.23% | ||||||
| Eaton Corp | 3,600 | 235,440 | ||||
| Fortune Brands Inc | 4,800 | 387,024 | ||||
| General Electric Co | 38,500 | 1,388,310 | ||||
| Tyco International Ltd (Bermuda) | 27,200 | 919,360 | ||||
| 2,930,134 | ||||||
| Producer Durables - 3.50% | ||||||
| Danaher Corp | 9,700 | 518,077 | ||||
| KLA-Tencor Corp * | 8,100 | 372,681 | ||||
| United Technologies Corp | 4,900 | 498,134 | ||||
| Waters Corp * | 7,200 | 257,688 | ||||
| 1,646,580 | ||||||
| Technology - 19.68% | ||||||
| Accenture Ltd ‘A’ * (Bermuda) | 13,900 | 335,685 | ||||
| Amdocs Ltd * (United Kingdom) | 15,800 | 448,720 | ||||
| Analog Devices Inc | 9,400 | 339,716 | ||||
| Cisco Systems Inc * | 48,500 | 867,665 | ||||
| Dell Inc * | 23,900 | 918,238 | ||||
| EMC Corp * | 49,700 | 612,304 | ||||
| Intel Corp | 29,300 | 680,639 | ||||
| International Business Machines Corp | 8,000 | 731,040 | ||||
| Linear Technology Corp | 8,800 | 337,128 | ||||
| Microchip Technology Inc | 9,000 | 234,090 | ||||
| Microsoft Corp | 49,100 | 1,186,747 | ||||
| Oracle Corp * | 63,000 | 786,240 | ||||
| QUALCOMM Inc ² | 21,000 | 769,650 | ||||
| Rockwell Automation Inc | 4,600 | 260,544 | ||||
| Symantec Corp * ² | 16,900 | 360,477 | ||||
| Xilinx Inc | 13,300 | 388,759 | ||||
| 9,257,642 | ||||||
| Utilities - 3.24% | ||||||
| Dominion Resources Inc VA | 5,300 | 394,479 | ||||
| FPL Group Inc | 10,800 | 433,620 | ||||
| SBC Communications Inc | 14,300 | 338,767 | ||||
| Vodafone Group PLC ADR (United Kingdom) | 13,400 | 355,904 | ||||
| 1,522,770 | ||||||
| Total Common Stocks | ||||||
| (Cost $42,562,827) | 45,462,305 | |||||
| See Notes to Financial Statements | See explanation of symbols and terms on C-30 |
C-4 |
PACIFIC FUNDS |
| Principal Amount | Value | |||||
|---|---|---|---|---|---|---|
| SHORT-TERM INVESTMENTS - 3.59% | ||||||
| U.S. Government Agency Issue - 3.17% | ||||||
| Federal Home Loan Bank | ||||||
| 2.550% due 04/01/05 | $ | 1,489,000 | $ | 1,489,000 | ||
| U.S. Treasury Bills - 0.42% | ||||||
| 2.755% due 06/16/05 ‡ | 200,000 | 198,865 | ||||
| Total Short-Term Investments | ||||||
| (Cost $1,687,852) | 1,687,865 | |||||
| TOTAL INVESTMENTS - 100.23% | ||||||
| (Cost $44,250,679) | 47,150,170 | |||||
| OTHER ASSETS & LIABILITIES, NET - (0.23%) | (109,875 | ) | ||||
| NET ASSETS - 100.00% | $ | 47,040,295 | ||||
| Notes to Schedule of Investments |
(a) As of March 31, 2005, the Fund was diversified as a percentage of net assets as follows: |
| Technology | 19.68 | % | |
| Consumer Discretionary | 17.79 | % | |
| Financial Services | 16.15 | % | |
| Health Care | 14.58 | % | |
| Multi-Industry | 6.23 | % | |
| Integrated Oils | 5.43 | % | |
| Short-Term Investments | 3.59 | % | |
| Producer Durables | 3.50 | % | |
| Utilities | 3.24 | % | |
| Materials & Processing | 2.84 | % | |
| Consumer Staples | 2.70 | % | |
| Energy | 2.38 | % | |
| Autos & Transportation | 2.12 | % | |
| 100.23 | % | ||
| Other Assets & Liabilities, Net | (0.23 | %) | |
| 100.00 | % | ||
| (b) Short-term securities represent either the stated coupon rate or the annualized effective yield on the date of purchase for discounted securities. |
(c) Securities with an approximate aggregate market value of $22,870 were segregated with the custodian to cover margin requirements for the following open futures contract as of March 31, 2005 : |
| Long Futures Outstanding | Number of Contracts | Notional Amount | Unrealized Depreciation | ||||||
|---|---|---|---|---|---|---|---|---|---|
| S&P 500 (06/05) | 1 | $ | 299,313 | ($ 3,343 | ) | ||||
(d) Transactions in written options for the year ended March 31, 2005, were as follows: |
| Number of Contracts | Premium | |||||
|---|---|---|---|---|---|---|
| Outstanding, March 31, 2004 | — | $ | — | |||
| Call Options Written | 386 | 33,433 | ||||
| Call Options Expired | (26 | ) | (2,289 | ) | ||
| Call Options Repurchased | (222 | ) | (18,198 | ) | ||
| Outstanding, March 31, 2005 | 138 | $ | 12,946 | |||
(e) Premiums received and value of written options outstanding as of March 31, 2005 : |
| Type | Number of Contracts | Premium | Value | |||||||
|---|---|---|---|---|---|---|---|---|---|---|
| Call - CBOE Symantec Corp | ||||||||||
| Strike @ $25.00 Exp. 04/16/05 | ||||||||||
| Broker: Lehman Brothers Holdings Inc | 52 | $ | 2,790 | $ | 260 | |||||
| Call - CBOE QUALCOMM Inc | ||||||||||
| Strike @ $37.50 Exp. 04/16/05 | ||||||||||
| Broker: Merrill Lynch & Co Inc | 53 | 6,206 | 2,385 | |||||||
| Call - CBOE BJ Services Co | ||||||||||
| Strike @ $47.50 Exp. 04/16/05 | ||||||||||
| Broker: Citigroup Inc | 23 | 2,921 | 10,465 | |||||||
| Call - CBOE Zimmer Holdings Inc | ||||||||||
| Strike @ $90.00 Exp. 04/16/05 | ||||||||||
| Broker: Credit Suisse Group | 10 | 1,029 | 50 | |||||||
| $ | 12,946 | $ | 13,160 | |||||||
| See Notes to Financial Statements | See explanation of symbols and terms on C-30 |
C-5 |
PACIFIC FUNDS |
| Shares | Value | |||||
|---|---|---|---|---|---|---|
| COMMON STOCKS - 92.57% | ||||||
| Autos & Transportation - 1.37% | ||||||
| JetBlue Airways Corp * | 2,700 | $ | 51,408 | |||
| Southwest Airlines Co | 4,100 | 58,384 | ||||
| 109,792 | ||||||
| Consumer Discretionary - 28.22% | ||||||
| Aeropostale Inc * | 1,000 | 32,750 | ||||
| ARAMARK Corp ‘B’ | 2,500 | 65,700 | ||||
| Aztar Corp * | 1,700 | 48,552 | ||||
| Bed Bath & Beyond Inc * | 1,700 | 62,118 | ||||
| Best Buy Co Inc | 1,300 | 70,213 | ||||
| CDW Corp | 1,740 | 98,623 | ||||
| ChoicePoint Inc * | 2,100 | 84,231 | ||||
| Cintas Corp | 2,000 | 82,620 | ||||
| Cooper Industries Ltd ‘A’ | 700 | 50,064 | ||||
| Fisher Scientific International Inc * | 1,650 | 93,918 | ||||
| Fossil Inc * | 2,300 | 59,627 | ||||
| Harman International Industries Inc | 300 | 26,527 | ||||
| Hot Topic Inc * ² | 2,200 | 48,070 | ||||
| International Game Technology | 1,400 | 37,324 | ||||
| Iron Mountain Inc * | 3,400 | 98,056 | ||||
| Jackson Hewitt Tax Service Inc | 2,700 | 56,484 | ||||
| Lamar Advertising Co ‘A’ * | 3,000 | 120,870 | ||||
| Linens ’n Things Inc * | 3,100 | 76,973 | ||||
| Manpower Inc | 1,700 | 73,984 | ||||
| MSC Industrial Direct Co Inc ‘A’ | 1,950 | 59,592 | ||||
| PETCO Animal Supplies Inc * | 1,600 | 58,896 | ||||
| Radio One Inc ‘D’ * | 5,000 | 73,750 | ||||
| RARE Hospitality International Inc * | 2,500 | 77,200 | ||||
| Regal Entertainment Group ‘A’ | 3,800 | 79,914 | ||||
| Royal Caribbean Cruises Ltd (Liberia) | 1,900 | 84,911 | ||||
| Ruby Tuesday Inc | 3,100 | 75,299 | ||||
| Sirva Inc * | 4,100 | 29,151 | ||||
| Staples Inc | 2,650 | 83,290 | ||||
| The Reader’s Digest Association Inc | 2,900 | 50,199 | ||||
| Tuesday Morning Corp * | 1,500 | 43,305 | ||||
| Univision Communications Inc ‘A’ * | 5,685 | 157,418 | ||||
| VeriSign Inc * | 2,100 | 60,270 | ||||
| WESCO International Inc * | 1,200 | 33,600 | ||||
| 2,253,499 | ||||||
| Consumer Staples - 1.02% | ||||||
| Coca-Cola Enterprises Inc | 1,700 | 34,884 | ||||
| Molson Coors Brewing Co ‘B’ | 600 | 46,302 | ||||
| 81,186 | ||||||
| Energy - 1.04% | ||||||
| BJ Services Co | 1,600 | 83,008 | ||||
| Financial Services - 13.30% | ||||||
| Affiliated Managers Group Inc * | 1,050 | 65,131 | ||||
| Alliance Data Systems Corp * | 4,300 | 173,720 | ||||
| CB Richard Ellis Group Inc ‘A’ * | 1,600 | 55,984 | ||||
| Dow Jones & Co Inc | 1,400 | 52,318 | ||||
| Fiserv Inc * | 2,500 | 99,500 | ||||
| Independence Community Bank Corp | 1,500 | 58,500 | ||||
| Investors Financial Services Corp | 3,480 | 170,207 | ||||
| La Quinta Corp * | 4,500 | 38,250 | ||||
| New York Community Bancorp Inc | 2,120 | 38,499 | ||||
| North Fork Bancorp Inc | 2,900 | 80,446 | ||||
| Paychex Inc | 4,250 | 139,485 | ||||
| SLM Corp | 700 | 34,888 | ||||
| Southwest Bancorp of Texas Inc | 3,000 | 55,050 | ||||
| 1,061,978 | ||||||
| Health Care - 19.23% | ||||||
| Advanced Medical Optics Inc * | 1,900 | 68,799 | ||||
| Amylin Pharmaceuticals Inc * | 2,800 | 48,972 | ||||
| Barr Pharmaceuticals Inc * | 1,100 | 53,713 | ||||
| Biomet Inc | 2,200 | 79,860 | ||||
| Caremark Rx Inc * | 2,000 | 79,560 | ||||
| Cerner Corp * | 900 | 47,259 | ||||
| Cytyc Corp * | 3,850 | 88,588 | ||||
| DaVita Inc * ² | 1,900 | 79,515 | ||||
| Endo Pharmaceuticals Holdings Inc * | 2,700 | 60,885 | ||||
| Eyetech Pharmaceuticals Inc * | 1,950 | 53,625 | ||||
| Impax Laboratories Inc * | 1,700 | 27,200 | ||||
| Invitrogen Corp * | 650 | 44,980 | ||||
| IVAX Corp * ² | 3,875 | 76,609 | ||||
| Kinetic Concepts Inc * | 1,500 | 89,475 | ||||
| Kyphon Inc * | 1,800 | 45,306 | ||||
| Manor Care Inc | 1,250 | 45,450 | ||||
| Medco Health Solutions Inc * | 850 | 42,135 | ||||
| Medicis Pharmaceutical Corp ‘A’ | 2,100 | 62,958 | ||||
| MedImmune Inc * | 2,100 | 50,001 | ||||
| MGI PHARMA Inc * | 3,000 | 75,810 | ||||
| Neurocrine Biosciences Inc * | 1,450 | 55,187 | ||||
| Omnicare Inc | 1,100 | 38,995 | ||||
| OSI Pharmaceuticals Inc * | 850 | 35,139 | ||||
| QLT Inc * (Canada) | 4,700 | 60,442 | ||||
| Triad Hospitals Inc * | 1,300 | 65,130 | ||||
| Valeant Pharmaceuticals International | 2,650 | 59,678 | ||||
| 1,535,271 | ||||||
| Materials & Processing - 4.81% | ||||||
| Airgas Inc | 1,000 | 23,890 | ||||
| American Standard Cos Inc | 1,700 | 79,016 | ||||
| Bowater Inc | 1,500 | 56,505 | ||||
| EnerSys * | 4,600 | 60,260 | ||||
| Nalco Holding Co * | 1,600 | 30,128 | ||||
| Owens-Illinois Inc * | 1,600 | 40,224 | ||||
| Rohm & Haas Co | 900 | 43,200 | ||||
| Sappi Ltd ADR (S. Africa) | 4,100 | 50,430 | ||||
| 383,653 | ||||||
| Multi-Industry - 2.11% | ||||||
| Brunswick Corp | 1,200 | 56,220 | ||||
| Textron Inc | 1,500 | 111,930 | ||||
| 168,150 | ||||||
| Producer Durables - 6.07% | ||||||
| Blount International Inc * | 5,200 | 88,296 | ||||
| Dover Corp | 1,300 | 49,127 | ||||
| KLA-Tencor Corp * | 1,400 | 64,414 | ||||
| Mine Safety Appliances Co | 1,300 | 50,362 | ||||
| Molex Inc | 1,500 | 39,540 | ||||
| Novellus Systems Inc * | 2,100 | 56,133 | ||||
| Plantronics Inc | 900 | 34,272 | ||||
| Polycom Inc * | 2,050 | 34,748 | ||||
| Tektronix Inc | 1,700 | 41,701 | ||||
| Terex Corp * | 600 | 25,980 | ||||
| 484,573 | ||||||
| Technology - 14.87% | ||||||
| Acxiom Corp | 2,100 | 43,953 | ||||
| ADTRAN Inc | 1,900 | 33,516 | ||||
| Affiliated Computer Services Inc ‘A’ * | 1,500 | 79,860 | ||||
| Amdocs Ltd * ² (United Kingdom) | 1,700 | 48,280 | ||||
| AMIS Holdings Inc * | 4,700 | 53,063 | ||||
| ATI Technologies Inc * (Canada) | 3,600 | 62,136 | ||||
| BEA Systems Inc * | 5,200 | 41,444 | ||||
| Broadcom Corp ‘A’ * | 1,700 | 50,864 | ||||
| See Notes to Financial Statements | See explanation of symbols and terms on C-30 |
C-6 |
PACIFIC FUNDS |
| Shares | Value | |||||
|---|---|---|---|---|---|---|
| Brocade Communications Systems Inc * | 400 | $ | 2,352 | |||
| Check Point Software Technologies Ltd * (Israel) | 1,900 | 41,306 | ||||
| Electronics for Imaging Inc * | 2,600 | 46,384 | ||||
| Integrated Circuit Systems Inc * | 2,800 | 53,536 | ||||
| Internet Security Systems Inc * | 2,000 | 36,600 | ||||
| Juniper Networks Inc * | 1,800 | 39,708 | ||||
| L-3 Communications Holdings Inc | 800 | 56,816 | ||||
| Maxim Integrated Products Inc | 1,400 | 57,218 | ||||
| McAfee Inc * | 2,600 | 58,656 | ||||
| Microchip Technology Inc | 3,725 | 96,887 | ||||
| Micron Technology Inc * | 3,700 | 38,258 | ||||
| PerkinElmer Inc | 2,100 | 43,323 | ||||
| Perot Systems Corp ‘A’ * | 2,600 | 34,944 | ||||
| RSA Security Inc * | 3,400 | 53,890 | ||||
| Synopsys Inc * | 2,300 | 41,630 | ||||
| Tekelec * | 2,400 | 38,256 | ||||
| TIBCO Software Inc * | 4,600 | 34,270 | ||||
| 1,187,150 | ||||||
| Utilities - 0.53% | ||||||
| DPL Inc | 1,700 | 42,500 | ||||
| Total Common Stocks | ||||||
| (Cost $7,038,355) | 7,390,760 | |||||
Principal | ||||||
| SHORT-TERM INVESTMENT - 9.00% | ||||||
| U.S. Government Agency Issue - 9.00% | ||||||
| Federal Home Loan Bank | ||||||
| 2.550% due 04/01/05 | $ | 719,000 | 719,000 | |||
| Total Short-Term Investment | ||||||
| (Cost $719,000) | 719,000 | |||||
| TOTAL INVESTMENTS - 101.57% | ||||||
| (Cost $7,757,355) | 8,109,760 | |||||
| OTHER ASSETS & LIABILITIES, NET - (1.57%) | (125,611 | ) | ||||
| NET ASSETS - 100.00% | $ | 7,984,149 | ||||
| Notes to Schedule of Investments |
(a) As of March 31, 2005, the Fund was diversified as a percentage of net assets as follows: |
| Consumer Discretionary | 28.22 | % | |
| Health Care | 19.23 | % | |
| Technology | 14.87 | % | |
| Financial Services | 13.30 | % | |
| Short-Term Investment | 9.00 | % | |
| Producer Durables | 6.07 | % | |
| Materials & Processing | 4.81 | % | |
| Multi-Industry | 2.11 | % | |
| Autos & Transportation | 1.37 | % | |
| Energy | 1.04 | % | |
| Consumer Staples | 1.02 | % | |
| Utilities | 0.53 | % | |
| 101.57 | % | ||
| Other Assets & Liabilities, Net | (1.57 | %) | |
| 100.00 | % | ||
| (b) Short-term securities represent either the stated coupon rate or the annualized effective yield on the date of purchase for discounted securities. |
(c) Transactions in written options for the year ended March 31, 2005, were as follows: |
| Number of Contracts | Premium | |||||
|---|---|---|---|---|---|---|
| Outstanding, March 31, 2004 | — | $ | — | |||
| Call Options Written | 305 | 26,550 | ||||
| Call Options Expired | (225 | ) | (18,632 | ) | ||
| Call Options Repurchased | (27 | ) | (2,633 | ) | ||
| Outstanding, March 31, 2005 | 53 | $ | 5,285 | |||
| (d) Premiums received and value of written options outstanding as of March 31, 2005: |
| Type | Number of Contracts | Premium | Value | |||||||
|---|---|---|---|---|---|---|---|---|---|---|
| Call - CBOE Hot Topic Inc | ||||||||||
| Strike @ $22.50 Exp. 04/16/05 | ||||||||||
| Broker: Lehman Brothers Holdings Inc | 11 | $ | 1,279 | $ | 413 | |||||
| Call - CBOE Amdocs Ltd | ||||||||||
| Strike @ $30.00 Exp. 04/16/05 | ||||||||||
| Broker: Citigroup Inc | 8 | 843 | 280 | |||||||
| Call - CBOE DaVita Inc | ||||||||||
| Strike @ $45.00 Exp. 04/16/05 | ||||||||||
| Broker: Morgan Stanley | 14 | 1,465 | 140 | |||||||
| Call - CBOE IVAX Corp | ||||||||||
| Strike @ $20.00 Exp. 06/18/05 | ||||||||||
| Broker: Susquehanna Financial Group | 20 | 1,698 | 2,100 | |||||||
| $ | 5,285 | $ | 2,933 | |||||||
| See Notes to Financial Statements | See explanation of symbols and terms on C-30 |
C-7 |
PACIFIC FUNDS |
Principal Amount | Value | |||||
|---|---|---|---|---|---|---|
| U.S. GOVERNMENT AGENCY ISSUES - 65.85% | ||||||
| Fannie Mae | ||||||
| 2.250% due 02/28/06 | $ | 1,000,000 | $ | 987,470 | ||
| 2.300% due 04/28/06 | 500,000 | 491,938 | ||||
| 2.350% due 07/28/06 | 1,000,000 | 981,080 | ||||
| 2.375% due 03/30/07 | 1,000,000 | 969,066 | ||||
| 2.500% due 05/12/06 | 400,000 | 394,514 | ||||
| 2.625% due 01/19/07 | 1,000,000 | 977,094 | ||||
| 3.250% due 07/12/06 | 1,000,000 | 992,981 | ||||
| Federal Farm Credit Bank | ||||||
| 1.850% due 03/03/06 | 1,200,000 | 1,180,358 | ||||
| 3.125% due 02/01/08 | 1,000,000 | 971,798 | ||||
| Federal Home Loan Bank | ||||||
| 1.700% due 12/30/05 | 2,000,000 | 1,972,950 | ||||
| 1.720% due 01/23/06 | 500,000 | 492,466 | ||||
| 2.000% due 02/13/06 | 500,000 | 493,376 | ||||
| 2.100% due 11/21/05 | 1,000,000 | 991,489 | ||||
| 2.300% due 08/30/06 | 400,000 | 391,628 | ||||
| 2.320% due 07/24/06 | 2,000,000 | 1,961,592 | ||||
| 2.500% due 03/13/06 | 500,000 | 494,476 | ||||
| 2.750% due 05/15/06 | 2,000,000 | 1,977,862 | ||||
| 2.875% due 05/23/06 | 1,000,000 | 990,037 | ||||
| 3.000% due 05/15/06 | 1,000,000 | 991,651 | ||||
| 4.875% due 02/15/07 | 1,000,000 | 1,015,981 | ||||
| 6.500% due 11/15/05 | 500,000 | 509,309 | ||||
| Freddie Mac | ||||||
| 2.050% due 07/14/06 | 2,000,000 | 1,956,470 | ||||
| 2.270% due 04/28/06 | 500,000 | 492,219 | ||||
| 2.810% due 02/02/06 | 500,000 | 496,712 | ||||
| 3.000% due 07/09/08 | 500,000 | 481,438 | ||||
| Total U.S. Government Agency Issues | ||||||
| (Cost $23,845,443) | 23,655,955 | |||||
| U.S. TREASURY OBLIGATIONS - 31.54% | ||||||
| U.S. Treasury Notes - 31.54% | ||||||
| 2.375% due 08/31/06 | 1,100,000 | 1,081,180 | ||||
| 2.500% due 10/31/06 | 2,200,000 | 2,160,470 | ||||
| 2.750% due 08/15/07 | 2,400,000 | 2,341,032 | ||||
| 3.375% due 02/28/07 | 4,600,000 | 4,567,837 | ||||
| 3.375% due 02/15/08 | 1,200,000 | 1,182,376 | ||||
| 11,332,895 | ||||||
| Total U.S. Treasury Obligations | ||||||
| (Cost $11,441,126) | 11,332,895 | |||||
Shares | ||||||
|---|---|---|---|---|---|---|
| SHORT-TERM INVESTMENTS - 4.52% | ||||||
| Money Market Funds - 4.52% | ||||||
| BlackRock Liquidity Funds Institutional TempCash | 8,396 | 8,396 | ||||
| BlackRock Liquidity Funds Institutional TempFund | 1,614,135 | 1,614,135 | ||||
| 1,622,531 | ||||||
| Total Short-Term Investments | ||||||
| (Cost $1,622,531) | 1,622,531 | |||||
| TOTAL INVESTMENTS - 101.91% | ||||||
| (Cost $36,909,100) | 36,611,381 | |||||
| OTHER ASSETS & LIABILITIES, NET - (1.91%) | (686,416 | ) | ||||
| NET ASSETS - 100.00% | $ | 35,924,965 | ||||
| Notes to Schedule of Investments |
(a) As of March 31, 2005, the Fund was diversified as a percentage of net assets as follows: |
| U.S. Government Agency Issues | 65.85 | % | |
| U.S. Treasury Obligations | 31.54 | % | |
| Short-Term Investments | 4.52 | % | |
| 101.91 | % | ||
| Other Assets & Liabilities, Net | (1.91 | %) | |
| 100.00 | % | ||
(b) The amount of $25,000 in cash was segregated with the custodian to cover margin requirements for the following open futures contracts as of March 31, 2005: |
| Long Futures Outstanding | Number of Contracts | Notional Amount | Unrealized Appreciation (Depreciation) | ||||||||
|---|---|---|---|---|---|---|---|---|---|---|---|
| Eurodollar (12/05) | 7 | $ | 7,000,000 | ($ 8,394 | ) | ||||||
| Eurodollar (03/06) | 7 | 7,000,000 | (4,296 | ) | |||||||
| Eurodollar (06/06) | 2 | 2,000,000 | (906 | ) | |||||||
| U.S. Treasury 2-Year Notes (06/05) | 8 | 1,600,000 | (1,944 | ) | |||||||
| U.S. Treasury 30-Year Bonds (06/05) | 3 | 300,000 | 5,055 | ||||||||
| Short Futures Outstanding | |||||||||||
| Eurodollar (06/05) | 3 | 3,000,000 | 139 | ||||||||
| Eurodollar (09/05) | 2 | 2,000,000 | 393 | ||||||||
| Eurodollar (09/06) | 1 | 1,000,000 | 1,859 | ||||||||
| Eurodollar (12/06) | 11 | 11,000,000 | 16,118 | ||||||||
| U.S. Treasury 5-Year Notes (06/05) | 6 | 600,000 | 10,400 | ||||||||
| U.S. Treasury 10-Year Notes (06/05) | 8 | 800,000 | (476 | ) | |||||||
| $ | 17,948 | ||||||||||
| See Notes to Financial Statements |
C-8 |
| PACIFIC FUNDS PF JANUS GROWTH LT FUND Schedule of Investments March 31, 2005 |
| Shares | Value | ||||
|---|---|---|---|---|---|
| PREFERRED STOCKS - 0.33% | |||||
| Financial Services - 0.33% | |||||
| Fannie Mae | 1,200 | $ | 66,675 | ||
| Total Preferred Stocks (Cost $60,000) | 66,675 | ||||
| COMMON STOCKS - 92.37% | |||||
| Autos & Transportation - 5.78% | |||||
| Bayerische Motoren Werke AG (Germany) | 3,476 | 157,932 | |||
| C.H. Robinson Worldwide Inc | 3,850 | 198,390 | |||
| Canadian National Railway Co (Canada) | 7,887 | 499,326 | |||
| FedEx Corp | 3,285 | 308,626 | |||
| Union Pacific Corp | 245 | 17,077 | |||
| 1,181,351 | |||||
| Consumer Discretionary - 29.72% | |||||
| Amazon.com Inc * | 1,415 | 48,492 | |||
| Avon Products Inc | 5,385 | 231,232 | |||
| Best Buy Co Inc | 3,580 | 193,356 | |||
| BMTC Group Inc ‘A’ (Canada) | 9,592 | 111,326 | |||
| Clear Channel Communications Inc | 6,030 | 207,854 | |||
| eBay Inc * | 2,840 | 105,818 | |||
| EchoStar Communications Corp ‘A’ | 3,175 | 92,869 | |||
| Electronic Arts Inc * | 3,770 | 195,211 | |||
| Harman International Industries Inc | 1,730 | 153,036 | |||
| Lamar Advertising Co ‘A’ * | 3,820 | 153,908 | |||
| Liberty Media Corp ‘A’ * | 80,306 | 832,773 | |||
| Liberty Media International Inc ‘A’ * | 4,201 | 183,752 | |||
| Lions Gate Entertainment Corp * (Canada) | 4,695 | 51,880 | |||
| Lowe’s Cos Inc | 1,740 | 99,337 | |||
| LVMH Moet Hennessy Louis Vuitton SA (France) | 3,869 | 289,386 | |||
| Marvel Enterprises Inc * | 5,490 | 109,800 | |||
| Nike Inc ’B’ | 3,610 | 300,749 | |||
| PETsMART Inc | 3,935 | 113,131 | |||
| R.R. Donnelley & Sons Co | 2,240 | 70,829 | |||
| Staples Inc | 9,785 | 307,543 | |||
| Starwood Hotels & Resorts Worldwide Inc | 9,765 | 586,193 | |||
| The Walt Disney Co | 8,710 | 250,238 | |||
| Time Warner Inc * | 29,255 | 513,425 | |||
| Univision Communications Inc ‘A’ * | 4,515 | 125,020 | |||
| Wal-Mart Stores Inc | 2,355 | 118,009 | |||
| Yahoo! Inc * | 18,475 | 626,302 | |||
| 6,071,469 | |||||
| Consumer Staples - 2.39% | |||||
| The Procter & Gamble Co | 6,655 | 352,715 | |||
| Whole Foods Market Inc | 1,335 | 136,344 | |||
| 489,059 | |||||
| Energy - 1.49% | |||||
| BJ Services Co | 3,680 | 190,918 | |||
| Reliant Energy Inc * | 10,010 | 113,914 | |||
| 304,832 | |||||
| Financial Services - 12.80% | |||||
| American Express Co | 2,805 | 144,093 | |||
| Automatic Data Processing Inc | 3,040 | 136,648 | |||
| Berkshire Hathaway Inc ‘B’ * | 221 | 631,176 | |||
| Chicago Mercantile Exchange Holdings Inc | 105 | 20,373 | |||
| Citigroup Inc | 4,360 | 195,938 | |||
| Fannie Mae | 1,150 | 62,618 | |||
| Freddie Mac | 2,880 | 182,016 | |||
| JPMorgan Chase & Co | 16,663 | 576,540 | |||
| MBNA Corp | 7,335 | 180,074 | |||
| NewAlliance Bancshares Inc | 7,130 | 99,820 | |||
| Standard Chartered PLC (United Kingdom) | 10,213 | 183,736 | |||
| The Goldman Sachs Group Inc | 1,835 | 201,832 | |||
| 2,614,864 | |||||
| Health Care - 12.52% | |||||
| Aetna Inc | 1,175 | 88,066 | |||
| Caremark Rx Inc * | 9,485 | 377,313 | |||
| Celgene Corp * | 4,010 | 136,540 | |||
| Forest Laboratories Inc * | 3,490 | 128,956 | |||
| Kinetic Concepts Inc * | 1,800 | 107,370 | |||
| LifePoint Hospitals Inc * | 750 | 32,880 | |||
| Neurocrine Biosciences Inc * | 1,430 | 54,426 | |||
| Pharmion Corp * | 1,255 | 36,395 | |||
| Roche Holding AG (Switzerland) | 5,359 | 574,411 | |||
| Sanofi-Aventis (France) | 2,133 | 179,863 | |||
| UnitedHealth Group Inc | 6,720 | 640,954 | |||
| WellPoint Inc * | 1,600 | 200,560 | |||
| 2,557,734 | |||||
| Integrated Oils - 1.21% | |||||
| BP PLC ADR (United Kingdom) | 2,555 | 159,432 | |||
| GlobalSantaFe Corp | 2,340 | 86,674 | |||
| 246,106 | |||||
| Materials & Processing - 2.75% | |||||
| American Standard Cos Inc | 2,120 | 98,538 | |||
| Delta & Pine Land Co | 1,510 | 40,770 | |||
| Givaudan SA (Switzerland) | 257 | 165,023 | |||
| POSCO (S. Korea) | 560 | 110,842 | |||
| Syngenta AG * (Switzerland) | 1,147 | 119,778 | |||
| Syngenta AG ADR * (Switzerland) | 1,285 | 26,985 | |||
| 561,936 | |||||
| Multi-Industry - 4.98% | |||||
| General Electric Co | 3,105 | 111,966 | |||
| Smiths Group PLC (United Kingdom) | 13,516 | 217,489 | |||
| Tyco International Ltd (Bermuda) | 20,365 | 688,337 | |||
| 1,017,792 | |||||
| Producer Durables - 1.71% | |||||
| Lockheed Martin Corp | 4,320 | 263,779 | |||
| Pentair Inc | 2,195 | 85,605 | |||
| 349,384 | |||||
| Technology - 14.27% | |||||
| Check Point Software Technologies Ltd * (Israel) | 3,475 | 75,547 | |||
| Cisco Systems Inc * | 18,915 | 338,389 | |||
| Corning Inc * | 11,185 | 124,489 | |||
| Dell Inc * | 6,560 | 252,035 | |||
| Maxim Integrated Products Inc | 8,700 | 355,569 | |||
| Microsoft Corp | 18,070 | 436,752 | |||
| Motorola Inc | 16,930 | 253,442 | |||
| SafeNet Inc * | 3,195 | 93,646 | |||
| Samsung Electronics Co Ltd (S. Korea) | 990 | 489,394 | |||
| Texas Instruments Inc | 19,460 | 496,035 | |||
| 2,915,298 | |||||
| See Notes to Financial Statements | See explanation of symbols and terms on C-30 |
C-9 |
| PACIFIC FUNDS PF JANUS GROWTH LT FUND Schedule of Investments (Continued) March 31, 2005 |
| Shares | Value | ||||
|---|---|---|---|---|---|
| Utilities - 2.75% | |||||
| Comcast Corp Special ‘A’ * | 10,305 | $ | 344,187 | ||
| Nextel Partners Inc ‘A’ * | 9,855 | 216,416 | |||
| 560,603 | |||||
| Total Common Stocks | |||||
| (Cost $16,078,232) | 18,870,428 | ||||
| Principal Amount | |||||
|---|---|---|---|---|---|
| SHORT-TERM INVESTMENTS - 7.38% | |||||
| U.S. Government Agency Issue - 7.34% | |||||
| Freddie Mac | |||||
| 2.540% due 04/01/05 | $ | 1,500,000 | 1,500,000 | ||
| Shares | ||||
|---|---|---|---|---|
| Money Market Funds - 0.04% | ||||
| BlackRock Liquidity Funds Institutional TempCash | 4,234 | 4,234 | ||
| BlackRock Liquidity Funds Institutional TempFund | 4,234 | 4,234 | ||
| 8,468 | ||||
| Total Short-Term Investments | ||||
| (Cost $1,508,468) | 1,508,468 | |||
| TOTAL INVESTMENTS - 100.08% | ||||
| (Cost $17,646,700) | 20,445,571 | |||
| OTHER ASSETS & LIABILITIES, NET - (0.08%) | (15,930 | ) | ||
| NET ASSETS - 100.00% | $ 20,429,641 | |||
| Notes to Schedule of Investments |
| (a) As of March 31, 2005, the Fund was diversified as a percentage of net assets as follows: |
| Consumer Discretionary | 29.72 | % |
| Technology | 14.27 | % |
| Financial Services | 13.13 | % |
| Health Care | 12.52 | % |
| Short-Term Investments | 7.38 | % |
| Autos & Transportation | 5.78 | % |
| Multi-Industry | 4.98 | % |
| Materials & Processing | 2.75 | % |
| Utilities | 2.75 | % |
| Consumer Staples | 2.39 | % |
| Producer Durables | 1.71 | % |
| Energy | 1.49 | % |
| Integrated Oils | 1.21 | % |
| 100.08 | % | |
| Other Assets & Liabilities, Net | (0.08 | %) |
| 100.00 | % | |
| (b) Short-term securities represent either the stated coupon rate or the annualized effective yield on the date of purchase for discounted securities. |
| (c) Forward foreign currency contracts outstanding as of March 31, 2005, were as follows: |
| Contracts to Buy or to Sell | Currency | Principal Amount Covered by Contracts | Expiration | Unrealized Appreciation (Depreciation) | |||||
|---|---|---|---|---|---|---|---|---|---|
| Buy | CHF | 20,000 | 04/05 | ($ 544 | ) | ||||
| Sell | CHF | 300,000 | 04/05 | (4,803 | ) | ||||
| Buy | EUR | 40,000 | 04/05 | 838 | |||||
| Sell | EUR | 180,000 | 04/05 | (6,269 | ) | ||||
| Sell | KRW | 185,000,000 | 05/05 | (13,733 | ) | ||||
| ($ 24,511 | ) | ||||||||
| See Notes to Financial Statements | See explanation of symbols and terms on C-30 |
C-10 |
| PACIFIC FUNDS PF LAZARD MID-CAP VALUE FUND Schedule of Investments March 31, 2005 |
| Shares | Value | ||||
|---|---|---|---|---|---|
| COMMON STOCKS - 95.86% | |||||
| Autos & Transportation - 5.57% | |||||
| CNF Inc | 8,700 | $ | 407,073 | ||
| Lear Corp | 8,500 | 377,060 | |||
| Norfolk Southern Corp | 8,700 | 322,335 | |||
| Southwest Airlines Co | 22,200 | 316,128 | |||
| 1,422,596 | |||||
| Consumer Discretionary - 27.46% | |||||
| ARAMARK Corp ‘B’ | 23,000 | 604,440 | |||
| Arbitron Inc | 8,700 | 373,230 | |||
| Belo Corp ‘A’ | 22,800 | 550,392 | |||
| Brinker International Inc * | 8,600 | 311,492 | |||
| CDW Corp | 6,400 | 362,752 | |||
| Dex Media Inc | 34,100 | 704,165 | |||
| Dollar Tree Stores Inc * | 22,800 | 655,044 | |||
| GTECH Holdings Corp | 21,500 | 505,895 | |||
| Mattel Inc | 16,100 | 343,735 | |||
| Newell Rubbermaid Inc | 14,800 | 324,712 | |||
| Polo Ralph Lauren Corp | 6,700 | 259,960 | |||
| Reebok International Ltd | 13,600 | 602,480 | |||
| Republic Services Inc | 11,300 | 378,324 | |||
| Sears Holdings Corp * | 1,951 | 259,875 | |||
| Westwood One Inc * | 38,500 | 783,475 | |||
| 7,019,971 | |||||
| Consumer Staples - 2.61% | |||||
| Dean Foods Co * | 8,800 | 301,840 | |||
| The Pepsi Bottling Group Inc | 13,100 | 364,835 | |||
| 666,675 | |||||
| Energy - 3.69% | |||||
| Baker Hughes Inc | 5,600 | 249,144 | |||
| BJ Services Co | 5,500 | 285,340 | |||
| Premcor Inc | 3,300 | 196,944 | |||
| Valero Energy Corp | 2,900 | 212,483 | |||
| 943,911 | |||||
| Financial Services - 18.51% | |||||
| AMB Property Corp | 8,100 | 306,180 | |||
| City National Corp | 3,500 | 244,370 | |||
| DST Systems Inc * | 8,900 | 411,002 | |||
| Federated Investors Inc ‘B’ | 10,200 | 288,762 | |||
| Health Care Property Investors Inc | 13,400 | 314,498 | |||
| Legg Mason Inc | 3,200 | 250,048 | |||
| M&T Bank Corp | 2,300 | 234,738 | |||
| Mercantile Bankshares Corp | 4,800 | 244,128 | |||
| MGIC Investment Corp | 4,200 | 259,014 | |||
| North Fork Bancorp Inc | 14,100 | 391,134 | |||
| Northern Trust Corp | 5,700 | 247,608 | |||
| Protective Life Corp | 12,800 | 503,040 | |||
| RenaissanceRe Holdings Ltd (Bermuda) | 9,400 | 438,980 | |||
| The Student Loan Corp | 1,200 | 250,812 | |||
| Trizec Properties Inc | 18,300 | 347,700 | |||
| 4,732,014 | |||||
| Health Care - 8.23% | |||||
| DaVita Inc * | 10,900 | 456,165 | |||
| Edwards Lifesciences Corp * | 8,400 | 363,048 | |||
| Health Net Inc * | 12,000 | 392,520 | |||
| Laboratory Corp of America Holdings * | 10,800 | 520,560 | |||
| Medco Health Solutions Inc * | 7,500 | 371,775 | |||
| 2,104,068 | |||||
| Integrated Oils - 1.82% | |||||
| GlobalSantaFe Corp | 8,400 | 311,136 | |||
| Unocal Corp | 2,500 | 154,225 | |||
| 465,361 | |||||
| Materials & Processing - 10.87% | |||||
| Avery Dennison Corp | 5,100 | 315,843 | |||
| Ball Corp | 9,200 | 381,616 | |||
| Celanese Corp ‘A’ * | 20,900 | 375,991 | |||
| Jacobs Engineering Group Inc * | 4,600 | 238,832 | |||
| Louisiana-Pacific Corp | 11,500 | 289,110 | |||
| Pactiv Corp * | 19,800 | 462,330 | |||
| Rohm & Haas Co | 5,800 | 278,400 | |||
| Temple-Inland Inc | 6,000 | 435,300 | |||
| 2,777,422 | |||||
| Multi-Industry - 2.63% | |||||
| Fortune Brands Inc | 5,200 | 419,276 | |||
| ITT Industries Inc | 2,800 | 252,672 | |||
| 671,948 | |||||
| Producer Durables - 3.27% | |||||
| Alliant Techsystems Inc * | 4,700 | 335,815 | |||
| Novellus Systems Inc * | 14,300 | 382,239 | |||
| Polycom Inc * | 6,900 | 116,955 | |||
| 835,009 | |||||
| Technology - 6.39% | |||||
| Arrow Electronics Inc * | 10,600 | 268,710 | |||
| Avaya Inc * | 30,000 | 350,400 | |||
| BEA Systems Inc * | 40,800 | 325,176 | |||
| Ingram Micro Inc ‘A’ * | 30 | 500 | |||
| Intersil Corp ‘A’ | 9,300 | 161,076 | |||
| Siebel Systems Inc * | 17,900 | 163,427 | |||
| Storage Technology Corp * | 4,600 | 141,680 | |||
| Vishay Intertechnology Inc * | 17,900 | 222,497 | |||
| 1,633,466 | |||||
| Utilities - 4.81% | |||||
| Citizens Communications Co | 13,300 | 172,102 | |||
| KeySpan Corp | 7,600 | 296,172 | |||
| MCI Inc | 5,500 | 137,060 | |||
| PanAmSat Holding Corp | 15,300 | 260,100 | |||
| Western Wireless Corp ‘A’ * | 9,600 | 364,416 | |||
| 1,229,850 | |||||
| Total Common Stocks | |||||
| (Cost $24,550,251) | 24,502,291 | ||||
| See Notes to Financial Statements | See explanation of symbols and terms on C-30 |
C-11 |
| PACIFIC FUNDS PF LAZARD MID-CAP VALUE FUND Schedule of Investments (Continued) March 31, 2005 |
| Shares | Value | ||||
|---|---|---|---|---|---|
| SHORT-TERM INVESTMENTS - 6.67% | |||||
| Money Market Funds - 6.67% | |||||
| BlackRock Liquidity Funds Institutional TempCash | 518,419 | $ | 518,419 | ||
| BlackRock Liquidity Funds Institutional TempFund | 1,185,685 | 1,185,685 | |||
| 1,704,104 | |||||
| Total Short-Term Investments | |||||
| (Cost $1,704,104) | 1,704,104 | ||||
| TOTAL INVESTMENTS - 102.53% | |||||
| (Cost $26,254,355) | 26,206,395 | ||||
| OTHER ASSETS & LIABILITIES, NET - (2.53%) | (645,614 | ) | |||
| NET ASSETS - 100.00% | $ | 25,560,781 | |||
| Note to Schedule of Investments |
| (a) As of March 31, 2005, the Fund was diversified as a percentage of net assets as follows: |
| Consumer Discretionary | 27.46 | % |
| Financial Services | 18.51 | % |
| Materials & Processing | 10.87 | % |
| Health Care | 8.23 | % |
| Short-Term Investments | 6.67 | % |
| Technology | 6.39 | % |
| Autos & Transportation | 5.57 | % |
| Utilities | 4.81 | % |
| Energy | 3.69 | % |
| Producer Durables | 3.27 | % |
| Multi-Industry | 2.63 | % |
| Consumer Staples | 2.61 | % |
| Integrated Oils | 1.82 | % |
| 102.53 | % | |
| Other Assets & Liabilities, Net | (2.53 | %) |
| 100.00 | % | |
| See Notes to Financial Statements |
C-12 |
| PACIFIC FUNDS PF LAZARD INTERNATIONAL VALUE FUND Schedule of Investments March 31, 2005 |
| Shares | Value | ||||
|---|---|---|---|---|---|
| COMMON STOCKS - 82.42% | |||||
| Denmark - 1.68% | |||||
| Danske Bank AS | 30,400 | $ | 882,014 | ||
| Finland - 3.32% | |||||
| Nokia OYJ * | 112,300 | 1,741,063 | |||
| France - 10.44% | |||||
| AXA | 35,100 | 935,023 | |||
| Sanofi-Aventis | 11,052 | 931,948 | |||
| Societe Generale | 13,000 | 1,350,674 | |||
| Total SA | 5,900 | 1,380,488 | |||
| Vivendi Universal SA * | 28,700 | 879,122 | |||
| 5,477,255 | |||||
| Germany - 3.37% | |||||
| Schering AG | 13,200 | 875,403 | |||
| Siemens AG | 11,300 | 894,267 | |||
| 1,769,670 | |||||
| Ireland - 1.77% | |||||
| Allied Irish Banks PLC | 44,217 | 925,689 | |||
| Italy - 6.18% | |||||
| Enel SPA | 88,700 | 848,562 | |||
| ENI SPA | 54,200 | 1,407,290 | |||
| Sanpaolo IMI SPA | 63,000 | 986,532 | |||
| 3,242,384 | |||||
| Japan - 7.45% | |||||
| Canon Inc | 25,800 | 1,383,475 | |||
| Kao Corp | 54,000 | 1,241,350 | |||
| Nomura Holdings Inc | 91,800 | 1,284,156 | |||
| 3,908,981 | |||||
| Netherlands - 5.26% | |||||
| Heineken NV | 39,650 | 1,373,870 | |||
| Royal Dutch Petroleum Co | 23,200 | 1,387,014 | |||
| 2,760,884 | |||||
| Switzerland - 15.61% | |||||
| Compagnie Financiere Richemont AG ‘A’ | 27,500 | 863,363 | |||
| Credit Suisse Group * | 32,500 | 1,395,322 | |||
| Nestle SA | 5,100 | 1,395,406 | |||
| Novartis AG | 18,700 | 872,422 | |||
| Roche Holding AG | 8,700 | 932,519 | |||
| Swiss Reinsurance Co | 12,500 | 895,134 | |||
| UBS AG | 21,700 | 1,832,448 | |||
| 8,186,614 | |||||
| United Kingdom - 27.34% | |||||
| Barclays PLC | 172,400 | 1,762,541 | |||
| BP PLC | 135,000 | 1,399,313 | |||
| Cadbury Schweppes PLC | 186,842 | 1,873,115 | |||
| Diageo PLC | 94,800 | 1,336,447 | |||
| GlaxoSmithKline PLC | 79,900 | 1,831,522 | |||
| HSBC Holdings PLC | 110,361 | 1,745,604 | |||
| Tesco PLC | 148,300 | 886,991 | |||
| Unilever PLC | 183,600 | 1,814,592 | |||
| Vodafone Group PLC | 636,984 | 1,691,256 | |||
| 14,341,381 | |||||
| Total Common Stocks | |||||
| (Cost $35,426,828) | 43,235,935 | ||||
| SHORT-TERM INVESTMENTS - 7.41% | |||||
| Money Market Funds - 7.41% | |||||
| BlackRock Liquidity Funds Institutional TempCash | 1,944,321 | 1,944,321 | |||
| BlackRock Liquidity Funds Institutional TempFund | 1,944,321 | 1,944,321 | |||
| 3,888,642 | |||||
| Total Short-Term Investments | |||||
| (Cost $3,888,642) | 3,888,642 | ||||
| TOTAL INVESTMENTS - 89.83% | |||||
| (Cost $39,315,470) | 47,124,577 | ||||
| OTHER ASSETS & LIABILITIES, NET - 10.17% | 5,337,414 | ||||
| NET ASSETS - 100.00% | $ | 52,461,991 | |||
| Note to Schedule of Investments |
| (a) As of March 31, 2005, the Fund was diversified as a percentage of net assets as follows: |
| Financial Services | 26.68 | % |
| Consumer Staples | 16.55 | % |
| Health Care | 10.38 | % |
| Integrated Oils | 7.94 | % |
| Short-Term Investments | 7.41 | % |
| Technology | 5.96 | % |
| Consumer Discretionary | 5.69 | % |
| Multi-Industry | 3.32 | % |
| Utilities | 3.22 | % |
| Energy | 2.68 | % |
| 89.83 | % | |
| Other Assets & Liabilities, Net | 10.17 | % |
| 100.00 | % | |
| See Notes to Financial Statements | See explanation of symbols and terms on C-30 |
C-13 |
PACIFIC FUNDS |
| Shares | Value | |||||
| COMMON STOCKS - 87.15% | ||||||
| Australia - 1.14% | ||||||
| QBE Insurance Group Ltd | 38,975 | $ | 448,196 | |||
| Austria - 1.73% | ||||||
| Erste Bank der Oesterreichischen Sparkassen AG | 12,940 | 676,833 | ||||
| Brazil - 0.79% | ||||||
| Cia Vale do Rio Doce ADR | 9,740 | 307,881 | ||||
| Canada - 3.35% | ||||||
| BCE Inc | 9,110 | 227,806 | ||||
| Canadian National Railway Co | 8,935 | 565,675 | ||||
| EnCana Corp | 7,330 | 517,651 | ||||
| 1,311,132 | ||||||
| France - 15.30% | ||||||
| AXA | 31,260 | 832,730 | ||||
| Business Objects SA * | 10,300 | 275,715 | ||||
| Credit Agricole SA | 18,813 | 511,399 | ||||
| Groupe Danone | 5,280 | 525,310 | ||||
| L’Air Liquide SA | 2,123 | 390,513 | ||||
| L’Air Liquide SA - Registered * + | 3,153 | 579,976 | ||||
| LVMH Moet Hennessy Louis Vuitton SA | 3,730 | 278,990 | ||||
| Sanofi-Aventis | 4,345 | 366,387 | ||||
| Schneider Electric SA | 11,335 | 888,222 | ||||
| Societe Television Francaise 1 | 5,270 | 166,688 | ||||
| Total SA | 3,520 | 823,613 | ||||
| Veolia Environnement | 10,060 | 356,794 | ||||
| 5,996,337 | ||||||
| Germany - 1.11% | ||||||
| Premiere AG * | 730 | 30,234 | ||||
| Schering AG | 6,130 | 406,532 | ||||
| 436,766 | ||||||
| Hong Kong - 2.66% | ||||||
| CNOOC Ltd | 668,500 | 359,987 | ||||
| Esprit Holdings Ltd | 45,000 | 307,233 | ||||
| Hutchison Telecommunications International Ltd * | 392,000 | 374,437 | ||||
| 1,041,657 | ||||||
| Hungary - 1.15% | ||||||
| OTP Bank RT GDR | 6,620 | 452,808 | ||||
| Indonesia - 0.30% | ||||||
| P.T. Bank Central Asia Tbk | 326,000 | 117,031 | ||||
| Ireland - 0.96% | ||||||
| DEPFA Bank PLC | 23,680 | 374,494 | ||||
| Italy - 1.97% | ||||||
| FASTWEB SPA * | 4,080 | 199,645 | ||||
| Riunione Adriatica di Sicurta SPA | 24,250 | 570,548 | ||||
| 770,193 | ||||||
| Japan - 13.19% | ||||||
| Asahi Glass Co Ltd | 47,000 | 495,290 | ||||
| Bridgestone Corp | 24,000 | 441,145 | ||||
| Canon Inc | 6,000 | 321,738 | ||||
| Chugai Pharmaceutical Co Ltd | 14,800 | 227,321 | ||||
| Murata Manufacturing Co Ltd | 5,700 | 305,651 | ||||
| Nintendo Co Ltd | 5,200 | 567,379 | ||||
| Nitto Denko Corp | 9,500 | 497,902 | ||||
| Sekisui Chemical Co Ltd | 46,000 | 334,179 | ||||
| Shinsei Bank Ltd | 80,000 | 455,096 | ||||
| Tokyo Gas Co Ltd | 139,640 | 562,571 | ||||
| Toray Industries Inc | 79,000 | 354,369 | ||||
| Toyota Motor Corp | 16,300 | 606,519 | ||||
| 5,169,160 | ||||||
| Mexico - 1.09% | ||||||
| Grupo Televisa SA ADR | 7,260 | 426,888 | ||||
| Netherlands - 1.05% | ||||||
| Reed Elsevier NV | 27,310 | 411,723 | ||||
| Poland - 0.54% | ||||||
| Powszechna Kasa Oszczednosci Bank Polski SA * | 24,080 | 212,445 | ||||
| Singapore - 2.20% | ||||||
| DBS Group Holdings Ltd | 35,000 | 315,917 | ||||
| SingTel | 348,290 | 544,351 | ||||
| 860,268 | ||||||
| South Korea - 1.84% | ||||||
| Samsung Electronics Co Ltd | 1,460 | 721,733 | ||||
| Spain - 4.53% | ||||||
| Banco Bilbao Vizcaya Argentaria SA | 33,860 | 551,290 | ||||
| Iberdrola SA | 16,640 | 435,289 | ||||
| Telefonica SA | 45,196 | 787,414 | ||||
| 1,773,993 | ||||||
| Sweden - 5.90% | ||||||
| Atlas Copco AB ‘A’ | 10,370 | 496,435 | ||||
| Hennes & Mauritz AB ‘B’ | 19,130 | 657,426 | ||||
| Sandvik AB | 19,440 | 808,293 | ||||
| Telefonaktiebolaget LM Ericsson ‘B’ * | 124,320 | 349,880 | ||||
| 2,312,034 | ||||||
| Switzerland - 6.52% | ||||||
| Nestle SA | 973 | 266,222 | ||||
| Roche Holding AG | 8,280 | 887,501 | ||||
| Straumann Holding AG | 620 | 134,259 | ||||
| Syngenta AG * | 1,815 | 189,535 | ||||
| Synthes Inc | 2,070 | 230,183 | ||||
| UBS AG | 10,018 | 845,966 | ||||
| 2,553,666 | ||||||
| Thailand - 0.51% | ||||||
| Bangkok Bank PCL | 70,490 | 201,812 | ||||
| See Notes to Financial Statements | See explanation of symbols and terms on C-30 |
C-14 | |
PACIFIC FUNDS |
Shares | Value | |||||
| United Kingdom - 19.32% | ||||||
| AMVESCAP PLC | 60,000 | $ | 378,423 | |||
| AstraZeneca PLC | 14,310 | 564,103 | ||||
| BG Group PLC | 22,640 | 175,949 | ||||
| Diageo PLC | 39,880 | 562,210 | ||||
| Hilton Group PLC | 77,800 | 442,538 | ||||
| Kingfisher PLC | 131,305 | 716,486 | ||||
| NEXT PLC | 13,230 | 398,023 | ||||
| Reckitt Benckiser PLC | 49,754 | 1,581,461 | ||||
| Royal Bank of Scotland Group PLC | 13,862 | 441,136 | ||||
| Smith & Nephew PLC | 29,510 | 277,439 | ||||
| The BOC Group PLC | 8,770 | 168,880 | ||||
| Vodafone Group PLC | 370,250 | 983,051 | ||||
| William Hill PLC | 60,770 | 632,769 | ||||
| Yell Group PLC | 27,520 | 245,988 | ||||
| 7,568,456 | ||||||
| Total Common Stocks (Cost $29,712,556) | 34,145,506 | |||||
| Principal Amount | ||||||
|---|---|---|---|---|---|---|
| SHORT-TERM INVESTMENTS - 5.89% | ||||||
| Commercial Paper - 3.97% | ||||||
| Cargill Inc | ||||||
| 2.820% due 04/01/05 | $ | 1,556,000 | 1,556,000 | |||
| U.S. Government Agency Issue - 1.92% | ||||||
| Federal Home Loan Bank | ||||||
| 2.400% due 04/01/05 | 749,000 | 749,000 | ||||
| Shares | ||||||
| Money Market Fund - 0.00% | ||||||
| BlackRock Liquidity Funds Institutional TempCash | 178 | 178 | ||||
| Total Short-Term Investments (Cost $2,305,178) | 2,305,178 | |||||
| TOTAL INVESTMENTS - 93.04% | ||||||
| (Cost $32,017,734) | 36,450,684 | |||||
| OTHER ASSETS & LIABILITIES, NET - 6.96% | 2,728,276 | |||||
| NET ASSETS - 100.00% | $ | 39,178,960 | ||||
| Notes to Schedule of Investments |
| (a) As of March 31, 2005, the Fund was diversified as a percentage of net assets as follows: |
| Financial Services | 18.85 | % |
| Consumer Discretionary | 13.48 | % |
| Utilities | 10.50 | % |
| Health Care | 7.90 | % |
| Materials & Processing | 7.62 | % |
| Consumer Staples | 7.49 | % |
| Producer Durables | 7.23 | % |
| Short-Term Investments | 5.88 | % |
| Integrated Oils | 4.79 | % |
| Technology | 4.27 | % |
| Autos & Transportation | 4.12 | % |
| Multi-Industry | 0.91 | % |
| 93.04 | % | |
| Other Assets & Liabilities, Net | 6.96 | % |
| 100.00 | % | |
| (b) Short-term securities represent either the stated coupon rate or the annualized effective yield on the date of purchase for discounted securities. |
| See Notes to Financial Statements | |
C-15 | |
PACIFIC FUNDS |
Shares | Value | |||||
| PREFERRED STOCKS - 0.09% | ||||||
| Financial Services - 0.09% | ||||||
| Fannie Mae | 700 | $ | 38,894 | |||
| Total Preferred Stocks (Cost $35,000) | 38,894 | |||||
| Principal Amount | ||||||
| CORPORATE BONDS & NOTES - 1.46% | ||||||
| Financial Services - 1.46% | ||||||
| General Motors Acceptance Corp | ||||||
| 3.560% due 01/16/07 § | $ | 200,000 | 191,735 | |||
| Pemex Project Funding Master Trust | ||||||
| 9.250% due 03/30/18 ~ | 200,000 | 241,000 | ||||
| Travelers Property Casualty Corp | ||||||
| 3.750% due 03/15/08 | 100,000 | 97,873 | ||||
| Verizon Wireless Capital LLC | ||||||
| 2.930% due 05/23/05 ~ § | 100,000 | 99,990 | ||||
| 630,598 | ||||||
| Total Corporate Bonds & Notes (Cost $641,365) | 630,598 | |||||
| U.S. TREASURY OBLIGATIONS - 101.02% | ||||||
| U.S. Treasury Inflation Protected Securities - 101.02% | ||||||
| 0.875% due 04/15/10 ^ | 201,312 | 196,983 | ||||
| 1.625% due 01/15/15 ^ | 99,865 | 98,422 | ||||
| 2.000% due 01/15/14 # ^ | 8,720,400 | 8,928,617 | ||||
| 2.000% due 07/15/14 # ^ | 7,214,422 | 7,371,249 | ||||
| 2.375% due 01/15/25 # ^ | 4,046,480 | 4,353,790 | ||||
| 3.000% due 07/15/12 # ^ | 3,420,274 | 3,765,386 | ||||
| 3.375% due 01/15/07 # ^ | 5,897,444 | 6,193,018 | ||||
| 3.375% due 04/15/32 # ^ | 268,573 | 356,504 | ||||
| 3.500% due 01/15/11 ^ | 2,191,240 | 2,448,514 | ||||
| 3.625% due 01/15/08 # ^ | 2,360,640 | 2,539,562 | ||||
| 3.625% due 04/15/28 ^ | 1,615,189 | 2,123,626 | ||||
| 3.875% due 01/15/09 # ^ | 930,184 | 1,026,099 | ||||
| 3.875% due 04/15/29 # ^ | 3,189,835 | 4,387,784 | ||||
| 43,789,554 | ||||||
| Total U.S. Treasury Obligations (Cost $43,440,903) | 43,789,554 | |||||
| FOREIGN GOVERNMENT BONDS - 1.64% | ||||||
| Bundesrepublik Deutschland (Germany) | ||||||
| 6.250% due 01/04/30 # | EUR100,000 | 172,840 | ||||
| France Government Bond OAT (France) | ||||||
| 5.750% due 10/25/32 # | 100,000 | 164,177 | ||||
| Russian Federation Government Bond (Russia) | ||||||
| 5.000% due 03/31/30 | $ | 100,000 | 102,550 | |||
| 8.250% due 03/31/10 | 100,000 | 107,960 | ||||
| Spanish Government Bond (Spain) | ||||||
| 5.750% due 07/30/32 # | EUR100,000 | 164,151 | ||||
| Total Foreign Government Bonds (Cost $720,250) | 711,678 | |||||
| MUNICIPAL BONDS - 0.48% | ||||||
| New Hampshire Municipal Bond Bank ‘B’ | ||||||
| 5.000% due 08/15/13 | $ | 100,000 | 108,448 | |||
| Tobacco Settlement Financing Corp RI ‘A’ | ||||||
| 6.000% due 06/01/23 | 100,000 | 100,568 | ||||
| Total Municipal Bonds (Cost $196,020) | 209,016 | |||||
| SHORT-TERM INVESTMENTS - 9.09% | ||||||
| Commercial Paper - 7.33% | ||||||
| ANZ DE Inc | ||||||
| 2.840% due 06/03/05 | 400,000 | 397,965 | ||||
| Barclays U.S. Funding LLC | ||||||
| 2.930% due 06/14/05 | 500,000 | 496,985 | ||||
| 2.945% due 06/16/05 | 100,000 | 99,380 | ||||
| DnB NOR Bank ASA (Norway) | ||||||
| 2.980% due 07/14/05 | 1,100,000 | 1,090,282 | ||||
| Skandinaviska Enskilda Banken AB (Sweden) | ||||||
| 2.880% due 06/09/05 | 500,000 | 497,171 | ||||
| 2.950% due 06/16/05 | 600,000 | 596,239 | ||||
| 3,178,022 | ||||||
| U.S. Treasury Bills - 0.22% | ||||||
| 2.688% due 06/02/05 ‡ | 5,000 | 4,977 | ||||
| 2.728% due 06/16/05 ‡ | 5,000 | 4,972 | ||||
| 2.740% due 06/16/05 ‡ | 85,000 | 84,518 | ||||
| 94,467 | ||||||
| Shares | ||||||
| Money Market Funds - 1.54% | ||||||
| BlackRock Liquidity Funds Institutional TempCash | 333,787 | 333,787 | ||||
| BlackRock Liquidity Funds Institutional TempFund | 333,787 | 333,787 | ||||
| 667,574 | ||||||
| Total Short-Term Investments (Cost $3,940,443) | 3,940,063 | |||||
| TOTAL INVESTMENTS - 113.78% | ||||||
| (Cost $48,973,981) | 49,319,803 | |||||
| OTHER ASSETS & LIABILITIES, NET - (13.78%) | (5,972,895 | ) | ||||
| NET ASSETS - 100.00% | $ | 43,346,908 | ||||
| See Notes to Financial Statements | See explanation of symbols and terms on C-30 |
C-16 | |
PACIFIC FUNDS |
| Notes to Schedule of Investments (a) As of March 31, 2005, the Fund was diversified as a percentage of net assets as follows: |
| U.S. Treasury Obligations | 101.02 | % | |
| Short-Term Investments | 9.09 | % | |
| Foreign Government Bonds | 1.64 | % | |
| Corporate Bonds & Notes | 1.46 | % | |
| Municipal Bonds | 0.48 | % | |
| Equity Securities | 0.09 | % | |
| 113.78 | % | ||
| Other Assets and Liabilities, Net | (13.78 | %) | |
| 100.00 | % | ||
| (b) Short-term securities represent either the stated coupon rate or the annualized effective yield on the date of purchase for discounted securities. (c) Securities with an approximate aggregate market value of $94,467 were segregated with the custodian to cover margin requirements for the following open futures contracts as of March 31, 2005: |
| Long Futures Outstanding | Number of Contracts | Notional Amount | Unrealized Appreciation (Depreciation) | ||||||
|---|---|---|---|---|---|---|---|---|---|
| Euro-Bund 10-Year Notes (06/05) | 14 | EUR1,400,000 | $ | 20,598 | |||||
| Eurodollar (06/05) | 15 | $ | 15,000,000 | (26,375 | ) | ||||
| U.S. Treasury 10-Year Notes (06/05) | 18 | 1,800,000 | 4,547 | ||||||
| U.S. Treasury 30-Year Bonds (06/05) | 5 | 500,000 | 1,094 | ||||||
| $ | (136 | ) | |||||||
| (d) Investment sold short outstanding as of March 31, 2005: |
| Type | Principal Amount | Value | ||||
|---|---|---|---|---|---|---|
| U.S. Treasury Notes | ||||||
| 4.250% due 11/15/13 # | $ | 600,000 | $ | 590,930 | ||
| Total Investment sold short | ||||||
| (Proceeds $594,668) | $ | 590,930 | ||||
| (e) Forward foreign currency contracts outstanding as of March 31, 2005 were as follows: |
| Contracts to Buy or to Sell | Currency | Principal Amount Covered by Contracts | Expiration | Unrealized Appreciation (Depreciation) | ||||||
|---|---|---|---|---|---|---|---|---|---|---|
| Sell | EUR | 467,000 | 04/05 | $ | 9,437 | |||||
| Buy | JPY | 40,527,000 | 04/05 | (7,841 | ) | |||||
| $ | 1,596 | |||||||||
| (f) Transactions in written options for the year ended March 31, 2005, were as follows: |
| Number of Contracts | Premium | |||||
|---|---|---|---|---|---|---|
| Outstanding, March 31, 2004 | 4,000,000 | $ | 34,776 | |||
| Call Options Written | 27 | 6,634 | ||||
| Put Options Written | 27 | 7,789 | ||||
| Call Options Expired | (2,000,009 | ) | (21,506 | ) | ||
| Put Options Expired | (2,000,009 | ) | (19,594 | ) | ||
| Outstanding, March 31, 2005 | 36 | $ | 8,099 | |||
| (g) Premiums received and value of written options outstanding as of March 31, 2005: |
| Counterparty | Type | Strike Price | Expiration Date | Number of Contracts | Premium | Value | ||||||||||
|---|---|---|---|---|---|---|---|---|---|---|---|---|---|---|---|---|
| Citigroup Inc | Put - CBOT U.S. Treasury 10-Year Futures | $ | 107.00 | 05/20/05 | 18 | $ | 4,917 | $ | 3,656 | |||||||
| Citigroup Inc | Call - CBOT U.S. Treasury 10-Year Futures | 112.00 | 05/20/05 | 13 | 2,420 | 1,016 | ||||||||||
| Merrill Lynch & Co Inc | Call - CBOT U.S. Treasury 10-Year Futures | 113.00 | 05/20/05 | 5 | 762 | 156 | ||||||||||
| $ | 8,099 | $ | 4,828 | |||||||||||||
| (h) Interest rate swaps outstanding as of March 31, 2005: |
Counterparty | Floating Rate Index | Pay/Receive Floating Rate | Fixed Rate | Expiration Date | Notional Amount | Unrealized Appreciation | |||||||||
|---|---|---|---|---|---|---|---|---|---|---|---|---|---|---|---|
| Lehman Brothers Holdings Inc | 3-Month USD-LIBOR | Receive | 4.000 % | 06/15/10 | $ | 200,000 | $ | 4,174 | |||||||
| JPMorgan Chase & Co | 3-Month USD-LIBOR | Receive | 5.000 % | 06/15/15 | 300,000 | 5,802 | |||||||||
| Lehman Brothers Holdings Inc | 3-Month USD-LIBOR | Receive | 5.000 % | 06/15/15 | 700,000 | 9,174 | |||||||||
| Morgan Stanley | 3-Month USD-LIBOR | Receive | 5.000 % | 06/15/15 | 1,500,000 | 35,072 | |||||||||
| The Goldman Sachs Group Inc | 3-Month USD-LIBOR | Receive | 5.000 % | 06/15/15 | 3,000,000 | 51,826 | |||||||||
| UBS AG | 3-Month USD-LIBOR | Receive | 5.000 % | 06/15/15 | 500,000 | 12,115 | |||||||||
| Barclays Bank PLC | 6-Month EUR-LIBOR | Pay | 4.500 % | 06/17/15 | EUR200,000 | 12,250 | |||||||||
| $ | 130,413 | ||||||||||||||
| See Notes to Financial Statements | See explanation of symbols and terms on C-30 |
C-17 | |
PACIFIC FUNDS |
| Shares | Value | |||||
|---|---|---|---|---|---|---|
| PREFERRED STOCKS - 0.13% | ||||||
| Financial Services - 0.13% | ||||||
| Fannie Mae | 1,085 | $ | 60,285 | |||
| Total Preferred Stocks (Cost $54,250) | 60,285 | |||||
| Principal Amount | ||||||
| CORPORATE BONDS & NOTES - 3.53% | ||||||
| Autos & Transportation - 0.19% | ||||||
| General Motors Corp | ||||||
| 8.250% due 07/15/23 | $ | 100,000 | 86,572 | |||
| Financial Services - 1.76% | ||||||
| Bank of America Corp | ||||||
| 4.875% due 01/15/13 | 100,000 | 99,416 | ||||
| CIT Group Inc | ||||||
| 7.750% due 04/02/12 | 100,000 | 115,826 | ||||
| Citigroup Inc | ||||||
| 5.625% due 08/27/12 | 50,000 | 51,879 | ||||
| General Motors Acceptance Corp | ||||||
| 6.875% due 08/28/12 | 200,000 | 178,447 | ||||
| Morgan Stanley | ||||||
| 5.300% due 03/01/13 | 100,000 | 100,729 | ||||
| Pemex Project Funding Master Trust | ||||||
| 9.250% due 03/30/18 ~ | 100,000 | 120,500 | ||||
| Qwest Capital Funding Inc | ||||||
| 7.250% due 02/15/11 | 100,000 | 93,750 | ||||
| Unilever Capital Corp | ||||||
| 6.875% due 11/01/05 | 50,000 | 51,257 | ||||
| 811,804 | ||||||
| Integrated Oils - 0.51% | ||||||
| Enterprise Products Operating LP | ||||||
| 4.625% due 10/15/09 | 100,000 | 97,685 | ||||
| Occidental Petroleum Corp | ||||||
| 8.450% due 02/15/29 | 100,000 | 135,208 | ||||
| 232,893 | ||||||
| Utilities - 1.07% | ||||||
| Entergy Gulf States Inc | ||||||
| 3.600% due 06/01/08 | 100,000 | 97,115 | ||||
| Pacific Gas & Electric Co | ||||||
| 3.260% due 04/03/06 § | 100,000 | 100,284 | ||||
| SBC Communications Inc | ||||||
| 4.125% due 09/15/09 | 100,000 | 97,360 | ||||
| 4.206% due 06/05/21 ~ | 200,000 | 200,350 | ||||
| 495,109 | ||||||
| Total Corporate Bonds & Notes (Cost $1,635,659) | 1,626,378 | |||||
| MORTGAGE-BACKED SECURITIES - 27.71% | ||||||
| Collateralized Mortgage Obligations - 12.63% | ||||||
| Banc of America Large Loan | ||||||
| 3.010% due 11/15/15 ~ “ § | 200,000 | 200,257 | ||||
| Countrywide Home Loan Mortgage Pass | ||||||
| Thru Trust | ||||||
| 3.170% due 03/25/35 “ § | 198,138 | 198,231 | ||||
| Credit-Based Asset Servicing & Securitization LLC 3.170% due 06/25/32 “ § | 300,515 | 301,000 | ||||
| CS First Boston Mortgage Securities Corp | ||||||
| 3.040% due 03/25/32 ~ “ § | 104,956 | 105,367 | ||||
| 3.180% due 03/25/32 ~ “ § | 108,390 | 107,901 | ||||
| Fannie Mae | ||||||
| 2.940% due 05/25/34 “ § | 91,807 | 91,572 | ||||
| 3.875% due 11/25/23 “ § | 850,000 | 887,397 | ||||
| 4.000% due 08/25/09 “ | 352,602 | 353,430 | ||||
| 5.000% due 04/25/14 “ | 554,813 | 557,173 | ||||
| 6.250% due 10/25/22 “ | 39,512 | 39,535 | ||||
| Freddie Mac | ||||||
| 2.750% due 02/15/12 “ | 370,249 | 368,137 | ||||
| 3.500% due 03/15/10 “ | 398,283 | 398,554 | ||||
| 5.000% due 09/15/16 “ | 57,858 | 58,374 | ||||
| 6.250% due 04/15/23 “ | 179,358 | 181,581 | ||||
| Government National Mortgage Association | ||||||
| 5.500% due 11/20/31 “ | 5,952 | 5,945 | ||||
| 6.000% due 09/16/28 “ | 421,342 | 423,625 | ||||
| Harborview Mortgage Loan Trust | ||||||
| 3.140% due 04/19/35 # “ § | 200,000 | 200,094 | ||||
| Homestar Mortgage Acceptance Corp | ||||||
| 3.040% due 01/25/22 “ § | 142,943 | 143,039 | ||||
| Mellon Residential Funding Corp | ||||||
| 3.050% due 06/15/30 “ § | 49,878 | 49,792 | ||||
| MLCC Mortgage Investors Inc | ||||||
| 3.190% due 03/15/25 “ § | 98,822 | 99,357 | ||||
| Residential Asset Securitization Trust | ||||||
| 3.250% due 05/25/33 “ § | 123,049 | 123,296 | ||||
| Small Business Administration Inc | ||||||
| 4.754% due 08/10/14 “ | 199,833 | 198,342 | ||||
| Washington Mutual Inc | ||||||
| 2.998% due 01/25/45 “ § | 197,595 | 198,042 | ||||
| 3.008% due 01/25/45 “ § | 197,888 | 198,084 | ||||
| 3.120% due 12/25/27 “ § | 250,727 | 250,639 | ||||
| 3.433% due 02/27/34 “ § | 27,805 | 27,699 | ||||
| 5.131% due 10/25/32 “ § | 48,862 | 49,421 | ||||
| 5,815,884 | ||||||
| Fannie Mae - 12.32% | ||||||
| 4.855% due 12/01/36 “ § | 68,227 | 69,870 | ||||
| 5.000% due 04/18/20 # “ | 500,000 | 499,687 | ||||
| 5.500% due 12/01/14 “ | 90,608 | 92,515 | ||||
| 5.500% due 06/01/23 # “ | 266,422 | 269,302 | ||||
| 5.500% due 02/01/33 “ | 530,058 | 532,350 | ||||
| 5.500% due 03/01/34 “ | 69,942 | 70,113 | ||||
| 5.500% due 04/13/35 # “ | 3,500,000 | 3,505,467 | ||||
| 6.000% due 09/01/22 # “ | 214,050 | 220,396 | ||||
| 6.000% due 01/01/23 # “ | 148,570 | 152,979 | ||||
| 6.500% due 03/01/17 “ | 246,069 | 257,105 | ||||
| 5,669,784 | ||||||
| Freddie Mac - 2.76% | ||||||
| 5.500% due 08/01/07 “ | 66,122 | 67,421 | ||||
| 5.500% due 03/01/23 # “ | 121,163 | 122,593 | ||||
| 5.662% due 04/01/32 “ § | 368,071 | 380,267 | ||||
| 5.947% due 11/01/31 “ § | 63,104 | 64,158 | ||||
| 6.000% due 12/01/22 “ | 171,151 | 176,387 | ||||
| 6.000% due 03/01/23 # “ | 370,228 | 381,311 | ||||
| 7.500% due 10/25/43 “ | 70,757 | 76,054 | ||||
| 1,268,191 | ||||||
| Total Mortgage-Backed Securities (Cost $12,761,780) | 12,753,859 | |||||
| See Notes to Financial Statements | See explanation of symbols and terms on C-30 |
C-18 | |
PACIFIC FUNDS |
| Principal Amount | Value | |||||
|---|---|---|---|---|---|---|
| ASSET-BACKED SECURITIES - 2.57% | ||||||
| Bank One Issuance Trust | ||||||
| 2.860% due 10/15/08 “ § | $ | 200,000 | $ | 200,191 | ||
| CitiFinancial Mortgage Securities Inc | ||||||
| 3.160% due 05/25/33 “ § | 46,542 | 46,622 | ||||
| Countrywide Asset-Backed Certificates | ||||||
| 2.990% due 05/25/23 “ § | 184,181 | 184,325 | ||||
| 3.040% due 09/25/21 “ § | 166,372 | 166,437 | ||||
| 3.040% due 10/25/21 “ § | 113,340 | 113,452 | ||||
| Fannie Mae Grantor Trust | ||||||
| 2.890% due 08/15/26 “ § | 309,081 | 309,260 | ||||
| First Franklin Mortgage Loan Asset-Backed | ||||||
| Certificates | ||||||
| 2.940% due 03/25/34 “ § | 20,316 | 20,329 | ||||
| Long Beach Mortgage Loan Trust | ||||||
| 3.000% due 02/25/24 “ § | 48,269 | 48,312 | ||||
| Morgan Stanley Dean Witter Capital I Inc Trust | ||||||
| 3.180% due 07/25/32 “ § | 10,071 | 10,156 | ||||
| Residential Asset Mortgage Products Inc | ||||||
| 3.000% due 06/25/24 “ § | 31,061 | 31,085 | ||||
| Residential Asset Securities Corp | ||||||
| 2.970% due 06/25/25 “ § | 51,476 | 51,507 | ||||
| Total Asset-Backed Securities (Cost $1,180,941) | 1,181,676 | |||||
| U.S. GOVERNMENT AGENCY ISSUE - 1.95% | ||||||
| Fannie Mae | ||||||
| 2.925% due 09/22/06 § | 900,000 | 899,595 | ||||
| Total U.S. Government Agency Issue (Cost $899,115) | 899,595 | |||||
| U.S. TREASURY OBLIGATIONS - 12.43% | ||||||
| U.S. Treasury Bonds - 5.54% | ||||||
| 6.000% due 02/15/26 | 1,300,000 | 1,487,535 | ||||
| 6.125% due 11/15/27 | 300,000 | 350,731 | ||||
| 6.250% due 08/15/23 | 500,000 | 582,325 | ||||
| 7.250% due 08/15/22 | 100,000 | 127,863 | ||||
| 2,548,454 | ||||||
| U.S. Treasury Inflation Protected Securities - 3.65% | ||||||
| 1.875% due 07/15/13 # ^ | 103,824 | 105,667 | ||||
| 2.000% due 07/15/14 # ^ | 1,416,268 | 1,447,055 | ||||
| 3.375% due 01/15/07 # ^ | 120,356 | 126,388 | ||||
| 1,679,110 | ||||||
| U.S. Treasury Notes - 3.24% | ||||||
| 1.625% due 04/30/05 | 900,000 | 899,438 | ||||
| 3.000% due 12/31/06 | 600,000 | 592,571 | ||||
| 1,492,009 | ||||||
| Total U.S. Treasury Obligations | ||||||
| (Cost $5,723,226) | 5,719,573 | |||||
| FOREIGN GOVERNMENT BONDS - 6.06% | ||||||
| Bundesrepublik Deutschland (Germany) 6.250% due 01/04/30 # | EUR200,000 | 345,680 | ||||
| 6.500% due 07/04/27 # | 200,000 | 350,836 | ||||
| France Government Bond OAT (France) | ||||||
| 4.750% due 04/25/35 # | 100,000 | 143,435 | ||||
| 5.750% due 10/25/32 # | 200,000 | 328,354 | ||||
| Hong Kong Government International Bond | ||||||
| (Hong Kong) | ||||||
| 5.125% due 08/01/14 ~ # | $ | 100,000 | 101,093 | |||
| Republic of Brazil (Brazil) | ||||||
| 3.063% due 04/15/06 § | 24,000 | 23,995 | ||||
| 3.125% due 04/15/09 § | 8,471 | 8,292 | ||||
| 3.125% due 04/15/12 § | 97,060 | 91,689 | ||||
| 8.000% due 04/15/14 | 100,272 | 99,899 | ||||
| 11.500% due 03/12/08 | 170,000 | 192,355 | ||||
| Republic of Panama (Panama) | ||||||
| 9.625% due 02/08/11 | 80,000 | 90,800 | ||||
| Republic of Peru (Peru) | ||||||
| 9.125% due 02/21/12 | 232,000 | 262,160 | ||||
| Russian Federation Government Bond (Russia) | ||||||
| 5.000% due 03/31/30 | 310,000 | 317,905 | ||||
| 8.250% due 03/31/10 | 40,000 | 43,184 | ||||
| Spanish Government Bond (Spain) | ||||||
| 5.750% due 07/30/32 # | EUR100,000 | 164,152 | ||||
| United Mexican States (Mexico) | ||||||
| 8.000% due 09/24/22 | $ | 185,000 | 210,438 | |||
| Notional Amount | ||||||
| United Mexican States Value Recovery Rights (Mexico) | ||||||
| 0.000% due 06/30/05 § | 250,000 | 3,500 | ||||
| 0.000% due 06/30/06 § | 250,000 | 6,500 | ||||
| 0.000% due 06/30/07 § | 250,000 | 5,875 | ||||
| Total Foreign Government Bonds | ||||||
| (Cost $2,700,865) | 2,790,142 | |||||
| Principal Amount | ||||||
| MUNICIPAL BONDS - 2.60% | ||||||
| Austin Texas Water & Wastewater System Revenue ‘A’ | ||||||
| 5.000% due 11/15/29 | 200,000 | 206,620 | ||||
| California State Economic Recovery ‘A’ | ||||||
| 5.000% due 07/01/11 | 100,000 | 108,628 | ||||
| Chicago Illinois ‘A’ | ||||||
| 5.000% due 01/01/34 | 200,000 | 204,362 | ||||
| Energy Northwest Washington Electric Revenue ‘A’ | ||||||
| 5.500% due 07/01/12 | 100,000 | 110,465 | ||||
| Florida State Board of Education ‘A’ | ||||||
| 5.000% due 06/01/32 | 100,000 | 103,100 | ||||
| Golden State Tobacco Securitization Corp CA ‘A-1’ | ||||||
| 6.250% due 06/01/33 | 50,000 | 51,343 | ||||
| 6.750% due 06/01/39 | 100,000 | 105,430 | ||||
| New York City Municipal Water Finance Authority | ||||||
| Water & Sewer Systems Revenue NY ‘E’ | ||||||
| 5.000% due 06/15/34 | 100,000 | 102,561 | ||||
| San Antonio Texas Refunding ‘A’ | ||||||
| 5.000% due 02/01/10 | 100,000 | 106,873 | ||||
| Tobacco Settlement Financing Corp NJ | ||||||
| 6.000% due 06/01/37 | 100,000 | 99,567 | ||||
| Total Municipal Bonds | ||||||
| (Cost $1,163,315) | 1,198,949 | |||||
| See Notes to Financial Statements | See explanation of symbols and terms on C-30 |
C-19 | |
PACIFIC FUNDS |
| Notional Amount | Value | |||||
|---|---|---|---|---|---|---|
| PURCHASED CALL OPTION - 0.02% | ||||||
| 30-Year Swaption (3-Month LIBOR vs. 5.750%) OTC | ||||||
| Strike @ $5.75 Exp. 04/27/09 | ||||||
| Broker: Lehman Brothers Holdings Inc | $ | 100,000 | $ | 9,121 | ||
| Total Purchased Call Option | ||||||
| (Cost $5,170) | 9,121 | |||||
| Number of Contracts | ||||||
| PURCHASED PUT OPTIONS - 0.01% | ||||||
| Eurodollar (06/05) Futures CME | ||||||
| Strike @ $91.50 Exp. 06/13/05 | ||||||
| Broker: Merrill Lynch & Co Inc | 7 | 44 | ||||
| Eurodollar (06/05) Futures CME | ||||||
| Strike @ $96.00 Exp. 06/13/05 | ||||||
| Broker: Merrill Lynch & Co Inc | 13 | 81 | ||||
| Eurodollar (09/05) Futures CME | ||||||
| Strike @ $94.50 Exp. 09/19/05 | ||||||
| Broker: Merrill Lynch & Co Inc | 10 | 63 | ||||
| Eurodollar (12/05) Futures CME | ||||||
| Strike @ $93.75 Exp. 12/19/05 | ||||||
| Broker: Merrill Lynch & Co Inc | 13 | 81 | ||||
| Eurodollar (12/05) Futures CME | ||||||
| Strike @ $94.00 Exp. 12/19/05 | ||||||
| Broker: Merrill Lynch & Co Inc | 11 | 69 | ||||
| Notional Amount | ||||||
| 30-Year Swaption (3-Month LIBOR vs. 6.250%) OTC | ||||||
| Strike @ $6.25 Exp. 04/27/09 | ||||||
| Broker: Lehman Brothers Holdings Inc | $ | 100,000 | 3,921 | |||
| Total Purchased Put Options | ||||||
| (Cost $7,734) | 4,259 | |||||
| Principal Amount | ||||||
| SHORT-TERM INVESTMENTS - 55.04% | ||||||
| Commercial Paper - 35.06% | ||||||
| ANZ DE Inc | ||||||
| 2.840% due 06/03/05 | 700,000 | 696,439 | ||||
| ASB Bank Ltd | ||||||
| 2.420% due 04/07/05 | 500,000 | 499,786 | ||||
| Bank of Ireland (Ireland) | ||||||
| 2.530% due 04/11/05 | 600,000 | 599,566 | ||||
| Barclays U.S. Funding LLC | ||||||
| 2.515% due 04/05/05 | 300,000 | 299,914 | ||||
| 2.665% due 05/02/05 | 100,000 | 99,766 | ||||
| 2.945% due 06/16/05 | 900,000 | 894,416 | ||||
| CBA DE Finance | ||||||
| 2.525% due 04/11/05 | 400,000 | 399,714 | ||||
| Danske Corp | ||||||
| 2.460% due 04/05/05 | 1,000,000 | 999,713 | ||||
| 2.725% due 06/06/05 | 100,000 | 99,466 | ||||
| 2.980% due 06/30/05 | 200,000 | 198,514 | ||||
| DnB NOR Bank ASA (Norway) | ||||||
| 2.750% due 06/10/05 | 1,100,000 | 1,093,682 | ||||
| Ford Motor Credit Co | ||||||
| 2.520% due 04/08/05 | 200,000 | 199,888 | ||||
| ForeningsSparbanken AB (Sweden) 2.980% due 06/29/05 | 200,000 | 198,517 | ||||
| General Electric Capital Corp | ||||||
| 2.970% due 06/20/05 | 800,000 | 794,759 | ||||
| HBOS Treasury Services PLC (United Kingdom) | ||||||
| 2.615% due 04/25/05 | 200,000 | 199,647 | ||||
| ING U.S. Funding LLC | ||||||
| 2.400% due 04/05/05 | 500,000 | 499,856 | ||||
| 2.940% due 06/16/05 | 100,000 | 99,379 | ||||
| 2.960% due 06/21/05 | 700,000 | 695,352 | ||||
| IXIS | ||||||
| 2.890% due 06/21/05 | 1,100,000 | 1,092,696 | ||||
| Nordea North America Inc | ||||||
| 2.600% due 04/25/05 | 1,100,000 | 1,098,039 | ||||
| Rabobank USA Financial Corp | ||||||
| 2.720% due 06/01/05 | 1,100,000 | 1,094,591 | ||||
| Skandinaviska Enskilda Banken AB (Sweden) | ||||||
| 2.760% due 05/17/05 | 1,100,000 | 1,095,959 | ||||
| Spintab AB (Sweden) | ||||||
| 2.750% due 06/03/05 | 100,000 | 99,486 | ||||
| UBS Finance DE LLC | ||||||
| 2.530% due 05/03/05 | 700,000 | 698,298 | ||||
| 2.670% due 05/25/05 | 200,000 | 199,132 | ||||
| 2.730% due 06/02/05 | 100,000 | 99,500 | ||||
| 2.785% due 04/28/05 | 300,000 | 299,373 | ||||
| Unicredit DE Inc | ||||||
| 2.510% due 04/06/05 | 600,000 | 599,785 | ||||
| Westpac Trust Securities Ltd | ||||||
| 2.765% due 05/17/05 | 1,200,000 | 1,195,638 | ||||
| 16,140,871 | ||||||
| Foreign Government Issues - 8.30% | ||||||
| French Treasury Bills (France) | ||||||
| 2.031% due 06/16/05 | EUR260,000 | 335,490 | ||||
| 2.027% due 06/23/05 | 500,000 | 644,919 | ||||
| 2.015% due 06/30/05 | 1,000,000 | 1,290,053 | ||||
| Spain Letras del Tesoro (Spain) | ||||||
| 2.025% due 06/17/05 | 1,200,000 | 1,549,066 | ||||
| 3,819,528 | ||||||
| U.S. Government Agency Issues - 7.56% | ||||||
| Fannie Mae | ||||||
| 2.710% due 06/13/05 | $ | 500,000 | 497,136 | |||
| 2.730% due 06/13/05 | 800,000 | 795,418 | ||||
| 2.760% due 06/13/05 | 700,000 | 695,990 | ||||
| 2.950% due 06/22/05 | 1,100,000 | 1,092,922 | ||||
| Freddie Mac | ||||||
| 2.450% due 04/01/05 | 300,000 | 300,000 | ||||
| 2.890% due 07/12/05 | 100,000 | 99,168 | ||||
| 3,480,634 | ||||||
| U.S. Treasury Bills - 1.56% | ||||||
| 2.533% due 05/19/05 | 200,000 | 199,294 | ||||
| 2.710% due 06/02/05 ‡ | 460,000 | 457,914 | ||||
| 2.740% due 06/16/05 ‡ | 60,000 | 59,660 | ||||
| 716,868 | ||||||
| See Notes to Financial Statements | See explanation of symbols and terms on C-30 |
C-20 | |
PACIFIC FUNDS |
| Shares | Value | |||||
|---|---|---|---|---|---|---|
| Money Market Funds - 2.56% | ||||||
| BlackRock Liquidity Funds Institutional TempCash | 588,847 | $ | 588,847 | |||
| BlackRock Liquidity Funds Institutional TempFund | 588,847 | 588,847 | ||||
| 1,177,694 | ||||||
Total Short-Term Investments | 25,335,595 | |||||
| TOTAL INVESTMENTS - 112.05% | ||||||
| (Cost $51,532,042) | 51,579,432 | |||||
| OTHER ASSETS & LIABILITIES, NET - (12.05%) | (5,545,398 | ) | ||||
| NET ASSETS - 100.00% | $ | 46,034,034 | ||||
| Notes to Schedule of Investments (a) As of March 31, 2005, the Fund was diversified as a percentage of net assets as follows: |
| Short-Term Investments | 55.04 | % | |
| Mortgage-Backed Securities | 27.71 | % | |
| U.S. Treasury Obligations | 12.43 | % | |
| Foreign Government Bonds | 6.06 | % | |
| Corporate Bonds & Notes | 3.53 | % | |
| Municipal Bonds | 2.60 | % | |
| Asset-Backed Securities | 2.57 | % | |
| U.S. Government Agency Issue | 1.95 | % | |
| Equity Securities | 0.13 | % | |
| Purchased Options | 0.03 | % | |
| 112.05 | % | ||
| Other Assets & Liabilities, Net | (12.05 | %) | |
| 100.00 | % | ||
| (b) Short-term securities represent either the stated coupon rate or the annualized effective yield on the date of purchase for discounted securities. | |
| (c) Securities with an approximate aggregate market value of $517,574 were segregated with the custodian to cover margin requirements for the following open futures contracts as of March 31, 2005: | |
| Long Futures Outstanding | Number of Contracts | Notional Amount | Unrealized Appreciation (Depreciation) | |||||
|---|---|---|---|---|---|---|---|---|
| Euro-Bund 10-Year Notes (06/05) | 13 | EUR1,300,000 | $ | 21,259 | ||||
| Eurodollar (06/05) | 23 | $ | 23,000,000 | (25,112 | ) | |||
| Eurodollar (09/05) | 21 | 21,000,000 | (31,688 | ) | ||||
| Eurodollar (12/05) | 53 | 53,000,000 | (37,788 | ) | ||||
| Eurodollar (12/06) | 2 | 2,000,000 | 1,800 | |||||
| U.S. Treasury 5-Year Notes (06/05) | 6 | 600,000 | (3,563 | ) | ||||
| U.S. Treasury 10-Year Notes (06/05) | 163 | 16,300,000 | (90,718 | ) | ||||
| U.S. Treasury 30-Year Bonds (06/05) | 30 | 3,000,000 | (57,187 | ) | ||||
| Short Futures Outstanding | ||||||||
| United Kingdom 90-Day | ||||||||
| GBP-LIBOR (12/05) Strike @ $94.25 | ||||||||
| Purchased Put Options | 5 | GBP2,500,000 | 3,720 | |||||
| ($219,277 | ) | |||||||
| (d) Investment sold short outstanding as of March 31, 2005: | |
| Type | Principal Amount | Value | |||||
|---|---|---|---|---|---|---|---|
| U.S. Treasury Notes | |||||||
| 4.250% 08/15/13 # | $ | 2,000,000 | $ | 1,972,892 | |||
| Total Investment sold short (Proceeds $1,964,702) | $ | 1,972,892 | |||||
| (e) Forward foreign currency contracts outstanding as of March 31, 2005 were as follows: | |
| Contracts to Buy or to Sell | Currency | Principal Amount Covered by Contracts | Expiration | Unrealized Appreciation (Depreciation) | ||||||
|---|---|---|---|---|---|---|---|---|---|---|
| Buy | BRL | 566,750 | 09/05 | ($ 685 | ) | |||||
| Buy | CNY | 789,750 | 09/05 | (2,765 | ) | |||||
| Sell | CNY | 789,750 | 09/05 | 2,493 | ||||||
| Sell | EUR | 2,795,000 | 04/05 | 80,269 | ||||||
| Sell | EUR | 1,260,000 | 06/05 | 9,752 | ||||||
| Buy | JPY | 67,272,000 | 04/05 | (13,306 | ) | |||||
| $ | 75,758 | |||||||||
| (f) Transactions in written options for the year ended March 31, 2005, were as follows: | |
| Number of Contracts | Premium | |||||
|---|---|---|---|---|---|---|
| Outstanding, March 31, 2004 | 7,000,000 | $ | 173,374 | |||
| Call Options Written | 38 | 13,014 | ||||
| Put Options Written | 31 | 10,524 | ||||
| Call Options Expired | (900,016 | ) | (28,043 | ) | ||
| Put Options Expired | (1,900,006 | ) | (47,470 | ) | ||
| Call Options Repurchased | (1,000,000 | ) | (27,150 | ) | ||
| Put Options Repurchased | — | — | ||||
| Outstanding, March 31, 2005 | 3,200,047 | $ | 94,249 | |||
| See Notes to Financial Statements | See explanation of symbols and terms on C-30 |
C-21 | |
PACIFIC FUNDS |
| (g) Premiums received and value of written options outstanding as of March 31, 2005: | |
| Counterparty | Type | Pay/Receive Floating Rate Based on 3-Month LIBOR | Exercise Rate | Expiration Date | Notional Amount | Premium | Value | ||||||||||||
|---|---|---|---|---|---|---|---|---|---|---|---|---|---|---|---|---|---|---|---|
| Lehman Brothers Holdings Inc | Call - OTC 7-Year Swaption | Receive | 4.000 | % | 09/23/05 | $ | 500,000 | $ | 7,550 | $ | 506 | ||||||||
| Merrill Lynch & Co Inc | Call - OTC 7-Year Swaption | Receive | 4.000 | % | 09/23/05 | 1,100,000 | 29,370 | 1,113 | |||||||||||
| Merrill Lynch & Co Inc | Put - OTC 7-Year Swaption | Pay | 6.000 | % | 09/23/05 | 1,100,000 | 37,290 | 1,609 | |||||||||||
| Lehman Brothers Holdings Inc | Put - OTC 7-Year Swaption | Pay | 7.000 | % | 09/23/05 | 500,000 | 7,700 | 39 | |||||||||||
| Strike Price | Number of Contracts | ||||||||||||||||||
| Merrill Lynch & Co Inc | Put - CBOT U.S. Treasury 10-Year Futures | $ | 106.000 | 05/20/05 | 6 | 1,102 | 656 | ||||||||||||
| Merrill Lynch & Co Inc | Put - CBOT U.S. Treasury 10-Year Futures | 107.000 | 05/20/05 | 7 | 2,411 | 1,422 | |||||||||||||
| Merrill Lynch & Co Inc | Put - CBOT U.S. Treasury 10-Year Futures | 109.000 | 05/20/05 | 9 | 2,779 | 6,610 | |||||||||||||
| Merrill Lynch & Co Inc | Call - CBOT U.S. Treasury 10-Year Futures | 111.000 | 05/20/05 | 7 | 1,895 | 1,531 | |||||||||||||
| Merrill Lynch & Co Inc | Call - CBOT U.S. Treasury 10-Year Futures | 112.000 | 05/20/05 | 6 | 634 | 469 | |||||||||||||
| Merrill Lynch & Co Inc | Call - CBOT U.S. Treasury 10-Year Futures | 115.000 | 05/20/05 | 9 | 2,076 | 141 | |||||||||||||
| Merrill Lynch & Co Inc | Put - CBOT U.S. Treasury 30-Year Futures | 108.000 | 05/20/05 | 3 | 1,442 | 1,078 | |||||||||||||
| $ | 94,249 | $ | 15,174 | ||||||||||||||||
| (h) Credit default swaps outstanding as of March 31, 2005: |
| Counterparty | Reference Entity | Buy/Sell Protection | Pay/Receive Fixed Rate | Expiration Date | Notional Amount | Unrealized Appreciation (Depreciation) | |||||||||||
|---|---|---|---|---|---|---|---|---|---|---|---|---|---|---|---|---|---|
| Lehman Brothers Holdings Inc | Russian Federation 5.000% due 03/31/30 | Sell | 1.000% | 07/28/05 | $ | 100,000 | $ | 155 | |||||||||
| Lehman Brothers Holdings Inc | Russian Federation 5.000% due 03/31/30 | Sell | 0.970% | 07/31/05 | 100,000 | 150 | |||||||||||
| Citibank NA | General Motors Acceptance Corp 6.875% due 08/28/12 | Sell | 2.950% | 06/20/06 | 100,000 | — | |||||||||||
| Merrill Lynch & Co Inc | Russian Federation 5.000% due 03/31/30 | Sell | 0.610% | 03/20/07 | 100,000 | (482 | ) | ||||||||||
| The Goldman Sachs Group Inc | Russian Federation 5.000% due 03/31/30 | Sell | 0.700% | 03/20/07 | 100,000 | (331 | ) | ||||||||||
| HSBC Bank USA NA | General Motors Corp 7.125% due 07/15/13 | Sell | 3.750% | 06/20/07 | 200,000 | — | |||||||||||
| Lehman Brothers Holdings Inc | Johnson & Johnson 3.800% due 05/15/13 | Buy | 0.110% | 12/20/08 | 100,000 | (93 | ) | ||||||||||
| Lehman Brothers Holdings Inc | The Home Depot Inc 5.375% due 04/01/06 | Buy | 0.120% | 12/20/08 | 100,000 | (216 | ) | ||||||||||
| Citigroup Inc | Wal-Mart Stores Inc 3.375% due 10/01/08 | Buy | 0.140% | 12/20/08 | 100,000 | (216 | ) | ||||||||||
| Barclays Bank PLC | Eli Lilly & Co 6.000% due 03/15/12 | Buy | 0.160% | 12/20/08 | 100,000 | (224 | ) | ||||||||||
| Morgan Stanley | Emerson Electric Co 4.625% due 10/15/12 | Buy | 0.210% | 12/20/08 | 100,000 | (100 | ) | ||||||||||
| Merrill Lynch & Co Inc | Gannett Co Inc 6.375% due 04/01/12 | Buy | 0.220% | 12/20/08 | 100,000 | (89 | ) | ||||||||||
| Morgan Stanley | The Allstate Corp 6.125% due 02/15/12 | Buy | 0.260% | 12/20/08 | 100,000 | (474 | ) | ||||||||||
| Citigroup Inc | Eaton Corp 5.750% due 07/15/12 | Buy | 0.280% | 12/20/08 | 100,000 | (551 | ) | ||||||||||
| Barclays Bank PLC | Fedex Corp 7.250% due 10/15/12 | Buy | 0.290% | 12/20/08 | 100,000 | (404 | ) | ||||||||||
| Lehman Brothers Holdings Inc | Whirlpool Corp 8.600% due 05/01/10 | Buy | 0.290% | 12/20/08 | 100,000 | 153 | |||||||||||
| Merrill Lynch & Co Inc | Ingersoll-Rand Co Ltd 6.480% due 06/01/25 | Buy | 0.320% | 12/20/08 | 100,000 | (497 | ) | ||||||||||
| ($3,219 | ) | ||||||||||||||||
| (i) Interest rate swaps outstanding as of March 31, 2005: |
| Counterparty | Floating Rate Index | Pay/Receive Floating Rate | Fixed Rate | Expiration Date | Notional Amount | Unrealized Appreciation (Depreciation) | ||||||||||
|---|---|---|---|---|---|---|---|---|---|---|---|---|---|---|---|---|
| Barclays Bank PLC | 3-Month USD-LIBOR | Pay | 4.000% | 06/15/10 | $ | 3,500,000 | ($ 73,048 | ) | ||||||||
| Greenwich Capital Markets | 3-Month USD-LIBOR | Pay | 4.000% | 06/15/10 | 500,000 | (7,885 | ) | |||||||||
| Lehman Brothers Holdings Inc | 3-Month USD-LIBOR | Pay | 4.000% | 06/15/10 | 800,000 | (14,092 | ) | |||||||||
| UBS Securities Inc | 6-Month EUR-LIBOR | Receive | 5.000% | 12/15/14 | EUR2,400,000 | (262,247 | ) | |||||||||
| JPMorgan Chase & Co | 6-Month GBP-LIBOR | Pay | 5.000% | 03/15/15 | GBP300,000 | (4,275 | ) | |||||||||
| Barclays Bank PLC | 3-Month USD-LIBOR | Receive | 5.000% | 06/15/15 | $ | 100,000 | 1,490 | |||||||||
| JPMorgan Chase & Co | 3-Month USD-LIBOR | Receive | 5.000% | 06/15/15 | 800,000 | 13,608 | ||||||||||
| Lehman Brothers Holdings Inc | 3-Month USD-LIBOR | Receive | 5.000% | 06/15/15 | 2,600,000 | 57,960 | ||||||||||
| Morgan Stanley | 3-Month USD-LIBOR | Receive | 5.000% | 06/15/15 | 1,200,000 | 25,516 | ||||||||||
| The Goldman Sachs Group Inc | 3-Month USD-LIBOR | Receive | 5.000% | 06/15/15 | 500,000 | 6,350 | ||||||||||
| Barclays Bank PLC | 3-Month USD-LIBOR | Receive | 6.000% | 06/15/25 | 700,000 | 3,424 | ||||||||||
| Morgan Stanley | 6-Month GBP-LIBOR | Receive | 5.000% | 06/18/34 | GBP100,000 | 1,509 | ||||||||||
| UBS Securities Inc | 6-Month GBP-LIBOR | Receive | 5.000% | 06/18/34 | 100,000 | 2,155 | ) | |||||||||
| JPMorgan Chase & Co | 6-Month EUR-LIBOR | Pay | 6.000% | 06/18/34 | EUR300,000 | 28,178 | ||||||||||
| ($225,667 | ) | |||||||||||||||
| See Notes to Financial Statements | See explanation of symbols and terms on C-30 |
C-22 | |
PACIFIC FUNDS |
| Principal Amount | Value | |||||||
|---|---|---|---|---|---|---|---|---|
SHORT-TERM INVESTMENTS - 100.12% | ||||||||
| Asset-Backed Securities - 1.81% | ||||||||
| GE Commercial Equipment Financing LLC | ||||||||
| 2.810% due 11/20/05 “ § | $ | 104,322 | $ | 104,322 | ||||
| Honda Auto Receivables Owner Trust | ||||||||
| 2.093% due 11/18/05 “ | 81,285 | 81,285 | ||||||
| Nissan Auto Receivables Owner Trust | ||||||||
| 1.930% due 09/15/05 “ | 103,057 | 103,057 | ||||||
| 2.640% due 01/17/06 “ | 188,227 | 188,227 | ||||||
| 476,891 | ||||||||
| Commercial Paper - 66.43% |
| Abbott Laboratories | ||||||||
| 2.640% due 04/26/05 | 450,000 | 449,175 | ||||||
| Becton Dickinson & Co | ||||||||
| 2.700% due 04/28/05 | 800,000 | 798,380 | ||||||
| Caterpillar Financial Services Corp | ||||||||
| 2.760% due 04/15/05 | 1,000,000 | 998,927 | ||||||
| Colgate-Palmolive Co | ||||||||
| 2.720% due 04/20/05 | 1,000,000 | 998,564 | ||||||
| Danske Corp | ||||||||
| 2.650% due 04/18/05 | 1,000,000 | 998,749 | ||||||
| E.I. du Pont de Nemours & Co | ||||||||
| 2.690% due 04/14/05 | 700,000 | 699,320 | ||||||
| Emerson Electric Co | ||||||||
| 2.730% due 04/11/05 | 1,000,000 | 999,242 | ||||||
| Equitable Resources Inc | ||||||||
| 2.750% due 04/04/05 | 1,100,000 | 1,099,748 | ||||||
| Gannett Co Inc | ||||||||
| 2.600% due 04/18/05 | 1,000,000 | 998,772 | ||||||
| General Electric Capital Corp | ||||||||
| 2.750% due 04/28/05 | 900,000 | 898,144 | ||||||
| Government of Canada (Canada) | ||||||||
| 2.750% due 04/08/05 | 1,050,000 | 1,049,439 | ||||||
| International Business Machines Corp | ||||||||
| 2.580% due 04/25/05 | 700,000 | 698,796 | ||||||
| Kimberly-Clark Worldwide Inc | ||||||||
| 2.730% due 04/22/05 | 1,000,000 | 998,407 | ||||||
| Morgan Stanley | ||||||||
| 2.790% due 04/13/05 | 775,000 | 774,279 | ||||||
| National Rural Utilities Cooperative Finance Corp | ||||||||
| 2.740% due 04/19/05 | 1,000,000 | 998,630 | ||||||
| PepsiCo Inc | ||||||||
| 2.670% due 04/14/05 | 500,000 | 499,518 | ||||||
| 2.750% due 05/09/05 | 700,000 | 697,968 | ||||||
| Pfizer Inc | ||||||||
| 2.700% due 04/01/05 | 600,000 | 600,000 | ||||||
| The Coca-Cola Co | ||||||||
| 2.720% due 04/19/05 | 1,000,000 | 998,640 | ||||||
| United Parcel Service Inc | ||||||||
| 2.520% due 04/01/05 | 200,000 | 200,000 | ||||||
| Wal-Mart Stores Inc | ||||||||
| 2.720% due 05/03/05 | 1,000,000 | 997,582 | ||||||
| 17,452,280 | ||||||||
| Corporate Notes - 7.16% |
| American Express Credit Corp | ||||||
| 2.860% due 06/24/05 § | 500,000 | 500,066 | ||||
| American Honda Finance Corp | ||||||
| 2.711% due 12/06/05 ~ § | 200,000 | 200,000 | ||||
| Bank of Nova Scotia (Canada) | ||||||
| 2.780% due 06/24/05 § | 325,000 | 324,987 | ||||
| Fifth Third Bancorp | ||||||
| 2.810% due 04/21/06 ~ § | 275,000 | 275,000 | ||||
| Pfizer Inc | ||||||
| 2.690% due 11/04/05 § | 220,000 | 220,000 | ||||
| UBS AG Stamford CT | ||||||
| 2.950% due 09/22/05 § | 360,000 | 359,901 | ||||
| 1,879,954 | ||||||
| U.S. Government Agency Issues - 24.62% |
| Fannie Mae | ||||||
| 1.360% due 05/03/05 | 500,000 | 499,950 | ||||
| 1.810% due 05/27/05 | 250,000 | 250,000 | ||||
| 2.750% due 07/26/05 § | 1,000,000 | 999,968 | ||||
| Federal Home Loan Bank | ||||||
| 1.470% due 05/04/05 | 500,000 | 500,000 | ||||
| 1.660% due 05/16/05 | 250,000 | 250,000 | ||||
| 2.510% due 11/04/05 | 400,000 | 400,000 | ||||
| 2.630% due 04/05/05 | 2,100,000 | 2,099,386 | ||||
| 2.720% due 09/16/05 § | 420,000 | 419,935 | ||||
| 2.750% due 03/07/06 § | 500,000 | 500,000 | ||||
| 2.875% due 03/03/06 § | 550,000 | 550,000 | ||||
| 6,469,239 | ||||||
| Shares | ||||||
|---|---|---|---|---|---|---|
| Money Market Fund - 0.10% | ||||||
| BlackRock Liquidity Funds Institutional TempFund | 25,332 | 25,332 | ||||
| Total Short-Term Investments | ||||||
| (Amortized Cost $26,303,696) | 26,303,696 | |||||
| TOTAL INVESTMENTS - 100.12% | ||||||
| (Amortized Cost $26,303,696) | 26,303,696 | |||||
| OTHER ASSETS & LIABILITIES, NET - (0.12%) | (32,378 | ) | ||||
| NET ASSETS - 100.00% | $ | 26,271,318 | ||||
Notes to Schedule of Investments |
| Commercial Paper | 66.43 | % | |||
| U.S. Government Agency Issues | 24.62 | % | |||
| Corporate Notes | 7.16 | % | |||
| Asset-Backed Securities | 1.81 | % | |||
| Money Market Fund | 0.10 | % | |||
| 100.12 | % | ||||
| Other Assets & Liabilities, Net | (0.12 | %) | |||
| 100.00 | % | ||||
(b) Short-term securities represent either the stated coupon rate or the annualized effective yield on the date of purchase for discounted securities. |
| See Notes to Financial Statements | See explanation of symbols and terms on C-30 |
C-23 | |
PACIFIC FUNDS |
| Shares | Value | |||||
|---|---|---|---|---|---|---|
| COMMON STOCKS - 91.10% | ||||||
| Consumer Discretionary - 14.17% | ||||||
| J.C. Penney Co Inc | 14,400 | $ | 747,648 | |||
| Kimberly-Clark Corp | 7,800 | 512,694 | ||||
| Liberty Media Corp ‘A’ * | 66,300 | 687,531 | ||||
| Liberty Media International Inc ‘A’ * | 3,400 | 148,716 | ||||
| Mattel Inc | 12,300 | 262,605 | ||||
| McDonald’s Corp | 26,600 | 828,324 | ||||
| Newell Rubbermaid Inc | 22,000 | 482,680 | ||||
| News Corp ‘B’ | 51,400 | 905,154 | ||||
| Target Corp | 8,500 | 425,170 | ||||
| Time Warner Inc * | 41,200 | 723,060 | ||||
| Viacom Inc ‘B’ | 21,300 | 741,879 | ||||
| Wal-Mart Stores Inc | 10,800 | 541,188 | ||||
| Waste Management Inc | 14,900 | 429,865 | ||||
| 7,436,514 | ||||||
| Consumer Staples - 5.24% | ||||||
| Altria Group Inc | 25,900 | 1,693,601 | ||||
| Sara Lee Corp | 6,600 | 146,256 | ||||
| The Kroger Co * | 56,800 | 910,504 | ||||
| 2,750,361 | ||||||
| Energy - 3.97% | ||||||
| El Paso Corp | 57,900 | 612,582 | ||||
| ENSCO International Inc | 23,100 | 869,946 | ||||
| EOG Resources Inc | 3,900 | 190,086 | ||||
| Nabors Industries Ltd * (Barbados) | 6,900 | 408,066 | ||||
| 2,080,680 | ||||||
| Financial Services - 27.21% | ||||||
| American Express Co | 13,100 | 672,947 | ||||
| American International Group Inc | 17,200 | 953,052 | ||||
| Bank of America Corp | 40,300 | 1,777,230 | ||||
| Capital One Financial Corp | 13,300 | 994,441 | ||||
| Comerica Inc | 8,800 | 484,704 | ||||
| Equity Office Properties Trust | 21,900 | 659,847 | ||||
| Equity Residential | 18,200 | 586,222 | ||||
| Freddie Mac | 13,200 | 834,240 | ||||
| JPMorgan Chase & Co | 18,200 | 629,720 | ||||
| Loews Corp | 9,100 | 669,214 | ||||
| MBNA Corp | 10,700 | 262,685 | ||||
| Merrill Lynch & Co Inc | 17,800 | 1,007,480 | ||||
| Morgan Stanley | 6,700 | 383,575 | ||||
| The Bank of New York Co Inc | 11,400 | 331,170 | ||||
| The Chubb Corp | 6,640 | 526,353 | ||||
| The Goldman Sachs Group Inc | 6,200 | 681,938 | ||||
| The St. Paul Travelers Cos Inc | 5,900 | 216,707 | ||||
| U.S. Bancorp | 23,400 | 674,388 | ||||
| Wachovia Corp | 15,100 | 768,741 | ||||
| Washington Mutual Inc | 11,600 | 458,200 | ||||
| Wells Fargo & Co | 11,800 | 705,640 | ||||
| 14,278,494 | ||||||
| Health Care - 4.78% | ||||||
| GlaxoSmithKline PLC ADR (United Kingdom) | 7,400 | 339,808 | ||||
| Johnson & Johnson | 9,200 | 617,872 | ||||
| Novartis AG ADR (Switzerland) | 8,700 | 406,986 | ||||
| Pfizer Inc | 21,600 | 567,432 | ||||
| Sanofi-Aventis ADR (France) | 8,200 | 347,188 | ||||
| Schering-Plough Corp | 12,700 | 230,505 | ||||
| 2,509,791 | ||||||
| Integrated Oils - 7.15% | ||||||
| BP PLC ADR (United Kingdom) | 8,000 | 499,200 | ||||
| GlobalSantaFe Corp | 13,200 | 488,928 | ||||
| Marathon Oil Corp | 14,800 | 694,416 | ||||
| Noble Corp | 6,300 | 354,123 | ||||
| Royal Dutch Petroleum Co ‘NY’ (Netherlands) | 8,400 | 504,336 | ||||
| Total SA ADR (France) | 10,300 | 1,207,469 | ||||
| 3,748,472 | ||||||
| Materials & Processing - 2.45% | ||||||
| Air Products & Chemicals Inc | 5,800 | 367,082 | ||||
| Avery Dennison Corp | 10,000 | 619,300 | ||||
| International Paper Co | 8,100 | 297,999 | ||||
| 1,284,381 | ||||||
| Multi-Industry - 1.70% | ||||||
| Honeywell International Inc | 24,000 | 893,040 | ||||
| Producer Durables - 5.82% | ||||||
| Lexmark International Inc ‘A’ * | 7,900 | 631,763 | ||||
| Lockheed Martin Corp | 14,100 | 860,946 | ||||
| The Boeing Co | 15,200 | 888,592 | ||||
| United Technologies Corp | 6,600 | 670,956 | ||||
| 3,052,257 | ||||||
| Technology - 9.00% | ||||||
| Comverse Technology Inc * | 18,200 | 459,004 | ||||
| Hewlett-Packard Co | 11,900 | 261,086 | ||||
| International Business Machines Corp | 6,600 | 603,108 | ||||
| Microsoft Corp | 40,100 | 969,217 | ||||
| Nokia OYJ ADR * (Finland) | 63,300 | 976,719 | ||||
| Nortel Networks Corp * (Canada) | 220,700 | 602,511 | ||||
| Raytheon Co | 15,200 | 588,240 | ||||
| Solectron Corp * | 76,200 | 264,414 | ||||
| 4,724,299 | ||||||
| Utilities - 9.61% | ||||||
| Alltel Corp | 11,500 | 630,775 | ||||
| AT&T Corp | 12,400 | 232,500 | ||||
| Comcast Corp ‘A’ * | 25,800 | 871,524 | ||||
| Nextel Communications Inc ‘A’ * | 35,000 | 994,700 | ||||
| PG&E Corp | 10,700 | 364,870 | ||||
| SBC Communications Inc | 30,700 | 727,283 | ||||
| Sempra Energy | 12,600 | 501,984 | ||||
| Sprint Corp | 11,300 | 257,075 | ||||
| Verizon Communications Inc | 13,000 | 461,500 | ||||
| 5,042,211 | ||||||
| Total Common Stocks | ||||||
| (Cost $43,923,531) | 47,800,500 | |||||
| See Notes to Financial Statements | See explanation of symbols and terms on C-30 |
C-24 | |
PACIFIC FUNDS |
| Shares | Value | |||||
|---|---|---|---|---|---|---|
| SHORT-TERM INVESTMENT - 4.53% | ||||||
| Money Market Fund - 4.53% | ||||||
| BlackRock Liquidity Funds Institutional TempFund | 2,376,885 | $ | 2,376,885 | |||
| Total Short-Term Investment | ||||||
| (Cost $2,376,885) | 2,376,885 | |||||
| TOTAL INVESTMENTS - 95.63% | ||||||
| (Cost $46,300,416) | 50,177,385 | |||||
| OTHER ASSETS & LIABILITIES, NET - 4.37% | 2,295,188 | |||||
| NET ASSETS - 100.00% | $ | 52,472,573 | ||||
| Note to Schedule of Investments |
| (a) As of March 31, 2005, the Fund was diversified as a percentage of net assets as follows: |
| Financial Services | 27.21 | % | |
| Consumer Discretionary | 14.17 | % | |
| Utilities | 9.61 | % | |
| Technology | 9.00 | % | |
| Integrated Oils | 7.15 | % | |
| Producer Durables | 5.82 | % | |
| Consumer Staples | 5.24 | % | |
| Health Care | 4.78 | % | |
| Short-Term Investment | 4.53 | % | |
| Energy | 3.97 | % | |
| Materials & Processing | 2.45 | % | |
| Multi-Industry | 1.70 | % | |
| 95.63 | % | ||
| Other Assets & Liabilities, Net | 4.37 | % | |
| 100.00 | % | ||
| See Notes to Financial Statements | |
C-25 | |
PACIFIC FUNDS |
| Shares | Value | |||||
|---|---|---|---|---|---|---|
| PREFERRED STOCKS - 0.27% | ||||||
| Integrated Oils - 0.27% | ||||||
| Petroleo Brasileiro SA ADR (Brazil) | 1,700 | $ | 65,399 | |||
| Total Preferred Stocks | ||||||
| (Cost $71,348) | 65,399 | |||||
| COMMON STOCKS - 89.21% | ||||||
| Autos & Transportation - 0.30% | ||||||
| Southwest Airlines Co | 5,100 | 72,624 | ||||
| Consumer Discretionary - 13.27% | ||||||
| Clear Channel Communications Inc | 14,900 | 513,603 | ||||
| Eastman Kodak Co | 4,500 | 146,475 | ||||
| Federated Department Stores Inc | 1,700 | 108,188 | ||||
| Jones Apparel Group Inc | 5,700 | 190,893 | ||||
| Kimberly-Clark Corp | 7,800 | 512,694 | ||||
| Liberty Media Corp ‘A’ * | 31,800 | 329,766 | ||||
| Mattel Inc | 7,200 | 153,720 | ||||
| McDonald’s Corp | 3,100 | 96,534 | ||||
| The May Department Stores Co | 2,800 | 103,656 | ||||
| The Walt Disney Co | 14,000 | 402,220 | ||||
| Time Warner Inc * | 16,400 | 287,820 | ||||
| Viacom Inc ‘B’ | 3,300 | 114,939 | ||||
| Wal-Mart Stores Inc | 5,200 | 260,572 | ||||
| 3,221,080 | ||||||
| Consumer Staples - 7.11% | ||||||
| Altria Group Inc | 7,500 | 490,425 | ||||
| CVS Corp | 3,300 | 173,646 | ||||
| Kraft Foods Inc ‘A’ | 9,500 | 313,975 | ||||
| The Coca-Cola Co | 7,100 | 295,857 | ||||
| Unilever NV ‘NY’ (Netherlands) | 6,600 | 451,572 | ||||
| 1,725,475 | ||||||
| Energy - 2.48% | ||||||
| Halliburton Co | 13,900 | 601,175 | ||||
| Financial Services - 21.66% | ||||||
| AMBAC Financial Group Inc | 1,100 | 82,225 | ||||
| American International Group Inc | 2,200 | 121,902 | ||||
| Assurant Inc | 1,900 | 64,030 | ||||
| Bank of America Corp | 15,100 | 665,910 | ||||
| Berkshire Hathaway Inc ‘B’ * | 5 | 14,280 | ||||
| Capital One Financial Corp | 200 | 14,954 | ||||
| Citigroup Inc | 12,900 | 579,726 | ||||
| Fannie Mae | 1,400 | 76,230 | ||||
| First Data Corp | 2,700 | 106,137 | ||||
| Freddie Mac | 14,500 | 916,400 | ||||
| Genworth Financial Inc ‘A’ | 4,100 | 112,832 | ||||
| JPMorgan Chase & Co | 5,300 | 183,380 | ||||
| Lehman Brothers Holdings Inc | 800 | 75,328 | ||||
| Merrill Lynch & Co Inc | 2,600 | 147,160 | ||||
| MetLife Inc | 2,800 | 109,480 | ||||
| RenaissanceRe Holdings Ltd (Bermuda) | 300 | 14,010 | ||||
| SunGard Data Systems Inc * | 3,500 | 120,750 | ||||
| SunTrust Banks Inc | 400 | 28,828 | ||||
| The Bank of New York Co Inc | 6,300 | 183,015 | ||||
| The Chubb Corp | 4,900 | 388,423 | ||||
| The Hartford Financial Services Group Inc | 800 | 54,848 | ||||
| The PNC Financial Services Group Inc | 5,700 | 293,436 | ||||
| The St. Paul Travelers Cos Inc | 2,986 | 109,676 | ||||
| Torchmark Corp | 3,500 | 182,700 | ||||
| Wachovia Corp | 2,656 | 135,217 | ||||
| Wells Fargo & Co | 8,000 | 478,400 | ||||
| 5,259,277 | ||||||
| Health Care - 13.56% | ||||||
| AmerisourceBergen Corp | 3,200 | 183,328 | ||||
| Bristol-Myers Squibb Co | 31,500 | 801,990 | ||||
| GlaxoSmithKline PLC ADR (United Kingdom) | 23,000 | 1,056,160 | ||||
| Pfizer Inc | 11,900 | 312,613 | ||||
| Roche Holding AG ADR (Switzerland) | 5,400 | 290,410 | ||||
| Sanofi-Aventis ADR (France) | 3,200 | 135,488 | ||||
| Schering-Plough Corp | 12,600 | 228,690 | ||||
| Wyeth | 6,700 | 282,606 | ||||
| 3,291,285 | ||||||
| Integrated Oils - 3.47% | ||||||
| ConocoPhillips | 1,200 | 129,408 | ||||
| GlobalSantaFe Corp | 3,700 | 137,048 | ||||
| Petroleo Brasileiro SA ADR (Brazil) | 2,900 | 128,122 | ||||
| Schlumberger Ltd | 1,200 | 84,576 | ||||
| Total SA ADR (France) | 2,800 | 328,244 | ||||
| Transocean Inc * | 700 | 36,022 | ||||
| 843,420 | ||||||
| Materials & Processing - 12.45% | ||||||
| Alcoa Inc | 15,100 | 458,889 | ||||
| E.I. du Pont de Nemours & Co | 10,800 | 553,392 | ||||
| Georgia-Pacific Corp | 17,510 | 621,430 | ||||
| International Paper Co | 27,700 | 1,019,083 | ||||
| Neenah Paper Inc | 196 | 6,589 | ||||
| Rohm & Haas Co | 3,400 | 163,200 | ||||
| The Dow Chemical Co | 4,000 | 199,400 | ||||
| 3,021,983 | ||||||
| Producer Durables - 0.47% | ||||||
| Cognex Corp | 1,700 | 42,296 | ||||
| Credence Systems Corp * | 3,800 | 30,058 | ||||
| Lexmark International Inc ‘A’ * | 400 | 31,988 | ||||
| Novellus Systems Inc * | 400 | 10,692 | ||||
| 115,034 | ||||||
| Technology - 2.91% | ||||||
| Affiliated Computer Services Inc ‘A’ * | 3,300 | 175,692 | ||||
| Check Point Software Technologies Ltd* (Israel) | 800 | 17,392 | ||||
| Cisco Systems Inc * | 3,900 | 69,771 | ||||
| Flextronics International Ltd* (Singapore) | 3,800 | 45,752 | ||||
| Hewlett-Packard Co | 7,500 | 164,550 | ||||
| Intel Corp | 700 | 16,261 | ||||
| International Business Machines Corp | 600 | 54,828 | ||||
| Jabil Circuit Inc * | 700 | 19,964 | ||||
| Microsoft Corp | 3,100 | 74,927 | ||||
| Nokia OYJ ADR * (Finland) | 2,400 | 37,032 | ||||
| Telefonaktiebolaget LM Ericsson ADR * (Sweden) | 1,100 | 31,020 | ||||
| 707,189 | ||||||
| Utilities - 11.53% | ||||||
| American Electric Power Co Inc | 5,100 | 173,706 | ||||
| Constellation Energy Group Inc | 4,000 | 206,800 | ||||
| Dominion Resources Inc VA | 2,800 | 208,404 | ||||
| FirstEnergy Corp | 5,200 | 218,140 | ||||
| Public Service Enterprise Group Inc | 2,400 | 130,536 | ||||
| SBC Communications Inc | 28,700 | 679,903 | ||||
| See Notes to Financial Statements | See explanation of symbols and terms on C-30 |
C-26 |
PACIFIC FUNDS |
| Shares | Value | |||||
|---|---|---|---|---|---|---|
| Sprint Corp | 18,700 | $ | 425,425 | |||
| Verizon Communications Inc | 21,300 | 756,150 | ||||
| 2,799,064 | ||||||
| Total Common Stocks | ||||||
| (Cost $19,561,991) | 21,657,606 | |||||
| Principal Amount | ||||||
| SHORT-TERM INVESTMENTS - 10.61% | ||||||
| U.S. Government Agency Issue - 10.61% | ||||||
| Freddie Mac | ||||||
| 2.540% due 04/01/05 | $ | 2,575,000 | 2,575,000 | |||
| Shares | ||||||
|---|---|---|---|---|---|---|
| Money Market Funds - 0.00% | ||||||
| BlackRock Liquidity Funds Institutional TempCash | 357 | 357 | ||||
| BlackRock Liquidity Funds Institutional TempFund | 357 | 357 | ||||
| 714 | ||||||
| Total Short-Term Investments | ||||||
| (Cost $2,575,714) | 2,575,714 | |||||
| TOTAL INVESTMENTS - 100.09% | ||||||
| (Cost $22,209,053) | 24,298,719 | |||||
| OTHER ASSETS & LIABILITIES, NET - (0.09%) | (21,797 | ) | ||||
| NET ASSETS - 100.00% | $ | 24,276,922 | ||||
Notes to Schedule of Investments |
| (a) As of March 31, 2005, the Fund was diversified as a percentage of net assets as follows: |
| Financial Services | 21.66 | % | |
| Health Care | 13.56 | % | |
| Consumer Discretionary | 13.27 | % | |
| Materials & Processing | 12.45 | % | |
| Utilities | 11.53 | % | |
| Short-Term Investments | 10.61 | % | |
| Consumer Staples | 7.11 | % | |
| Integrated Oils | 3.74 | % | |
| Technology | 2.91 | % | |
| Energy | 2.48 | % | |
| Producer Durables | 0.47 | % | |
| Autos & Transportation | 0.30 | % | |
| 100.09 | % | ||
| Other Assets & Liabilities, Net | (0.09 | %) | |
| 100.00 | % | ||
(b) Short-term securities represent either the stated coupon rate or the annualized effective yield on the date of purchase for discounted securities. |
| See Notes to Financial Statements |
C-27 |
PACIFIC FUNDS |
| Shares | Value | |||||
|---|---|---|---|---|---|---|
| COMMON STOCKS - 97.63% | ||||||
| Consumer Discretionary - 8.87% | ||||||
| Hilton Hotels Corp | 26,880 | $ | 600,768 | |||
| Lodgian Inc * | 1,200 | 12,300 | ||||
| Starwood Hotels & Resorts Worldwide Inc | 10,325 | 619,810 | ||||
| 1,232,878 | ||||||
| Financial Services - 87.49% | ||||||
| Acadia Realty Trust | 8,420 | 135,394 | ||||
| AMB Property Corp | 10,945 | 413,721 | ||||
| AMLI Residential Properties Trust | 800 | 21,912 | ||||
| Apartment Investment & Management Co ‘A’ | 2,265 | 84,258 | ||||
| Archstone-Smith Trust | 19,415 | 662,246 | ||||
| Arden Realty Inc | 12,640 | 427,864 | ||||
| AvalonBay Communities Inc | 10,215 | 683,281 | ||||
| Boston Properties Inc | 10,980 | 661,325 | ||||
| Brandywine Realty Trust | 6,175 | 175,370 | ||||
| BRE Properties Inc ‘A’ | 4,590 | 162,027 | ||||
| Brookfield Properties Corp (Canada) | 18,865 | 726,302 | ||||
| Capital Automotive REIT | 1,280 | 42,394 | ||||
| Catellus Development Corp | 10,720 | 285,688 | ||||
| Correctional Properties Trust | 655 | 16,539 | ||||
| Developers Diversified Realty Corp | 400 | 15,900 | ||||
| Equity Lifestyle Properties Inc | 5,435 | 191,584 | ||||
| Equity Office Properties Trust | 11,160 | 336,251 | ||||
| Equity Residential | 8,990 | 289,568 | ||||
| Essex Property Trust Inc | 3,890 | 268,177 | ||||
| Federal Realty Investment Trust | 9,720 | 469,962 | ||||
| Gables Residential Trust | 3,225 | 107,392 | ||||
| General Growth Properties Inc | 5,195 | 177,149 | ||||
| Health Care Property Investors Inc | 2,620 | 61,491 | ||||
| Heritage Property Investment Trust Inc | 3,750 | 111,300 | ||||
| Highwoods Properties Inc | 1,400 | 37,548 | ||||
| Host Marriott Corp | 19,790 | 327,722 | ||||
| Innkeepers USA Trust | 3,425 | 44,217 | ||||
| Kilroy Realty Corp | 100 | 4,091 | ||||
| Mack-Cali Realty Corp | 7,195 | 304,708 | ||||
| MeriStar Hospitality Corp * | 8,240 | 57,680 | ||||
| Omega Healthcare Investors Inc | 8,375 | 91,958 | ||||
| Pan Pacific Retail Properties Inc | 355 | 20,146 | ||||
| Post Properties Inc | 9,025 | 280,136 | ||||
| Prentiss Properties Trust | 200 | 6,832 | ||||
| ProLogis | 4,500 | 166,950 | ||||
| PS Business Parks Inc CA | 4,090 | 164,827 | ||||
| Public Storage Inc | 8,210 | 467,477 | ||||
| Reckson Associates Realty Corp | 6,560 | 201,392 | ||||
| Regency Centers Corp | 8,895 | 423,669 | ||||
| Senior Housing Properties Trust | 10,245 | 170,887 | ||||
| Shurgard Storage Centers Inc ‘A’ | 7,255 | 297,310 | ||||
| Simon Property Group Inc | 20,055 | 1,214,932 | ||||
| SL Green Realty Corp | 4,380 | 246,244 | ||||
| Spirit Finance Corp * | 4,935 | 53,594 | ||||
| Sunstone Hotel Investors Inc | 1,135 | 24,346 | ||||
| Taubman Centers Inc | 5,720 | 158,673 | ||||
| The Macerich Co | 8,025 | 427,572 | ||||
| Trizec Properties Inc | 765 | 14,535 | ||||
| Vornado Realty Trust | 6,190 | 428,781 | ||||
| 12,163,322 | ||||||
| Materials & Processing - 1.27% | ||||||
| Forest City Enterprises Inc ‘A’ | 2,765 | 176,407 | ||||
| Total Common Stocks | ||||||
| (Cost $13,917,705) | 13,572,607 | |||||
| SHORT-TERM INVESTMENT - 2.51% | ||||||
| Money Market Fund - 2.51% | ||||||
| BlackRock Liquidity Funds Institutional TempFund | 349,236 | 349,236 | ||||
| Total Short-Term Investment | ||||||
| (Cost $349,236) | 349,236 | |||||
| TOTAL INVESTMENTS - 100.14% | ||||||
| (Cost $14,266,941) | 13,921,843 | |||||
| OTHER ASSETS & LIABILITIES, NET - (0.14%) | (18,924 | ) | ||||
| NET ASSETS - 100.00% | $ | 13,902,919 | ||||
Notes to Schedule of Investments |
| (a) As of March 31, 2005, the Fund was diversified as a percentage of net assets as follows: |
| Financial Services | 87.49 | % | ||
| Consumer Discretionary | 8.87 | % | ||
| Short-Term Investment | 2.51 | % | ||
| Materials & Processing | 1.27 | % | ||
| 100.14 | % | |||
| Other Assets & Liabilities, Net | (0.14 | %) | ||
| 100.00 | % | |||
| See Notes to Financial Statements | See explanation of symbols and terms on C-30 |
C-28 |
PACIFIC FUNDS |
| Shares | Value | |||||
|---|---|---|---|---|---|---|
| COMMON STOCKS - 99.15% | ||||||
| Autos & Transportation - 2.38% | ||||||
| C.H. Robinson Worldwide Inc | 10,525 | $ | 542,353 | |||
| Expeditors International of Washington Inc | 7,200 | 385,560 | ||||
| 927,913 | ||||||
| Consumer Discretionary - 41.13% | ||||||
| Activision Inc * | 19,333 | 286,128 | ||||
| Amazon.com Inc * | 5,600 | 191,912 | ||||
| Career Education Corp * | 5,400 | 185,004 | ||||
| Chico’s FAS Inc * | 16,820 | 475,333 | ||||
| ChoicePoint Inc * | 12,525 | 502,378 | ||||
| Coach Inc * | 7,055 | 399,525 | ||||
| DreamWorks Animation SKG Inc ‘A’ * | 5,700 | 232,047 | ||||
| Electronic Arts Inc * | 4,575 | 236,893 | ||||
| Fastenal Co | 3,200 | 176,992 | ||||
| Fisher Scientific International Inc * | 4,810 | 273,785 | ||||
| Getty Images Inc * | 11,425 | 812,432 | ||||
| Harman International Industries Inc | 2,145 | 189,747 | ||||
| International Game Technology | 25,650 | 683,829 | ||||
| International Speedway Corp ‘A’ | 3,700 | 200,725 | ||||
| Iron Mountain Inc * | 6,512 | 187,806 | ||||
| ITT Educational Services Inc * | 3,850 | 186,725 | ||||
| Kerzner International Ltd * (Bahamas) | 3,075 | 188,282 | ||||
| Lamar Advertising Co ‘A’ * | 14,300 | 576,147 | ||||
| Laureate Education Inc * | 8,575 | 366,924 | ||||
| Mohawk Industries Inc * | 3,200 | 269,760 | ||||
| Monster Worldwide Inc * | 6,700 | 187,935 | ||||
| Overstock.com Inc * | 3,400 | 146,166 | ||||
| P.F. Chang’s China Bistro Inc * | 10,880 | 650,624 | ||||
| Penn National Gaming Inc * | 19,800 | 581,724 | ||||
| PETsMART Inc | 14,485 | 416,444 | ||||
| Pixar * | 2,200 | 214,610 | ||||
| Royal Caribbean Cruises Ltd (Liberia) | 21,570 | 963,963 | ||||
| SCP Pool Corp | 13,000 | 414,180 | ||||
| Sears Holdings Corp * | 4,150 | 552,656 | ||||
| Shanda Interactive Entertainment Ltd ADR * (China) | 11,400 | 344,280 | ||||
| Sonic Corp * | 9,275 | 309,785 | ||||
| Station Casinos Inc | 18,475 | 1,247,986 | ||||
| Strayer Education Inc | 5,075 | 575,099 | ||||
| The Cheesecake Factory Inc * | 9,350 | 331,458 | ||||
| The Corporate Executive Board Co | 16,575 | 1,059,971 | ||||
| Univision Communications Inc ‘A’ * | 13,850 | 383,507 | ||||
| Urban Outfitters Inc * | 9,200 | 441,324 | ||||
| Wynn Resorts Ltd * | 8,720 | 590,693 | ||||
| 16,034,779 | ||||||
| Consumer Staples - 0.53% | ||||||
| Whole Foods Market Inc | 2,000 | 204,260 | ||||
| Energy - 1.81% | ||||||
| Peabody Energy Corp | 8,000 | 370,880 | ||||
| XTO Energy Inc | 10,233 | 336,052 | ||||
| 706,932 | ||||||
| Financial Services - 10.03% | ||||||
| Ameritrade Holding Corp * | 17,350 | 177,144 | ||||
| Assurant Inc | 9,139 | 307,984 | ||||
| Calamos Asset Management Inc ‘A’ | 16,700 | 449,564 | ||||
| Chicago Mercantile Exchange Holdings Inc | 2,850 | 552,986 | ||||
| Global Payments Inc | 6,325 | 407,899 | ||||
| Interactive Data Corp * | 9,400 | 195,050 | ||||
| Legg Mason Inc | 7,530 | 588,394 | ||||
| Moody’s Corp | 4,500 | 363,870 | ||||
| Plum Creek Timber Co Inc | 8,100 | 289,170 | ||||
| White Mountains Insurance Group Ltd | 950 | 578,075 | ||||
| 3,910,136 | ||||||
| Health Care - 13.52% | ||||||
| C.R. Bard Inc | 4,400 | 299,552 | ||||
| Dade Behring Holdings Inc * | 9,175 | 540,683 | ||||
| Gen-Probe Inc * | 12,725 | 567,026 | ||||
| Genzyme Corp * | 7,025 | 402,111 | ||||
| IDEXX Laboratories Inc * | 3,375 | 182,790 | ||||
| INAMED Corp * | 9,450 | 660,366 | ||||
| Kinetic Concepts Inc * | 7,302 | 435,564 | ||||
| Patterson Cos Inc * | 13,400 | 669,330 | ||||
| Stericycle Inc * | 12,700 | 561,340 | ||||
| The Cooper Cos Inc | 6,100 | 444,690 | ||||
| VCA Antech Inc * | 25,100 | 507,773 | ||||
| 5,271,225 | ||||||
| Integrated Oils - 3.07% | ||||||
| Ultra Petroleum Corp * | 23,570 | 1,197,356 | ||||
| Materials & Processing - 4.97% | ||||||
| Cameco Corp (Canada) | 15,600 | 690,144 | ||||
| Monsanto Co | 4,020 | 259,290 | ||||
| Rinker Group Ltd ADR (Australia) | 7,196 | 602,953 | ||||
| Sealed Air Corp * | 3,790 | 196,852 | ||||
| The St. Joe Co | 2,800 | 188,440 | ||||
| 1,937,679 | ||||||
| Multi-Industry - 1.60% | ||||||
| Brascan Corp ‘A’ (Canada) | 16,542 | 624,460 | ||||
| Producer Durables - 3.44% | ||||||
| Crown Castle International Corp * | 41,762 | 670,698 | ||||
| Graco Inc | 5,400 | 217,944 | ||||
| NVR Inc * | 268 | 210,380 | ||||
| Rockwell Collins Inc | 5,100 | 242,709 | ||||
| 1,341,731 | ||||||
| Technology - 13.20% | ||||||
| Adobe Systems Inc | 9,115 | 612,255 | ||||
| Akamai Technologies Inc * | 18,600 | 236,778 | ||||
| Apple Computer Inc * | 9,600 | 400,032 | ||||
| Autodesk Inc | 9,200 | 273,792 | ||||
| Cognizant Technology Solutions Corp ‘A’ * | 9,350 | 431,970 | ||||
| Dolby Laboratories Inc ‘A’ * | 12,699 | 298,426 | ||||
| FLIR Systems Inc * | 6,100 | 184,830 | ||||
| Juniper Networks Inc * | 10,925 | 241,005 | ||||
| Marvell Technology Group Ltd* (Bermuda) | 16,675 | 639,319 | ||||
| Mercury Interactive Corp * | 8,075 | 382,594 | ||||
| Network Appliance Inc * | 11,775 | 325,697 | ||||
| Red Hat Inc * | 26,700 | 291,297 | ||||
| salesforce.com inc * | 25,100 | 376,249 | ||||
| Tessera Technologies Inc * | 10,400 | 449,592 | ||||
| 5,143,836 | ||||||
| Utilities - 3.47% | ||||||
| NII Holdings Inc * | 11,345 | 652,337 | ||||
| NTL Inc * | 4,298 | 273,654 | ||||
| Questar Corp | 7,225 | 428,081 | ||||
| 1,354,072 | ||||||
| Total Common Stocks | ||||||
| (Cost $32,673,573) | 38,654,379 | |||||
| See Notes to Financial Statements | See explanation of symbols and terms on C-30 |
C-29 |
PACIFIC FUNDS |
| Principal Amount | Value | |||||
| SHORT-TERM INVESTMENTS - 1.21% | ||||||
| U.S. Government Agency Issue - 1.21% | ||||||
| Freddie Mac | ||||||
| 2.540% due 04/01/05 | $ | 471,000 | $ | 471,000 | ||
| Shares | ||||||
|---|---|---|---|---|---|---|
| Money Market Fund - 0.00% | ||||||
| BlackRock Liquidity Funds Institutional TempCash | 244 | 244 | ||||
| Total Short-Term Investments | ||||||
| (Cost $471,244) | 471,244 | |||||
| TOTAL INVESTMENTS - 100.36% | ||||||
| (Cost $33,144,817) | 39,125,623 | |||||
| OTHER ASSETS & LIABILITIES, NET - (0.36%) | (140,276 | ) | ||||
| NET ASSETS - 100.00% | $ | 38,985,347 | ||||
Notes to Schedule of Investments |
| (a) As of March 31, 2005, the Fund was diversified as a percentage of net assets as follows: |
| Consumer Discretionary | 41.13 | % | |
| Health Care | 13.52 | % | |
| Technology | 13.20 | % | |
| Financial Services | 10.03 | % | |
| Materials & Processing | 4.97 | % | |
| Utilities | 3.47 | % | |
| Producer Durables | 3.44 | % | |
| Integrated Oils | 3.07 | % | |
| Autos & Transportation | 2.38 | % | |
| Energy | 1.81 | % | |
| Multi-Industry | 1.60 | % | |
| Short-Term Investments | 1.21 | % | |
| Consumer Staples | 0.53 | % | |
| 100.36 | % | ||
| Other Assets and Liabilities, Net | (0.36 | %) | |
| 100.00 | % | ||
(b) Short-term securities represent either the stated coupon rate or the annualized effective yield on the date of purchase for discounted securities. |
| Explanation of Symbols for Schedules of Investments | |
| * | Non-income producing securities. |
| + | Securities were fair valued under procedures established by the Board of Trustees. |
| ~ | Securities are not registered under the Securities Act of 1933 (1933 Act). These securities may be sold to “qualified institutional buyers” in transactions exempt from registration pursuant to Rule 144A of the 1933 Act. |
| # | Securities purchased on a when-issued or delayed-delivery basis. |
| ‡ | Securities were fully/partially segregated with the custodian to cover margin requirements for open futures contracts as of March 31, 2005. |
| “ | Pass-through securities backed by a pool of mortgages or other loans on which principal payments are periodically made. Therefore, the effective maturity is shorter than the stated maturity. |
| ^ | Securities with their principal amount adjusted for inflation. |
| § | Variable rate securities. The rate listed is as of March 31, 2005. |
| ² | A portion of this security is subject to call/put options written. |
| Explanation of Terms for Schedules of Investments | |
Currency Abbreviations: | |
| BRL | Brazilian Real |
| CHF | Swiss Franc |
| CNY | Chinese Yuan |
| EUR | Eurodollar |
| GBP | British Pound |
| JPY | Japanese Yen |
| KRW | Korean Won |
Other Abbreviations: | |
| ADR | American Depositary Receipt |
| CBOE | Chicago Board of Options Exchange |
| CBOT | Chicago Board of Trade |
| CME | Chicago Mercantile Exchange |
| GDR | Global Depositary Receipt |
| LIBOR | London Interbank Offered Rate |
| ‘NY’ | New York Shares |
| OTC | Over the Counter |
| See Notes to Financial Statements |
C-30 |
[THIS PAGE INTENTIONALLY LEFT BLANK] |
|
| PF Portfolio Optimization Model A | PF Portfolio Optimization Model B | PF Portfolio Optimization Model C | PF Portfolio Optimization Model D | PF Portfolio Optimization Model E | PF AIM Blue Chip Fund | PF AIM Aggressive Growth Fund | |||||||||||||||
|---|---|---|---|---|---|---|---|---|---|---|---|---|---|---|---|---|---|---|---|---|---|
| ASSETS | |||||||||||||||||||||
| Investments, at cost | $ | 18,245,945 | $ | 40,614,845 | $ | 121,504,556 | $ | 106,672,377 | $ | 39,678,737 | $ | 44,250,679 | $ | 7,757,355 | |||||||
| Investments, at value | $ | 18,341,997 | $ | 41,432,095 | $ | 124,903,512 | $ | 110,628,076 | $ | 41,734,222 | $ | 47,150,170 | $ | 8,109,760 | |||||||
| Cash | 42,791 | 432,955 | — | 323,372 | 66,728 | 654 | 64 | ||||||||||||||
| Receivables: | |||||||||||||||||||||
| Dividends and interest | 17,798 | 26,404 | 54,376 | 29,359 | 5,357 | 44,672 | 2,787 | ||||||||||||||
| Fund shares sold | 276,985 | 337,865 | 887,486 | 781,445 | 197,945 | 10,904 | 8,100 | ||||||||||||||
| Securities sold | — | — | 98,104 | — | — | 29,609 | 136,040 | ||||||||||||||
| Due from adviser | 22,377 | 39,959 | 86,616 | 80,063 | 40,466 | 22,560 | 28,284 | ||||||||||||||
| Prepaid expenses and other assets | 2,007 | 4,352 | 9,366 | 8,450 | 4,467 | 4,610 | 1,501 | ||||||||||||||
| Total Assets | 18,703,955 | 42,273,630 | 126,039,460 | 111,850,765 | 42,049,185 | 47,263,179 | 8,286,536 | ||||||||||||||
| LIABILITIES | |||||||||||||||||||||
| Payables: | |||||||||||||||||||||
| Fund shares redeemed | 80 | 22,612 | 40,837 | 272,063 | 57,046 | 16,700 | 10 | ||||||||||||||
| Securities purchased | 60,527 | 459,223 | 53,441 | 351,928 | 71,893 | 61,088 | 263,037 | ||||||||||||||
| Due to custodian | — | — | 98,104 | — | — | — | — | ||||||||||||||
| Variation margin | — | — | — | — | — | 375 | — | ||||||||||||||
| Accrued advisory fees | — | — | — | — | — | 37,949 | 6,801 | ||||||||||||||
| Accrued administration fees | 5,369 | 12,036 | 35,999 | 31,586 | 12,488 | 13,981 | 2,381 | ||||||||||||||
| Accrued trustees fees | 190 | 579 | 856 | 896 | 665 | 464 | 244 | ||||||||||||||
| Accrued deferred trustee compensation | 582 | 1,378 | 3,629 | 3,298 | 1,503 | 19,020 | 5,752 | ||||||||||||||
Accrued distribution and service | 4,280 | 9,030 | 29,508 | 27,319 | 10,260 | 20,753 | 3,765 | ||||||||||||||
| Accrued other | 13,192 | 31,364 | 70,409 | 64,800 | 32,328 | 39,394 | 17,464 | ||||||||||||||
| Outstanding options written, at value (premiums received $12,946 and $5,285, respectively) | — | — | — | — | — | 13,160 | 2,933 | ||||||||||||||
| Total Liabilities | 84,220 | 536,222 | 332,783 | 751,890 | 186,183 | 222,884 | 302,387 | ||||||||||||||
| NET ASSETS | $ | 18,619,735 | $ | 41,737,408 | $ | 125,706,677 | $ | 111,098,875 | $ | 41,863,002 | $ | 47,040,295 | $ | 7,984,149 | |||||||
See Notes to Financial Statements |
D-1 |
PACIFIC FUNDS |
| PF Portfolio Optimization Model A | PF Portfolio Optimization Model B | PF Portfolio Optimization Model C | PF Portfolio Optimization Model D | PF Portfolio Optimization Model E | PF AIM Blue Chip Fund | PF AIM Aggressive Growth Fund | ||||||||||||||||
|---|---|---|---|---|---|---|---|---|---|---|---|---|---|---|---|---|---|---|---|---|---|---|
| NET ASSETS CONSIST OF: | ||||||||||||||||||||||
| Paid-in capital | $ | 18,492,369 | $ | 40,922,738 | $ | 122,041,193 | $ | 106,727,609 | $ | 39,722,488 | $ | 47,312,514 | $ | 6,531,084 | ||||||||
| Undistributed/accumulated net investment income (loss) | 29,524 | 40,113 | 37,764 | (2,742 | ) | (1,195 | ) | (19,427 | ) | (5,752 | ) | |||||||||||
| Undistributed/accumulated net realized gain (loss) | 1,790 | (42,693 | ) | 228,764 | 418,309 | 86,224 | (3,148,726 | ) | 1,104,060 | |||||||||||||
| Net unrealized appreciation on investments and assets and liabilities in foreign currencies | 96,052 | 817,250 | 3,398,956 | 3,955,699 | 2,055,485 | 2,895,934 | 354,757 | |||||||||||||||
| NET ASSETS | $ | 18,619,735 | $ | 41,737,408 | $ | 125,706,677 | $ | 111,098,875 | $ | 41,863,002 | $ | 47,040,295 | $ | 7,984,149 | ||||||||
| Class A Shares: | ||||||||||||||||||||||
| Net Assets | $ | 8,261,712 | $ | 19,663,517 | $ | 53,782,826 | $ | 43,986,162 | $ | 18,243,756 | $ | 45,147,090 | $ | 7,116,388 | ||||||||
| Shares of beneficial interest outstanding | 811,882 | 1,904,110 | 5,103,902 | 4,126,386 | 1,696,457 | 4,450,661 | 604,246 | |||||||||||||||
| Net Asset Value* | $ | 10.18 | $ | 10.33 | $ | 10.54 | $ | 10.66 | $ | 10.75 | $ | 10.14 | $ | 11.78 | ||||||||
| Sales Charge - Maximum is 5.50% of offering price | 0.59 | 0.60 | 0.61 | 0.62 | 0.63 | 0.59 | 0.69 | |||||||||||||||
| Maximum offering price per share | $ | 10.77 | $ | 10.93 | $ | 11.15 | $ | 11.28 | $ | 11.38 | $ | 10.73 | $ | 12.47 | ||||||||
| Class B Shares: | ||||||||||||||||||||||
| Net Assets | $ | 1,449,976 | $ | 6,698,819 | $ | 19,413,643 | $ | 18,953,525 | $ | 6,109,689 | $ | 525,893 | $ | 283,242 | ||||||||
| Shares of beneficial interest outstanding | 142,926 | 650,985 | 1,848,658 | 1,783,097 | 569,731 | 52,699 | 24,431 | |||||||||||||||
| Net Asset Value and offering price per share* | $ | 10.14 | $ | 10.29 | $ | 10.50 | $ | 10.63 | $ | 10.72 | $ | 9.98 | $ | 11.59 | ||||||||
| Class C Shares: | ||||||||||||||||||||||
| Net Assets | $ | 8,908,047 | $ | 15,375,072 | $ | 52,510,208 | $ | 48,159,188 | $ | 17,509,557 | $ | 1,367,312 | $ | 584,519 | ||||||||
| Shares of beneficial interest outstanding | 879,062 | 1,493,796 | 5,005,261 | 4,539,002 | 1,634,036 | 137,177 | 50,357 | |||||||||||||||
| Net Asset Value and offering price per share* | $ | 10.13 | $ | 10.29 | $ | 10.49 | $ | 10.61 | $ | 10.72 | $ | 9.97 | $ | 11.61 | ||||||||
| * | Redemption price per share is equal to the Net Asset Value per share less any applicable contingent deferred sales charge. |
See Notes to Financial Statements |
D-2 |
PACIFIC FUNDS |
| PF Goldman Sachs Short Duration Bond Fund | PF Janus Growth LT Fund | PF Lazard Mid-Cap Value Fund | PF Lazard International Value Fund | PF MFS International Large-Cap Fund | PF PIMCO Inflation Managed Fund | PF PIMCO Managed Bond Fund | |||||||||||||||
|---|---|---|---|---|---|---|---|---|---|---|---|---|---|---|---|---|---|---|---|---|---|
| ASSETS | |||||||||||||||||||||
| Investments, at cost | $ | 36,909,100 | $ | 17,646,700 | $ | 26,254,355 | $ | 39,315,470 | $ | 32,017,734 | $ | 48,973,981 | $ | 51,532,042 | |||||||
| Investments, at value | $ | 36,611,381 | $ | 20,445,571 | $ | 26,206,395 | $ | 47,124,577 | $ | 36,450,684 | $ | 49,319,803 | $ | 51,579,432 | |||||||
| Cash (1) | 55,500 | — | — | — | — | — | — | ||||||||||||||
| Foreign currency held, at value (2) | — | — | — | — | 58,475 | 44,208 | 106,188 | ||||||||||||||
| Receivables: | |||||||||||||||||||||
| Dividends and interest | 200,290 | 24,392 | 17,135 | 208,301 | 111,660 | 306,771 | 163,636 | ||||||||||||||
| Fund shares sold | 149,941 | 27,535 | 65,262 | 132,895 | 133,645 | 77,346 | 134,590 | ||||||||||||||
| Securities sold | 3,650 | 118,812 | 157,583 | 5,111,533 | 2,659,589 | — | 156,355 | ||||||||||||||
| Securities sold short | — | — | — | — | — | 594,668 | 1,964,702 | ||||||||||||||
| Variation margin | 1,035 | — | — | — | — | 30,786 | 143,692 | ||||||||||||||
| Due from adviser | 17,314 | 18,806 | — | 25,188 | 32,979 | 30,191 | 32,872 | ||||||||||||||
| Forward foreign currency contracts appreciation | — | 838 | — | — | — | 9,437 | 92,514 | ||||||||||||||
| Prepaid expenses and other assets | 3,469 | 2,169 | 37,872 | 4,394 | 3,320 | 4,106 | 4,946 | ||||||||||||||
| Swap appreciation | — | — | — | — | — | 130,413 | — | ||||||||||||||
| Total Assets | 37,042,580 | 20,638,123 | 26,484,247 | 52,606,888 | 39,450,352 | 50,547,729 | 54,378,927 | ||||||||||||||
| LIABILITIES | |||||||||||||||||||||
| Payables: | |||||||||||||||||||||
| Fund shares redeemed | 14,727 | 4,614 | — | 13,633 | 9,523 | 53,325 | 25,597 | ||||||||||||||
| Securities purchased | 1,030,217 | 121,988 | 856,995 | — | 137,466 | 6,347,191 | 5,650,850 | ||||||||||||||
| Securities sold short, at value (proceeds $594,668 and $1,964,702, respectively) | — | — | — | — | — | 590,930 | 1,972,892 | ||||||||||||||
| Swap agreements | — | — | — | — | — | — | 25,827 | ||||||||||||||
| Income distributions | 25 | — | — | — | — | — | 2,843 | ||||||||||||||
| Accrued advisory fees | 17,411 | 12,672 | 17,856 | 36,797 | 33,713 | 21,352 | 22,558 | ||||||||||||||
| Accrued administration fees | 10,156 | 5,913 | 7,352 | 15,152 | 11,238 | 12,456 | 13,159 | ||||||||||||||
| Accrued trustees fees | 538 | 249 | 20 | 408 | 314 | 451 | 870 | ||||||||||||||
| Accrued deferred trustee compensation | 1,344 | 7,876 | 87 | 10,807 | 5,692 | 5,548 | 20,006 | ||||||||||||||
| Accrued distribution and service (12b-1) fees | 14,777 | 8,797 | 10,537 | 22,353 | 16,483 | 20,818 | 20,307 | ||||||||||||||
| Accrued other | 28,420 | 21,024 | 18,275 | 45,747 | 56,963 | 136,081 | 329,168 | ||||||||||||||
| Due to adviser | — | — | 12,344 | — | — | — | — | ||||||||||||||
| Forward foreign currency contracts depreciation | — | 25,349 | — | — | — | 7,841 | 16,756 | ||||||||||||||
| Outstanding options written, at value (premiums received $8,099 and $94,249, respectively) | — | — | — | — | — | 4,828 | 15,174 | ||||||||||||||
| Swap depreciation | — | — | — | — | — | — | 228,886 | ||||||||||||||
| Total Liabilities | 1,117,615 | 208,482 | 923,466 | 144,897 | 271,392 | 7,200,821 | 8,344,893 | ||||||||||||||
| NET ASSETS | $ | 35,924,965 | $ | 20,429,641 | $ | 25,560,781 | $ | 52,461,991 | $ | 39,178,960 | $ | 43,346,908 | $ | 46,034,034 | |||||||
| (1) | Includes margin deposits of $25,000 segregated for futures contracts in the PF Goldman Sachs Short Duration Bond Fund. |
| (2) | Foreign currency held at cost for the PF MFS International Large-Cap, PF PIMCO Inflation Managed, and PF PIMCO Managed Bond Fund were $54,360, $44,962, and $105,842, respectively. |
See Notes to Financial Statements |
D-3 |
PACIFIC FUNDS |
| PF Goldman Sachs Short Duration Bond Fund | PF Janus Growth LT Fund | PF Lazard Mid-Cap Value Fund | PF Lazard International Value Fund | PF MFS International Large-Cap Fund | PF PIMCO Inflation Managed Fund | PF PIMCO Managed Bond Fund | |||||||||||||||
|---|---|---|---|---|---|---|---|---|---|---|---|---|---|---|---|---|---|---|---|---|---|
| NET ASSETS CONSIST OF: | |||||||||||||||||||||
| Paid-in capital | $ | 36,354,540 | $ | 19,226,834 | $ | 25,486,759 | $ | 44,959,709 | $ | 35,003,850 | $ | 42,998,394 | $ | 46,403,776 | |||||||
| Undistributed/accumulated net investment income (loss) | 5,773 | 13,066 | 19,470 | 16,369 | (43,634 | ) | 82,018 | 237,751 | |||||||||||||
Undistributed/accumulated net | (155,577 | ) | (1,584,793 | ) | 102,512 | (320,899 | ) | (218,132 | ) | (217,824 | ) | (353,290 | ) | ||||||||
| Net unrealized appreciation (depreciation) on investments and assets and liabilities in foreign currencies | (279,771 | ) | 2,774,534 | (47,960 | ) | 7,806,812 | 4,436,876 | 484,320 | (254,203 | ) | |||||||||||
| NET ASSETS | $ | 35,924,965 | $ | 20,429,641 | $ | 25,560,781 | $ | 52,461,991 | $ | 39,178,960 | $ | 43,346,908 | $ | 46,034,034 | |||||||
| Class A Shares: | |||||||||||||||||||||
| Net Assets | $ | 35,333,453 | $ | 19,584,929 | $ | 25,454,199 | $ | 50,801,336 | $ | 38,194,969 | $ | 36,465,281 | $ | 42,546,355 | |||||||
| Shares of beneficial interest outstanding | 3,587,081 | 1,840,550 | 2,570,750 | 3,843,533 | 2,977,059 | 3,469,254 | 4,242,185 | ||||||||||||||
| Net Asset Value* | $ | 9.85 | $ | 10.64 | $ | 9.90 | $ | 13.22 | $ | 12.83 | $ | 10.51 | $ | 10.03 | |||||||
| Sales Charge - Maximum is 5.50% of offering price | 0.57 | 0.62 | 0.58 | 0.77 | 0.75 | 0.61 | 0.58 | ||||||||||||||
| Maximum offering price per share | $ | 10.42 | $ | 11.26 | $ | 10.48 | $ | 13.99 | $ | 13.58 | $ | 11.12 | $ | 10.61 | |||||||
| Class B Shares: | |||||||||||||||||||||
| Net Assets | $ | 12,924 | $ | 372,609 | $ | 33,106 | $ | 449,043 | $ | 390,627 | $ | 1,199,467 | $ | 1,134,877 | |||||||
| Shares of beneficial interest outstanding | 1,312 | 35,516 | 3,348 | 34,540 | 30,991 | 114,734 | 113,407 | ||||||||||||||
| Net Asset Value and offering price per share* | $ | 9.85 | $ | 10.49 | $ | 9.89 | $ | 13.00 | $ | 12.60 | $ | 10.45 | $ | 10.01 | |||||||
| Class C Shares: | |||||||||||||||||||||
| Net Assets | $ | 578,588 | $ | 472,103 | $ | 73,476 | $ | 1,211,612 | $ | 593,364 | $ | 5,682,160 | $ | 2,352,802 | |||||||
| Shares of beneficial interest outstanding | 58,865 | 45,140 | 7,430 | 93,232 | 47,006 | 543,594 | 234,780 | ||||||||||||||
| Net Asset Value and offering price per share* | $ | 9.83 | $ | 10.46 | $ | 9.89 | $ | 13.00 | $ | 12.62 | $ | 10.45 | $ | 10.02 | |||||||
| * | Redemption price per share is equal to the Net Asset Value per share less any applicable contingent deferred sales charge. |
See Notes to Financial Statements |
D-4 |
| PACIFIC FUNDS STATEMENTS OF ASSETS AND LIABILITIES (Continued) MARCH 31, 2005 |
| PF Pacific Life Money Market Fund | PF Salomon Brothers Large-Cap Value Fund | PF Van Kampen Comstock Fund | PF Van Kampen Real Estate Fund | PF Van Kampen Mid-Cap Growth Fund | |||||||||||
|---|---|---|---|---|---|---|---|---|---|---|---|---|---|---|---|
| ASSETS | |||||||||||||||
| Investments, at cost | $ | 26,303,696 | $ | 46,300,416 | $ | 22,209,053 | $ | 14,266,941 | $ | 33,144,817 | |||||
| Investments, at value | $ | 26,303,696 | $ | 50,177,385 | $ | 24,298,719 | $ | 13,921,843 | $ | 39,125,623 | |||||
| Cash | — | 2,376,333 | — | — | — | ||||||||||
| Receivables: | |||||||||||||||
| Dividends and interest | 22,105 | 98,179 | 43,800 | 56,126 | 4,154 | ||||||||||
| Fund shares sold | 29,358 | 73,386 | 41,034 | 16,938 | 2,207 | ||||||||||
| Securities sold | — | 664,905 | — | 11,697 | 210,087 | ||||||||||
| Due from adviser | 28,621 | 32,592 | 22,646 | — | 6,781 | ||||||||||
| Prepaid expenses and other assets | 3,653 | 5,489 | 2,763 | 35,833 | 3,997 | ||||||||||
| Total Assets | 26,387,433 | 53,428,269 | 24,408,962 | 14,042,437 | 39,352,849 | ||||||||||
| LIABILITIES | |||||||||||||||
| Payables: | |||||||||||||||
| Fund shares redeemed | 52,414 | 24,671 | 40,169 | 10 | 5,429 | ||||||||||
| Securities purchased | — | 797,530 | 23,020 | 78,370 | 256,978 | ||||||||||
| Income distributions | 107 | — | — | 7 | — | ||||||||||
| Accrued advisory fees | 8,099 | 37,179 | 19,089 | 12,993 | 30,170 | ||||||||||
| Accrued administration fees | 7,087 | 15,309 | 7,033 | 4,134 | 11,733 | ||||||||||
| Accrued trustees fees | 707 | 547 | 429 | 12 | 377 | ||||||||||
| Accrued deferred truste compensation | 10,747 | 13,438 | 6,796 | 53 | 9,036 | ||||||||||
| Accrued distribution and service (12b-1) fees | 9,563 | 22,741 | 10,558 | 5,921 | 17,662 | ||||||||||
| Accrued other | 27,391 | 44,281 | 24,946 | 9,689 | 36,117 | ||||||||||
| Due to adviser | — | — | — | 28,329 | — | ||||||||||
| Total Liabilities | 116,115 | 955,696 | 132,040 | 139,518 | 367,502 | ||||||||||
| NET ASSETS | $ | 26,271,318 | $ | 52,472,573 | $ | 24,276,922 | $ | 13,902,919 | $ | 38,985,347 | |||||
| See Notes to Financial Statements |
D-5 |
PACIFIC FUNDS |
| PF Pacific Life Money Market Fund | PF Salomon Brothers Large-Cap Value Fund | PF Van Kampen Comstock Fund | PF Van Kampen Real Estate Fund | PF Van Kampen Mid-Cap Growth Fund | |||||||||||
|---|---|---|---|---|---|---|---|---|---|---|---|---|---|---|---|
| NET ASSETS CONSIST OF: | |||||||||||||||
| Paid-in capital | $ | 26,262,861 | $ | 49,445,148 | $ | 21,432,296 | $ | 14,193,225 | $ | 36,128,332 | |||||
| Undistributed/accumulated net investment income (loss) | 8,448 | 23,592 | 29,817 | 56,788 | (9,036 | ) | |||||||||
| Undistributed/accumulated net realized gain (loss) | 9 | (873,136 | ) | 725,143 | (1,996 | ) | (3,114,755 | ) | |||||||
| Net unrealized appreciation (depreciation) on investments and assets and liabilities in foreign currencies | |||||||||||||||
| — | 3,876,969 | 2,089,666 | (345,098 | ) | 5,980,806 | ||||||||||
| NET ASSETS | $ | 26,271,318 | $ | 52,472,573 | $ | 24,276,922 | $ | 13,902,919 | $ | 38,985,347 | |||||
| Class A Shares: | |||||||||||||||
| Net Assets | $ | 22,341,225 | $ | 50,430,380 | $ | 23,017,232 | $ | 13,853,470 | $ | 36,882,043 | |||||
| Shares of beneficial interest outstanding | 22,342,099 | 4,461,024 | 1,829,803 | 1,475,371 | 4,128,984 | ||||||||||
| Net Asset Value* | $ | 1.00 | $ | 11.30 | $ | 12.58 | $ | 9.39 | $ | 8.93 | |||||
| Sales Charge - Maximum is 5.50% of offering price | — | 0.66 | 0.73 | 0.55 | 0.52 | ||||||||||
| Maximum offering price per share | $ | 1.00 | $ | 11.96 | $ | 13.31 | $ | 9.94 | $ | 9.45 | |||||
| Class B Shares: | |||||||||||||||
| Net Assets | $ | 672,256 | $ | 504,043 | $ | 387,849 | $ | 17,400 | $ | 666,937 | |||||
| Shares of beneficial interest outstanding | 672,605 | 45,046 | 31,236 | 1,854 | 75,760 | ||||||||||
| Net Asset Value and offering price per share* | $ | 1.00 | $ | 11.19 | $ | 12.42 | $ | 9.39 | $ | 8.80 | |||||
| Class C Shares: | |||||||||||||||
| Net Assets | $ | 3,257,837 | $ | 1,538,150 | $ | 871,841 | $ | 32,049 | $ | 1,436,367 | |||||
| Shares of beneficial interest outstanding | 3,258,373 | 137,767 | 70,264 | 3,417 | 163,433 | ||||||||||
| Net Asset Value and offering price per share* | $ | 1.00 | $ | 11.16 | $ | 12.41 | $ | 9.38 | $ | 8.79 | |||||
| * | Redemption price per share is equal to the Net Asset Value per share less any applicable contingent deferred sales charge. |
See Notes to Financial Statements |
D-6 |
| PF Portfolio Optimization Model A | PF Portfolio Optimization Model B | PF Portfolio Optimization Model C | PF Portfolio Optimization Model D | PF Portfolio Optimization Model E | PF AIM Blue Chip Fund | PF AIM Aggressive Growth Fund | |||||||||||||||
|---|---|---|---|---|---|---|---|---|---|---|---|---|---|---|---|---|---|---|---|---|---|
| INVESTMENT INCOME | |||||||||||||||||||||
| Dividends, net of foreign taxes withheld (1) | $ | — | $ | — | $ | — | $ | — | $ | — | $ | 640,873 | $ | 48,263 | |||||||
| Dividends from mutual fund investments | 158,081 | 301,302 | 613,494 | 350,924 | 67,971 | — | — | ||||||||||||||
| Interest | 557 | 1,021 | 3,860 | 3,530 | 1,140 | 31,684 | 10,479 | ||||||||||||||
| Total Investment Income | 158,638 | 302,323 | 617,354 | 354,454 | 69,111 | 672,557 | 58,742 | ||||||||||||||
| EXPENSES | |||||||||||||||||||||
| Advisory fees | — | — | — | — | — | 351,269 | 99,543 | ||||||||||||||
| Administration fees | 43,016 | 100,816 | 262,588 | 237,087 | 103,642 | 129,415 | 34,840 | ||||||||||||||
| Support services expenses | 6,820 | 16,960 | 39,477 | 37,022 | 19,210 | 22,157 | 7,972 | ||||||||||||||
| Custodian fees and expenses | 28,271 | 29,122 | 36,624 | 35,768 | 26,739 | 42,924 | 63,580 | ||||||||||||||
| Shareholder reports | 4,153 | 10,527 | 24,817 | 22,917 | 11,296 | 13,900 | 4,948 | ||||||||||||||
| Distribution and service (12b-1) fees | |||||||||||||||||||||
| Class A | — | — | — | — | — | 176,192 | 46,025 | ||||||||||||||
| Class B | 4,536 | 22,883 | 59,374 | 63,422 | 21,051 | 5,291 | 2,741 | ||||||||||||||
| Class C | 31,660 | 55,137 | 168,342 | 143,899 | 64,722 | 12,082 | 4,751 | ||||||||||||||
| Transfer agency out-of-pocket expenses | 16,427 | 41,222 | 95,476 | 88,868 | 45,730 | 60,822 | 23,461 | ||||||||||||||
| Registration fees | 35,066 | 40,003 | 50,883 | 44,546 | 41,088 | 30,290 | 30,384 | ||||||||||||||
| Legal and audit fees | 9,864 | 25,085 | 58,210 | 54,594 | 27,941 | 18,914 | 7,533 | ||||||||||||||
| Trustees’ fees and expenses | 2,737 | 6,968 | 16,045 | 14,895 | 7,706 | 8,686 | 3,269 | ||||||||||||||
| Offering expenses | 73,527 | 73,829 | 74,628 | 74,576 | 73,920 | — | — | ||||||||||||||
| Other | 7,795 | 11,279 | 20,398 | 19,368 | 11,861 | 12,087 | 11,420 | ||||||||||||||
| Total Expenses | 263,872 | 433,831 | 906,862 | 836,962 | 454,906 | 884,029 | 340,467 | ||||||||||||||
| Adviser Expense Reimbursement | (227,677 | ) | (355,811 | ) | (679,146 | ) | (629,641 | ) | (369,133 | ) | (172,805 | ) | (142,612 | ) | |||||||
| Net Expenses | 36,195 | 78,020 | 227,716 | 207,321 | 85,773 | 711,224 | 197,855 | ||||||||||||||
| NET INVESTMENT INCOME (LOSS) | 122,443 | 224,303 | 389,638 | 147,133 | (16,662 | ) | (38,667 | ) | (139,113 | ) | |||||||||||
| NET REALIZED AND UNREALIZED GAIN (LOSS) | |||||||||||||||||||||
| Net realized gain (loss) on: | |||||||||||||||||||||
| Investment security, swap, and forward transactions (1) | (2,863 | ) | (55,499 | ) | 184,884 | 323,758 | 53,453 | (412,922 | ) | 1,797,957 | |||||||||||
| Futures contracts and written option transactions | — | — | — | — | — | 59,990 | — | ||||||||||||||
| Foreign currency transactions | — | — | — | — | — | 12 | — | ||||||||||||||
| Capital gain distributions from mutual fund investments | 104,824 | 257,062 | 599,801 | 504,852 | 181,336 | — | — | ||||||||||||||
| Net Realized Gain (Loss) | 101,961 | 201,563 | 784,685 | 828,610 | 234,789 | (352,920 | ) | 1,797,957 | |||||||||||||
| Net change in unrealized appreciation (depreciation) on: | |||||||||||||||||||||
| Investment securities, swaps and forwards (1) | 42,929 | 707,315 | 3,143,457 | 3,782,782 | 1,994,245 | 526,290 | (1,115,986 | ) | |||||||||||||
| Futures contracts and written options | — | — | — | — | — | (16,864 | ) | 2,352 | |||||||||||||
| Foreign currencies | — | — | — | — | — | (17 | ) | — | |||||||||||||
| Change in Net Unrealized Appreciation (Depreciation) | 42,929 | 707,315 | 3,143,457 | 3,782,782 | 1,994,245 | 509,409 | (1,113,634 | ) | |||||||||||||
| NET GAIN | 144,890 | 908,878 | 3,928,142 | 4,611,392 | 2,229,034 | 156,489 | 684,323 | ||||||||||||||
| NET INCREASE IN NET ASSETS RESULTING FROM OPERATIONS | $ | 267,333 | $ | 1,133,181 | $ | 4,317,780 | $ | 4,758,525 | $ | 2,212,372 | $ | 117,822 | $ | 545,210 | |||||||
(1) | Dividends were net of $640 foreign taxes withheld for the PF AIM Blue Chip Fund. No foreign capital gains tax was withheld on realized and change in unrealized capital gains for all of these funds. |
| See Notes to Financial Statements |
D-7 |
PACIFIC FUNDS |
| PF Goldman Sachs Short Duration Bond Fund | PF Janus Growth LT Fund | PF Lazard Mid-Cap Value Fund (1) | PF Lazard International Value Fund | PF MFS International Large-Cap Fund | PF PIMCO Inflation Managed Fund | PF PIMCO Managed Bond Fund | |||||||||||||||
|---|---|---|---|---|---|---|---|---|---|---|---|---|---|---|---|---|---|---|---|---|---|
| INVESTMENT INCOME | |||||||||||||||||||||
| Dividends, net of foreign taxes withheld (2) | $ | 27,169 | $ | 183,409 | $ | 54,981 | $ | 846,166 | $ | 457,506 | $ | 6,886 | $ | 20,771 | |||||||
| Interest | 568,287 | 20,007 | 3,007 | — | 18,394 | 1,077,549 | 984,182 | ||||||||||||||
| Total Investment Income | 595,456 | 203,416 | 57,988 | 846,166 | 475,900 | 1,084,435 | 1,004,953 | ||||||||||||||
| EXPENSES | |||||||||||||||||||||
| Advisory fees | 143,818 | 121,347 | 35,822 | 296,895 | 265,523 | 185,409 | 206,465 | ||||||||||||||
| Administration fees | 83,894 | 56,629 | 14,750 | 122,251 | 88,508 | 108,155 | 120,438 | ||||||||||||||
| Support services expenses | 15,786 | 10,380 | 3,698 | 20,262 | 14,799 | 19,326 | 25,557 | ||||||||||||||
| Custodian fees and expenses | 11,744 | 48,285 | 21,000 | 90,016 | 216,362 | 21,142 | 57,834 | ||||||||||||||
| Shareholder reports | 9,238 | �� | 7,160 | 2,726 | 13,744 | 23,177 | 12,806 | 16,873 | |||||||||||||
| Distribution and service (12b-1) fees | |||||||||||||||||||||
| Class A | 117,801 | 77,059 | 21,007 | 167,584 | 122,926 | 122,955 | 154,433 | ||||||||||||||
| Class B | 134 | 3,378 | 63 | 3,765 | 2,971 | 9,179 | 10,676 | ||||||||||||||
| Class C | 3,959 | 4,300 | 66 | 10,355 | 4,056 | 53,926 | 24,567 | ||||||||||||||
| Transfer agency out-of-pocket expenses | 36,982 | 28,936 | 7,664 | 57,300 | 39,188 | 51,447 | 69,046 | ||||||||||||||
| Registration fees | 33,603 | 30,855 | 1,762 | 33,416 | 32,467 | 35,897 | 33,325 | ||||||||||||||
| Legal and audit fees | 23,001 | 9,627 | 3,516 | 21,723 | 17,331 | 21,165 | 21,235 | ||||||||||||||
| Trustees’ fees and expenses | 6,181 | 4,328 | 1,278 | 8,929 | 6,364 | 8,313 | 8,670 | ||||||||||||||
| Offering expenses | 62,697 | — | 16,616 | — | — | — | — | ||||||||||||||
| Other | 14,049 | 12,945 | 4,789 | 15,612 | 16,380 | 11,658 | 31,423 | ||||||||||||||
| Total Expenses | 562,887 | 415,229 | 134,757 | 861,852 | 850,052 | 661,378 | 780,542 | ||||||||||||||
| Adviser Expense Reimbursement | (189,312 | ) | (136,338 | ) | (58,835 | ) | (226,073 | ) | (340,780 | ) | (150,852 | ) | (229,552 | ) | |||||||
| Net Expenses | 373,575 | 278,891 | 75,922 | 635,779 | 509,272 | 510,526 | 550,990 | ||||||||||||||
| NET INVESTMENT INCOME (LOSS) | 221,881 | (75,475 | ) | (17,934 | ) | 210,387 | (33,372 | ) | 573,909 | 453,963 | |||||||||||
| NET REALIZED AND UNREALIZED GAIN (LOSS) | |||||||||||||||||||||
| Net realized gain (loss) on: | |||||||||||||||||||||
| Investment security, swap, and forward transactions (2) | (111,019 | ) | 133,470 | 102,512 | 49,566 | (167,843 | ) | 312,916 | 177,325 | ||||||||||||
| Closed short positions | — | — | — | — | — | (16,094 | ) | 55,190 | |||||||||||||
| Futures contracts and written option transactions | (43,332 | ) | — | — | — | — | 85,600 | 522,548 | |||||||||||||
| Foreign currency transactions | — | (5,933 | ) | — | (124,309 | ) | (6,392 | ) | (3,440 | ) | 54,320 | ||||||||||
| Net Realized Gain (Loss) | (154,351 | ) | 127,537 | 102,512 | (74,743 | ) | (174,235 | ) | 378,982 | 809,383 | |||||||||||
| Net change in unrealized appreciation (depreciation) on: | |||||||||||||||||||||
| Investment securities, swaps and forwards (2) | (348,734 | ) | 582,712 | (47,960 | ) | 4,758,564 | 3,538,821 | (112,656 | ) | (530,312 | ) | ||||||||||
| Short positions | — | — | — | — | — | 3,738 | (9,170 | ) | |||||||||||||
| Futures contracts and written options | 16,961 | — | — | — | — | (2,543 | ) | (416,887 | ) | ||||||||||||
| Foreign currencies | — | (20,830 | ) | — | (5,199 | ) | 1,647 | 1,212 | 57,347 | ||||||||||||
| Change in Net Unrealized Appreciation (Depreciation) | (331,773 | ) | 561,882 | (47,960 | ) | 4,753,365 | 3,540,468 | (110,249 | ) | (899,022 | ) | ||||||||||
| NET GAIN (LOSS) | (486,124 | ) | 689,419 | 54,552 | 4,678,622 | 3,366,233 | 268,733 | (89,639 | ) | ||||||||||||
| NET INCREASE (DECREASE) IN NET ASSETS RESULTING FROM OPERATIONS | ($ 264,243 | ) | $ | 613,944 | $ | 36,618 | $ | 4,889,009 | $ | 3,332,861 | $ | 842,642 | $ | 364,324 | |||||||
| (1) | Operations commenced on December 31, 2004. |
| (2) | Dividends were net of $0, $10,019, $0, $118,425, $65,522, $0, and $0 foreign taxes withheld, respectively. No foreign capital gains tax was withheld on realized and change in unrealized capital gains for all of these funds. |
See Notes to Financial Statements |
D-8 |
PACIFIC FUNDS |
| PF Pacific Life Money Market Fund | PF Salomon Brothers Large-Cap Value Fund | PF Van Kampen Comstock Fund | PF Van Kampen Real Estate Fund (1) | PF Van Kampen Mid-Cap Growth Fund | |||||||||||
|---|---|---|---|---|---|---|---|---|---|---|---|---|---|---|---|
| INVESTMENT INCOME | |||||||||||||||
| Dividends, net of foreign taxes withheld (2) | $ | 708 | $ | 918,713 | $ | 410,376 | $ | 100,105 | $ | 131,416 | |||||
| Interest | 344,772 | 12,116 | 28,092 | 1,947 | 16,074 | ||||||||||
| Total Investment Income | 345,480 | 930,829 | 438,468 | 102,052 | 147,490 | ||||||||||
| EXPENSES | |||||||||||||||
| Advisory fees | 77,476 | 338,817 | 170,146 | 27,674 | 278,344 | ||||||||||
| Administration fees | 67,791 | 139,513 | 62,685 | 8,805 | 108,245 | ||||||||||
| Support services expenses | 17,078 | 25,187 | 12,481 | 1,265 | 18,474 | ||||||||||
| Custodian fees and expenses | 22,664 | 36,535 | 44,000 | 8,500 | 56,046 | ||||||||||
| Shareholder reports | 10,171 | 17,201 | 8,763 | 1,652 | 12,394 | ||||||||||
| Distribution and service (12b-1) fees | |||||||||||||||
| Class A | 85,823 | 189,322 | 85,240 | 12,544 | 145,860 | ||||||||||
| Class B | 5,514 | 5,169 | 3,937 | 35 | 5,812 | ||||||||||
| Class C | 16,528 | 14,795 | 4,685 | 34 | 11,739 | ||||||||||
| Transfer agency out-of-pocket expenses | 40,971 | 66,555 | 32,343 | 4,645 | 49,259 | ||||||||||
| Registration fees | 33,675 | 32,745 | 31,540 | 1,090 | 32,275 | ||||||||||
| Legal and audit fees | 18,105 | 27,113 | 13,517 | 2,096 | 20,631 | ||||||||||
| Trustees’ fees and expenses | 4,057 | 10,075 | 5,305 | 774 | 7,333 | ||||||||||
| Offering expenses | — | — | — | 16,607 | — | ||||||||||
| Other | 8,763 | 13,707 | 12,179 | 4,095 | 14,470 | ||||||||||
| Total Expenses | 408,616 | 916,734 | 486,821 | 89,816 | 760,882 | ||||||||||
| Adviser Expense Reimbursement / Distributor Waiver | (216,395 | ) | (189,257 | ) | (142,219 | ) | (38,207 | ) | (179,956 | ) | |||||
| Net Expenses | 192,221 | 727,477 | 344,602 | 51,609 | 580,926 | ||||||||||
| NET INVESTMENT INCOME (LOSS) | 153,259 | 203,352 | 93,866 | 50,443 | (433,436 | ) | |||||||||
| NET REALIZED AND UNREALIZED GAIN (LOSS) | |||||||||||||||
| Net realized gain (loss) on: | |||||||||||||||
| Investment security, swap, and forward transactions (2) | (7 | ) | 671,715 | 1,491,523 | (1,996 | ) | 189,883 | ||||||||
| Net Realized Gain (Loss) | (7 | ) | 671,715 | 1,491,523 | (1,996 | ) | 189,883 | ||||||||
| Net change in unrealized appreciation (depreciation) on: Investment securities, swaps and forwards (2) | — | 938,647 | 372,160 | (345,098 | ) | 3,985,375 | |||||||||
| Change in Net Unrealized Appreciation (Depreciation) | — | 938,647 | 372,160 | (345,098 | ) | 3,985,375 | |||||||||
| NET GAIN (LOSS) | (7 | ) | 1,610,362 | 1,863,683 | (347,094 | ) | 4,175,258 | ||||||||
| NET INCREASE (DECREASE) IN NET ASSETS RESULTING FROM OPERATIONS | $ | 153,252 | $ | 1,813,714 | $ | 1,957,549 | ($296,651 | ) | $ | 3,741,822 | |||||
| (1) | Operations commenced on December 31, 2004. |
| (2) | Dividends were net of $0, $10,135, $5,796, $0, and $1,622 foreign taxes withheld, respectively. No foreign capital gains tax was withheld on realized and change in unrealized capital gains for all of these funds. |
See Notes to Financial Statements |
D-9 |
| PF Portfolio Optimization Model A | PF Portfolio Optimization Model B | PF Portfolio Optimization Model C | |||||||||||||||||
|---|---|---|---|---|---|---|---|---|---|---|---|---|---|---|---|---|---|---|---|
| Year Ended March 31, 2005 | Period Ended March 31, 2004 (1) | Year Ended March 31, 2005 | Period Ended March 31, 2004 (1) | Year Ended March 31, 2005 | Period Ended March 31, 2004 (1) | ||||||||||||||
| OPERATIONS | |||||||||||||||||||
| Net investment income | $ | 122,443 | $ | 2,383 | $ | 224,303 | $ | 3,639 | $ | 389,638 | $ | 2,432 | |||||||
| Net realized gain (loss) | 101,961 | (619 | ) | 201,563 | 115 | 784,685 | (1,022 | ) | |||||||||||
| Net change in unrealized appreciation | 42,929 | 53,123 | 707,315 | 109,935 | 3,143,457 | 255,499 | |||||||||||||
| Net Increase in Net Assets Resulting from Operations | 267,333 | 54,887 | 1,133,181 | 113,689 | 4,317,780 | 256,909 | |||||||||||||
| DISTRIBUTIONS TO SHAREHOLDERS | |||||||||||||||||||
| Net investment income | |||||||||||||||||||
| Class A | (79,955 | ) | — | (195,045 | ) | — | (349,335 | ) | — | ||||||||||
| Class B | (9,600 | ) | — | (46,158 | ) | — | (103,677 | ) | — | ||||||||||
| Class C | (80,037 | ) | — | (114,632 | ) | — | (266,646 | ) | — | ||||||||||
| Net realized gains | |||||||||||||||||||
| Class A | (11,708 | ) | — | (39,753 | ) | — | (83,398 | ) | — | ||||||||||
| Class B | (1,839 | ) | — | (12,566 | ) | — | (33,783 | ) | — | ||||||||||
| Class C | (14,838 | ) | — | (30,957 | ) | — | (89,938 | ) | — | ||||||||||
| Net Decrease in Net Assets Resulting from Dividends and Distributions to Shareholders | (197,977 | ) | — | (439,111 | ) | — | (926,777 | ) | — | ||||||||||
| CAPITAL SHARE TRANSACTIONS | |||||||||||||||||||
| Proceeds from sale of shares | |||||||||||||||||||
| Class A | 7,708,691 | 2,233,140 | 16,313,119 | 5,649,869 | 44,234,234 | 13,094,785 | |||||||||||||
| Class B | 1,238,441 | 467,679 | 4,426,424 | 3,164,117 | 13,817,119 | 5,567,570 | |||||||||||||
| Class C | 7,455,702 | 3,930,307 | 12,994,985 | 5,589,111 | 39,370,763 | 17,165,760 | |||||||||||||
| Dividends reinvestments | |||||||||||||||||||
| Class A | 88,651 | — | 218,240 | — | 410,402 | — | |||||||||||||
| Class B | 10,397 | — | 58,207 | — | 133,793 | — | |||||||||||||
| Class C | 91,445 | — | 137,435 | — | 342,801 | — | |||||||||||||
| Cost of shares repurchased | |||||||||||||||||||
| Class A | (1,528,911 | ) | (292,937 | ) | (2,416,936 | ) | (498,468 | ) | (4,956,243 | ) | (443,269 | ) | |||||||
| Class B | (254,285 | ) | (23,278 | ) | (894,911 | ) | (178,631 | ) | (657,815 | ) | (19,382 | ) | |||||||
| Class C | (2,404,615 | ) | (224,935 | ) | (3,357,470 | ) | (275,442 | ) | (5,586,638 | ) | (415,115 | ) | |||||||
| Net Increase in Net Assets Derived from Capital Share Transactions | 12,405,516 | 6,089,976 | 27,479,093 | 13,450,556 | 87,108,416 | 34,950,349 | |||||||||||||
| NET INCREASE IN NET ASSETS | 12,474,872 | 6,144,863 | 28,173,163 | 13,564,245 | 90,499,419 | 35,207,258 | |||||||||||||
| NET ASSETS | |||||||||||||||||||
| Beginning of Year/Period | 6,144,863 | — | 13,564,245 | — | 35,207,258 | — | |||||||||||||
| End of Year/Period | $ | 18,619,735 | $ | 6,144,863 | $ | 41,737,408 | $ | 13,564,245 | $ | 125,706,677 | $ | 35,207,258 | |||||||
| Undistributed Net Investment Income | $ | 29,524 | $ | 5,506 | $ | 40,113 | $ | 10,550 | $ | 37,764 | $ | 20,004 | |||||||
| (1) | Operations commenced on December 31, 2003. |
See Notes to Financial Statements |
D-10 |
PACIFIC FUNDS |
| PF Portfolio Optimization Model D | PF Portfolio Optimization Model E | PF AIM Blue Chip Fund | |||||||||||||||||
|---|---|---|---|---|---|---|---|---|---|---|---|---|---|---|---|---|---|---|---|
| Year Ended March 31, 2005 | Period Ended March 31, 2004 (1) | Year Ended March 31, 2005 | Period Ended March 31, 2004 (1) | Year Ended March 31, 2005 | Year Ended March 31, 2004 | ||||||||||||||
| OPERATIONS | |||||||||||||||||||
| Net investment income (loss) | $ | 147,133 | ($ 4,021 | ) | ($ 16,662 | ) | ($ 5,932 | ) | ($ 38,667 | ) | ($ 117,777 | ) | |||||||
| Net realized gain (loss) | 828,610 | (1,610 | ) | 234,789 | — | (352,920 | ) | (461,868 | ) | ||||||||||
| Net change in unrealized appreciation | 3,782,782 | 172,917 | 1,994,245 | 61,240 | 509,409 | 3,257,346 | |||||||||||||
| Net Increase in Net Assets Resulting from Operations | 4,758,525 | 167,286 | 2,212,372 | 55,308 | 117,822 | 2,677,701 | |||||||||||||
| DISTRIBUTIONS TO SHAREHOLDERS | |||||||||||||||||||
| Net investment income | |||||||||||||||||||
| Class A | (194,088 | ) | — | (34,000 | ) | — | — | — | |||||||||||
| Class B | (46,600 | ) | — | — | — | — | — | ||||||||||||
| Class C | (124,553 | ) | — | — | — | — | — | ||||||||||||
| Net realized gains | |||||||||||||||||||
| Class A | (79,868 | ) | — | (42,149 | ) | — | — | — | |||||||||||
| Class B | (36,432 | ) | — | (15,110 | ) | — | — | — | |||||||||||
| Class C | (88,848 | ) | — | (44,214 | ) | — | — | — | |||||||||||
| Net Decrease in Net Assets Resulting from Dividends and Distributions to Shareholders | (570,389 | ) | — | (135,473 | ) | — | — | — | |||||||||||
| CAPITAL SHARE TRANSACTIONS | |||||||||||||||||||
| Proceeds from sale of shares | |||||||||||||||||||
| Class A | 32,837,504 | 13,417,132 | 11,903,632 | 8,272,753 | 23,903,116 | 16,067,388 | |||||||||||||
| Class B | 12,368,615 | 7,233,852 | 3,882,486 | 2,426,197 | 107,633 | 1,156,383 | |||||||||||||
| Class C | 36,388,144 | 13,213,704 | 14,613,609 | 7,934,802 | 699,324 | 2,831,826 | |||||||||||||
| Dividends reinvestments | |||||||||||||||||||
| Class A | 249,956 | — | 75,834 | — | — | — | |||||||||||||
| Class B | 81,620 | — | 14,486 | — | — | — | |||||||||||||
| Class C | 209,147 | — | 42,948 | — | — | — | |||||||||||||
| Cost of shares repurchased | |||||||||||||||||||
| Class A | (4,063,303 | ) | (144,669 | ) | (2,753,189 | ) | (126,402 | ) | (2,295,870 | ) | (9,951,821 | ) | |||||||
| Class B | (1,244,222 | ) | (301,359 | ) | (490,578 | ) | (17,952 | ) | (73,287 | ) | (1,730,319 | ) | |||||||
| Class C | (2,959,284 | ) | (543,384 | ) | (5,966,870 | ) | (80,961 | ) | (413,586 | ) | (3,883,409 | ) | |||||||
| Shares issued in connection with acquisition (2) | |||||||||||||||||||
| Class A | — | — | — | — | — | 7,488,383 | |||||||||||||
| Class B | — | — | — | — | — | 50,735 | |||||||||||||
| Class C | — | — | — | — | — | 142,407 | |||||||||||||
| Net Increase in Net Assets Derived from Capital Share Transactions | 73,868,177 | 32,875,276 | 21,322,358 | 18,408,437 | 21,927,330 | 12,171,573 | |||||||||||||
| NET INCREASE IN NET ASSETS | 78,056,313 | 33,042,562 | 23,399,257 | 18,463,745 | 22,045,152 | 14,849,274 | |||||||||||||
| NET ASSETS | |||||||||||||||||||
| Beginning of Year/Period | 33,042,562 | — | 18,463,745 | — | 24,995,143 | 10,145,869 | |||||||||||||
| End of Year/Period | $ | 111,098,875 | $ | 33,042,562 | $ | 41,863,002 | $ | 18,463,745 | $ | 47,040,295 | $ | 24,995,143 | |||||||
| Undistributed/Accumulated Net Investment Income (Loss) | ($2,742 | ) | $ | 11,823 | ($1,195 | ) | $ | 2,375 | ($19,427 | ) | ($15,074 | ) | |||||||
| (1) | Operations commenced on December 31, 2003. |
| (2) | See Note 3 in Notes to Financial Statements. |
See Notes to Financial Statements |
D-11 |
PACIFIC FUNDS |
| PF AIM Aggressive Growth Fund | PF Goldman Sachs Short Duration Bond Fund | PF Janus Growth LT Fund | |||||||||||||||||
|---|---|---|---|---|---|---|---|---|---|---|---|---|---|---|---|---|---|---|---|
| Year Ended March 31, 2005 | Year Ended March 31, 2004 | Year Ended March 31, 2005 | Period Ended March 31, 2004 (1) | Year Ended March 31, 2005 | Year Ended March 31, 2004 | ||||||||||||||
| OPERATIONS | |||||||||||||||||||
| Net investment income (loss) | ($139,113 | ) | ($120,996 | ) | $ | 221,881 | $ | 6,069 | ($75,475 | ) | ($112,694 | ) | |||||||
| Net realized gain (loss) | 1,797,957 | 655,478 | (154,351 | ) | 30,469 | 127,537 | 404,380 | ||||||||||||
| Net change in unrealized appreciation (depreciation) | (1,113,634 | ) | 1,477,627 | (331,773 | ) | 52,002 | 561,882 | 2,481,096 | |||||||||||
| Net Increase (Decrease) in Net Assets Resulting from Operations | 545,210 | 2,012,109 | (264,243 | ) | 88,540 | 613,944 | 2,772,782 | ||||||||||||
| DISTRIBUTIONS TO SHAREHOLDERS | |||||||||||||||||||
| Net investment income | |||||||||||||||||||
| Class A | — | — | (240,151 | ) | — | — | — | ||||||||||||
| Class B | — | — | (51 | ) | — | — | — | ||||||||||||
| Class C | — | — | (2,267 | ) | — | — | — | ||||||||||||
| Net realized gains | |||||||||||||||||||
| Class A | (260,748 | ) | — | (30,850 | ) | — | — | — | |||||||||||
| Class B | (7,068 | ) | — | (16 | ) | — | — | — | |||||||||||
| Class C | (13,797 | ) | — | (272 | ) | — | — | — | |||||||||||
| Net Decrease in Net Assets Resulting from Dividends and Distributions to Shareholders | (281,613 | ) | — | (273,607 | ) | — | — | — | |||||||||||
| CAPITAL SHARE TRANSACTIONS | |||||||||||||||||||
| Proceeds from sale of shares | |||||||||||||||||||
| Class A | 7,019,974 | 3,105,811 | 23,363,478 | 13,672,919 | 8,414,454 | 5,380,341 | |||||||||||||
| Class B | 68,575 | 336,503 | 13,025 | 10,010 | 105,612 | 371,333 | |||||||||||||
| Class C | 308,946 | 590,678 | 694,686 | 62,360 | 338,137 | 894,919 | |||||||||||||
| Dividends reinvestments | |||||||||||||||||||
| Class A | 258,606 | — | 270,766 | — | — | — | |||||||||||||
| Class B | 7,068 | — | 67 | — | — | — | |||||||||||||
| Class C | 13,797 | — | 2,399 | — | — | — | |||||||||||||
| Cost of shares repurchased | |||||||||||||||||||
| Class A | (8,874,274 | ) | (1,507,321 | ) | (1,388,781 | ) | (143,651 | ) | (1,414,751 | ) | (2,589,629 | ) | |||||||
| Class B | (63,684 | ) | (198,653 | ) | (9,971 | ) | — | (34,726 | ) | (513,895 | ) | ||||||||
| Class C | (114,300 | ) | (452,324 | ) | (172,662 | ) | (370 | ) | (279,502 | ) | (1,386,348 | ) | |||||||
| Net Increase (Decrease) in Net Assets Derived from Capital Share Transactions | (1,375,292 | ) | 1,874,694 | 22,773,007 | 13,601,268 | 7,129,224 | 2,156,721 | ||||||||||||
| NET INCREASE (DECREASE) IN NET ASSETS | (1,111,695 | ) | 3,886,803 | 22,235,157 | 13,689,808 | 7,743,168 | 4,929,503 | ||||||||||||
| NET ASSETS | |||||||||||||||||||
| Beginning of Year/Period | 9,095,844 | 5,209,041 | 13,689,808 | — | 12,686,473 | 7,756,970 | |||||||||||||
| End of Year/Period | $ | 7,984,149 | $ | 9,095,844 | $ | 35,924,965 | $ | 13,689,808 | $ | 20,429,641 | $ | 12,686,473 | |||||||
| Undistributed/Accumulated Net Investment Income (Loss) | ($5,752 | ) | ($4,471 | ) | $ | 5,773 | $ | 22,118 | $ | 13,066 | ($16,707 | ) | |||||||
| (1) | Operations commenced on December 31, 2003. |
See Notes to Financial Statements |
D-12 |
PACIFIC FUNDS |
| PF Lazard Mid-Cap Value Fund | PF Lazard International Value Fund | PF MFS International Large-Cap Fund (2) | ||||||||||||||
|---|---|---|---|---|---|---|---|---|---|---|---|---|---|---|---|---|
| Period Ended March 31, 2005 (1) | Year Ended March 31, 2005 | Year Ended March 31, 2004 | Year Endeds March 31, 2005 | Year Ended | ||||||||||||
| OPERATIONS | ||||||||||||||||
| Net investment income (loss) | ($17,934 | ) | $ | 210,387 | $ | 92,834 | ($33,372 | ) | ($34,238 | ) | ||||||
| Net realized gain (loss) | 102,512 | (74,743 | ) | 414,365 | (174,235 | ) | 1,199,599 | |||||||||
| Net change in unrealized appreciation (depreciation) | (47,960 | ) | 4,753,365 | 3,986,597 | 3,540,468 | 1,176,430 | ||||||||||
| Net Increase in Net Assets Resulting from Operations | 36,618 | 4,889,009 | 4,493,796 | 3,332,861 | 2,341,791 | |||||||||||
| DISTRIBUTIONS TO SHAREHOLDERS | ||||||||||||||||
| Net investment income | ||||||||||||||||
| Class A | — | (51,361 | ) | (23,198 | ) | — | — | |||||||||
| Class B | — | — | (2,972 | ) | — | — | ||||||||||
| Class C | — | — | (6,770 | ) | — | — | ||||||||||
| Net realized gains | ||||||||||||||||
| Class A | — | (464,854 | ) | — | (393,509 | ) | — | |||||||||
| Class B | — | (5,764 | ) | — | (5,397 | ) | — | |||||||||
| Class C | — | (14,769 | ) | — | (5,069 | ) | — | |||||||||
| Net Decrease in Net Assets Resulting from Dividends and Distributions to Shareholders | — | (536,748 | ) | (32,940 | ) | (403,975 | ) | — | ||||||||
| CAPITAL SHARE TRANSACTIONS | ||||||||||||||||
| Proceeds from sale of shares | ||||||||||||||||
| Class A | 33,637,096 | 27,621,826 | 38,792,992 | 21,043,935 | 16,083,888 | |||||||||||
| Class B | 32,650 | 147,735 | 1,526,229 | 131,639 | 384,450 | |||||||||||
| Class C | 74,026 | 567,562 | 3,460,266 | 404,665 | 598,210 | |||||||||||
| Dividends reinvestments | ||||||||||||||||
| Class A | — | 515,467 | 22,913 | 393,369 | — | |||||||||||
| Class B | — | 4,688 | 2,905 | 4,018 | — | |||||||||||
| Class C | — | 14,702 | 6,759 | 5,069 | — | |||||||||||
| Cost of shares repurchased | ||||||||||||||||
| Class A | (8,219,609 | ) | (1,526,143 | ) | (28,999,092 | ) | (1,445,515 | ) | (7,367,278 | ) | ||||||
| Class B | — | (66,007 | ) | (2,442,743 | ) | (38,492 | ) | (257,516 | ) | |||||||
| Class C | — | (281,510 | ) | (5,365,157 | ) | (93,150 | ) | (580,936 | ) | |||||||
| Net Increase in Net Assets Derived from Capital Share Transactions | 25,524,163 | 26,998,320 | 7,005,072 | 20,405,538 | 8,860,818 | |||||||||||
| NET INCREASE IN NET ASSETS | 25,560,781 | 31,350,581 | 11,465,928 | 23,334,424 | 11,202,609 | |||||||||||
| NET ASSETS | ||||||||||||||||
| Beginning of Period/Year | — | 21,111,410 | 9,645,482 | 15,844,536 | 4,641,927 | |||||||||||
| End of Period/Year | $ | 25,560,781 | $ | 52,461,991 | $ | 21,111,410 | $ | 39,178,960 | $ | 15,844,536 | ||||||
| Undistributed/Accumulated Net Investment Income (Loss) | $ | 19,470 | $ | 16,369 | ($18,344 | ) | ($43,634 | ) | ($3,870 | ) | ||||||
| (1) | Operations commenced on December 31, 2004. |
| (2) | Formerly named PF MFS Global Growth Fund. |
See Notes to Financial Statements |
D-13 |
PACIFIC FUNDS |
| PF PIMCO Inflation Managed Fund | PF PIMCO Managed Bond Fund | PF Pacific Life Money Market Fund | |||||||||||||||||
|---|---|---|---|---|---|---|---|---|---|---|---|---|---|---|---|---|---|---|---|
| Year Ended March 31, 2005 | Year Ended March 31, 2004 | Year Ended March 31, 2005 | Year Ended March 31, 2004 | Year Ended March 31, 2005 | Year Ended March 31, 2004 | ||||||||||||||
| OPERATIONS | |||||||||||||||||||
| Net investment income | $ | 573,909 | $ | 136,733 | $ | 453,963 | $ | 351,686 | $ | 153,259 | $ | 20,524 | |||||||
| Net realized gain (loss) | 378,982 | 864,066 | 809,383 | 518,769 | (7 | ) | (7 | ) | |||||||||||
| Net change in unrealized appreciation (depreciation) | (110,249 | ) | 516,399 | (899,022 | ) | 397,005 | — | — | |||||||||||
| Net Increase in Net Assets Resulting from Operations | 842,642 | 1,517,198 | 364,324 | 1,267,460 | 153,252 | 20,517 | |||||||||||||
| DISTRIBUTIONS TO SHAREHOLDERS | |||||||||||||||||||
| Net investment income | |||||||||||||||||||
| Class A | (582,114 | ) | (154,803 | ) | (779,845 | ) | (534,088 | ) | (143,532 | ) | (22,723 | ) | |||||||
| Class B | (19,286 | ) | (15,333 | ) | (20,998 | ) | (65,410 | ) | (2,106 | ) | (722 | ) | |||||||
| Class C | (118,529 | ) | (43,314 | ) | (47,916 | ) | (145,679 | ) | (7,567 | ) | (1,079 | ) | |||||||
| Net realized gains | |||||||||||||||||||
| Class A | (728,503 | ) | (200,394 | ) | (681,854 | ) | — | — | — | ||||||||||
| Class B | (28,316 | ) | (27,945 | ) | (23,616 | ) | — | — | — | ||||||||||
| Class C | (175,898 | ) | (92,770 | ) | (54,667 | ) | — | — | — | ||||||||||
| Net Decrease in Net Assets Resulting from Dividends and Distributions to Shareholders | (1,652,646 | ) | (534,559 | ) | (1,608,896 | ) | (745,177 | ) | (153,205 | ) | (24,524 | ) | |||||||
| CAPITAL SHARE TRANSACTIONS | |||||||||||||||||||
| Proceeds from sale of shares | |||||||||||||||||||
| Class A | 22,634,655 | 11,697,438 | 25,351,645 | 36,395,333 | 16,732,059 | 38,550,926 | |||||||||||||
| Class B | 599,839 | 2,456,030 | 422,813 | 1,897,466 | 881,811 | 1,522,624 | |||||||||||||
| Class C | 4,071,866 | 7,431,039 | 1,118,396 | 5,604,847 | 8,159,389 | 3,533,422 | |||||||||||||
| Dividends reinvestments | |||||||||||||||||||
| Class A | 1,300,593 | 354,500 | 1,409,209 | 439,156 | 142,409 | 21,253 | |||||||||||||
| Class B | 45,117 | 42,578 | 41,282 | 64,598 | 1,999 | 662 | |||||||||||||
| Class C | 272,560 | 122,662 | 94,224 | 131,590 | 6,780 | 1,045 | |||||||||||||
| Cost of shares repurchased | |||||||||||||||||||
| Class A | (3,121,567 | ) | (2,863,640 | ) | (2,906,831 | ) | (35,689,854 | ) | (9,160,559 | ) | (37,033,673 | ) | |||||||
| Class B | (111,116 | ) | (2,010,159 | ) | (260,619 | ) | (3,010,031 | ) | (955,313 | ) | (1,560,988 | ) | |||||||
| Class C | (2,560,336 | ) | (4,119,142 | ) | (1,080,247 | ) | (8,061,275 | ) | (5,864,157 | ) | (3,651,257 | ) | |||||||
| Net Increase (Decrease) in Net Assets Derived from Capital Share Transactions | 23,131,611 | 13,111,306 | 24,189,872 | (2,228,170 | ) | 9,944,418 | 1,384,014 | ||||||||||||
| NET INCREASE (DECREASE) IN NET ASSETS | 22,321,607 | 14,093,945 | 22,945,300 | (1,705,887 | ) | 9,944,465 | 1,380,007 | ||||||||||||
| NET ASSETS | |||||||||||||||||||
| Beginning of Year | 21,025,301 | 6,931,356 | 23,088,734 | 24,794,621 | 16,326,853 | 14,946,846 | |||||||||||||
| End of Year | $ | 43,346,908 | $ | 21,025,301 | $ | 46,034,034 | $ | 23,088,734 | $ | 26,271,318 | $ | 16,326,853 | |||||||
| Undistributed/Accumulated Net Investment Income (Loss) | $ | 82,018 | ($1,017 | ) | $ | 237,751 | $ | 275,901 | $ | 8,448 | $ | 7,827 | |||||||
See Notes to Financial Statements |
D-14 |
PACIFIC FUNDS |
| PF Salomon Brothers Large-Cap Value Fund | PF Van Kampen Comstock Fund (1) | PF Van Kampen Real Estate Fund | |||||||||||||
|---|---|---|---|---|---|---|---|---|---|---|---|---|---|---|---|
| Year Ended March 31, 2005 | Year Ended March 31, 2004 | Year Ended March 31, 2005 | Year Ended March 31, 2004 | Period Ended March 31, 2005 (2) | |||||||||||
| OPERATIONS | |||||||||||||||
| Net investment income | $ | 203,352 | $ | 37,182 | $ | 93,866 | $ | 15,554 | $ | 50,443 | |||||
| Net realized gain (loss) | 671,715 | (191,570 | ) | 1,491,523 | (34,012 | ) | (1,996 | ) | |||||||
| Net change in unrealized appreciation (depreciation) | 938,647 | 6,352,314 | 372,160 | 2,444,827 | (345,098 | ) | |||||||||
| Net Increase (Decrease) in Net Assets Resulting from Operations | 1,813,714 | 6,197,926 | 1,957,549 | 2,426,369 | (296,651 | ) | |||||||||
| DISTRIBUTIONS TO SHAREHOLDERS | |||||||||||||||
| Net investment income | |||||||||||||||
| Class A | (200,695 | ) | (19,016 | ) | (75,062 | ) | — | (22,627 | ) | ||||||
| Class B | — | (1,551 | ) | — | — | (10 | ) | ||||||||
| Class C | — | (3,132 | ) | (491 | ) | — | (48 | ) | |||||||
| Net realized gains | |||||||||||||||
| Class A | — | — | — | — | — | ||||||||||
| Class B | — | — | — | — | — | ||||||||||
| Class C | — | — | — | — | — | ||||||||||
| Net Decrease in Net Assets Resulting from Dividends and Distributions to Shareholders | (200,695 | ) | (23,699 | ) | (75,553 | ) | — | (22,685 | ) | ||||||
| CAPITAL SHARE TRANSACTIONS | |||||||||||||||
| Proceeds from sale of shares | |||||||||||||||
| Class A | 26,154,271 | 16,905,955 | 10,064,547 | 5,748,025 | 18,966,370 | ||||||||||
| Class B | 150,380 | 1,355,041 | 138,195 | 395,196 | 18,222 | ||||||||||
| Class C | 663,039 | 3,456,042 | 696,356 | 646,355 | 32,845 | ||||||||||
| Dividends reinvestments | |||||||||||||||
| Class A | 199,478 | 18,591 | 74,771 | — | 22,627 | ||||||||||
| Class B | — | 1,431 | — | — | 10 | ||||||||||
| Class C | — | 3,106 | 471 | — | 40 | ||||||||||
| Cost of shares repurchased | |||||||||||||||
| Class A | (2,782,015 | ) | (7,962,209 | ) | (861,781 | ) | (1,296,281 | ) | (4,817,859 | ) | |||||
| Class B | (216,725 | ) | (2,258,347 | ) | (239,947 | ) | (282,850 | ) | — | ||||||
| Class C | (456,033 | ) | (5,252,643 | ) | (101,912 | ) | (618,950 | ) | — | ||||||
| Net Increase in Net Assets Derived from Capital Share Transactions | 23,712,395 | 6,266,967 | 9,770,700 | 4,591,495 | 14,222,255 | ||||||||||
| NET INCREASE IN NET ASSETS | 25,325,414 | 12,441,194 | 11,652,696 | 7,017,864 | 13,902,919 | ||||||||||
| NET ASSETS | |||||||||||||||
| Beginning of Year/Period | 27,147,159 | 14,705,965 | 12,624,226 | 5,606,362 | — | ||||||||||
| End of Year/Period | $ | 52,472,573 | $ | 27,147,159 | $ | 24,276,922 | $ | 12,624,226 | $ | 13,902,919 | |||||
| Undistributed Net Investment Income | $ | 23,592 | $ | 28,494 | $ | 29,817 | $ | 11,504 | $ | 56,788 | |||||
| (1) | Formerly named PF Janus Strategic Value Fund. |
| (2) | Operations commenced on December 31, 2004. |
See Notes to Financial Statements |
D-15 |
PACIFIC FUNDS |
| PF Van Kampen Mid-Cap Growth Fund (1) | |||||||
|---|---|---|---|---|---|---|---|
| Year Ended March 31, 2005 | Year Ended March 31, 2004 | ||||||
| OPERATIONS | |||||||
| Net investment loss | ($433,436 | ) | ($189,693 | ) | |||
| Net realized gain | 189,883 | 1,603,495 | |||||
| Net change in unrealized appreciation | 3,985,375 | 1,983,332 | |||||
| Net Increase in Net Assets Resulting from Operations | 3,741,822 | 3,397,134 | |||||
| DISTRIBUTIONS TO SHAREHOLDERS | |||||||
| Net investment income | |||||||
| Class A | — | — | |||||
| Class B | — | — | |||||
| Class C | — | — | |||||
| Net realized gains | |||||||
| Class A | — | — | |||||
| Class B | — | — | |||||
| Class C | — | — | |||||
| Net Decrease in Net Assets Resulting from Dividends and Distributions to Shareholders | — | — | |||||
| CAPITAL SHARE TRANSACTIONS | |||||||
| Proceeds from sale of shares | |||||||
| Class A | 17,109,249 | 14,036,444 | |||||
| Class B | 173,279 | 1,031,161 | |||||
| Class C | 515,228 | 2,469,277 | |||||
| Dividends reinvestments | |||||||
| Class A | — | — | |||||
| Class B | — | — | |||||
| Class C | — | — | |||||
| Cost of shares repurchased | |||||||
| Class A | (2,165,589 | ) | (4,394,169 | ) | |||
| Class B | (72,481 | ) | (1,389,725 | ) | |||
| Class C | (166,374 | ) | (3,217,337 | ) | |||
| Net Increase in Net Assets Derived from Capital Share Transactions | 15,393,312 | 8,535,651 | |||||
| NET INCREASE IN NET ASSETS | 19,135,134 | 11,932,785 | |||||
| NET ASSETS | |||||||
| Beginning of Year | 19,850,213 | 7,917,428 | |||||
| End of Year | $ | 38,985,347 | $ | 19,850,213 | |||
| Accumulated Net Investment Loss | ($9,036 | ) | ($6,464 | ) | |||
| (1) | Formerly named PF MFS Mid-Cap Growth Fund. |
See Notes to Financial Statements |
D-16 |
| PACIFIC FUNDS FINANCIAL HIGHLIGHTS Selected per share, ratios and supplemental data for each year or period ended were as follows: |
| Investment Activities | |||||||||||||||
| Net Asset Value, Beginning of Year or Period | Net Investment Income (Loss) | Net Realized and Unrealized Gain | Total from Investment Operations | ||||||||||||
| PF Portfolio Optimization Model A | |||||||||||||||
| Class A: | 4/1/2004 - 3/31/2005 (4) | $ | 10.15 | $ | 0.13 | $ | 0.05 | $ | 0.18 | ||||||
| 12/31/2003 - 3/31/2004 (4) | 10.00 | 0.02 | 0.13 | 0.15 | |||||||||||
| Class B: | 4/1/2004 - 3/31/2005 (4) | $ | 10.14 | $ | 0.08 | $ | 0.04 | $ | 0.12 | ||||||
| 12/31/2003 - 3/31/2004 (4) | 10.00 | — | 0.14 | 0.14 | |||||||||||
| Class C: | 4/1/2004 - 3/31/2005 (4) | $ | 10.13 | $ | 0.08 | $ | 0.04 | $ | 0.12 | ||||||
| 12/31/2003 - 3/31/2004 (4) | 10.00 | — | 0.13 | 0.13 | |||||||||||
| PF Portfolio Optimization Model B | |||||||||||||||
| Class A: | 4/1/2004 - 3/31/2005 (4) | $ | 10.14 | $ | 0.11 | $ | 0.22 | $ | 0.33 | ||||||
| 12/31/2003 - 3/31/2004 (4) | 10.00 | 0.01 | 0.13 | 0.14 | |||||||||||
| Class B: | 4/1/2004 - 3/31/2005 (4) | $ | 10.13 | $ | 0.06 | $ | 0.21 | $ | 0.27 | ||||||
| 12/31/2003 - 3/31/2004 (4) | 10.00 | — | 0.13 | 0.13 | |||||||||||
| Class C: | 4/1/2004 - 3/31/2005 (4) | $ | 10.13 | $ | 0.06 | $ | 0.21 | $ | 0.27 | ||||||
| 12/31/2003 - 3/31/2004 (4) | 10.00 | — | 0.13 | 0.13 | |||||||||||
| PF Portfolio Optimization Model C | |||||||||||||||
| Class A: | 4/1/2004 - 3/31/2005 (4) | $ | 10.14 | $ | 0.08 | $ | 0.43 | $ | 0.51 | ||||||
| 12/31/2003 - 3/31/2004 (4) | 10.00 | 0.01 | 0.13 | 0.14 | |||||||||||
| Class B: | 4/1/2004 - 3/31/2005 (4) | $ | 10.13 | $ | 0.03 | $ | 0.43 | $ | 0.46 | ||||||
| 12/31/2003 - 3/31/2004 (4) | 10.00 | — | 0.13 | 0.13 | |||||||||||
| Class C: | 4/1/2004 - 3/31/2005 (4) | $ | 10.12 | $ | 0.03 | $ | 0.43 | $ | 0.46 | ||||||
| 12/31/2003 - 3/31/2004 (4) | 10.00 | — | 0.12 | 0.12 | |||||||||||
| PF Portfolio Optimization Model D | |||||||||||||||
| Class A: | 4/1/2004 - 3/31/2005 (4) | $ | 10.11 | $ | 0.05 | $ | 0.58 | $ | 0.63 | ||||||
| 12/31/2003 - 3/31/2004 (4) | 10.00 | 0.01 | 0.10 | 0.11 | |||||||||||
| Class B: | 4/1/2004 - 3/31/2005 (4) | $ | 10.10 | $ | — | $ | 0.58 | $ | 0.58 | ||||||
| 12/31/2003 - 3/31/2004 (4) | 10.00 | (0.01 | ) | 0.11 | 0.10 | ||||||||||
| Class C: | 4/1/2004 - 3/31/2005 (4) | $ | 10.09 | $ | — | $ | 0.57 | $ | 0.57 | ||||||
| 12/31/2003 - 3/31/2004 (4) | 10.00 | (0.01 | ) | 0.10 | 0.09 | ||||||||||
| PF Portfolio Optimization Model E | |||||||||||||||
| Class A: | 4/1/2004 - 3/31/2005 (4) | $ | 10.08 | $ | 0.02 | $ | 0.70 | $ | 0.72 | ||||||
| 12/31/2003 - 3/31/2004 (4) | 10.00 | — | 0.08 | 0.08 | |||||||||||
| Class B: | 4/1/2004 - 3/31/2005 (4) | $ | 10.07 | ($0.03 | ) | $ | 0.71 | $ | 0.68 | ||||||
| 12/31/2003 - 3/31/2004 (4) | 10.00 | (0.01 | ) | 0.08 | 0.07 | ||||||||||
| Class C: | 4/1/2004 - 3/31/2005 (4) | $ | 10.07 | ($0.03 | ) | $ | 0.71 | $ | 0.68 | ||||||
| 12/31/2003 - 3/31/2004 (4) | 10.00 | (0.01 | ) | 0.08 | 0.07 | ||||||||||
| Distributions | |||||||||||||||
| Dividends from Net Investment Income | Distributions from Capital Gains | Total Distributions | Net Asset Value, End of Year or Period | ||||||||||||
| PF Portfolio Optimization Model A | |||||||||||||||
| Class A: | 4/1/2004 - 3/31/2005 (4) | ($0.13 | ) | ($0.02 | ) | ($0.15 | ) | $ | 10.18 | ||||||
| 12/31/2003 - 3/31/2004 (4) | — | — | — | 10.15 | |||||||||||
| Class B: | 4/1/2004 - 3/31/2005 (4) | ($0.10 | ) | ($0.02 | ) | ($0.12 | ) | $ | 10.14 | ||||||
| 12/31/2003 - 3/31/2004 (4) | — | — | — | 10.14 | |||||||||||
| Class C: | 4/1/2004 - 3/31/2005 (4) | ($0.10 | ) | ($0.02 | ) | ($0.12 | ) | $ | 10.13 | ||||||
| 12/31/2003 - 3/31/2004 (4) | — | — | — | 10.13 | |||||||||||
| PF Portfolio Optimization Model B | |||||||||||||||
| Class A: | 4/1/2004 - 3/31/2005 (4) | ($0.12 | ) | ($0.02 | ) | ($0.14 | ) | $ | 10.33 | ||||||
| 12/31/2003 - 3/31/2004 (4) | — | — | — | 10.14 | |||||||||||
| Class B: | 4/1/2004 - 3/31/2005 (4) | ($0.09 | ) | ($0.02 | ) | ($0.11 | ) | $ | 10.29 | ||||||
| 12/31/2003 - 3/31/2004 (4) | — | — | — | 10.13 | |||||||||||
| Class C: | 4/1/2004 - 3/31/2005 (4) | ($0.09 | ) | ($0.02 | ) | ($0.11 | ) | $ | 10.29 | ||||||
| 12/31/2003 - 3/31/2004 (4) | — | — | — | 10.13 | |||||||||||
| PF Portfolio Optimization Model C | |||||||||||||||
| Class A: | 4/1/2004 - 3/31/2005 (4) | ($0.09 | ) | ($0.02 | ) | ($0.11 | ) | $ | 10.54 | ||||||
| 12/31/2003 - 3/31/2004 (4) | — | — | — | 10.14 | |||||||||||
| Class B: | 4/1/2004 - 3/31/2005 (4) | ($0.07 | ) | ($0.02 | ) | ($0.09 | ) | $ | 10.50 | ||||||
| 12/31/2003 - 3/31/2004 (4) | — | — | — | 10.13 | |||||||||||
| Class C: | 4/1/2004 - 3/31/2005 (4) | ($0.07 | ) | ($0.02 | ) | ($0.09 | ) | $ | 10.49 | ||||||
| 12/31/2003 - 3/31/2004 (4) | — | — | — | 10.12 | |||||||||||
| PF Portfolio Optimization Model D | |||||||||||||||
| Class A: | 4/1/2004 - 3/31/2005 (4) | ($0.06 | ) | ($0.02 | ) | ($0.08 | ) | $ | 10.66 | ||||||
| 12/31/2003 - 3/31/2004 (4) | — | — | — | 10.11 | |||||||||||
| Class B: | 4/1/2004 - 3/31/2005 (4) | ($0.03 | ) | ($0.02 | ) | ($0.05 | ) | $ | 10.63 | ||||||
| 12/31/2003 - 3/31/2004 (4) | — | — | — | 10.10 | |||||||||||
| Class C: | 4/1/2004 - 3/31/2005 (4) | ($0.03 | ) | ($0.02 | ) | ($0.05 | ) | $ | 10.61 | ||||||
| 12/31/2003 - 3/31/2004 (4) | — | — | — | 10.09 | |||||||||||
| PF Portfolio Optimization Model E | |||||||||||||||
| Class A: | 4/1/2004 - 3/31/2005 (4) | ($0.02 | ) | ($0.03 | ) | ($0.05 | ) | $ | 10.75 | ||||||
| 12/31/2003 - 3/31/2004 (4) | — | — | — | 10.08 | |||||||||||
| Class B: | 4/1/2004 - 3/31/2005 (4) | $ | — | ($0.03 | ) | ($0.03 | ) | $ | 10.72 | ||||||
| 12/31/2003 - 3/31/2004 (4) | — | — | — | 10.07 | |||||||||||
| Class C: | 4/1/2004 - 3/31/2005 (4) | $ | — | ($0.03 | ) | ($0.03 | ) | $ | 10.72 | ||||||
| 12/31/2003 - 3/31/2004 (4) | — | — | — | 10.07 | |||||||||||
| Ratios/Supplemental Data | |||||||||||||||||||||||
| Total Returns (1) | Net Assets, End of Year or Period (in thousands) | Ratios of Expenses After Expense Reductions to Average Net Assets (2), (3) | Ratios of Expenses Before Expense Reductions to Average Net Assets (3) | Ratios of Net Investment Income (Loss) After Expense Reductions to Average Net Assets (3) | Ratios of Net Investment Loss Before Expense Reductions to Average Net Assets (2), (3) | Portfolio Turnover Rates | |||||||||||||||||
| PF Portfolio Optimization Model A | |||||||||||||||||||||||
| Class A: | 4/1/2004 - 3/31/2005 (4) | 1.74 | % | $ | 8,262 | 0.00 | % | 1.85 | % | 1.29 | % | (0.56 | %) | 20.21 | % | ||||||||
| 12/31/2003 - 3/31/2004 (4) | 1.50 | % | 1,957 | 0.00 | % | 4.00 | % | 0.61 | % | (3.39 | %) | 9.38 | % | ||||||||||
| Class B: | 4/1/2004 - 3/31/2005 (4) | 1.25 | % | $ | 1,450 | 0.50 | % | 2.35 | % | 0.79 | % | (1.06 | %) | 20.21 | % | ||||||||
| 12/31/2003 - 3/31/2004 (4) | 1.40 | % | 449 | 0.50 | % | 4.50 | % | 0.11 | % | (3.89 | %) | 9.38 | % | ||||||||||
| Class C: | 4/1/2004 - 3/31/2005 (4) | 1.18 | % | $ | 8,908 | 0.50 | % | 2.35 | % | 0.79 | % | (1.06 | %) | 20.21 | % | ||||||||
| 12/31/2003 - 3/31/2004 (4) | 1.30 | % | 3,739 | 0.50 | % | 4.50 | % | 0.11 | % | (3.89 | %) | 9.38 | % | ||||||||||
| PF Portfolio Optimization Model B | |||||||||||||||||||||||
| Class A: | 4/1/2004 - 3/31/2005 (4) | 3.28 | % | $ | 19,664 | 0.00 | % | 1.24 | % | 1.05 | % | (0.19 | %) | 7.82 | % | ||||||||
| 12/31/2003 - 3/31/2004 (4) | 1.40 | % | 5,197 | 0.00 | % | 2.36 | % | 0.46 | % | (1.90 | %) | 2.81 | % | ||||||||||
| Class B: | 4/1/2004 - 3/31/2005 (4) | 2.69 | % | $ | 6,699 | 0.50 | % | 1.74 | % | 0.55 | % | (0.69 | %) | 7.82 | % | ||||||||
| 12/31/2003 - 3/31/2004 (4) | 1.30 | % | 3,013 | 0.50 | % | 2.86 | % | (0.04 | %) | (2.40 | %) | 2.81 | % | ||||||||||
| Class C: | 4/1/2004 - 3/31/2005 (4) | 2.70 | % | $ | 15,375 | 0.50 | % | 1.74 | % | 0.55 | % | (0.69 | %) | 7.82 | % | ||||||||
| 12/31/2003 - 3/31/2004 (4) | 1.30 | % | 5,354 | 0.50 | % | 2.86 | % | (0.04 | %) | (2.40 | %) | 2.81 | % | ||||||||||
| PF Portfolio Optimization Model C | |||||||||||||||||||||||
| Class A: | 4/1/2004 - 3/31/2005 (4) | 5.09 | % | $ | 53,783 | 0.00 | % | 0.91 | % | 0.82 | % | (0.09 | %) | 5.78 | % | ||||||||
| 12/31/2003 - 3/31/2004 (4) | 1.40 | % | 12,743 | 0.00 | % | 1.81 | % | 0.36 | % | (1.45 | %) | 0.86 | % | ||||||||||
| Class B: | 4/1/2004 - 3/31/2005 (4) | 4.55 | % | $ | 19,414 | 0.50 | % | 1.41 | % | 0.32 | % | (0.59 | %) | 5.78 | % | ||||||||
| 12/31/2003 - 3/31/2004 (4) | 1.30 | % | 5,594 | 0.50 | % | 2.31 | % | (0.14 | %) | (1.95 | %) | 0.86 | % | ||||||||||
| Class C: | 4/1/2004 - 3/31/2005 (4) | 4.53 | % | $ | 52,510 | 0.50 | % | 1.41 | % | 0.32 | % | (0.59 | %) | 5.78 | % | ||||||||
| 12/31/2003 - 3/31/2004 (4) | 1.20 | % | 16,870 | 0.50 | % | 2.31 | % | (0.14 | %) | (1.95 | %) | 0.86 | % | ||||||||||
| PF Portfolio Optimization Model D | |||||||||||||||||||||||
| Class A: | 4/1/2004 - 3/31/2005 (4) | 6.26 | % | $ | 43,986 | 0.00 | % | 0.93 | % | 0.52 | % | (0.41 | %) | 10.16 | % | ||||||||
| 12/31/2003 - 3/31/2004 (4) | 1.10 | % | 13,362 | 0.00 | % | 1.97 | % | 0.22 | % | (1.75 | %) | 0.68 | % | ||||||||||
| Class B: | 4/1/2004 - 3/31/2005 (4) | 5.79 | % | $ | 18,954 | 0.50 | % | 1.43 | % | 0.02 | % | (0.91 | %) | 10.16 | % | ||||||||
| 12/31/2003 - 3/31/2004 (4) | 1.00 | % | 6,962 | 0.50 | % | 2.47 | % | (0.28 | %) | (2.25 | %) | 0.68 | % | ||||||||||
| Class C: | 4/1/2004 - 3/31/2005 (4) | 5.72 | % | $ | 48,159 | 0.50 | % | 1.43 | % | 0.02 | % | (0.91 | %) | 10.16 | % | ||||||||
| 12/31/2003 - 3/31/2004 (4) | 0.90 | % | 12,719 | 0.50 | % | 2.47 | % | (0.28 | %) | (2.25 | %) | 0.68 | % | ||||||||||
| PF Portfolio Optimization Model E | |||||||||||||||||||||||
| Class A: | 4/1/2004 - 3/31/2005 (4) | 7.17 | % | $ | 18,244 | 0.00 | % | 1.25 | % | 0.23 | % | (1.02 | %) | 22.37 | % | ||||||||
| 12/31/2003 - 3/31/2004 (4) | 0.80 | % | 8,187 | 0.00 | % | 2.02 | % | 0.09 | % | (1.93 | %) | 0.00 | % | ||||||||||
| Class B: | 4/1/2004 - 3/31/2005 (4) | 6.75 | % | $ | 6,110 | 0.50 | % | 1.75 | % | (0.27 | %) | (1.52 | %) | 22.37 | % | ||||||||
| 12/31/2003 - 3/31/2004 (4) | 0.70 | % | 2,409 | 0.50 | % | 2.52 | % | (0.41 | %) | (2.43 | %) | 0.00 | % | ||||||||||
| Class C: | 4/1/2004 - 3/31/2005 (4) | 6.75 | % | $ | 17,510 | 0.50 | % | 1.75 | % | (0.27 | %) | (1.52 | %) | 22.37 | % | ||||||||
| 12/31/2003 - 3/31/2004 (4) | 0.70 | % | 7,868 | 0.50 | % | 2.52 | % | (0.41 | %) | (2.43 | %) | 0.00 | % | ||||||||||
| See Notes to Financial Statements | See explanation of references on E-7 | |
| E-1 | ||
| PACIFIC FUNDS FINANCIAL HIGHLIGHTS (Continued) Selected per share, ratios and supplemental data for each year or period ended were as follows: |
| Investment Activities | ||||||||||||||
| Net Asset Value, Beginnig of Year or Period | Net Investment Income (Loss) | Net Realized and Unrealized Gain (Loss) | Total from Investment Operations | |||||||||||
| PF AIM Blue Chip Fund | ||||||||||||||
| Class A: | 4/1/2004 - 3/31/2005 (4) | $ | 10.19 | ($0.01 | ) | ($0.04 | ) | ($0.05 | ) | |||||
| 4/1/2003 - 3/31/2004 (4) | 8.05 | (0.07 | ) | 2.21 | 2.14 | |||||||||
| 4/1/2002 - 3/31/2003 (4) | 10.96 | (0.06 | ) | (2.85 | ) | (2.91 | ) | |||||||
| 9/28/2001 - 3/31/2002 (4) | 10.00 | (0.05 | ) | 1.06 | 1.01 | |||||||||
| Class B: | 4/1/2004 - 3/31/2005 (4) | $ | 10.07 | ($0.06 | ) | ($0.03 | ) | ($0.09 | ) | |||||
| 4/1/2003 - 3/31/2004 (4) | 7.98 | (0.11 | ) | 2.20 | 2.09 | |||||||||
| 4/1/2002 - 3/31/2003 (4) | 10.94 | (0.10 | ) | (2.86 | ) | (2.96 | ) | |||||||
| 9/28/2001 - 3/31/2002 (4) | 10.00 | (0.08 | ) | 1.06 | 0.98 | |||||||||
| Class C: | 4/1/2004 - 3/31/2005 (4) | $ | 10.06 | ($0.06 | ) | ($0.03 | ) | ($0.09 | ) | |||||
| 4/1/2003 - 3/31/2004 (4) | 7.98 | (0.11 | ) | 2.19 | 2.08 | |||||||||
| 4/1/2002 - 3/31/2003 (4) | 10.93 | (0.10 | ) | (2.85 | ) | (2.95 | ) | |||||||
| 9/28/2001 - 3/31/2002 (4) | 10.00 | (0.08 | ) | 1.06 | 0.98 | |||||||||
| PF AIM Aggressive Growth Fund | ||||||||||||||
| Class A: | 4/1/2004 - 3/31/2005 (4) | $ | 11.53 | ($0.16 | ) | $ | 0.69 | $ | 0.53 | |||||
| 4/1/2003 - 3/31/2004 (4) | 8.59 | (0.15 | ) | 3.09 | 2.94 | |||||||||
| 4/1/2002 - 3/31/2003 (4) | 11.63 | (0.16 | ) | (2.88 | ) | (3.04 | ) | |||||||
| 9/28/2001 - 3/31/2002 (4) | 10.00 | (0.09 | ) | 1.81 | 1.72 | |||||||||
| Class B: | 4/1/2004 - 3/31/2005 (4) | $ | 11.41 | ($0.21 | ) | $ | 0.67 | $ | 0.46 | |||||
| 4/1/2003 - 3/31/2004 (4) | 8.53 | (0.22 | ) | 3.10 | 2.88 | |||||||||
| 4/1/2002 - 3/31/2003 (4) | 11.61 | (0.19 | ) | (2.89 | ) | (3.08 | ) | |||||||
| 9/28/2001 - 3/31/2002 (4) | 10.00 | (0.12 | ) | 1.80 | 1.68 | |||||||||
| Class C: | 4/1/2004 - 3/31/2005 (4) | $ | 11.42 | ($0.21 | ) | $ | 0.68 | $ | 0.47 | |||||
| 4/1/2003 - 3/31/2004 (4) | 8.55 | (0.23 | ) | 3.10 | 2.87 | |||||||||
| 4/1/2002 - 3/31/2003 (4) | 11.61 | (0.19 | ) | (2.87 | ) | (3.06 | ) | |||||||
| 9/28/2001 - 3/31/2002 (4) | 10.00 | (0.12 | ) | 1.81 | 1.69 | |||||||||
| PF Goldman Sachs Short Duration Bond Fund | ||||||||||||||
| Class A: | 4/1/2004 - 3/31/2005 (4) | $ | 10.09 | $ | 0.09 | ($0.22 | ) | ($0.13 | ) | |||||
| 12/31/2003 - 3/31/2004 (4) | 10.00 | 0.01 | 0.08 | 0.09 | ||||||||||
| Class B: | 4/1/2004 - 3/31/2005 (4) | $ | 10.08 | $ | 0.04 | ($0.21 | ) | ($0.17 | ) | |||||
| 12/31/2003 - 3/31/2004 (4) | 10.00 | (0.01 | ) | 0.09 | 0.08 | |||||||||
| Class C: | 4/1/2004 - 3/31/2005 (4) | $ | 10.08 | $ | 0.04 | ($0.22 | ) | ($0.18 | ) | |||||
| 12/31/2003 - 3/31/2004 (4) | 10.00 | (0.01 | ) | 0.09 | 0.08 | |||||||||
| Distributions | |||||||||||||
| Dividends from Net Investment Income | Distributions from Capital Grains | Total Distributions | Net Asset Value, End of Year or Period | ||||||||||
| PF AIM Blue Chip Fund | |||||||||||||
| Class A: | 4/1/2004 - 3/31/2005 (4) | $ | — | $ | — | $ | — | $ | 10.14 | ||||
| 4/1/2003 - 3/31/2004 (4) | — | — | — | 10.19 | |||||||||
| 4/1/2002 - 3/31/2003 (4) | — | — | — | 8.05 | |||||||||
| 9/28/2001 - 3/31/2002 (4) | (0.03 | ) | (0.02 | ) | (0.05 | ) | 10.96 | ||||||
| Class B: | 4/1/2004 - 3/31/2005 (4) | $ | — | $ | — | $ | — | $ | 9.98 | ||||
| 4/1/2003 - 3/31/2004 (4) | — | — | — | 10.07 | |||||||||
| 4/1/2002 - 3/31/2003 (4) | — | — | — | 7.98 | |||||||||
| 9/28/2001 - 3/31/2002 (4) | (0.02 | ) | (0.02 | ) | (0.04 | ) | 10.94 | ||||||
| Class C: | 4/1/2004 - 3/31/2005 (4) | $ | — | $ | — | $ | — | $ | 9.97 | ||||
| 4/1/2003 - 3/31/2004 (4) | — | — | — | 10.06 | |||||||||
| 4/1/2002 - 3/31/2003 (4) | — | — | — | 7.98 | |||||||||
| 9/28/2001 - 3/31/2002 (4) | (0.03 | ) | (0.02 | ) | (0.05 | ) | 10.93 | ||||||
| PF AIM Aggressive Growth Fund | |||||||||||||
| Class A: | 4/1/2004 - 3/31/2005 (4) | $ | — | ($0.28 | ) | ($0.28 | ) | $ | 11.78 | ||||
| 4/1/2003 - 3/31/2004 (4) | — | — | — | 11.53 | |||||||||
| 4/1/2002 - 3/31/2003 (4) | — | — | — | 8.59 | |||||||||
| 9/28/2001 - 3/31/2002 (4) | (0.02 | ) | (0.07 | ) | (0.09 | ) | 11.63 | ||||||
| Class B: | 4/1/2004 - 3/31/2005 (4) | $ | — | ($0.28 | ) | ($0.28 | ) | $ | 11.59 | ||||
| 4/1/2003 - 3/31/2004 (4) | — | — | — | 11.41 | |||||||||
| 4/1/2002 - 3/31/2003 (4) | — | — | — | 8.53 | |||||||||
| 9/28/2001 - 3/31/2002 (4) | — | (0.07 | ) | (0.07 | ) | 11.61 | |||||||
| Class C: | 4/1/2004 - 3/31/2005 (4) | $ | — | ($0.28 | ) | ($0.28 | ) | $ | 11.61 | ||||
| 4/1/2003 - 3/31/2004 (4) | — | — | — | 11.42 | |||||||||
| 4/1/2002 - 3/31/2003 (4) | — | — | — | 8.55 | |||||||||
| 9/28/2001 - 3/31/2002 (4) | (0.01 | ) | (0.07 | ) | (0.08 | ) | 11.61 | ||||||
| PF Goldman Sachs Short Duration Bond Fund | |||||||||||||
| Class A: | 4/1/2004 - 3/31/2005 (4) | ($0.09 | ) | ($0.02 | ) | ($0.11 | ) | $ | 9.85 | ||||
| 12/31/2003 - 3/31/2004 (4) | — | — | — | 10.09 | |||||||||
| Class B: | 4/1/2004 - 3/31/2005 (4) | ($0.04 | ) | ($0.02 | ) | ($0.06 | ) | $ | 9.85 | ||||
| 12/31/2003 - 3/31/2004 (4) | — | — | — | 10.08 | |||||||||
| Class C: | 4/1/2004 - 3/31/2005 (4) | ($0.05 | ) | ($0.02 | ) | ($0.07 | ) | $ | 9.83 | ||||
| 12/31/2003 - 3/31/2004 (4) | — | — | — | 10.08 | |||||||||
| Ratios/Supplemental Data | |||||||||||||||||
| Total Returns(1) | Net Assets, End of Year or Period (in thousands) | Ratios of Expenses After Expense Reductions to Average Net Assets (2), (3) | Ratios of Expenses Before Expense Reductions to Average Net Assets (3) | Ratios of Net Investment Income (Loss) After Expense Reductions to Average Net Assets (3) | Ratios of Net Investment Income (Loss) Before Expense Reductions to Average Net Assets (2), (3) | Portfolio Turnover Rates | |||||||||||
| PF AIM Blue Chip Fund | |||||||||||||||||
| Class A: | 4/1/2004 - 3/31/2005 (4) | (0.49 | %) | $ | 45,147 | 1.90 | % | 2.37 | % | (0.08 | %) | (0.55 | %) | 38.40 | % | ||
| 4/1/2003 - 3/31/2004 (4) | 26.58 | % | 23,408 | 1.90 | % | 3.12 | % | (0.69 | %) | (1.91 | %) | 78.30 | % | ||||
| 4/1/2002 - 3/31/2003 (4) | (26.55 | %) | 7,922 | 1.90 | % | 3.94 | % | (0.67 | %) | (2.71 | %) | 35.58 | % | ||||
| 9/28/2001 - 3/31/2002 (4) | 10.09 | % | 10,867 | 1.90 | % | 5.99 | % | (0.92 | %) | (5.01 | %) | 12.63 | % | ||||
| Class B: | 4/1/2004 - 3/31/2005 (4) | (0.89 | %) | $ | 526 | 2.40 | % | 2.87 | % | (0.58 | %) | (1.05 | %) | 38.40 | % | ||
| 4/1/2003 - 3/31/2004 (4) | 26.19 | % | 497 | 2.40 | % | 3.62 | % | (1.19 | %) | (2.41 | %) | 78.30 | % | ||||
| 4/1/2002 - 3/31/2003 (4) | (27.06 | %) | 757 | 2.40 | % | 4.44 | % | (1.17 | %) | (3.21 | %) | 35.58 | % | ||||
| 9/28/2001 - 3/31/2002 (4) | 9.79 | % | 43 | 2.40 | % | 6.49 | % | (1.42 | %) | (5.51 | %) | 12.63 | % | ||||
| Class C: | 4/1/2004 - 3/31/2005 (4) | (0.89 | %) | $ | 1,367 | 2.40 | % | 2.87 | % | (0.58) | %) | (1.05 | %) | 38.40 | % | ||
| 4/1/2003 - 3/31/2004 (4) | 26.07 | % | 1,090 | 2.40 | % | 3.62 | % | (1.19 | %) | (2.41 | %) | 78.30 | % | ||||
| 4/1/2002 - 3/31/2003 (4) | (26.99 | %) | 1,467 | 2.40 | % | 4.44 | % | (1.17 | %) | (3.21 | %) | 35.58 | % | ||||
| 9/28/2001 - 3/31/2002 (4) | 9.74 | % | 154 | 2.40 | % | 6.49 | % | (1.42 | %) | (5.51 | %) | 12.63 | % | ||||
| PF AIM Aggressive Growth Fund | |||||||||||||||||
| Class A: | 4/1/2004 - 3/31/2005 (4) | 4.54 | % | $ | 7,116 | 1.95 | % | 3.38 | % | (1.36 | %) | (2.79 | %) | 201.57 | % | ||
| 4/1/2003 - 3/31/2004 (4) | 34.23 | % | 8,469 | 1.95 | % | 3.55 | % | (1.61 | %) | (3.21 | %) | 110.77 | % | ||||
| 4/1/2002 - 3/31/2003 (4) | (26.14 | %) | 5,031 | 1.95 | % | 4.27 | % | (1.66 | %) | (3.98 | %) | 71.87 | % | ||||
| 9/28/2001 - 3/31/2002 (4) | 17.21 | % | 7,654 | 1.95 | % | 6.84 | % | (1.67 | %) | (6.56 | %) | 44.75 | % | ||||
| Class B: | 4/1/2004 - 3/31/2005 (4) | 3.97 | % | $ | 283 | 2.45 | % | 3.88 | % | (1.86 | %) | (3.29 | %) | 201.57 | % | ||
| 4/1/2003 - 3/31/2004 (4) | 33.61 | % | 267 | 2.45 | % | 4.05 | % | (2.11 | %) | (3.71 | %) | 110.77 | % | ||||
| 4/1/2002 - 3/31/2003 (4) | (26.44 | %) | 63 | 2.45 | % | 4.77 | % | (2.16 | %) | (4.48 | %) | 71.87 | % | ||||
| 9/28/2001 - 3/31/2002 (4) | 16.84 | % | 12 | 2.45 | % | 7.34 | % | (2.17 | %) | (7.06 | %) | 44.75 | % | ||||
| Class C: | 4/1/2004 - 3/31/2005 (4) | 4.06 | % | $ | 585 | 2.45 | % | 3.88 | % | (1.86 | %) | (3.29 | %) | 201.57 | % | ||
| 4/1/2003 - 3/31/2004 (4) | 33.57 | % | 360 | 2.45 | % | 4.05 | % | (2.11 | %) | (3.71 | %) | 110.77 | % | ||||
| 4/1/2002 - 3/31/2003 (4) | (26.36 | %) | 115 | 2.45 | % | 4.77 | % | (2.16 | %) | (4.48 | %) | 71.87 | % | ||||
| 9/28/2001 - 3/31/2002 (4) | 16.91 | % | 25 | 2.45 | % | 7.34 | % | (2.17 | %) | (7.06 | %) | 44.75 | % | ||||
| PF Goldman Sachs Short Duration Bond Fund | |||||||||||||||||
| Class A: | 4/1/2004 - 3/31/2005 (4) | (1.34 | %) | $ | 35,333 | 1.55 | % | 2.34 | % | 0.93 | % | 0.14 | % | 203.81 | % | ||
| 12/31/2003 - 3/31/2004 (4) | 0.90 | % | 13,617 | 1.55 | % | 2.72 | % | 0.23 | % | (0.94 | %) | 144.88 | % | ||||
| Class B: | 4/1/2004 - 3/31/2005 (4) | (1.77 | %) | $ | 13 | 2.05 | % | 2.84 | % | 0.43 | % | (0.36 | %) | 203.81 | % | ||
| 12/31/2003 - 3/31/2004 (4) | 0.80 | % | 10 | 2.05 | % | 3.22 | % | (0.27 | %) | (1.44 | %) | 144.88 | % | ||||
| Class C: | 4/1/2004 - 3/31/2005 (4) | (1.81 | %) | $ | 579 | 2.05 | % | 2.84 | % | 0.43 | % | (0.36 | %) | 203.81 | % | ||
| 12/31/2003 - 3/31/2004 (4) | 0.80 | % | 62 | 2.05 | % | 3.22 | % | (0.27 | %) | (1.44 | %) | 144.88 | % | ||||
| See Notes to Financial Statements | See explanation of references on E-7 | |
| E-2 | ||
| PACIFIC FUNDS FINANCIAL HIGHLIGHTS (Continued) Selected per share, ratios and supplemental data for each year or period ended were as follows: |
| Investment Activities | |||||||||||||||
| Net Asset Value, Beginning of Year or Period | Net Investment Income (Loss) | Net Realized and Unrealized Gain (Loss) | Total from Investment Operations | ||||||||||||
| PF Janus Growth LT Fund | |||||||||||||||
| Class A: | 4/1/2004 - 3/31/2005 (4) | $ | 10.34 | ($0.05 | ) | $ | 0.35 | $ | 0.30 | ||||||
| 4/1/2003 - 3/31/2004 (4) | 7.62 | (0.10 | ) | 2.82 | 2.72 | ||||||||||
| 4/1/2002 - 3/31/2003 | 10.32 | (0.08 | ) | (2.62 | ) | (2.70 | ) | ||||||||
| 9/28/2001 - 3/31/2002 (4) | 10.00 | (0.04 | ) | 0.39 | 0.35 | ||||||||||
| Class B: | 4/1/2004 - 3/31/2005 (4) | $ | 10.24 | ($0.10 | ) | $ | 0.35 | $ | 0.25 | ||||||
| 4/1/2003 - 3/31/2004 (4) | 7.58 | (0.15 | ) | 2.81 | 2.66 | ||||||||||
| 4/1/2002 - 3/31/2003 | 10.30 | (0.06 | ) | (2.66 | ) | (2.72 | ) | ||||||||
| 9/28/2001 - 3/31/2002 (4) | 10.00 | (0.07 | ) | 0.40 | 0.33 | ||||||||||
| Class C: | 4/1/2004 - 3/31/2005 (4) | $ | 10.21 | ($0.10 | ) | $ | 0.35 | $ | 0.25 | ||||||
| 4/1/2003 - 3/31/2004 (4) | 7.57 | (0.15 | ) | 2.79 | 2.64 | ||||||||||
| 4/1/2002 - 3/31/2003 | 10.31 | (0.08 | ) | (2.66 | ) | (2.74 | ) | ||||||||
| 9/28/2001 - 3/31/2002 (4) | 10.00 | (0.07 | ) | 0.40 | 0.33 | ||||||||||
| PF Lazard Mid-Cap Value Fund | |||||||||||||||
| Class A: | 12/31/2004 - 3/31/2005 (4) | $ | 10.00 | ($0.01 | ) | ($0.09 | ) | ($0.10 | ) | ||||||
| Class B: | 12/31/2004 - 3/31/2005 (4) | $ | 10.00 | ($0.02 | ) | ($0.09 | ) | ($0.11 | ) | ||||||
| Class C: | 12/31/2004 - 3/31/2005 (4) | $ | 10.00 | ($0.02 | ) | ($0.09 | ) | ($0.11 | ) | ||||||
| PF Lazard International Value Fund | |||||||||||||||
| Class A: | 4/1/2004 - 3/31/2005 (4) | $ | 11.89 | $ | 0.08 | $ | 1.46 | $ | 1.54 | ||||||
| 4/1/2003 - 3/31/2004 (4) | 8.73 | 0.06 | 3.13 | 3.19 | |||||||||||
| 4/1/2002 - 3/31/2003 (4) | 11.09 | 0.07 | (2.33 | ) | (2.26 | ) | |||||||||
| 9/28/2001 - 3/31/2002 (4) | 10.00 | (0.02 | ) | 1.14 | 1.12 | ||||||||||
| Class B: | 4/1/2004 - 3/31/2005 (4) | $ | 11.73 | $ | 0.01 | $ | 1.45 | $ | 1.46 | ||||||
| 4/1/2003 - 3/31/2004 (4) | 8.66 | 0.02 | 3.07 | 3.09 | |||||||||||
| 4/1/2002 - 3/31/2003 (4) | 11.08 | 0.02 | (2.33 | ) | (2.31 | ) | |||||||||
| 9/28/2001 - 3/31/2002 (4) | 10.00 | (0.05 | ) | 1.14 | 1.09 | ||||||||||
| Class C: | 4/1/2004 - 3/31/2005 (4) | $ | 11.73 | $ | 0.01 | $ | 1.45 | $ | 1.46 | ||||||
| 4/1/2003 - 3/31/2004 (4) | 8.66 | 0.02 | 3.07 | 3.09 | |||||||||||
| 4/1/2002 - 3/31/2003 (4) | 11.07 | 0.02 | (2.32 | ) | (2.30 | ) | |||||||||
| 9/28/2001 - 3/31/2002 (4) | 10.00 | (0.05 | ) | 1.14 | 1.09 | ||||||||||
| Distributions | |||||||||||||||
| Dividends from Net Investment Income | Distributions from Capital Gains | Total Distributions | Net Asset Value, End of Year or Period | ||||||||||||
| PF Janus Growth LT Fund | |||||||||||||||
| Class A: | 4/1/2004 - 3/31/2005 (4) | $ | — | $ | — | $ | — | $ | 10.64 | ||||||
| 4/1/2003 - 3/31/2004 (4) | — | — | — | 10.34 | |||||||||||
| 4/1/2002 - 3/31/2003 | — | — | — | 7.62 | |||||||||||
| 9/28/2001 - 3/31/2002 (4) | (0.03 | ) | — | (0.03 | ) | 10.32 | |||||||||
| Class B: | 4/1/2004 - 3/31/2005 (4) | $ | — | $ | — | $ | — | $ | 10.49 | ||||||
| 4/1/2003 - 3/31/2004 (4) | — | — | — | 10.24 | |||||||||||
| 4/1/2002 - 3/31/2003 | — | — | — | 7.58 | |||||||||||
| 9/28/2001 - 3/31/2002 (4) | (0.03 | ) | — | (0.03 | ) | 10.30 | |||||||||
| Class C: | 4/1/2004 - 3/31/2005 (4) | $ | — | $ | — | $ | — | $ | 10.46 | ||||||
| 4/1/2003 - 3/31/2004 (4) | — | — | — | 10.21 | |||||||||||
| 4/1/2002 - 3/31/2003 | — | — | — | 7.57 | |||||||||||
| 9/28/2001 - 3/31/2002 (4) | (0.02 | ) | — | (0.02 | ) | 10.31 | |||||||||
| PF Lazard Mid-Cap Value Fund | |||||||||||||||
| Class A: | 12/31/2004 - 3/31/2005 (4) | $ | — | $ | — | $ | — | $ | 9.90 | ||||||
| Class B: | 12/31/2004 - 3/31/2005 (4) | $ | — | $ | — | $ | — | $ | 9.89 | ||||||
| Class C: | 12/31/2004 - 3/31/2005 (4) | $ | — | $ | — | $ | — | $ | 9.89 | ||||||
| PF Lazard International Value Fund | |||||||||||||||
| Class A: | 4/1/2004 - 3/31/2005 (4) | ($0.02 | ) | ($0.19 | ) | ($0.21 | ) | $ | 13.22 | ||||||
| 4/1/2003 - 3/31/2004 (4) | (0.03 | ) | — | (0.03 | ) | 11.89 | |||||||||
| 4/1/2002 - 3/31/2003 (4) | (0.04 | ) | (0.06 | ) | (0.10 | ) | 8.73 | ||||||||
| 9/28/2001 - 3/31/2002 (4) | (0.03 | ) | — | (0.03 | ) | 11.09 | |||||||||
| Class B: | 4/1/2004 - 3/31/2005 (4) | $ | — | ($0.19 | ) | ($0.19 | ) | $ | 13.00 | ||||||
| 4/1/2003 - 3/31/2004 (4) | (0.02 | ) | — | (0.02 | ) | 11.73 | |||||||||
| 4/1/2002 - 3/31/2003 (4) | (0.05 | ) | (0.06 | ) | (0.11 | ) | 8.66 | ||||||||
| 9/28/2001 - 3/31/2002 (4) | (0.01 | ) | — | (0.01 | ) | 11.08 | |||||||||
| Class C: | 4/1/2004 - 3/31/2005 (4) | $ | — | ($0.19 | ) | ($0.19 | ) | $ | 13.00 | ||||||
| 4/1/2003 - 3/31/2004 (4) | (0.02 | ) | — | (0.02 | ) | 11.73 | |||||||||
| 4/1/2002 - 3/31/2003 (4) | (0.05 | ) | (0.06 | ) | (0.11 | ) | 8.66 | ||||||||
| 9/28/2001 - 3/31/2002 (4) | (0.02 | ) | — | (0.02 | ) | 11.07 | |||||||||
| Ratios/Supplemental Data | |||||||||||||||||||||||
| Total Returns (1) | Net Assets, End of Year or Period (in thousands) | Ratios of Expenses After Expense Reductions to Average Net Assets (2), (3) | Ratios of Expenses Before Expense Reductions to Average Net Assets (3) | Ratios of Net Investment Income (Loss) After Expense Reductions to Average Net Assets (3) | Ratios of Net Investment Loss Before Expense Reductions to Average Net Assets (2), (3) | Portfolio Turnover Rates | |||||||||||||||||
| PF Janus Growth LT Fund | |||||||||||||||||||||||
| Class A: | 4/1/2004 - 3/31/2005 (4) | 2.90 | % | $ | 19,585 | 1.70 | % | 2.54 | % | (0.44 | %) | (1.28 | %) | 42.84 | % | ||||||||
| 4/1/2003 - 3/31/2004 (4) | 35.70 | % | 11,994 | 1.70 | % | 3.21 | % | (1.08 | %) | (2.59 | %) | 42.65 | % | ||||||||||
| 4/1/2002 - 3/31/2003 | (26.16 | %) | 6,832 | 1.70 | % | 4.01 | % | (0.95 | %) | (3.26 | %) | 124.73 | % | ||||||||||
| 9/28/2001 - 3/31/2002 (4) | 3.50 | % | 9,819 | 1.70 | % | 6.29 | % | (0.78 | %) | (5.37 | %) | 64.33 | % | ||||||||||
| Class B: | 4/1/2004 - 3/31/2005 (4) | 2.44 | % | $ | 373 | 2.20 | % | 3.04 | % | (0.94 | %) | (1.78 | %) | 42.84 | % | ||||||||
| 4/1/2003 - 3/31/2004 (4) | 34.91 | % | 293 | 2.20 | % | 3.71 | % | (1.58 | %) | (3.09 | %) | 42.65 | % | ||||||||||
| 4/1/2002 - 3/31/2003 | (26.31 | %) | 301 | 2.20 | % | 4.51 | % | (1.45 | %) | (3.76 | %) | 124.73 | % | ||||||||||
| 9/28/2001 - 3/31/2002 (4) | 3.27 | % | 57 | 2.20 | % | 6.79 | % | (1.28 | %) | (5.87 | %) | 64.33 | % | ||||||||||
| Class C: | 4/1/2004 - 3/31/2005 (4) | 2.45 | % | $ | 472 | 2.20 | % | 3.04 | % | (0.94 | %) | (1.78 | %) | 42.84 | % | ||||||||
| 4/1/2003 - 3/31/2004 (4) | 34.87 | % | 400 | 2.20 | % | 3.71 | % | (1.58 | %) | (3.09 | %) | 42.65 | % | ||||||||||
| 4/1/2002 - 3/31/2003 | (26.58 | %) | 624 | 2.20 | % | 4.51 | % | (1.45 | %) | (3.76 | %) | 124.73 | % | ||||||||||
| 9/28/2001 - 3/31/2002 (4) | 3.33 | % | 84 | 2.20 | % | 6.79 | % | (1.28 | %) | (5.87 | %) | 64.33 | % | ||||||||||
| PF Lazard Mid-Cap Value Fund | |||||||||||||||||||||||
| Class A: | 12/31/2004 - 3/31/2005 (4) | (1.00 | %) | $ | 25,454 | 1.80 | % | 3.20 | % | (0.42 | %) | (1.82 | %) | 16.26 | % | ||||||||
| Class B: | 12/31/2004 - 3/31/2005 (4) | (1.10 | %) | $ | 33 | 2.30 | % | 3.70 | % | (0.92 | %) | (2.32 | %) | 16.26 | % | ||||||||
| Class C: | 12/31/2004 - 3/31/2005 (4) | (1.10 | %) | $ | 73 | 2.30 | % | 3.70 | % | (0.92 | %) | (2.32 | %) | 16.26 | % | ||||||||
| PF Lazard International Value Fund | |||||||||||||||||||||||
| Class A: | 4/1/2004 - 3/31/2005 (4) | 13.13 | % | $ | 50,801 | 1.80 | % | 2.45 | % | 0.62 | % | (0.03 | %) | 20.92 | % | ||||||||
| 4/1/2003 - 3/31/2004 (4) | 36.57 | % | 20,007 | 1.80 | % | 2.86 | % | 0.73 | % | (0.33 | %) | 58.63 | % | ||||||||||
| 4/1/2002 - 3/31/2003 (4) | (20.50 | %) | 7,218 | 1.80 | % | 3.89 | % | 0.76 | % | (1.33 | %) | 19.60 | % | ||||||||||
| 9/28/2001 - 3/31/2002 (4) | 11.21 | % | 7,817 | 1.80 | % | 7.07 | % | (0.35 | %) | (5.62 | %) | 7.11 | % | ||||||||||
| Class B: | 4/1/2004 - 3/31/2005 (4) | 12.59 | % | $ | 449 | 2.30 | % | 2.95 | % | 0.12 | % | (0.53 | %) | 20.92 | % | ||||||||
| 4/1/2003 - 3/31/2004 (4) | 35.79 | % | 324 | 2.30 | % | 3.36 | % | 0.23 | % | (0.83 | %) | 58.63 | % | ||||||||||
| 4/1/2002 - 3/31/2003 (4) | (20.93 | %) | 771 | 2.30 | % | 4.39 | % | 0.26 | % | (1.83 | %) | 19.60 | % | ||||||||||
| 9/28/2001 - 3/31/2002 (4) | 10.95 | % | 26 | 2.30 | % | 7.57 | % | (0.85 | %) | (6.12 | %) | 7.11 | % | ||||||||||
| Class C: | 4/1/2004 - 3/31/2005 (4) | 12.59 | % | $ | 1,212 | 2.30 | % | 2.95 | % | 0.12 | % | (0.53 | %) | 20.92 | % | ||||||||
| 4/1/2003 - 3/31/2004 (4) | 35.79 | % | 781 | 2.30 | % | 3.36 | % | 0.23 | % | (0.83 | %) | 58.63 | % | ||||||||||
| 4/1/2002 - 3/31/2003 (4) | (20.93 | %) | 1,656 | 2.30 | % | 4.39 | % | 0.26 | % | (1.83 | %) | 19.60 | % | ||||||||||
| 9/28/2001 - 3/31/2002 (4) | 10.91 | % | 143 | 2.30 | % | 7.57 | % | (0.85 | %) | (6.12 | %) | 7.11 | % | ||||||||||
| See Notes to Financial Statements | See explanation of references on E-7 | |
| E-3 | ||
| PACIFIC FUNDS FINANCIAL HIGHLIGHTS (Continued) Selected per share, ratios and supplemental data for each year or period ended were as follows: |
| Investment Activities | |||||||||||||
| Net Asset Value, Beginnig of Year or Period | Net Investment Income (Loss) | Net Realized and Unrealized Gain (Loss) | Total from Investment Operations | ||||||||||
| PF MFS International Large-Cap Fund (5) | |||||||||||||
| Class A: | 4/1/2004 - 3/31/2005 (4) | $ | 11.61 | ($0.01 | ) | $ | 1.46 | $ | 1.45 | ||||
| 4/1/2003 - 3/31/2004 (4) | 8.20 | (0.04 | ) | 3.45 | 3.41 | ||||||||
| 4/1/2002 - 3/31/2003 (4) | 11.03 | (0.04 | ) | (2.59 | ) | (2.63 | ) | ||||||
| 9/28/2001 - 3/31/2002 (4) | 10.00 | (0.05 | ) | 1.10 | 1.05 | ||||||||
| Class B: | 4/1/2004 - 3/31/2005 (4) | $ | 11.46 | ($0.07 | ) | $ | 1.44 | $ | 1.37 | ||||
| 4/1/2003 - 3/31/2004 (4) | 8.14 | (0.09 | ) | 3.41 | 3.32 | ||||||||
| 4/1/2002 - 3/31/2003 (4) | 11.01 | (0.08 | ) | (2.59 | ) | (2.67 | ) | ||||||
| 9/28/2001 - 3/31/2002 (4) | 10.00 | (0.08 | ) | 1.10 | 1.02 | ||||||||
| Class C: | 4/1/2004 - 3/31/2005 (4) | $ | 11.48 | ($0.07 | ) | $ | 1.44 | $ | 1.37 | ||||
| 4/1/2003 - 3/31/2004 (4) | 8.14 | (0.09 | ) | 3.43 | 3.34 | ||||||||
| 4/1/2002 - 3/31/2003 (4) | 11.01 | (0.08 | ) | (2.59 | ) | (2.67 | ) | ||||||
| 9/28/2001 - 3/31/2002 (4) | 10.00 | (0.08 | ) | 1.10 | 1.02 | ||||||||
| PF PIMCO Inflation Managed Fund | |||||||||||||
| Class A: | 4/1/2004 - 3/31/2005 (4) | $ | 10.93 | $ | 0.20 | ($0.01 | ) | $ | 0.19 | ||||
| 4/1/2003 - 3/31/2004 (4) | 10.28 | 0.12 | 0.96 | 1.08 | |||||||||
| 12/31/2002 - 3/31/2003 (4) | 10.00 | 0.06 | 0.27 | 0.33 | |||||||||
| Class B: | 4/1/2004 - 3/31/2005 (4) | $ | 10.89 | $ | 0.15 | ($0.02 | ) | $ | 0.13 | ||||
| 4/1/2003 - 3/31/2004 (4) | 10.27 | 0.07 | 0.95 | 1.02 | |||||||||
| 12/31/2002 - 3/31/2003 (4) | 10.00 | 0.04 | 0.28 | 0.32 | |||||||||
| Class C: | 4/1/2004 - 3/31/2005 (4) | $ | 10.89 | $ | 0.15 | ($0.01 | ) | $ | 0.14 | ||||
| 4/1/2003 - 3/31/2004 (4) | 10.27 | 0.07 | 0.95 | 1.02 | |||||||||
| 12/31/2002 - 3/31/2003 (4) | 10.00 | 0.04 | 0.28 | 0.32 | |||||||||
| PF PIMCO Managed Bond Fund | |||||||||||||
| Class A: | 4/1/2004 - 3/31/2005 (4) | $ | 10.45 | $ | 0.14 | ($0.09 | ) | $ | 0.05 | ||||
| 4/1/2003 - 3/31/2004 (4) | 10.16 | 0.17 | 0.46 | 0.63 | |||||||||
| 4/1/2002 - 3/31/2003 (4) | 9.85 | 0.21 | 1.02 | 1.23 | |||||||||
| 9/28/2001 - 3/31/2002 | 10.00 | 0.06 | (0.09 | ) | (0.03 | ) | |||||||
| Class B: | 4/1/2004 - 3/31/2005 (4) | $ | 10.44 | $ | 0.09 | ($0.10 | ) | ($0.01 | ) | ||||
| 4/1/2003 - 3/31/2004 (4) | 10.14 | 0.12 | 0.46 | 0.58 | |||||||||
| 4/1/2002 - 3/31/2003 (4) | 9.84 | 0.15 | 1.03 | 1.18 | |||||||||
| 9/28/2001 - 3/31/2002 | 10.00 | 0.04 | (0.10 | ) | (0.06 | ) | |||||||
| Class C: | 4/1/2004 - 3/31/2005 (4) | $ | 10.44 | $ | 0.09 | ($0.09 | ) | $ | — | ||||
| 4/1/2003 - 3/31/2004 (4) | 10.14 | 0.12 | 0.46 | 0.58 | |||||||||
| 4/1/2002 - 3/31/2003 (4) | 9.84 | 0.15 | 1.03 | 1.18 | |||||||||
| 9/28/2001 - 3/31/2002 | 10.00 | 0.04 | (0.10 | ) | (0.06 | ) | |||||||
| Distributions | |||||||||||
| Dividends from Net Investment Income | Distributions from Capital Grains | Total Distributions | Net Asset Value, End of Year or Period | ||||||||
| PF MFS International Large-Cap Fund (5) | |||||||||||
| Class A: | 4/1/2004 - 3/31/2005 (4) | $ | — | ($0.23 | ) | ($0.23 | ) | $ | 12.83 | ||
| 4/1/2003 - 3/31/2004 (4) | — | — | — | 11.61 | |||||||
| 4/1/2002 - 3/31/2003 (4) | — | (0.20 | ) | (0.20 | ) | 8.20 | |||||
| 9/28/2001 - 3/31/2002 (4) | (0.01 | ) | (0.01 | ) | (0.02 | ) | 11.03 | ||||
| Class B: | 4/1/2004 - 3/31/2005 (4) | $ | — | ($0.23 | ) | ($0.23 | ) | $ | 12.60 | ||
| 4/1/2003 - 3/31/2004 (4) | — | — | — | 11.46 | |||||||
| 4/1/2002 - 3/31/2003 (4) | — | (0.20 | ) | (0.20 | ) | 8.14 | |||||
| 9/28/2001 - 3/31/2002 (4) | — | (0.01 | ) | (0.01 | ) | 11.01 | |||||
| Class C: | 4/1/2004 - 3/31/2005 (4) | $ | — | ($0.23 | ) | ($0.23 | ) | $ | 12.62 | ||
| 4/1/2003 - 3/31/2004 (4) | — | — | — | 11.48 | |||||||
| 4/1/2002 - 3/31/2003 (4) | — | (0.20 | ) | (0.20 | ) | 8.14 | |||||
| 9/28/2001 - 3/31/2002 (4) | — | (0.01 | ) | (0.01 | ) | 11.01 | |||||
| PF PIMCO Inflation Managed Fund | |||||||||||
| Class A: | 4/1/2004 - 3/31/2005 (4) | ($0.26 | ) | ($0.35 | ) | ($0.61 | ) | $ | 10.51 | ||
| 4/1/2003 - 3/31/2004 (4) | (0.20 | ) | (0.23 | ) | (0.43 | ) | 10.93 | ||||
| 12/31/2002 - 3/31/2003 (4) | (0.05 | ) | — | (0.05 | ) | 10.28 | |||||
| Class B: | 4/1/2004 - 3/31/2005 (4) | ($0.22 | ) | ($0.35 | ) | ($0.57 | ) | $ | 10.45 | ||
| 4/1/2003 - 3/31/2004 (4) | (0.17 | ) | (0.23 | ) | (0.40 | ) | 10.89 | ||||
| 12/31/2002 - 3/31/2003 (4) | (0.05 | ) | — | (0.05 | ) | 10.27 | |||||
| Class C: | 4/1/2004 - 3/31/2005 (4) | ($0.23 | ) | ($0.35 | ) | ($0.58 | ) | $ | 10.45 | ||
| 4/1/2003 - 3/31/2004 (4) | (0.17 | ) | (0.23 | ) | (0.40 | ) | 10.89 | ||||
| 12/31/2002 - 3/31/2003 (4) | (0.05 | ) | — | (0.05 | ) | 10.27 | |||||
| PF PIMCO Managed Bond Fund | |||||||||||
| Class A: | 4/1/2004 - 3/31/2005 (4) | ($0.25 | ) | ($0.22 | ) | ($0.47 | ) | $ | 10.03 | ||
| 4/1/2003 - 3/31/2004 (4) | (0.34 | ) | — | (0.34 | ) | 10.45 | |||||
| 4/1/2002 - 3/31/2003 (4) | (0.36 | ) | (0.56 | ) | (0.92 | ) | 10.16 | ||||
| 9/28/2001 - 3/31/2002 | (0.07 | ) | (0.05 | ) | (0.12 | ) | 9.85 | ||||
| Class B: | 4/1/2004 - 3/31/2005 (4) | ($0.20 | ) | ($0.22 | ) | ($0.42 | ) | $ | 10.01 | ||
| 4/1/2003 - 3/31/2004 (4) | (0.28 | ) | — | (0.28 | ) | 10.44 | |||||
| 4/1/2002 - 3/31/2003 (4) | (0.32 | ) | (0.56 | ) | (0.88 | ) | 10.14 | ||||
| 9/28/2001 - 3/31/2002 | (0.05 | ) | (0.05 | ) | (0.10 | ) | 9.84 | ||||
| Class C: | 4/1/2004 - 3/31/2005 (4) | ($0.20 | ) | ($0.22 | ) | ($0.42 | ) | $ | 10.02 | ||
| 4/1/2003 - 3/31/2004 (4) | (0.28 | ) | — | (0.28 | ) | 10.44 | |||||
| 4/1/2002 - 3/31/2003 (4) | (0.32 | ) | (0.56 | ) | (0.88 | ) | 10.14 | ||||
| 9/28/2001 - 3/31/2002 | (0.05 | ) | (0.05 | ) | (0.10 | ) | 9.84 | ||||
| Ratios/Supplemental Data | |||||||||||||||||
| Total Returns(1) | Net Assets, End of Year or Period (in thousands) | Ratios of Expenses After Expense Reductions to Average Net Assets (2), (3) | Ratios of Expenses Before Expense Reductions to Average Net Assets (3) | Ratios of Net Investment Income (Loss) After Expense Reductions to Average Net Assets (3) | Ratios of Net Investment Income (Loss) Before Expense Reductions to Average Net Assets (2), (3) | Portfolio Turnover Rates | |||||||||||
| PF MFS International Large-Cap Fund (5) | |||||||||||||||||
| Class A: | 4/1/2004 - 3/31/2005 (4) | 12.73 | % | $ | 38,195 | 2.00 | % | 3.35 | % | (0.12 | %) | (1.47 | %) | 55.12 | % | ||
| 4/1/2003 - 3/31/2004 (4) | 41.59 | % | 15,358 | 2.03 | % | 5.96 | % | (0.38 | %) | (4.31 | %) | 150.05 | % | ||||
| 4/1/2002 - 3/31/2003 (4) | (24.11 | %) | 4,505 | 2.05 | % | 9.08 | % | (0.40 | %) | (7.43 | %) | 137.37 | % | ||||
| 9/28/2001 - 3/31/2002 (4) | 10.54 | % | 6,808 | 2.05 | % | 9.38 | % | (0.92 | %) | (8.25 | %) | 77.66 | % | ||||
| Class B: | 4/1/2004 - 3/31/2005 (4) | 12.18 | % | $ | 391 | 2.50 | % | 3.85 | % | (0.62 | %) | (1.97 | %) | 55.12 | % | ||
| 4/1/2003 - 3/31/2004 (4) | 40.79 | % | 265 | 2.53 | % | 6.46 | % | (0.88 | %) | (4.81 | %) | 150.05 | % | ||||
| 4/1/2002 - 3/31/2003 (4) | (24.52 | %) | 58 | 2.55 | % | 9.58 | % | (0.90 | %) | (7.93 | %) | 137.37 | % | ||||
| 9/28/2001 - 3/31/2002 (4) | 10.24 | % | 22 | 2.55 | % | 9.88 | % | (1.42 | %) | (8.75 | %) | 77.66 | % | ||||
| Class C: | 4/1/2004 - 3/31/2005 (4) | 12.16 | % | $ | 593 | 2.50 | % | 3.85 | % | (0.62 | %) | (1.97 | %) | 55.12 | % | ||
| 4/1/2003 - 3/31/2004 (4) | 40.86 | % | 222 | 2.53 | % | 6.46 | % | (0.88 | %) | (4.81 | %) | 150.05 | % | ||||
| 4/1/2002 - 3/31/2003 (4) | (24.43 | %) | 79 | 2.55 | % | 9.58 | % | (0.90 | %) | (7.93 | %) | 137.37 | % | ||||
| 9/28/2001 - 3/31/2002 (4) | 10.24 | % | 11 | 2.55 | % | 9.88 | % | (1.42 | %) | (8.75 | %) | 77.66 | % | ||||
| PF PIMCO Inflation Managed Fund | |||||||||||||||||
| Class A: | 4/1/2004 - 3/31/2005 (4) | 1.99 | % | $ | 36,465 | 1.55 | % | 2.04 | % | 1.96 | % | 1.47 | % | 284.19 | % | ||
| 4/1/2003 - 3/31/2004 (4) | 10.75 | % | 16,263 | 1.55 | % | 2.73 | % | 1.13 | % | (0.05 | %) | 507.96 | % | ||||
| 12/31/2002 - 3/31/2003 (4) | 3.30 | % | 6,290 | 1.55 | % | 4.00 | % | 2.19 | % | (0.26 | %) | 199.92 | % | ||||
| Class B: | 4/1/2004 - 3/31/2005 (4) | 1.43 | % | $ | 1,199 | 2.05 | % | 2.54 | % | 1.46 | % | 0.97 | % | 284.19 | % | ||
| 4/1/2003 - 3/31/2004 (4) | 10.20 | % | 697 | 2.05 | % | 3.23 | % | 0.63 | % | (0.55 | %) | 507.96 | % | ||||
| 12/31/2002 - 3/31/2003 (4) | 3.16 | % | 161 | 2.05 | % | 4.50 | % | 1.69 | % | (0.76 | %) | 199.92 | % | ||||
| Class C: | 4/1/2004 - 3/31/2005 (4) | 1.44 | % | $ | 5,682 | 2.05 | % | 2.54 | % | 1.46 | % | 0.97 | % | 284.19 | % | ||
| 4/1/2003 - 3/31/2004 (4) | 10.27 | % | 4,065 | 2.05 | % | 3.23 | % | 0.63 | % | (0.55 | %) | 507.96 | % | ||||
| 12/31/2002 - 3/31/2003 (4) | 3.11 | % | 480 | 2.05 | % | 4.50 | % | 1.69 | % | (0.76 | %) | 199.92 | % | ||||
| PF PIMCO Managed Bond Fund | |||||||||||||||||
| Class A: | 4/1/2004 - 3/31/2005 (4) | 0.56 | % | $ | 42,546 | 1.55 | % | 2.22 | % | 1.37 | % | 0.70 | % | 323.24 | % | ||
| 4/1/2003 - 3/31/2004 (4) | 6.28 | % | 19,802 | 1.55 | % | 2.86 | % | 1.65 | % | 0.34 | % | 459.70 | % | ||||
| 4/1/2002 - 3/31/2003 (4) | 12.80 | % | 18,236 | 1.55 | % | 2.82 | % | 2.02 | % | 0.75 | % | 445.26 | % | ||||
| 9/28/2001 - 3/31/2002 | (0.28 | %) | 33,055 | 1.55 | % | 2.54 | % | 1.16 | % | 0.17 | % | 522.25 | % | ||||
| Class B: | 4/1/2004 - 3/31/2005 (4) | (0.05 | %) | $ | 1,135 | 2.05 | % | 2.72 | % | 0.87 | % | 0.20 | % | 323.24 | % | ||
| 4/1/2003 - 3/31/2004 (4) | 5.86 | % | 972 | 2.05 | % | 3.36 | % | 1.15 | % | (0.16 | %) | 459.70 | % | ||||
| 4/1/2002 - 3/31/2003 (4) | 12.27 | % | 1,986 | 2.05 | % | 3.32 | % | 1.52 | % | 0.25 | % | 445.26 | % | ||||
| 9/28/2001 - 3/31/2002 | (0.55 | %) | 173 | 2.05 | % | 3.04 | % | 0.66 | % | (0.33 | %) | 522.25 | % | ||||
| Class C: | 4/1/2004 - 3/31/2005 (4) | 0.04 | % | $ | 2,353 | 2.05 | % | 2.72 | % | 0.87 | % | 0.20 | % | 323.24 | % | ||
| 4/1/2003 - 3/31/2004 (4) | 5.86 | % | 2,315 | 2.05 | % | 3.36 | % | 1.15 | % | (0.16 | %) | 459.70 | % | ||||
| 4/1/2002 - 3/31/2003 (4) | 12.28 | % | 4,573 | 2.05 | % | 3.32 | % | 1.52 | % | 0.25 | % | 445.26 | % | ||||
| 9/28/2001 - 3/31/2002 | (0.57 | %) | 370 | 2.05 | % | 3.04 | % | 0.66 | % | (0.33 | %) | 522.25 | % | ||||
| See Notes to Financial Statements | See explanation of references on E-7 | |
| E-4 | ||
| PACIFIC FUNDS FINANCIAL HIGHLIGHTS (Continued) Selected per share, ratios and supplemental data for each year or period ended were as follows: |
| Investment Activities | ||||||||||||||||||||||
Net Asset | Net | Net | Total | |||||||||||||||||||
| PF Pacific Life Money Market Fund | ||||||||||||||||||||||
| Class A: | 4/1/2004 - 3/31/2005 | $ | 1.00 | $ | 0.01 | $ | — | $ | 0.01 | |||||||||||||
| 4/1/2003 - 3/31/2004 | 1.00 | — | (6) | — | — | |||||||||||||||||
| 4/1/2002 - 3/31/2003 | 1.00 | 0.01 | — | 0.01 | ||||||||||||||||||
| 9/28/2001 - 3/31/2002 | 1.00 | — | (6) | — | — | |||||||||||||||||
| Class B: | 4/1/2004 - 3/31/2005 | $ | 1.00 | $ | — | (6) | $ | — | $ | — | ||||||||||||
| 4/1/2003 - 3/31/2004 | 1.00 | — | (6) | — | — | |||||||||||||||||
| 4/1/2002 - 3/31/2003 | 1.00 | — | (6) | — | — | |||||||||||||||||
| 9/28/2001 - 3/31/2002 | 1.00 | — | (6) | — | — | |||||||||||||||||
| Class C: | 4/1/2004 - 3/31/2005 | $ | 1.00 | $ | — | (6) | $ | — | $ | — | ||||||||||||
| 4/1/2003 - 3/31/2004 | 1.00 | — | (6) | — | — | |||||||||||||||||
| 4/1/2002 - 3/31/2003 | 1.00 | — | (6) | — | — | |||||||||||||||||
| 9/28/2001 - 3/31/2002 | 1.00 | — | (6) | — | — | |||||||||||||||||
| PF Salomon Brothers Large-Cap Value Fund | ||||||||||||||||||||||
| Class A: | 4/1/2004 - 3/31/2005 (4) | $ | 10.94 | $ | 0.06 | $ | 0.35 | $ | 0.41 | |||||||||||||
| 4/1/2003 - 3/31/2004 (4) | 7.83 | 0.03 | 3.09 | 3.12 | ||||||||||||||||||
| 4/1/2002 - 3/31/2003 (4) | 10.92 | 0.04 | (3.05 | ) | (3.01 | ) | ||||||||||||||||
| 9/28/2001 - 3/31/2002 (4) | 10.00 | (0.01 | ) | 0.96 | 0.95 | |||||||||||||||||
| Class B: | 4/1/2004 - 3/31/2005 (4) | $ | 10.83 | $ | — | $ | 0.36 | $ | 0.36 | |||||||||||||
| 4/1/2003 - 3/31/2004 (4) | 7.78 | (0.02 | ) | 3.08 | 3.06 | |||||||||||||||||
| 4/1/2002 - 3/31/2003 (4) | 10.91 | (0.01 | ) | (3.03 | ) | (3.04 | ) | |||||||||||||||
| 9/28/2001 - 3/31/2002 (4) | 10.00 | (0.03 | ) | 0.97 | 0.94 | |||||||||||||||||
| Class C: | 4/1/2004 - 3/31/2005 (4) | $ | 10.81 | $ | — | $ | 0.35 | $ | 0.35 | |||||||||||||
| 4/1/2003 - 3/31/2004 (4) | 7.77 | (0.02 | ) | 3.07 | 3.05 | |||||||||||||||||
| 4/1/2002 - 3/31/2003 (4) | 10.90 | (0.01 | ) | (3.04 | ) | (3.05 | ) | |||||||||||||||
| 9/28/2001 - 3/31/2002 (4) | 10.00 | (0.03 | ) | 0.96 | 0.93 | |||||||||||||||||
| Distributions | |||||||||||||||||||||
| Dividends from Net Investment Income | Distributions | Total | Net Asset | ||||||||||||||||||
| PF Pacific Life Money Market Fund | |||||||||||||||||||||
| Class A: | 4/1/2004 - 3/31/2005 | ($0.01 | ) | $ | — | ($0.01 | ) | $ | 1.00 | ||||||||||||
| 4/1/2003 - 3/31/2004 | — | (6) | — | — | 1.00 | ||||||||||||||||
| 4/1/2002 - 3/31/2003 | (0.01 | ) | — | (0.01 | ) | 1.00 | |||||||||||||||
| 9/28/2001 - 3/31/2002 | — | (6) | — | — | 1.00 | ||||||||||||||||
| Class B: | 4/1/2004 - 3/31/2005 | $ | — | (6) | $ | — | $ | — | $ | 1.00 | |||||||||||
| 4/1/2003 - 3/31/2004 | — | (6) | — | — | 1.00 | ||||||||||||||||
| 4/1/2002 - 3/31/2003 | — | (6) | — | — | 1.00 | ||||||||||||||||
| 9/28/2001 - 3/31/2002 | — | (6) | — | — | 1.00 | ||||||||||||||||
| Class C: | 4/1/2004 - 3/31/2005 | $ | — | (6) | $ | — | $ | — | $ | 1.00 | |||||||||||
| 4/1/2003 - 3/31/2004 | — | (6) | — | — | 1.00 | ||||||||||||||||
| 4/1/2002 - 3/31/2003 | — | (6) | — | — | 1.00 | ||||||||||||||||
| 9/28/2001 - 3/31/2002 | — | (6) | — | — | 1.00 | ||||||||||||||||
| PF Salomon Brothers Large-Cap Value Fund | |||||||||||||||||||||
| Class A: | 4/1/2004 - 3/31/2005 (4) | ($0.05 | ) | $ | — | ($0.05 | ) | $ | 11.30 | ||||||||||||
| 4/1/2003 - 3/31/2004 (4) | (0.01 | ) | — | (0.01 | ) | 10.94 | |||||||||||||||
| 4/1/2002 - 3/31/2003 (4) | (0.02 | ) | (0.06 | ) | (0.08 | ) | 7.83 | ||||||||||||||
| 9/28/2001 - 3/31/2002 (4) | (0.02 | ) | (0.01 | ) | (0.03 | ) | 10.92 | ||||||||||||||
| Class B: | 4/1/2004 - 3/31/2005 (4) | $ | — | $ | — | $ | — | $ | 11.19 | ||||||||||||
| 4/1/2003 - 3/31/2004 (4) | (0.01 | ) | — | (0.01 | ) | 10.83 | |||||||||||||||
| 4/1/2002 - 3/31/2003 (4) | (0.03 | ) | (0.06 | ) | (0.09 | ) | 7.78 | ||||||||||||||
| 9/28/2001 - 3/31/2002 (4) | (0.02 | ) | (0.01 | ) | (0.03 | ) | 10.91 | ||||||||||||||
| Class C: | 4/1/2004 - 3/31/2005 (4) | $ | — | $ | — | $ | — | $ | 11.16 | ||||||||||||
| 4/1/2003 - 3/31/2004 (4) | (0.01 | ) | — | (0.01 | ) | 10.81 | |||||||||||||||
| 4/1/2002 - 3/31/2003 (4) | (0.02 | ) | (0.06 | ) | (0.08 | ) | 7.77 | ||||||||||||||
| 9/28/2001 - 3/31/2002 (4) | (0.02 | ) | (0.01 | ) | (0.03 | ) | 10.90 | ||||||||||||||
| Ratios/Supplemental Data | |||||||||||||||||||||
Total | Net |
| Ratios of Expenses Before Expense Reduc- tions to Average Net Assets (3) |
| Ratios of Net Invest- ment Income (Loss) Before Expense Reduc- tions to Average Net Assets (2),(3) | Port- folio Turnover Rates | |||||||||||||||
| PF Pacific Life Money Market Fund | |||||||||||||||||||||
| Class A: | 4/1/2004 - 3/31/2005 | 0.77 | % | $ | 22,341 | 0.95 | % | 2.05% | 0.83 | % | (0.27%) | N/A | |||||||||
| 4/1/2003 - 3/31/2004 | 0.18 | % | 14,627 | 0.95 | % | 2.53% | 0.14 | % | (1.44%) | N/A | |||||||||||
| 4/1/2002 - 3/31/2003 | 0.58 | % | 13,092 | 1.08 | % | 2.50% | 0.59 | % | (0.83%) | N/A | |||||||||||
| 9/28/2001 - 3/31/2002 | 0.33 | % | 27,056 | 1.35 | % | 2.59% | 0.57 | % | (0.67%) | N/A | |||||||||||
| Class B: | 4/1/2004 - 3/31/2005 | 0.35 | % | $ | 672 | 1.28 | %(7) | 2.55% | 0.50 | % (7) | (0.77%) | N/A | |||||||||
| 4/1/2003 - 3/31/2004 | 0.06 | % | 744 | 1.06 | %(7) | 3.03% | 0.03 | % (7) | (1.94%) | N/A | |||||||||||
| 4/1/2002 - 3/31/2003 | 0.12 | % | 782 | 1.49 | %(7) | 3.00% | 0.18 | % (7) | (1.33%) | N/A | |||||||||||
| 9/28/2001 - 3/31/2002 | 0.09 | % | 88 | 1.85 | % | 3.09% | 0.07 | % | (1.17%) | N/A | |||||||||||
| Class C: | 4/1/2004 - 3/31/2005 | 0.39 | % | $ | 3,258 | 1.34 | %(7) | 2.55% | 0.44 | % (7) | (0.77%) | N/A | |||||||||
| 4/1/2003 - 3/31/2004 | 0.06 | % | 956 | 1.06 | %(7) | 3.03% | 0.03 | % (7) | (1.94%) | N/A | |||||||||||
| 4/1/2002 - 3/31/2003 | 0.12 | % | 1,073 | 1.49 | %(7) | 3.00% | 0.18 | % (7) | (1.33%) | N/A | |||||||||||
| 9/28/2001 - 3/31/2002 | 0.09 | % | 75 | 1.85 | % | 3.09% | 0.07 | % | (1.17%) | N/A | |||||||||||
| PF Salomon Brothers Large-Cap Value Fund | |||||||||||||||||||||
| Class A: | 4/1/2004 - 3/31/2005 (4) | 3.78 | % | $ | 50,430 | 1.80 | % | 2.28% | 0.54 | % | 0.06% | 43.72% | |||||||||
| 4/1/2003 - 3/31/2004 (4) | 39.91 | % | 25,315 | 1.80 | % | 2.73% | 0.29 | % | (0.64%) | 38.10% | |||||||||||
| 4/1/2002 - 3/31/2003 (4) | (27.69 | %) | 11,736 | 1.80 | % | 2.94% | 0.41 | % | (0.73%) | 49.00% | |||||||||||
| 9/28/2001 - 3/31/2002 (4) | 9.54 | % | 19,748 | 1.80 | % | 3.93% | (0.14 | %) | (2.27%) | 27.37% | |||||||||||
| Class B: | 4/1/2004 - 3/31/2005 (4) | 3.32 | % | $ | 504 | 2.30 | % | 2.78% | 0.04 | % | (0.44%) | 43.72% | |||||||||
| 4/1/2003 - 3/31/2004 (4) | 39.36 | % | 556 | 2.30 | % | 3.23% | (0.21 | %) | (1.14%) | 38.10% | |||||||||||
| 4/1/2002 - 3/31/2003 (4) | (28.02 | %) | 955 | 2.30 | % | 3.44% | (0.09 | %) | (1.23%) | 49.00% | |||||||||||
| 9/28/2001 - 3/31/2002 (4) | 9.38 | % | 151 | 2.30 | % | 4.43% | (0.64 | %) | (2.77%) | 27.37% | |||||||||||
| Class C: | 4/1/2004 - 3/31/2005 (4) | 3.33 | % | $ | 1,538 | 2.30 | % | 2.78% | 0.04 | % | (0.44%) | 43.72% | |||||||||
| 4/1/2003 - 3/31/2004 (4) | 39.27 | % | 1,277 | 2.30 | % | 3.23% | (0.21 | %) | (1.14%) | 38.10% | |||||||||||
| 4/1/2002 - 3/31/2003 (4) | (28.08 | %) | 2,015 | 2.30 | % | 3.44% | (0.09 | %) | (1.23%) | 49.00% | |||||||||||
| 9/28/2001 - 3/31/2002 (4) | 9.30 | % | 243 | 2.30 | % | 4.43% | (0.64 | %) | (2.77%) | 27.37% | |||||||||||
| See Notes to Financial Statements | See explanation of references on E-7 | |
| E-5 | ||
| PACIFIC FUNDS FINANCIAL HIGHLIGHTS (Continued) Selected per share, ratios and supplemental data for each year or period ended were as follows: |
| Investment Activities | ||||||||||||||||||||||
| Net Asset Value, Beginning of Year or Period | Net Investment Income (Loss) | Net Realized and Unrealized Gain (Loss) | Total from Investment Operations | |||||||||||||||||||
| PF Van Kampen Comstock Fund (8) | ||||||||||||||||||||||
| Class A | 4/1/2004 - 3/31/2005 (4) | $ | 11.37 | $ | 0.07 | $ | 1.19 | $ | 1.26 | |||||||||||||
| 4/1/2003 - 3/31/2004 (4) | 8.16 | 0.02 | 3.19 | 3.21 | ||||||||||||||||||
| 4/1/2002 - 3/31/2003 | 11.45 | (0.11 | ) | (3.12 | ) | (3.23 | ) | |||||||||||||||
| 9/28/2001 - 3/31/2002 (4) | 10.00 | (0.05 | ) | 1.54 | 1.49 | |||||||||||||||||
| Class B: | 4/1/2004 - 3/31/2005 (4) | $ | 11.24 | $ | 0.01 | $ | 1.17 | $ | 1.18 | |||||||||||||
| 4/1/2003 - 3/31/2004 (4) | 8.10 | (0.03 | ) | 3.17 | 3.14 | |||||||||||||||||
| 4/1/2002 - 3/31/2003 | 11.43 | (0.11 | ) | (3.16 | ) | (3.27 | ) | |||||||||||||||
| 9/28/2001 - 3/31/2002 (4) | 10.00 | (0.07 | ) | 1.54 | 1.47 | |||||||||||||||||
| Class C: | 4/1/2004 - 3/31/2005 (4) | $ | 11.24 | $ | 0.01 | $ | 1.17 | $ | 1.18 | |||||||||||||
| 4/1/2003 - 3/31/2004 (4) | 8.11 | (0.03 | ) | 3.16 | 3.13 | |||||||||||||||||
| 4/1/2002 - 3/31/2003 | 11.43 | (0.11 | ) | (3.15 | ) | (3.26 | ) | |||||||||||||||
| 9/28/2001 - 3/31/2002 (4) | 10.00 | (0.07 | ) | 1.53 | 1.46 | |||||||||||||||||
| PF Van Kampen Real Estate Fund | ||||||||||||||||||||||
| Class A: | 12/31/2004 - 3/31/2005 (4) | $ | 10.00 | $ | 0.05 | ($0.64 | ) | ($0.59 | ) | |||||||||||||
| Class B: | 12/31/2004 - 3/31/2005 (4) | $ | 10.00 | $ | 0.04 | ($0.64 | ) | ($0.60 | ) | |||||||||||||
| Class C: | 12/31/2004 - 3/31/2005 (4) | $ | 10.00 | $ | 0.03 | ($0.64 | ) | ($0.61 | ) | |||||||||||||
| Distributions | |||||||||||||||||||||
| Dividends from Net Investment Income | Distributions from Capital Gains | Total Distributions | Net Asset Value, End of Year or Period | ||||||||||||||||||
| PF Van Kampen Comstock Fund (8) | |||||||||||||||||||||
| Class A | 4/1/2004 - 3/31/2005 (4) | ($0.05 | ) | $ | — | ($0.05 | ) | $ | 12.58 | ||||||||||||
| 4/1/2003 - 3/31/2004 (4) | — | — | — | 11.37 | |||||||||||||||||
| 4/1/2002 - 3/31/2003 | — | (0.06 | ) | (0.06 | ) | 8.16 | |||||||||||||||
| 9/28/2001 - 3/31/2002 (4) | (0.04 | ) | — | (0.04 | ) | 11.45 | |||||||||||||||
| Class B: | 4/1/2004 - 3/31/2005 (4) | $ | — | $ | — | $ | — | $ | 12.42 | ||||||||||||
| 4/1/2003 - 3/31/2004 (4) | — | — | — | 11.24 | |||||||||||||||||
| 4/1/2002 - 3/31/2003 | — | (0.06 | ) | (0.06 | ) | 8.10 | |||||||||||||||
| 9/28/2001 - 3/31/2002 (4) | (0.04 | ) | — | (0.04 | ) | 11.43 | |||||||||||||||
| Class C: | 4/1/2004 - 3/31/2005 (4) | ($0.01 | ) | $ | — | ($0.01 | ) | $ | 12.41 | ||||||||||||
| 4/1/2003 - 3/31/2004 (4) | — | — | — | 11.24 | |||||||||||||||||
| 4/1/2002 - 3/31/2003 | — | (0.06 | ) | (0.06 | ) | 8.11 | |||||||||||||||
| 9/28/2001 - 3/31/2002 (4) | (0.03 | ) | — | (0.03 | ) | 11.43 | |||||||||||||||
| PF Van Kampen Real Estate Fund | |||||||||||||||||||||
| Class A: | 12/31/2004 - 3/31/2005 (4) | ($0.02 | ) | $ | — | ($0.02 | ) | $ | 9.39 | ||||||||||||
| Class B: | 12/31/2004 - 3/31/2005 (4) | ($0.01 | ) | $ | — | ($0.01 | ) | $ | 9.39 | ||||||||||||
| Class C: | 12/31/2004 - 3/31/2005 (4) | ($0.01 | ) | $ | — | ($0.01 | ) | $ | 9.38 | ||||||||||||
| Ratios/Supplemental Data | |||||||||||||||
|---|---|---|---|---|---|---|---|---|---|---|---|---|---|---|---|
| Total Returns (1) | Net Assets, End of Year or Period (in thousands) | Ratios of Expenses After Expense Reductions to Average Net Assets (2), (3) | Ratios of Expenses Before Expense Reductions to Average Net Assets (3) | Ratios of Net Investment Income (Loss) After Expense Reductions to Average Net Assets (3) | Ratios of Net Investment Income (Loss) Before Expense Reductions to Average Net Assets (2),(3) | Port- folio Turn- over Rates | |||||||||
| Class A: 4/1/2004 - 3/31/2005 (4) | 11.08 | % | $ 23,017 | 1.90 | % | 2.70 | % | 0.55 | % | (0.25 | %) | 34.41 | % | ||
| 4/1/2003 - 3/31/2004 (4) | 39.34 | % | 11,945 | 1.90 | % | 3.59 | % | 0.24 | % | (1.45 | %) | 105.34 | % | ||
| 4/1/2002 - 3/31/2003 | (28.26 | %) | 5,331 | 1.90 | % | 3.87 | % | (1.04 | %) | (3.01 | %) | 37.78 | % | ||
| 9/28/2001 - 3/31/2002 (4) | 14.94 | % | 9,002 | 1.90 | % | 6.26 | % | (0.84 | %) | (5.20 | %) | 18.71 | % | ||
| Class B: 4/1/2004 - 3/31/2005 (4) | 10.50 | % | $ 388 | 2.40 | % | 3.20 | % | 0.05 | % | (0.75 | %) | 34.41 | % | ||
| 4/1/2003 - 3/31/2004 (4) | 38.77 | % | 453 | 2.40 | % | 4.09 | % | (0.26 | %) | (1.95 | %) | 105.34 | % | ||
| 4/1/2002 - 3/31/2003 | (28.66 | %) | 201 | 2.40 | % | 4.37 | % | (1.54 | %) | (3.51 | %) | 37.78 | % | ||
| 9/28/2001 - 3/31/2002 (4) | 14.71 | % | 105 | 2.40 | % | 6.76 | % | (1.34 | %) | (5.70 | %) | 18.71 | % | ||
| Class C: 4/1/2004 - 3/31/2005 (4) | 10.50 | % | $ 872 | 2.40 | % | 3.20 | % | 0.05 | % | (0.75 | %) | 34.41 | % | ||
| 4/1/2003 - 3/31/2004 (4) | 38.60 | % | 226 | 2.40 | % | 4.09 | % | (0.26 | %) | (1.95 | %) | 105.34 | % | ||
| 4/1/2002 - 3/31/2003 | (28.57 | %) | 74 | 2.40 | % | 4.37 | % | (1.54 | %) | (3.51 | %) | 37.78 | % | ||
| 9/28/2001 - 3/31/2002 (4) | 14.67 | % | 21 | 2.40 | % | 6.76 | % | (1.34 | %) | (5.70 | %) | 18.71 | % | ||
| PF Van Kampen Real Estate Fund | |||||||||||||||
| Class A: 12/31/2004 - 3/31/2005 (4) | (5.95 | %) | $ 13,853 | 2.05 | % | 3.57 | % | 2.01 | % | 0.49 | % | 0.79 | % | ||
| Class B: 12/31/2004 - 3/31/2005 (4) | (6.05 | %) | $ 17 | 2.55 | % | 4.07 | % | 1.51 | % | (0.01 | %) | 0.79 | % | ||
| Class C: 12/31/2004 - 3/31/2005 (4) | (6.06 | %) | $ 32 | 2.55 | % | 4.07 | % | 1.51 | % | (0.01 | %) | 0.79 | % | ||
| See Notes to Financial Statements | See explanation of references on E-7 | |
| E-6 | ||
| PACIFIC FUNDS FINANCIAL HIGHLIGHTS (Continued) Selected per share, ratios and supplemental data for each year or period ended were as follows: |
| Investment Activities | |||||||||||||||||||
| Net Asset Value, Beginning of Year or Period | Net Investment Loss | Net Realized and Unrealized Gain (Loss) | Total from Investment Operations | ||||||||||||||||
| PF Van Kampen Mid-Cap Growth Fund (9) | |||||||||||||||||||
| Class A: | 4/1/2004 - 3/31/2005 (4) | $ | 8.01 | ($0.12 | ) | $ | 1.04 | $ | 0.92 | ||||||||||
| 4/1/2003 - 3/31/2004 (4) | 5.92 | (0.10 | ) | 2.19 | 2.09 | ||||||||||||||
| 4/1/2002 - 3/31/2003 | 11.18 | (0.09 | ) | (4.33 | ) | (4.42 | ) | ||||||||||||
| 9/28/2001 - 3/31/2002 (4) | 10.00 | (0.08 | ) | 1.45 | 1.37 | ||||||||||||||
| Class B: | 4/1/2004 - 3/31/2005 (4) | $ | 7.93 | ($0.15 | ) | $ | 1.02 | $ | 0.87 | ||||||||||
| 4/1/2003 - 3/31/2004 (4) | 5.88 | (0.14 | ) | 2.19 | 2.05 | ||||||||||||||
| 4/1/2002 - 3/31/2003 | 11.17 | (0.08 | ) | (4.37 | ) | (4.45 | ) | ||||||||||||
| 9/28/2001 - 3/31/2002 (4) | 10.00 | (0.11 | ) | 1.45 | 1.34 | ||||||||||||||
| Class C: | 4/1/2004 - 3/31/2005 (4) | $ | 7.92 | ($0.16 | ) | $ | 1.03 | $ | 0.87 | ||||||||||
| 4/1/2003 - 3/31/2004 (4) | 5.88 | (0.14 | ) | 2.18 | 2.04 | ||||||||||||||
| 4/1/2002 - 3/31/2003 | 11.16 | (0.09 | ) | (4.35 | ) | (4.44 | ) | ||||||||||||
| 9/28/2001 - 3/31/2002 (4) | 10.00 | (0.11 | ) | 1.46 | 1.35 | ||||||||||||||
| Distributions | |||||||||||||||||||||
| Dividends from Net Investment Income | Distributions from Capital Gains | Total Distributions | Net Asset Value, End of Year or Period | ||||||||||||||||||
| PF Van Kampen Mid-Cap Growth Fund (9) | |||||||||||||||||||||
| Class A: | 4/1/2004 - 3/31/2005 (4) | $ | — | $ | — | $ | — | $ | 8.93 | ||||||||||||
| 4/1/2003 - 3/31/2004 (4) | — | — | — | 8.01 | |||||||||||||||||
| 4/1/2002 - 3/31/2003 | — | (0.84 | ) | (0.84 | ) | 5.92 | |||||||||||||||
| 9/28/2001 - 3/31/2002 (4) | (0.02 | ) | (0.17 | ) | (0.19 | ) | 11.18 | ||||||||||||||
| Class B: | 4/1/2004 - 3/31/2005 (4) | $ | — | $ | — | $ | — | $ | 8.80 | ||||||||||||
| 4/1/2003 - 3/31/2004 (4) | — | — | — | 7.93 | |||||||||||||||||
| 4/1/2002 - 3/31/2003 | — | (0.84 | ) | (0.84 | ) | 5.88 | |||||||||||||||
| 9/28/2001 - 3/31/2002 (4) | — | (0.17 | ) | (0.17 | ) | 11.17 | |||||||||||||||
| Class C: | 4/1/2004 - 3/31/2005 (4) | $ | — | $ | — | $ | — | $ | 8.79 | ||||||||||||
| 4/1/2003 - 3/31/2004 (4) | — | — | — | 7.92 | |||||||||||||||||
| 4/1/2002 - 3/31/2003 | — | (0.84 | ) | (0.84 | ) | 5.88 | |||||||||||||||
| 9/28/2001 - 3/31/2002 (4) | (0.02 | ) | (0.17 | ) | (0.19 | ) | 11.16 | ||||||||||||||
| Ratios/Supplemental Data | ||||||||||||||||||
| Total Returns (1) | Net Assets, End of Year or Period (in thousands) | Ratios of Expenses After Expense Reductions to Average Net Assets (2), (3) | Ratios of Expenses Before Expense Reduc- tions to Average Net Assets (3) | Ratios of Net Invest- ment Loss After Expense Reduc- tions to Average Net Assets (3) | Ratios of Net Invest- ment Loss Before Expense Reduc- tions to Average Net Assets (2),(3) | Port- folio Turnover Rates | ||||||||||||
| PF Van Kampen Mid-Cap Growth Fund (9) | ||||||||||||||||||
| Class A: | 4/1/2004 - 3/31/2005 (4) | 11.49 | % | $ | 36,882 | 1.85% | 2.43% | (1.37%) | (1.95%) | 82.70 | % | |||||||
| 4/1/2003 - 3/31/2004 (4) | 35.30 | % | 18,388 | 1.85% | 3.29% | (1.42%) | (2.86%) | 326.09 | % | |||||||||
| 4/1/2002 - 3/31/2003 | (40.51 | %) | 6,191 | 1.85% | 4.31% | (1.39%) | (3.85%) | 158.16 | % | |||||||||
| 9/28/2001 - 3/31/2002 (4) | 13.79 | % | 11,383 | 1.85% | 5.33% | (1.44%) | (4.92%) | 70.54 | % | |||||||||
| Class B: | 4/1/2004 - 3/31/2005 (4) | 10.97 | % | $ | 667 | 2.35% | 2.93% | (1.87%) | (2.45%) | 82.70 | % | |||||||
| 4/1/2003 - 3/31/2004 (4) | 34.86 | % | 504 | 2.35% | 3.79% | (1.92%) | (3.36%) | 326.09 | % | |||||||||
| 4/1/2002 - 3/31/2003 | (40.84 | %) | 586 | 2.35% | 4.81% | (1.89%) | (4.35%) | 158.16 | % | |||||||||
| 9/28/2001 - 3/31/2002 (4) | 13.52 | % | 82 | 2.35% | 5.83% | (1.94%) | (5.42%) | 70.54 | % | |||||||||
| Class C: | 4/1/2004 - 3/31/2005 (4) | 10.99 | % | $ | 1,436 | 2.35% | 2.93% | (1.87%) | (2.45%) | 82.70 | % | |||||||
| 4/1/2003 - 3/31/2004 (4) | 34.69 | % | 958 | 2.35% | 3.79% | (1.92%) | (3.36%) | 326.09 | % | |||||||||
| 4/1/2002 - 3/31/2003 | (40.78 | %) | 1,141 | 2.35% | 4.81% | (1.89%) | (4.35%) | 158.16 | % | |||||||||
| 9/28/2001 - 3/31/2002 (4) | 13.53 | % | 116 | 2.35% | 5.83% | (1.94%) | (5.42%) | 70.54 | % | |||||||||
| (1) | Total returns are not annualized for periods less than one full year. Calculation does not include the effect of any sales charges for Classes A, B and C. |
| (2) | The ratios of net expenses after expense reductions to average daily net assets are after adviser expense reimbursements, if any, as discussed in Note 7 to the Financial Statements. The ratios of net investment income (loss) before expense reductions to average daily net assets are grossed up by the adviser expense reimbursements, if any. |
| (3) | The ratios are annualized for periods of less than one full year. |
| (4) | Per share investment income has been calculated using the average shares method. |
| (5) | The PF MFS International Large-Cap Fund was formerly named the PF MFS Global Growth Fund. |
| (6) | Amount represents less than $0.01 per share. |
| (7) | The expense cap for the PF Pacific Life Money Market Fund is 0.05% for the period 7/1/02 - 6/30/05. The effect of the 12b-1 waiver by the Distributor on the ratios of net expenses and net investment income (loss) after expense reductions to the average daily net assets for the PF Pacific Life Money Market Class B and C were 0.17% and 0.11%, respectively, for the year ended March 31, 2005, and 0.39% and 0.09% for the years ended March 31, 2004 and 2003, respectively, for both Class B and C. |
| (8) | The PF Van Kampen Comstock Fund was formerly named the PF Janus Strategic Value Fund. |
| (9) | The PF Van Kampen Mid-Cap Growth Fund was formerly named the PF MFS Mid-Cap Growth Fund. |
| See Notes to Financial Statements | ||
| E-7 | ||
F-1 |
PACIFIC FUNDS usually 4:00 p.m. Eastern time, although it occasionally closes earlier. Equity securities are generally valued at the last reported sale price for securities traded on a principal exchange (U.S. or foreign) and the official closing price on the NASDAQ National Market System as reported by a pricing source approved by the Board. Securities traded on over-the-counter markets and listed securities for which no sales are reported, are generally valued at the mean between the most recent bid and asked quotes obtained from a quotation reporting system, from established market makers, or from broker-dealers. Fixed income securities are generally valued at prices obtained from pricing services, market makers, or broker-dealers. Certain bonds are valued by a benchmark, matrix, or other pricing processes approved by the Board. Money market instruments and short-term securities maturing within sixty days are valued at amortized cost, which approximates market value. The net asset value of the Portfolio Optimization Funds will be calculated based on the net asset values that are calculated for the underlying funds. Securities for which market quotations are not readily available or are deemed to be unreliable or inaccurate, are valued at their fair value as determined in good faith pursuant to procedures established by the Board. Fair values may not be indicative of the price that a Fund could obtain for a security if it were to dispose of the security as of the close of the NYSE. In determining the fair value of securities, the Funds may consider available information, including information that becomes known after the time of close of the NYSE, and the values that are determined will be deemed to be the price as of the time of the close of the NYSE. If events occur between the time of the determination of the closing price of a foreign security on an exchange or over-the-counter market and the time that the Fund’s NAV is determined, or if, under the Funds’ procedures, the closing price of a foreign security is not deemed to be reliable, and there could be a material effect on a Fund’s NAV, the security would be valued at fair value as determined in accordance with procedures and methodologies approved by the Board. Effective September 15, 2003, the Funds retained a statistical research service to assist in determining the fair value of foreign securities. This service utilizes statistics and programs based on historical performance of markets and other economic data, and fair values determined with the assistance of the service will be based on the data utilized by the service. These fair values may not be indicative of the price that a Fund could obtain for a foreign security if it were to dispose of the security as of the close of the NYSE. B. Securities Transactions and Investment Income Securities transactions are recorded on a trade date basis. Securities purchased or sold on a when-issued or delayed-delivery basis may be settled a month or more after the trade date; interest income is not accrued until settlement date. Dividend income is recorded on the ex-dividend date, except certain dividends from foreign securities are recorded as soon as a Fund is informed of the ex-dividend date. The Funds estimate components of distributions from Real Estate Investment Trusts (“REITs”). Distributions received in excess of income are recorded as a reduction of the cost of the related investments. Interest income is recorded on the accrual basis. Discounts and premiums are recorded on a daily basis using the effective yield method except for short-term securities and PF Pacific Life Money Market Fund, which recognize discounts and premiums on a straight-line basis. Realized gains and losses from securities transactions are recorded on the basis of identified cost. Gains and losses realized on principal paydowns from mortgage-backed securities are reported as interest income in the Statements of Operations. Each class of shares has equal rights as to assets and earnings, except that each class separately bears certain class-specific expenses related to distribution and service (12b-1) fees (see Note 4). Income, other non-class specific expenses, and realized and unrealized gains and losses on investments are allocated to each class of shares based on its relative daily net assets. C. Distributions to Shareholders The Funds currently declare and pay dividends on net investment income at least annually, except for the PF Goldman Sachs Short Duration Bond Fund, PF PIMCO Inflation Managed Fund, PF PIMCO Managed Bond Fund, PF Pacific Life Money Market Fund, and PF Van Kampen Real Estate Fund. Dividends are generally declared and paid monthly for the PF Goldman Sachs Short Duration Bond Fund, PF PIMCO Inflation Managed Fund, and PF PIMCO Managed Bond Fund; are generally declared daily and paid monthly for the PF Pacific Life Money Market Fund, and are generally declared and paid quarterly for the PF Van Kampen Real Estate Fund. Dividends may be declared less frequently if it is advantageous to the Funds. All realized capital gains are distributed at least annually for all Funds. Dividends on net investment income and capital gain distributions are determined in accordance with income tax regulations, which may differ from U.S. GAAP. These differences are primarily due to differing treatments for futures and options, foreign currency transactions, passive foreign investment companies (“PFICs”), post-October losses, capital loss carryforwards, and losses deferred due to wash sales. Permanent book and tax differences relating to shareholder distributions will result in reclassifications of paid-in capital. Dividends and distributions paid to shareholders are recorded on the ex-dividend date. D. Foreign Currency Translation Assets and liabilities initially expressed in non-U.S. currencies are translated into U.S. dollars based on the applicable exchange rates at the end of the reporting period. Purchases and sales of securities, interest income and dividends received, and expenses denominated in foreign currencies are translated into U.S. dollars at the exchange rates in effect on the transaction date. |
F-2 |
PACIFIC FUNDS The Funds do not separately report on the Statements of Operations the effect of changes in foreign exchange rates from changes in market prices of securities held. Such changes are included in net realized and change in unrealized gain or loss from investments. Net realized foreign exchange gains and losses arise from sales of a Fund’s securities, sales and maturities of short-term securities, sales of foreign currencies, currency gains or losses realized between the trade and settlement dates on securities transactions, the difference between the amounts of dividends, interest, and foreign withholding taxes recorded on each Fund’s books, and the U.S. dollar equivalent of the amounts actually received or paid. Net unrealized foreign exchange gains and losses arise from changes in the value of assets and liabilities, including investments in securities at the period-end, resulting from changes in the exchange rate. E. Expense Allocation General expenses of the Funds (including legal and audit fees, printing and mailing expenses, transfer agency out-of-pocket expenses, and fees and expenses of the independent trustees) are allocated to each Fund in proportion to its relative daily net assets. Expenses directly attributable to a particular Fund (including advisory, administration, custody, registration and distribution and service (12b-1) fees) are charged directly to that Fund. F. Offering Costs The Funds bear all costs associated with offering expenses including legal, printing and internal services support. All such costs are amortized to expense on a straight-line basis over twelve months from commencement of operations. G. Futures Contracts Certain Funds may use futures contracts to manage their exposure to the stock markets, fluctuations in interest rates, and foreign currency values. Initial margin deposits are made upon entering into futures contracts and can be either cash or securities. During the period a futures contract is open, changes in the value of the contract are recognized as unrealized gains or losses by “marking-to-market” on a daily basis to reflect the market value of the contract at the end of each day’s trading until the contracts are closed. Variation margin receivables or payables represent the difference between the change in unrealized appreciation and depreciation on the open contracts and the cash deposits made on the margin accounts. When the contract is closed, a Fund records a realized gain or loss equal to the difference between the proceeds from (or cost of) the closing transaction and the Fund’s cost of the contract. The primary risks associated with the use of futures contracts are the possibility of illiquid markets or imperfect correlation between the value of the instruments and the underlying securities, or that the counterparty will fail to perform its obligations. Futures contracts are valued at the settlement price established each day by the board of trade or exchange on which they are traded. H. Options Contracts Certain Funds may write or purchase call and put options on futures, swaps, securities, or currencies it owns or in which it may invest. Writing put options or purchasing call options tends to increase a Fund’s exposure to the underlying instrument. Writing call options or purchasing put options tends to decrease a Fund’s exposure to the underlying instrument. When a Fund writes or purchases a call or put option, an amount equal to the premium received by the Fund is included in a Fund’s Statement of Assets and Liability as a liability or an investment and subsequently adjusted to the current market value, based on the option’s quoted daily settlement price, of the option written or purchased. Premiums received or paid from writing or purchasing options, which expire unexercised are treated by a Fund on the expiration date as realized gains or losses. The difference between the premium and the amount paid or received on effecting a closing purchase or sale transaction, including brokerage commissions, is also treated as a realized gain or loss. If an option is exercised, the premium paid or received is added to the cost of the purchase or proceeds from the sale in determining whether the Fund has realized a gain or loss on investment transactions. A Fund, as a writer of an option, may have no control over whether the underlying future, swap, security or currency may be sold (call) or purchased (put) and as a result bears the market risk of an unfavorable change in the price of the future, swap, security or currency underlying the written option. There is the risk a Fund may not be able to enter into a closing transaction because of an illiquid market. The risk associated with purchasing put and call options is limited to the premium paid. I. Forward Foreign Currency Contracts Certain Funds may enter into forward foreign currency contracts (“forward contracts”) for the purpose of hedging against foreign exchange risk arising from a Fund’s investment in foreign securities. These contracts are “marked-to-market” daily at the applicable translation rates and any result of unrealized appreciation or depreciation is recorded in a Fund’s financial statements. A Fund records realized gains or losses at the time the forward contract is closed. A forward contract is extinguished through a closing transaction or upon delivery of the currency or entering an offsetting contract. Risks may arise upon entering these contracts from the potential inability of a counterparty to meet the terms of their contracts and from unanticipated movements in the value of a foreign currency relative to the U.S. dollar or other currencies. J. Swaps Certain Funds may enter into interest rate, total return, credit default, currency exchange, and other swap agreements in order to obtain a desired return at a lower cost than if a Fund had invested directly in the asset that yielded the desired return. Swaps involve commitments to exchange components of income (generally interest or returns) pegged to the underlying assets based on a notional principal amount. Swaps are “marked-to-market” daily based upon quotations from market makers and the change, if any, |
F-3 |
PACIFIC FUNDS NOTES TO FINANCIAL STATEMENTS (Continued) is recorded as unrealized gains or losses in the Statements of Operations. A Fund bears the risk of loss of the amount expected to be received under a swap agreement in the event of the default or bankruptcy of a counterparty. K. Credit Default Swaps Credit Default swaps are agreements in which one party pays fixed periodic payments to a counterparty in consideration for a guarantee from the counterparty to make a specific payment should a negative credit event take place. Risks arise from the possible inability of the counterparties to meet the terms of their contracts. L. Inflation-Indexed Bonds Inflation-indexed bonds are fixed income securities whose principal value is periodically adjusted to the rate of inflation. The interest rate on these bonds is generally fixed at issuance at a rate lower than typical bonds. Over the life of an inflation-indexed bond, however, interest will be paid based on a principal value, which is adjusted for inflation. Any increase or decrease in the principal amount of an inflation-indexed bond will result in an adjustment of interest income, even though investors do not receive their principal until maturity. M. Stripped Mortgage-Backed Securities Stripped mortgage-backed securities (“SMBS”) represent a participation in, or are secured by and payable from, mortgage loans on real property, and may be structured in classes with rights to receive varying proportions of principal and interest. SMBS include interest-only securities (“IOs”), which receive all of the interest, and principal-only securities (“POs”), which receive the entire principal. If the underlying mortgage assets experience greater than anticipated prepayments of principal, a Fund may fail to recoup some or all of its initial investment in these securities. The market value of these securities is highly sensitive to changes in interest rates. N. Government Sponsored Enterprise Securities Certain Funds invest in securities issued by the Federal Home Loan Mortgage Corporation (“Freddie Mac”) and similar United States Government sponsored entities such as Federal National Mortgage Association (“Fannie Mae”) and the Federal Home Loan Banks (“FHLB’s”). Freddie Mac, Fannie Mae, and FHLB’s, although chartered and sponsored by Congress, are not funded by Congressional appropriations and the debt and mortgage-backed securities issued by Freddie Mac, Fannie Mae and FHLB’s are neither guaranteed nor insured by the United States Government. O. When-Issued Securities and Delayed-Delivery Transactions Certain Funds may purchase or sell securities on a when-issued or delayed-delivery basis. Payment and delivery may take place after the customary settlement period for that security. The price or yield of the underlying securities is fixed at the time the transaction is negotiated. The market values of the securities purchased on a when-issued or delayed-delivery basis are identified as such in each applicable Fund’s Schedule of Investments. When delayed-delivery purchases are outstanding, a Fund will set aside, and maintain until the settlement date in a segregated account, liquid assets in an amount sufficient to meet the purchase price. When purchasing a security on a delayed-delivery basis, a Fund assumes the rights and risks of ownership of the security, including the risk of price and yield fluctuations, and takes such fluctuations into account when determining its NAV. A Fund may dispose of or renegotiate a delayed-delivery transaction after it is entered into, and may sell when-issued securities before they are delivered, which may result in a capital gain or loss. When a Fund has sold a security on a delayed-delivery basis, the Fund does not participate in future gains and losses with respect to the security. Risks may arise upon entering these contracts from the potential inability of a counterparty to meet the terms of their contracts, or if the issuer does not issue the securities due to political, economic, or other factors. P. Short Sales Certain Funds may enter into short sales. A short sale is a transaction in which a Fund sells securities it does not own in anticipation of a decline in the market price of the securities. A Fund is obligated to deliver securities at the market price at the time the short position is closed. Possible losses from short sales may be unlimited. Q. Repurchase Agreements Certain Funds may invest in repurchase agreements. Repurchase agreements permit the investor to maintain liquidity and earn income over periods of time as short as overnight. Repurchase agreements held by a Fund are fully collateralized by U.S. Government securities, or securities issued by U.S. Government agencies, and such collateral is in the possession of the Funds’ custodian or a designated broker-dealer. The collateral is evaluated daily to ensure its market value equals or exceeds the current market value of the repurchase agreements including accrued interest. In the event of default on the obligation to repurchase, a Fund has the right to liquidate the collateral and apply the proceeds in satisfaction of the obligation. R. Investment Risk The price of equity securities change in response to many factors, including a company’s historical and prospective earnings, the value of its assets, general economic conditions, interest rates, investor perceptions, and market liquidity. Fixed income securities are affected primarily by the financial condition of the companies that have issued them, and by changes in interest rates. There are certain additional risks involved in investing in foreign securities that are not inherent in investments in domestic securities. These risks may involve adverse political, social and economic developments and the possible imposition of currency exchange blockages or other foreign governmental laws or restrictions. In addition, the securities of some foreign companies and securities markets are less liquid and at times more volatile than securities of comparable U.S. companies and U.S. securities markets. The markets in emerging markets countries can be extremely volatile. |
F-4 |
| PACIFIC FUNDS NOTES TO FINANCIAL STATEMENTS (Continued) |
| 3. REORGANIZATION On December 31, 2003, PF AIM Blue Chip Fund, (the “Surviving Fund”), acquired all of the assets and liabilities of PF Putnam Research Fund, (the “Acquired Fund”), in a tax-free exchange for shares of the Surviving Fund, (together the “Reorganization”), pursuant to a plan of reorganization approved by the Board and shareholders of the Acquired Fund. Pacific Life paid all of the Reorganization costs which amounted to $78,947. The value of shares issued by the Surviving Fund is presented in the Statements of Changes in Net Assets. The number of shares acquired and issued by the Surviving Fund, and the net assets and unrealized appreciation/depreciation as of the Reorganization date immediately prior to and after the Reorganization were as follows: |
| Shares Acquired | Shares Issued In Acquisition | Surviving Fund Net Assets | Acquired Fund Net Assets | |||||||||
|---|---|---|---|---|---|---|---|---|---|---|---|---|
| Class A | 781,292 | 739,603 | $ | 5,959,088 | $ | 7,488,383 | ||||||
| Class B | 5,342 | 5,075 | 1,824,082 | 50,735 | ||||||||
| Class C | 15,005 | 14,225 | 3,982,255 | 142,407 | ||||||||
| Total | 801,639 | 758,903 | $ | 11,765,425 | $ | 7,681,525 | ||||||
| Net Assets After Reorganization | Net Asset Value of Surviving Fund | |||||||||||
|---|---|---|---|---|---|---|---|---|---|---|---|---|
| Class A | $ | 13,447,471 | $ | 10.12 | ||||||||
| Class B | 1,874,817 | 10.00 | ||||||||||
| Class C | 4,124,662 | 10.01 | ||||||||||
| Total | $ | 19,446,950 | ||||||||||
The net unrealized appreciation of the Acquired Fund at the time of Reorganization was $544,213. 4. INVESTMENT ADVISORY, ADMINISTRATION AND SHAREHOLDER SERVICES, AND DISTRIBUTION AGREEMENTS Pursuant to an Investment Advisory Agreement, Pacific Life serves as Investment Adviser to the Funds, and receives from the Funds the following advisory fee rates based on an annual percentage of the average daily net assets of each Fund. The fees are accrued daily by the Funds: |
| PF PIMCO | |||
| PF AIM Blue Chip | 0.95% | Inflation Managed | 0.60% |
| PF AIM | PF PIMCO | ||
| Aggressive Growth | 1.00% | Managed Bond | 0.60% |
| PF Goldman Sachs Short | PF Pacific Life | ||
| Duration Bond | 0.60% | Money Market | See (1) |
| PF Salomon Brothers | |||
| PF Janus Growth LT | 0.75% | Large-Cap Value | 0.85% |
| PF Lazard Mid-Cap Value | 0.85% | PF Van Kampen Comstock | 0.95% |
| PF Lazard | PF Van Kampen | ||
| International Value | 0.85% | Real Estate | 1.10% |
| PF MFS International | PF Van Kampen | ||
| Large-Cap | 1.05% | Mid-Cap Growth | 0.90% |
| (1) | An annual rate of 0.40% of the first $250 million of the average daily net assets, 0.35% of the next $250 million, and 0.30% in excess of $500 million. |
Pacific Life receives no fees for the investment advisory services under the Investment Advisory Agreement with respect to the Portfolio Optimization Funds. The Portfolio Optimization Funds indirectly bear the fees paid by the Underlying Funds in which they invest. Pursuant to Fund Management Agreements, the Funds and Pacific Life engage other fund managers under Pacific Life’s supervision for thirteen of the nineteen Funds. The following firms serve as sub-advisers for their respective Funds: A I M Capital Management, Inc., Goldman Sachs Asset Management, L.P., Janus Capital Management LLC, Lazard Asset Management LLC, MFS Investment Management, Pacific Investment Management Company LLC, Salomon Brothers Asset Management Inc, and Van Kampen. Pacific Life, as Investment Adviser to the Funds, pays the related management fees as compensation for advisory services provided to the Funds. Pursuant to an Administration and Shareholder Services Agreement (the “Agreement”), Pacific Life serves as Administrator (the “Administrator”) to the Funds. Under the Agreement, the Funds compensate the Administrator at an annual rate of 0.35% of average daily net assets for procuring or providing administrative, transfer agency, and shareholder services. In addition, the Funds compensate the Administrator for support services at cost for time spent by the legal, accounting, tax and compliance personnel for providing assistance, coordination and supervision to the Funds. Pacific Select Distributors, Inc. (the “Distributor”), a wholly owned subsidiary of Pacific Life, serves as distributor of the Funds’ shares. Under the distribution and service (12b-1) plans, each Fund pays to the Distributor fees at annual rates expressed as a percentage of average daily net assets. Each Fund, except the Portfolio Optimization Funds, pays a distribution fee as compensation for services rendered and expenses borne by the Distributor in connection with the distribution of shares of the Funds (0.25% for Class A shares and 0.75% for Class B and C shares). Additionally, each Fund pays a shareholder servicing fee as compensation in connection with services rendered to shareholders of the Funds and/or maintenance of shareholder accounts (0.25% for Class A, B, and C shares). For the Portfolio Optimization Funds, each class of shares invests in Class A shares of the Underlying Funds, which charge an annual distribution and shareholder servicing fee of 0.50% of average daily net assets without payment of a front-end sales charge. To avoid duplication of fees, the distribution and shareholder servicing fee for each class of the Portfolio Optimization Funds will be reduced by 0.50%. The Portfolio Optimization Funds’ Class A shares will not accrue a fee and Class B and Class C shares will accrue 0.50%. The fees are accrued daily. For the year ended March 31, 2005, the Distributor, acting as underwriter, received net commissions of $4,289,911 from the sale of Class A and Class C shares and received $196,336 in CDSC from redemptions of Class B and C shares. |
F-5 |
| PACIFIC FUNDS NOTES TO FINANCIAL STATEMENTS (Continued) |
5. TRUSTEE DEFERRED COMPENSATION PLAN Each independent trustee is eligible to participate in the Funds’ Deferred Compensation Plan (the “Plan”). The Plan allows each independent trustee to voluntarily defer receipt of all or a percentage of fees which otherwise would be payable for services performed. Amounts in the deferral account are obligations of the Funds that are payable in accordance with the Plan. Deferral amounts are treated as though equivalent dollar amounts had been invested in shares of certain Funds. A trustee who defers compensation has the option to select credit rate options that mirror the performance of the Class A shares of the corresponding series of the Pacific Funds without a sales load. Accordingly, the market value appreciation/depreciation of the trustee’s deferred compensation accounts will cause the expenses of each Fund to increase or decrease due to the market fluctuation. As of March 31, 2005, total deferred trustee compensation liability was $126,592. 6. TAX CHARACTER OF DISTRIBUTIONS The tax character of distributions paid during the year ended March 31, 2005, was as follows: |
| Distributions Paid From | ||||||||||
|---|---|---|---|---|---|---|---|---|---|---|
| Funds | Ordinary Income | Long-Term Capital Gain | Total Distributions | |||||||
| PF Portfolio Optimization Model A | $ | 169,592 | $ | 28,385 | $ | 197,977 | ||||
| PF Portfolio Optimization Model B | 355,835 | 83,276 | 439,111 | |||||||
| PF Portfolio Optimization Model C | 719,658 | 207,119 | 926,777 | |||||||
| PF Portfolio Optimization Model D | 365,241 | 205,148 | 570,389 | |||||||
| PF Portfolio Optimization Model E | 34,000 | 101,473 | 135,473 | |||||||
| PF AIM Aggressive Growth | — | 281,613 | 281,613 | |||||||
| PF Goldman Sachs Short | ||||||||||
| Duration Bond | 273,607 | — | 273,607 | |||||||
| PF Lazard International Value | 78,010 | 458,738 | 536,748 | |||||||
| PF MFS International Large-Cap | 97,765 | 306,210 | 403,975 | |||||||
| PF PIMCO Inflation Managed | 1,638,499 | 14,147 | 1,652,646 | |||||||
| PF PIMCO Managed Bond | 1,233,639 | 375,257 | 1,608,896 | |||||||
| PF Pacific Life Money Market | 153,205 | — | 153,205 | |||||||
| PF Salomon Brothers Large-Cap | ||||||||||
| Value | 200,695 | — | 200,695 | |||||||
| PF Van Kampen Comstock | 75,553 | — | 75,553 | |||||||
| PF Van Kampen Real Estate | 22,685 | — | 22,685 | |||||||
The tax character of distributions paid during the year ended March 31, 2004 was as follows: |
| Distributions Paid From | ||||||||||
|---|---|---|---|---|---|---|---|---|---|---|
| Funds | Ordinary Income | Long-Term Capital Gain | Total Distributions | |||||||
| PF Lazard International Value | $ | 32,940 | $ | — | $ | 32,940 | ||||
| PF PIMCO Inflation Managed | 528,324 | 6,235 | 534,559 | |||||||
| PF PIMCO Managed Bond | 745,177 | — | 745,177 | |||||||
| PF Pacific Life Money Market | 24,524 | — | 24,524 | |||||||
| PF Salomon Brothers Large-Cap | ||||||||||
| Value | 23,699 | — | 23,699 | |||||||
As of March 31, 2005 the components of distributable earnings on a tax basis were as follows: |
| Funds | Accumulated Capital and Other Losses | Undistributed Ordinary Income | Undistributed Long-Term Capital Gains | Unrealized Appreciation (Depreciation) | |||||||||
|---|---|---|---|---|---|---|---|---|---|---|---|---|---|
| PF Portfolio Optimization | |||||||||||||
| Model A | $ | — | $ | 62,218 | $ | 15,653 | $ | 49,989 | |||||
| PF Portfolio Optimization | |||||||||||||
| Model B | — | 41,257 | 14,727 | 759,830 | |||||||||
| PF Portfolio Optimization | |||||||||||||
| Model C | — | 201,356 | 108,074 | 3,359,105 | |||||||||
| PF Portfolio Optimization | |||||||||||||
| Model D | — | 241,247 | 206,317 | 3,926,445 | |||||||||
| PF Portfolio Optimization | |||||||||||||
| Model E | — | 70,104 | 111,429 | 1,960,176 | |||||||||
| PF AIM Blue Chip | (1,451,357 | ) | — | — | 2,451,980 | ||||||||
| PF AIM Aggressive Growth | — | 97,929 | 1,101,268 | 257,269 | |||||||||
| PF Goldman Sachs Short | |||||||||||||
| Duration Bond | (123,510 | ) | 6,884 | — | (311,654 | ) | |||||||
| PF Janus Growth LT | (1,397,720 | ) | — | — | 2,608,230 | ||||||||
| PF Lazard Mid-Cap Value | — | 131,874 | — | (57,765 | ) | ||||||||
| PF Lazard International | |||||||||||||
| Value | (58,295 | ) | 108,215 | 99,804 | 7,365,661 | ||||||||
| PF MFS International | |||||||||||||
| Large-Cap | (1,099 | ) | 22,109 | 37,141 | 4,177,678 | ||||||||
| PF PIMCO Inflation Managed | — | 105,495 | 14,981 | 79,220 | |||||||||
| PF PIMCO | |||||||||||||
| Managed Bond | (587,091 | ) | 337,316 | — | 37,120 | ||||||||
| PF Pacific Life Money Market | — | 19,311 | — | — | |||||||||
| PF Salomon Brothers Large- | |||||||||||||
| Cap Value | (828,124 | ) | 37,030 | — | 3,831,957 | ||||||||
| PF Van Kampen Comstock | — | 36,613 | 741,717 | 2,073,092 | |||||||||
| PF Van Kampen Real Estate | (1,702 | ) | 56,848 | — | (345,392 | ) | |||||||
| PF Van Kampen Mid-Cap | |||||||||||||
| Growth | (3,004,858 | ) | — | — | 5,870,909 | ||||||||
7. EXPENSE REDUCTIONS Pacific Life has contractually agreed to waive all or part of its investment advisory fees or administration fees, or otherwise reimburse each Fund, except the Portfolio Optimization Funds, for operating expenses (including organizational expenses, but not including investment advisory fees; distribution and service (12b-1) fees; foreign taxes on dividends, interest or gains; interest; taxes; brokerage commissions and other transactional expenses; extraordinary expenses such as litigation and other expenses not incurred in the ordinary course of each Fund’s business) that exceed an annual rate of 0.45% of a Fund’s average daily net assets for all Funds through December 31, 2005, except for the PF Pacific Life Money Market Fund. The expense cap for the PF Pacific Life Money Market Fund has been reduced to 0.05% for the period July 1, 2002 through June 30, 2005 an d will increase to 0.45% thereafter through December 31, 2005. Such waiver or reimbursement is subject to repayment to Pacific Life, for a period of time as permitted under regulatory and/or accounting standards (currently 3 years from the end of the fiscal year in which the reimbursement took place), to the extent such expenses fall below the 0.45% expense cap in future years. Any amounts repaid to |
F-6 |
PACIFIC FUNDS Pacific Life will have the effect of increasing such expenses of the Funds, but not above the 0.45% expense cap. There is no guarantee that Pacific Life will continue to cap expenses after December 31, 2005. The cumulative reimbursement amounts as of March 31, 2005 that are subject to repayment for each Fund are as follows: |
| Expiration | ||||||||||
|---|---|---|---|---|---|---|---|---|---|---|
| Funds | 2006 | 2007 | 2008 | |||||||
| PF Portfolio Optimization | ||||||||||
| Model A | $ | — | $ | 36,837 | $ | 227,677 | ||||
| PF Portfolio Optimization | ||||||||||
| Model B | — | 54,940 | 355,811 | |||||||
| PF Portfolio Optimization | ||||||||||
| Model C | — | 103,852 | 679,146 | |||||||
| PF Portfolio Optimization | ||||||||||
| Model D | — | 110,532 | 629,641 | |||||||
| PF Portfolio Optimization | ||||||||||
| Model E | — | 62,617 | 369,133 | |||||||
| PF AIM Blue Chip | 192,697 | 180,256 | 172,805 | |||||||
| PF AIM Aggressive Growth | 137,076 | 116,454 | 142,612 | |||||||
| PF Goldman Sachs Short | ||||||||||
| Duration Bond | — | 30,535 | 189,312 | |||||||
| PF Janus Growth LT | 181,111 | 148,424 | 136,338 | |||||||
| PF Lazard Mid-Cap Value | — | — | 58,835 | |||||||
| PF Lazard International | ||||||||||
| Value | 174,426 | 163,749 | 226,073 | |||||||
| PF MFS International | ||||||||||
| Large-Cap | 391,365 | 320,872 | 340,780 | |||||||
| PF PIMCO Inflation Managed | 35,513 | 164,752 | 150,852 | |||||||
| PF PIMCO Managed Bond | 360,805 | 306,150 | 229,552 | |||||||
| PF Pacific Life Money | ||||||||||
| Market | 291,629 | 271,427 | 213,591 | |||||||
| PF Salomon Brothers | ||||||||||
| Large-Cap Value | 187,014 | 192,635 | 189,257 | |||||||
| PF Van Kampen Comstock | 134,554 | 140,698 | 142,219 | |||||||
| PF Van Kampen Real Estate | — | — | 38,207 | |||||||
| PF Van Kampen | ||||||||||
| Mid-Cap Growth | 193,070 | 177,748 | 179,956 | |||||||
| Total | $ | 2,279,260 | $ | 2,582,478 | $ | 4,671,797 | ||||
Due to the current regulatory and/or accounting standards, all expense reimbursements made by the adviser for the period September 28, 2001 (the Funds’ commencement date of operations) to March 31, 2002 ($2,058,686) were expired for future recoupment as of March 31, 2005. Pacific Life’s expense reimbursement is presented in the accompanying Statements of Operations. Pacific Life has also contractually agreed to waive its administrative fee and charges for support services and otherwise reimburse each of the Portfolio Optimization Funds, for its operating expenses (including organizational expenses, but not including distribution and service (12b-1) fees; foreign taxes on dividends, interest or gains; interest; taxes; transactional expenses; extraordinary expenses such as litigation and other expenses not incurred in the ordinary course of each of the Portfolio Optimization Fund’s business) through December 31, 2005. There is no guarantee that Pacific Life will continue to waive expenses after The Distributor has also agreed to waive part of the 12b-1 fees for the PF Pacific Life Money Market Fund. The total amount waived by the Distributor for Class B and C was $922 and $1,882, respectively, for the year ended March 31, 2005. 8. TRANSACTIONS WITH AFFILIATES The Funds have incurred $2,598,548 of investment advisory fees, $1,893,068 of administration fees, and $333,911 of support services expenses payable to Pacific Life, for the year ended March 31, 2005. As of March 31, 2005, $314,639, $234,562, and $18,671 remained payable for investment advisory fees, administration fees, and support services expenses, respectively. For the year ended March 31, 2005, the Funds also incurred $2,384,305 of distribution expenses payable to the Distributor under the distribution and service (12b-1) plans. As of March 31, 2005, $285,432 remained payable. 9. FEDERAL INCOME TAX Each Fund declared and paid sufficient dividends on net investment income and capital gains distributions during the year ended March 31, 2005 to qualify as a regulated investment company and is not required to pay Federal income tax under Regulation M of the Internal Revenue Code (“the Code”). Each Fund intends to continue to qualify as a regulated investment company and distribute substantially all its taxable income and capital gains to its shareholders. Accordingly, no provision for Federal income taxes is required in the financial statements. Required distributions are based on net investment income and net realized gains determined on a tax basis and may differ from such amounts for financial reporting purposes. In addition, the year in which amounts are distributed may differ from the year in which the net investment income is earned and the net gains are realized by each Fund. Net capital loss carryovers and post-October capital losses, if any, as of March 31, 2005, are available to offset future realized capital gains and thereby reduce future capital gains distributions. Post-October foreign currency losses, if any, will offset future net investment income and thereby reduce future ordinary income distributions. The net capital loss carryovers and the post-October capital and foreign currency losses deferred as of March 31, 2005, are presented in the first table on the following page, and the aggregate cost of investments and the composition of unrealized appreciation and depreciation on investment securities for Federal income tax purposes as of March 31, 2005, are presented in the second table on the following page: |
F-7 |
PACIFIC FUNDS NOTES TO FINANCIAL STATEMENTS (Continued) |
| Funds | Net Capital Loss Carryover | Net Capital Loss Carryover Expiring in | Post- October Capital Loss Deferral | Post-October Foreign Currency Loss Deferral | |||||||||||||||
|---|---|---|---|---|---|---|---|---|---|---|---|---|---|---|---|---|---|---|---|
| 2011 | 2012 | 2013 | |||||||||||||||||
| PF Portfolio Optimization Model A | $ | — | $ | — | $ | — | $ | — | $ | — | $ | — | |||||||
| PF Portfolio Optimization Model B | — | — | — | — | — | — | |||||||||||||
| PF Portfolio Optimization Model C | — | — | — | — | — | — | |||||||||||||
| PF Portfolio Optimization Model D | — | — | — | — | — | — | |||||||||||||
| PF Portfolio Optimization Model E | — | — | — | — | — | — | |||||||||||||
| PF AIM Blue Chip* | (1,285,487 | ) | (739,723 | ) | (390,913 | ) | (154,851 | ) | (165,870 | ) | — | ||||||||
| PF AIM Aggressive Growth | — | — | — | — | — | — | |||||||||||||
| PF Goldman Sachs Short Duration Bond | (87,029 | ) | — | — | (87,029 | ) | (36,481 | ) | — | ||||||||||
| PF Janus Growth LT | (1,394,151 | ) | (1,394,151 | ) | — | — | — | (3,569 | ) | ||||||||||
| PFLazard Mid-Cap Value | — | — | — | — | — | — | |||||||||||||
| PF Lazard International Value | — | — | — | — | — | (58,295 | ) | ||||||||||||
| PF MFS International Large-Cap | — | — | — | — | — | (1,099 | ) | ||||||||||||
| PF PIMCO Inflation Managed | — | — | — | — | — | — | |||||||||||||
| PF PIMCO Managed Bond | — | — | — | — | (587,091 | ) | — | ||||||||||||
| PF Pacific Life Money Market | — | — | — | — | — | — | |||||||||||||
| PF Salomon Brothers Large-Cap Value | (828,124 | ) | — | (828,124 | ) | — | — | — | |||||||||||
| PF Van Kampen Comstock | — | — | — | — | — | — | |||||||||||||
| PF Van Real Estate | — | — | — | — | (1,702 | ) | — | ||||||||||||
| PF Van Kampen Mid-Cap Growth | (3,004,858 | ) | (3,004,858 | ) | — | — | — | — | |||||||||||
| Funds | Total Cost on Tax Basis | Gross Unrealized Appreciation | Gross Unrealized Depreciation | Net Unrealized Appreciation (Depreciation) | |||||||||
|---|---|---|---|---|---|---|---|---|---|---|---|---|---|
| PF Portfolio Optimization Model A | $ | 18,292,008 | $ | 162,685 | ($112,696 | ) | $ | 49,989 | |||||
| PF Portfolio Optimization Model B | 40,672,265 | 934,854 | (175,024 | ) | 759,830 | ||||||||
| PF Portfolio Optimization Model C | 121,544,407 | 3,785,015 | (425,910 | ) | 3,359,105 | ||||||||
| PF Portfolio Optimization Model D | 106,701,631 | 4,165,233 | (238,788 | ) | 3,926,445 | ||||||||
| PF Portfolio Optimization Model E | 39,774,046 | 1,988,431 | (28,255 | ) | 1,960,176 | ||||||||
| PF AIM Blue Chip* | 44,698,190 | 3,452,110 | (1,000,130 | ) | 2,451,980 | ||||||||
| PF AIM Aggressive Growth | 7,852,491 | 503,112 | (245,843 | ) | 257,269 | ||||||||
| PF Goldman Sachs Short Duration Bond | 36,923,035 | 3,250 | (314,904 | ) | (311,654 | ) | |||||||
| PF Janus Growth LT | 17,837,341 | 2,912,870 | (304,640 | ) | 2,608,230 | ||||||||
| PFLazard Mid-Cap Value | 26,264,160 | 711,111 | (768,876 | ) | (57,765 | ) | |||||||
| PF Lazard International Value | 39,758,916 | 7,460,600 | (94,939 | ) | 7,365,661 | ||||||||
| PF MFS International Large-Cap | 32,273,006 | 4,440,631 | (262,953 | ) | 4,177,678 | ||||||||
| PF PIMCO Inflation Managed | 49,240,583 | 446,099 | (366,879 | ) | 79,220 | ||||||||
| PF PIMCO Managed Bond | 51,542,312 | 545,526 | (508,406 | ) | 37,120 | ||||||||
| PF Pacific Life Money Market | 26,303,696 | — | — | — | |||||||||
| PF Salomon Brothers Large-Cap Value | 46,345,428 | 4,996,506 | (1,164,549 | ) | 3,831,957 | ||||||||
| PF Van Kampen Comstock | 22,225,627 | 2,369,481 | (296,389 | ) | 2,073,092 | ||||||||
| PF Van Real Estate | 14,267,235 | 103,123 | (448,515 | ) | (345,392 | ) | |||||||
| PF Van Kampen Mid-Cap Growth | 33,254,714 | 6,534,782 | (663,873 | ) | 5,870,909 | ||||||||
| * | The availability of a certain amount of this capital loss carryforward, which was acquired on December 31, 2003 in the merger with the PF Putnam Research Fund, may be limited in a given year. |
10. RECLASSIFICATION OF ACCOUNTS During the year ended March 31, 2005 reclassifications, as shown in the following table, have been made in each Fund’s capital accounts to report these balances on a tax basis, excluding certain temporary differences, as of March 31, 2005. Additional adjustments may be required in subsequent reporting periods. These reclassifications, which have no impact on the NAV of the Funds, are primarily attributable to the reclassification of foreign currency transactions, non-deductible expenses, treatment of net operating losses, use of tax equalization, and certain differences in the computation of distributable income and capital gains under Federal tax rules versus U.S. GAAP. The calculation of net investment income per share in the financial highlights excludes these adjustments. |
F-8 |
PACIFIC FUNDS |
| Funds | Paid-In Capital | Undistributed/ Accumulated Net Investment Income (Loss) | Undistributed/ Accumulated Net Realized Gain (Loss) | |||||||
|---|---|---|---|---|---|---|---|---|---|---|
| PF Portfolio Optimization Model A | $ | — | $ | 71,167 | ($71,167 | ) | ||||
| PF Portfolio Optimization Model B | — | 161,095 | (161,095 | ) | ||||||
| PF Portfolio Optimization Model C | — | 347,780 | (347,780 | ) | ||||||
| PF Portfolio Optimization Model D | — | 203,543 | (203,543 | ) | ||||||
| PF Portfolio Optimization Model E | — | 47,092 | (47,092 | ) | ||||||
| PF AIM Blue Chip | (34,301 | ) | 34,314 | (13 | ) | |||||
| PF AIM Aggressive Growth | — | 137,832 | (137,832 | ) | ||||||
| PF Goldman Sachs Short Duration Bond | (3,686 | ) | 4,243 | (557 | ) | |||||
| PF Janus Growth LT | (111,181 | ) | 105,248 | 5,933 | ||||||
| PF Lazard Mid-Cap Value | (37,404 | ) | 37,404 | — | ||||||
| PF Lazard International Value | — | (124,313 | ) | 124,313 | ||||||
| PF MFS International Large-Cap | — | (6,392 | ) | 6,392 | ||||||
| PF PIMCO Inflation Managed | — | 229,055 | (229,055 | ) | ||||||
| PF PIMCO Managed Bond | — | 356,646 | (356,646 | ) | ||||||
| PF Pacific Life Money Market | (640 | ) | 567 | 73 | ||||||
| PF Salomon Brothers Large-Cap Value | — | (7,559 | ) | 7,559 | ||||||
| PF Van Kampen Comstock | — | — | — | |||||||
| PF Van Kampen Real Estate | (29,030 | ) | 29,030 | — | ||||||
| PF Van Kampen Mid-Cap Growth | (435,178 | ) | 430,864 | 4,314 | ||||||
11. PURCHASES AND SALES OF SECURITIES Purchases and sales of securities (excluding short-term investments and the PF Pacific Life Money Market Fund since it trades exclusively in short-term debt securities) for the year ended March 31, 2005, are summarized in the following tables: |
| U.S. Government Securities | Other Securities | ||||||||||||
|---|---|---|---|---|---|---|---|---|---|---|---|---|---|
| Funds | Purchases | Sales | Purchases | Sales | |||||||||
| PF Portfolio Optimization Model A | $ | — | $ | — | $ | 14,718,433 | $ | 2,463,119 | |||||
| PF Portfolio Optimization Model B | — | — | 29,802,638 | 2,221,460 | |||||||||
| PF Portfolio Optimization Model C | — | — | 87,444,424 | 4,322,456 | |||||||||
| PF Portfolio Optimization Model D | — | — | 81,188,982 | 6,877,908 | |||||||||
| PF Portfolio Optimization Model E | — | — | 27,973,384 | 6,589,749 | |||||||||
| PF AIM Blue Chip | — | — | 35,719,781 | 13,547,782 | |||||||||
| PF AIM Aggressive Growth | — | — | 18,918,876 | 20,604,036 | |||||||||
| PF Goldman Sachs Short Duration Bond | 67,132,267 | 43,508,776 | — | — | |||||||||
| PF Janus Growth LT | — | — | 12,852,791 | 6,474,804 | |||||||||
| PF Lazard Mid-Cap Value | — | — | 26,938,603 | 2,372,769 | |||||||||
| PF Lazard International Value | — | — | 26,028,249 | 6,815,058 | |||||||||
| PF MFS International Large-Cap | — | — | 29,076,698 | 13,407,103 | |||||||||
| PF PIMCO Inflation Managed | 122,212,027 | 101,924,720 | 1,359,968 | 100,000 | |||||||||
| PF PIMCO Managed Bond | 70,025,679 | 63,648,457 | 5,416,239 | 2,456,619 | |||||||||
| PF Salomon Brothers Large-Cap Value | — | — | 36,887,388 | 16,215,543 | |||||||||
| PF Van Kampen Comstock | — | — | 14,141,085 | 5,676,196 | |||||||||
| PF Van Kampen Real Estate | — | — | 13,999,232 | 65,363 | |||||||||
| PF Van Kampen Mid-Cap Growth | — | — | 39,706,481 | 24,817,794 | |||||||||
F-9 |
PACIFIC FUNDS 12. SHARES OF BENEFICIAL INTEREST Transactions in shares of each Fund for the years or periods ended March 31, 2005 and 2004, were as follows: |
| PF Portfolio Optimization Model A (1) | PF Portfolio Optimization Model B (1) | PF Portfolio Optimization Model C (1) | PF Portfolio Optimization Model D (1) | ||||||||||||||
| Year ended 3/31/2005 | Period ended 3/31/2004 | Year ended 3/31/2005 | Period ended 3/31/2004 | Year ended 3/31/2005 | Period ended 3/31/2004 | Year ended 3/31/2005 | Period ended 3/31/2004 | ||||||||||
| Class A | |||||||||||||||||
| Beginning share balances | 192,835 | — | 512,407 | — | 1,256,147 | — | 1,321,143 | — | |||||||||
| Shares sold | 760,748 | 221,772 | 1,606,919 | 562,071 | 4,288,080 | 1,299,854 | 3,172,899 | 1,335,442 | |||||||||
| Distributions reinvested | 8,657 | — | 20,905 | — | 38,391 | — | 23,038 | — | |||||||||
| Shares redeemed | (150,358 | ) | (28,937 | ) | (236,121 | ) | (49,664 | ) | (478,716 | ) | (43,707 | ) | (390,694 | ) | (14,299 | ) | |
| Ending share balances | 811,882 | 192,835 | 1,904,110 | 512,407 | 5,103,902 | 1,256,147 | 4,126,386 | 1,321,143 | |||||||||
| Class B | |||||||||||||||||
| Beginning share balances | 44,261 | — | 297,569 | — | 552,018 | — | 689,014 | — | |||||||||
| Shares sold | 122,633 | 46,564 | 435,338 | 315,298 | 1,347,064 | 553,922 | 1,208,600 | 718,780 | |||||||||
| Distributions reinvested | 1,017 | — | 5,591 | — | 12,538 | — | 7,537 | — | |||||||||
| Shares redeemed | (24,985 | ) | (2,303 | ) | (87,513 | ) | (17,729 | ) | (62,962 | ) | (1,904 | ) | (122,054 | ) | (29,766 | ) | |
| Ending share balances | 142,926 | 44,261 | 650,985 | 297,569 | 1,848,658 | 552,018 | 1,783,097 | 689,014 | |||||||||
| Class C | |||||||||||||||||
| Beginning share balances | 369,190 | — | 528,693 | — | 1,666,836 | — | 1,260,451 | — | |||||||||
| Shares sold | 739,419 | 391,451 | 1,282,504 | 555,885 | 3,846,241 | 1,707,775 | 3,542,271 | 1,315,112 | |||||||||
| Distributions reinvested | 8,956 | — | 13,189 | — | 32,158 | — | 19,330 | — | |||||||||
| Shares redeemed | (238,503 | ) | (22,261 | ) | (330,590 | ) | (27,192 | ) | (539,974 | ) | (40,939 | ) | (283,050 | ) | (54,661 | ) | |
| Ending share balances | 879,062 | 369,190 | 1,493,796 | 528,693 | 5,005,261 | 1,666,836 | 4,539,002 | 1,260,451 | |||||||||
| PF Portfolio Optimization Model E (1) | PF AIM Blue Chip Fund | PF AIM Aggressive Growth Fund | PF Goldman Sachs Short Duration Bond Fund (1) | ||||||||||||||
| Year ended 3/31/2005 | Period ended 3/31/2004 | Year ended 3/31/2005 | Year ended 3/31/2004 | Year ended 3/31/2005 | Year ended 3/31/2004 | Year ended 3/31/2005 | Period ended 3/31/2004 | ||||||||||
| Class A | |||||||||||||||||
| Beginning share balances | 812,288 | — | 2,296,536 | 983,915 | 734,471 | 585,399 | 1,349,577 | — | |||||||||
| Shares sold | 1,147,473 | 824,754 | 2,383,955 | 1,591,780 | 603,513 | 290,771 | 2,350,005 | 1,363,837 | |||||||||
| Shares issued in connection with acquisition (2) | — | — | — | 739,603 | — | — | — | — | |||||||||
| Distributions reinvested | 6,900 | — | — | — | 21,390 | — | 27,316 | — | |||||||||
| Shares redeemed | (270,204 | ) | (12,466 | ) | (229,830 | ) | (1,018,762 | ) | (755,128 | ) | (141,699 | ) | (139,817 | ) | (14,260 | ) | |
| Ending share balances | 1,696,457 | 812,288 | 4,450,661 | 2,296,536 | 604,246 | 734,471 | 3,587,081 | 1,349,577 | |||||||||
| Class B | |||||||||||||||||
| Beginning share balances | 239,262 | — | 49,303 | 94,800 | 23,422 | 7,353 | 1,001 | — | |||||||||
| Shares sold | 377,653 | 241,042 | 10,794 | 124,313 | 6,032 | 34,140 | 1,310 | 1,001 | |||||||||
| Shares issued in connection with acquisition (2) | — | — | — | 5,075 | — | — | — | — | |||||||||
| Distributions reinvested | 1,320 | — | — | — | 593 | — | 7 | — | |||||||||
| Shares redeemed | (48,504 | ) | (1,780 | ) | (7,398 | ) | (174,885 | ) | (5,616 | ) | (18,071 | ) | (1,006 | ) | — | ||
| Ending share balances | 569,731 | 239,262 | 52,699 | 49,303 | 24,431 | 23,422 | 1,312 | 1,001 | |||||||||
| Class C | |||||||||||||||||
| Beginning share balances | 781,574 | — | 108,321 | 183,681 | 31,538 | 13,495 | 6,184 | — | |||||||||
| Shares sold | 1,415,830 | 789,592 | 70,457 | 304,661 | 27,832 | 58,980 | 69,913 | 6,221 | |||||||||
| Shares issued in connection with acquisition (2) | — | — | — | 14,225 | — | — | — | — | |||||||||
| Distributions reinvested | 3,915 | — | — | — | 1,156 | — | 243 | — | |||||||||
| Shares redeemed | (567,283 | ) | (8,018 | ) | (41,601 | ) | (394,246 | ) | (10,169 | ) | (40,937 | ) | (17,475 | ) | (37 | ) | |
| Ending share balances | 1,634,036 | 781,574 | 137,177 | 108,321 | 50,357 | 31,538 | 58,865 | 6,184 | |||||||||
| —————————— |
(1) Operations commenced on December 31, 2003. |
| (2) See Note 3 to Financial Statements regarding shares issued in connection with acquisition. |
F-10 |
PACIFIC FUNDS |
| PF Janus Growth LT Fund | PF Lazard Mid-Cap Value Fund (1) | PF Lazard International Value Fund | PF MFS International Large-Cap Fund (2) | ||||||||||||
| Year ended 3/31/2005 | Year ended 3/31/2004 | Period ended 3/31/2005 | Year ended 3/31/2005 | Year ended 3/31/2004 | Year ended 3/31/2005 | Year ended 3/31/2004 | |||||||||
| Class A | |||||||||||||||
| Beginning share balances | 1,160,421 | 896,084 | — | 1,682,429 | 826,623 | 1,323,185 | 549,549 | ||||||||
| Shares sold | 816,345 | 531,498 | 3,399,452 | 2,240,190 | 3,639,264 | 1,735,922 | 1,514,376 | ||||||||
| Distributions reinvested | — | — | — | 42,278 | 2,291 | 34,206 | — | ||||||||
| Shares redeemed | (136,216 | ) | (267,161 | ) | (828,702 | ) | (121,364 | ) | (2,785,749 | ) | (116,254 | ) | (740,740 | ) | |
| Ending share balances | 1,840,550 | 1,160,421 | 2,570,750 | 3,843,533 | 1,682,429 | 2,977,059 | 1,323,185 | ||||||||
| Class B | |||||||||||||||
| Beginning share balances | 28,582 | 39,741 | — | 27,595 | 89,093 | 23,083 | 7,073 | ||||||||
| Shares sold | 10,346 | 40,974 | 3,348 | 11,788 | 147,003 | 10,843 | 39,081 | ||||||||
| Distributions reinvested | — | — | — | 392 | 294 | 354 | — | ||||||||
| Shares redeemed | (3,412 | ) | (52,133 | ) | — | (5,235 | ) | (208,795 | ) | (3,289 | ) | (23,071 | ) | ||
| Ending share balances | 35,516 | 28,582 | 3,348 | 34,540 | 27,595 | 30,991 | 23,083 | ||||||||
| Class C | |||||||||||||||
| Beginning share balances | 39,194 | 82,377 | — | 66,585 | 191,224 | 19,368 | 9,692 | ||||||||
| Shares sold | 32,637 | 99,341 | 7,430 | 47,663 | 334,829 | 34,757 | 61,657 | ||||||||
| Distributions reinvested | — | — | — | 1,224 | 682 | 446 | — | ||||||||
| Shares redeemed | (26,691 | ) | (142,524 | ) | — | (22,240 | ) | (460,150 | ) | (7,565 | ) | (51,981 | ) | ||
| Ending share balances | 45,140 | 39,194 | 7,430 | 93,232 | 66,585 | 47,006 | 19,368 | ||||||||
| PF PIMCO Inflation Managed Fund | PF PIMCO Managed Bond Fund | PF Pacific Life Money Market Fund | PF Salomon Brothers Large-Cap Value Fund | ||||||||||||||
| Year ended 3/31/2005 | Year ended 3/31/2004 | Year ended 3/31/2005 | Year ended 3/31/2004 | Year ended 3/31/2005 | Year ended 3/31/2004 | Year ended 3/31/2005 | Year ended 3/31/2004 | ||||||||||
| Class A | |||||||||||||||||
| Beginning share balances | 1,487,762 | 611,735 | 1,894,467 | 1,795,231 | 14,628,191 | 13,089,685 | 2,314,111 | 1,499,384 | |||||||||
| Shares sold | 2,153,906 | 1,116,158 | 2,494,435 | 3,557,254 | 16,732,058 | 38,550,926 | 2,382,828 | 1,580,175 | |||||||||
| Distributions reinvested | 125,607 | 34,051 | 139,591 | 42,878 | 142,409 | 21,253 | 17,416 | 1,990 | |||||||||
| Shares redeemed | (298,021 | ) | (274,182 | ) | (286,308 | ) | (3,500,896 | ) | (9,160,559 | ) | (37,033,673 | ) | (253,331 | ) | (767,438 | ) | |
| Ending share balances | 3,469,254 | 1,487,762 | 4,242,185 | 1,894,467 | 22,342,099 | 14,628,191 | 4,461,024 | 2,314,111 | |||||||||
| Class B | |||||||||||||||||
| Beginning share balances | 64,022 | 15,668 | 93,157 | 195,812 | 744,107 | 781,809 | 51,317 | 122,759 | |||||||||
| Shares sold | 56,939 | 238,284 | 41,984 | 186,217 | 881,811 | 1,522,624 | 13,679 | 142,984 | |||||||||
| Distributions reinvested | 4,378 | 4,095 | 4,101 | 6,340 | 1,999 | 662 | — | 154 | |||||||||
| Shares redeemed | (10,605 | ) | (194,025 | ) | (25,835 | ) | (295,212 | ) | (955,312 | ) | (1,560,988 | ) | (19,950 | ) | (214,580 | ) | |
| Ending share balances | 114,734 | 64,022 | 113,407 | 93,157 | 672,605 | 744,107 | 45,046 | 51,317 | |||||||||
| Class C | |||||||||||||||||
| Beginning share balances | 373,276 | 46,773 | 221,685 | 450,834 | 956,361 | 1,073,151 | 118,129 | 259,334 | |||||||||
| Shares sold | 388,901 | 713,335 | 110,257 | 549,872 | 8,159,389 | 3,533,422 | 61,355 | 365,282 | |||||||||
| Distributions reinvested | 26,465 | 11,804 | 9,351 | 12,908 | 6,780 | 1,045 | — | 336 | |||||||||
| Shares redeemed | (245,048 | ) | (398,636 | ) | (106,513 | ) | (791,929 | ) | (5,864,157 | ) | (3,651,257 | ) | (41,717 | ) | (506,823 | ) | |
| Ending share balances | 543,594 | 373,276 | 234,780 | 221,685 | 3,258,373 | 956,361 | 137,767 | 118,129 | |||||||||
| —————————— | |
(1) | Operations commenced on December 31, 2004. |
| (2) | On December 31, 2003, the PF MFS Global Growth Fund changed its name to PF MFS International Large-Cap Fund. |
F-11 |
PACIFIC FUNDS |
| PF Van Kampen Comstock Fund (1) | PF Van Kampen Real Estate Fund (2) | PF Van Kampen Mid-Cap Growth Fund (1) | |||||||||
| Year ended 3/31/2005 | Year ended 3/31/2004 | Period ended 3/31/2005 | Year ended 3/31/2005 | Year ended 3/31/2004 | |||||||
| Class A | |||||||||||
| Beginning share balances | 1,050,285 | 652,997 | — | 2,295,133 | 1,046,112 | ||||||
| Shares sold | 844,873 | 521,760 | 1,983,219 | 2,086,147 | 1,836,920 | ||||||
| Distributions reinvested | 5,994 | — | 2,410 | — | — | ||||||
| Shares redeemed | (71,349 | ) | (124,472 | ) | (510,258 | ) | (252,296 | ) | (587,899 | ) | |
| Ending share balances | 1,829,803 | 1,050,285 | 1,475,371 | 4,128,984 | 2,295,133 | ||||||
| Class B | |||||||||||
| Beginning share balances | 40,335 | 24,782 | — | 63,585 | 99,558 | ||||||
| Shares sold | 11,674 | 41,480 | 1,853 | 20,939 | 148,639 | ||||||
| Distributions reinvested | — | — | 1 | — | — | ||||||
| Shares redeemed | (20,773 | ) | (25,927 | ) | — | (8,764 | ) | (184,612 | ) | ||
| Ending share balances | 31,236 | 40,335 | 1,854 | 75,760 | 63,585 | ||||||
| Class C | |||||||||||
| Beginning share balances | 20,136 | 9,186 | — | 120,845 | 194,145 | ||||||
| Shares sold | 58,452 | 67,612 | 3,413 | 62,090 | 357,590 | ||||||
| Distributions reinvested | 37 | — | 4 | — | — | ||||||
| Shares redeemed | (8,361 | ) | (56,662 | ) | — | (19,502 | ) | (430,890 | ) | ||
| Ending share balances | 70,264 | 20,136 | 3,417 | 163,433 | 120,845 | ||||||
| —————————— | |
(1) | On May 1, 2003, the PF Janus Strategic Value Fund and the PF MFS Mid-Cap Growth Fund changed their names to PF Van Kampen Comstock Fund and PF Van Kampen Mid-Cap Growth Fund, respectively. |
| (2) | Operations commenced on December 31, 2004. |
As of March 31, 2005, Pacific Life owned the following percentages of the total (aggregate of Classes A, B, and C) shares outstanding of each of the Funds: |
| PF AIM Blue Chip | 15.0 | % | PF MFS International Large-Cap | 17.1 | % |
| PF AIM Aggressive Growth | 75.9 | % | PF PIMCO Inflation Managed | 13.4 | % |
| PF Goldman Sachs Short Duration Bond | 12.5 | % | PF Pacific Life Money Market | 19.4 | % |
| PF Janus Growth LT | 26.1 | % | PF Salomon Brothers Large-Cap Value | 10.9 | % |
| PF Lazard Mid-Cap Value | 15.5 | % | PF Van Kampen Comstock | 26.3 | % |
| PF Lazard International Value | 13.0 | % | PF Van Kampen Real Estate | 27.1 | % |
| As of March 31, 2005, each of the Portfolio Optimization Funds owned the following percentages of the total (aggregate of Classes A, B, and C) shares outstanding of each of the following Underlying Funds, as applicable: |
| Portfolio Optimization Funds | |||||||||||
| Underlying Fund | Portfolio Optimization Model A | Portfolio Optimization Model B | Portfolio Optimization Model C | Portfolio Optimization Model D | Portfolio Optimization Model E | ||||||
| PF AIM Blue Chip | 1.53 | % | 7.80 | % | 25.43 | % | 28.56 | % | 12.89 | % | |
| PF Goldman Sachs Short Duration Bond | 14.33 | % | 18.81 | % | 37.77 | % | 14.95 | % | N/A | ||
| PF Janus Growth LT | N/A | N/A | 17.96 | % | 26.11 | % | 15.04 | % | |||
| PF Lazard Mid-Cap Value | 1.44 | % | 4.75 | % | 25.16 | % | 33.58 | % | 19.09 | % | |
| PF Lazard International Value | 1.40 | % | 6.77 | % | 28.07 | % | 32.46 | % | 11.94 | % | |
| PF MFS International Large-Cap | 0.92 | % | 4.85 | % | 24.83 | % | 32.21 | % | 14.33 | % | |
| PF PIMCO Inflation Managed | 4.67 | % | 10.30 | % | 28.45 | % | 12.40 | % | N/A | ||
| PF PIMCO Managed Bond | 8.35 | % | 14.91 | % | 31.74 | % | 18.60 | % | 2.51 | % | |
| PF Pacific Life Money Market | 13.33 | % | 17.49 | % | 14.10 | % | N/A | N/A | |||
| PF Salomon Brothers Large-Cap Value | 2.08 | % | 9.40 | % | 27.52 | % | 26.22 | % | 9.57 | % | |
| PF Van Kampen Comstock | 2.26 | % | 6.69 | % | 20.14 | % | 21.98 | % | 8.01 | % | |
| PF Van Kampen Real Estate | N/A | N/A | 27.82 | % | 30.79 | % | 13.79 | % | |||
| PF Van Kampen Mid-Cap Growth | N/A | 4.74 | % | 28.03 | % | 27.96 | % | 14.83 | % | ||
F-12 |
PACIFIC FUNDS 13. INDEMNIFICATIONS Under the Funds’ organizational documents, its officers and trustees are indemnified against certain liabilities arising out of performance of their duties to the Funds. In addition, in the normal course of business, the Funds enter into contracts with service providers and others that contain general indemnification clauses. The Funds’ maximum exposure under these arrangements is dependent on future claims that may be made against the Funds and, therefore, cannot be estimated; however, based on experience, the risk of loss from such claims is considered remote. 14. TAX INFORMATION (Unaudited) For corporate shareholders, the percentage of investment income (dividend income plus short-term gains, if any) for each of the Funds that qualify for the dividends-received deductions is as follows: |
| Funds | Percentage | |||
|---|---|---|---|---|
| PF Portfolio Optimization Model A | 3.07 | % | ||
| PF Portfolio Optimization Model B | 6.68 | % | ||
| PF Portfolio Optimization Model C | 10.79 | % | ||
| PF Portfolio Optimization Model D | 21.36 | % | ||
| PF Portfolio Optimization Model E | 100.00 | % | ||
| PF Salomon Brothers Large-Cap Value | 100.00 | % | ||
| PF Van Kampen Comstock | 78.06 | % | ||
The following Funds designated the listed amounts as long-term capital gain dividend during the year ended March 31, 2005. Required distributions are based on net realized long-term gains determined on a tax basis and may differ from such amounts for financial reporting purposes. |
| Funds | Amount | |||
|---|---|---|---|---|
| PF Portfolio Optimization Model A | $ | 44,038 | ||
| PF Portfolio Optimization Model B | 98,003 | |||
| PF Portfolio Optimization Model C | 315,193 | |||
| PF Portfolio Optimization Model D | 411,464 | |||
| PF Portfolio Optimization Model E | 212,902 | |||
| PF AIM Aggressive Growth | 1,382,881 | |||
| PF Lazard International Value | 458,738 | |||
| PF MFS International Large-Cap | 306,210 | |||
| PF PIMCO Inflation Managed | 29,128 | |||
| PF PIMCO Managed Bond | 375,257 | |||
| PF Putnam Equity Income | 2,525,000 | |||
| PF Van Kampen Comstock | 741,717 | |||
F-13 |
[THIS PAGE INTENTIONALLY LEFT BLANK] |
F-14 |

G-1 |
[THIS PAGEINTENTIONALLY LEFT BLANK] |
| Name and Age | Position(s) with the Fund and Length of Time Served * | Current Directorship(s) Held and Principal Occupation(s) (and certain additional occupation information) During Past 5 Years | Number of Portfolios/Funds in Fund Complex Overseen ** | |||
| INDEPENDENT TRUSTEES | ||||||
| Lucie H. Moore Year of birth 1956 | Trustee since 6/13/01 | Trustee of Pacific Select Fund; Chairman of the Development Committee of the Board of Trustees, the Pegasus School; Chairman of the Development Committee of the Board of Directors, Homeword; Advisory Board, Court Appointed Special Advocates (CASA) of Orange County; Former partner (1994) with Gibson, Dunn & Crutcher (Law). | 50 | |||
| Richard L. Nelson Year of birth 1930 | Trustee since 6/13/01 | Trustee of Pacific Select Fund; Former Trustee (2001) PIMCO Funds, Multi-Manager Series; Former Director (2000) of Wynn’s International, Inc. (Industrial); Retired Partner (1983) with Ernst & Young LLP (Accounting and Auditing). | 50 | |||
| Lyman W. Porter Year of birth 1930 | Trustee since 6/13/01 | Trustee of Pacific Select Fund; Professor Emeritus of Management in the Graduate School of Management at the University of California, Irvine; Member of the Board of Trustees of the American University of Armenia; Former Trustee (2001) PIMCO Funds, Multi-Manager Series; Former Member (1995) of the Academic Advisory Board of the Czechoslovak Management Center; Former Dean (1983) of the Graduate School of Management, University of California, Irvine. | 50 | |||
| Alan Richards Year of birth 1930 | Trustee since 6/13/01 | Trustee of Pacific Select Fund; Chairman of the Board and Director, NETirement.com, Inc.(Retirement Planning Software); Chairman of IBIS Capital, LLC (Financial); Co-owner and member of the Advisory Board of Lease & Financial International Inc. (Insurance); Former Trustee (2001) PIMCO Funds, Multi-Manager Series; Former Director (1998) of Western National Corporation (Insurance Holding Company); Retired Chairman (1986) of E.F. Hutton Insurance Group; Former Director (1986) of E.F. Hutton and Company, Inc. (Financial). | 50 | |||
| G. Thomas Willis Year of birth 1942 | Trustee since 3/18/04 | Trustee of Pacific Select Fund; Certified Public Accountant; Retired Partner (2002) of PricewaterhouseCoopers LLP, (Accounting and Auditing). | 50 |
H-1 |
| PACIFIC FUNDS TRUSTEES AND OFFICERS INFORMATION (Continued) (Unaudited) |
| Name and Age | Position(s) with the Fund and Length of Time Served * | Current Directorship(s) Held and Principal Occupation(s) (and certain additional occupation information) During Past 5 Years | Number of Portfolios/Funds in Fund Complex Overseen ** | |||
| INTERESTED PERSONS | ||||||
| Thomas C. Sutton Year of birth 1942 | Chairman of the Board and Trustee since 6/13/01 | Chairman of the Board, Director and Chief Executive Officer of Pacific Life, Pacific Mutual Holding Company and Pacific LifeCorp; and similar positions with other subsidiaries and affiliates of Pacific Life; Chairman of the Board and Trustee of Pacific Select Fund; Director of The Irvine Company (Real Estate); Director of Edison International (Utilities); Former Director of Newhall Land & Farming (2004); Former Management Board Member of PIMCO Advisors L.P. (1997); Former Equity Board Member of PIMCO Advisors L.P. (1997). | 50 | |||
| Glenn S. Schafer Year of birth 1949 | President and Trustee since 6/13/01 | President and Director of Pacific Life, Pacific Mutual Holding Company and Pacific LifeCorp and similar positions with other subsidiaries and affiliates of Pacific Life; President (2/99 to present) and Trustee (1/05 to present) of Pacific Select Fund; Director of Beckman Coulter, Inc. (manufacturer of Bio-Medical diagnostic systems); Director of Asset Management Finance Corp.; Former Management Board Member of PIMCO Advisors L.P. (2000); Former Equity Board Member of PIMCO Advisors L.P. (1997). | 50 | |||
| Brian D. Klemens Year of birth 1956 | Vice President and Treasurer since 6/13/01 | Vice President and Treasurer (12/98 to present) of Pacific Life, Pacific Mutual Holding Company, Pacific LifeCorp and similar positions with other subsidiaries and affiliates of Pacific Life; Vice President and Treasurer of Pacific Select Fund. | 50 | |||
| Diane N. Ledger Year of birth 1939 | Vice President and Assistant Secretary since 6/13/01 | Vice President, Variable Regulatory Compliance, Pacific Life and Pacific Life & Annuity Company; and Vice President and Assistant Secretary of Pacific Select Fund. | 50 | |||
| Audrey L. Milfs Year of birth 1945 | Secretary since 6/13/01 | Vice President, Director and Secretary of Pacific Life, Pacific Mutual Holding Company, Pacific LifeCorp and similar positions with other subsidiaries of Pacific Life; Secretary of Pacific Select Fund. | 50 | |||
| Robin S. Yonis Year of birth 1954 | Vice President and General Counsel since 6/13/01 | Vice President and Investment Counsel of Pacific Life and Pacific Life & Annuity Company; and Assistant Secretary of Pacific Mutual Holding Company and Pacific LifeCorp. | 19 | |||
| Sharon Pacheco Year of birth 1957 | Vice President and Chief Compliance Officer since 6/04/04 | Vice President (2/00 to present) and Assistant Vice President (11/97 to 2/00) of Pacific Life; Vice President (4/00 to present) and Assistant Vice President (8/99 to 4/00) of Pacific Life & Annuity Company; Chief Compliance Officer (1/03 to present) of Pacific Life and Pacific Life & Annuity Company; Vice President and Chief Compliance Officer (11/03 to present) of Pacific Mutual Holding Company, Pacific LifeCorp., and (6/04 to present) Pacific Select Fund. | 50 |
| * | Each trustee serves until he or she resigns, retires, or his or her successor is elected and qualified. It is anticipated that three of the Independent Trustees Messrs. Nelson, Porter, and Richards, will resign on or before December 31, 2005 pursuant to the Funds’ retirement policy. |
| ** | As of March 31, 2005, the “Fund Complex” consisted of Pacific Select Fund (31 portfolios) and Pacific Funds (19 funds). |
H-2 |
| PACIFIC FUNDS APPROVAL OF INVESTMENT ADVISORY AGREEMENT AND MANAGEMENT AGREEMENTS (Unaudited) |
| The Investment Advisory Agreement (“Advisory Contract”) with Pacific Life and the Management Agreements (the “Agreements”) with each of the sub-advisers (“Managers”) that manage various of the individual portfolios (“Funds”) that comprise the Pacific Funds were approved or renewed for Pacific Funds by Pacific Funds’ Board of Trustees (the “Board”), including the independent trustees, at an in-person meeting of the trustees held on December 10, 2004. Prior to December 10, the independent trustees held a separate meeting at which they considered the sufficiency of the information provided to assist them in their review of the Agreements and made preliminary assessments with respect to each Agreement. Pacific Life and the Managers provided materials to the Board for its evaluation, and the independent trustees were advised by independent legal counsel with respect to these and other relevant matters. Discussed below are the factors considered by the Board in approving the Advisory Contract and each Agreement. This discussion is not intended to be all-inclusive. The Board reviewed a variety of factors and considered a significant amount of information, including information received on an ongoing basis at Board and committee meetings. The approval determinations were made on the basis of each Trustee’s business judgment after consideration of all the information taken as a whole. Individual trustees may have given different weights to certain factors and assigned various degrees of materiality to information received in connection with the approval process. Approval of Investment Advisory Agreement Pacific Life supervises the management of Pacific Funds pursuant to the Advisory Contract. Pacific Life manages six funds directly: the five Portfolio Optimization Funds and the PF Pacific Life Money Market Fund. For the other Funds, Pacific Life has retained Managers. In evaluating the Advisory Contract, the Board, including the independent trustees, considered the following factors, among others: |
| • | The Board considered the benefits to shareholders of continuing to retain Pacific Life as the adviser to Pacific Funds, particularly in light of the nature, extent, and quality of services provided by Pacific Life. The Board considered the ability of Pacific Life to provide an appropriate level of support and resources to the Funds and whether Pacific Life has sufficiently qualified personnel. The Board noted the background and experience of Pacific Life’s senior management, and that the expertise of and amount of attention expected to be given to Pacific Funds by Pacific Life’s management team are substantial. The Board considered Pacific Life’s ability to attract and retain qualified business professionals. The Board noted Pacific Life’s significant investment in technology systems. The Board also considered Pacific Life’s compliance operations with respect to Pacific Funds, including the measures recently taken by Pacific Life to assist the Pacific Funds in complying with Rule 38a-1 under the Investment Company Act of 1940. The Board concluded that it was satisfied with the nature, extent and quality of the investment management services anticipated to be provided to Pacific Funds by Pacific Life under the Advisory Contract. The trustees also considered the services provided by Pacific Life as a “manager of managers” pursuant to an SEC exemptive order which permits Pacific Funds to retain new Managers without obtaining shareholder approval. In this connection, the Board noted that Pacific Life has been active in monitoring the performance of the Managers and, where it deems appropriate, recommending that Managers be replaced and further recommending replacement candidates for the Board’s approval. | |
| • | The Board considered information about each Fund’s historical performance. The Board was provided with a comparative analysis of the performance of each Fund to similar funds and relevant market indices, including the recent, medium, and long-term performance of each Fund and, for new Funds, a comparative analysis of accounts with substantially similar investment strategies. In addition, the Board reviewed information regarding the performance and expense levels of the Funds as compared to other funds in each Fund’s relevant peer group. The Board considered the performance of the Portfolio Optimization Funds and the PF Pacific Life Money Market Fund as well as the average and median performance of their peer funds and their respective benchmarks. | |
| • | The Board considered a report regarding the advisory fees charged under other investment advisory contracts with other investment advisers for other registered investment companies or other types of clients. Based on their evaluation of this information, the Board concluded that when compared with the management fees and total expenses charged by funds in their peer groups, the contractual management fees and expenses of each of the Funds are reasonable. | |
| • | The Board considered the cost of services to be provided and profits to be realized by Pacific Life and its affiliates from the relationship with Pacific Funds, including the overall financial soundness of Pacific Life. The Board reviewed profitability information provided by Pacific Life with respect to the profit or loss to Pacific Life from the Advisory Contract, the Administration and Shareholder Services Agreement between Pacific Life and Pacific Funds, and Pacific Life’s entire line of business. The Board noted that Pacific Life operates many of the Funds at a net loss, due in part to the fact that Pacific Funds were only recently launched in 2001 and due to the asset levels of the Funds during the period under review. The Board noted that Pacific Life does not charge an advisory fee to the Portfolio Optimization Funds and subsidizes all the expenses of these Funds. The Board noted that the Funds in which the Portfolio Optimization Funds invest benefit from the assets contributed from the Portfolio Optimization Funds. The Board also considered that Pacific Life waives fees or reimburses each of the Funds for certain operating expenses that exceed stated expense caps. The Board concluded that in light of the modest profit or lack of profit realized by Pacific Life from its relationship with the Funds, profitability would not be weighed heavily as a factor in their analysis. The Board also concluded that the compensation payable under the Advisory Contract is fair and bears a reasonable relationship to the services rendered. |
H-3 |
PACIFIC FUNDS |
| • | The Board considered the potential of Pacific Life to experience economies of scale as the Funds grow in size. The Board noted that, as administrator to Pacific Funds, Pacific Life procures at its own expense certain administrative and shareholder services for the Funds. The Board considered that Pacific Life is compensated at cost, rather than charging a flat or asset-based rate, for the time its legal, accounting, and compliance personnel spend providing assistance, coordination, and supervision in connection with the services provided by Pacific Life. The Board also noted that as Pacific Funds’ assets grow, the cost of such services to the Funds diminishes on a percentage basis. The Board concluded that because Pacific Life realized only modest profits or no profits from its relationship with the Funds, the sharing of economies of scale would not be weighed heavily as a factor in their analysis. | |
| • | The Board considered ancillary benefits to be received by Pacific Life and its affiliates as a result Pacific Life’s relationship with Pacific Funds, including soft dollar arrangements. The Board noted that because the Portfolio Optimization Funds invest primarily in shares of other Pacific Funds, they do not incur commissions or sales charges in connection with investments in the underlying Funds. Additionally, PF Pacific Life Money Market Fund executes principal transactions, and as a result it cannot generate and does not seek any soft-dollar or distribution benefits. The Board concluded that any potential benefits to be derived by Pacific Life from its relationship with Pacific Funds include potential for larger assets under management and reputational benefits, which are consistent with those generally derived by investment advisers to mutual funds. |
After consideration of these factors, the Board found that: (i) the compensation payable under the Advisory Contract bears a reasonable relationship to the services to be rendered and is fair and reasonable; and (ii) the Advisory Contract is in the best interests of Pacific Funds and its shareholders. Approval of Management Agreements For each Fund for which Pacific Life utilizes a Manager pursuant to a Management Agreement, the Board evaluated the applicable Agreement principally with reference to the following factors: (i) the nature, extent and quality of the services to be provided by the Manager; (ii) the investment performance of the Fund and the Manager; (iii) the reasonableness of compensation paid under the Agreement and a comparative analysis of expense ratios of, and advisory and sub-advisory fees paid by, similar peer funds and other funds or accounts managed by the Manager; (iv) the cost of services provided and profits to be realized by the Manager and its affiliates from the relationship with the Fund; (v) the extent to which the fees to be paid to the Manager reflect economies of scale; and (vi) if applicable, any benefits derived or to be derived by the Manager from a relationship with the Fund, such as soft dollar arrangements. The Board also considered the ability of each Manager to provide an appropriate level of support and resources to the Fund(s) sub-advised by that Manager and whether the Manager has sufficiently qualified personnel. The Board also considered the overall financial soundness of each Manager as it relates to the ability of the Manager to provide services to the Fund(s) it sub-advises. The Board also noted that the fees payable under each Agreement are paid by Pacific Life and negotiated by Pacific Life, and therefore are the result of arms’ length negotiations. Among the factors the Board considered in approving the Management Agreements are the following. |
| • | The Board considered the benefits to shareholders of continuing to retain each Manager, particularly in light of the nature, extent, and quality of services provided by the Manager. The Board considered the quality of the management services provided to the Funds over both the short and long term and the organizational depth and stability of the firm, including the background and experience of each Manager’s senior management and the expertise of and amount of attention expected to be given to the Funds by each Manager’s respective portfolio management team. The Board reviewed the qualifications, backgrounds and responsibilities of the portfolio managers responsible for the day-to-day management of the Funds. The Board also considered each Manager’s compliance operations with respect to the Funds, including the assessment of each Manager’s compliance program by the Pacific Funds’ Chief Compliance Officer as required under Rule 38a-1 of the Investment Company Act of 1940. If applicable, the Board also considered recent regulatory issues that had arisen with respect to certain Managers in connection with their management of their proprietary families of mutual funds (which had no impact on the Funds), and the Manager’s response to this matter. The Board concluded it was satisfied with the nature, extent and quality of the management services provided by the Managers and that appropriate replacements of Managers that the Board had determined were not performing satisfactorily had been made over the course of the year. In making these assessments the Board was aided by the assessments of Pacific Life and the various presentation materials (including frequent in-person presentations made by representatives of the Managers to the Board) during the course of the year. | |
| • | The Board considered information about each Fund’s historical performance, noting whether there were periods of underperformance and outperformance relative to each Fund’s peer funds as well as its respective benchmark or benchmarks over time. The Board concluded that the Managers, individually and as a group, had the ability to provide high quality investment management services to the Funds over the long-term, subject to ongoing review of performance by Pacific Life. In assessing performance, the Board also considered the length of time the Manager had sub-advised the Fund. The Board also noted that each |
H-4 |
PACIFIC FUNDS Manager had been retained by Pacific Life with a view to the use of the Fund sub-advised by that Manager in the Portfolio Optimization Funds, and the need for the Manager to adhere to its investment mandates, which could at times have an impact on the Fund’s performance. In assessing performance, the Board compared each sub-advised Fund’s performance against the following benchmarks: |
| Fund | Benchmark | Sub-Adviser | ||
| PF AIM Blue Chip Fund | S&P 500 Index | A I M Capital Management, Inc. | ||
| PF AIM Aggressive Growth Fund | Russell Midcap Growth Index | A I M Capital Management, Inc. | ||
| PF Goldman Sachs Short Duration Bond Fund | Merrill Lynch 1-3 Year Treasury Index | Goldman Sachs Asset Management, L.P. | ||
| PF Janus Growth LT Fund | S&P 500 Index | Janus Capital Management LLC | ||
| PF Lazard Mid-Cap Value Fund* | Russell Midcap Index | Lazard Asset Management LLC | ||
| PF Lazard International Value Fund | MSCI EAFE Index | Lazard Asset Management LLC | ||
| PF MFS International Large-Cap Fund | MSCI EAFE Index | MFS Investment Management | ||
| PF PIMCO Inflation Managed Fund | Lehman Brothers Global Real: U.S. TIPS Index | Pacific Investment Management Company LLC | ||
| PF PIMCO Managed Bond Fund | Lehman Brothers Government/Credit Index | Pacific Investment Management Company LLC | ||
| PF Salomon Brothers Large-Cap Value Fund | S&P 500 Index | Salomon Brothers Asset Management Inc | ||
| PF Van Kampen Comstock Fund | S&P 500 Index | Van Kampen | ||
| PF Van Kampen Real Estate Fund* | NAREIT Equity Index | Van Kampen | ||
| PF Van Kampen Mid-Cap Growth Fund | Russell Midcap Growth Index | Van Kampen |
| * | The PF Lazard Mid-Cap Value Fund and PF Van Kampen Real Estate Fund commenced operations on December 31, 2004, and as a result, the Board reviewed the performance of accounts with substantially similar investment strategies. |
| • | The Board considered information regarding the advisory fees charged under other investment advisory contracts, such as contracts of the Managers or other investment advisers with other registered investment companies or other types of clients. Based on their evaluation of this information, and the arm’s length nature of the fee negotiation between Pacific Life and each Manager with respect to these fees, the Board concluded that the fees payable under the Management Agreements were reasonable when compared to investment management fees paid by comparable funds and paid by other investment accounts managed by the Managers. | |
| • | The Board considered the profitability of each Agreement to each Manager to the extent practicable based on the financial information provided by each Manager, noting that in many cases it was difficult to accurately determine or evaluate such profitability because Managers managed substantial assets or had multiple business lines and, further, that any such assessment would involve assumptions regarding the individual Manager’s allocation policies, capital structure, cost of capital, business mix and other factors. Based on the information provided and the arm’s-length nature of the negotiation underlying the Agreements, the Board concluded that it was reasonable to infer that each Manager’s profitability with respect to its sub-advised Fund(s) was not excessive. | |
| • | The Board considered the extent to which economies of scale would be realized as assets of the Funds grew. The Board concluded that at the current time, given the recent organization of Pacific Funds and the Funds’ asset levels, the current fee structures reflected in each Agreement were appropriate. | |
| • | The Board considered any benefits to be derived by the Managers from their relationships with the Funds, such as soft dollar arrangements. The Board noted that certain Managers represented in the materials presented to the Board that in addition to the fees they receive under the Agreement, they expect to receive additional benefits from the Funds in the form of research, information and other services obtainable from brokers and their affiliates in return for brokerage commissions paid to such brokers. Certain Managers further represented that they may effect transactions with broker-dealers that furnish statistical, research or other information or services which the respective Manager believes will be beneficial to the respective Fund. The Board concluded that any potential benefits to be derived by the Managers from their relationships with the Funds included benefits which were consistent with those generally derived by sub-advisers to mutual funds. |
After consideration of these factors, the Board found that: (i) the compensation payable under each of the Management Agreements bears a reasonable relationship to the services to be rendered and are fair and reasonable; and (ii) each of the Management Agreements are in the best interests of the Funds and their shareholders. ________________________________ |
H-5 |
H-6 |
PACIFIC FUNDS
INDEPENDENT REGISTERED COUNSEL
PACIFIC FUNDS |
Item 2. | Code of Ethics. |
As of the end of the period covered by this report, the Registrant has adopted a code of ethics that applies to the Registrant’s principal executive officer, principal financial officer, principal accounting officer or controller, or persons performing similar functions. There were no substantive amendments or waivers to the Code of Ethics during the period covered by this report.
A copy of this code of ethics is filed as Exhibit 12(a)(1) to this Form N-CSR.
Item 3. | Audit Committee Financial Expert. |
The Registrant’s Board has determined that G. Thomas Willis, a member of the Registrant’s Audit Committee, is an “audit committee financial expert” and “independent,” as such terms are defined in this Item. This designation will not increase the designee’s duties, obligations or liability as compared to his duties, obligations and liability as a member of the Audit Committee and of the Board; nor will it reduce the responsibility of the other Audit Committee members. There may be other individuals who, through education or experience, would qualify as “audit committee financial experts” if the Board had designated them as such. Most importantly, the board believes each member of the Audit Committee contributes significantly to the effective oversight of the Registrant’s financial statements and condition. Mr. Willis is a retired partner of PricewaterhouseCoopers LLP.
Item 4. | Principal Accountant Fees and Services. |
(a) Audit Fees. The aggregate audit fees billed to the Registrant for the years ended March 31, 2005 and 2004 by the principal accountant were $163,000 and $157,500, respectively.
(b) Audit-Related Fees. There were no audit-related fees billed to the Registrant for the last two fiscal years by the principal accountant.
(c) Tax Fees. The aggregate tax fees billed to the Registrant for professional services for tax compliance, tax advice or tax planning for the years ended March 31, 2005 and 2004 by the principal accountant were $66,700 and $0, respectively.
(d) All Other Fees. None.
(e)(1) The Audit Committee is required to pre-approve audit and non-audit services performed for the Registrant by the independent auditor as outlined below in order to assure that the provision of such services does not impair the auditor’s independence:
Pre-Approval Requirements for Services to Registrant. Before the Auditor is engaged by the Registrant to render audit related or permissible non-audit services, either:
The Audit Committee shall pre-approve such engagement; or
Such engagement shall be entered into pursuant to pre-approval policies and procedures established by the Audit Committee. Any such policies and procedures must (1) be detailed as to the particular service and (2) not involve any delegation of the Audit Committee’s responsibilities to the Adviser. The Audit Committee may delegate to one or more of its members the authority to grant pre-approvals. The pre-approval policies and procedures shall include the requirement that the decisions of any member to whom authority is delegated under this Section shall be presented to the full Audit Committee at its next scheduled meeting.
De Minimis Exceptions to Pre-Approval Requirements. Pre-approval for a service provided to the Registrant other than audit, review or attest services is not required if: (1) the aggregate amount of all such non-audit services provided to the Registrant constitutes not more than 5 percent of the total amount of revenues paid by the Registrant to the Auditor during the fiscal year in which the non-audit services are provided; (2) such services were not recognized by the Registrant at the time of the engagement to be non-audit services; and (3) such services are promptly brought to the attention of the Audit Committee and are approved by the Audit Committee or by one or more members of the Audit Committee to whom authority to grant such approvals has been delegated by the Audit Committee.
Pre-Approval of Non-Audit Services Provided to the Adviser and Others. The Audit Committee shall pre-approve any non-audit services proposed to be provided by the Auditor to (i) the Adviser and (ii) any entity in the investment company complex, if the nature of the services provided relate directly to the operations or financial reporting of the Registrant.
(e)(2) No services included in (b)-(d) above were approved pursuant to paragraph
(c)(7)(i)(C) of Rule 2-01 of Regulation S-X.
(f) Not applicable.
(g) The aggregate fees billed for the years ended March 31, 2005 and 2004 by the Registrant’s principal accountant for non-audit services rendered to the Registrant, its investment adviser, and any entity controlling, controlled by, or under common control with the investment adviser that provides ongoing services to the Registrant were $76,700 and $108,038, respectively.
(h) The Registrant’s Audit Committee has considered whether the provision of non-audit services that were rendered to the Registrant’s investment adviser, and any entity controlling, controlled by, or under common control with the investment adviser that provides ongoing services to the Registrant which were
not pre-approved (not requiring pre-approval) is compatible with maintaining the principal accountant’s independence.
Item 5. | Audit Committee of Listed Registrants – not applicable |
Item 6. | Schedule of Investments – Schedule I – not applicable |
Item 7. | Disclosure of Proxy Voting Policies and Procedures for Closed-End Management Investment Companies – not applicable |
Item 8. | Portfolio Managers of Closed-End Management Investment Companies – not Applicable |
Item 9. | Purchases of Equity Securities by Closed-End Management Investment Company and Affiliated Purchasers – not applicable |
Item 10. | Submission of Matters to a Vote of Security Holders. |
There have been no material changes to the procedures by which shareholders may recommend nominees to the Registrant’s Board of Directors. |
Item 11. | Controls and Procedures |
(a) The Chairman of the Board, President and Treasurer have concluded that Pacific Funds’ disclosure controls and procedures (as defined in Rule 30a-3(c) under the Investment Company Act) provide reasonable assurances that material information relating to Pacific Funds is made known to them by the appropriate persons, based on their evaluation of these controls and procedures as of a date within 90 days of the filing of this report.
(b) There were no changes in Pacific Funds’ internal control over financial reporting that occurred during the Fund’s most recent fiscal half-year (the Fund’s second fiscal half-year in the case of an annual report) that have materially affected, or are reasonably likely to materially affect, the Fund’s internal control over financial reporting.
Item 12. Exhibits
(a)(1) Code of ethics that is subject to the disclosure of Item 2 hereof.
(a)(2) Exhibit 99.CERT—Certifications pursuant to Section 302 of the Sarbanes-Oxley Act of 2002.
Exhibit 99.906CERT—Certifications pursuant to Section 906 of the Sarbanes-Oxley Act of 2002
Signatures
Pursuant to the requirements of the Securities Exchange Act of 1934 and the Investment Company Act of 1940, the registrant has duly caused this report to be signed on its behalf by the undersigned, thereunto duly authorized.
Pacific Funds |
By: | /s/ Glenn S. Schafer | ||
| Glenn S. Schafer |
| |
| President |
| |
Date: June 3, 2005 |
Pursuant to the requirements of the Securities Exchange Act of 1934 and the Investment Company Act of 1940, this report has been signed below by the following persons on behalf of the registrant and in the capacities and on the dates indicated.
By: | /s/ Thomas C. Sutton |
|
| Thomas C. Sutton |
|
| Chairman of the Board of Trustees | |
Date: June 3, 2005 |
By: | /s/ Glenn S. Schafer | |
| Glenn S. Schafer | |
| President |
|
Date: June 3, 2005 |
By: | /s/ Brian D. Klemens |
|
| Brian D. Klemens |
|
| Treasurer (Principal Financial and | |
Accounting Officer)
Date: June 3, 2005 |