Table of Contents
UNITED STATES
SECURITIES AND EXCHANGE COMMISSION
Washington, D.C. 20549
FORM N-CSR
CERTIFIED SHAREHOLDER REPORT OF REGISTERED
MANAGEMENT INVESTMENT COMPANIES
Investment Company Act file number 811-10385
Pacific Life Funds
(Exact name of registrant as specified in charter)
700 Newport Center Drive, P.O. Box 7500
Newport Beach, CA 92660
(Address of principal executive offices) (Zip code)
Robin S. Yonis
Vice President and General Counsel of Pacific Life Funds
700 Newport Center Drive, P.O. Box 9000
Newport Beach, CA 92660
(Name and address of agent for service)
Copies to:
Anthony H. Zacharski, Esq.
Dechert LLP
90 State House Square
Hartford, CT 06103
Registrant’s telephone number, including area code: 949-219-6767
Date of fiscal year end: March 31
Date of reporting period: April 1, 2012 - March 31, 2013
Form N-CSR is to be used by management investment companies to file reports with the Commission not later than 10 days after the transmission to stockholders of any report that is required to be transmitted to stockholders under Rule 30e-1 under the Investment Company Act of 1940 (17 CFR 270.30e-1). The Commission may use the information provided on Form N-CSR in its regulatory, disclosure review, inspection, and policymaking roles.
A registrant is required to disclose the information specified by Form N-CSR, and the Commission will make this information public. A registrant is not required to respond to the collection of information contained in Form N-CSR unless the Form displays a currently valid Office of Management and Budget (“OMB”) control number. Please direct comments concerning the accuracy of the information collection burden estimate and any suggestions for reducing the burden to Secretary, Securities and Exchange Commission, 100 F Street, NE, Washington, DC 20549. The OMB has reviewed this collection of information under the clearance requirements of 44 U.S.C. § 3507.
Table of Contents
Item 1. Reports to Stockholders.
The following is a copy of the reports transmitted to stockholders pursuant to Rule 30e-1 under the Act (17 CFR 270.30e-1).
Table of Contents
ANNUAL REPORT
AS OF MARCH 31, 2013
TABLE OF CONTENTS | ||
| A-1 | ||
| A-2 | ||
| B-1 | ||
| C-1 | ||
| C-3 | ||
| C-5 | ||
| C-9 | ||
| D-1 | ||
| E-1 | ||
| F-1 | ||
| F-3 | ||
Approval of Investment Advisory Agreement and Fund Management Agreements | F-6 | |
| F-10 |
Table of Contents
We are pleased to share with you the Pacific Life Funds Annual Report dated March 31, 2013. Pacific Life Funds is comprised of thirty-three funds, eleven of which are included in this report (each individually, a “fund” and collectively, the “funds”) and are available for direct investment. Pacific Life Fund Advisors LLC (PLFA), as adviser to the funds, manages the PL Portfolio Optimization Conservative, PL Portfolio Optimization Moderate-Conservative, PL Portfolio Optimization Moderate, PL Portfolio Optimization Moderate-Aggressive and PL Portfolio Optimization Aggressive Funds (PL Portfolio Optimization Funds). Each of the PL Portfolio Optimization Funds is an asset allocation “fund of funds” and invests in certain other funds (PL Underlying Funds) of Pacific Life Funds. PLFA supervises the management of the PL Underlying Funds which are only available for investment by the PL Portfolio Optimization Funds and are included in a separate Annual Report. Please see “Where to Go for More Information” for instructions on how to obtain the PL Underlying Funds’ Annual Report. PLFA also does business under the name “Pacific Asset Management” and manages the PL Short Duration Income, PL Income, PL Strategic Income, PL Floating Rate Income, PL High Income and PL Money Market Funds under that name. The funds and the fund managers as of March 31, 2013 are listed below:
| Fund | Fund Manager | |
| PL Portfolio Optimization Conservative | ||
| PL Portfolio Optimization Moderate-Conservative | ||
| PL Portfolio Optimization Moderate | Pacific Life Fund Advisors LLC (PLFA) | |
| PL Portfolio Optimization Moderate-Aggressive | ||
| PL Portfolio Optimization Aggressive | ||
| PL Short Duration Income | Pacific Asset Management | |
| PL Income | ||
| PL Strategic Income | ||
| PL Floating Rate Income | ||
| PL High Income | ||
| PL Money Market |
We appreciate your confidence in the Pacific Life Funds and look forward to serving your financial needs in the years to come.
Sincerely,
|
| |
| James T. Morris | Mary Ann Brown | |
| Chairman of the Board | Chief Executive Officer | |
| Pacific Life Funds | Pacific Life Funds |


A-1
Table of Contents
PACIFIC LIFE FUNDS PERFORMANCE DISCUSSION
This Annual Report is provided for the general information of investors with beneficial interests in Pacific Life Funds. This report is not authorized for distribution to prospective investors unless preceded or accompanied by a current Pacific Life Funds’ Prospectus, as supplemented, which contains information about Pacific Life Funds and each of its funds, including their investment objectives, risks, charges and expenses. You should read the Prospectus carefully before investing. There is no assurance that a fund will achieve its investment objective. Each fund is subject to market risk. The net asset value of a fund changes as the values of its assets go up or down. The value of a fund’s shares will fluctuate, and when redeemed, may be worth more or less than their original cost. The total return for each fund (including the 7-day yield for the PL Money Market Fund) includes reinvestment of all dividends and capital gain distributions, if any, and does not include deductions of any applicable sales charges. Past performance is not predictive of future performance. Performance figures for each class reflect the deduction of any applicable maximum front-end sales charge at the time of investment and reflect any applicable contingent deferred sales charge that would be deducted upon redemption at the end of the period presented.
This report shows you the performance of the funds compared to benchmark indices. Index performance is provided for illustrative and comparative purposes only and does not predict or depict the performance of the funds. Indices are unmanaged, do not incur transaction costs and cannot be purchased directly by investors. Index returns on equity securities include reinvested dividends.
The composite benchmarks for the PL Portfolio Optimization Funds are composed using four broad-based indices. The percentage amounts of each broad-based index within each composite benchmark are based on each fund’s target asset class allocations in effect during the reporting period. The percentages attributed to a broad-based index within a composite benchmark will change if a fund’s target asset class allocations change.
PLFA has written the general market conditions commentary which expresses PLFA’s opinions and view on how the market generally performed for the year ended March 31, 2013. All views are subject to change at any time based upon market or other conditions, and Pacific Life Funds, its adviser and the fund managers disclaim any responsibility to update such views. Any references to “we”, “I”, or “ours” are references to the adviser or fund manager. The adviser and fund managers may include statements that constitute “forward-looking statements” under the United States (U.S.) securities laws. Forward-looking statements include information concerning possible or assumed future results of the Pacific Life Funds’ investment operations, asset levels, earnings, expenses, industry or market conditions, regulatory developments and other aspects of the Pacific Life Funds’ operations or general economic conditions. In addition, when used in this report, predictive verbs such as “believes”, “expects”, “anticipates”, “intends”, “plans”, “estimates”, “projects” and future or conditional verbs such as “will”, “may”, “could”, “should”, and “would”, or any other statement that necessarily depends on future events, are intended to identify forward-looking statements. Forward-looking statements are not guarantees of performance or economic results. They involve risks, uncertainties and assumptions. Although such statements are based on expectations that the adviser or fund manager believes to be reasonable, actual results may differ materially from expectations. Investors must not rely on any forward-looking statements.
In connection with any forward-looking statements and any investment in the Pacific Life Funds, investors should carefully consider the investment objectives, policies and risks described in the Pacific Life Funds’ current Prospectus, as supplemented, and Statement of Additional Information, as supplemented, as filed with the Securities and Exchange Commission (SEC), which may be obtained from the SEC’s website at www.sec.gov.
Market Conditions (for the year ended March 31, 2013)
Executive Summary
Over the reporting period, financial markets experienced pockets of volatility but managed to trend higher. While the geopolitical and economic uncertainty that overwhelmed investors lingered during the reporting period, no major disruptions caused the markets to veer off-course for a prolonged period. The short-term “risk-on” and “risk-off” trend persisted over the first half of the reporting period with macro headlines primarily driving market sentiments. However, volatility remained relatively tame and equity markets rallied over the latter half of the reporting period despite the anticipation of challenges coming from of Washington D.C.
Several key events caused volatility to rise in the first half of the reporting period. The euro crisis appeared to have reached peak levels around the start of the reporting period. Amid this challenging environment, European countries saw changes in their political landscape. This included new leaders who pushed for anti-austerity policies. The backlash from anti-austerity supporters (a united front against rampant unemployment and government spending cuts accompanied by strikes and demonstrations) caused additional concerns of unwinding the progress in Europe. Additionally, the economic drag from Europe had global implications that caused global economic growth projections to be revised downward. Concerns over China and its exports to Europe also weighed on its ability to sustain its dominant growth.
Despite the headwinds around the globe, financial markets marched higher over the second-half of the reporting period. The combination of high unemployment rate and lack of evidence of inflation, the Fed continued to provide further support by extending “Operation Twist” (its program to keep long-term rates low by selling its short-term assets and buying long-term Treasuries). The Fed also launched a third round of quantitative easing in September to purchase an additional $40 billion in mortgage-backed securities (MBS) per month. From abroad, the political and economic disturbances in Europe finally led the European Central Bank (ECB) to pledge full support to preserve the euro, which helped unfreeze capital flow throughout the European banking system.
Throughout the reporting period, central banks continued to play a vital role in sustaining the financial market recovery by providing unprecedented liquidity in the global banking system. While such efforts may have helped rejuvenate financial markets, political upheaval introduced uncertainty in the marketplace. Both U.S. and European politicians continued to muddle through their respective fiscal and economic issues. In the U.S., fears of the “fiscal cliff” scenario developed from the inability of Congress to promptly settle budgetary disagreements that led to the implementation of the sequestration budget cuts. In the eurozone, European politicians have struggled to agree and settle on the appropriate policy actions to recover their economies.
| See explanation of symbol and benchmark definitions on page A-20 |
A-2
Table of Contents
PACIFIC LIFE FUNDS PERFORMANCE DISCUSSION (Continued)
The global economy maintained a steady but slow recovery throughout the reporting period. Various risks continued to linger and influenced markets to varying degrees. The following sections highlight how specific market segments responded to the events that unfolded over the reporting period.
Fixed Income
As the overall market sentiment improved relative to the prior reporting period, the broad fixed income segment fell behind the broad equity market. For the reporting period, the overall fixed income market (as measured by the Barclays U.S. Aggregate Bond Index) gained 3.77%. Short-term Treasuries and credits barely budged over the reporting period as the Fed continued to maintain a near zero interest rate policy for the Federal Funds (Fed Funds). Long-term Treasuries benefited moderately from the Fed’s efforts to keep long-term yields low. Treasury yields (which have an inverse relationship to prices) continued to hit historic low levels, as the 10-Year Treasury yield dipped below 1.50% during the reporting period. The Barclays Long Term U.S. Treasury Index increased 7.31% over the reporting period.
In this environment, the riskier sectors within the fixed income segment performed relatively well. The high yield market experienced a strong rally with lower-rated credits outpacing those in the investment grade tiers. Emerging markets debt also delivered strong results over the reporting period, as the J.P. Morgan Emerging Markets Bond Index Global Diversified Index returned 10.11% over the reporting period. Additionally, the collateralized loan obligation market showed some revival throughout the reporting period, which boded well for bank loans. Throughout this low Treasury yield environment, investors looked across the riskier spectrum to obtain yields.
Domestic Equity
The domestic equity market experienced modest swings throughout the reporting period but managed to finish with a gain of 13.96% for the S&P 500 Index. Results were relatively mixed for the various categories within the domestic equities segment. One common theme among domestic equities was the double-digit returns across the market capitalization and style groups. With respect to market capitalization, mid-capitalization stocks outpaced those of large- and small-capitalizations. Value styles outperformed those of growth, which were primarily driven by the solid performances of the financials sectors over the reporting period. Financials tends to be the largest sector in value indices. The sector’s strong performance followed a dismal year in 2011, which then recovered as the central banks moved aggressively to support the global banking system. On the flipside, information technology, which tends to have heavy representation in growth indices, was the worst performing sector over the reporting period. Other sectors were driven by various reasons. Political factors over the reporting period, especially throughout the presidential election, had a material influence in the stock market. President Obama’s re-election, and his push to pass the Patient Protection and Affordable Healthcare Act, often times referred to as “Obamacare”, helped the healthcare sector experience a strong gain over the reporting period.
International Equity
After a difficult run during the prior reporting period, international stocks in developed markets experienced a healthy recovery over this reporting period. The Morgan Stanley Capital International (MSCI) Europe, Australasia, and Far East (MSCI EAFE) Index and the MSCI Emerging Markets Index returned 11.25% and 1.96%, respectively. Emerging markets equity returns, on the other hand, were less robust, particularly over the first quarter of 2013. Countries such as Brazil and China continued to deal with inflation that led to concerns over monetary tightening to slow their growth. Additionally, the Japanese yen had been devalued sharply, which helps Japan’s exports but threatens the competitiveness of other Asian exporters. Such concerns hurt South Korean stocks, which represent the largest country weighting in the MSCI Emerging Markets Index.
Concluding Remarks
Economic reports indicated that the world economy grew at approximately 3.20% in 2012 (International Monetary Fund—World Economic Outlook Update—April 2013). Emerging markets, particularly China, contributed to that growth. Developed nations, on the other hand, crawled at a sluggish pace or contracted. Despite the dismal economic indicators, equity markets in developed countries thrived over the reporting period. Perhaps, this was driven more out of relief of avoiding meltdown scenarios that markets had feared.
The question remains on the sustainability of the market rise. Over the reporting period, equity valuations had been trading below long-term averages. These trading ranges may have been a reflection of the general market environment. Over the past few years, the world has been dealing with various crises, which may have caused a hesitation to push valuations back to longer-term historic levels. However, these valuation levels have risen closer to the 10-year average over the first quarter of 2013 as U.S. economic reports continued to indicate steady improvements.
More clarity has been developing in 2013, but challenges still linger. The crisis level in the eurozone appears to be manageable, but economic activity is expected to remain weak in the region. Although the situation in the U.S. is relatively better than its developed counterparts in Europe, economic growth is expected to remain modest. The benign economic activity in developed nations is anticipated to dampen demand for exports from emerging markets. This may have some varying implications to these emerging markets nations. Nonetheless, growth in countries such as China is expected to remain healthy.
Performance over the reporting period showed investors that markets can diverge from economic fundamentals. The level of uncertainty and risks throughout the globe may have caused some investors to reduce or avoid equity exposure. However, those investors would have missed out on the impressive performance delivered from equities in developed markets. This validates the importance of proper asset allocation to navigate through various market conditions.
| See explanation of symbol and benchmark definitions on page A-20 |
A-3
Table of Contents
PACIFIC LIFE FUNDS PERFORMANCE DISCUSSION (Continued)
Performance of the PL Portfolio Optimization Funds
Since the performance of each PL Portfolio Optimization Fund is a composite of the performance of each of the PL Underlying Funds in which each invests (which may include bonds, domestic and/or international equities), there is no one, broad-based industry index to use as a comparison to a PL Portfolio Optimization Fund’s performance. Therefore, we at PLFA have provided information regarding four broad-based indices to use as a comparison to each fund’s performance.
In addition, to assist in performance comparisons, composite benchmarks were constructed for each PL Portfolio Optimization Fund; each is comprised of the four broad-based indices shown below. The composite benchmarks were constructed with allocations to each asset class that correspond to the target allocations for the PL Portfolio Optimization Funds. However, the actual allocation of any PL Portfolio Optimization Fund will naturally vary from these targets as a result of market performance over time. The one-year performance for these broad-based indices is shown in the following table.
Broad Based Indices | One Year (as of 3-31-13) | |||
S&P 500 Index (U.S. Stocks) | 13.96% | |||
Morgan Stanley Capital International (MSCI) EAFE Index (International Stocks) | 11.25% | |||
Barclays U.S. Aggregate Bond Index (Fixed Income) | 3.77% | |||
BofA Merrill Lynch U.S. 3-Month T-Bill Index (Cash) | 0.12% | |||
| See explanation of symbol and benchmark definitions on page A-20 |
A-4
Table of Contents
PACIFIC LIFE FUNDS PERFORMANCE DISCUSSION (Continued)
PL Portfolio Optimization Conservative Fund (managed by Pacific Life Fund Advisors LLC)
Q. How did the fund perform for the year ended March 31, 2013?
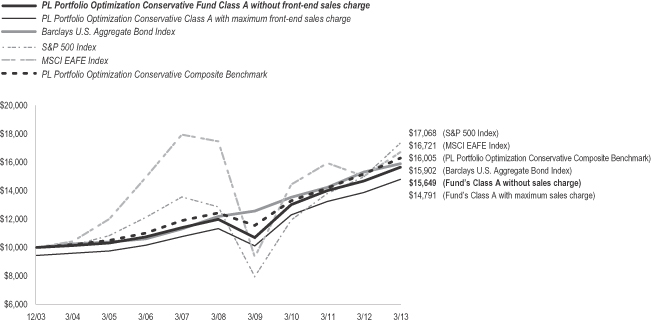
A. For the year ended March 31, 2013, the PL Portfolio Optimization Conservative Fund’s Class A returned 6.57%, compared to a 3.77% return for its benchmarks, the Barclays U.S. Aggregate Bond Index, a 13.96% return for the S&P 500 Index, a 11.25% return for the MSCI EAFE Index, and a 5.49% return for the PL Portfolio Optimization Conservative Composite Benchmark.
The following graph compares the performance of a hypothetical $10,000 investment in Class A shares of the fund to its benchmarks for the periods from inception through March 31, 2013. For comparison purposes, the performance of Class B, C, R and Advisor Class shares for the period from inception through March 31, 2013 are also shown in the table below. Performance data for Class B, C, R and Advisor Class shares will vary due to differences in fees and sales charges. The fund’s performance reflects reinvestments of all dividends and capital gains distributions, if any.
Performance Comparison
Average Annual Total Returns for the Periods Ended March 31, 2013
| 1 Year | 5 Years | Since | ||||||||||
Fund’s Class A without sales charge | 6.57% | 5.46% | 4.96% | |||||||||
Fund’s Class A with maximum sales charge | 0.75% | 4.28% | 4.32% | |||||||||
Fund’s Class B without sales charge | 5.89% | 4.74% | 4.39% | |||||||||
Fund’s Class B with maximum sales charge | 0.89% | 4.40% | 4.39% | |||||||||
Fund’s Class C without sales charge | 5.84% | 4.72% | 4.29% | |||||||||
Fund’s Class C with maximum sales charge | 4.84% | 4.72% | 4.29% | |||||||||
Barclays U.S. Aggregate Bond Index | 3.77% | 5.47% | 5.14% | |||||||||
S&P 500 Index | 13.96% | 5.81% | 5.95% | |||||||||
MSCI EAFE Index | 11.25% | (0.89% | ) | 5.70% | ||||||||
PL Portfolio Optimization Conservative | 5.49% | 5.16% | 5.21% | |||||||||
| 1 Year | 5 Years | Since | ||||||||||
Fund’s Class R without sales charge | 6.38% | 5.21% | 5.20% | |||||||||
Barclays U.S. Aggregate Bond Index | 3.77% | 5.47% | 5.52% | |||||||||
S&P 500 Index | 13.96% | 5.81% | 5.53% | |||||||||
MSCI EAFE Index | 11.25% | (0.89% | ) | 3.28% | ||||||||
PL Portfolio Optimization Conservative | 5.49% | 5.16% | 5.35% | |||||||||
Total Returns for the Period Ended March 31, 2013
| Since Inception (12/31/2012) | ||||||||
Fund’s Advisor Class without sales charge | 2.06% | |||||||
Barclays U.S. Aggregate Bond Index | (0.12% | ) | ||||||
S&P 500 Index | 10.61% | |||||||
MSCI EAFE Index | 5.13% | |||||||
PL Portfolio Optimization Conservative Composite Benchmark | 1.90% | |||||||
Performance data shown represents past performance. Investment return and principal value will fluctuate so that shares of the fund when redeemed may be worth more or less than their original cost. Past performance is not predictive of future performance. The table does not reflect the deduction of taxes that a shareholder would pay on fund distributions or redemption of fund shares. |
| See explanation of symbol and benchmark definitions on page A-20 |
A-5
Table of Contents
PACIFIC LIFE FUNDS PERFORMANCE DISCUSSION (Continued)
Q. Discuss both positive and negative factors that materially affected the fund’s performance during the year, including relevant market conditions, investment strategies and techniques, and particular sectors or securities.
A. The PL Portfolio Optimization Conservative Fund is primarily comprised of various fixed income funds with a small allocation to domestic and international equity funds. The allocation to fixed income funds includes exposure to intermediate-term bonds, short duration securities, inflation-protected bonds, and floating rate loans. The fund’s allocation to equity funds mainly encompasses domestic and foreign large-capitalization funds. Three alternative strategies, the PL Currencies Strategies, PL Global Absolute Return and PL Precious Metals Funds, which commenced operations on December 7, 2012, were added to the fund.
At the broad asset class level, the fund’s fixed income allocations collectively outperformed the Barclays U.S. Aggregate Bond Index. The fund’s domestic and international equity allocation lagged behind the S&P 500 Index and MSCI EAFE Index, respectively.
Within the fund’s fixed income allocation, riskier credit segments performed well over this reporting period. Allocation to riskier, fixed income categories such as the PL Floating Rate Loan and PL Emerging Markets Debt Funds contributed to fund performance. Moreover, the PL Managed Bond and PL Inflation Managed Funds were among the top contributors to fund performance. On the other hand, the PL Short Duration Bond Fund’s subdued returns hampered the fund’s relative performance. This was primarily a result of the Fed’s policy on maintaining the short-term rates near zero percent.
Although the fund’s equity allocation consists of primarily large-capitalization strategies, exposure to the PL Mid-Cap Growth Fund hurt performance. However, the allocation to large-capitalization value strategies (i.e. the PL Comstock and PL Large-Cap Value Funds) helped offset some of the fund’s detractors. Within the international equity segment, the PL International Value Fund mainly detracted from fund performance.
| See explanation of symbol and benchmark definitions on page A-20 |
A-6
Table of Contents
PACIFIC LIFE FUNDS PERFORMANCE DISCUSSION (Continued)
PL Portfolio Optimization Moderate-Conservative Fund (managed by Pacific Life Fund Advisors LLC)
Q. How did the fund perform for the year ended March 31, 2013?
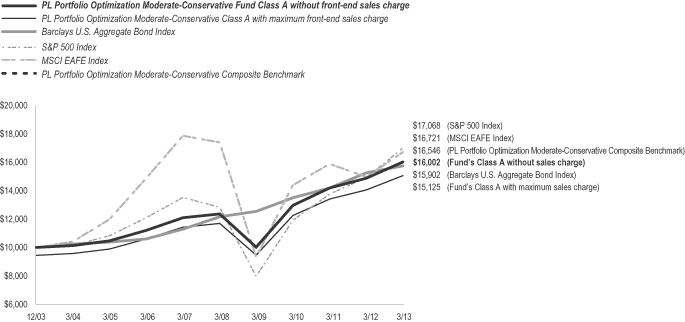
A. For the year ended March 31, 2013, the PL Portfolio Optimization Moderate-Conservative Fund’s Class A returned 7.22%, compared to a 3.77% return for its benchmarks, the Barclays U.S. Aggregate Bond Index, a 13.96% return for the S&P 500 Index, a 11.25% return for the MSCI EAFE Index, and a 7.47% return for the PL Portfolio Optimization Moderate-Conservative Composite Benchmark.
The following graph compares the performance of a hypothetical $10,000 investment in Class A shares of the fund to its benchmarks for the periods from inception through March 31, 2013. For comparison purposes, the performance of Class B, C, R and Advisor Class shares for the periods from inception through March 31, 2013 are also shown in the table below. Performance data for Class B, C, R and Advisor Class shares will vary due to differences in fees and sales charges. The fund’s performance reflects reinvestments of all dividends and capital gains distributions, if any.
Performance Comparison
Average Annual Total Returns for the Periods Ended March 31, 2013
| 1 Year | 5 Years | Since Inception (12/31/03) | ||||||||||
Fund’s Class A without sales charge | 7.22% | 5.23% | 5.21% | |||||||||
Fund’s Class A with maximum sales charge | 1.35% | 4.05% | 4.57% | |||||||||
Fund’s Class B without sales charge | 6.46% | 4.48% | 4.63% | |||||||||
Fund’s Class B with maximum sales charge | 1.46% | 4.14% | 4.63% | |||||||||
Fund’s Class C without sales charge | 6.41% | 4.48% | 4.54% | |||||||||
Fund’s Class C with maximum sales charge | 5.41% | 4.48% | 4.54% | |||||||||
Barclays U.S. Aggregate Bond Index | 3.77% | 5.47% | 5.14% | |||||||||
S&P 500 Index | 13.96% | 5.81% | 5.95% | |||||||||
MSCI EAFE Index | 11.25% | (0.89% | ) | 5.70% | ||||||||
PL Portfolio Optimization Moderate-Conservative Composite Benchmark | 7.47% | 5.12% | 5.59% | |||||||||
| 1 Year | 5 Years | Since Inception (9/30/05) | ||||||||||
Fund’s Class R without sales charge | 6.92% | 4.97% | 5.11% | |||||||||
Barclays U.S. Aggregate Bond Index | 3.77% | 5.47% | 5.52% | |||||||||
S&P 500 Index | 13.96% | 5.81% | 5.53% | |||||||||
MSCI EAFE Index | 11.25% | (0.89% | ) | 3.28% | ||||||||
PL Portfolio Optimization Moderate-Conservative Composite Benchmark | 7.47% | 5.12% | 5.47% | |||||||||
Total Returns for the Period Ended March 31, 2013
| Since Inception (12/31/2012) | ||||||||
Fund’s Advisor Class without sales charge | 3.60% | |||||||
Barclays U.S. Aggregate Bond Index | (0.12% | ) | ||||||
S&P 500 Index | 10.61% | |||||||
MSCI EAFE Index | 5.13% | |||||||
PL Portfolio Optimization Moderate-Conservative Composite Benchmark | 4.03% | |||||||
Performance data shown represents past performance. Investment return and principal value will fluctuate so that shares of the fund when redeemed may be worth more or less than their original cost. Past performance is not predictive of future performance. The table does not reflect the deduction of taxes that a shareholder would pay on fund distributions or redemption of fund shares. |
| See explanation of symbol and benchmark definitions on page A-20 |
A-7
Table of Contents
PACIFIC LIFE FUNDS PERFORMANCE DISCUSSION (Continued)
Q. Discuss both positive and negative factors that materially affected the fund’s performance during the year, including relevant market conditions, investment strategies and techniques, and particular sectors or securities.
A. The PL Portfolio Optimization Moderate-Conservative Fund has a diversified allocation mix that is primarily comprised of an allocation to fixed income funds with a smaller allocation to several domestic and international equity funds. The allocation to fixed income funds includes exposure to intermediate-term bonds as well as short duration securities, inflation-protected bonds, and floating rate loans. The exposure to equity funds is diversified across style (growth/value), market capitalization and region (including an allocation to emerging market funds). Three alternative strategies, the PL Currency Strategies, PL Global Absolute Return and PL Precious Metals Funds, which commenced operations on December 7, 2012, were added to the fund.
At the broad asset class level, the fund’s fixed income allocation collectively outperformed the Barclays U.S. Aggregate Bond Index. The fund’s domestic and international equity allocations lagged behind the S&P 500 Index and MSCI EAFE Index, respectively.
Within the fund’s fixed income allocation, riskier credit segments performed well over this reporting period. Allocation to riskier, fixed income categories such as the PL Floating Rate Loan and PL Emerging Markets Debt Funds contributed to fund performance. Moreover, the PL Managed Bond and PL Inflation Managed Funds were among the top contributors to fund performance. On the other hand, the PL Short Duration Bond Fund’s subdued returns hampered the fund’s relative performance. This was primarily a result of the Fed’s policy on maintaining the short-term rates near zero percent.
Although the fund’s equity allocation consists of primarily large-capitalization strategies, exposure to the PL Mid-Cap Growth Fund hurt performance. However, the allocation to value strategies (i.e. the PL Comstock, PL Large-Cap Value, and PL Small-Cap Value Funds) helped offset some of the fund’s detractors. Within the international equity segment, the PL Emerging Markets and PL International Value Funds primarily detracted from fund performance.
| See explanation of symbol and benchmark definitions on page A-20 |
A-8
Table of Contents
PACIFIC LIFE FUNDS PERFORMANCE DISCUSSION (Continued)
PL Portfolio Optimization Moderate Fund (managed by Pacific Life Fund Advisors LLC)
Q. How did the fund perform for the year ended March 31, 2013?
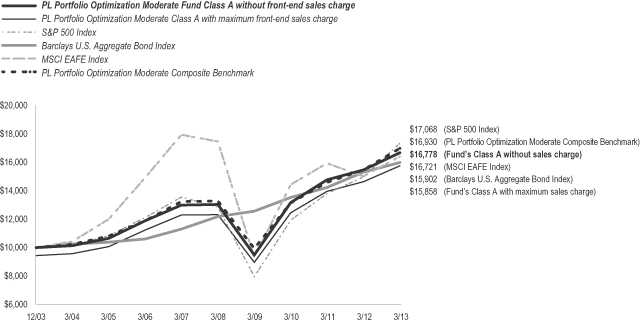
A. For the year ended March 31, 2013, the PL Portfolio Optimization Moderate Fund’s Class A returned 8.36%, compared to a 13.96% return for its benchmarks, the S&P 500 Index, a 3.77% return for the Barclays U.S. Aggregate Bond Index, a 11.25% return for the MSCI EAFE Index, and a 9.46% return for the PL Portfolio Optimization Moderate Composite Benchmark.
The following graph compares the performance of a hypothetical $10,000 investment in Class A shares of the fund to its benchmarks for the periods from inception through March 31, 2013. For comparison purposes, the performance of Class B, C, R and Advisor Class shares for the periods from inception through March 31, 2013 are also shown in the table below. Performance data for Class B, C, R and Advisor Class shares will vary due to differences in fees and sales charges. The fund’s performance reflects reinvestments of all dividends and capital gains distributions, if any.
Performance Comparison
Average Annual Total Returns for the Periods Ended March 31, 2013
| 1 Year | 5 Years | Since Inception (12/31/03) | ||||||||||
Fund’s Class A without sales charge | 8.36% | 5.16% | 5.75% | |||||||||
Fund’s Class A with maximum sales charge | 2.42% | 3.98% | 5.11% | |||||||||
Fund’s Class B without sales charge | 7.49% | 4.40% | 5.17% | |||||||||
Fund’s Class B with maximum sales charge | 2.49% | 4.06% | 5.17% | |||||||||
Fund’s Class C without sales charge | 7.50% | 4.41% | 5.07% | |||||||||
Fund’s Class C with maximum sales charge | 6.50% | 4.41% | 5.07% | |||||||||
S&P 500 Index | 13.96% | 5.81% | 5.95% | |||||||||
Barclays U.S. Aggregate Bond Index | 3.77% | 5.47% | 5.14% | |||||||||
MSCI EAFE Index | 11.25% | (0.89% | ) | 5.70% | ||||||||
PL Portfolio Optimization Moderate | 9.46% | 4.96% | 5.85% | |||||||||
| 1 Year | 5 Years | Since Inception (9/30/05) | ||||||||||
Fund’s Class R without sales charge | 8.02% | 4.91% | 5.31% | |||||||||
S&P 500 Index | 13.96% | 5.81% | 5.53% | |||||||||
Barclays U.S. Aggregate Bond Index | 3.77% | 5.47% | 5.52% | |||||||||
MSCI EAFE Index | 11.25% | (0.89% | ) | 3.28% | ||||||||
PL Portfolio Optimization Moderate | 9.46% | 4.96% | 5.50% | |||||||||
Total Returns for the Period Ended March 31, 2013
| Since Inception (12/31/2012) | ||||||||
Fund’s Advisor Class without sales charge | 5.24% | |||||||
S&P 500 Index | 10.61% | |||||||
Barclays U.S. Aggregate Bond Index | (0.12% | ) | ||||||
MSCI EAFE Index | 5.13% | |||||||
PL Portfolio Optimization Moderate | 6.18% | |||||||
Performance data shown represents past performance. Investment return and principal value will fluctuate so that shares of the fund when redeemed may be worth more or less than their original cost. Past performance is not predictive of future performance. The table does not reflect the deduction of taxes that a shareholder would pay on fund distributions or redemption of fund shares. |
| See explanation of symbol and benchmark definitions on page A-20 |
A-9
Table of Contents
PACIFIC LIFE FUNDS PERFORMANCE DISCUSSION (Continued)
Q. Discuss both positive and negative factors that materially affected the fund’s performance during the year, including relevant market conditions, investment strategies and techniques, and particular sectors or securities.
A. The PL Portfolio Optimization Moderate Fund has an allocation mix that is primarily comprised of an allocation to domestic and international equity funds with a smaller allocation to fixed income funds. The exposure to equity funds is diversified across style (growth/value), market capitalization and region (including allocations to emerging markets stocks). The allocation to fixed income funds includes exposure to intermediate-term bonds, short duration securities, inflation-protected bonds, and floating rate loans. Three, alternative strategies, the PL Currency Strategies, PL Global Absolute Return and PL Precious Metals Funds, which commenced operations on December 7, 2012, were added to the fund.
At the broad asset class level, the fund’s fixed income allocation collectively outperformed the Barclays U.S. Aggregate Bond Index. The fund’s domestic and international equity allocations lagged behind the S&P 500 Index and MSCI EAFE Index, respectively.
Within the fund’s fixed income allocation, riskier credit segments performed well over this reporting period. Allocation to riskier fixed income categories such as the PL Floating Rate Loan and PL Emerging Markets Debt Funds contributed to fund performance. Moreover, the PL Managed Bond and PL Inflation Managed Funds were among the top contributors to fund performance. On the other hand, the PL Short Duration Bond Fund’s subdued returns hampered the fund’s relative performance. This was primarily a result of the Fed’s policy on maintaining the short-term rates near zero percent.
Although the fund’s equity allocation consists of primarily large-capitalization strategies, exposure to the PL Mid-Cap Growth Fund hurt performance. However, the allocation to value strategies (i.e. the PL Comstock, PL Large-Cap Value, and PL Small-Cap Value Funds) helped offset some of the fund’s detractors. Within the international equity segment, the PL Emerging Markets and PL International Value Funds primarily detracted from fund performance.
While the three alternative strategies were added in December 2012, the continued drop in gold prices over the past couple of quarters had a negative impact on the investments in the PL Precious Metals Fund which in turn detracted from the fund’s performance.
| See explanation of symbol and benchmark definitions on page A-20 |
A-10
Table of Contents
PACIFIC LIFE FUNDS PERFORMANCE DISCUSSION (Continued)
PL Portfolio Optimization Moderate-Aggressive Fund (managed by Pacific Life Fund Advisors LLC)
Q. How did the fund perform for the year ended March 31, 2013?
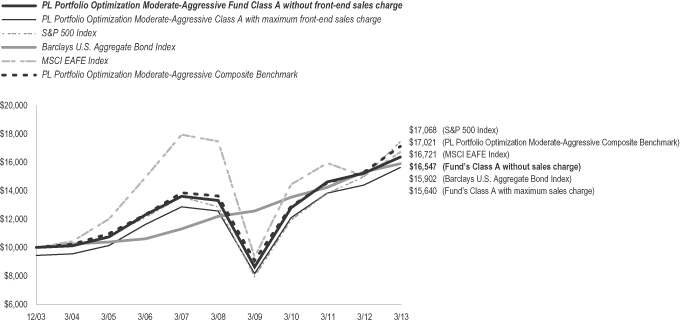
A. For the year ended March 31, 2013, the PL Portfolio Optimization Moderate-Aggressive Fund’s Class A returned 8.62%, compared to a 13.96% return for its benchmarks, the S&P 500 Index, a 3.77% return for the Barclays U.S. Aggregate Bond Index, a 11.25% return for the MSCI EAFE Index, and a 11.32% return for the PL Portfolio Optimization Moderate-Aggressive Composite Benchmark.
The following graph compares the performance of a hypothetical $10,000 investment in Class A shares of the fund to its benchmarks for the periods from inception through March 31, 2013. For comparison purposes, the performance of Class B, C, R and Advisor Class shares for the periods from inception through March 31, 2013 are also shown in the table below. Performance data for Class B, C, R and Advisor Class shares will vary due to differences in fees and sales charges. The fund’s performance reflects reinvestments of all dividends and capital gains distributions, if any.
Performance Comparison
Average Annual Total Returns for the Periods Ended March 31, 2013
| 1 Year | 5 Years | Since Inception (12/31/03) | ||||||||||
Fund’s Class A without sales charge | 8.62% | 4.46% | 5.60% | |||||||||
Fund’s Class A with maximum sales charge | 2.67% | 3.28% | 4.95% | |||||||||
Fund’s Class B without sales charge | 7.92% | 3.73% | 5.02% | |||||||||
Fund’s Class B with maximum sales charge | 2.92% | 3.38% | 5.02% | |||||||||
Fund’s Class C without sales charge | 7.95% | 3.72% | 4.93% | |||||||||
Fund’s Class C with maximum sales charge | 6.95% | 3.72% | 4.93% | |||||||||
S&P 500 Index | 13.96% | 5.81% | 5.95% | |||||||||
Barclays U.S. Aggregate Bond Index | 3.77% | 5.47% | 5.14% | |||||||||
MSCI EAFE Index | 11.25% | (0.89% | ) | 5.70% | ||||||||
PL Portfolio Optimization Moderate-Aggressive Composite Benchmark | 11.32% | 4.54% | 5.93% | |||||||||
| 1 Year | 5 Years | Since Inception (9/30/05) | ||||||||||
Fund’s Class R without sales charge | 8.38% | 4.21% | 4.90% | |||||||||
S&P 500 Index | 13.96% | 5.81% | 5.53% | |||||||||
Barclays U.S. Aggregate Bond Index | 3.77% | 5.47% | 5.52% | |||||||||
MSCI EAFE Index | 11.25% | (0.89% | ) | 3.28% | ||||||||
PL Portfolio Optimization Moderate-Aggressive Composite Benchmark | 11.32% | 4.54% | 5.30% | |||||||||
Total Returns for the Period Ended March 31, 2013
| Since Inception (12/31/2012) | ||||||||
Fund’s Advisor Class without sales charge | 6.72% | |||||||
S&P 500 Index | 10.61% | |||||||
Barclays U.S. Aggregate Bond Index | (0.12% | ) | ||||||
MSCI EAFE Index | 5.13% | |||||||
PL Portfolio Optimization Moderate-Aggressive Composite Benchmark | 8.36% | |||||||
Performance data shown represents past performance. Investment return and principal value will fluctuate so that shares of the fund when redeemed may be worth more or less than their original cost. Past performance is not predictive of future performance. The table does not reflect the deduction of taxes that a shareholder would pay on fund distributions or redemption of fund shares. |
| See explanation of symbol and benchmark definitions on page A-20 |
A-11
Table of Contents
PACIFIC LIFE FUNDS PERFORMANCE DISCUSSION (Continued)
Q. Discuss both positive and negative factors that materially affected the fund’s performance during the year, including relevant market conditions, investment strategies and techniques, and particular sectors or securities.
A. The PL Portfolio Optimization Moderate-Aggressive Fund has a diversified allocation mix that is primarily comprised of an allocation to domestic and international equity funds and has a moderate allocation to fixed income and sector funds. The exposure to equity funds is diversified across style (growth/value), market capitalization and region (which include allocations to emerging markets stocks). Three alternative strategies, the PL Currency Strategies, PL Global Absolute Return and PL Precious Metals Funds, which commenced operations on December 7, 2012, were added to the fund.
For the reporting period, the fund’s Class A returned 8.62% compared to 11.32% for the PL Portfolio Optimization Moderate-Aggressive Composite Benchmark. At the broad asset class level, the fund’s fixed income allocation collectively outperformed the Barclays U.S. Aggregate Bond Index. The fund’s domestic and international equity allocations lagged behind the S&P 500 Index and MSCI EAFE Index, respectively.
Although the fund’s equity allocation consists of primarily large-capitalization strategies, exposure to the PL Mid-Cap Growth Fund hurt performance. However, the allocation to value strategies (i.e. the PL Comstock, PL Large-Cap Value, and PL Small-Cap Value Funds) helped offset some of the fund’s detractors. Within the international equity segment, the PL Emerging Markets and PL International Value Funds primarily detracted from fund performance.
Within the fund’s fixed income allocation, riskier credit segments performed well over this reporting period. Allocation to riskier, fixed income categories such as the PL Floating Rate Loan Fund contributed to fund performance. Moreover, the PL Managed Bond and PL Inflation Managed Funds were among the top contributors to fund performance. On the other hand, the PL Short Duration Bond Fund’s subdued returns hampered the fund’s relative performance. This was primarily a result of the Fed’s policy on maintaining the short-term rates near zero percent.
While the three alternative strategies were added in December 2012, the continued drop in gold prices over the past couple of quarters had a negative impact on the investments in the PL Precious Metals Fund which in turn detracted from the fund’s performance.
| See explanation of symbol and benchmark definitions on page A-20 |
A-12
Table of Contents
PACIFIC LIFE FUNDS PERFORMANCE DISCUSSION (Continued)
PL Portfolio Optimization Aggressive Fund (managed by Pacific Life Fund Advisors LLC)
Q. How did the fund perform for the year ended March 31, 2013?
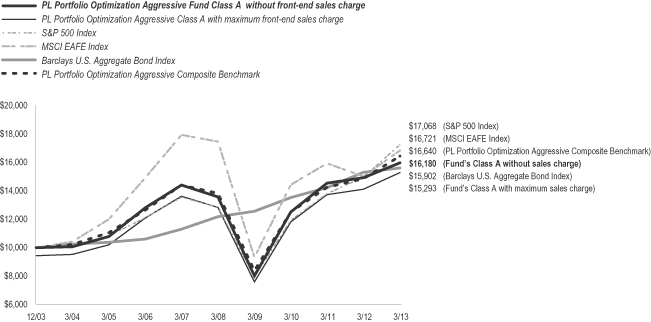
A. For the year ended March 31, 2013, the PL Portfolio Optimization Aggressive Fund’s Class A returned 8.30%, compared to a 13.96% return for its benchmarks, the S&P 500 Index, a 11.25% return for the MSCI EAFE Index, a 3.77% return for the Barclays U.S. Aggregate Bond Index, and a 11.88% return for the PL Portfolio Optimization Aggressive Composite Benchmark.
The following graph compares the performance of a hypothetical $10,000 investment in Class A shares of the fund to its benchmarks for the periods from inception through March 31, 2013. For comparison purposes, the performance of Class B, C, R and Advisor Class shares for the periods from inception through March 31, 2013 are also shown in the table below. Performance data for Class B, C, R and Advisor Class shares will vary due to differences in fees and sales charges. The fund’s performance reflects reinvestments of all dividends and capital gains distributions, if any.
Performance Comparison
Average Annual Total Returns for the Periods Ended March 31, 2013
| 1 Year | 5 Years | Since Inception (12/31/03) | ||||||||||
Fund’s Class A without sales charge | 8.30% | 3.54% | 5.34% | |||||||||
Fund’s Class A with maximum sales charge | 2.35% | 2.38% | 4.70% | |||||||||
Fund’s Class B without sales charge | 7.69% | 2.84% | 4.76% | |||||||||
Fund’s Class B with maximum sales charge | 2.69% | 2.48% | 4.76% | |||||||||
Fund’s Class C without sales charge | 7.71% | 2.86% | 4.71% | |||||||||
Fund’s Class C with maximum sales charge | 6.71% | 2.86% | 4.71% | |||||||||
S&P 500 Index | 13.96% | 5.81% | 5.95% | |||||||||
MSCI EAFE Index | 11.25% | (0.89% | ) | 5.70% | ||||||||
Barclays U.S. Aggregate Bond Index | 3.77% | 5.47% | 5.14% | |||||||||
PL Portfolio Optimization Aggressive Composite Benchmark | 11.88% | 3.77% | 5.67% | |||||||||
| 1 Year | 5 Years | Since Inception (9/30/05) | ||||||||||
Fund’s Class R without sales charge | 8.17% | 3.32% | 4.36% | |||||||||
S&P 500 Index | 13.96% | 5.81% | 5.53% | |||||||||
MSCI EAFE Index | 11.25% | (0.89% | ) | 3.28% | ||||||||
Barclays U.S. Aggregate Bond Index | 3.77% | 5.47% | 5.52% | |||||||||
PL Portfolio Optimization Aggressive Composite Benchmark | 11.88% | 3.77% | 4.81% | |||||||||
Total Returns for the Period Ended March 31, 2013
| Since Inception (12/31/2012) | ||||||||
Fund’s Advisor Class without sales charge | 7.56% | |||||||
S&P 500 Index | 10.61% | |||||||
MSCI EAFE Index | 5.13% | |||||||
Barclays U.S. Aggregate Bond Index | (0.12% | ) | ||||||
PL Portfolio Optimization Aggressive Composite Benchmark | 9.27% | |||||||
Performance data shown represents past performance. Investment return and principal value will fluctuate so that shares of the fund when redeemed may be worth more or less than their original cost. Past performance is not predictive of future performance. The table does not reflect the deduction of taxes that a shareholder would pay on fund distributions or redemption of fund shares. |
| See explanation of symbol and benchmark definitions on page A-20 |
A-13
Table of Contents
PACIFIC LIFE FUNDS PERFORMANCE DISCUSSION (Continued)
Q. Discuss both positive and negative factors that materially affected the fund’s performance during the year, including relevant market conditions, investment strategies and techniques, and particular sectors or securities.
A. The PL Portfolio Optimization Aggressive Fund allocates primarily to domestic and international equity funds that are diversified across style (growth/value), market capitalization and region (which include allocations to emerging markets stocks). The fund also has a small allocation to fixed income and sector funds. Three alternative strategies, PL Currency Strategies, PL Global Absolute Return and PL Precious Metals Funds, which commenced operations on December 7, 2012, were added to the fund.
At the broad asset class level, the fund’s fixed income allocation collectively outperformed the Barclays U.S. Aggregate Bond Index. The fund’s domestic and international equity allocations lagged behind the S&P 500 Index and MSCI EAFE Index, respectively.
Although the fund’s equity allocation consists of primarily large-capitalization strategies, exposure to the PL Mid-Cap Growth Fund hurt performance. However, the allocation to value strategies (i.e. the PL Comstock, PL Large-Cap Value, and PL Small-Cap Value Funds) helped offset some of the fund’s detractors. Within the international equity segment, the PL Emerging Markets and PL International Value Funds primarily detracted from fund performance.
While the three alternative strategies were added in December 2012, the continued drop in gold prices over the past couple of quarters had a negative impact on the investments in the PL Precious Metals Fund which in turn detracted from the fund’s performance.
The fund’s fixed income segment is represented by the PL Managed Bond Fund, which contributed to fund performance. The strategy’s overweight exposure to emerging markets debt and riskier credits helped boost its performance.
PL Short Duration Income Fund (managed by Pacific Asset Management)
Q. How did the fund perform for the year ended March 31, 2013?
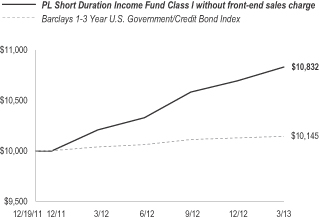
A. For the year ended March 31, 2013, the PL Short Duration Income Fund’s Class I returned 6.10%, compared to a 1.09% return for its benchmark, the Barclays 1-3 Year U.S. Government/Credit Bond Index.
The following graph compares the performance of a hypothetical $10,000 investment in Class I shares of the fund to its benchmark for the periods from inception through March 31, 2013. For comparison purposes, the performance of Class A, C and Advisor Class shares for the period from inception through March 31, 2013 are also shown in the table below. Performance data for Class A, C and Advisor Class shares will vary due to differences in fees and sales charges. The fund’s performance reflects reinvestments of all dividends and capital gains distributions, if any.
Performance Comparison
Average Annual Total Returns for the Periods Ended March 31, 2013
| 1 Year | Since Inception (12/19/11) | |||||||
Fund’s Class I without sales charge | 6.10% | 6.43% | ||||||
Barclays 1-3 Year U.S. Government/Credit Bond Index | 1.09% | 1.16% | ||||||
Total Returns for the Period Ended March 31, 2013
| Since Inception (6/29/2012) | ||||||
Fund’s Class A without sales charge | 4.78% | |||||
Fund’s Class A with maximum sales charge | 1.60% | |||||
Fund’s Class C without sales charge | 4.28% | |||||
Fund’s Class C with maximum sales charge | 3.28% | |||||
Fund’s Advisor Class without sales charge | 4.85% | |||||
Barclays 1-3 Year U.S. Government/Credit Bond Index | 0.87% | |||||
Performance data shown represents past performance. Investment return and principal value will fluctuate so that shares of the fund when redeemed may be worth more or less than their original cost. Past performance is not predictive of future performance. The table does not reflect the deduction of taxes that a shareholder would pay on fund distributions or redemption of fund shares. |
Q. Discuss both positive and negative factors that materially affected the fund’s performance during the year, including relevant market conditions, investment strategies and techniques, and particular sectors or securities.
A. For the reporting period, the fund’s Class I outperformed the benchmark. We at Pacific Asset Management manage the fund as a short maturity corporate bond fund that has the flexibility to go up to 30% in non-investment grade securities. The fund outperformed the benchmark during the reporting period primarily due to fixed-income asset allocation and overweights to high yield and floating rate securities. The fund maintained similar overweight allocations through the period in investment-grade corporate debt, floating rate loans, and high-yield bonds, which were all positive contributors to relative performance, as was the underweight to Treasuries. The fund’s duration position was largely unchanged and remains above benchmark.
| See explanation of symbol and benchmark definitions on page A-20 |
A-14
Table of Contents
PACIFIC LIFE FUNDS PERFORMANCE DISCUSSION (Continued)
PL Income Fund (managed by Pacific Asset Management)
Q. How did the fund perform for the year ended March 31, 2013?
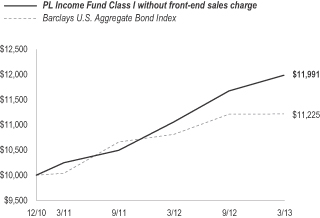
A. For the year ended March 31, 2013, the PL Income Fund’s Class I returned 8.39%, compared to a 3.77% return for its benchmark, the Barclays U.S. Aggregate Bond Index.
The following graph compares the performance of a hypothetical $10,000 investment in Class I shares of the fund to its benchmark for the periods from inception through March 31, 2013. For comparison purposes, the performance of Class A, C and Advisor Class shares for the periods from inception through March 31, 2013 are also shown in the table below. Performance data for Class A, C and Advisor Class shares will vary due to differences in fees and sales charges. The fund’s performance reflects reinvestments of all dividends and capital gains distributions, if any.
Performance Comparison
Average Annual Total Returns for the Periods Ended March 31, 2013
| 1 Year | Since Inception (12/31/2010) | |||||||
Fund’s Class A without sales charge | 8.13% | 8.22% | ||||||
Fund’s Class A with maximum sales charge | 3.54% | 6.16% | ||||||
Fund’s Class I without sales charge | 8.39% | 8.41% | ||||||
Barclays U.S. Aggregate Bond Index | 3.77% | 5.27% | ||||||
| 1 Year | Since Inception (6/30/2011) | |||||||
Fund’s Class C without sales charge | 7.37% | 7.00% | ||||||
Fund’s Class C with maximum sales charge | 6.37% | 7.00% | ||||||
Barclays U.S. Aggregate Bond Index | 3.77% | 5.20% | ||||||
Total Returns for the Period Ended March 31, 2013
| Since Inception (6/29/2012) | ||||||
Fund’s Advisor Class without sales charge | 5.97% | |||||
Barclays U.S. Aggregate Bond Index | 1.68% | |||||
Performance data shown represents past performance. Investment return and principal value will fluctuate so that shares of the fund when redeemed may be worth more or less than their original cost. Past performance is not predictive of future performance. The table does not reflect the deduction of taxes that a shareholder would pay on fund distributions or redemption of fund shares. |
Q. Discuss both positive and negative factors that materially affected the fund’s performance during the year, including relevant market conditions, investment strategies and techniques, and particular sectors or securities.
A. For the reporting period, the fund’s Class I outperformed the benchmark. We at Pacific Asset Management manage the fund as an investment grade corporate bond fund that can invest up to 40% in non-investment grade securities. The fund outperformed the benchmark during the reporting period due to fixed-income asset allocation and a focus on intermediate maturity bonds. The fund outperformed the benchmark during the reporting period due to asset allocation and security selection. The fund maintained similar overweight allocations through the period in investment-grade corporate debt, floating rate loans, and high-yield bonds, which were all positive contributors to the fund’s relative performance, as was the underweight to Treasuries, relative to the benchmark. The fund’s underweight to European banks was a negative to overall fund performance. The fund’s duration position was largely unchanged and remained under the benchmark at the end of the reporting period.
| See explanation of symbol and benchmark definitions on page A-20 |
A-15
Table of Contents
PACIFIC LIFE FUNDS PERFORMANCE DISCUSSION (Continued)
PL Strategic Income Fund (managed by Pacific Asset Management)
Q. How did the fund perform for the year ended March 31, 2013?
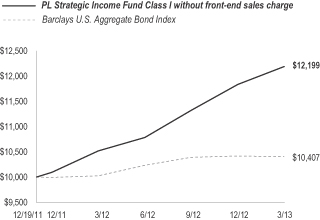
A. For the year ended March 31, 2013, the PL Strategic Income Fund’s Class I returned 15.94%, compared to a 3.77% return for its benchmark, the Barclays U.S. Aggregate Bond Index.
The following graph compares the performance of a hypothetical $10,000 investment in Class I shares of the fund to its benchmark for the periods from inception through March 31, 2013. For comparison purposes, the performance of Class A, C and Advisor Class shares for the period from inception through March 31, 2013 are also shown in the table below. Performance data for Class A, C and Advisor Class shares will vary due to differences in fees and sales charges. The fund’s performance reflects reinvestments of all dividends and capital gains distributions, if any.
Performance Comparison
Average Annual Total Returns for the Periods Ended March 31, 2013
| 1 Year | Since Inception (12/19/2011) | |||||||
Fund’s Class I without sales charge | 15.94% | 16.77% | ||||||
Barclays U.S Aggregate Bond Index | 3.77% | 3.16% | ||||||
Total Returns for the Period Ended March 31, 2013
| Since Inception (6/29/2012) | ||||||
Fund’s Class A without sales charge | 13.12% | |||||
Fund’s Class A with maximum sales charge | 8.28% | |||||
Fund’s Class C without sales charge | 12.52% | |||||
Fund’s Class C with maximum sales charge | 11.52% | |||||
Fund’s Advisor Class without sales charge | 13.31% | |||||
Barclays U.S Aggregate Bond Index | 1.68% | |||||
Performance data shown represents past performance. Investment return and principal value will fluctuate so that shares of the fund when redeemed may be worth more or less than their original cost. Past performance is not predictive of future performance. The table does not reflect the deduction of taxes that a shareholder would pay on fund distributions or redemption of fund shares. |
Q. Discuss both positive and negative factors that materially affected the fund’s performance during the year, including relevant market conditions, investment strategies and techniques, and particular sectors or securities.
A. For the reporting period, the fund’s Class I outperformed the benchmark. We at Pacific Asset Management manage the fund using a multi-sector, corporate credit strategy. The fund outperformed the benchmark during the reporting period primarily due to the continued overweight to risk assets and an overweight to high yield bonds. The fund’s structural overweight to high-yield issues was a contributor to the fund’s relative performance for the reporting period, as was the underweight to Treasuries. The fund’s underweight to banking, particularly European Banks, detracted from its performance. The fund marginally increased the weighting of below investment-grade positions, which benefited performance. The allocation of high yield bonds and floating rate loans changed as high yield bond positions were decreased and floating rate loans were increased. The portfolio duration position continues to be moderately higher than the benchmark, but remained consistent during the reporting period.
| See explanation of symbol and benchmark definitions on page A-20 |
A-16
Table of Contents
PACIFIC LIFE FUNDS PERFORMANCE DISCUSSION (Continued)
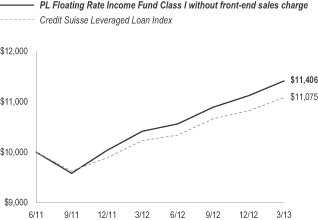
PL Floating Rate Income Fund (managed by Pacific Asset Management)
Q. How did the fund perform for the year ended March 31, 2013?
A. For the year ended March 31, 2013, the PL Floating Rate Income Fund’s Class I returned 9.56%, compared to a 8.27% return for its benchmark, the Credit Suisse Leveraged Loan Index.
The following graph compares the performance of a hypothetical $10,000 investment in Class I shares of the fund to its benchmark for the periods from inception through March 31, 2013. For comparison purposes, the performance of Class A, C, P and Advisor Class shares for the periods from inception through March 31, 2013 are also shown in the table below. Performance data for Class A, C, P and Advisor Class shares will vary due to differences in fees and sales charges. The fund’s performance reflects reinvestments of all dividends and capital gains distributions, if any.
Performance Comparison
Average Annual Total Returns for the Periods Ended March 31, 2013
| 1 Year | Since | |||||||
Fund’s Class I without sales charge | 9.56% | 7.79% | ||||||
Credit Suisse Leveraged Loan Index | 8.27% | 6.01% | ||||||
| 1 Year | Since Inception (12/30/2011)~ | |||||||
Fund’s Class A without sales charge | 9.36% | 10.62% | ||||||
Fund’s Class A with maximum sales charge | 6.10% | 8.00% | ||||||
Fund’s Class C without sales charge | 8.56% | 9.88% | ||||||
Fund’s Class C with maximum sales charge | 7.56% | 9.88% | ||||||
Credit Suisse Leveraged Loan Index | 8.27% | 9.51% | ||||||
Total Returns for the Periods Ended March 31, 2013
| Since Inception (6/29/2012) | ||||||
Fund’s Advisor Class without sales charge | 8.13% | |||||
Credit Suisse Leveraged Loan Index | 7.18% | |||||
| Since Inception (12/31/2012) | ||||||
Fund’s Class P without sales charge | 2.74% | |||||
Credit Suisse Leveraged Loan Index | 2.37% | |||||
Performance data shown represents past performance. Investment return and principal value will fluctuate so that shares of the fund when redeemed may be worth more or less than their original cost. Past performance is not predictive of future performance. The table does not reflect the deduction of taxes that a shareholder would pay on fund distributions or redemption of fund shares. |
Q. Discuss both positive and negative factors that materially affected the fund’s performance during the year, including relevant market conditions, investment strategies and techniques, and particular sectors or securities.
A. For the reporting period, the fund’s Class I outperformed the benchmark. We at Pacific Asset Management manage the fund using a non-investment grade strategy focusing on floating rate debt securities. The fund outperformed its benchmark in the reporting period due to security selection and asset allocation. The fund’s credit quality allocation and emphasis on larger and more liquid loan facilities were neutral to performance. The fund’s underweight to lower rated securities was a negative to performance. The fund’s underweight to the health care sector benefited performance while the underweight to utilities detracted. The fund’s tactical allocation to high yield bonds was a positive contributor to performance during the reporting period.
| See explanation of symbol and benchmark definitions on page A-20 |
A-17
Table of Contents
PACIFIC LIFE FUNDS PERFORMANCE DISCUSSION (Continued)
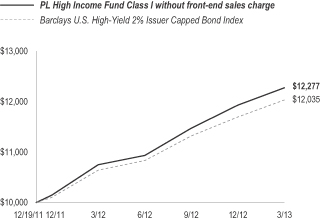
PL High Income Fund (managed by Pacific Asset Management)
Q. How did the fund perform for the year ended March 31, 2013?
A. For the year ended March 31, 2013, the PL High Income Fund’s Class I returned 14.21%, compared to a 13.08% return for its benchmark, the Barclays U.S. High-Yield 2% Issuer Capped Bond Index.
The following graph compares the performance of a hypothetical $10,000 investment in Class I shares of the fund to its benchmark for the periods from inception through March 31, 2013. For comparison purposes, the performance of Class A, C and Advisor Class shares for the period from inception through March 31, 2013 are also shown in the table below. Performance data for Class A, C and Advisor Class shares will vary due to differences in fees and sales charges. The fund’s performance reflects reinvestments of all dividends and capital gains distributions, if any.
Performance Comparison
Average Annual Total Returns for the Periods Ended March 31, 2013
| 1 Year | Since Inception (12/19/2011) | |||||||
Fund’s Class I without sales charge | 14.21% | 17.35% | ||||||
Barclays U.S. High-Yield 2% Issuer Capped Bond Index | 13.08% | 15.55% | ||||||
Total Returns for the Period Ended March 31, 2013
| Since Inception (6/29/2012) | ||||||
Fund’s Class A without sales charge | 12.59% | |||||
Fund’s Class A with maximum sales charge | 7.80% | |||||
Fund’s Class C without sales charge | 12.11% | |||||
Fund’s Class C with maximum sales charge | 11.11% | |||||
Fund’s Advisor Class without sales charge | 12.87% | |||||
Barclays U.S. High-Yield 2% Issuer Capped Bond Index | 11.09% | |||||
Performance data shown represents past performance. Investment return and principal value will fluctuate so that shares of the fund when redeemed may be worth more or less than their original cost. Past performance is not predictive of future performance. The table does not reflect the deduction of taxes that a shareholder would pay on fund distributions or redemption of fund shares. |
Q. Discuss both positive and negative factors that materially affected the fund’s performance during the year, including relevant market conditions, investment strategies and techniques, and particular sectors or securities.
A. For the reporting period, the fund’s Class I outperformed the benchmark. We at Pacific Asset Management manage the fund using a non-investment grade bond strategy. The fund outperformed during the reporting period due to sector allocation and security selection. The fund’s performance was negatively impacted by a mild underweight to B rated and CCC rated issues. The fund was overweight BB rated bonds, which underperformed during the reporting period. The fund’s allocation to larger and more liquid issues were neutral to performance. The fund’s duration position, which is longer than the benchmark, was also neutral to performance.
| See explanation of symbol and benchmark definitions on page A-20 |
A-18
Table of Contents
PACIFIC LIFE FUNDS PERFORMANCE DISCUSSION (Continued)
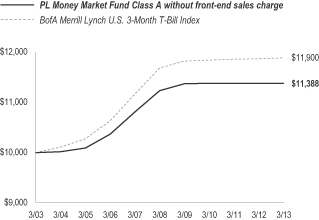
PL Money Market Fund (managed by Pacific Asset Management)
Q. How did the fund perform for the year ended March 31, 2013?
A. For the year ended March 31, 2013, the PL Money Market Fund’s Class A returned 0.00%, compared to a 0.12% return for its benchmark, the BofA Merrill Lynch U.S. 3-Month T-Bill Index. The current yield measured during the seven-day period ended March 31, 2013 was 0.00%.
The following graph compares the performance of a hypothetical $10,000 investment in Class A shares of the fund to its benchmark for the ten-year period ended March 31, 2013. For comparison purposes, the performance of class B and C shares for the period from inception through March 31, 2013 are also shown in the table below. Performance data for Class B and C shares will vary due to differences in fees and sales charges. The fund’s performance reflects reinvestments of all dividends and capital gains distributions, if any.
Performance Comparison
Average Annual Total Returns for the Periods Ended March 31, 2013
| 1 Year | 5 Years | 10 Years | ||||||||||
Fund’s Class A without sales charge | 0.00% | 0.26% | 1.31% | |||||||||
BofA Merrill Lynch U.S. 3-Month T-Bill Index | 0.12% | 0.34% | 1.75% | |||||||||
Total Returns for the Period Ended March 31, 2013
| Since Inception (6/29/2012) | ||||||||
Fund’s Class B without sales charge | 0.00% | |||||||
Fund’s Class C without sales charge | 0.00% | |||||||
BofA Merrill Lynch U.S. 3-Month T-Bill Index | 0.09% | |||||||
Performance data shown represents past performance. Investment return and principal value will fluctuate so that shares of the fund when redeemed may be worth more or less than their original cost. Past performance is not predictive of future performance. The table does not reflect the deduction of taxes that a shareholder would pay on fund distributions or redemption of fund shares. |
Q. Discuss both positive and negative factors that materially affected the fund’s performance during the year, including relevant market conditions, investment strategies and techniques, and particular sectors or securities.
A. For the reporting period, the fund’s Class A underperformed the benchmark. We at Pacific Asset Management manage the fund with a focus on stability, liquidity, and current income through a consistent, disciplined investment approach emphasizing industry and asset type diversification.
A low Fed Funds target rate and a shrinking supply of commercial paper constrained the absolute return environment for the fund. This environment generated relative outperformance by the longer duration assets in the fund. Citing the slack in the economy and the weakness in the labor force, the Fed remained accommodative throughout the reporting period. The Fed Funds target rate was unchanged, remaining at the range between 0.00% and 0.25%. The three-month London Interbank Offered Rate (LIBOR) was very stable during the reporting period. Fewer companies utilized the commercial paper market during the year, which reduced supply and further lowered available yields. Money market accounts continued to experience outflows, as investor’s deployed cash into higher risk asset classes.
Although the employment picture has started to improve and the economy is strengthening, we believe the Fed is going to remain cautious through the next few years and will want to ensure the recovery is on very solid footing before any tightening of monetary policy. We expect any tightening to be well forecasted to the market and would expect to shorten the fund’s weighted average maturity heading into a rate increase.
| See explanation of symbol and benchmark definitions on page A-20 |
A-19
Table of Contents
PACIFIC LIFE FUNDS PERFORMANCE DISCUSSION (Continued)
Explanation of Symbol for Pacific Life Funds Performance Discussion
| ~ | Due to data limitation, the benchmark since inception return reflects the commencement period from the first calendar day of the month the fund commenced its operations. |
Benchmark Definitions
Barclays 1-3 Year U.S. Government/Credit Bond Index is the 1-3 year component for the U.S. Government/Credit Index. The U.S. Government/Credit Bond Index is the non-securitized component of the U.S. Aggregate Bond Index. The U.S. Government/Credit Bond Index includes U.S. Treasuries, Government-related issues and corporates. The total return is equal to the change in price plus the coupon return.
Barclays U.S. Aggregate Bond Index covers the U.S. dollar-denominated, investment-grade, fixed-rate, taxable bond market of SEC-registered securities. The index includes bonds from the Treasury, government-related, corporate, mortgage-backed securities, asset-backed securities, and corporate mortgage-backed securities sectors. The total return is equal to the change in price plus the coupon return.
Barclays U.S. High-Yield 2% Issuer Capped Bond Index is an index that is an issuer-constrained version for the U.S. Corporate High-Yield Index that coves the U.S. dollar-denominated, non-investment grade fixed-rate taxable corporate bond market and limits issuer exposures to a maximum of 2% and redistributes the excess market value index-wide on a pro-rata basis. The total return is equal to the change in price plus the coupon return.
Barclays Long Term U.S. Treasury Index includes all publicly issued, U.S. Treasury securities that have a remaining maturity of 10 or more years, are rated investment grade, and have $250 million or more of outstanding face value. In addition, the securities must be denominated in U.S. dollars and must be fixed rate and non-convertible.
BofA Merrill Lynch U.S. 3-Month Treasury Bill (T-Bill) Index is an index comprised of a single Treasury bill issue purchased at the beginning of the month and held for a full month, then sold and rolled into a newly selected Treasury bill issue. Results include the reinvestment of all distributions.
Credit Suisse Leveraged Loan Index is an index of U.S. dollar-denominated leveraged loan market securities. The total return is equal to the change in price plus the coupon return.
Morgan Stanley Capital International (MSCI) Europe, Australasia and Far East (EAFE) Index is an index of stocks from 21 countries/regions in Europe, Australia, New Zealand and Asia. Results include reinvested dividends after deducting withholding taxes.
PL Portfolio Optimization Conservative Composite Benchmark is 15% S&P 500; 73% Barclays U.S. Aggregate Bond; 5% MSCI EAFE (Net), and 7% BofA Merrill Lynch U.S. 3-Month Treasury Bill Indices as of March 31, 2013.
PL Portfolio Optimization Moderate-Conservative Composite Benchmark is 30% S&P 500; 55% Barclays U.S. Aggregate Bond; 10% MSCI EAFE (Net), and 5% BofA Merrill Lynch U.S. 3-Month Treasury Bill Indices as of March 31, 2013.
PL Portfolio Optimization Moderate Composite Benchmark is 45% S&P 500; 38% Barclays U.S. Aggregate Bond; 15% MSCI EAFE (Net), and 2% BofA Merrill Lynch U.S. 3-Month Treasury Bill Indices as of March 31, 2013.
PL Portfolio Optimization Moderate-Aggressive Composite Benchmark is 60% S&P 500; 20% Barclays U.S. Aggregate Bond; and 20% MSCI EAFE (Net) Indices as of March 31, 2013.
PL Portfolio Optimization Aggressive Composite Benchmark is 65% S&P 500; 10% Barclays U.S. Aggregate Bond; and 25% MSCI EAFE (Net) Indices as of March 31, 2013.
S&P 500 Index is an index of the stocks of approximately 500 large-capitalization companies traded in U.S. stock markets. Results include reinvested dividends.
A-20
Table of Contents
PACIFIC LIFE FUNDS
PL PORTFOLIO OPTIMIZATION MODERATE-CONSERVATIVE FUND
Schedule of Investments
March 31, 2013
| Value | |||||||
AFFILIATED MUTUAL FUNDS - 100.0% | ||||||||
PL Floating Rate Loan Fund ‘P’ | 3,089,677 | $31,638,296 | ||||||
PL Inflation Managed Fund ‘P’ | 5,195,679 | 50,605,909 | ||||||
PL Managed Bond Fund ‘P’ | 15,817,905 | 175,736,920 | ||||||
PL Short Duration Bond Fund ‘P’ | 7,547,523 | 76,380,934 | ||||||
PL Emerging Markets Debt Fund ‘P’ | 2,315,046 | 24,377,439 | ||||||
PL Comstock Fund ‘P’ | 1,546,801 | 22,273,929 | ||||||
PL Growth LT Fund ‘P’ | 264,406 | 3,683,177 | ||||||
PL Large-Cap Growth Fund ‘P’ | 993,459 | 10,331,969 | ||||||
PL Large-Cap Value Fund ‘P’ | 1,678,744 | 23,435,269 | ||||||
PL Main Street Core Fund ‘P’ | 613,510 | 7,484,816 | ||||||
PL Mid-Cap Equity Fund ‘P’ | 730,071 | 8,030,780 | ||||||
PL Mid-Cap Growth Fund ‘P’ | 556,620 | 4,775,798 | ||||||
PL International Large-Cap Fund ‘P’ | 716,626 | 11,810,003 | ||||||
PL International Value Fund ‘P’ | 789,459 | 7,184,079 | ||||||
PL Currency Strategies Fund ‘P’ * | 1,460,271 | 15,070,002 | ||||||
PL Global Absolute Return Fund ‘P’ | 2,922,175 | 29,776,965 | ||||||
PL Precious Metals Fund ‘P’ | 532,213 | 4,374,793 | ||||||
|
| |||||||
Total Affiliated Mutual Funds | 506,971,078 | |||||||
|
| |||||||
TOTAL INVESTMENTS - 100.0% | 506,971,078 | |||||||
OTHER ASSETS & LIABILITIES, NET - 0.0% | 84,063 | |||||||
|
| |||||||
NET ASSETS - 100.0% | $507,055,141 | |||||||
|
| |||||||
Notes to Schedule of Investments
| (a) | As of March 31, 2013, the fund was diversified as a percentage of net assets as follows: |
Affiliated Fixed Income Funds | 79.6% | |||
Affiliated Equity Funds | 20.4% | |||
|
| |||
| 100.0% | ||||
Other Assets & Liabilities, Net | 0.0% | |||
|
| |||
| 100.0% | ||||
|
|
| Value | |||||||
AFFILIATED MUTUAL FUNDS - 100.0% | ||||||||
PL Floating Rate Loan Fund ‘P’ | 2,933,830 | $30,042,421 | ||||||
PL Inflation Managed Fund ‘P’ | 4,335,266 | 42,225,492 | ||||||
PL Managed Bond Fund ‘P’ | 10,091,364 | 112,115,054 | ||||||
PL Short Duration Bond Fund ‘P’ | 5,472,221 | 55,378,880 | ||||||
PL Emerging Markets Debt Fund ‘P’ | 1,491,770 | 15,708,340 | ||||||
PL Comstock Fund ‘P’ | 2,165,478 | 31,182,878 | ||||||
PL Growth LT Fund ‘P’ | 348,220 | 4,850,711 | ||||||
PL Large-Cap Growth Fund ‘P’ | 1,707,765 | 17,760,751 | ||||||
PL Large-Cap Value Fund ‘P’ | 2,911,588 | 40,645,763 | ||||||
PL Main Street Core Fund ‘P’ | 2,108,282 | 25,721,046 | ||||||
PL Mid-Cap Equity Fund ‘P’ | 930,601 | 10,236,612 | ||||||
PL Mid-Cap Growth Fund ‘P’ | 586,247 | 5,029,999 | ||||||
PL Small-Cap Growth Fund ‘P’ * | 499,727 | 6,641,374 | ||||||
PL Small-Cap Value Fund ‘P’ | 424,831 | 5,161,697 | ||||||
PL Emerging Markets Fund ‘P’ | 589,748 | 8,386,215 | ||||||
PL International Large-Cap Fund ‘P’ | 1,289,349 | 21,248,467 | ||||||
PL International Value Fund ‘P’ | 1,647,084 | 14,988,467 | ||||||
PL Currency Strategies Fund ‘P’ * | 1,352,427 | 13,957,046 | ||||||
PL Global Absolute Return Fund ‘P’ | 2,840,341 | 28,943,076 | ||||||
PL Precious Metals Fund ‘P’ | 1,108,221 | 9,109,580 | ||||||
|
| |||||||
Total Affiliated Mutual Funds | 499,333,869 | |||||||
|
| |||||||
TOTAL INVESTMENTS - 100.0% | 499,333,869 | |||||||
OTHER ASSETS & LIABILITIES, NET - 0.0% | 131,336 | |||||||
|
| |||||||
NET ASSETS - 100.0% | $499,465,205 | |||||||
|
| |||||||
Notes to Schedule of Investments
| (a) | As of March 31, 2013, the fund was diversified as a percentage of net assets as follows: |
Affiliated Fixed Income Funds | 59.8% | |||
Affiliated Equity Funds | 40.2% | |||
|
| |||
| 100.0% | ||||
Other Assets & Liabilities, Net | 0.0% | |||
|
| |||
| 100.0% | ||||
|
|
| (b) | Fair Value Measurements |
The following is a summary of the funds’ investments as categorized under the three-tier hierarchy of inputs used in valuing the funds’ assets and liabilities (See Note 3D in Notes to Financial Statements) as of March 31, 2013:
| Total Value at March 31, 2013 | Level 1 Quoted Price | Level 2 Significant Observable Inputs | Level 3 Significant Unobservable Inputs | |||||||||||||||
PL Portfolio Optimization Conservative Fund | ||||||||||||||||||
Assets | Affiliated Mutual Funds | $506,971,078 | $506,971,078 | $— | $— | |||||||||||||
|
|
|
|
|
|
|
| |||||||||||
PL Portfolio Optimization Moderate-Conservative Fund | ||||||||||||||||||
Assets | Affiliated Mutual Funds | $499,333,869 | $499,333,869 | $— | $— | |||||||||||||
|
|
|
|
|
|
|
| |||||||||||
| See Notes to Financial Statements | See explanation of symbols and terms, if any, on page B-25 |
B-1
Table of Contents
PACIFIC LIFE FUNDS
PL PORTFOLIO OPTIMIZATION MODERATE FUND
Schedule of Investments
March 31, 2013
PACIFIC LIFE FUNDS
PL PORTFOLIO OPTIMIZATION MODERATE-AGGRESSIVE FUND
Schedule of Investments
March 31, 2013
| Value | |||||||
AFFILIATED MUTUAL FUNDS - 99.9% | ||||||||
PL Floating Rate Loan Fund ‘P’ | 4,740,975 | $48,547,581 | ||||||
PL Inflation Managed Fund ‘P’ | 5,531,732 | 53,879,071 | ||||||
PL Managed Bond Fund ‘P’ | 17,696,831 | 196,611,792 | ||||||
PL Short Duration Bond Fund ‘P’ | 7,705,310 | 77,977,740 | ||||||
PL Emerging Markets Debt Fund ‘P’ | 3,391,795 | 35,715,604 | ||||||
PL Comstock Fund ‘P’ | 7,276,948 | 104,788,044 | ||||||
PL Growth LT Fund ‘P’ | 1,322,020 | 18,415,744 | ||||||
PL Large-Cap Growth Fund ‘P’ | 5,288,977 | 55,005,359 | ||||||
PL Large-Cap Value Fund ‘P’ | 9,279,466 | 129,541,349 | ||||||
PL Main Street Core Fund ‘P’ | 6,725,450 | 82,050,485 | ||||||
PL Mid-Cap Equity Fund ‘P’ | 4,617,032 | 50,787,357 | ||||||
PL Mid-Cap Growth Fund ‘P’ | 2,246,260 | 19,272,907 | ||||||
PL Small-Cap Growth Fund ‘P’ * | 1,170,085 | 15,550,433 | ||||||
PL Small-Cap Value Fund ‘P’ | 3,780,475 | 45,932,777 | ||||||
PL Real Estate Fund ‘P’ | 1,840,893 | 25,165,012 | ||||||
PL Emerging Markets Fund ‘P’ | 3,315,144 | 47,141,348 | ||||||
PL International Large-Cap Fund ‘P’ | 4,726,323 | 77,889,808 | ||||||
PL International Value Fund ‘P’ | 5,901,230 | 53,701,195 | ||||||
PL Currency Strategies Fund ‘P’ * | 4,649,260 | 47,980,363 | ||||||
PL Global Absolute Return Fund ‘P’ | 5,932,862 | 60,455,859 | ||||||
PL Precious Metals Fund ‘P’ | 2,684,504 | 22,066,620 | ||||||
|
| |||||||
Total Affiliated Mutual Funds | 1,268,476,448 | |||||||
|
| |||||||
TOTAL INVESTMENTS - 99.9% | 1,268,476,448 | |||||||
OTHER ASSETS & LIABILITIES, NET - 0.1% | 1,135,598 | |||||||
|
| |||||||
NET ASSETS - 100% | $1,269,612,046 | |||||||
|
| |||||||
Notes to Schedule of Investments
| (a) | As of March 31, 2013, the fund was diversified as a percentage of net assets as follows: |
Affiliated Equity Funds | 58.9% | |||
Affiliated Fixed Income Funds | 41.0% | |||
|
| |||
| 99.9% | ||||
Other Assets & Liabilities, Net | 0.1% | |||
|
| |||
| 100.0% | ||||
|
|
| Value | |||||||
AFFILIATED MUTUAL FUNDS - 100.0% | ||||||||
PL Inflation Managed Fund ‘P’ | 1,812,175 | $17,650,585 | ||||||
PL Managed Bond Fund ‘P’ | 6,626,173 | 73,616,782 | ||||||
PL Short Duration Bond Fund ‘P’ | 1,370,059 | 13,864,997 | ||||||
PL Emerging Markets Debt Fund ‘P’ | 956,982 | 10,077,020 | ||||||
PL Comstock Fund ‘P’ | 5,492,506 | 79,092,093 | ||||||
PL Growth LT Fund ‘P’ | 1,204,374 | 16,776,930 | ||||||
PL Large-Cap Growth Fund ‘P’ | 4,356,212 | 45,304,606 | ||||||
PL Large-Cap Value Fund ‘P’ | 7,153,355 | 99,860,840 | ||||||
PL Main Street Core Fund ‘P’ | 6,099,301 | 74,411,470 | ||||||
PL Mid-Cap Equity Fund ‘P’ | 4,760,402 | 52,364,418 | ||||||
PL Mid-Cap Growth Fund ‘P’ | 2,646,299 | 22,705,243 | ||||||
PL Small-Cap Growth Fund ‘P’ * | 1,324,613 | 17,604,103 | ||||||
PL Small-Cap Value Fund ‘P’ | 4,392,260 | 53,365,960 | ||||||
PL Real Estate Fund ‘P’ | 1,803,216 | 24,649,968 | ||||||
PL Emerging Markets Fund ‘P’ | 2,867,755 | 40,779,470 | ||||||
PL International Large-Cap Fund ‘P’ | 4,061,519 | 66,933,840 | ||||||
PL International Value Fund ‘P’ | 5,931,350 | 53,975,286 | ||||||
PL Currency Strategies Fund ‘P’ * | 3,103,289 | 32,025,945 | ||||||
PL Global Absolute Return Fund ‘P’ | 3,993,332 | 40,692,054 | ||||||
PL Precious Metals Fund ‘P’ | 2,651,805 | 21,797,835 | ||||||
|
| |||||||
Total Affiliated Mutual Funds | 857,549,445 | |||||||
|
| |||||||
TOTAL INVESTMENTS - 100.0% | 857,549,445 | |||||||
OTHER ASSETS & LIABILITIES, NET - 0.0% | 191,851 | |||||||
|
| |||||||
NET ASSETS - 100% | $857,741,296 | |||||||
|
| |||||||
Notes to Schedule of Investments
| (a) | As of March 31, 2013, the fund was diversified as a percentage of net assets as follows: |
Affiliated Equity Funds | 78.1% | |||
Affiliated Fixed Income Funds | 21.9% | |||
|
| |||
| 100.0% | ||||
Other Assets & Liabilities, Net | 0.0% | |||
|
| |||
| 100.0% | ||||
|
|
| (b) | Fair Value Measurements |
The following is a summary of the funds’ investments as categorized under the three-tier hierarchy of inputs used in valuing the funds’ assets and liabilities (See Note 3D in Notes to Financial Statements) as of March 31, 2013:
| Total Value at March 31, 2013 | Level 1 Quoted Price | Level 2 Significant Observable Inputs | Level 3 Significant Unobservable Inputs | |||||||||||||||
PL Portfolio Optimization Moderate Fund | ||||||||||||||||||
Assets | Affiliated Mutual Funds | $1,268,476,448 | $1,268,476,448 | $— | $— | |||||||||||||
|
|
|
|
|
|
|
| |||||||||||
PL Portfolio Optimization Moderate-Aggressive Fund | ||||||||||||||||||
Assets | Affiliated Mutual Funds | $857,549,445 | $857,549,445 | $— | $— | |||||||||||||
|
|
|
|
|
|
|
| |||||||||||
| See Notes to Financial Statements | See explanation of symbols and terms, if any, on page B-25 |
B-2
Table of Contents
PACIFIC LIFE FUNDS
PL PORTFOLIO OPTIMIZATION AGGRESSIVE FUND
Schedule of Investments
March 31, 2013
| Value | |||||||
AFFILIATED MUTUAL FUNDS - 100.0% | ||||||||
PL Managed Bond Fund ‘P’ | 653,990 | $7,265,825 | ||||||
PL Comstock Fund ‘P’ | 1,687,560 | 24,300,862 | ||||||
PL Growth LT Fund ‘P’ | 351,672 | 4,898,798 | ||||||
PL Large-Cap Growth Fund ‘P’ | 1,340,499 | 13,941,188 | ||||||
PL Large-Cap Value Fund ‘P’ | 2,191,877 | 30,598,605 | ||||||
PL Main Street Core Fund ‘P’ | 1,869,292 | 22,805,365 | ||||||
PL Mid-Cap Equity Fund ‘P’ | 1,541,448 | 16,955,924 | ||||||
PL Mid-Cap Growth Fund ‘P’ | 1,136,891 | 9,754,522 | ||||||
PL Small-Cap Growth Fund ‘P’ * | 834,879 | 11,095,542 | ||||||
PL Small-Cap Value Fund ‘P’ | 1,742,482 | 21,171,150 | ||||||
PL Real Estate Fund ‘P’ | 753,905 | 10,305,879 | ||||||
PL Emerging Markets Fund ‘P’ | 1,018,881 | 14,488,493 | ||||||
PL International Large-Cap Fund ‘P’ | 1,280,145 | 21,096,788 | ||||||
PL International Value Fund ‘P’ | 1,831,318 | 16,664,995 | ||||||
PL Currency Strategies Fund ‘P’ * | 927,664 | 9,573,494 | ||||||
PL Global Absolute Return Fund ‘P’ | 1,188,857 | 12,114,457 | ||||||
PL Precious Metals Fund ‘P’ | 1,045,484 | 8,593,879 | ||||||
|
| |||||||
Total Affiliated Mutual Funds | 255,625,766 | |||||||
|
| |||||||
TOTAL INVESTMENTS - 100.0% | 255,625,766 | |||||||
OTHER ASSETS & LIABILITIES, NET - (0.0%) | (120,462 | ) | ||||||
|
| |||||||
NET ASSETS - 100.0% | $255,505,304 | |||||||
|
| |||||||
Notes to Schedule of Investments
| (a) | As of March 31, 2013, the fund was diversified as a percentage of net assets as follows: |
Affiliated Equity Funds | 88.7% | |||
Affiliated Fixed Income Funds | 11.3% | |||
|
| |||
| 100.0% | ||||
Other Assets & Liabilities, Net | (0.0% | ) | ||
|
| |||
| 100.0% | ||||
|
|
| (b) | Fair Value Measurements |
The following is a summary of the fund’s investments as categorized under the three-tier hierarchy of inputs used in valuing the fund’s assets and liabilities (See Note 3D in Notes to Financial Statements) as of March 31, 2013:
| Total Value at March 31, 2013 | Level 1 Quoted Price | Level 2 Significant Observable Inputs | Level 3 Significant Unobservable Inputs | |||||||||||||||
Assets | Affiliated Mutual Funds | $255,625,766 | $255,625,766 | $— | $— | |||||||||||||
|
|
|
|
|
|
|
| |||||||||||
| See Notes to Financial Statements | See explanation of symbols and terms, if any, on page B-25 |
B-3
Table of Contents
PACIFIC LIFE FUNDS
PL SHORT DURATION INCOME FUND
Schedule of Investments
March 31, 2013
Principal Amount | Value | |||||||
CORPORATE BONDS & NOTES - 77.2% |
| |||||||
Consumer Discretionary - 11.9% |
| |||||||
Carnival Corp (Panama) | $500,000 | $501,029 | ||||||
DIRECTV Holdings LLC | 1,000,000 | 1,050,430 | ||||||
DISH DBS Corp | 200,000 | 208,500 | ||||||
Dollar General Corp | 250,000 | 269,687 | ||||||
D.R. Horton Inc | 500,000 | 506,250 | ||||||
Kia Motors Corp (South Korea) | 1,000,000 | 1,058,164 | ||||||
NBCUniversal Enterprise Inc | 1,000,000 | 998,043 | ||||||
Virgin Media Secured Finance PLC (United Kingdom) | 250,000 | 267,500 | ||||||
Wyndham Worldwide Corp | ||||||||
2.500% due 03/01/18 | 750,000 | 755,443 | ||||||
2.950% due 03/01/17 | 250,000 | 257,590 | ||||||
|
| |||||||
| 5,872,636 | ||||||||
|
| |||||||
Energy - 6.4% |
| |||||||
Korea National Oil Corp (South Korea) | 250,000 | 263,899 | ||||||
Murphy Oil Corp | 500,000 | 502,844 | ||||||
Petrobras International Finance Co (Cayman) | 1,000,000 | 1,023,318 | ||||||
Phillips 66 | 250,000 | 255,612 | ||||||
Pioneer Natural Resources Co | 350,000 | 396,149 | ||||||
Rosneft Oil Co (Ireland) | 200,000 | 201,500 | ||||||
Transocean Inc (Cayman) | 500,000 | 507,085 | ||||||
|
| |||||||
| 3,150,407 | ||||||||
|
| |||||||
Financials - 35.3% |
| |||||||
American International Group Inc | 1,000,000 | 1,026,397 | ||||||
Bank of America Corp | 500,000 | 500,117 | ||||||
Bank of America NA | 1,000,000 | 1,121,892 | ||||||
Berkshire Hathaway Inc | 500,000 | 507,035 | ||||||
Capital One Financial Corp | 750,000 | 765,750 | ||||||
Citigroup Inc | 1,000,000 | 999,558 | ||||||
Commonwealth Bank of Australia (Australia) | 250,000 | 256,045 | ||||||
Daimler Finance North America LLC | 1,000,000 | 1,012,339 | ||||||
ERP Operating LP REIT | 250,000 | 250,000 | ||||||
Export-Import Bank of Korea (South Korea) | 500,000 | 501,558 | ||||||
Ford Motor Credit Co LLC | 1,000,000 | 1,026,992 | ||||||
General Electric Capital Corp | 1,000,000 | 1,000,244 | ||||||
Health Care REIT Inc | 250,000 | 252,681 | ||||||
Principal Amount | Value | |||||||
ING US Inc | $1,000,000 | $1,015,903 | ||||||
JPMorgan Chase & Co | 1,000,000 | 1,002,044 | ||||||
Mack-Cali Realty LP REIT | 1,000,000 | 1,014,407 | ||||||
Metropolitan Life Global Funding I | 750,000 | 754,482 | ||||||
Morgan Stanley | 1,000,000 | 1,008,582 | ||||||
Nissan Motor Acceptance Corp | 1,000,000 | 999,871 | ||||||
SLM Corp | 600,000 | 625,136 | ||||||
The Goldman Sachs Group Inc | 1,000,000 | 1,009,808 | ||||||
The Korea Development Bank (South Korea) | 500,000 | 496,563 | ||||||
WT Finance Australia Property Ltd (Multi-National) | 250,000 | 266,490 | ||||||
|
| |||||||
| 17,413,894 | ||||||||
|
| |||||||
Health Care - 1.6% |
| |||||||
AbbVie Inc | �� | 500,000 | 504,205 | |||||
Express Scripts Holding Co | 250,000 | 255,510 | ||||||
|
| |||||||
| 759,715 | ||||||||
|
| |||||||
Industrials - 8.6% |
| |||||||
Air Lease Corp | 500,000 | 543,750 | ||||||
Avis Budget Car Rental LLC | 100,000 | 100,501 | ||||||
Delta Air Lines Pass-Through Trust ‘A’ | 750,000 | 811,875 | ||||||
ERAC USA Finance LLC | 500,000 | 503,327 | ||||||
Hutchison Whampoa International 12 II Ltd (Cayman) | 500,000 | 505,530 | ||||||
International Lease Finance Corp | ||||||||
3.875% due 04/15/18 | 250,000 | 250,156 | ||||||
5.650% due 06/01/14 | 250,000 | 262,187 | ||||||
Penske Truck Leasing Co LP | 500,000 | 510,720 | ||||||
Pentair Finance SA (Luxembourg) | 500,000 | 501,028 | ||||||
United Rentals North America Inc | 250,000 | 272,188 | ||||||
|
| |||||||
| 4,261,262 | ||||||||
|
| |||||||
Information Technology - 2.6% |
| |||||||
Arrow Electronics Inc | 750,000 | 757,851 | ||||||
Computer Sciences Corp | 250,000 | 256,898 | ||||||
The Western Union Co | 250,000 | 254,601 | ||||||
|
| |||||||
| 1,269,350 | ||||||||
|
| |||||||
Materials - 8.7% |
| |||||||
Alphabet Holding Co Inc | 200,000 | 209,000 | ||||||
ArcelorMittal (Luxembourg) | 350,000 | 361,977 | ||||||
Ashland Inc | 500,000 | 508,125 | ||||||
Cliffs Natural Resources Inc | 500,000 | 502,776 | ||||||
| See Notes to Financial Statements | See explanation of symbols and terms, if any, on page B-25 |
B-4
Table of Contents
PACIFIC LIFE FUNDS
PL SHORT DURATION INCOME FUND
Schedule of Investments (Continued)
March 31, 2013
Principal Amount | Value | |||||||
FMG Resources Property Ltd (Australia) | $500,000 | $516,250 | ||||||
Freeport-McMoRan Copper & Gold Inc | 1,000,000 | 1,007,705 | ||||||
Graphic Packaging International Inc | 150,000 | 166,125 | ||||||
Xstrata Finance Canada Ltd (Canada) | 1,000,000 | 1,011,995 | ||||||
|
| |||||||
| 4,283,953 | ||||||||
|
| |||||||
Telecommunication Services - 2.1% |
| |||||||
CC Holdings GS V LLC | 500,000 | 504,013 | ||||||
Intelsat Jackson Holdings SA (Luxemburg) | 500,000 | 551,250 | ||||||
|
| |||||||
| 1,055,263 | ||||||||
|
| |||||||
Total Corporate Bonds & Notes | 38,066,480 | |||||||
|
| |||||||
SENIOR LOAN NOTES - 17.9% | ||||||||
Consumer Discretionary - 2.4% | ||||||||
Aramark Corp Term D | 250,000 | 253,013 | ||||||
Capital Automotive LP Tranche B | 228,703 | 230,311 | ||||||
Lord & Taylor Holdings LLC | 179,627 | 181,798 | ||||||
Renfro Corp Term B | 250,000 | 253,750 | ||||||
Wendy’s International Inc | 248,750 | 251,770 | ||||||
|
| |||||||
| 1,170,642 | ||||||||
|
| |||||||
Consumer Staples - 0.5% |
| |||||||
Reynolds Group Holdings | 248,750 | 252,659 | ||||||
|
| |||||||
Energy - 1.6% |
| |||||||
Chesapeake Energy Corp | 500,000 | 516,339 | ||||||
EP Energy LLC Tranche B-1 | 250,000 | 253,237 | ||||||
|
| |||||||
| 769,576 | ||||||||
|
| |||||||
Financials - 0.8% |
| |||||||
Nuveen Investments Inc Tranche A | 250,000 | 254,844 | ||||||
Stockbridge/SBE Holdings Tranche B | 130,000 | 141,375 | ||||||
|
| |||||||
| 396,219 | ||||||||
|
| |||||||
Health Care - 3.0% |
| |||||||
ATI Holdings Inc | 498,750 | 507,166 | ||||||
Bausch & Lomb Inc | 248,125 | 250,805 | ||||||
Hologic Inc Tranche B | 248,750 | 252,507 | ||||||
Valeant Pharmaceuticals International Inc Series C-1 Tranche B | 249,375 | 252,596 | ||||||
Principal Amount | Value | |||||||
Warner Chilcott Co LLC | ||||||||
Term B-1 | $36,703 | $37,253 | ||||||
Term B-2 | 29,877 | 30,325 | ||||||
Warner Chilcott Corp Term B-1 | 84,314 | 85,579 | ||||||
WC Luxco SARL Term B-3 | 66,441 | 67,437 | ||||||
|
| |||||||
| 1,483,668 | ||||||||
|
| |||||||
Industrials - 5.1% |
| |||||||
AWAS Finance Luxembourg SARL | 215,509 | 218,741 | ||||||
Term B | 291,699 | 296,074 | ||||||
Bombardier Recreational Products Inc | 250,000 | 252,787 | ||||||
CSC Holdings LLC | 985,322 | 990,657 | ||||||
Flying Fortress Inc | 250,000 | 251,563 | ||||||
Hamilton Sundstrand | 498,750 | 502,713 | ||||||
|
| |||||||
| 2,512,535 | ||||||||
|
| |||||||
Materials - 2.0% |
| |||||||
Eagle Spinco Inc Term B | 250,000 | 252,500 | ||||||
FMG Resources Property Ltd | 497,500 | 503,985 | ||||||
Tronox Pigments BV (Netherlands) | 250,000 | 253,984 | ||||||
|
| |||||||
| 1,010,469 | ||||||||
|
| |||||||
Telecommunication Services - 2.5% |
| |||||||
Telesat Canada Term B | 248,747 | 251,077 | ||||||
Windstream Corp | 744,997 | 754,309 | ||||||
Tranche B-4 | 249,375 | 252,180 | ||||||
|
| |||||||
| 1,257,566 | ||||||||
|
| |||||||
Total Senior Loan Notes | 8,853,334 | |||||||
|
| |||||||
U.S. TREASURY OBLIGATIONS - 1.5% | ||||||||
U.S. Treasury Notes - 1.5% | ||||||||
0.250% due 11/30/13 | 50,000 | 50,041 | ||||||
0.250% due 02/28/15 | 500,000 | 500,118 | ||||||
0.875% due 11/30/16 | 175,000 | 177,488 | ||||||
|
| |||||||
Total U.S. Treasury Obligations | 727,647 | |||||||
|
| |||||||
| See Notes to Financial Statements | See explanation of symbols and terms, if any, on page B-25 |
B-5
Table of Contents
PACIFIC LIFE FUNDS
PL SHORT DURATION INCOME FUND
Schedule of Investments (Continued)
March 31, 2013
| Value | |||||||
SHORT-TERM INVESTMENT - 6.4% | ||||||||
Money Market Fund - 6.4% | ||||||||
BlackRock Liquidity Funds Treasury | 3,139,372 | $3,139,372 | ||||||
|
| |||||||
Total Short-Term Investment | 3,139,372 | |||||||
|
| |||||||
TOTAL INVESTMENTS - 103.0% | 50,786,833 | |||||||
OTHER ASSETS & LIABILITIES, NET - (3.0%) | (1,462,639 | ) | ||||||
|
| |||||||
NET ASSETS - 100.0% | $49,324,194 | |||||||
|
| |||||||
Notes to Schedule of Investments
| (a) | As of March 31, 2013, the fund was diversified as a percentage of net assets as follows: |
Corporate Bonds & Notes | 77.2% | |||
Senior Loan Notes | 17.9% | |||
Short-Term Investment | 6.4% | |||
Others (each less than 3.0%) | 1.5% | |||
|
| |||
| 103.0% | ||||
Other Assets & Liabilities, Net | (3.0% | ) | ||
|
| |||
| 100.0% | ||||
|
|
| (b) | As of March 31, 2013, the fund’s Standard & Poor’s quality ratings as a percentage of total fixed income investments were as follows (Unaudited): |
AA / U.S. Government & Agency Issues | 6.8% | |||
A | 23.1% | |||
BBB | 45.7% | |||
BB | 14.3% | |||
B | 9.0% | |||
Not Rated | 1.1% | |||
|
| |||
| 100.0% | ||||
|
|
| (c) | Fair Value Measurements |
The following is a summary of the fund’s investments as categorized under the three-tier hierarchy of inputs used in valuing the fund’s assets and liabilities (See Note 3D in Notes to Financial Statements) as of March 31, 2013:
| Total Value at March 31, 2013 | Level 1 Quoted Price | Level 2 Significant Observable Inputs | Level 3 Significant Unobservable Inputs | |||||||||||||||
Assets | Corporate Bonds & Notes | $38,066,480 | $— | $37,254,605 | $811,875 | |||||||||||||
Senior Loan Notes | 8,853,334 | — | 8,853,334 | — | ||||||||||||||
U.S. Treasury Obligations | 727,647 | — | 727,647 | — | ||||||||||||||
Short-Term Investment | 3,139,372 | 3,139,372 | — | — | ||||||||||||||
|
|
|
|
|
|
|
| |||||||||||
Total | $50,786,833 | $3,139,372 | $46,835,586 | $811,875 | ||||||||||||||
|
|
|
|
|
|
|
| |||||||||||
The following is a reconciliation of investments for significant unobservable inputs (Level 3) used in valuing the fund’s assets and liabilities (See Note 3D in Notes to Financial Statements) for the year ended March 31, 2013:
| Corporate Bonds & Notes | ||||
Value, Beginning of Year | $— | |||
Purchases | 788,813 | |||
Sales | — | |||
Accrued Discounts (Premiums) | (1,153 | ) | ||
Net Realized Gains (Losses) | — | |||
Change in Net Unrealized Appreciation | 24,215 | |||
Transfers In | — | |||
Transfers Out | — | |||
|
| |||
Value, End of Year | $811,875 | |||
|
| |||
Change in Net Unrealized Appreciation on Level 3 Investments Held at the End of Year, if Applicable | $24,215 | |||
|
| |||
The significant unobservable inputs were provided by a vendor-priced single broker quote.
| See Notes to Financial Statements | See explanation of symbols and terms, if any, on page B-25 |
B-6
Table of Contents
PACIFIC LIFE FUNDS
PL INCOME FUND
Schedule of Investments
March 31, 2013
Principal Amount | Value | |||||||
CORPORATE BONDS & NOTES - 72.9% |
| |||||||
Consumer Discretionary - 9.6% |
| |||||||
Cedar Fair LP | $2,500,000 | $2,493,750 | ||||||
Comcast Corp | 1,750,000 | 1,791,223 | ||||||
Cox Communications Inc | 2,000,000 | 1,979,596 | ||||||
DIRECTV Holdings LLC | 9,000,000 | 9,243,135 | ||||||
D.R. Horton Inc | 2,000,000 | 2,025,000 | ||||||
Hyatt Hotels Corp | 3,000,000 | 3,199,962 | ||||||
6.875% due 08/15/19 ~ | 1,750,000 | 2,087,678 | ||||||
Kia Motors Corp (South Korea) | 5,000,000 | 5,290,820 | ||||||
Marriott International Inc | 4,000,000 | 4,197,784 | ||||||
MDC Holdings Inc | 2,500,000 | 2,491,183 | ||||||
MGM Resorts International | 3,000,000 | 3,187,500 | ||||||
Mohawk Industries Inc | 5,000,000 | 5,111,660 | ||||||
NVR Inc | 4,000,000 | 4,116,788 | ||||||
Six Flags Entertainment Corp | 3,000,000 | 3,011,250 | ||||||
Wyndham Worldwide Corp | 6,000,000 | 6,182,160 | ||||||
|
| |||||||
| 56,409,489 | ||||||||
|
| |||||||
Consumer Staples - 2.5% |
| |||||||
Hawk Acquisition Sub Inc | 1,300,000 | 1,303,250 | ||||||
Reynolds Group Issuer Inc | 2,500,000 | 2,553,125 | ||||||
SABMiller Holdings Inc | 8,000,000 | 8,338,496 | ||||||
Spectrum Brands Escrow Corp | 2,500,000 | 2,718,750 | ||||||
|
| |||||||
| 14,913,621 | ||||||||
|
| |||||||
Energy - 9.1% |
| |||||||
Cimarex Energy Co | 3,000,000 | 3,232,500 | ||||||
DCP Midstream Operating LP | 3,300,000 | 3,327,103 | ||||||
Korea National Oil Corp (South Korea) | 4,000,000 | 4,222,376 | ||||||
MarkWest Energy Partners LP | 2,500,000 | 2,450,000 | ||||||
Newfield Exploration Co | 2,000,000 | 2,150,000 | ||||||
ONEOK Partners LP | 5,500,000 | 5,566,330 | ||||||
Peabody Energy Corp | 2,250,000 | 2,399,063 | ||||||
Petrobras International Finance Co (Cayman) | 3,000,000 | 3,253,848 | ||||||
Pioneer Natural Resources Co | 4,000,000 | 4,187,292 | ||||||
5.875% due 07/15/16 | 4,000,000 | 4,527,416 | ||||||
Plains Exploration & Production Co | 1,750,000 | 1,990,625 | ||||||
Sabine Pass Liquefaction LLC | 1,500,000 | 1,558,125 | ||||||
Principal Amount | Value | |||||||
Samson Investment Co | $1,000,000 | $1,067,500 | ||||||
The Williams Cos Inc | 6,000,000 | 5,972,760 | ||||||
Transocean Inc (Cayman) | 7,500,000 | 7,606,268 | ||||||
|
| |||||||
| 53,511,206 | ||||||||
|
| |||||||
Financials - 27.8% |
| |||||||
American International Group Inc | 3,000,000 | 3,079,191 | ||||||
Bank of America Corp | 4,500,000 | 4,501,048 | ||||||
Bank of America NA | 8,200,000 | 9,199,514 | ||||||
Berkshire Hathaway Finance Corp | 6,000,000 | 6,127,710 | ||||||
Capital One Financial Corp | 5,000,000 | 5,105,000 | ||||||
Carlyle Holdings Finance LLC | 4,000,000 | 4,108,520 | ||||||
Corrections Corp of America REIT | 500,000 | 511,875 | ||||||
Duke Realty LP REIT | 6,250,000 | 6,664,569 | ||||||
Export-Import Bank of Korea (South Korea) | 4,500,000 | 4,514,022 | ||||||
Ford Motor Credit Co LLC | 6,000,000 | 6,161,952 | ||||||
4.250% due 09/20/22 | 5,000,000 | 5,183,435 | ||||||
General Electric Capital Corp | 3,000,000 | 3,000,732 | ||||||
2.100% due 12/11/19 | 8,000,000 | 8,150,520 | ||||||
Health Care REIT Inc | 5,000,000 | 5,045,895 | ||||||
Host Hotels & Resorts LP REIT | 5,000,000 | 5,032,050 | ||||||
Hyundai Capital America | 6,000,000 | 6,057,924 | ||||||
ING US Inc | 6,000,000 | 6,095,418 | ||||||
JPMorgan Chase & Co | 6,250,000 | 6,257,556 | ||||||
Kilroy Realty LP REIT | 5,000,000 | 5,134,945 | ||||||
KKR Group Finance Co II LLC | 1,175,000 | 1,137,456 | ||||||
Liberty Mutual Group Inc | 6,500,000 | 7,145,138 | ||||||
Mack-Cali Realty LP REIT | 6,000,000 | 6,086,442 | ||||||
Morgan Stanley | 1,000,000 | 1,013,615 | ||||||
Neuberger Berman Group LLC | 3,500,000 | 3,683,750 | ||||||
Nissan Motor Acceptance Corp | 3,000,000 | 2,999,613 | ||||||
Prudential Financial Inc | 3,000,000 | 3,027,786 | ||||||
Raymond James Financial Inc | 4,000,000 | 4,571,732 | ||||||
Realty Income Corp REIT | 5,500,000 | 5,544,555 | ||||||
The Goldman Sachs Group Inc | 4,000,000 | 4,039,232 | ||||||
2.375% due 01/22/18 | 6,000,000 | 6,091,428 | ||||||
The Korea Development Bank (South Korea) | 5,000,000 | 4,942,605 | ||||||
Vornado Realty LP REIT | 6,500,000 | 7,218,478 | ||||||
| See Notes to Financial Statements | See explanation of symbols and terms, if any, on page B-25 |
B-7
Table of Contents
PACIFIC LIFE FUNDS
PL INCOME FUND
Schedule of Investments (Continued)
March 31, 2013
Principal Amount | Value | |||||||
WEA Finance LLC | $6,000,000 | $6,122,472 | ||||||
Wells Operating Partnership II LP REIT | 750,000 | 815,923 | ||||||
|
| |||||||
| 164,372,101 | ||||||||
|
| |||||||
Industrials - 7.9% |
| |||||||
Air Lease Corp | 7,500,000 | 8,156,250 | ||||||
American Airlines Pass-Through Trust ‘A’ | 1,900,000 | 1,932,063 | ||||||
Delta Air Lines Pass-Through Trust ‘A’ | 8,000,000 | 8,660,000 | ||||||
Hutchison Whampoa International 12 II Ltd | 5,000,000 | 5,055,295 | ||||||
International Lease Finance Corp | 1,750,000 | 1,751,094 | ||||||
7.125% due 09/01/18 ~ | 1,000,000 | 1,180,000 | ||||||
Owens Corning | 5,000,000 | 5,127,260 | ||||||
6.500% due 12/01/16 | 305,000 | 343,700 | ||||||
Penske Truck Leasing Co LP | 4,500,000 | 4,544,690 | ||||||
United Rentals North America Inc | 4,000,000 | 4,355,000 | ||||||
US Airways Pass-Through Trust ‘A’ | 5,000,000 | 5,246,875 | ||||||
|
| |||||||
| 46,352,227 | ||||||||
|
| |||||||
Information Technology - 0.7% |
| |||||||
Arrow Electronics Inc | 4,000,000 | 4,041,872 | ||||||
|
| |||||||
Materials - 11.3% |
| |||||||
Alphabet Holding Co Inc | 2,200,000 | 2,299,000 | ||||||
ArcelorMittal (Luxembourg) | 3,025,000 | 3,187,176 | ||||||
Ardagh Packaging Finance PLC (Ireland) | 2,750,000 | 3,021,563 | ||||||
Ashland Inc | 2,500,000 | 2,540,625 | ||||||
Cliffs Natural Resources Inc | 3,750,000 | 3,770,816 | ||||||
Domtar Corp | 5,000,000 | 5,001,830 | ||||||
FMG Resources Property Ltd (Australia) | 3,500,000 | 3,613,750 | ||||||
Freeport-McMoran Copper & Gold Inc | 8,000,000 | 8,045,072 | ||||||
Graphic Packaging International Inc | 3,000,000 | 3,322,500 | ||||||
LyondellBasell Industries NV (Netherlands) | 2,500,000 | 2,837,500 | ||||||
Rock-Tenn Co | 7,000,000 | 7,170,660 | ||||||
RPM International Inc | 4,000,000 | 3,975,568 | ||||||
Samarco Mineracao SA (Brazil) | 4,000,000 | 3,902,000 | ||||||
Sealed Air Corp | 2,000,000 | 2,300,000 | ||||||
Southern Copper Corp | 2,000,000 | 1,906,776 | ||||||
Tronox Finance LLC | 2,000,000 | 1,947,500 | ||||||
Principal Amount | Value | |||||||
Vale SA (Brazil) | $2,000,000 | $1,991,732 | ||||||
Xstrata Finance Canada Ltd (Canada) | 6,000,000 | 6,059,328 | ||||||
|
| |||||||
| 66,893,396 | ||||||||
|
| |||||||
Telecommunication Services - 1.6% |
| |||||||
CC Holdings GS V LLC | 5,000,000 | 5,051,500 | ||||||
Lynx I Corp | 3,000,000 | 3,135,000 | ||||||
SES (Luxembourg) | 1,300,000 | 1,310,869 | ||||||
|
| |||||||
| 9,497,369 | ||||||||
|
| |||||||
Utilities - 2.4% |
| |||||||
American Electric Power Co Inc | 5,000,000 | 5,024,800 | ||||||
Duke Energy Corp | 6,000,000 | 6,062,052 | ||||||
NRG Energy Inc | 3,000,000 | 3,195,000 | ||||||
|
| |||||||
| 14,281,852 | ||||||||
|
| |||||||
Total Corporate Bonds & Notes | 430,273,133 | |||||||
|
| |||||||
SENIOR LOAN NOTES - 20.0% | ||||||||
Consumer Discretionary - 3.3% |
| |||||||
Acosta Inc Term D | 1,746,250 | 1,770,261 | ||||||
Capital Automotive LP Tranche B | 2,717,682 | 2,736,790 | ||||||
ClubCorp Club Operations Inc Term B | 1,424,797 | 1,450,621 | ||||||
Getty Images Inc (Initial) | 3,491,250 | 3,548,294 | ||||||
Lord & Taylor Holdings LLC | 2,158,231 | 2,184,308 | ||||||
Seven Sea Cruises S DE RL Term B-1 | 1,975,000 | 2,004,625 | ||||||
The Goodyear Tire & Rubber Co (2nd Lien) | 2,000,000 | 2,024,984 | ||||||
The Neiman Marcus Group Inc | 2,000,000 | 2,009,500 | ||||||
Wendy’s International Inc | 1,990,000 | 2,014,156 | ||||||
|
| |||||||
| 19,743,539 | ||||||||
|
| |||||||
Consumer Staples - 2.7% |
| |||||||
Albertson’s LLC Term B | 1,983,333 | 2,019,636 | ||||||
BJ’s Wholesale Club Inc (1st Lien) | 2,992,500 | 3,024,295 | ||||||
Del Monte Foods Co (Initial) | 4,120,707 | 4,161,485 | ||||||
Pinnacle Foods Finance LLC Tranche E | 2,970,000 | 3,001,292 | ||||||
Sprouts Farmers Markets Holdings LLC | ||||||||
(Initial) | ||||||||
6.000% due 04/18/18 § | 1,969,868 | 1,988,335 | ||||||
(Term 1) | ||||||||
6.000% due 04/18/18 § | 992,500 | 999,944 | ||||||
SUPERVALU Inc | 1,000,000 | 1,018,839 | ||||||
|
| |||||||
| 16,213,826 | ||||||||
|
| |||||||
| See Notes to Financial Statements | See explanation of symbols and terms, if any, on page B-25 |
B-8
Table of Contents
PACIFIC LIFE FUNDS
PL INCOME FUND
Schedule of Investments (Continued)
March 31, 2013
Principal Amount | Value | |||||||
Energy - 0.9% | ||||||||
EP Energy LLC | ||||||||
Tranche B-1 | ||||||||
5.000% due 05/24/18 § | $2,500,000 | $2,532,365 | ||||||
Tranche B-2 | ||||||||
4.500% due 04/30/19 § | 1,000,000 | 1,014,250 | ||||||
Samson Investment Co (Initial 2nd Lien) | 1,500,000 | 1,521,750 | ||||||
|
| |||||||
| 5,068,365 | ||||||||
|
| |||||||
Financials - 1.9% | ||||||||
First Data Corp Term B | 2,500,000 | 2,523,177 | ||||||
Nuveen Investment Inc Tranche A (1st Lien) | 4,000,000 | 4,077,500 | ||||||
Realogy Corp Term B | 1,500,000 | 1,522,969 | ||||||
Stockbridge/SBE Holdings LLC Tranche B | 1,000,000 | 1,087,500 | ||||||
13.000% due 05/02/17 | 1,900,000 | 2,066,250 | ||||||
|
| |||||||
| 11,277,396 | ||||||||
|
| |||||||
Health Care - 3.2% | ||||||||
American Renal Holdings Inc | 1,500,000 | 1,506,562 | ||||||
Bausch & Lomb Inc | 2,977,500 | 3,009,657 | ||||||
Capsugel Holdings US Inc (Initial) | 3,703,815 | 3,770,176 | ||||||
DaVita Inc Tranche B-2 | 2,992,500 | 3,027,336 | ||||||
Hologic Inc Tranche B | 2,487,500 | 2,525,071 | ||||||
Pharmaceutical Product Development Inc | 1,496,250 | 1,517,292 | ||||||
Valeant Pharmaceuticals International | 3,491,250 | 3,536,346 | ||||||
|
| |||||||
| 18,892,440 | ||||||||
|
| |||||||
Industrials - 3.6% | ||||||||
AlixPartners LLP Term B-2 | 1,985,025 | 2,008,184 | ||||||
Bombardier Recreational Products Inc Term B | 3,000,000 | 3,033,438 | ||||||
CSC Holdings LLC | 4,583,496 | 4,608,311 | ||||||
Hamilton Sundstrand | 2,992,500 | 3,016,278 | ||||||
Rexnord LLC Term B | 2,238,750 | 2,265,792 | ||||||
Tomkins Air (Initial 1st Lien) | 2,992,500 | 3,041,128 | ||||||
WESCO Distribution Inc Tranche B-1 | 2,992,500 | 3,025,792 | ||||||
|
| |||||||
| 20,998,923 | ||||||||
|
| |||||||
Materials - 0.9% | ||||||||
Berry Plastics Corp Term D | 3,000,000 | 2,998,662 | ||||||
FMG Resources Property Ltd (Australia) | 1,990,000 | 2,015,942 | ||||||
|
| |||||||
| 5,014,604 | ||||||||
|
| |||||||
Principal Amount | Value | |||||||
Telecommunication Services - 3.5% | ||||||||
Cricket Communications Inc | $2,493,750 | $2,513,234 | ||||||
Intelsat Jackson Holding SA Tranche B-1 | 2,976,203 | 3,026,426 | ||||||
Level 3 Financing Inc | ||||||||
Tranche B | ||||||||
5.250% due 08/01/19 § | 2,500,000 | 2,534,688 | ||||||
Tranche B-II | ||||||||
4.750% due 08/01/19 § | 1,500,000 | 1,518,906 | ||||||
Telesat Canada Term B | 2,979,987 | 3,007,907 | ||||||
WaveDivision Holdings LLC (Initial) | 2,743,125 | 2,787,632 | ||||||
Windstream Corp Term B-3 | 5,461,237 | 5,529,503 | ||||||
|
| |||||||
| 20,918,296 | ||||||||
|
| |||||||
Total Senior Loan Notes | 118,127,389 | |||||||
|
| |||||||
U.S. TREASURY OBLIGATIONS - 3.5% | ||||||||
U.S. Treasury Bonds - 1.0% | ||||||||
2.750% due 11/15/42 | 1,500,000 | 1,393,595 | ||||||
3.000% due 05/15/42 | 2,000,000 | 1,962,500 | ||||||
3.750% due 08/15/41 | 2,000,000 | 2,266,250 | ||||||
|
| |||||||
| 5,622,345 | ||||||||
|
| |||||||
U.S. Treasury Notes - 2.5% | ||||||||
0.250% due 10/31/14 | 5,000,000 | 5,002,930 | ||||||
0.250% due 02/28/15 | 5,000,000 | 5,001,175 | ||||||
0.375% due 04/15/15 | 5,000,000 | 5,011,720 | ||||||
|
| |||||||
| 15,015,825 | ||||||||
|
| |||||||
Total U.S. Treasury Obligations | 20,638,170 | |||||||
|
| |||||||
Shares | ||||||||
SHORT-TERM INVESTMENT - 4.9% | ||||||||
Money Market Fund - 4.9% | ||||||||
BlackRock Liquidity Funds Treasury | 28,771,890 | 28,771,890 | ||||||
|
| |||||||
Total Short-Term Investment | 28,771,890 | |||||||
|
| |||||||
TOTAL INVESTMENTS - 101.3% | 597,810,582 | |||||||
OTHER ASSETS & LIABILITIES, NET - (1.3%) | (7,591,423 | ) | ||||||
|
| |||||||
NET ASSETS - 100.0% | $590,219,159 | |||||||
|
| |||||||
Notes to Schedule of Investments
| (a) | As of March 31, 2013, the fund was diversified as a percentage of net assets as follows: |
Corporate Bonds & Notes | 72.9% | |||
Senior Loan Notes | 20.0% | |||
Short-Term Investment | 4.9% | |||
U.S. Treasury Obligations | 3.5% | |||
|
| |||
| 101.3% | ||||
Other Assets & Liabilities, Net | (1.3% | ) | ||
|
| |||
| 100.0% | ||||
|
|
| See Notes to Financial Statements | See explanation of symbols and terms, if any, on page B-25 |
B-9
Table of Contents
PACIFIC LIFE FUNDS
PL INCOME FUND
Schedule of Investments (Continued)
March 31, 2013
| (b) | As of March 31, 2013, the fund’s Standard & Poor’s quality ratings as a percentage of total fixed income investments were as follows (Unaudited): |
AA / U.S. Government & Agency Issues | 6.7% | |||
A | 12.9% | |||
BBB | 44.7% | |||
BB | 17.8% | |||
B | 16.1% | |||
Not Rated | 1.8% | |||
|
| |||
| 100.0% | ||||
|
|
| (c) | Fair Value Measurements |
The following is a summary of the fund’s investments as categorized under the three-tier hierarchy of inputs used in valuing the fund’s assets and liabilities (See Note 3D in Notes to Financial Statements) as of March 31, 2013:
| Total Value at March 31, 2013 | Level 1 Quoted Price | Level 2 Significant Observable Inputs | Level 3 Significant Unobservable Inputs | |||||||||||||||
Assets | Corporate Bonds & Notes | $430,273,133 | $— | $414,434,195 | $15,838,938 | |||||||||||||
Senior Loan Notes | 118,127,389 | — | 118,127,389 | — | ||||||||||||||
U.S. Treasury Obligations | 20,638,170 | — | 20,638,170 | — | ||||||||||||||
Short-Term Investment | 28,771,890 | 28,771,890 | — | — | ||||||||||||||
|
|
|
|
|
|
|
| |||||||||||
Total | $597,810,582 | $28,771,890 | $553,199,754 | $15,838,938 | ||||||||||||||
|
|
|
|
|
|
|
| |||||||||||
The following is a reconciliation of investments for significant unobservable inputs (Level 3) used in valuing the fund’s assets and liabilities (See Note 3D in Notes to Financial Statements) for the year ended March 31, 2013:
| Corporate Bonds & Notes | ||||
Value, Beginning of Year | $525,000 | |||
Purchases | 15,270,750 | |||
Sales | (531,978 | ) | ||
Accrued Discounts (Premiums) | (13,881 | ) | ||
Net Realized Gains | 31,978 | |||
Change in Net Unrealized Appreciation | 557,069 | |||
Transfers In | — | |||
Transfers Out | — | |||
|
| |||
Value, End of Year | $15,838,938 | |||
|
| |||
Change in Net Unrealized Appreciation on Level 3 | $582,069 | |||
|
| |||
The significant unobservable inputs were provided by a vendor-priced single broker quote.
| See Notes to Financial Statements | See explanation of symbols and terms, if any, on page B-25 |
B-10
Table of Contents
PACIFIC LIFE FUNDS
PL STRATEGIC INCOME FUND
Schedule of Investments
March 31, 2013
Shares | Value | |||||||
COMMON STOCKS - 1.4% |
| |||||||
Consumer Discretionary - 0.4% |
| |||||||
Family Dollar Stores Inc | 1,400 | $82,670 | ||||||
Las Vegas Sands Corp | 2,350 | 132,423 | ||||||
MGM Resorts International * | 1,900 | 24,985 | ||||||
|
| |||||||
| 240,078 | ||||||||
|
| |||||||
Energy - 0.1% | ||||||||
Peabody Energy Corp | 3,000 | 63,450 | ||||||
|
| |||||||
Industrials - 0.2% | ||||||||
Kansas City Southern | 400 | 44,360 | ||||||
United Rentals Inc * | 900 | 49,473 | ||||||
|
| |||||||
| 93,833 | ||||||||
|
| |||||||
Materials - 0.5% | ||||||||
Freeport-McMoRan Copper & Gold Inc | 3,400 | 112,540 | ||||||
Sealed Air Corp | 5,500 | 132,605 | ||||||
|
| |||||||
| 245,145 | ||||||||
|
| |||||||
Utilities - 0.2% | ||||||||
NRG Energy Inc | 3,500 | 92,715 | ||||||
|
| |||||||
Total Common Stocks | 735,221 | |||||||
|
| |||||||
Principal Amount | ||||||||
CORPORATE BONDS & NOTES - 84.8% |
| |||||||
Consumer Discretionary - 16.8% | ||||||||
99 Cents Only Stores | $100,000 | 115,250 | ||||||
Beazer Homes USA Inc | ||||||||
7.250% due 02/01/23 ~ | 150,000 | 153,750 | ||||||
9.125% due 06/15/18 | 250,000 | 270,000 | ||||||
Boyd Gaming Corp | 250,000 | 261,250 | ||||||
Burlington Holdings LLC | 250,000 | 255,000 | ||||||
Caesars Entertainment Operating Co Inc | 100,000 | 106,875 | ||||||
Caesars Operating Escrow LLC | 100,000 | 101,125 | ||||||
Cedar Fair LP | 300,000 | 299,250 | ||||||
Cequel Communications Holdings I LLC | 200,000 | 208,500 | ||||||
CityCenter Holdings LLC | 100,000 | 107,875 | ||||||
Clear Channel Worldwide Holdings Inc | 182,000 | 192,920 | ||||||
Coinstar Inc | 100,000 | 102,500 | ||||||
Dana Holding Corp | 200,000 | 215,500 | ||||||
Griffey Intermediate Inc | 200,000 | 205,000 | ||||||
Hyatt Hotels Corp | 100,000 | 119,296 | ||||||
Jaguar Land Rover Automotive PLC (United Kingdom) | 200,000 | 226,000 | ||||||
Jo-Ann Stores Holdings Inc | 200,000 | 211,000 | ||||||
Principal Amount | Value | |||||||
Jo-Ann Stores Inc | $300,000 | $315,000 | ||||||
L Brands Inc | 250,000 | 266,250 | ||||||
Landry’s Holdings II Inc | 250,000 | 263,125 | ||||||
Lennar Corp | 200,000 | 196,500 | ||||||
Lynx II Corp | 400,000 | 421,000 | ||||||
MCE Finance Ltd (Cayman) | 250,000 | 253,125 | ||||||
MDC Holdings Inc | 250,000 | 249,118 | ||||||
MGM Resorts International | ||||||||
6.625% due 12/15/21 | 200,000 | 210,000 | ||||||
6.750% due 10/01/20 ~ | 200,000 | 212,500 | ||||||
Mohawk Industries Inc | 500,000 | 511,166 | ||||||
NCL Corp Ltd (Bermuda) | 100,000 | 102,375 | ||||||
NPC International Inc | 150,000 | 175,500 | ||||||
NVR Inc | 250,000 | 257,299 | ||||||
Petco Holdings Inc | 350,000 | 362,687 | ||||||
Six Flags Entertainment Corp | 350,000 | 351,312 | ||||||
The Goodyear Tire & Rubber Co | 100,000 | 103,625 | ||||||
The Ryland Group Inc | 100,000 | 102,500 | ||||||
The ServiceMaster Co | 200,000 | 215,500 | ||||||
Toll Brothers Finance Corp | 400,000 | 468,920 | ||||||
Wolverine World Wide Inc | 250,000 | 266,562 | ||||||
Wyndham Worldwide Corp | 350,000 | 352,100 | ||||||
|
| |||||||
| 8,807,255 | ||||||||
|
| |||||||
Consumer Staples - 1.9% | ||||||||
Hawk Acquisition Sub Inc | 100,000 | 100,250 | ||||||
Reynolds Group Issuer Inc | ||||||||
8.500% due 05/15/18 | 350,000 | 369,688 | ||||||
9.875% due 08/15/19 | 200,000 | 219,750 | ||||||
Spectrum Brands Escrow Corp | 100,000 | 107,625 | ||||||
U.S. Foods Inc | 200,000 | 213,250 | ||||||
|
| |||||||
| 1,010,563 | ||||||||
|
| |||||||
Energy - 14.9% | ||||||||
Alpha Natural Resources Inc | 250,000 | 269,375 | ||||||
Antero Resources Finance Corp | 350,000 | 367,500 | ||||||
Arch Coal Inc | 250,000 | 225,625 | ||||||
Atlas Pipeline Partners LP | 200,000 | 209,500 | ||||||
Basic Energy Services Inc | 300,000 | 308,250 | ||||||
Cimarex Energy Co | 100,000 | 107,750 | ||||||
Concho Resources Inc | 350,000 | 365,750 | ||||||
| See Notes to Financial Statements | See explanation of symbols and terms, if any, on page B-25 |
B-11
Table of Contents
PACIFIC LIFE FUNDS
PL STRATEGIC INCOME FUND
Schedule of Investments (Continued)
March 31, 2013
Principal Amount | Value | |||||||
DCP Midstream Operating LP | $350,000 | $352,875 | ||||||
Energy Transfer Partners LP | 250,000 | 249,475 | ||||||
EP Energy LLC | ||||||||
7.750% due 09/01/22 | 200,000 | 222,000 | ||||||
9.375% due 05/01/20 | 100,000 | 116,000 | ||||||
EV Energy Partners LP | 150,000 | 159,000 | ||||||
Exterran Partners LP | 100,000 | 99,875 | ||||||
Genesis Energy LP | 100,000 | 103,437 | ||||||
Halcon Resources Corp | 350,000 | 378,875 | ||||||
Hornbeck Offshore Services Inc | 100,000 | 99,500 | ||||||
Kodiak Oil & Gas Corp (Canada) | 200,000 | 209,750 | ||||||
Linn Energy LLC | 400,000 | 411,000 | ||||||
Lukoil International Finance BV (Netherlands) | 100,000 | 114,090 | ||||||
MarkWest Energy Partners LP | 350,000 | 343,000 | ||||||
MEG Energy Corp (Canada) | ||||||||
6.375% due 01/30/23 ~ | 100,000 | 104,500 | ||||||
6.500% due 03/15/21 ~ | 150,000 | 160,500 | ||||||
Newfield Exploration Co | 100,000 | 103,500 | ||||||
Northern Tier Energy LLC | 100,000 | 106,500 | ||||||
Peabody Energy Corp | 250,000 | 266,563 | ||||||
Petrobras International Finance Co (Cayman) | 200,000 | 216,923 | ||||||
Pioneer Natural Resources Co | 250,000 | 261,706 | ||||||
Plains Exploration & Production Co | 250,000 | 284,375 | ||||||
Sabine Pass LNG LP | ||||||||
6.500% due 11/01/20 ~ | 250,000 | 264,375 | ||||||
7.500% due 11/30/16 | 100,000 | 111,000 | ||||||
Samson Investment Co | 350,000 | 373,625 | ||||||
SESI LLC | 250,000 | 270,000 | ||||||
Tervita Corp (Canada) | 150,000 | 155,344 | ||||||
The Williams Cos Inc | 250,000 | 248,865 | ||||||
Transocean Inc (Cayman) | 200,000 | 197,555 | ||||||
|
| |||||||
| 7,837,958 | ||||||||
|
| |||||||
Financials - 14.2% | ||||||||
Bank of America Corp | 400,000 | 395,536 | ||||||
BRE Properties Inc REIT | 250,000 | 248,960 | ||||||
Carlyle Holdings Finance LLC | 250,000 | 256,783 | ||||||
CBRE Services Inc | 100,000 | 101,625 | ||||||
Corrections Corp of America REIT | 100,000 | 102,375 | ||||||
Duke Realty LP REIT | 250,000 | 266,583 | ||||||
Principal Amount | Value | |||||||
First Data Corp | ||||||||
6.750% due 11/01/20 ~ | $100,000 | $104,750 | ||||||
7.375% due 06/15/19 ~ | 100,000 | 106,875 | ||||||
10.625% due 06/15/21 ~ | 100,000 | 101,625 | ||||||
Ford Motor Credit Co LLC | 450,000 | 466,509 | ||||||
Health Care REIT Inc | 350,000 | 353,213 | ||||||
Host Hotels & Resorts LP REIT | 500,000 | 503,205 | ||||||
Igloo Holdings Corp | 250,000 | 259,375 | ||||||
ING US Inc | 400,000 | 406,361 | ||||||
Jefferies Finance LLC | 200,000 | 204,500 | ||||||
Kilroy Realty LP REIT | 250,000 | 256,747 | ||||||
KKR Group Finance Co II LLC | 325,000 | 314,616 | ||||||
Liberty Mutual Group Inc | 250,000 | 274,813 | ||||||
Mack-Cali Realty LP REIT | 200,000 | 202,881 | ||||||
Neuberger Berman Group LLC | 250,000 | 265,625 | ||||||
Nuveen Investments Inc | 300,000 | 311,250 | ||||||
Post Apartment Homes LP | 250,000 | 253,222 | ||||||
Prudential Financial Inc | 300,000 | 302,779 | ||||||
Raymond James Financial Inc | 350,000 | 400,026 | ||||||
Realty Income Corp REIT | 250,000 | 245,466 | ||||||
Regions Bank | 280,000 | 304,500 | ||||||
RHP Hotel Properties LP REIT | 50,000 | 50,000 | ||||||
UDR Inc REIT | 250,000 | 275,302 | ||||||
Vornado Realty LP REIT | 100,000 | 111,053 | ||||||
|
| |||||||
| 7,446,555 | ||||||||
|
| |||||||
Health Care - 2.4% | ||||||||
Biomet Inc | 300,000 | 319,500 | ||||||
CDRT Holding Corp | 100,000 | 104,250 | ||||||
DJO Finance LLC | 100,000 | 102,500 | ||||||
HCA Holdings Inc | 250,000 | 267,187 | ||||||
Jaguar Holding Co I | 100,000 | 107,875 | ||||||
Prospect Medical Holdings Inc | 250,000 | 267,500 | ||||||
Vanguard Health Holding Co II LLC | 100,000 | 107,000 | ||||||
|
| |||||||
| 1,275,812 | ||||||||
|
| |||||||
Industrials - 7.7% | ||||||||
ADS Waste Holdings Inc | 350,000 | 378,875 | ||||||
Air Lease Corp | ||||||||
4.750% due 03/01/20 | 150,000 | 154,500 | ||||||
6.125% due 04/01/17 | 200,000 | 217,500 | ||||||
| See Notes to Financial Statements | See explanation of symbols and terms, if any, on page B-25 |
B-12
Table of Contents
PACIFIC LIFE FUNDS
PL STRATEGIC INCOME FUND
Schedule of Investments (Continued)
March 31, 2013
Principal Amount | Value | |||||||
American Airlines Pass-Through Trust ‘B’ | $200,000 | $202,500 | ||||||
BC Mountain LLC | 100,000 | 106,250 | ||||||
Bombardier Inc (Canada) | ||||||||
5.750% due 03/15/22 ~ | 100,000 | 103,125 | ||||||
6.125% due 01/15/23 ~ | 100,000 | 104,250 | ||||||
Delta Air Lines Pass-Through Trust ‘A’ | 350,000 | 378,875 | ||||||
HD Supply Inc | ||||||||
8.125% due 04/15/19 | 100,000 | 113,500 | ||||||
11.500% due 07/15/20 | 300,000 | 356,250 | ||||||
International Lease Finance Corp | ||||||||
3.875% due 04/15/18 | 150,000 | 150,094 | ||||||
6.750% due 09/01/16 ~ | 200,000 | 227,000 | ||||||
Nortek Inc | 100,000 | 111,250 | ||||||
Owens Corning | ||||||||
4.200% due 12/15/22 | 450,000 | 461,453 | ||||||
6.500% due 12/01/16 | 31,000 | 34,933 | ||||||
Penske Truck Leasing Co LP | 250,000 | 255,360 | ||||||
United Rentals North America Inc | ||||||||
7.625% due 04/15/22 | 100,000 | 112,250 | ||||||
8.250% due 02/01/21 | 100,000 | 113,750 | ||||||
8.375% due 09/15/20 | 100,000 | 112,000 | ||||||
US Airways Pass Through Trust ‘A’ | 250,000 | 262,344 | ||||||
US Airways Pass-Through Trust ‘B’ | 100,000 | 106,500 | ||||||
|
| |||||||
| 4,062,559 | ||||||||
|
| |||||||
Information Technology - 2.0% | ||||||||
Advanced Micro Devices Inc | 100,000 | 91,250 | ||||||
Arrow Electronics Inc | 300,000 | 303,140 | ||||||
Equinix Inc | ||||||||
4.875% due 04/01/20 | 150,000 | 151,875 | ||||||
5.375% due 04/01/23 | 150,000 | 152,625 | ||||||
NeuStar Inc | 150,000 | 144,000 | ||||||
NXP BV (Netherlands) | 200,000 | 208,500 | ||||||
|
| |||||||
| 1,051,390 | ||||||||
|
| |||||||
Materials - 18.6% | ||||||||
AK Steel Corp | 150,000 | 133,125 | ||||||
Alphabet Holding Co Inc | 200,000 | 209,000 | ||||||
APERAM (Luxembourg) | 150,000 | 151,875 | ||||||
ArcelorMittal (Luxembourg) | ||||||||
6.000% due 03/01/21 | 300,000 | 316,084 | ||||||
7.250% due 03/01/41 | 100,000 | 99,927 | ||||||
Ardagh Packaging Finance PLC (Ireland) | ||||||||
7.000% due 11/15/20 ~ | 200,000 | 206,000 | ||||||
9.125% due 10/15/20 ~ | 100,000 | 110,750 | ||||||
9.125% due 10/15/20 ~ | 150,000 | 166,875 | ||||||
Ashland Inc | ||||||||
4.750% due 08/15/22 ~ | 100,000 | 102,000 | ||||||
6.875% due 05/15/43 ~ | 100,000 | 108,500 | ||||||
BOE Merger Corp | 200,000 | 216,250 | ||||||
Building Materials Corp of America | ||||||||
6.875% due 08/15/18 ~ | 100,000 | 107,750 | ||||||
7.000% due 02/15/20 ~ | 50,000 | 54,500 | ||||||
Celanese US Holdings LLC | 250,000 | 251,875 | ||||||
Principal Amount | Value | |||||||
Celulosa Arauco y Constitucion SA (Chile) | $250,000 | $261,424 | ||||||
Cliffs Natural Resources Inc | 250,000 | 251,388 | ||||||
Domtar Corp | 250,000 | 250,092 | ||||||
Eldorado Gold Corp (Canada) | 350,000 | 364,875 | ||||||
FMG Resources Property Ltd (Australia) | ||||||||
6.875% due 02/01/18 ~ | 250,000 | 263,750 | ||||||
6.875% due 04/01/22 ~ | 100,000 | 105,125 | ||||||
Freeport-McMoran Copper & Gold Inc | ||||||||
3.875% due 03/15/23 ~ | 500,000 | 502,817 | ||||||
5.450% due 03/15/43 ~ | 250,000 | 248,377 | ||||||
Goldcorp Inc (Canada) | 500,000 | 503,522 | ||||||
Graphic Packaging International Inc | ||||||||
4.750% due 04/15/21 | 100,000 | 101,625 | ||||||
7.875% due 10/01/18 | 250,000 | 276,875 | ||||||
Hexion U.S. Finance Corp | ||||||||
6.625% due 04/15/20 | 150,000 | 151,125 | ||||||
6.625% due 04/15/20 ~ | 100,000 | 100,750 | ||||||
Ineos Finance PLC (United Kingdom) | 100,000 | 109,375 | ||||||
Longview Fibre Paper & Packaging Inc | 100,000 | 105,000 | ||||||
Louisiana-Pacific Corp | 250,000 | 285,000 | ||||||
LyondellBasell Industries NV (Netherlands) | 200,000 | 227,000 | ||||||
New Gold Inc (Canada) | 200,000 | 210,500 | ||||||
Rock-Tenn Co | 350,000 | 379,550 | ||||||
RPM International Inc | 250,000 | 248,473 | ||||||
Samarco Mineracao SA (Brazil) | 250,000 | 243,875 | ||||||
Sappi Papier Holding GmbH (Austria) | 350,000 | 389,813 | ||||||
Sealed Air Corp | 100,000 | 115,000 | ||||||
Southern Copper Corp | ||||||||
3.500% due 11/08/22 | 200,000 | 200,188 | ||||||
5.250% due 11/08/42 | 250,000 | 238,347 | ||||||
Taminco Acquisition Corp | 150,000 | 152,250 | ||||||
TPC Group Inc | 350,000 | 366,187 | ||||||
Tronox Finance LLC | 250,000 | 243,437 | ||||||
Vale Overseas Ltd (Cayman) | 250,000 | 257,929 | ||||||
Xstrata Finance Canada Ltd (Canada) | 400,000 | 403,955 | ||||||
|
| |||||||
| 9,792,135 | ||||||||
|
| |||||||
Telecommunication Services - 5.0% | ||||||||
CC Holdings GS V LLC | 350,000 | 353,605 | ||||||
CenturyLink Inc | ||||||||
5.625% due 04/01/20 | 100,000 | 102,450 | ||||||
6.000% due 04/01/17 | 200,000 | 216,770 | ||||||
Cricket Communications Inc | 200,000 | 200,500 | ||||||
Digicel Ltd (Bermuda) | 300,000 | 299,250 | ||||||
Frontier Communications Corp | 100,000 | 101,625 | ||||||
| See Notes to Financial Statements | See explanation of symbols and terms, if any, on page B-25 |
B-13
Table of Contents
PACIFIC LIFE FUNDS
PL STRATEGIC INCOME FUND
Schedule of Investments (Continued)
March 31, 2013
Principal Amount | Value | |||||||
Intelsat Luxembourg SA (Luxembourg) | $500,000 | $510,000 | ||||||
MetroPCS Wireless Inc | ||||||||
6.250% due 04/01/21 ~ | 100,000 | 102,125 | ||||||
7.875% due 09/01/18 | 100,000 | 109,750 | ||||||
SES (Luxembourg) | 300,000 | 302,508 | ||||||
Sprint Nextel Corp | ||||||||
6.000% due 11/15/22 | 100,000 | 103,250 | ||||||
7.000% due 03/01/20 ~ | 100,000 | 116,750 | ||||||
Telesat LLC (Canada) | 100,000 | 105,000 | ||||||
|
| |||||||
| 2,623,583 | ||||||||
|
| |||||||
Utilities - 1.3% | ||||||||
Calpine Corp | 250,000 | 278,750 | ||||||
NRG Energy Inc | 250,000 | 285,625 | ||||||
Puget Energy Inc | 100,000 | 110,619 | ||||||
|
| |||||||
| 674,994 | ||||||||
|
| |||||||
Total Corporate Bonds & Notes | 44,582,804 | |||||||
|
| |||||||
SENIOR LOAN NOTES - 12.2% | ||||||||
Consumer Discretionary - 1.1% | ||||||||
ARAMARK Corp Term D | 350,000 | 354,218 | ||||||
Renfro Corp Term B | 250,000 | 253,750 | ||||||
|
| |||||||
| 607,968 | ||||||||
|
| |||||||
Consumer Staples - 1.9% | ||||||||
Albertson’s LLC Term B | 350,000 | 356,406 | ||||||
Reddy Ice Corp (1st Lien) | 350,000 | 346,500 | ||||||
SUPERVALU Inc | 300,000 | 305,652 | ||||||
|
| |||||||
| 1,008,558 | ||||||||
|
| |||||||
Energy - 0.7% | ||||||||
SES International Holdings Ltd | 350,000 | 352,888 | ||||||
|
| |||||||
Financials - 2.7% | ||||||||
Clipper Acquisitions Corp (Initial) | 299,250 | 302,243 | ||||||
Ocwen Loan Servicing LLC (Initial) | 350,000 | 356,125 | ||||||
Realogy Corp Term B | 400,000 | 406,125 | ||||||
Stockbridge/SBE Holdings LLC Tranche B | 350,000 | 380,625 | ||||||
|
| |||||||
| 1,445,118 | ||||||||
|
| |||||||
Health Care - 2.1% | ||||||||
American Renal Holdings Co Inc Term B | 400,000 | 401,750 | ||||||
Iasis Healthcare LLC Term B-2 | 349,125 | 354,471 | ||||||
Pharmaceutical Product Development Inc | 349,125 | 354,035 | ||||||
|
| |||||||
| 1,110,256 | ||||||||
|
| |||||||
Principal Amount | Value | |||||||
Industrials - 2.2% | ||||||||
Apex Tool Group LLC | $250,000 | $253,906 | ||||||
Bombardier Recreational Products Inc Term B | 350,000 | 353,901 | ||||||
Continental Airlines Inc Term B | 300,000 | 303,656 | ||||||
Sequa Corp (Initial) | 249,375 | 253,635 | ||||||
|
| |||||||
| 1,165,098 | ||||||||
|
| |||||||
Information Technology - 0.5% | ||||||||
SunGard Data Systems Inc Tranche D | 249,375 | 252,802 | ||||||
|
| |||||||
Materials - 0.5% | ||||||||
Tronox Pigments BV Term B (Netherlands) | 250,000 | 253,705 | ||||||
|
| |||||||
Telecommunication Services - 0.5% | ||||||||
Windstream Corp Tranche B-4 | 249,375 | 252,180 | ||||||
|
| |||||||
Total Senior Loan Notes | 6,448,573 | |||||||
|
| |||||||
Shares | ||||||||
SHORT-TERM INVESTMENT - 4.4% | ||||||||
Money Market Fund - 4.4% | ||||||||
BlackRock Liquidity Funds Treasury | 2,312,395 | 2,312,395 | ||||||
|
| |||||||
Total Short-Term Investment | 2,312,395 | |||||||
|
| |||||||
TOTAL INVESTMENTS - 102.8% | 54,078,993 | |||||||
OTHER ASSETS & LIABILITIES, NET - (2.8%) |
| (1,493,982 | ) | |||||
|
| |||||||
NET ASSETS - 100.0% | $52,585,011 | |||||||
|
| |||||||
Notes to Schedule of Investments
| (a) | As of March 31, 2013, the fund was diversified as a percentage of net assets as follows: |
Materials | 19.6% | |||
Consumer Discretionary | 18.3% | |||
Financials | 16.9% | |||
Energy | 15.7% | |||
Industrials | 10.1% | |||
Telecommunication Services | 5.5% | |||
Health Care | 4.5% | |||
Short-Term Investment | 4.4% | |||
Consumer Staples | 3.8% | |||
Others (each less than 3.0%) | 4.0% | |||
|
| |||
| 102.8% | ||||
Other Assets & Liabilities, Net | (2.8% | ) | ||
|
| |||
| 100.0% | ||||
|
|
| See Notes to Financial Statements | See explanation of symbols and terms, if any, on page B-25 |
B-14
Table of Contents
PACIFIC LIFE FUNDS
PL STRATEGIC INCOME FUND
Schedule of Investments (Continued)
March 31, 2013
| (b) | As of March 31, 2013, the fund’s Standard & Poor’s quality ratings as a percentage of total fixed income investments were as follows (Unaudited): |
A | 3.2% | |||
BBB | 26.6% | |||
BB | 25.3% | |||
B | 29.7% | |||
CCC | 13.1% | |||
Not Rated | 2.1% | |||
|
| |||
| 100.0% | ||||
|
|
| (c) | Fair Value Measurements |
The following is a summary of the fund’s investments as categorized under the three-tier hierarchy of inputs used in valuing the fund’s assets and liabilities (See Note 3D in Notes to Financial Statements) as of March 31, 2013:
| Total Value at March 31, 2013 | Level 1 Quoted Price | Level 2 Significant Observable Inputs | Level 3 Significant Unobservable Inputs | |||||||||||||||
Assets | Common Stocks (1) | $735,221 | $735,221 | $— | $— | |||||||||||||
Corporate Bonds & Notes | 44,582,804 | — | 43,632,585 | 950,219 | ||||||||||||||
Senior Loan Notes | 6,448,573 | — | 6,448,573 | — | ||||||||||||||
Short-Term Investment | 2,312,395 | 2,312,395 | — | — | ||||||||||||||
|
|
|
|
|
|
|
| |||||||||||
Total | $54,078,993 | $3,047,616 | $50,081,158 | $950,219 | ||||||||||||||
|
|
|
|
|
|
|
| |||||||||||
The following is a reconciliation of investments for significant unobservable inputs (Level 3) used in valuing the fund’s assets and liabilities (See Note 3D in Notes to Financial Statements) for the year ended March 31, 2013:
| Corporate Bonds & Notes | ||||
Value, Beginning of Year | $— | |||
Purchases | 918,438 | |||
Sales | — | |||
Accrued Discounts (Premiums) | (522 | ) | ||
Net Realized Gains (Losses) | — | |||
Change in Net Unrealized Appreciation | 32,303 | |||
Transfers In | — | |||
Transfers Out | — | |||
|
| |||
Value, End of Year | $950,219 | |||
|
| |||
Change in Net Unrealized Appreciation on Level 3 | $32,303 | |||
|
| |||
The significant unobservable inputs were provided by a vendor-priced single broker quote.
| (1) | For equity investments categorized in a single level, refer to the schedule of investments for further industry breakout. |
| See Notes to Financial Statements | See explanation of symbols and terms, if any, on page B-25 |
B-15
Table of Contents
PACIFIC LIFE FUNDS
PL FLOATING RATE INCOME FUND
Schedule of Investments
March 31, 2013
Principal Amount | Value | |||||||
CORPORATE BONDS & NOTES - 9.2% | ||||||||
Consumer Discretionary - 2.6% | ||||||||
Cedar Fair LP | $1,250,000 | $1,246,875 | ||||||
Clear Channel Communications Inc | 226,000 | 218,373 | ||||||
9.000% due 03/01/21 | 1,500,000 | 1,408,125 | ||||||
Lynx I Corp | 3,000,000 | 3,135,000 | ||||||
NPC International Inc | 150,000 | 175,500 | ||||||
|
| |||||||
| 6,183,873 | ||||||||
|
| |||||||
Consumer Staples - 1.4% | ||||||||
Reynolds Group Issuer Inc | 2,750,000 | 2,808,438 | ||||||
9.875% due 08/15/19 | 500,000 | 549,375 | ||||||
|
| |||||||
| 3,357,813 | ||||||||
|
| |||||||
Financials - 1.1% | ||||||||
First Data Corp | 1,500,000 | 1,571,250 | ||||||
Nuveen Investments Inc | 1,000,000 | 987,500 | ||||||
|
| |||||||
| 2,558,750 | ||||||||
|
| |||||||
Health Care - 1.4% | ||||||||
CHS/Community Health Systems Inc | 3,000,000 | 3,150,000 | ||||||
|
| |||||||
Industrials - 0.3% | ||||||||
Ceridian Corp | 500,000 | 584,375 | ||||||
|
| |||||||
Materials - 0.2% | ||||||||
Hexion U.S. Finance Corp | 500,000 | 503,750 | ||||||
|
| |||||||
Telecommunication Services - 2.2% | ||||||||
Intelsat Jackson Holdings SA (Luxemburg) | 1,500,000 | 1,653,750 | ||||||
Intelsat Luxembourg SA (Luxembourg) | 3,000,000 | 3,060,000 | ||||||
11.500% due 02/04/17 | 500,000 | 531,250 | ||||||
|
| |||||||
| 5,245,000 | ||||||||
|
| |||||||
Total Corporate Bonds & Notes | 21,583,561 | |||||||
|
| |||||||
SENIOR LOAN NOTES - 88.7% | ||||||||
Consumer Discretionary - 19.2% | ||||||||
99 Cents Only Stores Tranche B-1 | 493,763 | 501,015 | ||||||
Acosta Inc Term D | 997,500 | 1,011,216 | ||||||
Advantage Sales & Marketing Inc | 2,000,000 | 2,030,834 | ||||||
(2nd Lien) | 1,000,000 | 1,017,500 | ||||||
Alliance Laundry Systems LLC (Initial 1st Lien) | 1,492,405 | 1,502,665 | ||||||
Principal Amount | Value | |||||||
ARAMARK Corp Term D | $1,400,000 | $1,416,870 | ||||||
Caesars Entertainment Operating Co Inc | 1,500,000 | 1,393,500 | ||||||
5.454% due 01/28/18 § | 356,580 | 331,263 | ||||||
Capital Automotive LP Tranche B | 923,296 | 929,788 | ||||||
Cedar Fair LP (Facility) | 1,000,000 | 1,014,063 | ||||||
Clear Channel Communications Inc | 758,266 | 673,909 | ||||||
due 01/29/16 µ | 1,500,000 | 1,333,125 | ||||||
ClubCorp Club Operations Inc Term B | 711,500 | 724,396 | ||||||
David’s Bridal Inc (Initial) | 997,500 | 1,011,677 | ||||||
Focus Brands Inc (1st Lien) | 918,386 | 934,458 | ||||||
Getty Images Inc (Initial) | ||||||||
4.750% due 10/18/19 § | 2,493,750 | 2,534,496 | ||||||
Jacobs Entertainment Inc Tranche B (1st Lien) | 995,000 | 1,004,950 | ||||||
Lord & Taylor Holdings LLC | 719,410 | 728,103 | ||||||
Michaels Stores Inc Term B | 2,000,000 | 2,024,158 | ||||||
NEP/NCP Holdco Inc (1st Lien) | 1,496,250 | 1,513,083 | ||||||
NPC International Inc | 1,000,000 | 1,016,875 | ||||||
OSI Restaurant Group | 975,000 | 990,028 | ||||||
Party City Holdings Inc | 746,255 | 752,784 | ||||||
Penninsula Gaming LLC Term B | 997,500 | 1,016,827 | ||||||
Petco Animal Supplies Inc | 992,411 | 1,006,235 | ||||||
Renfro Corp Term B | 500,000 | 507,500 | ||||||
Savers Inc | 992,513 | 1,008,641 | ||||||
Serta Simmons Holdings LLC | 1,000,000 | 1,015,208 | ||||||
Seven Seas Cruise S DE RL Term B-1 | 1,987,500 | 2,017,312 | ||||||
STG-Fairway Acquisitions Inc (1st Lien) | 2,000,000 | 2,001,250 | ||||||
The Goodyear Tire & Rubber Co (2nd Lien) | 1,000,000 | 1,012,492 | ||||||
The Neiman Marcus Group Inc | 2,000,000 | 2,009,500 | ||||||
The ServiceMaster Co Tranche C | 1,000,000 | 1,010,625 | ||||||
4.250% due 01/31/17 § | 2,992,500 | 3,024,295 | ||||||
Wendy’s International Inc | 995,000 | 1,007,078 | ||||||
WideOpenWest Finance LLC | 1,500,000 | 1,513,125 | ||||||
6.250% due 07/17/18 § | 496,250 | 503,197 | ||||||
|
| |||||||
| 45,044,041 | ||||||||
|
| |||||||
| See Notes to Financial Statements | See explanation of symbols and terms, if any, on page B-25 |
B-16
Table of Contents
PACIFIC LIFE FUNDS
PL FLOATING RATE INCOME FUND
Schedule of Investments (Continued)
March 31, 2013
Principal Amount | Value | |||||||
Consumer Staples - 7.6% | ||||||||
Albertsons Inc Term B | $1,983,333 | $2,019,636 | ||||||
BJ’s Wholesale Club Inc | 498,750 | 504,049 | ||||||
(Initial 2nd Lien) 9.750% due 03/26/20 § | 500,000 | 520,313 | ||||||
Crossmark Holdings Inc (2nd Lien) | 1,000,000 | 1,006,250 | ||||||
Del Monte Foods Co | 717,272 | 724,370 | ||||||
Term B 4.000% due 02/15/18 § | 997,500 | 1,007,371 | ||||||
H.J. Heinz Co Term B-2 | 1,500,000 | 1,514,813 | ||||||
Pinnacle Foods Finance LLC Tranche E | 990,000 | 1,000,431 | ||||||
Reddy Ice Corp (1st Lien) | 1,075,000 | 1,064,250 | ||||||
Reynolds Group Holdings Inc | 746,250 | 757,977 | ||||||
Rite Aid Corp Tranche 1 (2nd Lien) | 361,930 | 375,804 | ||||||
5.750% due 08/21/20 § | 1,000,000 | 1,038,333 | ||||||
Smart & Final Inc (1st Lien) | 997,500 | 1,011,839 | ||||||
Spectrum Brands Inc Term B | 997,500 | 1,011,319 | ||||||
Sprouts Farmers Markets Holdings LLC | 492,462 | 497,079 | ||||||
Term-1 | 496,250 | 499,972 | ||||||
SUPERVALU Inc | 1,700,000 | 1,732,026 | ||||||
U.S. Foods Inc | 1,476,203 | 1,493,732 | ||||||
|
| |||||||
| 17,779,564 | ||||||||
|
| |||||||
Energy - 5.5% | ||||||||
American Petroleum Tankers Term B | 1,000,000 | 995,000 | ||||||
Chesapeake Energy Corp | 1,000,000 | 1,032,679 | ||||||
EMG Utica Term B | 1,000,000 | 1,007,500 | ||||||
EP Energy LLC | 1,250,000 | 1,266,182 | ||||||
Tranche B-2 4.500% due 04/30/19 § | 500,000 | 507,125 | ||||||
Offshore Group Investment Ltd (Cayman) | 1,000,000 | 1,007,500 | ||||||
Plains Exploration & Production Co | 1,000,000 | 1,003,750 | ||||||
Samson Investment Co | 3,000,000 | 3,043,500 | ||||||
SES International Holdings Ltd | 2,000,000 | 2,016,500 | ||||||
Tervita Corp | 1,000,000 | 1,013,281 | ||||||
|
| |||||||
| 12,893,017 | ||||||||
|
| |||||||
Principal Amount | Value | |||||||
Financials - 8.5% | ||||||||
Amwins Group LLC (1st Lien) | $1,740,638 | $1,763,121 | ||||||
CNO Financial Group Inc Tranche B-2 | 955,766 | 971,894 | ||||||
Compass Investors Inc (Initial) | 1,496,250 | 1,511,836 | ||||||
Duff & Phelps LLC Term B | 2,000,000 | 2,023,750 | ||||||
First Data Corp | ||||||||
4.204% due 03/23/18 § | 1,000,000 | 998,625 | ||||||
Term B 5.204% due 09/24/18 § | 1,000,000 | 1,009,271 | ||||||
Nuveen Investments Inc Tranche A | 1,000,000 | 1,019,375 | ||||||
(2nd Lien) | 1,000,000 | 1,032,500 | ||||||
Ocwen Loan Servicing LLC (Initial) | 1,650,000 | 1,678,875 | ||||||
Realogy Corp | 58,315 | 58,461 | ||||||
(Extended Synthetic Commitment) | 45,324 | 45,437 | ||||||
Term B | 2,000,000 | 2,030,626 | ||||||
Term B-1 | 1,000,000 | 1,015,313 | ||||||
ROC Finance LLC Term B | 2,000,000 | 2,012,500 | ||||||
Stockbridge/SBE Holdings LLC Tranche B | 1,250,000 | 1,359,375 | ||||||
13.000% due 05/02/17 § | 1,250,000 | 1,359,375 | ||||||
|
| |||||||
| 19,890,334 | ||||||||
|
| |||||||
Health Care - 11.0% | ||||||||
American Renal Holdings Co Inc | 1,000,000 | 1,004,375 | ||||||
Term B (1st Lien) | ||||||||
4.500% due 08/20/19 § | 1,000,000 | 1,007,500 | ||||||
Ardent Medical Services Inc (1st Lien) | 997,500 | 1,016,203 | ||||||
Bausch & Lomb Inc | 1,488,750 | 1,504,829 | ||||||
Capsugel Holdings US Inc (Initial) | 1,367,877 | 1,392,385 | ||||||
DaVita Inc Tranche B-2 | 1,246,875 | 1,261,390 | ||||||
DJO Finance LLC Tranche B | 1,239,385 | 1,259,835 | ||||||
Hologic Inc Tranche B | 995,000 | 1,010,028 | ||||||
Iasis Healthcare LLC Term B-2 | 2,910,474 | 2,955,042 | ||||||
Par Pharmaceutical Cos Inc Term B-1 | 2,990,006 | 3,027,058 | ||||||
Pharmaceutical Product Development Inc | 2,992,500 | 3,034,583 | ||||||
Quintiles Transnational Corp Term B-2 | 736,308 | 747,660 | ||||||
RCHP Inc (1st Lien) | 1,995,000 | 2,027,419 | ||||||
U.S. Renal Care Inc (Initial 1st Lien) | 992,500 | 1,009,869 | ||||||
| See Notes to Financial Statements | See explanation of symbols and terms, if any, on page B-25 |
B-17
Table of Contents
PACIFIC LIFE FUNDS
PL FLOATING RATE INCOME FUND
Schedule of Investments (Continued)
March 31, 2013
Principal Amount | Value | |||||||
United Surgical Partners International Inc | $1,500,000 | $1,505,000 | ||||||
Vanguard Health Holding Co II LLC Term B | 2,000,000 | 2,027,500 | ||||||
|
| |||||||
| 25,790,676 | ||||||||
|
| |||||||
Industrials - 18.4% | ||||||||
Advanced Disposal Term B | 2,992,500 | 3,029,532 | ||||||
Air Medical Group Holdings Inc Term B-1 | 1,496,250 | 1,533,656 | ||||||
AlixPartners LLP Term B-2 | 1,740,638 | 1,760,946 | ||||||
Apex Tool Group LLC | 1,250,000 | 1,269,531 | ||||||
AWAS Finance Luxembourg SARL | 825,352 | 837,732 | ||||||
Beechcraft Holdings LLC | 1,500,000 | 1,509,375 | ||||||
Bombardier Recreational Products Inc Term B | 2,000,000 | 2,022,292 | ||||||
Camp Systems (1st Lien) | 995,000 | 1,007,437 | ||||||
Ceridian Corp (Extended) | 997,811 | 1,018,079 | ||||||
Continental Airlines Inc Term B | 1,700,000 | 1,720,720 | ||||||
Delos Aircraft Inc | 1,000,000 | 1,007,500 | ||||||
Generac Power Systems Inc | 679,583 | 697,422 | ||||||
Hamilton Sundstrand | 1,000,000 | 1,007,946 | ||||||
4.000% due 12/13/19 § | 1,995,000 | 2,010,852 | ||||||
HD Supply Inc Term B | 746,250 | 765,373 | ||||||
HII Holding Corp (1st Lien) | 997,500 | 1,013,917 | ||||||
Husky Injection Molding Systems Ltd | 2,000,000 | 2,026,876 | ||||||
due 07/02/18 µ | 1,000,000 | 1,013,438 | ||||||
ISS A/S Term B | 1,500,000 | 1,506,563 | ||||||
LM US Member LLC | 1,379,355 | 1,401,770 | ||||||
(Canadian) | 116,895 | 118,794 | ||||||
McJunkin Red Man Corp | 995,000 | 1,007,438 | ||||||
Navistar Inc Tranche B | 997,500 | 1,010,678 | ||||||
Osmose Holdings Inc (Initial) | 1,246,875 | 1,262,461 | ||||||
Protection One Alarm Monitoring Inc | 1,000,000 | 1,007,500 | ||||||
Rexnord LLC Term B | 1,492,500 | 1,510,528 | ||||||
Roofing Supply Group LLC (Initial) | 995,000 | 1,010,236 | ||||||
Sequa Corp (Initial) | 997,500 | 1,014,540 | ||||||
SRS Distribution Inc | 2,000,000 | 2,016,666 | ||||||
Terex Corp | 995,000 | 1,010,174 | ||||||
Principal Amount | Value | |||||||
Tomkins PLC | $498,750 | $506,855 | ||||||
(Initial 2nd Lien) | 1,000,000 | 1,030,000 | ||||||
W3 Co Term B | 1,000,000 | 1,012,500 | ||||||
(2nd Lien) | 498,750 | 512,466 | ||||||
WESCO Distribution Inc Tranche B -1 | 997,500 | 1,008,597 | ||||||
|
| |||||||
| 43,200,390 | ||||||||
|
| |||||||
Information Technology - 5.5% | ||||||||
Eze Software Term B (1st Lien) | 1,000,000 | 1,013,750 | ||||||
Freescale Semiconductor Inc | ||||||||
4.250% due 12/01/16 § | 1,000,000 | 1,010,000 | ||||||
Term B-4 | 1,000,000 | 1,007,813 | ||||||
Infor (US) Inc Tranche B-2 | 995,000 | 1,013,449 | ||||||
Kronos Inc (1st Lien) | 1,995,000 | 2,020,562 | ||||||
MoneyGram Payment Systems Worldwide Inc | 1,000,000 | 1,009,063 | ||||||
NXP BV Tranche C | 2,500,000 | 2,560,418 | ||||||
4.750% due 01/10/20 § | 997,500 | 1,021,607 | ||||||
SSI Investments II Ltd | 740,585 | 751,694 | ||||||
SunGard Data Systems Inc | 448,875 | 455,044 | ||||||
Tranche E | 1,000,000 | 1,013,750 | ||||||
|
| |||||||
| 12,877,150 | ||||||||
|
| |||||||
Materials - 7.3% | ||||||||
Al Chem & Cy SCA Tranche B-1 (Luxembourg) | 2,000,000 | 2,007,500 | ||||||
Berlin Packaging LLC | 1,500,000 | 1,492,500 | ||||||
Berry Plastics Corp Term D | 2,000,000 | 1,999,108 | ||||||
Custom Building Products Inc | ||||||||
6.000% due 12/14/19 § | 1,496,625 | 1,522,816 | ||||||
Dupont Performance Coatings (Initial Term B) | 1,000,000 | 1,014,432 | ||||||
FMG Resources Property Ltd | 1,990,000 | 2,015,942 | ||||||
FPC Holdings Inc (Initial 1st Lien) | 997,500 | 1,011,839 | ||||||
Metals USA Inc Term B | 997,500 | 1,003,734 | ||||||
Taminco Global Chemical Corp Tranche B-2 | 990,019 | 1,001,775 | ||||||
Tronox Inc Term B (Netherlands) | 2,000,000 | 2,029,642 | ||||||
UCI International Inc | 987,558 | 996,816 | ||||||
Univar Inc Term B | 994,915 | 1,006,019 | ||||||
|
| |||||||
| 17,102,123 | ||||||||
|
| |||||||
| See Notes to Financial Statements | See explanation of symbols and terms, if any, on page B-25 |
B-18
Table of Contents
PACIFIC LIFE FUNDS
PL FLOATING RATE INCOME FUND
Schedule of Investments (Continued)
March 31, 2013
Principal Amount | Value | |||||||
Telecommunication Services - 5.4% | ||||||||
Avaya Inc Term B-5 | $2,000,000 | $2,016,712 | ||||||
Cricket Communications Inc | 1,000,000 | 1,007,813 | ||||||
4.750% due 10/10/19 § | 498,750 | 502,647 | ||||||
Term C | 2,000,000 | 2,015,312 | ||||||
Integra Telecom Holdings Inc (Initial) | 1,000,000 | 1,015,375 | ||||||
Level 3 Financing Inc | 500,000 | 506,938 | ||||||
Tranche B-II | 2,500,000 | 2,531,510 | ||||||
WaveDivision Holdings LLC (Initial) | 1,500,000 | 1,524,338 | ||||||
4.000% due 10/12/19 § | 1,496,250 | 1,520,527 | ||||||
|
| |||||||
| 12,641,172 | ||||||||
|
| |||||||
Utilities - 0.3% | ||||||||
Texas Competitive Electric Holdings Co LLC | 1,000,000 | 737,813 | ||||||
|
| |||||||
Total Senior Loan Notes | 207,956,280 | |||||||
|
| |||||||
Shares | ||||||||
SHORT-TERM INVESTMENT - 14.7% | ||||||||
Money Market Fund - 14.7% | ||||||||
BlackRock Liquidity Funds Treasury | 34,474,786 | 34,474,786 | ||||||
|
| |||||||
Total Short-Term Investment | 34,474,786 | |||||||
|
| |||||||
TOTAL INVESTMENTS - 112.6% | 264,014,627 | |||||||
OTHER ASSETS & LIABILITIES, NET - (12.6%) |
| (29,574,427 | ) | |||||
|
| |||||||
NET ASSETS - 100.0% | $234,440,200 | |||||||
|
| |||||||
Notes to Schedule of Investments
| (a) | As of March 31, 2013, the fund was diversified as a percentage of net assets as follows: |
Consumer Discretionary | 21.8% | |||
Industrials | 18.7% | |||
Short-Term Investment | 14.7% | |||
Health Care | 12.4% | |||
Financials | 9.6% | |||
Consumer Staples | 9.0% | |||
Telecommunication Services | 7.6% | |||
Materials | 7.5% | |||
Energy | 5.5% | |||
Information Technology | 5.5% | |||
Others (each less than 3.0%) | 0.3% | |||
|
| |||
| 112.6% | ||||
Other Assets & Liabilities, Net | (12.6% | ) | ||
|
| |||
| 100.0% | ||||
|
|
| (b) | As of March 31, 2013, the fund’s Standard & Poor’s quality ratings as a percentage of total fixed income investments were as follows (Unaudited): |
BBB | 2.1% | |||
BB | 21.9% | |||
B | 68.5% | |||
CCC | 6.4% | |||
Not Rated | 1.1% | |||
|
| |||
| 100.0% | ||||
|
|
| (c) | Fair Value Measurements |
The following is a summary of the fund’s investments as categorized under the three-tier hierarchy of inputs used in valuing the fund’s assets and liabilities (See Note 3D in Notes to Financial Statements) as of March 31, 2013:
| Total Value at March 31, 2013 | Level 1 Quoted Price | Level 2 Significant Observable Inputs | Level 3 Significant Unobservable Inputs | |||||||||||||||
Assets | Corporate Bonds & Notes | $21,583,561 | $— | $21,583,561 | $— | |||||||||||||
Senior Loan Notes | 207,956,280 | — | 207,956,280 | — | ||||||||||||||
Short-Term Investment | 34,474,786 | 34,474,786 | — | — | ||||||||||||||
|
|
|
|
|
|
|
| |||||||||||
Total | $264,014,627 | $34,474,786 | $229,539,841 | $— | ||||||||||||||
|
|
|
|
|
|
|
| |||||||||||
| See Notes to Financial Statements | See explanation of symbols and terms, if any, on page B-25 |
B-19
Table of Contents
PACIFIC LIFE FUNDS
PL HIGH INCOME FUND
Schedule of Investments
March 31, 2013
Shares | | |||||||
EXCHANGE-TRADED FUND - 3.4% |
| |||||||
PowerShares Senior Loan Portfolio | 20,000 | $502,000 | ||||||
|
| |||||||
Total Exchange-Traded Fund |
| 502,000 | ||||||
|
| |||||||
Principal Amount | ||||||||
CORPORATE BONDS & NOTES - 92.4% |
| |||||||
Consumer Discretionary - 19.1% |
| |||||||
99 Cents Only Stores | $50,000 | 57,625 | ||||||
Beazer Homes USA Inc | ||||||||
7.250% due 02/01/23 ~ | 50,000 | 51,250 | ||||||
9.125% due 06/15/18 | 75,000 | 81,000 | ||||||
Boyd Gaming Corp | 50,000 | 52,250 | ||||||
Burlington Holdings LLC | 50,000 | 51,000 | ||||||
Cablevision Systems Corp | 100,000 | 117,000 | ||||||
Caesars Entertainment Operating Co Inc | 50,000 | 53,437 | ||||||
Caesars Operating Escrow LLC | 50,000 | 50,562 | ||||||
CCO Holdings LLC | 150,000 | 151,125 | ||||||
Cedar Fair LP | ||||||||
5.250% due 03/15/21 ~ | 50,000 | 49,875 | ||||||
9.125% due 08/01/18 | 50,000 | 56,250 | ||||||
Cequel Communications Holdings I LLC | 100,000 | 104,250 | ||||||
CityCenter Holdings LLC | 50,000 | 53,937 | ||||||
CKE Restaurants Inc | 50,000 | 58,250 | ||||||
Clear Channel Communications Inc | 100,000 | 66,750 | ||||||
Clear Channel Worldwide Holdings Inc | 73,000 | 77,380 | ||||||
Coinstar Inc | 50,000 | 51,250 | ||||||
Dana Holding Corp | 50,000 | 53,875 | ||||||
DISH DBS Corp | ||||||||
4.625% due 07/15/17 | 50,000 | 52,125 | ||||||
6.750% due 06/01/21 | 100,000 | 111,625 | ||||||
Griffey Intermediate Inc | 100,000 | 102,500 | ||||||
Jo-Ann Stores Holdings Inc | 50,000 | 52,750 | ||||||
Jo-Ann Stores Inc | 75,000 | 78,750 | ||||||
L Brands Inc | 75,000 | 79,875 | ||||||
Landry’s Holdings II Inc | 50,000 | 52,625 | ||||||
Lennar Corp | 50,000 | 49,125 | ||||||
MGM Resorts International | ||||||||
6.625% due 12/15/21 | 150,000 | 157,500 | ||||||
6.750% due 10/01/20 ~ | 50,000 | 53,125 | ||||||
NCL Corp Ltd (Bermuda) | 50,000 | 51,188 | ||||||
NPC International Inc | 50,000 | 58,500 | ||||||
Petco Holdings Inc | 75,000 | 77,719 | ||||||
PVH Corp | 50,000 | 49,625 | ||||||
Principal Amount | | |||||||
Seven Seas Cruises S de RL LLC (Panama) | $50,000 | $54,375 | ||||||
Sinclair Television Group Inc | ||||||||
5.375% due 04/01/21 ~ | 50,000 | 49,875 | ||||||
6.125% due 10/01/22 ~ | 50,000 | 52,625 | ||||||
Six Flags Entertainment Corp | 75,000 | 75,281 | ||||||
Standard Pacific Corp | 100,000 | 118,250 | ||||||
The Goodyear Tire & Rubber Co | 50,000 | 51,813 | ||||||
The Ryland Group Inc | 50,000 | 51,250 | ||||||
The ServiceMaster Co | 50,000 | 53,875 | ||||||
Wolverine World Wide Inc | 50,000 | 53,312 | ||||||
|
| |||||||
| 2,824,754 | ||||||||
|
| |||||||
Consumer Staples - 4.7% |
| |||||||
Del Monte Corp | 50,000 | 52,125 | ||||||
Hawk Acquisition Sub Inc | 50,000 | 50,125 | ||||||
JBS USA LLC | 50,000 | 54,875 | ||||||
Reynolds Group Issuer Inc | ||||||||
5.750% due 10/15/20 | 50,000 | 51,062 | ||||||
9.000% due 04/15/19 | 125,000 | 132,812 | ||||||
9.875% due 08/15/19 | 75,000 | 82,406 | ||||||
Rite Aid Corp | 50,000 | 56,687 | ||||||
Spectrum Brands Escrow Corp | 50,000 | 53,812 | ||||||
Spectrum Brands Inc | 50,000 | 54,187 | ||||||
U.S. Foods Inc | 100,000 | 106,625 | ||||||
|
| |||||||
| 694,716 | ||||||||
|
| |||||||
Energy - 18.2% |
| |||||||
Access Midstream Partners LP | 100,000 | 98,875 | ||||||
Alpha Natural Resources Inc | 100,000 | 107,750 | ||||||
Antero Resources Finance Corp | 75,000 | 78,750 | ||||||
Arch Coal Inc | 50,000 | 45,125 | ||||||
Atlas Pipeline Partners LP | ||||||||
5.875% due 08/01/23 ~ | 50,000 | 50,000 | ||||||
6.625% due 10/01/20 ~ | 50,000 | 52,375 | ||||||
Basic Energy Services Inc | 50,000 | 51,375 | ||||||
Berry Petroleum Co | 50,000 | 54,250 | ||||||
Chaparral Energy Inc | 50,000 | 56,875 | ||||||
Chesapeake Energy Corp | ||||||||
5.375% due 06/15/21 | 50,000 | 50,313 | ||||||
9.500% due 02/15/15 | 50,000 | 56,750 | ||||||
Cimarex Energy Co | 50,000 | 53,875 | ||||||
Concho Resources Inc | 100,000 | 104,500 | ||||||
CONSOL Energy Inc | 50,000 | 55,625 | ||||||
Crosstex Energy LP | 50,000 | 54,375 | ||||||
Denbury Resources Inc | 50,000 | 48,313 | ||||||
| See Notes to Financial Statements | See explanation of symbols and terms, if any, on page B-25 |
B-20
Table of Contents
PACIFIC LIFE FUNDS
PL HIGH INCOME FUND
Schedule of Investments (Continued)
March 31, 2013
Principal Amount | | |||||||
EP Energy LLC | $50,000 | $55,000 | ||||||
EPE Holdings LLC | 50,000 | 52,625 | ||||||
EV Energy Partners LP | 50,000 | 53,000 | ||||||
Exterran Partners LP | 50,000 | 49,938 | ||||||
Genesis Energy LP | 50,000 | 51,719 | ||||||
Halcon Resources Corp | 100,000 | 108,250 | ||||||
Hornbeck Offshore Services Inc | 50,000 | 49,750 | ||||||
Kodiak Oil & Gas Corp (Canada) | 50,000 | 52,438 | ||||||
Linn Energy LLC | 100,000 | 107,750 | ||||||
MarkWest Energy Partners LP | 50,000 | 49,000 | ||||||
MEG Energy Corp (Canada) | ||||||||
6.375% due 01/30/23 ~ | 50,000 | 52,250 | ||||||
6.500% due 03/15/21 ~ | 50,000 | 53,500 | ||||||
Newfield Exploration Co | 50,000 | 51,750 | ||||||
Northern Tier Energy LLC | 50,000 | 53,250 | ||||||
Oasis Petroleum Inc | 50,000 | 54,750 | ||||||
Peabody Energy Corp | 50,000 | 53,312 | ||||||
Plains Exploration & Production Co | 50,000 | 55,500 | ||||||
QEP Resources Inc | 50,000 | 51,500 | ||||||
Regency Energy Partners LP | ||||||||
5.500% due 04/15/23 | 50,000 | 53,750 | ||||||
6.500% due 07/15/21 | 50,000 | 55,250 | ||||||
Sabine Pass Liquefaction LLC | ||||||||
5.625% due 02/01/21 ~ | 100,000 | 103,875 | ||||||
Sabine Pass LNG LP | ||||||||
7.500% due 11/30/16 | 50,000 | 55,500 | ||||||
Samson Investment Co | 75,000 | 80,062 | ||||||
SandRidge Energy Inc | 50,000 | 52,250 | ||||||
SESI LLC | 100,000 | 108,000 | ||||||
Tervita Corp (Canada) | 50,000 | 51,781 | ||||||
Venoco Inc | 50,000 | 53,750 | ||||||
|
| |||||||
| 2,688,626 | ||||||||
|
| |||||||
Financials - 6.3% |
| |||||||
Ally Financial Inc | 100,000 | 108,685 | ||||||
CBRE Services Inc | 50,000 | 50,813 | ||||||
CIT Group Inc | 75,000 | 82,687 | ||||||
Corrections Corp of America REIT | 50,000 | 51,187 | ||||||
E*TRADE Financial Corp | 50,000 | 52,562 | ||||||
First Data Corp | ||||||||
6.750% due 11/01/20 ~ | 75,000 | 78,563 | ||||||
10.625% due 06/15/21 ~ | 50,000 | 50,813 | ||||||
12.625% due 01/15/21 | 75,000 | 81,656 | ||||||
HBOS PLC (United Kingdom) | 50,000 | 48,174 | ||||||
Principal Amount | | |||||||
Igloo Holdings Corp | $50,000 | $51,875 | ||||||
Liberty Mutual Group Inc | 75,000 | 87,750 | ||||||
Neuberger Berman Group LLC | 50,000 | 53,125 | ||||||
Nuveen Investments Inc | 75,000 | 78,750 | ||||||
RBS Capital Trust II | 50,000 | 44,375 | ||||||
RHP Hotel Properties LP REIT | 25,000 | 25,000 | ||||||
|
| |||||||
| 946,015 | ||||||||
|
| |||||||
Health Care - 7.0% | ||||||||
Biomet Inc | 50,000 | 53,250 | ||||||
CDRT Holding Corp | 50,000 | 52,125 | ||||||
CHS/Community Health Systems Inc | ||||||||
5.125% due 08/15/18 | 25,000 | 26,250 | ||||||
8.000% due 11/15/19 | 50,000 | 55,625 | ||||||
DaVita Health Care Partners Inc | 50,000 | 52,188 | ||||||
DJO Finance LLC | 50,000 | 51,250 | ||||||
Fresenius Medical Care US Finance II Inc | 50,000 | 56,063 | ||||||
HCA Holdings Inc | 100,000 | 106,875 | ||||||
HCA Inc | 100,000 | 108,000 | ||||||
HealthSouth Corp | 50,000 | 50,375 | ||||||
Jaguar Holding Co I | 50,000 | 53,937 | ||||||
Prospect Medical Holdings Inc | 50,000 | 53,500 | ||||||
Sky Growth Acquisition Corp | 50,000 | 53,125 | ||||||
Tenet Healthcare Corp | ||||||||
4.750% due 06/01/20 ~ | 50,000 | 50,375 | ||||||
8.000% due 08/01/20 | 50,000 | 55,312 | ||||||
Valeant Pharmaceuticals International Inc | 50,000 | 52,937 | ||||||
Vanguard Health Holding Co II LLC | 100,000 | 107,000 | ||||||
|
| |||||||
| 1,038,187 | ||||||||
|
| |||||||
Industrials - 10.0% | ||||||||
ADS Waste Holdings Inc | 75,000 | 81,187 | ||||||
Air Lease Corp | ||||||||
4.750% due 03/01/20 | 50,000 | 51,500 | ||||||
6.125% due 04/01/17 | 100,000 | 108,750 | ||||||
Avis Budget Car Rental LLC | 100,000 | 111,375 | ||||||
B/E Aerospace Inc | 50,000 | 51,813 | ||||||
BC Mountain LLC | 50,000 | 53,125 | ||||||
Bombardier Inc (Canada) | ||||||||
5.750% due 03/15/22 ~ | 100,000 | 103,125 | ||||||
6.125% due 01/15/23 ~ | 50,000 | 52,125 | ||||||
Delta Air Lines Pass-Through Trust ‘A’ | 50,000 | 54,125 | ||||||
HD Supply Inc | ||||||||
8.125% due 04/15/19 | 50,000 | 56,750 | ||||||
11.500% due 07/15/20 | 100,000 | 118,750 | ||||||
International Lease Finance Corp | ||||||||
4.625% due 04/15/21 | 100,000 | 99,938 | ||||||
6.250% due 05/15/19 | 50,000 | 55,000 | ||||||
| See Notes to Financial Statements | See explanation of symbols and terms, if any, on page B-25 |
B-21
Table of Contents
PACIFIC LIFE FUNDS
PL HIGH INCOME FUND
Schedule of Investments (Continued)
March 31, 2013
Principal Amount | | |||||||
Nortek Inc | $50,000 | $55,625 | ||||||
Roofing Supply Group LLC | 50,000 | 56,750 | ||||||
The Hertz Corp | 50,000 | 53,000 | ||||||
United Rentals North America Inc | ||||||||
5.750% due 07/15/18 | 50,000 | 54,437 | ||||||
8.375% due 09/15/20 | 125,000 | 140,000 | ||||||
US Airways Pass-Through Trust ‘A’ | 47,174 | 54,133 | ||||||
US Airways Pass-Through Trust ‘B’ | 50,000 | 53,250 | ||||||
|
| |||||||
| 1,464,758 | ||||||||
|
| |||||||
Information Technology - 2.6% | ||||||||
Advanced Micro Devices Inc | 50,000 | 45,625 | ||||||
CDW LLC | 75,000 | 84,094 | ||||||
CommScope Inc | 50,000 | 54,500 | ||||||
Equinix Inc | ||||||||
4.875% due 04/01/20 | 50,000 | 50,625 | ||||||
5.375% due 04/01/23 | 50,000 | 50,875 | ||||||
Freescale Semiconductor Inc | 50,000 | 53,125 | ||||||
NeuStar Inc | 50,000 | 48,000 | ||||||
|
| |||||||
| 386,844 | ||||||||
|
| |||||||
Materials - 12.7% | ||||||||
AK Steel Corp | 50,000 | 44,375 | ||||||
Alphabet Holding Co Inc | 50,000 | 52,250 | ||||||
ArcelorMittal (Luxembourg) | ||||||||
6.000% due 03/01/21 | 150,000 | 158,042 | ||||||
7.250% due 03/01/41 | 50,000 | 49,963 | ||||||
Ardagh Packaging Finance PLC (Ireland) | ||||||||
9.125% due 10/15/20 ~ | 25,000 | 27,813 | ||||||
9.125% due 10/15/20 ~ | 100,000 | 110,750 | ||||||
Ashland Inc | ||||||||
4.750% due 08/15/22 ~ | 50,000 | 51,000 | ||||||
6.875% due 05/15/43 ~ | 25,000 | 27,125 | ||||||
BOE Merger Corp | 50,000 | 54,062 | ||||||
Building Materials Corp of America | 75,000 | 80,812 | ||||||
Celanese US Holdings LLC | 50,000 | 50,375 | ||||||
Eagle Spinco Inc | 50,000 | 51,063 | ||||||
Eldorado Gold Corp (Canada) | 75,000 | 78,188 | ||||||
FMG Resources Property Ltd (Australia) | ||||||||
6.000% due 04/01/17 ~ | 50,000 | 51,625 | ||||||
6.875% due 02/01/18 ~ | 100,000 | 105,500 | ||||||
8.250% due 11/01/19 ~ | 50,000 | 54,188 | ||||||
Graphic Packaging International Inc | 50,000 | 50,813 | ||||||
Hexion U.S. Finance Corp | ||||||||
6.625% due 04/15/20 ~ | 50,000 | 50,375 | ||||||
9.000% due 11/15/20 | 50,000 | 47,750 | ||||||
Ineos Finance PLC (United Kingdom) | 50,000 | 54,688 | ||||||
Louisiana-Pacific Corp | 50,000 | 57,000 | ||||||
Principal Amount | | |||||||
LyondellBasell Industries NV (Netherlands) | $50,000 | $56,750 | ||||||
New Gold Inc (Canada) | 50,000 | 52,625 | ||||||
Novelis Inc (Canada) | 50,000 | 55,000 | ||||||
Sappi Papier Holding GmbH (Austria) | 75,000 | 83,531 | ||||||
Sealed Air Corp | 100,000 | 115,000 | ||||||
Taminco Acquisition Corp | 50,000 | 50,750 | ||||||
TPC Group Inc | 100,000 | 104,625 | ||||||
Tronox Finance LLC | 50,000 | 48,687 | ||||||
|
| |||||||
| 1,874,725 | ||||||||
|
| |||||||
Telecommunication Services - 8.4% | ||||||||
CenturyLink Inc | 50,000 | 51,225 | ||||||
Cricket Communications Inc | 100,000 | 100,250 | ||||||
Crown Castle International Corp | 50,000 | 51,063 | ||||||
Digicel Ltd (Bermuda) | 75,000 | 79,125 | ||||||
Frontier Communications Corp | ||||||||
7.125% due 03/15/19 | 50,000 | 54,250 | ||||||
7.125% due 01/15/23 | 50,000 | 50,813 | ||||||
Hughes Satellite Systems Corp | 100,000 | 114,875 | ||||||
Intelsat Jackson Holdings SA (Luxemburg) | 50,000 | 55,125 | ||||||
Intelsat Luxembourg SA (Luxembourg) | ||||||||
7.750% due 06/01/21 ~ | 200,000 | 204,000 | ||||||
11.500% due 02/04/17 | 125,000 | 132,813 | ||||||
Level 3 Financing Inc | 50,000 | 52,562 | ||||||
MetroPCS Wireless Inc | 50,000 | 51,063 | ||||||
Sprint Capital Corp | 50,000 | 51,375 | ||||||
Sprint Nextel Corp | ||||||||
6.000% due 11/15/22 | 25,000 | 25,813 | ||||||
9.000% due 11/15/18 ~ | 50,000 | 61,937 | ||||||
9.125% due 03/01/17 | 50,000 | 59,375 | ||||||
Telesat LLC (Canada) | 50,000 | 52,500 | ||||||
|
| |||||||
| 1,248,164 | ||||||||
|
| |||||||
Utilities - 3.4% | ||||||||
Calpine Corp | 92,000 | 101,430 | ||||||
GenOn Energy Inc | 50,000 | 57,500 | ||||||
NRG Energy Inc | 100,000 | 114,250 | ||||||
Puget Energy Inc | 50,000 | 55,309 | ||||||
The AES Corp | 100,000 | 116,500 | ||||||
Wind Acquisition Holdings Finance SA | 50,000 | 52,188 | ||||||
|
| |||||||
| 497,177 | ||||||||
|
| |||||||
Total Corporate Bonds & Notes | 13,663,966 | |||||||
|
| |||||||
| See Notes to Financial Statements | See explanation of symbols and terms, if any, on page B-25 |
B-22
Table of Contents
PACIFIC LIFE FUNDS
PL HIGH INCOME FUND
Schedule of Investments (Continued)
March 31, 2013
Shares | | |||||||
SHORT-TERM INVESTMENT - 5.1% | ||||||||
Money Market Fund - 5.1% | ||||||||
BlackRock Liquidity Funds Treasury | 761,344 | $761,344 | ||||||
|
| |||||||
Total Short-Term Investment | 761,344 | |||||||
|
| |||||||
TOTAL INVESTMENTS - 100.9% | 14,927,310 | |||||||
OTHER ASSETS & LIABILITIES, NET - (0.9%) | (137,699 | ) | ||||||
|
| |||||||
NET ASSETS - 100.0% | $14,789,611 | |||||||
|
| |||||||
Notes to Schedule of Investments
| (a) | As of March 31, 2013, the fund was diversified as a percentage of net assets as follows: |
Consumer Discretionary | 19.1% | |||
Energy | 18.2% | |||
Materials | 12.7% | |||
Industrials | 10.0% | |||
Telecommunication Services | 8.4% | |||
Health Care | 7.0% | |||
Financials | 6.3% | |||
Short-Term Investment | 5.1% | |||
Consumer Staples | 4.7% | |||
Exchange-Traded Fund | 3.4% | |||
Utilities | 3.4% | |||
Others (each less than 3.0%) | 2.6% | |||
|
| |||
| 100.9% | ||||
Other Assets & Liabilities, Net | (0.9% | ) | ||
|
| |||
| 100.0% | ||||
|
|
| (b) | As of March 31, 2013, the fund’s Standard & Poor’s quality ratings as a percentage of total fixed income investments were as follows (Unaudited): |
A | 0.4% | |||
BBB | 3.1% | |||
BB | 34.4% | |||
B | 39.8% | |||
CCC | 20.2% | |||
Not Rated | 2.1% | |||
|
| |||
| 100.0% | ||||
|
|
| (c) | Fair Value Measurements |
The following is a summary of the fund’s investments as categorized under the three-tier hierarchy of inputs used in valuing the fund’s assets and liabilities (See Note 3D in Notes to Financial Statements) as of March 31, 2013:
| Total Value at March 31, 2013 | Level 1 Quoted Price | Level 2 Significant Observable Inputs | Level 3 Significant Unobservable Inputs | |||||||||||||||
Assets | Exchange-Traded Fund | $502,000 | $502,000 | $— | $— | |||||||||||||
Corporate Bonds & Notes | 13,663,966 | — | 13,502,458 | 161,508 | ||||||||||||||
Short-Term Investment | 761,344 | 761,344 | — | — | ||||||||||||||
|
|
|
|
|
|
|
| |||||||||||
Total | $14,927,310 | $1,263,344 | $13,502,458 | $161,508 | ||||||||||||||
|
|
|
|
|
|
|
| |||||||||||
The following is a reconciliation of investments for significant unobservable inputs (Level 3) used in valuing the fund's assets and liabilities (See Note 3D in Notes to Financial Statements) for the year ended March 31, 2013:
| Corporate Bonds & Notes | ||||
Value, Beginning of Year | $— | |||
Purchases | 100,000 | |||
Sales | — | |||
Accrued Discounts (Premiums) | — | |||
Net Realized Gains (Losses) | — | |||
Change in Net Unrealized Appreciation | 7,375 | |||
Transfers In | 54,133 | |||
Transfers Out | — | |||
|
| |||
Value, End of Year | $161,508 | |||
|
| |||
Change in Net Unrealized Appreciation on Level 3 | $7,375 | |||
|
| |||
The significant unobservable inputs were provided by a vendor-priced single broker quote.
| See Notes to Financial Statements | See explanation of symbols and terms, if any, on page B-25 |
B-23
Table of Contents
PACIFIC LIFE FUNDS
PL MONEY MARKET FUND
Schedule of Investments
March 31, 2013
Principal Amount | Value | |||||||
SHORT-TERM INVESTMENTS - 100.1% | ||||||||
Commercial Paper - 83.0% | ||||||||
Abbott Laboratories | $800,000 | $799,855 | ||||||
AstraZeneca PLC (United Kingdom) | 1,250,000 | 1,249,896 | ||||||
Bank of Montreal (Canada) | 1,250,000 | 1,249,995 | ||||||
Bank of Nova Scotia NY | ||||||||
0.120% due 04/01/13 | 700,000 | 700,000 | ||||||
0.130% due 04/03/13 | 600,000 | 599,996 | ||||||
Chevron Corp | 1,200,000 | 1,199,979 | ||||||
Dover Corp | 1,000,000 | 999,994 | ||||||
General Electric Capital Corp | ||||||||
0.140% due 08/01/13 | 900,000 | 899,573 | ||||||
0.150% due 07/03/13 | 400,000 | 399,845 | ||||||
John Deere Bank SA (Luxembourg) | 500,000 | 499,982 | ||||||
John Deere Capital Corp | 750,000 | 749,954 | ||||||
Johnson & Johnson | ||||||||
0.050% due 04/03/13 | 400,000 | 399,999 | ||||||
0.080% due 04/30/13 | 700,000 | 699,955 | ||||||
Nestle Capital Corp | ||||||||
0.050% due 04/08/13 | 600,000 | 599,994 | ||||||
0.120% due 07/12/13 | 750,000 | 749,745 | ||||||
NetJets Inc | ||||||||
0.080% due 04/25/13 | 500,000 | 499,973 | ||||||
0.100% due 04/05/13 | 800,000 | 799,991 | ||||||
Parker Hannifin Corp | 500,000 | 499,973 | ||||||
PepsiCo Inc | 1,000,000 | 999,971 | ||||||
Pfizer Inc | ||||||||
0.080% due 04/08/13 | 500,000 | 499,992 | ||||||
0.080% due 04/18/13 | 750,000 | 749,972 | ||||||
Philip Morris International Inc | ||||||||
0.040% due 05/07/13 | 300,000 | 299,988 | ||||||
0.050% due 05/07/13 | 1,000,000 | 999,950 | ||||||
Roche Holdings Inc | 750,000 | 749,912 | ||||||
Siemens Capital Co LLC | 900,000 | 899,956 | ||||||
The Coca-Cola Co | 900,000 | 899,904 | ||||||
Toronto-Dominion Holdings USA Inc | 400,000 | 399,961 | ||||||
Toyota Motor Credit Corp | 900,000 | 899,840 | ||||||
Principal Amount | Value | |||||||
Unilever Capital Corp | ||||||||
0.100% due 04/01/13 | $600,000 | $600,000 | ||||||
0.140% due 05/30/13 | 400,000 | 399,908 | ||||||
United Parcel Service Inc | 1,300,000 | 1,299,990 | ||||||
Wal-Mart Stores Inc | ||||||||
0.080% due 04/05/13 | 600,000 | 599,995 | ||||||
0.090% due 04/03/13 | 700,000 | 699,996 | ||||||
|
| |||||||
| 24,598,034 | ||||||||
|
| |||||||
U.S. Treasury Bills - 16.9% | ||||||||
0.076% due 04/25/13 | 1,500,000 | 1,499,924 | ||||||
0.087% due 05/16/13 | 1,500,000 | 1,499,837 | ||||||
0.091% due 04/04/13 | 1,250,000 | 1,249,991 | ||||||
0.131% due 05/23/13 | 750,000 | 749,856 | ||||||
|
| |||||||
| 4,999,608 | ||||||||
|
| |||||||
Shares | ||||||||
Money Market Fund - 0.2% | ||||||||
BlackRock Liquidity Funds Treasury | 49,627 | 49,627 | ||||||
|
| |||||||
Total Short-Term Investments | 29,647,269 | |||||||
|
| |||||||
TOTAL INVESTMENTS - 100.1% | 29,647,269 | |||||||
OTHER ASSETS & LIABILITIES, NET - (0.1%) | (18,317 | ) | ||||||
|
| |||||||
NET ASSETS - 100.0% | $29,628,952 | |||||||
|
| |||||||
Notes to Schedule of Investments
| (a) | As of March 31, 2013, the fund was diversified as a percentage of net assets as follows: |
Commercial Paper | 83.0 | % | ||
U.S. Treasury Bills | 16.9 | % | ||
Others (each less than 3.0%) | 0.2 | % | ||
|
| |||
| 100.1 | % | |||
Other Assets & Liabilities, Net | (0.1 | %) | ||
|
| |||
| 100.0 | % | |||
|
|
| (b) | As of March 31, 2013, the fund’s Standard & Poor’s quality ratings as a percentage of total fixed income investments were as follows (Unaudited): |
A-1 (Short-Term Debt Only) | 100.0 | % | ||
|
|
| (c) | Short-term investments reflect either the stated coupon rate or the annualized effective yield on the date of purchase for discounted investments. |
| (d) | Fair Value Measurements |
The following is a summary of the fund’s investments as categorized under the three-tier hierarchy of inputs used in valuing the fund’s assets and liabilities (See Note 3D in Notes to Financial Statements) as of March 31, 2013:
| Total Value at March 31, 2013 | Level 1 Quoted Price | Level 2 Significant Observable Inputs | Level 3 Significant Unobservable Inputs | |||||||||||||||
Assets | Short-Term Investments | $29,647,269 | $49,627 | $29,597,642 | $— | |||||||||||||
|
|
|
|
|
|
|
| |||||||||||
| See Notes to Financial Statements | See explanation of symbols and terms, if any, on page B-25 |
B-24
Table of Contents
PACIFIC LIFE FUNDS
Schedule of Investments (Continued)
Explanation of Symbols and Terms
March 31, 2013
Explanation of Symbols: | ||
| * | Non-income producing investments. | |
| ~ | Securities are not registered under the Securities Act of 1933 (1933 Act). These securities are either (1) exempt from registration pursuant to Rule 144A under the 1933 Act and may only be sold to “qualified institutional buyers”, or (2) the securities comply with Regulation S rules governing offers and sales made outside the United States without registration under the 1933 Act and contain certain restrictions as to public resale. | |
| § | Variable rate investments. The rate shown is based on the latest available information as of March 31, 2013. For senior loan notes, the rate shown may represent a weighted average interest rate. | |
| µ | Unsettled position. Contract rates do not take effect until settlement date. | |
Other Abbreviation: | ||
| REIT | Real Estate Investment Trust | |
Note:
The countries listed in the Schedules of Investments are based on country of incorporation.
The descriptions and Standard and Poor’s quality ratings of the companies, if any, shown in the Schedules of Investments were obtained from published reports or other sources believed to be reliable, and are not audited by the Independent Registered Public Accounting Firm.
| See Notes to Financial Statements |
B-25
Table of Contents
PACIFIC LIFE FUNDS
STATEMENTS OF ASSETS AND LIABILITIES
March 31, 2013
| PL Portfolio Optimization Funds | ||||||||||||||||||||
| Conservative Fund | Moderate- Conservative Fund | Moderate Fund | Moderate- Fund | Aggressive Fund | ||||||||||||||||
| ASSETS | ||||||||||||||||||||
Investments in affiliated mutual funds, at cost | $472,405,451 | $448,254,282 | $1,093,739,058 | $711,497,179 | $196,485,321 | |||||||||||||||
Investments in affiliated mutual funds, at value | $506,971,078 | $499,333,869 | $1,268,476,448 | $857,549,445 | $255,625,766 | |||||||||||||||
Receivables: | ||||||||||||||||||||
Fund shares sold | 1,705,024 | 1,739,768 | 5,339,313 | 2,439,205 | 779,977 | |||||||||||||||
Due from adviser | 59,306 | 43,971 | 110,082 | 72,032 | 25,938 | |||||||||||||||
Prepaid expenses and other assets | 13,529 | 14,933 | 26,983 | 21,145 | 9,063 | |||||||||||||||
Total Assets | 508,748,937 | 501,132,541 | 1,273,952,826 | 860,081,827 | 256,440,744 | |||||||||||||||
| LIABILITIES | ||||||||||||||||||||
Payables: | ||||||||||||||||||||
Fund shares redeemed | 1,178,292 | 847,339 | 2,014,026 | 1,184,972 | 413,999 | |||||||||||||||
Securities purchased | 120,866 | 440,868 | 1,363,834 | 496,514 | 323,409 | |||||||||||||||
Accrued advisory fees | 85,569 | 83,768 | 212,876 | 143,957 | 42,915 | |||||||||||||||
Accrued administration fees | 64,177 | 62,826 | 159,657 | 107,968 | 32,187 | |||||||||||||||
Accrued support service expenses | 46,409 | 43,955 | 113,485 | 77,998 | 23,668 | |||||||||||||||
Accrued custodian fees and expenses | 2,890 | 2,890 | 2,890 | 2,890 | 2,890 | |||||||||||||||
Accrued transfer agency out-of-pocket expenses | 25,815 | 25,300 | 67,317 | 49,284 | 15,083 | |||||||||||||||
Accrued legal, audit and tax service fees | 59,647 | 56,138 | 144,731 | 98,241 | 28,946 | |||||||||||||||
Accrued trustees’ fees and expenses and deferred compensation | 1,113 | 1,007 | 2,370 | 1,498 | 361 | |||||||||||||||
Accrued distribution and/or service fees | 62,463 | 59,319 | 145,211 | 99,178 | 28,972 | |||||||||||||||
Accrued other | 46,555 | 43,926 | 114,383 | 78,031 | 23,010 | |||||||||||||||
Total Liabilities | 1,693,796 | 1,667,336 | 4,340,780 | 2,340,531 | 935,440 | |||||||||||||||
NET ASSETS | $507,055,141 | $499,465,205 | $1,269,612,046 | $857,741,296 | $255,505,304 | |||||||||||||||
| NET ASSETS CONSIST OF: | ||||||||||||||||||||
Paid-in capital | $471,222,128 | $451,855,622 | $1,112,959,583 | $751,549,795 | $233,015,274 | |||||||||||||||
Undistributed/accumulated net investment income (loss) | (1,085 | ) | (31,405 | ) | 1,106,974 | 1,256,615 | 108,580 | |||||||||||||
Undistributed/accumulated net realized gain (loss) | 1,268,471 | (3,438,599 | ) | (19,191,901 | ) | (41,117,380 | ) | (36,758,995 | ) | |||||||||||
Net unrealized appreciation on investments | 34,565,627 | 51,079,587 | 174,737,390 | 146,052,266 | 59,140,445 | |||||||||||||||
NET ASSETS | $507,055,141 | $499,465,205 | $1,269,612,046 | $857,741,296 | $255,505,304 | |||||||||||||||
| Class A Shares: | ||||||||||||||||||||
Net Assets | $230,645,569 | $246,609,296 | $654,157,852 | $436,055,186 | $133,264,595 | |||||||||||||||
Shares of beneficial interest outstanding | 20,230,899 | 20,384,286 | 50,106,674 | 32,700,108 | 9,869,168 | |||||||||||||||
Net Asset Value per share* | $11.40 | $12.10 | $13.06 | $13.33 | $13.50 | |||||||||||||||
Sales Charge (1) | 0.66 | 0.70 | 0.76 | 0.78 | 0.79 | |||||||||||||||
Maximum offering price per share | $12.06 | $12.80 | $13.82 | $14.11 | $14.29 | |||||||||||||||
| Class B Shares: | ||||||||||||||||||||
Net Assets | $41,999,165 | $49,371,691 | $136,410,740 | $105,757,366 | $33,013,396 | |||||||||||||||
Shares of beneficial interest outstanding | 3,726,108 | 4,116,123 | 10,521,501 | 8,002,333 | 2,496,764 | |||||||||||||||
Net Asset Value and offering price per share* | $11.27 | $11.99 | $12.96 | $13.22 | $13.22 | |||||||||||||||
| Class C Shares: | ||||||||||||||||||||
Net Assets | $220,687,706 | $196,122,514 | $445,932,340 | $295,614,699 | $81,754,156 | |||||||||||||||
Shares of beneficial interest outstanding | 19,591,825 | 16,352,031 | 34,427,692 | 22,409,831 | 6,184,366 | |||||||||||||||
Net Asset Value and offering price per share* | $11.26 | $11.99 | $12.95 | $13.19 | $13.22 | |||||||||||||||
| Class R Shares: | ||||||||||||||||||||
Net Assets | $12,356,714 | $6,482,022 | $29,715,455 | $17,843,825 | $7,250,675 | |||||||||||||||
Shares of beneficial interest outstanding | 1,087,819 | 537,282 | 2,280,676 | 1,339,881 | 540,077 | |||||||||||||||
Net Asset Value per share | $11.36 | $12.06 | $13.03 | $13.32 | $13.43 | |||||||||||||||
| Advisor Class: | ||||||||||||||||||||
Net Assets | $1,365,987 | $879,682 | $3,395,659 | $2,470,220 | $222,482 | |||||||||||||||
Shares of beneficial interest outstanding | 119,747 | 72,694 | 260,077 | 185,157 | 16,463 | |||||||||||||||
Net Asset Value per share | $11.41 | $12.10 | $13.06 | $13.34 | $13.51 | |||||||||||||||
| * | Redemption price per share is equal to the Net Asset Value per share less any applicable contingent deferred sales charge. |
| (1) | The PL Portfolio Optimization Funds are subject to a maximum 5.50% front-end sales charge. |
See Notes to Financial Statements
C-1
Table of Contents
PACIFIC LIFE FUNDS
STATEMENTS OF ASSETS AND LIABILITIES (Continued)
March 31, 2013
| PL Short Duration Income Fund | PL Income Fund | PL Strategic Fund | PL Floating Rate Income Fund | PL High Income Fund | PL Money Market Fund | |||||||||||||||||||
| ASSETS | ||||||||||||||||||||||||
Investments, at cost | $50,253,298 | $587,642,070 | $52,646,388 | $260,727,606 | $14,298,444 | $29,647,269 | ||||||||||||||||||
Investments, at value | $50,786,833 | $597,810,582 | $54,078,993 | $264,014,627 | $14,927,310 | $29,647,269 | ||||||||||||||||||
Foreign currency held, at value (1) | — | — | 6,557 | — | 819 | — | ||||||||||||||||||
Receivables: | ||||||||||||||||||||||||
Dividends and interest | 265,104 | 4,525,270 | 703,885 | 748,907 | 244,123 | — | ||||||||||||||||||
Fund shares sold | 822,069 | 4,448,993 | 467,639 | 7,675,877 | 5,266 | 24,064 | ||||||||||||||||||
Securities sold | — | — | 517,092 | 15,578,295 | 208,668 | — | ||||||||||||||||||
Due from adviser | 3,244 | 56,830 | 8,562 | 21,883 | 6,082 | 8,011 | ||||||||||||||||||
Prepaid expenses and other assets | 4,647 | 12,909 | 5,533 | 14,253 | 4,235 | 3,594 | ||||||||||||||||||
Total Assets | 51,881,897 | 606,854,584 | 55,788,261 | 288,053,842 | 15,396,503 | 29,682,938 | ||||||||||||||||||
| LIABILITIES | ||||||||||||||||||||||||
Payables: | ||||||||||||||||||||||||
Fund shares redeemed | 328,082 | 2,100,232 | 46,375 | 139,196 | 6,097 | 32,073 | ||||||||||||||||||
Securities purchased | 2,187,003 | 13,721,671 | 3,091,454 | 53,134,767 | 575,000 | — | ||||||||||||||||||
Income distributions | 6,534 | 232,597 | 10,872 | 134,885 | 2,408 | — | ||||||||||||||||||
Accrued advisory fees | 15,763 | 247,833 | 25,282 | 113,110 | 7,437 | — | ||||||||||||||||||
Accrued administration fees | 5,911 | 74,350 | 6,321 | 26,102 | 1,859 | — | ||||||||||||||||||
Accrued support service expenses | 1,358 | 48,261 | 2,216 | 9,006 | 858 | 3,395 | ||||||||||||||||||
Accrued custodian fees and expenses | 3,828 | 13,325 | 6,265 | 7,655 | 4,541 | 4,818 | ||||||||||||||||||
Accrued transfer agency out-of-pocket expenses | 898 | 29,068 | 1,510 | 5,186 | 630 | 1,371 | ||||||||||||||||||
Accrued legal, audit and tax service fees | 1,754 | 65,787 | 3,509 | 12,280 | 1,754 | 4,386 | ||||||||||||||||||
Accrued trustees’ fees and expenses and deferred compensation | 3 | 105 | 6 | 20 | 3 | 3,300 | ||||||||||||||||||
Accrued distribution and/or service fees | 2,985 | 48,038 | 2,480 | 17,635 | 588 | 588 | ||||||||||||||||||
Accrued other | 3,584 | 54,158 | 6,960 | 13,800 | 5,717 | 4,055 | ||||||||||||||||||
Total Liabilities | 2,557,703 | 16,635,425 | 3,203,250 | 53,613,642 | 606,892 | 53,986 | ||||||||||||||||||
NET ASSETS | $49,324,194 | $590,219,159 | $52,585,011 | $234,440,200 | $14,789,611 | $29,628,952 | ||||||||||||||||||
| NET ASSETS CONSIST OF: | ||||||||||||||||||||||||
Paid-in capital | $48,593,269 | $573,106,414 | $50,189,973 | $229,994,584 | $13,929,172 | $29,632,391 | ||||||||||||||||||
Undistributed/accumulated net investment income (loss) | 15,134 | 219,811 | 34,596 | 113,212 | 9,171 | (3,294 | ) | |||||||||||||||||
Undistributed/accumulated net realized gain (loss) | 182,256 | 6,724,422 | 927,919 | 1,045,383 | 222,371 | (145 | ) | |||||||||||||||||
Net unrealized appreciation (depreciation) on investments | 533,535 | 10,168,512 | 1,432,523 | 3,287,021 | 628,897 | — | ||||||||||||||||||
NET ASSETS | $49,324,194 | $590,219,159 | $52,585,011 | $234,440,200 | $14,789,611 | $29,628,952 | ||||||||||||||||||
| Class A Shares: | ||||||||||||||||||||||||
Net Assets | $22,588,626 | $333,987,094 | $20,963,430 | $125,006,888 | $3,496,830 | $27,317,404 | ||||||||||||||||||
Shares of beneficial interest outstanding | 2,158,967 | 30,574,715 | 1,866,269 | 11,953,988 | 313,277 | 27,328,361 | ||||||||||||||||||
Net Asset Value per share* | $10.46 | $10.92 | $11.23 | $10.46 | $11.16 | $1.00 | ||||||||||||||||||
Sales Charge (2) | 0.32 | 0.48 | 0.50 | 0.32 | 0.50 | — | ||||||||||||||||||
Maximum offering price per share | $10.78 | $11.40 | $11.73 | $10.78 | $11.66 | $1.00 | ||||||||||||||||||
| Class B Shares: | ||||||||||||||||||||||||
Net Assets | $571,727 | |||||||||||||||||||||||
Shares of beneficial interest outstanding | 571,727 | |||||||||||||||||||||||
Net Asset Value and offering price per share* | $1.00 | |||||||||||||||||||||||
| Class C Shares: | ||||||||||||||||||||||||
Net Assets | $10,307,496 | $160,472,202 | $7,948,070 | $63,045,185 | $2,203,497 | $1,739,821 | ||||||||||||||||||
Shares of beneficial interest outstanding | 986,558 | 14,688,174 | 708,236 | 6,034,962 | 197,517 | 1,739,821 | ||||||||||||||||||
Net Asset Value and offering price per share* | $10.45 | $10.93 | $11.22 | $10.45 | $11.16 | $1.00 | ||||||||||||||||||
| Class I Shares: | ||||||||||||||||||||||||
Net Assets | $13,279,579 | $1,793,928 | $22,098,780 | $10,725,538 | $8,810,020 | |||||||||||||||||||
Shares of beneficial interest outstanding | 1,271,309 | 164,069 | 1,977,384 | 1,024,180 | 794,700 | |||||||||||||||||||
Net Asset Value per share | $10.45 | $10.93 | $11.18 | $10.47 | $11.09 | |||||||||||||||||||
| Class P Shares: | ||||||||||||||||||||||||
Net Assets | $14,265 | |||||||||||||||||||||||
Shares of beneficial interest outstanding | 1,363 | |||||||||||||||||||||||
Net Asset Value per share | $10.47 | |||||||||||||||||||||||
| Advisor Class: | ||||||||||||||||||||||||
Net Assets | $3,148,493 | $93,965,935 | $1,574,731 | $35,648,324 | $279,264 | |||||||||||||||||||
Shares of beneficial interest outstanding | 300,929 | 8,585,225 | 140,151 | 3,399,649 | 24,984 | |||||||||||||||||||
Net Asset Value per share | $10.46 | $10.95 | $11.24 | $10.49 | $11.18 | |||||||||||||||||||
| * | Redemption price per share is equal to the Net Asset Value per share less any applicable contingent deferred sales charge. |
| (1) | The cost of foreign currency for the PL Strategic Income and PL High Income Funds was $6,639 and $788, respectively. |
| (2) | The PL Short Duration Income and PL Floating Rate Income Funds are subject to a maximum 3.00% front-end sales charge. The PL Income, PL Strategic Income and PL High Income Funds are subject to a maximum 4.25% front-end sales charge. The PL Money Market is not subject to a front-end sales charge. |
See Notes to Financial Statements
C-2
Table of Contents
PACIFIC LIFE FUNDS
FOR THE YEAR ENDED MARCH 31, 2013
| PL Portfolio Optimization Funds | ||||||||||||||||||||
| Conservative Fund | Moderate- Conservative Fund | Moderate Fund | Moderate- Fund | Aggressive Fund | ||||||||||||||||
| INVESTMENT INCOME | ||||||||||||||||||||
Dividends from affiliated mutual fund investments | $11,700,948 | $9,385,276 | $20,086,484 | $10,937,380 | $2,763,754 | |||||||||||||||
Dividends from mutual fund investments | 165 | 5,572 | 11,669 | 10,580 | 2,313 | |||||||||||||||
Total Investment Income | 11,701,113 | 9,390,848 | 20,098,153 | 10,947,960 | 2,766,067 | |||||||||||||||
| EXPENSES | ||||||||||||||||||||
Advisory fees | 902,217 | 863,580 | 2,226,451 | 1,530,091 | 472,264 | |||||||||||||||
Administration fees | 676,662 | 647,685 | 1,669,838 | 1,147,568 | 354,198 | |||||||||||||||
Support services expenses | 76,754 | 73,017 | 190,355 | 132,177 | 41,560 | |||||||||||||||
Custodian fees and expenses | 8,755 | 8,755 | 8,755 | 8,755 | 8,755 | |||||||||||||||
Shareholder report expenses | 66,517 | 62,929 | 163,642 | 113,358 | 33,900 | |||||||||||||||
Distribution and/or service fees (1) | ||||||||||||||||||||
Class A | 532,733 | 534,447 | 1,426,579 | 963,328 | 308,723 | |||||||||||||||
Class B | 376,117 | 450,678 | 1,234,774 | 976,530 | 312,837 | |||||||||||||||
Class C | 1,891,125 | 1,667,050 | 3,940,117 | 2,664,954 | 748,250 | |||||||||||||||
Class R | 56,330 | 31,055 | 125,216 | 77,630 | 32,581 | |||||||||||||||
Transfer agency out-of-pocket expenses | 111,902 | 112,488 | 295,490 | 224,393 | 72,372 | |||||||||||||||
Registration fees | 110,293 | 94,957 | 150,114 | 116,992 | 81,250 | |||||||||||||||
Legal, audit and tax service fees | 87,149 | 82,407 | 212,992 | 145,833 | 44,063 | |||||||||||||||
Trustees’ fees and expenses | 15,320 | 14,538 | 37,796 | 26,126 | 8,077 | |||||||||||||||
Other | 27,486 | 26,569 | 65,657 | 46,719 | 16,303 | |||||||||||||||
Total Expenses | 4,939,360 | 4,670,155 | 11,747,776 | 8,174,454 | 2,535,133 | |||||||||||||||
Adviser Reimbursement (2) | (504,164 | ) | (475,646 | ) | (1,124,770 | ) | (814,333 | ) | (306,272 | ) | ||||||||||
Net Expenses | 4,435,196 | 4,194,509 | 10,623,006 | 7,360,121 | 2,228,861 | |||||||||||||||
NET INVESTMENT INCOME | 7,265,917 | 5,196,339 | 9,475,147 | 3,587,839 | 537,206 | |||||||||||||||
| NET REALIZED AND UNREALIZED GAIN (LOSS) | ||||||||||||||||||||
Net Realized Gain (Loss) On: | ||||||||||||||||||||
Investment security transactions in affiliated mutual funds | 4,239,775 | 3,254,891 | 7,788,552 | 2,644,027 | 1,522,630 | |||||||||||||||
Investment security transactions | 33 | 31 | 80 | 54 | 17 | |||||||||||||||
Capital gain distributions from affiliated mutual fund investments | 8,663,260 | 6,536,243 | 10,995,882 | 5,900,539 | 1,182,606 | |||||||||||||||
Net Realized Gain | 12,903,068 | 9,791,165 | 18,784,514 | 8,544,620 | 2,705,253 | |||||||||||||||
Change In Net Unrealized Appreciation (Depreciation) On: | ||||||||||||||||||||
Investment securities in affiliated mutual funds | 7,744,436 | 15,270,220 | 62,333,092 | 52,807,520 | 15,639,878 | |||||||||||||||
Change in Net Unrealized Appreciation | 7,744,436 | 15,270,220 | 62,333,092 | 52,807,520 | 15,639,878 | |||||||||||||||
NET GAIN | 20,647,504 | 25,061,385 | 81,117,606 | 61,352,140 | 18,345,131 | |||||||||||||||
NET INCREASE IN NET ASSETS | $27,913,421 | $30,257,724 | $90,592,753 | $64,939,979 | $18,882,337 | |||||||||||||||
| (1) | See Notes 1 and 5 in Notes to Financial Statements. The Advisor Class Service Plan was terminated prior to commencement of operations of the Advisor Class shares of the PL Portfolio Optimization Funds and therefore is not shown. |
| (2) | See Note 6B in Notes to Financial Statements. |
See Notes to Financial Statements
C-3
Table of Contents
PACIFIC LIFE FUNDS
STATEMENTS OF OPERATIONS (Continued)
FOR THE YEAR ENDED MARCH 31, 2013
| PL Short Duration Income Fund | PL Income Fund | PL Strategic Fund | PL Floating Rate Income | PL High Income | PL Money Market | |||||||||||||||||||
| INVESTMENT INCOME | ||||||||||||||||||||||||
Dividends, net of foreign taxes withheld | $166 | $4,541 | $38,466 | $37,311 | $15,500 | $20 | ||||||||||||||||||
Interest, net of foreign taxes withheld | 631,458 | 17,626,921 | 1,547,017 | 5,663,967 | 665,413 | 36,083 | ||||||||||||||||||
Other | — | 31,607 | — | 37,880 | — | — | ||||||||||||||||||
Total Investment Income | 631,624 | 17,663,069 | 1,585,483 | 5,739,158 | 680,913 | 36,103 | ||||||||||||||||||
| EXPENSES | ||||||||||||||||||||||||
Advisory fees | 88,162 | 2,413,664 | 169,889 | 677,456 | 61,703 | 62,465 | ||||||||||||||||||
Administration fees | 46,948 | 1,445,725 | 54,963 | 268,233 | 18,624 | 93,698 | ||||||||||||||||||
Support services expenses | 2,252 | 75,891 | 3,556 | 12,561 | 1,305 | 5,667 | ||||||||||||||||||
Custodian fees and expenses | 7,304 | 37,414 | 13,597 | 21,644 | 10,143 | 14,522 | ||||||||||||||||||
Shareholder report expenses | 1,809 | 65,526 | 2,550 | 21,017 | 1,292 | 4,918 | ||||||||||||||||||
Distribution and/or service fees (1) | ||||||||||||||||||||||||
Class A | 13,025 | 861,734 | 13,603 | 114,032 | 3,314 | 74,866 | ||||||||||||||||||
Class B | — | — | — | — | — | 2,654 | ||||||||||||||||||
Class C | 29,197 | 1,254,091 | 24,782 | 225,553 | 7,477 | 10,212 | ||||||||||||||||||
Advisor Class | 9 | 2,159 | 65 | 159 | 3 | — | ||||||||||||||||||
Transfer agency out-of-pocket expenses | 2,633 | 118,719 | 4,091 | 22,206 | 1,413 | 12,768 | ||||||||||||||||||
Registration fees | 9,173 | 148,142 | 9,701 | 84,729 | 4,214 | 56,118 | ||||||||||||||||||
Legal, audit and tax service fees | 2,560 | 92,325 | 4,723 | 16,708 | 2,163 | 6,448 | ||||||||||||||||||
Trustees’ fees and expenses | 425 | 14,994 | 697 | 2,603 | 273 | 1,132 | ||||||||||||||||||
Offering expenses | 56,728 | — | 56,728 | 28,099 | 56,728 | — | ||||||||||||||||||
Other | 11,978 | 48,733 | 24,241 | 26,193 | 21,739 | 9,174 | ||||||||||||||||||
Total Expenses | 272,203 | 6,579,117 | 383,186 | 1,521,193 | 190,391 | 354,642 | ||||||||||||||||||
Advisory Fee Waiver (2) | — | — | — | — | — | (62,465 | ) | |||||||||||||||||
Adviser Reimbursement (2) | (97,734 | ) | (1,323,370 | ) | (118,217 | ) | (347,661 | ) | (97,325 | ) | (110,746 | ) | ||||||||||||
Administration Fee Waiver (2) | — | — | — | — | — | (93,698 | ) | |||||||||||||||||
Service Fee Waiver (2) | — | — | — | — | — | (51,628 | ) | |||||||||||||||||
Net Expenses | 174,469 | 5,255,747 | 264,969 | 1,173,532 | 93,066 | 36,105 | ||||||||||||||||||
NET INVESTMENT INCOME (LOSS) | 457,155 | 12,407,322 | 1,320,514 | 4,565,626 | 587,847 | (2 | ) | |||||||||||||||||
| NET REALIZED AND UNREALIZED GAIN (LOSS) | ||||||||||||||||||||||||
Net Realized Gain (Loss) On: | ||||||||||||||||||||||||
Investment security transactions | 313,926 | 16,442,913 | 1,636,936 | 2,210,370 | 401,053 | 4 | ||||||||||||||||||
Foreign currency transactions | — | — | 1,010 | — | 539 | — | ||||||||||||||||||
Net Realized Gain | 313,926 | 16,442,913 | 1,637,946 | 2,210,370 | 401,592 | 4 | ||||||||||||||||||
Change In Net Unrealized Appreciation (Depreciation) On: | ||||||||||||||||||||||||
Investment securities | 398,995 | 6,339,135 | 1,086,596 | 2,842,575 | 357,684 | — | ||||||||||||||||||
Foreign currency transactions | — | — | (82 | ) | — | 31 | — | |||||||||||||||||
Change in Net Unrealized Appreciation (Depreciation) | 398,995 | 6,339,135 | 1,086,514 | 2,842,575 | 357,715 | — | ||||||||||||||||||
NET GAIN | 712,921 | 22,782,048 | 2,724,460 | 5,052,945 | 759,307 | 4 | ||||||||||||||||||
NET INCREASE IN NET ASSETS | $1,170,076 | $35,189,370 | $4,044,974 | $9,618,571 | $1,347,154 | $2 | ||||||||||||||||||
Foreign taxes withheld on dividends and interest | $— | $— | $30 | $— | $— | $— | ||||||||||||||||||
| (1) | See Notes 1 and 5 in Notes to Financial Statements. |
| (2) | See Note 6B in Notes to Financial Statements. |
See Notes to Financial Statements
C-4
Table of Contents
PACIFIC LIFE FUNDS
STATEMENTS OF CHANGES IN NET ASSETS
| PL Portfolio Optimization Conservative Fund | PL Portfolio Optimization Moderate-Conservative Fund | PL Portfolio Optimization Moderate Fund | ||||||||||||||||||||||
| Year Ended March 31, 2013 | Year Ended March 31, 2012 | Year Ended | Year Ended March 31, 2012 | Year Ended | Year Ended March 31, 2012 | |||||||||||||||||||
| OPERATIONS | ||||||||||||||||||||||||
Net investment income | $7,265,917 | $5,189,027 | $5,196,339 | $4,037,287 | $9,475,147 | $7,197,426 | ||||||||||||||||||
Net realized gain | 12,903,068 | 3,277,663 | 9,791,165 | 2,167,499 | 18,784,514 | 5,835,612 | ||||||||||||||||||
Change in net unrealized appreciation | 7,744,436 | 6,885,771 | 15,270,220 | 9,994,683 | 62,333,092 | 31,124,333 | ||||||||||||||||||
Net Increase in Net Assets | 27,913,421 | 15,352,461 | 30,257,724 | 16,199,469 | 90,592,753 | 44,157,371 | ||||||||||||||||||
| DISTRIBUTIONS TO SHAREHOLDERS | ||||||||||||||||||||||||
Net investment income | ||||||||||||||||||||||||
Class A | (6,866,244 | ) | (3,963,242 | ) | (5,343,531 | ) | (3,227,833 | ) | (10,031,160 | ) | (6,896,937 | ) | ||||||||||||
Class B | (979,829 | ) | (582,094 | ) | (813,926 | ) | (513,693 | ) | (1,273,955 | ) | (890,273 | ) | ||||||||||||
Class C | (5,195,691 | ) | (2,791,770 | ) | (3,133,431 | ) | (1,709,111 | ) | (4,109,216 | ) | (2,663,615 | ) | ||||||||||||
Class R | (309,315 | ) | (238,985 | ) | (133,452 | ) | (297,928 | ) | (358,782 | ) | (267,714 | ) | ||||||||||||
Advisor Class | — | — | — | — | — | — | ||||||||||||||||||
Net realized gains | ||||||||||||||||||||||||
Class A | (975,567 | ) | (463,189 | ) | — | — | — | — | ||||||||||||||||
Class B | (168,822 | ) | (88,712 | ) | — | — | — | — | ||||||||||||||||
Class C | (881,825 | ) | (435,773 | ) | — | — | — | — | ||||||||||||||||
Class R | (47,188 | ) | (30,666 | ) | — | — | — | — | ||||||||||||||||
Advisor Class | — | — | — | — | — | — | ||||||||||||||||||
Net Decrease from Dividends and | (15,424,481 | ) | (8,594,431 | ) | (9,424,340 | ) | (5,748,565 | ) | (15,773,113 | ) | (10,718,539 | ) | ||||||||||||
| CAPITAL SHARE TRANSACTIONS | ||||||||||||||||||||||||
Proceeds from sale of shares | ||||||||||||||||||||||||
Class A | 107,943,161 | 102,650,253 | 93,384,527 | 87,677,363 | 202,865,923 | 216,395,619 | ||||||||||||||||||
Class B | 12,505,939 | 13,149,877 | 12,613,199 | 15,240,310 | 28,937,285 | 32,094,003 | ||||||||||||||||||
Class C | 90,923,111 | 86,058,302 | 68,944,959 | 56,767,607 | 114,905,237 | 114,353,551 | ||||||||||||||||||
Class R | 5,039,462 | 5,023,414 | 1,983,464 | 7,592,421 | 12,475,430 | 11,467,594 | ||||||||||||||||||
Advisor Class | 1,363,246 | — | 876,491 | — | 3,384,697 | — | ||||||||||||||||||
Dividends and distribution reinvestments | ||||||||||||||||||||||||
Class A | 6,823,998 | 3,886,280 | 4,916,243 | 2,943,320 | 9,561,378 | 6,444,881 | ||||||||||||||||||
Class B | 1,024,939 | 588,109 | 757,288 | 474,922 | 1,219,636 | 849,836 | ||||||||||||||||||
Class C | 5,415,640 | 2,793,302 | 2,864,308 | 1,540,112 | 3,786,971 | 2,433,641 | ||||||||||||||||||
Class R | 356,503 | 269,651 | 133,452 | 297,928 | 357,758 | 267,001 | ||||||||||||||||||
Advisor Class | — | — | — | — | — | — | ||||||||||||||||||
Cost of shares repurchased | ||||||||||||||||||||||||
Class A | (73,161,140 | ) | (56,980,878 | ) | (50,735,951 | ) | (40,032,576 | ) | (114,813,077 | ) | (107,176,991 | ) | ||||||||||||
Class B | (5,699,887 | ) | (3,481,193 | ) | (6,952,917 | ) | (4,517,933 | ) | (17,515,390 | ) | (13,415,950 | ) | ||||||||||||
Class C | (39,366,794 | ) | (50,444,496 | ) | (28,604,386 | ) | (24,889,408 | ) | (65,771,079 | ) | (70,089,870 | ) | ||||||||||||
Class R | (3,906,311 | ) | (3,836,556 | ) | (2,221,581 | ) | (16,849,072 | ) | (8,134,764 | ) | (12,699,459 | ) | ||||||||||||
Advisor Class | (55 | ) | — | — | — | — | — | |||||||||||||||||
Net Increase in Net Assets from | 109,261,812 | 99,676,065 | 97,959,096 | 86,244,994 | 171,260,005 | 180,923,856 | ||||||||||||||||||
NET INCREASE IN NET ASSETS | 121,750,752 | 106,434,095 | 118,792,480 | 96,695,898 | 246,079,645 | 214,362,688 | ||||||||||||||||||
| NET ASSETS | ||||||||||||||||||||||||
Beginning of Year | 385,304,389 | 278,870,294 | 380,672,725 | 283,976,827 | 1,023,532,401 | 809,169,713 | ||||||||||||||||||
End of Year | $507,055,141 | $385,304,389 | $499,465,205 | $380,672,725 | $1,269,612,046 | $1,023,532,401 | ||||||||||||||||||
Undistributed/Accumulated Net Investment Income (Loss) | ($1,085 | ) | ($502,655 | ) | ($31,405 | ) | $262,665 | $1,106,974 | $1,676,553 | |||||||||||||||
| See Notes to Financial Statements |
C-5
Table of Contents
PACIFIC LIFE FUNDS
STATEMENTS OF CHANGES IN NET ASSETS (Continued)
| PL Portfolio Optimization Moderate-Aggressive Fund | PL Portfolio Optimization Aggressive Fund | |||||||||||||||
Year Ended | Year Ended March 31, 2012 | Year Ended | Year Ended March 31, 2012 | |||||||||||||
| OPERATIONS | ||||||||||||||||
Net investment income | $3,587,839 | $2,919,713 | $537,206 | $372,230 | ||||||||||||
Net realized gain | 8,544,620 | 3,749,164 | 2,705,253 | 130,355 | ||||||||||||
Change in net unrealized appreciation | 52,807,520 | 20,625,477 | 15,639,878 | 4,646,591 | ||||||||||||
Net Increase in Net Assets | 64,939,979 | 27,294,354 | 18,882,337 | 5,149,176 | ||||||||||||
| DISTRIBUTIONS TO SHAREHOLDERS | ||||||||||||||||
Net investment income | ||||||||||||||||
Class A | (4,411,653 | ) | (3,489,595 | ) | (920,030 | ) | (561,009 | ) | ||||||||
Class B | (403,481 | ) | (329,689 | ) | (8,876 | ) | — | |||||||||
Class C | (1,123,731 | ) | (803,908 | ) | (38,173 | ) | — | |||||||||
Class R | (141,142 | ) | (158,188 | ) | (32,924 | ) | (14,803 | ) | ||||||||
Advisor Class | — | — | — | — | ||||||||||||
Net realized gains | ||||||||||||||||
Class A | — | — | — | — | ||||||||||||
Class B | — | — | — | — | ||||||||||||
Class C | — | — | — | — | ||||||||||||
Class R | — | — | — | — | ||||||||||||
Advisor Class | — | — | — | — | ||||||||||||
Net Decrease from Dividends and | (6,080,007 | ) | (4,781,380 | ) | (1,000,003 | ) | (575,812 | ) | ||||||||
| CAPITAL SHARE TRANSACTIONS | ||||||||||||||||
Proceeds from sale of shares | ||||||||||||||||
Class A | 105,360,707 | 117,617,903 | 31,112,894 | 31,784,559 | ||||||||||||
Class B | 16,703,733 | 21,114,174 | 4,168,688 | 5,002,321 | ||||||||||||
Class C | 59,537,333 | 59,635,150 | 17,338,489 | 24,218,955 | ||||||||||||
Class R | 6,712,096 | 9,034,035 | 2,402,818 | 4,243,854 | ||||||||||||
Advisor Class | 2,461,098 | — | 218,532 | — | ||||||||||||
Dividends and distribution reinvestments | ||||||||||||||||
Class A | 4,251,446 | 3,328,483 | 886,650 | 536,454 | ||||||||||||
Class B | 389,965 | 317,388 | 8,599 | — | ||||||||||||
Class C | 1,055,840 | 751,703 | 35,307 | — | ||||||||||||
Class R | 140,878 | 158,188 | 32,924 | 14,803 | ||||||||||||
Advisor Class | — | — | — | — | ||||||||||||
Cost of shares repurchased | ||||||||||||||||
Class A | (68,791,354 | ) | (68,423,799 | ) | (30,471,856 | ) | (26,695,077 | ) | ||||||||
Class B | (14,658,748 | ) | (12,303,686 | ) | (5,479,851 | ) | (4,355,282 | ) | ||||||||
Class C | (42,516,841 | ) | (41,950,485 | ) | (17,905,394 | ) | (24,561,074 | ) | ||||||||
Class R | (4,951,355 | ) | (11,879,593 | ) | (2,365,955 | ) | (3,221,587 | ) | ||||||||
Advisor Class | — | — | — | — | ||||||||||||
Net Increase (Decrease) in Net Assets from | 65,694,798 | 77,399,461 | (18,155 | ) | 6,967,926 | |||||||||||
NET INCREASE IN NET ASSETS | 124,554,770 | 99,912,435 | 17,864,179 | 11,541,290 | ||||||||||||
| NET ASSETS | ||||||||||||||||
Beginning of Year | 733,186,526 | 633,274,091 | 237,641,125 | 226,099,835 | ||||||||||||
End of Year | $857,741,296 | $733,186,526 | $255,505,304 | $237,641,125 | ||||||||||||
Undistributed Net Investment Income | $1,256,615 | $1,546,068 | $108,580 | $410,096 | ||||||||||||
| See Notes to Financial Statements |
C-6
Table of Contents
PACIFIC LIFE FUNDS
STATEMENTS OF CHANGES IN NET ASSETS (Continued)
PL Short Duration | PL Income Fund | PL Strategic Income Fund (1) | ||||||||||||||||||||||
| Year Ended March 31, 2013 | Period Ended March 31, 2012 | Year Ended | Year Ended March 31, 2012 | Year Ended | Period Ended March 31, 2012 | |||||||||||||||||||
| OPERATIONS | ||||||||||||||||||||||||
Net investment income | $457,155 | $60,554 | $12,407,322 | $4,544,980 | $1,320,514 | $221,490 | ||||||||||||||||||
Net realized gain | 313,926 | 56,130 | 16,442,913 | 3,201,825 | 1,637,946 | 228,363 | ||||||||||||||||||
Change in net unrealized appreciation | 398,995 | 134,540 | 6,339,135 | 3,709,953 | 1,086,514 | 346,009 | ||||||||||||||||||
Net Increase in Net Assets | 1,170,076 | 251,224 | 35,189,370 | 11,456,758 | 4,044,974 | 795,862 | ||||||||||||||||||
| DISTRIBUTIONS TO SHAREHOLDERS | ||||||||||||||||||||||||
Net investment income | ||||||||||||||||||||||||
Class A | (105,796 | ) | — | (9,199,985 | ) | (3,012,121 | ) | (256,720 | ) | — | ||||||||||||||
Class C | (39,542 | ) | — | (2,518,096 | ) | (549,513 | ) | (94,548 | ) | — | ||||||||||||||
Class I | (285,926 | ) | (59,453 | ) | (48,871 | ) | (940,375 | ) | (962,751 | ) | (190,597 | ) | ||||||||||||
Advisor Class | (25,265 | ) | — | (469,805 | ) | — | (19,981 | ) | — | |||||||||||||||
Net realized gains | ||||||||||||||||||||||||
Class A | (43,053 | ) | — | (8,848,617 | ) | (486,579 | ) | (230,684 | ) | — | ||||||||||||||
Class C | (39,621 | ) | — | (3,399,639 | ) | (122,517 | ) | (114,979 | ) | — | ||||||||||||||
Class I | (86,775 | ) | — | (41,790 | ) | (2,113 | ) | (573,860 | ) | — | ||||||||||||||
Advisor Class | (18,351 | ) | — | (513,462 | ) | — | (17,232 | ) | — | |||||||||||||||
Net Decrease from Dividends and | (644,329 | ) | (59,453 | ) | (25,040,265 | ) | (5,113,218 | ) | (2,270,755 | ) | (190,597 | ) | ||||||||||||
| CAPITAL SHARE TRANSACTIONS | ||||||||||||||||||||||||
Proceeds from sale of shares | ||||||||||||||||||||||||
Class A | 25,242,662 | — | 265,671,625 | 270,672,136 | 21,885,984 | — | ||||||||||||||||||
Class C | 10,802,733 | — | 96,463,160 | 78,065,409 | 8,573,364 | — | ||||||||||||||||||
Class I | 277,900 | 12,000,000 | 747,113 | 1,088,751 | 1,544,246 | 17,000,000 | ||||||||||||||||||
Advisor Class | 4,103,874 | — | 94,493,687 | — | 1,532,710 | — | ||||||||||||||||||
Dividends and distribution reinvestments | ||||||||||||||||||||||||
Class A | 120,623 | — | 13,900,718 | 2,349,682 | 455,409 | — | ||||||||||||||||||
Class C | 60,412 | — | 4,945,701 | 545,408 | 185,360 | — | ||||||||||||||||||
Class I | 372,696 | 59,453 | 69,602 | 942,488 | 1,521,257 | 190,597 | ||||||||||||||||||
Advisor Class | 39,437 | — | 857,150 | — | 31,591 | — | ||||||||||||||||||
Cost of shares repurchased | ||||||||||||||||||||||||
Class A | (2,876,027 | ) | — | (201,102,389 | ) | (35,115,509 | ) | (1,598,140 | ) | — | ||||||||||||||
Class C | (592,240 | ) | — | (20,073,793 | ) | (2,932,504 | ) | (927,797 | ) | — | ||||||||||||||
Class I | — | — | (354,320 | ) | (52,949,486 | ) | (183,792 | ) | — | |||||||||||||||
Advisor Class | (1,004,847 | ) | — | (1,088,570 | ) | — | (5,262 | ) | — | |||||||||||||||
Net Increase in Net Assets from | 36,547,223 | 12,059,453 | 254,529,684 | 262,666,375 | 33,014,930 | 17,190,597 | ||||||||||||||||||
NET INCREASE IN NET ASSETS | 37,072,970 | 12,251,224 | 264,678,789 | 269,009,915 | 34,789,149 | 17,795,862 | ||||||||||||||||||
| NET ASSETS | ||||||||||||||||||||||||
Beginning of Year or Period | 12,251,224 | — | 325,540,370 | 56,530,455 | 17,795,862 | — | ||||||||||||||||||
End of Year or Period | $49,324,194 | $12,251,224 | $590,219,159 | $325,540,370 | $52,585,011 | $17,795,862 | ||||||||||||||||||
Undistributed Net Investment Income | $15,134 | $7,918 | $219,811 | $49,246 | $34,596 | $39,748 | ||||||||||||||||||
| (1) | Operations commenced on December 19, 2011. |
| See Notes to Financial Statements |
C-7
Table of Contents
PACIFIC LIFE FUNDS
STATEMENTS OF CHANGES IN NET ASSETS (Continued)
PL Floating Rate | PL High Income Fund (2) | PL Money Market Fund | ||||||||||||||||||||||
Year Ended | Period Ended March 31, 2012 | Year Ended | Period Ended March 31, 2012 | Year Ended | Year Ended March 31, 2012 | |||||||||||||||||||
| OPERATIONS | ||||||||||||||||||||||||
Net investment income (loss) | $4,565,626 | $1,305,553 | $587,847 | $140,612 | ($2 | ) | ($5 | ) | ||||||||||||||||
Net realized gain (loss) | 2,210,370 | (55,054 | ) | 401,592 | 111,589 | 4 | (149 | ) | ||||||||||||||||
Change in net unrealized appreciation (depreciation) | 2,842,575 | 444,446 | 357,715 | 271,182 | — | — | ||||||||||||||||||
Net Increase (Decrease) in Net Assets | 9,618,571 | 1,694,945 | 1,347,154 | 523,383 | 2 | (154 | ) | |||||||||||||||||
| DISTRIBUTIONS TO SHAREHOLDERS | ||||||||||||||||||||||||
Net investment income | ||||||||||||||||||||||||
Class A | (2,050,935 | ) | (76,686 | ) | (74,859 | ) | — | — | — | |||||||||||||||
Class B | — | — | — | — | — | — | ||||||||||||||||||
Class C | (848,981 | ) | (19,277 | ) | (37,167 | ) | — | — | — | |||||||||||||||
Class I | (1,249,900 | ) | (1,190,555 | ) | (495,793 | ) | (117,780 | ) | — | — | ||||||||||||||
Class P | (123 | ) | — | — | — | — | — | |||||||||||||||||
Advisor Class | (325,153 | ) | — | (3,547 | ) | — | — | — | ||||||||||||||||
Net realized gains | ||||||||||||||||||||||||
Class A | (598,819 | ) | — | (51,882 | ) | — | — | — | ||||||||||||||||
Class B | — | — | — | — | — | — | ||||||||||||||||||
Class C | (295,573 | ) | — | (30,651 | ) | — | — | — | ||||||||||||||||
Class I | (84,833 | ) | — | (206,640 | ) | — | — | — | ||||||||||||||||
Class P | — | — | — | — | — | — | ||||||||||||||||||
Advisor Class | (127,065 | ) | — | (1,098 | ) | — | — | — | ||||||||||||||||
Net Decrease from Dividends and Distributions to Shareholders | (5,581,382 | ) | (1,286,518 | ) | (901,637 | ) | (117,780 | ) | — | — | ||||||||||||||
| CAPITAL SHARE TRANSACTIONS | ||||||||||||||||||||||||
Proceeds from sale of shares | ||||||||||||||||||||||||
Class A | 120,227,225 | 11,991,538 | 3,832,157 | — | 42,618,839 | 45,578,881 | ||||||||||||||||||
Class B | — | — | — | — | 1,053,696 | — | ||||||||||||||||||
Class C | 59,364,754 | 3,395,490 | 2,970,629 | — | 5,087,169 | — | ||||||||||||||||||
Class I | 4,750,535 | 40,343,574 | 199,429 | 7,000,000 | — | — | ||||||||||||||||||
Class P | 14,291 | — | — | — | — | — | ||||||||||||||||||
Advisor Class | 41,065,562 | — | 280,533 | — | — | — | ||||||||||||||||||
Dividends and distribution reinvestments | ||||||||||||||||||||||||
Class A | 2,110,981 | 49,677 | 116,387 | — | — | — | ||||||||||||||||||
Class B | — | — | — | — | — | — | ||||||||||||||||||
Class C | 788,075 | 7,229 | 56,881 | — | — | — | ||||||||||||||||||
Class I | 1,210,163 | 1,173,730 | 702,433 | 117,780 | — | — | ||||||||||||||||||
Class P | 123 | — | — | — | — | — | ||||||||||||||||||
Advisor Class | 273,104 | — | 4,088 | — | — | — | ||||||||||||||||||
Cost of shares repurchased | ||||||||||||||||||||||||
Class A | (11,094,224 | ) | (26,109 | ) | (490,218 | ) | — | (47,369,048 | ) | (51,953,637 | ) | |||||||||||||
Class B | — | — | — | — | (481,969 | ) | — | |||||||||||||||||
Class C | (1,319,775 | ) | (46,348 | ) | (844,981 | ) | — | (3,347,348 | ) | — | ||||||||||||||
Class I | (38,351,412 | ) | (20,000 | ) | (1,000 | ) | — | — | — | |||||||||||||||
Class P | (350 | ) | — | — | — | — | — | |||||||||||||||||
Advisor Class | (5,913,249 | ) | — | (5,627 | ) | — | — | — | ||||||||||||||||
Net Increase (Decrease) in Net Assets from | 173,125,803 | 56,868,781 | 6,820,711 | 7,117,780 | (2,438,661 | ) | (6,374,756 | ) | ||||||||||||||||
NET INCREASE (DECREASE) IN NET ASSETS | 177,162,992 | 57,277,208 | 7,266,228 | 7,523,383 | (2,438,659 | ) | (6,374,910 | ) | ||||||||||||||||
| NET ASSETS | ||||||||||||||||||||||||
Beginning of Year or Period | 57,277,208 | — | 7,523,383 | — | 32,067,611 | 38,442,521 | ||||||||||||||||||
End of Year or Period | $234,440,200 | $57,277,208 | $14,789,611 | $7,523,383 | $29,628,952 | $32,067,611 | ||||||||||||||||||
Undistributed/Accumulated Net Investment Income (Loss) | $113,212 | $22,716 | $9,171 | $29,213 | ($3,294 | ) | ($3,657 | ) | ||||||||||||||||
| (1) | Operations commenced on June 30, 2011. |
| (2) | Operations commenced on December 19, 2011. |
| See Notes to Financial Statements |
C-8
Table of Contents
PACIFIC LIFE FUNDS
Selected per share, ratios and supplemental data for each year or period ended March 31 were as follows:
| For the Year or Period Ended | Net Asset Value, Beginning of Year or Period | Net Investment Income (Loss) (1) | Net Realized and Unrealized Gain (Loss) | Total from Investment Operations | Distributions from Net Investment Income | Distributions from Capital Gains | Total Distributions | Net Asset Value, End of Year or Period | Total Returns (2) | Net Assets, End of Year or Period (in thousands) | Ratios of Expenses Before Expense Reductions to Average Net Assets (3) | Ratios of Expenses After Expense Reductions to Average Net Assets (3), (4) | Ratios of Net Investment Income (Loss) to Average Net Assets (3) | Portfolio Turnover Rates | ||||||||||||||||||||||||||||||||||||
PL Portfolio Optimization Conservative Fund (5) |
| |||||||||||||||||||||||||||||||||||||||||||||||||
Class A: |
| |||||||||||||||||||||||||||||||||||||||||||||||||
| 4/1/2012 - 3/31/2013 | $11.07 | $0.23 | $0.49 | $0.72 | ($0.34 | ) | ($0.05 | ) | ($0.39 | ) | $11.40 | 6.57 | % | $230,646 | 0.71% | 0.60% | 2.01% | 27.28 | % | |||||||||||||||||||||||||||||||
| 4/1/2011 - 3/31/2012 | 10.87 | 0.22 | 0.29 | 0.51 | (0.28 | ) | (0.03 | ) | (0.31 | ) | 11.07 | 4.80 | % | 182,912 | 0.73% | 0.60% | 1.99% | 10.20 | % | |||||||||||||||||||||||||||||||
| 4/1/2010 - 3/31/2011 | 10.41 | 0.15 | 0.63 | 0.78 | (0.32 | ) | — | (0.32 | ) | 10.87 | 7.60 | % | 130,249 | 0.78% | 0.53% | 1.43% | 18.42 | % | ||||||||||||||||||||||||||||||||
| 4/1/2009 - 3/31/2010 | 8.84 | 0.32 | 1.59 | 1.91 | (0.31 | ) | (0.03 | ) | (0.34 | ) | 10.41 | 21.67 | % | 68,938 | 0.95% | 0.20% | 3.20% | 20.50 | % | |||||||||||||||||||||||||||||||
| 4/1/2008 - 3/31/2009 | 10.55 | 0.37 | (1.50 | ) | (1.13 | ) | (0.55 | ) | (0.03 | ) | (0.58 | ) | 8.84 | (10.78 | %) | 32,817 | 0.95% | 0.16% | 3.91% | 26.41 | % | |||||||||||||||||||||||||||||
Class B: |
| |||||||||||||||||||||||||||||||||||||||||||||||||
| 4/1/2012 - 3/31/2013 | $10.96 | $0.14 | $0.50 | $0.64 | ($0.28 | ) | ($0.05 | ) | ($0.33 | ) | $11.27 | 5.89 | % | $41,999 | 1.46% | 1.35% | 1.27% | 27.28 | % | |||||||||||||||||||||||||||||||
| 4/1/2011 - 3/31/2012 | 10.78 | 0.13 | 0.29 | 0.42 | (0.21 | ) | (0.03 | ) | (0.24 | ) | 10.96 | 4.02 | % | 33,122 | 1.48% | 1.35% | 1.24% | 10.20 | % | |||||||||||||||||||||||||||||||
| 4/1/2010 - 3/31/2011 | 10.34 | 0.07 | 0.63 | 0.70 | (0.26 | ) | — | (0.26 | ) | 10.78 | 6.80 | % | 22,282 | 1.53% | 1.27% | 0.68% | 18.42 | % | ||||||||||||||||||||||||||||||||
| 4/1/2009 - 3/31/2010 | 8.77 | 0.24 | 1.60 | 1.84 | (0.24 | ) | (0.03 | ) | (0.27 | ) | 10.34 | 21.07 | % | 13,336 | 1.70% | 0.95% | 2.45% | 20.50 | % | |||||||||||||||||||||||||||||||
| 4/1/2008 - 3/31/2009 | 10.49 | 0.30 | (1.50 | ) | (1.20 | ) | (0.49 | ) | (0.03 | ) | (0.52 | ) | 8.77 | (11.51 | %) | 8,306 | 1.70% | 0.91% | 3.16% | 26.41 | % | |||||||||||||||||||||||||||||
Class C: |
| |||||||||||||||||||||||||||||||||||||||||||||||||
| 4/1/2012 - 3/31/2013 | $10.96 | $0.14 | $0.49 | $0.63 | ($0.28 | ) | ($0.05 | ) | ($0.33 | ) | $11.26 | 5.84 | % | $220,688 | 1.46% | 1.35% | 1.22% | 27.28 | % | |||||||||||||||||||||||||||||||
| 4/1/2011 - 3/31/2012 | 10.77 | 0.13 | 0.30 | 0.43 | (0.21 | ) | (0.03 | ) | (0.24 | ) | 10.96 | 4.08 | % | 158,748 | 1.48% | 1.35% | 1.24% | 10.20 | % | |||||||||||||||||||||||||||||||
| 4/1/2010 - 3/31/2011 | 10.33 | 0.07 | 0.63 | 0.70 | (0.26 | ) | — | (0.26 | ) | 10.77 | 6.81 | % | 117,458 | 1.53% | 1.27% | 0.68% | 18.42 | % | ||||||||||||||||||||||||||||||||
| 4/1/2009 - 3/31/2010 | 8.76 | 0.24 | 1.61 | 1.85 | (0.25 | ) | (0.03 | ) | (0.28 | ) | 10.33 | 21.14 | % | 67,620 | 1.70% | 0.95% | 2.45% | 20.50 | % | |||||||||||||||||||||||||||||||
| 4/1/2008 - 3/31/2009 | 10.49 | 0.30 | (1.51 | ) | (1.21 | ) | (0.49 | ) | (0.03 | ) | (0.52 | ) | 8.76 | (11.63 | %) | 37,659 | 1.70% | 0.91% | 3.16% | 26.41 | % | |||||||||||||||||||||||||||||
Class R: |
| |||||||||||||||||||||||||||||||||||||||||||||||||
| 4/1/2012 - 3/31/2013 | $11.03 | $0.20 | $0.50 | $0.70 | ($0.32 | ) | ($0.05 | ) | ($0.37 | ) | $11.36 | 6.38 | % | $12,357 | 0.96% | 0.85% | 1.79% | 27.28 | % | |||||||||||||||||||||||||||||||
| 4/1/2011 - 3/31/2012 | 10.83 | 0.19 | 0.29 | 0.48 | (0.25 | ) | (0.03 | ) | (0.28 | ) | 11.03 | 4.58 | % | 10,522 | 0.98% | 0.85% | 1.74% | 10.20 | % | |||||||||||||||||||||||||||||||
| 4/1/2010 - 3/31/2011 | 10.38 | 0.13 | 0.61 | 0.74 | (0.29 | ) | — | (0.29 | ) | 10.83 | 7.25 | % | 8,881 | 1.03% | 0.75% | 1.20% | 18.42 | % | ||||||||||||||||||||||||||||||||
| 4/1/2009 - 3/31/2010 | 8.81 | 0.29 | 1.60 | 1.89 | (0.29 | ) | (0.03 | ) | (0.32 | ) | 10.38 | 21.53 | % | 7,972 | 1.20% | 0.45% | 2.95% | 20.50 | % | |||||||||||||||||||||||||||||||
| 4/1/2008 - 3/31/2009 | 10.53 | 0.34 | (1.50 | ) | (1.16 | ) | (0.53 | ) | (0.03 | ) | (0.56 | ) | 8.81 | (11.07 | %) | 3,197 | 1.20% | 0.41% | 3.66% | 26.41 | % | |||||||||||||||||||||||||||||
Advisor Class: |
| |||||||||||||||||||||||||||||||||||||||||||||||||
| 12/31/2012 - 3/31/2013 | $11.18 | ($0.01 | ) | $0.24 | $0.23 | $— | $— | $— | $11.41 | 2.06 | % | $1,366 | 0.48% | 0.40% | (0.40%) | 27.28 | % | |||||||||||||||||||||||||||||||||
PL Portfolio Optimization Moderate-Conservative Fund (5) |
| |||||||||||||||||||||||||||||||||||||||||||||||||
Class A: |
| |||||||||||||||||||||||||||||||||||||||||||||||||
| 4/1/2012 - 3/31/2013 | $11.56 | $0.18 | $0.64 | $0.82 | ($0.28 | ) | $— | ($0.28 | ) | $12.10 | 7.22 | % | $246,609 | 0.71% | 0.60% | 1.58% | 24.23 | % | ||||||||||||||||||||||||||||||||
| 4/1/2011 - 3/31/2012 | 11.25 | 0.18 | 0.35 | 0.53 | (0.22 | ) | — | (0.22 | ) | 11.56 | 4.87 | % | 188,660 | 0.73% | 0.60% | 1.62% | 9.52 | % | ||||||||||||||||||||||||||||||||
| 4/1/2010 - 3/31/2011 | 10.54 | 0.12 | 0.87 | 0.99 | (0.28 | ) | — | (0.28 | ) | 11.25 | 9.53 | % | 132,919 | 0.78% | 0.52% | 1.16% | 9.61 | % | ||||||||||||||||||||||||||||||||
| 4/1/2009 - 3/31/2010 | 8.36 | 0.26 | 2.19 | 2.45 | (0.27 | ) | — | (0.27 | ) | 10.54 | 29.60 | % | 78,160 | 0.95% | 0.20% | 2.58% | 10.42 | % | ||||||||||||||||||||||||||||||||
| 4/1/2008 - 3/31/2009 | 10.96 | 0.30 | (2.36 | ) | (2.06 | ) | (0.44 | ) | (0.10 | ) | (0.54 | ) | 8.36 | (19.15 | %) | 39,518 | 0.92% | 0.14% | 3.10% | 31.68 | % | |||||||||||||||||||||||||||||
Class B: |
| |||||||||||||||||||||||||||||||||||||||||||||||||
| 4/1/2012 - 3/31/2013 | $11.46 | $0.10 | $0.63 | $0.73 | ($0.20 | ) | $— | ($0.20 | ) | $11.99 | 6.46 | % | $49,372 | 1.46% | 1.35% | 0.85% | 24.23 | % | ||||||||||||||||||||||||||||||||
| 4/1/2011 - 3/31/2012 | 11.17 | 0.10 | 0.35 | 0.45 | (0.16 | ) | — | (0.16 | ) | 11.46 | 4.07 | % | 40,812 | 1.48% | 1.35% | 0.87% | 9.52 | % | ||||||||||||||||||||||||||||||||
| 4/1/2010 - 3/31/2011 | 10.47 | 0.04 | 0.87 | 0.91 | (0.21 | ) | — | (0.21 | ) | 11.17 | 8.78 | % | 28,411 | 1.53% | 1.27% | 0.41% | 9.61 | % | ||||||||||||||||||||||||||||||||
| 4/1/2009 - 3/31/2010 | 8.30 | 0.18 | 2.20 | 2.38 | (0.21 | ) | — | (0.21 | ) | 10.47 | 28.87 | % | 19,202 | 1.70% | 0.95% | 1.83% | 10.42 | % | ||||||||||||||||||||||||||||||||
| 4/1/2008 - 3/31/2009 | 10.89 | 0.23 | (2.36 | ) | (2.13 | ) | (0.36 | ) | (0.10 | ) | (0.46 | ) | 8.30 | (19.85 | %) | 11,943 | 1.67% | 0.89% | 2.35% | 31.68 | % | |||||||||||||||||||||||||||||
Class C: |
| |||||||||||||||||||||||||||||||||||||||||||||||||
| 4/1/2012 - 3/31/2013 | $11.47 | $0.09 | $0.64 | $0.73 | ($0.21 | ) | $— | ($0.21 | ) | $11.99 | 6.41 | % | $196,123 | 1.46% | 1.35% | 0.81% | 24.23 | % | ||||||||||||||||||||||||||||||||
| 4/1/2011 - 3/31/2012 | 11.16 | 0.10 | 0.36 | 0.46 | (0.15 | ) | — | (0.15 | ) | 11.47 | 4.20 | % | 144,900 | 1.48% | 1.35% | 0.87% | 9.52 | % | ||||||||||||||||||||||||||||||||
| 4/1/2010 - 3/31/2011 | 10.47 | 0.04 | 0.86 | 0.90 | (0.21 | ) | — | (0.21 | ) | 11.16 | 8.71 | % | 107,411 | 1.53% | 1.27% | 0.41% | 9.61 | % | ||||||||||||||||||||||||||||||||
| 4/1/2009 - 3/31/2010 | 8.30 | 0.18 | 2.20 | 2.38 | (0.21 | ) | — | (0.21 | ) | 10.47 | 28.87 | % | 65,086 | 1.70% | 0.95% | 1.83% | 10.42 | % | ||||||||||||||||||||||||||||||||
| 4/1/2008 - 3/31/2009 | 10.89 | 0.22 | (2.35 | ) | (2.13 | ) | (0.36 | ) | (0.10 | ) | (0.46 | ) | 8.30 | (19.84 | %) | 40,640 | 1.67% | 0.89% | 2.35% | 31.68 | % | |||||||||||||||||||||||||||||
| Class R: | ||||||||||||||||||||||||||||||||||||||||||||||||||
| 4/1/2012 - 3/31/2013 | $11.52 | $0.16 | $0.63 | $0.79 | ($0.25 | ) | $— | ($0.25 | ) | $12.06 | 6.92 | % | $6,482 | 0.96% | 0.85% | 1.39% | 24.23 | % | ||||||||||||||||||||||||||||||||
| 4/1/2011 - 3/31/2012 | 11.22 | 0.15 | 0.35 | 0.50 | (0.20 | ) | — | (0.20 | ) | 11.52 | 4.53 | % | 6,301 | 0.98% | 0.85% | 1.37% | 9.52 | % | ||||||||||||||||||||||||||||||||
| 4/1/2010 - 3/31/2011 | 10.51 | 0.10 | 0.86 | 0.96 | (0.25 | ) | — | (0.25 | ) | 11.22 | 9.32 | % | 15,236 | 1.03% | 0.76% | 0.91% | 9.61 | % | ||||||||||||||||||||||||||||||||
| 4/1/2009 - 3/31/2010 | 8.34 | 0.23 | 2.20 | 2.43 | (0.26 | ) | — | (0.26 | ) | 10.51 | 29.32 | % | 10,478 | 1.20% | 0.45% | 2.33% | 10.42 | % | ||||||||||||||||||||||||||||||||
| 4/1/2008 - 3/31/2009 | 10.94 | 0.27 | (2.36 | ) | (2.09 | ) | (0.41 | ) | (0.10 | ) | (0.51 | ) | 8.34 | (19.36 | %) | 4,957 | 1.17% | 0.39% | 2.85% | 31.68 | % | |||||||||||||||||||||||||||||
Advisor Class: |
| |||||||||||||||||||||||||||||||||||||||||||||||||
| 12/31/2012 - 3/31/2013 | $11.68 | ($0.01 | ) | $0.43 | $0.42 | $— | $— | $— | $12.10 | 3.60 | % | $880 | 0.46% | 0.40% | (0.40%) | 24.23 | % | |||||||||||||||||||||||||||||||||
| See Notes to Financial Statements | See explanation of references on C-12 |
C-9
Table of Contents
PACIFIC LIFE FUNDS
FINANCIAL HIGHLIGHTS (Continued)
Selected per share, ratios and supplemental data for each year or period ended March 31 were as follows:
| For the Year or Period Ended | Net Asset Value, Beginning of Year or Period | Net Investment Income (Loss) (1) | Net Realized and Unrealized Gain (Loss) | Total from Investment Operations | Distributions from Net Investment Income | Distributions from Capital Gains | Total Distributions | Net Asset Value, End of Year or Period | Total Returns (2) | Net Assets, End of Year or Period (in thousands) | Ratios of Expenses Before Expense Reductions to Average Net Assets (3) | Ratios of Expenses After Expense Reductions to Average Net Assets (3), (4) | Ratios of Net Investment Income (Loss) to Average Net Assets (3) | Portfolio Turnover Rates | ||||||||||||||||||||||||||||||||||||
PL Portfolio Optimization Moderate Fund (5) |
| |||||||||||||||||||||||||||||||||||||||||||||||||
Class A: |
| |||||||||||||||||||||||||||||||||||||||||||||||||
| 4/1/2012 - 3/31/2013 | $12.26 | $0.15 | $0.86 | $1.01 | ($0.21 | ) | $— | ($0.21 | ) | $13.06 | 8.36 | % | $654,158 | 0.70% | 0.60% | 1.20% | 24.88 | % | ||||||||||||||||||||||||||||||||
| 4/1/2011 - 3/31/2012 | 11.88 | 0.14 | 0.42 | 0.56 | (0.18 | ) | — | (0.18 | ) | 12.26 | 4.82 | % | 517,945 | 0.72% | 0.60% | 1.18% | 6.77 | % | ||||||||||||||||||||||||||||||||
| 4/1/2010 - 3/31/2011 | 10.81 | 0.10 | 1.19 | 1.29 | (0.22 | ) | — | (0.22 | ) | 11.88 | 12.10 | % | 384,999 | 0.77% | 0.52% | 0.91% | 9.36 | % | ||||||||||||||||||||||||||||||||
| 4/1/2009 - 3/31/2010 | 7.96 | 0.20 | 2.87 | 3.07 | (0.22 | ) | — | (0.22 | ) | 10.81 | 38.85 | % | 247,213 | 0.92% | 0.20% | 1.99% | 9.43 | % | ||||||||||||||||||||||||||||||||
| 4/1/2008 - 3/31/2009 | 11.51 | 0.23 | (3.30 | ) | (3.07 | ) | (0.31 | ) | (0.17 | ) | (0.48 | ) | 7.96 | (27.25 | %) | 137,205 | 0.89% | 0.14% | 2.35% | 25.95 | % | |||||||||||||||||||||||||||||
Class B: |
| |||||||||||||||||||||||||||||||||||||||||||||||||
| 4/1/2012 - 3/31/2013 | $12.18 | $0.06 | $0.85 | $0.91 | ($0.13 | ) | $— | ($0.13 | ) | $12.96 | 7.49 | % | $136,411 | 1.45% | 1.35% | 0.47% | 24.88 | % | ||||||||||||||||||||||||||||||||
| 4/1/2011 - 3/31/2012 | 11.80 | 0.05 | 0.43 | 0.48 | (0.10 | ) | — | (0.10 | ) | 12.18 | 4.13 | % | 115,513 | 1.47% | 1.35% | 0.43% | 6.77 | % | ||||||||||||||||||||||||||||||||
| 4/1/2010 - 3/31/2011 | 10.74 | 0.02 | 1.18 | 1.20 | (0.14 | ) | — | (0.14 | ) | 11.80 | 11.33 | % | 92,064 | 1.52% | 1.26% | 0.17% | 9.36 | % | ||||||||||||||||||||||||||||||||
| 4/1/2009 - 3/31/2010 | 7.90 | 0.12 | 2.87 | 2.99 | (0.15 | ) | — | (0.15 | ) | 10.74 | 38.14 | % | 65,336 | 1.67% | 0.95% | 1.24% | 9.43 | % | ||||||||||||||||||||||||||||||||
| 4/1/2008 - 3/31/2009 | 11.44 | 0.16 | (3.30 | ) | (3.14 | ) | (0.23 | ) | (0.17 | ) | (0.40 | ) | 7.90 | (27.95 | %) | 40,658 | 1.64% | 0.89% | 1.60% | 25.95 | % | |||||||||||||||||||||||||||||
Class C: |
| |||||||||||||||||||||||||||||||||||||||||||||||||
| 4/1/2012 - 3/31/2013 | $12.17 | $0.06 | $0.85 | $0.91 | ($0.13 | ) | $— | ($0.13 | ) | $12.95 | 7.50 | % | $445,932 | 1.45% | 1.35% | 0.46% | 24.88 | % | ||||||||||||||||||||||||||||||||
| 4/1/2011 - 3/31/2012 | 11.78 | 0.05 | 0.43 | 0.48 | (0.09 | ) | — | (0.09 | ) | 12.17 | 4.18 | % | 366,753 | 1.47% | 1.35% | 0.43% | 6.77 | % | ||||||||||||||||||||||||||||||||
| 4/1/2010 - 3/31/2011 | 10.73 | 0.02 | 1.17 | 1.19 | (0.14 | ) | — | (0.14 | ) | 11.78 | 11.26 | % | 308,449 | 1.52% | 1.26% | 0.17% | 9.36 | % | ||||||||||||||||||||||||||||||||
| 4/1/2009 - 3/31/2010 | 7.88 | 0.12 | 2.88 | 3.00 | (0.15 | ) | — | (0.15 | ) | 10.73 | 38.36 | % | 210,889 | 1.67% | 0.95% | 1.24% | 9.43 | % | ||||||||||||||||||||||||||||||||
| 4/1/2008 - 3/31/2009 | 11.42 | 0.16 | (3.30 | ) | (3.14 | ) | (0.23 | ) | (0.17 | ) | (0.40 | ) | 7.88 | (28.02 | %) | 123,122 | 1.64% | 0.89% | 1.60% | 25.95 | % | |||||||||||||||||||||||||||||
Class R: |
| |||||||||||||||||||||||||||||||||||||||||||||||||
| 4/1/2012 - 3/31/2013 | $12.24 | $0.11 | $0.86 | $0.97 | ($0.18 | ) | $— | ($0.18 | ) | $13.03 | 8.02 | % | $29,715 | 0.95% | 0.85% | 0.93% | 24.88 | % | ||||||||||||||||||||||||||||||||
| 4/1/2011 - 3/31/2012 | 11.84 | 0.11 | 0.43 | 0.54 | (0.14 | ) | — | (0.14 | ) | 12.24 | 4.67 | % | 23,321 | 0.97% | 0.85% | 0.93% | 6.77 | % | ||||||||||||||||||||||||||||||||
| 4/1/2010 - 3/31/2011 | 10.77 | 0.07 | 1.18 | 1.25 | (0.18 | ) | — | (0.18 | ) | 11.84 | 11.82 | % | 23,658 | 1.02% | 0.75% | 0.68% | 9.36 | % | ||||||||||||||||||||||||||||||||
| 4/1/2009 - 3/31/2010 | 7.93 | 0.17 | 2.87 | 3.04 | (0.20 | ) | — | (0.20 | ) | 10.77 | 38.61 | % | 24,232 | 1.17% | 0.45% | 1.74% | 9.43 | % | ||||||||||||||||||||||||||||||||
| 4/1/2008 - 3/31/2009 | 11.48 | 0.20 | (3.29 | ) | (3.09 | ) | (0.29 | ) | (0.17 | ) | (0.46 | ) | 7.93 | (27.48 | %) | 12,323 | 1.14% | 0.39% | 2.10% | 25.95 | % | |||||||||||||||||||||||||||||
Advisor Class: |
| |||||||||||||||||||||||||||||||||||||||||||||||||
| 12/31/2012 - 3/31/2013 | $12.41 | ($0.01 | ) | $0.66 | $0.65 | $— | $— | $— | $13.06 | 5.24 | % | $3,396 | 0.45% | 0.40% | (0.40%) | 24.88 | % | |||||||||||||||||||||||||||||||||
PL Portfolio Optimization Moderate-Aggressive Fund (5) |
| |||||||||||||||||||||||||||||||||||||||||||||||||
Class A: |
| |||||||||||||||||||||||||||||||||||||||||||||||||
| 4/1/2012 - 3/31/2013 | $12.41 | $0.10 | $0.96 | $1.06 | ($0.14 | ) | $— | ($0.14 | ) | $13.33 | 8.62 | % | $436,055 | 0.71% | 0.60% | 0.83% | 24.95 | % | ||||||||||||||||||||||||||||||||
| 4/1/2011 - 3/31/2012 | 12.05 | 0.10 | 0.38 | 0.48 | (0.12 | ) | — | (0.12 | ) | 12.41 | 4.13 | % | 365,426 | 0.72% | 0.60% | 0.82% | 7.52 | % | ||||||||||||||||||||||||||||||||
| 4/1/2010 - 3/31/2011 | 10.68 | 0.07 | 1.44 | 1.51 | (0.14 | ) | — | (0.14 | ) | 12.05 | 14.36 | % | 301,232 | 0.77% | 0.51% | 0.62% | 13.33 | % | ||||||||||||||||||||||||||||||||
| 4/1/2009 - 3/31/2010 | 7.31 | 0.13 | 3.38 | 3.51 | (0.14 | ) | — | (0.14 | ) | 10.68 | 48.26 | % | 225,236 | 0.92% | 0.20% | 1.33% | 13.96 | % | ||||||||||||||||||||||||||||||||
| 4/1/2008 - 3/31/2009 | 11.79 | 0.16 | (4.21 | ) | (4.05 | ) | (0.19 | ) | (0.24 | ) | (0.43 | ) | 7.31 | (35.15 | %) | 128,976 | 0.89% | 0.14% | 1.63% | 22.98 | % | |||||||||||||||||||||||||||||
Class B: |
| |||||||||||||||||||||||||||||||||||||||||||||||||
| 4/1/2012 - 3/31/2013 | $12.30 | $0.01 | $0.96 | $0.97 | ($0.05 | ) | $— | ($0.05 | ) | $13.22 | 7.92 | % | $105,757 | 1.46% | 1.35% | 0.09% | 24.95 | % | ||||||||||||||||||||||||||||||||
| 4/1/2011 - 3/31/2012 | 11.93 | 0.01 | 0.40 | 0.41 | (0.04 | ) | — | (0.04 | ) | 12.30 | 3.50 | % | 95,937 | 1.47% | 1.35% | 0.07% | 7.52 | % | ||||||||||||||||||||||||||||||||
| 4/1/2010 - 3/31/2011 | 10.57 | (0.01 | ) | 1.43 | 1.42 | (0.06 | ) | — | (0.06 | ) | 11.93 | 13.59 | % | 83,812 | 1.52% | 1.26% | (0.13%) | 13.33 | % | |||||||||||||||||||||||||||||||
| 4/1/2009 - 3/31/2010 | 7.21 | 0.05 | 3.38 | 3.43 | (0.07 | ) | — | (0.07 | ) | 10.57 | 47.84 | % | 68,751 | 1.67% | 0.95% | 0.58% | 13.96 | % | ||||||||||||||||||||||||||||||||
| 4/1/2008 - 3/31/2009 | 11.69 | 0.08 | (4.19 | ) | (4.11 | ) | (0.13 | ) | (0.24 | ) | (0.37 | ) | 7.21 | (35.97 | %) | 43,587 | 1.64% | 0.89% | 0.88% | 22.98 | % | |||||||||||||||||||||||||||||
Class C: |
| |||||||||||||||||||||||||||||||||||||||||||||||||
| 4/1/2012 - 3/31/2013 | $12.27 | $0.01 | $0.96 | $0.97 | ($0.05 | ) | $— | ($0.05 | ) | $13.19 | 7.95 | % | $295,615 | 1.46% | 1.35% | 0.09% | 24.95 | % | ||||||||||||||||||||||||||||||||
| 4/1/2011 - 3/31/2012 | 11.91 | 0.01 | 0.39 | 0.40 | (0.04 | ) | — | (0.04 | ) | 12.27 | 3.39 | % | 257,114 | 1.47% | 1.35% | 0.07% | 7.52 | % | ||||||||||||||||||||||||||||||||
| 4/1/2010 - 3/31/2011 | 10.55 | (0.01 | ) | 1.43 | 1.42 | (0.06 | ) | — | (0.06 | ) | 11.91 | 13.64 | % | 230,964 | 1.52% | 1.26% | (0.13%) | 13.33 | % | |||||||||||||||||||||||||||||||
| 4/1/2009 - 3/31/2010 | 7.18 | 0.05 | 3.39 | 3.44 | (0.07 | ) | — | (0.07 | ) | 10.55 | 48.18 | % | 189,917 | 1.67% | 0.95% | 0.58% | 13.96 | % | ||||||||||||||||||||||||||||||||
| 4/1/2008 - 3/31/2009 | 11.67 | 0.08 | (4.20 | ) | (4.12 | ) | (0.13 | ) | (0.24 | ) | (0.37 | ) | 7.18 | (36.12 | %) | 117,549 | 1.64% | 0.89% | 0.88% | 22.98 | % | |||||||||||||||||||||||||||||
| Class R: | ||||||||||||||||||||||||||||||||||||||||||||||||||
| 4/1/2012 - 3/31/2013 | $12.40 | $0.07 | $0.96 | $1.03 | ($0.11 | ) | $— | ($0.11 | ) | $13.32 | 8.38 | % | $17,844 | 0.96% | 0.85% | 0.55% | 24.95 | % | ||||||||||||||||||||||||||||||||
| 4/1/2011 - 3/31/2012 | 12.03 | 0.07 | 0.40 | 0.47 | (0.10 | ) | — | (0.10 | ) | 12.40 | 3.97 | % | 14,710 | 0.97% | 0.85% | 0.57% | 7.52 | % | ||||||||||||||||||||||||||||||||
| 4/1/2010 - 3/31/2011 | 10.67 | 0.04 | 1.44 | 1.48 | (0.12 | ) | — | (0.12 | ) | 12.03 | 14.00 | % | 17,265 | 1.02% | 0.76% | 0.37% | 13.33 | % | ||||||||||||||||||||||||||||||||
| 4/1/2009 - 3/31/2010 | 7.30 | 0.10 | 3.39 | 3.49 | (0.12 | ) | — | (0.12 | ) | 10.67 | 48.07 | % | 12,211 | 1.17% | 0.45% | 1.08% | 13.96 | % | ||||||||||||||||||||||||||||||||
| 4/1/2008 - 3/31/2009 | 11.79 | 0.13 | (4.21 | ) | (4.08 | ) | (0.17 | ) | (0.24 | ) | (0.41 | ) | 7.30 | (35.38 | %) | 5,307 | 1.14% | 0.39% | 1.38% | 22.98 | % | |||||||||||||||||||||||||||||
Advisor Class: |
| |||||||||||||||||||||||||||||||||||||||||||||||||
| 12/31/2012 - 3/31/2013 | $12.50 | ($0.01 | ) | $0.85 | $0.84 | $— | $— | $— | $13.34 | 6.72 | % | $2,470 | 0.45% | 0.40% | (0.40%) | 24.95 | % | |||||||||||||||||||||||||||||||||
| See Notes to Financial Statements | See explanation of references on C-12 |
C-10
Table of Contents
PACIFIC LIFE FUNDS
FINANCIAL HIGHLIGHTS (Continued)
Selected per share, ratios and supplemental data for each year or period ended March 31 were as follows:
| For the Year or Period Ended | Net Asset Value, Beginning of Year or Period | Net Investment Income (Loss) (1) | Net Realized and Unrealized Gain (Loss) | Total from Investment Operations | Distributions from Net Investment Income | Distributions from Capital Gains | Total Distributions | Net Asset Value, End of Year or Period | Total Returns (2) | Net Assets, End of Year or Period (in thousands) | Ratios of Expenses Before Expense Reductions to Average Net Assets (3) | Ratios of Expenses After Expense Reductions to Average Net Assets (3), (4) | Ratios of Net Investment Income (Loss) to Average Net Assets (3) | Portfolio Turnover Rates | ||||||||||||||||||||||||||||||||||||
PL Portfolio Optimization Aggressive Fund (5) |
| |||||||||||||||||||||||||||||||||||||||||||||||||
| Class A: | ||||||||||||||||||||||||||||||||||||||||||||||||||
| 4/1/2012 - 3/31/2013 | $12.56 | $0.07 | $0.96 | $1.03 | ($0.09 | ) | $— | ($0.09 | ) | $13.50 | 8.30 | % | $133,265 | 0.73% | 0.60% | 0.57% | 29.68 | % | ||||||||||||||||||||||||||||||||
| 4/1/2011 - 3/31/2012 | 12.29 | 0.06 | 0.27 | 0.33 | (0.06 | ) | — | (0.06 | ) | 12.56 | 2.73 | % | 122,397 | 0.74% | 0.60% | 0.52% | 12.51 | % | ||||||||||||||||||||||||||||||||
| 4/1/2010 - 3/31/2011 | 10.66 | 0.05 | 1.65 | 1.70 | (0.07 | ) | — | (0.07 | ) | 12.29 | 16.11 | % | 114,246 | 0.80% | 0.51% | 0.44% | 26.22 | % | ||||||||||||||||||||||||||||||||
| 4/1/2009 - 3/31/2010 | 6.92 | 0.09 | 3.75 | 3.84 | (0.10 | ) | — | (0.10 | ) | 10.66 | 55.84 | % | 98,669 | 0.94% | 0.20% | 0.94% | 25.89 | % | ||||||||||||||||||||||||||||||||
| 4/1/2008 - 3/31/2009 | 12.04 | 0.09 | (4.88 | ) | (4.79 | ) | — | (0.33 | ) | (0.33 | ) | 6.92 | (40.88 | %) | 59,937 | 0.92% | 0.14% | 0.97% | 18.16 | % | ||||||||||||||||||||||||||||||
| Class B: | ||||||||||||||||||||||||||||||||||||||||||||||||||
| 4/1/2012 - 3/31/2013 | $12.28 | ($0.02 | ) | $0.96 | $0.94 | ($0.00 | )(9) | $— | ($0.00 | )(9) | $13.22 | 7.69 | % | $33,013 | 1.48% | 1.35% | (0.17%) | 29.68 | % | |||||||||||||||||||||||||||||||
| 4/1/2011 - 3/31/2012 | 12.03 | (0.03 | ) | 0.28 | 0.25 | — | — | — | 12.28 | 2.08 | % | 31,969 | 1.49% | 1.35% | (0.23%) | 12.51 | % | |||||||||||||||||||||||||||||||||
| 4/1/2010 - 3/31/2011 | 10.46 | (0.03 | ) | 1.65 | 1.62 | (0.05 | ) | — | (0.05 | ) | 12.03 | 15.62 | % | 30,693 | 1.55% | 1.25% | (0.31%) | 26.22 | % | |||||||||||||||||||||||||||||||
| 4/1/2009 - 3/31/2010 | 6.72 | 0.02 | 3.75 | 3.77 | (0.03 | ) | — | (0.03 | ) | 10.46 | 56.15 | % | 28,776 | 1.69% | 0.95% | 0.19% | 25.89 | % | ||||||||||||||||||||||||||||||||
| 4/1/2008 - 3/31/2009 | 11.93 | 0.02 | (4.90 | ) | (4.88 | ) | — | (0.33 | ) | (0.33 | ) | 6.72 | (42.04 | %) | 18,042 | 1.67% | 0.89% | 0.22% | 18.16 | % | ||||||||||||||||||||||||||||||
| Class C: | ||||||||||||||||||||||||||||||||||||||||||||||||||
| 4/1/2012 - 3/31/2013 | $12.28 | ($0.02 | ) | $0.97 | $0.95 | ($0.01 | ) | $— | ($0.01 | ) | $13.22 | 7.71 | % | $81,754 | 1.48% | 1.35% | (0.18%) | 29.68 | % | |||||||||||||||||||||||||||||||
| 4/1/2011 - 3/31/2012 | 12.03 | (0.03 | ) | 0.28 | 0.25 | — | — | — | 12.28 | 2.08 | % | 76,613 | 1.49% | 1.35% | (0.23%) | 12.51 | % | |||||||||||||||||||||||||||||||||
| 4/1/2010 - 3/31/2011 | 10.46 | (0.03 | ) | 1.65 | 1.62 | (0.05 | ) | — | (0.05 | ) | 12.03 | 15.61 | % | 75,607 | 1.55% | 1.25% | (0.31%) | 26.22 | % | |||||||||||||||||||||||||||||||
| 4/1/2009 - 3/31/2010 | 6.71 | 0.02 | 3.75 | 3.77 | (0.02 | ) | — | (0.02 | ) | 10.46 | 56.11 | % | 68,230 | 1.69% | 0.95% | 0.19% | 25.89 | % | ||||||||||||||||||||||||||||||||
| 4/1/2008 - 3/31/2009 | 11.92 | 0.02 | (4.90 | ) | (4.88 | ) | — | (0.33 | ) | (0.33 | ) | 6.71 | (41.99 | %) | 43,588 | 1.67% | 0.89% | 0.22% | 18.16 | % | ||||||||||||||||||||||||||||||
| Class R: | ||||||||||||||||||||||||||||||||||||||||||||||||||
| 4/1/2012 - 3/31/2013 | $12.48 | $0.04 | $0.97 | $1.01 | ($0.06 | ) | $— | ($0.06 | ) | $13.43 | 8.17 | % | $7,251 | 0.98% | 0.85% | 0.33% | 29.68 | % | ||||||||||||||||||||||||||||||||
| 4/1/2011 - 3/31/2012 | 12.22 | 0.03 | 0.26 | 0.29 | (0.03 | ) | — | (0.03 | ) | 12.48 | 2.43 | % | 6,662 | 0.99% | 0.85% | 0.27% | 12.51 | % | ||||||||||||||||||||||||||||||||
| 4/1/2010 - 3/31/2011 | 10.61 | 0.02 | 1.65 | 1.67 | (0.06 | ) | — | (0.06 | ) | 12.22 | 16.02 | % | 5,553 | 1.05% | 0.76% | 0.19% | 26.22 | % | ||||||||||||||||||||||||||||||||
| 4/1/2009 - 3/31/2010 | 6.88 | 0.06 | 3.76 | 3.82 | (0.09 | ) | — | (0.09 | ) | 10.61 | 55.70 | % | 4,448 | 1.19% | 0.45% | 0.69% | 25.89 | % | ||||||||||||||||||||||||||||||||
| 4/1/2008 - 3/31/2009 | 12.03 | 0.06 | (4.88 | ) | (4.82 | ) | — | (0.33 | ) | (0.33 | ) | 6.88 | (41.17 | %) | 2,106 | 1.17% | 0.39% | 0.72% | 18.16 | % | ||||||||||||||||||||||||||||||
| Advisor Class: | ||||||||||||||||||||||||||||||||||||||||||||||||||
| 12/31/2012 - 3/31/2013 | $12.56 | ($0.01 | ) | $0.96 | $0.95 | $— | $— | $— | $13.51 | 7.56 | % | $222 | 0.48% | 0.40% | (0.40%) | 29.68 | % | |||||||||||||||||||||||||||||||||
PL Short Duration Income Fund (6) |
| |||||||||||||||||||||||||||||||||||||||||||||||||
| Class A: | ||||||||||||||||||||||||||||||||||||||||||||||||||
| 6/29/2012 - 3/31/2013 | $10.20 | $0.16 | $0.32 | $0.48 | ($0.15 | ) | ($0.07 | ) | ($0.22 | ) | $10.46 | 4.78 | % | $22,589 | 1.24% | 0.85% | 2.02% | 145.60 | % | |||||||||||||||||||||||||||||||
Class C: |
| |||||||||||||||||||||||||||||||||||||||||||||||||
| 6/29/2012 - 3/31/2013 | $10.20 | $0.10 | $0.33 | $0.43 | ($0.11 | ) | ($0.07 | ) | ($0.18 | ) | $10.45 | 4.28 | % | $10,307 | 1.99% | 1.60% | 1.27% | 145.60 | % | |||||||||||||||||||||||||||||||
Class I: |
| |||||||||||||||||||||||||||||||||||||||||||||||||
| 4/1/2012 - 3/31/2013 | $10.14 | $0.23 | $0.38 | $0.61 | ($0.23 | ) | ($0.07 | ) | ($0.30 | ) | $10.45 | 6.10 | % | $13,280 | 1.08% | 0.60% | 2.27% | 145.60 | % | |||||||||||||||||||||||||||||||
| 12/19/2011 - 3/31/2012 | 10.00 | 0.06 | 0.15 | 0.21 | (0.07 | ) | — | (0.07 | ) | 10.14 | 2.10 | % | 12,251 | 2.04% | 0.60% | 2.06% | 73.40 | % | ||||||||||||||||||||||||||||||||
Advisor Class: |
| |||||||||||||||||||||||||||||||||||||||||||||||||
| 6/29/2012 - 3/31/2013 | $10.20 | $0.18 | $0.31 | $0.49 | ($0.16 | ) | ($0.07 | ) | ($0.23 | ) | $10.46 | 4.85 | % | $3,148 | 0.99% | 0.60% | 2.27% | 145.60 | % | |||||||||||||||||||||||||||||||
PL Income Fund (7) |
| |||||||||||||||||||||||||||||||||||||||||||||||||
| Class A: | ||||||||||||||||||||||||||||||||||||||||||||||||||
| 4/1/2012 - 3/31/2013 | $10.61 | $0.30 | $0.55 | $0.85 | ($0.29 | ) | ($0.25 | ) | ($0.54 | ) | $10.92 | 8.13 | % | $333,987 | 1.17% | 0.90% | 2.76% | 171.37 | % | |||||||||||||||||||||||||||||||
| 4/1/2011 - 3/31/2012 | 10.16 | 0.30 | 0.48 | 0.78 | (0.30 | ) | (0.03 | ) | (0.33 | ) | 10.61 | 7.79 | % | 247,522 | 1.35% | 0.90% | 2.94% | 199.30 | % | |||||||||||||||||||||||||||||||
| 12/31/2010 - 3/31/2011 | 10.00 | 0.09 | 0.16 | 0.25 | (0.09 | ) | — | (0.09 | ) | 10.16 | 2.46 | % | 5,300 | 1.77% | 0.90% | 3.62% | 142.25 | % | ||||||||||||||||||||||||||||||||
Class C: |
| |||||||||||||||||||||||||||||||||||||||||||||||||
| 4/1/2012 - 3/31/2013 | $10.62 | $0.22 | $0.55 | $0.77 | ($0.21 | ) | ($0.25 | ) | ($0.46 | ) | $10.93 | 7.37 | % | $160,472 | 1.92% | 1.65% | 2.01% | 171.37 | % | |||||||||||||||||||||||||||||||
| 6/30/2011 - 3/31/2012 | 10.32 | 0.17 | 0.33 | 0.50 | (0.17 | ) | (0.03 | ) | (0.20 | ) | 10.62 | 4.89 | % | 76,726 | 2.07% | 1.65% | 2.17% | 199.30 | % | |||||||||||||||||||||||||||||||
Class I: |
| |||||||||||||||||||||||||||||||||||||||||||||||||
| 4/1/2012 - 3/31/2013 | $10.62 | $0.33 | $0.55 | $0.88 | ($0.32 | ) | ($0.25 | ) | ($0.57 | ) | $10.93 | 8.39 | % | $1,794 | 0.77% | 0.65% | 3.01% | 171.37 | % | |||||||||||||||||||||||||||||||
| 4/1/2011 - 3/31/2012 | 10.16 | 0.36 | 0.44 | 0.80 | (0.31 | ) | (0.03 | ) | (0.34 | ) | 10.62 | 7.95 | % | 1,292 | 0.95% | 0.65% | 3.42% | 199.30 | % | |||||||||||||||||||||||||||||||
| 12/31/2010 - 3/31/2011 | 10.00 | 0.10 | 0.15 | 0.25 | (0.09 | ) | — | (0.09 | ) | 10.16 | 2.48 | % | 51,231 | 1.37% | 0.65% | 3.87% | 142.25 | % | ||||||||||||||||||||||||||||||||
Advisor Class: |
| |||||||||||||||||||||||||||||||||||||||||||||||||
| 6/29/2012 - 3/31/2013 | $10.79 | $0.24 | $0.41 | $0.65 | ($0.24 | ) | ($0.25 | ) | ($0.49 | ) | $10.95 | 5.97 | % | $93,966 | 0.94% | 0.67% | 2.99% | 171.37 | % | |||||||||||||||||||||||||||||||
| See Notes to Financial Statements | See explanation of references on C-12 |
C-11
Table of Contents
PACIFIC LIFE FUNDS
FINANCIAL HIGHLIGHTS (Continued)
Selected per share, ratios and supplemental data for each year or period ended March 31 were as follows:
| For the Year or Period Ended | Net Asset Value, Beginning of Year or Period | Net Investment Income (Loss) (1) | Net Realized and Unrealized Gain | Total from Investment Operations | Distributions from Net Investment Income | Distributions from Capital Gains | Total Distributions | Net Asset Value, End of Year or Period | Total Returns (2) | Net Assets, End of Year or Period (in thousands) | Ratios of Expenses Before Expense Reductions to Average Net Assets (3) | Ratios of Expenses After Expense Reductions to Average Net Assets (3), (4) | Ratios of Net Investment Income (Loss) to Average Net Assets (3) | Portfolio Turnover Rates | ||||||||||||||||||||||||||||||||||||
PL Strategic Income Fund (6) |
| |||||||||||||||||||||||||||||||||||||||||||||||||
Class A: |
| |||||||||||||||||||||||||||||||||||||||||||||||||
| 6/29/2012 - 3/31/2013 | $10.53 | $0.38 | $0.98 | $1.36 | ($0.36 | ) | ($0.30 | ) | ($0.66 | ) | $11.23 | 13.12 | % | $20,963 | 1.47% | 1.05% | 4.55% | 352.86 | % | |||||||||||||||||||||||||||||||
Class C: |
| |||||||||||||||||||||||||||||||||||||||||||||||||
| 6/29/2012 - 3/31/2013 | $10.53 | $0.32 | $0.98 | $1.30 | ($0.31 | ) | ($0.30 | ) | ($0.61 | ) | $11.22 | 12.52 | % | $7,948 | 2.22% | 1.80% | 3.80% | 352.86 | % | |||||||||||||||||||||||||||||||
Class I: |
| |||||||||||||||||||||||||||||||||||||||||||||||||
| 4/1/2012 - 3/31/2013 | $10.40 | $0.52 | $1.09 | $1.61 | ($0.53 | ) | ($0.30 | ) | ($0.83 | ) | $11.18 | 15.94 | % | $22,099 | 1.22% | 0.80% | 4.80% | 352.86 | % | |||||||||||||||||||||||||||||||
| 12/19/2011 - 3/31/2012 | 10.00 | 0.14 | 0.38 | 0.52 | (0.12 | ) | — | (0.12 | ) | 10.40 | 5.22 | % | 17,796 | 1.78% | 0.80% | 4.84% | 155.66 | % | ||||||||||||||||||||||||||||||||
Advisor Class: |
| |||||||||||||||||||||||||||||||||||||||||||||||||
| 6/29/2012 - 3/31/2013 | $10.53 | $0.40 | $0.97 | $1.37 | ($0.36 | ) | ($0.30 | ) | ($0.66 | ) | $11.24 | 13.31 | % | $1,575 | 1.24% | 0.82% | 4.78% | 352.86 | % | |||||||||||||||||||||||||||||||
PL Floating Rate Income Fund (7) |
| |||||||||||||||||||||||||||||||||||||||||||||||||
Class A: |
| |||||||||||||||||||||||||||||||||||||||||||||||||
| 4/1/2012 - 3/31/2013 | $10.07 | $0.46 | $0.46 | $0.92 | ($0.43 | ) | ($0.10 | ) | ($0.53 | ) | $10.46 | 9.36 | % | $125,007 | 1.43% | 1.05% | 4.46% | 185.79 | % | |||||||||||||||||||||||||||||||
| 12/30/2011 - 3/31/2012 | 9.81 | 0.13 | 0.24 | 0.37 | (0.11 | ) | — | (0.11 | ) | 10.07 | 3.79 | % | 12,071 | 1.55% | 1.05% | 5.33% | 139.00 | % | ||||||||||||||||||||||||||||||||
| Class C: | ||||||||||||||||||||||||||||||||||||||||||||||||||
| 4/1/2012 - 3/31/2013 | $10.07 | $0.38 | $0.46 | $0.84 | ($0.36 | ) | ($0.10 | ) | ($0.46 | ) | $10.45 | 8.56 | % | $63,045 | 2.18% | 1.80% | 3.71% | 185.79 | % | |||||||||||||||||||||||||||||||
| 12/30/2011 - 3/31/2012 | 9.81 | 0.11 | 0.25 | 0.36 | (0.10 | ) | — | (0.10 | ) | 10.07 | 3.68 | % | 3,372 | 2.30% | 1.80% | 4.61% | 139.00 | % | ||||||||||||||||||||||||||||||||
| Class I: | ||||||||||||||||||||||||||||||||||||||||||||||||||
| 4/1/2012 - 3/31/2013 | $10.08 | $0.48 | $0.46 | $0.94 | ($0.45 | ) | ($0.10 | ) | ($0.55 | ) | $10.47 | 9.56 | % | $10,726 | 1.03% | 0.80% | 4.71% | 185.79 | % | |||||||||||||||||||||||||||||||
| 6/30/2011 - 3/31/2012 | 10.00 | 0.34 | 0.06 | 0.40 | (0.32 | ) | — | (0.32 | ) | 10.08 | 4.11 | % | 41,834 | 1.24% | 0.80% | 4.60% | 139.00 | % | ||||||||||||||||||||||||||||||||
| Class P: | ||||||||||||||||||||||||||||||||||||||||||||||||||
| 12/31/2012 - 3/31/2013 | $10.29 | $0.12 | $0.16 | $0.28 | ($0.10 | ) | $— | ($0.10 | ) | $10.47 | 2.74 | % | $14 | 0.99% | 0.80% | 4.70% | 185.79 | % | ||||||||||||||||||||||||||||||||
Advisor Class: |
| |||||||||||||||||||||||||||||||||||||||||||||||||
| 6/29/2012 - 3/31/2013 | $10.12 | $0.36 | $0.45 | $0.81 | ($0.34 | ) | ($0.10 | ) | (0.44 | ) | $10.49 | 8.13 | % | $35,648 | 1.15% | 0.80% | 4.70% | 185.79 | % | |||||||||||||||||||||||||||||||
PL High Income Fund (6) |
| |||||||||||||||||||||||||||||||||||||||||||||||||
Class A: |
| |||||||||||||||||||||||||||||||||||||||||||||||||
| 6/29/2012 - 3/31/2013 | $10.57 | $0.46 | $0.84 | $1.30 | ($0.44 | ) | ($0.27 | ) | ($0.71 | ) | $11.16 | 12.59 | % | $3,497 | 1.87% | 1.05% | 5.57% | 153.78 | % | |||||||||||||||||||||||||||||||
Class C: |
| |||||||||||||||||||||||||||||||||||||||||||||||||
| 6/29/2012 - 3/31/2013 | $10.57 | $0.40 | $0.85 | $1.25 | ($0.39 | ) | ($0.27 | ) | ($0.66 | ) | $11.16 | 12.11 | % | $2,203 | 2.62% | 1.80% | 4.82% | 153.78 | % | |||||||||||||||||||||||||||||||
Class I: |
| |||||||||||||||||||||||||||||||||||||||||||||||||
| 4/1/2012 - 3/31/2013 | $10.58 | $0.63 | $0.82 | $1.45 | ($0.67 | ) | ($0.27 | ) | ($0.94 | ) | $11.09 | 14.21 | % | $8,810 | 1.78% | 0.80% | 5.82% | 153.78 | % | |||||||||||||||||||||||||||||||
| 12/19/2011 - 3/31/2012 | 10.00 | 0.20 | 0.55 | 0.75 | (0.17 | ) | — | (0.17 | ) | 10.58 | 7.50 | % | 7,523 | 2.82% | 0.80% | 6.73% | 92.87 | % | ||||||||||||||||||||||||||||||||
Advisor Class: |
| |||||||||||||||||||||||||||||||||||||||||||||||||
| 6/29/2012 - 3/31/2013 | $10.57 | $0.48 | $0.85 | $1.33 | ($0.45 | ) | ($0.27 | ) | ($0.72 | ) | $11.18 | 12.87 | % | $279 | 1.63% | 0.81% | 5.81% | 153.78 | % | |||||||||||||||||||||||||||||||
PL Money Market Fund (8) |
| |||||||||||||||||||||||||||||||||||||||||||||||||
Class A: |
| |||||||||||||||||||||||||||||||||||||||||||||||||
| 4/1/2012 - 3/31/2013 | $1.00 | ($0.00 | )(9) | $0.00 | (9) | $0.00 | (9) | $— | $— | $— | $1.00 | 0.00 | % | $27,317 | 1.10% | 0.12% | (0.00%)(9) | N/A | ||||||||||||||||||||||||||||||||
| 4/1/2011 - 3/31/2012 | 1.00 | (0.00 | )(9) | 0.00 | (9) | (0.00 | )(9) | — | — | — | 1.00 | 0.00 | % | 32,068 | 1.01% | 0.11% | (0.00%)(9) | N/A | ||||||||||||||||||||||||||||||||
| 4/1/2010 - 3/31/2011 | 1.00 | (0.00 | )(9) | 0.00 | (9) | 0.00 | — | — | — | 1.00 | 0.00 | % | 38,443 | 1.00% | 0.24% | (0.00%)(9) | N/A | |||||||||||||||||||||||||||||||||
| 4/1/2009 - 3/31/2010 | 1.00 | (0.00 | )(9) | 0.00 | (9) | 0.00 | (0.00 | )(9) | — | (0.00 | )(9) | 1.00 | 0.03 | % | 34,669 | 1.09% | 0.36% | (0.00%)(9) | N/A | |||||||||||||||||||||||||||||||
| 4/1/2008 - 3/31/2009 | 1.00 | 0.01 | — | 0.01 | (0.01 | ) | — | (0.01 | ) | 1.00 | 1.27 | % | 55,424 | 1.18% | 0.78% | 1.22% | N/A | |||||||||||||||||||||||||||||||||
Class B: |
| |||||||||||||||||||||||||||||||||||||||||||||||||
| 6/29/2012 - 3/31/2013 | $1.00 | ($0.00 | )(9) | $0.00 | (9) | $0.00 | (9) | $— | $— | $— | $1.00 | 0.00 | % | $572 | 1.85% | 0.11% | (0.00%)(9) | N/A | ||||||||||||||||||||||||||||||||
Class C: |
| |||||||||||||||||||||||||||||||||||||||||||||||||
| 6/29/2012 - 3/31/2013 | $1.00 | ($0.00 | )(9) | $0.00 | (9) | $0.00 | (9) | $— | $— | $— | $1.00 | 0.00 | % | $1,740 | 1.85% | 0.11% | (0.00%)(9) | N/A | ||||||||||||||||||||||||||||||||
| (1) | Net investment income (loss) per share has been calculated using the average shares method except for the PL Money Market Fund. |
| (2) | The total returns include reinvestment of all dividends and capital gain distributions, if any, and do not include deductions of any applicable sales charges. Total returns are not annualized for periods less than one full year. |
| (3) | The ratios are annualized for periods of less than one full year. |
| (4) | The ratios of expenses after expense reductions to average net assets are after any advisory fee waivers, adviser expense reimbursements, administration fee waivers, and service fee waivers, as discussed in Note 6B in Notes to Financial Statements. The expense ratios for all the PL Portfolio Optimization Funds do not include fees and expenses of the underlying funds (see Note 1 in Notes to Financial Statements) in which the PL Portfolio Optimization Funds invest. |
| (5) | Advisor Class shares of the PL Portfolio Optimization Funds commenced operations on December 31, 2012. |
| (6) | Class A, Class C and Advisor Class shares of the PL Short Duration Income, PL Strategic Income and PL High Income Funds commenced operations on June 29, 2012. |
| (7) | Advisor Class shares of the PL Income and PL Floating Rate Income Funds commenced operations on June 29, 2012. Class P shares of the PL Floating Rate Income Fund commenced operations on December 31, 2012. |
| (8) | Class B and Class C shares of the PL Money Market Fund commenced operations on June 29, 2012. |
| (9) | Amount represents less than $0.005 per share or less than 0.005%. |
| See Notes to Financial Statements |
C-12
Table of Contents
PACIFIC LIFE FUNDS
1. ORGANIZATION
Pacific Life Funds (the “Trust”) is a Delaware statutory trust, which was formed on May 21, 2001, and is registered under the Investment Company Act of 1940 (“1940 Act”), as amended, as an open-end management investment company. Pacific Life Fund Advisors LLC (“PLFA” or “Adviser”) serves as investment adviser to the Trust. As of March 31, 2013, the Trust was comprised of thirty-three separate funds, eleven of which are presented in this report (each individually, a “Fund”, and collectively the “Funds”): PL Portfolio Optimization Conservative Fund, PL Portfolio Optimization Moderate-Conservative Fund, PL Portfolio Optimization Moderate Fund, PL Portfolio Optimization Moderate-Aggressive Fund, PL Portfolio Optimization Aggressive Fund (collectively, the “Portfolio Optimization Funds”); and the PL Short Duration Income Fund, PL Income Fund, PL Strategic Income Fund, PL Floating Rate Income Fund, PL High Income Fund and PL Money Market Fund.
The Portfolio Optimization Funds offer Class A, Class B, Class C, Class R and Advisor Class shares. Each class is distinguished by its applicable sales charges and distribution and/or service fees and in general: (i) Class A shares are subject to a maximum 5.50% front-end sales charge; (ii) Class B shares are subject to a maximum 5.00% contingent deferred sales charge (“CDSC”); (iii) Class C shares are subject to a maximum 1.00% CDSC; and (iv) Class R shares and Advisor Class shares are sold at net asset value (“NAV”) without a sales charge. The sales charge for Class A shares is reduced for purchases of $50,000 or more and may be waived in certain circumstances. There is no sales charge for Class A shares for purchases of $1 million or more, although there is a CDSC of 1.00% on redemptions of such Class A shares within one year of purchase.
The PL Short Duration Income Fund, PL Income Fund, PL Strategic Income Fund, PL Floating Rate Income Fund and PL High Income Fund offer Class A, Class C, Class I and Advisor Class shares. Additionally, the PL Floating Rate Income Fund offers Class P shares. Each class is distinguished by its level of distribution and/or service fees and in general: (i) Class A shares of the PL Short Duration Income and PL Floating Rate Income Funds are subject to a maximum 3.00% front-end sales charge, and Class A shares of the PL Income, PL Strategic Income and PL High Income Funds are subject to a maximum 4.25% front-end sales charge; (ii) Class C shares are subject to a maximum 1.00% CDSC; and (iii) Class I shares and Advisor Class shares are sold at NAV without a sales charge. The sales charge for Class A shares is reduced for purchases of $100,000 or more and may be waived in certain circumstances. There is no sales charge for Class A shares for purchases of $500,000 or more, although there is a CDSC of 1.00% of such Class A shares within one year of purchase, which may be waived in certain circumstances.
The PL Money Market Fund offers Class A, Class B and Class C shares, which are sold at NAV without an initial sales charge. Class B shares are subject to a maximum 5.00% CDSC. Class C shares are subject to a maximum 1.00% CDSC.
The Trust’s distributor receives all net commissions (front-end sales charges and CDSC) from the sales of all applicable share classes (see Note 5).
The Portfolio Optimization Funds invest their assets in Class P shares of other funds of the Trust (collectively, the “PL Underlying Funds”).
The annual report for the PL Underlying Funds is not included in this report; there is a separate annual report for the PL Underlying Funds, which is available without charge. For information on how to obtain the annual report for the PL Underlying Funds, see the Where to Go for More Information section of this report on page F-10.
2. SIGNIFICANT ACCOUNTING POLICIES
The financial statements have been prepared in conformity with accounting principles generally accepted in the United States of America (“U.S. GAAP”) for investment companies. In preparing the financial statements, management is required to make estimates and assumptions that affect the reported amounts of assets and liabilities and disclosure of contingent assets and liabilities at the date of the financial statements and the reported increases and decreases in net assets from operations during the reporting period. Actual results could differ from those estimates. The following is a summary of the significant accounting policies followed by the Trust in the preparation of the financial statements.
The Fund implemented the additional disclosure requirements under the Accounting Standards Update No. 2011-04 issued by the Financial Accounting Standards Board which requires additional disclosures for fair value measurements categorized within Level 3 of the three-tier hierarchy defined under the Accounting Standards Codification No. 820, Fair Value Measurements and Disclosure, as well as additional disclosure for all transfers in and out of Level 1 and Level 2 (see Note 3D and Notes to Schedules of Investments).
A. INVESTMENT TRANSACTIONS AND INCOME
Investment transactions are recorded on a trade date basis. Dividend income is recorded on the ex-dividend date. Interest income, adjusted for amortization of premium and accretion of discount, is recorded daily on an accrual basis. Investment income is recorded net of foreign taxes withheld, if any. A Fund may be subject to foreign taxes on income, gains on investments or currency repatriation, a portion of which may be recoverable. A Fund will accrue such taxes and reclaims as applicable, based upon the current interpretation of tax rules and regulations that exist in the markets in which the portfolio invests. Facility fees and other fees (such as origination fees) received from senior loans purchased (see Note 4) by a Fund are amortized over the expected term of each applicable senior loan. Commitment fees received by a Fund relating to unfunded senior loan commitments are amortized to income over the period of the commitment. Consent fees, which are compensation for agreeing to changes in the terms of debt instruments, are recorded as interest income when received. Realized gains and losses from investment transactions are recorded on the basis of identified cost, which is also used for Federal income tax purposes.
B. DISTRIBUTIONS TO SHAREHOLDERS
The Funds declare and pay dividends on net investment income at least annually, except for the PL Short Duration Income Fund, PL Income Fund, PL Strategic Income Fund, PL Floating Rate Income Fund, PL High Income Fund and PL Money Market Fund. Dividends, if any, are generally declared and paid monthly for the PL Short Duration Income Fund, PL Income Fund, PL Strategic Income Fund, PL Floating Rate Income Fund and PL High Income Fund and declared daily and paid monthly for the PL Money Market Fund. Dividends may be declared more or less frequently if advantageous to the specific Fund and its shareholders. All realized capital gains are distributed at least annually for each Fund. Dividends and distributions paid to shareholders are recorded on the ex-dividend date.
D-1
Table of Contents
PACIFIC LIFE FUNDS
NOTES TO FINANCIAL STATEMENTS (Continued)
C. FOREIGN CURRENCY TRANSLATION
The Trust’s accounting records are maintained in U.S. dollars. The market value of investments and other assets and liabilities, initially expressed in non-U.S. currencies, are translated into U.S. dollars based on the applicable exchange rates at the end of each business day. Purchases and sales of investments and income and expenses, denominated in foreign currencies, are translated into U.S. dollars at the exchange rates in effect on the transaction date.
None of the Funds separately report the effect of changes in foreign exchange rates from changes in market prices of investments held. Such changes are included with the net realized gain or loss and change in net unrealized appreciation or depreciation on investments. Other foreign currency transactions resulting in realized and unrealized gain or loss, if any, are reported separately as net realized gain or loss on foreign currency transactions and change in net unrealized appreciation or depreciation on foreign currencies.
D. ALLOCATION OF INCOME, EXPENSES, GAINS AND LOSSES
Income, non-class specific expenses, and realized and unrealized gains and losses are allocated on a daily basis to each class of shares based upon the relative portion of net assets of each class. Certain Trust expenses directly attributable to a particular Fund are charged to that Fund (such as Fund-specific transactional fees, proxies, liquidations, litigation, and organizational/start-up costs) and class-specific fees and expenses are charged directly to the respective share class within each Fund. Generally, other Trust expenses are allocated proportionately among all the Funds in relation to the net assets of each Fund.
E. OFFERING COSTS
A new Fund bears all costs (or the applicable pro-rata share if there is more than one new Fund) associated with the offering expenses of the Fund including legal, printing and support services (see Note 5). All such costs are amortized as an expense of the new Fund on a straight-line basis over twelve months from commencement of operations.
F. RECENT ACCOUNTING PRONOUNCEMENT
In December 2011, the Financial Accounting Standards Board (“FASB”) issued an Accounting Standards Update (“ASU”) that requires disclosures to make financial statements that are prepared under U.S. GAAP more comparable to those prepared under International Financial Reporting Standards. The new disclosure requirements mandate that entities disclose both gross and net information about instruments and transactions eligible for offset in the statement of assets and liabilities such as instruments and transactions subject to an agreement similar to a master netting arrangement. In addition, the ASU requires disclosure of collateral received and posted in connection with master netting agreements or similar arrangements. The ASU is effective for interim and annual reporting periods beginning on or after January 1, 2013. Management is currently evaluating the impact, if any, that the implementation of this ASU will have on the Trust’s financial statement disclosures.
3. VALUATION AND FAIR VALUE MEASUREMENTS
A. VALUATION POLICY
The Trust’s Board of Trustees (the “Board”) has adopted a policy (“Valuation Policy”) for determining the value of its investments each business day. Under the Valuation Policy, the Board has delegated certain functions to a Trustee Valuation Committee or another valuation committee to determine the fair value of certain investments. Each valuation committee that values each Fund’s investments, which includes using third party pricing services and/or alternate valuation methodologies approved by the Board, does so in accordance with the Valuation Policy. Notes 3B and 3C below describe in greater detail the methodologies used to value each Fund’s investments.
B. NET ASSET VALUE
Each Fund of the Trust is divided into shares and share classes. The price per share of each class of a Fund’s shares is called the NAV. The NAV forms the basis for all transactions involving buying, selling, exchanging or reinvesting shares. Each Fund’s NAV is calculated by taking the total value of a Fund’s assets (the value of the securities and other investments a Fund holds), subtracting a Fund’s liabilities, and dividing by the total number of shares outstanding.
Each Fund’s NAV is calculated once a day, every day the New York Stock Exchange (“NYSE”) is open, including days when foreign markets are closed. For purposes of calculating the NAV, the value of investments held by each Fund is generally determined as of the time of the close of the NYSE, which is usually 4:00 p.m. Eastern Time. Information that becomes known to the Trust or its agents after the close of the NYSE on a particular day will not normally be used to retroactively adjust the price of an investment or the NAV determined earlier that day.
Each Fund’s NAV will not be calculated on days when the NYSE is closed. There may be a delay in calculating the NAV if: (i) the NYSE is closed on a day other than a regular holiday or weekend, (ii) trading on the NYSE is restricted, (iii) an emergency exists (as determined by the Securities and Exchange Commission (“SEC”)), making the sale of investments or determinations of NAV not practicable, or (iv) the SEC permits a delay for the protection of shareholders.
Certain Funds may hold investments that are primarily listed on foreign exchanges. Because those investments trade on weekends or days when the Funds do not calculate their NAVs, the value of those investments may change on days when a shareholder will not be able to purchase or redeem Fund shares.
C. INVESTMENT VALUATION
The value of each security or other investment is the amount which a Fund might reasonably expect to receive for the investment upon its current sale in the ordinary course of business. For purposes of calculating the NAV, the value of investments held by each Fund is based primarily on pricing data obtained from various sources approved by the Board.
D-2
Table of Contents
PACIFIC LIFE FUNDS
NOTES TO FINANCIAL STATEMENTS (Continued)
Portfolio Optimization Funds
The investments of each Portfolio Optimization Fund consist of Class P shares of the PL Underlying Funds, which are valued at their respective NAVs.
Money Market Instruments and Short-Term Investments
The investments of the PL Money Market Fund and money market instruments and short-term investments in other Funds maturing within 60 days are valued at amortized cost in accordance with the 1940 Act. Amortized cost involves valuing an investment at cost on the date of acquisition and thereafter assuming a constant accretion of a discount or amortization of a premium to maturity, regardless of the impact of fluctuating interest rates on the market value of the instrument. While this method provides consistency in valuation (and may only be used if it approximates market value), it may result in periods during which value, as determined by amortized cost, is higher or lower than the price that would be received if the Fund sold the investment. Fund investments in other mutual funds for temporary cash management purposes are valued at their respective NAVs.
Domestic Equity Investments
For domestic equity investments (including exchange-traded funds), the Funds use the last reported sale price or official closing price from an exchange as of the time of the NYSE close and do not normally take into account trading, clearances or settlements that take place after the NYSE close. Investments, for which no sales are reported, are generally valued at the mean between the most recent bid and ask prices obtained from approved pricing services, established market makers, or from broker-dealers.
Domestic and Foreign Fixed Income Investments
Fixed income investments are generally valued by approved pricing and quotation services using the mean between the most recent bid and ask prices which are based upon evaluated prices determined from various observable market and other factors. Certain fixed-income investments are valued by benchmark, matrix, or other pricing processes approved by the Board.
Investment Values Determined by a Valuation Committee
The Valuation Policy includes methodologies approved for valuing investments in circumstances where market quotations are not readily available. In such circumstances, the Valuation Policy provides that the value of such investments may be determined in accordance with Board approved formulas and methodologies (“Alternate Valuation Methodologies”). Under the Valuation Policy these Alternate Valuation Methodologies may include, among others, the use of broker quotes, the use of purchase prices for initial public offerings, proration rates, and benchmark and matrix pricing. In the event market quotations or Alternate Valuation Methodologies are not readily available or are determined to be unreliable, the value of the investments will be determined in good faith by the Trustee Valuation Committee or determined by a valuation committee established under the Valuation Policy and then subsequently submitted for approval or ratification to either the Trustee Valuation Committee, or to the Board. Valuations determined by the Trustee Valuation Committee or other valuation committee may require subjective inputs about the value of such investments. While these valuations are intended to estimate the value a Fund might reasonably expect to receive upon the current sale of the investments in the ordinary course of business, such values may differ from the value that a Fund would actually realize if the investments were sold or values that would be obtained if a different valuation methodology had been used.
Market quotations are considered not readily available if: (i) the market quotations received are deemed unreliable or inaccurate, (ii) approved pricing services do not provide a valuation for a particular investment, or (iii) material events occur after the close of the principal market for a particular investment but prior to the close of the NYSE.
D. FAIR VALUE MEASUREMENTS AND DISCLOSURES
The Trust characterizes its investments as Level 1, Level 2 or Level 3 based upon the various inputs or methodologies used to value the investments. Under the Valuation Policy, a valuation oversight committee (“VOC”) has been established which determines the level in which each Fund’s investments are characterized. The VOC includes investment, legal, accounting and compliance members of the Trust’s Adviser, and the Trust’s Chief Compliance Officer (“CCO”). The three-tier hierarchy of inputs is summarized in the three broad levels listed below:
| • Level 1 - | Quoted prices (unadjusted) in active markets for identical investments |
| • Level 2 - | Significant observable market-based inputs, other than Level 1 quoted prices, or unobservable inputs that are corroborated by market data |
| • Level 3 - | Significant unobservable inputs that are not corroborated by observable market data |
The VOC reviews the Valuation Policy periodically (at least annually) to determine the appropriateness of the pricing methodologies used to value each Fund’s investments. The VOC also periodically evaluates how each Fund’s investments are characterized within the three-tier hierarchy and the appropriateness of third party pricing sources. The VOC also periodically (at least annually) conducts back testing of the methodologies used to value Level 2 and Level 3 investments to evaluate the unobservable inputs used to value those investments. Such back-testing includes comparing Level 2 and Level 3 investment values to subsequently available exchange-traded prices, transaction prices, and/or observable vendor prices. All changes to the Valuation Policy are reported to the Board on a quarterly basis with material changes, as determined by the Trust’s CCO, requiring approval by the Board.
The inputs or methodologies used for valuing each Fund’s investments are not necessarily an indication of the relative risks associated with investing in those investments. For example, money market instruments are valued using amortized cost in accordance with the rules under the 1940 Act. Generally, amortized cost approximates the current fair value of an investment, but since the value is not obtained from a quoted price in an active market, such investments are reflected as Level 2. Foreign investments that are valued with the assistance of a statistical research service approved by the Board and based on significant observable inputs (as described in Note 3C) are reflected as Level 2. For fair valuations using significant unobservable inputs, the Trust presents a reconciliation of the beginning to ending balances for reported market values that presents changes attributable to total realized and unrealized gains or losses, purchase and sales, and transfers in and out of Level 3 during the
D-3
Table of Contents
PACIFIC LIFE FUNDS
NOTES TO FINANCIAL STATEMENTS (Continued)
period. Transfers in and out between levels are based on values at the end of the period. The Trust also discloses the amounts and reasons for all transfers in and out of Level 1 and Level 2 fair value measurements. A reconciliation of Level 3 investments is presented only when a Fund had an amount of Level 3 investments at the beginning and/or end of the reporting period that was meaningful in relation to its net assets. The amounts and reasons for all transfers in and out of each level within the three-tier hierarchy are disclosed only when a Fund had an amount of total transfers during the reporting period that was meaningful in relation to its net assets as of the end of the reporting period. A summary of each Fund’s investments as of March 31, 2013 as categorized under the three-tier hierarchy of inputs, and the reconciliation of Level 3 investments and information on transfers in and out of each level, if applicable, can be found in the Notes to Schedule of Investments section of each Fund’s Schedule of Investments.
The following is a description of valuation inputs and techniques that the Trust currently utilizes to fair value each major category of assets and liabilities:
Equity Securities (Common and Preferred Stock) and Mutual Funds
Equity securities (foreign or domestic) that are actively traded on a securities exchange are fair valued based on quoted prices from the applicable exchange, and to the extent valuation adjustments are not applied to these securities, they are categorized as Level 1. Equity securities traded on inactive markets and certain foreign equity securities are fair valued using significant other observable inputs which include broker-dealer quotes, recently executed transactions adjusted for changes in the benchmark index, or evaluated price quotes received from pricing vendors that take into account the integrity of the market sector and issuer, the individual characteristics of the security, and information received from broker-dealers and other market sources pertaining to the issuer or security. To the extent that these inputs are observable and timely, the fair values of these securities would be categorized as Level 2; otherwise the fair values would be categorized as Level 3.
Investments in registered mutual funds, including affiliated mutual funds, are valued at their respective NAV and are categorized as Level 1.
U.S. Treasury Obligations
U.S. Treasuries are fair valued based on pricing models that evaluate the mean between the most recently published bid and ask price. The models also take into consideration data received from active market makers and inter-dealer brokers, yield curves, and the spread over comparable U.S. Treasury issues. The spreads change daily in response to market conditions and are generally obtained from the new issue market and broker-dealer sources. To the extent that these inputs are observable and timely, the fair values of U.S. Treasury obligations would be categorized as Level 2; otherwise the fair values would be categorized as Level 3.
Corporate Bonds and Notes and U.S. Government & Agency Issues
Corporate bonds held by a Fund are generally comprised of two main categories: investment grade bonds and high yield bonds. Investment grade bonds are reported at fair value using various inputs and techniques, which include broker-dealer quotations, live trading levels, recently executed transactions in securities of the issuer or comparable issuers, issuer credit information and options-adjusted spread models where applicable. Fair values for high yield bonds are based primarily on broker-dealer quotations from relevant market makers and recently executed transactions in securities of the issuer or comparable issuers. The broker-dealer quotations received are supported by credit analysis of the issuer that takes into consideration credit quality assessments, daily trading activity, and the activity of the underlying equities, listed bonds and sector-specific trends. To the extent that these inputs are observable and timely, the fair values of corporate bonds would be categorized as Level 2; otherwise the fair values would be categorized as Level 3.
U.S. Government & Agency Issues are reported at fair value using various inputs and techniques, which include broker-dealer quotations, live trading levels, recently executed transactions in securities of the issuer, issuer credit information, and options-adjusted spread models where applicable. To the extent that these inputs are observable and timely, the fair values of U.S. Government & Agency Issues would be categorized as Level 2; otherwise the fair values would be categorized as Level 3.
Senior Loan Notes
Floating rate senior loans (“Senior Loans”) are fair valued based on a quoted price received from a single broker-dealer or an average of quoted prices received from multiple broker-dealers or valued relative to other benchmark securities when broker-dealer quotes are unavailable. To the extent that these inputs are observable, the fair values of Senior Loans would be categorized as Level 2; otherwise the fair values would be categorized as Level 3.
Short-Term Investments
Short-term investments maturing within 60 days are valued using amortized cost, which is used if it approximates market value, and are reflected as Level 2.
4. INVESTMENTS AND RISKS
General Investment Risks
An investment in each Fund represents an indirect investment in the assets owned by that Fund. As with any mutual fund, the value of the assets owned by a Fund may move up or down, and as a result, an investment in a Fund at any point in time may be worth more or less than the original amount invested. Events in the financial markets have the potential to cause increased volatility and uncertainty, which may impact the value of each Fund’s investments. Due to interdependencies between markets, events in one market may adversely impact other markets or issuers in unforeseen ways. As a result, the value of a Fund’s investments may be adversely affected by events in the markets, either directly or indirectly, and each Fund is exposed to potential decreases in the value of those investments. In addition, traditionally liquid investments may experience periods of diminished liquidity. Governmental and regulatory responses to market events may impair the Adviser’s ability to pursue certain investment techniques or strategies and may have unexpected consequences on particular markets, strategies, or investments. Future events may impact a Fund in unforeseen ways, leading a Fund to alter its existing strategies or, potentially, to liquidate and close.
D-4
Table of Contents
PACIFIC LIFE FUNDS
NOTES TO FINANCIAL STATEMENTS (Continued)
Fund of Funds Investments
The Portfolio Optimization Funds are exposed to the same risks as the PL Underlying Funds in direct proportion to the allocation of assets among those funds. The annual report for the PL Underlying Funds contains information about the risks associated with investing in the PL Underlying Funds. Allocations among the PL Underlying Funds are determined using an asset allocation process, which seeks to optimize returns by allocating among different asset classes given various levels of risk tolerance. The allocations of the Portfolio Optimization Funds may not effectively decrease risk or increase returns for investors, and the selection and weighting of allocations to asset classes and/or PL Underlying Funds may cause them to underperform other mutual funds with a similar investment objective. Although the Portfolio Optimization Funds seek to provide diversification across major asset classes, they may invest a significant portion of their assets in any one or several PL Underlying Funds (See Note 6C).
Equity Investments
The price of equity investments change in response to many factors, including a company’s historical and prospective earnings, cash flows, the value of its assets, investor perceptions and many of the General Investment Risk factors noted above.
Fixed Income Investments
Fixed income (debt) investments are affected primarily by the financial condition of the companies or other entities that have issued them and by changes in interest rates, although the factors noted above may also have a significant impact on fixed income (debt) investments. There is a risk that an issuer of a Fund’s fixed income (debt) investments may not be able to meet its financial obligations (e.g., may not be able to make principal and/or interest payments when they are due or otherwise default on other financial terms) and/or go bankrupt. Securities such as high- yield/high-risk bonds, e.g., bonds with low credit ratings by Moody’s (Ba or lower) or Standard & Poor’s (BB and lower) or if unrated are of comparable quality as determined by the manager, are especially subject to credit risk during periods of economic uncertainty or during economic downturns and are more likely to default on their interest and/or principal payments than higher rated securities. Certain asset-backed instruments, such as collateralized debt obligations, collateralized mortgage obligations and other mortgage related securities, structured investment vehicles and other debt investments may have exposure to subprime loans or subprime mortgages, which are loans to persons with lower credit ratings. These instruments may present credit risk that is not transparent and that is greater than indicated by their ratings. The value of these instruments may be more acutely affected by downturns in the credit markets or the real estate market than certain other investments, and it may be difficult to value these instruments because of a thin secondary market.
Foreign Investments
There are certain additional risks involved in investing in foreign securities that are generally not inherent in investments in domestic securities. These risks may involve foreign currency fluctuations, adverse political, social and economic developments and the possible imposition of currency exchange blockages or other foreign governmental laws or restrictions. In addition, the securities of some foreign companies and securities markets are less liquid and at times more volatile than securities of comparable U.S. companies and U.S. securities markets. The markets in emerging markets countries can be extremely volatile.
Illiquid Investments
Each Fund may not invest in illiquid securities and illiquid bank loans (collectively, “Illiquid Investments”) if as a result of such investment, more than 15% of its net assets (5% of total assets for the PL Money Market Fund), taken at market value at the time of such investment, would be invested in Illiquid Investments. The term “Illiquid Investments” for this purpose means investments that cannot be disposed of within seven days in the ordinary course of business at approximately the amount at which a Fund has valued the investments. Illiquid Investments may be difficult to value and difficult to sell, which means a Fund may not be able to sell such investments quickly for their full value. The value of Illiquid Investments held by each Fund as of March 31, 2013 was less than 15% of its net assets (5% of total assets for the PL Money Market Fund).
Senior Loan Participations and Assignments
Certain Funds may invest in Senior Loans, the interest rates of which float or adjust periodically based upon a specified adjustment schedule, benchmark indicator, or prevailing interest rates of domestic or foreign corporations, partnerships and other entities (“Borrowers”). Senior Loans generally pay interest at rates which are periodically redetermined by reference to a base lending rate plus a premium. These base lending rates generally include prime rates of one or more major U.S. banks, LIBOR rates or certificates of deposit rates. Senior Loans often require prepayments from excess cash flow or permit the borrower to repay at its election. The degree to which borrowers repay cannot be predicted with accuracy. As a result, the actual maturity may be substantially less than the stated maturities. Senior Loans are exempt from registration under the Securities Act of 1933, may contain certain restrictions on resale, and cannot be sold publicly. A Fund’s investments in Senior Loans may be in the form of participations in loans or assignments of all or a portion of loans from third parties.
When a Fund purchases assignments, it acquires all the rights and obligations under the loan agreement of the assigning lender. Assignments may, however, be arranged through private negotiations between potential assignees and potential assignors, and the rights and obligations acquired by the purchaser of an assignment may differ from, and be more limited than those held by the assigning lender.
When a Fund purchases a participation of a Senior Loan interest, the Fund typically enters into a contractual agreement with the lender or other third party selling the participation. A participation interest in Senior Loans includes the right to receive payments of principal, interest and any fees to which it is entitled from the lender and only upon receipt by the lender of payments from the Borrower, but not from the Borrower directly. When investing in a participation interest, if a Borrower is unable to meet its obligations under a loan agreement, a Fund generally has no right to enforce compliance with the terms of the loan agreement. As a result, the Fund assumes the credit risk of the Borrower, the selling participant, and any other persons that are interpositioned between the Fund and the Borrower. If the lead lender in a typical lending syndicate becomes insolvent, enters Federal Deposit Insurance Corporation (“FDIC”) receivership or, if not FDIC insured, enters into bankruptcy, the Fund
D-5
Table of Contents
PACIFIC LIFE FUNDS
NOTES TO FINANCIAL STATEMENTS (Continued)
may incur certain costs and delays in receiving payment or may suffer a loss of principal and/or interest. As of March 31, 2013, no participation interest in Senior Loans was held by any of the Funds covered in this report.
U.S. Government Agencies or Government-Sponsored Enterprises
Certain Funds may invest in U.S. Government agencies or government-sponsored enterprises. U.S. Government securities are obligations of and, in certain cases, guaranteed by, the U.S. Government, its agencies or instrumentalities. The U.S. Government does not guarantee the NAV of each Fund’s shares. Some U.S. Government securities, such as Treasury bills, notes and bonds, and securities guaranteed by the Government National Mortgage Association (“GNMA” or “Ginnie Mae”), are supported by the full faith and credit of the U.S. Government; others, such as those of the Federal Home Loan Bank, are supported by the right of the issuer to borrow from the U.S. Department of the Treasury (the “U.S. Treasury”); others, such as those of the Federal National Mortgage Association (“FNMA” or “Fannie Mae”), are supported by the discretionary authority of the U.S. Government to purchase the agency’s obligations. Securities not backed by the full faith and credit of the U.S. Government may be subject to a greater risk of default. U.S. Government securities may include zero coupon securities, which do not distribute interest on a current basis and tend to be subject to greater risk than interest-paying securities of similar maturities.
Government-related guarantors (i.e., not backed by the full faith and credit of the U.S. Government) include FNMA and the Federal Home Loan Mortgage Corporation (“FHLMC” or “Freddie Mac”). FNMA is a government-sponsored corporation, the common stock of which is owned entirely by private stockholders. FNMA purchases conventional (i.e., not insured or guaranteed by any government agency) residential mortgages from a list of approved seller/servicers which include state and federally chartered savings and loan associations, mutual savings banks, commercial banks and credit unions and mortgage bankers. Pass-through securities issued by FNMA are guaranteed as to timely payment of principal and interest by FNMA, but are not backed by the full faith and credit of the U.S. Government. FHLMC issues Participation Certificates (“PCs”), which are pass-through securities, each representing an undivided interest in a pool of residential mortgages. FHLMC guarantees the timely payment of interest and ultimate collection of principal, but PCs are not backed by the full faith and credit of the U.S. Government.
5. INVESTMENT ADVISORY, ADMINISTRATION AND SHAREHOLDER SERVICES, SUPPORT SERVICES AND DISTRIBUTION AGREEMENTS
Pursuant to an Investment Advisory Agreement, PLFA, a wholly-owned subsidiary of Pacific Life Insurance Company (“Pacific Life”), serves as investment adviser to the Trust. PLFA manages the Portfolio Optimization Funds. PLFA also manages the PL Short Duration Income Fund, PL Income Fund, PL Strategic Income Fund, PL Floating Rate Income Fund, PL High Income Fund and PL Money Market Fund under the name Pacific Asset Management. PLFA receives advisory fees from each Fund based on the following advisory fee rates, which are based on an annual percentage of average daily net assets of each Fund:
PL Portfolio Optimization Conservative | 0.20% | PL Portfolio Optimization Aggressive | 0.20% | PL Floating Rate Income | 0.65% | |||||
PL Portfolio Optimization Moderate-Conservative | 0.20% | PL Short Duration Income | 0.40% | PL High Income | 0.60% | |||||
PL Portfolio Optimization Moderate | 0.20% | PL Income | 0.50% | PL Money Market | See (1) | |||||
PL Portfolio Optimization Moderate-Aggressive | 0.20% | PL Strategic Income | 0.60% |
| (1) | An annual rate of 0.20% of the first $250 million of the average daily net assets, 0.15% of the next $250 million, and 0.10% in excess of $500 million. |
Pursuant to an Administration and Shareholder Services Agreement (the “Administration Agreement”), Pacific Life serves as administrator (the “Administrator”) to the Trust. During the reporting period, the Trust paid the Administrator an administration fee at an annual rate of 0.15% for each class of the Portfolio Optimization Funds (which invest in the PL Underlying Funds that also have an administration fee at an annual rate of 0.15%), for Class I shares of the PL Short Duration Income Fund, PL Income Fund, PL Strategic Income Fund, PL Floating Rate Income Fund and PL High Income Fund and for Class P shares of the PL Floating Rate Income Fund. The Trust also compensated the Administrator at an annual rate of 0.30% for each class of the PL Money Market Fund and Class A, Class C and Advisor Class shares of the PL Short Duration Income Fund, PL Income Fund, PL Strategic Income Fund, PL Floating Rate Income Fund and PL High Income Fund. The administration fee is for procuring or providing administrative, transfer agency, and shareholder services. In addition, Pacific Life and PLFA provide support services to the Trust that are outside the scope of the Administrator’s and Adviser’s responsibilities under the Administration Agreement and Investment Advisory Agreement. Under the Support Services Agreement, the Trust compensated Pacific Life and PLFA for their expenses in providing support services to the Trust in connection with various matters, some of which include the time spent by legal, accounting, and compliance personnel of Pacific Life and PLFA (including individuals who may be officers or Trustees of the Trust), to attend meetings of the Board and to provide assistance with the coordination and supervision in connection with the services procured for the Trust under the Administration Agreement. Support services do not include services for which PLFA is responsible pursuant to the Investment Advisory Agreement. The Trust reimbursed Pacific Life and PLFA for these support services on an approximate cost basis.
Pursuant to a Distribution Agreement, Pacific Select Distributors, Inc. (the “Distributor”), a wholly-owned subsidiary of Pacific Life, serves as distributor of the Trust’s shares. Under the Distribution Agreement, the Distributor bears all expenses of providing services, including costs of sales presentations, mailings, advertisements, and other marketing efforts by the Distributor in connection with the distribution or sale of the Trust’s shares and makes distribution and/or service payments to selling groups in connection with the sale of certain of the Trust’s shares and subsequent servicing needs of shareholders provided by selling groups. The Distributor received distribution and service fees pursuant to class-
D-6
Table of Contents
PACIFIC LIFE FUNDS
NOTES TO FINANCIAL STATEMENTS (Continued)
specific distribution and service plans, each adopted in accordance with Rule 12b-1 under the 1940 Act (together the “12b-1 Plans”) for Class B, C and R shares. The Distributor also received service fees pursuant to a Class A Service Plan (“Class A Plan”) and an Advisor Class Service Plan (“Advisor Class Plan”) which were not adopted in accordance with Rule 12b-1 under the 1940 Act. The Advisor Class Plan was terminated effective October 1, 2012. Under the 12b-1 Plans, each Fund paid to the Distributor both distribution and service fees at an annual rate expressed as a percentage of average daily net assets. The distribution fee was 0.75% for Class B and C shares and 0.25% for R shares.
The service fee was 0.25% for Class B, C, and R shares. Under the Class A Plan and the Advisor Class Plan, each Fund paid the Distributor service fees at an annual rate of 0.25% of the average daily net assets attributable to the applicable share class. Effective October 1, 2012, the Advisor Class Plan was terminated and the related 0.25% service fee imposed under that plan was eliminated. There are no distribution and service fees for Class I and Class P shares. The distribution and service fees were accrued daily. For the year ended March 31, 2013, the Distributor, acting as underwriter, received net commissions (front-end sales charges) of $21,644,094 from the sale of Class A shares and received $979,090 in CDSC from redemptions of Class A, B and C shares.
6. TRANSACTIONS WITH AFFILIATES
A. ADVISORY FEES, ADMINISTRATION FEES, DISTRIBUTION AND SERVICE FEES AND EXPENSES FOR SUPPORT SERVICES
The Adviser, the Distributor and Pacific Life are related parties. The advisory fees earned by the Adviser, the administration fees earned by Pacific Life, the distribution and service fees earned by the Distributor, including any fee waivers, and expenses for support services recovered by PLFA and Pacific Life (see Note 5) from each Fund covered in this report for the year ended March 31, 2013 are presented in the Statements of Operations. The amounts of each of these fees that remained payable as of March 31, 2013 are presented in the Statements of Assets and Liabilities.
B. EXPENSE LIMITATION AGREEMENTS
To help limit the Trust’s expenses, PLFA has entered into expense limitation agreements with the Trust and has contractually agreed to reimburse each Fund for certain operating expenses that exceed an annual rate based on a percentage of a Fund’s average daily net assets. These operating expenses include, but are not limited to, administration fees, organizational expenses, custody expenses, expenses for audit, tax and certain legal services, preparation, printing, filing and distribution to existing shareholders of proxies, prospectuses and shareholder reports and other regulatory documents as applicable, independent trustees’ fees and establishing, overseeing and administering the Trust’s compliance program. These operating expenses do not include investment advisory fees; distribution and/or service fees; dividends on securities sold short; acquired fund fees and expenses; interest; taxes (including foreign taxes on dividends, interest or gains); brokerage commissions and other transactional expenses and extraordinary expenses such as litigation expenses and other expenses not incurred in the ordinary course of each Fund’s business. The current expense cap for the Class A, Class B, Class C and Class R shares of each Portfolio Optimization Fund is 0.15% through July 31, 2015 and 0.30% thereafter through July 31, 2022; the Adviser Class shares expense cap is 0.20% through December 31, 2015 and 0.30% thereafter through July 31, 2023. The current expense cap for the PL Short Duration Income Fund, PL Strategic Income Fund and PL High Income Fund is 0.20% through July 31, 2015. The current expense cap for the PL Income Fund is 0.15% through July 31, 2014 and 0.20% thereafter through July 31, 2015. The current expense cap for the PL Floating Rate Income Fund is 0.15% through December 31, 2014 and 0.20% thereafter through July 31, 2015. The current expense cap for the PL Money Market Fund is 0.30% through July 31, 2013. There is no guarantee that PLFA will continue to reimburse expenses upon the expiration of the applicable expense caps.
Any expense reimbursements are subject to repayment to PLFA for a period of time as permitted under regulatory and accounting guidance (currently 3 years from the end of the fiscal year in which the reimbursement or reduction took place) to the extent such expenses fall below the current expense cap in future years. Any amounts repaid to PLFA will have the effect of increasing such expenses of the Fund, but not above the expense cap. There was no recoupment of expense reimbursement by PLFA from any Funds covered in this report during the year ended March 31, 2013.
For the PL Money Market Fund, in addition to the above expense cap, PLFA, the Administrator and/or the Distributor have agreed, temporarily, to waive all or a portion of their fees, to the extent necessary to prevent the Fund’s expenses from exceeding earnings (i.e., to prevent the Fund from having a negative yield). However, there can be no assurance that a negative yield will not occur. Any fee waivers for the PL Money Market Fund are not subject to repayment to PLFA, the Administrator and/or the Distributor. There is no guarantee that PLFA, the Administrator, and/or the Distributor will continue to waive a portion of their fees in the future.
The Adviser expense reimbursement, the advisory fee waiver, the administration fee waiver, and the service fee waiver, if any, of each of the applicable Funds covered in this report for the year ended March 31, 2013 are presented in the Statements of Operations. Any amounts that remained due from the Adviser as of March 31, 2013 are presented in the Statements of Assets and Liabilities.
D-7
Table of Contents
PACIFIC LIFE FUNDS
NOTES TO FINANCIAL STATEMENTS (Continued)
The cumulative reimbursement and fee reduction amounts, if any, as of March 31, 2013 that are subject to repayment for each Fund covered in this report are as follows:
| Expiration Date | ||||||||||||
| Funds | 3/31/2014 | 3/31/2015 | 3/31/2016 | |||||||||
PL Portfolio Optimization Conservative | $486,514 | $406,199 | $504,164 | |||||||||
PL Portfolio Optimization Moderate-Conservative | 467,467 | 416,693 | 475,646 | |||||||||
PL Portfolio Optimization Moderate | 1,294,312 | 1,027,703 | 1,124,770 | |||||||||
PL Portfolio Optimization Moderate-Aggressive | 1,124,694 | 807,014 | 814,333 | |||||||||
PL Portfolio Optimization Aggressive | 477,661 | 316,090 | 306,272 | |||||||||
PL Short Duration Income | 42,485 | 97,734 | ||||||||||
PL Income | 85,763 | 651,413 | 1,323,370 | |||||||||
PL Strategic Income | 45,025 | 118,217 | ||||||||||
PL Floating Rate Income | 123,956 | 347,661 | ||||||||||
PL High Income | 42,254 | 97,325 | ||||||||||
PL Money Market | 112,758 | 93,514 | 110,746 | |||||||||
|
|
|
|
|
| |||||||
Total | $4,049,169 | $3,972,346 | $5,320,238 | |||||||||
|
|
|
|
|
| |||||||
Due to the current regulatory and accounting guidance, all expense reimbursements made by the Adviser for the period September 28, 2001 (the Pacific Life Funds’ commencement date of operations) to March 31, 2010 expired for future recoupment as of March 31, 2013. Based on the Trust’s experience, the likelihood of repayment by a Fund for the amounts presented in the table above prior to the expiration is considered remote and no liabilities for such repayments were recorded by any Fund as of March 31, 2013.
C. INVESTMENTS IN AFFILIATED FUNDS
As of March 31, 2013, each of the Portfolio Optimization Funds (aggregate of Classes A, B, C, R and Advisor Class) owned Class P shares in each of the applicable affiliated PL Underlying Funds. A summary of transactions for the year ended March 31, 2013 and total investments by each of the Portfolio Optimization Funds in each PL Underlying Fund as of March 31, 2013 is as follows:
Fund/Underlying Fund | Beginning Value as of April 1, 2012 | Purchase Cost (1) | Distributions Received and Reinvested (2) | Sales Proceeds | Net Realized Gain (Loss) (3) | Change in Unrealized Appreciation (Depreciation) | As of March 31, 2013 | |||||||||||||||||||||||||
Ending Value | Shares Balance | |||||||||||||||||||||||||||||||
| PL Portfolio Optimization Conservative Fund | ||||||||||||||||||||||||||||||||
PL Floating Rate Loan | $35,101,966 | $6,437,547 | $1,395,021 | $11,736,035 | $77,863 | $361,934 | $31,638,296 | 3,089,677 | ||||||||||||||||||||||||
PL Inflation Managed | 68,199,217 | 13,318,715 | 2,211,361 | 35,189,275 | 6,534,081 | (4,468,190 | ) | 50,605,909 | 5,195,679 | |||||||||||||||||||||||
PL Managed Bond | 145,233,374 | 37,188,180 | 5,359,439 | 17,318,484 | 2,115,299 | 3,159,112 | 175,736,920 | 15,817,905 | ||||||||||||||||||||||||
PL Short Duration Bond | 53,261,770 | 29,736,744 | 1,014,297 | 7,892,475 | (5,218 | ) | 265,816 | 76,380,934 | 7,547,523 | |||||||||||||||||||||||
PL Emerging Markets Debt | — | 32,380,291 | 553,887 | 10,202,346 | 616,220 | 1,029,387 | 24,377,439 | 2,315,046 | ||||||||||||||||||||||||
PL Comstock | 15,809,818 | 8,687,991 | 254,804 | 5,922,127 | 377,318 | 3,066,125 | 22,273,929 | 1,546,801 | ||||||||||||||||||||||||
PL Growth LT | — | 3,427,460 | 43,359 | 20,605 | 116 | 232,847 | 3,683,177 | 264,406 | ||||||||||||||||||||||||
PL Large-Cap Growth | 8,315,703 | 2,189,300 | — | 1,078,966 | 658,197 | 247,735 | 10,331,969 | 993,459 | ||||||||||||||||||||||||
PL Large-Cap Value | 19,630,552 | 5,372,543 | 400,282 | 4,873,641 | 167,966 | 2,737,567 | 23,435,269 | 1,678,744 | ||||||||||||||||||||||||
PL Main Street Core | 7,786,550 | 4,551,820 | 78,238 | 5,620,398 | 648,964 | 39,642 | 7,484,816 | 613,510 | ||||||||||||||||||||||||
PL Mid-Cap Equity | 11,699,118 | 2,813,284 | 50,177 | 6,750,438 | 409,851 | (191,212 | ) | 8,030,780 | 730,071 | |||||||||||||||||||||||
PL Mid-Cap Growth | — | 9,317,902 | 8,256 | 4,918,890 | 74,095 | 294,435 | 4,775,798 | 556,620 | ||||||||||||||||||||||||
PL International Large-Cap | 11,739,271 | 4,800,370 | 173,069 | 6,331,078 | 703,143 | 725,228 | 11,810,003 | 716,626 | ||||||||||||||||||||||||
PL International Value | 7,620,789 | 3,752,008 | 139,974 | 4,937,057 | 526,007 | 82,358 | 7,184,079 | 789,459 | ||||||||||||||||||||||||
PL Currency Strategies | — | 14,689,117 | — | 88,306 | 1,302 | 467,889 | 15,070,002 | 1,460,271 | ||||||||||||||||||||||||
PL Global Absolute Return | — | 29,378,234 | 18,124 | 176,611 | 1,094 | 556,124 | 29,776,965 | 2,922,175 | ||||||||||||||||||||||||
PL Precious Metals | — | 5,269,193 | 660 | 29,436 | (3,263 | ) | (862,361 | ) | 4,374,793 | 532,213 | ||||||||||||||||||||||
| $384,398,128 | $213,310,699 | $11,700,948 | $123,086,168 | $12,903,035 | $7,744,436 | $506,971,078 | ||||||||||||||||||||||||||
| PL Portfolio Optimization Moderate-Conservative Fund | ||||||||||||||||||||||||||||||||
PL Floating Rate Loan | $26,122,815 | $6,164,909 | $1,251,416 | $3,916,609 | $64,212 | $355,678 | $30,042,421 | 2,933,830 | ||||||||||||||||||||||||
PL Inflation Managed | 51,388,726 | 13,828,836 | 1,626,429 | 26,333,550 | 5,158,167 | (3,443,116 | ) | 42,225,492 | 4,335,266 | |||||||||||||||||||||||
PL Managed Bond | 103,929,699 | 25,624,992 | 3,153,212 | 24,691,885 | 1,875,866 | 2,223,170 | 112,115,054 | 10,091,364 | ||||||||||||||||||||||||
PL Short Duration Bond | 37,087,423 | 22,488,704 | 686,772 | 5,104,544 | 27,939 | 192,586 | 55,378,880 | 5,472,221 | ||||||||||||||||||||||||
PL Emerging Markets Debt | — | 14,885,303 | 374,970 | 273,280 | 38,511 | 682,836 | 15,708,340 | 1,491,770 | ||||||||||||||||||||||||
PL Comstock | 22,937,445 | 6,578,444 | 353,279 | 3,211,851 | 64,526 | 4,461,035 | 31,182,878 | 2,165,478 | ||||||||||||||||||||||||
PL Growth LT | 8,162,251 | 2,266,758 | 56,867 | 5,585,390 | 560,464 | (610,239 | ) | 4,850,711 | 348,220 | |||||||||||||||||||||||
PL Large-Cap Growth | 16,703,941 | 5,302,170 | — | 5,450,253 | 1,302,944 | (98,051 | ) | 17,760,751 | 1,707,765 | |||||||||||||||||||||||
PL Large-Cap Value | 30,886,858 | 8,208,287 | 676,458 | 4,167,423 | 144,316 | 4,897,267 | 40,645,763 | 2,911,588 | ||||||||||||||||||||||||
PL Main Street Core | 19,364,841 | 8,308,058 | 328,012 | 4,622,253 | 284,028 | 2,058,360 | 25,721,046 | 2,108,282 | ||||||||||||||||||||||||
PL Mid-Cap Equity | 15,326,405 | 2,041,166 | 62,408 | 7,438,912 | (8,574 | ) | 254,119 | 10,236,612 | 930,601 | |||||||||||||||||||||||
PL Mid-Cap Growth | 8,475,728 | 584,338 | 15,193 | 3,747,796 | (168,306 | ) | (129,158 | ) | 5,029,999 | 586,247 | ||||||||||||||||||||||
PL Small-Cap Growth | — | 5,827,977 | — | 147,962 | 1,098 | 960,261 | 6,641,374 | 499,727 | ||||||||||||||||||||||||
PL Small-Cap Value | 3,730,125 | 739,234 | 73,087 | 88,379 | (262 | ) | 707,892 | 5,161,697 | 424,831 | |||||||||||||||||||||||
PL Emerging Markets | 4,088,047 | 3,990,852 | 51,310 | 375,657 | (16,874 | ) | 648,537 | 8,386,215 | 589,748 | |||||||||||||||||||||||
PL International Large-Cap | 20,120,603 | 4,426,889 | 318,742 | 5,640,502 | 562,777 | 1,459,958 | 21,248,467 | 1,289,349 | ||||||||||||||||||||||||
PL International Value | 11,742,921 | 5,656,590 | 339,196 | 3,941,796 | (95,569 | ) | 1,287,125 | 14,988,467 | 1,647,084 | |||||||||||||||||||||||
PL Currency Strategies | — | 13,569,936 | — | 47,261 | 992 | 433,379 | 13,957,046 | 1,352,427 | ||||||||||||||||||||||||
PL Global Absolute Return | — | 28,499,194 | 16,708 | 94,521 | 28 | 521,667 | 28,943,076 | 2,840,341 | ||||||||||||||||||||||||
PL Precious Metals | — | 10,738,104 | 1,217 | 31,506 | (5,149 | ) | (1,593,086 | ) | 9,109,580 | 1,108,221 | ||||||||||||||||||||||
| $380,067,828 | $189,730,741 | $9,385,276 | $104,911,330 | $9,791,134 | $15,270,220 | $499,333,869 | ||||||||||||||||||||||||||
D-8
Table of Contents
PACIFIC LIFE FUNDS
NOTES TO FINANCIAL STATEMENTS (Continued)
Fund/Underlying Fund | Beginning Value as of April 1, 2012 | Purchase Cost (1) | Distributions Received and Reinvested (2) | Sales Proceeds | Net Realized Gain (Loss) (3) | Change in Unrealized Appreciation (Depreciation) | As of March 31, 2013 | |||||||||||||||||||||||||
Ending Value | Shares Balance | |||||||||||||||||||||||||||||||
| PL Portfolio Optimization Moderate Fund | ||||||||||||||||||||||||||||||||
PL Floating Rate Loan | $50,882,158 | $7,013,621 | $2,037,637 | $12,110,738 | $133,364 | $591,539 | $48,547,581 | 4,740,975 | ||||||||||||||||||||||||
PL Inflation Managed | 111,021,687 | 18,857,712 | 1,987,264 | 82,242,539 | 10,250,993 | (5,996,046 | ) | 53,879,071 | 5,531,732 | |||||||||||||||||||||||
PL Managed Bond | 172,681,481 | 41,281,810 | 5,535,375 | 29,787,377 | 3,126,974 | 3,773,529 | 196,611,792 | 17,696,831 | ||||||||||||||||||||||||
PL Short Duration Bond | 50,536,332 | 37,128,057 | 951,226 | 11,010,972 | 110,926 | 262,171 | 77,977,740 | 7,705,310 | ||||||||||||||||||||||||
PL Emerging Markets Debt | — | 33,582,676 | 860,510 | 406,084 | 96,930 | 1,581,572 | 35,715,604 | 3,391,795 | ||||||||||||||||||||||||
PL Comstock | 80,926,793 | 18,205,711 | 1,187,542 | 10,587,522 | (434,980 | ) | 15,490,500 | 104,788,044 | 7,276,948 | |||||||||||||||||||||||
PL Growth LT | 40,803,800 | 6,864,959 | 216,040 | 28,855,229 | 1,777,981 | (2,391,807 | ) | 18,415,744 | 1,322,020 | |||||||||||||||||||||||
PL Large-Cap Growth | 53,695,918 | 9,793,113 | — | 12,251,108 | 3,558,869 | 208,567 | 55,005,359 | 5,288,977 | ||||||||||||||||||||||||
PL Large-Cap Value | 102,395,841 | 25,875,679 | 2,128,079 | 17,026,512 | 1,128,241 | 15,040,021 | 129,541,349 | 9,279,466 | ||||||||||||||||||||||||
PL Main Street Core | 72,466,065 | 18,688,375 | 990,946 | 16,906,043 | 1,355,378 | 5,455,764 | 82,050,485 | 6,725,450 | ||||||||||||||||||||||||
PL Mid-Cap Equity | 61,135,915 | 10,119,972 | 283,788 | 22,961,565 | (1,401,256 | ) | 3,610,503 | 50,787,357 | 4,617,032 | |||||||||||||||||||||||
PL Mid-Cap Growth | 21,228,466 | 3,803,994 | 58,222 | 5,697,390 | (140,869 | ) | 20,484 | 19,272,907 | 2,246,260 | |||||||||||||||||||||||
PL Small-Cap Growth | 10,181,466 | 3,723,045 | — | 165,971 | (4,503 | ) | 1,816,396 | 15,550,433 | 1,170,085 | |||||||||||||||||||||||
PL Small-Cap Value | 30,238,045 | 9,278,076 | 650,649 | 484,376 | (9,999 | ) | 6,260,382 | 45,932,777 | 3,780,475 | |||||||||||||||||||||||
PL Real Estate | 20,203,471 | 3,027,516 | 302,637 | 277,799 | (8,459 | ) | 1,917,646 | 25,165,012 | 1,840,893 | |||||||||||||||||||||||
PL Emerging Markets | 31,173,205 | 13,507,269 | 282,028 | 832,524 | (64,205 | ) | 3,075,575 | 47,141,348 | 3,315,144 | |||||||||||||||||||||||
PL International Large-Cap | 82,466,664 | 6,561,938 | 1,275,808 | 20,165,971 | 146,659 | 7,604,710 | 77,889,808 | 4,726,323 | ||||||||||||||||||||||||
PL International Value | 30,144,471 | 23,595,391 | 1,300,341 | 6,011,743 | (836,546 | ) | 5,509,281 | 53,701,195 | 5,901,230 | |||||||||||||||||||||||
PL Currency Strategies | — | 46,584,359 | — | 59,740 | (111 | ) | 1,455,855 | 47,980,363 | 4,649,260 | |||||||||||||||||||||||
PL Global Absolute Return | — | 59,399,700 | 35,307 | 74,675 | (197 | ) | 1,095,724 | 60,455,859 | 5,932,862 | |||||||||||||||||||||||
PL Precious Metals | — | 26,143,435 | 3,085 | 29,870 | (756 | ) | (4,049,274 | ) | 22,066,620 | 2,684,504 | ||||||||||||||||||||||
| $1,022,181,778 | $423,036,408 | $20,086,484 | $277,945,748 | $18,784,434 | $62,333,092 | $1,268,476,448 | ||||||||||||||||||||||||||
| PL Portfolio Optimization Moderate-Aggressive Fund | ||||||||||||||||||||||||||||||||
PL Inflation Managed | $57,292,440 | $6,584,883 | $693,596 | $49,232,274 | $5,281,028 | ($2,969,088 | ) | $17,650,585 | 1,812,175 | |||||||||||||||||||||||
PL Managed Bond | 57,670,797 | 23,135,765 | 2,125,233 | 11,871,371 | 1,395,393 | 1,160,965 | 73,616,782 | 6,626,173 | ||||||||||||||||||||||||
PL Short Duration Bond | 14,493,982 | 6,739,769 | 153,852 | 7,681,797 | 129,002 | 30,189 | 13,864,997 | 1,370,059 | ||||||||||||||||||||||||
PL Emerging Markets Debt | — | 9,518,983 | 253,360 | 191,672 | 27,632 | 468,717 | 10,077,020 | 956,982 | ||||||||||||||||||||||||
PL Comstock | 66,059,556 | 20,901,366 | 857,841 | 20,349,471 | (470,492 | ) | 12,093,293 | 79,092,093 | 5,492,506 | |||||||||||||||||||||||
PL Growth LT | 44,915,791 | 1,868,357 | 175,022 | 29,684,528 | 1,762,673 | (2,260,385 | ) | 16,776,930 | 1,204,374 | |||||||||||||||||||||||
PL Large-Cap Growth | 38,341,867 | 4,562,177 | — | 904,090 | 2,539,844 | 764,808 | 45,304,606 | 4,356,212 | ||||||||||||||||||||||||
PL Large-Cap Value | 81,402,000 | 28,511,049 | 1,589,222 | 24,400,774 | 2,222,203 | 10,537,140 | 99,860,840 | 7,153,355 | ||||||||||||||||||||||||
PL Main Street Core | 67,171,262 | 3,716,012 | 972,208 | 3,254,458 | 150,468 | 5,655,978 | 74,411,470 | 6,099,301 | ||||||||||||||||||||||||
PL Mid-Cap Equity | 57,904,304 | 4,333,472 | 319,629 | 12,841,901 | (1,392,722 | ) | 4,041,636 | 52,364,418 | 4,760,402 | |||||||||||||||||||||||
PL Mid-Cap Growth | 29,526,051 | 3,914,977 | 65,711 | 10,168,768 | (71,849 | ) | (560,879 | ) | 22,705,243 | 2,646,299 | ||||||||||||||||||||||
PL Small-Cap Growth | 14,442,682 | 1,533,746 | — | 317,594 | 9,871 | 1,935,398 | 17,604,103 | 1,324,613 | ||||||||||||||||||||||||
PL Small-Cap Value | 35,788,864 | 10,476,225 | 756,549 | 941,422 | (11,391 | ) | 7,297,135 | 53,365,960 | 4,392,260 | |||||||||||||||||||||||
PL Real Estate | 22,694,774 | 254,547 | 296,698 | 541,985 | 10,746 | 1,935,188 | 24,649,968 | 1,803,216 | ||||||||||||||||||||||||
PL Emerging Markets | 36,453,408 | 3,508,406 | 245,667 | 1,505,241 | (108,460 | ) | 2,185,690 | 40,779,470 | 2,867,755 | |||||||||||||||||||||||
PL International Large-Cap | 66,066,327 | 4,906,288 | 1,097,453 | 11,324,017 | (239,576 | ) | 6,427,365 | 66,933,840 | 4,061,519 | |||||||||||||||||||||||
PL International Value | 42,879,424 | 12,368,434 | 1,308,216 | 6,344,983 | (2,687,100 | ) | 6,451,295 | 53,975,286 | 5,931,350 | |||||||||||||||||||||||
PL Currency Strategies | — | 31,074,797 | — | 42,438 | 402 | 993,184 | 32,025,945 | 3,103,289 | ||||||||||||||||||||||||
PL Global Absolute Return | — | 39,978,605 | 23,980 | 53,047 | (119 | ) | 742,635 | 40,692,054 | 3,993,332 | |||||||||||||||||||||||
PL Precious Metals | — | 25,952,252 | 3,143 | 31,829 | (2,987 | ) | (4,122,744 | ) | 21,797,835 | 2,651,805 | ||||||||||||||||||||||
| $733,103,529 | $243,840,110 | $10,937,380 | $191,683,660 | $8,544,566 | $52,807,520 | $857,549,445 | ||||||||||||||||||||||||||
| PL Portfolio Optimization Aggressive Fund | ||||||||||||||||||||||||||||||||
PL Managed Bond | $7,013,338 | $1,910,116 | $216,196 | $2,150,136 | $137,536 | $138,775 | $7,265,825 | 653,990 | ||||||||||||||||||||||||
PL Comstock | 21,587,180 | 6,718,416 | 272,353 | 7,907,805 | 42,767 | 3,587,951 | 24,300,862 | 1,687,560 | ||||||||||||||||||||||||
PL Growth LT | 14,466,008 | 205,493 | 58,600 | 9,599,533 | 1,191,836 | (1,423,606 | ) | 4,898,798 | 351,672 | |||||||||||||||||||||||
PL Large-Cap Growth | 12,173,884 | 2,187,825 | — | 1,424,725 | 942,750 | 61,454 | 13,941,188 | 1,340,499 | ||||||||||||||||||||||||
PL Large-Cap Value | 28,681,436 | 8,626,203 | 496,314 | 11,219,156 | 756,346 | 3,257,462 | 30,598,605 | 2,191,877 | ||||||||||||||||||||||||
PL Main Street Core | 26,682,081 | 1,788,097 | 301,985 | 7,717,563 | 233,755 | 1,517,010 | 22,805,365 | 1,869,292 | ||||||||||||||||||||||||
PL Mid-Cap Equity | 19,035,285 | 1,223,872 | 105,346 | 4,354,487 | (157,134 | ) | 1,103,042 | 16,955,924 | 1,541,448 | |||||||||||||||||||||||
PL Mid-Cap Growth | 14,338,560 | 2,048,122 | 28,276 | 6,222,436 | 177,716 | (615,716 | ) | 9,754,522 | 1,136,891 | |||||||||||||||||||||||
PL Small-Cap Growth | 11,735,785 | 901,652 | — | 2,662,869 | 195,605 | 925,369 | 11,095,542 | 834,879 | ||||||||||||||||||||||||
PL Small-Cap Value | 16,400,533 | 3,397,707 | 304,896 | 1,785,557 | 11,475 | 2,842,096 | 21,171,150 | 1,742,482 | ||||||||||||||||||||||||
PL Real Estate | 9,772,549 | 989,228 | 126,001 | 1,395,325 | 63,280 | 750,146 | 10,305,879 | 753,905 | ||||||||||||||||||||||||
PL Emerging Markets | 13,759,699 | 1,550,314 | 88,608 | 1,625,678 | (41,740 | ) | 757,290 | 14,488,493 | 1,018,881 | |||||||||||||||||||||||
PL International Large-Cap | 23,517,244 | 1,830,592 | 350,771 | 6,599,681 | 701,440 | 1,296,422 | 21,096,788 | 1,280,145 | ||||||||||||||||||||||||
PL International Value | 18,741,800 | 1,853,944 | 405,940 | 5,358,521 | (1,544,387 | ) | 2,566,219 | 16,664,995 | 1,831,318 | |||||||||||||||||||||||
PL Currency Strategies | — | 9,398,344 | — | 122,921 | 1,155 | 296,916 | 9,573,494 | 927,664 | ||||||||||||||||||||||||
PL Global Absolute Return | — | 12,038,811 | 7,208 | 153,649 | 148 | 221,939 | 12,114,457 | 1,188,857 | ||||||||||||||||||||||||
PL Precious Metals | — | 10,365,743 | 1,260 | 122,921 | (7,312 | ) | (1,642,891 | ) | 8,593,879 | 1,045,484 | ||||||||||||||||||||||
| $237,905,382 | $67,034,479 | $2,763,754 | $70,422,963 | $2,705,236 | $15,639,878 | $255,625,766 | ||||||||||||||||||||||||||
| (1) | Purchased cost excludes distributions received and reinvested, if any. |
| (2) | Distributions received include distributions from net investment income from the PL Underlying Funds, if any. |
| (3) | Net realized gain (loss) includes distributions from capital gains from the PL Underlying Funds, if any. |
D-9
Table of Contents
PACIFIC LIFE FUNDS
NOTES TO FINANCIAL STATEMENTS (Continued)
As of March 31, 2013, Pacific Life owned the following percentages of the total (aggregate of Class A, C, I and Advisor Class) shares outstanding of each of the following Funds:
| Fund | Ownership Percentage | |||
| PL Short Duration Income | 26.36% | |||
| PL Strategic Income | 39.33% | |||
| PL High Income | 58.25% | |||
D. INDEPENDENT TRUSTEES
The Trust pays each independent trustee of the Board retainer fees and specified amounts for various Board and committee services and for chairing those committees. The fees and expenses of the independent trustees of the Board are presented in the Statements of Operations.
Each independent trustee of the Board is eligible to participate in the Trust’s Deferred Compensation Plan (the “Plan”). The Plan allows each independent trustee to voluntarily defer receipt of all or a percentage of fees, which otherwise would be payable for services performed. Amounts in the deferral account are obligations of each Fund at the time of such deferral and are payable in accordance with the Plan. Deferral amounts are treated as though equivalent dollar amounts had been invested in shares of certain Funds. An independent trustee who defers compensation has the option to select credit rate options that track the performance, at NAV of Class A shares of the corresponding Portfolio Optimization Funds, PL Alternative Strategies Fund, PL Short Duration Income Fund, PL Income Fund, PL Strategic Income Fund, PL Floating Rate Income Fund, PL High Income Fund and/or PL Money Market Fund, and/or Class P shares of the corresponding PL Underlying Funds without a sales load. The obligation of each Fund under the Plan (the “DCP Liability”) is recorded as a liability (accrued trustees’ fees and expenses and deferred compensation). Accordingly, the market value appreciation or depreciation on a Fund’s DCP Liability account will cause the expenses of that Fund to increase or decrease due to market fluctuation. The change in net unrealized appreciation or depreciation on a Fund’s DCP Liability account is recorded as an increase or decrease to expenses (trustees’ fees and expenses). For the year ended March 31, 2013, such expenses were increased by $2,165 for all applicable Funds covered in this report as a result of the market value appreciation on such accounts. As of March 31, 2013, the total amount in the DCP Liability accounts was $9,507 for all applicable Funds covered in this report.
E. OFFICERS OF THE TRUST
None of the officers of the Trust received compensation from the Trust.
F. INDEMNIFICATIONS
Under the Trust’s organizational documents, its officers and trustees are indemnified against certain liabilities arising out of performance of their duties to the Trust. In addition, the Trust entered into an agreement with each of the trustees which provides that the Trust will indemnify and hold harmless each trustee against any expenses actually and reasonably incurred by any trustee in any proceeding arising out of or in connection with the trustee’s services to the Trust, to the fullest extent permitted by the Trust’s Declaration of Trust and By-Laws, the general trust law of the State of Delaware, the Securities Act of 1933, and the 1940 Act, each as now or hereinafter in force. In the normal course of business, the Trust enters into contracts with service providers and others that contain general indemnification clauses. The Trust’s maximum exposure under these arrangements and agreements is dependent on future claims that may be made against the Trust and/or the trustees and, therefore, cannot be estimated; however, based on experience, the risk of loss from such claims is considered remote.
7. UNFUNDED SENIOR LOAN COMMITMENTS
Unfunded loan commitments on senior loan participations and assignments (Note 4), if any, are marked to market daily and valued according to the Trust’s valuation policies and procedures. Any outstanding unfunded loan commitments are presented in the Notes to Schedules of Investments section of each applicable Fund’s Schedule of Investments. Any applicable net unrealized appreciation or depreciation at the end of the reporting period is recorded as an asset (unfunded loan commitment appreciation) or a liability (unfunded loan commitment depreciation) and any change in net unrealized appreciation or depreciation for the reporting period is recorded as a change in net unrealized appreciation or depreciation on unfunded loan commitment. As of March 31, 2013, no unfunded loan commitments were held by any Funds covered in this report.
8. PURCHASES AND SALES OF SECURITIES
The cost of purchases and proceeds from sales of investments (excluding short-term investments and the PL Money Market Fund since it trades exclusively in short-term debt investments) for the year ended March 31, 2013, are summarized in the following table:
| U.S. Government Securities | Other Securities | |||||||||||||||
| Fund | Purchases | Sales | Purchases | Sales | ||||||||||||
PL Portfolio Optimization Conservative | $— | $— | $233,674,907 | $123,086,168 | ||||||||||||
PL Portfolio Optimization Moderate-Conservative | — | — | 205,652,260 | 104,911,330 | ||||||||||||
PL Portfolio Optimization Moderate | — | — | 454,118,776 | 277,945,748 | ||||||||||||
PL Portfolio Optimization Moderate-Aggressive | — | — | 260,678,029 | 191,683,660 | ||||||||||||
PL Portfolio Optimization Aggressive | — | — | 70,980,837 | 70,422,963 | ||||||||||||
PL Short Duration Income | — | 254,150 | 66,719,715 | 31,618,078 | ||||||||||||
PL Income | 33,320,908 | 30,306,808 | 996,793,189 | 765,145,071 | ||||||||||||
PL Strategic Income | 725,625 | 1,142,268 | 130,294,238 | 98,225,076 | ||||||||||||
PL Floating Rate Income | — | — | 363,511,167 | 196,584,610 | ||||||||||||
PL High Income | — | — | 21,270,861 | 15,094,470 | ||||||||||||
D-10
Table of Contents
PACIFIC LIFE FUNDS
NOTES TO FINANCIAL STATEMENTS (Continued)
9. FEDERAL INCOME TAX INFORMATION
Each Fund intends to qualify each year as a regulated investment company (“RIC”) under Subchapter M of the Internal Revenue Code (the “Code”). A Fund that qualifies as a RIC does not have to pay income tax as long as it distributes sufficient taxable income and net capital gains. Each Fund declared and paid sufficient dividends on net investment income and capital gains distributions during the year or period ended March 31, 2013, to qualify as a RIC and is not required to pay Federal income tax under the Code. Accordingly, no provision for Federal income taxes is required in the financial statements. Required distributions are based on net investment income and net realized gains determined in accordance with income tax regulations, which may differ from U.S. GAAP for financial reporting purposes. These differences are primarily due to differing treatments for short-term capital gain distributions received, late year ordinary and post-October capital losses, capital loss carryforwards, and losses deferred due to wash sales. Permanent book and tax differences relating to shareholder distributions will result in reclassifications of capital accounts. In addition, the year in which amounts are distributed may differ from the year in which the net investment income is earned and the net gains are realized by each Fund.
The following table shows the accumulated capital losses and components of distributable earnings on a tax basis, and late year ordinary losses and post-October capital losses deferred, if any, for tax purposes as of March 31, 2013:
| Distributable Earnings | Late Year Ordinary and Post-October Losses Deferrals | |||||||||||||||||||||||||
| Fund | Accumulated Capital Losses | Undistributed Ordinary Income | Undistributed Long-Term Capital Gains | Late-Year Ordinary Losses | Short-Term Capital Losses | Total | ||||||||||||||||||||
PL Portfolio Optimization Conservative | $— | $311,305 | $4,692,498 | $— | $— | $— | ||||||||||||||||||||
PL Portfolio Optimization Moderate-Conservative | — | — | 1,192,253 | (30,412 | ) | — | (30,412 | ) | ||||||||||||||||||
PL Portfolio Optimization Moderate | (7,260,601 | ) | 1,109,295 | — | — | — | — | |||||||||||||||||||
PL Portfolio Optimization Moderate-Aggressive | (26,832,370 | ) | 1,258,078 | — | — | — | — | |||||||||||||||||||
PL Portfolio Optimization Aggressive | (24,677,921 | ) | 108,933 | — | — | — | — | |||||||||||||||||||
PL Short Duration Income | — | 155,546 | 48,378 | — | — | — | ||||||||||||||||||||
PL Income | — | 5,729,942 | 1,554,717 | — | — | — | ||||||||||||||||||||
PL Strategic Income | — | 823,253 | 150,134 | — | — | — | ||||||||||||||||||||
PL Floating Rate Income | — | 1,188,346 | 105,168 | — | — | — | ||||||||||||||||||||
PL High Income | — | 156,986 | 76,957 | — | — | — | ||||||||||||||||||||
PL Money Market | (145 | ) | — | — | — | — | — | |||||||||||||||||||
Accumulated capital losses represent net capital loss carryovers as of March 31, 2013 that may be available to offset future realized capital gains and thereby reduce future capital gains distributions. Under the Regulated Investment Company Modernization Act of 2010 (the “Modernization Act”), each Fund is permitted to carry forward capital losses incurred in taxable years beginning after December 22, 2010 for an unlimited period. Any losses incurred during those future taxable years will be required to be utilized prior to any losses incurred in pre-enactment taxable years. Additionally, post-enactment capital losses that are carried forward will retain their character as either short-term or long-term capital losses rather than being considered all short-term as under the previous law. Each Fund’s first fiscal year end subject to the Modernization Act was March 31, 2012. The following table shows the expiration dates for capital loss carryover from pre-enactment taxable years and the amounts of capital loss carryover, if any, by each of the applicable Funds as of March 31, 2013:
| Pre-Enactment | Post-Enactment | |||||||||||||||||||||
| Unlimited Period of Net | Accumulated Capital Loss Carryover | |||||||||||||||||||||
| Net Capital Loss Carryover Expiring in | Capital Loss Carryover | |||||||||||||||||||||
| Fund | 2018 | 2019 | Short-Term | Long-Term | ||||||||||||||||||
PL Portfolio Optimization Moderate | ($3,387,905 | ) | ($3,872,696 | ) | $— | $— | ($7,260,601 | ) | ||||||||||||||
PL Portfolio Optimization Moderate-Aggressive | (22,723,265 | ) | (4,109,105 | ) | — | — | (26,832,370 | ) | ||||||||||||||
PL Portfolio Optimization Aggressive | (21,647,525 | ) | (3,030,396 | ) | — | — | (24,677,921 | ) | ||||||||||||||
PL Money Market | — | — | (145 | ) | — | (145 | ) | |||||||||||||||
D-11
Table of Contents
PACIFIC LIFE FUNDS
NOTES TO FINANCIAL STATEMENTS (Continued)
The aggregate Federal tax cost of investments and the composition of unrealized appreciation and depreciation on investments as of March 31, 2013, were as follows:
| Fund | Total Cost of Investments on Tax Basis | Gross Unrealized Appreciation on Investments | Gross Unrealized Depreciation on Investments | Net Unrealized Appreciation (Depreciation) on Investments | Net Unrealized Appreciation (Depreciation) on Other (1) | Net Unrealized Appreciation (Depreciation) | ||||||||||||||||||
PL Portfolio Optimization Conservative | $476,140,783 | $36,941,352 | ($6,111,057 | ) | $30,830,295 | $— | $30,830,295 | |||||||||||||||||
PL Portfolio Optimization Moderate-Conservative | 452,885,134 | 53,994,724 | (7,545,989 | ) | 46,448,735 | — | 46,448,735 | |||||||||||||||||
PL Portfolio Optimization Moderate | 1,105,670,359 | 179,630,844 | (16,824,755 | ) | 162,806,089 | — | 162,806,089 | |||||||||||||||||
PL Portfolio Optimization Moderate-Aggressive | 725,782,189 | 150,175,010 | (18,407,754 | ) | 131,767,256 | — | 131,767,256 | |||||||||||||||||
PL Portfolio Optimization Aggressive | 208,566,395 | 60,783,336 | (13,723,965 | ) | 47,059,371 | — | 47,059,371 | |||||||||||||||||
PL Short Duration Income | 50,253,298 | 545,385 | (11,850 | ) | 533,535 | — | 533,535 | |||||||||||||||||
PL Income | 587,749,899 | 10,796,059 | (735,376 | ) | 10,060,683 | — | 10,060,683 | |||||||||||||||||
PL Strategic Income | 52,646,388 | 1,550,153 | (117,548 | ) | 1,432,605 | (82 | ) | 1,432,523 | ||||||||||||||||
PL Floating Rate Income | 260,727,640 | 3,523,540 | (236,553 | ) | 3,286,987 | — | 3,286,987 | |||||||||||||||||
PL High Income | 14,298,437 | 657,526 | (28,653 | ) | 628,873 | 31 | 628,904 | |||||||||||||||||
PL Money Market | 29,647,269 | — | — | — | — | — | ||||||||||||||||||
| (1) | Other includes net appreciation or depreciation on assets and liabilities in foreign currencies, if any. |
Each Fund recognizes the financial statement effects of a tax position taken or expected to be taken in a tax return when it is more likely than not, based on the technical merits, that the position will be sustained upon examination by the applicable tax authority. Tax positions not deemed to meet the more-likely-than-not threshold would be recorded as a tax liability for unrecognized tax benefits with a corresponding income tax expense. Each Fund is required to analyze all open tax years, as defined by the statute of limitations, for all major jurisdictions. As a result of each Fund’s evaluation, as of and during the year ended March 31, 2013, each Fund did not record a liability for any unrecognized tax benefits. Each Fund’s policy is to recognize interest and penalties on unrecognized tax benefits in income tax expense. During the year ended March 31, 2013, none of the Funds covered in this report incurred any interest or penalties. Each Fund is also not aware of any tax positions for which it is reasonably possible that the total amounts of unrecognized tax benefits will change materially in the next twelve months.
Each Fund remains subject to examination by Federal and State tax authorities (principal state jurisdictions include California and Delaware) for the tax years ended March 31, 2010 through March 31, 2013 for Federal purposes and March 31, 2009 through March 31, 2013 for State purposes.
10. TAX CHARACTER OF DISTRIBUTIONS
The tax character of income and capital gain distributions to shareholders during the years or periods ended March 31, 2013 and 2012, were as follows:
| For the Year Ended March 31, 2013 | For the Year or Period Ended March 31, 2012 | |||||||||||||||||||||||||
| Fund | Ordinary Income | Long-Term Capital Gains | Total Distributions | Ordinary Income | Long-Term Capital Gains | Total Distributions | ||||||||||||||||||||
PL Portfolio Optimization Conservative | $13,483,260 | $1,941,221 | $15,424,481 | $7,728,384 | $866,047 | $8,594,431 | ||||||||||||||||||||
PL Portfolio Optimization Moderate-Conservative | 9,424,340 | — | 9,424,340 | 5,748,565 | — | 5,748,565 | ||||||||||||||||||||
PL Portfolio Optimization Moderate | 15,773,113 | — | 15,773,113 | 10,718,539 | — | 10,718,539 | ||||||||||||||||||||
PL Portfolio Optimization Moderate-Aggressive | 6,080,007 | — | 6,080,007 | 4,781,380 | — | 4,781,380 | ||||||||||||||||||||
PL Portfolio Optimization Aggressive | 1,000,003 | — | 1,000,003 | 575,812 | — | 575,812 | ||||||||||||||||||||
PL Short Duration Income | 644,329 | — | 644,329 | 59,453 | — | 59,453 | ||||||||||||||||||||
PL Income | 24,411,888 | 628,377 | 25,040,265 | 5,113,218 | — | 5,113,218 | ||||||||||||||||||||
PL Strategic Income | 2,270,755 | — | 2,270,755 | 190,597 | — | 190,597 | ||||||||||||||||||||
PL Floating Rate Income | 5,581,382 | — | 5,581,382 | 1,286,518 | — | 1,286,518 | ||||||||||||||||||||
PL High Income | 901,637 | — | 901,637 | 117,780 | — | 117,780 | ||||||||||||||||||||
11. RECLASSIFICATION OF ACCOUNTS
During the year or period ended March 31, 2013, reclassifications as shown in the following table have been made in each Fund’s capital accounts to report these balances on a tax basis, excluding certain temporary differences. Additional adjustments may be required in subsequent reporting periods. These reclassifications, which have no impact on the NAV of the Funds, are primarily attributable to non-deductible expenses and treatment of net operating losses and capital gains under Federal tax rules versus U.S. GAAP.
D-12
Table of Contents
PACIFIC LIFE FUNDS
NOTES TO FINANCIAL STATEMENTS (Continued)
| Fund | Paid-in Capital | Undistributed/ Accumulated Net Investment Income (Loss) | Undistributed/ Accumulated Net Realized Gain (Loss) | |||||||||
PL Portfolio Optimization Conservative | $— | $6,586,732 | ($6,586,732 | ) | ||||||||
PL Portfolio Optimization Moderate-Conservative | — | 3,933,931 | (3,933,931 | ) | ||||||||
PL Portfolio Optimization Moderate | — | 5,728,387 | (5,728,387 | ) | ||||||||
PL Portfolio Optimization Moderate-Aggressive | — | 2,202,715 | (2,202,715 | ) | ||||||||
PL Portfolio Optimization Aggressive | — | 161,281 | (161,281 | ) | ||||||||
PL Short Duration Income | (6,590 | ) | 6,590 | — | ||||||||
PL Strategic Income | (6,699 | ) | 8,334 | (1,635 | ) | |||||||
PL Floating Rate Income | — | (38 | ) | 38 | ||||||||
PL High Income | (2,938 | ) | 3,477 | (539 | ) | |||||||
PL Money Market | (365 | ) | 365 | — | ||||||||
12. SHARES OF BENEFICIAL INTEREST
Each Fund is authorized to issue an unlimited number of shares of beneficial interest with no par value. Changes in shares of beneficial interest of each Fund for years or periods ended March 31, 2013 and 2012 were as follows:
| PL Portfolio Optimization Conservative Fund (1) | PL Portfolio Optimization Moderate-Conservative Fund (1) | PL Portfolio Optimization Moderate Fund (1) | PL Portfolio Optimization Moderate-Aggressive Fund (1) | |||||||||||||||||||||||||||||||||||
| Year or Period Ended 3/31/2013 | Year Ended 3/31/2012 | Year or Period Ended 3/31/2013 | Year Ended 3/31/2012 | Year or Period Ended 3/31/2013 | Year Ended 3/31/2012 | Year or Period Ended 3/31/2013 | Year Ended 3/31/2012 | |||||||||||||||||||||||||||||||
Class A | ||||||||||||||||||||||||||||||||||||||
Shares sold | 9,555,985 | 9,414,786 | 7,963,161 | 7,831,859 | 16,343,831 | 18,477,094 | 8,430,453 | 10,012,961 | ||||||||||||||||||||||||||||||
Dividends and distribution reinvested | 610,375 | 365,940 | 420,884 | 271,273 | 770,456 | 571,355 | 340,116 | 296,921 | ||||||||||||||||||||||||||||||
Shares repurchased | (6,465,096 | ) | (5,234,709 | ) | (4,318,443 | ) | (3,599,667 | ) | (9,237,993 | ) | (9,238,552 | ) | (5,509,217 | ) | (5,875,333 | ) | ||||||||||||||||||||||
Net increase | 3,701,264 | 4,546,017 | 4,065,602 | 4,503,465 | 7,876,294 | 9,809,897 | 3,261,352 | 4,434,549 | ||||||||||||||||||||||||||||||
Beginning shares outstanding | 16,529,635 | 11,983,618 | 16,318,684 | 11,815,219 | 42,230,380 | 32,420,483 | 29,438,756 | 25,004,207 | ||||||||||||||||||||||||||||||
Ending shares outstanding | 20,230,899 | 16,529,635 | 20,384,286 | 16,318,684 | 50,106,674 | 42,230,380 |
| 32,700,108 | 29,438,756 | |||||||||||||||||||||||||||||
Class B | ||||||||||||||||||||||||||||||||||||||
Shares sold | 1,120,671 | 1,221,610 | 1,090,064 | 1,382,047 | 2,362,221 | 2,768,421 | 1,361,711 | 1,820,845 | ||||||||||||||||||||||||||||||
Dividends and distribution reinvested | 92,587 | 55,798 | 65,283 | 44,056 | 98,836 | 75,743 | 31,423 | 28,570 | ||||||||||||||||||||||||||||||
Shares repurchased | (509,261 | ) | (322,557 | ) | (599,280 | ) | (409,613 | ) | (1,424,938 | ) | (1,163,612 | ) | (1,193,147 | ) | (1,069,955 | ) | ||||||||||||||||||||||
Net increase | 703,997 | 954,851 | 556,067 | 1,016,490 | 1,036,119 | 1,680,552 | 199,987 | 779,460 | ||||||||||||||||||||||||||||||
Beginning shares outstanding | 3,022,111 | 2,067,260 | 3,560,056 | 2,543,566 | 9,485,382 | 7,804,830 | 7,802,346 | 7,022,886 | ||||||||||||||||||||||||||||||
Ending shares outstanding | 3,726,108 | 3,022,111 | 4,116,123 | 3,560,056 | 10,521,501 | 9,485,382 |
| 8,002,333 | 7,802,346 | |||||||||||||||||||||||||||||
Class C | ||||||||||||||||||||||||||||||||||||||
Shares sold | 8,139,305 | 7,994,971 | 5,923,824 | 5,134,378 | 9,333,385 | 9,843,078 | 4,830,609 | 5,151,759 | ||||||||||||||||||||||||||||||
Dividends and distribution reinvested | 489,660 | 265,270 | 246,945 | 142,867 | 307,135 | 217,096 | 85,286 | 67,782 | ||||||||||||||||||||||||||||||
Shares repurchased | (3,525,119 | ) | (4,677,810 | ) | (2,454,247 | ) | (2,262,176 | ) | (5,356,599 | ) | (6,101,604 | ) | (3,457,043 | ) | (3,665,505 | ) | ||||||||||||||||||||||
Net increase | 5,103,846 | 3,582,431 | 3,716,522 | 3,015,069 | 4,283,921 | 3,958,570 | 1,458,852 | 1,554,036 | ||||||||||||||||||||||||||||||
Beginning shares outstanding | 14,487,979 | 10,905,548 | 12,635,509 | 9,620,440 | 30,143,771 | 26,185,201 | 20,950,979 | 19,396,943 | ||||||||||||||||||||||||||||||
Ending shares outstanding | 19,591,825 | 14,487,979 | 16,352,031 | 12,635,509 | 34,427,692 | 30,143,771 |
| 22,409,831 | 20,950,979 | |||||||||||||||||||||||||||||
Class R | ||||||||||||||||||||||||||||||||||||||
Shares sold | 448,640 | 463,890 | 169,324 | 689,513 | 1,002,477 | 990,223 | 537,806 | 777,958 | ||||||||||||||||||||||||||||||
Dividends and distribution reinvested | 32,002 | 25,463 | 11,455 | 27,509 | 28,875 | 23,691 | 11,279 | 14,124 | ||||||||||||||||||||||||||||||
Shares repurchased | (346,805 | ) | (355,060 | ) | (190,444 | ) | (1,528,021 | ) | (656,319 | ) | (1,106,493 | ) | (395,743 | ) | (1,040,572 | ) | ||||||||||||||||||||||
Net increase (decrease) | 133,837 | 134,293 | (9,665 | ) | (810,999 | ) | 375,033 | (92,579 | ) | 153,342 | (248,490 | ) | ||||||||||||||||||||||||||
Beginning shares outstanding | 953,982 | 819,689 | 546,947 | 1,357,946 | 1,905,643 | 1,998,222 | 1,186,539 | 1,435,029 | ||||||||||||||||||||||||||||||
Ending shares outstanding | 1,087,819 | 953,982 | 537,282 | 546,947 | 2,280,676 | 1,905,643 |
| 1,339,881 | 1,186,539 | |||||||||||||||||||||||||||||
Advisor Class | ||||||||||||||||||||||||||||||||||||||
Shares sold | 119,752 | 72,694 | 260,077 | 185,157 | ||||||||||||||||||||||||||||||||||
Dividends and distribution reinvested | — | — | — | — | ||||||||||||||||||||||||||||||||||
Shares repurchased | (5 | ) | — | — | — | |||||||||||||||||||||||||||||||||
Net increase | 119,747 | 72,694 | 260,077 | 185,157 | ||||||||||||||||||||||||||||||||||
Beginning shares outstanding | — | — | — | — | ||||||||||||||||||||||||||||||||||
Ending shares outstanding | 119,747 | 72,694 | 260,077 | 185,157 | ||||||||||||||||||||||||||||||||||
| (1) | Advisor Class shares of the PL Portfolio Optimization Funds commenced operations on December 31, 2012. |
D-13
Table of Contents
PACIFIC LIFE FUNDS
NOTES TO FINANCIAL STATEMENTS (Continued)
| PL Portfolio Optimization Aggressive Fund (1) | PL Short Duration Income Fund (2) | PL Income Fund (3) | PL Strategic Income Fund (2) | |||||||||||||||||||||||||||||||||||
| Year or Period Ended 3/31/2013 | Year Ended 3/31/2012 | Year or Period Ended 3/31/2013 | Period Ended 3/31/2012 | Year or Period Ended 3/31/2013 | Period Ended 3/31/2012 | Year or Period Ended 3/31/2013 | Period Ended 3/31/2012 | |||||||||||||||||||||||||||||||
Class A | ||||||||||||||||||||||||||||||||||||||
Shares sold | 2,482,556 | 2,681,939 | 2,423,165 | 24,375,409 | 25,930,108 | 1,968,516 | ||||||||||||||||||||||||||||||||
Dividends and distribution reinvested | 70,593 | 47,941 | 11,585 | 1,274,846 | 224,292 | 41,118 | ||||||||||||||||||||||||||||||||
Shares repurchased | (2,429,225 | ) | (2,280,849 | ) | (275,783 | ) | (18,412,186 | ) | (3,339,586 | ) | (143,365 | ) | ||||||||||||||||||||||||||
Net increase | 123,924 | 449,031 | 2,158,967 | 7,238,069 | 22,814,814 | 1,866,269 | ||||||||||||||||||||||||||||||||
Beginning shares outstanding | 9,745,244 | 9,296,213 | — | 23,336,646 | 521,832 | — | ||||||||||||||||||||||||||||||||
Ending shares outstanding | 9,869,168 | 9,745,244 | 2,158,967 | 30,574,715 | 23,336,646 | 1,866,269 | ||||||||||||||||||||||||||||||||
Class B | ||||||||||||||||||||||||||||||||||||||
Shares sold | 342,244 | 435,514 | ||||||||||||||||||||||||||||||||||||
Dividends and distribution reinvested | 698 | — | ||||||||||||||||||||||||||||||||||||
Shares repurchased | (449,859 | ) | (382,304 | ) | ||||||||||||||||||||||||||||||||||
Net increase (decrease) | (106,917 | ) | 53,210 | |||||||||||||||||||||||||||||||||||
Beginning shares outstanding | 2,603,681 | 2,550,471 | ||||||||||||||||||||||||||||||||||||
Ending shares outstanding | 2,496,764 | 2,603,681 | ||||||||||||||||||||||||||||||||||||
Class C | ||||||||||||||||||||||||||||||||||||||
Shares sold | 1,425,644 | 2,135,369 | 1,037,630 | 8,841,353 | 7,455,154 | 774,544 | ||||||||||||||||||||||||||||||||
Dividends and distribution reinvested | 2,871 | — | 5,815 | 453,539 | 51,918 | 16,763 | ||||||||||||||||||||||||||||||||
Shares repurchased | (1,484,191 | ) | (2,178,209 | ) | (56,887 | ) | (1,834,101 | ) | (279,689 | ) | (83,071 | ) | ||||||||||||||||||||||||||
Net increase (decrease) | (55,676 | ) | (42,840 | ) | 986,558 | 7,460,791 | 7,227,383 | 708,236 | ||||||||||||||||||||||||||||||
Beginning shares outstanding | 6,240,042 | 6,282,882 | — | 7,227,383 | — | — | ||||||||||||||||||||||||||||||||
Ending shares outstanding | 6,184,366 | 6,240,042 | 986,558 | 14,688,174 | 7,227,383 | 708,236 | ||||||||||||||||||||||||||||||||
Class R | ||||||||||||||||||||||||||||||||||||||
Shares sold | 193,028 | 360,732 | ||||||||||||||||||||||||||||||||||||
Dividends and distribution reinvested | 2,638 | 1,331 | ||||||||||||||||||||||||||||||||||||
Shares repurchased | (189,303 | ) | (282,883 | ) | ||||||||||||||||||||||||||||||||||
Net increase | 6,363 | 79,180 | ||||||||||||||||||||||||||||||||||||
Beginning shares outstanding | 533,714 | 454,534 | ||||||||||||||||||||||||||||||||||||
Ending shares outstanding | 540,077 | 533,714 | ||||||||||||||||||||||||||||||||||||
Class I | ||||||||||||||||||||||||||||||||||||||
Shares sold | 27,031 | 1,202,305 | 68,421 | 103,371 | 142,908 | 1,692,857 | ||||||||||||||||||||||||||||||||
Dividends and distribution reinvested | 36,099 | 5,874 | 6,379 | 91,641 | 139,813 | 18,364 | ||||||||||||||||||||||||||||||||
Shares repurchased | — | — | (32,427 | ) | (5,117,325 | ) | (16,558 | ) | — | |||||||||||||||||||||||||||||
Net increase (decrease) | 63,130 | 1,208,179 | 42,373 | (4,922,313 | ) | 266,163 | 1,711,221 | |||||||||||||||||||||||||||||||
Beginning shares outstanding | 1,208,179 | — | 121,696 | 5,044,009 | 1,711,221 | — | ||||||||||||||||||||||||||||||||
Ending shares outstanding | 1,271,309 | 1,208,179 | 164,069 | 121,696 | 1,977,384 | 1,711,221 | ||||||||||||||||||||||||||||||||
Advisor Class | ||||||||||||||||||||||||||||||||||||||
Shares sold | 16,463 | 393,447 | 8,605,542 | 137,777 | ||||||||||||||||||||||||||||||||||
Dividends and distribution reinvested | — | 3,791 | 78,443 | 2,852 | ||||||||||||||||||||||||||||||||||
Shares repurchased | — | (96,309 | ) | (98,760 | ) | (478 | ) | |||||||||||||||||||||||||||||||
Net increase | 16,463 | 300,929 | 8,585,225 | 140,151 | ||||||||||||||||||||||||||||||||||
Beginning shares outstanding | — | — | — | — | ||||||||||||||||||||||||||||||||||
Ending shares outstanding | 16,463 | 300,929 | 8,585,225 | 140,151 | ||||||||||||||||||||||||||||||||||
| (1) | Advisor Class shares of the PL Portfolio Optimization Funds commenced operations on December 31, 2012. |
| (2) | Class I shares of the PL Short Duration Income Fund and PL Strategic Income Fund commenced operations on December 19, 2011, and Class A, Class C and Advisor Class shares commenced operations on June 29, 2012. |
| (3) | Class C shares of the PL Income Fund commenced operations on June 30, 2011 and Advisor Class shares commenced operations on June 29, 2012. |
D-14
Table of Contents
PACIFIC LIFE FUNDS
NOTES TO FINANCIAL STATEMENTS (Continued)
| PL Floating Rate Income Fund (1) | PL High Income Fund (2) | PL Money Market Fund (3) | ||||||||||||||||||||||||||||||||
| Year or Period Ended 3/31/2013 | Period Ended 3/31/2012 | Year or Period Ended 3/31/2013 | Period Ended 3/31/2012 | Year or Period Ended 3/31/2013 | Year Ended 3/31/2012 | |||||||||||||||||||||||||||||
Class A | ||||||||||||||||||||||||||||||||||
Shares sold | 11,622,923 | 1,196,731 | 346,748 | 42,618,839 | 45,578,881 | |||||||||||||||||||||||||||||
Dividends and distribution reinvested | 204,727 | 4,943 | 10,556 | — | — | |||||||||||||||||||||||||||||
Shares repurchased | (1,072,728 | ) | (2,608 | ) | (44,027 | ) | (47,369,048 | ) | (51,953,637 | ) |
| |||||||||||||||||||||||
Net increase (decrease) | 10,754,922 | 1,199,066 | 313,277 | (4,750,209 | ) | (6,374,756 | ) | |||||||||||||||||||||||||||
Beginning shares outstanding | 1,199,066 | — | — | 32,078,570 | 38,453,326 |
| ||||||||||||||||||||||||||||
Ending shares outstanding | 11,953,988 | 1,199,066 | 313,277 | 27,328,361 | 32,078,570 |
| ||||||||||||||||||||||||||||
Class B | ||||||||||||||||||||||||||||||||||
Shares sold | 1,053,696 | |||||||||||||||||||||||||||||||||
Dividends and distribution reinvested | — | |||||||||||||||||||||||||||||||||
Shares repurchased | (481,969 | ) | ||||||||||||||||||||||||||||||||
Net increase | 571,727 | |||||||||||||||||||||||||||||||||
Beginning shares outstanding | — | |||||||||||||||||||||||||||||||||
Ending shares outstanding | 571,727 | |||||||||||||||||||||||||||||||||
Class C | ||||||||||||||||||||||||||||||||||
Shares sold | 5,751,227 | 338,818 | 268,167 | 5,087,169 | ||||||||||||||||||||||||||||||
Dividends and distribution reinvested | 76,451 | 719 | 5,164 | — | ||||||||||||||||||||||||||||||
Shares repurchased | (127,622 | ) | (4,631 | ) | (75,814 | ) | (3,347,348 | ) | ||||||||||||||||||||||||||
Net increase | 5,700,056 | 334,906 | 197,517 | 1,739,821 | ||||||||||||||||||||||||||||||
Beginning shares outstanding | 334,906 | — | — | — | ||||||||||||||||||||||||||||||
Ending shares outstanding | 6,034,962 | 334,906 | 197,517 | 1,739,821 | ||||||||||||||||||||||||||||||
Class I | ||||||||||||||||||||||||||||||||||
Shares sold | 460,598 | 4,034,813 | 18,696 | 700,000 | ||||||||||||||||||||||||||||||
Dividends and distribution reinvested | 118,470 | 119,051 | 64,838 | 11,256 | ||||||||||||||||||||||||||||||
Shares repurchased | (3,706,713 | ) | (2,039 | ) | (90 | ) | — | |||||||||||||||||||||||||||
Net increase (decrease) | (3,127,645 | ) | 4,151,825 | 83,444 | 711,256 | |||||||||||||||||||||||||||||
Beginning shares outstanding | 4,151,825 | — | 711,256 | — | ||||||||||||||||||||||||||||||
Ending shares outstanding | 1,024,180 | 4,151,825 | 794,700 | 711,256 | ||||||||||||||||||||||||||||||
Advisor Class | ||||||||||||||||||||||||||||||||||
Shares sold | 3,941,559 | 25,118 | ||||||||||||||||||||||||||||||||
Dividends and distribution reinvested | 26,303 | 369 | ||||||||||||||||||||||||||||||||
Shares repurchased | (568,213 | ) | (503 | ) | ||||||||||||||||||||||||||||||
Net increase | 3,399,649 | 24,984 | ||||||||||||||||||||||||||||||||
Beginning shares outstanding | — | — | ||||||||||||||||||||||||||||||||
Ending shares outstanding | 3,399,649 | 24,984 | ||||||||||||||||||||||||||||||||
Class P | ||||||||||||||||||||||||||||||||||
Shares sold | 1,385 | |||||||||||||||||||||||||||||||||
Dividends and distribution reinvested | 12 | |||||||||||||||||||||||||||||||||
Shares repurchased | (34 | ) | ||||||||||||||||||||||||||||||||
Net increase | 1,363 | |||||||||||||||||||||||||||||||||
Beginning shares outstanding | — | |||||||||||||||||||||||||||||||||
Ending shares outstanding | 1,363 | |||||||||||||||||||||||||||||||||
| (1) | Class I shares of the PL Floating Rate Income Fund commenced operations on June 30, 2011, Class A and Class C shares commenced operations on December 30, 2011, Advisor Class shares commenced operations on June 29, 2012, and Class P shares commenced operations on December 31, 2012. |
| (2) | Class I shares of the PL High Income Fund commenced operations on December 19, 2011, and Class A, Class C and Advisor Class shares commenced operations on June 29, 2012. |
| (3) | Class B and Class C shares of the PL Money Market Fund commenced operations on June 29, 2012. |
D-15
Table of Contents
PACIFIC LIFE FUNDS
NOTES TO FINANCIAL STATEMENTS (Continued)
13. OTHER TAX INFORMATION (Unaudited)
For corporate shareholders, the percentage of investment income (dividend income and short-term gains, if any) for each of the Funds that qualify for the dividends-received deductions for the year ended March 31, 2013 is as follows:
| Fund | Percentage | |||
PL Portfolio Optimization Conservative | 6.86% | |||
PL Portfolio Optimization Moderate-Conservative | 18.10% | |||
PL Portfolio Optimization Moderate | 37.89% | |||
PL Portfolio Optimization Moderate-Aggressive | 82.35% | |||
PL Portfolio Optimization Aggressive | 100.00% | |||
PL Strategic Income | 0.12% | |||
For the year ended March 31, 2013, certain dividends paid by the Funds may be subject to a maximum tax rate of 15%, as provided by the Jobs and Growth Tax Relief Reconciliation Act of 2003. Of the distributions made by the following Funds, the corresponding percentages represent the amount of each distribution which may qualify for the 15% dividend income tax rate.
| Fund | Percentage | |||
PL Portfolio Optimization Conservative | 9.25% | |||
PL Portfolio Optimization Moderate-Conservative | 26.23% | |||
PL Portfolio Optimization Moderate | 57.33% | |||
PL Portfolio Optimization Moderate-Aggressive | 100.00% | |||
PL Portfolio Optimization Aggressive | 100.00% | |||
PL Strategic Income | 0.13% | |||
Shareholders should not use the above tax information to prepare their tax returns. The information will be included with your Form 1099 DIV which will be sent to you separately in January 2014.
The following Funds designated the listed amounts as long-term capital gain dividends during the year ended March 31, 2013. Distributable long-term gains are based on net realized long-term gains determined on a tax basis and may differ from such amounts for financial reporting purposes.
| Fund | Amount | |||
PL Portfolio Optimization Conservative | $5,766,275 | |||
PL Portfolio Optimization Moderate-Conservative | 1,192,254 | |||
PL Short Duration Income | 48,378 | |||
PL Income | 2,056,759 | |||
PL Strategic Income | 150,134 | |||
PL Floating Rate Income | 105,168 | |||
PL High Income | 76,957 | |||
D-16
Table of Contents
REPORT OF INDEPENDENT REGISTERED PUBLIC ACCOUNTING FIRM
To The Board of Trustees and Shareholders of
Pacific Life Funds
We have audited the accompanying statements of assets and liabilities, including the schedules of investments, of PL Portfolio Optimization Conservative Fund, PL Portfolio Optimization Moderate-Conservative Fund, PL Portfolio Optimization Moderate Fund, PL Portfolio Optimization Moderate-Aggressive Fund, PL Portfolio Optimization Aggressive Fund, PL Short Duration Income Fund, PL Income Fund, PL Strategic Income Fund, PL Floating Rate Income Fund, PL High Income Fund, and PL Money Market Fund (collectively the “Funds”) (eleven of thirty-three funds comprising Pacific Life Funds) as of March 31, 2013, and the related statements of operations for the year then ended, the statements of changes in net assets for each of the two years in the period then ended (as to the PL Short Duration Income Fund, PL Strategic Income Fund, PL Floating Rate Income Fund, and PL High Income Fund, for the year ended March 31, 2013 and the period from commencement of operations through March 31, 2012), and the financial highlights for each of the periods presented. These financial statements and financial highlights are the responsibility of the Funds’ management. Our responsibility is to express an opinion on these financial statements and financial highlights based on our audits.
We conducted our audits in accordance with the standards of the Public Company Accounting Oversight Board (United States). Those standards require that we plan and perform the audit to obtain reasonable assurance about whether the financial statements and financial highlights are free of material misstatement. The Funds are not required to have, nor were we engaged to perform, an audit of their internal control over financial reporting. Our audits included consideration of internal control over financial reporting as a basis for designing audit procedures that are appropriate in the circumstances, but not for the purpose of expressing an opinion on the effectiveness of the Funds’ internal control over financial reporting. Accordingly, we express no such opinion. An audit also includes examining, on a test basis, evidence supporting the amounts and disclosures in the financial statements, assessing the accounting principles used and significant estimates made by management, as well as evaluating the overall financial statement presentation. Our procedures included confirmation of investments owned as of March 31, 2013, by correspondence with the custodian, agent banks, transfer agent, and brokers; where replies were not received from brokers, we performed other auditing procedures. We believe that our audits provide a reasonable basis for our opinion.
In our opinion, such financial statements and financial highlights referred to above present fairly, in all material respects, the financial position of each of the respective Funds as of March 31, 2013, and the results of their operations, the changes in their net assets, and the financial highlights for each of the periods presented, in conformity with accounting principles generally accepted in the United States of America.

Philadelphia, Pennsylvania
May 28, 2013
E-1
Table of Contents
PACIFIC LIFE FUNDS
(Unaudited)
We believe it is important for you to understand the impact of fees and expenses regarding your investment. All mutual funds have operating expenses. As a shareholder of a mutual fund, you incur two types of costs: (1) transactions costs such as initial sales charges (loads) on purchase payments and/or contingent deferred sales charges on redemptions; and (2) ongoing costs, which include advisory fees, administration fees, distribution and/or service fees, and other fund expenses. The following example is intended to help you understand your ongoing costs (in dollars) of investing in each fund and to compare these costs with those of other mutual funds. The example is based on an investment of $1,000.00 made at the beginning of the period and held for the entire six-month period from October 1, 2012 to March 31, 2013.
ACTUAL EXPENSES
The first section of the table for each fund entitled “Actual Fund Return”, provides information about actual account values and actual expenses based on each fund’s actual performance and each fund’s actual expenses, after any applicable fee waivers and expense reimbursements (See Note 6B in Notes to Financial Statements). The “Ending Account Value at 03/31/13” column shown is derived from the fund’s actual performance; the “Annualized Expense Ratio” column shows the fund’s actual annualized expense ratio; and the “Expenses Paid During the Period 10/01/12-03/31/13” column shows the dollar amount that would have been paid by you. All the information illustrated in the following table is based on the past six-month period from October 1, 2012 to March 31, 2013.
You may use the information in this section, together with the amount you invested, to estimate the expenses that you paid over the period. To do so, for each fund in your account, simply divide that fund’s value by $1,000.00 (for example, an $8,600.00 fund value divided by $1,000.00 = 8.6), then multiply the result by the number given for your fund(s) in the “Expenses Paid During the Period 10/01/12-03/31/13.”
HYPOTHETICAL EXAMPLE FOR COMPARISON PURPOSES
The second section of the table for each fund, entitled “Hypothetical”, provides information about hypothetical account values and hypothetical expenses based on a 5% per year hypothetical rate of return and actual fund’s expenses, after any applicable fee waivers and expense reimbursements (See Note 6B in Notes to Financial Statements). It assumes that the fund had an annual 5% rate of return before expenses, but that the expense ratio is unchanged. The hypothetical account values and expenses may not be used to estimate the actual ending account values or expenses you paid for the period.
You may use the hypothetical example information to compare the ongoing costs of investing in the fund compared to other mutual funds. To do so, compare this 5% hypothetical example with the 5% hypothetical examples that appear in the shareholder reports of other mutual funds.
Please note that the expenses shown in the table are meant to highlight your ongoing costs only and do not reflect any transactional costs, such as initial sales charges (loads) or contingent deferred sales charges. Therefore, the second section of the table is useful in comparing ongoing costs only, and will not help you determine the relative total costs of owning different mutual funds. In addition, if these other costs were included, your costs would have been higher.
| Beginning Account Value at 10/01/12 | Ending Account Value at 03/31/13 | Annualized Expense Ratio | Expenses 10/01/12 - | |||||||||||||
| PL Portfolio Optimization Conservative Fund (2) | ||||||||||||||||
Actual Fund Return |
| |||||||||||||||
Class A | $1,000.00 | $1,028.50 | 0.60% | $3.03 | ||||||||||||
Class B | 1,000.00 | 1,025.20 | 1.35% | 6.82 | ||||||||||||
Class C | 1,000.00 | 1,024.70 | 1.35% | 6.81 | ||||||||||||
Class R | 1,000.00 | 1,027.40 | 0.85% | 4.30 | ||||||||||||
Advisor Class (3) | 1,000.00 | 1,020.60 | 0.40% | 1.01 | ||||||||||||
Hypothetical |
| |||||||||||||||
Class A | $1,000.00 | $1,021.94 | 0.60% | $3.02 | ||||||||||||
Class B | 1,000.00 | 1,018.20 | 1.35% | 6.79 | ||||||||||||
Class C | 1,000.00 | 1,018.20 | 1.35% | 6.79 | ||||||||||||
Class R | 1,000.00 | 1,020.69 | 0.85% | 4.28 | ||||||||||||
Advisor Class (3) | 1,000.00 | 1,022.94 | 0.40% | 2.02 | ||||||||||||
| PL Portfolio Optimization Moderate-Conservative Fund (2) | ||||||||||||||||
Actual Fund Return |
| |||||||||||||||
Class A | $1,000.00 | $1,044.20 | 0.60% | $3.06 | ||||||||||||
Class B | 1,000.00 | 1,040.10 | 1.35% | 6.87 | ||||||||||||
Class C | 1,000.00 | 1,040.50 | 1.35% | 6.87 | ||||||||||||
Class R | 1,000.00 | 1,043.00 | 0.85% | 4.33 | ||||||||||||
Advisor Class (3) | 1,000.00 | 1,036.00 | 0.40% | 1.02 | ||||||||||||
Hypothetical |
| |||||||||||||||
Class A | $1,000.00 | $1,021.94 | 0.60% | $3.02 | ||||||||||||
Class B | 1,000.00 | 1,018.20 | 1.35% | 6.79 | ||||||||||||
Class C | 1,000.00 | 1,018.20 | 1.35% | 6.79 | ||||||||||||
Class R | 1,000.00 | 1,020.69 | 0.85% | 4.28 | ||||||||||||
Advisor Class (3) | 1,000.00 | 1,022.94 | 0.40% | 2.02 | ||||||||||||
| PL Portfolio Optimization Moderate Fund (2) | ||||||||||||||||
Actual Fund Return |
| |||||||||||||||
Class A | $1,000.00 | $1,062.80 | 0.60% | $3.09 | ||||||||||||
Class B | 1,000.00 | 1,058.40 | 1.35% | 6.93 | ||||||||||||
Class C | 1,000.00 | 1,058.50 | 1.35% | 6.93 | ||||||||||||
Class R | 1,000.00 | 1,061.10 | 0.85% | 4.37 | ||||||||||||
Advisor Class (3) | 1,000.00 | 1,052.40 | 0.40% | 1.02 | ||||||||||||
Hypothetical |
| |||||||||||||||
Class A | $1,000.00 | $1,021.94 | 0.60% | $3.02 | ||||||||||||
Class B | 1,000.00 | 1,018.20 | 1.35% | 6.79 | ||||||||||||
Class C | 1,000.00 | 1,018.20 | 1.35% | 6.79 | ||||||||||||
Class R | 1,000.00 | 1,020.69 | 0.85% | 4.28 | ||||||||||||
Advisor Class (3) | 1,000.00 | 1,022.94 | 0.40% | 2.02 | ||||||||||||
See explanation of references on page F-2
F-1
Table of Contents
PACIFIC LIFE FUNDS
DISCLOSURE OF FUND EXPENSES (Continued)
(Unaudited)
| Beginning Account Value at 10/01/12 | Ending Account Value at 03/31/13 | Annualized Expense Ratio | Expenses 10/01/12 - | |||||||||||||
| PL Portfolio Optimization Moderate-Aggressive Fund (2) | ||||||||||||||||
Actual Fund Return |
| |||||||||||||||
Class A | $1,000.00 | $1,077.60 | 0.60% | $3.11 | ||||||||||||
Class B | 1,000.00 | 1,074.80 | 1.35% | 6.98 | ||||||||||||
Class C | 1,000.00 | 1,074.20 | 1.35% | 6.98 | ||||||||||||
Class R | 1,000.00 | 1,076.90 | 0.85% | 4.40 | ||||||||||||
Advisor Class (3) | 1,000.00 | 1,067.20 | 0.40% | 1.03 | ||||||||||||
Hypothetical |
| |||||||||||||||
Class A | $1,000.00 | $1,021.94 | 0.60% | $3.02 | ||||||||||||
Class B | 1,000.00 | 1,018.20 | 1.35% | 6.79 | ||||||||||||
Class C | 1,000.00 | 1,018.20 | 1.35% | 6.79 | ||||||||||||
Class R | 1,000.00 | 1,020.69 | 0.85% | 4.28 | ||||||||||||
Advisor Class (3) | 1,000.00 | 1,022.94 | 0.40% | 2.02 | ||||||||||||
| PL Portfolio Optimization Aggressive Fund (2) | ||||||||||||||||
Actual Fund Return |
| |||||||||||||||
Class A | $1,000.00 | $1,085.50 | 0.60% | $3.12 | ||||||||||||
Class B | 1,000.00 | 1,083.90 | 1.35% | 7.01 | ||||||||||||
Class C | 1,000.00 | 1,084.20 | 1.35% | 7.01 | ||||||||||||
Class R | 1,000.00 | 1,085.20 | 0.85% | 4.42 | ||||||||||||
Advisor Class (3) | 1,000.00 | 1,075.60 | 0.40% | 1.03 | ||||||||||||
Hypothetical |
| |||||||||||||||
Class A | $1,000.00 | $1,021.94 | 0.60% | $3.02 | ||||||||||||
Class B | 1,000.00 | 1,018.20 | 1.35% | 6.79 | ||||||||||||
Class C | 1,000.00 | 1,018.20 | 1.35% | 6.79 | ||||||||||||
Class R | 1,000.00 | 1,020.69 | 0.85% | 4.28 | ||||||||||||
Advisor Class (3) | 1,000.00 | 1,022.94 | 0.40% | 2.02 | ||||||||||||
| PL Short Duration Income Fund | ||||||||||||||||
Actual Fund Return |
| |||||||||||||||
Class A | $1,000.00 | $1,021.70 | 0.85% | $4.28 | ||||||||||||
Class C | 1,000.00 | 1,018.50 | 1.60% | 8.05 | ||||||||||||
Class I | 1,000.00 | 1,023.60 | 0.60% | 3.03 | ||||||||||||
Advisor Class | 1,000.00 | 1,022.70 | 0.60% | 3.03 | ||||||||||||
Hypothetical |
| |||||||||||||||
Class A | $1,000.00 | $1,020.69 | 0.85% | $4.28 | ||||||||||||
Class C | 1,000.00 | 1,016.95 | 1.60% | 8.05 | ||||||||||||
Class I | 1,000.00 | 1,021.94 | 0.60% | 3.02 | ||||||||||||
Advisor Class | 1,000.00 | 1,021.94 | 0.60% | 3.02 | ||||||||||||
| PL Income Fund | ||||||||||||||||
Actual Fund Return |
| |||||||||||||||
Class A | $1,000.00 | $1,025.50 | 0.90% | $4.54 | ||||||||||||
Class C | 1,000.00 | 1,021.90 | 1.65% | 8.32 | ||||||||||||
Class I | 1,000.00 | 1,026.80 | 0.65% | 3.28 | ||||||||||||
Advisor Class | 1,000.00 | 1,026.90 | 0.65% | 3.28 | ||||||||||||
Hypothetical |
| |||||||||||||||
Class A | $1,000.00 | $1,020.44 | 0.90% | $4.53 | ||||||||||||
Class C | 1,000.00 | 1,016.70 | 1.65% | 8.30 | ||||||||||||
Class I | 1,000.00 | 1,021.69 | 0.65% | 3.28 | ||||||||||||
Advisor Class | 1,000.00 | 1,021.69 | 0.65% | 3.28 | ||||||||||||
| Beginning Account Value at 10/01/12 | Ending Account Value at 03/31/13 | Annualized Expense Ratio | Expenses 10/01/12 - | |||||||||||||
| PL Strategic Income Fund | ||||||||||||||||
Actual Fund Return |
| |||||||||||||||
Class A | $1,000.00 | $1,074.20 | 1.05% | $5.43 | ||||||||||||
Class C | 1,000.00 | 1,070.70 | 1.80% | 9.29 | ||||||||||||
Class I | 1,000.00 | 1,076.60 | 0.80% | 4.14 | ||||||||||||
Advisor Class | 1,000.00 | 1,076.20 | 0.80% | 4.14 | ||||||||||||
Hypothetical |
| |||||||||||||||
Class A | $1,000.00 | $1,019.70 | 1.05% | $5.29 | ||||||||||||
Class C | 1,000.00 | 1,015.96 | 1.80% | 9.05 | ||||||||||||
Class I | 1,000.00 | 1,020.94 | 0.80% | 4.03 | ||||||||||||
Advisor Class | 1,000.00 | 1,020.94 | 0.80% | 4.03 | ||||||||||||
| PL Floating Rate Income Fund | ||||||||||||||||
Actual Fund Return |
| |||||||||||||||
Class A | $1,000.00 | $1,047.80 | 1.05% | $5.36 | ||||||||||||
Class C | 1,000.00 | 1,043.30 | 1.80% | 9.17 | ||||||||||||
Class I | 1,000.00 | 1,047.60 | 0.80% | 4.08 | ||||||||||||
Class P (3) | 1,000.00 | 1,027.40 | 0.80% | 2.02 | ||||||||||||
Advisor Class | 1,000.00 | 1,048.90 | 0.80% | 4.09 | ||||||||||||
Hypothetical |
| |||||||||||||||
Class A | $1,000.00 | $1,019.70 | 1.05% | $5.29 | ||||||||||||
Class C | 1,000.00 | 1,015.96 | 1.80% | 9.05 | ||||||||||||
Class I | 1,000.00 | 1,020.94 | 0.80% | 4.03 | ||||||||||||
Class P (3) | 1,000.00 | 1,020.94 | 0.80% | 4.03 | ||||||||||||
Advisor Class | 1,000.00 | 1,020.94 | 0.80% | 4.03 | ||||||||||||
| PL High Income Fund | ||||||||||||||||
Actual Fund Return |
| |||||||||||||||
Class A | $1,000.00 | $1,067.40 | 1.05% | $5.41 | ||||||||||||
Class C | 1,000.00 | 1,064.40 | 1.80% | 9.26 | ||||||||||||
Class I | 1,000.00 | 1,070.00 | 0.80% | 4.13 | ||||||||||||
Advisor Class | 1,000.00 | 1,069.70 | 0.80% | 4.13 | ||||||||||||
Hypothetical |
| |||||||||||||||
Class A | $1,000.00 | $1,019.70 | 1.05% | $5.29 | ||||||||||||
Class C | 1,000.00 | 1,015.96 | 1.80% | 9.05 | ||||||||||||
Class I | 1,000.00 | 1,020.94 | 0.80% | 4.03 | ||||||||||||
Advisor Class | 1,000.00 | 1,020.94 | 0.80% | 4.03 | ||||||||||||
| PL Money Market Fund | ||||||||||||||||
Actual Fund Return |
| |||||||||||||||
Class A | $1,000.00 | $1,000.00 | 0.11% | $0.55 | ||||||||||||
Class B | 1,000.00 | 1,000.00 | 0.11% | 0.55 | ||||||||||||
Class C | 1,000.00 | 1,000.00 | 0.11% | 0.55 | ||||||||||||
Hypothetical |
| |||||||||||||||
Class A | $1,000.00 | $1,024.38 | 0.11% | $0.56 | ||||||||||||
Class B | 1,000.00 | 1,024.38 | 0.11% | 0.56 | ||||||||||||
Class C | 1,000.00 | 1,024.38 | 0.11% | 0.56 | ||||||||||||
| (1) | Expenses paid during the period are equal to the fund's annualized expense ratio (shown in table above), multiplied by the average account value over the period, multiplied by the number of days in the most recent fiscal half-year or applicable period, then divided by 365 days. |
| (2) | The annualized expense ratios for the Portfolio Optimization Funds do not include fees and expenses of the PL Underlying Funds (see Note 1 in Notes to Financial Statements) in which the Portfolio Optimization Funds invest. |
| (3) | This share class commenced operations on December 31, 2012. The actual return and expenses paid during the period was for the period December 31, 2012 to March 31, 2013, instead of the entire six-month period. The hypothetical return and expenses paid during the period are based on the entire six-month period for comparison purposes. |
F-2
Table of Contents
PACIFIC LIFE FUNDS
TRUSTEES AND OFFICERS INFORMATION
(Unaudited)
The business and affairs of the Pacific Life Funds (the “Trust”) are managed under the direction of the Board of Trustees under the Pacific Life Funds’ Declaration of Trust. Information pertaining to the trustees and officers of the Trust is set forth below. Trustees who are not deemed to be “interested persons” of the Trust, as defined in the 1940 Act, are referred to as “Independent Trustees.” Certain trustees and officers are deemed to be “interested persons” of the Trust and thus are referred to as “Interested Persons”, because of their positions with Pacific Life Insurance Company (“Pacific Life”) and Pacific Life Fund Advisors LLC, a wholly-owned subsidiary of Pacific Life. The Trust’s Statement of Additional Information includes additional information about the trustees. For information on availability of the Trust’s Statement of Additional Information, refer to the WHERE TO GO FOR MORE INFORMATION section of this report.
The address of each trustee and officer is c/o Pacific Life Funds, 700 Newport Center Drive, Newport Beach, CA 92660.
Name and Age | Position(s) with the Fund and Length of Time Served* | Current Directorship(s) Held and Principal Occupation(s) (and certain additional occupation information) During Past 5 years | Number of Portfolios in Fund Complex Overseen** | |||
INDEPENDENT TRUSTEES | ||||||
Frederick L. Blackmon Year of birth 1952 | Trustee since 9/13/05 | Trustee (1/05 to present) of Pacific Select Fund; Director (2005 to present) of Trustmark Mutual Holding Company; Former Executive Vice President and Chief Financial Officer (1995 to 2003) of Zurich Life and has been retired since that time; Former Executive Vice President and Chief Financial Officer (1989 to 1995) of Alexander Hamilton Life Insurance Company (subsidiary of Household International); Member of Board of Trustees (2010 to present) of Cranbrook Educational Community; Former Member of Board of Governors (1994 to 1999) of Cranbrook Schools; and Former Member of Board of Regents (1993 to 1996) Eastern Michigan University. | 87 | |||
Gale K. Caruso Year of birth 1957 | Trustee since 1/01/06 | Trustee (1/06 to present) of Pacific Select Fund; Former Member of the Board of Directors (2005 to 2009) of LandAmerica Financial Group, Inc.; Former President and Chief Executive Officer (1999 to 2003) of Zurich Life; Former Chairman, President and Chief Executive Officer of Scudder Canada Investor Services, Ltd. and Managing Director of Scudder Kemper Investments; Former Member of the Advisory Council of the Trust for Public Land in Maine; Former Member of the Board of Directors of Make-A-Wish of Maine; and Former Member of the Board of Directors of the Illinois Life Insurance Council. | 87 | |||
Lucie H. Moore Year of birth 1956 | Trustee since 6/13/01 | Trustee (10/98 to present) of Pacific Select Fund; Former Partner (1984 to 1994) with Gibson, Dunn & Crutcher (Law); Former Member of the Board of Trustees (2007 to 2011) of Sage Hill School; Former Member (2000 to 2009) and Former Vice Chairman (2001 to 2007) of the Board of Trustees of The Pegasus School; Former Member of the Board of Directors (2005 to 2010) of HomeWord; and Former Member of the Advisory Board (1993 to 2004) of Court Appointed Special Advocates (CASA) of Orange County. | 87 | |||
Nooruddin (Rudy) S. Veerjee Year of birth 1958 | Trustee since 9/13/05 | Trustee (1/05 to present) of Pacific Select Fund; Former President (1997 to 2000) of Transamerica Insurance and Investment Group and has been retired since that time; Former President (1994 to 1997) of Transamerica Asset Management; Former Chairman and Chief Executive Officer (1995 to 2000) of Transamerica Premier Funds (Mutual Fund); and Former Director (1994 to 2000) of various Transamerica Life Companies. | 87 | |||
G. Thomas Willis Year of birth 1942 | Trustee since 2/24/04 | Trustee (11/03 to present) of Pacific Select Fund; Certified Public Accountant in California (1967 to present); Former Audit Partner (1976 to 2002) of PricewaterhouseCoopers LLP (Accounting and Auditing) and has been retired since that time. | 87 | |||
F-3
Table of Contents
PACIFIC LIFE FUNDS
TRUSTEES AND OFFICERS INFORMATION (Continued)
(Unaudited)
Name and Age | Position(s) with the Fund and Length of Time Served* | Current Directorship(s) Held and Principal Occupation(s) (and certain additional occupation information) During Past 5 years | Number of Portfolios in Fund Complex Overseen** | |||
INTERESTED PERSONS | ||||||
James T. Morris Year of birth 1960 | Chairman of the Board and Trustee since 1/11/07, (Chief Executive Officer 1/11/07 to 12/31/09) | Director (4/07 to present), Chairman (5/08 to present), Chief Executive Officer (4/07 to present) and President (4/07 to 3/12) of Pacific Mutual Holding Company and Pacific LifeCorp; Director (4/07 to present), Chairman (5/08 to present), Chief Executive Officer (4/07 to present) and President (4/07 to 3/12) of Pacific Life; Chief Executive Officer (5/07 to present) and President (5/07 to 3/12) of Pacific Life Fund Advisors LLC; Chairman of the Board and Trustee (1/07 to present) and Chief Executive Officer (1/07 to 12/09) of Pacific Select Fund. | 87 | |||
Mary Ann Brown Year of birth 1951 | Chief Executive Officer since 1/01/10, (President 1/11/07 to 12/31/09) | Executive Vice President (4/10 to present) and Senior Vice President (5/06 to 3/10) of Pacific LifeCorp; Executive Vice President (4/10 to present) and Senior Vice President (3/05 to 3/10) of Pacific Life; Executive Vice President (4/10 to present) and Senior Vice President (5/07 to 3/10) of Pacific Life Fund Advisors LLC; and Chief Executive Officer (1/10 to present) and President (1/07 to 12/09) of Pacific Select Fund. | 87 | |||
Robin S. Yonis Year of birth 1954 | Vice President and General Counsel since 6/13/01 | Vice President, Fund Advisor General Counsel, and Assistant Secretary (5/07 to present) of Pacific Life Fund Advisors LLC; and Vice President and General Counsel (4/05 to present) of Pacific Select Fund. | 87 | |||
Brian D. Klemens Year of birth 1956 | Vice President and Treasurer since 6/13/01 | Vice President and Controller (10/07 to present) of Pacific Mutual Holding Company and Pacific LifeCorp; Vice President and Controller (10/07 to present) of Pacific Life; Vice President and Controller (10/07 to present) of Pacific Life Fund Advisors LLC; Vice President (5/00 to present) and Controller (10/07 to present) of Pacific Select Distributors, Inc.; and Vice President and Treasurer (4/96 to present) of Pacific Select Fund. | 87 | |||
Sharon E. Pacheco Year of birth 1957 | Vice President and Chief Compliance Officer since 6/04/04 | Vice President and Chief Compliance Officer (11/03 to present) of Pacific Mutual Holding Company and Pacific LifeCorp; Vice President (2/00 to present) and Chief Compliance Officer (1/03 to present) of Pacific Life; Vice President and Chief Compliance Officer (5/07 to present) of Pacific Life Fund Advisors LLC; and Vice President and Chief Compliance Officer (6/04 to present) of Pacific Select Fund. | 87 | |||
Eddie Tung Year of birth 1957 | Vice President and Assistant Treasurer since 11/14/05 | Assistant Vice President (4/03 to present) of Pacific Life; Assistant Vice President (5/07 to present) of Pacific Life Fund Advisors LLC; and Assistant Vice President and Assistant Treasurer (11/05 to present) of Pacific Select Fund. | 87 | |||
Howard T. Hirakawa Year of birth 1962 | Vice President since 6/20/06 | Vice President (5/07 to present) of Pacific Life Fund Advisors LLC; and Vice President (6/06 to present) of Pacific Select Fund. | 87 | |||
Jane M. Guon Year of birth 1964 | Vice President and Secretary since 1/01/11 | Vice President and Secretary (1/11 to present), Assistant Vice President (4/06 to 12/10) and Assistant Secretary (6/98 to 12/10) of Pacific Mutual Holding Company and Pacific LifeCorp; Director, Vice President, and Secretary (1/11 to present), Assistant Vice President (4/06 to 12/10) and Assistant Secretary (2/95 to 12/10) of Pacific Life; Vice President and Secretary (1/11 to present) and Assistant Vice President and Assistant Secretary (05/07 to 12/10) of Pacific Life Fund Advisors LLC; Vice President and Secretary (1/11 to present), Assistant Vice President (5/06 to 12/10) and Assistant Secretary (5/99 to 12/10) of Pacific Select Distributors, Inc.; and Vice President and Secretary (1/11 to present) of Pacific Select Fund. | 87 | |||
F-4
Table of Contents
PACIFIC LIFE FUNDS
TRUSTEES AND OFFICERS INFORMATION (Continued)
(Unaudited)
Name and Age | Position(s) with the Fund and Length of Time Served* | Current Directorship(s) Held and Principal Occupation(s) (and certain additional occupation information) During Past 5 years | Number of Portfolios in Fund Complex Overseen** | |||
INTERESTED PERSONS (Continued) | ||||||
Laurene E. MacElwee Year of birth 1966 | Vice President since 4/04/05 and Assistant Secretary since 6/13/01 | Vice President (4/11 to present), Assistant Secretary (5/07 to present) and Assistant Vice President (5/07 to 3/11) of Pacific Life Fund Advisors LLC; and Vice President (12/11 to present), Assistant Secretary (4/05 to present) and Assistant Vice President (4/05 to 12/11) of Pacific Select Fund. | 87 | |||
Carleton J. Muench Year of birth 1973 | Vice President since 11/30/06 | Assistant Vice President (5/07 to present) of Pacific Life Fund Advisors LLC; and Assistant Vice President (11/06 to present) of Pacific Select Fund. | 87 | |||
Kevin W. Steiner Year of birth 1975 | Vice President since 1/01/13 | Assistant Vice President (4/12 to present), Mutual Funds Compliance Director (4/08 to 3/12) and Mutual Funds Compliance Manager (10/06 to 3/08) of Pacific Life Fund Advisors LLC; and Assistant Vice President (1/13 to present) of Pacific Select Fund. | 87 | |||
| * | A trustee serves until he or she resigns, retires, or his or her successor is elected and qualified. |
| ** | As of March 31, 2013, the “Fund Complex” consisted of Pacific Select Fund (54 portfolios) and Pacific Life Funds (33 funds). |
F-5
Table of Contents
PACIFIC LIFE FUNDS
APPROVAL OF INVESTMENT ADVISORY AGREEMENT
AND FUND MANAGEMENT AGREEMENTS
(Unaudited)
The Board of Trustees (the “Trustees” or “Board”) of Pacific Life Funds (the “Trust”) oversees the management of each of the separate funds of the Trust (each a “Fund” and collectively, the “Funds”) and, as required by Section 15(c) of the Investment Company Act of 1940, as amended (the “1940 Act”), initially approves, and determines annually whether to renew the investment advisory agreement (the “Advisory Agreement”) with Pacific Life Fund Advisors LLC (“PLFA”) and each Fund management agreement (the “Fund Management Agreements,” together with the Advisory Agreement, the “Agreements”) with the various sub-advisers (“Fund Managers”). PLFA serves as the investment adviser for all of the Funds and directly manages the PL Short Duration, PL Income, PL Strategic Income, PL Floating Rate Income, PL High Income, and PL Money Market Funds (the “PAM Managed Funds”) under the name Pacific Asset Management (“PAM”) and the PL Portfolio Optimization Conservative, PL Portfolio Optimization Moderate-Conservative, PL Portfolio Optimization Moderate, PL Portfolio Optimization Moderate-Aggressive, and PL Portfolio Optimization Aggressive Funds (the “Asset Allocation Funds,” and together with the PAM Managed Funds, the “Directly Managed Funds”). For all other Funds (other than the PL Alternative Strategies Fund, which is a new fund and is discussed in a separate Annual Report dated March 31, 2013), PLFA has retained other firms to serve as Fund Managers under PLFA’s supervision. The Board, including all of the Trustees who are not “interested persons,” as that term is defined in the 1940 Act (“Independent Trustees”), last renewed the Agreements at an in-person meeting of the Trustees held on December 12, 2012.
At this meeting and other meetings, the Board considered information (both written and oral) provided to assist it in its review of the Agreements and made assessments with respect to each Agreement. The Board requested, received and reviewed written materials from PLFA and each Fund Manager that were submitted in response to requests from the Independent Trustees and supporting materials relating to those questions and responses. In addition, the Board received in-person presentations about the Funds throughout the year, and the Independent Trustees were advised by independent legal counsel with respect to these and other relevant matters. The Board reviewed a variety of factors and considered a significant amount of information, including information received on an ongoing basis at Board and committee meetings, including reports on Fund performance, expenses, fee comparisons, investment advisory, compliance, and other services provided to the Funds by PLFA and the Fund Managers. The Board also reviewed financial and profitability information regarding PLFA and the Fund Managers and information regarding the organization and operations of each entity, such as their compliance monitoring, portfolio trading and brokerage practices and the personnel providing investment management and administrative services to each Fund. The Board reviewed data provided by PLFA that was gathered from various independent providers of investment company data to provide the Board with information concerning the Funds’ investment performance, management fees and expense information. Additionally, the Independent Trustees retained an independent consultant (“Independent Consultant”) to assist the Trustees with certain of their analyses and to provide other relevant information. The Independent Consultant utilized and provided the Independent Trustees with data obtained from independent service providers as well as from other sources.
The Trustees’ determinations were made on the basis of each Trustee’s business judgment after consideration of all the information presented. In reviewing the materials presented and in considering the information in the management presentations, the Trustees did not identify any single issue or particular information that, in isolation, would be a controlling factor in making a final decision regarding the proposed renewals. Individual Trustees may have given different weights to certain factors and assigned various degrees of materiality to information received in connection with the approval process. The following summary describes the most important, but not all, of the factors considered by the Trustees in approving the renewals, and in the case of the Independent Trustees, certain factors were considered in light of the legal advice furnished to them by independent legal counsel and information from the Independent Consultant that they had retained. This discussion is not intended to be all-inclusive.
Annual Consideration and Approval of Investment Advisory and Fund Management Agreements
In evaluating the Advisory Agreement and each Fund Management Agreement, the Board, including all the Independent Trustees, considered the following factors, among others:
1. Nature, Extent and Quality of Services
Fund Oversight and Supervision—PLFA, its personnel and its resources. The Trustees considered the depth and quality of PLFA’s investment management process, including its monitoring and oversight of the Fund Managers and PAM; the experience, capability and integrity of its senior management and other personnel; the low turnover rates of its key personnel; and the overall financial strength and stability of its organization. The Trustees considered the high quality of the products and services provided by PLFA and its affiliates, such as the many educational services and tools offered to assist intermediaries in effectively understanding and meeting shareholder needs. The Trustees also noted that PLFA regularly informs the Trustees about matters relevant to the Trust, its shareholders and investing.
The Trustees also considered that the investment, legal, compliance and accounting professionals of PLFA and its affiliates have access to and utilize a variety of resources and systems relating to investment management, compliance, trading, performance analysis, security valuation and fund accounting. The Trustees further considered PLFA’s continuing need to attract and retain qualified personnel and to maintain and enhance its resources and systems to provide appropriate investment management, compliance and monitoring services for the Funds. The Board noted that PLFA monitors numerous investment, performance and compliance metrics for the Funds.
The Trustees considered PLFA’s continued development and use of analytical tools for assessing Fund performance and the performance of the Fund Managers, conducting an attribution analysis on performance and reporting on performance to the Trustees. The Trustees noted that PLFA uses these tools to identify Funds that are underperforming applicable benchmarks or peer groups, and then conducts various analyses to try to assess the sources of and reasons for underperformance. The Trustees noted that PLFA has developed processes to oversee and monitor the performance of Fund Managers, including the use of analytical methods to review Fund performance and execution of investment strategies. The Board noted that PLFA provides the Board with analysis of this data over rolling periods to assist the Board in identifying trends in Fund performance and other areas, and periodically provides the Trustees with information on economic and market trends to provide a
F-6
Table of Contents
PACIFIC LIFE FUNDS
APPROVAL OF INVESTMENT ADVISORY AGREEMENT
AND FUND MANAGEMENT AGREEMENTS (Continued)
(Unaudited)
context for assessing recent performance. The Board also noted that PLFA conducts periodic due diligence on Fund Managers involving onsite visits, in-person meetings and telephonic meetings to gather information that PLFA uses to gain an in-depth understanding of a Fund Manager’s investment process and to seek to identify issues that may be relevant to a Fund Manager’s services to a Fund or a Fund’s performance, including, but not limited to, the financial strength of a Fund Manager, significant staffing changes that could affect a Fund, material changes in a Fund Manager’s assets under management, compliance and regulatory concerns, best execution review and portfolio security valuation support. The Trustees also noted that PLFA appeared to have implemented effective methods for monitoring investment style consistency by Fund Managers and for analyzing the use of derivatives by Fund Managers. With respect to the PL Floating Rate Income, PL High Income, PL Income, PL Money Market, PL Short Duration Income and PL Strategic Income Funds (the “PAM Managed Funds”), the Board considered that PLFA provided oversight, diligence and reporting with regard to its PAM unit that is similar to the process it employs with regard to the Fund Managers. The Board also considered that PLFA manages directly the PL Portfolio Optimization Conservative, PL Portfolio Optimization Moderate-Conservative, PL Portfolio Optimization Moderate, PL Portfolio Optimization Growth, and PL Portfolio Optimization Aggressive-Growth Funds (the “Asset Allocation Funds,” and together with the PAM Managed Funds, the “Directly Managed Funds”).
The Trustees considered the time and attention paid by PLFA to matters involving the valuation of Trust securities, including researching and evaluating information concerning securities that are not actively or publicly traded, valuing securities subject to a trading halt, the value of equity securities traded on foreign exchanges, oversight of and due diligence on pricing vendors and the development of alternate valuation methodologies. The Trustees also considered PLFA’s oversight of transition management when overseeing significant changes in the Funds, such as cash movements between the Funds arising from reallocations by funds of funds and the transition from one Fund Manager to another, including steps taken by PLFA to reduce transaction costs associated with a Fund transition.
The Trustees considered PLFA’s policies, procedures and systems to ensure compliance with applicable laws and regulations with respect to the Directly Managed Funds, its compliance monitoring of the Fund Managers and its commitment to those programs; PLFA’s efforts to keep the Trustees informed about the Fund Managers; and its attention to matters that may involve conflicts of interest with each Fund. In this regard, the Trustees reviewed information throughout the year on PLFA’s compliance policies and procedures, its compliance history, and reports from the Trust’s Chief Compliance Officer (“CCO”) on compliance by PLFA, the Fund Managers, and the Funds with applicable laws and regulations. The Trustees also reviewed information on any responses by PLFA to regulatory and compliance developments throughout the year. The Trustees further considered the monitoring and additional services provided by PLFA to the Funds, including risk management analysis, preparation of periodic performance and financial reports, review of trade execution and coordination of other service providers to the Trust.
Fund Management—PLFA and the Fund Managers. The Trustees considered various materials relating to PLFA, including PAM, and the Fund Managers, including copies of each existing Advisory Agreement and Fund Management Agreement; copies of the Form ADV for PLFA and each Fund Manager; financial information relating to PLFA and each Fund Manager; and other information deemed relevant to the Trustees’ evaluation of PLFA and each Fund Manager, including qualitative assessments from senior management of PLFA.
The Trustees considered the benefits to shareholders of retaining PLFA and each Fund Manager and continuing the Advisory Agreement and Fund Management Agreements particularly in light of the nature, extent, and quality of the services that have been provided by PLFA and the Fund Managers. The Trustees noted the portfolio management services that have been provided by PLFA or PAM to the Directly Managed Funds and the portfolio management services that have been provided by the Fund Managers to the other Funds. The Trustees considered the quality of the portfolio management services which have benefited and should continue to benefit the Funds and their shareholders, the organizational depth and resources of PLFA and the Fund Managers, including the background and experience of PLFA and each of the Fund Manager’s management, and the expertise of PLFA, its PAM unit, and each Fund Manager’s portfolio management team, as well as the investment methodology used by PLFA, its PAM unit, and the Fund Manager.
The Trustees further noted the compliance monitoring conducted by PLFA and PAM on an ongoing basis and also noted the development of procedures and systems necessary to maintain compliance with applicable laws and regulations as well as the resources that PLFA dedicates to these programs. The Trustees considered that the CCO had in place a systematic process for periodically reviewing PLFA’s and each Fund Manager’s written compliance policies and procedures, including the assessment of PLFA’s and each Fund Manager’s compliance program as required under Rule 38a-1 of the 1940 Act and PLFA’s and each Fund Manager’s code of ethics. The Trustees also considered that PLFA and each Fund Manager continues to cooperate with the CCO in reviewing its compliance operations.
In making their assessments, the Trustees considered that PLFA has historically exercised diligence in monitoring the performance of the Fund Managers and PAM, and has recommended and taken measures to attempt to remedy relative underperformance by a Fund when PLFA and the Trustees believed it to be appropriate.
The Board concluded that it was satisfied with the nature, extent and quality of the investment management services provided by PLFA and the Fund Managers.
2. Investment Results
The Trustees considered the investment results of each Fund in light of its objective and market conditions over the past year. The Trustees compared each Fund’s total returns with both the total returns of appropriate groups of peer funds, based on information provided by PLFA using data from independent sources, and with one or more relevant benchmark indices. The Independent Trustees also considered information provided by an Independent Consultant who provided a presentation and analysis to the Trustees regarding peer group performance utilizing data from independent sources. The information provided to the Trustees included each Fund’s performance record for the prior ten calendar years, as applicable, and three-month, year-to-date, one-, three-, five- and ten-year or since inception periods, as applicable. In reviewing the performance data drawn from independent sources, as well as the performance of the respective benchmark indices, the Trustees took into consideration the goals and objectives of each Fund and noted that some Funds had outperformed their peer groups over certain periods and/or
F-7
Table of Contents
PACIFIC LIFE FUNDS
APPROVAL OF INVESTMENT ADVISORY AGREEMENT
AND FUND MANAGEMENT AGREEMENTS (Continued)
(Unaudited)
exceeded their respective benchmark indices while others underperformed their peer groups over certain periods and/or trailed their respective benchmark indices. The Trustees discussed with PLFA the fact that certain periods of underperformance may be transitory while other periods of underperformance may be reflective of broader issues which may warrant consideration of corrective action. The Trustees discussed these Funds with representatives of PLFA, including an assessment of the approach used by the Fund Managers as well as oversight and monitoring by PLFA as the investment adviser, to gain an understanding of underperformance and to assess whether any actions would be appropriate.
The Trustees also reviewed the monitoring of the Fund Managers’ investment results by PLFA, including PLFA’s historical practice of recommending to the Trustees the use of a new manager if performance lagged and could not be improved within a reasonable timeframe, and reviewed the monitoring of the PAM unit’s investment results by PLFA. Generally, the Trustees noted that there continues to be a strong record of well-managed Funds that work well in the Asset Allocation Funds and that the Asset Allocation Funds provide a range of professionally managed asset allocation investment options. The Trustees also noted that the Funds continue to deliver the investment style as disclosed to shareholders. The Trustees also noted only the Directly Managed Funds are open to new investors.
The Board concluded that PLFA continues to have a strong record of effectively managing a multi-manager fund group and asset allocation and income funds designed to give shareholders a reasonable array of choices through which to implement their investment programs. The Board further concluded that PLFA was implementing each Fund’s investment objective either directly or through the selection of Fund Managers and that PLFA’s record in managing each Fund indicates that its continued management as well as the continuation of the respective Fund Management Agreements will benefit each Fund and its shareholders.
3. Advisory Fees and Total Expense Ratios
The Trustees requested, received and reviewed information from PLFA relating to the advisory fees and the sub-advisory fees, including the portion of the advisory fees paid to each Fund Manager as compared to the portion retained by PLFA, and operating expense ratios for each of the Funds. The Independent Trustees also requested and reviewed information from the Independent Consultant along with their analysis of advisory fees, sub-advisory fees and certain other expenses. The Trustees reviewed the advisory fees, sub-advisory fees and operating expense ratios of each Fund and compared such amounts with the average fee and expense levels of other funds in applicable peer fund groups. During their review, the Trustees noted that all of the Funds were subject to contractual expense limitations agreed to by PLFA. The Trustees also reviewed written materials prepared by PLFA based on peer fund group information retrieved from the independent sources. The Independent Trustees requested and reviewed an analysis provided by the Independent Consultant of the asset-based breakpoint schedule for the Funds. The Independent Trustees noted that the breakpoints offer meaningful potential savings to shareholders of many of the Funds.
The Trustees also considered information from the Fund Managers regarding the comparative sub-advisory fees charged under other investment advisory contracts for similarly managed accounts, such as contracts of each Fund Manager with other similarly managed registered investment companies or other types of clients. The Trustees noted that in many cases there were differences in the level of services provided to the Funds by the Fund Managers and that the level of services provided by these Fund Managers on these other accounts were due to the different nature of the accounts or because there were other reasons to support the difference in fees, such as an affiliation between the Fund Manager and the account. These differences often explained variations in fee schedules. The Trustees were mindful that, with regard to the sub-advised Funds, the fee rates were the result of arms’-length negotiations between PLFA and the Fund Managers, and that any sub-advisory fees are paid by PLFA and are not paid directly by a Fund. The Trustees observed that certain of the Funds’ contractual advisory fees were higher than the average of their respective Morningstar category while others were either lower or approximately equal to these averages.
The Board concluded that the advisory fees, sub-advisory fees and total expenses of each Fund were fair and reasonable.
4. Costs, Level of Profits and Economies of Scale
The Trustees reviewed information provided by PLFA and the Fund Managers regarding PLFA’s costs of sponsoring the Funds and information regarding the profitability of PLFA and the Fund Managers.
PLFA and the Fund Managers’ Costs and Profitability. The Trustees noted that, based on the data available, PLFA appears to be providing products that are competitively priced with other funds, especially multi-manager and asset allocation funds. The Board considered the costs of the services to be provided and the overall financial results for PLFA and its affiliates from the management of the Trust, both including and excluding distribution costs. The Board noted that the Funds and not projected to produce profits for PLFA for the year ended December 31, 2012, and considered that the Funds have not been profitable to PLFA and its affiliates in the past, due in part to the relatively low level of assets. The Board also noted the projected profitability of the Funds to PLFA in the near term and noted that PLFA and its affiliates continue to subsidize and reimburse expenses for many of the Funds.
The Trustees also reviewed information provided regarding the structure and manner in which PLFA’s and the Fund Managers’ investment professionals were compensated and their respective views of the relationship of such compensation to the attraction and retention of quality personnel. The Trustees considered PLFA’s willingness to invest in technology, infrastructure and staff to reinforce and offer new services and to accommodate changing regulatory requirements.
With respect to the Fund Managers, the Trustees noted that it was difficult in many cases to accurately determine or evaluate the profitability of the Fund Management Agreements to the Fund Managers because of, among other things, the differences in the types of information provided by the Fund Managers, the fact that many Fund Managers manage substantial assets other than the Funds and, further, that any such assessment would involve assumptions regarding the Fund Managers’ expense allocation policies, capital structure, cost of capital, business mix and other factors.
F-8
Table of Contents
PACIFIC LIFE FUNDS
APPROVAL OF INVESTMENT ADVISORY AGREEMENT
AND FUND MANAGEMENT AGREEMENTS (Continued)
(Unaudited)
Accordingly, in the case of the Fund Managers, the Trustees focused their consideration on the data described above in light of the arms’-length nature of the relationship (for the Funds that are sub-advised) between PLFA and such Fund Managers with respect to the negotiation of fund sub-advisory fees and the fact that such fees are paid by PLFA.
Economies of Scale. The Trustees noted and considered the extent to which economies of scale are increasingly realized as each Fund grows and whether advisory fee levels reflect economies of scale if the Funds grow in size. The Trustees noted the Funds have relatively small asset levels that do not currently produce significant economies of scale. The Trustee noted, however, PLFA’s commitment to competitive total expenses of the Funds through expense limitation agreements, its and its affiliates’ consistent reinvestment in the business in the form of improvements in technology, product innovations and customer service. The Board concluded that the Funds’ cost structures were reasonable in light of the Trust’s size.
5. Ancillary Benefits
The Trustees requested and received from PLFA and the Fund Managers information concerning other benefits received by PLFA, the Fund Managers, and their affiliates as a result of their respective relationship with the Funds, including information about various service arrangements with PLFA affiliates and reimbursement at an approximate cost basis for support services in the case of PLFA and an affiliate, as well as commissions paid to broker-dealers affiliated with certain Fund Managers and the use of soft-dollars by certain of the Fund Managers. The Trustees also considered information concerning other significant economic relations between the Fund Managers and their affiliates and with PLFA and its affiliates and noted PLFA’s processes and procedures to identify and disclose such relationships to the Board. The Trustees also considered information provided to them as to how conflicts of interest that may arise from these relationships are managed.
The Board concluded that such benefits were consistent with those generally derived by investment advisers to mutual funds or were otherwise not unusual.
6. Conclusion
Based on their review, including their consideration of each of the factors referred to above, and assisted by the advice of the Independent Consultant and independent counsel to the Independent Trustees, the Board, including the Independent Trustees, concluded that the Advisory Agreement and each applicable Fund Management Agreement are fair and reasonable with respect to each Fund and its shareholders, and that the renewal of the Advisory Agreement and each applicable Fund Management Agreement would be in the best interests of the Funds and their shareholders. The Board did not indicate that any single factor was determinative of its decision to approve the Advisory Agreement and each applicable Fund Management Agreement, but indicated that the Board based its determination on the total mix of information available to it.
F-9
Table of Contents
PACIFIC LIFE FUNDS
WHERE TO GO FOR MORE INFORMATION
(Unaudited)
Availability of Quarterly Holdings
The Trust files Form N-Q (complete schedules of fund holdings) with the Securities and Exchange Commission (the “SEC”) for the first and third quarters of each fiscal year not later than 60 days after the close of the applicable quarter end. The Trust’s Form N-Q, (when required) is filed pursuant to applicable regulation and is available after filing (i) on the SEC’s Website at www.sec.gov; (ii) for review and copying at the SEC’s Public Reference Room in Washington, D.C. (Information on the operation of the Public Reference Room may be obtained by calling the SEC at 1-800-SEC-0330); and (iii) on the Trust’s Webpage at www.pacificlife.com/pacificlifefunds.htm. The SEC may charge you a fee for this information.
Availability of Proxy Voting Record
By August 31 of each year, the Trust files information regarding how portfolio managers voted proxies relating to fund securities during the most recent twelve-month period ended June 30. Such information is available after filing on the Trust’s’ Website and on the SEC’s Website noted below.
Information Relating to Investments Held by the Pacific Life Funds
For complete descriptions of the various securities and other instruments held by the Trust and their risks, please see the Trust’s prospectus and Statement of Additional Information (“SAI”). For a description of bond ratings, please see the Trust’s SAI. The prospectus and SAI are available as noted below.
Availability of Proxy Voting Policies
A description of the Proxy Voting Policies and Procedures that the Trust uses to determine how to vote proxies relating to fund securities is described in the Trust’s SAI.
How to obtain Information
The Trust’s prospectus, SAI (including Proxy Voting Policies) and the PL Underlying Funds’ annual and semi-annual reports are available:
| • | On the Trust’s Website at www.pacificlife.com/pacificlifefunds.htm |
| • | On the SEC’s Website at www.sec.gov |
| • | Upon request by calling, without charge, 1-800-722-2333, 7 a.m. through 5 p.m. Pacific Time |
F-10
Table of Contents
PACIFIC LIFE FUNDS
ANNUAL REPORT
AS OF MARCH 31, 2013
| A-1 | ||
| B-1 | ||
Financial Statements: | ||
| C-1 | ||
| C-5 | ||
| C-9 | ||
| C-16 | ||
| C-17 | ||
| D-1 | ||
| E-1 | ||
| F-1 | ||
| F-3 | ||
Approval of Investment Advisory Agreement and Fund Management Agreements | F-6 | |
| F-23 | ||
Table of Contents
PACIFIC LIFE FUNDS PERFORMANCE DISCUSSION
| PL Underlying Fund | Fund Manager | |
| PL Floating Rate Loan | Eaton Vance Management (Eaton Vance) | |
PL Inflation Managed PL Managed Bond | Pacific Investment Management Company LLC (PIMCO) | |
| PL Short Duration Bond | T. Rowe Price Associates, Inc. (T. Rowe Price) | |
| PL Emerging Markets Debt | Ashmore Investment Management, Limited (Ashmore) | |
| PL Comstock | Invesco Advisers, Inc. (Invesco) | |
| PL Growth LT | Janus Capital Management LLC (Janus) | |
| PL Large-Cap Growth | BlackRock Investment Management, LLC (BlackRock)1 | |
| PL Large-Cap Value | ClearBridge Advisors, LLC (ClearBridge) | |
| PL Main Street® Core | OppenheimerFunds, Inc. (Oppenheimer) | |
| PL Mid-Cap Equity | Scout Investments, Inc. (Scout) 2 | |
| PL Mid-Cap Growth | Morgan Stanley Investment Management Inc. (Morgan Stanley) | |
| PL Small-Cap Growth | Fred Alger Management, Inc. (Alger) | |
| PL Small-Cap Value | NFJ Investment Group LLC (NFJ) | |
| PL Real Estate | Morgan Stanley Investment Management Inc. (Morgan Stanley) | |
| PL Emerging Markets | OppenheimerFunds, Inc. (Oppenheimer) | |
| PL International Large-Cap | MFS Investment Management (MFS) | |
| PL International Value | J.P. Morgan Investment Management Inc. (JPMorgan) | |
| PL Currency Strategies | UBS Global Asset Management (Americas) Inc. (UBS) | |
| PL Global Absolute Return | Eaton Vance Management (Eaton Vance) | |
| PL Precious Metals | Wells Capital Management Incorporated (Wells Capital) | |
| PL Fund of Funds | ||
| PL Alternative Strategies 3 | Pacific Life Fund Advisors LLC (PLFA) |
| 1 | BlackRock, effective January 1, 2013, became the new fund manager for PL Large-Cap Growth Fund. The prior fund manager was UBS Global Asset Management (Americas) Inc. from April 1, 2012 to December 31, 2012. |
| 2 | Scout, effective January 1, 2013, became the new fund manager of the PL Mid-Cap Equity Fund. The prior fund manager was Lazard Asset Management LLC from April 1, 2012 to December 31, 2012. |
| 3 | The PL Alternative Strategies Fund commenced operations on December 31, 2012, and although the fund is effective, it is not currently offering shares to investors and is not available for sale at this time. Presently, only Pacific Life Fund Advisors LLC (PLFA) and certain of its affiliates can invest in the PL Alternative Strategies Fund. |
This Annual Report is provided for the general information of investors with beneficial interests in Pacific Life Funds. This report is not authorized for distribution to prospective investors unless preceded or accompanied by a current Pacific Life Funds’ Prospectus, as supplemented, which contains information about Pacific Life Funds and each of its funds, including their investment objectives, risks, charges and expenses. You should read the Prospectus carefully before investing. There is no assurance that a fund will achieve its investment objective. Each fund is subject to market risk. The net asset value of a fund changes as the values of its assets go up or down. The value of a fund’s shares will fluctuate, and when redeemed, may be worth more or less than their original cost. The total return for each fund includes reinvestment of all dividends and capital gain distributions, if any, and does not include deductions of any applicable sales charges. Past performance is not predictive of future performance. Performance figures for each class reflect the deduction of any applicable maximum front-end sales charge at the time of investment and reflect any applicable contingent deferred sales charge that would be deducted upon redemption at the end of the period presented.
This report shows you the performance of the funds compared to benchmark indices. Index performance is provided for illustrative and comparative purposes only and does not predict or depict the performance of the funds. Indices are unmanaged, do not incur transaction costs and cannot be purchased directly by investors. Index returns on equity securities include reinvested dividends.
PLFA supervises the management of all of the funds above, subject to the review of the Pacific Life Funds’ Board, and also does business under the name Pacific Asset Management. PLFA has written the general market conditions commentary which expresses PLFA’s opinions and view on how the market generally performed for the year ended March 31, 2013. All views are subject to change at any time based upon market or other conditions, and Pacific Life Funds, its adviser and the fund managers disclaim any responsibility to update such views. Any references to “we”, “I”, or “ours” are references to the adviser or fund manager.
The adviser and fund managers may include statements that constitute “forward-looking statements” under the United States (U.S.) securities laws. Forward-looking statements include information concerning possible or assumed future results of the Pacific Life Funds’ investment operations, asset levels, earnings, expenses, industry or market conditions, regulatory developments and other aspects of the Pacific Life Funds’ operations or general economic conditions. In addition, when used in this report, predictive verbs such as “believes”, “expects”, “anticipates”, “intends”, “plans”, “estimates”, “projects” and future or conditional verbs such as “will”, “may”, “could”, “should” and “would” or any other statement that necessarily depends on future events, are intended to identify forward-looking statements. Forward-looking statements are not guarantees of performance or economic results. They involve risks, uncertainties and assumptions. Although such statements are based on expectations that the adviser or fund manager believes to be reasonable, actual results may differ materially
A-1
Table of Contents
PACIFIC LIFE FUNDS PERFORMANCE DISCUSSION (Continued)
from expectations. Investors must not rely on any forward-looking statements. In connection with any forward-looking statements and any investment in the Pacific Life Funds, investors should carefully consider the investment objectives, policies and risks described in the Pacific Life Funds’ current Prospectus, as supplemented, and Statement of Additional Information, as supplemented, as filed with the Securities and Exchange Commission (SEC), which may be obtained from the SEC’s website at www.sec.gov.
Market Conditions (for the year ended March 31, 2013)
Executive Summary
Over the reporting period, financial markets experienced pockets of volatility but managed to trend higher. While the geopolitical and economic uncertainty that overwhelmed investors lingered during the reporting period, no major disruptions caused the markets to veer off-course for a prolonged period. The short-term “risk-on” and “risk-off” trend persisted over the first half of the reporting period with macro headlines primarily driving market sentiments. However, volatility remained relatively tame and equity markets rallied over the latter half of the reporting period despite the anticipation of challenges coming from of Washington D.C.
Several key events caused volatility to rise in the first half of the reporting period. The euro crisis appeared to have reached peak levels around the start of the reporting period. Amid this challenging environment, European countries saw changes in their political landscape. This included new leaders who pushed for anti-austerity policies. The backlash from anti-austerity supporters (a united front against rampant unemployment and government spending cuts accompanied by strikes and demonstrations) caused additional concerns of unwinding the progress in Europe. Additionally, the economic drag from Europe had global implications that caused global economic growth projections to be revised downward. Concerns over China and its exports to Europe also weighed on its ability to sustain its dominant growth.
Despite the headwinds around the globe, financial markets marched higher over the second-half of the reporting period. The combination of high unemployment rate and lack of evidence of inflation, the Fed continued to provide further support by extending “Operation Twist” (its program to keep long-term rates low by selling its short-term assets and buying long-term Treasuries). The Fed also launched a third round of quantitative easing in September to purchase an additional $40 billion in mortgage-backed securities (MBS) per month. From abroad, the political and economic disturbances in Europe finally led the European Central Bank (ECB) to pledge full support to preserve the euro, which helped unfreeze capital flow throughout the European banking system.
Throughout the reporting period, central banks continued to play a vital role in sustaining the financial market recovery by providing unprecedented liquidity in the global banking system. While such efforts may have helped rejuvenate financial markets, political upheaval introduced uncertainty in the marketplace. Both U.S. and European politicians continued to muddle through their respective fiscal and economic issues. In the U.S., fears of the “fiscal cliff” scenario developed from the inability of Congress to promptly settle budgetary disagreements that led to the implementation of the sequestration budget cuts. In the eurozone, European politicians have struggled to agree and settle on the appropriate policy actions to recover their economies.
The global economy maintained a steady but slow recovery throughout the reporting period. Various risks continued to linger and influenced markets to varying degrees. The following sections highlight how specific market segments responded to the events that unfolded over the reporting period.
Fixed Income
As the overall market sentiment improved relative to the prior reporting period, the broad fixed income segment fell behind the broad equity market. For the reporting period, the overall fixed income market (as measured by the Barclays U.S. Aggregate Bond Index) gained 3.77%. Short-term Treasuries and credits barely budged over the reporting period as the Fed continued to maintain a near zero interest rate policy for the Federal Funds (Fed Funds). Long-term Treasuries benefited moderately from the Fed’s efforts to keep long-term yields low. Treasury yields (which have an inverse relationship to prices) continued to hit historic low levels, as the 10-Year Treasury yield dipped below 1.50% during the reporting period. The Barclays Long Term U.S. Treasury Index increased 7.31% over the reporting period.
In this environment, the riskier sectors within the fixed income segment performed relatively well. The high yield market experienced a strong rally with lower-rated credits outpacing those in the investment grade tiers. Emerging markets debt also delivered strong results over the reporting period, as the J.P. Morgan Emerging Markets Bond Index Global Diversified Index returned 10.11% over the reporting period. Additionally, the collateralized loan obligation market showed some revival throughout the reporting period, which boded well for bank loans. Throughout this low Treasury yield environment, investors looked across the riskier spectrum to obtain yields.
Domestic Equity
The domestic equity market experienced modest swings throughout the reporting period but managed to finish with a gain of 13.96% for the S&P 500 Index. Results were relatively mixed for the various categories within the domestic equities segment. One common theme among domestic equities was the double-digit returns across the market capitalization and style groups. With respect to market capitalization, mid-capitalization stocks outpaced those of large- and small-capitalizations. Value styles outperformed those of growth, which were primarily driven by the solid performances of the financials sectors over the reporting period. Financials tends to be the largest sector in value indices. The sector’s strong performance followed a dismal year in 2011, which then recovered as the central banks moved aggressively to support the global banking system. On the flipside, information technology, which tends to have heavy representation in growth indices, was the worst performing sector over the reporting period. Other sectors were driven by various reasons. Political factors over the reporting period, especially throughout the presidential election, had a material influence in the stock market. President Obama’s re-election, and his push to pass the Patient Protection and Affordable Healthcare Act, often times referred to as “Obamacare”, helped the health care sector experience a strong gain over the reporting period.
| See benchmark definitions on page A-27 |
A-2
Table of Contents
PACIFIC LIFE FUNDS PERFORMANCE DISCUSSION (Continued)
International Equity
After a difficult run during the prior reporting period, international stocks in developed markets experienced a healthy recovery over this reporting period. The Morgan Stanley Capital International (MSCI) Europe, Australasia, and Far East (MSCI EAFE) Index and the MSCI Emerging Markets Index returned 11.25% and 1.96%, respectively. Emerging markets equity returns, on the other hand, were less robust, particularly over the first quarter of 2013. Countries such as Brazil and China continued to deal with inflation that led to concerns over monetary tightening to slow their growth. Additionally, the Japanese yen had been devalued sharply, which helps Japan’s exports but threatens the competitiveness of other Asian exporters. Such concerns hurt South Korean stocks, which represent the largest country weighting in the MSCI Emerging Markets Index.
Concluding Remarks
Economic reports indicated that the world economy grew at approximately 3.20% in 2012 (International Monetary Fund—World Economic Outlook Update—April 2013). Emerging markets, particularly China, contributed to that growth. Developed nations, on the other hand, crawled at a sluggish pace or contracted. Despite the dismal economic indicators, equity markets in developed countries thrived over the reporting period. Perhaps, this was driven more out of relief of avoiding meltdown scenarios that markets had feared.
The question remains on the sustainability of the market rise. Over the reporting period, equity valuations had been trading below long-term averages. These trading ranges may have been a reflection of the general market environment. Over the past few years, the world has been dealing with various crises, which may have caused a hesitation to push valuations back to longer-term historic levels. However, these valuation levels have risen closer to the 10-year average over the first quarter of 2013 as U.S. economic reports continued to indicate steady improvements.
More clarity has been developing in 2013, but challenges still linger. The crisis level in the eurozone appears to be manageable, but economic activity is expected to remain weak in the region. Although the situation in the U.S. is relatively better than its developed counterparts in Europe, economic growth is expected to remain modest. The benign economic activity in developed nations is anticipated to dampen demand for exports from emerging markets. This may have some varying implications to these emerging markets nations. Nonetheless, growth in countries such as China is expected to remain healthy.
Performance over the reporting period showed investors that markets can diverge from economic fundamentals. The level of uncertainty and risks throughout the globe may have caused some investors to reduce or avoid equity exposure. However, those investors would have missed out on the impressive performance delivered from equities in developed markets. This validates the importance of proper asset allocation to navigate through various market conditions.
PL Floating Rate Loan Fund (managed by Eaton Vance Management)
Q. How did the fund perform for the year ended March 31, 2013?
A. For the year ended March 31, 2013, the PL Floating Rate Loan Fund’s Class P returned 6.40%, compared to a 7.91% return for its benchmark, the S&P/LSTA Leveraged Loan Index.
The following graph compares the performance of a hypothetical $10,000 investment in Class P shares of the fund to its benchmark for the periods from inception through March 31, 2013. The fund’s performance reflects reinvestments of all dividends and capital gains distributions, if any.
Performance Comparison
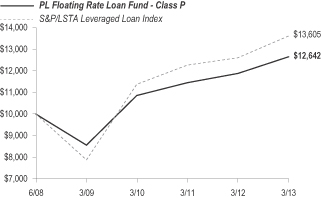
| Average Annual Total Returns for the Periods Ended March 31, 2013 (1) | ||||||||
| 1 Year | Since Inception (6/30/2008) | |||||||
Fund’s Class P | 6.40% | 5.06% | ||||||
S&P/LSTA Leveraged Loan Index | 7.91% | 6.70% | ||||||
| (1) | Eaton Vance Management began managing the fund on July 1, 2010, and some investment policies changed at that time. Another firm managed the fund before that date. |
Performance data shown represents past performance. Investment return and principal value will fluctuate so that shares of the fund when redeemed may be worth more or less than their original cost. Past performance is not predictive of future performance. | ||||
Q. Discuss both positive and negative factors that materially affected the fund’s performance during the year, including relevant market conditions, investment strategies and techniques, and particular sectors or securities.
A. For the reporting period, the fund’s Class P underperformed the benchmark. Relative to the benchmark, the fund maintains a greater focus on higher quality loans. Over the reporting period, the lower quality segments of the loan market produced robust gains, far outpacing
| See benchmark definitions on page A-27 |
A-3
Table of Contents
PACIFIC LIFE FUNDS PERFORMANCE DISCUSSION (Continued)
their higher quality counterparts as lower quality loans benefited from investors searching for yield and appetite for risk during the period. The CCC loan segment registered a 22.5% return, well ahead of the returns produced by the BB and B loan groups, which advanced 5.8% and 7.6% respectively. The fund’s overweight to the BB loan group and sizeable underweight to CCC loans was a drag on the fund’s relative performance.
We at Eaton Vance employ a rigorous, bottom-up credit research process where loan selection tends to drive fund performance. That said, analyzing results from the perspective of industry exposures relative to the fund’s benchmark can be instructive. Underweight exposures to utilities, the best-performing industry over the reporting period, and radio & television detracted from fund relative performance. An overweight exposure to the food products industry, which lagged the broader market over the reporting period, was also a drag on relative performance results. Contributing to relative fund performance were underweight exposures to aerospace & defense and telecommunications, as both industry groups lagged the broader market return.
The fund is well diversified with 245 loan issuer positions as of March 31, 2013. In the current low interest rate environment, where the 3-month London Interbank Offered Rate (LIBOR) rate stood at 0.28% as of March 31, 2013, the fund continues to benefit from its exposure to LIBOR floors as a form of incremental compensation, with the weighted average LIBOR rate for the fund at 1.01% as of March 31, 2013. Additionally, given the floating-rate nature of the asset class, the fund’s loans reset their coupons every 55 days on average as of March 31, 2013, resulting in limited interest rate risk exposure for the fund as compared to longer duration fixed income funds.
PL Inflation Managed Fund (managed by Pacific Investment Management Company LLC)
Q. How did the fund perform for the year ended March 31, 2013?
A. For the year ended March 31, 2013, the PL Inflation Managed Fund’s Class P returned 6.79%, compared to a 5.68% return for its benchmark, the Barclays U.S. TIPS Index.
The following graph compares the performance of a hypothetical $10,000 investment in Class P shares of the fund to its benchmark for the ten-year period ended March 31, 2013. The fund’s performance reflects reinvestments of all dividends and capital gains distributions, if any.
Performance Comparison
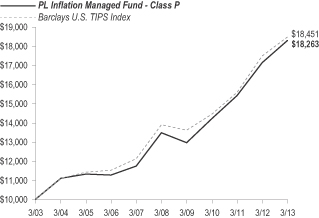
| Average Annual Total Returns for the Periods Ended March 31, 2013 | ||||||||||||
| 1 Year | 5 Years | 10 Years | ||||||||||
Fund’s Class P | 6.79% | 6.32% | 6.21% | |||||||||
Barclays U.S. TIPS Index | 5.68% | 5.89% | 6.32% | |||||||||
Performance data shown represents past performance. Investment return and principal value will fluctuate so that shares of the fund when redeemed may be worth more or less than their original cost. Past performance is not predictive of future performance. | ||||||
Q. Discuss both positive and negative factors that materially affected the fund’s performance during the year, including relevant market conditions, investment strategies and techniques, and particular sectors or securities.
A. For the reporting period, the fund’s Class P outperformed the benchmark. Investment strategies were implemented by investing in bonds and derivative instruments. We at PIMCO look to remain in risk reduction mode while preferring high quality income over price appreciation, as risk premiums still appear richly priced relative to our outlook. During the reporting period, an underweight position to Treasury Inflation Protected Securities (TIPS) was a negative influence on the fund’s performance as real yields rallied during the reporting period. Within investment grade credit, exposure to financials added to fund performance returns as this sector outperformed the broader corporate market amid strong and improving balance sheets and improving housing data. A modest allocation to non-Agency MBS which benefited from the on-going housing recovery, also contributed to the fund’s performance returns. Exposure to interest rates of non-U.S. developed countries through cash bonds and interest rate swaps, added to fund performance as central bank liquidity drove down yields. Modest duration exposure to Brazil during the first quarter of 2013 detracted from returns as rate rose. However, exposure to emerging local interest rates in Mexico through cash bonds and interest rate swaps contributed to fund returns.
PIMCO expects the global economy to grow at a real rate of 2.0 to 2.5 percent over the next twelve months. PIMCO anticipates stronger growth in the U.S. and China driven by housing and a successful leadership transition, respectively. In the U.S., improvements in housing prices, inventory, sales data and housing-related sectors such as construction suggest that housing may provide a substantial positive contribution to gross domestic product (GDP). This strength, however, will be weighed down by tight fiscal policy which is largely the result of the fiscal cliff deal and implementation of sequestration. Global growth will be tempered by PIMCO’s deteriorating outlook for the eurozone which has been slow to implement necessary structural reforms. The ratification of the European Stability Mechanism (ESM) and
| See benchmark definitions on page A-27 |
A-4
Table of Contents
PACIFIC LIFE FUNDS PERFORMANCE DISCUSSION (Continued)
the ECB’s conditional commitment to be the lender of last resort significantly reduced the probability of tail risk in the eurozone as both actions boosted confidence and slowed the process of delevering. The negative effects of austerity measures implemented throughout the eurozone are reflected in the weak growth numbers within the region and demonstrate recessions already underway. Although PIMCO anticipates emerging markets (EM) growth to outpace that of developed markets over the cyclical horizon, growth will come at a significantly lower level than in recent years. The economic outlook has improved on the back of flexible monetary policy and better starting balance sheets of EM sovereigns. China’s growth prospects have recovered following its smooth leadership transition in 2012 which may benefit other EM resource-producing countries.
In the face of poor starting conditions, nominal growth in the developed world may be bolstered by the persistent resolve of central banks whose balance sheets continue to expand. However, ongoing efforts by policymakers to offer short-term solutions are becoming increasingly ineffective in delivering real outcomes. Financial markets’ heightened sensitivity to policy-related news reflects acknowledgement of the difficulties that lie ahead in resolving significant structural problems in many economies.
PL Managed Bond Fund (managed by Pacific Investment Management Company LLC)
Q. How did the fund perform for the year ended March 31, 2013?
A. For the year ended March 31, 2013, the PL Managed Bond Fund’s Class P returned 6.85%, compared to a 3.77% return for its benchmark, the Barclays U.S. Aggregate Bond Index.
The following graph compares the performance of a hypothetical $10,000 investment in Class P shares of the fund to its benchmark for the ten-year period ended March 31, 2013. The fund’s performance reflects reinvestments of all dividends and capital gains distributions, if any.
Performance Comparison
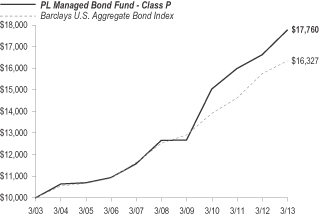
| Average Annual Total Returns for the Periods Ended March 31, 2013 | ||||||||||||
| 1 Year | 5 Years | 10 Years | ||||||||||
Fund’s Class P | 6.85% | 7.01% | 5.91% | |||||||||
Barclays U.S Aggregate Bond Index | 3.77% | 5.47% | 5.02% | |||||||||
Performance data shown represents past performance. Investment return and principal value will fluctuate so that shares of the fund when redeemed may be worth more or less than their original cost. Past performance is not predictive of future performance. | ||||||
Q. Discuss both positive and negative factors that materially affected the fund’s performance during the year, including relevant market conditions, investment strategies and techniques, and particular sectors or securities.
A. For the reporting period, the fund’s Class P outperformed the benchmark. Investment strategies were implemented by investing in bonds and derivative instruments. We at PIMCO look to remain in risk reduction mode while preferring high quality income over price appreciation, as risk premiums still appear richly priced relative to our outlook. Tactical duration positioning in the U.S. through the use of cash bonds and interest rate swaps was positive for the fund’s performance. An overall underweight to corporate bonds, which outperformed Treasuries despite volatile geopolitical developments, was negative for fund performance returns. However, a focus on financials more than offset this loss as this sector outperformed the broader corporate market amid strong, improving balance sheets and improving housing data. Additionally, holdings of Agency MBS during the reporting period impacted the fund’s performance positively as this sector outperformed like-duration Treasuries. An allocation to non-Agency MBS, which benefited from the on-going housing recovery, also contributed to returns.
Beyond core sectors, exposure to non-U.S. developed interest rates, particularly core Europe and Canada through cash bonds and interest rate swaps, added to fund performance as central bank liquidity drove down yields. Exposure to high yield, through the use of cash bonds and interest rate swaps, also added to fund performance as spreads tightened. Exposure to emerging markets, specifically Brazil and Mexico, through cash bonds and interest rate swaps, contributed to fund performance. Holdings of Build America Bonds (BABs) were also positive for fund performance, as spreads tightened on continued demand.
PIMCO expects the global economy to grow at a real rate of 2.0 to 2.5 percent over the next twelve months. PIMCO anticipates stronger growth in the U.S. and China driven by housing and a successful leadership transition, respectively. In the U.S., improvements in housing prices, inventory, sales data and housing-related sectors such as construction suggest that housing may provide a substantial positive contribution to GDP. This strength, however, will be weighed down by tight fiscal policy which is largely the result of the fiscal cliff deal and implementation of sequestration. Global growth will be tempered by PIMCO’s deteriorating outlook for the eurozone which has been slow to implement necessary structural reforms. The ratification of the ESM and the ECB’s conditional commitment to be the lender of last resort
| See benchmark definitions on page A-27 |
A-5
Table of Contents
PACIFIC LIFE FUNDS PERFORMANCE DISCUSSION (Continued)
significantly reduced the probability of tail risk in the eurozone as both actions boosted confidence and slowed the process of delevering. The negative effects of austerity measures implemented throughout the eurozone are reflected in the weak growth numbers within the region and demonstrate recessions already underway. Although PIMCO anticipates EM growth to outpace that of developed markets over the cyclical horizon, growth will come at a significantly lower level than in recent years. The economic outlook has improved on the back of flexible monetary policy and better starting balance sheets of EM sovereigns. China’s growth prospects have recovered following its smooth leadership transition in 2012 which may benefit other EM resource-producing countries.
In the face of poor starting conditions, nominal growth in the developed world may be bolstered by the persistent resolve of central banks whose balance sheets continue to expand. However, ongoing efforts by policymakers to offer short-term solutions are becoming increasingly ineffective in delivering real outcomes. Financial markets’ heightened sensitivity to policy-related news reflects acknowledgement of the difficulties that lie ahead in resolving significant structural problems in many economies.
PL Short Duration Bond Fund (managed by T. Rowe Price Associates, Inc.)
Q. How did the fund perform for the year ended March 31, 2013?
A. For the year ended March 31, 2013, the PL Short Duration Bond Fund’s Class P returned 1.86%, compared to a 1.09% return for its benchmark, the Barclays 1-3 Year U.S. Government/Credit Bond Index.
The following graph compares the performance of a hypothetical $10,000 investment in Class P shares of the fund to its benchmark for the periods from inception through March 31, 2013. The fund’s performance reflects reinvestments of all dividends and capital gains distributions, if any.
Performance Comparison
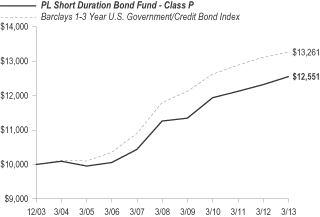
| Average Annual Total Returns for the Periods Ended March 31, 2013 (1) | ||||||||||||
| 1 Year | 5 Years | Since Inception (12/31/2003) | ||||||||||
Fund’s Class P | 1.86% | 2.20% | 2.49% | |||||||||
Barclays 1-3 Year U.S. Government/Credit Bond Index | 1.09% | 2.37% | 3.10% | |||||||||
| (1) | T. Rowe Price Associates, Inc. began managing the fund on July 1, 2011, and some investment policies changed at that time. Another firm managed the fund before that date. |
Performance data shown represents past performance. Investment return and principal value will fluctuate so that shares of the fund when redeemed may be worth more or less than their original cost. Past performance is not predictive of future performance. | ||||||
Q. Discuss both positive and negative factors that materially affected the fund’s performance during the year, including relevant market conditions, investment strategies and techniques, and particular sectors or securities.
A. For the reporting period, the fund’s Class P outperformed the benchmark. Sector allocations were the most significant drivers of fund returns relative to the benchmark. Specifically, an overweight allocation to short-dated, investment-grade corporate debt and an underweight allocation to Treasury securities relative to the benchmark caused the most substantial outperformance. In addition to our corporate allocation, the fund’s out-of-benchmark exposure to high yield bonds and commercial mortgage-backed securities was beneficial to fund performance.
Positioning on the yield curve was also a noteworthy driver of relative fund performance, as rates along the intermediate portion of the curve experienced declines—driven lower in part by significant investor concerns over global economic conditions, the sovereign debt crisis in the eurozone, and continued support for the Treasury market. As such, our modest exposure to intermediate maturities—mostly through MBS and investment-grade corporate bonds—benefited the fund. Although credit selection provided a mostly neutral-to-positive impact on relative performance, a selection of U.S. money center banking names detracted from the fund’s relative returns. In addition, while the fund’s sector allocations provided substantial outperformance relative to the index, the out-of-benchmark position in mortgage-backed securities weighed on relative fund performance results.
We at T. Rowe Price maintained a meaningful overweight to investment-grade corporate bonds, an out-of-benchmark allocation to securitized sectors, and a significant underweight to Treasuries and government-related securities during the reporting period. In addition, we maintained our modest position in TIPS, although we reduced our allocation during the first quarter of 2013.
Interest rates might have been biased to the upside during the reporting period, though we did not expect a substantial or rapid increase in rates. With that said, we reduced our duration posture, moving from a relatively long to modestly short duration position, relative to the
| See benchmark definitions on page A-27 |
A-6
Table of Contents
PACIFIC LIFE FUNDS PERFORMANCE DISCUSSION (Continued)
benchmark. This was accomplished via a reduction in our MBS allocation, by favoring corporate bonds in the three-year maturity space relative to five years and longer, and by shorting 10-year Treasury futures.
Our corporate allocation increased during the reporting period as we added several positions and made adjustments to the fund’s holdings. In particular, our corporate allocation trended higher as we added to our short-dated floating rate note (FRN) exposure in the fund. We added to the FRNs of both financial and industrial companies, and in particular to John Deere Capital Corp. and The Walt Disney Co.
We also took opportunities to rotate into more favorable positions within our corporate bond allocation. For example, we sold five-year Baxter International, Inc., Occidental Petroleum Corp., and BP Capital Markets P.L.C. bonds—which were trading at rich spread levels—in order to purchase the more attractively priced five-year bonds of Swedbank AB. We continued to add to strong industrial names with favorable business profiles. In maintaining our recent conviction to crossover names—securities rated as investment grade and high yield by different rating agencies—we added to Avon Products, Inc. The company was in the early stages of a major recovery after several years of ineffective management, and the new management team was in the process of implementing a plan for reigning in expenses and generating a more sustainable cash flow.
Derivatives held during the reporting period included interest rate futures and currency forwards. Interest rate futures that were used decreased duration for the fund. Currency forwards were used to both increase and decrease (during different periods) the fund’s exposure to underlying currencies during the reporting period.
PL Emerging Markets Debt Fund (managed by Ashmore Investment Management, Limited)
Q. How did the fund perform for the period ended March 31, 2013?
A. The fund commenced operations on June 29, 2012. For the period from inception through March 31, 2013, the PL Emerging Markets Debt Fund’s Class P returned 8.24%, compared to a 7.15% return for its benchmark, the JP Morgan Emerging Markets Bond Index (EMBI) Global Diversified Index.
The following graph compares the performance of a hypothetical $10,000 investment in Class P shares of the fund to its benchmark for the period from inception through March 31, 2013. The fund’s performance reflects reinvestments of all dividends and capital gains distributions, if any.
Performance Comparison
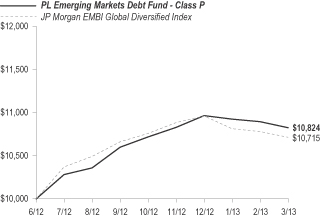
| Total Returns for the Period from Inception Through March 31, 2013 | ||||
| Since Inception (6/29/2012) | ||||
Fund’s Class P | 8.24% | |||
JP Morgan EMBI Global Diversified Index | 7.15% | |||
Performance data shown represents past performance. Investment return and principal value will fluctuate so that shares of the fund when redeemed may be worth more or less than their original cost. Past performance is not predictive of future performance. | ||
Q. Discuss both positive and negative factors that materially affected the fund’s performance during the period, including relevant market conditions, investment strategies and techniques, and particular sectors or securities.
A. For the period since inception through March 31, 2013, the fund’s Class P outperformed the benchmark. We at Ashmore are able to tactically manage exposure to external debt, local currency and corporate debt. The fund invests its assets in debt instruments that are economically tied to emerging market countries, which are issued by governments (sovereigns), government-guaranteed or majority government-owned entities (quasi-sovereigns), government agencies and corporate issuers, and may be denominated in any currency, including the local currency of the issuer.
The fund’s allocation to sovereign external debt has been declining slowly over the period, ending at around 64% of fund net asset value (NAV). Meanwhile, the fund’s exposure to corporate debt and local currency has been increased over the period, up to 24% and 8% of NAV respectively. The fund’s overweight position to corporate bonds has been a significant positive contributor to the fund’s performance over the reporting period, particularly in the first quarter of 2013, when sovereign external debt suffered from the increase in Treasury yields. Contribution to local currency assets has been mixed, with local interest rates returns delivering strong returns during 2012, while pure foreign exchange (FX) returns were modestly positive.
The fund’s off-benchmark exposure to local currency instruments has been managed dynamically since inception. The exposure was increased in September 2012, when emerging markets currencies benefited from a new round of quantitative easing by the Fed. We booked profit and reduced exposure in early 2013. Meanwhile, we have maintained local currency duration exposure to take advantage of monetary policy stimulus by global central banks. Over the reporting period, the fund’s exposure to local currency bonds was a positive contributor to its
| See benchmark definitions on page A-27 |
A-7
Table of Contents
PACIFIC LIFE FUNDS PERFORMANCE DISCUSSION (Continued)
performance, principally because the fund was invested in local markets where interest rates markets performed very well (Brazil, Russia). Over the reporting period, we also maintained a healthy exposure to corporate bonds, as their value relative to sovereigns has represented one of the best opportunities in emerging markets fixed income. Value was added to the fund as a result of overweight positions in quasi-sovereign and corporate bonds in Russia, Ukraine, Kazakhstan and China for instance.
Considering the fund’s country-level attribution across all three themes (sovereign external and local debt and corporate debt), China, Russia, South Africa, Ukraine, Poland and Argentina were the largest contributors to performance relative to the benchmark. In Russia, the fund benefited from security selection in quasi-sovereign bond issues. In Argentina, security selection and active trading around uncertain legal outcomes yielded some positive results. In Poland and South Africa, our timely positions in local government bonds in the summer of 2012 benefited from the downgrade of growth expectations in both countries. In Brazil, our positions in long-end nominal and inflation-linked bonds performed well despite giving back some profit in first quarter 2013 when the Brazilian yield curve snapped back. Among the largest detractors to fund performance over the period was Venezuela, where the fund’s exposure to the country was reduced a little too early and missed the strong rally in the country’s bonds that took place at the end of 2012. We also saw weaker relative performance in Turkey, where continued concerns about growth have kept the fund’s exposure vis-à-vis the benchmark lower. While the fund’s allocation was positive in the reporting period, our lower allocation meant that we did not fully participate in the stronger performance in the first part of the six-month period. Finally, in the same vein, our lower allocation to Colombia was a relative performance detractor for the fund. We see spreads in Colombia as quite tight and do not see much value in the bonds compared to other regional peers. However, given the strong credit profile of Colombia, the bonds tend to hold up better during periods of market dislocations, such as what we saw in the first quarter of 2013.
PL Comstock Fund (managed by Invesco Advisers, Inc.)
Q. How did the fund perform for the year ended March 31, 2013?
A. For the year ended March 31, 2013, the PL Comstock Fund’s Class P returned 16.96%, compared to a 18.77% return for its benchmark, the Russell 1000 Value Index.
The following graph compares the performance of a hypothetical $10,000 investment in Class P shares of the fund to its benchmark for the ten-year period ended March 31, 2013. The fund’s performance reflects reinvestments of all dividends and capital gains distributions, if any.
Performance Comparison
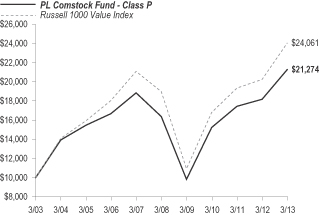
| Average Annual Total Returns for the Periods Ended March 31, 2013 (1) | ||||||||||||
| 1 Year | 5 Years | 10 Years | ||||||||||
Fund’s Class P | 16.96% | 5.37% | 7.84% | |||||||||
Russell 1000 Value Index | 18.77% | 4.85% | 9.18% | |||||||||
| (1) | Invesco Advisers, Inc. began managing the fund on June 1, 2010. Another firm managed the fund before that date. |
Performance data shown represents past performance. Investment return and principal value will fluctuate so that shares of the fund when redeemed may be worth more or less than their original cost. Past performance is not predictive of future performance. | ||||||
Q. Discuss both positive and negative factors that materially affected the fund’s performance during the year, including relevant market conditions, investment strategies and techniques, and particular sectors or securities.
A. For the reporting period, the fund’s Class P underperformed the benchmark. Invesco’s investment philosophy appreciates that, as financial markets tend to focus on short-term factors, stock prices often fail to reflect the intrinsic value of companies. We believe that longer-term investors can take advantage of pricing anomalies in financial markets by purchasing stocks of companies that are currently underpriced. The fund aims to exploit these market inefficiencies by investing in companies that appear undervalued relative to the market in general. Ultimately, we believe that the market will recognize the value in these companies, and we will sell them as their stock price begins to reflect their intrinsic value.
The fund’s investable universe includes all equities with a market capitalization greater than $5 billion. We filter for companies with sufficient liquidity and then on valuation metrics depending upon the growth or cyclical nature of their business. The result of this filtering process is a pool of highly liquid securities that we believe are statistically inexpensive relative to the broader market. Companies identified in the filtering process are thoroughly analyzed to assess intrinsic value and their ability to achieve fair value.
On the positive side, a significant overweight position in the consumer discretionary sector enhanced relative fund performance versus the benchmark. The fund’s main consumer discretionary exposure was in the media companies industry, with holdings such as Comcast
| See benchmark definitions on page A-27 |
A-8
Table of Contents
PACIFIC LIFE FUNDS PERFORMANCE DISCUSSION (Continued)
Corp. and News Corp. contributing the most to its performance within this industry. Comcast, a top cable provider that is well positioned to take advantage of secular changes in broadband and content delivery, exhibited significant free cash flow generation, enabling the company to return capital to investors in terms of buying back company stock at attractive valuations. Strong stock selection within the financials sector also contributed to its performance. The Allstate Corp. and Citigroup, Inc. were the top performers within this sector, posting strong returns for the period. Citigroup is trading at attractive valuations, despite the strong performance over the reporting period and has a strong capital and reserve position. Stock selection within consumer staples also helped fund performance, followed by strong stock selection within materials. Notably, International Paper Co., boosted fund performance on both an absolute and relative basis, as the company experienced continued revenue growth through the reporting period and successfully implemented price increases. Stock selection within consumer staples benefited the fund’s relative performance, with Wal-Mart Stores, Inc. acting as a large contributor within the sector. Stock selection within industrials enhanced fund performance, as well. Ingersoll-Rand P.L.C. was a clear contributor, posting over 30% returns for the period.
On the negative side, unfavorable stock selection within the energy sector detracted from fund performance. Select holdings such as Weatherford International Ltd. and Royal Dutch Shell P.L.C. were large detractors within the sector. Weatherford continues to deal with an unfavorable drilling and service environment, as well as working through issues with internal accounting controls. Weak stock selection within health care, specifically, within pharmaceuticals, also acted as a large detractor to fund relative performance for the year. Also, UnitedHealth Group, Inc. and Cardinal Health, Inc. were poor performers for the period, as these stocks provided negative fund returns for the reporting period. A material overweight within information technology sector hampered fund performance, as well. Hewlett-Packard Co. and Microsoft Corp. were large detractors within this sector. Investors continue to be concerned with Hewlett-Packard over the short-term for changes in management and resulting inconsistent strategic plans. Stock selection and an underweight to telecommunication services detracted from fund relative performance. Verizon Communications, Inc. and Vodafone Group P.L.C. disappointed investors with a negative return for the reporting period, based on poor financials. Additionally, not owning Sprint Nextel Corp. was a large detractor to the fund’s performance, as the stock experienced outsized returns, performing over 80% for the period. Stock selection in the utilities sector and cash also detracted from the fund’s performance. The fund’s modest cash position detracted from relative performance, as equity markets produced strong positive returns during the reporting period.
We used currency forward contracts during the reporting period for the purpose of hedging currency exposure of non-U.S.-based companies held in the fund. Derivatives were used solely for the purpose of hedging and not for speculative purposes or leverage. The use of currency forward contracts had a modest positive impact on the Fund’s performance relative to the benchmark for the reporting period.
PL Growth LT Fund (managed by Janus Capital Management LLC)
Q. How did the fund perform for the year ended March 31, 2013?
A. For the year ended March 31, 2013, the PL Growth LT Fund’s Class P returned 7.53% compared to a 10.09% return for its benchmark, the Russell 1000 Growth Index.
The following graph compares the performance of a hypothetical $10,000 investment in Class P shares of the fund to its benchmark for the ten-year period ended March 31, 2013. The fund’s performance reflects reinvestments of all dividends and capital gains distributions, if any.
Performance Comparison
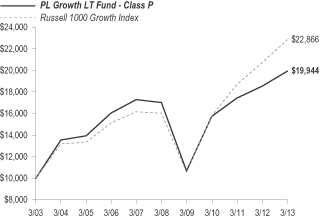
| Average Annual Total Returns for the Periods Ended March 31, 2013 | ||||||||||||
| 1 Year | 5 Years | 10 Years | ||||||||||
Fund’s Class P | 7.53% | 3.18% | 7.15% | |||||||||
Russell 1000 Growth Index | 10.09% | 7.30% | 8.62% | |||||||||
Performance data shown represents past performance. Investment return and principal value will fluctuate so that shares of the fund when redeemed may be worth more or less than their original cost. Past performance is not predictive of future performance. | ||||||
Q. Discuss both positive and negative factors that materially affected the fund’s performance during the year, including relevant market conditions, investment strategies and techniques, and particular sectors or securities.
A. For the reporting period, the fund’s Class P underperformed the benchmark. We at Janus believe that investing with conviction in companies with sustainable growth and high return on invested capital can drive consistent returns which we believe will allow us to outperform the fund’s benchmark and peers over time. We seek to identify companies across the market capitalization spectrum with high-quality management teams that wisely allocate capital to fund and drive long-term growth.
| See benchmark definitions on page A-27 |
A-9
Table of Contents
PACIFIC LIFE FUNDS PERFORMANCE DISCUSSION (Continued)
The market environment in recent months proved a bit of a headwind for the fund’s relative performance. We focus on companies with clear, sustainable, long-term growth drivers. These companies often have a high barrier to entry, a definable edge in an attractive industry with high growth potential, or a strong management team that has a clear vision for the future course of their company. These competitive advantages should allow the companies to grow regardless of the economy, and by and large, we have been impressed with the way the companies in the fund have grown this year as they execute on the strategies we believe separate them from the competition. However, the recent market rally has largely been driven on the premise of an improving global economy. Against that backdrop, we believe stocks that depend on a strong economy tended to rise a little faster than those that put up more consistent growth.
At the sector level, the consumer discretionary holdings had double-digit returns, but detracted from relative performance. The fund’s energy and industrials holdings also detracted from the fund’s relative results. The fund’s consumer staples holdings were the largest contributor to its relative results. The fund’s overweight to the health care sector and stock selection in the technology sector also contributed to the fund’s relative performance.
Apple, Inc. was the largest detractor from fund performance. The stock fell in recent months due to concerns that the competitive landscape for the company is becoming more challenging. While some of Apple’s competitors are gaining new, first-time smart phone users by offering less-expensive smart phones, we think Apple is not being given credit for the size and power of its current ecosystem. Current Apple users remain loyal to the brand, and those users are increasing their spending on Apple products. We believe Apple will continue to find ways to monetize its ecosystem. We also believe Apple has been one of the most innovative companies of the last two decades, and that the company will continue to be able to innovate and attract new consumers to its ecosystem.
On the other hand, J.C. Penney Co. was a large detractor from fund performance. Sales at the company were slow as the retailer’s new management team tried to implement new ways of doing business to turn the company around. After reviewing the management team and some of the changes taking place at the company, we sold the stock during the reporting period.
Zynga, Inc. also detracted from fund performance. We exited the position during the reporting period as the quick shift to mobile Internet use and a more challenging competitive landscape undermined the attractiveness of the investment for the long-term. OGX Petroleo e Gas Partipacoes S.A. also fell; the Brazilian-based company and its subsidiaries are primarily engaged in the research, mining, refining, processing, trade and transportation of oil and natural gas. The company reported slower-than-expected well flow rates during the reporting period. We sold the stock to pursue companies with better risk/reward profiles. EMC Corp. was another detractor. We like the company’s offerings around both big data and storage services, which are two of the fastest growing areas of enterprise information technology. We also think VMware, Inc,. in which EMC owns a majority stake, is well positioned to control and shape next generation data centers.
eBay, Inc. was our top contributor to fund performance. We think eBay has created a significant competitive advantage in becoming an ecommerce platform that can partner with merchants, instead of competing against them. The company’s PayPal unit has launched offline services, which give merchants who accept PayPal in their stores valuable marketing information on their customers that credit card companies cannot provide. eBay is also offering fulfillment services to merchants after its acquisition of GSI Commerce. In our view, such services create high barriers to entry for any competitors wanting to enter the ecommerce business, and offer promising growth potential as more retailers choose eBay as a partner.
Gilead Sciences, Inc. was a top contributor to fund performance as well. We believe our research team has done a tremendous job of understanding the potential of the drugs in Gilead’s pipelines as these drugs go through the development process. The market is now beginning to appreciate what some of these drugs mean to the company’s revenue streams. Gilead’s new single-pill Human Immunodeficiency Virus (HIV) treatment offers patients a simpler drug regimen than some other competing HIV drugs. The Gilead treatment is also potentially more tolerable than other single-pill competitors. Meanwhile, Gilead’s new treatment also allows the company the potential to capture a greater share of revenue for HIV treatment than its previous drug, which was used in combination with treatments from other companies. We think Gilead has also emerged as one of the leaders in a new wave of hepatitis C treatments. We continue to like the potential of this drug to treat a large addressable market of people suffering from hepatitis C.
Additionally, CBS Corp. was a top contributor to fund performance. We think CBS is one of a handful of companies that can continually launch and market hit television content. The value of this content continues to rise as its reach widens across new viewing platforms and spreads internationally. CBS has also made several moves that we believe create value for shareholders. The company has been buying back shares, and recently announced it would spin out its business concentrating on billboard advertising. The potential spin-out means a lower percentage of CBS revenue will come from advertising, making the business mix less cyclical in nature, and more focused on entertainment content.
While the economy has stabilized, we expect slow, economic growth going forward. However, we believe U.S. companies have generally honed their ability to perform well in a low-growth environment. Cheap energy, especially natural gas, is lowering manufacturing costs which is a long-term benefit for many industries. Meanwhile, the adoption of technology across a number of sectors is helping businesses plan and strategize and deliver more consistent results.
If the economy does grow at a slow pace, we think it favors our investment process. We are encouraged by the idea generation of our research analysts, who continue to find companies with reasonable valuations relative to their long-term, multi-year growth trajectories. These companies do not need rapid economic expansion to thrive. If we are correct in our understanding of their businesses, they have sustainable, competitive advantages that should allow them to continue to grow in many economic environments. In a growth-challenged world, companies that can put up better-than-average growth should be rewarded.
The fund uses derivatives primarily as a risk management tool. The two main benefits of effectively using derivatives are to reduce volatility and enhance returns. During the reporting period, the fund entered into forward currency contracts, index options and individual stock options. The aggregate derivative positions detracted from fund’s relative performance results.
| See benchmark definitions on page A-27 |
A-10
Table of Contents
PACIFIC LIFE FUNDS PERFORMANCE DISCUSSION (Continued)
PL Large-Cap Growth Fund (managed by BlackRock Investment Management, LLC)
Q. How did the fund perform for the year ended March 31, 2013?
A. For the year ended March 31, 2013, the PL Large-Cap Growth Fund’s Class P returned 7.66%, compared to a 10.09% return for its benchmark, the Russell 1000 Growth Index. Effective January 1, 2013, BlackRock Investment Management, LLC was appointed the interim manager of the PL Large-Cap Growth Fund by the Board on December 12, 2012. The prior fund manager, UBS Global Asset Management (Americas) Inc., managed the fund for the nine-month period from April 1, 2012 through December 31, 2012.
The following graph compares the performance of a hypothetical $10,000 investment in Class P shares of the fund to its benchmark for the ten-year period ended March 31, 2013. The fund’s performance reflects reinvestments of all dividends and capital gains distributions, if any.
Performance Comparison
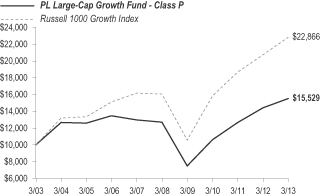
| Average Annual Total Returns for the Periods Ended March 31, 2013 (1) | ||||||||||||
| 1 Year | 5 Years | 10 Years | ||||||||||
Fund’s Class P | 7.66% | 4.10% | 4.50% | |||||||||
Russell 1000 Growth Index | 10.09% | 7.30% | 8.62% | |||||||||
| (1) | BlackRock Investment Management, LLC began managing the fund on January 1, 2013 pursuant to an interim agreement. Other firms managed the fund before that date. |
Performance data shown represents past performance. Investment return and principal value will fluctuate so that shares of the fund when redeemed may be worth more or less than their original cost. Past performance is not predictive of future performance. | ||||||
Q. Discuss both positive and negative factors that materially affected the fund’s performance during the year, including relevant market conditions, investment strategies and techniques, and particular sectors or securities.
A. For the reporting period, the fund’s Class P underperformed the benchmark.
BlackRock
During the three-month interim period from January 1, 2013 to March 31, 2013, BlackRock implemented its passively managed strategy for the fund which is to seek to replicate as closely as possible, the total return of the benchmark as represented by the Russell 1000 Growth Index. In accordance with its passive investment strategy, the fund was positioned to match the risk characteristics of the benchmark throughout the period.
UBS
During the nine-month period from April 1, 2012 to December 31, 2012, the UBS Large-Cap Growth team focused on adhering to its investment discipline, seeking to identify and invest in three diverse sources of growth and emphasizing the management of our risk budget.
Stock selection was the primary detractor from fund performance during the reporting period. In particular, the fund’s positioning within the consumer discretionary and information technology sectors hurt the fund’s performance. Within consumer discretionary, the fund’s holdings in Ralph Lauren Corp., priceline.com, Inc., Chipotle Mexican Grill, Inc., and Las Vegas Sands Corp. detracted from the fund’s performance. This was somewhat offset by strong performance from holdings of Amazon.com, Inc. and Discovery Communications, Inc. In the information technology sector, the fund’s holdings in Baidu, Inc., Facebook, Inc., NetApp, Inc., and Riverbed Technology, Inc. detracted from its performance; however, stock selection within materials was a positive contributor to fund performance, due to the fund’s holding in The Sherwin-Williams Co. Stock selection in telecommunication services also contributed to fund performance as Crown Castle International Corp. moved higher. Health care was also a strong area due to holdings in Gilead Sciences, Inc., Biogen Idec, Inc., and Watson Pharmaceuticals, Inc.
Sector allocation contributed modestly to fund performance during the reporting period. The fund’s overweight to the energy, health care, and consumer discretionary sectors and underweight to the telecommunication services and industrials sectors contributed to its performance during the reporting period. On the negative side, the fund’s overweight to information technology and underweight to the financials, consumer staples, and materials sectors was a detractor from its performance during reporting period.
| See benchmark definitions on page A-27 |
A-11
Table of Contents
PACIFIC LIFE FUNDS PERFORMANCE DISCUSSION (Continued)
PL Large-Cap Value Fund (managed by ClearBridge Advisors, LLC)
Q. How did the fund perform for the year ended March 31, 2013?
A. For the year ended March 31, 2013, the PL Large-Cap Value Fund’s Class P returned 15.54%, compared to a 18.77% return for its benchmark, the Russell 1000 Value Index.
The following graph compares the performance of a hypothetical $10,000 investment in Class P shares of the fund to its benchmark for the ten-year period ended March 31, 2013. The fund’s performance reflects reinvestments of all dividends and capital gains distributions, if any.
Performance Comparison
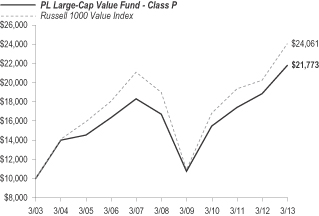
| Average Annual Total Returns for the Periods Ended March 31, 2013 (1) | ||||||||||||
| 1 Year | 5 Years | 10 Years | ||||||||||
Fund’s Class P | 15.54% | 5.46% | 8.09% | |||||||||
Russell 1000 Value Index | 18.77% | 4.85% | 9.18% | |||||||||
| (1) | ClearBridge Advisors, LLC assumed management of the fund on October 1, 2006. Salomon Brothers Asset Management Inc. an affiliate of ClearBridge, managed the fund before that date. |
Performance data shown represents past performance. Investment return and principal value will fluctuate so that shares of the fund when redeemed may be worth more or less than their original cost. Past performance is not predictive of future performance. | ||||||
Q. Discuss both positive and negative factors that materially affected the fund’s performance during the year, including relevant market conditions, investment strategies and techniques, and particular sectors or securities.
A. For the reporting period, the fund’s Class P underperformed the benchmark. The ClearBridge large-capitalization value team utilizes an interactive, research-driven approach to identify companies with strong business franchises and attractive valuations. We look for companies with proven business models and sustainable competitive advantages capable of generating superior returns over time across a range of potential scenarios. We place a heavy emphasis on higher certainty of near- and medium-term cash flows, while discounting earnings from emerging business models or products. We consider valuations relative to normalized earnings power.
On an absolute basis, the fund had positive returns in all ten economic sectors in which it was invested during the reporting period. The greatest contributions to the fund’s performance return came from the consumer discretionary, financials and consumer staples sectors. Relative to the benchmark, the fund’s overall sector allocation contributed to performance for the reporting period. Overweight positions in the consumer discretionary and consumer staples sectors positively impacted its relative performance for the reporting period. Furthermore, security selection within the consumer discretionary and utilities sectors added to the fund’s relative performance. In terms of individual holdings, the leading contributors to fund performance included positions in News Corp., Time Warner, Inc., Sempra Energy, The Home Depot, Inc. and The Travelers Cos., Inc.
Relative to the benchmark, overall security selection detracted from the fund’s performance. Specifically, stock selection within the financials, consumer staples, health care, energy, information technology, industrials, and telecommunication service sectors negatively impacted the fund’s relative performance. Additionally, an underweight position in the health care sector detracted from relative fund performance for the reporting period. On an individual holding basis, the leading detractors from fund performance for the reporting period included positions in Johnson Controls, Inc., Hewlett-Packard Co., Apache Corp., Microsoft Corp. and Suncor Energy, Inc.
During the reporting period, we opportunistically added to the fund’s existing holdings and established one new fund position in Teva Pharmaceuticals Industries Ltd. We also sold the fund’s full positions in El Paso Corp., Hewlett-Packard, Johnson Controls and Raytheon Co. The proceeds were reinvested in areas where we believe there to be better risk-adjusted return opportunities.
We believe our disciplined investment philosophy and consistent approach positions us to generate competitive, risk-adjusted returns over the long-term. We continue to focus on high quality companies that we think have competitively advantaged business models and trade at attractive valuations.
| See benchmark definitions on page A-27 |
A-12
Table of Contents
PACIFIC LIFE FUNDS PERFORMANCE DISCUSSION (Continued)
PL Main Street Core Fund (managed by OppenheimerFunds, Inc.)
Q. How did the fund perform for the year ended March 31, 2013?
A. For the year ended March 31, 2013, the PL Main Street Core Fund’s Class P returned 9.93%, compared to a 13.96% return for its benchmark, the S&P 500 Index.
The following graph compares the performance of a hypothetical $10,000 investment in Class P shares of the fund to its benchmark for the periods from inception through March 31, 2013. The fund’s performance reflects reinvestments of all dividends and capital gains distributions, if any.
Performance Comparison
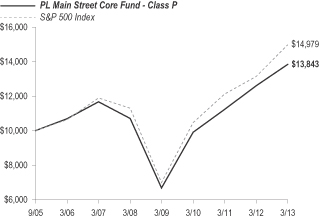
| Average Annual Total Returns for the Periods Ended March 31, 2013 | ||||||||||||
| 1 Year | 5 Years | Since Inception (9/30/2005) | ||||||||||
Fund’s Class P | 9.93% | 5.28% | 4.43% | |||||||||
S&P 500 Index | 13.96% | 5.81% | 5.53% | |||||||||
Performance data shown represents past performance. Investment return and principal value will fluctuate so that shares of the fund when redeemed may be worth more or less than their original cost. Past performance is not predictive of future performance. | ||||||
Q. Discuss both positive and negative factors that materially affected the fund’s performance during the year, including relevant market conditions, investment strategies and techniques, and particular sectors or securities.
A. For the reporting period, the fund’s Class P underperformed the benchmark. Its underperformance was primarily due to weaker relative stock selection in the telecommunication services, consumer discretionary and health care sectors. Relative to the benchmark, the strongest outperforming sectors were information technology and materials, where stock selection benefited.
During the reporting period, the two of the top performing holdings were eBay, Inc. and Citigroup, Inc. For the reporting period, eBay’s earnings beat expectations and management raised guidance for both 2012 revenues and profits, benefiting the fund’s performance. The company also benefited from a turnaround in its Marketplace segment with improvements to the user experience leading to increased loyalty and greater volumes of transactions. Citigroup’s stock performed positively for the fund as a newly appointed CEO announced cost restructurings, including headcount reductions, resulting in a boost to earnings expectations. Additionally, the market viewed an improving housing market as favorable to Citigroup’s book of existing home mortgages, potentially resulting in future profit growth for the company and creating demand for new mortgage loans.
Also contributing positively to fund performance were Covidien P.L.C., Chevron Corp. and Dr. Pepper Snapple Group, Inc. Covidien is engaged in the development, manufacture and sale of health care products for use in clinical and home settings. The company reported strong financial results and also announced a share repurchase program. A primary driver behind Chevron’s performance was the volatility of oil prices which trended upward in the summer of 2012. The company’s stock also rallied early in 2013 after reporting strong fourth quarter earnings. Shares of Dr. Pepper Snapple rallied early in the 2013 as well. The defensive characteristics of this consumer staples stock, partially due to the lack of European exposure, helped to buttress it against market declines—especially during May 2012. Management reaffirmed its full year 2012 guidance due, in part, to a more favorable commodity cost environment. Signs of more rational pricing, amongst the big three carbonated soft drinks manufacturers, also contributed to improved sentiment towards this stock.
The most significant detractor from fund performance this reporting period was information technology stock Apple, Inc. Having realized strong investment returns earlier in 2012, Apple gave back some of its relative outperformance during the reporting period as investors sought to lock in gains. And, despite successful launches of the iPhone 5 and iPad mini, the company endured a couple of
missteps which called into question management’s ability to execute flawlessly. This, in combination with the success of competing products—particularly in smartphones from Samsung Electronics Co. Ltd.—helped to bring down earnings expectations. In our opinion, Apple will continue to benefit from a sustainable competitive advantage due largely to product innovation.
Also detracting from fund performance were America Movil S.A.B. de C.V., Occidental Petroleum Corp., Celgene Corp. and Facebook, Inc. America Movil is a top mobile carrier in Latin America. The company faced strong competition in the region and also was faced with increased regulation in Mexico. This increased risk of regulatory scrutiny has led us to reduce our holdings of America Movil stock. Occidental Petroleum, which was sold early in the reporting period, was challenged by declining oil prices. Celgene is a global biopharmaceutical company stock that experienced declines early in the reporting period before the position was sold. The bulk of Facebook’s declines occurred over the first half of the reporting period as it faced concerns around how best to deliver effective advertising to mobile devices and monetize its significant network of users. It performed better over the second half of the reporting period.
| See benchmark definitions on page A-27 |
A-13
Table of Contents
PACIFIC LIFE FUNDS PERFORMANCE DISCUSSION (Continued)
At the end of the reporting period, the fund had its largest overweight positions in the information technology, financials and health care sectors. The fund was underweight most in consumer discretionary, telecommunication services and energy sectors and did not have investments in the utilities sector. Despite macroeconomic headwinds, we at Oppenheimer believe that many U.S. corporations have continued to build balance sheet strength and have generally made effective capital allocation decisions. While profit growth may remain slow, we believe balance sheets are likely to remain healthy and returns on capital should remain stable. While we expect market volatility to continue through 2013, we believe that even in an uncertain macroeconomic environment, there exist solid investment opportunities. Our long-term investment process remains the same. We seek companies that we believe have sustainable competitive advantages, the management skill and financial resources to generate stronger profit margins, take market share from weaker players, and/or return significant capital to shareholders. We focus on leading firms in structurally attractive industries with committed management teams that have proven records of performance. We seek to invest in such companies when their valuations are attractive and believe that this disciplined approach is the key to generating positive long-term returns. We believe our investment strategy has the potential to provide both upside participation and a degree of downside protection.
PL Mid-Cap Equity Fund (managed by Scout Investments, Inc.)
Q. How did the fund perform for the year ended March 31, 2013?
A. For the year ended March 31, 2013, the PL Mid-Cap Equity Fund’s Class P returned 7.63%, compared to a 17.30% return for its benchmark, the Russell Midcap Index. Effective January 1, 2013, Scout Investments Inc. assumed management of the fund. The prior fund manager, Lazard Asset Management LLC, managed the fund for the nine-month period from April 1, 2012 through December 31, 2012.
The following graph compares the performance of a hypothetical $10,000 investment in Class P shares of the fund to its benchmark for the periods from inception through March 31, 2013. The fund’s performance reflects reinvestments of all dividends and capital gains distributions, if any.
Performance Comparison
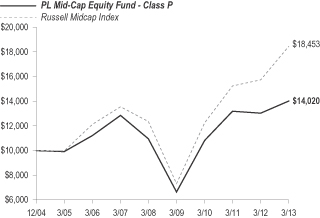
| Average Annual Total Returns for the Periods Ended March 31, 2013 (1) | ||||||||||||
| 1 Year | 5 Years | Since Inception (12/31/2004) | ||||||||||
Fund’s Class P | 7.63% | 5.06% | 4.18% | |||||||||
Russell Midcap Index | 17.30% | 8.37% | 7.71% | |||||||||
| (1) | Scout Investments, Inc. began managing the fund on January 1, 2013, and some investment policies changed at that time. Another firm managed the fund before that date. |
Performance data shown represents past performance. Investment return and principal value will fluctuate so that shares of the fund when redeemed may be worth more or less than their original cost. Past performance is not predictive of future performance. | ||||||
Q. Discuss both positive and negative factors that materially affected the fund’s performance during the year, including relevant market conditions, investment strategies and techniques, and particular sectors or securities.
A. For the reporting period, the fund’s Class P underperformed the benchmark.
Scout
Scout Investments, Inc. assumed management of the fund on January 1, 2013. For the three-month period, the fund’s Class P underperformed the benchmark. Scout’s cautiously bullish positioning and quality bias resulted in a positive fund return modestly below that of the benchmark during the three-month period. Underweighting telecommunication services, the worst-performing sector of the benchmark, and stock selection in the financials sector were the primary sources of relative gains for the fund. Less favorable results from stock picks in the consumer discretionary, consumer staples and information technology sectors accounted for the lagging performance return versus the benchmark. A small average cash balance also had a minor negative impact on the fund’s performance.
Believing that central banks will remain cooperative, we purchased shares of high-beta, high-quality life insurance and annuity companies that met our tests for quality and strong cash flows from operations. Having put their financial crisis problems behind them, these companies are poised to expand profits and dividends in a more stable environment.
Contributions from several of these holdings as well as KeyCorp, a leading regional bank, resulted in financials as the fund’s second strongest sector during the reporting period. KeyCorp’s gains were more idiosyncratic. New management is implementing a business strategy that aims to reduce loan losses and expand earnings and dividends per share through increased merchant banking to small- and mid-size companies, prudent cost-cutting and share repurchases. Investors responded positively, and KeyCorp’s market capitalization moved up near the corporation’s tangible book value.
| See benchmark definitions on page A-27 |
A-14
Table of Contents
PACIFIC LIFE FUNDS PERFORMANCE DISCUSSION (Continued)
In keeping with our expectations of slow economic growth, we tilted the fund toward energy, most notably compelling opportunities in natural gas exploration and production. We believe natural gas producers are undervalued. Natural gas production growth is tepid, and storage levels have fallen. Meanwhile, supplies and prices for West Texas crude oil and related products have risen, and stocks of U.S. oil producers may be vulnerable to price declines.
Further oil price increases may be limited because it is doubtful that the U.S. economy will expand rapidly enough to absorb the growing supply. Meanwhile, federal policy prohibits most crude oil exports. This combination could eventually lead to lower oil prices for U.S. grades of light sweet crude oil. With this scenario in mind, we favored low-cost natural gas producers whose large reserves will permit them to increase production rapidly in the event prices rise.
Overall, the fund’s energy stock selection detracted from relative performance; however, Hess Corp., an oil and gas company, was the fund’s largest individual contributor. One of the largest Bakken Shale producers, Hess also has operations outside the U.S. Under pressure from a shareholder group, the company is shedding non-core assets and seeking to optimize its corporate structure; changes that have been well received by investors.
In other fund developments, we invested in a hospital corporation, in the belief that the Patient Protection and Affordable Care Act will increase hospital patient volumes and reduce bad debt expenses. We also made investments leveraged to new themes in the technology sector. For example, we look for telecommunication equipment spending to increase because several large domestic and foreign telecommunication companies have announced their intent to expand network capacity, to better meet demand for more bandwidth and faster connection speeds. This trend should benefit JDS Uniphase Corp., a leading provider of optical products and test and measurement solutions for the communications industry. JDS is a volatile stock and was the fund’s single largest detractor for the reporting period. We expect sales of its optical equipment to rise as the transition to 100 gigabyte (GB) ethernet accelerates.
Finally, we anticipate an uptick in spending for semiconductor capital equipment. The memory chip market is showing strength, which should continue as new, three-dimensional architectures could soon enter production, assuming technical hurdles are met. These and other factors should support a positive inflection point in semiconductor capital equipment spending in 2013 and especially 2014.
We seek to invest in the securities of companies that are expected to benefit from macroeconomic or company-specific factors, and that are attractively priced relative to their fundamentals. In making investment decisions, the manager considers fundamental factors such as cash flow, financial strength, profitability, statistical valuation measures, potential or actual catalysts that could move the share price, accounting practices, management quality, risk factors such as litigation, the estimated fair value of the company, general economic and industry conditions, and additional information as appropriate.
Lazard
Lazard Asset Management LLC managed the fund from April 1, 2012 to December 31, 2012. Stock selection in the consumer staples sector contributed to fund performance for the reporting period. Shares of private-label food distributor Ralcorp Holdings, Inc. rose after ConAgra Foods, Inc. announced that it was acquiring the company for $90 per share, a substantial premium. The position was subsequently sold. Shares of food product maker H.J. Heinz Co. rose after the company reported solid quarterly results, driven by strong growth in the emerging markets and a continued improvement in its U.S. business. We like Heinz because of its strong, free cash-flow generation and emerging markets exposure, and we believe the company is favorably positioned within the high-growth global ketchup and sauce category. Stock selection and an underweight position in the energy sector also contributed to the fund’s returns during the reporting period. Shares of Marathon Petroleum Corp. rose after the company reported robust earnings, primarily due to retail fuel and merchandise margins, as well as corporate expense. The company also completed a significant portion of a $2 billion share repurchase program. The stock was sold from the portfolio as it neared its valuation target.
In contrast, stock selection and an overweight position in the information technology sector detracted from fund performance during the period. Shares of chipmaker Marvell Technology Group Ltd. declined after the company posted weak results due to a softening personal computer and hard-disk-drive market. Shares of NetApp, Inc., a storage and data management solution provider, declined after the company announced guidance which was lower than expected due to the macroeconomic environment. Given the likelihood of revenue growth and margin expansion, we saw upside in the stock from current levels. Stock selection in the consumer discretionary sector also hurt the fund’s performance returns. Shares of specialty bedding manufacturer Tempur-Pedic International, Inc. fell after management announced multiple downward revisions to its earnings forecast for the year, citing increasing competition in the industry. The position was sold during the nine-month period.
| See benchmark definitions on page A-27 |
A-15
Table of Contents
PACIFIC LIFE FUNDS PERFORMANCE DISCUSSION (Continued)
PL Mid-Cap Growth Fund (managed by Morgan Stanley Investment Management Inc.)
Q. How did the fund perform for the year ended March 31, 2013?
A. For the year ended March 31, 2013, the PL Mid-Cap Growth Fund’s Class P returned 0.61%, compared to a 12.76% return for its benchmark, the Russell Midcap Growth Index.
The following graph compares the performance of a hypothetical $10,000 investment in Class P shares of the fund to its benchmark for the ten-year period ended March 31, 2013. The fund’s performance reflects reinvestments of all dividends and capital gains distributions, if any.
Performance Comparison
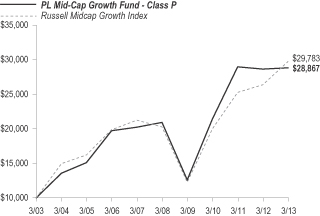
| Average Annual Total Returns for the Periods Ended March 31, 2013 (1) | ||||||||||||
| 1 Year | 5 Years | 10 Years | ||||||||||
Fund’s Class P | 0.61% | 6.63% | 11.18% | |||||||||
Russell Midcap Growth Index | 12.76% | 7.98% | 11.53% | |||||||||
| (1) | Morgan Stanley Investment Inc. manages the fund and formerly did business in certain instances under the name Van Kampen, and managed the PL Mid-Cap Growth Fund under the Van Kampen name from May 1, 2003 to May 1, 2010. Another firm managed the fund before May 1, 2003. |
Performance data shown represents past performance. Investment return and principal value will fluctuate so that shares of the fund when redeemed may be worth more or less than their original cost. Past performance is not predictive of future performance. | ||||||
Q. Discuss both positive and negative factors that materially affected the fund’s performance during the year, including relevant market conditions, investment strategies and techniques, and particular sectors or securities.
A. For the reporting period, the fund’s Class P underperformed the benchmark. For the year ended March 31, 2013, the fund’s underperformance relative to the benchmark was driven by weak stock selection in the consumer discretionary and the materials and processing sectors. The technology sector also dampened the fund’s relative results due to the negative effects of stock selection and an overweight in the sector. On an individual stock basis, social gaming developer Zynga, Inc. was the top detractor. The company’s business fundamentals deteriorated over the year, as the company saw game usage and monetization decline due to the greater usage of Facebook, Inc. on mobile devices as well as a shift towards newer, less profitable games. While we believe we underestimated the inherent churn in usage of Zynga’s base of games when making our initial assessment, we find the risk/reward compelling at current levels and consequently continue to own the stock. Online deals provider Groupon, Inc. was the second greatest detractor across the fund. The company first suffered from post-IPO volatility as well as negativity related to the company’s weak profit profile. Groupon has been spending heavily to build out its platform and subscriber base, and while this may impede near-term profit growth, we believe these investments can augment Groupon’s first mover, network effect, and scale competitive advantages, allowing the company to capitalize on the secular growth opportunity in local e-commerce. More recently, the company’s quarterly results have missed expectations due to slowing revenue growth, partly resulting from macroeconomic weakness and operational issues the company is facing in Europe. We continue to believe Groupon has a strong brand name and first mover competitive advantage in the daily deals space, and that it is well positioned to take share in the large global market for local advertising. Weight management solutions provider Weight Watchers International, Inc. was the third greatest detractor. While the company’s online business has generally fared well, meeting attendance has been disappointing due to weak marketing and messaging that has led to soft trends in consumer recruitment. We are monitoring the situation closely and are evaluating the portfolio positioning in Weight Watchers.
However, stock selection in the utilities sector was favorable to fund performance. The fund’s underweight exposure to the consumer staples sector and overweight exposure to the health care sector were additive as well. Leading professional networking site LinkedIn Corp. was the greatest contributor across the fund over the past year. The company has been executing well on its large market opportunity in the recruiting space. More recently, LinkedIn reported another strong quarter characterized by sizeable gains across its Talent Solutions, Marketing Solutions, and Premium Subscriptions segments, driven in part by new product launches that the company rolled out last year which are helping to drive greater levels of engagement on the site. We believe LinkedIn benefits from sustainable competitive advantages including the strong network effect inherent in operating the largest professional networking platform, and that the company has been very disruptive in the online hiring category. Accordingly, we believe LinkedIn can continue to gain market share in the recruiting space. Communications equipment maker Motorola Solutions, Inc. was the second greatest contributor across the fund over this period. The company, which is a leading provider of mission-critical communication devices used by both governments and enterprises has been executing strongly. We are attracted to the dominant market share Motorola Solutions has secured in what remains an otherwise fragmented industry, the high servicing-related element of its business which results in more predictable recurring revenue,
| See benchmark definitions on page A-27 |
A-16
Table of Contents
PACIFIC LIFE FUNDS PERFORMANCE DISCUSSION (Continued)
and the overall strong cash generation potential of the business model. Switching costs are high in this business, which provides further business visibility. Brookfield Infrastructure Partners L.P. was the third largest contributor, as the company has been reporting solid quarterly results and has been making additional investments in attractive assets across the utility, transport, and energy areas. We are attracted to the unique, one of a kind and difficult to replicate collection of long-lived assets Brookfield has gathered, which historically have generated stable cash flows and required minimal maintenance capital expenditure investments.
We the Morgan Stanley Investment Management team, look for quality growth companies that we believe have sustainable competitive advantages, business visibility, rising return on invested capital, free cash flow and a favorable risk/reward profile. We find these companies through intense fundamental research. Our emphasis is on secular growth, and as a result short-term market events are not as meaningful in the stock selection process. We continue to focus on assessing company prospects over a three-to five-year time horizon and on owning a fund of quality companies with diverse business drivers not tied to a particular market environment.
PL Small-Cap Growth Fund (managed by Fred Alger Management, Inc.)
Q. How did the fund perform for the year ended March 31, 2013?
A. For the year ended March 31, 2013, the PL Small-Cap Growth Fund’s Class P returned 12.06%, compared to a 14.52% return for its benchmark, the Russell 2000 Growth Index.
The following graph compares the performance of a hypothetical $10,000 investment in Class P shares of the fund to its benchmark for the ten-year period ended March 31, 2013. The fund’s performance reflects reinvestments of all dividends and capital gains distributions, if any.
Performance Comparison
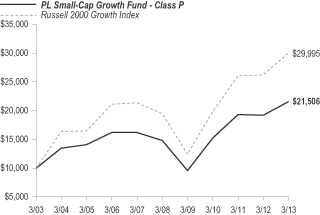
| Average Annual Total Returns for the Periods Ended March 31, 2013 (1) | ||||||||||||
| 1 Year | 5 Years | 10 Years | ||||||||||
Fund’s Class P | 12.06% | 7.82% | 7.96% | |||||||||
Russell 2000 Growth Index | 14.52% | 9.04% | 11.61% | |||||||||
| (1) | Fred Alger Management, Inc. began managing the fund on July 1, 2007, and some investment policies changed at that time. Other firms managed the fund before that date. |
Performance data shown represents past performance. Investment return and principal value will fluctuate so that shares of the fund when redeemed may be worth more or less than their original cost. Past performance is not predictive of future performance. | ||||||
Q. Discuss both positive and negative factors that materially affected the fund’s performance during the year, including relevant market conditions, investment strategies and techniques, and particular sectors or securities.
A. For the reporting period, the fund’s Class P underperformed the benchmark. Alger’s investment philosophy and process remains unchanged: a research intensive, bottom-up, fundamental approach focused on discovering the fastest growing companies undergoing “Positive Dynamic Change”. Our experienced research team continues to identify many small-capitalization companies undergoing “Positive Dynamic Change” where our forward looking assessment of their fundamentals exceeded Wall Street’s consensus. We believe our philosophy of “Investing in Positive Dynamic Change” has never been more appropriate than today. While change is almost always unsettling for some investors, we believe that it generates opportunities to buy strong companies with superior potential for growth that are trading at attractive valuations. We continue to believe that research is the cornerstone of portfolio management, regardless of economic conditions, and that our proven and disciplined process for identifying companies experiencing “Positive Dynamic Change” will continue to produce superior long-term results for our clients.
During the reporting period, the largest sector weightings in the fund were in the information technology and health care sectors. The largest sector overweight for the year was in consumer discretionary while the largest sector underweight was in health care. Favorable stock selection in the consumer discretionary and technology sectors were the most important contributors to fund performance. Industrials and health care detracted from the fund’s performance.
Mellanox Technologies Ltd. and Tenet Healthcare Corp. were among the top contributors to absolute fund performance. Mellanox is a provider of interconnect solutions that facilitate low latency, high speed data transmission between servers and storage systems. The company unexpectedly contributed to fund performance as a “high-unit volume growth” story because of very strong earnings growth driven by a substantially greater adoption of their Infiniband product. Tenet owns and operates acute care hospitals, ambulatory surgery centers, diagnostic imaging centers and other related health care facilities. Tenet contributed to fund performance as a “life-cycle” change story, as investors recognized that the company will be a beneficiary of increased patient coverage from the Patient Protection and
| See benchmark definitions on page A-27 |
A-17
Table of Contents
PACIFIC LIFE FUNDS PERFORMANCE DISCUSSION (Continued)
Affordable Healthcare Act, leading to potentially increased admissions and a significant reduction in bad debt. We believe the company continues to be well positioned to take advantage of change in the health care industry due to their strong, geographic footprint, scalability, and strong potential for earnings growth.
ComScore, Inc. and LogMeIn, Inc. were among the top detractors from absolute fund performance. ComScore offers a suite of digital marketing and audience management services to online advertisers and ad agencies. The ongoing secular shift in advertising to online and mobile ad spending has been an area undergoing dynamic change, and we originally identified ComScore as a beneficiary. The company detracted from fund performance because they failed to innovate and develop new analytics solutions, and lost market share in the face of increased competition. Revenue growth stagnated and dropped to levels below expectations, and we sold the shares as a result. LogMeIn develops and markets a suite of remote access, remote support, and collaboration solutions that provide instant, secure connections between internet enabled devices. We originally purchased the shares as a “high-unit volume growth” company as its solutions are used to connect more internet-enabled devices than any other connectivity service. However, the shares detracted from fund performance due to weaker-than-expected European demand and the subsequent downward pressure on revenue, and, as a result, we sold LogMeIn. As of March 31, 2013, the fund remained well diversified.
PL Small-Cap Value Fund (managed by NFJ Investment Group LLC)
Q. How did the fund perform for the year ended March 31, 2013?
A. For the year ended March 31, 2013, the PL Small-Cap Value Fund’s Class P returned 16.72%, compared to a 18.09% return for its benchmark, the Russell 2000 Value Index.
The following graph compares the performance of a hypothetical $10,000 investment in Class P shares of the fund to its benchmark for the periods from inception through March 31, 2013. The fund’s performance reflects reinvestments of all dividends and capital gains distributions, if any.
Performance Comparison
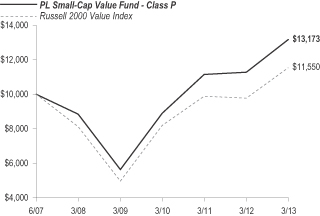
| Average Annual Total Returns for the Periods Ended March 31, 2013 | ||||||||||||
| 1 Year | 5 Years | Since Inception (6/29/2007) | ||||||||||
Fund’s Class P | 16.72% | 8.27% | 4.90% | |||||||||
Russell 2000 Value Index | 18.09% | 7.29% | 2.54% | |||||||||
Performance data shown represents past performance. Investment return and principal value will fluctuate so that shares of the fund when redeemed may be worth more or less than their original cost. Past performance is not predictive of future performance. | ||||||
Q. Discuss both positive and negative factors that materially affected the fund’s performance during the year, including relevant market conditions, investment strategies and techniques, and particular sectors or securities.
A. For the reporting period, the fund’s Class P underperformed the benchmark. We at NFJ focus on investing in undervalued companies relative to the market across a broad range of industry groups. We normally invest significantly in securities of companies that the portfolio managers expect will generate income (for example, by paying dividends).
Selection in the energy sector was beneficial to the fund’s performance, largely due to strength from petroleum refiner CVR Energy, Inc. and pipeline company Sunoco Logistics Partners L.P. CVR Energy, Inc. benefited from an efficient crude oil gathering system, as well as access to relatively cheap crude oil feedstock, while both Sunoco Logistics Partners continued to reap gains from wide crude oil differentials. An underweight in information technology contributed to the fund’s absolute returns. After telecommunication services, information technology was the weakest sector in the benchmark for the reporting period.
An underweight in the financials sector detracted from the fund’s performance returns. The financials sector was the largest by weight within the benchmark, and the fund remained underweight the sector during the reporting period to maintain a well-diversified portfolio with compelling valuations. Selection in materials also detracted during the reporting period, in part due to precious metals miner IAMGOLD Corp. The company reported lower fourth quarter and calendar year end results as higher costs chipped away at earnings. The fund exited the position during the first quarter of 2013 on poor price momentum. A second detractor, chemicals company Cabot Corp., recently reported an earnings’ miss for the first quarter of 2013, citing lower volumes and higher manufacturing costs. Additionally, an overweight in the energy sector detracted from the fund’s performance returns, as weakness from the oil, gas & consumables fuels industry offset stronger results from the energy equipment & services industry within the benchmark.
| See benchmark definitions on page A-27 |
A-18
Table of Contents
PACIFIC LIFE FUNDS PERFORMANCE DISCUSSION (Continued)
PL Real Estate Fund (managed by Morgan Stanley Investment Management Inc.)
Q. How did the fund perform for the year ended March 31, 2013?
A. For the year ended March 31, 2013, the PL Real Estate Fund’s Class P returned 9.98%, compared to a 13.96% return for its benchmarks, the broad-based S&P 500 Index and a 15.29% return for the FTSE NAREIT Equity REITs Index. The S&P 500 Index was added to compare the performance of the fund against a large portion of the U.S. equities market.
The following graph compares the performance of a hypothetical $10,000 investment in Class P shares of the fund to its benchmarks for the periods from inception through March 31, 2013. The fund’s performance reflects reinvestments of all dividends and capital gains distributions, if any.
Performance Comparison
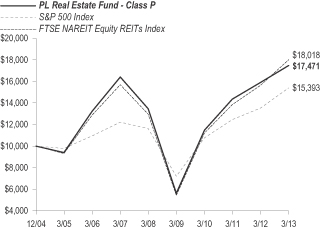
| Average Annual Total Returns for the Periods Ended March 31, 2013 (1) | ||||||||||||
| 1 Year | 5 Years | Since Inception (12/31/2004) | ||||||||||
Fund’s Class P | 9.98% | 5.38% | 7.00% | |||||||||
S&P 500 Index | 13.96% | 5.81% | 5.37% | |||||||||
FTSE NAREIT Equity REITs Index | 15.29% | 6.83% | 7.40% | |||||||||
| (1) | Morgan Stanley Investment Inc. manages the fund and formerly did business in certain instances under the name Van Kampen, and managed the PL Real Estate Fund under the Van Kampen name from fund’s inception until May 31, 2010. |
Performance data shown represents past performance. Investment return and principal value will fluctuate so that shares of the fund when redeemed may be worth more or less than their original cost. Past performance is not predictive of future performance. | ||||||
Q. Discuss both positive and negative factors that materially affected the fund’s performance during the year, including relevant market conditions, investment strategies and techniques, and particular sectors or securities.
A. For the reporting period, the fund’s Class P underperformed both its benchmarks, the broad-based S&P 500 Index and the sector-specific, FTSE NAREIT Equity REITs (FTSE NAREIT) Index. Stock selection relative to the FTSE NAREIT Index was favorable in the industrials sector; this benefit was unable to offset the negative impact of stock selection in the health care, apartment, diversified and central business district (CBD) office sectors which detracted from fund performance. From a top-down perspective, the fund benefited from the overweight to the diversified sector, and underweight to the specialty office sector. This benefit could not offset the negative impact of the overweight to the apartment and CBD office sectors, and underweight to the net lease and health care sectors. Cash held in the fund detracted from the fund’s relative performance. REITs most likely have also been impacted negatively by the “risk-on/risk-off” gyration of the broader equity markets which may have been reflected in the broad-based S&P 500 Index.
We, the Morgan Stanley fund management team, have maintained our core investment philosophy as a real estate value investor, resulting in the ownership of stocks whose share prices provide real estate exposure at what we believe were the best valuation relative to their underlying asset values. Our company-specific research leads us to an overweighting in the fund to a group of companies that are focused in the ownership of upscale urban hotels, high quality malls, apartments, CBD office assets and a number of out-of-favor companies, and underweighting to companies concentrated in the ownership of health care, specialty office, storage and industrial assets.
| See benchmark definitions on page A-27 |
A-19
Table of Contents
PACIFIC LIFE FUNDS PERFORMANCE DISCUSSION (Continued)
PL Emerging Markets Fund (managed by OppenheimerFunds, Inc.)
Q. How did the fund perform for the year ended March 31, 2013?
A. For the year ended March 31, 2013, the PL Emerging Markets Fund’s Class P returned 5.60%, compared to a 1.96% return for its benchmark, the MSCI Emerging Markets Index.
The following graph compares the performance of a hypothetical $10,000 investment in Class P shares of the fund to its benchmark for the periods from inception through March 31, 2013. The fund’s performance reflects reinvestments of all dividends and capital gains distributions, if any.
Performance Comparison
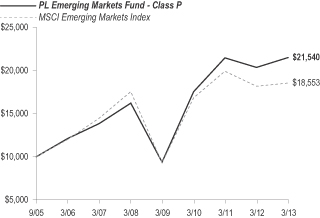
| Average Annual Total Returns for the Periods Ended March 31, 2013 | ||||||||||||
| 1 Year | 5 Years | Since Inception (9/30/2005) | ||||||||||
Fund’s Class P | 5.60% | 5.83% | 10.77% | |||||||||
MSCI Emerging Markets Index | 1.96% | 1.09% | 8.59% | |||||||||
Performance data shown represents past performance. Investment return and principal value will fluctuate so that shares of the fund when redeemed may be worth more or less than their original cost. Past performance is not predictive of future performance. | ||||||
Q. Discuss both positive and negative factors that materially affected the fund’s performance during the year, including relevant market conditions, investment strategies and techniques, and particular sectors or securities.
A. For the reporting period, the fund’s Class P outperformed the benchmark. The fund’s outperformance relative to the benchmark was primarily in the consumer staples sector, due to stronger relative stock selection and an overweight position. Stronger relative stock selection in the consumer discretionary and financials sectors also benefited fund performance. The most significant underperforming sector relative to the benchmark was information technology, where weaker stock selection detracted from fund performance. On a country basis, relative to the benchmark, the fund’s strongest performers were Brazil, India, Russia and the Philippines. The most material detractor from performance was China, followed by the United Kingdom (U.K.) and Taiwan.
During the reporting period, among the top two individual contributors to fund performance were consumer staples stocks Fomento Economico Mexicano S.A.B. de C.V. (FEMSA) and Magnit O.J.S.C. FEMSA is the largest beverage company in Mexico and Latin America, controlling Coca-Cola FEMSA and is the largest independent Coca-Cola bottler in the world. It also owns and operates OXXO, the largest convenience store chain in Latin America and holds a 20% stake in Heineken N.V. The stock continued to perform well as sales increased across its businesses. The company also agreed to purchase a 75% stake in drug store chain YZA, and announced plans to further expand OXXO and venture further into new businesses. Magnit is one of Russia’s largest food retailers, with nearly 6,000 retail outlets. The company announced sales growth and continued to expand, opening new stores and hypermarkets.
Also benefiting fund performance were SM Prime Holdings, Inc., Prada S.P.A. and Haci Omer Sabanci Holdings A.S. SM Prime Holdings is the largest shopping mall and retail operator in the Philippines. The company continued to expand by opening new malls in the Philippines and China and also benefited from robust consumer spending and strong economic fundamentals. We at Oppenheimer believe SM Prime will continue to benefit from a growing middle class in China and increased consumer discretionary spending. Prada is an Italian-based manufacturer of luxury leather goods and clothing for men and women. Strong demand in Asia and Europe helped drive shares of Prada higher over the reporting period. Haci Omer Sabanci Holdings is a Turkish conglomerate whose main activities are banking and retailing. The firm also has investments and experience in power generation and distribution and in cement. During the reporting period, Sabanci made acquisitions in these two areas that were viewed favorably by the market.
The most significant detractors from performance this period were information technology stocks Baidu, Inc. and HTC Corp. Baidu is a leading internet search provider in China, often called the “Google of China,” with an estimated 80% share of the market. The stock has suffered due to controversy over its ability to adapt to and monetize mobile search. As a result, the stock’s valuation has become increasingly attractive to us and we have added significantly to the fund’s position. HTC is a smartphone designer and manufacturer, producing both Android and Windows operating system handsets. The company faced heightened competition, particularly from Samsung Electronics Co. Ltd. in the Android space. In addition, investors’ skepticism over the attractiveness of a new Windows phone launch weighed on the stock. The fund’s position was sold.
Also detracting from performance were Anglo American P.L.C., Tullow Oil P.L.C. and New Oriental Education & Technology Group, Inc. Although Anglo American and Tullow are domiciled in the U.K., their primary business is in emerging markets which increased exposure to that market. Anglo American is a mining company that reported a decline in earnings, attributed to weaker commodity prices, cost pressures and an operating loss in its platinum business. America Movil S.A.B. de C.V. is the dominant provider of wireless telecommunication services
| See benchmark definitions on page A-27 |
A-20
Table of Contents
PACIFIC LIFE FUNDS PERFORMANCE DISCUSSION (Continued)
in Latin America and one of the fund’s top holdings at period end. The company faced stronger competition in the region and also was faced with increased regulation in Mexico. Tullow Oil experienced declines after releasing weaker-than-expected production guidance. New Oriental Education & Technology Group is one of the leading private education providers that operates in China but lists its stock in the U.S. The stock fell on the back of investor concerns regarding a regulatory investigation into the shareholding structure of Chinese companies listed in the U.S. We remained of the opinion that New Oriental is in a solid position to overcome this regulatory obstacle.
At the reporting period end, the fund had its most significant overweight positions relative to the benchmark in the consumer staples and consumer discretionary sectors and its largest underweights in financials and materials.
As we look ahead into the remainder of 2013, we are mindful of the fact that it has been five years since the financial crisis watershed of the Lehman bankruptcy in September 2008. Since that time, we have seen in the major emerging market economies a full cycle of expansion and slowdown, and we think expansion is likely again. The opportunities for developing markets growth appear to us to be better than they have been for some time. In the U.S., deleveraging continues, but slow growth is apparent in housing and employment data. During 2012, the appetite for safety drove up the valuation of high quality companies with highly visible earnings, to the benefit of many of our holdings. We have harvested some of these gains and redeployed capital into companies that we believe are undervalued, some whose earnings visibility may be considered low by other market participants, and some with higher economic sensitivity. We continue to structure the fund for long-term growth, seeking companies with persistent competitive advantages, high barriers to entry, and the financial strength necessary to develop their potential.
PL International Large-Cap Fund (managed by MFS Investment Management)
Q. How did the fund perform for the year ended March 31, 2013?
A. For the year ended March 31, 2013, the PL International Large-Cap Fund’s Class P returned 10.88%, compared to a 11.25% return for its benchmark, the MSCI EAFE Index.
The following graph compares the performance of a hypothetical $10,000 investment in Class P shares of the fund to its benchmark for the ten-year period ended March 31, 2013. The fund’s performance reflects reinvestments of all dividends and capital gains distributions, if any.
Performance Comparison
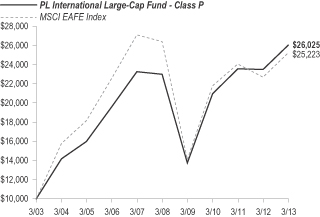
| Average Annual Total Returns for the Periods Ended March 31, 2013 | ||||||||||||
| 1 Year | 5 Years | 10 Years | ||||||||||
Fund’s Class P | 10.88% | 2.52% | 10.04% | |||||||||
MSCI EAFE Index | 11.25% | (0.89% | ) | 9.69% | ||||||||
Performance data shown represents past performance. Investment return and principal value will fluctuate so that shares of the fund when redeemed may be worth more or less than their original cost. Past performance is not predictive of future performance. | ||||||
Q. Discuss both positive and negative factors that materially affected the fund’s performance during the year, including relevant market conditions, investment strategies and techniques, and particular sectors or securities.
A. For the reporting period, the fund’s Class P underperformed the benchmark. We at MFS, use a bottom up investment style, involving the research of the fundamentals of each individual opportunity and analyzing certain aspects of a company such as earnings, cash flows, growth potential and management abilities. All of our investment decisions are driven by the fundamentals of each individual opportunity and as such, it is common for our portfolios to have different currency exposure than the benchmark.
Stock selection, and to a lesser extent, an underweight position in the financial services sector were primary detractors from the fund’s relative performance. This was mainly due to the fund’s overweight position in diversified bank ING Groep N.V. (Netherlands) which underperformed during the reporting period. Stock selection was also a negative factor in the retailing sector as holdings of Hong Kong-based exporter Li & Fung Ltd. significantly underperformed the benchmark.
An overweight allocation to the poor-performing technology sector held back the fund’s relative returns. Overweight positions in digital camera and office equipment maker Canon, Inc. (Japan) and electro-optical component manufacturer Hoya Corp. (Japan) detracted from fund relative results. Holdings of contract electronics manufacturer Hon Hai Precision Industry Co. Ltd. (Taiwan) and information technology security company Check Point Software Technologies Ltd. (Israel) also dampened relative fund performance as both stocks underperformed the broad market.
Elsewhere, overweight positions in natural gas and oil exploration company Inpex Corp. (Japan) and industrial robots manufacturer FANUC Corp. (Japan) detracted from the fund’s relative performance results. Holdings of mobile telecommunications service provider Tim Participações S.A. (Brazil) and telecommunication service provider China Unicom Ltd. (Hong Kong) also hampered fund performance as both stocks performed poorly during the reporting period.
| See benchmark definitions on page A-27 |
A-21
Table of Contents
PACIFIC LIFE FUNDS PERFORMANCE DISCUSSION (Continued)
A combination of stock selection and an overweight position in the consumer staples sector contributed positively to the fund’s relative results as the sector significantly outperformed the benchmark during the reporting period. Overweight positions in Dutch brewer Heineken N.V., skin and beauty care products maker Beiersdorf A.G. (Germany), and alcoholic beverage producer Diageo P.L.C. (U.K.) boosted the fund’s relative performance.
Stock selection in the basic materials, special products & services, and health care sectors positively contributed to relative results. While no individual stocks in the basic materials sector were among the fund’s top contributors, the special products & services sector benefited from an overweight position in travel services provider Amadeus IT Holding S.A. Within the health care sector, overweight positions in health care products maker Bayer A.G. (Germany) and pharmaceutical company Merck K.G.a.A. (Germany) strengthened relative performance as both stocks outperformed the broad market as defined by the fund’s benchmark.
Elsewhere, holdings of railroad operator Canadian National Railway Co. (Canada), diversified bank ICICI Bank Ltd. (India), and automotive parts manufacturer Delphi Automotive P.L.C. (U.K.) benefited relative results. An overweight position in automotive parts manufacturer Denso Corp. (Japan) also boosted the fund’s relative performance.
PL International Value Fund (managed by J.P. Morgan Investment Management Inc.)
Q. How did the fund perform for the year ended March 31, 2013?
A. For the year ended March 31, 2013, the PL International Value Fund’s Class P returned 8.26%, compared to a 11.25% return for its benchmark, the MSCI EAFE Index.
The following graph compares the performance of a hypothetical $10,000 investment in Class P shares of the fund to its benchmark for the ten-year period ended March 31, 2013. The fund’s performance reflects reinvestments of all dividends and capital gains distributions, if any.
Performance Comparison
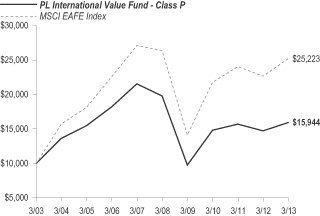
| Average Annual Total Returns for the Periods Ended March 31, 2013 (1) | ||||||||||||
| 1 Year | 5 Years | 10 Years | ||||||||||
Fund’s Class P | 8.26% | (4.21% | ) | 4.78% | ||||||||
MSCI EAFE Index | 11.25% | (0.89% | ) | 9.69% | ||||||||
| (1) | J.P. Morgan Investment Management, Inc. began managing the fund on January 1, 2011, and some investment policies changed at that time. Another firm managed the fund before that date. |
Performance data shown represents past performance. Investment return and principal value will fluctuate so that shares of the fund when redeemed may be worth more or less than their original cost. Past performance is not predictive of future performance. | ||||||
Q. Discuss both positive and negative factors that materially affected the fund’s performance during the year, including relevant market conditions, investment strategies and techniques, and particular sectors or securities.
A. For the reporting period, the fund’s Class P underperformed the benchmark. JPMorgan’s transparent and uniform investment philosophy drives all in-house research efforts and all investment decisions. We seek to add value to the fund by capitalizing on mis-valuations that arise within and across the world’s equity markets. We do this by investing in undervalued securities, as identified by in-house valuation tools and research analysts. The fund’s strategy adheres to a bottom-up approach. Asset allocation is a by-product of stock selection opportunities.
From a sector perspective, stock selection in banks–capital markets and industrial cyclical were the largest detractors from fund performance, along with an underweight allocation in consumer non-durables. Stock selection in insurance and technology–semi-conductors contributed to fund performance, along with an underweight allocation in basic industries. Regionally, stock selection in Continental Europe and Japan were the major detractors from fund performance. Stock selection in the U.K. aided relative returns for the fund.
At the stock level, Hitachi Ltd., the Japanese industrial conglomerate, detracted from fund performance. The company scaled back its profit forecast for the current fiscal year (ended March 31) after fiscal third-quarter numbers were lower-than-expected. That said, our long-term thesis remains intact. The company continues to cut costs and restructure in an effort to bring profitability more in line with its peers, and management is becoming more shareholder-oriented.
| See benchmark definitions on page A-27 |
A-22
Table of Contents
PACIFIC LIFE FUNDS PERFORMANCE DISCUSSION (Continued)
Alternatively, Prudential P.L.C., the U.K. insurer, contributed to the fund’s relative performance. The stock surged as higher earnings prompted the company to raise its dividend by 16%. In contrast, some of its rivals, like Aviva P.L.C. and RSA Insurance Group P.L.C., recently cut their annual payouts. Prudential’s operating profits rose to a higher-than-expected 25% in 2012. The company largely avoided the European sovereign debt crisis, having held very little sovereign debt in the eurozone. Meanwhile, it is starting to reap the benefits of investing in the fast-growing Southeast Asian economies. Asia now accounts for about half the company’s revenues (in contrast to a few years ago when its business in the region had to be supported with cash from Prudential’s U.K. operations) and has become the largest contributor of cash to the group.
PL Currency Strategies Fund (managed by UBS Global Asset Management (Americas) Inc.)
Q. How did the fund perform for the period ended March 31, 2013?
A. The fund commenced operations on December 7, 2012. For the period from inception through March 31, 2013, the PL Currency Strategies Fund’s Class P returned 3.20%, compared to a 0.02% return for its benchmark, the Citigroup 1-Month U.S. T-Bill Index.
The following graph compares the performance of a hypothetical $10,000 investment in Class P shares of the fund to its benchmark for the period from inception through March 31, 2013. The fund’s performance reflects reinvestments of all dividends and capital gains distributions, if any.
Performance Comparison
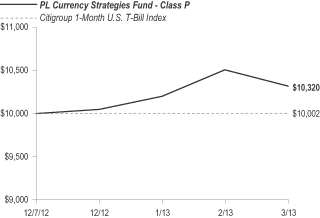
| Total Returns for the Period from Inception Through March 31, 2013 | ||||
| Since Inception (12/7/2012) | ||||
Fund’s Class P | 3.20% | |||
Citigroup 1-Month U.S. T-Bill Index | 0.02% | |||
Performance data shown represents past performance. Investment return and principal value will fluctuate so that shares of the fund when redeemed may be worth more or less than their original cost. Past performance is not predictive of future performance. | ||
Q. Discuss both positive and negative factors that materially affected the fund’s performance during the period, including relevant market conditions, investment strategies and techniques, and particular sectors or securities.
A. For the period from inception through March 31, 2013, the fund’s Class P outperformed the benchmark. The fund’s currency positions throughout the reporting period remained roughly unchanged, as befits our long-term approach to currency investing. We at UBS hold underweight positions in the Australian dollar (AUD) and New Zealand dollar (NZD) versus long positions in the U.S. dollar (USD) and emerging market currencies. The nature of this strategy is such that the majority of the exposures are gained through derivatives. For the reporting period, derivatives had a positive impact on fund performance.
Historical correlation analysis shows that both the AUD and NZD appear to demonstrate a positive correlation with commodity prices. For 2013, commodity prices on the whole have broadly stayed level with both the AUD and NZD displaying a similar trend. On a trade-weighted basis, both currencies appear overvalued, and we at UBS believe the fundamental mispricing gap remains. However, due to the “risk-on” nature of the markets at the end of the fourth quarter of 2012 through the end of the first quarter 2013, higher beta1 currencies consolidated gains, causing the AUD and NZD short positions to negatively impact the fund’s performance.
In emerging markets, we are long the Korean won (KRW) and Mexican peso (MXN). In our view, the KRW is attractive on a valuation basis and supported by relatively strong economic fundamentals. Similarly, we believe MXN appears undervalued on a valuation basis and, moreover, the real carry opportunity (i.e. the interest rate offered after accounting for inflation differentials between Mexico and other countries) is attractive. Together, these “risk-on” currencies should also benefit from stronger data releases in the U.S. and China. During the reporting period, we entered a long South African rand (ZAR) position. The trade provides attractive nominal carry, appears undervalued with reference to our proprietary valuation model, and provides long exposure to a commodity-backed currency to partly offset our short exposure to the commodity-backed NZD and AUD. During the reporting period, these positions positively impacted the fund. As noted earlier, the “risk-on” environment was beneficial for higher risk currencies such as the emerging market currencies held in the fund.
The fund is overweight to the USD. Our proprietary valuation model indicates that the USD is undervalued. Moreover, the U.S. appears to have made more progress along the de-leveraging cycle than other developed counterparts. Given stronger U.S. economic data, combined with the potential for greater energy self-sufficiency from shale gas, we expect the currency to appreciate in the long term. This position benefited the fund during the period.
| 1 | Beta is the degree to which a security’s returns (in this case currency) will move with the broad market. |
| See benchmark definitions on page A-27 |
A-23
Table of Contents
PACIFIC LIFE FUNDS PERFORMANCE DISCUSSION (Continued)
PL Global Absolute Return Fund (managed by Eaton Vance Management)
Q. How did the fund perform for the period ended March 31, 2013?
A. The fund commenced operations on December 7, 2012. For the period from inception through March 31, 2013, the PL Global Absolute Return Fund’s Class P returned 1.96%, compared to a 0.03% return for its benchmark, the BofA Merrill Lynch U.S. 3-Month T-Bill Index.
The following graph compares the performance of a hypothetical $10,000 investment in Class P shares of the fund to its benchmark for the period from inception through March 31, 2013. The fund’s performance reflects reinvestments of all dividends and capital gains distributions, if any.
Performance Comparison
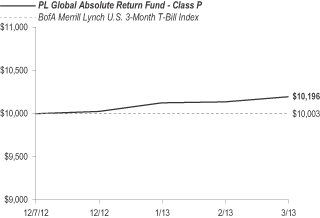
| Total Returns for the Period from Inception Through March 31, 2013 | ||||
| Since Inception (12/7/2012) | ||||
Fund’s Class P | 1.96% | |||
BofA Merrill Lynch U.S. 3-Month T-Bill Index | 0.03% | |||
Performance data shown represents past performance. Investment return and principal value will fluctuate so that shares of the fund when redeemed may be worth more or less than their original cost. Past performance is not predictive of future performance. | ||
Q. Discuss both positive and negative factors that materially affected the fund’s performance during the period, including relevant market conditions, investment strategies and techniques, and particular sectors or securities.
A. For the period from inception through March 31, 2013, the fund’s Class P outperformed the benchmark. The fund benefited from a broad mix of contributors across its positions in Europe, Asia, and Africa. Currency and credit positions in Latin America, hedging positions in the Dollar Bloc, and mixed credit positions in the Middle East were slight drags on fund performance. Eaton Vance invests the fund in securities, derivatives and other instruments to establish long and short investment exposures around the world, typically seeking to establish such investment exposure to individual countries based on management’s view of the investment merits of a country. The fund normally invests in multiple countries and may have a significant exposure to foreign currencies.
In Eastern Europe, a short position in the Hungarian forint aided the fund’s performance, as the prime minister appointed a personal friend and political ally to head the central bank, and the institution’s independence going forward was called into question by investors. The fund’s long position in the Serbian dinar positively impacted fund performance, as the central bank continued its policy-rate hiking cycle in an effort to keep inflation at bay and the country moved closer to European Union membership. A long interest rate position in Poland also contributed to relative fund performance.
In Western Europe, however, a short position in French credit negatively impacted fund performance, as the risk premium applied to the country’s sovereign debt remained low as some investors continued to view France as a core country within the eurozone. The fund’s long position in the Norwegian krone detracted from fund performance, as the Norwegian central bank indicated a readiness to intervene to weaken the currency. In addition, investors migrated away from the krone and toward the Swedish krona, which was perceived as being more attractively valued.
In Asia, a short position in the Japanese yen was beneficial to the fund’s performance. The yen weakened on expectations that a new prime minister and new central bank president would institute policies to stimulate inflation. A long position in the South Korean won was unfavorable due to rising tensions with North Korea and equity flows out of South Korea and into Japan.
| See benchmark definitions on page A-27 |
A-24
Table of Contents
PACIFIC LIFE FUNDS PERFORMANCE DISCUSSION (Continued)
PL Precious Metals Fund (managed by Wells Capital Management Incorporated)
Q. How did the fund perform for the period ended March 31, 2013?
A. The fund commenced operations on December 7, 2012. For the period from inception through March 31, 2013, the PL Precious Metals Fund’s Class P returned -17.79%, compared to a 11.72% return for its benchmarks, the S&P 500 Index and a -15.30% return for the FTSE Gold Mines Index. The S&P 500 Index is a broad-based benchmark index and is provided to compare the performance of the fund against a large portion of the U.S. equities market.
The following graph compares the performance of a hypothetical $10,000 investment in Class P shares of the fund to its benchmarks for the period from inception through March 31, 2013. The fund’s performance reflects reinvestments of all dividends and capital gains distributions, if any.
Performance Comparison
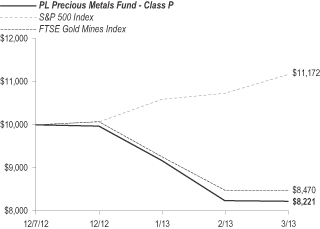
| Total Returns for the Period from Inception Through March 31, 2013 | ||||
| Since Inception (12/7/2012) | ||||
Fund’s Class P | (17.79% | ) | ||
S&P 500 Index | 11.72% | |||
FTSE Gold Mines Index | (15.30% | ) | ||
Performance data shown represents past performance. Investment return and principal value will fluctuate so that shares of the fund when redeemed may be worth more or less than their original cost. Past performance is not predictive of future performance. | ||
Q. Discuss both positive and negative factors that materially affected the fund’s performance during the period, including relevant market conditions, investment strategies and techniques, and particular sectors or securities.
A. For the period from inception through March 31, 2013, the fund’s Class P underperformed both its benchmarks, the broad-based S&P 500 Index and the sector-specific, FTSE Gold Mines Index. The Wells Capital fund management team invests in companies involved in the exploration, development, mining, processing, or dealing of gold, precious metals, and minerals, which tend to have relatively high correlation to underlying commodity prices and relatively low correlation to the prices of other stocks and bonds. We take a disciplined approach to risk management through top-down analysis and bottom-up stock selection, while diversifying across market capitalizations, production profiles, and geographies. Additionally, we focus on a long-term investment horizon, looking for companies that have lower-than-average cost structures, are well managed, and are likely to improve their relative values over time.
Comparing the performance of the fund to the S&P 500 Index, the fund meaningfully underperformed for the period. Given there is only one gold stock (Newmont Mining Corp.) in the S&P 500 Index, and given the dramatic decline in gold prices for the period, this underperformance is not surprising, in our opinion.
The fund benefited from holding relatively more cash than normal by buying shares into a declining gold market. The fund held approximately 5.1% of assets in cash on average throughout the reporting period, which outperformed the sector-specific FTSE Gold Mines Index’s precious metals equity holdings and added to the fund’s relative performance. Entering the fourth quarter of 2012, gold-related stocks traded at a discount compared with the underlying commodity, and the discount expanded throughout the period.
Cash was the best performing asset in the fund providing stable returns in a declining market. Investment in Aurizon Mines Ltd. aided fund performance. The stock, which was not in the sector-specific FTSE Gold Mines Index, appreciated 26%, lifted by an announcement that Hecla Mining Co. agreed to acquire the company at a substantial premium. Aurizon’s board unanimously supported the Hecla transaction.
The fund’s underweight position in AngloGold Ashanti Ltd. and larger-capitalization Gold Fields Ltd. also helped the fund’s relative performance during this difficult fourth quarter. As investors looked to reduce their exposure to precious metals firms facing heightened risks, they disproportionately sold companies domiciled in South Africa. We have historically maintained a geographic underweight to South Africa due to the country’s longstanding trend of high and increasing labor costs, which comprise nearly half of total mining costs. Our underweight to the country added to the fund’s relative results.
Platinum Group Metals Ltd. soared during the reporting period as two events caused significant price movement and confidence movement. First, the company completed a successful financing (debt and equity) in early January to fund development costs at a platinum mine and exploration and working capital at other projects. Second, the shares were added to the S&P/TSX Global Mining Index effective at the market open on Monday, March 18, 2013.
An underweight to firms with the largest market capitalizations, such as GoldCorp, Inc. and Newmont Mining Corp., previously aided relative fund results in 2012 but hindered fund results in the first quarter of 2013. Larger companies that were perceived to carry less risk did not decline as substantially as other precious metals stocks. These firms are highly liquid, have relatively stable earnings, and typically have strong balance sheets. While we have a notable allocation to large-capitalization stocks on an absolute basis, the sector-specific
| See benchmark definitions on page A-27 |
A-25
Table of Contents
PACIFIC LIFE FUNDS PERFORMANCE DISCUSSION (Continued)
FTSE Gold Mines Index has even more exposure. The fund’s underweight is partly a result of our risk management process; we typically look to avoid concentrated stock risk by limiting individual position weights to below 10%. Index constituents such as GoldCorp and Newmont Mining have 14% and 11% weights, respectively, in the sector-specific FTSE Gold Mines Index. In addition, larger mining firms are often more focused on sustaining their businesses than they are on growth.
Silver exposure detracted from the fund’s performance returns after aiding results in 2012. Enthusiasm for the metal waned during the reporting period, and negative trading momentum pulled down prices even further. Fresnillo P.L.C., a silver producer and one of the stronger stocks in the fourth quarter of 2012, is well positioned as the low-cost silver producer but was the second largest detractor from fund performance in the first quarter of 2013. Hochschild Mining P.L.C., another silver miner, was another large detractor from fund performance as management announced solid fourth quarter production but guided analysts’ earnings expectations lower due to higher expenses.
PL Alternative Strategies Fund (managed by Pacific Life Fund Advisors LLC)
Q. How did the fund perform for the period ended March 31, 2013?
A. The fund commenced operations on December 31, 2012. For the period from inception through March 31, 2013, the PL Alternative Strategies Fund’s Class A returned -0.60%, compared to a 0.01% return for its benchmark, the Citigroup 1-Month U.S. T-Bill Index.
The following graph compares the performance of a hypothetical $10,000 investment in Class A shares of the fund to its benchmark for the period from inception through March 31, 2013. For comparison purposes, the performance of Class C and Advisor Class shares for the period from inception through March 31, 2013 are also shown. Performance data for Class C and Advisor Class shares will vary due to differences in fees and sales charges. The fund’s performance reflects reinvestments of all dividends and capital gains distributions, if any.
Performance Comparison
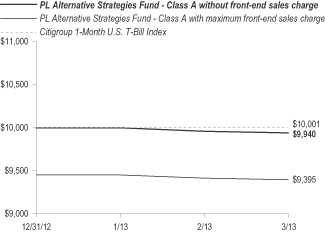
| Total Returns for the Period from Inception Through March 31, 2013 | ||||
| Since Inception (12/31/12) | ||||
Fund’s Class A without sales charge | (0.60% | ) | ||
Fund’s Class A with maximum sales charge | (6.05% | ) | ||
Fund’s Class C without sales charge | (0.80% | ) | ||
Fund’s Class C with maximum sales charge | (1.79% | ) | ||
Fund’s Advisor Class without sales charge | (0.60% | ) | ||
Citigroup 1-Month U.S. T-Bill Index | 0.01% | |||
Performance data shown represents past performance. Investment return and principal value will fluctuate so that shares of the fund when redeemed may be worth more or less than their original cost. Past performance is not predictive of future performance. | ||
Q. Discuss both positive and negative factors that materially affected the fund’s performance during the period, including relevant market conditions, investment strategies and techniques, and particular sectors or securities.
A. For the period from inception through March 31, 2013, the fund’s Class A underperformed the benchmark. The fund is primarily comprised of various non-traditional asset classes and investment strategies. The allocations include precious metals equities, currencies, and global absolute return strategies. The fund also invests in inflation-protected bonds, floating rate loan, real estate, and emerging markets debt strategies.
The fund’s allocation to the PL Global Absolute Return and PL Real Estate Funds were among the top contributors to fund performance. On the other hand, the PL Precious Metals Fund’s weak returns dragged fund performance. While the PL Precious Metals Fund invests primarily in gold mining stocks, the weak returns resulted primarily from the drop in gold prices over the reporting period. Gold tends to protect against a weakening U.S. dollar and/or higher inflation; however, recent market environments have dealt with low inflationary expectations and a rising U.S. dollar.
| See benchmark definitions on page A-27 |
A-26
Table of Contents
PACIFIC LIFE FUNDS PERFORMANCE DISCUSSION (Continued)
Benchmark Definitions
Barclays 1-3 Year U.S. Government/Credit Bond Index is the 1-3 year component for the U.S. Government/Credit Index. The U.S. Government/Credit Bond Index is the non-securitized component of the U.S. Aggregate Bond Index. The U.S. Government/Credit Bond Index includes U.S. Treasuries, Government-related issues and corporates. The total return is equal to the change in price plus the coupon return.
Barclays Long Term U.S. Treasury Index includes all publicly issued, U.S. Treasury securities that have a remaining maturity of 10 or more years, are rated investment grade, and have $250 million or more of outstanding face value. In addition, the securities must be denominated in U.S. dollars and must be fixed rate and non-convertible.
Barclays U.S. Aggregate Bond Index covers the U.S. dollar-denominated, investment grade, fixed-rate, taxable bond market of SEC-registered securities. The index includes bonds from the U.S. Treasury, government-related, corporate, mortgage-backed securities, asset-backed securities, and corporate mortgage-backed securities sectors. The total return is equal to the change in price plus the coupon return.
Barclays U.S. Treasury Inflation Protected Securities (TIPS) Index is an index of all outstanding treasury inflation protected securities issued by the U.S. government. The total return is equal to the change in price plus the coupon return.
BofA Merrill Lynch U.S. 3-Month Treasury Bill (T-Bill) Index is an index comprised of a single Treasury bill issue purchased at the beginning of the month and held for a full month, then sold and rolled into a newly selected Treasury bill issue. Results include the reinvestment of all distributions.
Citigroup 1-Month U.S. Treasury Bill (T-Bill) Index is a market-value-weighted index of public obligations of the U.S. Treasury with maturities of one month.
FTSE Gold Mines Index represents an accurate reflection and comprehensive coverage of the global gold markets. The index includes all gold mining companies that have a sustainable and attributable gold production of at least 300,000 ounces a year and that derive 51% or more of their revenue from mined gold.
FTSE National Association of Real Estate Investment Trusts (NAREIT) Equity Real Estate Investment Trusts (REITs) Index is one index of a series of indexes represented in the FTSE NAREIT U.S. Real Estate Index Series and represents tax-qualified REITs listed on the New York Stock Exchange (NYSE), American Stock Exchange and National Association of Securities Dealers Automated Quotations (NASDAQ). Results include reinvested dividends.
J.P. Morgan Emerging Markets Bond Index (EMBI) Global Diversified Index represents the dollar-denominated sovereign bonds issued by a selection of emerging market countries within the JPM EMBI Global Index, which tracks total returns for traded external debt instruments in the emerging markets. The EMBI Global Index defines emerging markets countries with two criteria: the country’s per capita income per World Bank and its debt-restructuring history over the past 10 years. The JPM EMBI Global Diversified Index expands on these criteria and limits the weights of countries with larger debt stocks by only including a specified portion of these countries’ eligible current face amounts of debt outstanding.
Morgan Stanley Capital International (MSCI) Europe, Australasia and Far East (EAFE) Index is an index of stocks from 21 countries/regions in Europe, Australia, New Zealand and Asia. Results include reinvested dividends after deducting withholding taxes.
MSCI Emerging Markets Index is an index typically made up of stocks from approximately 26 emerging market countries. Results include reinvested dividends.
Russell 1000 Growth Index is an index of large companies that have higher price-to-book ratios and forecasted growth values than the Russell 1000 Value Index. Results include reinvested dividends.
Russell 1000 Value Index measures the performance of the large-capitalization value segment of the U.S. equity universe. It is an index of companies with a less-than average growth orientation. Companies in this index have lower price-to book and price-earnings ratios, higher dividend yields and lower forecasted growth rates than companies in the Russell 1000 Growth Index. Results include reinvested dividends.
Russell 2000 Growth Index measures the performance of the small-capitalization growth segment of the U.S. equity universe. It is an index of approximately 1,200 small companies with higher price-to-book ratios and forecasted growth values than companies in the Russell 2000 Value Index. Results include reinvested dividends.
Russell 2000 Value Index measures the performance of the small-capitalization value segment of the U.S. equity universe. It is an index of companies that have lower price-to-book ratios and lower forecasted growth values than companies in the Russell 2000 Growth Index. Results include reinvested dividends.
Russell Midcap Growth Index is an index that measures the performance of the mid-capitalization growth segment of the U.S. equity universe. It includes those companies within the Russell Midcap Index with higher price-to-book ratios and higher forecasted growth values. Results include reinvested dividends.
Russell Midcap Index is an index of approximately 800 of the smallest companies in the Russell 1000 Index. Results include reinvested dividends.
S&P 500 Index is an index of the stocks of approximately 500 large-capitalization companies traded in U.S. stock markets. Results include reinvested dividends.
S&P/LSTA Leveraged Loan Index is a daily total return index that uses Loan Syndications & Trading Association/Loan Pricing Corp. (LSTA/LPC) mark-to-market pricing to calculate market value change. On a real-time basis, the leveraged loan index (LLI) tracks the current outstanding balance and spread over London Interbank Offered Rate (LIBOR) for fully funded term loans. The facilities included in the LLI represent a broad cross section of leveraged loans syndicated in the U.S., including dollar-denominated loans to overseas issuers.
A-27
Table of Contents
PACIFIC LIFE FUNDS
PL FLOATING RATE LOAN FUND
March 31, 2013
Shares | | |||||||
COMMON STOCKS - 1.0% |
| |||||||
Consumer Discretionary - 1.0% |
| |||||||
Metro-Goldwyn-Mayer Studios Inc ‘A’ * ¯ | 27,061 | $1,119,627 | ||||||
|
| |||||||
Total Common Stocks | 1,119,627 | |||||||
|
| |||||||
Principal | ||||||||
SENIOR LOAN NOTES - 93.9% |
| |||||||
Consumer Discretionary - 30.7% | ||||||||
99 Cents Only Stores Tranche B-1 | $988,763 | 1,003,285 | ||||||
Advantage Sales & Marketing Inc (1st Lien) | 662,302 | 672,513 | ||||||
Affinion Group Inc Tranche B | 347,066 | 339,908 | ||||||
Allied Security Holdings LLC (1st Lien) | 497,469 | 501,822 | ||||||
Allison Transmission Inc Term B-3 | 595,756 | 604,022 | ||||||
AMC Entertainment Inc Term B-3 | 987,500 | 996,012 | ||||||
ARAMARK Corp Term D | 300,000 | 303,615 | ||||||
Ascend Learning LLC (1st Lien) | 497,480 | 497,014 | ||||||
ASP HHI Acquisition Co Inc | 957,896 | 968,672 | ||||||
Asurion LLC Tranche B-1 | 1,072,313 | 1,082,254 | ||||||
Audio Visual Services Group Inc (1st Lien) | 149,250 | 150,369 | ||||||
Bass Pro Group LLC | 174,563 | 176,599 | ||||||
Brickman Group Holdings Inc Tranche B-1 | 250,000 | 255,000 | ||||||
Burger King Corp Tranche B | 223,875 | 227,209 | ||||||
Caesars Entertainment Operating Co Inc Term B-6 | 479,033 | 445,022 | ||||||
Cequel Communications LLC | 544,500 | 550,328 | ||||||
Charter Communications Operating LLC | 89,071 | 89,597 | ||||||
Term D | 99,000 | 100,213 | ||||||
Chrysler Group LLC Term B | 1,031,625 | 1,053,271 | ||||||
Clear Channel Communication Inc Term B | 492,133 | 437,383 | ||||||
Cumulus Media Holdings Inc (1st Lien) | 493,370 | 500,339 | ||||||
David’s Bridal Inc (Initial) | 74,813 | 75,876 | ||||||
Education Management LLC | 494,585 | 412,449 | ||||||
Tranche C-3 | 296,751 | 257,617 | ||||||
Endurance Business Media Inc (1st Lien) | 249,375 | 251,557 | ||||||
Equinox Holdings Inc (Initial 1st Lien) | 150,000 | 152,719 | ||||||
Principal | | |||||||
Federal-Mogul Corp | $638,574 | $598,574 | ||||||
Tranche C | 325,803 | 305,395 | ||||||
FoxCo Acquisition Sub LLC (Initial) | 149,250 | 152,173 | ||||||
General Nutrition Centers Inc Tranche B | 1,123,466 | 1,134,701 | ||||||
Genpact Ltd | 174,125 | 176,882 | ||||||
Getty Images Inc (Initial) | 573,563 | 582,934 | ||||||
Go Daddy Operating Co LLC Tranche B-2 | 518,489 | 522,161 | ||||||
Gray Television Inc (Initial) | 240,991 | 244,907 | ||||||
Harbor Freight Tools USA Inc (Initial) | 149,250 | 151,302 | ||||||
Interactive Data Corp Term B | 479,027 | 485,165 | ||||||
J Crew Group Inc Term B-1 | 494,962 | 501,273 | ||||||
Jo-Ann Stores Inc Term B | 976,444 | 985,476 | ||||||
Landry’s Inc | 470,994 | 475,312 | ||||||
Language Line LLC Tranche B | 600,025 | 597,275 | ||||||
Laureate Education Inc (Extended) | 1,059,824 | 1,072,180 | ||||||
Media Holdco LP | 99,750 | 100,498 | ||||||
MGM Resorts International Term B | 299,250 | 304,647 | ||||||
Michaels Stores Inc Term B | 325,000 | 328,926 | ||||||
National Vision Inc | 74,063 | 74,988 | ||||||
Nine Entertainment Group Ltd Term B | 100,000 | 100,422 | ||||||
Ollie’s Holdings Inc | 249,375 | 251,869 | ||||||
OSI Restaurant Group | 316,875 | 321,759 | ||||||
Party City Holdings Inc | 174,563 | 176,090 | ||||||
Petco Animal Supplies Inc | 488,750 | 495,558 | ||||||
Pilot Travel Centers LLC Tranche B | 410,768 | 415,438 | ||||||
4.250% due 08/07/19 § | 149,250 | 151,092 | ||||||
Pinnacle Entertainment Inc Series A | 74,250 | 74,900 | ||||||
RGIS Services LLC Tranche C | 198,000 | 201,094 | ||||||
Sabre Holdings Term B | 149,625 | 151,775 | ||||||
SeaWorld Parks & Entertainment Inc | 290,386 | 293,161 | ||||||
Serta Simmons Holdings LLC | 200,000 | 203,042 | ||||||
Six Flags Theme Parks Inc Term B | 506,452 | 514,208 | ||||||
SRAM LLC (1st Lien) | 473,370 | 474,553 | ||||||
| See Notes to Financial Statements | See explanation of symbols and terms, if any, on page B-79 |
B-1
Table of Contents
PACIFIC LIFE FUNDS
PL FLOATING RATE LOAN FUND
Schedule of Investments (Continued)
March 31, 2013
Principal | | |||||||
Standard Aero Ltd | $85,579 | $86,488 | ||||||
Tranche B-2 | 38,796 | 39,208 | ||||||
SurveyMonkey.com LLC | 250,000 | 254,375 | ||||||
SymphonyIRI Group Inc Term B | 491,251 | 497,392 | ||||||
Tempur-Pedic International Inc Term B | 224,438 | 227,864 | ||||||
The Goodyear Tire & Rubber Co (2nd Lien) | 925,000 | 936,555 | ||||||
The Neiman Marcus Group Inc | 925,000 | 935,059 | ||||||
The Servicemaster Co Tranche C | 374,063 | 378,037 | ||||||
Travelport LLC | 494,329 | 492,784 | ||||||
Tribune Co Term B | 224,438 | 226,850 | ||||||
TWCC Holding Corp | 734,303 | 745,470 | ||||||
Univision Communications Inc | 879,400 | 885,666 | ||||||
Veyance Technologies Inc | 300,000 | 301,625 | ||||||
Virgin Media Term B (United Kingdom) | 475,000 | 473,219 | ||||||
Visant Corp Tranche B | 496,586 | 482,826 | ||||||
VWR Funding Inc | 356,401 | 361,079 | ||||||
Term B-1 | 249,375 | 252,492 | ||||||
Weight Watchers International Inc Term F | 173,688 | 174,849 | ||||||
Wendy’s International Inc | 995,000 | 1,007,078 | ||||||
WMG Acquisition Corp (Initial) | 74,063 | 75,451 | ||||||
Zuffa LLC (Initial) | 324,188 | 329,050 | ||||||
|
| |||||||
| 33,887,812 | ||||||||
|
| |||||||
Consumer Staples - 8.7% | ||||||||
AdvancePierre Foods Inc (1st Lien) | 149,625 | 152,056 | ||||||
Albertson’s LLC Term B | 75,000 | 76,373 | ||||||
Blue Buffalo Co Ltd Term B | 572,129 | 579,102 | ||||||
Clearwater Seafoods Ltd Partnership Term B | 471,373 | 476,087 | ||||||
Del Monte Foods Co Term B | 474,568 | 479,264 | ||||||
Dole Food Co Inc | 353,075 | 354,592 | ||||||
Tranche C-2 | 631,820 | 634,535 | ||||||
H.J. Heinz Company Term B-2 | 1,300,000 | 1,312,838 | ||||||
JBS USA LLC | 982,538 | 991,135 | ||||||
KIK Custom Products Inc (2nd Lien) | 500,000 | 439,166 | ||||||
Principal | | |||||||
NBTY Inc Term B-2 | $325,000 | $329,428 | ||||||
Reynolds Group Holdings | 995,000 | 1,010,635 | ||||||
Rite Aid Corp Tranche 6 | 250,000 | 252,943 | ||||||
Spectrum Brands Inc Term B | 423,938 | 429,811 | ||||||
Sprouts Farmers Markets Holdings LLC (Initial) | 498,728 | 503,403 | ||||||
Sun Products Corp Tranche B | 275,000 | 278,266 | ||||||
SUPERVALU Inc | 225,000 | 229,239 | ||||||
US Foods Inc (Extended) | 993,943 | 1,009,005 | ||||||
|
| |||||||
| 9,537,878 | ||||||||
|
| |||||||
Energy - 3.7% | ||||||||
Arch Coal Inc | 397,187 | 404,337 | ||||||
CITGO Petroleum Corp Term B | 145,536 | 147,234 | ||||||
Crestwood Holdings LLC | 140,966 | 143,786 | ||||||
Energy Transfer Equity LP | 325,000 | 327,167 | ||||||
Frac Tech Services Term B | 246,743 | 235,126 | ||||||
MEG Energy Corp | 773,044 | 782,868 | ||||||
Obsidian Natural Gas Trust | 743,757 | 751,195 | ||||||
Patriot Coal Corp | 100,000 | 100,875 | ||||||
Plains Exploration & Production Co | 250,000 | 250,937 | ||||||
Ruby Western Pipeline Holdings LLC | 50,000 | 50,687 | ||||||
Samson Investment Co (Initial 2nd Lien) | 100,000 | 101,450 | ||||||
Sheridan Investment Partners I LLC Tranche B-2 | 245,994 | 250,094 | ||||||
Sheridan Production Partners I-A LP Tranche B-2 | 32,596 | 33,139 | ||||||
Sheridan Production Partners I-M LP Tranche B-2 | 19,910 | 20,242 | ||||||
Tallgrass Operations LLC | 274,313 | 279,341 | ||||||
Tervita Corp | 200,000 | 202,656 | ||||||
|
| |||||||
| 4,081,134 | ||||||||
|
| |||||||
Financials - 5.8% | ||||||||
Alliant Holdings I LLC (Initial) | 249,375 | 252,414 | ||||||
American Capital Ltd | 150,000 | 152,625 | ||||||
Amwins Group (1st Lien) | 99,750 | 101,038 | ||||||
Citco Funding LLC | 541,126 | 542,479 | ||||||
Clipper Acquisitions Corp (Initial) | 199,500 | 201,495 | ||||||
CNO Financial Group Inc Tranche B-2 | 119,471 | 121,487 | ||||||
Compass Investors Inc (Initial) | 274,313 | 277,170 | ||||||
Cunningham Lindsay U.S. Inc (Initial 1st Lien) | 299,250 | 305,235 | ||||||
| See Notes to Financial Statements | See explanation of symbols and terms, if any, on page B-79 |
B-2
Table of Contents
PACIFIC LIFE FUNDS
PL FLOATING RATE LOAN FUND
Schedule of Investments (Continued)
March 31, 2013
Principal | | |||||||
First Data Corp | $523,620 | $522,900 | ||||||
Term B | 150,000 | 151,391 | ||||||
Harbourvest Partners LP | 480,357 | 483,960 | ||||||
HUB International Ltd | 948,892 | 958,618 | ||||||
LPL Holdings Inc (Initial) | 95,000 | 95,309 | ||||||
Tranche B | 297,000 | 299,970 | ||||||
McGraw-Hill Global Education Holdings LLC | 100,000 | 97,000 | ||||||
Nuveen Investments Inc Tranche A (1st Lien) | 883,260 | 900,373 | ||||||
Ocwen Loan Servicing LLC (Initial) | 150,000 | 152,625 | ||||||
SOPHOS Term B | 496,250 | 500,282 | ||||||
Walter Investment Management Corp Tranche B | 320,886 | 327,063 | ||||||
|
| |||||||
| 6,443,434 | ||||||||
|
| |||||||
Health Care - 14.5% | ||||||||
Alere Inc Term B | 788,000 | 795,551 | ||||||
Alliance Imaging Inc (Initial) | 350,134 | 353,636 | ||||||
Aptalis Pharma Inc Term B-1 | 488,750 | 493,638 | ||||||
Ardent Medical Services Inc (1st Lien) | 199,500 | 203,241 | ||||||
Aveta Inc | 63,158 | 63,553 | ||||||
Biomet Inc Term B-1 | 1,021,851 | 1,033,583 | ||||||
CHS/Community Health Systems Inc | 638,054 | 645,731 | ||||||
DaVita Inc Tranche B-2 | 374,063 | 378,417 | ||||||
DJO Finance LLC Term B | 360,592 | 367,128 | ||||||
Drumm Investors LLC | 494,823 | 479,669 | ||||||
Emergency Medical Services Corp | 457,157 | 463,443 | ||||||
Grifols Inc Tranche B | 759,143 | 768,022 | ||||||
HCA Inc Tranche B-3 | 581,925 | 587,499 | ||||||
Health Management Associates Inc Term B | 1,142,479 | 1,154,618 | ||||||
Hologic Inc Tranche B | 223,875 | 227,256 | ||||||
IMS Health Inc Tranche B-1 | 556,025 | 562,743 | ||||||
InVentiv Health Inc | 263,957 | 261,977 | ||||||
Kinetic Concepts Inc Term C-1 | 696,487 | 709,981 | ||||||
MedAssets Inc Term B | 71,063 | 71,773 | ||||||
MMM Holdings Inc | 86,842 | 87,493 | ||||||
Principal | | |||||||
MultiPlan Inc Term B-1 | $542,718 | $549,570 | ||||||
One Call Medical Inc | 99,750 | 100,623 | ||||||
Par Pharmaceutical Cos Inc Term B-1 | 124,376 | 125,917 | ||||||
Pharmaceutical Product Development Inc | 997,500 | 1,011,528 | ||||||
Quintiles Transnational Corp Term B-2 | 902,898 | 916,818 | ||||||
Radnet Management Inc Tranche B | 199,000 | 201,612 | ||||||
RPI Finance Trust | 416,124 | 420,979 | ||||||
Sage Products Inc (1st Lien) | 250,000 | 252,578 | ||||||
Select Medical Corp | 99,750 | 100,373 | ||||||
Term A | 231,153 | 232,405 | ||||||
TriZetto Group Inc | 493,719 | 497,885 | ||||||
Truven Holding Corp Tranche B | 198,998 | 202,480 | ||||||
Valeant Pharmaceuticals International Inc | 299,250 | 302,204 | ||||||
Series D-1 Tranche B | 497,503 | 502,600 | ||||||
Warner Chilcott Co LLC | 144,975 | 147,150 | ||||||
Term B-2 | 118,013 | 119,783 | ||||||
Warner Chilcott Corp Term B-1 | 333,042 | 338,037 | ||||||
WC Luxco SARL Term B-3 | 262,441 | 266,377 | ||||||
|
| |||||||
| 15,997,871 | ||||||||
|
| |||||||
Industrials - 10.0% | ||||||||
Advanced Disposal Term B | 224,438 | 227,215 | ||||||
Alpha Topco Ltd Term B-2 (Facility) | 272,257 | 276,146 | ||||||
Ameriforge Group Inc (Initial 1st Lien) | 74,813 | 75,888 | ||||||
Apex Tool Group LLC | 100,000 | 101,562 | ||||||
BakerCorp International Inc Term B | 500,000 | 503,333 | ||||||
Beechcraft Holdings LLC | 375,000 | 377,344 | ||||||
Bombardier Recreational Products Inc (Canada) | 525,000 | 530,852 | ||||||
Brand Energy & Infrastructure Services Inc | 80,242 | 80,576 | ||||||
Tranche 1 | 19,258 | 19,475 | ||||||
Colfax Corp Term B | 349,125 | 351,798 | ||||||
Delos Aircraft Inc | 100,000 | 100,750 | ||||||
DynCorp International Inc | 500,000 | 504,062 | ||||||
| See Notes to Financial Statements | See explanation of symbols and terms, if any, on page B-79 |
B-3
Table of Contents
PACIFIC LIFE FUNDS
PL FLOATING RATE LOAN FUND
Schedule of Investments (Continued)
March 31, 2013
Principal | | |||||||
Edwards Ltd (Cayman) (Initial 1st Lien) | $175,000 | $175,328 | ||||||
Flying Fortress Inc | 425,000 | 427,656 | ||||||
Grede LLC Term B | 505,000 | 508,787 | ||||||
Hamilton Sundstrand | 749,375 | 755,330 | ||||||
Husky Injection Molding System Ltd Term B | 446,719 | 452,722 | ||||||
IG Investment Holdings LLC Tranche B (1st Lien) | 99,750 | 100,498 | ||||||
John Maneely Co | 987,425 | 997,904 | ||||||
KAR Auction Services Inc Term B | 319,325 | 323,117 | ||||||
Merrill Communications LLC | 25,000 | 25,125 | ||||||
Metaldyne Co LLC | 174,563 | 177,617 | ||||||
Milacron LLC Term B | 50,000 | 50,563 | ||||||
Monitronics International Inc Term B | 123,751 | 125,607 | ||||||
Pelican Products Inc (1st Lien) | 248,125 | 248,745 | ||||||
Rexnord LLC Term B | 1,012,226 | 1,024,453 | ||||||
Schaeffler Technologies AG Term C (Germany) | 100,000 | 101,250 | ||||||
Sensata Technologies BV | 343,875 | 348,112 | ||||||
Sequa Corp (Initial) | 199,500 | 202,908 | ||||||
SumTotal Systems LLC (1st Lien) | 149,625 | 151,869 | ||||||
Swift Transportation Co LLC | 361,905 | 365,524 | ||||||
Tranche B-2 | 167,285 | 169,899 | ||||||
Tank Holding Corp Term 1 | 146,451 | 147,000 | ||||||
The Hertz Corp Tranche B-1 | 224,438 | 227,851 | ||||||
U.S. Security Associates Holdings Inc Term B | 493,736 | 498,982 | ||||||
West Corp Term B-8 | 223,254 | 227,161 | ||||||
|
| |||||||
| 10,983,009 | ||||||||
|
| |||||||
Information Technology - 7.5% | ||||||||
Aeroflex Inc Tranche B | 438,528 | 447,116 | ||||||
ARRIS Group Inc Term B | 125,000 | 125,391 | ||||||
Aspect Software Inc Tranche B | 440,605 | 446,663 | ||||||
Booz Allen Hamilton Inc Tranche B (Initial) | 99,500 | 101,042 | ||||||
CompuCom Systems Inc (1st Lien) | 249,375 | 252,700 | ||||||
Dealer Computer Services Inc Tranche B | 136,161 | 137,309 | ||||||
DG FastChannel Inc (Initial) | 416,803 | 412,896 | ||||||
Eagle Parent Inc Term B | 467,693 | 474,124 | ||||||
Principal | | |||||||
Expert Global Solutions Inc Term B | $271,345 | $274,058 | ||||||
Freescale Semiconductor Inc Tranche B-4 | 325,000 | 327,539 | ||||||
Infor US Inc Tranche B-2 | 694,759 | 707,641 | ||||||
Kronos Inc (1st Lien) | 199,500 | 202,056 | ||||||
Micro Holding LP (Initial) | 125,000 | 125,469 | ||||||
Mitel US Holdings Inc (1st Lien) | 75,000 | 76,125 | ||||||
Novell Inc (1st Lien) | 424,688 | 429,731 | ||||||
NXP BV Tranche C | 124,688 | 127,701 | ||||||
Rocket Software Inc | 493,752 | 496,632 | ||||||
Rovi Solutions Corp Tranche B-2 | 92,314 | 92,314 | ||||||
RP Crown Parent LLC Term B | 324,188 | 331,076 | ||||||
Sophia LP Term B | 145,023 | 147,402 | ||||||
Spansion LLC | 99,487 | 100,689 | ||||||
SSI Investments II Ltd | 486,273 | 493,567 | ||||||
SunGard Data Systems Inc | 106,742 | 107,475 | ||||||
Tranche E | 700,000 | 709,625 | ||||||
Vertafore Inc (1st Lien) | 497,457 | 502,743 | ||||||
Wall Street Systems Inc (1st Lien) | 149,625 | 151,495 | ||||||
Web.com Group Inc Term B | 469,344 | 474,185 | ||||||
|
| |||||||
| 8,274,764 | ||||||||
|
| |||||||
Materials - 6.3% | ||||||||
AZ Chem U.S. Inc Term B | 117,426 | 119,628 | ||||||
Berry Plastics Corp Term D | 250,000 | 249,888 | ||||||
BWAY Holding Co (Initial) | 324,188 | 328,442 | ||||||
DuPont Performance Coatings Term B (Initial) | 350,000 | 355,051 | ||||||
Essar Steel Algoma Inc (Canada) | 497,500 | 509,937 | ||||||
Fairmount Minerals Ltd Tranche B | 375,952 | 378,849 | ||||||
FMG Resources Property Ltd (Australia) | 721,375 | 730,779 | ||||||
Ineos US Finance LLC | 965,250 | 981,841 | ||||||
John Henry Holdings Inc (1st Lien) | 74,813 | 76,122 | ||||||
Noranda Aluminum Term B | 123,750 | 125,838 | ||||||
Novelis Inc (Initial) | 977,507 | 992,017 | ||||||
PQ Corp | 149,625 | 151,402 | ||||||
Tronox Inc Term B (Netherlands) | 225,000 | 228,335 | ||||||
| See Notes to Financial Statements | See explanation of symbols and terms, if any, on page B-79 |
B-4
Table of Contents
PACIFIC LIFE FUNDS
PL FLOATING RATE LOAN FUND
Schedule of Investments (Continued)
March 31, 2013
Principal | | |||||||
United Central Industrial Supply Co LLC (1st Lien) | $148,800 | $142,476 | ||||||
Univar Inc Term B | 830,879 | 840,152 | ||||||
Walter Energy Inc Term B | 707,503 | 712,632 | ||||||
|
| |||||||
| 6,923,389 | ||||||||
|
| |||||||
Telecommunication Services - 3.9% | ||||||||
Cricket Communications Inc | 250,000 | 251,914 | ||||||
4.750% due 10/10/19 § | 498,750 | 502,647 | ||||||
Greeneden U.S. Holdings II LLC | 39,474 | 39,770 | ||||||
Intelsat Jackson Holdings SA Tranche B-1 | 925,785 | 941,408 | ||||||
MetroPCS Wireless Inc Tranche B-3 | 612,061 | 614,991 | ||||||
SBA Finance Communications Corp | 73,688 | 74,609 | ||||||
Syniverse Holdings Inc (Initial) | 248,125 | 250,064 | ||||||
Telesat Canada Term B (Canada) | 521,063 | 525,944 | ||||||
TNS Inc (Initial 1st Lien) | 50,000 | 50,094 | ||||||
UPC Financing Partnership (Facility X) | 1,000,000 | 1,007,969 | ||||||
|
| |||||||
| 4,259,410 | ||||||||
|
| |||||||
Utilities - 2.8% | ||||||||
Calpine Corp | 1,029,000 | 1,044,274 | ||||||
Term B-2 | 98,250 | 99,708 | ||||||
Dynergy Power LLC | 410,486 | 429,300 | ||||||
LSP Madison Funding LLC | 316,667 | 321,417 | ||||||
NRG Energy Inc | 515,813 | 523,485 | ||||||
Texas Competitive Electric Holdings Co LLC | 500,000 | 356,248 | ||||||
The AES Corp | 75,000 | 76,160 | ||||||
3.750% due 06/01/18 § | 229,888 | 233,444 | ||||||
|
| |||||||
| 3,084,036 | ||||||||
|
| |||||||
Total Senior Loan Notes | 103,472,737 | |||||||
|
| |||||||
Shares | | |||||||
SHORT-TERM INVESTMENT - 7.5% | ||||||||
Money Market Fund - 7.5% | ||||||||
BlackRock Liquidity Funds Treasury | 8,234,553 | $8,234,553 | ||||||
|
| |||||||
Total Short-Term Investment | 8,234,553 | |||||||
|
| |||||||
TOTAL INVESTMENTS - 102.4% | 112,826,917 | |||||||
OTHER ASSETS & LIABILITIES, NET - (2.4%) | (2,622,584 | ) | ||||||
|
| |||||||
NET ASSETS - 100.0% | $110,204,333 | |||||||
|
| |||||||
Notes to Schedule of Investments
| (a) | As of March 31, 2013, the fund was diversified as a percentage of net assets as follows: |
Consumer Discretionary | 31.7% | |||
Health Care | 14.5% | |||
Industrials | 10.0% | |||
Consumer Staples | 8.7% | |||
Information Technology | 7.5% | |||
Short-Term Investment | 7.5% | |||
Materials | 6.3% | |||
Financials | 5.8% | |||
Telecommunication Services | 3.9% | |||
Energy | 3.7% | |||
Others (each less than 3.0%) | 2.8% | |||
|
| |||
| 102.4% | ||||
Other Assets & Liabilities, Net | (2.4% | ) | ||
|
| |||
| 100.0% | ||||
|
|
| (b) | As of March 31, 2013, the fund’s Standard & Poor’s quality ratings as a percentage of total fixed income investments were are follows (Unaudited): |
BBB | 4.9% | |||
BB | 42.3% | |||
B | 48.7% | |||
CCC | 2.0% | |||
Not Rated | 2.1% | |||
|
| |||
| 100.0% | ||||
|
|
| (c) | Restricted securities as of March 31, 2013 were as follows: |
| Issuer and Acquisition Date | Cost | Value | Value as a % of Net Assets | |||||||||
Metro-Goldwyn-Mayer Studios Inc ‘A’ | $671,651 | $1,119,627 | 1.0% | |||||||||
|
|
|
|
|
| |||||||
| (d) | Fair Value Measurements |
The following is a summary of the fund’s investments as categorized under the three-tier hierarchy of inputs used in valuing the fund’s assets and liabilities (See Note 3D in Notes to Financial Statements) as of March 31, 2013:
Total Value at March 31, 2013 | Level 1 Quoted Price | Level 2 Significant Observable Inputs | Level 3 Significant Unobservable Inputs | |||||||||||||||
Assets | Common Stocks (1) | $1,119,627 | $— | $1,119,627 | $— | |||||||||||||
Senior Loan Notes | 103,472,737 | — | 103,472,737 | — | ||||||||||||||
Short-Term Investment | 8,234,553 | 8,234,553 | — | — | ||||||||||||||
|
|
|
|
|
|
|
| |||||||||||
Total | $112,826,917 | $8,234,553 | $104,592,364 | $— | ||||||||||||||
|
|
|
|
|
|
|
| |||||||||||
| (1) | For equity investments categorized in a single level, refer to the schedule of investments for further industry breakout. |
| See Notes to Financial Statements | See explanation of symbols and terms, if any, on page B-79 |
B-5
Table of Contents
PACIFIC LIFE FUNDS
PL INFLATION MANAGED FUND
Schedule of Investments
March 31, 2013
Principal | Value | |||||||
CORPORATE BONDS & NOTES - 1.4% | ||||||||
Financials - 0.7% | ||||||||
Ally Financial Inc | $700,000 | $712,943 | ||||||
Credit Agricole Home Loan SFH (France) | 400,000 | 401,060 | ||||||
Intesa Sanpaolo SPA (Italy) | 100,000 | 97,826 | ||||||
|
| |||||||
| 1,211,829 | ||||||||
|
| |||||||
Health Care - 0.4% | ||||||||
HCA Inc | 600,000 | 665,250 | ||||||
|
| |||||||
Industrials - 0.3% | ||||||||
International Lease Finance Corp | ||||||||
6.500% due 09/01/14 ~ | 100,000 | 107,000 | ||||||
6.750% due 09/01/16 ~ | 100,000 | 113,500 | ||||||
7.125% due 09/01/18 ~ | 200,000 | 236,000 | ||||||
|
| |||||||
| 456,500 | ||||||||
|
| |||||||
Total Corporate Bonds & Notes | 2,333,579 | |||||||
|
| |||||||
MORTGAGE-BACKED SECURITIES - 3.0% | ||||||||
Collateralized Mortgage Obligations - Commercial - 0.9% |
| |||||||
Banc of America Large Loan Trust | 904,939 | 912,372 | ||||||
JPMorgan Chase Commercial Mortgage Securities Corp | 110,000 | 124,452 | ||||||
Morgan Stanley Capital I Trust | 100,000 | 116,849 | ||||||
Silenus European Loan Conduit Ltd (Ireland) | EUR 276,299 | 337,352 | ||||||
|
| |||||||
| 1,491,025 | ||||||||
|
| |||||||
Collateralized Mortgage Obligations - Residential - 2.1% |
| |||||||
Bear Stearns Adjustable Rate Mortgage Trust | ||||||||
2.240% due 08/25/35 " § | $21,147 | 21,321 | ||||||
2.320% due 08/25/35 " § | 39,501 | 40,244 | ||||||
2.600% due 03/25/35 " § | 74,136 | 74,932 | ||||||
2.793% due 03/25/35 " § | 21,165 | 21,385 | ||||||
Citigroup Mortgage Loan Trust Inc | ||||||||
2.270% due 09/25/35 " § | 36,098 | 35,915 | ||||||
2.340% due 09/25/35 " § | 29,400 | 29,036 | ||||||
Countrywide Home Loan Mortgage Pass-Through Trust | ||||||||
4.261% due 01/19/34 " § | 99,588 | 100,164 | ||||||
Fannie Mae | ||||||||
0.554% due 07/25/37 " § | 360,976 | 362,938 | ||||||
0.584% due 07/25/37 " § | 309,434 | 311,503 | ||||||
0.644% due 05/25/36 " § | 282,885 | 285,128 | ||||||
0.649% due 02/25/37 " § | 75,668 | 76,032 | ||||||
0.884% due 02/25/41 " § | 484,172 | 488,225 | ||||||
GSR Mortgage Loan Trust | 62,772 | 64,843 | ||||||
JP Morgan Mortgage Trust | 215,851 | 218,896 | ||||||
Merrill Lynch Mortgage Investors Trust | 172,965 | 176,402 | ||||||
New York Mortgage Trust Inc | 568,895 | 496,147 | ||||||
Reperforming Loan REMIC Trust | 23,692 | 21,420 | ||||||
Principal | Value | |||||||
Residential Accredit Loans Inc | $140,763 | $68,298 | ||||||
Structured Asset Mortgage Investments II Trust | 126,927 | 77,547 | ||||||
Wells Fargo Mortgage Backed Securities Trust | 422,944 | 418,312 | ||||||
|
| |||||||
| 3,388,688 | ||||||||
|
| |||||||
Total Mortgage-Backed Securities | 4,879,713 | |||||||
|
| |||||||
ASSET-BACKED SECURITIES - 3.0% | ||||||||
AMMC V Ltd CLO (Cayman) | 81,266 | 81,004 | ||||||
Ares VIR Ltd CLO (Cayman) | 343,852 | 340,317 | ||||||
Asset Backed Funding Certificates | 167,606 | 167,465 | ||||||
Freddie Mac Structured Pass-Through Securities | 2,208 | 2,047 | ||||||
Harvest SA CLO (Luxembourg) | EUR 76,195 | 96,641 | ||||||
Hillmark Funding CDO (Cayman) | $1,100,000 | 1,067,048 | ||||||
Park Place Securities Inc | 199,791 | 199,597 | ||||||
Plymouth Rock Ltd Inc CLO (Cayman) | 83,176 | 83,154 | ||||||
SLM Student Loan Trust | ||||||||
0.463% due 12/15/23 " § | EUR 1,630,823 | 2,045,438 | ||||||
0.473% due 09/15/21 " § ~ | 555,880 | 710,099 | ||||||
Wood Street BV CLO (Netherlands) | 157,250 | 196,989 | ||||||
|
| |||||||
Total Asset-Backed Securities | 4,989,799 | |||||||
|
| |||||||
U.S. TREASURY OBLIGATIONS - 91.4% | ||||||||
U.S. Treasury Inflation Protected Securities - 91.4% |
| |||||||
0.125% due 04/15/17 ^ | $3,041,310 | 3,282,714 | ||||||
0.125% due 01/15/22 ^ ‡ | 17,662,068 | 19,236,965 | ||||||
0.125% due 07/15/22 ^ | 17,406,244 | 18,937,461 | ||||||
0.125% due 01/15/23 ^ | 3,591,216 | 3,882,442 | ||||||
0.500% due 04/15/15 ^ | 4,356,291 | 4,578,532 | ||||||
0.625% due 07/15/21 ^ ‡ | 14,149,576 | 16,210,107 | ||||||
0.625% due 02/15/43 ^ | 2,103,171 | 2,120,751 | ||||||
0.750% due 02/15/42 ^ | 917,118 | 962,258 | ||||||
1.250% due 04/15/14 ^ | 2,720,025 | 2,811,402 | ||||||
1.250% due 07/15/20 ^ | 12,881,004 | 15,406,892 | ||||||
1.625% due 01/15/15 ^ | 10,370,654 | 11,068,245 | ||||||
1.750% due 01/15/28 ^ | 5,055,860 | 6,444,245 | ||||||
1.875% due 07/15/13 ^ | 6,393,819 | 6,522,693 | ||||||
1.875% due 07/15/15 ^ | 828,653 | 909,447 | ||||||
2.000% due 07/15/14 ^ | 1,221,550 | 1,293,602 | ||||||
2.000% due 01/15/16 ^ | 5,684,588 | 6,339,645 | ||||||
2.500% due 01/15/29 ^ | 6,756,561 | 9,466,577 | ||||||
2.625% due 07/15/17 ^ | 2,333,058 | 2,809,513 | ||||||
3.375% due 04/15/32 ^ | 194,585 | 313,889 | ||||||
3.625% due 04/15/28 ^ | 384,380 | 601,825 | ||||||
3.875% due 04/15/29 ^ ‡ | 10,434,843 | 17,000,644 | ||||||
|
| |||||||
Total U.S. Treasury Obligations | 150,199,849 | |||||||
|
| |||||||
| See Notes to Financial Statements | See explanation of symbols and terms, if any, on page B-79 |
B-6
Table of Contents
PACIFIC LIFE FUNDS
PL INFLATION MANAGED FUND
Schedule of Investments (Continued)
March 31, 2013
Principal | Value | |||||||
FOREIGN GOVERNMENT BONDS & NOTES - 8.9% |
| |||||||
Australian Government (Australia) | AUD 400,000 | $799,339 | ||||||
Canada Housing Trust No. 1 (Canada) | CAD 1,200,000 | 1,220,141 | ||||||
Canadian Government (Canada) | 1,752,060 | 2,432,067 | ||||||
Instituto Credito Oficial (Spain) | EUR 1,600,000 | 2,025,124 | ||||||
Italy Buoni Poliennali Del Tesoro (Italy) | ||||||||
1.700% due 09/15/18 ^ | 198,608 | 245,691 | ||||||
2.100% due 09/15/16 ^ | 1,735,091 | 2,266,457 | ||||||
Mexican Bonos de Proteccion al Ahorro (Mexico) | MXN 4,400,000 | 353,617 | ||||||
Mexican Udibonos (Mexico) | ||||||||
4.500% due 12/18/14 ^ | 987,020 | 85,032 | ||||||
5.000% due 06/16/16 ^ | 13,078,010 | 1,193,196 | ||||||
New South Wales Treasury Corp (Australia) | ||||||||
2.500% due 11/20/35 ^ | AUD 200,000 | 253,524 | ||||||
2.750% due 11/20/25 ^ | 1,800,000 | 2,444,022 | ||||||
United Kingdom Gilt Inflation-Linked (United Kingdom) | ||||||||
0.125% due 03/22/44 ^ ~ | GBP 50,704 | 83,475 | ||||||
0.625% due 11/22/42 ^ ~ | 231,410 | 448,453 | ||||||
2.500% due 07/26/16 ^ ~ | 100,000 | 537,089 | ||||||
Xunta de Galicia (Spain) | ||||||||
5.763% due 04/03/17 | EUR 100,000 | 132,692 | ||||||
6.131% due 04/03/18 | 100,000 | 133,885 | ||||||
|
| |||||||
Total Foreign Government Bonds & Notes | 14,653,804 | |||||||
|
| |||||||
MUNICIPAL BONDS - 0.1% |
| |||||||
Tobacco Settlement Finance Authority of WV ‘A’ | $95,000 | 81,890 | ||||||
Tobacco Settlement Financing Corp of RI ‘A’ | 50,000 | 50,088 | ||||||
|
| |||||||
Total Municipal Bonds | 131,978 | |||||||
|
| |||||||
PURCHASED OPTIONS - 0.0% |
| |||||||
(See Note (g) in Notes to Schedule of Investments) | 33,336 | |||||||
|
| |||||||
SHORT-TERM INVESTMENTS - 0.5% |
| |||||||
U.S. Treasury Bills - 0.3% | ||||||||
1.250% due 03/15/14 | 408,000 | 412,255 | ||||||
|
| |||||||
| Value | |||||||
Money Market Fund - 0.2% | ||||||||
BlackRock Liquidity Funds Treasury | 313,730 | $313,730 | ||||||
|
| |||||||
Total Short-Term Investments | 725,985 | |||||||
|
| |||||||
TOTAL INVESTMENTS - 108.3% | 177,948,043 | |||||||
OTHER ASSETS & LIABILITIES, NET - (8.3%) |
| (13,666,737 | ) | |||||
|
| |||||||
NET ASSETS - 100.0% | $164,281,306 | |||||||
|
| |||||||
Notes to Schedule of Investments
| (a) | As of March 31, 2013, the fund was diversified as a percentage of net assets as follows: |
U.S. Treasury Obligations | 91.4% | |||
Foreign Government Bonds & Notes | 8.9% | |||
Asset-Backed Securities | 3.0% | |||
Mortgage-Backed Securities | 3.0% | |||
Others (each less than 3.0%) | 2.0% | |||
|
| |||
| 108.3% | ||||
Other Assets & Liabilities, Net | (8.3% | ) | ||
|
| |||
| 100.0% | ||||
|
|
| (b) | As of March 31, 2013, the fund’s Standard & Poor’s quality ratings as a percentage of total fixed income investments were as follows (Unaudited): |
AAA | 4.6% | |||
A-1 (Short-Term debt only) | 0.2% | |||
AA / U.S. Government & Agency Issues | 86.2% | |||
A | 1.1% | |||
BBB | 0.6% | |||
BB | 0.4% | |||
B | 0.7% | |||
CCC | 0.1% | |||
Not Rated | 6.1% | |||
|
| |||
| 100.0% | ||||
|
|
| (c) | Short-term investments reflect either the stated coupon rate or the annualized effective yield on the date of purchase for discounted investments. |
| (d) | The average amount of borrowings by the fund on sale-buyback financing transactions (See Note 4 in Notes to Financial Statements) outstanding during the year ended March 31, 2013 was $23,615,841 at a weighted average interest rate of 0.208%. |
| (e) | Open futures contracts outstanding as of March 31, 2013 were as follows: |
| Long Futures Outstanding | Number of Contracts | Notional Amount | Unrealized Appreciation (Depreciation) | |||||||||
Eurodollar (03/16) | 44 | $44,000,000 | $8,094 | |||||||||
U.S. Treasury 10-Year | 12 | 1,200,000 | (1,141 | ) | ||||||||
|
| |||||||||||
Total Futures Contracts | $6,953 | |||||||||||
|
| |||||||||||
| (f) | Forward foreign currency contracts outstanding as of March 31, 2013 were as follows: |
| Currency Purchased | Currency Sold | Expiration | Counterparty | Unrealized Appreciation (Depreciation) | ||||||||||||||||
| BRL | 1,970,498 | USD | 952,991 | 04/13 | UBS | $21,591 | ||||||||||||||
| BRL | 89,697 | USD | 44,826 | 06/13 | HSB | (789 | ) | |||||||||||||
| BRL | 1,970,498 | USD | 981,813 | 06/13 | UBS | (14,387 | ) | |||||||||||||
| CAD | 560,000 | USD | 549,990 | 06/13 | DUB | 216 | ||||||||||||||
| EUR | 116,000 | USD | 149,250 | 06/13 | BRC | (468 | ) | |||||||||||||
| See Notes to Financial Statements | See explanation of symbols and terms, if any, on page B-79 |
B-7
Table of Contents
PACIFIC LIFE FUNDS
PL INFLATION MANAGED FUND
Schedule of Investments (Continued)
March 31, 2013
| Currency Purchased | Currency Sold | Expiration | Counterparty | Unrealized Appreciation (Depreciation) | ||||||||||||||||
| EUR | 88,000 | USD | 114,532 | 06/13 | CIT | ($1,663 | ) | |||||||||||||
| EUR | 175,000 | USD | 227,345 | 06/13 | MSC | (2,889 | ) | |||||||||||||
| GBP | 151,000 | USD | 224,877 | 06/13 | BRC | 4,468 | ||||||||||||||
| GBP | 432,000 | USD | 649,662 | 06/13 | DUB | 6,478 | ||||||||||||||
| GBP | 160,000 | USD | 240,232 | 06/13 | RBC | 2,783 | ||||||||||||||
| MXN | 2,626,700 | USD | 200,000 | 04/13 | DUB | 12,542 | ||||||||||||||
| MXN | 2,584,300 | USD | 195,731 | 04/13 | HSB | 13,380 | ||||||||||||||
| MXN | 149,407 | USD | 11,432 | 04/13 | JPM | �� | 658 | |||||||||||||
| MXN | 4,310,226 | USD | 334,866 | 06/13 | UBS | 11,140 | ||||||||||||||
| USD | 340,556 | AUD | 328,000 | 04/13 | CIT | (762 | ) | |||||||||||||
| USD | 3,512,681 | AUD | 3,419,000 | 04/13 | WBC | (45,152 | ) | |||||||||||||
| USD | 41,245 | AUD | 40,000 | 05/13 | CIT | (292 | ) | |||||||||||||
| USD | 989,107 | BRL | 1,970,498 | 04/13 | UBS | 14,525 | ||||||||||||||
| USD | 83,654 | BRL | 167,425 | 06/13 | UBS | 1,456 | ||||||||||||||
| USD | 4,189,956 | CAD | 4,314,000 | 06/13 | RBS | (48,597 | ) | |||||||||||||
| USD | 8,932,337 | EUR | 6,873,000 | 04/13 | RBS | 121,872 | ||||||||||||||
| USD | 8,815,074 | EUR | 6,871,000 | 05/13 | MSC | — | ||||||||||||||
| USD | 557,164 | EUR | 430,000 | 06/13 | CIT | 5,643 | ||||||||||||||
| USD | 511,899 | GBP | 336,000 | 06/13 | MSC | 1,568 | ||||||||||||||
| USD | 2,294,830 | GBP | 1,518,000 | 06/13 | RBS | (10,775 | ) | |||||||||||||
| USD | 82,459 | MXN | 1,050,182 | 04/13 | HSB | (2,517 | ) | |||||||||||||
| USD | 337,448 | MXN | 4,310,226 | 04/13 | UBS | (11,318 | ) | |||||||||||||
|
| |||||||||||||||||||
Total Forward Foreign Currency Contracts | $78,711 | |||||||||||||||||||
|
| |||||||||||||||||||
| (g) | Purchased options outstanding as of March 31, 2013 were as follows: |
Interest Rate Swaptions
| Description | Pay/Receive Floating Rate Based on 3-Month USD-LIBOR | Exercise Rate | Expiration Date | Counter- party | Notional Amount | Cost | Value | |||||||||||||||||
Put - OTC 30-Year Interest Rate Swap | Receive | 3.875% | 04/14/14 | DUB | $1,700,000 | $86,445 | $33,336 | |||||||||||||||||
|
|
|
| |||||||||||||||||||||
Total Purchased Options | $86,445 | $33,336 | ||||||||||||||||||||||
|
|
|
| |||||||||||||||||||||
| (h) | Transactions in written options for the year ended March 31, 2013 were as follows: |
| Number of Contracts | Notional Amount in EUR | Notional Amount in $ | Premium | |||||||||||||
Outstanding, March 31, 2012 | — | — | 45,400,000 | $419,828 | ||||||||||||
Call Options Written | 11 | — | 33,200,000 | 98,787 | ||||||||||||
Put Options Written | 11 | 6,100,000 | 41,500,000 | 223,454 | ||||||||||||
Call Options Closed | (9 | ) | — | (11,500,000 | ) | (85,150 | ) | |||||||||
Put Options Closed | (9 | ) | — | (1,200,000 | ) | (14,525 | ) | |||||||||
Call Options Expired | — | — | (32,300,000 | ) | (123,126 | ) | ||||||||||
Put Options Expired | — | — | (46,000,000 | ) | (309,203 | ) | ||||||||||
|
|
|
|
|
|
|
| |||||||||
Outstanding, March 31, 2013 | 4 | 6,100,000 | 29,100,000 | $210,065 | ||||||||||||
|
|
|
|
|
|
|
| |||||||||
| (i) | Premiums received and value of written options outstanding as of March 31, 2013 were as follows: |
Inflation Floor/Cap Options
| Description | Strike Index | Exercise Index | Expiration Date | Counter- party | Notional Amount | Premium | Value | |||||||||||||||||
Floor - OTC U.S. CPI Urban Consumers NSA | 216.69 | Maximum of [(1+0.00%)10 | 04/07/20 | CIT | $2,000,000 | $17,720 | ($3,579 | ) | ||||||||||||||||
Floor - OTC U.S. CPI Urban Consumers NSA | 217.97 | Maximum of [(1+0.00%)10 | 09/29/20 | CIT | 300,000 | 3,870 | (568 | ) | ||||||||||||||||
Floor - OTC U.S. CPI Urban Consumers NSA | 218.01 | Maximum of [(1+0.00%)10 | 10/13/20 | DUB | 700,000 | 6,860 | (1,298 | ) | ||||||||||||||||
|
|
|
| |||||||||||||||||||||
| $28,450 | ($5,445 | ) | ||||||||||||||||||||||
|
|
|
| |||||||||||||||||||||
| See Notes to Financial Statements | See explanation of symbols and terms, if any, on page B-79 |
B-8
Table of Contents
PACIFIC LIFE FUNDS
PL INFLATION MANAGED FUND
Schedule of Investments (Continued)
March 31, 2013
Interest Rate Swaptions
| Description | Pay/Receive Floating Rate Based on 3-Month USD-LIBOR | Exercise Rate | Expiration Date | Counter- party | Notional Amount | Premium | Value | |||||||||||||||||
Call - OTC 2-Year Interest Rate Swap | Receive | 1.500% | 04/02/13 | GSC | $4,500,000 | $12,075 | ($277 | ) | ||||||||||||||||
Call - OTC 5-Year Interest Rate Swap | Receive | 0.800% | 04/29/13 | MSC | 300,000 | 120 | (28 | ) | ||||||||||||||||
Call - OTC 10-Year Interest Rate Swap | Receive | 1.800% | 07/29/13 | BRC | 700,000 | 3,120 | (2,363 | ) | ||||||||||||||||
Call - OTC 10-Year Interest Rate Swap | Receive | 1.800% | 07/29/13 | GSC | 1,900,000 | 7,760 | (6,414 | ) | ||||||||||||||||
Call - OTC 10-Year Interest Rate Swap | Receive | 1.800% | 07/29/13 | JPM | 500,000 | 1,830 | (1,688 | ) | ||||||||||||||||
Call - OTC 10-Year Interest Rate Swap | Receive | 1.800% | 07/29/13 | MSC | 1,100,000 | 5,165 | (3,714 | ) | ||||||||||||||||
Call - OTC 10-Year Interest Rate Swap | Receive | 1.800% | 07/29/13 | RBS | 200,000 | 610 | (675 | ) | ||||||||||||||||
|
|
|
| |||||||||||||||||||||
| 30,680 | (15,159 | ) | ||||||||||||||||||||||
|
|
|
| |||||||||||||||||||||
Put - OTC 2-Year Interest Rate Swap | Pay | 1.500% | 04/20/13 | GSC | 4,500,000 | 17,287 | (10,715 | ) | ||||||||||||||||
Put - OTC 5-Year Interest Rate Swap | Pay | 1.150% | 04/29/13 | MSC | 300,000 | 300 | (202 | ) | ||||||||||||||||
Put - OTC 5-Year Interest Rate Swap | Pay | 1.400% | 09/03/13 | DUB | 700,000 | 2,335 | (2,200 | ) | ||||||||||||||||
Put - OTC 10-Year Interest Rate Swap | Pay | 2.650% | 07/29/13 | BRC | 700,000 | 5,100 | (2,214 | ) | ||||||||||||||||
Put - OTC 10-Year Interest Rate Swap | Pay | 2.650% | 07/29/13 | GSC | 1,900,000 | 11,675 | (6,010 | ) | ||||||||||||||||
Put - OTC 10-Year Interest Rate Swap | Pay | 2.650% | 07/29/13 | JPM | 500,000 | 3,030 | (1,582 | ) | ||||||||||||||||
Put - OTC 10-Year Interest Rate Swap | Pay | 2.650% | 07/29/13 | MSC | 1,100,000 | 8,095 | (3,480 | ) | ||||||||||||||||
Put - OTC 10-Year Interest Rate Swap | Pay | 2.650% | 07/29/13 | RBS | 200,000 | 610 | (633 | ) | ||||||||||||||||
Put - OTC 5-Year Interest Rate Swap | Pay | 2.850% | 04/14/14 | DUB | 7,000,000 | 84,000 | (10,875 | ) | ||||||||||||||||
| Based on 3-Month EUR-LIBOR | ||||||||||||||||||||||||
Put - OTC 2-Year Interest Rate Swap | Pay | 0.850% | 04/24/13 | BRC | EUR 1,300,000 | 1,827 | (14 | ) | ||||||||||||||||
Put - OTC 2-Year Interest Rate Swap | Pay | 1.150% | 07/24/13 | BRC | 2,100,000 | 3,595 | (458 | ) | ||||||||||||||||
Put - OTC 2-Year Interest Rate Swap | Pay | 1.150% | 07/24/13 | HSB | 600,000 | 1,051 | (131 | ) | ||||||||||||||||
Put - OTC 5-Year Interest Rate Swap | Pay | 1.700% | 07/24/13 | BRC | 1,400,000 | 7,224 | (582 | ) | ||||||||||||||||
Put - OTC 5-Year Interest Rate Swap | Pay | 1.700% | 07/24/13 | CIT | 300,000 | 1,356 | (125 | ) | ||||||||||||||||
Put - OTC 5-Year Interest Rate Swap | Pay | 1.700% | 07/24/13 | DUB | 300,000 | 1,542 | (125 | ) | ||||||||||||||||
Put - OTC 5-Year Interest Rate Swap | Pay | 1.700% | 07/24/13 | RBS | 100,000 | 590 | (42 | ) | ||||||||||||||||
|
|
|
| |||||||||||||||||||||
| 149,617 | (39,388 | ) | ||||||||||||||||||||||
|
|
|
| |||||||||||||||||||||
| $180,297 | ($54,547 | ) | ||||||||||||||||||||||
|
|
|
| |||||||||||||||||||||
Options on Exchange-Traded Futures Contracts
| Description | Exercise Price | Expiration Date | Counter- party | Number of Contracts | Premium | Value | ||||||||||||||||
Call - CME 10-Year U.S. Treasury Note Futures (05/13) | $132.50 | 04/26/13 | MSC | 2 | $511 | ($688 | ) | |||||||||||||||
|
|
|
| |||||||||||||||||||
Put - CME 10-Year U.S. Treasury Note Futures (05/13) | 129.00 | 04/26/13 | MSC | 2 | 807 | (63 | ) | |||||||||||||||
|
|
|
| |||||||||||||||||||
| $1,318 | ($751 | ) | ||||||||||||||||||||
|
|
|
| |||||||||||||||||||
Total Written Options | $210,065 | ($60,743 | ) | |||||||||||||||||||
|
|
|
| |||||||||||||||||||
| (j) | Swap agreements outstanding as of March 31, 2013 were as follows: |
Interest Rate Swaps
| Floating Rate Index | Counter- party | Pay/Receive Floating Rate | Fixed Rate | Expiration Date | Notional Amount | Value | Upfront Premiums Paid (Received) | Unrealized Appreciation (Depreciation) | ||||||||||||||||||
OTC BRL - CDI Compounded | JPM | Pay | 7.900% | 01/02/15 | BRL 100,000 | ($230 | ) | ($357 | ) | $127 | ||||||||||||||||
OTC BRL - CDI Compounded | GSC | Pay | 8.150% | 01/02/15 | 2,000,000 | (2,451 | ) | (4,806 | ) | 2,355 | ||||||||||||||||
OTC BRL - CDI Compounded | GSC | Pay | 8.255% | 01/02/15 | 1,900,000 | 3,404 | 2,397 | 1,007 | ||||||||||||||||||
OTC BRL - CDI Compounded | MSC | Pay | 8.270% | 01/02/15 | 100,000 | (61 | ) | (171 | ) | 110 | ||||||||||||||||
OTC BRL - CDI Compounded | DUB | Pay | 8.485% | 01/02/15 | 2,300,000 | 1,823 | (175 | ) | 1,998 | |||||||||||||||||
OTC BRL - CDI Compounded | UBS | Pay | 8.560% | 01/02/15 | 7,800,000 | 9,979 | 3,449 | 6,530 | ||||||||||||||||||
OTC BRL - CDI Compounded | HSB | Pay | 8.825% | 01/02/15 | 6,500,000 | 49,166 | 39,932 | 9,234 | ||||||||||||||||||
OTC France CPI Excluding Tobacco | CIT | Pay | 2.000% | 07/25/16 | EUR 500,000 | 12,753 | 1,405 | 11,348 | ||||||||||||||||||
OTC BRL - CDI Compounded | UBS | Pay | 8.150% | 01/02/17 | BRL 3,700,000 | (43,182 | ) | — | (43,182 | ) | ||||||||||||||||
OTC BRL - CDI Compounded | MSC | Pay | 8.220% | 01/02/17 | 4,700,000 | (50,399 | ) | (249 | ) | (50,150 | ) | |||||||||||||||
OTC BRL - CDI Compounded | GSC | Pay | 8.300% | 01/02/17 | 3,000,000 | (27,647 | ) | 3,861 | (31,508 | ) | ||||||||||||||||
| See Notes to Financial Statements | See explanation of symbols and terms, if any, on page B-79 |
B-9
Table of Contents
PACIFIC LIFE FUNDS
PL INFLATION MANAGED FUND
Schedule of Investments (Continued)
March 31, 2013
| Floating Rate Index | Counter- party | Pay/Receive Floating Rate | Fixed Rate | Expiration Date | Notional Amount | Value | Upfront Premiums Paid (Received) | Unrealized Appreciation (Depreciation) | ||||||||||||||||||||
OTC US CPI Urban Consumers NSA | GSC | Receive | 2.415% | 02/12/17 | $600,000 | ($260 | ) | $— | ($260 | ) | ||||||||||||||||||
OTC US CPI Urban Consumers NSA | CIT | Receive | 2.250% | 07/15/17 | 4,100,000 | 5,919 | 984 | 4,935 | ||||||||||||||||||||
OTC US CPI Urban Consumers NSA | DUB | Receive | 2.250% | 07/15/17 | 3,800,000 | 5,486 | 3,520 | 1,966 | ||||||||||||||||||||
OTC US CPI Urban Consumers NSA | RBS | Receive | 2.250% | 07/15/17 | 2,600,000 | 3,754 | (2,517 | ) | 6,271 | |||||||||||||||||||
OTC France CPI Excluding Tobacco | MSC | Pay | 2.000% | 02/01/18 | EUR 700,000 | 9,404 | 281 | 9,123 | ||||||||||||||||||||
OTC France CPI Excluding Tobacco | RBS | Pay | 2.000% | 02/01/18 | 100,000 | 1,344 | 108 | 1,236 | ||||||||||||||||||||
OTC France CPI Excluding Tobacco | GSC | Pay | 2.150% | 04/01/21 | 200,000 | 1,457 | 683 | 774 | ||||||||||||||||||||
OTC France CPI Excluding Tobacco | MSC | Pay | 2.150% | 04/01/21 | 900,000 | 6,557 | (3,280 | ) | 9,837 | |||||||||||||||||||
OTC US CPI Urban Consumers NSA | CIT | Receive | 2.500% | 07/15/22 | $500,000 | 6,354 | 3,815 | 2,539 | ||||||||||||||||||||
OTC US CPI Urban Consumers NSA | DUB | Receive | 2.500% | 07/15/22 | 3,100,000 | 39,393 | 39,506 | (113 | ) | |||||||||||||||||||
CME-3-Month USD-LIBOR | CME | Receive | 2.750% | 06/19/43 | 2,200,000 | 126,522 | 132,056 | (5,534 | ) | |||||||||||||||||||
|
|
|
|
|
| |||||||||||||||||||||||
Total Interest Rate Swaps | $159,085 | $220,442 | ($61,357 | ) | ||||||||||||||||||||||||
|
|
|
|
|
| |||||||||||||||||||||||
Total Swap Agreements | $159,085 | $220,442 | ($61,357 | ) | ||||||||||||||||||||||||
|
|
|
|
|
| |||||||||||||||||||||||
| (k) | As of March 31, 2013, investments with total aggregate values of $65,536 and $303,030 were fully or partially segregated with the broker(s)/custodian as collateral for open futures contracts and swap contracts, respectively. |
| (l) | Fair Value Measurements |
The following is a summary of the fund’s investments as categorized under the three-tier hierarchy of inputs used in valuing the fund’s assets and liabilities (See Note 3D in Notes to Financial Statements) as of March 31, 2013:
| Total Value at March 31, 2013 | Level 1 Quoted Price | Level 2 Significant Observable Inputs | Level 3 Significant Unobservable Inputs | |||||||||||||||
Assets | Corporate Bonds & Notes | $2,333,579 | $— | $2,333,579 | $— | |||||||||||||
Mortgage-Backed Securities | 4,879,713 | — | 4,879,713 | — | ||||||||||||||
Asset-Backed Securities | 4,989,799 | — | 4,989,799 | — | ||||||||||||||
U.S. Treasury Obligations | 150,199,849 | — | 150,199,849 | — | ||||||||||||||
Foreign Government Bonds & Notes | 14,653,804 | — | 14,653,804 | — | ||||||||||||||
Municipal Bonds | 131,978 | — | 131,978 | — | ||||||||||||||
Short-Term Investments | 725,985 | 313,730 | 412,255 | — | ||||||||||||||
Derivatives: | ||||||||||||||||||
Foreign Currency Contracts | ||||||||||||||||||
Forward Foreign Currency Contracts | 218,320 | — | 218,320 | — | ||||||||||||||
Interest Rate Contracts | ||||||||||||||||||
Futures | 8,094 | 8,094 | — | — | ||||||||||||||
Purchased Options | 33,336 | — | 33,336 | — | ||||||||||||||
Swaps | 283,315 | — | 283,315 | — | ||||||||||||||
|
|
|
|
|
|
|
| |||||||||||
Total Interest Rate Contracts | 324,745 | 8,094 | 316,651 | — | ||||||||||||||
|
|
|
|
|
|
|
| |||||||||||
Total Assets - Derivatives | 543,065 | 8,094 | 534,971 | — | ||||||||||||||
|
|
|
|
|
|
|
| |||||||||||
Total Assets | 178,457,772 | 321,824 | 178,135,948 | — | ||||||||||||||
|
|
|
|
|
|
|
| |||||||||||
Liabilities | Derivatives: | |||||||||||||||||
Foreign Currency Contracts | ||||||||||||||||||
Forward Foreign Currency Contracts | (139,609 | ) | — | (139,609 | ) | — | ||||||||||||
Interest Rate Contracts | ||||||||||||||||||
Futures | (1,141 | ) | (1,141 | ) | — | — | ||||||||||||
Written Options | (60,743 | ) | (751 | ) | (54,547 | ) | (5,445 | ) | ||||||||||
Swaps | (124,230 | ) | — | (124,230 | ) | — | ||||||||||||
|
|
|
|
|
|
|
| |||||||||||
Total Interest Rate Contracts | (186,114 | ) | (1,892 | ) | (178,777 | ) | (5,445 | ) | ||||||||||
|
|
|
|
|
|
|
| |||||||||||
Total Liabilities - Derivatives | (325,723 | ) | (1,892 | ) | (318,386 | ) | (5,445 | ) | ||||||||||
|
|
|
|
|
|
|
| |||||||||||
Total Liabilities | (325,723 | ) | (1,892 | ) | (318,386 | ) | (5,445 | ) | ||||||||||
|
|
|
|
|
|
|
| |||||||||||
Total | $178,132,049 | $319,932 | $177,817,562 | ($5,445 | ) | |||||||||||||
|
|
|
|
|
|
|
| |||||||||||
Certain of the fund’s liabilities are held at carrying amount, which approximates fair value for financial statement purposes. As of March 31, 2013 such liabilities are categorized within the three-tier hierarchy of inputs as follows:
| Total Value at March 31, 2013 | Level 1 Quoted Price | Level 2 Significant | Level 3 Significant | |||||||||||||||
Liabilities | Sale-Buyback Financing Transactions | ($15,204,972 | ) | $— | ($15,204,972 | ) | $— | |||||||||||
|
|
|
|
|
|
|
| |||||||||||
| See Notes to Financial Statements | See explanation of symbols and terms, if any, on page B-79 |
B-10
Table of Contents
PACIFIC LIFE FUNDS
PL MANAGED BOND FUND
Schedule of Investments
March 31, 2013
Shares | Value | |||||||
CONVERTIBLE PREFERRED STOCKS - 0.7% | ||||||||
Financials - 0.7% |
| |||||||
Wells Fargo & Co 7.500% | 3,000 | $3,866,250 | ||||||
|
| |||||||
Total Convertible Preferred Stocks | 3,866,250 | |||||||
|
| |||||||
PREFERRED STOCKS - 0.0% | ||||||||
Financials - 0.0% | ||||||||
Fannie Mae | 8,000 | 26,000 | ||||||
|
| |||||||
Total Preferred Stocks | 26,000 | |||||||
|
| |||||||
Principal | ||||||||
CORPORATE BONDS & NOTES - 18.8% | ||||||||
Consumer Discretionary - 0.0% | ||||||||
General Motors Co Escrow Receipt | EUR 200,000 | - | ||||||
|
| |||||||
Consumer Staples - 0.4% | ||||||||
Anheuser-Busch InBev Worldwide Inc | $1,300,000 | 1,304,232 | ||||||
Kraft Foods Group Inc | 517,000 | 629,851 | ||||||
Mondelez International Inc | 183,000 | 219,811 | ||||||
Reynolds American Inc | 100,000 | 119,194 | ||||||
|
| |||||||
| 2,273,088 | ||||||||
|
| |||||||
Energy - 0.3% | ||||||||
AK Transneft OJSC (Ireland) | 100,000 | 127,900 | ||||||
Colorado Interstate Gas Co LLC | 200,000 | 230,905 | ||||||
NGPL PipeCo LLC | 500,000 | 535,000 | ||||||
Odebrecht Drilling Norbe VIII/IX Ltd (Cayman) | 95,000 | 104,975 | ||||||
Petrobras International Finance Co (Cayman) | 400,000 | 451,322 | ||||||
TNK-BP Finance SA (Luxembourg) | 200,000 | 240,750 | ||||||
|
| |||||||
| 1,690,852 | ||||||||
|
| |||||||
Financials - 14.4% | ||||||||
Ally Financial Inc | ||||||||
3.680% due 06/20/14 § | 4,600,000 | 4,729,352 | ||||||
4.500% due 02/11/14 | 500,000 | 511,875 | ||||||
4.625% due 06/26/15 | 300,000 | 314,055 | ||||||
7.500% due 09/15/20 | 200,000 | 244,750 | ||||||
8.300% due 02/12/15 | 600,000 | 667,500 | ||||||
American Express Bank FSB | 600,000 | 600,935 | ||||||
American Express Co | 200,000 | 202,516 | ||||||
American International Group Inc | ||||||||
5.450% due 05/18/17 | 100,000 | 114,811 | ||||||
6.250% due 03/15/87 | 1,000,000 | 1,112,600 | ||||||
Principal | Value | |||||||
ANZ International Ltd (New Zealand) | $300,000 | $305,321 | ||||||
Banco Santander Brasil SA (Brazil) | ||||||||
2.380% due 03/18/14 § ~ | 600,000 | 601,050 | ||||||
4.250% due 01/14/16 ~ | 300,000 | 313,581 | ||||||
Banco Santander Chile (Chile) | 1,000,000 | 987,500 | ||||||
Bank of America Corp | ||||||||
1.722% due 01/30/14 § | 1,200,000 | 1,210,724 | ||||||
4.500% due 04/01/15 | 1,900,000 | 2,014,251 | ||||||
Bank of China Ltd (Hong Kong) | 100,000 | 112,635 | ||||||
Bank of Montreal (Canada) | ||||||||
1.950% due 01/30/18 ~ | 300,000 | 312,374 | ||||||
2.850% due 06/09/15 ~ | 100,000 | 105,066 | ||||||
Banque PSA Finance SA (France) | 600,000 | 594,939 | ||||||
Barclays Bank PLC (United Kingdom) | 720,000 | 968,288 | ||||||
BBVA Bancomer SA (Mexico) | 3,800,000 | 4,332,000 | ||||||
BM&FBOVESPA SA (Brazil) | 100,000 | 111,550 | ||||||
BNP Paribas SA (France) | 1,000,000 | 1,004,662 | ||||||
BPCE SA (France) | ||||||||
2.375% due 10/04/13 ~ | 100,000 | 101,036 | ||||||
9.000% § ± | EUR 300,000 | 404,938 | ||||||
CIT Group Inc | $100,000 | 104,125 | ||||||
Citigroup Inc | ||||||||
1.480% due 11/30/17 § | EUR 500,000 | 618,788 | ||||||
2.293% due 08/13/13 § | $200,000 | 201,334 | ||||||
5.500% due 04/11/13 | 700,000 | 700,820 | ||||||
5.500% due 10/15/14 | 1,000,000 | 1,067,491 | ||||||
Commonwealth Bank of Australia (Australia) | 1,600,000 | 1,602,032 | ||||||
Credit Agricole Home Loan SFH (France) | 1,400,000 | 1,403,709 | ||||||
Credit Suisse NY (Switzerland) | 300,000 | 304,066 | ||||||
Daimler Finance North America LLC | ||||||||
0.905% due 01/09/15 § ~ | 2,000,000 | 2,008,974 | ||||||
1.480% due 09/13/13 § ~ | 400,000 | 401,607 | ||||||
Dexia Credit Local SA (France) | ||||||||
0.781% due 04/29/14 § ~ | 800,000 | 794,713 | ||||||
1.104% due 09/18/13 § | EUR 1,600,000 | 2,059,172 | ||||||
Ford Motor Credit Co LLC | ||||||||
7.000% due 04/15/15 | $500,000 | 552,971 | ||||||
8.700% due 10/01/14 | 200,000 | 221,931 | ||||||
HBOS PLC (United Kingdom) | 8,100,000 | 7,543,125 | ||||||
HSBC Bank PLC (United Kingdom) | 200,000 | 202,022 | ||||||
ICICI Bank Ltd (India) | ||||||||
4.750% due 11/25/16 ~ | 1,700,000 | 1,828,268 | ||||||
5.500% due 03/25/15 ~ | 600,000 | 637,618 | ||||||
ING Bank NV (Netherlands) | 100,000 | 104,359 | ||||||
Intesa Sanpaolo SPA (Italy) | 500,000 | 503,004 | ||||||
LBG Capital No. 2 PLC (United Kingdom) | GBP 800,000 | 1,333,488 | ||||||
Lloyds TSB Bank PLC (United Kingdom) | $1,100,000 | 1,475,271 | ||||||
Macquarie Bank Ltd (Australia) | 5,300,000 | 5,502,036 | ||||||
Merrill Lynch & Co Inc | 900,000 | 1,087,984 | ||||||
| See Notes to Financial Statements | See explanation of symbols and terms, if any, on page B-79 |
B-11
Table of Contents
PACIFIC LIFE FUNDS
PL MANAGED BOND FUND
Schedule of Investments (Continued)
March 31, 2013
Principal | Value | |||||||
Metropolitan Life Global Funding I | $300,000 | $300,284 | ||||||
Morgan Stanley | 1,900,000 | 2,202,951 | ||||||
National Australia Bank Ltd (Australia) | 1,600,000 | 1,611,872 | ||||||
Nationwide Building Society (United Kingdom) | 300,000 | 351,839 | ||||||
Nordea Bank AB (Sweden) | 100,000 | 101,182 | ||||||
Nordea Eiendomskreditt AS (Norway) | 900,000 | 903,509 | ||||||
Nykredit Realkredit AS (Denmark) | ||||||||
1.319% due 04/01/38 § | DKK 691,220 | 121,336 | ||||||
1.319% due 10/01/38 § | 891,192 | 156,515 | ||||||
Principal Life Income Funding Trusts | $100,000 | 100,287 | ||||||
RCI Banque SA (France) | 1,300,000 | 1,299,936 | ||||||
Realkredit Danmark AS (Denmark) | DKK 3,114,827 | 549,171 | ||||||
Santander Issuances SAU (Spain) | GBP 3,000,000 | 4,706,518 | ||||||
SLM Corp | ||||||||
2.612% due 10/01/14 § ^ | $100,000 | 101,025 | ||||||
5.000% due 10/01/13 | 2,600,000 | 2,652,000 | ||||||
6.250% due 01/25/16 | 100,000 | 109,756 | ||||||
8.000% due 03/25/20 | 400,000 | 465,500 | ||||||
8.450% due 06/15/18 | 600,000 | 714,000 | ||||||
Springleaf Finance Corp | EUR 1,000,000 | 1,281,854 | ||||||
SSIF Nevada LP | $3,300,000 | 3,320,569 | ||||||
State Bank of India (India) | 1,000,000 | 1,054,081 | ||||||
Stone Street Trust | 700,000 | 761,291 | ||||||
Temasek Financial I Ltd (Singapore) | 300,000 | 342,659 | ||||||
The Bear Stearns Cos LLC | 400,000 | 478,190 | ||||||
The Dai-ichi Life Insurance Co Ltd (Japan) | 300,000 | 339,477 | ||||||
The Goldman Sachs Group Inc | 1,200,000 | 1,350,822 | ||||||
Vnesheconombank (Ireland) | ||||||||
5.375% due 02/13/17 ~ | 200,000 | 215,480 | ||||||
5.450% due 11/22/17 ~ | 100,000 | 108,780 | ||||||
Volkswagen International Finance NV (Netherlands) | 995,000 | 997,628 | ||||||
Wachovia Corp | 300,000 | 300,277 | ||||||
|
| |||||||
| 81,236,006 | ||||||||
|
| |||||||
Health Care - 0.2% | ||||||||
AbbVie Inc | 1,200,000 | 1,218,127 | ||||||
|
| |||||||
Industrials - 1.3% | ||||||||
Caterpillar Inc | 1,400,000 | 1,400,798 | ||||||
International Lease Finance Corp | ||||||||
5.625% due 09/20/13 | 255,000 | 260,100 | ||||||
5.750% due 05/15/16 | 100,000 | 108,509 | ||||||
Noble Group Ltd (Bermuda) | 200,000 | 225,000 | ||||||
Principal | Value | |||||||
Russian Railways (Ireland) | $500,000 | $551,250 | ||||||
United Technologies Corp | 5,100,000 | 5,111,664 | ||||||
|
| |||||||
| 7,657,321 | ||||||||
|
| |||||||
Information Technology - 0.3% | ||||||||
Hewlett-Packard Co | 1,600,000 | 1,599,966 | ||||||
|
| |||||||
Materials - 1.1% | ||||||||
Braskem Finance Ltd (Cayman) | 3,600,000 | 3,792,600 | ||||||
CSN Islands XI Corp (Cayman) | 700,000 | 780,500 | ||||||
CSN Resources SA (Luxembourg) | 600,000 | 644,700 | ||||||
Gerdau Holdings Inc | 400,000 | 457,800 | ||||||
GTL Trade Finance Inc (United Kingdom) | 600,000 | 691,200 | ||||||
|
| |||||||
| 6,366,800 | ||||||||
|
| |||||||
Telecommunication Services - 0.5% | ||||||||
Deutsche Telekom International Finance BV (Netherlands) | GBP 900,000 | 1,740,839 | ||||||
Verizon Communications Inc | $900,000 | 905,074 | ||||||
|
| |||||||
| 2,645,913 | ||||||||
|
| |||||||
Utilities - 0.3% | ||||||||
CMS Energy Corp | 1,000,000 | 1,145,994 | ||||||
Electricite de France SA (France) | 200,000 | 207,769 | ||||||
Entergy Corp | 500,000 | 522,740 | ||||||
|
| |||||||
| 1,876,503 | ||||||||
|
| |||||||
Total Corporate Bonds & Notes | 106,564,576 | |||||||
|
| |||||||
SENIOR LOAN NOTES - 0.4% | ||||||||
Financials - 0.4% | ||||||||
Springleaf Financial Funding Co | 2,000,000 | 2,016,562 | ||||||
|
| |||||||
Total Senior Loan Notes | 2,016,562 | |||||||
|
| |||||||
MORTGAGE-BACKED SECURITIES - 45.0% | ||||||||
Collateralized Mortgage Obligations - Commercial - 1.1% |
| |||||||
Bear Stearns Commercial Mortgage Securities Trust |
| |||||||
5.471% due 01/12/45 " § | 100,000 | 115,462 | ||||||
5.700% due 06/11/50 " | 200,000 | 235,315 | ||||||
Commercial Mortgage Pass-Through Certificates | 887,094 | 997,187 | ||||||
JPMorgan Chase Commercial Mortgage Securities Trust | 500,000 | 559,753 | ||||||
LB-UBS Commercial Mortgage Trust | 600,000 | 694,493 | ||||||
Merrill Lynch Floating Trust | 395,233 | 389,540 | ||||||
| See Notes to Financial Statements | See explanation of symbols and terms, if any, on page B-79 |
B-12
Table of Contents
PACIFIC LIFE FUNDS
PL MANAGED BOND FUND
Schedule of Investments (Continued)
March 31, 2013
Principal | Value | |||||||
Merrill Lynch/Countrywide Commercial Mortgage Trust | $500,000 | $582,402 | ||||||
Morgan Stanley Capital I Trust | 1,700,000 | 1,918,226 | ||||||
Silenus European Loan Conduit Ltd (Ireland) | EUR 34,537 | 42,169 | ||||||
Wachovia Bank Commercial Mortgage Trust | $600,000 | 682,571 | ||||||
|
| |||||||
| 6,217,118 | ||||||||
|
| |||||||
Collateralized Mortgage Obligations - Residential - 3.3% |
| |||||||
Alternative Loan Trust | 362,088 | 297,580 | ||||||
Arran Residential Mortgages Funding PLC | ||||||||
1.426% due 11/19/47 " § ~ | EUR 511,944 | 656,888 | ||||||
1.626% due 05/16/47 " § ~ | 959,289 | 1,252,400 | ||||||
Banc of America Funding Trust | $112,430 | 115,533 | ||||||
Banc of America Mortgage Trust | 55,957 | 56,948 | ||||||
BCAP LLC Trust | 100,000 | 94,800 | ||||||
Bear Stearns Adjustable Rate Mortgage Trust | ||||||||
2.320% due 08/25/35 " § | 50,642 | 51,595 | ||||||
2.470% due 10/25/35 " § | 340,961 | 330,814 | ||||||
2.736% due 08/25/33 " § | 137,681 | 138,114 | ||||||
2.793% due 03/25/35 " § | 93,377 | 94,347 | ||||||
3.006% due 01/25/35 " § | 1,250,667 | 1,197,580 | ||||||
Bear Stearns Alt-A Trust | ||||||||
2.768% due 05/25/35 " § | 56,896 | 52,074 | ||||||
2.926% due 09/25/35 " § | 67,300 | 56,942 | ||||||
2.932% due 11/25/36 " § | 90,194 | 61,538 | ||||||
Chase Mortgage Finance Corp | 243,321 | 229,639 | ||||||
Chevy Chase Funding LLC | 66,559 | 56,909 | ||||||
Citigroup Mortgage Loan Trust | ||||||||
2.340% due 09/25/35 " § | 58,801 | 58,072 | ||||||
2.570% due 10/25/35 " § | 106,413 | 104,768 | ||||||
Countrywide Home Loan Mortgage Pass-Through Trust | 29,999 | 24,089 | ||||||
Credit Suisse First Boston Mortgage Securities Corp | ||||||||
0.827% due 03/25/32 " § ~ | 4,635 | 4,330 | ||||||
6.000% due 11/25/35 " | 102,997 | 80,482 | ||||||
Downey Saving and Loan Association Mortgage Loan Trust | 335,262 | 82,849 | ||||||
Fannie Mae | ||||||||
0.404% due 10/27/37 " § | 3,400,000 | 3,403,806 | ||||||
0.514% due 04/25/37 " § | 125,709 | 126,292 | ||||||
0.654% due 09/25/35 " § | 258,797 | 261,235 | ||||||
1.625% due 11/25/23 " § | 198,662 | 204,039 | ||||||
4.500% due 10/25/17 " | 5,718 | 5,733 | ||||||
Freddie Mac | ||||||||
1.375% due 10/25/44 " § | 44,335 | 44,291 | ||||||
1.575% due 07/25/44 " § | 233,397 | 239,370 | ||||||
8.000% due 04/15/30 " | 224,877 | 266,309 | ||||||
Granite Master Issuer PLC (United Kingdom) | ||||||||
0.339% due 12/20/54 " § ~ | EUR 534,586 | 675,462 | ||||||
0.399% due 12/20/54 " § ~ | 859,928 | 1,086,540 | ||||||
0.463% due 12/20/54 " § | $427,294 | 419,175 | ||||||
Granite Mortgages PLC (United Kingdom) | ||||||||
0.589% due 01/20/44 " § ~ | EUR 27,679 | 35,205 | ||||||
0.887% due 09/20/44 " § ~ | GBP 153,740 | 230,658 | ||||||
0.891% due 01/20/44 " § ~ | 28,010 | 42,204 | ||||||
Principal | Value | |||||||
HarborView Mortgage Loan Trust | ||||||||
0.373% due 12/19/36 " § | $582,212 | $385,317 | ||||||
0.393% due 01/19/38 " § | 192,452 | 153,579 | ||||||
0.423% due 05/19/35 " § | 33,695 | 27,617 | ||||||
JPMorgan Mortgage Trust | ||||||||
4.863% due 02/25/35 " § | 21,224 | 21,541 | ||||||
5.268% due 07/25/35 " § | 306,919 | 318,633 | ||||||
5.750% due 01/25/36 " | 48,240 | 45,575 | ||||||
Mellon Residential Funding Corp | 8,849 | 8,783 | ||||||
Merrill Lynch Mortgage Investors Trust | ||||||||
0.414% due 02/25/36 " § | 45,945 | 41,023 | ||||||
2.446% due 11/25/35 " § | 3,173,561 | 3,006,324 | ||||||
Morgan Stanley Mortgage Loan Trust | 223,834 | 230,221 | ||||||
Reperforming Loan REMIC Trust | 118,458 | 107,098 | ||||||
Residential Accredit Loans Inc Trust | ||||||||
0.384% due 06/25/46 " § | 93,842 | 45,532 | ||||||
6.000% due 06/25/36 " | 244,050 | 191,987 | ||||||
Residential Asset Securitization Trust | 8,094 | 7,806 | ||||||
Structured Asset Mortgage Investments Trust | 201,192 | 136,904 | ||||||
Structured Asset Securities Corp | ||||||||
2.635% due 08/25/32 " § | 24,091 | 23,988 | ||||||
2.739% due 10/25/35 " § ~ | 50,579 | 44,452 | ||||||
Washington Mutual Mortgage | ||||||||
0.514% due 01/25/45 " § | 25,243 | 24,391 | ||||||
0.524% due 01/25/45 " § | 26,482 | 25,283 | ||||||
1.577% due 08/25/42 " § | 4,468 | 4,297 | ||||||
2.212% due 02/27/34 " § | 7,699 | 7,835 | ||||||
2.571% due 09/25/46 " § | 93,638 | 82,870 | ||||||
5.091% due 02/25/37 " § | 524,244 | 503,185 | ||||||
Wells Fargo Mortgage-Backed Securities Trust | ||||||||
2.624% due 12/25/34 " § | 99,173 | 102,826 | ||||||
2.641% due 03/25/36 " § | 653,933 | 633,350 | ||||||
2.721% due 04/25/36 " § | 76,750 | 72,677 | ||||||
4.500% due 11/25/18 " | 5,086 | 5,090 | ||||||
|
| |||||||
| 18,396,794 | ||||||||
|
| |||||||
Fannie Mae - 39.8% | ||||||||
1.375% due 10/01/44 " § | 43,263 | 43,924 | ||||||
2.175% due 09/01/35 " § | 172,850 | 184,148 | ||||||
2.310% due 08/01/22 " | 500,000 | 505,858 | ||||||
2.492% due 11/01/34 " § | 139,803 | 150,850 | ||||||
2.500% due 04/16/27 - 10/01/27 " | 6,946,947 | 7,210,904 | ||||||
2.655% due 12/01/35 " § | 29,679 | 31,712 | ||||||
2.817% due 11/01/32 " § | 156,433 | 166,943 | ||||||
2.870% due 09/01/27 " | 500,000 | 485,342 | ||||||
3.000% due 09/01/21 - 04/11/43 " | 51,159,483 | 53,791,256 | ||||||
3.500% due 08/01/26 - 04/12/42 " | 36,769,288 | 38,963,151 | ||||||
4.000% due 07/01/25 - 04/12/42 " | 27,854,897 | 29,744,100 | ||||||
4.482% due 12/01/36 " § | 16,258 | 17,227 | ||||||
4.500% due 07/01/18 - 08/01/41 " | 36,068,886 | 38,928,233 | ||||||
5.000% due 09/01/25 - 08/01/40 " | 33,774,993 | 36,634,234 | ||||||
5.500% due 12/01/20 - 09/01/41 " | 13,587,978 | 14,835,784 | ||||||
6.000% due 09/01/22 - 04/13/40 " | 3,032,965 | 3,333,566 | ||||||
6.500% due 03/01/17 " | 23,445 | 25,353 | ||||||
|
| |||||||
| 225,052,585 | ||||||||
|
| |||||||
Freddie Mac - 0.8% | ||||||||
2.375% due 11/01/31 " § | 6,689 | 7,146 | ||||||
2.384% due 04/01/32 " § | 22,952 | 24,208 | ||||||
2.457% due 09/01/35 " § | 22,883 | 24,304 | ||||||
2.740% due 06/01/35 " § | 223,514 | 239,173 | ||||||
2.995% due 09/01/35 " § | 141,283 | 151,281 | ||||||
4.500% due 09/01/41 " | 550,802 | 590,540 | ||||||
| See Notes to Financial Statements | See explanation of symbols and terms, if any, on page B-79 |
B-13
Table of Contents
PACIFIC LIFE FUNDS
PL MANAGED BOND FUND
Schedule of Investments (Continued)
March 31, 2013
Principal | Value | |||||||
5.500% due 03/01/23 - 05/01/40 " | $3,077,540 | $3,338,522 | ||||||
6.000% due 12/01/22 - 03/01/23 " | 85,241 | 93,092 | ||||||
|
| |||||||
| 4,468,266 | ||||||||
|
| |||||||
Total Mortgage-Backed Securities | 254,134,763 | |||||||
|
| |||||||
ASSET-BACKED SECURITIES - 3.8% | ||||||||
Argent Securities Inc | 1,425,664 | 1,225,484 | ||||||
Asset Backed Funding Certificates Trust | 109,796 | 105,570 | ||||||
Auto ABS SARL (Italy) | EUR 162,084 | 207,713 | ||||||
Bear Stearns Asset Backed Securities Trust | ||||||||
0.404% due 12/25/36 " § | $500,000 | 439,724 | ||||||
3.014% due 10/25/36 " § | 146,915 | 143,359 | ||||||
CIT Mortgage Loan Trust | 4,260,377 | 4,214,712 | ||||||
Citibank Omni Master Trust | 3,200,000 | 3,313,478 | ||||||
Countrywide Asset-Backed Certificates | ||||||||
0.304% due 08/25/37 " § | 3,016,711 | 2,960,629 | ||||||
0.554% due 05/25/46 " § ~ | 2,755,383 | 2,479,751 | ||||||
Duane Street I Ltd CLO (Cayman) | 1,329,503 | 1,326,033 | ||||||
Galaxy Ltd CLO (Cayman) | 130,715 | 130,606 | ||||||
Halcyon Structured Asset Management Long Secured/Short Unsecured Ltd CLO (Cayman) | 2,199,676 | 2,175,429 | ||||||
Hillmark Funding CDO (Cayman) | 1,100,000 | 1,067,047 | ||||||
HSBC Home Equity Loan Trust | 431,225 | 427,610 | ||||||
Long Beach Mortgage Loan Trust | 18,554 | 16,640 | ||||||
Park Place Securities Inc | 138,718 | 134,836 | ||||||
Securitized Asset-Backed | 127,907 | 70,693 | ||||||
United States Small Business Administration | 19,274 | 19,742 | ||||||
Wind River Ltd CLO (Cayman) | 185,657 | 184,912 | ||||||
Wood Street BV CLO (Netherlands) | EUR 469,895 | 587,664 | ||||||
|
| |||||||
Total Asset-Backed Securities | 21,231,632 | |||||||
|
| |||||||
U.S. GOVERNMENT AGENCY ISSUES - 11.6% | ||||||||
Fannie Mae | ||||||||
0.500% due 03/30/16 | $2,700,000 | 2,705,122 | ||||||
0.875% due 08/28/17 | 3,900,000 | 3,916,088 | ||||||
0.875% due 12/20/17 | 400,000 | 400,318 | ||||||
0.875% due 02/08/18 | 1,100,000 | 1,098,591 | ||||||
1.125% due 04/27/17 | 1,900,000 | 1,937,375 | ||||||
1.250% due 01/30/17 | 4,200,000 | 4,296,814 | ||||||
5.000% due 02/13/17 | 900,000 | 1,052,508 | ||||||
5.000% due 05/11/17 | 900,000 | 1,058,162 | ||||||
5.375% due 06/12/17 | 3,500,000 | 4,178,542 | ||||||
Freddie Mac | ||||||||
0.875% due 03/07/18 | 300,000 | 299,912 | ||||||
1.000% due 03/08/17 | 3,000,000 | 3,040,575 | ||||||
1.000% due 06/29/17 | 13,700,000 | 13,879,785 | ||||||
1.000% due 07/28/17 | 7,300,000 | 7,379,117 | ||||||
1.000% due 09/29/17 | 6,300,000 | 6,353,752 | ||||||
Principal | Value | |||||||
1.250% due 05/12/17 | $700,000 | $716,337 | ||||||
1.250% due 08/01/19 | 5,600,000 | 5,587,137 | ||||||
1.250% due 10/02/19 | 5,000,000 | 4,977,120 | ||||||
2.375% due 01/13/22 | 400,000 | 417,443 | ||||||
3.750% due 03/27/19 | 1,200,000 | 1,378,423 | ||||||
5.500% due 08/23/17 | 900,000 | 1,085,887 | ||||||
|
| |||||||
Total U.S. Government Agency Issues | 65,759,008 | |||||||
|
| |||||||
U.S. TREASURY OBLIGATIONS - 31.1% | ||||||||
U.S. Treasury Inflation Protected Securities - 6.8% |
| |||||||
0.125% due 04/15/17 ^ | 709,639 | 765,967 | ||||||
0.125% due 01/15/22 ^ | 203,466 | 221,714 | ||||||
0.125% due 07/15/22 ^ | 2,202,816 | 2,404,338 | ||||||
0.625% due 07/15/21 ^ | 4,188,683 | 4,798,660 | ||||||
1.125% due 01/15/21 ^ | 3,263,060 | 3,852,196 | ||||||
1.250% due 07/15/20 ^ | 633,492 | 757,716 | ||||||
1.375% due 01/15/20 ^ | 532,400 | 635,012 | ||||||
1.750% due 01/15/28 ^ | 659,460 | 840,554 | ||||||
1.875% due 07/15/19 ^ | 539,200 | 660,983 | ||||||
2.000% due 01/15/26 ^ ‡ | 2,204,228 | 2,876,174 | ||||||
2.125% due 01/15/19 ^ | 321,741 | 392,926 | ||||||
2.125% due 02/15/40 ^ ‡ | 6,285,388 | 8,888,915 | ||||||
2.375% due 01/15/25 ^ | 3,664,650 | 4,930,673 | ||||||
2.375% due 01/15/27 ^ | 3,996,265 | 5,452,716 | ||||||
3.625% due 04/15/28 ^ | 711,815 | 1,114,491 | ||||||
|
| |||||||
| 38,593,035 | ||||||||
|
| |||||||
U.S. Treasury Notes - 24.3% | ||||||||
0.250% due 12/15/15 | 12,100,000 | 12,076,369 | ||||||
0.375% due 11/15/15 ‡ | 26,500,000 | 26,545,554 | ||||||
0.375% due 01/15/16 | 13,900,000 | 13,917,375 | ||||||
0.375% due 02/15/16 | 6,400,000 | 6,405,504 | ||||||
0.375% due 03/15/16 | 200,000 | 200,172 | ||||||
0.750% due 10/31/17 | 3,100,000 | 3,110,416 | ||||||
0.750% due 12/31/17 ‡ | 8,200,000 | 8,216,015 | ||||||
0.750% due 02/28/18 | 7,000,000 | 7,002,737 | ||||||
0.750% due 03/31/18 | 2,800,000 | 2,798,250 | ||||||
0.875% due 01/31/18 | 2,600,000 | 2,618,281 | ||||||
0.875% due 07/31/19 ‡ | 18,300,000 | 18,078,405 | ||||||
1.000% due 08/31/19 | 4,000,000 | 3,975,940 | ||||||
1.000% due 09/30/19 | 500,000 | 496,680 | ||||||
1.125% due 03/31/20 | 5,100,000 | 5,055,719 | ||||||
1.250% due 10/31/19 | 2,300,000 | 2,319,046 | ||||||
1.250% due 02/29/20 | 2,800,000 | 2,807,218 | ||||||
1.500% due 08/31/18 ‡ | 1,200,000 | 1,241,437 | ||||||
1.625% due 08/15/22 | 3,600,000 | 3,556,969 | ||||||
1.625% due 11/15/22 | 7,200,000 | 7,079,623 | ||||||
1.750% due 05/15/22 | 2,800,000 | 2,810,937 | ||||||
2.000% due 02/15/22 | 800,000 | 823,125 | ||||||
2.000% due 02/15/23 ‡ | 5,300,000 | 5,372,048 | ||||||
3.375% due 11/15/19 | 300,000 | 343,688 | ||||||
3.500% due 02/15/18 | 200,000 | 226,547 | ||||||
|
| |||||||
| 137,078,055 | ||||||||
|
| |||||||
Total U.S. Treasury Obligations | 175,671,090 | |||||||
|
| |||||||
FOREIGN GOVERNMENT BONDS & NOTES - 7.4% |
| |||||||
Banco Nacional de Desenvolvimento Economico e Social (Brazil) | EUR 100,000 | 139,081 | ||||||
Italy Buoni Poliennali del Tesoro (Italy) | ||||||||
1.700% due 09/15/18 ^ | 99,304 | 122,846 | ||||||
2.500% due 03/01/15 | 700,000 | 904,424 | ||||||
3.500% due 11/01/17 | 2,800,000 | 3,595,027 | ||||||
4.500% due 07/15/15 | 300,000 | 401,900 | ||||||
| See Notes to Financial Statements | See explanation of symbols and terms, if any, on page B-79 |
B-14
Table of Contents
PACIFIC LIFE FUNDS
PL MANAGED BOND FUND
Schedule of Investments (Continued)
March 31, 2013
Principal | Value | |||||||
4.750% due 09/15/16 | EUR 300,000 | $407,783 | ||||||
4.750% due 06/01/17 | 1,300,000 | 1,753,514 | ||||||
6.000% due 11/15/14 | 100,000 | 136,603 | ||||||
Province of British Columbia (Canada) | CAD 100,000 | 113,342 | ||||||
Province of Ontario (Canada) | ||||||||
1.650% due 09/27/19 | $400,000 | 400,451 | ||||||
3.000% due 07/16/18 | 100,000 | 108,727 | ||||||
3.150% due 06/02/22 | CAD 5,600,000 | 5,733,020 | ||||||
4.000% due 06/02/21 | 800,000 | 875,491 | ||||||
4.200% due 06/02/20 | 200,000 | 221,359 | ||||||
4.300% due 03/08/17 | 300,000 | 324,892 | ||||||
4.400% due 06/02/19 | 300,000 | 333,903 | ||||||
4.600% due 06/02/39 | 100,000 | 115,841 | ||||||
4.700% due 06/02/37 | 400,000 | 466,711 | ||||||
5.500% due 06/02/18 | 100,000 | 115,518 | ||||||
Province of Quebec (Canada) | ||||||||
3.000% due 09/01/23 | 1,000,000 | 991,662 | ||||||
3.500% due 07/29/20 | $600,000 | 665,972 | ||||||
3.500% due 12/01/22 | CAD 2,300,000 | 2,398,217 | ||||||
4.250% due 12/01/21 | 1,100,000 | 1,217,867 | ||||||
4.500% due 12/01/17 | 200,000 | 220,288 | ||||||
4.500% due 12/01/18 | 200,000 | 222,602 | ||||||
Societe de Financement de | $200,000 | 206,730 | ||||||
Spain Government (Spain) | ||||||||
3.000% due 04/30/15 | EUR 100,000 | 129,668 | ||||||
3.150% due 01/31/16 | 1,100,000 | 1,418,717 | ||||||
3.750% due 10/31/15 | 3,100,000 | 4,059,183 | ||||||
3.800% due 01/31/17 | 300,000 | 389,558 | ||||||
4.250% due 10/31/16 | 10,000,000 | 13,191,304 | ||||||
4.400% due 01/31/15 | 300,000 | 399,900 | ||||||
|
| |||||||
Total Foreign Government Bonds & Notes | 41,782,101 | |||||||
|
| |||||||
MUNICIPAL BONDS - 5.2% | ||||||||
American Municipal Power Inc OH ‘B’ | $1,000,000 | 1,488,230 | ||||||
Buckeye Tobacco Settlement Financing Authority OH ‘A2’ | 800,000 | 720,608 | ||||||
City of North Las Vegas NV | 900,000 | 1,013,841 | ||||||
County of Clark Airport NV ‘C’ | 200,000 | 280,966 | ||||||
Dallas/Fort Worth International Airport TX | 2,900,000 | 3,315,802 | ||||||
Irvine Ranch Water District CA | 900,000 | 902,007 | ||||||
Los Angeles Unified School District CA ‘A1’ | 400,000 | 432,852 | ||||||
Massachusetts School Building Authority | 2,000,000 | 2,371,120 | ||||||
Metropolitan Transportation Authority NY ‘E’ | 2,100,000 | 2,304,876 | ||||||
New Jersey Economic Development Authority ‘B’ | 4,100,000 | 3,529,567 | ||||||
New York Liberty Development Corp | 3,700,000 | 4,332,515 | ||||||
North Carolina Turnpike Authority ‘B’ | 100,000 | 117,253 | ||||||
Southern California Public Power Authority | 1,600,000 | 1,918,752 | ||||||
State of California | ||||||||
5.650% due 04/01/39 § | 100,000 | 100,000 | ||||||
7.500% due 04/01/34 | 100,000 | 139,284 | ||||||
Principal | Value | |||||||
7.550% due 04/01/39 | $100,000 | $144,467 | ||||||
7.600% due 11/01/40 | 1,400,000 | 2,049,586 | ||||||
Tobacco Settlement Finance Authority of WV ‘A’ | 840,000 | 724,088 | ||||||
University of Arizona | 2,700,000 | 3,235,005 | ||||||
University of California | 500,000 | 576,535 | ||||||
|
| |||||||
Total Municipal Bonds | 29,697,354 | |||||||
|
| |||||||
SHORT-TERM INVESTMENTS - 0.8% | ||||||||
Commercial Paper - 0.6% | ||||||||
Santander SA | ||||||||
2.370% due 01/02/14 | 3,300,000 | 3,266,820 | ||||||
|
| |||||||
Shares | ||||||||
Money Market Fund - 0.1% | ||||||||
BlackRock Liquidity Funds Treasury | 865,158 | 865,158 | ||||||
|
| |||||||
Principal | ||||||||
Repurchase Agreement - 0.1% | ||||||||
JPMorgan Chase & Co | $500,000 | 500,000 | ||||||
|
| |||||||
Total Short-Term Investments | 4,631,978 | |||||||
|
| |||||||
TOTAL INVESTMENTS - 124.8% |
| 705,381,314 | ||||||
OTHER ASSETS & LIABILITIES, NET - (24.8%) |
| (140,096,049 | ) | |||||
|
| |||||||
NET ASSETS - 100.0% | $565,285,265 | |||||||
|
| |||||||
Notes to Schedule of Investments
| (a) | As of March 31, 2013, the fund was diversified as a percentage of net assets as follows: |
Mortgage-Backed Securities | 45.0% | |||
U.S. Treasury Obligations | 31.1% | |||
Corporate Bonds & Notes | 18.8% | |||
U.S. Government Agency Issues | 11.6% | |||
Foreign Government Bonds & Notes | 7.4% | |||
Municipal Bonds | 5.2% | |||
Asset-Backed Securities | 3.8% | |||
Others (each less than 3.0%) | 1.9% | |||
|
| |||
| 124.8% | ||||
Other Assets & Liabilities, Net | (24.8% | ) | ||
|
| |||
| 100.0% | ||||
|
|
| See Notes to Financial Statements | See explanation of symbols and terms, if any, on page B-79 |
B-15
Table of Contents
PACIFIC LIFE FUNDS
PL MANAGED BOND FUND
Schedule of Investments (Continued)
March 31, 2013
| (b) | As of March 31, 2013, the fund’s Standard & Poor’s quality ratings as a percentage of total fixed income investments were as follows (Unaudited): |
AAA | 2.7% | |||
AA/U.S. Government & Agency Issues | 71.9% | |||
A | 7.8% | |||
BBB | 8.5% | |||
BB | 1.9% | |||
B | 1.7% | |||
CCC | 1.8% | |||
CC | 0.1% | |||
D | 0.6% | |||
Not Rated | 3.0% | |||
|
| |||
| 100.0% | ||||
|
|
| (c) | Investments reflect the stated coupon rate or for discounted investments or zero coupon bonds, the annualized effective yield on the date of purchase. |
| (d) | Investments with a total aggregate value of $153,542 or less than 0.1% of the fund’s net assets were in default as of March 31, 2013. |
| (e) | Open futures contracts outstanding as of March 31, 2013 were as follows: |
| Long Futures Outstanding | Number of Contracts | Notional Amount | Unrealized (Depreciation) | |||||||||
Euribor (12/14) | 8 | EUR 8,000,000 | $4,604 | |||||||||
Euribor (03/15) | 8 | 8,000,000 | 550 | |||||||||
Euribor (03/15) | 2 | 2,000,000 | (579 | ) | ||||||||
Euribor (06/15) | 6 | 6,000,000 | 713 | |||||||||
Euribor (06/15) | 1 | 1,000,000 | (241 | ) | ||||||||
Eurodollar (12/14) | 1 | $1,000,000 | 162 | |||||||||
Eurodollar (06/15) | 256 | 256,000,000 | 122,524 | |||||||||
Eurodollar (09/15) | 14 | 14,000,000 | 1,734 | |||||||||
Eurodollar (09/15) | 15 | 15,000,000 | (1,751 | ) | ||||||||
Eurodollar (12/15) | 90 | 90,000,000 | 20,382 | |||||||||
Eurodollar (12/15) | 189 | 189,000,000 | (20,011 | ) | ||||||||
Eurodollar (03/16) | 39 | 39,000,000 | 4,545 | |||||||||
U.S. Treasury 10-Year | 53 | 5,300,000 | 52,847 | |||||||||
|
| |||||||||||
| 185,479 | ||||||||||||
|
| |||||||||||
Short Futures Outstanding | ||||||||||||
Euro-Bund 10 Year | 51 | EUR 5,100,000 | (140,924 | ) | ||||||||
|
| |||||||||||
Total Futures Contracts | $44,555 | |||||||||||
|
| |||||||||||
| (f) | Reverse repurchase agreements outstanding as of March 31, 2013 were as follows: |
| Counterparty | Interest Rate | Settlement Date | Maturity Date | Repurchase Amount | Principal Amount | |||||||||||||||
BOA | 0.190% | 03/15/13 | 04/02/13 | $998,845 | $998,750 | |||||||||||||||
BNS | 0.100% | 03/13/13 | 04/05/13 | 3,192,204 | 3,192,000 | |||||||||||||||
RBS | (0.050% | ) | 03/28/13 | 04/08/13 | 5,379,418 | 5,379,500 | ||||||||||||||
|
| |||||||||||||||||||
| $9,570,250 | ||||||||||||||||||||
|
| |||||||||||||||||||
| (g) | The average amount of borrowings by the fund on reverse repurchase agreements while outstanding for the year ended March 31, 2013 was $3,190,083 at a weighted average interest rate of 0.081%. The average amount of borrowings by the fund on sale-buyback financing transactions (See Note 4 in Notes to Financial Statements) outstanding during the year ended March 31, 2013 was $2,849,261 at a weighted average interest rate of 0.235%. |
| (h) | Forward foreign currency contracts outstanding as of March 31, 2013 were as follows: |
Currency Purchased | Currency Sold | Expiration | Counterparty | Unrealized Appreciation (Depreciation) | ||||||||||||||||
| BRL | 6,557,770 | USD | 3,171,529 | 04/13 | UBS | $71,855 | ||||||||||||||
| BRL | 6,557,770 | USD | 3,267,449 | 06/13 | UBS | (47,879 | ) | |||||||||||||
| IDR | 992,000,000 | USD | 100,000 | 08/13 | JPM | 225 | ||||||||||||||
| MXN | 5,150,702 | USD | 395,587 | 04/13 | HSB | 21,187 | ||||||||||||||
| MXN | 47,051,730 | USD | 3,612,665 | 04/13 | JPM | 194,568 | ||||||||||||||
| MXN | 5,106,800 | USD | 400,000 | 04/13 | MSC | 13,221 | ||||||||||||||
| MXN | 12,793,100 | USD | 1,000,000 | 04/13 | UBS | 35,164 | ||||||||||||||
| MXN | 70,102,332 | USD | 5,434,205 | 06/13 | HSB | 193,298 | ||||||||||||||
| USD | 3,291,723 | BRL | 6,557,770 | 04/13 | UBS | 48,339 | ||||||||||||||
| USD | 13,116,681 | CAD | 13,505,000 | 06/13 | RBS | (152,134 | ) | |||||||||||||
| USD | 767,780 | DKK | 4,263,000 | 05/13 | BRC | 34,346 | ||||||||||||||
| USD | 467,825 | EUR | 358,000 | 06/13 | BRC | 8,652 | ||||||||||||||
| USD | 1,527,666 | EUR | 1,179,000 | 06/13 | CIT | 15,474 | ||||||||||||||
| USD | 23,249,387 | EUR | 17,880,000 | 06/13 | DUB | 316,393 | ||||||||||||||
| USD | 8,186,620 | EUR | 6,500,000 | 08/13 | DUB | (153,632 | ) | |||||||||||||
| USD | 378,711 | EUR | 300,000 | 09/13 | UBS | (6,342 | ) | |||||||||||||
| USD | 6,125,980 | EUR | 4,663,949 | 09/13 | UBS | 138,866 | ||||||||||||||
| USD | 126,735 | EUR | 100,000 | 04/14 | CIT | (1,914 | ) | |||||||||||||
| USD | 9,196,521 | GBP | 6,085,000 | 06/13 | RBS | (45,642 | ) | |||||||||||||
| USD | 2,135,431 | JPY | 190,076,000 | 04/13 | BRC | 115,983 | ||||||||||||||
| USD | 5,475,034 | MXN | 70,102,332 | 04/13 | HSB | (197,360 | ) | |||||||||||||
|
| |||||||||||||||||||
Total Forward Foreign Currency Contracts |
| $602,668 | ||||||||||||||||||
|
| |||||||||||||||||||
| See Notes to Financial Statements | See explanation of symbols and terms, if any, on page B-79 |
B-16
Table of Contents
PACIFIC LIFE FUNDS
PL MANAGED BOND FUND
Schedule of Investments (Continued)
March 31, 2013
| (i) | Transactions in written options for the year ended March 31, 2013 were as follows: |
| Number of Contracts | Notional Amount in EUR | Notional Amount in $ | Premium | |||||||||||||
Outstanding, March 31, 2012 | — | — | 139,900,000 | $1,383,751 | ||||||||||||
Call Options Written | 47 | 5,400,000 | 113,800,000 | 221,149 | ||||||||||||
Put Options Written | 47 | 6,600,000 | 158,600,000 | 508,785 | ||||||||||||
Call Options Closed | — | (1,000,000 | ) | (43,100,000 | ) | (74,021 | ) | |||||||||
Put Options Closed | — | — | (1,600,000 | ) | (31,040 | ) | ||||||||||
Call Options Expired | (47 | ) | (1,000,000 | ) | (50,900,000 | ) | (97,698 | ) | ||||||||
Put Options Expired | (47 | ) | — | (259,400,000 | ) | (1,665,503 | ) | |||||||||
|
|
|
|
|
|
|
| |||||||||
Outstanding, March 31, 2013 | — | 10,000,000 | 57,300,000 | $245,423 | ||||||||||||
|
|
|
|
|
|
|
| |||||||||
| (j) | Premiums received and value of written options outstanding as of March 31, 2013 were as follows: |
Inflation Floor/Cap Options
| Description | Strike Index | Exercise Index | Expiration Date | Counter- party | Notional Amount | Premium | Value | |||||||||||||||||
Floor - OTC U.S. CPI Urban Consumers NSA | 215.95 | Maximum of ((1 + 0.00%)10 | 03/12/20 | CIT | $1,200,000 | $10,320 | ($2,093 | ) | ||||||||||||||||
Floor - OTC U.S. CPI Urban Consumers NSA | 217.97 | Maximum of ((1 + 0.00%)10 - Inflation Adjustment) or $0 | 09/29/20 | CIT | 600,000 | 7,740 | (1,136 | ) | ||||||||||||||||
|
|
|
| |||||||||||||||||||||
| $18,060 | ($3,229 | ) | ||||||||||||||||||||||
|
|
|
| |||||||||||||||||||||
Interest Rate Swaptions
| Description | Pay/Receive Floating Rate Based on 3-Month USD-LIBOR | Exercise Rate | Expiration Date | Counter- party | Notional Amount | Premium | Value | |||||||||||||||||
Call - OTC 5-Year Interest Rate Swap | Receive | 0.750% | 04/02/13 | JPM | $2,500,000 | $1,000 | $— | |||||||||||||||||
Call - OTC 5-Year Interest Rate Swap | Receive | 0.750% | 04/02/13 | MSC | 2,800,000 | 980 | — | |||||||||||||||||
Call - OTC 5-Year Interest Rate Swap | Receive | 0.850% | 04/29/13 | MSC | 2,200,000 | 2,695 | (645 | ) | ||||||||||||||||
Call - OTC 10-Year Interest Rate Swap | Receive | 1.800% | 07/29/13 | BRC | 600,000 | 2,520 | (2,026 | ) | ||||||||||||||||
Call - OTC 10-Year Interest Rate Swap | Receive | 1.800% | 07/29/13 | DUB | 1,500,000 | 3,000 | (5,064 | ) | ||||||||||||||||
Call - OTC 10-Year Interest Rate Swap | Receive | 1.800% | 07/29/13 | GSC | 4,700,000 | 23,415 | (15,868 | ) | ||||||||||||||||
Call - OTC 10-Year Interest Rate Swap | Receive | 1.800% | 07/29/13 | JPM | 2,100,000 | 8,490 | (7,090 | ) | ||||||||||||||||
Call - OTC 10-Year Interest Rate Swap | Receive | 1.800% | 07/29/13 | MSC | 2,400,000 | 12,330 | (8,103 | ) | ||||||||||||||||
Call - OTC 10-Year Interest Rate Swap | Receive | 1.800% | 07/29/13 | RBS | 2,400,000 | 8,650 | (8,102 | ) | ||||||||||||||||
| Based on 3-Month EUR-LIBOR | ||||||||||||||||||||||||
Call - OTC 1-Year Interest Rate Swap | Receive | 0.400% | 03/12/14 | BRC | EUR 2,200,000 | 4,253 | (4,097 | ) | ||||||||||||||||
Call - OTC 1-Year Interest Rate Swap | Receive | 0.400% | 03/12/14 | GSC | 2,200,000 | 4,537 | (4,097 | ) | ||||||||||||||||
|
|
|
| |||||||||||||||||||||
| 71,870 | (55,092 | ) | ||||||||||||||||||||||
|
|
|
| |||||||||||||||||||||
| Based on 3-Month USD-LIBOR | ||||||||||||||||||||||||
Put - OTC 5-Year Interest Rate Swap | Pay | 1.150% | 04/02/13 | JPM | $2,500,000 | 4,687 | — | |||||||||||||||||
Put - OTC 5-Year Interest Rate Swap | Pay | 1.150% | 04/02/13 | MSC | 2,800,000 | 4,707 | — | |||||||||||||||||
Put - OTC 5-Year Interest Rate Swap | Pay | 1.200% | 04/29/13 | MSC | 2,200,000 | 1,540 | (936 | ) | ||||||||||||||||
Put - OTC 5-Year Interest Rate Swap | Pay | 1.300% | 04/29/13 | DUB | 3,200,000 | 7,995 | (536 | ) | ||||||||||||||||
Put - OTC 5-Year Interest Rate Swap | Pay | 1.300% | 04/29/13 | JPM | 2,600,000 | 6,482 | (435 | ) | ||||||||||||||||
Put - OTC 2-Year Interest Rate Swap | Pay | 1.200% | 07/11/13 | DUB | 4,500,000 | 31,760 | (131 | ) | ||||||||||||||||
Put - OTC 10-Year Interest Rate Swap | Pay | 2.650% | 07/29/13 | BRC | 600,000 | 4,500 | (1,898 | ) | ||||||||||||||||
Put - OTC 10-Year Interest Rate Swap | Pay | 2.650% | 07/29/13 | DUB | 1,500,000 | 9,450 | (4,745 | ) | ||||||||||||||||
Put - OTC 10-Year Interest Rate Swap | Pay | 2.650% | 07/29/13 | GSC | 4,700,000 | 21,145 | (14,868 | ) | ||||||||||||||||
Put - OTC 10-Year Interest Rate Swap | Pay | 2.650% | 07/29/13 | JPM | 2,100,000 | 9,495 | (6,643 | ) | ||||||||||||||||
Put - OTC 10-Year Interest Rate Swap | Pay | 2.650% | 07/29/13 | MSC | 2,400,000 | 16,740 | (7,592 | ) | ||||||||||||||||
Put - OTC 10-Year Interest Rate Swap | Pay | 2.650% | 07/29/13 | RBS | 2,400,000 | 12,430 | (7,592 | ) | ||||||||||||||||
Put - OTC 5-Year Interest Rate Swap | Pay | 1.400% | 09/03/13 | DUB | 2,800,000 | 9,190 | (8,801 | ) | ||||||||||||||||
| See Notes to Financial Statements | See explanation of symbols and terms, if any, on page B-79 |
B-17
Table of Contents
PACIFIC LIFE FUNDS
PL MANAGED BOND FUND
Schedule of Investments (Continued)
March 31, 2013
| Description | Pay/Receive Floating Rate Based on | Exercise Rate | Expiration Date | Counter- party | Notional Amount | Premium | Value | |||||||||||||||||
Put - OTC 5-Year Interest Rate Swap | Pay | 1.700% | 07/24/13 | BRC | EUR 900,000 | $4,529 | ($374 | ) | ||||||||||||||||
Put - OTC 5-Year Interest Rate Swap | Pay | 1.700% | 07/24/13 | DUB | 300,000 | 1,486 | (125 | ) | ||||||||||||||||
Put - OTC 1-Year Interest Rate Swap | Pay | 0.400% | 03/12/14 | BRC | 2,200,000 | 4,820 | (4,488 | ) | ||||||||||||||||
Put - OTC 1-Year Interest Rate Swap | Pay | 0.400% | 03/12/14 | GSC | 2,200,000 | 4,537 | (4,488 | ) | ||||||||||||||||
|
|
|
| |||||||||||||||||||||
| 155,493 | (63,652 | ) | ||||||||||||||||||||||
|
|
|
| |||||||||||||||||||||
| $227,363 | ($118,744 | ) | ||||||||||||||||||||||
|
|
|
| |||||||||||||||||||||
Total Written Options | $245,423 | ($121,973 | ) | |||||||||||||||||||||
|
|
|
| |||||||||||||||||||||
| (k) | Swap agreements outstanding as of March 31, 2013 were as follows: |
Credit Default Swaps on Corporate and Sovereign Issues – Sell Protection (1)
| Referenced Obligation | Fixed Deal Receive Rate | Expiration Date | Counter- party | Implied Credit Spread at 03/31/13 (3) | Notional Amount (4) | Value | Upfront Premiums Paid (Received) | Unrealized Appreciation (Depreciation) | ||||||||||||||||||
General Electric Capital Corp | 4.000% | 12/20/13 | CIT | 0.156% | $200,000 | $5,949 | $— | $5,949 | ||||||||||||||||||
General Electric Capital Corp | 4.230% | 12/20/13 | DUB | 0.156% | 200,000 | 6,304 | — | 6,304 | ||||||||||||||||||
General Electric Capital Corp | 4.325% | 12/20/13 | CIT | 0.156% | 200,000 | 6,451 | — | 6,451 | ||||||||||||||||||
General Electric Capital Corp | 4.400% | 12/20/13 | BRC | 0.156% | 200,000 | 6,587 | — | 6,587 | ||||||||||||||||||
General Electric Capital Corp | 4.500% | 12/20/13 | BRC | 0.156% | 300,000 | 10,082 | — | 10,082 | ||||||||||||||||||
General Electric Capital Corp | 4.700% | 12/20/13 | BRC | 0.156% | 400,000 | 14,062 | — | 14,062 | ||||||||||||||||||
General Electric Capital Corp | 4.750% | 12/20/13 | DUB | 0.156% | 400,000 | 14,215 | — | 14,215 | ||||||||||||||||||
MetLife Inc | 1.000% | 12/20/14 | CIT | 0.384% | 1,800,000 | 19,906 | (43,994 | ) | 63,900 | |||||||||||||||||
Mexico Government | 1.000% | 03/20/15 | BRC | 0.450% | 400,000 | 4,496 | (9,000 | ) | 13,496 | |||||||||||||||||
Mexico Government | 1.000% | 03/20/15 | CIT | 0.450% | 400,000 | 4,496 | (9,184 | ) | 13,680 | |||||||||||||||||
Mexico Government | 1.000% | 03/20/15 | DUB | 0.450% | 200,000 | 2,249 | (4,592 | ) | 6,841 | |||||||||||||||||
Brazilian Government | 1.000% | 06/20/15 | DUB | 0.870% | 1,000,000 | 3,216 | (10,975 | ) | 14,191 | |||||||||||||||||
United Kingdom Index-Linked Treasury Gilt | 1.000% | 06/20/15 | GSC | 0.195% | 1,100,000 | 20,215 | 10,163 | 10,052 | ||||||||||||||||||
Brazilian Government | 1.000% | 06/20/15 | HSB | 0.870% | 1,000,000 | 3,216 | (10,975 | ) | 14,191 | |||||||||||||||||
Brazilian Government | 1.000% | 09/20/15 | BRC | 0.919% | 1,000,000 | 2,325 | (7,735 | ) | 10,060 | |||||||||||||||||
Mexico Government | 1.000% | 09/20/15 | BRC | 0.521% | 1,000,000 | 12,230 | (7,735 | ) | 19,965 | |||||||||||||||||
Brazilian Government | 1.000% | 09/20/15 | HSB | 0.919% | 600,000 | 1,394 | (5,961 | ) | 7,355 | |||||||||||||||||
Brazilian Government | 1.000% | 09/20/15 | UBS | 0.919% | 500,000 | 1,162 | (4,731 | ) | 5,893 | |||||||||||||||||
MetLife Inc | 1.000% | 12/20/15 | CIT | 0.633% | 800,000 | 8,268 | (29,083 | ) | 37,351 | |||||||||||||||||
General Electric Capital Corp | 1.000% | 12/20/15 | MSC | 0.541% | 500,000 | 6,426 | (9,796 | ) | 16,222 | |||||||||||||||||
China Government | 1.000% | 03/20/16 | BRC | 0.372% | 1,000,000 | 19,024 | 11,950 | 7,074 | ||||||||||||||||||
Brazilian Government | 1.000% | 03/20/16 | CIT | 0.992% | 2,200,000 | 1,264 | (15,567 | ) | 16,831 | |||||||||||||||||
Mexico Government | 1.000% | 03/20/16 | CIT | 0.593% | 1,100,000 | 13,674 | (8,978 | ) | 22,652 | |||||||||||||||||
Mexico Government | 1.000% | 03/20/16 | DUB | 0.593% | 700,000 | 8,702 | (5,135 | ) | 13,837 | |||||||||||||||||
Berkshire Hathaway Finance Corp | 1.000% | 06/20/16 | CIT | 0.510% | 900,000 | 14,500 | (2,156 | ) | 16,656 | |||||||||||||||||
Brazilian Government | 1.000% | 06/20/16 | CIT | 1.020% | 700,000 | (212 | ) | (2,363 | ) | 2,151 | ||||||||||||||||
China Government | 1.000% | 09/20/16 | DUB | 0.443% | 300,000 | 5,895 | 1,657 | 4,238 | ||||||||||||||||||
Brazilian Government | 1.000% | 09/20/16 | GSC | 1.072% | 200,000 | (425 | ) | (1,217 | ) | 792 | ||||||||||||||||
China Government | 1.000% | 09/20/16 | UBS | 0.443% | 300,000 | 5,895 | 1,557 | 4,338 | ||||||||||||||||||
Indonesia Government | 1.000% | 09/20/16 | UBS | 1.065% | 100,000 | (191 | ) | (1,578 | ) | 1,387 | ||||||||||||||||
United Kingdom Index-Linked Treasury Gilt | 1.000% | 12/20/16 | GSC | 0.332% | 300,000 | 7,556 | 890 | 6,666 | ||||||||||||||||||
Australian Government | 1.000% | 06/20/17 | CIT | 0.315% | 400,000 | 11,660 | 4,549 | 7,111 | ||||||||||||||||||
Brazilian Government | 1.000% | 06/20/17 | CIT | 1.189% | 1,600,000 | (11,917 | ) | (21,914 | ) | 9,997 | ||||||||||||||||
Brazilian Government | 1.000% | 06/20/17 | DUB | 1.189% | 400,000 | (2,980 | ) | (4,361 | ) | 1,381 | ||||||||||||||||
Indonesia Government | 1.000% | 06/20/17 | DUB | 1.281% | 200,000 | (2,235 | ) | (5,884 | ) | 3,649 | ||||||||||||||||
Japanese Government | 1.000% | 06/20/17 | MSC | 0.609% | 1,700,000 | 28,267 | 2,266 | 26,001 | ||||||||||||||||||
Indonesia Government | 1.000% | 06/20/17 | UBS | 1.281% | 800,000 | (8,939 | ) | (24,192 | ) | 15,253 | ||||||||||||||||
Reynolds American Inc | 1.280% | 06/20/17 | DUB | 0.655% | 200,000 | 5,298 | — | 5,298 | ||||||||||||||||||
MetLife Inc | 1.000% | 03/20/18 | DUB | 1.172% | 1,200,000 | (9,527 | ) | (68,165 | ) | 58,638 | ||||||||||||||||
Mexico Government | 1.000% | 03/20/21 | CIT | 1.267% | 100,000 | (1,934 | ) | (4,247 | ) | 2,313 | ||||||||||||||||
Indonesia Government | 1.000% | 06/20/21 | BRC | 2.085% | 1,500,000 | (116,097 | ) | (95,221 | ) | (20,876 | ) | |||||||||||||||
Mexico Government | 1.000% | 06/20/21 | BRC | 1.283% | 1,200,000 | (25,240 | ) | (34,805 | ) | 9,565 | ||||||||||||||||
|
|
|
|
|
| |||||||||||||||||||||
| $95,287 | ($416,512 | ) | $511,799 | |||||||||||||||||||||||
|
|
|
|
|
| |||||||||||||||||||||
| See Notes to Financial Statements | See explanation of symbols and terms, if any, on page B-79 |
B-18
Table of Contents
PACIFIC LIFE FUNDS
PL MANAGED BOND FUND
Schedule of Investments (Continued)
March 31, 2013
Credit Default Swaps on Credit Indices – Buy Protection (2)
| Referenced Obligation | Fixed Deal Pay Rate | Expiration Date | Counter- party | Notional Amount (4) | Value (5) | Upfront Premiums Paid (Received) | Unrealized Depreciation | |||||||||||||||
OTC - Dow Jones iTraxx 17SEN2 | 1.000% | 06/20/17 | BRC | EUR 1,400,000 | $65,140 | $91,912 | ($26,772 | ) | ||||||||||||||
OTC - Dow Jones iTraxx 17SEN2 | 1.000% | 06/20/17 | CIT | 200,000 | 9,305 | 13,130 | (3,825 | ) | ||||||||||||||
|
|
|
|
|
| |||||||||||||||||
| $74,445 | $105,042 | ($30,597 | ) | |||||||||||||||||||
|
|
|
|
|
| |||||||||||||||||
Credit Default Swaps on Credit Indices – Sell Protection (1)
| ||||||||||||||||||||||
| Referenced Obligation | Fixed Deal Receive Rate | Expiration Date | Counter- party | Notional Amount (4) | Value (5) | Upfront Premiums Paid (Received) | Unrealized Appreciation (Depreciation) | |||||||||||||||
OTC - Dow Jones CDX NA EM13 5Y | 5.000% | 06/20/15 | BRC | $1,700,000 | $76,586 | $99,450 | ($22,864 | ) | ||||||||||||||
OTC - Dow Jones CDX NA EM13 5Y | 5.000% | 06/20/15 | DUB | 900,000 | 40,545 | 117,500 | (76,955 | ) | ||||||||||||||
OTC - Dow Jones CDX NA EM13 5Y | 5.000% | 06/20/15 | HSB | 1,200,000 | 54,061 | 135,550 | (81,489 | ) | ||||||||||||||
OTC - Dow Jones CDX NA EM13 5Y | 5.000% | 06/20/15 | MSC | 900,000 | 40,546 | 101,250 | (60,704 | ) | ||||||||||||||
OTC - Dow Jones CDX NA IG-9 10Y | 0.548% | 12/20/17 | GSC | 96,450 | 1,673 | — | 1,673 | |||||||||||||||
OTC - CMBX.NA | 0.080% | 12/13/49 | DUB | 200,000 | (6,297 | ) | (11,625 | ) | 5,328 | |||||||||||||
OTC - CMBX.NA | 0.080% | 12/13/49 | GSC | 100,000 | (3,148 | ) | (3,750 | ) | 602 | |||||||||||||
OTC - CMBX.NA | 0.350% | 02/17/51 | CIT | 400,000 | (11,717 | ) | (14,312 | ) | 2,595 | |||||||||||||
|
|
|
|
|
| |||||||||||||||||
| $192,249 | $424,063 | ($231,814 | ) | |||||||||||||||||||
|
|
|
|
|
| |||||||||||||||||
Total Credit Default Swaps | $361,981 | $112,593 | $249,388 | |||||||||||||||||||
|
|
|
|
|
| |||||||||||||||||
| (1) | If the fund is a seller of protection and a credit event occurs, as defined under the terms of that particular swap agreement, the fund will either (i) pay to the buyer of protection an amount equal to the notional amount of the swap and take delivery of the referenced obligation or underlying investments comprising the referenced index or (ii) pay a net settlement amount in the form of cash or investments equal to the notional amount of the swap less the recovery value of the referenced obligation or underlying investments comprising the referenced index. |
| (2) | If the fund is a buyer of protection and a credit event occurs, as defined under the terms of that particular swap agreement, the fund will either (i) receive from the seller of protection an amount equal to the notional amount of the swap and deliver the referenced obligation or underlying investments comprising the referenced index or (ii) receive a net settlement amount in the form of cash or investments equal to the notional amount of the swap less the recovery value of the referenced obligation or underlying investments comprising the referenced index. |
| (3) | An implied credit spread is the spread in yield between a U.S. Treasury security and the referenced obligation or underlying investment that are identical in all respects except for the quality rating. Implied credit spreads, represented in absolute terms, utilized in determining the value of credit default swap agreements on corporate issues or sovereign issues of an emerging country as of year end serve as an indicator of the current status of the payment/performance risk and represent the likelihood of risk of default for the credit derivative. The implied credit spread of a particular referenced entity reflects the cost of buying/selling protection and may include upfront payments required to be made to enter into the agreement. Wider credit spreads, in comparison to narrower credit spreads, represent a deterioration of the referenced entity’s credit soundness and a greater likelihood of risk of default or other credit event occurring as defined under the terms of the agreement. A credit spread identified as "Defaulted” indicates a credit event has occurred for the referenced entity or obligation. |
| (4) | The maximum potential amount the fund could be required to pay as a seller of credit protection or receive as a buyer of credit protection if a credit event occurs as defined under the terms of that particular swap agreement. |
| (5) | The quoted market prices and resulting values for credit default swap agreements on credit indices serve as an indicator of the current status of the payment/performance risk and is a representation of the likelihood of an expected liability (or profit) for the credit derivative had the notional amount of the swap agreement been closed/sold as of the year end. Increasing values, in absolute terms when compared to the notional amount of the swap, represent a deterioration of the referenced entity’s credit soundness and a greater likelihood of risk of default or other credit event occurring as defined under the terms of the agreement. |
Interest Rate Swaps
| Floating Rate Index | Counter- party | Pay/Receive Floating Rate | Fixed Rate | Expiration Date | Notional Amount | Value | Upfront Premiums Paid (Received) | Unrealized Appreciation (Depreciation) | ||||||||||||||||||||
CME - 3-Month USD-LIBOR | CME | Pay | 1.500% | 03/18/16 | $53,300,000 | $394,641 | $410,773 | ($16,132 | ) | |||||||||||||||||||
OTC - 28-Day Mexico Interbank TIIE Banxico | BRC | Pay | 5.600% | 09/06/16 | MXN 1,100,000 | 2,610 | 552 | 2,058 | ||||||||||||||||||||
OTC - 28-Day Mexico Interbank TIIE Banxico | HSB | Pay | 5.600% | 09/06/16 | 2,100,000 | 4,983 | 820 | 4,163 | ||||||||||||||||||||
OTC - 28-Day Mexico Interbank TIIE Banxico | MSC | Pay | 5.600% | 09/06/16 | 1,400,000 | 3,285 | 280 | 3,005 | ||||||||||||||||||||
OTC - 28-Day Mexico Interbank TIIE Banxico | GSC | Pay | 8.170% | 11/04/16 | 1,200,000 | 11,165 | 1,757 | 9,408 | ||||||||||||||||||||
OTC - 28-Day Mexico Interbank TIIE Banxico | BRC | Pay | 5.500% | 09/13/17 | 13,000,000 | 28,300 | (10,195 | ) | 38,495 | |||||||||||||||||||
OTC - 28-Day Mexico Interbank TIIE Banxico | HSB | Pay | 5.500% | 09/13/17 | 5,000,000 | 12,028 | (1,920 | ) | 13,948 | |||||||||||||||||||
OTC - 28-Day Mexico Interbank TIIE Banxico | MSC | Pay | 5.500% | 09/13/17 | 3,000,000 | 7,218 | (1,453 | ) | 8,671 | |||||||||||||||||||
OTC - 1-Day USD Federal Funds Rate Compounded - OIS | CME | Pay | 1.000% | 10/15/17 | $35,300,000 | 3,884 | (41,606 | ) | 45,490 | |||||||||||||||||||
OTC - 28-Day Mexico Interbank TIIE Banxico | BRC | Pay | 6.000% | 09/02/22 | MXN 27,000,000 | 83,331 | (14,093 | ) | 97,424 | |||||||||||||||||||
CME - 3-Month USD-LIBOR | CME | Receive | 2.750% | 06/19/43 | $16,000,000 | 920,160 | 1,026,733 | (106,573 | ) | |||||||||||||||||||
|
|
|
|
|
| |||||||||||||||||||||||
Total Interest Rate Swaps | $1,471,605 | $1,371,648 | $99,957 | |||||||||||||||||||||||||
|
|
|
|
|
| |||||||||||||||||||||||
Total Swap Agreements | $1,833,586 | $1,484,241 | $349,345 | |||||||||||||||||||||||||
|
|
|
|
|
| |||||||||||||||||||||||
| See Notes to Financial Statements | See explanation of symbols and terms, if any, on page B-79 |
B-19
Table of Contents
PACIFIC LIFE FUNDS
PL MANAGED BOND FUND
Schedule of Investments (Continued)
March 31, 2013
| (l) | As of March 31, 2013, investments with total aggregate values of $461,844, $1,458,077 and $9,580,251 were fully or partially segregated with the broker(s)/custodian as collateral for open futures contracts, swap contracts and reverse repurchase agreements, respectively. In addition, $145,000 in cash was segregated as collateral for swap contracts. |
| (m) | Fair Value Measurements |
The following is a summary of the fund’s investments as categorized under the three-tier hierarchy of inputs used in valuing the fund’s assets and liabilities (See Note 3D in Notes to Financial Statements) as of March 31, 2013:
| Total Value at March 31, 2013 | Level 1 Quoted Price | Level 2 Significant Observable Inputs | Level 3 Significant Unobservable Inputs | |||||||||||||||
Assets | Convertible Preferred Stocks | $3,866,250 | $3,866,250 | $— | $— | |||||||||||||
Preferred Stocks | 26,000 | 26,000 | — | — | ||||||||||||||
Corporate Bonds & Notes | 106,564,576 | — | 106,564,576 | — | ||||||||||||||
Senior Loan Notes | 2,016,562 | — | 2,016,562 | — | ||||||||||||||
Mortgage-Backed Securities | 254,134,763 | — | 254,134,763 | — | ||||||||||||||
Asset-Backed Securities | 21,231,632 | — | 21,231,632 | — | ||||||||||||||
U.S. Government Agency Issues | 65,759,008 | — | 65,759,008 | — | ||||||||||||||
U.S. Treasury Obligations | 175,671,090 | — | 175,671,090 | — | ||||||||||||||
Foreign Government Bonds & Notes | 41,782,101 | — | 41,782,101 | — | ||||||||||||||
Municipal Bonds | 29,697,354 | — | 29,697,354 | — | ||||||||||||||
Short-Term Investments | 4,631,978 | 865,158 | 3,766,820 | — | ||||||||||||||
Derivatives: | ||||||||||||||||||
Credit Contracts | ||||||||||||||||||
Swaps | 562,840 | — | 562,840 | — | ||||||||||||||
Foreign Currency Contracts | ||||||||||||||||||
Forward Foreign Currency Contracts | 1,207,571 | — | 1,207,571 | — | ||||||||||||||
Interest Rate Contracts | ||||||||||||||||||
Futures | 208,061 | 208,061 | — | — | ||||||||||||||
Swaps | 1,471,605 | — | 1,471,605 | — | ||||||||||||||
|
|
|
|
|
|
|
| |||||||||||
Total Interest Rate Contracts | 1,679,666 | 208,061 | 1,471,605 | — | ||||||||||||||
|
|
|
|
|
|
|
| |||||||||||
Total Assets - Derivatives | 3,450,077 | 208,061 | 3,242,016 | — | ||||||||||||||
|
|
|
|
|
|
|
| |||||||||||
Total Assets | 708,831,391 | 4,965,469 | 703,865,922 | — | ||||||||||||||
|
|
|
|
|
|
|
| |||||||||||
Liabilities | Derivatives: | |||||||||||||||||
Credit Contracts | ||||||||||||||||||
Swaps | (200,859 | ) | — | (200,859 | ) | — | ||||||||||||
Foreign Currency Contracts | ||||||||||||||||||
Forward Foreign Currency Contracts | (604,903 | ) | — | (604,903 | ) | — | ||||||||||||
Interest Rate Contracts | ||||||||||||||||||
Futures | (163,506 | ) | (163,506 | ) | — | — | ||||||||||||
Written Options | (121,973 | ) | — | (118,744 | ) | (3,229 | ) | |||||||||||
|
|
|
|
|
|
|
| |||||||||||
Total Interest Rate Contracts | (285,479 | ) | (163,506 | ) | (118,744 | ) | (3,229 | ) | ||||||||||
|
|
|
|
|
|
|
| |||||||||||
Total Liabilities - Derivatives | (1,091,241 | ) | (163,506 | ) | (924,506 | ) | (3,229 | ) | ||||||||||
|
|
|
|
|
|
|
| |||||||||||
Total Liabilities | (1,091,241 | ) | (163,506 | ) | (924,506 | ) | (3,229 | ) | ||||||||||
|
|
|
|
|
|
|
| |||||||||||
Total | $707,740,150 | $4,801,963 | $702,941,416 | ($3,229 | ) | |||||||||||||
|
|
|
|
|
|
|
| |||||||||||
Certain of the fund’s liabilities are held at carrying amount, which approximates fair value for financial statement purposes. As of March 31, 2013 such liabilities are categorized within the three-tier hierarchy of inputs as follows:
| Total Value at March 31, 2013 | Level 1 Quoted Price | Level 2 Significant Observable Inputs | Level 3 Significant Unobservable Inputs | |||||||||||||||
Liabilities | Sale-Buyback Financing Transactions | ($2,522,062 | ) | $— | ($2,522,062 | ) | $— | |||||||||||
Reverse Repurchase Agreements | (9,570,250 | ) | — | (9,570,250 | ) | — | ||||||||||||
|
|
|
|
|
|
|
| |||||||||||
| ($12,092,312 | ) | $— | ($12,092,312 | ) | $— | |||||||||||||
|
|
|
|
|
|
|
| |||||||||||
| See Notes to Financial Statements | See explanation of symbols and terms, if any, on page B-79 |
B-20
Table of Contents
PACIFIC LIFE FUNDS
PL SHORT DURATION BOND FUND
Schedule of Investments
March 31, 2013
Principal | Value | |||||||
CORPORATE BONDS & NOTES - 51.3% |
| |||||||
Consumer Discretionary - 3.6% |
| |||||||
Carnival Corp (Panama) | $225,000 | $225,463 | ||||||
CBS Corp | 120,000 | 122,162 | ||||||
COX Communications Inc | 161,000 | 173,954 | ||||||
DIRECTV Holdings LLC | ||||||||
1.750% due 01/15/18 | 340,000 | 336,598 | ||||||
3.550% due 03/15/15 | 200,000 | 209,462 | ||||||
4.750% due 10/01/14 | 850,000 | 899,503 | ||||||
Dollar General Corp | 340,000 | 366,775 | ||||||
DR Horton Inc | 325,000 | 346,531 | ||||||
Easton-Bell Sports Inc | 130,000 | 140,239 | ||||||
NBCUniversal Enterprise Inc | 290,000 | 289,432 | ||||||
NBCUniversal Media LLC | 560,000 | 567,912 | ||||||
Speedway Motorsports Inc | 140,000 | 148,400 | ||||||
Staples Inc | 425,000 | 454,209 | ||||||
TCM Sub LLC | 1,060,000 | 1,102,390 | ||||||
The Interpublic Group of Cos Inc | ||||||||
2.250% due 11/15/17 | 365,000 | 365,473 | ||||||
6.250% due 11/15/14 | 398,000 | 427,850 | ||||||
The Walt Disney Co | 955,000 | 954,920 | ||||||
Thomson Reuters Corp (Canada) | 250,000 | 268,080 | ||||||
Time Warner Cable Inc | ||||||||
7.500% due 04/01/14 | 375,000 | 400,028 | ||||||
8.250% due 02/14/14 | 175,000 | 186,197 | ||||||
|
| |||||||
| 7,985,578 | ||||||||
|
| |||||||
Consumer Staples - 3.1% |
| |||||||
Altria Group Inc | 668,000 | 699,988 | ||||||
Avon Products Inc | 195,000 | 197,666 | ||||||
BAT International Finance PLC (United Kingdom) | ||||||||
1.400% due 06/05/15 ~ | 710,000 | 718,830 | ||||||
8.125% due 11/15/13 ~ | 150,000 | 156,717 | ||||||
Bunge Ltd Finance Corp | 730,000 | 756,144 | ||||||
Coca-Cola Amatil Ltd (Australia) | 705,000 | 729,685 | ||||||
General Mills Inc | 140,000 | 140,218 | ||||||
Heineken NV (Netherlands) | 355,000 | 353,923 | ||||||
Imperial Tobacco Finance PLC (United Kingdom) | 755,000 | 760,967 | ||||||
Kraft Foods Group Inc | 315,000 | 320,024 | ||||||
PepsiCo Inc | 350,000 | 350,457 | ||||||
Pernod-Ricard SA (France) | 510,000 | 536,323 | ||||||
Reynolds American Inc | 125,000 | 125,123 | ||||||
SABMiller Holdings Inc | 530,000 | 538,781 | ||||||
Principal | Value | |||||||
Spectrum Brands Inc | $225,000 | $255,938 | ||||||
The Coca-Cola Co | 380,000 | 380,326 | ||||||
|
| |||||||
| 7,021,110 | ||||||||
|
| |||||||
Energy - 6.4% |
| |||||||
Anadarko Petroleum Corp | 345,000 | 412,367 | ||||||
Antero Resources Finance Corp | 275,000 | 299,750 | ||||||
BG Energy Capital PLC (United Kingdom) | 755,000 | 800,614 | ||||||
Bill Barrett Corp | 200,000 | 215,000 | ||||||
Canadian Natural Resources Ltd (Canada) | ||||||||
1.450% due 11/14/14 | 540,000 | 546,216 | ||||||
5.700% due 05/15/17 | 455,000 | 531,998 | ||||||
Chesapeake Energy Corp | 375,000 | 380,156 | ||||||
DCP Midstream LLC | ||||||||
5.375% due 10/15/15 ~ | 365,000 | 396,971 | ||||||
9.700% due 12/01/13 ~ | 230,000 | 242,904 | ||||||
DCP Midstream Operating LP | 245,000 | 249,107 | ||||||
Diamond Offshore Drilling Inc | 284,000 | 301,834 | ||||||
Ensco PLC (United Kingdom) | 500,000 | 532,982 | ||||||
Enterprise Products Operating LLC | ||||||||
1.250% due 08/13/15 | 340,000 | 342,685 | ||||||
5.600% due 10/15/14 | 316,000 | 338,862 | ||||||
Gazprom OAO (Luxembourg) | 360,000 | 386,042 | ||||||
Kinder Morgan Energy Partners LP | ||||||||
3.500% due 03/01/16 | 175,000 | 187,072 | ||||||
5.125% due 11/15/14 | 285,000 | 305,135 | ||||||
Magellan Midstream Partners LP | 225,000 | 238,519 | ||||||
Marathon Oil Corp | 470,000 | 469,152 | ||||||
Noble Corp (Cayman) | 365,000 | 368,303 | ||||||
Noble Holding International Ltd (Cayman) | ||||||||
2.500% due 03/15/17 | 65,000 | 66,928 | ||||||
3.050% due 03/01/16 | 415,000 | 433,180 | ||||||
3.450% due 08/01/15 | 110,000 | 115,272 | ||||||
7.375% due 03/15/14 | 55,000 | 58,359 | ||||||
ONEOK Partners LP | 640,000 | 676,621 | ||||||
Petrohawk Energy Corp | ||||||||
7.250% due 08/15/18 | 690,000 | 773,286 | ||||||
10.500% due 08/01/14 | 125,000 | 132,221 | ||||||
Phillips 66 | 290,000 | 296,511 | ||||||
Pioneer Natural Resources Co | 620,000 | 701,749 | ||||||
Regency Energy Partners LP | 27,000 | 28,755 | ||||||
Rowan Cos Inc | 120,000 | 133,942 | ||||||
Talisman Energy Inc (Canada) | 455,000 | 488,725 | ||||||
Tennessee Gas Pipeline Co LLC | 410,000 | 486,793 | ||||||
Transocean Inc (Cayman) | ||||||||
2.500% due 10/15/17 | 330,000 | 334,676 | ||||||
4.950% due 11/15/15 | 355,000 | 384,343 | ||||||
5.050% due 12/15/16 | 130,000 | 144,581 | ||||||
| See Notes to Financial Statements | See explanation of symbols and terms, if any, on page B-79 |
B-21
Table of Contents
PACIFIC LIFE FUNDS
PL SHORT DURATION BOND FUND
Schedule of Investments (Continued)
March 31, 2013
Principal | Value | |||||||
Williams Partners LP | $645,000 | $679,529 | ||||||
Woodside Finance Ltd (Australia) | 705,000 | 744,350 | ||||||
|
| |||||||
| 14,225,490 | ||||||||
|
| |||||||
Financials - 20.6% |
| |||||||
ACE INA Holdings Inc | 710,000 | 754,699 | ||||||
Aflac Inc | 75,000 | 78,951 | ||||||
Ally Financial Inc | 500,000 | 506,627 | ||||||
American Express Credit Corp | 660,000 | 701,396 | ||||||
American Honda Finance Corp | 650,000 | 659,172 | ||||||
American International Group Inc | ||||||||
3.000% due 03/20/15 | 175,000 | 181,647 | ||||||
4.250% due 09/15/14 | 910,000 | 953,868 | ||||||
American Tower Corp REIT | 1,095,000 | 1,168,222 | ||||||
Anglo American Capital PLC (United Kingdom) | 250,000 | 251,409 | ||||||
ANZ International Ltd (New Zealand) | 830,000 | 847,081 | ||||||
Bank of America Corp | ||||||||
1.104% due 03/22/16 § | 225,000 | 224,310 | ||||||
1.250% due 01/11/16 | 365,000 | 363,850 | ||||||
1.500% due 10/09/15 | 1,225,000 | 1,229,803 | ||||||
Bank of Nova Scotia (Canada) | 540,000 | 540,121 | ||||||
Barclays Bank PLC (United Kingdom) | 1,100,000 | 1,159,972 | ||||||
BB&T Corp | ||||||||
1.600% due 08/15/17 | 245,000 | 247,743 | ||||||
5.700% due 04/30/14 | 350,000 | 369,561 | ||||||
Berkshire Hathaway Inc | 365,000 | 367,312 | ||||||
Boston Properties LP | 470,000 | 511,558 | ||||||
Capital One Financial Corp | ||||||||
2.125% due 07/15/14 | 135,000 | 137,155 | ||||||
2.150% due 03/23/15 | 660,000 | 673,860 | ||||||
7.375% due 05/23/14 | 275,000 | 295,287 | ||||||
CIT Group Inc | 230,000 | 241,500 | ||||||
Citigroup Inc | ||||||||
1.084% due 04/01/16 § | 820,000 | 821,082 | ||||||
1.250% due 01/15/16 | 720,000 | 719,682 | ||||||
CNH Capital LLC | 770,000 | 793,100 | ||||||
Commonwealth Bank of Australia (Australia) | 675,000 | 691,322 | ||||||
Daimler Finance North America LLC | ||||||||
0.894% due 03/28/14 § ~ | 500,000 | 501,384 | ||||||
1.875% due 09/15/14 ~ | 190,000 | 192,853 | ||||||
DNB Bank ASA (Norway) | 785,000 | 832,538 | ||||||
Fifth Third Bancorp | ||||||||
3.625% due 01/25/16 | 85,000 | 90,934 | ||||||
6.250% due 05/01/13 | 425,000 | 426,934 | ||||||
Fifth Third Bank | 250,000 | 250,004 | ||||||
Ford Motor Credit Co LLC | ||||||||
2.750% due 05/15/15 | 640,000 | 653,624 | ||||||
3.000% due 06/12/17 | 250,000 | 256,748 | ||||||
3.875% due 01/15/15 | 400,000 | 416,006 | ||||||
Principal | Value | |||||||
General Electric Capital Corp | ||||||||
0.994% due 04/02/18 § | $925,000 | $925,226 | ||||||
2.375% due 06/30/15 | 625,000 | 646,950 | ||||||
Harley-Davidson Financial Services Inc | 445,000 | 446,816 | ||||||
HSBC Finance Corp | 100,000 | 99,906 | ||||||
HSBC USA Inc | 235,000 | 241,907 | ||||||
Hyundai Capital America | 195,000 | 196,451 | ||||||
Hyundai Capital Services Inc (South Korea) | ||||||||
3.500% due 09/13/17 ~ | 200,000 | 213,135 | ||||||
4.375% due 07/27/16 ~ | 525,000 | 567,866 | ||||||
JPMorgan Chase & Co | ||||||||
0.908% due 02/26/16 § | 440,000 | 440,571 | ||||||
2.000% due 08/15/17 | 1,125,000 | 1,147,244 | ||||||
KeyBank NA | 180,000 | 196,152 | ||||||
KeyCorp | 325,000 | 346,502 | ||||||
Kilroy Realty LP | 405,000 | 441,040 | ||||||
MetLife Inc | 125,000 | 127,019 | ||||||
Metropolitan Life Global Funding I | ||||||||
1.500% due 01/10/18 ~ | 365,000 | 367,181 | ||||||
1.700% due 06/29/15 ~ | 860,000 | 878,662 | ||||||
Morgan Stanley | ||||||||
1.538% due 02/25/16 § | 1,060,000 | 1,065,270 | ||||||
1.902% due 01/24/14 § | 985,000 | 993,325 | ||||||
National Bank of Canada (Canada) | 965,000 | 962,862 | ||||||
National Rural Utilities Cooperative Finance Corp | 80,000 | 80,800 | ||||||
New York Life Global Funding | 580,000 | 609,070 | ||||||
Nissan Motor Acceptance Corp | 605,000 | 614,824 | ||||||
Nordea Bank AB (Sweden) | 760,000 | 768,985 | ||||||
PNC Funding Corp | 350,000 | 368,681 | ||||||
Principal Financial Group Inc | 115,000 | 116,376 | ||||||
Principal Life Global Funding II | 560,000 | 562,089 | ||||||
Prudential Financial Inc | 705,000 | 749,873 | ||||||
Regions Financial Corp | ||||||||
5.750% due 06/15/15 | 200,000 | 217,133 | ||||||
7.750% due 11/10/14 | 205,000 | 226,095 | ||||||
Simon Property Group LP | 515,000 | 543,477 | ||||||
SLM Corp | 910,000 | 946,599 | ||||||
Societe Generale SA (France) | 225,000 | 228,510 | ||||||
Sumitomo Mitsui Banking Corp (Japan) | ||||||||
0.900% due 01/18/16 | 280,000 | 279,338 | ||||||
1.900% due 01/12/15 ~ | 705,000 | 717,495 | ||||||
Sumitomo Mitsui Trust Bank Ltd (Japan) | 720,000 | 721,711 | ||||||
Sun Life Financial Global Funding III LP | 775,000 | 774,980 | ||||||
Swedbank AB (Sweden) | 1,065,000 | 1,062,555 | ||||||
The Bank of New York Mellon Corp | 555,000 | 555,238 | ||||||
| See Notes to Financial Statements | See explanation of symbols and terms, if any, on page B-79 |
B-22
Table of Contents
PACIFIC LIFE FUNDS
PL SHORT DURATION BOND FUND
Schedule of Investments (Continued)
March 31, 2013
Principal | Value | |||||||
The Goldman Sachs Group Inc | $1,485,000 | $1,499,565 | ||||||
The Royal Bank of Scotland Group PLC (United Kingdom) | 415,000 | 426,787 | ||||||
Toyota Motor Credit Corp | 215,000 | 215,310 | ||||||
UBS AG (Switzerland) | 400,000 | 402,093 | ||||||
Union Bank NA | 435,000 | 448,365 | ||||||
Ventas Realty LP REIT | ||||||||
2.000% due 02/15/18 | 170,000 | 171,236 | ||||||
3.125% due 11/30/15 | 650,000 | 687,530 | ||||||
Volkswagen International Finance NV (Netherlands) | 795,000 | 805,383 | ||||||
WEA Finance LLC | 490,000 | 544,485 | ||||||
Wells Fargo & Co | ||||||||
1.250% due 02/13/15 | 700,000 | 708,394 | ||||||
2.100% due 05/08/17 | 615,000 | 635,064 | ||||||
|
| |||||||
| 46,103,441 | ||||||||
|
| |||||||
Health Care - 3.2% |
| |||||||
Actavis Inc | ||||||||
1.875% due 10/01/17 | 385,000 | 390,076 | ||||||
5.000% due 08/15/14 | 485,000 | 511,801 | ||||||
AbbVie Inc | 970,000 | 978,159 | ||||||
Agilent Technologies Inc | ||||||||
2.500% due 07/15/13 | 220,000 | 221,280 | ||||||
6.500% due 11/01/17 | 565,000 | 677,599 | ||||||
Boston Scientific Corp | 330,000 | 350,233 | ||||||
Cardinal Health Inc | ||||||||
1.900% due 06/15/17 | 270,000 | 274,488 | ||||||
5.500% due 06/15/13 | 505,000 | 509,994 | ||||||
Catholic Health Initiatives | 65,000 | 65,868 | ||||||
Celgene Corp | 115,000 | 116,936 | ||||||
Express Scripts Holding Co | ||||||||
2.750% due 11/21/14 | 615,000 | 633,697 | ||||||
3.125% due 05/15/16 | 350,000 | 370,040 | ||||||
Gilead Sciences Inc | 570,000 | 585,963 | ||||||
Life Technologies Corp | 225,000 | 237,396 | ||||||
McKesson Corp | 185,000 | 185,628 | ||||||
UnitedHealth Group Inc | ||||||||
0.850% due 10/15/15 | 200,000 | 200,732 | ||||||
1.875% due 11/15/16 | 155,000 | 160,219 | ||||||
WellPoint Inc | ||||||||
1.250% due 09/10/15 | 300,000 | 302,662 | ||||||
6.000% due 02/15/14 | 300,000 | 314,031 | ||||||
|
| |||||||
| 7,086,802 | ||||||||
|
| |||||||
Industrials - 3.1% |
| |||||||
Aircastle Ltd (Bermuda) | 330,000 | 378,263 | ||||||
Eaton Corp | 265,000 | 266,171 | ||||||
ERAC USA Finance LLC | ||||||||
1.400% due 04/15/16 ~ | 55,000 | 55,366 | ||||||
2.750% due 07/01/13 ~ | 915,000 | 919,914 | ||||||
2.750% due 03/15/17 ~ | 175,000 | 182,536 | ||||||
Florida East Coast Railway Corp | 290,000 | 312,475 | ||||||
Principal | Value | |||||||
GATX Corp | ||||||||
2.375% due 07/30/18 | $110,000 | $111,452 | ||||||
3.500% due 07/15/16 | 360,000 | 381,597 | ||||||
General Electric Co | 740,000 | 742,930 | ||||||
Heathrow Funding Ltd (United Kingdom) | 610,000 | 628,451 | ||||||
John Deere Capital Corp | 785,000 | 785,482 | ||||||
Norfolk Southern Corp | 930,000 | 1,050,779 | ||||||
Penske Truck Leasing Co LP | 150,000 | 153,216 | ||||||
Roper Industries Inc | ||||||||
1.850% due 11/15/17 | 105,000 | 106,023 | ||||||
6.625% due 08/15/13 | 150,000 | 153,201 | ||||||
Southwest Airlines Co | 315,000 | 333,013 | ||||||
Waste Management Inc | ||||||||
5.000% due 03/15/14 | 150,000 | 156,153 | ||||||
6.375% due 03/11/15 | 260,000 | 287,346 | ||||||
|
| |||||||
| 7,004,368 | ||||||||
|
| |||||||
Information Technology - 2.2% |
| |||||||
Altera Corp | 335,000 | 342,785 | ||||||
Arrow Electronics Inc | 205,000 | 212,985 | ||||||
Autodesk Inc | 170,000 | 168,636 | ||||||
Broadcom Corp | ||||||||
1.500% due 11/01/13 | 150,000 | 150,889 | ||||||
2.375% due 11/01/15 | 200,000 | 208,695 | ||||||
Fiserv Inc | 740,000 | 780,372 | ||||||
Hewlett-Packard Co | ||||||||
2.350% due 03/15/15 | 220,000 | 224,557 | ||||||
2.625% due 12/09/14 | 300,000 | 307,704 | ||||||
HP Enterprise Services LLC | 375,000 | 381,477 | ||||||
International Business Machines Corp | 1,390,000 | 1,390,648 | ||||||
Xerox Corp | ||||||||
1.110% due 05/16/14 § | 400,000 | 398,854 | ||||||
2.950% due 03/15/17 | 70,000 | 72,190 | ||||||
5.650% due 05/15/13 | 275,000 | 276,526 | ||||||
|
| |||||||
| 4,916,318 | ||||||||
|
| |||||||
Materials - 2.1% |
| |||||||
ArcelorMittal (Luxembourg) | 375,000 | 377,379 | ||||||
Ashland Inc | 525,000 | 535,500 | ||||||
Barrick Gold Corp (Canada) | 330,000 | 333,717 | ||||||
Barrick Gold Financeco LLC | 400,000 | 409,653 | ||||||
CRH America Inc | 150,000 | 153,478 | ||||||
Eastman Chemical Co | 230,000 | 239,074 | ||||||
Goldcorp Inc (Canada) | 230,000 | 231,132 | ||||||
International Paper Co | 295,000 | 319,004 | ||||||
Rio Tinto Finance USA Ltd (Australia) | 640,000 | 696,434 | ||||||
Rock-Tenn Co | 495,000 | 507,068 | ||||||
| See Notes to Financial Statements | See explanation of symbols and terms, if any, on page B-79 |
B-23
Table of Contents
PACIFIC LIFE FUNDS
PL SHORT DURATION BOND FUND
Schedule of Investments (Continued)
March 31, 2013
Principal | Value | |||||||
Teck Resources Ltd (Canada) | $140,000 | $141,526 | ||||||
The Dow Chemical Co | 725,000 | 755,631 | ||||||
|
| |||||||
| 4,699,596 | ||||||||
|
| |||||||
Telecommunication Services - 2.8% |
| |||||||
America Movil SAB de CV (Mexico) | ||||||||
2.375% due 09/08/16 | 275,000 | 284,288 | ||||||
3.625% due 03/30/15 | 200,000 | 210,674 | ||||||
AT&T Inc | 435,000 | 437,105 | ||||||
CC Holdings GS V LLC | 465,000 | 468,733 | ||||||
Crown Castle Towers LLC | 550,000 | 584,525 | ||||||
Digicel Ltd (Bermuda) | 125,000 | 133,125 | ||||||
GTP Acquisition Partners I LLC | 190,000 | 202,325 | ||||||
Rogers Communications Inc (Canada) | 1,000,000 | 1,051,594 | ||||||
SBA Tower Trust | 715,000 | 752,419 | ||||||
Telecom Italia Capital SA (Luxembourg) | 565,000 | 576,875 | ||||||
Telefonica Emisiones SAU (Spain) | 280,000 | 280,451 | ||||||
UPC Holding BV (Netherlands) | 415,000 | 465,319 | ||||||
Verizon Communications Inc | 545,000 | 545,049 | ||||||
Vivendi SA (France) | 305,000 | 311,475 | ||||||
|
| |||||||
| 6,303,957 | ||||||||
|
| |||||||
Utilities - 4.2% |
| |||||||
Alabama Power Co | 255,000 | 255,058 | ||||||
CenterPoint Energy Resources Corp | 75,000 | 75,000 | ||||||
CMS Energy Corp | ||||||||
2.750% due 05/15/14 | 585,000 | 597,641 | ||||||
4.250% due 09/30/15 | 200,000 | 215,695 | ||||||
Commonwealth Edison Co | 120,000 | 124,404 | ||||||
Dominion Resources Inc | ||||||||
1.400% due 09/15/17 | 645,000 | 647,221 | ||||||
1.800% due 03/15/14 | 325,000 | 328,682 | ||||||
1.950% due 08/15/16 | 165,000 | 170,309 | ||||||
DTE Energy Co | 305,000 | 328,195 | ||||||
Duke Energy Corp | ||||||||
1.625% due 08/15/17 | 220,000 | 222,275 | ||||||
2.150% due 11/15/16 | 460,000 | 475,816 | ||||||
Enel Finance International NV (Netherlands) | 145,000 | 149,090 | ||||||
Florida Gas Transmission Co LLC | 165,000 | 175,100 | ||||||
Georgia Power Co | ||||||||
0.600% due 03/15/16 § | 220,000 | 220,288 | ||||||
1.300% due 09/15/13 | 325,000 | 326,454 | ||||||
Great Plains Energy Inc | 225,000 | 226,400 | ||||||
Iberdrola Finance Ireland Ltd (Ireland) | 275,000 | 283,261 | ||||||
Korea Hydro & Nuclear Power Co Ltd (South Korea) | 275,000 | 287,587 | ||||||
Principal | Value | |||||||
MidAmerican Energy Holdings Co | $250,000 | $259,466 | ||||||
Mississippi Power Co | 120,000 | 125,926 | ||||||
Monongahela Power Co Inc | 1,040,000 | 1,090,632 | ||||||
NextEra Energy Capital Holdings Inc | 185,000 | 186,498 | ||||||
Nisource Finance Corp | 525,000 | 554,575 | ||||||
PacifiCorp | 200,000 | 204,523 | ||||||
Progress Energy Inc | 150,000 | 157,626 | ||||||
PSEG Power LLC | 130,000 | 135,327 | ||||||
Sempra Energy | 450,000 | 452,429 | ||||||
Sierra Pacific Power Co | 242,000 | 246,786 | ||||||
The Southern Co | 145,000 | 149,825 | ||||||
Veolia Environnement SA (France) | 250,000 | 251,557 | ||||||
Wisconsin Electric Power Co | 375,000 | 394,500 | ||||||
|
| |||||||
| 9,318,146 | ||||||||
|
| |||||||
Total Corporate Bonds & Notes | 114,664,806 | |||||||
|
| |||||||
MORTGAGE-BACKED SECURITIES - 21.4% |
| |||||||
Collateralized Mortgage Obligations - Commercial - 4.5% |
| |||||||
Banc of America Commercial Mortgage Trust | 930,000 | 1,047,795 | ||||||
Banc of America Merrill Lynch Commercial Mortgage Inc | 435,000 | 466,388 | ||||||
Bear Stearns Commercial Mortgage Securities Trust | ||||||||
4.674% due 06/11/41 " | 150,000 | 160,505 | ||||||
4.715% due 02/11/41 " | 563,484 | 573,657 | ||||||
4.978% due 07/11/42 " § | 625,000 | 655,985 | ||||||
5.116% due 02/11/41 " § | 260,000 | 278,037 | ||||||
5.200% due 01/12/41 " § | 611,511 | 629,320 | ||||||
5.201% due 12/11/38 " | 195,000 | 220,212 | ||||||
5.540% due 09/11/41 " | 175,000 | 197,985 | ||||||
Citigroup Commercial Mortgage Trust | 305,000 | 316,590 | ||||||
Commercial Mortgage Trust | ||||||||
1.156% due 12/10/44 " | 71,525 | 72,176 | ||||||
5.167% due 06/10/44 " § | 70,000 | 76,488 | ||||||
5.524% due 07/10/37 " § | 100,000 | 104,395 | ||||||
DBUBS Mortgage Trust | 120,788 | 122,844 | ||||||
Greenwich Capital Commercial Funding Corp | 145,000 | 164,145 | ||||||
GS Mortgage Securities Trust | 320,000 | 354,596 | ||||||
JP Morgan Chase Commercial Mortgage Securities Corp | ||||||||
1.031% due 05/15/45 " | 54,464 | 54,872 | ||||||
4.719% due 01/15/38 " | 330,000 | 336,906 | ||||||
4.996% due 08/15/42 " § | 400,000 | 436,521 | ||||||
5.370% due 06/12/41 " § | 620,000 | 647,959 | ||||||
LB-UBS Commercial Mortgage Trust | ||||||||
4.954% due 09/15/30 " | 75,000 | 81,053 | ||||||
5.866% due 06/15/38 " § | 915,000 | 1,040,652 | ||||||
| See Notes to Financial Statements | See explanation of symbols and terms, if any, on page B-79 |
B-24
Table of Contents
PACIFIC LIFE FUNDS
PL SHORT DURATION BOND FUND
Schedule of Investments (Continued)
March 31, 2013
Principal | Value | |||||||
Merrill Lynch Countrywide Commercial | $645,000 | $734,307 | ||||||
Morgan Stanley Capital I Trust | ||||||||
5.270% due 06/13/41 " § | 620,000 | 647,969 | ||||||
5.731% due 07/12/44 " § | 350,000 | 394,929 | ||||||
WF-RBS Commercial Mortgage Trust | 232,643 | 236,140 | ||||||
|
| |||||||
| 10,052,426 | ||||||||
|
| |||||||
Collateralized Mortgage Obligations - Residential - 4.5% |
| |||||||
Fannie Mae | ||||||||
0.654% due 07/25/42 " § | 885,391 | 893,966 | ||||||
5.000% due 08/25/19 " | 360,329 | 387,142 | ||||||
Fosse Master Issuer PLC (United Kingdom) | ||||||||
1.703% due 10/18/54 " § ~ | 405,025 | 412,216 | ||||||
Freddie Mac | ||||||||
0.653% due 05/15/36 " § | 1,145,277 | 1,158,544 | ||||||
0.703% due 08/15/41 " § | 1,413,215 | 1,426,708 | ||||||
1.426% due 08/25/17 " | 640,000 | 653,316 | ||||||
Government National Mortgage Association | ||||||||
0.653% due 07/16/42 " § | 2,422,113 | 2,446,652 | ||||||
2.000% due 06/16/42 " | 875,257 | 896,710 | ||||||
HarborView Mortgage Loan Trust | 151,627 | 124,275 | ||||||
Holmes Master Issuer PLC (United Kingdom) | 775,000 | 791,412 | ||||||
Silverstone Master Issuer PLC (United Kingdom) | ||||||||
1.852% due 01/21/55 " § ~ | 150,000 | 152,649 | ||||||
1.852% due 01/21/55 " § ~ | 525,000 | 538,890 | ||||||
Structured Adjustable Rate Mortgage Loan Trust 2.816% due 11/25/34 " § | 262,214 | 265,706 | ||||||
|
| |||||||
| 10,148,186 | ||||||||
|
| |||||||
Fannie Mae - 10.1% |
| |||||||
2.195% due 01/01/35 " § | 1,110,744 | 1,177,818 | ||||||
2.388% due 09/01/34 " § | 759,200 | 809,920 | ||||||
2.493% due 11/01/34 " § | 576,685 | 622,257 | ||||||
2.500% due 10/01/27 " | 1,069,648 | 1,111,223 | ||||||
2.606% due 09/01/35 " § | 955,960 | 1,031,973 | ||||||
3.000% due 09/01/27 " | 1,459,804 | 1,537,721 | ||||||
3.500% due 12/01/25 - 01/01/27 " | 3,064,951 | 3,251,918 | ||||||
4.000% due 07/01/25 - 10/01/41 " | 3,706,330 | 3,966,365 | ||||||
4.500% due 04/01/26 - 07/01/26 " | 1,579,943 | 1,700,591 | ||||||
5.000% due 07/01/19 - 07/01/41 " | 2,974,215 | 3,223,488 | ||||||
5.500% due 01/01/35 - 12/01/39 " | 3,298,103 | 3,617,382 | ||||||
6.000% due 11/01/35 " | 417,226 | 460,757 | ||||||
|
| |||||||
| 22,511,413 | ||||||||
|
| |||||||
Freddie Mac - 1.4% |
| |||||||
4.500% due 11/01/23 " | 2,013,133 | 2,146,415 | ||||||
5.000% due 11/01/16 – 04/01/18 " | 101,982 | 109,159 | ||||||
5.500% due 01/01/20 – 12/01/39 " | 821,157 | 889,448 | ||||||
|
| |||||||
| 3,145,022 | ||||||||
|
| |||||||
Government National Mortgage Association - 0.9% |
| |||||||
2.500% due 09/20/27 " | 1,104,509 | 1,151,587 | ||||||
3.000% due 09/20/27 " | 804,893 | 856,905 | ||||||
|
| |||||||
| 2,008,492 | ||||||||
|
| |||||||
Total Mortgage-Backed Securities | 47,865,539 | |||||||
|
| |||||||
ASSET-BACKED SECURITIES - 13.3% |
| |||||||
Ally Auto Receivables Trust | 155,000 | 155,803 | ||||||
Ally Master Owner Trust | ||||||||
1.000% due 02/15/18 " | 230,000 | 230,560 | ||||||
1.003% due 02/15/17 " § | 725,000 | 730,845 | ||||||
1.210% due 06/15/17 " | 1,060,000 | 1,068,590 | ||||||
2.150% due 01/15/16 " | 155,000 | 156,971 | ||||||
Principal | Value | |||||||
American Express Credit Account Master Trust | ||||||||
0.373% due 04/17/17 " § | $315,000 | $315,506 | ||||||
0.990% due 03/15/18 " | 440,000 | 441,057 | ||||||
1.070% due 05/15/18 " ~ | 100,000 | 100,774 | ||||||
1.290% due 03/15/18 " ~ | 500,000 | 504,359 | ||||||
AmeriCredit Automobile Receivables Trust | ||||||||
0.620% due 06/08/17 " | 195,000 | 194,966 | ||||||
1.050% due 10/11/16 " | 270,000 | 271,703 | ||||||
1.170% due 05/09/16 " | 345,000 | 346,933 | ||||||
1.730% due 02/08/17 " | 200,000 | 203,122 | ||||||
2.330% due 03/08/16 " | 240,000 | 243,214 | ||||||
Bank of America Auto Trust | 560,000 | 562,113 | ||||||
BMW Vehicle Lease Trust | 440,000 | 439,902 | ||||||
Capital Auto Receivables Asset Trust | ||||||||
0.790% due 06/20/17 " | 520,000 | 521,033 | ||||||
8.250% due 01/15/15 " ~ | 365,000 | 372,210 | ||||||
CarMax Auto Owner Trust | 430,000 | 430,206 | ||||||
CIT Equipment Collateral | 245,000 | 245,954 | ||||||
Citigroup Mortgage Loan Trust Inc | 331,870 | 299,641 | ||||||
CNH Equipment Trust | ||||||||
0.570% due 12/15/17 " | 820,000 | 820,734 | ||||||
0.690% due 06/15/18 " | 755,000 | 756,035 | ||||||
0.910% due 08/15/16 " | 300,000 | 301,156 | ||||||
0.940% due 05/15/17 " | 150,000 | 150,825 | ||||||
1.030% due 11/17/14 " | 2,918 | 2,919 | ||||||
Enterprise Fleet Financing LLC | 480,000 | 479,861 | ||||||
Ford Credit Auto Lease Trust | ||||||||
0.850% due 01/15/15 " | 210,000 | 210,590 | ||||||
1.100% due 12/15/15 " ~ | 100,000 | 100,110 | ||||||
1.500% due 03/15/17 " ~ | 125,000 | 125,123 | ||||||
Ford Credit Auto Owner Trust | 100,000 | 104,440 | ||||||
Ford Credit Floorplan Master Owner Trust | ||||||||
0.740% due 09/15/16 " | 555,000 | 556,106 | ||||||
4.200% due 02/15/17 " ~ | 365,000 | 389,340 | ||||||
4.990% due 02/15/17 " ~ | 260,000 | 274,536 | ||||||
GE Capital Credit Card Master Note Trust | 535,000 | 540,110 | ||||||
GE Dealer Floorplan Master Note Trust | ||||||||
0.643% due 10/20/17 " § | 630,000 | 631,673 | ||||||
0.803% due 07/20/16 " § | 270,000 | 271,786 | ||||||
GE Equipment Midticket LLC | 410,000 | 411,023 | ||||||
GE Equipment Small Ticket LLC | 135,000 | 135,525 | ||||||
GSAA Home Equity Trust | ||||||||
0.262% due 07/25/37 " § | 337,617 | 290,721 | ||||||
0.484% due 10/25/35 " § | 114,579 | 105,143 | ||||||
0.574% due 10/25/35 " § | 585,000 | 535,810 | ||||||
GSAA Trust | 416,433 | 381,452 | ||||||
Honda Auto Receivables Owner Trust | ||||||||
0.560% due 05/15/16 " | 1,030,000 | 1,031,146 | ||||||
0.770% due 01/15/16 " | 725,000 | 727,624 | ||||||
Huntington Auto Trust | ||||||||
0.810% due 09/15/16 " | 470,000 | 471,879 | ||||||
1.010% due 01/15/16 " ~ | 231,079 | 232,069 | ||||||
Hyundai Auto Receivables Trust | ||||||||
0.720% due 03/15/16 " | 205,000 | 205,666 | ||||||
0.730% due 06/15/18 " | 565,000 | 565,054 | ||||||
0.750% due 09/17/18 " | 215,000 | 215,101 | ||||||
0.810% due 03/15/18 " | 840,000 | 843,336 | ||||||
3.510% due 11/15/17 " | 290,000 | 307,016 | ||||||
| See Notes to Financial Statements | See explanation of symbols and terms, if any, on page B-79 |
B-25
Table of Contents
PACIFIC LIFE FUNDS
PL SHORT DURATION BOND FUND
Schedule of Investments (Continued)
March 31, 2013
Principal | Value | |||||||
Mercedes-Benz Auto Lease Trust | ||||||||
0.880% due 11/17/14 " | $220,000 | $220,704 | ||||||
1.070% due 11/15/17 " | 180,000 | 180,873 | ||||||
Mercedes-Benz Auto Receivables Trust | 680,000 | 686,225 | ||||||
Motor PLC (United Kingdom) | 250,000 | 251,741 | ||||||
Navistar Financial Dealer Note Master Trust | 535,000 | 535,246 | ||||||
Nissan Auto Lease Trust | ||||||||
0.920% due 02/16/15 " | 375,000 | 376,086 | ||||||
1.040% due 08/15/14 " | 620,669 | 621,957 | ||||||
Nissan Auto Receivables Owner Trust | ||||||||
0.460% due 10/17/16 " | 555,000 | 554,840 | ||||||
0.730% due 05/16/16 " | 505,000 | 507,136 | ||||||
Sierra Timeshare Receivables Funding Co LLC | 255,000 | 254,956 | ||||||
SMART Trust (Australia) | ||||||||
0.840% due 09/14/16 " | 245,000 | 244,859 | ||||||
0.970% due 03/14/17 " | 195,000 | 195,312 | ||||||
1.500% due 05/14/16 " ~ | 215,000 | 216,978 | ||||||
1.540% due 03/14/15 " ~ | 88,470 | 88,993 | ||||||
1.590% due 10/14/16 " ~ | 505,000 | 511,171 | ||||||
Toyota Auto Receivables Owner Trust | 790,000 | 792,952 | ||||||
Volkswagen Auto Loan Enhanced Trust | 245,000 | 246,228 | ||||||
Wells Fargo Home Equity Asset-Backed Securities Trust | 334,449 | 301,546 | ||||||
Wheels SPV LLC | 263,418 | 264,961 | ||||||
World Financial Network Credit Card Master Trust | 1,100,000 | 1,099,977 | ||||||
World Omni Auto Receivables Trust | 865,000 | 868,541 | ||||||
World Omni Master Owner Trust | 655,000 | 655,441 | ||||||
|
| |||||||
Total Asset-Backed Securities | 29,686,094 | |||||||
|
| |||||||
U.S. GOVERNMENT AGENCY ISSUES - 4.0% |
| |||||||
Fannie Mae | ||||||||
0.500% due 07/02/15 | 400,000 | 401,467 | ||||||
0.750% due 12/19/14 | 1,055,000 | 1,063,835 | ||||||
0.875% due 08/28/14 | 990,000 | 999,099 | ||||||
1.000% due 09/23/13 | 525,000 | 527,193 | ||||||
Federal Home Loan Bank | 3,125,000 | 3,136,753 | ||||||
Freddie Mac | ||||||||
0.500% due 04/17/15 | 730,000 | 733,227 | ||||||
0.750% due 11/25/14 | 700,000 | 706,038 | ||||||
0.875% due 10/28/13 | 1,325,000 | 1,330,686 | ||||||
|
| |||||||
Total U.S. Government Agency Issues | 8,898,298 | |||||||
|
| |||||||
U.S. TREASURY OBLIGATIONS - 4.3% |
| |||||||
U.S. Treasury Inflation Protected Securities - 2.3% |
| |||||||
0.500% due 04/15/15 ^ | 1,174,074 | 1,233,970 | ||||||
1.875% due 07/15/13 ^ | 3,028,163 | 3,089,198 | ||||||
2.000% due 07/15/14 ^ | 903,336 | 956,619 | ||||||
|
| |||||||
| 5,279,787 | ||||||||
|
| |||||||
U.S. Treasury Notes - 2.0% |
| |||||||
0.250% due 05/31/14 ‡ | 4,500,000 | 4,503,870 | ||||||
|
| |||||||
Total U.S. Treasury Obligations | 9,783,657 | |||||||
|
| |||||||
Principal | Value | |||||||
FOREIGN GOVERNMENT NOTES - 0.5% |
| |||||||
Mexican Udibonos (Mexico) | MXN 12,337,745 | $1,112,463 | ||||||
|
| |||||||
Total Foreign Government Notes | 1,112,463 | |||||||
|
| |||||||
Shares | ||||||||
SHORT-TERM INVESTMENT - 5.4% |
| |||||||
Money Market Fund - 5.4% |
| |||||||
BlackRock Liquidity Funds Treasury Trust Fund Portfolio | 12,064,690 | 12,064,690 | ||||||
|
| |||||||
Total Short-Term Investment | 12,064,690 | |||||||
|
| |||||||
TOTAL INVESTMENTS - 100.2% | 224,075,547 | |||||||
OTHER ASSETS & LIABILITIES, NET - (0.2%) |
| (474,849 | ) | |||||
|
| |||||||
NET ASSETS - 100.0% | $223,600,698 | |||||||
|
| |||||||
Notes to Schedule of Investments
| (a) | As of March 31, 2013, the fund was diversified as a percentage of net assets as follows: |
Corporate Bonds & Notes | 51.3% | |||
Mortgage-Backed Securities | 21.4% | |||
Asset-Backed Securities | 13.3% | |||
Short-Term Investment | 5.4% | |||
U.S. Treasury Obligations | 4.3% | |||
U.S. Government Agency Issues | 4.0% | |||
Others (each less than 3.0%) | 0.5% | |||
|
| |||
| 100.2% | ||||
Other Assets & Liabilities, Net | (0.2% | ) | ||
|
| |||
| 100.0% | ||||
|
|
| (b) | As of March 31, 2013, the fund’s Standard & Poor’s quality ratings as a percentage of total fixed income investments were are follows (Unaudited): |
AAA | 11.4% | |||
AA / U.S. Government & Agency Issue | 29.8% | |||
A | 22.6% | |||
BBB | 23.8% | |||
BB | 3.6% | |||
B | 1.2% | |||
CCC | 0.2% | |||
Not Rated | 7.4% | |||
|
| |||
| 100.0% | ||||
|
|
| (c) | Open futures contracts outstanding as of March 31, 2013 were as follows: |
| Short Futures Outstanding | Number of Contracts | Notional Amount | Unrealized (Depreciation) | |||||||||
U.S. Treasury 10-Year Notes (06/13) | 34 | $3,400,000 | ($15,897 | ) | ||||||||
U.S. Treasury 10-Year Notes (06/13) | 16 | 1,600,000 | 2,198 | |||||||||
|
| |||||||||||
Total Futures Contracts | ($13,699 | ) | ||||||||||
|
| |||||||||||
| (d) | As of March 31, 2013, an investment with a value of $70,060 was fully or partially segregated with the broker(s)/custodian as collateral for open futures contracts. |
| See Notes to Financial Statements | See explanation of symbols and terms, if any, on page B-79 |
B-26
Table of Contents
PACIFIC LIFE FUNDS
PL SHORT DURATION BOND FUND
Schedule of Investments (Continued)
March 31, 2013
| (e) | Forward foreign currency contracts outstanding as of March 31, 2013 were as follows: |
| Currency Purchased | Currency Sold | Expiration | Counterparty | Unrealized Depreciation | ||||||||||||||||||
USD | 1,081,473 | MXN | 13,535,930 | 06/13 | RBC | ($5,873 | ) | |||||||||||||||
|
| |||||||||||||||||||||
| (f) | Fair Value Measurements |
The following is a summary of the fund’s investments as categorized under the three-tier hierarchy of inputs used in valuing the fund’s assets and liabilities (See Note 3D in Notes to Financial Statements) as of March 31, 2013:
| Total Value at March 31, 2013 | Level 1 Quoted Price | Level 2 Significant | Level 3 Significant | |||||||||||||||
Assets | Corporate Bonds & Notes | $114,664,806 | $— | $114,664,806 | $— | |||||||||||||
Mortgage-Backed Securities | 47,865,539 | — | 47,865,539 | — | ||||||||||||||
Asset-Backed Securities | 29,686,094 | — | 28,769,445 | 916,649 | ||||||||||||||
U.S. Government Agency Issues | 8,898,298 | — | 8,898,298 | — | ||||||||||||||
U.S. Treasury Obligations | 9,783,657 | — | 9,783,657 | — | ||||||||||||||
Foreign Government Notes | 1,112,463 | — | 1,112,463 | — | ||||||||||||||
Short-Term Investment | 12,064,690 | 12,064,690 | — | — | ||||||||||||||
Derivatives: | ||||||||||||||||||
Interest Rate Contracts | ||||||||||||||||||
Futures | 2,198 | 2,198 | — | — | ||||||||||||||
|
|
|
|
|
|
|
| |||||||||||
Total Assets | 224,077,745 | 12,066,888 | 211,094,208 | 916,649 | ||||||||||||||
|
|
|
|
|
|
|
| |||||||||||
Liabilities | Derivatives: | |||||||||||||||||
Foreign Currency Contracts | ||||||||||||||||||
Forward Foreign Currency Contracts | (5,873 | ) | — | (5,873 | ) | — | ||||||||||||
Interest Rate Contracts | ||||||||||||||||||
Futures | (15,897 | ) | (15,897 | ) | — | — | ||||||||||||
|
|
|
|
|
|
|
| |||||||||||
Total Liabilities - Derivatives | (21,770 | ) | (15,897 | ) | (5,873 | ) | — | |||||||||||
|
|
|
|
|
|
|
| |||||||||||
Total Liabilities | (21,770 | ) | (15,897 | ) | (5,873 | ) | — | |||||||||||
|
|
|
|
|
|
|
| |||||||||||
Total | $224,055,975 | $12,050,991 | $211,088,335 | $916,649 | ||||||||||||||
|
|
|
|
|
|
|
| |||||||||||
| See Notes to Financial Statements | See explanation of symbols and terms, if any, on page B-79 |
B-27
Table of Contents
PACIFIC LIFE FUNDS
PL EMERGING MARKETS DEBT FUND
Schedule of Investments
March 31, 2013
Principal | Value | |||||||
CORPORATE BONDS & NOTES - 39.0% | ||||||||
Austria - 0.4% | ||||||||
OGX Austria GmbH | ||||||||
8.375% due 04/01/22 ~ | $200,000 | $151,500 | ||||||
8.500% due 06/01/18 ~ | 200,000 | 157,000 | ||||||
|
| |||||||
| 308,500 | ||||||||
|
| |||||||
Azerbaijan - 0.3% | ||||||||
State Oil Co of the Azerbaijan Republic | 200,000 | 214,000 | ||||||
|
| |||||||
Barbados - 0.3% | ||||||||
Columbus International Inc | 250,000 | 281,250 | ||||||
|
| |||||||
Bermuda - 1.9% | ||||||||
Central European Media Enterprises Ltd | EUR 250,000 | 334,083 | ||||||
China Oriental Group Co Ltd | ||||||||
7.000% due 11/17/17 ~ | $100,000 | 99,250 | ||||||
8.000% due 08/18/15 ~ | 200,000 | 205,500 | ||||||
Digicel Group Ltd | ||||||||
8.250% due 09/30/20 ~ | 300,000 | 321,000 | ||||||
10.500% due 04/15/18 ~ | 100,000 | 112,250 | ||||||
Digicel Ltd | 200,000 | 211,000 | ||||||
Qtel International Finance Ltd | ||||||||
3.875% due 01/31/28 ~ | 50,000 | 49,490 | ||||||
4.500% due 01/31/43 ~ | 100,000 | 96,500 | ||||||
7.875% due 06/10/19 ~ | 160,000 | 209,600 | ||||||
|
| |||||||
| 1,638,673 | ||||||||
|
| |||||||
Cayman - 5.6% | ||||||||
Agile Property Holdings Ltd | 100,000 | 107,600 | ||||||
Amber Circle Funding Ltd | 230,000 | 230,455 | ||||||
Central China Real Estate Ltd | 100,000 | 110,750 | ||||||
China Shanshui Cement Group Ltd | 200,000 | 225,000 | ||||||
Country Garden Holdings Co Ltd | 200,000 | 205,260 | ||||||
Dar Al-Arkan International Sukuk Co II | 300,000 | 330,375 | ||||||
Dubai DOF Sukuk Ltd | 50,000 | 58,750 | ||||||
Dubai Holding Commercial Operations MTN Ltd | ||||||||
4.750% due 01/30/14 | EUR 350,000 | 449,771 | ||||||
6.000% due 02/01/17 | GBP 200,000 | 308,450 | ||||||
Emaar Sukuk Ltd | $200,000 | 220,500 | ||||||
Evergrande Real Estate Group Ltd | ||||||||
7.500% due 01/19/14 ~ | CNY 1,000,000 | 163,478 | ||||||
9.250% due 01/19/16 ~ | 1,400,000 | 230,018 | ||||||
13.000% due 01/27/15 ~ | $250,000 | 274,375 | ||||||
Fibria Overseas Finance Ltd | 200,000 | 222,900 | ||||||
Hidili Industry International Development Ltd | 200,000 | 148,500 | ||||||
Jafz Sukuk Ltd | 50,000 | 56,875 | ||||||
JBS Finance II Ltd | 300,000 | 331,500 | ||||||
Kuwait Projects Co | 200,000 | 256,500 | ||||||
Principal | Value | |||||||
Longfor Properties Co Ltd | $200,000 | $221,000 | ||||||
Marfrig Overseas Ltd | 200,000 | 190,000 | ||||||
Mongolian Mining Corp | 200,000 | 206,000 | ||||||
Nile Finance Ltd | 120,000 | 110,700 | ||||||
Shimao Property Holdings Ltd | 100,000 | 109,940 | ||||||
|
| |||||||
| 4,768,697 | ||||||||
|
| |||||||
Chile - 1.5% | ||||||||
Automotores Gildemeister SA | 150,000 | 157,875 | ||||||
Banco del Estado de Chile | 120,000 | 129,627 | ||||||
Corp Nacional del Cobre de Chile | ||||||||
3.750% due 11/04/20 ~ | 130,000 | 136,859 | ||||||
7.500% due 01/15/19 ~ | 180,000 | 227,469 | ||||||
Empresa Nacional del Petroleo | ||||||||
5.250% due 08/10/20 ~ | 100,000 | 106,371 | ||||||
6.250% due 07/08/19 ~ | 130,000 | 146,286 | ||||||
Inversiones Alsacia SA | 130,862 | 124,483 | ||||||
SMU SA | 200,000 | 215,000 | ||||||
|
| |||||||
| 1,243,970 | ||||||||
|
| |||||||
Colombia - 0.1% | ||||||||
Ecopetrol SA | 100,000 | 125,750 | ||||||
|
| |||||||
El Salvador - 0.1% | ||||||||
Telemovil Finance Co Ltd | 100,000 | 109,500 | ||||||
|
| |||||||
Georgia - 0.3% | ||||||||
Georgian Railway JSC | 200,000 | 229,500 | ||||||
|
| |||||||
Hong Kong - 0.4% | ||||||||
Fosun International Ltd | 200,000 | 212,500 | ||||||
Industrial & Commercial Bank of China Asia Ltd 5.125% due 11/30/20 ~ | 150,000 | 166,901 | ||||||
|
| |||||||
| 379,401 | ||||||||
|
| |||||||
Indonesia - 0.3% | ||||||||
P.T. Pertamina Persero | 200,000 | 205,520 | ||||||
P.T. Perusahaan Listrik Negara | 50,000 | 48,188 | ||||||
|
| |||||||
| 253,708 | ||||||||
|
| |||||||
Ireland - 3.0% | ||||||||
Alfa Bank OJSC | 200,000 | 212,750 | ||||||
Brunswick Rail Finance Ltd | 200,000 | 212,500 | ||||||
Credit Bank of Moscow | 200,000 | 208,000 | ||||||
Metalloinvest Finance Ltd | 200,000 | 211,126 | ||||||
MTS International Funding Ltd | 300,000 | 382,500 | ||||||
| See Notes to Financial Statements | See explanation of symbols and terms, if any, on page B-79 |
B-28
Table of Contents
PACIFIC LIFE FUNDS
PL EMERGING MARKETS DEBT FUND
Schedule of Investments (Continued)
March 31, 2013
Principal | Value | |||||||
Rosneft Oil Co | $200,000 | $198,750 | ||||||
VEB-Leasing | 200,000 | 211,000 | ||||||
Vnesheconombank | ||||||||
5.450% due 11/22/17 ~ | 50,000 | 54,390 | ||||||
6.800% due 11/22/25 ~ | 280,000 | 329,000 | ||||||
6.902% due 07/09/20 ~ | 510,000 | 594,787 | ||||||
|
| |||||||
| 2,614,803 | ||||||||
|
| |||||||
Kazakhstan - 1.1% | ||||||||
ATF Bank JSC | 100,000 | 95,875 | ||||||
Development Bank of Kazakhstan JSC | 420,000 | 408,450 | ||||||
Kazkommertsbank JSC | ||||||||
7.500% due 11/29/16 ~ | 200,000 | 195,340 | ||||||
8.000% due 11/03/15 ~ | 200,000 | 200,500 | ||||||
|
| |||||||
| 900,165 | ||||||||
|
| |||||||
Luxembourg - 5.1% | ||||||||
Altice Financing SA | 200,000 | 219,080 | ||||||
Evraz Group SA | ||||||||
6.750% due 04/27/18 ~ | 300,000 | 311,250 | ||||||
9.500% due 04/24/18 ~ | 100,000 | 115,125 | ||||||
Gazprom Neft OAO | 210,000 | 208,162 | ||||||
Gazprom OAO | ||||||||
4.950% due 02/06/28 ~ | 100,000 | 99,000 | ||||||
6.510% due 03/07/22 ~ | 100,000 | 116,000 | ||||||
9.250% due 04/23/19 ~ | 50,000 | 64,750 | ||||||
MHP SA | ||||||||
8.250% due 04/02/20 ~ | 200,000 | 198,742 | ||||||
10.250% due 04/29/15 ~ | 400,000 | 431,106 | ||||||
Minerva Luxembourg SA | ||||||||
7.750% due 01/31/23 ~ | 200,000 | 215,000 | ||||||
12.250% due 02/10/22 ~ | 300,000 | 375,000 | ||||||
Promsvyazbank OJSC | ||||||||
8.500% due 04/25/17 ~ | 200,000 | 213,000 | ||||||
10.200% due 11/06/19 ~ | 200,000 | 213,500 | ||||||
Russian Standard Bank | 200,000 | 215,520 | ||||||
Sberbank of Russia | ||||||||
5.717% due 06/16/21 ~ | 150,000 | 163,406 | ||||||
6.125% due 02/07/22 ~ | 400,000 | 448,000 | ||||||
Severstal OAO | 100,000 | 109,250 | ||||||
TMK OAO | 500,000 | 530,000 | ||||||
VTB Bank OJSC | 130,000 | 143,650 | ||||||
|
| |||||||
| 4,389,541 | ||||||||
|
| |||||||
Malaysia - 0.7% | ||||||||
Axiata SPV1 Labuan Ltd | 100,000 | 113,935 | ||||||
MMI International Ltd | 200,000 | 206,000 | ||||||
Petronas Capital Ltd | ||||||||
5.250% due 08/12/19 ~ | 150,000 | 175,004 | ||||||
7.875% due 05/22/22 ~ | 100,000 | 139,597 | ||||||
|
| |||||||
| 634,536 | ||||||||
|
| |||||||
Mexico - 1.8% | ||||||||
Cemex SAB de CV | 200,000 | 222,500 | ||||||
Comision Federal de Electricidad | 200,000 | 220,000 | ||||||
Principal | Value | |||||||
Corp GEO SAB de CV | $200,000 | $175,000 | ||||||
Desarrolladora Homex SAB de CV | ||||||||
9.500% due 12/11/19 ~ | 100,000 | 86,500 | ||||||
9.750% due 03/25/20 ~ | 100,000 | 86,000 | ||||||
Petroleos Mexicanos | ||||||||
5.500% due 06/27/44 | 70,000 | 72,380 | ||||||
6.000% due 03/05/20 | 70,000 | 82,950 | ||||||
6.500% due 06/02/41 | 220,000 | 260,150 | ||||||
8.000% due 05/03/19 | 130,000 | 167,050 | ||||||
Urbi Desarrollos Urbanos SAB de CV | ||||||||
9.500% due 01/21/20 ~ | 100,000 | 62,000 | ||||||
9.750% due 02/03/22 ~ | 200,000 | 126,000 | ||||||
|
| |||||||
| 1,560,530 | ||||||||
|
| |||||||
Netherlands - 5.3% | ||||||||
Bharti Airtel International Netherlands BV | 200,000 | 201,800 | ||||||
DTEK Finance BV | 200,000 | 211,500 | ||||||
Indo Energy Finance II BV | 200,000 | 206,500 | ||||||
Kazakhstan Temir Zholy Finance BV | ||||||||
6.375% due 10/06/20 ~ | 220,000 | 257,950 | ||||||
6.950% due 07/10/42 ~ | 100,000 | 117,250 | ||||||
Kazkommerts International BV | 100,000 | 102,300 | ||||||
KazMunaiGas Finance Sub BV | ||||||||
6.375% due 04/09/21 ~ | 280,000 | 327,250 | ||||||
7.000% due 05/05/20 ~ | 240,000 | 286,800 | ||||||
9.125% due 07/02/18 ~ | 100,000 | 126,363 | ||||||
11.750% due 01/23/15 ~ | 170,000 | 197,837 | ||||||
Lukoil International Finance BV | 100,000 | 119,000 | ||||||
Majapahit Holding BV | ||||||||
7.750% due 10/17/16 ~ | 170,000 | 197,838 | ||||||
7.750% due 01/20/20 ~ | 220,000 | 270,600 | ||||||
8.000% due 08/07/19 ~ | 130,000 | 160,875 | ||||||
Marfrig Holding Europe BV | 200,000 | 181,500 | ||||||
Metinvest BV | ||||||||
8.750% due 02/14/18 ~ | 500,000 | 514,000 | ||||||
10.250% due 05/20/15 ~ | 100,000 | 105,970 | ||||||
OSX 3 Leasing BV | 100,000 | 99,750 | ||||||
Polish Television Holding BV | EUR 100,000 | 138,440 | ||||||
VimpelCom Holdings BV | $400,000 | 446,120 | ||||||
WPE International Cooperatief UA | 100,000 | 94,000 | ||||||
Zhaikmunai LP | 200,000 | 214,500 | ||||||
|
| |||||||
| 4,578,143 | ||||||||
|
| |||||||
Nigeria - 0.2% | ||||||||
Sea Trucks Group | 200,000 | 200,000 | ||||||
|
| |||||||
Peru - 0.2% | ||||||||
CFG Investment SAC | 200,000 | 187,650 | ||||||
|
| |||||||
Philippines - 0.7% | ||||||||
Development Bank of Philippines | 200,000 | 225,574 | ||||||
Power Sector Assets & Liabilities Management Corp | 260,000 | 351,650 | ||||||
|
| |||||||
| 577,224 | ||||||||
|
| |||||||
| See Notes to Financial Statements | See explanation of symbols and terms, if any, on page B-79 |
B-29
Table of Contents
PACIFIC LIFE FUNDS
PL EMERGING MARKETS DEBT FUND
Schedule of Investments (Continued)
March 31, 2013
Principal | Value | |||||||
Singapore - 0.3% | ||||||||
Yanlord Land Group Ltd | $200,000 | $225,000 | ||||||
|
| |||||||
South Africa - 0.5% | ||||||||
African Bank Ltd | 200,000 | 222,400 | ||||||
Edcon Holdings Proprietary Ltd | EUR 100,000 | 117,931 | ||||||
Edcon Proprietary Ltd | 68,000 | 87,166 | ||||||
|
| |||||||
| 427,497 | ||||||||
|
| |||||||
Spain - 0.4% | ||||||||
Cemex Espana Luxembourg | ||||||||
9.250% due 05/12/20 ~ | $300,000 | 334,500 | ||||||
|
| |||||||
Sri Lanka - 0.2% | ||||||||
Bank of Ceylon | 200,000 | 211,500 | ||||||
|
| |||||||
Sweden - 0.6% | ||||||||
Eileme 2 AB | ||||||||
11.625% due 01/31/20 ~ | 200,000 | 235,000 | ||||||
11.750% due 01/31/20 ~ | EUR 200,000 | 297,390 | ||||||
|
| |||||||
| 532,390 | ||||||||
|
| |||||||
Ukraine - 0.4% | ||||||||
National JSC Naftogaz of Ukraine | $340,000 | 350,608 | ||||||
|
| |||||||
United Arab Emirates - 1.6% | ||||||||
Dolphin Energy Ltd | 136,134 | 154,852 | ||||||
DP World Ltd | 500,000 | 571,000 | ||||||
Dubai Electricity & Water Authority | 240,000 | 292,800 | ||||||
Emirates Airline | ||||||||
4.500% due 02/06/25 ~ | 100,000 | 98,610 | ||||||
5.125% due 06/08/16 ~ | 200,000 | 210,500 | ||||||
|
| |||||||
| 1,327,762 | ||||||||
|
| |||||||
United Kingdom - 4.2% | ||||||||
Afren PLC | ||||||||
10.250% due 04/08/19 ~ | 200,000 | 239,000 | ||||||
11.500% due 02/01/16 ~ | 200,000 | 238,000 | ||||||
Atlantic Finance Ltd | 250,000 | 271,250 | ||||||
CNPC HK Overseas Capital Ltd | 200,000 | 243,212 | ||||||
DTEK Finance PLC | 200,000 | 197,978 | ||||||
Ferrexpo Finance PLC | 300,000 | 300,750 | ||||||
Franshion Development Ltd | 200,000 | 217,760 | ||||||
Oschadbank | 290,000 | 287,100 | ||||||
Privatbank CJSC | 150,000 | 147,757 | ||||||
Sinochem Overseas Capital Co Ltd | ||||||||
4.500% due 11/12/20 ~ | 300,000 | 325,560 | ||||||
6.300% due 11/12/40 ~ | 100,000 | 115,479 | ||||||
Principal | Value | |||||||
Sinopec Group Overseas Development Ltd | $200,000 | $212,976 | ||||||
Star Energy Geothermal Wayang Windu Ltd | 96,429 | 102,817 | ||||||
State Export-Import Bank of Ukraine JSC | 320,000 | 324,000 | ||||||
Vedanta Resources PLC | ||||||||
8.250% due 06/07/21 ~ | 200,000 | 230,000 | ||||||
9.500% due 07/18/18 ~ | 100,000 | 118,000 | ||||||
|
| |||||||
| 3,571,639 | ||||||||
|
| |||||||
United States - 0.9% | ||||||||
CEDC Finance Corp International Inc | EUR 150,000 | 150,554 | ||||||
NII Capital Corp | $300,000 | 217,500 | ||||||
Pemex Project Funding Master Trust | 100,000 | 115,375 | ||||||
Reliance Holdings USA Inc | 250,000 | 277,005 | ||||||
|
| |||||||
| 760,434 | ||||||||
|
| |||||||
Venezuela - 0.6% | ||||||||
Petroleos de Venezuela SA | ||||||||
5.250% due 04/12/17 ~ | 150,000 | 130,875 | ||||||
5.375% due 04/12/27 ~ | 300,000 | 208,500 | ||||||
5.500% due 04/12/37 ~ | 120,000 | 81,900 | ||||||
12.750% due 02/17/22 ~ | 110,000 | 124,575 | ||||||
|
| |||||||
| 545,850 | ||||||||
|
| |||||||
Total Corporate Bonds & Notes | 33,482,721 | |||||||
|
| |||||||
FOREIGN GOVERNMENT BONDS & NOTES - 56.6% |
| |||||||
Argentina - 1.7% | ||||||||
Argentina Boden | 655,000 | 556,750 | ||||||
Argentina Bonar | 170,000 | 169,150 | ||||||
Argentine Republic Government | ||||||||
2.500% due 12/31/38 § | 134,000 | 42,545 | ||||||
8.280% due 12/31/33 | 1,010,582 | 546,938 | ||||||
8.750% due 06/02/17 | 175,000 | 129,500 | ||||||
|
| |||||||
| 1,444,883 | ||||||||
|
| |||||||
Belarus - 1.1% | ||||||||
Republic of Belarus | ||||||||
8.750% due 08/03/15 ~ | 310,000 | 323,950 | ||||||
8.950% due 01/26/18 ~ | 580,000 | 622,050 | ||||||
|
| |||||||
| 946,000 | ||||||||
|
| |||||||
Bolivia - 0.1% | ||||||||
Bolivian Government | 100,000 | 99,650 | ||||||
|
| |||||||
Brazil - 7.3% | ||||||||
Banco Nacional de Desenvolvimento Economico e Social | ||||||||
5.500% due 07/12/20 ~ | 100,000 | 113,250 | ||||||
6.500% due 06/10/19 ~ | 270,000 | 317,925 | ||||||
Brazil Letras do Tesouro Nacional | BRL 1,540,000 | 659,324 | ||||||
Brazil Notas do Tesouro Nacional ‘B’ | ||||||||
6.000% due 08/15/20 ^ | 880,000 | 1,138,872 | ||||||
6.000% due 08/15/50 ^ | 1,360,000 | 1,972,689 | ||||||
Brazilian Government | ||||||||
2.625% due 01/05/23 | $200,000 | 192,500 | ||||||
4.875% due 01/22/21 | 600,000 | 699,000 | ||||||
| See Notes to Financial Statements | See explanation of symbols and terms, if any, on page B-79 |
B-30
Table of Contents
PACIFIC LIFE FUNDS
PL EMERGING MARKETS DEBT FUND
Schedule of Investments (Continued)
March 31, 2013
Principal | Value | |||||||
5.875% due 01/15/19 | $90,000 | $108,675 | ||||||
6.000% due 01/17/17 | 70,000 | 81,655 | ||||||
8.250% due 01/20/34 | 270,000 | 411,750 | ||||||
8.875% due 04/15/24 | 150,000 | 230,625 | ||||||
10.125% due 05/15/27 | 220,000 | 379,830 | ||||||
|
| |||||||
| 6,306,095 | ||||||||
|
| |||||||
Chile - 0.1% | ||||||||
Chile Government | 100,000 | 105,450 | ||||||
|
| |||||||
Colombia - 2.3% | ||||||||
Colombia Government | ||||||||
4.375% due 07/12/21 | 200,000 | 224,830 | ||||||
6.125% due 01/18/41 | 390,000 | 492,288 | ||||||
7.375% due 03/18/19 | 240,000 | 310,200 | ||||||
7.375% due 09/18/37 | 140,000 | 201,250 | ||||||
8.125% due 05/21/24 | 280,000 | 404,460 | ||||||
10.375% due 01/28/33 | 20,000 | 34,550 | ||||||
11.750% due 02/25/20 | 190,000 | 297,825 | ||||||
|
| |||||||
| 1,965,403 | ||||||||
|
| |||||||
Costa Rica - 0.3% | ||||||||
Costa Rica Government | 240,000 | 240,840 | ||||||
|
| |||||||
Croatia - 1.4% | ||||||||
Croatia Government | ||||||||
6.250% due 04/27/17 ~ | 200,000 | 214,730 | ||||||
6.375% due 03/24/21 ~ | 440,000 | 475,420 | ||||||
6.625% due 07/14/20 ~ | 200,000 | 218,500 | ||||||
6.750% due 11/05/19 ~ | 300,000 | 330,027 | ||||||
|
| |||||||
| 1,238,677 | ||||||||
|
| |||||||
Dominican Republic - 0.4% | ||||||||
Dominican Republic | 270,000 | 303,885 | ||||||
|
| |||||||
Ecuador - 0.1% | ||||||||
Ecuador Government | 100,000 | 104,750 | ||||||
|
| |||||||
Egypt - 0.2% | ||||||||
Egypt Government | ||||||||
5.750% due 04/29/20 ~ | 100,000 | 85,250 | ||||||
6.875% due 04/30/40 ~ | 100,000 | 78,250 | ||||||
|
| |||||||
| 163,500 | ||||||||
|
| |||||||
El Salvador - 0.9% | ||||||||
El Salvador Government | ||||||||
5.875% due 01/30/25 ~ | 230,000 | 242,305 | ||||||
7.625% due 02/01/41 ~ | 180,000 | 207,450 | ||||||
7.650% due 06/15/35 ~ | 240,000 | 276,360 | ||||||
8.250% due 04/10/32 ~ | 20,000 | 25,050 | ||||||
|
| |||||||
| 751,165 | ||||||||
|
| |||||||
Ghana - 0.2% | ||||||||
Republic of Ghana | 130,000 | 149,175 | ||||||
|
| |||||||
Guatemala - 0.2% | ||||||||
Guatemala Government | 200,000 | 196,500 | ||||||
|
| |||||||
Principal | Value | |||||||
Hungary - 1.3% | ||||||||
Hungary Government | ||||||||
5.375% due 02/21/23 | $260,000 | $246,636 | ||||||
6.250% due 01/29/20 | 270,000 | 277,087 | ||||||
6.375% due 03/29/21 | 324,000 | 335,340 | ||||||
7.625% due 03/29/41 | 280,000 | 287,000 | ||||||
|
| |||||||
| 1,146,063 | ||||||||
|
| |||||||
Indonesia - 2.4% | ||||||||
Indonesia Government | ||||||||
4.875% due 05/05/21 ~ | 110,000 | 120,862 | ||||||
5.875% due 03/13/20 ~ | 190,000 | 220,400 | ||||||
6.625% due 02/17/37 ~ | 100,000 | 124,000 | ||||||
6.875% due 01/17/18 ~ | 320,000 | 378,800 | ||||||
7.500% due 01/15/16 ~ | 150,000 | 172,500 | ||||||
7.750% due 01/17/38 ~ | 190,000 | 266,095 | ||||||
8.500% due 10/12/35 ~ | 340,000 | 504,050 | ||||||
10.375% due 05/04/14 ~ | 60,000 | 65,850 | ||||||
11.625% due 03/04/19 ~ | 170,000 | 247,350 | ||||||
|
| |||||||
| 2,099,907 | ||||||||
|
| |||||||
Iraq - 0.7% | ||||||||
Republic of Iraq | 680,000 | 627,300 | ||||||
|
| |||||||
Ivory Coast - 1.3% | ||||||||
Ivory Coast Government | 1,160,000 | 1,081,700 | ||||||
|
| |||||||
Kazakhstan - 0.2% | ||||||||
Kazatomprom Natsionalnaya Atomnaya Kompaniya AO | 190,000 | 203,537 | ||||||
|
| |||||||
Latvia - 0.3% | ||||||||
Republic of Latvia | 300,000 | 289,950 | ||||||
|
| |||||||
Lebanon - 1.2% | ||||||||
Lebanon Government | ||||||||
5.150% due 11/12/18 ~ | 50,000 | 49,875 | ||||||
6.100% due 10/04/22 ~ | 420,000 | 425,250 | ||||||
6.375% due 03/09/20 | 240,000 | 250,200 | ||||||
6.600% due 11/27/26 | 170,000 | 173,825 | ||||||
8.250% due 04/12/21 ~ | 90,000 | 103,500 | ||||||
8.500% due 01/19/16 ~ | 30,000 | 33,600 | ||||||
|
| |||||||
| 1,036,250 | ||||||||
|
| |||||||
Lithuania - 1.7% | ||||||||
Lithuania Government | ||||||||
5.125% due 09/14/17 ~ | 120,000 | 133,350 | ||||||
6.125% due 03/09/21 ~ | 280,000 | 333,200 | ||||||
6.625% due 02/01/22 ~ | 400,000 | 491,500 | ||||||
7.375% due 02/11/20 ~ | 420,000 | 530,250 | ||||||
|
| |||||||
| 1,488,300 | ||||||||
|
| |||||||
Mexico - 4.5% | ||||||||
Mexican Bonos | ||||||||
7.750% due 05/29/31 | MXN 2,500,000 | 251,003 | ||||||
8.500% due 05/31/29 | 5,070,000 | 541,123 | ||||||
10.000% due 11/20/36 | 9,300,000 | 1,155,152 | ||||||
Mexico Government | ||||||||
3.625% due 03/15/22 | $100,000 | 106,555 | ||||||
4.750% due 03/08/44 | 338,000 | 351,824 | ||||||
5.125% due 01/15/20 | 190,000 | 223,440 | ||||||
| See Notes to Financial Statements | See explanation of symbols and terms, if any, on page B-79 |
B-31
Table of Contents
PACIFIC LIFE FUNDS
PL EMERGING MARKETS DEBT FUND
Schedule of Investments (Continued)
March 31, 2013
Principal | Value | |||||||
5.625% due 01/15/17 | $150,000 | $173,250 | ||||||
5.750% due 10/12/10 | 154,000 | 169,708 | ||||||
5.950% due 03/19/19 | 140,000 | 170,100 | ||||||
6.050% due 01/11/40 | 280,000 | 347,900 | ||||||
6.750% due 09/27/34 | 250,000 | 333,750 | ||||||
|
| |||||||
| 3,823,805 | ||||||||
|
| |||||||
Mongolia - 0.2% | ||||||||
Mongolia Government | 200,000 | 187,500 | ||||||
|
| |||||||
Morocco - 0.5% | ||||||||
Morocco Government | ||||||||
4.250% due 12/11/22 ~ | 200,000 | 205,100 | ||||||
5.500% due 12/11/42 ~ | 200,000 | 199,500 | ||||||
|
| |||||||
| 404,600 | ||||||||
|
| |||||||
Nigeria - 0.3% | ||||||||
Nigeria Government | 200,000 | 232,000 | ||||||
|
| |||||||
Pakistan - 0.4% | ||||||||
Pakistan Government | 400,000 | 360,000 | ||||||
|
| |||||||
Panama - 0.8% | ||||||||
Panama Government | ||||||||
6.700% due 01/26/36 | 240,000 | 321,000 | ||||||
8.875% due 09/30/27 | 120,000 | 186,120 | ||||||
9.375% due 04/01/29 | 90,000 | 146,835 | ||||||
|
| |||||||
| 653,955 | ||||||||
|
| |||||||
Paraguay - 0.2% | ||||||||
Republic of Paraguay | 200,000 | 201,800 | ||||||
|
| |||||||
Peru - 1.5% | ||||||||
El Fondo MIVIVIENDA SA | 100,000 | 97,450 | ||||||
Peruvian Government | ||||||||
7.125% due 03/30/19 | 50,000 | 64,425 | ||||||
7.350% due 07/21/25 | 328,000 | 464,612 | ||||||
8.375% due 05/03/16 | 140,000 | 171,220 | ||||||
8.750% due 11/21/33 | 300,000 | 492,000 | ||||||
|
| |||||||
| 1,289,707 | ||||||||
|
| |||||||
Philippines - 2.5% | ||||||||
Philippine Government | ||||||||
4.000% due 01/15/21 | 280,000 | 310,100 | ||||||
5.500% due 03/30/26 | 230,000 | 281,750 | ||||||
6.375% due 10/23/34 | 200,000 | 262,500 | ||||||
7.750% due 01/14/31 | 280,000 | 406,000 | ||||||
8.375% due 06/17/19 | 130,000 | 175,825 | ||||||
9.500% due 02/02/30 | 310,000 | 509,175 | ||||||
10.625% due 03/16/25 | 124,000 | 208,630 | ||||||
|
| |||||||
| 2,153,980 | ||||||||
|
| |||||||
Poland - 1.3% | ||||||||
Poland Government | ||||||||
3.000% due 03/17/23 | 270,000 | 262,170 | ||||||
5.000% due 03/23/22 | 460,000 | 526,668 | ||||||
6.375% due 07/15/19 | 250,000 | 307,762 | ||||||
|
| |||||||
| 1,096,600 | ||||||||
|
| |||||||
Principal | Value | |||||||
Qatar - 0.4% | ||||||||
Qatar Government | ||||||||
5.750% due 01/20/42 ~ | $200,000 | $239,000 | ||||||
6.400% due 01/20/40 ~ | 100,000 | 128,500 | ||||||
|
| |||||||
| 367,500 | ||||||||
|
| |||||||
Romania - 1.1% | ||||||||
Romanian Government | ||||||||
4.375% due 08/22/23 ~ | 290,000 | 285,412 | ||||||
6.750% due 02/07/22 ~ | 532,000 | 621,110 | ||||||
|
| |||||||
| 906,522 | ||||||||
|
| |||||||
Russia - 3.3% | ||||||||
Russian Federal | RUB 48,500,000 | 1,584,450 | ||||||
Russian Foreign | ||||||||
5.000% due 04/29/20 ~ | $100,000 | 113,300 | ||||||
7.500% due 03/31/30 § ~ | 914,500 | 1,134,666 | ||||||
12.750% due 06/24/28 ~ | 20,000 | 38,300 | ||||||
|
| |||||||
| 2,870,716 | ||||||||
|
| |||||||
Senegal - 0.3% | ||||||||
Senegal Government | 200,000 | 238,000 | ||||||
|
| |||||||
Serbia - 0.5% | ||||||||
Republic of Serbia | 150,000 | 148,650 | ||||||
7.250% due 09/28/21 ~ | 240,000 | 266,700 | ||||||
|
| |||||||
| 415,350 | ||||||||
|
| |||||||
South Africa - 1.2% | ||||||||
South Africa Government | ||||||||
5.500% due 03/09/20 | 230,000 | 263,925 | ||||||
5.875% due 05/30/22 | 250,000 | 294,375 | ||||||
6.250% due 03/08/41 | 100,000 | 121,750 | ||||||
6.875% due 05/27/19 | 270,000 | 330,075 | ||||||
|
| |||||||
| 1,010,125 | ||||||||
|
| |||||||
Sri Lanka - 0.4% | ||||||||
Sri Lanka Government | ||||||||
6.250% due 07/27/21 ~ | 200,000 | 212,748 | ||||||
7.400% due 01/22/15 ~ | 100,000 | 107,000 | ||||||
|
| |||||||
| 319,748 | ||||||||
|
| |||||||
Turkey - 3.5% | ||||||||
Turkey Government | ||||||||
3.250% due 03/23/23 | 200,000 | 189,500 | ||||||
5.625% due 03/30/21 | 200,000 | 229,100 | ||||||
6.000% due 01/14/41 | 200,000 | 224,750 | ||||||
6.750% due 04/03/18 | 510,000 | 603,075 | ||||||
6.750% due 05/30/40 | 140,000 | 173,250 | ||||||
6.875% due 03/17/36 | 230,000 | 284,337 | ||||||
7.000% due 09/26/16 | 160,000 | 184,400 | ||||||
7.000% due 03/11/19 | 110,000 | 133,237 | ||||||
7.000% due 06/05/20 | 40,000 | 49,200 | ||||||
7.250% due 03/05/38 | 90,000 | 116,550 | ||||||
7.375% due 02/05/25 | 320,000 | 409,600 | ||||||
7.500% due 07/14/17 | 160,000 | 191,400 | ||||||
8.000% due 02/14/34 | 90,000 | 123,975 | ||||||
11.875% due 01/15/30 | 60,000 | 109,650 | ||||||
|
| |||||||
| 3,022,024 | ||||||||
|
| |||||||
| See Notes to Financial Statements | See explanation of symbols and terms, if any, on page B-79 |
B-32
Table of Contents
PACIFIC LIFE FUNDS
PL EMERGING MARKETS DEBT FUND
Schedule of Investments (Continued)
March 31, 2013
Principal | Value | |||||||
Ukraine - 2.1% | ||||||||
Ukraine Government | ||||||||
6.250% due 06/17/16 ~ | $200,000 | $196,780 | ||||||
7.750% due 09/23/20 ~ | 200,000 | 208,800 | ||||||
7.800% due 11/28/22 ~ | 470,000 | 478,225 | ||||||
7.950% due 02/23/21 ~ | 330,000 | 345,180 | ||||||
9.250% due 07/24/17 ~ | 500,000 | 543,800 | ||||||
|
| |||||||
| 1,772,785 | ||||||||
|
| |||||||
United Arab Emirates - 0.4% | ||||||||
Emirate of Dubai Government | 270,000 | 334,125 | ||||||
|
| |||||||
Uruguay - 1.5% | ||||||||
Uruguay Government | ||||||||
4.125% due 11/20/45 | 304,374 | 280,937 | ||||||
7.625% due 03/21/36 | 130,000 | 188,435 | ||||||
7.875% due 01/15/33 | 280,000 | 407,960 | ||||||
8.000% due 11/18/22 | 289,277 | 404,699 | ||||||
|
| |||||||
| 1,282,031 | ||||||||
|
| |||||||
Venezuela - 3.6% | ||||||||
Venezuela Government | ||||||||
6.000% due 12/09/20 ~ | 130,000 | 108,875 | ||||||
7.000% due 03/31/38 ~ | 10,000 | 7,925 | ||||||
7.650% due 04/21/25 | 80,000 | 70,400 | ||||||
7.750% due 10/13/19 ~ | 230,000 | 216,200 | ||||||
8.250% due 10/13/24 ~ | 130,000 | 118,625 | ||||||
8.500% due 10/08/14 | 180,000 | 183,600 | ||||||
9.000% due 05/07/23 ~ | 176,000 | 169,400 | ||||||
9.250% due 09/15/27 | 230,000 | 227,470 | ||||||
9.250% due 05/07/28 ~ | 200,000 | 192,500 | ||||||
10.750% due 09/19/13 | 50,000 | 51,250 | ||||||
11.750% due 10/21/26 ~ | 638,000 | 709,137 | ||||||
11.950% due 08/05/31 ~ | 663,000 | 749,190 | ||||||
12.750% due 08/23/22 ~ | 227,000 | 265,930 | ||||||
|
| |||||||
| 3,070,502 | ||||||||
|
| |||||||
Vietnam - 0.6% | ||||||||
Vietnam Government | ||||||||
6.750% due 01/29/20 ~ | 200,000 | 234,000 | ||||||
6.875% due 01/15/16 ~ | 240,000 | 267,000 | ||||||
|
| |||||||
| 501,000 | ||||||||
|
| |||||||
Zambia - 0.1% | ||||||||
Zambia Government | 100,000 | 99,625 | ||||||
|
| |||||||
Total Foreign Government Bonds & Notes | 48,602,980 | |||||||
|
| |||||||
PURCHASED OPTIONS - 0.0% | ||||||||
(See Note (f) in Notes to Schedule of Investments) | 42,147 | |||||||
|
| |||||||
| Value | |||||||
SHORT-TERM INVESTMENT - 2.3% | ||||||||
Money Market Fund - 2.3% | ||||||||
BlackRock Liquidity Funds Treasury Trust Fund Portfolio | 1,961,509 | $1,961,509 | ||||||
|
| |||||||
Total Short-Term Investment | 1,961,509 | |||||||
|
| |||||||
TOTAL INVESTMENTS - 97.9% | 84,089,357 | |||||||
OTHER ASSETS & LIABILITIES, NET - 2.1% | 1,756,480 | |||||||
|
| |||||||
NET ASSETS - 100.0% | $85,845,837 | |||||||
|
| |||||||
Notes to Schedule of Investments
| (a) | As of March 31, 2013, the fund was diversified as a percentage of net assets as follows: |
Foreign Government Bonds & Notes | 56.6% | |||
Corporate Bonds & Notes | 39.0% | |||
Others (each less than 3.0%) | 2.3% | |||
|
| |||
| 97.9% | ||||
Other Assets & Liabilities, Net | 2.1% | |||
|
| |||
| 100.0% | ||||
|
|
| (b) | As of March 31, 2013, the fund’s Standard & Poor’s quality ratings as a percentage of total fixed income investments were are follows (Unaudited): |
AA | 1.0% | |||
A | 5.5% | |||
BBB | 26.5% | |||
BB | 21.5% | |||
B | 20.3% | |||
CCC | 1.0% | |||
CC | 0.2% | |||
Not Rated | 24.0% | |||
|
| |||
| 100.0% | ||||
|
|
| (c) | Investments reflect the stated coupon rate or for discounted investments or zero coupon bonds, the annualized effective yield on the date of purchase. |
| (d) | Investments with a total aggregate value of $150,554 or 0.2% of the net assets were in default as of March 31, 2013. |
| See Notes to Financial Statements | See explanation of symbols and terms, if any, on page B-79 |
B-33
Table of Contents
PACIFIC LIFE FUNDS
PL EMERGING MARKETS DEBT FUND
Schedule of Investments (Continued)
March 31, 2013
| (e) | Forward foreign currency contracts outstanding as of March 31, 2013 were as follows: |
Currency Purchased | Currency Sold | Expiration | Counterparty | Unrealized Appreciation (Depreciation) | ||||||||||||||||
| BRL | 3,076,855 | USD | 1,522,442 | 04/13 | BRC | ($671 | ) | |||||||||||||
| BRL | 2,339,890 | USD | 1,162,101 | 04/13 | GSC | (4,823 | ) | |||||||||||||
| BRL | 950,950 | USD | 461,828 | 05/13 | HSB | 6,856 | ||||||||||||||
| MXN | 4,843,773 | USD | 380,000 | 04/13 | DUB | 11,342 | ||||||||||||||
| MXN | 5,224,003 | USD | 410,000 | 04/13 | JPM | 12,062 | ||||||||||||||
| MXN | 10,687,433 | USD | 846,000 | 05/13 | DUB | 15,065 | ||||||||||||||
| MXN | 10,561,131 | USD | 850,000 | 06/13 | GSC | (1,263 | ) | |||||||||||||
| RUB | 25,583,250 | USD | 840,000 | 05/13 | UBS | (24,916 | ) | |||||||||||||
| RUB | 25,681,580 | USD | 822,613 | 06/13 | HSB | (9,365 | ) | |||||||||||||
| USD | 1,970,580 | BRL | 3,878,045 | 04/13 | HSB | 52,553 | ||||||||||||||
| USD | 731,426 | BRL | 1,538,700 | 04/13 | SCB | (29,594 | ) | |||||||||||||
| USD | 1,517,187 | BRL | 3,076,855 | 05/13 | BRC | 733 | ||||||||||||||
| USD | 280,000 | BRL | 569,405 | 05/13 | BRC | (636 | ) | |||||||||||||
| USD | 1,158,075 | BRL | 2,339,890 | 05/13 | GSC | 4,840 | ||||||||||||||
| USD | 303,050 | CNY | 1,907,850 | 05/13 | UBS | (2,958 | ) | |||||||||||||
| USD | 1,843,877 | EUR | 1,415,753 | 04/13 | DUB | 28,797 | ||||||||||||||
| USD | 264,363 | GBP | 176,713 | 04/13 | BRC | (4,108 | ) | |||||||||||||
| USD | 46,139 | MXN | 590,000 | 04/13 | BRC | (1,529 | ) | |||||||||||||
| USD | 860,587 | MXN | 11,055,704 | 04/13 | JPM | (32,635 | ) | |||||||||||||
| USD | 917,352 | MXN | 11,598,078 | 05/13 | CIT | (17,082 | ) | |||||||||||||
| USD | 420,000 | RUB | 13,066,200 | 04/13 | BRC | 1,683 | ||||||||||||||
| USD | 860,000 | RUB | 26,816,950 | 04/13 | CSF | 2,622 | ||||||||||||||
| USD | 1,646,339 | RUB | 50,020,718 | 04/13 | HSB | 47,103 | ||||||||||||||
| USD | 430,000 | RUB | 13,379,450 | 05/13 | BRC | 4,425 | ||||||||||||||
| USD | 3,447 | RUB | 106,478 | 05/13 | UBS | 60 | ||||||||||||||
|
| |||||||||||||||||||
Total Forward Foreign Currency Contracts |
| $58,561 | ||||||||||||||||||
|
| |||||||||||||||||||
| (f) | Purchased options outstanding as of March 31, 2013 were as follows: |
Foreign Currency Options
| Description | Exercise Price | Expiration Date | Counter- party | Notional Amount | Cost | Value | ||||||||||||||||
Put - OTC Euro versus U.S. Dollar | $1.31 | 07/12/13 | BOA | EUR 590,000 | $11,653 | $23,623 | ||||||||||||||||
Put - OTC Euro versus U.S. Dollar | 1.27 | 09/18/13 | BOA | 700,000 | 15,614 | 18,524 | ||||||||||||||||
|
|
|
| |||||||||||||||||||
Total Purchased Options | $27,267 | $42,147 | ||||||||||||||||||||
|
|
|
| |||||||||||||||||||
| (g) | Swap agreements outstanding as of March 31, 2013 were as follows: |
Interest Rate Swaps
| Floating Rate Index | Counter- party | Pay/Receive Floating Rate | Fixed Rate | Expiration Date | Notional Amount | Value | Upfront Premiums Paid (Received) | Unrealized Depreciation | ||||||||||||||||||||
Brazil Cetip Interbank Deposit Rate | HSB | Pay | 8.270% | 01/02/17 | BRL 436,911 | ($16,535 | ) | $— | ($16,535 | ) | ||||||||||||||||||
|
|
|
|
|
| |||||||||||||||||||||||
Total Swap Agreements | ($16,535 | ) | $— | ($16,535 | ) | |||||||||||||||||||||||
|
|
|
|
|
| |||||||||||||||||||||||
| See Notes to Financial Statements | See explanation of symbols and terms, if any, on page B-79 |
B-34
Table of Contents
PACIFIC LIFE FUNDS
PL EMERGING MARKETS DEBT FUND
Schedule of Investments (Continued)
March 31, 2013
| (h) | Fair Value Measurements |
The following is a summary of the fund’s investments as categorized under the three-tier hierarchy of inputs used in valuing the fund’s assets and liabilities (See Note 3D in Notes to Financial Statements) as of March 31, 2013:
| Total Value at March 31, 2013 | Level 1 Quoted Price | Level 2 Significant Observable Inputs | Level 3 Significant Unobservable Inputs | |||||||||||||||
Assets | Corporate Bonds & Notes | $33,482,721 | $— | $33,482,721 | $— | |||||||||||||
Foreign Government Bonds & Notes | 48,602,980 | — | 48,602,980 | — | ||||||||||||||
Short-Term Investment | 1,961,509 | 1,961,509 | — | — | ||||||||||||||
Derivatives: | ||||||||||||||||||
Foreign Currency Contracts | ||||||||||||||||||
Forward Foreign Currency Contracts | 188,141 | — | 188,141 | — | ||||||||||||||
Purchased Options | 42,147 | — | 42,147 | — | ||||||||||||||
|
|
|
|
|
|
|
| |||||||||||
Total Foreign Currency Contracts | 230,288 | — | 230,288 | — | ||||||||||||||
|
|
|
|
|
|
|
| |||||||||||
Total Assets | 84,277,498 | 1,961,509 | 82,315,989 | — | ||||||||||||||
|
|
|
|
|
|
|
| |||||||||||
Liabilities | Derivatives: | |||||||||||||||||
Foreign Currency Contracts | ||||||||||||||||||
Forward Foreign Currency Contracts | (129,580 | ) | — | (129,580 | ) | — | ||||||||||||
Interest Rate Contracts | ||||||||||||||||||
Swaps | (16,535 | ) | — | (16,535 | ) | — | ||||||||||||
|
|
|
|
|
|
|
| |||||||||||
Total Liabilities - Derivatives | (146,115 | ) | — | (146,115 | ) | — | ||||||||||||
|
|
|
|
|
|
|
| |||||||||||
Total Liabilities | (146,115 | ) | — | (146,115 | ) | — | ||||||||||||
|
|
|
|
|
|
|
| |||||||||||
Total | $84,131,383 | $1,961,509 | $82,169,874 | $— | ||||||||||||||
|
|
|
|
|
|
|
| |||||||||||
| See Notes to Financial Statements | See explanation of symbols and terms, if any, on page B-79 |
B-35
Table of Contents
PACIFIC LIFE FUNDS
PL COMSTOCK FUND
Schedule of Investments
March 31, 2013
| Value | |||||||
COMMON STOCKS - 95.0% |
| |||||||
Consumer Discretionary - 14.7% | ||||||||
Carnival Corp (Panama) | 60,788 | $2,085,028 | ||||||
Comcast Corp ‘A’ | 120,907 | 5,079,303 | ||||||
General Motors Co * | 172,236 | 4,791,606 | ||||||
Johnson Controls Inc | 49,346 | 1,730,564 | ||||||
Kohl’s Corp | 22,942 | 1,058,314 | ||||||
Lowe’s Cos Inc | 33,654 | 1,276,160 | ||||||
Newell Rubbermaid Inc | 51,273 | 1,338,225 | ||||||
News Corp ‘B’ | 143,672 | 4,419,351 | ||||||
Staples Inc | 120,261 | 1,615,105 | ||||||
Target Corp | 31,370 | 2,147,277 | ||||||
Time Warner Cable Inc | 57,647 | 5,537,571 | ||||||
Time Warner Inc | 28,247 | 1,627,592 | ||||||
Viacom Inc ‘B’ | 94,285 | 5,805,127 | ||||||
|
| |||||||
| 38,511,223 | ||||||||
|
| |||||||
Consumer Staples - 5.6% | ||||||||
Archer-Daniels-Midland Co | 57,905 | 1,953,136 | ||||||
CVS Caremark Corp | 77,644 | 4,269,644 | ||||||
Mondelez International Inc ‘A’ | 82,423 | 2,522,968 | ||||||
The Procter & Gamble Co | 11,151 | 859,296 | ||||||
Tyson Foods Inc ‘A’ | 70,110 | 1,740,130 | ||||||
Unilever NV ‘NY’ (Netherlands) | 65,369 | 2,680,129 | ||||||
Wal-Mart Stores Inc | 8,625 | 645,409 | ||||||
|
| |||||||
| 14,670,712 | ||||||||
|
| |||||||
Energy - 13.5% | ||||||||
BP PLC ADR (United Kingdom) | 127,949 | 5,418,640 | ||||||
Chevron Corp | 29,116 | 3,459,563 | ||||||
Halliburton Co | 129,167 | 5,219,638 | ||||||
Murphy Oil Corp | 64,991 | 4,141,876 | ||||||
Noble Corp (Switzerland) | 35,223 | 1,343,757 | ||||||
Occidental Petroleum Corp | 38,382 | 3,007,997 | ||||||
QEP Resources Inc | 101,634 | 3,236,027 | ||||||
Royal Dutch Shell PLC ‘A’ ADR (United Kingdom) | 59,040 | 3,847,046 | ||||||
Weatherford International Ltd (Switzerland) * | 459,255 | 5,575,356 | ||||||
|
| |||||||
| 35,249,900 | ||||||||
|
| |||||||
Financials - 23.2% | ||||||||
Aflac Inc | 17,146 | 891,935 | ||||||
Bank of America Corp | 339,523 | 4,135,390 | ||||||
Citigroup Inc | 224,042 | 9,911,618 | ||||||
Fifth Third Bancorp | 156,732 | 2,556,299 | ||||||
JPMorgan Chase & Co | 171,446 | 8,136,827 | ||||||
MetLife Inc | 80,096 | 3,045,250 | ||||||
Morgan Stanley | 127,641 | 2,805,549 | ||||||
State Street Corp | 35,016 | 2,069,095 | ||||||
The Allstate Corp | 120,125 | 5,894,534 | ||||||
The Bank of New York Mellon Corp | 198,740 | 5,562,733 | ||||||
The Goldman Sachs Group Inc | 18,295 | 2,692,109 | ||||||
The PNC Financial Services Group Inc | 60,916 | 4,050,914 | ||||||
The Travelers Cos Inc | 20,180 | 1,698,954 | ||||||
U.S. Bancorp | 52,705 | 1,788,281 | ||||||
Wells Fargo & Co | 145,675 | 5,388,518 | ||||||
|
| |||||||
| 60,628,006 | ||||||||
|
| |||||||
Health Care - 14.3% | ||||||||
Bristol-Myers Squibb Co | 124,245 | 5,117,652 | ||||||
Cardinal Health Inc | 46,156 | 1,921,013 | ||||||
GlaxoSmithKline PLC ADR (United Kingdom) | 54,593 | 2,560,958 | ||||||
Merck & Co Inc | 117,126 | 5,180,483 | ||||||
Novartis AG (Switzerland) | 42,441 | 3,022,285 | ||||||
Pfizer Inc | 210,643 | 6,079,157 | ||||||
Roche Holding AG ADR (Switzerland) | 42,563 | 2,494,192 | ||||||
Sanofi ADR (France) | 74,518 | 3,806,379 | ||||||
UnitedHealth Group Inc | 79,968 | 4,574,969 | ||||||
WellPoint Inc | 39,445 | 2,612,442 | ||||||
|
| |||||||
| 37,369,530 | ||||||||
|
| |||||||
| Value | |||||||
Industrials - 6.4% |
| |||||||
Emerson Electric Co | 55,087 | $3,077,711 | ||||||
General Electric Co | 240,005 | 5,548,916 | ||||||
Honeywell International Inc | 26,765 | 2,016,743 | ||||||
Ingersoll-Rand PLC (Ireland) | 76,824 | 4,226,088 | ||||||
Textron Inc | 60,262 | 1,796,410 | ||||||
|
| |||||||
| 16,665,868 | ||||||||
|
| |||||||
Information Technology - 10.4% | ||||||||
Cisco Systems Inc | 132,978 | 2,780,570 | ||||||
Corning Inc | 236,824 | 3,156,864 | ||||||
eBay Inc * | 77,436 | 4,198,580 | ||||||
Hewlett-Packard Co | 255,526 | 6,091,740 | ||||||
Intel Corp | 62,647 | 1,368,837 | ||||||
Microsoft Corp | 194,609 | 5,567,764 | ||||||
Yahoo! Inc * | 177,129 | 4,167,845 | ||||||
|
| |||||||
| 27,332,200 | ||||||||
|
| |||||||
Materials - 2.5% | ||||||||
Alcoa Inc | 296,408 | 2,525,396 | ||||||
International Paper Co | 85,622 | 3,988,273 | ||||||
|
| |||||||
| 6,513,669 | ||||||||
|
| |||||||
Telecommunication Services - 2.3% | ||||||||
AT&T Inc | 37,705 | 1,383,396 | ||||||
Verizon Communications Inc | 47,060 | 2,312,999 | ||||||
Vodafone Group PLC ADR (United Kingdom) | 79,373 | 2,254,987 | ||||||
|
| |||||||
| 5,951,382 | ||||||||
|
| |||||||
Utilities - 2.1% | ||||||||
FirstEnergy Corp | 45,368 | 1,914,530 | ||||||
PPL Corp | 119,062 | 3,727,831 | ||||||
|
| |||||||
| 5,642,361 | ||||||||
|
| |||||||
Total Common Stocks | 248,534,851 | |||||||
|
| |||||||
SHORT-TERM INVESTMENT - 5.0% | ||||||||
Money Market Fund - 5.0% | ||||||||
BlackRock Liquidity Funds Treasury | 13,218,753 | 13,218,753 | ||||||
|
| |||||||
Total Short-Term Investment | 13,218,753 | |||||||
|
| |||||||
TOTAL INVESTMENTS - 100.0% | 261,753,604 | |||||||
OTHER ASSETS & LIABILITIES, NET - (0.0%) | (82,218 | ) | ||||||
|
| |||||||
NET ASSETS - 100.0% | $261,671,386 | |||||||
|
| |||||||
| See Notes to Financial Statements | See explanation of symbols and terms, if any, on page B-79 |
B-36
Table of Contents
PACIFIC LIFE FUNDS
PL COMSTOCK FUND
Schedule of Investments (Continued)
March 31, 2013
Notes to Schedule of Investments
| (a) | As of March 31, 2013, the fund was diversified as a percentage of net assets as follows: |
Financials | 23.2% | |||
Consumer Discretionary | 14.7% | |||
Health Care | 14.3% | |||
Energy | 13.5% | |||
Information Technology | 10.4% | |||
Industrials | 6.4% | |||
Consumer Staples | 5.6% | |||
Short-Term Investment | 5.0% | |||
Others (each less than 3.0%) | 6.9% | |||
|
| |||
| 100.0% | ||||
Other Assets & Liabilities, Net | (0.0% | ) | ||
|
| |||
| 100.0% | ||||
|
|
| (b) | Forward foreign currency contracts outstanding as of March 31, 2013 were as follows: |
| Currency Purchased | Currency Sold | Expiration | Counterparty | Unrealized Appreciation (Depreciation) | ||||||||||||||||
| USD | 1,257,618 | CHF | 1,195,869 | 04/13 | BNY | ($2,406 | ) | |||||||||||||
| USD | 1,153,882 | CHF | 1,096,441 | 04/13 | CIT | (1,380 | ) | |||||||||||||
| USD | 2,061,535 | CHF | 1,958,974 | 04/13 | SSB | (2,533 | ) | |||||||||||||
| USD | 1,872,128 | EUR | 1,439,711 | 04/13 | BNY | 26,416 | ||||||||||||||
| USD | 2,816,893 | EUR | 2,166,608 | 04/13 | CIB | 39,298 | ||||||||||||||
| USD | 2,059,667 | EUR | 1,583,682 | 04/13 | CIT | 29,384 | ||||||||||||||
| USD | 2,022,552 | EUR | 1,554,888 | 04/13 | SSB | 29,182 | ||||||||||||||
| USD | 2,463,771 | GBP | 1,653,992 | 04/13 | BNY | (49,147 | ) | |||||||||||||
| USD | 2,894,764 | GBP | 1,942,272 | 04/13 | CIB | (56,138 | ) | |||||||||||||
| USD | 1,543,772 | GBP | 1,035,879 | 04/13 | CIT | (30,044 | ) | |||||||||||||
| USD | 1,500,978 | GBP | 1,007,104 | 04/13 | SSB | (29,120 | ) | |||||||||||||
|
| |||||||||||||||||||
Total Forward Foreign Currency Contracts | ($46,488 | ) | ||||||||||||||||||
|
| |||||||||||||||||||
| (c) | Fair Value Measurements |
The following is a summary of the fund’s investments as categorized under the three-tier hierarchy of inputs used in valuing the fund’s assets and liabilities (See Note 3D in Notes to Financial Statements) as of March 31, 2013:
Total Value at March 31, 2013 | Level 1 Quoted Price | Level 2 Significant Observable Inputs | Level 3 Significant Unobservable Inputs | |||||||||||||||
Assets | Common Stocks | |||||||||||||||||
Consumer Discretionary | $38,511,223 | $38,511,223 | $— | $— | ||||||||||||||
Consumer Staples | 14,670,712 | 14,670,712 | — | — | ||||||||||||||
Energy | 35,249,900 | 35,249,900 | — | — | ||||||||||||||
Financials | 60,628,006 | 60,628,006 | — | — | ||||||||||||||
Health Care | 37,369,530 | 34,347,245 | 3,022,285 | — | ||||||||||||||
Industrials | 16,665,868 | 16,665,868 | — | — | ||||||||||||||
Information Technology | 27,332,200 | 27,332,200 | — | — | ||||||||||||||
Materials | 6,513,669 | 6,513,669 | — | — | ||||||||||||||
Telecommunications Services | 5,951,382 | 5,951,382 | — | — | ||||||||||||||
Utilities | 5,642,361 | 5,642,361 | — | — | ||||||||||||||
|
|
|
|
|
|
|
| |||||||||||
| 248,534,851 | 245,512,566 | 3,022,285 | — | |||||||||||||||
Short-Term Investment | 13,218,753 | 13,218,753 | — | — | ||||||||||||||
Derivatives: | ||||||||||||||||||
Foreign Currency Contracts | ||||||||||||||||||
Forward Foreign Currency Contracts | 124,280 | — | 124,280 | — | ||||||||||||||
|
|
|
|
|
|
|
| |||||||||||
Total Assets | 261,877,884 | 258,731,319 | 3,146,565 | — | ||||||||||||||
|
|
|
|
|
|
|
| |||||||||||
Liabilities | Derivatives: | |||||||||||||||||
Foreign Currency Contracts | ||||||||||||||||||
Forward Foreign Currency Contracts | (170,768 | ) | — | (170,768 | ) | — | ||||||||||||
|
|
|
|
|
|
|
| |||||||||||
Total Liabilities | (170,768 | ) | — | (170,768 | ) | — | ||||||||||||
|
|
|
|
|
|
|
| |||||||||||
Total | $261,707,116 | $258,731,319 | $2,975,797 | $— | ||||||||||||||
|
|
|
|
|
|
|
| |||||||||||
During the year ended March 31, 2013, an investment with a value of $3,022,285 was transferred from level 1 to level 2 due to valuation adjustments made to exchange-traded prices as a result of market movements following the close of local trading.
| See Notes to Financial Statements | See explanation of symbols and terms, if any, on page B-79 |
B-37
Table of Contents
PACIFIC LIFE FUNDS
PL GROWTH LT FUND
Schedule of Investments
March 31, 2013
| Value | |||||||
COMMON STOCKS - 95.1% | ||||||||
Consumer Discretionary - 16.9% | ||||||||
Amazon.com Inc * | 1,052 | $280,347 | ||||||
AutoZone Inc * | 1,863 | 739,183 | ||||||
CBS Corp ‘B’ | 16,458 | 768,424 | ||||||
Coach Inc | 11,857 | 592,731 | ||||||
L Brands Inc | 26,511 | 1,183,981 | ||||||
Mattel Inc | 10,009 | 438,294 | ||||||
News Corp ‘A’ | 8,111 | 247,548 | ||||||
Nike Inc ‘B’ | 16,917 | 998,272 | ||||||
Nordstrom Inc | 5,097 | 281,507 | ||||||
Polaris Industries Inc | 2,709 | 250,555 | ||||||
Prada SPA (Italy) | 26,100 | 267,147 | ||||||
priceline.com Inc * | 346 | 238,024 | ||||||
Starbucks Corp | 8,205 | 467,357 | ||||||
The TJX Cos Inc | 10,291 | 481,104 | ||||||
The Walt Disney Co | 6,449 | 366,303 | ||||||
Time Warner Cable Inc | 6,617 | 635,629 | ||||||
|
| |||||||
| 8,236,406 | ||||||||
|
| |||||||
Consumer Staples - 10.2% | ||||||||
Anheuser-Busch InBev NV (Belgium) | 8,482 | 840,673 | ||||||
Colgate-Palmolive Co | 3,870 | 456,776 | ||||||
Costco Wholesale Corp | 5,005 | 531,081 | ||||||
Mead Johnson Nutrition Co | 2,645 | 204,855 | ||||||
Pernod-Ricard SA (France) | 7,122 | 888,400 | ||||||
Philip Morris International Inc | 4,840 | 448,716 | ||||||
Reckitt Benckiser Group PLC (United Kingdom) | 3,337 | 238,512 | ||||||
SABMiller PLC (United Kingdom) | 12,934 | 683,561 | ||||||
Unilever NV CVA (Netherlands) | 3,469 | 142,209 | ||||||
Whole Foods Market Inc | 5,756 | 499,333 | ||||||
|
| |||||||
| 4,934,116 | ||||||||
|
| |||||||
Energy - 4.3% | ||||||||
Dresser-Rand Group Inc * | 4,883 | 301,086 | ||||||
EOG Resources Inc | 2,908 | 372,428 | ||||||
Helmerich & Payne Inc | 5,452 | 330,936 | ||||||
Kinder Morgan Inc | 7,048 | 272,617 | ||||||
National Oilwell Varco Inc | 4,335 | 306,701 | ||||||
Noble Energy Inc | 4,338 | 501,733 | ||||||
|
| |||||||
| 2,085,501 | ||||||||
|
| |||||||
Financials - 2.5% | ||||||||
AIA Group Ltd (Hong Kong) | 55,800 | 244,580 | ||||||
Simon Property Group Inc REIT | 1,828 | 289,848 | ||||||
T. Rowe Price Group Inc | 5,618 | 420,620 | ||||||
Ventas Inc REIT | 3,734 | 273,329 | ||||||
|
| |||||||
| 1,228,377 | ||||||||
|
| |||||||
Health Care - 14.2% | ||||||||
AbbVie Inc | 22,495 | 917,346 | ||||||
Aetna Inc | 7,377 | 377,112 | ||||||
Alexion Pharmaceuticals Inc * | 1,303 | 120,059 | ||||||
Celgene Corp * | 7,187 | 833,045 | ||||||
Express Scripts Holding Co * | 14,928 | 860,599 | ||||||
Gilead Sciences Inc * | 23,537 | 1,151,665 | ||||||
Medivation Inc * | 8,248 | 385,759 | ||||||
Perrigo Co | 4,768 | 566,105 | ||||||
Shire PLC ADR (United Kingdom) | 2,382 | 217,620 | ||||||
Valeant Pharmaceuticals | 4,599 | 345,017 | ||||||
Varian Medical Systems Inc * | 3,731 | 268,632 | ||||||
Vertex Pharmaceuticals Inc * | 6,170 | 339,227 | ||||||
Zoetis Inc * | 15,248 | 509,283 | ||||||
|
| |||||||
| 6,891,469 | ||||||||
|
| |||||||
| Value | |||||||
Industrials - 12.0% | ||||||||
Canadian Pacific Railway Ltd (Canada) | 5,695 | $743,027 | ||||||
Danaher Corp | 12,748 | 792,288 | ||||||
FANUC Corp (Japan) | 3,500 | 538,462 | ||||||
Fastenal Co | 6,668 | 342,402 | ||||||
Precision Castparts Corp | 6,017 | 1,140,944 | ||||||
Sensata Technologies Holding NV (Netherlands) * | 16,146 | 530,719 | ||||||
Tyco International Ltd (Switzerland) | 14,730 | 471,360 | ||||||
Union Pacific Corp | 1,308 | 186,272 | ||||||
Verisk Analytics Inc ‘A’ * | 6,134 | 378,038 | ||||||
W.W. Grainger Inc | 3,193 | 718,361 | ||||||
|
| |||||||
| 5,841,873 | ||||||||
|
| |||||||
Information Technology - 30.6% | ||||||||
Amdocs Ltd (United Kingdom) | 12,270 | 444,788 | ||||||
Amphenol Corp ‘A’ | 7,777 | 580,553 | ||||||
ANSYS Inc * | 5,586 | 454,812 | ||||||
Apple Inc | 7,515 | 3,326,365 | ||||||
Atmel Corp * | 39,745 | 276,625 | ||||||
Cisco Systems Inc | 12,018 | 251,296 | ||||||
eBay Inc * | 16,772 | 909,378 | ||||||
EMC Corp * | 7,752 | 185,195 | ||||||
Google Inc ‘A’ * | 2,606 | 2,069,242 | ||||||
Informatica Corp * | 12,246 | 422,120 | ||||||
Intuit Inc | 13,057 | 857,192 | ||||||
LinkedIn Corp ‘A’ * | 1,009 | 177,645 | ||||||
MasterCard Inc ‘A’ | 1,245 | 673,707 | ||||||
Motorola Solutions Inc | 11,163 | 714,767 | ||||||
ON Semiconductor Corp * | 45,616 | 377,700 | ||||||
Oracle Corp | 34,523 | 1,116,474 | ||||||
Taiwan Semiconductor Manufacturing Co Ltd (Taiwan) | 84,455 | 282,154 | ||||||
TE Connectivity Ltd (Switzerland) | 18,867 | 791,093 | ||||||
Telefonaktiebolaget LM Ericsson ‘B’ (Sweden) | 9,639 | 120,270 | ||||||
Teradata Corp * | 1,793 | 104,908 | ||||||
Visa Inc ‘A’ | 1,194 | 202,789 | ||||||
VMware Inc ‘A’ * | 7,004 | 552,476 | ||||||
|
| |||||||
| 14,891,549 | ||||||||
|
| |||||||
Materials - 3.3% | ||||||||
Ball Corp | 9,266 | 440,876 | ||||||
Monsanto Co | 6,027 | 636,632 | ||||||
Praxair Inc | 4,479 | 499,588 | ||||||
|
| |||||||
| 1,577,096 | ||||||||
|
| |||||||
Telecommunication Services - 0.6% | ||||||||
Crown Castle International Corp * | 4,369 | 304,257 | ||||||
|
| |||||||
Utilities - 0.5% | ||||||||
Brookfield Infrastructure Partners LP (Bermuda) | 6,563 | 249,788 | ||||||
|
| |||||||
Total Common Stocks | 46,240,432 | |||||||
|
| |||||||
| See Notes to Financial Statements | See explanation of symbols and terms, if any, on page B-79 |
B-38
Table of Contents
PACIFIC LIFE FUNDS
PL GROWTH LT FUND
Schedule of Investments (Continued)
March 31, 2013
| Value | |||||||
SHORT-TERM INVESTMENT - 5.0% | ||||||||
Money Market Fund - 5.0% | ||||||||
BlackRock Liquidity Funds Treasury Trust Fund Portfolio | 2,399,166 | $2,399,166 | ||||||
|
| |||||||
Total Short-Term Investment | 2,399,166 | |||||||
|
| |||||||
TOTAL INVESTMENTS - 100.1% | 48,639,598 | |||||||
OTHER ASSETS & LIABILITIES, NET - (0.1%) | (28,641 | ) | ||||||
|
| |||||||
NET ASSETS - 100.0% | $48,610,957 | |||||||
|
| |||||||
Notes to Schedule of Investments
| (a) | As of March 31, 2013, the fund was diversified as a percentage of net assets as follows: |
Information Technology | 30.6% | |||
Consumer Discretionary | 16.9% | |||
Health Care | 14.2% | |||
Industrials | 12.0% | |||
Consumer Staples | 10.2% | |||
Short-Term Investment | 5.0% | |||
Energy | 4.3% | |||
Materials | 3.3% | |||
Others (each less than 3.0%) | 3.6% | |||
|
| |||
| 100.1% | ||||
Other Assets & Liabilities, Net | (0.1% | ) | ||
|
| |||
| 100.0% | ||||
|
|
| (b) | Forward foreign currency contracts outstanding as of March 31, 2013 were as follows: |
| Currency Purchased | Currency Sold | Expiration | Counterparty | Unrealized Appreciation (Depreciation) | ||||||||||||||||
| GBP | 130,000 | USD | 196,820 | 05/13 | HSB | $671 | ||||||||||||||
| USD | 626,089 | EUR | 483,000 | 04/13 | CSF | 6,870 | ||||||||||||||
| USD | 495,972 | EUR | 380,000 | 05/13 | HSB | 8,756 | ||||||||||||||
| USD | 239,773 | EUR | 185,000 | 05/13 | RBC | 2,563 | ||||||||||||||
| USD | 261,025 | GBP | 175,000 | 04/13 | CSF | (4,849 | ) | |||||||||||||
| USD | 25,520 | GBP | 17,000 | 04/13 | JPM | (308 | ) | |||||||||||||
| USD | 756,417 | GBP | 509,000 | 05/13 | HSB | (16,836 | ) | |||||||||||||
| USD | 183,044 | JPY | 17,600,000 | 04/13 | CSF | (3,948 | ) | |||||||||||||
| USD | 128,147 | JPY | 11,900,000 | 04/13 | JPM | 1,721 | ||||||||||||||
| USD | 186,617 | JPY | 17,950,000 | 05/13 | HSB | (4,111 | ) | |||||||||||||
| USD | 1,581 | JPY | 150,000 | 05/13 | RBC | (12 | ) | |||||||||||||
|
| |||||||||||||||||||
Total Forward Foreign Currency Contracts | ($9,483 | ) | ||||||||||||||||||
|
| |||||||||||||||||||
| (c) | Transactions in written options for the year ended March 31, 2013 were as follows: |
| Number of Contracts | Premium | |||||||
Outstanding, March 31, 2012 | — | $— | ||||||
Call Options Written | 143 | 150,140 | ||||||
Call Options Closed | (74 | ) | (137,508 | ) | ||||
Call Options Expired | (69 | ) | (12,632 | ) | ||||
|
|
|
| |||||
Outstanding, March 31, 2013 | — | $— | ||||||
|
|
|
| |||||
| See Notes to Financial Statements | See explanation of symbols and terms, if any, on page B-79 |
B-39
Table of Contents
PACIFIC LIFE FUNDS
PL GROWTH LT FUND
Schedule of Investments (Continued)
March 31, 2013
| (d) | Fair Value Measurements |
The following is a summary of the fund’s investments as categorized under the three-tier hierarchy of inputs used in valuing the fund’s assets and liabilities (See Note 3D in Notes to Financial Statements) as of March 31, 2013:
| Total Value at March 31, 2013 | Level 1 Quoted Price | Level 2 Significant Observable Inputs | Level 3 Significant Unobservable Inputs | |||||||||||||||
Assets | Common Stocks | |||||||||||||||||
Consumer Discretionary | $8,236,406 | $7,969,259 | $267,147 | $— | ||||||||||||||
Consumer Staples | 4,934,116 | 2,140,761 | 2,793,355 | — | ||||||||||||||
Energy | 2,085,501 | 2,085,501 | — | — | ||||||||||||||
Financials | 1,228,377 | 983,797 | 244,580 | — | ||||||||||||||
Health Care | 6,891,469 | 6,891,469 | — | — | ||||||||||||||
Industrials | 5,841,873 | 5,303,411 | 538,462 | — | ||||||||||||||
Information Technology | 14,891,549 | 14,489,125 | 402,424 | — | ||||||||||||||
Materials | 1,577,096 | 1,577,096 | — | — | ||||||||||||||
Telecommunication Services | 304,257 | 304,257 | — | — | ||||||||||||||
Utilities | 249,788 | 249,788 | — | — | ||||||||||||||
|
|
|
|
|
|
|
| |||||||||||
| 46,240,432 | 41,994,464 | 4,245,968 | — | |||||||||||||||
| Short-Term Investment | 2,399,166 | 2,399,166 | — | — | ||||||||||||||
| Derivatives: | ||||||||||||||||||
Foreign Currency Contracts | 20,581 | — | 20,581 | — | ||||||||||||||
|
|
|
|
|
|
|
| |||||||||||
Total Assets | 48,660,179 | 44,393,630 | 4,266,549 | — | ||||||||||||||
|
|
|
|
|
|
|
| |||||||||||
Liabilities | Derivatives: | |||||||||||||||||
Foreign Currency Contracts | (30,064 | ) | — | (30,064 | ) | — | ||||||||||||
|
|
|
|
|
|
|
| |||||||||||
Total Liabilities | (30,064 | ) | — | (30,064 | ) | — | ||||||||||||
|
|
|
|
|
|
|
| |||||||||||
Total | $48,630,115 | $44,393,630 | $4,236,485 | $— | ||||||||||||||
|
|
|
|
|
|
|
| |||||||||||
| See Notes to Financial Statements | See explanation of symbols and terms, if any, on page B-79 |
B-40
Table of Contents
PACIFIC LIFE FUNDS
PL LARGE-CAP GROWTH FUND
Schedule of Investments
March 31, 2013
| Value | |||||||
COMMON STOCKS - 98.2% | ||||||||
Consumer Discretionary - 16.6% | ||||||||
Aaron’s Inc | 994 | $28,508 | ||||||
Advance Auto Parts Inc | 1,340 | 110,751 | ||||||
Allison Transmission Holdings Inc | 451 | 10,828 | ||||||
Amazon.com Inc * | 6,573 | 1,751,639 | ||||||
AMC Networks Inc ‘A’ * | 1,078 | 68,108 | ||||||
American Eagle Outfitters Inc | 2,613 | 48,863 | ||||||
Apollo Group Inc ‘A’ * | 1,651 | 28,711 | ||||||
Ascena Retail Group Inc * | 2,112 | 39,178 | ||||||
AutoNation Inc * | 322 | 14,087 | ||||||
AutoZone Inc * | 656 | 260,281 | ||||||
Bally Technologies Inc * | 704 | 36,587 | ||||||
Bed Bath & Beyond Inc * | 4,224 | 272,110 | ||||||
Big Lots Inc * | 1,025 | 36,152 | ||||||
BorgWarner Inc * | 2,048 | 158,392 | ||||||
Brinker International Inc | 1,296 | 48,794 | ||||||
Cablevision Systems Corp ‘A’ | 388 | 5,804 | ||||||
CarMax Inc * | 714 | 29,774 | ||||||
Carter’s Inc * | 832 | 47,649 | ||||||
CBS Corp ‘B’ | 2,026 | 94,594 | ||||||
Charter Communications Inc ‘A’ * | 897 | 93,449 | ||||||
Chico’s FAS Inc | 2,024 | 34,003 | ||||||
Chipotle Mexican Grill Inc * | 583 | 189,982 | ||||||
Choice Hotels International Inc | 43 | 1,819 | ||||||
Cinemark Holdings Inc | 2,183 | 64,268 | ||||||
Clear Channel Outdoor Holdings Inc ‘A’ * | 433 | 3,243 | ||||||
Coach Inc | 5,221 | 260,998 | ||||||
Comcast Corp ‘A’ | 23,223 | 975,598 | ||||||
D.R. Horton Inc | 352 | 8,554 | ||||||
Darden Restaurants Inc | 2,338 | 120,828 | ||||||
Deckers Outdoor Corp * | 378 | 21,051 | ||||||
Delphi Automotive PLC (United Kingdom) | 5,963 | 264,757 | ||||||
Dick’s Sporting Goods Inc | 1,723 | 81,498 | ||||||
DIRECTV * | 10,412 | 589,423 | ||||||
Discovery Communications Inc ‘A’ * | 4,339 | 341,653 | ||||||
DISH Network Corp ‘A’ | 2,900 | 109,910 | ||||||
Dollar General Corp * | 3,307 | 167,268 | ||||||
Dollar Tree Inc * | 4,261 | 206,360 | ||||||
DSW Inc ‘A’ | 532 | 33,942 | ||||||
Dunkin’ Brands Group Inc | 1,224 | 45,141 | ||||||
Expedia Inc | 1,036 | 62,170 | ||||||
Family Dollar Stores Inc | 1,767 | 104,341 | ||||||
Foot Locker Inc | 539 | 18,455 | ||||||
Fossil Inc * | 993 | 95,924 | ||||||
Garmin Ltd (Switzerland) | 138 | 4,560 | ||||||
Gentex Corp | 2,478 | 49,585 | ||||||
Genuine Parts Co | 2,842 | 221,676 | ||||||
GNC Holdings Inc ‘A’ | 1,185 | 46,547 | ||||||
Groupon Inc * | 755 | 4,621 | ||||||
H&R Block Inc | 3,168 | 93,203 | ||||||
Hanesbrands Inc * | 1,813 | 82,600 | ||||||
Harley-Davidson Inc | 4,208 | 224,286 | ||||||
Hasbro Inc | 1,929 | 84,760 | ||||||
HomeAway Inc * | 494 | 16,055 | ||||||
International Game Technology | 2,545 | 41,993 | ||||||
ITT Educational Services Inc * | 417 | 5,746 | ||||||
Jarden Corp * | 471 | 20,182 | ||||||
John Wiley & Sons Inc ‘A’ | 351 | 13,675 | ||||||
Kohl’s Corp | 274 | 12,640 | ||||||
L Brands Inc | 4,414 | 197,129 | ||||||
Lamar Advertising Co ‘A’ * | 1,267 | 61,589 | ||||||
Las Vegas Sands Corp | 7,220 | 406,847 | ||||||
Liberty Global Inc ‘A’ * | 4,766 | 349,824 | ||||||
Liberty Interactive Corp ‘A’ * | 1,375 | 29,398 | ||||||
Liberty Media Corp * | 121 | 13,507 | ||||||
Liberty Ventures ‘A’ * | 93 | 7,029 | ||||||
LKQ Corp * | 5,323 | 115,828 | ||||||
| Value | |||||||
Lowe’s Cos Inc | 2,682 | $101,701 | ||||||
Macy’s Inc | 962 | 40,250 | ||||||
Marriott International Inc ‘A’ | 4,018 | 169,680 | ||||||
Mattel Inc | 4,813 | 210,761 | ||||||
McDonald’s Corp | 18,463 | 1,840,576 | ||||||
Michael Kors Holdings Ltd (United Kingdom) * | 1,566 | 88,933 | ||||||
Morningstar Inc | 413 | 28,877 | ||||||
Netflix Inc * | 1,021 | 193,388 | ||||||
News Corp ‘A’ | 13,091 | 399,537 | ||||||
Nike Inc ‘B’ | 13,141 | 775,450 | ||||||
Nordstrom Inc | 2,706 | 149,452 | ||||||
Norwegian Cruise Line Holdings Ltd (Bermuda) * | 250 | 7,413 | ||||||
NVR Inc * | 84 | 90,729 | ||||||
O’Reilly Automotive Inc * | 2,023 | 207,459 | ||||||
Omnicom Group Inc | 4,953 | 291,732 | ||||||
Pandora Media Inc * | 1,757 | 24,879 | ||||||
Panera Bread Co ‘A’ * | 524 | 86,586 | ||||||
Penn National Gaming Inc * | 92 | 5,008 | ||||||
PetSmart Inc | 1,952 | 121,219 | ||||||
Polaris Industries Inc | 1,182 | 109,323 | ||||||
priceline.com Inc * | 905 | 622,577 | ||||||
PVH Corp | 1,320 | 140,989 | ||||||
Ralph Lauren Corp | 1,128 | 190,982 | ||||||
Regal Entertainment Group ‘A’ | 516 | 8,602 | ||||||
Ross Stores Inc | 4,116 | 249,512 | ||||||
Sally Beauty Holdings Inc * | 2,697 | 79,238 | ||||||
Scripps Networks Interactive Inc ‘A’ | 1,553 | 99,920 | ||||||
Sirius XM Radio Inc | 69,150 | 212,982 | ||||||
Starbucks Corp | 13,780 | 784,909 | ||||||
Starwood Hotels & Resorts Worldwide Inc | 3,594 | 229,046 | ||||||
Starz-Liberty Capital * | 121 | 2,680 | ||||||
Target Corp | 636 | 43,534 | ||||||
Tempur-Pedic International Inc * | 1,024 | 50,821 | ||||||
Tesla Motors Inc * | 1,217 | 46,112 | ||||||
The Gap Inc | 5,557 | 196,718 | ||||||
The Goodyear Tire & Rubber Co * | 4,679 | 59,002 | ||||||
The Home Depot Inc | 27,809 | 1,940,512 | ||||||
The Interpublic Group of Cos Inc | 462 | 6,020 | ||||||
The Madison Square Garden Co ‘A’ * | 62 | 3,571 | ||||||
The TJX Cos Inc | 13,462 | 629,349 | ||||||
The Walt Disney Co | 11,950 | 678,760 | ||||||
Thor Industries Inc | 54 | 1,987 | ||||||
Tiffany & Co | 1,924 | 133,795 | ||||||
Time Warner Cable Inc | 5,369 | 515,746 | ||||||
Tractor Supply Co | 1,297 | 135,057 | ||||||
TripAdvisor Inc * | 1,604 | 84,242 | ||||||
Tupperware Brands Corp | 1,036 | 84,683 | ||||||
Ulta Salon Cosmetics & Fragrance Inc * | 1,141 | 92,615 | ||||||
Under Armour Inc ‘A’ * | 1,454 | 74,445 | ||||||
Urban Outfitters Inc * | 1,982 | 76,783 | ||||||
VF Corp | 1,592 | 267,058 | ||||||
Viacom Inc ‘B’ | 8,992 | 553,637 | ||||||
Virgin Media Inc | 5,046 | 247,103 | ||||||
Visteon Corp * | 54 | 3,116 | ||||||
Weight Watchers International Inc | 458 | 19,286 | ||||||
Williams-Sonoma Inc | 853 | 43,947 | ||||||
Wyndham Worldwide Corp | 2,482 | 160,039 | ||||||
Wynn Resorts Ltd | 1,468 | 183,735 | ||||||
Yum! Brands Inc | 8,367 | 601,922 | ||||||
|
| |||||||
| 23,586,710 | ||||||||
|
| |||||||
Consumer Staples - 12.7% | ||||||||
Altria Group Inc | 28,688 | 986,580 | ||||||
Avon Products Inc | 6,008 | 124,546 | ||||||
Brown-Forman Corp ‘B’ | 2,339 | 167,005 | ||||||
Campbell Soup Co | 2,497 | 113,264 | ||||||
Church & Dwight Co Inc | 1,568 | 101,340 | ||||||
Coca-Cola Enterprises Inc | 378 | 13,956 | ||||||
Colgate-Palmolive Co | 7,951 | 938,457 | ||||||
Costco Wholesale Corp | 7,871 | 835,192 | ||||||
| See Notes to Financial Statements | See explanation of symbols and terms, if any, on page B-79 |
B-41
Table of Contents
PACIFIC LIFE FUNDS
PL LARGE-CAP GROWTH FUND
Schedule of Investments (Continued)
March 31, 2013
| Value | |||||||
Crimson Wine Group Ltd * l | — | $2 | ||||||
CVS Caremark Corp | 4,703 | 258,618 | ||||||
Dean Foods Co * | 2,721 | 49,332 | ||||||
Dr Pepper Snapple Group Inc | 3,901 | 183,152 | ||||||
Flowers Foods Inc | 2,113 | 69,602 | ||||||
General Mills Inc | 9,208 | 454,046 | ||||||
Green Mountain Coffee Roasters Inc * | 2,115 | 120,047 | ||||||
H.J. Heinz Co | 3,621 | 261,690 | ||||||
Herbalife Ltd (Cayman) | 2,016 | 75,499 | ||||||
Hillshire Brands Co | 1,914 | 67,277 | ||||||
Hormel Foods Corp | 1,320 | 54,542 | ||||||
Ingredion Inc | 281 | 20,322 | ||||||
Kellogg Co | 4,149 | 267,320 | ||||||
Kimberly-Clark Corp | 6,369 | 624,035 | ||||||
Kraft Foods Group Inc | 529 | 27,259 | ||||||
Lorillard Inc | 7,114 | 287,050 | ||||||
McCormick & Co Inc | 2,371 | 174,387 | ||||||
Mead Johnson Nutrition Co | 3,704 | 286,875 | ||||||
Mondelez International Inc ‘A’ | 1,585 | 48,517 | ||||||
Monster Beverage Corp * | 2,460 | 117,440 | ||||||
Nu Skin Enterprises Inc ‘A’ | 923 | 40,797 | ||||||
PepsiCo Inc | 28,414 | 2,247,832 | ||||||
Philip Morris International Inc | 28,477 | 2,640,103 | ||||||
Reynolds American Inc | 2,037 | 90,626 | ||||||
Safeway Inc | 573 | 15,099 | ||||||
Sysco Corp | 5,664 | 199,203 | ||||||
The Clorox Co | 139 | 12,306 | ||||||
The Coca-Cola Co | 70,578 | 2,854,174 | ||||||
The Estee Lauder Cos Inc ‘A’ | 4,181 | 267,709 | ||||||
The Fresh Market Inc * | 473 | 20,230 | ||||||
The Hershey Co | 2,726 | 238,607 | ||||||
The Kroger Co | 9,585 | 317,647 | ||||||
The Procter & Gamble Co | 3,634 | 280,036 | ||||||
Wal-Mart Stores Inc | 24,227 | 1,812,906 | ||||||
WhiteWave Foods Co ‘A’ * | 231 | 3,943 | ||||||
Whole Foods Market Inc | 3,335 | 289,311 | ||||||
|
| |||||||
| 18,057,881 | ||||||||
|
| |||||||
Energy - 4.1% | ||||||||
Atwood Oceanics Inc * | 309 | 16,235 | ||||||
Cabot Oil & Gas Corp | 3,812 | 257,729 | ||||||
Cameron International Corp * | 3,439 | 224,223 | ||||||
CARBO Ceramics Inc | 339 | 30,873 | ||||||
Cheniere Energy Inc * | 2,642 | 73,976 | ||||||
Cobalt International Energy Inc * | 3,195 | 90,099 | ||||||
Concho Resources Inc * | 1,911 | 186,189 | ||||||
Continental Resources Inc * | 794 | 69,022 | ||||||
Dresser-Rand Group Inc * | 1,397 | 86,139 | ||||||
EOG Resources Inc | 4,898 | 627,287 | ||||||
Era Group Inc * | 164 | 3,444 | ||||||
FMC Technologies Inc * | 4,346 | 236,379 | ||||||
Golar LNG Ltd (Bermuda) | 748 | 27,646 | ||||||
Halliburton Co | 5,357 | 216,476 | ||||||
Helmerich & Payne Inc | 382 | 23,187 | ||||||
Kinder Morgan Inc | 8,876 | 343,324 | ||||||
Kosmos Energy Ltd (Bermuda) * | 1,218 | 13,763 | ||||||
Laredo Petroleum Holdings Inc * | 331 | 6,054 | ||||||
National Oilwell Varco Inc | 1,757 | 124,308 | ||||||
Noble Energy Inc | 732 | 84,663 | ||||||
Oceaneering International Inc | 1,957 | 129,964 | ||||||
Oil States International Inc * | 886 | 72,271 | ||||||
Pioneer Natural Resouces Co | 2,028 | 251,979 | ||||||
Range Resources Corp | 2,946 | 238,744 | ||||||
RPC Inc | 927 | 14,063 | ||||||
Schlumberger Ltd (Netherlands) | 24,228 | 1,814,435 | ||||||
SEACOR Holdings Inc | 164 | 12,084 | ||||||
SM Energy Co | �� | 1,024 | 60,641 | |||||
Southwestern Energy Co * | 2,234 | 83,239 | ||||||
The Williams Cos Inc | 12,246 | 458,735 | ||||||
| Value | |||||||
Whiting Petroleum Corp * | 288 | $14,642 | ||||||
World Fuel Services Corp | 396 | 15,729 | ||||||
|
| |||||||
| 5,907,542 | ||||||||
|
| |||||||
Financials - 4.8% | ||||||||
Affiliated Managers Group Inc * | 700 | 107,499 | ||||||
Alexander & Baldwin Inc * | 53 | 1,895 | ||||||
Allied World Assurance Co Holdings AG (Switzerland) | 319 | 29,578 | ||||||
American Campus Communities Inc REIT | 177 | 8,025 | ||||||
American Express Co | 11,697 | 789,080 | ||||||
American Tower Corp REIT | 7,169 | 551,439 | ||||||
Aon PLC (United Kingdom) | 477 | 29,336 | ||||||
Apartment Investment & Management Co ‘A’ REIT | 1,958 | 60,032 | ||||||
Arch Capital Group Ltd (Bermuda) * | 262 | 13,773 | ||||||
Arthur J. Gallagher & Co | 2,186 | 90,304 | ||||||
BlackRock Inc | 1,238 | 318,017 | ||||||
Boston Properties Inc REIT | 435 | 43,961 | ||||||
BRE Properties Inc REIT | 375 | 18,255 | ||||||
Brown & Brown Inc | 181 | 5,799 | ||||||
Camden Property Trust REIT | 1,156 | 79,394 | ||||||
CBOE Holdings Inc | 1,300 | 48,022 | ||||||
CBRE Group Inc ‘A’ * | 5,883 | 148,546 | ||||||
Digital Realty Trust Inc REIT | 2,333 | 156,101 | ||||||
Eaton Vance Corp | 2,132 | 89,182 | ||||||
Endurance Specialty Holdings Ltd (Bermuda) | 78 | 3,729 | ||||||
Equity Lifestyle Properties Inc REIT | 586 | 45,005 | ||||||
Equity Residential REIT | 442 | 24,337 | ||||||
Erie Indemnity Co ‘A’ | 444 | 33,535 | ||||||
Essex Property Trust Inc REIT | 690 | 103,900 | ||||||
Extra Space Storage Inc REIT | 1,192 | 46,810 | ||||||
Federal Realty Investment Trust REIT | 918 | 99,181 | ||||||
Federated Investors Inc ‘B’ | 1,317 | 31,173 | ||||||
Franklin Resources Inc | 596 | 89,883 | ||||||
HCP Inc REIT | 545 | 27,174 | ||||||
Home Properties Inc REIT | 470 | 29,807 | ||||||
IntercontinentalExchange Inc * | 1,327 | 216,394 | ||||||
Kilroy Realty Corp REIT | 100 | 5,240 | ||||||
Lazard Ltd ‘A’ (Bermuda) | 2,146 | 73,243 | ||||||
Leucadia National Corp | 802 | 21,999 | ||||||
LPL Financial Holdings Inc | 751 | 24,212 | ||||||
Marsh & McLennan Cos Inc | 7,860 | 298,444 | ||||||
Mid-America Apartment Communities Inc REIT | 664 | 45,856 | ||||||
Moody’s Corp | 3,614 | 192,698 | ||||||
MSCI Inc * | 2,267 | 76,919 | ||||||
People’s United Financial Inc | 1,256 | 16,881 | ||||||
Plum Creek Timber Co Inc REIT | 2,898 | 151,276 | ||||||
Post Properties Inc REIT | 383 | 18,039 | ||||||
Public Storage REIT | 2,592 | 394,813 | ||||||
Rayonier Inc REIT | 1,770 | 105,616 | ||||||
Realogy Holdings Corp * | 216 | 10,549 | ||||||
Regency Centers Corp REIT | 930 | 49,206 | ||||||
SEI Investments Co | 2,571 | 74,173 | ||||||
Signature Bank * | 145 | 11,420 | ||||||
Simon Property Group Inc REIT | 4,633 | 734,608 | ||||||
T. Rowe Price Group Inc | 4,634 | 346,948 | ||||||
Tanger Factory Outlet Centers Inc REIT | 1,760 | 63,677 | ||||||
Taubman Centers Inc REIT | 300 | 23,298 | ||||||
The Hanover Insurance Group Inc | 354 | 17,587 | ||||||
The McGraw-Hill Cos Inc | 5,081 | 264,618 | ||||||
The St. Joe Co * | 135 | 2,869 | ||||||
The Travelers Cos Inc | 3,067 | 258,211 | ||||||
Validus Holdings Ltd (Bermuda) | 255 | 9,529 | ||||||
Waddell & Reed Financial Inc ‘A’ | 1,625 | 71,143 | ||||||
Weyerhaeuser Co REIT | 3,150 | 98,847 | ||||||
|
| |||||||
| 6,801,085 | ||||||||
|
| |||||||
| See Notes to Financial Statements | See explanation of symbols and terms, if any, on page B-79 |
B-42
Table of Contents
PACIFIC LIFE FUNDS
PL LARGE-CAP GROWTH FUND
Schedule of Investments (Continued)
March 31, 2013
| Value | |||||||
Health Care - 12.6% | ||||||||
Abbott Laboratories | 27,099 | $957,137 | ||||||
AbbVie Inc | 27,099 | 1,105,097 | ||||||
Actavis Inc * | 2,324 | 214,064 | ||||||
Agilent Technologies Inc | 6,315 | 265,041 | ||||||
Alexion Pharmaceuticals Inc * | 3,490 | 321,569 | ||||||
Allergan Inc | 5,514 | 615,528 | ||||||
AmerisourceBergen Corp | 4,291 | 220,772 | ||||||
Amgen Inc | 14,129 | 1,448,364 | ||||||
ARIAD Pharmaceuticals Inc * | 3,234 | 58,503 | ||||||
Baxter International Inc | 9,153 | 664,874 | ||||||
Becton Dickinson & Co | 3,432 | 328,134 | ||||||
Biogen Idec Inc * | 4,352 | 839,544 | ||||||
BioMarin Pharmaceutical Inc * | 2,209 | 137,532 | ||||||
Bristol-Myers Squibb Co | 27,864 | 1,147,718 | ||||||
Bruker Corp * | 1,603 | 30,617 | ||||||
C.R. Bard Inc | 1,501 | 151,271 | ||||||
Cardinal Health Inc | 3,341 | 139,052 | ||||||
Catamaran Corp (Canada) * | 3,746 | 198,650 | ||||||
Celgene Corp * | 8,003 | 927,628 | ||||||
Cerner Corp * | 2,632 | 249,382 | ||||||
Charles River Laboratories International Inc * | 535 | 23,684 | ||||||
Covance Inc * | 61 | 4,534 | ||||||
Covidien PLC (Ireland) | 423 | 28,696 | ||||||
DaVita HealthCare Partners Inc * | 1,716 | 203,500 | ||||||
DENTSPLY International Inc | 1,086 | 46,068 | ||||||
Edwards Lifesciences Corp * | 2,111 | 173,440 | ||||||
Eli Lilly & Co | 6,776 | 384,809 | ||||||
Endo Health Solutions Inc * | 1,268 | 39,004 | ||||||
Express Scripts Holding Co * | 14,634 | 843,650 | ||||||
Gilead Sciences Inc * | 27,518 | 1,346,456 | ||||||
HCA Holdings Inc | 1,990 | 80,854 | ||||||
Henry Schein Inc * | 944 | 87,367 | ||||||
IDEXX Laboratories Inc * | 1,012 | 93,499 | ||||||
Illumina Inc * | 2,240 | 120,960 | ||||||
Incyte Corp Ltd * | 1,655 | 38,744 | ||||||
Intuitive Surgical Inc * | 721 | 354,148 | ||||||
Johnson & Johnson | 11,227 | 915,337 | ||||||
Laboratory Corp of America Holdings * | 1,731 | 156,136 | ||||||
Life Technologies Corp * | 289 | 18,678 | ||||||
McKesson Corp | 4,277 | 461,745 | ||||||
Medivation Inc * | 1,384 | 64,730 | ||||||
Medtronic Inc | 1,087 | 51,046 | ||||||
Mettler-Toledo International Inc * | 568 | 121,109 | ||||||
Mylan Inc * | 6,820 | 197,371 | ||||||
Myriad Genetics Inc * | 1,459 | 37,059 | ||||||
Onyx Pharmaceuticals Inc * | 1,274 | 113,208 | ||||||
Patterson Cos Inc | 1,646 | 62,614 | ||||||
Perrigo Co | 1,709 | 202,910 | ||||||
Quest Diagnostics Inc | 322 | 18,177 | ||||||
Regeneron Pharmaceuticals Inc * | 1,403 | 247,489 | ||||||
ResMed Inc | 2,590 | 120,072 | ||||||
Salix Pharmaceuticals Ltd * | 1,117 | 57,168 | ||||||
Sirona Dental Systems Inc * | 177 | 13,050 | ||||||
St Jude Medical Inc * | 3,962 | 160,223 | ||||||
Stryker Corp | 4,141 | 270,159 | ||||||
Techne Corp | 633 | 42,949 | ||||||
Tenet Healthcare Corp * | 107 | 5,091 | ||||||
The Cooper Cos Inc | 243 | 26,215 | ||||||
Thoratec Corp * | 1,008 | 37,800 | ||||||
United Therapeutics Corp * | 821 | 49,974 | ||||||
Universal Health Services Inc ‘B’ | 91 | 5,812 | ||||||
Varian Medical Systems Inc * | 2,000 | 144,000 | ||||||
Vertex Pharmaceuticals Inc * | 3,867 | 212,608 | ||||||
Warner Chilcott PLC ‘A’ (Ireland) | 2,881 | 39,038 | ||||||
Waters Corp * | 1,592 | 149,505 | ||||||
WellPoint Inc | 324 | 21,459 | ||||||
Zimmer Holdings Inc | 304 | 22,867 | ||||||
Zoetis Inc * | 1,257 | 41,984 | ||||||
|
| |||||||
| 17,977,473 | ||||||||
|
| |||||||
| Value | |||||||
Industrials - 12.7% | ||||||||
3M Co | 11,333 | $1,204,811 | ||||||
AMETEK Inc | 4,426 | 191,911 | ||||||
Armstrong World Industries Inc | 364 | 20,344 | ||||||
BE Aerospace Inc * | 1,783 | 107,497 | ||||||
C.H. Robinson Worldwide Inc | 2,998 | 178,261 | ||||||
Carlisle Cos Inc | 96 | 6,508 | ||||||
Caterpillar Inc | 11,855 | 1,031,029 | ||||||
Chicago Bridge & Iron Co NV (Netherlands) | 1,132 | 70,297 | ||||||
Cintas Corp | 849 | 37,466 | ||||||
Clean Harbors Inc * | 1,026 | 59,600 | ||||||
Colfax Corp * | 163 | 7,586 | ||||||
Con-way Inc | 527 | 18,556 | ||||||
Copa Holdings SA ‘A’ (Panama) | 512 | 61,240 | ||||||
Copart Inc * | 1,927 | 66,058 | ||||||
Covanta Holding Corp | 134 | 2,700 | ||||||
CSX Corp | 12,781 | 314,796 | ||||||
Cummins Inc | 3,492 | 404,409 | ||||||
Danaher Corp | 3,599 | 223,678 | ||||||
Deere & Co | 7,226 | 621,291 | ||||||
Delta Air Lines Inc * | 9,740 | 160,807 | ||||||
Donaldson Co Inc | 2,718 | 98,364 | ||||||
Eaton Corp PLC (Ireland) | 1,554 | 95,183 | ||||||
Emerson Electric Co | 11,209 | 626,247 | ||||||
Equifax Inc | 1,972 | 113,567 | ||||||
Expeditors International of Washington Inc | 3,439 | 122,807 | ||||||
Fastenal Co | 5,379 | 276,212 | ||||||
FedEx Corp | 341 | 33,486 | ||||||
Flowserve Corp | 807 | 135,342 | ||||||
Fluor Corp | 2,265 | 150,237 | ||||||
Fortune Brands Home & Security Inc * | 454 | 16,993 | ||||||
General Cable Corp * | 54 | 1,978 | ||||||
Graco Inc | 1,145 | 66,444 | ||||||
Hertz Global Holdings Inc * | 2,418 | 53,825 | ||||||
Honeywell International Inc | 14,156 | 1,066,655 | ||||||
Hubbell Inc ‘B’ | 906 | 87,982 | ||||||
IDEX Corp | 281 | 15,011 | ||||||
IHS Inc ‘A’ * | 924 | 96,761 | ||||||
Illinois Tool Works Inc | 6,906 | 420,852 | ||||||
Ingersoll-Rand PLC (Ireland) | 4,450 | 244,795 | ||||||
Iron Mountain Inc | 2,833 | 102,866 | ||||||
ITT Corp | 377 | 10,718 | ||||||
JB Hunt Transport Services Inc | 1,632 | 121,551 | ||||||
Joy Global Inc | 1,914 | 113,921 | ||||||
Kansas City Southern | 1,536 | 170,342 | ||||||
Kirby Corp * | 791 | 60,749 | ||||||
Landstar System Inc | 807 | 46,072 | ||||||
Lennox International Inc | 971 | 61,649 | ||||||
Lincoln Electric Holdings Inc | 1,548 | 83,871 | ||||||
Lockheed Martin Corp | 4,220 | 407,314 | ||||||
Masco Corp | 6,434 | 130,289 | ||||||
Matson Inc | 53 | 1,304 | ||||||
MRC Global Inc * | 241 | 7,936 | ||||||
MSC Industrial Direct Co Inc ‘A’ | 854 | 73,256 | ||||||
Nielsen Holdings NV (Netherlands) | 522 | 18,698 | ||||||
Nordson Corp | 1,118 | 73,732 | ||||||
PACCAR Inc | 1,507 | 76,194 | ||||||
Pall Corp | 2,078 | 142,073 | ||||||
Parker Hannifin Corp | 1,231 | 112,735 | ||||||
Pitney Bowes Inc | 1,807 | 26,852 | ||||||
Polypore International Inc * | 800 | 32,144 | ||||||
Precision Castparts Corp | 2,640 | 500,597 | ||||||
Robert Half International Inc | 2,621 | 98,366 | ||||||
Rockwell Automation Inc | 2,594 | 223,992 | ||||||
Rockwell Collins Inc | 2,491 | 157,232 | ||||||
Rollins Inc | 1,099 | 26,980 | ||||||
Roper Industries Inc | 1,774 | 225,848 | ||||||
Snap-on Inc | 200 | 16,540 | ||||||
Southwest Airlines Co | 2,562 | 34,536 | ||||||
| See Notes to Financial Statements | See explanation of symbols and terms, if any, on page B-79 |
B-43
Table of Contents
PACIFIC LIFE FUNDS
PL LARGE-CAP GROWTH FUND
Schedule of Investments (Continued)
March 31, 2013
| Value | |||||||
Spirit Aerosystems Holdings Inc ‘A’ * | 466 | $8,849 | ||||||
SPX Corp | 263 | 20,766 | ||||||
Stericycle Inc * | 1,524 | 161,818 | ||||||
Textron Inc | 301 | 8,973 | ||||||
The Babcock & Wilcox Co | 2,251 | 63,951 | ||||||
The Boeing Co | 12,289 | 1,055,011 | ||||||
The Dun & Bradstreet Corp | 520 | 43,498 | ||||||
The Manitowoc Co Inc | 1,733 | 35,630 | ||||||
The Timken Co | 133 | 7,525 | ||||||
The Toro Co | 1,030 | 47,421 | ||||||
TransDigm Group Inc | 919 | 140,533 | ||||||
Triumph Group Inc | 293 | 23,001 | ||||||
Union Pacific Corp | 8,652 | 1,232,131 | ||||||
United Continental Holdings Inc * | 6,124 | 196,029 | ||||||
United Parcel Service Inc ‘B’ | 13,161 | 1,130,530 | ||||||
United Rentals Inc * | 1,725 | 94,823 | ||||||
United Technologies Corp | 16,558 | 1,547,014 | ||||||
Valmont Industries Inc | 438 | 68,884 | ||||||
Verisk Analytics Inc ‘A’ * | 2,290 | 141,133 | ||||||
W.W. Grainger Inc | 1,061 | 238,704 | ||||||
WABCO Holdings Inc * | 1,113 | 78,567 | ||||||
Wabtec Corp | 889 | 90,776 | ||||||
Waste Connections Inc | 126 | 4,533 | ||||||
Xylem Inc | 349 | 9,618 | ||||||
|
| |||||||
| 18,119,661 | ||||||||
|
| |||||||
Information Technology - 28.4% | ||||||||
Accenture PLC ‘A’ (Ireland) | 11,698 | 888,697 | ||||||
Acme Packet Inc * | 1,002 | 29,278 | ||||||
Adobe Systems Inc * | 5,179 | 225,338 | ||||||
Advanced Micro Devices Inc * | 10,813 | 27,573 | ||||||
Akamai Technologies Inc * | 3,008 | 106,152 | ||||||
Alliance Data Systems Corp * | 905 | 146,510 | ||||||
Altera Corp | 5,882 | 208,635 | ||||||
Amphenol Corp ‘A’ | 2,951 | 220,292 | ||||||
Analog Devices Inc | 437 | 20,316 | ||||||
ANSYS Inc * | 1,680 | 136,786 | ||||||
Apple Inc | 16,988 | 7,519,398 | ||||||
Atmel Corp * | 657 | 4,573 | ||||||
Autodesk Inc * | 4,273 | 176,218 | ||||||
Automatic Data Processing Inc | 8,886 | 577,768 | ||||||
Avago Technologies Ltd (Singapore) | 4,113 | 147,739 | ||||||
BMC Software Inc * | 2,655 | 123,006 | ||||||
Broadcom Corp ‘A’ | 6,220 | 215,647 | ||||||
Broadridge Financial Solutions Inc | 2,391 | 59,392 | ||||||
CA Inc | 350 | 8,810 | ||||||
Cadence Design Systems Inc * | 5,159 | 71,865 | ||||||
Citrix Systems Inc * | 3,383 | 244,117 | ||||||
Cognizant Technology Solutions Corp ‘A’ * | 5,532 | 423,807 | ||||||
Compuware Corp * | 203 | 2,538 | ||||||
Concur Technologies Inc * | 873 | 59,940 | ||||||
Cypress Semiconductor Corp * | 1,449 | 15,982 | ||||||
Diebold Inc | 87 | 2,638 | ||||||
Dolby Laboratories Inc ‘A’ | 507 | 17,015 | ||||||
DST Systems Inc | 94 | 6,699 | ||||||
eBay Inc * | 21,043 | 1,140,951 | ||||||
EchoStar Corp ‘A’ * | 180 | 7,015 | ||||||
EMC Corp * | 38,147 | 911,332 | ||||||
Equinix Inc * | 882 | 190,785 | ||||||
F5 Networks Inc * | 1,422 | 126,672 | ||||||
Facebook Inc ‘A’ * | 7,692 | 196,761 | ||||||
FactSet Research Systems Inc | 839 | 77,691 | ||||||
Fiserv Inc * | 2,085 | 183,126 | ||||||
FleetCor Technologies Inc * | 917 | 70,306 | ||||||
FLIR Systems Inc | 2,147 | 55,843 | �� | |||||
Fortinet Inc * | 2,244 | 53,138 | ||||||
Freescale Semiconductor Ltd (Bermuda) * | 819 | 12,195 | ||||||
Fusion-io Inc * | 1,161 | 19,006 | ||||||
Gartner Inc * | 1,716 | 93,368 | ||||||
Genpact Ltd (Bermuda) | 1,749 | 31,814 | ||||||
| Value | |||||||
Global Payments Inc | 1,473 | $73,149 | ||||||
Google Inc ‘A’ * | 4,704 | 3,735,117 | ||||||
Harris Corp | 581 | 26,924 | ||||||
IAC/InterActiveCorp | 207 | 9,249 | ||||||
Informatica Corp * | 2,040 | 70,319 | ||||||
Intel Corp | 67,913 | 1,483,899 | ||||||
International Business Machines Corp | 19,804 | 4,224,193 | ||||||
Intuit Inc | 5,335 | 350,243 | ||||||
IPG Photonics Corp | 548 | 36,393 | ||||||
Jabil Circuit Inc | 585 | 10,811 | ||||||
Jack Henry & Associates Inc | 1,633 | 75,461 | ||||||
Lam Research Corp * | 931 | 38,599 | ||||||
Lender Processing Services Inc | 1,454 | 37,019 | ||||||
Linear Technology Corp | 4,113 | 157,816 | ||||||
LinkedIn Corp ‘A’ * | 1,187 | 208,983 | ||||||
LSI Corp * | 10,689 | 72,471 | ||||||
MasterCard Inc ‘A’ | 1,971 | 1,066,567 | ||||||
Maxim Integrated Products Inc | 2,699 | 88,122 | ||||||
Microchip Technology Inc | 3,489 | 128,256 | ||||||
MICROS Systems Inc * | 1,511 | 68,766 | ||||||
Microsoft Corp | 136,755 | 3,912,561 | ||||||
Motorola Solutions Inc | 5,014 | 321,046 | ||||||
National Instruments Corp | 1,604 | 52,531 | ||||||
NCR Corp * | 2,953 | 81,385 | ||||||
NetApp Inc * | 4,353 | 148,698 | ||||||
NetSuite Inc * | 540 | 43,232 | ||||||
NeuStar Inc ‘A’ * | 1,148 | 53,416 | ||||||
Nuance Communications Inc * | 4,454 | 89,882 | ||||||
Oracle Corp | 69,418 | 2,244,978 | ||||||
Palo Alto Networks Inc * | 94 | 5,320 | ||||||
Paychex Inc | 5,542 | 194,358 | ||||||
QUALCOMM Inc | 31,145 | 2,085,158 | ||||||
Rackspace Hosting Inc * | 1,954 | 98,638 | ||||||
Red Hat Inc * | 3,544 | 179,185 | ||||||
Riverbed Technology Inc * | 2,796 | 41,688 | ||||||
Rovi Corp * | 368 | 7,879 | ||||||
SAIC Inc | 1,731 | 23,455 | ||||||
salesforce.com inc * | 2,661 | 475,867 | ||||||
ServiceNow Inc * | 194 | 7,023 | ||||||
Silicon Laboratories Inc * | 673 | 27,835 | ||||||
Skyworks Solutions Inc * | 3,187 | 70,210 | ||||||
SolarWinds Inc * | 1,163 | 68,733 | ||||||
Solera Holdings Inc | 1,301 | 75,887 | ||||||
Splunk Inc * | 268 | 10,728 | ||||||
Stratasys Ltd (Israel) * | 220 | 16,328 | ||||||
Symantec Corp * | 709 | 17,498 | ||||||
Synopsys Inc * | 187 | 6,710 | ||||||
Teradata Corp * | 3,101 | 181,440 | ||||||
Teradyne Inc * | 391 | 6,342 | ||||||
Texas Instruments Inc | 13,971 | 495,691 | ||||||
The Western Union Co | 10,394 | 156,326 | ||||||
TIBCO Software Inc * | 3,130 | 63,289 | ||||||
Total System Services Inc | 2,635 | 65,295 | ||||||
Trimble Navigation Ltd * | 4,496 | 134,700 | ||||||
Vantiv Inc ‘A’ * | 680 | 16,143 | ||||||
VeriFone Systems Inc * | 1,850 | 38,258 | ||||||
VeriSign Inc * | 2,629 | 124,299 | ||||||
Visa Inc ‘A’ | 9,494 | 1,612,461 | ||||||
VMware Inc ‘A’ * | 1,598 | 126,050 | ||||||
Western Digital Corp | 1,673 | 84,118 | ||||||
Workday Inc ‘A’ * | 336 | 20,708 | ||||||
Xilinx Inc | 4,851 | 185,163 | ||||||
Zebra Technologies Corp ‘A’ * | 142 | 6,692 | ||||||
Zynga Inc ‘A’ * | 2,421 | 8,135 | ||||||
|
| |||||||
| 40,504,428 | ||||||||
|
| |||||||
Materials - 3.8% | ||||||||
Airgas Inc | 1,242 | 123,157 | ||||||
Albemarle Corp | 963 | 60,207 | ||||||
Allied Nevada Gold Corp * | 1,545 | 25,431 | ||||||
AptarGroup Inc | 386 | 22,137 | ||||||
| See Notes to Financial Statements | See explanation of symbols and terms, if any, on page B-79 |
B-44
Table of Contents
PACIFIC LIFE FUNDS
PL LARGE-CAP GROWTH FUND
Schedule of Investments (Continued)
March 31, 2013
| Value | |||||||
Ball Corp | 2,825 | $134,413 | ||||||
Carpenter Technology Corp | 61 | 3,007 | ||||||
Celanese Corp ‘A’ | 2,810 | 123,781 | ||||||
CF Industries Holdings Inc | 251 | 47,783 | ||||||
Compass Minerals International Inc | 569 | 44,894 | ||||||
Crown Holdings Inc * | 615 | 25,590 | ||||||
Eastman Chemical Co | 2,233 | 156,020 | ||||||
Ecolab Inc | 4,724 | 378,770 | ||||||
EI du Pont de Nemours & Co | 17,024 | 836,900 | ||||||
FMC Corp | 2,459 | 140,237 | ||||||
International Flavors & Fragrances Inc | 1,475 | 113,088 | ||||||
Intrepid Potash Inc | 443 | 8,311 | ||||||
LyondellBasell Industries NV ‘A’ (Netherlands) | 404 | 25,569 | ||||||
Martin Marietta Materials Inc | 401 | 40,910 | ||||||
Molycorp Inc * | 322 | 1,674 | ||||||
Monsanto Co | 9,691 | 1,023,660 | ||||||
NewMarket Corp | 150 | 39,054 | ||||||
Owens-Illinois Inc * | 2,324 | 61,935 | ||||||
Packaging Corp of America | 1,685 | 75,606 | ||||||
PPG Industries Inc | 2,570 | 344,226 | ||||||
Praxair Inc | 5,427 | 605,328 | ||||||
Rock Tenn Co ‘A’ | 141 | 13,083 | ||||||
Rockwood Holdings Inc | 356 | 23,297 | ||||||
Royal Gold Inc | 1,187 | 84,313 | ||||||
RPM International Inc | 880 | 27,790 | ||||||
Sigma-Aldrich Corp | 2,234 | 173,537 | ||||||
Silgan Holdings Inc | 844 | 39,879 | ||||||
Southern Copper Corp | 2,252 | 84,608 | ||||||
Steel Dynamics Inc | 817 | 12,966 | ||||||
Tahoe Resources Inc (Canada) * | 315 | 5,541 | ||||||
The Scotts Miracle-Gro Co ‘A’ | 638 | 27,587 | ||||||
The Sherwin-Williams Co | 1,578 | 266,508 | ||||||
The Valspar Corp | 1,696 | 105,576 | ||||||
Westlake Chemical Corp | 80 | 7,480 | ||||||
WR Grace & Co * | 1,249 | 96,810 | ||||||
|
| |||||||
| 5,430,663 | ||||||||
|
| |||||||
Telecommunication Services - 2.3% | ||||||||
Crown Castle International Corp * | 5,323 | 370,694 | ||||||
Level 3 Communications Inc * | 1,436 | 29,136 | ||||||
SBA Communications Corp ‘A’ * | 2,171 | 156,355 | ||||||
tw telecom Inc * | 2,831 | 71,313 | ||||||
Verizon Communications Inc | 51,616 | 2,536,926 | ||||||
Windstream Corp | 6,007 | 47,756 | ||||||
|
| |||||||
| 3,212,180 | ||||||||
|
| |||||||
Utilities - 0.2% | ||||||||
Aqua America Inc | 272 | 8,552 | ||||||
ITC Holdings Corp | 952 | 84,975 | ||||||
ONEOK Inc | 3,824 | 182,290 | ||||||
Questar Corp | 691 | 16,812 | ||||||
|
| |||||||
| 292,629 | ||||||||
|
| |||||||
Total Common Stocks | 139,890,252 | |||||||
|
| |||||||
| Value | |||||||
SHORT-TERM INVESTMENT - 4.3% | ||||||||
Money Market Fund - 4.3% | ||||||||
BlackRock Liquidity Funds Treasury | 6,092,223 | $6,092,223 | ||||||
|
| |||||||
Total Short-Term Investment | 6,092,223 | |||||||
|
| |||||||
TOTAL INVESTMENTS - 102.5% | 145,982,475 | |||||||
OTHER ASSETS & LIABILITIES, NET - (2.5%) | (3,584,463 | ) | ||||||
|
| |||||||
NET ASSETS - 100.0% | $142,398,012 | |||||||
|
| |||||||
Notes to Schedule of Investments
| (a) | As of March 31, 2013, the fund was diversified as a percentage of net assets as follows: |
Information Technology | 28.4% | |||
Consumer Discretionary | 16.6% | |||
Industrials | 12.7% | |||
Consumer Staples | 12.7% | |||
Health Care | 12.6% | |||
Financials | 4.8% | |||
Short-Term Investment | 4.3% | |||
Energy | 4.1% | |||
Materials | 3.8% | |||
Others (each less than 3.0%) | 2.5% | |||
|
| |||
| 102.5% | ||||
Other Assets & Liabilities, Net | (2.5% | ) | ||
|
| |||
| 100.0% | ||||
|
|
| (b) | As of March 31, 2013, $293,600 in cash was segregated with the broker(s)/custodian as collateral for open futures contracts. |
| (c) | Open futures contracts outstanding as of March 31, 2013 were as follows: |
| Long Futures Outstanding | Number of Contracts | Notional Amount | Unrealized Appreciation | |||||||||
NASDAQ 100 E-Mini (06/13) | 10 | $558,797 | $3,376 | |||||||||
S&P 500 E-Mini (06/13) | 25 | 1,920,844 | 32,466 | |||||||||
|
| |||||||||||
Total Futures Contracts | $35,842 | |||||||||||
|
| |||||||||||
| (d) | Fair Value Measurements |
The following is a summary of the fund’s investments as categorized under the three-tier hierarchy of inputs used in valuing the fund’s assets and liabilities (See Note 3D in Notes to Financial Statements) as of March 31, 2013:
| Total Value at March 31, 2013 | Level 1 Quoted Price | Level 2 Significant Observable Inputs | Level 3 Significant Unobservable Inputs | |||||||||||||||
Assets | Common Stocks (1) | $139,890,252 | $139,890,252 | $— | $— | |||||||||||||
| Short-Term Investment | 6,092,223 | 6,092,223 | — | — | ||||||||||||||
| Derivatives: | ||||||||||||||||||
Equity Contracts | ||||||||||||||||||
Futures | 35,842 | 35,842 | — | — | ||||||||||||||
|
|
|
|
|
|
|
| |||||||||||
Total | $146,018,317 | $146,018,317 | $— | $— | ||||||||||||||
|
|
|
|
|
|
|
| |||||||||||
| (1) | For equity investments categorized in a single level, refer to the schedule of investments for further industry breakout. |
| See Notes to Financial Statements | See explanation of symbols and terms, if any, on page B-79 |
B-45
Table of Contents
PACIFIC LIFE FUNDS
PL LARGE-CAP VALUE FUND
Schedule of Investments
March 31, 2013
| Value | |||||||
COMMON STOCKS - 96.6% | ||||||||
Consumer Discretionary - 15.0% | ||||||||
DISH Network Corp ‘A’ | 182,583 | $6,919,896 | ||||||
McDonald’s Corp | 27,409 | 2,732,403 | ||||||
News Corp ‘A’ | 330,150 | 10,076,178 | ||||||
SES SA FDR (Luxembourg) | 99,909 | 3,132,866 | ||||||
Target Corp | 56,096 | 3,839,771 | ||||||
The Home Depot Inc | 89,637 | 6,254,870 | ||||||
Time Warner Cable Inc | 70,485 | 6,770,789 | ||||||
Time Warner Inc | 154,610 | 8,908,628 | ||||||
|
| |||||||
| 48,635,401 | ||||||||
|
| |||||||
Consumer Staples - 12.3% | ||||||||
Altria Group Inc | 100,338 | 3,450,624 | ||||||
Anheuser-Busch InBev NV ADR (Belgium) | 61,709 | 6,143,131 | ||||||
CVS Caremark Corp | 181,779 | 9,996,027 | ||||||
Kimberly-Clark Corp | 65,972 | 6,463,937 | ||||||
Lorillard Inc | 80,067 | 3,230,703 | ||||||
Philip Morris International Inc | 113,563 | 10,528,426 | ||||||
|
| |||||||
| 39,812,848 | ||||||||
|
| |||||||
Energy - 11.4% | ||||||||
Apache Corp | 37,441 | 2,888,948 | ||||||
Chevron Corp | 78,253 | 9,298,021 | ||||||
Exxon Mobil Corp | 82,886 | 7,468,857 | ||||||
Halliburton Co | 144,255 | 5,829,345 | ||||||
Royal Dutch Shell PLC ‘A’ ADR (United Kingdom) | 65,622 | 4,275,930 | ||||||
Suncor Energy Inc (Canada) | 114,705 | 3,442,297 | ||||||
Transocean Ltd (Switzerland) * | 74,605 | 3,876,476 | ||||||
|
| |||||||
| 37,079,874 | ||||||||
|
| |||||||
Financials - 24.5% | ||||||||
American Express Co | 106,578 | 7,189,752 | ||||||
Capital One Financial Corp | 65,388 | 3,593,071 | ||||||
JPMorgan Chase & Co | 253,832 | 12,046,867 | ||||||
Loews Corp | 94,192 | 4,151,041 | ||||||
Marsh & McLennan Cos Inc | 145,960 | 5,542,101 | ||||||
MetLife Inc | 95,101 | 3,615,740 | ||||||
State Street Corp | 136,540 | 8,068,149 | ||||||
The Bank of New York Mellon Corp | 127,910 | 3,580,201 | ||||||
The Progressive Corp | 128,798 | 3,254,725 | ||||||
The Travelers Cos Inc | 79,359 | 6,681,234 | ||||||
U.S. Bancorp | 289,258 | 9,814,524 | ||||||
Wells Fargo & Co | 319,893 | 11,832,842 | ||||||
|
| |||||||
| 79,370,247 | ||||||||
|
| |||||||
Health Care - 8.9% | ||||||||
Johnson & Johnson | 73,043 | 5,955,196 | ||||||
Merck & Co Inc | 153,292 | 6,780,105 | ||||||
Novartis AG ADR (Switzerland) | 51,864 | 3,694,791 | ||||||
Pfizer Inc | 144,156 | 4,160,342 | ||||||
Teva Pharmaceutical Industries Ltd ADR (Israel) | 96,861 | 3,843,444 | ||||||
WellPoint Inc | 65,065 | 4,309,255 | ||||||
|
| |||||||
| 28,743,133 | ||||||||
|
| |||||||
Industrials - 8.6% | ||||||||
General Electric Co | 314,139 | 7,262,894 | ||||||
Honeywell International Inc | 110,415 | 8,319,770 | ||||||
Illinois Tool Works Inc | 92,985 | 5,666,506 | ||||||
United Technologies Corp | 70,564 | 6,592,795 | ||||||
|
| |||||||
| 27,841,965 | ||||||||
|
| |||||||
Information Technology - 7.8% | ||||||||
International Business Machines Corp | 32,164 | 6,860,581 | ||||||
Microsoft Corp | 138,827 | 3,971,840 | ||||||
Motorola Solutions Inc | 87,928 | 5,630,030 | ||||||
TE Connectivity Ltd (Switzerland) | 120,443 | 5,050,175 | ||||||
Xerox Corp | 449,642 | 3,866,921 | ||||||
|
| |||||||
| 25,379,547 | ||||||||
|
| |||||||
| Value | |||||||
Materials - 2.9% | ||||||||
Air Products & Chemicals Inc | 52,370 | $4,562,475 | ||||||
Crown Holdings Inc * | 112,605 | 4,685,494 | ||||||
|
| |||||||
| 9,247,969 | ||||||||
|
| |||||||
Telecommunication Services - 2.9% | ||||||||
AT&T Inc | 98,867 | 3,627,430 | ||||||
CenturyLink Inc | 70,439 | 2,474,522 | ||||||
Verizon Communications Inc | 67,341 | 3,309,810 | ||||||
|
| |||||||
| 9,411,762 | ||||||||
|
| |||||||
Utilities - 2.3% | ||||||||
Sempra Energy | 92,150 | 7,366,471 | ||||||
|
| |||||||
Total Common Stocks | 312,889,217 | |||||||
|
| |||||||
SHORT-TERM INVESTMENT - 3.3% | ||||||||
Money Market Fund - 3.3% | ||||||||
BlackRock Liquidity Funds Treasury | 10,757,096 | 10,757,096 | ||||||
|
| |||||||
Total Short-Term Investment | 10,757,096 | |||||||
|
| |||||||
TOTAL INVESTMENTS - 99.9% | 323,646,313 | |||||||
OTHER ASSETS & LIABILITIES, NET - 0.1% | 438,297 | |||||||
|
| |||||||
NET ASSETS - 100.0% | $324,084,610 | |||||||
|
| |||||||
Notes to Schedule of Investments
| (a) | As of March 31, 2013, the fund was diversified as a percentage of net assets as follows: |
Financials | 24.5% | |||
Consumer Discretionary | 15.0% | |||
Consumer Staples | 12.3% | |||
Energy | 11.4% | |||
Health Care | 8.9% | |||
Industrials | 8.6% | |||
Information Technology | 7.8% | |||
Short-Term Investment | 3.3% | |||
Others (each less than 3.0%) | 8.1% | |||
|
| |||
| 99.9% | ||||
Other Assets & Liabilities, Net | 0.1% | |||
|
| |||
| 100.0% | ||||
|
|
| See Notes to Financial Statements | See explanation of symbols and terms, if any, on page B-79 |
B-46
Table of Contents
PACIFIC LIFE FUNDS
PL LARGE-CAP VALUE FUND
Schedule of Investments (Continued)
March 31, 2013
| (b) | Fair Value Measurements |
The following is a summary of the fund’s investments as categorized under the three-tier hierarchy of inputs used in valuing the fund’s assets and liabilities (See Note 3D in Notes to Financial Statements) as of March 31, 2013:
| Total Value at March 31, 2013 | Level 1 Quoted Price | Level 2 Significant Observable Inputs | Level 3 Significant Unobservable Inputs | |||||||||||||||
Assets | Common Stocks | |||||||||||||||||
Consumer Discretionary | $48,635,401 | $45,502,535 | $3,132,866 | $— | ||||||||||||||
Consumer Staples | 39,812,848 | 39,812,848 | — | — | ||||||||||||||
Energy | 37,079,874 | 37,079,874 | — | — | ||||||||||||||
Financials | 79,370,247 | 79,370,247 | — | — | ||||||||||||||
Health Care | 28,743,133 | 28,743,133 | — | — | ||||||||||||||
Industrials | 27,841,965 | 27,841,965 | — | — | ||||||||||||||
Information Technology | 25,379,547 | 25,379,547 | — | — | ||||||||||||||
Materials | 9,247,969 | 9,247,969 | — | — | ||||||||||||||
Telecommunication Services | 9,411,762 | 9,411,762 | — | — | ||||||||||||||
Utilities | 7,366,471 | 7,366,471 | — | — | ||||||||||||||
|
|
|
|
|
|
|
| |||||||||||
| 312,889,217 | 309,756,351 | 3,132,866 | — | |||||||||||||||
Short-Term Investment | 10,757,096 | 10,757,096 | — | — | ||||||||||||||
|
|
|
|
|
|
|
| |||||||||||
Total | $323,646,313 | $320,513,447 | $3,132,866 | $— | ||||||||||||||
|
|
|
|
|
|
|
| |||||||||||
| See Notes to Financial Statements | See explanation of symbols and terms, if any, on page B-79 |
B-47
Table of Contents
PACIFIC LIFE FUNDS
PL MAIN STREET® CORE FUND
Schedule of Investments
March 31, 2013
Shares | Value | |||||||
PREFERRED STOCKS - 1.4% | ||||||||
Consumer Staples - 1.4% |
| |||||||
Henkel AG & Co KGaA (Germany) | 31,200 | $3,004,024 | ||||||
|
| |||||||
Total Preferred Stocks | 3,004,024 | |||||||
|
| |||||||
COMMON STOCKS - 96.3% | ||||||||
Consumer Discretionary - 4.7% | ||||||||
AutoZone Inc * | 12,580 | 4,991,367 | ||||||
Ford Motor Co | 159,742 | 2,100,607 | ||||||
The TJX Cos Inc | 61,240 | 2,862,970 | ||||||
|
| |||||||
| 9,954,944 | ||||||||
|
| |||||||
Consumer Staples - 10.7% | ||||||||
Dr Pepper Snapple Group Inc | 104,240 | 4,894,068 | ||||||
Kraft Foods Group Inc | 64,945 | 3,346,616 | ||||||
Philip Morris International Inc | 108,545 | 10,063,207 | ||||||
The J.M. Smucker Co | 44,970 | 4,459,225 | ||||||
|
| |||||||
| 22,763,116 | ||||||||
|
| |||||||
Energy - 8.7% | ||||||||
Chevron Corp | 63,834 | 7,584,756 | ||||||
National Oilwell Varco Inc | 99,360 | 7,029,720 | ||||||
Noble Energy Inc | 34,148 | 3,949,558 | ||||||
|
| |||||||
| 18,564,034 | ||||||||
|
| |||||||
Financials - 20.0% | ||||||||
American International Group Inc * | 56,910 | 2,209,246 | ||||||
CIT Group Inc * | 147,043 | 6,393,430 | ||||||
Citigroup Inc | 125,807 | 5,565,702 | ||||||
CME Group Inc ‘A’ | 40,550 | 2,489,364 | ||||||
Discover Financial Services | 80,585 | 3,613,431 | ||||||
JPMorgan Chase & Co | 199,740 | 9,479,660 | ||||||
Lincoln National Corp | 46,320 | 1,510,495 | ||||||
M&T Bank Corp | 6,080 | 627,213 | ||||||
Marsh & McLennan Cos Inc | 92,670 | 3,518,680 | ||||||
Moody’s Corp | 20,870 | 1,112,788 | ||||||
MSCI Inc * | 41,450 | 1,406,399 | ||||||
The McGraw-Hill Cos Inc | 88,928 | 4,631,370 | ||||||
|
| |||||||
| 42,557,778 | ||||||||
|
| |||||||
Health Care - 16.1% | ||||||||
Abbott Laboratories | 68,720 | 2,427,190 | ||||||
AbbVie Inc | 68,720 | 2,802,402 | ||||||
Actavis Inc * | 61,690 | 5,682,266 | ||||||
Bristol-Myers Squibb Co | 51,360 | 2,115,518 | ||||||
Covidien PLC (Ireland) | 102,700 | 6,967,168 | ||||||
Express Scripts Holding Co * | 117,819 | 6,792,265 | ||||||
Pfizer Inc | 131,195 | 3,786,288 | ||||||
Sanofi (France) | 22,890 | 2,334,227 | ||||||
UnitedHealth Group Inc | 24,160 | 1,382,194 | ||||||
|
| |||||||
| 34,289,518 | ||||||||
|
| |||||||
Industrials - 10.2% | ||||||||
CSX Corp | 218,790 | 5,388,798 | ||||||
L-3 Communications Holdings Inc | 20,190 | 1,633,775 | ||||||
The ADT Corp | 55,982 | 2,739,759 | ||||||
Towers Watson & Co ‘A’ | 40,610 | 2,815,085 | ||||||
Tyco International Ltd (Switzerland) | 111,965 | 3,582,880 | ||||||
United Parcel Service Inc ‘B’ | 62,706 | 5,386,445 | ||||||
|
| |||||||
| 21,546,742 | ||||||||
|
| |||||||
Shares | Value | |||||||
Information Technology - 22.6% | ||||||||
Amdocs Ltd (United Kingdom) | 21,710 | $786,987 | ||||||
Apple Inc | 25,352 | 11,221,556 | ||||||
Corning Inc | 151,980 | 2,025,893 | ||||||
eBay Inc * | 139,390 | 7,557,726 | ||||||
Facebook Inc ‘A’ * | 24,920 | 637,454 | ||||||
Google Inc ‘A’ * | 4,406 | 3,498,496 | ||||||
International Business Machines Corp | 48,280 | 10,298,124 | ||||||
Microsoft Corp | 149,350 | 4,272,904 | ||||||
QUALCOMM Inc | 68,452 | 4,582,861 | ||||||
Western Digital Corp | 59,960 | 3,014,789 | ||||||
|
| |||||||
| 47,896,790 | ||||||||
|
| |||||||
Materials - 2.6% | ||||||||
PPG Industries Inc | 5,240 | 701,846 | ||||||
Vulcan Materials Co | 93,150 | 4,815,855 | ||||||
|
| |||||||
| 5,517,701 | ||||||||
|
| |||||||
Telecommunication Services - 0.7% | ||||||||
America Movil SAB de CV ‘L’ ADR (Mexico) | 74,640 | 1,564,454 | ||||||
|
| |||||||
Total Common Stocks | 204,655,077 | |||||||
|
| |||||||
SHORT-TERM INVESTMENT - 2.1% | ||||||||
Money Market Fund - 2.1% | ||||||||
BlackRock Liquidity Funds Treasury | 4,352,085 | 4,352,085 | ||||||
|
| |||||||
Total Short-Term Investment | 4,352,085 | |||||||
|
| |||||||
TOTAL INVESTMENTS - 99.8% | 212,011,186 | |||||||
OTHER ASSETS & LIABILITIES, NET - 0.2% | 417,120 | |||||||
|
| |||||||
NET ASSETS - 100.0% | $212,428,306 | |||||||
|
| |||||||
Notes to Schedule of Investments
| (a) | As of March 31, 2013, the fund was diversified as a percentage of net assets as follows: |
Information Technology | 22.6% | |||
Financials | 20.0% | |||
Health Care | 16.1% | |||
Consumer Staples | 12.1% | |||
Industrials | 10.2% | |||
Energy | 8.7% | |||
Consumer Discretionary | 4.7% | |||
Others (each less than 3.0%) | 5.4% | |||
|
| |||
| 99.8% | ||||
Other Assets & Liabilities, Net | 0.2% | |||
|
| |||
| 100.0% | ||||
|
|
| See Notes to Financial Statements | See explanation of symbols and terms, if any, on page B-79 |
B-48
Table of Contents
PACIFIC LIFE FUNDS
PL MAIN STREET CORE FUND
Schedule of Investments (Continued)
March 31, 2013
| (b) | Fair Value Measurements |
The following is a summary of the fund’s investments as categorized under the three-tier hierarchy of inputs used in valuing the fund’s assets and liabilities (See Note 3D in Notes to Financial Statements) as of March 31, 2013:
| Total Value at March 31, 2013 | Level 1 Quoted Price | Level 2 Significant Observable Inputs | Level 3 Significant Unobservable Inputs | |||||||||||||||
Assets | Preferred Stocks (1) | $3,004,024 | $— | $3,004,024 | $— | |||||||||||||
Common Stocks | ||||||||||||||||||
Consumer Discretionary | 9,954,944 | 9,954,944 | — | — | ||||||||||||||
Consumer Staples | 22,763,116 | 22,763,116 | — | — | ||||||||||||||
Energy | 18,564,034 | 18,564,034 | — | — | ||||||||||||||
Financials | 42,557,778 | 42,557,778 | — | — | ||||||||||||||
Health Care | 34,289,518 | 31,955,291 | 2,334,227 | — | ||||||||||||||
Industrials | 21,546,742 | 21,546,742 | — | — | ||||||||||||||
Information Technology | 47,896,790 | 47,896,790 | — | — | ||||||||||||||
Materials | 5,517,701 | 5,517,701 | — | — | ||||||||||||||
Telecommunication Services | 1,564,454 | 1,564,454 | — | |||||||||||||||
|
|
|
|
|
|
|
| |||||||||||
| 204,655,077 | 202,320,850 | 2,334,227 | — | |||||||||||||||
Short-Term Investment | 4,352,085 | 4,352,085 | — | — | ||||||||||||||
|
|
|
|
|
|
|
| |||||||||||
Total | $212,011,186 | $206,672,935 | $5,338,251 | $— | ||||||||||||||
|
|
|
|
|
|
|
| |||||||||||
| (1) | For equity investments categorized in a single level, refer to the schedule of investments for further industry breakout. |
| See Notes to Financial Statements | See explanation of symbols and terms, if any, on page B-79 |
B-49
Table of Contents
PACIFIC LIFE FUNDS
PL MID-CAP EQUITY FUND
Schedule of Investments
March 31, 2013
Shares | Value | |||||||
CONVERTIBLE PREFERRED STOCKS - 0.0% | ||||||||
Industrials - 0.0% | ||||||||
Better Place LLC ‘B’ 8.000% * ¯ + | 229,480 | $— | ||||||
|
| |||||||
Total Convertible Preferred Stocks | — | |||||||
|
| |||||||
COMMON STOCKS - 99.0% | ||||||||
Consumer Discretionary - 13.2% | ||||||||
AutoZone Inc * | 1,847 | 732,834 | ||||||
Chipotle Mexican Grill Inc * | 2,784 | 907,222 | ||||||
D.R. Horton Inc | 48,976 | 1,190,117 | ||||||
Discovery Communications Inc ‘C’ * | 10,650 | 740,601 | ||||||
Dollar General Corp * | 28,272 | 1,429,998 | ||||||
HomeAway Inc * | 19,397 | 630,403 | ||||||
Life Time Fitness Inc * | 17,619 | 753,741 | ||||||
LKQ Corp * | 46,628 | 1,014,625 | ||||||
Michael Kors Holdings Ltd (United Kingdom) * | 11,735 | 666,431 | ||||||
Nordstrom Inc | 16,462 | 909,196 | ||||||
Polaris Industries Inc | 10,966 | 1,014,245 | ||||||
priceline.com Inc * | 807 | 555,160 | ||||||
Ross Stores Inc | 27,100 | 1,642,802 | ||||||
TripAdvisor Inc * | 24,784 | 1,301,656 | ||||||
TRW Automotive Holdings Corp * | 50,909 | 2,799,995 | ||||||
Ulta Salon Cosmetics & Fragrance Inc * | 7,235 | 587,265 | ||||||
Whirlpool Corp | 6,079 | 720,118 | ||||||
Wynn Resorts Ltd | 5,771 | 722,298 | ||||||
|
| |||||||
| 18,318,707 | ||||||||
|
| |||||||
Consumer Staples - 7.6% | ||||||||
Darling International Inc * | 62,217 | 1,117,417 | ||||||
Hormel Foods Corp | 43,839 | 1,811,427 | ||||||
Monster Beverage Corp * | 14,562 | 695,190 | ||||||
The Hershey Co | 16,994 | 1,487,485 | ||||||
The J.M. Smucker Co | 32,965 | 3,268,810 | ||||||
Tyson Foods Inc ‘A’ | 56,966 | 1,413,896 | ||||||
Whole Foods Market Inc | 8,256 | 716,208 | ||||||
|
| |||||||
| 10,510,433 | ||||||||
|
| |||||||
Energy - 14.0% | ||||||||
Bristow Group Inc | 10,952 | 722,175 | ||||||
Cabot Oil & Gas Corp | 41,760 | 2,823,394 | ||||||
Energy XXI Ltd (Bermuda) | 22,918 | 623,828 | ||||||
Gulfport Energy Corp * | 56,982 | 2,611,485 | ||||||
Hess Corp | 27,883 | 1,996,702 | ||||||
Kodiak Oil & Gas Corp (Canada) * | 88,713 | 806,401 | ||||||
Oasis Petroleum Inc * | 14,263 | 542,992 | ||||||
Oceaneering International Inc | 10,813 | 718,091 | ||||||
Peabody Energy Corp | 29,399 | 621,789 | ||||||
Tesoro Corp | 11,270 | 659,859 | ||||||
Tidewater Inc | 50,141 | 2,532,121 | ||||||
Western Refining Inc | 20,938 | 741,415 | ||||||
WPX Energy Inc * | 249,056 | 3,989,877 | ||||||
|
| |||||||
| 19,390,129 | ||||||||
|
| |||||||
Financials - 22.4% | ||||||||
Arch Capital Group Ltd (Bermuda) * | 23,160 | 1,217,521 | ||||||
AXIS Capital Holdings Ltd (Bermuda) | 51,511 | 2,143,888 | ||||||
Comerica Inc | 72,934 | 2,621,977 | ||||||
CYS Investments Inc REIT | 214,483 | 2,518,030 | ||||||
Hatteras Financial Corp REIT | 105,851 | 2,903,493 | ||||||
KeyCorp | 495,471 | 4,934,891 | ||||||
Lincoln National Corp | 99,140 | 3,232,956 | ||||||
Principal Financial Group Inc | 81,582 | 2,776,235 | ||||||
Reinsurance Group of America Inc | 16,220 | 967,847 | ||||||
Signature Bank * | 12,787 | 1,007,104 | ||||||
Shares | Value | |||||||
The Hartford Financial Services Group Inc | 208,590 | $5,381,622 | ||||||
Validus Holdings Ltd (Bermuda) | 18,911 | 706,704 | ||||||
W.R. Berkley Corp | 12,691 | 563,100 | ||||||
|
| |||||||
| 30,975,368 | ||||||||
|
| |||||||
Health Care - 7.5% | ||||||||
Catamaran Corp (Canada) * | 6,430 | 340,983 | ||||||
Centene Corp * | 15,587 | 686,452 | ||||||
HMS Holdings Corp * | 27,242 | 739,620 | ||||||
Hologic Inc * | 88,682 | 2,004,213 | ||||||
Humana Inc | 12,231 | 845,284 | ||||||
MEDNAX Inc * | 17,750 | 1,590,933 | ||||||
The Cooper Cos Inc | 12,792 | 1,380,001 | ||||||
Universal Health Services Inc ‘B’ | 11,327 | 723,455 | ||||||
Vertex Pharmaceuticals Inc * | 21,676 | 1,191,746 | ||||||
Zimmer Holdings Inc | 11,993 | 902,113 | ||||||
|
| |||||||
| 10,404,800 | ||||||||
|
| |||||||
Industrials - 9.6% | ||||||||
AGCO Corp | 36,111 | 1,882,105 | ||||||
Chart Industries Inc * | 12,068 | 965,561 | ||||||
Fluor Corp | 20,984 | 1,391,869 | ||||||
Jacobs Engineering Group Inc * | 33,221 | 1,868,349 | ||||||
Manpower Inc | 12,213 | 692,721 | ||||||
Parker Hannifin Corp | 20,116 | 1,842,223 | ||||||
Quanta Services Inc * | 11,650 | 332,957 | ||||||
Rockwell Automation Inc | 6,935 | 598,837 | ||||||
Textron Inc | 78,186 | 2,330,725 | ||||||
United Rentals Inc * | 13,998 | 769,470 | ||||||
WESCO International Inc * | 9,452 | 686,310 | ||||||
|
| |||||||
| 13,361,127 | ||||||||
|
| |||||||
Information Technology - 13.2% | ||||||||
ANSYS Inc * | 9,524 | 775,444 | ||||||
Applied Materials Inc | 48,988 | 660,358 | ||||||
Avnet Inc * | 22,319 | 807,948 | ||||||
Computer Sciences Corp | 33,374 | 1,643,002 | ||||||
Cree Inc * | 19,821 | 1,084,407 | ||||||
FEI Co | 8,531 | 550,676 | ||||||
IAC/ InterActiveCorp | 57,493 | 2,568,787 | ||||||
IPG Photonics Corp | 10,879 | 722,475 | ||||||
JDS Uniphase Corp * | 141,383 | 1,890,291 | ||||||
Lam Research Corp * | 62,265 | 2,581,507 | ||||||
Linear Technology Corp | 40,205 | 1,542,666 | ||||||
MICROS Systems Inc * | 26,836 | 1,221,306 | ||||||
Skyworks Solutions Inc * | 44,544 | 981,304 | ||||||
Teradata Corp * | 12,507 | 731,785 | ||||||
Trimble Navigation Ltd * | 15,554 | 465,998 | ||||||
|
| |||||||
| 18,227,954 | ||||||||
|
| |||||||
Materials - 5.8% | ||||||||
Agnico-Eagle Mines Ltd (Canada) | 12,012 | 492,972 | ||||||
Allegheny Technologies Inc | 26,698 | 846,594 | ||||||
Celanese Corp ‘A’ | 14,472 | 637,492 | ||||||
Compass Minerals International Inc | 17,219 | 1,358,579 | ||||||
Eagle Materials Inc | 26,408 | 1,759,565 | ||||||
NewMarket Corp | 3,628 | 944,586 | ||||||
Royal Gold Inc | 9,549 | 678,265 | ||||||
Silver Wheaton Corp (Canada) | 17,236 | 540,349 | ||||||
Westlake Chemical Corp | 8,004 | 748,374 | ||||||
|
| |||||||
| 8,006,776 | ||||||||
|
| |||||||
Utilities - 5.7% | ||||||||
Alliant Energy Corp | 57,646 | 2,892,676 | ||||||
Questar Corp | 164,830 | 4,010,314 | ||||||
Xcel Energy Inc | 32,765 | 973,121 | ||||||
|
| |||||||
| 7,876,111 | ||||||||
|
| |||||||
Total Common Stocks | 137,071,405 | |||||||
|
| |||||||
| See Notes to Financial Statements | See explanation of symbols and terms, if any, on page B-79 |
B-50
Table of Contents
PACIFIC LIFE FUNDS
PL MID-CAP EQUITY FUND
Schedule of Investments (Continued)
March 31, 2013
Shares | Value | |||||||
SHORT-TERM INVESTMENT - 1.0% | ||||||||
Money Market Fund - 1.0% | ||||||||
BlackRock Liquidity Funds Treasury | 1,335,249 | $1,335,249 | ||||||
|
| |||||||
Total Short-Term Investment | 1,335,249 | |||||||
|
| |||||||
TOTAL INVESTMENTS - 100.0% | 138,406,654 | |||||||
OTHER ASSETS & LIABILITIES, NET - 0.0% | 8,963 | |||||||
|
| |||||||
NET ASSETS - 100.0% | $138,415,617 | |||||||
|
| |||||||
Notes to Schedule of Investments
| (a) | As of March 31, 2013, the fund was diversified as a percentage of net assets as follows: |
Financials | 22.4% | |||
Energy | 14.0% | |||
Consumer Discretionary | 13.2% | |||
Information Technology | 13.2% | |||
Industrials | 9.6% | |||
Consumer Staples | 7.6% | |||
Health Care | 7.5% | |||
Materials | 5.8% | |||
Utilities | 5.7% | |||
Others (each less than 3.0%) | 1.0% | |||
|
| |||
| 100.0% | ||||
Other Assets & Liabilities, Net | 0.0% | |||
|
| |||
| 100.0% | ||||
|
|
| (b) | Restricted securities as of March 31, 2013 were as follows: |
Issuer and Acquisition Date | Cost | Value | Value as a % of Net Assets | |||||||||
Better Place LLC ‘B’ 8.000% | ||||||||||||
Acq. 01/25/10 | $573,700 | $— | —% | |||||||||
|
|
|
|
|
| |||||||
| (c) | Fair Value Measurements |
The following is a summary of the fund’s investments as categorized under the three-tier hierarchy of inputs used in valuing the fund’s assets and liabilities (See Note 3D in Notes to Financial Statements) as of March 31, 2013:
| Total Value at March 31, 2013 | Level 1 Quoted Price | Level 2 Significant Observable Inputs | Level 3 Significant Unobservable Inputs | |||||||||||||||
Assets | Common Stocks (1) | $137,071,405 | $137,071,405 | $— | $— | |||||||||||||
Short-Term Investment | 1,335,249 | 1,335,249 | — | — | ||||||||||||||
|
|
|
|
|
|
|
| |||||||||||
Total | $138,406,654 | $138,406,654 | $— | $— | ||||||||||||||
|
|
|
|
|
|
|
| |||||||||||
| (1) | For equity investments categorized in a single level, refer to the schedule of investments for further industry breakout. |
| See Notes to Financial Statements | See explanation of symbols and terms, if any, on page B-79 |
B-51
Table of Contents
PACIFIC LIFE FUNDS
PL MID-CAP GROWTH FUND
Schedule of Investments
March 31, 2013
Shares | Value | |||||||
CONVERTIBLE PREFERRED STOCKS - 0.0% | ||||||||
Industrials - 0.0% | ||||||||
Better Place LLC ‘B’ 8.000% * ¯ + | 118,395 | $— | ||||||
|
| |||||||
Total Convertible Preferred Stocks | — | |||||||
|
| |||||||
COMMON STOCKS - 98.1% | ||||||||
Consumer Discretionary - 13.0% | ||||||||
Aimia Inc (Canada) | 26,956 | 408,645 | ||||||
Coach Inc | 9,149 | 457,359 | ||||||
Dollar Tree Inc * | 34,050 | 1,649,041 | ||||||
Dunkin’ Brands Group Inc | 25,576 | 943,243 | ||||||
Groupon Inc * | 139,352 | 852,834 | ||||||
Morningstar Inc | 13,584 | 949,793 | ||||||
New Oriental Education & Technology Group ADR (Cayman) | 39,890 | 718,020 | ||||||
Tesla Motors Inc * | 18,308 | 693,690 | ||||||
TripAdvisor Inc * | 2,577 | 135,344 | ||||||
Weight Watchers International Inc | 14,345 | 604,068 | ||||||
Wyndham Worldwide Corp | 8,741 | 563,620 | ||||||
|
| |||||||
| 7,975,657 | ||||||||
|
| |||||||
Consumer Staples - 6.6% | ||||||||
DE Master Blenders 1753 NV (Netherlands) * | 117,964 | 1,824,344 | ||||||
McCormick & Co Inc | 4,650 | 342,008 | ||||||
Mead Johnson Nutrition Co | 13,094 | 1,014,130 | ||||||
Monster Beverage Corp * | 18,546 | 885,386 | ||||||
|
| |||||||
| 4,065,868 | ||||||||
|
| |||||||
Energy - 2.6% | ||||||||
Range Resources Corp | 19,653 | 1,592,679 | ||||||
|
| |||||||
Financials - 11.3% | ||||||||
Arch Capital Group Ltd (Bermuda) * | 21,856 | 1,148,970 | ||||||
Greenhill & Co Inc | 9,955 | 531,398 | ||||||
IntercontinentalExchange Inc * | 6,302 | 1,027,667 | ||||||
MSCI Inc * | 47,011 | 1,595,083 | ||||||
The McGraw-Hill Cos Inc | 21,442 | 1,116,699 | ||||||
The Progressive Corp | 60,521 | 1,529,366 | ||||||
|
| |||||||
| 6,949,183 | ||||||||
|
| |||||||
Health Care - 10.7% | ||||||||
athenahealth Inc * | 16,941 | 1,643,955 | ||||||
Illumina Inc * | 35,906 | 1,938,924 | ||||||
Intuitive Surgical Inc * | 2,592 | 1,273,164 | ||||||
Ironwood Pharmaceuticals Inc ‘A’ * | 33,267 | 608,453 | ||||||
Qualicorp SA (Brazil) * | 100,273 | 1,008,312 | ||||||
Techne Corp | 2,087 | 141,603 | ||||||
|
| |||||||
| 6,614,411 | ||||||||
|
| |||||||
Industrials - 15.8% | ||||||||
Covanta Holding Corp | 39,908 | 804,146 | ||||||
Edenred (France) | 71,105 | 2,328,329 | ||||||
IHS Inc ‘A’ * | 15,342 | 1,606,614 | ||||||
Intertek Group PLC (United Kingdom) | 17,561 | 907,262 | ||||||
Sensata Technologies Holding NV (Netherlands) * | 19,505 | 641,129 | ||||||
Stericycle Inc * | 14,832 | 1,574,862 | ||||||
Verisk Analytics Inc ‘A’ * | 30,464 | 1,877,496 | ||||||
|
| |||||||
| 9,739,838 | ||||||||
|
| |||||||
Information Technology - 29.6% | ||||||||
3D Systems Corp * | 9,680 | 312,083 | ||||||
Akamai Technologies Inc * | 43,483 | 1,534,515 | ||||||
First Solar Inc * | 24,621 | 663,782 | ||||||
Shares | Value | |||||||
Gartner Inc * | 32,270 | $1,755,811 | ||||||
LinkedIn Corp ‘A’ * | 9,914 | 1,745,459 | ||||||
MercadoLibre Inc | 7,948 | 767,459 | ||||||
Motorola Solutions Inc | 38,286 | 2,451,453 | ||||||
Qihoo 360 Technology Co Ltd ADR (Cayman) * | 15,635 | 463,265 | ||||||
salesforce.com inc * | 9,697 | 1,734,115 | ||||||
ServiceNow Inc * | 9,707 | 351,393 | ||||||
SINA Corp (Cayman) * | 5,530 | 268,703 | ||||||
Solera Holdings Inc | 39,879 | 2,326,142 | ||||||
Splunk Inc * | 9,811 | 392,734 | ||||||
Trimble Navigation Ltd * | 20,147 | 603,604 | ||||||
Workday Inc ‘A’ * | 7,304 | 450,146 | ||||||
Yandex NV ‘A’ (Netherlands) * | 56,191 | 1,299,136 | ||||||
Youku Tudou Inc ADR (Cayman) * | 38,462 | 645,008 | ||||||
Zynga Inc ‘A’ * | 130,185 | 437,422 | ||||||
|
| |||||||
| 18,202,230 | ||||||||
|
| |||||||
Materials - 5.4% | ||||||||
Intrepid Potash Inc | 6,991 | 131,151 | ||||||
Martin Marietta Materials Inc | 15,532 | 1,584,575 | ||||||
Rockwood Holdings Inc | 24,981 | 1,634,757 | ||||||
|
| |||||||
| 3,350,483 | ||||||||
|
| |||||||
Utilities - 3.1% | ||||||||
Brookfield Infrastructure Partners LP (Bermuda) | 50,497 | 1,921,916 | ||||||
|
| |||||||
Total Common Stocks | 60,412,265 | |||||||
|
| |||||||
SHORT-TERM INVESTMENT - 1.7% | ||||||||
Money Market Fund - 1.7% | ||||||||
BlackRock Liquidity Funds Treasury | 1,050,988 | 1,050,988 | ||||||
|
| |||||||
Total Short-Term Investment | 1,050,988 | |||||||
|
| |||||||
TOTAL INVESTMENTS - 99.8% | 61,463,253 | |||||||
OTHER ASSETS & LIABILITIES, NET - 0.2% | 93,600 | |||||||
|
| |||||||
NET ASSETS - 100.0% | $61,556,853 | |||||||
|
| |||||||
Notes to Schedule of Investments
| (a) | As of March 31, 2013, the fund was diversified as a percentage of net assets as follows: |
Information Technology | 29.6% | |||
Industrials | 15.8% | |||
Consumer Discretionary | 13.0% | |||
Financials | 11.3% | |||
Health Care | 10.7% | |||
Consumer Staples | 6.6% | |||
Materials | 5.4% | |||
Utilities | 3.1% | |||
Others (each less than 3.0%) | 4.3% | |||
|
| |||
| 99.8% | ||||
Other Assets & Liabilities, Net | 0.2% | |||
|
| |||
| 100.0% | ||||
|
|
| (b) | Restricted securities as of March 31, 2013 were as follows: |
| Issuer and Acquisition Date | Cost | Value | Value as a % of Net Assets | |||||||||
Better Place LLC ‘B’ 8.000% | $295,986 | $— | 0.0% | |||||||||
|
|
|
|
|
| |||||||
| See Notes to Financial Statements | See explanation of symbols and terms, if any, on page B-79 |
B-52
Table of Contents
PACIFIC LIFE FUNDS
PL MID-CAP GROWTH FUND
Schedule of Investments (Continued)
March 31, 2013
| (c) | Fair Value Measurements |
The following is a summary of the fund’s investments as categorized under the three-tier hierarchy of inputs used in valuing the fund’s assets and liabilities (See Note 3D in Notes to Financial Statements) as of March 31, 2013:
| Total Value at March 31, 2013 | Level 1 Quoted Price | Level 2 Significant Observable Inputs | Level 3 Significant Unobservable Inputs | |||||||||||||||
Assets | Common Stocks | |||||||||||||||||
Consumer Discretionary | $7,975,657 | $7,975,657 | $— | $— | ||||||||||||||
Consumer Staples | 4,065,868 | 2,241,524 | 1,824,344 | — | ||||||||||||||
Energy | 1,592,679 | 1,592,679 | — | — | ||||||||||||||
Financials | 6,949,183 | 6,949,183 | — | — | ||||||||||||||
Health Care | 6,614,411 | 6,614,411 | — | — | ||||||||||||||
Industrials | 9,739,838 | 6,504,247 | 3,235,591 | — | ||||||||||||||
Information Technology | 18,202,230 | 18,202,230 | — | — | ||||||||||||||
Materials | 3,350,483 | 3,350,483 | — | — | ||||||||||||||
Utilities | 1,921,916 | 1,921,916 | — | — | ||||||||||||||
|
|
|
|
|
|
|
| |||||||||||
| 60,412,265 | 55,352,330 | 5,059,935 | — | |||||||||||||||
Short-Term Investment | 1,050,988 | 1,050,988 | — | — | ||||||||||||||
|
|
|
|
|
|
|
| |||||||||||
Total | $61,463,253 | $56,403,318 | $5,059,935 | $— | ||||||||||||||
|
|
|
|
|
|
|
| |||||||||||
During the year ended March 31, 2013, an investment with a value of $1,008,312 was transferred from level 2 to level 1 due to the removal of valuation adjustments made to exchange-traded prices as a result of market movements following the close of local trading.
| See Notes to Financial Statements | See explanation of symbols and terms, if any, on page B-79 |
B-53
Table of Contents
PACIFIC LIFE FUNDS
PL SMALL-CAP GROWTH FUND
Schedule of Investments
March 31, 2013
Shares | | |||||||
COMMON STOCKS - 95.8% |
| |||||||
Consumer Discretionary - 17.2% |
| |||||||
American Axle & Manufacturing Holdings Inc * | 27,250 | $371,962 | ||||||
ANN Inc * | 15,200 | 441,104 | ||||||
Brunswick Corp | 13,450 | 460,259 | ||||||
Buffalo Wild Wings Inc * | 5,050 | 442,026 | ||||||
Dana Holding Corp | 22,550 | 402,066 | ||||||
Domino’s Pizza Inc | 10,550 | 542,692 | ||||||
DSW Inc ‘A’ | 7,650 | 488,070 | ||||||
Fifth & Pacific Cos Inc * | 32,450 | 612,656 | ||||||
Five Below Inc * | 13,650 | 517,198 | ||||||
Interval Leisure Group Inc | 14,865 | 323,165 | ||||||
Life Time Fitness Inc * | 8,770 | 375,181 | ||||||
Lions Gate Entertainment Corp (Canada) * | 19,650 | 467,081 | ||||||
Marriott Vacations Worldwide Corp * | 12,750 | 547,103 | ||||||
Pier 1 Imports Inc | 25,150 | 578,450 | ||||||
Six Flags Entertainment Corp | 7,700 | 558,096 | ||||||
Sotheby’s | 4,050 | 151,511 | ||||||
The Children’s Place * | 5,480 | 245,613 | ||||||
Tupperware Brands Corp | 6,475 | 529,267 | ||||||
Vitamin Shoppe Inc * | 8,850 | 432,323 | ||||||
Wolverine World Wide Inc | 6,000 | 266,220 | ||||||
|
| |||||||
| 8,752,043 | ||||||||
|
| |||||||
Consumer Staples - 3.4% | ||||||||
B&G Foods Inc | 16,700 | 509,183 | ||||||
The Fresh Market Inc * | 6,600 | 282,282 | ||||||
The Hain Celestial Group Inc * | 8,135 | 496,886 | ||||||
United Natural Foods Inc * | 8,800 | 432,960 | ||||||
|
| |||||||
| 1,721,311 | ||||||||
|
| |||||||
Energy - 5.9% | ||||||||
Approach Resources Inc * | 15,900 | 391,299 | ||||||
Berry Petroleum Co ‘A’ | 4,350 | 201,361 | ||||||
Bristow Group Inc | 3,200 | 211,008 | ||||||
Dril-Quip Inc * | 3,065 | 267,176 | ||||||
Energy XXI Ltd (Bermuda) | 15,650 | 425,993 | ||||||
Helix Energy Solutions Group Inc * | 10,750 | 245,960 | ||||||
Kodiak Oil & Gas Corp * | 38,850 | 353,147 | ||||||
Northern Oil & Gas Inc * | 28,750 | 413,425 | ||||||
Rosetta Resources Inc * | 10,800 | 513,864 | ||||||
|
| |||||||
| 3,023,233 | ||||||||
|
| |||||||
Financials - 6.5% | ||||||||
Fortress Investment Group LLC ‘A’ | 57,150 | 365,760 | ||||||
Jones Lang LaSalle Inc | 3,850 | 382,729 | ||||||
Northwest Bancshares Inc | 22,750 | 288,698 | ||||||
Ryman Hospitality Properties REIT | 9,917 | 453,703 | ||||||
Silver Bay Realty Trust Corp REIT | 18,344 | 379,720 | ||||||
Texas Capital Bancshares Inc * | 11,350 | 459,108 | ||||||
Two Harbors Investment Corp REIT | 33,550 | 423,066 | ||||||
WisdomTree Investments Inc * | 51,150 | 531,960 | ||||||
|
| |||||||
| 3,284,744 | ||||||||
|
| |||||||
Health Care - 18.5% | ||||||||
Achillion Pharmaceuticals Inc * | 13,500 | 117,990 | ||||||
Acorda Therapeutics Inc * | 7,800 | 249,834 | ||||||
Align Technology Inc * | 12,450 | 417,199 | ||||||
Alkermes PLC (Ireland) * | 17,400 | 412,554 | ||||||
athenahealth Inc * | 3,650 | 354,196 | ||||||
Centene Corp * | 5,750 | 253,230 | ||||||
Cepheid Inc * | 11,600 | 445,092 | ||||||
Cubist Pharmaceuticals Inc * | 5,500 | 257,510 | ||||||
Endologix Inc * | 24,150 | 390,022 | ||||||
Greenway Medical Technologies Inc * | 17,400 | 276,660 | ||||||
HealthSouth Corp * | 15,100 | 398,187 | ||||||
HeartWare International Inc * | 3,800 | 336,034 | ||||||
HMS Holdings Corp * | 13,050 | 354,308 | ||||||
Shares | | |||||||
Idenix Pharmaceuticals Inc * | 30,500 | $108,580 | ||||||
Insulet Corp * | 18,870 | 487,978 | ||||||
Molina Healthcare Inc * | 8,350 | 257,765 | ||||||
NxStage Medical Inc * | 20,500 | 231,240 | ||||||
Orexigen Therapeutics Inc * | 27,100 | 169,375 | ||||||
PAREXEL International Corp * | 7,375 | 291,386 | ||||||
Pharmacyclics Inc * | 4,750 | 381,948 | ||||||
Questcor Pharmaceuticals Inc | 10,000 | 325,400 | ||||||
Seattle Genetics Inc * | 6,100 | 216,611 | ||||||
Synageva BioPharma Corp * | 5,250 | 288,330 | ||||||
Team Health Holdings Inc * | 16,150 | 587,537 | ||||||
Tenet Healthcare Corp * | 10,262 | 488,266 | ||||||
Theravance Inc * | 5,300 | 125,186 | ||||||
Thoratec Corp * | 7,020 | 263,250 | ||||||
ViroPharma Inc * | 11,000 | 276,760 | ||||||
Volcano Corp * | 14,850 | 330,561 | ||||||
Wright Medical Group Inc * | 13,250 | 315,483 | ||||||
|
| |||||||
| 9,408,472 | ||||||||
|
| |||||||
Industrials - 16.5% | ||||||||
A.O. Smith Corp | 6,300 | 463,491 | ||||||
Actuant Corp ‘A’ | 18,695 | 572,440 | ||||||
Acuity Brands Inc | 3,550 | 246,192 | ||||||
Alaska Air Group Inc * | 10,100 | 645,996 | ||||||
Avis Budget Group Inc * | 16,050 | 446,671 | ||||||
Beacon Roofing Supply Inc * | 12,050 | 465,853 | ||||||
Chart Industries Inc * | 5,700 | 456,057 | ||||||
Esterline Technologies Corp * | 5,030 | 380,771 | ||||||
Genesee & Wyoming Inc ‘A’ * | 6,870 | 639,665 | ||||||
Hexcel Corp * | 17,500 | 507,675 | ||||||
Hub Group Inc ‘A’ * | 13,250 | 509,595 | ||||||
Middleby Corp * | 3,000 | 456,450 | ||||||
Primoris Services Corp | 15,350 | 339,389 | ||||||
RBC Bearings Inc * | 11,065 | 559,446 | ||||||
Tetra Tech Inc * | 19,500 | 594,555 | ||||||
The ExOne Co * | 10,300 | 345,050 | ||||||
United Rentals Inc * | 7,050 | 387,539 | ||||||
US Airways Group Inc * | 22,000 | 373,340 | ||||||
|
| |||||||
| 8,390,175 | ||||||||
|
| |||||||
Information Technology - 21.9% | ||||||||
Allot Communications Ltd (Israel) * | 1,830 | 21,850 | ||||||
Applied Micro Circuits Corp * | 23,850 | 176,967 | ||||||
Aruba Networks Inc * | 9,950 | 246,163 | ||||||
Aspen Technology Inc * | 16,700 | 539,243 | ||||||
BroadSoft Inc * | 13,150 | 348,081 | ||||||
Cadence Design Systems Inc * | 41,650 | 580,184 | ||||||
Cognex Corp | 13,550 | 571,132 | ||||||
CommVault Systems Inc * | 6,600 | 541,068 | ||||||
CoStar Group Inc * | 4,250 | 465,205 | ||||||
Cypress Semiconductor Corp * | 28,100 | 309,943 | ||||||
DealerTrack Holdings Inc * | 15,300 | 449,514 | ||||||
E2open Inc * | 8,000 | 159,520 | ||||||
ExactTarget Inc * | 21,950 | 510,776 | ||||||
Finisar Corp * | 17,550 | 231,484 | ||||||
Fortinet Inc * | 15,400 | 364,672 | ||||||
Freescale Semiconductor Ltd (Bermuda) * | 15,300 | 227,817 | ||||||
Fusion-io Inc * | 12,550 | 205,443 | ||||||
Infoblox Inc * | 18,650 | 404,705 | ||||||
InterXion Holding NV (Netherlands) * | 14,250 | 345,135 | ||||||
MAXIMUS Inc | 6,550 | 523,804 | ||||||
Microsemi Corp * | 22,100 | 512,057 | ||||||
OpenTable Inc * | 5,290 | 333,164 | ||||||
OSI Systems Inc * | 5,100 | 317,679 | ||||||
Radware Ltd (Israel) * | 10,550 | 398,052 | ||||||
Ruckus Wireless Inc * | 14,090 | 295,890 | ||||||
Semtech Corp * | 4,550 | 161,025 | ||||||
Silicon Graphics International Corp * | 25,400 | 349,250 | ||||||
Sourcefire Inc * | 4,600 | 272,458 | ||||||
Trulia Inc * | 8,950 | 280,851 | ||||||
| See Notes to Financial Statements | See explanation of symbols and terms, if any, on page B-79 |
B-54
Table of Contents
PACIFIC LIFE FUNDS
PL SMALL-CAP GROWTH FUND
Schedule of Investments (Continued)
March 31, 2013
Shares | | |||||||
Ultimate Software Group Inc * | 5,200 | $541,632 | ||||||
WEX Inc * | 6,215 | 487,878 | ||||||
|
| |||||||
| 11,172,642 | ||||||||
|
| |||||||
Materials - 4.6% | ||||||||
Berry Plastics Group Inc * | 18,550 | 353,377 | ||||||
Chemtura Corp * | 21,300 | 460,293 | ||||||
Cytec Industries Inc | 6,800 | 503,744 | ||||||
Eagle Materials Inc | 6,100 | 406,443 | ||||||
PolyOne Corp | 16,475 | 402,155 | ||||||
Rockwood Holdings Inc | 3,150 | 206,136 | ||||||
|
| |||||||
| 2,332,148 | ||||||||
|
| |||||||
Telecommunication Services - 0.8% | ||||||||
Cogent Communications Group Inc | 15,600 | 411,840 | ||||||
|
| |||||||
Utilities - 0.5% | ||||||||
ITC Holdings Corp | 2,930 | 261,532 | ||||||
|
| |||||||
Total Common Stocks | 48,758,140 | |||||||
|
| |||||||
SHORT-TERM INVESTMENT - 4.0% |
| |||||||
Money Market Fund - 4.0% | ||||||||
BlackRock Liquidity Funds Treasury Trust Fund Portfolio | 2,045,606 | 2,045,606 | ||||||
|
| |||||||
Total Short-Term Investment | 2,045,606 | |||||||
|
| |||||||
TOTAL INVESTMENTS - 99.8% | 50,803,746 | |||||||
OTHER ASSETS & LIABILITIES, NET - 0.2% |
| 94,295 | ||||||
|
| |||||||
NET ASSETS - 100.0% |
| $50,898,041 | ||||||
|
| |||||||
Notes to Schedule of Investments
| (a) | As of March 31, 2013, the fund was diversified as a percentage of net assets as follows: |
Information Technology | 21.9% | |||
Health Care | 18.5% | |||
Consumer Discretionary | 17.2% | |||
Industrials | 16.5% | |||
Financials | 6.5% | |||
Energy | 5.9% | |||
Materials | 4.6% | |||
Short-Term Investment | 4.0% | |||
Consumer Staples | 3.4% | |||
Others (each less than 3.0%) | 1.3% | |||
|
| |||
| 99.8% | ||||
Other Assets & Liabilities, Net | 0.2% | |||
|
| |||
| 100.0% | ||||
|
|
| (b) | Fair Value Measurements |
The following is a summary of the fund’s investments as categorized under the three-tier hierarchy of inputs used in valuing the fund’s assets and liabilities (See Note 3D in Notes to Financial Statements) as of March 31, 2013:
| Total Value at March 31, 2013 | Level 1 Quoted Price | Level 2 Significant Observable Input | Level 3 Significant Unobservable Input | |||||||||||||||
Assets | Common Stocks (1) | $48,758,140 | $48,758,140 | $— | $— | |||||||||||||
| Short-Term Investment | 2,045,606 | 2,045,606 | — | — | ||||||||||||||
|
|
|
|
|
|
|
| |||||||||||
Total | $50,803,746 | $50,803,746 | $— | $— | ||||||||||||||
|
|
|
|
|
|
|
| |||||||||||
| (1) | For equity investments categorized in a single level, refer to the schedule of investments for further industry breakout. |
| See Notes to Financial Statements | See explanation of symbols and terms, if any, on page B-79 |
B-55
Table of Contents
PACIFIC LIFE FUNDS
PL SMALL-CAP VALUE FUND
Schedule of Investments
March 31, 2013
| Value | |||||||
COMMON STOCKS - 94.8% |
| |||||||
Consumer Discretionary - 10.4% |
| |||||||
Aaron’s Inc | 36,000 | $1,032,480 | ||||||
Bob Evans Farms Inc | 4,461 | 190,128 | ||||||
Cinemark Holdings Inc | 52,600 | 1,548,544 | ||||||
Cracker Barrel Old Country Store Inc | 13,000 | 1,051,050 | ||||||
Group 1 Automotive Inc | 17,500 | 1,051,225 | ||||||
Harman International Industries Inc | 28,500 | 1,271,955 | ||||||
Hillenbrand Inc | 22,600 | 571,328 | ||||||
International Game Technology | 84,437 | 1,393,211 | ||||||
Meredith Corp | 33,709 | 1,289,706 | ||||||
Rent-A-Center Inc | 6,102 | 225,408 | ||||||
Sturm Ruger & Co Inc | 12,690 | 643,764 | ||||||
The Buckle Inc | 25,335 | 1,181,878 | ||||||
True Religion Apparel Inc | 15,809 | 412,773 | ||||||
Wolverine World Wide Inc | 28,500 | 1,264,545 | ||||||
|
| |||||||
| 13,127,995 | ||||||||
|
| |||||||
Consumer Staples - 6.0% |
| |||||||
Cal-Maine Foods Inc | 18,400 | 783,104 | ||||||
Casey’s General Stores Inc | 10,591 | 617,455 | ||||||
Cott Corp (Canada) | 32,100 | 324,852 | ||||||
Fresh Del Monte Produce Inc (Cayman) | 15,700 | 423,586 | ||||||
Harris Teeter Supermarkets Inc | 27,200 | 1,161,712 | ||||||
Ingredion Inc | 24,900 | 1,800,768 | ||||||
The Andersons Inc | 18,109 | 969,193 | ||||||
Universal Corp | 22,300 | 1,249,692 | ||||||
Weis Markets Inc | 5,800 | 236,060 | ||||||
|
| |||||||
| 7,566,422 | ||||||||
|
| |||||||
Energy - 12.6% |
| |||||||
Alliance Resource Partners LP | 10,400 | 662,480 | ||||||
Berry Petroleum Co ‘A’ | 36,600 | 1,694,214 | ||||||
Bristow Group Inc | 25,700 | 1,694,658 | ||||||
Buckeye Partners LP | 15,100 | 923,516 | ||||||
Calumet Specialty Products Partners LP | 11,500 | 428,375 | ||||||
Cimarex Energy Co | 9,600 | 724,224 | ||||||
CVR Energy Inc | 30,700 | 1,584,734 | ||||||
Delek US Holdings Inc | 4,100 | 161,786 | ||||||
Energen Corp | 24,500 | 1,274,245 | ||||||
Ensign Energy Services Inc (Canada) | 14,700 | 250,631 | ||||||
Pioneer Southwest Energy Partners LP | 13,700 | 334,691 | ||||||
Precision Drilling Corp (Canada) | 20,300 | 187,369 | ||||||
Ship Finance International Ltd (Bermuda) | 50,657 | 893,589 | ||||||
Sunoco Logistics Partners LP | 10,238 | 669,565 | ||||||
Tidewater Inc | 25,200 | 1,272,600 | ||||||
TransMontaigne Partners LP | 7,600 | 385,624 | ||||||
Western Refining Inc | 29,500 | 1,044,595 | ||||||
World Fuel Services Corp | 40,300 | 1,600,716 | ||||||
|
| |||||||
| 15,787,612 | ||||||||
|
| |||||||
Financials - 19.9% |
| |||||||
American Financial Group Inc | 25,000 | 1,184,500 | ||||||
American Realty Capital Properties Inc REIT | 75,142 | 1,103,085 | ||||||
AmTrust Financial Services Inc | 21,230 | 735,620 | ||||||
Bank of Hawaii Corp | 24,200 | 1,229,602 | ||||||
Canadian Western Bank (Canada) | 18,282 | 510,208 | ||||||
CapitalSource Inc | 119,100 | 1,145,742 | ||||||
Cardinal Financial Corp | 14,566 | 264,810 | ||||||
Cash America International Inc | 25,000 | 1,311,750 | ||||||
Community Trust Bancorp Inc | 3,800 | 129,314 | ||||||
First American Financial Corp | 50,700 | 1,296,399 | ||||||
First Niagara Financial Group Inc | 140,900 | 1,248,374 | ||||||
FirstMerit Corp | 20,100 | 332,253 | ||||||
Franklin Street Properties Corp REIT | 42,400 | 619,888 | ||||||
Fulton Financial Corp | 106,400 | 1,244,880 | ||||||
Glacier Bancorp Inc | 1,516 | 28,774 | ||||||
Hatteras Financial Corp REIT | 22,800 | 625,404 | ||||||
Shares | | |||||||
Home Loan Servicing Solutions Ltd (Cayman) | 34,508 | $805,072 | ||||||
Lakeland Financial Corp | 4,962 | 132,436 | ||||||
Montpelier Re Holdings Ltd (Bermuda) | 15,809 | 411,824 | ||||||
Old National Bancorp | 43,800 | 602,250 | ||||||
Omega Healthcare Investors Inc REIT | 46,200 | 1,402,632 | ||||||
Prosperity Bancshares Inc | 25,100 | 1,189,489 | ||||||
PS Business Parks Inc REIT | 11,000 | 868,120 | ||||||
Raymond James Financial Inc | 26,800 | 1,235,480 | ||||||
Retail Properties of America Inc ‘A’ REIT | 61,144 | 904,931 | ||||||
Starwood Property Trust Inc REIT | 48,100 | 1,335,256 | ||||||
Susquehanna Bancshares Inc | 78,500 | 975,755 | ||||||
Tompkins Financial Corp | 4,000 | 169,120 | ||||||
Trustmark Corp | 35,706 | 893,007 | ||||||
Washington Federal Inc | 49,431 | 865,043 | ||||||
WesBanco Inc | 7,129 | 170,740 | ||||||
|
| |||||||
| 24,971,758 | ||||||||
|
| |||||||
Health Care - 6.1% |
| |||||||
Owens & Minor Inc | 40,100 | 1,305,656 | ||||||
PerkinElmer Inc | 42,850 | 1,441,474 | ||||||
STERIS Corp | 36,300 | 1,510,443 | ||||||
Teleflex Inc | 18,300 | 1,546,533 | ||||||
The Cooper Cos Inc | 16,300 | 1,758,444 | ||||||
The Ensign Group Inc | 2,183 | 72,912 | ||||||
|
| |||||||
| 7,635,462 | ||||||||
|
| |||||||
Industrials - 17.7% |
| |||||||
ABM Industries Inc | 14,300 | 318,032 | ||||||
Alliant Techsystems Inc | 22,200 | 1,607,946 | ||||||
Applied Industrial Technologies Inc | 10,200 | 459,000 | ||||||
Barnes Group Inc | 36,600 | 1,058,838 | ||||||
Belden Inc | 30,000 | 1,549,500 | ||||||
Crane Co | 27,200 | 1,519,392 | ||||||
Cubic Corp | 8,400 | 358,848 | ||||||
Curtiss-Wright Corp | 32,400 | 1,124,280 | ||||||
Elbit Systems Ltd (Israel) | 3,900 | 164,346 | ||||||
Ennis Inc | 14,300 | 215,501 | ||||||
Great Lakes Dredge & Dock Co | 33,200 | 223,436 | ||||||
ITT Corp | 46,123 | 1,311,277 | ||||||
KBR Inc | 35,100 | 1,126,008 | ||||||
Kennametal Inc | 33,300 | 1,300,032 | ||||||
Standex International Corp | 4,767 | 263,234 | ||||||
TAL International Group Inc | 18,200 | 824,642 | ||||||
Textainer Group Holdings Ltd (Bermuda) | 14,449 | 571,458 | ||||||
The Brink’s Co | 35,300 | 997,578 | ||||||
Titan International Inc | 44,500 | 938,060 | ||||||
Trinity Industries Inc | 23,917 | 1,084,158 | ||||||
Triumph Group Inc | 23,500 | 1,844,750 | ||||||
UniFirst Corp | 7,200 | 651,600 | ||||||
United Stationers Inc | 1,195 | 46,187 | ||||||
Valmont Industries Inc | 11,500 | 1,808,605 | ||||||
Werner Enterprises Inc | 38,460 | 928,424 | ||||||
|
| |||||||
| 22,295,132 | ||||||||
|
| |||||||
Information Technology - 3.5% |
| |||||||
AVX Corp | 22,600 | 268,940 | ||||||
Broadridge Financial Solutions Inc | 13,500 | 335,340 | ||||||
Diebold Inc | 35,494 | 1,076,178 | ||||||
Fair Isaac Corp | 18,392 | 840,330 | ||||||
j2 Global Inc | 22,630 | 887,322 | ||||||
Jabil Circuit Inc | 51,200 | 946,176 | ||||||
|
| |||||||
| 4,354,286 | ||||||||
|
| |||||||
Materials - 14.0% |
| |||||||
A. Schulman Inc | 20,500 | 646,980 | ||||||
AMCOL International Corp | 11,782 | 355,698 | ||||||
Buckeye Technologies Inc | 22,300 | 667,885 | ||||||
Cabot Corp | 28,600 | 978,120 | ||||||
Commercial Metals Co | 72,840 | 1,154,514 | ||||||
Domtar Corp | 4,200 | 326,004 | ||||||
HudBay Minerals Inc (Canada) | 103,972 | 999,957 | ||||||
Innophos Holdings Inc | 17,900 | 976,624 | ||||||
| See Notes to Financial Statements | See explanation of symbols and terms, if any, on page B-79 |
B-56
Table of Contents
PACIFIC LIFE FUNDS
PL SMALL-CAP VALUE FUND
Schedule of Investments (Continued)
March 31, 2013
Shares | | |||||||
Methanex Corp (Canada) | 36,500 | $1,482,995 | ||||||
Neenah Paper Inc | 13,900 | 427,564 | ||||||
NewMarket Corp | 4,900 | 1,275,764 | ||||||
Olin Corp | 15,300 | 385,866 | ||||||
Quaker Chemical Corp | 8,294 | 489,512 | ||||||
Rentech Nitrogen Partners LP | 13,276 | 476,343 | ||||||
Rock-Tenn Co ‘A’ | 13,900 | 1,289,781 | ||||||
Royal Gold Inc | 16,230 | 1,152,817 | ||||||
Sensient Technologies Corp | 30,700 | 1,200,063 | ||||||
Silgan Holdings Inc | 6,200 | 292,950 | ||||||
Sonoco Products Co | 39,670 | 1,388,053 | ||||||
Steel Dynamics Inc | 72,300 | 1,147,401 | ||||||
Stepan Co | 8,516 | 537,360 | ||||||
|
| |||||||
| 17,652,251 | ||||||||
|
| |||||||
Telecommunication Services - 0.5% |
| |||||||
Manitoba Telecom Services Inc (Canada) | 18,400 | 597,726 | ||||||
|
| |||||||
Utilities - 4.1% | ||||||||
Avista Corp | 20,300 | 556,220 | ||||||
El Paso Electric Co | 17,740 | 596,951 | ||||||
Great Plains Energy Inc | 30,100 | 698,019 | ||||||
IDACORP Inc | 12,033 | 580,833 | ||||||
Portland General Electric Co | 17,100 | 518,643 | ||||||
Suburban Propane Partners LP | 13,800 | 614,100 | ||||||
UGI Corp | 39,800 | 1,527,922 | ||||||
|
| |||||||
| 5,092,688 | ||||||||
|
| |||||||
Total Common Stocks | 119,081,332 | |||||||
|
| |||||||
Shares | | |||||||
SHORT-TERM INVESTMENT - 5.0% | ||||||||
Money Market Fund - 5.0% | ||||||||
BlackRock Liquidity Funds Treasury | 6,316,659 | $6,316,659 | ||||||
|
| |||||||
Total Short-Term Investment | 6,316,659 | |||||||
|
| |||||||
TOTAL INVESTMENTS - 99.8% | 125,397,991 | |||||||
OTHER ASSETS & LIABILITIES, NET - 0.2% | 248,793 | |||||||
|
| |||||||
NET ASSETS - 100.0% | $125,646,784 | |||||||
|
| |||||||
Notes to Schedule of Investments
| (a) | As of March 31, 2013, the fund was diversified as a percentage of net assets as follows: |
Financials | 19.9% | |||
Industrials | 17.7% | |||
Materials | 14.0% | |||
Energy | 12.6% | |||
Consumer Discretionary | 10.4% | |||
Health Care | 6.1% | |||
Consumer Staples | 6.0% | |||
Short-Term Investment | 5.0% | |||
Utilities | 4.1% | |||
Information Technology | 3.5% | |||
Others (each less than 3.0%) | 0.5% | |||
|
| |||
| 99.8% | ||||
Other Assets & Liabilities, Net | 0.2% | |||
|
| |||
| 100.0% | ||||
|
|
| (b) | Fair Value Measurements |
The following is a summary of the fund’s investments as categorized under the three-tier hierarchy of inputs used in valuing the fund’s assets and liabilities (See Note 3D in Notes to Financial Statements) as of March 31, 2013:
| Total Value at March 31, 2013 | Level 1 Quoted Price | Level 2 Significant Observable Inputs | Level 3 Significant Unobservable Inputs | |||||||||||||||
Assets | Common Stocks (1) | $119,081,332 | $119,081,332 | $— | $— | |||||||||||||
Short-Term Investment | 6,316,659 | 6,316,659 | — | — | ||||||||||||||
|
|
|
|
|
|
|
| |||||||||||
Total | $125,397,991 | $125,397,991 | $— | $— | ||||||||||||||
|
|
|
|
|
|
|
| |||||||||||
| (1) | For equity investments categorized in a single level, refer to the schedule of investments for further industry breakout. |
| See Notes to Financial Statements | See explanation of symbols and terms, if any, on page B-79 |
B-57
Table of Contents
PACIFIC LIFE FUNDS
PL REAL ESTATE FUND
Schedule of Investments
March 31, 2013
Shares | | |||||||
COMMON STOCKS - 96.3% | ||||||||
Consumer Discretionary - 2.1% | ||||||||
Starwood Hotels & Resorts Worldwide Inc | 19,595 | $1,248,789 | ||||||
|
| |||||||
Financials - 94.0% | ||||||||
Acadia Realty Trust REIT | 10,463 | 290,557 | ||||||
Alexandria Real Estate Equities Inc REIT | 4,910 | 348,512 | ||||||
American Campus Communities Inc REIT | 1,000 | 45,340 | ||||||
Apartment Investment & Management Co ‘A’ REIT | 17,926 | 549,611 | ||||||
Ashford Hospitality Trust Inc REIT | 24,660 | 304,798 | ||||||
AvalonBay Communities Inc REIT | 27,179 | 3,442,764 | ||||||
Boston Properties Inc REIT | 27,539 | 2,783,091 | ||||||
Brookfield Office Properties Inc (Canada) | 32,454 | 557,235 | ||||||
Camden Property Trust REIT | 17,104 | 1,174,703 | ||||||
Cousins Properties Inc REIT | 36,478 | 389,950 | ||||||
DCT Industrial Trust Inc REIT | 114,540 | 847,596 | ||||||
Digital Realty Trust Inc REIT | 12,340 | 825,669 | ||||||
Duke Realty Corp REIT | 32,530 | 552,359 | ||||||
Equity Lifestyle Properties Inc REIT | 16,339 | 1,254,835 | ||||||
Equity Residential REIT | 94,605 | 5,208,951 | ||||||
Essex Property Trust Inc REIT | 1,980 | 298,148 | ||||||
Federal Realty Investment Trust REIT | 5,468 | 590,763 | ||||||
Forest City Enterprises Inc ‘A’ * | 85,273 | 1,515,301 | ||||||
General Growth Properties Inc REIT | 112,603 | 2,238,548 | ||||||
HCP Inc REIT | 71,962 | 3,588,025 | ||||||
Health Care REIT Inc | 6,983 | 474,215 | ||||||
Healthcare Realty Trust Inc REIT | 32,509 | 922,930 | ||||||
Host Hotels & Resorts Inc REIT | 215,602 | 3,770,879 | ||||||
Hudson Pacific Properties Inc REIT | 19,310 | 419,993 | ||||||
Lexington Realty Trust REIT | 2,730 | 32,214 | ||||||
Mack-Cali Realty Corp REIT | 39,085 | 1,118,222 | ||||||
Plum Creek Timber Co Inc REIT | 2,389 | 124,706 | ||||||
Prologis Inc REIT | 25,362 | 1,013,973 | ||||||
PS Business Parks Inc REIT | 3,741 | 295,240 | ||||||
Public Storage REIT | 18,627 | 2,837,265 | ||||||
Regency Centers Corp REIT | 47,636 | 2,520,421 | ||||||
Retail Opportunity Investments Corp REIT | 11,613 | 162,698 | ||||||
Senior Housing Properties Trust REIT | 41,853 | 1,122,916 | ||||||
Simon Property Group Inc REIT | 52,737 | 8,361,979 | ||||||
Sovran Self Storage Inc REIT | 1,042 | 67,199 | ||||||
Taubman Centers Inc REIT | 760 | 59,022 | ||||||
Terreno Realty Corp REIT | 2,930 | 52,681 | ||||||
The Macerich Co REIT | 23,365 | 1,504,239 | ||||||
Ventas Inc REIT | 14,940 | 1,093,608 | ||||||
Vornado Realty Trust REIT | 43,136 | 3,607,895 | ||||||
Winthrop Realty Trust REIT | 13,079 | 164,534 | ||||||
|
| |||||||
| 56,533,585 | ||||||||
|
| |||||||
Shares | | |||||||
Health Care - 0.2% | ||||||||
Assisted Living Concepts Inc ‘A’ | 11,945 | $142,026 | ||||||
|
| |||||||
Total Common Stocks | 57,924,400 | |||||||
|
| |||||||
SHORT-TERM INVESTMENT - 3.5% | ||||||||
Money Market Fund - 3.5% | ||||||||
BlackRock Liquidity Funds Treasury | 2,100,485 | 2,100,485 | ||||||
|
| |||||||
Total Short-Term Investment | 2,100,485 | |||||||
|
| |||||||
TOTAL INVESTMENTS - 99.8% | 60,024,885 | |||||||
OTHER ASSETS & LIABILITIES, NET - 0.2% | 113,467 | |||||||
|
| |||||||
NET ASSETS - 100.0% | $60,138,352 | |||||||
|
| |||||||
Notes to Schedule of Investments
| (a) | As of March 31, 2013, the fund was diversified by property sector as a percentage of net assets as follows: |
Retail | 26.2% | |||
Specialized | 23.8% | |||
Residential | 19.9% | |||
Office | 9.1% | |||
Diversified | 8.4% | |||
Real Estate Operating Companies | 3.4% | |||
Industrial | 3.2% | |||
Others (each less than 3.0%) | 2.3% | |||
|
| |||
| 96.3% | ||||
Short-Term Investment | 3.5% | |||
Other Assets & Liabilities, Net | 0.2% | |||
|
| |||
| 100.0% | ||||
|
|
| (b) | Fair Value Measurements |
The following is a summary of the fund’s investments as categorized under the three-tier hierarchy of inputs used in valuing the fund’s assets and liabilities (See Note 3D in Notes to Financial Statements) as of March 31, 2013:
| Total Value at March 31, 2013 | Level 1 Quoted Price | Level 2 Significant Observable Inputs | Level 3 Significant Unobservable Inputs | |||||||||||||||
Assets | Common Stocks (1) | $57,924,400 | $57,924,400 | $— | $— | |||||||||||||
Short-Term Investment | 2,100,485 | 2,100,485 | — | — | ||||||||||||||
|
|
|
|
|
|
|
| |||||||||||
Total | $60,024,885 | $60,024,885 | $— | $— | ||||||||||||||
|
|
|
|
|
|
|
| |||||||||||
| (1) | For equity investments categorized in a single level, refer to the schedule of investments for further industry breakout. |
| See Notes to Financial Statements | See explanation of symbols and terms, if any, on page B-79 |
B-58
Table of Contents
PACIFIC LIFE FUNDS
PL EMERGING MARKETS FUND
Schedule of Investments
March 31, 2013
Shares | Value | |||||||
PREFERRED STOCKS - 5.5% | ||||||||
Brazil - 4.5% | ||||||||
Banco Bradesco SA ADR | 65,110 | $1,108,172 | ||||||
Cia de Bebidas das Americas ADR | 11,200 | 474,096 | ||||||
Lojas Americanas SA | 153,946 | 1,327,863 | ||||||
Petroleo Brasileiro SA ADR | 88,000 | 1,597,200 | ||||||
Vale SA ADR | 27,580 | 455,897 | ||||||
|
| |||||||
| 4,963,228 | ||||||||
|
| |||||||
Colombia - 1.0% | ||||||||
Banco Davivienda SA | 38,827 | 553,000 | ||||||
Bancolombia SA ADR | 9,720 | 614,790 | ||||||
|
| |||||||
| 1,167,790 | ||||||||
|
| |||||||
Total Preferred Stocks | 6,131,018 | |||||||
|
| |||||||
COMMON STOCKS - 88.9% | ||||||||
Bermuda - 0.7% | ||||||||
Credicorp Ltd | 2,660 | 441,693 | ||||||
Jardine Strategic Holdings Ltd | 8,008 | 317,694 | ||||||
|
| |||||||
| 759,387 | ||||||||
|
| |||||||
Brazil - 6.7% | ||||||||
B2W Cia Global Do Varejo * | 38,181 | 284,173 | ||||||
BM&FBOVESPA SA | 264,316 | 1,778,893 | ||||||
Diagnosticos da America SA | 91,000 | 523,281 | ||||||
Embraer SA ADR | 28,700 | 1,023,729 | ||||||
Estacio Participacoes SA | 41,300 | 889,051 | ||||||
Kroton Educacional SA | 74,596 | 953,515 | ||||||
MRV Engenharia e Participacoes SA | 93,900 | 391,724 | ||||||
Natura Cosmeticos SA | 48,100 | 1,161,588 | ||||||
Sul America SA | 43,200 | 431,412 | ||||||
|
| |||||||
| 7,437,366 | ||||||||
|
| |||||||
Cayman - 11.0% | ||||||||
Baidu Inc ADR * | 44,040 | 3,862,308 | ||||||
Ctrip.com International Ltd ADR * | 42,940 | 918,057 | ||||||
Eurasia Drilling Co Ltd GDR (LI) ~ | 15,610 | 554,091 | ||||||
Home Inns & Hotels Management Inc ADR * | 14,660 | 436,721 | ||||||
NetEase Inc ADR | 11,860 | 649,572 | ||||||
New Oriental Education & Technology Group ADR | 34,920 | 628,560 | ||||||
SOHO China Ltd | 476,000 | 398,140 | ||||||
Tencent Holdings Ltd | 58,200 | 1,853,447 | ||||||
Tingyi Holding Corp | 528,000 | 1,378,216 | ||||||
Want Want China Holdings Ltd | 796,000 | 1,221,266 | ||||||
Youku Tudou Inc ADR * | 19,620 | 329,027 | ||||||
|
| |||||||
| 12,229,405 | ||||||||
|
| |||||||
Chile - 1.0% | ||||||||
Cencosud SA | 178,756 | 1,110,827 | ||||||
SACI Falabella | 3,253 | 39,188 | ||||||
|
| |||||||
| 1,150,015 | ||||||||
|
| |||||||
China - 2.2% | ||||||||
China Oilfield Services Ltd ‘H’ | 138,000 | 290,121 | ||||||
China Shenhua Energy Co Ltd ‘H’ | 133,000 | 482,149 | ||||||
Shandong Weigao Group Medical Polymer Co Ltd ‘H’ | 589,000 | 533,618 | ||||||
Sinopharm Group Co Ltd ‘H’ | 239,800 | 776,222 | ||||||
Tsingtao Brewery Co Ltd ‘H’ | 50,000 | 319,149 | ||||||
|
| |||||||
| 2,401,259 | ||||||||
|
| |||||||
Colombia - 1.1% | ||||||||
Almacenes Exito SA | 32,793 | 592,807 | ||||||
Almacenes Exito SA GDR ~ | 37,600 | 678,774 | ||||||
|
| |||||||
| 1,271,581 | ||||||||
|
| |||||||
Shares | Value | |||||||
Denmark - 2.2% | ||||||||
Carlsberg AS ‘B’ | 21,551 | $2,102,133 | ||||||
FLSmidth & Co AS | 4,787 | 290,828 | ||||||
|
| |||||||
| 2,392,961 | ||||||||
|
| |||||||
Egypt - 0.4% | ||||||||
Commercial International Bank SAE | 99,485 | 443,242 | ||||||
Orascom Construction Industries * | 270 | 9,525 | ||||||
|
| |||||||
| 452,767 | ||||||||
|
| |||||||
Hong Kong - 4.6% | ||||||||
AIA Group Ltd | 247,200 | 1,083,518 | ||||||
CNOOC Ltd | 631,000 | 1,209,411 | ||||||
Hang Lung Group Ltd | 82,000 | 461,115 | ||||||
Hang Lung Properties Ltd | 286,000 | 1,069,655 | ||||||
Hong Kong Exchanges & Clearing Ltd | 75,035 | 1,280,672 | ||||||
|
| |||||||
| 5,104,371 | ||||||||
|
| |||||||
India - 13.6% | ||||||||
Ambuja Cements Ltd | 157,063 | 504,292 | ||||||
Apollo Hospitals Enterprise Ltd | 35,519 | 547,823 | ||||||
Asian Paints Ltd | 5,872 | 531,552 | ||||||
Cipla Ltd | 87,289 | 610,562 | ||||||
Colgate-Palmolive India Ltd | 23,843 | 544,732 | ||||||
DLF Ltd | 169,045 | 732,318 | ||||||
HDFC Bank Ltd ADR | 24,260 | 907,809 | ||||||
Hindustan Unilever Ltd | 127,370 | 1,094,534 | ||||||
Housing Development Finance Corp Ltd | 144,553 | 2,201,832 | ||||||
ICICI Bank Ltd ADR | 37,380 | 1,603,602 | ||||||
Infosys Ltd | 40,778 | 2,181,702 | ||||||
Marico Ltd | 101,779 | 400,349 | ||||||
Sobha Developers Ltd | 4,861 | 31,206 | ||||||
Sun Pharmaceutical Industries Ltd | 19,169 | 288,982 | ||||||
Sun TV Network Ltd * | 28,874 | 207,723 | ||||||
Tata Consultancy Services Ltd | 37,004 | 1,073,130 | ||||||
Ultratech Cement Ltd | 6,526 | 224,748 | ||||||
United Spirits Ltd | 6,245 | 218,455 | ||||||
Zee Entertainment Enterprises Ltd | 291,758 | 1,131,376 | ||||||
|
| |||||||
| 15,036,727 | ||||||||
|
| |||||||
Indonesia - 1.5% | ||||||||
P.T. Astra International Tbk | 1,525,500 | 1,241,182 | ||||||
P.T. Semen Indonesia Persero Tbk | 57,000 | 103,826 | ||||||
P.T. Unilever Indonesia Tbk | 124,500 | 292,535 | ||||||
|
| |||||||
| 1,637,543 | ||||||||
|
| |||||||
Italy - 2.2% | ||||||||
Prada SPA | 148,300 | 1,517,930 | ||||||
Saipem SPA | 13,846 | 426,707 | ||||||
Salvatore Ferragamo Italia SPA | 19,506 | 540,470 | ||||||
|
| |||||||
| 2,485,107 | ||||||||
|
| |||||||
Luxembourg - 1.2% | ||||||||
Tenaris SA ADR | 32,830 | 1,338,807 | ||||||
|
| |||||||
Malaysia - 1.0% | ||||||||
Genting Bhd | 339,400 | 1,101,160 | ||||||
|
| |||||||
Mexico - 5.9% | ||||||||
America Movil SAB de CV ‘L’ ADR | 143,800 | 3,014,048 | ||||||
Fomento Economico Mexicano SAB de CV | 142,718 | 1,620,101 | ||||||
Grupo Financiero Inbursa SAB de CV ‘O’ | 176,150 | 512,326 | ||||||
Grupo Televisa SAB ADR | 19,850 | 528,208 | ||||||
Wal-Mart de Mexico SAB de CV ‘V’ | 263,649 | 860,655 | ||||||
|
| |||||||
| 6,535,338 | ||||||||
|
| |||||||
| See Notes to Financial Statements | See explanation of symbols and terms, if any, on page B-79 |
B-59
Table of Contents
PACIFIC LIFE FUNDS
PL EMERGING MARKETS FUND
Schedule of Investments (Continued)
March 31, 2013
Shares | Value | |||||||
Netherlands - 2.3% | ||||||||
Heineken NV | 15,812 | $1,193,587 | ||||||
Yandex NV ‘A’ * | 56,830 | 1,313,910 | ||||||
|
| |||||||
| 2,507,497 | ||||||||
|
| |||||||
Nigeria - 1.2% | ||||||||
Guaranty Trust Bank PLC | 1,835,104 | 300,932 | ||||||
Nigerian Breweries PLC | 661,754 | 681,204 | ||||||
Zenith Bank PLC | 2,226,937 | 299,172 | ||||||
|
| |||||||
| 1,281,308 | ||||||||
|
| |||||||
Peru - 0.4% | ||||||||
Inretail Peru Corp * | 17,400 | 415,860 | ||||||
|
| |||||||
Philippines - 2.6% | ||||||||
Jollibee Foods Corp | 179,760 | 558,390 | ||||||
SM Investments Corp | 42,230 | 1,154,128 | ||||||
SM Prime Holdings Inc | 2,492,070 | 1,163,942 | ||||||
|
| |||||||
| 2,876,460 | ||||||||
|
| |||||||
Russia - 3.9% | ||||||||
Magnit OJSC (RTS) | 11,600 | 2,237,960 | ||||||
NovaTek OAO GDR (LI) ~ | 19,400 | 2,088,235 | ||||||
|
| |||||||
| 4,326,195 | ||||||||
|
| |||||||
South Africa - 2.6% | ||||||||
ABSA Group Ltd | 25,001 | 421,391 | ||||||
Impala Platinum Holdings Ltd | 52,609 | 774,610 | ||||||
MTN Group Ltd | 63,995 | 1,125,334 | ||||||
Standard Bank Group Ltd | 41,193 | 530,353 | ||||||
|
| |||||||
| 2,851,688 | ||||||||
|
| |||||||
South Korea - 3.4% | ||||||||
E-Mart Co Ltd | 4,443 | 876,356 | ||||||
NHN Corp | 9,915 | 2,399,690 | �� | |||||
Shinsegae Co Ltd | 2,354 | 469,926 | ||||||
|
| |||||||
| 3,745,972 | ||||||||
|
| |||||||
Switzerland - 0.2% | ||||||||
Cie Financiere Richemont SA ‘A’ | 1,338 | 105,181 | ||||||
Cie Financiere Richemont SA Receipt | 19,524 | 153,296 | ||||||
|
| |||||||
| 258,477 | ||||||||
|
| |||||||
Taiwan - 1.8% | ||||||||
Epistar Corp | 146,000 | 261,443 | ||||||
Synnex Technology International Corp | 240,118 | 434,864 | ||||||
Taiwan Semiconductor Manufacturing Co Ltd | 397,995 | 1,329,653 | ||||||
|
| |||||||
| 2,025,960 | ||||||||
|
| |||||||
Thailand - 0.6% | ||||||||
Siam Commercial Bank PCL | 104,600 | 633,994 | ||||||
|
| |||||||
Turkey - 3.8% | ||||||||
Akbank TAS | 99,084 | 520,171 | ||||||
Anadolu Efes Biracilik Ve Malt Sanayii AS | 47,087 | 754,901 | ||||||
BIM Birlesik Magazalar AS | 10,413 | 507,851 | ||||||
Enka Insaat ve Sanayi AS | 142,811 | 441,900 | ||||||
Haci Omer Sabanci Holding AS | 257,331 | 1,521,999 | ||||||
Turkiye Garanti Bankasi AS | 98,010 | 519,945 | ||||||
|
| |||||||
| 4,266,767 | ||||||||
|
| |||||||
United Arab Emirates - 1.0% | ||||||||
DP World Ltd | 77,465 | 1,068,826 | ||||||
|
| |||||||
Shares | Value | |||||||
United Kingdom - 9.1% | ||||||||
Anglo American PLC | 77,255 | $2,003,636 | ||||||
Antofagasta PLC | 24,250 | 373,337 | ||||||
BG Group PLC | 86,510 | 1,483,135 | ||||||
Burberry Group PLC | 15,406 | 311,394 | ||||||
Genting Singapore PLC | 273,000 | 329,903 | ||||||
Glencore International PLC | 123,490 | 673,252 | ||||||
Mail.ru Group Ltd GDR (LI) ~ | 17,900 | 493,324 | ||||||
SABMiller PLC | 29,060 | 1,535,819 | ||||||
Tullow Oil PLC | 88,510 | 1,656,714 | ||||||
Unilever PLC | 28,627 | 1,214,572 | ||||||
|
| |||||||
| 10,075,086 | ||||||||
|
| |||||||
United States - 0.7% | ||||||||
MercadoLibre Inc | 8,260 | 797,586 | ||||||
|
| |||||||
Total Common Stocks | 98,465,470 | |||||||
|
| |||||||
EQUITY-LINKED STRUCTURED SECURITIES - 0.1% |
| |||||||
Vietnam - 0.1% | ||||||||
Vietnam Dairy Products JSC | 27,000 | 148,263 | ||||||
|
| |||||||
Total Equity-Linked Structured Securities | 148,263 | |||||||
|
| |||||||
EXCHANGE-TRADED FUND - 0.8% | ||||||||
iShares FTSE A50 China Index | 623,600 | 837,635 | ||||||
|
| |||||||
Total Exchange-Traded Fund | 837,635 | |||||||
|
| |||||||
SHORT-TERM INVESTMENT - 5.2% | ||||||||
Money Market Fund - 5.2% | ||||||||
BlackRock Liquidity Funds Treasury Trust Fund Portfolio | 5,730,607 | 5,730,607 | ||||||
|
| |||||||
Total Short-Term Investment | 5,730,607 | |||||||
|
| |||||||
TOTAL INVESTMENTS - 100.5% | 111,312,993 | |||||||
OTHER ASSETS & LIABILITIES, NET - (0.5%) | (502,870 | ) | ||||||
|
| |||||||
NET ASSETS - 100.0% | $110,810,123 | |||||||
|
| |||||||
| See Notes to Financial Statements | See explanation of symbols and terms, if any, on page B-79 |
B-60
Table of Contents
PACIFIC LIFE FUNDS
PL EMERGING MARKETS FUND
Schedule of Investments (Continued)
March 31, 2013
Notes to Schedule of Investments
| (a) | As of March 31, 2013, the fund was diversified as a percentage of net assets as follows: |
Consumer Staples | 21.3% | |||
Financials | 21.3% | |||
Information Technology | 15.3% | |||
Consumer Discretionary | 12.7% | |||
Energy | 10.0% | |||
Short-Term Investment | 5.2% | |||
Industrials | 3.9% | |||
Telecommunication Services | 3.7% | |||
Materials | 3.3% | |||
Health Care | 3.0% | |||
Others (each less than 3.0%) | 0.8% | |||
|
| |||
| 100.5% | ||||
Other Assets & Liabilities, Net | (0.5% | ) | ||
|
| |||
| 100.0% | ||||
|
|
| (b) | As of March 31, 2013, the fund was diversified by country of incorporation as a percentage of net assets as follows: |
India | 13.6% | |||
Brazil | 11.2% | |||
Cayman | 11.0% | |||
United Kingdom | 9.1% | |||
Mexico | 5.9% | |||
United States (includes Short-Term Investment) | 5.9% | |||
Hong Kong | 4.6% | |||
Russia | 3.9% | |||
Turkey | 3.8% | |||
South Korea | 3.4% | |||
Others (each less than 3.0%) | 28.1% | |||
|
| |||
| 100.5% | ||||
Other Assets & Liabilities, Net | (0.5% | ) | ||
|
| |||
| 100.0% | ||||
|
|
| (c) | Fair Value Measurements |
The following is a summary of the fund’s investments as categorized under the three-tier hierarchy of inputs used in valuing the fund’s assets and liabilities (See Note 3D in Notes to Financial Statements) as of March 31, 2013:
| Total Value at March 31, 2013 | Level 1 Quoted Price | Level 2 Significant Observable Inputs | Level 3 Significant Unobservable Inputs | |||||||||||||||
Assets | Preferred Stocks | |||||||||||||||||
Brazil | $4,963,228 | $4,963,228 | $— | $— | ||||||||||||||
Colombia | 1,167,790 | 614,790 | 553,000 | — | ||||||||||||||
|
|
|
|
|
|
|
| |||||||||||
| 6,131,018 | 5,578,018 | 553,000 | — | |||||||||||||||
Common Stocks | ||||||||||||||||||
Bermuda | 759,387 | 441,693 | 317,694 | — | ||||||||||||||
Brazil | 7,437,366 | 7,437,366 | — | — | ||||||||||||||
Cayman | 12,229,405 | 6,824,245 | 5,405,160 | — | ||||||||||||||
Chile | 1,150,015 | 1,150,015 | — | — | ||||||||||||||
China | 2,401,259 | — | 2,401,259 | — | ||||||||||||||
Colombia | 1,271,581 | — | 1,271,581 | — | ||||||||||||||
Denmark | 2,392,961 | — | 2,392,961 | — | ||||||||||||||
Egypt | 452,767 | — | 452,767 | — | ||||||||||||||
Hong Kong | 5,104,371 | — | 5,104,371 | — | ||||||||||||||
India | 15,036,727 | 2,511,411 | 12,525,316 | — | ||||||||||||||
Indonesia | 1,637,543 | — | 1,637,543 | — | ||||||||||||||
Italy | 2,485,107 | — | 2,485,107 | — | ||||||||||||||
Luxembourg | 1,338,807 | 1,338,807 | — | — | ||||||||||||||
Malaysia | 1,101,160 | — | 1,101,160 | — | ||||||||||||||
Mexico | 6,535,338 | 3,542,256 | 2,993,082 | — | ||||||||||||||
Netherlands | 2,507,497 | 1,313,910 | 1,193,587 | — | ||||||||||||||
Nigeria | 1,281,308 | 1,281,308 | — | — | ||||||||||||||
Peru | 415,860 | — | 415,860 | — | ||||||||||||||
Philippines | 2,876,460 | — | 2,876,460 | — | ||||||||||||||
Russia | 4,326,195 | — | 4,326,195 | — | ||||||||||||||
South Africa | 2,851,688 | — | 2,851,688 | — | ||||||||||||||
South Korea | 3,745,972 | — | 3,745,972 | — | ||||||||||||||
Switzerland | 258,477 | — | 258,477 | — | ||||||||||||||
Taiwan | 2,025,960 | — | 2,025,960 | — | ||||||||||||||
Thailand | 633,994 | — | 633,994 | — | ||||||||||||||
Turkey | 4,266,767 | — | 4,266,767 | — | ||||||||||||||
United Arab Emirates | 1,068,826 | 1,068,826 | — | — | ||||||||||||||
United Kingdom | 10,075,086 | — | 10,075,086 | — | ||||||||||||||
United States | 797,586 | 797,586 | — | — | ||||||||||||||
|
|
|
|
|
|
|
| |||||||||||
| 98,465,470 | 27,707,423 | 70,758,047 | — | |||||||||||||||
Equity-Linked Structured Securities | 148,263 | — | 148,263 | — | ||||||||||||||
Exchange-Traded Fund | 837,635 | — | 837,635 | — | ||||||||||||||
Short-Term Investment | 5,730,607 | 5,730,607 | — | — | ||||||||||||||
|
|
|
|
|
|
|
| |||||||||||
Total | $111,312,993 | $39,016,048 | $72,296,945 | $— | ||||||||||||||
|
|
|
|
|
|
|
| |||||||||||
During the year ended March 31, 2013, investments with a value of $4,632,213 were transferred from level 1 to level 2 due to valuation adjustments made to exchange-traded prices as a result of market movements following the close of local trading.
| See Notes to Financial Statements | See explanation of symbols and terms, if any, on page B-79 |
B-61
Table of Contents
PACIFIC LIFE FUNDS
PL INTERNATIONAL LARGE-CAP FUND
Schedule of Investments
March 31, 2013
Shares | | |||||||
PREFERRED STOCKS - 1.0% | ||||||||
Brazil - 1.0% | ||||||||
Itau Unibanco Holding SA ADR | 107,971 | $1,921,884 | ||||||
|
| |||||||
Total Preferred Stocks | 1,921,884 | |||||||
|
| |||||||
COMMON STOCKS - 97.4% | ||||||||
Australia - 1.8% | ||||||||
QBE Insurance Group Ltd | 193,511 | 2,731,103 | ||||||
Westpac Banking Corp | 24,767 | 796,636 | ||||||
|
| |||||||
| 3,527,739 | ||||||||
|
| |||||||
Bermuda - 1.2% | ||||||||
Li & Fung Ltd | 1,746,400 | 2,411,991 | ||||||
|
| |||||||
Brazil - 0.8% | ||||||||
BM&FBOVESPA SA | 165,237 | 1,112,074 | ||||||
Tim Participacoes SA ADR | 22,390 | 489,893 | ||||||
|
| |||||||
| 1,601,967 | ||||||||
|
| |||||||
Canada - 3.2% | ||||||||
Canadian National Railway Co | 48,645 | 4,879,093 | ||||||
Valeant Pharmaceuticals International Inc * | 18,860 | 1,414,877 | ||||||
|
| |||||||
| 6,293,970 | ||||||||
|
| |||||||
Czech Republic - 0.5% | ||||||||
Komercni Banka AS | 5,772 | 1,101,802 | ||||||
|
| |||||||
France - 11.8% | ||||||||
Air Liquide SA | 31,226 | 3,796,898 | ||||||
Danone SA | 58,440 | 4,071,774 | ||||||
Dassault Systemes SA | 9,954 | 1,151,487 | ||||||
Legrand SA | 53,695 | 2,342,870 | ||||||
LVMH Moet Hennessy Louis Vuitton SA | 23,363 | 4,013,693 | ||||||
Pernod-Ricard SA | 32,854 | 4,098,216 | ||||||
Schneider Electric SA | 54,395 | 3,978,617 | ||||||
|
| |||||||
| 23,453,555 | ||||||||
|
| |||||||
Germany - 11.5% | ||||||||
Bayer AG | 64,014 | 6,604,838 | ||||||
Beiersdorf AG | 37,907 | 3,501,822 | ||||||
Deutsche Boerse AG | 8,523 | 516,158 | ||||||
Linde AG | 29,690 | 5,522,982 | ||||||
Merck KGaA | 20,522 | 3,097,049 | ||||||
SAP AG | 45,821 | 3,672,084 | ||||||
|
| |||||||
| 22,914,933 | ||||||||
|
| |||||||
Hong Kong - 1.9% | ||||||||
AIA Group Ltd | 535,600 | 2,347,622 | ||||||
China Unicom Ltd | 1,036,000 | 1,391,183 | ||||||
|
| |||||||
| 3,738,805 | ||||||||
|
| |||||||
India - 1.4% | ||||||||
ICICI Bank Ltd ADR | 63,452 | 2,722,091 | ||||||
|
| |||||||
Israel - 0.5% | ||||||||
Check Point Software Technologies Ltd * | 23,562 | 1,107,178 | ||||||
|
| |||||||
Italy - 0.7% | ||||||||
Saipem SPA | 43,924 | 1,353,653 | ||||||
|
| |||||||
Shares | | |||||||
Japan - 13.3% | ||||||||
Canon Inc | 59,850 | $2,207,091 | ||||||
Denso Corp | 101,000 | 4,294,752 | ||||||
FANUC Corp | 15,400 | 2,369,231 | ||||||
Honda Motor Co Ltd | 127,200 | 4,901,454 | ||||||
Hoya Corp | 114,900 | 2,161,502 | ||||||
Inpex Corp | 529 | 2,843,279 | ||||||
Lawson Inc | 32,800 | 2,519,832 | ||||||
NTT DOCOMO Inc | 647 | 961,570 | ||||||
Shin-Etsu Chemical Co Ltd | 64,700 | 4,293,566 | ||||||
|
| |||||||
| 26,552,277 | ||||||||
|
| |||||||
Mexico - 0.3% | ||||||||
Grupo Financiero Santander | 40,461 | 624,313 | ||||||
|
| |||||||
Netherlands - 7.7% | ||||||||
Akzo Nobel NV | 51,671 | 3,283,215 | ||||||
Heineken NV | 75,575 | 5,704,866 | ||||||
ING Groep NV CVA * | 356,943 | 2,565,268 | ||||||
Randstad Holding NV | 90,941 | 3,726,867 | ||||||
|
| |||||||
| 15,280,216 | ||||||||
|
| |||||||
Russia - 0.5% | ||||||||
Sberbank of Russia ADR | 78,587 | 1,001,984 | ||||||
|
| |||||||
Singapore - 1.7% | ||||||||
DBS Group Holdings Ltd | 193,000 | 2,496,785 | ||||||
Singapore Telecommunications Ltd | 296,380 | 859,348 | ||||||
|
| |||||||
| 3,356,133 | ||||||||
|
| |||||||
South Korea - 1.0% | ||||||||
Samsung Electronics Co Ltd | 1,533 | 2,087,951 | ||||||
|
| |||||||
Spain - 2.5% | ||||||||
Amadeus IT Holding SA ‘A’ | 108,633 | 2,940,801 | ||||||
Banco Santander SA | 226,325 | 1,531,082 | ||||||
Red Electrica Corp SA | 9,520 | 479,231 | ||||||
|
| |||||||
| 4,951,114 | ||||||||
|
| |||||||
Sweden - 1.0% | ||||||||
Hennes & Mauritz AB ‘B’ | 53,534 | 1,917,093 | ||||||
|
| |||||||
Switzerland - 10.7% | ||||||||
Givaudan SA | 387 | 475,520 | ||||||
Julius Baer Group Ltd | 81,211 | 3,163,615 | ||||||
Kuehne + Nagel International AG | 9,707 | 1,060,095 | ||||||
Nestle SA | 97,306 | 7,039,702 | ||||||
Roche Holding AG | 15,383 | 3,591,517 | ||||||
Sonova Holding AG | 9,732 | 1,168,777 | ||||||
Swiss Re AG | 22,823 | 1,857,427 | ||||||
UBS AG (XVTX) | 194,067 | 2,980,320 | ||||||
|
| |||||||
| 21,336,973 | ||||||||
|
| |||||||
Taiwan - 2.4% | ||||||||
Hon Hai Precision Industry Co Ltd | 573,080 | 1,591,177 | ||||||
Taiwan Semiconductor | 186,618 | 3,207,963 | ||||||
|
| |||||||
| 4,799,140 | ||||||||
|
| |||||||
United Kingdom - 20.3% | ||||||||
Barclays PLC | 430,707 | 1,888,570 | ||||||
BG Group PLC | 152,249 | 2,610,171 | ||||||
Compass Group PLC | 340,173 | 4,342,929 | ||||||
Delphi Automotive PLC | 55,498 | 2,464,111 | ||||||
Diageo PLC | 124,584 | 3,905,774 | ||||||
| See Notes to Financial Statements | See explanation of symbols and terms, if any, on page B-79 |
B-62
Table of Contents
PACIFIC LIFE FUNDS
PL INTERNATIONAL LARGE-CAP FUND
Schedule of Investments (Continued)
March 31, 2013
Shares | | |||||||
Hays PLC | 578,980 | $833,528 | ||||||
HSBC Holdings PLC (LI) | 561,919 | 5,908,072 | ||||||
Reckitt Benckiser Group PLC | 52,897 | 3,780,814 | ||||||
Rio Tinto PLC | 65,477 | 3,099,134 | ||||||
Royal Dutch Shell PLC ‘A’ (LI) | 21,035 | 684,964 | ||||||
Smiths Group PLC | 110,463 | 2,097,899 | ||||||
Standard Chartered PLC | 189,141 | 4,915,577 | ||||||
WPP PLC | 243,859 | 3,870,721 | ||||||
|
| |||||||
| 40,402,264 | ||||||||
|
| |||||||
United States - 0.7% | ||||||||
Yum! Brands Inc | 18,200 | 1,309,308 | ||||||
|
| |||||||
Total Common Stocks | 193,846,450 | |||||||
|
| |||||||
Principal | ||||||||
SHORT-TERM INVESTMENTS - 1.1% | ||||||||
Commercial Paper - 1.0% | ||||||||
HSBC USA Inc | $1,983,000 | 1,983,000 | ||||||
|
| |||||||
| ||||||||
Money Market Fund - 0.1% | ||||||||
BlackRock Liquidity Funds Treasury | 278,828 | 278,828 | ||||||
|
| |||||||
Total Short-Term Investments | 2,261,828 | |||||||
|
| |||||||
TOTAL INVESTMENTS - 99.5% | 198,030,162 | |||||||
OTHER ASSETS & LIABILITIES, NET - 0.5% | 932,711 | |||||||
|
| |||||||
NET ASSETS - 100.0% | $198,962,873 | |||||||
|
| |||||||
Notes to Schedule of Investments
| (a) | As of March 31, 2013, the fund was diversified as a percentage of net assets as follows: |
Financials | 21.2% | |||
Consumer Staples | 17.4% | |||
Consumer Discretionary | 14.8% | |||
Industrials | 10.7% | |||
Materials | 10.3% | |||
Information Technology | 10.1% | |||
Health Care | 8.0% | |||
Energy | 3.8% | |||
Others (each less than 3.0%) | 3.2% | |||
|
| |||
| 99.5% | ||||
Other Assets & Liabilities, Net | 0.5% | |||
|
| |||
| 100.0% | ||||
|
|
| (b) | As of March 31, 2013, the fund was diversified by country of incorporation as a percentage of net assets as follows: |
United Kingdom | 20.3% | |||
Japan | 13.3% | |||
France | 11.8% | |||
Germany | 11.5% | |||
Switzerland | 10.7% | |||
Netherlands | 7.7% | |||
Canada | 3.2% | |||
Others (each less than 3.0%) | 21.0% | |||
|
| |||
| 99.5% | ||||
Other Assets & Liabilities, Net | 0.5% | |||
|
| |||
| 100.0% | ||||
|
|
| (c) | Short-term investments reflect either the stated coupon rate or the annualized effective yield on the date of purchase for discounted investments. |
| See Notes to Financial Statements | See explanation of symbols and terms, if any, on page B-79 |
B-63
Table of Contents
PACIFIC LIFE FUNDS
PL INTERNATIONAL LARGE-CAP FUND
Schedule of Investments (Continued)
March 31, 2013
| (d) | Fair Value Measurements |
The following is a summary of the fund’s investments as categorized under the three-tier hierarchy of inputs used in valuing the fund’s assets and liabilities (See Note 3D in Notes to Financial Statements) as of March 31, 2013:
| Total Value at March 31, 2013 | Level 1 Quoted Price | Level 2 Significant Observable Inputs | Level 3 Significant Unobservable Inputs | |||||||||||||||
Assets | Preferred Stocks (1) | $1,921,884 | $1,921,884 | $— | $— | |||||||||||||
Common Stocks | ||||||||||||||||||
Australia | 3,527,739 | — | 3,527,739 | — | ||||||||||||||
Bermuda | 2,411,991 | — | 2,411,991 | — | ||||||||||||||
Brazil | 1,601,967 | 1,601,967 | — | — | ||||||||||||||
Canada | 6,293,970 | 6,293,970 | — | — | ||||||||||||||
Czech Republic | 1,101,802 | — | 1,101,802 | — | ||||||||||||||
France | 23,453,555 | — | 23,453,555 | — | ||||||||||||||
Germany | 22,914,933 | — | 22,914,933 | — | ||||||||||||||
Hong Kong | 3,738,805 | — | 3,738,805 | — | ||||||||||||||
India | 2,722,091 | 2,722,091 | — | — | ||||||||||||||
Israel | 1,107,178 | 1,107,178 | — | — | ||||||||||||||
Italy | 1,353,653 | — | 1,353,653 | — | ||||||||||||||
Japan | 26,552,277 | — | 26,552,277 | — | ||||||||||||||
Mexico | 624,313 | 624,313 | — | — | ||||||||||||||
Netherlands | 15,280,216 | — | 15,280,216 | — | ||||||||||||||
Russia | 1,001,984 | 1,001,984 | — | — | ||||||||||||||
Singapore | 3,356,133 | — | 3,356,133 | — | ||||||||||||||
South Korea | 2,087,951 | — | 2,087,951 | — | ||||||||||||||
Spain | 4,951,114 | — | 4,951,114 | — | ||||||||||||||
Sweden | 1,917,093 | — | 1,917,093 | — | ||||||||||||||
Switzerland | 21,336,973 | — | 21,336,973 | — | ||||||||||||||
Taiwan | 4,799,140 | 3,207,963 | 1,591,177 | — | ||||||||||||||
United Kingdom | 40,402,264 | 2,464,111 | 37,938,153 | — | ||||||||||||||
United States | 1,309,308 | 1,309,308 | — | — | ||||||||||||||
|
|
|
|
|
|
|
| |||||||||||
| 193,846,450 | 20,332,885 | 173,513,565 | — | |||||||||||||||
Short-Term Investments | 2,261,828 | 278,828 | 1,983,000 | — | ||||||||||||||
|
|
|
|
|
|
|
| |||||||||||
Total | $198,030,162 | $22,533,597 | $175,496,565 | $— | ||||||||||||||
|
|
|
|
|
|
|
| |||||||||||
| (1) | For equity investments categorized in a simple level, refer to the schedule of investments for further geographical region breakout. |
| See Notes to Financial Statements | See explanation of symbols and terms, if any, on page B-79 |
B-64
Table of Contents
PACIFIC LIFE FUNDS
PL INTERNATIONAL VALUE FUND
Schedule of Investments
March 31, 2013
Shares | | |||||||
PREFERRED STOCKS - 1.4% | ||||||||
Germany - 1.4% |
| |||||||
Volkswagen AG | 10,748 | $2,136,502 | ||||||
|
| |||||||
Total Preferred Stocks | 2,136,502 | |||||||
|
| |||||||
COMMON STOCKS - 96.9% | ||||||||
Australia - 2.5% | ||||||||
Australia & New Zealand Banking Group Ltd | 92,611 | 2,761,534 | ||||||
Goodman Group REIT | 194,717 | 971,139 | ||||||
|
| |||||||
| 3,732,673 | ||||||||
|
| |||||||
Belgium - 1.5% | ||||||||
Solvay SA | 16,519 | 2,238,816 | ||||||
|
| |||||||
Brazil - 0.5% | ||||||||
Cia Energetica de Minas Gerais ADR | 61,600 | 729,960 | ||||||
|
| |||||||
Canada - 0.6% | ||||||||
First Quantum Minerals Ltd | 43,122 | 820,118 | ||||||
|
| |||||||
China - 2.5% | ||||||||
China Construction Bank Corp ‘H’ | 1,981,000 | 1,622,490 | ||||||
China Shenhua Energy Co Ltd ‘H’ | 309,000 | 1,120,181 | ||||||
PetroChina Co Ltd ‘H’ | 744,000 | 978,700 | ||||||
|
| |||||||
| 3,721,371 | ||||||||
|
| |||||||
Denmark - 0.8% | ||||||||
Danske Bank AS * | 67,082 | 1,202,610 | ||||||
|
| |||||||
Finland - 0.8% | ||||||||
UPM-Kymmene OYJ | 103,888 | 1,163,861 | ||||||
|
| |||||||
France - 13.7% | ||||||||
AXA SA | 83,905 | 1,446,401 | ||||||
BNP Paribas SA | 53,007 | 2,730,799 | ||||||
Cie de St-Gobain | 39,983 | 1,483,922 | ||||||
GDF Suez | 40,429 | 779,235 | ||||||
Lafarge SA | 18,032 | 1,199,321 | ||||||
Renault SA | 24,508 | 1,538,971 | ||||||
Sanofi | 48,725 | 4,968,773 | ||||||
Schneider Electric SA | 27,844 | 2,036,595 | ||||||
Societe Generale SA * | 41,038 | 1,353,813 | ||||||
Sodexo | 20,441 | 1,905,926 | ||||||
Suez Environnement Co | 51,358 | 655,418 | ||||||
|
| |||||||
| 20,099,174 | ||||||||
|
| |||||||
Germany - 6.2% | ||||||||
Allianz SE | 25,401 | 3,451,417 | ||||||
BASF SE | 19,303 | 1,691,244 | ||||||
Bayer AG | 26,445 | 2,728,543 | ||||||
Deutsche Boerse AG | 19,447 | 1,177,722 | ||||||
|
| |||||||
| 9,048,926 | ||||||||
|
| |||||||
Hong Kong - 2.9% | ||||||||
China Overseas Land & Investment Ltd | 224,000 | 620,024 | ||||||
Hutchison Whampoa Ltd | 224,000 | 2,343,674 | ||||||
Wharf Holdings Ltd | 150,000 | 1,338,695 | ||||||
|
| |||||||
| 4,302,393 | ||||||||
|
| |||||||
Shares | | |||||||
Italy - 3.7% | ||||||||
ENI SPA | 197,271 | $4,429,706 | ||||||
Intesa Sanpaolo SPA | 630,475 | 929,116 | ||||||
|
| |||||||
| 5,358,822 | ||||||||
|
| |||||||
Japan - 23.5% | ||||||||
Bridgestone Corp | 38,800 | 1,308,923 | ||||||
Canon Inc | 54,200 | 1,998,736 | ||||||
Daiwa House Industry Co Ltd | 70,000 | 1,370,585 | ||||||
Hitachi Ltd | 432,000 | 2,519,534 | ||||||
Honda Motor Co Ltd | 72,800 | 2,805,235 | ||||||
Japan Airlines Co Ltd | 24,400 | 1,138,268 | ||||||
Japan Tobacco Inc | 48,100 | 1,539,476 | ||||||
Kirin Holdings Co Ltd | 52,000 | 837,759 | ||||||
Marubeni Corp | 125,000 | 955,796 | ||||||
Mitsubishi Heavy Industries Ltd | 197,000 | 1,140,300 | ||||||
Mitsubishi UFJ Financial Group Inc | 361,700 | 2,180,257 | ||||||
Mitsui Fudosan Co Ltd | 68,000 | 1,939,803 | ||||||
Nippon Telegraph & Telephone Corp | 23,900 | 1,042,602 | ||||||
Nissan Motor Co Ltd | 114,700 | 1,111,397 | ||||||
ORIX Corp | 144,300 | 1,843,097 | ||||||
Otsuka Holdings Co Ltd | 36,200 | 1,260,743 | ||||||
Seven & I Holdings Co Ltd | 52,700 | 1,747,760 | ||||||
Sumitomo Corp | 108,600 | 1,369,675 | ||||||
Sumitomo Electric Industries Ltd | 99,200 | 1,218,641 | ||||||
Sumitomo Mitsui Financial Group Inc | 81,500 | 3,344,398 | ||||||
The Dai-ichi Life Insurance Co Ltd | 504 | 677,073 | ||||||
Yamato Holdings Co Ltd | 62,800 | 1,139,538 | ||||||
|
| |||||||
| 34,489,596 | ||||||||
|
| |||||||
Netherlands - 3.8% | ||||||||
ASML Holding NV | 20,677 | 1,392,168 | ||||||
European Aeronautic Defence & | 31,491 | 1,605,558 | ||||||
ING Groep NV CVA * | 151,195 | 1,086,604 | ||||||
Unilever NV CVA | 34,982 | 1,434,064 | ||||||
|
| |||||||
| 5,518,394 | ||||||||
|
| |||||||
Norway - 1.3% | ||||||||
Telenor ASA | 85,587 | 1,877,088 | ||||||
|
| |||||||
Russia - 0.7% | ||||||||
Sberbank of Russia ADR | 79,526 | 1,013,957 | ||||||
|
| |||||||
South Africa - 0.3% | ||||||||
African Bank Investments Ltd | 114,100 | 374,887 | ||||||
|
| |||||||
South Korea - 0.8% | ||||||||
Samsung Electronics Co Ltd | 861 | 1,172,685 | ||||||
|
| |||||||
Spain - 3.1% | ||||||||
Iberdrola SA | 261,870 | 1,221,210 | ||||||
Repsol SA | 87,566 | 1,781,729 | ||||||
Telefonica SA | 108,879 | 1,471,713 | ||||||
|
| |||||||
| 4,474,652 | ||||||||
|
| |||||||
Sweden - 2.1% | ||||||||
Nordea Bank AB | 60,984 | 691,971 | ||||||
Telefonaktiebolaget LM Ericsson ‘B’ | 192,372 | 2,400,313 | ||||||
|
| |||||||
| 3,092,284 | ||||||||
|
| |||||||
Switzerland - 5.4% | ||||||||
Credit Suisse Group AG | 52,918 | 1,396,583 | ||||||
Novartis AG | 42,041 | 2,993,800 | ||||||
| See Notes to Financial Statements | See explanation of symbols and terms, if any, on page B-79 |
B-65
Table of Contents
PACIFIC LIFE FUNDS
PL INTERNATIONAL VALUE FUND
Schedule of Investments (Continued)
March 31, 2013
Shares | | |||||||
Roche Holding AG | 6,426 | $1,500,298 | ||||||
Swiss Re AG | 25,205 | 2,051,284 | ||||||
|
| |||||||
| 7,941,965 | ||||||||
|
| |||||||
United Kingdom - 20.2% | ||||||||
Barclays PLC | 547,531 | 2,400,822 | ||||||
British American Tobacco PLC | 12,571 | 673,088 | ||||||
Centrica PLC | 264,728 | 1,481,436 | ||||||
Experian PLC | 40,757 | 712,479 | ||||||
HSBC Holdings PLC | 541,753 | 5,696,044 | ||||||
InterContinental Hotels Group PLC | 66,443 | 2,037,728 | ||||||
Kingfisher PLC | 241,057 | 1,056,593 | ||||||
Pearson PLC | 55,082 | 990,963 | ||||||
Prudential PLC | 145,185 | 2,358,086 | ||||||
Rio Tinto PLC | 20,169 | 954,632 | ||||||
Royal Dutch Shell PLC ‘A’ | 142,783 | 4,649,453 | ||||||
SABMiller PLC | 32,208 | 1,702,190 | ||||||
Tullow Oil PLC | 61,130 | 1,144,220 | ||||||
Vodafone Group PLC | 1,313,036 | 3,727,468 | ||||||
|
| |||||||
| 29,585,202 | ||||||||
|
| |||||||
Total Common Stocks | 141,959,434 | |||||||
|
| |||||||
SHORT-TERM INVESTMENT - 1.7% | ||||||||
Money Market Fund -1.7% | ||||||||
BlackRock Liquidity Funds Treasury | 2,521,047 | 2,521,047 | ||||||
|
| |||||||
Total Short-Term Investment | 2,521,047 | |||||||
|
| |||||||
TOTAL INVESTMENTS -100.0% | 146,616,983 | |||||||
OTHER ASSETS & LIABILITIES, NET - (0.0%) | (67,331 | ) | ||||||
|
| |||||||
NET ASSETS - 100.0% | $146,549,652 | |||||||
|
| |||||||
Notes to Schedule of Investments
| (a) | As of March 31, 2013, the fund was diversified as a percentage of net assets as follows: |
Financials | 32.8% | |||
Industrials | 10.3% | |||
Consumer Discretionary | 10.2% | |||
Energy | 9.6% | |||
Health Care | 9.2% | |||
Information Technology | 6.5% | |||
Telecommunication Services | 5.5% | |||
Materials | 5.5% | |||
Consumer Staples | 5.4% | |||
Utilities | 3.3% | |||
Others (each less than 3.0%) | 1.7% | |||
|
| |||
| 100.0% | ||||
Other Assets & Liabilities, Net | (0.0% | ) | ||
|
| |||
| 100.0% | ||||
|
|
| (b) | As of March 31, 2013, the fund was diversified by country of incorporation as a percentage of net assets as follows: |
Japan | 23.5% | |||
United Kingdom | 20.2% | |||
France | 13.7% | |||
Germany | 7.6% | |||
Switzerland | 5.4% | |||
Netherlands | 3.8% | |||
Italy | 3.7% | |||
Spain | 3.1% | |||
Others (each less than 3.0%) | 19.0% | |||
|
| |||
| 100.0% | ||||
Other Assets & Liabilities, Net | (0.0% | ) | ||
|
| |||
| 100.0% | ||||
|
|
| (c) | Forward foreign currency contracts outstanding as of March 31, 2013 were as follows: |
| Currency Purchased | Currency Sold | Expiration | Counterparty | Unrealized Appreciation (Depreciation) | ||||||||||||||||
| AUD | 288,478 | USD | 299,004 | 05/13 | CSF | $535 | ||||||||||||||
| AUD | 9,166,824 | USD | 9,485,371 | 05/13 | RBC | 32,932 | ||||||||||||||
| CHF | 669,868 | EUR | 542,095 | 05/13 | CIT | 10,917 | ||||||||||||||
| CHF | 5,410,070 | USD | 5,950,101 | 05/13 | RBC | (248,472 | ) | |||||||||||||
| CHF | 1,157,076 | USD | 1,244,555 | 05/13 | SSB | (25,122 | ) | |||||||||||||
| CHF | 328,472 | USD | 349,520 | 05/13 | UBS | (3,346 | ) | |||||||||||||
| EUR | 560,284 | USD | 722,832 | 05/13 | CSF | (4,459 | ) | |||||||||||||
| GBP | 525,227 | USD | 789,806 | 05/13 | BRC | 8,095 | ||||||||||||||
| GBP | 424,411 | USD | 655,221 | 05/13 | CSF | (10,475 | ) | |||||||||||||
| GBP | 205,168 | USD | 310,241 | 05/13 | HSB | 1,440 | ||||||||||||||
| GBP | 670,104 | USD | 1,052,694 | 05/13 | SSB | (34,702 | ) | |||||||||||||
| GBP | 273,564 | USD | 409,741 | 05/13 | WBC | 5,845 | ||||||||||||||
| HKD | 4,895,689 | USD | 631,662 | 05/13 | HSB | (862 | ) | |||||||||||||
| JPY | 48,624,367 | EUR | 388,203 | 05/13 | BRC | 18,927 | ||||||||||||||
| JPY | 55,912,632 | USD | 582,366 | 05/13 | BRC | 11,757 | ||||||||||||||
| JPY | 47,649,094 | USD | 510,156 | 05/13 | CIT | (3,840 | ) | |||||||||||||
| NZD | 239,302 | USD | 199,163 | 05/13 | HSB | 577 | ||||||||||||||
| SEK | 11,359,519 | USD | 1,784,522 | 05/13 | HSB | (42,716 | ) | |||||||||||||
| SGD | 3,408,646 | USD | 2,753,705 | 05/13 | HSB | (5,338 | ) | |||||||||||||
| USD | 595,854 | CAD | 598,244 | 05/13 | RBC | 7,412 | ||||||||||||||
| USD | 1,324,141 | CHF | 1,247,950 | 05/13 | BRC | 8,937 | ||||||||||||||
| USD | 454,815 | CHF | 430,621 | 05/13 | CSF | 987 | ||||||||||||||
| USD | 473,455 | CHF | 446,761 | 05/13 | WBC | 2,618 | ||||||||||||||
| See Notes to Financial Statements | See explanation of symbols and terms, if any, on page B-79 |
B-66
Table of Contents
PACIFIC LIFE FUNDS
PL INTERNATIONAL VALUE FUND
Schedule of Investments (Continued)
March 31, 2013
| Currency Purchased | Currency Sold | Expiration | Counterparty | Unrealized Appreciation (Depreciation) | ||||||||||||||||
| USD | 370,073 | EUR | 286,732 | 05/13 | CIT | $2,437 | ||||||||||||||
| USD | 653,241 | EUR | 506,004 | 05/13 | CSF | 4,464 | ||||||||||||||
| USD | 747,158 | EUR | 572,286 | 05/13 | HSB | 13,396 | ||||||||||||||
| USD | 7,906,628 | EUR | 5,824,378 | 05/13 | RBS | 438,856 | ||||||||||||||
| USD | 667,833 | EUR | 504,165 | 05/13 | SSB | 21,412 | ||||||||||||||
| USD | 443,135 | EUR | 329,542 | 05/13 | UBS | 20,610 | ||||||||||||||
| USD | 371,520 | GBP | 245,378 | 05/13 | CIT | (1,247 | ) | |||||||||||||
| USD | 500,665 | GBP | 329,730 | 05/13 | CSF | (245 | ) | |||||||||||||
| USD | 941,935 | GBP | 597,046 | 05/13 | TDB | 34,931 | ||||||||||||||
| USD | 369,904 | HKD | 2,869,120 | 05/13 | BRC | 224 | ||||||||||||||
| USD | 4,016,300 | HKD | 31,142,592 | 05/13 | TDB | 3,638 | ||||||||||||||
| USD | 490,026 | JPY | 45,264,780 | 05/13 | CIT | 9,046 | ||||||||||||||
| USD | 501,113 | JPY | 47,375,733 | 05/13 | HSB | (2,298 | ) | |||||||||||||
| USD | 658,077 | JPY | 62,328,871 | 05/13 | MSC | (4,225 | ) | |||||||||||||
| USD | 598,013 | JPY | 54,578,883 | 05/13 | RBS | 18,080 | ||||||||||||||
| USD | 369,527 | JPY | 34,944,321 | 05/13 | SSB | (1,789 | ) | |||||||||||||
| USD | 2,919,436 | JPY | 265,363,591 | 05/13 | TDB | 99,702 | ||||||||||||||
| USD | 625,198 | JPY | 60,150,737 | 05/13 | UBS | (13,959 | ) | |||||||||||||
| USD | 366,501 | NOK | 2,019,091 | 05/13 | HSB | 21,303 | ||||||||||||||
| USD | 197,716 | NZD | 239,302 | 05/13 | GSC | (2,025 | ) | |||||||||||||
|
| |||||||||||||||||||
Total Forward Foreign Currency Contracts |
| $393,958 | ||||||||||||||||||
|
| |||||||||||||||||||
| (d) | Fair Value Measurements |
The following is a summary of the fund’s investments as categorized under the three-tier hierarchy of inputs used in valuing the fund’s assets and liabilities (See Note 3D in Notes to Financial Statements) as of March 31, 2013:
| Total Value at March 31, 2013 | Level 1 Quoted Price | Level 2 Significant Observable Input | Level 3 Significant Unobservable Input | |||||||||||||||
Assets | Preferred Stocks (1) | $2,136,502 | $— | $2,136,502 | $— | |||||||||||||
Common Stocks | ||||||||||||||||||
Australia | 3,732,673 | — | 3,732,673 | — | ||||||||||||||
Belgium | 2,238,816 | — | 2,238,816 | — | ||||||||||||||
Brazil | 729,960 | 729,960 | — | — | ||||||||||||||
Canada | 820,118 | 820,118 | — | — | ||||||||||||||
China | 3,721,371 | — | 3,721,371 | — | ||||||||||||||
Denmark | 1,202,610 | — | 1,202,610 | — | ||||||||||||||
Finland | 1,163,861 | — | 1,163,861 | — | ||||||||||||||
France | 20,099,174 | — | 20,099,174 | — | ||||||||||||||
Germany | 9,048,926 | — | 9,048,926 | — | ||||||||||||||
Hong Kong | 4,302,393 | — | 4,302,393 | — | ||||||||||||||
Italy | 5,358,822 | — | 5,358,822 | — | ||||||||||||||
Japan | 34,489,596 | — | 34,489,596 | — | ||||||||||||||
Netherlands | 5,518,394 | — | 5,518,394 | — | ||||||||||||||
Norway | 1,877,088 | — | 1,877,088 | |||||||||||||||
Russia | 1,013,957 | 1,013,957 | — | — | ||||||||||||||
South Africa | 374,887 | — | 374,887 | — | ||||||||||||||
South Korea | 1,172,685 | — | 1,172,685 | — | ||||||||||||||
Spain | 4,474,652 | — | 4,474,652 | — | ||||||||||||||
Sweden | 3,092,284 | — | 3,092,284 | — | ||||||||||||||
Switzerland | 7,941,965 | — | 7,941,965 | — | ||||||||||||||
United Kingdom | 29,585,202 | — | 29,585,202 | — | ||||||||||||||
|
|
|
|
|
|
|
| |||||||||||
| 141,959,434 | 2,564,035 | 139,395,399 | — | |||||||||||||||
Short-Term Investment | 2,521,047 | 2,521,047 | — | — | ||||||||||||||
Derivatives: | ||||||||||||||||||
Foreign Currency Contracts | ||||||||||||||||||
Forward Foreign Currency Contracts | 799,078 | — | 799,078 | — | ||||||||||||||
|
|
|
|
|
|
|
| |||||||||||
Total Assets | 147,416,061 | 5,085,082 | 142,330,979 | — | ||||||||||||||
|
|
|
|
|
|
|
| |||||||||||
Liabilities | Derivatives: | |||||||||||||||||
Foreign Currency Contracts | ||||||||||||||||||
Forward Foreign Currency Contracts | (405,120 | ) | — | (405,120 | ) | — | ||||||||||||
|
|
|
|
|
|
|
| |||||||||||
Total Liabilities | (405,120 | ) | — | (405,120 | ) | — | ||||||||||||
|
|
|
|
|
|
|
| |||||||||||
Total | $147,010,941 | $5,085,082 | $141,925,859 | $— | ||||||||||||||
|
|
|
|
|
|
|
| |||||||||||
| (1) | For equity investments categorized in a single level, refer to the schedule of investments for further geographical region breakout. |
| See Notes to Financial Statements | See explanation of symbols and terms, if any, on page B-79 |
B-67
Table of Contents
PACIFIC LIFE FUNDS
PL CURRENCY STRATEGIES FUND
Schedule of Investments
March 31, 2013
Principal | Value | |||||||
FOREIGN GOVERNMENT BONDS & NOTES - 45.9% |
| |||||||
Canada - 12.7% |
| |||||||
Canadian Government | CAD 15,250,000 | $15,010,107 | ||||||
|
| |||||||
France - 9.1% | ||||||||
French Treasury | EUR 8,300,000 | 10,767,721 | ||||||
|
| |||||||
Germany - 11.7% | ||||||||
Bundesobligation | 10,850,000 | 13,918,284 | ||||||
|
| |||||||
United Kingdom - 12.4% | ||||||||
United Kingdom Gilt | GBP 9,500,000 | 14,707,126 | ||||||
|
| |||||||
Total Foreign Government Bonds & Notes |
| 54,403,238 | ||||||
|
| |||||||
SHORT-TERM INVESTMENTS - 54.0% | ||||||||
U.S. Treasury Bills - 12.0% | ||||||||
0.175% due 09/19/13 ‡ | $14,200,000 | 14,193,255 | ||||||
|
| |||||||
Shares | Value | |||||||
Money Market Fund - 42.0% | ||||||||
BlackRock Liquidity Funds Treasury | 49,880,737 | $49,880,737 | ||||||
|
| |||||||
Total Short-Term Investments | 64,073,992 | |||||||
|
| |||||||
TOTAL INVESTMENTS - 99.9% | 118,477,230 | |||||||
OTHER ASSETS & LIABILITIES, NET - 0.1% |
| 165,448 | ||||||
|
| |||||||
NET ASSETS - 100.0% | $118,642,678 | |||||||
|
| |||||||
Notes to Schedule of Investments
| (a) | As of March 31, 2013, the fund was diversified as a percentage of net assets as follows: |
Short-Term Investments | 54.0% | |||
Foreign Government Bonds & Notes | 45.9% | |||
|
| |||
| 99.9% | ||||
Other Assets & Liabilities, Net | 0.1% | |||
|
| |||
| 100.0% | ||||
|
|
| (b) | As of March 31, 2013, the fund’s Standard & Poor’s quality ratings as a percentage of total fixed income investments were are follows (Unaudited): |
AAA | 63.6% | |||
A-1 (Short Term Debt Only) | 20.7% | |||
AA | 15.7% | |||
|
| |||
| 100.0% | ||||
|
|
| (c) | Short-term investments reflect either the stated coupon rate or the annualized effective yield on the date of purchase for discounted investments. |
| (d) | As of March 31, 2013, investments with a total aggregate value of $976,536 were fully or partially segregated with the broker(s)/custodian as collateral for forward foreign currency contracts. In addition, $740,000 in cash was segregated as collateral for forward foreign currency contracts. |
| (e) | Forward foreign currency contracts outstanding as of March 31, 2013 were as follows: |
| Currency Purchased | Currency Sold | Expiration | Counterparty | Unrealized Appreciation (Depreciation) | ||||||||||||||||
| AUD | 1,130,000 | USD | 1,178,809 | 04/13 | RBS | ($3,884 | ) | |||||||||||||
| EUR | 13,858,095 | USD | 17,820,002 | 04/13 | RBS | (53,896 | ) | |||||||||||||
| INR | 1,955,250,000 | USD | 35,692,771 | 04/13 | RBS | 144,415 | ||||||||||||||
| KRW | 18,378,000,000 | USD | 16,832,599 | 04/13 | MSC | (331,441 | ) | |||||||||||||
| KRW | 1,322,000,000 | USD | 1,186,928 | 04/13 | MSC | 64 | ||||||||||||||
| MXN | 454,440,000 | USD | 35,730,629 | 04/13 | BRC | 998,830 | ||||||||||||||
| PHP | 697,250,000 | USD | 17,124,087 | 04/13 | GSC | (31,274 | ) | |||||||||||||
| PLN | 54,165,000 | USD | 17,063,739 | 04/13 | BRC | (458,106 | ) | |||||||||||||
| USD | 62,552,347 | AUD | 61,100,000 | 04/13 | BRC | (976,812 | ) | |||||||||||||
| USD | 59,678,068 | CAD | 61,600,000 | 04/13 | MSC | (937,392 | ) | |||||||||||||
| USD | 17,820,000 | CHF | 16,904,979 | 04/13 | RBS | 8,111 | ||||||||||||||
| USD | 17,138,354 | CZK | 332,760,000 | 04/13 | GSC | 587,536 | ||||||||||||||
| USD | 25,732,101 | EUR | 19,645,000 | 04/13 | MSC | 547,175 | ||||||||||||||
| USD | 14,258,075 | GBP | 9,500,000 | 04/13 | BRC | (175,316 | ) | |||||||||||||
| USD | 17,492,193 | NOK | 99,430,000 | 04/13 | MSC | 480,795 | ||||||||||||||
| USD | 71,395,648 | NZD | 86,385,000 | 04/13 | RBS | (796,374 | ) | |||||||||||||
| ZAR | 156,190,000 | USD | 17,101,953 | 04/13 | RBS | (157,398 | ) | |||||||||||||
|
| |||||||||||||||||||
Total Forward Foreign Currency Contracts | ($1,154,967 | ) | ||||||||||||||||||
|
| |||||||||||||||||||
| See Notes to Financial Statements | See explanation of symbols and terms, if any, on page B-79 |
B-68
Table of Contents
PACIFIC LIFE FUNDS
PL CURRENCY STRATEGIES FUND
Schedule of Investments (Continued)
March 31, 2013
| (f) | Fair Value Measurements |
The following is a summary of the fund’s investments as categorized under the three-tier hierarchy of inputs used in valuing the fund’s assets and liabilities (See Note 3D in Notes to Financial Statements) as of March 31, 2013:
| Total Value at March 31, 2013 | Level 1 Quoted Price | Level 2 Significant Observable Inputs | Level 3 Significant Unobservable Inputs | |||||||||||||||
Assets | Foreign Government Bonds & Notes | $54,403,238 | $— | $54,403,238 | $— | |||||||||||||
Short-Term Investments | 64,073,992 | 49,880,737 | 14,193,255 | — | ||||||||||||||
Derivatives: | ||||||||||||||||||
Foreign Currency Contracts | ||||||||||||||||||
Forward Foreign Currency Contracts | 2,766,926 | — | 2,766,926 | — | ||||||||||||||
|
|
|
|
|
|
|
| |||||||||||
Total Assets | 121,244,156 | 49,880,737 | 71,363,419 | — | ||||||||||||||
|
|
|
|
|
|
|
| |||||||||||
Liabilities | Derivatives: | |||||||||||||||||
Foreign Currency Contracts | ||||||||||||||||||
Forward Foreign Currency Contracts | (3,921,893 | ) | — | (3,921,893 | ) | — | ||||||||||||
|
|
|
|
|
|
|
| |||||||||||
Total Liabilities | (3,921,893 | ) | — | (3,921,893 | ) | — | ||||||||||||
|
|
|
|
|
|
|
| |||||||||||
Total | $117,322,263 | $49,880,737 | $67,441,526 | $— | ||||||||||||||
|
|
|
|
|
|
|
| |||||||||||
| See Notes to Financial Statements | See explanation of symbols and terms, if any, on page B-79 |
B-69
Table of Contents
PACIFIC LIFE FUNDS
PL GLOBAL ABSOLUTE RETURN FUND
Schedule of Investments
March 31, 2013
Shares | Value | |||||||
COMMON STOCKS - 1.7% | ||||||||
France - 0.4% | ||||||||
Sanofi | 3,686 | $375,883 | ||||||
Total SA | 6,722 | 321,289 | ||||||
|
| |||||||
| 697,172 | ||||||||
|
| |||||||
Germany - 1.0% | ||||||||
Deutsche Euroshop AG | 14,000 | 566,648 | ||||||
Deutsche Wohnen AG | 30,000 | 545,631 | ||||||
GSW Immobilien AG | 13,900 | 550,459 | ||||||
|
| |||||||
| 1,662,738 | ||||||||
|
| |||||||
Luxembourg - 0.3% | ||||||||
GAGFAH SA * | 46,800 | 574,926 | ||||||
|
| |||||||
Total Common Stocks | 2,934,836 | |||||||
|
| |||||||
Principal | ||||||||
MORTGAGE-BACKED SECURITIES - 0.4% |
| |||||||
United States - 0.4% | ||||||||
Fannie Mae (IO) | ||||||||
5.946% due 01/25/43 " § | $2,972,087 | 661,907 | ||||||
|
| |||||||
Total Mortgage-Backed Securities | 661,907 | |||||||
|
| |||||||
FOREIGN GOVERNMENT BONDS & NOTES - 36.3% |
| |||||||
Cyprus - 0.9% | ||||||||
Cyprus Government | ||||||||
3.750% due 06/03/13 | EUR 420,000 | 492,617 | ||||||
3.750% due 11/01/15 | 350,000 | 302,838 | ||||||
4.375% due 07/15/14 | 350,000 | 347,703 | ||||||
4.625% due 02/03/20 | 515,000 | 387,841 | ||||||
|
| |||||||
| 1,530,999 | ||||||||
|
| |||||||
Guatemala - 0.5% | ||||||||
Guatemala Government | $900,000 | 884,250 | ||||||
|
| |||||||
Israel - 0.2% | ||||||||
Israel Government | 357,000 | 345,157 | ||||||
|
| |||||||
Jordan - 0.9% | ||||||||
Jordan Government | ||||||||
6.925% due 06/04/14 | JOD 400,000 | 558,255 | ||||||
7.078% due 07/18/14 | 700,000 | 979,941 | ||||||
|
| |||||||
| 1,538,196 | ||||||||
|
| |||||||
Mexico - 4.2% | ||||||||
Mexican Bonos | MXN 87,000,000 | 7,246,186 | ||||||
|
| |||||||
New Zealand - 4.1% | ||||||||
New Zealand Government | NZD 7,190,000 | 7,030,543 | ||||||
|
| |||||||
Principal | Value | |||||||
Paraguay - 0.2% | ||||||||
Republic of Paraguay | $376,000 | $379,384 | ||||||
|
| |||||||
Philippines - 1.4% | ||||||||
Philippine Government | PHP 85,990,000 | 2,389,487 | ||||||
|
| |||||||
Romania - 2.8% | ||||||||
Romania Government | ||||||||
5.750% due 01/27/16 | RON 790,000 | 231,563 | ||||||
5.800% due 10/26/15 | 8,030,000 | 2,357,863 | ||||||
5.850% due 07/28/14 | 2,930,000 | 856,038 | ||||||
5.900% due 07/26/17 | 4,130,000 | 1,217,806 | ||||||
11.000% due 03/05/14 | 400,000 | 122,300 | ||||||
|
| |||||||
| 4,785,570 | ||||||||
|
| |||||||
Serbia - 6.6% | ||||||||
Serbia Treasury | ||||||||
10.000% due 01/10/15 | RSD 604,100,000 | 6,817,621 | ||||||
10.000% due 01/24/18 | 103,830,000 | 1,115,980 | ||||||
Serbia Treasury Bills | ||||||||
10.026% due 04/03/14 | 36,510,000 | 378,227 | ||||||
10.594% due 02/20/14 | 111,310,000 | 1,165,125 | ||||||
11.348% due 01/23/14 | 188,540,000 | 1,989,174 | ||||||
|
| |||||||
| 11,466,127 | ||||||||
|
| |||||||
Sri Lanka - 5.0% | ||||||||
Sri Lanka Government International | ||||||||
5.875% due 07/25/22 ~ | $1,776,000 | 1,851,480 | ||||||
6.250% due 10/04/20 ~ | 796,000 | 851,720 | ||||||
Sri Lanka Government | ||||||||
7.000% due 03/01/14 | LKR 7,500,000 | 57,269 | ||||||
8.500% due 04/01/18 | 250,730,000 | 1,767,435 | ||||||
9.000% due 05/01/21 | 503,840,000 | 3,409,160 | ||||||
11.750% due 04/01/14 | 37,500,000 | 298,391 | ||||||
11.750% due 03/15/15 | 37,500,000 | 299,854 | ||||||
|
| |||||||
| 8,535,309 | ||||||||
|
| |||||||
Turkey - 9.5% | ||||||||
Turkey Government | ||||||||
4.000% due 04/01/20 ^ | TRY 9,604,905 | 6,303,999 | ||||||
5.690% due 07/17/13 | 17,764,000 | 9,656,947 | ||||||
6.043% due 04/09/14 | 909,776 | 472,638 | ||||||
|
| |||||||
| 16,433,584 | ||||||||
|
| |||||||
Total Foreign Government Bonds & Notes | 62,564,792 | |||||||
|
| |||||||
PURCHASED OPTIONS - 0.2% | ||||||||
(See Note (g) in Notes to Schedule of Investments) |
| 322,731 | ||||||
|
| |||||||
SHORT-TERM INVESTMENTS - 61.9% | ||||||||
Foreign Government Issues - 20.2% | ||||||||
Bank Negara Malaysia Monetary Notes (Malaysia) | MYR 44,196,000 | 14,235,522 | ||||||
Mexico Cetes (Mexico) | MXN 3,542,000 | 285,612 | ||||||
Nigeria Treasury Bills (Nigeria) | ||||||||
10.045% due 12/05/13 | NGN 433,302,000 | 2,528,510 | ||||||
10.441% due 08/01/13 | 700,000,000 | 4,248,742 | ||||||
10.910% due 06/06/13 | 800,000,000 | 4,942,441 | ||||||
Philippines Treasury Bills (Philippines) | PHP 196,820,000 | 4,820,426 | ||||||
| See Notes to Financial Statements | See explanation of symbols and terms, if any, on page B-79 |
B-70
Table of Contents
PACIFIC LIFE FUNDS
PL GLOBAL ABSOLUTE RETURN FUND
Schedule of Investments (Continued)
March 31, 2013
Principal | Value | |||||||
Romania Treasury Bills (Romania) | RON 5,700,000 | $1,590,613 | ||||||
Singapore Treasury Bills (Singapore) | SGD 140,000 | 112,869 | ||||||
Sri Lanka Treasury Bills (Sri Lanka) | ||||||||
11.123% due 02/28/14 | LKR 81,910,000 | 587,917 | ||||||
11.141% due 02/21/14 | 22,700,000 | 163,094 | ||||||
11.151% due 03/07/14 | 22,600,000 | 161,709 | ||||||
11.281% due 03/14/14 | 40,000,000 | 285,330 | ||||||
11.284% due 03/28/14 | 77,670,000 | 550,958 | ||||||
11.351% due 02/14/14 | 23,000,000 | 165,605 | ||||||
|
| |||||||
| 34,679,348 | ||||||||
|
| |||||||
Shares | ||||||||
Money Market Fund - 34.6% | ||||||||
BlackRock Liquidity Funds Treasury | 59,471,122 | 59,471,122 | ||||||
|
| |||||||
Principal Amount | ||||||||
Repurchase Agreement - 4.2% | ||||||||
Citibank Inc | EUR 5,616,000 | 7,198,892 | ||||||
|
| |||||||
U.S. Treasury Bills - 2.9% | ||||||||
0.049% due 04/04/13 ‡ | $5,000,000 | 4,999,978 | ||||||
|
| |||||||
Total Short-Term Investments | 106,349,340 | |||||||
|
| |||||||
TOTAL INVESTMENTS - 100.5% | 172,833,606 | |||||||
TOTAL SECURITIES SOLD SHORT - (4.1%) |
| |||||||
(See Note (d) to Schedule of Investments) | (7,135,222 | ) | ||||||
OTHER ASSETS & LIABILITIES, NET - 3.6% |
| 6,226,946 | ||||||
|
| |||||||
NET ASSETS - 100.0% | $171,925,330 | |||||||
|
| |||||||
Notes to Schedule of Investments
| (a) | As of March 31, 2013, the fund was diversified as a percentage of net assets as follows: |
Short-Term Investments | 61.9% | |||
Foreign Government Bonds & Notes | 36.3% | |||
Others (each less than 3.0%) | 2.3% | |||
|
| |||
| 100.5% | ||||
Securities Sold Short | (4.1% | ) | ||
Other Assets & Liabilities, Net | 3.6% | |||
|
| |||
| 100.0% | ||||
|
|
| (b) | As of March 31, 2013, the fund’s Standard & Poor’s quality ratings as a percentage of total fixed income investments were are follows (Unaudited): |
A-1 (Short-Term Debt Only) | 11.1% | |||
AA/US Government & Agency Issues | 7.0% | |||
A | 6.9% | |||
BB | 1.1% | |||
B | 2.5% | |||
CCC | 1.4% | |||
Not Rated | 70.0% | |||
|
| |||
| 100.0% | ||||
|
|
| (c) | Investments reflect the stated coupon rate or for discounted investments or zero coupon bonds, the annualized effective yield on the date of purchase. |
| (d) | Securities sold short outstanding as of March 31, 2013 were as follows: |
| Description | Principal Amount | Value | ||||||
Foreign Government Bonds & Notes - (4.1%) |
| |||||||
France Government | EUR 4,800,000 | ($7,135,222) | ||||||
|
| |||||||
Total Securities Sold Short | ($7,135,222) | |||||||
|
| |||||||
| (e) | Open futures contracts outstanding as of March 31, 2013 were as follows: |
| Long Futures Outstanding | Number of Contracts | Notional Amount | Unrealized (Depreciation) | |||||||||
Nikkei 225 Index (06/13) | 14 | JPY 170,839,774 | $29,303 | |||||||||
|
| |||||||||||
Short Futures Outstanding | ||||||||||||
CAC 40 Index (04/13) | 65 | EUR 2,496,975 | 91,114 | |||||||||
Euro-Bobl 5-Year | �� | 69 | 6,900,000 | (78,811 | ) | |||||||
Euro-Schatz 10-Year | 30 | 3,000,000 | (48,501 | ) | ||||||||
Japanese Government 10-Year Bond (06/13) | 6 | JPY 600,000,000 | (67,573 | ) | ||||||||
U.S. 10-Year Deliverable Interest Rate Swap (06/13) | 19 | $1,900,000 | (25,858 | ) | ||||||||
|
| |||||||||||
| (129,629 | ) | |||||||||||
|
| |||||||||||
Total Futures Contracts |
| ($100,326 | ) | |||||||||
|
| |||||||||||
| See Notes to Financial Statements | See explanation of symbols and terms, if any, on page B-79 |
B-71
Table of Contents
PACIFIC LIFE FUNDS
PL GLOBAL ABSOLUTE RETURN FUND
Schedule of Investments (Continued)
March 31, 2013
| (f) | Forward foreign currency contracts outstanding as of March 31, 2013 were as follows: |
| Currency Purchased | Currency Sold | Expiration | Counterparty | Unrealized Appreciation (Depreciation) | ||||||||||||||||
| CNH | 58,012,000 | USD | 9,295,752 | 04/13 | CIT | $27,445 | ||||||||||||||
| CNY | 48,638,000 | USD | 7,746,878 | 06/13 | JPM | 45,856 | ||||||||||||||
| COP | 3,004,842,000 | USD | 1,665,149 | 05/13 | MSC | (26,867 | ) | |||||||||||||
| EUR | 231,628 | HRK | 1,784,000 | 03/14 | CIT | (290 | ) | |||||||||||||
| EUR | 544,088 | HRK | 4,189,000 | 04/14 | CIT | — | ||||||||||||||
| EUR | 10,128,706 | HUF | 3,021,469,000 | 04/13 | JPM | 287,948 | ||||||||||||||
| EUR | 330,612 | HUF | 101,306,000 | 04/13 | JPM | (1,872 | ) | |||||||||||||
| EUR | 978,447 | HUF | 291,264,228 | 04/13 | SCB | 30,396 | ||||||||||||||
| EUR | 413,176 | USD | 536,959 | 05/13 | GSC | (7,136 | ) | |||||||||||||
| HKD | 15,004,000 | USD | 1,934,951 | 05/13 | HSB | (1,624 | ) | |||||||||||||
| HUF | 646,300,000 | EUR | 2,158,002 | 04/13 | JPM | (50,626 | ) | |||||||||||||
| IDR | 8,232,027,000 | USD | 845,177 | 05/13 | CIT | (2,451 | ) | |||||||||||||
| IDR | 16,065,788,000 | USD | 1,651,500 | 05/13 | SCB | (6,603 | ) | |||||||||||||
| INR | 1,043,352,000 | USD | 18,792,194 | 04/13 | JPM | 331,090 | ||||||||||||||
| KRW | 13,622,874,000 | USD | 12,517,802 | 04/13 | SCB | (284,069 | ) | |||||||||||||
| KRW | 775,573,000 | USD | 709,582 | 05/13 | CIT | (14,597 | ) | |||||||||||||
| KRW | 730,179,000 | USD | 652,732 | 05/13 | JPM | 1,427 | ||||||||||||||
| MXN | 52,990,000 | USD | 4,112,374 | 04/13 | MSC | 167,617 | ||||||||||||||
| MYR | 1,010,000 | USD | 322,684 | 04/13 | JPM | 3,065 | ||||||||||||||
| MYR | 7,558,000 | USD | 2,423,601 | 04/13 | SCB | 14,031 | ||||||||||||||
| NOK | 42,022,000 | EUR | 5,721,452 | 04/13 | CIT | (144,256 | ) | |||||||||||||
| PEN | 16,807,000 | USD | 6,590,838 | 04/13 | SCB | (106,953 | ) | |||||||||||||
| PEN | 853,000 | USD | 329,726 | 05/13 | CIT | (738 | ) | |||||||||||||
| PHP | 73,373,000 | USD | 1,799,769 | 04/13 | CIT | (1,368 | ) | |||||||||||||
| PHP | 60,475,330 | USD | 1,491,083 | 04/13 | JPM | (8,481 | ) | |||||||||||||
| RSD | 271,582,001 | EUR | 2,423,974 | 04/13 | CIT | (9,784 | ) | |||||||||||||
| RUB | 17,400,000 | USD | 551,768 | 06/13 | CIT | 464 | ||||||||||||||
| RUB | 34,814,000 | USD | 1,099,274 | 06/13 | HSB | 5,634 | ||||||||||||||
| RUB | 50,204,000 | USD | 1,612,540 | 07/13 | HSB | (26,177 | ) | |||||||||||||
| RUB | 12,909,000 | USD | 403,532 | 09/13 | HSB | (113 | ) | |||||||||||||
| RUB | 34,814,000 | USD | 1,084,295 | 09/13 | HSB | 3,678 | ||||||||||||||
| RUB | 4,491,000 | USD | 140,410 | 09/13 | JPM | (61 | ) | |||||||||||||
| RUB | 17,360,000 | USD | 536,258 | 12/13 | GSC | (1,284 | ) | |||||||||||||
| RUB | 34,814,000 | USD | 1,070,048 | 12/13 | JPM | 2,796 | ||||||||||||||
| SEK | 40,600,000 | EUR | 4,740,969 | 04/13 | CIT | 151,121 | ||||||||||||||
| SEK | 3,675,000 | EUR | 425,374 | 05/13 | JPM | 17,947 | ||||||||||||||
| SGD | 7,684,000 | USD | 6,141,452 | 06/13 | JPM | 54,883 | ||||||||||||||
| USD | 6,375,492 | AUD | 6,208,000 | 05/13 | JPM | (61,937 | ) | |||||||||||||
| USD | 1,910,676 | CNY | 12,000,000 | 06/13 | HSB | (11,953 | ) | |||||||||||||
| USD | 238,124 | EUR | 183,422 | 05/13 | CIT | 2,918 | ||||||||||||||
| USD | 22,056,041 | EUR | 16,506,672 | 05/13 | GSC | 889,206 | ||||||||||||||
| USD | 364,227 | EUR | 285,094 | 05/13 | GSC | (1,354 | ) | |||||||||||||
| USD | 19,158,430 | EUR | 14,727,455 | 06/13 | GSC | 269,978 | ||||||||||||||
| USD | 843,964 | IDR | 8,232,027,000 | 05/13 | CIT | 1,238 | ||||||||||||||
| USD | 1,645,579 | IDR | 16,065,788,000 | 05/13 | SCB | 682 | ||||||||||||||
| USD | 5,051,462 | JPY | 459,792,000 | 04/13 | GSC | 166,470 | ||||||||||||||
| USD | 6,497,491 | JPY | 572,429,000 | 04/13 | HSB | 415,843 | ||||||||||||||
| USD | 6,866,990 | NZD | 8,440,357 | 06/13 | JPM | (156,165 | ) | |||||||||||||
| USD | 112,032 | TRY | 200,000 | 04/13 | JPM | 1,672 | ||||||||||||||
| USD | 4,141,714 | TWD | 122,661,000 | 05/13 | JPM | 36,136 | ||||||||||||||
| USD | 6,405,987 | ZAR | 59,276,520 | 06/13 | SCB | 22,046 | ||||||||||||||
| ZAR | 7,524,435 | USD | 804,524 | 06/13 | JPM | 5,840 | ||||||||||||||
| ZAR | 4,734,565 | USD | 506,368 | 06/13 | SCB | 3,534 | ||||||||||||||
|
| |||||||||||||||||||
Total Forward Foreign Currency Contracts | $2,034,202 | |||||||||||||||||||
|
| |||||||||||||||||||
| See Notes to Financial Statements | See explanation of symbols and terms, if any, on page B-79 |
B-72
Table of Contents
PACIFIC LIFE FUNDS
PL GLOBAL ABSOLUTE RETURN FUND
Schedule of Investments (Continued)
March 31, 2013
| (g) | Purchased options outstanding as of March 31, 2013 were as follows: |
Foreign Currency Options
| Description | Exercise Price | Expiration Date | Counter- party | Notional Amounts | Cost | Value | ||||||||||||||||
Call - OTC Colombian Peso versus U.S. Dollar | $1,757.00 | 02/18/14 | CIT | COP 10,912,021,000 | $70,604 | $37,090 | ||||||||||||||||
Call - OTC Colombian Peso versus U.S. Dollar | 1,757.00 | 02/18/14 | JPM | 2,561,813,000 | 17,701 | 8,707 | ||||||||||||||||
Put - OTC British Pound versus U.S. Dollar | 1.40 | 03/13/14 | CIT | GBP 5,619,000 | 127,124 | 71,744 | ||||||||||||||||
Put - OTC British Pound versus U.S. Dollar | 1.35 | 03/13/14 | MSC | 11,256,000 | 165,647 | 82,906 | ||||||||||||||||
|
|
|
| |||||||||||||||||||
| $381,076 | $200,447 | |||||||||||||||||||||
|
|
|
| |||||||||||||||||||
Options on Exchange-Traded Futures Contracts
| Description | Exercise Price | Expiration Date | Counter- party | Number of Contracts | Cost | Value | ||||||||||||||
Put - CME Dow Jones Euro Stoxx 50 (04/13) | EUR 2,450.00 | 04/19/13 | GSC | 542 | $65,929 | $73,645 | ||||||||||||||
Put - CME Dow Jones Euro Stoxx 50 (04/13) | 2,400.00 | 04/19/13 | GSC | 558 | 77,320 | 48,639 | ||||||||||||||
|
|
|
| |||||||||||||||||
| $143,249 | $122,284 | |||||||||||||||||||
|
|
|
| |||||||||||||||||
Total Purchased Options | $524,325 | $322,731 | ||||||||||||||||||
|
|
|
| |||||||||||||||||
| (h) | Swap agreements outstanding as of March 31, 2013 were as follows: |
Credit Default Swaps on Sovereign Issues – Buy Protection (1)
| Referenced Obligation | Fixed Deal Rate | Expiration Date | Counter- party | Implied Credit Spread at 03/31/13 (3) | Notional Amount (4) | Value | Upfront Premiums | Unrealized Appreciation (Depreciation) | ||||||||||||||||||||||
Croatia Government | 1.000% | 12/20/16 | MSC | 2.970% | $198,000 | $13,678 | $10,567 | $3,111 | ||||||||||||||||||||||
China Government | 1.000% | 12/20/17 | JPM | 0.667% | 3,100,000 | (48,962 | ) | (59,131 | ) | 10,169 | ||||||||||||||||||||
Croatia Government | 1.000% | 03/20/18 | CIT | 3.320% | 1,200,000 | 125,128 | 83,000 | 42,128 | ||||||||||||||||||||||
Thailand Government | 1.000% | 03/20/18 | CIT | 0.942% | 3,300,000 | (10,416 | ) | (16,419 | ) | 6,003 | ||||||||||||||||||||
Croatia Government | 1.000% | 03/20/18 | HSB | 3.320% | 313,000 | 32,802 | 29,014 | 3,788 | ||||||||||||||||||||||
China Government | 1.000% | 03/20/18 | JPM | 0.705% | 1,100,000 | (16,136 | ) | (17,332 | ) | 1,196 | ||||||||||||||||||||
Qatar Government | 1.000% | 03/20/18 | JPM | 0.655% | 418,000 | (7,193 | ) | (7,056 | ) | (137 | ) | |||||||||||||||||||
Tunisia Government | 1.000% | 03/20/18 | JPM | 3.587% | 375,000 | 43,145 | 40,581 | 2,564 | ||||||||||||||||||||||
Croatia Government | 1.000% | 03/20/18 | MSC | 3.320% | 2,262,000 | 237,702 | 194,313 | 43,389 | ||||||||||||||||||||||
Lebanon Government | 5.000% | 03/20/18 | JPM | 4.198% | 689,000 | (25,557 | ) | (29,026 | ) | 3,469 | ||||||||||||||||||||
Colombia Government | 1.000% | 06/20/18 | CIT | 0.987% | 460,000 | (389 | ) | (695 | ) | 306 | ||||||||||||||||||||
Qatar Government | 1.000% | 06/20/18 | GSC | 0.693% | 1,420,000 | (22,695 | ) | (20,960 | ) | (1,735 | ) | |||||||||||||||||||
Colombia Government | 1.000% | 12/20/22 | CIT | 1.365% | 6,520,000 | 203,291 | 223,551 | (20,260 | ) | |||||||||||||||||||||
Russia Government | 1.000% | 12/20/22 | GSC | 2.081% | 5,240,000 | 468,575 | 413,671 | 54,904 | ||||||||||||||||||||||
Mexico Government | 1.000% | 12/20/22 | HSB | 1.336% | 6,520,000 | 187,298 | 217,967 | (30,669 | ) | |||||||||||||||||||||
South Africa Government | 1.000% | 12/20/22 | HSB | 2.337% | 22,560,000 | 2,463,545 | 1,985,816 | 477,729 | ||||||||||||||||||||||
Spain Government | 1.000% | 12/20/22 | HSB | 3.275% | 5,250,000 | 875,189 | 974,920 | (99,731 | ) | |||||||||||||||||||||
Brazil Government | 1.000% | 12/20/22 | MSC | 1.750% | 6,520,000 | 410,197 | 284,509 | 125,688 | ||||||||||||||||||||||
Belgium Government | 1.000% | 03/20/23 | JPM | 1.210% | 2,980,000 | 53,880 | 74,487 | (20,607 | ) | |||||||||||||||||||||
Mexico Government | 1.000% | 06/20/23 | CIT | 1.355% | 461,000 | 14,617 | 15,032 | (415 | ) | |||||||||||||||||||||
|
|
|
|
|
| |||||||||||||||||||||||||
| $4,997,699 | $4,396,809 | $600,890 | ||||||||||||||||||||||||||||
|
|
|
|
|
| |||||||||||||||||||||||||
Credit Default Swaps on Sovereign Issues – Sell Protection (2)
| Referenced Obligation | Fixed Deal Receive Rate | Expiration Date | Counter- party | Implied Credit Spread at 03/31/13 (3) | Notional Amount (4) | Value | Upfront Premiums | Unrealized Depreciation | ||||||||||||||||||||||
South Africa Government | 1.000% | 12/20/17 | HSB | 1.697% | $22,560,000 | ($705,760 | ) | ($463,220 | ) | ($242,540 | ) | |||||||||||||||||||
Turkey Government | 1.000% | 12/20/22 | GSC | 1.880% | 5,240,000 | (385,054 | ) | (346,016 | ) | (39,038 | ) | |||||||||||||||||||
|
|
|
|
|
| |||||||||||||||||||||||||
| ($1,090,814 | ) | ($809,236 | ) | ($281,578 | ) | |||||||||||||||||||||||||
|
|
|
|
|
| |||||||||||||||||||||||||
| See Notes to Financial Statements | See explanation of symbols and terms, if any, on page B-79 |
B-73
Table of Contents
PACIFIC LIFE FUNDS
PL GLOBAL ABSOLUTE RETURN FUND
Schedule of Investments (Continued)
March 31, 2013
Credit Default Swaps on Credit Indices – Buy Protection (1)
| Referenced Obligation | Fixed Deal Rate | Expiration Date | Counter- party | Notional Amount (4) | Value (5) | Upfront Premiums | Unrealized Depreciation | |||||||||||||||||||
iTraxx FINSEN - 18 5Y | 1.000% | 06/20/18 | MSC | EUR 1,890,000 | $107,301 | $107,907 | ($606 | ) | ||||||||||||||||||
iTraxx FINSUB - 18 5Y | 5.000% | 06/20/18 | JPM | 1,260,000 | (144,135 | ) | (142,112 | ) | (2,023 | ) | ||||||||||||||||
|
|
|
|
|
| |||||||||||||||||||||
| ($36,834 | ) | ($34,205 | ) | ($2,629 | ) | |||||||||||||||||||||
|
|
|
|
|
| |||||||||||||||||||||
| Credit Default Swaps on Credit Indices – Sell Protection (2) | ||||||||||||||||||||||||||
| Referenced Obligation | Fixed Deal Receive Rate | Expiration Date | Counter- party | Notional Amount (4) | Value (5) | Upfront Premiums Paid (Received) | Unrealized Appreciation (Depreciation) | |||||||||||||||||||
Dow Jones CDX NA - HY20 5Y | 5.000% | 06/20/18 | CIT | $2,517,000 | $80,229 | $83,375 | ($3,146 | ) | ||||||||||||||||||
|
|
|
|
|
| |||||||||||||||||||||
Total Credit Default Swaps | $3,950,280 | $3,636,743 | $313,537 | |||||||||||||||||||||||
|
|
|
|
|
| |||||||||||||||||||||
| (1) | If the fund is a buyer of protection and a credit event occurs, as defined under the terms of that particular swap agreement, the fund will either (i) receive from the seller of protection an amount equal to the notional amount of the swap and deliver the referenced obligation or underlying investments comprising the referenced index or (ii) receive a net settlement amount in the form of cash or investments equal to the notional amount of the swap less the recovery value of the referenced obligation or underlying investments comprising the referenced index. |
| (2) | If the fund is a seller of protection and a credit event occurs, as defined under the terms of that particular swap agreement, the fund will either (i) pay to the buyer of protection an amount equal to the notional amount of the swap and take delivery of the referenced obligation or underlying investments comprising the referenced index or (ii) pay a net settlement amount in the form of cash or investments equal to the notional amount of the swap less the recovery value of the referenced obligation or underlying investments comprising the referenced index. |
| (3) | An implied credit spread is the spread in yield between a U.S. Treasury security and the referenced obligation or underlying investment that are identical in all respects except for the quality rating. Implied credit spreads, represented in absolute terms, utilized in determining the value of credit default swap agreements on sovereign issues of an emerging country as of year end serve as an indicator of the current status of the payment/performance risk and represent the likelihood of risk of default for the credit derivative. The implied credit spread of a particular referenced entity reflects the cost of buying/selling protection and may include upfront payments required to be made to enter into the agreement. Wider credit spreads, in comparison to narrower credit spreads, represent a deterioration of the referenced entity’s credit soundness and a greater likelihood of risk of default or other credit event occurring as defined under the terms of the agreement. A credit spread identified as “Defaulted” indicates a credit event has occurred for the referenced entity or obligation. |
| (4) | The maximum potential amount the fund could be required to pay as a seller of credit protection or receive as a buyer of credit protection if a credit event occurs as defined under the terms of that particular swap agreement. |
| (5) | The quoted market prices and resulting values for credit default swap agreements on credit indices serve as an indicator of the current status of the payment/performance risk and is a representation of the likelihood of an expected liability (or profit) for the credit derivative had the notional amount of the swap agreement been closed/sold as of the year end. Increasing values, in absolute terms when compared to the notional amount of the swap, represent a deterioration of the referenced entity’s credit soundness and a greater likelihood of risk of default or other credit event occurring as defined under the terms of the agreement. |
Cross Currency Swaps
| Notional Amount on Fixed Rate Currency Received | Notional Amount on Floating Rate Currency Delivered | Pay/Receive Floating Rate | Counter- party | Fixed Rate | Expiration Date | Value | Upfront Premiums Paid (Received) | Unrealized Appreciation | ||||||||||||||||||||||
| TRY 11,627,055 | $6,521,062 | Receive | MSC | 5.370% | 04/01/20 | $269,600 | $— | $269,600 | ||||||||||||||||||||||
|
|
|
|
|
| |||||||||||||||||||||||||
Interest Rate Swaps
| Floating Rate Index | Counter- party | Pay/Receive Floating Rate | Fixed Rate | Expiration Date | Notional Amount | Value | Upfront Premiums Paid (Received) | Unrealized Appreciation (Depreciation) | ||||||||||||||||||||
1-Month MXN Interbank TIIE | JPM | Receive | 4.692% | 01/28/14 | MXN 1,579,700,000 | ($369,558 | ) | $— | ($369,558 | ) | ||||||||||||||||||
6-Month PLN-WIBOR | HSB | Pay | 3.430% | 12/12/17 | PLN 60,000,000 | 31,070 | — | 31,070 | ||||||||||||||||||||
6-Month PLN-WIBOR | HSB | Receive | 3.620% | 12/12/17 | 13,000,000 | (57,543 | ) | — | (57,543 | ) | ||||||||||||||||||
6-Month PLN-WIBOR | HSB | Receive | 3.356% | 12/12/17 | 6,880,000 | (6,448 | ) | — | (6,448 | ) | ||||||||||||||||||
3-Month New Zealand Bank Bills | CIT | Pay | 3.720% | 12/12/22 | NZD 15,830,000 | (101,806 | ) | — | (101,806 | ) | ||||||||||||||||||
3-Month New Zealand Bank Bills | JPM | Pay | 4.125% | 02/25/23 | 1,422,000 | 19,059 | — | 19,059 | ||||||||||||||||||||
3-Month New Zealand Bank Bills | JPM | Pay | 4.140% | 02/25/23 | 2,873,000 | 41,515 | — | 41,515 | ||||||||||||||||||||
|
|
|
|
|
| |||||||||||||||||||||||
Total Interest Rate Swaps | ($443,711 | ) | $— | ($443,711 | ) | |||||||||||||||||||||||
|
|
|
|
|
| |||||||||||||||||||||||
| See Notes to Financial Statements | See explanation of symbols and terms, if any, on page B-79 |
B-74
Table of Contents
PACIFIC LIFE FUNDS
PL GLOBAL ABSOLUTE RETURN FUND
Schedule of Investments (Continued)
March 31, 2013
Total Return Swaps
| Receive Total Return | Pay | Counter- party | Expiration Date | Notional Amount | Value | Upfront Premiums Paid (Received) | Unrealized Appreciation | |||||||||||||||||||
Interest from Guatemala Bills | 3-Month USD-LIBOR +50 bp | CIT | 12/5/2013 | GTQ 2,350,000 | $3,841 | $— | $3,841 | |||||||||||||||||||
|
|
|
|
|
| |||||||||||||||||||||
Total Swap Agreements | $3,780,010 | $3,636,743 | $143,267 | |||||||||||||||||||||||
|
|
|
|
|
| |||||||||||||||||||||
| (i) | As of March 31, 2013, investments with total aggregate values of $589,997 and $312,999 were fully or partially segregated with the broker(s)/custodian as collateral for open futures and swap contracts, respectively. |
| (j) | Fair Value Measurements |
The following is a summary of the fund’s investments as categorized under the three-tier hierarchy of inputs used in valuing the fund’s assets and liabilities (See Note 3D in Notes to Financial Statements) as of March 31, 2013:
Total Value at March 31, 2013 | Level 1 Quoted Price | Level 2 Significant | Level 3 Significant | |||||||||||||||
Assets | Common Stocks (1) | $2,934,836 | $— | $2,934,836 | $— | |||||||||||||
Mortgage-Backed Securities | 661,907 | — | 661,907 | — | ||||||||||||||
Foreign Government Bonds & Notes | 62,564,792 | — | 61,026,596 | 1,538,196 | ||||||||||||||
Short-Term Investments | 106,349,340 | 59,471,122 | 46,878,218 | — | ||||||||||||||
Derivatives: | ||||||||||||||||||
Credit Contracts | ||||||||||||||||||
Swaps | 5,316,577 | — | 5,316,577 | — | ||||||||||||||
Equity Contracts | ||||||||||||||||||
Futures | 120,417 | 120,417 | — | — | ||||||||||||||
Purchased Options | 122,284 | 122,284 | — | — | ||||||||||||||
|
|
|
|
|
|
|
| |||||||||||
Total Equity Contracts | 242,701 | 242,701 | — | — | ||||||||||||||
Foreign Currency Contracts | ||||||||||||||||||
Forward Foreign Currency Contracts | 2,960,961 | — | 2,960,961 | — | ||||||||||||||
Purchased Options | 200,447 | — | 200,447 | — | ||||||||||||||
Swaps | 269,600 | — | 269,600 | — | ||||||||||||||
|
|
|
|
|
|
|
| |||||||||||
Total Foreign Currency Contracts | 3,431,008 | — | 3,431,008 | — | ||||||||||||||
Interest Rate Contracts | ||||||||||||||||||
Swaps | 95,485 | — | 91,644 | 3,841 | ||||||||||||||
|
|
|
|
|
|
|
| |||||||||||
Total Assets - Derivatives | 9,085,771 | 242,701 | 8,839,229 | 3,841 | ||||||||||||||
|
|
|
|
|
|
|
| |||||||||||
Total Assets | 181,596,646 | 59,713,823 | 120,340,786 | 1,542,037 | ||||||||||||||
|
|
|
|
|
|
|
| |||||||||||
Liabilities | Securities Sold Short | |||||||||||||||||
Foreign Government Bonds & Notes | (7,135,222 | ) | — | (7,135,222 | ) | — | ||||||||||||
Derivatives: | ||||||||||||||||||
Credit Contracts | ||||||||||||||||||
Swaps | (1,366,297 | ) | — | (1,366,297 | ) | — | ||||||||||||
Foreign Currency Contracts | ||||||||||||||||||
Forward Foreign Currency Contracts | (926,759 | ) | — | (926,759 | ) | — | ||||||||||||
Interest Rate Contracts | ||||||||||||||||||
Futures | (220,743 | ) | (220,743 | ) | — | — | ||||||||||||
Swaps | (535,355 | ) | — | (535,355 | ) | — | ||||||||||||
|
|
|
|
|
|
|
| |||||||||||
Total Interest Rate Contracts | (756,098 | ) | (220,743 | ) | (535,355 | ) | — | |||||||||||
|
|
|
|
|
|
|
| |||||||||||
Total Liabilities - Derivatives | (3,049,154 | ) | (220,743 | ) | (2,828,411 | ) | — | |||||||||||
|
|
|
|
|
|
|
| |||||||||||
Total Liabilities | (10,184,376 | ) | (220,743 | ) | (9,963,633 | ) | — | |||||||||||
|
|
|
|
|
|
|
| |||||||||||
Total | $171,412,270 | $59,493,080 | $110,377,153 | $1,542,037 | ||||||||||||||
|
|
|
|
|
|
|
| |||||||||||
| (1) | For equity investments categorized in a single level, refer to the schedule of investments for further geographical region breakout. |
| See Notes to Financial Statements | See explanation of symbols and terms, if any, on page B-79 |
B-75
Table of Contents
PACIFIC LIFE FUNDS
PL PRECIOUS METALS FUND
Schedule of Investments
March 31, 2013
Shares | Value | |||||||
COMMON STOCKS - 91.3% | ||||||||
Australia - 9.5% | ||||||||
Gryphon Minerals Ltd * | 270,410 | $98,372 | ||||||
Newcrest Mining Ltd | 213,023 | 4,451,591 | ||||||
Perseus Mining Ltd * | 430,274 | 808,982 | ||||||
Regis Resources Ltd * | 164,745 | 711,253 | ||||||
Troy Resources Ltd | 79,274 | 179,085 | ||||||
|
| |||||||
| 6,249,283 | ||||||||
|
| |||||||
Bermuda - 0.9% | ||||||||
Continental Gold Ltd * | 90,150 | 578,607 | ||||||
|
| |||||||
Canada - 58.4% | ||||||||
Agnico-Eagle Mines Ltd | 72,080 | 2,958,163 | ||||||
Alamos Gold Inc | 117,583 | 1,614,690 | ||||||
Aureus Mining Inc * | 190,931 | 112,095 | ||||||
AuRico Gold Inc * | 55,000 | 346,508 | ||||||
B2Gold Corp * | 170,000 | 517,104 | ||||||
Barrick Gold Corp | 148,643 | 4,370,104 | ||||||
Centerra Gold Inc | 103,838 | 618,418 | ||||||
Detour Gold Corp * | 90,355 | 1,737,100 | ||||||
Eldorado Gold Corp | 313,601 | 2,997,555 | ||||||
First Quantum Minerals Ltd | 27,489 | 522,801 | ||||||
Franco-Nevada Corp | 38,553 | 1,759,810 | ||||||
Goldcorp Inc | 169,804 | 5,710,509 | ||||||
IAMGOLD Corp | 163,437 | 1,179,301 | ||||||
Kinross Gold Corp | 385,932 | 3,054,480 | ||||||
MAG Silver Corp * | 37,430 | 355,195 | ||||||
New Gold Inc * | 123,557 | 1,123,854 | ||||||
Osisko Mining Corp * | 280,767 | 1,666,609 | ||||||
Platinum Group Metals Ltd * | 224,000 | 315,322 | ||||||
Pretium Resources Inc * | 8,486 | 67,330 | ||||||
Rio Alto Mining Ltd * | 63,710 | 292,883 | ||||||
SEMAFO Inc | 40,249 | 100,637 | ||||||
Silver Wheaton Corp | 44,754 | 1,403,038 | ||||||
Tahoe Resources Inc * | 49,459 | 870,042 | ||||||
Torex Gold Resources Inc * | 329,392 | 564,200 | ||||||
Yamana Gold Inc | 278,495 | 4,290,443 | ||||||
|
| |||||||
| 38,548,191 | ||||||||
|
| |||||||
Peru - 1.6% | ||||||||
Cia de Minas Buenaventura SA ADR | 41,754 | 1,083,934 | ||||||
|
| |||||||
South Africa - 3.2% | ||||||||
AngloGold Ashanti Ltd ADR | 46,457 | 1,094,062 | ||||||
Gold Fields Ltd ADR | 62,566 | 484,887 | ||||||
Impala Platinum Holdings Ltd | 36,972 | 544,372 | ||||||
|
| |||||||
| 2,123,321 | ||||||||
|
| |||||||
United Kingdom - 10.8% | ||||||||
Fresnillo PLC | 74,285 | 1,548,384 | ||||||
Hochschild Mining PLC | 72,124 | 302,298 | ||||||
Randgold Resources Ltd ADR | 61,085 | 5,252,088 | ||||||
|
| |||||||
| 7,102,770 | ||||||||
|
| |||||||
United States - 6.9% | ||||||||
Newmont Mining Corp | 62,921 | 2,635,761 | ||||||
Royal Gold Inc | 27,017 | 1,919,018 | ||||||
|
| |||||||
| 4,554,779 | ||||||||
|
| |||||||
Total Common Stocks | 60,240,885 | |||||||
|
| |||||||
Shares | Value | |||||||
SHORT-TERM INVESTMENT - 8.9% |
| |||||||
Money Market Fund - 8.9% | ||||||||
BlackRock Liquidity Funds Treasury | 5,853,175 | $5,853,175 | ||||||
|
| |||||||
Total Short-Term Investment | 5,853,175 | |||||||
|
| |||||||
TOTAL INVESTMENTS - 100.2% | 66,094,060 | |||||||
OTHER ASSETS & LIABILITIES, NET - (0.2%) |
| (143,305 | ) | |||||
|
| |||||||
NET ASSETS - 100.0% |
| $65,950,755 | ||||||
|
| |||||||
Notes to Schedule of Investments
| (a) | As of March 31, 2013, the fund was diversified by precious metals sector as a percentage of net assets as follows: |
Gold | 82.0% | |||
Precious Metals & Minerals | 8.1% | |||
Others (each less than 3.0%) | 1.2% | |||
|
| |||
| 91.3% | ||||
Short-Term Investment | 8.9% | |||
Other Assets & Liabilities, Net | (0.2% | ) | ||
|
| |||
| 100.0% | ||||
|
|
| (b) | As of March 31, 2013, the fund was diversified by country of incorporation as a percentage of net assets as follows: |
Canada | 58.4% | |||
United States (Includes Short-Term Investment) | 15.8% | |||
United Kingdom | 10.8% | |||
Australia | 9.5% | |||
South Africa | 3.2% | |||
Others (each less than 3.0%) | 2.5% | |||
|
| |||
| 100.2% | ||||
Other Assets & Liabilities, Net | (0.2% | ) | ||
|
| |||
| 100.0% | ||||
|
|
| See Notes to Financial Statements | See explanation of symbols and terms, if any, on page B-79 |
B-76
Table of Contents
PACIFIC LIFE FUNDS
PL PRECIOUS METALS FUND
Schedule of Investments (Continued)
March 31, 2013
| (c) | Fair Value Measurements |
The following is a summary of the fund’s investments as categorized under the three-tier hierarchy of inputs used in valuing the fund’s assets and liabilities (See Note 3D in Notes to Financial Statements) as of March 31, 2013:
| Total Value at March 31, 2013 | Level 1 Quoted Price | Level 2 Significant Observable Inputs | Level 3 Significant Unobservable Inputs | |||||||||||||||
Assets | Common Stocks | |||||||||||||||||
Australia | $6,249,283 | $— | $6,249,283 | $— | ||||||||||||||
Bermuda | 578,607 | 578,607 | — | — | ||||||||||||||
Canada | 38,548,191 | 38,436,096 | 112,095 | — | ||||||||||||||
Peru | 1,083,934 | 1,083,934 | — | — | ||||||||||||||
South Africa | 2,123,321 | 1,578,949 | 544,372 | — | ||||||||||||||
United Kingdom | 7,102,770 | 5,252,088 | 1,850,682 | — | ||||||||||||||
United States | 4,554,779 | 4,554,779 | — | — | ||||||||||||||
|
|
|
|
|
|
|
| |||||||||||
| 60,240,885 | 51,484,453 | 8,756,432 | — | |||||||||||||||
Short-Term Investment | 5,853,175 | 5,853,175 | — | — | ||||||||||||||
|
|
|
|
|
|
|
| |||||||||||
Total | $66,094,060 | $57,337,628 | $8,756,432 | $— | ||||||||||||||
|
|
|
|
|
|
|
| |||||||||||
| See Notes to Financial Statements | See explanation of symbols and terms, if any, on page B-79 |
B-77
Table of Contents
PACIFIC LIFE FUNDS
PL ALTERNATIVE STRATEGIES FUND
Schedule of Investments
March 31, 2013
Shares | Value | |||||||
AFFILIATED MUTUAL FUNDS - 264.1% | ||||||||
PL Floating Rate Income Fund ‘P’ | 382 | $3,999 | ||||||
PL Inflation Managed Fund ‘P’ | 1,216 | 11,844 | ||||||
PL Real Estate Fund ‘P’ | 300 | 4,098 | ||||||
PL Emerging Markets Debt Fund ‘P’ | 372 | 3,915 | ||||||
PL Currency Strategies Fund ‘P’ * | 1,909 | 19,696 | ||||||
PL Global Absolute Return Fund ‘P’ | 2,351 | 23,952 | ||||||
PL Precious Metals Fund ‘P’ | 1,362 | 11,195 | ||||||
|
| |||||||
Total Affiliated Mutual Funds | 78,699 | |||||||
|
| |||||||
TOTAL INVESTMENTS - 264.1% | 78,699 | |||||||
OTHER ASSETS & LIABILITIES, NET - (164.1%) |
| (48,904 | ) | |||||
|
| |||||||
NET ASSETS - 100.0% | $29,795 | |||||||
|
| |||||||
Notes to Schedule of Investments
| (a) | As of March 31, 2013, the fund was diversified as a percentage of net assets as follows: |
Affiliated Fixed Income Funds | 212.8% | |||
Affiliated Equity Funds | 51.3% | |||
|
| |||
| 264.1% | ||||
Other Assets & Liabilities, Net | (164.1% | ) | ||
|
| |||
| 100.0% | ||||
|
|
| (b) | Fair Value Measurements |
The following is a summary of the fund’s investments as categorized under the three-tier hierarchy of inputs used in valuing the fund’s assets and liabilities (See Note 3D in Notes to Financial Statements) as of March 31, 2013:
| Total Value at March 31, 2013 | Level 1 Quoted Price | Level 2 Significant Observable Inputs | Level 3 Significant Unobservable Inputs | |||||||||||||||
Assets | Affiliated Mutual Funds | $78,699 | $78,699 | $— | $— | |||||||||||||
|
|
|
|
|
|
|
| |||||||||||
| See Notes to Financial Statements | See explanation of symbols and terms, if any, on page B-79 |
B-78
Table of Contents
PACIFIC LIFE FUNDS
Schedule of Investments (Continued)
Explanation of Symbols and Terms
March 31, 2013
Explanation of Symbols: | ||
| * | Non-income producing investments. | |
| " | Pass-through securities backed by a pool of mortgages or other loans on which principal payments are periodically made. Therefore, the effective maturity is shorter than the stated maturity. | |
| ^ | Investments with their principal amount adjusted for inflation. | |
| § | Variable rate investments. The rate shown is based on the latest available information as of March 31, 2013. For Senior Loan Notes, the rate shown may represent a weighted average interest rate. | |
| W | Investments were in default as of March 31, 2013. | |
| ± | The security is a perpetual bond and has no definite maturity date. | |
| µ | Unsettled position. Contract rates do not take effect until settlement date. | |
| ~ | Securities are not registered under the Securities Act of 1933 (1933 Act). These securities are either (1) exempt from registration pursuant to Rule 144A of the 1933 Act and may only be sold to “qualified institutional buyers”, or (2) the securities comply with Regulation S rules governing offers and sales made outside the United States without registration under the 1933 Act and contain certain restrictions as to public resale. | |
| ¯ | Restricted Securities. These securities are not registered and may not be sold to the public. There are legal and/or contractual restrictions on resale. The Trust does not have the right to demand that such securities be registered. The values of these securities are determined by valuations provided by pricing services, brokers, dealers, market makers, or in good faith under the procedures established by the Trust’s Board of Trustees (the “Board’). | |
| ‡ | Investments were fully or partially segregated with the broker(s)/custodian as collateral for securities sold short, futures contracts, swap contracts and/or reverse repurchase agreements, if any, as of March 31, 2013. | |
| + | The values of these investments were determined by the Trustee Valuation Committee or determined by a valuation committee established under the Valuation Policy and then subsequently submitted for approval or ratification to either the Trustee Valuation Committee, or to the Board. Each determination was made in good faith in accordance with the procedures established by the Board and the provisions of the Investment Company Act of 1940 (See Note 3D in Notes to Financial Statements). | |
| l | Total shares owned by the fund as of March 31, 2013 were less than one share. | |
Counterparty Abbreviations: | ||
| BNP | BNP Paribas | |
| BNS | Bank of Nova Scotia | |
| BNY | Bank of New York Mellon | |
| BOA | Bank of America | |
| BRC | Barclays | |
| CIB | Canadian Imperial Bank of Commerce | |
| CIT | Citigroup | |
| CME | Chicago Mercantile Exchange | |
| CSF | Credit Suisse | |
| DUB | Deutsche Bank | |
| GSC | Goldman Sachs | |
| HSB | HSBC | |
| JPM | JPMorgan Chase | |
| MSC | Morgan Stanley | |
| RBC | Royal Bank of Canada | |
| RBS | Royal Bank of Scotland | |
| SCB | Standard Chartered Bank | |
| SSB | State Street Bank | |
| TDB | Toronto Dominion Bank | |
| UBS | UBS | |
| WBC | Westpac Banking Group | |
Currency Abbreviations: | ||
| AUD | Australian Dollar | |
| BRL | Brazilian Real | |
| CAD | Canadian Dollar | |
| CHF | Swiss Franc | |
| CNH | Renminbi Offshore (Hong Kong) | |
| CNY | Chinese Renminbi | |
| COP | Colombian Peso | |
| CZK | Czech Koruna | |
| DKK | Danish Krone | |
| EUR | Euro | |
| GBP | British Pound | |
| GTQ | Guatemalan Quetzal | |
| HKD | Hong Kong Dollar | |
| HRK | Croatian Kuna | |
| HUF | Hungarian Forint | |
| IDR | Indonesian Rupiah | |
| INR | Indian Rupee | |
| JOD | Jordanian Dinar | |
| JPY | Japanese Yen | |
| KRW | Korean Won | |
| LKR | Sri Lankan Rupee | |
| MXN | Mexican Peso | |
| MYR | Malaysian Ringgit | |
| NGN | Nigerian Naira | |
| NOK | Norwegian Krone | |
| NZD | New Zealand Dollar | |
| PEN | Peruvian Nuevo Sol | |
| PHP | Philippine Peso | |
| PLN | Polish Zloty | |
| RON | Romanian Leu | |
| RSD | Serbian Dinar | |
| RUB | Russian Ruble | |
| SEK | Swedish Krona | |
| SGD | Singapore Dollar | |
| TRY | Turkish Lira | |
| TWD | Taiwan Dollar | |
| USD | United States Dollar | |
| ZAR | South African Rand | |
Other Abbreviations: | ||
| ADR | American Depositary Receipt | |
| CDO | Collateralized Debt Obligation | |
| CLO | Collateralized Loan Obligation | |
| CPI | Consumer Price Index | |
| CVA | Certificaten Van Aandelen (Dutch Certificate) | |
| FDR | Fiduciary Depositary Receipt | |
| GDR | Global Depositary Receipt | |
| IO | Interest Only | |
| LIBOR | London Interbank Offered Rate | |
| ‘NY’ | New York Shares | |
| OTC | Over the Counter | |
| REIT | Real Estate Investment Trust | |
| WIBOR | Warsaw Interbank Offered Rate | |
Notes:
The countries listed in the Schedules of Investments are based on country of incorporation.
The descriptions and Standard and Poor’s quality ratings of the companies and credit spreads, if any, shown in the Schedules of Investments were obtained from published reports or other sources believed to be reliable, and are not audited by the Independent Registered Public Accounting Firm.
| See Notes to Financial Statements |
B-79
Table of Contents
PACIFIC LIFE FUNDS
STATEMENTS OF ASSETS AND LIABILITIES
MARCH 31, 2013
| PL Floating Rate Loan Fund | PL Inflation Managed Fund | PL Managed Bond Fund | PL Short Duration Bond Fund | PL Emerging Markets Debt Fund | PL Comstock Fund | |||||||||||||||||||
| ASSETS | ||||||||||||||||||||||||
Investments and repurchase agreements, at cost | $111,207,037 | $170,659,629 | $689,165,357 | $222,218,412 | $81,874,000 | $196,505,369 | ||||||||||||||||||
Investments, at value | $112,826,917 | $177,948,043 | $704,881,314 | $224,075,547 | $84,089,357 | $261,753,604 | ||||||||||||||||||
Repurchase agreements, at value | — | — | 500,000 | — | — | — | ||||||||||||||||||
Cash (1) | — | — | 145,000 | — | — | — | ||||||||||||||||||
Foreign currency held, at value (2) | — | 73,634 | 130,627 | — | 304,934 | 53 | ||||||||||||||||||
| Receivables: | ||||||||||||||||||||||||
Dividends and interest | 322,657 | 530,924 | 3,052,473 | 1,129,582 | 1,353,969 | 460,290 | ||||||||||||||||||
Fund shares sold | 247,871 | — | 493,259 | 234,661 | 186,051 | — | ||||||||||||||||||
Securities sold | — | 1,088,524 | 21,376,102 | — | 610,716 | 396,130 | ||||||||||||||||||
Reverse repurchase agreements | — | — | 5,379,500 | — | — | — | ||||||||||||||||||
Variation margin | — | — | — | 7,031 | — | — | ||||||||||||||||||
Foreign tax reclaim | — | — | — | — | — | 22,029 | ||||||||||||||||||
Due from adviser | 19,014 | 15,801 | 66,183 | 25,893 | — | 18,027 | ||||||||||||||||||
Forward foreign currency contracts appreciation | — | 218,320 | 1,207,571 | — | 188,141 | 124,280 | ||||||||||||||||||
Prepaid expenses and other assets | 1,671 | 2,556 | 8,808 | 3,317 | 1,421 | 3,451 | ||||||||||||||||||
Swap contracts, at value | — | 283,315 | 2,034,445 | — | — | — | ||||||||||||||||||
Total Assets | 113,418,130 | 180,161,117 | 739,275,282 | 225,476,031 | 86,734,589 | 262,777,864 | ||||||||||||||||||
| LIABILITIES | ||||||||||||||||||||||||
| Payables: | ||||||||||||||||||||||||
Securities purchased | 3,090,688 | 15 | 157,727,673 | 1,684,653 | 561,233 | 660,912 | ||||||||||||||||||
Reverse repurchase agreements | — | — | 9,570,250 | — | — | — | ||||||||||||||||||
Variation margin | — | 143,645 | 1,400,516 | — | — | — | ||||||||||||||||||
Sale-buyback financing transactions | — | 15,204,972 | 2,522,062 | — | — | — | ||||||||||||||||||
Due to brokers (3) | — | 60,000 | 1,365,000 | — | — | — | ||||||||||||||||||
Accrued advisory fees | 59,539 | 55,511 | 190,239 | 75,131 | 102,800 | 161,147 | ||||||||||||||||||
Accrued administration fees | 13,740 | 20,817 | 71,340 | 28,174 | 10,840 | 32,887 | ||||||||||||||||||
Accrued support service expenses | 10,719 | 22,964 | 55,267 | 19,633 | 7,934 | 23,286 | ||||||||||||||||||
Accrued custodian fees and expenses | 10,109 | 8,027 | 24,595 | 7,698 | 14,604 | 9,776 | ||||||||||||||||||
Accrued transfer agency out-of-pocket expenses | 3,595 | 5,393 | 19,003 | 7,190 | 3,082 | 7,447 | ||||||||||||||||||
Accrued legal, audit and tax service fees | 12,280 | 18,420 | 64,910 | 24,560 | 10,526 | 25,438 | ||||||||||||||||||
Accrued trustees’ fees and expenses and deferred compensation | 195 | 1,547 | 7,429 | 575 | 17 | 2,348 | ||||||||||||||||||
Accrued interest | — | — | 161 | — | — | — | ||||||||||||||||||
Accrued offering expenses | — | — | — | — | 12,856 | — | ||||||||||||||||||
Accrued other | 12,932 | 13,918 | 43,837 | 21,846 | 18,745 | 12,469 | ||||||||||||||||||
Forward foreign currency contracts depreciation | — | 139,609 | 604,903 | 5,873 | 129,580 | 170,768 | ||||||||||||||||||
Outstanding options written, at value (premiums received $210,065 and $245,423) | — | 60,743 | 121,973 | — | — | — | ||||||||||||||||||
Swap contracts, at value | — | 124,230 | 200,859 | — | 16,535 | — | ||||||||||||||||||
Total Liabilities | 3,213,797 | 15,879,811 | 173,990,017 | 1,875,333 | 888,752 | 1,106,478 | ||||||||||||||||||
NET ASSETS | $110,204,333 | $164,281,306 | $565,285,265 | $223,600,698 | $85,845,837 | $261,671,386 | ||||||||||||||||||
| NET ASSETS CONSIST OF: | ||||||||||||||||||||||||
Paid-in capital | $106,853,826 | $159,206,985 | $544,166,046 | $221,515,232 | $81,537,691 | $216,173,850 | ||||||||||||||||||
Undistributed/accumulated net investment income (loss) | 1,187,713 | (1,022,547 | ) | 2,331,238 | 634,635 | 944,026 | 1,591,825 | |||||||||||||||||
Undistributed/accumulated net realized gain (loss) | 542,914 | (1,358,861 | ) | 1,480,409 | (386,972 | ) | 1,112,970 | (21,295,681 | ) | |||||||||||||||
Net unrealized appreciation on investments | 1,619,880 | 7,455,729 | 17,307,572 | 1,837,803 | 2,251,150 | 65,201,392 | ||||||||||||||||||
NET ASSETS | $110,204,333 | $164,281,306 | $565,285,265 | $223,600,698 | $85,845,837 | $261,671,386 | ||||||||||||||||||
| Class P Shares: | ||||||||||||||||||||||||
Shares of beneficial interest outstanding | 10,764,482 | 16,876,068 | 50,886,262 | 22,095,114 | 8,155,966 | 18,169,292 | ||||||||||||||||||
Net Asset Value Per Share | $10.24 | $9.73 | $11.11 | $10.12 | $10.53 | $14.40 | ||||||||||||||||||
| (1) | Includes cash collateral segregated for open swap contracts in the PL Managed Bond Fund of $145,000. |
| (2) | The cost of foreign currency for the PL Inflation Managed, PL Managed Bond, PL Emerging Markets Debt and PL Comstock Funds were $74,155, $134,118, $310,844 and $53, respectively. |
| (3) | The PL Inflation Managed and PL Managed Bond Funds received cash collateral to mitigate risk of loss to certain counterparties, which will be repaid based on master netting arrangements between the Funds and the counterparties. The Funds invest such cash collateral in investments securities (See Note 5 in Notes to Financial Statements). |
See Notes to Financial Statements
C-1
Table of Contents
PACIFIC LIFE FUNDS
STATEMENTS OF ASSETS AND LIABILITIES (Continued)
MARCH 31, 2013
| PL Growth LT Fund | PL Large-Cap Growth Fund | PL Large-Cap Value Fund | PL Main Street Core Fund | PL Mid-Cap Equity Fund | PL Mid-Cap Growth Fund | |||||||||||||||||||
| ASSETS | ||||||||||||||||||||||||
Investments, at cost | $36,850,670 | $124,490,490 | $228,610,164 | $159,548,251 | $127,470,847 | $48,748,574 | ||||||||||||||||||
Investments, at value | $48,639,598 | $145,982,475 | $323,646,313 | $212,011,186 | $138,406,654 | $61,463,253 | ||||||||||||||||||
Cash (1) | — | 293,600 | — | — | — | — | ||||||||||||||||||
Foreign currency held, at value (2) | — | — | — | — | — | 796 | ||||||||||||||||||
| Receivables: | ||||||||||||||||||||||||
Dividends and interest | 35,411 | 139,402 | 730,505 | 182,159 | 249,000 | 30,740 | ||||||||||||||||||
Fund shares sold | — | 64,634 | — | 61,976 | — | — | ||||||||||||||||||
Securities sold | — | 84,730 | — | 335,135 | 1,174,094 | 221,156 | ||||||||||||||||||
Variation margin | — | 9,375 | — | — | — | — | ||||||||||||||||||
Foreign tax reclaim | 3,115 | — | 1,461 | — | — | 9,913 | ||||||||||||||||||
Due from adviser | 6,181 | 27,230 | 21,301 | 19,085 | 28,314 | 1,101 | ||||||||||||||||||
Forward foreign currency contracts appreciation | 20,581 | — | — | — | — | — | ||||||||||||||||||
Prepaid expenses and other assets | 735 | 2,142 | 4,755 | 3,915 | 1,920 | 956 | ||||||||||||||||||
Total Assets | 48,705,621 | 146,603,588 | 324,404,335 | 212,613,456 | 139,859,982 | 61,727,915 | ||||||||||||||||||
| LIABILITIES | ||||||||||||||||||||||||
| Payables: | ||||||||||||||||||||||||
Securities purchased | — | 4,063,720 | — | — | 1,289,056 | 92,351 | ||||||||||||||||||
Accrued advisory fees | 22,448 | 56,379 | 176,628 | 79,744 | 75,390 | 36,002 | ||||||||||||||||||
Accrued administration fees | 6,122 | 17,804 | 40,760 | 26,581 | 17,398 | 7,715 | ||||||||||||||||||
Accrued support service expenses | 6,689 | 13,221 | 29,993 | 21,669 | 14,290 | 6,407 | ||||||||||||||||||
Accrued custodian fees and expenses | 13,199 | 14,608 | 6,660 | 6,300 | 22,161 | 13,081 | ||||||||||||||||||
Accrued transfer agency out-of-pocket expenses | 1,541 | 4,622 | 10,272 | 8,474 | 4,109 | 2,054 | ||||||||||||||||||
Accrued legal, audit and tax service fees | 5,263 | 15,789 | 35,086 | 28,946 | 14,034 | 7,017 | ||||||||||||||||||
Accrued trustees’ fees and expenses and deferred | 2,404 | 5,997 | 4,083 | 496 | 284 | 2,518 | ||||||||||||||||||
Accrued other | 6,934 | 13,436 | 16,243 | 12,940 | 7,643 | 3,917 | ||||||||||||||||||
Forward foreign currency contracts depreciation | 30,064 | — | — | — | — | — | ||||||||||||||||||
Total Liabilities | 94,664 | 4,205,576 | 319,725 | 185,150 | 1,444,365 | 171,062 | ||||||||||||||||||
NET ASSETS | $48,610,957 | $142,398,012 | $324,084,610 | $212,428,306 | $138,415,617 | $61,556,853 | ||||||||||||||||||
| NET ASSETS CONSIST OF: | ||||||||||||||||||||||||
Paid-in capital | $44,920,309 | $102,863,459 | $240,325,976 | $175,723,437 | $119,065,789 | $48,954,569 | ||||||||||||||||||
Undistributed net investment income | 583,521 | 291,556 | 1,306,979 | 510,062 | 261,091 | 92,010 | ||||||||||||||||||
Accumulated net realized gain (loss) | (8,672,160 | ) | 17,715,170 | (12,584,494 | ) | (16,268,128 | ) | 8,152,930 | (203,989 | ) | ||||||||||||||
Net unrealized appreciation on investments | 11,779,287 | 21,527,827 | 95,036,149 | 52,462,935 | 10,935,807 | 12,714,263 | ||||||||||||||||||
NET ASSETS | $48,610,957 | $142,398,012 | $324,084,610 | $212,428,306 | $138,415,617 | $61,556,853 | ||||||||||||||||||
| Class P Shares: | ||||||||||||||||||||||||
Shares of beneficial interest outstanding | 3,490,693 | 13,686,911 | 23,215,030 | 17,415,835 | 12,579,554 | 7,172,316 | ||||||||||||||||||
Net Asset Value Per Share | $13.93 | $10.40 | $13.96 | $12.20 | $11.00 | $8.58 | ||||||||||||||||||
| (1) | Includes cash collateral segregated for open futures contracts in the PL Large-Cap Growth Fund of $293,600. |
| (2) | The cost of foreign currency for the PL Mid-Cap Growth Fund was $792. |
See Notes to Financial Statements
C-2
Table of Contents
PACIFIC LIFE FUNDS
STATEMENTS OF ASSETS AND LIABILITIES (Continued)
MARCH 31, 2013
| PL Small-Cap Growth Fund | PL Small-Cap Value Fund | PL Real Estate Fund | PL Emerging Markets Fund | PL International Large-Cap Fund | PL International Value Fund | |||||||||||||||||||
| ASSETS | ||||||||||||||||||||||||
Investments, at cost | $39,810,794 | $97,369,513 | $38,236,142 | $88,192,288 | $144,881,899 | $126,475,141 | ||||||||||||||||||
Investments, at value | $50,803,746 | $125,397,991 | $60,024,885 | $111,312,993 | $198,030,162 | $146,616,983 | ||||||||||||||||||
Foreign currency held, at value (1) | — | — | — | 75,142 | 109,534 | 277,901 | ||||||||||||||||||
| Receivables: | ||||||||||||||||||||||||
Dividends and interest | 31,106 | 182,292 | 144,708 | 196,930 | 614,644 | 527,132 | ||||||||||||||||||
Fund shares sold | — | — | — | 188,940 | — | 23,892 | ||||||||||||||||||
Securities sold | 177,271 | 306,066 | 120,912 | 234,252 | 1,849,500 | 207,993 | ||||||||||||||||||
Foreign tax reclaim | — | — | — | 6,405 | 231,828 | 82,792 | ||||||||||||||||||
Due from adviser | 2,451 | 8,176 | 7,568 | 50,622 | 13,466 | 16,148 | ||||||||||||||||||
Forward foreign currency contracts appreciation | — | — | — | — | — | 799,078 | ||||||||||||||||||
Prepaid expenses and other assets | 712 | 1,869 | 952 | 1,622 | 2,980 | 2,253 | ||||||||||||||||||
Total Assets | 51,015,286 | 125,896,394 | 60,299,025 | 112,066,906 | 200,852,114 | 148,554,172 | ||||||||||||||||||
| LIABILITIES | ||||||||||||||||||||||||
| Payables: | ||||||||||||||||||||||||
Securities purchased | 60,120 | 112,883 | 81,758 | 954,907 | 1,619,386 | 1,422,363 | ||||||||||||||||||
Accrued advisory fees | 25,759 | 78,856 | 45,472 | 74,748 | 144,175 | 81,511 | ||||||||||||||||||
Accrued administration fees | 6,440 | 15,771 | 7,579 | 14,015 | 25,443 | 18,810 | ||||||||||||||||||
Accrued support service expenses | 4,336 | 9,972 | 5,932 | 9,792 | 20,260 | 13,473 | ||||||||||||||||||
Accrued custodian fees and expenses | 8,333 | 7,782 | 7,206 | 106,793 | 34,382 | 32,303 | ||||||||||||||||||
Accrued transfer agency out-of-pocket expenses | 1,541 | 3,852 | 2,054 | 3,595 | 6,420 | 4,879 | ||||||||||||||||||
Accrued legal, audit and tax service fees | 5,263 | 13,157 | 7,017 | 12,280 | 21,929 | 16,666 | ||||||||||||||||||
Accrued trustees’ fees and expenses and deferred compensation | 1,554 | 67 | 99 | 228 | 1,797 | 2,822 | ||||||||||||||||||
Accrued foreign capital gains tax | — | — | — | 66,573 | — | — | ||||||||||||||||||
Accrued other | 3,899 | 7,270 | 3,556 | 13,852 | 15,449 | 6,573 | ||||||||||||||||||
Forward foreign currency contracts depreciation | — | — | — | — | — | 405,120 | ||||||||||||||||||
Total Liabilities | 117,245 | 249,610 | 160,673 | 1,256,783 | 1,889,241 | 2,004,520 | ||||||||||||||||||
NET ASSETS | $50,898,041 | $125,646,784 | $60,138,352 | $110,810,123 | $198,962,873 | $146,549,652 | ||||||||||||||||||
| NET ASSETS CONSIST OF: | ||||||||||||||||||||||||
Paid-in capital | $42,881,890 | $97,324,262 | $46,996,318 | $89,111,087 | $160,185,098 | $182,964,102 | ||||||||||||||||||
Undistributed/accumulated net investment income (loss) | 87,425 | 621,521 | 207,595 | (277,253 | ) | 1,204,416 | 570,294 | |||||||||||||||||
Accumulated net realized loss | (3,064,226 | ) | (327,669 | ) | (8,854,304 | ) | (1,066,151 | ) | (15,570,764 | ) | (57,521,989 | ) | ||||||||||||
Net unrealized appreciation on investments | 10,992,952 | 28,028,670 | 21,788,743 | 23,042,440 | 53,144,123 | 20,537,245 | ||||||||||||||||||
NET ASSETS | $50,898,041 | $125,646,784 | $60,138,352 | $110,810,123 | $198,962,873 | $146,549,652 | ||||||||||||||||||
| Class P Shares: | ||||||||||||||||||||||||
Shares of beneficial interest outstanding | 3,829,304 | 10,340,048 | 4,398,314 | 7,791,528 | 12,073,963 | 16,100,442 | ||||||||||||||||||
Net Asset Value Per Share | $13.29 | $12.15 | $13.67 | $14.22 | $16.48 | $9.10 | ||||||||||||||||||
| (1) | The cost of foreign currency for the PL Emerging Markets, PL International Large-Cap and PL International Value Funds were $86,204, $108,986 and $276,607, respectively. |
See Notes to Financial Statements
C-3
Table of Contents
PACIFIC LIFE FUNDS
STATEMENTS OF ASSETS AND LIABILITIES (Continued)
MARCH 31, 2013
| PL Currency Strategies Fund | PL Global Absolute Return Fund | PL Precious Metals Fund | PL Alternative Strategies Fund | |||||||||||||
| ASSETS | ||||||||||||||||
Investments and repurchase agreements at, cost | $118,636,325 | $174,063,996 | $78,328,828 | $78,850 | ||||||||||||
Investments, at value | $118,477,230 | $165,634,714 | $66,094,060 | $78,699 | ||||||||||||
Repurchase agreements, at value | — | 7,198,892 | — | — | ||||||||||||
Cash (1) | 740,000 | — | — | — | ||||||||||||
Foreign currency held, at value (2) | 1,274 | 650,237 | 36,428 | — | ||||||||||||
| Receivables: | ||||||||||||||||
Dividends and interest | 864,959 | 1,130,265 | 46,518 | — | ||||||||||||
Fund shares sold | 81,780 | 412,409 | 750,019 | — | ||||||||||||
Securities sold | — | 107,450 | — | — | ||||||||||||
Foreign tax reclaim | — | 1,244 | 14,329 | — | ||||||||||||
Swap agreements | — | 336,041 | — | — | ||||||||||||
Due from adviser | 6,515 | — | — | 14,260 | ||||||||||||
Forward foreign currency contracts appreciation | 2,766,926 | 2,960,961 | — | — | ||||||||||||
Prepaid expenses and other assets | 1,750 | 2,684 | 1,167 | 2,567 | ||||||||||||
Swap contracts, at value | — | 5,681,662 | — | — | ||||||||||||
Total Assets | 122,940,434 | 184,116,559 | 66,942,521 | 95,526 | ||||||||||||
| LIABILITIES | ||||||||||||||||
| Payables: | ||||||||||||||||
Securities purchased | — | 191,604 | 895,626 | — | ||||||||||||
Swap agreements | — | 349,395 | — | — | ||||||||||||
Due to broker (3) | 230,000 | 1,271,056 | — | — | ||||||||||||
Securities sold short, at value (proceeds $7,426,837) | — | 7,135,222 | — | — | ||||||||||||
Variation margin | — | 21,025 | — | — | ||||||||||||
Accrued advisory fees | 65,794 | 169,618 | 46,324 | 5 | ||||||||||||
Accrued administration fees | 15,183 | 21,458 | 7,716 | 4 | ||||||||||||
Accrued support service expenses | 2,689 | 4,123 | 1,792 | 3,943 | ||||||||||||
Accrued custodian fees and expenses | 7,299 | 38,011 | 9,714 | 2,167 | ||||||||||||
Accrued transfer agency out-of-pocket expenses | 3,852 | 5,906 | 2,568 | 5,650 | ||||||||||||
Accrued legal, audit and tax service fees | 13,157 | 20,175 | 8,772 | 19,297 | ||||||||||||
Accrued trustees’ fees and expenses and deferred | 21 | 32 | 14 | 31 | ||||||||||||
Accrued distribution and/or service fees | — | — | — | 2 | ||||||||||||
Accrued interest | — | 111,982 | — | — | ||||||||||||
Accrued offering expenses | 15,343 | 15,343 | 15,343 | 23,312 | ||||||||||||
Accrued other | 22,525 | 7,868 | 3,897 | 11,320 | ||||||||||||
Forward foreign currency contracts depreciation | 3,921,893 | 926,759 | — | — | ||||||||||||
Swap contracts, at value | — | 1,901,652 | — | — | ||||||||||||
Total Liabilities | 4,297,756 | 12,191,229 | 991,766 | 65,731 | ||||||||||||
NET ASSETS | $118,642,678 | $171,925,330 | $65,950,755 | $29,795 | ||||||||||||
| NET ASSETS CONSIST OF: | ||||||||||||||||
Paid-in capital | $114,975,593 | $168,927,249 | $78,240,884 | $29,993 | ||||||||||||
Undistributed/accumulated net investment income (loss) | 4,997,060 | 1,744,989 | 51,396 | — | ||||||||||||
Undistributed/accumulated net realized gain (loss) | — | 135,136 | (106,883 | ) | (47 | ) | ||||||||||
Net unrealized appreciation (depreciation) on investments | (1,329,975 | ) | 1,117,956 | (12,234,642 | ) | (151 | ) | |||||||||
NET ASSETS | $118,642,678 | $171,925,330 | $65,950,755 | $29,795 | ||||||||||||
| Class A Shares: | ||||||||||||||||
Net Assets | $9,936 | |||||||||||||||
Shares of beneficial interest outstanding | 1,000 | |||||||||||||||
Net Asset Value per share* | $9.94 | |||||||||||||||
Sales Charge - Maximum is 5.50% of offering price | 0.58 | |||||||||||||||
Maximum offering price per share | $10.52 | |||||||||||||||
| Class C Shares: | ||||||||||||||||
Net Assets | $9,918 | |||||||||||||||
Shares of beneficial interest outstanding | 1,000 | |||||||||||||||
Net Asset Value and offering price per share* | $9.92 | |||||||||||||||
| Class P Shares: | ||||||||||||||||
Net Assets | $118,642,678 | $171,925,330 | $65,950,755 | |||||||||||||
Shares of beneficial interest outstanding | 11,494,820 | 16,879,918 | 8,023,588 | |||||||||||||
Net Asset Value Per Share | $10.32 | $10.19 | $8.22 | |||||||||||||
| Advisor Class: | ||||||||||||||||
Net Assets | $9,941 | |||||||||||||||
Shares of beneficial interest outstanding | 1,000 | |||||||||||||||
Net Asset Value per share | $9.94 | |||||||||||||||
| * | Redemption price per share is equal to the Net Asset Value per share less any applicable contingent deferred sales charge. |
| (1) | Includes cash collateral segregated for open forward foreign currency contracts in the PL Currency Strategies Fund of $740,000. |
| (2) | The cost of foreign currency for the PL Currency Strategies, PL Global Absolute Return, and PL Precious Metals Funds were $1,292, $650,673, and $36,251, respectively. |
| (3) | The PL Currency Strategies and PL Global Absolute Return Funds received cash collateral to mitigate risk of loss to certain counterparties, which will be repaid based on master netting arrangements between the Funds and the counterparties (See Note 5 in Notes to Financial Statements). |
See Notes to Financial Statements
C-4
Table of Contents
PACIFIC LIFE FUNDS
FOR THE YEAR OR PERIOD ENDED MARCH 31, 2013
| PL Floating Rate Loan Fund | PL Inflation Managed Fund | PL Managed Bond Fund | PL Short Duration Bond Fund | PL Emerging Markets Debt Fund (1) | PL Comstock Fund | |||||||||||||||||||
| INVESTMENT INCOME | ||||||||||||||||||||||||
Dividends, net of foreign taxes withheld | $866 | $254 | $106,142 | $1,320 | $296 | $5,786,607 | ||||||||||||||||||
Interest, net of foreign taxes withheld | 5,500,428 | 5,120,882 | 12,440,997 | 3,360,736 | 3,517,241 | — | ||||||||||||||||||
Other | 11,580 | — | — | — | — | — | ||||||||||||||||||
Total Investment Income | 5,512,874 | 5,121,136 | 12,547,139 | 3,362,056 | 3,517,537 | 5,786,607 | ||||||||||||||||||
| EXPENSES | ||||||||||||||||||||||||
Advisory fees | 786,963 | 808,980 | 2,169,814 | 822,771 | 492,736 | 1,808,938 | ||||||||||||||||||
Administration fees | 157,393 | 303,368 | 813,680 | 308,539 | 94,153 | 361,788 | ||||||||||||||||||
Support services expenses | 18,353 | 44,430 | 91,459 | 30,822 | 7,934 | 38,516 | ||||||||||||||||||
Custodian fees and expenses | 29,495 | 25,106 | 65,133 | 21,649 | 33,908 | 27,167 | ||||||||||||||||||
Shareholder report expenses | 3,078 | 7,608 | 15,483 | 4,983 | 2,357 | 6,028 | ||||||||||||||||||
Transfer agency out-of-pocket expenses | 17,186 | 39,744 | 86,644 | 29,716 | 9,055 | 36,266 | ||||||||||||||||||
Registration fees | 2,756 | 4,328 | 14,383 | 5,398 | 2,208 | 5,677 | ||||||||||||||||||
Legal, audit and tax service fees | 18,955 | 34,802 | 98,263 | 35,904 | 13,428 | 39,849 | ||||||||||||||||||
Trustees’ fees and expenses | 3,588 | 8,177 | 18,088 | 6,222 | 1,917 | 7,526 | ||||||||||||||||||
Offering expenses | — | — | — | — | 37,808 | — | ||||||||||||||||||
Interest expense | — | 63,006 | 66,056 | — | — | — | ||||||||||||||||||
Other | 44,907 | 45,956 | 121,698 | 66,082 | 40,662 | 18,386 | ||||||||||||||||||
Total Expenses | 1,082,674 | 1,385,505 | 3,560,701 | 1,332,086 | 736,166 | 2,350,141 | ||||||||||||||||||
Advisory Fee Waiver (2) | (104,928 | ) | — | — | — | — | (36,179 | ) | ||||||||||||||||
Adviser Reimbursement (3) | (138,319 | ) | (210,150 | ) | (511,150 | ) | (200,776 | ) | (149,277 | ) | (179,416 | ) | ||||||||||||
Net Expenses | 839,427 | 1,175,355 | 3,049,551 | 1,131,310 | 586,889 | 2,134,546 | ||||||||||||||||||
NET INVESTMENT INCOME | 4,673,447 | 3,945,781 | 9,497,588 | 2,230,746 | 2,930,648 | 3,652,061 | ||||||||||||||||||
| NET REALIZED AND UNREALIZED GAIN (LOSS) | ||||||||||||||||||||||||
| Net Realized Gain (Loss) On: | ||||||||||||||||||||||||
Investment security transactions | 844,658 | 13,790,300 | 11,918,977 | 552,593 | 1,329,746 | 5,838,592 | ||||||||||||||||||
Closed short positions | — | 1,719 | (31,739 | ) | — | — | — | |||||||||||||||||
Futures contracts and swap transactions | — | 266,517 | 1,382,518 | 28,295 | 38,125 | — | ||||||||||||||||||
Written option transactions | — | 250,443 | 1,704,174 | — | — | — | ||||||||||||||||||
Foreign currency transactions | — | (215,441 | ) | 407,716 | (34,077 | ) | (1,064 | ) | 190,990 | |||||||||||||||
Net Realized Gain | 844,658 | 14,093,538 | 15,381,646 | 546,811 | 1,366,807 | 6,029,582 | ||||||||||||||||||
| Change In Net Unrealized Appreciation (Depreciation) On: | ||||||||||||||||||||||||
Investment securities | 745,495 | (1,454,034 | ) | 9,312,560 | 1,068,308 | 2,215,357 | 31,593,035 | |||||||||||||||||
Futures contracts and swaps | — | (231,229 | ) | 472,841 | (13,699 | ) | (16,535 | ) | — | |||||||||||||||
Written options | — | 133,521 | (803,855 | ) | — | — | — | |||||||||||||||||
Foreign currencies | — | 233,267 | 1,888,100 | (2,802 | ) | 52,328 | (46,075 | ) | ||||||||||||||||
Change in Net Unrealized Appreciation (Depreciation) | 745,495 | (1,318,475 | ) | 10,869,646 | 1,051,807 | 2,251,150 | 31,546,960 | |||||||||||||||||
NET GAIN | 1,590,153 | 12,775,063 | 26,251,292 | 1,598,618 | 3,617,957 | 37,576,542 | ||||||||||||||||||
NET INCREASE IN NET ASSETS | $6,263,600 | $16,720,844 | $35,748,880 | $3,829,364 | $6,548,605 | $41,228,603 | ||||||||||||||||||
Foreign taxes withheld on dividends and interest | $— | $— | $177,738 | $— | $— | $92,452 | ||||||||||||||||||
| (1) | Operations commenced on June 29, 2012. |
| (2) | See Note 6 in Notes to Financial Statements. |
| (3) | See Note 7B in Notes to Financial Statements. |
See Notes to Financial Statements
C-5
Table of Contents
PACIFIC LIFE FUNDS
STATEMENTS OF OPERATIONS (Continued)
FOR THE YEAR ENDED MARCH 31, 2013
| PL Growth LT Fund | PL Large-Cap Growth Fund | PL Large-Cap Value Fund | PL Main Street Core Fund | PL Mid-Cap Equity Fund | PL Mid-Cap Growth Fund | |||||||||||||||||||
| INVESTMENT INCOME | ||||||||||||||||||||||||
Dividends, net of foreign taxes withheld | $771,701 | $1,441,630 | $7,832,620 | $3,630,124 | $1,988,685 | $891,334 | ||||||||||||||||||
Interest, net of foreign taxes withheld | 3,954 | — | — | — | — | — | ||||||||||||||||||
Total Investment Income | 775,655 | 1,441,630 | 7,832,620 | 3,630,124 | 1,988,685 | 891,334 | ||||||||||||||||||
| EXPENSES | ||||||||||||||||||||||||
Advisory fees | 320,212 | 965,362 | 1,961,266 | 901,411 | 888,793 | 429,917 | ||||||||||||||||||
Administration fees | 87,331 | 193,072 | 452,600 | 300,470 | 205,106 | 92,125 | ||||||||||||||||||
Support services expenses | 14,732 | 22,604 | 49,263 | 35,879 | 26,392 | 11,769 | ||||||||||||||||||
Custodian fees and expenses | 35,505 | 24,601 | 22,337 | 20,647 | 37,096 | 46,563 | ||||||||||||||||||
Shareholder report expenses | 2,402 | 3,692 | 7,940 | 5,958 | 4,132 | 1,859 | ||||||||||||||||||
Transfer agency out-of-pocket expenses | 12,792 | 21,235 | 46,686 | 34,028 | 24,027 | 10,796 | ||||||||||||||||||
Registration fees | 1,274 | 3,511 | 7,796 | 6,385 | 3,218 | 1,586 | ||||||||||||||||||
Legal, audit and tax service fees | 10,584 | 23,990 | 53,250 | 41,639 | 23,770 | 11,293 | ||||||||||||||||||
Trustees’ fees and expenses | 2,624 | 4,423 | 9,738 | 7,150 | 4,958 | 2,237 | ||||||||||||||||||
Other | 15,753 | 16,871 | 20,652 | 16,241 | 13,989 | 8,958 | ||||||||||||||||||
Total Expenses | 503,209 | 1,279,361 | 2,631,528 | 1,369,808 | 1,231,481 | 617,103 | ||||||||||||||||||
Advisory Fee Waiver (1) | — | (114,768 | ) | — | — | — | — | |||||||||||||||||
Adviser Reimbursement (2) | (95,666 | ) | (120,927 | ) | (217,662 | ) | (167,926 | ) | (137,581 | ) | (95,060 | ) | ||||||||||||
Net Expenses | 407,543 | 1,043,666 | 2,413,866 | 1,201,882 | 1,093,900 | 522,043 | ||||||||||||||||||
NET INVESTMENT INCOME | 368,112 | 397,964 | 5,418,754 | 2,428,242 | 894,785 | 369,291 | ||||||||||||||||||
| NET REALIZED AND UNREALIZED GAIN (LOSS) | ||||||||||||||||||||||||
| Net Realized Gain (Loss) On: | ||||||||||||||||||||||||
Investment security transactions | 12,091,534 | 24,394,908 | 5,135,174 | 11,693,601 | 16,576,332 | 867,465 | ||||||||||||||||||
Futures contracts transactions | — | 305,194 | — | — | — | — | ||||||||||||||||||
Written option transactions | 119,230 | — | — | — | — | — | ||||||||||||||||||
Foreign currency transactions | 162,837 | — | (860 | ) | 435 | — | (10,698 | ) | ||||||||||||||||
Net Realized Gain | 12,373,601 | 24,700,102 | 5,134,314 | 11,694,036 | 16,576,332 | 856,767 | ||||||||||||||||||
| Change In Net Unrealized Appreciation (Depreciation) On: | ||||||||||||||||||||||||
Investment securities | (13,401,912 | ) | (14,883,544 | ) | 35,708,225 | 5,836,593 | (10,408,293 | ) | (2,170,605 | ) | ||||||||||||||
Futures contracts | — | 35,842 | — | — | — | — | ||||||||||||||||||
Foreign currencies | 43,755 | — | — | 58 | — | 923 | ||||||||||||||||||
Change in Net Unrealized Appreciation (Depreciation) | (13,358,157 | ) | (14,847,702 | ) | 35,708,225 | 5,836,651 | (10,408,293 | ) | (2,169,682 | ) | ||||||||||||||
NET GAIN (LOSS) | (984,556 | ) | 9,852,400 | 40,842,539 | 17,530,687 | 6,168,039 | (1,312,915 | ) | ||||||||||||||||
NET INCREASE (DECREASE) IN NET ASSETS | ($616,444 | ) | $10,250,364 | $46,261,293 | $19,958,929 | $7,062,824 | ($943,624 | ) | ||||||||||||||||
Foreign taxes withheld on dividends and interest | $19,440 | $44 | $111,142 | $810 | $1,017 | $12,908 | ||||||||||||||||||
| (1) | See Note 6 in Notes to Financial Statements. |
| (2) | See Note 7B in Notes to Financial Statements. |
See Notes to Financial Statements
C-6
Table of Contents
PACIFIC LIFE FUNDS
STATEMENTS OF OPERATIONS (Continued)
FOR THE YEAR ENDED MARCH 31, 2013
| PL Small-Cap Growth Fund | PL Small-Cap Value Fund | PL Real Estate Fund | PL Emerging Markets Fund | PL International Large-Cap Fund | PL International Fund | |||||||||||||||||||
| INVESTMENT INCOME | ||||||||||||||||||||||||
Dividends, net of foreign taxes withheld | $410,373 | $3,118,247 | $1,311,923 | $1,571,979 | $5,193,532 | $4,277,050 | ||||||||||||||||||
Interest, net of foreign taxes withheld | — | — | — | — | 1,899 | 4,023 | ||||||||||||||||||
Total Investment Income | 410,373 | 3,118,247 | 1,311,923 | 1,571,979 | 5,195,431 | 4,281,073 | ||||||||||||||||||
| EXPENSES | ||||||||||||||||||||||||
Advisory fees | 255,364 | 783,990 | 492,192 | 800,458 | 1,733,231 | 896,589 | ||||||||||||||||||
Administration fees | 63,841 | 156,798 | 82,032 | 150,086 | 305,864 | 206,905 | ||||||||||||||||||
Support services expenses | 7,036 | 16,265 | 9,525 | 16,067 | 35,470 | 21,963 | ||||||||||||||||||
Custodian fees and expenses | 25,875 | 25,269 | 19,921 | 295,579 | 106,436 | 85,464 | ||||||||||||||||||
Shareholder report expenses | 1,098 | 2,548 | 1,634 | 2,559 | 5,395 | 3,489 | ||||||||||||||||||
Transfer agency out-of-pocket expenses | 6,700 | 15,550 | 9,098 | 15,293 | 32,879 | 20,932 | ||||||||||||||||||
Registration fees | 1,170 | 2,912 | 1,557 | 2,718 | 4,931 | 3,676 | ||||||||||||||||||
Legal, audit and tax service fees | 7,851 | 19,053 | 10,503 | 18,145 | 35,079 | 24,723 | ||||||||||||||||||
Trustees’ fees and expenses | 1,400 | 3,262 | 1,909 | 3,193 | 6,789 | 4,364 | ||||||||||||||||||
Other | 12,822 | 16,210 | 6,800 | 55,139 | 30,049 | 22,895 | ||||||||||||||||||
Total Expenses | 383,157 | 1,041,857 | 635,171 | 1,359,237 | 2,296,123 | 1,291,000 | ||||||||||||||||||
Adviser Reimbursement (1) | (63,952 | ) | (101,068 | ) | (60,947 | ) | (408,692 | ) | (257,028 | ) | (187,506 | ) | ||||||||||||
Net Expenses | 319,205 | 940,789 | 574,224 | 950,545 | 2,039,095 | 1,103,494 | ||||||||||||||||||
NET INVESTMENT INCOME | 91,168 | 2,177,458 | 737,699 | 621,434 | 3,156,336 | 3,177,579 | ||||||||||||||||||
| NET REALIZED AND UNREALIZED GAIN (LOSS) | ||||||||||||||||||||||||
| Net Realized Gain (Loss) On: | ||||||||||||||||||||||||
Investment security transactions | 3,143,110 | 5,579,295 | 1,860,532 | 1,677,819 | 3,080,903 | (1,799,377 | ) | |||||||||||||||||
Futures contracts transactions | — | — | — | — | — | 157,787 | ||||||||||||||||||
Foreign currency transactions | — | (3,750 | ) | — | (57,499 | ) | (41,234 | ) | (214,253 | ) | ||||||||||||||
Net Realized Gain (Loss) | 3,143,110 | 5,575,545 | 1,860,532 | 1,620,320 | 3,039,669 | (1,855,843 | ) | |||||||||||||||||
| Change In Net Unrealized Appreciation (Depreciation) On: | ||||||||||||||||||||||||
Investment securities (2) | 2,601,887 | 11,150,217 | 2,801,030 | 4,875,582 | 16,364,657 | 12,907,274 | ||||||||||||||||||
Futures contracts | — | — | — | — | — | (4,639 | ) | |||||||||||||||||
Foreign currencies | — | 230 | — | (8,189 | ) | (6,374 | ) | 574,510 | ||||||||||||||||
Change in Net Unrealized Appreciation | 2,601,887 | 11,150,447 | 2,801,030 | 4,867,393 | 16,358,283 | 13,477,145 | ||||||||||||||||||
NET GAIN | 5,744,997 | 16,725,992 | 4,661,562 | 6,487,713 | 19,397,952 | 11,621,302 | ||||||||||||||||||
NET INCREASE IN NET ASSETS | $5,836,165 | $18,903,450 | $5,399,261 | $7,109,147 | $22,554,288 | $14,798,881 | ||||||||||||||||||
Foreign taxes withheld on dividends and interest | $— | $15,112 | $4,653 | $131,318 | $591,297 | $403,949 | ||||||||||||||||||
| (1) | See Note 7B in Notes to Financial Statements. |
| (2) | Change in net unrealized appreciation (depreciation) on investment securities for the PL Emerging Markets Fund was net of increase in deferred foreign capital gains tax of $7,084. |
See Notes to Financial Statements
C-7
Table of Contents
PACIFIC LIFE FUNDS
STATEMENTS OF OPERATIONS (Continued)
FOR THE PERIODS ENDED MARCH 31, 2013
| PL Currency Strategies Fund (1) | PL Global Absolute Return Fund (1) | PL Precious Metals Fund (1) | PL Alternative Strategies Fund (2) | |||||||||||||
| INVESTMENT INCOME | ||||||||||||||||
Dividends, net of foreign taxes withheld | $7,127 | $9,949 | $234,930 | $— | ||||||||||||
Dividends from affiliated mutual fund investments | — | — | — | 25 | ||||||||||||
Interest, net of foreign taxes withheld | 48,746 | 1,676,514 | — | — | ||||||||||||
Total Investment Income | 55,873 | 1,686,463 | 234,930 | 25 | ||||||||||||
| EXPENSES | ||||||||||||||||
Advisory fees | 232,587 | 407,407 | 147,636 | 15 | ||||||||||||
Administration fees | 53,674 | 76,389 | 29,527 | 11 | ||||||||||||
Support services expenses | 2,689 | 4,123 | 1,792 | 3,943 | ||||||||||||
Custodian fees and expenses | 7,384 | 38,096 | 9,799 | 2,167 | ||||||||||||
Shareholder report expenses | 850 | 1,290 | 560 | 6,070 | ||||||||||||
Distribution and/or service fees | ||||||||||||||||
Class A | — | — | — | 6 | ||||||||||||
Class C | — | — | — | 24 | ||||||||||||
Transfer agency out-of-pocket expenses | 3,852 | 5,906 | 2,568 | 5,650 | ||||||||||||
Registration fees | 2,760 | 4,232 | 1,840 | 4,048 | ||||||||||||
Legal, audit and tax service fees | 13,246 | 20,312 | 8,831 | 19,428 | ||||||||||||
Trustees’ fees and expenses | 902 | 1,383 | 602 | 1,323 | ||||||||||||
Offering expenses | 15,343 | 15,343 | 15,343 | 24,931 | ||||||||||||
Interest expense | — | 30,762 | — | — | ||||||||||||
Other | 1,907 | 3,756 | 2,108 | 2,547 | ||||||||||||
Total Expenses | 335,194 | 608,999 | 220,606 | 70,163 | ||||||||||||
Advisory Fee Waiver (3) | — | — | (13,779 | ) | — | |||||||||||
Adviser Reimbursement (4) | (31,042 | ) | (68,978 | ) | (33,601 | ) | (70,089 | ) | ||||||||
Net Expenses | 304,152 | 540,021 | 173,226 | 74 | ||||||||||||
NET INVESTMENT INCOME (LOSS) | (248,279 | ) | 1,146,442 | 61,704 | (49 | ) | ||||||||||
| NET REALIZED AND UNREALIZED GAIN (LOSS) | ||||||||||||||||
| Net Realized Gain (Loss) On: | ||||||||||||||||
Investment security transactions | — | 141,278 | (106,883 | ) | (5 | ) | ||||||||||
Futures contracts and swap transactions | — | (24,330 | ) | — | — | |||||||||||
Foreign currency transactions | 5,245,339 | 778,297 | (4,419 | ) | — | |||||||||||
Net Realized Gain (Loss) | 5,245,339 | 895,245 | (111,302 | ) | (5 | ) | ||||||||||
| Change In Net Unrealized Appreciation (Depreciation) On: | ||||||||||||||||
Investment securities | (159,095 | ) | (1,230,390 | ) | (12,234,768 | ) | (151 | ) | ||||||||
Short positions | — | 291,615 | — | — | ||||||||||||
Futures contracts and swaps | — | 42,941 | — | — | ||||||||||||
Foreign currencies | (1,170,880 | ) | 2,013,790 | 126 | — | |||||||||||
Change in Net Unrealized Appreciation (Depreciation) | (1,329,975 | ) | 1,117,956 | (12,234,642 | ) | (151 | ) | |||||||||
NET GAIN (LOSS) | 3,915,364 | 2,013,201 | (12,345,944 | ) | (156 | ) | ||||||||||
NET INCREASE (DECREASE) IN NET ASSETS | $3,667,085 | $3,159,643 | ($12,284,240 | ) | ($205 | ) | ||||||||||
Foreign taxes withheld on dividends and interest | $— | $— | $42,307 | $— | ||||||||||||
| (1) | Operations commenced on December 7, 2012. |
| (2) | Operations commenced on December 31, 2012. |
| (3) | See Note 6 in Notes to Financial Statements. |
| (4) | See Note 7B in Notes to Financial Statements. |
See Notes to Financial Statements
C-8
Table of Contents
PACIFIC LIFE FUNDS
STATEMENTS OF CHANGES IN NET ASSETS
| PL Floating Rate Loan Fund | PL Inflation Managed Fund | PL Managed Bond Fund | ||||||||||||||||||||||
| Year Ended March 31, 2013 | Year Ended March 31, 2012 | Year Ended March 31, 2013 | Year Ended March 31, 2012 | Year Ended March 31, 2013 | Year Ended March 31, 2012 | |||||||||||||||||||
| OPERATIONS | ||||||||||||||||||||||||
Net investment income | $4,673,447 | $4,130,067 | $3,945,781 | $7,173,178 | $9,497,588 | $9,784,211 | ||||||||||||||||||
Net realized gain | 844,658 | 502,188 | 14,093,538 | 15,897,068 | 15,381,646 | 4,380,097 | ||||||||||||||||||
Change in net unrealized appreciation (depreciation) | 745,495 | (922,280 | ) | (1,318,475 | ) | 3,518,275 | 10,869,646 | 1,966,331 | ||||||||||||||||
Net Increase in Net Assets | 6,263,600 | 3,709,975 | 16,720,844 | 26,588,521 | 35,748,880 | 16,130,639 | ||||||||||||||||||
| DISTRIBUTIONS TO SHAREHOLDERS | ||||||||||||||||||||||||
| Net investment income | ||||||||||||||||||||||||
Class P | (4,684,073 | ) | (3,822,618 | ) | (6,518,650 | ) | (8,896,184 | ) | (16,389,453 | ) | (11,687,819 | ) | ||||||||||||
| Net realized gains | ||||||||||||||||||||||||
Class P | (282,067 | ) | — | (16,271,162 | ) | (11,006,526 | ) | (7,038,055 | ) | — | ||||||||||||||
Net Decrease from Dividends and | (4,966,140 | ) | (3,822,618 | ) | (22,789,812 | ) | (19,902,710 | ) | (23,427,508 | ) | (11,687,819 | ) | ||||||||||||
| CAPITAL SHARE TRANSACTIONS | ||||||||||||||||||||||||
| Proceeds from sale of shares | ||||||||||||||||||||||||
Class P | 19,616,078 | 27,980,424 | 52,603,023 | 63,874,744 | 129,140,864 | 122,951,772 | ||||||||||||||||||
| Dividends and distribution reinvestments | ||||||||||||||||||||||||
Class P | 4,966,140 | 3,822,618 | 22,789,812 | 19,902,710 | 23,427,508 | 11,687,819 | ||||||||||||||||||
| Cost of shares repurchased | ||||||||||||||||||||||||
Class P | (27,763,381 | ) | (5,667,963 | ) | (192,998,689 | ) | (31,863,538 | ) | (85,819,252 | ) | (31,850,108 | ) | ||||||||||||
Net Increase (Decrease) in Net Assets from | (3,181,163 | ) | 26,135,079 | (117,605,854 | ) | 51,913,916 | 66,749,120 | 102,789,483 | ||||||||||||||||
NET INCREASE (DECREASE) IN NET ASSETS | (1,883,703 | ) | 26,022,436 | (123,674,822 | ) | 58,599,727 | 79,070,492 | 107,232,303 | ||||||||||||||||
| NET ASSETS | ||||||||||||||||||||||||
Beginning of Year | 112,088,036 | 86,065,600 | 287,956,128 | 229,356,401 | 486,214,773 | 378,982,470 | ||||||||||||||||||
End of Year | $110,204,333 | $112,088,036 | $164,281,306 | $287,956,128 | $565,285,265 | $486,214,773 | ||||||||||||||||||
Undistributed/Accumulated Net Investment Income (Loss) | $1,187,713 | $1,198,339 | ($1,022,547 | ) | $849,845 | $2,331,238 | $6,200,177 | |||||||||||||||||
See Notes to Financial Statements
C-9
Table of Contents
PACIFIC LIFE FUNDS
STATEMENTS OF CHANGES IN NET ASSETS (Continued)
| PL Short Duration Bond Fund | PL Emerging Markets Debt Fund (1) | PL Comstock Fund | ||||||||||||||||||
| Year Ended March 31, 2013 | Year Ended March 31, 2012 | Period Ended March 31, 2013 | Year Ended March 31, 2013 | Year Ended March 31, 2012 | ||||||||||||||||
| OPERATIONS | ||||||||||||||||||||
Net investment income | $2,230,746 | $1,527,338 | $2,930,648 | $3,652,061 | $2,652,992 | |||||||||||||||
Net realized gain | 546,811 | 365,029 | 1,366,807 | 6,029,582 | 8,095,045 | |||||||||||||||
Change in net unrealized appreciation | 1,051,807 | 335,227 | 2,251,150 | 31,546,960 | 220,561 | |||||||||||||||
Net Increase in Net Assets | 3,829,364 | 2,227,594 | 6,548,605 | 41,228,603 | 10,968,598 | |||||||||||||||
| DISTRIBUTIONS TO SHAREHOLDERS | ||||||||||||||||||||
| Net investment income | ||||||||||||||||||||
Class P | (2,806,146 | ) | (1,583,339 | ) | (2,042,727 | ) | (2,925,820 | ) | (2,469,410 | ) | ||||||||||
| Net realized gains | ||||||||||||||||||||
Class P | (46,248 | ) | (194,538 | ) | (197,732 | ) | — | — | ||||||||||||
Net Decrease from Dividends and | (2,852,394 | ) | (1,777,877 | ) | (2,240,459 | ) | (2,925,820 | ) | (2,469,410 | ) | ||||||||||
| CAPITAL SHARE TRANSACTIONS | ||||||||||||||||||||
| Proceeds from sale of shares | ||||||||||||||||||||
Class P | 96,093,274 | 40,795,923 | 90,381,544 | 61,091,927 | 39,955,205 | |||||||||||||||
| Dividends and distribution reinvestments | ||||||||||||||||||||
Class P | 2,852,394 | 1,777,877 | 2,240,459 | 2,925,820 | 2,469,410 | |||||||||||||||
| Cost of shares repurchased | ||||||||||||||||||||
Class P | (31,689,788 | ) | (8,788,892 | ) | (11,084,312 | ) | (47,978,778 | ) | (10,059,434 | ) | ||||||||||
Net Increase in Net Assets from | 67,255,880 | 33,784,908 | 81,537,691 | 16,038,969 | 32,365,181 | |||||||||||||||
NET INCREASE IN NET ASSETS | 68,232,850 | 34,234,625 | 85,845,837 | 54,341,752 | 40,864,369 | |||||||||||||||
| NET ASSETS | ||||||||||||||||||||
Beginning of Year or Period | 155,367,848 | 121,133,223 | — | 207,329,634 | 166,465,265 | |||||||||||||||
End of Year or Period | $223,600,698 | $155,367,848 | $85,845,837 | $261,671,386 | $207,329,634 | |||||||||||||||
Undistributed Net Investment Income | $634,635 | $483,512 | $944,026 | $1,591,825 | $674,594 | |||||||||||||||
| (1) | Operations commenced on June 29, 2012. |
See Notes to Financial Statements
C-10
Table of Contents
PACIFIC LIFE FUNDS
STATEMENTS OF CHANGES IN NET ASSETS (Continued)
| PL Growth LT Fund | PL Large-Cap Growth Fund | PL Large-Cap Value Fund | ||||||||||||||||||||||
| Year Ended March 31, 2013 | Year Ended March 31, 2012 | Year Ended March 31, 2013 | Year Ended March 31, 2012 | Year Ended March 31, 2013 | Year Ended March 31, 2012 | |||||||||||||||||||
| OPERATIONS | ||||||||||||||||||||||||
Net investment income (loss) | $368,112 | $568,645 | $397,964 | ($285,215 | ) | $5,418,754 | $4,585,584 | |||||||||||||||||
Net realized gain (loss) | 12,373,601 | (779,013 | ) | 24,700,102 | 2,701,430 | 5,134,314 | 953,473 | |||||||||||||||||
Change in net unrealized appreciation (depreciation) | (13,358,157 | ) | 4,289,690 | (14,847,702 | ) | 13,258,222 | 35,708,225 | 14,291,995 | ||||||||||||||||
Net Increase (Decrease) in Net Assets | (616,444 | ) | 4,079,322 | 10,250,364 | 15,674,437 | 46,261,293 | 19,831,052 | |||||||||||||||||
| DISTRIBUTIONS TO SHAREHOLDERS | ||||||||||||||||||||||||
| Net investment income | ||||||||||||||||||||||||
Class P | (549,887 | ) | (536,165 | ) | — | — | (5,290,356 | ) | (4,290,204 | ) | ||||||||||||||
| Net realized gains | ||||||||||||||||||||||||
Class P | — | — | (7,584,966 | ) | (1,890,797 | ) | — | — | ||||||||||||||||
Net Decrease from Dividends and | (549,887 | ) | (536,165 | ) | (7,584,966 | ) | (1,890,797 | ) | (5,290,356 | ) | (4,290,204 | ) | ||||||||||||
| CAPITAL SHARE TRANSACTIONS | ||||||||||||||||||||||||
| Proceeds from sale of shares | ||||||||||||||||||||||||
Class P | 14,624,438 | 17,297,129 | 24,025,886 | 19,512,148 | 76,584,620 | 41,530,441 | ||||||||||||||||||
| Dividends and distribution reinvestments | ||||||||||||||||||||||||
Class P | 549,887 | 536,165 | 7,584,966 | 1,890,797 | 5,290,356 | 4,290,204 | ||||||||||||||||||
| Cost of shares repurchased | ||||||||||||||||||||||||
Class P | (73,736,695 | ) | (28,612,620 | ) | (21,100,445 | ) | (5,065,264 | ) | (61,678,368 | ) | (26,880,017 | ) | ||||||||||||
Net Increase (Decrease) in Net Assets from | (58,562,370 | ) | (10,779,326 | ) | 10,510,407 | 16,337,681 | 20,196,608 | 18,940,628 | ||||||||||||||||
NET INCREASE (DECREASE) IN NET ASSETS | (59,728,701 | ) | (7,236,169 | ) | 13,175,805 | 30,121,321 | 61,167,545 | 34,481,476 | ||||||||||||||||
| NET ASSETS | ||||||||||||||||||||||||
Beginning of Year | 108,339,658 | 115,575,827 | 129,222,207 | 99,100,886 | 262,917,065 | 228,435,589 | ||||||||||||||||||
End of Year | $48,610,957 | $108,339,658 | $142,398,012 | $129,222,207 | $324,084,610 | $262,917,065 | ||||||||||||||||||
Undistributed/Accumulated Net Investment Income (Loss) | $583,521 | $601,465 | $291,556 | ($106,408 | ) | $1,306,979 | $1,179,441 | |||||||||||||||||
See Notes to Financial Statements
C-11
Table of Contents
PACIFIC LIFE FUNDS
STATEMENTS OF CHANGES IN NET ASSETS (Continued)
| PL Main Street Core Fund | PL Mid-Cap Equity Fund | PL Mid-Cap Growth Fund | ||||||||||||||||||||||
| Year Ended March 31, 2013 | Year Ended March 31, 2012 | Year Ended March 31, 2013 | Year Ended March 31, 2012 | Year Ended March 31, 2013 | Year Ended March 31, 2012 | |||||||||||||||||||
| OPERATIONS | ||||||||||||||||||||||||
Net investment income (loss) | $2,428,242 | $1,681,456 | $894,785 | $732,213 | $369,291 | ($131,025 | ) | |||||||||||||||||
Net realized gain | 11,694,036 | 2,717,308 | 16,576,332 | 6,873,001 | 856,767 | 5,871,520 | ||||||||||||||||||
Change in net unrealized appreciation (depreciation) | 5,836,651 | 16,697,945 | (10,408,293 | ) | (5,959,364 | ) | (2,169,682 | ) | (5,166,639 | ) | ||||||||||||||
Net Increase (Decrease) in Net Assets | 19,958,929 | 21,096,709 | 7,062,824 | 1,645,850 | (943,624 | ) | 573,856 | |||||||||||||||||
| DISTRIBUTIONS TO SHAREHOLDERS | ||||||||||||||||||||||||
| Net investment income | ||||||||||||||||||||||||
Class P | (2,671,391 | ) | (1,459,944 | ) | (821,347 | ) | (669,458 | ) | (175,658 | ) | (316,392 | ) | ||||||||||||
| Net realized gains | ||||||||||||||||||||||||
Class P | — | — | — | — | (1,858,301 | ) | (7,220,657 | ) | ||||||||||||||||
Net Decrease from Dividends and | (2,671,391 | ) | (1,459,944 | ) | (821,347 | ) | (669,458 | ) | (2,033,959 | ) | (7,537,049 | ) | ||||||||||||
| CAPITAL SHARE TRANSACTIONS | ||||||||||||||||||||||||
| Proceeds from sale of shares | ||||||||||||||||||||||||
Class P | 37,024,387 | 23,559,879 | 20,531,766 | 35,444,468 | 19,652,232 | 11,042,280 | ||||||||||||||||||
| Dividends and distribution reinvestments | ||||||||||||||||||||||||
Class P | 2,671,391 | 1,459,944 | 821,347 | 669,458 | 2,033,959 | 7,537,049 | ||||||||||||||||||
| Cost of shares repurchased | ||||||||||||||||||||||||
Class P | (38,092,744 | ) | (9,008,456 | ) | (54,347,302 | ) | (7,677,376 | ) | (30,738,180 | ) | (2,505,288 | ) | ||||||||||||
Net Increase (Decrease) in Net Assets from | 1,603,034 | 16,011,367 | (32,994,189 | ) | 28,436,550 | (9,051,989 | ) | 16,074,041 | ||||||||||||||||
NET INCREASE (DECREASE) IN NET ASSETS | 18,890,572 | 35,648,132 | (26,752,712 | ) | 29,412,942 | (12,029,572 | ) | 9,110,848 | ||||||||||||||||
| NET ASSETS | ||||||||||||||||||||||||
Beginning of Year | 193,537,734 | 157,889,602 | 165,168,329 | 135,755,387 | 73,586,425 | 64,475,577 | ||||||||||||||||||
End of Year | $212,428,306 | $193,537,734 | $138,415,617 | $165,168,329 | $61,556,853 | $73,586,425 | ||||||||||||||||||
Undistributed/Accumulated Net Investment Income (Loss) | $510,062 | $739,211 | $261,091 | $187,653 | $92,010 | ($94,893 | ) | |||||||||||||||||
See Notes to Financial Statements
C-12
Table of Contents
PACIFIC LIFE FUNDS
STATEMENTS OF CHANGES IN NET ASSETS (Continued)
| PL Small-Cap Growth Fund | PL Small-Cap Value Fund | PL Real Estate Fund | ||||||||||||||||||||||
| Year Ended March 31, 2013 | Year Ended March 31, 2012 | Year Ended March 31, 2013 | Year Ended March 31, 2012 | Year Ended March 31, 2013 | Year Ended March 31, 2012 | |||||||||||||||||||
| OPERATIONS | ||||||||||||||||||||||||
Net investment income (loss) | $91,168 | ($102,302 | ) | $2,177,458 | $1,236,211 | $737,699 | $519,888 | |||||||||||||||||
Net realized gain | 3,143,110 | 1,940,485 | 5,575,545 | 609,763 | 1,860,532 | 1,062,067 | ||||||||||||||||||
Change in net unrealized appreciation (depreciation) | 2,601,887 | (1,384,256 | ) | 11,150,447 | (727,008 | ) | 2,801,030 | 3,552,200 | ||||||||||||||||
Net Increase in Net Assets | 5,836,165 | 453,927 | 18,903,450 | 1,118,966 | 5,399,261 | 5,134,155 | ||||||||||||||||||
| DISTRIBUTIONS TO SHAREHOLDERS | ||||||||||||||||||||||||
| Net investment income | ||||||||||||||||||||||||
Class P | — | — | (1,785,180 | ) | (1,046,454 | ) | (725,336 | ) | (324,119 | ) | ||||||||||||||
| Net realized gains | ||||||||||||||||||||||||
Class P | — | — | — | — | — | — | ||||||||||||||||||
Net Decrease from Dividends and | — | — | (1,785,180 | ) | (1,046,454 | ) | (725,336 | ) | (324,119 | ) | ||||||||||||||
| CAPITAL SHARE TRANSACTIONS | ||||||||||||||||||||||||
| Proceeds from sale of shares | ||||||||||||||||||||||||
Class P | 11,986,420 | 6,252,737 | 23,891,241 | 13,399,076 | 4,275,582 | 11,623,068 | ||||||||||||||||||
| Dividends and distribution reinvestments | ||||||||||||||||||||||||
Class P | — | — | 1,785,180 | 1,046,454 | 725,336 | 324,119 | ||||||||||||||||||
| Cost of shares repurchased | ||||||||||||||||||||||||
Class P | (3,294,395 | ) | (2,691,970 | ) | (3,299,732 | ) | (4,613,313 | ) | (2,215,456 | ) | (5,938,153 | ) | ||||||||||||
Net Increase in Net Assets from | 8,692,025 | 3,560,767 | 22,376,689 | 9,832,217 | 2,785,462 | 6,009,034 | ||||||||||||||||||
NET INCREASE IN NET ASSETS | 14,528,190 | 4,014,694 | 39,494,959 | 9,904,729 | 7,459,387 | 10,819,070 | ||||||||||||||||||
| NET ASSETS | ||||||||||||||||||||||||
Beginning of Year | 36,369,851 | 32,355,157 | 86,151,825 | 76,247,096 | 52,678,965 | 41,859,895 | ||||||||||||||||||
End of Year | $50,898,041 | $36,369,851 | $125,646,784 | $86,151,825 | $60,138,352 | $52,678,965 | ||||||||||||||||||
Undistributed/Accumulated Net Investment Income (Loss) | $87,425 | ($8,199 | ) | $621,521 | $325,094 | $207,595 | $195,232 | |||||||||||||||||
See Notes to Financial Statements
C-13
Table of Contents
PACIFIC LIFE FUNDS
STATEMENTS OF CHANGES IN NET ASSETS (Continued)
| PL Emerging Markets Fund | PL International Large-Cap Fund | PL International Value Fund | ||||||||||||||||||||||
| Year Ended March 31, 2013 | Year Ended March 31, 2012 | Year Ended March 31, 2013 | Year Ended March 31, 2012 | Year Ended March 31, 2013 | Year Ended March 31, 2012 | |||||||||||||||||||
| OPERATIONS | ||||||||||||||||||||||||
Net investment income | $621,434 | $778,205 | $3,156,336 | $2,519,676 | $3,177,579 | $3,008,134 | ||||||||||||||||||
Net realized gain (loss) | 1,620,320 | 340,600 | 3,039,669 | (2,624,161 | ) | (1,855,843 | ) | (8,382,616 | ) | |||||||||||||||
Change in net unrealized appreciation (depreciation) | 4,867,393 | (2,935,849 | ) | 16,358,283 | 7,176,932 | 13,477,145 | 1,902,876 | |||||||||||||||||
Net Increase (Decrease) in Net Assets | 7,109,147 | (1,817,044 | ) | 22,554,288 | 7,072,447 | 14,798,881 | (3,471,606 | ) | ||||||||||||||||
| DISTRIBUTIONS TO SHAREHOLDERS | ||||||||||||||||||||||||
| Net investment income | ||||||||||||||||||||||||
Class P | (667,612 | ) | (436,891 | ) | (3,215,843 | ) | (2,241,781 | ) | (3,493,667 | ) | (3,217,735 | ) | ||||||||||||
| Net realized gains | ||||||||||||||||||||||||
Class P | — | (1,469,568 | ) | — | — | — | — | |||||||||||||||||
Net Decrease from Dividends and | (667,612 | ) | (1,906,459 | ) | (3,215,843 | ) | (2,241,781 | ) | (3,493,667 | ) | (3,217,735 | ) | ||||||||||||
| CAPITAL SHARE TRANSACTIONS | ||||||||||||||||||||||||
| Proceeds from sale of shares | ||||||||||||||||||||||||
Class P | 22,556,840 | 26,496,874 | 22,507,884 | 69,389,238 | 47,205,389 | 30,876,665 | ||||||||||||||||||
| Dividends and distribution reinvestments | ||||||||||||||||||||||||
Class P | 667,612 | 1,906,459 | 3,215,843 | 2,241,781 | 3,493,667 | 3,217,735 | ||||||||||||||||||
| Cost of shares repurchased | ||||||||||||||||||||||||
Class P | (4,339,098 | ) | (3,466,862 | ) | (50,043,057 | ) | (10,550,933 | ) | (26,573,122 | ) | (6,528,836 | ) | ||||||||||||
Net Increase (Decrease) in Net Assets from | 18,885,354 | 24,936,471 | (24,319,330 | ) | 61,080,086 | 24,125,934 | 27,565,564 | |||||||||||||||||
NET INCREASE (DECREASE) IN NET ASSETS | 25,326,889 | 21,212,968 | (4,980,885 | ) | 65,910,752 | 35,431,148 | 20,876,223 | |||||||||||||||||
| NET ASSETS | ||||||||||||||||||||||||
Beginning of Year | 85,483,234 | 64,270,266 | 203,943,758 | 138,033,006 | 111,118,504 | 90,242,281 | ||||||||||||||||||
End of Year | $110,810,123 | $85,483,234 | $198,962,873 | $203,943,758 | $146,549,652 | $111,118,504 | ||||||||||||||||||
Undistributed/Accumulated Net Investment Income (Loss) | ($277,253 | ) | ($165,916 | ) | $1,204,416 | $1,305,157 | $570,294 | $1,083,553 | ||||||||||||||||
See Notes to Financial Statements
C-14
Table of Contents
PACIFIC LIFE FUNDS
STATEMENTS OF CHANGES IN NET ASSETS (Continued)
| PL Currency Strategies Fund (1) | PL Global Absolute Return Fund (1) | PL Precious Metals Fund (1) | PL Alternative Strategies Fund (2) | |||||||||||||
| Period Ended March 31, 2013 | Period Ended March 31, 2013 | Period Ended March 31, 2013 | Period Ended March 31, 2013 | |||||||||||||
| OPERATIONS | ||||||||||||||||
Net investment income (loss) | ($248,279 | ) | $1,146,442 | $61,704 | ($49 | ) | ||||||||||
Net realized gain (loss) | 5,245,339 | 895,245 | (111,302 | ) | (5 | ) | ||||||||||
Change in net unrealized appreciation (depreciation) | (1,329,975 | ) | 1,117,956 | (12,234,642 | ) | (151 | ) | |||||||||
Net Increase (Decrease) in Net Assets | 3,667,085 | 3,159,643 | (12,284,240 | ) | (205 | ) | ||||||||||
| DISTRIBUTIONS TO SHAREHOLDERS | ||||||||||||||||
| Net investment income | ||||||||||||||||
Class A | — | — | — | — | ||||||||||||
Class C | — | — | — | — | ||||||||||||
Class P | — | (101,328 | ) | (9,365 | ) | — | ||||||||||
Advisor Class | — | — | — | — | ||||||||||||
| Net realized gains | ||||||||||||||||
Class A | — | — | — | — | ||||||||||||
Class C | — | — | — | — | ||||||||||||
Class P | — | — | — | — | ||||||||||||
Advisor Class | — | — | — | — | ||||||||||||
Net Decrease from Dividends and | — | (101,328 | ) | (9,365 | ) | — | ||||||||||
| CAPITAL SHARE TRANSACTIONS | ||||||||||||||||
| Proceeds from sale of shares | ||||||||||||||||
Class A | — | — | — | 10,000 | ||||||||||||
Class C | — | — | — | 10,000 | ||||||||||||
Class P | 115,338,018 | 169,320,302 | 78,481,614 | — | ||||||||||||
Advisor Class | — | — | — | 10,000 | ||||||||||||
| Dividends and distribution reinvestments | ||||||||||||||||
Class A | — | — | — | — | ||||||||||||
Class C | — | — | — | — | ||||||||||||
Class P | — | 101,328 | 9,365 | — | ||||||||||||
Advisor Class | — | — | — | — | ||||||||||||
| Cost of shares repurchased | ||||||||||||||||
Class A | — | — | — | — | ||||||||||||
Class C | — | — | — | — | ||||||||||||
Class P | (362,425 | ) | (554,615 | ) | (246,619 | ) | — | |||||||||
Advisor Class | — | — | — | — | ||||||||||||
Net Increase in Net Assets from | 114,975,593 | 168,867,015 | 78,244,360 | 30,000 | ||||||||||||
NET INCREASE IN NET ASSETS | 118,642,678 | 171,925,330 | 65,950,755 | 29,795 | ||||||||||||
| NET ASSETS | ||||||||||||||||
Beginning of Periods | — | — | — | — | ||||||||||||
End of Periods | $118,642,678 | $171,925,330 | $65,950,755 | $29,795 | ||||||||||||
Undistributed/Accumulated Net Investment Income (Loss) | $4,997,060 | $1,744,989 | $51,396 | $— | ||||||||||||
| (1) | Operations commenced on December 7, 2012. |
| (2) | Operations commenced on December 31, 2012. |
See Notes to Financial Statements
C-15
Table of Contents
PACIFIC LIFE FUNDS
FOR THE YEAR ENDED MARCH 31, 2013
| PL Inflation Managed Fund | ||||
| CASH FLOWS FROM OPERATING ACTIVITIES: | ||||
Net increase in net assets from operations | $16,720,844 | |||
| Adjustments to reconcile net increase in net assets from operations to net cash provided by operating activities: | ||||
Purchases of long-term securities | (283,436,466 | ) | ||
Proceeds from disposition of long-term securities | 447,656,255 | |||
Proceeds from securities sold short | 34,546,814 | |||
Proceeds of short-term securities, net | 4,675,390 | |||
Purchases to cover securities sold short | (34,545,095 | ) | ||
Increase in swap premiums | 162,319 | |||
Proceeds of written options | 322,241 | |||
Cost of closed and expired options | (532,004 | ) | ||
Litigation income | 6,674 | |||
Decrease in dividends and interest receivable | 773,984 | |||
Decrease in investments sold receivable | 766,448 | |||
Decrease in receivable due from adviser | 6,406 | |||
Decrease in prepaid expenses and other assets | 2,938 | |||
Decrease in payable for securities purchased | (51,297,530 | ) | ||
Decrease in payable due to brokers | (560,000 | ) | ||
Decrease in accrued advisory fees | (38,806 | ) | ||
Decrease in accrued administration fees | (14,552 | ) | ||
Increase in accrued services expenses | 14,612 | |||
Decrease in accrued custodian fees and expenses | (20,590 | ) | ||
Decrease in accrued transfer agency out-of-pocket expenses | (7,139 | ) | ||
Decrease in accrued legal, audit and tax service fees | (15,160 | ) | ||
Increase in accrued trustees’ fees and expenses and deferred compensation | 197 | |||
Decrease in accrued other payables | (5,673 | ) | ||
Change in net unrealized depreciation on investment securities | 1,454,034 | |||
Change in net unrealized depreciation on swaps | 89,387 | |||
Change in net unrealized appreciation on written options | (133,521 | ) | ||
Change in net unrealized appreciation on foreign currencies | (233,267 | ) | ||
Net realized gain on investment securities | (13,790,300 | ) | ||
Net realized gain on closed short positions | (1,719 | ) | ||
Net realized gain on swaps | (93,300 | ) | ||
Net realized gain on written options | (250,443 | ) | ||
Net realized loss on foreign currency | 215,441 | |||
Increase in variation margin payable | 115,610 | |||
Net amortization on investments | (138,720 | ) | ||
Net cash provided by operating activities | 122,415,309 | |||
| CASH FLOWS FROM FINANCING ACTIVITIES (2): | ||||
Proceeds from shares sold | 55,283,662 | |||
Payment of shares redeemed | (192,998,689 | ) | ||
Increase in payable for sale-buyback financing transactions | 15,204,972 | |||
Net cash used in financing activities | (122,510,055 | ) | ||
NET DECREASE IN CASH AND FOREIGN CURRENCY | (94,746 | ) | ||
| CASH AND FOREIGN CURRENCY: | ||||
Beginning of Year | 168,380 | |||
End of Year | $73,634 | |||
| (1) | Information on financial transactions which have been settled through the receipt or disbursement of cash is presented in the Statement of Cash Flows. The cash amounts shown in the Statement of Cash Flows are the amounts included within the Statements of Assets and Liabilities and include cash and foreign currency, if any, on hand at the custodian bank and do not include any short-term investments. The PL Inflation Managed Fund has not met the exemption criteria under the Financial Accounting Standards Board Accounting Standards Codification Topic 230, Statement of Cash Flows, and therefore includes a Statement of Cash Flows. All other funds have met the exemption criteria. Interest expense paid by the PL Inflation Managed Fund was $63,006. |
| (2) | Reinvestment of dividends for the PL Inflation Managed Fund was $22,789,812. |
See Notes to Financial Statements
C-16
Table of Contents
PACIFIC LIFE FUNDS
Selected per share, ratios and supplemental data for each year or period ended March 31, were as follows:
| For the Year or Period Ended | Net Asset Value, Beginning of Year or Period | Net Investment Income (Loss) (2) | Net Realized and Unrealized Gain (Loss) | Total from Investment Operations | Distributions from Net Investment Income | Distributions from Capital Gains | Total Distributions | Net Asset Value, End of Year or Period | Total Returns (3) | Net Assets, End of Year or Period (in thousands) | Ratios of Expenses Before Expense Reductions to Average Net Assets (4) | Ratios of Expenses After Expense Reductions to Average Net Assets (4), (5) | Ratios of Net Investment Income (Loss) to Average Net Assets (4) | Portfolio Turnover Rates | ||||||||||||||||||||||||||||||||||||
PL Floating Rate Loan Fund |
| |||||||||||||||||||||||||||||||||||||||||||||||||
| 4/1/2012 - 3/31/2013 | $10.10 | $0.46 | $0.18 | $0.64 | ($0.47 | ) | ($0.03 | ) | ($0.50 | ) | $10.24 | 6.40 | % | $110,204 | 1.03% | 0.80% | 4.45% | 94.47 | % | |||||||||||||||||||||||||||||||
| 4/1/2011 - 3/31/2012 | 10.12 | 0.43 | (0.06 | ) | 0.37 | (0.39 | ) | — | (0.39 | ) | 10.10 | 3.80 | % | 112,088 | 1.04% | 0.80% | 4.33% | 44.93 | % | |||||||||||||||||||||||||||||||
| 4/1/2010 - 3/31/2011 | 9.88 | 0.34 | 0.19 | 0.53 | (0.29 | ) | — | (0.29 | ) | 10.12 | 5.51 | % | 86,066 | 1.22% | 0.90% | 4.29% | 92.44 | % | ||||||||||||||||||||||||||||||||
| 4/1/2009 - 3/31/2010 | 8.18 | 0.45 | 1.70 | 2.15 | (0.45 | ) | — | (0.45 | ) | 9.88 | 26.70 | % | 53,122 | 1.54% | 1.30% | 4.78% | 118.03 | % | ||||||||||||||||||||||||||||||||
| 6/30/2008 - 3/31/2009 | 10.00 | 0.39 | (1.82 | ) | (1.43 | ) | (0.39 | ) | — | (0.39 | ) | 8.18 | (14.37 | %) | 27,811 | 1.53% | 1.30% | 5.90% | 56.30 | % | ||||||||||||||||||||||||||||||
PL Inflation Managed Fund |
| |||||||||||||||||||||||||||||||||||||||||||||||||
| 4/1/2012 - 3/31/2013 | $10.79 | $0.21 | $0.52 | $0.73 | ($0.51 | ) | ($1.28 | ) | ($1.79 | ) | $9.73 | 6.79 | % | $164,281 | 0.69% | 0.58% | 1.95% | 111.18 | % | |||||||||||||||||||||||||||||||
| 4/1/2011 - 3/31/2012 | 10.53 | 0.31 | 0.85 | 1.16 | (0.40 | ) | (0.50 | ) | (0.90 | ) | 10.79 | 11.11 | % | 287,956 | 0.67% | 0.56% | 2.83% | 372.47 | % | |||||||||||||||||||||||||||||||
| 4/1/2010 - 3/31/2011 | 10.10 | 0.24 | 0.61 | 0.85 | (0.21 | ) | (0.21 | ) | (0.42 | ) | 10.53 | 8.56 | % | 229,356 | 0.82% | 0.64% | 2.31% | 322.90 | % | |||||||||||||||||||||||||||||||
| 4/1/2009 - 3/31/2010 | 9.59 | 0.29 | 0.62 | 0.91 | (0.40 | ) | — | (0.40 | ) | 10.10 | 9.68 | % | 149,453 | 1.21% | 0.95% | 2.90% | 299.61 | % | ||||||||||||||||||||||||||||||||
| 4/1/2008 - 3/31/2009 | 11.08 | 0.39 | (0.80 | ) | (0.41 | ) | (0.41 | ) | (0.67 | ) | (1.08 | ) | 9.59 | (3.85 | %) | 81,266 | 1.35% | 1.01% | 3.94% | 745.76 | % | |||||||||||||||||||||||||||||
PL Managed Bond Fund |
| |||||||||||||||||||||||||||||||||||||||||||||||||
| 4/1/2012 - 3/31/2013 | $10.86 | $0.20 | $0.55 | $0.75 | ($0.35 | ) | ($0.15 | ) | ($0.50 | ) | $11.11 | 6.85 | % | $565,285 | 0.66% | 0.56% | 1.75% | 495.01 | % | |||||||||||||||||||||||||||||||
| 4/1/2011 - 3/31/2012 | 10.75 | 0.25 | 0.15 | 0.40 | (0.29 | ) | — | (0.29 | ) | 10.86 | 4.02 | % | 486,215 | 0.67% | 0.55% | 2.33% | 519.00 | % | ||||||||||||||||||||||||||||||||
| 4/1/2010 - 3/31/2011 | 10.75 | 0.24 | 0.43 | 0.67 | (0.30 | ) | (0.37 | ) | (0.67 | ) | 10.75 | 6.31 | % | 378,982 | 0.82% | 0.63% | 2.16% | 501.72 | % | |||||||||||||||||||||||||||||||
| 4/1/2009 - 3/31/2010 | 9.70 | 0.30 | 1.48 | 1.78 | (0.50 | ) | (0.23 | ) | (0.73 | ) | 10.75 | 18.68 | % | 235,957 | 1.22% | 0.95% | 2.86% | 351.53 | % | |||||||||||||||||||||||||||||||
| 4/1/2008 - 3/31/2009 | 10.73 | 0.43 | (0.45 | ) | (0.02 | ) | (0.55 | ) | (0.46 | ) | (1.01 | ) | 9.70 | 0.07 | % | 137,724 | 1.30% | 1.01% | 4.36% | 441.01 | % | |||||||||||||||||||||||||||||
PL Short Duration Bond Fund |
| |||||||||||||||||||||||||||||||||||||||||||||||||
| 4/1/2012 - 3/31/2013 | $10.07 | $0.11 | $0.08 | $0.19 | ($0.14 | ) | ($0.00 | )(7) | ($0.14 | ) | $10.12 | 1.86 | % | $223,601 | 0.65% | 0.55% | 1.08% | 62.52 | % | |||||||||||||||||||||||||||||||
| 4/1/2011 - 3/31/2012 | 10.04 | 0.11 | 0.05 | 0.16 | (0.12 | ) | (0.01 | ) | (0.13 | ) | 10.07 | 1.62 | % | 155,368 | 0.68% | 0.55% | 1.14% | 150.23 | % | |||||||||||||||||||||||||||||||
| 4/1/2010 - 3/31/2011 | 10.00 | 0.10 | 0.06 | 0.16 | (0.08 | ) | (0.04 | ) | (0.12 | ) | 10.04 | 1.57 | % | 121,133 | 0.81% | 0.64% | 1.00% | 195.72 | % | |||||||||||||||||||||||||||||||
| 4/1/2009 - 3/31/2010 | 9.69 | 0.18 | 0.33 | 0.51 | (0.20 | ) | — | (0.20 | ) | 10.00 | 5.27 | % | 75,674 | 1.22% | 0.95% | 1.84% | 167.12 | % | ||||||||||||||||||||||||||||||||
| 4/1/2008 - 3/31/2009 | 10.22 | 0.32 | (0.25 | ) | 0.07 | (0.31 | ) | (0.29 | ) | (0.60 | ) | 9.69 | 0.75 | % | 47,355 | 1.26% | 1.02% | 3.20% | 146.36 | % | ||||||||||||||||||||||||||||||
PL Emerging Markets Debt Fund (1) |
| |||||||||||||||||||||||||||||||||||||||||||||||||
| 6/29/2012 - 3/31/2013 | $10.00 | $0.37 | $0.46 | $0.83 | ($0.27 | ) | ($0.03 | ) | ($0.30 | ) | $10.53 | 8.24 | % | $85,846 | 1.17% | 0.94% | 4.67% | 61.02 | % | |||||||||||||||||||||||||||||||
PL Comstock Fund |
| |||||||||||||||||||||||||||||||||||||||||||||||||
| 4/1/2012 - 3/31/2013 | $12.47 | $0.19 | $1.91 | $2.10 | ($0.17 | ) | $— | ($0.17 | ) | $14.40 | 16.96 | % | $261,671 | 0.97% | 0.89% | 1.51% | 34.81 | % | ||||||||||||||||||||||||||||||||
| 4/1/2011 - 3/31/2012 | 12.13 | 0.17 | 0.32 | 0.49 | (0.15 | ) | — | (0.15 | ) | 12.47 | 4.22 | % | 207,330 | 0.99% | 0.89% | 1.47% | 23.54 | % | ||||||||||||||||||||||||||||||||
| 4/1/2010 - 3/31/2011 | 10.69 | 0.13 | 1.41 | 1.54 | (0.10 | ) | — | (0.10 | ) | 12.13 | 14.55 | % | 166,465 | 1.13% | 0.99% | 1.16% | 30.58 | % | ||||||||||||||||||||||||||||||||
| 4/1/2009 - 3/31/2010 | 6.95 | 0.09 | 3.74 | 3.83 | (0.09 | ) | — | (0.09 | ) | 10.69 | 55.34 | % | 128,169 | 1.51% | 1.30% | 0.93% | 27.65 | % | ||||||||||||||||||||||||||||||||
| 4/1/2008 - 3/31/2009 | 11.84 | 0.16 | (4.89 | ) | (4.73 | ) | (0.16 | ) | — | (0.16 | ) | 6.95 | (40.11 | %) | 74,862 | 1.58% | 1.37% | 1.68% | 59.96 | % | ||||||||||||||||||||||||||||||
PL Growth LT Fund |
| |||||||||||||||||||||||||||||||||||||||||||||||||
| 4/1/2012 - 3/31/2013 | $13.12 | $0.08 | $0.90 | $0.98 | ($0.17 | ) | $— | ($0.17 | ) | $13.93 | 7.53 | % | $48,611 | 0.86% | 0.70% | 0.63% | 71.67 | % | ||||||||||||||||||||||||||||||||
| 4/1/2011 - 3/31/2012 | 12.42 | 0.06 | 0.71 | 0.77 | (0.07 | ) | — | (0.07 | ) | 13.12 | 6.26 | % | 108,340 | 0.85% | 0.70% | 0.54% | 83.66 | % | ||||||||||||||||||||||||||||||||
| 4/1/2010 - 3/31/2011 | 11.21 | 0.07 | 1.14 | 1.21 | — | — | — | 12.42 | 10.79 | % | 115,576 | 0.95% | 0.79% | 0.58% | 82.71 | % | ||||||||||||||||||||||||||||||||||
| 4/1/2009 - 3/31/2010 | 7.74 | 0.02 | 3.60 | 3.62 | (0.15 | ) | — | (0.15 | ) | 11.21 | 47.26 | % | 89,219 | 1.37% | 1.10% | 0.19% | 60.31 | % | ||||||||||||||||||||||||||||||||
| 4/1/2008 - 3/31/2009 | 12.63 | 0.03 | (4.63 | ) | (4.60 | ) | — | (0.29 | ) | (0.29 | ) | 7.74 | (37.27 | %) | 74,158 | 1.42% | 1.15% | 0.32% | 80.89 | % | ||||||||||||||||||||||||||||||
PL Large-Cap Growth Fund |
| |||||||||||||||||||||||||||||||||||||||||||||||||
| 4/1/2012 - 3/31/2013 | $10.30 | $0.03 | $0.70 | $0.73 | $— | ($0.63 | ) | ($0.63 | ) | $10.40 | 7.66 | % | $142,398 | 0.99% | 0.81% | 0.31% | 130.53 | % | ||||||||||||||||||||||||||||||||
| 4/1/2011 - 3/31/2012 | 9.23 | (0.02 | ) | 1.25 | 1.23 | — | (0.16 | ) | (0.16 | ) | 10.30 | 13.65 | % | 129,222 | 1.00% | 0.88% | (0.26%) | 76.21 | % | |||||||||||||||||||||||||||||||
| 4/1/2010 - 3/31/2011 | 7.71 | (0.01 | ) | 1.53 | 1.52 | — | — | — | 9.23 | 19.72 | % | 99,101 | 1.12% | 0.95% | (0.11%) | 101.69 | % | |||||||||||||||||||||||||||||||||
| 4/1/2009 - 3/31/2010 | 5.44 | (0.03 | ) | 2.30 | 2.27 | — | — | — | 7.71 | 41.73 | % | 61,106 | 1.59% | 1.28% | (0.38%) | 115.83 | % | |||||||||||||||||||||||||||||||||
| 4/1/2008 - 3/31/2009 | 9.24 | (0.05 | ) | (3.75 | ) | (3.80 | ) | — | — | — | 5.44 | (41.13 | %) | 16,515 | 1.81% | 1.37% | (0.61%) | 179.61 | % | |||||||||||||||||||||||||||||||
PL Large-Cap Value Fund |
| |||||||||||||||||||||||||||||||||||||||||||||||||
| 4/1/2012 - 3/31/2013 | $12.31 | $0.23 | $1.66 | $1.89 | ($0.24 | ) | $— | ($0.24 | ) | $13.96 | 15.54 | % | $324,085 | 0.87% | 0.80% | 1.80% | 26.17 | % | ||||||||||||||||||||||||||||||||
| 4/1/2011 - 3/31/2012 | 11.59 | 0.22 | 0.71 | 0.93 | (0.21 | ) | — | (0.21 | ) | 12.31 | 8.21 | % | 262,917 | 0.89% | 0.80% | 1.96% | 20.28 | % | ||||||||||||||||||||||||||||||||
| 4/1/2010 - 3/31/2011 | 10.42 | 0.16 | 1.15 | 1.31 | (0.14 | ) | — | (0.14 | ) | 11.59 | 12.69 | % | 228,436 | 1.01% | 0.89% | 1.56% | 18.76 | % | ||||||||||||||||||||||||||||||||
| 4/1/2009 - 3/31/2010 | 7.35 | 0.14 | 3.07 | 3.21 | (0.14 | ) | — | (0.14 | ) | 10.42 | 43.79 | % | 162,312 | 1.38% | 1.20% | 1.52% | 16.28 | % | ||||||||||||||||||||||||||||||||
| 4/1/2008 - 3/31/2009 | 11.59 | 0.16 | (4.27 | ) | (4.11 | ) | (0.12 | ) | (0.01 | ) | (0.13 | ) | 7.35 | (35.61 | %) | 62,931 | 1.48% | 1.25% | 1.63% | 38.49 | % | |||||||||||||||||||||||||||||
PL Main Street Core Fund |
| |||||||||||||||||||||||||||||||||||||||||||||||||
| 4/1/2012 - 3/31/2013 | $11.26 | $0.14 | $0.96 | $1.10 | ($0.16 | ) | $— | ($0.16 | ) | $12.20 | 9.93 | % | $212,428 | 0.68% | 0.60% | 1.21% | 59.84 | % | ||||||||||||||||||||||||||||||||
| 4/1/2011 - 3/31/2012 | 10.13 | 0.10 | 1.11 | 1.21 | (0.08 | ) | — | (0.08 | ) | 11.26 | 12.12 | % | 193,538 | 0.70% | 0.60% | 1.00% | 47.65 | % | ||||||||||||||||||||||||||||||||
| 4/1/2010 - 3/31/2011 | 9.00 | 0.09 | 1.10 | 1.19 | (0.06 | ) | — | (0.06 | ) | 10.13 | 13.28 | % | 157,890 | 0.83% | 0.70% | 0.93% | 58.13 | % | ||||||||||||||||||||||||||||||||
| 4/1/2009 - 3/31/2010 | 6.11 | 0.07 | 2.89 | 2.96 | (0.07 | ) | — | (0.07 | ) | 9.00 | 48.57 | % | 146,028 | 1.23% | 1.00% | 0.89% | 130.37 | % | ||||||||||||||||||||||||||||||||
| 4/1/2008 - 3/31/2009 | 9.91 | 0.09 | (3.81 | ) | (3.72 | ) | (0.08 | ) | — | (0.08 | ) | 6.11 | (37.66 | %) | 85,261 | 1.41% | 1.06% | 1.07% | 101.22 | % | ||||||||||||||||||||||||||||||
| See Notes to Financial Statements | See explanation of symbols and terms, if any, on page C-19 |
C-17
Table of Contents
PACIFIC LIFE FUNDS
FINANCIAL HIGHLIGHTS (1) (Continued)
Selected per share, ratios and supplemental data for each year or period ended March 31, were as follows:
| For the Year or Period Ended | Net Asset Value, Beginning of Year or Period | Net Investment Income (Loss) (2) | Net Realized and Unrealized Gain (Loss) | Total from Investment Operations | Distributions from Net Investment Income | Distributions from Capital Gains | Total Distributions | Net Asset Value, End of Year or Period | Total Returns (3) | Net Assets, End of Year or Period (in thousands) | Ratios of Expenses Before Expense Reductions to Average Net Assets (4) | Ratios of Expenses After Expense Reductions to Average Net Assets (4), (5) | Ratios of Net Investment Income (Loss) to Average Net Assets (4) | Portfolio Turnover Rates | ||||||||||||||||||||||||||||||||||||
PL Mid-Cap Equity Fund (6) |
| |||||||||||||||||||||||||||||||||||||||||||||||||
| 4/1/2012 - 3/31/2013 | $10.29 | $0.06 | $0.72 | $0.78 | ($0.07 | ) | $— | ($0.07 | ) | $11.00 | 7.63 | % | $138,416 | 0.90% | 0.80% | 0.65% | 191.01 | % | ||||||||||||||||||||||||||||||||
| 4/1/2011 - 3/31/2012 | 10.46 | 0.05 | (0.18 | ) | (0.13 | ) | (0.04 | ) | — | (0.04 | ) | 10.29 | (1.17 | %) | 165,168 | 0.89% | 0.80% | 0.51% | 102.11 | % | ||||||||||||||||||||||||||||||
| 4/1/2010 - 3/31/2011 | 8.66 | 0.08 | 1.79 | 1.87 | (0.07 | ) | — | (0.07 | ) | 10.46 | 21.70 | % | 135,755 | 1.02% | �� | 0.89% | 0.87% | 87.04 | % | |||||||||||||||||||||||||||||||
| 4/1/2009 - 3/31/2010 | 5.33 | 0.03 | 3.34 | 3.37 | (0.04 | ) | — | (0.04 | ) | 8.66 | 63.29 | % | 101,650 | 1.41% | 1.20% | 0.44% | 74.00 | % | ||||||||||||||||||||||||||||||||
| 4/1/2008 - 3/31/2009 | 8.92 | 0.07 | (3.58 | ) | (3.51 | ) | (0.08 | ) | (0.00 | )(7) | (0.08 | ) | 5.33 | (39.44 | %) | 59,135 | 1.52% | 1.26% | 1.01% | 82.26 | % | |||||||||||||||||||||||||||||
PL Mid-Cap Growth Fund |
| |||||||||||||||||||||||||||||||||||||||||||||||||
| 4/1/2012 - 3/31/2013 | $8.87 | $0.05 | ($0.03 | ) | $0.02 | ($0.02 | ) | ($0.29 | ) | ($0.31 | ) | $8.58 | 0.61 | % | $61,557 | 1.00% | 0.85% | 0.60% | 48.19 | % | ||||||||||||||||||||||||||||||
| 4/1/2011 - 3/31/2012 | 10.28 | (0.02 | ) | (0.28 | ) | (0.30 | ) | (0.05 | ) | (1.06 | ) | (1.11 | ) | 8.87 | (1.08 | %) | 73,586 | 0.98% | 0.85% | (0.21%) | 26.59 | % | ||||||||||||||||||||||||||||
| 4/1/2010 - 3/31/2011 | 8.41 | 0.02 | 2.83 | 2.85 | (0.02 | ) | (0.96 | ) | (0.98 | ) | 10.28 | 35.16 | % | 64,476 | 1.17% | 0.95% | 0.24% | 44.37 | % | |||||||||||||||||||||||||||||||
| 4/1/2009 - 3/31/2010 | 4.98 | (0.03 | ) | 3.56 | 3.53 | — | (0.10 | ) | (0.10 | ) | 8.41 | 70.89 | % | 54,994 | 1.53% | 1.25% | (0.42%) | 31.79 | % | |||||||||||||||||||||||||||||||
| 4/1/2008 - 3/31/2009 | 9.31 | (0.05 | ) | (3.57 | ) | (3.62 | ) | — | (0.71 | ) | (0.71 | ) | 4.98 | (40.02 | %) | 18,873 | 1.80% | 1.34% | (0.60%) | 47.92 | % | |||||||||||||||||||||||||||||
PL Small-Cap Growth Fund |
| |||||||||||||||||||||||||||||||||||||||||||||||||
| 4/1/2012 - 3/31/2013 | $11.86 | $0.03 | $1.40 | $1.43 | $— | $— | $— | $13.29 | 12.06 | % | $50,898 | 0.90% | 0.75% | 0.21% | 91.58 | % | ||||||||||||||||||||||||||||||||||
| 4/1/2011 - 3/31/2012 | 11.90 | (0.03 | ) | (0.01 | ) | (0.04 | ) | — | — | — | 11.86 | (0.34 | %) | 36,370 | 0.93% | 0.75% | (0.31%) | 66.60 | % | |||||||||||||||||||||||||||||||
| 4/1/2010 - 3/31/2011 | 9.41 | (0.06 | ) | 2.55 | 2.49 | — | — | — | 11.90 | 26.46 | % | 32,355 | 1.11% | 0.84% | (0.63%) | 85.58 | % | |||||||||||||||||||||||||||||||||
| 4/1/2009 - 3/31/2010 | 5.88 | (0.06 | ) | 3.59 | 3.53 | — | — | — | 9.41 | 60.03 | % | 25,691 | 1.56% | 1.15% | (0.81%) | 87.50 | % | |||||||||||||||||||||||||||||||||
| 4/1/2008 - 3/31/2009 | 9.12 | (0.07 | ) | (3.17 | ) | (3.24 | ) | — | — | — | 5.88 | (35.53 | %) | 24,046 | 1.71% | 1.28% | (0.96%) | 72.93 | % | |||||||||||||||||||||||||||||||
PL Small-Cap Value Fund |
| |||||||||||||||||||||||||||||||||||||||||||||||||
| 4/1/2012 - 3/31/2013 | $10.58 | $0.22 | $1.52 | $1.74 | ($0.17 | ) | $— | ($0.17 | ) | $12.15 | 16.72 | % | $125,647 | 1.00% | 0.90% | 2.08% | 38.47 | % | ||||||||||||||||||||||||||||||||
| 4/1/2011 - 3/31/2012 | 10.60 | 0.16 | (0.05 | ) | 0.11 | (0.13 | ) | — | (0.13 | ) | 10.58 | 1.19 | % | 86,152 | 1.02% | 0.90% | 1.59% | 20.85 | % | |||||||||||||||||||||||||||||||
| 4/1/2010 - 3/31/2011 | 8.57 | 0.16 | 1.98 | 2.14 | (0.11 | ) | — | (0.11 | ) | 10.60 | 25.11 | % | 76,247 | 1.13% | 0.97% | 1.71% | 31.06 | % | ||||||||||||||||||||||||||||||||
| 4/1/2009 - 3/31/2010 | 5.49 | 0.13 | 3.06 | 3.19 | (0.11 | ) | — | (0.11 | ) | 8.57 | 58.28 | % | 38,173 | 1.58% | 1.30% | 1.82% | 31.57 | % | ||||||||||||||||||||||||||||||||
| 4/1/2008 - 3/31/2009 | 8.80 | 0.16 | (3.34 | ) | (3.18 | ) | (0.13 | ) | — | (0.13 | ) | 5.49 | (36.39 | %) | 27,018 | 1.73% | 1.34% | 2.21% | 47.41 | % | ||||||||||||||||||||||||||||||
PL Real Estate Fund |
| |||||||||||||||||||||||||||||||||||||||||||||||||
| 4/1/2012 - 3/31/2013 | $12.59 | $0.17 | $1.08 | $1.25 | ($0.17 | ) | $— | ($0.17 | ) | $13.67 | 9.98 | % | $60,138 | 1.16% | 1.05% | 1.35% | 23.31 | % | ||||||||||||||||||||||||||||||||
| 4/1/2011 - 3/31/2012 | 11.46 | 0.13 | 1.08 | 1.21 | (0.08 | ) | — | (0.08 | ) | 12.59 | 10.62 | % | 52,679 | 1.18% | 1.05% | 1.13% | 23.69 | % | ||||||||||||||||||||||||||||||||
| 4/1/2010 - 3/31/2011 | 9.24 | 0.08 | 2.23 | 2.31 | (0.09 | ) | — | (0.09 | ) | 11.46 | 25.16 | % | 41,860 | 1.34% | 1.14% | 0.77% | 32.30 | % | ||||||||||||||||||||||||||||||||
| 4/1/2009 - 3/31/2010 | 4.60 | 0.12 | 4.64 | 4.76 | (0.12 | ) | — | (0.12 | ) | 9.24 | 104.32 | % | 36,352 | 1.76% | 1.45% | 1.68% | 26.55 | % | ||||||||||||||||||||||||||||||||
| 4/1/2008 - 3/31/2009 | 11.25 | 0.15 | (6.65 | ) | (6.50 | ) | (0.15 | )(8) | — | (0.15 | ) | 4.60 | (58.24 | %) | 20,775 | 1.89% | 1.51% | 1.79% | 42.37 | % | ||||||||||||||||||||||||||||||
PL Emerging Markets Fund |
| |||||||||||||||||||||||||||||||||||||||||||||||||
| 4/1/2012 - 3/31/2013 | $13.55 | $0.08 | $0.68 | $0.76 | ($0.09 | ) | $— | ($0.09 | ) | $14.22 | 5.60 | % | $110,810 | 1.36% | 0.95% | 0.62% | 40.46 | % | ||||||||||||||||||||||||||||||||
| 4/1/2011 - 3/31/2012 | 14.68 | 0.14 | (0.95 | ) | (0.81 | ) | (0.07 | ) | (0.25 | ) | (0.32 | ) | 13.55 | (5.15 | %) | 85,483 | 1.49% | 0.95% | 1.09% | 29.84 | % | |||||||||||||||||||||||||||||
| 4/1/2010 - 3/31/2011 | 12.19 | 0.11 | 2.64 | 2.75 | (0.26 | ) | — | (0.26 | ) | 14.68 | 22.53 | % | 64,270 | 1.56% | 1.04% | 0.80% | 45.98 | % | ||||||||||||||||||||||||||||||||
| 4/1/2009 - 3/31/2010 | 6.54 | 0.06 | 5.66 | 5.72 | (0.07 | ) | — | (0.07 | ) | 12.19 | 87.45 | % | 47,714 | 2.15% | 1.35% | 0.57% | 55.24 | % | ||||||||||||||||||||||||||||||||
| 4/1/2008 - 3/31/2009 | 13.58 | 0.11 | (5.39 | ) | (5.28 | ) | (0.07 | ) | (1.69 | ) | (1.76 | ) | 6.54 | (42.31 | %) | 30,820 | 2.34% | 1.42% | 1.18% | 61.50 | % | |||||||||||||||||||||||||||||
PL International Large-Cap Fund |
| |||||||||||||||||||||||||||||||||||||||||||||||||
| 4/1/2012 - 3/31/2013 | $15.12 | $0.23 | $1.40 | $1.63 | ($0.27 | ) | $— | ($0.27 | ) | $16.48 | 10.88 | % | $198,963 | 1.13% | 1.00% | 1.55% | 27.63 | % | ||||||||||||||||||||||||||||||||
| 4/1/2011 - 3/31/2012 | 15.37 | 0.22 | (0.30 | ) | (0.08 | ) | (0.17 | ) | — | (0.17 | ) | 15.12 | (0.32 | %) | 203,944 | 1.17% | 1.00% | 1.52% | 23.96 | % | ||||||||||||||||||||||||||||||
| 4/1/2010 - 3/31/2011 | 13.83 | 0.16 | 1.52 | 1.68 | (0.14 | ) | — | (0.14 | ) | 15.37 | 12.36 | % | 138,033 | 1.30% | 1.09% | 1.16% | 33.73 | % | ||||||||||||||||||||||||||||||||
| 4/1/2009 - 3/31/2010 | 9.17 | 0.16 | 4.64 | 4.80 | (0.14 | ) | — | (0.14 | ) | 13.83 | 52.64 | % | 108,002 | 1.72% | 1.40% | 1.26% | 24.61 | % | ||||||||||||||||||||||||||||||||
| 4/1/2008 - 3/31/2009 | 15.55 | 0.17 | (6.37 | ) | (6.20 | ) | (0.06 | ) | (0.12 | ) | (0.18 | ) | 9.17 | (40.24 | %) | 65,124 | 1.82% | 1.46% | 1.39% | 25.95 | % | |||||||||||||||||||||||||||||
PL International Value Fund |
| |||||||||||||||||||||||||||||||||||||||||||||||||
| 4/1/2012 - 3/31/2013 | $8.62 | $0.20 | $0.51 | $0.71 | ($0.23 | ) | $— | ($0.23 | ) | $9.10 | 8.26 | % | $146,550 | 0.94% | 0.80% | 2.30% | 65.56 | % | ||||||||||||||||||||||||||||||||
| 4/1/2011 - 3/31/2012 | 9.51 | 0.26 | (0.89 | ) | (0.63 | ) | (0.26 | ) | — | (0.26 | ) | 8.62 | (6.20 | %) | 111,119 | 1.02% | 0.80% | 3.06% | 63.04 | % | ||||||||||||||||||||||||||||||
| 4/1/2010 - 3/31/2011 | 9.19 | 0.18 | 0.35 | 0.53 | (0.21 | ) | — | (0.21 | ) | 9.51 | 5.99 | % | 90,242 | 1.14% | 0.90% | 2.01% | 149.95 | % | ||||||||||||||||||||||||||||||||
| 4/1/2009 - 3/31/2010 | 6.14 | 0.19 | 3.00 | 3.19 | (0.14 | ) | — | (0.14 | ) | 9.19 | 52.10 | % | 86,284 | 1.56% | 1.20% | 2.28% | 59.92 | % | ||||||||||||||||||||||||||||||||
| 4/1/2008 - 3/31/2009 | 12.82 | 0.26 | (6.72 | ) | (6.46 | ) | (0.22 | ) | (0.00 | )(7) | (0.22 | ) | 6.14 | (50.74 | %) | 78,604 | 1.58% | 1.27% | 2.82% | 31.43 | % | |||||||||||||||||||||||||||||
PL Currency Strategies Fund (1) |
| |||||||||||||||||||||||||||||||||||||||||||||||||
| 12/7/2012 - 3/31/2013 | $10.00 | ($0.02 | ) | $0.34 | $0.32 | $— | $— | $— | $10.32 | 3.20 | % | $118,643 | 0.94% | 0.85% | (0.69%) | 49.21 | % | |||||||||||||||||||||||||||||||||
PL Global Absolute Return Fund (1) |
| |||||||||||||||||||||||||||||||||||||||||||||||||
| 12/7/2012 - 3/31/2013 | $10.00 | $0.07 | $0.13 | $0.20 | ($0.01 | ) | $— | ($0.01 | ) | $10.19 | 1.96 | % | $171,925 | 1.20% | 1.06% | 2.25% | 37.92 | % | ||||||||||||||||||||||||||||||||
PL Precious Metals Fund (1) |
| |||||||||||||||||||||||||||||||||||||||||||||||||
| 12/7/2012 - 3/31/2013 | $10.00 | $0.01 | ($1.79 | ) | ($1.78 | ) | ($0.00 | )(7) | $— | ($0.00 | )(7) | $8.22 | (17.79 | %) | $65,951 | 1.12% | 0.88% | 0.31% | 3.43 | % | ||||||||||||||||||||||||||||||
PL Alternative Strategies Fund (1) |
| |||||||||||||||||||||||||||||||||||||||||||||||||
| Class A: | ||||||||||||||||||||||||||||||||||||||||||||||||||
| 12/31/2012 - 3/31/2013 | $10.00 | ($0.01 | ) | ($0.05 | ) | ($0.06 | ) | $— | $— | $— | $9.94 | (0.60 | %) | $10 | 950.88% | 0.85% | (0.50%) | 14.84 | % | |||||||||||||||||||||||||||||||
Class C: |
| |||||||||||||||||||||||||||||||||||||||||||||||||
| 12/31/2012 - 3/31/2013 | $10.00 | ($0.03 | ) | ($0.05 | ) | ($0.08 | ) | $— | $— | $— | $9.92 | (0.80 | %) | $10 | 951.64% | 1.60% | (1.26%) | 14.84 | % | |||||||||||||||||||||||||||||||
Advisor Class: |
| |||||||||||||||||||||||||||||||||||||||||||||||||
| 12/31/2012 - 3/31/2013 | $10.00 | ($0.01 | ) | ($0.05 | ) | ($0.06 | ) | $— | $— | $— | $9.94 | (0.60 | %) | $10 | 950.64% | 0.60% | (0.26%) | 14.84 | % | |||||||||||||||||||||||||||||||
| See Notes to Financial Statements | See explanation of symbols and terms, if any, on page C-19 |
C-18
Table of Contents
PACIFIC LIFE FUNDS
FINANCIAL HIGHLIGHTS (1) (Continued)
| (1) | All the funds covered in this report, except PL Alternative Strategies Fund, currently offer Class P shares only. Effective July 2, 2010, all Class A shares of these funds were converted to Class P shares. Performance information prior to the conversion for these funds pertains to Class A shares and reflects the fees and expenses associated with that share class. The PL Emerging Markets Debt Fund commenced operations on June 29, 2012. The PL Currency Strategies, PL Global Absolute Return and PL Precious Metals Funds commenced operations on December 7, 2012. The PL Alternative Strategies Fund commenced operations on December 31, 2012. |
| (2) | Net investment income (loss) per share has been calculated using the average shares method. |
| (3) | The total returns include reinvestment of all dividends and capital gain distributions, if any, and do not include deductions of any applicable sales charges. Total returns are not annualized for periods less than one full year. |
| (4) | The ratios are annualized for periods of less than one full year. |
| (5) | The ratios of expenses after expense reductions to average net assets are after any advisory fee waivers and adviser expense reimbursements as discussed in Note 6 and Note 7B, respectively, in Notes to the Financial Statements. |
| (6) | Prior to July 1, 2008, the PL Mid-Cap Equity Fund was named PL Mid-Cap Value Fund. |
| (7) | Amount represents less than $0.005 per share or less than 0.005%. |
| (8) | Includes return of capital distribution of $0.01 per share. |
| See Notes to Financial Statements |
C-19
Table of Contents
PACIFIC LIFE FUNDS
1. ORGANIZATION
Pacific Life Funds (the “Trust”) is a Delaware statutory trust, which was formed on May 21, 2001, and is registered under the Investment Company Act of 1940 (“1940 Act”), as amended, as an open-end management investment company. Pacific Life Fund Advisors LLC (“PLFA” or “Adviser”) serves as investment advisor to the Trust. As of March 31, 2013, the Trust was comprised of thirty-three separate funds, twenty-two of which are covered by this report (each individually, a “Fund”, and collectively the “Funds”): PL Floating Rate Loan Fund, PL Inflation Managed Fund, PL Managed Bond Fund, PL Short Duration Bond Fund, PL Emerging Markets Debt Fund, PL Comstock Fund, PL Growth LT Fund, PL Large-Cap Growth Fund, PL Large-Cap Value Fund, PL Main Street® Core Fund (Main Street is a registered trademark of OppenheimerFunds, Inc.), PL Mid-Cap Equity Fund, PL Mid-Cap Growth Fund, PL Small-Cap Growth Fund, PL Small-Cap Value Fund, PL Real Estate Fund, PL Emerging Markets Fund, PL International Large-Cap Fund, PL International Value Fund, PL Currency Strategies Fund, PL Global Absolute Return Fund and PL Precious Metals Fund (collectively the “PL Underlying Funds”); and the PL Alternative Strategies Fund.
The PL Underlying Funds offer Class P shares only, which are sold at Net Asset Value (“NAV”). Presently, only the PL Portfolio Optimization Conservative Fund, PL Portfolio Optimization Moderate-Conservative Fund, PL Portfolio Optimization Moderate Fund, PL Portfolio Optimization Moderate-Aggressive Fund, and PL Portfolio Optimization Aggressive Fund (collectively, the “Portfolio Optimization Funds”), PL Alternative Strategies Fund, the Adviser and certain of its affiliates can invest in the PL Underlying Funds.
The PL Alternative Strategies Fund commenced operations on December 31, 2012. The PL Alternative Strategies Fund invests in certain PL Underlying Funds and Class P shares of the PL Floating Rate Income Fund. Although the Fund is effective, it is not currently offering shares to investors and is not available for sale at this time. Presently, only the Adviser and certain of its affiliates can invest in the PL Alternative Strategies Fund. The PL Alternative Strategies Fund offers Class A, Class C and Advisor shares. Each class is distinguished by its applicable sales charges and distribution and/or service fees and in general: (i) Class A shares are subject to a maximum 5.50% front-end sales charge; (ii) Class C shares are subject to a maximum 1.00% Contingent Deferred Sales Charge (“CDSC”); and (iii) Advisor Class shares are sold at NAV without a sales charge or CDSC. The sales charge for Class A shares is reduced for purchases of $50,000 or more and may be waived in certain circumstances. There is no sales charge for Class A shares for purchases of $1 million or more, although there is a CDSC of 1.00% on redemptions of such Class A shares within one year of purchase, which may be waived in certain circumstances.
The annual report for the Portfolio Optimization Funds and the PL Floating Rate Income Fund is not included in this report; there is a separate annual report for the Portfolio Optimization Funds and the PL Floating Rate Income Fund which is available without charge. For information on how to obtain the annual report for the Portfolio Optimization Funds and the PL Floating Rate Income Fund, see the Where to Go for More Information section of this report on page F-23.
2. SIGNIFICANT ACCOUNTING POLICIES
The financial statements have been prepared in conformity with accounting principles generally accepted in the United States of America (“U.S. GAAP”) for investment companies. In preparing the financial statements, management is required to make estimates and assumptions that affect the reported amounts of assets and liabilities and disclosures of contingent assets and liabilities at the date of the financial statements and the reported amounts of increases and decreases in net assets from operations during the reporting period. Actual results could differ from those estimates. The following is a summary of the significant accounting policies followed by the Trust in the preparation of the financial statements.
Effective April 1, 2012, the Trust implemented Accounting Standards Update (“ASU”) No. 2011-03 issued by the Financial Accounting Standards Board (“FASB”) related to accounting for repurchase agreements and sale-buyback transactions that both entitle and obligate a transferor to repurchase or redeem financial assets before their maturity. This ASU modified the criteria for determining effective control of transferred assets and as a result certain agreements previously accounted for as “purchases and sales” are now required to be accounted for as “secured borrowings”. This ASU had an impact on the interest income and interest expense, and caused the portfolio turnover rate to decrease significantly for certain Funds (see Note 4 on Sale-Buybacks under “Borrowings and Other Financing Transactions”).
The Trust also implemented the additional disclosure requirements under the ASU No. 2011-04 issued by FASB which requires additional disclosures for fair value measurements categorized within Level 3 of the three-tier hierarchy defined under the Accounting Standards Codification No. 820, Fair Value Measurements and Disclosure, as well as additional disclosure for all transfers in and out of Level 1 and Level 2 (see Note 3D and Notes to Schedules of Investments).
A. INVESTMENT TRANSACTIONS AND INCOME
Investment transactions are recorded on a trade date basis. Securities purchased or sold on a when-issued or delayed-delivery basis as well as certain loan transactions and mortgage securities (such as Government National Mortgage Association (“GNMA”) securities) may be settled a month or more after the trade date. Dividend income is recorded on the ex-dividend date, except certain dividends from foreign securities, which are recorded as soon as a Fund is informed of the ex-dividend date or upon receipt of the dividend. A Fund’s estimated components of distributions received from real estate investment trusts may be considered income, return of capital distributions or capital gain distributions. Return of capital distributions are recorded as a reduction of cost of the related investments. Interest income, adjusted for amortization of premium and accretion of discount, is recorded daily on an accrual basis. Investment income is recorded net of foreign taxes withheld, if any. A Fund may be subject to foreign taxes on income, gains on investments or currency repatriation, a portion of which may be recoverable. A Fund will accrue such taxes and reclaims as applicable, based upon the current interpretation of tax rules and regulations that exist in the markets in which a Fund invests. Facility fees and other fees (such as origination fees) received from senior loans purchased (see Note 4) by a Fund are amortized over the expected term of each applicable senior loan. Commitment fees received by a Fund relating to unfunded senior loan commitments are amortized to income over the period of the commitment. Consent fees, which are compensation for agreeing to changes in the terms of debt instruments, are recorded as interest income when received. Realized gains and losses from investment transactions are recorded on the basis of identified cost, which is also used for Federal income tax purposes. Gains and losses realized on principal paydowns from mortgage-backed and asset-backed securities are recorded as interest income.
D-1
Table of Contents
PACIFIC LIFE FUNDS
NOTES TO FINANCIAL STATEMENTS (Continued)
B. DISTRIBUTIONS TO SHAREHOLDERS
Each Fund covered in this report distributes all of its net investment income and realized capital gains, if any, to shareholders at least annually, although distributions could occur more if advantageous to the applicable Fund and its shareholders. Dividends and distributions paid to shareholders are recorded on the ex-dividend date.
C. FOREIGN CURRENCY TRANSLATION
The Trust’s accounting records are maintained in U.S. dollars. The market value of investments and other assets and liabilities, initially expressed in non-U.S. currencies, are translated into U.S. dollars based on the applicable exchange rates at the end of each business day. Purchases and sales of investments and income and expenses, denominated in foreign currencies, are translated into U.S. dollars at the exchange rates in effect on the transaction date.
None of the Funds separately report the effect of changes in foreign exchange rates from changes in market prices of investments held. Such changes are included with the net realized gain or loss and change in net unrealized appreciation or depreciation on investments. Other foreign currency transactions resulting in realized and unrealized gain or loss, if any, are reported separately as net realized gain or loss on foreign currency transactions and change in net unrealized appreciation or depreciation on foreign currencies.
D. ALLOCATION OF INCOME, EXPENSES, GAINS AND LOSSES
Certain Trust expenses directly attributable to a particular Fund are charged to that Fund (such as Fund-specific transactional fees, proxies, liquidations, litigation, and organizational/start-up costs). Generally, other Trust expenses are allocated proportionately among all the Funds in relation to the net assets of each Fund. For the PL Alternative Strategies Fund, income, non-class specific expenses, and realized and unrealized gains and losses are allocated on a daily basis to each class of shares based upon the relative portion of net assets of each class.
E. OFFERING COSTS
A new Fund bears all costs (or the applicable pro-rata share if there is more than one new Fund) associated with the offering expenses of the Fund including legal, printing and support services (see Notes 6 and 7A). All such costs are amortized as an expense of the new Fund on a straight-line basis over twelve months from commencement of operations.
F. RECENT ACCOUNTING PRONOUNCEMENT
In December 2011, the Financial Accounting Standards Board (“FASB”) issued an Accounting Standards Update (“ASU”) that requires disclosures to make financial statements that are prepared under U.S. GAAP more comparable to those prepared under International Financial Reporting Standards. The new disclosure requirements mandate that entities disclose both gross and net information about instruments and transactions eligible for offset in the statement of assets and liabilities such as instruments and transactions subject to an agreement similar to a master netting arrangement. In addition, this ASU requires disclosure of collateral received and posted in connection with master netting agreements or similar arrangements. This ASU is effective for interim and annual reporting periods beginning on or after January 1, 2013. Management is currently evaluating the impact, if any, that the implementation of this ASU will have on the Trust’s financial statement disclosures.
3. VALUATION AND FAIR VALUE MEASUREMENTS
A. VALUATION POLICY
The Trust’s Board of Trustees (the “Board”) has adopted a policy (“Valuation Policy”) for determining the value of its investments each business day. Under the Valuation Policy, the Board has delegated certain functions to a Trustee Valuation Committee or another valuation committee to determine the fair value of certain investments. Each valuation committee that values each Fund’s investments, which includes using third party pricing services and/or alternate valuation methodologies approved by the Board, does so in accordance with the Valuation Policy. Notes 3B and 3C below describe in greater detail the methodologies used to value each Fund’s investments.
B. NET ASSET VALUE
Each Fund of the Trust is divided into shares and share classes, if applicable. The price per share of each class of a Fund’s shares is called the NAV. The NAV forms the basis for all transactions involving buying, selling, exchanging or reinvesting shares. Each Fund’s NAV is calculated by taking the total value of a Fund’s assets (the value of the securities and other investments a Fund holds), subtracting a Fund’s liabilities, and dividing by the total number of shares outstanding.
Each Fund’s NAV is calculated once a day, every day the New York Stock Exchange (“NYSE”) is open, including days when foreign markets are closed. For purposes of calculating the NAV, the value of investments held by each Fund is generally determined as of the time of the close of the NYSE, which is usually 4:00 p.m. Eastern Time. Information that becomes known to the Trust or its agents after the close of the NYSE on a particular day will not normally be used to retroactively adjust the price of an investment or the NAV determined earlier that day.
Each Fund’s NAV will not be calculated on days when the NYSE is closed. There may be a delay in calculating the NAV if: (i) the NYSE is closed on a day other than a regular holiday or weekend, (ii) trading on the NYSE is restricted, (iii) an emergency exists (as determined by the Securities and Exchange Commission (“SEC”)), making the sale of investments or determinations of NAV not practicable, or (iv) the SEC permits a delay for the protection of shareholders.
Certain Funds may hold investments that are primarily listed on foreign exchanges. Because those investments trade on weekends or days when the Funds do not calculate their NAVs, the value of those investments may change on days when a shareholder will not be able to purchase or redeem Fund shares.
D-2
Table of Contents
PACIFIC LIFE FUNDS
NOTES TO FINANCIAL STATEMENTS (Continued)
C. INVESTMENT VALUATION
The value of each security or other investment is the amount which a Fund might reasonably expect to receive for the investment upon its current sale in the ordinary course of business. For purposes of calculating the NAV, the value of investments held by each Fund is based primarily on pricing data obtained from various sources approved by the Board:
PL Alternative Strategies Fund
The investments of the PL Alternative Strategies Fund consist of Class P shares of the PL Floating Rate Income Fund and certain PL Underlying Funds, which are valued at their respective NAVs.
Money Market Instruments and Short-Term Investments
Money market instruments and short-term investments maturing within 60 days are valued at amortized cost in accordance with the 1940 Act. Amortized cost involves valuing an investment at cost on the date of acquisition and thereafter assuming a constant accretion of a discount or amortization of a premium to maturity, regardless of the impact of fluctuating interest rates on the market value of the instrument. While this method provides consistency in valuation (and may only be used if it approximates market value), it may result in periods during which value, as determined by amortized cost, is higher or lower than the price that would be received if the Fund sold the investment. Fund investments in other mutual funds for temporary cash management purposes are valued at their respective NAVs.
Domestic Equity Investments
For domestic equity investments (including exchange-traded funds), the Trust uses the last reported sale price or official closing price from an exchange as of the time of the NYSE close and do not normally take into account trading, clearances or settlements that take place after the NYSE close. Investments, for which no sales are reported, are generally valued at the mean between the most recent bid and ask prices obtained from approved pricing services, established market makers, or from broker-dealers.
Foreign Equity Investments
Foreign equity investments are normally priced based on data reflecting the closing of the principal markets or market participants for those investments, which may be earlier than the NYSE close. The Trust then may adjust for market events occurring between the close of certain foreign exchanges and the NYSE close. The Trust has retained an independent statistical service approved by the Board to assist in determining the value of certain foreign equity investments. This service utilizes proprietary computer models based on historical performance of markets and other considerations to determine the appropriate adjustments for market events. Quotations of foreign investments in foreign currencies are converted into U.S. dollar equivalents using a foreign exchange quotation from an approved source.
Exchange Traded Futures, Options and Swaps
Exchange traded futures, options and swaps are normally priced at the settlement price determined by the relevant exchange. Exchange traded futures, options and swaps for which no settlement prices are reported, are generally valued at the mean between the most recent bid and ask prices obtained from approved pricing services, established market makers, or from broker-dealer.
Over the Counter (“OTC”) Investments and Certain Equity Investments
OTC investments (including swaps and options), are generally valued by approved pricing services that use evaluated prices determined from various observable market and other factors. Certain OTC swap contracts are valued using alternative valuation methodologies pursuant to the Valuation Policy. Forward foreign currency contracts are generally valued using the mean between broker-dealer bid and ask quotations, and foreign currency exchange rates gathered from leading market makers.
Domestic and Foreign Fixed Income Investments
Fixed income investments are generally valued by approved pricing and quotation services using the mean between the most recent bid and ask prices which are based upon evaluated prices determined from various observable market and other factors. Certain fixed-income investments are valued by a benchmark, matrix, or other pricing processes approved by the Board.
Investment Values Determined by a Valuation Committee
The Valuation Policy includes methodologies approved for valuing investments in circumstances where market quotations are not readily available. In such circumstances, the Valuation Policy provides that the value of such investments may be determined in accordance with Board approved formulas and methodologies (“Alternate Valuation Methodologies”). Under the Valuation Policy these Alternate Valuation Methodologies may include, among others, the use of broker quotes, the use of purchase prices for initial public offerings, proration rates, and benchmark and matrix pricing. In the event market quotations or Alternate Valuation Methodologies are not readily available or are determined to be unreliable, the value of the investments will be determined in good faith by the Trustee Valuation Committee or determined by a valuation committee established under the Valuation Policy and then subsequently submitted for approval or ratification to either the Trustee Valuation Committee, or to the Board. Valuations determined by a Trustee Valuation Committee or other valuation committee may require subjective inputs about the value of such investments. While these valuations are intended to estimate the value a Fund might reasonably expect to receive upon the current sale of the investments in the ordinary course of business, such values may differ from the value that a Fund would actually realize if the investments were sold or values that would be obtained if a different valuation methodology had been used.
Market quotations are considered not readily available if: (i) the market quotations received are deemed unreliable or inaccurate, (ii) approved pricing services do not provide a valuation for a particular investment, or (iii) material events occur after the close of the principal market for a particular investment but prior to the close of the NYSE.
D-3
Table of Contents
PACIFIC LIFE FUNDS
NOTES TO FINANCIAL STATEMENTS (Continued)
D. FAIR VALUE MEASUREMENTS AND DISCLOSURES
The Trust characterizes its investments as Level 1, Level 2 or Level 3 based upon the various inputs or methodologies used to value the investments. Under the Valuation Policy, a valuation oversight committee (“VOC”) has been established which determines the level in which each Fund’s investments are characterized. The VOC includes investment, legal, accounting and compliance members of the Trust’s Adviser, and the Trust’s Chief Compliance Officer (“CCO”). The three-tier hierarchy of inputs is summarized in the three broad levels listed below:
| • Level 1 - | Quoted prices (unadjusted) in active markets for identical investments |
| • Level 2 - | Significant observable market-based inputs, other than Level 1 quoted prices, or unobservable inputs that are corroborated by market data |
| • Level 3 - | Significant unobservable inputs that are not corroborated by observable market data |
The VOC reviews the Valuation Policy periodically (at least annually) to determine the appropriateness of the pricing methodologies used to value each Fund’s investments. The VOC also periodically evaluates how each Fund’s investments are characterized within the three-tier hierarchy and the appropriateness of third party pricing sources. The VOC also periodically (at least annually) conducts back testing of the methodologies used to value Level 2 and Level 3 investments to evaluate the unobservable inputs used to value those investments. Such back-testing includes comparing Level 2 and Level 3 investment values to subsequently available exchange-traded prices, transaction prices, and/or observable vendor prices. All changes to the Valuation Policy are reported to the Board on a quarterly basis with material changes, as determined by the Trust’s CCO, requiring approval by the Board.
The inputs or methodologies used for valuing each Fund’s investments are not necessarily an indication of the relative risks associated with investing in those investments. For example, money market instruments are valued using amortized cost in accordance with the rules under the 1940 Act. Generally, amortized cost approximates the current fair value of an investment, but since the value is not obtained from a quoted price in an active market, such investments are reflected as Level 2. Foreign investments that are valued with the assistance of a statistical research service approved by the Board, and based on significant observable inputs (as described in Note 3C) are reflected as Level 2. For fair valuations using significant unobservable inputs, the Trust presents a reconciliation of the beginning to ending balances for reported market values that presents changes attributable to total realized and unrealized gains or losses, purchase and sales, and transfers in and out of Level 3 during the period. Transfers in and out between levels are based on values at the end of the period. The Trust also discloses the amounts and reasons for all transfers in and out of Level 1 and Level 2 fair value measurements. A reconciliation of Level 3 investments is presented only when a Fund had an amount of Level 3 investments at the beginning and/or end of the reporting period that was meaningful in relation to its net assets. The amounts and reasons for all transfers in and out of each level within the three-tier hierarchy are disclosed only when a Fund had an amount of total transfers during the reporting period that was meaningful in relation to its net assets as of the end of the reporting period. A summary of each Fund’s investments as of March 31, 2013 as categorized under the three-tier hierarchy of inputs, and the reconciliation of Level 3 investments and information on transfers in and out of each level, if applicable, can be found in the Notes to Schedule of Investments section of each Fund’s Schedule of Investments.
The following is a description of valuation inputs and techniques that the Trust currently utilizes to fair value each major category of assets and liabilities.
Equity Securities (Common and Preferred Stock) and Mutual Funds
Equity securities (foreign or domestic) that are actively traded on a securities exchange are fair valued based on quoted prices from the applicable exchange, and to the extent valuation adjustments are not applied to these securities, they are categorized as Level 1. Equity securities traded on inactive markets and certain foreign equity securities are fair valued using significant other observable inputs which include broker-dealer quotes, recently executed transactions adjusted for changes in the benchmark index, or evaluated price quotes received from pricing vendors that take into account the integrity of the market sector and issuer, the individual characteristics of the security, and information received from broker-dealers and other market sources pertaining to the issuer or security. To the extent that these inputs are observable and timely, the fair values of these securities would be categorized as Level 2; otherwise the fair values would be categorized as Level 3.
Investments in registered mutual funds, including affiliated mutual funds, are valued at their respective NAV and are categorized as Level 1.
U.S. Treasury Obligations
U.S. Treasuries are fair valued based on pricing models that evaluate the mean between the most recently published bid and ask price. The models also take into consideration data received from active market makers and inter-dealer brokers, yield curves, and the spread over comparable U.S. Treasury issues. The spreads change daily in response to market conditions and are generally obtained from the new issue market and broker-dealer sources. To the extent that these inputs are observable and timely, the fair values of U.S. Treasury obligations would be categorized as Level 2; otherwise the fair values would be categorized as Level 3.
Mortgage-Backed Securities and Asset-Backed Securities
Mortgage-backed securities, including government sponsored enterprises, are fair valued using pricing models based on inputs that include issuer type, coupon, and cash flows, mortgage prepayment projection tables and adjustable rate mortgage evaluations that incorporate index data, periodic and life caps, the next coupon reset date, and the convertibility of the bond. To the extent that these inputs are observable and timely, the fair values of mortgage-backed securities would be categorized as Level 2; otherwise the fair value would be categorized as Level 3.
Asset-backed securities and collateralized mortgage obligations are fair valued using pricing models based on a security’s average life volatility. The models also take into account tranche characteristics such as coupon average life, collateral types, ratings, the issuer and tranche type, underlying collateral and performance of the collateral, and discount margin for certain floating rate issues. To the extent that these inputs are observable and timely, the fair values of asset-backed securities and collateralized mortgage obligations would be categorized as Level 2; otherwise the fair values would be categorized as Level 3.
D-4
Table of Contents
PACIFIC LIFE FUNDS
NOTES TO FINANCIAL STATEMENTS (Continued)
Municipal Bonds
Municipal bonds are fair valued based on pricing models that take into account, among other factors, information received from market makers and broker-dealers, current trades, bid lists, offerings, market movements, the callability of the bond, state of issuance, benchmark yield curves, and bond insurance. To the extent that these inputs are observable and timely, the fair values of municipal bonds would be categorized as Level 2; otherwise the fair values would be categorized as Level 3.
Foreign Government Bonds and Notes
Foreign government bonds and notes are fair valued based on discounted cash flow models that incorporate option adjusted spreads along with benchmark curves and credit spreads. In addition, international bond markets are monitored daily for information pertaining to the issuer and/or the specific issue. To the extent that these inputs are observable and timely, the fair values of foreign government bonds and notes would be categorized as Level 2; otherwise the fair values would be categorized as Level 3.
Corporate Bonds and Notes and U.S. Government & Agency Issues
Corporate bonds held by a Fund are generally comprised of two main categories: investment grade bonds and high yield bonds. Investment grade bonds are reported at fair value using various inputs and techniques, which include broker-dealer quotations, live trading levels, recently executed transactions in securities of the issuer or comparable issuers, issuer credit information, and option-adjusted spread models where applicable. Fair values for high yield bonds are based primarily on broker-dealer quotations from relevant market makers and recently executed transactions in securities of the issuer or comparable issuers. The broker-dealer quotations received are supported by credit analysis of the issuer that takes into consideration credit quality assessments, daily trading activity, and the activity of the underlying equities, listed bonds and sector-specific trends. To the extent that these inputs are observable and timely, the fair values of corporate bonds would be categorized as Level 2; otherwise the fair values would be categorized as Level 3.
U.S. Government & Agency Issues are reported at fair value using various inputs and techniques, which include broker-dealer quotations, live trading levels, recently executed transactions in securities of the issuer, issuer credit information, and option-adjusted spread models where applicable. To the extent that these inputs are observable and timely, the fair values of U.S. Government & Agency Issues would be categorized as Level 2; otherwise the fair values would be categorized as Level 3.
Futures Contracts
Futures contracts and options on futures contracts are traded on commodity exchanges and are fair valued based on quoted prices from the applicable exchange, and to the extent valuation adjustments are not applied to futures contracts, they are categorized as Level 1. To the extent that valuation adjustments are observable and timely, the fair values of futures contracts would be categorized as Level 2; otherwise the fair values would be categorized as Level 3.
Options Contracts
Exchange listed options contracts are traded on securities exchanges and are fair valued based on quoted prices from the applicable exchange, and to the extent valuation adjustments are not applied or mean variation to exchange listed options contracts, they are categorized as Level 1. If valuation adjustments are applied and such adjustments are observable and timely, the fair values of exchange listed options contracts would be categorized as Level 2; otherwise the fair values would be categorized as Level 3. OTC options contracts are fair valued based on either broker-dealer quotations or pricing models that incorporate various inputs such as interest rates, credit spreads, currency exchange rates and volatility measurements for in-the-money, at-the-money, and out-of-the-money contracts based on a given strike price. To the extent that these inputs are observable and timely, the fair values of OTC options contracts would be categorized as Level 2; otherwise the fair values would be categorized as Level 3.
Forward Foreign Currency Contracts
Forward foreign currency contracts are fair valued using various inputs and techniques, which include broker-dealer quotations and foreign currency exchange rates gathered from leading market makers. To the extent that these inputs are observable and timely, the fair values of forward foreign currency contracts would be categorized as Level 2; otherwise the fair values would be categorized as Level 3.
Swaps
Interest Rate Swaps – Interest rate swaps that are actively traded and cleared on a securities exchange or swap execution facility are fair valued based on quoted prices from the applicable exchange, and to the extent valuation adjustments are not applied to these securities, they are categorized as Level 1. Interest rate swaps traded over-the-counter are fair valued using pricing models that are based on real-time snap shots of relevant interest rate curves that are built using the most actively traded securities for a given maturity. The pricing models also incorporate cash and money market rates. In addition, market data pertaining to interest rate swaps are monitored regularly to ensure that interest rates are properly depicting the current market rate. To the extent that these inputs are observable and timely, the fair values of interest rate swaps would be categorized as Level 2; otherwise the fair values would be categorized as Level 3.
Credit Default Swaps – Credit default swaps that are actively traded and cleared on a securities exchange or swap execution facility are fair valued based on quoted prices from the applicable exchange, and to the extent valuation adjustments are not applied to these securities, they are categorized as Level 1. Credit default swaps traded over-the-counter are fair valued using pricing models that take into account, among other factors, information received from market makers and broker-dealers, default probabilities from index specific credit spread curves, recovery rates, and cash flows. To the extent that these inputs are observable and timely, the fair values of credit default swaps would be categorized as Level 2; otherwise the fair values would be categorized as Level 3.
Total Return Swaps – Total return swaps that are actively traded and cleared on a securities exchange or swaps execution facility are fair valued based on quoted prices from the applicable exchange, and to the extent valuation adjustments are not applied to these securities, they
D-5
Table of Contents
PACIFIC LIFE FUNDS
NOTES TO FINANCIAL STATEMENTS (Continued)
are categorized as Level 1. Total Return swaps traded over-the-counter are fair valued using pricing models that take into account among other factors, index spread curves, nominal values, modified duration values and cash flows. To the extent that these inputs are observable and timely, the fair values of total return swaps would be categorized as Level 2; otherwise the fair values would be categorized as Level 3.
Senior Loan Notes
Floating rate senior loans (“Senior Loans”) are fair valued based on a quoted price received from a single broker-dealer or an average of quoted prices received from multiple broker-dealers or valued relative to other benchmark securities when broker-dealer quotes are unavailable. To the extent that these inputs are observable, the fair values of Senior Loans would be categorized as Level 2; otherwise the fair values would be categorized as Level 3.
Short-Term Investments
Short-term investments maturing within 60 days are valued using amortized cost, which is used if it approximates market value, and are reflected as Level 2. Repurchase agreements are fully collateralized. The collateral is evaluated daily to ensure its market value equals or exceeds the current market value of the repurchase agreements including accrued interest.
Credit-Oriented Investments
For non-publicly traded instruments that represent debt to the Trust, the carrying amount approximates fair value due to the relatively short- term maturity of these financial instruments, and are reflected as Level 2. The Trust may use market transactions for identical or similar instruments or a market yield approach, which utilizes expected future cash flows that are discounted using estimated current market rates. Discounted cash flow calculations may be adjusted to reflect current market conditions and/or the perceived credit risk of each Fund as applicable. Consideration may also include an evaluation of collateral.
4. INVESTMENTS AND RISKS
General Investment Risks
An investment in each Fund represents an indirect investment in the assets owned by that Fund. As with any mutual fund, the value of assets owned by a Fund may move up or down, and as a result, an investment in a Fund at any point in time may be worth more or less than the original amount invested. Events in the financial markets have the potential to cause increased volatility and uncertainty, which may impact the value of each Fund’s investments. Due to interdependencies between markets, events in one market may adversely impact other markets or issuers in unforeseen ways. As a result, the value of a Fund’s investments may be adversely affected by events in the markets, either directly or indirectly, and each Fund is exposed to potential decreases in the value of those investments. In addition, traditionally liquid investments may experience periods of diminished liquidity. Governmental and regulatory responses to market events may impair either the Adviser’s or a sub-adviser’s ability to pursue certain investment techniques or strategies and may have unexpected consequences on particular markets, strategies, or investments. Future events may impact a Fund in unforeseen ways, leading a Fund to alter its existing strategies or, potentially, to liquidate and close.
Fund of Funds Investments
The PL Alternative Strategies Fund is a fund of funds and therefore is exposed to the same risks as the PL Underlying Funds and PL Floating Rate Income Fund in direct proportion to the allocation of assets among those funds. This annual report contains information about the risks associated with investing in the PL Underlying Funds. The risks associated with investing in the PL Floating Rate Income Fund are not included in this report. See the Where to Go for More Information section of this report on page F-23 for information on the annual report for the PL Floating Rate Income Fund. Allocations among the PL Underlying Funds and PL Floating Rate Income Fund are determined using an asset allocation process, which seeks to provide performance that has a low to moderate correlation with the performance of traditional equity and fixed income asset classes over long-term periods. The allocations of the PL Alternative Strategies Fund may not effectively decrease risk or increase returns for investors, and the selection and weighting of allocations to asset classes and/or PL Underlying Funds and PL Floating Rate Income Fund may cause them to underperform other mutual funds with a similar investment objective. The PL Alternative Strategies Fund may invest a significant portion of its assets in any one or several PL Underlying Funds and PL Floating Rate Income Fund (See Note 7C).
Equity Investments
The price of equity investments change in response to many factors, including a company’s historical and prospective earnings, cash flows, the value of its assets, investor perceptions and many of the General Investment Risk factors noted above.
Fixed Income Investments
Fixed income (debt) investments are affected primarily by the financial condition of the companies or other entities that have issued them and by changes in interest rates, although the factors noted above may also have a significant impact on fixed income (debt) investments. There is a risk that an issuer of a Fund’s fixed income (debt) investments may not be able to meet its financial obligations (e.g., may not be able to make principal and/or interest payments when they are due or otherwise default on other financial terms) and/or go bankrupt. Securities such as high- yield/high-risk bonds, e.g., bonds with low credit ratings by Moody’s (Ba or lower) or Standard & Poor’s (BB and lower) or if unrated are of comparable quality as determined by the manager, are especially subject to credit risk during periods of economic uncertainty or during economic downturns and are more likely to default on their interest and/or principal payments than higher rated securities. Certain asset-backed instruments, such as collateralized debt obligations, collateralized mortgage obligations and other mortgage related securities, structured investment vehicles and other debt investments may have exposure to subprime loans or subprime mortgages, which are loans to persons with lower credit ratings. These instruments may present credit risk that is not transparent and that is greater than indicated by their ratings. The value of these instruments may be more acutely affected by downturns in the credit markets or the real estate market than certain other investments, and it may be difficult to value these instruments because of a thin secondary market.
D-6
Table of Contents
PACIFIC LIFE FUNDS
NOTES TO FINANCIAL STATEMENTS (Continued)
Foreign Investments
There are certain additional risks involved in investing in foreign securities that are generally not inherent in investments in domestic securities. These risks may involve foreign currency fluctuations, adverse political, social and economic developments and the possible imposition of currency exchange blockages or other foreign governmental laws or restrictions. In addition, the securities of some foreign companies and securities markets are less liquid and at times more volatile than securities of comparable U.S. companies and U.S. securities markets. The markets in emerging markets countries can be extremely volatile.
Illiquid Investments
Each Fund may not invest in illiquid securities and illiquid bank loans (collectively, “Illiquid Investments”) if as a result of such investment, more than 15% of its net assets, taken at market value at the time of such investment, would be invested in Illiquid Investments. The term “Illiquid Investments” for this purpose means investments that cannot be disposed of within seven days in the ordinary course of business at approximately the amount at which a Fund has valued the investments. Illiquid Investments may be difficult to value and difficult to sell, which means a Fund may not be able to sell such investments quickly for their full value. The value of Illiquid Investments held by each Fund as of March 31, 2013 was less than 15% of its net assets.
Senior Loan Participations and Assignments
Certain Funds may invest in Senior Loans, the interest rates of which float or adjust periodically based upon a specified adjustment schedule, benchmark indicator, or prevailing interest rates of domestic or foreign corporations, partnerships and other entities (“Borrowers”). Senior Loans generally pay interest at rates which are periodically redetermined by reference to a base lending rate plus a premium. These base lending rates generally include prime rates of one or more major U.S. banks, LIBOR rates or certificates of deposit rates. Senior Loans often require prepayments from excess cash flow or permit the borrower to repay at its election. The degree to which borrowers repay cannot be predicted with accuracy. As a result, the actual maturity may be substantially less than the stated maturities. Senior Loans are exempt from registration under the Securities Act of 1933, may contain certain restrictions on resale, and cannot be sold publicly. A Fund’s investments in Senior Loans may be in the form of participations in loans or assignments of all or a portion of loans from third parties.
When a Fund purchases assignments, it acquires all the rights and obligations under the loan agreement of the assigning lender. Assignments may, however, be arranged through private negotiations between potential assignees and potential assignors, and the rights and obligations acquired by the purchaser of an assignment may differ from, and be more limited than those held by the assigning lender.
When a Fund purchases a participation of a Senior Loan interest, the Fund typically enters into a contractual agreement with the lender or other third party selling the participation. A participation interest in Senior Loans includes the right to receive payments of principal, interest and any fees to which it is entitled from the lender and only upon receipt by the lender of payments from the Borrower, but not from the Borrower directly. When investing in a participation interest, if a Borrower is unable to meet its obligations under a loan agreement, a Fund generally has no right to enforce compliance with the terms of the loan agreement. As a result, the Fund assumes the credit risk of the Borrower, the selling participant, and any other persons that are interpositioned between the Fund and the Borrower. If the lead lender in a typical lending syndicate becomes insolvent, enters Federal Deposit Insurance Corporation (“FDIC”) receivership or, if not FDIC insured, enters into bankruptcy, the Fund may incur certain costs and delays in receiving payment or may suffer a loss of principal and/or interest. As of March 31, 2013, no participation interest in Senior Loans was held by any of the Funds covered in this report.
Inflation-Indexed Bonds
Certain Funds may invest in inflation-indexed bonds. Inflation-indexed bonds are fixed income (debt) securities whose principal value is periodically adjusted to the rate of inflation. The interest rate on these bonds is generally fixed at issuance at a rate lower than typical bonds. Over the life of an inflation indexed bond, however, interest will be paid based on a principal value, which is adjusted for inflation. Any increase or decrease in the principal amount of an inflation-indexed bond will result in an adjustment to interest income.
Mortgage-Related and Other Asset-Backed Securities
Certain Funds may invest in mortgage-related and other asset-backed securities. These securities include mortgage pass-through securities, collateralized mortgage obligations (“CMOs”), collateralized loan obligations (“CLOs”), mortgage dollar rolls, CMO residuals, stripped mortgage- backed securities (“SMBS”), and other securities that directly or indirectly represent a participation in, or are secured by and payable from, mortgage loans secured by real property. Mortgage-related and other asset-backed securities are debt securities issued by a corporation, trust or custodian, or by a U.S. Government agency or instrumentality, that are collateralized by a pool of mortgages, mortgage pass-through securities, U.S. Government securities or other assets. The value of some mortgage-related and asset-backed securities may be particularly sensitive to changes in prevailing interest rates. Early repayment of principal on some mortgage-related securities may expose a Fund to a lower rate of return upon reinvestment of principal. The value of these securities may fluctuate in response to the market’s perception of the creditworthiness of the issuers. Additionally, although mortgage and mortgage-related securities are generally supported by some form of government or private guarantee and/or insurance, there is no assurance that private guarantors or issuers will meet their obligations.
SMBS represent a participation in, or are secured by and payable from, mortgage loans on real property, and may be structured in classes with rights to receive varying proportions of principal and interest. SMBS include interest-only securities (“IOs”), which receive all of the interest, and principal-only securities (“POs”), which receive the entire principal. The cash flows and yields on IOs are extremely sensitive to the rate of principal payments (including prepayments) on the underlying mortgage loans. If the underlying mortgages experience higher than anticipated prepayments, an investor in IOs of SMBS may fail to recoup fully its initial investment, even if the IOs are highly rated or are derived from securities guaranteed by the U.S. Government. Unlike other fixed-income and other mortgage-backed securities, the market value of IOs tends to move in the same direction as interest rates. As prepayments on the underlying mortgages of POs increase, the yields on POs increase. Payments received from IOs are recorded as interest income. Because principal will not be received at the maturity of an IO, adjustments are
D-7
Table of Contents
PACIFIC LIFE FUNDS
NOTES TO FINANCIAL STATEMENTS (Continued)
made to the book value of the security on the coupon date until maturity. These adjustments are included in interest income. Payments received from POs are treated as reductions to the cost and par value of the securities. Any excess principal paydown gains or losses associated with the payments received are recorded as interest income.
U.S. Government Agencies or Government-Sponsored Enterprises
Certain Funds may invest in U.S. Government agencies or government-sponsored enterprises. U.S. Government securities are obligations of and, in certain cases, guaranteed by, the U.S. Government, its agencies or instrumentalities. The U.S. Government does not guarantee the NAV of each Fund’s shares. Some U.S. Government securities, such as Treasury bills, notes and bonds, and securities guaranteed by GNMA (or “Ginnie Mae”), are supported by the full faith and credit of the U.S. Government; others, such as those of the Federal Home Loan Bank, are supported by the right of the issuer to borrow from the U.S. Department of the Treasury (the “U.S. Treasury”); others, such as those of the Federal National Mortgage Association (“FNMA” or “Fannie Mae”), are supported by the discretionary authority of the U. S. Government to purchase the agency’s obligations. Securities not backed by the full faith and credit of the U.S. Government may be subject to a greater risk of default. U.S. Government securities may include zero coupon securities, which do not distribute interest on a current basis and tend to be subject to greater risk than interest-paying securities of similar maturities.
Government-related guarantors (i.e., not backed by the full faith and credit of the U.S. Government) include FNMA and the Federal Home Loan Mortgage Corporation (“FHLMC” or “Freddie Mac”). FNMA is a government-sponsored corporation, the common stock of which is owned entirely by private stockholders. FNMA purchases conventional (i.e., not insured or guaranteed by any government agency) residential mortgages from a list of approved seller/servicers which include state and federally chartered savings and loan associations, mutual savings banks, commercial banks and credit unions and mortgage bankers. Pass-through securities issued by FNMA are guaranteed as to timely payment of principal and interest by FNMA, but are not backed by the full faith and credit of the U.S. Government. FHLMC issues Participation Certificates (“PCs”), which are pass-through securities, each representing an undivided interest in a pool of residential mortgages. FHLMC guarantees the timely payment of interest and ultimate collection of principal, but PCs are not backed by the full faith and credit of the U.S. Government.
When-Issued Securities
Certain Funds may purchase and sell securities on a when-issued basis. These transactions are made conditionally because a security, although authorized, has not yet been issued in the market. A commitment by a Fund is made regarding these transactions to purchase or sell securities for a predetermined price or yield, with payment and delivery taking place beyond the customary settlement period. A Fund may sell when-issued securities before they are delivered, which may result in a capital gain or loss. Risk may arise upon entering these contracts from the potential inability of a counterparty to meet the terms of their contracts, or if the issuer does not issue the securities due to political, economic, or other factors.
Delayed-Delivery Transactions
Certain Funds may purchase or sell securities on a delayed-delivery basis. Payment and delivery may take place after the customary settlement period for that security. The price or yield of the underlying securities is fixed at the time the transaction is negotiated. When delayed- delivery purchases are outstanding, a Fund will set aside, and maintain until the settlement date in a segregated account, liquid assets in an amount sufficient to meet the purchase price. When purchasing a security on a delayed-delivery basis, a Fund assumes the rights and risks of ownership of the security, including the risk of price and yield fluctuations, and takes such fluctuations into account when determining its NAV. A Fund may dispose of or renegotiate a delayed-delivery transaction after it is entered into, and may sell delayed-delivery securities before they are delivered, which may result in a capital gain or loss. When a Fund has sold a security on a delayed-delivery basis, the Fund does not participate in future gains and losses with respect to the security.
Short Sales
Certain Funds may enter into short sales. A short sale is a transaction in which a Fund sells securities it does not own. A Fund’s use of short sales involves the risk that the price of the security in the open market may be higher when purchased to close out the Fund’s short position, resulting in a loss to the Fund. Such a loss is theoretically unlimited because there is no limit on the potential increase in the price of a security or guarantee as to the price at which the manager would be able to purchase the security in the open market.
When a Fund sells securities short, it must borrow those securities to make delivery to the buyer. The Fund incurs an expense for such borrowing. The Fund may not be able to purchase a security that it needs to deliver to close out a short position at an acceptable price. This may result in losses and/or require the Fund to sell long positions before the manager had intended. A Fund may not be able to successfully implement its short sale strategy, which may limit its ability to achieve its investment goal, due to limited availability of desired or eligible securities, the cost of borrowing securities, regulatory changes limiting or barring short sales, or for other reasons. Securities sold in short sale transactions and the interest and dividends payable on such securities, if any, are recorded as a liability.
The use of proceeds received from selling short to purchase additional securities (long positions), results in leverage which may increase a Fund’s exposure to long positions. Leverage could magnify gains and losses and, therefore, increases a Fund’s volatility.
Repurchase Agreements
Certain Funds may invest in repurchase agreements. Repurchase agreements permit the investor to maintain liquidity and earn income over periods of time as short as overnight. Repurchase agreements held by a Fund are fully collateralized by U.S. Government securities, or securities issued by U.S. Government agencies, or securities that are within the three highest credit categories assigned by established rating agencies (Aaa, Aa, or A by Moody’s or AAA, AA or A by Standard & Poor’s) or, if not rated by Moody’s or Standard & Poor’s, are of equivalent investment quality as determined by the Adviser or the applicable portfolio manager. Such collateral is in the possession of the Trust’s custodian or a designated broker-dealer. The collateral is evaluated daily to ensure its market value equals or exceeds the current market value of the repurchase agreements including accrued interest. In the event of default on the obligation to repurchase, a Fund has the right to liquidate the collateral and apply the proceeds in satisfaction of the obligation.
D-8
Table of Contents
PACIFIC LIFE FUNDS
NOTES TO FINANCIAL STATEMENTS (Continued)
Borrowings and Other Financing Transactions
The following disclosures contain information on a Fund’s ability to lend or borrow cash or securities to the extent permitted under the 1940 Act, which may be viewed as borrowing or financing transactions by a Fund. The location and fair value amounts of these instruments are described below. For a detailed description of credit and counterparty risks that can be associated with borrowings and other financing transactions, see Note 5.
Reverse Repurchase Agreements – Certain Funds may enter into reverse repurchase agreements. In a reverse repurchase agreement, a Fund sells to a financial institution a security that it holds with an agreement to repurchase the same security at the agreed-upon price and date. Securities sold under reverse repurchase agreements are recorded as a liability. Interest payments made are recorded as a component of interest expense. In periods of increased demand for the security, a Fund may receive a fee for use of the security by the counterparty, which may result in interest income to the Fund. A reverse repurchase agreement involves the risk that the market value of the security sold by a Fund may decline below the repurchase price of the security. A Fund will segregate assets determined to be liquid by the applicable Fund manager or otherwise cover its obligations under reverse repurchase agreements.
Sale-Buybacks – Certain Funds may enter into transactions referred to as sale-buybacks. A sale-buyback transaction consists of a sale of a security by a Fund to a financial institution, the counterparty, with a simultaneous agreement to repurchase the same or substantially the same security at an agreed-upon price and date. Effective April 1, 2012 such transactions are recorded as secured borrowings; whereas, previously such transactions were recorded as purchases and sales. A Fund is not entitled to receive principal and interest payments, if any, made on the security sold to the counterparty during the term of the agreement. The agreed-upon proceeds for securities to be repurchased by a Fund are recorded as a liability. A Fund will recognize net income represented by the price differential between the price received for the transferred security and the agreed-upon repurchase price. This is commonly referred to as the price drop. A price drop consists of (i) the foregone interest and inflationary income adjustments, if any, a Fund would have otherwise received had the security not been sold and (ii) the negotiated financing terms between a Fund and counterparty. Foregone interest and inflationary income adjustments, if any, are recorded as components of interest income. Interest payments based upon negotiated financing terms made by the Fund to counterparties are recorded as a component of interest expense. In periods of increased demand for the security, a Fund may receive a fee for use of the security by the counterparty, which may result in interest income to a Fund. A Fund will segregate assets determined to be liquid or otherwise cover its obligations under sale-buyback transactions.
Segregation and Collateral
If a Fund engages in certain transactions such as derivative investments or repurchase agreements, it may require collateral in the form of cash or investments to be held in segregated accounts at the Trust’s custodian, with an exchange or clearing member firm, or segregated on the Trust’s books and records maintained by the custodian and/or the portfolio manager. In each instance that segregation of collateral is required, it is done so in accordance with the 1940 Act and/or any interpretive guidance issued by the SEC. There is a possibility that a Fund could experience a delay in selling investments that are segregated as collateral.
5. DERIVATIVE INVESTMENTS AND RISKS
A. PRINCIPAL MARKET RISKS MANAGED BY INVESTING IN DERIVATIVES
Derivative instruments are investments whose values are tied to the value of an underlying security or asset, a group of assets, interest rates, exchange rates, currency or an index. Certain Funds are permitted to invest in derivative instruments, including, but not limited to, futures contracts, options contracts, forward foreign currency contracts, interest rate swaps, and credit default swaps. Derivatives may have little or no initial cash investment value relative to their market value exposure and therefore can produce significant gains or losses in excess of their cost. This is sometimes referred to as leverage. Leverage can magnify a Fund’s gains and losses and therefore increase its volatility. A Fund’s investments in derivatives may increase, decrease or change the level or types of exposure to certain risk factors. The primary risks a Fund may attempt to manage through investing in derivative instruments include, but are not limited to, interest rate, foreign investments and currency, price volatility, and credit (including counterparty) risks.
Interest rate risk – A Fund may be exposed to interest rate risk through investments in fixed income securities. Interest rate risk is the risk that fixed income securities will decline in value as a result of changes in interest rates. For example, the value of bonds, fixed rate loans and short-term money market instruments may decline in value when interest rates rise. Fixed income securities with longer durations tend to be more sensitive to changes in interest rates, making them more volatile than fixed income securities with shorter durations or money market instruments. Therefore, duration is a potentially useful tool to measure the sensitivity of a fixed income security’s yield (market price to interest rate movement). To manage these risks, certain Funds may invest in derivative instruments tied to interest rates.
Foreign investments and currency risk – A Fund may be exposed to foreign investments and/or currency risk through direct investment in securities or through options, futures or currency transactions. The prices of foreign securities that are denominated in foreign currencies are affected by the value of the U.S. dollar. With respect to securities denominated in foreign currencies, in general, as the value of the U.S. dollar rises, the U.S. dollar price of a foreign security will fall. As the value of the U.S. dollar falls, the U.S. dollar value of the foreign security will rise. Currency rates in foreign countries may fluctuate significantly over short periods of time for a number of reasons. Foreign investments may be riskier than U.S. investments for many reasons, including changes in currency exchange rates, unstable political and economic conditions, a lack of adequate and timely company information, differences in the way securities markets operate, relatively lower market liquidity, less stringent financial reporting and accounting guidance and controls, less secure foreign banks or securities depositories than those in the U.S., foreign taxation issues and foreign controls on investments. As a result, a Fund’s investments in foreign currency denominated securities and other foreign investments may reduce the returns of the Fund. To manage these risks, certain Funds may invest in derivative instruments tied to foreign investments and/or currencies.
D-9
Table of Contents
PACIFIC LIFE FUNDS
NOTES TO FINANCIAL STATEMENTS (Continued)
Price volatility risk – Derivatives tied to equity and fixed income securities are exposed to potential price volatility. Fixed income securities are affected by many factors, including prevailing interest rates, market conditions and market liquidity. Volatility of below investment grade fixed income securities (including loans) may be relatively greater than for investment grade fixed income securities. Equity securities tend to go up or down in value, sometimes rapidly and unpredictably. The prices of equity securities change in response to many factors, including a company’s historical and prospective earnings, the value of its assets, general economic conditions, interest rates, investor perceptions and market liquidity. Due to the complexities of markets, events in one market or sector may adversely impact other markets or sectors.
To manage these risks, certain Funds may invest in various derivative instruments. Derivative instruments may be used to manage a Fund’s exposure to price volatility risk but may also be subject to greater price volatility than investments in traditional securities. The value of commodity-linked derivative instruments may be affected by changes in overall market movements, commodity index volatility, changes in interest rates, or factors affecting a particular industry or commodity, such as drought, floods, weather, livestock disease, embargoes, tariffs and international economic, political and regulatory developments.
Credit and Counterparty risk – Credit risk is the risk that a fixed income security’s issuer (or borrower or counterparty) will be unable or unwilling to meet its financial obligations (e.g., may not be able to make principal and/or interest payments when they are due or otherwise default on other financial terms) and/or may go bankrupt. This is also sometimes described as counterparty risk. A Fund may lose money if the issuer or guarantor of fixed income security, or counterparty of a derivative contract, repurchase or reverse repurchase agreement, or a loan of Fund securities, is unable or unwilling to make timely principal and/or interest payments, or to otherwise honor its obligations. A Fund may attempt to minimize concentrations of credit risk by undertaking transactions with a large number of borrowers or counterparties on recognized and reputable exchanges. A Fund’s investments in fixed income (debt) investments may range in quality from those rated in the lowest category in which it is permitted to invest to those rated in the highest category by a rating agency, or if unrated, determined by the manager to be of comparable quality.
Similar to credit risk, a Fund may be exposed to counterparty risk, or the risk that an institution or other entity with which a Fund has unsettled or open transactions will default. Financial assets of counterparties, which potentially expose a Fund to counterparty risk, consist mainly of cash due from counterparties and investments. Certain managers may attempt to minimize credit risks to a Fund by performing extensive reviews of each counterparty, entering into transactions with counterparties that the manager believes to be creditworthy at the time of the transaction and requiring the posting of collateral in applicable transactions. To manage these risks, certain Funds may invest in derivative instruments tied to a security issuers’ financial strength.
A Fund’s transactions in listed securities are settled/paid for upon delivery with their counterparties. Therefore, the risk of counterparty default for listed securities is considered minimal, as delivery of securities sold is only made once a Fund has received payment. Payment is made on a purchase once the securities have been delivered by the counterparty. The trade will fail if either party fails to meet its obligations.
Credit Related Contingent Features – Certain Funds are parties to various agreements, including but not limited to International Swaps and Derivatives Agreements, Master Repurchase Agreements, and Master Securities Forward Transactions Agreements (collectively “Master Agreements”), which govern the terms of certain transactions with select counterparties. These Master Agreements generally include provisions for general obligations, representations, agreements, collateral and certain events of default or termination, such as credit related contingent features. These provisions reduce the counterparty risk associated with relevant transactions by allowing a Fund or its counterparties to elect to terminate early and cause settlement of all outstanding transactions if a triggering event occurs under the applicable Master Agreement. These triggering events include, but are not limited to, bankruptcy, failure to make timely payments, restructuring, obligation acceleration, obligation default, a material decline in net assets, decline in credit rating or repudiation/moratorium. Thus, if a credit related contingent feature is triggered, it would allow a Fund or its counterparty to close out all transactions under the agreement and demand payment or additional collateral to cover their exposure to the other counterparty. Any election made by a counterparty to early terminate a transaction could have a material adverse impact on a Fund’s financial statements. To reduce credit and counterparty risk associated with transactions, a Fund may enter into master netting arrangements to the extent that if an event of default occurs, all amounts with the counterparty are terminated and settled on a net basis. A Fund’s overall exposure to credit risk, subject to master netting arrangements, can change substantially within a short period, as it is affected by each transaction subject to the arrangement.
B. DERIVATIVE INVESTMENTS
In addition to managing the market risks described above, certain Funds, if permitted by their investment objectives, may also invest in derivatives for purposes of hedging, duration management, to gain exposure to specific investment opportunities, as a substitute for securities, to increase returns, or to otherwise help achieve a Fund’s investment goal. Each derivative instrument and the reasons a Fund invested in derivatives during the reporting period are discussed in further detail below.
Futures Contracts – A futures contract is a commitment to buy or sell a specific amount of a financial instrument or commodity at a negotiated price on a specified future date. Futures contracts are subject to the possibility of illiquid markets, and the possibility of an imperfect correlation between the value of the instruments and the underlying securities. Initial margin deposits are made upon entering into futures contracts and can be funded with either cash or securities. During the period a futures contract is open, changes in the value of the contract are recognized as unrealized appreciation or depreciation by marking-to-market on a daily basis to reflect the market value of the contract at the end of each day’s trading. Variation margin receivables or payables represent the difference between the change in unrealized appreciation and depreciation on the open contracts and the cash deposits made on the margin accounts. When the contract is closed, a Fund records a realized gain or loss equal to the difference between the proceeds from (or cost of) the closing transaction and the Fund’s cost of the contract. Futures contracts are valued at the settlement price established each day by the board of trade or exchange on which they are traded.
D-10
Table of Contents
PACIFIC LIFE FUNDS
NOTES TO FINANCIAL STATEMENTS (Continued)
During the reporting period, the Funds entered into futures contracts for the following reasons: The PL Inflation Managed and PL Managed Bond Funds used financial and money market futures as a means of managing exposure to the securities markets or to movements in interest rates. The PL Short Duration Bond Fund entered into interest rate futures to manage duration. The PL Large-Cap Growth Fund entered into futures contracts to maintain full exposure to the equity markets. The PL International Value Fund entered into futures contracts to maintain full exposure to the equity markets. The PL Global Absolute Return Fund Entered into futures contracts to manage duration and interest rate risk, to maintain full exposure to the equities market, to manage exposure to various markets, to provide daily liquidity for the Fund’s inflows and outflows, and as a part of the Fund’s investment strategy. The PL Comstock, PL Main Street Core, PL International Value, PL Large-Cap Value, PL International Large-Cap, PL Growth LT and PL Mid-Cap Equity Funds utilized futures to gain market exposure with the cash generated during PLFA’s reallocation of assets related to the Portfolio Optimization Funds and the PL Alternative Strategies Fund.
Options Contracts – An options contract is a commitment that gives the purchaser of the contract the right, but not the obligation, to buy or sell an underlying asset at a specific price on or before a specified future date. On the other hand, the writer of an options contract is obligated, upon the exercise of the option, to buy or sell an underlying asset at a specific price on or before a specified future date. A swaption is an option contract granting the owner the right to enter into an underlying swap. Inflation-capped options are options on U.S. inflation rates at a stated strike price. The seller of an inflation capped option receives an upfront premium and in return the buyer receives the right to receive a payment at the expiration of the option if the cumulative annualized inflation rate over the life of the option is above (for caps) or below (for floors) the stated strike price. The purpose of inflation-capped options is to protect the buyer from inflation erosion above a certain rate on a given notional exposure. A floor can be used to give downside protection to investments in inflation-linked products below a certain rate on a given notional exposure. Writing put options or purchasing call options tends to increase a Fund’s exposure to the underlying instrument. Writing call options or purchasing put options tends to decrease a Fund’s exposure to the underlying instrument. When a Fund writes or purchases a call, put, or inflation-capped option, an amount equal to the premium received or paid by the Fund is recorded as a liability or an investment, respectively, and subsequently adjusted to the current market value, based on the quoted daily settlement price of the option written or purchased. Certain options may be written or purchased with premiums to be determined on a future date. The premiums for these options are based upon implied volatility parameters at specified terms. Premiums received or paid from writing or purchasing options, which expire unexercised, are treated by a Fund on the expiration date as realized gains or losses. The difference between the premium and the amount paid or received on a closing purchase or sale transaction, including brokerage commissions, is also treated as a realized gain or loss. If an option is exercised, the premium paid or realized is added to the cost of the purchase or proceeds from the sale in determining whether the Fund has realized a gain or loss on investment transactions. A Fund, as a writer of an option, may have no control over whether the underlying instrument may be sold (call) or purchased (put) and as a result bears the market risk of an unfavorable change in the price of the underlying written option. In addition, an illiquid market may make it difficult for a Fund to close out an option contract.
The maximum risk of loss associated with writing put options is limited to the exercised fair value of the option contract. The maximum risk of loss associated with writing call options is potentially unlimited. Listed options contracts present minimal counterparty credit risk since they are exchange traded and the exchange’s clearinghouse, as counterparty to all exchange traded options, guarantees the options against default. A Fund’s maximum risk of loss from counterparty credit risk related to OTC options contracts is limited to the premium paid.
During the reporting period, the Funds entered into option contracts for the following reasons: The PL Inflation Managed and PL Managed Bond Funds purchased and wrote options and swaptions on futures, currencies, volatility and swaps, as a means of capitalizing on anticipated changes in market volatility. Both Funds also wrote options to generate income and wrote inflation floors to hedge duration. The PL Growth LT Fund invested in option contracts for purposes of risk management and to increase returns. The Emerging Markets Debt Fund entered into option contracts for purposes of hedging and as a part of the fund’s investment strategy. The PL Global Absolute Return Fund purchased or wrote options for purposes of risk management, to facilitate buying and selling securities, and as a part of the Fund’s investment strategy.
Forward Foreign Currency Contracts – A forward foreign currency contract (“Forward Contract”) is a commitment to buy or sell a specific amount of a foreign currency at a negotiated price on a specified future date. Forward Contracts can help a Fund manage the risk of changes in currency exchange rates. These contracts are marked-to-market daily at the applicable forward currency translation rates. A Fund records realized gains or losses at the time the Forward Contract is closed. A Forward Contract is extinguished through a closing transaction or upon delivery of the currency or entering an offsetting contract. A Fund’s maximum risk of loss from counterparty credit risk related to Forward Contracts is the fair value of the contract. The risk may be mitigated to some extent if a master netting arrangement between a Fund and the counterparty is in place and to the extent a Fund obtains collateral to cover the Fund’s exposure to the counterparty.
During the reporting period, the Funds entered into Forward Contracts for the following reasons: The PL Inflation Managed and PL Managed Bond Funds entered into Forward Contracts in connection with settling planned purchases or sales of securities, to hedge the currency exposure associated with some or all of a Fund’s securities or as part of each Funds’ investment strategy. The PL Emerging Markets Debt Fund entered into Forward Contracts to help protect the Fund’s returns against adverse currency movements, to gain market exposure, and as part of the Fund’s investment strategy. The PL Comstock Fund entered into Forward Contracts to manage currency risk and to help protect the Fund’s returns against adverse currency movements. The PL Growth LT and PL Short Duration Bond Funds entered into Forward Contracts for hedging purposes to help protect the Fund’s returns against adverse currency movements. The PL International Value Fund entered into Forward Contracts to manage currency risk and for hedging purposes to insulate the Fund’s returns against adverse currency movements. The PL Global Absolute Return Fund entered into Forward Contracts to hedge against currency exposure associated with the Fund’s investments and to protect the Fund returns against adverse currency movements, as a substitute for securities, and as a part of the Fund’s investment strategy. The PL Currency Strategies Fund purchased or sold non-deliverable Forward Contracts to gain or increase exposure to various currencies (both long and short positions) for hedging purposes to protect the Fund’s returns against adverse currency movements and as a part of the Fund’s investment strategy.
D-11
Table of Contents
PACIFIC LIFE FUNDS
NOTES TO FINANCIAL STATEMENTS (Continued)
Swaps Agreements – Swaps are privately negotiated agreements between the Funds and their counterparties to exchange cash flows, assets, foreign currencies or market-linked returns at specified intervals and may be executed in the over-the-counter market or in a multilateral or other trade facility platform, such as a registered commodities exchange (“centrally cleared swaps”). In connection with these agreements, securities may be identified as collateral in accordance with the terms of the respective swap agreements to provide assets of value and recourse in the event of default or bankruptcy/insolvency. Swaps are marked-to-market daily based upon values received from third party vendors or quotations from market makers. Market values greater than zero are recorded as an asset and market values less than zero are recorded as a liability. The change in value of swaps, including accruals of periodic amounts of interest to be paid or received on swaps, is recorded as unrealized appreciation or depreciation. Daily changes in valuation of centrally cleared swaps, if any, are recorded as variation margin receivable or payable. Payments received or made at the beginning of the measurement period are recorded as an asset or liability and represent payments made or received upon entering into the swap agreement to compensate for differences between the stated terms of the swap agreement and prevailing market conditions (credit spreads, currency exchange rates, interest rates, and other relevant factors). These upfront payments are recorded as the calculation of realized gain or loss when the swap is closed. A liquidation payment received or made at the termination of the swap is recorded as realized gain or loss. Net periodic payments received by a Fund are recorded as realized gain.
Interest Rate Swaps – Interest rate swap agreements involve the exchange by a Fund with another party of their respective commitments to pay or receive interest with respect to the notional amount of principal. Certain forms of interest rate swap agreements may include: (i) interest rate caps, under which, in return for a premium, one party agrees to make payments to the other to the extent that interest rates exceed a specified rate, or “cap”, (ii) interest rate floors, under which, in return for a premium, one party agrees to make payments to the other to the extent that interest rates fall below a specified rate, or “floor”, (iii) interest rate collars, under which a party sells a cap and purchases a floor or vice versa in an attempt to protect itself against interest rate movements exceeding given minimum or maximum levels, (iv) callable interest rate swaps, under which the counterparty may terminate the swap transaction in whole at zero cost by a predetermined date and time prior to the maturity date, (v) spreadlocks, which allow the interest rate swap users to lock in the forward differential (or spread) between the interest rate swap rate and a specified benchmark, or (vi) basis swaps, under which two parties can exchange variable interest rates based on different money markets.
Certain Funds hold fixed rate bonds whose value may decrease if interest rates rise. To help hedge against this risk and to maintain the ability to generate income at prevailing market rates, certain Funds enter into interest rate swap agreements.
A Fund investing in interest rate swaps is subject to the risk that there is no liquid market for these agreements, that the counterparties may default on their obligations to perform or disagree as to the meaning of the contractual terms in the agreements, or that there may be unfavorable changes in interest rates. A Fund’s maximum risk of loss from counterparty credit risk related to interest rate swaps is the discounted net value of the cash flows to be received from/paid to the counterparty over the contract’s remaining life, to the extent that the amount is positive. The risk may be mitigated to some extent if a master netting arrangement between a Fund and the counterparty is in place and to the extent a Fund obtains collateral to cover the Fund’s exposure to the counterparty.
During the reporting period, the Funds entered into interest rate swaps for the following reasons: The PL Inflation Managed and PL Managed Bond Funds entered into interest rate swaps to manage nominal or real interest rate risk, as well as other risk exposures in various global markets, or as a substitute for cash bond exposure. The PL Emerging Markets Debt Fund entered into interest rate swaps for duration management and to gain exposure to the currency markets. The PL Global Absolute Return Fund entered into interest rate swaps to manage interest rate risk and exposure to various markets, and as a part of the Fund’s investment strategy.
Credit Default Swaps – Credit default swap agreements involve one party making a stream of payments (referred to as the buyer of protection) to another party (the seller of protection) in exchange for the right to receive a specified return in the event of a default or other credit event for the referenced entity, obligation or index. As a seller of protection, a Fund generally receives an upfront payment or a fixed rate of income throughout the term of the swap provided there is no credit event. As the seller, a Fund would effectively add leverage to its Fund because, in addition to its total net assets, a Fund would be subject to investment exposure on the notional amount of the swap.
A Fund investing in credit default swaps is subject to the risk that there is no liquid market for these agreements, that the counterparties may default on their obligations to perform or disagree as to the meaning of the contractual terms in the agreements, or that there may be unfavorable changes in interest rates.
If a Fund is a seller of protection and a credit event occurs, as defined under the terms of that particular swap agreement, a Fund will either (i) pay to the buyer of protection an amount equal to the notional amount of the swap and take delivery of the referenced obligation, other deliverable obligations or underlying securities comprising the referenced index or (ii) pay a net settlement amount in the form of cash or securities equal to the notional amount of the swap less the recovery value of the referenced obligation or underlying securities comprising the referenced index. If a Fund is a buyer of protection and a credit event occurs, as defined under the terms of that particular swap agreement, a Fund will either (i) receive from the seller of protection an amount equal to the notional amount of the swap and deliver the referenced obligation, other deliverable obligations or underlying securities comprising the referenced index or (ii) receive a net settlement amount in the form of cash or securities equal to the notional amount of the swap less the recovery value of the referenced obligation or underlying securities comprising the referenced index. Recovery values are assumed by market makers considering either industry standard recovery rates or entity specific factors and considerations until a credit event occurs. If a credit event has occurred, the recovery value is determined by a facilitated auction whereby a minimum number of allowable broker bids, together with a specified valuation method, are used to calculate the settlement value.
Credit default swap agreements on corporate issues, sovereign issues of an emerging country or U.S. Treasury obligation issues involve one party making a stream of payments to another party in exchange for the right to receive a specified return in the event of a default or other credit event. If a credit event occurs and cash settlement is not elected, a variety of other deliverable obligations may be delivered in lieu of the
D-12
Table of Contents
PACIFIC LIFE FUNDS
NOTES TO FINANCIAL STATEMENTS (Continued)
specific referenced obligation. The ability to deliver other obligations may result in a cheapest-to-deliver option (the buyer of protection’s right to choose the deliverable obligation with the lowest value following a credit event). A Fund may use credit default swaps on corporate issues, sovereign issues of an emerging country or U.S. Treasury obligation issues to provide a measure of protection against defaults of the issuers (i.e., to reduce risk where a Fund owns or has exposure to the referenced obligation) or to take an active long or short position with respect to the likelihood of a particular issuer’s default.
Credit default swap agreements on asset-backed securities involve one party making a stream of payments to another party in exchange for the right to receive a specified return in the event of a default or other credit event. Unlike credit default swaps on corporate and sovereign issues of an emerging country, deliverable obligations in most instances would be limited to the specific referenced obligation as performance for asset-backed securities can vary across deals. Prepayments, principal paydowns, and other writedowns or loss events on the underlying mortgage loans will reduce the outstanding principal balance of the referenced obligation. These reductions may be temporary or permanent as defined under the terms of the swap agreement and the notional amount for the swap agreement will be adjusted by corresponding amounts. A Fund may use credit default swaps on asset-backed securities to provide a measure of protection against defaults of the referenced obligation or to take an active long or short position with respect to the likelihood of a particular referenced obligation’s default.
Credit default swap agreements on credit indices involve one party making a stream of payments to another party in exchange for the right to receive a specified return in the event of a write-down, principal shortfall, interest shortfall or default of all or part of the referenced entities comprising the credit index. Credit default swap agreements on indices are benchmarks for protecting investors owning bonds against default. A credit index is a list of a basket of credit instruments or exposures designed to be representative of some part of the credit market as a whole. These indices are made up of reference credits that are judged by a poll of dealers to be the most liquid entities in the credit default swap market based on the sector of the index. Components of the indices may include, but are not limited to, investment grade securities, high yield securities, asset-backed securities, emerging markets, and/or various credit ratings within each sector. Credit indices are traded using credit default swaps with standardized terms including a fixed spread and standard maturity dates. An index credit default swap references all the names in the index, and if there is a default, the credit event is settled based on that name’s weight in the index. The composition of the indices changes periodically, usually every six months, and for most indices, each name has an equal weight in the index. A Fund may use credit default swaps on credit indices to hedge a Fund of credit default swaps or bonds with a credit default swap on indices which is less expensive than it would be to buy many credit default swaps to achieve a similar effect.
An implied credit spread is the spread in yield between a U.S. Treasury security and the referenced obligation or underlying investment that are identical in all respects except for the quality rating. Wider credit spreads, in absolute terms when compared to the notional amount of the swap, represent a deterioration of the referenced entity’s credit soundness and a greater likelihood or risk of default or other credit event occurring as defined under the terms of the agreement. Implied credit spreads, represented in absolute terms, utilized in determining the market value of credit default swap agreements on corporate issues, sovereign issues of an emerging country or U.S. Treasury obligation issues as of period end, are disclosed in the Notes to Schedules of Investments and serve as an indicator of the current status of the payment/performance risk and represent the likelihood or risk of default for the credit derivative. The implied credit spread of a particular referenced entity reflects the cost of buying/selling protection and may include upfront payments required to be made to enter into the agreement. For credit default swap agreements on asset-backed securities and credit indices, the quoted market prices and resulting values serve as the indicator of the current status of the payment/performance risk.
A Fund may use pair trades of credit default swaps. Pair trades attempt to match a long position with a short position of two securities in the same market sector for hedging purposes. Pair trades of credit default swaps attempt to gain exposure to credit risk while hedging or offsetting the effects of overall market movements. For example, a Fund may purchase protection through a credit default swap referenced to the debt of an issuer, and simultaneously selling protection through a credit default swap referenced to the debt of a different issuer with the intent to realize gains from the pricing differences of the two issuers who are expected to have similar market risks.
A Fund may use spread curve trades by simultaneously purchasing and selling protection through credit default swaps referenced to the same issuer but with different maturities. Spread curves attempt to gain exposure to credit risk on a forward basis by realizing gains on the expected differences in spreads.
A Fund’s maximum risk of loss from counterparty credit risk related to credit default swaps, either as the buyer or seller of protection, is the fair value of the contract. The risk may be mitigated to some extent if a master netting arrangement between a Fund and the counterparty is in place and to the extent a Fund obtains collateral to cover the Fund’s exposure to the counterparty.
The aggregate fair value of credit default swaps in a net liability position is reflected as unrealized depreciation and is disclosed in the Notes to Schedules of Investments. The collateral posted, net of assets received as collateral, for swap contracts is also disclosed in the Notes to Schedules of Investments. The maximum potential amount of future payments (undiscounted) that a Fund as a seller of protection could be required to make under a credit default swap agreement is an amount equal to the notional amount of the agreement. Notional amounts of all credit default swap agreements outstanding as of March 31, 2013 for which a Fund is the seller of protection are disclosed in the Notes to Schedules of Investments. These potential amounts are partially offset by any recovery values of the respective referenced obligations, upfront payments received upon entering into the agreement, or net amounts received from the settlement of buy protection credit default swap agreements entered into by a Fund for the same referenced entity or entities.
During the reporting period, the Funds entered into credit default swaps for the following reasons: The PL Inflation Managed and PL Managed Bond Funds sold credit protection through credit default swaps to increase exposure to the credit risk of individual securities or to the broader investment grade, high yield, or emerging markets. Both Funds also purchased credit protection to reduce credit exposure to individual issuers, reduce broader credit risk, or to take advantage of the basis between the credit default swap and the cash bond market. The PL Global Absolute Return Fund entered into credit default swaps for hedging purposes, to increase or decrease credit exposure to various indices, individual issuers and securities or groups or securities, and as a part of the Fund’s investment strategy.
D-13
Table of Contents
PACIFIC LIFE FUNDS
NOTES TO FINANCIAL STATEMENTS (Continued)
Total Return Swaps – A Fund investing in total return swaps is subject to the risk that there is no liquid market for these agreements, that the counterparties may default on their obligations to perform or disagree as to the meaning of the contractual terms in the agreements, or that there may be unfavorable changes in the value of the underlying index or reference instrument (generally caused by changes in interest rates or declines in credit quality). A total return swap agreement is one in which one party makes payments based on a set rate, either fixed or variable, while the other party makes payments based on the return of an underlying index or reference instrument, which includes both the income it generates and any capital gains. To the extent the total return of the index or reference instrument underlying the transaction exceeds or falls short of the offsetting interest rate obligation, a Fund will receive a payment from or make a payment to the counterparty. A Fund’s maximum risk of loss from counterparty credit risk related to total return swaps is the discounted net value of the cash flows to be received from or paid to the counterparty over the contract’s remaining life, to the extent that the amount is positive. The risk may be mitigated to some extent if a master netting arrangement between a Fund and the counterparty is in place and to the extent a Fund obtains collateral to cover a Fund’s exposure to the counterparty.
During the reporting period, the Funds entered into total return swaps for the following reasons: The PL Global Absolute Return Fund entered into total return swaps to maintain exposure to various markets, to increase or decrease credit exposure to various indices, individual issuers and securities or groups or securities, and as a part of the Fund’s investment strategy.
For financial reporting purposes, the Trust does not offset fair value amounts recognized for derivative instruments and fair value amounts recognized for the right to reclaim cash collateral (receivables) or the obligation to return cash collateral (payables) arising from derivative instruments recognized at fair value executed with the same counterparty under a master netting arrangement. The derivative investments held as of March 31, 2013 as disclosed in the Notes to Schedules of Investments and the amounts of realized gains and losses and changes in net unrealized appreciation and depreciation on derivative investments as disclosed in the Statements of Operations serve as indicators of the volume of derivative activity for each applicable Fund during the year ended March 31, 2013.
The following is a summary of the location of fair value amounts of derivative investments, if any, disclosed in the Trust’s Statements of Assets and Liabilities:
| Location on the Statements of Assets and Liabilities | ||||||
| Derivative Investments Risk Type | Asset Derivative Investments | Liability Derivative Investments | ||||
| Interest rate contracts | Investments, at value | Outstanding options written, at value | ||||
| Receivable: Variation margin | Payable: Variation margin | |||||
| Swap contracts, at value | Swap contracts, at value | |||||
| Foreign currency contracts | Investments, at value | Outstanding options written, at value | ||||
| Receivable: Variation margin | Payable: Variation margin | |||||
| Forward foreign currency contracts appreciation | Forward foreign currency contracts depreciation | |||||
| Credit contracts | Swap contracts, at value | Swap contracts, at value | ||||
| Equity contracts | Investments, at value | Outstanding options written, at value | ||||
| Receivable: Variation margin | Payable: Variation margin | |||||
The following is a summary of fair values of derivative investments disclosed in the Statements of Assets and Liabilities, categorized by primary risk exposure as of March 31, 2013:
| Asset Derivative Investments Value | ||||||||||||||||||||
| Fund | Total Value at March 31, 2013 | Credit Contracts | Equity Contracts | Foreign Currency Contracts | Interest Rate Contracts | |||||||||||||||
PL Inflation Managed | $543,065 | $— | $— | $218,320 | $324,745 | * | ||||||||||||||
PL Managed Bond | 3,450,077 | 562,840 | — | 1,207,571 | 1,679,666 | * | ||||||||||||||
PL Short Duration Bond | 2,198 | — | — | — | 2,198 | * | ||||||||||||||
PL Emerging Markets Debt | 230,288 | — | — | 230,288 | — | |||||||||||||||
PL Comstock | 124,280 | — | — | 124,280 | — | |||||||||||||||
PL Growth LT | 20,581 | — | — | 20,581 | — | |||||||||||||||
PL Large-Cap Growth | 35,842 | — | 35,842 | * | — | — | ||||||||||||||
PL International Value | 799,078 | — | — | 799,078 | — | |||||||||||||||
PL Currency Strategies | 2,766,926 | — | — | 2,766,926 | — | |||||||||||||||
PL Global Absolute Return | 9,085,771 | 5,316,577 | 242,701 | * | 3,431,008 | 95,485 | ||||||||||||||
| Liability Derivative Investments Value | ||||||||||||||||||||
| Fund | Total Value at March 31, 2013 | Credit Contracts | Equity Contracts | Foreign Currency Contracts | Interest Rate Contracts | |||||||||||||||
PL Inflation Managed | ($325,723 | ) | $— | $— | ($139,609 | ) | ($186,114 | )* | ||||||||||||
PL Managed Bond | (1,091,241 | ) | (200,859 | ) | — | (604,903 | ) | (285,479 | )* | |||||||||||
PL Short Duration Bond | (21,770 | ) | — | — | (5,873 | ) | (15,897 | )* | ||||||||||||
PL Emerging Markets Debt | (146,115 | ) | — | — | (129,580 | ) | (16,535 | ) | ||||||||||||
PL Comstock | (170,768 | ) | — | — | (170,768 | ) | — | |||||||||||||
PL Growth LT | (30,064 | ) | — | — | (30,064 | ) | — | |||||||||||||
PL International Value | (405,120 | ) | — | — | (405,120 | ) | — | |||||||||||||
PL Currency Strategies | (3,921,893 | ) | — | — | (3,921,893 | ) | — | |||||||||||||
PL Global Absolute Return | (3,049,154 | ) | (1,366,297 | ) | — | (926,759 | ) | (756,098 | )* | |||||||||||
| * | Includes cumulative appreciation (depreciation) of futures contracts and centrally cleared swaps as reported in the Notes to Schedule of Investments. Only current day’s variation margin is reported within the Statement of Assets and Liabilities. |
D-14
Table of Contents
PACIFIC LIFE FUNDS
NOTES TO FINANCIAL STATEMENTS (Continued)
The following is a summary of the location of realized gains and losses and changes in net unrealized appreciation and depreciation of derivative investments, if any, disclosed in the Trust’s Statements of Operations:
| Derivative Investments Risk Type | Location of Gain (Loss) on Derivative Investments Recognized in the Statements of Operations | |||
| Interest rate contracts | Net realized gain (loss) on investment security transactions | |||
| Equity contracts | Net realized gain (loss) on futures contracts and swap transactions | |||
| Net realized gain (loss) on written option transactions | ||||
| Change in net unrealized appreciation (depreciation) on investment securities | ||||
| Change in net unrealized appreciation (depreciation) on futures contracts and swaps | ||||
| Change in net unrealized appreciation (depreciation) on written options | ||||
| Foreign currency contracts | Net realized gain (loss) on investment security transactions | |||
| Net realized gain (loss) on futures contracts and swap transactions | ||||
| Net realized gain (loss) on written option transactions | ||||
| Net realized gain (loss) on foreign currency transactions | ||||
| Change in net unrealized appreciation (depreciation) on investment securities | ||||
| Change in net unrealized appreciation (depreciation) on futures contracts and swaps | ||||
| Change in net unrealized appreciation (depreciation) on written options | ||||
| Change in net unrealized appreciation (depreciation) on foreign currencies | ||||
| Credit contracts | Net realized gain (loss) on futures contracts and swap transactions | |||
| Change in net unrealized appreciation (depreciation) on futures contracts and swaps |
The following is a summary of each Fund’s realized gain and/or loss and change in net unrealized appreciation and/or depreciation on derivative investments recognized in the Statements of Operations categorized by primary risk exposure for the year ended March 31, 2013:
| Realized Gain (Loss) on Derivative Investments Recognized in the Statement of Operations | ||||||||||||||||||||
| Fund | Total | Credit Contracts | Equity Contracts | Foreign Currency Contracts | Interest Rate Contracts | |||||||||||||||
PL Inflation Managed | $1,398,684 | ($40,663 | ) | $— | $907,374 | $531,973 | ||||||||||||||
PL Managed Bond | 7,592,384 | (421,572 | ) | — | 4,505,692 | 3,508,264 | ||||||||||||||
PL Short Duration Bond | (6,387 | ) | — | — | (34,682 | ) | 28,295 | |||||||||||||
PL Emerging Markets Debt | (58,594 | ) | — | — | (96,719 | ) | 38,125 | |||||||||||||
PL Comstock | 62,214 | — | — | 62,214 | — | |||||||||||||||
PL Growth LT | 68,586 | — | (93,119 | ) | 161,705 | — | ||||||||||||||
PL Large-Cap Growth | 305,194 | — | 305,194 | — | — | |||||||||||||||
PL International Value | 2,943 | — | 157,787 | (154,844 | ) | — | ||||||||||||||
PL Currency Strategies | 6,754,910 | — | — | 6,754,910 | — | |||||||||||||||
PL Global Absolute Return | 1,159,538 | 145,110 | — | 1,284,754 | (270,326 | ) | ||||||||||||||
| Change in Net Unrealized Appreciation (Depreciation) on Derivative Investments Recognized in the Statement of Operations | ||||||||||||||||||||
| Fund | Total | Credit Contracts | Equity Contracts | Foreign Currency Contracts | Interest Rate Contracts | |||||||||||||||
PL Inflation Managed | $92,391 | $62,142 | $— | $243,208 | ($212,959 | ) | ||||||||||||||
PL Managed Bond | 1,611,636 | 1,038,618 | — | 1,942,650 | (1,369,632 | ) | ||||||||||||||
PL Short Duration Bond | (16,741 | ) | — | — | (3,042 | ) | (13,699 | ) | ||||||||||||
PL Emerging Markets Debt | 56,906 | — | — | 73,441 | (16,535 | ) | ||||||||||||||
PL Comstock | (46,488 | ) | — | — | (46,488 | ) | — | |||||||||||||
PL Growth LT | (56,151 | ) | — | (100,891 | ) | 44,740 | — | |||||||||||||
PL Large-Cap Growth | 35,842 | — | 35,842 | — | — | |||||||||||||||
PL International Value | 578,828 | — | (4,639 | ) | 583,467 | — | ||||||||||||||
PL Currency Strategies | (1,154,967 | ) | — | — | (1,154,967 | ) | — | |||||||||||||
PL Global Absolute Return | 1,875,549 | 313,537 | 99,452 | 2,123,173 | (660,613 | ) | ||||||||||||||
D-15
Table of Contents
PACIFIC LIFE FUNDS
NOTES TO FINANCIAL STATEMENTS (Continued)
6. INVESTMENT ADVISORY, ADMINISTRATION AND SHAREHOLDER SERVICES, SUPPORT SERVICES AND DISTRIBUTION AGREEMENTS
Pursuant to an Investment Advisory Agreement, PLFA, a wholly-owned subsidiary of Pacific Life Insurance Company (“Pacific Life”), serves as Adviser to the Trust. For the PL Underlying Funds, PLFA has retained other management firms to sub-advise each Fund, as discussed later in this section. PLFA manages the PL Alternative Strategies Fund. PLFA receives advisory fees from each Fund based on the following advisory fee rates, which are based on an annual percentage of average daily net assets of each Fund:
PL Floating Rate Loan (1) | 0.75% | PL Large-Cap Value | 0.65% | PL International Large-Cap | 0.85% | |||||
PL Inflation Managed | 0.40% | PL Main Street Core | 0.45% | PL International Value | 0.65% | |||||
PL Managed Bond | 0.40% | PL Mid-Cap Equity | 0.65% | PL Currency Strategies | 0.65% | |||||
PL Short Duration Bond | 0.40% | PL Mid-Cap Growth | 0.70% | PL Global Absolute Return | 0.80% | |||||
PL Emerging Markets Debt | 0.785% | PL Small-Cap Growth | 0.60% | PL Precious Metals (4) | 0.75% | |||||
PL Comstock (2) | 0.75% | PL Small-Cap Value | 0.75% | PL Alternative Strategies Fund | 0.20% | |||||
PL Growth LT | 0.55% | PL Real Estate | 0.90% | |||||||
PL Large-Cap Growth (3) | 0.75% | PL Emerging Markets | 0.80% |
| (1) | PLFA has contractually agreed to waive 0.10% of its advisory fees through July 31, 2013 as long as Eaton Vance Management remains manager of the Fund. There is no guarantee that PLFA will continue such waiver after that date. |
| (2) | PLFA has contractually agreed to waive 0.015% of its advisory fees through July 31, 2013 as long as Invesco Advisers, Inc. remains manager of the Fund. There is no guarantee that PLFA will continue such waiver after that date. |
| (3) | PLFA has contractually agreed to waive 0.025% of its advisory fees from April 1, 2012 through December 31, 2012, 0.275% from January 1, 2013 to April 30, 2013, and 0.045% from May 1, 2013 through July 31, 2013 as long as BlackRock Investment Management, LLC remains manager of the Fund. There is no guarantee that PLFA will continue such waiver after that date. |
| (4) | PLFA has contractually agreed to waive 0.07% of its advisory fees through July 31, 2013 as long as Wells Capital Management Inc. remains the manager of the Fund. There is no guarantee that PLFA will continue such waiver after that date. |
Pursuant to Fund Management Agreements, the Trust and PLFA engage various management firms under PLFA’s supervision for the PL Underlying Funds. As of March 31, 2013, the following firms serve as sub-advisers for their respective Fund(s): Eaton Vance Management for the PL Floating Rate Loan and PL Global Absolute Return Funds; Pacific Investment Management Company LLC for the PL Inflation Managed and PL Managed Bond Funds; T. Rowe Price Associates, Inc. for the PL Short Duration Bond Fund; Ashmore Investment Management Limited for the PL Emerging Markets Debt Fund; Invesco Advisers, Inc. for the PL Comstock Fund; Janus Capital Management LLC for the PL Growth LT Fund; BlackRock Investment Management, LLC for the PL Large-Cap Growth Fund; ClearBridge Advisors, LLC for the PL Large-Cap Value Fund; OppenheimerFunds, Inc. for the PL Main Street Core and PL Emerging Markets Funds; Scout Investments, Inc for the PL Mid-Cap Equity Fund; Morgan Stanley Investment Management Inc. for the PL Mid-Cap Growth and PL Real Estate Funds; Fred Alger Management, Inc. for the PL Small-Cap Growth Fund; NFJ Investment Group LLC for the PL Small-Cap Value Fund; MFS Investment Management for the PL International Large-Cap Fund; J.P. Morgan Investment Management Inc. for the PL International Value Fund; UBS Global Asset Management (Americas) Inc. for the PL Currency Strategies Fund; and Wells Capital Management Inc. for the PL Precious Metals Fund. PLFA, as Adviser to the Trust, pays the related management fees to these sub-advisers as compensation for their sub-advisory services provided to their respective Fund.
Pursuant to an Administration and Shareholder Services Agreement (the “Administration Agreement”), Pacific Life serves as administrator (the “Administrator”) to the Trust. The Trust paid the Administrator an administration fee at an annual rate of 0.15% for the PL Alternative Strategies Fund and each of the PL Underlying Funds. The administration fee is for procuring or providing administrative, transfer agency, and shareholder services. In addition, Pacific Life and PLFA provide support services to the Trust that are outside the scope of the Administrator’s and Adviser’s responsibilities under the Administration Agreement and Investment Advisory Agreement. Under the Support Services Agreement, the Trust compensated Pacific Life and PLFA for their expenses in providing support services to the Trust in connection with various matters, some of which include the time spent by legal, accounting, and compliance personnel of Pacific Life and PLFA (including individuals who may be officers or Trustees of the Trust), to attend meetings of the Board and to provide assistance with the coordination and supervision in connection with the services procured for the Trust under the Administration Agreement. Support services do not include any services for which PLFA is responsible pursuant to the Investment Advisory Agreement. The Trust reimbursed Pacific Life and PLFA for these support services on an approximate cost basis.
Pursuant to a Distribution Agreement, Pacific Select Distributors, Inc. (the “Distributor”), a wholly-owned subsidiary of Pacific Life, serves as distributor of the Trust’s shares. Under the Distribution Agreement, the Distributor bears all expenses of providing services, including costs of sales presentations, mailings, advertisements, and other marketing efforts by the Distributor in connection with the distribution or sale of the Trust’s shares and makes distribution and/or service payments to selling groups in connection with the sale of certain of the Trust’s shares and subsequent servicing needs of shareholders provided by selling groups. The Class P shares of the PL Underlying Funds covered in this report is not subject to a distribution and/or service fee. The Distributor received distribution and service fees pursuant to class specific distribution and service plans, each adopted in accordance with Rule 12b-1 under the 1940 Act (together the “12b-1 Plans”) for Class C shares. The Distributor also received service fees pursuant to a Class A Service Plan (“Class A Plan”) and an Advisor Class Service Plan (“Advisor Class Plan”) which were not adopted in accordance with Rule 12b-1 under the 1940 Act. Under the 12b-1 Plans, each Fund paid to the Distributor both distribution and service fees at an annual rate expressed as a percentage of average daily net assets. The distribution fee was 0.75% for C shares.
D-16
Table of Contents
PACIFIC LIFE FUNDS
NOTES TO FINANCIAL STATEMENTS (Continued)
The service fee was 0.25% for Class C shares. Under the Class A Plan, each Fund paid the Distributor service fees at an annual rate of 0.25% of the average daily net assets attributable to the applicable share class. There are no distribution and service fees for the Advisor Class shares. The distribution and service fees were accrued daily.
7. TRANSACTIONS WITH AFFILIATES
A. ADVISORY FEES, ADMINISTRATION FEES AND EXPENSES FOR SUPPORT SERVICES
The Adviser and Pacific Life are related parties. The advisory fees earned by the Adviser, including any advisory fee waiver, the administration fees earned by Pacific Life, including any fee waivers, and expenses for support services recovered by PLFA and Pacific Life (see Note 6) by each Fund covered in this report for the year ended March 31, 2013 are presented in the Statements of Operations. The amounts of each of these fees that remained payable as of March 31, 2013 are presented in the Statements of Assets and Liabilities.
B. EXPENSE LIMITATION AGREEMENTS
To help limit the Trust’s expenses, PLFA has entered into expense limitation agreements with the Trust and has contractually agreed to reimburse each Fund for certain operating expenses that exceed an annual rate based on a percentage of a Fund’s average daily net assets. These operating expenses include, but are not limited to, administration fees, organizational expenses, custody expenses, expenses for audit, tax and certain legal services, preparation, printing, filing and distribution to existing shareholders of proxies, prospectuses and shareholder reports and other regulatory documents as applicable, independent trustees’ fees, and establishing, overseeing and administering the Trust’s compliance program. These operating expenses do not include investment advisory fees; distribution and/or service fees, if any; interest; taxes (including foreign taxes on dividends, interest or gains); brokerage commissions and other transactional expenses; dividends on securities sold short; acquired fund fees and expenses; and extraordinary expenses such as litigation expenses and other expenses not incurred in the ordinary course of each Fund’s business. The current expense cap for the PL Underlying Funds, except the PL Currency Strategies Fund, PL Global Absolute Return Fund and PL Precious Metals Fund, is 0.15% through July 31, 2015 and 0.30% thereafter through July 31, 2022. The current expense cap for the Currency Strategies Fund, PL Global Absolute Return Fund and PL Precious Metals Fund is 0.20% through July 31, 2014. The current expense cap for the Alternative Strategies Fund is 0.40% through July 31, 2016.
There is no guarantee that PLFA will continue to cap expenses upon the expiration of the applicable expense caps. Any expense reimbursements are subject to repayment to PLFA for a period of time as permitted under regulatory and accounting guidance (currently 3 years from the end of the fiscal year in which the reimbursement or reduction took place), to the extent such expenses fall below the expense cap in future years. Any amounts repaid to PLFA will have the effect of increasing such expenses of the Fund, but not above the expense cap. There was no recoupment of expense reimbursement by PLFA from any Funds covered in this report during the year ended March 31, 2013.
The cumulative reimbursement and fee reduction amounts, if any, as of March 31, 2013 that are subject to repayment for each Fund covered in this report are as follows:
| Expiration Date | ||||||||||||
| Fund | 3/31/2014 | 3/31/2015 | 3/31/2016 | |||||||||
PL Floating Rate Loan | $161,181 | $131,663 | $138,319 | |||||||||
PL Inflation Managed | 329,563 | 295,942 | 210,150 | |||||||||
PL Managed Bond | 558,213 | 506,074 | 511,150 | |||||||||
PL Short Duration Bond | 164,455 | 168,516 | 200,776 | |||||||||
PL Emerging Markets Debt | 149,277 | |||||||||||
PL Comstock | 194,706 | 167,205 | 179,416 | |||||||||
PL Growth LT | 154,975 | 163,768 | 95,666 | |||||||||
PL Large-Cap Growth | 112,128 | 106,391 | 120,927 | |||||||||
PL Large-Cap Value | 228,247 | 206,530 | 217,662 | |||||||||
PL Main Street Core | 176,595 | 160,866 | 167,926 | |||||||||
PL Mid-Cap Equity | 153,964 | 136,380 | 137,581 | |||||||||
PL Mid-Cap Growth | 116,589 | 83,455 | 95,060 | |||||||||
PL Small-Cap Growth | 73,729 | 59,708 | 63,952 | |||||||||
PL Small-Cap Value | 92,291 | 93,513 | 101,068 | |||||||||
PL Real Estate | 72,505 | 59,572 | 60,947 | |||||||||
PL Emerging Markets | 270,343 | 388,707 | 408,692 | |||||||||
PL International Large-Cap | 255,021 | 289,591 | 257,028 | |||||||||
PL International Value | 200,306 | 213,243 | 187,506 | |||||||||
PL Currency Strategies | �� | 31,042 | ||||||||||
PL Global Absolute Return | 68,978 | |||||||||||
PL Precious Metals | 33,601 | |||||||||||
PL Alternative Strategies | 70,089 | |||||||||||
|
|
|
|
|
| |||||||
Total | $3,314,811 | $3,231,124 | $3,506,813 | |||||||||
|
|
|
|
|
| |||||||
Due to the current regulatory and accounting guidance, all expense reimbursements made by the Adviser for the period September 28, 2001 (the Pacific Life Funds’ commencement date of operations) to March 31, 2010 expired for future recoupment as of March 31, 2013. Based on the Trust’s experience, the likelihood of repayment by a Fund for the amounts presented in the table above prior to the expiration is considered remote and no liabilities for such repayments were recorded by any Fund as of March 31, 2013. The Adviser expense reimbursement is presented in the Statements of Operations. Any amounts that remained due from the Advisor as of March 31, 2013 are presented in the Statements of Assets and Liabilities.
C. INVESTMENTS IN AFFILIATED FUNDS
As of March 31, 2013, the PL Alternative Strategies Fund (aggregate of Classes A, C, and Advisor Class) owned Class P shares in the PL Floating Rate Income Fund and in certain affiliated PL Underlying Funds. A summary of transactions for the period from inception through
D-17
Table of Contents
PACIFIC LIFE FUNDS
NOTES TO FINANCIAL STATEMENTS (Continued)
March 31, 2013 and total investments by the PL Alternative Strategies Fund in the PL Floating Rate Income Fund and in certain PL Underlying Funds as of March 31, 2013 is as follows:
Fund/Underlying Fund | Beginning Value as of April 1, 2012 (1) | Purchase Cost (2) | Distributions Received and Reinvested (3) | Sales Proceeds | Net Realized Gain (Loss) (4) | Change in Unrealized Appreciation (Depreciation) | As of March 31, 2013 | |||||||||||||||||||||||||
| Ending Value | Shares Balance | |||||||||||||||||||||||||||||||
| PL Alternative Strategies Fund | ||||||||||||||||||||||||||||||||
PL Floating Rate Income | $— | $4,292 | $25 | $350 | $2 | $30 | $3,999 | 382 | ||||||||||||||||||||||||
PL Inflation Managed | — | 12,875 | — | 1,050 | (4 | ) | 23 | 11,844 | 1,216 | |||||||||||||||||||||||
PL Real Estate | — | 4,291 | — | 350 | 12 | 145 | 4,098 | 300 | ||||||||||||||||||||||||
PL Emerging Markets Debt | — | 4,292 | — | 350 | 1 | (28 | ) | 3,915 | 372 | |||||||||||||||||||||||
PL Currency Strategies | — | 21,457 | — | 1,750 | 2 | (13 | ) | 19,696 | 1,909 | |||||||||||||||||||||||
PL Global Absolute Return | — | 25,749 | — | 2,100 | 21 | 282 | 23,952 | 2,351 | ||||||||||||||||||||||||
PL Precious Metals | — | 12,874 | — | 1,050 | (39 | ) | (590 | ) | 11,195 | 1,362 | ||||||||||||||||||||||
| $— | $85,830 | $25 | $7,000 | ($5 | ) | ($151 | ) | $78,699 | ||||||||||||||||||||||||
| (1) | Operations commenced on December 31, 2012. |
| (2) | Purchased cost excludes distributions received and reinvested, if any. |
| (3) | Distributions received include distributions from net investment income from the PL Underlying Funds and the PL Floating Rate Income Fund, if any. |
| (4) | Net realized gain (loss) includes distributions from capital gains from the PL Underlying Funds and the PL Floating Rate Income Fund, if any. |
As of March 31, 2013, Pacific Life owned 100% of the total (aggregate of Class A, C, and Advisor Class) shares outstanding of the PL Alternative Strategies Fund.
D. INDEPENDENT TRUSTEES
The Trust pays each independent trustee of the Board retainer fees and specified amounts for various Board and committee services and for chairing those committees. The fees and expenses of the independent trustees of the Board are presented in the Statements of Operations.
Each independent trustee of the Board is eligible to participate in the Trust’s Deferred Compensation Plan (the “Plan”). The Plan allows each independent trustee to voluntarily defer receipt of all or a percentage of fees which otherwise would be payable for services performed. Amounts in the deferral account are obligations of each Fund at the time of such deferral and are payable in accordance with the Plan. Deferral amounts are treated as though equivalent dollar amounts had been invested in shares of certain Funds. An independent trustee who defers compensation has the option to select credit rate options that track the performance, at NAV of Class A shares of the corresponding Portfolio Optimization Funds, PL Alternative Strategies Fund, PL Short Duration Income Fund, PL Income Fund, PL Strategic Income Fund, PL Floating Rate Income Fund, PL High Income Fund and/or PL Money Market Fund, and/or Class P shares of the corresponding PL Underlying Funds without a sales load. The obligation of each Fund under the Plan (the “DCP Liability”) is recorded as a liability (accrued trustees’ fees and expenses and deferred compensation). Accordingly, the market value appreciation or depreciation on a Fund’s DCP Liability account will cause the expenses of that Fund to increase or decrease due to market fluctuation. The change in net unrealized appreciation or depreciation on a Fund’s DCP Liability account is recorded as an increase or decrease to expenses (trustees’ fees and expenses). For the year ended March 31, 2013, such expenses were increased by $1,896 for all applicable Funds covered in this report as a result of the market value appreciation on such accounts. As of March 31, 2013, the total amount in the DCP Liability accounts was $34,280 for all applicable Funds covered in this report.
E. OFFICERS OF THE TRUST
None of the officers of the Trust received compensation from the Trust.
F. INDEMNIFICATIONS
Under the Trust’s organizational documents, its officers and trustees are indemnified against certain liabilities arising out of performance of their duties to the Trust. In addition, the Trust entered into an agreement with each of the trustees which provides that the Trust will indemnify and hold harmless each trustee against any expenses actually and reasonably incurred by any trustee in any proceeding arising out of or in connection with the trustee’s services to the Trust, to the fullest extent permitted by the Trust’s Declaration of Trust and By-Laws, the general trust law of the State of Delaware, the Securities Act of 1933, and the 1940 Act, each as now or hereinafter in force. In the normal course of business, the Trust enters into contracts with service providers and others that contain general indemnification clauses. The Trust’s maximum exposure under these arrangements and agreements is dependent on future claims that may be made against the Trust and/or the trustees and, therefore, cannot be estimated; however, based on experience, the risk of loss from such claims is considered remote.
8. UNFUNDED SENIOR LOAN COMMITMENTS
Unfunded loan commitments on senior loan participations and assignments (Note 4), if any, are marked to market daily and valued according to the Trust’s valuation policies and procedures. Any outstanding unfunded loan commitments are presented in the Notes to Schedules of Investments section of each applicable Fund’s Schedule of Investments. Any applicable net unrealized appreciation or depreciation at the end of the reporting period is recorded as an asset (unfunded loan commitment appreciation) or a liability (unfunded loan commitment depreciation) and any change in net unrealized appreciation or depreciation for the reporting period is recorded as a change in net unrealized appreciation or depreciation on unfunded loan commitment. As of March 31, 2013, no unfunded loan commitments were held by any Funds covered in this report.
D-18
Table of Contents
PACIFIC LIFE FUNDS
NOTES TO FINANCIAL STATEMENTS (Continued)
9. PURCHASES AND SALES OF SECURITIES
The cost of purchases and proceeds from sales of investments (excluding short-term investments) for the year ended March 31, 2013, were as follows:
| U.S. Government Securities | Other Securities | |||||||||||||||
| Fund | Purchases | Sales | Purchases | Sales | ||||||||||||
PL Floating Rate Loan | $— | $— | $94,788,256 | $100,939,729 | ||||||||||||
PL Inflation Managed | 262,289,047 | 377,478,509 | 21,147,419 | 68,987,756 | ||||||||||||
PL Managed Bond | 3,346,153,043 | 3,252,881,801 | 138,774,501 | 170,854,868 | ||||||||||||
PL Short Duration Bond | 67,820,199 | 59,555,228 | 122,685,987 | 64,834,505 | ||||||||||||
PL Emerging Markets Debt | — | — | 120,252,900 | 42,267,620 | ||||||||||||
PL Comstock | — | — | 94,082,426 | 79,219,719 | ||||||||||||
PL Growth LT | — | — | 40,980,154 | 94,773,303 | ||||||||||||
PL Large-Cap Growth | — | — | 167,658,744 | 165,801,761 | ||||||||||||
PL Large-Cap Value | — | — | 91,476,428 | 76,265,317 | ||||||||||||
PL Main Street Core | — | — | 118,386,325 | 116,598,877 | ||||||||||||
PL Mid-Cap Equity | — | — | 258,104,639 | 284,588,189 | ||||||||||||
PL Mid-Cap Growth | — | — | 28,316,198 | 37,673,757 | ||||||||||||
PL Small-Cap Growth | — | — | 45,751,858 | 37,270,684 | ||||||||||||
PL Small-Cap Value | — | — | 60,470,795 | 37,856,798 | ||||||||||||
PL Real Estate | — | — | 16,513,943 | 12,303,155 | ||||||||||||
PL Emerging Markets | — | — | 55,137,431 | 38,842,929 | ||||||||||||
PL International Large-Cap | — | — | 55,877,630 | 81,031,585 | ||||||||||||
PL International Value | — | — | 111,323,206 | 86,828,036 | ||||||||||||
PL Currency Strategies | — | — | 83,269,704 | 28,250,165 | ||||||||||||
PL Global Absolute Return | 1,365,886 | 682,943 | 156,533,256 | 48,497,278 | ||||||||||||
PL Precious Metals | — | — | 74,653,631 | 2,071,095 | ||||||||||||
PL Alternative Strategies | — | — | 85,855 | 7,000 | ||||||||||||
10. FEDERAL INCOME TAX INFORMATION
Each Fund intends to qualify each year as a regulated investment company (“RIC”) under Subchapter M of the Internal Revenue Code (the “Code”). A Fund that qualifies as a RIC does not have to pay income tax as long as it distributes sufficient taxable income and net capital gains. Each Fund declared and paid sufficient dividends on net investment income and capital gains distributions during the year or period ended March 31, 2013, to qualify as a RIC and is not required to pay Federal income tax under the Code. Accordingly, no provision for Federal income taxes is required in the financial statements. Required distributions are based on net investment income and net realized gains determined in accordance with income tax regulations, which may differ from such amounts for financial reporting purposes. These differences are primarily due to differing treatments for sale-buyback financing transactions, futures and options, swap income, paydown gain/loss, partnership income, foreign currency transactions, passive foreign investment companies, late year ordinary and post-October capital losses, capital loss carryforwards, and losses deferred due to wash sales. Permanent book and tax differences relating to shareholder distributions will result in reclassifications of capital accounts. In addition, the year in which amounts are distributed may differ from the year in which the net investment income is earned and the net gains are realized by each Fund.
The following table shows the accumulated capital losses and components of distributable earnings on a tax basis, and late year ordinary losses and post-October capital losses deferred, if any, as of March 31, 2013:
| Distributable Earnings | Late Year Ordinary and Post-October Losses Deferral | |||||||||||||||||||||||||||||
| Funds | Accumulated Capital Losses | Undistributed Ordinary Income | Undistributed Long-Term Capital Gains | Late-Year Ordinary Losses | Short-Term Capital Losses | Long-Term Capital Losses | Total | |||||||||||||||||||||||
PL Floating Rate Loan | $— | $1,316,347 | $415,183 | $— | $— | $— | $— | |||||||||||||||||||||||
PL Inflation Managed | — | 969,033 | 1,799,266 | — | — | — | — | |||||||||||||||||||||||
PL Managed Bond | — | 5,249,049 | 335,216 | — | — | — | — | |||||||||||||||||||||||
PL Short Duration Bond | (400,482 | ) | 692,686 | — | — | — | — | — | ||||||||||||||||||||||
PL Emerging Markets Debt | — | 2,223,395 | — | — | — | — | — | |||||||||||||||||||||||
PL Comstock | (15,567,387 | ) | 1,547,697 | — | — | (39,394 | ) | — | (39,394 | ) | ||||||||||||||||||||
PL Growth LT | (8,082,253 | ) | 573,620 | — | — | — | — | — | ||||||||||||||||||||||
PL Large-Cap Growth | — | 2,005,094 | 16,228,244 | — | — | — | — | |||||||||||||||||||||||
PL Large-Cap Value | (11,105,101 | ) | 1,311,059 | — | — | — | — | — | ||||||||||||||||||||||
PL Main Street Core | (15,493,924 | ) | 510,526 | — | — | — | — | — | ||||||||||||||||||||||
PL Mid-Cap Equity | — | 261,379 | 8,498,830 | — | — | — | — | |||||||||||||||||||||||
PL Mid-Cap Growth | — | 152,026 | 201,852 | — | — | — | — | |||||||||||||||||||||||
PL Small-Cap Growth | (2,656,903 | ) | 98,333 | — | (9,352 | ) | — | — | (9,352 | ) | ||||||||||||||||||||
PL Small-Cap Value | (565,420 | ) | 643,956 | — | — | — | — | — | ||||||||||||||||||||||
PL Real Estate | (7,118,950 | ) | 207,691 | — | — | — | — | — | ||||||||||||||||||||||
PL Emerging Markets | — | 338,384 | 716,973 | — | — | — | — | |||||||||||||||||||||||
PL International Large-Cap | (11,259,863 | ) | 1,245,736 | — | — | (316,774 | ) | — | (316,774 | ) | ||||||||||||||||||||
PL International Value | (56,218,765 | ) | 1,569,454 | — | — | — | — | — | ||||||||||||||||||||||
PL Currency Strategies | — | 4,034,419 | — | — | — | — | — | |||||||||||||||||||||||
PL Global Absolute Return | — | 4,380,767 | — | — | — | — | — | |||||||||||||||||||||||
PL Precious Metals | — | 187,701 | — | — | 106,883 | — | 106,883 | |||||||||||||||||||||||
D-19
Table of Contents
PACIFIC LIFE FUNDS
NOTES TO FINANCIAL STATEMENTS (Continued)
Accumulated capital losses represent net capital loss carryovers as of March 31, 2013 that may be available to offset future realized capital gains and thereby reduce future capital gains distributions. Under the Regulated Investment Company Modernization Act of 2010 (the “Modernization Act”), each Fund is permitted to carry forward capital losses incurred in taxable years beginning after December 22, 2010 for an unlimited period. Any losses incurred during those future taxable years will be required to be utilized prior to any losses incurred in pre-enactment taxable years. Additionally, post-enactment capital losses that are carried forward will retain their character as either short-term or long-term capital losses rather than being considered all short-term as under the previous law. Each Fund’s first fiscal year end subject to the Modernization Act was March 31, 2012. The following table shows the expiration dates for capital loss carryover from pre-enactment taxable years and the amounts of capital loss carryover, if any, by each of the applicable Funds as of March 31, 2013:
| Pre-Enactment | Post-Enactment | |||||||||||||||||||||||||
| Net Capital Loss Carryover Expiring In | Unlimited Period of Net Capital Loss Carryover | Accumulated Capital Loss Carryover | ||||||||||||||||||||||||
| Fund | 2017 | 2018 | 2019 | Short-Term | Long-Term | |||||||||||||||||||||
PL Short Duration Bond | $— | $— | $— | ($400,482 | ) | $— | ($400,482 | ) | ||||||||||||||||||
PL Comstock | — | (15,567,387 | ) | — | — | — | (15,567,387 | ) | ||||||||||||||||||
PL Growth LT | — | (8,082,253 | ) | — | — | — | (8,082,253 | ) | ||||||||||||||||||
PL Large-Cap Value | (277,230 | ) | (10,501,973 | ) | (325,898 | ) | — | — | (11,105,101 | ) | ||||||||||||||||
PL Main Street Core | — | (15,493,924 | ) | — | — | — | (15,493,924 | ) | ||||||||||||||||||
PL Small-Cap Growth | — | (2,656,903 | ) | — | — | — | (2,656,903 | ) | ||||||||||||||||||
PL Small-Cap Value | — | (565,420 | ) | — | — | — | (565,420 | ) | ||||||||||||||||||
PL Real Estate | — | (7,118,950 | ) | — | — | — | (7,118,950 | ) | ||||||||||||||||||
PL International Large-Cap | (312,566 | ) | (8,295,134 | ) | (2,652,163 | ) | — | — | (11,259,863 | ) | ||||||||||||||||
PL International Value | (6,971,246 | ) | (38,541,418 | ) | — | (7,203,007 | ) | (3,503,094 | ) | (56,218,765 | ) | |||||||||||||||
The aggregate Federal tax cost of investments and the composition of unrealized appreciation and depreciation on investments as of March 31, 2013, were as follows:
| Fund | Total Cost of Investments on Tax Basis | Gross Unrealized Appreciation on Investments | Gross Unrealized Depreciation on Investments | Net Unrealized Appreciation (Depreciation) on Investments | Net Unrealized Appreciation (Depreciation) on Other (1) | Net Unrealized Appreciation (Depreciation) | ||||||||||||||||||
PL Floating Rate Loan | $111,207,748 | $1,832,779 | ($213,610 | ) | $1,619,169 | $— | $1,619,169 | |||||||||||||||||
PL Inflation Managed | 175,237,891 | 8,335,743 | (5,625,591 | ) | 2,710,152 | 167,315 | 2,877,467 | |||||||||||||||||
PL Managed Bond | 689,496,599 | 18,515,293 | (2,630,578 | ) | 15,884,715 | 1,091,615 | 16,976,330 | |||||||||||||||||
PL Short Duration Bond | 222,281,764 | 2,195,879 | (402,096 | ) | 1,793,783 | (19,332 | ) | 1,774,451 | ||||||||||||||||
PL Emerging Markets Debt | 81,883,511 | 3,387,849 | (1,182,003 | ) | 2,205,846 | 35,793 | 2,241,639 | |||||||||||||||||
PL Comstock | 202,194,269 | 66,958,399 | (7,399,064 | ) | 59,559,335 | (46,843 | ) | 59,512,492 | ||||||||||||||||
PL Growth LT | 37,437,755 | 12,240,709 | (1,038,866 | ) | 11,201,843 | (9,641 | ) | 11,192,202 | ||||||||||||||||
PL Large-Cap Growth | 124,675,175 | 22,418,560 | (1,111,260 | ) | 21,307,300 | 35,842 | 21,343,142 | |||||||||||||||||
PL Large-Cap Value | 230,089,557 | 96,372,737 | (2,815,981 | ) | 93,556,756 | — | 93,556,756 | |||||||||||||||||
PL Main Street Core | 160,322,455 | 52,594,432 | (905,701 | ) | 51,688,731 | — | 51,688,731 | |||||||||||||||||
PL Mid-Cap Equity | 127,816,747 | 12,888,172 | (2,298,265 | ) | 10,589,907 | — | 10,589,907 | |||||||||||||||||
PL Mid-Cap Growth | 49,211,916 | 16,275,987 | (4,024,650 | ) | 12,251,337 | (416 | ) | 12,250,921 | ||||||||||||||||
PL Small-Cap Growth | 40,218,117 | 11,711,271 | (1,125,642 | ) | 10,585,629 | — | 10,585,629 | |||||||||||||||||
PL Small-Cap Value | 97,154,221 | 29,271,938 | (1,028,168 | ) | 28,243,770 | 192 | 28,243,962 | |||||||||||||||||
PL Real Estate | 39,971,496 | 21,819,085 | (1,765,696 | ) | 20,053,389 | — | 20,053,389 | |||||||||||||||||
PL Emerging Markets | 90,590,081 | 26,993,965 | (6,271,053 | ) | 20,722,912 | (78,265 | ) | 20,644,647 | ||||||||||||||||
PL International Large-Cap | 148,917,199 | 55,908,029 | (6,795,066 | ) | 49,112,963 | (4,140 | ) | 49,108,823 | ||||||||||||||||
PL International Value | 128,374,895 | 22,753,387 | (4,511,299 | ) | 18,242,088 | 395,403 | 18,637,491 | |||||||||||||||||
PL Currency Strategies | 118,636,325 | 303,230 | (462,325 | ) | (159,095 | ) | (1,170,880 | ) | (1,329,975 | ) | ||||||||||||||
PL Global Absolute Return | 174,132,388 | 646,951 | (1,945,733 | ) | (1,298,782 | ) | 2,348,346 | 1,049,564 | ||||||||||||||||
PL Precious Metals | 78,464,963 | 137,032 | (12,507,935 | ) | (12,370,903 | ) | 126 | (12,370,777 | ) | |||||||||||||||
PL Alternative Strategies | 78,897 | 480 | (678 | ) | (198 | ) | — | (198 | ) | |||||||||||||||
| (1) | Other includes net appreciation or deprecation on derivatives, securities sold short, and assets and liabilities in foreign currencies, if any. |
Each Fund recognizes the financial statement effects of a tax position taken or expected to be taken in a tax return when it is more likely than not, based on the technical merits, that the position will be sustained upon examination by the applicable tax authority. Tax positions not deemed to meet the more-likely-than-not threshold would be recorded as a tax liability for unrecognized tax benefits with a corresponding income tax expense. Each Fund is required to analyze all open tax years, as defined by the statute of limitations, for all major jurisdictions. As a result of each Fund’s evaluation, as of and during the year ended March 31, 2013, each Fund did not record a liability for any unrecognized tax benefits. Each Fund’s policy is to recognize interest and penalties on unrecognized tax benefits in income tax expense. During the year ended March 31, 2013, none of the Funds covered in this report incurred any interest or penalties. Each Fund is also not aware of any tax positions for which it is reasonably possible that the total amounts of unrecognized tax benefits will change materially in the next twelve months.
D-20
Table of Contents
PACIFIC LIFE FUNDS
NOTES TO FINANCIAL STATEMENTS (Continued)
Each Fund remains subject to examination by Federal and State tax authorities (principal state jurisdictions include California and Delaware) for the tax years ended March 31, 2010 through March 31, 2013 for Federal purposes and March 31, 2009 through March 31, 2013 for State purposes.
11. TAX CHARACTER OF DISTRIBUTIONS
The tax character of income and capital gain distributions to shareholders during the years or periods ended March 31, 2013 and 2012, were as follows:
| For the Year or Period Ended March 31, 2013 | For the year or period ended March 31, 2012 | |||||||||||||||||||||||||
| Funds | Ordinary Income | Long-Term Capital Gains | Total Distributions | Ordinary Income | Long-Term Capital Gains | Total Distributions | ||||||||||||||||||||
PL Floating Rate Loan | $4,747,623 | $218,517 | $4,966,140 | $3,822,618 | $— | $3,822,618 | ||||||||||||||||||||
PL Inflation Managed | 16,375,562 | 6,414,250 | 22,789,812 | 16,846,737 | 3,055,973 | 19,902,710 | ||||||||||||||||||||
PL Managed Bond | 23,397,454 | 30,054 | 23,427,508 | 11,687,819 | — | 11,687,819 | ||||||||||||||||||||
PL Short Duration Bond | 2,806,267 | 46,127 | 2,852,394 | 1,583,339 | 194,538 | 1,777,877 | ||||||||||||||||||||
PL Emerging Markets Debt | 2,240,459 | — | 2,240,459 | — | — | — | ||||||||||||||||||||
PL Comstock | 2,925,820 | — | 2,925,820 | 2,469,410 | — | 2,469,410 | ||||||||||||||||||||
PL Growth LT | 549,887 | — | 549,887 | 536,165 | — | 536,165 | ||||||||||||||||||||
PL Large-Cap Growth | 660,404 | 6,924,562 | 7,584,966 | — | 1,890,797 | 1,890,797 | ||||||||||||||||||||
PL Large-Cap Value | 5,290,356 | — | 5,290,356 | 4,290,204 | — | 4,290,204 | ||||||||||||||||||||
PL Main Street Core | 2,671,391 | — | 2,671,391 | 1,459,944 | — | 1,459,944 | ||||||||||||||||||||
PL Mid-Cap Equity | 821,347 | — | 821,347 | 669,458 | — | 669,458 | ||||||||||||||||||||
PL Mid-Cap Growth | 175,658 | 1,858,301 | 2,033,959 | 510,818 | 7,026,231 | 7,537,049 | ||||||||||||||||||||
PL Small Cap Value | 1,785,180 | — | 1,785,180 | 1,046,454 | — | 1,046,454 | ||||||||||||||||||||
PL Real Estate | 725,336 | — | 725,336 | 324,119 | — | 324,119 | ||||||||||||||||||||
PL Emerging Markets | 667,612 | — | 667,612 | 436,893 | 1,469,566 | 1,906,459 | ||||||||||||||||||||
PL International Large-Cap | 3,215,843 | — | 3,215,843 | 2,241,781 | — | 2,241,781 | ||||||||||||||||||||
PL International Value | 3,493,667 | — | 3,493,667 | 3,217,735 | — | 3,217,735 | ||||||||||||||||||||
PL Global Absolute Return | 101,328 | — | 101,328 | |||||||||||||||||||||||
PL Precious Metals | 9,365 | — | 9,365 | |||||||||||||||||||||||
12. RECLASSIFICATION OF ACCOUNTS
During the year or period ended March 31, 2013, reclassifications as shown in the following table have been made in each Fund’s capital accounts to report these balances on a tax basis, excluding certain temporary differences. Additional adjustments may be required in subsequent reporting periods. These reclassifications, which have no impact on the NAV of the Funds, are primarily attributable to reclassifications of sale-buyback financing transactions, foreign currency transactions, non-deductible expenses, swap income, treatment of net operating losses and capital gains under Federal tax rules versus U.S. GAAP.
| Fund | Paid-In Capital | Undistributed/ Accumulated | Undistributed/ Accumulated | |||||||||
PL Inflation Managed | $— | $700,477 | ($700,477 | ) | ||||||||
PL Managed Bond | — | 3,022,926 | (3,022,926 | ) | ||||||||
PL Short Duration Bond | — | 726,523 | (726,523 | ) | ||||||||
PL Emerging Markets Debt | — | 56,105 | (56,105 | ) | ||||||||
PL Comstock | — | 190,990 | (190,990 | ) | ||||||||
PL Growth LT | — | 163,831 | (163,831 | ) | ||||||||
PL Large-Cap Value | — | (860 | ) | 860 | ||||||||
PL Main Street Core | — | 14,000 | (14,000 | ) | ||||||||
PL Mid-Cap Growth | — | (6,730 | ) | 6,730 | ||||||||
PL Small-Cap Growth | (467 | ) | 4,456 | (3,989 | ) | |||||||
PL Small-Cap Value | — | (95,851 | ) | 95,851 | ||||||||
PL Emerging Markets | — | (65,159 | ) | 65,159 | ||||||||
PL International Large-Cap | — | (41,234 | ) | 41,234 | ||||||||
PL International Value | — | (197,171 | ) | 197,171 | ||||||||
PL Currency Strategies | — | 5,245,339 | (5,245,339 | ) | ||||||||
PL Global Absolute Return | 60,234 | 699,875 | (760,109 | ) | ||||||||
PL Precious Metals | (3,476 | ) | (943 | ) | 4,419 | |||||||
PL Alternative Strategies | (7 | ) | 49 | (42 | ) | |||||||
D-21
Table of Contents
PACIFIC LIFE FUNDS
NOTES TO FINANCIAL STATEMENTS (Continued)
13. SHARES OF BENEFICIAL INTEREST
Each Fund is authorized to issue an unlimited number of shares of beneficial interest with no par value. Changes in shares of beneficial interest of each Fund for the years or periods ended March 31, 2013 and 2012 were as follows:
| PL Floating Rate Loan Fund | PL Inflation Managed Fund | PL Managed Bond Fund | PL Short Duration Bond Fund | |||||||||||||||||||||||||||||||||||
| Year ended 3/31/2013 | Year ended 3/31/2012 | Year ended 3/31/2013 | Year ended 3/31/2012 | Year ended 3/31/2013 | Year ended 3/31/2012 | Year ended 3/31/2013 | Year ended 3/31/2012 | |||||||||||||||||||||||||||||||
Class P | ||||||||||||||||||||||||||||||||||||||
Shares sold | 1,909,740 | 2,778,851 | 4,964,939 | 5,832,301 | 11,521,367 | 11,330,537 | 9,482,046 | 4,052,837 | ||||||||||||||||||||||||||||||
Dividends and distributions reinvested | 495,128 | 391,261 | 2,330,247 | 1,868,799 | 2,123,981 | 1,103,666 | 282,695 | 178,681 | ||||||||||||||||||||||||||||||
Shares repurchased | (2,740,083 | ) | (570,742 | ) | (17,101,423 | ) | (2,797,468 | ) | (7,517,935 | ) | (2,937,545 | ) | (3,099,568 | ) | (872,644 | ) | ||||||||||||||||||||||
Net increase (decrease) | (335,215 | ) | 2,599,370 | (9,806,237 | ) | 4,903,632 | 6,127,413 | 9,496,658 | 6,665,173 | 3,358,874 | ||||||||||||||||||||||||||||
Beginning shares outstanding | 11,099,697 | 8,500,327 | 26,682,305 | 21,778,673 | 44,758,849 | 35,262,191 | 15,429,941 | 12,071,067 | ||||||||||||||||||||||||||||||
Ending shares outstanding | 10,764,482 | 11,099,697 | 16,876,068 | 26,682,305 | 50,886,262 | 44,758,849 | 22,095,114 | 15,429,941 | ||||||||||||||||||||||||||||||
| PL Emerging Markets Debt Fund (1) | PL Comstock Fund | PL Growth LT Fund | PL Large-Cap Growth Fund | |||||||||||||||||||||||||||||||||||
| Period ended 3/31/2013 | Year ended 3/31/2012 | Year ended 3/31/2013 | Year ended 3/31/2012 | Year ended 3/31/2013 | Year ended 3/31/2012 | Year ended 3/31/2013 | Year ended 3/31/2012 | |||||||||||||||||||||||||||||||
Class P | ||||||||||||||||||||||||||||||||||||||
Shares sold | 8,969,861 | 5,045,692 | 3,553,403 | 1,122,315 | 1,423,438 | 2,436,595 | 2,164,349 | |||||||||||||||||||||||||||||||
Dividends and distributions reinvested | 210,175 | 227,690 | 225,311 | 42,429 | 47,701 | 801,793 | 220,116 | |||||||||||||||||||||||||||||||
Shares repurchased | (1,024,070 | ) | (3,729,655 | ) | (880,653 | ) | (5,932,271 | ) | (2,515,096 | ) | (2,098,207 | ) | (573,437 | ) | ||||||||||||||||||||||||
Net increase (decrease) | 8,155,966 | 1,543,727 | 2,898,061 | (4,767,527 | ) | (1,043,957 | ) | 1,140,181 | 1,811,028 | |||||||||||||||||||||||||||||
Beginning shares outstanding | — | 16,625,565 | 13,727,504 | 8,258,220 | 9,302,177 | 12,546,730 | 10,735,702 | |||||||||||||||||||||||||||||||
Ending shares outstanding | 8,155,966 | 18,169,292 | 16,625,565 | 3,490,693 | 8,258,220 | 13,686,911 | 12,546,730 | |||||||||||||||||||||||||||||||
| PL Large-Cap Value Fund | PL Main Street Core Fund | PL Mid-Cap Equity Fund | PL Mid-Cap Growth Fund | |||||||||||||||||||||||||||||||||||
| Year ended 3/31/2013 | Year ended 3/31/2012 | Year ended 3/31/2013 | Year ended 3/31/2012 | Year ended 3/31/2013 | Year ended 3/31/2012 | Year ended 3/31/2013 | Year ended 3/31/2012 | |||||||||||||||||||||||||||||||
Class P | ||||||||||||||||||||||||||||||||||||||
Shares sold | 6,250,172 | 3,684,819 | 3,359,407 | 2,375,126 | 2,081,452 | 3,794,349 | 2,446,638 | 1,280,313 | ||||||||||||||||||||||||||||||
Dividends and distributions reinvested | 420,537 | 390,728 | 238,944 | 150,046 | 83,386 | 72,609 | 261,099 | 994,334 | ||||||||||||||||||||||||||||||
Shares repurchased | (4,820,154 | ) | (2,423,173 | ) | (3,364,647 | ) | (929,081 | ) | (5,630,087 | ) | (806,734 | ) | (3,829,537 | ) | (250,642 | ) | ||||||||||||||||||||||
Net increase (decrease) | 1,850,555 | 1,652,374 | 233,704 | 1,596,091 | (3,465,249 | ) | 3,060,224 | (1,121,800 | ) | 2,024,005 | ||||||||||||||||||||||||||||
Beginning shares outstanding | 21,364,475 | 19,712,101 | 17,182,131 | 15,586,040 | 16,044,803 | 12,984,579 | 8,294,116 | 6,270,111 | ||||||||||||||||||||||||||||||
Ending shares outstanding | 23,215,030 | 21,364,475 | 17,415,835 | 17,182,131 | 12,579,554 | 16,044,803 | 7,172,316 | 8,294,116 | ||||||||||||||||||||||||||||||
| PL Small-Cap Growth Fund | PL Small-Cap Value Fund | PL Real Estate Fund | PL Emerging Markets Fund | |||||||||||||||||||||||||||||||||||
| Year ended 3/31/2013 | Year ended 3/31/2012 | Year ended 3/31/2013 | Year ended 3/31/2012 | Year ended 3/31/2013 | Year ended 3/31/2012 | Year ended 3/31/2013 | Year ended 3/31/2012 | |||||||||||||||||||||||||||||||
Class P | ||||||||||||||||||||||||||||||||||||||
Shares sold | 1,049,923 | 603,780 | 2,341,212 | 1,315,442 | 331,977 | 1,025,141 | 1,754,612 | 2,024,174 | ||||||||||||||||||||||||||||||
Dividends and distributions reinvested | — | — | 166,996 | 106,890 | 56,140 | 28,862 | 47,585 | 162,945 | ||||||||||||||||||||||||||||||
Shares repurchased | (286,381 | ) | (257,367 | ) | (311,597 | ) | (468,973 | ) | (173,345 | ) | (523,132 | ) | (318,740 | ) | (257,654 | ) | ||||||||||||||||||||||
Net increase | 763,542 | 346,413 | 2,196,611 | 953,359 | 214,772 | 530,871 | 1,483,457 | 1,929,465 | ||||||||||||||||||||||||||||||
Beginning shares outstanding | 3,065,762 | 2,719,349 | 8,143,437 | 7,190,078 | 4,183,542 | 3,652,671 | 6,308,071 | 4,378,606 | ||||||||||||||||||||||||||||||
Ending shares outstanding | 3,829,304 | 3,065,762 | 10,340,048 | 8,143,437 | 4,398,314 | 4,183,542 | 7,791,528 | 6,308,071 | ||||||||||||||||||||||||||||||
| PL International Large-Cap Fund | PL International Value Fund | PL Currency Strategies Fund (2) | PL Global Absolute Return Fund (2) | |||||||||||||||||||||||||||||||||||
| Year ended 3/31/2013 | Year ended 3/31/2012 | Year ended 3/31/2013 | Year ended 3/31/2012 | Period ended 3/31/2013 | Year ended 3/31/2012 | Period ended 3/31/2013 | Year ended 3/31/2012 | |||||||||||||||||||||||||||||||
Class P | ||||||||||||||||||||||||||||||||||||||
Shares sold | 1,581,107 | 5,074,872 | 5,850,166 | 3,744,103 | 11,530,536 | 16,924,946 | ||||||||||||||||||||||||||||||||
Dividends and distributions reinvested | 202,254 | 172,048 | 393,875 | 424,503 | — | 10,153 | ||||||||||||||||||||||||||||||||
Shares repurchased | (3,195,516 | ) | (739,664 | ) | (3,035,641 | ) | (768,129 | ) | (35,716 | ) | (55,181 | ) | ||||||||||||||||||||||||||
Net increase (decrease) | (1,412,155 | ) | 4,507,256 | 3,208,400 | 3,400,477 | 11,494,820 | 16,879,918 | |||||||||||||||||||||||||||||||
Beginning shares outstanding | 13,486,118 | 8,978,862 | 12,892,042 | 9,491,565 | — | — | ||||||||||||||||||||||||||||||||
Ending shares outstanding | 12,073,963 | 13,486,118 | 16,100,442 | 12,892,042 | 11,494,820 | 16,879,918 | ||||||||||||||||||||||||||||||||
| (1) | The PL Emerging Markets Debt Fund commenced operations on June 29, 2012. |
| (2) | The PL Currency Strategies and PL Global Absolute Return Funds commenced operations on December 7, 2012. |
D-22
Table of Contents
PACIFIC LIFE FUNDS
NOTES TO FINANCIAL STATEMENTS (Continued)
| PL Precious Metals Fund (1) | ||||||||||||||||||||||||
| Period ended 3/31/2013 | ||||||||||||||||||||||||
Class P | ||||||||||||||||||||||||
Shares sold | 8,049,164 | |||||||||||||||||||||||
Dividends and distributions reinvested | 955 | |||||||||||||||||||||||
Shares repurchased | (26,531 | ) | ||||||||||||||||||||||
Net increase | 8,023,588 | |||||||||||||||||||||||
Beginning shares outstanding | — | |||||||||||||||||||||||
Ending shares outstanding | 8,023,588 | |||||||||||||||||||||||
PL Alternative | ||||||||||||||||||||||||
| Period ended 3/31/2013 | ||||||||||||||||||||||||
Class A | ||||||||||||||||||||||||
Shares sold | 1,000 | |||||||||||||||||||||||
Dividends and distribution reinvested | — | |||||||||||||||||||||||
Shares repurchased | — | |||||||||||||||||||||||
Net increase | 1,000 | |||||||||||||||||||||||
Beginning shares outstanding | — | |||||||||||||||||||||||
Ending shares outstanding | 1,000 | |||||||||||||||||||||||
Class C | ||||||||||||||||||||||||
Shares sold | 1,000 | |||||||||||||||||||||||
Dividends and distribution reinvested | — | |||||||||||||||||||||||
Shares repurchased | — | |||||||||||||||||||||||
Net increase | 1,000 | |||||||||||||||||||||||
Beginning shares outstanding | — | |||||||||||||||||||||||
Ending shares outstanding | 1,000 | |||||||||||||||||||||||
Advisor Class | ||||||||||||||||||||||||
Shares sold | 1,000 | |||||||||||||||||||||||
Dividends and distribution reinvested | — | |||||||||||||||||||||||
Shares repurchased | — | |||||||||||||||||||||||
Net increase | 1,000 | |||||||||||||||||||||||
Beginning shares outstanding | — | |||||||||||||||||||||||
Ending shares outstanding | 1,000 | |||||||||||||||||||||||
| (1) | The PL Precious Metals Fund commenced operations on December 7, 2012. |
| (2) | The PL Alternative Strategies Fund commenced operations on December 31, 2012. |
D-23
Table of Contents
PACIFIC LIFE FUNDS
NOTES TO FINANCIAL STATEMENTS (Continued)
14. OTHER TAX INFORMATION (Unaudited)
For corporate shareholders, the percentage of investment income (dividend income and short-term gains, if any) for each of the Funds that qualify for the dividends-received deductions for the year ended March 31, 2013 is as follows:
| Fund | Percentage | |||
PL Managed Bond | 1.10% | |||
PL Comstock | 100.00% | |||
PL Growth LT | 100.00% | |||
PL Large-Cap Growth | 100.00% | |||
PL Large-Cap Value | 100.00% | |||
PL Main Street Core | 100.00% | |||
PL Mid-Cap Equity | 100.00% | |||
PL Mid-Cap Growth | 100.00% | |||
PL Small-Cap Value | 100.00% | |||
PL Real Estate | 6.40% | |||
PL Emerging Markets | 0.19% | |||
PL Precious Metals | 15.56% | |||
For the year or period ended March 31, 2013, certain dividends paid by the Funds may be subject to a maximum tax rate of 15%, as provided by the Jobs and Growth Tax Relief Reconciliation Act of 2003. Of the distributions made by the following Funds, the corresponding percentages represent the amount of each distribution which may qualify for the 15% dividend income tax rate.
| Fund | Percentage | |||
PL Inflation Managed | 0.01% | |||
PL Managed Bond | 1.10% | |||
PL Comstock | 100.00% | |||
PL Growth LT | 100.00% | |||
PL Large-Cap Growth | 100.00% | |||
PL Large-Cap Value | 100.00% | |||
PL Main Street Core | 100.00% | |||
PL Mid-Cap Equity | 100.00% | |||
PL Mid-Cap Growth | 100.00% | |||
PL Small-Cap Value | 100.00% | |||
PL Real Estate | 10.82% | |||
PL Emerging Markets | 98.29% | |||
PL International Large-Cap | 100.00% | |||
PL International Value | 99.01% | |||
PL Global Absolute Return | 0.19% | |||
PL Precious Metals | 100.00% | |||
Shareholders should not use the above tax information to prepare their tax returns. The information will be included with your Form 1099 DIV which will be sent to you separately in January 2014.
The following Funds designated the listed amounts as long-term capital gain dividends during the year ended March 31, 2013. Distributable long-term gains are based on net realized long-term gains determined on a tax basis and may differ from such amounts for financial reporting purposes.
| Fund | Amount | |||
PL Floating Rate Loan | $633,700 | |||
PL Inflation Managed | 7,480,482 | |||
PL Managed Bond | 365,270 | |||
PL Large-Cap Growth | 22,133,765 | |||
PL Mid-Cap Equity | 8,498,830 | |||
PL Mid-Cap Growth | 1,858,301 | |||
PL Emerging Markets | 716,973 | |||
D-24
Table of Contents
REPORT OF INDEPENDENT REGISTERED PUBLIC ACCOUNTING FIRM
To The Board of Trustees and Shareholders of Pacific Life Funds
We have audited the accompanying statements of assets and liabilities, including the schedules of investments, of PL Floating Rate Loan Fund, PL Inflation Managed Fund, PL Managed Bond Fund, PL Short Duration Bond Fund, PL Emerging Markets Debt Fund, PL Comstock Fund, PL Growth LT Fund, PL Large-Cap Growth Fund, PL Large-Cap Value Fund, PL Main Street® Core Fund, PL Mid-Cap Equity Fund, PL Mid-Cap Growth Fund, PL Small-Cap Growth Fund, PL Small-Cap Value Fund, PL Real Estate Fund, PL Emerging Markets Fund, PL International Large-Cap Fund, PL International Value Fund, PL Currency Strategies Fund, PL Global Absolute Return Fund, PL Precious Metals Fund, and PL Alternative Strategies Fund (collectively the “Funds”) (twenty-two of thirty-three funds comprising Pacific Life Funds) as of March 31, 2013, the related statements of operations for the year then ended (as to the PL Emerging Markets Debt Fund, PL Currency Strategies Fund, PL Global Absolute Return Fund, PL Precious Metals Fund, and PL Alternative Strategies Fund, for the period from commencement of operations through March 31, 2013), the statements of changes in net assets for each of the two years in the period then ended (as to the PL Emerging Markets Debt Fund, PL Currency Strategies Fund, PL Global Absolute Return Fund, PL Precious Metals Fund, and PL Alternative Strategies Fund, for the period from commencement of operations through March 31, 2013), the statement of cash flows for the year then ended for the PL Inflation Managed Fund, and the financial highlights for each of the periods presented. These financial statements and financial highlights are the responsibility of the Funds’ management. Our responsibility is to express an opinion on these financial statements and financial highlights based on our audits.
We conducted our audits in accordance with the standards of the Public Company Accounting Oversight Board (United States). Those standards require that we plan and perform the audit to obtain reasonable assurance about whether the financial statements and financial highlights are free of material misstatement. The Funds are not required to have, nor were we engaged to perform, an audit of their internal control over financial reporting. Our audits included consideration of internal control over financial reporting as a basis for designing audit procedures that are appropriate in the circumstances, but not for the purpose of expressing an opinion on the effectiveness of the Funds’ internal control over financial reporting. Accordingly, we express no such opinion. An audit also includes examining, on a test basis, evidence supporting the amounts and disclosures in the financial statements, assessing the accounting principles used and significant estimates made by management, as well as evaluating the overall financial statement presentation. Our procedures included confirmation of investments owned as of March 31, 2013, by correspondence with the custodian, agent banks, transfer agent, and brokers; where replies were not received from brokers, we performed other auditing procedures. We believe that our audits provide a reasonable basis for our opinion.
In our opinion, such financial statements and financial highlights referred to above present fairly, in all material respects, the financial position of each of the respective Funds as of March 31, 2013, and the results of their operations, the changes in their net assets, the cash flows for the PL Inflation Managed Fund, and the financial highlights for each of the periods presented, in conformity with accounting principles generally accepted in the United States of America.

Philadelphia, Pennsylvania
May 28, 2013
E-1
Table of Contents
PACIFIC LIFE FUNDS
(Unaudited)
We believe it is important for you to understand the impact of fees and expenses regarding your investment. All mutual funds have operating expenses. As a shareholder of a mutual fund, you incur two types of costs: (1) transactions costs such as initial sales charges (loads) on purchase payments and/or contingent deferred sales charges on redemptions (applicable to the PL Alternative Strategies Fund only); and (2) ongoing costs, which include advisory fees, administration fees and other fund expenses. The following example is intended to help you understand your ongoing costs (in dollars) of investing in each fund and to compare these costs with those of other mutual funds. The example is based on an investment of $1,000.00 made at the beginning of the period and held for the entire six-month period from October 1, 2012 to March 31, 2013.
ACTUAL EXPENSES
The first section of the table for each fund entitled “Actual Fund Return”, provides information about actual account values and actual expenses based on each fund’s actual performance and each fund’s actual expenses, after any applicable advisory fee waivers and adviser expense reimbursements (See Notes 6 and 7B in Notes to Financial Statements). The “Ending Account Value at 03/31/13” column shown is derived from the fund’s actual performance; the “Annualized Expense Ratio” column shows the fund’s actual annualized expense ratio; and the “Expenses Paid During the Period 10/01/12-03/31/13” column shows the dollar amount that would have been paid by you. All the information illustrated in the following table is based on the past six-month period from October 1, 2012 to March 31, 2013.
You may use the information in this section, together with the amount you invested, to estimate the expenses that you paid over the period. To do so, for each fund in your account, simply divide that fund’s value by $1,000.00 (for example, an $8,600.00 fund value divided by $1,000.00 = 8.6), then multiply the result by the number given for your fund(s) in the “Expenses Paid During the Period 10/01/12-03/31/13.”
HYPOTHETICAL EXAMPLE FOR COMPARISON PURPOSES
The second section of the table for each fund, entitled “Hypothetical”, provides information about hypothetical account values and hypothetical expenses based on a 5% per year hypothetical rate of return and actual fund’s expenses, after any applicable advisory fee waivers and adviser expense reimbursements (See Note 6 and 7B in Notes to Financial Statements). It assumes that the fund had an annual 5% rate of return before expenses, but that the expense ratio is unchanged. The hypothetical account values and expenses may not be used to estimate the actual ending account values or expenses you paid for the period.
You may use the hypothetical example information to compare the ongoing costs of investing in the fund compared to other mutual funds. To do so, compare this 5% hypothetical example with the 5% hypothetical examples that appear in the shareholder reports of other mutual funds.
Please note that the expenses shown in the table are meant to highlight your ongoing costs only and do not reflect any transactional costs, such as initial sales charges (loads) or contingent deferred sales charges. Therefore, the second section of the table is useful in comparing ongoing costs only, and will not help you determine the relative total costs of owning different mutual funds. In addition, if these other costs were included, your costs would have been higher.
| Beginning Account Value at 10/01/12 | Ending Account Value at 03/31/13 | Annualized Expense Ratio | Expenses Paid During the Period 10/01/12 - 03/31/13 (1) | |||||||||||||
| PL Floating Rate Loan Fund | ||||||||||||||||
Actual Fund Return |
| |||||||||||||||
Class P | $1,000.00 | $1,034.30 | 0.80% | $4.06 | ||||||||||||
Hypothetical |
| |||||||||||||||
Class P | $1,000.00 | $1,020.94 | 0.80% | $4.03 | ||||||||||||
| PL Inflation Managed Fund | ||||||||||||||||
Actual Fund Return |
| |||||||||||||||
Class P | $1,000.00 | $1,006.40 | 0.60% | $3.00 | ||||||||||||
Hypothetical |
| |||||||||||||||
Class P | $1,000.00 | $1,021.94 | 0.60% | $3.02 | ||||||||||||
| PL Managed Bond Fund | ||||||||||||||||
Actual Fund Return |
| |||||||||||||||
Class P | $1,000.00 | $1,015.20 | 0.57% | $2.86 | ||||||||||||
Hypothetical |
| |||||||||||||||
Class P | $1,000.00 | $1,022.09 | 0.57% | $2.87 | ||||||||||||
| PL Short Duration Bond Fund | ||||||||||||||||
Actual Fund Return |
| |||||||||||||||
Class P | $1,000.00 | $1,003.70 | 0.55% | $2.75 | ||||||||||||
Hypothetical |
| |||||||||||||||
Class P | $1,000.00 | $1,022.19 | 0.55% | $2.77 | ||||||||||||
| PL Emerging Markets Debt Fund | ||||||||||||||||
Actual Fund Return |
| |||||||||||||||
Class P | $1,000.00 | $1,021.20 | 0.94% | $4.74 | ||||||||||||
Hypothetical |
| |||||||||||||||
Class P | $1,000.00 | $1,020.24 | 0.94% | $4.73 | ||||||||||||
| PL Comstock Fund | ||||||||||||||||
Actual Fund Return |
| |||||||||||||||
Class P | $1,000.00 | $1,141.20 | 0.89% | $4.75 | ||||||||||||
Hypothetical |
| |||||||||||||||
Class P | $1,000.00 | $1,020.49 | 0.89% | $4.48 | ||||||||||||
| PL Growth LT Fund | ||||||||||||||||
Actual Fund Return |
| |||||||||||||||
Class P | $1,000.00 | $1,072.00 | 0.70% | $3.62 | ||||||||||||
Hypothetical |
| |||||||||||||||
Class P | $1,000.00 | $1,021.44 | 0.70% | $3.53 | ||||||||||||
| PL Large-Cap Growth Fund | ||||||||||||||||
Actual Fund Return |
| |||||||||||||||
Class P | $1,000.00 | $1,077.70 | 0.75% | $3.89 | ||||||||||||
Hypothetical |
| |||||||||||||||
Class P | $1,000.00 | $1,021.19 | 0.75% | $3.78 | ||||||||||||
| PL Large-Cap Value Fund | ||||||||||||||||
Actual Fund Return |
| |||||||||||||||
Class P | $1,000.00 | $1,112.90 | 0.80% | $4.21 | ||||||||||||
Hypothetical |
| |||||||||||||||
Class P | $1,000.00 | $1,020.94 | 0.80% | $4.03 | ||||||||||||
See explanation of references on page F-2
F-1
Table of Contents
PACIFIC LIFE FUNDS
DISCLOSURE OF FUND EXPENSES (Continued)
(Unaudited)
| Beginning Account Value at 10/01/12 | Ending Account Value at 03/31/13 | Annualized Expense Ratio | Expenses 10/01/12 - | |||||||||||||
| PL Main Street Core Fund | ||||||||||||||||
Actual Fund Return |
| |||||||||||||||
Class P | $1,000.00 | $1,079.20 | 0.60% | $3.11 | ||||||||||||
Hypothetical |
| |||||||||||||||
Class P | $1,000.00 | $1,021.94 | 0.60% | $3.02 | ||||||||||||
| PL Mid-Cap Equity Fund | ||||||||||||||||
Actual Fund Return |
| |||||||||||||||
Class P | $1,000.00 | $1,130.10 | 0.80% | $4.25 | ||||||||||||
Hypothetical |
| |||||||||||||||
Class P | $1,000.00 | $1,020.94 | 0.80% | $4.03 | ||||||||||||
| PL Mid-Cap Growth Fund | ||||||||||||||||
Actual Fund Return |
| |||||||||||||||
Class P | $1,000.00 | $1,105.80 | 0.85% | $4.46 | ||||||||||||
Hypothetical |
| |||||||||||||||
Class P | $1,000.00 | $1,020.69 | 0.85% | $4.28 | ||||||||||||
| PL Small-Cap Growth Fund | ||||||||||||||||
Actual Fund Return |
| |||||||||||||||
Class P | $1,000.00 | $1,128.20 | 0.75% | $3.98 | ||||||||||||
Hypothetical |
| |||||||||||||||
Class P | $1,000.00 | $1,021.19 | 0.75% | $3.78 | ||||||||||||
| PL Small-Cap Value Fund | ||||||||||||||||
Actual Fund Return |
| |||||||||||||||
Class P | $1,000.00 | $1,159.50 | 0.90% | $4.85 | ||||||||||||
Hypothetical |
| |||||||||||||||
Class P | $1,000.00 | $1,020.44 | 0.90% | $4.53 | ||||||||||||
| PL Real Estate Fund | ||||||||||||||||
Actual Fund Return |
| |||||||||||||||
Class P | $1,000.00 | $1,075.00 | 1.05% | $5.43 | ||||||||||||
Hypothetical |
| |||||||||||||||
Class P | $1,000.00 | $1,019.70 | 1.05% | $5.29 | ||||||||||||
| PL Emerging Markets Fund | ||||||||||||||||
Actual Fund Return |
| |||||||||||||||
Class P | $1,000.00 | $1,049.00 | 0.95% | $4.85 | ||||||||||||
Hypothetical |
| |||||||||||||||
Class P | $1,000.00 | $1,020.19 | 0.95% | $4.78 | ||||||||||||
| PL International Large-Cap Fund | ||||||||||||||||
Actual Fund Return |
| |||||||||||||||
Class P | $1,000.00 | $1,118.40 | 1.00% | $5.28 | ||||||||||||
Hypothetical |
| |||||||||||||||
Class P | $1,000.00 | $1,019.95 | 1.00% | $5.04 | ||||||||||||
PL International Value Fund |
| |||||||||||||||
Actual Fund Return |
| |||||||||||||||
Class P | $1,000.00 | $1,110.90 | 0.80% | $4.21 | ||||||||||||
Hypothetical |
| |||||||||||||||
Class P | $1,000.00 | $1,020.94 | 0.80% | $4.03 | ||||||||||||
| Beginning Account Value at 10/01/12 | Ending Account Value at 03/31/13 | Annualized Expense Ratio | Expenses Paid During the Period 10/01/12 - 03/31/13 (1) | |||||||||||||
| PL Currency Strategies Fund (2) | ||||||||||||||||
Actual Fund Return |
| |||||||||||||||
Class P (2) | $1,000.00 | $1,032.00 | 0.85% | $2.65 | ||||||||||||
Hypothetical |
| |||||||||||||||
Class P (2) | $1,000.00 | $1,020.69 | 0.85% | $4.28 | ||||||||||||
| PL Global Absolute Return Fund (2) | ||||||||||||||||
Actual Fund Return |
| |||||||||||||||
Class P (2) | $1,000.00 | $1,019.60 | 1.06% | $3.28 | ||||||||||||
Hypothetical |
| |||||||||||||||
Class P (2) | $1,000.00 | $1,019.65 | 1.06% | $5.34 | ||||||||||||
| PL Precious Metals Fund (2) | ||||||||||||||||
Actual Fund Return |
| |||||||||||||||
Class P (2) | $1,000.00 | $822.10 | 0.88% | $2.46 | ||||||||||||
Hypothetical |
| |||||||||||||||
Class P (2) | $1,000.00 | $1,020.54 | 0.88% | $4.43 | ||||||||||||
PL Alternative Strategies Fund (3) (4) |
| |||||||||||||||
Actual Fund Return |
| |||||||||||||||
Class A (3) | $1,000.00 | $994.00 | 0.85% | $2.11 | ||||||||||||
Class C (3) | 1,000.00 | 992.00 | 1.60% | 3.97 | ||||||||||||
Advisor Class (3) | 1,000.00 | 994.00 | 0.60% | 1.49 | ||||||||||||
Hypothetical |
| |||||||||||||||
Class A (3) | $1,000.00 | $1,020.69 | 0.85% | $4.28 | ||||||||||||
Class C (3) | 1,000.00 | 1,016.95 | 1.60% | 8.05 | ||||||||||||
Advisor Class (3) | 1,000.00 | 1,021.94 | 0.60% | 3.02 | ||||||||||||
| (1) | Expenses paid during the period are equal to the fund’s annualized expense ratio (shown in table above), multiplied by the average account value over the period, multiplied by the number of days in the most recent fiscal half-year or applicable period, then divided by 365 days. |
| (2) | This Fund commenced operations on December 7, 2012. The actual fund return and expenses paid during the period for this fund was for the period December 7, 2012 to March 31, 2013, instead of the entire 6-month period. The hypothetical return and expenses paid during the period are based on the entire six-month period for comparison purposes. |
| (3) | This Fund commenced operations on December 31, 2012. The actual fund return and expenses paid during the period for this fund was for the period December 31, 2012 to March 31, 2013, instead of the entire 6-month period. The hypothetical return and expenses paid during the period are based on the entire six-month period for comparison purposes. |
| (4) | The annualized expense ratios for the PL Alternative Strategies Fund do not include fees and expenses of the PL Underlying Funds and Class P shares of the PL Floating Rate Income Fund (see Note 1 in Notes to Financial Statements) in which the PL Alternative Strategies Fund invests. |
F-2
Table of Contents
PACIFIC LIFE FUNDS
TRUSTEES AND OFFICERS INFORMATION
(Unaudited)
The business and affairs of the Pacific Life Funds (the “Trust”) are managed under the direction of the Board of Trustees under the Pacific Life Funds’ Declaration of Trust. Information pertaining to the trustees and officers of the Trust is set forth below. Trustees who are not deemed to be “interested persons” of the Trust, as defined in the 1940 Act, are referred to as “Independent Trustees.” Certain trustees and officers are deemed to be “interested persons” of the Trust and thus are referred to as “Interested Persons”, because of their positions with Pacific Life Insurance Company (“Pacific Life”) and Pacific Life Fund Advisors LLC, a wholly-owned subsidiary of Pacific Life. The Trust’s Statement of Additional Information includes additional information about the trustees. For information on availability of the Trust’s Statement of Additional Information, refer to the WHERE TO GO FOR MORE INFORMATION section of this report.
The address of each trustee and officer is c/o Pacific Life Funds, 700 Newport Center Drive, Newport Beach, CA 92660.
Name and Age | Position(s) with the Fund and Length of Time Served* | Current Directorship(s) Held and Principal Occupation(s) (and certain additional occupation information) During Past 5 years | Number of Portfolios in Fund Complex Overseen** | |||
INDEPENDENT TRUSTEES | ||||||
Frederick L. Blackmon Year of birth 1952 | Trustee since 9/13/05 | Trustee (1/05 to present) of Pacific Select Fund; Director (2005 to present) of Trustmark Mutual Holding Company; Former Executive Vice President and Chief Financial Officer (1995 to 2003) of Zurich Life and has been retired since that time; Former Executive Vice President and Chief Financial Officer (1989 to 1995) of Alexander Hamilton Life Insurance Company (subsidiary of Household International); Member of Board of Trustees (2010 to present) of Cranbrook Educational Community; Former Member of Board of Governors (1994 to 1999) of Cranbrook Schools; and Former Member of Board of Regents (1993 to 1996) Eastern Michigan University. | 87 | |||
Gale K. Caruso Year of birth 1957 | Trustee since 1/01/06 | Trustee (1/06 to present) of Pacific Select Fund; Former Member of the Board of Directors (2005 to 2009) of LandAmerica Financial Group, Inc.; Former President and Chief Executive Officer (1999 to 2003) of Zurich Life; Former Chairman, President and Chief Executive Officer of Scudder Canada Investor Services, Ltd. and Managing Director of Scudder Kemper Investments; Former Member of the Advisory Council of the Trust for Public Land in Maine; Former Member of the Board of Directors of Make-A-Wish of Maine; and Former Member of the Board of Directors of the Illinois Life Insurance Council. | 87 | |||
Lucie H. Moore Year of birth 1956 | Trustee since 6/13/01 | Trustee (10/98 to present) of Pacific Select Fund; Former Partner (1984 to 1994) with Gibson, Dunn & Crutcher (Law); Former Member of the Board of Trustees (2007 to 2011) of Sage Hill School; Former Member (2000 to 2009) and Former Vice Chairman (2001 to 2007) of the Board of Trustees of The Pegasus School; Former Member of the Board of Directors (2005 to 2010) of HomeWord; and Former Member of the Advisory Board (1993 to 2004) of Court Appointed Special Advocates (CASA) of Orange County. | 87 | |||
Nooruddin (Rudy) S. Veerjee Year of birth 1958 | Trustee since 9/13/05 | Trustee (1/05 to present) of Pacific Select Fund; Former President (1997 to 2000) of Transamerica Insurance and Investment Group and has been retired since that time; Former President (1994 to 1997) of Transamerica Asset Management; Former Chairman and Chief Executive Officer (1995 to 2000) of Transamerica Premier Funds (Mutual Fund); and Former Director (1994 to 2000) of various Transamerica Life Companies. | 87 | |||
G. Thomas Willis Year of birth 1942 | Trustee since 2/24/04 | Trustee (11/03 to present) of Pacific Select Fund; Certified Public Accountant in California (1967 to present); Former Audit Partner (1976 to 2002) of PricewaterhouseCoopers LLP (Accounting and Auditing) and has been retired since that time. | 87 | |||
F-3
Table of Contents
PACIFIC LIFE FUNDS
TRUSTEES AND OFFICERS INFORMATION (Continued)
(Unaudited)
Name and Age | Position(s) with the Fund and Length of Time Served* | Current Directorship(s) Held and Principal Occupation(s) (and certain additional occupation information) During Past 5 years | Number of Portfolios in Fund Complex Overseen** | |||
INTERESTED PERSONS | ||||||
James T. Morris Year of birth 1960 | Chairman of the Board and Trustee since 1/11/07, (Chief Executive Officer 1/11/07 to 12/31/09) | Director (4/07 to present), Chairman (5/08 to present), Chief Executive Officer (4/07 to present) and President (4/07 to 3/12) of Pacific Mutual Holding Company and Pacific LifeCorp; Director (4/07 to present), Chairman (5/08 to present), Chief Executive Officer (4/07 to present) and President (4/07 to 3/12) of Pacific Life; Chief Executive Officer (5/07 to present) and President (5/07 to 3/12) of Pacific Life Fund Advisors LLC; Chairman of the Board and Trustee (1/07 to present) and Chief Executive Officer (1/07 to 12/09) of Pacific Select Fund. | 87 | |||
Mary Ann Brown Year of birth 1951 | Chief Executive Officer since 1/01/10, (President 1/11/07 to 12/31/09) | Executive Vice President (4/10 to present) and Senior Vice President (5/06 to 3/10) of Pacific LifeCorp; Executive Vice President (4/10 to present) and Senior Vice President (3/05 to 3/10) of Pacific Life; Executive Vice President (4/10 to present) and Senior Vice President (5/07 to 3/10) of Pacific Life Fund Advisors LLC; and Chief Executive Officer (1/10 to present) and President (1/07 to 12/09) of Pacific Select Fund. | 87 | |||
Robin S. Yonis Year of birth 1954 | Vice President and General Counsel since 6/13/01 | Vice President, Fund Advisor General Counsel, and Assistant Secretary (5/07 to present) of Pacific Life Fund Advisors LLC; and Vice President and General Counsel (4/05 to present) of Pacific Select Fund. | 87 | |||
Brian D. Klemens Year of birth 1956 | Vice President and Treasurer since 6/13/01 | Vice President and Controller (10/07 to present) of Pacific Mutual Holding Company and Pacific LifeCorp; Vice President and Controller (10/07 to present) of Pacific Life; Vice President and Controller (10/07 to present) of Pacific Life Fund Advisors LLC; Vice President (5/00 to present) and Controller (10/07 to present) of Pacific Select Distributors, Inc.; and Vice President and Treasurer (4/96 to present) of Pacific Select Fund. | 87 | |||
Sharon E. Pacheco Year of birth 1957 | Vice President and Chief Compliance Officer since 6/04/04 | Vice President and Chief Compliance Officer (11/03 to present) of Pacific Mutual Holding Company and Pacific LifeCorp; Vice President (2/00 to present) and Chief Compliance Officer (1/03 to present) of Pacific Life; Vice President and Chief Compliance Officer (5/07 to present) of Pacific Life Fund Advisors LLC; and Vice President and Chief Compliance Officer (6/04 to present) of Pacific Select Fund. | 87 | |||
Eddie Tung Year of birth 1957 | Vice President and Assistant Treasurer since 11/14/05 | Assistant Vice President (4/03 to present) of Pacific Life; Assistant Vice President (5/07 to present) of Pacific Life Fund Advisors LLC; and Assistant Vice President and Assistant Treasurer (11/05 to present) of Pacific Select Fund. | 87 | |||
Howard T. Hirakawa Year of birth 1962 | Vice President since 6/20/06 | Vice President (5/07 to present) of Pacific Life Fund Advisors LLC; and Vice President (6/06 to present) of Pacific Select Fund. | 87 | |||
Jane M. Guon Year of birth 1964 | Vice President and Secretary since 1/01/11 | Vice President and Secretary (1/11 to present), Assistant Vice President (4/06 to 12/10) and Assistant Secretary (6/98 to 12/10) of Pacific Mutual Holding Company and Pacific LifeCorp; Director, Vice President, and Secretary (1/11 to present), Assistant Vice President (4/06 to 12/10) and Assistant Secretary (2/95 to 12/10) of Pacific Life; Vice President and Secretary (1/11 to present) and Assistant Vice President and Assistant Secretary (05/07 to 12/10) of Pacific Life Fund Advisors LLC; Vice President and Secretary (1/11 to present), Assistant Vice President (5/06 to 12/10) and Assistant Secretary (5/99 to 12/10) of Pacific Select Distributors, Inc.; and Vice President and Secretary (1/11 to present) of Pacific Select Fund. | 87 | |||
F-4
Table of Contents
PACIFIC LIFE FUNDS
TRUSTEES AND OFFICERS INFORMATION (Continued)
(Unaudited)
Name and Age | Position(s) with the Fund and Length of Time Served* | Current Directorship(s) Held and Principal Occupation(s) (and certain additional occupation information) During Past 5 years | Number of Portfolios in Fund Complex Overseen** | |||
INTERESTED PERSONS (Continued) | ||||||
Laurene E. MacElwee Year of birth 1966 | Vice President since 4/04/05 and Assistant Secretary since 6/13/01 | Vice President (4/11 to present), Assistant Secretary (5/07 to present) and Assistant Vice President (5/07 to 3/11) of Pacific Life Fund Advisors LLC; and Vice President (12/11 to present), Assistant Secretary (4/05 to present) and Assistant Vice President (4/05 to 12/11) of Pacific Select Fund. | 87 | |||
Carleton J. Muench Year of birth 1973 | Vice President since 11/30/06 | Assistant Vice President (5/07 to present) of Pacific Life Fund Advisors LLC; and Assistant Vice President (11/06 to present) of Pacific Select Fund. | 87 | |||
Kevin W. Steiner Year of birth 1975 | Vice President since 1/01/13 | Assistant Vice President (4/12 to present), Mutual Funds Compliance Director (4/08 to 3/12) and Mutual Funds Compliance Manager (10/06 to 3/08) of Pacific Life Fund Advisors LLC; and Assistant Vice President (1/13 to present) of Pacific Select Fund. | 87 | |||
| * | A trustee serves until he or she resigns, retires, or his or her successor is elected and qualified. |
| ** | As of March 31, 2013, the “Fund Complex” consisted of Pacific Select Fund (54 portfolios) and Pacific Life Funds (33 funds). |
F-5
Table of Contents
PACIFIC LIFE FUNDS
APPROVAL OF INVESTMENT ADVISORY AGREEMENT
AND FUND MANAGEMENT AGREEMENTS
(Unaudited)
The Board of Trustees (the “Trustees” or “Board”) of Pacific Life Funds (the “Trust”) oversees the management of each of the separate funds of the Trust (each a “Fund” and collectively, the “Funds”) and, as required by Section 15(c) of the Investment Company Act of 1940, as amended (the “1940 Act”), initially approves, and determines annually whether to renew the investment advisory agreement (the “Advisory Agreement”) with Pacific Life Fund Advisors LLC (“PLFA”) and each Fund management agreement (the “Fund Management Agreements,” together with the Advisory Agreement, the “Agreements”) with the various sub-advisers (“Fund Managers”). PLFA serves as the investment adviser for all of the Funds and directly manages the PL Short Duration, PL Income, PL Strategic Income, PL Floating Rate Income, PL High Income, and PL Money Market Funds (the “PAM Managed Funds”) under the name Pacific Asset Management (“PAM”) and the PL Portfolio Optimization Conservative, PL Portfolio Optimization Moderate-Conservative, PL Portfolio Optimization Moderate, PL Portfolio Optimization Moderate-Aggressive, and PL Portfolio Optimization Aggressive Funds (the “Asset Allocation Funds,” and together with the PAM Managed Funds, the “Directly Managed Funds”). For all other Funds (other than the PL Alternative Strategies Fund, which is a new fund and is discussed below), PLFA has retained other firms to serve as Fund Managers under PLFA’s supervision. The Board, including all of the Trustees who are not “interested persons,” as that term is defined in the 1940 Act (“Independent Trustees”), last renewed the Agreements at an in-person meeting of the Trustees held on December 12, 2012.1
At this meeting and other meetings, the Board considered information (both written and oral) provided to assist it in its review of the Agreements and made assessments with respect to each Agreement. The Board requested, received and reviewed written materials from PLFA and each Fund Manager that were submitted in response to requests from the Independent Trustees and supporting materials relating to those questions and responses. In addition, the Board received in-person presentations about the Funds throughout the year, and the Independent Trustees were advised by independent legal counsel with respect to these and other relevant matters. The Board reviewed a variety of factors and considered a significant amount of information, including information received on an ongoing basis at Board and committee meetings, including reports on Fund performance, expenses, fee comparisons, investment advisory, compliance, and other services provided to the Funds by PLFA and the Fund Managers. The Board also reviewed financial and profitability information regarding PLFA and the Fund Managers and information regarding the organization and operations of each entity, such as their compliance monitoring, portfolio trading and brokerage practices and the personnel providing investment management and administrative services to each Fund. The Board reviewed data provided by PLFA that was gathered from various independent providers of investment company data to provide the Board with information concerning the Funds’ investment performance, management fees and expense information. Additionally, the Independent Trustees retained an independent consultant (“Independent Consultant”) to assist the Trustees with certain of their analyses and to provide other relevant information. The Independent Consultant utilized and provided the Independent Trustees with data obtained from independent service providers as well as from other sources.
The Trustees’ determinations were made on the basis of each Trustee’s business judgment after consideration of all the information presented. In reviewing the materials presented and in considering the information in the management presentations, the Trustees did not identify any single issue or particular information that, in isolation, would be a controlling factor in making a final decision regarding the proposed renewals. Individual Trustees may have given different weights to certain factors and assigned various degrees of materiality to information received in connection with the approval process. The following summary describes the most important, but not all, of the factors considered by the Trustees in approving the renewals, and in the case of the Independent Trustees, certain factors were considered in light of the legal advice furnished to them by independent legal counsel and information from the Independent Consultant that they had retained. This discussion is not intended to be all-inclusive.
Annual Consideration and Approval of Investment Advisory and Fund Management Agreements
In evaluating the Advisory Agreement and each Fund Management Agreement, the Board, including all the Independent Trustees, considered the following factors, among others:
1. Nature, Extent and Quality of Services
Fund Oversight and Supervision—PLFA, its personnel and its resources. The Trustees considered the depth and quality of PLFA’s investment management process, including its monitoring and oversight of the Fund Managers and PAM; the experience, capability and integrity of its senior management and other personnel; the low turnover rates of its key personnel; and the overall financial strength and stability of its organization. The Trustees considered the high quality of the products and services provided by PLFA and its affiliates, such as the many educational services and tools offered to assist intermediaries in effectively understanding and meeting shareholder needs. The Trustees also noted that PLFA regularly informs the Trustees about matters relevant to the Trust, its shareholders and investing.
The Trustees also considered that the investment, legal, compliance and accounting professionals of PLFA and its affiliates have access to and utilize a variety of resources and systems relating to investment management, compliance, trading, performance analysis, security valuation and fund accounting. The Trustees further considered PLFA’s continuing need to attract and retain qualified personnel and to maintain and enhance its resources and systems to provide appropriate investment management, compliance and monitoring services for the Funds. The Board noted that PLFA monitors numerous investment, performance and compliance metrics for the Funds.
The Trustees considered PLFA’s continued development and use of analytical tools for assessing Fund performance and the performance of the Fund Managers, conducting an attribution analysis on performance and reporting on performance to the Trustees. The Trustees noted that
| 1 | At the December 12th meeting, the Board did not consider the continuance of the Fund Management Agreements relating to the PL Emerging Markets Debt, PL Mid-Cap Equity, PL Precious Metals, PL Currency Strategies and PL Global Absolute Return Funds, as those agreements were not up for renewal at that time. Additionally, new Fund Management Agreements with respect to the PL Growth LT and PL Large-Cap Growth Funds were approved by the Board at the December 12th meeting and the Board did not consider the continuance of the existing Fund Management Agreements with respect to those Funds at that time. |
F-6
Table of Contents
PACIFIC LIFE FUNDS
APPROVAL OF INVESTMENT ADVISORY AGREEMENT
AND FUND MANAGEMENT AGREEMENTS (Continued)
(Unaudited)
PLFA uses these tools to identify Funds that are underperforming applicable benchmarks or peer groups, and then conducts various analyses to try to assess the sources of and reasons for underperformance. The Trustees noted that PLFA has developed processes to oversee and monitor the performance of Fund Managers, including the use of analytical methods to review Fund performance and execution of investment strategies. The Board noted that PLFA provides the Board with analysis of this data over rolling periods to assist the Board in identifying trends in Fund performance and other areas, and periodically provides the Trustees with information on economic and market trends to provide a context for assessing recent performance. The Board also noted that PLFA conducts periodic due diligence on Fund Managers involving onsite visits, in-person meetings and telephonic meetings to gather information that PLFA uses to gain an in-depth understanding of a Fund Manager’s investment process and to seek to identify issues that may be relevant to a Fund Manager’s services to a Fund or a Fund’s performance, including, but not limited to, the financial strength of a Fund Manager, significant staffing changes that could affect a Fund, material changes in a Fund Manager’s assets under management, compliance and regulatory concerns, best execution review and portfolio security valuation support. The Trustees also noted that PLFA appeared to have implemented effective methods for monitoring investment style consistency by Fund Managers and for analyzing the use of derivatives by Fund Managers. With respect to the PL Floating Rate Income, PL High Income, PL Income, PL Money Market, PL Short Duration Income and PL Strategic Income Funds (the “PAM Managed Funds”), the Board considered that PLFA provided oversight, diligence and reporting with regard to its PAM unit that is similar to the process it employs with regard to the Fund Managers. The Board also considered that PLFA manages directly the PL Portfolio Optimization Conservative, PL Portfolio Optimization Moderate-Conservative, PL Portfolio Optimization Moderate, PL Portfolio Optimization Growth, and PL Portfolio Optimization Aggressive-Growth Funds (the “Asset Allocation Funds,” and together with the PAM Managed Funds, the “Directly Managed Funds”).
The Trustees considered the time and attention paid by PLFA to matters involving the valuation of Trust securities, including researching and evaluating information concerning securities that are not actively or publicly traded, valuing securities subject to a trading halt, the value of equity securities traded on foreign exchanges, oversight of and due diligence on pricing vendors and the development of alternate valuation methodologies. The Trustees also considered PLFA’s oversight of transition management when overseeing significant changes in the Funds, such as cash movements between the Funds arising from reallocations by funds of funds and the transition from one Fund Manager to another, including steps taken by PLFA to reduce transaction costs associated with a Fund transition.
The Trustees considered PLFA’s policies, procedures and systems to ensure compliance with applicable laws and regulations with respect to the Directly Managed Funds, its compliance monitoring of the Fund Managers and its commitment to those programs; PLFA’s efforts to keep the Trustees informed about the Fund Managers; and its attention to matters that may involve conflicts of interest with each Fund. In this regard, the Trustees reviewed information throughout the year on PLFA’s compliance policies and procedures, its compliance history, and reports from the Trust’s Chief Compliance Officer (“CCO”) on compliance by PLFA, the Fund Managers, and the Funds with applicable laws and regulations. The Trustees also reviewed information on any responses by PLFA to regulatory and compliance developments throughout the year. The Trustees further considered the monitoring and additional services provided by PLFA to the Funds, including risk management analysis, preparation of periodic performance and financial reports, review of trade execution and coordination of other service providers to the Trust.
Fund Management—PLFA and the Fund Managers. The Trustees considered various materials relating to PLFA, including PAM, and the Fund Managers, including copies of each existing Advisory Agreement and Fund Management Agreement; copies of the Form ADV for PLFA and each Fund Manager; financial information relating to PLFA and each Fund Manager; and other information deemed relevant to the Trustees’ evaluation of PLFA and each Fund Manager, including qualitative assessments from senior management of PLFA.
The Trustees considered the benefits to shareholders of retaining PLFA and each Fund Manager and continuing the Advisory Agreement and Fund Management Agreements particularly in light of the nature, extent, and quality of the services that have been provided by PLFA and the Fund Managers. The Trustees noted the portfolio management services that have been provided by PLFA or PAM to the Directly Managed Funds and the portfolio management services that have been provided by the Fund Managers to the other Funds. The Trustees considered the quality of the portfolio management services which have benefited and should continue to benefit the Funds and their shareholders, the organizational depth and resources of PLFA and the Fund Managers, including the background and experience of PLFA and each of the Fund Manager’s management, and the expertise of PLFA, its PAM unit, and each Fund Manager’s portfolio management team, as well as the investment methodology used by PLFA, its PAM unit, and the Fund Manager.
The Trustees further noted the compliance monitoring conducted by PLFA and PAM on an ongoing basis and also noted the development of procedures and systems necessary to maintain compliance with applicable laws and regulations as well as the resources that PLFA dedicates to these programs. The Trustees considered that the CCO had in place a systematic process for periodically reviewing PLFA’s and each Fund Manager’s written compliance policies and procedures, including the assessment of PLFA’s and each Fund Manager’s compliance program as required under Rule 38a-1 of the 1940 Act and PLFA’s and each Fund Manager’s code of ethics. The Trustees also considered that PLFA and each Fund Manager continues to cooperate with the CCO in reviewing its compliance operations.
In making their assessments, the Trustees considered that PLFA has historically exercised diligence in monitoring the performance of the Fund Managers and PAM, and has recommended and taken measures to attempt to remedy relative underperformance by a Fund when PLFA and the Trustees believed it to be appropriate.
The Board concluded that it was satisfied with the nature, extent and quality of the investment management services provided by PLFA and the Fund Managers.
2. Investment Results
The Trustees considered the investment results of each Fund in light of its objective and market conditions over the past year. The Trustees compared each Fund’s total returns with both the total returns of appropriate groups of peer funds, based on information provided by PLFA using data from independent sources, and with one or more relevant benchmark indices. The Independent Trustees also considered information
F-7
Table of Contents
PACIFIC LIFE FUNDS
APPROVAL OF INVESTMENT ADVISORY AGREEMENT
AND FUND MANAGEMENT AGREEMENTS (Continued)
(Unaudited)
provided by an Independent Consultant who provided a presentation and analysis to the Trustees regarding peer group performance utilizing data from independent sources. The information provided to the Trustees included each Fund’s performance record for the prior ten calendar years, as applicable, and three-month, year-to-date, one-, three-, five- and ten-year or since inception periods, as applicable. In reviewing the performance data drawn from independent sources, as well as the performance of the respective benchmark indices, the Trustees took into consideration the goals and objectives of each Fund and noted that some Funds had outperformed their peer groups over certain periods and/or exceeded their respective benchmark indices while others underperformed their peer groups over certain periods and/or trailed their respective benchmark indices. The Trustees discussed with PLFA the fact that certain periods of underperformance may be transitory while other periods of underperformance may be reflective of broader issues which may warrant consideration of corrective action. The Trustees discussed these Funds with representatives of PLFA, including an assessment of the approach used by the Fund Managers as well as oversight and monitoring by PLFA as the investment adviser, to gain an understanding of underperformance and to assess whether any actions would be appropriate.
The Trustees also reviewed the monitoring of the Fund Managers’ investment results by PLFA, including PLFA’s historical practice of recommending to the Trustees the use of a new manager if performance lagged and could not be improved within a reasonable timeframe, and reviewed the monitoring of the PAM unit’s investment results by PLFA. Generally, the Trustees noted that there continues to be a strong record of well-managed Funds that work well in the Asset Allocation Funds and that the Asset Allocation Funds provide a range of professionally managed asset allocation investment options. The Trustees also noted that the Funds continue to deliver the investment style as disclosed to shareholders. The Trustees also noted only the Directly Managed Funds are open to new investors.
The Board concluded that PLFA continues to have a strong record of effectively managing a multi-manager fund group and asset allocation and income funds designed to give shareholders a reasonable array of choices through which to implement their investment programs. The Board further concluded that PLFA was implementing each Fund’s investment objective either directly or through the selection of Fund Managers and that PLFA’s record in managing each Fund indicates that its continued management as well as the continuation of the respective Fund Management Agreements will benefit each Fund and its shareholders.
3. Advisory Fees and Total Expense Ratios
The Trustees requested, received and reviewed information from PLFA relating to the advisory fees and the sub-advisory fees, including the portion of the advisory fees paid to each Fund Manager as compared to the portion retained by PLFA, and operating expense ratios for each of the Funds. The Independent Trustees also requested and reviewed information from the Independent Consultant along with their analysis of advisory fees, sub-advisory fees and certain other expenses. The Trustees reviewed the advisory fees, sub-advisory fees and operating expense ratios of each Fund and compared such amounts with the average fee and expense levels of other funds in applicable peer fund groups. During their review, the Trustees noted that all of the Funds were subject to contractual expense limitations agreed to by PLFA. The Trustees also reviewed written materials prepared by PLFA based on peer fund group information retrieved from the independent sources. The Independent Trustees requested and reviewed an analysis provided by the Independent Consultant of the asset-based breakpoint schedule for the Funds. The Independent Trustees noted that the breakpoints offer meaningful potential savings to shareholders of many of the Funds.
The Trustees also considered information from the Fund Managers regarding the comparative sub-advisory fees charged under other investment advisory contracts for similarly managed accounts, such as contracts of each Fund Manager with other similarly managed registered investment companies or other types of clients. The Trustees noted that in many cases there were differences in the level of services provided to the Funds by the Fund Managers and that the level of services provided by these Fund Managers on these other accounts were due to the different nature of the accounts or because there were other reasons to support the difference in fees, such as an affiliation between the Fund Manager and the account. These differences often explained variations in fee schedules. The Trustees were mindful that, with regard to the sub-advised Funds, the fee rates were the result of arms’-length negotiations between PLFA and the Fund Managers, and that any sub-advisory fees are paid by PLFA and are not paid directly by a Fund. The Trustees observed that certain of the Funds’ contractual advisory fees were higher than the average of their respective Morningstar category while others were either lower or approximately equal to these averages.
The Board concluded that the advisory fees, sub-advisory fees and total expenses of each Fund were fair and reasonable.
4. Costs, Level of Profits and Economies of Scale
The Trustees reviewed information provided by PLFA and the Fund Managers regarding PLFA’s costs of sponsoring the Funds and information regarding the profitability of PLFA and the Fund Managers.
PLFA and the Fund Managers’ Costs and Profitability. The Trustees noted that, based on the data available, PLFA appears to be providing products that are competitively priced with other funds, especially multi-manager and asset allocation funds. The Board considered the costs of the services to be provided and the overall financial results for PLFA and its affiliates from the management of the Trust, both including and excluding distribution costs. The Board noted that the Funds and not projected to produce profits for PLFA for the year ended December 31, 2012, and considered that the Funds have not been profitable to PLFA and its affiliates in the past, due in part to the relatively low level of assets. The Board also noted the projected profitability of the Funds to PLFA in the near term and noted that PLFA and its affiliates continue to subsidize and reimburse expenses for many of the Funds.
The Trustees also reviewed information provided regarding the structure and manner in which PLFA’s and the Fund Managers’ investment professionals were compensated and their respective views of the relationship of such compensation to the attraction and retention of quality personnel. The Trustees considered PLFA’s willingness to invest in technology, infrastructure and staff to reinforce and offer new services and to accommodate changing regulatory requirements.
With respect to the Fund Managers, the Trustees noted that it was difficult in many cases to accurately determine or evaluate the profitability of the Fund Management Agreements to the Fund Managers because of, among other things, the differences in the types of information provided by the Fund Managers, the fact that many Fund Managers manage substantial assets other than the Funds and, further, that any such
F-8
Table of Contents
PACIFIC LIFE FUNDS
APPROVAL OF INVESTMENT ADVISORY AGREEMENT
AND FUND MANAGEMENT AGREEMENTS (Continued)
(Unaudited)
assessment would involve assumptions regarding the Fund Managers’ expense allocation policies, capital structure, cost of capital, business mix and other factors.
Accordingly, in the case of the Fund Managers, the Trustees focused their consideration on the data described above in light of the arms’-length nature of the relationship (for the Funds that are sub-advised) between PLFA and such Fund Managers with respect to the negotiation of fund sub-advisory fees and the fact that such fees are paid by PLFA.
Economies of Scale. The Trustees noted and considered the extent to which economies of scale are increasingly realized as each Fund grows and whether advisory fee levels reflect economies of scale if the Funds grow in size. The Trustees noted the Funds have relatively small asset levels that do not currently produce significant economies of scale. The Trustee noted, however, PLFA’s commitment to competitive total expenses of the Funds through expense limitation agreements, its and its affiliates’ consistent reinvestment in the business in the form of improvements in technology, product innovations and customer service. The Board concluded that the Funds’ cost structures were reasonable in light of the Trust’s size.
5. Ancillary Benefits
The Trustees requested and received from PLFA and the Fund Managers information concerning other benefits received by PLFA, the Fund Managers, and their affiliates as a result of their respective relationship with the Funds, including information about various service arrangements with PLFA affiliates and reimbursement at an approximate cost basis for support services in the case of PLFA and an affiliate, as well as commissions paid to broker-dealers affiliated with certain Fund Managers and the use of soft-dollars by certain of the Fund Managers. The Trustees also considered information concerning other significant economic relations between the Fund Managers and their affiliates and with PLFA and its affiliates and noted PLFA’s processes and procedures to identify and disclose such relationships to the Board. The Trustees also considered information provided to them as to how conflicts of interest that may arise from these relationships are managed.
The Board concluded that such benefits were consistent with those generally derived by investment advisers to mutual funds or were otherwise not unusual.
6. Conclusion
Based on their review, including their consideration of each of the factors referred to above, and assisted by the advice of the Independent Consultant and independent counsel to the Independent Trustees, the Board, including the Independent Trustees, concluded that the Advisory Agreement and each applicable Fund Management Agreement are fair and reasonable with respect to each Fund and its shareholders, and that the renewal of the Advisory Agreement and each applicable Fund Management Agreement would be in the best interests of the Funds and their shareholders. The Board did not indicate that any single factor was determinative of its decision to approve the Advisory Agreement and each applicable Fund Management Agreement, but indicated that the Board based its determination on the total mix of information available to it.
Other Advisory Agreement and Fund Management Agreement Approvals
In addition to considering the renewal of the Advisory Agreement and existing Fund Management Agreements during the period, the Board considered and approved the Advisory Agreement and Fund Management Agreements with respect to new Funds and also approved changes with respect the Fund Managers for certain Funds as discussed below. Under the 1940 Act, a change in a Fund Manager, a change in the compensation paid to a Fund Manager, or an assignment of any Fund Management Agreement requires shareholder approval of a new Fund Management Agreement. However, under an exemptive order issued to Pacific Life Insurance Company and the Trust by the Securities and Exchange Commission (“SEC”) on October 13, 1999 and relied upon by PLFA, in accordance with the terms of the exemptive order, PLFA can hire, terminate and replace, as applicable, Fund Managers and enter into new Fund Management Agreements (except, as a general matter, Fund Managers affiliated with PLFA) without shareholder approval.
Approval of Advisory Agreement and Fund Management Agreements with Respect to the PL Precious Metals Fund
At an in-person meeting on September 11, 2012, the Board, including all of the Independent Trustees, approved, effective on or about December 7, 2012, the Advisory Agreement with PLFA with respect to the PL Precious Metals Fund (the “PL Precious Metals Advisory Agreement”) and the Fund Management Agreement with Wells Capital Management, Inc. (“Wells Capital”) with respect to the Fund (the “Wells Capital Fund Management Agreement”), and appointed Wells Capital as the Fund Manager for this Fund.
In evaluating the PL Precious Metals Advisory Agreement and Wells Capital Fund Management Agreement, the Board, including the Independent Trustees, considered the factors described below. Additionally, in its evaluation of the Wells Capital Fund Management Agreement, the Board considered the various screening processes that PLFA utilizes in identifying a proposed new fund manager, including screening for qualified firms through the use of quantitative data and information gathered from independent third-party databases, as well as the due diligence conducted by PLFA on the investment resources and personnel of a fund manager and an assessment of the investment strategies used by a fund manager and the due diligence conducted by the Trust’s CCO. In addition, the Board reviewed the specific criteria and information evaluated by PLFA during the selection process of Wells Capital, including information about other firms considered by PLFA, and PLFA’s analysis in reaching its conclusion to recommend Wells Capital as the new fund manager.
In evaluating the PL Precious Metals Advisory Agreement and Wells Capital Fund Management Agreement, the Board, including all the Independent Trustees, considered the following factors, among others:
1. Nature, Extent and Quality of Services to be Provided
Fund Oversight and Supervision—PLFA, its personnel and its resources. The Trustees considered the depth and quality of PLFA’s investment management process, including its sophisticated monitoring and oversight of Fund Managers; the experience, capability and integrity of its senior management and other personnel; the low turnover rates of its key personnel; and the overall financial strength and stability
F-9
Table of Contents
PACIFIC LIFE FUNDS
APPROVAL OF INVESTMENT ADVISORY AGREEMENT
AND FUND MANAGEMENT AGREEMENTS (Continued)
(Unaudited)
of its organization. The Trustees considered the high quality of the products and services provided by PLFA and its affiliates, such as the many educational services and tools offered to assist intermediaries in effectively understanding and meeting shareholder needs. The Trustees also noted that PLFA regularly informs the Trustees about matters relevant to the Trust and its shareholders and investing.
The Trustees also considered that PLFA’s investment, legal, compliance and accounting professionals have access to and utilize a variety of resources and systems relating to investment management, compliance, trading, performance analysis, security valuation and fund accounting. The Trustees further considered PLFA’s continuing need to attract and retain qualified personnel and to maintain and enhance its resources and systems to provide the appropriate investment management, compliance and monitoring services required for the Fund. The Board noted that PLFA monitors numerous investment, performance and compliance metrics for the Funds of the Trust.
The Trustees considered the benefits to shareholders of retaining PLFA to serve as the investment adviser to the PL Precious Metals Fund in light of the nature, extent, and quality of services expected to be provided by PLFA. The Trustees considered the ability of PLFA to provide an appropriate level of support and resources to the PL Precious Metals Fund and whether PLFA has sufficiently qualified personnel. The Trustees based this review on information and materials provided to them throughout the year by PLFA. The Trustees considered PLFA’s continued development and use of analytical tools for assessing Fund performance and the performance of Fund Managers, conducting an attribution analysis on performance and reporting on performance to the Trustees. The Trustees noted that PLFA uses these tools to monitor and identify when a Fund is underperforming applicable benchmarks or peer groups, and then conducts various analyses to try to assess the sources of and reasons for underperformance. The Trustees noted that PLFA has developed processes to oversee and monitor a Fund Manager’s execution of investment strategies. The Board noted that PLFA provides the Board with analysis of this data over rolling periods to assist the Board in identifying trends in Fund performance and other areas, and periodically provides the Trustees with information on economic and market trends to provide a context for assessing recent performance. The Board also noted that PLFA conducts periodic due diligence on a Fund Manager involving on-site visits, in-person meetings and telephonic meetings to gather information that PLFA uses to attempt to gain an in-depth understanding of a Fund Manager’s investment process and to seek to identify issues that may be relevant to a Fund Manager’s investment process and to seek to identify issues that may be relevant to a Fund Manager’s services to a Fund or a Fund’s performance. The Trustees also considered the background and experience of PLFA’s senior management, and the experience of and significant amount of attention expected to be given to the PL Precious Metals Fund by PLFA’s management and staff. The Trustees also considered PLFA’s compliance operations with respect to the Trust, including the measures taken by PLFA to assist the Trust in complying with Rule 38a-1 under the 1940 Act. The Trustees further considered the monitoring and additional services provided by PLFA to the Fund, including assistance with security valuation, risk management analysis, preparation of periodic performance and financial reports, review of trade execution and coordination of other service providers to the Trust.
The Board concluded that it was satisfied with the nature, extent and quality of the investment management services to be provided by PLFA to the Fund under the PL Precious Metals Advisory Agreement.
Wells Capital. The Trustees considered the benefits to shareholders of retaining Wells Capital as the Fund Manager, particularly in light of the nature, extent, and quality of the services expected to be provided by Wells Capital. In this regard, the Trustees considered various materials relating to the proposed Fund Manager, including copies of the proposed Wells Capital Fund Management Agreement; copies of Wells Capital’s Form ADV; financial information; and other information deemed relevant to the Trustees’ evaluation, including comprehensive assessments from senior management of PLFA.
The Trustees considered that under the Wells Capital Fund Management Agreement, Wells Capital would be responsible for providing the investment management services for the Fund’s assets, including investment research, advice and supervision, and determining which securities would be purchased or sold by the Fund. The Trustees considered the quality of the management services expected to be provided to the PL Precious Metals Fund over both the short- and long-term, the organizational depth and resources of Wells Capital, including the background and experience of Wells Capital’s management and the expertise of the Fund management team, as well as the investment strategies, processes and philosophy to be used with respect to the investment strategy.
In addition, the Trustees considered Wells Capital’s written compliance policies and procedures and noted that the Trust’s CCO had provided an assessment of Wells Capital’s compliance program, as required under Rule 38a-1 of the 1940 Act, and its code of ethics.
In making these assessments, the Trustees took note of the extensive due diligence PLFA conducted with respect to Wells Capital, and were aided by the assessment and recommendation of PLFA and the in-person presentation and materials provided by Wells Capital.
The Board concluded it was satisfied with the nature, extent and quality of the investment management services anticipated to be provided to the PL Precious Metals Fund by PLFA under the PL Precious Metals Advisory Agreement and Wells Capital under the Wells Capital Fund Management Agreement.
2. Performance
The Trustees considered PLFA’s efforts and process to search for and screen advisory firms that are qualified to manage a precious metals Fund, and the identification by PLFA of Wells Capital to serve as Fund Manager with regard to the day-to-day investment activities of the PL Precious Metals Fund. Because this consideration related to a newly organized Fund, no actual performance record for this Fund was available. However, the Trustees considered factors concerning performance in connection with its consideration of this matter and in connection with approval of the related Wells Capital Fund Management Agreement, as described below.
The Trustees considered information about the historical performance of an account managed by the same Wells Capital Fund management team that would manage the PL Precious Metals Fund using similar investment strategies as those proposed for the PL Precious Metals Fund (the “Comparable Performance”). The Trustees considered the Comparable Performance against a pertinent benchmark and against the applicable peer group for the year-to-date, one-, three-, five- and ten-year periods as of March 31, 2012. The Trustees also considered the
F-10
Table of Contents
PACIFIC LIFE FUNDS
APPROVAL OF INVESTMENT ADVISORY AGREEMENT
AND FUND MANAGEMENT AGREEMENTS (Continued)
(Unaudited)
Comparable Performance against a pertinent benchmark and an applicable peer group for the previous six calendar years as of December 31, 2011. Additionally, the Trustees considered performance information presented by PLFA for another potential fund manager. The Trustees also considered the need for Wells Capital to adhere to the Fund’s general investment mandate in order to function appropriately in the Portfolio Optimization Funds.
The Board determined that Wells Capital’s performance record was acceptable.
3. Advisory and Fund Management Fees
PLFA. The Trustees requested, received and reviewed information from PLFA relating to the proposed advisory fee for the PL Precious Metals Fund. The Trustees reviewed the proposed advisory fees for the Fund and compared such amounts with the average fees of other funds in an applicable peer fund group. The Trustees also noted that the Fund would be subject to contractual expense limitations agreed to by PLFA. The Trustees considered that the proposed advisory fee was in line with industry averages for precious metals products based on the data presented to the Board.
The Board concluded that the compensation payable under the PL Precious Metals Advisory Agreement is fair and reasonable.
Wells Capital. The Trustees considered information regarding the comparative sub-advisory fees charged under other investment advisory contracts of the Fund Manager with regard to other investment accounts with substantially similar investment strategies as the PL Precious Metals Fund. The Trustees noted that in certain cases there were differences in the level of services proposed to be provided to the PL Precious Metals Fund by Wells Capital and that the level of services provided by Wells Capital on these other accounts was due to the different nature of the accounts or an affiliation between Wells Capital and the account. These differences often explained differences in fee schedules. The Trustees noted that the fee rates were the result of arms’-length negotiations between PLFA and Wells Capital, and that the PL Precious Metals Fund’s sub-advisory management fees are paid by PLFA and are not paid directly by the PL Precious Metals Fund. The Trustees also considered that the sub-advisory management fees payable to Wells Capital under the Wells Capital Fund Management Agreement contained breakpoints.
The Board concluded that the compensation payable under the Wells Capital Fund Management Agreement is fair and reasonable.
4. Costs, Level of Profits and Economies of Scale
Costs and Profitability. The Trustees reviewed information regarding PLFA’s projected costs of sponsoring the Fund and information regarding the anticipated projected profitability of the proposed Fund to PLFA. The Trustees considered the projected cost of services to be provided and projected profits to be realized by PLFA from the relationship with the PL Precious Metals Fund based on the projected assets, income and expenses of PLFA in its relationship with the Fund. The Trustees noted that this projected information contains estimates because there is no actual operating history for the PL Precious Metals Fund. The Trustees also considered the overall financial soundness of PLFA.
The Trustees considered the projected profitability of the Wells Capital Fund Management Agreement to Wells Capital to the extent practicable based on the financial information provided by Wells Capital. The Trustees considered that it was difficult to accurately determine or evaluate the projected profitability of the Wells Capital Fund Management Agreement to Wells Capital because it managed substantial assets or had multiple business lines and, further, that any such assessment would involve assumptions regarding its allocation policies, capital structure, cost of capital, business mix and other factors. The Trustees gave less weight to projected profitability considerations than other information provided in connection with this matter, given the arms’-length nature of the relationship between PLFA and Wells Capital with respect to the negotiation of Fund management fees, the fact that such fees are paid by PLFA and the fact that the projected profitability of the Wells Capital Fund Management Agreement to Wells Capital is an estimate.
Economies of Scale. The Trustees considered the extent to which economies of scale may be realized by the PL Precious Metals Fund as assets grow. Because the PL Precious Metals Fund has no operating history and no assets, no economies of scale exist at this time with respect to the Fund. In this regard, the Trustees considered that the Fund’s advisory fee was set to be competitive with its peer group, all of which were existing funds. As a result, the Fund’s advisory fee was designed to take into account the growth of the Fund to a competitive level and the resultant economies of scale that the Fund could be expected to realize. The Trustees also noted that there would be an expense limitation agreement in place for the PL Precious Metals Fund.
The Board concluded that the PL Precious Metals Fund’s fee structure reflected in the PL Precious Metals Advisory Agreement and Wells Capital Fund Management Agreement is fair and reasonable.
5. Ancillary Benefits
The Trustees received from PLFA information concerning other benefits that may be received by PLFA and Wells Capital and their affiliates as a result of their relationship with the PL Precious Metals Fund, including fees for administrative services and reimbursement at an approximate cost basis for certain support services, as well as commissions that may be paid to broker-dealers affiliated with the Fund Manager and the anticipated use of soft-dollars by the Fund Manager. In this regard, the Trustees noted that Wells Capital represented that it is restricted in the use of any affiliated broker-dealer and that it anticipates using soft dollar credits generated by Fund commissions to pay for research services. The potential benefits that may be derived by PLFA from its relationship with the PL Precious Metals Fund could include larger assets under management and reputational benefits, which are consistent with those generally derived by investment advisers to mutual funds. The Trustees considered potential benefits to be derived by Wells Capital from its relationship with the PL Precious Metals Fund and that such benefits were consistent with those generally derived by sub-advisers to mutual funds or were otherwise not unusual.
6. Conclusion
Based on their review, including the consideration of each of the factors referred to above, the Board found that: (i) the PL Precious Metals Advisory Agreement and Wells Capital Fund Management Agreement are in the best interests of the PL Precious Metals Fund and its
F-11
Table of Contents
PACIFIC LIFE FUNDS
APPROVAL OF INVESTMENT ADVISORY AGREEMENT
AND FUND MANAGEMENT AGREEMENTS (Continued)
(Unaudited)
shareholders; and (ii) the compensation payable under the PL Precious Metals Advisory Agreement and the Wells Capital Fund Management Agreement is fair and reasonable. No single factor was determinative of the Board’s findings, but rather the Trustees based their determination on the total mix of information available to them.
Approval of Advisory Agreement and Fund Management Agreements with Respect to the PL Currency Strategies Fund
At an in-person meeting on September 11, 2012, the Board, including all of the Independent Trustees, approved, effective on or about December 7, 2012, the Advisory Agreement with PLFA with respect to the PL Currency Strategies Fund (the “PL Currency Strategies Advisory Agreement”) and the Fund Management Agreement with UBS Global Asset Management (Americas) Inc. (“UBS”) with respect to the Fund (the “UBS Fund Management Agreement”), and appointed UBS as the Fund Manager for this Fund.
In evaluating the PL Currency Strategies Advisory Agreement and UBS Fund Management Agreement, the Board, including the Independent Trustees, considered the factors described below. Additionally, in its evaluation of the UBS Fund Management Agreement, the Board considered the various screening processes that PLFA utilizes in identifying a proposed new fund manager, including screening for qualified firms through the use of quantitative data and information gathered from independent third-party databases, as well as the due diligence conducted by PLFA on the investment resources and personnel of a fund manager and an assessment of the investment strategies used by a fund manager and the due diligence conducted by the Trust’s CCO. In addition, the Board reviewed the specific criteria and information evaluated by PLFA during the selection process of UBS, including information about other firms considered by PLFA, and PLFA’s analysis in reaching its conclusion to recommend UBS as the new fund manager.
In evaluating the PL Currency Strategies Advisory Agreement and UBS Fund Management Agreement, the Board, including all the Independent Trustees, considered the following factors, among others:
1. Nature, Extent and Quality of Services to be Provided
Fund Oversight and Supervision—PLFA, its personnel and its resources. The Trustees considered the depth and quality of PLFA’s investment management process, including its sophisticated monitoring and oversight of Fund Managers; the experience, capability and integrity of its senior management and other personnel; the low turnover rates of its key personnel; and the overall financial strength and stability of its organization. The Trustees considered the high quality of the products and services provided by PLFA and its affiliates, such as the many educational services and tools offered to assist intermediaries in effectively understanding and meeting shareholder needs. The Trustees also noted that PLFA regularly informs the Trustees about matters relevant to the Trust and its shareholders and investing.
The Trustees also considered that PLFA’s investment, legal, compliance and accounting professionals have access to and utilize a variety of resources and systems relating to investment management, compliance, trading, performance analysis, security valuation and Fund accounting. The Trustees further considered PLFA’s continuing need to attract and retain qualified personnel and to maintain and enhance its resources and systems to provide the appropriate investment management, compliance and monitoring services required for the Fund. The Board noted that PLFA monitors numerous investment, performance and compliance metrics for the Funds of the Trust.
The Trustees considered the benefits to shareholders of retaining PLFA to serve as the investment adviser to the PL Currency Strategies Fund in light of the nature, extent, and quality of services expected to be provided by PLFA. The Trustees considered the ability of PLFA to provide an appropriate level of support and resources to the PL Currency Strategies Fund and whether PLFA has sufficiently qualified personnel. The Trustees based this review on information and materials provided to them throughout the year by PLFA. The Trustees considered PLFA’s continued development and use of analytical tools for assessing Fund performance and the performance of Fund Managers, conducting an attribution analysis on performance and reporting on performance to the Trustees. The Trustees noted that PLFA uses these tools to monitor and identify when a Fund is underperforming applicable benchmarks or peer groups, and then conducts various analyses to try to assess the sources of and reasons for underperformance. The Trustees noted that PLFA has developed processes to oversee and monitor a Fund Manager’s execution of investment strategies. The Board noted that PLFA provides the Board with analysis of this data over rolling periods to assist the Board in identifying trends in Fund performance and other areas, and periodically provides the Trustees with information on economic and market trends to provide a context for assessing recent performance. The Board also noted that PLFA conducts periodic due diligence on a Fund Manager involving on-site visits, in-person meetings and telephonic meetings to gather information that PLFA uses to attempt to gain an in-depth understanding of a Fund Manager’s investment process and to seek to identify issues that may be relevant to a Fund Manager’s investment process and to seek to identify issues that may be relevant to a Fund Manager’s services to a Fund or a Fund’s performance. The Trustees also considered the background and experience of PLFA’s senior management, and the experience of and significant amount of attention expected to be given to the PL Currency Strategies Fund by PLFA’s management and staff. The Trustees also considered PLFA’s compliance operations with respect to the Trust, including the measures taken by PLFA to assist the Trust in complying with Rule 38a-1 under the 1940 Act. The Trustees further considered the monitoring and additional services provided by PLFA to the Fund, including assistance with security valuation, risk management analysis, preparation of periodic performance and financial reports, review of trade execution and coordination of other service providers to the Trust.
The Board concluded that it was satisfied with the nature, extent and quality of the investment management services to be provided by PLFA to the Fund under the PL Currency Strategies Advisory Agreement.
UBS. The Trustees considered the benefits to shareholders of retaining UBS as the Fund Manager, particularly in light of the nature, extent, and quality of the services expected to be provided by UBS. In this regard, the Trustees considered various materials relating to the proposed Fund Manager, including copies of the proposed UBS Fund Management Agreement; copies of UBS’s Form ADV; financial information; and other information deemed relevant to the Trustees’ evaluation, including comprehensive assessments from senior management of PLFA.
The Trustees considered that under the UBS Fund Management Agreement, UBS would be responsible for providing the investment management services for the Fund’s assets, including investment research, advice and supervision, and determining which securities would be
F-12
Table of Contents
PACIFIC LIFE FUNDS
APPROVAL OF INVESTMENT ADVISORY AGREEMENT
AND FUND MANAGEMENT AGREEMENTS (Continued)
(Unaudited)
purchased or sold by the Fund. The Trustees considered the quality of the management services expected to be provided to the PL Currency Strategies Fund over both the short- and long-term, the organizational depth and resources of UBS, including the background and experience of UBS’s management and the expertise of the Fund management team, as well as the investment strategies, processes and philosophy to be used with respect to the investment strategy.
In addition, the Trustees considered that they had previously reviewed and approved UBS’s written compliance policies and procedures and that the Trust’s CCO previously provided an assessment of UBS’s compliance program, as required under Rule 38a-1 of the 1940 Act, and its code of ethics.
In making these assessments, the Trustees took note of the extensive due diligence PLFA conducted with respect to UBS, and were aided by the assessment and recommendation of PLFA and the in-person presentation and materials provided by UBS.
The Board concluded it was satisfied with the nature, extent and quality of the investment management services anticipated to be provided to the PL Currency Strategies Fund by PLFA under the PL Currency Strategies Advisory Agreement and UBS under the UBS Fund Management Agreement.
2. Performance
The Trustees considered PLFA’s efforts and process to search for and screen advisory firms that are qualified to manage a currency strategies Fund, and the identification by PLFA of UBS to serve as Fund Manager with regard to the day-to-day investment activities of the PL Currency Strategies Fund. Because this consideration related to a newly organized Fund, no actual performance record for this Fund was available. However, the Trustees considered factors concerning performance in connection with its consideration of this matter and in connection with approval of the related UBS Fund Management Agreement, as described below.
The Trustees considered information about the historical performance of accounts managed by the same UBS Fund management team that would manage the PL Currency Strategies Fund using similar, though not identical, investment strategies as those proposed for the PL Currency Strategies Fund (the “Comparable Performance”). The Trustees considered the Comparable Performance against a pertinent benchmark and against the applicable peer group for the year-to-date, one-, three- and five-year periods as of March 31, 2012. The Trustees also considered the Comparable Performance against a pertinent benchmark and an applicable peer group for the previous six calendar years as of December 31, 2011. The Trustees also considered the need for UBS to adhere to the Fund’s general investment mandate in order to function appropriately in the PL Portfolio Optimization Funds.
The Board determined that UBS’s performance record was acceptable.
3. Advisory and Fund Management Fees
PLFA. The Trustees requested, received and reviewed information from PLFA relating to the proposed advisory fee for the PL Currency Strategies Fund. The Trustees reviewed the proposed advisory fees for the Fund and compared such amounts with the average fees of other funds in an applicable peer fund group. The Trustees also noted that the Fund would be subject to contractual expense limitations agreed to by PLFA. The Trustees considered that the proposed advisory fee was in line with industry averages for currency strategies products based on the data presented to the Board.
The Board concluded that the compensation payable under the PL Currency Strategies Advisory Agreement is fair and reasonable.
UBS. The Trustees considered information regarding the comparative sub-advisory fees charged under other investment advisory contracts of the Fund Manager with regard to other investment accounts with substantially similar investment strategies as the PL Currency Strategies Fund. The Trustees noted that in certain cases there were differences in the level of services proposed to be provided to the PL Currency Strategies Fund by UBS and that the level of services provided by UBS on these other accounts was due to the different nature of the accounts or an affiliation between UBS and the account. These differences often explained differences in fee schedules. The Trustees noted that the fee rates were the result of arms’-length negotiations between PLFA and UBS, and that the PL Currency Strategies Fund’s sub-advisory management fees are paid by PLFA and are not paid directly by the PL Currency Strategies Fund. The Trustees also considered that the sub-advisory management fees payable to UBS under the UBS Fund Management Agreement contained breakpoints.
The Board concluded that the compensation payable under the UBS Fund Management Agreement is fair and reasonable.
4. Costs, Level of Profits and Economies of Scale
Costs and Profitability. The Trustees reviewed information regarding PLFA’s projected costs of sponsoring the Fund and information regarding the anticipated projected profitability of the proposed Fund to PLFA. The Trustees considered the projected cost of services to be provided and projected profits to be realized by PLFA from the relationship with the PL Currency Strategies Fund based on the projected assets, income and expenses of PLFA in its relationship with the Fund. The Trustees noted that this projected information contains estimates because there is no actual operating history for the PL Currency Strategies Fund. The Trustees also considered the overall financial soundness of PLFA.
The Trustees considered the projected profitability of the UBS Fund Management Agreement to UBS to the extent practicable based on the financial information provided by UBS. The Trustees considered that it was difficult to accurately determine or evaluate the projected profitability of the UBS Fund Management Agreement to UBS because it managed substantial assets or had multiple business lines and, further, that any such assessment would involve assumptions regarding its allocation policies, capital structure, cost of capital, business mix and other factors. The Trustees gave less weight to projected profitability considerations than other information provided in connection with this matter, given the arms’-length nature of the relationship between PLFA and UBS with respect to the negotiation of Fund management fees, the fact that such fees are paid by PLFA and the fact that the projected profitability of the UBS Fund Management Agreement to UBS is an estimate.
Economies of Scale. The Trustees considered the extent to which economies of scale may be realized by the PL Currency Strategies Fund as assets grow. Because the PL Currency Strategies Fund has no operating history and no assets, no economies of scale exist at this time with
F-13
Table of Contents
PACIFIC LIFE FUNDS
APPROVAL OF INVESTMENT ADVISORY AGREEMENT
AND FUND MANAGEMENT AGREEMENTS (Continued)
(Unaudited)
respect to the Fund. In this regard, the Trustees considered that the Fund’s advisory fee was set to be competitive with its peer group, all of which were existing funds. As a result, the Fund’s advisory fee was designed to take into account the growth of the Fund to a competitive level and the resultant economies of scale that the Fund could be expected to realize. The Trustees also noted that there would be an expense limitation agreement in place for the PL Currency Strategies Fund.
The Board concluded that the PL Currency Strategies Fund’s fee structure reflected in the PL Currency Strategies Advisory Agreement and UBS Fund Management Agreement is fair and reasonable.
5. Ancillary Benefits
The Trustees received from PLFA information concerning other benefits that may be received by PLFA and UBS and their affiliates as a result of their relationship with the PL Currency Strategies Fund, including fees for administrative services and reimbursement at an approximate cost basis for certain support services, as well as commissions that may be paid to broker-dealers affiliated with the Fund Manager and the anticipated use of soft-dollars by the Fund Manager. In this regard, the Trustees noted that UBS represented that they do not anticipate utilizing an affiliated broker-dealer for foreign exchange trades, which are expected to be the primary investments of the Fund, or utilizing soft dollar credits generated by Fund commissions to pay for research services. The potential benefits that may be derived by PLFA from its relationship with the PL Currency Strategies Fund could include larger assets under management and reputational benefits, which are consistent with those generally derived by investment advisers to mutual funds. The Trustees considered potential benefits to be derived by UBS from its relationship with the PL Currency Strategies Fund and that such benefits were consistent with those generally derived by sub-advisers to mutual funds or were otherwise not unusual.
6. Conclusion
Based on their review, including the consideration of each of the factors referred to above, the Board found that: (i) the PL Currency Strategies Advisory Agreement and UBS Fund Management Agreement are in the best interests of the PL Currency Strategies Fund and its shareholders; and (ii) the compensation payable under the PL Currency Strategies Advisory Agreement and the UBS Fund Management Agreement is fair and reasonable. No single factor was determinative of the Board���s findings, but rather the Trustees based their determination on the total mix of information available to them.
Approval of Advisory Agreement and Fund Management Agreements with Respect to the PL Global Absolute Return Fund
At an in-person meeting on September 11, 2012, the Board, including all of the Independent Trustees, approved, effective on or about December 7, 2012, the Advisory Agreement with PLFA with respect to the PL Global Absolute Return Fund (the “PL Global Absolute Return Advisory Agreement”) and the Fund Management Agreement with Eaton Vance Management (“Eaton Vance”) with respect to the Fund (the “Eaton Vance Fund Management Agreement”), and appointed Eaton Vance as the Fund Manager for this Fund.
In evaluating the PL Global Absolute Return Advisory Agreement and Eaton Vance Fund Management Agreement, the Board, including the Independent Trustees, considered the factors described below. Additionally, in its evaluation of the Eaton Vance Fund Management Agreement, the Board considered the various screening processes that PLFA utilizes in identifying a proposed new fund manager, including screening for qualified firms through the use of quantitative data and information gathered from independent third-party databases, as well as the due diligence conducted by PLFA on the investment resources and personnel of a fund manager and an assessment of the investment strategies used by a fund manager and the due diligence conducted by the Trust’s CCO. In addition, the Board reviewed the specific criteria and information evaluated by PLFA during the selection process of Eaton Vance and PLFA’s analysis in reaching its conclusion to recommend Eaton Vance as the new fund manager.
In evaluating the PL Global Absolute Return Advisory Agreement and Eaton Vance Fund Management Agreement, the Board, including all the Independent Trustees, considered the following factors, among others:
1. Nature, Extent and Quality of Services to be Provided
Fund Oversight and Supervision—PLFA, its personnel and its resources. The Trustees considered the depth and quality of PLFA’s investment management process, including its sophisticated monitoring and oversight of Fund Managers; the experience, capability and integrity of its senior management and other personnel; the low turnover rates of its key personnel; and the overall financial strength and stability of its organization. The Trustees considered the high quality of the products and services provided by PLFA and its affiliates, such as the many educational services and tools offered to assist intermediaries in effectively understanding and meeting shareholder needs. The Trustees also noted that PLFA regularly informs the Trustees about matters relevant to the Trust and its shareholders and investing.
The Trustees also considered that PLFA’s investment, legal, compliance and accounting professionals have access to and utilize a variety of resources and systems relating to investment management, compliance, trading, performance analysis, security valuation and Fund accounting. The Trustees further considered PLFA’s continuing need to attract and retain qualified personnel and to maintain and enhance its resources and systems to provide the appropriate investment management, compliance and monitoring services required for the Fund. The Board noted that PLFA monitors numerous investment, performance and compliance metrics for the Funds of the Trust.
The Trustees considered the benefits to shareholders of retaining PLFA to serve as the investment adviser to the PL Global Absolute Return Fund in light of the nature, extent, and quality of services expected to be provided by PLFA. The Trustees considered the ability of PLFA to provide an appropriate level of support and resources to the PL Global Absolute Return Fund and whether PLFA has sufficiently qualified personnel. The Trustees based this review on information and materials provided to them throughout the year by PLFA. The Trustees considered PLFA’s continued development and use of analytical tools for assessing Fund performance and the performance of Fund Managers, conducting an attribution analysis on performance and reporting on performance to the Trustees. The Trustees noted that PLFA uses these tools to monitor and identify when a Fund is underperforming applicable benchmarks or peer groups, and then conducts various analyses to try
F-14
Table of Contents
PACIFIC LIFE FUNDS
APPROVAL OF INVESTMENT ADVISORY AGREEMENT
AND FUND MANAGEMENT AGREEMENTS (Continued)
(Unaudited)
to assess the sources of and reasons for underperformance. The Trustees noted that PLFA has developed processes to oversee and monitor a Fund Manager’s execution of investment strategies. The Board noted that PLFA provides the Board with analysis of this data over rolling periods to assist the Board in identifying trends in Fund performance and other areas, and periodically provides the Trustees with information on economic and market trends to provide a context for assessing recent performance. The Board also noted that PLFA conducts periodic due diligence on a Fund Manager involving on-site visits, in-person meetings and telephonic meetings to gather information that PLFA uses to attempt to gain an in-depth understanding of a Fund Manager’s investment process and to seek to identify issues that may be relevant to a Fund Manager’s investment process and to seek to identify issues that may be relevant to a Fund Manager’s services to a Fund or a Fund’s performance. The Trustees also considered the background and experience of PLFA’s senior management, and the experience of and significant amount of attention expected to be given to the PL Global Absolute Return Fund by PLFA’s management and staff. The Trustees also considered PLFA’s compliance operations with respect to the Trust, including the measures taken by PLFA to assist the Trust in complying with Rule 38a-1 under the 1940 Act. The Trustees further considered the monitoring and additional services provided by PLFA to the Fund, including assistance with security valuation, risk management analysis, preparation of periodic performance and financial reports, review of trade execution and coordination of other service providers to the Trust.
The Board concluded that it was satisfied with the nature, extent and quality of the investment management services to be provided by PLFA to the Fund under the PL Global Absolute Return Advisory Agreement.
Eaton Vance. The Trustees considered the benefits to shareholders of retaining Eaton Vance as the Fund Manager, particularly in light of the nature, extent, and quality of the services expected to be provided by Eaton Vance. In this regard, the Trustees considered various materials relating to the proposed Fund Manager, including copies of the proposed Eaton Vance Fund Management Agreement; copies of Eaton Vance’s Form ADV; financial information; and other information deemed relevant to the Trustees’ evaluation, including comprehensive assessments from senior management of PLFA.
The Trustees considered that under the Eaton Vance Fund Management Agreement, Eaton Vance would be responsible for providing the investment management services for the Fund’s assets, including investment research, advice and supervision, and determining which securities would be purchased or sold by the Fund. The Trustees considered the quality of the management services expected to be provided to the PL Global Absolute Return Fund over both the short- and long-term, the organizational depth and resources of Eaton Vance, including the background and experience of Eaton Vance’s management and the expertise of the Fund management team, as well as the investment strategies, processes and philosophy to be used with respect to the investment strategy.
In addition, the Trustees considered that they had previously reviewed and approved Eaton Vance’s written compliance policies and procedures and that the Trust’s CCO previously provided an assessment of Eaton Vance’s compliance program, as required under Rule 38a-1 of the 1940 Act, and its code of ethics.
In making these assessments, the Trustees took note of the extensive due diligence PLFA conducted with respect to Eaton Vance, and were aided by the assessment and recommendation of PLFA and the in-person presentation and materials provided by Eaton Vance. The Board concluded it was satisfied with the nature, extent and quality of the investment management services anticipated to be provided to the PL Global Absolute Return Fund by PLFA under the PL Global Absolute Return Advisory Agreement and Eaton Vance under the Eaton Vance Fund Management Agreement.
2. Performance
The Trustees considered PLFA’s efforts and process to search for and screen advisory firms that are qualified to manage a global absolute return Fund, and the identification by PLFA of Eaton Vance to serve as Fund Manager with regard to the day-to-day investment activities of the PL Global Absolute Return Fund. Because this consideration related to a newly organized Fund, no actual performance record for this Fund was available. However, the Trustees considered factors concerning performance in connection with its consideration of this matter and in connection with approval of the related Eaton Vance Fund Management Agreement, as described below.
The Trustees considered information about the historical performance of accounts managed by the same Eaton Vance Fund management team that would manage the PL Global Absolute Return Fund using similar investment strategies as those proposed for the PL Global Absolute Return Fund (the “Comparable Performance”). The Trustees considered the Comparable Performance against a pertinent benchmark and against the applicable peer group for the year-to-date, one-, three-, five- and ten-year periods as of March 31, 2012. The Trustees also considered the Comparable Performance against a pertinent benchmark and an applicable peer group for the previous twelve calendar years as of December 31, 2011. The Trustees also considered the need for Eaton Vance to adhere to the Fund’s general investment mandate in order to function appropriately in the PL Portfolio Optimization Funds.
The Board determined that Eaton Vance’s performance record was acceptable.
3. Advisory and Fund Management Fees
PLFA. The Trustees requested, received and reviewed information from PLFA relating to the proposed advisory fee for the PL Global Absolute Return Fund. The Trustees reviewed the proposed advisory fees for the Fund and compared such amounts with the average fees of other funds in an applicable peer fund group. The Trustees also noted that the Fund would be subject to contractual expense limitations agreed to by PLFA. The Trustees considered that the proposed advisory fee was in line with industry averages for global absolute return products based on the data presented to the Board.
The Board concluded that the compensation payable under the PL Global Absolute Return Advisory Agreement is fair and reasonable.
Eaton Vance. The Trustees considered information regarding the comparative sub-advisory fees charged under other investment advisory contracts of the Fund Manager with regard to other investment accounts with substantially similar investment strategies as the PL Global
F-15
Table of Contents
PACIFIC LIFE FUNDS
APPROVAL OF INVESTMENT ADVISORY AGREEMENT
AND FUND MANAGEMENT AGREEMENTS (Continued)
(Unaudited)
Absolute Return Fund. The Trustees noted that in certain cases there were differences in the level of services proposed to be provided to the PL Global Absolute Return Fund by Eaton Vance and that the level of services provided by Eaton Vance on these other accounts was due to the different nature of the accounts or an affiliation between Eaton Vance and the account. These differences often explained differences in fee schedules. The Trustees noted that the fee rates were the result of arms’-length negotiations between PLFA and Eaton Vance, and that the PL Global Absolute Return Fund’s sub-advisory management fees are paid by PLFA and are not paid directly by the PL Global Absolute Return Fund. The Trustees also considered that the sub- advisory management fees payable to Eaton Vance under the Eaton Vance Fund Management Agreement contained breakpoints.
The Board concluded that the compensation payable under the Eaton Vance Fund Management Agreement is fair and reasonable.
4. Costs, Level of Profits and Economies of Scale
Costs and Profitability. The Trustees reviewed information regarding PLFA’s projected costs of sponsoring the Fund and information regarding the anticipated projected profitability of the proposed Fund to PLFA. The Trustees considered the projected cost of services to be provided and projected profits to be realized by PLFA from the relationship with the PL Global Absolute Return Fund based on the projected assets, income and expenses of PLFA in its relationship with the Fund. The Trustees noted that this projected information contains estimates because there is no actual operating history for the PL Global Absolute Return Fund. The Trustees also considered the overall financial soundness of PLFA.
The Trustees considered the projected profitability of the Eaton Vance Fund Management Agreement to Eaton Vance to the extent practicable based on the financial information provided by Eaton Vance. The Trustees considered that it was difficult to accurately determine or evaluate the projected profitability of the Eaton Vance Fund Management Agreement to Eaton Vance because it managed substantial assets or had multiple business lines and, further, that any such assessment would involve assumptions regarding its allocation policies, capital structure, cost of capital, business mix and other factors. The Trustees gave less weight to projected profitability considerations than other information provided in connection with this matter, given the arms’-length nature of the relationship between PLFA and Eaton Vance with respect to the negotiation of Fund management fees, the fact that such fees are paid by PLFA and the fact that the projected profitability of the Eaton Vance Fund Management Agreement to Eaton Vance is an estimate.
Economies of Scale. The Trustees considered the extent to which economies of scale may be realized by the PL Global Absolute Return Fund as assets grow. Because the PL Global Absolute Return Fund has no operating history and no assets, no economies of scale exist at this time with respect to the Fund. In this regard, the Trustees considered that the Fund’s advisory fee was set to be competitive with its peer group, all of which were existing funds. As a result, the Fund’s advisory fee was designed to take into account the growth of the Fund to a competitive level and the resultant economies of scale that the Fund could be expected to realize. The Trustees also noted that there would be an expense limitation agreement in place for the PL Global Absolute Return Fund.
The Board concluded that the PL Global Absolute Return Fund’s fee structure reflected in the PL Global Absolute Return Advisory Agreement and Eaton Vance Fund Management Agreement is fair and reasonable.
5. Ancillary Benefits
The Trustees received from PLFA information concerning other benefits that may be received by PLFA and Eaton Vance and their affiliates as a result of their relationship with the PL Global Absolute Return Fund, including fees for administrative services and reimbursement at an approximate cost basis for certain support services, as well as commissions that may be paid to broker-dealers affiliated with the Fund Manager and the anticipated use of soft-dollars by the Fund Manager. In this regard, the Trustees noted that Eaton Vance represented that they do not anticipate utilizing an affiliated broker-dealer for trades or utilizing soft dollar credits generated by Fund commissions to pay for research services. The potential benefits that may be derived by PLFA from its relationship with the PL Global Absolute Return Fund could include larger assets under management and reputational benefits, which are consistent with those generally derived by investment advisers to mutual funds. The Trustees considered potential benefits to be derived by Eaton Vance from its relationship with the PL Global Absolute Return Fund and that such benefits were consistent with those generally derived by sub-advisers to mutual funds or were otherwise not unusual.
6. Conclusion
Based on their review, including the consideration of each of the factors referred to above, the Board found that: (i) the PL Global Absolute Return Advisory Agreement and Eaton Vance Fund Management Agreement are in the best interests of the PL Global Absolute Return Fund and its shareholders; and (ii) the compensation payable under the PL Global Absolute Return Advisory Agreement and the Eaton Vance Fund Management Agreement is fair and reasonable. No single factor was determinative of the Board’s findings, but rather the Trustees based their determination on the total mix of information available to them.
Approval of Advisory Agreement with Respect to the PL Alternative Strategies Fund
At an in-person meeting on September 11, 2012, the Board, including all of the Independent Trustees, approved, effective on or about December 7, 2012, the Advisory Agreement with PLFA with respect to the PL Alternative Strategies Fund (the “PL Alternative Strategies Advisory Agreement”).
In evaluating the PL Alternative Strategies Advisory Agreement, the Board, including all the Independent Trustees, considered the following factors, among others:
1. Nature, Extent and Quality of Services to be Provided
PLFA, its personnel and its resources. The Trustees considered the depth and quality of PLFA’s investment management process, including its experience managing asset allocation funds-of-funds; the experience, capability and integrity of its senior management and other personnel; the low turnover rates of its key personnel; and the overall financial strength and stability of its organization. The Trustees considered the high
F-16
Table of Contents
PACIFIC LIFE FUNDS
APPROVAL OF INVESTMENT ADVISORY AGREEMENT
AND FUND MANAGEMENT AGREEMENTS (Continued)
(Unaudited)
quality of the products and services provided by PLFA and its affiliates, such as the many educational services and tools offered to assist intermediaries in effectively understanding and meeting shareholder needs. The Trustees also noted that PLFA regularly informs the Trustees about matters relevant to the Trust and its shareholders and investing.
The Trustees also considered that PLFA’s investment, legal, compliance and accounting professionals have access to and utilize a variety of resources and systems relating to investment management, compliance, trading, performance analysis, security valuation and Fund accounting. The Trustees further considered PLFA’s continuing need to attract and retain qualified personnel and to maintain and enhance its resources and systems to provide the appropriate investment management, compliance and monitoring services required for the Fund. The Board noted that PLFA monitors numerous investment, performance and compliance metrics for the Funds of the Trust.
The Trustees considered the benefits to shareholders of retaining PLFA to serve as the investment adviser to the PL Alternative Strategies Fund in light of the nature, extent, and quality of services expected to be provided by PLFA. The Trustees considered that PLFA serves as adviser to the Portfolio Optimization Portfolios and the Pacific Dynamix Portfolios of Pacific Select Fund and the Portfolio Optimization Funds of the Trust, all of which are asset allocation fund-of-funds, and provides asset allocation services to other accounts. The Trustees considered the ability of PLFA to provide an appropriate level of support and resources to the PL Alternative Strategies Fund and whether PLFA has sufficiently qualified personnel. The Trustees based this review on information and materials provided to them throughout the year by PLFA. The Trustees considered PLFA’s continued development and use of analytical tools for assessing Fund performance, conducting an attribution analysis on performance and reporting on performance to the Trustees. The Trustees noted that PLFA uses these tools to monitor and identify when a Fund is underperforming applicable benchmarks or peer groups, and then conducts various analyses to try to assess the sources of and reasons for underperformance. The Board noted that PLFA provides the Board with analysis of this data over rolling periods to assist the Board in identifying trends in Fund performance and other areas, and periodically provides the Trustees with information on economic and market trends to provide a context for assessing recent performance. The Trustees also considered the background and experience of PLFA’s senior management, and the experience of and significant amount of attention expected to be given to the PL Alternative Strategies Fund by PLFA’s management and staff. The Trustees also considered PLFA’s compliance operations with respect to the Trust, including the measures taken by PLFA to assist the Trust in complying with Rule 38a-1 under the 1940 Act. The Trustees further considered the monitoring and additional services provided by PLFA to the Fund, including assistance with security valuation, risk management analysis, preparation of periodic performance and financial reports, review of trade execution and coordination of other service providers to the Trust.
The Board concluded that it was satisfied with the nature, extent and quality of the investment management services to be provided by PLFA to the Fund under the PL Alternative Strategies Advisory Agreement.
2. Performance
The Trustees considered PLFA’s experience managing asset allocation fund-of-funds and other accounts and its qualifications to manage the PL Alternative Strategies Fund. Because this consideration related to a newly-organization fund, no actual performance record was available. However, the Trustees considered information about the hypothetical performance of an account managed by PLFA using the investment strategies that would be used for the proposed PL Alternative Strategies Fund (the “Hypothetical Performance”). The Trustees considered the Hypothetical Performance against the applicable peer group for the year-to-date, one-, three-, and five-year periods as of June 30, 2012. The Trustees also considered the Hypothetical Performance against an applicable peer group for the previous seven calendar years.
The Board determined that PLFA’s performance record was acceptable.
3. Advisory and Fund Management Fees
PLFA. The Trustees requested, received and reviewed information from PLFA relating to the proposed advisory fee for the PL Alternative Strategies Fund. The Trustees reviewed the proposed advisory fees for the Fund and compared such amounts with the average fees of other funds in an applicable peer fund group. The Trustees also noted that the Fund would be subject to contractual expense limitations agreed to by PLFA. The Trustees considered that the proposed advisory fee was in line with industry averages for multialternative products based on the data presented to the Board.
The Board concluded that the compensation payable under the PL Alternative Strategies Advisory Agreement is fair and reasonable.
4. Costs, Level of Profits and Economies of Scale
Costs and Profitability. The Trustees reviewed information regarding PLFA’s projected costs of sponsoring the Fund and information regarding the anticipated projected profitability of the proposed Fund to PLFA. The Trustees considered the projected cost of services to be provided and projected profits to be realized by PLFA from the relationship with the PL Alternative Strategies Fund based on the projected assets, income and expenses of PLFA in its relationship with the Fund. The Trustees noted that this projected information contains estimates because there is no actual operating history for the PL Alternative Strategies Fund. The Trustees also considered the overall financial soundness of PLFA.
Economies of Scale. The Trustees considered the extent to which economies of scale may be realized by the PL Alternative Strategies Fund as assets grow. Because the PL Alternative Strategies Fund has no operating history and no assets, no economies of scale exist at this time with respect to the Fund. In this regard, the Trustees considered that the Fund’s advisory fee was set to be competitive with its peer group, all of which were existing funds. As a result, the Fund’s advisory fee was designed to take into account the growth of the Fund to a competitive level and the resultant economies of scale that the Fund could be expected to realize. The Trustees also noted that there would be an expense limitation agreement in place for the PL Alternative Strategies Fund.
The Board concluded that the PL Alternative Strategies Fund’s fee structure reflected in the PL Alternative Strategies Advisory Agreement is fair and reasonable.
F-17
Table of Contents
PACIFIC LIFE FUNDS
APPROVAL OF INVESTMENT ADVISORY AGREEMENT
AND FUND MANAGEMENT AGREEMENTS (Continued)
(Unaudited)
5. Ancillary Benefits
The Trustees received from PLFA information concerning other benefits that may be received by PLFA its affiliates as a result of their relationship with the PL Alternative Strategies Fund, including fees for administrative services and reimbursement at an approximate cost basis for certain support services, as well as commissions that may be paid to broker-dealers affiliated with the Fund Manager and the anticipated use of soft-dollars by the Fund Manager. In this regard, the Trustees noted that PLFA represented that it does not anticipate utilizing an affiliated broker-dealer for trades or utilizing soft dollar credits to pay for research services. The potential benefits that may be derived by PLFA from its relationship with the PL Alternative Strategies Fund could include larger assets under management and reputational benefits, which are consistent with those generally derived by investment advisers to mutual funds.
6. Conclusion
Based on their review, including the consideration of each of the factors referred to above, the Board found that: (i) the PL Alternative Strategies Advisory Agreement is in the best interests of the PL Alternative Strategies Fund and its shareholders; and (ii) the compensation payable under the PL Alternative Strategies Advisory Agreement is fair and reasonable. No single factor was determinative of the Board’s findings, but rather the Trustees based their determination on the total mix of information available to them.
Approval of Fund Management Agreement with Respect to PL Growth LT Fund
At an in-person meeting on December 12, 2012, the Board, including all of the Independent Trustees, approved, effective no later than May 1, 2013, a new Fund Management Agreement with Massachusetts Financial Services Company, doing business as MFS Investment Management (“MFS”) with respect to the PL Growth LT Fund (the “MFS Fund Management Agreement”), and appointed MFS as the new Fund Manager for this Fund. The Board also approved a change to the name of the Fund and effective May 1, 2013, the Fund will be named the PL Growth Fund. In connection with this matter, also at the December 12, 2012 meeting, the Board terminated the Fund Management Agreement for the Fund with the current fund manager upon the effectiveness of the MFS Fund Management Agreement. MFS’s appointment as new Fund Manager was made in accordance with the exemptive order issued by the SEC with regard to the Trust and does not require shareholder approval.
In evaluating the MFS Fund Management Agreement, the Board, including the Independent Trustees, considered the factors, among others, described below. Additionally, the Board considered the various screening processes that PLFA utilizes in identifying a proposed new fund manager, including screening for qualified firms through the use of quantitative data and information gathered from independent third-party databases, as well as the due diligence conducted by PLFA on the investment resources and personnel of a fund manager and an assessment of the investment strategies used by a fund manager and the due diligence conducted by the Trust’s CCO. In addition, the Board reviewed the specific criteria and information evaluated by PLFA during the selection process of MFS, including information about other firms considered by PLFA, and PLFA’s analysis in reaching its conclusion to recommend MFS as the new Fund Manager.
In evaluating the MFS Fund Management Agreement, the Board, including all the Independent Trustees, considered the following factors, among others:
1. Nature, Extent and Quality of Services to be Provided
The Trustees considered the benefits to shareholders of retaining MFS as the Fund Manager, particularly in light of the nature, extent, and quality of the services expected to be provided by MFS. In this regard, the Trustees considered various materials relating to the proposed Fund Manager, including copies of the proposed MFS Fund Management Agreement; copies of MFS’s Form ADV; financial information; and other information deemed relevant to the Trustees’ evaluation, including comprehensive assessments from senior management of PLFA.
The Trustees considered that under the MFS Fund Management Agreement, MFS would be responsible for providing the investment management services for the Fund’s assets, including investment research, advice and supervision, and determining which securities would be purchased or sold by the Fund. The Trustees considered the quality of the management services expected to be provided to the PL Growth LT Fund over both the short- and long-term, the organizational depth and resources of MFS, including the background and experience of MFS’s management and the expertise of the fund management team, as well as the investment strategies, processes and philosophy to be used with respect to the investment strategy.
In addition, the Trustees considered MFS’s written compliance policies and procedures and noted that the Trust’s CCO had previously provided an assessment of MFS’s compliance program, as required under Rule 38a-1 of the 1940 Act, and its code of ethics.
In making these assessments, the Trustees took note of the extensive due diligence PLFA conducted with respect to MFS, and were aided by the assessment and recommendation of PLFA and the in-person presentation and materials provided by MFS. The Board concluded it was satisfied with the nature, extent and quality of the investment management services anticipated to be provided to the PL Growth LT Fund by MFS under the MFS Fund Management Agreement.
2. Performance
The Trustees considered PLFA’s efforts and process to search for and screen advisory firms that are qualified to manage a growth fund, and PLFA’s identification of MFS to serve as Fund Manager with regard to the day-to-day investment activities of the PL Growth LT Fund. The Trustees considered factors concerning performance in connection with its consideration of this matter and in connection with approval of the related MFS Fund Management Agreement, as described below.
The Trustees considered information about the historical performance of an account managed by the same MFS fund management team that would manage the PL Growth LT Fund using similar investment strategies as those proposed for the PL Growth LT Fund (the “Comparable Performance”). The Trustees considered the Comparable Performance against a pertinent benchmark and against the applicable peer group for the year-to-date, one-, three-, five-, and ten-year periods as of September 30, 2012. The Trustees also considered the Comparable
F-18
Table of Contents
PACIFIC LIFE FUNDS
APPROVAL OF INVESTMENT ADVISORY AGREEMENT
AND FUND MANAGEMENT AGREEMENTS (Continued)
(Unaudited)
Performance against a pertinent benchmark and an applicable peer group for the previous nine calendar years. The Trustees also considered information about the historical performance of additional accounts managed by MFS using similar investment strategies as those proposed for the Growth LT Fund against a pertinent benchmark for the one-, three-, five- and ten-year periods (as available) as of September 30, 2012. Additionally, the Trustees considered performance information presented by PLFA for another potential manager of the Fund. The Trustees also considered the need for MFS to adhere to the Fund’s general investment mandate in order to function appropriately in the PL Portfolio Optimization Funds.
The Board determined that MFS’s performance record was acceptable.
3. Advisory and Fund Management Fees
The Trustees considered information regarding the comparative advisory fees charged under other investment advisory contracts of the Fund Manager with regard to other investment accounts with substantially similar investment strategies as the PL Growth LT Fund. The Trustees also considered that the proposed sub-advisory fees payable to MFS under the Fund Management Agreement contain breakpoints and were lower than the sub-advisory fees paid to the current fund manager. The Trustees considered that the advisory fee schedule would remain unchanged from the current fee schedule for the Fund and that the total advisory fees paid by shareholders would not increase. The Trustees noted that in certain cases there were differences in the level of services proposed to be provided to the PL Growth LT Fund by MFS and that the level of services provided by MFS on these other accounts was due to the different nature of the accounts or an affiliation between MFS and the account. These differences often explained differences in fee schedules. The Trustees noted that the fee rates were the result of arms’-length negotiations between PLFA and MFS, and that the PL Growth LT Fund’s sub-advisory management fees are paid by PLFA and are not paid directly by the PL Growth LT Fund. Additionally, the Trustees considered that there are certain costs associated with a manager change, but that the advisory fee rates and ongoing operating expenses paid by the shareholders were not expected to materially increase as a result of this portfolio manager change.
The Board concluded that the compensation payable under the MFS Fund Management Agreement is fair and reasonable.
4. Costs, Level of Profits and Economies of Scale
The Trustees considered information about the profitability of other investment accounts managed by MFS using similar investment strategies as those proposed for the Growth LT Fund in assessing the projected profitability of the MFS Fund Management Agreement to MFS to the extent practicable based on the information provided by MFS. The Trustees considered that it was difficult to accurately determine or evaluate the projected profitability of the MFS Fund Management Agreement to MFS because it managed substantial assets and had multiple business lines and, further, that any such assessment would involve assumptions regarding its allocation policies, capital structure, cost of capital, business mix and other factors. The Trustees focused their consideration on other information provided in connection with this matter, given the arms’-length nature of the relationship between PLFA and MFS with respect to the negotiation of Fund sub-advisory fees, the fact that such fees are paid by PLFA and the fact that the projected profitability of the MFS Fund Management Agreement to MFS is an estimate because it had not yet begun to manage the Fund.
The Board concluded that the PL Growth LT Fund’s fee structure reflected in the MFS Fund Management Agreement is fair and reasonable.
5. Ancillary Benefits
The Trustees received from PLFA and MFS information concerning other benefits that may be received by MFS and its affiliates as a result of their relationship with the PL Growth LT Fund, including commissions that may be paid to broker-dealers affiliated with the Fund Manager and the anticipated use of soft-dollars by the Fund Manager. In this regard, the Trustees noted that MFS represented that it does not anticipate utilizing an affiliated broker-dealer and that it anticipates using soft dollar credits generated by Fund commissions to pay for research services. The potential benefits that may be derived by MFS from its relationship with the PL Growth LT Fund could include larger assets under management and reputational benefits, which are consistent with those generally derived by sub-advisers to mutual funds. The Trustees considered potential benefits to be derived by MFS from its relationship with the PL Growth LT Fund and that such benefits were consistent with those generally derived by sub-advisers to mutual funds or were otherwise not unusual.
6. Conclusion
Based on their review, including the consideration of each of the factors referred to above, the Board found that: (i) the MFS Fund Management Agreement is in the best interests of the PL Growth LT Fund and its shareholders; and (ii) the compensation payable under the MFS Fund Management Agreement is fair and reasonable. No single factor was determinative of the Board’s findings, but rather the Trustees based their determination on the total mix of information available to them.
Approval of Interim Fund Management Agreement with Respect to PL Large-Cap Growth Fund
At an in-person meeting on December 12, 2012, the Board, including all of the Independent Trustees, approved, effective January 1, 2013, a new Interim Fund Management Agreement with BlackRock Investment Management, LLC (“BlackRock”) with respect to the PL Large-Cap Growth Fund (the “BlackRock Interim Fund Management Agreement”), and appointed BlackRock as the new Interim Fund Manager for this Fund. In connection with this matter, also at the December 12, 2012 meeting, the Board also approved the termination of the Fund Management Agreement for the Fund with the prior fund manager upon the effectiveness of the BlackRock Interim Fund Management Agreement. In evaluating the BlackRock Interim Fund Management Agreement, the Board, including the Independent Trustees, considered the interim nature of the BlackRock Interim Fund Management Agreement and the factors described below.
F-19
Table of Contents
PACIFIC LIFE FUNDS
APPROVAL OF INVESTMENT ADVISORY AGREEMENT
AND FUND MANAGEMENT AGREEMENTS (Continued)
(Unaudited)
In evaluating the BlackRock Interim Fund Management Agreement, the Board, including all the Independent Trustees, considered the following factors, among others:
1. Nature, Extent and Quality of Services to be Provided
The Trustees considered the benefits to shareholders of retaining BlackRock as the Interim Fund Manager, particularly in light of the nature, extent, and quality of the services expected to be provided by BlackRock. In this regard, the Trustees considered various materials relating to the proposed Interim Fund Manager, including copies of the proposed BlackRock Interim Fund Management Agreement; copies of BlackRock’s Form ADV; financial information; and other information deemed relevant to the Trustees’ evaluation, including comprehensive assessments from senior management of PLFA. The Trustees also considered the fact that BlackRock already serves as a portfolio manager to other Portfolios in the Trust and that PLFA and the Board have developed substantial knowledge about BlackRock from this relationship.
The Trustees considered that under the BlackRock Interim Fund Management Agreement, BlackRock would be responsible for providing the investment management services for the Fund’s assets, including investment research, advice and supervision, and determining which securities would be purchased or sold by the Fund. The Trustees considered the quality of the management services expected to be provided to the PL Large-Cap Growth Fund , the organizational depth and resources of BlackRock, including the background and experience of BlackRock’s management and the expertise of the fund management team, as well as the investment strategies, processes and philosophy to be used with respect to the investment strategy.
In addition, the Trustees considered BlackRock’s written compliance policies and procedures and noted that the Trust’s CCO had previously provided an assessment of BlackRock’s compliance program, as required under Rule 38a-1 of the 1940 Act, and its code of ethics.
In making these assessments, the Trustees took note of the due diligence PLFA conducted with respect to BlackRock, their prior knowledge of and working relationship with BlackRock, including the fact that BlackRock already manages the proposed strategy for a series of Pacific Select Funds and were aided by the assessment and recommendation of PLFA and the in-person presentation and materials provided by BlackRock. The Board concluded it was satisfied with the nature, extent and quality of the investment management services anticipated to be provided to the PL Large-Cap Growth Fund by BlackRock under the BlackRock Interim Fund Management Agreement.
2. Performance
The Trustees considered PLFA’s ongoing efforts to search for and screen advisory firms that are qualified to manage, on a longer-term basis, a large-cap growth fund. The Trustees considered that while that search process was underway, it would be appropriate to engage BlackRock to serve as Interim Fund Manager with regard to the day-to-day investment activities of the PL Large-Cap Growth Fund using an index strategy. The Trustees considered that the performance objective during this interim period was to retain benchmark large-cap market exposure without assuming additional risk and considered that BlackRock’s large-cap index strategy was the appropriate means to achieve that objective.
The Trustees considered information about the historical performance of accounts managed by the same BlackRock fund management team that would manage the PL Large-Cap Growth Fund using similar investment strategies as those proposed for the PL Large-Cap Growth Fund (the “Comparable Performance”). The Trustees considered the Comparable Performance against a pertinent benchmark for the one-, three-, and five-year and since inception periods (as available) as of June 30, 2012 and noted that the strategy seeks to replicate the performance of a benchmark index.
The Board determined that BlackRock’s performance record was acceptable.
3. Advisory and Fund Management Fees
The Trustees considered information regarding the comparative advisory fees charged under other investment advisory contracts of the Interim Fund Manager with regard to other investment accounts with substantially similar investment strategies as the PL Large-Cap Growth Fund. The Trustees noted that in certain cases there were differences in the level of services proposed to be provided to the PL Large-Cap Growth Fund by BlackRock and that the level of services provided by BlackRock on these other accounts was due to the different nature of the accounts or an affiliation between BlackRock and the account. These differences often explained differences in fee schedules. The Trustees noted that the fee rates were the result of arms’-length negotiations between PLFA and BlackRock, and that the PL Large-Cap Growth Fund’s sub-advisory fees are paid by PLFA and are not paid directly by the PL Large-Cap Growth Fund. The Trustees considered that PLFA had agreed to waive a portion of its advisory fee while BlackRock serves as Interim Fund Manager
The Board concluded that the compensation payable under the BlackRock Interim Fund Management Agreement is fair and reasonable.
4. Costs, Level of Profits and Economies of Scale
The Trustees considered the projected profitability of the BlackRock Interim Fund Management Agreement to BlackRock to the extent practicable based on the financial information provided by BlackRock. Given the short-term interim nature of the proposed engagement, the Trustees did not consider this information as particularly meaningful.
The Board concluded that the PL Large-Cap Growth Fund’s fee structure reflected in the BlackRock Interim Fund Management Agreement is fair and reasonable.
5. Ancillary Benefits
The Trustees received from PLFA and BlackRock information concerning other benefits that may be received by BlackRock and its affiliates as a result of their relationship with the PL Large-Cap Growth Fund, including commissions that may be paid to broker-dealers affiliated with the Interim Fund Manager and the anticipated use of soft-dollars by the Interim Fund Manager. In this regard, the Trustees noted that BlackRock represented that it does not anticipate utilizing an affiliated broker-dealer or soft dollar credits generated by Fund commissions to pay for research services. The potential benefits that may be derived by BlackRock from its relationship with the PL Large-Cap Growth Fund could
F-20
Table of Contents
PACIFIC LIFE FUNDS
APPROVAL OF INVESTMENT ADVISORY AGREEMENT
AND FUND MANAGEMENT AGREEMENTS (Continued)
(Unaudited)
include larger assets under management and reputational benefits, which are consistent with those generally derived by investment advisers to mutual funds. The Trustees considered potential benefits to be derived by BlackRock from its relationship with the PL Large-Cap Growth Fund and that such benefits were consistent with those generally derived by sub-advisers to mutual funds or were otherwise not unusual.
6. Conclusion
Based on their review, including the consideration of each of the factors referred to above, the Board found that: (i) the BlackRock Interim Fund Management Agreement is in the best interests of the PL Large-Cap Growth Fund and its shareholders; and (ii) the compensation payable under the BlackRock Interim Fund Management Agreement is fair and reasonable. No single factor was determinative of the Board’s findings, but rather the Trustees based their determination on the total mix of information available to them.
Approval of Fund Management Agreement with Respect to PL Large-Cap Growth Fund
At an in-person meeting on March 14, 2013, the Board, including all of the Independent Trustees, approved, effective no later than May 1, 2013, a new Fund Management Agreement with BlackRock with respect to the Fund (the “BlackRock Fund Management Agreement”), and appointed BlackRock as the Fund Manager for this Fund. In connection with this matter, also at the March 14, 2013 meeting, the Board terminated the BlackRock Interim Fund Management Agreement upon the effectiveness of the BlackRock Fund Management Agreement. BlackRock’s appointment as Fund Manager was made in accordance with the exemptive order issued by the SEC with regard to the Trust and does not require shareholder approval.
In evaluating the BlackRock Fund Management Agreement, the Board, including the Independent Trustees, considered the factors, among others, described below. Additionally, the Board considered the various screening processes that PLFA utilizes in identifying a proposed new fund manager, including screening for qualified firms through the use of quantitative data and information gathered from independent third-party databases, as well as the due diligence conducted by PLFA on the investment resources and personnel of a fund manager and an assessment of the investment strategies used by a fund manager and the due diligence conducted by the Trust’s CCO. In addition, the Board reviewed the specific criteria and information evaluated by PLFA during the selection process of BlackRock, including information about other firms considered by PLFA, and PLFA’s analysis in reaching its conclusion to recommend BlackRock as the Fund Manager.
In evaluating the BlackRock Fund Management Agreement, the Board, including all the Independent Trustees, considered the following factors, among others:
1. Nature, Extent and Quality of Services to be Provided
The Trustees considered the benefits to shareholders of retaining BlackRock as the Fund Manager, particularly in light of the nature, extent, and quality of the services expected to be provided by BlackRock. In this regard, the Trustees considered various materials relating to the proposed Fund Manager, including copies of the proposed BlackRock Fund Management Agreement; copies of BlackRock’s Form ADV; financial information; and other information deemed relevant to the Trustees’ evaluation, including comprehensive assessments from senior management of PLFA.
The Trustees considered that under the BlackRock Fund Management Agreement, BlackRock would be responsible for providing the investment management services for the Fund’s assets, including investment research, advice and supervision, and determining which securities would be purchased or sold by the Fund. The Trustees considered the quality of the management services expected to be provided to the PL Large-Cap Growth Fund over both the short- and long-term, the organizational depth and resources of BlackRock, including the background and experience of BlackRock’s management and the expertise of the fund management team, as well as the investment strategies, processes and philosophy to be used with respect to the investment strategy. The Trustees considered that the fund management team (the “FM Team”) at BlackRock that would be responsible for the day-to-day management of the Fund was led by the same lead portfolio manager and supported by certain of the same core team members that had been responsible for the management of the Fund while at a previous fund management firm. The Trustees noted that PLFA’s recommendation to engage BlackRock to actively manage the Fund was the completion of a two phase transition plan recommended by PLFA to address the departure of the FM Team from that previous fund management firm.
In addition, the Trustees considered BlackRock’s written compliance policies and procedures and noted that the Trust’s CCO had previously provided an assessment of BlackRock’s compliance program, as required under Rule 38a-1 of the 1940 Act, and its code of ethics.
In making these assessments, the Trustees took note of the due diligence PLFA conducted with respect to BlackRock, PLFA’s and the Board’s prior experience with BlackRock and with the proposed FM Team while they were employed by the previous fund management firm, and were aided by the assessment and recommendation of PLFA and the in-person presentation and materials provided by BlackRock.
The Board concluded it was satisfied with the nature, extent and quality of the investment management services anticipated to be provided to the PL Large-Cap Growth Fund by BlackRock under the BlackRock Fund Management Agreement.
2. Performance
The Trustees considered PLFA’s efforts and process to search for and screen advisory firms that are qualified to manage a large-cap growth fund. The Trustees considered that while certain core members of the FM Team that left the previous fund management firm had joined BlackRock, PLFA nonetheless conducted a broad search process to identify an appropriate replacement Fund Manager. This search process resulted in PLFA’s identification of BlackRock to serve as Fund Manager with regard to the day-to-day investment activities of the PL Large-Cap Growth Fund. The Trustees considered a number of factors in connection with its consideration of this matter and in connection with approval of the related BlackRock Fund Management Agreement, as described below.
The Trustees considered information about the historical performance of the FM Team for similar investment strategies as those proposed for the PL Large-Cap Growth Fund (the “Comparable Performance”). The Trustees considered the Comparable Performance against a pertinent benchmark and against the applicable peer group for the one-, three-, five-, and ten-year periods as of December 31, 2012. The Trustees also
F-21
Table of Contents
PACIFIC LIFE FUNDS
APPROVAL OF INVESTMENT ADVISORY AGREEMENT
AND FUND MANAGEMENT AGREEMENTS (Continued)
(Unaudited)
considered the Comparable Performance against a pertinent benchmark and an applicable peer group for the previous seven calendar years. Additionally, the Trustees considered performance information presented by PLFA for another potential manager of the Fund. The Trustees also considered the need for BlackRock to adhere to the Fund’s general investment mandate in order to function appropriately in the PL Portfolio Optimization Funds.
The Board determined that the performance record of the FM Team was acceptable.
3. Advisory and Fund Management Fees
The Trustees considered information regarding the comparative advisory fees charged under other investment advisory contracts of the Fund Manager with regard to other investment accounts with substantially similar investment strategies as the PL Large-Cap Growth Fund. The Trustees also considered that the proposed sub-advisory fees payable to BlackRock under the Fund Management Agreement contain breakpoints and were lower than the sub-advisory fees which had been paid to the previous fund management firm. The Trustees considered that the advisory fee schedule would remain unchanged from the current fee schedule for the Fund, but that PLFA had agreed to an advisory fee waiver that would reduce the total advisory fees paid by shareholders as long as BlackRock remains the Fund Manager of the PL Large-Cap Growth Fund. In comparing the proposed fees to be paid by the Fund to fees charged by BlackRock for other similarly managed accounts, the Trustees noted differences in the level of services provided by BlackRock on these other accounts as well as differences in the nature or size of the accounts, the costs associated with managing the accounts and regulatory burdens. The Trustees noted that the fee rates were the result of arms’-length negotiations between PLFA and BlackRock, and that the PL Large-Cap Growth Fund’s sub-advisory fees are paid by PLFA and are not paid directly by the PL Large-Cap Growth Fund. Additionally, the Trustees considered that there are certain costs associated with a change in the fund management firm due principally to restructuring of the Fund, and that BlackRock will reimburse the Fund for brokerage commissions paid as a result of trading activity due to the change. Accordingly, the change in Fund Manager is not expected to materially impact the operating expenses paid by shareholders.
The Board concluded that the compensation payable under the BlackRock Fund Management Agreement is fair and reasonable.
4. Costs, Level of Profits and Economies of Scale
The Trustees considered that it was difficult to accurately determine or evaluate the projected profitability of the BlackRock Fund Management Agreement to BlackRock because it managed substantial assets and had multiple business lines, and further, any such assessment would involve assumptions regarding its allocation policies, capital structure, cost of capital, business mix and other factors. Accordingly, the Trustees focused their consideration on other information provided in connection with this matter, given the arms’-length nature of the relationship between PLFA and BlackRock with respect to the negotiation of Fund sub-advisory fees, the fact that such fees are paid by PLFA.
The Board concluded that the PL Large-Cap Growth Fund’s fee structure reflected in the BlackRock Fund Management Agreement is fair and reasonable.
5. Ancillary Benefits
The Trustees received from PLFA and BlackRock information concerning other benefits that may be received by BlackRock and its affiliates as a result of their relationship with the PL Large-Cap Growth Fund, including commissions that may be paid to broker-dealers affiliated with the Fund Manager and the anticipated use of soft-dollars by the Fund Manager. In this regard, the Trustees noted that BlackRock represented that it does not anticipate utilizing an affiliated broker-dealer and that it anticipates using soft dollar credits generated by Fund commissions to pay for research services. The potential benefits that may be derived by BlackRock from its relationship with the PL Large-Cap Growth Fund could include larger assets under management and reputational benefits, which are consistent with those generally derived by sub-advisers to mutual funds. The Trustees considered potential benefits to be derived by BlackRock from its relationship with the PL Large-Cap Growth Fund and that such benefits were consistent with those generally derived by sub-advisers to mutual funds or were otherwise not unusual.
6. Conclusion
Based on their review, including the consideration of each of the factors referred to above, the Board found that: (i) the BlackRock Fund Management Agreement is in the best interests of the PL Large-Cap Growth Fund and its shareholders; and (ii) the compensation payable under the BlackRock Fund Management Agreement is fair and reasonable. No single factor was determinative of the Board’s findings, but rather the Trustees based their determination on the total mix of information available to them.
F-22
Table of Contents
PACIFIC LIFE FUNDS
WHERE TO GO FOR MORE INFORMATION
(Unaudited)
Availability of Quarterly Holdings
The Trust files Form N-Q (complete schedules of fund holdings) with the Securities and Exchange Commission (the “SEC”) for the first and third quarters of each fiscal year not later than 60 days after the close of the applicable quarter end. The Trust’s Form N-Q, (when required) is filed pursuant to applicable regulation and is available after filing (i) on the SEC’s Website at www.sec.gov; (ii) for review and copying at the SEC’s Public Reference Room in Washington, D.C. (Information on the operation of the Public Reference Room may be obtained by calling the SEC at 1-800-SEC-0330); and (iii) on the Trust’s Webpage at www.pacificlife.com/pacificlifefunds.htm. The SEC may charge you a fee for this information.
Availability of Proxy Voting Record
By August 31 of each year, the Trust files information regarding how portfolio managers voted proxies relating to fund securities during the most recent twelve-month period ended June 30. Such information is available after filing on the Trust’s’ Website and on the SEC’s Website noted below.
Information Relating to Investments Held by the Pacific Life Funds
For complete descriptions of the various securities and other instruments held by the Trust and their risks, please see the Trust’s Prospectus and Statement of Additional Information (“SAI”). For a description of bond ratings, please see the Trust’s SAI. The Prospectus and SAI are available as noted below.
Availability of Proxy Voting Policies
A description of the Proxy Voting Policies and Procedures that the Trust uses to determine how to vote proxies relating to fund securities is described in the Trust’s SAI.
How to obtain Information
The Trust’s Prospectus, SAI (including Proxy Voting Policies) and the Portfolio Optimization Funds’ annual and semi-annual reports are available:
| • | On the Trust’s Website at www.pacificlife.com/pacificlifefunds.htm |
| • | On the SEC’s Website at www.sec.gov |
| • | Upon request by calling, without charge, 1-800-722-2333, 7 a.m. through 5 p.m. Pacific Time |
F-23
Table of Contents
Item 2. Code of Ethics.
As of the end of the period covered by this report, the Registrant has adopted a code of ethics that applies to the Registrant’s principal executive officer, principal financial officer, principal accounting officer or controller, or persons performing similar functions. There were no substantive amendments or waivers to the Code of Ethics during the period covered by this report.
A copy of this Code of Ethics is filed as Exhibit 99 to this Form N-CSR.
Item 3. Audit Committee Financial Expert.
The Registrant’s Board has determined that G. Thomas Willis, a member of the Registrant’s Audit Committee, is an “audit committee financial expert” and “independent,” as such terms are defined in this Item. This designation does not increase the designee’s duties, obligations or liability as compared to his duties, obligations and liability as a member of the Audit Committee and of the Board; nor does it reduce the responsibility of the other Audit Committee members. There may be other individuals who, through education or experience, would qualify as “audit committee financial experts” if the Board had designated them as such. Most importantly, the Board believes each member of the Audit Committee contributes significantly to the effective oversight of the Registrant’s financial statements and condition. Mr. Willis is a retired partner of PricewaterhouseCoopers LLP.
Item 4. Principal Accountant Fees and Services.
Audit Fees
| (a) | The aggregate fees billed for the fiscal years ended March 31, 2013 and 2012 for professional services rendered by the principal accountant for the audit of the registrant’s annual financial statements or services that are normally provided by the accountant in connection with statutory and regulatory filings or engagements for those fiscal years are $636,730 and $505,505, respectively. |
Audit-Related Fees
| (b) | There were no aggregate fees billed for the fiscal years ended March 31, 2013 and 2012 for assurance and related services by the principal accountant that are reasonably related to the performance of the audit of the registrant’s financial statements and are not reported under paragraph (a) of this Item. |
Table of Contents
Tax Fees
| (c) | The aggregate fees billed for the fiscal years ended March 31, 2013 and 2012 for professional services rendered by the principal accountant for tax compliance, tax advice, and tax planning are $123,750 and $101,500, respectively. The nature of the services comprising the fees was the review of income tax returns and excise tax. |
All Other Fees
| (d) | There were no aggregate fees billed for the fiscal years ended March 31, 2013 and 2012 for products and services provided by the principal accountant, other than the services reported in paragraphs (a) through (c) of this Item. |
| (e)(1) | The Audit Committee is required to pre-approve audit and non-audit services performed for the Registrant by the independent auditor as outlined below in order to assure that the provision of such services does not impair the auditor’s independence: |
Pre-Approval Requirements for Services to Registrant. Before the Auditor is engaged by the Registrant to render audit related or permissible non-audit services, either:
(i) The Audit Committee shall pre-approve such engagement; or
(ii) Such engagement shall be entered into pursuant to pre-approval policies and procedures established by the Audit committee. Any such policies and procedures must (1) be detailed as to the particular service and (2) not involve any delegation of the Audit Committee’s responsibilities to the Adviser. The Audit Committee may delegate to one or more of its members the authority to grant pre-approvals. The pre-approval policies and procedures shall include the requirement that the decisions of any member to whom authority is delegated under this Section shall be presented to the full Audit Committee at its next scheduled meeting.
(iii) De Minimis Exceptions to Pre-Approval Requirements. Pre-approval for a service provided to the Registrant other than audit, review or attest services is not required if: (1) the aggregate amount of all such non-audit services provided to the Registrant constitutes not more than 5 percent of the total amount of revenues paid by the Registrant to the Auditor during the fiscal year in which the non-audit services are provided; (2) such services were not recognized by the Registrant at the time of the engagement to be non-audit services; and (3) such services are promptly brought to the attention of the Audit Committee and are approved by the Audit Committee or by one or more members of the Audit Committee to whom authority to grant such approvals has been delegated by the Audit Committee.
Pre-Approval of Non-Audit Services Provided to the Adviser and Others. The Audit Committee shall pre-approve any non-audit services proposed to be provided by the Auditor to (i) the Adviser and (ii) any entity in the investment company complex (see note 4), if the nature of the services provided relate directly to the operations or financial reporting of the Registrant.
Application of De Minimis Exception: The De Minimis exceptions set forth above apply to pre-approvals under this Section as well, except that the “total amount of revenues” calculation for this Section’s services is based on the total amount of revenues paid to the Auditor by the Registrant and any other entity that has its services approved under this Section (i.e., the Adviser or any control person).
Table of Contents
| (e)(2) | No services included in (b)-(d) above were approved pursuant to paragraph (c)(7)(i)(C) of Rule 2-01 of Regulation S-X. |
| (f) | Not applicable. |
| (g) | The aggregate fees billed for the years ended March 31, 2013 and 2012 by the Registrant’s principal accountant for non-audit services rendered to the Registrant, its investment adviser, and any entity controlling, controlled by, or under common control with the investment adviser that provides ongoing services to the Registrant were $213,166 and $169,000, respectively. |
| (h) | The Registrant’s Audit Committee has considered whether the provision of non-audit services that were rendered to the Registrant’s investment adviser, and any entity controlling, controlled by, or under common control with the investment adviser that provides ongoing services to the Registrant which were not pre-approved (not requiring pre-approval) is compatible with maintaining the principal accountant’s independence. |
Item 5. Audit Committee of Listed registrants.
Not applicable.
Item 6. Investments.
| (a) | Schedule I. |
| (b) | Not applicable. |
Item 7. Disclosure of Proxy Voting Policies and Procedures for Closed-End Management Investment Companies.
Not applicable.
Item 8. Portfolio Managers of Closed-End Management Investment Companies.
Not applicable.
Item 9. Purchases of Equity Securities by Closed-End Management Investment Company and Affiliated Purchasers.
Not applicable.
Table of Contents
Item 10. Submission of Matters to a Vote of Security Holders.
There have been no material changes to the procedures by which shareholders may recommend nominees to the Registrant’s Board of Directors.
Item 11. Controls and Procedures.
| (a) | The Chief Executive Officer and Treasurer have concluded that Registrant’s disclosure controls and procedures (as defined in Rule 30a-3(c) under the Investment Company Act) and internal controls over financial reporting (as defined in Rule 30a-3(d) under the Investment Company Act) provide reasonable assurances that material information relating to Registrant is made known to them by the appropriate persons, based on their evaluation of these controls and procedures as of a date within 90 days of the filing of this report. |
| (b) | There were no changes in Registrant’s internal control over financial reporting that occurred during the second fiscal quarter of the period covered by this report that have materially affected, or are reasonably likely to materially affect, the Registrant’s internal control over financial reporting. |
Item 12. Exhibits.
| (a)(1) | Code of Ethics, subject to the disclosure of Item 2 hereof- attached hereto as Exhibit 99. | |
| (a)(2) | Separate certifications pursuant to Rule 30a-2(a) under the Investment Company Act of 1940 (17 CFR 270.30a-2(a)) is attached hereto as Exhibit 99 CERT. | |
| (a)(3) | Not applicable. | |
| (b) | Certification pursuant to Rule 30a-2(b) under the Investment Company Act of 1940 (17 CFR 270.30a-2(b)) is attached hereto as Exhibit 99.906 CERT pursuant to Section 906 of the Sarbanes Oxley Act of 2002. | |
| (12.other) | Not applicable | |
Table of Contents
Signatures
Pursuant to the requirements of the Securities Exchange Act of 1934 and the Investment Company Act of 1940, the registrant has duly caused this report to be signed on its behalf by the undersigned, thereunto duly authorized.
| Pacific Life Funds | ||
| By: | /s/ Mary Ann Brown | |
| Mary Ann Brown | ||
| Chief Executive Officer | ||
| Date: | June 5, 2013 | |
Pursuant to the requirements of the Securities Exchange Act of 1934 and the Investment Company Act of 1940, this report has been signed below by the following persons on behalf of the registrant and in the capacities and on the dates indicated.
| By: | /s/ Mary Ann Brown | |
| Mary Ann Brown | ||
| Chief Executive Officer | ||
| Date: | June 5, 2013 | |
| By: | /s/ Brian D. Klemens | |
| Brian D. Klemens | ||
| Treasurer (Principal Financial and Accounting Officer) | ||
| Date: | June 5, 2013 | |