Table of Contents
UNITED STATES
SECURITIES AND EXCHANGE COMMISSION
Washington, D.C. 20549
FORM N-CSR
CERTIFIED SHAREHOLDER REPORT OF REGISTERED MANAGEMENT INVESTMENT COMPANIES
Investment Company Act file number 811-10385
Pacific Funds Series Trust
(Exact name of registrant as specified in charter)
700 Newport Center Drive, P.O. Box 7500
Newport Beach, CA 92660
(Address of principal executive offices) (Zip code)
Audrey L. Cheng
Vice President of Pacific Funds Series Trust
700 Newport Center Drive, P.O. Box 9000
Newport Beach, CA 92660
(Name and address of agent for service)
Copies to:
Anthony H. Zacharski, Esq.
Dechert LLP
90 State House Square
Hartford, CT 06103
Registrant’s telephone number, including area code: 949-219-3202
Date of fiscal year end: March 31
Date of reporting period: March 31, 2018
Form N-CSR is to be used by management investment companies to file reports with the Commission not later than 10 days after the transmission to stockholders of any report that is required to be transmitted to stockholders under Rule 30e-1 under the Investment Company Act of 1940 (17 CFR 270.30e-1). The Commission may use the information provided on Form N-CSR in its regulatory, disclosure review, inspection, and policymaking roles.
A registrant is required to disclose the information specified by Form N-CSR, and the Commission will make this information public. A registrant is not required to respond to the collection of information contained in Form N-CSR unless the Form displays a currently valid Office of Management and Budget (“OMB”) control number. Please direct comments concerning the accuracy of the information collection burden estimate and any suggestions for reducing the burden to Secretary, Securities and Exchange Commission, 100 F Street, NE, Washington, DC 20549. The OMB has reviewed this collection of information under the clearance requirements of 44 U.S.C. § 3507.
Table of Contents
Item 1. Reports to Stockholders.
The following is a copy of the report transmitted to stockholders pursuant to Rule 30e-1 under the Act (17 CFR 270 30e-1).
Table of Contents
March 31, 2018
ANNUAL REPORT

Table of Contents
PACIFIC FUNDS
ANNUAL REPORT
AS OF MARCH 31, 2018
| A-1 | ||||
| A-2 | ||||
| B-1 | ||||
Financial Statements: | ||||
| C-1 | ||||
| C-4 | ||||
| C-7 | ||||
| C-13 | ||||
| D-1 | ||||
| E-1 | ||||
| F-1 | ||||
| F-2 | ||||
| F-5 | ||||
| F-8 | ||||
| F-22 |
Pacific Funds Series Trust, which is a Delaware statutory trust, may be referred to as “Pacific Funds” or the “Trust”.
Table of Contents
PACIFIC FUNDS
We are pleased to share with you the Annual Report dated March 31, 2018 for Pacific Funds Series Trust (“Pacific Funds” or the “Trust”). Pacific Funds is comprised of 40 Funds, 18 of which are included in this report (each individually, a “Fund” and collectively, the “Funds”) and are available for direct investment. Pacific Life Fund Advisors LLC (PLFA), as Adviser to the Funds, manages Pacific FundsSM Portfolio Optimization Conservative, Pacific FundsSM Portfolio Optimization Moderate-Conservative, Pacific FundsSM Portfolio Optimization Moderate, Pacific FundsSM Portfolio Optimization Growth, Pacific FundsSM Portfolio Optimization Aggressive-Growth (together, the “Portfolio Optimization Funds”), and Pacific FundsSM Diversified Alternatives. PLFA also does business under the name “Pacific Asset Management” and manages Pacific FundsSM Short Duration Income, Pacific FundsSM Core Income, Pacific FundsSM Strategic Income, Pacific FundsSM Floating Rate Income, Pacific FundsSM Limited Duration High Income, and Pacific FundsSM High Income under that name.
Each of the Portfolio Optimization Funds and Pacific Funds Diversified Alternatives is an asset allocation “Fund of Funds” that invests in Class P shares of certain other funds of the Trust (the “PF Underlying Funds”). PLFA supervises the management of those PF Underlying Funds which are only available for investment by the Portfolio Optimization Funds and Pacific Funds Diversified Alternatives and are included in a separate PF Underlying Funds Annual Report. Please see “Where to Go for More Information” for instructions on how to obtain the PF Underlying Funds’ Annual Report. The Portfolio Optimization Funds and Pacific Funds Diversified Alternatives also invest in Class P shares of Pacific FundsSM Core Income, Pacific FundsSM High Income, Pacific FundsSM Floating Rate Income and Pacific FundsSM Small-Cap Growth.
The Adviser, Pacific Asset Management and Rothschild Asset Management Inc. (together, the “Managers”) and their Funds as of March 31, 2018 are listed below:
| Manager | Fund | Page Number | ||
| Pacific Life Fund Advisors LLC (PLFA) | Pacific FundsSM Portfolio Optimization Conservative | A-4 | ||
Pacific FundsSM Portfolio Optimization Moderate-Conservative | A-6 | |||
Pacific FundsSM Portfolio Optimization Moderate | A-8 | |||
| Pacific FundsSM Portfolio Optimization Growth | A-10 | |||
| Pacific FundsSM Portfolio Optimization Aggressive-Growth | A-12 | |||
| Pacific FundsSM Diversified Alternatives | A-13 | |||
| Pacific Asset Management | Pacific FundsSM Short Duration Income | A-14 | ||
| Pacific FundsSM Core Income | A-15 | |||
Pacific FundsSM Strategic Income | A-16 | |||
| Pacific FundsSM Floating Rate Income | A-17 | |||
| Pacific FundsSM Limited Duration High Income | A-18 | |||
| Pacific FundsSM High Income | A-19 | |||
| Rothschild Asset Management Inc. (Rothschild) | Pacific FundsSM Large-Cap | A-20 | ||
Pacific FundsSM Large-Cap Value | A-21 | |||
Pacific FundsSM Small/Mid-Cap | A-22 | |||
Pacific FundsSM Small-Cap | A-23 | |||
| Pacific FundsSM Small-Cap Value | A-24 | |||
| Pacific FundsSM Small-Cap Growth | A-26 |
We appreciate your confidence in the Trust and look forward to serving your financial needs in the years to come.
Sincerely,
 |  | |
| James T. Morris | Adrian Griggs | |
| Chairman of the Board | Chief Executive Officer | |
| Pacific Funds Series Trust | Pacific Funds Series Trust |
A-1
Table of Contents
PACIFIC FUNDS PERFORMANCE DISCUSSION
This Annual Report is provided for the general information of investors with beneficial interests in the Trust. This report is not authorized for distribution to prospective investors unless preceded or accompanied by a current Trust prospectus, as supplemented, which contains information about the Trust and each of its Funds, including their investment objectives, risks, charges and expenses. You should read the prospectus carefully before investing. There is no assurance that a Fund will achieve its investment objective. Each Fund is subject to market risk. The net asset value (NAV) of a Fund changes as the value of its assets go up or down. The value of a Fund’s shares will fluctuate, and when redeemed may be worth more or less than their original cost. The total return for each Fund includes reinvestment of all dividends and capital gain distributions, if any, and does not include deductions of any applicable sales charges. Past performance is not predictive of future performance.
This report shows you the performance of the Funds compared to benchmark indices. Index performance is provided for illustrative and comparative purposes only and does not predict or depict the performance of the Funds. Indices are unmanaged, do not incur transaction costs, do not include fees and expenses, and cannot be purchased directly by investors. Index returns include reinvested dividends.
The composite benchmarks for the Portfolio Optimization Funds are composed of up to four broad-based indices. The percentage amounts of each broad-based index within each composite benchmark are based on each Fund’s target asset class allocations in effect during the reporting period. The percentages attributed to a broad-based index within a composite benchmark will change if a Fund’s target asset class allocations change.
PLFA has written the general market conditions commentary, which expresses PLFA’s opinions and views on how the market generally performed for the Trust’s fiscal year ended March 31, 2018. PLFA also does business under the name “Pacific Asset Management” and manages the Pacific Funds Short Duration Income, Pacific Funds Core Income, Pacific Funds Strategic Income, Pacific Funds Floating Rate Income, Pacific Funds Limited Duration High Income, and Pacific Funds High Income under that name.
All views are subject to change at any time based upon market or other conditions, and the Trust, its Adviser, Pacific Asset Management and Rothschild Asset Management Inc. disclaim any responsibility to update such views. Any references to “we”, “I”, or “ours” are references to the Managers. Any sectors referenced are provided by the applicable Manager and could be different from the sectors listed in the Schedules of Investments if obtained from another source. The Managers may include statements that constitute “forward-looking statements” under the United States (U.S.) securities laws. Forward-looking statements include information concerning possible or assumed future results of the Trust’s investment operations, asset levels, earnings, expenses, industry or market conditions, regulatory developments and other aspects of the Trust’s operations or general economic conditions. In addition, when used in this report, predictive verbs such as “believes”, “expects”, “anticipates”, “intends”, “plans”, “estimates”, “projects” and future or conditional verbs such as “will”, “may”, “could”, “should”, and “would”, or any other statement that necessarily depends on future events, are intended to identify forward- looking statements. Forward-looking statements are not guarantees of performance or economic results. They involve risks, uncertainties and assumptions. Although such statements are based on expectations that the Managers believe to be reasonable, actual results may differ materially from expectations. Investors must not rely on any forward-looking statements.
In connection with any forward-looking statements and any investment in the Trust, investors should carefully consider the investment objectives, policies and risks described in the Trust’s current prospectus, as supplemented, and Statement of Additional Information, as supplemented, as filed with the U.S. Securities and Exchange Commission (SEC), which may be obtained from the SEC’s website at www.sec.gov.
Market Conditions (for the year ended March 31, 2018)
Executive Summary
Although volatility spiked in the first quarter of 2018, positive market conditions and economic optimism supported risk assets throughout the 12-month reporting period. Globally, economic growth continued apace and concerns eased over potential geopolitical events, providing a tailwind for global equities.
Over the reporting period, the S&P 500 Index returned 13.99%. Although the Federal Reserve (Fed) maintained its gradual monetary tightening trajectory, many central banks around the globe continued providing support through quantitative easing programs. Economic activity strengthened across much of Europe and Japan, although uncertainty on trade and tariffs curtailed some of the optimism. Additionally, the tide of the populist movement that drew concerns over the prior period ebbed throughout Europe, which further eased investor anxieties over the reporting period.
Crude oil prices, which plummeted in the prior period, stabilized as Organization of Petroleum Exporting Countries (OPEC) and Russia agreed to cut production and heightened tensions in the Middle East raised concerns of disruptions to the global oil supply. After crude oil (West Texas Intermediate) price hit the low-$40s, it finished the reporting period above $60 per barrel.
In the U.S., investors welcomed the stimulative tax reform that lowered the corporate tax rate from 35% to 21%. Additionally, the Trump administration has been a proponent of deregulation, which would be beneficial for certain sectors such as financials and energy. However, Trump’s rhetoric on trade and potential tariffs caused the market to swing wildly towards the end of the reporting period.
Fixed Income
The U.S. 10-year Treasury yield climbed to 2.9% toward the end of the reporting period as inflation remained tame throughout the reporting period. While the 10-year yield had trended lower during the summer, it crept higher once the Fed announced that it would begin to unwind the $4.5 trillion balance sheet it had amassed since the Financial Crisis. The broad bond market (as defined by the Bloomberg Barclays U.S. Aggregate Bond Index) returned 1.20% for the reporting period.
Riskier bond asset classes delivered solid returns over the reporting period. High yield bonds, especially those of lower credit quality, outperformed higher-rated investment-grade bonds. Credit spreads, which move in the opposite direction to prices, trended lower throughout the reporting period. This contraction coincided with steadily improving energy prices since energy producers represent a
A-2
See benchmark definitions on A-27 and A-28
Table of Contents
PACIFIC FUNDS PERFORMANCE DISCUSSION (Continued)
sizeable portion of the high yield market. Improving commodity prices also provided a tailwind for emerging market debt, given that much of it is issued by commodity exporters.
Domestic Equity
Domestic equities edged out solid gains despite experiencing some volatility throughout the reporting period. The S&P 500 Index gained 13.99% over the reporting period. Reversing the trend from the prior reporting period, growth stocks finished this reporting period significantly higher than their value counterparts. Compared to value, growth styles tend to have a sizeable overweight to the information technology sector. The information technology sector of the S&P 500 Index was the strongest performing one over the reporting period.
International Equity
International equities ended the year with solid gains as the MSCI Europe, Australasia and Far East (EAFE) Index (Net) returned 14.80% over the reporting period. Japan and the U.K. represent a large portion of the MSCI EAFE Index (Net), which contributed to performance. In general, Japan and European markets delivered solid returns as their respective central banks remained very accommodative.
Emerging market equities also performed well as the MSCI Emerging Markets Index (Net) returned 24.93% over the reporting period. Over the reporting period, emerging market equities were the best performers amongst the broad equity regions. Asian markets, which represent a large portion of the index, provided much of the boost as the Chinese economy continued to show resilience and the One Belt One Road initiative gained traction. This initiative is China’s grand plan to build a global infrastructure network.
Concluding Remarks
While volatility has returned to the markets, the underlying economic trend in the U.S. and abroad has remained firmly positive. We read the return of volatility as indicating that the euphoria, which typically precedes a major business cycle downturn, has yet to materialize and remains a dormant risk. We anticipate that earnings will drive equity markets higher as firms benefit from the near-term effects of the tax overhaul, while strength in manufacturing and consumer spending extend the current expansion. The most concerning risks, in our view, remain the potential for an inflationary surprise that forces the Fed to hike interest rates more aggressively and the current war of words between the U.S. and China turning into an outright trade war.
Abroad, central banks remain more accommodative, which makes overseas equities relatively more attractive to us, especially when combined with our expectation for continued U.S. dollar weakness. We believe that emerging market equities should also continue to be a bright spot if global trade tensions do not erupt into all-out trade conflict. Starting from cheaper valuations relative to developed equities globally, emerging market equities have also shown less sensitivity to recent volatility that is indicative of the nascent deeper ties between emerging economies that have traditionally relied more on exports to developed countries.
For fixed income, we expect continued pressure from rising rates and less diversification benefits. Previously when volatility surged, the market took it as evidence that the Fed would continue with its monetary easing policy, which then led to lower yields and higher values for fixed-income. Given current economic and labor market strength and the potential for inflation, we do not see volatility carrying the same implication for Fed policy. We see fixed income providing less diversification to equities, especially during a period where the Fed is expected to raise interest rates. By contrast, in an overall portfolio, we see well-constructed allocations to alternatives as helpful diversifiers that need not face the same headwinds of Fed policy. Also, we see the return to more historically normal volatility levels as additional support for alternatives in diversifying against equity drawdowns.
Performance of the Portfolio Optimization Funds and Pacific Funds Diversified Alternatives
The performance of the Portfolio Optimization Funds and Pacific Funds Diversified Alternatives are composites of the performance of each of the PF Underlying Funds in which each invests (which may include bonds, domestic and/or international equities). The Portfolio Optimization Funds are compared to two broad-based indices; however, to further assist in performance comparisons, composite benchmarks were constructed for the Portfolio Optimization Funds. Each composite benchmark is comprised of up to four broad-based indices shown below. The composite benchmarks were constructed with allocations to each asset class that correspond to the target allocations for Portfolio Optimization Funds. However, the actual allocations of any Portfolio Optimization Fund will naturally vary from these targets as a result of market performance over time. Pacific Funds Diversified Alternatives does not have a composite benchmark. The one-year performance for these broad-based indices is shown in the following table.
Broad-Based Indices | One Year Performance (as of 3-31-18) | |||
S&P 500 Index (representing U.S. Stocks) | 13.99% | |||
Morgan Stanley Capital International (MSCI) EAFE Index (Net) (International Stocks) | 14.80% | |||
Bloomberg Barclays U.S. Aggregate Bond Index (Fixed Income) | 1.20% | |||
ICE BofA Merrill Lynch U.S. 3-Month T-Bill Index (Cash) | 1.11% | |||
| See benchmark definitions on A-27 and A-28 |
A-3
Table of Contents
PACIFIC FUNDS PERFORMANCE DISCUSSION (Continued)
Pacific Funds Portfolio Optimization Conservative (managed by Pacific Life Fund Advisors LLC)
Q. How did the Fund perform for the year ended March 31, 2018?
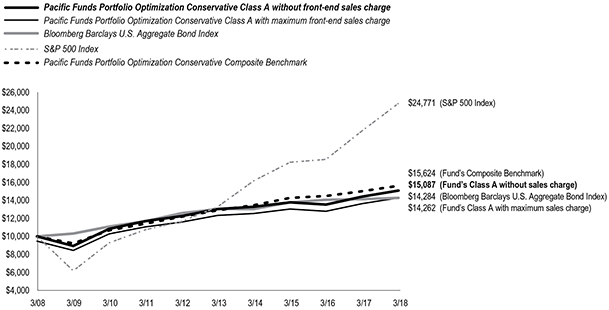
A. For the year ended March 31, 2018, Pacific Funds Portfolio Optimization Conservative’s Class A (without sales charge) returned 4.60%, compared to a 1.20% return for the Bloomberg Barclays U.S. Aggregate Bond Index, a 13.99% return for the S&P 500 Index and a 4.00% return for the Pacific Funds Portfolio Optimization Conservative Composite Benchmark.
The following graph compares the performance of a hypothetical $10,000 investment in Class A shares of the Fund to its benchmarks for the ten-year period ended March 31, 2018. For comparison purposes, the performance of all classes for the periods ended March 31, 2018 are also shown in the table below. Performance data for Class B, C, R and Advisor Class shares will vary due to differences in fees and sales charges. The Fund’s performance reflects reinvestments of all dividends and capital gains distributions, if any.
Performance Comparison
Average Annual Total Returns for the Periods Ended March 31, 2018
| 1 Year | 5 Years | 10 Years | ||||||||||
Fund’s Class A without sales charge | 4.60% | 2.95% | 4.20% | |||||||||
Fund’s Class A with maximum sales charge | (1.16% | ) | 1.80% | 3.61% | ||||||||
Fund’s Class B without sales charge | 3.78% | 2.20% | 3.61% | |||||||||
Fund’s Class B with maximum sales charge | (1.22% | ) | 1.84% | 3.61% | ||||||||
Fund’s Class C without sales charge | 3.89% | 2.22% | 3.46% | |||||||||
Fund’s Class C with maximum sales charge | 2.89% | 2.22% | 3.46% | |||||||||
Fund’s Class R without sales charge | 4.37% | 2.70% | 3.95% | |||||||||
Bloomberg Barclays U.S. Aggregate Bond Index | 1.20% | 1.82% | 3.63% | |||||||||
S&P 500 Index | 13.99% | 13.31% | 9.49% | |||||||||
Pacific Funds Portfolio Optimization Conservative Composite Benchmark | 4.00% | 3.93% | 4.56% | |||||||||
Average Annual Total Returns for the Periods Ended March 31, 2018
| 1 Year | 5 Years | Since Inception (12/31/12) | ||||||||||
Fund’s Advisor Class without sales charge | 4.79% | 3.16% | 3.41% | |||||||||
Bloomberg Barclays U.S. Aggregate Bond Index | 1.20% | 1.82% | 1.72% | |||||||||
S&P 500 Index | 13.99% | 13.31% | 14.83% | |||||||||
Pacific Funds Portfolio Optimization Conservative Composite Benchmark | 4.00% | 3.93% | 4.12% | |||||||||
Performance data shown represents past performance. Investment return and principal value will fluctuate so that shares of the Fund when redeemed may be worth more or less than their original cost. Past performance is not predictive of future performance. The table does not reflect the deduction of taxes that a shareholder would pay on Fund distributions or redemption of Fund shares. |
| See benchmark definitions on A-27 and A-28 |
A-4
Table of Contents
PACIFIC FUNDS PERFORMANCE DISCUSSION (Continued)
Q. Discuss both positive and negative factors that materially affected the Fund’s performance during the year, including relevant market conditions, investment strategies and techniques, and particular sectors or securities.
A. For the reporting period, the Fund’s Class A outperformed the Pacific Funds Portfolio Optimization Conservative Composite Benchmark. The Pacific Funds Portfolio Optimization Conservative Composite Benchmark is comprised of the Bloomberg Barclays U.S. Aggregate Bond, S&P 500, ICE BofA Merrill Lynch U.S. 3-Month T-Bill, and MSCI EAFE (Net) Indices in a weighting that is fixed and specific to the Fund. The Fund was primarily invested in various fixed income strategies, with a smaller allocation to equity and alternative strategies, during the reporting period. Fixed income investments included allocations to intermediate-term bond, short duration bond, inflation-indexed bond, emerging markets bond, and floating rate strategies. The equity segment consisted mainly of allocations to domestic and foreign large-capitalization strategies. The Fund’s alternatives allocation consisted of investments in a global absolute return strategy, a currency strategy, and an equity long/short strategy.
Among the fixed income lineup, emerging market bonds were solid contributors to performance over the reporting period as the asset class fared relatively well and the manager outperformed its benchmark. Allocation to bank loans and high yield bonds also helped performance as credit spreads tightened over the reporting period. The PF Managed Bond Fund, which represented the largest weight in the Fund, outperformed the Bloomberg Barclays U.S. Aggregate Bond Index and likewise contributed to performance over the reporting period. On the other hand, exposure to short-term bonds detracted from performance.
As for domestic equities, exposure to value stocks was a headwind over the reporting period as growth sectors such as information technology surged past value sectors. Although exposure to value stocks, which include large-cap value, mid-cap value and small-cap value, detracted from performance, the PF Comstock Fund and the PF Mid-Cap Value Fund outperformed their respective benchmarks, and therefore contributed to performance. The PF Real Estate Fund struggled over the period as rising interest rates were a headwind, and it was the only underlying fund within domestic equities to have negative returns over the reporting period. Additionally, the PF Main Street Core Fund and PF Large-Cap Value Fund underperformed their respective benchmarks and detracted from performance.
International equities also added to performance over the reporting period. An overweight to emerging markets had a positive impact on performance, and the PF Emerging Markets Fund outpaced its benchmark, the MSCI Emerging Markets Index (Net), which further added to the contribution from the asset class.
Alternatives as a group also contributed positively to performance over the reporting period. The PF Equity Long/Short Fund continued to deliver strong results and was the top performer among the alternatives group. The PF Global Absolute Return Fund also had positive gains, while the PF Currency Strategies Fund fell over the reporting period.
| See benchmark definitions on A-27 and A-28 |
A-5
Table of Contents
PACIFIC FUNDS PERFORMANCE DISCUSSION (Continued)
Pacific Funds Portfolio Optimization Moderate-Conservative (managed by Pacific Life Fund Advisors LLC)
Q. How did the Fund perform for the year ended March 31, 2018?
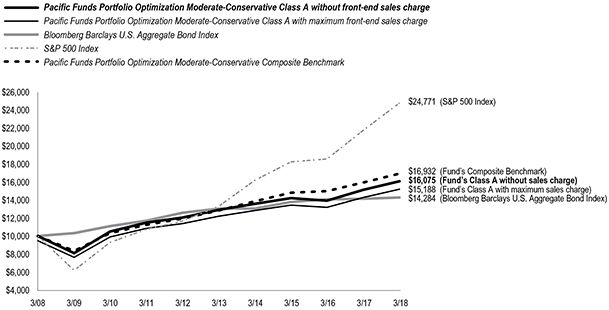
A. For the year ended March 31, 2018, Pacific Funds Portfolio Optimization Moderate-Conservative’s Class A (without sales charge) returned 6.36%, compared to a 1.20% return for the Bloomberg Barclays U.S. Aggregate Bond Index, a 13.99% return for the S&P 500 Index and a 6.32% return for the Pacific Funds Portfolio Optimization Moderate-Conservative Composite Benchmark.
The following graph compares the performance of a hypothetical $10,000 investment in Class A shares of the Fund to its benchmarks for the ten-year period ended March 31, 2018. For comparison purposes, the performance of all classes for the periods ended March 31, 2018 are also shown in the table below. Performance data for Class B, C, R and Advisor Class shares will vary due to differences in fees and sales charges. The Fund’s performance reflects reinvestments of all dividends and capital gains distributions, if any.
Performance Comparison
Average Annual Total Returns for the Periods Ended March 31, 2018
| 1 Year | 5 Years | 10 Years | ||||||||||
Fund’s Class A without sales charge | 6.36% | 4.49% | 4.86% | |||||||||
Fund’s Class A with maximum sales charge | 0.51% | 3.32% | 4.27% | |||||||||
Fund’s Class B without sales charge | 5.58% | 3.76% | 4.27% | |||||||||
Fund’s Class B with maximum sales charge | 0.58% | 3.41% | 4.27% | |||||||||
Fund’s Class C without sales charge | 5.60% | 3.75% | 4.12% | |||||||||
Fund’s Class C with maximum sales charge | 4.60% | 3.75% | 4.12% | |||||||||
Fund’s Class R without sales charge | 6.11% | 4.25% | 4.61% | |||||||||
Bloomberg Barclays U.S. Aggregate Bond Index | 1.20% | 1.82% | 3.63% | |||||||||
S&P 500 Index | 13.99% | 13.31% | 9.49% | |||||||||
Pacific Funds Portfolio Optimization Moderate-Conservative Composite Benchmark | 6.32% | 5.70% | 5.41% | |||||||||
Average Annual Total Returns for the Periods Ended March 31, 2018
| 1 Year | 5 Years | Since Inception (12/31/12) | ||||||||||
Fund’s Advisor Class without sales charge | 6.62% | 4.74% | 5.22% | |||||||||
Bloomberg Barclays U.S. Aggregate Bond Index | 1.20% | 1.82% | 1.72% | |||||||||
S&P 500 Index | 13.99% | 13.31% | 14.83% | |||||||||
Pacific Funds Portfolio Optimization Moderate-Conservative Composite Benchmark | 6.32% | 5.70% | 6.13% | |||||||||
Performance data shown represents past performance. Investment return and principal value will fluctuate so that shares of the Fund when redeemed may be worth more or less than their original cost. Past performance is not predictive of future performance. The table does not reflect the deduction of taxes that a shareholder would pay on Fund distributions or redemption of Fund shares. |
Q. Discuss both positive and negative factors that materially affected the Fund’s performance during the year, including relevant market conditions, investment strategies and techniques, and particular sectors or securities.
A. For the reporting period, the Fund’s Class A outperformed the Pacific Funds Portfolio Optimization Moderate-Conservative Composite Benchmark. The Pacific Funds Portfolio Optimization Moderate-Conservative Composite Benchmark is comprised of the Bloomberg Barclays U.S. Aggregate Bond, S&P 500, MSCI EAFE (Net), and ICE BofA Merrill Lynch U.S. 3-Month T-Bill Indices in a weighting that is fixed and specific to the Fund. The Fund had a diversified allocation mix that was modestly tilted to fixed income during the reporting period. Fixed income investments included intermediate-term bond strategies as well as short duration bond, inflation-indexed bond, high yield bond, emerging markets bond, and floating rate strategies. The Fund’s equity exposure was diversified across style (growth/value), market capitalization and region
| See benchmark definitions on A-27 and A-28 |
A-6
Table of Contents
PACIFIC FUNDS PERFORMANCE DISCUSSION (Continued)
(including an allocation to foreign small-capitalization and emerging markets strategies). The Fund’s alternatives allocation consisted of investments in a global absolute return strategy, a currency strategy, and an equity long/short strategy.
Among the fixed income lineup, emerging market bonds were solid contributors to performance over the reporting period as the asset class fared relatively well and the manager outperformed its benchmark. Allocation to bank loans and high yield bonds also helped performance as credit spreads tightened over the reporting period. The PF Managed Bond Fund, which represents the largest weight in the Fund, outperformed the Bloomberg Barclays U.S. Aggregate Bond Index and likewise contributed to performance over the reporting period. On the other hand, exposure to short-term bonds detracted from performance.
As for domestic equities, exposure to value stocks was a headwind over the reporting period as growth sectors such as information technology surged past value sectors. Although exposure to value stocks, which include large-cap value, mid-cap value and small-cap value, detracted from performance, the PF Comstock Fund and the PF Mid-Cap Value Fund outperformed their respective benchmarks, and therefore contributed to performance. The PF Real Estate Fund struggled over the period as rising interest rates were a headwind, and it was the only underlying fund within domestic equities to have negative returns over the reporting period. Additionally, the PF Main Street Core Fund and PF Large-Cap Value Fund underperformed their respective benchmarks and detracted from performance.
International equities added to performance over the reporting period. An overweight to emerging markets had a positive impact on performance, and the PF Emerging Markets Fund outpaced its benchmark, the MSCI Emerging Markets Index (Net), which further added to the contribution from the asset class. Exposure to international small-capitalization stocks was also additive to performance as they benefited from Europe’s accelerating economic growth.
Alternatives as a group also contributed positively to performance over the reporting period. The PF Equity Long/Short Fund continued to deliver strong results and was the top performer among the alternatives group. The PF Global Absolute Return Fund also had positive gains, while the PF Currency Strategies Fund fell over the reporting period.
| See benchmark definitions on A-27 and A-28 |
A-7
Table of Contents
PACIFIC FUNDS PERFORMANCE DISCUSSION (Continued)
Pacific Funds Portfolio Optimization Moderate (managed by Pacific Life Fund Advisors LLC)
Q. How did the Fund perform for the year ended March 31, 2018?
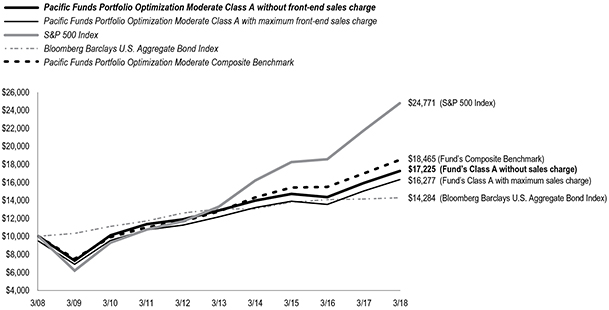
A. For the year ended March 31, 2018, Pacific Funds Portfolio Optimization Moderate’s Class A (without sales charge) returned 8.36%, compared to a 13.99% return for the S&P 500 Index, a 1.20% return for the Bloomberg Barclays U.S. Aggregate Bond Index and a 8.93% return for the Pacific Funds Portfolio Optimization Moderate Composite Benchmark.
The following graph compares the performance of a hypothetical $10,000 investment in Class A shares of the Fund to its benchmarks for the ten-year period ended March 31, 2018. For comparison purposes, the performance of all classes for the periods ended March 31, 2018 are also shown in the table below. Performance data for Class B, C, R and Advisor Class shares will vary due to differences in fees and sales charges. The Fund’s performance reflects reinvestments of all dividends and capital gains distributions, if any.
Performance Comparison
Average Annual Total Returns for the Periods Ended March 31, 2018
| 1 Year | 5 Years | 10 Years | ||||||||||
Fund’s Class A without sales charge | 8.36% | 6.02% | 5.59% | |||||||||
Fund’s Class A with maximum sales charge | 2.37% | 4.82% | 4.99% | |||||||||
Fund’s Class B without sales charge | 7.53% | 5.27% | 4.99% | |||||||||
Fund’s Class B with maximum sales charge | 2.53% | 4.94% | 4.99% | |||||||||
Fund’s Class C without sales charge | 7.47% | 5.26% | 4.84% | |||||||||
Fund’s Class C with maximum sales charge | 6.47% | 5.26% | 4.84% | |||||||||
Fund’s Class R without sales charge | 8.05% | 5.76% | 5.33% | |||||||||
S&P 500 Index | 13.99% | 13.31% | 9.49% | |||||||||
Bloomberg Barclays U.S. Aggregate Bond Index | 1.20% | 1.82% | 3.63% | |||||||||
Pacific Funds Portfolio Optimization Moderate Composite Benchmark | 8.93% | 7.70% | 6.33% | |||||||||
Average Annual Total Returns for the Periods Ended March 31, 2018
| 1 Year | 5 Years | Since Inception (12/31/12) | ||||||||||
Fund’s Advisor Class without sales charge | 8.54% | 6.27% | 7.00% | |||||||||
S&P 500 Index | 13.99% | 13.31% | 14.83% | |||||||||
Bloomberg Barclays U.S. Aggregate Bond Index | 1.20% | 1.82% | 1.72% | |||||||||
Pacific Funds Portfolio Optimization Moderate Composite Benchmark | 8.93% | 7.70% | 8.42% | |||||||||
Performance data shown represents past performance. Investment return and principal value will fluctuate so that shares of the Fund when redeemed may be worth more or less than their original cost. Past performance is not predictive of future performance. The table does not reflect the deduction of taxes that a shareholder would pay on Fund distributions or redemption of Fund shares. |
Q. Discuss both positive and negative factors that materially affected the Fund’s performance during the year, including relevant market conditions, investment strategies and techniques, and particular sectors or securities.
A. For the reporting period, the Fund’s Class A underperformed the Pacific Funds Portfolio Optimization Moderate Composite Benchmark. The Pacific Funds Portfolio Optimization Moderate Composite Benchmark is comprised of the S&P 500, Bloomberg Barclays U.S. Aggregate Bond, MSCI EAFE (Net), and ICE BofA Merrill Lynch U.S. 3-Month T-Bill Indices in a weighting that is fixed and specific to the Fund. The Fund allocated to a mix of equity and fixed income strategies over the reporting period, with a larger allocation toward equity investments. The equity exposure was diversified across style (growth/value), market capitalization and region (including allocations to foreign small-capitalization and emerging markets stocks). The Fund also maintained exposure to select market sectors such as publicly-traded real estate investment trusts (REITs). Fixed
| See benchmark definitions on A-27 and A-28 |
A-8
Table of Contents
PACIFIC FUNDS PERFORMANCE DISCUSSION (Continued)
income investments included intermediate-term bond, short duration bond, inflation-indexed bond, emerging markets bond, and floating rate loan strategies. The Fund’s alternatives allocation consisted of investments in a global absolute return strategy, a currency strategy, and an equity long/short strategy.
Within domestic equities, exposure to value stocks was a headwind over the reporting period as growth sectors such as information technology surged past value sectors. Although exposure to value stocks, which include large-cap value, mid-cap value and small-cap value, detracted from performance, PF Comstock and PF Mid-Cap Value outperformed their respective benchmarks, and therefore contributed to performance. The PF Real Estate Fund struggled over the period as rising interest rates were a headwind, and it was the only underlying fund within domestic equities to have negative returns over the reporting period. Additionally, the PF Main Street Core Fund and PF Large-Cap Value Fund underperformed their respective benchmarks and detracted from performance.
International equities added to performance over the reporting period. An overweight to emerging markets had a positive impact on performance, and the PF Emerging Markets Fund outpaced its benchmark, the MSCI Emerging Markets Index (Net), which further added to the contribution from the asset class. Exposure to international small-capitalization stocks was also additive to performance as they benefited from Europe’s accelerating economic growth.
Among the fixed income lineup, emerging market bonds were solid contributors to performance over the reporting period as the asset class fared relatively well and the manager outperformed its benchmark. Allocation to bank loans also helped performance as their yields adjusted higher with the Fed hiking short-term interest rates. The PF Managed Bond Fund, which represents the largest weight in the Fund, outperformed the Bloomberg Barclays U.S. Aggregate Bond Index and likewise contributed to performance over the reporting period. On the other hand, exposure to short-term bonds detracted from performance.
Alternatives as a group also contributed positively to performance over the reporting period. The PF Equity Long/Short Fund continued to deliver strong results and was the top performer among the alternatives group. The PF Global Absolute Return Fund also had positive gains, while the PF Currency Strategies Fund fell over the reporting period.
| See benchmark definitions on A-27 and A-28 |
A-9
Table of Contents
PACIFIC FUNDS PERFORMANCE DISCUSSION (Continued)
Pacific Funds Portfolio Optimization Growth (managed by Pacific Life Fund Advisors LLC)
Q. How did the Fund perform for the year ended March 31, 2018?
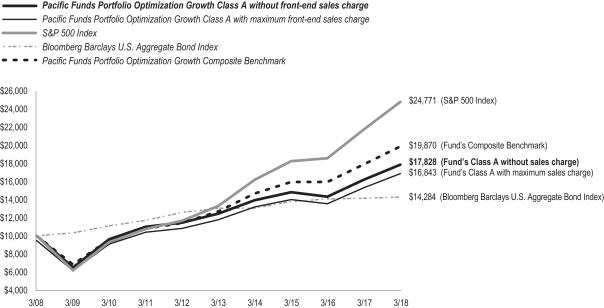
A. For the year ended March 31, 2018, Pacific Funds Portfolio Optimization Growth’s Class A (without sales charge) returned 10.10%, compared to a 13.99% return for the S&P 500 Index, a 1.20% return for the Bloomberg Barclays U.S. Aggregate Bond Index and a 11.16% return for the Pacific Funds Portfolio Optimization Growth Composite Benchmark.
The following graph compares the performance of a hypothetical $10,000 investment in Class A shares of the Fund to its benchmarks for the ten-year period ended March 31, 2018. For comparison purposes, the performance of all classes for the periods ended March 31, 2018 are also shown in the table below. Performance data for Class B, C, R and Advisor Class shares will vary due to differences in fees and sales charges. The Fund’s performance reflects reinvestments of all dividends and capital gains distributions, if any.
Performance Comparison
Average Annual Total Returns for the Periods Ended March 31, 2018
| 1 Year | 5 Years | 10 Years | ||||||||||
Fund’s Class A without sales charge | 10.10% | 7.47% | 5.95% | |||||||||
Fund’s Class A with maximum sales charge | 4.05% | 6.25% | 5.35% | |||||||||
Fund’s Class B without sales charge | 9.33% | 6.70% | 5.35% | |||||||||
Fund’s Class B with maximum sales charge | 4.33% | 6.39% | 5.35% | |||||||||
Fund’s Class C without sales charge | 9.29% | 6.71% | 5.21% | |||||||||
Fund’s Class C with maximum sales charge | 8.29% | 6.71% | 5.21% | |||||||||
Fund’s Class R without sales charge | 9.86% | 7.21% | 5.70% | |||||||||
S&P 500 Index | 13.99% | 13.31% | 9.49% | |||||||||
Bloomberg Barclays U.S. Aggregate Bond Index | 1.20% | 1.82% | 3.63% | |||||||||
Pacific Funds Portfolio Optimization Growth Composite Benchmark | 11.16% | 9.41% | 7.11% | |||||||||
Average Annual Total Returns for the Periods Ended March 31, 2018
| 1 Year | 5 Years | Since Inception (12/31/12) | ||||||||||
Fund’s Advisor Class without sales charge | 10.42% | 7.73% | 8.68% | |||||||||
S&P 500 Index | 13.99% | 13.31% | 14.83% | |||||||||
Bloomberg Barclays U.S. Aggregate Bond Index | 1.20% | 1.82% | 1.72% | |||||||||
Pacific Funds Portfolio Optimization Growth Composite Benchmark | 11.16% | 9.41% | 10.37% | |||||||||
Performance data shown represents past performance. Investment return and principal value will fluctuate so that shares of the Fund when redeemed may be worth more or less than their original cost. Past performance is not predictive of future performance. The table does not reflect the deduction of taxes that a shareholder would pay on Fund distributions or redemption of Fund shares. |
Q. Discuss both positive and negative factors that materially affected the Fund’s performance during the year, including relevant market conditions, investment strategies and techniques, and particular sectors or securities.
A. For the reporting period, the Fund’s Class A underperformed the Pacific Funds Portfolio Optimization Growth Composite Benchmark. The Pacific Funds Portfolio Optimization Growth Composite Benchmark is comprised of the S&P 500, Bloomberg Barclays U.S. Aggregate Bond, and MSCI EAFE (Net) Indices in a weighting that is fixed and specific to the Fund. The Fund had a diversified allocation mix that was tilted to equity. The equity exposure was diversified across style (growth/value), market capitalization and region (including allocations to foreign small capitalization and emerging markets stocks). The Fund also maintained exposure to select market sectors such as publicly-traded REITs. Fixed income investments included intermediate-term bond strategies as well as specific strategies such as short duration bond, inflation-indexed bond and emerging markets bond strategies. The Fund’s alternatives allocation consisted of investments in a global absolute return strategy, a currency strategy, and an equity long/short strategy.
| See benchmark definitions on A-27 and A-28 |
A-10
Table of Contents
PACIFIC FUNDS PERFORMANCE DISCUSSION (Continued)
Within domestic equities, exposure to value stocks was a headwind over the reporting period as growth sectors such as information technology surged past value sectors. Although exposure to value stocks, which include large-cap value, mid-cap value and small-cap value, detracted from performance, the PF Comstock Fund and the PF Mid-Cap Value Fund outperformed their respective benchmarks, and therefore contributed to performance. The PF Real Estate Fund struggled over the period as rising interest rates were a headwind, and it was the only underlying fund within domestic equities to have negative returns over the reporting period. Additionally, the PF Main Street Core Fund and PF Large-Cap Value Fund underperformed their respective benchmarks and detracted from performance.
International equities added to performance over the reporting period. An overweight to emerging markets had a positive impact on performance, and the PF Emerging Markets Fund outpaced its benchmark, the MSCI Emerging Markets Index (Net), which further added to the contribution from the asset class. Exposure to international small-capitalization stocks was also additive to performance as they benefited from Europe’s accelerating economic growth.
Among the fixed income lineup, emerging market bonds were solid contributors to performance over the reporting period as the asset class fared relatively well and the manager outperformed its benchmark. Allocation to bank loans also helped performance as credit spreads tightened over the reporting period. The PF Managed Bond Fund, which represents the largest weight in the Fund, outperformed the Bloomberg Barclays U.S. Aggregate Bond Index and likewise contributed to performance over the reporting period. On the other hand, exposure to short-term bonds detracted from performance.
Alternatives as a group also contributed positively to performance over the reporting period. The PF Equity Long/Short Fund continued to deliver strong results and was the top performer among the alternatives group. The PF Global Absolute Return Fund also had positive gains, while the PF Currency Strategies Fund fell modestly over the reporting period.
| See benchmark definitions on A-27 and A-28 |
A-11
Table of Contents
PACIFIC FUNDS PERFORMANCE DISCUSSION (Continued)
Pacific Funds Portfolio Optimization Aggressive-Growth (managed by Pacific Life Fund Advisors LLC)
Q. How did the Fund perform for the year ended March 31, 2018?
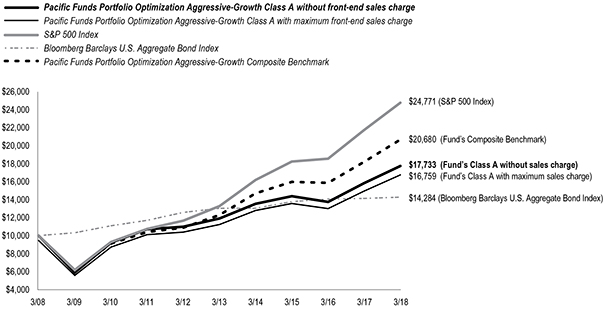
A. For the year ended March 31, 2018, Pacific Funds Portfolio Optimization Aggressive-Growth’s Class A (without sales charge) returned 12.17%, compared to a 13.99% return for the S&P 500 Index, a 1.20% return for the Bloomberg Barclays U.S. Aggregate Bond Index and a 13.56% return for the Pacific Funds Portfolio Optimization Aggressive-Growth Composite Benchmark.
The following graph compares the performance of a hypothetical $10,000 investment in Class A shares of the Fund to its benchmarks for the ten-year period ended March 31, 2018. For comparison purposes, the performance of all classes for the periods ended March 31, 2018 are also shown in the table below. Performance data for Class B, C, R and Advisor Class shares will vary due to differences in fees and sales charges. The Fund’s performance reflects reinvestments of all dividends and capital gains distributions, if any.
Performance Comparison
Average Annual Total Returns for the Periods Ended March 31, 2018
| 1 Year | 5 Years | 10 Years | ||||||||||
Fund’s Class A without sales charge | 12.17% | 8.30% | 5.90% | |||||||||
Fund’s Class A with maximum sales charge | 6.00% | 7.08% | 5.30% | |||||||||
Fund’s Class B without sales charge | 11.35% | 7.57% | 5.33% | |||||||||
Fund’s Class B with maximum sales charge | 6.35% | 7.27% | 5.33% | |||||||||
Fund’s Class C without sales charge | 11.39% | 7.57% | 5.19% | |||||||||
Fund’s Class C with maximum sales charge | 10.39% | 7.57% | 5.19% | |||||||||
Fund’s Class R without sales charge | 11.92% | 8.04% | 5.66% | |||||||||
S&P 500 Index | 13.99% | 13.31% | 9.49% | |||||||||
Bloomberg Barclays U.S. Aggregate Bond Index | 1.20% | 1.82% | 3.63% | |||||||||
Pacific Funds Portfolio Optimization Aggressive-Growth Composite Benchmark | 13.56% | 10.98% | 7.54% | |||||||||
Average Annual Total Returns for the Periods Ended March 31, 2018
| 1 Year | 5 Years | Since Inception (12/31/12) | ||||||||||
Fund’s Advisor Class without sales charge | 12.48% | 8.56% | 9.65% | |||||||||
S&P 500 Index | 13.99% | 13.31% | 14.83% | |||||||||
Bloomberg Barclays U.S. Aggregate Bond Index | 1.20% | 1.82% | 1.72% | |||||||||
Pacific Funds Portfolio Optimization Aggressive-Growth Composite Benchmark | 13.56% | 10.98% | 12.20% | |||||||||
Performance data shown represents past performance. Investment return and principal value will fluctuate so that shares of the Fund when redeemed may be worth more or less than their original cost. Past performance is not predictive of future performance. The table does not reflect the deduction of taxes that a shareholder would pay on Fund distributions or redemption of Fund shares. |
Q. Discuss both positive and negative factors that materially affected the Fund’s performance during the year, including relevant market conditions, investment strategies and techniques, and particular sectors or securities.
A. For the reporting period, the Fund’s Class A underperformed the Pacific Funds Portfolio Optimization Aggressive-Growth Composite Benchmark. The Pacific Funds Portfolio Optimization Aggressive-Growth Composite Benchmark is comprised of the S&P 500, MSCI EAFE (Net), and Bloomberg Barclays U.S. Aggregate Bond Indices in a weighting that is fixed and specific to the Fund. The Fund primarily allocated to domestic and international equity funds that are diversified across style (growth/value), market capitalization and region (which included allocations to foreign small-capitalization and emerging markets stocks). The Fund also maintained exposure to select sectors, such as publicly-traded REITs, as well as a small allocation to intermediate-term fixed income securities. The Fund’s alternatives allocation consisted of investments in a global absolute return strategy, a currency strategy, and an equity long/short strategy.
| See benchmark definitions on A-27 and A-28 |
A-12
Table of Contents
PACIFIC FUNDS PERFORMANCE DISCUSSION (Continued)
Within domestic equities, exposure to value stocks was a headwind over the reporting period as growth sectors such as information technology surged past value sectors. Although exposure to value stocks, which include large-cap value, mid-cap value and small-cap value, detracted from performance, the PF Comstock Fund and the PF Mid-Cap Value Fund outperformed their respective benchmarks, and therefore contributed to performance. The PF Real Estate Fund struggled over the period as rising interest rates were a headwind, and it was the only underlying fund within domestic equities to have negative returns over the reporting period. Additionally, the PF Main Street Core Fund and PF Large-Cap Value Fund underperformed their respective benchmarks and detracted from performance.
International equities added to performance over the reporting period. An overweight to emerging markets had a positive impact on performance, and the PF Emerging Markets Fund outpaced its benchmark, the MSCI Emerging Markets Index (Net), which further added to the contribution from the asset class. Exposure to international small-capitalization stocks was also additive to performance as they benefited from Europe’s accelerating economic growth.
Alternatives as a group also contributed positively to performance over the reporting period. The PF Equity Long/Short Fund continued to deliver strong results and was the top performer among the alternatives group. The PF Global Absolute Return Fund also had positive gains, while the PF Currency Strategies Fund fell modestly over the reporting period.
Pacific Funds Diversified Alternatives (managed by Pacific Life Fund Advisors LLC)
Q. How did the Fund perform for the year ended March 31, 2018?
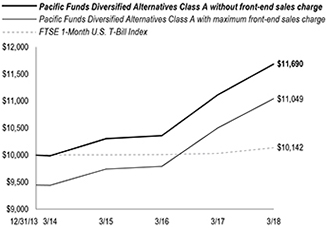
A. For the year ended March 31, 2018, Pacific Funds Diversified Alternatives’ Class A (without sales charge) returned 5.13%, compared to a 1.04% return for its benchmark, the FTSE 1-Month U.S. T-Bill Index.
The following graph compares the performance of a hypothetical $10,000 investment in Class A shares of the Fund to its benchmark for the period from inception through March 31, 2018. For comparison purposes, the performance of all classes for the periods ended March 31, 2018 are also shown in the table below. Performance data for Class C and Advisor Class shares will vary due to differences in fees and sales charges. The Fund’s performance reflects reinvestments of all dividends and capital gains distributions, if any.
Performance Comparison
Average Annual Total Returns for the Periods Ended March 31, 2018
| 1 Year | Since Inception (12/31/13) | |||||||
Fund’s Class A without sales charge | 5.13% | 3.75% | ||||||
Fund’s Class A with maximum sales charge | (0.61% | ) | 2.38% | |||||
Fund’s Class C without sales charge | 4.31% | 2.96% | ||||||
Fund’s Class C with maximum sales charge | 3.31% | 2.96% | ||||||
Fund’s Advisor Class without sales charge | 5.38% | 3.97% | ||||||
FTSE 1-Month U.S. T-Bill Index | 1.04% | 0.33% | (1) | |||||
| (1) | Due to data limitation, the benchmark since inception return reflects the commencement period from the first calendar day of the month the portfolio commenced its operations. |
Performance data shown represents past performance. Investment return and principal value will fluctuate so that shares of the Fund when redeemed may be worth more or less than their original cost. Past performance is not predictive of future performance. The table does not reflect the deduction of taxes that a shareholder would pay on Fund distributions or redemption of Fund shares. | ||
Q. Discuss both positive and negative factors that materially affected the Fund’s performance during the year, including relevant market conditions, investment strategies and techniques, and particular sectors or securities.
A. For the reporting period, the Fund’s Class A outperformed the benchmark. The Fund is a “fund of funds” that seeks to achieve its investment goal by investing in other funds, and to maintain a low to moderate correlation of its returns with the returns of traditional equity and fixed income asset classes over long-term periods by gaining exposure to a number of non-traditional asset classes and alternative investment strategies. Over the reporting period, the Fund was primarily invested in non-traditional asset classes and alternative investment strategies. The Fund’s investments included global absolute return, currencies, and long-short equity strategies. The Fund also invested in inflation-indexed debt, floating rate loan, real estate, international small-cap, and emerging markets equity and debt strategies.
The Fund’s allocation to PF Emerging Markets Fund, PF Equity Long/Short Fund and PF International Small-Cap Fund were the top contributors to performance. All three of these funds have exposure to foreign equity markets that outpaced the U.S. equity market. Emerging markets and international small-caps were among the top performing asset classes over the reporting period.
PF Real Estate Fund was the weakest-performing fund over the reporting period. PF Real Estate Fund, which was the smallest allocation in the Fund, faced headwinds when interest rates climbed higher over the reporting period. Real estate investment trusts (REITs) had previously benefitted from falling interest rates as investors looked for other sources of yield; however, rising rates unwound some of the prior gains.
| See benchmark definitions on A-27 and A-28 |
A-13
Table of Contents
PACIFIC FUNDS PERFORMANCE DISCUSSION (Continued)
Pacific Funds Short Duration Income (managed by Pacific Asset Management)
Q. How did the Fund perform for the year ended March 31, 2018?
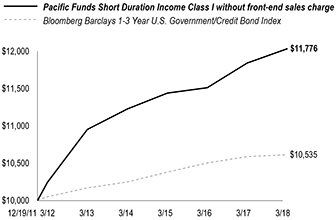
A. For the year ended March 31, 2018, Pacific Funds Short Duration Income’s Class I (without sales charge) returned 1.43%, compared to a 0.24% return for its benchmark, the Bloomberg Barclays 1-3 Year U.S. Government/Credit Bond Index.
The following graph compares the performance of a hypothetical $10,000 investment in Class I shares of the Fund to its benchmark for the period from inception through March 31, 2018. For comparison purposes, the performance of all classes for the periods ended March 31, 2018 are also shown in the table below. Performance data for Class A, C and Advisor Class shares will vary due to differences in fees and sales charges. The Fund’s performance reflects reinvestments of all dividends and capital gains distributions, if any.
Performance Comparison
Average Annual Total Returns for the Periods Ended March 31, 2018
| 1 Year | 5 Years | Since Inception (12/19/11) | ||||||||||
Fund’s Class I without sales charge | 1.43% | 1.69% | 2.64% | |||||||||
Bloomberg Barclays 1-3 Year U.S. Government/Credit Bond Index | 0.24% | 0.76% | 0.84% | |||||||||
| 1 Year | 5 Years | Since Inception (06/29/12) | ||||||||||
Fund’s Class A without sales charge | 1.18% | 1.44% | 2.07% | |||||||||
Fund’s Class A with maximum sales charge | (1.87% | ) | 0.83% | 1.53% | ||||||||
Fund’s Class C without sales charge | 0.43% | 0.68% | 1.32% | |||||||||
Fund’s Class C with maximum sales charge | (0.56% | ) | 0.68% | 1.32% | ||||||||
Fund’s Advisor Class without sales charge | 1.43% | 1.69% | 2.30% | |||||||||
Bloomberg Barclays 1-3 Year U.S. Government/Credit Bond Index | 0.24% | 0.76% | 0.81% | |||||||||
Performance data shown represents past performance. Investment return and principal value will fluctuate so that shares of the Fund when redeemed may be worth more or less than their original cost. Past performance is not predictive of future performance. The table does not reflect the deduction of taxes that a shareholder would pay on Fund distributions or redemption of Fund shares. |
Q. Discuss both positive and negative factors that materially affected the Fund’s performance during the year, including relevant market conditions, investment strategies and techniques, and particular sectors or securities.
A. For the reporting period, the Fund’s Class I outperformed the benchmark. The Fund uses a short duration corporate debt focused strategy. Using a fundamental approach with a top-down overlay, Pacific Asset Management’s team of portfolio managers and research analysts look at the relative value of each security and assess the macro environment and marketplace for tailwinds and catalysts in the process of individual investment selection.
The Fund outperformed the benchmark for the reporting period due primarily to asset allocation and the focus on credit. Credit related fixed income, notably lower quality investment grade, high yield, and bank loans outperformed government bonds. The outperformance was driven by a combination of fundamentals and technical reasons that benefited credit risk during the reporting period. Fundamentally, the improvement in global growth and corporate profits supported credit risk. Strong demand for corporate bonds supported technical factors. The Fund’s emphasis on BBB rated corporate bonds particularly drove the outperformance relative to the benchmark. The Fund also benefited from overweights to bank loans and high yield investments, which benefited from an improvement in the risk appetite of investors. Duration was neutral to performance. A detractor to relative performance was security selection within the independent energy sector. Also, the Fund’s cash position detracted from relative performance.
As we enter the second quarter of 2018, the Fund reflects several themes. The improvement in global growth, corporate profits, and economic sentiment continues to paint a favorable view of corporate health. We believe that recent tax reform may also serve as a catalyst for higher economic growth, though valuations in many markets may have priced in too much optimism towards fiscal reform spurring economic growth. Therefore, we are neutral risk as measured by our benchmarks. We emphasize BBB rated corporate bonds as the investment team believes they offer one of the best long-term risk/reward opportunities within investment grade fixed income. Within non-investment grade fixed income, we favor bank loans given their lower volatility and lower interest rate sensitivity relative to high yield bonds. We are neutral duration as measured to our benchmark.
| See benchmark definitions on A-27 and A-28 |
A-14
Table of Contents
PACIFIC FUNDS PERFORMANCE DISCUSSION (Continued)
Pacific Funds Core Income (managed by Pacific Asset Management)
Q. How did the Fund perform for the year ended March 31, 2018?
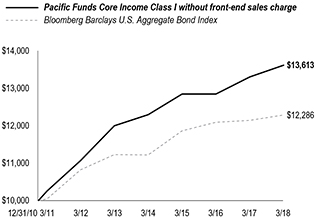
A. For the year ended March 31, 2018, Pacific Funds Core Income’s Class I (without sales charge) returned 2.35%, compared to a 1.20% return for its benchmark, the Bloomberg Barclays U.S. Aggregate Bond Index.
The following graph compares the performance of a hypothetical $10,000 investment in Class I shares of the Fund to its benchmark for the period from inception through March 31, 2018. For comparison purposes, the performance of all classes for the periods ended March 31, 2018 are also shown in the table below. Performance data for Class A, C, P and Advisor Class shares will vary due to differences in fees and sales charges. The Fund’s performance reflects reinvestments of all dividends and capital gains distributions, if any.
Performance Comparison
Average Annual Total Returns for the Periods Ended March 31, 2018
| 1 Year | 5 Years | Since Inception (12/31/10) | ||||||||||
Fund’s Class I without sales charge | 2.35% | 2.57% | 4.35% | |||||||||
Fund’s Class A without sales charge | 2.05% | 2.28% | 4.08% | |||||||||
Fund’s Class A with maximum sales charge | (2.32% | ) | 1.40% | 3.47% | ||||||||
Bloomberg Barclays U.S. Aggregate Bond Index | 1.20% | 1.82% | 2.88% | |||||||||
| 1 Year | 5 Years | Since Inception (06/30/11) | ||||||||||
Fund’s Class C without sales charge | 1.38% | 1.52% | 2.91% | |||||||||
Fund’s Class C with maximum sales charge | 0.38% | 1.52% | 2.91% | |||||||||
Bloomberg Barclays U.S. Aggregate Bond Index | 1.20% | 1.82% | 2.69% | |||||||||
| 1 Year | 5 Years | Since Inception (06/29/12) | ||||||||||
Fund’s Advisor Class without sales charge | 2.45% | 2.56% | 3.26% | |||||||||
Bloomberg Barclays U.S. Aggregate Bond Index | 1.20% | 1.82% | 1.88% | |||||||||
| 1 Year | Since Inception (04/27/15) | |||||||||||
Fund’s Class P without sales charge | 2.29% | 1.69% | ||||||||||
Bloomberg Barclays U.S. Aggregate Bond Index | 1.20% | 1.15% | ||||||||||
Performance data shown represents past performance. Investment return and principal value will fluctuate so that shares of the Fund when redeemed may be worth more or less than their original cost. Past performance is not predictive of future performance. The table does not reflect the deduction of taxes that a shareholder would pay on Fund distributions or redemption of Fund shares. |
Q. Discuss both positive and negative factors that materially affected the Fund’s performance during the year, including relevant market conditions, investment strategies and techniques, and particular sectors or securities.
A. For the reporting period, the Fund’s Class I outperformed the benchmark. The Fund uses an intermediate term strategy focused on corporate debt. Using a fundamental approach with a top-down overlay, Pacific Asset Management’s team of portfolio managers and research analysts look at the relative value of each security and assess the macro environment and marketplace for tailwinds and catalysts in the process of individual investment selection.
The Fund outperformed the benchmark for the reporting period due primarily to asset allocation and the focus on credit. Credit related fixed income, notably lower quality investment grade corporate debt instruments, high yield investments, and bank loans, outperformed government bonds. The outperformance was driven by a combination of fundamentals and technical reasons that benefited credit risk during the reporting period. Fundamentally, the improvement in global growth and corporate profits supported credit risk. Strong demand for corporate bonds supported technical factors. The Fund’s emphasis on BBB rated corporate bonds particularly drove the outperformance relative to the benchmark. The Fund also benefited from overweights to bank loans and high yield investments, which benefited from an improvement in the risk appetite of investors. The Fund’s duration risk was less than the benchmark, benefiting returns. Credit selection within the sovereign sector detracted. Additionally, the Fund’s cash position was a detractor from performance.
As we enter the second quarter of 2018, the Fund reflects several themes. The improvement in global growth, corporate profits, and economic sentiment continues to paint a favorable view of corporate health. We believe that recent tax reform may also serve as a catalyst for higher economic growth, though valuations in many markets may have priced in too much optimism towards fiscal reform spurring economic growth. Therefore, we are neutral risk as measured by our benchmarks. We emphasize BBB rated corporate bonds as the investment team believes they offer one of the best long-term risk/reward opportunities within investment grade fixed income. Within non-investment grade fixed income, we favor bank loans given their lower volatility and lower interest rate sensitivity relative to high yield bonds. We are underweight duration relative to the benchmark.
| See benchmark definitions on A-27 and A-28 |
A-15
Table of Contents
PACIFIC FUNDS PERFORMANCE DISCUSSION (Continued)
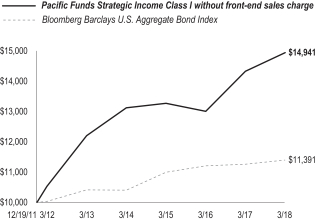
Pacific Funds Strategic Income (managed by Pacific Asset Management)
Q. How did the Fund perform for the year ended March 31, 2018?
A. For the year ended March 31, 2018, Pacific Funds Strategic Income’s Class I (without sales charge) returned 4.28%, compared to a 1.20% return for its benchmark, the Bloomberg Barclays U.S. Aggregate Bond Index.
The following graph compares the performance of a hypothetical $10,000 investment in Class I shares of the Fund to its benchmark for the period from inception through March 31, 2018. For comparison purposes, the performance of all classes for the periods ended March 31, 2018 are also shown in the table below. Performance data for Class A, C and Advisor Class shares will vary due to differences in fees and sales charges. The Fund’s performance reflects reinvestments of all dividends and capital gains distributions, if any.
Performance Comparison
Average Annual Total Returns for the Periods Ended March 31, 2018
| 1 Year | 5 Years | Since Inception (12/19/11) | ||||||||||
Fund’s Class I without sales charge | 4.28% | 4.14% | 6.60% | |||||||||
Bloomberg Barclays U.S Aggregate Bond Index | 1.20% | 1.82% | 2.10% | |||||||||
| 1 Year | 5 Years | Since Inception (06/29/12) | ||||||||||
Fund’s Class A without sales charge | 3.95% | 3.85% | 5.57% | |||||||||
Fund’s Class A with maximum sales charge | (0.43% | ) | 2.95% | 4.77% | ||||||||
Fund’s Class C without sales charge | 3.25% | 3.09% | 4.81% | |||||||||
Fund’s Class C with maximum sales charge | 2.25% | 3.09% | 4.81% | |||||||||
Fund’s Advisor Class without sales charge | 4.21% | 4.09% | 5.82% | |||||||||
Bloomberg Barclays U.S Aggregate Bond Index | 1.20% | 1.82% | 1.88% | |||||||||
Performance data shown represents past performance. Investment return and principal value will fluctuate so that shares of the Fund when redeemed may be worth more or less than their original cost. Past performance is not predictive of future performance. The table does not reflect the deduction of taxes that a shareholder would pay on Fund distributions or redemption of Fund shares. |
Q. Discuss both positive and negative factors that materially affected the Fund’s performance during the year, including relevant market conditions, investment strategies and techniques, and particular sectors or securities.
A. For the reporting period, the Fund’s Class I outperformed the benchmark. The Fund uses a multi-sector credit strategy focused on non-investment grade securities. Pacific Asset Management’s team of portfolio managers and research analysts look at the relative value of each security and assess the macro environment and marketplace for tailwinds and catalysts in the process of individual investment selection.
The Fund outperformed the benchmark for the reporting period due primarily to asset allocation and the focus on credit. Credit related fixed income, notably lower quality investment grade, high yield, and bank loans outperformed government bonds. Fundamentally, the improvement in global growth and corporate profits supported credit risk. Strong demand for corporate bonds supported technical factors. The Fund also benefited from overweights to bank loans and high yield investments, which benefited from an improvement of the risk appetite of investors. The Fund’s underweight to duration was a benefit to performance. Security selection was a detractor as names in building materials and cable/satellite sectors underperformed. Additionally, the Fund’s cash position was a detractor to relative performance.
As we enter the second quarter of 2018, the Fund reflects several themes. The improvement in global growth, corporate profits, and economic sentiment continues to paint a favorable view of corporate health. We believe that recent tax reform may also serve as a catalyst for higher economic growth, though valuations in many markets may have priced in too much optimism towards fiscal reform spurring economic growth. Therefore, we are overweight risk as measured to our long-term targets. We are underweight duration relative to the benchmark.
| See benchmark definitions on A-27 and A-28 |
A-16
Table of Contents
PACIFIC FUNDS PERFORMANCE DISCUSSION (Continued)
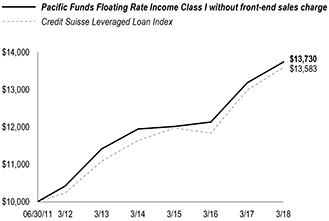
Pacific Funds Floating Rate Income (managed by Pacific Asset Management)
Q. How did the Fund perform for the year ended March 31, 2018?
A. For the year ended March 31, 2018, Pacific Funds Floating Rate Income’s Class I (without sales charge) returned 4.25%, compared to a 4.64% return for its benchmark, the Credit Suisse Leveraged Loan Index.
The following graph compares the performance of a hypothetical $10,000 investment in Class I shares of the Fund to its benchmark for the period from inception through March 31, 2018. For comparison purposes, the performance of all classes for the periods ended March 31, 2018 are also shown in the table below. Performance data for Class A, C, P and Advisor Class shares will vary due to differences in fees and sales charges. The Fund’s performance reflects reinvestments of all dividends and capital gains distributions, if any.
Performance Comparison
Average Annual Total Returns for the Periods Ended March 31, 2018
| 1 Year | 5 Years | Since Inception (06/30/11) | ||||||||||
Fund’s Class I without sales charge | 4.25% | 3.78% | 4.81% | |||||||||
Credit Suisse Leveraged Loan Index | 4.64% | 4.17% | 4.64% | |||||||||
| 1 Year | 5 Years | Since Inception (12/30/11) | ||||||||||
Fund’s Class A without sales charge | 3.85% | 3.47% | 4.87% | |||||||||
Fund’s Class A with maximum sales charge | 0.77% | 2.85% | 4.36% | |||||||||
Fund’s Class C without sales charge | 3.14% | 2.71% | 4.11% | |||||||||
Fund’s Class C with maximum sales charge | 2.14% | 2.71% | 4.11% | |||||||||
Credit Suisse Leveraged Loan Index | 4.64% | 4.17% | 5.30% | |||||||||
| 1 Year | 5 Years | Since Inception (06/29/12) | ||||||||||
Fund’s Advisor Class without sales charge | 4.20% | 3.74% | 4.65% | |||||||||
Credit Suisse Leveraged Loan Index | 4.64% | 4.17% | 5.01% | |||||||||
| 1 Year | 5 Years | Since Inception (12/31/12) | ||||||||||
Fund’s Class P without sales charge | 4.20% | 3.74% | 4.09% | |||||||||
Credit Suisse Leveraged Loan Index | 4.64% | 4.17% | 4.44% | |||||||||
Performance data shown represents past performance. Investment return and principal value will fluctuate so that shares of the Fund when redeemed may be worth more or less than their original cost. Past performance is not predictive of future performance. The table does not reflect the deduction of taxes that a shareholder would pay on Fund distributions or redemption of Fund shares. |
Q. Discuss both positive and negative factors that materially affected the Fund’s performance during the year, including relevant market conditions, investment strategies and techniques, and particular sectors or securities.
A. For the reporting period, the Fund’s Class I underperformed the benchmark. Pacific Asset Management’s team of portfolio managers and research analysts look for investment opportunities in income producing floating rate loans and floating rate debt securities. The Fund’s underweights to health care and media/telecommunication detracted from performance. Security selection in the transportation sector detracted from performance, notably given one issuer’s exposure to the energy market. The Fund’s overweight to largely liquid broadly syndicated loans and underweight to distressed issuers benefited performance. The Fund’s overweight to housing, manufacturing, and forest products/containers benefited performance.
As we enter the second quarter of 2018 we are underweight risk relative to the benchmark as measured by yield. Our underweight in yield is due to our limited exposure to distressed issuers, notably in energy. We believe that the fundamental backdrop, anchored by stable corporate health and economic data, provide an attractive bottom-up view for U.S. credit. Technical conditions are also favorable given ongoing demand for attractive yield on floating rate loans. As a result, we continue to favor B versus BB rated issuers given stable corporate health conditions. We have a high conviction Fund and would welcome a return of volatility to the market and the opportunities it may provide. We are overweight housing, manufacturing, and forest products/containers - sectors heavily focused on U.S. domestic profits. We are underweight energy, healthcare, and media/telecom. Within healthcare, we find limited relative value in many of the largest issuers given low coupon levels.
| See benchmark definitions on A-27 and A-28 |
A-17
Table of Contents
PACIFIC FUNDS PERFORMANCE DISCUSSION (Continued)
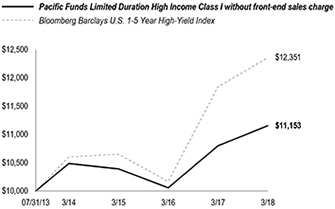
Pacific Funds Limited Duration High Income (managed by Pacific Asset Management)
Q. How did the Fund perform for the year ended March 31, 2018?
A. For the year ended March 31, 2018, Pacific Funds Limited Duration High Income’s Class I (without sales charge) returned 3.28%, compared to a 4.30% return for its benchmark, the Bloomberg Barclays U.S. 1-5 Year High-Yield Index.
The following graph compares the performance of a hypothetical $10,000 investment in Class I shares of the Fund to its benchmark for the period from inception through March 31, 2018. For comparison purposes, the performance of all classes for the periods ended March 31, 2018 are also shown in the table below. Performance data for Class A, C and Advisor Class shares will vary due to differences in fees and sales charges. The Fund’s performance reflects reinvestments of all dividends and capital gains distributions, if any.
Performance Comparison
Average Annual Total Returns for the Periods Ended March 31, 2018
| 1 Year | Since Inception (07/31/13) | |||||||
Fund’s Class I without sales charge | 3.28% | 2.37% | ||||||
Fund’s Class A without sales charge | 3.02% | 2.09% | ||||||
Fund’s Class A with maximum sales charge | (0.05% | ) | 1.43% | |||||
Fund’s Class C without sales charge | 2.31% | 1.34% | ||||||
Fund’s Class C with maximum sales charge | 1.32% | 1.34% | ||||||
Fund’s Advisor Class without sales charge | 3.28% | 2.32% | ||||||
Bloomberg Barclays U.S. 1-5 Year High-Yield Index | 4.30% | 4.63% | ||||||
Performance data shown represents past performance. Investment return and principal value will fluctuate so that shares of the Fund when redeemed may be worth more or less than their original cost. Past performance is not predictive of future performance. The table does not reflect the deduction of taxes that a shareholder would pay on Fund distributions or redemption of Fund shares. |
Q. Discuss both positive and negative factors that materially affected the Fund’s performance during the year, including relevant market conditions, investment strategies and techniques, and particular sectors or securities.
A. For the reporting period, the Fund’s Class I underperformed the benchmark. The Fund uses a multi-sector credit strategy that focuses on high yield and bank loan instruments. Using a fundamental approach with a top-down overlay, Pacific Asset Management’s team of portfolio managers and research analysts look at the relative value of each security and assess the macro environment and marketplace for risks and catalysts in the process of individual investment selection.
The Fund underperformed the benchmark for the reporting period due to asset allocation and sector positioning. During the reporting period, the Fund was underweight CCC rated bonds and bank loans which saw outperformance given the improvement of the risk appetite of investors, notably in the beginning of the reporting period. The Fund’s underweight to wirelines was a contributor to fund performance. The Fund’s overweight to retail during the reporting period was also a detractor from performance. The Fund’s duration was below the benchmark, benefiting returns. Credit selection on a relative basis detracted from performance.
As we enter the second quarter of 2018, the Fund reflects several themes. The improvement in global growth, corporate profits, and economic sentiment continues to paint a favorable view of corporate health. We believe that recent tax reform may also serve as a catalyst for higher economic growth, though valuations in many markets may have priced in too much optimism towards fiscal reform spurring economic growth. Therefore, we are neutral risk as measured to our long-term targets. We are underweight duration relative to the benchmark.
| See benchmark definitions on A-27 and A-28 |
A-18
Table of Contents
PACIFIC FUNDS PERFORMANCE DISCUSSION (Continued)
Pacific Funds High Income (managed by Pacific Asset Management)
Q. How did the Fund perform for the year ended March 31, 2018?
A. For the year ended March 31, 2018, Pacific Funds High Income’s Class I (without sales charge) returned 4.95%, compared to a 3.78% return for its benchmark, the Bloomberg Barclays U.S. High-Yield 2% Issuer Capped Bond Index.
The following graph compares the performance of a hypothetical $10,000 investment in Class I shares of the Fund to its benchmark for the period from inception through March 31, 2018. For comparison purposes, the performance of all classes for the periods ended March 31, 2018 are also shown in the table below. Performance data for Class A, C, P and Advisor Class shares will vary due to differences in fees and sales charges. The Fund’s performance reflects reinvestments of all dividends and capital gains distributions, if any.
Performance Comparison
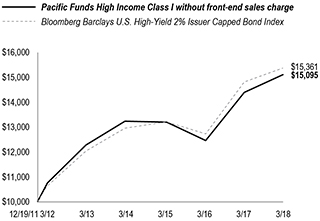
Average Annual Total Returns for the Periods Ended March 31, 2018
| 1 Year | 5 Years | Since Inception (12/19/11) | ||||||||||
Fund’s Class I without sales charge | 4.95% | 4.22% | 6.77% | |||||||||
Bloomberg Barclays U.S. High-Yield 2% Issuer Capped Bond Index | 3.78% | 5.00% | 7.07% | |||||||||
| 1 Year | 5 Years | Since Inception (06/29/12) | ||||||||||
Fund’s Class A without sales charge | 4.66% | 3.97% | 5.59% | |||||||||
Fund’s Class A with maximum sales charge | 0.18% | 3.06% | 4.79% | |||||||||
Fund’s Class C without sales charge | 3.84% | 3.18% | 4.82% | |||||||||
Fund’s Class C with maximum sales charge | 2.84% | 3.18% | 4.82% | |||||||||
Fund’s Advisor Class without sales charge | 4.91% | 4.21% | 5.85% | |||||||||
Bloomberg Barclays U.S. High-Yield 2% Issuer Capped Bond Index | 3.78% | 5.00% | 6.26% | |||||||||
| 1 Year | Since Inception (01/14/15) | |||||||||||
Fund’s Class P without sales charge | 4.92% | 5.22% | ||||||||||
Bloomberg Barclays U.S. High-Yield 2% Issuer Capped Bond Index | 3.78% | 5.68% | ||||||||||
Performance data shown represents past performance. Investment return and principal value will fluctuate so that shares of the Fund when redeemed may be worth more or less than their original cost. Past performance is not predictive of future performance. The table does not reflect the deduction of taxes that a shareholder would pay on Fund distributions or redemption of Fund shares. |
Q. Discuss both positive and negative factors that materially affected the Fund’s performance during the year, including relevant market conditions, investment strategies and techniques, and particular sectors or securities.
A. For the reporting period, the Fund’s Class I outperformed the benchmark. The Fund seeks a high level of current income by investing in non-investment grade debt instruments. Using a fundamental approach with a top-down overlay, Pacific Asset Management’s team of portfolio managers and research analysts look at the relative value of each security and assess the macro environment and marketplace for tailwinds and catalysts in the process of individual investment selection.
During the reporting period, the Fund outperformed the benchmark due to security selection and an overweight to CCC rated bonds. The Fund’s overweight to diversified manufacturing, construction machinery and metals/mining benefited performance, while underweights to services, banking, and chemicals detracted. Security selection in the retail sector was a detractor from performance. For the reporting period, the Fund’s overweight to CCC rated securities benefited performance given a favorable technical and fundamental environment. Cash allocation during the reporting period was a drag on relative performance. Regarding derivatives, the Fund held small positions in total return swap contracts on the Markit iBoxx USD Liquid High Yield Index to gain market exposure to the high yield universe.
As we enter the second quarter of 2018, the Fund reflects several themes. The improvement in global growth, corporate profits, and economic sentiment continues to paint a favorable view of corporate health. We believe that recent tax reform may also serve as a catalyst for higher economic growth, though valuations in many markets generally reflect many of these positive tailwinds. Therefore, we are neutral overall market risk versus the benchmark and believe that credit selection and not asset allocation will be the primary driver of returns in 2018.
| See benchmark definitions on A-27 and A-28 |
A-19
Table of Contents
PACIFIC FUNDS PERFORMANCE DISCUSSION (Continued)
Pacific Funds Large-Cap (managed by Rothschild Asset Management Inc.)
Q. How did the Fund perform for the year ended March 31, 2018?
A. For the year ended March 31, 2018, Pacific Funds Large-Cap’s Investor Class (without sales charge) returned 12.46%, compared to a 13.99% return for its benchmark, the S&P 500 Index.
The following graph compares the performance of a hypothetical $10,000 investment in Investor Class shares of the Fund to its benchmark for the period from inception through March 31, 2018. For comparison purposes, the performance of all classes for the periods ended March 31, 2018 are also shown in the table below. Performance data for Class A, C, S and Advisor Class shares will vary due to differences in fees and sales charges. The Fund’s performance reflects reinvestments of all dividends and capital gains distributions, if any.
Performance Comparison
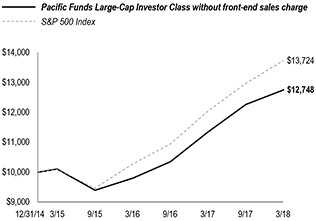
Average Annual Total Returns for the Periods Ended March 31, 2018
| 1 Year | Since Inception (12/31/14) | |||||||
Fund’s Investor Class without sales charge | 12.46% | 7.76% | ||||||
S&P 500 Index | 13.99% | 10.23% | ||||||
| 1 Year | Since Inception (03/20/15) | |||||||
Fund’s Class S without sales charge | 12.85% | 7.80% | ||||||
S&P 500 Index | 13.99% | 9.98% | ||||||
| 1 Year | Since Inception (01/11/16) | |||||||
Fund’s Class A without sales charge | 12.43% | 15.59% | ||||||
Fund’s Class A with maximum sales charge | 7.67% | 13.38% | ||||||
Fund’s Class C without sales charge | 11.60% | 14.73% | ||||||
Fund’s Class C with maximum sales charge | 10.60% | 14.73% | ||||||
Fund’s Advisor Class without sales charge | 12.83% | 15.91% | ||||||
S&P 500 Index | 13.99% | 17.80% | ||||||
Performance data shown represents past performance. Investment return and principal value will fluctuate so that shares of the Fund when redeemed may be worth more or less than their original cost. Past performance is not predictive of future performance. The table does not reflect the deduction of taxes that a shareholder would pay on Fund distributions or redemption of Fund shares. |
Q. Discuss both positive and negative factors that materially affected the Fund’s performance during the year, including relevant market conditions, investment strategies and techniques, and particular sectors or securities.
A. For the reporting period, the Fund’s Investor Class underperformed the benchmark. We at Rothschild maintain the Fund’s strategy by investing in common stocks and other equity securities of large capitalization U.S. companies. We invest in securities that we believe are attractively valued relative to peers with the potential to exceed investor expectations. We analyze a variety of quantitative and fundamental inputs in making stock decisions, and seek to build a portfolio that is well diversified at the issuer level and by economic sector.
Performance for the reporting period was positive for all but two sectors in the Fund, namely, consumer staples and consumer discretionary stocks. Information technology, financials, and industrials were the leading sectors, while laggards included consumer staples, consumer discretionary, and utilities. While market performance was strong for the reporting period, it masked an increase in volatility starting in late January 2018. Initially, the trigger was higher than expected wage inflation, leading to a higher Fed funds rate; then risk-parity portfolio rebalancing (investors reallocating away from equities to manage volatility), Silicon Valley regulatory headwinds, and proposed tariffs further rattled markets.
Overall, sector allocation was negative, due to overweight positions in the telecommunication services, energy, and consumer discretionary sectors. Conversely, underweight positions in consumer staples and financials, along with an overweight position in information technology, provided tailwinds. The largest drag, however, came from a very small cash position (used to meet cash flows), as even a 1% or 2% allocation can provide a noticeable headwind in a strong market. Stock selection was flat, as detractors in information technology, health care, and telecommunication services exceeded contributors in energy, financials, and consumer discretionary. While we added value through stock selection in seven out of eleven sectors, most of this value creation was undone in the information technology sector, specifically in the semiconductor industry, where we participated but could not justify holding highly cyclical names with extravagant valuations, such as semiconductor company NVIDIA.
Turning to individual stocks, our top relative contributors included industrial conglomerate General Electric Company, which we sold in 2017. An underweight to GE, which declined sharply (down 53.2%), contributed to the Fund’s performance relative to the benchmark. The stock continued to decline throughout the reporting period after announcing larger downward earnings revisions and a dividend cut. Defense contractor Northrop Grumman Corporation (up 48.9 %) rose as the company is expected to benefit from higher defense spending and the pending integration of the $9 billion Orbital ATK acquisition, which is expected to provide Northrop with new opportunities in missile defense and
| See benchmark definitions on A-27 and A-28 |
A-20
Table of Contents
PACIFIC FUNDS PERFORMANCE DISCUSSION (Continued)
space. Robust market activity and rising interest rates support a constructive backdrop for financial services company E*Trade (up 48.8%), although speculation regarding potential merger & acquisition (M&A) activity lurks in the background.
The Fund’s relative detractors included media company CBS Corporation (down 25.0%; since sold). While we think CBS is one of the better positioned media companies, industry challenges including weaker advertising trends and changing consumer television viewing habits have created broad headwinds for all players. We see more value in Viacom (a recent purchase) given its discounted valuation, the turnaround potential of the franchise under new leadership, and the M&A optionality. Two other relative detractors came in the form of benchmark stocks which rallied but were not held in the Fund. Aerospace company Boeing (up 90.0%) surged during the reporting period, though we believed the market was ignoring potential risks—such as the company’s potential to miss its design and execution schedules, its status as a highly likely target of potential global trade tensions, and the potential for its backlog to disappear if global economies slow. We continued to believe that as the market began to embrace the stock, and concluded that its valuation and risk-reward were not in our favor. While semiconductor company NVIDIA rose sharply (up 113.3%), we did not own the stock due to its rich valuation—which does not fit into our framework of attractive valuation (vs. peers and its own history) and expectational upside.
Pacific Funds Large-Cap Value (managed by Rothschild Asset Management Inc.)
Q. How did the Fund perform for the year ended March 31, 2018?
A. For the year ended March 31, 2018, Pacific Funds Large-Cap Value’s Investor Class (without sales charge) returned 9.05%, compared to a 6.95% return for its benchmark, the Russell 1000 Value Index.
The following graph compares the performance of a hypothetical $10,000 investment in Investor Class shares of the Fund to its benchmark for the period from inception through March 31, 2018. For comparison purposes, the performance of all classes for the periods ended March 31, 2018 are also shown in the table below. Performance data for Class A, C, S and Advisor Class shares will vary due to differences in fees and sales charges. The Fund’s performance reflects reinvestments of all dividends and capital gains distributions, if any.
Performance Comparison
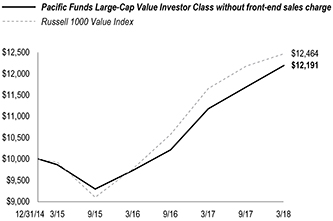
Average Annual Total Returns for the Periods Ended March 31, 2018
| 1 Year | Since Inception (12/31/14) | |||||||
Fund’s Investor Class without sales charge | 9.05% | 6.29% | ||||||
Russell 1000 Value Index | 6.95% | 7.01% | ||||||
| 1 Year | Since Inception (01/11/16) | |||||||
Fund’s Class A without sales charge | 9.03% | 13.33% | ||||||
Fund’s Class A with maximum sales charge | 4.37% | 11.13% | ||||||
Fund’s Class C without sales charge | 8.16% | 12.48% | ||||||
Fund’s Class C with maximum sales charge | 7.16% | 12.48% | ||||||
Fund’s Advisor Class without sales charge | 9.33% | 13.60% | ||||||
Fund’s Class S without sales charge | 9.36% | 13.73% | ||||||
Russell 1000 Value Index | 6.95% | 15.54% | ||||||
Performance data shown represents past performance. Investment return and principal value will fluctuate so that shares of the Fund when redeemed may be worth more or less than their original cost. Past performance is not predictive of future performance. The table does not reflect the deduction of taxes that a shareholder would pay on Fund distributions or redemption of Fund shares. |
Q. Discuss both positive and negative factors that materially affected the Fund’s performance during the year, including relevant market conditions, investment strategies and techniques, and particular sectors or securities.
A. For the reporting period, the Fund’s Investor Class outperformed the benchmark. We at Rothschild maintain the Fund’s strategy by investing in common stocks and other equity securities of large capitalization U.S. companies. We invest in securities that we believe are attractively valued relative to peers with the potential to exceed investor expectations. We analyze a variety of quantitative and fundamental inputs in making stock decisions, and the team seeks to build a portfolio that is well-diversified at the issuer level and by economic sector.
Fund performance for the reporting period was positive for most sectors in the Fund. Information technology, financials, and industrials were leaders, while laggards included telecommunication services, consumer staples, and consumer discretionary. While market performance was strong for the reporting period, it masked an increase in volatility starting in late January 2018. Initially, the trigger was higher than expected wage inflation, leading to a higher Fed funds rate; then risk-parity portfolio rebalancing (investors reallocating away from equities to manage volatility), Silicon Valley regulatory headwinds, and proposed tariffs further rattled markets.
Overall, sector allocation was positive, due to underweight positions in consumer staples and real estate, along with an overweight position in telecommunication services. Conversely, an overweight position in industrials, along with an underweight position in financials, provided headwinds. Stock selection was positive, as contributors in industrials, financials, and energy exceeded detractors in consumer discretionary, information technology, and materials.
| See benchmark definitions on A-27 and A-28 |
A-21
Table of Contents
PACIFIC FUNDS PERFORMANCE DISCUSSION (Continued)
Turning to individual stocks, our top relative contributors included industrial conglomerate General Electric Company, which we sold in 2017. An underweight position in GE, which declined sharply (down 53.2%), contributed to the Fund’s performance relative to the benchmark. The stock continued to decline throughout the reporting period after announcing larger downward earnings revisions and a dividend cut. Defense contractor Northrop Grumman Corporation (up 48.9 %) rose as the company is expected to benefit from higher defense spending and the pending integration of the $9 billion Orbital ATK acquisition, which is expected to provide Northrop with new opportunities in missile defense and space. ON Semiconductor (up 54.2%), a semiconductor company, delivered an upbeat presentation at a consumer electronics show reiterating strong trends in its end markets. The company stated that its free cash flow target of $900 million is expected to be achieved one year ahead of schedule.
The Fund’s relative detractors included chip-maker Intel, which we sold earlier in 2017. The company outperformed after reporting decent PC segment results and improved results in the Data Center Group. Though Intel provided earnings guidance above expectations for the fourth quarter of 2018, we do not view results as enticing given the possibility of a PC channel inventory correction (i.e., the supply of personal computers may soon exceed demand). We prefer other peers such as ON Semiconductor. Retailer Foot Locker (down 34.5%) announced disappointing results, and industry data points signaled a continued promotional environment for athletic footwear and athletic apparel. Competitor Finnish Line added that the pricing pressure would continue through back-to-school season. Decelerating traffic in U.S. malls coupled with fears that vendors like Nike will disintermediate retail partners such as Foot Locker through online-only channels led us to also question if the company will return to positive mid-single-digit same store sales later this year as expected by the market. We no longer hold the stock. While we think CBS Corporation (down 25.0%; since sold) is one of the better positioned media companies, industry challenges including weaker advertising trends and changing consumer television viewing habits have created broad headwinds for all players. We see more value in Viacom (a recent purchase) given its discounted valuation, the turnaround potential of the franchise under new leadership, and its ability to consider mergers and acquisitions.
Pacific Funds Small/Mid-Cap (managed by Rothschild Asset Management Inc.)
Q. How did the Fund perform for the year ended March 31, 2018?
A. For the year ended March 31, 2018, Pacific Funds Small/Mid-Cap’s Class S (without sales charge) returned 11.43%, compared to a 12.31% return for its benchmark, the Russell 2500 Index.
The following graph compares the performance of a hypothetical $10,000 investment in Class S shares of the Fund to its benchmark for the period from inception through March 31, 2018. For comparison purposes, the performance of all classes for the periods ended March 31, 2018 are also shown in the table below. Performance data for Class A, C, Advisor and Investor Class shares will vary due to differences in fees and sales charges. The Fund’s performance reflects reinvestments of all dividends and capital gains distributions, if any.
Performance Comparison
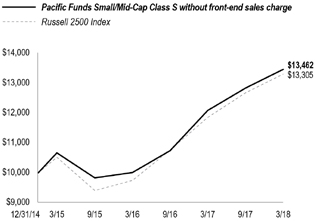
Average Annual Total Returns for the Periods Ended March 31, 2018
| 1 Year | Since Inception (12/31/14) | |||||||
Fund’s Class S without sales charge | 11.43% | 9.59% | ||||||
Russell 2500 Index | 12.31% | 9.18% | ||||||
| 1 Year | Since Inception (01/11/16) | |||||||
Fund’s Class A without sales charge | 11.02% | 17.16% | ||||||
Fund’s Class A with maximum sales charge | 6.29% | 14.92% | ||||||
Fund’s Class C without sales charge | 10.28% | 16.29% | ||||||
Fund’s Class C with maximum sales charge | 9.28% | 16.29% | ||||||
Fund’s Advisor Class without sales charge | 11.34% | 17.39% | ||||||
Fund’s Investor Class without sales charge | 11.04% | 17.04% | ||||||
Russell 2500 Index | 12.31% | 19.09% | ||||||
Performance data shown represents past performance. Investment return and principal value will fluctuate so that shares of the Fund when redeemed may be worth more or less than their original cost. Past performance is not predictive of future performance. The table does not reflect the deduction of taxes that a shareholder would pay on Fund distributions or redemption of Fund shares. |
Q. Discuss both positive and negative factors that materially affected the Fund’s performance during the year, including relevant market conditions, investment strategies and techniques, and particular sectors or securities.
A. For the reporting period, the Fund’s Class S underperformed the benchmark. We at Rothschild maintain the Fund’s strategy by investing in common stocks and other equity securities of small and medium capitalization U.S. companies. We invest in securities that we believe are attractively valued relative to peers with the potential to exceed investor expectations. The team analyzes a variety of quantitative and fundamental inputs in making stock decisions, and seeks to build a portfolio that is well-diversified at the issuer level and by economic sector.
Performance for the reporting period varied widely across sectors in the Fund. Leading sectors included health care, materials, and industrials, while laggards included energy, consumer staples, and real estate. While market performance was strong for the reporting period, it
| See benchmark definitions on A-27 and A-28 |
A-22
Table of Contents
PACIFIC FUNDS PERFORMANCE DISCUSSION (Continued)
masked an increase in volatility starting in late January. Initially, the trigger was higher than expected wage inflation, leading to a higher Fed funds rate; then risk-parity portfolio rebalancing (investors reallocating away from equities to manage volatility), Silicon Valley regulatory headwinds, and proposed tariffs further rattled markets.
Overall, sector allocation was significantly positive, as underweight positions in the real estate and energy sectors, along with an overweight position in information technology, provided tailwinds. Conversely, there was also a drag due to a very small cash position (used to meet cash flows), as even a 1% or 2% allocation can provide a noticeable headwind in a strong market. Stock selection was negative, with detractors in information technology, consumer discretionary, and energy exceeding contributors in health care, materials, and industrials.
Turning to individual stocks, our top relative contributors included Nektar Therapeutics (up 352.8%), a clinical-stage biopharmaceutical company. After providing a promising clinical update at an industry conference for its immunotherapy drug, Nektar’s rise continued after announcing additional encouraging clinical results and an economically favorable partnership with Bristol-Meyers Squibb, a major player in the immunotherapy space. GrubHub (up 127.2%), an online food ordering and delivery platform, reported solid results along with a strategic partnership with Yum! Brands (the parent company of Taco Bell, KFC and Pizza Hut). Molina Healthcare (up 78.0%), a managed care company, rose as management provided better than expected timeline for operational efficiencies and recovery towards industry peer margins at a major industry conference.
Our largest relative detractors included Laredo Petroleum Inc. (LPI) (down 38.8%), an exploration and production company. LPI shares lagged, as the company missed on production in the fourth quarter of 2017 and issued initial 2018 guidance that was also below expectations. The company also announced a $200mm buyback program, albeit one likely to be funded with debt rather than free cash flow. We no longer hold the stock. AMC Entertainment (down 53.0%), a movie exhibitor, reported solid first quarter 2017 results in April. However, negative box office returns in May of 2017, along with concerns over movie window changes and premium video-on-demand, drove negative sentiment and selling pressure. Cardtronics (down 52.3%), an ATM processor, had a series of seemingly transitory negative developments, including weather impacts and technology implementation delays along with certain international market structure changes that could impact profitability going forward.
Pacific Funds Small-Cap (managed by Rothschild Asset Management Inc.)
Q. How did the Fund perform for the year ended March 31, 2018?
A. For the year ended March 31, 2018, Pacific Funds Small-Cap’s Class S (without sales charge) returned 11.54%, compared to a 11.79% return for its benchmark, the Russell 2000 Index.
The following graph compares the performance of a hypothetical $10,000 investment in Class S shares of the Fund to its benchmark for the period from inception through March 31, 2018. For comparison purposes, the performance of all classes for the periods ended March 31, 2018 are also shown in the table below. Performance data for Class A, C, Advisor and Investor Class shares will vary due to differences in fees and sales charges. The Fund’s performance reflects reinvestments of all dividends and capital gains distributions, if any.
Performance Comparison
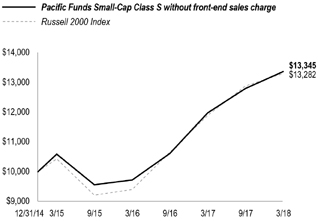
Average Annual Total Returns for the Periods Ended March 31, 2018
| 1 Year | Since Inception (12/31/14) | |||||||
Fund’s Class S without sales charge | 11.54% | 9.29% | ||||||
Russell 2000 Index | 11.79% | 9.13% | ||||||
| 1 Year | Since Inception (01/11/16) | |||||||
Fund’s Class A without sales charge | 11.17% | 18.19% | ||||||
Fund’s Class A with maximum sales charge | 6.47% | 15.93% | ||||||
Fund’s Class C without sales charge | 10.32% | 17.26% | ||||||
Fund’s Class C with maximum sales charge | 9.32% | 17.26% | ||||||
Fund’s Advisor Class without sales charge | 11.45% | 18.47% | ||||||
Fund’s Investor Class without sales charge | 11.10% | 18.08% | ||||||
Russell 2000 Index | 11.79% | 20.34% | ||||||
Performance data shown represents past performance. Investment return and principal value will fluctuate so that shares of the Fund when redeemed may be worth more or less than their original cost. Past performance is not predictive of future performance. The table does not reflect the deduction of taxes that a shareholder would pay on Fund distributions or redemption of Fund shares. |
Q. Discuss both positive and negative factors that materially affected the Fund’s performance during the year, including relevant market conditions, investment strategies and techniques, and particular sectors or securities.
A. For the reporting period, the Fund’s Class S underperformed the benchmark. We at Rothschild maintain the Fund’s strategy by investing in common stocks and other equity securities of small capitalization U.S. companies. We invest in securities that we believe are attractively valued relative to peers with the potential to exceed investor expectations. We analyze a variety of quantitative and fundamental inputs in making stock decisions, and seek to build a portfolio that is well diversified at the issuer level and by economic sector.
| See benchmark definitions on A-27 and A-28 |
A-23
Table of Contents
PACIFIC FUNDS PERFORMANCE DISCUSSION (Continued)
Fund performance for the reporting period was positive for all but two sectors in the Fund, namely, energy and real estate. Health care, industrials, and information technology were leaders, while laggards included energy, real estate, and consumer staples. While market performance was strong for the reporting period, it masked an increase in volatility starting in late January 2018. Initially, the trigger was higher than expected wage inflation, leading to a higher Fed funds rate; then risk-parity portfolio rebalancing (investors reallocating away from equities to manage volatility), Silicon Valley regulatory headwinds, and proposed tariffs further rattled markets.
Overall, sector allocation was positive, largely driven by modest underweight positions in the energy, and real estate sectors. In aggregate, no sector proved a drag on performance. There was also a drag due to a very small cash position (used to meet cash flows), as even a 1% or 2% allocation can provide a noticeable headwind in a strong market. Stock selection was also positive, with contributors in health care and industrials sectors exceeding the effects of detractors in information technology, consumer discretionary, and energy.
Turning to individual stocks, our top relative contributors included Nektar Therapeutics (up 352.8%), a clinical-stage biopharmaceutical company. After providing a promising clinical update at an industry conference for its immunotherapy drug, Nektar’s rise continued after announcing additional encouraging clinical results and an economically favorable partnership with Bristol-Meyers Squibb, a major player in the immunotherapy space. GrubHub (up 127.2%), an online food ordering and delivery platform, reported solid results along with a strategic partnership with Yum! Brands (the parent company of Taco Bell, KFC and Pizza Hut). Industrial company Harsco Corporation (up 62.0%) rose as end-market strength and operational improvement across each of its three business segments resulted in several quarters in which revenue, adjusted earnings before interest, taxes, depreciation, and amortization (EBITDA), and earnings per share exceeded estimates. In addition, earnings guidance for 2018 exceeded the consensus estimate.
Our largest relative detractors included medical technology company NuVasive (down 30.1%) preannounced worse than expected fourth quarter 2017 results, which were believed to be conservative enough to reset expectations following a disappointing third quarter 2017. Sanchez Energy Corporation (down 68.6%), an energy exploration and development company, was pressured over financial leverage concerns along with a read-through from a competitor’s poor well results. Due to uncertainty regarding the company’s return to free cash flow generation, we exited the position. Knowles Corp. (down 33.6%) is a leading supplier of microphones and hearing aid solutions along with other acoustics products. Shares were negatively impacted after the company offered more muted guidance for the rest of the year due to a delayed handset launch from one of their largest customers and order pushouts in China. We view these issues as temporary and continue to like the growing opportunity in the “Internet of Things.”
Pacific Funds Small-Cap Value (managed by Rothschild Asset Management Inc.)
Q. How did the Fund perform for the year ended March 31, 2018?
A. For the year ended March 31, 2018, Pacific Funds Small–Cap Value’s Class S (without sales charge) returned 5.78%, compared to a 5.13% return for its benchmark, the Russell 2000 Value Index.
The following graph compares the performance of a hypothetical $10,000 investment in Class S shares of the Fund to its benchmark for the period from inception through March 31, 2018. For comparison purposes, the performance of all classes for the periods ended March 31, 2018 are also shown in the table below. Performance data for Class A, C, Advisor and Investor Class shares will vary due to differences in fees and sales charges. The Fund’s performance reflects reinvestments of all dividends and capital gains distributions, if any.
Performance Comparison
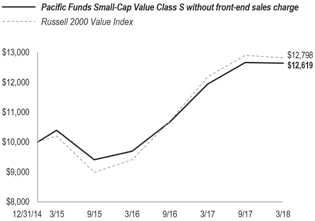
Average Annual Total Returns for the Periods Ended March 31, 2018
| 1 Year | Since Inception (12/31/14) | |||||||
Fund’s Class S without sales charge | 5.78% | 7.43% | ||||||
Russell 2000 Value Index | 5.13% | 7.89% | ||||||
| 1 Year | Since Inception (01/11/16) | |||||||
Fund’s Class A without sales charge | 5.41% | 16.03% | ||||||
Fund’s Class A with maximum sales charge | 0.93% | 13.80% | ||||||
Fund’s Class C without sales charge | 4.72% | 15.23% | ||||||
Fund’s Class C with maximum sales charge | 3.76% | 15.23% | ||||||
Fund’s Advisor Class without sales charge | 5.70% | 16.39% | ||||||
Fund’s Investor Class without sales charge | 5.40% | 16.01% | ||||||
Russell 2000 Value Index | 5.13% | 19.56% | ||||||
Performance data shown represents past performance. Investment return and principal value will fluctuate so that shares of the Fund when redeemed may be worth more or less than their original cost. Past performance is not predictive of future performance. The table does not reflect the deduction of taxes that a shareholder would pay on Fund distributions or redemption of Fund shares. |
| See benchmark definitions on A-27 and A-28 |
A-24
Table of Contents
PACIFIC FUNDS PERFORMANCE DISCUSSION (Continued)
Q. Discuss both positive and negative factors that materially affected the Fund’s performance during the year, including relevant market conditions, investment strategies and techniques, and particular sectors or securities.
A. For the reporting period, the Fund’s Class S outperformed the benchmark. We at Rothschild maintain the Fund’s strategy by investing in common stocks and other equity securities of small capitalization U.S. companies. We invest in securities that we believe are attractively valued relative to peers with the potential to exceed investor expectations. We analyze a variety of quantitative and fundamental inputs in making stock decisions, and seek to build a portfolio that is well-diversified at the issuer level and by economic sector.
Performance during the reporting period varied dramatically across sectors. Health care, industrials, and materials were leaders, while laggards included energy, information technology, and real estate. While market performance was strong for the reporting period, it masked an increase in volatility starting in late January 2018. Initially, the trigger was higher than expected wage inflation, leading to a higher Fed funds rate; then risk-parity portfolio rebalancing (investors reallocating away from equities to manage volatility), Silicon Valley regulatory headwinds, and proposed tariffs further rattled markets.
Overall, sector allocation was positive, as overweight positions in industrials, along with underweight positions in energy and real estate, provided tailwinds. Conversely, an overweight position in information technology, along with underweight positions in consumer discretionary provided headwinds. Stock selection was also positive, with contributors in health care, real estate, and materials exceeding the effects of detractors in information technology, energy and consumer discretionary.
Turning to individual stocks, our top relative contributors included Molina Healthcare (up 78.0%), a managed care company, which rose as management provided better than expected timeline for operational efficiencies and recovery towards industry peer margins at a major industry conference. Haemonetics Corporation (up 80.3%), a global supplier of blood and plasma services, reported fourth quarter 2017 results and 2018 guidance which beat expectations, while also announcing an 8% equity buyback. The company reported better than expected sales from its lagging blood transfusion center business and better operating margins from efficiency gains at its plasma and blood center segments. Harsco Corporation (up 62.0%), a diversified industrial company, rose as end-market strength and operational improvement across each of its three business segments resulted in several quarters in which revenue, adjusted EBITDA (earnings before interest, taxes, and depreciation), and earnings per share exceeded street estimates. In addition, earnings guidance for 2018 exceeded the consensus estimate.
Our largest relative detractors included AMC Entertainment (down 58.2%), a movie exhibitor. Though the company reported solid first quarter 2017 results in April, negative box office returns in May of 2017, along with concerns over movie window changes and premium video-on-demand, drove negative sentiment and selling pressure. Sanchez Energy Corporation (down 70.3%), an energy exploration and development company, was pressured over financial leverage concerns along with a read-through from a competitor’s poor well results. Due to uncertainty regarding the company’s return to free cash flow generation, we exited the position. Maiden Holdings (down 43.9%) provides specialty reinsurance products for the global property and casualty market. Maiden reported another reserve charge, delaying and further pressuring its return outlook.
| See benchmark definitions on A-27 and A-28 |
A-25
Table of Contents
PACIFIC FUNDS PERFORMANCE DISCUSSION (Continued)
Pacific Funds Small-Cap Growth (managed by Rothschild Asset Management Inc.)
Q. How did the Fund perform for the year ended March 31, 2018?
A. For the year ended March 31, 2018, Pacific Funds Small–Cap Growth’s Investor Class (without sales charge) returned 14.52%, compared to a 18.63% return for its benchmark, the Russell 2000 Growth Index.
The following graph compares the performance of a hypothetical $10,000 investment in Investor Class shares of the Fund to its benchmark for the period from inception through March 31, 2018. For comparison purposes, the performance of all classes for the periods ended March 31, 2018 are also shown in the table below. Performance data for Class A, C, S and Advisor Class shares will vary due to differences in fees and sales charges. The Fund’s performance reflects reinvestments of all dividends and capital gains distributions, if any.
Performance Comparison
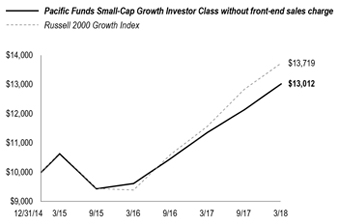
Average Annual Total Returns for the Periods Ended March 31, 2018
| 1 Year | Since Inception (12/31/14) | |||||||
Fund’s Investor Class without sales charge | 14.52% | 8.45% | ||||||
Russell 2000 Growth Index | 18.63% | 10.22% | ||||||
| 1 Year | Since Inception (01/11/16) | |||||||
Fund’s Class A without sales charge | 14.51% | 16.37% | ||||||
Fund’s Class A with maximum sales charge | 9.68% | 14.13% | ||||||
Fund’s Class C without sales charge | 13.62% | 15.55% | ||||||
Fund’s Class C with maximum sales charge | 12.62% | 15.55% | ||||||
Fund’s Advisor Class without sales charge | 14.80% | 16.73% | ||||||
Fund’s Class S without sales charge | 14.97% | 16.86% | ||||||
Russell 2000 Growth Index | 18.63% | 20.94% | ||||||
| 1 Year | Since Inception (06/08/16) | |||||||
Fund’s Class P without sales charge | 14.80% | 15.62% | ||||||
Russell 2000 Growth Index | 18.63% | 18.64% | ||||||
Performance data shown represents past performance. Investment return and principal value will fluctuate so that shares of the Fund when redeemed may be worth more or less than their original cost. Past performance is not predictive of future performance. The table does not reflect the deduction of taxes that a shareholder would pay on Fund distributions or redemption of Fund shares. |
Q. Discuss both positive and negative factors that materially affected the Fund’s performance during the year, including relevant market conditions, investment strategies and techniques, and particular sectors or securities.
A. For the reporting period, the Fund’s Investor Class underperformed the benchmark. We at Rothschild maintain the Fund’s strategy by investing in common stocks and other equity securities of small capitalization U.S. companies. We invest in securities that we believe are attractively valued relative to peers with the potential to exceed investor expectations. We analyze a variety of quantitative and fundamental inputs in making stock decisions, and seek to build a portfolio that is well diversified at the issuer level and by economic sector.
Performance for the reporting period was positive for all sectors in the Fund with the notable exception of energy. Leading sectors included health care, financials, and industrials, while laggards included energy, utilities, and real estate. While market performance was strong for the reporting period, it masked an increase in volatility starting in late January 2018. Initially, the trigger was higher than expected wage inflation, leading to a higher Fed funds rate; then risk-parity portfolio rebalancing (investors reallocating away from equities to manage volatility), Silicon Valley regulatory headwinds, and proposed tariffs further rattled markets.
Overall, sector allocation was positive, as underweight positions in the real estate, financials, and consumer staples sectors provided tailwinds. Conversely, overweight positions in consumer discretionary and industrials, along with underweight positions in telecommunication services, provided headwinds. Stock selection was negative, with detractors in information technology, consumer discretionary, and energy exceeding contributors in health care, financials, and materials.
Turning to individual stocks, our top relative contributors included Nektar Therapeutics (up 352.8%), a clinical-stage biopharmaceutical company. After providing a promising clinical update at an industry conference for its immunotherapy drug, Nektar’s rise continued after announcing additional encouraging clinical results and an economically favorable partnership with Bristol-Meyers Squibb, a major player in the immunotherapy space. GrubHub (up 127.2%), an online food ordering and delivery platform, reported solid results along with a strategic partnership with Yum! Brands (the parent company of Taco Bell, KFC and Pizza Hut). RingCentral (up 78.1%), a unified communication as a service company, reported significantly better than expected results and guidance.
Our largest relative detractors included Cardtronics (down 52.3%), an ATM processor. The company had a series of seemingly transitory negative developments, including weather impacts and technology implementation delays along with certain international market structure
| See benchmark definitions on A-27 and A-28 |
A-26
Table of Contents
PACIFIC FUNDS PERFORMANCE DISCUSSION (Continued)
changes that could impact profitability going forward. AMC Entertainment (down 58.2%), a movie exhibitor, reported solid results in April 2017. However, negative box office returns in May of 2017, along with concerns over movie window changes and premium video-on-demand, drove negative sentiment and selling pressure. Despite ultimately coming to a global settlement with Broadcom in December of 2017, Xperi Corp (down 35.6%), a technology licensing company, came under pressure throughout the reporting period due to consistent settlement delays along with an inability to re-sign a large customer that resulted in filing an infringement lawsuit.
Benchmark Definitions
Bloomberg Barclays 1-3 Year U.S. Government/Credit Bond Index measures performance of U.S. dollar-denominated U.S. Treasuries, government related, and investment grade U.S. corporate securities with maturities of one to three years. Results include the reinvestment of all distributions.
Bloomberg Barclays U.S. 1-5 Year High-Yield Index is an index that covers the universe of fixed-rate, non-investment-grade debt with maturities between one and five years. Results include the reinvestment of all distributions.
Bloomberg Barclays U.S. Aggregate Bond Index measures the performance of the U.S. investment grade bonds market, which includes investment grade U.S. government bonds, investment grade corporate bonds, mortgage pass-through securities and asset-backed securities that are publicly offered for sale in the U.S. The securities in the index must have at least 1 year remaining to maturity. In addition, the securities must be denominated in U.S. dollars and must be fixed rate, non-convertible, and taxable. Results include the reinvestment of all distributions.
Bloomberg Barclays U.S. High-Yield 2% Issuer Capped Bond Index is an index that is an issuer-constrained version for the U.S. Corporate High-Yield Index that covers the U.S. dollar-denominated, non-investment grade fixed-rate taxable corporate bond market and limits issuer exposures to a maximum of 2% and redistributes the excess market value index-wide on a pro-rata basis. The total return is equal to the change in price plus the coupon return. Results include the reinvestment of all distributions.
Credit Suisse Leveraged Loan Index tracks the investable market of the U.S. dollar-denominated leveraged loan market. It consists of issues rated “5B” or lower, meaning that the highest rated issues included in this index are Moody’s/S&P ratings of Baa1/BB+ or Ba1/BBB+. All loans are funded term loans with a tenor of at least one year and are made by issuers domiciled in developed countries. Results include the reinvestment of all distributions.
FTSE 1-Month U.S. Treasury Bill (T-Bill) Index (formerly named Citigroup 1-Month U.S. T-Bill Index) is a market value-weighted index of public obligations of the U.S. Treasury with maturities of one month. Results include the reinvestment of all distributions.
ICE BofA Merrill Lynch U.S. 3-Month Treasury Bill (T-Bill) Index is an index comprised of a single issue purchased at the beginning of the month and held for a full month. At the end of the month that issue is sold and rolled into a newly selected issue. The issue selected at each month-end rebalancing is the outstanding Treasury Bill that matures closest to, but not beyond, three months from the rebalancing date. To qualify for selection, an issue must have settled on or before the month-end rebalancing date. Results include the reinvestment of all distributions.
Morgan Stanley Capital International (MSCI) Emerging Markets Index (Net) is a free float-adjusted market capitalization index that is designed to measure equity market performance of large and mid-capitalization securities in emerging markets. As of March 31, 2018, the MSCI Emerging Markets Index (Net) consists of the following 24 emerging market country indices: Brazil, Chile, China, Colombia, Czech Republic, Egypt, Greece, Hungary, India, Indonesia, South Korea, Malaysia, Mexico, Pakistan, Peru, Philippines, Poland, Qatar, Russia, South Africa, Taiwan, Thailand, Turkey, and United Arab Emirates. The word “(Net)” in the index name means the net total return for the index, which includes the reinvestment of dividends after the deduction of withholding tax, applying the tax rate to non-resident individuals who do not benefit from double taxation treaties.
MSCI Europe, Australasia and Far East (EAFE) Index (Net) is a free float-adjusted market capitalization index that is designed to measure the equity market performance of developed markets, excluding the U.S. & Canada. As of March 31, 2018, the MSCI EAFE Index (Net) consists of the following 21 developed market country indices: Australia, Austria, Belgium, Denmark, Finland, France, Germany, Hong Kong, Ireland, Israel, Italy, Japan, the Netherlands, New Zealand, Norway, Portugal, Singapore, Spain, Sweden, Switzerland, and the United Kingdom. The word “(Net)” in the index name means the net total return for the index, which includes the reinvestment of dividends after the deduction of withholding tax, applying the tax rate to nonresident individuals who do not benefit from double taxation treaties.
Pacific Funds Portfolio Optimization Composite Benchmarks: The composite benchmarks for the Portfolio Optimization Funds show the performance of a combination of three or more broad-based market indices that represent fixed income, domestic equity, international equity and cash asset class categories in weights that are fixed and specific to each Fund. The composition of each Fund’s composite benchmark is shown below. Results include the reinvestment of all distributions. Prior to July 1, 2012, the weighting to each asset category was adjusted annually to reflect the Fund’s target allocations for the year.
Pacific Funds Portfolio Optimization Conservative Composite Benchmark is 71% Bloomberg Barclays U.S. Aggregate Bond; 17% S&P 500; 7% ICE BofA Merrill Lynch U.S. 3-Month Treasury Bill; and 5% MSCI EAFE (Net) Indices. Results include the reinvestment of all distributions.
Pacific Funds Portfolio Optimization Moderate-Conservative Composite Benchmark is 55% Bloomberg Barclays U.S. Aggregate Bond; 30% S&P 500; 10% MSCI EAFE (Net), and 5% ICE BofA Merrill Lynch U.S. 3-Month Treasury Bill Indices. Results include the reinvestment of all distributions.
Pacific Funds Portfolio Optimization Moderate Composite Benchmark is 45% S&P 500; 38% Bloomberg Barclays U.S. Aggregate Bond; 15% MSCI EAFE (Net), and 2% ICE BofA Merrill Lynch U.S. 3-Month Treasury Bill Indices. Results include the reinvestment of all distributions.
Pacific Funds Portfolio Optimization Growth Composite Benchmark is 58% S&P 500; 23% Bloomberg Barclays U.S. Aggregate Bond; and 19% MSCI EAFE (Net) Indices. Results include the reinvestment of all distributions. Results include the reinvestment of all distributions.
Pacific Funds Portfolio Optimization Aggressive-Growth Composite Benchmark is 69% S&P 500; 26% MSCI EAFE (Net); and 5% Bloomberg Barclays U.S. Aggregate Bond Indices. Results include the reinvestment of all distributions.
Russell 1000 Index measures the performance of the large-capitalization segment of the U.S. equity universe. It is a subset of the Russell 3000 Index and includes approximately 1,000 of the largest securities based on a combination of their market capitalization and current index membership. The
A-27
Table of Contents
PACIFIC FUNDS PERFORMANCE DISCUSSION (Continued)
Russell 1000 Index represents approximately 92% of the investable U.S. equity market. It is constructed to provide a comprehensive and unbiased barometer for the large-capitalization and is completely reconstituted annually to ensure new and growing equities are reflected. Results include the reinvestment of all distributions.
Russell 1000 Value Index measures the performance of the large-cap value segment of the U.S. equity universe. It includes those Russell 1000 Index companies with lower price-to-book ratios and lower expected growth values. The Russell 1000 Value Index is constructed to provide a comprehensive and unbiased barometer for the large-cap value segment. The Index is completely reconstituted annually to ensure new and growing equities are included and that the represented companies continue to reflect value characteristics. Results include the reinvestment of all distributions.
Russell 2000 Growth Index measures the performance of the small-cap growth segment of the U.S. equity universe. It includes those Russell 2000 Index companies with higher price-to-value ratios and higher forecasted growth values. The Russell 2000 Growth Index is constructed to provide a comprehensive and unbiased barometer for the small-cap growth segment. The Index is completely reconstituted annually to ensure larger stocks do not distort the performance and characteristics of the true small-cap opportunity set and that the represented companies continue to reflect growth characteristics. Results include the reinvestment of all distributions.
Russell 2000 Index measures the performance of the small-cap segment of the U.S. equity universe. The Russell 2000 Index is a subset of the Russell 3000® Index representing approximately 10% of the total market capitalization of that index. It includes approximately 2,000 of the smallest securities based on a combination of their market cap and current index membership. The Russell 2000 Index is constructed to provide a comprehensive and unbiased small-cap barometer and is completely reconstituted annually to ensure larger stocks do not distort the performance and characteristics of the true small-cap opportunity set. Results include the reinvestment of all distributions.
Russell 2000 Value Index measures the performance of the small-cap value segment of the U.S. equity universe. It includes those Russell 2000 Index companies with lower price-to-book ratios and lower forecasted growth values. The Russell 2000 Value Index is constructed to provide a comprehensive and unbiased barometer for the small-cap value segment. The Index is completely reconstituted annually to ensure larger stocks do not distort the performance and characteristics of the true small-cap opportunity set and that the represented companies continue to reflect value characteristics. Results include the reinvestment of all distributions.
Russell 2500 Index measures the performance of the small to mid-cap segment of the U.S. equity universe, commonly referred to as “smid cap.” The Russell 2500 Index is a subset of the Russell 3000 Index. It includes approximately 2,500 of the smallest securities based on a combination of their market cap and current index membership. The Russell 2500 Index is constructed to provide a comprehensive and unbiased barometer for the small- to mid-cap segment. The Index is completely reconstituted annually to ensure larger stocks do not distort the performance and characteristics of the true small to mid-cap opportunity set. Results include the reinvestment of all distributions.
Russell 3000 Index measures the performance of the largest 3,000 U.S. companies representing approximately 98% of the investable U.S. equity market. Results include the reinvestment of all distributions.
S&P 500 Index is a capitalization-weighted index of 500 stocks. The index is designed to measure performance of the broad domestic economy through changes in the aggregate market value of 500 stocks representing all major industries. Results include the reinvestment of all distributions.
A-28
Table of Contents
PACIFIC FUNDSSM PORTFOLIO OPTIMIZATION CONSERVATIVE
Schedule of Investments
March 31, 2018
PACIFIC FUNDS
PACIFIC FUNDSSM PORTFOLIO OPTIMIZATION MODERATE-CONSERVATIVE
Schedule of Investments
March 31, 2018
Shares | Value | |||||||
AFFILIATED MUTUAL FUNDS - 100.1% | ||||||||
Pacific Funds Core Income ‘P’ | 1,144,727 | $12,008,188 | ||||||
Pacific Funds Floating Rate Income ‘P’ | 1,063,960 | 10,788,557 | ||||||
Pacific Funds High Income ‘P’ | 1,314,855 | 13,332,629 | ||||||
PF Inflation Managed Fund ‘P’ | 2,529,039 | 22,457,862 | ||||||
PF Managed Bond Fund ‘P’ | 10,258,248 | 108,532,267 | ||||||
PF Short Duration Bond Fund ‘P’ | 4,100,194 | 40,140,896 | ||||||
PF Emerging Markets Debt Fund ‘P’ | 1,319,319 | 12,362,023 | ||||||
PF Comstock Fund ‘P’ | 283,141 | 4,391,519 | ||||||
PF Growth Fund ‘P’ | 85,809 | 2,177,824 | ||||||
PF Large-Cap Growth Fund ‘P’ | 40,720 | 431,220 | ||||||
PF Large-Cap Value Fund ‘P’ | 317,292 | 5,438,384 | ||||||
PF Main Street Core Fund ‘P’ | 124,691 | 1,735,705 | ||||||
PF Mid-Cap Equity Fund ‘P’ | 68,605 | 736,134 | ||||||
PF Mid-Cap Value Fund ‘P’ | 371,025 | 4,689,761 | ||||||
PF Small-Cap Value Fund ‘P’ | 131,005 | 1,469,882 | ||||||
PF Emerging Markets Fund ‘P’ | 434,893 | 7,523,652 | ||||||
PF International Large-Cap Fund ‘P’ | 275,571 | 5,745,646 | ||||||
PF International Small-Cap Fund ‘P’ | 268,096 | 3,013,395 | ||||||
PF International Value Fund ‘P’ | 239,427 | 2,434,976 | ||||||
PF Real Estate Fund ‘P’ | 129,847 | 1,539,980 | ||||||
PF Currency Strategies Fund ‘P’ | 615,085 | 5,609,576 | ||||||
PF Equity Long/Short Fund ‘P’ | 574,762 | 5,580,935 | ||||||
PF Global Absolute Return Fund ‘P’ | 598,826 | 5,670,880 | ||||||
PF Multi-Asset Fund ‘P’ * | 3,001,545 | 28,274,555 | ||||||
|
| |||||||
Total Affiliated Mutual Funds | 306,086,446 | |||||||
|
| |||||||
TOTAL INVESTMENTS - 100.1% | 306,086,446 | |||||||
OTHER ASSETS & LIABILITIES, NET - (0.1%) | (278,218 | ) | ||||||
|
| |||||||
NET ASSETS - 100.0% | $305,808,228 | |||||||
|
| |||||||
Notes to Schedule of Investments
| (a) | As of March 31, 2018, the Fund’s composition as a percentage of net assets was as follows: |
Affiliated Fixed Income Funds | 73.7% | |||
Affiliated Equity Funds | 26.4% | |||
|
| |||
| 100.1% | ||||
Other Assets & Liabilities, Net | (0.1% | ) | ||
|
| |||
| 100.0% | ||||
|
|
Shares | Value | |||||||
AFFILIATED MUTUAL FUNDS - 100.1% | ||||||||
Pacific Funds Core Income ‘P’ | 1,439,561 | $15,100,997 | ||||||
Pacific Funds Floating Rate Income ‘P’ | 1,580,115 | 16,022,369 | ||||||
Pacific Funds High Income ‘P’ | 1,143,805 | 11,598,181 | ||||||
PF Inflation Managed Fund ‘P’ | 2,122,750 | 18,850,021 | ||||||
PF Managed Bond Fund ‘P’ | 12,926,476 | 136,762,116 | ||||||
PF Short Duration Bond Fund ‘P’ | 3,219,737 | 31,521,230 | ||||||
PF Emerging Markets Debt Fund ‘P’ | 1,713,577 | 16,056,221 | ||||||
Pacific Funds Small-Cap Growth ‘P’ | 122,248 | 1,509,760 | ||||||
PF Comstock Fund ‘P’ | 716,854 | 11,118,411 | ||||||
PF Developing Growth Fund ‘P’ * | 43,980 | 652,667 | ||||||
PF Growth Fund ‘P’ | 91,827 | 2,330,560 | ||||||
PF Large-Cap Growth Fund ‘P’ | 221,741 | 2,348,242 | ||||||
PF Large-Cap Value Fund ‘P’ | 734,387 | 12,587,390 | ||||||
PF Main Street Core Fund ‘P’ | 756,393 | 10,528,986 | ||||||
PF Mid-Cap Equity Fund ‘P’ | 264,747 | 2,840,731 | ||||||
PF Mid-Cap Value Fund ‘P’ | 550,440 | 6,957,566 | ||||||
PF Small-Cap Value Fund ‘P’ | 391,132 | 4,388,500 | ||||||
PF Emerging Markets Fund ‘P’ | 1,033,882 | 17,886,152 | ||||||
PF International Large-Cap Fund ‘P’ | 623,058 | 12,990,756 | ||||||
PF International Small-Cap Fund ‘P’ | 795,890 | 8,945,799 | ||||||
PF International Value Fund ‘P’ | 977,694 | 9,943,151 | ||||||
PF Real Estate Fund ‘P’ | 385,495 | 4,571,967 | ||||||
PF Currency Strategies Fund ‘P’ | 913,667 | 8,332,641 | ||||||
PF Equity Long/Short Fund ‘P’ | 853,603 | 8,288,482 | ||||||
PF Global Absolute Return Fund ‘P’ | 889,419 | 8,422,793 | ||||||
PF Multi-Asset Fund ‘P’ * | 7,581,667 | 71,419,307 | ||||||
|
| |||||||
Total Affiliated Mutual Funds | 451,974,996 | |||||||
|
| |||||||
TOTAL INVESTMENTS - 100.1% | 451,974,996 | |||||||
OTHER ASSETS & LIABILITIES, NET - (0.1%) | (444,190 | ) | ||||||
|
| |||||||
NET ASSETS - 100.0% | $451,530,806 | |||||||
|
| |||||||
Notes to Schedule of Investments
| (a) | As of March 31, 2018, the Fund’s composition as a percentage of net assets was as follows: |
Affiliated Fixed Income Funds | 56.3% | |||
Affiliated Equity Funds | 43.8% | |||
|
| |||
| 100.1% | ||||
Other Assets & Liabilities, Net | (0.1% | ) | ||
|
| |||
| 100.0% | ||||
|
|
| (b) | The Funds’ investments are affiliated mutual funds (See Note 7C in Notes to Financial Statements). |
| (c) | Fair Value Measurements |
The following is a summary of the Funds’ investments as categorized under the three-tier hierarchy of inputs used in valuing the Funds’ assets and liabilities (See Note 3D in Notes to Financial Statements) as of March 31, 2018:
| Total Value at March 31, 2018 | Level 1 Quoted Price | Level 2 Significant Observable Inputs | Level 3 Significant Unobservable Inputs | |||||||||||||||
Pacific Funds Portfolio Optimization Conservative |
| |||||||||||||||||
Assets | Affiliated Mutual Funds | $306,086,446 | $306,086,446 | $— | $— | |||||||||||||
|
|
|
|
|
|
|
| |||||||||||
Pacific Funds Portfolio Optimization Moderate-Conservative |
| |||||||||||||||||
Assets | Affiliated Mutual Funds | $451,974,996 | $451,974,996 | $— | $— | |||||||||||||
|
|
|
|
|
|
|
| |||||||||||
| See Notes to Financial Statements | See explanation of symbols and terms, if any, on B-45 |
B-1
Table of Contents
PACIFIC FUNDS
PACIFIC FUNDSSM PORTFOLIO OPTIMIZATION MODERATE
Schedule of Investments
March 31, 2018
PACIFIC FUNDS
PACIFIC FUNDSSM PORTFOLIO OPTIMIZATION GROWTH
Schedule of Investments
March 31, 2018
Shares | Value | |||||||
AFFILIATED MUTUAL FUNDS - 100.2% | ||||||||
Pacific Funds Core Income ‘P’ | 2,846,854 | $29,863,502 | ||||||
Pacific Funds Floating Rate Income ‘P’ | 2,007,201 | 20,353,016 | ||||||
Pacific Funds High Income ‘P’ | 3,324,264 | 33,708,038 | ||||||
PF Inflation Managed Fund ‘P’ | 3,068,110 | 27,244,820 | ||||||
PF Managed Bond Fund ‘P’ | 25,006,028 | 264,563,772 | ||||||
PF Short Duration Bond Fund ‘P’ | 4,149,467 | 40,623,281 | ||||||
PF Emerging Markets Debt Fund ‘P’ | 2,901,593 | 27,187,923 | ||||||
Pacific Funds Small-Cap Growth ‘P’ | 779,770 | 9,630,161 | ||||||
PF Comstock Fund ‘P’ | 2,410,244 | 37,382,885 | ||||||
PF Developing Growth Fund ‘P’ * | 217,841 | 3,232,758 | ||||||
PF Growth Fund ‘P’ | 2,648,085 | 67,208,407 | ||||||
PF Large-Cap Growth Fund ‘P’ | 1,613,648 | 17,088,528 | ||||||
PF Large-Cap Value Fund ‘P’ | 2,787,714 | 47,781,415 | ||||||
PF Main Street Core Fund ‘P’ | 3,659,250 | 50,936,766 | ||||||
PF Mid-Cap Equity Fund ‘P’ | 1,207,641 | 12,957,985 | ||||||
PF Mid-Cap Value Fund ‘P’ | 2,755,559 | 34,830,270 | ||||||
PF Small-Cap Value Fund ‘P’ | 2,909,220 | 32,641,447 | ||||||
PF Emerging Markets Fund ‘P’ | 3,829,511 | 66,250,540 | ||||||
PF International Large-Cap Fund ‘P’ | 2,035,296 | 42,435,927 | ||||||
PF International Small-Cap Fund ‘P’ | 2,948,991 | 33,146,658 | ||||||
PF International Value Fund ‘P’ | 4,149,609 | 42,201,525 | ||||||
PF Real Estate Fund ‘P’ | 1,143,886 | 13,566,494 | ||||||
PF Currency Strategies Fund ‘P’ | 2,556,410 | 23,314,463 | ||||||
PF Equity Long/Short Fund ‘P’ | 2,254,823 | 21,894,327 | ||||||
PF Global Absolute Return Fund ‘P’ | 2,348,741 | 22,242,579 | ||||||
PF Multi-Asset Fund ‘P’ * | 32,226,909 | 303,577,481 | ||||||
|
| |||||||
Total Affiliated Mutual Funds | 1,325,864,968 | |||||||
|
| |||||||
TOTAL INVESTMENTS - 100.2% | 1,325,864,968 | |||||||
OTHER ASSETS & LIABILITIES, NET - (0.2%) | (2,139,979 | ) | ||||||
|
| |||||||
NET ASSETS - 100.0% | $1,323,724,989 | |||||||
|
| |||||||
Notes to Schedule of Investments
| (a) | As of March 31, 2018, the Fund’s composition as a percentage of net assets was as follows: |
Affiliated Equity Funds | 65.0% | |||
Affiliated Fixed Income Funds | 35.2% | |||
|
| |||
| 100.2% | ||||
Other Assets & Liabilities, Net | (0.2% | ) | ||
|
| |||
| 100.0% | ||||
|
|
Shares | Value | |||||||
AFFILIATED MUTUAL FUNDS - 100.2% | ||||||||
Pacific Funds Core Income ‘P’ | 930,719 | $9,763,241 | ||||||
Pacific Funds Floating Rate Income ‘P’ | 1,012,862 | 10,270,420 | ||||||
Pacific Funds High Income ‘P’ | 1,008,773 | 10,228,959 | ||||||
PF Inflation Managed Fund ‘P’ | 581,669 | 5,165,217 | ||||||
PF Managed Bond Fund ‘P’ | 8,370,455 | 88,559,419 | ||||||
PF Emerging Markets Debt Fund ‘P’ | 2,198,992 | 20,604,556 | ||||||
Pacific Funds Small-Cap Growth ‘P’ | 868,661 | 10,727,966 | ||||||
PF Comstock Fund ‘P’ | 3,070,904 | 47,629,727 | ||||||
PF Developing Growth Fund ‘P�� * | 264,884 | 3,930,872 | ||||||
PF Growth Fund ‘P’ | 3,945,609 | 100,139,562 | ||||||
PF Large-Cap Growth Fund ‘P’ | 1,582,267 | 16,756,209 | ||||||
PF Large-Cap Value Fund ‘P’ | 3,613,674 | 61,938,367 | ||||||
PF Main Street Core Fund ‘P’ | 3,812,101 | 53,064,448 | ||||||
PF Mid-Cap Equity Fund ‘P’ | 915,087 | 9,818,882 | ||||||
PF Mid-Cap Value Fund ‘P’ | 1,574,318 | 19,899,376 | ||||||
PF Small-Cap Value Fund ‘P’ | 2,645,058 | 29,677,556 | ||||||
PF Emerging Markets Fund ‘P’ | 3,482,751 | 60,251,593 | ||||||
PF International Large-Cap Fund ‘P’ | 2,163,835 | 45,115,963 | ||||||
PF International Small-Cap Fund ‘P’ | 2,682,550 | 30,151,859 | ||||||
PF International Value Fund ‘P’ | 6,189,298 | 62,945,157 | ||||||
PF Real Estate Fund ‘P’ | 1,300,119 | 15,419,418 | ||||||
PF Currency Strategies Fund ‘P’ | 1,478,671 | 13,485,480 | ||||||
PF Equity Long/Short Fund ‘P’ | 1,394,369 | 13,539,320 | ||||||
PF Global Absolute Return Fund ‘P’ | 1,453,610 | 13,765,686 | ||||||
PF Multi-Asset Fund ‘P’ * | 25,724,897 | 242,328,530 | ||||||
|
| |||||||
Total Affiliated Mutual Funds | 995,177,783 | |||||||
|
| |||||||
TOTAL INVESTMENTS - 100.2% | 995,177,783 | |||||||
OTHER ASSETS & LIABILITIES, NET - (0.2%) | (1,790,782 | ) | ||||||
|
| |||||||
NET ASSETS - 100.0% | $993,387,001 | |||||||
|
| |||||||
Notes to Schedule of Investments
| (a) | As of March 31, 2018, the Fund’s composition as a percentage of net assets was as follows: |
Affiliated Equity Funds | 84.2% | |||
Affiliated Fixed Income Funds | 16.0% | |||
|
| |||
| 100.2% | ||||
Other Assets & Liabilities, Net | (0.2% | ) | ||
|
| |||
| 100.0% | ||||
|
|
| (b) | The Funds’ investments are affiliated mutual funds (See Note 7C in Notes to Financial Statements). |
| (c) | Fair Value Measurements |
The following is a summary of the Funds’ investments as categorized under the three-tier hierarchy of inputs used in valuing the Funds’ assets and liabilities (See Note 3D in Notes to Financial Statements) as of March 31, 2018:
| Total Value at March 31, 2018 | Level 1 Quoted Price | Level 2 Significant Observable Inputs | Level 3 Significant Unobservable Inputs | |||||||||||||||
Pacific Funds Portfolio Optimization Moderate |
| |||||||||||||||||
Assets | Affiliated Mutual Funds | $1,325,864,968 | $1,325,864,968 | $— | $— | |||||||||||||
|
|
|
|
|
|
|
| |||||||||||
Pacific Funds Portfolio Optimization Growth |
| |||||||||||||||||
Assets | Affiliated Mutual Funds | $995,177,783 | $995,177,783 | $— | $— | |||||||||||||
|
|
|
|
|
|
|
| |||||||||||
| See Notes to Financial Statements | See explanation of symbols and terms, if any, on B-45 |
B-2
Table of Contents
PACIFIC FUNDS
PACIFIC FUNDSSM PORTFOLIO OPTIMIZATION AGGRESSIVE-GROWTH
Schedule of Investments
March 31, 2018
PACIFIC FUNDS
PACIFIC FUNDSSM DIVERSIFIED ALTERNATIVES
Schedule of Investments
March 31, 2018
Shares | Value | |||||||
AFFILIATED MUTUAL FUNDS - 100.1% | ||||||||
Pacific Funds Floating Rate Income ‘P’ | 341,576 | $3,463,583 | ||||||
PF Managed Bond Fund ‘P’ | 2,272 | 24,042 | ||||||
PF Emerging Markets Debt Fund ‘P’ | 368,848 | 3,456,106 | ||||||
Pacific Funds Small-Cap Growth ‘P’ | 397,073 | 4,903,851 | ||||||
PF Comstock Fund ‘P’ | 1,054,484 | 16,355,050 | ||||||
PF Developing Growth Fund ‘P’ * | 111,171 | 1,649,781 | ||||||
PF Growth Fund ‘P’ | 1,373,671 | 34,863,767 | ||||||
PF Large-Cap Growth Fund ‘P’ | 1,265,143 | 13,397,863 | ||||||
PF Large-Cap Value Fund ‘P’ | 1,587,020 | 27,201,526 | ||||||
PF Main Street Core Fund ‘P’ | 1,497,489 | 20,845,041 | ||||||
PF Mid-Cap Equity Fund ‘P’ | 462,076 | 4,958,077 | ||||||
PF Mid-Cap Value Fund ‘P’ | 350,247 | 4,427,120 | ||||||
PF Small-Cap Value Fund ‘P’ | 1,189,093 | 13,341,629 | ||||||
PF Emerging Markets Fund ‘P’ | 1,368,350 | 23,672,464 | ||||||
PF International Large-Cap Fund ‘P’ | 916,541 | 19,109,882 | ||||||
PF International Small-Cap Fund ‘P’ | 1,050,850 | 11,811,550 | ||||||
PF International Value Fund ‘P’ | 2,570,755 | 26,144,575 | ||||||
PF Real Estate Fund ‘P’ | 437,657 | 5,190,610 | ||||||
PF Currency Strategies Fund ‘P’ | 384,784 | 3,509,231 | ||||||
PF Equity Long/Short Fund ‘P’ | 348,272 | 3,381,718 | ||||||
PF Global Absolute Return Fund ‘P’ | 364,133 | 3,448,337 | ||||||
PF Multi-Asset Fund ‘P’ * | 9,313,524 | 87,733,392 | ||||||
|
| |||||||
Total Affiliated Mutual Funds | 332,889,195 | |||||||
|
| |||||||
TOTAL INVESTMENTS - 100.1% | 332,889,195 | |||||||
OTHER ASSETS & LIABILITIES, NET - (0.1%) | (311,550 | ) | ||||||
|
| |||||||
NET ASSETS - 100.0% | $332,577,645 | |||||||
|
| |||||||
Notes to Schedule of Investments
| (a) | As of March 31, 2018, the Fund’s composition as a percentage of net assets was as follows: |
Affiliated Equity Funds | 97.0% | |||
Affiliated Fixed Income Funds | 3.1% | |||
|
| |||
| 100.1% | ||||
Other Assets & Liabilities, Net | (0.1% | ) | ||
|
| |||
| 100.0% | ||||
|
|
Shares | Value | |||||||
AFFILIATED MUTUAL FUNDS - 99.8% | ||||||||
Pacific Funds Floating Rate Income ‘P’ | 363,236 | $3,683,217 | ||||||
PF Inflation Managed Fund ‘P’ | 231,554 | 2,056,202 | ||||||
PF Emerging Markets Debt Fund ‘P’ | 649,878 | 6,089,353 | ||||||
PF Emerging Markets Fund ‘P’ | 161,841 | 2,799,853 | ||||||
PF International Small-Cap Fund ‘P’ | 246,914 | 2,775,316 | ||||||
PF Real Estate Fund ‘P’ | 103,555 | 1,228,163 | ||||||
PF Currency Strategies Fund ‘P’ | 913,870 | 8,334,492 | ||||||
PF Equity Long/Short Fund ‘P’ | 454,320 | 4,411,448 | ||||||
PF Global Absolute Return Fund ‘P’ | 991,327 | 9,387,866 | ||||||
|
| |||||||
Total Affiliated Mutual Funds | 40,765,910 | |||||||
|
| |||||||
TOTAL INVESTMENTS - 99.8% | 40,765,910 | |||||||
OTHER ASSETS & LIABILITIES, NET - 0.2% | 91,277 | |||||||
|
| |||||||
NET ASSETS - 100.0% | $40,857,187 | |||||||
|
| |||||||
Notes to Schedule of Investments
| (a) | As of March 31, 2018, the Fund’s composition as a percentage of net assets was as follows: |
Affiliated Fixed Income Funds | 51.9% | |||
Affiliated Equity Funds | 47.9% | |||
|
| |||
| 99.8% | ||||
Other Assets & Liabilities, Net | 0.2% | |||
|
| |||
| 100.0% | ||||
|
|
| (b) | The Funds’ investments are affiliated mutual funds (See Note 7C in Notes to Financial Statements). |
| (c) | Fair Value Measurements |
The following is a summary of the Funds’ investments as categorized under the three-tier hierarchy of inputs used in valuing the Funds’ assets and liabilities (See Note 3D in Notes to Financial Statements) as of March 31, 2018:
Total Value at March 31, 2018 | Level 1 Quoted Price | Level 2 Significant Observable Inputs | Level 3 Significant Unobservable Inputs | |||||||||||||||
Pacific Funds Portfolio Optimization Aggressive-Growth |
| |||||||||||||||||
Assets | Affiliated Mutual Funds | $332,889,195 | $332,889,195 | $— | $— | |||||||||||||
|
|
|
|
|
|
|
| |||||||||||
Pacific Funds Diversified Alternatives |
| |||||||||||||||||
Assets | Affiliated Mutual Funds | $40,765,910 | $40,765,910 | $— | $— | |||||||||||||
|
|
|
|
|
|
|
| |||||||||||
| See Notes to Financial Statements | See explanation of symbols and terms, if any, on B-45 |
B-3
Table of Contents
PACIFIC FUNDS
PACIFIC FUNDSSM SHORT DURATION INCOME
Schedule of Investments
March 31, 2018
Principal Amount |
| |||||||
CORPORATE BONDS & NOTES - 70.2% | ||||||||
Basic Materials - 1.4% | ||||||||
Anglo American Capital PLC (United Kingdom) 3.750% due 04/10/22 ~ | $3,000,000 | $2,993,166 | ||||||
Glencore Funding LLC (Switzerland) | 3,000,000 | 2,897,445 | ||||||
|
| |||||||
| 5,890,611 | ||||||||
|
| |||||||
Communications - 7.0% | ||||||||
Alibaba Group Holding Ltd (China) | ||||||||
2.800% due 06/06/23 | 1,700,000 | 1,644,407 | ||||||
3.125% due 11/28/21 | 2,856,000 | 2,850,444 | ||||||
AT&T Inc | 3,000,000 | 2,985,948 | ||||||
Charter Communications Operating LLC | 3,738,000 | 3,750,033 | ||||||
DISH DBS Corp | 2,000,000 | 2,005,200 | ||||||
eBay Inc | 1,750,000 | 1,763,702 | ||||||
Sprint Corp | 1,000,000 | 1,036,250 | ||||||
Sprint Spectrum Co LLC | 1,750,000 | 1,743,437 | ||||||
Tencent Holdings Ltd (China) | 3,000,000 | 3,005,310 | ||||||
2.875% due 02/11/20 ~ | 2,765,000 | 2,760,784 | ||||||
Verizon Communications Inc | ||||||||
1.750% due 08/15/21 | 3,250,000 | 3,103,687 | ||||||
3.145% (USD LIBOR + 1.000%) due 03/16/22 § | 2,250,000 | 2,294,280 | ||||||
|
| |||||||
| 28,943,482 | ||||||||
|
| |||||||
Consumer, Cyclical - 6.5% | ||||||||
Alimentation Couche-Tard Inc (Canada) | 3,000,000 | 2,910,553 | ||||||
Daimler Finance North America LLC (Germany) 2.300% due 02/12/21 ~ | 5,000,000 | 4,877,826 | ||||||
Delta Air Lines Inc | ||||||||
2.600% due 12/04/20 | 2,050,000 | 2,012,421 | ||||||
2.875% due 03/13/20 | 1,250,000 | 1,242,297 | ||||||
Ford Motor Credit Co LLC | 3,500,000 | 3,551,919 | ||||||
General Motors Financial Co Inc | 3,500,000 | 3,552,771 | ||||||
GLP Capital LP | 1,750,000 | 1,790,512 | ||||||
Hyundai Capital America | 1,000,000 | 997,252 | ||||||
Lennar Corp | 1,500,000 | 1,511,250 | ||||||
Toll Brothers Finance Corp | 3,350,000 | 3,379,145 | ||||||
United Airlines Pass-Through Trust ‘B’ | ||||||||
4.625% due 03/03/24 | 764,806 | 775,934 | ||||||
4.750% due 10/11/23 | 577,522 | 587,513 | ||||||
|
| |||||||
| 27,189,393 | ||||||||
|
| |||||||
Consumer, Non-Cyclical - 13.1% | ||||||||
AbbVie Inc | 2,000,000 | 1,950,687 | ||||||
Anheuser-Busch InBev Finance Inc (Belgium) 2.650% due 02/01/21 | 4,000,000 | 3,970,683 | ||||||
Principal Amount |
| |||||||
Anheuser-Busch InBev Worldwide Inc (Belgium) 3.052% (USD LIBOR + 0.740%) | $ | 1,350,000 | $ | 1,359,000 | ||||
BAT Capital Corp (United Kingdom) | 5,000,000 | 5,017,392 | ||||||
2.764% due 08/15/22 ~ | 2,000,000 | 1,935,852 | ||||||
Becton Dickinson and Co | ||||||||
2.133% due 06/06/19 | 4,650,000 | 4,598,356 | ||||||
2.944% (USD LIBOR + 0.875%) | ||||||||
due 12/29/20 § | 2,000,000 | 2,002,387 | ||||||
Campbell Soup Co | 7,000,000 | 7,045,214 | ||||||
Cardinal Health Inc | 3,000,000 | 2,999,613 | ||||||
CHS/Community Health Systems Inc | 500,000 | 467,500 | ||||||
CVS Health Corp | 2,000,000 | 2,015,875 | ||||||
Humana Inc | 2,500,000 | 2,487,414 | ||||||
Laboratory Corp of America Holdings | 2,500,000 | 2,481,113 | ||||||
Moody’s Corp | 3,000,000 | 2,898,483 | ||||||
Mylan NV | 3,000,000 | 2,977,337 | ||||||
Smithfield Foods Inc | 3,280,000 | 3,236,092 | ||||||
Teva Pharmaceutical Finance Netherlands III BV (Israel) | 2,500,000 | 2,252,567 | ||||||
Valeant Pharmaceuticals International Inc | 3,075,000 | 3,186,469 | ||||||
Zimmer Biomet Holdings Inc | 1,350,000 | 1,352,258 | ||||||
|
| |||||||
| 54,234,292 | ||||||||
|
| |||||||
Energy - 3.5% | ||||||||
Andeavor Logistics LP | 900,000 | 885,096 | ||||||
BP Capital Markets PLC (United Kingdom) | 2,000,000 | 1,991,159 | ||||||
EQT Corp | 2,800,000 | 2,739,812 | ||||||
Kinder Morgan Inc | 3,000,000 | 3,214,248 | ||||||
Nabors Industries Inc | 300,000 | 294,783 | ||||||
Petrobras Global Finance BV (Brazil) | 3,400,000 | 3,641,400 | ||||||
Summit Midstream Holdings LLC | 1,750,000 | 1,715,000 | ||||||
|
| |||||||
| 14,481,498 | ||||||||
|
| |||||||
Financial - 31.6% | ||||||||
AerCap Ireland Capital DAC (Netherlands) | ||||||||
3.300% due 01/23/23 | 3,100,000 | 3,017,149 | ||||||
4.250% due 07/01/20 | 2,000,000 | 2,036,124 | ||||||
Air Lease Corp | ||||||||
2.500% due 03/01/21 | 2,000,000 | 1,962,223 | ||||||
2.750% due 01/15/23 | 2,000,000 | 1,932,413 | ||||||
American Express Co | 2,000,000 | 1,951,350 | ||||||
American Tower Corp REIT | 3,500,000 | 3,513,052 | ||||||
| See Notes to Financial Statements | See explanation of symbols and terms, if any, on B-45 |
B-4
Table of Contents
PACIFIC FUNDS
PACIFIC FUNDS SHORT DURATION INCOME
Schedule of Investments (Continued)
March 31, 2018
Principal Amount |
| |||||||
Ares Capital Corp | $ | 3,500,000 | $ | 3,403,215 | ||||
Australia & New Zealand Banking Group Ltd (Australia) | 5,000,000 | 5,039,607 | ||||||
Bank of America Corp | ||||||||
2.328% due 10/01/21 | 2,450,000 | 2,396,330 | ||||||
2.557% (USD LIBOR + 0.770%) | ||||||||
due 02/05/26 § | 3,000,000 | 2,942,156 | ||||||
2.925% (USD LIBOR + 1.180%) | ||||||||
due 10/21/22 § | 3,500,000 | 3,555,682 | ||||||
3.550% due 03/05/24 | 1,700,000 | 1,705,756 | ||||||
BOC Aviation Ltd (Singapore) | 3,500,000 | 3,351,260 | ||||||
Capital One Financial Corp | 1,625,000 | 1,614,313 | ||||||
Capital One NA | 1,625,000 | 1,632,098 | ||||||
CBOE Global Markets Inc | 1,750,000 | 1,729,906 | ||||||
Citigroup Inc | 4,500,000 | 4,612,500 | ||||||
Citizens Bank NA | 2,000,000 | 2,002,237 | ||||||
Cooperatieve Rabobank UA (Netherlands) | 5,000,000 | 4,994,137 | ||||||
Credit Suisse Group AG (Switzerland) | 3,000,000 | 3,043,207 | ||||||
Credit Suisse Group Funding Guernsey Ltd (Switzerland) | 1,500,000 | 1,500,520 | ||||||
Crown Castle International Corp REIT | ||||||||
2.250% due 09/01/21 | 3,000,000 | 2,893,364 | ||||||
4.875% due 04/15/22 | 2,000,000 | 2,102,610 | ||||||
HSBC Holdings PLC (United Kingdom) | ||||||||
3.262% due 03/13/23 | 3,400,000 | 3,356,689 | ||||||
3.821% (USD LIBOR + 1.500%) | ||||||||
due 01/05/22 § | 2,000,000 | 2,060,721 | ||||||
Industrial & Commercial Bank of China Ltd (China) | 3,830,000 | 3,710,080 | ||||||
ING Groep NV (Netherlands) | 2,250,000 | 2,286,609 | ||||||
Intesa Sanpaolo SpA (Italy) | 2,000,000 | 1,953,950 | ||||||
Jefferies Finance LLC | 1,000,000 | 1,015,000 | ||||||
JPMorgan Chase & Co | 3,450,000 | 3,465,326 | ||||||
2.971% (USD LIBOR + 1.230%) | ||||||||
due 10/24/23 § | 1,500,000 | 1,523,165 | ||||||
Mitsubishi UFJ Financial Group Inc (Japan) 2.665% due 07/25/22 | 5,000,000 | 4,845,638 | ||||||
Morgan Stanley | ||||||||
2.450% due 02/01/19 | 2,000,000 | 1,996,314 | ||||||
2.675% (USD LIBOR + 0.930%) | ||||||||
due 07/22/22 § | 4,000,000 | 4,017,042 | ||||||
3.141% (USD LIBOR + 1.400%) | ||||||||
due 10/24/23 § | 1,500,000 | 1,534,999 | ||||||
Royal Bank of Scotland Group PLC (United Kingdom) | 1,850,000 | 1,867,232 | ||||||
Principal Amount |
| |||||||
SL Green Operating Partnership LP REIT | $ | 1,150,000 | $ | 1,122,372 | ||||
Sumitomo Mitsui Financial Group Inc (Japan) 2.471% (USD LIBOR + 0.740%) | 5,000,000 | 5,012,488 | ||||||
2.784% due 07/12/22 | 3,250,000 | 3,170,694 | ||||||
The Allstate Corp | 1,000,000 | 1,002,604 | ||||||
The Goldman Sachs Group Inc | ||||||||
2.552% (USD LIBOR + 0.780%) | ||||||||
due 10/31/22 § | 6,000,000 | 5,992,816 | ||||||
3.075% (USD LIBOR + 1.050%) | ||||||||
due 06/05/23 § | 3,750,000 | 3,772,034 | ||||||
UBS AG (Switzerland) | 4,200,000 | 4,126,916 | ||||||
Wells Fargo & Co | ||||||||
2.625% due 07/22/22 | 4,400,000 | 4,257,636 | ||||||
3.450% due 02/13/23 | 3,000,000 | 2,960,652 | ||||||
Westpac Banking Corp (Australia) | 3,000,000 | 2,991,608 | ||||||
|
| |||||||
| 130,973,794 | ||||||||
|
| |||||||
Industrial - 2.0% | ||||||||
Masco Corp | 2,811,000 | 2,826,376 | ||||||
Northrop Grumman Corp | 2,800,000 | 2,741,216 | ||||||
Park Aerospace Holdings Ltd (Ireland) | 750,000 | 737,587 | ||||||
United Parcel Service Inc | 2,000,000 | 1,956,556 | ||||||
|
| |||||||
| 8,261,735 | ||||||||
|
| |||||||
Technology - 2.2% | ||||||||
Dell International LLC | ||||||||
3.480% due 06/01/19 ~ | 2,500,000 | 2,511,847 | ||||||
Fidelity National Information Services Inc | 2,150,000 | 2,151,261 | ||||||
VMware Inc | 4,650,000 | 4,524,576 | ||||||
|
| |||||||
| 9,187,684 | ||||||||
|
| |||||||
Utilities - 2.9% | ||||||||
Duke Energy Corp | 2,150,000 | 2,066,032 | ||||||
Emera US Finance LP (Canada) | 3,500,000 | 3,459,206 | ||||||
FirstEnergy Corp | 3,800,000 | 3,688,317 | ||||||
Sempra Energy | 3,000,000 | 3,001,691 | ||||||
|
| |||||||
| 12,215,246 | ||||||||
|
| |||||||
Total Corporate Bonds & Notes | 291,377,735 | |||||||
|
| |||||||
SENIOR LOAN NOTES - 13.0% | ||||||||
Basic Materials - 0.4% | ||||||||
INEOS US Finance LLC Term B (Luxembourg) 3.877% (USD LIBOR + 2.000%) | 498,750 | 500,776 | ||||||
PQ Corp Term B | 985,031 | 989,517 | ||||||
|
| |||||||
| 1,490,293 | ||||||||
|
| |||||||
| See Notes to Financial Statements | See explanation of symbols and terms, if any, on B-45 |
B-5
Table of Contents
PACIFIC FUNDS
PACIFIC FUNDS SHORT DURATION INCOME
Schedule of Investments (Continued)
March 31, 2018
Principal Amount |
| |||||||
Communications - 2.7% | ||||||||
Altice US Finance I Corp Term B | $ | 2,493,719 | $ | 2,493,719 | ||||
Avaya Inc Term B | 1,496,250 | 1,509,498 | ||||||
Charter Communications Operating LLC Term B 3.880% (USD LIBOR + 2.000%) | 598,500 | 601,343 | ||||||
CSC Holdings LLC | 976,992 | 977,236 | ||||||
Frontier Communications Corp Term B-1 | 2,481,250 | 2,453,336 | ||||||
Sprint Communications Inc Term B | 2,972,487 | 2,976,667 | ||||||
|
| |||||||
| 11,011,799 | ||||||||
|
| |||||||
Consumer, Cyclical - 3.5% | ||||||||
BJ’s Wholesale Club Inc Term B | 1,496,231 | 1,496,912 | ||||||
HD Supply Inc Term B-3 | 1,259,299 | 1,268,941 | ||||||
Hilton Worldwide Finance LLC Term B-2 | 2,642,399 | 2,659,815 | ||||||
Las Vegas Sands LLC Term B | 1,924,216 | 1,930,470 | ||||||
New Red Finance Inc Term B (Canada) | 1,470,477 | 1,473,847 | ||||||
Nexeo Solutions LLC Term B | 982,600 | 995,189 | ||||||
SeaWorld Parks & Entertainment Inc | 1,987,619 | 1,983,536 | ||||||
Term B-5 | ||||||||
5.302% (USD LIBOR + 3.000%) | ||||||||
due 03/31/24 § | 1,488,722 | 1,485,155 | ||||||
Univar USA Inc Term B-3 | 1,135,397 | 1,144,001 | ||||||
|
| |||||||
| 14,437,866 | ||||||||
|
| |||||||
Consumer, Non-Cyclical - 1.4% | ||||||||
Albertson’s LLC Term B-4 | 2,546,244 | 2,521,490 | ||||||
CHS/Community Health Systems Inc Term G 4.734% (USD LIBOR + 2.750%) | 2,000,000 | 1,955,000 | ||||||
US Foods Inc Term B | 1,473,750 | 1,485,929 | ||||||
|
| |||||||
| 5,962,419 | ||||||||
|
| |||||||
Energy - 0.4% | ||||||||
Arch Coal Inc Term B | 1,488,722 | 1,495,235 | ||||||
|
| |||||||
Principal Amount |
| |||||||
Financial - 0.9% | ||||||||
MGM Growth Properties Operating Partnership LP REIT Term B | $ | 1,470,000 | $ | 1,474,988 | ||||
USI Inc Term B | 1,990,000 | 1,998,083 | ||||||
VICI Properties 1 LLC Term B | 477,273 | 479,427 | ||||||
|
| |||||||
| 3,952,498 | ||||||||
|
| |||||||
Industrial - 2.3% | ||||||||
Avolon (US) LLC Term B-2 (Ireland) | 1,985,000 | 1,988,998 | ||||||
Berry Global Inc Term Q | 1,205,010 | 1,211,317 | ||||||
BWAY Corp Term B | 744,375 | 748,950 | ||||||
CIRCOR International Inc Term B | 997,500 | 1,001,657 | ||||||
Proampac PG Borrower LLC | 1,979,950 | 2,000,575 | ||||||
Reynolds Group Holdings Inc Term B | 2,704,968 | 2,721,874 | ||||||
|
| |||||||
| 9,673,371 | ||||||||
|
| |||||||
Technology - 0.5% | ||||||||
Tempo Acquisition LLC Term B | 1,994,975 | 2,006,197 | ||||||
|
| |||||||
Utilities - 0.9% | ||||||||
Calpine Construction Finance Co LP | 997,500 | 1,001,508 | ||||||
Talen Energy Supply LLC Term B-1 | 1,483,766 | 1,461,509 | ||||||
Vistra Operations Co LLC | ||||||||
4.377% (USD LIBOR + 2.500%) | ||||||||
due 08/04/23 § | 1,206,161 | 1,215,810 | ||||||
Term C | ||||||||
4.377% (USD LIBOR + 2.500%) | ||||||||
due 08/04/23 § | 214,286 | 216,000 | ||||||
|
| |||||||
| 3,894,827 | ||||||||
|
| |||||||
Total Senior Loan Notes | 53,924,505 | |||||||
|
| |||||||
ASSET-BACKED SECURITIES - 15.0% | ||||||||
Ally Auto Receivables Trust | ||||||||
2.480% due 05/16/22 | 535,000 | 530,191 | ||||||
3.020% due 09/15/23 | 1,000,000 | 991,606 | ||||||
ALM XII CLO Ltd (Cayman) | 3,000,000 | 3,000,696 | ||||||
| See Notes to Financial Statements | See explanation of symbols and terms, if any, on B-45 |
B-6
Table of Contents
PACIFIC FUNDS
PACIFIC FUNDS SHORT DURATION INCOME
Schedule of Investments (Continued)
March 31, 2018
Principal Amount |
| |||||||
American Express Credit Account Master Trust | ||||||||
2.157% (USD LIBOR + 0.380%) | ||||||||
due 02/18/25 § | $ | 375,000 | $ | 377,857 | ||||
2.350% due 05/15/25 | 1,500,000 | 1,468,847 | ||||||
AmeriCredit Automobile Receivables Trust | ||||||||
1.530% due 07/08/21 | 1,250,000 | 1,237,722 | ||||||
2.300% due 02/18/22 | 1,250,000 | 1,233,048 | ||||||
2.360% due 12/19/22 | 2,000,000 | 1,968,994 | ||||||
2.600% due 09/18/23 | 2,000,000 | 1,965,310 | ||||||
Babson CLO Ltd (Cayman) | 1,000,000 | 1,000,000 | ||||||
Birchwood Park CLO Ltd (Cayman) | 850,000 | 850,421 | ||||||
Capital Auto Receivables Asset Trust | 250,000 | 247,745 | ||||||
Carlyle Global Market Strategies CLO (Cayman) | ||||||||
3.310% (USD LIBOR + 1.550%) | ||||||||
due 07/27/26 § | 500,000 | 500,758 | ||||||
3.745% (USD LIBOR + 2.000%) | ||||||||
due 04/20/27 § ~ | 1,550,000 | 1,551,965 | ||||||
Chase Issuance Trust | 1,300,000 | 1,279,094 | ||||||
CIFC Funding 2015-III Ltd (Cayman) | 3,000,000 | 2,984,580 | ||||||
Citibank Credit Card Issuance Trust | ||||||||
1.750% due 11/19/21 | 1,000,000 | 985,678 | ||||||
1.800% due 09/20/21 | 1,415,000 | 1,398,439 | ||||||
2.150% due 07/15/21 | 1,157,000 | 1,150,883 | ||||||
Dryden Senior Loan Fund ‘B’ (Cayman) | 2,000,000 | 2,000,000 | ||||||
Ford Credit Auto Owner Trust | ||||||||
2.140% due 10/15/22 | 2,000,000 | 1,979,144 | ||||||
2.350% due 04/15/23 | 1,000,000 | 982,675 | ||||||
2.360% due 03/15/29 ~ | 3,000,000 | 2,918,608 | ||||||
2.500% due 05/15/24 | 1,750,000 | 1,720,376 | ||||||
OCP CLO Ltd (Cayman) | 2,000,000 | 1,999,533 | ||||||
Octagon Investment Partners 25 Ltd (Cayman) 2.704% (USD LIBOR + 0.800%) | 4,000,000 | 3,998,187 | ||||||
OneMain Financial Issuance Trust | 1,600,000 | 1,573,721 | ||||||
Regatta IV Funding CLO Ltd (Cayman) | 1,000,000 | 1,001,117 | ||||||
Santander Drive Auto Receivables Trust | ||||||||
2.080% due 02/16/21 | 650,000 | 648,519 | ||||||
2.660% due 11/15/21 | 500,000 | 499,003 | ||||||
SLC Student Loan Trust | ||||||||
2.235% (USD LIBOR + 0.110%) | ||||||||
due 03/15/27 § | 1,588,249 | 1,582,704 | ||||||
2.819% (USD LIBOR + 0.875%) | ||||||||
due 11/25/42 § | 508,803 | 515,358 | ||||||
3.725% (USD LIBOR + 1.600%) | ||||||||
due 12/15/32 § | 479,314 | 496,262 | ||||||
SLM Private Credit Student Loan Trust | ||||||||
2.415% (USD LIBOR + 0.290%) | ||||||||
due 06/15/39 § | 1,954,131 | 1,923,002 | ||||||
2.435% (USD LIBOR + 0.310%) | ||||||||
due 12/15/38 § | 800,000 | 756,101 | ||||||
SLM Private Education Loan Trust | 720,000 | 722,542 | ||||||
Principal Amount |
| |||||||
SLM Student Loan Trust | ||||||||
2.295% (USD LIBOR + 0.550%) | ||||||||
due 04/27/26 § ~ | $ | 449,072 | $ | 450,805 | ||||
2.375% (USD LIBOR + 0.630%) | ||||||||
due 01/25/40 § ~ | 1,400,000 | 1,402,843 | ||||||
SMB Private Education Loan Trust | ||||||||
2.340% due 09/15/34 ~ | 3,500,000 | 3,396,971 | ||||||
2.677% (USD LIBOR + 0.900%) | ||||||||
due 09/15/34 § ~ | 2,900,000 | 2,939,788 | ||||||
2.700% due 05/15/31 ~ | 982,498 | 969,164 | ||||||
3.227% (USD LIBOR + 1.450%) | ||||||||
due 02/17/32 § ~ | 700,000 | 719,485 | ||||||
Synchrony Credit Card Master Note Trust 2.210% due 05/15/24 | 500,000 | 489,673 | ||||||
Verizon Owner Trust | ||||||||
1.420% due 01/20/21 ~ | 250,000 | 248,067 | ||||||
2.060% due 09/20/21 ~ | 1,000,000 | 990,500 | ||||||
Washington Mill CLO Ltd (Cayman) | 500,000 | 500,553 | ||||||
|
| |||||||
Total Asset-Backed Securities | 62,148,535 | |||||||
|
| |||||||
U.S. TREASURY OBLIGATIONS - 1.4% | ||||||||
U.S. Treasury Notes - 1.4% | ||||||||
0.750% due 09/30/18 | 2,000,000 | 1,988,457 | ||||||
1.250% due 10/31/18 | 4,000,000 | 3,983,196 | ||||||
|
| |||||||
Total U.S. Treasury Obligations | 5,971,653 | |||||||
|
| |||||||
MUNICIPAL BONDS - 0.2% | ||||||||
Pennsylvania Higher Education Assistance Agency ‘A’ | 897,379 | 899,828 | ||||||
|
| |||||||
Total Municipal Bonds | 899,828 | |||||||
|
| |||||||
Shares | ||||||||
SHORT-TERM INVESTMENT - 0.3% | ||||||||
Money Market Fund - 0.3% | ||||||||
BlackRock Liquidity Funds T-Fund Portfolio | 1,055,441 | 1,055,441 | ||||||
|
| |||||||
Total Short-Term Investment | 1,055,441 | |||||||
|
| |||||||
TOTAL INVESTMENTS - 100.1% | 415,377,697 | |||||||
OTHER ASSETS & LIABILITIES, NET - (0.1%) | (246,018 | ) | ||||||
|
| |||||||
NET ASSETS - 100.0% | $415,131,679 | |||||||
|
| |||||||
| See Notes to Financial Statements | See explanation of symbols and terms, if any, on B-45 |
B-7
Table of Contents
PACIFIC FUNDS
PACIFIC FUNDS SHORT DURATION INCOME
Schedule of Investments (Continued)
March 31, 2018
Notes to Schedule of Investments
| (a) | As of March 31, 2018, the Fund’s composition as a percentage of net assets was as follows: |
Corporate Bonds & Notes | 70.2% | |||
Asset-Backed Securities | 15.0% | |||
Senior Loan Notes | 13.0% | |||
Others (each less than 3.0%) | 1.9% | |||
|
| |||
| 101.1% | ||||
Other Assets & Liabilities, Net | (0.1% | ) | ||
|
| |||
| 100.0% | ||||
|
|
| (b) | Fair Value Measurements |
The following is a summary of the Fund’s investments as categorized under the three-tier hierarchy of inputs used in valuing the Fund’s assets and liabilities (See Note 3D in Notes to Financial Statements) as of March 31, 2018:
| Total Value at March 31, 2018 | Level 1 Quoted Price | Level 2 Significant | Level 3 Significant | |||||||||||||||
Assets | Corporate Bonds & Notes | $291,377,735 | $— | $291,377,735 | $— | |||||||||||||
Senior Loan Notes | 53,924,505 | — | 53,924,505 | — | ||||||||||||||
Asset-Backed Securities | 62,148,535 | — | 62,148,535 | — | ||||||||||||||
U.S. Treasury Obligations | 5,971,653 | — | 5,971,653 | — | ||||||||||||||
Municipal Bonds | 899,828 | — | 899,828 | — | ||||||||||||||
Short-Term Investment | 1,055,441 | 1,055,441 | — | — | ||||||||||||||
|
|
|
|
|
|
|
| |||||||||||
Total | $415,377,697 | $1,055,441 | $414,322,256 | $— | ||||||||||||||
|
|
|
|
|
|
|
| |||||||||||
| See Notes to Financial Statements | See explanation of symbols and terms, if any, on B-45 |
B-8
Table of Contents
PACIFIC FUNDS
PACIFIC FUNDSSM CORE INCOME
Schedule of Investments
March 31, 2018
Shares |
| |||||||
EXCHANGE-TRADED FUND - 0.2% |
| |||||||
iShares iBoxx $ High Yield Corporate Bond | 20,000 | $1,712,800 | ||||||
|
| |||||||
Total Exchange-Traded Fund |
| 1,712,800 | ||||||
|
| |||||||
Principal Amount | ||||||||
CORPORATE BONDS & NOTES - 46.9% |
| |||||||
Basic Materials - 1.1% |
| |||||||
Glencore Funding LLC (Switzerland) | $2,000,000 | 1,933,061 | ||||||
Teck Resources Ltd (Canada) | 3,000,000 | 3,105,000 | ||||||
Vale SA (Brazil) | 2,250,000 | 2,386,125 | ||||||
|
| |||||||
| 7,424,186 | ||||||||
|
| |||||||
Communications - 5.2% |
| |||||||
Alibaba Group Holding Ltd (China) | 1,450,000 | 1,387,060 | ||||||
Amazon.com Inc | 2,000,000 | 2,000,058 | ||||||
AT&T Inc | ||||||||
4.750% due 05/15/46 | 2,400,000 | 2,335,935 | ||||||
4.900% due 08/14/37 | 2,500,000 | 2,526,189 | ||||||
5.250% due 03/01/37 | 2,000,000 | 2,119,265 | ||||||
Charter Communications Operating LLC | 2,300,000 | 2,229,106 | ||||||
6.384% due 10/23/35 | 3,500,000 | 3,915,511 | ||||||
Sprint Corp | 4,500,000 | 4,663,125 | ||||||
Sprint Spectrum Co LLC | 3,850,000 | 3,835,562 | ||||||
Tencent Holdings Ltd (China) | 2,700,000 | 2,587,340 | ||||||
Verizon Communications Inc | 3,000,000 | 3,042,418 | ||||||
4.812% due 03/15/39 | 3,356,000 | 3,439,368 | ||||||
5.250% due 03/16/37 | 1,950,000 | 2,105,850 | ||||||
|
| |||||||
| 36,186,787 | ||||||||
|
| |||||||
Consumer, Cyclical - 8.3% |
| |||||||
Air Canada Pass-Through Trust ‘A’ (Canada) | 4,450,725 | 4,499,905 | ||||||
Air Canada Pass-Through Trust ‘AA’ (Canada) | 1,669,802 | 1,664,584 | ||||||
Alimentation Couche-Tard Inc (Canada) | 3,000,000 | 2,931,258 | ||||||
American Airlines Pass-Through Trust ‘AA’ | 4,640,650 | 4,603,014 | ||||||
3.600% due 03/22/29 | 2,806,410 | 2,783,398 | ||||||
American Airlines Pass-Through Trust ‘B’ | 700,934 | 704,439 | ||||||
British Airways Pass-Through Trust ‘A’ (United Kingdom) | 3,295,184 | 3,426,827 | ||||||
Continental Airlines Pass-Through Trust ‘A’ | 2,791,021 | 2,846,563 | ||||||
Delta Air Lines Pass-Through Trust ‘AA’ | 1,428,050 | 1,417,411 | ||||||
Downstream Development Authority of the Quapaw Tribe of Oklahoma | 2,750,000 | 2,832,500 | ||||||
Ford Motor Credit Co LLC | 2,500,000 | 2,453,171 | ||||||
Principal Amount |
| |||||||
General Motors Co | $ | 3,000,000 | $ | 2,924,626 | ||||
Hawaiian Airlines Pass-Through Certificates ‘A’ | 1,939,739 | 1,944,976 | ||||||
Kohl’s Corp | 2,000,000 | 1,942,677 | ||||||
Lennar Corp | 2,500,000 | 2,656,250 | ||||||
Mattamy Group Corp (Canada) | 2,500,000 | 2,537,500 | ||||||
Nordstrom Inc | 2,000,000 | 1,882,740 | ||||||
Six Flags Entertainment Corp | 2,000,000 | 1,952,500 | ||||||
Spirit Airlines Pass-Through Trust ‘A’ | 627,790 | 628,293 | ||||||
Spirit Airlines Pass-Through Trust ‘AA’ | 450,000 | 438,409 | ||||||
United Airlines Pass-Through Trust ‘B’ | 1,800,000 | 1,755,124 | ||||||
4.750% due 10/11/23 | 4,273,661 | 4,347,595 | ||||||
US Airways Pass-Through Trust ‘A’ | 2,678,804 | 2,767,204 | ||||||
Virgin Australia Pass-Through Trust ‘A’ (Australia) | 1,227,005 | 1,260,257 | ||||||
|
| |||||||
| 57,201,221 | ||||||||
|
| |||||||
Consumer, Non-Cyclical - 4.0% |
| |||||||
Anheuser-Busch InBev Finance Inc (Belgium) | 5,000,000 | 4,975,671 | ||||||
Anheuser-Busch InBev Worldwide Inc (Belgium) | 1,950,000 | 1,998,624 | ||||||
BAT Capital Corp (United Kingdom) | 4,500,000 | 4,479,255 | ||||||
Campbell Soup Co | 5,000,000 | 4,981,229 | ||||||
CHS/Community Health Systems Inc | 2,000,000 | 1,870,000 | ||||||
MEDNAX Inc | 2,000,000 | 2,015,000 | ||||||
Mylan Inc | 900,000 | 900,195 | ||||||
Teva Pharmaceutical Finance Netherlands III BV (Israel) | 1,000,000 | 901,027 | ||||||
2.800% due 07/21/23 | 1,500,000 | 1,271,975 | ||||||
Valeant Pharmaceuticals International Inc | 4,500,000 | 4,663,125 | ||||||
|
| |||||||
| 28,056,101 | ||||||||
|
| |||||||
Energy - 9.3% |
| |||||||
Andeavor Logistics LP | 1,200,000 | 1,183,947 | ||||||
5.250% due 01/15/25 | 5,900,000 | 6,005,610 | ||||||
Colonial Pipeline Co | 750,000 | 747,495 | ||||||
Colorado Interstate Gas Co LLC | 1,050,000 | 1,028,552 | ||||||
Concho Resources Inc | 1,200,000 | 1,277,666 | ||||||
EnLink Midstream Partners LP | 4,000,000 | 3,936,170 | ||||||
EQT Corp | 3,200,000 | 3,070,784 | ||||||
EQT Midstream Partners LP | 2,500,000 | 2,402,401 | ||||||
Kinder Morgan Energy Partners LP | 2,500,000 | 2,425,853 | ||||||
Kinder Morgan Inc | 3,550,000 | 3,542,514 | ||||||
| See Notes to Financial Statements | See explanation of symbols and terms, if any, on B-45 |
B-9
Table of Contents
PACIFIC FUNDS
PACIFIC FUNDS CORE INCOME
Schedule of Investments (Continued)
March 31, 2018
Principal Amount |
| |||||||
Marathon Oil Corp | $ | 2,000,000 | $ | 2,033,145 | ||||
5.200% due 06/01/45 | 3,000,000 | 3,161,182 | ||||||
MPLX LP | 550,000 | 543,881 | ||||||
4.500% due 04/15/38 | 2,450,000 | 2,410,373 | ||||||
Nabors Industries Inc | 900,000 | 884,349 | ||||||
NuStar Logistics LP | 875,000 | 850,937 | ||||||
ONEOK Inc | 1,300,000 | 1,282,322 | ||||||
4.950% due 07/13/47 | 2,650,000 | 2,694,565 | ||||||
Petrobras Global Finance BV (Brazil) | 3,500,000 | 3,460,625 | ||||||
7.250% due 03/17/44 | 1,150,000 | 1,175,875 | ||||||
7.375% due 01/17/27 | 2,000,000 | 2,169,000 | ||||||
Petroleos Mexicanos (Mexico) | 2,000,000 | 1,970,000 | ||||||
6.350% due 02/12/48 ~ | 2,100,000 | 2,039,625 | ||||||
6.500% due 03/13/27 | 2,200,000 | 2,352,350 | ||||||
Sabine Pass Liquefaction LLC | 1,400,000 | 1,380,565 | ||||||
5.000% due 03/15/27 | 2,100,000 | 2,181,899 | ||||||
Southwestern Energy Co | 2,500,000 | 2,437,500 | ||||||
Transcontinental Gas Pipe Line Co LLC | 850,000 | 831,172 | ||||||
Western Gas Partners LP | 3,150,000 | 3,192,431 | ||||||
Williams Partners LP | 1,800,000 | 1,785,659 | ||||||
|
| |||||||
| 64,458,447 | ||||||||
|
| |||||||
Financial - 12.8% |
| |||||||
Ares Capital Corp | 4,000,000 | 3,889,389 | ||||||
4.250% due 03/01/25 | 3,500,000 | 3,403,545 | ||||||
Bank of America Corp | 2,350,000 | 2,332,637 | ||||||
4.200% due 08/26/24 | 5,000,000 | 5,073,287 | ||||||
4.250% due 10/22/26 | 3,500,000 | 3,526,094 | ||||||
Citigroup Inc | 3,600,000 | 3,559,483 | ||||||
4.400% due 06/10/25 | 5,000,000 | 5,094,499 | ||||||
4.600% due 03/09/26 | 3,948,000 | 4,054,007 | ||||||
Columbia Property Trust Operating | 3,500,000 | 3,461,112 | ||||||
Healthcare Realty Trust Inc REIT | 1,900,000 | 1,803,127 | ||||||
High Street Funding Trust I | 1,150,000 | 1,157,682 | ||||||
Hudson Pacific Properties LP REIT | 3,500,000 | 3,358,915 | ||||||
Jefferies Finance LLC | 2,500,000 | 2,537,500 | ||||||
JPMorgan Chase & Co | 4,000,000 | 4,024,617 | ||||||
Kilroy Realty LP REIT | 2,400,000 | 2,331,012 | ||||||
Morgan Stanley | 7,500,000 | 7,850,922 | ||||||
Piedmont Operating Partnership LP REIT | 3,100,000 | 3,156,151 | ||||||
Teachers Insurance & Annuity Association of America | 3,000,000 | 3,002,419 | ||||||
The Goldman Sachs Group Inc | 2,000,000 | 1,925,966 | ||||||
3.500% due 11/16/26 | 8,000,000 | 7,711,033 | ||||||
Principal Amount |
| |||||||
UDR Inc REIT | $ | 2,000,000 | $ | 1,843,627 | ||||
Ventas Realty LP REIT | 4,450,000 | 4,337,212 | ||||||
Wells Fargo & Co | 3,750,000 | 3,641,942 | ||||||
4.750% due 12/07/46 | 2,550,000 | 2,614,647 | ||||||
Welltower Inc REIT | 3,000,000 | 3,000,596 | ||||||
|
| |||||||
| 88,691,421 | ||||||||
|
| |||||||
Industrial - 2.1% |
| |||||||
Allegion US Holding Co Inc | 3,500,000 | 3,338,580 | ||||||
Masco Corp | 1,300,000 | 1,648,004 | ||||||
Novelis Corp | 2,000,000 | 1,975,000 | ||||||
6.250% due 08/15/24 ~ | 3,000,000 | 3,082,500 | ||||||
Owens-Brockway Glass Container Inc | 2,500,000 | 2,533,625 | ||||||
Park Aerospace Holdings Ltd (Ireland) | 1,000,000 | 983,450 | ||||||
Standard Industries Inc | 875,000 | 827,706 | ||||||
|
| |||||||
| 14,388,865 | ||||||||
|
| |||||||
Technology - 0.8% |
| |||||||
Apple Inc | 3,250,000 | 3,143,197 | ||||||
Dell International LLC | 2,400,000 | 2,587,277 | ||||||
|
| |||||||
| 5,730,474 | ||||||||
|
| |||||||
Utilities - 3.3% |
| |||||||
Calpine Corp | 3,500,000 | 3,390,625 | ||||||
5.750% due 01/15/25 | 2,000,000 | 1,835,000 | ||||||
Edison International | 2,000,000 | 2,015,416 | ||||||
Exelon Corp | 4,000,000 | 4,466,420 | ||||||
FirstEnergy Corp | 3,000,000 | 3,162,466 | ||||||
IPALCO Enterprises Inc | 3,500,000 | 3,429,169 | ||||||
Talen Energy Supply LLC | 2,000,000 | 1,420,000 | ||||||
The Southern Co | 3,300,000 | 3,139,388 | ||||||
|
| |||||||
| 22,858,484 | ||||||||
|
| |||||||
Total Corporate Bonds & Notes |
| 324,995,986 | ||||||
|
| |||||||
SENIOR LOAN NOTES - 17.8% |
| |||||||
Basic Materials - 0.4% |
| |||||||
PQ Corp Term B | 2,955,094 | 2,968,551 | ||||||
|
| |||||||
Communications - 3.4% |
| |||||||
Altice US Finance I Corp Term B | 6,415,942 | 6,415,942 | ||||||
Avaya Inc Term B | 2,493,750 | 2,515,830 | ||||||
| See Notes to Financial Statements | See explanation of symbols and terms, if any, on B-45 |
B-10
Table of Contents
PACIFIC FUNDS
PACIFIC FUNDS CORE INCOME
Schedule of Investments (Continued)
March 31, 2018
Principal Amount |
| |||||||
Charter Communications Operating LLC Term B | $ | 997,500 | $ | 1,002,238 | ||||
CSC Holdings LLC | 2,961,992 | 2,962,733 | ||||||
Frontier Communications Corp Term B-1 | 4,962,500 | 4,906,672 | ||||||
Level 3 Parent LLC Term B | 2,500,000 | 2,506,445 | ||||||
Sprint Communications Inc Term B | 2,974,975 | 2,979,158 | ||||||
|
| |||||||
| 23,289,018 | ||||||||
|
| |||||||
Consumer, Cyclical - 4.5% |
| |||||||
BJ’s Wholesale Club Inc Term B | 2,493,719 | 2,494,853 | ||||||
ClubCorp Holdings Inc Term B | 2,203,353 | 2,220,273 | ||||||
Federal-Mogul LLC Term C | 728,539 | 733,927 | ||||||
HD Supply Inc Term B-3 | 2,205,356 | 2,222,240 | ||||||
Hilton Worldwide Finance LLC Term B-2 | 3,999,111 | 4,025,469 | ||||||
Las Vegas Sands LLC Term B | 4,826,123 | 4,841,808 | ||||||
New Red Finance Inc Term B (Canada) | 5,308,111 | 5,320,278 | ||||||
Nexeo Solutions LLC Term B | 1,965,200 | 1,990,378 | ||||||
SeaWorld Parks & Entertainment Inc Term B-5 | 3,974,925 | 3,965,401 | ||||||
Univar USA Inc Term B-3 | 3,415,812 | 3,441,697 | ||||||
|
| |||||||
| 31,256,324 | ||||||||
|
| |||||||
Consumer, Non-Cyclical - 1.8% |
| |||||||
Albertson’s LLC Term B-4 | 3,841,224 | 3,803,879 | ||||||
CHS/Community Health Systems Inc Term G | 2,000,000 | 1,955,000 | ||||||
Jaguar Holding Co II | 3,190,095 | 3,205,050 | ||||||
US Foods Inc Term B | 3,438,750 | 3,467,168 | ||||||
|
| |||||||
| 12,431,097 | ||||||||
|
| |||||||
Energy - 0.4% |
| |||||||
Arch Coal Inc Term B | 2,977,444 | 2,990,470 | ||||||
|
| |||||||
Principal Amount |
| |||||||
Financial - 1.3% |
| |||||||
HUB International Ltd Term B | $ | 3,852,591 | $ | 3,876,670 | ||||
USI Inc Term B | 3,980,000 | 3,996,167 | ||||||
VICI Properties 1 LLC REIT Term B | 954,545 | 958,854 | ||||||
|
| |||||||
| 8,831,691 | ||||||||
|
| |||||||
Industrial - 3.3% |
| |||||||
Avolon (US) LLC Term B-2 (Ireland) | 3,970,000 | 3,977,995 | ||||||
BWAY Corp Term B | 1,488,750 | 1,497,900 | ||||||
CIRCOR International Inc Term B | 1,995,000 | 2,003,313 | ||||||
Proampac PG Borrower LLC | 3,959,900 | 4,001,150 | ||||||
Reynolds Group Holdings Inc Term B | 5,495,720 | 5,530,068 | ||||||
TransDigm Inc |
| |||||||
Term E 4.627% (USD LIBOR + 2.750%) due 05/14/22 § | 1,942,642 | 1,952,052 | ||||||
Term F 4.773% (USD LIBOR + 2.750%) due 06/09/23 § | 3,870,296 | 3,889,648 | ||||||
|
| |||||||
| 22,852,126 | ||||||||
|
| |||||||
Technology - 1.4% |
| |||||||
First Data Corp |
| |||||||
4.122% (USD LIBOR + 2.250%) due 07/10/22 § | 3,206,671 | 3,214,887 | ||||||
4.122% (USD LIBOR + 2.250%) due 04/26/24 § | 455,966 | 457,224 | ||||||
ON Semiconductor Corp Term B | 1,420,153 | 1,429,294 | ||||||
Solera LLC Term B | 2,651,361 | 2,662,547 | ||||||
Tempo Acquisition LLC Term B | 1,994,975 | 2,006,197 | ||||||
|
| |||||||
| 9,770,149 | ||||||||
|
| |||||||
Utilities - 1.3% |
| |||||||
Calpine Construction Finance Co LP | 1,995,000 | 2,003,016 | ||||||
Talen Energy Supply LLC Term B-1 | 3,955,056 | 3,895,730 | ||||||
Vistra Operations Co LLC |
| |||||||
Term B 4.377% (USD LIBOR + 2.500%) due 08/04/23 § | 2,412,321 | 2,431,620 | ||||||
Term C 4.377% (USD LIBOR + 2.500%) due 08/04/23 § | 428,571 | 432,000 | ||||||
|
| |||||||
| 8,762,366 | ||||||||
|
| |||||||
Total Senior Loan Notes |
| 123,151,792 | ||||||
|
| |||||||
| See Notes to Financial Statements | See explanation of symbols and terms, if any, on B-45 |
B-11
Table of Contents
PACIFIC FUNDS
PACIFIC FUNDS CORE INCOME
Schedule of Investments (Continued)
March 31, 2018
Principal Amount |
| |||||||
MORTGAGE-BACKED SECURITIES - 1.2% |
| |||||||
Fannie Mae - 0.6% |
| |||||||
2.500% due 04/01/33 | $ | 4,500,000 | $ | 4,407,201 | ||||
|
| |||||||
Freddie Mac - 0.6% |
| |||||||
2.500% due 04/01/33 | 4,000,000 | 3,915,217 | ||||||
|
| |||||||
Total Mortgage-Backed Securities |
| 8,322,418 | ||||||
|
| |||||||
ASSET-BACKED SECURITIES - 21.1% |
| |||||||
ALM XII CLO Ltd (Cayman) |
| |||||||
3.322% (USD LIBOR + 1.600%) due 04/16/27 § ~ | 1,900,000 | 1,903,077 | ||||||
3.772% (USD LIBOR + 2.050%) due 04/16/27 § ~ | 1,100,000 | 1,100,267 | ||||||
American Express Credit Account Master Trust | 2,500,000 | 2,448,079 | ||||||
AmeriCredit Automobile Receivables Trust | 1,000,000 | 989,577 | ||||||
2.240% due 06/19/23 | 950,000 | 936,381 | ||||||
2.300% due 02/18/22 | 2,500,000 | 2,466,096 | ||||||
2.400% due 05/18/22 | 1,850,000 | 1,831,563 | ||||||
2.690% due 06/19/23 | 1,050,000 | 1,036,454 | ||||||
2.710% due 08/18/22 | 1,500,000 | 1,482,583 | ||||||
Apidos CLO XV (Cayman) | 1,005,253 | 1,005,253 | ||||||
Atrium XI CLO (Cayman) | 1,250,000 | 1,250,962 | ||||||
BA Credit Card Trust | 3,500,000 | 3,495,026 | ||||||
Babson CLO Ltd (Cayman) | 2,000,000 | 2,000,000 | ||||||
Birchwood Park CLO Ltd (Cayman) | 1,600,000 | 1,600,793 | ||||||
BlueMountain CLO Ltd (Cayman) | 2,500,000 | 2,503,554 | ||||||
Capital Auto Receivables Asset Trust | 1,250,000 | 1,233,974 | ||||||
2.110% due 03/22/21 | 600,000 | 594,588 | ||||||
3.090% due 08/22/22 ~ | 1,600,000 | 1,602,400 | ||||||
Carlyle Global Market Strategies CLO Ltd (Cayman) | ||||||||
2.910% (USD LIBOR + 1.150%) due 07/27/26 § ~ | 1,500,000 | 1,502,126 | ||||||
3.310% (USD LIBOR + 1.550%) due 07/27/26 § ~ | 1,500,000 | 1,502,273 | ||||||
3.745% (USD LIBOR + 2.000%) due 04/20/27 § ~ | 2,975,000 | 2,978,772 | ||||||
CIFC Funding Ltd (Cayman) | ||||||||
2.941% (USD LIBOR + 0.870%) due 04/19/29 § ~ | 3,000,000 | 2,984,580 | ||||||
3.721% (USD LIBOR + 1.650%) due 04/19/29 § ~ | 1,805,000 | 1,794,287 | ||||||
Citibank Credit Card Issuance Trust | 4,000,000 | 3,953,184 | ||||||
1.920% due 04/07/22 | 2,500,000 | 2,463,216 | ||||||
2.150% due 07/15/21 | 4,660,000 | 4,635,364 | ||||||
2.535% (USD LIBOR + 0.770%) due 05/14/29 § | 6,000,000 | 6,066,760 | ||||||
Dryden Senior Loan Fund ‘B’ (Cayman) | 1,600,000 | 1,600,000 | ||||||
Principal Amount |
| |||||||
Ford Credit Auto Owner Trust | $ | 850,000 | $ | 827,678 | ||||
2.240% due 06/15/22 | 1,000,000 | 985,113 | ||||||
2.350% due 04/15/23 | 2,500,000 | 2,456,689 | ||||||
2.360% due 03/15/29 ~ | 6,000,000 | 5,837,216 | ||||||
3.190% due 07/15/31 ~ | 6,500,000 | 6,488,457 | ||||||
Navient Private Education Loan Trust | 1,049,428 | 1,052,273 | ||||||
Navient Student Loan Trust | 300,070 | 300,447 | ||||||
2.592% (USD LIBOR + 0.720%) due 03/25/67 § ~ | 4,000,000 | 4,013,618 | ||||||
Nelnet Student Loan Trust | 2,248,066 | 2,255,348 | ||||||
Oak Hill Credit Partners X CLO Ltd (Cayman) | 2,500,000 | 2,503,413 | ||||||
OCP CLO Ltd (Cayman) | 2,000,000 | 1,999,533 | ||||||
Octagon Investment Partners 25 Ltd (Cayman) | 2,000,000 | 2,001,891 | ||||||
OneMain Financial Issuance Trust | 4,000,000 | 3,934,304 | ||||||
Regatta IV Funding CLO Ltd (Cayman) | 2,000,000 | 2,002,234 | ||||||
Santander Drive Auto Receivables Trust | 3,000,000 | 2,985,527 | ||||||
2.080% due 02/16/21 | 700,000 | 698,405 | ||||||
2.100% due 06/15/21 | 2,000,000 | 1,991,171 | ||||||
2.630% due 07/15/22 | 2,350,000 | 2,339,311 | ||||||
2.660% due 11/15/21 | 1,000,000 | 998,005 | ||||||
2.960% due 03/15/24 | 1,850,000 | 1,842,115 | ||||||
Securitized Term Auto Receivables Trust (Canada) | 1,000,000 | 986,095 | ||||||
SLM Private Credit Student Loan Trust ‘A’ | 3,908,262 | 3,846,004 | ||||||
SLM Student Loan Trust | ||||||||
1.855% (USD LIBOR + 0.110%) due 01/25/27 § | 1,686,280 | 1,684,533 | ||||||
2.295% (USD LIBOR + 0.550%) due 10/25/64 § ~ | 5,000,000 | 4,965,200 | ||||||
SMB Private Education Loan Trust | 2,500,000 | 2,426,408 | ||||||
2.677% (USD LIBOR + 0.900%) due 09/15/34 § ~ | 4,600,000 | 4,663,111 | ||||||
2.700% due 05/15/31 ~ | 2,456,245 | 2,422,909 | ||||||
2.820% due 10/15/35 ~ | 4,150,000 | 4,061,524 | ||||||
2.880% due 09/15/34 ~ | 4,500,000 | 4,433,002 | ||||||
3.227% (USD LIBOR + 1.450%) due 02/17/32 § ~ | 1,850,000 | 1,901,497 | ||||||
3.500% due 02/15/36 ~ | 2,300,000 | 2,305,520 | ||||||
Synchrony Credit Card Master Note Trust | 1,000,000 | 979,347 | ||||||
Verizon Owner Trust | 600,000 | 595,362 | ||||||
2.060% due 04/20/22 ~ | 2,000,000 | 1,974,439 | ||||||
Volvo Financial Equipment LLC | 1,250,000 | 1,233,479 | ||||||
Washington Mill CLO Ltd (Cayman) | 1,000,000 | 1,001,106 | ||||||
|
| |||||||
Total Asset-Backed Securities |
| 145,953,473 | ||||||
|
| |||||||
| See Notes to Financial Statements | See explanation of symbols and terms, if any, on B-45 |
B-12
Table of Contents
PACIFIC FUNDS
PACIFIC FUNDS CORE INCOME
Schedule of Investments (Continued)
March 31, 2018
Principal Amount |
| |||||||
U.S. GOVERNMENT AGENCY ISSUES - 1.6% |
| |||||||
Fannie Mae | $ | 5,500,000 | $ | 5,497,239 | ||||
Freddie Mac | 5,500,000 | 5,420,696 | ||||||
|
| |||||||
Total U.S. Government Agency Issues |
| 10,917,935 | ||||||
|
| |||||||
U.S. TREASURY OBLIGATIONS - 9.4% |
| |||||||
U.S. Treasury Bonds - 1.6% |
| |||||||
2.250% due 08/15/46 | 4,050,000 | 3,480,805 | ||||||
2.500% due 02/15/45 | 2,000,000 | 1,822,679 | ||||||
2.500% due 02/15/46 | 3,500,000 | 3,179,215 | ||||||
2.500% due 05/15/46 | 3,000,000 | 2,722,218 | ||||||
|
| |||||||
| 11,204,917 | ||||||||
|
| |||||||
U.S. Treasury Notes - 7.8% |
| |||||||
0.750% due 10/31/18 | 3,450,000 | 3,425,938 | ||||||
1.125% due 03/31/20 | 5,000,000 | 4,885,805 | ||||||
1.125% due 04/30/20 | 1,500,000 | 1,464,065 | ||||||
1.250% due 01/31/19 | 4,500,000 | 4,469,078 | ||||||
1.250% due 07/31/23 | 5,000,000 | 4,665,837 | ||||||
1.375% due 08/31/23 | 4,000,000 | 3,752,474 | ||||||
1.375% due 09/30/23 | 4,500,000 | 4,215,164 | ||||||
1.500% due 10/31/19 | 4,000,000 | 3,953,272 | ||||||
1.500% due 08/15/26 | 1,500,000 | 1,360,654 | ||||||
1.625% due 07/31/20 | 5,500,000 | 5,411,663 | ||||||
1.625% due 02/15/26 | 2,000,000 | 1,844,253 | ||||||
1.625% due 05/15/26 | 5,000,000 | 4,596,791 | ||||||
1.875% due 10/31/22 | 3,000,000 | 2,914,010 | ||||||
2.000% due 10/31/21 | 3,000,000 | 2,951,553 | ||||||
2.125% due 12/31/21 | 4,500,000 | 4,443,280 | ||||||
|
| |||||||
| 54,353,837 | ||||||||
|
| |||||||
Total U.S. Treasury Obligations |
| 65,558,754 | ||||||
|
| |||||||
Principal Amount |
| |||||||
FOREIGN GOVERNMENT BONDS & NOTES - 2.8% |
| |||||||
Chile Government (Chile) | $ | 3,750,000 | $ | 3,601,875 | ||||
Export-Import Bank of Korea (South Korea) | 2,900,000 | 2,863,628 | ||||||
Mexico Government (Mexico) | 5,538,000 | 5,362,169 | ||||||
4.350% due 01/15/47 | 2,000,000 | 1,832,760 | ||||||
Province of British Columbia (Canada) | 3,000,000 | 2,892,906 | ||||||
Province of Ontario (Canada) | 3,000,000 | 2,964,690 | ||||||
|
| |||||||
Total Foreign Government Bonds & Notes |
| 19,518,028 | ||||||
|
| |||||||
Shares | ||||||||
SHORT-TERM INVESTMENT - 0.8% |
| |||||||
Money Market Fund - 0.8% |
| |||||||
BlackRock Liquidity Funds T-Fund Portfolio | 5,270,156 | 5,270,156 | ||||||
|
| |||||||
Total Short-Term Investment |
| 5,270,156 | ||||||
|
| |||||||
TOTAL INVESTMENTS - 101.8% |
| 705,401,342 | ||||||
OTHER ASSETS & LIABILITIES, NET - (1.8%) |
| (12,418,979 | ) | |||||
|
| |||||||
NET ASSETS - 100.0% |
| $692,982,363 | ||||||
|
| |||||||
Notes to Schedule of Investments
| (a) | As of March 31, 2018, the Fund’s composition as a percentage of net assets was as follows: |
Corporate Bonds & Notes | 46.9% | |||
Asset-Backed Securities | 21.1% | |||
Senior Loan Notes | 17.8% | |||
U.S. Treasury Obligations | 9.4% | |||
Others (each less than 3.0%) | 6.6% | |||
|
| |||
| 101.8% | ||||
Other Assets & Liabilities, Net | (1.8% | ) | ||
|
| |||
| 100.0% | ||||
|
|
| (b) | Fair Value Measurements |
The following is a summary of the Fund’s investments as categorized under the three-tier hierarchy of inputs used in valuing the Fund’s assets and liabilities (See Note 3D in Notes to Financial Statements) as of March 31, 2018:
Total Value at March 31, 2018 | Level 1 Quoted Price | Level 2 Significant Observable Inputs | Level 3 Significant Unobservable Inputs | |||||||||||||||
Assets | Exchange-Traded Fund | $1,712,800 | $1,712,800 | $— | $— | |||||||||||||
Corporate Bonds & Notes | 324,995,986 | — | 324,995,986 | — | ||||||||||||||
Senior Loan Notes | 123,151,792 | — | 123,151,792 | — | ||||||||||||||
Mortgage-Backed Securities | 8,322,418 | — | 8,322,418 | — | ||||||||||||||
Asset-Backed Securities | 145,953,473 | — | 145,953,473 | — | ||||||||||||||
U.S. Government Agency Issues | 10,917,935 | — | 10,917,935 | — | ||||||||||||||
U.S. Treasury Obligations | 65,558,754 | — | 65,558,754 | — | ||||||||||||||
Foreign Government Bonds & Notes | 19,518,028 | — | 19,518,028 | — | ||||||||||||||
Short-Term Investment | 5,270,156 | 5,270,156 | — | — | ||||||||||||||
|
|
|
|
|
|
|
| |||||||||||
Total | $705,401,342 | $6,982,956 | $698,418,386 | $— | ||||||||||||||
|
|
|
|
|
|
|
| |||||||||||
| See Notes to Financial Statements | See explanation of symbols and terms, if any, on B-45 |
B-13
Table of Contents
PACIFIC FUNDS
PACIFIC FUNDSSM STRATEGIC INCOME
Schedule of Investments
March 31, 2018
Shares | Value | |||||||
COMMON STOCKS - 5.1% |
| |||||||
Basic Materials - 0.3% |
| |||||||
Constellium NV ‘A’ (Netherlands) * | 153,655 | $1,667,157 | ||||||
|
| |||||||
Consumer, Cyclical - 1.0% |
| |||||||
Cedar Fair LP | 17,299 | 1,105,060 | ||||||
Las Vegas Sands Corp | 17,710 | 1,273,349 | ||||||
Modular Space Holdings Inc * ± | 40,245 | 719,379 | ||||||
Mohawk Industries Inc * | 6,772 | 1,572,594 | ||||||
Six Flags Entertainment Corp | 15,667 | 975,427 | ||||||
|
| |||||||
| 5,645,809 | ||||||||
|
| |||||||
Energy - 1.2% |
| |||||||
Concho Resources Inc * | 8,270 | 1,243,229 | ||||||
Continental Resources Inc * | 20,750 | 1,223,212 | ||||||
Diamondback Energy Inc * | 10,300 | 1,303,156 | ||||||
Pioneer Natural Resources Co | 7,350 | 1,262,583 | ||||||
WPX Energy Inc * | 83,210 | 1,229,844 | ||||||
|
| |||||||
| 6,262,024 | ||||||||
|
| |||||||
Financial - 1.4% |
| |||||||
Bank of America Corp | 39,630 | 1,188,504 | ||||||
Citigroup Inc | 18,432 | 1,244,160 | ||||||
JPMorgan Chase & Co | 11,000 | 1,209,670 | ||||||
The Goldman Sachs Group Inc | 6,042 | 1,521,738 | ||||||
The PNC Financial Services Group Inc | 7,650 | 1,156,986 | ||||||
Wells Fargo & Co | 22,350 | 1,171,363 | ||||||
|
| |||||||
| 7,492,421 | ||||||||
|
| |||||||
Industrial - 1.2% |
| |||||||
ADT Inc | 118,860 | 942,560 | ||||||
Allegion PLC | 20,040 | 1,709,212 | ||||||
Berry Global Group Inc * | 19,000 | 1,041,390 | ||||||
Crown Holdings Inc * | 24,880 | 1,262,660 | ||||||
Xylem Inc | 20,309 | 1,562,168 | ||||||
|
| |||||||
| 6,517,990 | ||||||||
|
| |||||||
Total Common Stocks |
| 27,585,401 | ||||||
|
| |||||||
EXCHANGE-TRADED FUNDS - 2.0% |
| |||||||
iShares iBoxx $ High Yield Corporate Bond | 40,000 | 3,425,600 | ||||||
SPDR Bloomberg Barclays High Yield Bond | 100,000 | 3,585,000 | ||||||
SPDR S&P 500 Trust | 14,000 | 3,684,100 | ||||||
|
| |||||||
Total Exchange-Traded Funds |
| 10,694,700 | ||||||
|
| |||||||
Principal Amount | ||||||||
CORPORATE BONDS & NOTES - 66.5% |
| |||||||
Basic Materials - 3.3% |
| |||||||
Alcoa Nederland Holding BV | $2,600,000 | 2,814,500 | ||||||
Barminco Finance Pty Ltd (Australia) | 3,125,000 | 3,074,219 | ||||||
Constellium NV (Netherlands) | 375,000 | 369,375 | ||||||
5.875% due 02/15/26 ~ | 250,000 | 246,875 | ||||||
6.625% due 03/01/25 ~ | 1,250,000 | 1,268,750 | ||||||
Corp Nacional del Cobre de Chile (Chile) | 3,000,000 | 2,921,370 | ||||||
Glencore Finance Canada Ltd (Switzerland) | 1,400,000 | 1,421,726 | ||||||
Principal Amount | Value | |||||||
Glencore Funding LLC (Switzerland) | $ | 3,750,000 | $ | 3,624,490 | ||||
Hexion Inc | 1,350,000 | 1,265,625 | ||||||
10.375% due 02/01/22 ~ | 625,000 | 607,812 | ||||||
|
| |||||||
| 17,614,742 | ||||||||
|
| |||||||
Communications - 5.4% |
| |||||||
Alibaba Group Holding Ltd (China) | 1,350,000 | 1,281,942 | ||||||
AT&T Inc | 100,000 | 101,048 | ||||||
5.450% due 03/01/47 | 2,000,000 | 2,127,178 | ||||||
CCO Holdings LLC | 900,000 | 918,000 | ||||||
Cequel Communications Holdings I LLC | 375,000 | 385,312 | ||||||
Charter Communications Operating LLC | 1,500,000 | 1,380,211 | ||||||
4.200% due 03/15/28 | 1,500,000 | 1,437,713 | ||||||
6.384% due 10/23/35 | 500,000 | 559,359 | ||||||
CSC Holdings LLC | 350,000 | 331,481 | ||||||
10.125% due 01/15/23 ~ | 400,000 | 445,000 | ||||||
10.875% due 10/15/25 ~ | 1,000,000 | 1,177,490 | ||||||
DISH DBS Corp | 3,200,000 | 2,864,000 | ||||||
Frontier Communications Corp | 575,000 | 559,187 | ||||||
11.000% due 09/15/25 | 1,375,000 | 1,037,266 | ||||||
Radiate Holdco LLC | 2,175,000 | 2,115,187 | ||||||
Sprint Communications Inc | 350,000 | 344,312 | ||||||
Sprint Corp | 4,375,000 | 4,533,594 | ||||||
7.625% due 02/15/25 | 3,090,000 | 3,047,512 | ||||||
7.625% due 03/01/26 | 775,000 | 758,531 | ||||||
Sprint Spectrum Co LLC | 175,000 | 174,344 | ||||||
Townsquare Media Inc | 1,250,000 | 1,179,687 | ||||||
Verizon Communications Inc | 2,500,000 | 2,535,348 | ||||||
|
| |||||||
| 29,293,702 | ||||||||
|
| |||||||
Consumer, Cyclical - 12.4% |
| |||||||
Air Canada Pass-Through Trust ‘B’ (Canada) | 857,139 | 856,068 | ||||||
Air Canada Pass-Through Trust ‘C’ (Canada) | 750,000 | 760,125 | ||||||
American Airlines Pass-Through Trust ‘A’ | 1,392,147 | 1,399,734 | ||||||
American Airlines Pass-Through Trust ‘B’ | 1,260,948 | 1,309,809 | ||||||
American Axle & Manufacturing Inc | 1,250,000 | 1,251,562 | ||||||
6.250% due 03/15/26 | 1,075,000 | 1,069,302 | ||||||
6.500% due 04/01/27 | 525,000 | 526,969 | ||||||
Aramark Services Inc | 2,500,000 | 2,525,750 | ||||||
AV Homes Inc | 2,000,000 | 2,045,440 | ||||||
Beazer Homes USA Inc | 2,475,000 | 2,304,844 | ||||||
7.250% due 02/01/23 | 71,000 | 73,751 | ||||||
Boyne USA Inc | 175,000 | 180,469 | ||||||
Caesars Resort Collection LLC | 2,475,000 | 2,378,920 | ||||||
| See Notes to Financial Statements | See explanation of symbols and terms, if any, on B-45 |
B-14
Table of Contents
PACIFIC FUNDS
PACIFIC FUNDS STRATEGIC INCOME
Schedule of Investments (Continued)
March 31, 2018
Principal Amount | Value | |||||||
Carrols Restaurant Group Inc | $ | 750,000 | $ | 783,750 | ||||
Constellation Merger Sub Inc | 2,600,000 | 2,528,500 | ||||||
Downstream Development Authority of the Quapaw Tribe of Oklahoma | 2,250,000 | 2,317,500 | ||||||
Ford Motor Co | 250,000 | 247,284 | ||||||
Ford Motor Credit Co LLC | 2,000,000 | 1,962,537 | ||||||
3.815% due 11/02/27 | 3,000,000 | 2,823,870 | ||||||
4.250% due 09/20/22 | 1,250,000 | 1,269,917 | ||||||
Gateway Casinos & Entertainment Ltd (Canada) | 1,275,000 | 1,358,672 | ||||||
General Motors Financial Co Inc | 1,550,000 | 1,537,468 | ||||||
4.375% due 09/25/21 | 1,500,000 | 1,542,966 | ||||||
Golden Nugget Inc 6.750% due 10/15/24 ~ | 2,725,000 | 2,752,250 | ||||||
8.750% due 10/01/25 ~ | 1,450,000 | 1,508,000 | ||||||
Hilton Grand Vacations Borrower LLC | 1,850,000 | 1,972,562 | ||||||
L Brands Inc | 2,175,000 | 2,052,656 | ||||||
Lennar Corp | 1,575,000 | 1,515,937 | ||||||
6.250% due 12/15/21 ~ | 415,000 | 440,937 | ||||||
6.625% due 05/01/20 ~ | 750,000 | 795,937 | ||||||
8.375% due 01/15/21 ~ | 500,000 | 556,250 | ||||||
Live Nation Entertainment Inc | 250,000 | 253,750 | ||||||
Mattamy Group Corp (Canada) | 1,450,000 | 1,471,750 | ||||||
Mattel Inc | 925,000 | 788,562 | ||||||
5.450% due 11/01/41 | 1,925,000 | 1,579,077 | ||||||
6.750% due 12/31/25 ~ | 850,000 | 833,170 | ||||||
MGM Resorts International | 1,150,000 | 1,224,750 | ||||||
7.750% due 03/15/22 | 2,000,000 | 2,232,500 | ||||||
Mohawk Industries Inc | 480,000 | 487,231 | ||||||
Norwegian Air Shuttle ASA Pass-Through Trust ‘B’ (Norway) | 354,298 | 369,798 | ||||||
Six Flags Entertainment Corp | 2,250,000 | 2,196,562 | ||||||
Tesla Inc | 2,650,000 | 2,322,062 | ||||||
The Men’s Wearhouse Inc | 2,250,000 | 2,323,125 | ||||||
Viking Cruises Ltd | 725,000 | 688,750 | ||||||
VOC Escrow Ltd | 725,000 | 692,375 | ||||||
Wyndham Hotels & Resorts Inc | 1,100,000 | 1,113,750 | ||||||
Wyndham Worldwide Corp | 350,000 | 341,084 | ||||||
4.150% due 04/01/24 | 1,750,000 | 1,747,060 | ||||||
5.625% due 03/01/21 | 1,250,000 | 1,310,972 | ||||||
|
| |||||||
| 66,626,064 | ||||||||
|
| |||||||
Consumer, Non-Cyclical - 8.1% |
| |||||||
Ahern Rentals Inc | 2,900,000 | 2,834,750 | ||||||
Anheuser-Busch InBev Finance Inc (Belgium) | 2,000,000 | 1,990,268 | ||||||
B&G Foods Inc | 700,000 | 653,625 | ||||||
Principal Amount | Value | |||||||
BAT Capital Corp (United Kingdom) | $ | 2,200,000 | $ | 2,123,161 | ||||
Charles River Laboratories International Inc | 725,000 | 738,594 | ||||||
CHS/Community Health Systems Inc | 2,750,000 | 2,571,250 | ||||||
CVS Health Corp | 1,350,000 | 1,361,019 | ||||||
Eagle Holding Co II LLC | 800,000 | 808,000 | ||||||
HCA Inc | 2,425,000 | 2,484,897 | ||||||
Herc Rentals Inc | 1,068,000 | 1,145,430 | ||||||
Jaguar Holding Co II | 500,000 | 506,875 | ||||||
JBS Investments GmbH (Brazil) | 775,000 | 801,544 | ||||||
JBS USA LUX SA (Brazil) | 500,000 | 468,750 | ||||||
5.875% due 07/15/24 ~ | 425,000 | 416,096 | ||||||
7.250% due 06/01/21 ~ | 1,575,000 | 1,596,656 | ||||||
Pilgrim’s Pride Corp | 625,000 | 608,594 | ||||||
5.875% due 09/30/27 ~ | 1,100,000 | 1,036,750 | ||||||
Prime Security Services Borrower LLC | 2,858,000 | 3,104,502 | ||||||
Reynolds American Inc (United Kingdom) | 1,500,000 | 1,544,498 | ||||||
Shire Acquisitions Investments Ireland DAC | 1,750,000 | 1,690,706 | ||||||
Tenet Healthcare Corp | 875,000 | 844,375 | ||||||
5.125% due 05/01/25 ~ | 500,000 | 482,500 | ||||||
7.500% due 01/01/22 ~ | 125,000 | 132,187 | ||||||
Teva Pharmaceutical Finance Co BV (Israel) | 1,340,000 | 1,262,000 | ||||||
Teva Pharmaceutical Finance Netherlands III BV (Israel) | 1,000,000 | 901,027 | ||||||
6.000% due 04/15/24 ~ | 350,000 | 340,183 | ||||||
The ADT Corp | 2,550,000 | 2,671,125 | ||||||
TMS International Corp | 2,300,000 | 2,403,500 | ||||||
Valeant Pharmaceuticals International Inc | 25,000 | 24,431 | ||||||
5.625% due 12/01/21 ~ | 1,350,000 | 1,294,312 | ||||||
5.875% due 05/15/23 ~ | 900,000 | 802,125 | ||||||
7.250% due 07/15/22 ~ | 750,000 | 752,812 | ||||||
7.500% due 07/15/21 ~ | 2,400,000 | 2,427,000 | ||||||
9.000% due 12/15/25 ~ | 350,000 | 349,125 | ||||||
9.250% due 04/01/26 ~ | 375,000 | 374,531 | ||||||
|
| |||||||
| 43,547,198 | ||||||||
|
| |||||||
Energy - 12.0% |
| |||||||
Andeavor Logistics LP | 3,825,000 | 3,893,467 | ||||||
Callon Petroleum Co | 1,350,000 | 1,387,530 | ||||||
Cheniere Corpus Christi Holdings LLC | 250,000 | 249,063 | ||||||
5.875% due 03/31/25 | 2,150,000 | 2,257,500 | ||||||
7.000% due 06/30/24 | 1,000,000 | 1,110,000 | ||||||
Cheniere Energy Partners LP | 1,425,000 | 1,408,969 | ||||||
Chesapeake Energy Corp | 311,000 | 329,271 | ||||||
8.000% due 01/15/25 ~ | 1,400,000 | 1,358,000 | ||||||
8.000% due 06/15/27 ~ | 275,000 | 263,313 | ||||||
| See Notes to Financial Statements | See explanation of symbols and terms, if any, on B-45 |
B-15
Table of Contents
PACIFIC FUNDS
PACIFIC FUNDS STRATEGIC INCOME
Schedule of Investments (Continued)
March 31, 2018
Principal Amount | Value | |||||||
Denbury Resources Inc | $ | 500,000 | $ | 398,750 | ||||
9.250% due 03/31/22 ~ | 1,625,000 | 1,663,594 | ||||||
Diamondback Energy Inc | 1,675,000 | 1,703,056 | ||||||
Endeavor Energy Resources LP | 1,575,000 | 1,571,063 | ||||||
5.750% due 01/30/28 ~ | 750,000 | 750,000 | ||||||
Energy Transfer LP | 1,200,000 | 1,178,044 | ||||||
4.750% due 01/15/26 | 500,000 | 506,066 | ||||||
EnLink Midstream Partners LP | 2,500,000 | 2,498,559 | ||||||
EP Energy LLC | 2,150,000 | 1,445,875 | ||||||
Halcon Resources Corp | 3,125,000 | 3,085,938 | ||||||
6.750% due 02/15/25 ~ | 725,000 | 711,406 | ||||||
Kinder Morgan Inc | 4,100,000 | 4,091,354 | ||||||
MEG Energy Corp (Canada) | 1,250,000 | 1,050,000 | ||||||
6.500% due 01/15/25 ~ | 275,000 | 267,781 | ||||||
Moss Creek Resources Holdings Inc | 2,050,000 | 2,075,010 | ||||||
NuStar Logistics LP | 1,575,000 | 1,531,688 | ||||||
Parsley Energy LLC | 1,125,000 | 1,127,813 | ||||||
5.625% due 10/15/27 ~ | 150,000 | 150,375 | ||||||
Petrobras Global Finance BV (Brazil) | 1,750,000 | 1,897,875 | ||||||
Petroleos Mexicanos (Mexico) | 1,350,000 | 1,443,488 | ||||||
Precision Drilling Corp (Canada) | 1,125,000 | 1,174,219 | ||||||
Sabine Pass Liquefaction LLC | 2,525,000 | 2,715,532 | ||||||
Sanchez Energy Corp | 1,025,000 | 752,734 | ||||||
7.250% due 02/15/23 ~ | 2,075,000 | 2,090,563 | ||||||
SemGroup Corp | 1,500,000 | 1,440,000 | ||||||
7.250% due 03/15/26 | 275,000 | 275,688 | ||||||
SESI LLC | 1,700,000 | 1,734,000 | ||||||
Southwestern Energy Co | 2,150,000 | 2,182,250 | ||||||
7.750% due 10/01/27 | 500,000 | 511,250 | ||||||
Sunoco Logistics Partners Operations LP | 1,200,000 | 1,138,227 | ||||||
Targa Resources Partners LP | 650,000 | 622,375 | ||||||
5.125% due 02/01/25 | 1,050,000 | 1,048,688 | ||||||
5.375% due 02/01/27 | 200,000 | 200,000 | ||||||
Ultra Resources Inc | 100,000 | 82,375 | ||||||
USA Compression Partners LP | 1,375,000 | 1,399,063 | ||||||
Western Gas Partners LP | 1,000,000 | 1,003,330 | ||||||
4.650% due 07/01/26 | 1,500,000 | 1,520,206 | ||||||
Whiting Petroleum Corp | 2,475,000 | 2,512,125 | ||||||
6.625% due 01/15/26 ~ | 750,000 | 756,563 | ||||||
|
| |||||||
| 64,564,036 | ||||||||
|
| |||||||
Principal Amount | Value | |||||||
Financial - 11.4% |
| |||||||
AerCap Ireland Capital DAC (Netherlands) | $ | 1,850,000 | $ | 1,800,557 | ||||
3.950% due 02/01/22 | 750,000 | 753,603 | ||||||
5.000% due 10/01/21 | 250,000 | 260,389 | ||||||
Air Lease Corp | 1,500,000 | 1,431,920 | ||||||
3.750% due 02/01/22 | 1,750,000 | 1,766,626 | ||||||
4.250% due 09/15/24 | 1,000,000 | 1,014,673 | ||||||
ASP AMC Merger Sub Inc | 1,800,000 | 1,696,500 | ||||||
Avation Capital SA (United Kingdom) | 500,000 | 505,000 | ||||||
Bank of America Corp | 2,000,000 | 2,015,443 | ||||||
3.366% due 01/23/26 | 1,000,000 | 973,147 | ||||||
4.200% due 08/26/24 | 2,500,000 | 2,536,643 | ||||||
BOC Aviation Ltd (Singapore) | 4,000,000 | 3,717,544 | ||||||
Citigroup Inc | 3,000,000 | 3,018,989 | ||||||
4.400% due 06/10/25 | 1,500,000 | 1,528,350 | ||||||
Credit Suisse Group AG (Switzerland) | 2,000,000 | 1,989,362 | ||||||
ESH Hospitality Inc REIT | 2,100,000 | 2,048,130 | ||||||
Greystar Real Estate Partners LLC | 1,625,000 | 1,625,000 | ||||||
Jefferies Finance LLC | 500,000 | 497,500 | ||||||
7.375% due 04/01/20 ~ | 2,000,000 | 2,030,000 | ||||||
7.500% due 04/15/21 ~ | 2,000,000 | 2,032,500 | ||||||
JPMorgan Chase & Co | 2,000,000 | 1,962,365 | ||||||
3.125% due 01/23/25 | 1,100,000 | 1,061,046 | ||||||
MGM Growth Properties Operating | 275,000 | 284,625 | ||||||
Morgan Stanley | 2,000,000 | 2,033,499 | ||||||
3.591% due 07/22/28 | 4,000,000 | 3,870,929 | ||||||
3.772% due 01/24/29 | 1,050,000 | 1,034,272 | ||||||
5.000% due 11/24/25 | 2,000,000 | 2,093,579 | ||||||
Springleaf Finance Corp | 1,700,000 | 1,736,720 | ||||||
6.875% due 03/15/25 | 575,000 | 578,594 | ||||||
The Goldman Sachs Group Inc | 2,000,000 | 1,929,711 | ||||||
2.741% (USD LIBOR + 1.000%) due 07/24/23 § | 3,000,000 | 3,001,801 | ||||||
3.272% due 09/29/25 | 2,500,000 | 2,407,458 | ||||||
3.500% due 11/16/26 | 1,000,000 | 963,879 | ||||||
3.750% due 02/25/26 | 1,300,000 | 1,278,706 | ||||||
UBS Group Funding Switzerland AG (Switzerland) | 2,000,000 | 2,033,973 | ||||||
UDR Inc REIT | 2,000,000 | 1,914,938 | ||||||
|
| |||||||
| 61,427,971 | ||||||||
|
| |||||||
Industrial - 11.3% |
| |||||||
Apex Tool Group LLC | 2,425,000 | 2,431,063 | ||||||
ARD Finance SA (Luxembourg) | 2,050,000 | 2,129,438 | ||||||
| See Notes to Financial Statements | See explanation of symbols and terms, if any, on B-45 |
B-16
Table of Contents
PACIFIC FUNDS
PACIFIC FUNDS STRATEGIC INCOME
Schedule of Investments (Continued)
March 31, 2018
Principal Amount | Value | |||||||
Ardagh Packaging Finance PLC (Ireland) | $ | 750,000 | $ | 755,625 | ||||
7.250% due 05/15/24 ~ | 1,400,000 | 1,494,500 | ||||||
Bombardier Inc (Canada) | 600,000 | 618,750 | ||||||
8.750% due 12/01/21 ~ | 1,700,000 | 1,872,125 | ||||||
Brand Industrial Services Inc | 2,425,000 | 2,540,188 | ||||||
BWAY Holding Co | 1,350,000 | 1,361,813 | ||||||
7.250% due 04/15/25 ~ | 2,900,000 | 2,965,250 | ||||||
Cloud Crane LLC | 3,300,000 | 3,663,000 | ||||||
Coveris Holdings SA (Luxembourg) | 4,290,000 | 4,322,175 | ||||||
Flex Acquisition Co Inc | 1,650,000 | 1,636,594 | ||||||
Itron Inc | 3,125,000 | 3,086,875 | ||||||
JPW Industries Holding Corp | 1,635,000 | 1,718,794 | ||||||
Masco Corp | 1,075,000 | 1,080,880 | ||||||
7.750% due 08/01/29 | 4,110,000 | 5,210,227 | ||||||
New Enterprise Stone & Lime Co Inc | 750,000 | 752,813 | ||||||
10.125% due 04/01/22 ~ | 2,600,000 | 2,801,500 | ||||||
Novelis Corp | 1,975,000 | 1,950,313 | ||||||
6.250% due 08/15/24 ~ | 1,400,000 | 1,438,500 | ||||||
Park Aerospace Holdings Ltd (Ireland) | 2,050,000 | 2,016,073 | ||||||
5.500% due 02/15/24 ~ | 450,000 | 437,625 | ||||||
Penske Truck Leasing Co LP | 1,500,000 | 1,502,766 | ||||||
3.300% due 04/01/21 ~ | 1,000,000 | 1,002,227 | ||||||
Pisces Midco Inc | 175,000 | 177,625 | ||||||
Standard Industries Inc | 4,100,000 | 3,878,395 | ||||||
Titan Acquisition Ltd (Canada) | 1,750,000 | 1,748,906 | ||||||
TransDigm Inc | 1,000,000 | 1,027,500 | ||||||
US Concrete Inc | 2,025,000 | 2,111,063 | ||||||
Zekelman Industries Inc | 2,785,000 | 3,070,463 | ||||||
|
| |||||||
| 60,803,066 | ||||||||
|
| |||||||
Technology - 1.0% |
| |||||||
Dell International LLC | 1,000,000 | 1,060,832 | ||||||
5.875% due 06/15/21 ~ | 200,000 | 205,250 | ||||||
6.020% due 06/15/26 ~ | 250,000 | 269,508 | ||||||
Infor Software Parent LLC | 1,550,000 | 1,571,313 | ||||||
Infor US Inc | 250,000 | 255,625 | ||||||
NXP BV (Netherlands) | 550,000 | 547,250 | ||||||
4.625% due 06/01/23 ~ | 1,500,000 | 1,530,450 | ||||||
|
| |||||||
| 5,440,228 | ||||||||
|
| |||||||
Utilities - 1.6% |
| |||||||
Calpine Corp | 2,200,000 | 2,131,250 | ||||||
5.875% due 01/15/24 ~ | 1,500,000 | 1,518,450 | ||||||
Dynegy Inc | 800,000 | 867,000 | ||||||
8.125% due 01/30/26 ~ | 500,000 | 553,750 | ||||||
Principal Amount | Value | |||||||
NRG Energy Inc | $ | 2,675,000 | $ | 2,848,875 | ||||
Talen Energy Supply LLC | 500,000 | 352,500 | ||||||
6.500% due 06/01/25 | 800,000 | 568,000 | ||||||
|
| |||||||
| 8,839,825 | ||||||||
|
| |||||||
Total Corporate Bonds & Notes | 358,156,832 | |||||||
|
| |||||||
SENIOR LOAN NOTES - 22.2% |
| |||||||
Basic Materials - 0.4% |
| |||||||
INEOS US Finance LLC Term B (Luxembourg) | 1,995,000 | 2,003,104 | ||||||
|
| |||||||
Communications - 2.2% |
| |||||||
Altice US Finance I Corp Term B | 2,460,008 | 2,460,008 | ||||||
CSC Holdings LLC | 651,328 | 651,491 | ||||||
Term B 4.277% (USD LIBOR + 2.500%) due 01/25/26 § | 2,500,000 | 2,503,515 | ||||||
Frontier Communications Corp Term B-1 | 3,476,237 | 3,437,130 | ||||||
Sprint Communications Inc Term B | 2,479,975 | 2,483,462 | ||||||
|
| |||||||
| 11,535,606 | ||||||||
|
| |||||||
Consumer, Cyclical - 4.5% |
| |||||||
Caesars Resort Collection LLC Term B | 4,987,500 | 5,027,131 | ||||||
CEC Entertainment Inc Term B | 2,691,644 | 2,551,679 | ||||||
ClubCorp Holdings Inc Term B | 3,427,438 | 3,453,758 | ||||||
Neiman Marcus Group Ltd LLC | 2,459,719 | 2,131,499 | ||||||
New Red Finance Inc Term B (Canada) | 3,965,767 | 3,974,857 | ||||||
Petco Animal Supplies Inc Term B-1 | 2,954,849 | 2,177,969 | ||||||
PetSmart Inc Term B | 1,949,875 | 1,569,649 | ||||||
SeaWorld Parks & Entertainment Inc Term B-5 | 3,476,178 | 3,467,849 | ||||||
|
| |||||||
| 24,354,391 | ||||||||
|
| |||||||
Consumer, Non-Cyclical - 1.3% |
| |||||||
Jaguar Holding Co II | 3,423,360 | 3,439,408 | ||||||
Prime Security Services Borrower LLC Term B | 3,475,003 | 3,505,649 | ||||||
|
| |||||||
| 6,945,057 | ||||||||
|
| |||||||
| See Notes to Financial Statements | See explanation of symbols and terms, if any, on B-45 |
B-17
Table of Contents
PACIFIC FUNDS
PACIFIC FUNDS STRATEGIC INCOME
Schedule of Investments (Continued)
March 31, 2018
Principal Amount | Value | |||||||
Energy - 0.5% |
| |||||||
Arch Coal Inc Term B | $ | 2,481,203 | $ | 2,492,058 | ||||
|
| |||||||
Financial - 2.0% |
| |||||||
USI Inc Term B | 3,980,000 | 3,996,167 | ||||||
VF Holdings Corp | 3,956,159 | 3,993,248 | ||||||
VICI Properties 1 LLC Term B | 2,863,636 | 2,876,563 | ||||||
|
| |||||||
| 10,865,978 | ||||||||
|
| |||||||
Industrial - 8.3% |
| |||||||
Advanced Disposal Services Inc Term B | 2,971,819 | 2,984,408 | ||||||
Avolon (US) LLC Term B-2 (Ireland) | 2,981,231 | 2,987,235 | ||||||
Brand Industrial Services Inc | 3,979,950 | 4,017,537 | ||||||
BWAY Corp Term B | 3,229,356 | 3,249,204 | ||||||
Crosby US Acquisition Corp | 1,193,766 | 1,175,561 | ||||||
(2nd Lien) 7.904% (USD LIBOR + 6.000%) due 11/22/21 § | 1,150,000 | 1,115,500 | ||||||
CROWN Americas LLC Term B | 3,500,000 | 3,534,689 | ||||||
EWT Holdings III Corp | 2,805,451 | 2,829,124 | ||||||
Flex Acquisition Co Inc | 1,985,000 | 1,996,787 | ||||||
Gates Global LLC Term B-2 | 3,899,470 | 3,926,037 | ||||||
Kloeckner Pentaplast of America Inc | 2,985,000 | 2,884,256 | ||||||
North American Lifting Holdings Inc (2nd Lien) | 2,000,000 | 1,690,000 | ||||||
Proampac PG Borrower LLC | 1,975,000 | 1,995,574 | ||||||
(2nd Lien) 10.354% (USD LIBOR + 8.500%) due 10/18/24 § | 500,000 | 509,375 | ||||||
Reynolds Group Holdings Inc Term B | 4,187,617 | 4,213,790 | ||||||
Principal Amount | Value | |||||||
TransDigm Inc |
| |||||||
Term E 4.627% (USD LIBOR + 2.750%) due 05/14/22 § | $ | 2,977,741 | $ | 2,992,165 | ||||
Term F 4.773% (USD LIBOR + 2.750%) due 06/09/23 § | 982,309 | 987,220 | ||||||
Term G 4.707% (USD LIBOR + 2.500%) due 08/22/24 § | 1,492,500 | 1,499,133 | ||||||
|
| |||||||
| 44,587,595 | ||||||||
|
| |||||||
Technology - 2.1% |
| |||||||
First Data Corp | 1,374,288 | 1,377,809 | ||||||
4.122% (USD LIBOR + 2.250%) due 04/26/24 § | 2,500,000 | 2,506,900 | ||||||
Kronos Inc (2nd Lien) | 1,500,000 | 1,559,375 | ||||||
Solera LLC Term B | 3,949,622 | 3,966,286 | ||||||
Tempo Acquisition LLC Term B | 1,985,000 | 1,996,166 | ||||||
|
| |||||||
| 11,406,536 | ||||||||
|
| |||||||
Utilities - 0.9% |
| |||||||
Calpine Construction Finance Co LP | 2,992,500 | 3,004,524 | ||||||
Talen Energy Supply LLC Term B-1 | 1,984,962 | 1,955,188 | ||||||
|
| |||||||
| 4,959,712 | ||||||||
|
| |||||||
Total Senior Loan Notes |
| 119,150,037 | ||||||
|
| |||||||
MORTGAGE-BACKED SECURITIES - 0.7% | ||||||||
Fannie Mae - 0.4% |
| |||||||
2.500% due 04/01/33 | 2,000,000 | 1,958,756 | ||||||
|
| |||||||
Freddie Mac - 0.3% |
| |||||||
2.500% due 04/01/33 | 2,000,000 | 1,957,608 | ||||||
|
| |||||||
Total Mortgage-Backed Securities |
| 3,916,364 | ||||||
|
| |||||||
ASSET-BACKED SECURITIES - 1.9% |
| |||||||
ALM XII Ltd (Cayman) | 900,000 | 901,457 | ||||||
3.772% (USD LIBOR + 2.050%) due 04/16/27 § ~ | 600,000 | 600,146 | ||||||
Babson CLO Ltd (Cayman) | 1,000,000 | 1,000,000 | ||||||
Birchwood Park CLO Ltd (Cayman) | 700,000 | 700,347 | ||||||
Carlyle Global Market Strategies CLO Ltd (Cayman) | 1,200,000 | 1,201,522 | ||||||
| See Notes to Financial Statements | See explanation of symbols and terms, if any, on B-45 |
B-18
Table of Contents
PACIFIC FUNDS
PACIFIC FUNDS STRATEGIC INCOME
Schedule of Investments (Continued)
March 31, 2018
Principal Amount | Value | |||||||
CIFC Funding 2015-III Ltd (Cayman) | $1,100,000 | $1,093,472 | ||||||
Dryden Senior Loan Fund ‘B’ (Cayman) | 2,600,000 | 2,600,000 | ||||||
SLM Private Credit Student Loan Trust | 1,954,131 | 1,923,002 | ||||||
|
| |||||||
| 10,019,946 | ||||||||
|
| |||||||
Total Asset-Backed Securities |
| 10,019,946 | ||||||
|
| |||||||
FOREIGN GOVERNMENT BONDS & NOTES - 1.0% |
| |||||||
Mexico Government (Mexico) | 2,738,419 | 2,662,688 | ||||||
4.600% due 02/10/48 | 2,990,977 | 2,848,500 | ||||||
|
| |||||||
Total Foreign Government Bonds & Notes |
| 5,511,188 | ||||||
|
| |||||||
Shares | ||||||||
SHORT-TERM INVESTMENT - 2.1% | ||||||||
Money Market Fund - 2.1% | ||||||||
BlackRock Liquidity Funds T-Fund Portfolio | 11,320,016 | 11,320,016 | ||||||
|
| |||||||
Total Short-Term Investment | 11,320,016 | |||||||
|
| |||||||
TOTAL INVESTMENTS - 101.5% | 546,354,484 | |||||||
OTHER ASSETS & LIABILITIES, NET - (1.5%) | (7,935,688 | ) | ||||||
|
| |||||||
NET ASSETS - 100.0% | $538,418,796 | |||||||
|
| |||||||
Notes to Schedule of Investments
| (a) | As of March 31, 2018, the Fund’s composition as a percentage of net assets was as follows: |
Corporate Bonds & Notes | 66.5% | |||
Senior Loan Notes | 22.2% | |||
Common Stocks | 5.1% | |||
Others (each less than 3.0%) | 7.7% | |||
|
| |||
| 101.5% | ||||
Other Assets & Liabilities, Net | (1.5% | ) | ||
|
| |||
| 100.0% | ||||
|
|
| (b) | Pursuant to the terms of the following senior loan agreement, the Fund had an unfunded loan commitment which could be extended at the option of the borrower. |
| Borrower | Unfunded Loan Commitment | Value | Unrealized Appreciation (Depreciation) | |||||||
Allied Universal Holdco LLC | $1,492,500 | $1,482,756 | ($9,744 | ) | ||||||
|
| |||||||||
| (c) | Fair Value Measurements |
The following is a summary of the Fund’s investments as categorized under the three-tier hierarchy of inputs used in valuing the Fund’s assets and liabilities (See Note 3D in Notes to Financial Statements) as of March 31, 2018:
Total Value at March 31, 2018 | Level 1 Quoted Price | Level 2 Significant Observable Inputs | Level 3 Significant Unobservable Inputs | |||||||||||||||
Assets | Common Stocks | $27,585,401 | $26,866,022 | $— | $719,379 | |||||||||||||
Exchange-Traded Funds | 10,694,700 | 10,694,700 | — | — | ||||||||||||||
Corporate Bonds & Notes | 358,156,832 | — | 358,156,832 | — | ||||||||||||||
Senior Loan Notes | 119,150,037 | — | 117,460,037 | 1,690,000 | ||||||||||||||
Mortgage-Backed Securities | 3,916,364 | — | 3,916,364 | — | ||||||||||||||
Asset-Backed Securities | 10,019,946 | — | 10,019,946 | — | ||||||||||||||
Foreign Government Bonds & Notes | 5,511,188 | — | 5,511,188 | — | ||||||||||||||
Short-Term Investment | 11,320,016 | 11,320,016 | — | — | ||||||||||||||
Unfunded Loan Commitment | 1,482,756 | — | 1,482,756 | — | ||||||||||||||
|
|
|
|
|
|
|
| |||||||||||
Total | $547,837,240 | $48,880,738 | $496,547,123 | $2,409,379 | ||||||||||||||
|
|
|
|
|
|
|
| |||||||||||
| See Notes to Financial Statements | See explanation of symbols and terms, if any, on B-45 |
B-19
Table of Contents
PACIFIC FUNDS
PACIFIC FUNDSSM FLOATING RATE INCOME
Schedule of Investments
March 31, 2018
Principal Amount | Value | |||||||
CORPORATE BONDS & NOTES - 2.5% | ||||||||
Communications - 0.7% | ||||||||
Sprint Corp |
| |||||||
7.250% due 09/15/21 | $1,509,000 | $1,563,701 | ||||||
7.875% due 09/15/23 | 8,527,000 | 8,729,516 | ||||||
|
| |||||||
| 10,293,217 | ||||||||
|
| |||||||
Consumer, Cyclical - 0.4% |
| |||||||
Constellation Merger Sub Inc | 2,609,000 | 2,537,252 | ||||||
Mattel Inc | 3,184,000 | 3,120,957 | ||||||
|
| |||||||
| 5,658,209 | ||||||||
|
| |||||||
Consumer, Non-Cyclical - 1.1% |
| |||||||
Prime Security Services Borrower LLC | 6,584,000 | 7,151,870 | ||||||
Valeant Pharmaceuticals International Inc | ||||||||
5.625% due 12/01/21 ~ | 2,309,000 | 2,213,754 | ||||||
6.750% due 08/15/21 ~ | 7,527,000 | 7,574,044 | ||||||
|
| |||||||
| 16,939,668 | ||||||||
|
| |||||||
Industrial - 0.3% |
| |||||||
Reynolds Group Issuer Inc | 4,000,000 | 4,060,000 | ||||||
|
| |||||||
Total Corporate Bonds & Notes |
| 36,951,094 | ||||||
|
| |||||||
SENIOR LOAN NOTES - 93.4% | ||||||||
Basic Materials - 2.5% | ||||||||
Encapsys LLC | ||||||||
(2nd Lien) |
| |||||||
9.377% (USD LIBOR + 7.500%) |
| |||||||
due 10/27/25 § | 1,500,000 | 1,524,375 | ||||||
Term B |
| |||||||
5.127% (USD LIBOR + 3.250%) |
| |||||||
due 10/27/24 § | 2,000,000 | 2,018,750 | ||||||
GrafTech Finance Inc Term B | 4,000,000 | 4,005,000 | ||||||
HVSC Merger Sub Corp Term B | 4,738,125 | 4,786,985 | ||||||
MacDermid Inc | ||||||||
Term B-6 |
| |||||||
4.877% (USD LIBOR + 3.000%) |
| |||||||
due 06/07/23 § | 4,368,846 | 4,404,343 | ||||||
Term B-7 |
| |||||||
4.377% (USD LIBOR + 2.500%) |
| |||||||
due 06/07/20 § | 9,962,380 | 10,019,664 | ||||||
PQ Corp Term B | 10,480,163 | 10,527,889 | ||||||
|
| |||||||
| 37,287,006 | ||||||||
|
| |||||||
Communications - 9.5% | ||||||||
Altice US Finance I Corp Term B | 14,403,687 | 14,403,687 | ||||||
Avaya Inc Term B | 16,169,475 | 16,312,640 | ||||||
Charter Communications Operating LLC Term B | 8,782,545 | 8,824,262 | ||||||
Principal Amount | Value | |||||||
CSC Holdings LLC | ||||||||
4.036% (USD LIBOR + 2.250%) due 07/17/25 § | $10,006,620 | $10,009,122 | ||||||
Term B |
| |||||||
4.277% (USD LIBOR + 2.500%) |
| |||||||
due 01/25/26 § ¥ | 8,300,000 | 8,311,670 | ||||||
Intelsat Jackson Holdings SA Term B-3 | 13,650,000 | 13,676,658 | ||||||
MTN Infrastructure TopCo Inc Term B | 7,000,000 | 7,054,684 | ||||||
Radiate Holdco LLC Term B | 12,859,988 | 12,846,587 | ||||||
Sprint Communications Inc Term B | 20,622,922 | 20,651,918 | ||||||
Uber Technologies Inc | ||||||||
due 03/22/25 ¥ | 8,250,000 | 8,311,875 | ||||||
Term B |
| |||||||
5.877% (USD LIBOR + 4.000%) |
| |||||||
due 07/13/23 § | 13,723,178 | 13,796,940 | ||||||
West Corp Term B-1 | 6,250,000 | 6,312,500 | ||||||
|
| |||||||
| 140,512,543 | ||||||||
|
| |||||||
Consumer, Cyclical - 22.8% | ||||||||
24 Hour Fitness Worldwide Inc Term B | 8,442,944 | 8,490,436 | ||||||
Bass Pro Group LLC Term B | 13,017,293 | 12,908,273 | ||||||
Belk Inc Term B | 7,278,979 | 6,336,613 | ||||||
BJ’s Wholesale Club Inc | ||||||||
(2nd Lien) 9.191% (USD LIBOR + 7.500%) due 01/27/25 § | 6,900,000 | 6,940,972 | ||||||
Term B 5.191% (USD LIBOR + 3.750%) due 02/03/24 § | 4,862,751 | 4,864,964 | ||||||
Caesars Resort Collection LLC Term B | 18,453,750 | 18,600,384 | ||||||
CEC Entertainment Inc Term B | 11,155,008 | 10,574,947 | ||||||
ClubCorp Holdings Inc Term B | 13,464,936 | 13,568,333 | ||||||
Dexko Global Inc | ||||||||
5.802% (USD LIBOR + 3.500%) due 07/24/24 § | 3,990,000 | 4,027,406 | ||||||
(2nd Lien) |
| |||||||
10.552% (USD LIBOR + 8.250%) due 07/24/25 § | 2,750,000 | 2,791,250 | ||||||
EG America LLC (United Kingdom) | ||||||||
due 03/23/26 ¥ | 11,000,000 | 11,027,500 | ||||||
Term B |
| |||||||
due 02/06/25 ¥ | 13,000,000 | 13,005,421 | ||||||
EG Finco Ltd Term B-1 (United Kingdom) | 10,250,000 | 10,230,781 | ||||||
FPC Holdings Inc Term B | 5,000,000 | 4,893,750 | ||||||
Golden Entertainment Inc Term B | 5,985,000 | 5,999,963 | ||||||
Golden Nugget Inc | 10,420,598 | 10,521,553 | ||||||
| See Notes to Financial Statements | See explanation of symbols and terms, if any, on B-45 |
B-20
Table of Contents
PACIFIC FUNDS
PACIFIC FUNDS FLOATING RATE INCOME
Schedule of Investments (Continued)
March 31, 2018
Principal Amount | Value | |||||||
K-MAC Holdings Corp | ||||||||
5.036% (USD LIBOR + 3.250%) due 03/16/25 § ¥ | $7,000,000 | $7,045,934 | ||||||
(2nd Lien) |
| |||||||
8.536% (USD LIBOR + 6.750%) |
| |||||||
due 03/16/26 § ¥ | 11,000,000 | 11,165,000 | ||||||
Navistar Inc Term B | 13,500,000 | 13,613,913 | ||||||
Neiman Marcus Group Ltd LLC | 8,628,831 | 7,477,417 | ||||||
NEP/NCP Holdco Inc | 3,469,923 | 3,487,994 | ||||||
New Red Finance Inc Term B (Canada) | 20,616,622 | 20,663,875 | ||||||
Nexeo Solutions LLC Term B | 17,322,324 | 17,544,258 | ||||||
NPC International Inc | ||||||||
5.377% (USD LIBOR + 3.500%) | ||||||||
due 04/20/24 § | 8,357,579 | 8,488,166 | ||||||
(2nd Lien) |
| |||||||
9.377% (USD LIBOR + 7.500%) due 04/18/25 § | 4,250,000 | 4,356,250 | ||||||
Petco Animal Supplies Inc Term B-1 | 8,924,432 | 6,578,047 | ||||||
PF Chang’s China Bistro Inc | 8,208,750 | 7,798,313 | ||||||
Playa Resorts Holding BV Term B | 10,750,681 | 10,833,999 | ||||||
SeaWorld Parks & Entertainment Inc | ||||||||
Term B-2 |
| |||||||
4.552% (USD LIBOR + 2.250%) |
| |||||||
due 05/14/20 § | 390,758 | 389,955 | ||||||
Term B-5 |
| |||||||
5.302% (USD LIBOR + 3.000%) | ||||||||
due 03/31/24 § ¥ | 11,939,699 | 11,911,091 | ||||||
SMG US Midco 2 Inc(2nd Lien) | 2,700,000 | 2,762,999 | ||||||
Spin Holdco Inc Term B | 12,421,212 | 12,509,192 | ||||||
SRS Distribution Inc | ||||||||
(2nd Lien) |
| |||||||
10.627% (USD LIBOR + 8.750%) |
| |||||||
due 02/24/23 § | 11,892,210 | 12,182,083 | ||||||
Term B-4 |
| |||||||
5.303% (USD LIBOR + 3.250%) |
| |||||||
due 08/25/22 § | 7,013,285 | 7,071,145 | ||||||
Tacala Investment Corp | ||||||||
(2nd Lien) |
| |||||||
8.664% (USD LIBOR + 7.000%) |
| |||||||
due 02/01/26 § | 7,250,000 | 7,413,125 | ||||||
Term B |
| |||||||
4.914% (USD LIBOR + 3.250%) |
| |||||||
due 02/01/25 § ¥ | 9,610,000 | 9,676,069 | ||||||
Univar USA Inc Term B-3 | 7,523,843 | 7,580,858 | ||||||
|
| |||||||
| 335,332,229 | ||||||||
|
| |||||||
Principal Amount | Value | |||||||
Consumer, Non-Cyclical - 9.0% | ||||||||
Air Medical Group Holdings Inc Term B | ||||||||
4.936% (USD LIBOR + 3.250%) due 04/28/22 § | $6,945,792 | $6,983,237 | ||||||
6.015% (USD LIBOR + 4.250%) due 03/14/25 § | 6,234,375 | 6,299,643 | ||||||
Albertson’s LLC Term B-6 | 10,168,657 | 10,060,615 | ||||||
Alphabet Holding Co Inc | ||||||||
5.377% (USD LIBOR + 3.500%) due 09/28/24 § | 2,559,631 | 2,386,856 | ||||||
(2nd Lien) |
| |||||||
9.627% (USD LIBOR + 7.750%) |
| |||||||
due 08/15/25 § | 7,750,000 | 7,130,000 | ||||||
Avantor Inc | 4,064,813 | 4,112,237 | ||||||
Brightview Landscapes LLC (2nd Lien) | 2,870,922 | 2,895,147 | ||||||
CHS/Community Health Systems Inc Term G | 11,517,969 | 11,258,814 | ||||||
Diamond BC BV | 7,605,938 | 7,605,938 | ||||||
Garda World Security Corp Term B (Canada) | 11,666,332 | 11,803,412 | ||||||
NVA Holdings Inc Term B-3 | 9,725,000 | 9,755,391 | ||||||
PAREXEL International Corp Term B | 11,950,598 | 11,968,524 | ||||||
Pi Lux Finco SARL (2nd Lien) (Luxembourg) | 4,750,000 | 4,761,134 | ||||||
Prime Security Services Borrower LLC Term B | 9,598,232 | 9,682,878 | ||||||
PSC Industrial Outsourcing LP | ||||||||
(2nd Lien) |
| |||||||
10.286% (USD LIBOR + 8.500%) |
| |||||||
due 10/05/25 § | 2,000,000 | 1,990,000 | ||||||
Term B |
| |||||||
6.036% (USD LIBOR + 4.250%) |
| |||||||
due 10/05/24 § | 5,735,625 | 5,792,981 | ||||||
Reddy Ice Corp | 10,495,453 | 10,511,720 | ||||||
Romulus Merger Sub LLC | 1,545,455 | 1,533,381 | ||||||
Valeant Pharmaceuticals International Inc | 5,934,212 | 6,004,312 | ||||||
|
| |||||||
| 132,536,220 | ||||||||
|
| |||||||
Energy - 1.1% | ||||||||
Arch Coal Inc Term B | 5,458,647 | 5,482,528 | ||||||
EP Energy LLC Term B-3 (2nd Lien) | 180,322 | 177,617 | ||||||
| See Notes to Financial Statements | See explanation of symbols and terms, if any, on B-45 |
B-21
Table of Contents
PACIFIC FUNDS
PACIFIC FUNDS FLOATING RATE INCOME
Schedule of Investments (Continued)
March 31, 2018
Principal Amount | Value | |||||||
PowerTeam Services LLC | ||||||||
5.552% (USD LIBOR + 3.250%) due 03/05/25 § | $6,500,000 | $6,500,000 | ||||||
(2nd Lien) |
| |||||||
9.552% (USD LIBOR + 7.250%) |
| |||||||
due 03/05/26 § | 4,150,000 | 4,134,438 | ||||||
|
| |||||||
| 16,294,583 | ||||||||
|
| |||||||
Financial - 9.8% | ||||||||
AlixPartners LLP Term B | 12,634,937 | 12,706,009 | ||||||
Alliant Holdings Intermediate LLC | 16,041,675 | 16,157,528 | ||||||
AssuredPartners Inc Term B | 7,500,000 | 7,546,875 | ||||||
Dakota Holding Corp Term B | ||||||||
due 02/13/25 ¥ | 1,500,000 | 1,507,125 | ||||||
5.552% (USD LIBOR + 3.250%) | 6,750,000 | 6,779,531 | ||||||
HUB International Ltd Term B | 16,340,542 | 16,442,671 | ||||||
Iron Mountain Inc Term B | 3,750,000 | 3,751,564 | ||||||
Mayfield Agency Borrower Inc (2nd Lien) 10.377% (USD LIBOR + 8.500%) | 2,625,000 | 2,623,359 | ||||||
NFP Corp Term B | 22,508,739 | 22,609,578 | ||||||
Sedgwick Claims Management Services Inc | ||||||||
due 02/28/21 ¥ | 4,750,000 | 4,752,375 | ||||||
(2nd Lien) |
| |||||||
due 02/28/22 ¥ | 2,500,000 | 2,515,625 | ||||||
USI Inc Term B | 17,755,246 | 17,827,368 | ||||||
VF Holdings Corp | 18,895,206 | 19,072,349 | ||||||
VICI Properties 1 LLC Term B | 9,306,818 | 9,348,829 | ||||||
|
| |||||||
| 143,640,786 | ||||||||
|
| |||||||
Industrial - 28.6% | ||||||||
Accudyne Industries Borrower SCA Term B | 11,946,234 | 12,027,648 | ||||||
Advanced Disposal Services Inc Term B | 8,172,502 | 8,207,121 | ||||||
Allflex Holdings III Inc Term B | 5,849,877 | 5,894,967 | ||||||
Anchor Glass Container Corp (2nd Lien) | 5,830,000 | 5,684,250 | ||||||
Avolon (US) LLC Term B-2 (Ireland) | 16,376,250 | 16,409,232 | ||||||
Brand Industrial Services Inc | 17,629,344 | 17,795,835 | ||||||
BWAY Corp Term B | 9,925,000 | 9,985,999 | ||||||
Principal Amount | Value | |||||||
CIRCOR International Inc Term B | $7,231,875 | $7,262,010 | ||||||
Clark Equipment Co Term B (South Korea) | 8,975,494 | 8,992,323 | ||||||
Crosby US Acquisition Corp | ||||||||
4.904% (USD LIBOR + 3.000%) due 11/22/20 § | 10,983,566 | 10,816,067 | ||||||
(2nd Lien) |
| |||||||
7.904% (USD LIBOR + 6.000%) |
| |||||||
due 11/22/21 § | 8,786,340 | 8,522,750 | ||||||
DiversiTech Holdings Inc | ||||||||
(2nd Lien) |
| |||||||
9.810% (USD LIBOR + 7.500%) |
| |||||||
due 06/01/25 § | 5,750,000 | 5,821,875 | ||||||
Term B |
| |||||||
5.310% (USD LIBOR + 3.000%) |
| |||||||
due 06/01/24 § | 9,433,133 | 9,486,195 | ||||||
Drillship Kithira Owners Inc (Cayman) | 15,927,031 | 16,574,067 | ||||||
Engineered Machinery Holdings Inc (2nd Lien) | ||||||||
9.184% (USD LIBOR + 7.250%) due 07/19/25 § | 520,199 | 526,701 | ||||||
9.552% (USD LIBOR + 7.250%) due 07/19/25 § ¥ | 7,701,992 | 7,798,267 | ||||||
EWT Holdings III Corp | 10,481,720 | 10,570,164 | ||||||
Flex Acquisition Co Inc | 17,135,550 | 17,237,301 | ||||||
Gardner Denver Inc Term B-1 | 6,591,875 | 6,632,619 | ||||||
Gates Global LLC Term B-2 | 13,449,729 | 13,541,362 | ||||||
GYP Holdings III Corp | 5,605,387 | 5,635,163 | ||||||
KBR Inc | 3,500,000 | 3,497,813 | ||||||
Kloeckner Pentaplast of America Inc | 16,785,575 | 16,219,062 | ||||||
KPEX Holdings Inc | 4,436,250 | 4,458,431 | ||||||
Marvis Tire Express Services Corp | 12,930,035 | 12,946,197 | ||||||
North American Lifting Holdings Inc | 11,678,510 | 11,094,585 | ||||||
Pisces Midco Inc Term B | 11,000,000 | 11,027,500 | ||||||
Power Products LLC | 6,184,374 | 6,253,948 | ||||||
Pro Mach Group Inc Term B | 10,500,000 | 10,529,064 | ||||||
Proampac PG Borrower LLC | ||||||||
5.303% (USD LIBOR + 3.500%) | 15,675,917 | 15,839,213 | ||||||
(2nd Lien) |
| |||||||
10.354% (USD LIBOR + 8.500%) | ||||||||
due 10/18/24 § | 3,710,000 | 3,779,563 | ||||||
Quikrete Holdings Inc Term B | 10,707,948 | 10,768,180 | ||||||
| See Notes to Financial Statements | See explanation of symbols and terms, if any, on B-45 |
B-22
Table of Contents
PACIFIC FUNDS
PACIFIC FUNDS FLOATING RATE INCOME
Schedule of Investments (Continued)
March 31, 2018
Principal Amount | Value | |||||||
Reynolds Group Holdings Inc Term B | $18,298,395 | $18,412,760 | ||||||
Spectrum Holdings III Corp (2nd Lien) | 5,405,000 | 5,459,050 | ||||||
StandardAero Aviation Holdings Inc | 13,154,647 | 13,293,389 | ||||||
Titan Acquisition Ltd Term B (Canada) | 11,000,000 | 10,990,551 | ||||||
Transcendia Holdings Inc Term B | 4,973,784 | 5,014,196 | ||||||
TransDigm Inc | ||||||||
Term F |
| |||||||
4.773% (USD LIBOR + 2.750%) |
| |||||||
due 06/09/23 § | 7,257,979 | 7,294,269 | ||||||
Term G |
| |||||||
4.707% (USD LIBOR + 2.500%) |
| |||||||
due 08/22/24 § | 19,612,097 | 19,699,253 | ||||||
TricorBraun Inc | 589,197 | 593,799 | ||||||
6.052% (USD LIBOR + 3.750%) | 5,847,553 | 5,893,234 | ||||||
USIC Holdings Inc | 4,443,750 | 4,478,002 | ||||||
Wrangler Buyer Corp Term B | 3,755,689 | 3,783,076 | ||||||
Zekelman Industries Inc | 4,750,729 | 4,782,203 | ||||||
Zodiac Pool Solutions LLC | 10,762,946 | 10,803,307 | ||||||
|
| |||||||
| 422,332,561 | ||||||||
|
| |||||||
Technology - 8.3% | ||||||||
Applied Systems Inc (2nd Lien) | 13,989,070 | 14,496,174 | ||||||
Cypress Intermediate Holdings III Inc | ||||||||
(2nd Lien) |
| |||||||
8.627% (USD LIBOR + 6.750%) |
| |||||||
due 03/31/25 § | 11,955,000 | 12,204,059 | ||||||
Term B |
| |||||||
4.880% (USD LIBOR + 3.000%) |
| |||||||
due 03/31/24 § | 4,451,288 | 4,470,299 | ||||||
HS Purchaser LLC | 5,000,000 | 5,012,500 | ||||||
Kronos Inc | ||||||||
(2nd Lien) |
| |||||||
10.037% (USD LIBOR + 8.250%) |
| |||||||
due 11/01/24 § | 14,050,000 | 14,606,141 | ||||||
Term B |
| |||||||
4.880% (USD LIBOR + 3.500%) |
| |||||||
due 11/01/23 § ¥ | 5,500,000 | 5,537,472 | ||||||
RP Crown Parent LLC Term B | 9,203,401 | 9,255,170 | ||||||
Solera LLC Term B | 20,239,916 | 20,325,308 | ||||||
Sophia LP Term B | 8,893,652 | 8,926,078 | ||||||
SS&C Technologies Holdings Europe SARL | 3,155,222 | 3,175,188 | ||||||
Principal Amount | Value | |||||||
SS&C Technologies Inc Term B-3 | $8,844,778 | $8,900,748 | ||||||
Tempo Acquisition LLC Term B | 15,880,000 | 15,969,325 | ||||||
|
| |||||||
| 122,878,462 | ||||||||
|
| |||||||
Utilities - 1.8% | ||||||||
Helix Gen Funding LLC Term B | 4,146,716 | 4,192,214 | ||||||
Pike Corp Term B | 7,000,000 | 7,070,000 | ||||||
Talen Energy Supply LLC | ||||||||
Term B-1 | ||||||||
5.877% (USD LIBOR + 4.000%) due 07/06/23 § ¥ | 10,751,180 | 10,589,913 | ||||||
Term B-2 | ||||||||
5.877% (USD LIBOR + 4.000%) due 04/13/24 § ¥ | 4,513,054 | 4,456,641 | ||||||
|
| |||||||
| 26,308,768 | ||||||||
|
| |||||||
Total Senior Loan Notes | 1,377,123,158 | |||||||
|
| |||||||
Shares | ||||||||
SHORT-TERM INVESTMENT - 13.6% | ||||||||
Money Market Fund - 13.6% | ||||||||
BlackRock Liquidity Funds T-Fund Portfolio | 201,540,870 | 201,540,870 | ||||||
|
| |||||||
Total Short-Term Investment | 201,540,870 | |||||||
|
| |||||||
TOTAL INVESTMENTS - 109.5% | 1,615,615,122 | |||||||
OTHER ASSETS & LIABILITIES, NET - (9.5%) | (140,732,338 | ) | ||||||
|
| |||||||
NET ASSETS - 100.0% | $1,474,882,784 | |||||||
|
| |||||||
Notes to Schedule of Investments
| (a) | As of March 31, 2018, the Fund’s composition by sector as a percentage of net assets was as follows: |
Industrial | 28.9% | |||
Consumer, Cyclical | 23.2% | |||
Short-Term Investment | 13.6% | |||
Communications | 10.2% | |||
Consumer, Non-Cyclical | 10.1% | |||
Financial | 9.8% | |||
Technology | 8.3% | |||
Others (each less than 3.0%) | 5.4% | |||
|
| |||
| 109.5% | ||||
Other Assets & Liabilities, Net | (9.5% | ) | ||
|
| |||
| 100.0% | ||||
|
|
| See Notes to Financial Statements | See explanation of symbols and terms, if any, on B-45 |
B-23
Table of Contents
PACIFIC FUNDS
PACIFIC FUNDS FLOATING RATE INCOME
Schedule of Investments (Continued)
March 31, 2018
| (b) | Pursuant to the terms of the following senior loan agreements, the Fund had unfunded loan commitments which could be extended at the option of the borrower. |
| Borrower | Unfunded Loan Commitments | Value | Unrealized Appreciation (Depreciation) | |||||||||
Engineered Machinery Holdings Inc (2nd Lien) | $99,762 | $100,324 | $562 | |||||||||
KPEX Holdings Inc | 438,202 | 440,944 | 2,742 | |||||||||
Marvis Tire Express Services Corp | 2,069,965 | 2,072,553 | 2,588 | |||||||||
MTN Infrastructure TopCo Inc | 5,177,552 | 5,238,522 | 60,970 | |||||||||
Romulus Merger Sub LLC | 454,545 | 450,995 | (3,550 | ) | ||||||||
|
|
|
|
|
| |||||||
| $8,240,026 | $8,303,338 | $63,312 | ||||||||||
|
|
|
|
|
| |||||||
| (c) | Fair Value Measurements |
The following is a summary of the Fund’s investments as categorized under the three-tier hierarchy of inputs used in valuing the Fund’s assets and liabilities (See Note 3D in Notes to Financial Statements) as of March 31, 2018:
| Total Value at March 31, 2018 | Level 1 Quoted Price | Level 2 Significant Observable Inputs | Level 3 Significant Unobservable Inputs | |||||||||||||||
Assets | Corporate Bonds & Notes | $36,951,094 | $— | $36,951,094 | $— | |||||||||||||
Senior Loan Notes | 1,377,123,158 | — | 1,377,123,158 | — | ||||||||||||||
Short-Term Investment | 201,540,870 | 201,540,870 | — | — | ||||||||||||||
Unfunded Loan Commitments | 8,303,338 | — | 8,303,338 | — | ||||||||||||||
|
|
|
|
|
|
|
| |||||||||||
Total | $1,623,918,460 | $201,540,870 | $1,422,377,590 | $— | ||||||||||||||
|
|
|
|
|
|
|
| |||||||||||
| See Notes to Financial Statements | See explanation of symbols and terms, if any, on B-45 |
B-24
Table of Contents
PACIFIC FUNDS
PACIFIC FUNDSSM LIMITED DURATION HIGH INCOME
Schedule of Investments
March 31, 2018
Shares | Value | |||||||
COMMON STOCKS - 1.1% |
| |||||||
Consumer, Cyclical - 1.1% |
| |||||||
Modular Space Corp * ± | 21,952 | $392,392 | ||||||
|
| |||||||
Total Common Stocks |
| 392,392 | ||||||
|
| |||||||
Principal | ||||||||
CORPORATE BONDS & NOTES - 61.5% |
| |||||||
Basic Materials - 3.7% |
| |||||||
ArcelorMittal (Luxembourg) | $250,000 | 260,625 | ||||||
Barminco Finance Pty Ltd (Australia) | 150,000 | 147,563 | ||||||
Constellium NV (Netherlands) | 500,000 | 507,500 | ||||||
Freeport-McMoran Inc | 250,000 | 248,138 | ||||||
Hexion Inc | 150,000 | 140,625 | ||||||
|
| |||||||
| 1,304,451 | ||||||||
|
| |||||||
Communications - 12.0% |
| |||||||
CCO Holdings LLC | 250,000 | 254,375 | ||||||
Cequel Communications Holdings I LLC | 274,000 | 279,480 | ||||||
Charter Communications Operating LLC | 250,000 | 255,708 | ||||||
Clear Channel Worldwide Holdings Inc | 300,000 | 306,750 | ||||||
CSC Holdings LLC | 250,000 | 258,750 | ||||||
DISH DBS Corp 5.875% due 11/15/24 | 300,000 | 268,500 | ||||||
6.750% due 06/01/21 | 250,000 | 253,125 | ||||||
Frontier Communications Corp | 75,000 | 56,578 | ||||||
Hughes Satellite Systems Corp | 400,000 | 430,768 | ||||||
Intelsat Connect Finance SA (Luxembourg) | 156,000 | 120,510 | ||||||
Level 3 Financing Inc | 250,000 | 236,250 | ||||||
Outfront Media Capital LLC | 250,000 | 255,313 | ||||||
Radiate Holdco LLC | 150,000 | 145,875 | ||||||
Sprint Communications Inc | 150,000 | 147,563 | ||||||
Sprint Corp | 550,000 | 569,938 | ||||||
T-Mobile USA Inc | 250,000 | 261,025 | ||||||
Townsquare Media Inc | 150,000 | 141,563 | ||||||
|
| |||||||
| 4,242,071 | ||||||||
|
| |||||||
Consumer, Cyclical - 9.6% |
| |||||||
Aramark Services Inc | 125,000 | 126,287 | ||||||
AV Homes Inc | 200,000 | 204,544 | ||||||
Beacon Roofing Supply Inc | 250,000 | 263,750 | ||||||
Principal Amount | Value | |||||||
Beazer Homes USA Inc | $200,000 | $186,250 | ||||||
7.250% due 02/01/23 | 23,000 | 23,891 | ||||||
Caesars Resort Collection LLC | 200,000 | 192,236 | ||||||
Constellation Merger Sub Inc | 180,000 | 175,050 | ||||||
Downstream Development Authority of the Quapaw Tribe of Oklahoma | 150,000 | 154,500 | ||||||
Golden Nugget Inc | 300,000 | 303,000 | ||||||
Hilton Grand Vacations Borrower LLC | 175,000 | 186,594 | ||||||
IHO Verwaltungs GmbH (Germany) | 200,000 | 194,750 | ||||||
Lennar Corp | 250,000 | 251,900 | ||||||
6.625% due 05/01/20 ~ | 400,000 | 424,500 | ||||||
Live Nation Entertainment Inc | 25,000 | 25,375 | ||||||
Mattamy Group Corp (Canada) | 125,000 | 126,875 | ||||||
Mattel Inc | 150,000 | 127,875 | ||||||
6.750% due 12/31/25 ~ | 25,000 | 24,505 | ||||||
MGM Resorts International | 250,000 | 266,250 | ||||||
The Men’s Wearhouse Inc | 125,000 | 129,063 | ||||||
|
| |||||||
| 3,387,195 | ||||||||
|
| |||||||
Consumer, Non-Cyclical - 8.3% |
| |||||||
Ahern Rentals Inc | 100,000 | 97,750 | ||||||
B&G Foods Inc | 50,000 | 46,688 | ||||||
CHS/Community Health Systems Inc | 200,000 | 187,000 | ||||||
HCA Inc | 400,000 | 409,880 | ||||||
Herc Rentals Inc | 204,000 | 218,790 | ||||||
JBS USA LUX SA (Brazil) | 300,000 | 304,125 | ||||||
MEDNAX Inc | 250,000 | 251,875 | ||||||
Pilgrim’s Pride Corp | 50,000 | 48,688 | ||||||
Tenet Healthcare Corp | 100,000 | 96,500 | ||||||
6.750% due 06/15/23 | 250,000 | 245,625 | ||||||
The ADT Corp | 300,000 | 314,250 | ||||||
TMS International Corp | 160,000 | 167,200 | ||||||
Valeant Pharmaceuticals International Inc | 25,000 | 24,431 | ||||||
5.625% due 12/01/21 ~ | 150,000 | 143,813 | ||||||
5.875% due 05/15/23 ~ | 50,000 | 44,563 | ||||||
7.500% due 07/15/21 ~ | 350,000 | 353,938 | ||||||
|
| |||||||
| 2,955,116 | ||||||||
|
| |||||||
Energy - 7.6% |
| |||||||
Callon Petroleum Co | 200,000 | 205,560 | ||||||
Cheniere Corpus Christi Holdings LLC | 200,000 | 222,000 | ||||||
Cheniere Energy Partners LP | 175,000 | 173,031 | ||||||
| See Notes to Financial Statements | See explanation of symbols and terms, if any, on B-45 |
B-25
Table of Contents
PACIFIC FUNDS
PACIFIC FUNDS LIMITED DURATION HIGH INCOME
Schedule of Investments (Continued)
March 31, 2018
Principal Amount | Value | |||||||
Chesapeake Energy Corp | $25,000 | $24,250 | ||||||
Continental Resources Inc | 150,000 | 144,938 | ||||||
Diamondback Energy Inc | 25,000 | 25,419 | ||||||
Endeavor Energy Resources LP | 150,000 | 149,625 | ||||||
Energy Transfer Equity LP | 75,000 | 73,125 | ||||||
Ensco PLC | 125,000 | 121,250 | ||||||
EP Energy LLC | 200,000 | 134,500 | ||||||
Halcon Resources Corp | 150,000 | 148,125 | ||||||
6.750% due 02/15/25 ~ | 50,000 | 49,062 | ||||||
Moss Creek Resources Holdings Inc | 150,000 | 151,830 | ||||||
Parsley Energy LLC | 25,000 | 25,062 | ||||||
Precision Drilling Corp (Canada) | 125,000 | 130,469 | ||||||
Range Resources Corp | 100,000 | 101,000 | ||||||
Sanchez Energy Corp | 75,000 | 55,078 | ||||||
7.250% due 02/15/23 ~ | 125,000 | 125,937 | ||||||
SemGroup Corp | 50,000 | 48,000 | ||||||
7.250% due 03/15/26 | 25,000 | 25,062 | ||||||
SESI LLC | 200,000 | 204,000 | ||||||
Southwestern Energy Co | 150,000 | 152,250 | ||||||
Whiting Petroleum Corp | 200,000 | 203,000 | ||||||
|
| |||||||
| 2,692,573 | ||||||||
|
| |||||||
Financial - 2.5% |
| |||||||
Ally Financial Inc | 350,000 | 353,062 | ||||||
ASP AMC Merger Sub Inc | 175,000 | 164,937 | ||||||
Greystar Real Estate Partners LLC | 150,000 | 150,000 | ||||||
Jefferies Finance LLC | 200,000 | 203,000 | ||||||
|
| |||||||
| 870,999 | ||||||||
|
| |||||||
Industrial - 14.6% |
| |||||||
Apex Tool Group LLC | 150,000 | 150,375 | ||||||
ARD Finance SA (Luxembourg) | 200,000 | 207,750 | ||||||
Ardagh Packaging Finance PLC (Ireland) | 200,000 | 201,500 | ||||||
Berry Global Inc | 400,000 | 406,012 | ||||||
Bombardier Inc (Canada) | 25,000 | 25,781 | ||||||
8.750% due 12/01/21 ~ | 125,000 | 137,656 | ||||||
Brand Industrial Services Inc | 150,000 | 157,125 | ||||||
BWAY Holding Co | 150,000 | 151,312 | ||||||
7.250% due 04/15/25 ~ | 150,000 | 153,375 | ||||||
Cloud Crane LLC | 125,000 | 138,750 | ||||||
Coveris Holdings SA (Luxembourg) | 250,000 | 251,875 | ||||||
Principal Amount | Value | |||||||
Flex Acquisition Co Inc | $165,000 | $163,659 | ||||||
Itron Inc | 150,000 | 148,170 | ||||||
Louisiana-Pacific Corp | 175,000 | 175,875 | ||||||
New Enterprise Stone & Lime Co Inc | 50,000 | 50,187 | ||||||
10.125% due 04/01/22 ~ | 150,000 | 161,625 | ||||||
Novelis Corp | 350,000 | 345,625 | ||||||
Owens-Brockway Glass Container Inc | 250,000 | 259,219 | ||||||
Reynolds Group Issuer Inc (New Zealand) | 387,643 | 392,973 | ||||||
Sealed Air Corp | 500,000 | 506,875 | ||||||
Standard Industries Inc | 175,000 | 165,541 | ||||||
Titan Acquisition Ltd (Canada) | 125,000 | 124,922 | ||||||
TransDigm Inc | 250,000 | 251,875 | ||||||
US Concrete Inc | 200,000 | 208,500 | ||||||
Zekelman Industries Inc | 200,000 | 220,500 | ||||||
|
| |||||||
| 5,157,057 | ||||||||
|
| |||||||
Technology - 2.0% |
| |||||||
Infor Software Parent LLC | 250,000 | 253,437 | ||||||
NXP BV (Netherlands) | 200,000 | 204,060 | ||||||
Sensata Technologies BV | 250,000 | 262,187 | ||||||
|
| |||||||
| 719,684 | ||||||||
|
| |||||||
Utilities - 1.2% |
| |||||||
Calpine Corp | 250,000 | 229,375 | ||||||
NRG Energy Inc | 200,000 | 213,000 | ||||||
|
| |||||||
| 442,375 | ||||||||
|
| |||||||
Total Corporate Bonds & Notes |
| 21,771,521 | ||||||
|
| |||||||
SENIOR LOAN NOTES - 30.4% |
| |||||||
Communications - 0.7% |
| |||||||
Avaya Inc Term B | 249,375 | 251,583 | ||||||
|
| |||||||
Consumer, Cyclical - 10.6% |
| |||||||
Belk Inc Term B | 348,998 | 303,816 | ||||||
BJ’s Wholesale Club Inc Term B | 249,372 | 249,485 | ||||||
CEC Entertainment Inc Term B | 480,000 | 455,040 | ||||||
ClubCorp Holdings Inc Term B | 244,817 | 246,697 | ||||||
Navistar Inc Term B | 250,000 | 252,110 | ||||||
| See Notes to Financial Statements | See explanation of symbols and terms, if any, on B-45 |
B-26
Table of Contents
PACIFIC FUNDS
PACIFIC FUNDS LIMITED DURATION HIGH INCOME
Schedule of Investments (Continued)
March 31, 2018
Principal Amount | Value | |||||||
Neiman Marcus Group Ltd LLC | $478,800 | $414,910 | ||||||
New Red Finance Inc Term B (Canada) | 369,241 | 370,087 | ||||||
Nexeo Solutions LLC Term B | 245,650 | 248,797 | ||||||
Petco Animal Supplies Inc Term B-1 | 486,269 | 358,421 | ||||||
PetSmart Inc Term B | 729,375 | 587,147 | ||||||
SMG US Midco 2 Inc | 250,000 | 252,761 | ||||||
|
| |||||||
| 3,739,271 | ||||||||
|
| |||||||
Consumer, Non-Cyclical - 7.3% |
| |||||||
Avantor Inc | 249,375 | 252,284 | ||||||
Brightview Landscapes LLC (2nd Lien) | 140,426 | 141,610 | ||||||
CHS/Community Health Systems Inc | 20,712 | 20,246 | ||||||
Term H 5.234% (USD LIBOR + 3.000%) due 01/27/21 § | 38,365 | 36,956 | ||||||
Jaguar Holding Co II | 583,500 | 586,235 | ||||||
MPH Acquisition Holdings LLC Term B | 337,752 | 339,758 | ||||||
Reddy Ice Corp | 477,994 | 478,735 | ||||||
US Foods Inc Term B | 730,120 | 736,154 | ||||||
|
| |||||||
| 2,591,978 | ||||||||
|
| |||||||
Financial - 2.1% |
| |||||||
HUB International Ltd Term B | 238,806 | 240,298 | ||||||
VF Holdings Corp | 492,500 | 497,117 | ||||||
|
| |||||||
| 737,415 | ||||||||
|
| |||||||
Industrial - 5.0% |
| |||||||
Avolon (US) LLC Term B-2 (Ireland) | 496,250 | 497,249 | ||||||
Crosby US Acquisition Corp | 479,950 | 472,631 | ||||||
EWT Holdings III Corp | 255,275 | 257,429 | ||||||
Gates Global LLC Term B-2 | 171,006 | 172,171 | ||||||
Principal Amount | Value | |||||||
RBS Global Inc Term B | $102,564 | $103,253 | ||||||
Wrangler Buyer Corp Term B | 249,375 | 251,193 | ||||||
|
| |||||||
| 1,753,926 | ||||||||
|
| |||||||
Technology - 2.0% |
| |||||||
First Data Corp | 458,096 | 459,270 | ||||||
Kronos Inc (2nd Lien) | 250,000 | 259,896 | ||||||
|
| |||||||
| �� | 719,166 | |||||||
|
| |||||||
Utilities - 2.7% |
| |||||||
AES Corp Term B | 495,000 | 495,928 | ||||||
Vistra Operations Co LLC | 402,054 | 405,270 | ||||||
Term C 4.377% (USD LIBOR + 2.500%) due 08/04/23 § | 71,429 | 72,000 | ||||||
|
| |||||||
| 973,198 | ||||||||
|
| |||||||
Total Senior Loan Notes |
| 10,766,537 | ||||||
|
| |||||||
Shares | ||||||||
SHORT-TERM INVESTMENT - 6.5% |
| |||||||
Money Market Fund - 6.5% |
| |||||||
BlackRock Liquidity Funds T-Fund Portfolio | 2,289,215 | 2,289,215 | ||||||
|
| |||||||
Total Short-Term Investment |
| 2,289,215 | ||||||
|
| |||||||
TOTAL INVESTMENTS - 99.5% |
| 35,219,665 | ||||||
OTHER ASSETS & LIABILITIES, NET - 0.5% |
| 184,028 | ||||||
|
| |||||||
NET ASSETS - 100.0% |
| $35,403,693 | ||||||
|
| |||||||
Notes to Schedule of Investments
| (a) | As of March 31, 2018, the Fund’s composition by sector as a percentage of net assets was as follows: |
Consumer, Cyclical | 21.3% | |||
Industrial | 19.6% | |||
Consumer, Non-Cyclical | 15.6% | |||
Communications | 12.7% | |||
Energy | 7.6% | |||
Short-Term Investment | 6.5% | |||
Financial | 4.6% | |||
Technology | 4.0% | |||
Utilities | 3.9% | |||
Basic Materials | 3.7% | |||
|
| |||
| 99.5% | ||||
Other Assets & Liabilities, Net | 0.5% | |||
|
| |||
| 100.0% | ||||
|
|
| See Notes to Financial Statements | See explanation of symbols and terms, if any, on B-45 |
B-27
Table of Contents
PACIFIC FUNDS
PACIFIC FUNDS LIMITED DURATION HIGH INCOME
Schedule of Investments (Continued)
March 31, 2018
| (b) | Fair Value Measurements |
The following is a summary of the Fund’s investments as categorized under the three-tier hierarchy of inputs used in valuing the Fund’s assets and liabilities (See Note 3D in Notes to Financial Statements) as of March 31, 2018:
Total Value at March 31, 2018 | Level 1 Quoted Price | Level 2 Significant Observable Inputs | Level 3 Significant Unobservable Inputs | |||||||||||||||
Assets | Common Stocks | $392,392 | $— | $— | $392,392 | |||||||||||||
Corporate Bonds & Notes | 21,771,521 | — | 21,771,521 | — | ||||||||||||||
Senior Loan Notes | 10,766,537 | — | 10,766,537 | — | ||||||||||||||
Short-Term Investment | 2,289,215 | 2,289,215 | — | — | ||||||||||||||
|
|
|
|
|
|
|
| |||||||||||
Total | $35,219,665 | $2,289,215 | $32,538,058 | $392,392 | ||||||||||||||
|
|
|
|
|
|
|
| |||||||||||
The following is a reconciliation of investments for significant unobservable inputs (Level 3) used in valuing the Fund’s assets and liabilities (See Note 3D in Notes to Financial Statements) for the year ended March 31, 2018:
| Common Stocks | ||||
Value, Beginning of Year | $290,864 | |||
Purchases | — | |||
Sales (Includes Paydowns) | — | |||
Accrued Discounts (Premiums) | — | |||
Net Realized Gains (Losses) | — | |||
Change in Net Unrealized Appreciation (Depreciation) | 101,528 | |||
Transfers In | — | |||
Transfers Out | — | |||
|
| |||
Value, End of Year | $392,392 | |||
|
| |||
Change in Net Unrealized Appreciation (Depreciation) on Level 3 Investments Held at the End of Year, if Applicable | $101,528 | |||
|
| |||
All significant unobservable inputs were provided by a single broker quote.
| See Notes to Financial Statements | See explanation of symbols and terms, if any, on B-45 |
B-28
Table of Contents
PACIFIC FUNDS
PACIFIC FUNDSSM HIGH INCOME
Schedule of Investments
March 31, 2018
Shares | Value | |||||||
COMMON STOCKS - 2.3% |
| |||||||
Basic Materials - 0.1% |
| |||||||
Constellium NV ‘A’ (Netherlands) * | 11,031 | $119,686 | ||||||
|
| |||||||
Consumer, Cyclical - 1.0% |
| |||||||
Cedar Fair LP | 3,875 | 247,535 | ||||||
Las Vegas Sands Corp | 2,235 | 160,696 | ||||||
Modular Space Corp * ± | 7,317 | 130,791 | ||||||
Mohawk Industries Inc * | 352 | 81,741 | ||||||
Six Flags Entertainment Corp | 2,720 | 169,347 | ||||||
|
| |||||||
| 790,110 | ||||||||
|
| |||||||
Financial - 0.6% |
| |||||||
Bank of America Corp | 7,651 | 229,453 | ||||||
The PNC Financial Services Group Inc | 785 | 118,723 | ||||||
Wells Fargo & Co | 2,206 | 115,616 | ||||||
|
| |||||||
| 463,792 | ||||||||
|
| |||||||
Industrial - 0.6% |
| |||||||
ADT Inc | 13,173 | 104,462 | ||||||
Allegion PLC | 2,651 | 226,104 | ||||||
Xylem Inc | 2,243 | 172,532 | ||||||
|
| |||||||
| 503,098 | ||||||||
|
| |||||||
Total Common Stocks |
| 1,876,686 | ||||||
|
| |||||||
EXCHANGE-TRADED FUND - 0.3% |
| |||||||
SPDR Bloomberg Barclays High Yield Bond | 6,400 | 229,440 | ||||||
|
| |||||||
Total Exchange-Traded Fund |
| 229,440 | ||||||
|
| |||||||
Principal Amount | ||||||||
CORPORATE BONDS & NOTES - 89.6% |
| |||||||
Basic Materials - 3.9% |
| |||||||
Alcoa Nederland Holding BV | $400,000 | 433,000 | ||||||
Barminco Finance Pty Ltd (Australia) | 500,000 | 491,875 | ||||||
Blue Cube Spinco Inc | 125,000 | 143,944 | ||||||
Constellium NV (Netherlands) | 1,000,000 | 1,015,000 | ||||||
Freeport-McMoRan Inc | 125,000 | 134,687 | ||||||
Hexion Inc 6.625% due 04/15/20 | 250,000 | 234,375 | ||||||
10.375% due 02/01/22 ~ | 225,000 | 218,812 | ||||||
Olin Corp | 525,000 | 503,344 | ||||||
|
| |||||||
| 3,175,037 | ||||||||
|
| |||||||
Communications - 12.7% |
| |||||||
Altice Financing SA (Luxembourg) | 125,000 | 122,812 | ||||||
Altice France SA (France) | 450,000 | 430,312 | ||||||
CCO Holdings LLC | 850,000 | 867,000 | ||||||
Clear Channel Worldwide Holdings Inc | 374,000 | 382,415 | ||||||
7.625% due 03/15/20 | 350,000 | 350,875 | ||||||
Principal Amount | Value | |||||||
CSC Holdings LLC | $950,000 | $983,250 | ||||||
Frontier Communications Corp | 25,000 | 24,312 | ||||||
11.000% due 09/15/25 | 300,000 | 226,312 | ||||||
Intelsat Connect Finance SA (Luxembourg) | 39,000 | 30,127 | ||||||
Intelsat Jackson Holdings SA (Luxembourg) 7.250% due 10/15/20 | 850,000 | 790,500 | ||||||
8.000% due 02/15/24 ~ | 75,000 | 79,031 | ||||||
Level 3 Financing Inc | 925,000 | 874,125 | ||||||
Outfront Media Capital LLC | 725,000 | 737,687 | ||||||
Radiate Holdco LLC | 425,000 | 413,312 | ||||||
Sprint Corp | 625,000 | 647,656 | ||||||
7.625% due 02/15/25 | 1,400,000 | 1,380,750 | ||||||
7.625% due 03/01/26 | 25,000 | 24,469 | ||||||
T-Mobile USA Inc | 1,125,000 | 1,081,406 | ||||||
6.000% due 04/15/24 | 100,000 | 104,410 | ||||||
Townsquare Media Inc | 125,000 | 117,969 | ||||||
Virgin Media Secured Finance PLC | 700,000 | 682,059 | ||||||
|
| |||||||
| 10,350,789 | ||||||||
|
| |||||||
Consumer, Cyclical - 18.9% |
| |||||||
American Airlines Pass-Through Trust ‘B’ | 147,111 | 152,811 | ||||||
American Axle & Manufacturing Inc | 75,000 | 75,094 | ||||||
6.250% due 03/15/26 | 325,000 | 323,277 | ||||||
6.500% due 04/01/27 | 75,000 | 75,281 | ||||||
Aramark Services Inc | 350,000 | 353,605 | ||||||
AV Homes Inc | 675,000 | 690,336 | ||||||
Beazer Homes USA Inc | 775,000 | 721,719 | ||||||
7.250% due 02/01/23 | 9,000 | 9,349 | ||||||
Boyne USA Inc | 25,000 | 25,781 | ||||||
Caesars Resort Collection LLC | 475,000 | 456,560 | ||||||
Carrols Restaurant Group Inc | 125,000 | 130,625 | ||||||
CCM Merger Inc | 425,000 | 430,312 | ||||||
CEC Entertainment Inc | 125,000 | 111,250 | ||||||
Cedar Fair LP | 350,000 | 356,562 | ||||||
Constellation Merger Sub Inc | 1,025,000 | 996,812 | ||||||
Downstream Development Authority of the | 350,000 | 360,500 | ||||||
Golden Nugget Inc | 775,000 | 782,750 | ||||||
8.750% due 10/01/25 ~ | 650,000 | 676,000 | ||||||
Hilton Grand Vacations Borrower LLC | 375,000 | 399,844 | ||||||
IHO Verwaltungs GmbH (Germany) | 700,000 | 676,375 | ||||||
Jacobs Entertainment Inc | 450,000 | 478,125 | ||||||
| See Notes to Financial Statements | See explanation of symbols and terms, if any, on B-45 |
B-29
Table of Contents
PACIFIC FUNDS
PACIFIC FUNDS HIGH INCOME
Schedule of Investments (Continued)
March 31, 2018
Principal Amount | Value | |||||||
L Brands Inc | $275,000 | $259,531 | ||||||
6.950% due 03/01/33 | 175,000 | 168,875 | ||||||
Lennar Corp | 800,000 | 791,000 | ||||||
4.750% due 11/29/27 ~ | 175,000 | 168,437 | ||||||
5.375% due 10/01/22 ~ | 100,000 | 103,250 | ||||||
6.625% due 05/01/20 ~ | 75,000 | 79,594 | ||||||
Lithia Motors Inc | 450,000 | 452,250 | ||||||
Live Nation Entertainment Inc | 325,000 | 329,875 | ||||||
Mattamy Group Corp (Canada) | 400,000 | 406,000 | ||||||
Mattel Inc | 375,000 | 319,687 | ||||||
5.450% due 11/01/41 | 325,000 | 266,597 | ||||||
6.750% due 12/31/25 ~ | 25,000 | 24,505 | ||||||
Neiman Marcus Group Ltd LLC | 190,000 | 121,125 | ||||||
New Red Finance Inc (Canada) | 425,000 | 406,810 | ||||||
Party City Holdings Inc | 125,000 | 127,969 | ||||||
Scientific Games International Inc | 650,000 | 633,750 | ||||||
Six Flags Entertainment Corp | 575,000 | 561,344 | ||||||
5.500% due 04/15/27 ~ | 50,000 | 49,625 | ||||||
Tesla Inc | 650,000 | 569,562 | ||||||
The Men’s Wearhouse Inc | 425,000 | 438,812 | ||||||
US Airways Pass-Through Trust ‘B’ | 183,498 | 189,692 | ||||||
Viking Cruises Ltd | 400,000 | 380,000 | ||||||
VOC Escrow Ltd | 25,000 | 23,875 | ||||||
Wyndham Hotels & Resorts Inc | 200,000 | 202,500 | ||||||
|
| |||||||
| 15,357,633 | ||||||||
|
| |||||||
Consumer, Non-Cyclical - 12.4% |
| |||||||
Ahern Rentals Inc | 1,045,000 | 1,021,487 | ||||||
B&G Foods Inc | 450,000 | 420,187 | ||||||
Charles River Laboratories International Inc | 125,000 | 127,344 | ||||||
CHS/Community Health Systems Inc | 450,000 | 420,750 | ||||||
Eagle Holding Co II LLC | 635,000 | 641,350 | ||||||
HCA Inc | 1,000,000 | 967,500 | ||||||
5.250% due 04/15/25 | 650,000 | 666,055 | ||||||
Herc Rentals Inc | 393,000 | 421,492 | ||||||
Jaguar Holding Co II | 90,000 | 91,237 | ||||||
JBS Investments GmbH (Brazil) | 200,000 | 206,850 | ||||||
JBS USA LUX SA (Brazil) | 75,000 | 73,429 | ||||||
7.250% due 06/01/21 ~ | 50,000 | 50,687 | ||||||
NVA Holdings Inc | 500,000 | 505,000 | ||||||
Pilgrim’s Pride Corp | 50,000 | 48,687 | ||||||
5.875% due 09/30/27 ~ | 50,000 | 47,125 | ||||||
Prime Security Services Borrower LLC | 292,000 | 317,185 | ||||||
Principal Amount | Value | |||||||
Tenet Healthcare Corp | $625,000 | $603,125 | ||||||
5.125% due 05/01/25 ~ | 75,000 | 72,375 | ||||||
6.750% due 06/15/23 | 625,000 | 614,062 | ||||||
7.500% due 01/01/22 ~ | 25,000 | 26,437 | ||||||
Teva Pharmaceutical Finance Co BV (Israel) | 35,000 | 32,963 | ||||||
Teva Pharmaceutical Finance Netherlands III BV (Israel) | 375,000 | 337,885 | ||||||
TMS International Corp | 665,000 | 694,925 | ||||||
Valeant Pharmaceuticals International Inc | 275,000 | 268,744 | ||||||
5.875% due 05/15/23 ~ | 50,000 | 44,562 | ||||||
7.250% due 07/15/22 ~ | 550,000 | 552,063 | ||||||
7.500% due 07/15/21 ~ | 750,000 | 758,438 | ||||||
9.000% due 12/15/25 ~ | 25,000 | 24,938 | ||||||
9.250% due 04/01/26 ~ | 25,000 | 24,969 | ||||||
|
| |||||||
| 10,081,851 | ||||||||
|
| |||||||
Energy - 14.4% |
| |||||||
Callon Petroleum Co | 675,000 | 693,765 | ||||||
Cheniere Corpus Christi Holdings LLC | 25,000 | 24,906 | ||||||
5.875% due 03/31/25 | 375,000 | 393,750 | ||||||
Cheniere Energy Partners LP | 625,000 | 617,969 | ||||||
Chesapeake Energy Corp | 35,000 | 37,056 | ||||||
8.000% due 01/15/25 ~ | 275,000 | 266,750 | ||||||
8.000% due 06/15/27 ~ | 25,000 | 23,938 | ||||||
Denbury Resources Inc | 30,000 | 23,925 | ||||||
9.250% due 03/31/22 ~ | 300,000 | 307,125 | ||||||
Endeavor Energy Resources LP | 50,000 | 49,875 | ||||||
5.750% due 01/30/28 ~ | 375,000 | 375,000 | ||||||
Energy Transfer Equity LP | 75,000 | 73,125 | ||||||
5.875% due 01/15/24 | 50,000 | 51,750 | ||||||
Ensco PLC | 50,000 | 34,375 | ||||||
EP Energy LLC | 320,000 | 209,600 | ||||||
8.000% due 02/15/25 ~ | 245,000 | 164,763 | ||||||
Halcon Resources Corp | 25,000 | 24,531 | ||||||
6.750% due 02/15/25 | 475,000 | 469,063 | ||||||
MEG Energy Corp (Canada) | 100,000 | 84,000 | ||||||
6.500% due 01/15/25 ~ | 25,000 | 24,344 | ||||||
Moss Creek Resources Holdings Inc | 350,000 | 354,270 | ||||||
Noble Holding International Ltd | 104,000 | 96,980 | ||||||
NuStar Logistics LP | 75,000 | 72,938 | ||||||
Parsley Energy LLC | 625,000 | 626,563 | ||||||
5.625% due 10/15/27 ~ | 25,000 | 25,063 | ||||||
Precision Drilling Corp (Canada) | 325,000 | 339,219 | ||||||
Range Resources Corp | 485,000 | 489,850 | ||||||
Sanchez Energy Corp | 325,000 | 238,672 | ||||||
7.250% due 02/15/23 ~ | 350,000 | 352,625 | ||||||
| See Notes to Financial Statements | See explanation of symbols and terms, if any, on B-45 |
B-30
Table of Contents
PACIFIC FUNDS
PACIFIC FUNDS HIGH INCOME
Schedule of Investments (Continued)
March 31, 2018
Principal Amount | Value | |||||||
SemGroup Corp | $500,000 | $475,000 | ||||||
6.375% due 03/15/25 | 75,000 | 72,000 | ||||||
7.250% due 03/15/26 | 25,000 | 25,063 | ||||||
SESI LLC | 50,000 | 51,000 | ||||||
7.750% due 09/15/24 ~ | 300,000 | 311,250 | ||||||
SM Energy Co | 500,000 | 476,250 | ||||||
Southwestern Energy Co | 625,000 | 634,375 | ||||||
7.750% due 10/01/27 | 35,000 | 35,788 | ||||||
Summit Midstream Holdings LLC | 100,000 | 98,000 | ||||||
5.750% due 04/15/25 | 25,000 | 23,938 | ||||||
Targa Resources Partners LP | 850,000 | 848,938 | ||||||
5.375% due 02/01/27 | 50,000 | 50,000 | ||||||
6.750% due 03/15/24 | 50,000 | 53,062 | ||||||
Transocean Inc | 240,000 | 212,700 | ||||||
Ultra Resources Inc | 400,000 | 329,500 | ||||||
USA Compression Partners LP | 425,000 | 432,438 | ||||||
Weatherford International Ltd | 175,000 | 152,688 | ||||||
Whiting Petroleum Corp | 475,000 | 482,125 | ||||||
6.625% due 01/15/26 ~ | 25,000 | 25,219 | ||||||
WPX Energy Inc | 25,000 | 24,750 | ||||||
6.000% due 01/15/22 | 400,000 | 413,000 | ||||||
|
| |||||||
| 11,772,874 | ||||||||
|
| |||||||
Financial - 6.1% |
| |||||||
Ally Financial Inc | 1,350,000 | 1,395,968 | ||||||
ASP AMC Merger Sub Inc | 375,000 | 353,438 | ||||||
ESH Hospitality Inc REIT | 400,000 | 390,120 | ||||||
Greystar Real Estate Partners LLC | 325,000 | 325,000 | ||||||
Jefferies Finance LLC | 306,000 | 304,470 | ||||||
7.375% due 04/01/20 ~ | 375,000 | 380,625 | ||||||
MGM Growth Properties Operating | 425,000 | 439,875 | ||||||
Springleaf Finance Corp | 25,000 | 25,156 | ||||||
8.250% due 12/15/20 | 675,000 | 736,594 | ||||||
The Howard Hughes Corp | 650,000 | 643,500 | ||||||
|
| |||||||
| 4,994,746 | ||||||||
|
| |||||||
Industrial - 15.6% |
| |||||||
Apex Tool Group LLC | 425,000 | 426,063 | ||||||
ARD Securities Finance SARL (Luxembourg) | 200,000 | 210,000 | ||||||
Ardagh Packaging Finance PLC (Ireland) | 750,000 | 800,625 | ||||||
Bombardier Inc (Canada) | 125,000 | 128,906 | ||||||
8.750% due 12/01/21 ~ | 325,000 | 357,906 | ||||||
Brand Industrial Services Inc | 450,000 | 471,375 | ||||||
BWAY Holding Co | 125,000 | 126,094 | ||||||
7.250% due 04/15/25 ~ | 800,000 | 818,000 | ||||||
Principal Amount | Value | |||||||
Cloud Crane LLC | $650,000 | $721,500 | ||||||
Core & Main LP | 425,000 | 416,500 | ||||||
Coveris Holdings SA (Luxembourg) | 701,000 | 706,258 | ||||||
CPG Merger Sub LLC | 125,000 | 126,719 | ||||||
Flex Acquisition Co Inc | 485,000 | 481,059 | ||||||
Itron Inc | 350,000 | 345,730 | ||||||
JPW Industries Holding Corp | 575,000 | 604,469 | ||||||
Louisiana-Pacific Corp | 600,000 | 603,000 | ||||||
New Enterprise Stone & Lime Co Inc | 25,000 | 25,094 | ||||||
10.125% due 04/01/22 ~ | 375,000 | 404,063 | ||||||
Novelis Corp | 750,000 | 740,625 | ||||||
6.250% due 08/15/24 ~ | 125,000 | 128,438 | ||||||
Park Aerospace Holdings Ltd (Ireland) | 425,000 | 417,966 | ||||||
5.500% due 02/15/24 ~ | 50,000 | 48,625 | ||||||
Pisces Midco Inc | 25,000 | 25,375 | ||||||
Sealed Air Corp | 75,000 | 76,031 | ||||||
5.125% due 12/01/24 ~ | 25,000 | 25,560 | ||||||
5.500% due 09/15/25 ~ | 575,000 | 596,563 | ||||||
Standard Industries Inc | 675,000 | 638,516 | ||||||
Titan Acquisition Ltd (Canada) | 335,000 | 334,791 | ||||||
TransDigm Inc | 1,000,000 | 1,027,500 | ||||||
US Concrete Inc | 115,000 | 119,888 | ||||||
Zekelman Industries Inc | 650,000 | 716,625 | ||||||
|
| |||||||
| 12,669,864 | ||||||||
|
| |||||||
Technology - 2.9% |
| |||||||
Dell International LLC | 625,000 | 641,406 | ||||||
Infor Software Parent LLC | 1,025,000 | 1,039,094 | ||||||
Nuance Communications Inc | 100,000 | 98,750 | ||||||
Sensata Technologies BV | 575,000 | 603,031 | ||||||
|
| |||||||
| 2,382,281 | ||||||||
|
| |||||||
Utilities - 2.7% |
| |||||||
Calpine Corp | 50,000 | 48,438 | ||||||
5.875% due 01/15/24 ~ | 700,000 | 708,610 | ||||||
Dynegy Inc | 100,000 | 108,375 | ||||||
8.125% due 01/30/26 ~ | 475,000 | 526,063 | ||||||
NRG Energy Inc | 415,000 | 441,975 | ||||||
Talen Energy Supply LLC | 525,000 | 372,750 | ||||||
|
| |||||||
| 2,206,211 | ||||||||
|
| |||||||
Total Corporate Bonds & Notes |
| 72,991,286 | ||||||
|
| |||||||
| See Notes to Financial Statements | See explanation of symbols and terms, if any, on B-45 |
B-31
Table of Contents
PACIFIC FUNDS
PACIFIC FUNDS HIGH INCOME
Schedule of Investments (Continued)
March 31, 2018
Principal Amount | Value | |||||||
SENIOR LOAN NOTES - 2.1% | ||||||||
Consumer, Cyclical - 0.4% |
| |||||||
Neiman Marcus Group Ltd LLC | $349,740 | $303,072 | ||||||
|
| |||||||
Consumer, Non-Cyclical - 0.3% |
| |||||||
CHS/Community Health Systems Inc Term G | 250,000 | 244,375 | ||||||
|
| |||||||
Industrial - 1.4% |
| |||||||
Crosby US Acquisition Corp (2nd Lien) | 150,000 | 145,500 | ||||||
EWT Holdings III Corp | 685,777 | 691,564 | ||||||
North American Lifting Holdings Inc | 350,000 | 295,750 | ||||||
|
| |||||||
| 1,132,814 | ||||||||
|
| |||||||
Total Senior Loan Notes |
| 1,680,261 | ||||||
|
| |||||||
Shares | Value | |||||||
SHORT-TERM INVESTMENT - 5.4% |
| |||||||
Money Market Fund - 5.4% |
| |||||||
BlackRock Liquidity Funds T-Fund Portfolio | 4,411,375 | $4,411,375 | ||||||
|
| |||||||
Total Short-Term Investment |
| 4,411,375 | ||||||
|
| |||||||
TOTAL INVESTMENTS - 99.7% |
| 81,189,048 | ||||||
OTHER ASSETS & LIABILITIES, NET - 0.3% |
| 249,786 | ||||||
|
| |||||||
NET ASSETS - 100.0% |
| $81,438,834 | ||||||
|
| |||||||
Notes to Schedule of Investments
| (a) | As of March 31, 2018, the Fund’s composition by sector as a percentage of net assets was as follows: |
Consumer, Cyclical | 20.3% | |||
Industrial | 17.6% | |||
Energy | 14.4% | |||
Communications | 12.7% | |||
Consumer, Non-Cyclical | 12.7% | |||
Financial | 6.7% | |||
Short-Term Investment | 5.4% | |||
Basic Materials | 4.0% | |||
Others (each less than 3.0%) | 5.9% | |||
|
| |||
| 99.7% | ||||
Other Assets & Liabilities, Net | 0.3% | |||
|
| |||
| 100.0% | ||||
|
|
| (b) | Fair Value Measurements |
The following is a summary of the Fund’s investments as categorized under the three-tier hierarchy of inputs used in valuing the Fund’s assets and liabilities (See Note 3D in Notes to Financial Statements) as of March 31, 2018:
| Total Value at March 31, 2018 | Level 1 Quoted Price | Level 2 Significant Observable Inputs | Level 3 Significant Unobservable Inputs | |||||||||||||||
Assets | Common Stocks | $1,876,686 | $1,745,895 | $— | $130,791 | |||||||||||||
Exchange-Traded Fund | 229,440 | 229,440 | — | — | ||||||||||||||
Corporate Bonds & Notes | 72,991,286 | — | 72,991,286 | — | ||||||||||||||
Senior Loan Notes | 1,680,261 | — | 1,384,511 | 295,750 | ||||||||||||||
Short-Term Investment | 4,411,375 | 4,411,375 | — | — | ||||||||||||||
|
|
|
|
|
|
|
| |||||||||||
Total | $81,189,048 | $6,386,710 | $74,375,797 | $426,541 | ||||||||||||||
|
|
|
|
|
|
|
| |||||||||||
| See Notes to Financial Statements | See explanation of symbols and terms, if any, on B-45 |
B-32
Table of Contents
PACIFIC FUNDS
PACIFIC FUNDSSM LARGE-CAP
Schedule of Investments
March 31, 2018
Shares | Value | |||||||
COMMON STOCKS - 98.3% | ||||||||
Basic Materials - 3.2% | ||||||||
Air Products & Chemicals Inc | 1,320 | $209,920 | ||||||
DowDuPont Inc | 4,079 | 259,873 | ||||||
Westlake Chemical Corp | 882 | 98,034 | ||||||
|
| |||||||
| 567,827 | ||||||||
|
| |||||||
Communications - 15.4% | ||||||||
Alphabet Inc ‘A’ * | 324 | 336,033 | ||||||
Alphabet Inc ‘C’ * | 233 | 240,407 | ||||||
Amazon.com Inc * | 427 | 618,014 | ||||||
AT&T Inc | 8,028 | 286,198 | ||||||
CBS Corp ‘B’ | 3,005 | 154,427 | ||||||
Comcast Corp ‘A’ | 6,275 | 214,417 | ||||||
Facebook Inc ‘A’ * | 2,466 | 394,042 | ||||||
The Walt Disney Co | 2,104 | 211,326 | ||||||
Verizon Communications Inc | 5,807 | 277,691 | ||||||
|
| |||||||
| 2,732,555 | ||||||||
|
| |||||||
Consumer, Cyclical - 7.5% | ||||||||
BorgWarner Inc | 3,637 | 182,686 | ||||||
Costco Wholesale Corp | 825 | 155,455 | ||||||
Delta Air Lines Inc | 3,745 | 205,263 | ||||||
Foot Locker Inc | 4,224 | 192,361 | ||||||
PVH Corp | 676 | 102,367 | ||||||
The Home Depot Inc | 1,726 | 307,642 | ||||||
Tiffany & Co | 1,926 | 188,093 | ||||||
|
| |||||||
| 1,333,867 | ||||||||
|
| |||||||
Consumer, Non-Cyclical - 20.6% | ||||||||
AbbVie Inc | 3,076 | 291,143 | ||||||
Allergan PLC | 739 | 124,366 | ||||||
Biogen Inc * | 587 | 160,732 | ||||||
Danaher Corp | 1,375 | 134,626 | ||||||
Eli Lilly & Co | 3,224 | 249,441 | ||||||
Gilead Sciences Inc | 3,180 | 239,740 | ||||||
Johnson & Johnson | 1,406 | 180,179 | ||||||
Laboratory Corp of America Holdings * | 1,137 | 183,910 | ||||||
Medtronic PLC | 3,222 | 258,469 | ||||||
Pfizer Inc | 6,973 | 247,472 | ||||||
Post Holdings Inc * | 1,650 | 125,004 | ||||||
The Hershey Co | 907 | 89,757 | ||||||
The Kroger Co | 7,239 | 173,302 | ||||||
The Procter & Gamble Co | 4,472 | 354,540 | ||||||
Thermo Fisher Scientific Inc | 1,325 | 273,560 | ||||||
Tyson Foods Inc ‘A’ | 2,891 | 211,592 | ||||||
UnitedHealth Group Inc | 1,600 | 342,400 | ||||||
|
| |||||||
| 3,640,233 | ||||||||
|
| |||||||
Energy - 6.7% | ||||||||
Chevron Corp | 709 | 80,854 | ||||||
ConocoPhillips | 4,211 | 249,670 | ||||||
Devon Energy Corp | 3,876 | 123,218 | ||||||
EOG Resources Inc | 2,246 | 236,436 | ||||||
Exxon Mobil Corp | 1,476 | 110,124 | ||||||
Halliburton Co | 2,058 | 96,603 | ||||||
Marathon Petroleum Corp | 1,831 | 133,864 | ||||||
TechnipFMC PLC (United Kingdom) | 5,242 | 154,377 | ||||||
|
| |||||||
| 1,185,146 | ||||||||
|
| |||||||
Financial - 19.7% | ||||||||
American Express Co | 2,075 | 193,556 | ||||||
American Tower Corp REIT | 1,603 | 232,980 | ||||||
Bank of America Corp | 11,154 | 334,508 | ||||||
Chubb Ltd | 1,483 | 202,830 | ||||||
Discover Financial Services | 2,969 | 213,560 | ||||||
E*TRADE Financial Corp * | 4,205 | 232,999 | ||||||
Highwoods Properties Inc REIT | 3,346 | 146,622 | ||||||
Shares | Value | |||||||
Huntington Bancshares Inc | 12,464 | $188,206 | ||||||
Intercontinental Exchange Inc | 2,615 | 189,640 | ||||||
JPMorgan Chase & Co | 4,314 | 474,411 | ||||||
Raymond James Financial Inc | 2,250 | 201,173 | ||||||
State Street Corp | 2,364 | 235,762 | ||||||
SunTrust Banks Inc | 3,317 | 225,689 | ||||||
Visa Inc ‘A’ | 3,537 | 423,096 | ||||||
|
| |||||||
| 3,495,032 | ||||||||
|
| |||||||
Industrial - 8.5% | ||||||||
Cummins Inc | 1,154 | 187,052 | ||||||
Deere & Co | 1,404 | 218,069 | ||||||
Honeywell International Inc | 1,873 | 270,667 | ||||||
Northrop Grumman Corp | 690 | 240,893 | ||||||
Parker-Hannifin Corp | 1,076 | 184,028 | ||||||
Stanley Black & Decker Inc | 1,253 | 191,960 | ||||||
Waste Management Inc | 2,412 | 202,897 | ||||||
|
| |||||||
| 1,495,566 | ||||||||
|
| |||||||
Technology - 15.2% | ||||||||
Apple Inc | 3,391 | 568,942 | ||||||
Applied Materials Inc | 3,866 | 214,988 | ||||||
Broadcom Ltd | 1,078 | 254,031 | ||||||
Cognizant Technology Solutions Corp ‘A’ | 2,894 | 232,967 | ||||||
Electronic Arts Inc * | 1,302 | 157,854 | ||||||
Intel Corp | 2,010 | 104,681 | ||||||
Microsoft Corp | 8,206 | 748,962 | ||||||
Oracle Corp | 6,166 | 282,095 | ||||||
QUALCOMM Inc | 2,275 | 126,058 | ||||||
|
| |||||||
| 2,690,578 | ||||||||
|
| |||||||
Utilities - 1.5% | ||||||||
Public Service Enterprise Group Inc | 5,145 | 258,485 | ||||||
|
| |||||||
Total Common Stocks | 17,399,289 | |||||||
|
| |||||||
SHORT-TERM INVESTMENT - 1.3% | ||||||||
Money Market Fund - 1.3% | ||||||||
BlackRock Liquidity Funds T-Fund Portfolio | 237,165 | 237,165 | ||||||
|
| |||||||
Total Short-Term Investment | 237,165 | |||||||
|
| |||||||
TOTAL INVESTMENTS - 99.6% | 17,636,454 | |||||||
OTHER ASSETS & LIABILITIES, NET - 0.4% | 66,403 | |||||||
|
| |||||||
NET ASSETS - 100.0% | $17,702,857 | |||||||
|
| |||||||
Notes to Schedule of Investments
| (a) | As of March 31, 2018, the Fund’s composition by sector as a percentage of net assets was as follows: |
Consumer, Non-Cyclical | 20.6% | |||
Financial | 19.7% | |||
Communications | 15.4% | |||
Technology | 15.2% | |||
Industrial | 8.5% | |||
Consumer, Cyclical | 7.5% | |||
Energy | 6.7% | |||
Basic Materials | 3.2% | |||
Others (each less than 3.0%) | 2.8% | |||
|
| |||
| 99.6% | ||||
Other Assets & Liabilities, Net | 0.4% | |||
|
| |||
| 100.0% | ||||
|
|
| See Notes to Financial Statements | See explanation of symbols and terms, if any, on B-45 |
B-33
Table of Contents
PACIFIC FUNDS
PACIFIC FUNDS LARGE-CAP
Schedule of Investments (Continued)
March 31, 2018
| (b) | Fair Value Measurements |
The following is a summary of the Fund's investments as categorized under the three-tier hierarchy of inputs used in valuing the Fund's assets and liabilities (See Note 3D in Notes to Financial Statements) as of March 31, 2018:
| Total Value at March 31, 2018 | Level 1 Quoted Price | Level 2 Significant Observable Inputs | Level 3 Significant Unobservable Inputs | |||||||||||||||
Assets | Common Stocks | $17,399,289 | $17,399,289 | $— | $— | |||||||||||||
Short-Term Investment | 237,165 | 237,165 | — | — | ||||||||||||||
|
|
|
|
|
|
|
| |||||||||||
Total | $17,636,454 | $17,636,454 | $— | $— | ||||||||||||||
|
|
|
|
|
|
|
| |||||||||||
| See Notes to Financial Statements | See explanation of symbols and terms, if any, on B-45 |
B-34
Table of Contents
PACIFIC FUNDS
PACIFIC FUNDSSM LARGE-CAP VALUE
Schedule of Investments
March 31, 2018
Shares | Value | |||||||
COMMON STOCKS - 98.2% | ||||||||
Basic Materials - 3.5% | ||||||||
Air Products & Chemicals Inc | 2,320 | $368,950 | ||||||
DowDuPont Inc | 3,427 | 218,334 | ||||||
Nucor Corp | 2,835 | 173,190 | ||||||
Westlake Chemical Corp | 2,554 | 283,877 | ||||||
|
| |||||||
| 1,044,351 | ||||||||
|
| |||||||
Communications - 11.1% | ||||||||
AT&T Inc | 23,421 | 834,959 | ||||||
CBS Corp ‘B’ | 4,796 | 246,466 | ||||||
Cisco Systems Inc | 16,908 | 725,184 | ||||||
Comcast Corp ‘A’ | 10,013 | 342,144 | ||||||
eBay Inc * | 8,054 | 324,093 | ||||||
The Walt Disney Co | 2,581 | 259,236 | ||||||
Verizon Communications Inc | 10,709 | 512,104 | ||||||
|
| |||||||
| 3,244,186 | ||||||||
|
| |||||||
Consumer, Cyclical - 4.2% | ||||||||
BorgWarner Inc | 6,837 | 343,423 | ||||||
Delta Air Lines Inc | 6,846 | 375,229 | ||||||
PVH Corp | 1,921 | 290,897 | ||||||
The Home Depot Inc | 1,259 | 224,404 | ||||||
|
| |||||||
| 1,233,953 | ||||||||
|
| |||||||
Consumer, Non-Cyclical - 20.0% | ||||||||
AbbVie Inc | 3,027 | 286,506 | ||||||
Allergan PLC | 1,610 | 270,947 | ||||||
Biogen Inc * | 1,037 | 283,951 | ||||||
Danaher Corp | 2,335 | 228,620 | ||||||
Eli Lilly & Co | 2,524 | 195,282 | ||||||
Gilead Sciences Inc | 4,711 | 355,162 | ||||||
Hill-Rom Holdings Inc | 2,111 | 183,657 | ||||||
Johnson & Johnson | 4,804 | 615,633 | ||||||
Laboratory Corp of America Holdings * | 2,094 | 338,705 | ||||||
Medtronic PLC | 3,283 | 263,362 | ||||||
PepsiCo Inc | 3,596 | 392,503 | ||||||
Pfizer Inc | 18,112 | 642,795 | ||||||
Quanta Services Inc * | 5,733 | 196,929 | ||||||
The Hershey Co | 1,510 | 149,430 | ||||||
The Procter & Gamble Co | 4,898 | 388,313 | ||||||
Thermo Fisher Scientific Inc | 1,469 | 303,290 | ||||||
Tyson Foods Inc ‘A’ | 6,343 | 464,244 | ||||||
UnitedHealth Group Inc | 1,427 | 305,378 | ||||||
|
| |||||||
| 5,864,707 | ||||||||
|
| |||||||
Energy - 10.5% | ||||||||
Chevron Corp | 5,587 | 637,142 | ||||||
ConocoPhillips | 8,644 | 512,503 | ||||||
Devon Energy Corp | 7,500 | 238,425 | ||||||
Energen Corp * | 4,076 | 256,217 | ||||||
EOG Resources Inc | 4,628 | 487,190 | ||||||
Exxon Mobil Corp | 5,956 | 444,377 | ||||||
Halliburton Co | 5,132 | 240,896 | ||||||
Marathon Petroleum Corp | 3,679 | 268,972 | ||||||
|
| |||||||
| 3,085,722 | ||||||||
|
| |||||||
Financial - 28.0% | ||||||||
American Express Co | 3,700 | 345,136 | ||||||
Ameriprise Financial Inc | 1,999 | 295,732 | ||||||
Bank of America Corp | 36,227 | 1,086,448 | ||||||
Berkshire Hathaway Inc ‘B’ * | 977 | 194,892 | ||||||
Chubb Ltd | 3,894 | 532,582 | ||||||
Discover Financial Services | 6,068 | 436,471 | ||||||
E*TRADE Financial Corp * | 7,120 | 394,519 | ||||||
Equity LifeStyle Properties Inc REIT | 3,432 | 301,227 | ||||||
Highwoods Properties Inc REIT | 3,868 | 169,496 | ||||||
Huntington Bancshares Inc | 32,886 | 496,579 | ||||||
Intercontinental Exchange Inc | 4,834 | 350,562 | ||||||
Shares | Value | |||||||
JPMorgan Chase & Co | 11,781 | $1,295,557 | ||||||
Morgan Stanley | 5,837 | 314,965 | ||||||
Prologis Inc REIT | 5,849 | 368,429 | ||||||
State Street Corp | 5,453 | 543,828 | ||||||
SunTrust Banks Inc | 7,405 | 503,836 | ||||||
The Allstate Corp | 2,969 | 281,461 | ||||||
Wells Fargo & Co | 5,920 | 310,267 | ||||||
|
| |||||||
| 8,221,987 | ||||||||
|
| |||||||
Industrial - 9.8% | ||||||||
Caterpillar Inc | 2,060 | 303,603 | ||||||
Deere & Co | 1,529 | 237,484 | ||||||
Honeywell International Inc | 1,983 | 286,563 | ||||||
Northrop Grumman Corp | 1,595 | 556,846 | ||||||
Parker-Hannifin Corp | 2,071 | 354,203 | ||||||
Raytheon Co | 2,204 | 475,667 | ||||||
Stanley Black & Decker Inc | 1,217 | 186,444 | ||||||
Waste Management Inc | 5,582 | 469,558 | ||||||
|
| |||||||
| 2,870,368 | ||||||||
|
| |||||||
Technology - 6.2% | ||||||||
Broadcom Ltd | 964 | 227,167 | ||||||
Microsoft Corp | 4,467 | 407,703 | ||||||
ON Semiconductor Corp * | 15,479 | 378,616 | ||||||
Oracle Corp | 13,323 | 609,527 | ||||||
QUALCOMM Inc | 3,398 | 188,283 | ||||||
|
| |||||||
| 1,811,296 | ||||||||
|
| |||||||
Utilities - 4.9% | ||||||||
American Electric Power Co Inc | 4,477 | 307,077 | ||||||
DTE Energy Co | 2,268 | 236,779 | ||||||
Public Service Enterprise Group Inc | 7,739 | 388,807 | ||||||
Xcel Energy Inc | 10,923 | 496,778 | ||||||
|
| |||||||
| 1,429,441 | ||||||||
|
| |||||||
Total Common Stocks | 28,806,011 | |||||||
|
| |||||||
SHORT-TERM INVESTMENT - 1.9% | ||||||||
Money Market Fund - 1.9% | ||||||||
BlackRock Liquidity Funds T-Fund Portfolio | 550,645 | 550,645 | ||||||
|
| |||||||
Total Short-Term Investment | 550,645 | |||||||
|
| |||||||
TOTAL INVESTMENTS - 100.1% | 29,356,656 | |||||||
OTHER ASSETS & LIABILITIES, NET - (0.1%) | (31,930 | ) | ||||||
|
| |||||||
NET ASSETS - 100.0% | $29,324,726 | |||||||
|
| |||||||
Notes to Schedule of Investments
| (a) | As of March 31, 2018, the Fund’s composition by sector as a percentage of net assets was as follows: |
Financial | 28.0% | |||
Consumer, Non-Cyclical | 20.0% | |||
Communications | 11.1% | |||
Energy | 10.5% | |||
Industrial | 9.8% | |||
Technology | 6.2% | |||
Utilities | 4.9% | |||
Consumer, Cyclical | 4.2% | |||
Basic Materials | 3.5% | |||
Others (each less than 3.0%) | 1.9% | |||
|
| |||
| 100.1% | ||||
Other Assets & Liabilities, Net | (0.1% | ) | ||
|
| |||
| 100.0% | ||||
|
|
| See Notes to Financial Statements | See explanation of symbols and terms, if any, on B-45 |
B-35
Table of Contents
PACIFIC FUNDS
PACIFIC FUNDS LARGE-CAP VALUE
Schedule of Investments (Continued)
March 31, 2018
| (b) | Fair Value Measurements |
The following is a summary of the Fund's investments as categorized under the three-tier hierarchy of inputs used in valuing the Fund's assets and liabilities (See Note 3D in Notes to Financial Statements) as of March 31, 2018:
| Total Value at March 31, 2018 | Level 1 Quoted Price | Level 2 Significant Observable Inputs | Level 3 Significant Unobservable Inputs | |||||||||||||||
Assets | Common Stocks | $28,806,011 | $28,806,011 | $— | $— | |||||||||||||
Short-Term Investment | 550,645 | 550,645 | — | — | ||||||||||||||
|
|
|
|
|
|
|
| |||||||||||
Total | $29,356,656 | $29,356,656 | $— | $— | ||||||||||||||
|
|
|
|
|
|
|
| |||||||||||
| See Notes to Financial Statements | See explanation of symbols and terms, if any, on B-45 |
B-36
Table of Contents
PACIFIC FUNDS
PACIFIC FUNDSSM SMALL/MID-CAP
Schedule of Investments
March 31, 2018
Shares | Value | |||||||
RIGHTS - 0.0% | ||||||||
Consumer, Non-Cyclical - 0.0% | ||||||||
Dyax Corp - Contingent Value Rights * Ù ± | 142 | $325 | ||||||
|
| |||||||
Total Rights | 325 | |||||||
|
| |||||||
COMMON STOCKS - 97.2% | ||||||||
Basic Materials - 4.4% | ||||||||
Commercial Metals Co | 37,173 | 760,560 | ||||||
Kaiser Aluminum Corp | 19,198 | 1,937,078 | ||||||
Kraton Corp * | 45,547 | 2,173,047 | ||||||
PolyOne Corp | 32,542 | 1,383,686 | ||||||
Steel Dynamics Inc | 28,321 | 1,252,355 | ||||||
The Chemours Co | 38,763 | 1,888,146 | ||||||
US Silica Holdings Inc | 23,842 | 608,448 | ||||||
|
| |||||||
| 10,003,320 | ||||||||
|
| |||||||
Communications - 5.4% | ||||||||
Ciena Corp * | 61,121 | 1,583,034 | ||||||
GrubHub Inc * | 16,504 | 1,674,661 | ||||||
Imperva Inc * | 27,536 | 1,192,309 | ||||||
LogMeIn Inc | 13,728 | 1,586,270 | ||||||
NETGEAR Inc * | 28,323 | 1,620,076 | ||||||
Sinclair Broadcast Group Inc ‘A’ | 46,761 | 1,463,619 | ||||||
TiVo Corp | 66,906 | 906,576 | ||||||
Vonage Holdings Corp * | 150,274 | 1,600,418 | ||||||
Web.com Group Inc * | 42,502 | 769,286 | ||||||
|
| |||||||
| 12,396,249 | ||||||||
|
| |||||||
Consumer, Cyclical - 14.6% | ||||||||
AMC Entertainment Holdings Inc ‘A’ | 36,440 | 511,982 | ||||||
Aramark | 61,003 | 2,413,279 | ||||||
Beacon Roofing Supply Inc * | 26,372 | 1,399,562 | ||||||
Big Lots Inc | 23,772 | 1,034,795 | ||||||
Bloomin’ Brands Inc | 82,887 | 2,012,496 | ||||||
Camping World Holdings Inc ‘A’ | 27,103 | 874,072 | ||||||
Cooper-Standard Holdings Inc * | 17,504 | 2,149,666 | ||||||
iRobot Corp * | 21,508 | 1,380,599 | ||||||
Lithia Motors Inc ‘A’ | 10,711 | 1,076,670 | ||||||
Marriott Vacations Worldwide Corp | 9,081 | 1,209,589 | ||||||
Meritor Inc * | 63,191 | 1,299,207 | ||||||
Michael Kors Holdings Ltd * | 33,508 | 2,080,177 | ||||||
Pool Corp | 8,757 | 1,280,449 | ||||||
SkyWest Inc | 32,609 | 1,773,930 | ||||||
Sleep Number Corp * | 50,318 | 1,768,678 | ||||||
Sonic Corp | 47,806 | 1,206,145 | ||||||
Steven Madden Ltd | 25,855 | 1,135,034 | ||||||
Texas Roadhouse Inc | 35,577 | 2,055,639 | ||||||
The Children’s Place Inc | 11,510 | 1,556,728 | ||||||
Wabash National Corp | 80,996 | 1,685,527 | ||||||
Watsco Inc | 13,606 | 2,462,278 | ||||||
Wolverine World Wide Inc | 39,891 | 1,152,850 | ||||||
|
| |||||||
| 33,519,352 | ||||||||
|
| |||||||
Consumer, Non-Cyclical - 23.9% | ||||||||
Acadia Healthcare Co Inc * | 37,541 | 1,470,856 | ||||||
Adtalem Global Education Inc * | 37,352 | 1,776,088 | ||||||
Amedisys Inc * | 23,868 | 1,440,195 | ||||||
Cardtronics PLC ‘A’ * | 25,235 | 562,993 | ||||||
Central Garden & Pet Co ‘A’ * | 47,307 | 1,873,830 | ||||||
Charles River Laboratories International Inc * | 19,824 | 2,116,014 | ||||||
Deluxe Corp | 25,707 | 1,902,575 | ||||||
Euronet Worldwide Inc * | 19,694 | 1,554,250 | ||||||
Green Dot Corp ‘A’ * | 38,576 | 2,475,036 | ||||||
Hill-Rom Holdings Inc | 30,850 | 2,683,950 | ||||||
Shares | Value | |||||||
Horizon Pharma PLC * | 58,032 | $824,054 | ||||||
Hostess Brands Inc * | 113,029 | 1,671,699 | ||||||
Insperity Inc | 44,019 | 3,061,521 | ||||||
Ionis Pharmaceuticals Inc * | 21,620 | 953,010 | ||||||
J&J Snack Foods Corp | 6,710 | 916,318 | ||||||
Lamb Weston Holdings Inc | 29,184 | 1,699,092 | ||||||
LHC Group Inc * | 25,843 | 1,590,895 | ||||||
LivaNova PLC * | 21,618 | 1,913,193 | ||||||
ManpowerGroup Inc | 6,591 | 758,624 | ||||||
MarketAxess Holdings Inc | 6,777 | 1,473,591 | ||||||
Merit Medical Systems Inc * | 29,444 | 1,335,285 | ||||||
Molina Healthcare Inc * | 22,015 | 1,787,178 | ||||||
Nektar Therapeutics * | 20,360 | 2,163,454 | ||||||
NuVasive Inc * | 23,575 | 1,230,851 | ||||||
Patterson Cos Inc | 38,307 | 851,565 | ||||||
Performance Food Group Co * | 60,968 | 1,819,895 | ||||||
Post Holdings Inc * | 9,936 | 752,751 | ||||||
PRA Health Sciences Inc * | 17,662 | 1,465,240 | ||||||
Service Corp International | 61,071 | 2,304,820 | ||||||
Supernus Pharmaceuticals Inc * | 58,214 | 2,666,201 | ||||||
Teleflex Inc | 10,300 | 2,626,294 | ||||||
The Cooper Cos Inc | 9,369 | 2,143,721 | ||||||
Vanda Pharmaceuticals Inc * | 70,475 | 1,187,504 | ||||||
|
| |||||||
| 55,052,543 | ||||||||
|
| |||||||
Energy - 1.8% | ||||||||
Energen Corp * | 36,641 | 2,303,253 | ||||||
Newfield Exploration Co * | 32,448 | 792,380 | ||||||
PDC Energy Inc * | 23,162 | 1,135,633 | ||||||
|
| |||||||
| 4,231,266 | ||||||||
|
| |||||||
Financial - 17.8% | ||||||||
Alleghany Corp | 3,614 | 2,220,586 | ||||||
Chemical Financial Corp | 37,905 | 2,072,645 | ||||||
DCT Industrial Trust Inc REIT | 29,659 | 1,670,988 | ||||||
Douglas Emmett Inc REIT | 41,271 | 1,517,122 | ||||||
East West Bancorp Inc | 33,415 | 2,089,774 | ||||||
Equity LifeStyle Properties Inc REIT | 20,815 | 1,826,933 | ||||||
Everest Re Group Ltd | 4,400 | 1,130,008 | ||||||
FNB Corp | 162,819 | 2,189,916 | ||||||
Highwoods Properties Inc REIT | 28,291 | 1,239,712 | ||||||
Hudson Pacific Properties Inc REIT | 45,008 | 1,464,110 | ||||||
IBERIABANK Corp | 24,626 | 1,920,828 | ||||||
Mid-America Apartment Communities Inc REIT | 9,716 | 886,488 | ||||||
Moelis & Co ‘A’ | 10,682 | 543,180 | ||||||
PacWest Bancorp | 41,461 | 2,053,563 | ||||||
PS Business Parks Inc REIT | 7,707 | 871,199 | ||||||
Radian Group Inc | 114,988 | 2,189,372 | ||||||
Raymond James Financial Inc | 21,228 | 1,897,995 | ||||||
Texas Capital Bancshares Inc * | 21,803 | 1,960,090 | ||||||
The Hanover Insurance Group Inc | 14,210 | 1,675,217 | ||||||
Umpqua Holdings Corp | 78,820 | 1,687,536 | ||||||
Washington Real Estate Investment Trust REIT | 51,735 | 1,412,366 | ||||||
Western Alliance Bancorp * | 25,693 | 1,493,020 | ||||||
Wintrust Financial Corp | 23,743 | 2,043,085 | ||||||
Zions Bancorp | 53,748 | 2,834,132 | ||||||
|
| |||||||
| 40,889,865 | ||||||||
|
| |||||||
Industrial - 17.1% | ||||||||
AAR Corp | 32,656 | 1,440,456 | ||||||
Aerojet Rocketdyne Holdings Inc * | 56,399 | 1,577,480 | ||||||
American Woodmark Corp * | 18,421 | 1,813,547 | ||||||
Barnes Group Inc | 30,692 | 1,838,144 | ||||||
EMCOR Group Inc | 27,536 | 2,145,880 | ||||||
EnPro Industries Inc | 14,930 | 1,155,283 | ||||||
Generac Holdings Inc * | 36,464 | 1,674,062 | ||||||
Graphic Packaging Holding Co | 136,376 | 2,093,372 | ||||||
Harsco Corp * | 93,752 | 1,935,979 | ||||||
Hubbell Inc | 8,887 | 1,082,259 | ||||||
ITT Inc | 36,203 | 1,773,223 | ||||||
| See Notes to Financial Statements | See explanation of symbols and terms, if any, on B-45 |
B-37
Table of Contents
PACIFIC FUNDS
PACIFIC FUNDS SMALL/MID-CAP
Schedule of Investments (Continued)
March 31, 2018
Shares | Value | |||||||
Kirby Corp * | 12,109 | $931,788 | ||||||
Lydall Inc * | 22,491 | 1,085,191 | ||||||
MasTec Inc * | 42,761 | 2,011,905 | ||||||
Owens Corning | 30,531 | 2,454,692 | ||||||
PerkinElmer Inc | 24,960 | 1,889,971 | ||||||
Rexnord Corp * | 50,455 | 1,497,504 | ||||||
Rogers Corp * | 8,344 | 997,442 | ||||||
Ryder System Inc | 22,151 | 1,612,371 | ||||||
Spirit AeroSystems Holdings Inc ‘A’ | 16,530 | 1,383,561 | ||||||
SPX Corp * | 72,740 | 2,362,595 | ||||||
TopBuild Corp * | 22,148 | 1,694,765 | ||||||
US Concrete Inc * | 22,265 | 1,344,806 | ||||||
WestRock Co | 22,804 | 1,463,333 | ||||||
|
| |||||||
| 39,259,609 | ||||||||
|
| |||||||
Technology - 10.2% | ||||||||
Acxiom Corp * | 67,931 | 1,542,713 | ||||||
Ambarella Inc * | 24,385 | 1,194,621 | ||||||
Aspen Technology Inc * | 20,442 | 1,612,669 | ||||||
Bottomline Technologies Inc * | 44,067 | 1,707,596 | ||||||
CommVault Systems Inc * | 26,327 | 1,505,904 | ||||||
j2 Global Inc | 23,344 | 1,842,308 | ||||||
Microsemi Corp * | 18,712 | 1,211,041 | ||||||
MKS Instruments Inc | 14,538 | 1,681,320 | ||||||
Nuance Communications Inc * | 53,503 | 842,672 | ||||||
PTC Inc * | 17,078 | 1,332,255 | ||||||
RealPage Inc * | 50,638 | 2,607,857 | ||||||
Silicon Laboratories Inc * | 23,127 | 2,079,117 | ||||||
Synopsys Inc * | 18,104 | 1,506,977 | ||||||
Take-Two Interactive Software Inc * | 21,591 | 2,111,168 | ||||||
Xperi Corp | 27,449 | 580,546 | ||||||
|
| |||||||
| 23,358,764 | ||||||||
|
| |||||||
Utilities - 2.0% | ||||||||
Avista Corp | 19,037 | 975,646 | ||||||
Black Hills Corp | 25,003 | 1,357,663 | ||||||
CMS Energy Corp | 24,444 | 1,107,069 | ||||||
Portland General Electric Co | 30,764 | 1,246,250 | ||||||
|
| |||||||
| 4,686,628 | ||||||||
|
| |||||||
Total Common Stocks | 223,397,596 | |||||||
|
| |||||||
Shares | Value | |||||||
SHORT-TERM INVESTMENT - 2.6% | ||||||||
Money Market Fund - 2.6% | ||||||||
BlackRock Liquidity Funds T-Fund Portfolio | 6,046,582 | $6,046,582 | ||||||
|
| |||||||
Total Short-Term Investment | 6,046,582 | |||||||
|
| |||||||
TOTAL INVESTMENTS - 99.8% | 229,444,503 | |||||||
OTHER ASSETS & LIABILITIES, NET - 0.2% | 556,291 | |||||||
|
| |||||||
NET ASSETS - 100.0% | $230,000,794 | |||||||
|
| |||||||
Notes to Schedule of Investments
| (a) | As of March 31, 2018, the Fund’s composition by sector as a percentage of net assets was as follows: |
Consumer, Non-Cyclical | 23.9% | |||
Financial | 17.8% | |||
Industrial | 17.1% | |||
Consumer, Cyclical | 14.6% | |||
Technology | 10.2% | |||
Communications | 5.4% | |||
Basic Materials | 4.4% | |||
Others (each less than 3.0%) | 6.4% | |||
|
| |||
| 99.8% | ||||
Other Assets & Liabilities, Net | 0.2% | |||
|
| |||
| 100.0% | ||||
|
|
| (b) | An investment with a value of $325 or less than 0.1% of the Fund’s net assets was valued by the Trustee Valuation Committee or determined by a valuation committee established under the Valuation Policy and then subsequently submitted for approval or ratification to either the Trustee Valuation Committee or to the Board of Trustees. |
| (c) | Fair Value Measurements |
The following is a summary of the Fund’s investments as categorized under the three-tier hierarchy of inputs used in valuing the Fund’s assets and liabilities (See Note 3D in Notes to Financial Statements) as of March 31, 2018:
| Total Value at March 31, 2018 | Level 1 Quoted Price | Level 2 Significant Observable Inputs | Level 3 Significant Unobservable Inputs | |||||||||||||||
Assets | Rights | $325 | $— | $— | $325 | |||||||||||||
Common Stocks | 223,397,596 | 223,397,596 | — | — | ||||||||||||||
Short-Term Investment | 6,046,582 | 6,046,582 | — | — | ||||||||||||||
|
|
|
|
|
|
|
| |||||||||||
Total | $229,444,503 | 229,444,178 | $— | $325 | ||||||||||||||
|
|
|
|
|
|
|
| |||||||||||
| See Notes to Financial Statements | See explanation of symbols and terms, if any, on B-45 |
B-38
Table of Contents
PACIFIC FUNDS
PACIFIC FUNDSSM SMALL-CAP
Schedule of Investments
March 31, 2018
Shares | Value | |||||||
COMMON STOCKS - 98.1% | ||||||||
Basic Materials - 2.9% | ||||||||
Commercial Metals Co | 6,392 | $130,780 | ||||||
Kraton Corp * | 4,515 | 215,411 | ||||||
PolyOne Corp | 5,857 | 249,040 | ||||||
US Silica Holdings Inc | 1,418 | 36,187 | ||||||
|
| |||||||
| 631,418 | ||||||||
|
| |||||||
Communications - 4.9% | ||||||||
Ciena Corp * | 5,903 | 152,888 | ||||||
GrubHub Inc * | 1,715 | 174,021 | ||||||
Imperva Inc * | 2,706 | 117,170 | ||||||
NETGEAR Inc * | 2,453 | 140,312 | ||||||
Sinclair Broadcast Group Inc ‘A’ | 5,027 | 157,345 | ||||||
TiVo Corp | 7,654 | 103,712 | ||||||
Vonage Holdings Corp * | 12,746 | 135,745 | ||||||
Web.com Group Inc * | 3,592 | 65,015 | ||||||
|
| |||||||
| 1,046,208 | ||||||||
|
| |||||||
Consumer, Cyclical - 11.7% | ||||||||
Beacon Roofing Supply Inc * | 1,184 | 62,835 | ||||||
Big Lots Inc | 2,246 | 97,768 | ||||||
Bloomin’ Brands Inc | 6,379 | 154,882 | ||||||
Camping World Holdings Inc ‘A’ | 2,365 | 76,271 | ||||||
Cooper-Standard Holdings Inc * | 1,471 | 180,654 | ||||||
Golden Entertainment Inc * | 2,255 | 52,384 | ||||||
Lithia Motors Inc ‘A’ | 1,465 | 147,262 | ||||||
Marriott Vacations Worldwide Corp | 1,839 | 244,955 | ||||||
Meritor Inc * | 10,029 | 206,196 | ||||||
SkyWest Inc | 4,031 | 219,286 | ||||||
Sleep Number Corp * | 5,054 | 177,648 | ||||||
Sonic Corp | 4,338 | 109,448 | ||||||
Steven Madden Ltd | 3,349 | 147,021 | ||||||
Texas Roadhouse Inc | 4,037 | 233,258 | ||||||
The Children’s Place Inc | 1,256 | 169,874 | ||||||
Wabash National Corp | 7,631 | 158,801 | ||||||
Wolverine World Wide Inc | 2,440 | 70,516 | ||||||
|
| |||||||
| 2,509,059 | ||||||||
|
| |||||||
Consumer, Non-Cyclical - 23.7% | ||||||||
ABM Industries Inc | 2,423 | 81,122 | ||||||
Acadia Healthcare Co Inc * | 4,581 | 179,484 | ||||||
Adtalem Global Education Inc * | 4,537 | 215,734 | ||||||
Amedisys Inc * | 2,404 | 145,057 | ||||||
Amphastar Pharmaceuticals Inc * | 5,896 | 110,550 | ||||||
Bluebird Bio Inc * | 529 | 90,327 | ||||||
Cardtronics PLC ‘A’ * | 1,757 | 39,199 | ||||||
Central Garden & Pet Co ‘A’ * | 5,806 | 229,976 | ||||||
Deluxe Corp | 2,234 | 165,338 | ||||||
Encompass Health Corp | 3,976 | 227,308 | ||||||
FibroGen Inc * | 2,437 | 112,589 | ||||||
Green Dot Corp ‘A’ * | 2,356 | 151,161 | ||||||
Horizon Pharma PLC * | 10,824 | 153,701 | ||||||
Hostess Brands Inc * | 9,280 | 137,251 | ||||||
ICU Medical Inc * | 1,168 | 294,803 | ||||||
Insperity Inc | 4,470 | 310,888 | ||||||
J&J Snack Foods Corp | 724 | 98,869 | ||||||
LHC Group Inc * | 2,601 | 160,118 | ||||||
LivaNova PLC * | 1,606 | 142,131 | ||||||
Masimo Corp * | 1,265 | 111,257 | ||||||
Merit Medical Systems Inc * | 5,318 | 241,171 | ||||||
Molina Healthcare Inc * | 944 | 76,634 | ||||||
Nektar Therapeutics * | 3,023 | 321,224 | ||||||
NuVasive Inc * | 3,631 | 189,575 | ||||||
Performance Food Group Co * | 3,537 | 105,579 | ||||||
PRA Health Sciences Inc * | 1,878 | 155,799 | ||||||
SP Plus Corp * | 2,193 | 78,071 | ||||||
Supernus Pharmaceuticals Inc * | 5,878 | 269,212 | ||||||
Shares | Value | |||||||
Syneos Health Inc * | 3,515 | $124,783 | ||||||
TrueBlue Inc * | 5,271 | 136,519 | ||||||
Vanda Pharmaceuticals Inc * | 7,964 | 134,193 | ||||||
Viad Corp | 2,180 | 114,341 | ||||||
|
| |||||||
| 5,103,964 | ||||||||
|
| |||||||
Energy - 1.2% | ||||||||
Laredo Petroleum Inc * | 8,778 | 76,456 | ||||||
PDC Energy Inc * | 2,599 | 127,429 | ||||||
QEP Resources Inc * | 4,866 | 47,638 | ||||||
|
| |||||||
| 251,523 | ||||||||
|
| |||||||
Financial - 22.4% | ||||||||
AG Mortgage Investment Trust Inc REIT | 5,367 | 93,225 | ||||||
Apollo Commercial Real Estate Finance Inc REIT | 3,462 | 62,247 | ||||||
Argo Group International Holdings Ltd | 1,851 | 106,247 | ||||||
Berkshire Hills Bancorp Inc | 2,862 | 108,613 | ||||||
BrightSphere Investment Group PLC | 10,294 | 162,233 | ||||||
Capstead Mortgage Corp REIT | 6,277 | 54,296 | ||||||
Cathay General Bancorp | 4,612 | 184,388 | ||||||
CenterState Bank Corp | 6,206 | 164,645 | ||||||
Chemical Financial Corp | 2,979 | 162,892 | ||||||
Enterprise Financial Services Corp | 3,475 | 162,977 | ||||||
First Industrial Realty Trust Inc REIT | 7,507 | 219,430 | ||||||
First Interstate BancSystem Inc ‘A’ | 895 | 35,397 | ||||||
First Merchants Corp | 4,537 | 189,193 | ||||||
First Midwest Bancorp Inc | 6,377 | 156,810 | ||||||
Hanmi Financial Corp | 3,103 | 95,417 | ||||||
Heritage Insurance Holdings Inc | 5,585 | 84,669 | ||||||
IBERIABANK Corp | 2,401 | 187,278 | ||||||
Independent Bank Corp | 2,857 | 65,425 | ||||||
Invesco Mortgage Capital Inc REIT | 2,012 | 32,957 | ||||||
Moelis & Co ‘A’ | 3,251 | 165,313 | ||||||
National Storage Affiliates Trust REIT | 4,999 | 125,375 | ||||||
Old National Bancorp | 9,843 | 166,347 | ||||||
Pacific Premier Bancorp Inc * | 1,526 | 61,345 | ||||||
Potlatch Corp REIT | 2,674 | 139,182 | ||||||
Preferred Bank | 1,476 | 94,759 | ||||||
PS Business Parks Inc REIT | 1,452 | 164,134 | ||||||
Radian Group Inc | 10,057 | 191,485 | ||||||
Simmons First National Corp ‘A’ | 6,475 | 184,214 | ||||||
Stifel Financial Corp | 2,800 | 165,844 | ||||||
Sunstone Hotel Investors Inc REIT | 8,855 | 134,773 | ||||||
Texas Capital Bancshares Inc * | 2,227 | 200,207 | ||||||
United Community Banks Inc | 6,467 | 204,681 | ||||||
Washington Real Estate Investment Trust REIT | 4,965 | 135,544 | ||||||
Wintrust Financial Corp | 2,116 | 182,082 | ||||||
WSFS Financial Corp | 3,526 | 168,895 | ||||||
|
| |||||||
| 4,812,519 | ||||||||
|
| |||||||
Industrial - 18.8% | ||||||||
AAR Corp | 2,711 | 119,582 | ||||||
Air Transport Services Group Inc * | 6,756 | 157,550 | ||||||
American Woodmark Corp * | 1,577 | 155,256 | ||||||
Barnes Group Inc | 3,663 | 219,377 | ||||||
Belden Inc | 657 | 45,294 | ||||||
EMCOR Group Inc | 2,895 | 225,607 | ||||||
EnerSys | 2,638 | 182,998 | ||||||
Generac Holdings Inc * | 2,838 | 130,293 | ||||||
Harsco Corp * | 11,545 | 238,404 | ||||||
Knight-Swift Transportation Holdings Inc l | — | 22 | ||||||
Knowles Corp * | 9,320 | 117,339 | ||||||
Littelfuse Inc | 1,230 | 256,061 | ||||||
MasTec Inc * | 5,128 | 241,272 | ||||||
Rexnord Corp * | 7,646 | 226,933 | ||||||
Rogers Corp * | 833 | 99,577 | ||||||
Saia Inc * | 3,559 | 267,459 | ||||||
SPX Corp * | 4,490 | 145,835 | ||||||
SYNNEX Corp | 1,221 | 144,566 | ||||||
TopBuild Corp * | 2,458 | 188,086 | ||||||
| See Notes to Financial Statements | See explanation of symbols and terms, if any, on B-45 |
B-39
Table of Contents
PACIFIC FUNDS
PACIFIC FUNDS SMALL-CAP
Schedule of Investments (Continued)
March 31, 2018
Shares | Value | |||||||
Trinseo SA | 3,436 | $254,436 | ||||||
Universal Forest Products Inc | 4,696 | 152,385 | ||||||
US Concrete Inc * | 1,735 | 104,794 | ||||||
Vishay Intertechnology Inc | 8,840 | 164,424 | ||||||
Werner Enterprises Inc | 3,703 | 135,159 | ||||||
YRC Worldwide Inc * | 6,526 | 57,625 | ||||||
|
| |||||||
| 4,030,334 | ||||||||
|
| |||||||
Technology - 10.5% | ||||||||
Acxiom Corp * | 5,240 | 119,000 | ||||||
Ambarella Inc * | 2,102 | 102,977 | ||||||
Bottomline Technologies Inc * | 2,053 | 79,554 | ||||||
Cabot Microelectronics Corp | 1,164 | 124,676 | ||||||
CACI International Inc ‘A’ * | 1,129 | 170,874 | ||||||
CommVault Systems Inc * | 2,575 | 147,290 | ||||||
Entegris Inc | 6,987 | 243,148 | ||||||
Glu Mobile Inc * | 22,961 | 86,563 | ||||||
Integrated Device Technology Inc * | 4,419 | 135,045 | ||||||
j2 Global Inc | 2,606 | 205,666 | ||||||
MKS Instruments Inc | 944 | 109,174 | ||||||
Power Integrations Inc | 1,372 | 93,776 | ||||||
RealPage Inc * | 4,898 | 252,247 | ||||||
Silicon Laboratories Inc * | 1,350 | 121,365 | ||||||
Verint Systems Inc * | 4,057 | 172,828 | ||||||
Xperi Corp | 4,007 | 84,748 | ||||||
|
| |||||||
| 2,248,931 | ||||||||
|
| |||||||
Utilities - 2.0% | ||||||||
ALLETE Inc | 2,778 | 200,711 | ||||||
Black Hills Corp | 1,965 | 106,700 | ||||||
Southwest Gas Holdings Inc | 1,913 | 129,376 | ||||||
|
| |||||||
| 436,787 | ||||||||
|
| |||||||
Total Common Stocks | 21,070,743 | |||||||
|
| |||||||
Shares | Value | |||||||
SHORT-TERM INVESTMENT - 1.9% | ||||||||
Money Market Fund - 1.9% | ||||||||
BlackRock Liquidity Funds T-Fund Portfolio | 417,954 | $417,954 | ||||||
|
| |||||||
Total Short-Term Investment | 417,954 | |||||||
|
| |||||||
TOTAL INVESTMENTS - 100.0% | 21,488,697 | |||||||
OTHER ASSETS & LIABILITIES, NET - (0.0%) | (10,233 | ) | ||||||
|
| |||||||
NET ASSETS - 100.0% | $21,478,464 | |||||||
|
| |||||||
Notes to Schedule of Investments
| (a) | As of March 31, 2018, the Fund’s composition by sector as a percentage of net assets was as follows: |
Consumer, Non-Cyclical | 23.7% | |||
Financial | 22.4% | |||
Industrial | 18.8% | |||
Consumer, Cyclical | 11.7% | |||
Technology | 10.5% | |||
Communications | 4.9% | |||
Others (each less than 3.0%) | 8.0% | |||
|
| |||
| 100.0% | ||||
Other Assets & Liabilities, Net | (0.0% | ) | ||
|
| |||
| 100.0% | ||||
|
|
| (b) | Fair Value Measurements |
The following is a summary of the Fund’s investments as categorized under the three-tier hierarchy of inputs used in valuing the Fund’s assets and liabilities (See Note 3D in Notes to Financial Statements) as of March 31, 2018:
| Total Value at March 31, 2018 | Level 1 Quoted Price | Level 2 Significant Observable Inputs | Level 3 Significant Unobservable Inputs | |||||||||||||||
Assets | Common Stocks | $21,070,743 | $21,070,743 | $— | $— | |||||||||||||
Short-Term Investment | 417,954 | 417,954 | — | — | ||||||||||||||
|
|
|
|
|
|
|
| |||||||||||
Total | $21,488,697 | $21,488,697 | $— | $— | ||||||||||||||
|
|
|
|
|
|
|
| |||||||||||
| See Notes to Financial Statements | See explanation of symbols and terms, if any, on B-45 |
B-40
Table of Contents
PACIFIC FUNDS
PACIFIC FUNDSSM SMALL-CAP VALUE
Schedule of Investments
March 31, 2018
Shares | Value | |||||||
COMMON STOCKS - 99.2% | ||||||||
Basic Materials - 3.0% | ||||||||
Commercial Metals Co | 7,509 | $153,634 | ||||||
Kaiser Aluminum Corp | 2,147 | 216,632 | ||||||
Kraton Corp * | 7,159 | 341,556 | ||||||
Minerals Technologies Inc | 1,778 | 119,037 | ||||||
|
| |||||||
| 830,859 | ||||||||
|
| |||||||
Communications - 1.6% | ||||||||
NETGEAR Inc * | 4,295 | 245,674 | ||||||
TiVo Corp | 16,033 | 217,247 | ||||||
|
| |||||||
| 462,921 | ||||||||
|
| |||||||
Consumer, Cyclical - 10.4% | ||||||||
Beacon Roofing Supply Inc * | 4,190 | 222,363 | ||||||
Big Lots Inc | 3,386 | 147,393 | ||||||
Caleres Inc | 4,800 | 161,280 | ||||||
Cooper-Standard Holdings Inc * | 2,505 | 307,639 | ||||||
FirstCash Inc | 4,468 | 363,025 | ||||||
Golden Entertainment Inc * | 2,102 | 48,829 | ||||||
Haverty Furniture Cos Inc | 3,939 | 79,371 | ||||||
Marriott Vacations Worldwide Corp | 2,424 | 322,877 | ||||||
Meritor Inc * | 9,163 | 188,391 | ||||||
Red Robin Gourmet Burgers Inc * | 2,432 | 141,056 | ||||||
SkyWest Inc | 7,604 | 413,658 | ||||||
The Children’s Place Inc | 2,215 | 299,579 | ||||||
Wabash National Corp | 10,099 | 210,160 | ||||||
|
| |||||||
| 2,905,621 | ||||||||
|
| |||||||
Consumer, Non-Cyclical - 14.1% | ||||||||
ABM Industries Inc | 6,646 | 222,508 | ||||||
Acadia Healthcare Co Inc * | 4,006 | 156,955 | ||||||
Adtalem Global Education Inc * | 9,905 | 470,983 | ||||||
AngioDynamics Inc * | 7,191 | 124,045 | ||||||
Bluebird Bio Inc * | 682 | 116,451 | ||||||
Central Garden & Pet Co ‘A’ * | 8,871 | 351,380 | ||||||
CONMED Corp | 4,198 | 265,859 | ||||||
Deluxe Corp | 3,777 | 279,536 | ||||||
Haemonetics Corp * | 5,271 | 385,626 | ||||||
Horizon Pharma PLC * | 16,405 | 232,951 | ||||||
Hostess Brands Inc * | 13,140 | 194,341 | ||||||
LHC Group Inc * | 4,427 | 272,526 | ||||||
LivaNova PLC * | 1,603 | 141,866 | ||||||
Molina Healthcare Inc * | 2,249 | 182,574 | ||||||
RPX Corp | 10,061 | 107,552 | ||||||
SP Plus Corp * | 5,237 | 186,437 | ||||||
Viad Corp | 4,803 | 251,917 | ||||||
|
| |||||||
| 3,943,507 | ||||||||
|
| |||||||
Energy - 2.7% | ||||||||
Exterran Corp * | 7,340 | 195,978 | ||||||
Helix Energy Solutions Group Inc * | 12,342 | 71,460 | ||||||
Laredo Petroleum Inc * | 15,755 | 137,226 | ||||||
PDC Energy Inc * | 3,839 | 188,226 | ||||||
QEP Resources Inc * | 17,853 | 174,781 | ||||||
|
| |||||||
| 767,671 | ||||||||
|
| |||||||
Financial - 39.7% | ||||||||
AG Mortgage Investment Trust Inc REIT | 5,088 | 88,379 | ||||||
Agree Realty Corp REIT | 1,906 | 91,564 | ||||||
Aircastle Ltd | 3,941 | 78,268 | ||||||
Apollo Commercial Real Estate Finance Inc REIT | 8,655 | 155,614 | ||||||
Argo Group International Holdings Ltd | 5,668 | 325,343 | ||||||
Berkshire Hills Bancorp Inc | 7,241 | 274,796 | ||||||
BrightSphere Investment Group PLC | 14,450 | 227,732 | ||||||
Camden National Corp | 4,251 | 189,170 | ||||||
Capstead Mortgage Corp REIT | 17,803 | 153,996 | ||||||
Cathay General Bancorp | 7,610 | 304,248 | ||||||
Shares | Value | |||||||
CenterState Bank Corp | 9,367 | $ | 248,507 | |||||
Chemical Financial Corp | 6,373 | 348,476 | ||||||
CNO Financial Group Inc | 4,216 | 91,361 | ||||||
Enterprise Financial Services Corp | 6,679 | 313,245 | ||||||
First Industrial Realty Trust Inc REIT | 12,384 | 361,984 | ||||||
First Interstate BancSystem Inc ‘A’ | 7,324 | 289,664 | ||||||
First Merchants Corp | 7,500 | 312,750 | ||||||
First Midwest Bancorp Inc | 12,742 | 313,326 | ||||||
Heritage Financial Corp | 7,770 | 237,762 | ||||||
Heritage Insurance Holdings Inc | 9,807 | 148,674 | ||||||
Hilltop Holdings Inc | 10,072 | 236,289 | ||||||
Hope Bancorp Inc | 7,443 | 135,388 | ||||||
Horizon Bancorp | 6,063 | 181,951 | ||||||
IBERIABANK Corp | 5,022 | 391,716 | ||||||
Independent Bank Corp | 7,885 | 180,566 | ||||||
Invesco Mortgage Capital Inc REIT | 12,055 | 197,461 | ||||||
Investors Bancorp Inc | 7,312 | 99,736 | ||||||
MFA Financial Inc REIT | 16,525 | 124,433 | ||||||
National Storage Affiliates Trust REIT | 11,669 | 292,659 | ||||||
Old National Bancorp | 17,875 | 302,088 | ||||||
Pacific Premier Bancorp Inc * | 3,305 | 132,861 | ||||||
PotlatchDeltic Corp REIT | 5,578 | 290,335 | ||||||
Preferred Bank | 3,573 | 229,387 | ||||||
PS Business Parks Inc REIT | 2,772 | 313,347 | ||||||
QCR Holdings Inc | 4,240 | 190,164 | ||||||
Radian Group Inc | 19,890 | 378,706 | ||||||
Simmons First National Corp ‘A’ | 10,612 | 301,911 | ||||||
State Bank Financial Corp | 7,461 | 223,905 | ||||||
Stifel Financial Corp | 5,055 | 299,408 | ||||||
Sunstone Hotel Investors Inc REIT | 15,678 | 238,619 | ||||||
Texas Capital Bancshares Inc * | 3,066 | 275,633 | ||||||
Umpqua Holdings Corp | 12,264 | 262,572 | ||||||
United Community Banks Inc | 10,666 | 337,579 | ||||||
Washington Real Estate Investment Trust REIT | 10,738 | 293,147 | ||||||
Wintrust Financial Corp | 4,411 | 379,567 | ||||||
WSFS Financial Corp | 5,583 | 267,426 | ||||||
|
| |||||||
| 11,111,713 | ||||||||
|
| |||||||
Industrial - 16.0% | ||||||||
AAR Corp | 4,455 | 196,510 | ||||||
ArcBest Corp | 4,873 | 156,180 | ||||||
Barnes Group Inc | 4,807 | 287,891 | ||||||
Belden Inc | 4,350 | 299,889 | ||||||
EMCOR Group Inc | 5,346 | 416,614 | ||||||
EnerSys | 2,071 | 143,665 | ||||||
Harsco Corp * | 14,232 | 293,891 | ||||||
Knowles Corp * | 16,939 | 213,262 | ||||||
MasTec Inc * | 2,925 | 137,621 | ||||||
Rexnord Corp * | 8,841 | 262,401 | ||||||
Sanmina Corp * | 5,609 | 146,675 | ||||||
SYNNEX Corp | 2,120 | 251,008 | ||||||
TopBuild Corp * | 4,410 | 337,453 | ||||||
TriMas Corp * | 10,397 | 272,921 | ||||||
Trinseo SA | 4,892 | 362,253 | ||||||
Universal Forest Products Inc | 8,001 | 259,632 | ||||||
Vishay Intertechnology Inc | 10,661 | 198,295 | ||||||
Werner Enterprises Inc | 4,187 | 152,825 | ||||||
YRC Worldwide Inc * | 10,622 | 93,792 | ||||||
|
| |||||||
| 4,482,778 | ||||||||
|
| |||||||
Technology - 7.1% | ||||||||
Acxiom Corp * | 10,224 | 232,187 | ||||||
Ambarella Inc * | 2,742 | 134,331 | ||||||
Bottomline Technologies Inc * | 3,480 | 134,850 | ||||||
CACI International Inc ‘A’ * | 3,057 | 462,677 | ||||||
CSG Systems International Inc | 6,019 | 272,600 | ||||||
Glu Mobile Inc * | 37,300 | 140,621 | ||||||
Insight Enterprises Inc * | 5,699 | 199,066 | ||||||
Verint Systems Inc * | 9,767 | 416,074 | ||||||
|
| |||||||
| 1,992,406 | ||||||||
|
| |||||||
| See Notes to Financial Statements | See explanation of symbols and terms, if any, on B-45 |
B-41
Table of Contents
PACIFIC FUNDS
PACIFIC FUNDS SMALL-CAP VALUE
Schedule of Investments (Continued)
March 31, 2018
Shares | Value | |||||||
Utilities - 4.6% |
| |||||||
ALLETE Inc | 5,644 | $407,779 | ||||||
Black Hills Corp | 5,403 | 293,383 | ||||||
Portland General Electric Co | 7,351 | 297,789 | ||||||
Southwest Gas Holdings Inc | 4,406 | 297,978 | ||||||
|
| |||||||
| 1,296,929 | ||||||||
|
| |||||||
Total Common Stocks | 27,794,405 | |||||||
|
| |||||||
EXCHANGE-TRADED FUND - 0.1% | ||||||||
iShares Russell 2000 Value | 228 | 27,789 | ||||||
|
| |||||||
Total Exchange-Traded Fund | 27,789 | |||||||
|
| |||||||
SHORT-TERM INVESTMENT - 0.8% | ||||||||
Money Market Fund - 0.8% | ||||||||
BlackRock Liquidity Funds T-Fund Portfolio | 216,929 | 216,929 | ||||||
|
| |||||||
Total Short-Term Investment | 216,929 | |||||||
|
| |||||||
TOTAL INVESTMENTS - 100.1% | 28,039,123 | |||||||
OTHER ASSETS & LIABILITIES, NET - (0.1%) | (40,489 | ) | ||||||
|
| |||||||
NET ASSETS - 100.0% | $27,998,634 | |||||||
|
| |||||||
Notes to Schedule of Investments
| (a) | As of March 31, 2018, the Fund’s composition by sector as a percentage of net assets was as follows: |
Financial | 39.7% | |||
Industrial | 16.0% | |||
Consumer, Non-Cyclical | 14.1% | |||
Consumer, Cyclical | 10.4% | |||
Technology | 7.1% | |||
Utilities | 4.6% | |||
Basic Materials | 3.0% | |||
Others (each less than 3.0%) | 5.2% | |||
|
| |||
| 100.1% | ||||
Other Assets & Liabilities, Net | (0.1% | ) | ||
|
| |||
| 100.0% | ||||
|
|
| (b) | Fair Value Measurements |
The following is a summary of the Fund’s investments as categorized under the three-tier hierarchy of inputs used in valuing the Fund’s assets and liabilities (See Note 3D in Notes to Financial Statements) as of March 31, 2018:
| Total Value at March 31, 2018 | Level 1 Quoted Price | Level 2 Significant Observable Inputs | Level 3 Significant Unobservable Inputs | |||||||||||||||
Assets | Common Stocks | $27,794,405 | $27,794,405 | $— | $— | |||||||||||||
Exchange-Traded Fund | 27,789 | 27,789 | — | — | ||||||||||||||
Short-Term Investment | 216,929 | 216,929 | — | — | ||||||||||||||
|
|
|
|
|
|
|
| |||||||||||
Total | $28,039,123 | $28,039,123 | $— | $— | ||||||||||||||
|
|
|
|
|
|
|
| |||||||||||
| See Notes to Financial Statements | See explanation of symbols and terms, if any, on B-45 |
B-42
Table of Contents
PACIFIC FUNDS
PACIFIC FUNDSSM SMALL-CAP GROWTH
Schedule of Investments
March 31, 2018
Shares | Value | |||||||
RIGHTS - 0.0% | ||||||||
Consumer, Non-Cyclical - 0.0% | ||||||||
Dyax Corp - Contingent Value Rights * W ± | 375 | $859 | ||||||
|
| |||||||
Total Rights | 859 | |||||||
|
| |||||||
COMMON STOCKS - 97.8% | ||||||||
Basic Materials - 2.6% | ||||||||
Kaiser Aluminum Corp | 5,225 | 527,202 | ||||||
PolyOne Corp | 16,121 | 685,465 | ||||||
US Silica Holdings Inc | 6,793 | 173,357 | ||||||
|
| |||||||
| 1,386,024 | ||||||||
|
| |||||||
Communications - 11.4% | ||||||||
Ciena Corp * | 25,137 | 651,048 | ||||||
GrubHub Inc * | 8,849 | 897,908 | ||||||
Imperva Inc * | 12,644 | 547,485 | ||||||
NETGEAR Inc * | 10,867 | 621,592 | ||||||
RingCentral Inc ‘A’ * | 18,361 | 1,165,924 | ||||||
Shutterfly Inc * | 8,752 | 711,100 | ||||||
Sinclair Broadcast Group Inc ‘A’ | 15,917 | 498,202 | ||||||
TiVo Corp | 28,757 | 389,657 | ||||||
Vonage Holdings Corp * | 66,432 | 707,501 | ||||||
|
| |||||||
| 6,190,417 | ||||||||
|
| |||||||
Consumer, Cyclical - 14.1% | ||||||||
AMC Entertainment Holdings Inc ‘A’ | 16,684 | 234,410 | ||||||
Beacon Roofing Supply Inc * | 11,033 | 585,521 | ||||||
Bloomin’ Brands Inc | 28,719 | 697,297 | ||||||
Camping World Holdings Inc ‘A’ | 12,224 | 394,224 | ||||||
FirstCash Inc | 4,986 | 405,113 | ||||||
Golden Entertainment Inc * | 14,384 | 334,140 | ||||||
iRobot Corp * | 5,083 | 326,278 | ||||||
Lithia Motors Inc ‘A’ | 6,153 | 618,500 | ||||||
Sleep Number Corp * | 19,451 | 683,703 | ||||||
Sonic Corp | 17,558 | 442,988 | ||||||
Steven Madden Ltd | 10,840 | 475,876 | ||||||
Texas Roadhouse Inc | 10,460 | 604,379 | ||||||
The Children’s Place Inc | 3,921 | 530,315 | ||||||
Universal Electronics Inc * | 6,850 | 356,543 | ||||||
Wabash National Corp | 22,840 | 475,300 | ||||||
Wolverine World Wide Inc | 16,594 | 479,567 | ||||||
|
| |||||||
| 7,644,154 | ||||||||
|
| |||||||
Consumer, Non-Cyclical - 32.1% | ||||||||
Acadia Healthcare Co Inc * | 9,215 | 361,044 | ||||||
ACADIA Pharmaceuticals Inc * | 7,138 | 160,391 | ||||||
Aclaris Therapeutics Inc * | 11,167 | 195,646 | ||||||
Amedisys Inc * | 10,036 | 605,572 | ||||||
Amicus Therapeutics Inc * | 25,390 | 381,866 | ||||||
Amphastar Pharmaceuticals Inc * | 16,087 | 301,631 | ||||||
BioTelemetry Inc * | 13,233 | 410,885 | ||||||
Bluebird Bio Inc * | 952 | 162,554 | ||||||
Cardtronics PLC ‘A’ * | 14,996 | 334,561 | ||||||
Deluxe Corp | 11,970 | 885,900 | ||||||
Encompass Health Corp | 10,424 | 595,940 | ||||||
Esperion Therapeutics Inc * | 5,080 | 367,436 | ||||||
FibroGen Inc * | 10,687 | 493,739 | ||||||
Green Dot Corp ‘A’ * | 13,138 | 842,934 | ||||||
Horizon Pharma PLC * | 42,118 | 598,076 | �� | |||||
ICU Medical Inc * | 2,844 | 717,826 | ||||||
Insperity Inc | 15,662 | 1,089,292 | ||||||
iRhythm Technologies Inc * | 7,836 | 493,276 | ||||||
J&J Snack Foods Corp | 3,547 | 484,378 | ||||||
LHC Group Inc * | 7,606 | 468,225 | ||||||
Shares | Value | |||||||
LivaNova PLC * | 6,132 | $ | 542,682 | |||||
Merit Medical Systems Inc * | 10,986 | 498,215 | ||||||
Molina Healthcare Inc * | 6,116 | 496,497 | ||||||
Nektar Therapeutics * | 12,842 | 1,364,591 | ||||||
NuVasive Inc * | 10,185 | 531,759 | ||||||
Performance Food Group Co * | 18,960 | 565,956 | ||||||
Puma Biotechnology Inc * | 7,428 | 505,475 | ||||||
Revance Therapeutics Inc * | 12,134 | 373,727 | ||||||
Supernus Pharmaceuticals Inc * | 22,440 | 1,027,752 | ||||||
Syneos Health Inc * | 10,365 | 367,958 | ||||||
TrueBlue Inc * | 14,701 | 380,756 | ||||||
Ultragenyx Pharmaceutical Inc * | 6,244 | 318,382 | ||||||
Vanda Pharmaceuticals Inc * | 25,894 | 436,314 | ||||||
|
| |||||||
| 17,361,236 | ||||||||
|
| |||||||
Financial - 5.1% | ||||||||
BrightSphere Investment Group PLC | 29,011 | 457,213 | ||||||
Home BancShares Inc | 20,526 | 468,198 | ||||||
Moelis & Co ‘A’ | 9,696 | 493,042 | ||||||
Pacific Premier Bancorp Inc * | 10,148 | 407,950 | ||||||
PS Business Parks Inc REIT | 3,938 | 445,152 | ||||||
Texas Capital Bancshares Inc * | 5,306 | 477,009 | ||||||
|
| |||||||
| 2,748,564 | ||||||||
|
| |||||||
Industrial - 18.0% | ||||||||
Aerojet Rocketdyne Holdings Inc * | 18,034 | 504,411 | ||||||
American Woodmark Corp * | 6,307 | 620,924 | ||||||
EnPro Industries Inc | 6,874 | 531,910 | ||||||
Forward Air Corp | 7,358 | 388,944 | ||||||
Generac Holdings Inc * | 12,909 | 592,652 | ||||||
Harsco Corp * | 23,006 | 475,074 | ||||||
Littelfuse Inc | 3,744 | 779,426 | ||||||
Lydall Inc * | 8,542 | 412,152 | ||||||
Masonite International Corp * | 7,481 | 458,959 | ||||||
MasTec Inc * | 13,065 | 614,708 | ||||||
Rogers Corp * | 5,368 | 641,691 | ||||||
Saia Inc * | 9,238 | 694,236 | ||||||
SPX Corp * | 21,868 | 710,273 | ||||||
Tetra Tech Inc | 9,202 | 450,438 | ||||||
TopBuild Corp * | 7,496 | 573,594 | ||||||
Trinseo SA | 8,342 | 617,725 | ||||||
US Concrete Inc * | 8,286 | 500,474 | ||||||
YRC Worldwide Inc * | 22,959 | 202,728 | ||||||
|
| |||||||
| 9,770,319 | ||||||||
|
| |||||||
Technology - 14.5% | ||||||||
Acxiom Corp * | 23,631 | 536,660 | ||||||
Ambarella Inc * | 8,165 | 400,003 | ||||||
Bottomline Technologies Inc * | 18,052 | 699,515 | ||||||
CommVault Systems Inc * | 11,827 | 676,504 | ||||||
Glu Mobile Inc * | 124,235 | 468,366 | ||||||
Hortonworks Inc * | 19,838 | 404,100 | ||||||
Integrated Device Technology Inc * | 19,883 | 607,624 | ||||||
j2 Global Inc | 6,987 | 551,414 | ||||||
MaxLinear Inc * | 18,631 | 423,855 | ||||||
MKS Instruments Inc | 8,032 | 928,901 | ||||||
RealPage Inc * | 21,646 | 1,114,769 | ||||||
Silicon Laboratories Inc * | 7,195 | 646,831 | ||||||
Xperi Corp | 17,405 | 368,116 | ||||||
|
| |||||||
| 7,826,658 | ||||||||
|
| |||||||
Total Common Stocks | 52,927,372 | |||||||
|
| |||||||
| See Notes to Financial Statements | See explanation of symbols and terms, if any, on B-45 |
B-43
Table of Contents
PACIFIC FUNDS
PACIFIC FUNDS SMALL-CAP GROWTH
Schedule of Investments (Continued)
March 31, 2018
Shares | Value | |||||||
SHORT-TERM INVESTMENT - 2.2% | ||||||||
Money Market Fund - 2.2% | ||||||||
BlackRock Liquidity Funds T-Fund Portfolio | 1,212,666 | $1,212,666 | ||||||
|
| |||||||
Total Short-Term Investment | 1,212,666 | |||||||
|
| |||||||
TOTAL INVESTMENTS - 100.0% | 54,140,897 | |||||||
OTHER ASSETS & LIABILITIES, NET - (0.0%) | (11,726 | ) | ||||||
|
| |||||||
NET ASSETS - 100.0% | $54,129,171 | |||||||
|
| |||||||
Notes to Schedule of Investments
| (a) | As of March 31, 2018, the Fund’s composition by sector as a percentage of net assets was as follows: |
Consumer, Non-Cyclical | 32.1% | |||
Industrial | 18.0% | |||
Technology | 14.5% | |||
Consumer, Cyclical | 14.1% | |||
Communications | 11.4% | |||
Financial | 5.1% | |||
Others (each less than 3.0%) | 4.8% | |||
|
| |||
| 100.0% | ||||
Other Assets & Liabilities, Net | (0.0% | ) | ||
|
| |||
| 100.0% | ||||
|
|
| (b) | An investment with a value of $859 or less than 0.1% of the Fund’s net assets was valued by the Trustee Valuation Committee or determined by a valuation committee established under the Valuation Policy and then subsequently submitted for approval or ratification to either the Trustee Valuation Committee or to the Board of Trustees. |
| (c) | Fair Value Measurements |
The following is a summary of the Fund's investments as categorized under the three-tier hierarchy of inputs used in valuing the Fund's assets and liabilities (See Note 3D in Notes to Financial Statements) as of March 31, 2018:
| Total Value at March 31, 2018 | Level 1 Quoted Price | Level 2 Significant Observable Inputs | Level 3 Significant Unobservable Inputs | |||||||||||||||
Assets | Rights | $859 | $— | $— | $859 | |||||||||||||
Common Stocks | 52,927,372 | 52,927,372 | — | — | ||||||||||||||
Short-Term Investment | 1,212,666 | 1,212,666 | — | — | ||||||||||||||
|
|
|
|
|
|
|
| |||||||||||
Total | $54,140,897 | $54,140,038 | $— | $859 | ||||||||||||||
|
|
|
|
|
|
|
| |||||||||||
| See Notes to Financial Statements | See explanation of symbols and terms, if any, on B-45 |
B-44
Table of Contents
PACIFIC FUNDS
Schedule of Investments (Continued)
Explanation of Symbols and Terms
March 31, 2018
Explanation of Symbols: | ||
| * | Non-income producing investments. | |
| § | Variable rate investments. The rate shown is based on the latest available information as of March 31, 2018. For Senior Loan Notes, the rate shown may represent a weighted average interest rate. Interest rates for certain securities are subject to interest rate caps and floors, which would result in a period end rate being more, less or equal to the referenced rate plus spread. Certain variable rate securities are not based on a published reference rate and spread but are determined by the issuer or agent and are based on current market conditions. These securities do not indicate a reference rate and spread in their description. | |
| ¥ | All or a portion of this senior loan position has not settled. Rates do not take effect until settlement date. Rates shown, if any, are for the settled portion. | |
| # | Securities purchased on a when-issued basis. | |
| ~ | Securities are not registered under the Securities Act of 1933 (1933 Act). These securities are either (1) exempt from registration pursuant to Rule 144A under the 1933 Act and may only be sold to “qualified institutional buyers”, or (2) the securities comply with Regulation S rules governing offers and sales made outside the United States without registration under the 1933 Act and contain certain restrictions as to public resale. | |
| W | The values of these investments were determined by the Trustee Valuation Committee or determined by a valuation committee established under the Valuation Policy and then subsequently submitted for approval or ratification to either the Trustee Valuation Committee, or to the Board of Trustees (the “Board”). Each determination was made in good faith in accordance with the procedures established by the Board and the provisions of the Investment Company Act of 1940 (See Note 3C in Notes to Financial Statements). | |
| ± | Investments categorized as a significant unobservable input (Level 3) (See Note 3D in Notes to Financial Statements). | |
Reference Rate Abbreviation: | ||
| USD LIBOR | United States Dollar London Interbank Offered Rate | |
Other Abbreviations: | ||
| PIK | Payment In Kind | |
| REIT | Real Estate Investment Trust | |
Notes:
For debt investments, the interest rates disclosed in the Schedules of Investments reflect the stated coupon rate or for discounted investments or zero coupon bonds, the yield-to-maturity.
The countries listed in the Schedules of Investments are based on country of risk (See Note 4 in Notes to Financial Statements under Investments and Risks - Foreign and Emerging Markets Investments).
The sectors listed in the Schedules of Investments are obtained from a third party source (that is not affiliated with the Trust or the investment adviser) believed to be reliable. Sector names and weightings could be different if obtained from another source.
The descriptions of the companies shown in the Schedules of Investments were obtained from published reports or other sources believed to be reliable, and are not audited by the Independent Registered Public Accounting Firm.
See Notes to Financial Statements
B-45
Table of Contents
PACIFIC FUNDS
STATEMENTS OF ASSETS AND LIABILITIES
MARCH 31, 2018
| Pacific Funds Portfolio Optimization | Pacific Funds Diversified Alternatives | |||||||||||||||||||||||||||||
| Conservative | Moderate- Conservative | Moderate | Growth | Aggressive- Growth | ||||||||||||||||||||||||||
ASSETS | ||||||||||||||||||||||||||||||
Investments in affiliated mutual funds, at cost | $292,426,295 | $417,987,865 | $1,167,491,164 | $830,992,082 | $260,902,112 | $40,416,744 | ||||||||||||||||||||||||
Investments in affiliated mutual funds, at value | $306,086,446 | $451,974,996 | $1,325,864,968 | $995,177,783 | $332,889,195 | $40,765,910 | ||||||||||||||||||||||||
Receivables: | ||||||||||||||||||||||||||||||
Fund shares sold | 234,456 | 230,993 | 522,267 | 293,196 | 201,488 | 140,700 | ||||||||||||||||||||||||
Securities sold | — | 349,295 | 280,379 | 168,848 | 22,030 | — | ||||||||||||||||||||||||
Due from adviser | 17,143 | 20,319 | 54,054 | 42,722 | 19,456 | — | ||||||||||||||||||||||||
Prepaid expenses and other assets | 10,465 | 11,378 | 18,105 | 16,338 | 8,670 | 5,834 | ||||||||||||||||||||||||
Total Assets | 306,348,510 | 452,586,981 | 1,326,739,773 | 995,698,887 | 333,140,839 | 40,912,444 | ||||||||||||||||||||||||
LIABILITIES | ||||||||||||||||||||||||||||||
Payables: | ||||||||||||||||||||||||||||||
Fund shares redeemed | 287,436 | 761,475 | 2,155,844 | 1,671,881 | 352,197 | 29,708 | ||||||||||||||||||||||||
Securities purchased | 52,212 | — | — | — | — | 4,370 | ||||||||||||||||||||||||
Accrued advisory fees | 51,968 | 77,421 | 228,005 | 171,518 | 57,552 | 8,809 | ||||||||||||||||||||||||
Accrued administration fees | 38,976 | 58,066 | 171,004 | 128,639 | 43,164 | 5,086 | ||||||||||||||||||||||||
Accrued support service expenses | 11,136 | 16,361 | 47,536 | 35,300 | 11,412 | 653 | ||||||||||||||||||||||||
Accrued transfer agency out-of-pocket expenses | 10,322 | 15,236 | 44,572 | 33,266 | 10,814 | 786 | ||||||||||||||||||||||||
Accrued legal, audit and tax service fees | 35,747 | 53,590 | 157,910 | 119,047 | 39,659 | 3,982 | ||||||||||||||||||||||||
Accrued trustees’ fees and expenses and deferred compensation | 4,106 | 4,905 | 13,162 | 9,136 | 2,704 | 14 | ||||||||||||||||||||||||
Accrued distribution and/or service fees | 32,218 | 44,724 | 125,879 | 90,189 | 28,752 | 700 | ||||||||||||||||||||||||
Accrued other | 16,161 | 24,397 | 70,872 | 52,910 | 16,940 | 1,149 | ||||||||||||||||||||||||
Total Liabilities | 540,282 | 1,056,175 | 3,014,784 | 2,311,886 | 563,194 | 55,257 | ||||||||||||||||||||||||
NET ASSETS | $305,808,228 | $451,530,806 | $1,323,724,989 | $993,387,001 | $332,577,645 | $40,857,187 | ||||||||||||||||||||||||
NET ASSETS CONSIST OF: | ||||||||||||||||||||||||||||||
Paid-in capital | $280,121,677 | $388,429,718 | $1,052,477,547 | $746,269,137 | $241,044,443 | $40,737,910 | ||||||||||||||||||||||||
Undistributed/accumulated net investment income (loss) | 204,014 | (365,209 | ) | (262,560 | ) | (1,234,668 | ) | (357,597 | ) | (13,526 | ) | |||||||||||||||||||
Undistributed/accumulated net realized gain (loss) | 11,822,386 | 29,479,166 | 113,136,198 | 84,166,831 | 19,903,716 | (216,363 | ) | |||||||||||||||||||||||
Net unrealized appreciation (depreciation) on investments | 13,660,151 | 33,987,131 | 158,373,804 | 164,185,701 | 71,987,083 | 349,166 | ||||||||||||||||||||||||
NET ASSETS | $305,808,228 | $451,530,806 | $1,323,724,989 | $993,387,001 | $332,577,645 | $40,857,187 | ||||||||||||||||||||||||
Class A Shares: | ||||||||||||||||||||||||||||||
Net Assets | $131,023,197 | $227,419,531 | $690,689,237 | $555,327,586 | $189,902,829 | $4,903,707 | ||||||||||||||||||||||||
Shares of beneficial interest outstanding | 11,658,921 | 18,077,695 | 48,445,092 | 35,912,645 | 11,150,086 | 493,040 | ||||||||||||||||||||||||
Net Asset Value per share* | $11.24 | $12.58 | $14.26 | $15.46 | $17.03 | $9.95 | ||||||||||||||||||||||||
Sales Charge — Maximum is 5.50% of offering price | 0.65 | 0.73 | 0.83 | 0.90 | 0.99 | 0.58 | ||||||||||||||||||||||||
Maximum offering price per share | $11.89 | $13.31 | $15.09 | $16.36 | $18.02 | $10.53 | ||||||||||||||||||||||||
Class B Shares: | ||||||||||||||||||||||||||||||
Net Assets | $24,600,446 | $39,004,099 | $119,869,829 | $88,936,699 | $27,173,115 | |||||||||||||||||||||||||
Shares of beneficial interest outstanding | 2,236,374 | 3,159,284 | 8,522,666 | 5,839,928 | 1,634,770 | |||||||||||||||||||||||||
Net Asset Value per share* | $11.00 | $12.35 | $14.06 | $15.23 | $16.62 | |||||||||||||||||||||||||
Class C Shares: | ||||||||||||||||||||||||||||||
Net Assets | $137,036,341 | $174,766,061 | $465,912,508 | $317,342,092 | $97,876,978 | $3,070,127 | ||||||||||||||||||||||||
Shares of beneficial interest outstanding | 12,463,008 | 14,163,892 | 33,182,283 | 20,904,013 | 5,899,237 | 314,093 | ||||||||||||||||||||||||
Net Asset Value per share* | $11.00 | $12.34 | $14.04 | $15.18 | $16.59 | $9.77 | ||||||||||||||||||||||||
Class R Shares: | ||||||||||||||||||||||||||||||
Net Assets | $5,013,535 | $5,145,614 | $24,165,484 | $15,500,553 | $7,558,217 | |||||||||||||||||||||||||
Shares of beneficial interest outstanding | 449,198 | 411,688 | 1,700,679 | 1,005,522 | 446,946 | |||||||||||||||||||||||||
Net Asset Value per share | $11.16 | $12.50 | $14.21 | $15.42 | $16.91 | |||||||||||||||||||||||||
Advisor Class: | ||||||||||||||||||||||||||||||
Net Assets | $8,134,709 | $5,195,501 | $23,087,931 | $16,280,071 | $10,066,506 | $32,883,353 | ||||||||||||||||||||||||
Shares of beneficial interest outstanding | 722,168 | 411,763 | 1,615,701 | 1,049,862 | 589,743 | 3,293,511 | ||||||||||||||||||||||||
Net Asset Value per share | $11.26 | $12.62 | $14.29 | $15.51 | $17.07 | $9.98 | ||||||||||||||||||||||||
| * | Redemption price per share is equal to the Net Asset Value per share less any applicable contingent deferred sales charge. |
See Notes to Financial Statements
C-1
Table of Contents
PACIFIC FUNDS
STATEMENTS OF ASSETS AND LIABILITIES (Continued)
MARCH 31, 2018
| Pacific Funds Short Duration Income | Pacific Funds Core Income | Pacific Funds Strategic Income | Pacific Funds Floating Rate Income | Pacific Funds Limited Duration High Income | Pacific Funds High Income | |||||||||||||||||||||||||
ASSETS | ||||||||||||||||||||||||||||||
Investments, at cost (excluding derivatives) | $418,089,982 | $710,276,490 | $547,903,822 | $1,612,169,251 | $35,690,746 | $81,565,075 | ||||||||||||||||||||||||
Investments, at value (excluding derivatives) | $415,377,697 | $705,401,342 | $546,354,484 | $1,615,615,122 | $35,219,665 | $81,189,048 | ||||||||||||||||||||||||
Cash | 97,193 | 151,577 | 1,476,506 | 1,290,520 | 13,355 | 88,568 | ||||||||||||||||||||||||
Foreign currency held, at value (1) | — | — | 5,170 | — | — | 646 | ||||||||||||||||||||||||
Receivables: | ||||||||||||||||||||||||||||||
Dividends and interest | 2,042,000 | 4,540,923 | 5,801,297 | 3,808,468 | 452,100 | 1,337,780 | ||||||||||||||||||||||||
Fund shares sold | 1,206,606 | 987,864 | 3,318,302 | 6,623,865 | — | 42,962 | ||||||||||||||||||||||||
Securities sold | 1,669,730 | 2,997,434 | 4,500,000 | 140,233,972 | — | — | ||||||||||||||||||||||||
Due from adviser | 105,170 | 178,622 | 144,515 | 311,671 | 12,500 | 11,674 | ||||||||||||||||||||||||
Unfunded loan commitment appreciation | — | — | — | 66,862 | — | — | ||||||||||||||||||||||||
Prepaid expenses and other assets | 13,474 | 14,041 | 13,125 | 21,755 | 4,554 | 4,212 | ||||||||||||||||||||||||
Total Assets | 420,511,870 | 714,271,803 | 561,613,399 | 1,767,972,235 | 35,702,174 | 82,674,890 | ||||||||||||||||||||||||
LIABILITIES | ||||||||||||||||||||||||||||||
Payables: | ||||||||||||||||||||||||||||||
Fund shares redeemed | 1,607,406 | 7,491,053 | 2,653,949 | 2,304,644 | 9,722 | 50,995 | ||||||||||||||||||||||||
Securities purchased | 3,350,000 | 12,729,908 | 19,617,117 | 288,569,115 | 247,813 | 1,132,808 | ||||||||||||||||||||||||
Income distributions | 64,589 | 365,150 | 364,682 | 695,260 | 614 | 438 | ||||||||||||||||||||||||
Accrued advisory fees | 140,759 | 308,071 | 272,787 | 774,373 | 18,948 | 29,118 | ||||||||||||||||||||||||
Accrued administration fees | 105,016 | 173,429 | 135,843 | 315,583 | 5,873 | 8,891 | ||||||||||||||||||||||||
Accrued support service expenses | 12,168 | 26,225 | 13,989 | 41,761 | 1,169 | 859 | ||||||||||||||||||||||||
Accrued custodian fees and expenses | 4,209 | 8,013 | 5,414 | 24,430 | 1,201 | 494 | ||||||||||||||||||||||||
Accrued transfer agency out-of-pocket expenses | 12,129 | 25,157 | 14,551 | 40,876 | 1,118 | 853 | ||||||||||||||||||||||||
Accrued legal, audit and tax service fees | 46,705 | 89,327 | 58,856 | 153,328 | 4,053 | 3,587 | ||||||||||||||||||||||||
Accrued trustees’ fees and expenses and deferred compensation | 220 | 455 | 262 | 745 | 20 | — | ||||||||||||||||||||||||
Accrued distribution and/or service fees | 11,185 | 22,039 | 12,365 | 40,023 | 732 | 954 | ||||||||||||||||||||||||
Accrued other | 25,805 | 50,613 | 35,044 | 125,763 | 7,218 | 7,059 | ||||||||||||||||||||||||
Unfunded loan commitment depreciation | — | — | 9,744 | 3,550 | — | — | ||||||||||||||||||||||||
Total Liabilities | 5,380,191 | 21,289,440 | 23,194,603 | 293,089,451 | 298,481 | 1,236,056 | ||||||||||||||||||||||||
NET ASSETS | $415,131,679 | $692,982,363 | $538,418,796 | $1,474,882,784 | $35,403,693 | $81,438,834 | ||||||||||||||||||||||||
NET ASSETS CONSIST OF: | ||||||||||||||||||||||||||||||
Paid-in capital | $419,397,112 | $712,622,700 | $547,807,223 | $1,508,704,546 | $39,506,432 | $90,462,420 | ||||||||||||||||||||||||
Undistributed/accumulated net investment income (loss) | 166,774 | 350,493 | 367,263 | 873,980 | 25,758 | 94,127 | ||||||||||||||||||||||||
Undistributed/accumulated net realized gain (loss) | (1,719,922 | ) | (15,115,682 | ) | (8,195,138 | ) | (38,204,925 | ) | (3,657,416 | ) | (8,741,544 | ) | ||||||||||||||||||
Net unrealized appreciation (depreciation) on investments and assets and liabilities in foreign currencies | (2,712,285 | ) | (4,875,148 | ) | (1,560,552 | ) | 3,509,183 | (471,081 | ) | (376,169 | ) | |||||||||||||||||||
NET ASSETS | $415,131,679 | $692,982,363 | $538,418,796 | $1,474,882,784 | $35,403,693 | $81,438,834 | ||||||||||||||||||||||||
Class A Shares: | ||||||||||||||||||||||||||||||
Net Assets | $94,196,780 | $132,006,201 | $71,948,162 | $209,033,998 | $4,813,163 | $5,462,549 | ||||||||||||||||||||||||
Shares of beneficial interest outstanding | 9,201,812 | 12,628,391 | 6,719,202 | 20,647,447 | 533,751 | 534,053 | ||||||||||||||||||||||||
Net Asset Value per share* | $10.24 | $10.45 | $10.71 | $10.12 | $9.02 | $10.23 | ||||||||||||||||||||||||
Sales Charge (2) | 0.32 | 0.46 | 0.48 | 0.31 | 0.28 | 0.45 | ||||||||||||||||||||||||
Maximum offering price per share | $10.56 | $10.91 | $11.19 | $10.43 | $9.30 | $10.68 | ||||||||||||||||||||||||
Class C Shares: | ||||||||||||||||||||||||||||||
Net Assets | $44,337,447 | $101,156,427 | $57,388,954 | $191,239,334 | $3,260,241 | $4,418,079 | ||||||||||||||||||||||||
Shares of beneficial interest outstanding | 4,339,492 | 9,674,451 | 5,370,759 | 18,925,609 | 362,410 | 432,577 | ||||||||||||||||||||||||
Net Asset Value per share* | $10.22 | $10.46 | $10.69 | $10.10 | $9.00 | $10.21 | ||||||||||||||||||||||||
Class I Shares: | ||||||||||||||||||||||||||||||
Net Assets | $4,329,059 | $4,339,204 | $3,881,653 | $294,351,938 | $24,718,754 | $210,953 | ||||||||||||||||||||||||
Shares of beneficial interest outstanding | 423,459 | 414,745 | 364,609 | 29,034,423 | 2,741,438 | 20,807 | ||||||||||||||||||||||||
Net Asset Value per share | $10.22 | $10.46 | $10.65 | $10.14 | $9.02 | $10.14 | ||||||||||||||||||||||||
Class P Shares: | ||||||||||||||||||||||||||||||
Net Assets | $66,750,471 | $64,557,493 | $68,844,124 | |||||||||||||||||||||||||||
Shares of beneficial interest outstanding | 6,361,862 | 6,368,950 | 6,791,699 | |||||||||||||||||||||||||||
Net Asset Value per share | $10.49 | $10.14 | $10.14 | |||||||||||||||||||||||||||
Advisor Class: | ||||||||||||||||||||||||||||||
Net Assets | $272,268,393 | $388,730,060 | $405,200,027 | $715,700,021 | $2,611,535 | $2,503,129 | ||||||||||||||||||||||||
Shares of beneficial interest outstanding | 26,593,196 | 37,106,318 | 37,837,334 | 70,450,011 | 289,829 | 244,547 | ||||||||||||||||||||||||
Net Asset Value per share | $10.24 | $10.48 | $10.71 | $10.16 | $9.01 | $10.24 | ||||||||||||||||||||||||
| * | Redemption price per share is equal to the Net Asset Value per share less any applicable contingent deferred sales charge. |
| (1) | The cost of foreign currency for Pacific Funds Strategic Income and Pacific Funds High Income was $6,640 and $788, respectively. |
| (2) | The Class A shares of Pacific Funds Short Duration Income, Pacific Funds Floating Rate Income, and Pacific Funds Limited Duration High Income are subject to a maximum 3.00% front-end sales charge. The Class A shares of Pacific Funds Core Income, Pacific Funds Strategic Income, and Pacific Funds High Income are subject to a maximum 4.25% front-end sales charge. |
See Notes to Financial Statements
C-2
Table of Contents
PACIFIC FUNDS
STATEMENTS OF ASSETS AND LIABILITIES (Continued)
MARCH 31, 2018
| Pacific Funds Large-Cap | Pacific Funds Large-Cap Value | Pacific Funds Small/Mid-Cap | Pacific Funds Small-Cap | Pacific Funds Small-Cap Value | Pacific Funds Small-Cap Growth | |||||||||||||||||||||||
ASSETS | ||||||||||||||||||||||||||||
Investments, at cost (excluding derivatives) | $15,521,635 | $24,766,495 | $202,558,767 | $19,021,841 | $23,232,978 | $47,251,715 | ||||||||||||||||||||||
Investments, at value (excluding derivatives) | $17,636,454 | $29,356,656 | $229,444,503 | $21,488,697 | $28,039,123 | $54,140,897 | ||||||||||||||||||||||
Cash | 2,969 | 11,044 | 20,004 | 3,939 | 5,496 | 4,130 | ||||||||||||||||||||||
Receivables: | ||||||||||||||||||||||||||||
Dividends and interest | 10,757 | 25,529 | 125,101 | 15,872 | 37,795 | 8,775 | ||||||||||||||||||||||
Fund shares sold | 56,511 | 13,229 | 815,274 | 23,996 | 10,000 | 5,000 | ||||||||||||||||||||||
Securities sold | 508,968 | — | — | 111,096 | 15,433 | 26,767 | ||||||||||||||||||||||
Due from adviser | 8,484 | 9,012 | 50,332 | 10,067 | 8,903 | 9,665 | ||||||||||||||||||||||
Prepaid expenses and other assets | 5,257 | 5,672 | 9,404 | 5,799 | 5,895 | 6,094 | ||||||||||||||||||||||
Total Assets | 18,229,400 | 29,421,142 | 230,464,618 | 21,659,466 | 28,122,645 | 54,201,328 | ||||||||||||||||||||||
LIABILITIES | ||||||||||||||||||||||||||||
Payables: | ||||||||||||||||||||||||||||
Fund shares redeemed | 3,053 | 62,521 | 182,266 | 747 | 15,044 | 15,904 | ||||||||||||||||||||||
Securities purchased | 504,690 | — | — | 152,645 | 71,610 | — | ||||||||||||||||||||||
Accrued advisory fees | 8,325 | 16,334 | 165,167 | 15,615 | 20,881 | 35,352 | ||||||||||||||||||||||
Accrued administration fees | 4,461 | 7,301 | 57,018 | 5,459 | 6,133 | 8,382 | ||||||||||||||||||||||
Accrued support service expenses | 803 | 1,867 | 10,319 | 881 | 2,141 | 2,255 | ||||||||||||||||||||||
Accrued custodian fees and expenses | 396 | 499 | 1,595 | 414 | 501 | 554 | ||||||||||||||||||||||
Accrued transfer agency out-of-pocket expenses | 468 | 989 | 5,870 | 519 | 1,031 | 1,262 | ||||||||||||||||||||||
Accrued legal, audit and tax service fees | 1,922 | 3,426 | 24,797 | 2,355 | 3,418 | 4,874 | ||||||||||||||||||||||
Accrued trustees’ fees and expenses and deferred compensation | 8 | 18 | 105 | 10 | 19 | 23 | ||||||||||||||||||||||
Accrued distribution and/or service fees | 793 | 842 | 3,635 | 351 | 307 | 213 | ||||||||||||||||||||||
Accrued other | 1,624 | 2,619 | 13,052 | 2,006 | 2,926 | 3,338 | ||||||||||||||||||||||
Total Liabilities | 526,543 | 96,416 | 463,824 | 181,002 | 124,011 | 72,157 | ||||||||||||||||||||||
NET ASSETS | $17,702,857 | $29,324,726 | $230,000,794 | $21,478,464 | $27,998,634 | $54,129,171 | ||||||||||||||||||||||
NET ASSETS CONSIST OF: | ||||||||||||||||||||||||||||
Paid-in capital | $15,395,374 | $23,741,480 | $202,702,459 | $18,977,017 | $21,496,622 | $46,322,884 | ||||||||||||||||||||||
Undistributed/accumulated net investment income (loss) | 17,471 | 49,423 | — | — | 1,539 | (42,866 | ) | |||||||||||||||||||||
Undistributed/accumulated net realized gain (loss) | 175,193 | 943,662 | 412,599 | 34,591 | 1,694,328 | 959,971 | ||||||||||||||||||||||
Net unrealized appreciation (depreciation) on investments and assets and liabilities in foreign currencies | 2,114,819 | 4,590,161 | 26,885,736 | 2,466,856 | 4,806,145 | 6,889,182 | ||||||||||||||||||||||
NET ASSETS | $17,702,857 | $29,324,726 | $230,000,794 | $21,478,464 | $27,998,634 | $54,129,171 | ||||||||||||||||||||||
Class A Shares: | ||||||||||||||||||||||||||||
Net Assets | $4,939,028 | $3,304,488 | $21,130,707 | $2,367,455 | $1,104,873 | $713,388 | ||||||||||||||||||||||
Shares of beneficial interest outstanding | 402,170 | 291,335 | 1,596,645 | 184,090 | 98,873 | 58,168 | ||||||||||||||||||||||
Net Asset Value per share* | $12.28 | $11.34 | $13.23 | $12.86 | $11.17 | $12.26 | ||||||||||||||||||||||
Sales Charge — Maximum is 4.25% of offering price | 0.55 | 0.50 | 0.59 | 0.57 | 0.50 | 0.54 | ||||||||||||||||||||||
Maximum offering price per share | $12.83 | $11.84 | $13.82 | $13.43 | $11.67 | $12.80 | ||||||||||||||||||||||
Class C Shares: | ||||||||||||||||||||||||||||
Net Assets | $3,545,339 | $4,327,359 | $15,457,567 | $796,999 | $1,567,924 | $759,467 | ||||||||||||||||||||||
Shares of beneficial interest outstanding | 290,044 | 384,542 | 1,187,788 | 62,441 | 141,813 | 62,971 | ||||||||||||||||||||||
Net Asset Value per share* | $12.22 | $11.25 | $13.01 | $12.76 | $11.06 | $12.06 | ||||||||||||||||||||||
Class P Shares: | ||||||||||||||||||||||||||||
Net Assets | $26,764,327 | |||||||||||||||||||||||||||
Shares of beneficial interest outstanding | 2,167,752 | |||||||||||||||||||||||||||
Net Asset Value per share | $12.35 | |||||||||||||||||||||||||||
Advisor Class: | ||||||||||||||||||||||||||||
Net Assets | $8,069,772 | $19,624,163 | $176,897,473 | $14,767,307 | $15,511,414 | $13,573,608 | ||||||||||||||||||||||
Shares of beneficial interest outstanding | 652,418 | 1,725,310 | 13,316,587 | 1,132,530 | 1,379,747 | 1,098,756 | ||||||||||||||||||||||
Net Asset Value per share | $12.37 | $11.37 | $13.28 | $13.04 | $11.24 | $12.35 | ||||||||||||||||||||||
Investor Class: | ||||||||||||||||||||||||||||
Net Assets | $456,595 | $105,561 | $6,537,794 | $3,089,356 | $157,720 | $1,492,648 | ||||||||||||||||||||||
Shares of beneficial interest outstanding | 37,608 | 9,411 | 495,153 | 238,699 | 14,133 | 121,826 | ||||||||||||||||||||||
Net Asset Value per share | $12.14 | $11.22 | $13.20 | $12.94 | $11.16 | $12.25 | ||||||||||||||||||||||
Class S: | ||||||||||||||||||||||||||||
Net Assets | $692,123 | $1,963,155 | $9,977,253 | $457,347 | $9,656,703 | $10,825,733 | ||||||||||||||||||||||
Shares of beneficial interest outstanding | 56,965 | 173,068 | 750,768 | 38,113 | 861,164 | 874,359 | ||||||||||||||||||||||
Net Asset Value per share | $12.15 | $11.34 | $13.29 | $12.00 | $11.21 | $12.38 | ||||||||||||||||||||||
| * | Redemption price per share is equal to the Net Asset Value per share less any applicable contingent deferred sales charge. |
See Notes to Financial Statements
C-3
Table of Contents
PACIFIC FUNDS
FOR THE YEAR ENDED MARCH 31, 2018
| Pacific Funds Portfolio Optimization | Pacific Funds Diversified Alternatives | |||||||||||||||||||||||||||||
| Conservative | Moderate- Conservative | Moderate | Growth | Aggressive- Growth | ||||||||||||||||||||||||||
INVESTMENT INCOME | ||||||||||||||||||||||||||||||
Dividends from affiliated mutual fund investments | $8,953,119 | $12,141,913 | $27,678,489 | $17,893,129 | $4,473,064 | $736,818 | ||||||||||||||||||||||||
Total Investment Income | 8,953,119 | 12,141,913 | 27,678,489 | 17,893,129 | 4,473,064 | 736,818 | ||||||||||||||||||||||||
EXPENSES | ||||||||||||||||||||||||||||||
Advisory fees | 643,432 | 953,881 | 2,771,955 | 2,060,512 | 669,726 | 45,951 | ||||||||||||||||||||||||
Administration fees | 482,574 | 715,410 | 2,078,967 | 1,545,384 | 502,295 | 34,464 | ||||||||||||||||||||||||
Support services expenses | 51,298 | 76,652 | 220,632 | 163,377 | 51,799 | 2,133 | ||||||||||||||||||||||||
Shareholder report expenses | 27,401 | 41,015 | 118,664 | 87,965 | 28,452 | 1,598 | ||||||||||||||||||||||||
Distribution and/or service fees (1) | ||||||||||||||||||||||||||||||
Class A | 336,368 | 583,704 | 1,784,000 | 1,411,424 | 471,330 | 8,766 | ||||||||||||||||||||||||
Class B | 275,528 | 429,640 | 1,298,822 | 961,771 | 292,852 | |||||||||||||||||||||||||
Class C | 1,462,020 | 1,898,617 | 4,976,235 | 3,380,603 | 1,007,292 | 23,340 | ||||||||||||||||||||||||
Class R | 33,844 | 26,516 | 122,665 | 80,597 | 39,060 | |||||||||||||||||||||||||
Transfer agency out-of-pocket expenses | 23,646 | 35,281 | 101,781 | 75,253 | 23,718 | 1,259 | ||||||||||||||||||||||||
Registration fees | 73,831 | 72,016 | 86,955 | 84,984 | 74,347 | 44,874 | ||||||||||||||||||||||||
Legal, audit and tax service fees | 45,322 | 68,016 | 199,309 | 149,735 | 49,339 | 4,324 | ||||||||||||||||||||||||
Trustees’ fees and expenses | 14,705 | 22,020 | 63,762 | 47,392 | 15,239 | 827 | ||||||||||||||||||||||||
Recoupment of adviser reimbursement (2) | — | — | — | — | — | 6,784 | ||||||||||||||||||||||||
Other | 13,951 | 19,820 | 50,842 | 37,855 | 13,585 | 2,243 | ||||||||||||||||||||||||
Total Expenses | 3,483,920 | 4,942,588 | 13,874,589 | 10,086,852 | 3,239,034 | 176,563 | ||||||||||||||||||||||||
Adviser Expense Reimbursement (2) | (250,155 | ) | (334,819 | ) | (841,944 | ) | (646,561 | ) | (256,481 | ) | (6,603 | ) | ||||||||||||||||||
Net Expenses | 3,233,765 | 4,607,769 | 13,032,645 | 9,440,291 | 2,982,553 | 169,960 | ||||||||||||||||||||||||
NET INVESTMENT INCOME (LOSS) | 5,719,354 | 7,534,144 | 14,645,844 | 8,452,838 | 1,490,511 | 566,858 | ||||||||||||||||||||||||
NET REALIZED AND UNREALIZED GAIN (LOSS) | ||||||||||||||||||||||||||||||
Net Realized Gain (Loss) On: | ||||||||||||||||||||||||||||||
Investment security transactions in affiliated mutual funds | 13,429,797 | 30,560,228 | 100,606,332 | 72,978,024 | 19,165,394 | (279,865 | ) | |||||||||||||||||||||||
Capital gain distributions from affiliated mutual fund investments | 3,730,087 | 8,927,170 | 41,599,890 | 38,895,732 | 15,735,713 | 425,539 | ||||||||||||||||||||||||
Net Realized Gain (Loss) | 17,159,884 | 39,487,398 | 142,206,222 | 111,873,756 | 34,901,107 | 145,674 | ||||||||||||||||||||||||
Change In Net Unrealized Appreciation (Depreciation) On: | ||||||||||||||||||||||||||||||
Investment securities in affiliated mutual fund investments | (9,276,548 | ) | (18,755,868 | ) | (49,367,075 | ) | (23,161,117 | ) | 1,005,591 | 258,496 | ||||||||||||||||||||
Change in Net Unrealized Appreciation (Depreciation) | (9,276,548 | ) | (18,755,868 | ) | (49,367,075 | ) | (23,161,117 | ) | 1,005,591 | 258,496 | ||||||||||||||||||||
NET GAIN (LOSS) | 7,883,336 | 20,731,530 | 92,839,147 | 88,712,639 | 35,906,698 | 404,170 | ||||||||||||||||||||||||
NET INCREASE (DECREASE) IN NET ASSETS | $13,602,690 | $28,265,674 | $107,484,991 | $97,165,477 | $37,397,209 | $971,028 | ||||||||||||||||||||||||
| (1) | The Advisor Class shares are not subject to distribution and service fees (see Notes 1 and 6 in Notes to Financial Statements). |
| (2) | See Note 7B in Notes to Financial Statements. |
See Notes to Financial Statements
C-4
Table of Contents
PACIFIC FUNDS
STATEMENTS OF OPERATIONS (Continued)
FOR THE YEAR ENDED MARCH 31, 2018
| Pacific Funds Short Duration Income | Pacific Funds Core Income | Pacific Funds Strategic Income | Pacific Funds Floating Rate Income | Pacific Funds Limited Duration High Income | Pacific Funds High Income | |||||||||||||||||||||||||
INVESTMENT INCOME | ||||||||||||||||||||||||||||||
Dividends, net of foreign taxes withheld | $119,739 | $266,853 | $606,095 | $870,440 | $16,647 | $40,756 | ||||||||||||||||||||||||
Interest, net of foreign taxes withheld | 9,700,046 | 26,348,842 | 19,542,838 | 62,844,383 | 1,718,896 | 1,584,757 | ||||||||||||||||||||||||
Other | 3,652 | 348 | — | 110,350 | 148 | — | ||||||||||||||||||||||||
Total Investment Income | 9,823,437 | 26,616,043 | 20,148,933 | 63,825,173 | 1,735,691 | 1,625,513 | ||||||||||||||||||||||||
EXPENSES | ||||||||||||||||||||||||||||||
Advisory fees | 1,411,522 | 3,834,154 | 2,597,338 | 8,104,895 | 225,050 | 169,051 | ||||||||||||||||||||||||
Administration fees | 1,052,553 | 2,120,516 | 1,293,445 | 3,265,280 | 68,456 | 61,231 | ||||||||||||||||||||||||
Support services expenses | 49,924 | 118,122 | 58,350 | 180,870 | 6,213 | 4,258 | ||||||||||||||||||||||||
Custodian fees and expenses | 13,521 | 29,041 | 17,827 | 76,226 | 4,346 | 1,859 | ||||||||||||||||||||||||
Shareholder report expenses | 28,565 | 66,054 | 35,215 | 103,975 | 2,914 | 1,821 | ||||||||||||||||||||||||
Distribution and/or service fees (1) | ||||||||||||||||||||||||||||||
Class A | 210,240 | 374,082 | 175,640 | 520,224 | 12,722 | 13,946 | ||||||||||||||||||||||||
Class C | 432,840 | 1,110,736 | 543,813 | 1,872,971 | 34,339 | 47,719 | ||||||||||||||||||||||||
Transfer agency out-of-pocket expenses | 24,708 | 57,201 | 29,689 | 88,978 | 2,505 | 2,031 | ||||||||||||||||||||||||
Registration fees | 85,931 | 91,643 | 86,545 | 125,845 | 56,566 | 54,381 | ||||||||||||||||||||||||
Legal, audit and tax service fees | 55,730 | 111,340 | 69,546 | 193,631 | 4,997 | 4,338 | ||||||||||||||||||||||||
Trustees’ fees and expenses | 14,492 | 32,526 | 17,477 | 51,548 | 1,437 | 1,220 | ||||||||||||||||||||||||
Interest expense | — | — | — | 162,918 | — | — | ||||||||||||||||||||||||
Other | 28,389 | 50,483 | 42,177 | 68,708 | 16,587 | 18,095 | ||||||||||||||||||||||||
Total Expenses | 3,408,415 | 7,995,898 | 4,967,062 | 14,816,069 | 436,132 | 379,950 | ||||||||||||||||||||||||
Advisory Fee Waiver (2) | — | — | — | (61,727 | ) | (6,925 | ) | — | ||||||||||||||||||||||
Adviser Expense Reimbursement (3) | (1,000,932 | ) | (2,102,504 | ) | (1,246,313 | ) | (3,114,566 | ) | (141,501 | ) | (119,953 | ) | ||||||||||||||||||
Net Expenses | 2,407,483 | 5,893,394 | 3,720,749 | 11,639,776 | 287,706 | 259,997 | ||||||||||||||||||||||||
NET INVESTMENT INCOME (LOSS) | 7,415,954 | 20,722,649 | 16,428,184 | 52,185,397 | 1,447,985 | 1,365,516 | ||||||||||||||||||||||||
NET REALIZED AND UNREALIZED GAIN (LOSS) | ||||||||||||||||||||||||||||||
Net Realized Gain (Loss) On: | ||||||||||||||||||||||||||||||
Investment security transactions | 808,998 | 3,341,867 | 4,492,052 | 848,283 | 13,879 | 494,515 | ||||||||||||||||||||||||
Swap transactions | — | — | — | — | — | 30,952 | ||||||||||||||||||||||||
Net Realized Gain (Loss) | 808,998 | 3,341,867 | 4,492,052 | 848,283 | 13,879 | 525,467 | ||||||||||||||||||||||||
Change In Net Unrealized Appreciation (Depreciation) On: | ||||||||||||||||||||||||||||||
Investment securities | (4,727,335 | ) | (8,743,244 | ) | (5,931,020 | ) | (4,186,584 | ) | (405,697 | ) | (959,273 | ) | ||||||||||||||||||
Foreign currencies | — | — | 161 | — | — | 20 | ||||||||||||||||||||||||
Swaps | — | — | — | — | — | (9,619 | ) | |||||||||||||||||||||||
Unfunded loan commitments | — | — | (9,744 | ) | 18,598 | — | — | |||||||||||||||||||||||
Change in Net Unrealized Appreciation (Depreciation) | (4,727,335 | ) | (8,743,244 | ) | (5,940,603 | ) | (4,167,986 | ) | (405,697 | ) | (968,872 | ) | ||||||||||||||||||
NET GAIN (LOSS) | (3,918,337 | ) | (5,401,377 | ) | (1,448,551 | ) | (3,319,703 | ) | (391,818 | ) | (443,405 | ) | ||||||||||||||||||
NET INCREASE (DECREASE) IN NET ASSETS RESULTING FROM OPERATIONS | $3,497,617 | $15,321,272 | $14,979,633 | $48,865,694 | $1,056,167 | $922,111 | ||||||||||||||||||||||||
Foreign taxes withheld on dividends and interest | $13,573 | $1,495 | $8,761 | $— | $375 | $1,212 | ||||||||||||||||||||||||
| (1) | Class I, Class P, and the Advisor Class shares are not subject to distribution and service fees (see Notes 1 and 6 in Notes to Financial Statements). |
| (2) | See Note 6 in Notes to Financial Statements. |
| (3) | See Note 7B in Notes to Financial Statements. |
See Notes to Financial Statements
C-5
Table of Contents
PACIFIC FUNDS
STATEMENTS OF OPERATIONS (Continued)
FOR THE YEAR ENDED MARCH 31, 2018
| Pacific Funds Large-Cap | Pacific Funds Large-Cap Value | Pacific Funds Small/Mid-Cap | Pacific Funds Small-Cap | Pacific Funds Small-Cap Value | Pacific Funds Small-Cap Growth | |||||||||||||||||||||||||
INVESTMENT INCOME | ||||||||||||||||||||||||||||||
Dividends, net of foreign taxes withheld | $235,574 | $621,086 | $1,738,365 | $173,629 | $465,947 | $253,668 | ||||||||||||||||||||||||
Total Investment Income | 235,574 | 621,086 | 1,738,365 | 173,629 | 465,947 | 253,668 | ||||||||||||||||||||||||
EXPENSES | ||||||||||||||||||||||||||||||
Advisory fees | 90,376 | 195,685 | 1,451,376 | 129,285 | 275,782 | 331,813 | ||||||||||||||||||||||||
Administration fees | 40,913 | 87,861 | 498,316 | 45,189 | 82,254 | 81,746 | ||||||||||||||||||||||||
Support services expenses | 2,128 | 5,562 | 26,237 | 2,244 | 5,661 | 7,009 | ||||||||||||||||||||||||
Custodian fees and expenses | 1,449 | 1,872 | 5,422 | 1,483 | 1,925 | 2,075 | ||||||||||||||||||||||||
Shareholder report expenses | 1,043 | 2,588 | 13,891 | 1,060 | 2,584 | 3,462 | ||||||||||||||||||||||||
Distribution and/or service fees (1) | ||||||||||||||||||||||||||||||
Class A | 11,205 | 7,711 | 48,035 | 4,455 | 2,648 | 1,417 | ||||||||||||||||||||||||
Class C | 32,772 | 40,457 | 117,369 | 8,106 | 15,623 | 4,726 | ||||||||||||||||||||||||
Investor Class | 1,041 | 262 | 17,795 | 2,510 | 392 | 3,186 | ||||||||||||||||||||||||
Transfer agency out-of-pocket expenses | 917 | 2,247 | 11,269 | 973 | 2,252 | 2,961 | ||||||||||||||||||||||||
Registration fees | 60,206 | 58,677 | 79,434 | 59,087 | 57,450 | 57,805 | ||||||||||||||||||||||||
Legal, audit and tax service fees | 2,243 | 4,315 | 28,606 | 2,684 | 4,240 | 6,018 | ||||||||||||||||||||||||
Trustees’ fees and expenses | 536 | 1,292 | 6,730 | 590 | 1,269 | 1,702 | ||||||||||||||||||||||||
Other | 5,547 | 6,112 | 12,210 | 6,163 | 6,746 | 6,573 | ||||||||||||||||||||||||
Total Expenses | 250,376 | 414,641 | 2,316,690 | 263,829 | 458,826 | 510,493 | ||||||||||||||||||||||||
Advisory Fee Waiver (2) | (13,904 | ) | — | — | — | — | — | |||||||||||||||||||||||
Adviser Expense Reimbursement (3) | (87,705 | ) | (111,953 | ) | (341,697 | ) | (88,698 | ) | (104,441 | ) | (107,736 | ) | ||||||||||||||||||
Net Expenses | 148,767 | 302,688 | 1,974,993 | 175,131 | 354,385 | 402,757 | ||||||||||||||||||||||||
NET INVESTMENT INCOME (LOSS) | 86,807 | 318,398 | (236,628 | ) | (1,502 | ) | 111,562 | (149,089 | ) | |||||||||||||||||||||
NET REALIZED AND UNREALIZED GAIN (LOSS) | ||||||||||||||||||||||||||||||
Net Realized Gain (Loss) On: | ||||||||||||||||||||||||||||||
Investment security transactions | 422,128 | 1,291,881 | 657,794 | 271,077 | 2,665,440 | 2,754,520 | ||||||||||||||||||||||||
Net Realized Gain (Loss) | 422,128 | 1,291,881 | 657,794 | 271,077 | 2,665,440 | 2,754,520 | ||||||||||||||||||||||||
Change In Net Unrealized Appreciation (Depreciation) On: | ||||||||||||||||||||||||||||||
Investment securities | 1,000,877 | 1,131,106 | 16,333,908 | 1,124,666 | (874,669 | ) | 1,827,259 | |||||||||||||||||||||||
Change in Net Unrealized Appreciation (Depreciation) | 1,000,877 | 1,131,106 | 16,333,908 | 1,124,666 | (874,669 | ) | 1,827,259 | |||||||||||||||||||||||
NET GAIN (LOSS) | 1,423,005 | 2,422,987 | 16,991,702 | 1,395,743 | 1,790,771 | 4,581,779 | ||||||||||||||||||||||||
NET INCREASE (DECREASE) IN NET ASSETS RESULTING FROM OPERATIONS | $1,509,812 | $2,741,385 | $16,755,074 | $1,394,241 | $1,902,333 | $4,432,690 | ||||||||||||||||||||||||
| (1) | The Class P, Advisor, and Class S shares are not subject to distribution and service fees (see Notes 1 and 6 in Notes to Financial Statements). |
| (2) | See Note 6 in Notes to Financial Statements. |
| (3) | See Note 7B in Notes to Financial Statements. |
See Notes to Financial Statements
C-6
Table of Contents
PACIFIC FUNDS
STATEMENTS OF CHANGES IN NET ASSETS
| Pacific Funds Portfolio Optimization Conservative | Pacific Funds Portfolio Optimization Moderate-Conservative | Pacific Funds Portfolio Optimization Moderate | ||||||||||||||||||||||||||||||||||||
Year Ended | Year Ended March 31, 2017 | Year Ended | Year Ended March 31, 2017 | Year Ended | Year Ended March 31, 2017 | |||||||||||||||||||||||||||||||||
OPERATIONS | ||||||||||||||||||||||||||||||||||||||
Net investment income (loss) | $5,719,354 | $4,679,620 | $7,534,144 | $6,771,647 | $14,645,844 | $18,477,814 | ||||||||||||||||||||||||||||||||
Net realized gain (loss) | 17,159,884 | 2,778,068 | 39,487,398 | 5,252,361 | 142,206,222 | 26,425,429 | ||||||||||||||||||||||||||||||||
Change in net unrealized appreciation (depreciation) | (9,276,548 | ) | 14,438,850 | (18,755,868 | ) | 28,729,583 | (49,367,075 | ) | 102,713,381 | |||||||||||||||||||||||||||||
Net Increase (Decrease) in Net Assets | 13,602,690 | 21,896,538 | 28,265,674 | 40,753,591 | 107,484,991 | 147,616,624 | ||||||||||||||||||||||||||||||||
DIVIDENDS AND DISTRIBUTIONS TO SHAREHOLDERS | ||||||||||||||||||||||||||||||||||||||
Net investment income | ||||||||||||||||||||||||||||||||||||||
Class A | (2,912,601 | ) | (2,896,693 | ) | (4,861,302 | ) | (4,726,702 | ) | (11,726,102 | ) | (13,130,548 | ) | ||||||||||||||||||||||||||
Class B | (421,675 | ) | (439,380 | ) | (633,795 | ) | (651,590 | ) | (1,396,913 | ) | (1,685,804 | ) | ||||||||||||||||||||||||||
Class C | (2,263,679 | ) | (2,195,350 | ) | (2,848,132 | ) | (2,924,445 | ) | (5,375,396 | ) | (6,559,239 | ) | ||||||||||||||||||||||||||
Class R | (118,481 | ) | (193,444 | ) | (100,872 | ) | (104,475 | ) | (382,575 | ) | (375,854 | ) | ||||||||||||||||||||||||||
Advisor Class | (147,955 | ) | (89,445 | ) | (115,522 | ) | (92,773 | ) | (428,003 | ) | (314,926 | ) | ||||||||||||||||||||||||||
Net realized gains | ||||||||||||||||||||||||||||||||||||||
Class A | — | (1,861,955 | ) | (2,532,640 | ) | (5,435,852 | ) | (15,115,123 | ) | (25,233,447 | ) | |||||||||||||||||||||||||||
Class B | — | (397,080 | ) | (462,792 | ) | (1,034,360 | ) | (2,761,348 | ) | (4,712,449 | ) | |||||||||||||||||||||||||||
Class C | — | (2,020,417 | ) | (2,043,625 | ) | (4,740,186 | ) | (10,579,522 | ) | (18,432,497 | ) | |||||||||||||||||||||||||||
Class R | — | (134,051 | ) | (56,995 | ) | (129,428 | ) | (548,419 | ) | (806,091 | ) | |||||||||||||||||||||||||||
Advisor Class | — | (49,454 | ) | (55,238 | ) | (94,380 | ) | (489,198 | ) | (508,114 | ) | |||||||||||||||||||||||||||
Net Decrease from Dividends and | (5,864,391 | ) | (10,277,269 | ) | (13,710,913 | ) | (19,934,191 | ) | (48,802,599 | ) | (71,758,969 | ) | ||||||||||||||||||||||||||
CAPITAL SHARE TRANSACTIONS | ||||||||||||||||||||||||||||||||||||||
Proceeds from sale of shares | ||||||||||||||||||||||||||||||||||||||
Class A | 21,118,348 | 20,641,518 | 28,225,155 | 29,875,459 | 65,600,073 | 70,798,439 | ||||||||||||||||||||||||||||||||
Class B | 1,060,894 | 2,827,965 | 838,578 | 2,703,181 | 2,400,014 | 8,030,046 | ||||||||||||||||||||||||||||||||
Class C | 14,413,486 | 21,242,698 | 11,011,781 | 17,661,394 | 30,037,376 | 45,860,306 | ||||||||||||||||||||||||||||||||
Class R | 1,904,395 | 2,087,592 | 658,179 | 1,069,627 | 6,480,702 | 5,214,365 | ||||||||||||||||||||||||||||||||
Advisor Class | 7,308,745 | 3,092,771 | 2,838,923 | 3,539,110 | 13,885,108 | 9,290,977 | ||||||||||||||||||||||||||||||||
Dividends and distribution reinvestments | ||||||||||||||||||||||||||||||||||||||
Class A | 2,851,921 | 4,531,370 | 7,238,144 | 9,961,916 | 26,555,935 | 37,969,820 | ||||||||||||||||||||||||||||||||
Class B | 403,817 | 801,904 | 1,058,797 | 1,645,794 | 4,060,560 | 6,254,491 | ||||||||||||||||||||||||||||||||
Class C | 2,169,873 | 4,045,927 | 4,734,975 | 7,399,874 | 15,594,027 | 24,326,639 | ||||||||||||||||||||||||||||||||
Class R | 118,481 | 327,495 | 157,867 | 233,903 | 930,994 | 1,181,945 | ||||||||||||||||||||||||||||||||
Advisor Class | 130,245 | 90,870 | 148,989 | 140,834 | 806,051 | 665,876 | ||||||||||||||||||||||||||||||||
Cost of shares repurchased | ||||||||||||||||||||||||||||||||||||||
Class A | (33,043,648 | ) | (47,987,873 | ) | (51,882,098 | ) | (68,788,872 | ) | (152,420,279 | ) | (199,648,777 | ) | ||||||||||||||||||||||||||
Class B | (7,281,860 | ) | (8,585,320 | ) | (9,415,432 | ) | (8,504,928 | ) | (26,922,276 | ) | (29,401,294 | ) | ||||||||||||||||||||||||||
Class C | (36,458,058 | ) | (50,196,070 | ) | (46,863,745 | ) | (54,450,785 | ) | (116,379,682 | ) | (136,343,420 | ) | ||||||||||||||||||||||||||
Class R | (5,572,314 | ) | (4,475,168 | ) | (1,760,589 | ) | (1,359,415 | ) | (8,442,266 | ) | (8,909,350 | ) | ||||||||||||||||||||||||||
Advisor Class | (4,859,568 | ) | (2,925,769 | ) | (2,855,308 | ) | (3,864,077 | ) | (10,245,364 | ) | (12,744,303 | ) | ||||||||||||||||||||||||||
Net Increase (Decrease) in Net Assets from | (35,735,243 | ) | (54,480,090 | ) | (55,865,784 | ) | (62,736,985 | ) | (148,059,027 | ) | (177,454,240 | ) | ||||||||||||||||||||||||||
NET INCREASE (DECREASE) IN NET ASSETS | (27,996,944 | ) | (42,860,821 | ) | (41,311,023 | ) | (41,917,585 | ) | (89,376,635 | ) | (101,596,585 | ) | ||||||||||||||||||||||||||
NET ASSETS | ||||||||||||||||||||||||||||||||||||||
Beginning of Year | 333,805,172 | 376,665,993 | 492,841,829 | 534,759,414 | 1,413,101,624 | 1,514,698,209 | ||||||||||||||||||||||||||||||||
End of Year | $305,808,228 | $333,805,172 | $451,530,806 | $492,841,829 | $1,323,724,989 | $1,413,101,624 | ||||||||||||||||||||||||||||||||
Undistributed/Accumulated Net Investment Income (Loss) | $204,014 | ($200,930 | ) | ($365,209 | ) | ($892,512 | ) | ($262,560 | ) | ($2,862,407 | ) | |||||||||||||||||||||||||||
See Notes to Financial Statements
C-7
Table of Contents
PACIFIC FUNDS
STATEMENTS OF CHANGES IN NET ASSETS (Continued)
| Pacific Funds Portfolio Optimization Growth | Pacific Funds Portfolio Optimization Aggressive-Growth | Pacific Funds Diversified Alternatives | ||||||||||||||||||||||||||||||||||||
Year Ended | Year Ended March 31, 2017 | Year Ended | Year Ended March 31, 2017 | Year Ended | Year Ended March 31, 2017 | |||||||||||||||||||||||||||||||||
OPERATIONS | ||||||||||||||||||||||||||||||||||||||
Net investment income (loss) | $8,452,838 | $12,850,495 | $1,490,511 | $3,003,547 | $566,858 | $433,954 | ||||||||||||||||||||||||||||||||
Net realized gain (loss) | 111,873,756 | 23,413,481 | 34,901,107 | 12,803,315 | 145,674 | (80,215 | ) | |||||||||||||||||||||||||||||||
Change in net unrealized appreciation (depreciation) | (23,161,117 | ) | 89,929,806 | 1,005,591 | 27,751,137 | 258,496 | 208,284 | |||||||||||||||||||||||||||||||
Net Increase (Decrease) in Net Assets | 97,165,477 | 126,193,782 | 37,397,209 | 43,557,999 | 971,028 | 562,023 | ||||||||||||||||||||||||||||||||
DIVIDENDS AND DISTRIBUTIONS TO SHAREHOLDERS | ||||||||||||||||||||||||||||||||||||||
Net investment income | ||||||||||||||||||||||||||||||||||||||
Class A | (8,314,557 | ) | (9,094,417 | ) | (2,191,024 | ) | (2,203,191 | ) | (98,284 | ) | (150,590 | ) | ||||||||||||||||||||||||||
Class B | (854,443 | ) | (1,058,850 | ) | (170,680 | ) | (206,477 | ) | ||||||||||||||||||||||||||||||
Class C | (3,023,542 | ) | (3,759,307 | ) | (605,589 | ) | (705,928 | ) | (55,299 | ) | (76,046 | ) | ||||||||||||||||||||||||||
Class R | (211,322 | ) | (218,727 | ) | (77,380 | ) | (74,738 | ) | ||||||||||||||||||||||||||||||
Advisor Class | (269,165 | ) | (196,174 | ) | (122,224 | ) | (86,145 | ) | (489,276 | ) | (211,895 | ) | ||||||||||||||||||||||||||
Net realized gains | ||||||||||||||||||||||||||||||||||||||
Class A | (14,105,079 | ) | (25,096,077 | ) | (5,356,432 | ) | (9,677,910 | ) | — | — | ||||||||||||||||||||||||||||
Class B | (2,390,612 | ) | (4,451,793 | ) | (830,146 | ) | (1,616,412 | ) | ||||||||||||||||||||||||||||||
Class C | (8,452,254 | ) | (16,040,093 | ) | (2,902,552 | ) | (5,560,851 | ) | — | — | ||||||||||||||||||||||||||||
Class R | (415,832 | ) | (693,273 | ) | (230,283 | ) | (382,436 | ) | ||||||||||||||||||||||||||||||
Advisor Class | (405,922 | ) | (439,770 | ) | (256,767 | ) | (281,707 | ) | — | — | ||||||||||||||||||||||||||||
Net Decrease from Dividends and | (38,442,728 | ) | (61,048,481 | ) | (12,743,077 | ) | (20,795,795 | ) | (642,859 | ) | (438,531 | ) | ||||||||||||||||||||||||||
CAPITAL SHARE TRANSACTIONS | ||||||||||||||||||||||||||||||||||||||
Proceeds from sale of shares | ||||||||||||||||||||||||||||||||||||||
Class A | 51,974,122 | 53,513,336 | 17,680,573 | 18,570,332 | 2,577,620 | 676,037 | ||||||||||||||||||||||||||||||||
Class B | 2,326,243 | 6,937,497 | 1,055,232 | 3,291,525 | ||||||||||||||||||||||||||||||||||
Class C | 22,707,932 | 28,988,316 | 13,056,528 | 13,026,047 | 2,068,688 | 1,137,079 | ||||||||||||||||||||||||||||||||
Class R | 2,363,340 | 3,136,442 | 1,544,987 | 1,377,281 | ||||||||||||||||||||||||||||||||||
Advisor Class | 6,843,745 | 6,810,080 | 4,131,416 | 5,782,462 | 25,813,307 | 6,383,645 | ||||||||||||||||||||||||||||||||
Dividends and distribution reinvestments | ||||||||||||||||||||||||||||||||||||||
Class A | 22,209,123 | 33,892,955 | 7,488,586 | 11,753,676 | 92,137 | 134,927 | ||||||||||||||||||||||||||||||||
Class B | 3,159,808 | 5,370,543 | 986,595 | 1,802,299 | ||||||||||||||||||||||||||||||||||
Class C | 11,246,878 | 19,283,093 | 3,424,678 | 6,062,645 | 55,259 | 75,677 | ||||||||||||||||||||||||||||||||
Class R | 627,154 | 912,000 | 307,663 | 457,174 | ||||||||||||||||||||||||||||||||||
Advisor Class | 610,159 | 573,035 | 362,989 | 351,442 | 487,508 | 211,895 | ||||||||||||||||||||||||||||||||
Cost of shares repurchased | ||||||||||||||||||||||||||||||||||||||
Class A | (111,400,463 | ) | (133,069,630 | ) | (29,068,542 | ) | (34,153,004 | ) | (478,948 | ) | (1,356,105 | ) | ||||||||||||||||||||||||||
Class B | (20,370,468 | ) | (22,051,722 | ) | (7,037,527 | ) | (7,239,118 | ) | ||||||||||||||||||||||||||||||
Class C | (83,362,341 | ) | (89,208,884 | ) | (25,517,655 | ) | (27,017,151 | ) | (540,742 | ) | (401,172 | ) | ||||||||||||||||||||||||||
Class R | (3,743,904 | ) | (8,078,468 | ) | (2,178,564 | ) | (2,057,339 | ) | ||||||||||||||||||||||||||||||
Advisor Class | (5,247,841 | ) | (6,919,008 | ) | (2,145,476 | ) | (6,137,725 | ) | (2,514,438 | ) | (290,018 | ) | ||||||||||||||||||||||||||
Net Increase (Decrease) in Net Assets from | (100,056,513 | ) | (99,910,415 | ) | (15,908,517 | ) | (14,129,454 | ) | 27,560,391 | 6,571,965 | ||||||||||||||||||||||||||||
NET INCREASE (DECREASE) IN NET ASSETS | (41,333,764 | ) | (34,765,114 | ) | 8,745,615 | 8,632,750 | 27,888,560 | 6,695,457 | ||||||||||||||||||||||||||||||
NET ASSETS | ||||||||||||||||||||||||||||||||||||||
Beginning of Year | 1,034,720,765 | 1,069,485,879 | 323,832,030 | 315,199,280 | 12,968,627 | 6,273,170 | ||||||||||||||||||||||||||||||||
End of Year | $993,387,001 | $1,034,720,765 | $332,577,645 | $323,832,030 | $40,857,187 | $12,968,627 | ||||||||||||||||||||||||||||||||
Undistributed/Accumulated Net Investment Income (Loss) | ($1,234,668 | ) | ($2,175,840 | ) | ($357,597 | ) | ($703,742 | ) | ($13,526 | ) | ($5,607 | ) | ||||||||||||||||||||||||||
See Notes to Financial Statements
C-8
Table of Contents
PACIFIC FUNDS
STATEMENTS OF CHANGES IN NET ASSETS (Continued)
| Pacific Funds Short Duration Income | Pacific Funds Core Income | Pacific Funds Strategic Income | ||||||||||||||||||||||||||||||||||||
| Year Ended March 31, 2018 | Year Ended March 31, 2017 | Year Ended March 31, 2018 | Year Ended March 31, 2017 | Year Ended March 31, 2018 | Year Ended March 31, 2017 | |||||||||||||||||||||||||||||||||
OPERATIONS | ||||||||||||||||||||||||||||||||||||||
Net investment income (loss) | $7,415,954 | $4,816,269 | $20,722,649 | $18,482,368 | $16,428,184 | $9,448,942 | ||||||||||||||||||||||||||||||||
Net realized gain (loss) | 808,998 | 731,984 | 3,341,867 | 4,466,294 | 4,492,052 | (2,029,475 | ) | |||||||||||||||||||||||||||||||
Change in net unrealized appreciation (depreciation) | (4,727,335 | ) | 643,525 | (8,743,244 | ) | (3,862,633 | ) | (5,940,603 | ) | 14,452,574 | ||||||||||||||||||||||||||||
Net Increase (Decrease) in Net Assets | 3,497,617 | 6,191,778 | 15,321,272 | 19,086,029 | 14,979,633 | 21,872,041 | ||||||||||||||||||||||||||||||||
DIVIDENDS AND DISTRIBUTIONS TO SHAREHOLDERS | ||||||||||||||||||||||||||||||||||||||
Net investment income | ||||||||||||||||||||||||||||||||||||||
Class A | (1,670,968 | ) | (1,227,149 | ) | (3,861,326 | ) | (4,826,887 | ) | (2,533,746 | ) | (2,172,945 | ) | ||||||||||||||||||||||||||
Class C | (522,455 | ) | (454,025 | ) | (2,037,140 | ) | (2,444,399 | ) | (1,592,221 | ) | (1,405,025 | ) | ||||||||||||||||||||||||||
Class I | (89,609 | ) | (54,322 | ) | (139,896 | ) | (120,832 | ) | (136,861 | ) | (56,031 | ) | ||||||||||||||||||||||||||
Class P | (3,205,207 | ) | (2,531,674 | ) | ||||||||||||||||||||||||||||||||||
Advisor Class | (5,007,525 | ) | (3,070,775 | ) | (11,251,230 | ) | (8,536,077 | ) | (11,977,951 | ) | (5,862,236 | ) | ||||||||||||||||||||||||||
Net realized gains | ||||||||||||||||||||||||||||||||||||||
Class A | — | — | — | — | — | — | ||||||||||||||||||||||||||||||||
Class C | — | — | — | — | — | — | ||||||||||||||||||||||||||||||||
Class I | — | — | — | — | — | — | ||||||||||||||||||||||||||||||||
Class P | — | — | ||||||||||||||||||||||||||||||||||||
Advisor Class | — | — | — | — | — | — | ||||||||||||||||||||||||||||||||
Net Decrease from Dividends and | (7,290,557 | ) | (4,806,271 | ) | (20,494,799 | ) | (18,459,869 | ) | (16,240,779 | ) | (9,496,237 | ) | ||||||||||||||||||||||||||
CAPITAL SHARE TRANSACTIONS | ||||||||||||||||||||||||||||||||||||||
Proceeds from sale of shares | ||||||||||||||||||||||||||||||||||||||
Class A | 58,408,543 | 43,294,940 | 30,371,212 | 53,216,416 | 31,105,423 | 33,503,568 | ||||||||||||||||||||||||||||||||
Class C | 15,019,325 | 17,051,848 | 11,003,930 | 19,632,417 | 19,269,415 | 15,648,664 | ||||||||||||||||||||||||||||||||
Class I | 2,696,087 | 2,142,132 | 1,487,585 | 1,739,345 | 2,419,650 | 1,806,030 | ||||||||||||||||||||||||||||||||
Class P | 1,057,954 | 133,255,892 | ||||||||||||||||||||||||||||||||||||
Advisor Class | 249,409,205 | 136,012,122 | 266,427,285 | 231,900,698 | 301,909,775 | 151,557,523 | ||||||||||||||||||||||||||||||||
Dividends and distribution reinvestments | ||||||||||||||||||||||||||||||||||||||
Class A | 1,505,440 | 1,165,652 | 3,401,268 | 4,409,873 | 2,058,751 | 1,977,405 | ||||||||||||||||||||||||||||||||
Class C | 491,064 | 411,509 | 1,813,120 | 2,157,620 | 1,371,761 | 1,254,878 | ||||||||||||||||||||||||||||||||
Class I | 89,514 | 53,032 | 139,095 | 119,602 | 134,988 | 53,586 | ||||||||||||||||||||||||||||||||
Class P | 3,205,207 | 2,531,674 | ||||||||||||||||||||||||||||||||||||
Advisor Class | 4,566,532 | 2,752,103 | 7,861,439 | 6,151,740 | 9,467,320 | 5,061,475 | ||||||||||||||||||||||||||||||||
Cost of shares repurchased | ||||||||||||||||||||||||||||||||||||||
Class A | (31,774,445 | ) | (47,411,008 | ) | (61,588,358 | ) | (94,720,079 | ) | (28,122,369 | ) | (23,925,551 | ) | ||||||||||||||||||||||||||
Class C | (13,904,093 | ) | (18,790,677 | ) | (31,816,511 | ) | (42,744,488 | ) | (13,321,375 | ) | (13,699,228 | ) | ||||||||||||||||||||||||||
Class I | (1,825,490 | ) | (488,855 | ) | (1,833,325 | ) | (889,532 | ) | (1,106,790 | ) | (423,951 | ) | ||||||||||||||||||||||||||
Class P | (59,290,467 | ) | (27,196,114 | ) | ||||||||||||||||||||||||||||||||||
Advisor Class | (141,710,576 | ) | (106,431,612 | ) | (219,522,626 | ) | (150,931,268 | ) | (122,216,357 | ) | (61,407,661 | ) | ||||||||||||||||||||||||||
Net Increase (Decrease) in Net Assets from | 142,971,106 | 29,761,186 | (47,283,192 | ) | 138,633,796 | 202,970,192 | 111,406,738 | |||||||||||||||||||||||||||||||
NET INCREASE (DECREASE) IN NET ASSETS | 139,178,166 | 31,146,693 | (52,456,719 | ) | 139,259,956 | 201,709,046 | 123,782,542 | |||||||||||||||||||||||||||||||
NET ASSETS | ||||||||||||||||||||||||||||||||||||||
Beginning of Year | 275,953,513 | 244,806,820 | 745,439,082 | 606,179,126 | 336,709,750 | 212,927,208 | ||||||||||||||||||||||||||||||||
End of Year | $415,131,679 | $275,953,513 | $692,982,363 | $745,439,082 | $538,418,796 | $336,709,750 | ||||||||||||||||||||||||||||||||
Undistributed/Accumulated Net Investment Income (Loss) | $166,774 | $38,026 | $350,493 | $139,264 | $367,263 | $88,156 | ||||||||||||||||||||||||||||||||
See Notes to Financial Statements
C-9
Table of Contents
PACIFIC FUNDS
STATEMENTS OF CHANGES IN NET ASSETS (Continued)
| Pacific Funds Floating Rate Income | Pacific Funds Limited Duration High Income | Pacific Funds High Income | ||||||||||||||||||||||||||||||||||||
| Year Ended March 31, 2018 | Year Ended March 31, 2017 | Year Ended March 31, 2018 | Year Ended March 31, 2017 | Year Ended March 31, 2018 | Year Ended March 31, 2017 | |||||||||||||||||||||||||||||||||
OPERATIONS | ||||||||||||||||||||||||||||||||||||||
Net investment income (loss) | $52,185,397 | $33,450,844 | $1,447,985 | $1,327,270 | $1,365,516 | $3,260,551 | ||||||||||||||||||||||||||||||||
Net realized gain (loss) | 848,283 | 11,494,263 | 13,879 | (162,300 | ) | 525,467 | (1,783,038 | ) | ||||||||||||||||||||||||||||||
Change in net unrealized appreciation (depreciation) | (4,167,986 | ) | 16,369,027 | (405,697 | ) | 1,100,148 | (968,872 | ) | 9,932,095 | |||||||||||||||||||||||||||||
Net Increase (Decrease) in Net Assets | 48,865,694 | 61,314,134 | 1,056,167 | 2,265,118 | 922,111 | 11,409,608 | ||||||||||||||||||||||||||||||||
DIVIDENDS AND DISTRIBUTIONS TO SHAREHOLDERS | ||||||||||||||||||||||||||||||||||||||
Net investment income | ||||||||||||||||||||||||||||||||||||||
Class A | (8,455,737 | ) | (7,537,571 | ) | (206,017 | ) | (225,008 | ) | (287,489 | ) | (362,887 | ) | ||||||||||||||||||||||||||
Class C | (6,345,408 | ) | (5,464,855 | ) | (116,741 | ) | (96,954 | ) | (212,556 | ) | (228,459 | ) | ||||||||||||||||||||||||||
Class I | (10,496,193 | ) | (6,718,654 | ) | (1,023,159 | ) | (924,173 | ) | (124,627 | ) | (235,771 | ) | ||||||||||||||||||||||||||
Class P | (3,251,568 | ) | (286,295 | ) | (651,705 | ) | (2,450,055 | ) | ||||||||||||||||||||||||||||||
Advisor Class | (23,304,092 | ) | (13,081,724 | ) | (108,014 | ) | (83,321 | ) | (123,295 | ) | (116,166 | ) | ||||||||||||||||||||||||||
Net realized gains | ||||||||||||||||||||||||||||||||||||||
Class A | — | — | — | — | — | — | ||||||||||||||||||||||||||||||||
Class C | — | — | — | — | — | — | ||||||||||||||||||||||||||||||||
Class I | — | — | — | — | — | — | ||||||||||||||||||||||||||||||||
Class P | — | — | — | — | ||||||||||||||||||||||||||||||||||
Advisor Class | — | — | — | — | — | — | ||||||||||||||||||||||||||||||||
Net Decrease from Dividends and | (51,852,998 | ) | (33,089,099 | ) | (1,453,931 | ) | (1,329,456 | ) | (1,399,672 | ) | (3,393,338 | ) | ||||||||||||||||||||||||||
CAPITAL SHARE TRANSACTIONS | ||||||||||||||||||||||||||||||||||||||
Proceeds from sale of shares | ||||||||||||||||||||||||||||||||||||||
Class A | 83,291,116 | 82,939,080 | 960,615 | 1,628,742 | 3,546,975 | 3,274,163 | ||||||||||||||||||||||||||||||||
Class C | 46,285,914 | 43,488,000 | 799,744 | 658,538 | 762,952 | 1,284,968 | ||||||||||||||||||||||||||||||||
Class I | 131,227,624 | 164,737,598 | 1,161,044 | 83,759 | 458,335 | 5,292,386 | ||||||||||||||||||||||||||||||||
Class P | 6,914,472 | 79,129,961 | 60,058,075 | 7,026,921 | ||||||||||||||||||||||||||||||||||
Advisor Class | 456,907,837 | 336,633,817 | 1,680,358 | 1,099,678 | 1,531,699 | 1,574,589 | ||||||||||||||||||||||||||||||||
Dividends and distribution reinvestments | ||||||||||||||||||||||||||||||||||||||
Class A | 7,678,324 | 6,984,894 | 204,106 | 220,218 | 283,527 | 360,665 | ||||||||||||||||||||||||||||||||
Class C | 5,716,395 | 4,965,005 | 110,228 | 91,087 | 210,060 | 223,956 | ||||||||||||||||||||||||||||||||
Class I | 6,157,540 | 4,730,223 | 1,023,159 | 924,173 | 124,561 | 235,287 | ||||||||||||||||||||||||||||||||
Class P | 3,251,568 | 286,295 | 651,705 | 2,450,055 | ||||||||||||||||||||||||||||||||||
Advisor Class | 20,332,301 | 11,318,848 | 107,450 | 83,017 | 119,839 | 112,291 | ||||||||||||||||||||||||||||||||
Cost of shares repurchased | ||||||||||||||||||||||||||||||||||||||
Class A | (88,619,207 | ) | (81,263,712 | ) | (1,808,576 | ) | (4,025,446 | ) | (3,956,374 | ) | (8,988,593 | ) | ||||||||||||||||||||||||||
Class C | (40,876,685 | ) | (35,425,874 | ) | (817,442 | ) | (733,142 | ) | (1,330,054 | ) | (1,431,053 | ) | ||||||||||||||||||||||||||
Class I | (92,405,337 | ) | (16,253,229 | ) | (7,019 | ) | (18,058 | ) | (5,617,055 | ) | (605,738 | ) | ||||||||||||||||||||||||||
Class P | (24,098,458 | ) | (1,052,617 | ) | (1,993,459 | ) | (119,565,200 | ) | ||||||||||||||||||||||||||||||
Advisor Class | (210,975,450 | ) | (139,052,368 | ) | (1,176,057 | ) | (1,183,622 | ) | (1,423,922 | ) | (1,209,101 | ) | ||||||||||||||||||||||||||
Net Increase (Decrease) in Net Assets from | 310,787,954 | 462,165,921 | 2,237,610 | (1,171,056 | ) | 53,426,864 | (109,964,404 | ) | ||||||||||||||||||||||||||||||
NET INCREASE (DECREASE) IN NET ASSETS | 307,800,650 | 490,390,956 | 1,839,846 | (235,394 | ) | 52,949,303 | (101,948,134 | ) | ||||||||||||||||||||||||||||||
NET ASSETS | ||||||||||||||||||||||||||||||||||||||
Beginning of Year | 1,167,082,134 | 676,691,178 | 33,563,847 | 33,799,241 | 28,489,531 | 130,437,665 | ||||||||||||||||||||||||||||||||
End of Year | $1,474,882,784 | $1,167,082,134 | $35,403,693 | $33,563,847 | $81,438,834 | $28,489,531 | ||||||||||||||||||||||||||||||||
Undistributed/Accumulated Net Investment Income (Loss) | $873,980 | $541,581 | $25,758 | $7,988 | $94,127 | $80,315 | ||||||||||||||||||||||||||||||||
See Notes to Financial Statements
C-10
Table of Contents
PACIFIC FUNDS
STATEMENTS OF CHANGES IN NET ASSETS (Continued)
| Pacific Funds Large-Cap | Pacific Funds Large-Cap Value | Pacific Funds Small/Mid-Cap | ||||||||||||||||||||||||||||||||||||
Year Ended | Year Ended | Year Ended | Year Ended | Year Ended | Year Ended | |||||||||||||||||||||||||||||||||
OPERATIONS | ||||||||||||||||||||||||||||||||||||||
Net investment income (loss) | $86,807 | $78,588 | $318,398 | $349,055 | ($236,628 | ) | ($37,140 | ) | ||||||||||||||||||||||||||||||
Net realized gain (loss) | 422,128 | (11,973 | ) | 1,291,881 | 427,273 | 657,794 | 171,935 | |||||||||||||||||||||||||||||||
Change in net unrealized appreciation (depreciation) | 1,000,877 | 1,030,767 | 1,131,106 | 3,366,911 | 16,333,908 | 10,252,328 | ||||||||||||||||||||||||||||||||
Net Increase (Decrease) in Net Assets | 1,509,812 | 1,097,382 | 2,741,385 | 4,143,239 | 16,755,074 | 10,387,123 | ||||||||||||||||||||||||||||||||
DIVIDENDS AND DISTRIBUTIONS TO SHAREHOLDERS | ||||||||||||||||||||||||||||||||||||||
Net investment income | ||||||||||||||||||||||||||||||||||||||
Class A | (35,500 | ) | (29,632 | ) | (35,012 | ) | (20,862 | ) | — | — | ||||||||||||||||||||||||||||
Class C | (2,093 | ) | (9,343 | ) | (25,207 | ) | (13,567 | ) | — | — | ||||||||||||||||||||||||||||
Advisor Class | (40,042 | ) | (15,121 | ) | (285,750 | ) | (214,064 | ) | — | (21,749 | ) | |||||||||||||||||||||||||||
Investor Class | (3,345 | ) | (5,861 | ) | (1,526 | ) | (4,572 | ) | — | — | ||||||||||||||||||||||||||||
Class S | (9,360 | ) | (18,654 | ) | (25,707 | ) | (18,228 | ) | — | (8,326 | ) | |||||||||||||||||||||||||||
Net realized gains | ||||||||||||||||||||||||||||||||||||||
Class A | (30,938 | ) | — | (69,181 | ) | (4,816 | ) | (20,277 | ) | (39,391 | ) | |||||||||||||||||||||||||||
Class C | (23,450 | ) | — | (94,471 | ) | (4,860 | ) | (14,961 | ) | (9,936 | ) | |||||||||||||||||||||||||||
Advisor Class | (38,500 | ) | — | (496,519 | ) | (53,074 | ) | (150,439 | ) | (87,592 | ) | |||||||||||||||||||||||||||
Investor Class | (4,283 | ) | — | (2,272 | ) | (513 | ) | (8,905 | ) | (9,984 | ) | |||||||||||||||||||||||||||
Class S | (3,547 | ) | — | (37,097 | ) | (2,889 | ) | (10,307 | ) | (20,534 | ) | |||||||||||||||||||||||||||
Net Decrease from Dividends and | (191,058 | ) | (78,611 | ) | (1,072,742 | ) | (337,445 | ) | (204,889 | ) | (197,512 | ) | ||||||||||||||||||||||||||
CAPITAL SHARE TRANSACTIONS | ||||||||||||||||||||||||||||||||||||||
Proceeds from sale of shares | ||||||||||||||||||||||||||||||||||||||
Class A | 2,836,240 | 4,071,979 | 1,653,951 | 2,488,423 | 15,490,343 | 23,533,423 | ||||||||||||||||||||||||||||||||
Class C | 1,039,440 | 2,217,279 | 1,510,001 | 2,425,871 | 8,607,340 | 6,514,556 | ||||||||||||||||||||||||||||||||
Advisor Class | 9,049,665 | 1,498,606 | 1,451,424 | 21,759,017 | 118,174,037 | 73,752,828 | ||||||||||||||||||||||||||||||||
Investor Class | 377,037 | 124,900 | 23,121 | 288,145 | 4,781,673 | 5,564,036 | ||||||||||||||||||||||||||||||||
Class S | 356,031 | 94,312 | 494,965 | 984,695 | 491,152 | 6,912,122 | ||||||||||||||||||||||||||||||||
Dividends and distribution reinvestments | ||||||||||||||||||||||||||||||||||||||
Class A | 65,908 | 29,244 | 101,722 | 21,351 | 19,606 | 39,301 | ||||||||||||||||||||||||||||||||
Class C | 22,688 | 6,898 | 105,137 | 14,612 | 14,371 | 9,079 | ||||||||||||||||||||||||||||||||
Advisor Class | 76,302 | 13,694 | 777,555 | 266,822 | 147,311 | 102,575 | ||||||||||||||||||||||||||||||||
Investor Class | 7,628 | 5,861 | 3,798 | 5,085 | 8,905 | 9,934 | ||||||||||||||||||||||||||||||||
Class S | 12,907 | 18,654 | 62,804 | 21,117 | 10,307 | 28,860 | ||||||||||||||||||||||||||||||||
Cost of shares repurchased | ||||||||||||||||||||||||||||||||||||||
Class A | (2,988,482 | ) | (470,964 | ) | (1,189,450 | ) | (662,237 | ) | (14,661,733 | ) | (9,476,400 | ) | ||||||||||||||||||||||||||
Class C | (640,775 | ) | (180,400 | ) | (552,537 | ) | (80,513 | ) | (1,682,738 | ) | (256,162 | ) | ||||||||||||||||||||||||||
Advisor Class | (3,725,130 | ) | (85,123 | ) | (8,592,650 | ) | (1,181,401 | ) | (23,352,704 | ) | (11,022,181 | ) | ||||||||||||||||||||||||||
Investor Class | (270,990 | ) | (560,461 | ) | (21,651 | ) | (754,855 | ) | (5,902,271 | ) | (1,758,049 | ) | ||||||||||||||||||||||||||
Class S | (897,495 | ) | (933,354 | ) | (40,946 | ) | (10,881 | ) | (37,472 | ) | (544,425 | ) | ||||||||||||||||||||||||||
Net Increase (Decrease) in Net Assets from | 5,320,974 | 5,851,125 | (4,212,756 | ) | 25,585,251 | 102,108,127 | 93,409,497 | |||||||||||||||||||||||||||||||
NET INCREASE (DECREASE) IN NET ASSETS | 6,639,728 | 6,869,896 | (2,544,113 | ) | 29,391,045 | 118,658,312 | 103,599,108 | |||||||||||||||||||||||||||||||
NET ASSETS | ||||||||||||||||||||||||||||||||||||||
Beginning of Year | 11,063,129 | 4,193,233 | 31,868,839 | 2,477,794 | 111,342,482 | 7,743,374 | ||||||||||||||||||||||||||||||||
End of Year | $17,702,857 | $11,063,129 | $29,324,726 | $31,868,839 | $230,000,794 | $111,342,482 | ||||||||||||||||||||||||||||||||
Undistributed/Accumulated Net Investment Income (Loss) | $17,471 | $21,427 | $49,423 | $105,544 | $— | $— | ||||||||||||||||||||||||||||||||
See Notes to Financial Statements
C-11
Table of Contents
PACIFIC FUNDS
STATEMENTS OF CHANGES IN NET ASSETS (Continued)
| Pacific Funds Small-Cap | Pacific Funds Small-Cap Value | Pacific Funds Small-Cap Growth | ||||||||||||||||||||||||||||||||||||
Year Ended | Year Ended | Year Ended | Year Ended | Year Ended | Year Ended | |||||||||||||||||||||||||||||||||
OPERATIONS | ||||||||||||||||||||||||||||||||||||||
Net investment income (loss) | ($1,502 | ) | $6,199 | $111,562 | $131,321 | ($149,089 | ) | ($112,237 | ) | |||||||||||||||||||||||||||||
Net realized gain (loss) | 271,077 | 36,392 | 2,665,440 | 2,025,062 | 2,754,520 | 600,294 | ||||||||||||||||||||||||||||||||
Change in net unrealized appreciation (depreciation) | 1,124,666 | 1,314,715 | (874,669 | ) | 5,644,679 | 1,827,259 | 5,056,267 | |||||||||||||||||||||||||||||||
Net Increase (Decrease) in Net Assets | 1,394,241 | 1,357,306 | 1,902,333 | 7,801,062 | 4,432,690 | 5,544,324 | ||||||||||||||||||||||||||||||||
DIVIDENDS AND DISTRIBUTIONS TO SHAREHOLDERS | ||||||||||||||||||||||||||||||||||||||
Net investment income | ||||||||||||||||||||||||||||||||||||||
Class A | (1,364 | ) | (14,555 | ) | (2,806 | ) | (2,105 | ) | — | — | ||||||||||||||||||||||||||||
Class C | — | — | — | (1,057 | ) | — | — | |||||||||||||||||||||||||||||||
Class P | — | — | ||||||||||||||||||||||||||||||||||||
Advisor Class | (8,019 | ) | (5,176 | ) | (89,039 | ) | (93,814 | ) | — | — | ||||||||||||||||||||||||||||
Investor Class | — | (382 | ) | (354 | ) | (776 | ) | — | (2,474 | ) | ||||||||||||||||||||||||||||
Class S | — | (10,854 | ) | (60,605 | ) | (54,308 | ) | — | (835 | ) | ||||||||||||||||||||||||||||
Net realized gains | ||||||||||||||||||||||||||||||||||||||
Class A | (25,601 | ) | — | (93,928 | ) | (1,689 | ) | (20,463 | ) | (7,302 | ) | |||||||||||||||||||||||||||
Class C | (14,438 | ) | — | (126,239 | ) | (2,819 | ) | (23,761 | ) | (2,156 | ) | |||||||||||||||||||||||||||
Class P | (482,393 | ) | (241,918 | ) | ||||||||||||||||||||||||||||||||||
Advisor Class | (204,616 | ) | — | (1,716,659 | ) | (124,783 | ) | (505,887 | ) | (217,288 | ) | |||||||||||||||||||||||||||
Investor Class | (47 | ) | — | (6,608 | ) | (487 | ) | (50,324 | ) | (20,495 | ) | |||||||||||||||||||||||||||
Class S | (5,916 | ) | — | (823,893 | ) | (41,373 | ) | (430,196 | ) | (172,777 | ) | |||||||||||||||||||||||||||
Net Decrease from Dividends and | (260,001 | ) | (30,967 | ) | (2,920,131 | ) | (323,211 | ) | (1,513,024 | ) | (665,245 | ) | ||||||||||||||||||||||||||
CAPITAL SHARE TRANSACTIONS | ||||||||||||||||||||||||||||||||||||||
Proceeds from sale of shares | ||||||||||||||||||||||||||||||||||||||
Class A | 1,248,952 | 1,862,736 | 820,522 | 695,651 | 322,272 | 440,356 | ||||||||||||||||||||||||||||||||
Class C | 347,384 | 568,990 | 857,695 | 966,236 | 594,445 | 152,043 | ||||||||||||||||||||||||||||||||
Class P | 15,447,521 | 14,045,027 | ||||||||||||||||||||||||||||||||||||
Advisor Class | 7,913,651 | 7,736,431 | 2,581,805 | 24,518,128 | 2,024,783 | 11,027,246 | ||||||||||||||||||||||||||||||||
Investor Class | 3,164,853 | 540,100 | 119,544 | 142,826 | 190,193 | 14,046 | ||||||||||||||||||||||||||||||||
Class S | 304,126 | 115,500 | 455,387 | 7,595,633 | 738,140 | 7,796,633 | ||||||||||||||||||||||||||||||||
Dividends and distribution reinvestments | ||||||||||||||||||||||||||||||||||||||
Class A | 22,792 | 12,324 | 95,628 | 3,750 | 20,463 | 7,302 | ||||||||||||||||||||||||||||||||
Class C | 14,438 | — | 126,228 | 2,490 | 23,761 | 2,156 | ||||||||||||||||||||||||||||||||
Class P | 482,393 | 241,918 | ||||||||||||||||||||||||||||||||||||
Advisor Class | 150,773 | 2,523 | 1,778,765 | 216,384 | 505,887 | 217,288 | ||||||||||||||||||||||||||||||||
Investor Class | 47 | 382 | 6,962 | 1,263 | 50,324 | 22,969 | ||||||||||||||||||||||||||||||||
Class S | 5,916 | 10,854 | 884,498 | 95,681 | 430,196 | 173,612 | ||||||||||||||||||||||||||||||||
Cost of shares repurchased | ||||||||||||||||||||||||||||||||||||||
Class A | (757,281 | ) | (678,286 | ) | (518,797 | ) | (143,206 | ) | (191,258 | ) | (17,255 | ) | ||||||||||||||||||||||||||
Class C | (271,294 | ) | (121,196 | ) | (466,654 | ) | (60,297 | ) | (77,739 | ) | (15,583 | ) | ||||||||||||||||||||||||||
Class P | (2,042,042 | ) | (3,251,562 | ) | ||||||||||||||||||||||||||||||||||
Advisor Class | (2,556,841 | ) | (553,730 | ) | (8,873,257 | ) | (10,074,494 | ) | (3,478,137 | ) | (170,930 | ) | ||||||||||||||||||||||||||
Investor Class | (613,752 | ) | (20,571 | ) | (165,781 | ) | (15,458 | ) | (22,005 | ) | (10,765 | ) | ||||||||||||||||||||||||||
Class S | (15,132 | ) | (538,525 | ) | (1,012,550 | ) | (803,056 | ) | (1,050,902 | ) | (10,777 | ) | ||||||||||||||||||||||||||
Net Increase (Decrease) in Net Assets from | 8,958,632 | 8,937,532 | (3,310,005 | ) | 23,141,531 | 13,968,295 | 30,663,724 | |||||||||||||||||||||||||||||||
NET INCREASE (DECREASE) IN NET ASSETS | 10,092,872 | 10,263,871 | (4,327,803 | ) | 30,619,382 | 16,887,961 | 35,542,803 | |||||||||||||||||||||||||||||||
NET ASSETS | ||||||||||||||||||||||||||||||||||||||
Beginning of Year | 11,385,592 | 1,121,721 | 32,326,437 | 1,707,055 | 37,241,210 | 1,698,407 | ||||||||||||||||||||||||||||||||
End of Year | $21,478,464 | $11,385,592 | $27,998,634 | $32,326,437 | $54,129,171 | $37,241,210 | ||||||||||||||||||||||||||||||||
Undistributed/Accumulated Net Investment Income (Loss) | $— | $1,564 | $1,539 | $10,458 | ($42,866 | ) | ($39,502 | ) | ||||||||||||||||||||||||||||||
See Notes to Financial Statements
C-12
Table of Contents
PACIFIC FUNDS
Selected per share, ratios and supplemental data for each year or period ended March 31, were as follows:
| Fund |
| Selected Per Share Data |
| Ratios to Average Net Assets | Supplemental Data | |||||||||||||||||||||||||||||||||||||||||||||||||||
| Investment Operations | Distributions | |||||||||||||||||||||||||||||||||||||||||||||||||||||||
| For the Year or Period Ended (1) | Net Asset Value, Beginning of Year or Period | Net Investment Income (Loss) (2) | Net Realized and Unrealized Gain (Loss) | Total | Net Investment Income | Capital Gains | Total | Net Asset Value, End of Year or Period | Expenses Before Reductions (3) | Expenses After Reductions (3), (4) | Net Investment Income (Loss) (3) | Total Returns (5) | Net Assets, End of Year or Period (in thousands) | Portfolio Turnover Rates | ||||||||||||||||||||||||||||||||||||||||||
Pacific Funds Portfolio Optimization Conservative | ||||||||||||||||||||||||||||||||||||||||||||||||||||||||
Class A | ||||||||||||||||||||||||||||||||||||||||||||||||||||||||
| 4/1/2017 - 3/31/2018 | $10.98 | $0.25 | $0.26 | $0.51 | ($0.25 | ) | $— | ($0.25 | ) | $11.24 | 0.68 | % | 0.60 | % | 2.18 | % | 4.60 | % | $131,023 | 30 | % | |||||||||||||||||||||||||||||||||||
| 4/1/2016 - 3/31/2017 | 10.63 | 0.19 | 0.52 | 0.71 | (0.22 | ) | (0.14 | ) | (0.36 | ) | 10.98 | 0.68 | % | 0.60 | % | 1.70 | % | 6.59 | % | 136,881 | 57 | % | ||||||||||||||||||||||||||||||||||
| 4/1/2015 - 3/31/2016 | 11.22 | 0.22 | (0.43 | ) | (0.21 | ) | (0.28 | ) | (0.10 | ) | (0.38 | ) | 10.63 | 0.67 | % | 0.60 | % | 1.99 | % | (1.73 | %) | 154,762 | 42 | % | ||||||||||||||||||||||||||||||||
| 4/1/2014 - 3/31/2015 | 11.29 | 0.16 | 0.26 | 0.42 | (0.23 | ) | (0.26 | ) | (0.49 | ) | 11.22 | 0.68 | % | 0.60 | % | 1.44 | % | 3.71 | % | 169,945 | 17 | % | ||||||||||||||||||||||||||||||||||
| 4/1/2013 - 3/31/2014 | 11.40 | 0.10 | 0.10 | 0.20 | (0.15 | ) | (0.16 | ) | (0.31 | ) | 11.29 | 0.70 | % | 0.60 | % | 0.90 | % | 1.78 | % | 190,492 | 11 | % | ||||||||||||||||||||||||||||||||||
Class B | ||||||||||||||||||||||||||||||||||||||||||||||||||||||||
| 4/1/2017 - 3/31/2018 | $10.76 | $0.16 | $0.26 | $0.42 | ($0.18 | ) | $— | ($0.18 | ) | $11.00 | 1.43 | % | 1.35 | % | 1.43 | % | 3.78 | % | $24,600 | 30 | % | |||||||||||||||||||||||||||||||||||
| 4/1/2016 - 3/31/2017 | 10.45 | 0.10 | 0.50 | 0.60 | (0.15 | ) | (0.14 | ) | (0.29 | ) | 10.76 | 1.43 | % | 1.35 | % | 0.95 | % | 5.89 | % | 29,734 | 57 | % | ||||||||||||||||||||||||||||||||||
| 4/1/2015 - 3/31/2016 | 11.05 | 0.13 | (0.41 | ) | (0.28 | ) | (0.22 | ) | (0.10 | ) | (0.32 | ) | 10.45 | 1.42 | % | 1.35 | % | 1.24 | % | (2.51 | %) | 33,675 | 42 | % | ||||||||||||||||||||||||||||||||
| 4/1/2014 - 3/31/2015 | 11.14 | 0.08 | 0.25 | 0.33 | (0.16 | ) | (0.26 | ) | (0.42 | ) | 11.05 | 1.43 | % | 1.35 | % | 0.69 | % | 3.00 | % | 37,979 | 17 | % | ||||||||||||||||||||||||||||||||||
| 4/1/2013 - 3/31/2014 | 11.27 | 0.02 | 0.10 | 0.12 | (0.09 | ) | (0.16 | ) | (0.25 | ) | 11.14 | 1.45 | % | 1.35 | % | 0.15 | % | 1.06 | % | 39,160 | 11 | % | ||||||||||||||||||||||||||||||||||
Class C | ||||||||||||||||||||||||||||||||||||||||||||||||||||||||
| 4/1/2017 - 3/31/2018 | $10.76 | $0.16 | $0.26 | $0.42 | ($0.18 | ) | $— | ($0.18 | ) | $11.00 | 1.43 | % | 1.35 | % | 1.43 | % | 3.89 | % | $137,036 | 30 | % | |||||||||||||||||||||||||||||||||||
| 4/1/2016 - 3/31/2017 | 10.44 | 0.10 | 0.51 | 0.61 | (0.15 | ) | (0.14 | ) | (0.29 | ) | 10.76 | 1.43 | % | 1.35 | % | 0.95 | % | 5.79 | % | 153,433 | 57 | % | ||||||||||||||||||||||||||||||||||
| 4/1/2015 - 3/31/2016 | 11.05 | 0.13 | (0.42 | ) | (0.29 | ) | (0.22 | ) | (0.10 | ) | (0.32 | ) | 10.44 | 1.42 | % | 1.35 | % | 1.24 | % | (2.51 | %) | 173,137 | 42 | % | ||||||||||||||||||||||||||||||||
| 4/1/2014 - 3/31/2015 | 11.13 | 0.08 | 0.26 | 0.34 | (0.16 | ) | (0.26 | ) | (0.42 | ) | 11.05 | 1.43 | % | 1.35 | % | 0.69 | % | 3.09 | % | 191,946 | 17 | % | ||||||||||||||||||||||||||||||||||
| 4/1/2013 - 3/31/2014 | 11.26 | 0.02 | 0.10 | 0.12 | (0.09 | ) | (0.16 | ) | (0.25 | ) | 11.13 | 1.45 | % | 1.35 | % | 0.15 | % | 1.04 | % | 204,180 | 11 | % | ||||||||||||||||||||||||||||||||||
Class R | ||||||||||||||||||||||||||||||||||||||||||||||||||||||||
| 4/1/2017 - 3/31/2018 | $10.90 | $0.22 | $0.26 | $0.48 | ($0.22 | ) | $— | ($0.22 | ) | $11.16 | 0.93 | % | 0.85 | % | 1.93 | % | 4.37 | % | $5,014 | 30 | % | |||||||||||||||||||||||||||||||||||
| 4/1/2016 - 3/31/2017 | 10.57 | 0.16 | 0.51 | 0.67 | (0.20 | ) | (0.14 | ) | (0.34 | ) | 10.90 | 0.93 | % | 0.85 | % | 1.45 | % | 6.36 | % | 8,354 | 57 | % | ||||||||||||||||||||||||||||||||||
| 4/1/2015 - 3/31/2016 | 11.16 | 0.19 | (0.42 | ) | (0.23 | ) | (0.26 | ) | (0.10 | ) | (0.36 | ) | 10.57 | 0.92 | % | 0.85 | % | 1.74 | % | (2.05 | %) | 10,116 | 42 | % | ||||||||||||||||||||||||||||||||
| 4/1/2014 - 3/31/2015 | 11.24 | 0.14 | 0.25 | 0.39 | (0.21 | ) | (0.26 | ) | (0.47 | ) | 11.16 | 0.93 | % | 0.85 | % | 1.19 | % | 3.48 | % | 11,820 | 17 | % | ||||||||||||||||||||||||||||||||||
| 4/1/2013 - 3/31/2014 | 11.36 | 0.07 | 0.10 | 0.17 | (0.13 | ) | (0.16 | ) | (0.29 | ) | 11.24 | 0.95 | % | 0.85 | % | 0.65 | % | 1.52 | % | 11,132 | 11 | % | ||||||||||||||||||||||||||||||||||
Advisor Class | ||||||||||||||||||||||||||||||||||||||||||||||||||||||||
| 4/1/2017 - 3/31/2018 | $11.00 | $0.28 | $0.25 | $0.53 | ($0.27 | ) | $— | ($0.27 | ) | $11.26 | 0.43 | % | 0.35 | % | 2.43 | % | 4.79 | % | $8,135 | 30 | % | |||||||||||||||||||||||||||||||||||
| 4/1/2016 - 3/31/2017 | 10.65 | 0.21 | 0.52 | 0.73 | (0.24 | ) | (0.14 | ) | (0.38 | ) | 11.00 | 0.43 | % | 0.35 | % | 1.95 | % | 6.89 | % | 5,404 | 57 | % | ||||||||||||||||||||||||||||||||||
| 4/1/2015 - 3/31/2016 | 11.23 | 0.25 | (0.43 | ) | (0.18 | ) | (0.30 | ) | (0.10 | ) | (0.40 | ) | 10.65 | 0.42 | % | 0.35 | % | 2.24 | % | (1.53 | %) | 4,976 | 42 | % | ||||||||||||||||||||||||||||||||
| 4/1/2014 - 3/31/2015 | 11.29 | 0.19 | 0.26 | 0.45 | (0.25 | ) | (0.26 | ) | (0.51 | ) | 11.23 | 0.43 | % | 0.35 | % | 1.69 | % | 4.01 | % | 7,872 | 17 | % | ||||||||||||||||||||||||||||||||||
| 4/1/2013 - 3/31/2014 | 11.41 | 0.12 | 0.09 | 0.21 | (0.17 | ) | (0.16 | ) | (0.33 | ) | 11.29 | 0.45 | % | 0.40 | % | 1.10 | % | 1.87 | % | 3,867 | 11 | % | ||||||||||||||||||||||||||||||||||
Pacific Funds Portfolio Optimization Moderate-Conservative | ||||||||||||||||||||||||||||||||||||||||||||||||||||||||
Class A | ||||||||||||||||||||||||||||||||||||||||||||||||||||||||
| 4/1/2017 - 3/31/2018 | $12.21 | $0.25 | $0.53 | $0.78 | ($0.27 | ) | ($0.14 | ) | ($0.41 | ) | $12.58 | 0.67 | % | 0.60 | % | 1.95 | % | 6.36 | % | $227,420 | 30 | % | ||||||||||||||||||||||||||||||||||
| 4/1/2016 - 3/31/2017 | 11.73 | 0.20 | 0.79 | 0.99 | (0.24 | ) | (0.27 | ) | (0.51 | ) | 12.21 | 0.67 | % | 0.60 | % | 1.68 | % | 8.49 | % | 236,725 | 53 | % | ||||||||||||||||||||||||||||||||||
| 4/1/2015 - 3/31/2016 | 12.61 | 0.25 | (0.50 | ) | (0.25 | ) | (0.29 | ) | (0.34 | ) | (0.63 | ) | 11.73 | 0.67 | % | 0.60 | % | 2.07 | % | (1.87 | %) | 255,376 | 34 | % | ||||||||||||||||||||||||||||||||
| 4/1/2014 - 3/31/2015 | 12.48 | 0.18 | 0.40 | 0.58 | (0.25 | ) | (0.20 | ) | (0.45 | ) | 12.61 | 0.67 | % | 0.60 | % | 1.40 | % | 4.69 | % | 276,898 | 17 | % | ||||||||||||||||||||||||||||||||||
| 4/1/2013 - 3/31/2014 | 12.10 | 0.11 | 0.50 | 0.61 | (0.18 | ) | (0.05 | ) | (0.23 | ) | 12.48 | 0.69 | % | 0.60 | % | 0.89 | % | 5.08 | % | 274,899 | 5 | % | ||||||||||||||||||||||||||||||||||
Class B | ||||||||||||||||||||||||||||||||||||||||||||||||||||||||
| 4/1/2017 - 3/31/2018 | $12.01 | $0.15 | $0.52 | $0.67 | ($0.19 | ) | ($0.14 | ) | ($0.33 | ) | $12.35 | 1.42 | % | 1.35 | % | 1.20 | % | 5.58 | % | $39,004 | 30 | % | ||||||||||||||||||||||||||||||||||
| 4/1/2016 - 3/31/2017 | 11.56 | 0.11 | 0.78 | 0.89 | (0.17 | ) | (0.27 | ) | (0.44 | ) | 12.01 | 1.42 | % | 1.35 | % | 0.93 | % | 7.75 | % | 45,184 | 53 | % | ||||||||||||||||||||||||||||||||||
| 4/1/2015 - 3/31/2016 | 12.46 | 0.16 | (0.49 | ) | (0.33 | ) | (0.23 | ) | (0.34 | ) | (0.57 | ) | 11.56 | 1.42 | % | 1.35 | % | 1.32 | % | (2.61 | %) | 47,540 | 34 | % | ||||||||||||||||||||||||||||||||
| 4/1/2014 - 3/31/2015 | 12.36 | 0.08 | 0.40 | 0.48 | (0.18 | ) | (0.20 | ) | (0.38 | ) | 12.46 | 1.42 | % | 1.35 | % | 0.65 | % | 3.91 | % | 51,223 | 17 | % | ||||||||||||||||||||||||||||||||||
| 4/1/2013 - 3/31/2014 | 11.99 | 0.02 | 0.51 | 0.53 | (0.11 | ) | (0.05 | ) | (0.16 | ) | 12.36 | 1.44 | % | 1.35 | % | 0.14 | % | 4.47 | % | 52,285 | 5 | % | ||||||||||||||||||||||||||||||||||
Class C | ||||||||||||||||||||||||||||||||||||||||||||||||||||||||
| 4/1/2017 - 3/31/2018 | $12.00 | $0.15 | $0.52 | $0.67 | ($0.19 | ) | ($0.14 | ) | ($0.33 | ) | $12.34 | 1.42 | % | 1.35 | % | 1.20 | % | 5.60 | % | $174,766 | 30 | % | ||||||||||||||||||||||||||||||||||
| 4/1/2016 - 3/31/2017 | 11.56 | 0.11 | 0.77 | 0.88 | (0.17 | ) | (0.27 | ) | (0.44 | ) | 12.00 | 1.42 | % | 1.35 | % | 0.93 | % | 7.74 | % | 200,105 | 53 | % | ||||||||||||||||||||||||||||||||||
| 4/1/2015 - 3/31/2016 | 12.45 | 0.16 | (0.48 | ) | (0.32 | ) | (0.23 | ) | (0.34 | ) | (0.57 | ) | 11.56 | 1.42 | % | 1.35 | % | 1.32 | % | (2.61 | %) | 221,192 | 34 | % | ||||||||||||||||||||||||||||||||
| 4/1/2014 - 3/31/2015 | 12.35 | 0.08 | 0.40 | 0.48 | (0.18 | ) | (0.20 | ) | (0.38 | ) | 12.45 | 1.42 | % | 1.35 | % | 0.65 | % | 3.93 | % | 240,803 | 17 | % | ||||||||||||||||||||||||||||||||||
| 4/1/2013 - 3/31/2014 | 11.99 | 0.02 | 0.51 | 0.53 | (0.12 | ) | (0.05 | ) | (0.17 | ) | 12.35 | 1.44 | % | 1.35 | % | 0.14 | % | 4.41 | % | 228,445 | 5 | % | ||||||||||||||||||||||||||||||||||
| See Notes to Financial Statements | See explanation of references on C-22 |
C-13
Table of Contents
PACIFIC FUNDS
FINANCIAL HIGHLIGHTS (Continued)
Selected per share, ratios and supplemental data for each year or period ended March 31, were as follows:
| Fund |
| Selected Per Share Data |
| Ratios to Average Net Assets | Supplemental Data | |||||||||||||||||||||||||||||||||||||||||||||||||||
| Investment Operations | Distributions | |||||||||||||||||||||||||||||||||||||||||||||||||||||||
| For the Year or Period Ended (1) | Net Asset Value, Beginning of Year or Period | Net Investment Income (Loss) (2) | Net Realized and Unrealized Gain (Loss) | Total | Net Investment Income | Capital Gains | Total | Net Asset Value, End of Year or Period | Expenses Before Reductions (3) | Expenses After Reductions (3), (4) | Net Investment Income (Loss) (3) | Total Returns (5) | Net Assets, End of Year or Period (in thousands) | Portfolio Turnover Rates | ||||||||||||||||||||||||||||||||||||||||||
Pacific Funds Portfolio Optimization Moderate-Conservative (Continued) | ||||||||||||||||||||||||||||||||||||||||||||||||||||||||
Class R | ||||||||||||||||||||||||||||||||||||||||||||||||||||||||
| 4/1/2017 - 3/31/2018 | $12.14 | $0.21 | $0.53 | $0.74 | ($0.24 | ) | ($0.14 | ) | ($0.38 | ) | $12.50 | 0.92 | % | 0.85 | % | 1.70 | % | 6.11 | % | $5,146 | 30 | % | ||||||||||||||||||||||||||||||||||
| 4/1/2016 - 3/31/2017 | 11.68 | 0.17 | 0.78 | 0.95 | (0.22 | ) | (0.27 | ) | (0.49 | ) | 12.14 | 0.92 | % | 0.85 | % | 1.43 | % | 8.26 | % | 5,934 | 53 | % | ||||||||||||||||||||||||||||||||||
| 4/1/2015 - 3/31/2016 | 12.56 | 0.22 | (0.49 | ) | (0.27 | ) | (0.27 | ) | (0.34 | ) | (0.61 | ) | 11.68 | 0.92 | % | 0.85 | % | 1.82 | % | (2.15 | %) | 5,761 | 34 | % | ||||||||||||||||||||||||||||||||
| 4/1/2014 - 3/31/2015 | 12.44 | 0.14 | 0.41 | 0.55 | (0.23 | ) | (0.20 | ) | (0.43 | ) | 12.56 | 0.92 | % | 0.85 | % | 1.15 | % | 4.43 | % | 6,881 | 17 | % | ||||||||||||||||||||||||||||||||||
| 4/1/2013 - 3/31/2014 | 12.06 | 0.08 | 0.51 | 0.59 | (0.16 | ) | (0.05 | ) | (0.21 | ) | 12.44 | 0.94 | % | 0.85 | % | 0.64 | % | 4.91 | % | 7,000 | 5 | % | ||||||||||||||||||||||||||||||||||
Advisor Class | ||||||||||||||||||||||||||||||||||||||||||||||||||||||||
| 4/1/2017 - 3/31/2018 | $12.24 | $0.28 | $0.53 | $0.81 | ($0.29 | ) | ($0.14 | ) | ($0.43 | ) | $12.62 | 0.42 | % | 0.35 | % | 2.20 | % | 6.62 | % | $5,196 | 30 | % | ||||||||||||||||||||||||||||||||||
| 4/1/2016 - 3/31/2017 | 11.75 | 0.23 | 0.79 | 1.02 | (0.26 | ) | (0.27 | ) | (0.53 | ) | 12.24 | 0.42 | % | 0.35 | % | 1.93 | % | 8.78 | % | 4,895 | 53 | % | ||||||||||||||||||||||||||||||||||
| 4/1/2015 - 3/31/2016 | 12.62 | 0.28 | (0.49 | ) | (0.21 | ) | (0.32 | ) | (0.34 | ) | (0.66 | ) | 11.75 | 0.42 | % | 0.35 | % | 2.32 | % | (1.60 | %) | 4,891 | 34 | % | ||||||||||||||||||||||||||||||||
| 4/1/2014 - 3/31/2015 | 12.49 | 0.21 | 0.40 | 0.61 | (0.28 | ) | (0.20 | ) | (0.48 | ) | 12.62 | 0.42 | % | 0.35 | % | 1.65 | % | 4.89 | % | 5,568 | 17 | % | ||||||||||||||||||||||||||||||||||
| 4/1/2013 - 3/31/2014 | 12.10 | 0.13 | 0.51 | 0.64 | (0.20 | ) | (0.05 | ) | (0.25 | ) | 12.49 | 0.44 | % | 0.40 | % | 1.09 | % | 5.32 | % | 2,892 | 5 | % | ||||||||||||||||||||||||||||||||||
Pacific Funds Portfolio Optimization Moderate | ||||||||||||||||||||||||||||||||||||||||||||||||||||||||
Class A | ||||||||||||||||||||||||||||||||||||||||||||||||||||||||
| 4/1/2017 - 3/31/2018 | $13.67 | $0.20 | $0.94 | $1.14 | ($0.24 | ) | ($0.31 | ) | ($0.55 | ) | $14.26 | 0.66 | % | 0.60 | % | 1.40 | % | 8.36 | % | $690,689 | 36 | % | ||||||||||||||||||||||||||||||||||
| 4/1/2016 - 3/31/2017 | 12.99 | 0.22 | 1.17 | 1.39 | (0.24 | ) | (0.47 | ) | (0.71 | ) | 13.67 | 0.66 | % | 0.60 | % | 1.60 | % | 10.94 | % | 720,438 | 48 | % | ||||||||||||||||||||||||||||||||||
| 4/1/2015 - 3/31/2016 | 14.20 | 0.25 | (0.60 | ) | (0.35 | ) | (0.28 | ) | (0.58 | ) | (0.86 | ) | 12.99 | 0.66 | % | 0.60 | % | 1.85 | % | (2.50 | %) | 771,853 | 35 | % | ||||||||||||||||||||||||||||||||
| 4/1/2014 - 3/31/2015 | 13.98 | 0.18 | 0.55 | 0.73 | (0.32 | ) | (0.19 | ) | (0.51 | ) | 14.20 | 0.66 | % | 0.60 | % | 1.28 | % | 5.30 | % | 844,759 | 19 | % | ||||||||||||||||||||||||||||||||||
| 4/1/2013 - 3/31/2014 | 13.06 | 0.11 | 1.00 | 1.11 | (0.19 | ) | — | (0.19 | ) | 13.98 | 0.69 | % | 0.60 | % | 0.84 | % | 8.51 | % | 814,707 | 1 | % | |||||||||||||||||||||||||||||||||||
Class B | ||||||||||||||||||||||||||||||||||||||||||||||||||||||||
| 4/1/2017 - 3/31/2018 | $13.52 | $0.09 | $0.92 | $1.01 | ($0.16 | ) | ($0.31 | ) | ($0.47 | ) | $14.06 | 1.41 | % | 1.35 | % | 0.65 | % | 7.53 | % | $119,870 | 36 | % | ||||||||||||||||||||||||||||||||||
| 4/1/2016 - 3/31/2017 | 12.87 | 0.11 | 1.17 | 1.28 | (0.16 | ) | (0.47 | ) | (0.63 | ) | 13.52 | 1.41 | % | 1.35 | % | 0.85 | % | 10.18 | % | 134,766 | 48 | % | ||||||||||||||||||||||||||||||||||
| 4/1/2015 - 3/31/2016 | 14.10 | 0.15 | (0.60 | ) | (0.45 | ) | (0.20 | ) | (0.58 | ) | (0.78 | ) | 12.87 | 1.41 | % | 1.35 | % | 1.10 | % | (3.21 | %) | 142,921 | 35 | % | ||||||||||||||||||||||||||||||||
| 4/1/2014 - 3/31/2015 | 13.89 | 0.07 | 0.55 | 0.62 | (0.22 | ) | (0.19 | ) | (0.41 | ) | 14.10 | 1.41 | % | 1.35 | % | 0.53 | % | 4.49 | % | 159,975 | 19 | % | ||||||||||||||||||||||||||||||||||
| 4/1/2013 - 3/31/2014 | 12.96 | 0.01 | 1.01 | 1.02 | (0.09 | ) | — | (0.09 | ) | 13.89 | 1.44 | % | 1.35 | % | 0.09 | % | 7.90 | % | 156,450 | 1 | % | |||||||||||||||||||||||||||||||||||
Class C | ||||||||||||||||||||||||||||||||||||||||||||||||||||||||
| 4/1/2017 - 3/31/2018 | $13.50 | $0.09 | $0.92 | $1.01 | ($0.16 | ) | ($0.31 | ) | ($0.47 | ) | $14.04 | 1.41 | % | 1.35 | % | 0.65 | % | 7.47 | % | $465,913 | 36 | % | ||||||||||||||||||||||||||||||||||
| 4/1/2016 - 3/31/2017 | 12.85 | 0.11 | 1.17 | 1.28 | (0.16 | ) | (0.47 | ) | (0.63 | ) | 13.50 | 1.41 | % | 1.35 | % | 0.85 | % | 10.19 | % | 515,691 | 48 | % | ||||||||||||||||||||||||||||||||||
| 4/1/2015 - 3/31/2016 | 14.08 | 0.15 | (0.60 | ) | (0.45 | ) | (0.20 | ) | (0.58 | ) | (0.78 | ) | 12.85 | 1.41 | % | 1.35 | % | 1.10 | % | (3.22 | %) | 554,661 | 35 | % | ||||||||||||||||||||||||||||||||
| 4/1/2014 - 3/31/2015 | 13.87 | 0.07 | 0.55 | 0.62 | (0.22 | ) | (0.19 | ) | (0.41 | ) | 14.08 | 1.41 | % | 1.35 | % | 0.53 | % | 4.51 | % | 601,814 | 19 | % | ||||||||||||||||||||||||||||||||||
| 4/1/2013 - 3/31/2014 | 12.95 | 0.01 | 1.01 | 1.02 | (0.10 | ) | — | (0.10 | ) | 13.87 | 1.44 | % | 1.35 | % | 0.09 | % | 7.89 | % | 566,257 | 1 | % | |||||||||||||||||||||||||||||||||||
Class R | ||||||||||||||||||||||||||||||||||||||||||||||||||||||||
| 4/1/2017 - 3/31/2018 | $13.64 | $0.16 | $0.94 | $1.10 | ($0.22 | ) | ($0.31 | ) | ($0.53 | ) | $14.21 | 0.91 | % | 0.85 | % | 1.15 | % | 8.05 | % | $24,165 | 36 | % | ||||||||||||||||||||||||||||||||||
| 4/1/2016 - 3/31/2017 | 12.97 | 0.18 | 1.17 | 1.35 | (0.21 | ) | (0.47 | ) | (0.68 | ) | 13.64 | 0.91 | % | 0.85 | % | 1.35 | % | 10.66 | % | 24,224 | 48 | % | ||||||||||||||||||||||||||||||||||
| 4/1/2015 - 3/31/2016 | 14.18 | 0.22 | (0.60 | ) | (0.38 | ) | (0.25 | ) | (0.58 | ) | (0.83 | ) | 12.97 | 0.91 | % | 0.85 | % | 1.60 | % | (2.70 | %) | 25,429 | 35 | % | ||||||||||||||||||||||||||||||||
| 4/1/2014 - 3/31/2015 | 13.96 | 0.15 | 0.54 | 0.69 | (0.28 | ) | (0.19 | ) | (0.47 | ) | 14.18 | 0.91 | % | 0.85 | % | 1.03 | % | 5.00 | % | 28,097 | 19 | % | ||||||||||||||||||||||||||||||||||
| 4/1/2013 - 3/31/2014 | 13.03 | 0.08 | 1.00 | 1.08 | (0.15 | ) | — | (0.15 | ) | 13.96 | 0.94 | % | 0.85 | % | 0.59 | % | 8.33 | % | 31,641 | 1 | % | |||||||||||||||||||||||||||||||||||
Advisor Class | ||||||||||||||||||||||||||||||||||||||||||||||||||||||||
| 4/1/2017 - 3/31/2018 | $13.69 | $0.24 | $0.94 | $1.18 | ($0.27 | ) | ($0.31 | ) | ($0.58 | ) | $14.29 | 0.41 | % | 0.35 | % | 1.65 | % | 8.54 | % | $23,088 | 36 | % | ||||||||||||||||||||||||||||||||||
| 4/1/2016 - 3/31/2017 | 13.00 | 0.25 | 1.18 | 1.43 | (0.27 | ) | (0.47 | ) | (0.74 | ) | 13.69 | 0.41 | % | 0.35 | % | 1.85 | % | 11.30 | % | 17,983 | 48 | % | ||||||||||||||||||||||||||||||||||
| 4/1/2015 - 3/31/2016 | 14.20 | 0.29 | (0.60 | ) | (0.31 | ) | (0.31 | ) | (0.58 | ) | (0.89 | ) | 13.00 | 0.41 | % | 0.35 | % | 2.10 | % | (2.24 | %) | 19,835 | 35 | % | ||||||||||||||||||||||||||||||||
| 4/1/2014 - 3/31/2015 | 13.98 | 0.22 | 0.55 | 0.77 | (0.36 | ) | (0.19 | ) | (0.55 | ) | 14.20 | 0.41 | % | 0.35 | % | 1.53 | % | 5.54 | % | 21,896 | 19 | % | ||||||||||||||||||||||||||||||||||
| 4/1/2013 - 3/31/2014 | 13.06 | 0.14 | 1.00 | 1.14 | (0.22 | ) | — | (0.22 | ) | 13.98 | 0.44 | % | 0.40 | % | 1.04 | % | 8.73 | % | 19,945 | 1 | % | |||||||||||||||||||||||||||||||||||
Pacific Funds Portfolio Optimization Growth | ||||||||||||||||||||||||||||||||||||||||||||||||||||||||
Class A | ||||||||||||||||||||||||||||||||||||||||||||||||||||||||
| 4/1/2017 - 3/31/2018 | $14.61 | $0.18 | $1.30 | $1.48 | ($0.23 | ) | ($0.40 | ) | ($0.63 | ) | $15.46 | 0.66 | % | 0.60 | % | 1.14 | % | 10.10 | % | $555,328 | 39 | % | ||||||||||||||||||||||||||||||||||
| 4/1/2016 - 3/31/2017 | 13.74 | 0.22 | 1.54 | 1.76 | (0.23 | ) | (0.66 | ) | (0.89 | ) | 14.61 | 0.67 | % | 0.60 | % | 1.55 | % | 13.08 | % | 560,395 | 43 | % | ||||||||||||||||||||||||||||||||||
| 4/1/2015 - 3/31/2016 | 15.34 | 0.19 | (0.69 | ) | (0.50 | ) | (0.23 | ) | (0.87 | ) | (1.10 | ) | 13.74 | 0.66 | % | 0.60 | % | 1.29 | % | (3.35 | %) | 570,267 | 34 | % | ||||||||||||||||||||||||||||||||
| 4/1/2014 - 3/31/2015 | 14.74 | 0.16 | 0.77 | 0.93 | (0.33 | ) | — | (0.33 | ) | 15.34 | 0.66 | % | 0.60 | % | 1.07 | % | 6.36 | % | 607,360 | 21 | % | |||||||||||||||||||||||||||||||||||
| 4/1/2013 - 3/31/2014 | 13.33 | 0.09 | 1.51 | 1.60 | (0.19 | ) | — | (0.19 | ) | 14.74 | 0.69 | % | 0.60 | % | 0.66 | % | 12.01 | % | 555,319 | 1 | % | |||||||||||||||||||||||||||||||||||
| See Notes to Financial Statements | See explanation of references on C-22 |
C-14
Table of Contents
PACIFIC FUNDS
FINANCIAL HIGHLIGHTS (Continued)
Selected per share, ratios and supplemental data for each year or period ended March 31, were as follows:
| Fund |
| Selected Per Share Data |
| Ratios to Average Net Assets | Supplemental Data | |||||||||||||||||||||||||||||||||||||||||||||||||||
| Investment Operations | Distributions | |||||||||||||||||||||||||||||||||||||||||||||||||||||||
| For the Year or Period Ended (1) | Net Asset Value, Beginning of Year or Period | Net Investment Income (Loss) (2) | Net Realized and Unrealized Gain (Loss) | Total | Net Investment Income | Capital Gains | Total | Net Asset Value, End of Year or Period | Expenses Before Reductions (3) | Expenses After Reductions (3), (4) | Net Investment Income (Loss) (3) | Total Returns (5) | Net Assets, End of Year or Period (in thousands) | Portfolio Turnover Rates | ||||||||||||||||||||||||||||||||||||||||||
Pacific Funds Portfolio Optimization Growth (Continued) | ||||||||||||||||||||||||||||||||||||||||||||||||||||||||
Class B | ||||||||||||||||||||||||||||||||||||||||||||||||||||||||
| 4/1/2017 - 3/31/2018 | $14.42 | $0.06 | $1.29 | $1.35 | ($0.14 | ) | ($0.40 | ) | ($0.54 | ) | $15.23 | 1.41 | % | 1.35 | % | 0.39 | % | 9.33 | % | $88,937 | 39 | % | ||||||||||||||||||||||||||||||||||
| 4/1/2016 - 3/31/2017 | 13.59 | 0.11 | 1.53 | 1.64 | (0.15 | ) | (0.66 | ) | (0.81 | ) | 14.42 | 1.42 | % | 1.35 | % | 0.80 | % | 12.30 | % | 98,256 | 43 | % | ||||||||||||||||||||||||||||||||||
| 4/1/2015 - 3/31/2016 | 15.22 | 0.08 | (0.69 | ) | (0.61 | ) | (0.15 | ) | (0.87 | ) | (1.02 | ) | 13.59 | 1.41 | % | 1.35 | % | 0.54 | % | (4.13 | %) | 102,001 | 34 | % | ||||||||||||||||||||||||||||||||
| 4/1/2014 - 3/31/2015 | 14.62 | 0.05 | 0.77 | 0.82 | (0.22 | ) | — | (0.22 | ) | 15.22 | 1.41 | % | 1.35 | % | 0.32 | % | 5.61 | % | 119,159 | 21 | % | |||||||||||||||||||||||||||||||||||
| 4/1/2013 - 3/31/2014 | 13.22 | (0.01 | ) | 1.50 | 1.49 | (0.09 | ) | — | (0.09 | ) | 14.62 | 1.44 | % | 1.35 | % | (0.09 | %) | 11.25 | % | 119,506 | 1 | % | ||||||||||||||||||||||||||||||||||
Class C | ||||||||||||||||||||||||||||||||||||||||||||||||||||||||
| 4/1/2017 - 3/31/2018 | $14.38 | $0.06 | $1.28 | $1.34 | ($0.14 | ) | ($0.40 | ) | ($0.54 | ) | $15.18 | 1.41 | % | 1.35 | % | 0.39 | % | 9.29 | % | $317,342 | 39 | % | ||||||||||||||||||||||||||||||||||
| 4/1/2016 - 3/31/2017 | 13.55 | 0.11 | 1.53 | 1.64 | (0.15 | ) | (0.66 | ) | (0.81 | ) | 14.38 | 1.42 | % | 1.35 | % | 0.80 | % | 12.33 | % | 347,447 | 43 | % | ||||||||||||||||||||||||||||||||||
| 4/1/2015 - 3/31/2016 | 15.18 | 0.08 | (0.69 | ) | (0.61 | ) | (0.15 | ) | (0.87 | ) | (1.02 | ) | 13.55 | 1.41 | % | 1.35 | % | 0.54 | % | (4.13 | %) | 366,805 | 34 | % | ||||||||||||||||||||||||||||||||
| 4/1/2014 - 3/31/2015 | 14.59 | 0.05 | 0.76 | 0.81 | (0.22 | ) | — | (0.22 | ) | 15.18 | 1.41 | % | 1.35 | % | 0.32 | % | 5.59 | % | 398,716 | 21 | % | |||||||||||||||||||||||||||||||||||
| 4/1/2013 - 3/31/2014 | 13.19 | (0.01 | ) | 1.50 | 1.49 | (0.09 | ) | — | (0.09 | ) | 14.59 | 1.44 | % | 1.35 | % | (0.09 | %) | 11.33 | % | 375,368 | 1 | % | ||||||||||||||||||||||||||||||||||
| Class R | ||||||||||||||||||||||||||||||||||||||||||||||||||||||||
| 4/1/2017 - 3/31/2018 | $14.57 | $0.14 | $1.31 | $1.45 | ($0.20 | ) | ($0.40 | ) | ($0.60 | ) | $15.42 | 0.91 | % | 0.85 | % | 0.89 | % | 9.86 | % | $15,501 | 39 | % | ||||||||||||||||||||||||||||||||||
| 4/1/2016 - 3/31/2017 | 13.71 | 0.18 | 1.54 | 1.72 | (0.20 | ) | (0.66 | ) | (0.86 | ) | 14.57 | 0.92 | % | 0.85 | % | 1.30 | % | 12.86 | % | 15,347 | 43 | % | ||||||||||||||||||||||||||||||||||
| 4/1/2015 - 3/31/2016 | 15.32 | 0.15 | (0.68 | ) | (0.53 | ) | (0.21 | ) | (0.87 | ) | (1.08 | ) | 13.71 | 0.91 | % | 0.85 | % | 1.04 | % | (3.60 | %) | 18,328 | 34 | % | ||||||||||||||||||||||||||||||||
| 4/1/2014 - 3/31/2015 | 14.72 | 0.12 | 0.77 | 0.89 | (0.29 | ) | — | (0.29 | ) | 15.32 | 0.91 | % | 0.85 | % | 0.82 | % | 6.10 | % | 21,383 | 21 | % | |||||||||||||||||||||||||||||||||||
| 4/1/2013 - 3/31/2014 | 13.32 | 0.06 | 1.49 | 1.55 | (0.15 | ) | — | (0.15 | ) | 14.72 | 0.94 | % | 0.85 | % | 0.41 | % | 11.67 | % | 20,326 | 1 | % | |||||||||||||||||||||||||||||||||||
Advisor Class | ||||||||||||||||||||||||||||||||||||||||||||||||||||||||
| 4/1/2017 - 3/31/2018 | $14.64 | $0.22 | $1.31 | $1.53 | ($0.26 | ) | ($0.40 | ) | ($0.66 | ) | $15.51 | 0.41 | % | 0.35 | % | 1.39 | % | 10.42 | % | $16,280 | 39 | % | ||||||||||||||||||||||||||||||||||
| 4/1/2016 - 3/31/2017 | 13.76 | 0.26 | 1.54 | 1.80 | (0.26 | ) | (0.66 | ) | (0.92 | ) | 14.64 | 0.42 | % | 0.35 | % | 1.80 | % | 13.34 | % | 13,275 | 43 | % | ||||||||||||||||||||||||||||||||||
| 4/1/2015 - 3/31/2016 | 15.35 | 0.22 | (0.68 | ) | (0.46 | ) | (0.26 | ) | (0.87 | ) | (1.13 | ) | 13.76 | 0.41 | % | 0.35 | % | 1.54 | % | (3.10 | %) | 12,084 | 34 | % | ||||||||||||||||||||||||||||||||
| 4/1/2014 - 3/31/2015 | 14.75 | 0.19 | 0.78 | 0.97 | (0.37 | ) | — | (0.37 | ) | 15.35 | 0.41 | % | 0.35 | % | 1.32 | % | 6.61 | % | 10,165 | 21 | % | |||||||||||||||||||||||||||||||||||
| 4/1/2013 - 3/31/2014 | 13.34 | 0.12 | 1.51 | 1.63 | (0.22 | ) | — | (0.22 | ) | 14.75 | 0.44 | % | 0.40 | % | 0.86 | % | 12.21 | % | 5,111 | 1 | % | |||||||||||||||||||||||||||||||||||
Pacific Funds Portfolio Optimization Aggressive-Growth | ||||||||||||||||||||||||||||||||||||||||||||||||||||||||
| Class A | ||||||||||||||||||||||||||||||||||||||||||||||||||||||||
| 4/1/2017 - 3/31/2018 | $15.79 | $0.12 | $1.81 | $1.93 | ($0.20 | ) | ($0.49 | ) | ($0.69 | ) | $17.03 | 0.68 | % | 0.60 | % | 0.74 | % | 12.17 | % | $189,903 | 41 | % | ||||||||||||||||||||||||||||||||||
| 4/1/2016 - 3/31/2017 | 14.70 | 0.19 | 1.96 | 2.15 | (0.19 | ) | (0.87 | ) | (1.06 | ) | 15.79 | 0.68 | % | 0.60 | % | 1.25 | % | 15.06 | % | 179,825 | 41 | % | ||||||||||||||||||||||||||||||||||
| 4/1/2015 - 3/31/2016 | 15.85 | 0.16 | (0.85 | ) | (0.69 | ) | (0.28 | ) | (0.18 | ) | (0.46 | ) | 14.70 | 0.68 | % | 0.60 | % | 1.03 | % | (4.37 | %) | 170,874 | 35 | % | ||||||||||||||||||||||||||||||||
| 4/1/2014 - 3/31/2015 | 15.23 | 0.15 | 0.79 | 0.94 | (0.32 | ) | — | (0.32 | ) | 15.85 | 0.68 | % | 0.60 | % | 0.97 | % | 6.18 | % | 177,171 | 20 | % | |||||||||||||||||||||||||||||||||||
| 4/1/2013 - 3/31/2014 | 13.50 | 0.08 | 1.77 | 1.85 | (0.12 | ) | — | (0.12 | ) | 15.23 | 0.71 | % | 0.60 | % | 0.58 | % | 13.70 | % | 161,858 | 5 | % | |||||||||||||||||||||||||||||||||||
| Class B | ||||||||||||||||||||||||||||||||||||||||||||||||||||||||
| 4/1/2017 - 3/31/2018 | $15.46 | ($0.00 | )(6) | $1.75 | $1.75 | ($0.10 | ) | ($0.49 | ) | ($0.59 | ) | $16.62 | 1.43 | % | 1.35 | % | (0.01 | %) | 11.35 | % | $27,173 | 41 | % | |||||||||||||||||||||||||||||||||
| 4/1/2016 - 3/31/2017 | 14.43 | 0.07 | 1.93 | 2.00 | (0.10 | ) | (0.87 | ) | (0.97 | ) | 15.46 | 1.43 | % | 1.35 | % | 0.50 | % | 14.22 | % | 29,946 | 41 | % | ||||||||||||||||||||||||||||||||||
| 4/1/2015 - 3/31/2016 | 15.57 | 0.04 | (0.84 | ) | (0.80 | ) | (0.16 | ) | (0.18 | ) | (0.34 | ) | 14.43 | 1.43 | % | 1.35 | % | 0.28 | % | (5.15 | %) | 30,038 | 35 | % | ||||||||||||||||||||||||||||||||
| 4/1/2014 - 3/31/2015 | 14.94 | 0.03 | 0.80 | 0.83 | (0.20 | ) | — | (0.20 | ) | 15.57 | 1.43 | % | 1.35 | % | 0.22 | % | 5.55 | % | 35,840 | 20 | % | |||||||||||||||||||||||||||||||||||
| 4/1/2013 - 3/31/2014 | 13.22 | (0.02 | ) | 1.76 | 1.74 | (0.02 | ) | — | (0.02 | ) | 14.94 | 1.46 | % | 1.35 | % | (0.17 | %) | 13.13 | % | 37,704 | 5 | % | ||||||||||||||||||||||||||||||||||
| Class C | ||||||||||||||||||||||||||||||||||||||||||||||||||||||||
| 4/1/2017 - 3/31/2018 | $15.43 | ($0.00 | )(6) | $1.75 | $1.75 | ($0.10 | ) | ($0.49 | ) | ($0.59 | ) | $16.59 | 1.43 | % | 1.35 | % | (0.01 | %) | 11.39 | % | $97,877 | 41 | % | |||||||||||||||||||||||||||||||||
| 4/1/2016 - 3/31/2017 | 14.41 | 0.07 | 1.93 | 2.00 | (0.11 | ) | (0.87 | ) | (0.98 | ) | 15.43 | 1.43 | % | 1.35 | % | 0.50 | % | 14.18 | % | 99,582 | 41 | % | ||||||||||||||||||||||||||||||||||
| 4/1/2015 - 3/31/2016 | 15.55 | 0.04 | (0.83 | ) | (0.79 | ) | (0.17 | ) | (0.18 | ) | (0.35 | ) | 14.41 | 1.43 | % | 1.35 | % | 0.28 | % | (5.13 | %) | 100,573 | 35 | % | ||||||||||||||||||||||||||||||||
| 4/1/2014 - 3/31/2015 | 14.93 | 0.03 | 0.79 | 0.82 | (0.20 | ) | — | (0.20 | ) | 15.55 | 1.43 | % | 1.35 | % | 0.22 | % | 5.54 | % | 110,241 | 20 | % | |||||||||||||||||||||||||||||||||||
| 4/1/2013 - 3/31/2014 | 13.22 | (0.02 | ) | 1.75 | 1.73 | (0.02 | ) | — | (0.02 | ) | 14.93 | 1.46 | % | 1.35 | % | (0.17 | %) | 13.12 | % | 101,888 | 5 | % | ||||||||||||||||||||||||||||||||||
| Class R | ||||||||||||||||||||||||||||||||||||||||||||||||||||||||
| 4/1/2017 - 3/31/2018 | $15.70 | $0.08 | $1.79 | $1.87 | ($0.17 | ) | ($0.49 | ) | ($0.66 | ) | $16.91 | 0.93 | % | 0.85 | % | 0.49 | % | 11.92 | % | $7,558 | 41 | % | ||||||||||||||||||||||||||||||||||
| 4/1/2016 - 3/31/2017 | 14.63 | 0.15 | 1.95 | 2.10 | (0.16 | ) | (0.87 | ) | (1.03 | ) | 15.70 | 0.93 | % | 0.85 | % | 1.00 | % | 14.71 | % | 7,313 | 41 | % | ||||||||||||||||||||||||||||||||||
| 4/1/2015 - 3/31/2016 | 15.77 | 0.12 | (0.84 | ) | (0.72 | ) | (0.24 | ) | (0.18 | ) | (0.42 | ) | 14.63 | 0.93 | % | 0.85 | % | 0.78 | % | (4.59 | %) | 7,036 | 35 | % | ||||||||||||||||||||||||||||||||
| 4/1/2014 - 3/31/2015 | 15.15 | 0.11 | 0.79 | 0.90 | (0.28 | ) | — | (0.28 | ) | 15.77 | 0.93 | % | 0.85 | % | 0.72 | % | 5.94 | % | 8,893 | 20 | % | |||||||||||||||||||||||||||||||||||
| 4/1/2013 - 3/31/2014 | 13.43 | 0.05 | 1.75 | 1.80 | (0.08 | ) | — | (0.08 | ) | 15.15 | 0.96 | % | 0.85 | % | 0.33 | % | 13.45 | % | 8,151 | 5 | % | |||||||||||||||||||||||||||||||||||
| See Notes to Financial Statements | See explanation of references on C-22 |
C-15
Table of Contents
PACIFIC FUNDS
FINANCIAL HIGHLIGHTS (Continued)
Selected per share, ratios and supplemental data for each year or period ended March 31, were as follows:
| Fund |
| Selected Per Share Data |
| Ratios to Average Net Assets | Supplemental Data | |||||||||||||||||||||||||||||||||||||||||||||||||||
| Investment Operations | Distributions | |||||||||||||||||||||||||||||||||||||||||||||||||||||||
| For the Year or Period Ended (1) | Net Asset Value, Beginning of Year or Period | Net Investment Income (Loss) (2) | Net Realized and Unrealized Gain (Loss) | Total | Net Investment Income | Capital Gains | Total | Net Asset Value, End of Year or Period | Expenses Before Reductions (3) | Expenses After Reductions (3), (4) | Net Investment Income (Loss) (3) | Total Returns (5) | Net Assets, End of Year or Period (in thousands) | Portfolio Turnover Rates | ||||||||||||||||||||||||||||||||||||||||||
Pacific Funds Portfolio Optimization Aggressive-Growth (Continued) | ||||||||||||||||||||||||||||||||||||||||||||||||||||||||
| Advisor Class | ||||||||||||||||||||||||||||||||||||||||||||||||||||||||
| 4/1/2017 - 3/31/2018 | $15.82 | $0.17 | $1.80 | $1.97 | ($0.23 | ) | ($0.49 | ) | ($0.72 | ) | $17.07 | 0.43 | % | 0.35 | % | 0.99 | % | 12.48 | % | $10,067 | 41 | % | ||||||||||||||||||||||||||||||||||
| 4/1/2016 - 3/31/2017 | 14.71 | 0.23 | 1.97 | 2.20 | (0.22 | ) | (0.87 | ) | (1.09 | ) | 15.82 | 0.43 | % | 0.35 | % | 1.50 | % | 15.32 | % | 7,166 | 41 | % | ||||||||||||||||||||||||||||||||||
| 4/1/2015 - 3/31/2016 | 15.86 | 0.19 | (0.84 | ) | (0.65 | ) | (0.32 | ) | (0.18 | ) | (0.50 | ) | 14.71 | 0.43 | % | 0.35 | % | 1.28 | % | (4.13 | %) | 6,679 | 35 | % | ||||||||||||||||||||||||||||||||
| 4/1/2014 - 3/31/2015 | 15.23 | 0.19 | 0.79 | 0.98 | (0.35 | ) | — | (0.35 | ) | 15.86 | 0.43 | % | 0.35 | % | 1.22 | % | 6.50 | % | 6,480 | 20 | % | |||||||||||||||||||||||||||||||||||
| 4/1/2013 - 3/31/2014 | 13.51 | 0.11 | 1.76 | 1.87 | (0.15 | ) | — | (0.15 | ) | 15.23 | 0.46 | % | 0.40 | % | 0.78 | % | 13.84 | % | 2,719 | 5 | % | |||||||||||||||||||||||||||||||||||
Pacific Funds Diversified Alternatives | ||||||||||||||||||||||||||||||||||||||||||||||||||||||||
| Class A | ||||||||||||||||||||||||||||||||||||||||||||||||||||||||
| 4/1/2017 - 3/31/2018 | $9.70 | $0.23 | $0.26 | $0.49 | ($0.24 | ) | $— | ($0.24 | ) | $9.95 | 0.88 | % | 0.85 | % | 2.36 | % | 5.13 | % | $4,904 | 20 | % | |||||||||||||||||||||||||||||||||||
| 4/1/2016 - 3/31/2017 | 9.63 | 0.58 | 0.11 | 0.69 | (0.62 | ) | — | (0.62 | ) | 9.70 | 1.24 | % | 0.85 | % | 5.96 | % | 7.28 | % | 2,647 | 37 | % | |||||||||||||||||||||||||||||||||||
| 4/1/2015 - 3/31/2016 | 10.00 | 0.35 | (0.31 | ) | 0.04 | (0.37 | ) | (0.04 | ) | (0.41 | ) | 9.63 | 1.36 | % | 0.85 | % | 3.65 | % | 0.55 | % | 3,136 | 73 | % | |||||||||||||||||||||||||||||||||
| 4/1/2014 - 3/31/2015 | 9.99 | 0.38 | (0.06 | ) | 0.32 | (0.29 | ) | (0.02 | ) | (0.31 | ) | 10.00 | 2.83 | % | 0.85 | % | 3.77 | % | 3.19 | % | 1,465 | 23 | % | |||||||||||||||||||||||||||||||||
| 12/31/2013 - 3/31/2014 | 10.00 | (0.01 | ) | (0.00 | )(6) | (0.01 | ) | — | — | — | 9.99 | 3.36 | % | 0.85 | % | (0.34 | %) | (0.10 | %) | 10 | 1 | % | ||||||||||||||||||||||||||||||||||
| Class C | ||||||||||||||||||||||||||||||||||||||||||||||||||||||||
| 4/1/2017 - 3/31/2018 | $9.57 | $0.16 | $0.24 | $0.40 | ($0.20 | ) | $— | ($0.20 | ) | $9.77 | 1.63 | % | 1.60 | % | 1.61 | % | 4.31 | % | $3,070 | 20 | % | |||||||||||||||||||||||||||||||||||
| 4/1/2016 - 3/31/2017 | 9.55 | 0.51 | 0.10 | 0.61 | (0.59 | ) | — | (0.59 | ) | 9.57 | 1.99 | % | 1.60 | % | 5.21 | % | 6.48 | % | 1,452 | 37 | % | |||||||||||||||||||||||||||||||||||
| 4/1/2015 - 3/31/2016 | 9.92 | 0.28 | (0.31 | ) | (0.03 | ) | (0.30 | ) | (0.04 | ) | (0.34 | ) | 9.55 | 2.11 | % | 1.60 | % | 2.90 | % | (0.19 | %) | 661 | 73 | % | ||||||||||||||||||||||||||||||||
| 4/1/2014 - 3/31/2015 | 9.97 | 0.30 | (0.06 | ) | 0.24 | (0.27 | ) | (0.02 | ) | (0.29 | ) | 9.92 | 3.58 | % | 1.60 | % | 3.02 | % | 2.39 | % | 558 | 23 | % | |||||||||||||||||||||||||||||||||
| 12/31/2013 - 3/31/2014 | 10.00 | (0.03 | ) | (0.00 | )(6) | (0.03 | ) | — | — | — | 9.97 | 4.11 | % | 1.60 | % | (1.09 | %) | (0.30 | %) | 10 | 1 | % | ||||||||||||||||||||||||||||||||||
| Advisor Class | ||||||||||||||||||||||||||||||||||||||||||||||||||||||||
| 4/1/2017 - 3/31/2018 | $9.73 | $0.26 | $0.25 | $0.51 | ($0.26 | ) | $— | ($0.26 | ) | $9.98 | 0.63 | % | 0.60 | % | 2.61 | % | 5.38 | % | $32,883 | 20 | % | |||||||||||||||||||||||||||||||||||
| 4/1/2016 - 3/31/2017 | 9.65 | 0.61 | 0.12 | 0.73 | (0.65 | ) | — | (0.65 | ) | 9.73 | 0.99 | % | 0.60 | % | 6.21 | % | 7.49 | % | 8,870 | 37 | % | |||||||||||||||||||||||||||||||||||
| 4/1/2015 - 3/31/2016 | 10.01 | 0.39 | (0.33 | ) | 0.06 | (0.38 | ) | (0.04 | ) | (0.42 | ) | 9.65 | 1.11 | % | 0.60 | % | 3.90 | % | 0.86 | % | 2,476 | 73 | % | |||||||||||||||||||||||||||||||||
| 4/1/2014 - 3/31/2015 | 9.99 | 0.41 | (0.08 | ) | 0.33 | (0.29 | ) | (0.02 | ) | (0.31 | ) | 10.01 | 2.58 | % | 0.60 | % | 4.02 | % | 3.37 | % | 3,771 | 23 | % | |||||||||||||||||||||||||||||||||
| 12/31/2013 - 3/31/2014 | 10.00 | (0.00 | )(6) | (0.01 | ) | (0.01 | ) | — | — | — | 9.99 | 3.11 | % | 0.60 | % | (0.09 | %) | (0.10 | %) | 1,978 | 1 | % | ||||||||||||||||||||||||||||||||||
Pacific Funds Short Duration Income | ||||||||||||||||||||||||||||||||||||||||||||||||||||||||
| Class A | ||||||||||||||||||||||||||||||||||||||||||||||||||||||||
| 4/1/2017 - 3/31/2018 | $10.32 | $0.21 | ($0.09 | ) | $0.12 | ($0.20 | ) | $— | ($0.20 | ) | $10.24 | 1.04 | % | 0.75 | % | 2.03 | % | 1.18 | % | $94,197 | 76 | % | ||||||||||||||||||||||||||||||||||
| 4/1/2016 - 3/31/2017 | 10.26 | 0.18 | 0.06 | 0.24 | (0.18 | ) | — | (0.18 | ) | 10.32 | 1.05 | % | 0.83 | % | 1.77 | % | 2.36 | % | 66,901 | 86 | % | |||||||||||||||||||||||||||||||||||
| 4/1/2015 - 3/31/2016 | 10.41 | 0.17 | (0.15 | ) | 0.02 | (0.17 | ) | — | (0.17 | ) | 10.26 | 1.06 | % | 0.85 | % | 1.62 | % | 0.15 | % | 69,477 | 41 | % | ||||||||||||||||||||||||||||||||||
| 4/1/2014 - 3/31/2015 | 10.46 | 0.19 | (0.03 | ) | 0.16 | (0.18 | ) | (0.03 | ) | (0.21 | ) | 10.41 | 1.09 | % | 0.85 | % | 1.77 | % | 1.51 | % | 48,685 | 78 | % | |||||||||||||||||||||||||||||||||
| 4/1/2013 - 3/31/2014 | 10.46 | 0.17 | 0.04 | 0.21 | (0.18 | ) | (0.03 | ) | (0.21 | ) | 10.46 | 1.14 | % | 0.85 | % | 1.68 | % | 2.00 | % | 60,012 | 98 | % | ||||||||||||||||||||||||||||||||||
Class C | ||||||||||||||||||||||||||||||||||||||||||||||||||||||||
| 4/1/2017 - 3/31/2018 | $10.30 | $0.13 | ($0.09 | ) | $0.04 | ($0.12 | ) | $— | ($0.12 | ) | $10.22 | 1.79 | % | 1.50 | % | 1.28 | % | 0.43 | % | $44,337 | 76 | % | ||||||||||||||||||||||||||||||||||
| 4/1/2016 - 3/31/2017 | 10.24 | 0.11 | 0.05 | 0.16 | (0.10 | ) | — | (0.10 | ) | 10.30 | 1.80 | % | 1.58 | % | 1.02 | % | 1.60 | % | 43,092 | 86 | % | |||||||||||||||||||||||||||||||||||
| 4/1/2015 - 3/31/2016 | 10.39 | 0.09 | (0.15 | ) | (0.06 | ) | (0.09 | ) | — | (0.09 | ) | 10.24 | 1.81 | % | 1.60 | % | 0.87 | % | (0.58 | %) | 44,180 | 41 | % | |||||||||||||||||||||||||||||||||
| 4/1/2014 - 3/31/2015 | 10.45 | 0.11 | (0.03 | ) | 0.08 | (0.11 | ) | (0.03 | ) | (0.14 | ) | 10.39 | 1.84 | % | 1.60 | % | 1.02 | % | 0.68 | % | 31,569 | 78 | % | |||||||||||||||||||||||||||||||||
| 4/1/2013 - 3/31/2014 | 10.45 | 0.10 | 0.03 | 0.13 | (0.10 | ) | (0.03 | ) | (0.13 | ) | 10.45 | 1.89 | % | 1.60 | % | 0.93 | % | 1.28 | % | 23,769 | 98 | % | ||||||||||||||||||||||||||||||||||
Class I | ||||||||||||||||||||||||||||||||||||||||||||||||||||||||
| 4/1/2017 - 3/31/2018 | $10.30 | $0.24 | ($0.09 | ) | $0.15 | ($0.23 | ) | $— | ($0.23 | ) | $10.22 | 0.64 | % | 0.50 | % | 2.28 | % | 1.43 | % | $4,329 | 76 | % | ||||||||||||||||||||||||||||||||||
| 4/1/2016 - 3/31/2017 | 10.25 | 0.21 | 0.05 | 0.26 | (0.21 | ) | — | (0.21 | ) | 10.30 | 0.65 | % | 0.53 | % | 2.06 | % | 2.56 | % | 3,407 | 86 | % | |||||||||||||||||||||||||||||||||||
| 4/1/2015 - 3/31/2016 | 10.39 | 0.20 | (0.14 | ) | 0.06 | (0.20 | ) | — | (0.20 | ) | 10.25 | 0.66 | % | 0.55 | % | 1.92 | % | 0.54 | % | 1,695 | 41 | % | ||||||||||||||||||||||||||||||||||
| 4/1/2014 - 3/31/2015 | 10.45 | 0.21 | (0.03 | ) | 0.18 | (0.21 | ) | (0.03 | ) | (0.24 | ) | 10.39 | 0.69 | % | 0.57 | % | 2.05 | % | 1.70 | % | 1,516 | 78 | % | |||||||||||||||||||||||||||||||||
| 4/1/2013 - 3/31/2014 | 10.45 | 0.21 | 0.02 | 0.23 | (0.20 | ) | (0.03 | ) | (0.23 | ) | 10.45 | 0.74 | % | 0.60 | % | 1.93 | % | 2.20 | % | 979 | 98 | % | ||||||||||||||||||||||||||||||||||
Advisor Class | ||||||||||||||||||||||||||||||||||||||||||||||||||||||||
| 4/1/2017 - 3/31/2018 | $10.32 | $0.24 | ($0.09 | ) | $0.15 | ($0.23 | ) | $— | ($0.23 | ) | $10.24 | 0.79 | % | 0.50 | % | 2.28 | % | 1.43 | % | $272,268 | 76 | % | ||||||||||||||||||||||||||||||||||
| 4/1/2016 - 3/31/2017 | 10.26 | 0.21 | 0.06 | 0.27 | (0.21 | ) | — | (0.21 | ) | 10.32 | 0.80 | % | 0.57 | % | 2.02 | % | 2.62 | % | 162,554 | 86 | % | |||||||||||||||||||||||||||||||||||
| 4/1/2015 - 3/31/2016 | 10.41 | 0.19 | (0.15 | ) | 0.04 | (0.19 | ) | — | (0.19 | ) | 10.26 | 0.81 | % | 0.60 | % | 1.87 | % | 0.40 | % | 129,455 | 41 | % | ||||||||||||||||||||||||||||||||||
| 4/1/2014 - 3/31/2015 | 10.46 | 0.21 | (0.02 | ) | 0.19 | (0.21 | ) | (0.03 | ) | (0.24 | ) | 10.41 | 0.83 | % | 0.60 | % | 2.02 | % | 1.78 | % | 51,901 | 78 | % | |||||||||||||||||||||||||||||||||
| 4/1/2013 - 3/31/2014 | 10.46 | 0.20 | 0.03 | 0.23 | (0.20 | ) | (0.03 | ) | (0.23 | ) | 10.46 | 0.89 | % | 0.60 | % | 1.93 | % | 2.25 | % | 9,595 | 98 | % | ||||||||||||||||||||||||||||||||||
| See Notes to Financial Statements | See explanation of references on C-22 |
C-16
Table of Contents
PACIFIC FUNDS
FINANCIAL HIGHLIGHTS (Continued)
Selected per share, ratios and supplemental data for each year or period ended March 31, were as follows:
| Fund |
| Selected Per Share Data |
| Ratios to Average Net Assets | Supplemental Data | |||||||||||||||||||||||||||||||||||||||||||||||||||
| Investment Operations | Distributions | |||||||||||||||||||||||||||||||||||||||||||||||||||||||
| For the Year or Period Ended (1) | Net Asset Value, Beginning of Year or Period | Net Investment Income (Loss) (2) | Net Realized and Unrealized Gain (Loss) | Total | Net Investment Income | Capital Gains | Total | Net Asset Value, End of Year or Period | Expenses Before Reductions (3) | Expenses After Reductions (3), (4) | Net Investment Income (Loss) (3) | Total Returns (5) | Net Assets, End of Year or Period (in thousands) | Portfolio Turnover Rates | ||||||||||||||||||||||||||||||||||||||||||
Pacific Funds Core Income | ||||||||||||||||||||||||||||||||||||||||||||||||||||||||
Class A | ||||||||||||||||||||||||||||||||||||||||||||||||||||||||
| 4/1/2017 - 3/31/2018 | $10.51 | $0.28 | ($0.06 | ) | $0.22 | ($0.28 | ) | $— | ($0.28 | ) | $10.45 | 1.12 | % | 0.85 | % | 2.62 | % | 2.05 | % | $132,006 | 91 | % | ||||||||||||||||||||||||||||||||||
| 4/1/2016 - 3/31/2017 | 10.45 | 0.28 | 0.06 | 0.34 | (0.28 | ) | — | (0.28 | ) | 10.51 | 1.13 | % | 0.93 | % | 2.63 | % | 3.23 | % | 160,226 | 82 | % | |||||||||||||||||||||||||||||||||||
| 4/1/2015 - 3/31/2016 | 10.79 | 0.31 | (0.34 | ) | (0.03 | ) | (0.31 | ) | — | (0.31 | ) | 10.45 | 1.14 | % | 0.95 | % | 2.92 | % | (0.27 | %) | 196,297 | 74 | % | |||||||||||||||||||||||||||||||||
| 4/1/2014 - 3/31/2015 | 10.66 | 0.31 | 0.13 | 0.44 | (0.31 | ) | — | (0.31 | ) | 10.79 | 1.14 | % | 0.93 | % | 2.93 | % | 4.17 | % | 218,368 | 53 | % | |||||||||||||||||||||||||||||||||||
| 4/1/2013 - 3/31/2014 | 10.92 | 0.32 | (0.09 | ) | 0.23 | (0.33 | ) | (0.16 | ) | (0.49 | ) | 10.66 | 1.16 | % | 0.90 | % | 3.03 | % | 2.27 | % | 221,086 | 120 | % | |||||||||||||||||||||||||||||||||
Class C | ||||||||||||||||||||||||||||||||||||||||||||||||||||||||
| 4/1/2017 - 3/31/2018 | $10.51 | $0.20 | ($0.05 | ) | $0.15 | ($0.20 | ) | $— | ($0.20 | ) | $10.46 | 1.87 | % | 1.60 | % | 1.87 | % | 1.38 | % | $101,156 | 91 | % | ||||||||||||||||||||||||||||||||||
| 4/1/2016 - 3/31/2017 | 10.45 | 0.20 | 0.06 | 0.26 | (0.20 | ) | — | (0.20 | ) | 10.51 | 1.88 | % | 1.68 | % | 1.88 | % | 2.46 | % | 120,546 | 82 | % | |||||||||||||||||||||||||||||||||||
| 4/1/2015 - 3/31/2016 | 10.79 | 0.23 | (0.34 | ) | (0.11 | ) | (0.23 | ) | — | (0.23 | ) | 10.45 | 1.89 | % | 1.70 | % | 2.17 | % | (1.03 | %) | 140,657 | 74 | % | |||||||||||||||||||||||||||||||||
| 4/1/2014 - 3/31/2015 | 10.66 | 0.23 | 0.13 | 0.36 | (0.23 | ) | — | (0.23 | ) | 10.79 | 1.89 | % | 1.68 | % | 2.18 | % | 3.42 | % | 183,952 | 53 | % | |||||||||||||||||||||||||||||||||||
| 4/1/2013 - 3/31/2014 | 10.93 | 0.24 | (0.10 | ) | 0.14 | (0.25 | ) | (0.16 | ) | (0.41 | ) | 10.66 | 1.91 | % | 1.65 | % | 2.28 | % | 1.41 | % | 122,946 | 120 | % | |||||||||||||||||||||||||||||||||
Class I | ||||||||||||||||||||||||||||||||||||||||||||||||||||||||
| 4/1/2017 - 3/31/2018 | $10.52 | $0.31 | ($0.06 | ) | $0.25 | ($0.31 | ) | $— | ($0.31 | ) | $10.46 | 0.72 | % | 0.55 | % | 2.92 | % | 2.35 | % | $4,339 | 91 | % | ||||||||||||||||||||||||||||||||||
| 4/1/2016 - 3/31/2017 | 10.46 | 0.31 | 0.06 | 0.37 | (0.31 | ) | — | (0.31 | ) | 10.52 | 0.73 | % | 0.62 | % | 2.93 | % | 3.54 | % | 4,563 | 82 | % | |||||||||||||||||||||||||||||||||||
| 4/1/2015 - 3/31/2016 | 10.80 | 0.34 | (0.34 | ) | 0.00 | (0.34 | ) | — | (0.34 | ) | 10.46 | 0.74 | % | 0.65 | % | 3.22 | % | 0.03 | % | 3,585 | 74 | % | ||||||||||||||||||||||||||||||||||
| 4/1/2014 - 3/31/2015 | 10.67 | 0.34 | 0.13 | 0.47 | (0.34 | ) | — | (0.34 | ) | 10.80 | 0.73 | % | 0.65 | % | 3.21 | % | 4.46 | % | 3,806 | 53 | % | |||||||||||||||||||||||||||||||||||
| 4/1/2013 - 3/31/2014 | 10.93 | 0.35 | (0.09 | ) | 0.26 | (0.36 | ) | (0.16 | ) | (0.52 | ) | 10.67 | 0.76 | % | 0.65 | % | 3.28 | % | 2.53 | % | 1,187 | 120 | % | |||||||||||||||||||||||||||||||||
Class P | ||||||||||||||||||||||||||||||||||||||||||||||||||||||||
| 4/1/2017 - 3/31/2018 | $10.55 | $0.31 | ($0.07 | ) | $0.24 | ($0.30 | ) | $— | ($0.30 | ) | $10.49 | 0.72 | % | 0.60 | % | 2.87 | % | 2.29 | % | $66,750 | 91 | % | ||||||||||||||||||||||||||||||||||
| 4/1/2016 - 3/31/2017 | 10.49 | 0.30 | 0.06 | 0.36 | (0.30 | ) | — | (0.30 | ) | 10.55 | 0.73 | % | 0.70 | % | 2.86 | % | 3.46 | % | 122,260 | 82 | % | |||||||||||||||||||||||||||||||||||
| 4/27/2015 - 3/31/2016 | 10.88 | 0.31 | (0.39 | ) | (0.08 | ) | (0.31 | ) | — | (0.31 | ) | 10.49 | 0.74 | % | 0.70 | % | 3.17 | % | (0.75 | %) | 15,964 | 74 | % | |||||||||||||||||||||||||||||||||
Advisor Class | ||||||||||||||||||||||||||||||||||||||||||||||||||||||||
| 4/1/2017 - 3/31/2018 | $10.53 | $0.31 | ($0.05 | ) | $0.26 | ($0.31 | ) | $— | ($0.31 | ) | $10.48 | 0.87 | % | 0.55 | % | 2.92 | % | 2.45 | % | $388,730 | 91 | % | ||||||||||||||||||||||||||||||||||
| 4/1/2016 - 3/31/2017 | 10.47 | 0.31 | 0.05 | 0.36 | (0.30 | ) | — | (0.30 | ) | 10.53 | 0.88 | % | 0.66 | % | 2.90 | % | 3.50 | % | 337,844 | 82 | % | |||||||||||||||||||||||||||||||||||
| 4/1/2015 - 3/31/2016 | 10.81 | 0.33 | (0.34 | ) | (0.01 | ) | (0.33 | ) | — | (0.33 | ) | 10.47 | 0.89 | % | 0.70 | % | 3.17 | % | (0.02 | %) | 249,677 | 74 | % | |||||||||||||||||||||||||||||||||
| 4/1/2014 - 3/31/2015 | 10.68 | 0.34 | 0.13 | 0.47 | (0.34 | ) | — | (0.34 | ) | 10.81 | 0.88 | % | 0.69 | % | 3.17 | % | 4.43 | % | 219,437 | 53 | % | |||||||||||||||||||||||||||||||||||
| 4/1/2013 - 3/31/2014 | 10.95 | 0.35 | (0.10 | ) | 0.25 | (0.36 | ) | (0.16 | ) | (0.52 | ) | 10.68 | 0.91 | % | 0.65 | % | 3.28 | % | 2.53 | % | 69,489 | 120 | % | |||||||||||||||||||||||||||||||||
Pacific Funds Strategic Income | ||||||||||||||||||||||||||||||||||||||||||||||||||||||||
Class A | ||||||||||||||||||||||||||||||||||||||||||||||||||||||||
| 4/1/2017 - 3/31/2018 | $10.68 | $0.40 | $0.02 | $0.42 | ($0.39 | ) | $— | ($0.39 | ) | $10.71 | 1.23 | % | 0.95 | % | 3.70 | % | 3.95 | % | $71,948 | 94 | % | |||||||||||||||||||||||||||||||||||
| 4/1/2016 - 3/31/2017 | 10.09 | 0.39 | 0.59 | 0.98 | (0.39 | ) | — | (0.39 | ) | 10.68 | 1.25 | % | 1.02 | % | 3.71 | % | 9.82 | % | 66,765 | 116 | % | |||||||||||||||||||||||||||||||||||
| 4/1/2015 - 3/31/2016 | 10.75 | 0.43 | (0.66 | ) | (0.23 | ) | (0.43 | ) | — | (0.43 | ) | 10.09 | 1.26 | % | 1.05 | % | 4.20 | % | (2.17 | %) | 52,218 | 94 | % | |||||||||||||||||||||||||||||||||
| 4/1/2014 - 3/31/2015 | 11.20 | 0.46 | (0.37 | ) | 0.09 | (0.44 | ) | (0.10 | ) | (0.54 | ) | 10.75 | 1.28 | % | 1.05 | % | 4.18 | % | 0.84 | % | 51,175 | 157 | % | |||||||||||||||||||||||||||||||||
| 4/1/2013 - 3/31/2014 | 11.23 | 0.48 | 0.30 | 0.78 | (0.49 | ) | (0.32 | ) | (0.81 | ) | 11.20 | 1.43 | % | 1.05 | % | 4.34 | % | 7.25 | % | 37,896 | 190 | % | ||||||||||||||||||||||||||||||||||
Class C | ||||||||||||||||||||||||||||||||||||||||||||||||||||||||
| 4/1/2017 - 3/31/2018 | $10.66 | $0.32 | $0.02 | $0.34 | ($0.31 | ) | $— | ($0.31 | ) | $10.69 | 1.98 | % | 1.65 | % | 3.00 | % | 3.25 | % | $57,389 | 94 | % | |||||||||||||||||||||||||||||||||||
| 4/1/2016 - 3/31/2017 | 10.07 | 0.31 | 0.59 | 0.90 | (0.31 | ) | — | (0.31 | ) | 10.66 | 2.00 | % | 1.76 | % | 2.97 | % | 9.03 | % | 50,016 | 116 | % | |||||||||||||||||||||||||||||||||||
| 4/1/2015 - 3/31/2016 | 10.73 | 0.36 | (0.67 | ) | (0.31 | ) | (0.35 | ) | — | (0.35 | ) | 10.07 | 2.01 | % | 1.80 | % | 3.45 | % | (2.90 | %) | 44,196 | 94 | % | |||||||||||||||||||||||||||||||||
| 4/1/2014 - 3/31/2015 | 11.19 | 0.38 | (0.38 | ) | — | (0.36 | ) | (0.10 | ) | (0.46 | ) | 10.73 | 2.03 | % | 1.80 | % | 3.43 | % | 0.03 | % | 42,684 | 157 | % | |||||||||||||||||||||||||||||||||
| 4/1/2013 - 3/31/2014 | 11.22 | 0.40 | 0.30 | 0.70 | (0.41 | ) | (0.32 | ) | (0.73 | ) | 11.19 | 2.18 | % | 1.80 | % | 3.59 | % | 6.51 | % | 23,451 | 190 | % | ||||||||||||||||||||||||||||||||||
Class I | ||||||||||||||||||||||||||||||||||||||||||||||||||||||||
| 4/1/2017 - 3/31/2018 | $10.62 | $0.43 | $0.02 | $0.45 | ($0.42 | ) | $— | ($0.42 | ) | $10.65 | 0.83 | % | 0.65 | % | 4.00 | % | 4.28 | % | $3,882 | 94 | % | |||||||||||||||||||||||||||||||||||
| 4/1/2016 - 3/31/2017 | 10.03 | 0.42 | 0.59 | 1.01 | (0.42 | ) | — | (0.42 | ) | 10.62 | 0.85 | % | 0.71 | % | 4.01 | % | 10.20 | % | 2,446 | 116 | % | |||||||||||||||||||||||||||||||||||
| 4/1/2015 - 3/31/2016 | 10.70 | 0.46 | (0.67 | ) | (0.21 | ) | (0.46 | ) | — | (0.46 | ) | 10.03 | 0.86 | % | 0.75 | % | 4.50 | % | (1.98 | %) | 948 | 94 | % | |||||||||||||||||||||||||||||||||
| 4/1/2014 - 3/31/2015 | 11.15 | 0.49 | (0.37 | ) | 0.12 | (0.47 | ) | (0.10 | ) | (0.57 | ) | 10.70 | 0.88 | % | 0.77 | % | 4.46 | % | 1.13 | % | 1,381 | 157 | % | |||||||||||||||||||||||||||||||||
| 4/1/2013 - 3/31/2014 | 11.18 | 0.52 | 0.28 | 0.80 | (0.51 | ) | (0.32 | ) | (0.83 | ) | 11.15 | 1.03 | % | 0.80 | % | 4.59 | % | 7.51 | % | 1,686 | 190 | % | ||||||||||||||||||||||||||||||||||
| See Notes to Financial Statements | See explanation of references on C-22 |
C-17
Table of Contents
PACIFIC FUNDS
FINANCIAL HIGHLIGHTS (Continued)
Selected per share, ratios and supplemental data for each year or period ended March 31, were as follows:
| Fund |
| Selected Per Share Data |
| Ratios to Average Net Assets | Supplemental Data | |||||||||||||||||||||||||||||||||||||||||||||||||||
| Investment Operations | Distributions | |||||||||||||||||||||||||||||||||||||||||||||||||||||||
| For the Year or Period Ended (1) | Net Asset Value, Beginning of Year or Period | Net Investment Income (Loss) (2) | Net Realized and Unrealized Gain (Loss) | Total | Net Investment Income | Capital Gains | Total | Net Asset Value, End of Year or Period | Expenses Before Reductions (3) | Expenses After Reductions (3), (4) | Net Investment Income (Loss) (3) | Total Returns (5) | Net Assets, End of Year or Period (in thousands) | Portfolio Turnover Rates | ||||||||||||||||||||||||||||||||||||||||||
Pacific Funds Strategic Income (Continued) | ||||||||||||||||||||||||||||||||||||||||||||||||||||||||
Advisor Class | ||||||||||||||||||||||||||||||||||||||||||||||||||||||||
| 4/1/2017 - 3/31/2018 | $10.68 | $0.43 | $0.02 | $0.45 | ($0.42 | ) | $— | ($0.42 | ) | $10.71 | 0.98 | % | 0.70 | % | 3.95 | % | 4.21 | % | $405,200 | 94 | % | |||||||||||||||||||||||||||||||||||
| 4/1/2016 - 3/31/2017 | 10.09 | 0.42 | 0.58 | 1.00 | (0.41 | ) | — | (0.41 | ) | 10.68 | 1.00 | % | 0.77 | % | 3.96 | % | 10.09 | % | 217,482 | 116 | % | |||||||||||||||||||||||||||||||||||
| 4/1/2015 - 3/31/2016 | 10.76 | 0.46 | (0.68 | ) | (0.22 | ) | (0.45 | ) | — | (0.45 | ) | 10.09 | 1.01 | % | 0.80 | % | 4.45 | % | (2.01 | %) | 115,565 | 94 | % | |||||||||||||||||||||||||||||||||
| 4/1/2014 - 3/31/2015 | 11.20 | 0.48 | (0.35 | ) | 0.13 | (0.47 | ) | (0.10 | ) | (0.57 | ) | 10.76 | 1.03 | % | 0.80 | % | 4.43 | % | 1.20 | % | 66,223 | 157 | % | |||||||||||||||||||||||||||||||||
| 4/1/2013 - 3/31/2014 | 11.24 | 0.51 | 0.29 | 0.80 | (0.52 | ) | (0.32 | ) | (0.84 | ) | 11.20 | 1.18 | % | 0.80 | % | 4.59 | % | 7.42 | % | 9,302 | 190 | % | ||||||||||||||||||||||||||||||||||
Pacific Funds Floating Rate Income | ||||||||||||||||||||||||||||||||||||||||||||||||||||||||
Class A | ||||||||||||||||||||||||||||||||||||||||||||||||||||||||
| 4/1/2017 - 3/31/2018 | $10.15 | $0.42 | ($0.04 | ) | $0.38 | ($0.41 | ) | $— | ($0.41 | ) | $10.12 | 1.28 | % | 1.01 | %(9) | 4.11 | % | 3.85 | % | $209,034 | 158 | % | ||||||||||||||||||||||||||||||||||
| 4/1/2016 - 3/31/2017 | 9.76 | 0.42 | 0.38 | 0.80 | (0.41 | ) | — | (0.41 | ) | 10.15 | 1.30 | % | 1.09 | % | 4.21 | % | 8.32 | % | 207,238 | 168 | % | |||||||||||||||||||||||||||||||||||
| 4/1/2015 - 3/31/2016 | 10.08 | 0.39 | (0.32 | ) | 0.07 | (0.39 | ) | — | (0.39 | ) | 9.76 | 1.30 | % | 1.12 | % | 3.92 | % | 0.72 | % | 191,376 | 99 | % | ||||||||||||||||||||||||||||||||||
| 4/1/2014 - 3/31/2015 | 10.51 | 0.44 | (0.40 | ) | 0.04 | (0.44 | ) | (0.03 | ) | (0.47 | ) | 10.08 | 1.29 | % | 1.07 | % | 4.20 | % | 0.38 | % | 215,160 | 80 | % | |||||||||||||||||||||||||||||||||
| 4/1/2013 - 3/31/2014 | 10.46 | 0.40 | 0.04 | 0.44 | (0.37 | ) | (0.02 | ) | (0.39 | ) | 10.51 | 1.30 | % | 1.05 | % | 3.86 | % | 4.30 | % | 375,848 | 123 | % | ||||||||||||||||||||||||||||||||||
Class C | ||||||||||||||||||||||||||||||||||||||||||||||||||||||||
| 4/1/2017 - 3/31/2018 | $10.13 | $0.34 | ($0.03 | ) | $0.31 | ($0.34 | ) | $— | ($0.34 | ) | $10.10 | 2.03 | % | 1.71 | %(9) | 3.41 | % | 3.14 | % | $191,239 | 158 | % | ||||||||||||||||||||||||||||||||||
| 4/1/2016 - 3/31/2017 | 9.74 | 0.35 | 0.37 | 0.72 | (0.33 | ) | — | (0.33 | ) | 10.13 | 2.05 | % | 1.83 | % | 3.47 | % | 7.54 | % | 180,612 | 168 | % | |||||||||||||||||||||||||||||||||||
| 4/1/2015 - 3/31/2016 | 10.06 | 0.31 | (0.31 | ) | 0.00 | (0.32 | ) | — | (0.32 | ) | 9.74 | 2.05 | % | 1.87 | % | 3.17 | % | (0.04 | %) | 161,326 | 99 | % | ||||||||||||||||||||||||||||||||||
| 4/1/2014 - 3/31/2015 | 10.50 | 0.36 | (0.40 | ) | (0.04 | ) | (0.37 | ) | (0.03 | ) | (0.40 | ) | 10.06 | 2.04 | % | 1.82 | % | 3.45 | % | (0.46 | %) | 179,798 | 80 | % | ||||||||||||||||||||||||||||||||
| 4/1/2013 - 3/31/2014 | 10.45 | 0.33 | 0.04 | 0.37 | (0.30 | ) | (0.02 | ) | (0.32 | ) | 10.50 | 2.05 | % | 1.80 | % | 3.11 | % | 3.57 | % | 214,365 | 123 | % | ||||||||||||||||||||||||||||||||||
Class I | ||||||||||||||||||||||||||||||||||||||||||||||||||||||||
| 4/1/2017 - 3/31/2018 | $10.16 | $0.45 | ($0.03 | ) | $0.42 | ($0.44 | ) | $— | ($0.44 | ) | $10.14 | 0.88 | % | 0.71 | %(9) | 4.41 | % | 4.25 | % | $294,352 | 158 | % | ||||||||||||||||||||||||||||||||||
| 4/1/2016 - 3/31/2017 | 9.77 | 0.45 | 0.38 | 0.83 | (0.44 | ) | — | (0.44 | ) | 10.16 | 0.89 | % | 0.78 | % | 4.52 | % | 8.63 | % | 249,811 | 168 | % | |||||||||||||||||||||||||||||||||||
| 4/1/2015 - 3/31/2016 | 10.09 | 0.42 | (0.32 | ) | 0.10 | (0.42 | ) | — | (0.42 | ) | 9.77 | 0.90 | % | 0.82 | % | 4.22 | % | 1.02 | % | 91,984 | 99 | % | ||||||||||||||||||||||||||||||||||
| 4/1/2014 - 3/31/2015 | 10.53 | 0.46 | (0.40 | ) | 0.06 | (0.47 | ) | (0.03 | ) | (0.50 | ) | 10.09 | 0.89 | % | 0.81 | % | 4.46 | % | 0.55 | % | 88,508 | 80 | % | |||||||||||||||||||||||||||||||||
| 4/1/2013 - 3/31/2014 | 10.47 | 0.43 | 0.05 | 0.48 | (0.40 | ) | (0.02 | ) | (0.42 | ) | 10.53 | 0.90 | % | 0.80 | % | 4.11 | % | 4.65 | % | 96,635 | 123 | % | ||||||||||||||||||||||||||||||||||
Class P | ||||||||||||||||||||||||||||||||||||||||||||||||||||||||
| 4/1/2017 - 3/31/2018 | $10.16 | $0.44 | ($0.02 | ) | $0.42 | ($0.44 | ) | $— | ($0.44 | ) | $10.14 | 0.88 | % | 0.76 | %(9) | 4.36 | % | 4.20 | % | $64,557 | 158 | % | ||||||||||||||||||||||||||||||||||
| 4/1/2016 - 3/31/2017 | 9.76 | 0.45 | 0.38 | 0.83 | (0.43 | ) | — | (0.43 | ) | 10.16 | 0.89 | % | 0.87 | % | 4.43 | % | 8.56 | % | 78,660 | 168 | % | |||||||||||||||||||||||||||||||||||
| 4/1/2015 - 3/31/2016 | 10.09 | 0.41 | (0.33 | ) | 0.08 | (0.41 | ) | — | (0.41 | ) | 9.76 | 0.90 | % | 0.87 | % | 4.17 | % | 0.97 | % | 568 | 99 | % | ||||||||||||||||||||||||||||||||||
| 4/1/2014 - 3/31/2015 | 10.52 | 0.45 | (0.38 | ) | 0.07 | (0.47 | ) | (0.03 | ) | (0.50 | ) | 10.09 | 0.89 | % | 0.83 | % | 4.44 | % | 0.64 | % | 691 | 80 | % | |||||||||||||||||||||||||||||||||
| 4/1/2013 - 3/31/2014 | 10.47 | 0.43 | 0.04 | 0.47 | (0.40 | ) | (0.02 | ) | (0.42 | ) | 10.52 | 0.90 | % | 0.80 | % | 4.11 | % | 4.53 | % | 249 | 123 | % | ||||||||||||||||||||||||||||||||||
Advisor Class | ||||||||||||||||||||||||||||||||||||||||||||||||||||||||
| 4/1/2017 - 3/31/2018 | $10.18 | $0.44 | ($0.02 | ) | $0.42 | ($0.44 | ) | $— | ($0.44 | ) | $10.16 | 1.03 | % | 0.76 | %(9) | 4.36 | % | 4.20 | % | $715,700 | 158 | % | ||||||||||||||||||||||||||||||||||
| 4/1/2016 - 3/31/2017 | 9.79 | 0.45 | 0.37 | 0.82 | (0.43 | ) | — | (0.43 | ) | 10.18 | 1.04 | % | 0.83 | % | 4.47 | % | 8.56 | % | 450,761 | 168 | % | |||||||||||||||||||||||||||||||||||
| 4/1/2015 - 3/31/2016 | 10.11 | 0.41 | (0.32 | ) | 0.09 | (0.41 | ) | — | (0.41 | ) | 9.79 | 1.05 | % | 0.87 | % | 4.17 | % | 0.96 | % | 231,437 | 99 | % | ||||||||||||||||||||||||||||||||||
| 4/1/2014 - 3/31/2015 | 10.54 | 0.46 | (0.39 | ) | 0.07 | (0.47 | ) | (0.03 | ) | (0.50 | ) | 10.11 | 1.04 | % | 0.82 | % | 4.45 | % | 0.63 | % | 270,383 | 80 | % | |||||||||||||||||||||||||||||||||
| 4/1/2013 - 3/31/2014 | 10.49 | 0.43 | 0.04 | 0.47 | (0.40 | ) | (0.02 | ) | (0.42 | ) | 10.54 | 1.05 | % | 0.80 | % | 4.11 | % | 4.54 | % | 368,122 | 123 | % | ||||||||||||||||||||||||||||||||||
Pacific Funds Limited Duration High Income | ||||||||||||||||||||||||||||||||||||||||||||||||||||||||
Class A | ||||||||||||||||||||||||||||||||||||||||||||||||||||||||
| 4/1/2017 - 3/31/2018 | $9.12 | $0.37 | ($0.10 | ) | $0.27 | ($0.37 | ) | $— | ($0.37 | ) | $9.02 | 1.48 | % | 0.95 | % | 4.06 | % | 3.02 | % | $4,813 | 65 | % | ||||||||||||||||||||||||||||||||||
| 4/1/2016 - 3/31/2017 | 8.86 | 0.35 | 0.26 | 0.61 | (0.35 | ) | — | (0.35 | ) | 9.12 | 1.47 | % | 1.05 | % | 3.87 | % | 7.01 | % | 5,506 | 77 | % | |||||||||||||||||||||||||||||||||||
| 4/1/2015 - 3/31/2016 | 9.60 | 0.41 | (0.74 | ) | (0.33 | ) | (0.41 | ) | — | (0.41 | ) | 8.86 | 1.45 | % | 1.08 | % | 4.44 | % | (3.48 | %) | 7,503 | 48 | % | |||||||||||||||||||||||||||||||||
| 4/1/2014 - 3/31/2015 | 10.22 | 0.45 | (0.58 | ) | (0.13 | ) | (0.45 | ) | (0.04 | ) | (0.49 | ) | 9.60 | 1.49 | % | 1.08 | % | 4.51 | % | (1.27 | %) | 7,094 | 49 | % | ||||||||||||||||||||||||||||||||
| 7/31/2013 - 3/31/2014 | 10.00 | 0.26 | 0.22 | 0.48 | (0.25 | ) | (0.01 | ) | (0.26 | ) | 10.22 | 1.67 | % | 1.08 | % | 3.94 | % | 4.85 | % | 8,677 | 53 | % | ||||||||||||||||||||||||||||||||||
Class C | ||||||||||||||||||||||||||||||||||||||||||||||||||||||||
| 4/1/2017 - 3/31/2018 | $9.10 | $0.31 | ($0.10 | ) | $0.21 | ($0.31 | ) | $— | ($0.31 | ) | $9.00 | 2.23 | % | 1.65 | % | 3.36 | % | 2.31 | % | $3,260 | 65 | % | ||||||||||||||||||||||||||||||||||
| 4/1/2016 - 3/31/2017 | 8.85 | 0.28 | 0.26 | 0.54 | (0.29 | ) | — | (0.29 | ) | 9.10 | 2.22 | % | 1.78 | % | 3.14 | % | 6.12 | % | 3,206 | 77 | % | |||||||||||||||||||||||||||||||||||
| 4/1/2015 - 3/31/2016 | 9.58 | 0.34 | (0.73 | ) | (0.39 | ) | (0.34 | ) | — | (0.34 | ) | 8.85 | 2.20 | % | 1.83 | % | 3.69 | % | (4.10 | %) | 3,104 | 48 | % | |||||||||||||||||||||||||||||||||
| 4/1/2014 - 3/31/2015 | 10.20 | 0.37 | (0.57 | ) | (0.20 | ) | (0.38 | ) | (0.04 | ) | (0.42 | ) | 9.58 | 2.21 | % | 1.83 | % | 3.76 | % | (1.99 | %) | 3,664 | 49 | % | ||||||||||||||||||||||||||||||||
| 7/31/2013 - 3/31/2014 | 10.00 | 0.21 | 0.22 | 0.43 | (0.22 | ) | (0.01 | ) | (0.23 | ) | 10.20 | 2.42 | % | 1.83 | % | 3.19 | % | 4.28 | % | 2,442 | 53 | % | ||||||||||||||||||||||||||||||||||
| See Notes to Financial Statements | See explanation of references on C-22 |
C-18
Table of Contents
PACIFIC FUNDS
FINANCIAL HIGHLIGHTS (Continued)
Selected per share, ratios and supplemental data for each year or period ended March 31, were as follows:
| Fund |
| Selected Per Share Data |
| Ratios to Average Net Assets | Supplemental Data | |||||||||||||||||||||||||||||||||||||||||||||||||||
| Investment Operations | Distributions | |||||||||||||||||||||||||||||||||||||||||||||||||||||||
| For the Year or Period Ended (1) | Net Asset Value, Beginning of Year or Period | Net Investment Income (Loss) (2) | Net Realized and Unrealized Gain (Loss) | Total | Net Investment Income | Capital Gains | Total | Net Asset Value, End of Year or Period | Expenses Before Reductions (3) | Expenses After Reductions (3), (4) | Net Investment Income (Loss) (3) | Total Returns (5) | Net Assets, End of Year or Period (in thousands) | Portfolio Turnover Rates | ||||||||||||||||||||||||||||||||||||||||||
Pacific Funds Limited Duration High Income (Continued) | ||||||||||||||||||||||||||||||||||||||||||||||||||||||||
Class I | ||||||||||||||||||||||||||||||||||||||||||||||||||||||||
| 4/1/2017 - 3/31/2018 | $9.11 | $0.39 | ($0.08 | ) | $0.31 | ($0.40 | ) | $— | ($0.40 | ) | $9.02 | 1.08 | % | 0.70 | % | 4.31 | % | 3.28 | % | $24,719 | 65 | % | ||||||||||||||||||||||||||||||||||
| 4/1/2016 - 3/31/2017 | 8.86 | 0.38 | 0.25 | 0.63 | (0.38 | ) | — | (0.38 | ) | 9.11 | 1.07 | % | 0.76 | % | 4.16 | % | 7.32 | % | 22,819 | 77 | % | |||||||||||||||||||||||||||||||||||
| 4/1/2015 - 3/31/2016 | 9.60 | 0.44 | (0.74 | ) | (0.30 | ) | (0.44 | ) | — | (0.44 | ) | 8.86 | 1.05 | % | 0.78 | % | 4.74 | % | (3.19 | %) | 21,217 | 48 | % | |||||||||||||||||||||||||||||||||
| 4/1/2014 - 3/31/2015 | 10.22 | 0.48 | (0.58 | ) | (0.10 | ) | (0.48 | ) | (0.04 | ) | (0.52 | ) | 9.60 | 1.09 | % | 0.80 | % | 4.79 | % | (0.89 | %) | 21,921 | 49 | % | ||||||||||||||||||||||||||||||||
| 7/31/2013 - 3/31/2014 | 10.00 | 0.28 | 0.21 | 0.49 | (0.26 | ) | (0.01 | ) | (0.27 | ) | 10.22 | 1.27 | % | 0.83 | % | 4.19 | % | 4.87 | % | 22,227 | 53 | % | ||||||||||||||||||||||||||||||||||
Advisor Class | ||||||||||||||||||||||||||||||||||||||||||||||||||||||||
| 4/1/2017 - 3/31/2018 | $9.11 | $0.39 | ($0.09 | ) | $0.30 | ($0.40 | ) | $— | ($0.40 | ) | $9.01 | 1.23 | % | 0.70 | % | 4.31 | % | 3.28 | % | $2,612 | 65 | % | ||||||||||||||||||||||||||||||||||
| 4/1/2016 - 3/31/2017 | 8.86 | 0.37 | 0.25 | 0.62 | (0.37 | ) | — | (0.37 | ) | 9.11 | 1.22 | % | 0.79 | % | 4.13 | % | 7.17 | % | 2,032 | 77 | % | |||||||||||||||||||||||||||||||||||
| 4/1/2015 - 3/31/2016 | 9.60 | 0.44 | (0.75 | ) | (0.31 | ) | (0.43 | ) | — | (0.43 | ) | 8.86 | 1.20 | % | 0.83 | % | 4.69 | % | (3.24 | %) | 1,975 | 48 | % | |||||||||||||||||||||||||||||||||
| 4/1/2014 - 3/31/2015 | 10.21 | 0.46 | (0.55 | ) | (0.09 | ) | (0.48 | ) | (0.04 | ) | (0.52 | ) | 9.60 | 1.18 | % | 0.83 | % | 4.76 | % | (0.92 | %) | 5,669 | 49 | % | ||||||||||||||||||||||||||||||||
| 7/31/2013 - 3/31/2014 | 10.00 | 0.28 | 0.21 | 0.49 | (0.27 | ) | (0.01 | ) | (0.28 | ) | 10.21 | 1.42 | % | 0.83 | % | 4.19 | % | 4.89 | % | 1,860 | 53 | % | ||||||||||||||||||||||||||||||||||
Pacific Funds High Income | ||||||||||||||||||||||||||||||||||||||||||||||||||||||||
Class A | ||||||||||||||||||||||||||||||||||||||||||||||||||||||||
| 4/1/2017 - 3/31/2018 | $10.29 | $0.50 | ($0.03 | ) | $0.47 | ($0.53 | ) | $— | ($0.53 | ) | $10.23 | 1.46 | % | 0.95 | % | 4.82 | % | 4.66 | % | $5,463 | 72 | % | ||||||||||||||||||||||||||||||||||
| 4/1/2016 - 3/31/2017 | 9.44 | 0.48 | 0.92 | 1.40 | (0.55 | ) | — | (0.55 | ) | 10.29 | 1.32 | % | 1.03 | % | 4.81 | % | 15.16 | % | 5,626 | 61 | % | |||||||||||||||||||||||||||||||||||
| 4/1/2015 - 3/31/2016 | 10.48 | 0.50 | (1.10 | ) | (0.60 | ) | (0.44 | ) | — | (0.44 | ) | 9.44 | 1.28 | % | 1.05 | % | 5.05 | % | (5.79 | %) | 10,391 | 54 | % | |||||||||||||||||||||||||||||||||
| 4/1/2014 - 3/31/2015 | 11.22 | 0.54 | (0.60 | ) | (0.06 | ) | (0.52 | ) | (0.16 | ) | (0.68 | ) | 10.48 | 1.50 | % | 1.05 | % | 4.90 | % | (0.49 | %) | 5,900 | 60 | % | ||||||||||||||||||||||||||||||||
| 4/1/2013 - 3/31/2014 | 11.16 | 0.56 | 0.25 | 0.81 | (0.55 | ) | (0.20 | ) | (0.75 | ) | 11.22 | 1.67 | % | 1.05 | % | 5.03 | % | 7.50 | % | 6,441 | 99 | % | ||||||||||||||||||||||||||||||||||
Class C | ||||||||||||||||||||||||||||||||||||||||||||||||||||||||
| 4/1/2017 - 3/31/2018 | $10.28 | $0.43 | ($0.04 | ) | $0.39 | ($0.46 | ) | $— | ($0.46 | ) | $10.21 | 2.21 | % | 1.65 | % | 4.12 | % | 3.84 | % | $4,418 | 72 | % | ||||||||||||||||||||||||||||||||||
| 4/1/2016 - 3/31/2017 | 9.43 | 0.41 | 0.92 | 1.33 | (0.48 | ) | — | (0.48 | ) | 10.28 | 2.07 | % | 1.76 | % | 4.07 | % | 14.36 | % | 4,802 | 61 | % | |||||||||||||||||||||||||||||||||||
| 4/1/2015 - 3/31/2016 | 10.47 | 0.43 | (1.10 | ) | (0.67 | ) | (0.37 | ) | — | (0.37 | ) | 9.43 | 2.03 | % | 1.80 | % | 4.30 | % | (6.52 | %) | 4,324 | 54 | % | |||||||||||||||||||||||||||||||||
| 4/1/2014 - 3/31/2015 | 11.21 | 0.45 | (0.59 | ) | (0.14 | ) | (0.44 | ) | (0.16 | ) | (0.60 | ) | 10.47 | 2.24 | % | 1.80 | % | 4.15 | % | (1.22 | %) | 5,419 | 60 | % | ||||||||||||||||||||||||||||||||
| 4/1/2013 - 3/31/2014 | 11.16 | 0.47 | 0.25 | 0.72 | (0.47 | ) | (0.20 | ) | (0.67 | ) | 11.21 | 2.42 | % | 1.80 | % | 4.28 | % | 6.65 | % | 5,245 | 99 | % | ||||||||||||||||||||||||||||||||||
Class I | ||||||||||||||||||||||||||||||||||||||||||||||||||||||||
| 4/1/2017 - 3/31/2018 | $10.21 | $0.52 | ($0.02 | ) | $0.50 | ($0.57 | ) | $— | ($0.57 | ) | $10.14 | 1.07 | % | 0.70 | % | 5.07 | % | 4.95 | % | $211 | 72 | % | ||||||||||||||||||||||||||||||||||
| 4/1/2016 - 3/31/2017 | 9.37 | 0.51 | 0.91 | 1.42 | (0.58 | ) | — | (0.58 | ) | 10.21 | 0.90 | % | 0.73 | % | 5.10 | % | 15.52 | % | 5,204 | 61 | % | |||||||||||||||||||||||||||||||||||
| 4/1/2015 - 3/31/2016 | 10.41 | 0.54 | (1.11 | ) | (0.57 | ) | (0.47 | ) | — | (0.47 | ) | 9.37 | 0.88 | % | 0.75 | % | 5.35 | % | (5.57 | %) | 58 | 54 | % | |||||||||||||||||||||||||||||||||
| 4/1/2014 - 3/31/2015 | 11.14 | 0.57 | (0.61 | ) | (0.04 | ) | (0.53 | ) | (0.16 | ) | (0.69 | ) | 10.41 | 1.10 | % | 0.77 | % | 5.18 | % | (0.30 | %) | 241 | 60 | % | ||||||||||||||||||||||||||||||||
| 4/1/2013 - 3/31/2014 | 11.09 | 0.58 | 0.24 | 0.82 | (0.57 | ) | (0.20 | ) | (0.77 | ) | 11.14 | 1.27 | % | 0.80 | % | 5.28 | % | 7.72 | % | 9,493 | 99 | % | ||||||||||||||||||||||||||||||||||
Class P | ||||||||||||||||||||||||||||||||||||||||||||||||||||||||
| 4/1/2017 - 3/31/2018 | $10.20 | $0.52 | ($0.02 | ) | $0.50 | ($0.56 | ) | $— | ($0.56 | ) | $10.14 | 1.06 | % | 0.73 | % | 5.04 | % | 4.92 | % | $68,844 | 72 | % | ||||||||||||||||||||||||||||||||||
| 4/1/2016 - 3/31/2017 | 9.36 | 0.49 | 0.93 | 1.42 | (0.58 | ) | — | (0.58 | ) | 10.20 | 0.95 | % | 0.80 | % | 5.04 | % | 15.47 | % | 10,554 | 61 | % | |||||||||||||||||||||||||||||||||||
| 4/1/2015 - 3/31/2016 | 10.40 | 0.52 | (1.09 | ) | (0.57 | ) | (0.47 | ) | — | (0.47 | ) | 9.36 | 0.88 | % | 0.80 | % | 5.30 | % | (5.60 | %) | 113,998 | 54 | % | |||||||||||||||||||||||||||||||||
| 1/14/2015 - 3/31/2015 | 10.22 | 0.11 | 0.19 | 0.30 | (0.12 | ) | — | (0.12 | ) | 10.40 | 1.06 | % | 0.80 | % | 5.15 | % | 2.94 | % | 38,919 | 60 | % | |||||||||||||||||||||||||||||||||||
Advisor Class | ||||||||||||||||||||||||||||||||||||||||||||||||||||||||
| 4/1/2017 - 3/31/2018 | $10.30 | $0.53 | ($0.03 | ) | $0.50 | ($0.56 | ) | $— | ($0.56 | ) | $10.24 | 1.21 | % | 0.70 | % | 5.07 | % | 4.91 | % | $2,503 | 72 | % | ||||||||||||||||||||||||||||||||||
| 4/1/2016 - 3/31/2017 | 9.44 | 0.51 | 0.93 | 1.44 | (0.58 | ) | — | (0.58 | ) | 10.30 | 1.06 | % | 0.77 | % | 5.07 | % | 15.58 | % | 2,304 | 61 | % | |||||||||||||||||||||||||||||||||||
| 4/1/2015 - 3/31/2016 | 10.49 | 0.53 | (1.12 | ) | (0.59 | ) | (0.46 | ) | — | (0.46 | ) | 9.44 | 1.03 | % | 0.80 | % | 5.30 | % | (5.66 | %) | 1,666 | 54 | % | |||||||||||||||||||||||||||||||||
| 4/1/2014 - 3/31/2015 | 11.23 | 0.57 | (0.60 | ) | (0.03 | ) | (0.55 | ) | (0.16 | ) | (0.71 | ) | 10.49 | 1.24 | % | 0.80 | % | 5.15 | % | (0.23 | %) | 3,807 | 60 | % | ||||||||||||||||||||||||||||||||
| 4/1/2013 - 3/31/2014 | 11.18 | 0.58 | 0.24 | 0.82 | (0.57 | ) | (0.20 | ) | (0.77 | ) | 11.23 | 1.42 | % | 0.80 | % | 5.28 | % | 7.67 | % | 3,064 | 99 | % | ||||||||||||||||||||||||||||||||||
Pacific Funds Large-Cap (7) | ||||||||||||||||||||||||||||||||||||||||||||||||||||||||
| Class A | ||||||||||||||||||||||||||||||||||||||||||||||||||||||||
| 4/1/2017 - 3/31/2018 | $11.08 | $0.08 | $1.30 | $1.38 | ($0.10 | ) | ($0.08 | ) | ($0.18 | ) | $12.28 | 1.73 | % | 1.00 | % | 0.69 | % | 12.43 | % | $4,939 | 98 | % | ||||||||||||||||||||||||||||||||||
| 4/1/2016 - 3/31/2017 | 9.66 | 0.11 | 1.40 | 1.51 | (0.09 | ) | — | (0.09 | ) | 11.08 | 2.86 | % | 1.00 | % | 1.08 | % | 15.69 | % | 4,599 | 108 | % | |||||||||||||||||||||||||||||||||||
| 1/11/2016 - 3/31/2016 | 9.10 | 0.03 | 0.53 | 0.56 | — | — | — | 9.66 | 6.07 | % | 1.00 | % | 1.35 | % | 6.15 | % | 551 | 27 | % | |||||||||||||||||||||||||||||||||||||
| Class C | ||||||||||||||||||||||||||||||||||||||||||||||||||||||||
| 4/1/2017 - 3/31/2018 | $11.03 | ($0.01 | ) | $1.29 | $1.28 | ($0.01 | ) | ($0.08 | ) | ($0.09 | ) | $12.22 | 2.48 | % | 1.75 | % | (0.06 | %) | 11.60 | % | $3,545 | 98 | % | |||||||||||||||||||||||||||||||||
| 4/1/2016 - 3/31/2017 | 9.65 | 0.03 | 1.39 | 1.42 | (0.04 | ) | — | (0.04 | ) | 11.03 | 3.61 | % | 1.75 | % | 0.33 | % | 14.74 | % | 2,804 | 108 | % | |||||||||||||||||||||||||||||||||||
| 1/11/2016 - 3/31/2016 | 9.10 | 0.01 | 0.54 | 0.55 | — | — | — | 9.65 | 6.82 | % | 1.75 | % | 0.60 | % | 6.04 | % | 525 | 27 | % | |||||||||||||||||||||||||||||||||||||
| See Notes to Financial Statements | See explanation of references on C-22 |
C-19
Table of Contents
PACIFIC FUNDS
FINANCIAL HIGHLIGHTS (Continued)
Selected per share, ratios and supplemental data for each year or period ended March 31, were as follows:
| Fund |
| Selected Per Share Data |
| Ratios to Average Net Assets | Supplemental Data | |||||||||||||||||||||||||||||||||||||||||||||||||||
| Investment Operations | Distributions | |||||||||||||||||||||||||||||||||||||||||||||||||||||||
| For the Year or Period Ended (1) | Net Asset Value, Beginning of Year or Period | Net Investment Income (Loss) (2) | Net Realized and Unrealized Gain (Loss) | Total | Net Investment Income | Capital Gains | Total | Net Asset Value, End of Year or Period | Expenses Before Reductions (3) | Expenses After Reductions (3), (4) | Net Investment Income (Loss) (3) | Total Returns (5) | Net Assets, End of Year or Period (in thousands) | Portfolio Turnover Rates | ||||||||||||||||||||||||||||||||||||||||||
Pacific Funds Large-Cap (Continued) (7) | ||||||||||||||||||||||||||||||||||||||||||||||||||||||||
| Advisor Class | ||||||||||||||||||||||||||||||||||||||||||||||||||||||||
| 4/1/2017 - 3/31/2018 | $11.11 | $0.12 | $1.30 | $1.42 | ($0.08 | ) | ($0.08 | ) | ($0.16 | ) | $12.37 | 1.48 | % | 0.75 | % | 0.94 | % | 12.83 | % | $8,070 | 98 | % | ||||||||||||||||||||||||||||||||||
| 4/1/2016 - 3/31/2017 | 9.67 | 0.14 | 1.39 | 1.53 | (0.09 | ) | — | (0.09 | ) | 11.11 | 2.61 | % | 0.75 | % | 1.33 | % | 15.89 | % | 2,176 | 108 | % | |||||||||||||||||||||||||||||||||||
| 1/11/2016 - 3/31/2016 | 9.10 | 0.03 | 0.54 | 0.57 | — | — | — | 9.67 | 5.82 | % | 0.75 | % | 1.60 | % | 6.26 | % | 564 | 27 | % | |||||||||||||||||||||||||||||||||||||
| Investor Class | ||||||||||||||||||||||||||||||||||||||||||||||||||||||||
| 4/1/2017 - 3/31/2018 | $10.93 | $0.08 | $1.28 | $1.36 | ($0.07 | ) | ($0.08 | ) | ($0.15 | ) | $12.14 | 1.73 | % | 1.00 | % | 0.69 | % | 12.46 | % | $457 | 98 | % | ||||||||||||||||||||||||||||||||||
| 4/1/2016 - 3/31/2017 | 9.65 | 0.11 | 1.39 | 1.50 | (0.22 | ) | — | (0.22 | ) | 10.93 | 2.86 | % | 1.00 | % | 1.08 | % | 15.66 | % | 299 | 108 | % | |||||||||||||||||||||||||||||||||||
| 12/1/2015 - 3/31/2016 | 10.07 | 0.04 | (0.31 | ) | (0.27 | ) | (0.15 | )(8) | — | (0.15 | ) | 9.65 | 6.37 | % | 1.00 | % | 1.35 | % | (2.68 | %) | 674 | 27 | % | |||||||||||||||||||||||||||||||||
| 12/31/2014 - 11/30/2015 | 10.00 | 0.12 | (0.05 | ) | 0.07 | — | — | — | 10.07 | 15.97 | % | 1.00 | % | 1.20 | % | 0.70 | % | 631 | 45 | % | ||||||||||||||||||||||||||||||||||||
| Class S | ||||||||||||||||||||||||||||||||||||||||||||||||||||||||
| 4/1/2017 - 3/31/2018 | $11.03 | $0.12 | $1.30 | $1.42 | ($0.22 | ) | ($0.08 | ) | ($0.30 | ) | $12.15 | 1.33 | % | 0.65 | % | 1.04 | % | 12.85 | % | $692 | 98 | % | ||||||||||||||||||||||||||||||||||
| 4/1/2016 - 3/31/2017 | 9.66 | 0.15 | 1.39 | 1.54 | (0.17 | ) | — | (0.17 | ) | 11.03 | 2.46 | % | 0.65 | % | 1.43 | % | 16.08 | % | 1,184 | 108 | % | |||||||||||||||||||||||||||||||||||
| 12/1/2015 - 3/31/2016 | 10.09 | 0.05 | (0.30 | ) | (0.25 | ) | (0.18 | )(8) | — | (0.18 | ) | 9.66 | 5.99 | % | 0.65 | % | 1.70 | % | (2.54 | %) | 1,879 | 27 | % | |||||||||||||||||||||||||||||||||
| 3/20/2015 - 11/30/2015 | 10.26 | 0.12 | (0.29 | ) | (0.17 | ) | — | — | — | 10.09 | 9.85 | % | 0.65 | % | 1.72 | % | (1.66 | %) | 1,895 | 45 | % | |||||||||||||||||||||||||||||||||||
Pacific Funds Large-Cap Value (7) | ||||||||||||||||||||||||||||||||||||||||||||||||||||||||
| Class A | ||||||||||||||||||||||||||||||||||||||||||||||||||||||||
| 4/1/2017 - 3/31/2018 | $10.75 | $0.11 | $0.86 | $0.97 | ($0.13 | ) | ($0.25 | ) | ($0.38 | ) | $11.34 | 1.47 | % | 1.10 | % | 0.96 | % | 9.03 | % | $3,304 | 50 | % | ||||||||||||||||||||||||||||||||||
| 4/1/2016 - 3/31/2017 | 9.46 | 0.14 | 1.27 | 1.41 | (0.10 | ) | (0.02 | ) | (0.12 | ) | 10.75 | 1.79 | % | 1.10 | % | 1.35 | % | 14.92 | % | 2,572 | 65 | % | ||||||||||||||||||||||||||||||||||
| 1/11/2016 - 3/31/2016 | 8.97 | 0.04 | 0.45 | 0.49 | — | — | — | 9.46 | 10.34 | % | 1.10 | % | 1.92 | % | 5.46 | % | 499 | 48 | % | |||||||||||||||||||||||||||||||||||||
| Class C | ||||||||||||||||||||||||||||||||||||||||||||||||||||||||
| 4/1/2017 - 3/31/2018 | $10.69 | $0.02 | $0.86 | $0.88 | ($0.07 | ) | ($0.25 | ) | ($0.32 | ) | $11.25 | 2.22 | % | 1.85 | % | 0.21 | % | 8.16 | % | $4,327 | 50 | % | ||||||||||||||||||||||||||||||||||
| 4/1/2016 - 3/31/2017 | 9.45 | 0.06 | 1.26 | 1.32 | (0.06 | ) | (0.02 | ) | (0.08 | ) | 10.69 | 2.54 | % | 1.85 | % | 0.60 | % | 14.03 | % | 3,056 | 65 | % | ||||||||||||||||||||||||||||||||||
| 1/11/2016 - 3/31/2016 | 8.97 | 0.02 | 0.46 | 0.48 | — | — | — | 9.45 | 11.09 | % | 1.85 | % | 1.17 | % | 5.35 | % | 477 | 48 | % | |||||||||||||||||||||||||||||||||||||
| Advisor Class | ||||||||||||||||||||||||||||||||||||||||||||||||||||||||
| 4/1/2017 - 3/31/2018 | $10.78 | $0.14 | $0.87 | $1.01 | ($0.17 | ) | ($0.25 | ) | ($0.42 | ) | $11.37 | 1.22 | % | 0.85 | % | 1.21 | % | 9.33 | % | $19,624 | 50 | % | ||||||||||||||||||||||||||||||||||
| 4/1/2016 - 3/31/2017 | 9.47 | 0.16 | 1.26 | 1.42 | (0.09 | ) | (0.02 | ) | (0.11 | ) | 10.78 | 1.54 | % | 0.85 | % | 1.60 | % | 15.10 | % | 24,779 | 65 | % | ||||||||||||||||||||||||||||||||||
| 1/11/2016 - 3/31/2016 | 8.97 | 0.04 | 0.46 | 0.50 | — | — | — | 9.47 | 10.09 | % | 0.85 | % | 2.17 | % | 5.57 | % | 777 | 48 | % | |||||||||||||||||||||||||||||||||||||
| Investor Class | ||||||||||||||||||||||||||||||||||||||||||||||||||||||||
| 4/1/2017 - 3/31/2018 | $10.64 | $0.11 | $0.86 | $0.97 | ($0.14 | ) | ($0.25 | ) | ($0.39 | ) | $11.22 | 1.47 | % | 1.10 | % | 0.96 | % | 9.05 | % | $106 | 50 | % | ||||||||||||||||||||||||||||||||||
| 4/1/2016 - 3/31/2017 | 9.46 | 0.13 | 1.28 | 1.41 | (0.21 | ) | (0.02 | ) | (0.23 | ) | 10.64 | 1.79 | % | 1.10 | % | 1.35 | % | 14.84 | % | 96 | 65 | % | ||||||||||||||||||||||||||||||||||
| 12/1/2015 - 3/31/2016 | 10.01 | 0.06 | (0.34 | ) | (0.28 | ) | (0.27 | ) | — | (0.27 | ) | 9.46 | 12.77 | % | 1.07 | % | 1.95 | % | (2.76 | %) | 514 | 48 | % | |||||||||||||||||||||||||||||||||
| 12/31/2014 - 11/30/2015 | 10.00 | 0.13 | (0.12 | ) | 0.01 | — | — | — | 10.01 | 30.13 | % | 1.00 | % | 1.42 | % | 0.10 | % | 500 | 44 | % | ||||||||||||||||||||||||||||||||||||
| Class S | ||||||||||||||||||||||||||||||||||||||||||||||||||||||||
| 4/1/2017 - 3/31/2018 | $10.75 | $0.15 | $0.86 | $1.01 | ($0.17 | ) | ($0.25 | ) | ($0.42 | ) | $11.34 | 1.07 | % | 0.75 | % | 1.31 | % | 9.36 | % | $1,963 | 50 | % | ||||||||||||||||||||||||||||||||||
| 4/1/2016 - 3/31/2017 | 9.47 | 0.17 | 1.28 | 1.45 | (0.15 | ) | (0.02 | ) | (0.17 | ) | 10.75 | 1.39 | % | 0.75 | % | 1.70 | % | 15.35 | % | 1,365 | 65 | % | ||||||||||||||||||||||||||||||||||
| 1/11/2016 - 3/31/2016 | 8.97 | 0.04 | 0.46 | 0.50 | — | — | — | 9.47 | 9.93 | % | 0.75 | % | 2.27 | % | 5.57 | % | 210 | 48 | % | |||||||||||||||||||||||||||||||||||||
Pacific Funds Small/Mid-Cap (7) | ||||||||||||||||||||||||||||||||||||||||||||||||||||||||
| Class A | ||||||||||||||||||||||||||||||||||||||||||||||||||||||||
| 4/1/2017 - 3/31/2018 | $11.93 | ($0.04 | ) | $1.35 | $1.31 | $— | ($0.01 | ) | ($0.01 | ) | $13.23 | 1.51 | % | 1.30 | % | (0.28 | %) | 11.02 | % | $21,131 | 23 | % | ||||||||||||||||||||||||||||||||||
| 4/1/2016 - 3/31/2017 | 9.93 | (0.02 | ) | 2.05 | �� | 2.03 | — | (0.03 | ) | (0.03 | ) | 11.93 | 1.71 | % | 1.30 | % | (0.19 | %) | 20.44 | % | 18,360 | 45 | % | |||||||||||||||||||||||||||||||||
| 1/11/2016 - 3/31/2016 | 9.33 | 0.00 | (6) | 0.60 | 0.60 | — | — | — | 9.93 | 5.43 | % | 1.30 | % | 0.07 | % | 6.43 | % | 2,254 | 11 | % | ||||||||||||||||||||||||||||||||||||
| Class C | ||||||||||||||||||||||||||||||||||||||||||||||||||||||||
| 4/1/2017 - 3/31/2018 | $11.81 | ($0.13 | ) | $1.34 | $1.21 | $— | ($0.01 | ) | ($0.01 | ) | $13.01 | 2.26 | % | 2.05 | % | (1.03 | %) | 10.28 | % | $15,458 | 23 | % | ||||||||||||||||||||||||||||||||||
| 4/1/2016 - 3/31/2017 | 9.91 | (0.10 | ) | 2.03 | 1.93 | — | (0.03 | ) | (0.03 | ) | 11.81 | 2.46 | % | 2.05 | % | (0.94 | %) | 19.47 | % | 7,383 | 45 | % | ||||||||||||||||||||||||||||||||||
| 1/11/2016 - 3/31/2016 | 9.33 | (0.01 | ) | 0.59 | 0.58 | — | — | — | 9.91 | 6.18 | % | 2.05 | % | (0.68 | %) | 6.22 | % | 527 | 11 | % | ||||||||||||||||||||||||||||||||||||
| Advisor Class | ||||||||||||||||||||||||||||||||||||||||||||||||||||||||
| 4/1/2017 - 3/31/2018 | $11.94 | 0.00 | (6) | $1.35 | $1.35 | $— | ($0.01 | ) | ($0.01 | ) | $13.28 | 1.26 | % | 1.05 | % | (0.03 | %) | 11.34 | % | $176,897 | 23 | % | ||||||||||||||||||||||||||||||||||
| 4/1/2016 - 3/31/2017 | 9.92 | 0.01 | 2.05 | 2.06 | (0.01 | ) | (0.03 | ) | (0.04 | ) | 11.94 | 1.46 | % | 1.05 | % | 0.06 | % | 20.73 | % | 70,260 | 45 | % | ||||||||||||||||||||||||||||||||||
| 1/11/2016 - 3/31/2016 | 9.33 | 0.01 | 0.58 | 0.59 | — | — | — | 9.92 | 5.18 | % | 1.05 | % | 0.32 | % | 6.32 | % | 1,965 | 11 | % | |||||||||||||||||||||||||||||||||||||
| See Notes to Financial Statements | See explanation of references on C-22 |
C-20
Table of Contents
PACIFIC FUNDS
FINANCIAL HIGHLIGHTS (Continued)
Selected per share, ratios and supplemental data for each year or period ended March 31, were as follows:
| Fund |
| Selected Per Share Data |
| Ratios to Average Net Assets | Supplemental Data | |||||||||||||||||||||||||||||||||||||||||||||||||||
| Investment Operations | Distributions | |||||||||||||||||||||||||||||||||||||||||||||||||||||||
| For the Year or Period Ended (1) | Net Asset Value, Beginning of Year or Period | Net Investment Income (Loss) (2) | Net Realized and Unrealized Gain (Loss) | Total | Net Investment Income | Capital Gains | Total | Net Asset Value, End of Year or Period | Expenses Before Reductions (3) | Expenses After Reductions (3), (4) | Net Investment Income (Loss) (3) | Total Returns (5) | Net Assets, End of Year or Period (in thousands) | Portfolio Turnover Rates | ||||||||||||||||||||||||||||||||||||||||||
Pacific Funds Small/Mid-Cap (Continued) (7) | ||||||||||||||||||||||||||||||||||||||||||||||||||||||||
| Investor Class | ||||||||||||||||||||||||||||||||||||||||||||||||||||||||
| 4/1/2017 - 3/31/2018 | $11.90 | ($0.04 | ) | $1.35 | $1.31 | $— | ($0.01 | ) | ($0.01 | ) | $13.20 | 1.51 | % | 1.35 | % | (0.33 | %) | 11.04 | % | $6,538 | 23 | % | ||||||||||||||||||||||||||||||||||
| 4/1/2016 - 3/31/2017 | 9.91 | (0.03 | ) | 2.05 | 2.02 | — | (0.03 | ) | (0.03 | ) | 11.90 | 1.71 | % | 1.35 | % | (0.24 | %) | 20.38 | % | 6,808 | 45 | % | ||||||||||||||||||||||||||||||||||
| 1/11/2016 - 3/31/2016 | 9.33 | 0.00 | (6) | 0.58 | 0.58 | — | — | — | 9.91 | 5.43 | % | 1.35 | % | 0.02 | % | 6.22 | % | 2,286 | 11 | % | ||||||||||||||||||||||||||||||||||||
| Class S | ||||||||||||||||||||||||||||||||||||||||||||||||||||||||
| 4/1/2017 - 3/31/2018 | $11.94 | $0.00 | (6) | $1.36 | $1.36 | $— | (0.01 | ) | ($0.01 | ) | $13.29 | 1.11 | % | 1.00 | % | 0.02 | % | 11.43 | % | $9,977 | 23 | % | ||||||||||||||||||||||||||||||||||
| 4/1/2016 - 3/31/2017 | 9.92 | 0.01 | 2.05 | 2.06 | (0.01 | ) | (0.03 | ) | (0.04 | ) | 11.94 | 1.31 | % | 1.00 | % | 0.11 | % | 20.78 | % | 8,531 | 45 | % | ||||||||||||||||||||||||||||||||||
| 12/1/2015 - 3/31/2016 | 10.48 | 0.01 | (0.49 | ) | (0.48 | ) | (0.03 | ) | (0.05 | ) | (0.08 | ) | 9.92 | 9.62 | % | 1.00 | % | 0.37 | % | (4.55 | %) | 711 | 11 | % | ||||||||||||||||||||||||||||||||
| 12/31/2014 - 11/30/2015 | 10.00 | 0.01 | 0.47 | 0.48 | — | — | — | 10.48 | 29.84 | % | 1.00 | % | 0.12 | % | 4.80 | % | 524 | 30 | % | |||||||||||||||||||||||||||||||||||||
Pacific Funds Small-Cap (7) | ||||||||||||||||||||||||||||||||||||||||||||||||||||||||
| Class A | ||||||||||||||||||||||||||||||||||||||||||||||||||||||||
| 4/1/2017 - 3/31/2018 | $11.77 | ($0.02 | ) | $1.33 | $1.31 | ($0.01 | ) | ($0.21 | ) | ($0.22 | ) | $12.86 | 1.89 | % | 1.30 | % | (0.16 | %) | 11.17 | % | $2,367 | 62 | % | |||||||||||||||||||||||||||||||||
| 4/1/2016 - 3/31/2017 | 9.68 | (0.00 | )(6) | 2.19 | 2.19 | (0.10 | ) | — | (0.10 | ) | 11.77 | 3.44 | % | 1.30 | % | (0.04 | %) | 22.70 | % | 1,759 | 62 | % | ||||||||||||||||||||||||||||||||||
| 1/11/2016 - 3/31/2016 | 9.10 | 0.01 | 0.57 | 0.58 | — | — | — | 9.68 | 17.67 | % | 1.30 | % | 0.31 | % | 6.37 | % | 324 | 27 | % | |||||||||||||||||||||||||||||||||||||
| Class C | ||||||||||||||||||||||||||||||||||||||||||||||||||||||||
| 4/1/2017 - 3/31/2018 | $11.76 | ($0.11 | ) | $1.32 | $1.21 | $— | ($0.21 | ) | ($0.21 | ) | $12.76 | 2.64 | % | 2.05 | % | (0.91 | %) | 10.32 | % | $797 | 62 | % | ||||||||||||||||||||||||||||||||||
| 4/1/2016 - 3/31/2017 | 9.66 | (0.09 | ) | 2.19 | 2.10 | — | — | — | 11.76 | 4.19 | % | 2.05 | % | (0.79 | %) | 21.74 | % | 641 | 62 | % | ||||||||||||||||||||||||||||||||||||
| 1/11/2016 - 3/31/2016 | 9.10 | (0.01 | ) | 0.57 | 0.56 | — | — | — | 9.66 | 18.42 | % | 2.05 | % | (0.44 | %) | 6.15 | % | 130 | 27 | % | ||||||||||||||||||||||||||||||||||||
| Advisor Class | ||||||||||||||||||||||||||||||||||||||||||||||||||||||||
| 4/1/2017 - 3/31/2018 | $11.90 | $0.01 | $1.35 | $1.36 | ($0.01 | ) | ($0.21 | ) | ($0.22 | ) | $13.04 | 1.64 | % | 1.05 | % | 0.09 | % | 11.45 | % | $14,767 | 62 | % | ||||||||||||||||||||||||||||||||||
| 4/1/2016 - 3/31/2017 | 9.68 | 0.02 | 2.21 | 2.23 | (0.01 | ) | — | (0.01 | ) | 11.90 | 3.19 | % | 1.05 | % | 0.21 | % | 23.03 | % | 8,265 | 62 | % | |||||||||||||||||||||||||||||||||||
| 1/11/2016 - 3/31/2016 | 9.10 | 0.01 | 0.57 | 0.58 | — | — | — | 9.68 | 17.42 | % | 1.05 | % | 0.56 | % | 6.37 | % | 153 | 27 | % | |||||||||||||||||||||||||||||||||||||
| Investor Class | ||||||||||||||||||||||||||||||||||||||||||||||||||||||||
| 4/1/2017 - 3/31/2018 | $11.84 | ($0.03 | ) | $1.34 | $1.31 | $— | ($0.21 | ) | ($0.21 | ) | $12.94 | 1.89 | % | 1.35 | % | (0.21 | %) | 11.10 | % | $3,089 | 62 | % | ||||||||||||||||||||||||||||||||||
| 4/1/2016 - 3/31/2017 | 9.67 | (0.01 | ) | 2.20 | 2.19 | (0.02 | ) | — | (0.02 | ) | 11.84 | 3.44 | % | 1.35 | % | (0.09 | %) | 22.65 | % | 580 | 62 | % | ||||||||||||||||||||||||||||||||||
| 1/11/2016 - 3/31/2016 | 9.10 | 0.01 | 0.56 | 0.57 | — | — | — | 9.67 | 17.67 | % | 1.35 | % | 0.26 | % | 6.26 | % | 18 | 27 | % | |||||||||||||||||||||||||||||||||||||
| Class S | ||||||||||||||||||||||||||||||||||||||||||||||||||||||||
| 4/1/2017 - 3/31/2018 | $10.95 | $0.02 | $1.24 | $1.26 | $— | ($0.21 | ) | ($0.21 | ) | $12.00 | 1.49 | % | 1.00 | % | 0.14 | % | 11.54 | % | $457 | 62 | % | |||||||||||||||||||||||||||||||||||
| 4/1/2016 - 3/31/2017 | 9.67 | 0.03 | 2.17 | 2.20 | (0.92 | ) | — | (0.92 | ) | 10.95 | 3.04 | % | 1.00 | % | 0.26 | % | 23.03 | % | 140 | 62 | % | |||||||||||||||||||||||||||||||||||
| 12/1/2015 - 3/31/2016 | 10.31 | 0.02 | (0.60 | ) | (0.58 | ) | (0.06 | ) | — | (0.06 | ) | 9.67 | 10.38 | % | 1.00 | % | 0.61 | % | (5.68 | %) | 497 | 27 | % | |||||||||||||||||||||||||||||||||
| 12/31/2014 - 11/30/2015 | 10.00 | 0.02 | 0.29 | 0.31 | — | — | — | 10.31 | 30.41 | % | 1.00 | % | 0.24 | % | 3.10 | % | 516 | 27 | % | |||||||||||||||||||||||||||||||||||||
Pacific Funds Small-Cap Value (7) | ||||||||||||||||||||||||||||||||||||||||||||||||||||||||
| Class A | ||||||||||||||||||||||||||||||||||||||||||||||||||||||||
| 4/1/2017 - 3/31/2018 | $11.52 | $0.02 | $0.62 | $0.64 | ($0.03 | ) | ($0.96 | ) | ($0.99 | ) | $11.17 | 1.65 | % | 1.30 | % | 0.14 | % | 5.41 | % | $1,105 | 47 | % | ||||||||||||||||||||||||||||||||||
| 4/1/2016 - 3/31/2017 | 9.47 | 0.03 | 2.13 | 2.16 | (0.06 | ) | (0.05 | ) | (0.11 | ) | 11.52 | 1.90 | % | 1.30 | % | 0.23 | % | 22.65 | % | 743 | 76 | % | ||||||||||||||||||||||||||||||||||
| 1/11/2016 - 3/31/2016 | 8.80 | 0.02 | 0.65 | 0.67 | — | — | — | 9.47 | 15.99 | % | 1.30 | % | 0.97 | % | 7.73 | % | 148 | 17 | % | |||||||||||||||||||||||||||||||||||||
| Class C | ||||||||||||||||||||||||||||||||||||||||||||||||||||||||
| 4/1/2017 - 3/31/2018 | $11.46 | ($0.07 | ) | $0.63 | $0.56 | $— | ($0.96 | ) | ($0.96 | ) | $11.06 | 2.40 | % | 2.05 | % | (0.61 | %) | 4.72 | % | $1,568 | 47 | % | ||||||||||||||||||||||||||||||||||
| 4/1/2016 - 3/31/2017 | 9.46 | (0.06 | ) | 2.12 | 2.06 | (0.01 | ) | (0.05 | ) | (0.06 | ) | 11.46 | 2.65 | % | 2.05 | % | (0.52 | %) | 21.81 | % | 1,105 | 76 | % | |||||||||||||||||||||||||||||||||
| 1/11/2016 - 3/31/2016 | 8.80 | 0.00 | (6) | 0.66 | 0.66 | — | — | — | 9.46 | 16.74 | % | 2.05 | % | 0.22 | % | 7.50 | % | 121 | 17 | % | ||||||||||||||||||||||||||||||||||||
| Advisor Class | ||||||||||||||||||||||||||||||||||||||||||||||||||||||||
| 4/1/2017 - 3/31/2018 | $11.59 | $0.05 | $0.63 | $0.68 | ($0.07 | ) | ($0.96 | ) | ($1.03 | ) | $11.24 | 1.40 | % | 1.05 | % | 0.39 | % | 5.70 | % | $15,511 | 47 | % | ||||||||||||||||||||||||||||||||||
| 4/1/2016 - 3/31/2017 | 9.48 | 0.05 | 2.15 | 2.20 | (0.04 | ) | (0.05 | ) | (0.09 | ) | 11.59 | 1.65 | % | 1.05 | % | 0.48 | % | 23.02 | % | 20,617 | 76 | % | ||||||||||||||||||||||||||||||||||
| 1/11/2016 - 3/31/2016 | 8.80 | 0.02 | 0.66 | 0.68 | — | — | — | 9.48 | 15.74 | % | 1.05 | % | 1.22 | % | 7.84 | % | 261 | 17 | % | |||||||||||||||||||||||||||||||||||||
| Investor Class | ||||||||||||||||||||||||||||||||||||||||||||||||||||||||
| 4/1/2017 - 3/31/2018 | $11.51 | $0.01 | $0.63 | $0.64 | ($0.03 | ) | ($0.96 | ) | ($0.99 | ) | $11.16 | 1.65 | % | 1.35 | % | 0.09 | % | 5.40 | % | $158 | 47 | % | ||||||||||||||||||||||||||||||||||
| 4/1/2016 - 3/31/2017 | 9.47 | 0.02 | 2.13 | 2.15 | (0.06 | ) | (0.05 | ) | (0.11 | ) | 11.51 | 1.90 | % | 1.35 | % | 0.18 | % | 22.59 | % | 206 | 76 | % | ||||||||||||||||||||||||||||||||||
| 1/11/2016 - 3/31/2016 | 8.80 | 0.02 | 0.65 | 0.67 | — | — | — | 9.47 | 15.99 | % | 1.35 | % | 0.92 | % | 7.73 | % | 59 | 17 | % | |||||||||||||||||||||||||||||||||||||
| See Notes to Financial Statements | See explanation of references on C-22 |
C-21
Table of Contents
PACIFIC FUNDS
FINANCIAL HIGHLIGHTS (Continued)
Selected per share, ratios and supplemental data for each year or period ended March 31, were as follows:
| Fund |
| Selected Per Share Data |
| Ratios to Average Net Assets | Supplemental Data | |||||||||||||||||||||||||||||||||||||||||||||||||||
| Investment Operations | Distributions | |||||||||||||||||||||||||||||||||||||||||||||||||||||||
| For the Year or Period Ended (1) | Net Asset Value, Beginning of Year or Period | Net Investment Income (Loss) (2) | Net Realized and Unrealized Gain (Loss) | Total | Net Investment Income | Capital Gains | Total | Net Asset Value, End of Year or Period | Expenses Before Reductions (3) | Expenses After Reductions (3), (4) | Net Investment Income (Loss) (3) | Total Returns (5) | Net Assets, End of Year or Period (in thousands) | Portfolio Turnover Rates | ||||||||||||||||||||||||||||||||||||||||||
Pacific Funds Small-Cap Value (Continued) (7) | ||||||||||||||||||||||||||||||||||||||||||||||||||||||||
| Class S | ||||||||||||||||||||||||||||||||||||||||||||||||||||||||
| 4/1/2017 - 3/31/2018 | $11.55 | $0.05 | $0.64 | $0.69 | ($0.07 | ) | ($0.96 | ) | ($1.03 | ) | $11.21 | 1.25 | % | 1.00 | % | 0.44 | % | 5.78 | % | $9,657 | 47 | % | ||||||||||||||||||||||||||||||||||
| 4/1/2016 - 3/31/2017 | 9.47 | 0.06 | 2.13 | 2.19 | (0.06 | ) | (0.05 | ) | (0.11 | ) | 11.55 | 1.50 | % | 1.00 | % | 0.53 | % | 23.02 | % | 9,655 | 76 | % | ||||||||||||||||||||||||||||||||||
| 12/1/2015 - 3/31/2016 | 10.14 | 0.04 | (0.49 | ) | (0.45 | ) | (0.12 | ) | (0.10 | ) | (0.22 | ) | 9.47 | 16.02 | % | 1.00 | % | 1.27 | % | (4.37 | %) | 1,118 | 17 | % | ||||||||||||||||||||||||||||||||
| 12/31/2014 - 11/30/2015 | 10.00 | 0.06 | 0.08 | 0.14 | — | — | — | 10.14 | 26.85 | % | 1.00 | % | 0.63 | % | 1.40 | % | 706 | 29 | % | |||||||||||||||||||||||||||||||||||||
Pacific Funds Small-Cap Growth (7) | ||||||||||||||||||||||||||||||||||||||||||||||||||||||||
| Class A | ||||||||||||||||||||||||||||||||||||||||||||||||||||||||
| 4/1/2017 - 3/31/2018 | $11.14 | ($0.08 | ) | $1.68 | $1.60 | $— | ($0.48 | ) | ($0.48 | ) | $12.26 | 1.62 | % | 1.30 | % | (0.65 | %) | 14.51 | % | $713 | 51 | % | ||||||||||||||||||||||||||||||||||
| 4/1/2016 - 3/31/2017 | 9.61 | (0.07 | ) | 1.80 | 1.73 | — | (0.20 | ) | (0.20 | ) | 11.14 | 1.93 | % | 1.30 | % | (0.68 | %) | 17.83 | % | 514 | 49 | % | ||||||||||||||||||||||||||||||||||
| 1/11/2016 - 3/31/2016 | 9.27 | (0.01 | ) | 0.35 | 0.34 | — | — | — | 9.61 | 12.44 | % | 1.30 | % | (0.70 | %) | 3.88 | % | 43 | 7 | % | ||||||||||||||||||||||||||||||||||||
| Class C | ||||||||||||||||||||||||||||||||||||||||||||||||||||||||
| 4/1/2017 - 3/31/2018 | $11.05 | ($0.16 | ) | $1.65 | $1.49 | $— | ($0.48 | ) | ($0.48 | ) | $12.06 | 2.37 | % | 2.05 | % | (1.40 | %) | 13.62 | % | $759 | 51 | % | ||||||||||||||||||||||||||||||||||
| 4/1/2016 - 3/31/2017 | 9.61 | (0.15 | ) | 1.79 | 1.64 | — | (0.20 | ) | (0.20 | ) | 11.05 | 2.68 | % | 2.05 | % | (1.43 | %) | 17.14 | % | 187 | 49 | % | ||||||||||||||||||||||||||||||||||
| 1/11/2016 - 3/31/2016 | 9.27 | (0.03 | ) | 0.37 | 0.34 | — | — | — | 9.61 | 13.19 | % | 2.05 | % | (1.45 | %) | 3.67 | % | 34 | 7 | % | ||||||||||||||||||||||||||||||||||||
| Class P | ||||||||||||||||||||||||||||||||||||||||||||||||||||||||
| 4/1/2017 - 3/31/2018 | $11.19 | ($0.05 | ) | $1.69 | $1.64 | $— | ($0.48 | ) | ($0.48 | ) | $12.35 | 1.22 | % | 1.05 | % | (0.40 | %) | 14.80 | % | $26,764 | 51 | % | ||||||||||||||||||||||||||||||||||
| 6/8/2016 - 3/31/2017 | 10.06 | (0.04 | ) | 1.37 | 1.33 | — | (0.20 | ) | (0.20 | ) | 11.19 | 1.43 | % | 1.05 | % | (0.43 | %) | 13.29 | % | 12,385 | 49 | % | ||||||||||||||||||||||||||||||||||
| Advisor Class | ||||||||||||||||||||||||||||||||||||||||||||||||||||||||
| 4/1/2017 - 3/31/2018 | $11.19 | ($0.05 | ) | $1.69 | $1.64 | $— | ($0.48 | ) | ($0.48 | ) | $12.35 | 1.37 | % | 1.05 | % | (0.40 | %) | 14.80 | % | $13,574 | 51 | % | ||||||||||||||||||||||||||||||||||
| 4/1/2016 - 3/31/2017 | 9.64 | (0.05 | ) | 1.80 | 1.75 | — | (0.20 | ) | (0.20 | ) | 11.19 | 1.68 | % | 1.05 | % | (0.43 | %) | 18.23 | % | 13,321 | 49 | % | ||||||||||||||||||||||||||||||||||
| 1/11/2016 - 3/31/2016 | 9.27 | (0.01 | ) | 0.38 | 0.37 | — | — | — | 9.64 | 12.19 | % | 1.05 | % | (0.45 | %) | 3.99 | % | 234 | 7 | % | ||||||||||||||||||||||||||||||||||||
| Investor Class | ||||||||||||||||||||||||||||||||||||||||||||||||||||||||
| 4/1/2017 - 3/31/2018 | $11.13 | ($0.07 | ) | $1.67 | $1.60 | $— | ($0.48 | ) | ($0.48 | ) | $12.25 | 1.62 | % | 1.25 | % | (0.60 | %) | 14.52 | % | $1,493 | 51 | % | ||||||||||||||||||||||||||||||||||
| 4/1/2016 - 3/31/2017 | 9.62 | (0.06 | ) | 1.79 | 1.73 | (0.02 | ) | (0.20 | ) | (0.22 | ) | 11.13 | 1.93 | % | 1.25 | % | (0.63 | %) | 18.11 | % | 1,155 | 49 | % | |||||||||||||||||||||||||||||||||
| 12/1/2015 - 3/31/2016 | 10.42 | (0.02 | ) | (0.78 | ) | (0.80 | ) | — | — | — | 9.62 | 12.79 | % | 1.25 | % | (0.65 | %) | (7.68 | %) | 977 | 7 | % | ||||||||||||||||||||||||||||||||||
| 12/31/2014 - 11/30/2015 | 10.00 | (0.07 | ) | 0.49 | 0.42 | — | — | — | 10.42 | 17.40 | % | 1.25 | % | (0.70 | %) | 4.20 | % | 1,047 | 34 | % | ||||||||||||||||||||||||||||||||||||
| Class S | ||||||||||||||||||||||||||||||||||||||||||||||||||||||||
| 4/1/2017 - 3/31/2018 | $11.20 | ($0.03 | ) | $1.69 | $1.66 | $— | ($0.48 | ) | ($0.48 | ) | $12.38 | 1.22 | % | 0.90 | % | (0.25 | %) | 14.97 | % | $10,826 | 51 | % | ||||||||||||||||||||||||||||||||||
| 4/1/2016 - 3/31/2017 | 9.63 | (0.03 | ) | 1.80 | 1.77 | (0.00 | )(6) | (0.20 | ) | (0.20 | ) | 11.20 | 1.53 | % | 0.90 | % | (0.28 | %) | 18.47 | % | 9,680 | 49 | % | |||||||||||||||||||||||||||||||||
| 1/11/2016 - 3/31/2016 | 9.27 | (0.00 | )(6) | 0.36 | 0.36 | — | — | — | 9.63 | 12.04 | % | 0.90 | % | (0.29 | %) | 3.88 | % | 411 | 7 | % | ||||||||||||||||||||||||||||||||||||
| (1) | For share classes that commenced operations after April 1, 2013, the first date reported represents the commencement date of operations for that share class. |
| (2) | Net investment income (loss) per share has been calculated using the average shares method. |
| (3) | The ratios are annualized for periods of less than one full year. |
| (4) | The ratios of expenses after expense reductions to average net assets are after advisory fee waivers and adviser expense reimbursements, if any, as discussed in Notes 6 and 7B in Notes to Financial Statements. The expense ratios for all the Portfolio Optimization Funds and Pacific Funds Diversified Alternatives do not include fees and expenses of the underlying funds (see Note 1 in Notes to Financial Statements) in which the Portfolio Optimization Funds and Pacific Funds Diversified Alternatives invest. |
| (5) | The total returns include reinvestment of all dividends and capital gain distributions, if any, and do not include deductions of any applicable sales charges. Total returns are not annualized for periods less than one full year. |
| (6) | Reflects an amount rounding to less than $0.01 per share. |
| (7) | Because of the change in fiscal year end from November 30 to March 31 for the Fund, the following periods are shown for the Fund prior to April 1, 2016: (i) the period from December 31, 2014 through November 30, 2015, which reflects the fiscal year end prior to the reorganization and (ii) the period from December 1, 2015 or class commencement date through March 31, 2016, which reflects the change in fiscal year end for the Fund upon the reorganization. |
| (8) | Includes $0.01 per share return of capital distribution. |
| (9) | The annualized ratios of expenses, excluding interest expense, after expense reductions to average net assets for the year ended March 31, 2018 are as follows: |
| Fund | Class A | Class C | Class I | Class P | Advisor Class | |||||||||||||||
Pacific Funds Floating Rate Income | 1.00% | 1.70% | 0.70% | 0.75% | 0.75% | |||||||||||||||
| See Notes to Financial Statements |
C-22
Table of Contents
PACIFIC FUNDS
1. ORGANIZATION
Pacific Funds Series Trust (which may be referred to as “Pacific Funds” or the “Trust”) is registered under the Investment Company Act of 1940 (“1940 Act”), as amended, as an open-end, management investment company, and is organized as a Delaware statutory trust. Pacific Life Fund Advisors LLC (“PLFA” or the “Investment Adviser”) serves as investment adviser to the Trust. As of March 31, 2018, the Trust was comprised of forty separate funds, eighteen of which are presented in these financial statements (each individually a “Fund”, and collectively the “Funds”):
| Fund | Fund | |
| Pacific FundsSM Portfolio Optimization Conservative (1) | Pacific FundsSM Floating Rate Income (2) | |
| Pacific FundsSM Portfolio Optimization Moderate-Conservative (1) | Pacific FundsSM Limited Duration High Income (2) | |
| Pacific FundsSM Portfolio Optimization Moderate (1) | Pacific FundsSM High Income (2) | |
| Pacific FundsSM Portfolio Optimization Growth (1) | Pacific FundsSM Large-Cap (3) | |
| Pacific FundsSM Portfolio Optimization Aggressive-Growth (1) | Pacific FundsSM Large-Cap Value (3) | |
| Pacific FundsSM Diversified Alternatives | Pacific FundsSM Small/Mid-Cap (3) | |
| Pacific FundsSM Short Duration Income (2) | Pacific FundsSM Small-Cap (3) | |
| Pacific FundsSM Core Income (2) | Pacific FundsSM Small-Cap Value (3) | |
| Pacific FundsSM Strategic Income (2) | Pacific FundsSM Small-Cap Growth (3) |
| (1) | These Funds are collectively known as the “Portfolio Optimization Funds”. |
| (2) | These Funds are collectively known as the “PF Fixed Income Funds”. |
| (3) | These Funds are collectively known as the “PF U.S. Equity Funds”. |
The Portfolio Optimization Funds offer Class A, Class B, Class C, Class R, and Advisor Class shares. Pacific Funds Diversified Alternatives offers Class A, Class C, and Advisor Class shares. Each class is distinguished by its applicable sales charges and level of distribution and/or service fees (see Note 6) and in general: (i) Class A shares are subject to a maximum 5.50% front-end sales charge; (ii) Class B shares are subject to a maximum 5.00% contingent deferred sales charge (“CDSC”); (iii) Class C shares are subject to a maximum 1.00% CDSC; and (iv) Class R and Advisor Class shares are sold at net asset value without a sales charge. The sales charge for Class A shares is reduced for purchases of $50,000 or more and may be waived in certain circumstances. There is no sales charge for Class A shares for purchases of $1 million or more, although there is a CDSC of 1.00% on redemptions of such Class A shares within one year of purchase, which may be waived in certain circumstances. Class B shares were closed to any new or additional purchases (except through reinvestment of dividends and capital gains distributions) as of the close of business on July 31, 2017.
The PF Fixed Income Funds offer Class A, Class C, Class I, and Advisor Class shares. Additionally, Pacific Funds Core Income, Pacific Funds Floating Rate Income, and Pacific Funds High Income offer Class P shares. Each class is distinguished by its applicable sales charges and level of distribution and/or service fees (see Note 6) and in general: (i) Class A shares of Pacific Funds Short Duration Income, Pacific Funds Floating Rate Income, and Pacific Funds Limited Duration High Income are subject to a maximum 3.00% front-end sales charge, and Class A shares of Pacific Funds Core Income, Pacific Funds Strategic Income, and Pacific Funds High Income are subject to a maximum 4.25% front-end sales charge; (ii) Class C shares are subject to a maximum 1.00% CDSC; and (iii) Class I, Class P, and Advisor Class shares are sold at net asset value without a sales charge. The sales charge for Class A shares is reduced for purchases of $100,000 or more and may be waived in certain circumstances. There is no sales charge for Class A shares for purchases of $500,000 or more, although there is a CDSC of 1.00% of such Class A shares within one year of purchase, which may be waived in certain circumstances.
The PF U.S. Equity Funds offer Class A, Class C, Advisor Class, Investor Class, and Class S shares. Additionally, Pacific Funds Small-Cap Growth offers Class P shares. Each class is distinguished by its applicable sales charges and level of distribution and/or service fees (see Note 6) and in general: (i) Class A shares are subject to a maximum 4.25% front-end sales charge; (ii) Class C shares are subject to a maximum 1.00% CDSC; and (iii) Class P, Advisor Class, Investor Class, and Class S shares are sold at net asset value without a sales charge. The sales charge for Class A shares is reduced for purchases of $100,000 or more and may be waived in certain circumstances. There is no sales charge for Class A shares for purchases of $500,000 or more, although there is a CDSC of 1.00% of such Class A shares within one year of purchase, which may be waived in certain circumstances.
The Trust’s distributor receives all net commissions (front-end sales charges and CDSCs) from the sales of all applicable share classes (see Note 6).
The Portfolio Optimization Funds invest their assets in Class P shares of certain other funds of the Trust (collectively, the “PF Underlying Funds”) as well as Class P shares of Pacific Funds Core Income, Pacific Funds Floating Rate Income, Pacific Funds High Income, and Pacific Funds Small-Cap Growth. Pacific Funds Diversified Alternatives invests all of its assets in certain PF Underlying Funds and Class P shares of Pacific Funds Floating Rate Income.
There is a separate annual report containing the financial statements for the PF Underlying Funds, which is available without charge. For information on how to obtain the annual report for these Funds, see the Where to Go for More Information section of this report on page F-22.
The Trust’s Board of Trustees approved a Plan of Liquidation for Pacific Funds Limited Duration High Income, which is expected to occur on or about June 28, 2018. Effective March 30, 2018, Pacific Funds Limited Duration High Income was closed to new investors and any subsequent investments from existing investors.
D-1
Table of Contents
PACIFIC FUNDS
NOTES TO FINANCIAL STATEMENTS (Continued)
2. SIGNIFICANT ACCOUNTING POLICIES
The following is a summary of the significant accounting policies followed by the Trust in the preparation of its financial statements in conformity with accounting principles generally accepted in the United States of America (“U.S. GAAP”), which may require management to make estimates and assumptions that affect the reported amounts of assets and liabilities and disclosures of contingent assets and liabilities at the date of the financial statements and the increases and decreases in net assets from operations during the reporting period. Actual results could differ from those estimates. Each Fund qualifies as an investment company under U.S. GAAP and follows the accounting and reporting guidance applicable to the Investment Companies Topic of U.S. GAAP.
Effective January 1, 2017, the Trust implemented Accounting Standards Update (“ASU”) No. 2016-19, Technical Corrections and Improvements issued by the Financial Accounting Standards Board (“FASB”). This ASU made technical changes to various sections of the accounting standards codification (“ASC”), including modifications to Topic 820, Fair Value Measurement and requires disclosure of reason(s) for the change in valuation approach and valuation technique. Changes in valuation approach and valuation technique, if any, are disclosed in Note 3D.
A. INVESTMENT TRANSACTIONS AND INCOME
Investment transactions are recorded on a trade date basis. Securities purchased or sold on a when-issued or delayed-delivery basis as well as certain loan transactions and mortgage securities (such as Government National Mortgage Association (“GNMA”) securities) may be settled a month or more after the trade date. Dividend income is recorded on the ex-dividend date, except certain dividends from foreign securities, which are recorded as soon as a Fund is informed of the ex-dividend date or upon receipt of the dividend. A Fund’s estimated components of distributions received from real estate investment trusts may be considered income, return of capital distributions or capital gain distributions. Return of capital distributions are recorded as a reduction of cost of the related investments. Interest income, adjusted for amortization of premium and accretion of discount, is recorded daily on an accrual basis. Investment income is recorded net of foreign taxes withheld, if any. A Fund may be subject to foreign taxes on income, gains on investments, or currency repatriation, a portion of which may be recoverable. A Fund will accrue such taxes and reclaims as applicable, based upon the current interpretation of tax rules and regulations that exist in the markets in which that Fund invests. Facility fees and other fees (such as origination fees) received from floating rate senior loan notes purchased (see Note 4) by a Fund are amortized over the expected term of each applicable senior loan. Commitment fees received by a Fund relating to unfunded senior loan commitments are amortized to income over the period of the commitment. Consent fees, which are compensation for agreeing to changes in the terms of debt instruments, are recorded as interest income when received. Realized gains and losses from investment transactions are recorded on the basis of identified cost. Gains and losses realized on principal paydowns from mortgage-backed and asset-backed securities are recorded as interest income. Litigation settlements on securities that were previously held are recorded as realized gains on investment securities.
B. DISTRIBUTIONS TO SHAREHOLDERS
For the Portfolio Optimization Funds, Pacific Funds Diversified Alternatives, and PF U.S. Equity Funds, dividends on net investment income, if any, are generally declared and paid annually. For the PF Fixed Income Funds, dividends on net investment income, if any, are generally declared and paid monthly. Dividends may be declared more or less frequently if advantageous to the specific Fund and its shareholders.
All realized capital gains are distributed at least annually for each Fund. Dividends and distributions paid to shareholders are recorded on the ex-dividend date.
C. FOREIGN CURRENCY TRANSLATION
The Trust’s accounting records are maintained in U.S. dollars. The market value of investments and other assets and liabilities, which are denominated in non-U.S. currencies, are translated into U.S. dollars based on the applicable exchange rates at the end of each business day. Purchases and sales of investments and income and expenses, denominated in foreign currencies, are translated into U.S. dollars at the exchange rates in effect on the transaction date.
None of the Funds separately report the effect of changes in foreign exchange rates from changes in market prices of investments held. Such changes are included with the net realized gain or loss and change in net unrealized appreciation or depreciation on investments. Other foreign currency transactions resulting in realized and unrealized gain or loss, if any, are reported separately as net realized gain or loss on foreign currency transactions and change in net unrealized appreciation or depreciation on foreign currencies.
D. ALLOCATION OF INCOME, EXPENSES, GAINS AND LOSSES
Income, non-class specific expenses, and realized and unrealized gains and losses are allocated on a daily basis to each class of shares based upon the relative portion of net assets of each class. Certain Trust expenses directly attributable to a particular Fund are charged to that Fund (such as fund-specific transactional fees, proxies, liquidations, litigation, and organizational/start-up costs) and class-specific fees and expenses are charged directly to the respective share class within each Fund. Generally, other Trust expenses are allocated proportionately among all the Funds in relation to the net assets of each Fund.
E. OFFERING COSTS
A new Fund bears all costs (or the applicable pro-rata share if there is more than one new Fund) associated with the offering expenses of the Fund including legal, printing, and support services (see Notes 6 and 7A). All such costs are amortized as an expense of the new Fund on a straight-line basis over twelve months from commencement of operations.
F. NEW PRONOUNCEMENTS
On October 13, 2016, the U.S. Securities and Exchange Commission (“SEC”) adopted new rules (the “Reporting Rules”) and amended existing rules (the “Amended Rules”) intended to modernize reporting and enhance the disclosure of information for most registered investment
D-2
Table of Contents
PACIFIC FUNDS
NOTES TO FINANCIAL STATEMENTS (Continued)
companies. The Amended Rules include amendments relating to Regulation S-X, which modify the form and content of the financial statements of the Trust, went into effect as of August 1, 2017 and are reflected in this annual report. For the Trust, the effective date of the Reporting Rules will be June 1, 2018. At this time, management is evaluating the implications of the Reporting Rules and determining their impact on the Trust’s financial statements and accompanying notes.
On March 30, 2017, the FASB issued ASU 2017-08, Premium Amortization on Purchased Callable Debt Securities, that will require the premium associated with the purchase of callable debt securities be amortized to the earliest call date and no longer amortized through the contractual life of the instrument. The changes are effective for fiscal years, and interim periods within those fiscal years, beginning after December 15, 2018. At this time, management is evaluating the implications of this ASU and its impact on the financial statements of the Trust.
3. VALUATION AND FAIR VALUE MEASUREMENTS
A. VALUATION POLICY
The Trust’s Board of Trustees (the “Board”) has adopted a policy (“Valuation Policy”) for determining the value of the Trust’s investments each business day. Under the Valuation Policy, the Board has delegated certain functions to the Trustee Valuation Committee (“TVC”) and/or the Valuation Oversight Committee (“VOC”) or its delegate to determine the fair value of certain investments, which includes using third party pricing services. Each valuation committee that values the Funds’ investments does so in accordance with the Valuation Policy. Notes 3B and 3C below describe in greater detail the methodologies used to value each Fund’s investments.
B. DETERMINATION OF NET ASSET VALUE (“NAV”)
Each Fund presented in these financial statements is divided into shares and share classes. The price per share of each class of a Fund’s shares is called the NAV. The NAV forms the basis for all transactions involving buying, selling, exchanging or reinvesting shares. Each Fund’s NAV is calculated by taking the total value of a Fund’s assets, subtracting a Fund’s liabilities, and dividing by the total number of shares outstanding.
Each Fund’s NAV is calculated once per day, every day the New York Stock Exchange (“NYSE”) is open, including days when foreign markets and/or bond markets are closed. For purposes of calculating the NAV, the value of investments held by each Fund is generally determined as of the scheduled closing time of the NYSE, which is usually 4:00 p.m. Eastern Time. Information that becomes known to the Trust or its agents after the scheduled close of the NYSE on a particular day will not normally be used to retroactively adjust the price of an investment for that same business day. Such information may include late dividend notifications, legal or regulatory matters, corporate actions, and corrected/adjusted last sales prices or official closing prices from an exchange.
Each Fund’s NAV will not be calculated on days when the NYSE is closed. There may be a delay in calculating the NAV if: (i) the NYSE is closed on a day other than a regular holiday or weekend, (ii) trading on the NYSE is restricted, (iii) an emergency exists (as determined by the SEC), making the sale of investments or determinations of NAV not practicable, or (iv) the SEC permits a delay for the protection of shareholders.
Certain Funds may hold investments that are primarily listed on foreign exchanges. Because those investments trade on weekends and other days when the Funds do not calculate their NAVs, the value of those investments may change on days when a shareholder will not be able to purchase or redeem shares of those Funds.
C. INVESTMENT VALUATION
The value of each security or other investment is the amount which a Fund might reasonably expect to receive for the investment upon its current sale in the ordinary course of business. For purposes of calculating the NAV, the value of investments held by each Fund is based primarily on pricing data obtained from various sources approved by the Board.
Domestic Equity Investments
For domestic equity investments (including exchange-traded funds), the Trust generally uses the official closing price or last reported sale price from an exchange as of the scheduled closing time of the NYSE and does not normally take into account trading, clearances or settlements that take place after the scheduled close of the NYSE. Investments for which no official closing price or last reported sales price are reported are generally valued at the mean between the most recent bid and ask prices obtained from approved pricing services, established market makers, or from broker-dealers.
Over-the-Counter (“OTC”) Investments
OTC investments (including forward commitments, swap agreements and option contracts) are generally valued by approved pricing services that use evaluated prices from various observable market and other factors. Certain OTC swap agreements are valued using industry pricing models, broker quotes or other methodologies pursuant to the Valuation Policy.
Domestic and Foreign Debt Investments
Debt investments are generally valued using the mean between bid and ask prices provided by approved pricing and quotation services, which are based upon evaluated prices determined from various observable market and other factors. Certain debt investments are valued by using a benchmark, matrix, or other pricing methodology approved pursuant to the Valuation Policy.
D-3
Table of Contents
PACIFIC FUNDS
NOTES TO FINANCIAL STATEMENTS (Continued)
Investments in Affiliated or Unaffiliated Investment Companies
Fund investments in affiliated or unaffiliated investment companies, including mutual funds, are valued at their respective published NAVs.
Investment Values Determined by a Valuation Committee
The Trust’s Valuation Policy includes methodologies approved for valuing investments in circumstances where market quotations are not readily available. In such circumstances, the Valuation Policy provides that the value of such investments may be determined in accordance with Board approved formulas and methodologies (“Alternate Valuation Methodologies”). Under the Valuation Policy these Alternate Valuation Methodologies may include, among others, amortized cost, the use of broker quotes, the use of purchase prices, last reported sale/trade prices, benchmark, proxy and matrix pricing. In the event market quotations or Alternate Valuation Methodologies are not readily available or are determined to be unreliable, the value of the investments will be determined in good faith by the TVC, or determined by the VOC or its delegate pursuant to the Valuation Policy and then subsequently submitted for approval or ratification to either the TVC or the Board. Valuations determined by the TVC or the VOC or its delegate may require subjective inputs about the value of such investments. While these valuations are intended to estimate the value a Fund might reasonably expect to receive upon the current sale of the investments in the ordinary course of business, such values may differ from the value that a Fund would actually realize if the investments were sold or values that would be obtained if a different valuation methodology had been used.
Market quotations are considered not readily available if: (i) the market quotations received are deemed unreliable or inaccurate, (ii) approved pricing services do not provide a valuation for a particular investment, or (iii) material events occur after the close of the principal market for a particular investment but prior to the scheduled close of the NYSE.
D. FAIR VALUE MEASUREMENTS AND DISCLOSURES
The Trust characterizes its investments as Level 1, Level 2, or Level 3 based upon the various inputs or methodologies used to value the investments. Under the Valuation Policy, the VOC determines the level in which each investment is characterized. The VOC includes investment, legal, and compliance members of the Trust’s Investment Adviser, accounting members of the Trust’s Administrator (see Note 6), and the Trust’s Chief Compliance Officer (“CCO”). The three-tier hierarchy of inputs is summarized in the three broad levels listed below:
| • Level 1 - Quoted | prices (unadjusted) in active markets for identical investments |
| • Level 2 - Significant | observable market-based inputs, other than Level 1 quoted prices, or unobservable inputs that are corroborated by market data |
| • Level 3 - Significant | unobservable inputs that are not corroborated by observable market data |
The VOC reviews the Valuation Policy periodically (at least annually) to determine the appropriateness of the pricing methodologies used to value each Fund’s investments. The VOC also periodically evaluates how the Trust’s investments are characterized within the three-tier hierarchy and the appropriateness of third party pricing sources. The VOC also periodically (at least annually) conducts back-testing of the value of various Level 2 and Level 3 investments to evaluate the effectiveness of the pricing methodologies including the unobservable inputs used to value those investments. Such back-testing includes comparing Level 2 and Level 3 investment values to subsequently available exchange-traded prices, transaction prices, and/or observable vendor prices. All changes to the Valuation Policy are reported to the Board on a quarterly basis with material changes, as determined by the Trust’s CCO, requiring approval by the Board.
The inputs or methodologies used for characterizing each Fund’s investments within the three-tier hierarchy are not necessarily an indication of the relative risks associated with investing in those investments. Foreign equity investments that are valued with the assistance of a statistical research service approved by the Board and based on significant observable inputs are reflected as Level 2. Changes in valuation techniques may result in transfers into or out of an assigned level within the hierarchy. Transfers between different levels of the fair value hierarchy resulting from such changes are deemed to have occurred as of the end of the reporting period. A summary of each Fund’s investments as of March 31, 2018, as categorized under the three-tier hierarchy of inputs, can be found in the Notes to Schedule of Investments section of each Fund’s Schedule of Investments.
The following is a description of valuation inputs and techniques that the Trust currently utilizes to fair value each major category of assets and liabilities:
Equity Securities (Common and Preferred Stock) and Mutual Funds
Equity securities (foreign or domestic) that are actively traded on a securities exchange are fair valued based on quoted prices from the applicable exchange, and to the extent valuation adjustments are not applied to these securities, they are categorized as Level 1. Equity securities traded on inactive markets are fair valued using significant other observable inputs which include broker-dealer quotes, recently executed transactions adjusted for changes in the benchmark index, or evaluated price quotes received from pricing vendors that take into account the integrity of the market sector and issuer, the individual characteristics of the security, and information received from broker-dealers and other market sources pertaining to the issuer or security. To the extent that these inputs are observable and timely, the fair values of these securities would be categorized as Level 2; otherwise the fair values would be categorized as Level 3.
Investments in registered mutual funds, including affiliated registered mutual funds, are valued at their respective published NAV and are categorized as Level 1.
U.S. Treasury Obligations
U.S. Treasuries are fair valued based on pricing models that evaluate the mean between the most recently published bid and ask price from market data sources. The models also take into consideration yield curves and data received from active market makers and inter-dealer
D-4
Table of Contents
PACIFIC FUNDS
NOTES TO FINANCIAL STATEMENTS (Continued)
brokers. Yield curves change daily in response to market conditions and are generally obtained from the new issue market and broker-dealer sources. To the extent that these inputs are observable and timely, the fair values of U.S. Treasury obligations would be categorized as Level 2; otherwise the fair values would be categorized as Level 3.
Mortgage-Backed and Asset-Backed Securities
Mortgage-backed securities, including government sponsored enterprises, are fair valued using pricing models based on inputs that include issuer type, coupon, and cash flows, mortgage prepayment projection tables and adjustable rate mortgage evaluations that incorporate index data, periodic and life caps, the next coupon reset date, and the convertibility of the bond. To the extent that these inputs are observable and timely, the fair values of mortgage-backed securities would be categorized as Level 2; otherwise the fair value would be categorized as Level 3.
Asset-backed securities and collateralized mortgage obligations are fair valued using pricing models based on a security’s average life volatility. The models also take into account tranche characteristics such as coupon average life, collateral types, ratings, the issuer and tranche type, underlying collateral and performance of the collateral, and discount margin for certain floating rate issues. To the extent that these inputs are observable and timely, the fair values of asset-backed securities and collateralized mortgage obligations would be categorized as Level 2; otherwise the fair values would be categorized as Level 3.
Foreign Government Bonds and Notes
Foreign government bonds and notes are fair valued based on discounted cash flow models that incorporate option adjusted spreads along with benchmark curves and credit spreads. In addition, international bond markets are monitored daily for information pertaining to the issuer and/or the specific issue. To the extent that these inputs are observable and timely, the fair values of foreign government bonds and notes would be categorized as Level 2; otherwise the fair values would be categorized as Level 3.
Corporate Bonds and Notes and U.S. Government Agency Issues
Corporate bonds held by a Fund are generally comprised of two main categories: investment grade bonds and high yield bonds. Investment grade bonds are reported at fair value using various inputs and techniques, which include broker-dealer quotations, live trading levels, recently executed transactions in securities of the issuer or comparable issuers, issuer credit information, and option-adjusted spread models where applicable. Fair values for high yield bonds are based primarily on broker-dealer quotations from relevant market makers and recently executed transactions in securities of the issuer or comparable issuers. The broker-dealer quotations received are supported by credit analysis of the issuer that takes into consideration credit quality assessments, daily trading activity, and the activity of the underlying equities, listed bonds, and sector-specific trends. To the extent that these inputs are observable and timely, the fair values of corporate bonds would be categorized as Level 2; otherwise the fair values would be categorized as Level 3.
U.S. Government Agency Issues are reported at fair value using various inputs and techniques, which include broker-dealer quotations, live trading levels, recently executed transactions in securities of the issuer, issuer credit information, and option-adjusted spread models where applicable. To the extent that these inputs are observable and timely, the fair values of U.S. Government Agency Issues would be categorized as Level 2; otherwise the fair values would be categorized as Level 3.
Swap Agreements
Total Return Swaps – Total return swaps that are traded and cleared on a securities exchange or swap execution facility are fair valued based on quoted prices from the applicable exchange and are categorized as Level 2. Total Return swaps traded over-the-counter are fair valued using pricing models that take into account among other factors, index spread curves, nominal values, modified duration values and cash flows. To the extent that these inputs are observable and timely, the fair values of total return swaps would be categorized as Level 2; otherwise the fair values would be categorized as Level 3.
Senior Loan Notes
Floating rate senior loan notes (“Senior Loans”) are fair valued based on a quoted price received from a single broker-dealer or an average of quoted prices received from multiple broker-dealers or valued relative to other benchmark securities when broker-dealer quotes are unavailable. To the extent that these inputs are observable, the fair values of Senior Loans would be categorized as Level 2; otherwise the fair values would be categorized as Level 3.
4. INVESTMENTS AND RISKS
General Investment Risks
An investment in each Fund represents an indirect investment in the assets owned by that Fund. As with any mutual fund, the value of the assets owned by each Fund may move up or down, and as a result, an investment in a Fund at any point in time may be worth more or less than the original amount invested.
A Fund’s transactions in listed securities are settled/paid for upon delivery to or from their counterparties; therefore, the risk of counterparty default for listed securities is considered minimal, as delivery of securities sold is only made once a Fund has received payment. Payment is made on a purchase once the securities have been delivered by the counterparty. The trade will fail if either party fails to meet its obligations.
Market and Regulatory Risks
Events in the financial markets and economy may cause volatility and uncertainty and affect Fund performance. Market events may affect a single issuer, industry, sector, or the market as a whole. In addition, because of interdependencies between markets, events in one market may adversely impact other markets or issuers in which a Fund invests in unforeseen ways. Traditionally liquid investments may experience periods of diminished liquidity. During a general downturn in the financial markets, multiple asset classes may decline in value and a Fund may lose value, regardless of the individual results of the securities and other instruments in which the Fund invests. Governmental and regulatory
D-5
Table of Contents
PACIFIC FUNDS
NOTES TO FINANCIAL STATEMENTS (Continued)
actions, including tax law changes, may also impair Fund management and have unexpected or adverse consequences on particular markets, strategies, or investments. Future market or regulatory events may impact a Fund in unforeseen ways, such as causing the Fund to alter its existing strategies or potentially, to liquidate and close.
Fund of Funds Investments
The Portfolio Optimization Funds and Pacific Funds Diversified Alternatives are exposed to the same risks as the applicable PF Underlying Funds, Pacific Funds Core Income, Pacific Funds Floating Rate Income, Pacific Funds High Income, and Pacific Funds Small-Cap Growth in direct proportion to the allocation of assets among those funds. This annual report contains information about the risks associated with investing in Pacific Funds Core Income, Pacific Funds Floating Rate Income, Pacific Funds High Income, and Pacific Funds Small-Cap Growth. The annual report for the PF Underlying Funds contains information about the risks associated with investing in the PF Underlying Funds. Allocations among the PF Underlying Funds, Pacific Funds Core Income, Pacific Funds Floating Rate Income, Pacific Funds High Income, and Pacific Funds Small-Cap Growth are determined using an asset allocation process, which seeks to optimize returns by allocating among different asset classes given various levels of risk tolerance. The allocations of the Portfolio Optimization Funds and Pacific Funds Diversified Alternatives may not effectively decrease risk or increase returns for investors, and the selection and weighting of allocations to asset classes and/or PF Underlying Funds, Pacific Funds Core Income, Pacific Funds Floating Rate Income, Pacific Funds High Income, and Pacific Funds Small-Cap Growth may cause them to underperform other mutual funds with a similar investment objective. Although the Portfolio Optimization Funds and Pacific Funds Diversified Alternatives seek to provide diversification across major asset classes, they may invest a significant portion of their assets in any one or several PF Underlying Funds, Pacific Funds Core Income, Pacific Funds Floating Rate Income, Pacific Funds High Income, and Pacific Funds Small-Cap Growth (See Note 7C).
Equity Investments
Stock markets are volatile. Equity investments tend to go up or down in value, sometimes rapidly and unpredictably, in response to many factors, including a company’s historical and prospective earnings, the value of its assets, general economic conditions, interest rates, investor perceptions, and market liquidity. Due to the complexities of markets, events in one market or sector may adversely impact other markets or sectors.
Debt Investments
Debt investments are subject to many risks, including, but not limited to, interest rate risk, credit risk, market and regulatory risk, price volatility, and liquidity risk, which may affect their value. There is a risk that an issuer or guarantor of a debt investment might be unable or unwilling to meet its financial obligations and might not make interest or principal payments on an instrument when those payments are due (“default”). Defaults may potentially reduce a Fund’s income or ability to recover amounts due and may reduce the value of the debt investment, sometimes dramatically. High yield/high risk or “junk” securities may be more volatile than higher rated securities. High yield/high risk securities (including loans) are typically issued by companies that are highly leveraged, less creditworthy or financially distressed and are considered to be mostly speculative in nature (high risk), subject to greater liquidity risk, and subject to a greater risk of default than higher rated securities, especially during periods of economic uncertainty or during economic downturns. Debt investments, including bonds, fixed rate loans, and short-term instruments may be affected by changes in interest rates. Debt investments with longer durations tend to be more sensitive to changes in interest rates, making them more volatile than debt investments with shorter durations or floating or adjustable interest rates. The value of debt investments may fall when interest rates rise. Certain debt investments may be difficult to value, purchase, and sell, particularly during adverse market conditions, because there is a limited market for the investment or there are restrictions on resale.
Given the historically low interest rate environment in the U.S., risks associated with rising interest rates are heightened. The negative impact on debt investments from potential interest rate increases could be swift and significant, including falling market values, increased redemptions and reduced liquidity. Substantial redemptions from bond and other income funds may worsen that impact. Additionally, regulations applicable to and changing business practices of broker-dealers that make markets in debt investments may result in those broker-dealers restricting their market making activities for certain debt investments, which may reduce the liquidity and increase the volatility of such debt investments.
Certain asset-backed instruments, such as collateralized debt obligations, collateralized mortgage obligations, and other mortgage-related securities, structured investment vehicles, and other debt investments may have exposure to subprime loans or subprime mortgages, which are loans to persons with lower credit ratings. These instruments may present credit risk that is not transparent and that is greater than indicated by their ratings. The value of these instruments may be more acutely affected by downturns in the credit markets or the real estate market than certain other investments, and it may be difficult to value these instruments because of a thin secondary market.
Foreign and Emerging Markets Investments
Exposure to foreign markets can involve additional risks relating to market, economic, political, regulatory, geopolitical, or other conditions. These factors can make foreign investments more volatile and less liquid than U.S. investments. In addition, foreign markets can react differently to these conditions than the U.S. market. Markets and economies throughout the world are becoming increasingly interconnected, and conditions or events in one market, country or region may adversely impact investments or issuers in another market, country or region. Investments in or exposure to investments in emerging market countries may be riskier than investments in or exposure to investments in U.S. and certain developed markets. Risk may be more enhanced for investments in or exposure to investments in frontier market countries.
The Funds may face potential risks associated with the United Kingdom’s vote on June 23, 2016 to leave the European Union (the “EU”), commonly referred to as “Brexit.” There are considerable uncertainties about the repercussions resulting from Brexit, including the impact on trade agreements, regulations, and treaties. The exact time frame for the implementation of Brexit is unknown and may change. Brexit may also increase the likelihood that other EU members may decide to leave the EU. These potential consequences may result in increased market volatility and illiquidity in the United Kingdom, the EU and other financial markets, as well as slower economic growth and fluctuations in
D-6
Table of Contents
PACIFIC FUNDS
NOTES TO FINANCIAL STATEMENTS (Continued)
exchange rates. Any of these events may have a significant adverse effect on global markets and economies, which in turn could negatively impact the value of the Funds’ investments.
The countries listed in the Schedules of Investments for individual investment holdings (each a “Holding”) are each considered the country of risk to which a Holding, and therefore the Fund, is exposed. Each Holding’s country of risk is obtained from a third-party source that uses factors such as reporting currency, sales/revenue and location of management of the Holding’s issuer to determine country of risk. The country of risk may not be exclusive, however, as there may be other countries of risk to which a Holding is exposed that are not disclosed, although the country identified is expected to be the primary country of risk for that Holding. A Holding is generally subject to greater country risk based on where it conducts business or is economically tied to rather than where it is formed or incorporated. Foreign markets risks may include currency risk, market and regulatory risk, liquidity risk, emerging markets risk, frontier markets risk, and geographic focus risk, among other risks.
Senior Loan Participations and Assignments
Certain Funds may invest in Senior Loans of domestic or foreign corporations, partnerships, and other entities (“Borrowers”), the interest rates of which float or adjust periodically based upon a specified adjustment schedule, benchmark indicator, or prevailing interest rates. Senior Loans generally pay interest at rates which are periodically redetermined by reference to a base lending rate plus a premium. These base lending rates generally include prime rates of one or more major U.S. banks, London Interbank Offered Rates (“LIBOR”) or certificates of deposit rates. Senior Loans often require prepayments from excess cash flow or permit the Borrower to repay at its election. The degree to which Borrowers repay cannot be predicted with accuracy. As a result, the actual maturity may be substantially less than the stated maturities. Senior Loans are exempt from registration under the Securities Act of 1933, may contain certain restrictions on resale, and cannot be sold publicly. A Fund’s investments in Senior Loans may be in the form of participations in loans or assignments of all or a portion of loans from third parties.
When a Fund purchases assignments, it acquires all the rights and obligations under the loan agreement of the assigning lender. Assignments may, however, be arranged through private negotiations between potential assignees and potential assignors, and the rights and obligations acquired by the purchaser of an assignment may differ from, and be more limited than those held by the assigning lender.
When a Fund purchases a participation of a Senior Loan interest, the Fund typically enters into a contractual agreement with the lender or other third party selling the participation. A participation interest in Senior Loans includes the right to receive payments of principal, interest, and any fees to which it is entitled from the lender and only upon receipt by the lender of payments from the Borrower, but not from the Borrower directly. When investing in a participation interest, if a Borrower is unable to meet its obligations under a loan agreement, a Fund generally has no right to enforce compliance with the terms of the loan agreement. As a result, the Fund assumes the credit risk of the Borrower, the selling participant, and any other persons that are interpositioned between the Fund and the Borrower. If the lead lender in a typical lending syndicate becomes insolvent, enters Federal Deposit Insurance Corporation (“FDIC”) receivership or, if not FDIC insured, enters into bankruptcy, the Fund may incur certain costs and delays in receiving payment or may suffer a loss of principal and/or interest. As of March 31, 2018, no participation interest in Senior Loans was held by any of the Funds presented in these financial statements.
Unfunded loan commitments on senior loan participations and assignments, if any, are marked to market daily and valued according to the Trust’s valuation policies and procedures. Any outstanding unfunded loan commitments are presented in the Notes to Schedules of Investments section of each applicable Fund’s Schedule of Investments. Any applicable net unrealized appreciation or depreciation at the end of the reporting period is recorded as an asset (unfunded loan commitment appreciation) or a liability (unfunded loan commitment depreciation) and any change in net unrealized appreciation or depreciation for the reporting period is recorded as a change in net unrealized appreciation or depreciation on unfunded loan commitment. As of March 31, 2018, Pacific Funds Strategic Income and Pacific Funds Floating Rate Income had unfunded loan commitments of $1,492,500 and $8,240,026, respectively (see details in the Notes to Schedules of Investments).
U.S. Government Securities
Certain Funds may invest in securities issued by U.S. Government agencies or government-sponsored enterprises. U.S. Government securities are obligations of, and in certain cases, guaranteed by the U.S. Government, its agencies or instrumentalities. Some U.S. Government securities, such as Treasury Bills, Treasury Notes, Treasury Bonds, and securities guaranteed by GNMA (or “Ginnie Mae”), are supported by the full faith and credit of the U.S. Government; others, such as those of the Federal Home Loan Bank, are supported by the right of the issuer to borrow from the U.S. Department of the Treasury (the “U.S. Treasury”); others, such as those of the Federal National Mortgage Association (“FNMA” or “Fannie Mae”), are supported by the discretionary authority of the U.S. Government to purchase the agency’s obligations. Securities not backed by the full faith and credit of the U.S. Government may be subject to a greater risk of default. U.S. Government securities may include zero coupon securities, which do not distribute interest on a current basis and tend to be subject to greater risk than interest-paying securities of similar maturities.
Government-related guarantors (i.e., not backed by the full faith and credit of the U.S. Government) include FNMA and the Federal Home Loan Mortgage Corporation (“FHLMC” or “Freddie Mac”). FNMA and FHLMC are government-sponsored corporations, the common stocks of which are owned entirely by private stockholders. FNMA purchases conventional (i.e., not insured or guaranteed by any government agency) residential mortgages from a list of approved seller/servicers which include state and federally chartered savings and loan associations, mutual savings banks, commercial banks and credit unions, and mortgage bankers. Pass-through securities issued by FNMA are guaranteed as to timely payment of principal and interest by FNMA, but are not backed by the full faith and credit of the U.S. Government. FHLMC issues Participation Certificates (“PCs”), which are pass-through securities, each representing an undivided interest in a pool of residential mortgages. FHLMC guarantees the timely payment of interest and ultimate collection of principal, but PCs are not backed by the full faith and credit of the U.S. Government.
D-7
Table of Contents
PACIFIC FUNDS
NOTES TO FINANCIAL STATEMENTS (Continued)
Segregation and Collateral
If a Fund engages in certain transactions, such as derivative investments or repurchase agreements, it may require collateral in the form of cash or investments to be held in segregated accounts at the Trust’s custodian, with an exchange or clearing member firm, or segregated on the Fund’s books and records maintained by the custodian and/or the manager of the Fund. In each instance that segregation of collateral is required, it is done so in accordance with the 1940 Act and/or any interpretive guidance issued by the SEC. In the event of the counterparty default on the transaction, a Fund has the right to liquidate the collateral and apply the proceeds to the counterparty’s obligations to that Fund. Upon an event of default, if the seller defaults and the value of the collateral declines, or if the seller enters an insolvency proceeding, realization of the collateral by the Fund may be delayed, limited or wholly denied. There is also a possibility that a Fund could experience a delay in selling investments that are segregated as collateral.
5. DERIVATIVE INVESTMENTS AND RISKS, AND ENFORCEABLE MASTER NETTING ARRANGEMENTS
A. PRINCIPAL MARKET RISKS MANAGED BY INVESTING IN DERIVATIVES
Derivative instruments are investments whose values are tied to the value of an underlying security or asset, a group of assets, interest rates, exchange rates, currency or an index. Certain Funds are permitted to invest in derivative instruments, including, but not limited to, futures contracts, option contracts, forward foreign currency contracts, and swap agreements. Derivatives may have little or no initial cash investment value relative to their market value exposure and therefore can produce significant gains or losses in excess of their cost. This is sometimes referred to as leverage. Leverage can magnify a Fund’s gains and losses and therefore increase its volatility. A Fund’s investments in derivatives may increase, decrease or change the level or types of exposure to certain risk factors. The primary risks a Fund may attempt to manage through investing in derivative instruments include, but are not limited to, interest rate, foreign investments and currency, price volatility, and credit (including counterparty) risks.
Interest Rate Risk – A Fund may be exposed to interest rate risk through investments in debt securities. Interest rate risk is the risk that debt securities will decline in value as a result of changes in interest rates. For example, the value of bonds, fixed rate loans and short-term money market instruments may decline in value when interest rates rise. In a low interest rate environment, the risks associated with rising interest rates are heightened. Debt securities with longer durations tend to be more sensitive to changes in interest rates, making them more volatile than debt securities with shorter durations or money market instruments. Therefore, duration is a potentially useful tool to measure the sensitivity of a debt security’s yield (market price to interest rate movement). To manage these risks, certain Funds may invest in derivative instruments tied to interest rates.
Foreign Investments and Currency Risk – A Fund may be exposed to foreign investments and/or currency risk through direct investment in securities or through options, futures or currency transactions. The prices of foreign securities that are denominated in foreign currencies are affected by the value of the U.S. dollar. With respect to securities denominated in foreign currencies, in general, as the value of the U.S. dollar rises, the U.S. dollar price of a foreign security will fall. As the value of the U.S. dollar falls, the U.S. dollar value of the foreign security will rise. Currency rates in foreign countries may fluctuate significantly over short periods of time for a number of reasons. Foreign investments may be riskier than U.S. investments for many reasons, including changes in currency exchange rates, unstable political and economic conditions, a lack of adequate and timely company information, differences in the way securities markets operate, relatively lower market liquidity, less stringent financial reporting and accounting guidance and controls, less secure foreign banks or securities depositories than those in the U.S., foreign taxation issues, and foreign controls on investments. As a result, a Fund’s investments in foreign currency-denominated securities and other foreign investments may reduce the returns of the Fund. To manage these risks, certain Funds may invest in derivative instruments tied to foreign investments and/or currencies.
Price Volatility Risk – Derivatives tied to equity and debt securities are exposed to potential price volatility. Debt securities are affected by many factors, including prevailing interest rates, market conditions, and market liquidity. Volatility of below investment grade debt securities (including loans) may be relatively greater than for investment grade debt securities. Equity securities tend to go up or down in value, sometimes rapidly and unpredictably. The prices of equity securities change in response to many factors, including a company’s historical and prospective earnings, the value of its assets, general economic conditions, interest rates, investor perceptions, and market liquidity. Due to the complexities of markets, events in one market or sector may adversely impact other markets or sectors. To manage these risks, certain Funds may invest in various derivative instruments. Derivative instruments may be used to manage a Fund’s exposure to price volatility risk but may also be subject to greater price volatility than investments in traditional securities. The value of commodity-linked derivative instruments may be affected by changes in overall market movements, commodity index volatility, changes in interest rates, or factors affecting a particular industry or commodity, such as drought, floods, weather, livestock disease, embargoes, tariffs, and international economic, political, and regulatory developments.
Credit and Counterparty Risk – Credit risk is the risk that a debt security’s issuer (or borrower or counterparty) will be unable or unwilling to meet its financial obligations (e.g., may not be able to make principal and/or interest payments when they are due or otherwise default on other financial terms) and/or may go bankrupt. This is also sometimes described as counterparty risk. A Fund may lose money if the issuer or guarantor of debt security, or counterparty of a derivative contract, repurchase or reverse repurchase agreement, or a loan of Fund securities, is unable or unwilling to make timely principal and/or interest payments, or to otherwise honor its obligations. A Fund may attempt to minimize concentrations of credit risk by undertaking transactions with a large number of borrowers or counterparties on recognized and reputable exchanges. A Fund’s investments in debt investments may range in quality from those rated in the lowest category in which it is permitted to invest to those rated in the highest category by a rating agency, or if unrated, determined by the manager to be of comparable quality.
Similar to credit risk, a Fund may be exposed to counterparty risk, or the risk that an institution or other entity with which a Fund has unsettled or open transactions will default. Financial assets of counterparties, which potentially expose a Fund to counterparty risk, consist mainly of cash due from counterparties and investments. Certain managers may attempt to minimize credit risks to the Funds by performing extensive reviews
D-8
Table of Contents
PACIFIC FUNDS
NOTES TO FINANCIAL STATEMENTS (Continued)
of each counterparty, entering into transactions with counterparties that the manager believes to be creditworthy at the time of the transaction and requiring the posting of collateral in applicable transactions. To manage these risks, certain Funds may invest in derivative instruments tied to a security issuers’ financial strength.
B. DERIVATIVE INVESTMENTS
In addition to managing the market risks described above, certain Funds, if permitted by their investment objectives, may also invest in derivatives for purposes of hedging, duration management, to gain exposure to specific investment opportunities, as a substitute for securities, to enhance returns, or to otherwise help achieve a Fund’s investment goal. Each derivative instrument and the reasons a Fund invested in derivatives during the reporting period are discussed in further detail below. The Portfolio Optimization Funds and Pacific Funds Diversified Alternatives are exposed to the same derivative risks as the applicable PF Underlying Funds, Pacific Funds Core Income, Pacific Funds Floating Rate Income, Pacific Funds High Income, and/or Pacific Funds Small-Cap Growth in direct proportion to the allocation of assets among those funds. The annual report of the PF Underlying Funds discusses in further detail the derivative instruments and the reasons a PF Underlying Fund invested in derivatives during the reporting period.
Swap Agreements – Swap agreements are bilaterally negotiated agreements between the Funds and their counterparties to exchange swap investment cash flows, assets, foreign currencies or market-linked returns at specified intervals. Swap agreements are privately negotiated in the OTC market or are executed in a multilateral or other execution facility platform, such as a registered commodities exchange (“centrally cleared swaps”). In connection with these agreements, cash and securities may be identified as collateral in accordance with the terms of the respective swap agreements to provide assets of value and recourse in the event of default or bankruptcy/insolvency. Swaps are marked-to-market daily based upon values received from third party vendors or quotations from market makers. Market values greater than zero are recorded as an asset and market values less than zero are recorded as a liability. The change in value of swaps, including accruals of periodic amounts of interest to be paid or received on swaps, is recorded as unrealized appreciation or depreciation. Daily changes in valuation of centrally cleared swaps, if any, are recorded as variation margin receivable or payable. OTC swap payments received or made at the beginning of the measurement period are recorded as an asset or liability and represent payments made or received upon entering into the swap agreement to compensate for differences between the stated terms of the swap agreement and prevailing market conditions (credit spreads, currency exchange rates, interest rates, and other relevant factors). These upfront payments are recorded as realized gain or loss when the swap is closed. A liquidation payment received or made at the termination of the swap is recorded as realized gain or loss. Net periodic payments received by a Fund are recorded as realized gain.
Total Return Swaps – A Fund investing in total return swaps is subject to the risk that there is no liquid market for these agreements, that the counterparties may default on their obligations to perform or that there may be unfavorable changes in the value of the underlying index or reference instrument (generally caused by changes in interest rates or declines in credit quality). A total return swap agreement is one in which one party makes payments based on a set rate, either fixed or variable, while the other party makes payments based on the return of an underlying index or reference instrument, which includes both the income it generates and any capital gains. To the extent the total return of the index or reference instrument underlying the transaction exceeds or falls short of the offsetting interest rate obligation, a Fund will receive a payment from or make a payment to the counterparty. A Fund’s maximum risk of loss from counterparty credit risk related to total return swaps is the discounted net value of the cash flows to be received from or paid to the counterparty over the contract’s remaining life, to the extent that the amount is positive. The risk may be mitigated to some extent if a master netting arrangement between a Fund and the counterparty is in place and to the extent a Fund obtains collateral to cover a Fund’s exposure to the counterparty.
A Fund may enter into fully funded total return swaps which involves one party making an initial payment equal to the estimated value of the reference instrument. The parties to the swap then exchange respective commitments to pay or receive a net amount based on the change in the fair value of a reference instrument and a specified notional amount.
During the reporting period, Pacific Funds High Income entered into total return swaps on credit indices to obtain long exposure to the broader high yield market, primarily for purposes of liquidity. This Fund did not hold any swaps as of the end of the reporting period.
The following is a summary of the location of realized gains and losses and changes in net unrealized appreciation and depreciation of derivative investments, if any, disclosed in the Trust’s Statements of Operations:
| Derivative Investments Risk Type | Location of Gain (Loss) on Derivative Investments Recognized in the Statements of Operations | |
Interest rate contracts | Net realized gain (loss) on swap transactions Change in net unrealized appreciation (depreciation) on swaps |
The following is a summary of Pacific Funds High Income’s net realized gain or loss and change in net unrealized appreciation or depreciation on derivative investments recognized in its Statement of Operations categorized by primary risk exposure for the fiscal year ended March 31, 2018:
Derivative Investments Risk Type | Realized Gain (Loss) | Change in Net Unrealized Appreciation (Depreciation) | ||||||
Interest rate contracts | $30,952 | ($9,619 | ) | |||||
For financial reporting purposes, the Trust does not offset fair value amounts recognized for derivative instruments and fair value amounts recognized for the right to reclaim cash collateral (receivables) or the obligation to return cash collateral (payables) arising from derivative instruments recognized at fair value executed with the same counterparty under a master netting arrangement.
The average number of positions and value of derivative investments in interest rate contracts held by Pacific Funds High Income for the fiscal year ended March 31, 2018 were 1 and $12,842, respectively. The average number of positions and value of derivative investments and the amounts of net realized gain or loss and changes in net unrealized appreciation or depreciation on derivative investments as disclosed in its
D-9
Table of Contents
PACIFIC FUNDS
NOTES TO FINANCIAL STATEMENTS (Continued)
Statement of Operations serve as indicators of volume of financial derivative activity for Pacific Funds High Income for the fiscal year ended March 31, 2018.
C. ENFORCEABLE MASTER NETTING ARRANGEMENTS
Master Agreements and Netting Arrangements – Certain Funds are parties to various agreements, including but not limited to International Swaps and Derivatives Association Agreements and related Credit Support Annex, Master Repurchase Agreements, and Master Securities Forward Transactions Agreements (collectively “Master Agreements”), which govern the terms of certain transactions with select counterparties. These Master Agreements generally include provisions for general obligations, representations, agreements, collateral, and certain events of default or termination. These Master Agreements also include provisions for netting arrangements that help reduce credit and counterparty risk associated with relevant transactions (“netting arrangements”). The netting arrangements are generally tied to credit related events that, if triggered, would cause an event of default or termination giving a Fund or counterparty the right to terminate early and cause settlement, on a net basis, of all transactions under the applicable Master Agreement. In the event of an early termination as a result of an event of default under the Master Agreement, the total value exposure of all transactions will be offset against collateral exchanged to date, which would result in a net receivable or payable that would be due from or to the counterparty. However, bankruptcy or insolvency laws of a particular jurisdiction may impose restrictions on or prohibitions against the right of offset in the event of a bankruptcy or insolvency. Credit related events include, but are not limited to, bankruptcy, failure to make timely payments, restructuring, obligation acceleration, obligation default, a material decline in net assets, decline in credit rating or repudiation/moratorium. Any election made by a counterparty to early terminate the transactions under a Master Agreement could have a material adverse impact on a Fund’s financial statements. A Fund’s overall exposure to credit risk, subject to netting arrangements can change substantially within a short period, as it is affected by each transaction subject to the arrangement.
Master Agreements can also help limit counterparty risk by specifying collateral posting arrangements at pre-arranged exposure levels. Under the Master Agreements, collateral is routinely transferred if the total net exposure to certain transactions under the relevant Master Agreement with a counterparty in a given Fund exceeds a specified threshold, net of collateral already in place, which typically ranges from $0 to $250,000 depending on the counterparty and the type of Master Agreement. Collateral under the Master Agreements is usually in the form of cash or U.S. Treasury Bills but could include other types of securities. The value of all derivative transactions outstanding under a Master Agreement is calculated daily to determine the amount of collateral to be received or pledged by the counterparty. Posting of collateral for OTC derivative transactions are covered under tri-party collateral agreements between the Trust, the Trust’s custodian, and each counterparty. Collateral for centrally cleared derivatives transactions are posted with the applicable derivatives clearing organization.
6. INVESTMENT ADVISORY, ADMINISTRATION AND SHAREHOLDER SERVICES, SUPPORT SERVICES, AND DISTRIBUTION AGREEMENTS
Pursuant to an Investment Advisory Agreement, PLFA, a wholly-owned subsidiary of Pacific Life Insurance Company (“Pacific Life”), serves as Investment Adviser to each Fund of the Trust. PLFA manages the Portfolio Optimization Funds and Pacific Funds Diversified Alternatives. PLFA also manages the PF Fixed Income Funds under the name Pacific Asset Management. For the PF U.S. Equity Funds, PLFA has retained another investment management firm to sub-advise each Fund, as discussed later in this section. PLFA receives investment advisory fees from each Fund which are based on the following annual percentage of the average daily net assets of each Fund:
| Fund | Advisory Fee Rate | |
Pacific Funds Portfolio Optimization Conservative (1) Pacific Funds Portfolio Optimization Moderate-Conservative (1) Pacific Funds Portfolio Optimization Moderate (1) Pacific Funds Portfolio Optimization Growth (1) Pacific Funds Portfolio Optimization Aggressive-Growth (1) Pacific Funds Diversified Alternatives (1) | 0.20% | |
| Pacific Funds Short Duration Income (2) | 0.40% | |
| Pacific Funds Core Income (2) | 0.50% | |
Pacific Funds Strategic Income (2) Pacific Funds High Income (2) | 0.60% | |
Pacific Funds Floating Rate Income (2) Pacific Funds Limited Duration High Income (2), (3) Pacific Funds Large-Cap (4) Pacific Funds Large-Cap Value | 0.65% | |
Pacific Funds Small/Mid-Cap Pacific Funds Small-Cap Pacific Funds Small-Cap Value Pacific Funds Small-Cap Growth | 0.85% |
| (1) | PLFA has agreed to waive the following advisory fees through July 31, 2018: 1) 0.025% on net assets above $2 billion through $3 billion; 2) 0.050% on net assets above $3 billion through $5 billion; 3) 0.075% on net assets above $5 billion through $7.5 billion; and 4) 0.100% on net assets above $7.5 billion. There is no guarantee that PLFA will continue such waiver after that date. As of the fiscal year ended March 31, 2018, none of the Funds meet net asset levels where portions of the advisory fee would be waived. |
| (2) | PLFA has agreed to waive the following advisory fees through July 31, 2018: 1) 0.025% on net assets above $1 billion through $2 billion; 2) 0.050% on net assets above $2 billion through $3 billion; and 3) 0.075% on net assets above $3 billion. There is no guarantee that PLFA will continue such waiver after that date. As of the fiscal year ended March 31, 2018, none of the Funds meet net asset levels where portions of the advisory fee would be waived with exception of Pacific Funds Floating Rate Income. |
| (3) | PLFA agreed to waive 0.02% of its advisory fee through July 31, 2018 for Pacific Funds Limited Duration High Income. There is no guarantee that PLFA will continue such waiver after that date. |
| (4) | PLFA agreed to waive 0.10% of its advisory fee through July 31, 2018 for Pacific Funds Large-Cap. There is no guarantee that PLFA will continue such waiver after that date. |
D-10
Table of Contents
PACIFIC FUNDS
NOTES TO FINANCIAL STATEMENTS (Continued)
Pursuant to a Sub-Advisory Agreement, the Trust and PLFA engaged Rothschild Asset Management Inc. under PLFA’s supervision to act as sub-adviser for the PF U.S. Equity Funds. PLFA, as Investment Adviser to each PF U.S. Equity Fund, pays related management fees to Rothschild Asset Management Inc. as compensation for its sub-advisory services provided to each PF U.S. Equity Fund.
Pursuant to an Administration and Shareholder Services Agreement (the “Administration Agreement”), Pacific Life serves as administrator (the “Administrator”) to the Trust. The administration fee is for procuring or providing administrative, transfer agency, and shareholder services. In addition, Pacific Life and PLFA provide support services to the Trust that are outside the scope of the Administrator’s and Investment Adviser’s responsibilities under the Administration Agreement and Investment Advisory Agreement. Under the Support Services Agreement, the Trust compensates Pacific Life and PLFA for their expenses in providing support services to the Trust in connection with various matters, some of which include the time spent by legal, accounting, and compliance personnel of Pacific Life and PLFA (including individuals who may be officers or Trustees of the Trust), to attend meetings of the Board and to provide assistance with the coordination and supervision in connection with the services procured for the Trust. Support services do not include services for which PLFA is responsible pursuant to the Investment Advisory Agreement. The Trust reimburses Pacific Life and PLFA for these support services on an approximate cost basis.
Pacific Life receives an administration fee from each Fund and applicable share class presented in these financial statements, which are based on the following annual percentage of average daily net assets of each Fund:
| Fund | Share Class | Administration Fee Rate | ||
| Portfolio Optimization Funds | A, B, C, R, and Advisor | 0.15% | ||
| Pacific Funds Diversified Alternatives | A, C, and Advisor | 0.15% | ||
Pacific Funds Short Duration Income Pacific Funds Strategic Income Pacific Funds Limited Duration High Income | A, C, and Advisor | 0.30% | ||
| I | 0.15% | |||
Pacific Funds Core Income Pacific Funds Floating Rate Income Pacific Funds High Income | A, C, and Advisor | 0.30% | ||
| I and P | 0.15% | |||
| PF U.S. Equity Funds | A, C, Advisor, and Investor | 0.30% | ||
| S | 0.15% | |||
| Pacific Funds Small-Cap Growth | P | 0.15% |
Pursuant to a Distribution Agreement, Pacific Select Distributors, LLC (the “Distributor”), a wholly-owned subsidiary of Pacific Life, serves as distributor of the Trust’s shares. Under the Distribution Agreement, the Distributor bears all expenses of providing services, including costs of sales presentations, mailings, advertisements, and other marketing efforts by the Distributor in connection with the distribution or sale of the Trust’s shares and makes distribution and/or service payments to selling groups in connection with the sale of certain of the Trust’s shares and subsequent servicing needs of shareholders provided by selling groups. The Distributor receives distribution and service fees pursuant to class-specific distribution and service plans, each adopted in accordance with Rule 12b-1 (“12b-1”) under the 1940 Act (together the “12b-1 Plans”) for Class B, C, R, and Investor Class shares. The Distributor also receives service fees pursuant to a non-12b-1 service plan for Class A shares (“Class A Plan”). The Distributor receives distribution and/or service fees from each Fund and applicable share class presented in these financial statements, which are based on the following annual percentages of average daily net assets:
| Plan | Share Class | Distribution Fee Rate | Service Fee Rate | |||||
12b-1 Plans | B and C | 0.75% | 0.25% | |||||
| R | 0.25% | 0.25% | ||||||
| Investor | 0.25% | |||||||
Class A Plan | A | 0.25% | ||||||
There are no distribution and service fees for Class I, Class P, Advisor Class, and Class S shares. The distribution and service fees are accrued daily. For the fiscal year ended March 31, 2018, the Distributor, acting as underwriter, received net commissions (front-end sales charges) of $6,902,370 from the sale of Class A shares and received $272,546 in CDSC from redemptions of Class A, B, and C shares.
7. TRANSACTIONS WITH AFFILIATES
A. ADVISORY FEES, ADMINISTRATION FEES, DISTRIBUTION AND/OR SERVICE FEES, AND EXPENSES FOR SUPPORT SERVICES
The Investment Adviser, the Distributor, and Pacific Life are related parties. The advisory fees earned by the Investment Adviser, including any advisory fee waiver, the administration fees earned by Pacific Life, the distribution and/or service fees earned by the Distributor, and expenses for support services recovered by PLFA and Pacific Life (see Note 6) from each Fund presented in these financial statements for the fiscal year ended March 31, 2018 are presented in the Statements of Operations. The amounts of each of these fees that remained payable as of March 31, 2018 are presented in the Statements of Assets and Liabilities.
B. EXPENSE LIMITATION AGREEMENTS
To help limit the Trust’s expenses, PLFA has contractually agreed to reimburse each Fund presented in these financial statements for certain operating expenses that exceed an annual rate based on a percentage of a Fund’s average daily net assets. These operating expenses include, but are not limited to: administration fees and expenses; organizational expenses; custody expenses; expenses for audit, tax, and certain legal services; preparation, printing, filing, and distribution to existing shareholders of proxies, prospectuses and shareholder reports, and other regulatory documents, as applicable; independent trustees’ fees and expenses; and establishing, overseeing, and administering the Trust’s
D-11
Table of Contents
PACIFIC FUNDS
NOTES TO FINANCIAL STATEMENTS (Continued)
compliance program. These operating expenses do not include: investment advisory fees; distribution and/or service fees; dividends on securities sold short; acquired fund fees and expenses; interest (including commitment fees); taxes (including foreign taxes on dividends, interest or gains); brokerage commissions and other transactional expenses; and extraordinary expenses such as litigation expenses, liquidation expenses, reorganization expenses, and other expenses not incurred in the ordinary course of each Fund’s business. The expense caps for each Fund and share class presented in these financial statements are as follows:
| Fund | Share Class | Expense Caps | ||
| Portfolio Optimization Funds | A, B, C, R, and Advisor | 0.15% through 7/31/2018 and 0.30% thereafter through 7/31/2023 | ||
| Pacific Funds Short Duration Income | A, C, I, and Advisor | 0.10% through 7/31/2018 | ||
| Pacific Funds Core Income | A and C | 0.10% through 7/31/2018 | ||
| I and Advisor | 0.05% through 7/31/2018 | |||
| P | 0.20% through 7/31/2017 and 0.05% thereafter through 7/31/2018 | |||
| Pacific Funds Strategic Income | A and Advisor | 0.10% through 7/31/2018 | ||
| C and I | 0.05% through 7/31/2018 | |||
| Pacific Funds Floating Rate Income | A and Advisor | 0.10% through 7/31/2018 | ||
| C and I | 0.05% through 7/31/2018 | |||
| P | 0.20% through 7/31/2017 and 0.05% thereafter through 7/31/2018 | |||
| Pacific Funds Limited Duration High Income | A, I, and Advisor | 0.07% through 7/31/2018 | ||
| C | 0.02% through 7/31/2018 | |||
| Pacific Funds High Income | A, I, and Advisor | 0.10% through 7/31/2018 | ||
| C | 0.05% through 7/31/2018 | |||
| P | 0.20% through 7/31/2017 and 0.10% thereafter through 7/31/2018 | |||
| Pacific Funds Diversified Alternatives | A, C, and Advisor | 0.40% through 7/31/2018 | ||
Pacific Funds Large-Cap Pacific Funds Large-Cap Value | A, C, Advisor, and Investor | 0.20% through 1/10/2019 | ||
| S | 0.10% through 1/10/2019 | |||
| Pacific Funds Small/Mid-Cap Pacific Funds Small-Cap Pacific Funds Small-Cap Value | A, C, and Advisor | 0.20% through 1/10/2019 | ||
| Investor | 0.25% through 1/10/2019 | |||
| S | 0.15% through 1/10/2019 | |||
| Pacific Funds Small-Cap Growth | A, C, and Advisor | 0.20% through 1/10/2019 | ||
| Investor | 0.15% through 1/10/2019 | |||
| S | 0.05% through 1/10/2019 | |||
| P | 0.20% through 1/10/2019 |
There is no guarantee that PLFA will continue to cap expenses for a Fund upon the expiration of the expense cap. In addition, any expense reimbursements made by PLFA to a Fund are subject to recoupment by PLFA from such Fund in future periods, not to exceed three years from the date on which the reimbursement took place, provided that the recoupment would be limited to the lesser of: (i) the expense cap in effect at the time of the reimbursement or (ii) the expense cap in effect at the time of recoupment. Any amounts repaid to PLFA will have the effect of increasing such expenses of the applicable Funds, but not above the expense cap. The amounts of adviser reimbursement to each of the applicable Funds presented in these financial statements for the fiscal year ended March 31, 2018 are presented in the Statements of Operations. Any amounts that remained due from the Investment Adviser as of March 31, 2018 are presented in the Statements of Assets and Liabilities.
The cumulative expense reimbursement amounts, if any, as of March 31, 2018 that are subject to recoupment by PLFA from the Funds presented in these financial statements are as follows:
| Fund | 3/31/2019 | 3/31/2020 | 3/31/2021 | |||||||||
Pacific Funds Portfolio Optimization Conservative | $289,997 | $290,877 | $250,155 | |||||||||
Pacific Funds Portfolio Optimization Moderate-Conservative | 393,236 | 376,333 | 334,819 | |||||||||
Pacific Funds Portfolio Optimization Moderate | 954,419 | 946,295 | 841,944 | |||||||||
Pacific Funds Portfolio Optimization Growth | 708,782 | 694,650 | 646,561 | |||||||||
Pacific Funds Portfolio Optimization Aggressive-Growth | 259,000 | 256,470 | 256,481 | |||||||||
Pacific Funds Diversified Alternatives | 30,877 | 28,564 | 6,603 | |||||||||
Pacific Funds Short Duration Income | 369,896 | 600,137 | 1,000,932 | |||||||||
Pacific Funds Core Income | 1,162,780 | 1,321,088 | 2,102,504 | |||||||||
Pacific Funds Strategic Income | 445,582 | 587,614 | 1,246,313 | |||||||||
Pacific Funds Floating Rate Income | 1,185,282 | 1,512,901 | 3,114,566 | |||||||||
Pacific Funds Limited Duration High Income | 105,916 | 108,215 | 141,501 | |||||||||
Pacific Funds High Income | 124,097 | 118,054 | 119,953 | |||||||||
Pacific Funds Large-Cap | 31,382 | 136,174 | 87,705 | |||||||||
Pacific Funds Large-Cap Value | 29,093 | 157,996 | 111,953 | |||||||||
Pacific Funds Small/Mid-Cap | 27,939 | 202,048 | 341,697 | |||||||||
Pacific Funds Small-Cap | 25,943 | 135,916 | 88,698 | |||||||||
Pacific Funds Small-Cap Value | 29,397 | 161,192 | 104,441 | |||||||||
Pacific Funds Small-Cap Growth | 25,758 | 150,256 | 107,736 | |||||||||
|
|
|
|
|
| |||||||
Total | $6,199,376 | $7,784,780 | $10,904,562 | |||||||||
|
|
|
|
|
| |||||||
D-12
Table of Contents
PACIFIC FUNDS
NOTES TO FINANCIAL STATEMENTS (Continued)
During the fiscal year ended March 31, 2018, PLFA recouped $6,784 from Pacific Funds Diversified Alternatives under the expense limitation agreement. There was no recoupment of expense reimbursement by PLFA from any other Funds presented in these financial statements for the fiscal year ended March 31, 2018.
C. INVESTMENTS IN AFFILIATED FUNDS
As of March 31, 2018, each of the Portfolio Optimization Funds and Pacific Funds Diversified Alternatives (aggregate of all share classes) owned Class P shares in each of the applicable affiliated PF Underlying Funds, Pacific Funds Core Income, Pacific Funds Floating Rate Income, Pacific Funds High Income, and/or Pacific Funds Small-Cap Growth. A summary of holdings and transactions with affiliated mutual fund investments as of and for the fiscal year ended March 31, 2018 is as follows:
| Fund/Underlying Fund | Beginning Value as of April 1, 2017 | Purchase Cost (1) | Distributions Received and Reinvested (2) | Sales Proceeds | Net Realized Gain (Loss) (3) | Change in Unrealized Appreciation (Depreciation) | As of March 31, 2018 | |||||||||||||||||||||||||
Ending Value | Shares Balance | |||||||||||||||||||||||||||||||
| Pacific Funds Portfolio Optimization Conservative | ||||||||||||||||||||||||||||||||
Pacific Funds Core Income | $26,197,345 | $780,203 | $680,879 | $15,543,291 | ($370,830 | ) | $263,882 | $12,008,188 | 1,144,727 | |||||||||||||||||||||||
Pacific Funds Floating Rate Income | 10,732,721 | 1,201,513 | 447,014 | 1,572,069 | (8,492 | ) | (12,130 | ) | 10,788,557 | 1,063,960 | ||||||||||||||||||||||
Pacific Funds High Income | 3,329,211 | 10,452,429 | 190,952 | 564,065 | 15,047 | (90,945 | ) | 13,332,629 | 1,314,855 | |||||||||||||||||||||||
PF Inflation Managed | 3,024,870 | 19,852,075 | 36,413 | 555,193 | 6,840 | 92,857 | 22,457,862 | 2,529,039 | ||||||||||||||||||||||||
PF Managed Bond | 145,401,365 | 4,187,359 | 5,172,494 | 45,584,874 | (251,692 | ) | (392,385 | ) | 108,532,267 | 10,258,248 | ||||||||||||||||||||||
PF Short Duration Bond | 44,247,111 | 2,049,475 | 638,068 | 6,441,626 | (33,299 | ) | (318,833 | ) | 40,140,896 | 4,100,194 | ||||||||||||||||||||||
PF Emerging Markets Debt | 5,390,649 | 7,513,595 | 420,005 | 1,013,360 | 57,877 | (6,743 | ) | 12,362,023 | 1,319,319 | |||||||||||||||||||||||
PF Comstock | 8,792,188 | 280,671 | 90,372 | 5,880,416 | 2,231,844 | (1,123,140 | ) | 4,391,519 | 283,141 | |||||||||||||||||||||||
PF Growth | 2,330,880 | 297,843 | 4,358 | 986,475 | 391,563 | 139,655 | 2,177,824 | 85,809 | ||||||||||||||||||||||||
PF Large-Cap Growth | 1,494,341 | 32,046 | — | 1,475,442 | 801,000 | (420,725 | ) | 431,220 | 40,720 | |||||||||||||||||||||||
PF Large-Cap Value | 20,400,496 | 512,527 | 258,317 | 17,238,327 | 7,108,960 | (5,603,589 | ) | 5,438,384 | 317,292 | |||||||||||||||||||||||
PF Main Street Core | 3,965,204 | 97,478 | 49,390 | 2,672,153 | 1,379,691 | (1,083,905 | ) | 1,735,705 | 124,691 | |||||||||||||||||||||||
PF Mid-Cap Equity | 1,659,730 | 37,558 | 6,875 | 1,207,832 | 720,936 | (481,133 | ) | 736,134 | 68,605 | |||||||||||||||||||||||
PF Mid-Cap Growth (4) | 831,952 | 16,443 | 2,029 | 1,002,974 | 149,730 | 2,820 | — | — | ||||||||||||||||||||||||
PF Mid-Cap Value | 10,767,032 | 270,920 | 23,209 | 7,488,402 | 1,150,967 | (33,965 | ) | 4,689,761 | 371,025 | |||||||||||||||||||||||
PF Small-Cap Value | 4,993,610 | 135,128 | 9,459 | 4,071,522 | 1,009,752 | (606,545 | ) | 1,469,882 | 131,005 | |||||||||||||||||||||||
PF Emerging Markets | 9,314,328 | 225,890 | 55,263 | 4,275,290 | 908,615 | 1,294,846 | 7,523,652 | 434,893 | ||||||||||||||||||||||||
PF International Large-Cap | 4,425,014 | 2,871,481 | 70,648 | 2,209,977 | 819,662 | (231,182 | ) | 5,745,646 | 275,571 | |||||||||||||||||||||||
PF International Small-Cap | 1,707,669 | 1,437,819 | 43,014 | 409,228 | 151,612 | 82,509 | 3,013,395 | 268,096 | ||||||||||||||||||||||||
PF International Value | 4,230,816 | 185,371 | 167,200 | 2,536,307 | 564,628 | (176,732 | ) | 2,434,976 | 239,427 | |||||||||||||||||||||||
PF Real Estate | 845,369 | 862,179 | 13,231 | 135,956 | 108,994 | (153,837 | ) | 1,539,980 | 129,847 | |||||||||||||||||||||||
PF Currency Strategies | 6,700,420 | 297,475 | 151,021 | 1,289,653 | (131,331 | ) | (118,356 | ) | 5,609,576 | 615,085 | ||||||||||||||||||||||
PF Equity Long/Short | 6,532,630 | 187,606 | 406,313 | 2,023,570 | 469,937 | 8,019 | 5,580,935 | 574,762 | ||||||||||||||||||||||||
PF Global Absolute Return | 6,630,330 | 231,661 | 16,325 | 1,437,176 | (93,634 | ) | 323,374 | 5,670,880 | 598,826 | |||||||||||||||||||||||
PF Multi-Asset | — | 28,904,920 | — | — | — | (630,365 | ) | 28,274,555 | 3,001,545 | |||||||||||||||||||||||
| $333,945,281 | $82,921,665 | $8,952,849 | $127,615,178 | $17,158,377 | ($9,276,548 | ) | $306,086,446 | |||||||||||||||||||||||||
| Pacific Funds Portfolio Optimization Moderate-Conservative | ||||||||||||||||||||||||||||||||
Pacific Funds Core Income | $34,511,446 | $214,808 | $894,281 | $20,379,116 | ($489,710 | ) | $349,288 | $15,100,997 | 1,439,561 | |||||||||||||||||||||||
Pacific Funds Floating Rate Income | 14,635,674 | 2,816,295 | 608,526 | 2,008,886 | (10,469 | ) | (18,771 | ) | 16,022,369 | 1,580,115 | ||||||||||||||||||||||
Pacific Funds High Income | 3,688,600 | 8,358,011 | 206,649 | 588,991 | (9,889 | ) | (56,199 | ) | 11,598,181 | 1,143,805 | ||||||||||||||||||||||
PF Inflation Managed | 4,468,845 | 15,083,123 | 52,906 | 822,716 | 11,267 | 56,596 | 18,850,021 | 2,122,750 | ||||||||||||||||||||||||
PF Managed Bond | 176,858,945 | 1,079,922 | 6,258,496 | 46,720,099 | (346,618 | ) | (368,530 | ) | 136,762,116 | 12,926,476 | ||||||||||||||||||||||
PF Short Duration Bond | 33,050,478 | 2,729,061 | 469,248 | 4,472,560 | (24,502 | ) | (230,495 | ) | 31,521,230 | 3,219,737 | ||||||||||||||||||||||
PF Emerging Markets Debt | 7,466,510 | 9,246,245 | 582,584 | 1,304,439 | 7,198 | 58,123 | 16,056,221 | 1,713,577 | ||||||||||||||||||||||||
Pacific Funds Small-Cap Growth | 1,484,356 | 102,035 | — | 273,997 | 83,671 | 113,695 | 1,509,760 | 122,248 | ||||||||||||||||||||||||
PF Comstock | 17,797,209 | 153,051 | 182,801 | 9,098,137 | 3,858,379 | (1,774,892 | ) | 11,118,411 | 716,854 | |||||||||||||||||||||||
PF Developing Growth | 992,712 | 4,864 | — | 616,881 | 131,429 | 140,543 | 652,667 | 43,980 | ||||||||||||||||||||||||
PF Growth | 7,624,629 | 37,287 | 14,219 | 7,285,672 | 3,863,670 | (1,923,573 | ) | 2,330,560 | 91,827 | |||||||||||||||||||||||
PF Large-Cap Growth | 5,150,899 | 24,928 | — | 4,143,965 | 2,347,391 | (1,031,011 | ) | 2,348,242 | 221,741 | |||||||||||||||||||||||
PF Large-Cap Value | 42,287,304 | 342,503 | 538,299 | 33,605,024 | 13,324,588 | (10,300,280 | ) | 12,587,390 | 734,387 | |||||||||||||||||||||||
PF Main Street Core | 23,186,452 | 114,403 | 290,899 | 14,771,466 | 4,614,219 | (2,905,521 | ) | 10,528,986 | 756,393 | |||||||||||||||||||||||
PF Mid-Cap Equity | 4,903,641 | 23,950 | 20,374 | 2,824,371 | 1,321,588 | (604,451 | ) | 2,840,731 | 264,747 | |||||||||||||||||||||||
PF Mid-Cap Growth (4) | 1,229,058 | 5,836 | 2,994 | �� | 1,461,808 | 490,160 | (266,240 | ) | — | — | ||||||||||||||||||||||
PF Mid-Cap Value | 17,128,871 | 134,031 | 37,527 | 12,143,309 | 2,200,138 | (399,692 | ) | 6,957,566 | 550,440 | |||||||||||||||||||||||
PF Small-Cap Value | 10,327,064 | 86,639 | 19,709 | 6,826,633 | 2,068,848 | (1,287,127 | ) | 4,388,500 | 391,132 | |||||||||||||||||||||||
PF Emerging Markets | 19,623,947 | 93,701 | 115,990 | 6,536,320 | 1,390,049 | 3,198,785 | 17,886,152 | 1,033,882 | ||||||||||||||||||||||||
PF International Large-Cap | 15,087,149 | 2,080,497 | 239,950 | 6,517,878 | 2,302,855 | (201,817 | ) | 12,990,756 | 623,058 | |||||||||||||||||||||||
PF International Small-Cap | 5,046,045 | 4,267,283 | 126,600 | 1,178,790 | 495,912 | 188,749 | 8,945,799 | 795,890 | ||||||||||||||||||||||||
PF International Value | 15,001,601 | 393,361 | 595,592 | 7,406,353 | 1,106,966 | 251,984 | 9,943,151 | 977,694 | ||||||||||||||||||||||||
PF Real Estate | 2,497,786 | 2,562,650 | 38,815 | 394,923 | 302,756 | (435,117 | ) | 4,571,967 | 385,495 | |||||||||||||||||||||||
PF Currency Strategies | 9,898,304 | 99,182 | 221,146 | 1,519,861 | (99,859 | ) | (266,271 | ) | 8,332,641 | 913,667 | ||||||||||||||||||||||
PF Equity Long/Short | 9,645,873 | 52,381 | 600,016 | 2,704,198 | 665,280 | 29,130 | 8,288,482 | 853,603 | ||||||||||||||||||||||||
PF Global Absolute Return | 9,794,988 | 97,936 | 23,891 | 1,830,069 | (120,154 | ) | 456,201 | 8,422,793 | 889,419 | |||||||||||||||||||||||
PF Multi-Asset | — | 72,948,282 | — | — | — | (1,528,975 | ) | 71,419,307 | 7,581,667 | |||||||||||||||||||||||
| $493,388,386 | $123,152,265 | $12,141,512 | $197,436,462 | $39,485,163 | ($18,755,868 | ) | $451,974,996 | |||||||||||||||||||||||||
D-13
Table of Contents
PACIFIC FUNDS
NOTES TO FINANCIAL STATEMENTS (Continued)
| Fund/Underlying Fund | Beginning Value as of April 1, 2017 | Purchase Cost (1) | Distributions Received and Reinvested (2) | Sales Proceeds | Net Realized Gain (Loss) (3) | Change in Unrealized Appreciation (Depreciation) | As of March 31, 2018 | |||||||||||||||||||||||||
Ending Value | Shares Balance | |||||||||||||||||||||||||||||||
| Pacific Funds Portfolio Optimization Moderate | ||||||||||||||||||||||||||||||||
Pacific Funds Core Income | $43,930,994 | $40,031 | $1,165,881 | $15,092,777 | ($331,505 | ) | $150,878 | $29,863,502 | 2,846,854 | |||||||||||||||||||||||
Pacific Funds Floating Rate Income | 28,045,584 | 58,731 | 1,133,215 | 8,838,482 | (44,523 | ) | (1,509 | ) | 20,353,016 | 2,007,201 | ||||||||||||||||||||||
Pacific Funds High Income | 3,534,206 | 30,903,511 | 236,698 | 768,484 | 737 | (198,630 | ) | 33,708,038 | 3,324,264 | |||||||||||||||||||||||
PF Inflation Managed | 4,995,346 | 23,005,928 | 59,245 | 926,114 | 13,259 | 97,156 | 27,244,820 | 3,068,110 | ||||||||||||||||||||||||
PF Managed Bond | 315,853,739 | 285,310 | 11,225,007 | 61,631,898 | (77,538 | ) | (1,090,848 | ) | 264,563,772 | 25,006,028 | ||||||||||||||||||||||
PF Short Duration Bond | 69,666,294 | 142,072 | 986,054 | 29,636,672 | (419,160 | ) | (115,307 | ) | 40,623,281 | 4,149,467 | ||||||||||||||||||||||
PF Emerging Markets Debt | 14,307,707 | 13,972,887 | 1,121,513 | 2,322,477 | 98,394 | 9,899 | 27,187,923 | 2,901,593 | ||||||||||||||||||||||||
Pacific Funds Small-Cap Growth | 4,977,924 | 5,106,771 | — | 892,487 | 271,405 | 166,548 | 9,630,161 | 779,770 | ||||||||||||||||||||||||
PF Comstock | 73,971,553 | 157,915 | 764,320 | 46,269,056 | 14,658,952 | (5,900,799 | ) | 37,382,885 | 2,410,244 | |||||||||||||||||||||||
PF Developing Growth | 3,566,974 | 3,218 | — | 1,288,387 | 452,862 | 498,091 | 3,232,758 | 217,841 | ||||||||||||||||||||||||
PF Growth | 48,074,923 | 22,104,733 | 89,517 | 13,289,265 | 4,277,232 | 5,951,267 | 67,208,407 | 2,648,085 | ||||||||||||||||||||||||
PF Large-Cap Growth | 31,727,129 | 29,496 | — | 22,777,129 | 11,789,334 | (3,680,302 | ) | 17,088,528 | 1,613,648 | |||||||||||||||||||||||
PF Large-Cap Value | 175,343,140 | 370,434 | 2,235,752 | 143,404,753 | 41,963,667 | (28,726,825 | ) | 47,781,415 | 2,787,714 | |||||||||||||||||||||||
PF Main Street Core | 115,054,900 | 114,049 | 1,460,042 | 74,256,897 | 19,918,898 | (11,354,226 | ) | 50,936,766 | 3,659,250 | |||||||||||||||||||||||
PF Mid-Cap Equity | 28,190,915 | 27,301 | 118,201 | 19,442,862 | 7,511,543 | (3,447,113 | ) | 12,957,985 | 1,207,641 | |||||||||||||||||||||||
PF Mid-Cap Growth (4) | 5,652,549 | 5,318 | 13,862 | 6,702,950 | 1,480,557 | (449,336 | ) | — | — | |||||||||||||||||||||||
PF Mid-Cap Value | 84,405,247 | 177,100 | 186,100 | 58,724,849 | 9,595,437 | (808,765 | ) | 34,830,270 | 2,755,559 | |||||||||||||||||||||||
PF Small-Cap Value | 45,942,046 | 95,370 | 88,548 | 16,532,294 | 7,466,739 | (4,418,962 | ) | 32,641,447 | 2,909,220 | |||||||||||||||||||||||
PF Emerging Markets | 79,848,861 | 70,202 | 473,650 | 33,000,193 | 8,282,537 | 10,575,483 | 66,250,540 | 3,829,511 | ||||||||||||||||||||||||
PF International Large-Cap | 56,376,394 | 50,234 | 899,813 | 22,892,019 | 8,239,616 | (238,111 | ) | 42,435,927 | 2,035,296 | |||||||||||||||||||||||
PF International Small-Cap | 14,504,353 | 19,762,842 | 365,197 | 3,306,026 | 1,422,579 | 397,713 | 33,146,658 | 2,948,991 | ||||||||||||||||||||||||
PF International Value | 55,338,398 | 1,437,804 | 2,224,205 | 21,776,961 | 3,141,228 | 1,836,851 | 42,201,525 | 4,149,609 | ||||||||||||||||||||||||
PF Real Estate | 14,359,383 | 1,729,740 | 223,502 | 1,992,167 | 2,538,224 | (3,292,188 | ) | 13,566,494 | 1,143,886 | |||||||||||||||||||||||
PF Currency Strategies | 35,565,076 | 70,486 | 791,559 | 11,701,334 | (1,312,143 | ) | (99,181 | ) | 23,314,463 | 2,556,410 | ||||||||||||||||||||||
PF Equity Long/Short | 27,661,043 | 28,405 | 1,729,861 | 9,526,561 | 1,840,157 | 161,422 | 21,894,327 | 2,254,823 | ||||||||||||||||||||||||
PF Global Absolute Return | 35,193,032 | 71,257 | 85,585 | 14,313,183 | (578,744 | ) | 1,784,632 | 22,242,579 | 2,348,741 | |||||||||||||||||||||||
PF Multi-Asset | — | 310,752,394 | — | — | — | (7,174,913 | ) | 303,577,481 | 32,226,909 | |||||||||||||||||||||||
| $1,416,087,710 | $430,573,539 | $27,677,327 | $641,306,277 | $142,199,744 | ($49,367,075 | ) | $1,325,864,968 | |||||||||||||||||||||||||
| Pacific Funds Portfolio Optimization Growth | ||||||||||||||||||||||||||||||||
Pacific Funds Core Income | $17,627,318 | $22,911 | $464,166 | $8,275,284 | ($183,572 | ) | $107,702 | $9,763,241 | 930,719 | |||||||||||||||||||||||
Pacific Funds Floating Rate Income | 20,520,738 | 26,475 | 819,172 | 11,067,346 | (54,579 | ) | 25,960 | 10,270,420 | 1,012,862 | |||||||||||||||||||||||
Pacific Funds High Income | — | 10,344,124 | 17,405 | 71,920 | (239 | ) | (60,411 | ) | 10,228,959 | 1,008,773 | ||||||||||||||||||||||
PF Inflation Managed | — | 5,172,062 | — | 35,960 | 27 | 29,088 | 5,165,217 | 581,669 | ||||||||||||||||||||||||
PF Managed Bond | 99,642,190 | 141,825 | 3,573,859 | 14,422,898 | 17,826 | (393,383 | ) | 88,559,419 | 8,370,455 | |||||||||||||||||||||||
PF Short Duration Bond | 20,595,676 | 22,392 | 293,972 | 20,751,308 | (330,913 | ) | 170,181 | — | — | |||||||||||||||||||||||
PF Emerging Markets Debt | 14,132,939 | 7,267,412 | 1,123,781 | 1,991,579 | (48,000 | ) | 120,003 | 20,604,556 | 2,198,992 | |||||||||||||||||||||||
Pacific Funds Small-Cap Growth | 3,642,238 | 7,533,194 | — | 595,607 | 193,446 | (45,305 | ) | 10,727,966 | 868,661 | |||||||||||||||||||||||
PF Comstock | 61,205,154 | 766,234 | 642,861 | 21,710,077 | 8,027,217 | (1,301,662 | ) | 47,629,727 | 3,070,904 | |||||||||||||||||||||||
PF Developing Growth | 2,609,859 | 1,145,294 | — | 467,737 | 143,911 | 499,545 | 3,930,872 | 264,884 | ||||||||||||||||||||||||
PF Growth | 51,211,678 | 49,236,536 | 96,770 | 10,231,294 | 2,965,927 | 6,859,945 | 100,139,562 | 3,945,609 | ||||||||||||||||||||||||
PF Large-Cap Growth | 33,531,647 | 27,176 | — | 25,627,525 | 11,717,571 | (2,892,660 | ) | 16,756,209 | 1,582,267 | |||||||||||||||||||||||
PF Large-Cap Value | 143,630,147 | 171,324 | 1,846,397 | 93,723,434 | 21,261,568 | (11,247,635 | ) | 61,938,367 | 3,613,674 | |||||||||||||||||||||||
PF Main Street Core | 116,009,936 | 101,693 | 1,496,931 | 73,178,993 | 18,466,141 | (9,831,260 | ) | 53,064,448 | 3,812,101 | |||||||||||||||||||||||
PF Mid-Cap Equity | 23,205,115 | 17,219 | 98,818 | 16,878,557 | 6,201,699 | (2,825,412 | ) | 9,818,882 | 915,087 | |||||||||||||||||||||||
PF Mid-Cap Growth (4) | 5,169,854 | 2,282 | 12,941 | 6,139,321 | 1,778,488 | (824,244 | ) | — | — | |||||||||||||||||||||||
PF Mid-Cap Value | 64,331,090 | 51,864 | 143,674 | 51,683,896 | 10,925,958 | (3,869,314 | ) | 19,899,376 | 1,574,318 | |||||||||||||||||||||||
PF Small-Cap Value | 40,337,435 | 45,537 | 78,582 | 13,459,295 | 6,763,695 | (4,088,398 | ) | 29,677,556 | 2,645,058 | |||||||||||||||||||||||
PF Emerging Markets | 68,608,472 | 72,835 | 410,485 | 25,066,887 | 5,481,540 | 10,745,148 | 60,251,593 | 3,482,751 | ||||||||||||||||||||||||
PF International Large-Cap | 73,509,502 | 68,802 | 1,183,728 | 40,310,112 | 11,522,509 | (858,466 | ) | 45,115,963 | 2,163,835 | |||||||||||||||||||||||
PF International Small-Cap | 15,918,977 | 15,051,447 | 404,412 | 3,362,461 | 1,560,036 | 579,448 | 30,151,859 | 2,682,550 | ||||||||||||||||||||||||
PF International Value | 73,093,034 | 1,983,886 | 3,000,555 | 21,721,593 | 2,456,542 | 4,132,733 | 62,945,157 | 6,189,298 | ||||||||||||||||||||||||
PF Real Estate | 15,759,866 | 2,277,165 | 247,325 | 2,028,134 | 2,801,707 | (3,638,511 | ) | 15,419,418 | 1,300,120 | |||||||||||||||||||||||
PF Currency Strategies | 26,022,438 | 33,297 | 583,306 | 12,063,549 | (1,063,371 | ) | (26,641 | ) | 13,485,480 | 1,478,671 | ||||||||||||||||||||||
PF Equity Long/Short | 20,271,769 | 20,618 | 1,289,977 | 9,531,960 | 1,302,120 | 186,796 | 13,539,320 | 1,394,369 | ||||||||||||||||||||||||
PF Global Absolute Return | 25,750,455 | 33,500 | 63,145 | 12,967,650 | (38,305 | ) | 924,541 | 13,765,686 | 1,453,610 | |||||||||||||||||||||||
PF Multi-Asset | — | 247,967,435 | — | — | — | (5,638,905 | ) | 242,328,530 | 25,724,897 | |||||||||||||||||||||||
| $1,036,337,527 | $349,604,539 | $17,892,262 | $497,364,377 | $111,868,949 | ($23,161,117 | ) | $995,177,783 | |||||||||||||||||||||||||
D-14
Table of Contents
PACIFIC FUNDS
NOTES TO FINANCIAL STATEMENTS (Continued)
| Fund/Underlying Fund | Beginning Value as of April 1, 2017 | Purchase Cost (1) | Distributions Received and Reinvested (2) | Sales Proceeds | Net Realized Gain (Loss) (3) | Change in Unrealized Appreciation (Depreciation) | As of March 31, 2018 | |||||||||||||||||||||||||
Ending Value | Shares Balance | |||||||||||||||||||||||||||||||
| Pacific Funds Portfolio Optimization Aggressive-Growth | ||||||||||||||||||||||||||||||||
Pacific Funds Floating Rate Income | $3,693,132 | $98,550 | $156,116 | $477,564 | ($2,422 | ) | ($4,229 | ) | $3,463,583 | 341,576 | ||||||||||||||||||||||
PF Managed Bond | 4,082,207 | 88,867 | 151,378 | 4,250,435 | (113,030 | ) | 65,055 | 24,042 | 2,272 | |||||||||||||||||||||||
PF Emerging Markets Debt | — | 3,473,354 | — | 31,988 | (15 | ) | 14,755 | 3,456,106 | 368,848 | |||||||||||||||||||||||
Pacific Funds Small-Cap Growth | 2,279,926 | 2,705,521 | — | 279,951 | 109,107 | 89,248 | 4,903,851 | 397,073 | ||||||||||||||||||||||||
PF Comstock | 22,005,391 | 448,669 | 239,366 | 8,889,799 | 2,902,467 | (351,044 | ) | 16,355,050 | 1,054,484 | |||||||||||||||||||||||
PF Developing Growth | 1,633,649 | 23,840 | — | 462,816 | 170,191 | 284,917 | 1,649,781 | 111,171 | ||||||||||||||||||||||||
PF Growth | 25,904,792 | 7,104,965 | 50,516 | 4,168,812 | 1,419,194 | 4,553,112 | 34,863,767 | 1,373,671 | ||||||||||||||||||||||||
PF Large-Cap Growth | 17,276,219 | 233,655 | — | 8,705,618 | 4,263,042 | 330,565 | 13,397,863 | 1,265,143 | ||||||||||||||||||||||||
PF Large-Cap Value | 51,832,193 | 1,428,919 | 689,282 | 30,240,622 | 5,151,535 | (1,659,781 | ) | 27,201,526 | 1,587,020 | |||||||||||||||||||||||
PF Main Street Core | 43,056,847 | 828,005 | 573,811 | 26,831,965 | 5,672,359 | (2,454,016 | ) | 20,845,041 | 1,497,489 | |||||||||||||||||||||||
PF Mid-Cap Equity | 8,069,808 | 120,886 | 35,432 | 4,472,947 | 1,914,672 | (709,774 | ) | 4,958,077 | 462,076 | |||||||||||||||||||||||
PF Mid-Cap Growth (4) | 1,618,068 | 17,382 | 4,222 | 1,945,417 | 620,295 | (314,550 | ) | — | — | |||||||||||||||||||||||
PF Mid-Cap Value | 20,617,446 | 403,715 | 47,520 | 18,974,819 | 3,993,870 | (1,660,612 | ) | 4,427,120 | 350,247 | |||||||||||||||||||||||
PF Small-Cap Value | 16,994,556 | 396,899 | 34,222 | 5,236,495 | 2,465,254 | (1,312,807 | ) | 13,341,629 | 1,189,093 | |||||||||||||||||||||||
PF Emerging Markets | 22,313,188 | 317,179 | 138,315 | 4,452,706 | 873,896 | 4,482,592 | 23,672,464 | 1,368,350 | ||||||||||||||||||||||||
PF International Large-Cap | 27,312,051 | 385,488 | 455,861 | 13,050,649 | 3,541,243 | 465,888 | 19,109,882 | 916,541 | ||||||||||||||||||||||||
PF International Small-Cap | 4,982,548 | 6,950,004 | 131,253 | 892,626 | 482,065 | 158,306 | 11,811,550 | 1,050,850 | ||||||||||||||||||||||||
PF International Value | 26,992,101 | 1,213,439 | 1,151,994 | 5,666,686 | 528,313 | 1,925,414 | 26,144,575 | 2,570,755 | ||||||||||||||||||||||||
PF Real Estate | 4,932,674 | 947,026 | 80,320 | 493,659 | 904,383 | (1,180,134 | ) | 5,190,610 | 437,657 | |||||||||||||||||||||||
PF Currency Strategies | 6,515,930 | 161,555 | 151,286 | 3,042,323 | (320,398 | ) | 43,181 | 3,509,231 | 384,784 | |||||||||||||||||||||||
PF Equity Long/Short | 5,551,912 | 106,870 | 365,566 | 3,060,325 | 360,038 | 57,657 | 3,381,718 | 348,272 | ||||||||||||||||||||||||
PF Global Absolute Return | 6,447,732 | 164,309 | 16,322 | 3,406,450 | (36,511 | ) | 262,935 | 3,448,337 | 364,133 | |||||||||||||||||||||||
PF Multi-Asset | — | 89,814,479 | — | — | — | (2,081,087 | ) | 87,733,392 | 9,313,524 | |||||||||||||||||||||||
| $324,112,370 | $117,433,576 | $4,472,782 | $149,034,672 | $34,899,548 | $1,005,591 | $332,889,195 | ||||||||||||||||||||||||||
| Pacific Funds Diversified Alternatives | ||||||||||||||||||||||||||||||||
Pacific Funds Floating Rate Income | $1,019,403 | $2,712,909 | $87,524 | $134,108 | ($724 | ) | ($1,787 | ) | $3,683,217 | 363,236 | ||||||||||||||||||||||
PF Inflation Managed | 647,480 | 1,478,899 | 16,462 | 77,238 | (1,032 | ) | (8,369 | ) | 2,056,202 | 231,554 | ||||||||||||||||||||||
PF Emerging Markets Debt | 1,297,055 | 4,782,355 | 216,174 | 154,476 | (8,047 | ) | (43,708 | ) | 6,089,353 | 649,878 | ||||||||||||||||||||||
PF Emerging Markets | 927,717 | 1,979,340 | 11,623 | 429,721 | (8,538 | ) | 319,432 | 2,799,853 | 161,841 | |||||||||||||||||||||||
PF International Small-Cap | 656,824 | 2,069,422 | 35,486 | 77,238 | 98,706 | (7,884 | ) | 2,775,316 | 246,914 | |||||||||||||||||||||||
PF Real Estate | 651,300 | 988,567 | 13,469 | 364,624 | 92,184 | (152,733 | ) | 1,228,163 | 103,555 | |||||||||||||||||||||||
PF Currency Strategies | 3,101,046 | 7,179,568 | 155,454 | 2,038,285 | (175,352 | ) | 112,061 | 8,334,492 | 913,870 | |||||||||||||||||||||||
PF Equity Long/Short | 1,395,304 | 3,110,389 | 184,147 | 326,768 | 173,132 | (124,756 | ) | 4,411,448 | 454,320 | |||||||||||||||||||||||
PF Global Absolute Return | 3,197,393 | 7,069,069 | 16,460 | 1,036,543 | (24,753 | ) | 166,240 | 9,387,866 | 991,327 | |||||||||||||||||||||||
| $12,893,522 | $31,370,518 | $736,799 | $4,639,001 | $145,576 | $258,496 | $40,765,910 | ||||||||||||||||||||||||||
| (1) | Purchase cost excludes distributions received and reinvested, if any. |
| (2) | Distributions received include distributions from net investment income, if any, from the PF Underlying Funds, Pacific Funds Core Income, Pacific Funds Floating Rate Income, Pacific Funds High Income, and/or Pacific Funds Small-Cap Growth. |
| (3) | Net realized gain (loss) includes capital gains distributions from the PF Underlying Funds, Pacific Funds Core Income, Pacific Funds Floating Rate Income, Pacific Funds High Income, and/or Pacific Funds Small-Cap Growth, if any. |
| (4) | All shares in the PF Mid-Cap Growth Fund were fully redeemed as of February 13, 2018. |
As of March 31, 2018, Pacific Life owned the following percentages of the total shares outstanding (aggregate of all share classes) of each of the following Funds:
| Fund | Ownership | |||
Pacific Funds Diversified Alternatives | 5.72% | |||
Pacific Funds Limited Duration High Income | 66.20% | |||
Pacific Funds Large-Cap Value | 57.75% | |||
Pacific Funds Small-Cap Value | 42.27% | |||
Pacific Funds Small-Cap Growth | 23.43% | |||
D. INDEPENDENT TRUSTEES
The Trust pays each independent trustee of the Board retainer fees and specified amounts for various Board and committee services and for chairing those committees. The fees and expenses of the independent trustees of the Board are presented in the Statements of Operations. Each independent trustee of the Board is eligible to participate in the Trust’s Deferred Compensation Plan (the “Plan”). The Plan allows each independent trustee to voluntarily defer receipt of all or a percentage of fees, which otherwise would be payable for services performed. Amounts in the deferral account are obligations of each Fund at the time of such deferral and are payable in accordance with the Plan. Prior to December 31, 2017, deferred amounts were treated as though equivalent dollar amounts had been invested in shares of certain Funds. An independent trustee who deferred compensation had the option to select credit rate options that track the performance, at NAV without a sales load, of Class A shares of the Portfolio Optimization Funds, Pacific Funds Diversified Alternatives, Pacific Funds Short Duration Income, Pacific Funds Core Income, Pacific Funds Strategic Income, Pacific Funds Floating Rate Income, Pacific Funds Limited Duration High Income, and/or Pacific Funds High Income, Pacific Funds Large-Cap, Pacific Funds Large-Cap Value, Pacific Funds Small/Mid-Cap, Pacific Funds Small-Cap, Pacific Funds Small-Cap Value, and Pacific Funds Small-Cap Growth, and/or Class P shares of the PF Underlying Funds. Effective January 1, 2018, a Trustee who defers compensation has the option to select credit rate options that track the performance, at NAV of Class A of certain
D-15
Table of Contents
PACIFIC FUNDS
NOTES TO FINANCIAL STATEMENTS (Continued)
series of the Trust without a sales load or at NAV of Class I shares of the Pacific Select Fund. The obligation of each Fund under the Plan (the “DCP Liability”) is recorded as a liability (accrued trustees’ fees and expenses and deferred compensation). Accordingly, the market value appreciation or depreciation on a Fund’s DCP Liability account will cause the expenses of that Fund to increase or decrease due to market fluctuation. The change in net unrealized appreciation or depreciation on a Fund’s DCP Liability account is recorded as an increase or decrease to expenses (trustees’ fees and expenses). For the fiscal year ended March 31, 2018, such expenses increased by $7,856 for all applicable Funds presented in these financial statements as a result of the market value appreciation on such accounts. As of March 31, 2018, the total amount in the DCP Liability accounts for all applicable Funds presented in these financial statements was $30,154.
E. OFFICERS OF THE TRUST
None of the officers of the Trust received compensation from the Trust.
F. INDEMNIFICATIONS
Under the Trust’s organizational documents, its officers and trustees are indemnified against certain liabilities arising out of performance of their duties to the Trust. In addition, the Trust entered into an agreement with each of the trustees which provides that the Trust will indemnify and hold harmless each trustee against any expenses actually and reasonably incurred by any trustee in any proceeding arising out of or in connection with the trustee’s services to the Trust, to the fullest extent permitted by the Trust’s Declaration of Trust and By-Laws, the general trust law of the State of Delaware, the Securities Act of 1933, and the 1940 Act, each as now or hereinafter in force. In the normal course of business, the Trust enters into contracts with service providers and others that contain general indemnification clauses. The Trust’s maximum exposure under these arrangements and agreements is dependent on future claims that may be made against the Trust and/or the trustees and, therefore, cannot be estimated; however, based on experience, the risk of loss from such claims is considered remote.
8. COMMITTED LINE OF CREDIT
The Trust has an unsecured $125,000,000 committed revolving line of credit agreement with The Bank of New York Mellon (the “Bank”), which is renewed annually. The committed line of credit applies to Pacific Funds Floating Rate Income only. The interest rate on borrowing under the line of credit agreement is the higher of the Federal Funds effective rate or the overnight Eurodollar rate, plus 1.20%. Pacific Funds Floating Rate Income pays the Bank a commitment fee equal to 0.25% (0.20% prior to March 7, 2018) per annum on the daily unused portion of the committed line up to a maximum of $312,500 ($150,000 prior to March 7, 2018). As of March 31, 2018, the actual interest rate on borrowing by the Trust was 2.90%. The commitment fees and interest incurred by Pacific Funds Floating Rate Income are recorded as an expense. For the fiscal year ended March 31, 2018, Pacific Funds Floating Rate Income had no loans outstanding in connection with this revolving line of credit.
9. PURCHASES AND SALES OF INVESTMENTS
The cost of purchases and proceeds from sales of investments (excluding short-term investments) for the fiscal year ended March 31, 2018, are summarized in the following table:
| U.S. Government Securities | Other Securities | |||||||||||||||
| Fund | Purchases | Sales | Purchases | Sales | ||||||||||||
| Pacific Funds Portfolio Optimization Conservative | $— | $— | $95,604,601 | $127,615,178 | ||||||||||||
| Pacific Funds Portfolio Optimization Moderate-Conservative | — | — | 144,220,947 | 197,436,462 | ||||||||||||
| Pacific Funds Portfolio Optimization Moderate | — | — | 499,850,756 | 641,306,277 | ||||||||||||
| Pacific Funds Portfolio Optimization Growth | — | — | 406,392,533 | 497,364,377 | ||||||||||||
| Pacific Funds Portfolio Optimization Aggressive-Growth | — | — | 137,642,071 | 149,034,672 | ||||||||||||
| Pacific Funds Diversified Alternatives | — | — | 32,532,856 | 4,639,001 | ||||||||||||
| Pacific Funds Short Duration Income | 5,078,790 | 7,679,033 | 400,321,638 | 252,773,533 | ||||||||||||
| Pacific Funds Core Income | 115,699,391 | 128,417,504 | 558,242,153 | 557,826,357 | ||||||||||||
| Pacific Funds Strategic Income | 29,781,251 | 25,762,658 | 577,461,467 | 367,169,193 | ||||||||||||
| Pacific Funds Floating Rate Income | — | — | 2,186,722,281 | 1,917,199,201 | ||||||||||||
| Pacific Funds Limited Duration High Income | — | — | 22,600,513 | 21,419,251 | ||||||||||||
| Pacific Funds High Income | — | — | 70,919,067 | 20,022,624 | ||||||||||||
| Pacific Funds Large-Cap | — | — | 18,624,952 | 13,441,248 | ||||||||||||
| Pacific Funds Large-Cap Value | — | — | 14,673,575 | 19,411,937 | ||||||||||||
| Pacific Funds Small/Mid-Cap | — | — | 134,022,114 | 37,943,235 | ||||||||||||
| Pacific Funds Small-Cap | — | — | 17,889,234 | 9,356,488 | ||||||||||||
| Pacific Funds Small-Cap Value | — | — | 14,772,647 | 20,370,882 | ||||||||||||
| Pacific Funds Small-Cap Growth | — | — | 31,835,782 | 19,809,026 | ||||||||||||
10. FEDERAL INCOME TAX INFORMATION
Each Fund intends to qualify each year as a regulated investment company (“RIC”) under Subchapter M of the Internal Revenue Code (the “Code”). A Fund that qualifies as a RIC does not have to pay income tax as long as it distributes sufficient taxable income and net capital gains. Each Fund declared and paid sufficient dividends on net investment income and capital gains distributions during the year or period ended March 31, 2018, to qualify as a RIC and is not required to pay Federal income tax under the Code. Accordingly, no provision for Federal income taxes is required in the financial statements. Required distributions are based on net investment income and net realized gains determined in accordance with income tax regulations, which may differ from U.S. GAAP for financial reporting purposes. These differences are primarily due to differing treatments for short-term capital gain distributions received, late year ordinary and post-October capital losses, capital loss carryforwards, and losses deferred due to wash sales. Permanent book and tax differences relating to shareholder distributions will result in reclassifications of capital accounts. In addition, the year in which amounts are distributed may differ from the year in which the net investment income is earned and the net gains are realized by each Fund.
D-16
Table of Contents
PACIFIC FUNDS
NOTES TO FINANCIAL STATEMENTS (Continued)
The following table shows the accumulated capital losses and components of distributable earnings on a tax basis, and late year ordinary losses and post-October capital losses deferred, if any, for tax purposes as of March 31, 2018:
Distributable Earning | Late-Year Ordinary and | |||||||||||||||||||||||||||||||
Fund | Accumulated | Undistributed | Undistributed | Late-Year | Short-Term | Long-Term | Total | |||||||||||||||||||||||||
Pacific Funds Portfolio Optimization Conservative | $— | $207,524 | $15,081,462 | $— | $— | $— | $— | |||||||||||||||||||||||||
Pacific Funds Portfolio Optimization Moderate-Conservative | — | — | 33,401,316 | 361,146 | — | — | 361,146 | |||||||||||||||||||||||||
Pacific Funds Portfolio Optimization Moderate | — | — | 120,304,302 | 251,828 | — | — | 251,828 | |||||||||||||||||||||||||
Pacific Funds Portfolio Optimization Growth | — | — | 94,558,020 | 1,227,329 | — | — | 1,227,329 | |||||||||||||||||||||||||
Pacific Funds Portfolio Optimization Aggressive-Growth | — | — | 29,526,080 | 355,476 | — | — | 355,476 | |||||||||||||||||||||||||
Pacific Funds Diversified Alternatives | — | — | 211,070 | 13,526 | — | — | 13,526 | |||||||||||||||||||||||||
Pacific Funds Short Duration Income | (1,660,459 | ) | 231,364 | — | — | — | — | — | ||||||||||||||||||||||||
Pacific Funds Core Income | (14,940,157 | ) | 715,643 | — | — | — | — | — | ||||||||||||||||||||||||
Pacific Funds Strategic Income | (8,207,407 | ) | 731,945 | — | — | — | — | — | ||||||||||||||||||||||||
Pacific Funds Floating Rate Income | (38,073,700 | ) | 1,569,240 | — | — | — | — | — | ||||||||||||||||||||||||
Pacific Funds Limited Duration High Income | (3,657,416 | ) | 26,372 | — | — | — | — | — | ||||||||||||||||||||||||
Pacific Funds High Income | (8,690,963 | ) | 94,566 | — | — | — | — | — | ||||||||||||||||||||||||
Pacific Funds Large-Cap | — | 25,939 | 294,863 | — | — | — | — | |||||||||||||||||||||||||
Pacific Funds Large-Cap Value | — | 168,814 | 886,735 | — | — | — | — | |||||||||||||||||||||||||
Pacific Funds Small/Mid-Cap | — | — | 699,237 | — | — | — | — | |||||||||||||||||||||||||
Pacific Funds Small-Cap | — | 42,545 | 88,174 | — | — | — | — | |||||||||||||||||||||||||
Pacific Funds Small-Cap Value | — | 218,035 | 1,506,171 | — | — | — | — | |||||||||||||||||||||||||
Pacific Funds Small-Cap Growth | — | — | 1,078,811 | 42,866 | — | — | 42,866 | |||||||||||||||||||||||||
Accumulated capital losses represent net capital loss carryovers as of March 31, 2018 that may be available to offset future realized capital gains and thereby reduce future capital gains distributions. The following table shows the amounts of capital loss carryover, if any, by each of the applicable Funds as of March 31, 2018 and capital loss carryover from prior years utilized during the year or period ended March 31, 2018:
| Unlimited Period of Net | Accumulated Capital Loss Carryover | Capital Loss Carryover Utilized During the Year Ended March 31, 2018 | ||||||||||||||
| Capital Loss Carryover | ||||||||||||||||
| Fund | Short Term | Long Term | ||||||||||||||
Pacific Funds Portfolio Optimization Conservative | $— | $— | $— | $1,090,496 | ||||||||||||
Pacific Funds Diversified Alternatives | — | — | — | 109,306 | ||||||||||||
Pacific Funds Short Duration Income | — | (1,660,459 | ) | (1,660,459 | ) | 805,629 | ||||||||||
Pacific Funds Core Income | (5,856,804 | ) | (9,083,353 | ) | (14,940,157 | ) | 4,741,349 | |||||||||
Pacific Funds Strategic Income | — | (8,207,407 | ) | (8,207,407 | ) | 4,382,803 | ||||||||||
Pacific Funds Floating Rate Income | — | (38,073,700 | ) | (38,073,700 | ) | 932,499 | ||||||||||
Pacific Funds Limited Duration High Income | (250,677 | ) | (3,406,739 | ) | (3,657,416 | ) | 3,875 | |||||||||
Pacific Funds High Income | (3,230,606 | ) | (5,460,357 | ) | (8,690,963 | ) | 426,975 | |||||||||
Pacific Funds Large-Cap | — | — | — | 76,446 | ||||||||||||
The aggregate cost of investments and the composition of unrealized appreciation and depreciation on investments and net unrealized appreciation and/or depreciation on derivatives for Federal income tax purposes as of March 31, 2018, were as follows:
| Fund | Total Cost of Investments on Tax Basis (1) | Gross Unrealized Appreciation on Investments | Gross Unrealized Depreciation on Investments | Net Unrealized Appreciation (Depreciation) on Investments | Net Unrealized Appreciation (Depreciation) on Other (2) | Net Unrealized Appreciation (Depreciation) | ||||||||||||||||||
Pacific Funds Portfolio Optimization Conservative | $295,685,371 | $15,508,305 | ($5,107,230 | ) | $10,401,075 | $— | $10,401,075 | |||||||||||||||||
Pacific Funds Portfolio Optimization Moderate-Conservative | 421,910,015 | 37,208,624 | (7,143,643 | ) | 30,064,981 | — | 30,064,981 | |||||||||||||||||
Pacific Funds Portfolio Optimization Moderate | 1,174,659,268 | 168,344,313 | (17,138,613 | ) | 151,205,700 | — | 151,205,700 | |||||||||||||||||
Pacific Funds Portfolio Optimization Growth | 841,383,271 | 170,916,011 | (17,121,499 | ) | 153,794,512 | — | 153,794,512 | |||||||||||||||||
Pacific Funds Portfolio Optimization Aggressive-Growth | 270,524,476 | 74,222,744 | (11,858,025 | ) | 62,364,719 | — | 62,364,719 | |||||||||||||||||
Pacific Funds Diversified Alternatives | 40,844,177 | 623,360 | (701,627 | ) | (78,267 | ) | — | (78,267 | ) | |||||||||||||||
Pacific Funds Short Duration Income | 418,149,445 | 1,374,952 | (4,146,700 | ) | (2,771,748 | ) | — | (2,771,748 | ) | |||||||||||||||
Pacific Funds Core Income | 710,452,015 | 3,857,248 | (8,907,921 | ) | (5,050,673 | ) | — | (5,050,673 | ) | |||||||||||||||
Pacific Funds Strategic Income | 547,891,553 | 7,546,829 | (9,083,898 | ) | (1,537,069 | ) | (11,214 | ) | (1,548,283 | ) | ||||||||||||||
Pacific Funds Floating Rate Income | 1,612,300,476 | 8,676,782 | (5,362,136 | ) | 3,314,646 | 63,312 | 3,377,958 | |||||||||||||||||
Pacific Funds Limited Duration High Income | 35,690,746 | 251,419 | (722,500 | ) | (471,081 | ) | — | (471,081 | ) | |||||||||||||||
Pacific Funds High Income | 81,615,656 | 485,205 | (911,813 | ) | (426,608 | ) | (142 | ) | (426,750 | ) | ||||||||||||||
Pacific Funds Large-Cap | 15,649,773 | 2,385,582 | (398,901 | ) | 1,986,681 | — | 1,986,681 | |||||||||||||||||
Pacific Funds Large-Cap Value | 24,828,959 | 5,084,578 | (556,881 | ) | 4,527,697 | — | 4,527,697 | |||||||||||||||||
Pacific Funds Small/Mid-Cap | 202,845,405 | 32,955,748 | (6,356,650 | ) | 26,599,098 | — | 26,599,098 | |||||||||||||||||
Pacific Funds Small-Cap | 19,117,969 | 3,094,205 | (723,477 | ) | 2,370,728 | — | 2,370,728 | |||||||||||||||||
Pacific Funds Small-Cap Value | 23,261,317 | 5,565,907 | (788,101 | ) | 4,777,806 | — | 4,777,806 | |||||||||||||||||
Pacific Funds Small-Cap Growth | 47,370,555 | 9,010,359 | (2,240,017 | ) | 6,770,342 | — | 6,770,342 | |||||||||||||||||
| (1) | The difference between the total cost of investments on tax basis and investments, at cost, as presented in the Statements of Assets and Liabilities is primarily due to wash sale loss deferrals. |
| (2) | Other includes net appreciation or depreciation on derivatives, short sales, and foreign currencies, if any. |
D-17
Table of Contents
PACIFIC FUNDS
NOTES TO FINANCIAL STATEMENTS (Continued)
Each Fund recognizes the financial statement effects of a tax position taken or expected to be taken in a tax return when it is more likely than not, based on the technical merits, that the position will be sustained upon examination by the applicable tax authority. Tax positions not deemed to meet the more-likely-than-not threshold would be recorded as a tax liability for unrecognized tax benefits with a corresponding income tax expense. Management has analyzed all open tax years, as defined by the statute of limitations, for all major jurisdictions and has determined that no provision for income tax is required in the financial statements. Each Fund remains subject to examination by Federal and State tax authorities for the returns filed for tax years ended as of and after March 31, 2014.
11. TAX CHARACTER OF DISTRIBUTIONS
The tax character of income and capital gains distributions to shareholders during the fiscal year ended March 31, 2018 and 2017, were as follows:
| For the Year Ended March 31, 2018 | For the Year Ended March 31, 2017 | |||||||||||||||||||||||||||||||||||
| Fund | Ordinary Income | Long-Term Capital Gains | Return of Capital | Total Distributions | Ordinary Income | Long-Term Capital Gains | Return of Capital | Total Distributions | ||||||||||||||||||||||||||||
Pacific Funds Portfolio Optimization Conservative | $5,864,391 | $— | $— | $5,864,391 | $5,814,312 | $4,462,957 | $— | $10,277,269 | ||||||||||||||||||||||||||||
Pacific Funds Portfolio Optimization Moderate-Conservative | 8,726,055 | 4,984,858 | — | 13,710,913 | 8,499,985 | 11,434,206 | — | 19,934,191 | ||||||||||||||||||||||||||||
Pacific Funds Portfolio Optimization Moderate | 19,841,711 | 28,960,888 | — | 48,802,599 | 22,066,371 | 49,692,598 | — | 71,758,969 | ||||||||||||||||||||||||||||
Pacific Funds Portfolio Optimization Growth | 13,468,839 | 24,973,889 | — | 38,442,728 | 14,327,475 | 46,721,006 | — | 61,048,481 | ||||||||||||||||||||||||||||
Pacific Funds Portfolio Optimization Aggressive-Growth | 3,290,514 | 9,452,563 | — | 12,743,077 | 3,276,479 | 17,519,316 | — | 20,795,795 | ||||||||||||||||||||||||||||
Pacific Funds Diversified Alternatives | 642,859 | — | — | 642,859 | 438,531 | — | — | 438,531 | ||||||||||||||||||||||||||||
Pacific Funds Short Duration Income | 7,264,060 | — | — | 7,264,060 | 4,802,390 | — | — | 4,802,390 | ||||||||||||||||||||||||||||
Pacific Funds Core Income | 20,400,769 | — | — | 20,400,769 | 18,444,792 | — | — | 18,444,792 | ||||||||||||||||||||||||||||
Pacific Funds Strategic Income | 16,016,399 | — | — | 16,016,399 | 9,412,691 | — | — | 9,412,691 | ||||||||||||||||||||||||||||
Pacific Funds Floating Rate Income | 51,890,071 | — | — | 51,890,071 | 32,499,720 | — | — | 32,499,720 | ||||||||||||||||||||||||||||
Pacific Funds Limited Duration High Income | 1,454,027 | — | — | 1,454,027 | 1,329,456 | — | — | 1,329,456 | ||||||||||||||||||||||||||||
Pacific Funds High Income | 1,400,258 | — | — | 1,400,258 | 3,393,419 | — | — | 3,393,419 | ||||||||||||||||||||||||||||
Pacific Funds Large-Cap | 99,599 | 91,459 | — | 191,058 | 78,611 | — | — | 78,611 | ||||||||||||||||||||||||||||
Pacific Funds Large-Cap Value | 787,226 | 285,516 | — | 1,072,742 | 337,445 | — | — | 337,445 | ||||||||||||||||||||||||||||
Pacific Funds Small/Mid-Cap | 158,695 | 46,194 | — | 204,889 | 197,512 | — | — | 197,512 | ||||||||||||||||||||||||||||
Pacific Funds Small-Cap | 130,030 | 129,971 | — | 260,001 | 30,967 | — | — | 30,967 | ||||||||||||||||||||||||||||
Pacific Funds Small-Cap Value | 2,228,046 | 692,924 | — | 2,920,970 | 322,372 | — | — | 322,372 | ||||||||||||||||||||||||||||
Pacific Funds Small-Cap Growth | 508,907 | 1,004,117 | — | 1,513,024 | 606,829 | 58,416 | — | 665,245 | ||||||||||||||||||||||||||||
12. RECLASSIFICATIONS OF ACCOUNTS
During the fiscal year ended March 31, 2018, reclassifications as shown in the following table have been made in each Fund’s capital accounts to report these balances on a tax basis, excluding certain temporary differences, as of March 31, 2018. Additional adjustments may be required in subsequent reporting periods. These reclassifications, which have no impact on the NAV of the Funds, are primarily attributable to non-deductible expenses, swap income, redesignation of dividends paid, partnerships, defaulted bonds, and short-term capital gains received under Federal tax rules, versus U.S. GAAP. The calculation net investment income per share in the financial highlights excludes these adjustments.
| Fund | Paid-In Capital | Undistributed/ Accumulated Net Investment Income (Loss) | Undistributed/ Accumulated Net Realized Gain (Loss) | |||||||||
Pacific Funds Portfolio Optimization Conservative | $— | $549,981 | ($549,981 | ) | ||||||||
Pacific Funds Portfolio Optimization Moderate-Conservative | — | 1,552,782 | (1,552,782 | ) | ||||||||
Pacific Funds Portfolio Optimization Moderate | — | 7,262,992 | (7,262,992 | ) | ||||||||
Pacific Funds Portfolio Optimization Growth | — | 5,161,363 | (5,161,363 | ) | ||||||||
Pacific Funds Portfolio Optimization Aggressive-Growth | — | 2,022,531 | (2,022,531 | ) | ||||||||
Pacific Funds Diversified Alternatives | — | 68,082 | (68,082 | ) | ||||||||
Pacific Funds Short Duration Income | — | 3,351 | (3,351 | ) | ||||||||
Pacific Funds Core Income | — | (16,621 | ) | 16,621 | ||||||||
Pacific Funds Strategic Income | (87 | ) | 91,702 | (91,615 | ) | |||||||
Pacific Funds Limited Duration High Income | — | 23,716 | (23,716 | ) | ||||||||
Pacific Funds High Income | (44 | ) | 47,968 | (47,924 | ) | |||||||
Pacific Funds Large-Cap | — | (423 | ) | 423 | ||||||||
Pacific Funds Large-Cap Value | — | (1,317 | ) | 1,317 | ||||||||
Pacific Funds Small/Mid-Cap | (236,628 | ) | 236,628 | — | ||||||||
Pacific Funds Small-Cap | — | 9,321 | (9,321 | ) | ||||||||
Pacific Funds Small-Cap Value | — | 32,323 | (32,323 | ) | ||||||||
Pacific Funds Small-Cap Growth | — | 145,725 | (145,725 | ) | ||||||||
D-18
Table of Contents
PACIFIC FUNDS
NOTES TO FINANCIAL STATEMENTS (Continued)
13. SHARES OF BENEFICIAL INTEREST
Each Fund is authorized to issue an unlimited number of shares of beneficial interest with no par value unless otherwise determined by the trustees of the Board. Changes in shares of beneficial interest of each Fund for the year or period ended March 31, 2018 and 2017, were as follows:
| Pacific Funds Portfolio Optimization Conservative | Pacific Funds Portfolio Optimization Moderate-Conservative | Pacific Funds Portfolio Optimization Moderate | Pacific Funds Portfolio Optimization Growth | |||||||||||||||||||||||||||||||||||||||||
| Year Ended 3/31/2018 | Year Ended 3/31/2017 | Year Ended 3/31/2018 | Year Ended 3/31/2017 | Year Ended 3/31/2018 | Year Ended 3/31/2017 | Year Ended 3/31/2018 | Year Ended 3/31/2017 | |||||||||||||||||||||||||||||||||||||
Class A | ||||||||||||||||||||||||||||||||||||||||||||
Shares sold | 1,862,768 | 1,890,752 | 2,219,877 | 2,475,492 | 4,573,013 | 5,276,412 | 3,358,865 | 3,754,929 | ||||||||||||||||||||||||||||||||||||
Dividends and distribution reinvested | 251,720 | 418,969 | 567,952 | 831,373 | 1,840,517 | 2,843,340 | 1,421,816 | 2,389,226 | ||||||||||||||||||||||||||||||||||||
Shares repurchased | (2,925,798 | ) | (4,392,205 | ) | (4,098,294 | ) | (5,684,302 | ) | (10,664,851 | ) | (14,849,661 | ) | (7,232,106 | ) | (9,297,851 | ) | ||||||||||||||||||||||||||||
Net increase (decrease) | (811,310 | ) | (2,082,484 | ) | (1,310,465 | ) | (2,377,437 | ) | (4,251,321 | ) | (6,729,909 | ) | (2,451,425 | ) | (3,153,696 | ) | ||||||||||||||||||||||||||||
Beginning shares outstanding | 12,470,231 | 14,552,715 | 19,388,160 | 21,765,597 | 52,696,413 | 59,426,322 | 38,364,070 | 41,517,766 | ||||||||||||||||||||||||||||||||||||
Ending shares outstanding | 11,658,921 | 12,470,231 | 18,077,695 | 19,388,160 | 48,445,092 | 52,696,413 | 35,912,645 | 38,364,070 | ||||||||||||||||||||||||||||||||||||
Class B | ||||||||||||||||||||||||||||||||||||||||||||
Shares sold | 96,799 | 263,649 | 68,406 | 227,371 | 173,280 | 605,017 | 156,935 | 493,424 | ||||||||||||||||||||||||||||||||||||
Dividends and distribution reinvested | 36,347 | 75,508 | 84,578 | 139,557 | 285,597 | 473,576 | 205,810 | 383,632 | ||||||||||||||||||||||||||||||||||||
Shares repurchased | (658,988 | ) | (800,566 | ) | (756,471 | ) | (715,131 | ) | (1,905,989 | ) | (2,213,735 | ) | (1,336,648 | ) | (1,567,168 | ) | ||||||||||||||||||||||||||||
Net increase (decrease) | (525,842 | ) | (461,409 | ) | (603,487 | ) | (348,203 | ) | (1,447,112 | ) | (1,135,142 | ) | (973,903 | ) | (690,112 | ) | ||||||||||||||||||||||||||||
Beginning shares outstanding | 2,762,216 | 3,223,625 | 3,762,771 | 4,110,974 | 9,969,778 | 11,104,920 | 6,813,831 | 7,503,943 | ||||||||||||||||||||||||||||||||||||
Ending shares outstanding | 2,236,374 | 2,762,216 | 3,159,284 | 3,762,771 | 8,522,666 | 9,969,778 | 5,839,928 | 6,813,831 | ||||||||||||||||||||||||||||||||||||
Class C | ||||||||||||||||||||||||||||||||||||||||||||
Shares sold | 1,302,659 | 1,981,634 | 888,220 | 1,487,544 | 2,134,712 | 3,468,847 | 1,500,550 | 2,068,777 | ||||||||||||||||||||||||||||||||||||
Dividends and distribution reinvested | 195,310 | 381,110 | 378,552 | 627,774 | 1,098,406 | 1,845,550 | 734,622 | 1,382,132 | ||||||||||||||||||||||||||||||||||||
Shares repurchased | (3,293,276 | ) | (4,685,467 | ) | (3,774,978 | ) | (4,583,366 | ) | (8,262,627 | ) | (10,269,873 | ) | (5,498,751 | ) | (6,348,745 | ) | ||||||||||||||||||||||||||||
Net increase (decrease) | (1,795,307 | ) | (2,322,723 | ) | (2,508,206 | ) | (2,468,048 | ) | (5,029,509 | ) | (4,955,476 | ) | (3,263,579 | ) | (2,897,836 | ) | ||||||||||||||||||||||||||||
Beginning shares outstanding | 14,258,315 | 16,581,038 | 16,672,098 | 19,140,146 | 38,211,792 | 43,167,268 | 24,167,592 | 27,065,428 | ||||||||||||||||||||||||||||||||||||
Ending shares outstanding | 12,463,008 | 14,258,315 | 14,163,892 | 16,672,098 | 33,182,283 | 38,211,792 | 20,904,013 | 24,167,592 | ||||||||||||||||||||||||||||||||||||
Class R | ||||||||||||||||||||||||||||||||||||||||||||
Shares sold | 169,031 | 191,730 | 52,403 | 88,903 | 452,515 | 389,499 | 153,184 | 220,934 | ||||||||||||||||||||||||||||||||||||
Dividends and distribution reinvested | 10,522 | 30,462 | 12,463 | 19,629 | 64,753 | 88,738 | 40,288 | 64,456 | ||||||||||||||||||||||||||||||||||||
Shares repurchased | (496,622 | ) | (412,838 | ) | (141,956 | ) | (113,097 | ) | (592,663 | ) | (663,485 | ) | (241,006 | ) | (569,194 | ) | ||||||||||||||||||||||||||||
Net increase (decrease) | (317,069 | ) | (190,646 | ) | (77,090 | ) | (4,565 | ) | (75,395 | ) | (185,248 | ) | (47,534 | ) | (283,804 | ) | ||||||||||||||||||||||||||||
Beginning shares outstanding | 766,267 | 956,913 | 488,778 | 493,343 | 1,776,074 | 1,961,322 | 1,053,056 | 1,336,860 | ||||||||||||||||||||||||||||||||||||
Ending shares outstanding | 449,198 | 766,267 | 411,688 | 488,778 | 1,700,679 | 1,776,074 | 1,005,522 | 1,053,056 | ||||||||||||||||||||||||||||||||||||
Advisor Class | ||||||||||||||||||||||||||||||||||||||||||||
Shares sold | 645,171 | 282,213 | 223,680 | 290,140 | 960,627 | 687,375 | 442,524 | 475,009 | ||||||||||||||||||||||||||||||||||||
Dividends and distribution reinvested | 11,476 | 8,390 | 11,659 | 11,730 | 55,742 | 49,802 | 38,927 | 40,383 | ||||||||||||||||||||||||||||||||||||
Shares repurchased | (425,881 | ) | (266,576 | ) | (223,525 | ) | (318,021 | ) | (713,947 | ) | (950,013 | ) | (338,539 | ) | (486,960 | ) | ||||||||||||||||||||||||||||
Net increase (decrease) | 230,766 | 24,027 | 11,814 | (16,151 | ) | 302,422 | (212,836 | ) | 142,912 | 28,432 | ||||||||||||||||||||||||||||||||||
Beginning shares outstanding | 491,402 | 467,375 | 399,949 | 416,100 | 1,313,279 | 1,526,115 | 906,950 | 878,518 | ||||||||||||||||||||||||||||||||||||
Ending shares outstanding | 722,168 | 491,402 | 411,763 | 399,949 | 1,615,701 | 1,313,279 | 1,049,862 | 906,950 | ||||||||||||||||||||||||||||||||||||
D-19
Table of Contents
PACIFIC FUNDS
NOTES TO FINANCIAL STATEMENTS (Continued)
| Pacific Funds Portfolio Optimization Aggressive-Growth | Pacific Funds Diversified Alternatives | Pacific Funds Short Duration Income | Pacific Funds Core Income | |||||||||||||||||||||||||||||||||||||||||
| Year Ended 3/31/2018 | Year Ended 3/31/2017 | Year Ended 3/31/2018 | Year Ended 3/31/2017 | Year Ended 3/31/2018 | Year Ended 3/31/2017 | Year Ended 3/31/2018 | Year Ended 3/31/2017 | |||||||||||||||||||||||||||||||||||||
Class A | ||||||||||||||||||||||||||||||||||||||||||||
Shares sold | 1,046,502 | 1,216,635 | 259,543 | 69,431 | 5,645,132 | 4,194,724 | 2,853,778 | 5,010,760 | ||||||||||||||||||||||||||||||||||||
Dividends and distribution reinvested | 438,169 | 772,029 | 9,360 | 14,293 | 145,784 | 113,206 | 320,338 | 416,698 | ||||||||||||||||||||||||||||||||||||
Shares repurchased | (1,719,876 | ) | (2,226,168 | ) | (48,684 | ) | (136,645 | ) | (3,072,099 | ) | (4,596,951 | ) | (5,788,158 | ) | (8,965,679 | ) | ||||||||||||||||||||||||||||
Net increase (decrease) | (235,205 | ) | (237,504 | ) | 220,219 | (52,921 | ) | 2,718,817 | (289,021 | ) | (2,614,042 | ) | (3,538,221 | ) | ||||||||||||||||||||||||||||||
Beginning shares outstanding | 11,385,291 | 11,622,795 | 272,821 | 325,742 | 6,482,995 | 6,772,016 | 15,242,433 | 18,780,654 | ||||||||||||||||||||||||||||||||||||
Ending shares outstanding | 11,150,086 | 11,385,291 | 493,040 | 272,821 | 9,201,812 | 6,482,995 | 12,628,391 | 15,242,433 | ||||||||||||||||||||||||||||||||||||
Class B | ||||||||||||||||||||||||||||||||||||||||||||
Shares sold | 65,522 | 219,638 | ||||||||||||||||||||||||||||||||||||||||||
Dividends and distribution reinvested | 59,328 | 121,129 | ||||||||||||||||||||||||||||||||||||||||||
Shares repurchased | (427,490 | ) | (484,527 | ) | ||||||||||||||||||||||||||||||||||||||||
Net increase (decrease) | (302,640 | ) | (143,760 | ) | ||||||||||||||||||||||||||||||||||||||||
Beginning shares outstanding | 1,937,410 | 2,081,170 | ||||||||||||||||||||||||||||||||||||||||||
Ending shares outstanding | 1,634,770 | 1,937,410 | ||||||||||||||||||||||||||||||||||||||||||
Class C | ||||||||||||||||||||||||||||||||||||||||||||
Shares sold | 789,991 | 869,084 | 212,173 | 115,889 | 1,455,593 | 1,655,175 | 1,034,435 | 1,851,314 | ||||||||||||||||||||||||||||||||||||
Dividends and distribution reinvested | 206,344 | 408,431 | 5,700 | 8,111 | 47,646 | 39,998 | 170,753 | 203,792 | ||||||||||||||||||||||||||||||||||||
Shares repurchased | (1,550,277 | ) | (1,803,310 | ) | (55,446 | ) | (41,538 | ) | (1,347,545 | ) | (1,825,910 | ) | (2,995,730 | ) | (4,045,482 | ) | ||||||||||||||||||||||||||||
Net increase (decrease) | (553,942 | ) | (525,795 | ) | 162,427 | 82,462 | 155,694 | (130,737 | ) | (1,790,542 | ) | (1,990,376 | ) | |||||||||||||||||||||||||||||||
Beginning shares outstanding | 6,453,179 | 6,978,974 | 151,666 | 69,204 | 4,183,798 | 4,314,535 | 11,464,993 | 13,455,369 | ||||||||||||||||||||||||||||||||||||
Ending shares outstanding | 5,899,237 | 6,453,179 | 314,093 | 151,666 | 4,339,492 | 4,183,798 | 9,674,451 | 11,464,993 | ||||||||||||||||||||||||||||||||||||
Class I | ||||||||||||||||||||||||||||||||||||||||||||
Shares sold | 260,960 | 207,447 | 139,908 | 163,720 | ||||||||||||||||||||||||||||||||||||||||
Dividends and distribution reinvested | 8,683 | 5,253 | 13,088 | 11,303 | ||||||||||||||||||||||||||||||||||||||||
Shares repurchased | (176,849 | ) | (47,460 | ) | (172,027 | ) | (83,946 | ) | ||||||||||||||||||||||||||||||||||||
Net increase (decrease) | 92,794 | 165,240 | (19,031 | ) | 91,077 | |||||||||||||||||||||||||||||||||||||||
Beginning shares outstanding | 330,665 | 165,425 | 433,776 | 342,699 | ||||||||||||||||||||||||||||||||||||||||
Ending shares outstanding | 423,459 | 330,665 | 414,745 | 433,776 | ||||||||||||||||||||||||||||||||||||||||
Class P | ||||||||||||||||||||||||||||||||||||||||||||
Shares sold | 99,141 | 12,396,863 | ||||||||||||||||||||||||||||||||||||||||||
Dividends and distribution reinvested | 300,661 | 238,533 | ||||||||||||||||||||||||||||||||||||||||||
Shares repurchased | (5,627,239 | ) | (2,567,647 | ) | ||||||||||||||||||||||||||||||||||||||||
Net increase (decrease) | (5,227,437 | ) | 10,067,749 | |||||||||||||||||||||||||||||||||||||||||
Beginning shares outstanding | 11,589,299 | 1,521,550 | ||||||||||||||||||||||||||||||||||||||||||
Ending shares outstanding | 6,361,862 | 11,589,299 | ||||||||||||||||||||||||||||||||||||||||||
Class R | ||||||||||||||||||||||||||||||||||||||||||||
Shares sold | 91,655 | 90,924 | ||||||||||||||||||||||||||||||||||||||||||
Dividends and distribution reinvested | 18,141 | 30,232 | ||||||||||||||||||||||||||||||||||||||||||
Shares repurchased | (128,684 | ) | (136,353 | ) | ||||||||||||||||||||||||||||||||||||||||
Net increase (decrease) | (18,888 | ) | (15,197 | ) | ||||||||||||||||||||||||||||||||||||||||
Beginning shares outstanding | 465,834 | 481,031 | ||||||||||||||||||||||||||||||||||||||||||
Ending shares outstanding | 446,946 | 465,834 | ||||||||||||||||||||||||||||||||||||||||||
Advisor Class | ||||||||||||||||||||||||||||||||||||||||||||
Shares sold | 244,236 | 378,874 | 2,584,747 | 662,659 | 24,113,523 | 13,183,137 | 24,984,787 | 21,898,290 | ||||||||||||||||||||||||||||||||||||
Dividends and distribution reinvested | 21,172 | 23,071 | 49,465 | 22,399 | 442,376 | 267,237 | 738,996 | 580,811 | ||||||||||||||||||||||||||||||||||||
Shares repurchased | (128,735 | ) | (402,913 | ) | (252,423 | ) | (29,918 | ) | (13,714,412 | ) | (10,315,633 | ) | (20,688,961 | ) | (14,245,105 | ) | ||||||||||||||||||||||||||||
Net increase (decrease) | 136,673 | (968 | ) | 2,381,789 | 655,140 | 10,841,487 | 3,134,741 | 5,034,822 | 8,233,996 | |||||||||||||||||||||||||||||||||||
Beginning shares outstanding | 453,070 | 454,038 | 911,722 | 256,582 | 15,751,709 | 12,616,968 | 32,071,496 | 23,837,500 | ||||||||||||||||||||||||||||||||||||
Ending shares outstanding | 589,743 | 453,070 | 3,293,511 | 911,722 | 26,593,196 | 15,751,709 | 37,106,318 | 32,071,496 | ||||||||||||||||||||||||||||||||||||
D-20
Table of Contents
PACIFIC FUNDS
NOTES TO FINANCIAL STATEMENTS (Continued)
| Pacific Funds Strategic Income | Pacific Funds Floating Rate Income | Pacific Funds Limited Duration High Income | Pacific Funds High Income | |||||||||||||||||||||||||||||||||||||||||
| Year Ended 3/31/2018 | Year Ended 3/31/2017 | Year Ended 3/31/2018 | Year Ended 3/31/2017 | Year Ended 3/31/2018 | Year Ended 3/31/2017 | Year Ended 3/31/2018 | Year Ended 3/31/2017 | |||||||||||||||||||||||||||||||||||||
Class A | ||||||||||||||||||||||||||||||||||||||||||||
Shares sold | 2,876,142 | 3,161,537 | 8,217,926 | 8,223,582 | 105,197 | 179,997 | 340,288 | 327,013 | ||||||||||||||||||||||||||||||||||||
Dividends and distribution reinvested | 190,685 | 187,637 | 758,911 | 698,572 | 22,355 | 24,390 | 27,282 | 36,115 | ||||||||||||||||||||||||||||||||||||
Shares repurchased | (2,600,456 | ) | (2,272,653 | ) | (8,747,944 | ) | (8,117,918 | ) | (197,830 | ) | (446,919 | ) | (380,058 | ) | (917,907 | ) | ||||||||||||||||||||||||||||
Net increase (decrease) | 466,371 | 1,076,521 | 228,893 | 804,236 | (70,278 | ) | (242,532 | ) | (12,488 | ) | (554,779 | ) | ||||||||||||||||||||||||||||||||
Beginning shares outstanding | 6,252,831 | 5,176,310 | 20,418,554 | 19,614,318 | 604,029 | 846,561 | 546,541 | 1,101,320 | ||||||||||||||||||||||||||||||||||||
Ending shares outstanding | 6,719,202 | 6,252,831 | 20,647,447 | 20,418,554 | 533,751 | 604,029 | 534,053 | 546,541 | ||||||||||||||||||||||||||||||||||||
Class C | ||||||||||||||||||||||||||||||||||||||||||||
Shares sold | 1,785,872 | 1,485,820 | 4,575,555 | 4,321,348 | 87,546 | 72,834 | 73,339 | 129,064 | ||||||||||||||||||||||||||||||||||||
Dividends and distribution reinvested | 127,294 | 119,373 | 566,096 | 497,422 | 12,102 | 10,103 | 20,241 | 22,367 | ||||||||||||||||||||||||||||||||||||
Shares repurchased | (1,235,156 | ) | (1,301,415 | ) | (4,042,161 | ) | (3,553,114 | ) | (89,712 | ) | (81,378 | ) | (128,162 | ) | (142,966 | ) | ||||||||||||||||||||||||||||
Net increase (decrease) | 678,010 | 303,778 | 1,099,490 | 1,265,656 | 9,936 | 1,559 | (34,582 | ) | 8,465 | |||||||||||||||||||||||||||||||||||
Beginning shares outstanding | 4,692,749 | 4,388,971 | 17,826,119 | 16,560,463 | 352,474 | 350,915 | 467,159 | 458,694 | ||||||||||||||||||||||||||||||||||||
Ending shares outstanding | 5,370,759 | 4,692,749 | 18,925,609 | 17,826,119 | 362,410 | 352,474 | 432,577 | 467,159 | ||||||||||||||||||||||||||||||||||||
Class I | ||||||||||||||||||||||||||||||||||||||||||||
Shares sold | 225,115 | 170,929 | 12,933,593 | 16,312,206 | 126,549 | 9,412 | 44,474 | 540,027 | ||||||||||||||||||||||||||||||||||||
Dividends and distribution reinvested | 12,568 | 5,192 | 607,872 | 472,000 | 112,103 | 102,269 | 12,101 | 23,423 | ||||||||||||||||||||||||||||||||||||
Shares repurchased | (103,454 | ) | (40,230 | ) | (9,085,917 | ) | (1,619,335 | ) | (765 | ) | (2,014 | ) | (545,262 | ) | (60,184 | ) | ||||||||||||||||||||||||||||
Net increase (decrease) | 134,229 | 135,891 | 4,455,548 | 15,164,871 | 237,887 | 109,667 | (488,687 | ) | 503,266 | |||||||||||||||||||||||||||||||||||
Beginning shares outstanding | 230,380 | 94,489 | 24,578,875 | 9,414,004 | 2,503,551 | 2,393,884 | 509,494 | 6,228 | ||||||||||||||||||||||||||||||||||||
Ending shares outstanding | 364,609 | 230,380 | 29,034,423 | 24,578,875 | 2,741,438 | 2,503,551 | 20,807 | 509,494 | ||||||||||||||||||||||||||||||||||||
Class P | ||||||||||||||||||||||||||||||||||||||||||||
Shares sold | 681,526 | 7,758,276 | 5,887,930 | 718,855 | ||||||||||||||||||||||||||||||||||||||||
Dividends and distribution reinvested | 321,026 | 28,212 | 63,442 | 251,058 | ||||||||||||||||||||||||||||||||||||||||
Shares repurchased | (2,374,473 | ) | (103,794 | ) | (194,186 | ) | (12,113,949 | ) | ||||||||||||||||||||||||||||||||||||
Net increase (decrease) | (1,371,921 | ) | 7,682,694 | 5,757,186 | (11,144,036 | ) | ||||||||||||||||||||||||||||||||||||||
Beginning shares outstanding | 7,740,871 | 58,177 | 1,034,513 | 12,178,549 | ||||||||||||||||||||||||||||||||||||||||
Ending shares outstanding | 6,368,950 | 7,740,871 | 6,791,699 | 1,034,513 | ||||||||||||||||||||||||||||||||||||||||
Advisor Class | ||||||||||||||||||||||||||||||||||||||||||||
Shares sold | 27,902,838 | 14,328,334 | 44,928,526 | 33,337,402 | 183,638 | 121,710 | 146,665 | 156,239 | ||||||||||||||||||||||||||||||||||||
Dividends and distribution reinvested | 876,500 | 480,505 | 2,003,170 | 1,128,020 | 11,781 | 9,195 | 11,534 | 11,165 | ||||||||||||||||||||||||||||||||||||
Shares repurchased | (11,306,609 | ) | (5,898,144 | ) | (20,747,337 | ) | (13,844,107 | ) | (128,716 | ) | (130,786 | ) | (137,360 | ) | (120,174 | ) | ||||||||||||||||||||||||||||
Net increase (decrease) | 17,472,729 | 8,910,695 | 26,184,359 | 20,621,315 | 66,703 | 119 | 20,839 | 47,230 | ||||||||||||||||||||||||||||||||||||
Beginning shares outstanding | 20,364,605 | 11,453,910 | 44,265,652 | 23,644,337 | 223,126 | 223,007 | 223,708 | 176,478 | ||||||||||||||||||||||||||||||||||||
Ending shares outstanding | 37,837,334 | 20,364,605 | 70,450,011 | 44,265,652 | 289,829 | 223,126 | 244,547 | 223,708 | ||||||||||||||||||||||||||||||||||||
D-21
Table of Contents
PACIFIC FUNDS
NOTES TO FINANCIAL STATEMENTS (Continued)
| Pacific Funds Large Cap | Pacific Funds Large-Cap Value | Pacific Funds Small/Mid-Cap | Pacific Funds Small Cap | |||||||||||||||||||||||||||||||||||||||||
| Year Ended 3/31/2018 | Year Ended 3/31/2017 | Year Ended 3/31/2018 | Year Ended 3/31/2017 | Year Ended 3/31/2018 | Year Ended 3/31/2017 | Year Ended 3/31/2018 | Year Ended 3/31/2017 | |||||||||||||||||||||||||||||||||||||
Class A | ||||||||||||||||||||||||||||||||||||||||||||
Shares sold | 240,285 | 401,920 | 148,815 | 246,956 | 1,217,736 | 2,173,102 | 95,701 | 179,504 | ||||||||||||||||||||||||||||||||||||
Dividends and distribution reinvested | 5,266 | 2,769 | 8,802 | 2,055 | 1,494 | 3,389 | 1,776 | 1,076 | ||||||||||||||||||||||||||||||||||||
Shares repurchased | (258,602 | ) | (46,452 | ) | (105,439 | ) | (62,593 | ) | (1,162,227 | ) | (863,934 | ) | (62,757 | ) | (64,638 | ) | ||||||||||||||||||||||||||||
Net increase (decrease) | (13,051 | ) | 358,237 | 52,178 | 186,418 | 57,003 | 1,312,557 | 34,720 | 115,942 | |||||||||||||||||||||||||||||||||||
Beginning shares outstanding | 415,221 | 56,984 | 239,157 | 52,739 | 1,539,642 | 227,085 | 149,370 | 33,428 | ||||||||||||||||||||||||||||||||||||
Ending shares outstanding | 402,170 | 415,221 | 291,335 | 239,157 | 1,596,645 | 1,539,642 | 184,090 | 149,370 | ||||||||||||||||||||||||||||||||||||
Class C | ||||||||||||||||||||||||||||||||||||||||||||
Shares sold | 86,657 | 216,157 | 138,902 | 242,134 | 694,691 | 593,776 | 28,721 | 52,812 | ||||||||||||||||||||||||||||||||||||
Dividends and distribution reinvested | 1,836 | 654 | 9,196 | 1,403 | 1,110 | 787 | 1,132 | — | ||||||||||||||||||||||||||||||||||||
Shares repurchased | (52,654 | ) | (17,021 | ) | (49,534 | ) | (8,023 | ) | (132,991 | ) | (22,803 | ) | (21,930 | ) | (11,747 | ) | ||||||||||||||||||||||||||||
Net increase (decrease) | 35,839 | 199,790 | 98,564 | 235,514 | 562,810 | 571,760 | 7,923 | 41,065 | ||||||||||||||||||||||||||||||||||||
Beginning shares outstanding | 254,205 | 54,415 | 285,978 | 50,464 | 624,978 | 53,218 | 54,518 | 13,453 | ||||||||||||||||||||||||||||||||||||
Ending shares outstanding | 290,044 | 254,205 | 384,542 | 285,978 | 1,187,788 | 624,978 | 62,441 | 54,518 | ||||||||||||||||||||||||||||||||||||
Advisor Class | ||||||||||||||||||||||||||||||||||||||||||||
Shares sold | 774,299 | 144,202 | 128,648 | 2,304,006 | 9,245,101 | 6,631,504 | 633,456 | 729,346 | ||||||||||||||||||||||||||||||||||||
Dividends and distribution reinvested | 6,060 | 1,293 | 66,983 | 25,475 | 11,179 | 8,897 | 11,601 | 218 | ||||||||||||||||||||||||||||||||||||
Shares repurchased | (323,783 | ) | (7,967 | ) | (768,092 | ) | (113,813 | ) | (1,824,233 | ) | (953,943 | ) | (207,244 | ) | (50,661 | ) | ||||||||||||||||||||||||||||
Net increase (decrease) | 456,576 | 137,528 | (572,461 | ) | 2,215,668 | 7,432,047 | 5,686,458 | 437,813 | 678,903 | |||||||||||||||||||||||||||||||||||
Beginning shares outstanding | 195,842 | 58,314 | 2,297,771 | 82,103 | 5,884,540 | 198,082 | 694,717 | 15,814 | ||||||||||||||||||||||||||||||||||||
Ending shares outstanding | 652,418 | 195,842 | 1,725,310 | 2,297,771 | 13,316,587 | 5,884,540 | 1,132,530 | 694,717 | ||||||||||||||||||||||||||||||||||||
Investor Class | ||||||||||||||||||||||||||||||||||||||||||||
Shares sold | 31,271 | 12,133 | 1,998 | 28,767 | 372,712 | 498,571 | 240,780 | 49,010 | ||||||||||||||||||||||||||||||||||||
Dividends and distribution reinvested | 618 | 562 | 332 | 492 | 679 | 862 | 4 | 33 | ||||||||||||||||||||||||||||||||||||
Shares repurchased | (21,675 | ) | (55,207 | ) | (1,977 | ) | (74,544 | ) | (450,208 | ) | (158,044 | ) | (51,108 | ) | (1,906 | ) | ||||||||||||||||||||||||||||
Net increase (decrease) | 10,214 | (42,512 | ) | 353 | (45,285 | ) | (76,817 | ) | 341,389 | 189,676 | 47,137 | |||||||||||||||||||||||||||||||||
Beginning shares outstanding | 27,394 | 69,906 | 9,058 | 54,343 | 571,970 | 230,581 | 49,023 | 1,886 | ||||||||||||||||||||||||||||||||||||
Ending shares outstanding | 37,608 | 27,394 | 9,411 | 9,058 | 495,153 | 571,970 | 238,699 | 49,023 | ||||||||||||||||||||||||||||||||||||
Class S | ||||||||||||||||||||||||||||||||||||||||||||
Shares sold | 29,866 | 9,756 | 44,243 | 103,921 | 38,303 | 691,926 | 26,161 | 11,798 | ||||||||||||||||||||||||||||||||||||
Dividends and distribution reinvested | 1,039 | 1,775 | 5,426 | 2,022 | 782 | 2,494 | 495 | 1,020 | ||||||||||||||||||||||||||||||||||||
Shares repurchased | (81,335 | ) | (98,629 | ) | (3,641 | ) | (1,115 | ) | (2,909 | ) | (51,489 | ) | (1,361 | ) | (51,380 | ) | ||||||||||||||||||||||||||||
Net increase (decrease) | (50,430 | ) | (87,098 | ) | 46,028 | 104,828 | 36,176 | 642,931 | 25,295 | (38,562 | ) | |||||||||||||||||||||||||||||||||
Beginning shares outstanding | 107,395 | 194,493 | 127,040 | 22,212 | 714,592 | 71,661 | 12,818 | 51,380 | ||||||||||||||||||||||||||||||||||||
Ending shares outstanding | 56,965 | 107,395 | 173,068 | 127,040 | 750,768 | 714,592 | 38,113 | 12,818 | ||||||||||||||||||||||||||||||||||||
D-22
Table of Contents
PACIFIC FUNDS
NOTES TO FINANCIAL STATEMENTS (Continued)
| Pacific Funds Small-Cap Value | Pacific Funds Small-Cap Growth | |||||||||||||||||||
| Year Ended 3/31/2018 | Year Ended 3/31/2017 | Year Ended 3/31/2018 | Year Ended 3/31/2017 | |||||||||||||||||
Class A | ||||||||||||||||||||
Shares sold | 71,018 | 62,697 | 26,759 | 42,667 | ||||||||||||||||
Dividends and distribution reinvested | 8,365 | 319 | 1,727 | 667 | ||||||||||||||||
Shares repurchased | (45,061 | ) | (14,037 | ) | (16,453 | ) | (1,690 | ) | ||||||||||||
Net increase (decrease) | 34,322 | 48,979 | 12,033 | 41,644 | ||||||||||||||||
Beginning shares outstanding | 64,551 | 15,572 | 46,135 | 4,491 | ||||||||||||||||
Ending shares outstanding | 98,873 | 64,551 | 58,168 | 46,135 | ||||||||||||||||
Class C | ||||||||||||||||||||
Shares sold | 75,210 | 88,998 | 50,695 | 14,763 | ||||||||||||||||
Dividends and distribution reinvested | 11,162 | 212 | 2,034 | 198 | ||||||||||||||||
Shares repurchased | (41,000 | ) | (5,517 | ) | (6,659 | ) | (1,558 | ) | ||||||||||||
Net increase (decrease) | 45,372 | 83,693 | 46,070 | 13,403 | ||||||||||||||||
Beginning shares outstanding | 96,441 | 12,748 | 16,901 | 3,498 | ||||||||||||||||
Ending shares outstanding | 141,813 | 96,441 | 62,971 | 16,901 | ||||||||||||||||
Class P | ||||||||||||||||||||
Shares sold | 1,192,397 | 1,395,678 | ||||||||||||||||||
Dividends and distribution reinvested | 40,435 | 22,013 | ||||||||||||||||||
Shares repurchased | (171,822 | ) | (310,949 | ) | ||||||||||||||||
Net increase (decrease) | 1,061,010 | 1,106,742 | ||||||||||||||||||
Beginning shares outstanding | 1,106,742 | — | ||||||||||||||||||
Ending shares outstanding | 2,167,752 | 1,106,742 | ||||||||||||||||||
Advisor Class | ||||||||||||||||||||
Shares sold | 221,165 | 2,578,419 | 170,917 | 1,161,626 | ||||||||||||||||
Dividends and distribution reinvested | 154,246 | 18,336 | 42,405 | 19,771 | ||||||||||||||||
Shares repurchased | (775,141 | ) | (844,845 | ) | (304,493 | ) | (15,767 | ) | ||||||||||||
Net increase (decrease) | (399,730 | ) | 1,751,910 | (91,171 | ) | 1,165,630 | ||||||||||||||
Beginning shares outstanding | 1,779,477 | 27,567 | 1,189,927 | 24,297 | ||||||||||||||||
Ending shares outstanding | 1,379,747 | 1,779,477 | 1,098,756 | 1,189,927 | ||||||||||||||||
Investor Class | ||||||||||||||||||||
Shares sold | 10,384 | 13,015 | 15,685 | 1,274 | ||||||||||||||||
Dividends and distribution reinvested | 610 | 108 | 4,250 | 2,101 | ||||||||||||||||
Shares repurchased | (14,758 | ) | (1,504 | ) | (1,916 | ) | (1,079 | ) | ||||||||||||
Net increase (decrease) | (3,764 | ) | 11,619 | 18,019 | 2,296 | |||||||||||||||
Beginning shares outstanding | 17,897 | 6,278 | 103,807 | 101,511 | ||||||||||||||||
Ending shares outstanding | 14,133 | 17,897 | 121,826 | 103,807 | ||||||||||||||||
Class S | ||||||||||||||||||||
Shares sold | 39,304 | 786,410 | 61,575 | 806,759 | ||||||||||||||||
Dividends and distribution reinvested | 76,957 | 8,126 | 35,999 | 15,799 | ||||||||||||||||
Shares repurchased | (90,779 | ) | (76,854 | ) | (87,375 | ) | (1,079 | ) | ||||||||||||
Net increase (decrease) | 25,482 | 717,682 | 10,199 | 821,479 | ||||||||||||||||
Beginning shares outstanding | 835,682 | 118,000 | 864,160 | 42,681 | ||||||||||||||||
Ending shares outstanding | 861,164 | 835,682 | 874,359 | 864,160 | ||||||||||||||||
D-23
Table of Contents
REPORT OF INDEPENDENT REGISTERED PUBLIC ACCOUNTING FIRM
To the Board of Trustees and Shareholders of
Pacific Funds Series Trust:
Opinion on the Financial Statements and Financial Highlights
We have audited the accompanying statements of assets and liabilities of Pacific FundsSM Portfolio Optimization Conservative, Pacific FundsSM Portfolio Optimization Moderate-Conservative, Pacific FundsSM Portfolio Optimization Moderate, Pacific FundsSM Portfolio Optimization Growth, Pacific FundsSM Portfolio Optimization Aggressive-Growth, Pacific FundsSM Diversified Alternatives, Pacific FundsSM Short Duration Income, Pacific FundsSM Core Income, Pacific FundsSM Strategic Income, Pacific FundsSM Floating Rate Income, Pacific FundsSM Limited Duration High Income, Pacific FundsSM High Income, Pacific FundsSM Large-Cap, Pacific FundsSM Large-Cap Value, Pacific FundsSM Small/Mid-Cap, Pacific FundsSM Small-Cap, Pacific FundsSM Small-Cap Value, and Pacific FundsSM Small-Cap Growth (the “Funds”) (eighteen of the funds comprising Pacific Funds Series Trust), including the schedules of investments, as of March 31, 2018; the related statements of operations for the year then ended, the statements of changes in net assets for each of the two years in the period then ended, and the financial highlights for each of the periods indicated in the table below; and the related notes. In our opinion, the financial statements and financial highlights present fairly, in all material respects, the financial position of each of the Funds as of March 31, 2018, and the results of their operations for the year then ended, the changes in their net assets for each of the two years in the period then ended, and the financial highlights for the periods listed in the table below, in conformity with accounting principles generally accepted in the United States of America.
| Individual Fund Comprising the Pacific Funds Series Trust | Financial Highlights | |
| Pacific FundsSM Portfolio Optimization Conservative, Pacific FundsSM Portfolio Optimization Moderate-Conservative, Pacific FundsSM Portfolio Optimization Moderate, Pacific FundsSM Portfolio Optimization Growth, Pacific FundsSM Portfolio Optimization Aggressive-Growth, Pacific FundsSM Short Duration Income, Pacific FundsSM Core Income, Pacific FundsSM Strategic Income, Pacific FundsSM Floating Rate Income, and Pacific FundsSM High Income | For the years ended March 31, 2018, 2017, 2016, 2015, and 2014 | |
| Pacific FundsSM Diversified Alternatives | For the years ended March 31, 2018, 2017, 2016, 2015, and the period from December 31, 2013 (commencement of operations) through March 31, 2014 | |
| Pacific FundsSM Limited Duration High Income | For the years ended March 31, 2018, 2017, 2016, 2015, and the period from July 31, 2013 (commencement of operations) through March 31, 2014 | |
| Pacific FundsSM Large-Cap, Pacific FundsSM Large-Cap Value, Pacific FundsSM Small/Mid-Cap, Pacific FundsSM Small-Cap, Pacific FundsSM Small-Cap Value, and Pacific FundsSM Small-Cap Growth | For the years ended March 31, 2018, 2017, and the period from December 1, 2015 through March 31, 2016 |
The financial statements of Pacific FundsSM Large-Cap, Pacific FundsSM Large-Cap Value, Pacific FundsSM Small/Mid-Cap, Pacific FundsSM Small-Cap, Pacific FundsSM Small-Cap Value, and Pacific FundsSM Small-Cap Growth for the period from December 31, 2014 (commencement of operations) through November 30, 2015 were audited by other auditors whose report, dated January 28, 2016, expressed an unqualified opinion on those statements.
Basis for Opinion
These financial statements and financial highlights are the responsibility of the Funds’ management. Our responsibility is to express an opinion on the Funds’ financial statements and financial highlights based on our audits. We are a public accounting firm registered with the Public Company Accounting Oversight Board (United States) (PCAOB) and are required to be independent with respect to the Funds in accordance with the U.S. federal securities laws and the applicable rules and regulations of the Securities and Exchange Commission and the PCAOB.
We conducted our audits in accordance with the standards of the PCAOB. Those standards require that we plan and perform the audit to obtain reasonable assurance about whether the financial statements and financial highlights are free of material misstatement, whether due to error or fraud. The Funds are not required to have, nor were we engaged to perform, an audit of their internal control over financial reporting. As part of our audits we are required to obtain an understanding of internal control over financial reporting but not for the purpose of expressing an opinion on the effectiveness of the Funds’ internal control over financial reporting. Accordingly, we express no such opinion.
Our audits included performing procedures to assess the risks of material misstatement of the financial statements and financial highlights, whether due to error or fraud, and performing procedures that respond to those risks. Such procedures included examining, on a test basis, evidence regarding the amounts and disclosures in the financial statements and financial highlights. Our audits also included evaluating the accounting principles used and significant estimates made by management, as well as evaluating the overall presentation of the financial statements and financial highlights. Our procedures included confirmation of securities owned as of March 31, 2018, by correspondence with the custodian and brokers; when replies were not received from brokers, we performed other auditing procedures. We believe that our audits provide a reasonable basis for our opinion.

Philadelphia, PA
May 24, 2018
We have served as the auditor of one or more affiliated investment companies of Pacific Funds Series Trust since 1988.
E-1
Table of Contents
PACIFIC FUNDS
(Unaudited)
For corporate shareholders, the percentage of investment income (dividend income and short-term gains, if any) for each of the Funds that qualify for the dividends-received deductions for the year ended March 31, 2018 is as follows:
| Fund | Percentage | |||
Pacific Funds Portfolio Optimization Conservative | 9.37% | |||
Pacific Funds Portfolio Optimization Moderate-Conservative | 16.68% | |||
Pacific Funds Portfolio Optimization Moderate | 33.52% | |||
Pacific Funds Portfolio Optimization Growth | 44.44% | |||
Pacific Funds Portfolio Optimization Aggressive-Growth | 70.02% | |||
Pacific Funds Strategic Income | 1.31% | |||
Pacific Funds Large-Cap | 100.00% | |||
Pacific Funds Large-Cap Value | 74.06% | |||
Pacific Funds Small/Mid-Cap | 100.00% | |||
Pacific Funds Small-Cap | 84.36% | |||
Pacific Funds Small-Cap Value | 18.34% | |||
Pacific Funds Small-Cap Growth | 43.91% | |||
For the year ended March 31, 2018, certain dividends paid by the Funds may be subject to a maximum tax rate of 15%, as provided by the Jobs and Growth Tax Relief Reconciliation Act of 2003. Of the distributions made by the following Funds, the corresponding percentages represent the amount of each distribution which may qualify for the 15% dividend income tax rate.
| Fund | Percentage | |||
Pacific Funds Portfolio Optimization Conservative | 15.42% | |||
Pacific Funds Portfolio Optimization Moderate-Conservative | 30.39% | |||
Pacific Funds Portfolio Optimization Moderate | 56.16% | |||
Pacific Funds Portfolio Optimization Growth | 85.50% | |||
Pacific Funds Portfolio Optimization Aggressive-Growth | 100.00% | |||
Pacific Funds Diversified Alternatives | 8.58% | |||
Pacific Funds Strategic Income | 1.94% | |||
Pacific Funds High Income | 1.41% | |||
Pacific Funds Large-Cap | 100.00% | |||
Pacific Funds Large-Cap Value | 76.16% | |||
Pacific Funds Small/Mid-Cap | 100.00% | |||
Pacific Funds Small-Cap | 84.80% | |||
Pacific Funds Small-Cap Value | 20.84% | |||
Pacific Funds Small-Cap Growth | 50.78% | |||
Shareholders should not use the above tax information to prepare their tax returns. The information will be included with your Form 1099 DIV which will be sent to you separately in January 2019. The Funds intend to pass through the maximum allowable percentages to shareholders.
The following Funds designated the listed amounts as long-term capital gains distributions during the year ended March 31, 2018. Distributable long-term gains are based on net realized long-term gains determined on a tax basis and may differ from such amounts for financial reporting purposes.
| Fund | Amount | |||
Pacific Funds Portfolio Optimization Conservative | $15,081,462 | |||
Pacific Funds Portfolio Optimization Moderate-Conservative | 36,569,673 | |||
Pacific Funds Portfolio Optimization Moderate | 129,962,314 | |||
Pacific Funds Portfolio Optimization Growth | 102,122,507 | |||
Pacific Funds Portfolio Optimization Aggressive-Growth | 30,465,050 | |||
Pacific Funds Diversified Alternatives | 211,070 | |||
Pacific Funds Large-Cap | 386,322 | |||
Pacific Funds Large-Cap Value | 1,163,612 | |||
Pacific Funds Small/Mid-Cap | 719,654 | |||
Pacific Funds Small-Cap | 218,145 | |||
Pacific Funds Small-Cap Value | 2,104,673 | |||
Pacific Funds Small-Cap Growth | 2,023,215 | |||
F-1
Table of Contents
PACIFIC FUNDS
(Unaudited)
We believe it is important for you to understand the impact of fees and expenses regarding your investment. All mutual funds have operating expenses. As a shareholder of a mutual fund, you incur two types of costs: (1) transactions costs such as initial sales charges (loads) on purchase payments and/or contingent deferred sales charges on redemptions; and (2) ongoing costs, which include advisory fees, administration fees, distribution and/or service fees, and other fund expenses. The following example is intended to help you understand your ongoing costs (in dollars) of investing in each fund and to compare these costs with those of other mutual funds. The example is based on an investment of $1,000.00 made at the beginning of the period and held for the entire six-month period from October 1, 2017 to March 31, 2018.
ACTUAL EXPENSES
The first section of the table for each fund entitled “Actual Fund Return”, provides information about actual account values and actual expenses based on each fund’s actual performance and each fund’s actual expenses, after any applicable fee waivers and expense reimbursements (See Notes 6 and 7B in Notes to Financial Statements). The “Ending Account Value at 03/31/18” column shown is derived from the fund’s actual performance; the “Annualized Expense Ratio” column shows the fund’s actual annualized expense ratio; and the “Expenses Paid During the Period 10/01/17-03/31/18” column shows the dollar amount that would have been paid by you. All the information illustrated in the following table is based on the past six-month period from October 1, 2017 to March 31, 2018.
You may use the information in this section, together with the amount you invested, to estimate the expenses that you paid over the period. To do so, for each fund in your account, simply divide that fund’s value by $1,000.00 (for example, an $8,600.00 fund value divided by $1,000.00 = 8.6), then multiply the result by the number given for your fund(s) in the “Expenses Paid During the Period 10/01/17-03/31/18.”
HYPOTHETICAL EXAMPLE FOR COMPARISON PURPOSES
The second section of the table for each fund, entitled “Hypothetical”, provides information about hypothetical account values and hypothetical expenses based on a 5% per year hypothetical rate of return and actual fund’s expenses, after any applicable fee waivers and expense reimbursements (See Notes 6 and 7B in Notes to Financial Statements). It assumes that the fund had an annual 5% rate of return before expenses, but that the expense ratio is unchanged. The hypothetical account values and expenses may not be used to estimate the actual ending account values or expenses you paid for the period.
You may use the hypothetical example information to compare the ongoing costs of investing in the fund compared to other mutual funds. To do so, compare this 5% hypothetical example with the 5% hypothetical examples that appear in the shareholder reports of other mutual funds.
Please note that the expenses shown in the table are meant to highlight your ongoing costs only and do not reflect any transactional costs, such as initial sales charges (loads) or contingent deferred sales charges. Therefore, the second section of the table is useful in comparing ongoing costs only, and will not help you determine the relative total costs of owning different mutual funds. In addition, if these other costs were included, your costs would have been higher.
Beginning Account Value at 10/01/17 | Ending Account Value at 03/31/18 | Annualized Expense Ratio | Expenses Paid During the Period 10/01/17 - 03/31/18 (1) | |||||||||||||
| Pacific Funds Portfolio Optimization Conservative (2) | ||||||||||||||||
Actual Fund Return | ||||||||||||||||
Class A | $1,000.00 | $1,004.80 | 0.60% | $3.00 | ||||||||||||
Class B | 1,000.00 | 1,000.60 | 1.35% | 6.73 | ||||||||||||
Class C | 1,000.00 | 1,001.60 | 1.35% | 6.74 | ||||||||||||
Class R | 1,000.00 | 1,003.20 | 0.85% | 4.25 | ||||||||||||
Advisor Class | 1,000.00 | 1,005.80 | 0.35% | 1.75 | ||||||||||||
Hypothetical | ||||||||||||||||
Class A | $1,000.00 | $1,021.94 | 0.60% | $3.02 | ||||||||||||
Class B | 1,000.00 | 1,018.20 | 1.35% | 6.79 | ||||||||||||
Class C | 1,000.00 | 1,018.20 | 1.35% | 6.79 | ||||||||||||
Class R | 1,000.00 | 1,020.69 | 0.85% | 4.28 | ||||||||||||
Advisor Class | 1,000.00 | 1,023.19 | 0.35% | 1.77 | ||||||||||||
| Pacific Funds Portfolio Optimization Moderate-Conservative (2) | ||||||||||||||||
Actual Fund Return | ||||||||||||||||
Class A | $1,000.00 | $1,011.40 | 0.60% | $3.01 | ||||||||||||
Class B | 1,000.00 | 1,008.00 | 1.35% | 6.76 | ||||||||||||
Class C | 1,000.00 | 1,007.30 | 1.35% | 6.76 | ||||||||||||
Class R | 1,000.00 | 1,010.30 | 0.85% | 4.26 | ||||||||||||
Advisor Class | 1,000.00 | 1,012.50 | 0.35% | 1.76 | ||||||||||||
Hypothetical | ||||||||||||||||
Class A | $1,000.00 | $1,021.94 | 0.60% | $3.02 | ||||||||||||
Class B | 1,000.00 | 1,018.20 | 1.35% | 6.79 | ||||||||||||
Class C | 1,000.00 | 1,018.20 | 1.35% | 6.79 | ||||||||||||
Class R | 1,000.00 | 1,020.69 | 0.85% | 4.28 | ||||||||||||
Advisor Class | 1,000.00 | 1,023.19 | 0.35% | 1.77 | ||||||||||||
| Pacific Funds Portfolio Optimization Moderate (2) | ||||||||||||||||
Actual Fund Return | ||||||||||||||||
Class A | $1,000.00 | $1,020.10 | 0.60% | $3.02 | ||||||||||||
Class B | 1,000.00 | 1,016.70 | 1.35% | 6.79 | ||||||||||||
Class C | 1,000.00 | 1,016.00 | 1.35% | 6.79 | ||||||||||||
Class R | 1,000.00 | 1,019.20 | 0.85% | 4.28 | ||||||||||||
Advisor Class | 1,000.00 | 1,021.30 | 0.35% | 1.76 | ||||||||||||
Hypothetical | ||||||||||||||||
Class A | $1,000.00 | $1,021.94 | 0.60% | $3.02 | ||||||||||||
Class B | 1,000.00 | 1,018.20 | 1.35% | 6.79 | ||||||||||||
Class C | 1,000.00 | 1,018.20 | 1.35% | 6.79 | ||||||||||||
Class R | 1,000.00 | 1,020.69 | 0.85% | 4.28 | ||||||||||||
Advisor Class | 1,000.00 | 1,023.19 | 0.35% | 1.77 | ||||||||||||
| Pacific Funds Portfolio Optimization Growth (2) | ||||||||||||||||
Actual Fund Return | ||||||||||||||||
Class A | $1,000.00 | $1,025.90 | 0.60% | $3.03 | ||||||||||||
Class B | 1,000.00 | 1,022.40 | 1.35% | 6.81 | ||||||||||||
Class C | 1,000.00 | 1,021.80 | 1.35% | 6.80 | ||||||||||||
Class R | 1,000.00 | 1,024.80 | 0.85% | 4.29 | ||||||||||||
Advisor Class | 1,000.00 | 1,027.70 | 0.35% | 1.77 | ||||||||||||
Hypothetical | ||||||||||||||||
Class A | $1,000.00 | $1,021.94 | 0.60% | $3.02 | ||||||||||||
Class B | 1,000.00 | 1,018.20 | 1.35% | 6.79 | ||||||||||||
Class C | 1,000.00 | 1,018.20 | 1.35% | 6.79 | ||||||||||||
Class R | 1,000.00 | 1,020.69 | 0.85% | 4.28 | ||||||||||||
Advisor Class | 1,000.00 | 1,023.19 | 0.35% | 1.77 | ||||||||||||
See explanation of references on page F-4
F-2
Table of Contents
PACIFIC FUNDS
DISCLOSURE OF FUND EXPENSES (Continued)
(Unaudited)
Beginning Account Value at 10/01/17 | Ending Account Value at 03/31/18 | Annualized Expense Ratio | Expenses Paid During the Period 10/01/17 - 03/31/18 (1) | |||||||||||||
| Pacific Funds Portfolio Optimization Aggressive-Growth (2) | ||||||||||||||||
Actual Fund Return | ||||||||||||||||
Class A | $1,000.00 | $1,035.80 | 0.60% | $3.05 | ||||||||||||
Class B | 1,000.00 | 1,032.10 | 1.35% | 6.84 | ||||||||||||
Class C | 1,000.00 | 1,032.30 | 1.35% | 6.84 | ||||||||||||
Class R | 1,000.00 | 1,034.90 | 0.85% | 4.31 | ||||||||||||
Advisor Class | 1,000.00 | 1,037.00 | 0.35% | 1.78 | ||||||||||||
Hypothetical | ||||||||||||||||
Class A | $1,000.00 | $1,021.94 | 0.60% | $3.02 | ||||||||||||
Class B | 1,000.00 | 1,018.20 | 1.35% | 6.79 | ||||||||||||
Class C | 1,000.00 | 1,018.20 | 1.35% | 6.79 | ||||||||||||
Class R | 1,000.00 | 1,020.69 | 0.85% | 4.28 | ||||||||||||
Advisor Class | 1,000.00 | 1,023.19 | 0.35% | 1.77 | ||||||||||||
| Pacific Funds Diversified Alternatives (2) | ||||||||||||||||
Actual Fund Return | ||||||||||||||||
Class A | $1,000.00 | $1,019.80 | 0.85% | $4.28 | ||||||||||||
Class C | 1,000.00 | 1,015.60 | 1.60% | 8.04 | ||||||||||||
Advisor Class | 1,000.00 | 1,021.30 | 0.60% | 3.02 | ||||||||||||
Hypothetical | ||||||||||||||||
Class A | $1,000.00 | $1,020.69 | 0.85% | $4.28 | ||||||||||||
Class C | 1,000.00 | 1,016.95 | 1.60% | 8.05 | ||||||||||||
Advisor Class | 1,000.00 | 1,021.94 | 0.60% | 3.02 | ||||||||||||
| Pacific Funds Short Duration Income | ||||||||||||||||
Actual Fund Return | ||||||||||||||||
Class A | $1,000.00 | $998.20 | 0.75% | $3.74 | ||||||||||||
Class C | 1,000.00 | 994.50 | 1.50% | 7.46 | ||||||||||||
Class I | 1,000.00 | 999.40 | 0.50% | 2.49 | ||||||||||||
Advisor Class | 1,000.00 | 999.40 | 0.50% | 2.49 | ||||||||||||
Hypothetical | ||||||||||||||||
Class A | $1,000.00 | $1,021.19 | 0.75% | $3.78 | ||||||||||||
Class C | 1,000.00 | 1,017.45 | 1.50% | 7.54 | ||||||||||||
Class I | 1,000.00 | 1,022.44 | 0.50% | 2.52 | ||||||||||||
Advisor Class | 1,000.00 | 1,022.44 | 0.50% | 2.52 | ||||||||||||
| Pacific Funds Core Income | ||||||||||||||||
Actual Fund Return | ||||||||||||||||
Class A | $1,000.00 | $991.20 | 0.85% | $4.22 | ||||||||||||
Class C | 1,000.00 | 988.50 | 1.60% | 7.93 | ||||||||||||
Class I | 1,000.00 | 993.70 | 0.55% | 2.73 | ||||||||||||
Class P | 1,000.00 | 993.70 | 0.55% | 2.73 | ||||||||||||
Advisor Class | 1,000.00 | 993.70 | 0.55% | 2.73 | ||||||||||||
Hypothetical | ||||||||||||||||
Class A | $1,000.00 | $1,020.69 | 0.85% | $4.28 | ||||||||||||
Class C | 1,000.00 | 1,016.95 | 1.60% | 8.05 | ||||||||||||
Class I | 1,000.00 | 1,022.19 | 0.55% | 2.77 | ||||||||||||
Class P | 1,000.00 | 1,022.19 | 0.55% | 2.77 | ||||||||||||
Advisor Class | 1,000.00 | 1,022.19 | 0.55% | 2.77 | ||||||||||||
Beginning Account Value at 10/01/17 | Ending Account Value at 03/31/18 | Annualized Expense Ratio | Expenses Paid During the Period 10/01/17 - 03/31/18 (1) | |||||||||||||
| Pacific Funds Strategic Income | ||||||||||||||||
Actual Fund Return | ||||||||||||||||
Class A | $1,000.00 | $1,006.60 | 0.95% | $4.75 | ||||||||||||
Class C | 1,000.00 | 1,003.10 | 1.65% | 8.24 | ||||||||||||
Class I | 1,000.00 | 1,008.20 | 0.65% | 3.25 | ||||||||||||
Advisor Class | 1,000.00 | 1,007.80 | 0.70% | 3.50 | ||||||||||||
Hypothetical | ||||||||||||||||
Class A | $1,000.00 | $1,020.19 | 0.95% | $4.78 | ||||||||||||
Class C | 1,000.00 | 1,016.70 | 1.65% | 8.30 | ||||||||||||
Class I | 1,000.00 | 1,021.69 | 0.65% | 3.28 | ||||||||||||
Advisor Class | 1,000.00 | 1,021.44 | 0.70% | 3.53 | ||||||||||||
| Pacific Funds Floating Rate Income | ||||||||||||||||
Actual Fund Return | ||||||||||||||||
Class A | $1,000.00 | $1,022.70 | 1.01% | $5.09 | ||||||||||||
Class C | 1,000.00 | 1,019.20 | 1.71% | 8.61 | ||||||||||||
Class I | 1,000.00 | 1,025.20 | 0.71% | 3.58 | ||||||||||||
Class P | 1,000.00 | 1,025.20 | 0.71% | 3.58 | ||||||||||||
Advisor Class | 1,000.00 | 1,024.80 | 0.76% | 3.84 | ||||||||||||
Hypothetical | ||||||||||||||||
Class A | $1,000.00 | $1,019.90 | 1.01% | $5.09 | ||||||||||||
Class C | 1,000.00 | 1,016.40 | 1.71% | 8.60 | ||||||||||||
Class I | 1,000.00 | 1,021.39 | 0.71% | 3.58 | ||||||||||||
Class P | 1,000.00 | 1,021.39 | 0.71% | 3.58 | ||||||||||||
Advisor Class | 1,000.00 | 1,021.14 | 0.76% | 3.83 | ||||||||||||
| Pacific Funds Limited Duration High Income | ||||||||||||||||
Actual Fund Return | ||||||||||||||||
Class A | $1,000.00 | $1,005.80 | 0.95% | 4.75 | ||||||||||||
Class C | 1,000.00 | 1,002.30 | 1.65% | 8.24 | ||||||||||||
Class I | 1,000.00 | 1,007.00 | 0.70% | 3.50 | ||||||||||||
Advisor Class | 1,000.00 | 1,007.00 | 0.70% | 3.50 | ||||||||||||
Hypothetical | ||||||||||||||||
Class A | $1,000.00 | $1,020.19 | 0.95% | $4.78 | ||||||||||||
Class C | 1,000.00 | 1,016.70 | 1.65% | 8.30 | ||||||||||||
Class I | 1,000.00 | 1,021.44 | 0.70% | 3.53 | ||||||||||||
Advisor Class | 1,000.00 | 1,021.44 | 0.70% | 3.53 | ||||||||||||
| Pacific Funds High Income | ||||||||||||||||
Actual Fund Return | ||||||||||||||||
Class A | $1,000.00 | $1,002.60 | 0.95% | $4.74 | ||||||||||||
Class C | 1,000.00 | 999.10 | 1.65% | 8.22 | ||||||||||||
Class I | 1,000.00 | 1,003.70 | 0.70% | 3.50 | ||||||||||||
Class P | 1,000.00 | 1,004.70 | 0.70% | 3.50 | ||||||||||||
Advisor Class | 1,000.00 | 1,003.80 | 0.70% | 3.50 | ||||||||||||
Hypothetical | ||||||||||||||||
Class A | $1,000.00 | $1,020.19 | 0.95% | $4.78 | ||||||||||||
Class C | 1,000.00 | 1,016.70 | 1.65% | 8.30 | ||||||||||||
Class I | 1,000.00 | 1,021.44 | 0.70% | 3.53 | ||||||||||||
Class P | 1,000.00 | 1,021.44 | 0.70% | 3.53 | ||||||||||||
Advisor Class | 1,000.00 | 1,021.44 | 0.70% | 3.53 | ||||||||||||
| See explanation of references on page F-4 |
F-3
Table of Contents
PACIFIC FUNDS
DISCLOSURE OF FUND EXPENSES (Continued)
(Unaudited)
| Beginning Account Value at 10/01/17 | Ending Account Value at 03/31/18 | Annualized Expense Ratio | Expenses 10/01/17 - | |||||||||||||
| Pacific Funds Large-Cap | ||||||||||||||||
Actual Fund Return | ||||||||||||||||
Class A | $1,000.00 | $1,039.80 | 1.00% | $5.09 | ||||||||||||
Class C | 1,000.00 | 1,036.20 | 1.75% | 8.88 | ||||||||||||
Advisor Class | 1,000.00 | 1,041.10 | 0.75% | 3.82 | ||||||||||||
Investor Class | 1,000.00 | 1,040.00 | 1.00% | 5.09 | ||||||||||||
Class S | 1,000.00 | 1,041.60 | 0.65% | 3.31 | ||||||||||||
Hypothetical | ||||||||||||||||
Class A | $1,000.00 | $1,019.95 | 1.00% | $5.04 | ||||||||||||
Class C | 1,000.00 | 1,016.21 | 1.75% | 8.80 | ||||||||||||
Advisor Class | 1,000.00 | 1,021.19 | 0.75% | 3.78 | ||||||||||||
Investor Class | 1,000.00 | 1,019.95 | 1.00% | 5.04 | ||||||||||||
Class S | 1,000.00 | 1,021.69 | 0.65% | 3.28 | ||||||||||||
| Pacific Funds Large-Cap Value | ||||||||||||||||
Actual Fund Return | ||||||||||||||||
Class A | $1,000.00 | $1,042.80 | 1.10% | $5.60 | ||||||||||||
Class C | 1,000.00 | 1,039.80 | 1.85% | 9.41 | ||||||||||||
Advisor Class | 1,000.00 | 1,044.80 | 0.85% | 4.33 | ||||||||||||
Investor Class | 1,000.00 | 1,043.40 | 1.10% | 5.60 | ||||||||||||
Class S | 1,000.00 | 1,045.00 | 0.75% | 3.82 | ||||||||||||
Hypothetical | ||||||||||||||||
Class A | $1,000.00 | $1,019.45 | 1.10% | $5.54 | ||||||||||||
Class C | 1,000.00 | 1,015.71 | 1.85% | 9.30 | ||||||||||||
Advisor Class | 1,000.00 | 1,020.69 | 0.85% | 4.28 | ||||||||||||
Investor Class | 1,000.00 | 1,019.45 | 1.10% | 5.54 | ||||||||||||
Class S | 1,000.00 | 1,021.19 | 0.75% | 3.78 | ||||||||||||
| Pacific Funds Small/Mid-Cap | ||||||||||||||||
Actual Fund Return | ||||||||||||||||
Class A | $1,000.00 | $1,046.10 | 1.30% | $6.63 | ||||||||||||
Class C | 1,000.00 | 1,042.80 | 2.05% | 10.44 | ||||||||||||
Advisor Class | 1,000.00 | 1,047.60 | 1.05% | 5.36 | ||||||||||||
Investor Class | 1,000.00 | 1,046.30 | 1.35% | 6.89 | ||||||||||||
Class S | 1,000.00 | 1,048.40 | 1.00% | 5.11 | ||||||||||||
Hypothetical | ||||||||||||||||
Class A | $1,000.00 | $1,018.45 | 1.30% | $6.54 | ||||||||||||
Class C | 1,000.00 | 1,014.71 | 2.05% | 10.30 | ||||||||||||
Advisor Class | 1,000.00 | 1,019.70 | 1.05% | 5.29 | ||||||||||||
Investor Class | 1,000.00 | 1,018.20 | 1.35% | 6.79 | ||||||||||||
Class S | 1,000.00 | 1,019.95 | 1.00% | 5.04 | ||||||||||||
| Pacific Funds Small-Cap | ||||||||||||||||
Actual Fund Return | ||||||||||||||||
Class A | $1,000.00 | $1,041.80 | 1.30% | $6.62 | ||||||||||||
Class C | 1,000.00 | 1,037.90 | 2.05% | 10.42 | ||||||||||||
Advisor Class | 1,000.00 | 1,043.40 | 1.05% | 5.35 | ||||||||||||
Investor Class | 1,000.00 | 1,041.50 | 1.35% | 6.87 | ||||||||||||
Class S | 1,000.00 | 1,043.90 | 1.00% | 5.10 | ||||||||||||
Hypothetical | ||||||||||||||||
Class A | $1,000.00 | $1,018.45 | 1.30% | $6.54 | ||||||||||||
Class C | 1,000.00 | 1,014.71 | 2.05% | 10.30 | ||||||||||||
Advisor Class | 1,000.00 | 1,019.70 | 1.05% | 5.29 | ||||||||||||
Investor Class | 1,000.00 | 1,018.20 | 1.35% | 6.79 | ||||||||||||
Class S | 1,000.00 | 1,019.95 | 1.00% | 5.04 | ||||||||||||
| Beginning Account Value at 10/01/17 | Ending Account Value at 03/31/18 | Annualized Expense Ratio | Expenses 10/01/17 - | |||||||||||||
| Pacific Funds Small-Cap Value | ||||||||||||||||
Actual Fund Return | ||||||||||||||||
Class A | $1,000.00 | $996.90 | 1.30% | $6.47 | ||||||||||||
Class C | 1,000.00 | 994.30 | 2.05% | 10.19 | ||||||||||||
Advisor Class | 1,000.00 | 998.40 | 1.05% | 5.23 | ||||||||||||
Investor Class | 1,000.00 | 997.70 | 1.35% | 6.72 | ||||||||||||
Class S | 1,000.00 | 998.20 | 1.00% | 4.98 | ||||||||||||
Hypothetical | ||||||||||||||||
Class A | $1,000.00 | $1,018.45 | 1.30% | $6.54 | ||||||||||||
Class C | 1,000.00 | 1,014.71 | 2.05% | 10.30 | ||||||||||||
Advisor Class | 1,000.00 | 1,019.70 | 1.05% | 5.29 | ||||||||||||
Investor Class | 1,000.00 | 1,018.20 | 1.35% | 6.79 | ||||||||||||
Class S | 1,000.00 | 1,019.95 | 1.00% | 5.04 | ||||||||||||
| Pacific Funds Small-Cap Growth | ||||||||||||||||
Actual Fund Return | ||||||||||||||||
Class A | $1,000.00 | $1,072.80 | 1.30% | $6.72 | ||||||||||||
Class C | 1,000.00 | 1,069.40 | 2.05% | 10.58 | ||||||||||||
Class P | 1,000.00 | 1,075.00 | 1.05% | 5.43 | ||||||||||||
Advisor Class | 1,000.00 | 1,074.10 | 1.05% | 5.43 | ||||||||||||
Investor Class | 1,000.00 | 1,072.90 | 1.25% | 6.46 | ||||||||||||
Class S | 1,000.00 | 1,075.70 | 0.90% | 4.66 | ||||||||||||
Hypothetical | ||||||||||||||||
Class A | $1,000.00 | $1,018.45 | 1.30% | $6.54 | ||||||||||||
Class C | 1,000.00 | 1,014.71 | 2.05% | 10.30 | ||||||||||||
Class P | 1,000.00 | 1,019.70 | 1.05% | 5.29 | ||||||||||||
Advisor Class | 1,000.00 | 1,019.70 | 1.05% | 5.29 | ||||||||||||
Investor Class | 1,000.00 | 1,018.70 | 1.25% | 6.29 | ||||||||||||
Class S | 1,000.00 | 1,020.44 | 0.90% | 4.53 | ||||||||||||
| (1) | Expenses paid during the period are equal to the fund’s annualized expense ratio (shown in table above), multiplied by the average account value over the period, multiplied by the number of days in the most recent fiscal half-year or applicable period, then divided by 365 days. |
| (2) | The annualized expense ratios for the Portfolio Optimization Funds and Pacific Funds Diversified Alternatives do not include fees and expenses of their respective PF Underlying Funds and the Class P shares of Pacific Funds Core Income, Pacific Funds Floating Rate Income, Pacific Funds High Income, and Pacific Funds Small-Cap Growth in which the Portfolio Optimization Funds and Pacific Funds Diversified Alternatives invest (see Note 1 in Notes to Financial Statements). |
F-4
Table of Contents
PACIFIC FUNDS
TRUSTEES AND OFFICERS INFORMATION
(Unaudited)
The business and affairs of the Pacific Funds Series Trust (which may be referred to as “Pacific Funds” or the “Trust”) are managed under the direction of the Board of Trustees under the Declaration of Trust. Information pertaining to the trustees and officers of the Trust is set forth below. Trustees who are not deemed to be “interested persons” of the Trust, as defined in the 1940 Act, are referred to as “Independent Trustees.” Certain trustees and officers are deemed to be “interested persons” of the Trust and thus are referred to as “Interested Persons”, because of their positions with Pacific Life Insurance Company (“Pacific Life”) and Pacific Life Fund Advisors LLC, a wholly-owned subsidiary of Pacific Life. The Trust’s Statement of Additional Information includes additional information about the trustees. For information on availability of the Trust’s Statement of Additional Information, refer to the WHERE TO GO FOR MORE INFORMATION section of this report.
The address of each trustee and officer is c/o Pacific Funds Series Trust, 700 Newport Center Drive, Newport Beach, CA 92660.
Name and Age | Position(s) with the Fund and Length of Time Served* | Current Directorship(s) Held and Principal Occupation(s) (and certain additional occupation information) During Past 5 years | Number of Funds In Fund Complex Overseen** | |||||
INDEPENDENT TRUSTEES | ||||||||
Frederick L. Blackmon Year of birth 1952 | Trustee since 9/13/05 | Trustee (1/05 to present) of Pacific Select Fund; Former Director (2005 to 2016) of Trustmark Mutual Holding Company; Former Member of Board of Trustees (2010 to 2016) of Cranbrook Educational Community.
Formerly: Executive Vice President and Chief Financial Officer of Zurich Life; Executive Vice President and Chief Financial Officer of Alexander Hamilton Life Insurance Company (subsidiary of Household International); Member of Board of Governors of Cranbrook Schools; Member of Board of Regents of Eastern Michigan University. | | 97 | | |||
Gale K. Caruso Year of birth 1957 | Trustee since 1/01/06 | Trustee (1/06 to present) of Pacific Select Fund; Independent Trustee (2/15 to present) of Matthews Asia Funds.
Formerly: Member of the Board of Directors of LandAmerica Financial Group, Inc.; President and Chief Executive Officer of Zurich Life; Chairman, President and Chief Executive Officer of Scudder Canada Investor Services, Ltd.; Managing Director of Scudder Kemper Investments; Member of the Advisory Council to the Trust for Public Land in Maine; Member of the Board of Directors of Make-A-Wish of Maine. | | 97 | | |||
Lucie H. Moore Year of birth 1956 | Trustee since 6/12/01 | Trustee (10/98 to present ) of Pacific Select Funds; Member of the Board of Trustees (2014 to present) of Azusa Pacific University; Member of the Board of Trustees (2016 to present) of Pacifica Christian High School Orange County.
Formerly: Partner of Gibson, Dunn & Crutcher (Law); Member of the Board of Trustees of Sage Hill School; Member of the Board of Trustees of The Pegasus School; and Member of the Advisory Board of Court Appointed Special Advocates (CASA) of Orange County. | | 97 | | |||
Nooruddin (Rudy) S. Veerjee Year of birth 1958 | Trustee since 9/13/05 | Trustee (1/05 to present) of Pacific Select Fund.
Formerly: President of Transamerica Insurance and Investment Group; President of Transamerica Asset Management; Chairman and Chief Executive Officer of Transamerica Premier Funds (Mutual Fund); and Director of various Transamerica Life Companies. | | 97 | | |||
Paul A. Keller Year of birth 1954 | Trustee since 6/20/16 | Trustee (6/16 to present) of Pacific Select Fund; Consultant to the Trust and Pacific Select Fund (11/15 to 6/16); Independent Trustee (8/10 to present) of Fenimore Asset Management Trust (FAM Funds); Business Consultant (7/10 to present) (sole proprietor); Certified Public Accountant in New York (1982 to present); Adjunct Professor of Accounting (2011 to 2015), SUNY College at Old Westbury; Interim Chief Financial Officer (2014 to 2015) of The Leon Levy Foundation.
Formerly: Partner of PricewaterhouseCoopers LLP; Partner of McGladrey & Pullen LLP. | 97 | |||||
F-5
Table of Contents
PACIFIC FUNDS
TRUSTEES AND OFFICERS INFORMATION (Continued)
(Unaudited)
Name and Age | Position(s) with the Fund and Length of Time Served* | Current Directorship(s) Held and Principal Occupation(s) (and certain additional occupation information) During Past 5 years | Number of Funds In Fund Complex Overseen** | |||||
INTERESTED PERSONS | ||||||||
James T. Morris Year of birth 1960 | Chairman of the Board and Trustee since 1/11/07 | Director (4/07 to present), Chairman (5/08 to present), Chief Executive Officer (4/07 to present) and President (1/16 to present) of Pacific Mutual Holding Company and Pacific LifeCorp; Director (4/07 to present), Chairman (5/08 to present), Chief Executive Officer (4/07 to present) and President (1/16 to present) of Pacific Life; Chief Executive Officer (5/07 to 10/15) and President (5/07 to 3/12) of Pacific Life Fund Advisors LLC; Director (4/16 to present) of Edison International (a public utility holding company); and Chairman of the Board and Trustee (1/07 to present) of Pacific Select Fund. | 97 | |||||
Adrian S. Griggs Year of birth 1966 | Chief Executive Officer since 1/1/2018 | Chief Operating Officer (1/17 to present), Executive Vice President (4/12 to present) and Chief Financial Officer (4/12 to 2/17) of Pacific Mutual Holding Company and Pacific LifeCorp; Chief Operating Officer (1/17 to present), Executive Vice President (4/12 to present), Chief Financial Officer (4/12 to 2/17) and Director (1/16 to present) of Pacific Life; Chief Financial Officer (4/12 to 10/15) and Executive Vice President (4/12 to 10/15) of Pacific Life Fund Advisors LLC; Chief Executive Officer (1/15 to present) of Pacific Select Distributors, LLC; and Chief Executive Officer (1/18 to present) of Pacific Select Fund. | 97 | |||||
Robin S. Yonis Year of birth 1954 | Vice President and General Counsel since 6/13/01 and Assistant Secretary since 9/17/15 | Vice President, Fund Advisor General Counsel and Assistant Secretary (5/07 to present) of Pacific Life Fund Advisors LLC; and Vice President and General Counsel (4/05 to present) and Assistant Secretary (9/15 to present) of Pacific Select Fund. | 97 | |||||
Sharon E. Pacheco Year of birth 1957 | Vice President and Chief Compliance Officer since 6/04/04 | Vice President and Chief Compliance Officer (11/03 to present) of Pacific Mutual Holding Company and Pacific LifeCorp; Vice President (2/00 to present) and Chief Compliance Officer (1/03 to present) of Pacific Life; Vice President and Chief Compliance Officer (5/07 to present) of Pacific Life Fund Advisors LLC; and Vice President and Chief Compliance Officer (6/04 to present) of Pacific Select Fund. | 97 | |||||
Howard T. Hirakawa Year of birth 1962 | Senior Vice President since 12/10/2014 (Vice President 6/06 to 12/09/14) | Senior Vice President (4/14 to present), Vice President (5/07 to 3/14) of Pacific Life Fund Advisors LLC; and Senior Vice President (12/14 to present) and Vice President (6/06 to 12/14) of Pacific Select Fund. | 97 | |||||
Trevor T. Smith Year of birth 1975 | Vice President since 3/23/16 and Treasurer since 4/01/18 (Assistant Treasurer 3/23/16 to 3/31/18) | Assistant Vice President (1/17 to present) and Director of Variable Product Accounting (4/09 to 12/16) of Pacific Life; Assistant Vice President (3/16 to present), Treasurer (4/18 to present) and Assistant Treasurer (3/16 to 3/18) of Pacific Select Fund. | 97 | |||||
Laurene E. MacElwee Year of birth 1966 | Vice President since 4/04/05 and Assistant Secretary since 6/13/01 | Vice President (4/11 to present), Assistant Secretary (5/07 to present) of Pacific Life Fund Advisors LLC; and Vice President (12/11 to present), Assistant Secretary (4/05 to present) of Pacific Select Fund. | 97 | |||||
Carleton J. Muench Year of birth 1973 | Vice President since 11/30/06 | Vice President (4/14 to present), Assistant Vice President (5/07 to 3/14) of Pacific Life Fund Advisors LLC; and Vice President (12/14 to present) and Assistant Vice President (11/06 to 12/14) of Pacific Select Fund. | 97 | |||||
F-6
Table of Contents
PACIFIC FUNDS
TRUSTEES AND OFFICERS INFORMATION (Continued)
(Unaudited)
Name and Age | Position(s) with the Fund and Length of Time Served* | Current Directorship(s) Held and Principal Occupation(s) (and certain additional occupation information) During Past 5 years | Number of Funds In Fund Complex Overseen** | |||||
INTERESTED PERSONS (Continued) | ||||||||
Jane M. Guon Year of birth 1964 | Vice President and Secretary since 1/01/11 | Vice President and Secretary (1/11 to present) of Pacific Mutual Holding Company and Pacific LifeCorp; Vice President and Secretary (1/11 to present) and Director (1/11 to 3/17) of Pacific Life; Vice President and Secretary (1/11 to present) of Pacific Life Fund Advisors LLC, Vice President and Secretary (1/11 to present) of Pacific Select Distributors, LLC; and Vice President and Secretary (1/11 to present) of Pacific Select Fund. | 97 | |||||
Kevin W. Steiner Year of birth 1975 | Vice President since 1/01/13 | Assistant Vice President (4/12 to present) of Pacific Life Fund Advisors LLC; and Assistant Vice President (1/13 to present) of Pacific Select Fund. | 97 | |||||
Audrey L. Cheng Year of birth 1975 | Vice President since 12/11/13 | Assistant Vice President (9/11 to present) of Pacific Life; Assistant Vice President (12/13 to present) of Pacific Select Fund.
Formerly: Vice President and Attorney of Pacific Investment Management Company LLC (“PIMCO”). | 97 | |||||
| * | A trustee serves until he or she resigns, retires, or his or her successor is elected and qualified. |
| ** | As of March 31, 2018, the “Fund Complex” consisted of Pacific Select Fund (57 funds) and Pacific Funds (40 funds). |
F-7
Table of Contents
PACIFIC FUNDS
APPROVAL OF INVESTMENT ADVISORY
AND SUB-ADVISORY AGREEMENTS
(Unaudited)
I. Introduction and Background
The Board of Trustees (the “Trustees” or “Board”) of Pacific Funds Series Trust (“Pacific Funds” or the “Trust”) oversees the management of each of the separate funds of the Trust (each a “Fund” and collectively, the “Funds”) and, as required by Section 15(c) of the Investment Company Act of 1940, as amended (the “1940 Act”), initially approves and, after the initial period, determines annually whether to renew the investment advisory agreement (the “Advisory Agreement”) with Pacific Life Fund Advisors LLC (“PLFA”) and each sub-advisory agreement (the “Sub-Advisory Agreements,” together with the Advisory Agreement, the “Agreements”) with the various sub-advisers (the “Sub-Advisers”). PLFA serves as the investment adviser for all of the Funds and directly manages Pacific Funds Short Duration Income, Pacific Funds Core Income, Pacific Funds Strategic Income, Pacific Funds Floating Rate Income, Pacific Funds Limited Duration High Income and Pacific Funds High Income (the “PAM Managed Funds”) under the name Pacific Asset Management (“PAM”); Pacific Funds Portfolio Optimization Conservative, Pacific Funds Portfolio Optimization Moderate-Conservative, Pacific Funds Portfolio Optimization Moderate, Pacific Funds Portfolio Optimization Growth and Pacific Funds Portfolio Optimization Aggressive-Growth (the “Portfolio Optimization Funds”); and Pacific Funds Diversified Alternatives (together with the Portfolio Optimization Funds, the “Asset Allocation Funds” and together with the Portfolio Optimization Funds and PAM Managed Funds, the “Directly Managed Funds”). For all other Funds, PLFA has retained other firms to serve as Sub-Advisers under PLFA’s supervision. The Board, including all of the Trustees who are not “interested persons,” as that term is defined in the 1940 Act (“Independent Trustees”), last renewed the Agreements at an in-person meeting of the Trustees held on December 13, 2017.1
At this meeting and other meetings, the Board considered information (both written and oral) provided to assist it in its review of the Agreements and made assessments with respect to each Agreement. The Board requested, received and reviewed written materials from PLFA and each Sub-Adviser that were submitted in response to requests from the Independent Trustees and supporting materials relating to those questions and responses. In addition, the Board received in-person presentations about the Funds throughout the year, and the Independent Trustees were advised by independent legal counsel with respect to these and other relevant matters. The Board reviewed a variety of factors and considered a significant amount of information, including information received on an ongoing basis at Board and committee meetings, including reports on Fund performance, expenses, fee comparisons, investment advisory, compliance, and other services provided to the Funds by PLFA and the Sub-Advisers. The Board also reviewed financial and profitability information regarding PLFA and the Sub-Advisers and information regarding the organization and operations of each entity, such as their compliance monitoring, portfolio trading and brokerage practices and the personnel providing investment management and administrative services to each Fund. The Board considered the services provided to the Funds under the Agreements and the fees and expenses incurred by and charged to the Funds under the Agreements. The Board took into account that PLFA and its affiliates provide additional services to the Funds under other affiliated service agreements that are essential for the operation of the Funds and that although PLFA and its affiliates are separately compensated under those affiliated service agreements, these additional services are provided in connection with PLFA’s advisory relationship with the Funds. The Board reviewed data provided by PLFA that was gathered from various independent providers of investment company data to provide the Board with information concerning the Funds’ investment performance, management fees and expense information (both on an absolute basis and compared to peers). Additionally, the Independent Trustees retained an independent consultant (“Independent Consultant”), with substantial industry experience in providing fund boards of directors with analysis to assist them in their annual 15(c) review process, to assist the Trustees with certain of their analyses and to provide other relevant information. In connection with the analysis, the Independent Consultant utilized and provided the Independent Trustees with information obtained from independent service providers as well as from other sources.
The Trustees’ determinations were made on the basis of each Trustee’s business judgment after consideration of all the information presented. In reviewing the materials presented and in considering the information in the management presentations, the Trustees did not identify any single issue or particular information that, in isolation, would be a controlling factor in making a final decision regarding the proposed Agreements. Individual Trustees may have given different weights to certain factors and assigned various degrees of materiality to information received in connection with the approval process. The following summary describes the most important, but not all, of the factors considered by the Trustees in approving the Agreements, and in the case of the Independent Trustees, certain factors were considered in light of the legal advice furnished to them by independent legal counsel and information from the Independent Consultant that they had retained. This discussion is not intended to be all-inclusive.
II. Annual Consideration and Approval of Investment Advisory and Sub-Advisory Agreements
In evaluating the Advisory Agreement and each Sub-Advisory Agreement, the Board, including all the Independent Trustees, considered the following factors, among others:
A. Nature, Extent and Quality of Services
PLFA – The Trustees considered the depth and quality of PLFA’s investment management process, including its monitoring and oversight of the Sub-Advisers and PAM, and the benefits to shareholders of retaining PLFA and continuing the Advisory Agreement in light of the nature, extent, and quality of the services that have been provided by PLFA, including PAM. The Trustees considered the overall financial strength and stability of PLFA and its ability to provide a high level and quality of services to the Funds. They also considered PLFA’s responsiveness to questions or concerns raised by the Trustees throughout the year, including PLFA’s willingness to consider and implement investment and operational changes designed to improve investment results and the services provided to the Funds and their shareholders.
The Trustees noted that PLFA’s officers and employees regularly consult with, and report to, the Board regarding the investment management services provided to the Funds. The Trustees considered the experience, capability and integrity of PLFA’s senior management
| 1 | At the December 13th meeting, the Board did not consider the continuance of the Sub-Advisory Agreements relating to the PF Mid-Cap Value Fund and PF International Value Fund, as those agreements were not up for renewal at that time. |
F-8
Table of Contents
PACIFIC FUNDS
APPROVAL OF INVESTMENT ADVISORY
AND SUB-ADVISORY AGREEMENTS (Continued)
(Unaudited)
and other personnel and the low turnover rates of its key personnel. The Trustees noted that the investment, legal, compliance, risk management and accounting professionals of PLFA and its affiliates have access to and utilize a variety of resources and systems relating to investment management, compliance, trading, performance and risk analysis, security valuation and fund accounting. The Trustees took into account the scope of services provided by PLFA under the Advisory Agreement. The Trustees considered that although PLFA is separately compensated at “approximate cost” for time spent on Fund matters by certain legal, compliance and accounting professionals of PLFA and its affiliates for services outside of the scope of the Advisory Agreement, these services are being provided as a result of PLFA’s advisory relationship with the Funds. The Trustees further considered PLFA’s continuing need and ability to attract and retain qualified personnel and to maintain and enhance its resources and systems to provide appropriate investment management, compliance, risk management and monitoring services for the Funds. The Trustees also considered the additional resources that PLFA has continued to invest in to enhance its management and oversight of the Funds, including additional tools to further enhance the asset allocation and Sub-Adviser research processes. In this regard, the Trustees also considered the role of PLFA’s internal conflicts review committee in considering and evaluating potential conflicts of interest with regard to Sub-Adviser selection and monitoring.
Directly Managed Funds – The Trustees considered the services provided by PLFA in rendering investment management services for those Funds for which the day-to-day investment management is provided by PLFA, including PAM. The Trustees considered that PLFA, including PAM, is responsible for identifying investments for each Directly Managed Fund and determining when and what securities, cash and/or other investments to purchase, retain, or sell for each Directly Managed Fund. The Trustees also considered that PLFA, including PAM, is responsible for the valuation of portfolio securities, including, but not limited to, the review of custodian pricing files, research and analysis related to fair valued securities and due diligence oversight of pricing vendors. The Trustees additionally noted that PLFA is responsible for evaluating and voting proxies for portfolio holdings of the Directly Managed Funds. With respect to the Asset Allocation Funds, the Trustees also considered, among other things, PLFA’s experience, resources and expertise in analyzing the composition of the various Funds that serve as investment options for the Asset Allocation Funds (collectively, the “Underlying Funds”) and in developing an asset allocation that is appropriate for each Asset Allocation Fund’s investment objectives and risk profile. The Trustees considered, in this regard, the tools and resources used by PLFA in constructing its asset allocation models. The Trustees considered that PLFA had recently engaged an independent consultant to review PLFA’s asset allocation process, and that the independent consultant commented favorably on PLFA’s asset allocation capabilities. With respect to the PAM Managed Funds, the Trustees also considered the investment oversight and monitoring of PAM discussed below under “Sub-Advised Funds.”
The Trustees also considered that PLFA provides certain additional services to the Funds outside of the scope of the Advisory Agreement at approximate cost and that such services are essential for the administration and operation of the Funds, including administration of the Funds’ compliance program. In this regard, the Trustees considered PLFA’s policies, procedures and systems to ensure compliance with applicable laws and regulations with respect to the Directly Managed Funds, its attention to matters that may involve conflicts of interest between itself and a Fund, and that all rebalancing of PLFA’s asset allocation models are presented to an internal conflicts review committee that considers and evaluates potential conflicts of interest in the allocation among the Underlying Funds. The Trustees reviewed information provided throughout the year on PLFA’s compliance policies and procedures, its compliance history, and received reports from the Trust’s Chief Compliance Officer (“CCO”) on compliance by PLFA with applicable laws and regulations. The Trustees also reviewed information on any responses by PLFA to regulatory and compliance developments throughout the year. The Trustees further noted the compliance monitoring conducted by PLFA and PAM on an ongoing basis and noted the development of additional procedures and systems necessary to maintain compliance with applicable laws and regulations as well as the resources that PLFA dedicates to these programs. The Trustees considered that the CCO has in place a systematic process for periodically reviewing PLFA’s written compliance policies and procedures, including the assessment of PLFA’s compliance program as required under Rule 38a-1 of the 1940 Act and PLFA’s code of ethics. The Trustees also considered that PLFA continues to cooperate with the CCO in reviewing its compliance operations.
Sub-Advised Funds – The Trustees considered PLFA’s responsibilities in rendering services to the Sub-Advised Funds and the fact that PLFA monitors and evaluates the performance of the Sub-Advisers in comparison to each Fund’s investment objective as well as to appropriate benchmark indices and peer funds. The Trustees also considered that PLFA monitors each Sub-Advised Fund’s adherence to its investment objectives and policies. The Trustees noted that PLFA provides the Board with periodic and special reports related to each Sub-Advised Fund’s performance and PLFA’s investment monitoring and evaluation. The Trustees also considered PLFA’s process in continuously analyzing and, from time to time as necessary and appropriate, recommending for consideration by the Board, the termination of a Sub-Advisory Agreement with a Sub-Adviser and the replacement of a Sub-Adviser.
For both Directly Managed Funds and Sub-Advised Funds, the Trustees considered the high quality of the products, information, analysis and services provided by PLFA to the Funds, including return analysis, attribution analysis, risk analysis, preparation of periodic performance and other reports, assessment of liquidity, analysis of derivatives, and coordination and oversight of other service providers to the Trust. The Trustees also noted that PLFA regularly informs the Trustees about matters relevant to the Trust and its shareholders, including relationships with financial intermediaries.
The Trustees considered the analyses conducted by PLFA of the Underlying Funds and a Sub-Adviser’s management of an Underlying Fund in the broader context of asset allocation strategies intended to target certain return and risk characteristics. The Trustees noted that PLFA has historically recommended new Underlying Funds that PLFA believed would contribute to the Asset Allocation Funds’ targeted return and risk objectives. The Trustees also took into account PLFA’s continuing analysis of the Underlying Funds and each Sub-Adviser’s investment performance for the impact on broader asset allocation strategies for the Asset Allocation Funds.
F-9
Table of Contents
PACIFIC FUNDS
APPROVAL OF INVESTMENT ADVISORY
AND SUB-ADVISORY AGREEMENTS (Continued)
(Unaudited)
The Trustees considered the depth and quality of PLFA’s monitoring and oversight of the Sub-Advisers and PAM. The Board noted that PLFA monitors numerous investment, performance, and risk metrics for the Funds. The Trustees considered PLFA’s continued investment in, and development of, its research and analytical capabilities, including investments in personnel and enhanced analytical tools for assessing Fund performance and the performance of the Sub-Advisers, including analytical tools relating to return analysis, risk analysis, and Fund performance attribution and reporting on such matters to the Trustees. The Trustees noted that PLFA uses these tools to analyze a Fund’s performance and risk profile and identify Funds that are underperforming as well as those that are performing well, and to analyze the Funds’ performance records against various measures. The Board considered that PLFA also conducts various analyses to assess the sources of and reasons for performance. The Trustees noted that PLFA has developed, and continues to enhance, processes to oversee and monitor the performance of Sub-Advisers, including the use of analytical methods to review Fund performance and execution of investment strategies. The Board noted that PLFA provides the Board with analyses of this data over rolling periods to assist the Board in identifying trends in Fund performance and other areas, and periodically provides the Trustees with information on economic and market trends to provide a context for assessing recent performance. The Trustees also noted that PLFA has developed effective methods for monitoring the Sub-Advisers’ investment style consistency, for analyzing the use of derivatives by Sub-Advisers and for tracking Fund liquidity. With respect to the PAM Managed Funds, the Board considered that PLFA provides oversight, diligence and reporting with regard to its PAM unit that is similar to the process it employs with regard to the Sub-Advisers. In making their assessments, the Trustees considered that PLFA has historically exercised diligence in monitoring the performance of the Sub-Advisers and PAM, and has recommended and taken measures to attempt to remedy relative underperformance by a Fund when PLFA and the Trustees believed it to be appropriate. The Trustees also considered the significant work performed by PLFA in conducting searches for new Sub-Advisers to replace existing Sub-Advisers where appropriate or to manage new Funds in the Trust.
The Board also noted that PLFA conducts regular due diligence on Sub-Advisers involving onsite visits, in-person meetings and telephonic meetings to gather information that PLFA uses to gain an in-depth understanding of a Sub-Adviser’s investment process and to seek to identify issues that may be relevant to a Sub-Adviser’s services to a Fund or a Fund’s performance, including, but not limited to, a Sub-Adviser’s investment process, investment capabilities, resources and personnel, the financial strength of a Sub-Adviser, significant staffing changes that could affect a Fund, material changes in a Sub-Adviser’s assets under management, compliance and regulatory concerns, best execution review and portfolio security valuation support.
The Trustees considered the time and attention paid by PLFA to matters involving the valuation of Fund securities for both the PAM Managed Funds and Sub-Advised Funds. The Trustees considered that PLFA has established a Valuation Oversight Committee that is responsible for, among other things, researching and evaluating information concerning securities that are not actively or publicly traded, valuing securities subject to a trading halt or for which a market quotation is not readily available, the valuation of equity securities traded in foreign markets, oversight of and due diligence on pricing vendors and the development of alternate valuation methodologies.
The Trustees considered PLFA’s oversight, review and analysis of trade execution reports and trends in trade execution for both the PAM Managed Funds and Sub-Advised Funds. The Trustees noted that PLFA works with a third-party transaction cost analysis consultant that provides statistical analysis on portfolio trading, and that PLFA presents information about the Funds’ portfolio trading costs to the Board annually and, where warranted, engages in a dialogue with personnel of a Sub-Adviser on trading costs and the quality of execution. The Board also noted that PLFA conducts regular review and analysis of each Sub-Adviser’s use of soft dollars and presents information about the Sub-Advisers’ use of soft dollars to the Board annually.
The Trustees also considered PLFA’s implementation of transition management programs when handling significant changes in the Funds, such as cash movements between the Funds arising from reallocations by funds of funds and the transition of Fund assets from one Sub-Adviser to another, including steps taken by PLFA to reduce transaction costs associated with a Fund transition. The Trustees considered that PLFA coordinates the onboarding process for new Sub-Advisers and oversees the establishment of necessary accounts and documentation for the Sub-Advisers to begin managing Fund assets.
In addition to the services described above, the Trustees also considered the compliance monitoring that PLFA and its affiliates conduct on the Sub-Advisers and the commitment of PLFA and its affiliates to those programs and PLFA’s efforts to keep the Trustees informed about the compliance programs of Sub-Advisers. In this regard, the Trustees reviewed information and reports from the Trust’s CCO on compliance by the Sub-Advisers with applicable laws and regulations. The Trustees considered that the CCO has in place a systematic process for periodically reviewing each Sub-Adviser’s written compliance policies and procedures, including the assessment of each Sub-Adviser’s compliance program as required under Rule 38a-1 of the 1940 Act and each Sub-Adviser’s code of ethics. The Trustees considered that PLFA is compensated at approximate cost for the administration of the Funds’ compliance program. The Trustees also considered that each Sub-Adviser continues to cooperate with the CCO in reviewing its compliance operations.
Sub-Advisers. The Trustees considered the benefits to shareholders of retaining each Sub-Adviser and continuing the Sub-Advisory Agreements, particularly in light of the nature, extent, and quality of the services that have been provided by the Sub-Advisers. The Trustees considered the services provided by each Sub-Adviser in rendering investment management services to a Sub-Advised Fund. The Trustees considered that each Sub-Adviser is responsible for identifying investments for a Sub-Advised Fund and determining when and what securities, cash and/or other investments to purchase, retain, or sell for a Sub-Advised Fund. The Trustees also considered that each Sub-Adviser is responsible for evaluating and voting proxies for portfolio holdings of a Sub-Advised Fund. The Trustees considered the quality of the portfolio management services which have benefited and should continue to benefit the Sub-Advised Funds and their shareholders, the organizational depth and resources of the Sub-Advisers, including the background and experience of each Sub-Adviser’s management personnel, and the expertise of each Sub-Adviser’s portfolio management team, as well as the investment methodology used by the Sub-Adviser. The Trustees also considered that the Sub-Advisers provide PLFA with information that assists PLFA in performing its oversight role.
F-10
Table of Contents
PACIFIC FUNDS
APPROVAL OF INVESTMENT ADVISORY
AND SUB-ADVISORY AGREEMENTS (Continued)
(Unaudited)
The Board concluded that it was satisfied with the nature, extent and quality of the investment management services provided by PLFA and the Sub-Advisers.
B. Investment Results
The Trustees considered the investment results of each Fund in light of its objective, strategies and market conditions. The Trustees compared each Fund’s total returns with the total returns of appropriate peer funds, which were selected by an Independent Consultant using data from Morningstar (each a “Selected Performance Peer Group”), and the Trustees reviewed a description of the Independent Consultant’s methodology for selecting the peer funds in each Selected Performance Peer Group. In addition, with respect to Funds other than the Portfolio Optimization Funds, the Trustees compared each Fund’s total returns with the total returns of the Fund’s broad-based market index, sector index, composite index or an alternative index selected by the Independent Consultant, as applicable (each, a “primary benchmark”). With respect to the Portfolio Optimization Funds, the Trustees compared each Fund’s total returns with the total returns of a custom benchmark that is comprised of certain broad-based market indices based on the broad asset class target allocations for the Fund.
The information provided to the Trustees included each Fund’s performance record for the one-, three-, five- and ten-year or since inception periods ended September 30, 2017, as available, compared to the applicable benchmark and Selected Performance Peer Group. The Trustees placed greater emphasis on a Fund’s performance against peers as opposed to an unmanaged index.
The Trustees considered the performance of each Fund on a case-by-case basis and noted that some Funds had outperformed their Selected Performance Peer Group over certain periods and/or exceeded the return of their respective benchmark while others underperformed their Selected Performance Peer Group over certain periods and/or trailed the return of their respective benchmark. In considering each Fund’s investment results, the Board placed greater emphasis on each Fund’s long-term performance track record rather than shorter-term performance. The Board also took into account that each Fund’s track record is measured as of a specific date, and that track records can vary as of different measurement dates. Therefore, in reviewing a Fund that is currently underperforming, the Trustees also considered the broader perspective of the Fund’s performance over varying time periods, the market conditions experienced during the periods under review, as well as the outlook for the Fund going forward in light of expected future market conditions. In the case of the Underlying Funds, the Board also considered the views of PLFA about the role of a particular Fund within a broader asset allocation strategy for the Asset Allocation Funds. Where there had been a change in Sub-Adviser for a Fund, the Board took into account that the current Sub-Adviser was only responsible for certain portions of the performance record. The Trustees discussed with PLFA the fact that certain periods of underperformance may be transitory while other periods of underperformance may be reflective of broader issues that may warrant consideration of corrective action. The Trustees discussed these Funds with representatives of PLFA, including an assessment of the approach used by the Sub-Advisers, and the approach used by PLFA and PAM with respect to the Directly Managed Funds, as well as the oversight and monitoring by PLFA as the investment adviser, to gain an understanding of underperformance and to assess whether any actions would be appropriate. In addition, the Board considered any specific actions that PLFA, PAM or a Sub-Adviser have taken, or agreed to take, to enhance the investment performance of a Fund, and the results of those actions. In reviewing the performance of each Fund, the Board took into account, among other things, each Fund’s performance track record. A summary of each Fund’s track record is provided below.
Pacific Funds Large-Cap
The Fund: (1) outperformed its Selected Performance Peer Group median for the one-year period; (2) underperformed its primary benchmark for the one-year period; and (3) is ranked in the third quintile of its Selected Performance Peer Group for the one-year period. In evaluating the performance of the Fund, the Board also considered that the Fund had not been in operation for a sufficient time period to establish a meaningful track record.
PF Comstock Fund
The Fund: (1) outperformed its Selected Performance Peer Group median for the one-, five- and ten-year periods and underperformed for the three-year period; (2) outperformed its primary benchmark for the one-year period, underperformed for the three- and five-year periods and slightly underperformed for the ten-year period; and (3) is ranked in the first quintile of its Selected Performance Peer Group for the one-year period, the fourth quintile for the three-year period, the second quintile for the five-year period and the third quintile for the ten-year period. In evaluating the performance of the Fund, the Board also considered PLFA’s views as to the reasons for the Fund’s relative performance against peers and its benchmark over various time periods and PLFA’s future outlook for the Fund.
PF Equity Long/Short Fund
The Fund: (1) outperformed its Selected Performance Peer Group median for the one-year period; (2) outperformed its primary benchmark for the one-year period; and (3) is ranked in the first quintile of its Selected Performance Peer Group for the one-year period. In evaluating the performance of the Fund, the Board also considered that the Fund had not been in operation for a sufficient time period to establish a meaningful track record.
PF Growth Fund
The Fund: (1) outperformed its Selected Performance Peer Group median for the one-, three- and five-year periods and underperformed for the ten-year period; (2) underperformed its primary benchmark for the one-, three-, five- and ten-year periods; and (3) is ranked in the second quintile of its Selected Performance Peer Group for the one- and five-year periods, the first quintile for the three-year period and the fourth quintile for the ten-year period. In evaluating the performance of the Fund, the Board also considered that the current Sub-Adviser has managed the Fund since 2013.
F-11
Table of Contents
PACIFIC FUNDS
APPROVAL OF INVESTMENT ADVISORY
AND SUB-ADVISORY AGREEMENTS (Continued)
(Unaudited)
PF Large-Cap Growth Fund
The Fund: (1) outperformed its Selected Performance Peer Group median for the one-, three- and five-year periods and underperformed for the ten-year period; (2) underperformed its primary benchmark for the one-, three-, five- and ten-year periods; and (3) is ranked in the second quintile of its Selected Performance Peer Group for the one- and three-year periods, the third quintile for the five-year period and the fourth quintile for the ten-year period. In evaluating the performance of the Fund, the Board also considered that the current Sub-Adviser has managed the Fund since 2013.
PF Large-Cap Value Fund
The Fund: (1) outperformed its Selected Performance Peer Group median for the one- and ten-year periods, underperformed for the three-year period and slightly underperformed for the five-year period; (2) outperformed its primary benchmark for the one- and ten-year periods and underperformed for the three- and five-year periods; and (3) is ranked in the third quintile of its Selected Performance Peer Group for the one-, three-, five- and ten-year periods.
PF Main Street Core Fund
The Fund: (1) outperformed its Selected Performance Peer Group median for the one-, three-, five- and ten-year periods; (2) outperformed its primary benchmark for the one- and three-year periods and underperformed for the five- and ten-year periods; and (3) is ranked in the second quintile of its Selected Performance Peer Group for the one- and ten-year periods and the first quintile for the three- and five-year periods.
Pacific Funds Large-Cap Value
The Fund: (1) underperformed its Selected Performance Peer Group median for the one-year period; (2) underperformed its primary benchmark for the one-year period; and (3) is ranked in the fourth quintile of its Selected Performance Peer Group for the one-year period. In evaluating the performance of the Fund, the Board also considered that the Fund had not been in operation for a sufficient time period to establish a meaningful track record.
Pacific Funds Small/Mid-Cap
The Fund: (1) outperformed its Selected Performance Peer Group median for the one-year period; (2) outperformed its primary benchmark for the one-year period; and (3) is ranked in the third quintile of its Selected Performance Peer Group for the one-year period. In evaluating the performance of the Fund, the Board also considered that the Fund had not been in operation for a sufficient time period to establish a meaningful track record.
Pacific Funds Small-Cap
The Fund: (1) outperformed its Selected Performance Peer Group median for the one-year period; (2) underperformed its primary benchmark for the one-year period; and (3) is ranked in the second quintile of its Selected Performance Peer Group for the one-year period. In evaluating the performance of the Fund, the Board also considered that the Fund had not been in operation for a sufficient time period to establish a meaningful track record.
Pacific Funds Small-Cap Growth
The Fund: (1) underperformed its Selected Performance Peer Group median for the one-year period; (2) underperformed its primary benchmark for the one-year period; and (3) is ranked in the fifth quintile of its Selected Performance Peer Group for the one-year period. In evaluating the performance of the Fund, the Board also considered that the Fund had not been in operation for a sufficient time period to establish a meaningful track record.
Pacific Funds Small-Cap Value
The Fund: (1) underperformed its Selected Performance Peer Group median for the one-year period; (2) underperformed its primary benchmark for the one-year period; and (3) is ranked in the third quintile of its Selected Performance Peer Group for the one-year period. In evaluating the performance of the Fund, the Board also considered that the Fund had not been in operation for a sufficient time period to establish a meaningful track record.
PF Developing Growth Fund
The Fund: (1) underperformed its Selected Performance Peer Group median for the one-, three-, five- and ten-year periods; (2) underperformed its primary benchmark for the one-, three-, five- and ten-year periods; and (3) is ranked in the fourth quintile of its Selected Performance Peer Group for the one-year period and the fifth quintile for the three-, five- and ten-year periods. In evaluating the performance of the Fund, the Board also considered that the current Sub-Adviser has managed the Fund since 2014. The Board also considered PLFA’s views as to the reasons for the Fund’s relative performance against peers and its benchmark over various time periods and PLFA’s future outlook for the Fund.
PF Mid-Cap Equity Fund
The Fund: (1) outperformed its Selected Performance Peer Group median for the one-, three-, five- and ten-year periods; (2) outperformed its primary benchmark for the one-, three- and five-year periods and underperformed for the ten-year period; and (3) is ranked in the first quintile of its Selected Performance Peer Group for the one-, three- and five-year periods and the third quintile for the ten-year period. In evaluating the performance of the Fund, the Board also considered that the current Sub-Adviser has managed the Fund since 2013. The Board also considered that it had recently approved a new Sub-Advisory Agreement for the Fund effective November 2017 in connection with a change in control of the Sub-Adviser and, therefore, the Sub-Advisory Agreement was not up for renewal at this time.
F-12
Table of Contents
PACIFIC FUNDS
APPROVAL OF INVESTMENT ADVISORY
AND SUB-ADVISORY AGREEMENTS (Continued)
(Unaudited)
PF Mid-Cap Growth Fund
The Fund: (1) outperformed its Selected Performance Peer Group median for the one-year period and underperformed for the three-, five- and ten-year periods; (2) outperformed its primary benchmark for the one-year period and underperformed for the three-, five- and ten-year periods; and (3) is ranked in the second quintile of its Selected Performance Peer Group for the one-year period and the fourth quintile for the three-, five- and ten-year periods. In evaluating the performance of the Fund, the Board also considered that the current Sub-Adviser has managed the Fund since 2013. The Board also considered PLFA’s views as to the reasons for the Fund’s relative performance against peers and its benchmark over various time periods and PLFA’s future outlook for the Fund.
PF Mid-Cap Value Fund
The Fund: (1) underperformed its Selected Performance Peer Group median for the one-year period; (2) outperformed its primary benchmark for the one-year period; and (3) is ranked in the third quintile of its Selected Performance Peer Group for the one-year period. In evaluating the performance of the Fund, the Board also considered that the Fund had not been in operation for a sufficient time period to establish a meaningful track record.
PF Small-Cap Value Fund
The Fund: (1) outperformed its Selected Performance Peer Group median for the one-, three-, five- and ten-year periods; (2) underperformed its primary benchmark for the one-year period and outperformed for the three-, five- and ten-year periods; and (3) is ranked in the third quintile of its Selected Performance Peer Group for the one-year period and the first quintile for the three-, five- and ten-year periods. In evaluating the performance of the Fund, the Board also considered that the current Sub-Adviser has managed the Fund since 2014.
PF Emerging Markets Debt Fund
The Fund: (1) outperformed its Selected Performance Peer Group median for the one- and three-year periods and performed in line for the five-year period; (2) outperformed its primary benchmark for the one-, three- and five-year periods; and (3) is ranked in the first quintile of its Selected Performance Peer Group for the one- and three-year periods and the third quintile for the five-year period.
PF Emerging Markets Fund
The Fund: (1) outperformed its Selected Performance Peer Group median for the one-, five- and ten-year periods and underperformed for the three-year period; (2) underperformed its primary benchmark for the one- and three-year periods and outperformed for the five- and ten-year periods; and (3) is ranked in the third quintile of its Selected Performance Peer Group for the one-year period, the fourth quintile for the three-year period, the second quintile for the five-year period and the first quintile for the ten-year period.
PF International Large-Cap Fund
The Fund: (1) outperformed its Selected Performance Peer Group median for the one- and ten-year periods and underperformed for the three- and five-year periods; (2) outperformed its primary benchmark for the one-, three- and ten-year periods and underperformed for the five-year period; and (3) is ranked in the second quintile of its Selected Performance Peer Group for the one-year period, the fourth quintile for the three-year period, the third quintile for the five-year period and the first quintile for the ten-year period. In evaluating the performance of the Fund, the Board also considered PLFA’s views as to the reasons for the Fund’s relative performance against peers and its benchmark over various time periods and PLFA’s future outlook for the Fund. The Board also considered that more recent performance relative to peers has improved.
PF International Small-Cap Fund
The Fund: (1) performed in line with its Selected Performance Peer Group median for the one-year period; (2) outperformed its primary benchmark for the one-year period; and (3) is ranked in the third quintile of its Selected Performance Peer Group for the one-year period. In evaluating the performance of the Fund, the Board also considered that the Fund had not been in operation for a sufficient time period to establish a meaningful track record.
PF International Value Fund
The Fund: (1) outperformed its Selected Performance Peer Group median for the one- and three-year periods and underperformed for the five- and ten-year periods; (2) outperformed its primary benchmark for the one-year period and underperformed for the three-, five- and ten-year periods; and (3) is ranked in the first quintile of its Selected Performance Peer Group for the one-year period, the third quintile for the three-year period, the fourth quintile for the five-year period and the fifth quintile for the ten-year period. In evaluating the performance of the Fund, the Board also considered that the prior Sub-Adviser had recently been replaced and the current Sub-Adviser has only managed the Fund since May 2017 and, therefore, the Sub-Advisory Agreement was not up for renewal at this time.
Pacific Funds Diversified Alternatives
The Fund: (1) outperformed its Selected Performance Peer Group median for the one- and three-year periods; (2) outperformed its primary benchmark for the one-year period and underperformed for the three-year period; and (3) is ranked in the first quintile of its Selected Performance Peer Group for the one- and three-year periods.
PF Currency Strategies Fund
The Fund: (1) underperformed its Selected Performance Peer Group median for the one-year period and outperformed for the three-year period; (2) underperformed its primary benchmark for the one- and three-year periods; and (3) is ranked in the fourth quintile of its Selected Performance Peer Group for the one-year period and the second quintile for the three-year period. In evaluating the performance of the Fund,
F-13
Table of Contents
PACIFIC FUNDS
APPROVAL OF INVESTMENT ADVISORY
AND SUB-ADVISORY AGREEMENTS (Continued)
(Unaudited)
the Board also considered that one of the Fund’s co-Sub-Advisers was the sole Sub-Adviser from the Fund’s inception until 2014, and that the other co-Sub-Adviser has managed the Fund since 2014. The Board also considered PLFA’s views as to the reasons for the Fund’s relative performance against peers and its benchmark over various time periods and PLFA’s future outlook for the Fund.
PF Global Absolute Return Fund
The Fund: (1) underperformed its Selected Performance Peer Group median for the one-year period and outperformed for the three-year period; (2) underperformed its primary benchmark for the one- and three-year periods; and (3) is ranked in the fourth quintile of its Selected Performance Peer Group for the one-year period and the second quintile for the three-year period. In evaluating the performance of the Fund, the Board also considered that the Selected Performance Peer Group was of limited usefulness due to the diversity of investment approaches of funds in the peer group. The Board also considered PLFA’s views as to the reasons for the Fund’s relative performance against peers and its benchmark over various time periods and PLFA’s future outlook for the Fund.
PF Real Estate Fund
The Fund: (1) underperformed its Selected Performance Peer Group median for the one-, three-, five- and ten-year periods; (2) underperformed its primary benchmark for the one-, three-, five- and ten-year periods; and (3) is ranked in the fifth quintile of its Selected Performance Peer Group for the one- and three-year periods and the fourth quintile for the five- and ten-year periods. In evaluating the performance of the Fund, the Board also considered PLFA’s views as to the reasons for the Fund’s relative performance against peers and its benchmark over various time periods and PLFA’s future outlook for the Fund. The Board also considered that the Fund has been on the “watch list” for a period of time, and that PLFA will be considering what further action, if any, is appropriate.
Pacific Funds Core Income
The Fund: (1) underperformed its Selected Performance Peer Group median for the one-, three- and five-year periods; (2) outperformed its primary benchmark for the one- and five-year periods and slightly outperformed for the three-year period; and (3) is ranked in the fourth quintile of its Selected Performance Peer Group for the one- and five-year periods and the fifth quintile for the three-year period. In evaluating the performance of the Fund, the Board also considered PLFA’s views as to the reasons for the Fund’s relative performance against peers and its benchmark over various time periods and PLFA’s future outlook for the Fund.
Pacific Funds Floating Rate Income
The Fund: (1) outperformed its Selected Performance Peer Group median for the one-, three- and five-year periods; (2) outperformed its primary benchmark for the one-year period and underperformed for the three- and five-year periods; and (3) is ranked in the second quintile of its Selected Performance Peer Group for the one-, three- and five-year periods.
Pacific Funds High Income
The Fund: (1) outperformed its Selected Performance Peer Group median for the one-year period, underperformed for the three-year period and slightly underperformed for the five-year period; (2) outperformed its primary benchmark for the one-year period and underperformed for the three- and five-year periods; and (3) is ranked in the first quintile of its Selected Performance Peer Group for the one-year period and the third quintile for the three- and five-year periods.
Pacific Funds Limited Duration High Income
The Fund: (1) underperformed its Selected Performance Peer Group median for the one- and three-year periods; (2) underperformed its primary benchmark for the one- and three-year periods; and (3) is ranked in the fifth quintile of its Selected Performance Peer Group for the one- and three-year periods. In evaluating the performance of the Fund, the Board also considered PLFA’s views as to the reasons for the Fund’s relative performance against peers and its benchmark over various time periods and PLFA’s future outlook for the Fund. The Board further considered that PLFA had advised it would consider what further action, if any, would be appropriate.
Pacific Funds Short Duration Income
The Fund: (1) outperformed its Selected Performance Peer Group median for the one-, three- and five-year periods; (2) outperformed its primary benchmark for the one-, three- and five-year periods; and (3) is ranked in the first quintile of its Selected Performance Peer Group for the one- and five-year periods and the second quintile for the three-year period.
Pacific Funds Strategic Income
The Fund: (1) outperformed its Selected Performance Peer Group median for the one-, three- and five-year periods; (2) outperformed its primary benchmark for the one-, three- and five-year periods; and (3) is ranked in the third quintile of its Selected Performance Peer Group for the one- and three-year periods and the first quintile for the five-year period.
PF Inflation Managed Fund
The Fund: (1) outperformed its Selected Performance Peer Group median for the one- and ten-year periods and underperformed for the three- and five-year periods; (2) outperformed its primary benchmark for the one-year period, underperformed for the three- and five-year periods and slightly underperformed for the ten-year period; and (3) is ranked in the third quintile of its Selected Performance Peer Group for the one- and five-year periods, the fourth quintile for the three-year period and the first quintile for the ten-year period. In evaluating the performance of the Fund, the Board also considered that the current Sub-Adviser co-managed the Fund with another firm from January 2015 to October 2016 and since October 2016 has been the sole Sub-Adviser.
F-14
Table of Contents
PACIFIC FUNDS
APPROVAL OF INVESTMENT ADVISORY
AND SUB-ADVISORY AGREEMENTS (Continued)
(Unaudited)
PF Managed Bond Fund
The Fund: (1) outperformed its Selected Performance Peer Group median for the one-, three-, five- and ten-year periods; (2) outperformed its primary benchmark for the one-, three-, five- and ten-year periods; and (3) is ranked in the first quintile of its Selected Performance Peer Group for the one-, three-, five- and ten-year periods. In evaluating the performance of the Fund, the Board also considered that one of the Fund’s co-Sub-Advisers was the sole Sub-Adviser from the Fund’s inception until 2014, and that the other co-Sub-Adviser has co-managed the Fund since 2014.
PF Short Duration Bond Fund
The Fund: (1) underperformed its Selected Performance Peer Group median for the one-, three-, five- and ten-year periods; (2) outperformed its primary benchmark for the one-year period, slightly underperformed for the three- and five-year periods and underperformed for the ten-year period; and (3) is ranked in the third quintile of its Selected Performance Peer Group for the one-year period and the fourth quintile for the three-, five- and ten-year periods. In evaluating the performance of the Fund, the Board also considered that the current Sub-Adviser has managed the Fund since 2011. The Board also considered that PLFA had advised that recent underperformance is attributable to the Sub-Adviser managing the Fund more conservatively versus peers, which results in lower credit exposure. The Board further considered that PLFA advised that performance has been in line with expectations given the Fund’s investment style.
Pacific Funds Portfolio Optimization Conservative
The Fund: (1) outperformed its Selected Performance Peer Group median for the one- and ten-year periods and performed in line for the three- and five-year periods; (2) outperformed its custom benchmark for the one-year period and underperformed for the three-, five- and ten-year periods; and (3) is ranked in the first quintile of its Selected Performance Peer Group for the one-year period, the third quintile for the three- and five-year periods and the second quintile for the ten-year period.
Pacific Funds Portfolio Optimization Moderate-Conservative
The Fund: (1) outperformed its Selected Performance Peer Group median for the one- and three-year periods, slightly underperformed for the five-year period and underperformed for the ten-year period; (2) outperformed its custom benchmark for the one-year period and underperformed for the three-, five- and ten-year periods; and (3) is ranked in the second quintile of its Selected Performance Peer Group for the one- and three-year periods and the fourth quintile for the five- and ten-year periods.
Pacific Funds Portfolio Optimization Moderate
The Fund: (1) outperformed its Selected Performance Peer Group median for the one-year period, slightly outperformed for the three-year period and underperformed for the five- and ten-year periods; (2) outperformed its custom benchmark for the one-year period and underperformed for the three-, five- and ten-year periods; and (3) is ranked in the second quintile of its Selected Performance Peer Group for the one-year period, the third quintile for the three-year period and the fourth quintile for the five- and ten-year periods.
Pacific Funds Portfolio Optimization Growth
The Fund: (1) outperformed its Selected Performance Peer Group median for the one- and three-year periods, slightly outperformed for the five-year period and underperformed for the ten-year period; (2) outperformed its custom benchmark for the one-year period and underperformed for the three-, five- and ten-year periods; and (3) is ranked in the first quintile of its Selected Performance Peer Group for the one-year period, the second quintile for the three-year period, the third quintile for the five-year period and the fifth quintile for the ten-year period.
Pacific Funds Portfolio Optimization Aggressive-Growth
The Fund: (1) outperformed its Selected Performance Peer Group for the one-year period and underperformed for the three-, five- and ten-year periods; (2) underperformed its custom benchmark for the one-, three-, five- and ten-year periods; and (3) is ranked in the first quintile of its Selected Performance Peer Group for the one-year period, the fourth quintile for the three-year period and the fifth quintile for the five- and ten-year periods. In evaluating the performance of the Fund, the Board also considered PLFA’s views as to the reasons for the Fund’s relative performance against peers and its benchmark over various time periods and PLFA’s future outlook for the Fund. The Board also considered that PLFA is encouraged by recent improved performance relative to peers.
The Trustees reviewed the monitoring of each Sub-Advisers’ investment results by PLFA, including PLFA’s historical practice of recommending to the Trustees the use of a new sub-adviser if performance lagged and the prospects for improvement within a reasonable timeframe were not promising, and reviewed the monitoring of the PAM unit’s investment results by PLFA. Generally, the Trustees noted that there continues to be a record of well-managed Funds that work well in the Asset Allocation Funds and that the Asset Allocation Funds provide a range of professionally managed asset allocation investment options. The Trustees considered the steps PLFA has taken to seek to improve performance of the Asset Allocation Funds, including ongoing assessment of asset allocation determinations, diversifying asset class investment options by adding additional Underlying Funds, and adding or changing Sub-Advisers to the Underlying Funds. The Trustees also noted that the Funds continue to deliver the investment style as disclosed to shareholders. The Trustees also noted the use by investors of the Asset Allocation Funds and the benefits the Asset Allocation Funds provide for shareholders generally.
The Board concluded that PLFA continues to have a long record of effectively managing a multi-manager fund group and asset allocation funds designed to give shareholders a reasonable array of choices through which to implement their investment programs. The Board further concluded that PLFA was implementing each Fund’s investment objective either directly or through the selection of Sub-Advisers and that PLFA’s record in managing each Fund indicates that its continued management, as well as the continuation of the respective Sub-Advisory Agreements, will benefit each Fund and its shareholders.
F-15
Table of Contents
PACIFIC FUNDS
APPROVAL OF INVESTMENT ADVISORY
AND SUB-ADVISORY AGREEMENTS (Continued)
(Unaudited)
C. Advisory Fees and Total Expense Ratios
The Trustees requested, received and reviewed information from PLFA relating to the advisory fees paid by the Funds and the sub-advisory fees paid by PLFA, including the portion of the advisory fees paid to each Sub-Adviser as compared to the portion retained by PLFA. The Trustees considered the nature and quality of the services provided by PLFA and also considered the nature and quality of services provided by each Sub-Adviser. The Independent Trustees also requested and reviewed information from the Independent Consultant along with the Independent Consultant’s analysis of advisory fees, sub-advisory fees and certain Fund expenses, excluding any applicable service or distribution fees, which were selected by the Independent Consultant for purposes of the peer group expense comparisons (“Operating Expenses”). The Trustees reviewed the advisory fees, sub-advisory fees and Operating Expenses of each Fund and compared such amounts with the fees and expense levels of applicable peer funds identified by the Independent Consultant (each a “Selected Expense Peer Group”). The Trustees reviewed a description of the Independent Consultant’s methodology for constructing the Selected Expense Peer Groups, noting that each Selected Expense Peer Group includes a group of similarly-sized funds with comparable strategies from a universe of funds that (i) included both sub-advised and directly managed funds; (ii) excluded funds that are managed with non-standard business models and expense structures; and (iii) excluded index funds. With respect to the Portfolio Optimization Funds, the Trustees also compared the net expense ratio with the average net expense ratio of funds in the Morningstar Category determined to be similar to the relevant Portfolio Optimization Fund (“Comparable Peer Fund Average”).
A summary of some of the comparative fee and expense information considered by the Trustees for each Fund is provided below.
Pacific Funds Large-Cap
The Trustees considered that (a) the advisory fee for the Fund is less than the median advisory fee rate of the funds in its Selected Expense Peer Group and ranked in the second quintile of its Selected Expense Peer Group; and (b) the Operating Expenses for the Fund are less than the median Operating Expenses of the funds in its Selected Expense Peer Group and ranked in the first quintile of its Selected Expense Peer Group. The Trustees considered that PLFA currently has contractually agreed to waive 0.10% of its advisory fee.
PF Comstock Fund
The Trustees considered that (a) the advisory fee for the Fund is slightly greater than the median advisory fee rate of the funds in its Selected Expense Peer Group and ranked in the third quintile of its Selected Expense Peer Group; and (b) the Operating Expenses for the Fund are less than the median Operating Expenses of the funds in its Selected Expense Peer Group and ranked in the second quintile of its Selected Expense Peer Group. The Trustees considered that PLFA currently has contractually agreed to waive 0.015% of its advisory fee.
PF Equity Long/Short Fund
The Trustees considered that (a) the advisory fee for the Fund is less than the median advisory fee rate of the funds in its Selected Expense Peer Group and ranked in the second quintile of its Selected Expense Peer Group; and (b) the Operating Expenses for the Fund are less than the median Operating Expenses of the funds in its Selected Expense Peer Group and ranked in the first quintile of its Selected Expense Peer Group. The Trustees considered that PLFA currently has contractually agreed to waive 0.15% of its advisory fee.
PF Growth Fund
The Trustees considered that (a) the advisory fee for the Fund is less than the median advisory fee rate of the funds in its Selected Expense Peer Group and ranked in the first quintile of its Selected Expense Peer Group; and (b) the Operating Expenses for the Fund are less than the median Operating Expenses of the funds in its Selected Expense Peer Group and ranked in the first quintile of its Selected Expense Peer Group.
PF Large-Cap Growth Fund
The Trustees considered that (a) the advisory fee for the Fund is slightly greater than the median advisory fee rate of the funds in its Selected Expense Peer Group and ranked in the fourth quintile of its Selected Expense Peer Group; and (b) the Operating Expenses for the Fund are less than the median Operating Expenses of the funds in its Selected Expense Peer Group and ranked in the second quintile of its Selected Expense Peer Group. The Trustees considered that PLFA currently has contractually agreed to waive 0.045% of its advisory fee.
PF Large-Cap Value Fund
The Trustees considered that (a) the advisory fee for the Fund is slightly less than the median advisory fee rate of the funds in its Selected Expense Peer Group and ranked in the second quintile of its Selected Expense Peer Group; and (b) the Operating Expenses for the Fund are less than the median Operating Expenses of the funds in its Selected Expense Peer Group and ranked in the second quintile of its Selected Expense Peer Group.
PF Main Street Core Fund
The Trustees considered that (a) the advisory fee for the Fund is less than the median advisory fee rate of the funds in its Selected Expense Peer Group and ranked in the first quintile of its Selected Expense Peer Group; and (b) the Operating Expenses for the Fund are less than the median Operating Expenses of the funds in its Selected Expense Peer Group and ranked in the first quintile of its Selected Expense Peer Group.
Pacific Funds Large-Cap Value
The Trustees considered that (a) the advisory fee for the Fund is slightly less than the median advisory fee rate of the funds in its Selected Expense Peer Group and ranked in the second quintile of its Selected Expense Peer Group; and (b) the Operating Expenses for the Fund are
F-16
Table of Contents
PACIFIC FUNDS
APPROVAL OF INVESTMENT ADVISORY
AND SUB-ADVISORY AGREEMENTS (Continued)
(Unaudited)
less than the median Operating Expenses of the funds in its Selected Expense Peer Group and ranked in the first quintile of its Selected Expense Peer Group.
Pacific Funds Small/Mid-Cap
The Trustees considered that (a) the advisory fee for the Fund is slightly greater than the median advisory fee rate of the funds in its Selected Expense Peer Group and ranked in the third quintile of its Selected Expense Peer Group; and (b) the Operating Expenses for the Fund are slightly less than the median Operating Expenses of the funds in its Selected Expense Peer Group and ranked in the second quintile of its Selected Expense Peer Group.
Pacific Funds Small-Cap
The Trustees considered that (a) the advisory fee for the Fund is slightly greater than the median advisory fee rate of the funds in its Selected Expense Peer Group and ranked in the third quintile of its Selected Expense Peer Group; and (b) the Operating Expenses for the Fund are slightly less than the median Operating Expenses of the funds in its Selected Expense Peer Group and ranked in the second quintile of its Selected Expense Peer Group.
Pacific Funds Small-Cap Growth
The Trustees considered that (a) the advisory fee for the Fund is slightly greater than the median advisory fee rate of the funds in its Selected Expense Peer Group and ranked in the third quintile of its Selected Expense Peer Group; and (b) the Operating Expenses for the Fund are slightly less than the median Operating Expenses of the funds in its Selected Expense Peer Group and ranked in the second quintile of its Selected Expense Peer Group.
Pacific Funds Small-Cap Value
The Trustees considered that (a) the advisory fee for the Fund is slightly greater than the median advisory fee rate of the funds in its Selected Expense Peer Group and ranked in the third quintile of its Selected Expense Peer Group; and (b) the Operating Expenses for the Fund are slightly less than the median Operating Expenses of the funds in its Selected Expense Peer Group and ranked in the second quintile of its Selected Expense Peer Group.
PF Developing Growth Fund
The Trustees considered that (a) the advisory fee for the Fund is less than the median advisory fee rate of the funds in its Selected Expense Peer Group and ranked in the first quintile of its Selected Expense Peer Group; and (b) the Operating Expenses for the Fund are less than the median Operating Expenses of the funds in its Selected Expense Peer Group and ranked in the first quintile of its Selected Expense Peer Group.
PF Mid-Cap Equity Fund
The Trustees considered that (a) the advisory fee for the Fund is less than the median advisory fee rate of the funds in its Selected Expense Peer Group and ranked in the second quintile of its Selected Expense Peer Group; and (b) the Operating Expenses for the Fund are less than the median Operating Expenses of the funds in its Selected Expense Peer Group and ranked in the first quintile of its Selected Expense Peer Group.
PF Mid-Cap Growth Fund
The Trustees considered that (a) the advisory fee for the Fund is slightly less than the median advisory fee rate of the funds in its Selected Expense Peer Group and ranked in the second quintile of its Selected Expense Peer Group; and (b) the Operating Expenses for the Fund are less than the median Operating Expenses of the funds in its Selected Expense Peer Group and ranked in the first quintile of its Selected Expense Peer Group. The Trustees considered that PLFA currently has contractually agreed to waive 0.025% of its advisory fee.
PF Mid-Cap Value Fund
The Trustees considered that (a) the advisory fee for the Fund is less than the median advisory fee rate of the funds in its Selected Expense Peer Group and ranked in the first quintile of its Selected Expense Peer Group; and (b) the Operating Expenses for the Fund are less than the median Operating Expenses of the funds in its Selected Expense Peer Group and ranked in the first quintile of its Selected Expense Peer Group.
PF Small-Cap Value Fund
The Trustees considered that (a) the advisory fee for the Fund is slightly less than the median advisory fee rate of the funds in its Selected Expense Peer Group and ranked in the second quintile of its Selected Expense Peer Group; and (b) the Operating Expenses for the Fund are less than the median Operating Expenses of the funds in its Selected Expense Peer Group and ranked in the second quintile of its Selected Expense Peer Group.
PF Emerging Markets Debt Fund
The Trustees considered that (a) the advisory fee for the Fund is greater than the median advisory fee rate of the funds in its Selected Expense Peer Group and ranked in the fifth quintile of its Selected Expense Peer Group; and (b) the Operating Expenses for the Fund are slightly less than the median Operating Expenses of the funds in its Selected Expense Peer Group and ranked in the second quintile of its Selected Expense Peer Group. The Trustees noted that, while the Fund’s advisory fee is in the fifth quintile of its Selected Expense Peer Group, the fee is only marginally higher (by 0.066%) than the median advisory fee rate of the funds in this group and that PLFA had advised that it believes it is reasonable to pay a premium for a sub-adviser with local resources and analysts in emerging market countries around the globe.
F-17
Table of Contents
PACIFIC FUNDS
APPROVAL OF INVESTMENT ADVISORY
AND SUB-ADVISORY AGREEMENTS (Continued)
(Unaudited)
PF Emerging Markets Fund
The Trustees considered that (a) the advisory fee for the Fund is less than the median advisory fee rate of the funds in its Selected Expense Peer Group and ranked in the first quintile of its Selected Expense Peer Group; and (b) the Operating Expenses for the Fund are less than the median Operating Expenses of the funds in its Selected Expense Peer Group and ranked in the second quintile of its Selected Expense Peer Group.
PF International Large-Cap Fund
The Trustees considered that (a) the advisory fee for the Fund is in line with the median advisory fee rate of the funds in its Selected Expense Peer Group and ranked in the third quintile of its Selected Expense Peer Group; and (b) the Operating Expenses for the Fund are less than the median Operating Expenses of the funds in its Selected Expense Peer Group and ranked in the first quintile of its Selected Expense Peer Group.
PF International Small-Cap Fund
The Trustees considered that (a) the advisory fee for the Fund is less than the median advisory fee rate of the funds in its Selected Expense Peer Group and ranked in the second quintile of its Selected Expense Peer Group; and (b) the Operating Expenses for the Fund are less than the median Operating Expenses of the funds in its Selected Expense Peer Group and ranked in the first quintile of its Selected Expense Peer Group.
PF International Value Fund
The Trustees considered that (a) the advisory fee for the Fund is less than the median advisory fee rate of the funds in its Selected Expense Peer Group and ranked in the first quintile of its Selected Expense Peer Group; and (b) the Operating Expenses for the Fund are less than the median Operating Expenses of the funds in its Selected Expense Peer Group and ranked in the first quintile of its Selected Expense Peer Group.
Pacific Funds Diversified Alternatives
The Trustees considered that (a) the advisory fee for the Fund is slightly less than the median advisory fee rate of the funds in its Selected Expense Peer Group and ranked in the second quintile of its Selected Expense Peer Group; and (b) the Operating Expenses for the Fund are less than the median Operating Expenses of the funds in its Selected Expense Peer Group and ranked in the second quintile of its Selected Expense Peer Group. The Trustees noted that pursuant to a fee waiver agreement, PLFA has agreed to a breakpoint schedule that will reduce its advisory fee once the Fund attains varying higher asset levels, but that the Fund has not yet reached the first breakpoint.
PF Currency Strategies Fund
The Trustees considered that (a) the advisory fee for the Fund is less than the median advisory fee rate of the funds in its Selected Expense Peer Group and ranked in the first quintile of its Selected Expense Peer Group; and (b) the Operating Expenses for the Fund are less than the median Operating Expenses of the funds in its Selected Expense Peer Group and ranked in the second quintile of its Selected Expense Peer Group.
PF Global Absolute Return Fund
The Trustees considered that (a) the advisory fee for the Fund is in line with the median advisory fee rate of the funds in its Selected Expense Peer Group and ranked in the third quintile of its Selected Expense Peer Group; and (b) the Operating Expenses for the Fund are greater than the median Operating Expenses of the funds in its Selected Expense Peer Group and ranked in the third quintile of its Selected Expense Peer Group.
PF Real Estate Fund
The Trustees considered that (a) the advisory fee for the Fund is greater than the median advisory fee rate of the funds in its Selected Expense Peer Group and ranked in the third quintile of its Selected Expense Peer Group; and (b) the Operating Expenses for the Fund are less than the median Operating Expenses of the funds in its Selected Expense Peer Group and ranked in the second quintile of its Selected Expense Peer Group.
Pacific Funds Core Income
The Trustees considered that (a) the advisory fee for the Fund is slightly greater than the median advisory fee rate of the funds in its Selected Expense Peer Group and ranked in the third quintile of its Selected Expense Peer Group; and (b) the Operating Expenses for the Fund are less than the median Operating Expenses of the funds in its Selected Expense Peer Group and ranked in the second quintile of its Selected Expense Peer Group. The Trustees noted that pursuant to a fee waiver agreement, PLFA has agreed to a breakpoint schedule that will reduce its advisory fee once the Fund attains varying higher asset levels, but that the Fund has not yet reached the first breakpoint.
Pacific Funds Floating Rate Income
The Trustees considered that (a) the advisory fee for the Fund is slightly greater than the median advisory fee rate of the funds in its Selected Expense Peer Group and ranked in the fifth quintile of its Selected Expense Peer Group; and (b) the Operating Expenses for the Fund are less than the median Operating Expenses of the funds in its Selected Expense Peer Group and ranked in the first quintile of its Selected Expense Peer Group. The Trustees noted that, while the Fund’s advisory fee is in the fifth quintile of its Selected Expense Peer Group, the fee is only marginally higher (by 0.008%) than the median advisory fee rate of the funds in this group. The Trustees further noted that pursuant to a fee waiver agreement, PLFA has agreed to a breakpoint schedule that reduces its advisory fee by 0.025% on net assets above $1 billion, and that the advisory fee will be further reduced pursuant to this fee waiver agreement once the Fund attains varying higher asset levels.
F-18
Table of Contents
PACIFIC FUNDS
APPROVAL OF INVESTMENT ADVISORY
AND SUB-ADVISORY AGREEMENTS (Continued)
(Unaudited)
Pacific Funds High Income
The Trustees considered that (a) the advisory fee for the Fund is slightly less than the median advisory fee rate of the funds in its Selected Expense Peer Group and ranked in the third quintile of its Selected Expense Peer Group; and (b) the Operating Expenses for the Fund are less than the median Operating Expenses of the funds in its Selected Expense Peer Group and ranked in the second quintile of its Selected Expense Peer Group. The Trustees noted that pursuant to a fee waiver agreement, PLFA has agreed to a breakpoint schedule that will reduce its advisory fee once the Fund attains varying higher asset levels, but that the Fund has not yet reached the first breakpoint.
Pacific Funds Limited Duration High Income
The Trustees considered that (a) the advisory fee for the Fund is in line with the median advisory fee rate of the funds in its Selected Expense Peer Group and ranked in the third quintile of its Selected Expense Peer Group; and (b) the Operating Expenses for the Fund are less than the median Operating Expenses of the funds in its Selected Expense Peer Group and ranked in the second quintile of its Selected Expense Peer Group. The Trustees noted that PLFA currently has contractually agreed to waive 0.02% of its advisory fee. The Trustees noted that pursuant to a fee waiver agreement, PLFA has agreed to a breakpoint schedule that will reduce its advisory fee once the Fund attains varying higher asset levels, but that the Fund has not yet reached the first breakpoint.
Pacific Funds Short Duration Income
The Trustees considered that (a) the advisory fee for the Fund is in line with the median advisory fee rate of the funds in its Selected Expense Peer Group and ranked in the third quintile of its Selected Expense Peer Group; and (b) the Operating Expenses for the Fund are slightly less than the median Operating Expenses of the funds in its Selected Expense Peer Group and ranked in the second quintile of its Selected Expense Peer Group. The Trustees noted that pursuant to a fee waiver agreement, PLFA has agreed to a breakpoint schedule that will reduce its advisory fee once the Fund attains varying higher asset levels, but that the Fund has not yet reached the first breakpoint.
Pacific Funds Strategic Income
The Trustees considered that (a) the advisory fee for the Fund is greater than the median advisory fee rate of the funds in its Selected Expense Peer Group and ranked in the fifth quintile of its Selected Expense Peer Group; and (b) the Operating Expenses for the Fund are slightly less than the median Operating Expenses of the funds in its Selected Expense Peer Group and ranked in the third quintile of its Selected Expense Peer Group. The Trustees noted that the Selected Expense Peer Group includes several intermediate-term bond funds, which are generally priced lower than multi-sector bond funds, such as the Fund. The Trustees further noted that pursuant to a fee waiver agreement, PLFA has agreed to a breakpoint schedule that will reduce its advisory fee once the Fund attains varying higher asset levels, but that the Fund has not yet reached the first breakpoint.
PF Inflation Managed Fund
The Trustees considered that (a) the advisory fee for the Fund is in line with the median advisory fee rate of the funds in its Selected Expense Peer Group and ranked in the second quintile of its Selected Expense Peer Group; and (b) the Operating Expenses for the Fund are slightly greater than the median Operating Expenses of the funds in its Selected Expense Peer Group and ranked in the fourth quintile of its Selected Expense Peer Group.
PF Managed Bond Fund
The Trustees considered that (a) the advisory fee for the Fund is slightly less than the median advisory fee rate of the funds in its Selected Expense Peer Group and ranked in the second quintile of its Selected Expense Peer Group; and (b) the Operating Expenses for the Fund are less than the median Operating Expenses of the funds in its Selected Expense Peer Group and ranked in the second quintile of its Selected Expense Peer Group.
PF Short Duration Bond Fund
The Trustees considered that (a) the advisory fee for the Fund is in line with the median advisory fee rate of the funds in its Selected Expense Peer Group and ranked in the third quintile of its Selected Expense Peer Group; and (b) the Operating Expenses for the Fund are greater than the median Operating Expenses of the funds in its Selected Expense Peer Group and ranked in the fourth quintile of its Selected Expense Peer Group.
Pacific Funds Portfolio Optimization Conservative
The Trustees considered that (a) the advisory fee for the Fund is greater than the median advisory fee rate of the funds in its Selected Expense Peer Group and ranked in the fourth quintile of its Selected Expense Peer Group; (b) the Operating Expenses for the Fund are greater than the median Operating Expenses of the funds in its Selected Expense Peer Group and ranked in the fourth quintile of its Selected Expense Peer Group; and (c) the net expense ratio was greater than the Comparable Peer Fund Average. The Trustees noted that pursuant to a fee waiver agreement, PLFA has agreed to a breakpoint schedule that will reduce its advisory fee once the Fund attains varying higher asset levels, but that the Fund has not yet reached the first breakpoint.
Pacific Funds Portfolio Optimization Moderate-Conservative
The Trustees considered that (a) the advisory fee for the Fund is greater than the median advisory fee rate of the funds in its Selected Expense Peer Group and ranked in the fourth quintile of its Selected Expense Peer Group; (b) the Operating Expenses for the Fund are greater than the median Operating Expenses of the funds in its Selected Expense Peer Group and ranked in the fourth quintile of its Selected Expense Peer Group; and (c) the net expense ratio was less than the Comparable Peer Fund Average. The Trustees noted that pursuant to a fee waiver agreement, PLFA has agreed to a breakpoint schedule that will reduce its advisory fee once the Fund attains varying higher asset levels, but that the Fund has not yet reached the first breakpoint.
F-19
Table of Contents
PACIFIC FUNDS
APPROVAL OF INVESTMENT ADVISORY
AND SUB-ADVISORY AGREEMENTS (Continued)
(Unaudited)
Pacific Funds Portfolio Optimization Moderate
The Trustees considered that (a) the advisory fee for the Fund is greater than the median advisory fee rate of the funds in its Selected Expense Peer Group and ranked in the fourth quintile of its Selected Expense Peer Group; (b) the Operating Expenses for the Fund are greater than the median Operating Expenses of the funds in its Selected Expense Peer Group and ranked in the fourth quintile of its Selected Expense Peer Group; and (c) the net expense ratio was less than the Comparable Peer Fund Average. The Trustees noted that pursuant to a fee waiver agreement, PLFA has agreed to a breakpoint schedule that will reduce its advisory fee once the Fund attains varying higher asset levels, but that the Fund has not yet reached the first breakpoint.
Pacific Funds Portfolio Optimization Growth
The Trustees considered that (a) the advisory fee for the Fund is greater than the median advisory fee rate of the funds in its Selected Expense Peer Group and ranked in the fourth quintile of its Selected Expense Peer Group; (b) the Operating Expenses for the Fund are greater than the median Operating Expenses of the funds in its Selected Expense Peer Group and ranked in the fourth quintile of its Selected Expense Peer Group; and (c) the net expense ratio was in line with the Comparable Peer Fund Average. The Trustees noted that pursuant to a fee waiver agreement, PLFA has agreed to a breakpoint schedule that will reduce its advisory fee once the Fund attains varying higher asset levels, but that the Fund has not yet reached the first breakpoint.
Pacific Funds Portfolio Optimization Aggressive-Growth
The Trustees considered that (a) the advisory fee for the Fund is greater than the median advisory fee rate of the funds in its Selected Expense Peer Group and ranked in the fourth quintile of its Selected Expense Peer Group; (b) the Operating Expenses for the Fund are greater than the median Operating Expenses of the funds in its Selected Expense Peer Group and ranked in the fourth quintile of its Selected Expense Peer Group; and (c) the net expense ratio was less than the Comparable Peer Fund Average. The Trustees noted that pursuant to a fee waiver agreement, PLFA has agreed to a breakpoint schedule that will reduce its advisory fee once the Fund attains varying higher asset levels, but that the Fund has not yet reached the first breakpoint.
During their review, the Trustees considered that all of the Funds, except for the Equity Long/Short Fund, were subject to contractual expense limitations on certain operating expenses agreed to by PLFA.
The Trustees also considered information from the Sub-Advisers regarding the comparative sub-advisory fees charged under other investment advisory contracts for similarly managed accounts, such as contracts of each Sub-Adviser with other similarly managed registered investment companies or other types of clients. The Trustees noted that in many cases there were differences in the level of services provided to the Funds by the Sub-Advisers and that the level of services provided by these Sub-Advisers on these other accounts differed due to the nature of the accounts or because there were other reasons to support the difference in fees, such as an affiliation between the Sub-Adviser and the account. These differences often explained variations in fee schedules. The Trustees were mindful that, with regard to the Sub-Advised Funds, the fee rates were the result of arms’-length negotiations between PLFA and the Sub-Advisers, and that any sub-advisory fees are paid by PLFA and are not paid directly by a Fund.
The Board concluded that the advisory fees, sub-advisory fees and total expenses of each Fund were fair and reasonable.
D. Costs, Level of Profits and Economies of Scale
The Trustees reviewed information provided by PLFA regarding PLFA’s costs of sponsoring and operating the Funds and information regarding the profitability of PLFA from each Fund. For purposes of analyzing PLFA’s costs and profitability with respect to the Funds, the Trustees assigned credibility to PLFA’s view that little weight should be given to the fees of Pacific Select Fund, another open-end investment company advised by PLFA that consists of multiple funds, on the basis that there are significant differences between Pacific Funds and Pacific Select Fund, including differences in fund size and platforms on which the funds are offered. For the Sub-Advised Funds, the Trustees also reviewed information provided by the Sub-Advisers regarding their costs in managing the Sub-Advised Funds and their profitability from the Funds.
PLFA and the Sub-Advisers’ Costs and Profitability. The Trustees noted that, based on the data available, PLFA appears to be providing and operating products that are competitively priced with other funds, especially other multi-manager and asset allocation funds. The Trustees noted PLFA’s willingness to build its investment capabilities and to sponsor new funds that PLFA believed would benefit the Asset Allocation Funds, despite the potential subsidies required by PLFA during a new fund’s start-up phase. The Trustees also noted that the analysis of the Trust’s profitability to PLFA supported a conclusion that PLFA’s costs and profitability are reasonable, whether considered inclusive or exclusive of distribution costs.
The Trustees also reviewed information provided regarding the structure and manner in which PLFA’s investment professionals were compensated and their respective views of the relationship of such compensation to the attraction and retention of quality personnel. The Trustees considered PLFA’s willingness to invest in technology, infrastructure and staff to reinforce and offer new services and to accommodate changing regulatory requirements. The Trustees also considered the organizational strengths of the Sub-Advisers and their ability to attract and retain investment personnel over time and to sustain the staffing of investment teams that provide services to the Sub-Advised Funds.
With respect to the Sub-Advisers, the Trustees noted that it was difficult in many cases to accurately determine or evaluate the Sub-Advisers’ costs and the profitability of the Sub-Advisory Agreements to the Sub-Advisers because of, among other things, the differences in the types and content of information provided by the Sub-Advisers, the fact that many Sub-Advisers manage substantial assets other than the Funds and, further, that any such assessment would involve assumptions regarding the Sub-Advisers’ expense allocation policies, capital structure, cost of capital, business mix and other factors.
F-20
Table of Contents
PACIFIC FUNDS
APPROVAL OF INVESTMENT ADVISORY
AND SUB-ADVISORY AGREEMENTS (Continued)
(Unaudited)
Accordingly, in the case of the Sub-Advisers, the Trustees considered the data described above in light of the arms’-length nature of the relationship (for the Sub-Advised Funds) between PLFA and such Sub-Advisers with respect to the negotiation of fund sub-advisory fees and the fact that such fees are paid by PLFA.
Economies of Scale. The Trustees noted and considered the extent to which economies of scale are realized by PLFA and the Sub-Advisers as each Fund grows, and whether advisory fee levels reflect economies of scale if the Funds grow in size. The Trustees noted PLFA’s commitment to competitive total expenses of certain Funds through expense limitation agreements and, for certain Asset Allocation and PAM Managed Funds, through advisory fee waivers. The Trustees also noted PLFA’s and its affiliates’ consistent reinvestment in the business in the form of adding to investment capabilities and resources, improvements in technology, product innovations and customer service. The Trustees considered information relating to economies of scale provided by PLFA, PLFA’s willingness to discuss and evaluate the topic of economies of scale with the Trustees, and PLFA’s agreement to enter into advisory fee waivers for certain PAM Managed Funds and Asset Allocation Funds that create effective breakpoints at asset levels at which PLFA believes it will have attained a level of profit that can be shared with these Funds.
With respect to the Sub-Advised Funds, the Trustees considered that the advisory fee for each Fund was originally set at an amount that was intended to be lower than peers to attract assets at the Fund’s inception. The Trustees noted that because fees for the Funds started relatively low from the first dollar under management in relation to peers, economies of scale will be realized at higher asset levels than would otherwise be the case. The Trustees also considered that some Sub-Advisers have agreed to breakpoints in their sub-advisory fee schedules. The Trustees noted that in setting its advisory fees relatively low at inception as compared to peers, and in subsidizing the expenses of the Funds from their inception and for many years, PLFA’s economics from the Sub-Advised Funds should be considered separate and apart from the economics of the Sub-Advisers. The Trustees noted PLFA’s view that the sub-advisory fee breakpoints were important for PLFA’s economics to overcome its expenses from the Funds. The Trustees also noted that shareholders will benefit from effective breakpoints for the Asset Allocation Funds.
The Trustees also considered PLFA’s willingness to reduce its own fees through certain advisory fee waivers and expense limitation agreements, whereby PLFA will reimburse the Funds for certain expenses that exceed stated expense caps. The Trustees considered that the advisory fee waivers effectively implement breakpoints in PLFA’s advisory fees at higher asset levels of these Funds, which are intended to share economies of scale that PLFA has attained.
The Trustees noted that PLFA and its affiliates had consistently reinvested in the business in the form of improvements in technology, product innovations, personnel and resources. The Trustees additionally noted that economies of scale were difficult to measure with precision, particularly on a Fund by Fund basis. This analysis is complicated by the additional services and content provided by PLFA and its affiliates through reinvestment in the business, as discussed above. The Trustees considered that the Funds are well managed, and provide shareholders with sophisticated asset allocation investment options at reasonable fee levels. The Board noted that PLFA had taken steps to ensure that shareholders benefit by negotiating favorable terms with service providers, and to provide certain support services, including, but not limited to, legal, compliance and accounting services, to the Funds on an approximate cost basis as opposed to an asset-based charge.
The Board determined that PLFA and its affiliates are sharing economies of scale given its agreement to reduce its own fees through fee waivers as assets grow for certain Funds, its commitment to competitive total expenses of the Funds, and the consistent reinvestment in the business in the form of improvements in technology and other resources and investments in personnel. The Board considered that PLFA has not yet attained levels of profitability that warrant sharing of economies of scale for some Funds, including the Sub-Advised Funds, but noted that shareholders will benefit in the future from the effective breakpoints for the Asset Allocation Funds. The Board further considered that it will continue to review whether there are additional economies of scale that will be realized as the Funds grow that can be shared with shareholders. The Board concluded that the Funds’ cost structures were reasonable and that overall profitability appeared reasonable at the current time. The Board further concluded that PLFA was sharing economies of scale with each Fund and its shareholders to their benefit.
E. Ancillary Benefits
The Trustees requested and received from PLFA and the Sub-Advisers information concerning other benefits received by PLFA, Pacific Life, the Sub-Advisers, and their affiliates as a result of their respective relationship with the Funds, including various service arrangements with PLFA affiliates and reimbursement at an approximate cost basis for support services in the case of PLFA, as well as commissions paid to broker-dealers affiliated with certain Sub-Advisers and the use of soft-dollars by certain of the Sub-Advisers. The Trustees also considered ancillary benefits received by Pacific Life and its affiliates from the Funds. The Trustees considered information concerning other significant economic relations between the Sub-Advisers and their affiliates and with PLFA and its affiliates and noted PLFA’s processes and procedures to identify and disclose such relationships to the Board. The Trustees also considered PLFA’s and each Sub-Adviser’s strong practices and procedures with regard to managing conflicts of interest and ensuring that such conflicts do not prevent PLFA or the Sub-Advisers from acting in the best interests of the Funds and their shareholders.
The Board concluded that such benefits were consistent with those generally derived by investment advisers to mutual funds or were otherwise not unusual.
F. Conclusion
Based on their review, including their consideration of each of the factors referred to above, and assisted by the advice of the Independent Consultant and independent counsel to the Independent Trustees, the Board, including the Independent Trustees, concluded that the Advisory Agreement and each applicable Sub-Advisory Agreement are fair and reasonable with respect to each Fund and its shareholders, and that the renewal of the Advisory Agreement and each applicable Sub-Advisory Agreement would be in the best interests of the Funds and their shareholders. The Board did not indicate that any single factor was determinative of its decision to approve the Advisory Agreement and each applicable Sub-Advisory Agreement, but indicated that the Board based its determination on the total mix of information available to it.
F-21
Table of Contents
PACIFIC FUNDS
WHERE TO GO FOR MORE INFORMATION
(Unaudited)
Availability of Quarterly Holdings
The Trust files Form N-Q (complete schedules of fund holdings) with the Securities and Exchange Commission (the “SEC”) for the first and third quarters of each fiscal year not later than 60 days after the close of the applicable quarter end. The Trust’s Form N-Q, (when required) is filed pursuant to applicable regulations and is available after filing (i) on the SEC’s website at http://www.sec.gov; (ii) for review and copying at the SEC’s Public Reference Room in Washington, D.C. (information on the operation of the Public Reference Room may be obtained by calling the SEC at 1-800-SEC-0330); and (iii) on the Trust’s website at https://www.pacificlife.com/pacificfunds.html. The SEC may charge you a fee for this information.
Availability of Proxy Voting Record
By August 31 of each year, the Trust files information regarding how the Trust’s managers voted proxies relating to fund securities during the most recent twelve-month period ended June 30. Such information is available after filing on the Trust’s’ website and on the SEC’s website noted below.
Information Relating to Investments Held by the Trust
For complete descriptions of the various securities and other instruments held by the Trust and their risks, please see the Trust’s prospectus and Statement of Additional Information (“SAI”). The prospectus and SAI are available as noted below.
Availability of Proxy Voting Policies
A description of the Proxy Voting Policies and Procedures that the Trust uses to determine how to vote proxies relating to fund securities is described in the Trust’s SAI.
How to obtain Information
The Trust’s prospectus, SAI (including Proxy Voting Policies) and annual and semi-annual reports are available:
| • | On the Trust’s website at https://www.pacificlife.com/pacificfunds.html |
| • | On the SEC’s website at http://www.sec.gov |
| • | Upon request by calling, without charge, 1-800-722-2333, 7 a.m. through 5 p.m. Pacific Time |
F-22
Table of Contents
Pacific Funds
Mailing address:
P.O. Box 9768
Providence, RI 02940-9768
ADDRESS SERVICE REQUESTED
Annual Report as of March 31, 2018 for:
• Pacific Funds
| Form Nos. | 3012-18A |
Table of Contents

PF Underlying Funds
Annual Report
As of March 31, 2018
Table of Contents
PACIFIC FUNDS
ANNUAL REPORT
AS OF MARCH 31, 2018
| A-2 | ||||
| B-1 | ||||
Financial Statements: | ||||
| C-1 | ||||
| C-5 | ||||
| C-9 | ||||
| C-13 | ||||
| C-14 | ||||
| D-1 | ||||
| E-1 | ||||
| F-1 | ||||
| F-2 | ||||
| F-4 | ||||
| F-7 | ||||
| F-21 | ||||
Pacific Funds Series Trust, which is a Delaware statutory trust, may be referred to as “Pacific Funds” or the “Trust”.
Table of Contents
PACIFIC FUNDS
| Sub-Adviser/Manager | Fund | Page Number | ||
| Pacific Investment Management Company LLC (PIMCO) | PF Inflation Managed Fund | A-3 | ||
| Pacific Investment Management Company LLC (PIMCO)/ Western Asset Management Company (Western Asset) | PF Managed Bond Fund | A-4 | ||
| T. Rowe Price Associates, Inc. (T. Rowe Price) | PF Short Duration Bond Fund | A-5 | ||
| Ashmore Investment Management Limited (Ashmore) | PF Emerging Markets Debt Fund | A-6 | ||
| Invesco Advisers, Inc. (Invesco) | PF Comstock Fund | A-7 | ||
| Lord, Abbett & Co. LLC (Lord Abbett) | PF Developing Growth Fund | A-9 | ||
| MFS Investment Management (MFS) | PF Growth Fund | A-10 | ||
| BlackRock Investment Management, LLC (BlackRock) | PF Large-Cap Growth Fund | A-11 | ||
| ClearBridge Investments, LLC (ClearBridge) | PF Large-Cap Value Fund | A-12 | ||
| OppenheimerFunds, Inc. (Oppenheimer) | PF Main Street® Core Fund | A-13 | ||
| Scout Investments, Inc. (Scout) | PF Mid-Cap Equity Fund | A-14 | ||
| Boston Partners Global Investors, Inc. (Boston Partners) | PF Mid-Cap Value Fund | A-15 | ||
| AllianceBernstein L.P. (AllianceBernstein) | PF Small-Cap Value Fund | A-16 | ||
| OppenheimerFunds, Inc. (Oppenheimer) | PF Emerging Markets Fund | A-17 | ||
| MFS Investment Management (MFS) | PF International Large-Cap Fund | A-18 | ||
| QS Investors, LLC (QS Investors) | PF International Small-Cap Fund | A-19 | ||
Wellington Management Company LLP (Wellington) | PF International Value Fund | A-20 | ||
| Morgan Stanley Investment Management Inc. (Morgan Stanley) | PF Real Estate Fund | A-22 | ||
| Macro Currency Group (MCG)/ UBS Asset Management (Americas) Inc. (UBS) | PF Currency Strategies Fund | A-23 | ||
| AQR Capital Management, LLC (AQR) | PF Equity Long/Short Fund | A-24 | ||
| Eaton Vance Investment Managers (Eaton Vance) | PF Global Absolute Return Fund | A-25 | ||
| Pacific Life Fund Advisors LLC (PLFA) and Pacific Asset Management | PF Multi-Asset Fund | A-26 |
A-1
Table of Contents
PACIFIC FUNDS PERFORMANCE DISCUSSION
This Annual Report is provided for the general information of investors with beneficial interests in Pacific Funds Series Trust (Trust) and contains information on certain funds (the “Funds” or “Underlying Funds”) of the Trust. This report is not authorized for distribution to prospective investors unless preceded or accompanied by a current Trust prospectus, as supplemented, which contains information about the Trust and each of its Funds, including their investment objectives, risks, charges and expenses. You should read the prospectus carefully before investing. There is no assurance that a Fund will achieve its investment objective. Each Fund is subject to market risk. The net asset value (NAV) of a Fund changes as the value of its assets go up or down. The value of a Fund’s shares will fluctuate, and when redeemed may be worth more or less than original cost. The total return for each Fund includes reinvestment of all dividends and capital gain distributions, if any, and does not include deductions of any applicable sales charges. Past performance is not predictive of future performance.
This report shows you the performance of the Funds compared to benchmark indices. Index performance is provided for illustrative and comparative purposes only and does not predict or depict the performance of the Funds. Indices are unmanaged, do not incur transaction costs, do not include fees or expenses and cannot be purchased directly by investors. Index returns include reinvested dividends.
Pacific Life Fund Advisors LLC (“PLFA” or the “Adviser”) supervises the management of the Funds contained in this report, subject to the oversight of the Trust’s Board of Trustees (Board). PLFA also directly manages the PF Multi-Asset Fund. In addition, PLFA does business under the name “Pacific Asset Management” and manages the collateral portion of the PF Multi-Asset Fund under this name. To manage the other Funds in this report, PLFA has retained other portfolio management firms or “sub-advisers” (Managers).
PLFA has written the general market conditions commentary, which expresses PLFA’s opinions and views on how the market generally performed for the Trust’s fiscal year ended March 31, 2018. All views are subject to change at any time based upon market or other conditions, and the Trust, its Adviser and the Managers disclaim any responsibility to update such views. Any references to “we”, “I”, or “ours” are references to the Adviser or the applicable Manager. Any sectors referenced are provided by the applicable Manager, and could be different from the sectors listed in the Schedules of Investments if obtained from another source. The Adviser and the Managers may include statements that constitute “forward-looking statements” under the United States (U.S.) securities laws. Forward- looking statements include information concerning possible or assumed future results of the Trust’s investment operations, asset levels, earnings, expenses, industry or market conditions, regulatory developments and other aspects of the Trust’s operations or general economic conditions. In addition, when used in this report, predictive verbs such as “believes”, “expects”, “anticipates”, “intends”, “plans”, “estimates”, “projects” and future or conditional verbs such as “will”, “may”, “could”, “should” and “would” or any other statement that necessarily depends on future events, are intended to identify forward-looking statements. Forward-looking statements are not guarantees of performance or economic results. They involve risks, uncertainties and assumptions. Although such statements are based on expectations that the Adviser or applicable Manager believes to be reasonable, actual results may differ materially from expectations. Investors must not rely on any forward- looking statements.
In connection with any forward-looking statements and any investment in the Trust, investors should carefully consider the investment objectives, policies and risks described in the Trust’s current prospectus, as supplemented, and Statement of Additional Information, as supplemented, as filed with the Securities and Exchange Commission (SEC), which may be obtained from the SEC’s website at www.sec.gov.
Market Conditions (for the year ended March 31, 2018)
Executive Summary
Although volatility spiked in the first quarter of 2018, positive market conditions and economic optimism supported risk assets throughout the 12-month reporting period. Globally, economic growth continued apace and concerns eased over potential geopolitical events, providing a tailwind for global equities.
Over the reporting period, the S&P 500 Index returned 13.99%. Although the Federal Reserve (Fed) maintained its gradual monetary tightening trajectory, many central banks around the globe continued providing support through quantitative easing programs. Economic activity strengthened across much of Europe and Japan, although uncertainty on trade and tariffs curtailed some of the optimism. Additionally, the tide of the populist movement that drew concerns over the prior period ebbed throughout Europe, which further eased investor anxieties over the reporting period.
Crude oil prices, which plummeted in the prior period, stabilized as Organization of the Petroleum Exporting Countries (OPEC) and Russia agreed to cut production and heightened tensions in the Middle East raised concerns of disruptions to the global oil supply. After crude oil (West Texas Intermediate) price hit the low-$40s, it finished the reporting period above $60 per barrel.
In the U.S., investors welcomed the stimulative tax reform that lowered the corporate tax rate from 35% to 21%. Additionally, the Trump administration has been a proponent of deregulation, which would be beneficial for certain sectors such as financials and energy. However, Trump’s rhetoric on trade and potential tariffs caused the market to swing wildly towards the end of the reporting period.
Fixed Income
The U.S. 10-year Treasury yield climbed to 2.9% toward the end of the reporting period as inflation remained tame throughout the reporting period. While the 10-year yield had trended lower during the summer, it crept higher once the Fed announced that it would begin to unwind the $4.5 trillion balance sheet it had amassed since the Financial Crisis. The broad bond market (as defined by the Bloomberg Barclays U.S. Aggregate Bond Index) returned 1.20% for the reporting period.
Riskier bond asset classes delivered solid returns over the reporting period. High yield bonds, especially those of lower credit quality, outperformed higher-rated investment-grade bonds. Credit spreads, which move in the opposite direction to prices, trended lower throughout the reporting period. This contraction coincided with steadily improving energy prices since energy producers represent a sizeable portion of the high yield market. Improving commodity prices also provided a tailwind for emerging market debt, given that much of it is issued by commodity exporters.
Domestic Equity
Domestic equities edged out solid gains despite experiencing some volatility throughout the reporting period. The S&P 500 Index gained 13.99% over the reporting period. Reversing the trend from the prior reporting period, growth stocks finished this reporting period higher than
| See benchmark definitions on A-27 and A-28 |
A-2
Table of Contents
PACIFIC FUNDS PERFORMANCE DISCUSSION (Continued)
their value counterparts. Compared to value, growth styles tend to have a sizeable overweight to the information technology sector. The information technology sector of the S&P 500 Index was the strongest performing one over the reporting period.
International Equity
International equities ended the year with solid gains as the MSCI Europe, Australasia and Far East (EAFE) Index returned 14.80% over the reporting period. Japan and the United Kingdom (U.K.) represent a large portion of the MSCI EAFE Index (Net), which contributed to performance. In general, Japan and European markets delivered solid returns as their respective central banks remained very accommodative.
Emerging market equities also performed well as the MSCI Emerging Markets Index (Net) returned 24.93% over the reporting period. Over the reporting period, emerging market equities were the best performers amongst the broad equity regions. Asian markets, which represent a large portion of the index, provided much of the boost as the Chinese economy continued to show resilience and the One Belt One Road initiative gained traction. This initiative is China’s grand plan to build a global infrastructure network.
Concluding Remarks
While volatility has returned to the markets, the underlying economic trend in the U.S. and abroad has remained firmly positive. We read the return of volatility as indicating that the euphoria, which typically precedes a major business cycle downturn, has yet to materialize and remains a dormant risk. We anticipate that earnings will drive equity markets higher as firms benefit from the near-term effects of the tax overhaul, while strength in manufacturing and consumer spending extend the current expansion. The most concerning risks, in our view, remain the potential for an inflationary surprise that forces the Fed to hike interest rates more aggressively and the current war of words between the U.S. and China turning into an outright trade war.
Abroad, central banks remain more accommodative, which makes overseas equities relatively more attractive to us, especially when combined with our expectation for continued U.S. dollar weakness. We believe that emerging market equities should also continue to be a bright spot if global trade tensions do not erupt into all-out trade conflict. Starting from cheaper valuations relative to developed equities globally, emerging market equities have also shown less sensitivity to recent volatility that is indicative of the nascent deeper ties between emerging economies that have traditionally relied more on exports to developed countries.
For fixed income, we expect continued pressure from rising rates and less diversification benefits. Previously when volatility surged, the market took it as evidence that the Fed would continue with its monetary easing policy, which then led to lower yields and higher values for fixed-income. Given current economic and labor market strength and the potential for inflation, we do not see volatility carrying the same implication for Fed policy. We see fixed income providing less diversification to equities, especially during a period where the Fed is expected to raise interest rates. By contrast, in an overall portfolio, we see well-constructed allocations to alternatives as helpful diversifiers that need not face the same headwinds of Fed policy. Also, we see the return to more historically normal volatility levels as additional support for alternatives in diversifying against equity drawdowns.
PF Inflation Managed Fund (sub-advised by Pacific Investment Management Company LLC)
Q. How did the Fund perform for the year ended March 31, 2018?
A. For the year ended March 31, 2018, the PF Inflation Managed Fund’s Class P returned 0.87%, compared to a 0.92% return for its benchmark, the Bloomberg Barclays U.S. TIPS Index.
The following graph compares the performance of a hypothetical $10,000 investment in Class P shares of the Fund to its benchmark for the ten-year period ended March 31, 2018. The Fund’s performance reflects reinvestments of all dividends and capital gains distributions, if any.
Performance Comparison
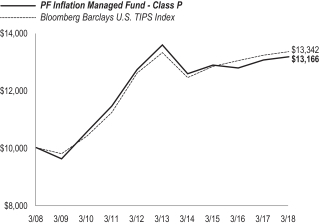
| Average Annual Total Returns for the Periods Ended March 31, 2018 (1) | ||||||||||||
| 1 Year | 5 Years | 10 Years | ||||||||||
Fund’s Class P | 0.87% | (0.62% | ) | 2.79% | ||||||||
Bloomberg Barclays U.S. TIPS Index | 0.92% | 0.05% | 2.93% | |||||||||
| (1) | Effective October 31, 2016, Pacific Investment Management Company LLC (“PIMCO”) became the sole sub-adviser to the Fund. Between January 15, 2015 and October 31, 2016, Western Asset Management Company served as co-sub-adviser of the Fund with PIMCO. Prior to January 15, 2015, PIMCO served as the sole sub-adviser. |
Performance data shown represents past performance. Investment return and principal value will fluctuate so that shares of the Fund when redeemed may be worth more or less than their original cost. Past performance is not predictive of future performance. | ||||||
| See benchmark definitions on A-27 and A-28 |
A-3
Table of Contents
PACIFIC FUNDS PERFORMANCE DISCUSSION (Continued)
Q. Discuss both positive and negative factors that materially affected the Fund’s performance during the year, including relevant market conditions, investment strategies and techniques, and particular sectors or securities.
A. For the reporting period, the Fund underperformed the benchmark. We at PIMCO implement the investment strategies of the Fund by investing in debt securities and derivative instruments primarily including government guaranteed bonds that have returns indexed to inflation, such as U.S. Treasury Inflation-Protected Securities (TIPS). Real duration strategies in the U.S. and U.K. detracted, though this was partially offset by an overweight to widening breakeven inflation exposure (the difference between nominal and real yields) via derivatives. U.S. nominal duration positioning, particularly yield curve positioning, contributed to performance amid rising interest rates. A tactical short to nominal duration in the U.K. contributed to performance as rates rose in the U.K. as well.
Spread strategies contributed to performance as select holdings of non-Agency mortgage backed securities (MBS) gained amid a strong housing sector. Currency strategies, however, were broadly negative and thus detracted from Fund performance, particularly a short to the euro as the currency appreciated. Additionally, currency positioning within Argentina detracted as the currency depreciated.
During the reporting period the Fund sold credit protection through credit default swaps to obtain exposure to the credit risk of individual securities or to the broader investment grade, high yield, and emerging market sectors through the use of credit default swaps and credit default swaps on credit indices. The Fund also purchased credit protection during the reporting period to reduce credit exposure to individual issuers, reduce broader credit risk, and to take advantage of the basis between the credit default swap and cash bond market. The Fund entered into interest rate swaps to manage nominal or real interest rate exposure in various global markets and as a substitute for cash bond exposure. The Fund entered into futures contracts to manage interest rate exposure, as a substitute for cash bond exposure, and for purposes of liquidity. Interest rate swaps and futures allowed the portfolio managers to effectively manage risk and gain or reduce exposure by targeting specific markets and areas of the yield curve that may not otherwise be accessible through the use of cash bonds. The Fund sold/wrote options on futures, currencies, To Be Announced (TBA) securities (Agency MBS-related instruments), and swaps and also purchased options and swaptions on futures, currencies, and TBAs as a means of capitalizing on anticipated changes in market volatility and to generate income. The Fund purchased and sold foreign currency contracts in connection with settling planned purchases or sales of securities to hedge the currency exposure associated with some or all of the Fund’s securities, and to express certain views on currency markets. The Fund also held inflation caps and floors to hedge duration.
PF Managed Bond Fund (co-sub-advised by Pacific Investment Management Company LLC and Western Asset Management Company)
Q. How did the Fund perform for the year ended March 31, 2018?
A. For the year ended March 31, 2018, the PF Managed Bond Fund’s Class P returned 3.29%, compared to a 1.20% return for its benchmark, the Bloomberg Barclays U.S. Aggregate Bond Index.
The following graph compares the performance of a hypothetical $10,000 investment in Class P shares of the Fund to its benchmark for the ten-year period ended March 31, 2018. The Fund’s performance reflects reinvestments of all dividends and capital gains distributions, if any.
Performance Comparison
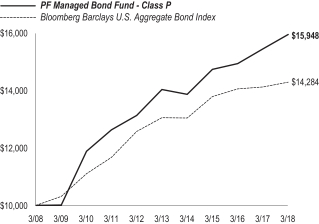
| Average Annual Total Returns for the Periods Ended March 31, 2018 (1) | ||||||||||||
| 1 Year | 5 Years | 10 Years | ||||||||||
Fund’s Class P | 3.29% | 2.59% | 4.78% | |||||||||
Bloomberg Barclays U.S. Aggregate Bond Index | 1.20% | 1.82% | 3.63% | |||||||||
| (1) | Western Asset Management Company became co-sub-adviser to the Fund on August 1, 2014, and some investment policies changed at that time. Pacific Investment Management Company LLC was the sole sub-adviser to the Fund before that date. |
Performance data shown represents past performance. Investment return and principal value will fluctuate so that shares of the Fund when redeemed may be worth more or less than their original cost. Past performance is not predictive of future performance. | ||||||
Q. Discuss both positive and negative factors that materially affected the Fund’s performance during the year, including relevant market conditions, investment strategies and techniques, and particular sectors or securities.
A. For the reporting period, the Fund’s Class P outperformed the benchmark. The Fund is co-sub-advised by PIMCO and Western Asset. The following are separate discussions from each co-sub-adviser.
PIMCO
We at PIMCO implement the investment strategies for the PIMCO managed portion of the Fund by investing in debt securities and derivative instruments. U.S. interest rate exposure, particularly underweights to the front-and long-end of the yield curve, contributed as nominal interest rates rose. Exposure to local rates in the U.K., Brazil and Peru were additive; however, short exposure to French duration detracted as rates fell.
| See benchmark definitions on A-27 and A-28 |
A-4
Table of Contents
PACIFIC FUNDS PERFORMANCE DISCUSSION (Continued)
Currency exposure within the U.K., Europe, and dollar bloc countries was positive; however, contributions were partially offset by shorts to the Japanese yen and emerging markets Asian currencies such as the South Korean won, Singapore dollar and Taiwanese dollar, as those currencies appreciated. Within spread strategies, security selection, as well as an allocation to non-Agency MBS and overweight to Agency MBS contributed positively to returns. An underweight to investment-grade corporate credit detracted from performance as spreads broadly tightened, while an allocation to high yield financials and utilities added. Security selection within taxable municipals and a modest overweight position for most of the reporting period also contributed as spreads tightened.
During the reporting period, our portion of the Fund sold credit protection through credit default swaps to obtain exposure to the credit risk of individual securities or to the broader investment grade, high yield, emerging market, mortgage, and other asset classes through the use of credit default swaps and credit default swaps on credit indices. Our portion of the Fund entered into interest rate swaps to manage nominal or real interest rate exposure in various global markets and as a substitute for cash bond exposure. Our portion of the Fund entered into futures contracts to manage interest rate exposure, as a substitute for cash bond exposure, and for purposes of liquidity. Interest rate swaps and futures allowed the portfolio managers to effectively manage risk and gain or reduce exposure by targeting specific markets and areas of the yield curve that may not otherwise be accessible through the use of cash bonds. Our portion of the Fund sold/wrote options and swaptions on futures, currencies, TBAs, and swaps and also purchased options and swaptions on futures, swaps, and TBAs as a means of capitalizing on anticipated changes in market volatility and to generate income. Our portion of the Fund purchased and sold foreign currency contracts in connection with settling planned purchases or sales of securities, to hedge the currency exposure associated with some or all of the Fund’s securities, and to express certain views on currency markets. Lastly, our portion of the Fund also held inflation floors to hedge duration.
Western Asset
For Western Asset’s portion of the Fund a global investment platform is utilized to build a diversified portfolio of investment grade bonds with opportunistic allocations to high yield, emerging markets and non-U.S. dollar securities to enhance returns. Value is added through sector rotation, yield curve positioning, issue selection and duration management.
Most sectors delivered positive contributions to relative return during the reporting period. Non-agency mortgage exposure was the single largest contributor over the reporting period as the housing market continued to recover, which contributed to improved pricing in the sector. Overweight exposures to commercial mortgage-backed securities (CMBS) and asset-backed securities (ABS) also contributed as their spreads tightened. High Yield and investment grade credit overweights were also positive contributors over the reporting period as their spreads tightened. Non-U.S. dollar developed market bond and currency exposure was another strong contributor. A short position to German rates contributed as yields rose and a long Italy vs short Germany position contributed as the spread between the two countries narrowed. A long position to the Euro was a significant contributor as the currency strengthened 15.5% versus the U.S. dollar over the reporting period. Emerging market (EM) exposure was a slight positive net contributor to performance as bond positions contributed but long currency positions detracted as they generally weakened versus the U.S. dollar. Macro top down strategies were a net contributor to performance. A long duration position was a detractor as rates rose over the reporting period, 10-year U.S. Treasury yields from 2.40% to 2.74%. However, yield curve positioning, with an emphasis on the 20-30-year part of the yield curve, more than made up and was a meaningful contributor to returns as the yield curve flattened. Derivatives, primarily interest rate futures and options, were used to manage this portion of the Fund’s duration and yield curve positioning, as well as currency positions, and detracted from returns.
PF Short Duration Bond Fund (sub-advised by T. Rowe Price Associates, Inc.)
Q. How did the Fund perform for the year ended March 31, 2018?
A. For the year ended March 31, 2018, the PF Short Duration Bond Fund’s Class P returned 0.65%, compared to a 0.24% return for its benchmark, the Bloomberg Barclays 1-3 Year U.S. Government/Credit Bond Index.
The following graph compares the performance of a hypothetical $10,000 investment in Class P shares of the Fund to its benchmark for the ten-year period ended March 31, 2018. The Fund’s performance reflects reinvestments of all dividends and capital gains distributions, if any.
Performance Comparison
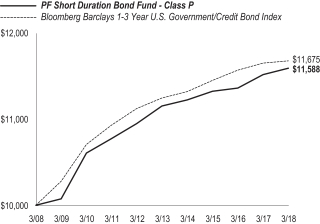
| Average Annual Total Returns for the Periods Ended March 31, 2018 (1) | ||||||||||||
| 1 Year | 5 Years | 10 Years | ||||||||||
Fund’s Class P | 0.65% | 0.77% | 1.48% | |||||||||
Bloomberg Barclays 1-3 Year U.S. Government/Credit Bond Index | 0.24% | 0.76% | 1.56% | |||||||||
| (1) | T. Rowe Price Associates, Inc. began managing the Fund on July 1, 2011, and some investment policies changed at that time. Another firm managed the Fund before that date. |
Performance data shown represents past performance. Investment return and principal value will fluctuate so that shares of the Fund when redeemed may be worth more or less than their original cost. Past performance is not predictive of future performance. | ||||||
| See benchmark definitions on A-27 and A-28 |
A-5
Table of Contents
PACIFIC FUNDS PERFORMANCE DISCUSSION (Continued)
Q. Discuss both positive and negative factors that materially affected the Fund’s performance during the year, including relevant market conditions, investment strategies and techniques, and particular sectors or securities.
A. For the reporting period, the Fund’s Class P outperformed the benchmark. We at T. Rowe Price maintain the Fund’s strategy by investing in debt securities (including derivatives on such securities). In our attempt to seek current income, the strategy focuses on high-quality, investment-grade securities, generally expecting to track the duration of the benchmark (plus or minus a half year), as well as using futures, forwards, and swaps. Furthermore, the Fund will invest in out-of-benchmark securitized sectors to seek incremental yield in the strategy. In addition to making active sector allocation and security selection decisions, we also monitor the Fund’s duration as part of our management of the Fund. Duration is often used to measure a bond’s sensitivity to interest rates.
Sector allocation was the primary contributor to the Fund’s positive relative performance. Our strategic overweight allocation to bonds with 1-3 year maturities, corporate bonds, both investment-grade and crossover bonds (i.e., bonds that are split rated on the lower end of the investment-grade credit ratings spectrum or the higher end of the non-investment-grade ratings spectrum), contributed to the Fund’s relative performance for the reporting period. Solid demand from investors looking for additional yield provided support for short-maturity corporate bonds. As a result, the Fund’s significant overweight to the U.S. investment-grade corporate sector provided a meaningful contribution to relative results. Similarly, the Fund’s out-of-benchmark exposure to securitized sectors: ABS, MBS, and CMBS, also contributed to relative performance. ABS, MBS, and CMBS provide an incremental yield advantage over U.S. Treasuries. The securitized space continues to be supported by positive fundamentals on the heels of a strengthening U.S. economy and positive consumer sentiment. Our corresponding underweight allocation to U.S. Treasury securities helped relative results, as risk assets rallied throughout most of the reporting period.
Yield curve positioning further supported the Fund’s relative performance as our overweight allocation to the intermediate portion of the curve and modest out-of-benchmark exposure to longer maturities outperformed as the curve noticeably flattened over the reporting period amid U.S. rate increases and contained inflation expectations.
Security selection within investment-grade corporates was a modest drag on performance. Select bonds within the health care and financial industries underperformed amid competitive pressures within the pharmaceutical industry.
As of the end of the reporting period, the Fund held interest rate futures and currency forwards generating gross exposure of 28.9%. The Fund also held index credit default swaptions at various points during the reporting period. The estimated impact of employing currency forwards detracted -0.01% and futures detracted -0.29% from returns during the reporting period, and there was a negligible return impact from the use of options.
PF Emerging Markets Debt Fund (sub-advised by Ashmore Investment Management Limited)
Q. How did the Fund perform for the year ended March 31, 2018?
A. For the year ended March 31, 2018, the PF Emerging Markets Debt Fund’s Class P returned 8.76%, compared to a 4.30% return for the broad-based J.P. Morgan Emerging Markets Bond Index (EMBI) Global Diversified Index and 7.55% for the Emerging Markets Debt Composite Benchmark.
The following graph compares the performance of a hypothetical $10,000 investment in Class P shares of the Fund to its benchmarks for the period from inception through March 31, 2018. The Fund’s performance reflects reinvestments of all dividends and capital gains distributions, if any.
Performance Comparison
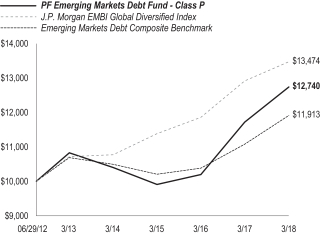
| Average Annual Total Returns for the Periods Ended March 31, 2018 | ||||||||||||
| 1 Year | 5 Years | Since Inception (06/29/12) | ||||||||||
Fund’s Class P | 8.76% | 3.31% | 4.30% | |||||||||
J.P. Morgan EMBI Global Diversified Index | 4.30% | 4.69% | 5.32% | |||||||||
Emerging Markets Debt Composite Benchmark | 7.55% | 2.19% | 3.09% | |||||||||
Performance data shown represents past performance. Investment return and principal value will fluctuate so that shares of the Fund when redeemed may be worth more or less than their original cost. Past performance is not predictive of future performance. | ||
Q. Discuss both positive and negative factors that materially affected the Fund’s performance during the year, including relevant market conditions, investment strategies and techniques, and particular sectors or securities.
A. For the reporting period, the Fund’s Class P outperformed both the broad-based J.P. Morgan EMBI Global Diversified Index and the sector-specific Emerging Markets Debt Composite Benchmark. The Fund invests its assets in debt instruments that are economically tied to emerging market countries, which are issued by governments (sovereigns), government-guaranteed or majority government-owned entities
| See benchmark definitions on A-27 and A-28 |
A-6
Table of Contents
PACIFIC FUNDS PERFORMANCE DISCUSSION (Continued)
(quasi-sovereigns), and government agencies and corporate issuers, and may be denominated in any currency, including the local currency of the issuer. We at Ashmore tactically manage exposure to emerging market sovereign external debt, local currency sovereign debt and corporate debt in seeking to maximize total return consistent with prudent investment management.
Over the reporting period, the Fund’s exposures to the various investment themes were largely consistent, with shifts of 1-2%. The Fund’s allocation to emerging markets sovereign external debt decreased marginally, starting the reporting period at 56% and ending at around 55% of the Fund’s net asset value (NAV). During the reporting period, the Fund’s exposure to corporate debt decreased, starting the reporting period at 7.7% and ending at around 6.4% of NAV. Finally, the Fund’s exposure to local currency debt also decreased, starting the reporting period at 56.6% and ending at around 56% of NAV.
The Fund’s security selection in local currency sovereign debt and sovereign external debt, and the off-benchmark allocation to corporate debt all contributed positively to the Fund’s absolute and relative returns over the reporting period. In the external (government issued) debt space, the top country contributors to performance were Ecuador and Kazakhstan, while the top detractors from performance were Venezuela and Oman. Security selection within local currency assets was the largest contributor to the Fund’s performance, owing notably to long positions in the Brazilian Real and Czech Krona, and successful positioning ahead of important votes in South Africa (the Rand) and Chile (the Peso). Overall, the largest country contributors to Fund performance were South Africa, Ecuador, Brazil, Czech Republic and Chile. The largest country detractor over the reporting period was an overweight position in Venezuela. Positions in Malaysia, Argentina and Colombia also detracted from relative performance.
The Fund’s positions in derivatives are mainly in foreign exchange (FX) forwards – notably to hedge the FX exposure of some local currency bond positions, through interest rates swaps and total return swaps – for efficient portfolio management purposes.
The following are current events from different countries in which the Fund invested that impacted their respective markets during the reporting period. Ecuador’s political transition continued unabated as President Luis Alberto Moreno pursued changes to the country’s political institutions and focused on his anti-corruption agenda. Russian and Brazilian corporate bonds were strong contributors to excess returns as these economies stabilized and corporations focused on de-leveraging their balance sheets. The Czech Krona was one of the strongest performers in the emerging markets foreign currency space during the reporting period, taking its cue from a resurgent Euro and benefitting from the removal of the currency floor that had been the central bank’s preferred stimulus policy until then. The Czech National Bank (CNB) ended up being the only European Central Bank (ECB) to hike rates twice during the reporting period. South Africa delivered strong returns on the back of Cyril Ramaphosa’s election as African National Congress (ANC) president and his subsequent replacement of Jacob Zuma as President of South Africa. Conversely, prices for Venezuelan debt dropped sharply towards the end of the reporting period in response to President Nicolas Maduro’s announcement of efforts to restructure/renegotiate outstanding debt early in November of 2017. This led to some underperformance in the Fund despite strong mitigants from security selection and trading strategies. Mexico lagged over the reporting period on the back of a combination of weaker growth reported and continued concerns about the outcome of the North American Free Trade Agreement (NAFTA) renegotiations. Malaysia performed better than expected, and the Fund’s underweight position led to some modest underperformance.
PF Comstock Fund (sub-advised by Invesco Advisers, Inc.)
Q. How did the Fund perform for the year ended March 31, 2018?
A. For the year ended March 31, 2018, the PF Comstock Fund’s Class P returned 12.13%, compared to a 6.95% return for its benchmark, the Russell 1000 Value Index.
The following graph compares the performance of a hypothetical $10,000 investment in Class P shares of the Fund to its benchmark for the ten-year period ended March 31, 2018. The Fund’s performance reflects reinvestments of all dividends and capital gains distributions, if any.
Performance Comparison
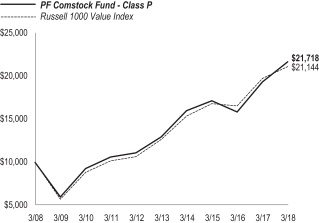
| Average Annual Total Returns for the Periods Ended March 31, 2018 (1) | ||||||||||||
| 1 Year | 5 Years | 10 Years | ||||||||||
Fund’s Class P | 12.13% | 10.83% | 8.06% | |||||||||
Russell 1000 Value Index | 6.95% | 10.78% | 7.78% | |||||||||
| (1) | Invesco Advisers, Inc. began managing the Fund on June 1, 2010. Another firm managed the Fund before that date. |
Performance data shown represents past performance. Investment return and principal value will fluctuate so that shares of the Fund when redeemed may be worth more or less than their original cost. Past performance is not predictive of future performance. | ||||||
| See benchmark definitions on A-27 and A-28 |
A-7
Table of Contents
PACIFIC FUNDS PERFORMANCE DISCUSSION (Continued)
Q. Discuss both positive and negative factors that materially affected the Fund’s performance during the year, including relevant market conditions, investment strategies and techniques, and particular sectors or securities.
A. For the reporting period, the Fund’s Class P outperformed the benchmark. We primarily focus on a security’s potential for long-term growth of capital, emphasizing a value style of investing, seeking well-established, undervalued companies, which may be medium or large-sized companies. As financial markets tend to focus on short-term factors, stock prices often fail to reflect the intrinsic value of companies. We at Invesco believe that longer-term investors can take advantage of pricing anomalies in financial markets by purchasing stocks of companies that are currently underpriced. We employ a strategy that aims to exploit these market inefficiencies by investing in companies that appear undervalued relative to the market in general. Ultimately, we believe that the market will recognize the value in these companies and will sell them as their stock price begins to reflect their intrinsic value.
For the reporting period, most broad U.S. equity market indices delivered double-digit gains, with the exception of value stocks, delivering single digit gains. As a group, value underperformed growth stocks across market capitalizations. Sector performance within the benchmark was mixed with information technology, financials and materials sectors posting double-digit returns and telecommunication services, real estate, consumer staples and energy posting negative returns.
Stock selection in and an overweight exposure to information technology sector were the largest contributors to Fund performance relative to the benchmark. Notably, within banks, Citigroup and Bank of America performed well for the reporting period, outperforming the sector and the benchmark. Within diversified financials, Ally Financial and Morgan Stanley were top performers. These companies benefited from investor optimism about higher interest rates, improving economy and newly passed tax reform. Financials also benefited when the Fed’s Comprehensive Capital Analysis and Review in June 2017 was better than expected, providing a favorable view of the financial strength of U.S. banks.
Strong stock selection in and an overweight exposure to the information technology sector also boosted the Fund’s relative performance for the reporting period. Within hardware and equipment, NetApp and Cisco Systems were large contributors to relative Fund performance. Software and services companies PayPal and Microsoft were also large contributors to the Fund’s relative performance. NetApp’s stock rallied in November 2017 after reporting earnings that far exceeded expectations due to strong customer demand in cloud tools and flash storage devices.
Stock selection and an underweight to consumer staples also boosted relative performance, mainly from what the Fund did not own. Not owning large benchmark holdings, Proctor & Gamble and Philip Morris International, helped relative performance, as those stocks underperformed the sector and benchmark for the reporting period.
Stock selection in energy stocks was also a large driver of Fund performance, with Royal Dutch Shell being a top contributor to relative returns. Another large driver of relative Fund performance was having no exposure to Exxon Mobile or Schlumberger.
Being materially underweight in the telecommunication services sector and having no exposure to the real estate sector also helped relative Fund performance. The team has kept the Fund underweight in these sectors based on the opinion that valuations are unattractive.
Stock selection within the industrials sector also contributed to Fund performance relative to the benchmark. Notably, Caterpillar was a large contributor with returns of over 60% for the reporting period. Caterpillar reported consecutive quarters of improving revenue and profits and analysts upgraded the stock on projected strong demand for construction equipment. Being underweight to General Electric also aided relative Fund performance, as the stock posted double-digit negative returns for the reporting period.
We used currency forward contracts during the reporting period for the purpose of hedging currency exposure of non-U.S.-based companies held in the Fund. Derivatives were used solely for the purpose of hedging and not for speculative purposes or leverage. The use of currency forward contracts had a negative impact on the Fund’s performance relative to the benchmark for the reporting period.
Stock selection within the consumer discretionary sector also detracted from Fund performance relative to the benchmark. Strong gains in Carnival Cruise were offset by poor performance from Advance Auto Parts when the company’s stock price fell after missing earnings expectations and management projecting a drop in same-store-sales due to industry headwinds.
The Fund’s cash position, while less than 3.5% on average during the reporting period, was a detractor from relative Fund performance given the strong equity market.
At the close of the reporting period, the Fund’s financials sector weighting was overweight to the benchmark, as we have a favorable view of large banks within financials. We are also overweight the energy sector versus the benchmark and maintain a constructive view on the long–term prospects for our energy holdings, as we believe supply and demand for oil is expected to balance over time. Therefore, the Fund is expected to be more sensitive to broad moves within these sectors for the foreseeable future.
| See benchmark definitions on A-27 and A-28 |
A-8
Table of Contents
PACIFIC FUNDS PERFORMANCE DISCUSSION (Continued)
PF Developing Growth Fund (sub-advised by Lord, Abbett & Co. LLC)
Q. How did the Fund perform for the year ended March 31, 2018?
A. For the year ended March 31, 2018, the PF Developing Growth Fund’s Class P returned 29.04%, compared to a 18.63% return for its benchmark, the Russell 2000 Growth Index.
The following graph compares the performance of a hypothetical $10,000 investment in Class P shares of the Fund to its benchmark for the ten-year period ended March 31, 2018. The Fund’s performance reflects reinvestments of all dividends and capital gains distributions, if any.
Performance Comparison
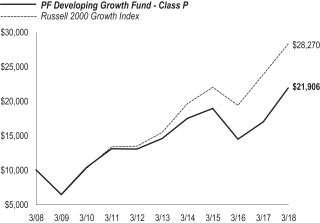
| Average Annual Total Returns for the Periods Ended March 31, 2018 (1) | ||||||||||||
| 1 Year | 5 Years | 10 Years | ||||||||||
Fund’s Class P | 29.04% | 8.49% | 8.16% | |||||||||
Russell 2000 Growth Index | 18.63% | 12.90% | 10.95% | |||||||||
| (1) | Effective October 31, 2016, the Fund changed its name from PF Small-Cap Growth Fund. Lord, Abbett & Co. LLC began managing the Fund on May 1, 2014 and some investment policies changed at that time. Other firms managed the Fund before that date. |
Performance data shown represents past performance. Investment return and principal value will fluctuate so that shares of the Fund when redeemed may be worth more or less than their original cost. Past performance is not predictive of future performance. | ||||||
Q. Discuss both positive and negative factors that materially affected the Fund’s performance during the year, including relevant market conditions, investment strategies and techniques, and particular sectors or securities.
A. For the reporting period, the Fund’s Class P outperformed the benchmark. The Fund seeks to own small-capitalization growth companies that we at Lord Abbett believe have above-average long-term growth potential, including companies that can transform markets through innovative products and services.
The leading contributor to the Fund’s relative performance during the reporting period was security selection in the information technology sector. Within this sector, the Fund’s holdings of GrubHub, Inc., an operator of an online and mobile food service platform, contributed to relative performance. Shares of GrubHub rose as investors were optimistic about its acquisition and integration of Orderup, Foodler and Eat24. Additionally, it announced a strategic partnership with Yum! Brands. The partnership would expand GrubHub’s delivery services to a large portion of iconic restaurant chains such as Taco Bell, KFC, and Pizza Hut. Another contributor within this sector during the reporting period was the Fund’s position in 2U, Inc., a provider of cloud based software-as-a-service platforms for colleges and universities. Shares of 2U rose as investors were optimistic about the announcement of its strategic partnership with co-working company WeWork, which would provide 2U a new marketing outlet and access to WeWork’s worldwide network of facilities.
Additionally, security selection within the consumer discretionary sector was a major contributor to the Fund’s performance during the reporting period. Specifically, the Fund’s holding of Planet Fitness, Inc., an operator of fitness center franchises, contributed. Shares of Planet Fitness rose as it saw an increase in its Black Card Membership program, which carries a higher membership fee versus its traditional monthly membership. The Fund’s position in Canada Goose Holdings, an outerwear retailer, contributed to performance. Shares of Canada Goose rose throughout the reporting period as it reported its fourth consecutive beat of sales and earnings estimates and continued to be one of the best growth prospects in its industry.
Security selection within the health care sector also positively impacted the Fund’s relative performance during the reporting period. Within this sector, Insulet Corp., a medical device company focused on the development of insulin systems for individuals with diabetes, contributed to performance. Shares of Insulet gained as strong execution throughout the reporting period in all of its business segments helped growth. Additionally, it announced a new agreement with UnitedHealth, which would allow UnitedHealth patients’ in-network coverage of Omnipod, Insulet’s Type 1 diabetes monitoring system.
The leading detractor from the Fund’s performance relative to the benchmark during the reporting period was security selection within the materials sector. Within this sector, the Fund’s positioning in United States Steel Co., a producer of steel products, detracted from performance. Shares of United Sates Steel fell as increases in maintenance costs and the acceleration of its asset revitalization program led to a significant increase in total capital spending, which negatively impacted earnings. The Fund’s position in AK Steel Holding Corp., an operator of steel making and metallurgical coal plants, also detracted from performance. Shares of AK Steel were adversely affected by increased raw material costs, which put near-term pressure on the company’s pricing and margins. Additionally, the lack of progress on an infrastructure spending bill and the current administration’s delay in prioritizing an investigation into steel imports’ impact on national security, were also headwinds.
| See benchmark definitions on A-27 and A-28 |
A-9
Table of Contents
PACIFIC FUNDS PERFORMANCE DISCUSSION (Continued)
Security selection and an overweight in the financials sector were detractors from the Fund’s performance relative to the benchmark during the reporting period. Within this sector, the Fund’s holdings of Chemical Financial Corp., a diversified financial holding company, detracted, as it reported first quarter 2017 earnings that were below consensus estimates due to higher expenses & fees and lower net interest income.
PF Growth Fund (sub-advised by MFS Investment Management)
Q. How did the Fund perform for the year ended March 31, 2018?
A. For the year ended March 31, 2018, the PF Growth Fund’s Class P returned 25.93%, compared to a 21.25% return for its benchmark, the Russell 1000 Growth Index.
The following graph compares the performance of a hypothetical $10,000 investment in Class P shares of the Fund to its benchmark for the ten-year period ended March 31, 2018. The Fund’s performance reflects reinvestments of all dividends and capital gains distributions, if any.
Performance Comparison
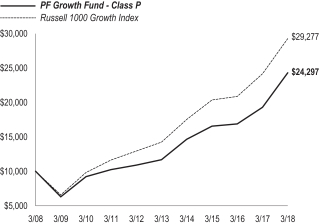
| Average Annual Total Returns for the Periods Ended March 31, 2018 (1) | ||||||||||||
| 1 Year | 5 Years | 10 Years | ||||||||||
Fund’s Class P | 25.93% | 15.75% | 9.28% | |||||||||
Russell 1000 Growth Index | 21.25% | 15.53% | 11.34% | |||||||||
| (1) | MFS Investment Management began managing the Fund on May 1, 2013, and some investment policies changed at that time. Another firm managed the Fund before that date. |
Performance data shown represents past performance. Investment return and principal value will fluctuate so that shares of the Fund when redeemed may be worth more or less than their original cost. Past performance is not predictive of future performance. | ||||||
Q. Discuss both positive and negative factors that materially affected the Fund’s performance during the year, including relevant market conditions, investment strategies and techniques, and particular sectors or securities.
A. For the reporting period, the Fund’s Class P outperformed the benchmark. The Fund normally invests primarily in common stocks, focusing on investing the Fund’s assets in the stocks of companies that we, the MFS investment management team, believe to have above average earnings growth potential compared to other companies (also called growth companies). We build the Fund from the bottom up, selecting companies with the best opportunities for growth two to three years into the future. When applying the Fund’s valuation analysis, we consider the magnitude and potential growth rate of a company against what the market has discounted. At the sector level, we typically limit significant over- and under-weights relative to the benchmark, allowing bottom-up stock selection to drive performance results over time.
Stock selection and, to a lesser extent, an underweight allocation to the communications sector contributed to the Fund’s performance relative to the benchmark. Within this sector, an overweight position in internet television show and movie subscription services provider Netflix and not holding shares of entertainment giant Walt Disney strengthened relative performance.
Stock selection and, to a lesser extent, an overweight allocation to both the technology and financial sectors contributed to relative performance. Within the technology sector, the Fund’s overweight positions in software company Adobe Systems and computer graphics processors maker NVIDIA, and not holding shares of diversified technology products and services company International Business Machines (IBM), contributed to relative results. Within the financial sector, overweight positions in debit and credit transaction processing company Mastercard and payments technology firm Visa Inc. contributed to relative results.
Stock selection within the consumer, cyclical sector further contributed to relative performance led by the Fund’s overweight position in online retailer and web services provider Amazon.com.
Elsewhere, not holding shares of tobacco company Altria Group and poor-performing diversified industrial conglomerate General Electric benefited relative returns.
The Fund’s underweight position in the industrial sector detracted from relative performance. Within this sector, not holding shares of strong-performing aerospace company Boeing and an overweight position in underperforming construction materials producer Vulcan Materials weighed on relative returns.
Stocks in other sectors that detracted from relative results included the Fund’s overweight positions in tobacco company Philip Morris International, specialty pharmaceutical company Allergan (security not held at reporting period end), biopharmaceutical firm Celgene, credit reporting agency Equifax (security not held at reporting period end), medical device maker Medtronic and apparel retailer Ross Stores. In addition, not holding shares of research-based biopharmaceutical company Abbvie detracted from relative returns.
| See benchmark definitions on A-27 and A-28 |
A-10
Table of Contents
PACIFIC FUNDS PERFORMANCE DISCUSSION (Continued)
The Fund’s cash and/or cash equivalents position during the reporting period detracted from relative performance. Under normal market conditions, the Fund strives to be fully invested and generally holds cash to buy new holdings and to provide liquidity. In a period when markets rose, as measured by the Fund’s benchmark, holding cash hurt performance versus the benchmark, which has no cash position.
PF Large-Cap Growth Fund (sub-advised by BlackRock Investment Management, LLC)
Q. How did the Fund perform for the year ended March 31, 2018?
A. For the year ended March 31, 2018, the PF Large-Cap Growth Fund’s Class P returned 28.46%, compared to a 21.25% return for its benchmark, the Russell 1000 Growth Index.
The following graph compares the performance of a hypothetical $10,000 investment in Class P shares of the Fund to its benchmark for the ten-year period ended March 31, 2018. The Fund’s performance reflects reinvestments of all dividends and capital gains distributions, if any.
Performance Comparison
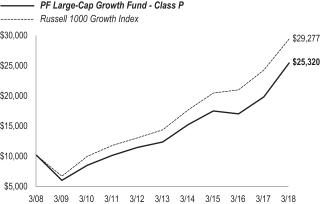
| Average Annual Total Returns for the Periods Ended March 31, 2018 (1) | ||||||||||||
| 1 Year | 5 Years | 10 Years | ||||||||||
Fund’s Class P | 28.46% | 15.68% | 9.74% | |||||||||
Russell 1000 Growth Index | 21.25% | 15.53% | 11.34% | |||||||||
| (1) | BlackRock Investment Management, LLC began managing the Fund on May 1, 2013, and some investment policies changed at that time. Other firms managed the Fund before that date. |
Performance data shown represents past performance. Investment return and principal value will fluctuate so that shares of the Fund when redeemed may be worth more or less than their original cost. Past performance is not predictive of future performance. | ||||||
Q. Discuss both positive and negative factors that materially affected the Fund’s performance during the year, including relevant market conditions, investment strategies and techniques, and particular sectors or securities.
A. For the reporting period, the Fund’s Class P outperformed the benchmark. We, the BlackRock portfolio management team, implement the Fund’s investment strategy by investing in large-capitalization companies that we believe possess dominant market positions or franchises, a major technological edge, or a unique competitive advantage.
In sector terms, consumer discretionary and information technology were the largest contributors to the Fund’s relative performance during the reporting period. Internet & direct marketing retail holdings and an underweight to media drove gains within consumer discretionary, while internet software & services accounted for the majority of the outperformance in information technology. Stock selection and an underweight to the consumer staples sector also proved advantageous. Conversely, industrials and financials detracted from performance during the reporting period. Weakness among electrical equipment and professional services holdings, coupled with an underweight to aerospace & defense, hindered returns in industrials. Within financials, banks were the main drag on performance. An overweight to energy also weighed, albeit to a lesser degree.
At the stock level, the conglomerate Tencent Holdings Ltd., electronic commerce company Amazon.com Inc. and entertainment company Netflix Inc. were the top individual contributors to the Fund’s performance. Additional contributors included Alibaba Group Holding Ltd., Adobe Systems Inc. and Constellation Brands Inc.
The largest detractors from the Fund’s relative performance during the reporting period were positions in pharmaceutical company Alexion Pharmaceuticals Inc. and credit reporting agency Equifax Inc, as well as zero exposure to aircraft manufacturer Boeing Co.
Looking forward, we maintain our positive outlook for U.S. equities as a whole. Our view rests on a combination of sustained and accelerating growth for the domestic economy, still-low (albeit gradually rising) interest rates and low and stable inflation. Moreover, we believe that robust corporate earnings look set to continue in 2018 and may get an added boost from recently-passed tax legislation. We remain cautiously optimistic given the benign economic environment and the relatively positive company fundamental backdrop. In our view, this coupled with a resurgence in business, consumer and investor optimism, should allow for stocks to move higher again this year, notwithstanding the recent spate of volatility.
Though some investors worry about high short-term valuations, we continue to find opportunities in best-in-class growth business models with strong earnings and sustainable and growing free cash flow. As always, we will look to take advantage of any incremental volatility to upgrade the Fund’s portfolio, adding to our favorite business models on weakness and/or acquiring new names where the risk/reward is compelling.
From a positioning standpoint, at the end of the reporting period, the Fund’s largest sector overweight relative to the benchmark was consumer discretionary, followed by information technology and financials. Industrials was the largest sector underweight, followed by consumer staples and real estate.
| See benchmark definitions on A-27 and A-28 |
A-11
Table of Contents
PACIFIC FUNDS PERFORMANCE DISCUSSION (Continued)
PF Large-Cap Value Fund (sub-advised by ClearBridge Investments, LLC)
Q. How did the Fund perform for the year ended March 31, 2018?
A. For the year ended March 31, 2018, the PF Large-Cap Value Fund’s Class P returned 6.01%, compared to a 6.95% return for its benchmark, the Russell 1000 Value Index.
The following graph compares the performance of a hypothetical $10,000 investment in Class P shares of the Fund to its benchmark for the ten-year period ended March 31, 2018. The Fund’s performance reflects reinvestments of all dividends and capital gains distributions, if any.
Performance Comparison
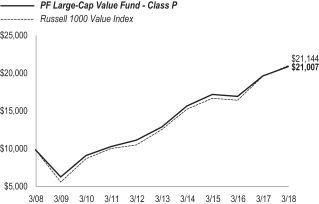
| Average Annual Total Returns for the Periods Ended March 31, 2018 | ||||||||||||
| 1 Year | 5 Years | 10 Years | ||||||||||
Fund’s Class P | 6.01% | 10.00% | 7.71% | |||||||||
Russell 1000 Value Index | 6.95% | 10.78% | 7.78% | |||||||||
Performance data shown represents past performance. Investment return and principal value will fluctuate so that shares of the Fund when redeemed may be worth more or less than their original cost. Past performance is not predictive of future performance. | ||||||
Q. Discuss both positive and negative factors that materially affected the Fund’s performance during the year, including relevant market conditions, investment strategies and techniques, and particular sectors or securities.
A. For the reporting period, the Fund’s Class P underperformed the benchmark. We, the ClearBridge large-capitalization value team, utilize an interactive, research-driven approach to identify large-capitalization companies with what we believe to be strong business franchises and attractive valuations. We look for companies with proven business models and sustainable competitive advantages capable of generating superior returns over time across a range of potential scenarios. We place an emphasis on higher certainty of near- and medium-term cash flows, while discounting earnings from emerging business models or products. The investment process relies on critically important valuation work focusing on each company’s regular earnings capability, separating out the effects from one-time events, business and economic cycles, and anomalies that can skew results. We refer to this as assumptions about normalized earnings power.
Relative to the benchmark, overall sector allocation contributed to performance for the reporting period. The Fund’s stock selection in the industrials, real estate and energy sectors contributed the most to relative performance for the reporting period. In terms of allocation, the Fund’s underweight position in the telecommunication services and real estate sectors and overweight position in the materials and financials sector contributed to relative performance for the reporting period. On an individual stock basis, the leading contributors to relative performance included positions in Microsoft and TE Connectivity in the information technology sector, Progressive in the financial sector, Anthem in the health care sector and General Electric in the industrials sector.
Relative to the benchmark, overall stock selection detracted from performance for the reporting period. The Fund’s stock selection in the consumer discretionary, materials, financials, information technology and consumer staples sectors also detracted from relative performance. On an individual stock basis, the leading detractors from relative Fund performance for the reporting period included our holdings in DISH Network in the consumer discretionary sector, Teva Pharmaceutical in the health care sector, CVS Health and British American Tobacco in the consumer staples sector and Oracle and Nuance in the information technology sector.
During the reporting period, we established new positions in McCormick in the consumer staples sector, PPG Industries in the materials sector and Oracle in the information technology sector. Additionally, existing Fund holding Reynolds American was acquired by British American Tobacco in a cash and stock transaction. We maintained our new position in British American Tobacco. Furthermore, we exited our positions in Crown Holdings in the materials sector, General Electric in the industrials sector, International Business Machines and Nuance Communications in the information technology sector, SES S.A. in the consumer discretionary sector and Teva Pharmaceutical in the health care sector during the reporting period.
| See benchmark definitions on A-27 and A-28 |
A-12
Table of Contents
PACIFIC FUNDS PERFORMANCE DISCUSSION (Continued)
PF Main Street Core Fund (sub-advised by OppenheimerFunds, Inc.)
Q. How did the Fund perform for the year ended March 31, 2018?
A. For the year ended March 31, 2018, the PF Main Street Core Fund’s Class P returned 7.12%, compared to a 13.99% return for its benchmark, the S&P 500 Index.
The following graph compares the performance of a hypothetical $10,000 investment in Class P shares of the Fund to its benchmark for the ten-year period ended March 31, 2018. The Fund’s performance reflects reinvestments of all dividends and capital gains distributions, if any.
Performance Comparison
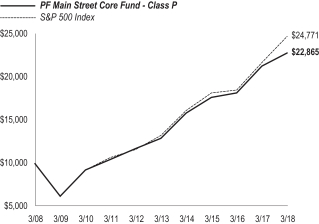
| Average Annual Total Returns for the Periods Ended March 31, 2018 | ||||||||||||
| 1 Year | 5 Years | 10 Years | ||||||||||
Fund’s Class P | 7.12% | 12.07% | 8.62% | |||||||||
S&P 500 Index | 13.99% | 13.31% | 9.49% | |||||||||
Performance data shown represents past performance. Investment return and principal value will fluctuate so that shares of the Fund when redeemed may be worth more or less than their original cost. Past performance is not predictive of future performance. | ||||||
Q. Discuss both positive and negative factors that materially affected the Fund’s performance during the year, including relevant market conditions, investment strategies and techniques, and particular sectors or securities.
A. For the reporting period the Fund’s Class P underperformed the benchmark. We, the Oppenheimer Main Street Core team, strive to keep the Fund in an “all-weather” orientation. Whether rates, commodity prices, currencies or even whole economies go up or down, our goal is to have a portfolio that can outperform no matter the environment. We seek to identify companies with sustainable competitive advantages. Second, we seek to identify company management teams that we believe are likely to successfully execute on their plans. Lastly, we seek to correctly value stocks and to see what expectations the market is pricing in. We typically weight the Fund more heavily towards companies that we believe have structural competitive advantages and/or management teams that are executing (e.g., gaining market share, expanding profit margins), with at least reasonable stock valuations. In our view, companies with these qualities generally have more stable earnings. We use a fundamental research and quantitative models to select securities for the Fund, which is comprised of both growth and value stocks. We seek to maintain a broadly diversified portfolio across all major economic sectors by applying investment parameters for both sector and position size.
The Fund underperformed the benchmark due mainly to stock selection in the industrials, consumer discretionary, health care, information technology, utilities, consumer staples, and materials sectors. The Fund outperformed the benchmark in the financials, energy, and telecommunication services sectors, due mainly to stronger relative stock selection.
Holdings that detracted from the Fund’s performance included General Electric (industrials), PG&E Corp. (utilities), Kraft Heinz (consumer staples), Celgene (health care), and Magellan Midstream Partners, L.P. (energy). Not owning Amazon.com (consumer discretionary) also negatively impacted performance versus the benchmark, as the company performed well during the reporting period.
General Electric has struggled to generate free cash flow and underwent a CEO change in November 2017. There was further pessimism after the November investor meeting as investors felt the restructuring plan outlined was not aggressive enough and the company also announced a dividend cut. In addition, the SEC started looking into the company’s accounting practices after the company disclosed a large charge related to its insurance business. We have reduced this position due to uncertainty around future free cash flow and potential restructuring moves.
PG&E is one of the largest utility companies in California. The stock experienced pressure during the reporting period due to concerns that the company could potentially be at fault for some of the fires in northern California. The stock saw further pressure after the company announced it would be suspending the dividend to preserve cash for potential future claims.
Kraft, and consumer packaged goods companies in general, faced volume and pricing headwinds, which negatively impacted the stock this reporting period.
Celgene experienced significant weakness in October after lowering guidance for 2017 and longer-term through 2020. This was primarily due to lower expected revenues from Otezla, a drug treating certain types of arthritis. Secondarily, there was disappointment due to the withdrawal of a pipeline drug.
Master Limited Partnerships (MLPs) in the energy sector were strongly out of favor in the first quarter and Magellan was also down. Three reasons for the underperformance included the following: 1) Fear of interest rates rising faster and/or further (MLPs are largely owned for their relatively high yields), 2) Tax reform reduced the relative tax advantage of the MLP structure, and 3) A regulatory ruling in mid-March that will
| See benchmark definitions on A-27 and A-28 |
A-13
Table of Contents
PACIFIC FUNDS PERFORMANCE DISCUSSION (Continued)
cause pipeline rates to fall for certain types of pipelines spooked MLP investors. There is no getting around points #1 and #2. But on point #3, we believe Magellan appears to be the baby in the dirty bathwater given the regulatory change does not affect the types of pipes the company owns.
Top contributors to performance this reporting period included Alphabet (information technology), Apple (information technology), and PayPal Holdings (information technology).
Alphabet benefitted from the generally robust relative strength of the large-cap “growth” tech names during the reporting period as well strong company fundamentals.
Apple performed well after earnings reports eased prior fears of mediocre product acceptance. Sales of the new iPhone X were strong and the company displayed pricing power as well. The initial enthusiasm around iPhone X sales has waned somewhat more recently, but the stock performed positively during this reporting period.
PayPal has continued to benefit from strong revenue growth driven by impressive customer acquisition and engagement, as well as the secular tailwinds of electronic payments and e-commerce spending.
As of the end of the reporting period, the Fund had overweight positions in the financials, health care, and materials sectors. The Fund had underweight positions in the real estate, consumer discretionary, industrials, information technology, telecommunication services, consumer staples, energy, and utilities sectors.
PF Mid-Cap Equity Fund (sub-advised by Scout Investments, Inc.)
Q. How did the Fund perform for the year ended March 31, 2018?
A. For the year ended March 31, 2018, the PF Mid-Cap Equity Fund’s Class P returned 16.31%, compared to a 12.20% return for its benchmark, the Russell Midcap Index.
The following graph compares the performance of a hypothetical $10,000 investment in Class P shares of the Fund to its benchmark for the ten-year period ended March 31, 2018. The Fund’s performance reflects reinvestments of all dividends and capital gains distributions, if any.
Performance Comparison
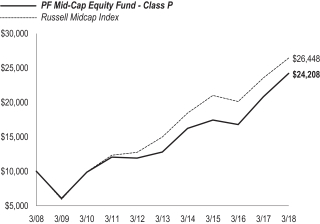
| Average Annual Total Returns for the Periods Ended March 31, 2018 (1) | ||||||||||||
| 1 Year | 5 Years | 10 Years | ||||||||||
Fund’s Class P | 16.31% | 13.59% | 9.24% | |||||||||
Russell Midcap Index | 12.20% | 12.09% | 10.21% | |||||||||
| (1) | Scout Investments, Inc. began managing the Fund on January 1, 2013, and some investment policies changed at that time. Another firm managed the Fund before that date. |
Performance data shown represents past performance. Investment return and principal value will fluctuate so that shares of the Fund when redeemed may be worth more or less than their original cost. Past performance is not predictive of future performance. | ||||||
Q. Discuss both positive and negative factors that materially affected the Fund’s performance during the year, including relevant market conditions, investment strategies and techniques, and particular sectors or securities.
A. For the reporting period, the Fund’s Class P outperformed the benchmark. We at Scout maintain the Fund’s strategy, which is keenly focused on individual stock selection, by investing Fund assets primarily in equity securities of companies with medium market capitalizations. We seek to invest in the securities of companies that we believe are expected to benefit from either macroeconomic or company-specific factors, and that are attractively priced relative to their fundamentals. The strategy favors stocks with positive cash flows, strong balance sheets, attractive valuations, and fundamental top-down (macroeconomic or political changes) or bottom-up (company-specific) catalysts to unlock that value, while selecting away from those stocks that the strategy perceives to be exposed to unnecessary risk factors. The Fund generally owns stocks of companies that may be considered either “value” or “growth” companies.
Stock selection in seven out of eleven sectors contributed to the Fund’s outperformance during the reporting period, with positive contributions from the information technology, health care, industrials, consumer discretionary, financials, materials, and utilities sectors. The real estate, energy, telecommunications, and consumer staples sectors were a drag on overall stock selection during the reporting period.
Overall, sector allocation was a detractor to relative performance during the reporting period, primarily due to the Fund’s cash allocation which caused a drag due to strong equity returns. Additionally, the Fund’s underweight position in the financials sector had the largest negative impact on performance during the reporting period among the sectors. The underweight position in real estate had the largest positive impact,
| See benchmark definitions on A-27 and A-28 |
A-14
Table of Contents
PACIFIC FUNDS PERFORMANCE DISCUSSION (Continued)
followed by an overweight position in information technology and an underweight position in telecommunication services. All other sectors had a minimal impact on relative performance.
The health care sector performance benefited from a rally in ABIOMED, Inc., the Fund’s top contributor during the reporting period, as investors continued to appreciate ABIOMED’s near monopoly market position in small cardiovascular pumps, and the growth potential of this business. Informational technology and consulting services company DXC Technologies Co., was also a positive contributor during the reporting period, as cost reductions continue following its merger with Hewlett Packard Enterprise Services. DXC capped the reporting period with a quarterly report that beat expectations on both cost controls and revenue. Growth in digital solutions also provided upside. IPG Photonics Corp. posted strong performance during the reporting period as they continued to be a market leader in the new generation of laser cutting technology which is becoming more prevalent in manufacturing.
The detractors from performance during the reporting period were an eclectic group consisting of real estate investment trust, an energy company, and an airline, namely billboard operator Outfront Media Inc., Pioneer Natural Resources Co., and Alaska Air Group Inc. Outfront suffered from a weak national advertising market for billboards, and from rising interest rates in the U.S. which hurt investor sentiment in the sector. Pioneer Natural Resources was hurt by a newly discovered water pressure issue in the Permian Basin, found only in areas where there are numerous legacy vertical wells in production. Since some of Pioneer’s best acreage is found in this region, the stock suffered despite engineering solutions implemented by Pioneer. In addition, well costs are expected to increase due to increased engineering, thus lowering the return on investment. Alaska Air struggled with rising labor costs, merger integration issues, and weaker investor sentiment regarding airlines as competition fears increased due to rising capacity growth. We believe travel demand growth remains strong and airlines could benefit from lower U.S. corporate taxes.
PF Mid-Cap Value Fund (sub-advised by Boston Partners Global Investors, Inc.)
Q. How did the Fund perform for the year ended March 31, 2018?
A. For the year ended March 31, 2018, the PF Mid-Cap Value Fund’s Class P returned 10.36%, compared to a 6.50% return for its benchmark, the Russell Midcap Value Index.
The following graph compares the performance of a hypothetical $10,000 investment in Class P shares of the Fund to its benchmark for the period from inception through March 31, 2018. The Fund’s performance reflects reinvestments of all dividends and capital gains distributions, if any.
Performance Comparison
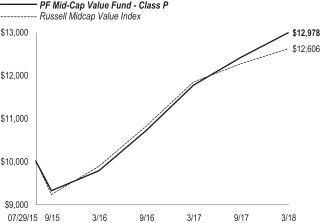
| Average Annual Total Returns for the Periods Ended March 31, 2018 | ||||||||
| 1 Year | Since Inception (07/29/15) | |||||||
Fund’s Class P | 10.36% | 10.24% | ||||||
Russell Midcap Value Index | 6.50% | 9.06% | ||||||
Performance data shown represents past performance. Investment return and principal value will fluctuate so that shares of the Fund when redeemed may be worth more or less than their original cost. Past performance is not predictive of future performance. | ||||||
Q. Discuss both positive and negative factors that materially affected the Fund’s performance during the year, including relevant market conditions, investment strategies and techniques, and particular sectors or securities.
A. For the reporting period, the Fund’s Class P outperformed the benchmark. Under normal market conditions, the Fund invests primarily in common stock of mid-capitalization U.S. companies that we, the management team at Boston Partners, identify as having value characteristics along with strong business fundamentals and positive business momentum. In selecting investments for the Fund, various factors are examined in order to determine the value characteristics of an issuer, including price-to-earnings ratios and price-to-book value ratios. These value characteristics are examined in the context of the issuer’s fundamentals and business momentum, such as operating return on assets, earnings growth, and cash flow. Securities for the Fund are selected based on a continuous study of trends in industries and companies, including the anticipated stability of earnings.
During the reporting period, the Fund maintained an overweight position in the technology and finance sectors, which benefitted the Fund. The technology overweight of approximately 11% as well as strong stock selection in this sector were the primary contributors to relative performance. Computer equipment and services companies such as DXC Technology and NetApp appreciated during the reporting period, and the tech industry overall has continued to benefit from positive business momentum. Stock selection was also strong in the finance sector, where merger & acquisition activity in the insurance industry produced several outperformers. Most notable were XL Group and Validus Holdings, which both jumped over 40% on the news that they are to be acquired by AXA and American International Group, respectively. The Fund’s other insurance holdings such as Aon, Allstate, and Everest Re also benefitted as the industry was subsequently revalued upwards by
| See benchmark definitions on A-27 and A-28 |
A-15
Table of Contents
PACIFIC FUNDS PERFORMANCE DISCUSSION (Continued)
investors. Among financial services companies, TD Ameritrade performed strongly as the combination of an inexpensive valuation, strong asset growth, rising markets, and margin expansion opportunities from the recent Scottrade acquisition drove the shares higher.
Stock selection in the consumer services and utilities sectors detracted from returns during the reporting period. Our lack of exposure to the inexpensive soft good retailers like Kohl’s and Dollar General Corporation, as well as to hotel and cruise companies like MGM Resorts and Royal Caribbean Cruises, detracted from the Fund’s relative return as these industries performed well despite their uneven business momentum. In utilities, holding PG&E detracted from returns as the company battled liability fears over the California wildfires in 2017. We had sold out of the stock at the end of 2017, but re-initiated a position in March 2018 as the company’s valuation profile became more favorable in our view.
Throughout the reporting period, the low growth and high dividend yielding areas of the market such as real estate and utilities continued to underperform as investors generally remained optimistic about global growth and the prospects for rising interest rates. Our underweight to these sectors contributed to relative returns over the reporting period. Technology and finance have benefitted from positive business momentum and tax reform, and our overweight positioning also helped relative performance. While our underweight to consumer services detracted marginally from relative returns, overall our sector allocation contributed to relative returns during the reporting period.
PF Small-Cap Value Fund (sub-advised by AllianceBernstein L.P.)
Q. How did the Fund perform for the year ended March 31, 2018?
A. For the year ended March 31, 2018, the PF Small-Cap Value Fund’s Class P returned 6.54%, compared to a 5.13% return for its benchmark, the Russell 2000 Value Index.
The following graph compares the performance of a hypothetical $10,000 investment in Class P shares of the Fund to its benchmark for the ten-year period ended March 31, 2018. The Fund’s performance reflects reinvestments of all dividends and capital gains distributions, if any.
Performance Comparison
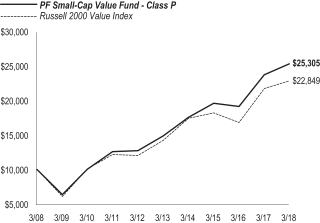
| Average Annual Total Returns for the Periods Ended March 31, 2018 (1) | ||||||||||||
| 1 Year | 5 Years | 10 Years | ||||||||||
Fund’s Class P | 6.54% | 11.21% | 9.73% | |||||||||
Russell 2000 Value Index | 5.13% | 9.96% | 8.61% | |||||||||
| (1) | AllianceBernstein L.P. began managing the Fund on May 1, 2014 and some investment policies changed at that time. Another firm managed the Fund before that date. |
Performance data shown represents past performance. Investment return and principal value will fluctuate so that shares of the Fund when redeemed may be worth more or less than their original cost. Past performance is not predictive of future performance. | ||||||
Q. Discuss both positive and negative factors that materially affected the Fund’s performance during the year, including relevant market conditions, investment strategies and techniques, and particular sectors or securities.
A. For the reporting period, the Fund’s Class P outperformed the benchmark. We at AllianceBernstein maintain the Fund’s investment objective by seeking long-term growth of capital. The Fund seeks out-of-favor small-capitalization stocks with attractive long-term earnings prospects that the Fund’s investment team believes are undervalued. We believe that small-capitalization stocks offer greater opportunity for fundamental stock selection than larger capitalization stocks since small-capitalization stocks are covered by fewer industry analysts. The Fund invests primarily in a portfolio of equity securities of small-capitalization U.S. companies.
During the reporting period, the Fund’s performance rose in absolute terms and outperformed the benchmark. Overall security selection contributed to its performance mainly due to the Fund’s technology, financials and materials holdings. Stock selection in the consumer-discretionary sector detracted from the Fund’s relative performance.
Overall sector allocation also contributed to the Fund’s performance for the reporting period. An overweight position in industrials and an underweight position in real estate counteracted the negative effects of overweights in technology and energy.
Crocs Retail, a manufacturer and retailer of iconic molded rubber footwear, contributed to the Fund’s performance for the reporting period after the company showed progress on reducing excess inventory, closing unprofitable stores, and increasing profit margins. Investors were heartened by Croc’s revenue growth in the final quarter of the reporting period that came despite store closures.
General Cable, a wire and cable company, contributed to performance during the reporting period as it announced that it would be acquired by Prysmian Group for $30 a share. General Cable had announced earlier that it would review strategic options, including a sale of the company.
| See benchmark definitions on A-27 and A-28 |
A-16
Table of Contents
PACIFIC FUNDS PERFORMANCE DISCUSSION (Continued)
Discount clothing retailer Citi Trends was among the top contributors to performance after reporting stronger-than-expected same-store sales for the final quarter of the reporting period. The company also delivered improved profit margins driven by its merchandising efforts.
The leading detractor to the Fund’s performance was FTD Companies. Shares of the online florist lagged as investors were disappointed by the new management team’s turnaround plan which was introduced early in 2018.
Also detracting from performance for the reporting period was LifePoint Health, an operator of primarily rural hospitals in the U.S. The stock sold off sharply as the company reported disappointing profit margins due to operational issues at recently acquired hospitals. Oasis Petroleum detracted from performance for the reporting period as investors were uncertain that the oil and gas producer’s acquisition of acreage in a new area, the Delaware Basin, would justify the dilution from the equity it issued to make the purchase.
PF Emerging Markets Fund (sub-advised by OppenheimerFunds, Inc.)
Q. How did the Fund perform for the year ended March 31, 2018?
A. For the year ended March 31, 2018, the PF Emerging Markets Fund’s Class P returned 25.93%, compared to a 24.93% return for its benchmark, the MSCI Emerging Markets Index (Net).
The following graph compares the performance of a hypothetical $10,000 investment in Class P shares of the Fund to its benchmark for the ten-year period ended March 31, 2018. The Fund’s performance reflects reinvestments of all dividends and capital gains distributions, if any.
Performance Comparison
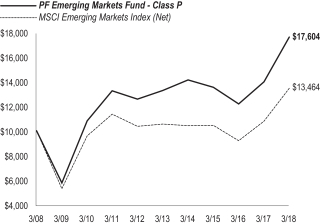
| Average Annual Total Returns for the Periods Ended March 31, 2018 | ||||||||||||
| 1 Year | 5 Years | 10 Years | ||||||||||
Fund’s Class P | 25.93% | 5.81% | 5.82% | |||||||||
MSCI Emerging Markets Index (Net) | 24.93% | 4.99% | 3.02% | |||||||||
Performance data shown represents past performance. Investment return and principal value will fluctuate so that shares of the Fund when redeemed may be worth more or less than their original cost. Past performance is not predictive of future performance. | ||||||
Q. Discuss both positive and negative factors that materially affected the Fund’s performance during the year, including relevant market conditions, investment strategies and techniques, and particular sectors or securities.
A. For the reporting period, the Fund’s Class P outperformed the benchmark. We, the Oppenheimer Emerging Markets team, are long-term investors in companies that we believe have competitive advantages and real options that manifest themselves over many years. The Fund mainly invests in common stocks of issuers in developing or emerging markets throughout the world, and focuses on companies with above-average earnings growth potential. While cyclical slowdowns can hurt all companies, extraordinary companies can often emerge from difficult periods with even greater competitive advantages. This is because such companies tend to have the cash flow and balance sheet flexibility to invest their businesses even during tough times. Using our long-term focus, we seek to take advantage of dislocations in the market and to buy these companies at compelling valuations.
On a sector basis, the Fund’s outperformance in relation to its benchmark stemmed largely from stock selection in health care, information technology, and financials. The Fund’s underweight in telecommunication services and zero exposure in utilities also contributed positively to relative performance. The Fund underperformed its benchmark in the consumer staples, real estate, consumer discretionary, and energy sectors. Stock selection was the primary reason for the underperformance in the consumer staples, real estate, energy, and industrials sectors. The Fund underperformed in consumer discretionary due to an overweight position. The Fund’s cash position was also a drag on Fund performance given the strong performance of the market during the reporting period.
With respect to the Fund’s country exposure, the top three performers versus the benchmark were China, South Korea and France. Stock selection drove the outperformance in China and South Korea. The Fund’s overweight position in France benefited performance. Detractors from performance included stock selection in Russia and South Africa.
During the reporting period, the top individual contributors to performance included Tencent Holdings Ltd. (information technology) (China), Alibaba Group Holding Ltd. (information technology) (China), and Taiwan Semiconductor Manufacturing Co., Ltd. (information technology) (Taiwan).
Tencent Holdings, a Chinese Internet company, is a dominant player in the Chinese consumer market, including gaming, messaging, payments and content. These businesses have seen strong momentum and improving monetization. Advertising, a traditional source of revenue for most Internet companies, has only recently started to make a significant contribution. While the company continues to invest and refine existing business segments, it is also investing in new opportunities, including an international expansion and artificial intelligence.
| See benchmark definitions on A-27 and A-28 |
A-17
Table of Contents
PACIFIC FUNDS PERFORMANCE DISCUSSION (Continued)
Taiwan Semiconductor Manufacturing (TSMC), a manufacturer and marketer of integrated circuits, exhibited strong performance this reporting period. We believe that TSMC’s significant spending on capex and research & development over the last few years has given the company market share dominance that, in our view, will remain unrivaled in the near term. In the long term, we believe TSMC can be a cornerstone of the next wave of the technology industry’s innovation boom—Artificial Intelligence, Big Data, Autonomous Driving, etc.
Alibaba is one of China’s most dominant internet companies and holds the leading position in its sizeable ecommerce market. Alibaba is also a leading player in fintech (financial technology), cloud computing, digital content and other growth areas in the Chinese online ecosystem. The company reported better-than-expected revenues for the fourth quarter of 2017 across key platforms. However, as expected, it saw a margin contraction given investments in new growth areas. One of those areas is in New Retail, which combines online and offline to transform traditional retail and to drive efficiency improvements throughout the value chain. Investments in globalization and logistics and distribution also weighed on margins. We believe Alibaba is a highly innovative company with real options in several ancillary verticals that will become material over time as these investments begin to contribute more meaningfully.
The most significant detractors from performance for the reporting period included Steinhoff International Holdings NV (consumer discretionary) (South Africa), Magnit PJSC (consumer staples) (Russia), and Glenmark Pharmaceuticals Limited (health care) (India).
Steinhoff International, the world’s second-largest household products and furniture retailer has been transforming itself into a vertically integrated, diversified global mass market retailer through acquisitions. The company doubled its sales over the last couple of years, which increased corporate structure complexities attributable to a growing number of businesses globally and its decentralized operating approach. Concerns around unresolved legal and tax disputes along with recently reported accounting irregularities resulted in the resignation of the CEO and the Chairman of the Board, and a delay in reporting fiscal year 2017 results. These events created a panic in the markets and resulted in a significant correction in the share price. An external auditor has been appointed to conduct an accounting review. We will continue to monitor the situation closely and evaluate as new information becomes publicly available.
Magnit, a leading Russian food retailer, has been operating in a challenging environment. The relatively weak Russian economy has resulted in lower disposable income levels that have affected Magnit’s core consumer base. This, along with an increasingly intense competitive landscape and a major refurbishment program, led to weak operating results.
Glenmark Pharmaceuticals experienced declines after reporting profit that was below market expectations for its fiscal fourth quarter. Concerns surrounding the company’s ability to reduce debt combined with pricing pressure in the U.S. weighed on the stock. We exited our position during the reporting period.
PF International Large-Cap Fund (sub-advised by MFS Investment Management)
Q. How did the Fund perform for the year ended March 31, 2018?
A. For the year ended March 31, 2018, the PF International Large-Cap Fund’s Class P returned 16.54%, compared to a 14.80% return for its benchmark, the MSCI EAFE Index (Net).
The following graph compares the performance of a hypothetical $10,000 investment in Class P shares of the Fund to its benchmark for the ten-year period ended March 31, 2018. The Fund’s performance reflects reinvestments of all dividends and capital gains distributions, if any.
Performance Comparison
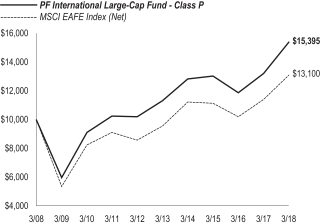
| Average Annual Total Returns for the Periods Ended March 31, 2018 | ||||||||||||
| 1 Year | 5 Years | 10 Years | ||||||||||
Fund’s Class P | 16.54% | 6.33% | 4.41% | |||||||||
MSCI EAFE Index (Net) | 14.80% | 6.50% | 2.74% | |||||||||
Performance data shown represents past performance. Investment return and principal value will fluctuate so that shares of the Fund when redeemed may be worth more or less than their original cost. Past performance is not predictive of future performance. | ||||||
Q. Discuss both positive and negative factors that materially affected the Fund’s performance during the year, including relevant market conditions, investment strategies and techniques, and particular sectors or securities.
A. For the reporting period, the Fund’s Class P outperformed the benchmark. We at MFS use a bottom-up investment style, which involves the research of the fundamentals of each individual opportunity and analyzing certain aspects of a company such as earnings, cash flows, growth potential and management abilities. In managing the Fund, we invest primarily in the securities of foreign issuers with large market capitalizations.
| See benchmark definitions on A-27 and A-28 |
A-18
Table of Contents
PACIFIC FUNDS PERFORMANCE DISCUSSION (Continued)
Stock selection in both the financial and consumer, non-cyclical sectors contributed to the Fund’s performance relative to the benchmark. Within the financial sector, the Fund’s overweight positions in financial services holding company DBS Group Holdings (Singapore) and insurance company AIA Group (Hong Kong) contributed to relative performance. Within the consumer, non-cyclical sector, overweight positions in medical products and equipment manufacturer Terumo (Japan) and wine and alcoholic beverage producer Pernod Ricard (France) contributed to relative returns. Additionally, not holding shares of tobacco distributor British American Tobacco (U.K.) contributed to relative results.
A combination of an overweight allocation and stock selection in the technology sector also benefited relative returns. An overweight position in tourism and travel information technology solutions provider Amadeus IT Holding (Spain) and the Fund’s out-of-benchmark position in shares of integrated circuits manufacturer Taiwan Semiconductor(b) (Taiwan) contributed to relative performance.
Stock selection within the consumer, cyclical sector further contributed to relative results. Within this sector, the Fund’s out-of-benchmark positions in online and mobile commerce company Alibaba Group Holding Ltd (China) and restaurant operator Yum China Holdings(b) (China) contributed to relative performance. In addition, an overweight position in luxury goods company LVMH (France) contributed to relative returns.
Stock selection in the communications sector detracted from relative performance, primarily due to the Fund’s overweight position in communications company WPP Group (U.K.).
A combination of an underweight allocation to, and stock selection within, the energy sector held back relative results. However, there were no individual stocks within this sector that were among the Fund’s top relative detractors during the reporting period.
Stock selection in the industrial sector further weakened relative performance led by the Fund’s out-of-benchmark position in railroad company Canadian National Railway (Canada).
Other top relative detractors during the reporting period included overweight positions in pharmaceutical company Bayer (Germany), pharmaceutical and diagnostic company Roche Holding (Switzerland), household products manufacturer Reckitt Benckiser Group (U. K.), pharmaceutical company Merck KGaA (Germany), retailer Hennes & Mauritz(h) (Sweden) (security not held at reporting period end), tobacco company Japan Tobacco (Japan), optical glasses and eyeglasses maker HOYA (Japan) and information technology security company Check Point Software Technologies (Israel).
PF International Small-Cap Fund (sub-advised by QS Investors, LLC)
Q. How did the Fund perform for the year ended March 31, 2018?
A. For the year ended March 31, 2018, the PF International Small-Cap Fund’s Class P returned 19.24%, compared to a 21.77% return for its benchmark, the S&P Developed Ex-U.S. SmallCap Index.
The following graph compares the performance of a hypothetical $10,000 investment in Class P shares of the Fund to its benchmark for the period from inception through March 31, 2018. The Fund’s performance reflects reinvestments of all dividends and capital gains distributions, if any.
Performance Comparison
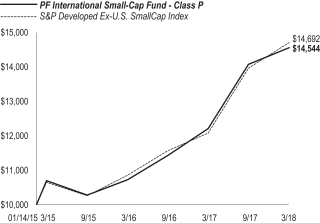
| Average Annual Total Returns for the Periods Ended March 31, 2018 (1) | ||||||||
| 1 Year | Since Inception (01/14/15) | |||||||
Fund’s Class P | 19.24% | 12.38% | ||||||
S&P Developed Ex-U.S. SmallCap Index | 21.77% | 12.74% | ||||||
| (1) | Effective April 1, 2016, QS Investors, LLC (“QS Investors”) began managing the Fund. QS Batterymarch Financial Management, Inc., which was named Batterymarch Financial Management, Inc. prior to June 30, 2014 and which came under common management with QS Investors as of May 31, 2014, managed the Fund prior to that date. |
Performance data shown represents past performance. Investment return and principal value will fluctuate so that shares of the Fund when redeemed may be worth more or less than their original cost. Past performance is not predictive of future performance. | ||||||
Q. Discuss both positive and negative factors that materially affected the Fund’s performance during the year, including relevant market conditions, investment strategies and techniques, and particular sectors or securities.
A. For the reporting period, the Fund’s Class P underperformed the benchmark. We at QS Investors seek to manage a well-diversified, style neutral portfolio with modest region and sector allocations in relation to the benchmark through bottom up stock selection based on fundamentals and implemented with quantitative tools, risk controls and cost-efficient trading. The Fund primarily invests in securities of companies with small market capitalizations that are located in developed foreign countries. The Fund continues to invest in more than 200 companies and generally expects to invest a significant amount of its assets in about the same number of non-U.S. countries as the benchmark (which is comprised of developed countries outside the U.S.).
| See benchmark definitions on A-27 and A-28 |
A-19
Table of Contents
PACIFIC FUNDS PERFORMANCE DISCUSSION (Continued)
For the reporting period, stock selection results were mixed across all major regions and most sectors, which detracted from performance overall. Stock selection detracted from relative return in continental Europe, Japan and in the resource-based countries of Australia, New Zealand and Canada. Selection in Japanese consumer discretionary and European industrials stocks were the primary detractors at the industry group level.
At the security level, the largest detractors were overweights to Australian telecommunication’s stock Vita Group Limited, and Japanese manufacturer Unitika Ltd., which both suffered significant declines. Siemens Gamesa Renewable Energy, S.A., which was the result of a merger of Siemens wind power business with Gamesa at the beginning of the reporting period, was also a leading detractor. Wind turbine manufacturers are facing relentless pricing pressure as governments slash subsidies for renewables to force them into competition with conventional energy sources. Shares in Siemens Gamesa have lost 38% since the merger became effective in 2017.
Stock selection contributed to relative return in Asia Developed ex Japan and the U.K., led by the consumer staples sector. At the security level, an overweight to Japan’s Tokai Carbon Co. Ltd. was the primary contributor. That security returned approximately 240% over the reporting period, with prices of graphite electrodes increasing drastically due to the shortage of raw material used to make furnaces, which led to company profits skyrocketing. Holdings in Venture Corporation Limited, a Singapore-based provider of technology services, products and solutions which is not included in the benchmark, and Maruwa Co., Ltd., a Japanese company mainly engaged in manufacture and sale of ceramic products and lighting equipment, were also strong contributors with returns in excess of 100% for the reporting period.
Region and sector allocation results were mixed and detracted from performance overall, with the impact of an underweight to continental Europe and an overweight to Emerging Markets in Asia having the largest negative impact. These impacts were somewhat offset by sector weightings within Japan and Emerging Markets outside of Asia which benefited performance.
PF International Value Fund (sub-advised by Wellington Management Company LLP)
Q. How did the Fund perform for the year ended March 31, 2018?
A. For the year ended March 31, 2018, the PF International Value Fund’s Class P returned 14.01%, compared to a 14.80% return for its benchmark, the MSCI EAFE Index (Net). Effective May 1, 2017, Wellington Management Company LLP assumed management of the Fund. The prior sub-adviser, J.P. Morgan Investment Management Inc., managed the Fund for the one-month period from April 1, 2017 through April 30, 2017.
The following graph compares the performance of a hypothetical $10,000 investment in Class P shares of the Fund to its benchmark for the ten-year period ended March 31, 2018. The Fund’s performance reflects reinvestments of all dividends and capital gains distributions, if any.
Performance Comparison
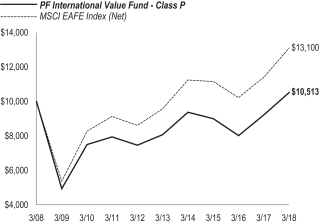
| Average Annual Total Returns for the Periods Ended March 31, 2018 (1) | ||||||||||||
| 1 Year | 5 Years | 10 Years | ||||||||||
Fund’s Class P | 14.01% | 5.45% | 0.50% | |||||||||
MSCI EAFE Index (Net) | 14.80% | 6.50% | 2.74% | |||||||||
| (1) | Wellington Management Company LLP began managing the Fund on May 1, 2017 and some investment policies changed at that time. Other firms managed the Fund before that date. |
Performance data shown represents past performance. Investment return and principal value will fluctuate so that shares of the Fund when redeemed may be worth more or less than their original cost. Past performance is not predictive of future performance. | ||||||
Q. Discuss both positive and negative factors that materially affected the Fund’s performance during the year, including relevant market conditions, investment strategies and techniques, and particular sectors or securities.
A. For the reporting period the Fund’s Class P underperformed the benchmark.
Wellington
Wellington Management Company LLP assumed management of the Fund on May 1, 2017. For the eleven-month period of May 1, 2017 through March 31, 2018, the Fund’s Class P outperformed the benchmark, The Fund invests primarily in a diversified portfolio of equity securities of large non-U.S. companies that we at Wellington believe to be undervalued. We use a “contrarian value” approach to selecting securities, applying fundamental analysis to identify securities that we believe are undervalued by the market.
The Fund’s outperformance relative to its benchmark was driven largely by sector allocation, which is a residual of our stock-selection process. Our bias toward the more cyclical segments of the market such as energy, coupled with our underweighted allocation to defensive sectors such as health care and consumer staples proved beneficial to Fund performance. Strong security selection within financials (Sberbank
| See benchmark definitions on A-27 and A-28 |
A-20
Table of Contents
PACIFIC FUNDS PERFORMANCE DISCUSSION (Continued)
Russia), industrials (Air France-KLM), and health care (Roche Holding AG) also contributed positively to performance during the reporting period. Security selection within materials, information technology, and telecommunication services detracted from Fund performance, as did a small cash position.
On a country-by-country basis, opportunistic allocations to Russia and Taiwan, as well as our lack of exposure to Australia, contributed most to relative performance. Security selection also contributed, particularly within Germany and the U.K. Partially offsetting these results were security selection within Japan and Italy, as well as an out-of-benchmark allocation to Canada, which detracted from performance.
Top contributors to benchmark-relative returns included out-of-benchmark positions in Air France-KLM (industrials) and MediaTek (information technology). Air France-KLM is a leading airline in Europe and benefitted from an accelerating macroeconomic backdrop and an undersupply within the industry. The stock was up substantially during the reporting period, and we eliminated the position with gains. MediaTek is a Taiwanese maker of integrated circuits and chipsets. Shares outperformed as the company continued to improve gross margins driven by a better product mix. We trimmed our position with gains during the reporting period.
Top detractors from relative performance included out-of-benchmark positions in Eldorado Gold (materials) and Kt Corp (telecommunication services). Eldorado is a Canada-listed gold producer with mines in Turkey, Greece, and Brazil. The company continued to face strong headwinds driven by a decline in production at Kisladag, Turkey’s largest gold mine and Eldorado’s flagship asset, and increased political risks in Greece as the Ministry of Energy and Environment informed Eldorado they would seek arbitration over a gold mine. Kt Corp is South Korea’s largest telephone company. The telecommunication industry in Korea struggled with a populist government threatening a price cap for consumers. The company was also challenged by broad-based weakness in Korea due to geopolitical uncertainty. We trimmed our positions in both companies but continued to hold the stocks at the end of the reporting period.
The Fund did not utilize derivatives during the reporting period.
JP Morgan
J.P. Morgan Investment Management Inc. managed the Fund from April 1, 2017, through April 30, 2017. For that one-month period, the Fund’s Class P Shares underperformed the benchmark. We at JP Morgan sought to manage the Fund’s strategy by capitalizing on what we believed were mis-valuations that arose within and across the world’s equity markets. We did this by investing primarily in equity securities of relatively large non-U.S. companies that we believed to be undervalued, as identified by in-house valuation tools and research analysts. Our process is dominated by bottom-up stock selection. Our transparent and uniform investment philosophy drives all in-house research efforts and all investment decisions. We also managed the Fund’s currency exposures to manage currency deviations relative to the Fund’s benchmark.
Derivatives were used to manage currency deviations relative to the benchmark (e.g., our stock selection process led us to be overweight in Continental Europe during the period, which in turn caused the Fund to be effectively overweight in the euro). In the period, we sought to reduce that euro overweight through the use of currency forwards. We did not seek to add value via active currency management but strived simply to reduce currency deviations versus the benchmark as a method of risk management. This means that currency did not materially add to or subtract value from the Fund relative to the benchmark. The currency exposure in the Fund was managed by our separate currency overlay team.
From a sector perspective, an overweight allocation in energy, along with stock selection in autos and basic industries had a negative impact on performance, while stock selection in banks, technology, semi-conductors and media contributed to the Fund’s performance during the period. Regionally, stock selection in Japan and Europe, including the U.K., detracted from performance, while stock selection and an underweight allocation to the Pacific Rim and an overweight allocation to Continental Europe aided.
At the stock level, ArcelorMittal, a European steelmaker, detracted from performance during the period. The company was hurt by rising Chinese steel production and risks of slowing demand from emerging markets.
On the upside, ING Group, the European bank, contributed to performance during the period. The bank enjoyed solid loan demand and is benefiting from the rise in interest rates in Europe.
| See benchmark definitions on A-27 and A-28 |
A-21
Table of Contents
PACIFIC FUNDS PERFORMANCE DISCUSSION (Continued)
PF Real Estate Fund (sub-advised by Morgan Stanley Investment Management Inc.)
Q. How did the Fund perform for the year ended March 31, 2018?
A. For the year ended March 31, 20172018, the PF Real Estate Fund’s Class P returned -4.15%, compared to a 13.99% return for the broad-based S&P 500 Index and a -4.51% return for the sector-specific benchmark, the FTSE NAREIT Equity REITs Index.
The following graph compares the performance of a hypothetical $10,000 investment in Class P shares of the Fund to its benchmarks for the ten-year period ended March 31, 2018. The Fund’s performance reflects reinvestments of all dividends and capital gains distributions, if any.
Performance Comparison
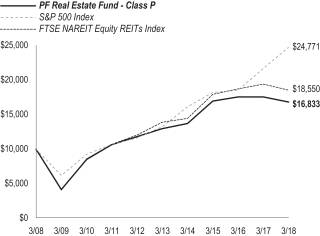
| Average Annual Total Returns for the Periods Ended March 31, 2018 (1) | ||||||||||||
| 1 Year | 5 Years | 10 Years | ||||||||||
Fund’s Class P | (4.15% | ) | 5.31% | 5.35% | ||||||||
S&P 500 Index | 13.99% | 13.31% | 9.49% | |||||||||
FTSE NAREIT Equity REITs Index | (4.51% | ) | 5.92% | 6.37% | ||||||||
| (1) | Morgan Stanley Investment Inc. manages the Fund and formerly did business in certain instances under the name Van Kampen, and managed the Fund under the Van Kampen name from the Fund’s inception until May 31, 2010. |
Performance data shown represents past performance. Investment return and principal value will fluctuate so that shares of the Fund when redeemed may be worth more or less than their original cost. Past performance is not predictive of future performance. | ||||||
Q. Discuss both positive and negative factors that materially affected the Fund’s performance during the year, including relevant market conditions, investment strategies and techniques, and particular sectors or securities.
A. For the reporting period, the Fund’s Class P outperformed the sector specific FTSE NAREIT Equity REITs Index, but underperformed the broad-based S&P 500 Index. We, the managers at Morgan Stanley Investment Management, have maintained our core investment philosophy as a real estate value investor, resulting in the ownership of stocks whose share prices we believe provide real estate exposure at the best valuation relative to their underlying asset values. Our company-specific research leads us to an overweighting in the Fund to a group of companies that are focused in the ownership of New York City (NYC) office assets, Class A malls, a number of out of favor companies and an underweighting to companies concentrated in the ownership of net lease, data center, and health care assets.
During the reporting period, the Fund underperformed the broader equity markets, as measured by the broad-based index. Share price weakness appeared to be largely related to concerns with regard to impact on Real Estate Investment Trust (REIT) share prices in a higher interest rate environment. There are concerns that property values may have peaked or are even poised to decline after significant appreciation and due to higher interest rates. Despite these concerns, asset values have generally remained steady but we believe that lower quality properties remain most at-risk for price declines. The Fund outperformed the sector-specific index both from bottom-up stock selection and top-down sector allocation. Stock selection in hotel, apartment, and mall stocks contributed to relative performance. This was partially offset by stock selection in data centers, secondary central business district (CBD)/suburban office, and primary CBD office assets. From a top-down perspective, the underweight to diversified and health care assets and overweight to primary CBD office contributed to relative performance. This was partially offset by the underweight to data centers and industrial stocks and overweight to malls. There has been a wide disparity with segments grouped at Premium/Par, Discounts to NAVs and at significant discounts to NAVs. Premium/Par are segments with perceived defensive characteristics (net lease, health care) and/or benefiting from secular demand growth of digital technology and e-commerce (industrial, data center). Discounts are segments experiencing decelerating same-store net operating income growth due to conventional supply-demand factors in the latter part of the real estate cycle (hotels, apartment, office ex-NYC); and significant discounts are segments experiencing extreme negative investor sentiment (NYC office and retail).
| See benchmark definitions on A-27 and A-28 |
A-22
Table of Contents
PACIFIC FUNDS PERFORMANCE DISCUSSION (Continued)
PF Currency Strategies Fund (co-sub-advised by Macro Currency Group and UBS Asset Management (Americas) Inc.)
Q. How did the Fund perform for the year ended March 31, 2018?
A. For the year ended March 31, 2018, the PF Currency Strategies Fund’s Class P returned -1.32% compared to a 1.04% return for the FTSE 1-Month U.S. T-Bill Index.
The following graph compares the performance of a hypothetical $10,000 investment in Class P shares of the Fund to its benchmark for the period from inception through March 31, 2018. The Fund’s performance reflects reinvestments of all dividends and capital gains distributions, if any.
Performance Comparison
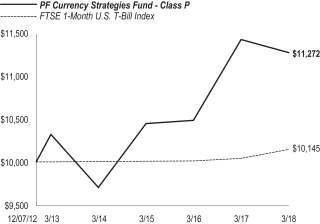
| Average Annual Total Returns for the Periods Ended March 31, 2018 (1) | ||||||||||||
| 1 Year | 5 Years | Since Inception (12/07/12) | ||||||||||
Fund’s Class P | (1.32% | ) | 1.78% | 2.28% | ||||||||
FTSE 1-Month U.S. T-Bill Index | 1.04% | 0.28% | 0.27% | (2) | ||||||||
| (1) | Effective October 30, 2015, UBS Global Asset Management (Americas) Inc. changed its name to UBS Asset Management (Americas) Inc. Macro Currency Group became co-sub-adviser to the Fund on May 1, 2014, and some investment policies changed at that time. UBS Global Asset Management (Americas) Inc. was the sole sub-adviser to the Fund before that date. |
| (2) | Due to data limitation, the benchmark since inception return reflects the commencement period from the first calendar day of the month the portfolio commenced its operations. |
Performance data shown represents past performance. Investment return and principal value will fluctuate so that shares of the Fund when redeemed may be worth more or less than their original cost. Past performance is not predictive of future performance. | ||
Q. Discuss both positive and negative factors that materially affected the Fund’s performance during the year, including relevant market conditions, investment strategies and techniques, and particular sectors or securities.
A. For the reporting period, the Fund’s Class P underperformed the benchmark. The Fund is co-sub-advised by MCG and UBS. The following are separate discussions from each co-sub-adviser.
MCG
MCG’s overall management of the Fund involves a combination of “systematic” and “discretionary” strategies. The systematic strategy seeks to capture longer-term fundamental shifts in currency movements, with an investment time horizon that is typically twelve months. The discretionary strategy of the Fund applies a qualitative approach that seeks to identify and take advantage of macroeconomic themes that influence exchange rates over the medium-term (typically a two-week to six-month horizon), a shorter time horizon than the systematic strategy. Both the systematic and discretionary approaches utilize non-deliverable currency forwards as part of the Fund’s investment strategy.
During the reporting period, our portion of the Fund’s performance negatively impacted the overall Fund performance. The discretionary sub-component of our portion of the Fund returned -4.76% over the course of the reporting period, while the systematic sub-component (including the systematic hedge) also detracted from the overall performance, returning -2.45% resulting with an overall annual return of -7.12%. Performance of the strategy was heavily impacted by the outcome of European elections in the first half of the reporting period and the Sintra Central Bank offsite which heralded the beginning of policy normalization for several major central banks.
Over the course of the reporting period, we held various positions, both long and short, across the developed market currency universe primarily through the use of derivatives, including non-deliverable forwards. The main detractor from our portion of the Fund’s performance was a short position in the euro, which rallied during the reporting period. Constructive outcomes in European elections, particularly France, coupled with the initiation of policy normalization by the ECB helped drive the euro higher. Other short positions that detracted from performance were the Swiss franc and Swedish krona, as both currencies were lifted by the rising euro. The Canadian dollar long position in March of 2018 detracted from performance due the governor of the Bank of Canada suggesting they may shift their policy and our long U.S. dollar suffered due to U.S. dollar weakness over the course of the reporting period. These losses were partially offset by long positions in peripheral European currencies including the British pound sterling and Danish krone, each of which benefitted from improving growth backdrops and the British pound sterling in particular from growing optimism on post-Brexit relations with the European Union. A long position in Japanese yen contributed to performance as it benefited from market volatility in the first quarter of 2018.
UBS
We at UBS maintain our portion of the Fund’s strategy by seeking to gain positive (or long) exposures to currencies that we believe are undervalued and have negative (or short) exposures to currencies that we believe to be overvalued. When analyzing a potential investment opportunity and the desired amount of exposure, we consider the economic and investment outlook and the degree of risk relative to the potential return on such investment in order to maximize the risk-adjusted return.
For the reporting period, derivatives, including non-deliverable forwards, had a positive impact on performance for our portion of the Fund.
| See benchmark definitions on A-27 and A-28 |
A-23
Table of Contents
PACIFIC FUNDS PERFORMANCE DISCUSSION (Continued)
During the reporting period, our portion of the Fund’s performance contributed positively to overall Fund performance. Contributing to performance, our portion of the Fund held a short Swiss franc position against the euro throughout much of the reporting period. In our view, the Swiss National Bank’s action in 2015 to remove the 1.20 euro and the Swiss franc floor resulted in an overshoot, with the Swiss franc appearing overvalued. We established short positions against the euro and this exchange rate has largely corrected over the reporting period.
Over the reporting period, our portion of the Fund also held a long euro position against the U.S. dollar which benefited performance. The euro reacted positively to improving Eurozone growth and statements from the ECB insinuating that they are likely to raise interest rates in the near future.
Our portion of the Fund held a short Canadian dollar position which detracted from our portion of the Fund’s performance, as the Bank of Canada hiked rates more aggressively than expected, causing the Canadian dollar to appreciate. Additionally, our portion of the Fund held a long position in the Swedish krona against the euro which detracted from our portion of the Fund’s performance as the krona weakened over housing market concerns and the European data was more positive than expected driving the euro higher than anticipated.
In emerging markets, our portion of the Fund’s long Mexican peso position against the U.S. dollar contributed to performance. The peso’s strong appreciation for most of the reporting period has driven our portion of the Fund’s performance and can be attributed to a change in the market’s perception of the implications of a Trump presidency and higher interest rates in Mexico. Additionally, our portion of the Fund’s long position in the Colombian peso against the U.S. dollar contributed positively to performance as the Colombian peso was supported by higher oil prices and a weaker U.S. dollar.
However, a long Turkish lira position against the South African rand had a negative impact on our portion of the Fund’s performance. Increasing tensions between Turkey and the U.S. drove down the value of the lira and positive political developments in South Africa caused an appreciation in the rand.
Our portion of the Fund remains constructive on the U.S. dollar at the expense of richly-valued developed market commodity currencies, such as the New Zealand dollar, seeing scope for near-term dollar appreciation. We believe the temporary factors helping to support the New Zealand economy will recede leading to a correction.
Our portion of the Fund also established long positions in select emerging market currencies versus the U.S. dollar as we believe these positions are attractively valued.
PF Equity Long/Short Fund (sub-advised by AQR Capital Management, LLC)
Q. How did the Fund perform for the year ended March 31, 2018?
A. For the year ended March 31, 2018, the PF Equity Long/Short Fund’s Class P returned 14.45%, compared to a 13.59% return for the broad- based MSCI World Index (Net) and 7.27% for the Equity Long/Short Composite Benchmark.
The following graph compares the performance of a hypothetical $10,000 investment in Class P shares of the Fund to its benchmarks for the period from inception through March 31, 2018. The Fund’s performance reflects reinvestments of all dividends and capital gains distributions, if any.
Performance Comparison
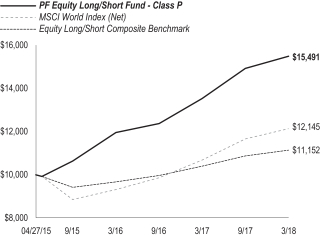
| Average Annual Total Returns for the Periods Ended March 31, 2018 | ||||||||
| 1 Year | Since Inception (04/27/15) | |||||||
Fund’s Class P | 14.45% | 16.12% | ||||||
MSCI World Index (Net) | 13.59% | 6.86% | ||||||
Equity Long/Short Composite Benchmark | 7.27% | 3.80% | ||||||
Performance data shown represents past performance. Investment return and principal value will fluctuate so that shares of the Fund when redeemed may be worth more or less than their original cost. Past performance is not predictive of future performance. | ||||||
Q. Discuss both positive and negative factors that materially affected the Fund’s performance during the year, including relevant market conditions, investment strategies and techniques, and particular sectors or securities.
A. For the reporting period, the Fund’s Class P outperformed both the broad-based MSCI World Index (Net) and the style-specific Equity Long/Short Composite Benchmark. We at AQR manage the Fund’s strategy by seeking to provide higher risk-adjusted returns with lower volatility relative to global equity markets. The strategy seeks to generate returns from three different sources, including: 1) the potential gains from the Fund’s long and short equity positions by generally entering into total return basket swaps, 2) overall exposure to equity markets, generally through the use of futures and currency forwards contracts, and 3) the active increase and decrease of the Fund’s net exposure to equity markets. The strategy primarily seeks to add alpha (excess return over the broad-based benchmark) via its long/short (market-neutral) stock
| See benchmark definitions on A-27 and A-28 |
A-24
Table of Contents
PACIFIC FUNDS PERFORMANCE DISCUSSION (Continued)
portfolio. The strategy also seeks to manage the Fund’s beta (a measure of the Fund’s sensitivity to broad global market movements) relative to the broad-based benchmark to a long-term target of 0.5, and within a shorter-term range of 0.3 to 0.7 (which indicates a moderate to high sensitivity to broad global market movements), depending on market views. The Fund invests both in total return basket swaps and futures contracts, as well as currency forwards, to gain economic exposure to specific stocks and global equity markets. These derivative positions are responsible for substantially all the performance in the Fund.
The reporting period was marked by strong performance for developed equity markets globally, despite poor performance and heightened volatility during the first quarter of 2018. In 2017, developed equity markets largely rose on improving global growth, subdued inflation and strong corporate fundamentals. U.S. equity markets in particular reached all-time highs amid historically low volatility. Performance across major indices was more muted later in the year, as markets responded to risks surrounding the French election, former FBI director James Comey’s dismissal and escalating tensions with North Korea. Several developed markets rallied again in the fourth quarter of 2017 to end the year higher. U.S. markets rose on better than expected growth data and the successful passing of corporate tax reform. Global equity markets continued their bullish trend into 2018, but then sharply reversed when most markets posted negative returns in February and March. Markets responded to a combination of factors including early-quarter data on rising wage growth, uncertainty regarding the new Fed Chairman’s views and policies, and escalating trade tensions.
All components of the Fund’s strategy contributed to returns over the reporting period. Positive performance was largely driven by the Fund’s 0.5 beta exposure and market neutral stock selection, the Fund’s tactical market exposure component also contributed, though more modestly. Within stock selection, the best performing investment theme over the reporting period was momentum. Conversely, valuation was the worst performing theme. By sector, consumer discretionary and industrials were the largest contributors to performance, while utilities and consumer staples were the largest detractors from performance. By country, the U.S. was responsible for the majority of positive performance. The largest detractors from a country perspective were Denmark and Spain. The Fund benefited from its static long-term beta exposure of 0.5 relative to the broad-benchmark, given the index’s strong performance over the reporting period. The Fund’s tactical market exposure (the desired deviation from a beta of 0.5) contributed modestly. This was due mainly to a slight underweight to the benchmark, which was particularly beneficial during January and February of 2018 when equity markets fell. Our tactical market view ended the reporting period negative and consequently our expected beta to the broad benchmark was 0.44.
The Fund ended the reporting period with a highly diversified stock portfolio of 556 long positions and 499 short positions. Securities remained globally diversified, with around half of the Fund invested outside of the U.S. The stock selection strategy does take small industry views. As of the end of the reporting period, the Fund’s largest sector exposures were in industrials, consumer discretionary, and information technology.
PF Global Absolute Return Fund (sub-advised by Eaton Vance Investment Managers)
Q. How did the Fund perform for the year ended March 31, 2018?
A. For the year ended March 31, 2018, the PF Global Absolute Return Fund’s Class P returned 3.99%, compared to a 1.11% return for its benchmark, the ICE BofA Merrill Lynch U.S. 3-Month T-Bill Index.
The following graph compares the performance of a hypothetical $10,000 investment in Class P shares of the Fund to its benchmark for the period from inception through March 31, 2018. The Fund’s performance reflects reinvestments of all dividends and capital gains distributions, if any.
Performance Comparison
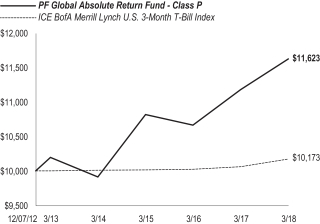
| Average Annual Total Returns for the Periods Ended March 31, 2018 (1) | ||||||||||||
| 1 Year | 5 Years | Since Inception (12/07/12) | ||||||||||
Fund’s Class P | 3.99% | 2.65% | 2.87% | |||||||||
ICE BofA Merrill Lynch U.S. 3-Month T-Bill Index | 1.11% | 0.34% | 0.32% | |||||||||
| (1) | Eaton Vance Investment Managers assumed management of the Fund on August 1, 2013. Eaton Vance Management, an affiliate of Eaton Vance Investment Managers, managed the Fund from the Fund’s inception to July 31, 2013. |
Performance data shown represents past performance. Investment return and principal value will fluctuate so that shares of the Fund when redeemed may be worth more or less than their original cost. Past performance is not predictive of future performance. | ||
Q. Discuss both positive and negative factors that materially affected the Fund’s performance during the year, including relevant market conditions, investment strategies and techniques, and particular sectors or securities.
A. For the reporting period, the Fund’s Class P outperformed the benchmark. We at Eaton Vance maintain the Fund’s strategy by investing in securities, derivatives and other instruments to establish long and short investment exposures around the world, typically seeking to establish
| See benchmark definitions on A-27 and A-28 |
A-25
Table of Contents
PACIFIC FUNDS PERFORMANCE DISCUSSION (Continued)
such investment exposures to individual countries based on our portfolio management team’s view of the investment merits of a country. The decision to utilize cash instruments or derivatives is based on relative value and efficiency as deemed by the portfolio management team. The Fund typically employs significant use of derivative instruments both to gain exposure to enhance total returns as well as to hedge against certain investment risks (like fluctuations in securities prices, interest rates or currency exchange rates) and to manage the Fund’s duration. The Fund primarily uses the following derivative instruments: forward foreign currency contracts, cross-currency swaps, total return swaps and credit default swaps. It may also use interest rate swaps, interest rate futures, bond futures, equity index futures and options, among other derivatives instruments.
During the reporting period, the investments in the regions that contributed the most to the Fund’s positive performance were Eastern Europe and Asia. Latin America (territories in the Western Hemisphere where Spanish, French and Portuguese are spoken) and the Dollar Bloc (Canada, New Zealand and Australia) countries were also beneficial to returns. Middle East & Africa and Western Europe were regions in which investments detracted from performance.
Eastern Europe was the top performing region for the reporting period. The majority of the contribution came from sovereign credit and currency. Notable performers included long exposure in the Serbian dinar as well as long credit positions in Cyprus, Belarus and Macedonia.
In Asia, positive performance was driven by interest rate exposures and currency investments. Long local exposures in Sri Lanka, both in rates and currency (the rupee), provided much of the contribution, in addition to, long currency exposure in Kazakhstan (the tenge).
Latin America also contributed to Fund performance as a result of sovereign credit and rates positioning. Long exposure in El Salvador and Ecuador credit, along with local debt exposure in Dominican Republic, were top contributors. In the Dollar Bloc region, local exposures in Australia contributed to performance.
Western Europe detracted the most from Fund performance primarily due to currency and corporate credit positioning. Top detractors included a short position in the euro and long position in Sweden’s krona as well as a short broad European corporate credit position.
In the Middle East & Africa region, negative performance was mostly due to rates and sovereign credit positioning. A short position in Saudi Arabian rates and short positions in both South African sovereign credit and South African currency (the rand) were among largest detractors.
PF Multi-Asset Fund (managed by Pacific Life Fund Advisors LLC, collateral portion managed by Pacific Asset Management)
Q. How did the Fund perform for the period ended March 31, 2018?
A. The PF Multi-Asset Fund commenced operations on January 31, 2018. For the period from inception through March 31, 2018, the Fund’s Class P returned -5.80%, compared to a -6.27% return for its benchmark, the MSCI World Index (Net).
The following graph compares the performance of a hypothetical $10,000 investment in Class P shares of the Fund to its benchmarks for the period from inception through March 31, 2018. The Fund’s performance reflects reinvestments of all dividends and capital gains distributions, if any.
Performance Comparison
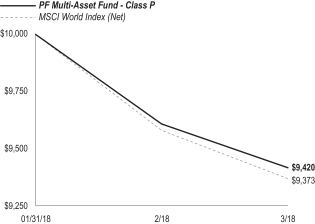
| Total Returns for the Periods Ended March 31, 2018 | ||||
| Since Inception (01/31/18) | ||||
Fund’s Class P | (5.80% | ) | ||
MSCI World Index (Net) | (6.27% | ) | ||
Performance data shown represents past performance. Investment return and principal value will fluctuate so that shares of the Fund when redeemed may be worth more or less than their original cost. Past performance is not predictive of future performance. | ||||||
Q. Discuss both positive and negative factors that materially affected the Fund’s performance during the period, including relevant market conditions, investment strategies and techniques, and particular sectors or securities.
A. For the period from inception through March 31, 2018, the Fund’s Class P outperformed the benchmark. The Fund gains exposure to the large capitalization and mid-capitalization asset class categories of the U.S. and developed non-U.S. equity markets, including growth and value styles, by entering into total return swaps. We at PLFA actively manage the Fund’s positions in these market segments based on our investment views, which take into account the following factors that span across different time horizons: valuations, economic fundamentals and investor sentiment.
For the period from inception through the end of the reporting period, the Fund outperformed the benchmark by 0.47%. The Fund returned -5.80% while the benchmark returned -6.27%. The primary contributors to the Fund’s performance were the Fund’s overweight position to U.S. equities relative to the benchmark. Additionally, the exposure to U.S. growth also contributed to the Fund’s performance.
| See benchmark definitions on A-27 and A-28 |
A-26
Table of Contents
PACIFIC FUNDS PERFORMANCE DISCUSSION (Continued)
On the other hand, the exposure to U.S. large-cap value detracted from performance. The energy sector, which is among the larger exposures in the Russell 1000 Value Index, was among the worst performing sectors over the reporting period. During this period, Brent Crude Oil prices traded in a volatile range between $70 and $60 per barrel.
Another detractor from the Fund’s performance was the return of the collateral pool, which underperformed the financing cost of the Fund’s swap positions by -0.30%. An increase in U.S. interest rates detracted from performance as the 2-year U.S. Treasury yield rose 0.13% to 2.17%. Additionally, widening credit spreads also detracted from performance as U.S. investment grade spreads widened from 0.18% to 1.00%. Lastly, a widening of the spread between LIBOR (London InterBank Offered Rate) and OIS (the overnight interest rate based on the Fed Funds effective rate) also detracted from performance.
Benchmark Definitions
Bloomberg Barclays 1-3 Year U.S. Government/Credit Bond Index measures performance of U.S. dollar-denominated U.S. Treasuries, government-related, and investment grade U.S. corporate securities with maturities of one to three years. Results include the reinvestment of all distributions.
Bloomberg Barclays U.S. Aggregate Bond Index measures the performance of the U.S. investment grade bond market, which includes investment grade U.S. government bonds, investment grade corporate bonds, mortgage pass-through securities and asset-backed securities that are publicly offered for sale in the U.S. The securities in the Index must have at least 1 year remaining to maturity. In addition, the securities must be denominated in U.S. dollars and must be fixed rate, nonconvertible, and taxable. Results include the reinvestment of all distributions.
Bloomberg Barclays U.S. Treasury Inflation-Protected Securities (TIPS) Index is an index of all outstanding treasury inflation protected securities issued by the U.S. government. The total return is equal to the change in price plus the coupon return. Results include the reinvestment of all distributions.
Emerging Markets Debt Composite Benchmark is 50% J.P. Morgan EMBI Global Diversified; 25% J.P. Morgan ELMI+; 25% J.P. Morgan GBI- EM Global Diversified. Results include the reinvestment of all distributions.
Equity Long/Short Composite Benchmark is 50% ICE BofA Merrill Lynch U.S. 3-Month T-Bill Index and 50% MSCI World Index (Net). Results include the reinvestment of all distributions.
FTSE 1-Month U.S. Treasury Bill (T-Bill) Index (formerly named Citigroup 1-Month U.S. T-Bill Index) is a market value-weighted index of public obligations of the U.S. Treasury with maturities of one month. Results include the reinvestment of all distributions.
FTSE National Association of Real Estate Investment Trusts (NAREIT) Equity Real Estate Investment Trusts (REITs) Index is one index of a series of indices represented in the FTSE NAREIT U.S. Real Estate Index Series and is a free float adjusted market capitalization weighted index of tax-qualified REITs listed on the New York Stock Exchange (NYSE), American Stock Exchange and National Association of Securities Dealers Automated Questions (NASDAQ). Results include the reinvestment of all distributions.
ICE BofA Merrill Lynch U.S. 3-Month Treasury Bill (T-Bill) Index is an index comprised of a single issue purchased at the beginning of the month and held for a full month. At the end of the month that issue is sold and rolled into a newly selected issue. The issue selected at each month-end rebalancing is the outstanding Treasury Bill that matures closest to, but not beyond, three months from the rebalancing date. To qualify for selection, an issue must have settled on or before the month-end rebalancing date. Results include the reinvestment of all distributions.
J.P. Morgan Emerging Local Markets Index Plus (ELMI+) is a performance benchmark for emerging markets money market instruments and tracks total returns for local-currency-denominated money market instruments. The benchmark was introduced in June 1996 and consists of foreign exchange forward contracts laddered with maturities ranging from one to three months. Country weights are based on a trade-weighted allocation, with maximum weight of 10% for countries with convertible currencies and 2% for countries with non-convertible currencies. Results include the reinvestment of all distributions.
J.P. Morgan Emerging Markets Bond Index (EMBI) Global Diversified tracks total returns of U.S. dollar-denominated debt instruments issued by emerging market sovereign and quasi-sovereign entities: Brady bonds, loans, Eurobonds. The diversified index limits the exposure of some of the larger countries. The performance of the index does not reflect the deduction of expenses associated with a fund, such as investment management fees. Results include the reinvestment of all distributions.
J.P. Morgan Government Bond Index-Emerging Markets (GBI-EM) Global Diversified tracks total returns of emerging markets local currency denominated fixed income instruments. The benchmark instruments of the index are regularly traded, fixed rate local sovereign bonds to which international investors can gain exposure. Country weights are based on a trade-weighted allocation, with maximum weight of 10% for countries. Results include the reinvestment of all distributions.
Morgan Stanley Capital International (MSCI) Emerging Markets Index (Net) is a free float-adjusted market capitalization index that is designed to measure equity market performance of large and mid-capitalization securities in emerging markets. As of April 1, 2018, the MSCI Emerging Markets Index (Net) consists of the following 24 emerging market country indices: Brazil, Chile, China, Colombia, Czech Republic, Egypt, Greece, Hungary, India, Indonesia, South Korea, Malaysia, Mexico, Pakistan, Peru, Philippines, Poland, Qatar, Russia, South Africa, Taiwan, Thailand, Turkey, and United Arab Emirates. The word “(Net)” in the index name means the net total return for the index, which includes the reinvestment of dividends after the deduction of withholding tax, applying the tax rate to non-resident individuals who do not benefit from double taxation treaties.
MSCI Europe, Australasia and Far East (EAFE) Index (Net) is a free float-adjusted market capitalization index that is designed to measure the equity market performance of developed markets, excluding the U.S. & Canada. As of April 1, 2018, the MSCI EAFE Index (Net) consists of the following 21 developed market country indices: Australia, Austria, Belgium, Denmark, Finland, France, Germany, Hong Kong, Ireland, Israel, Italy, Japan, the Netherlands, New Zealand, Norway, Portugal, Singapore, Spain, Sweden, Switzerland, and the U.K. The word “(Net)” in the index
A-27
Table of Contents
PACIFIC FUNDS PERFORMANCE DISCUSSION (Continued)
name means the net total return for the index, which includes the reinvestment of dividends after the deduction of withholding tax, applying the tax rate to non-resident individuals who do not benefit from double taxation treaties.
MSCI World Index (Net) is a free float-adjusted market capitalization weighted index that is designed to measure the equity market performance of developed markets. As of April 1, 2018, the MSCI World Index (Net) consists of the following 23 developed market country indices: Australia, Austria, Belgium, Canada, Denmark, Finland, France, Germany, Hong Kong, Ireland, Israel, Italy, Japan, Netherlands, New Zealand, Norway, Portugal, Singapore, Spain, Sweden, Switzerland, the U.K., and the U.S. The word “(Net)” in the index name means the net total return for the index, which includes the reinvestment of dividends after the deduction of withholding tax, applying the tax rate to non-resident individuals who do not benefit from double taxation treaties.
Russell 1000 Growth Index measures the performance of the large-cap growth segment of the U.S. equity universe. It includes those Russell 1000 Index companies with higher price-to-book ratios and higher forecasted growth values. The Russell 1000 Growth Index is constructed to provide a comprehensive and unbiased barometer for the large-cap growth segment. The Index is completely reconstituted annually to ensure new and growing equities are included and that the represented companies continue to reflect growth characteristics. Results include the reinvestment of all distributions.
Russell 1000 Index measures the performance of the large-capitalization segment of the U.S. equity universe. It is a subset of the Russell 3000 Index and includes approximately 1,000 of the largest securities based on a combination of their market capitalization and current index membership. The Russell 1000 Index represents approximately 92% of the investable U.S. equity market. It is constructed to provide a comprehensive and unbiased barometer for the large-capitalization and is completely reconstituted annually to ensure new and growing equities are reflected. Results include the reinvestment of all distributions.
Russell 1000 Value Index measures the performance of the large-cap value segment of the U.S. equity universe. It includes those Russell 1000 Index companies with lower price-to-book ratios and lower expected growth values. The Russell 1000 Value Index is constructed to provide a comprehensive and unbiased barometer for the large-cap value segment. The Index is completely reconstituted annually to ensure new and growing equities are included and that the represented companies continue to reflect value characteristics. Results include the reinvestment of all distributions.
Russell 2000 Growth Index measures the performance of the small-cap growth segment of the U.S. equity universe. It includes those Russell 2000 Index companies with higher price-to-value ratios and higher forecasted growth values. The Russell 2000 Growth Index is constructed to provide a comprehensive and unbiased barometer for the small-cap growth segment. The Index is completely reconstituted annually to ensure larger stocks do not distort the performance and characteristics of the true small-cap opportunity set and that the represented companies continue to reflect growth characteristics. Results include the reinvestment of all distributions.
Russell 2000 Index measures the performance of the small-cap segment of the U.S. equity universe. The Russell 2000 Index is a subset of the Russell 3000® Index representing approximately 10% of the total market capitalization of that index. It includes approximately 2,000 of the smallest securities based on a combination of their market cap and current index membership. The Russell 2000 Index is constructed to provide a comprehensive and unbiased small-cap barometer and is completely reconstituted annually to ensure larger stocks do not distort the performance and characteristics of the true small-cap opportunity set. Results include the reinvestment of all distributions.
Russell 2000 Value Index measures the performance of the small-cap value segment of the U.S. equity universe. It includes those Russell 2000 Index companies with lower price-to-book ratios and lower forecasted growth values. The Russell 2000 Value Index is constructed to provide a comprehensive and unbiased barometer for the small-cap value segment. The Index is completely reconstituted annually to ensure larger stocks do not distort the performance and characteristics of the true small-cap opportunity set and that the represented companies continue to reflect value characteristics. Results include the reinvestment of all distributions.
Russell 3000 Index measures the performance of the largest 3,000 U.S. companies representing approximately 98% of the investable U.S. equity market. Results include the reinvestment of all distributions.
Russell Midcap Index measures the performance of the mid-cap segment of the U.S. equity universe. The Russell Midcap is a subset of the Russell 1000 Index. It includes approximately 800 of the smallest securities based on a combination of their market cap and current index membership. The Russell Midcap represents approximately 31% of the total market capitalization of the Russell 1000 companies. The Russell Midcap Index is constructed to provide a comprehensive and unbiased barometer for the mid-cap segment. The Index is completely reconstituted annually to ensure larger stocks do not distort the performance and characteristics of the true mid-cap opportunity set. Results include the reinvestment of all distributions.
Russell Midcap Value Index measures the performance of the mid-cap value segment of the U.S. equity universe. It includes those Russell Midcap Index companies with lower price-to-book ratios and lower forecasted growth values. The Russell Midcap Value Index is constructed to provide a comprehensive and unbiased barometer of the mid-cap value market. The Index is completely reconstituted annually to ensure larger stocks do not distort the performance and characteristics of the true mid-cap value market. Results include the reinvestment of all distributions.
S&P 500 Index is a capitalization-weighted index of 500 stocks. The index is designed to measure performance of the broad domestic economy through changes in the aggregate market value of 500 stocks representing all major industries. Results include the reinvestment of all distributions.
S&P Developed Ex-U.S. SmallCap Index comprises the stocks representing the lowest 15% of float-adjusted market cap in each developed country, excluding the U.S. It is a subset of the S&P Global BMI, a comprehensive, rules-based index measuring global stock market performance. Results include the reinvestment of all distributions.
A-28
Table of Contents
PF INFLATION MANAGED FUND
Schedule of Investments
March 31, 2018
Principal Amount |
| |||||||
CORPORATE BONDS & NOTES - 0.8% | ||||||||
Energy - 0.5% | ||||||||
Petrobras Global Finance BV (Brazil) | $180,000 | $178,425 | ||||||
7.375% due 01/17/27 | 180,000 | 195,210 | ||||||
|
| |||||||
| 373,635 | ||||||||
|
| |||||||
Financial - 0.3% | ||||||||
Bank of America Corp | 10,000 | 10,076 | ||||||
International Lease Finance Corp | 100,000 | 101,676 | ||||||
The Goldman Sachs Group Inc | 100,000 | 101,613 | ||||||
|
| |||||||
| 213,365 | ||||||||
|
| |||||||
Utilities - 0.0% | ||||||||
NextEra Energy Capital Holdings Inc | 20,000 | 20,000 | ||||||
|
| |||||||
Total Corporate Bonds & Notes |
| 607,000 | ||||||
|
| |||||||
MORTGAGE-BACKED SECURITIES - 1.9% | ||||||||
Collateralized Mortgage Obligations - Residential - 0.8% |
| |||||||
Banc of America Mortgage Trust | 53,153 | 49,398 | ||||||
Countrywide Home Loan Mortgage Pass-Through Trust | 20,077 | 20,452 | ||||||
Fannie Mae | ||||||||
2.222% (USD LIBOR + 0.350%) | 24,861 | 24,833 | ||||||
2.252% (USD LIBOR + 0.380%) | 39,213 | 39,435 | ||||||
2.312% (USD LIBOR + 0.440%) | 21,265 | 21,268 | ||||||
2.317% (USD LIBOR + 0.445%) | 8,960 | 8,945 | ||||||
2.552% (USD LIBOR + 0.680%) | 107,759 | 109,881 | ||||||
GSR Mortgage Loan Trust | 17,584 | 18,001 | ||||||
JP Morgan Mortgage Trust | 47,123 | 46,851 | ||||||
Merrill Lynch Mortgage Investors Trust | 59,191 | 59,767 | ||||||
Residential Accredit Loans Inc Trust | 96,866 | 42,870 | ||||||
Structured Adjustable Rate Mortgage Loan Trust 0.440% (USD LIBOR + 0.250%) | 19,548 | 18,182 | ||||||
Structured Asset Mortgage Investments II Trust 2.082% (USD LIBOR + 0.210%) | 77,766 | 65,629 | ||||||
WaMu Mortgage Pass-Through Certificates | 61,494 | 60,560 | ||||||
|
| |||||||
| 586,072 | ||||||||
|
| |||||||
Principal Amount |
| |||||||
Fannie Mae - 1.1% | ||||||||
3.000% due 05/01/48 | $200,000 | $194,643 | ||||||
3.500% due 05/01/48 - 06/01/48 | 670,000 | 669,435 | ||||||
|
| |||||||
| 864,078 | ||||||||
|
| |||||||
Total Mortgage-Backed Securities | 1,450,150 | |||||||
|
| |||||||
ASSET-BACKED SECURITIES - 1.9% | ||||||||
Asset Backed Funding Corp Trust | 21,723 | 21,769 | ||||||
Bayview Opportunity Master Fund IVa Trust | 500,000 | 500,000 | ||||||
Freddie Mac Structured Pass-Through Certificates 2.152% (USD LIBOR + 0.280%) | 1,044 | 1,033 | ||||||
Home Equity Asset Trust | 35,739 | 35,476 | ||||||
MidOcean Credit CLO IV (Cayman) | 450,000 | 450,000 | ||||||
TICP CLO Ltd (Cayman) | 450,000 | 450,000 | ||||||
|
| |||||||
Total Asset-Backed Securities | 1,458,278 | |||||||
|
| |||||||
U.S. TREASURY OBLIGATIONS - 106.4% | ||||||||
U.S. Treasury Inflation Protected Securities - 105.6% |
| |||||||
0.125% due 04/15/19 ^ | 2,356,823 | 2,355,107 | ||||||
0.125% due 04/15/20 ^ | 4,369,240 | 4,351,987 | ||||||
0.125% due 04/15/21 ^ | 987,254 | 978,828 | ||||||
0.125% due 04/15/22 ^ | 163,074 | 160,738 | ||||||
0.125% due 07/15/22 ^ | 21,557 | 21,336 | ||||||
0.125% due 01/15/23 ^ | 953,570 | 937,434 | ||||||
0.125% due 07/15/24 ^ | 6,614,087 | 6,459,065 | ||||||
0.125% due 07/15/26 ^ | 124,088 | 119,192 | ||||||
0.250% due 01/15/25 ^ | 792,201 | 774,379 | ||||||
0.375% due 07/15/23 ^ | 884,033 | 880,891 | ||||||
0.375% due 07/15/25 ^ | 656,398 | 647,832 | ||||||
0.375% due 01/15/27 ^ | 20,522 | 19,988 | ||||||
0.375% due 07/15/27 ^ | 5,066,400 | 4,939,444 | ||||||
0.500% due 01/15/28 ^ ‡ | 10,916,908 | 10,714,390 | ||||||
0.625% due 07/15/21 ^ | 6,765,724 | 6,846,555 | ||||||
0.625% due 01/15/24 ^ | 6,623,441 | 6,656,088 | ||||||
0.625% due 01/15/26 ^ | 469,422 | 469,118 | ||||||
0.750% due 02/15/42 ^ | 219,390 | 213,396 | ||||||
0.750% due 02/15/45 ^ | 115,786 | 111,482 | ||||||
0.875% due 02/15/47 ^ | 183,801 | 182,147 | ||||||
1.000% due 02/15/46 ^ | 445,639 | 455,692 | ||||||
1.000% due 02/15/48 ^ | 3,246,635 | 3,325,128 | ||||||
1.125% due 01/15/21 ^ | 6,798,540 | 6,953,032 | ||||||
1.250% due 07/15/20 ^ | 534,183 | 548,353 | ||||||
1.375% due 02/15/44 ^ | 3,562,859 | 3,956,795 | ||||||
1.750% due 01/15/28 ^ | 766,688 | 842,465 | ||||||
2.000% due 01/15/26 ^ | 6,259,186 | 6,907,962 | ||||||
2.125% due 02/15/40 ^ | 11,468 | 14,460 | ||||||
2.125% due 02/15/41 ^ | 113,186 | 143,543 | ||||||
2.375% due 01/15/25 ^ | 5,628,072 | 6,299,493 | ||||||
2.500% due 01/15/29 ^ | 1,463,881 | 1,733,028 | ||||||
3.375% due 04/15/32 ^ | 82,389 | 110,820 | ||||||
3.625% due 04/15/28 ^ | 219,148 | 280,819 | ||||||
3.875% due 04/15/29 ^ | 447,808 | 595,689 | ||||||
|
| |||||||
| 80,006,676 | ||||||||
|
| |||||||
| See Notes to Financial Statements | See explanation of symbols and terms, if any, on B-114 and B-115 |
B-1
Table of Contents
PACIFIC FUNDS
PF INFLATION MANAGED FUND
Schedule of Investments (Continued)
March 31, 2018
Principal Amount |
| |||||||
U.S. Treasury Notes - 0.8% |
| |||||||
1.750% due 11/30/21 | $440,000 | $428,768 | ||||||
1.875% due 02/28/22 | 200,000 | 195,309 | ||||||
|
| |||||||
| 624,077 | ||||||||
|
| |||||||
Total U.S. Treasury Obligations |
| 80,630,753 | ||||||
|
| |||||||
FOREIGN GOVERNMENT BONDS & NOTES - 2.6% |
| |||||||
Argentina Bonar (Argentina) | ARS 12,000 | 612 | ||||||
Argentina POM Politica Monetaria (Argentina) 27.250% (ARS Reference + 0.000%) | 500,000 | 26,341 | ||||||
Argentine Republic Government (Argentina) | $320,000 | 326,720 | ||||||
Autonomous Community of Catalonia (Spain) 4.950% due 02/11/20 | EUR 100,000 | 132,122 | ||||||
Bundesobligation (Germany) | 100,000 | 123,048 | ||||||
Cyprus Government (Cyprus) | ||||||||
3.750% due 07/26/23 | 90,000 | 124,500 | ||||||
4.250% due 11/04/25 | 10,000 | 14,400 | ||||||
Italy Buoni Poliennali Del Tesoro (Italy) | ||||||||
0.100% due 05/15/23 | 219,740 | 279,317 | ||||||
0.250% due 05/15/18 | 100,000 | 123,161 | ||||||
Mexican Bonos (Mexico) | MXN 493,000 | 27,775 | ||||||
New Zealand Government (New Zealand) | NZD 850,000 | 642,416 | ||||||
United Kingdom Gilt Inflation-Linked (United Kingdom) | ||||||||
0.125% due 03/22/26 ^ ~ | GBP 97,258 | 158,128 | ||||||
0.125% due 11/22/65 ^ ~ | 1,060 | 3,450 | ||||||
|
| |||||||
Total Foreign Government Bonds & Notes | 1,981,990 | |||||||
|
| |||||||
SHORT-TERM INVESTMENTS - 6.4% | ||||||||
Commercial Paper - 1.1% | ||||||||
Canadian Imperial Bank of Commerce (Canada) 1.703% due 04/16/18 | CAD 100,000 | 77,561 | ||||||
HSBC Bank Canada (Canada) | 200,000 | 155,153 | ||||||
National Bank Canada (Canada) | 700,000 | 542,994 | ||||||
The Toronto-Dominion Bank (Canada) | 100,000 | 77,561 | ||||||
|
| |||||||
| 853,269 | ||||||||
|
| |||||||
Principal Amount |
| |||||||
Foreign Government Issues - 5.2% | ||||||||
Argentina Treasury Bill (Argentina) | ARS 200,000 | $8,935 | ||||||
Hellenic Republic Treasury Bill (Greece) | EUR 30,000 | 36,758 | ||||||
Italy Buoni Ordinari del Tesoro BOT (Italy) (0.469%) due 05/14/18 | 300,000 | 369,345 | ||||||
United Kingdom Treasury Bill (United Kingdom) 0.309% due 04/20/18 | GBP 2,500,000 | 3,506,899 | ||||||
|
| |||||||
| 3,921,937 | ||||||||
|
| |||||||
Shares | ||||||||
Money Market Fund - 0.1% | ||||||||
BlackRock Liquidity Funds T-Fund Portfolio | 52,241 | 52,241 | ||||||
|
| |||||||
Total Short-Term Investments |
| 4,827,447 | ||||||
|
| |||||||
TOTAL INVESTMENTS - 120.0% | 90,955,618 | |||||||
DERIVATIVES - (0.1%) | ||||||||
(See Notes (e) through (i) in Notes to Schedule of Investments) |
| (72,963 | ) | |||||
|
| |||||||
OTHER ASSETS & LIABILITIES, NET - (19.9%) |
| (15,110,359 | ) | |||||
|
| |||||||
NET ASSETS - 100.0% | $75,772,296 | |||||||
|
| |||||||
Notes to Schedule of Investments
| (a) | As of March 31, 2018, the Fund’s composition as a percentage of net assets was as follows: |
U.S. Treasury Obligations | 106.4% | |||
Short-Term Investments | 6.4% | |||
Others (each less than 3.0%) | 7.2% | |||
|
| |||
| 120.0% | ||||
Derivatives | (0.1% | ) | ||
Other Assets & Liabilities, Net | (19.9% | ) | ||
|
| |||
| 100.0% | ||||
|
|
| (b) | As of March 31, 2018, an investment with a value of $2,464,272 was fully or partially segregated with the broker(s)/custodian as collateral for a reverse repurchase agreement. |
| (c) | The average amount of borrowings by the Fund on reverse repurchase agreements outstanding during the year ended March 31, 2018 was $2,450,000 at a weighted average interest rate of 1.700%. The average amount of borrowings by the Fund on sale-buyback financing transactions (See Note 4 in Notes to Financial Statements) outstanding during the year ended March 31, 2018 was $4,814,939 at a weighted average interest rate of 0.381%. |
| (d) | A reverse repurchase agreement outstanding as of March 31, 2018 was as follows: |
| Counter- party | Collateral Pledged | Interest Rate | Trade Date | Maturity Date | Repurchase Amount | Principal Amount | Value | |||||||||||||||||||
JPM | U.S. Treasury Inflation Protected Securities 0.500% due 01/15/28 | 1.700% | 03/22/18 | 04/05/18 | ($2,451,620 | ) | $2,450,000 | ($2,450,000 | ) | |||||||||||||||||
|
| |||||||||||||||||||||||||
| See Notes to Financial Statements | See explanation of symbols and terms, if any, on B-114 and B-115 |
B-2
Table of Contents
PACIFIC FUNDS
PF INFLATION MANAGED FUND
Schedule of Investments (Continued)
March 31, 2018
| (e) | Open futures contracts outstanding as of March 31, 2018 were as follows: |
| Long Futures Outstanding | Expiration Month | Number of Contracts | Notional Amount | Value | Unrealized Appreciation (Depreciation) | |||||||||||||||
U.S. Treasury 5-Year Notes | 06/18 | 2 | $227,987 | $228,922 | $935 | |||||||||||||||
|
| |||||||||||||||||||
Short Futures Outstanding | ||||||||||||||||||||
Euro-BTP | 06/18 | 3 | 445,987 | 448,315 | (2,328 | ) | ||||||||||||||
Euro-Bund | 06/18 | 1 | 194,226 | 196,171 | (1,945 | ) | ||||||||||||||
Euro-OAT | 06/18 | 1 | 186,830 | 190,215 | (3,385 | ) | ||||||||||||||
Japan 10-Year Bonds | 06/18 | 3 | 4,253,926 | 4,253,090 | 836 | |||||||||||||||
Long Gilt | 06/18 | 3 | 507,390 | 516,948 | (9,558 | ) | ||||||||||||||
U.S. Treasury 10-Year Bonds | 06/18 | 27 | 3,254,824 | 3,270,797 | (15,973 | ) | ||||||||||||||
U.S. Treasury Long Bonds | 06/18 | 11 | 1,587,610 | 1,612,875 | (25,265 | ) | ||||||||||||||
|
| |||||||||||||||||||
| (57,618 | ) | |||||||||||||||||||
|
| |||||||||||||||||||
Total Futures Contracts | ($56,683 | ) | ||||||||||||||||||
|
| |||||||||||||||||||
| (f) | Forward foreign currency contracts outstanding as of March 31, 2018 were as follows: |
| Currency Purchased | Currency Sold | Settlement Month | Counterparty | Unrealized Appreciation | Unrealized (Depreciation) | |||||||||||||||||||||
| ARS | 153,120 | USD | 7,499 | 04/18 | BRC | $80 | $— | |||||||||||||||||||
| ARS | 444,350 | USD | 21,205 | 05/18 | GSC | 244 | — | |||||||||||||||||||
| ARS | 153,120 | USD | 7,477 | 05/18 | JPM | — | (2 | ) | ||||||||||||||||||
| EUR | 52,000 | USD | 64,457 | 04/18 | RBC | — | (447 | ) | ||||||||||||||||||
| GBP | 542,000 | USD | 756,301 | 04/18 | DUB | 4,311 | — | |||||||||||||||||||
| GBP | 41,000 | USD | 56,968 | 04/18 | GSC | 569 | — | |||||||||||||||||||
| GBP | 22,000 | USD | 30,586 | 04/18 | JPM | 287 | — | |||||||||||||||||||
| GBP | 12,000 | USD | 16,569 | 04/18 | RBC | 271 | — | |||||||||||||||||||
| IDR | 265,832,000 | USD | 19,340 | 06/18 | JPM | — | (159 | ) | ||||||||||||||||||
| INR | 2,350,075 | USD | 35,686 | 06/18 | SCB | — | (6 | ) | ||||||||||||||||||
| JPY | 3,000,000 | USD | 28,140 | 04/18 | RBC | 65 | — | |||||||||||||||||||
| NZD | 8,000 | USD | 5,764 | 04/18 | JPM | 18 | — | |||||||||||||||||||
| RUB | 1,760,490 | USD | 30,963 | 04/18 | DUB | — | (298 | ) | ||||||||||||||||||
| RUB | 787,245 | USD | 13,863 | 04/18 | GSC | — | (150 | ) | ||||||||||||||||||
| USD | 7,565 | ARS | 153,120 | 04/18 | JPM | — | (13 | ) | ||||||||||||||||||
| USD | 45,627 | AUD | 59,000 | 04/18 | UBS | 312 | — | |||||||||||||||||||
| USD | 231,218 | CAD | 300,000 | 04/18 | GSC | — | (1,703 | ) | ||||||||||||||||||
| USD | 617,741 | CAD | 800,000 | 04/18 | UBS | — | (3,388 | ) | ||||||||||||||||||
| USD | 49,361 | CAD | 62,000 | 05/18 | RBS | 1,195 | — | |||||||||||||||||||
| USD | 480,656 | EUR | 391,000 | 04/18 | BRC | �� | — | (649 | ) | |||||||||||||||||
| USD | 608,981 | EUR | 492,000 | 04/18 | GSC | 3,349 | — | |||||||||||||||||||
| USD | 115,078 | EUR | 93,000 | 04/18 | RBC | 598 | — | |||||||||||||||||||
| USD | 123,596 | EUR | 100,000 | 04/18 | UBS | 424 | — | |||||||||||||||||||
| USD | 123,882 | EUR | 100,000 | 05/18 | DUB | 429 | — | |||||||||||||||||||
| USD | 372,273 | EUR | 300,000 | 05/18 | GSC | 1,942 | — | |||||||||||||||||||
| USD | 12,432 | EUR | 10,000 | 08/18 | JPM | — | (19 | ) | ||||||||||||||||||
| USD | 24,747 | EUR | 20,000 | 08/18 | RBC | — | (155 | ) | ||||||||||||||||||
| USD | 3,496,923 | GBP | 2,500,000 | 04/18 | BRC | — | (13,750 | ) | ||||||||||||||||||
| USD | 1,044,362 | GBP | 747,000 | 04/18 | GSC | — | (3,935 | ) | ||||||||||||||||||
| USD | 56,161 | JPY | 5,900,000 | 04/18 | RBC | 692 | — | |||||||||||||||||||
| USD | 25,732 | KRW | 27,739,600 | 06/18 | GSC | — | (368 | ) | ||||||||||||||||||
| USD | 23,303 | MXN | 438,000 | 05/18 | GSC | — | (635 | ) | ||||||||||||||||||
| USD | 511,689 | NZD | 714,000 | 04/18 | GSC | — | (4,312 | ) | ||||||||||||||||||
| USD | 157,648 | NZD | 215,000 | 04/18 | JPM | 2,270 | — | |||||||||||||||||||
| USD | 44,256 | RUB | 2,521,010 | 06/18 | BRC | 594 | — | |||||||||||||||||||
|
|
|
| |||||||||||||||||||||||
Total Forward Foreign Currency Contracts |
| $17,650 | ($29,989 | ) | ||||||||||||||||||||||
|
|
|
| |||||||||||||||||||||||
| See Notes to Financial Statements | See explanation of symbols and terms, if any, on B-114 and B-115 |
B-3
Table of Contents
PACIFIC FUNDS
PF INFLATION MANAGED FUND
Schedule of Investments (Continued)
March 31, 2018
| (g) | Purchased options outstanding as of March 31, 2018 were as follows: |
Interest Rate Floor/Cap Options
| Description | Exercise Rate | Floating Rate Index | Expiration Date | Counter- party | Notional Amount | Cost | Value | |||||||||||||||||||||
Cap - ICE Swap Rate | 0.170% | 5-Year/10-Year ICE Swap Rate | 04/03/18 | MSC | $700,000 | $210 | $— | |||||||||||||||||||||
Cap - ICE Swap Rate | 0.174% | 5-Year/10-Year ICE Swap Rate | 06/11/18 | MSC | 400,000 | 160 | 11 | |||||||||||||||||||||
|
|
|
| |||||||||||||||||||||||||
| $370 | $11 | |||||||||||||||||||||||||||
|
|
|
| |||||||||||||||||||||||||
Interest Rate Swaptions
| Description | Pay/Receive Floating Rate | Floating Rate Index | Exercise Rate | Expiration Date | Counter- party | Notional Amount | Cost | Value | ||||||||||||||||||||||||
Call-30-Year Interest Rate Swap | Pay | 3-Month USD-LIBOR | 2.150% | 06/15/18 | DUB | $50,000 | $5,018 | $16 | ||||||||||||||||||||||||
|
|
|
| |||||||||||||||||||||||||||||
Put-30-Year Interest Rate Swap | Receive | 3-Month USD-LIBOR | 2.150% | 06/15/18 | DUB | 50,000 | 5,017 | 6,819 | ||||||||||||||||||||||||
Put-10-Year Interest Rate Swap | Receive | 3-Month USD-LIBOR | 2.765% | 07/16/18 | MSC | 150,000 | 1,740 | 2,063 | ||||||||||||||||||||||||
|
|
|
| |||||||||||||||||||||||||||||
| 6,757 | 8,882 | |||||||||||||||||||||||||||||||
|
|
|
| |||||||||||||||||||||||||||||
Total Interest Rate Swaptions | $11,775 | $8,898 | ||||||||||||||||||||||||||||||
|
|
|
| |||||||||||||||||||||||||||||
Total Purchased Options | $12,145 | $8,909 | ||||||||||||||||||||||||||||||
|
|
|
| |||||||||||||||||||||||||||||
| (h) | Premiums received and value of written options outstanding as of March 31, 2018 were as follows: |
Credit Default Swaptions on Credit Indices - Buy Protection
| Description | Exercise Rate | Expiration Date | Counter- party | Notional Amount | Premium | Value | ||||||||||||||||||
Call - iTraxx Main 28 5Y | 0.475% | 04/18/18 | DUB | EUR 100,000 | $95 | ($39 | ) | |||||||||||||||||
Call - iTraxx Main 29 5Y | 0.500% | 06/20/18 | BRC | 900,000 | 551 | (403 | ) | |||||||||||||||||
|
|
|
| |||||||||||||||||||||
| 646 | (442 | ) | ||||||||||||||||||||||
|
|
|
| |||||||||||||||||||||
| Credit Default Swaptions on Credit Indices - Sell Protection | ||||||||||||||||||||||||
Put - iTraxx Main 28 5Y | 0.700% | 04/18/18 | DUB | 100,000 | 103 | (17 | ) | |||||||||||||||||
Put - iTraxx Main 29 5Y | 0.800% | 06/20/18 | BRC | 900,000 | 1,626 | (1,472 | ) | |||||||||||||||||
Put - CDX IG 30 5Y | 0.900% | 06/20/18 | JPM | $400,000 | 494 | (463 | ) | |||||||||||||||||
Put - CDX IG 30 5Y | 0.950% | 07/18/18 | BRC | 100,000 | 172 | (141 | ) | |||||||||||||||||
Put - CDX IG 30 5Y | 0.950% | 07/18/18 | DUB | 100,000 | 166 | (141 | ) | |||||||||||||||||
|
|
|
| |||||||||||||||||||||
| 2,561 | (2,234 | ) | ||||||||||||||||||||||
|
|
|
| |||||||||||||||||||||
Total Credit Default Swaptions on Credit Indices | $3,207 | ($2,676 | ) | |||||||||||||||||||||
|
|
|
| |||||||||||||||||||||
Inflation Floor/Cap Options
| Description | Initial Index | Floating Rate | Expiration Date | Counter- party | Notional Amount | Premium | Value | |||||||||||||||||
Cap - U.S. CPI Urban Consumers NSA | 233.92 | Maximum of [0, Final Index/Initial Index - (1 + 4.000%)10] | 04/22/24 | JPM | $1,900,000 | $13,823 | ($777 | ) | ||||||||||||||||
Cap - U.S. CPI Urban Consumers NSA | 234.78 | Maximum of [0, Final Index/Initial Index - (1 + 4.000%)10] | 05/16/24 | JPM | 200,000 | 1,390 | (90 | ) | ||||||||||||||||
|
|
|
| |||||||||||||||||||||
| 15,213 | (867 | ) | ||||||||||||||||||||||
|
|
|
| |||||||||||||||||||||
Floor - U.S. CPI Urban Consumers NSA | 234.81 | Maximum of [0, 0.000% | 03/24/20 | JPM | 700,000 | 7,910 | (498 | ) | ||||||||||||||||
Floor - U.S. CPI Urban Consumers NSA | 216.69 | Maximum of [0, (1 + 0.000%)10 | 04/07/20 | CIT | 2,000,000 | 17,720 | — | |||||||||||||||||
Floor - U.S. CPI Urban Consumers NSA | 217.97 | Maximum of [0, (1 + 0.000%)10 | 09/29/20 | CIT | 300,000 | 3,870 | — | |||||||||||||||||
|
|
|
| |||||||||||||||||||||
| 29,500 | (498 | ) | ||||||||||||||||||||||
|
|
|
| |||||||||||||||||||||
Total Inflation Floor/Cap Options | $44,713 | ($1,365 | ) | |||||||||||||||||||||
|
|
|
| |||||||||||||||||||||
Interest Rate Floor/Cap Options
| Description | Exercise Rate | Floating Rate Index | Expiration Date | Counter- party | Notional Amount | Premium | Value | |||||||||||||||||||||
Cap - ICE Swap Rate | 0.155% | 10-Year/30-Year ICE Swap Rate | 04/03/18 | MSC | $700,000 | $252 | $— | |||||||||||||||||||||
Cap - ICE Swap Rate | 0.155% | 10-Year/30-Year ICE Swap Rate | 06/11/18 | MSC | 400,000 | 160 | (7 | ) | ||||||||||||||||||||
|
|
|
| |||||||||||||||||||||||||
| 412 | (7 | ) | ||||||||||||||||||||||||||
|
|
|
| |||||||||||||||||||||||||
Floor - ICE Swap Rate | 0.000% | 2-Year/10-Year ICE Swap Rate | 01/02/20 | MSC | 1,000,000 | 775 | (1,404 | ) | ||||||||||||||||||||
|
|
|
| |||||||||||||||||||||||||
Total Interest Rate Floor/Cap Options | $1,187 | ($1,411 | ) | |||||||||||||||||||||||||
|
|
|
| |||||||||||||||||||||||||
| See Notes to Financial Statements | See explanation of symbols and terms, if any, on B-114 and B-115 |
B-4
Table of Contents
PACIFIC FUNDS
PF INFLATION MANAGED FUND
Schedule of Investments (Continued)
March 31, 2018
Options on Futures
| Description | Exercise Price | Expiration Date | Exchange | Number of Contracts | Notional Amount | Premium | Value | |||||||||||||||||||||
Call - U.S. Treasury 10-Year Notes (05/18) | $121.50 | 04/20/18 | CME | 9 | $1,093,500 | $1,846 | ($2,813 | ) | ||||||||||||||||||||
|
|
|
| |||||||||||||||||||||||||
Put - U.S. Treasury 10-Year Notes (05/18) | 120.00 | 04/20/18 | CME | 9 | 1,080,000 | 2,505 | (844 | ) | ||||||||||||||||||||
Put - U.S. Treasury 30-Year Notes (05/18) | 143.00 | 04/20/18 | CME | 2 | 286,000 | 1,748 | (250 | ) | ||||||||||||||||||||
Put - Euro-Bobl (05/18) | EUR 129.00 | 05/25/18 | EUX | 1 | EUR 129,000 | 391 | (12 | ) | ||||||||||||||||||||
|
|
|
| |||||||||||||||||||||||||
| 4,644 | (1,106 | ) | ||||||||||||||||||||||||||
|
|
|
| |||||||||||||||||||||||||
Total Options on Futures | $6,490 | ($3,919 | ) | |||||||||||||||||||||||||
|
|
|
| |||||||||||||||||||||||||
Options on Securities
| Description | Exercise Price | Expiration Date | Counter- party | Notional Amount | Premium | Value | ||||||||||||||||
Call - Fannie Mae 3.500% due 05/14/48 | $99.88 | 05/07/18 | JPM | $100,000 | $457 | ($583 | ) | |||||||||||||||
|
|
|
| |||||||||||||||||||
Put - Fannie Mae 3.500% due 05/14/48 | 98.88 | 05/07/18 | JPM | 100,000 | 492 | (116 | ) | |||||||||||||||
|
|
|
| |||||||||||||||||||
Total Options on Securities | $949 | ($699 | ) | |||||||||||||||||||
|
|
|
| |||||||||||||||||||
Total Written Options | $56,546 | ($10,070 | ) | |||||||||||||||||||
|
|
|
| |||||||||||||||||||
| (i) | Swap agreements outstanding as of March 31, 2018 were as follows: |
Credit Default Swaps on Corporate Issues - Sell Protection (1)
| Referenced Obligation | Payment Frequency | Fixed Deal Receive Rate | Expiration Date | Exchange | Implied Credit Spread at 03/31/18 (2) | Notional Amount (3) | Value | Upfront Premiums Paid (Received) | Unrealized Appreciation (Depreciation) | |||||||||||||||||||||
Daimler AG | Q | 1.000% | 12/20/20 | ICE | 0.294% | EUR 10,000 | $236 | $165 | $71 | |||||||||||||||||||||
|
|
|
|
|
| |||||||||||||||||||||||||
Credit Default Swaps on Credit Indices - Buy Protection (4)
| Referenced Obligation | Payment Frequency | Fixed Deal Pay Rate | Expiration Date | Exchange | Notional Amount (3) | Value (5) | Upfront Premiums Paid (Received) | Unrealized Appreciation (Depreciation) | ||||||||||||||||||||
iTraxx Main 28 5Y | Q | 1.000% | 12/20/22 | ICE | EUR 40,000 | ($1,104 | ) | ($1,059 | ) | ($45 | ) | |||||||||||||||||
|
|
|
|
|
| |||||||||||||||||||||||
Credit Default Swaps on Credit Indices - Sell Protection (1)
| Referenced Obligation | Payment Frequency | Fixed Deal Receive Rate | Expiration Date | Counter- party | Notional Amount (3) | Value (5) | Upfront Premiums Paid (Received) | Unrealized Appreciation (Depreciation) | ||||||||||||||||||||||||
CMBX NA AAA 7 | M | 0.500% | 01/17/47 | DUB | $60,000 | $667 | ($1,864 | ) | $2,531 | |||||||||||||||||||||||
CMBX NA AAA 7 | M | 0.500% | 01/17/47 | MSC | 40,000 | 445 | (1,242 | ) | 1,687 | |||||||||||||||||||||||
|
|
|
|
|
| |||||||||||||||||||||||||||
| $1,112 | ($3,106 | ) | $4,218 | |||||||||||||||||||||||||||||
|
|
|
|
|
| |||||||||||||||||||||||||||
Total Credit Default Swaps | $244 | ($4,000 | ) | $4,244 | ||||||||||||||||||||||||||||
|
|
|
|
|
| |||||||||||||||||||||||||||
| (1) | If the Fund is a seller of protection and a credit event occurs, as defined under the terms of that particular swap agreement, the Fund will either (i) pay to the buyer of protection an amount equal to the notional amount of the swap and take delivery of the referenced obligation or underlying investments comprising the referenced index or (ii) pay a net settlement amount in the form of cash or investments equal to the notional amount of the swap less the recovery value of the referenced obligation or underlying investments comprising the referenced index. |
| (2) | An implied credit spread is the spread in yield between a U.S. Treasury security and the referenced obligation or underlying investment that are identical in all respects except for the quality rating. Implied credit spreads, represented in absolute terms, utilized in determining the value of credit default swap agreements on corporate and sovereign issues as of year end serve as an indicator of the current status of the payment/performance risk and represent the likelihood of risk of default for the credit derivative. The implied credit spread of a particular referenced entity reflects the cost of buying/selling protection and may include upfront payments required to be made to enter into the agreement. Wider credit spreads, in comparison to narrower credit spreads, represent a deterioration of the referenced entity’s credit soundness and a greater likelihood of risk of default or other credit event occurring as defined under the terms of the agreement. A credit spread identified as “Defaulted” indicates a credit event has occurred for the referenced entity or obligation. |
| (3) | The maximum potential amount the Fund could be required to pay as a seller of credit protection or receive as a buyer of credit protection if a credit event occurs as defined under the terms of that particular swap agreement. |
| (4) | If the Fund is a buyer of protection and a credit event occurs, as defined under the terms of that particular swap agreement, the Fund will either (i) receive from the seller of protection an amount equal to the notional amount of the swap and deliver the referenced obligation or underlying investments comprising the referenced index or (ii) receive a net settlement amount in the form of cash or investments equal to the notional amount of the swap less the recovery value of the referenced obligation or underlying investments comprising the referenced index. |
| (5) | The quoted market prices and resulting values for credit default swap agreements on credit indices serve as an indicator of the current status of the payment/performance risk and represent the likelihood of an expected liability (or profit) for the credit derivative had the notional amount of the swap agreement been closed/sold as of year end. Increasing values (buy protection) or decreasing values (sell protection), when compared to the notional amount of the swap, represent a deterioration of the referenced entity’s credit soundness and a greater likelihood of risk of default or other credit event occurring as defined under the terms of the agreement. |
| See Notes to Financial Statements | See explanation of symbols and terms, if any, on B-114 and B-115 |
B-5
Table of Contents
PACIFIC FUNDS
PF INFLATION MANAGED FUND
Schedule of Investments (Continued)
March 31, 2018
Interest Rate Swaps - Pay Floating Rate
| Floating Rate Index | Payment Frequency Fixed Rate/ Floating Rate | Exchange | Fixed Rate | Expiration Date | Notional Amount | Value | Upfront Premiums Paid (Received) | Unrealized Appreciation (Depreciation) | ||||||||||||||||||||||||
3-Month USD-LIBOR | S / Q | CME | 1.250% | 06/15/18 | $200,000 | ($389 | ) | $934 | ($1,323 | ) | ||||||||||||||||||||||
U.S. CPI Urban Consumers NSA | Z / Z | LCH | 2.070% | 03/23/19 | 620,000 | 325 | 36 | 289 | ||||||||||||||||||||||||
U.S. CPI Urban Consumers NSA | Z / Z | LCH | 2.027% | 11/23/20 | 100,000 | 811 | — | 811 | ||||||||||||||||||||||||
U.S. CPI Urban Consumers NSA | Z / Z | LCH | 2.021% | 11/25/20 | 100,000 | 826 | — | 826 | ||||||||||||||||||||||||
Eurostat Eurozone HICP | Z / Z | LCH | 1.295% | 03/15/21 | EUR 40,000 | 33 | — | 33 | ||||||||||||||||||||||||
1-Day EUR-EONIA | A / A | LCH | 0.050% | 09/19/21 | 40,000 | 67 | (41 | ) | 108 | |||||||||||||||||||||||
Eurostat Eurozone HICP | Z / Z | LCH | 1.165% | 12/15/21 | 50,000 | 706 | 42 | 664 | ||||||||||||||||||||||||
U.S. CPI Urban Consumers NSA | Z / Z | LCH | 2.210% | 02/05/23 | $120,000 | 91 | — | 91 | ||||||||||||||||||||||||
3-Month USD-LIBOR | S / Q | CME | 2.678% | 10/25/23 | 200,000 | (971 | ) | — | (971 | ) | ||||||||||||||||||||||
3-Month USD-LIBOR | S / Q | CME | 2.500% | 12/19/23 | 120,000 | (1,634 | ) | (305 | ) | (1,329 | ) | |||||||||||||||||||||
28-Day MXN TIIE | L / L | CME | 7.200% | 06/05/24 | MXN 10,000,000 | (6,584 | ) | (11,791 | ) | 5,207 | ||||||||||||||||||||||
28-Day MXN TIIE | L / L | CME | 8.035% | 12/17/26 | 500,000 | 794 | (53 | ) | 847 | |||||||||||||||||||||||
GBP Retail Price | Z / Z | LCH | 3.428% | 03/15/47 | GBP 30,000 | 615 | 1,774 | (1,159 | ) | |||||||||||||||||||||||
3-Month USD-LIBOR | S / Q | CME | 2.500% | 06/20/48 | $210,000 | (16,447 | ) | (17,106 | ) | 659 | ||||||||||||||||||||||
|
|
|
|
|
| |||||||||||||||||||||||||||
| ($21,757 | ) | ($26,510 | ) | $4,753 | ||||||||||||||||||||||||||||
|
|
|
|
|
| |||||||||||||||||||||||||||
Interest Rate Swaps - Receive Floating Rate
| Floating Rate Index | Payment Frequency Fixed Rate/ Floating Rate | Counterparty | Fixed Rate | Expiration Date | Notional Amount | Value | Upfront Premiums Paid (Received) | Unrealized Appreciation (Depreciation) | ||||||||||||||||||||||||
U.S. CPI Urban Consumers NSA | Z / Z | MSC | 2.058% | 05/12/25 | $700,000 | ($5,991 | ) | $— | ($5,991 | ) | ||||||||||||||||||||||
U.S. CPI Urban Consumers NSA | Z / Z | MSC | 1.788% | 07/18/26 | 100,000 | (4,677 | ) | — | (4,677 | ) | ||||||||||||||||||||||
U.S. CPI Urban Consumers NSA | Z / Z | MSC | 1.805% | 09/20/26 | 10,000 | (444 | ) | — | (444 | ) | ||||||||||||||||||||||
|
|
|
|
|
| |||||||||||||||||||||||||||
| (11,112 | ) | — | (11,112 | ) | ||||||||||||||||||||||||||||
|
|
|
|
|
| |||||||||||||||||||||||||||
| Exchange | ||||||||||||||||||||||||||||||||
3-Month USD-LIBOR | S / Q | CME | 1.750% | 06/20/20 | 500,000 | 8,605 | 9,788 | (1,183 | ) | |||||||||||||||||||||||
3-Month USD-LIBOR | S / Q | CME | 2.000% | 07/27/26 | 400,000 | 14,967 | 5,823 | 9,144 | ||||||||||||||||||||||||
U.S. CPI Urban Consumers NSA | Z / Z | LCH | 1.800% | 09/12/26 | 100,000 | (4,355 | ) | (1,009 | ) | (3,346 | ) | |||||||||||||||||||||
U.S. CPI Urban Consumers NSA | Z / Z | LCH | 1.780% | 09/15/26 | 100,000 | (4,575 | ) | (4,854 | ) | 279 | ||||||||||||||||||||||
3-Month USD-LIBOR | S / Q | CME | 2.400% | 12/07/26 | 400,000 | 12,189 | 4,037 | 8,152 | ||||||||||||||||||||||||
Eurostat Eurozone HICP | Z / Z | LCH | 1.385% | 12/15/26 | EUR 1,990,000 | (28,096 | ) | (26,531 | ) | (1,565 | ) | |||||||||||||||||||||
3-Month USD-LIBOR | S / Q | LCH | 1.750% | 12/21/26 | $340,000 | 26,886 | (2,170 | ) | 29,056 | |||||||||||||||||||||||
Eurostat Eurozone HICP | Z / Z | LCH | 1.360% | 06/15/27 | EUR 30,000 | (525 | ) | (441 | ) | (84 | ) | |||||||||||||||||||||
6-Month JPY-LIBOR | S / S | LCH | 0.300% | 09/20/27 | JPY 10,000,000 | (405 | ) | (181 | ) | (224 | ) | |||||||||||||||||||||
U.S. CPI Urban Consumers NSA | Z / Z | LCH | 2.180% | 09/20/27 | $20,000 | (280 | ) | — | (280 | ) | ||||||||||||||||||||||
France CPI Ex Tobacco | Z / Z | LCH | 1.575% | 01/15/28 | EUR 60,000 | 441 | — | 441 | ||||||||||||||||||||||||
U.S. CPI Urban Consumers NSA | Z / Z | LCH | 2.335% | 02/05/28 | $960,000 | 4,907 | 1,730 | 3,177 | ||||||||||||||||||||||||
France CPI Ex Tobacco | Z / Z | LCH | 1.606% | 02/15/28 | EUR 10,000 | 116 | — | 116 | ||||||||||||||||||||||||
Eurostat Eurozone HICP | Z / Z | LCH | 1.535% | 03/15/28 | 40,000 | 62 | — | 62 | ||||||||||||||||||||||||
3-Month NZD-Bank Bills | S / Q | CME | 3.250% | 03/21/28 | NZD 100,000 | (1,202 | ) | 308 | (1,510 | ) | ||||||||||||||||||||||
3-Month USD-LIBOR | S / Q | CME | 3.100% | 04/17/28 | $1,570,000 | (11,605 | ) | (10,345 | ) | (1,260 | ) | |||||||||||||||||||||
6-Month GBP-LIBOR | S / S | LCH | 1.500% | 09/19/28 | GBP 370,000 | 1,922 | 8,491 | (6,569 | ) | |||||||||||||||||||||||
6-Month JPY-LIBOR | S / S | LCH | 0.450% | 03/20/29 | JPY 40,000,000 | (5,269 | ) | (2,227 | ) | (3,042 | ) | |||||||||||||||||||||
GBP Retail Price | Z / Z | LCH | 3.190% | 04/15/30 | GBP 300,000 | (465 | ) | (16,852 | ) | 16,387 | ||||||||||||||||||||||
GBP Retail Price | Z / Z | LCH | 3.400% | 06/15/30 | 200,000 | 7,374 | 2,397 | 4,977 | ||||||||||||||||||||||||
GBP Retail Price | Z / Z | LCH | 3.530% | 10/15/31 | 50,000 | 1,714 | 478 | 1,236 | ||||||||||||||||||||||||
3-Month USD-LIBOR | S / Q | CME | 2.250% | 12/21/46 | $30,000 | 3,829 | 2,278 | 1,551 | ||||||||||||||||||||||||
U.S. Fed Funds | A / A | LCH | 2.000% | 12/15/47 | 40,000 | 3,051 | (72 | ) | 3,123 | |||||||||||||||||||||||
3-Month USD-LIBOR | S / Q | CME | 2.750% | 12/20/47 | 144,000 | 3,567 | 5,671 | (2,104 | ) | |||||||||||||||||||||||
6-Month GBP-LIBOR | S / S | LCH | 1.750% | 09/19/48 | GBP 30,000 | (2,472 | ) | (1,577 | ) | (895 | ) | |||||||||||||||||||||
3-Month USD-LIBOR | S / Q | CME | 2.948% | 10/19/48 | $30,000 | (427 | ) | — | (427 | ) | ||||||||||||||||||||||
3-Month USD-LIBOR | S / Q | CME | 2.969% | 10/25/48 | 50,000 | (931 | ) | — | (931 | ) | ||||||||||||||||||||||
3-Month USD-LIBOR | S / Q | CME | 2.750% | 12/19/48 | 30,000 | 822 | 508 | 314 | ||||||||||||||||||||||||
|
|
|
|
|
| |||||||||||||||||||||||||||
| $29,845 | ($24,750 | ) | $54,595 | |||||||||||||||||||||||||||||
|
|
|
|
|
| |||||||||||||||||||||||||||
Total Interest Rate Swaps - Receive Floating Rate |
| $18,733 | ($24,750 | ) | $43,483 | |||||||||||||||||||||||||||
|
|
|
|
|
| |||||||||||||||||||||||||||
Total Interest Rate Swaps | ($3,024 | ) | ($51,260 | ) | $48,236 | |||||||||||||||||||||||||||
|
|
|
|
|
| |||||||||||||||||||||||||||
Total Swap Agreements | ($2,780 | ) | ($55,260 | ) | $52,480 | |||||||||||||||||||||||||||
|
|
|
|
|
| |||||||||||||||||||||||||||
| See Notes to Financial Statements | See explanation of symbols and terms, if any, on B-114 and B-115 |
B-6
Table of Contents
PACIFIC FUNDS
PF INFLATION MANAGED FUND
Schedule of Investments (Continued)
March 31, 2018
| (j) | Fair Value Measurements |
The following is a summary of the Fund’s investments as categorized under the three-tier hierarchy of inputs used in valuing the Fund’s assets and liabilities (See Note 3D in Notes to Financial Statements) as of March 31, 2018:
| Total Value at March 31, 2018 | Level 1 Quoted Price | Level 2 Significant | Level 3 Significant | |||||||||||||||
Assets | Corporate Bonds & Notes | $607,000 | $— | $607,000 | $— | |||||||||||||
Mortgage-Backed Securities | 1,450,150 | — | 1,450,150 | — | ||||||||||||||
Asset-Backed Securities | 1,458,278 | — | 1,458,278 | — | ||||||||||||||
U.S. Treasury Obligations | 80,630,753 | — | 80,630,753 | — | ||||||||||||||
Foreign Government Bonds & Notes | 1,981,990 | — | 1,981,990 | — | ||||||||||||||
Short-Term Investments | 4,827,447 | 52,241 | 4,775,206 | — | ||||||||||||||
Derivatives: | ||||||||||||||||||
Credit Contracts | ||||||||||||||||||
Swaps | 1,348 | — | 1,348 | — | ||||||||||||||
Foreign Currency Contracts | ||||||||||||||||||
Forward Foreign Currency Contracts | 17,650 | — | 17,650 | — | ||||||||||||||
Interest Rate Contracts | ||||||||||||||||||
Futures | 1,771 | 1,771 | — | — | ||||||||||||||
Purchased Options | 8,909 | — | 8,909 | — | ||||||||||||||
Swaps | 94,720 | — | 94,720 | — | ||||||||||||||
|
|
|
|
|
|
|
| |||||||||||
Total Interest Rate Contracts | 105,400 | 1,771 | 103,629 | — | ||||||||||||||
|
|
|
|
|
|
|
| |||||||||||
Total Assets - Derivatives | 124,398 | 1,771 | 122,627 | — | ||||||||||||||
|
|
|
|
|
|
|
| |||||||||||
Total Assets | 91,080,016 | 54,012 | 91,026,004 | — | ||||||||||||||
|
|
|
|
|
|
|
| |||||||||||
Liabilities | Reverse Repurchase Agreement | (2,450,000 | ) | — | (2,450,000 | ) | — | |||||||||||
Sale-buyback Financing Transactions | (11,435,396 | ) | — | (11,435,396 | ) | — | ||||||||||||
Derivatives: | ||||||||||||||||||
Credit Contracts | ||||||||||||||||||
Written Options | (2,676 | ) | — | (2,676 | ) | |||||||||||||
Swaps | (1,104 | ) | — | (1,104 | ) | — | ||||||||||||
|
|
|
|
|
|
|
| |||||||||||
Total Credit Contracts | (3,780 | ) | — | (3,780 | ) | — | ||||||||||||
|
|
|
|
|
|
|
| |||||||||||
Foreign Currency Contracts | (29,989 | ) | — | (29,989 | ) | — | ||||||||||||
Interest Rate Contracts | ||||||||||||||||||
Futures | (58,454 | ) | (58,454 | ) | — | — | ||||||||||||
Written Options | (7,394 | ) | — | (7,394 | ) | — | ||||||||||||
Swaps | (97,744 | ) | — | (97,744 | ) | — | ||||||||||||
|
|
|
|
|
|
|
| |||||||||||
Total Interest Rate Contracts | (163,592 | ) | (58,454 | ) | (105,138 | ) | — | |||||||||||
|
|
|
|
|
|
|
| |||||||||||
Total Liabilities - Derivatives | (197,361 | ) | (58,454 | ) | (138,907 | ) | — | |||||||||||
|
|
|
|
|
|
|
| |||||||||||
Total Liabilities | (14,082,757 | ) | (58,454 | ) | (14,024,303 | ) | — | |||||||||||
|
|
|
|
|
|
|
| |||||||||||
Total | $76,997,259 | ($4,442 | ) | $77,001,701 | $— | |||||||||||||
|
|
|
|
|
|
|
| |||||||||||
| See Notes to Financial Statements | See explanation of symbols and terms, if any, on B-114 and B-115 |
B-7
Table of Contents
PACIFIC FUNDS
PF MANAGED BOND FUND
Schedule of Investments
March 31, 2018
Principal Amount |
| |||||||
CORPORATE BONDS & NOTES - 34.6% | ||||||||
Basic Materials - 1.0% | ||||||||
Alcoa Nederland Holding BV | $220,000 | $236,500 | ||||||
Anglo American Capital PLC (United Kingdom) | ||||||||
3.625% due 09/11/24 ~ | 450,000 | 433,815 | ||||||
3.750% due 04/10/22 ~ | 240,000 | 239,453 | ||||||
ArcelorMittal (Luxembourg) | 180,000 | 213,750 | ||||||
Barrick Gold Corp (Canada) | 30,000 | 32,796 | ||||||
Barrick North America Finance LLC (Canada) | 170,000 | 193,885 | ||||||
BHP Billiton Finance USA Ltd (Australia) | ||||||||
2.875% due 02/24/22 | 15,000 | 14,915 | ||||||
6.750% due 10/19/75 ~ | 770,000 | 866,250 | ||||||
Equate Petrochemical BV (Kuwait) | 370,000 | 368,011 | ||||||
Freeport-McMoRan Inc | ||||||||
3.550% due 03/01/22 | 190,000 | 184,300 | ||||||
5.450% due 03/15/43 | 100,000 | 92,470 | ||||||
6.875% due 02/15/23 | 210,000 | 226,275 | ||||||
Glencore Funding LLC (Switzerland) | ||||||||
2.875% due 04/16/20 ~ | 60,000 | 59,531 | ||||||
4.000% due 03/27/27 ~ | 640,000 | 618,580 | ||||||
4.125% due 05/30/23 ~ | 50,000 | 50,384 | ||||||
OCP SA (Malaysia) | 200,000 | 197,505 | ||||||
Potash Corp of Saskatchewan Inc (Canada) | 100,000 | 103,098 | ||||||
Southern Copper Corp (Peru) | 840,000 | 1,038,932 | ||||||
Vale Overseas Ltd (Brazil) | 660,000 | 779,592 | ||||||
Westlake Chemical Corp | 70,000 | 72,100 | ||||||
Yamana Gold Inc (Canada) | 210,000 | 207,051 | ||||||
|
| |||||||
| 6,229,193 | ||||||||
|
| |||||||
Communications - 2.8% | ||||||||
21st Century Fox America Inc | ||||||||
6.200% due 12/15/34 | 100,000 | 124,434 | ||||||
6.650% due 11/15/37 | 10,000 | 13,060 | ||||||
Altice Financing SA (Luxembourg) | EUR 300,000 | 382,018 | ||||||
Altice France SA | ||||||||
6.250% due 05/15/24 ~ | $450,000 | 425,813 | ||||||
7.375% due 05/01/26 ~ | 210,000 | 200,813 | ||||||
Altice Luxembourg SA (Luxembourg) | EUR 800,000 | 915,912 | ||||||
Amazon.com Inc | ||||||||
3.875% due 08/22/37 ~ | $160,000 | 159,371 | ||||||
4.050% due 08/22/47 ~ | 200,000 | 199,380 | ||||||
4.950% due 12/05/44 | 280,000 | 316,194 | ||||||
America Movil Sab de CV (Mexico) | 300,000 | 310,315 | ||||||
AT&T Inc | ||||||||
3.000% due 02/15/22 | 80,000 | 79,061 | ||||||
3.400% due 05/15/25 | 170,000 | 163,969 | ||||||
3.900% due 08/14/27 | 360,000 | 362,927 | ||||||
4.350% due 06/15/45 | 840,000 | 769,251 | ||||||
4.900% due 08/14/37 | 230,000 | 232,409 | ||||||
5.300% due 08/14/58 | 120,000 | 121,283 | ||||||
Bharti Airtel Ltd (India) | 230,000 | 223,432 | ||||||
British Telecommunications PLC (United Kingdom) | 60,000 | 87,790 | ||||||
Principal Amount |
| |||||||
CCO Holdings LLC | $ | 140,000 | $ | 133,266 | ||||
Charter Communications Operating LLC | ||||||||
3.579% due 07/23/20 | 2,140,000 | 2,146,889 | ||||||
4.200% due 03/15/28 | 140,000 | 134,186 | ||||||
6.384% due 10/23/35 | 50,000 | 55,936 | ||||||
Comcast Corp | ||||||||
3.375% due 08/15/25 | 150,000 | 146,813 | ||||||
3.999% due 11/01/49 | 151,000 | 141,701 | ||||||
5.150% due 03/01/20 | 550,000 | 572,380 | ||||||
5.650% due 06/15/35 | 20,000 | 23,626 | ||||||
DISH DBS Corp | ||||||||
5.875% due 11/15/24 | 400,000 | 358,000 | ||||||
6.750% due 06/01/21 | 210,000 | 212,625 | ||||||
Myriad International Holdings BV (South Africa) | 450,000 | 459,574 | ||||||
NBCUniversal Media LLC | 300,000 | 311,758 | ||||||
Netflix Inc | 40,000 | 42,000 | ||||||
Sprint Capital Corp | 350,000 | 366,625 | ||||||
Sprint Communications Inc | 104,000 | 107,380 | ||||||
Sprint Corp | ||||||||
7.625% due 02/15/25 | 240,000 | 236,700 | ||||||
7.875% due 09/15/23 | 20,000 | 20,475 | ||||||
Sprint Spectrum Co LLC | ||||||||
3.360% due 03/20/23 ~ | 175,000 | 174,344 | ||||||
4.738% due 09/20/29 ~ | 450,000 | 453,375 | ||||||
Telefonica Emisiones SAU (Spain) | ||||||||
4.103% due 03/08/27 | 210,000 | 210,038 | ||||||
5.134% due 04/27/20 | 280,000 | 290,947 | ||||||
Time Warner Cable LLC | ||||||||
4.125% due 02/15/21 | 1,120,000 | 1,132,648 | ||||||
5.875% due 11/15/40 | 410,000 | 428,964 | ||||||
6.550% due 05/01/37 | 100,000 | 112,607 | ||||||
7.300% due 07/01/38 | 190,000 | 227,846 | ||||||
8.250% due 04/01/19 | 60,000 | 62,978 | ||||||
Time Warner Entertainment Co LP | 100,000 | 130,336 | ||||||
Time Warner Inc | 100,000 | 104,484 | ||||||
Univision Communications Inc | 210,000 | 196,350 | ||||||
Verizon Communications Inc | ||||||||
2.625% due 08/15/26 | 20,000 | 18,287 | ||||||
2.946% due 03/15/22 | 60,000 | 59,029 | ||||||
3.376% due 02/15/25 | 846,000 | 832,366 | ||||||
3.500% due 11/01/24 | 80,000 | 79,270 | ||||||
3.850% due 11/01/42 | 60,000 | 52,952 | ||||||
4.125% due 03/16/27 | 910,000 | 922,867 | ||||||
4.150% due 03/15/24 | 300,000 | 308,175 | ||||||
4.600% due 04/01/21 | 220,000 | 229,457 | ||||||
5.500% due 03/16/47 | 30,000 | 33,314 | ||||||
Viacom Inc | ||||||||
3.875% due 04/01/24 | 130,000 | 129,574 | ||||||
4.250% due 09/01/23 | 40,000 | 40,628 | ||||||
|
| |||||||
| 16,788,202 | ||||||||
|
| |||||||
Consumer, Cyclical - 1.8% | ||||||||
Beacon Escrow Corp | 80,000 | 76,600 | ||||||
BMW US Capital LLC (Germany) | 40,000 | 38,365 | ||||||
Cintas Corp | ||||||||
2.900% due 04/01/22 | 210,000 | 206,852 | ||||||
3.700% due 04/01/27 | 210,000 | 210,009 | ||||||
Daimler Finance North America LLC (Germany) | 500,000 | 499,247 | ||||||
| See Notes to Financial Statements | See explanation of symbols and terms, if any, on B-114 and B-115 |
B-8
Table of Contents
PACIFIC FUNDS
PF MANAGED BOND FUND
Schedule of Investments (Continued)
March 31, 2018
Principal Amount |
| |||||||
Delta Air Lines Pass-Through Trust ‘A’ | $ | 228,486 | $ | 252,785 | ||||
Dollar Tree Inc | 170,000 | 178,010 | ||||||
Ford Motor Co | 80,000 | 73,096 | ||||||
Ford Motor Credit Co LLC | ||||||||
3.200% due 01/15/21 | 1,100,000 | 1,091,479 | ||||||
3.664% due 09/08/24 | 290,000 | 279,902 | ||||||
5.875% due 08/02/21 | 400,000 | 427,061 | ||||||
8.125% due 01/15/20 | 600,000 | 649,881 | ||||||
General Motors Co | ||||||||
5.150% due 04/01/38 | 40,000 | 39,944 | ||||||
6.250% due 10/02/43 | 100,000 | 110,033 | ||||||
General Motors Financial Co Inc | ||||||||
2.450% due 11/06/20 | 480,000 | 469,552 | ||||||
3.150% due 01/15/20 | 400,000 | 400,088 | ||||||
3.200% due 07/13/20 | 600,000 | 599,036 | ||||||
3.500% due 07/10/19 | 700,000 | 704,701 | ||||||
4.250% due 05/15/23 | 30,000 | 30,569 | ||||||
4.350% due 01/17/27 | 40,000 | 39,780 | ||||||
4.375% due 09/25/21 | 380,000 | 390,885 | ||||||
GLP Capital LP | 30,000 | 30,525 | ||||||
Hilton Worldwide Finance LLC | 250,000 | 247,813 | ||||||
McDonald’s Corp | ||||||||
3.500% due 03/01/27 | 100,000 | 99,007 | ||||||
3.700% due 01/30/26 | 310,000 | 312,080 | ||||||
NCL Corp Ltd | 120,000 | 121,500 | ||||||
Newell Brands Inc | ||||||||
3.150% due 04/01/21 | 220,000 | 218,092 | ||||||
3.850% due 04/01/23 | 270,000 | 269,685 | ||||||
4.200% due 04/01/26 | 190,000 | 188,396 | ||||||
Taylor Morrison Communities Inc | ||||||||
5.250% due 04/15/21 ~ | 300,000 | 302,976 | ||||||
5.625% due 03/01/24 ~ | 440,000 | 442,068 | ||||||
The Goodyear Tire & Rubber Co | 250,000 | 244,063 | ||||||
The TJX Cos Inc | 50,000 | 45,154 | ||||||
Toll Brothers Finance Corp | 80,000 | 79,600 | ||||||
Walgreens Boots Alliance Inc | 270,000 | 255,415 | ||||||
WestJet Airlines Ltd (Canada) | 600,000 | 597,882 | ||||||
ZF North America Capital Inc (Germany) | 430,000 | 436,450 | ||||||
|
| |||||||
| 10,658,581 | ||||||||
|
| |||||||
Consumer, Non-Cyclical - 4.8% | ||||||||
Abbott Laboratories | ||||||||
3.750% due 11/30/26 | 350,000 | 348,541 | ||||||
4.750% due 11/30/36 | 160,000 | 172,629 | ||||||
4.900% due 11/30/46 | 290,000 | 318,672 | ||||||
AbbVie Inc | 430,000 | 424,203 | ||||||
Aetna Inc | 100,000 | 96,164 | ||||||
Allergan Funding SCS | ||||||||
3.450% due 03/15/22 | 180,000 | 178,574 | ||||||
3.800% due 03/15/25 | 420,000 | 413,175 | ||||||
4.550% due 03/15/35 | 30,000 | 29,417 | ||||||
4.750% due 03/15/45 | 21,000 | 20,620 | ||||||
Allergan Sales LLC | 700,000 | 731,133 | ||||||
Principal Amount |
| |||||||
Altria Group Inc | ||||||||
2.850% due 08/09/22 | $ | 330,000 | $ | 323,208 | ||||
9.250% due 08/06/19 | 320,000 | 346,909 | ||||||
Amgen Inc | ||||||||
2.125% due 05/01/20 | 40,000 | 39,316 | ||||||
3.625% due 05/22/24 | 80,000 | 80,613 | ||||||
4.663% due 06/15/51 | 11,000 | 11,411 | ||||||
5.375% due 05/15/43 | 30,000 | 34,439 | ||||||
Anheuser-Busch InBev Finance Inc (Belgium) | ||||||||
2.650% due 02/01/21 | 370,000 | 367,288 | ||||||
3.300% due 02/01/23 | 470,000 | 470,625 | ||||||
3.650% due 02/01/26 | 110,000 | 109,465 | ||||||
4.900% due 02/01/46 | 750,000 | 810,625 | ||||||
Anheuser-Busch InBev Worldwide Inc (Belgium) | ||||||||
2.500% due 07/15/22 | 640,000 | 622,093 | ||||||
5.375% due 01/15/20 | 220,000 | 230,226 | ||||||
Anthem Inc | ||||||||
2.950% due 12/01/22 | 220,000 | 214,635 | ||||||
3.125% due 05/15/22 | 150,000 | 148,108 | ||||||
3.350% due 12/01/24 | 100,000 | 97,186 | ||||||
3.650% due 12/01/27 | 180,000 | 174,252 | ||||||
3.700% due 08/15/21 | 80,000 | 80,958 | ||||||
BAT Capital Corp (United Kingdom) | ||||||||
2.719% (USD LIBOR + 0.880%) due 08/15/22 § ~ | 800,000 | 805,288 | ||||||
3.557% due 08/15/27 ~ | 870,000 | 833,653 | ||||||
4.540% due 08/15/47 ~ | 420,000 | 416,413 | ||||||
Baxalta Inc | 500,000 | 496,686 | ||||||
Becton Dickinson & Co | ||||||||
3.363% due 06/06/24 | 460,000 | 443,171 | ||||||
3.734% due 12/15/24 | 130,000 | 127,951 | ||||||
4.685% due 12/15/44 | 90,000 | 90,788 | ||||||
Campbell Soup Co | 600,000 | 603,875 | ||||||
Cardinal Health Inc | ||||||||
2.616% due 06/15/22 | 140,000 | 135,430 | ||||||
3.079% due 06/15/24 | 180,000 | 171,888 | ||||||
Celgene Corp | ||||||||
2.250% due 08/15/21 | 170,000 | 164,516 | ||||||
3.550% due 08/15/22 | 90,000 | 89,939 | ||||||
3.875% due 08/15/25 | 320,000 | 317,356 | ||||||
5.000% due 08/15/45 | 100,000 | 104,398 | ||||||
5.250% due 08/15/43 | 60,000 | 65,509 | ||||||
Centene Corp | ||||||||
4.750% due 05/15/22 | 120,000 | 122,100 | ||||||
4.750% due 01/15/25 | 140,000 | 136,850 | ||||||
6.125% due 02/15/24 | 120,000 | 125,184 | ||||||
Constellation Brands Inc | ||||||||
4.250% due 05/01/23 | 70,000 | 71,760 | ||||||
4.750% due 11/15/24 | 190,000 | 199,986 | ||||||
CVS Health Corp | ||||||||
2.750% due 12/01/22 | 890,000 | 857,323 | ||||||
3.125% due 03/09/20 | 700,000 | 701,689 | ||||||
3.350% due 03/09/21 | 140,000 | 140,835 | ||||||
3.700% due 03/09/23 | 130,000 | 130,543 | ||||||
3.875% due 07/20/25 | 277,000 | 274,876 | ||||||
4.100% due 03/25/25 | 250,000 | 251,926 | ||||||
4.300% due 03/25/28 | 1,570,000 | 1,582,814 | ||||||
5.050% due 03/25/48 | 10,000 | 10,538 | ||||||
5.125% due 07/20/45 | 160,000 | 171,211 | ||||||
Danone SA (France) | 940,000 | 891,455 | ||||||
DaVita Inc | 10,000 | 9,691 | ||||||
Ecolab Inc | 106,000 | 110,836 | ||||||
Eli Lilly & Co | 160,000 | 156,187 | ||||||
EMD Finance LLC (Germany) | 500,000 | 494,738 | ||||||
| See Notes to Financial Statements | See explanation of symbols and terms, if any, on B-114 and B-115 |
B-9
Table of Contents
PACIFIC FUNDS
PF MANAGED BOND FUND
Schedule of Investments (Continued)
March 31, 2018
Principal Amount |
| |||||||
Gilead Sciences Inc | ||||||||
2.550% due 09/01/20 | $ | 50,000 | $ | 49,607 | ||||
3.650% due 03/01/26 | 90,000 | 90,359 | ||||||
3.700% due 04/01/24 | 200,000 | 200,957 | ||||||
4.150% due 03/01/47 | 300,000 | 293,944 | ||||||
4.750% due 03/01/46 | 30,000 | 32,342 | ||||||
GlaxoSmithKline Capital PLC (United Kingdom) | 180,000 | 178,802 | ||||||
HCA Inc | ||||||||
4.500% due 02/15/27 | 10,000 | 9,675 | ||||||
5.250% due 06/15/26 | 20,000 | 20,310 | ||||||
5.375% due 02/01/25 | 20,000 | 20,100 | ||||||
5.500% due 06/15/47 | 50,000 | 48,438 | ||||||
5.875% due 03/15/22 | 210,000 | 221,813 | ||||||
5.875% due 05/01/23 | 170,000 | 176,375 | ||||||
7.500% due 02/15/22 | 80,000 | 88,100 | ||||||
Humana Inc | ||||||||
3.150% due 12/01/22 | 110,000 | 108,728 | ||||||
3.950% due 03/15/27 | 150,000 | 149,626 | ||||||
4.625% due 12/01/42 | 110,000 | 111,030 | ||||||
4.800% due 03/15/47 | 20,000 | 20,675 | ||||||
4.950% due 10/01/44 | 80,000 | 84,465 | ||||||
Johnson & Johnson | 230,000 | 229,093 | ||||||
Kraft Heinz Foods Co | ||||||||
3.000% due 06/01/26 | 160,000 | 147,857 | ||||||
3.500% due 06/06/22 | 120,000 | 119,970 | ||||||
3.950% due 07/15/25 | 180,000 | 179,392 | ||||||
4.875% due 02/15/25 ~ | 172,000 | 179,381 | ||||||
5.000% due 07/15/35 | 150,000 | 155,812 | ||||||
5.000% due 06/04/42 | 50,000 | 50,276 | ||||||
5.200% due 07/15/45 | 80,000 | 81,470 | ||||||
Lamb Weston Holdings Inc | 190,000 | 188,813 | ||||||
Medtronic Global Holdings SCA | 240,000 | 236,966 | ||||||
Medtronic Inc | 770,000 | 769,975 | ||||||
Merck & Co Inc | 210,000 | 202,492 | ||||||
MPH Acquisition Holdings LLC | 150,000 | 155,250 | ||||||
Pernod Ricard SA (France) | ||||||||
4.450% due 01/15/22 ~ | 310,000 | 322,025 | ||||||
5.500% due 01/15/42 ~ | 150,000 | 174,534 | ||||||
Philip Morris International Inc | ||||||||
1.875% due 11/01/19 | 350,000 | 345,295 | ||||||
2.500% due 08/22/22 | 500,000 | 483,867 | ||||||
2.500% due 11/02/22 | 190,000 | 183,590 | ||||||
4.500% due 03/20/42 | 80,000 | 82,902 | ||||||
Reynolds American Inc | ||||||||
3.250% due 06/12/20 | 81,000 | 81,040 | ||||||
5.850% due 08/15/45 | 150,000 | 175,830 | ||||||
6.150% due 09/15/43 | 30,000 | 36,165 | ||||||
6.875% due 05/01/20 | 400,000 | 429,148 | ||||||
8.125% due 06/23/19 | 120,000 | 127,399 | ||||||
Tenet Healthcare Corp | 120,000 | 125,550 | ||||||
Teva Pharmaceutical Finance Co BV (Israel) | 100,000 | 88,637 | ||||||
Teva Pharmaceutical Finance Netherlands II BV (Israel) | EUR 600,000 | 741,091 | ||||||
Teva Pharmaceutical Finance Netherlands III BV (Israel) | ||||||||
1.700% due 07/19/19 | $80,000 | 77,377 | ||||||
2.200% due 07/21/21 | 520,000 | 468,534 | ||||||
2.800% due 07/21/23 | 40,000 | 33,919 | ||||||
3.150% due 10/01/26 | 30,000 | 24,111 | ||||||
Principal Amount |
| |||||||
Teva Pharmaceutical Finance IV BV (Israel) | ||||||||
3.650% due 11/10/21 | $ | 100,000 | $ | 94,179 | ||||
United Rentals North America Inc | ||||||||
4.875% due 01/15/28 | 30,000 | 29,025 | ||||||
5.500% due 07/15/25 | 90,000 | 92,475 | ||||||
5.875% due 09/15/26 | 90,000 | 93,938 | ||||||
UnitedHealth Group Inc | ||||||||
2.700% due 07/15/20 | 180,000 | 179,237 | ||||||
2.875% due 12/15/21 | 120,000 | 118,960 | ||||||
3.750% due 07/15/25 | 80,000 | 81,065 | ||||||
3.875% due 10/15/20 | 230,000 | 234,732 | ||||||
Valeant Pharmaceuticals International Inc | ||||||||
5.625% due 12/01/21 ~ | 40,000 | 38,350 | ||||||
5.875% due 05/15/23 ~ | 50,000 | 44,563 | ||||||
6.500% due 03/15/22 ~ | 60,000 | 62,175 | ||||||
7.000% due 03/15/24 ~ | 170,000 | 177,863 | ||||||
7.500% due 07/15/21 ~ | 280,000 | 283,150 | ||||||
9.000% due 12/15/25 ~ | 130,000 | 129,675 | ||||||
9.250% due 04/01/26 ~ | 60,000 | 59,925 | ||||||
Wm Wrigley Jr Co | 170,000 | 171,476 | ||||||
|
| |||||||
| 28,695,783 | ||||||||
|
| |||||||
Energy - 3.5% | ||||||||
Anadarko Petroleum Corp | ||||||||
4.850% due 03/15/21 | 80,000 | 83,220 | ||||||
5.550% due 03/15/26 | 100,000 | 109,277 | ||||||
6.450% due 09/15/36 | 630,000 | 756,319 | ||||||
8.700% due 03/15/19 | 420,000 | 441,972 | ||||||
Apache Corp | ||||||||
3.250% due 04/15/22 | 30,000 | 29,700 | ||||||
4.250% due 01/15/44 | 400,000 | 367,598 | ||||||
4.750% due 04/15/43 | 80,000 | 79,643 | ||||||
5.100% due 09/01/40 | 190,000 | 194,848 | ||||||
Baker Hughes LLC | ||||||||
3.200% due 08/15/21 | 110,000 | 110,298 | ||||||
5.125% due 09/15/40 | 30,000 | 33,261 | ||||||
BP Capital Markets PLC (United Kingdom) | ||||||||
2.183% (USD LIBOR + 0.350%) due 08/14/18 § | 500,000 | 500,326 | ||||||
3.119% due 05/04/26 | 260,000 | 251,770 | ||||||
3.216% due 11/28/23 | 100,000 | 99,166 | ||||||
3.245% due 05/06/22 | 30,000 | 30,065 | ||||||
3.506% due 03/17/25 | 350,000 | 349,532 | ||||||
Chesapeake Energy Corp | ||||||||
5.750% due 03/15/23 | 30,000 | 27,188 | ||||||
6.125% due 02/15/21 | 230,000 | 232,300 | ||||||
8.000% due 12/15/22 ~ | 16,000 | 16,940 | ||||||
Chevron Corp | 570,000 | 548,627 | ||||||
CNOOC Finance USA LLC (China) | 950,000 | 919,279 | ||||||
ConocoPhillips | 80,000 | 105,107 | ||||||
Continental Resources Inc | 100,000 | 97,625 | ||||||
Devon Energy Corp | ||||||||
3.250% due 05/15/22 | 310,000 | 306,662 | ||||||
5.850% due 12/15/25 | 525,000 | 596,895 | ||||||
Ecopetrol SA (Colombia) | ||||||||
5.375% due 06/26/26 | 250,000 | 261,125 | ||||||
5.875% due 05/28/45 | 650,000 | 643,305 | ||||||
Energy Transfer Partners LP | 230,000 | 245,598 | ||||||
EOG Resources Inc | 160,000 | 165,467 | ||||||
Exxon Mobil Corp | ||||||||
3.043% due 03/01/26 | 350,000 | 343,331 | ||||||
4.114% due 03/01/46 | 270,000 | 285,259 | ||||||
Genesis Energy LP | 200,000 | 189,500 | ||||||
| See Notes to Financial Statements | See explanation of symbols and terms, if any, on B-114 and B-115 |
B-10
Table of Contents
PACIFIC FUNDS
PF MANAGED BOND FUND
Schedule of Investments (Continued)
March 31, 2018
Principal Amount |
| |||||||
Halliburton Co | $ | 390,000 | $ | 392,171 | ||||
Kinder Morgan Energy Partners LP | ||||||||
3.500% due 03/01/21 | 80,000 | 80,091 | ||||||
3.950% due 09/01/22 | 150,000 | 151,283 | ||||||
6.850% due 02/15/20 | 210,000 | 223,194 | ||||||
Kinder Morgan Inc | ||||||||
4.300% due 03/01/28 | 270,000 | 269,431 | ||||||
5.000% due 02/15/21 ~ | 400,000 | 415,623 | ||||||
MPLX LP | ||||||||
4.000% due 03/15/28 | 130,000 | 128,353 | ||||||
4.500% due 04/15/38 | 240,000 | 236,118 | ||||||
4.700% due 04/15/48 | 430,000 | 422,555 | ||||||
4.875% due 12/01/24 | 230,000 | 241,400 | ||||||
Noble Energy Inc | ||||||||
3.850% due 01/15/28 | 240,000 | 236,286 | ||||||
5.250% due 11/15/43 | 200,000 | 214,019 | ||||||
Occidental Petroleum Corp | ||||||||
3.000% due 02/15/27 | 200,000 | 191,816 | ||||||
4.100% due 02/15/47 | 280,000 | 278,550 | ||||||
4.400% due 04/15/46 | 80,000 | 83,616 | ||||||
4.625% due 06/15/45 | 240,000 | 255,441 | ||||||
Petrobras Global Finance BV (Brazil) | ||||||||
5.299% due 01/27/25 ~ | 1,955,000 | 1,933,006 | ||||||
6.250% due 03/17/24 | 1,010,000 | 1,068,580 | ||||||
Petroleos Mexicanos (Mexico) | ||||||||
6.375% due 01/23/45 | 500,000 | 487,250 | ||||||
6.875% due 08/04/26 | 220,000 | 241,406 | ||||||
QEP Resources Inc | 150,000 | 159,750 | ||||||
Range Resources Corp | 310,000 | 298,778 | ||||||
Sabine Pass Liquefaction LLC | 200,000 | 218,823 | ||||||
Schlumberger Holdings Corp | 190,000 | 189,622 | ||||||
Shell International Finance BV (Netherlands) | ||||||||
2.875% due 05/10/26 | 350,000 | 337,460 | ||||||
4.000% due 05/10/46 | 110,000 | 110,774 | ||||||
4.375% due 03/25/20 | 420,000 | 432,803 | ||||||
4.375% due 05/11/45 | 330,000 | 350,914 | ||||||
4.550% due 08/12/43 | 130,000 | 141,611 | ||||||
Sinopec Group Overseas Development Ltd (China) | 730,000 | 747,508 | ||||||
The Williams Cos Inc | 450,000 | 549,844 | ||||||
Transcontinental Gas Pipe Co LLC | 1,020,000 | 1,256,270 | ||||||
Whiting Petroleum Corp | ||||||||
6.250% due 04/01/23 | 60,000 | 60,900 | ||||||
6.625% due 01/15/26 ~ | 150,000 | 151,313 | ||||||
Williams Partners LP | 90,000 | 93,291 | ||||||
WPX Energy Inc | 30,000 | 33,750 | ||||||
|
| |||||||
| 21,104,803 | ||||||||
|
| |||||||
Financial - 17.0% | ||||||||
ABN AMRO Bank NV (Netherlands) | 200,000 | 205,278 | ||||||
AerCap Ireland Capital DAC (Netherlands) | ||||||||
3.750% due 05/15/19 | 1,550,000 | 1,560,024 | ||||||
4.625% due 07/01/22 | 160,000 | 164,132 | ||||||
5.000% due 10/01/21 | 150,000 | 156,233 | ||||||
Ally Financial Inc | ||||||||
3.600% due 05/21/18 | 800,000 | 801,000 | ||||||
8.000% due 11/01/31 | 460,000 | 563,500 | ||||||
Ambac LSNI LLC (Cayman) | 400,000 | 405,000 | ||||||
Principal Amount |
| |||||||
American Express Co | $ | 700,000 | $ | 699,208 | ||||
American Express Credit Corp | 200,000 | 197,443 | ||||||
American International Group Inc | 820,000 | 808,268 | ||||||
American Tower Corp REIT | 500,000 | 541,864 | ||||||
AvalonBay Communities Inc REIT | 300,000 | 296,842 | ||||||
Bank of America Corp | ||||||||
2.600% due 01/15/19 | 110,000 | 110,121 | ||||||
2.741% (USD LIBOR + 1.000%) due 04/24/23 § | 500,000 | 503,861 | ||||||
2.815% (USD LIBOR + 0.790%) due 03/05/24 § | 700,000 | 697,076 | ||||||
3.004% due 12/20/23 ~ | 655,000 | 642,666 | ||||||
3.300% due 01/11/23 | 360,000 | 359,259 | ||||||
3.419% due 12/20/28 ~ | 603,000 | 577,906 | ||||||
3.500% due 04/19/26 | 360,000 | 353,860 | ||||||
3.550% due 03/05/24 | 390,000 | 391,320 | ||||||
3.593% due 07/21/28 | 100,000 | 97,175 | ||||||
4.000% due 04/01/24 | 850,000 | 868,916 | ||||||
4.100% due 07/24/23 | 500,000 | 516,332 | ||||||
4.200% due 08/26/24 | 390,000 | 395,716 | ||||||
4.250% due 10/22/26 | 2,200,000 | 2,216,402 | ||||||
4.450% due 03/03/26 | 90,000 | 92,038 | ||||||
5.650% due 05/01/18 | 900,000 | 902,277 | ||||||
5.875% due 03/15/28 | 600,000 | 604,535 | ||||||
6.100% due 03/17/25 | 160,000 | 168,600 | ||||||
6.250% due 09/05/24 | 280,000 | 297,178 | ||||||
Barclays Bank PLC (United Kingdom) | 800,000 | 879,380 | ||||||
Barclays PLC (United Kingdom) | ||||||||
3.684% due 01/10/23 | 500,000 | 496,030 | ||||||
6.500% due 09/15/19 | EUR 600,000 | 786,031 | ||||||
Blackstone CQP Holdco LP | $600,000 | 604,500 | ||||||
Brighthouse Financial Inc | 350,000 | 321,445 | ||||||
Chubb INA Holdings Inc | ||||||||
2.300% due 11/03/20 | 120,000 | 118,213 | ||||||
3.350% due 05/03/26 | 140,000 | 137,760 | ||||||
CIT Group Inc | 110,000 | 112,895 | ||||||
Citigroup Inc | ||||||||
2.700% due 03/30/21 | 800,000 | 788,782 | ||||||
2.750% due 04/25/22 | 800,000 | 779,802 | ||||||
2.965% (USD LIBOR + 0.930%) due 06/07/19 § | 300,000 | 302,034 | ||||||
4.400% due 06/10/25 | 400,000 | 407,560 | ||||||
4.450% due 09/29/27 | 1,550,000 | 1,569,101 | ||||||
4.750% due 05/18/46 | 60,000 | 61,101 | ||||||
5.300% due 05/06/44 | 232,000 | 255,161 | ||||||
5.500% due 09/13/25 | 520,000 | 564,405 | ||||||
5.950% due 01/30/23 | 300,000 | 309,195 | ||||||
5.950% due 05/15/25 | 1,350,000 | 1,389,488 | ||||||
6.675% due 09/13/43 | 70,000 | 90,883 | ||||||
8.125% due 07/15/39 | 10,000 | 15,160 | ||||||
Commonwealth Bank of Australia (Australia) | ||||||||
3.900% due 07/12/47 ~ | 210,000 | 204,238 | ||||||
5.000% due 10/15/19 ~ | 160,000 | 164,910 | ||||||
Cooperatieve Rabobank UA (Netherlands) | ||||||||
3.750% due 07/21/26 | 680,000 | 657,036 | ||||||
4.375% due 08/04/25 | 880,000 | 889,743 | ||||||
4.625% due 12/01/23 | 290,000 | 302,530 | ||||||
4.750% due 01/15/20 ~ | 340,000 | 350,138 | ||||||
5.500% due 06/29/20 ~ | EUR 300,000 | 399,081 | ||||||
6.875% due 03/19/20 ~ | 300,000 | 416,191 | ||||||
11.000% due 06/30/20 ~ | $380,000 | 416,959 | ||||||
| See Notes to Financial Statements | See explanation of symbols and terms, if any, on B-114 and B-115 |
B-11
Table of Contents
PACIFIC FUNDS
PF MANAGED BOND FUND
Schedule of Investments (Continued)
March 31, 2018
Principal Amount |
| |||||||
Credit Agricole SA (France) | $ | 300,000 | $ | 322,500 | ||||
Credit Suisse Group Funding Guernsey Ltd (Switzerland) | ||||||||
3.750% due 03/26/25 | 500,000 | 488,809 | ||||||
3.800% due 09/15/22 | 800,000 | 806,158 | ||||||
3.800% due 06/09/23 | 500,000 | 501,352 | ||||||
4.875% due 05/15/45 | 640,000 | 680,814 | ||||||
Deutsche Bank AG (Germany) | ||||||||
2.692% (USD LIBOR + 0.970%) due 07/13/20 § | 500,000 | 501,488 | ||||||
3.150% due 01/22/21 | 600,000 | 591,349 | ||||||
3.721% (USD LIBOR + 1.910%) due 05/10/19 § | 800,000 | 810,928 | ||||||
4.250% due 10/14/21 | 600,000 | 609,793 | ||||||
ERP Operating LP REIT | 200,000 | 197,550 | ||||||
GE Capital International Funding Co | ||||||||
2.342% due 11/15/20 | 383,000 | 374,643 | ||||||
3.373% due 11/15/25 | 485,000 | 468,993 | ||||||
Host Hotels & Resorts LP REIT | 200,000 | 197,152 | ||||||
HSBC Holdings PLC (United Kingdom) | ||||||||
3.400% due 03/08/21 | 740,000 | 743,612 | ||||||
3.900% due 05/25/26 | 430,000 | 429,306 | ||||||
4.250% due 08/18/25 | 620,000 | 615,732 | ||||||
6.250% due 03/23/23 | 390,000 | 395,850 | ||||||
6.375% due 09/17/24 | 280,000 | 284,200 | ||||||
6.500% due 03/23/28 | 390,000 | 398,288 | ||||||
ING Bank NV (Netherlands) | 440,000 | 475,976 | ||||||
International Lease Finance Corp | ||||||||
5.875% due 08/15/22 | 400,000 | 430,151 | ||||||
6.250% due 05/15/19 | 500,000 | 517,268 | ||||||
Intesa Sanpaolo SPA (Italy) | ||||||||
3.125% due 07/14/22 ~ | 300,000 | 290,131 | ||||||
3.375% due 01/12/23 ~ | 220,000 | 214,935 | ||||||
3.875% due 07/14/27 ~ | 230,000 | 217,574 | ||||||
5.017% due 06/26/24 ~ | 880,000 | 868,780 | ||||||
5.710% due 01/15/26 ~ | 200,000 | 200,916 | ||||||
JPMorgan Chase & Co | ||||||||
2.250% due 01/23/20 | 600,000 | 592,803 | ||||||
2.550% due 03/01/21 | 300,000 | 295,322 | ||||||
2.700% due 05/18/23 | 1,400,000 | 1,351,151 | ||||||
4.125% due 12/15/26 | 520,000 | 523,200 | ||||||
4.250% due 10/01/27 | 120,000 | 121,622 | ||||||
4.350% due 08/15/21 | 290,000 | 300,455 | ||||||
4.950% due 06/01/45 | 350,000 | 378,937 | ||||||
JPMorgan Chase Bank NA | 700,000 | 700,106 | ||||||
Kimco Realty Corp REIT | 900,000 | 847,830 | ||||||
KKR Group Finance Co II LLC | 30,000 | 32,225 | ||||||
Lifestorage LP REIT | 800,000 | 765,162 | ||||||
Lloyds Banking Group PLC (United Kingdom) | ||||||||
3.265% (AUD Bank Bill + 1.400%) due 03/07/25 § | AUD 800,000 | 610,651 | ||||||
3.574% due 11/07/28 | $200,000 | 189,014 | ||||||
4.000% due 03/07/25 | AUD 900,000 | 694,432 | ||||||
4.375% due 03/22/28 | $200,000 | 202,263 | ||||||
4.500% due 11/04/24 | 610,000 | 615,362 | ||||||
MetLife Inc | 230,000 | 240,062 | ||||||
Mitsubishi UFJ Financial Group Inc (Japan) | 200,000 | 197,414 | ||||||
3.455% due 03/02/23 | 600,000 | 599,582 | ||||||
Principal Amount |
| |||||||
Morgan Stanley | ||||||||
2.294% (USD LIBOR + 0.550%) due 02/10/21 § | $ | 500,000 | $ | 500,410 | ||||
2.450% due 02/01/19 | 800,000 | 798,526 | ||||||
3.125% due 07/27/26 | 200,000 | 189,352 | ||||||
Nasdaq Inc | 800,000 | 790,078 | ||||||
Navient Corp | 330,000 | 351,450 | ||||||
New York Life Global Funding | 1,000,000 | 984,674 | ||||||
Nuveen Finance LLC | 80,000 | 79,826 | ||||||
Nykredit Realkredit AS (Denmark) | ||||||||
1.000% due 04/01/18 | DKK 3,900,000 | 643,713 | ||||||
1.000% due 10/01/18 ~ | 14,700,000 | 2,444,585 | ||||||
Quicken Loans Inc | $190,000 | 190,475 | ||||||
Realkredit Danmark AS (Denmark) | ||||||||
1.000% due 04/01/18 | DKK 27,300,000 | 4,505,991 | ||||||
2.000% due 04/01/18 | 31,900,000 | 5,265,243 | ||||||
Reliance Standard Life Global Funding II | $70,000 | 69,313 | ||||||
Royal Bank of Canada (Canada) | 170,000 | 166,337 | ||||||
Royal Bank of Scotland Group PLC (United Kingdom) | ||||||||
2.500% due 03/22/23 ~ | EUR 600,000 | 788,238 | ||||||
3.875% due 09/12/23 | $600,000 | 593,035 | ||||||
5.125% due 05/28/24 | 1,700,000 | 1,730,884 | ||||||
6.125% due 12/15/22 | 160,000 | 169,916 | ||||||
Santander Holdings USA Inc | 70,000 | 71,149 | ||||||
Santander UK Group Holdings PLC (United Kingdom) | ||||||||
2.375% due 03/16/20 | 100,000 | 98,631 | ||||||
2.875% due 10/16/20 | 1,100,000 | 1,090,838 | ||||||
Simon Property Group LP REIT | 400,000 | 395,692 | ||||||
Standard Chartered PLC (United Kingdom) | 710,000 | 783,701 | ||||||
Sumitomo Mitsui Banking Corp (Japan) | 600,000 | 594,249 | ||||||
Sumitomo Mitsui Financial Group Inc (Japan) | 290,000 | 279,891 | ||||||
Sumitomo Mitsui Trust Bank Ltd (Japan) | 800,000 | 800,401 | ||||||
Teachers Insurance & Annuity Association of America | ||||||||
4.900% due 09/15/44 ~ | 100,000 | 110,281 | ||||||
6.850% due 12/16/39 ~ | 18,000 | 24,030 | ||||||
The Depository Trust & Clearing Corp | 250,000 | 256,125 | ||||||
The Goldman Sachs Group Inc | ||||||||
2.552% (USD LIBOR + 0.780%) due 10/31/22 § | 500,000 | 499,401 | ||||||
2.556% (USD LIBOR + 0.750%) due 02/23/23 § | 600,000 | 598,067 | ||||||
3.325% (USD LIBOR + 1.200%) due 09/15/20 § | 500,000 | 508,068 | ||||||
3.500% due 01/23/25 | 700,000 | 686,941 | ||||||
3.750% due 05/22/25 | 600,000 | 594,154 | ||||||
3.850% due 07/08/24 | 740,000 | 743,679 | ||||||
4.250% due 10/21/25 | 2,220,000 | 2,232,335 | ||||||
5.150% due 05/22/45 | 310,000 | 334,638 | ||||||
5.250% due 07/27/21 | 620,000 | 656,837 | ||||||
6.250% due 02/01/41 | 550,000 | 697,775 | ||||||
| See Notes to Financial Statements | See explanation of symbols and terms, if any, on B-114 and B-115 |
B-12
Table of Contents
PACIFIC FUNDS
PF MANAGED BOND FUND
Schedule of Investments (Continued)
March 31, 2018
Principal Amount |
| |||||||
The Royal Bank of Scotland PLC (United Kingdom) | EUR 200,000 | $ | 246,364 | |||||
The Toronto-Dominion Bank (Canada) | $1,200,000 | 1,180,310 | ||||||
UBS AG (Switzerland) | ||||||||
2.304% (USD LIBOR + 0.320%) due 05/28/19 § ~ | 800,000 | 800,464 | ||||||
2.355% (USD LIBOR + 0.320%) due 12/07/18 § ~ | 800,000 | 800,750 | ||||||
UBS Group Funding Switzerland AG (Switzerland) | ||||||||
3.000% due 04/15/21 ~ | 1,000,000 | 989,973 | ||||||
3.491% due 05/23/23 ~ | 610,000 | 603,145 | ||||||
4.125% due 09/24/25 ~ | 1,420,000 | 1,428,455 | ||||||
4.253% due 03/23/28 ~ | 630,000 | 634,942 | ||||||
US Capital Funding II Ltd (Cayman) | 600,000 | 564,000 | ||||||
Vesteda Finance BV (Netherlands) | EUR 600,000 | 794,144 | ||||||
Visa Inc | ||||||||
3.150% due 12/14/25 | $760,000 | 745,723 | ||||||
4.300% due 12/14/45 | 350,000 | 375,519 | ||||||
Washington Prime Group LP | 700,000 | 668,104 | ||||||
WEA Finance LLC REIT (Australia) | 650,000 | 651,429 | ||||||
Wells Fargo & Co | ||||||||
3.000% due 10/23/26 | 650,000 | 608,978 | ||||||
3.002% (USD LIBOR + 1.230%) due 10/31/23 § | 2,000,000 | 2,030,347 | ||||||
3.450% due 02/13/23 | 110,000 | 108,557 | ||||||
4.300% due 07/22/27 | 1,550,000 | 1,560,198 | ||||||
4.400% due 06/14/46 | 90,000 | 87,407 | ||||||
4.600% due 04/01/21 | 1,310,000 | 1,360,406 | ||||||
4.900% due 11/17/45 | 460,000 | 482,524 | ||||||
5.606% due 01/15/44 | 350,000 | 401,525 | ||||||
5.875% due 06/15/25 | 60,000 | 63,195 | ||||||
Westpac Banking Corp (Australia) | ||||||||
2.300% due 05/26/20 | 40,000 | 39,431 | ||||||
2.600% due 11/23/20 | 200,000 | 197,572 | ||||||
|
| |||||||
| 101,618,014 | ||||||||
|
| |||||||
Industrial - 1.3% | ||||||||
Caterpillar Financial Services Corp | 220,000 | 212,688 | ||||||
CNH Industrial Capital LLC | 400,000 | 412,500 | ||||||
DAE Funding LLC (United Arab Emirates) | ||||||||
4.500% due 08/01/22 ~ | 82,000 | 78,003 | ||||||
5.000% due 08/01/24 ~ | 80,000 | 75,900 | ||||||
Eaton Corp | ||||||||
2.750% due 11/02/22 | 810,000 | 791,815 | ||||||
4.150% due 11/02/42 | 180,000 | 178,792 | ||||||
General Electric Co | ||||||||
3.150% due 09/07/22 | 187,000 | 184,295 | ||||||
5.000% due 01/21/21 | 400,000 | 396,500 | ||||||
5.300% due 02/11/21 | 480,000 | 503,443 | ||||||
5.500% due 01/08/20 | 20,000 | 20,805 | ||||||
5.875% due 01/14/38 | 40,000 | 46,575 | ||||||
6.000% due 08/07/19 | 132,000 | 136,857 | ||||||
6.875% due 01/10/39 | 798,000 | 1,034,107 | ||||||
Harris Corp | 140,000 | 154,718 | ||||||
John Deere Capital Corp | 100,000 | 98,087 | ||||||
Lockheed Martin Corp | ||||||||
3.100% due 01/15/23 | 20,000 | 19,895 | ||||||
3.550% due 01/15/26 | 420,000 | 416,953 | ||||||
4.500% due 05/15/36 | 70,000 | 74,392 | ||||||
Principal Amount |
| |||||||
Northrop Grumman Corp | ||||||||
2.930% due 01/15/25 | $ | 20,000 | $ | 19,195 | ||||
3.250% due 01/15/28 | 660,000 | 630,839 | ||||||
Park Aerospace Holdings Ltd (Ireland) | ||||||||
5.250% due 08/15/22 ~ | 200,000 | 196,690 | ||||||
5.500% due 02/15/24 ~ | 130,000 | 126,425 | ||||||
Raytheon Co | 160,000 | 160,993 | ||||||
Reynolds Group Issuer Inc (New Zealand) | ||||||||
5.125% due 07/15/23 ~ | 100,000 | 101,095 | ||||||
5.750% due 10/15/20 | 193,822 | 196,487 | ||||||
The Boeing Co | 630,000 | 657,076 | ||||||
United Parcel Service Inc | ||||||||
2.500% due 04/01/23 | 110,000 | 106,623 | ||||||
3.050% due 11/15/27 | 80,000 | 77,040 | ||||||
United Technologies Corp | ||||||||
4.500% due 04/15/20 | 210,000 | 217,134 | ||||||
4.500% due 06/01/42 | 70,000 | 71,147 | ||||||
Waste Management Inc | 240,000 | 240,747 | ||||||
|
| |||||||
| 7,637,816 | ||||||||
|
| |||||||
Technology - 1.1% | ||||||||
Apple Inc | ||||||||
2.000% due 11/13/20 | 240,000 | 235,875 | ||||||
2.450% due 08/04/26 | 620,000 | 575,008 | ||||||
Broadcom Corp | ||||||||
3.125% due 01/15/25 | 190,000 | 179,782 | ||||||
3.875% due 01/15/27 | 30,000 | 29,204 | ||||||
Dell International LLC | ||||||||
3.480% due 06/01/19 ~ | 710,000 | 713,365 | ||||||
4.420% due 06/15/21 ~ | 1,000,000 | 1,026,325 | ||||||
5.450% due 06/15/23 ~ | 500,000 | 530,416 | ||||||
7.125% due 06/15/24 ~ | 410,000 | 438,072 | ||||||
First Data Corp | ||||||||
5.000% due 01/15/24 ~ | 480,000 | 481,800 | ||||||
7.000% due 12/01/23 ~ | 10,000 | 10,538 | ||||||
Intel Corp | ||||||||
3.700% due 07/29/25 | 120,000 | 122,684 | ||||||
3.734% due 12/08/47 ~ | 76,000 | 74,059 | ||||||
Microsoft Corp | ||||||||
2.400% due 08/08/26 | 1,120,000 | 1,043,376 | ||||||
2.700% due 02/12/25 | 140,000 | 135,231 | ||||||
2.875% due 02/06/24 | 580,000 | 569,814 | ||||||
3.300% due 02/06/27 | 570,000 | 566,148 | ||||||
3.450% due 08/08/36 | 20,000 | 19,517 | ||||||
3.950% due 08/08/56 | 80,000 | 79,578 | ||||||
|
| |||||||
| 6,830,792 | ||||||||
|
| |||||||
Utilities - 1.3% | ||||||||
American Electric Power Co Inc | 500,000 | 489,384 | ||||||
Duke Energy Carolinas LLC | 60,000 | 71,902 | ||||||
Duke Energy Corp | 30,000 | 28,222 | ||||||
Emera US Finance LP (Canada) | 800,000 | 782,269 | ||||||
FirstEnergy Corp | ||||||||
3.900% due 07/15/27 | 460,000 | 452,318 | ||||||
4.250% due 03/15/23 | 410,000 | 420,172 | ||||||
7.375% due 11/15/31 | 1,410,000 | 1,857,413 | ||||||
IPALCO Enterprises Inc | 800,000 | 804,080 | ||||||
National Fuel Gas Co | 2,000,000 | 2,077,371 | ||||||
Pacific Gas & Electric Co | ||||||||
5.800% due 03/01/37 | 130,000 | 151,184 | ||||||
6.050% due 03/01/34 | 490,000 | 584,925 | ||||||
| See Notes to Financial Statements | See explanation of symbols and terms, if any, on B-114 and B-115 |
B-13
Table of Contents
PACIFIC FUNDS
PF MANAGED BOND FUND
Schedule of Investments (Continued)
March 31, 2018
Principal Amount |
| |||||||
Progress Energy Inc | $ | 60,000 | $ | 61,675 | ||||
Virginia Electric & Power Co | 160,000 | 209,497 | ||||||
|
| |||||||
| 7,990,412 | ||||||||
|
| |||||||
Total Corporate Bonds & Notes |
| 207,553,596 | ||||||
|
| |||||||
SENIOR LOAN NOTES - 5.0% | ||||||||
Communications - 0.9% | ||||||||
Altice France SA Term B-12 (France) | 519,698 | 500,799 | ||||||
CenturyLink Inc Term B | 593,513 | 585,167 | ||||||
Charter Communications Operating LLC Term B | 862,803 | 866,901 | ||||||
CSC Holdings LLC | 365,658 | 365,749 | ||||||
Level 3 Parent LLC Term B | 710,000 | 711,830 | ||||||
Sinclair Television Group Inc Term B | 540,000 | 543,440 | ||||||
Sprint Communications Inc Term B | 71,638 | 71,739 | ||||||
Univision Communications Inc Term C-5 | 709,480 | 699,392 | ||||||
UPC Financing Partnership Term AR | 560,000 | 562,400 | ||||||
Virgin Media Bristol LLC Term K | 458,463 | 461,328 | ||||||
Ziggo Secured Finance Partnership Term E (Netherlands) | 159,750 | 158,801 | ||||||
|
| |||||||
| 5,527,546 | ||||||||
|
| |||||||
Consumer, Cyclical - 1.7% | ||||||||
American Airlines Inc Term B | ||||||||
3.777% (USD LIBOR + 2.000%) due 12/14/23 § | 79,200 | 79,363 | ||||||
3.875% (USD LIBOR + 2.000%) due 06/27/20 § | 634,329 | 636,034 | ||||||
American Axle & Manufacturing Inc Term B | 117,828 | 118,454 | ||||||
American Builders & Contractors Supply Co Inc Term B-1 | 703,945 | 706,487 | ||||||
Aramark Services Inc Term B-1 | 249,375 | 251,765 | ||||||
Aristocrat International Pty Ltd Term B (Australia) | 19,950 | 20,075 | ||||||
3.745% (USD LIBOR + 2.000%) | 443,925 | 446,468 | ||||||
Beacon Roofing Supply Inc Term B | 590,000 | 593,605 | ||||||
Principal Amount |
| |||||||
Boyd Gaming Corp Term B | $ | 258,281 | $ | 259,987 | ||||
Caesars Resort Collection LLC Term B | 526,181 | 530,362 | ||||||
CityCenter Holdings LLC Term B | 63,580 | 63,942 | ||||||
CWGS Group LLC Term B | 425,700 | 427,190 | ||||||
Golden Nugget Inc | 700,262 | 707,046 | ||||||
Hilton Worldwide Finance LLC Term B-2 | 701,690 | 706,315 | ||||||
Michaels Stores Inc Term B-1 | 1,245,837 | 1,253,277 | ||||||
New Red Finance Inc Term B (Canada) | 702,864 | 704,475 | ||||||
Party City Holdings Inc | 508,735 | 511,350 | ||||||
Petco Animal Supplies Inc Term B-1 | 902,947 | 665,547 | ||||||
PetSmart Inc Term B | 581,489 | 468,099 | ||||||
Scientific Games International Inc Term B-5 | 590,400 | 593,260 | ||||||
Station Casinos LLC Term B | 478,334 | 480,276 | ||||||
|
| |||||||
| 10,223,377 | ||||||||
|
| |||||||
Consumer, Non-Cyclical - 1.1% | ||||||||
Air Medical Group Holdings Inc Term B | 550,136 | 553,102 | ||||||
Albertson’s LLC | ||||||||
Term B-4 | 303,596 | 300,645 | ||||||
Term B-6 | 218,003 | 215,686 | ||||||
Catalent Pharma Solutions Inc Term B | 335,974 | 337,794 | ||||||
Change Healthcare Holdings LLC Term B | 912,385 | 915,616 | ||||||
HCA Inc Term B-10 | 542,530 | 547,165 | ||||||
Jaguar Holding Co II | 758,024 | 761,577 | ||||||
MPH Acquisition Holdings LLC Term B | 657,164 | 661,066 | ||||||
PAREXEL International Corp Term B | 219,449 | 219,778 | ||||||
| See Notes to Financial Statements | See explanation of symbols and terms, if any, on B-114 and B-115 |
B-14
Table of Contents
PACIFIC FUNDS
PF MANAGED BOND FUND
Schedule of Investments (Continued)
March 31, 2018
Principal Amount |
| |||||||
Post Holdings Inc Term B | $ | 620,110 | $ | 622,192 | ||||
Prime Security Services Borrower LLC Term B | 703,758 | 709,964 | ||||||
Trans Union LLC Term B-3 | 631,975 | 634,524 | ||||||
Valeant Pharmaceuticals International Inc Term BF4 | 300,000 | 303,544 | ||||||
|
| |||||||
| 6,782,653 | ||||||||
|
| |||||||
Financial - 0.4% | ||||||||
Flying Fortress Holdings LLC Term B | 500,000 | 502,634 | ||||||
Lions Gate Capital Holdings LLC Term B | 114,469 | 114,970 | ||||||
MGM Growth Properties Operating Partnership LP REIT Term B | 671,581 | 674,016 | ||||||
RPI Finance Trust Term B-6 | 638,563 | 642,155 | ||||||
VICI Properties 1 LLC REIT Term B | 268,636 | 269,849 | ||||||
|
| |||||||
| 2,203,624 | ||||||||
|
| |||||||
Industrial - 0.6% | ||||||||
Avolon (US) LLC Term B-2 (Ireland) | 706,441 | 707,864 | ||||||
Berry Global Inc | ||||||||
Term Q | 637,270 | 640,605 | ||||||
Term R | 74,623 | 75,043 | ||||||
Quikrete Holdings Inc Term B | 267,190 | 268,693 | ||||||
Reynolds Group Holdings Inc Term B | 695,620 | 699,968 | ||||||
XPO Logistics Inc Term B | 676,896 | 680,154 | ||||||
Zebra Technologies Corp Term B | 356,737 | 359,152 | ||||||
|
| |||||||
| 3,431,479 | ||||||||
|
| |||||||
Technology - 0.3% | ||||||||
Dell International LLC Term B | 669,125 | 670,589 | ||||||
First Data Corp | 698,263 | 700,191 | ||||||
ON Semiconductor Corp Term B | 215,281 | 216,666 | ||||||
Western Digital Corp Term B-3 | 174,469 | 175,638 | ||||||
|
| |||||||
| 1,763,084 | ||||||||
|
| |||||||
Principal Amount |
| |||||||
Utilities - 0.0% | ||||||||
Vistra Operations Co LLC | ||||||||
Term B | $ | 33,893 | $ | 34,164 | ||||
Term C | 6,021 | 6,070 | ||||||
|
| |||||||
| 40,234 | ||||||||
|
| |||||||
Total Senior Loan Notes |
| 29,971,997 | ||||||
|
| |||||||
MORTGAGE-BACKED SECURITIES - 42.7% | ||||||||
Collateralized Mortgage Obligations - Commercial - 4.8% |
| |||||||
BAMLL Re-REMIC Trust | 1,812,145 | 1,367,209 | ||||||
Banc of America Commercial Mortgage Trust | 354,159 | 235,519 | ||||||
BANK | 470,000 | 472,269 | ||||||
BBCCRE Trust | 320,000 | 277,953 | ||||||
BX Trust | 800,000 | 802,761 | ||||||
CD Commercial Mortgage Trust | 4,879 | 2,895 | ||||||
CHT Trust | 520,000 | 521,807 | ||||||
Citigroup Commercial Mortgage Trust | ||||||||
3.110% due 04/10/48 ~ | 150,000 | 114,238 | ||||||
3.172% due 09/10/58 | 350,000 | 264,850 | ||||||
3.251% due 05/10/35 ~ | 500,000 | 501,217 | ||||||
4.017% due 10/10/47 | 270,000 | 274,415 | ||||||
Commercial Mortgage Trust | ||||||||
4.239% due 11/10/47 § | 160,000 | 162,485 | ||||||
4.353% due 02/10/48 § | 90,000 | 88,374 | ||||||
Core Industrial Trust | 400,000 | 395,581 | ||||||
Credit Suisse Commercial Mortgage Trust | 116,474 | 96,004 | ||||||
CSAIL Commercial Mortgage Trust | 1,060,000 | 1,066,758 | ||||||
CSMC Trust | ||||||||
2.761% due 04/05/33 ~ | 480,000 | 475,811 | ||||||
3.953% due 09/15/37 ~ | 400,000 | 408,963 | ||||||
4.373% due 09/15/37 ~ | 1,230,000 | 1,071,651 | ||||||
7.777% (USD LIBOR + 6.000%) due 11/15/33 § ~ | 490,000 | 494,591 | ||||||
DBUBS Mortgage Trust | 260,000 | 274,549 | ||||||
Fannie Mae | ||||||||
2.499% due 09/25/26 | 430,000 | 409,257 | ||||||
3.136% due 11/25/27 § | 130,000 | 128,355 | ||||||
Fannie Mae (IO) | 11,323,711 | 227,809 | ||||||
FORT CRE LLC | 135,764 | 135,796 | ||||||
Freddie Mac Multifamily Structured Pass-Through Certificates (IO) | 21,992,484 | 82,448 | ||||||
Freddie Mac Structured Pass-Through Certificates | 200,000 | 195,617 | ||||||
GE Commercial Mortgage Co | 200,000 | 105,172 | ||||||
| See Notes to Financial Statements | See explanation of symbols and terms, if any, on B-114 and B-115 |
B-15
Table of Contents
PACIFIC FUNDS
PF MANAGED BOND FUND
Schedule of Investments (Continued)
March 31, 2018
Principal Amount |
| |||||||
Government National Mortgage Association (IO) | ||||||||
0.467% due 01/16/53 § | $ | 12,642,495 | $ | 400,325 | ||||
0.651% due 04/16/47 § | 4,967,623 | 192,156 | ||||||
GRACE Mortgage Trust | 600,000 | 598,701 | ||||||
GS Mortgage Securities Trust | ||||||||
3.203% due 02/10/29 ~ | 400,000 | 401,442 | ||||||
4.422% due 11/10/48 § | 720,000 | 726,550 | ||||||
5.622% due 11/10/39 | 137,582 | 129,824 | ||||||
Hudson Yards Mortgage Trust | 540,000 | 512,565 | ||||||
JP Morgan Chase Commercial Mortgage Securities Trust | ||||||||
2.870% due 08/15/49 | 700,000 | 667,880 | ||||||
4.057% (USD LIBOR + 2.280%) due 11/15/31 § ~ | 338,278 | 339,153 | ||||||
4.127% (USD LIBOR + 2.350%) due 08/15/27 § ~ | 210,000 | 210,385 | ||||||
4.572% due 07/15/47 § | 380,000 | 378,322 | ||||||
5.327% (USD LIBOR + 3.550%) due 08/15/27 § ~ | 120,000 | 120,208 | ||||||
5.411% due 05/15/47 | 1,450,000 | 1,065,657 | ||||||
5.438% due 01/15/49 ~ | 470,000 | 113,084 | ||||||
5.502% due 06/12/47 § | 570,000 | 472,582 | ||||||
5.640% due 02/12/49 § | 991,559 | 718,384 | ||||||
JPMBB Commercial Mortgage Securities Trust | ||||||||
3.364% due 09/15/47 § ~ | 680,000 | 427,061 | ||||||
4.618% due 08/15/48 § | 550,000 | 561,608 | ||||||
LSTAR Commercial Mortgage Trust | ||||||||
2.729% due 04/20/48 § ~ | 655,500 | 649,686 | ||||||
3.112% due 04/20/48 § ~ | 850,000 | 845,354 | ||||||
ML-CFC Commercial Mortgage Trust | 81,471 | 62,347 | ||||||
Morgan Stanley Bank of America Merrill | ||||||||
3.040% due 04/15/48 | 1,000,000 | 997,302 | ||||||
3.720% due 12/15/49 | 550,000 | 558,930 | ||||||
Morgan Stanley Capital I Trust | ||||||||
2.782% due 08/15/49 | 540,000 | 512,495 | ||||||
3.402% due 07/13/29 § ~ | 600,000 | 602,892 | ||||||
3.446% due 07/13/29 § ~ | 700,000 | 699,592 | ||||||
Waterfall Commercial Mortgage Trust | 312,753 | 307,289 | ||||||
Wells Fargo Commercial Mortgage Trust | ||||||||
2.652% due 08/15/49 | 2,670,000 | 2,512,675 | ||||||
3.184% due 04/15/50 | 340,000 | 334,156 | ||||||
3.848% due 05/15/48 § | 380,000 | 367,040 | ||||||
4.291% due 07/15/46 § | 290,000 | 301,078 | ||||||
Wells Fargo Commercial Mortgage Trust (IO) 1.284% due 03/15/50 § | 4,763,862 | 424,902 | ||||||
WFRBS Commercial Mortgage Trust | 770,000 | 542,404 | ||||||
WFRBS Commercial Mortgage Trust (IO) | 4,601,586 | 141,595 | ||||||
|
| |||||||
| 28,549,978 | ||||||||
|
| |||||||
Collateralized Mortgage Obligations - Residential - 7.6% |
| |||||||
Alternative Loan Trust | ||||||||
2.042% (USD LIBOR + 0.170%) due 07/25/46 § | 532,216 | 512,706 | ||||||
2.082% (USD LIBOR + 0.210%) due 05/25/35 § | 334,599 | 319,564 | ||||||
2.783% (US FED + 1.500%) due 09/25/35 § | 352,945 | 345,984 | ||||||
3.439% due 06/25/37 § | 149,593 | 129,600 | ||||||
American Home Mortgage Investment Trust | 1,387,886 | 563,987 | ||||||
Banc of America Funding Corp | 2,472,040 | 1,808,861 | ||||||
Principal Amount |
| |||||||
Banc of America Funding Trust | ||||||||
2.170% due 09/29/36 § ~ | $ | 3,362,275 | $ | 1,909,914 | ||||
3.502% (USD LIBOR + 1.500%) due 09/26/45 § ~ | 2,760,000 | 2,177,052 | ||||||
3.608% due 05/25/35 § | 31,171 | 32,758 | ||||||
BCAP LLC Trust | ||||||||
2.021% due 03/28/37 § ~ | 1,946,774 | 1,890,046 | ||||||
3.320% due 08/26/35 § ~ | 2,355,622 | 1,992,731 | ||||||
4.967% due 03/26/37 § ~ | 50,984 | 50,990 | ||||||
Bear Stearns Adjustable Rate Mortgage Trust | ||||||||
3.475% due 08/25/33 § | 39,464 | 39,563 | ||||||
3.741% due 01/25/35 § | 477,493 | 476,616 | ||||||
3.905% due 10/25/36 § | 13,802 | 13,401 | ||||||
Bear Stearns ALT-A Trust | ||||||||
3.688% due 05/25/35 § | 24,782 | 25,016 | ||||||
4.267% due 11/25/36 § | 61,716 | 52,897 | ||||||
Chase Mortgage Finance Trust | ||||||||
3.541% due 09/25/36 § | 95,144 | 93,837 | ||||||
3.714% due 02/25/37 § | 341,464 | 344,975 | ||||||
ChaseFlex Trust | 528,611 | 522,661 | ||||||
Chevy Chase Funding LLC | ||||||||
2.064% due 05/25/35 § ~ | 1,077,511 | 815,809 | ||||||
2.122% (USD LIBOR + 0.250%) due 08/25/35 § ~ | 26,108 | 25,676 | ||||||
Citigroup Mortgage Loan Trust Inc | ||||||||
3.180% (UST + 2.150%) due 09/25/35 § | 16,167 | 16,395 | ||||||
3.314% due 06/27/37 § ~ | 2,000,000 | 1,787,588 | ||||||
COLT Mortgage Loan Trust | 207,514 | 210,677 | ||||||
Countrywide Home Loan Mortgage Pass-Through Trust | 11,798 | 11,646 | ||||||
Credit Suisse First Boston Mortgage Securities Corp | 55,937 | 47,806 | ||||||
Downey Saving & Loan Association Mortgage Loan Trust | 118,287 | 98,471 | ||||||
Eurosail-UK PLC (United Kingdom) | ||||||||
1.554% (GBP LIBOR + 0.950%) due 06/13/45 § ~ | GBP 928,152 | 1,294,846 | ||||||
Fannie Mae | ||||||||
2.025% (USD LIBOR + 0.450%) due 09/25/46 § | $1,057,122 | 1,057,802 | ||||||
3.125% (US PRIME - 1.625%) due 11/25/23 § | 101,001 | 102,599 | ||||||
5.500% due 04/25/35 | 425,696 | 475,537 | ||||||
Fannie Mae (IO) | ||||||||
4.000% due 03/25/43 | 501,383 | 96,516 | ||||||
4.000% due 04/25/43 | 1,956,864 | 380,304 | ||||||
4.129% (6.000% - USD LIBOR) due 11/25/45 § | 2,119,767 | 372,317 | ||||||
4.229% (6.100% - USD LIBOR) due 09/25/46 § | 1,380,996 | 188,117 | ||||||
Fannie Mae Connecticut Avenue Securities | 1,550,000 | 1,755,702 | ||||||
Freddie Mac | 86,445 | 100,184 | ||||||
Freddie Mac (IO) | ||||||||
3.500% due 04/15/43 | 1,177,728 | 191,784 | ||||||
4.000% due 04/15/43 | 498,799 | 68,389 | ||||||
4.323% (6.100% - USD LIBOR) due 08/15/44 § | 342,601 | 62,248 | ||||||
| See Notes to Financial Statements | See explanation of symbols and terms, if any, on B-114 and B-115 |
B-16
Table of Contents
PACIFIC FUNDS
PF MANAGED BOND FUND
Schedule of Investments (Continued)
March 31, 2018
Principal Amount |
| |||||||
Freddie Mac Structured Agency Credit Risk Debt Notes | ||||||||
3.672% (USD LIBOR + 1.800%) due 07/25/30 § | $ | 1,120,000 | $ | 1,109,878 | ||||
5.022% (USD LIBOR + 3.150%) due 07/25/30 § | 1,120,000 | 1,073,986 | ||||||
5.872% (USD LIBOR + 4.000%) due 08/25/24 § | 480,747 | 525,055 | ||||||
Government National Mortgage Association | ||||||||
2.175% (USD LIBOR + 0.600%) due 07/20/65 § | 736,713 | 739,598 | ||||||
2.375% (USD LIBOR + 0.800%) due 06/20/66 § | 649,896 | 658,550 | ||||||
2.375% (USD LIBOR + 0.800%) due 07/20/66 § | 1,299,194 | 1,315,861 | ||||||
2.550% (USD LIBOR + 0.750%) due 04/20/67 § | 781,596 | 806,631 | ||||||
4.287% due 09/20/66 § | 953,278 | 1,048,007 | ||||||
Government National Mortgage Association (IO) | ||||||||
4.000% due 11/20/44 | 1,246,461 | 243,174 | ||||||
4.314% (6.100% - USD LIBOR) due 10/16/46 § | 263,242 | 50,492 | ||||||
4.328% (6.150% - USD LIBOR) due 02/20/46 § | 1,853,834 | 337,192 | ||||||
4.500% due 11/16/45 | 430,534 | 87,620 | ||||||
Great Hall Mortgages PLC (United Kingdom) | 362,521 | 355,040 | ||||||
GSR Mortgage Loan Trust | ||||||||
6.000% due 11/25/35 | 885,927 | 792,401 | ||||||
6.000% due 07/25/37 | 444,678 | 410,307 | ||||||
HarborView Mortgage Loan Trust | ||||||||
1.978% (USD LIBOR + 0.170%) due 12/19/36 § | 266,803 | 243,156 | ||||||
2.032% (USD LIBOR + 0.160%) due 05/25/38 § | 419,853 | 365,116 | ||||||
2.248% (USD LIBOR + 0.440%) due 05/19/35 § | 387,041 | 374,143 | ||||||
3.795% due 08/19/36 § | 192,678 | 181,234 | ||||||
3.869% due 02/25/36 § | 93,192 | 70,826 | ||||||
JP Morgan Mortgage Trust | ||||||||
3.500% due 04/25/48 § ~ | 1,600,000 | 1,577,000 | ||||||
3.536% due 07/25/35 § | 71,121 | 71,516 | ||||||
5.750% due 01/25/36 | 17,973 | 15,463 | ||||||
Ludgate Funding PLC (United Kingdom) | GBP 556,139 | 746,149 | ||||||
Merrill Lynch Mortgage Investors Trust | $500,642 | 505,043 | ||||||
Morgan Stanley Resecuritization Trust | 1,723,428 | 1,327,211 | ||||||
New Residential Mortgage Loan Trust | 941,136 | 959,877 | ||||||
Nomura Resecuritization Trust | ||||||||
1.761% (USD LIBOR + 0.306%) due 10/26/36 § ~ | 3,284,057 | 2,652,720 | ||||||
8.318% due 06/26/35 § ~ | 1,902,607 | 1,845,077 | ||||||
Prime Mortgage Trust | 1,680,241 | 1,228,070 | ||||||
RBSSP Resecuritization Trust | 217,477 | 222,610 | ||||||
Reperforming Loan REMIC Trust | ||||||||
2.212% (USD LIBOR + 0.340%) due 06/25/35 § ~ | 40,654 | 39,325 | ||||||
2.212% (USD LIBOR + 0.340%) due 01/25/36 § ~ | 242,604 | 231,397 | ||||||
WaMu Mortgage Pass-Through Certificates Trust | ||||||||
2.683% (US FED + 1.400%) due 08/25/42 § | 1,939 | 1,884 | ||||||
3.316% due 02/25/37 § | 188,080 | 181,225 | ||||||
Principal Amount |
| |||||||
Wells Fargo Mortgage-Backed Securities Trust | ||||||||
3.478% due 12/25/34 § | $ | 23,240 | $ | 23,713 | ||||
3.603% due 04/25/36 § | 19,879 | 20,186 | ||||||
3.755% due 03/25/36 § | 183,326 | 181,510 | ||||||
3.973% due 04/25/35 § | 465,972 | 474,137 | ||||||
|
| |||||||
| 45,555,952 | ||||||||
|
| |||||||
Fannie Mae - 21.7% | ||||||||
2.310% due 08/01/22 | 500,000 | 488,683 | ||||||
2.482% (US FED + 1.200%) due 10/01/44 § | 16,512 | 16,796 | ||||||
2.810% due 04/01/25 | 30,000 | 29,637 | ||||||
3.000% due 09/01/21 - 05/01/48 | 40,289,286 | 39,464,229 | ||||||
3.168% (UST + 2.043%) due 09/01/35 § | 47,731 | 50,212 | ||||||
3.392% (USD LIBOR + 1.642%) due 11/01/32 § | 45,231 | 47,286 | ||||||
3.487% (USD LIBOR + 1.737%) due 12/01/35 § | 8,078 | 8,212 | ||||||
3.500% due 09/01/42 - 03/01/57 | 40,379,437 | 40,469,297 | ||||||
3.564% (UST + 2.360%) due 11/01/34 § | 45,273 | 48,113 | ||||||
4.000% due 08/01/18 - 05/01/48 | 32,932,998 | 33,819,632 | ||||||
4.255% (US FED + 1.926%) due 12/01/36 § | 4,334 | 4,572 | ||||||
4.500% due 04/01/19 - 02/01/45 | 8,551,555 | 9,053,975 | ||||||
5.000% due 02/01/25 - 04/01/48 | 4,115,752 | 4,417,014 | ||||||
5.500% due 12/01/20 - 08/01/39 | 1,728,705 | 1,879,554 | ||||||
6.000% due 02/01/33 - 06/01/40 | 299,613 | 336,118 | ||||||
|
| |||||||
| 130,133,330 | ||||||||
|
| |||||||
Freddie Mac - 4.2% | ||||||||
3.000% due 01/01/47 - 04/01/48 | 7,421,504 | 7,238,296 | ||||||
3.090% (UST + 2.250%) due 04/01/32 § | 12,507 | 13,092 | ||||||
3.099% (USD LIBOR + 1.345%) due 09/01/35 § | 7,982 | 8,252 | ||||||
3.489% (UST + 2.250%) due 11/01/31 § | 3,385 | 3,558 | ||||||
3.500% due 10/01/42 - 05/01/48 | 3,487,101 | 3,498,633 | ||||||
3.545% (USD LIBOR + 1.721%) due 06/01/35 § | 71,496 | 75,185 | ||||||
3.620% (USD LIBOR + 1.870%) due 09/01/35 § | 41,235 | 43,429 | ||||||
4.000% due 12/01/42 - 04/01/48 | 10,858,929 | 11,152,842 | ||||||
4.500% due 11/01/44 - 07/01/47 | 2,212,563 | 2,321,780 | ||||||
5.500% due 03/01/23 - 05/01/40 | 708,221 | 776,871 | ||||||
6.000% due 12/01/22 - 03/01/23 | 19,257 | 21,401 | ||||||
|
| |||||||
| 25,153,339 | ||||||||
|
| |||||||
Government National Mortgage Association - 4.4% |
| |||||||
3.000% due 11/20/47 - 04/20/48 | 7,871,140 | 7,741,011 | ||||||
3.500% due 10/20/47 - 04/20/48 | 2,887,798 | 2,916,368 | ||||||
4.000% due 08/20/47 - 04/20/48 | 6,640,614 | 6,826,694 | ||||||
4.500% due 04/20/48 | 8,080,000 | 8,398,969 | ||||||
5.000% due 10/15/38 - 04/15/39 | 180,771 | 194,232 | ||||||
|
| |||||||
| 26,077,274 | ||||||||
|
| |||||||
Total Mortgage-Backed Securities |
| 255,469,873 | ||||||
|
| |||||||
ASSET-BACKED SECURITIES - 7.0% | ||||||||
AccessLex Institute 1.805% | 1,965,161 | 1,925,551 | ||||||
Aegis Asset Backed Securities Trust | 881,402 | 888,695 | ||||||
Argent Securities Inc | ||||||||
2.692% (USD LIBOR + 0.820%) due 02/25/34 § | 779,964 | 764,160 | ||||||
2.997% (USD LIBOR + 1.125%) due 11/25/34 § | 469,638 | 464,301 | ||||||
| See Notes to Financial Statements | See explanation of symbols and terms, if any, on B-114 and B-115 |
B-17
Table of Contents
PACIFIC FUNDS
PF MANAGED BOND FUND
Schedule of Investments (Continued)
March 31, 2018
Principal Amount |
| |||||||
Asset-Backed Funding Certificates Trust | $ | 67,722 | $ | 66,348 | ||||
Basic Asset Backed Securities Trust | 673,776 | 650,958 | ||||||
Bear Stearns Asset Backed Securities I Trust | ||||||||
2.072% (USD LIBOR + 0.200%) due 12/25/36 § | 251,247 | 251,015 | ||||||
2.112% (USD LIBOR + 0.240%) due 12/25/36 § | 1,320,730 | 983,762 | ||||||
2.877% (USD LIBOR + 1.005%) due 06/25/35 § | 300,000 | 300,447 | ||||||
Business Loan Express Business Loan Trust | 159,091 | 153,630 | ||||||
Carlyle Global Market Strategies CLO Ltd (Cayman) | 800,000 | 801,133 | ||||||
Cent CLO 21 Ltd (Cayman) | 800,000 | 800,921 | ||||||
Chapel BV (Netherlands) | EUR 44,868 | 55,402 | ||||||
CIT Mortgage Loan Trust | $679,743 | 684,787 | ||||||
Citigroup Mortgage Loan Trust | ||||||||
2.042% (USD LIBOR + 0.170%) due 05/25/37 § | 186,755 | 185,812 | ||||||
2.322% (USD LIBOR + 0.450%) due 11/25/45 § ~ | 627,063 | 620,203 | ||||||
Community Funding CLO (Cayman) | 660,000 | 646,277 | ||||||
Countrywide Asset-Backed Certificates | ||||||||
2.002% (USD LIBOR + 0.130%) due 04/25/46 § | 616,680 | 549,033 | ||||||
2.272% (USD LIBOR + 0.400%) due 06/25/36 § | 500,000 | 491,487 | ||||||
DT Auto Owner Trust | 108,309 | 108,214 | ||||||
Evergreen Credit Card Trust (Canada) | 700,000 | 700,231 | ||||||
First Franklin Mortgage Loan Trust | 755,929 | 756,175 | ||||||
Flagship CLO VIII Ltd (Cayman) | 900,000 | 901,001 | ||||||
GSAA Home Equity Trust | ||||||||
1.972% (USD LIBOR + 0.100%) due 03/25/37 § | 535,814 | 277,784 | ||||||
6.000% due 08/25/47 | 667,799 | 623,126 | ||||||
Hertz Vehicle Financing II LP | 450,000 | 445,711 | ||||||
Home Equity Asset Trust | 621,902 | 628,943 | ||||||
Jamestown CLO VIII Ltd (Cayman) | 700,000 | 700,475 | ||||||
Long Beach Mortgage Loan Trust | ||||||||
2.022% (USD LIBOR + 0.150%) due 09/25/36 § | 184,118 | 126,900 | ||||||
2.027% (USD LIBOR + 0.155%) due 08/25/36 § | 677,169 | 458,239 | ||||||
2.172% (USD LIBOR + 0.300%) due 02/25/36 § | 1,147,521 | 981,181 | ||||||
Principal Amount |
| |||||||
Mastr Asset Backed Securities Trust | $ | 695,730 | $ | 318,102 | ||||
Merrill Lynch Mortgage Investors Trust | 478,668 | 304,377 | ||||||
Monarch Grove CLO (Cayman) | 500,000 | 500,200 | ||||||
Morgan Stanley Home Equity Loan Trust | ||||||||
1.972% (USD LIBOR + 0.100%) due 12/25/36 § | 1,105,619 | 677,952 | ||||||
2.012% (USD LIBOR + 0.140%) due 12/25/36 § | 872,714 | 537,616 | ||||||
2.042% (USD LIBOR + 0.170%) due 04/25/37 § | 1,071,938 | 712,094 | ||||||
Navient Student Loan Trust | ||||||||
2.218% (USD LIBOR + 0.240%) due 03/25/67 § ~ | 600,000 | 599,909 | ||||||
2.672% (USD LIBOR + 0.800%) due 07/26/66 § ~ | 982,115 | 989,863 | ||||||
2.922% (USD LIBOR + 1.050%) due 07/26/66 § ~ | 450,000 | 461,034 | ||||||
Oaktree CLO Ltd (Cayman) | 800,000 | 801,412 | ||||||
OneMain Financial Issuance Trust | 1,043,329 | 1,046,887 | ||||||
Option One Mortgage Loan Trust | 1,051,559 | 730,190 | ||||||
OZLM IX Ltd (Cayman) | 900,000 | 900,961 | ||||||
Regatta V Funding Ltd (Cayman) | 800,000 | 800,917 | ||||||
Residential Asset Securities | 1,100,000 | 1,057,166 | ||||||
SBA Small Business Investment Cos | 95,095 | 94,157 | ||||||
3.187% due 03/10/28 | 230,000 | 230,024 | ||||||
Securitized Asset-Backed Receivables LLC Trust | ||||||||
2.002% (USD LIBOR + 0.130%) due 05/25/37 § | 86,348 | 66,813 | ||||||
2.012% (USD LIBOR + 0.140%) due 05/25/36 § | 191,084 | 125,008 | ||||||
Securitized Term Auto Receivables Trust (Canada) | 260,489 | 260,001 | ||||||
SLM Student Loan Trust | 173,707 | 173,620 | ||||||
1.895% (USD LIBOR + 0.150%) due 03/25/44 § | 4,450,000 | 4,297,231 | ||||||
2.291% (USD LIBOR + 0.550%) due 10/26/26 § | 234,624 | 235,026 | ||||||
2.845% (USD LIBOR + 1.100%) due 07/25/23 § | 525,812 | 529,924 | ||||||
SMB Private Education Loan Trust | 550,000 | 564,977 | ||||||
Sofi Professional Loan Program Trust | 600,000 | 598,668 | ||||||
Structured Asset Investment Loan Trust | 619,092 | 621,322 | ||||||
Structured Asset Securities Corp Mortgage Loan Trust | 1,000,000 | 946,109 | ||||||
| See Notes to Financial Statements | See explanation of symbols and terms, if any, on B-114 and B-115 |
B-18
Table of Contents
PACIFIC FUNDS
PF MANAGED BOND FUND
Schedule of Investments (Continued)
March 31, 2018
Principal Amount |
| |||||||
Symphony CLO XV Ltd (Cayman) | $ | 800,000 | $ | 800,712 | ||||
THL Credit Wind River CLO Ltd (Cayman) | 800,000 | 801,028 | ||||||
Towd Point Mortgage Trust | 1,042,492 | 1,030,676 | ||||||
Venture XII CLO Ltd (Cayman) | ||||||||
2.784% (USD LIBOR + 0.800%) due 02/28/26 § ~ | 700,000 | 699,845 | ||||||
Venture XVI CLO Ltd (Cayman) | ||||||||
2.567% (USD LIBOR + 0.850%) due 01/15/28 § ~ | 700,000 | 700,548 | ||||||
VOLT LXII LLC | 531,412 | 529,824 | ||||||
|
| |||||||
Total Asset-Backed Securities |
| 41,736,095 | ||||||
|
| |||||||
U.S. GOVERNMENT AGENCY ISSUES - 0.8% |
| |||||||
Fannie Mae | ||||||||
2.382% due 10/09/19 | 2,680,000 | 2,585,419 | ||||||
6.625% due 11/15/30 | 1,500,000 | 2,054,967 | ||||||
|
| |||||||
Total U.S. Government Agency Issues |
| 4,640,386 | ||||||
|
| |||||||
U.S. TREASURY OBLIGATIONS - 9.2% |
| |||||||
U.S. Treasury Bonds - 4.5% |
| |||||||
2.500% due 02/15/45 | 1,000,000 | 911,340 | ||||||
2.750% due 08/15/47 | 100,000 | 95,384 | ||||||
2.875% due 05/15/43 | 4,700,000 | 4,624,545 | ||||||
3.000% due 05/15/42 | 3,000,000 | 3,027,937 | ||||||
3.125% due 02/15/43 | 3,500,000 | 3,601,556 | ||||||
3.625% due 08/15/43 | 9,800,000 | 10,951,802 | ||||||
3.625% due 02/15/44 | 270,000 | 302,001 | ||||||
3.750% due 11/15/43 | 1,500,000 | 1,710,336 | ||||||
4.250% due 05/15/39 | 200,000 | 243,030 | ||||||
4.375% due 05/15/40 | 1,000,000 | 1,237,867 | ||||||
4.625% due 02/15/40 | 400,000 | 511,106 | ||||||
|
| |||||||
| 27,216,904 | ||||||||
|
| |||||||
U.S. Treasury Inflation Protected Securities - 0.7% |
| |||||||
0.625% due 02/15/43 ^ | 2,501,192 | 2,355,059 | ||||||
0.750% due 02/15/42 ^ | 932,408 | 906,934 | ||||||
1.375% due 02/15/44 ^ | 436,051 | 484,264 | ||||||
2.125% due 02/15/41 ^ | 215,053 | 272,732 | ||||||
|
| |||||||
| 4,018,989 | ||||||||
|
| |||||||
U.S. Treasury Notes - 4.0% | ||||||||
1.625% due 04/30/23 | 90,000 | 85,908 | ||||||
1.625% due 05/31/23 ‡ | 2,000,000 | 1,906,989 | ||||||
1.875% due 07/31/22 ‡ | 1,700,000 | 1,654,114 | ||||||
1.875% due 08/31/22 | 4,000,000 | 3,889,961 | ||||||
2.000% due 10/31/22 ‡ | 1,020,000 | 995,923 | ||||||
2.125% due 09/30/24 | 5,800,000 | 5,609,968 | ||||||
2.250% due 01/31/24 | 2,000,000 | 1,958,148 | ||||||
2.250% due 02/15/27 | 600,000 | 576,365 | ||||||
2.250% due 08/15/27 | 300,000 | 287,483 | ||||||
2.250% due 11/15/27 | 2,380,000 | 2,278,437 | ||||||
2.375% due 05/15/27 | 2,300,000 | 2,230,247 | ||||||
2.625% due 03/31/25 | 2,250,000 | 2,240,012 | ||||||
2.750% due 02/15/24 ‡ | 400,000 | 402,445 | ||||||
|
| |||||||
| 24,116,000 | ||||||||
|
| |||||||
Total U.S. Treasury Obligations |
| 55,351,893 | ||||||
|
| |||||||
Principal Amount |
| |||||||
FOREIGN GOVERNMENT BONDS & NOTES - 5.5% |
| |||||||
Abu Dhabi Government International Bond (United Arab Emirates) | $ | 400,000 | $ | 385,870 | ||||
Argentina POM Politica Monetaria (Argentina) | ARS 1,230,000 | 64,798 | ||||||
Argentine Bonos del Tesoro (Argentina) | ||||||||
18.200% due 10/03/21 | 15,570,000 | 774,911 | ||||||
21.200% due 09/19/18 | 260,000 | 12,752 | ||||||
Argentine Republic Government International (Argentina) | $420,000 | 405,409 | ||||||
5.625% due 01/26/22 | 1,130,000 | 1,149,210 | ||||||
6.875% due 01/11/48 | 630,000 | 576,056 | ||||||
7.125% due 07/06/36 | 460,000 | 443,900 | ||||||
7.500% due 04/22/26 | 150,000 | 160,575 | ||||||
Brazil Notas do Tesouro Nacional ‘F’ (Brazil) | ||||||||
10.000% due 01/01/21 | BRL 3,338,000 | 1,063,413 | ||||||
10.000% due 01/01/23 | 2,390,000 | 757,525 | ||||||
10.000% due 01/01/27 | 786,000 | 246,264 | ||||||
Brazilian Government International (Brazil) | ||||||||
5.000% due 01/27/45 | $200,000 | 180,202 | ||||||
5.625% due 01/07/41 | 1,000,000 | 983,750 | ||||||
China Government (China) | ||||||||
3.310% due 11/30/25 | CNY 3,000,000 | 449,878 | ||||||
3.380% due 11/21/24 | 7,000,000 | 1,061,396 | ||||||
3.390% due 05/21/25 | 1,000,000 | 151,319 | ||||||
Colombia Government (Colombia) | $450,000 | 491,625 | ||||||
Ecuador Government International Bond (Ecuador) | 280,000 | 270,606 | ||||||
Egypt Government International Bond (Egypt) | 310,000 | 315,062 | ||||||
Indonesia Government (Indonesia) | ||||||||
3.500% due 01/11/28 | 200,000 | 191,839 | ||||||
3.750% due 04/25/22 ~ | 750,000 | 752,222 | ||||||
4.875% due 05/05/21 ~ | 500,000 | 521,587 | ||||||
5.125% due 01/15/45 ~ | 200,000 | 208,617 | ||||||
5.250% due 01/08/47 ~ | 200,000 | 212,898 | ||||||
Israel Government International Bond (Israel) | 600,000 | 578,629 | ||||||
Japan Bank for International Cooperation (Japan) | 700,000 | 683,961 | ||||||
Japanese Government CPI Linked (Japan) | JPY 286,885,655 | 2,854,702 | ||||||
Kenya Government International Bond (Kenya) | ||||||||
6.875% due 06/24/24 ~ | $200,000 | 209,385 | ||||||
7.250% due 02/28/28 ~ | 200,000 | 209,480 | ||||||
Kuwait International Government (Kuwait) | 470,000 | 461,766 | ||||||
Mexican Bonos (Mexico) | ||||||||
6.500% due 06/09/22 | MXN 30,710,000 | 1,647,039 | ||||||
7.750% due 11/23/34 | 20,610,000 | 1,158,706 | ||||||
7.750% due 11/13/42 | 38,690,000 | 2,162,192 | ||||||
8.000% due 11/07/47 | 19,030,000 | 1,093,373 | ||||||
10.000% due 12/05/24 | 11,400,000 | 719,981 | ||||||
Nigeria Government International Bond (Nigeria) | ||||||||
6.500% due 11/28/27 ~ | $200,000 | 203,086 | ||||||
7.143% due 02/23/30 ~ | 200,000 | 208,100 | ||||||
Peru Government Bond (Peru) | PEN 6,100,000 | 2,087,639 | ||||||
Peruvian Government International (Peru) | ||||||||
5.625% due 11/18/50 | $400,000 | 482,000 | ||||||
6.550% due 03/14/37 | 100,000 | 128,500 | ||||||
Province of Ontario (Canada) | ||||||||
1.650% due 09/27/19 | 200,000 | 197,646 | ||||||
3.150% due 06/02/22 | CAD 900,000 | 721,069 | ||||||
| See Notes to Financial Statements | See explanation of symbols and terms, if any, on B-114 and B-115 |
B-19
Table of Contents
PACIFIC FUNDS
PF MANAGED BOND FUND
Schedule of Investments (Continued)
March 31, 2018
Principal Amount |
| |||||||
Province of Quebec (Canada) | $600,000 | $ | 611,657 | |||||
Republic of Poland Government International (Poland) | 1,230,000 | 1,279,640 | ||||||
Russian Federal (Russia) | RUB 119,742,000 | 2,107,950 | ||||||
Tokyo Metropolitan Government (Japan) | $1,000,000 | 978,471 | ||||||
|
| |||||||
Total Foreign Government Bonds & Notes |
| 32,616,656 | ||||||
|
| |||||||
MUNICIPAL BONDS - 1.0% | ||||||||
Alabama Economic Settlement Authority | 1,000,000 | 999,160 | ||||||
City of Chicago IL ‘B’ | ||||||||
5.630% due 01/01/22 | 400,000 | 402,832 | ||||||
7.750% due 01/01/42 | 400,000 | 436,000 | ||||||
New Jersey Economic Development Authority ‘B’ | 1,900,000 | 1,859,663 | ||||||
Tobacco Settlement Finance Authority of WV ‘A’ | 730,000 | 725,438 | ||||||
University of Arizona ‘A’ | 1,300,000 | 1,401,946 | ||||||
|
| |||||||
Total Municipal Bonds |
| 5,825,039 | ||||||
|
| |||||||
SHORT-TERM INVESTMENTS - 18.4% | ||||||||
Certificates Of Deposit - 0.5% | ||||||||
Barclays Bank PLC (United Kingdom) | ||||||||
1.940% due 09/04/18 | 600,000 | 598,650 | ||||||
2.355% (USD LIBOR + 0.470%) due 05/17/18 § | 2,500,000 | 2,501,550 | ||||||
|
| |||||||
| 3,100,200 | ||||||||
|
| |||||||
Commercial Paper - 0.2% | ||||||||
ING (US) Funding | 900,000 | 899,802 | ||||||
Spire Inc | 600,000 | 599,798 | ||||||
|
| |||||||
| 1,499,600 | ||||||||
|
| |||||||
Foreign Government Issues - 6.7% | ||||||||
Argentina Treasury Bills (Argentina) | ||||||||
(3.464)% due 09/14/18 | ARS 21,600,000 | 1,090,309 | ||||||
2.697% due 02/22/19 | $1,800,000 | 1,757,466 | ||||||
2.727% due 01/25/19 | 500,000 | 489,066 | ||||||
2.750% due 01/11/19 | 300,000 | 293,691 | ||||||
2.855% due 08/10/18 | 400,000 | 395,949 | ||||||
2.873% due 07/27/18 | 200,000 | 198,177 | ||||||
Hellenic Republic Treasury Bills (Greece) | ||||||||
0.998% due 07/06/18 | EUR 1,600,000 | 1,963,534 | ||||||
1.025% due 08/03/18 | 300,000 | 367,848 | ||||||
Japan Treasury Bills (Japan) | ||||||||
0.085% due 04/09/18 | JPY 290,000,000 | 2,725,493 | ||||||
0.148% due 05/01/18 | 780,000,000 | 7,331,406 | ||||||
0.150% due 05/07/18 | 90,000,000 | 845,953 | ||||||
0.152% due 05/14/18 | 1,540,000,000 | 14,475,653 | ||||||
0.152% due 05/21/18 | 750,000,000 | 7,050,042 | ||||||
0.154% due 06/04/18 | 110,000,000 | 1,034,070 | ||||||
|
| |||||||
| 40,018,657 | ||||||||
|
| |||||||
Shares | Value | |||||||
Money Market Fund - 11.0% | ||||||||
BlackRock Liquidity Funds T-Fund Portfolio | 65,648,832 | $ | 65,648,832 | |||||
|
| |||||||
Total Short-Term Investments |
| 110,267,289 | ||||||
|
| |||||||
TOTAL INVESTMENTS - 124.2% |
| 743,432,824 | ||||||
DERIVATIVES - 0.1% |
| |||||||
(See Notes (d) through (h) in Notes to Schedule of Investments) |
| 766,175 | ||||||
|
| |||||||
OTHER ASSETS & LIABILITIES, NET - (24.3%) |
| (145,522,520 | ) | |||||
|
| |||||||
NET ASSETS - 100.0% | $598,676,479 | |||||||
|
| |||||||
Notes to Schedule of Investments
| (a) | As of March 31, 2018, the Fund’s composition as a percentage of net assets was as follows: |
Mortgage-Backed Securities | 42.7% | |||
Corporate Bonds & Notes | 34.6% | |||
Short-Term Investments | 18.4% | |||
U.S. Treasury Obligations | 9.2% | |||
Asset-Backed Securities | 7.0% | |||
Foreign Government Bonds & Notes | 5.5% | |||
Senior Loan Notes | 5.0% | |||
Others (each less than 3.0%) | 1.8% | |||
|
| |||
| 124.2% | ||||
|
| |||
Derivatives | 0.1% | |||
Other Assets & Liabilities, Net | (24.3% | ) | ||
|
| |||
| 100.0% | ||||
|
|
| (b) | As of March 31, 2018, investments with a total aggregate value of $2,478,588 were fully or partially segregated with the broker(s)/custodian as collateral for open futures contracts, forward foreign currency contracts, option contracts and swap agreements. |
| (c) | The average amount of borrowings by the Fund on sale-buyback financing transactions (See Note 4 in Notes to Financial Statements) outstanding during the year ended March 31, 2018 was $11,732,947 at a weighted average interest rate of 1.220%. |
| See Notes to Financial Statements | See explanation of symbols and terms, if any, on B-114 and B-115 |
B-20
Table of Contents
PACIFIC FUNDS
PF MANAGED BOND FUND
Schedule of Investments (Continued)
March 31, 2018
| (d) | Open futures contracts outstanding as of March 31, 2018 were as follows: |
| Long Futures Outstanding | Expiration Month | Number of Contracts | Notional Amount | Value | Unrealized Appreciation (Depreciation) | |||||||||||||||
CAD FX | 06/18 | 79 | $6,167,884 | $6,132,375 | ($35,509 | ) | ||||||||||||||
EUR FX | 06/18 | 19 | 2,946,460 | 2,935,144 | (11,316 | ) | ||||||||||||||
Eurodollar | 12/19 | 550 | 133,670,415 | 133,670,625 | 210 | |||||||||||||||
Eurodollar | 03/20 | 8 | 1,953,914 | 1,944,100 | (9,814 | ) | ||||||||||||||
Eurodollar | 06/20 | 191 | 46,449,806 | 46,413,000 | (36,806 | ) | ||||||||||||||
Eurodollar | 03/21 | 79 | 19,269,555 | 19,191,075 | (78,480 | ) | ||||||||||||||
Euro-Bobl | 06/18 | 7 | 1,121,788 | 1,130,477 | 8,689 | |||||||||||||||
Euro-Bund | 06/18 | 81 | 15,571,458 | 15,889,838 | 318,380 | |||||||||||||||
Japan 10-Year Bonds | 06/18 | 2 | 2,832,016 | 2,835,393 | 3,377 | |||||||||||||||
MXN FX | 06/18 | 373 | 9,868,021 | 10,128,815 | 260,794 | |||||||||||||||
U.S. Treasury 2-Year Notes | 06/18 | 211 | 44,851,443 | 44,860,579 | 9,136 | |||||||||||||||
U.S. Treasury 5-Year Notes | 06/18 | 1,885 | 215,066,786 | 215,758,872 | 692,086 | |||||||||||||||
U.S. Treasury 10-Year Notes | 06/18 | 228 | 27,401,573 | 27,620,064 | 218,491 | |||||||||||||||
U.S. Ultra Long Bonds | 06/18 | 482 | 73,672,894 | 75,892,344 | 2,219,450 | |||||||||||||||
|
| |||||||||||||||||||
| 3,558,688 | ||||||||||||||||||||
|
| |||||||||||||||||||
Short Futures Outstanding | ||||||||||||||||||||
AUD FX | 06/18 | 43 | 3,387,893 | 3,300,680 | 87,213 | |||||||||||||||
Australia 10-Year Bonds | 06/18 | 38 | 3,723,634 | 3,782,982 | (59,348 | ) | ||||||||||||||
Canada 10-Year Bonds | 06/18 | 29 | 2,944,637 | 2,999,829 | (55,192 | ) | ||||||||||||||
Euribor | 06/18 | 162 | 49,992,501 | 49,992,740 | (239 | ) | ||||||||||||||
Euro-Bobl | 06/18 | 10 | 1,604,805 | 1,614,967 | (10,162 | ) | ||||||||||||||
Euro-BTP | 06/18 | 34 | 5,670,681 | 5,806,327 | (135,646 | ) | ||||||||||||||
Euro-Bund | 06/18 | 175 | 33,896,839 | 34,329,896 | (433,057 | ) | ||||||||||||||
Euro-Buxl | 06/18 | 21 | 4,225,172 | 4,273,332 | (48,160 | ) | ||||||||||||||
Eurodollar | 06/18 | 360 | 87,949,715 | 87,930,000 | 19,715 | |||||||||||||||
Eurodollar | 09/18 | 868 | 211,770,300 | 211,846,250 | (75,950 | ) | ||||||||||||||
Eurodollar | 12/18 | 119 | 29,144,986 | 29,007,738 | 137,248 | |||||||||||||||
Eurodollar | 12/19 | 28 | 6,861,932 | 6,805,050 | 56,882 | |||||||||||||||
Eurodollar | 03/20 | 42 | 10,274,361 | 10,206,525 | 67,836 | |||||||||||||||
Euro-OAT | 06/18 | 107 | 19,938,991 | 20,353,053 | (414,062 | ) | ||||||||||||||
Euro-Schatz | 06/18 | 2 | 275,133 | 275,560 | (427 | ) | ||||||||||||||
GBP FX | 06/18 | 20 | 1,742,993 | 1,757,250 | (14,257 | ) | ||||||||||||||
Japan 10-Year Bonds | 06/18 | 6 | 8,497,112 | 8,506,179 | (9,067 | ) | ||||||||||||||
JPY FX | 06/18 | 40 | 4,740,244 | 4,721,750 | 18,494 | |||||||||||||||
U.S. Treasury 10-Year Notes | 06/18 | 150 | 18,099,780 | 18,171,095 | (71,315 | ) | ||||||||||||||
U.S. Treasury Ultra 10-Year Notes | 06/18 | 43 | 5,502,698 | 5,583,953 | (81,255 | ) | ||||||||||||||
U.S. Ultra Long Bonds | 06/18 | 133 | 18,968,142 | 19,501,125 | (532,983 | ) | ||||||||||||||
|
| |||||||||||||||||||
| (1,553,732 | ) | |||||||||||||||||||
|
| |||||||||||||||||||
Total Futures Contracts | $2,004,956 | |||||||||||||||||||
|
| |||||||||||||||||||
| (e) | Forward foreign currency contracts outstanding as of March 31, 2018 were as follows: |
| Currency Purchased | Currency Sold | Settlement Month | Counterparty | Unrealized Appreciation | Unrealized (Depreciation) | |||||||||||||||||||
| ARS | 19,790,000 | USD | 1,011,662 | 04/18 | BRC | $— | ($34,212 | ) | ||||||||||||||||
| ARS | 17,170,000 | USD | 776,088 | 10/18 | CIT | — | (2,110 | ) | ||||||||||||||||
| ARS | 2,620,000 | USD | 118,472 | 10/18 | JPM | — | (369 | ) | ||||||||||||||||
| AUD | 42,000 | USD | 32,267 | 04/18 | BRC | — | (9 | ) | ||||||||||||||||
| BRL | 16,484,900 | USD | 5,060,055 | 04/18 | CIT | — | (75,008 | ) | ||||||||||||||||
| BRL | 3,996,000 | USD | 1,200,000 | 04/18 | JPM | 9,999 | — | |||||||||||||||||
| CAD | 2,870,640 | USD | 2,301,982 | 04/18 | CIT | — | (72,950 | ) | ||||||||||||||||
| CAD | 924,000 | USD | 716,997 | 05/18 | HSB | 669 | — | |||||||||||||||||
| CAD | 1,446,000 | USD | 1,119,814 | 05/18 | UBS | 3,287 | — | |||||||||||||||||
| DKK | 609,000 | USD | 93,420 | 04/18 | HSB | 7,134 | — | |||||||||||||||||
| EUR | 1,051,602 | USD | 1,285,883 | 04/18 | BRC | 9,930 | — | |||||||||||||||||
| EUR | 1,003,000 | USD | 1,255,062 | 04/18 | CIT | — | (19,137 | ) | ||||||||||||||||
| EUR | 4,656,000 | USD | 5,766,815 | 04/18 | UBS | — | (35,472 | ) | ||||||||||||||||
| GBP | 1,210,000 | USD | 1,662,401 | 04/18 | BRC | 36,695 | — | |||||||||||||||||
| GBP | 254,000 | USD | 353,948 | 05/18 | BRC | 3,090 | — | |||||||||||||||||
| GBP | 1,443,000 | USD | 2,000,810 | 05/18 | HSB | 27,563 | — | |||||||||||||||||
| IDR | 46,874,390,000 | USD | 3,496,523 | 04/18 | BRC | — | (97,162 | ) | ||||||||||||||||
| INR | 280,700,000 | USD | 4,356,531 | 04/18 | JPM | — | (63,673 | ) | ||||||||||||||||
| JPY | 165,490,000 | USD | 1,561,057 | 04/18 | BRC | — | (3,785 | ) | ||||||||||||||||
| JPY | 99,852,576 | USD | 938,541 | 04/18 | RBS | 107 | — | |||||||||||||||||
| JPY | 107,900,000 | USD | 1,029,628 | 05/18 | DUB | — | (12,547 | ) | ||||||||||||||||
| See Notes to Financial Statements | See explanation of symbols and terms, if any, on B-114 and B-115 |
B-21
Table of Contents
PACIFIC FUNDS
PF MANAGED BOND FUND
Schedule of Investments (Continued)
March 31, 2018
| Currency Purchased | Currency Sold | Settlement Month | Counterparty | Unrealized Appreciation | Unrealized (Depreciation) | |||||||||||||||||||
| JPY | 591,300,000 | USD | 5,612,165 | 05/18 | HSB | $— | ($38,486 | ) | ||||||||||||||||
| JPY | 135,000,000 | USD | 1,272,138 | 05/18 | JPM | 392 | — | |||||||||||||||||
| JPY | 129,100,000 | USD | 1,218,889 | 05/18 | UBS | — | (1,974 | ) | ||||||||||||||||
| KRW | 582,357,726 | USD | 543,000 | 04/18 | SCB | 3,426 | — | |||||||||||||||||
| KRW | 969,662,600 | USD | 914,000 | 06/18 | BRC | — | (1,651 | ) | ||||||||||||||||
| KRW | 542,950,000 | USD | 500,000 | 06/18 | DUB | 10,858 | — | |||||||||||||||||
| KRW | 5,098,224,650 | USD | 4,718,920 | 06/18 | HSB | 77,967 | — | |||||||||||||||||
| KRW | 582,357,726 | USD | 544,769 | 06/18 | SCB | 3,168 | — | |||||||||||||||||
| MXN | 32,000,000 | USD | 1,701,594 | 04/18 | BRC | 53,113 | — | |||||||||||||||||
| NOK | 3,550,000 | USD | 448,863 | 05/18 | RBS | 4,649 | — | |||||||||||||||||
| PHP | 15,920,000 | USD | 305,361 | 04/18 | CIT | — | (555 | ) | ||||||||||||||||
| RUB | 110,581,436 | USD | 1,936,356 | 04/18 | HSB | — | (11,863 | ) | ||||||||||||||||
| RUB | 209,547,381 | USD | 3,609,492 | 04/18 | HSB | 42,299 | — | |||||||||||||||||
| RUB | 108,678,750 | USD | 1,820,872 | 04/18 | JPM | 72,132 | — | |||||||||||||||||
| RUB | 9,065,250 | USD | 158,000 | 04/18 | UBS | — | (64 | ) | ||||||||||||||||
| RUB | 20,041,680 | USD | 344,677 | 05/18 | HSB | 2,903 | — | |||||||||||||||||
| RUB | 87,680,270 | USD | 1,539,198 | 06/18 | BRC | — | (20,662 | ) | ||||||||||||||||
| RUB | 77,805,446 | USD | 1,360,025 | 06/18 | HSB | — | (12,510 | ) | ||||||||||||||||
| SEK | 6,580,496 | USD | 791,000 | 04/18 | BNP | — | (2,624 | ) | ||||||||||||||||
| SEK | 780,987 | USD | 94,000 | 04/18 | GSC | — | (434 | ) | ||||||||||||||||
| SEK | 5,175,000 | USD | 631,162 | 05/18 | DUB | — | (9,311 | ) | ||||||||||||||||
| SEK | 13,200,000 | USD | 1,613,780 | 05/18 | HSB | — | (27,610 | ) | ||||||||||||||||
| SEK | 7,365,000 | USD | 884,472 | 05/18 | JPM | 539 | — | |||||||||||||||||
| SEK | 4,540,000 | USD | 549,573 | 05/18 | RBS | — | (4,026 | ) | ||||||||||||||||
| SEK | 2,050,000 | USD | 246,952 | 05/18 | UBS | — | (615 | ) | ||||||||||||||||
| TWD | 15,102,900 | USD | 519,000 | 04/18 | HSB | — | (880 | ) | ||||||||||||||||
| TWD | 18,226,350 | USD | 629,102 | 06/18 | DUB | — | (301 | ) | ||||||||||||||||
| TWD | 32,232,420 | USD | 1,115,733 | 06/18 | HSB | — | (3,729 | ) | ||||||||||||||||
| TWD | 12,776,010 | USD | 442,000 | 06/18 | JPM | — | (1,233 | ) | ||||||||||||||||
| TWD | 10,642,560 | USD | 368,000 | 06/18 | SCB | — | (836 | ) | ||||||||||||||||
| USD | 978,607 | ARS | 19,790,000 | 04/18 | BRC | 1,157 | — | |||||||||||||||||
| USD | 30,256 | AUD | 38,007 | 04/18 | BRC | 1,065 | — | |||||||||||||||||
| USD | 1,331,357 | AUD | 1,709,000 | 04/18 | HSB | 18,757 | — | |||||||||||||||||
| USD | 132,241 | AUD | 171,000 | 04/18 | UBS | 904 | — | |||||||||||||||||
| USD | 1,197,124 | BRL | 3,996,000 | 04/18 | JPM | — | (12,875 | ) | ||||||||||||||||
| USD | 806,182 | CAD | 1,036,000 | 04/18 | DUB | 1,962 | — | |||||||||||||||||
| USD | 716,590 | CAD | 924,000 | 04/18 | HSB | — | (660 | ) | ||||||||||||||||
| USD | 3,039,471 | CNH | 19,925,254 | 04/18 | CIT | — | (134,555 | ) | ||||||||||||||||
| USD | 7,136,028 | CNY | 46,696,029 | 04/18 | BRC | — | (280,507 | ) | ||||||||||||||||
| USD | 345,552 | DKK | 2,150,000 | 04/18 | BRC | — | (9,439 | ) | ||||||||||||||||
| USD | 2,519,936 | DKK | 17,162,000 | 04/18 | JPM | — | (313,720 | ) | ||||||||||||||||
| USD | 1,525,238 | DKK | 9,565,000 | 04/18 | RBS | — | (54,060 | ) | ||||||||||||||||
| USD | 1,281,444 | DKK | 7,980,717 | 04/18 | SCB | — | (36,270 | ) | ||||||||||||||||
| USD | 4,138,255 | DKK | 27,654,000 | 04/18 | UBS | — | (427,757 | ) | ||||||||||||||||
| USD | 2,408,843 | DKK | 14,847,000 | 10/18 | SCB | — | (77,912 | ) | ||||||||||||||||
| USD | 1,366,141 | EUR | 1,106,000 | 04/18 | BRC | 3,297 | — | |||||||||||||||||
| USD | 3,232,939 | EUR | 2,601,522 | 04/18 | CIT | 27,271 | — | |||||||||||||||||
| USD | 5,089,313 | EUR | 4,118,000 | 04/18 | DUB | 20,226 | — | |||||||||||||||||
| USD | 664,594 | EUR | 538,000 | 04/18 | JPM | 2,338 | — | |||||||||||||||||
| USD | 5,778,827 | EUR | 4,656,000 | 05/18 | UBS | 35,935 | — | |||||||||||||||||
| USD | 1,944,630 | EUR | 1,600,000 | 07/18 | BRC | — | (38,809 | ) | ||||||||||||||||
| USD | 377,225 | EUR | 300,000 | 08/18 | BRC | 4,515 | — | |||||||||||||||||
| USD | 469,814 | GBP | 330,000 | 04/18 | CIT | 6,425 | — | |||||||||||||||||
| USD | 2,674,843 | GBP | 1,922,000 | 05/18 | JPM | — | (26,844 | ) | ||||||||||||||||
| USD | 2,027,915 | GBP | 1,457,000 | 05/18 | RBS | — | (20,138 | ) | ||||||||||||||||
| USD | 5,748,213 | JPY | 625,232,363 | 04/18 | BRC | — | (135,265 | ) | ||||||||||||||||
| USD | 3,522,570 | JPY | 389,900,000 | 04/18 | JPM | — | (143,783 | ) | ||||||||||||||||
| USD | 1,039,506 | JPY | 108,900,000 | 05/18 | DUB | 12,999 | — | |||||||||||||||||
| USD | 825,464 | JPY | 90,000,000 | 05/18 | HSB | — | (22,423 | ) | ||||||||||||||||
| USD | 1,343,937 | JPY | 141,600,000 | 05/18 | JPM | 9,195 | — | |||||||||||||||||
| USD | 3,085,811 | JPY | 328,400,000 | 05/18 | RBS | — | (9,735 | ) | ||||||||||||||||
| USD | 28,349,160 | JPY | 3,070,000,000 | 05/18 | UBS | — | (583,957 | ) | ||||||||||||||||
| USD | 1,038,324 | JPY | 110,000,000 | 06/18 | JPM | 12 | — | |||||||||||||||||
| USD | 543,777 | KRW | 582,357,726 | 04/18 | SCB | — | (2,649 | ) | ||||||||||||||||
| USD | 6,798,949 | KRW | 7,196,687,874 | 06/18 | UBS | 27,631 | — | |||||||||||||||||
| USD | 2,243,484 | MXN | 43,380,011 | 04/18 | CIT | — | (135,241 | ) | ||||||||||||||||
| USD | 131,906 | NOK | 1,015,000 | 05/18 | BRC | 2,240 | — | |||||||||||||||||
| USD | 344,255 | NOK | 2,645,000 | 05/18 | RBS | 6,356 | — | |||||||||||||||||
| USD | 200,000 | PEN | 653,800 | 05/18 | JPM | — | (2,305 | ) | ||||||||||||||||
| USD | 4,626,420 | PHP | 241,661,000 | 05/18 | DUB | 5,710 | — | |||||||||||||||||
| USD | 871,543 | RUB | 50,369,947 | 04/18 | HSB | — | (4,971 | ) | ||||||||||||||||
| See Notes to Financial Statements | See explanation of symbols and terms, if any, on B-114 and B-115 |
B-22
Table of Contents
PACIFIC FUNDS
PF MANAGED BOND FUND
Schedule of Investments (Continued)
March 31, 2018
| Currency Purchased | Currency Sold | Settlement Month | Counterparty | Unrealized Appreciation | Unrealized (Depreciation) | |||||||||||||||||||||
| USD | 6,562,508 | RUB | 375,616,947 | 04/18 | HSB | $20,891 | $— | |||||||||||||||||||
| USD | 924,000 | RUB | 53,178,423 | 04/18 | JPM | — | (3,076 | ) | ||||||||||||||||||
| USD | 1,026,000 | RUB | 58,834,698 | 04/18 | JPM | 1,197 | — | |||||||||||||||||||
| USD | 370,000 | RUB | 21,302,262 | 05/18 | JPM | 557 | — | |||||||||||||||||||
| USD | 500,000 | RUB | 28,819,174 | 06/18 | JPM | 880 | — | |||||||||||||||||||
| USD | 881,840 | SEK | 7,365,000 | 04/18 | JPM | — | (524 | ) | ||||||||||||||||||
| USD | 402,686 | SEK | 3,285,000 | 05/18 | DUB | 7,946 | — | |||||||||||||||||||
| USD | 250,926 | SEK | 2,050,000 | 05/18 | JPM | 4,589 | — | |||||||||||||||||||
| USD | 178,216 | SEK | 1,455,000 | 05/18 | RBS | 3,377 | — | |||||||||||||||||||
| USD | 365,609 | SEK | 2,980,000 | 05/18 | UBS | 7,519 | — | |||||||||||||||||||
| USD | 519,178 | TWD | 15,102,900 | 04/18 | HSB | 1,059 | — | |||||||||||||||||||
| USD | 2,933,672 | TWD | 85,372,791 | 06/18 | SCB | — | (11,652 | ) | ||||||||||||||||||
|
|
|
| |||||||||||||||||||||||
Total Forward Foreign Currency Contracts |
| $605,930 | ($3,044,925 | ) | ||||||||||||||||||||||
|
|
|
| |||||||||||||||||||||||
| (f) | Purchased options outstanding as of March 31, 2018 were as follows: |
Credit Default Swaptions on Credit Indices - Buy Protection
| Description | Exercise Rate | Expiration Date | Counter- party | Notional Amount | Cost | Value | ||||||||||||||||
Put - CDX IG 29 5Y | 1.300% | 04/18/18 | JPM | $4,000,000 | $600 | $43 | ||||||||||||||||
|
|
|
| |||||||||||||||||||
Credit Default Swaptions on Credit Indices - Sell Protection
Call - CDX IG 30 5Y | 0.625% | 04/18/18 | JPM | 700,000 | 350 | 3 | ||||||||||||||||||
Call - CDX IG 30 5Y | 0.650% | 06/20/18 | JPM | 700,000 | 1,278 | 13 | ||||||||||||||||||
|
|
|
| |||||||||||||||||||||
| 1,628 | 16 | |||||||||||||||||||||||
|
|
|
| |||||||||||||||||||||
Total Credit Default Swaptions on Credit Indices | $2,228 | $59 | ||||||||||||||||||||||
|
|
|
| |||||||||||||||||||||
Foreign Currency Options
| Description | Exercise Price | Expiration Date | Counter- party | Notional Amount | Cost | Value | ||||||||||||||||
Call - EUR versus USD | $1.23 | 04/27/18 | CIT | $4,468,000 | $43,028 | $280 | ||||||||||||||||
Call - EUR versus USD | 1.23 | 05/11/18 | CIT | 4,340,000 | 40,986 | 263 | ||||||||||||||||
|
|
|
| |||||||||||||||||||
| $84,014 | $543 | |||||||||||||||||||||
|
|
|
| |||||||||||||||||||
Interest Rate Swaptions
| Description | Pay/Receive Floating Rate | Floating Rate Index | Exercise Rate | Expiration Date | Counter- party | Notional Amount | Cost | Value | ||||||||||||||||||||
Put - 30-Year Interest Rate Swap | Receive | 3-Month USD-LIBOR | 2.905% | 08/20/18 | MSC | $900,000 | $88,800 | $22,399 | ||||||||||||||||||||
Put - 30-Year Interest Rate Swap | Receive | 3-Month USD-LIBOR | 2.940% | 08/20/18 | GSC | 300,000 | 29,340 | 6,630 | ||||||||||||||||||||
|
|
|
| |||||||||||||||||||||||||
| $118,140 | $29,029 | |||||||||||||||||||||||||||
|
|
|
| |||||||||||||||||||||||||
Options on Futures
| Description | Exercise Price | Expiration Date | Exchange | Number of Contracts | Notional Amount | Cost | Value | |||||||||||||||||||
Call - Euro-FX (04/18) | $1.24 | 04/06/18 | CME | 3 | $465,000 | $3,943 | $1,088 | |||||||||||||||||||
Call - U.S. Treasury 10-Year Notes (05/18) | 120.00 | 04/20/18 | CME | 6 | 720,000 | 2,636 | 7,500 | |||||||||||||||||||
Call - U.S. Treasury 10-Year Notes (05/18) | 121.25 | 04/20/18 | CME | 3 | 363,750 | 1,084 | 1,266 | |||||||||||||||||||
Call - U.S. Treasury 10-Year Notes (05/18) | 125.50 | 04/20/18 | CME | 300 | 37,650,000 | 5,226 | 4,689 | |||||||||||||||||||
Call - U.S. Treasury 30-Year Bonds (05/18) | 144.00 | 04/20/18 | CME | 24 | 3,456,000 | 26,184 | 69,000 | |||||||||||||||||||
Call - U.S. Treasury 30-Year Bonds (05/18) | 145.50 | 04/20/18 | CME | 4 | 582,000 | 3,351 | 6,875 | |||||||||||||||||||
Call - Euro-Bund (05/18) | EUR 159.00 | 04/20/18 | CME | 5 | EUR 795,000 | 1,538 | 4,737 | |||||||||||||||||||
Call - Euro-OAT (05/18) | 170.00 | 05/25/18 | CME | 81 | 13,770,000 | 1,089 | 997 | |||||||||||||||||||
|
|
|
| |||||||||||||||||||||||
| 45,051 | 96,152 | |||||||||||||||||||||||||
|
|
|
| |||||||||||||||||||||||
Put - U.S. Treasury 2-Year Notes (05/18) | $105.38 | 04/20/18 | CME | 200 | $42,150,000 | 3,485 | — | |||||||||||||||||||
Put - U.S. Treasury 5-Year Notes (05/18) | 107.50 | 04/20/18 | CME | 350 | 37,625,000 | 3,365 | — | |||||||||||||||||||
Put - U.S. Treasury 5-Year Notes (05/18) | 107.75 | 04/20/18 | CME | 1,050 | 113,137,500 | 10,094 | — | |||||||||||||||||||
Put - U.S. Treasury 5-Year Notes (05/18) | 110.00 | 04/20/18 | CME | 228 | 25,080,000 | 3,973 | — | |||||||||||||||||||
Put - U.S. Treasury 10-Year Notes (05/18) | 116.50 | 04/20/18 | CME | 500 | 58,250,000 | 8,713 | — | |||||||||||||||||||
Put - U.S. Treasury 30-Year Bonds (05/18) | 133.00 | 04/20/18 | CME | 62 | 8,246,000 | 1,080 | — | |||||||||||||||||||
Put - Euro-Bund (05/18) | EUR 158.00 | 04/20/18 | CME | 10 | EUR 1,580,000 | 4,187 | 1,354 | |||||||||||||||||||
Put - Euro-FX (05/18) | $1.25 | 05/04/18 | CME | 1 | $156,250 | 1,802 | 2,425 | |||||||||||||||||||
| See Notes to Financial Statements | See explanation of symbols and terms, if any, on B-114 and B-115 |
B-23
Table of Contents
PACIFIC FUNDS
PF MANAGED BOND FUND
Schedule of Investments (Continued)
March 31, 2018
| Description | Exercise Price | Expiration Date | Exchange | Number of Contracts | Notional Amount | Cost | Value | |||||||||||||||||||||
Put - U.S. Treasury 5-Year Notes (06/18) | $105.25 | 05/25/18 | CME | 20 | $2,105,000 | $171 | $— | |||||||||||||||||||||
Put - U.S. Treasury 5-Year Notes (06/18) | 105.50 | 05/25/18 | CME | 128 | 13,504,000 | 1,114 | — | |||||||||||||||||||||
Put - U.S. Treasury 5-Year Notes (06/18) | 106.00 | 05/25/18 | CME | 50 | 5,300,000 | 428 | — | |||||||||||||||||||||
Put - U.S. Treasury 10-Year Notes (06/18) | 108.00 | 05/25/18 | CME | 119 | 12,852,000 | 1,017 | — | |||||||||||||||||||||
Put - U.S. Treasury 10-Year Notes (06/18) | 108.50 | 05/25/18 | CME | 215 | 23,327,500 | 1,816 | — | |||||||||||||||||||||
Put - U.S. Treasury 5-Year Notes (06/18) | 111.00 | 05/25/18 | CME | 107 | 11,877,000 | 1,864 | 1,672 | |||||||||||||||||||||
Put - Euro-Bund (05/18) | EUR 140.00 | 05/25/18 | CME | 80 | EUR 11,200,000 | 1,066 | 984 | |||||||||||||||||||||
Put - Euro-Bund (05/18) | 141.00 | 05/25/18 | CME | 43 | 6,063,000 | 571 | 529 | |||||||||||||||||||||
|
|
|
| |||||||||||||||||||||||||
| 44,746 | 6,964 | |||||||||||||||||||||||||||
|
|
|
| |||||||||||||||||||||||||
Total Options on Futures | $89,797 | $103,116 | ||||||||||||||||||||||||||
|
|
|
| |||||||||||||||||||||||||
Options on Securities
| Description | Exercise Price | Expiration Date | Counter- party | Notional Amount | Cost | Value | ||||||||||||||||||
Put - Fannie Mae 3.500% due 05/14/48 | $69.00 | 05/07/18 | JPM | $3,300,000 | $129 | $— | ||||||||||||||||||
|
|
|
| |||||||||||||||||||||
Total Purchased Options | $294,308 | $132,747 | ||||||||||||||||||||||
|
|
|
| |||||||||||||||||||||
| (g) | Premiums received and value of written options outstanding as of March 31, 2018 were as follows: |
Credit Default Swaptions on Credit Indices – Sell Protection
| Description | Exercise Rate | Expiration Date | Counter- party | Notional Amount | Premium | Value | ||||||||||||||||
Put - CDX IG 30 5Y | 0.900% | 06/20/18 | JPM | $500,000 | $585 | ($579 | ) | |||||||||||||||
Put - CDX IG 30 5Y | 0.950% | 07/18/18 | DUB | 600,000 | 998 | (844 | ) | |||||||||||||||
|
|
|
| |||||||||||||||||||
| $1,583 | ($1,423 | ) | ||||||||||||||||||||
|
|
|
| |||||||||||||||||||
Foreign Currency Options
| Description | Exercise Price | Expiration Date | Counter- party | Notional Amount | Premium | Value | ||||||||||||||||||
Call - AUD versus USD | $0.81 | 04/12/18 | RBS | AUD 950,000 | $4,332 | ($9 | ) | |||||||||||||||||
|
|
|
| |||||||||||||||||||||
Put - AUD versus USD | 0.77 | 04/12/18 | RBS | 950,000 | 3,933 | (4,123 | ) | |||||||||||||||||
Put - EUR versus USD | 1.27 | 04/27/18 | CIT | $4,468,000 | 36,460 | (30 | ) | |||||||||||||||||
Put - EUR versus USD | 1.26 | 05/11/18 | CIT | 4,340,000 | 37,362 | (10,039 | ) | |||||||||||||||||
|
|
|
| |||||||||||||||||||||
| 77,755 | (14,192 | ) | ||||||||||||||||||||||
|
|
|
| |||||||||||||||||||||
Total Foreign Currency Options | $82,087 | ($14,201 | ) | |||||||||||||||||||||
|
|
|
| |||||||||||||||||||||
Inflation Floor/Cap Options
| Description | Initial Index | Floating Rate | Expiration Date | Counter- party | Notional Amount | Premium | Value | |||||||||||||||||||
Floor - U.S. CPI Urban Consumers NSA | 215.95 | Maximum of [0, (1 + 0.000%)10 | 03/12/20 | CIT | $1,200,000 | $10,320 | $— | |||||||||||||||||||
Floor - U.S. CPI Urban Consumers NSA | 217.97 | Maximum of [0, (1 + 0.000%)10 | 09/29/20 | CIT | 600,000 | 7,740 | — | |||||||||||||||||||
|
|
|
| |||||||||||||||||||||||
| $18,060 | $— | |||||||||||||||||||||||||
|
|
|
| |||||||||||||||||||||||
Interest Rate Swaptions
| Description | Pay/Receive Floating Rate | Floating Rate Index | Exercise Rate | Expiration Date | Counter- party | Notional Amount | Premium | Value | ||||||||||||||||||||||||
Put - 5-Year Interest Rate Swap | Pay | 3-Month USD-LIBOR | 2.800% | 08/20/18 | GSC | $1,200,000 | $26,727 | ($7,530 | ) | |||||||||||||||||||||||
Put - 5-Year Interest Rate Swap | Pay | 3-Month USD-LIBOR | 2.800% | 08/20/18 | MSC | 3,800,000 | 84,793 | (23,844 | ) | |||||||||||||||||||||||
|
|
|
| |||||||||||||||||||||||||||||
| $111,520 | ($31,374 | ) | ||||||||||||||||||||||||||||||
|
|
|
| |||||||||||||||||||||||||||||
| See Notes to Financial Statements | See explanation of symbols and terms, if any, on B-114 and B-115 |
B-24
Table of Contents
PACIFIC FUNDS
PF MANAGED BOND FUND
Schedule of Investments (Continued)
March 31, 2018
Options on Futures
| Description | Exercise Price | Expiration Date | Exchange | Number of Contracts | Notional Amount | Premium | Value | |||||||||||||||||||||
Call - U.S. Treasury 10-Year Notes (04/18) | $121.50 | 04/06/18 | CME | 6 | $729,000 | $880 | ($1,031 | ) | ||||||||||||||||||||
Call - U.S. Treasury 30-Year Bonds (04/18) | 145.00 | 04/06/18 | CME | 15 | 2,175,000 | 8,645 | (26,484 | ) | ||||||||||||||||||||
Call - U.S. Treasury 5-Year Notes (05/18) | 114.00 | 04/20/18 | CME | 51 | 5,814,000 | 13,580 | (29,484 | ) | ||||||||||||||||||||
Call - U.S. Treasury 5-Year Notes (05/18) | 114.50 | 04/20/18 | CME | 17 | 1,946,500 | 3,157 | (4,781 | ) | ||||||||||||||||||||
Call - U.S. Treasury 5-Year Notes (05/18) | 114.75 | 04/20/18 | CME | 17 | 1,950,750 | 1,962 | (3,188 | ) | ||||||||||||||||||||
Call - U.S. Treasury 10-Year Notes (05/18) | 120.50 | 04/20/18 | CME | 30 | 3,615,000 | 12,368 | (25,781 | ) | ||||||||||||||||||||
Call - U.S. Treasury 10-Year Notes (05/18) | 120.75 | 04/20/18 | CME | 7 | 845,250 | 2,394 | (4,813 | ) | ||||||||||||||||||||
Call - U.S. Treasury 10-Year Notes (05/18) | 121.00 | 04/20/18 | CME | 31 | 3,751,000 | 11,288 | (16,953 | ) | ||||||||||||||||||||
Call - U.S. Treasury 10-Year Notes (05/18) | 121.50 | 04/20/18 | CME | 14 | 1,701,000 | 3,662 | (4,375 | ) | ||||||||||||||||||||
Call - U.S. Treasury 30-Year Bonds (05/18) | 146.00 | 04/20/18 | CME | 11 | 1,606,000 | 8,121 | (15,469 | ) | ||||||||||||||||||||
Call - U.S. Treasury 30-Year Bonds (05/18) | 147.00 | 04/20/18 | CME | 5 | 735,000 | 2,616 | (4,531 | ) | ||||||||||||||||||||
Call - U.S. Treasury 30-Year Bonds (05/18) | 147.50 | 04/20/18 | CME | 8 | 1,180,000 | 2,329 | (5,750 | ) | ||||||||||||||||||||
Call - Euro-Bund (05/18) | EUR 160.00 | 04/20/18 | CME | 12 | EUR 1,920,000 | 3,213 | (3,987 | ) | ||||||||||||||||||||
Call - JPY FX (05/18) | $96.00 | 05/04/18 | CME | 6 | $720,000 | 6,514 | (3,150 | ) | ||||||||||||||||||||
Call - U.S. Treasury 10-Year Notes (06/18) | 121.00 | 05/25/18 | CME | 16 | 1,936,000 | 7,237 | (13,250 | ) | ||||||||||||||||||||
Call - U.S. Treasury 10-Year Notes (06/18) | 121.50 | 05/25/18 | CME | 15 | 1,822,500 | 4,895 | (9,141 | ) | ||||||||||||||||||||
Call - U.S. Treasury 10-Year Notes (06/18) | 123.00 | 05/25/18 | CME | 13 | 1,599,000 | 6,195 | (2,641 | ) | ||||||||||||||||||||
Call - U.S. Treasury 30-Year Bonds (06/18) | 147.00 | 05/25/18 | CME | 9 | 1,323,000 | 8,453 | (14,484 | ) | ||||||||||||||||||||
Call - U.S. Treasury 30-Year Bonds (06/18) | 148.00 | 05/25/18 | CME | 6 | 888,000 | 5,614 | (7,125 | ) | ||||||||||||||||||||
Call - U.S. Treasury 30-Year Bonds (06/18) | 149.00 | 05/25/18 | CME | 7 | 1,043,000 | 8,050 | (6,016 | ) | ||||||||||||||||||||
Call - U.S. Treasury 30-Year Bonds (06/18) | 150.00 | 05/25/18 | CME | 28 | 4,200,000 | 28,496 | (17,500 | ) | ||||||||||||||||||||
Call - Euro-Bund (06/18) | EUR 158.00 | 05/25/18 | CME | 7 | EUR 1,106,000 | 4,373 | (15,676 | ) | ||||||||||||||||||||
|
|
|
| |||||||||||||||||||||||||
| 154,042 | (235,610 | ) | ||||||||||||||||||||||||||
|
|
|
| |||||||||||||||||||||||||
Put - U.S. Treasury 5-Year Notes (04/18) | $114.25 | 04/06/18 | CME | 7 | $799,750 | 776 | (656 | ) | ||||||||||||||||||||
Put - U.S. Treasury 30-Year Bonds (04/18) | 145.00 | 04/06/18 | CME | 2 | 290,000 | 621 | (281 | ) | ||||||||||||||||||||
Put - U.S. Treasury 5-Year Notes (05/18) | 114.00 | 04/20/18 | CME | 40 | 4,560,000 | 7,295 | (4,375 | ) | ||||||||||||||||||||
Put - U.S. Treasury 10-Year Notes (05/18) | 120.00 | 04/20/18 | CME | 27 | 3,240,000 | 5,874 | (2,531 | ) | ||||||||||||||||||||
Put - U.S. Treasury 10-Year Notes (05/18) | 120.50 | 04/20/18 | CME | 36 | 4,338,000 | 11,442 | (7,313 | ) | ||||||||||||||||||||
Put - Euro-Bund (05/18) | EUR 157.50 | 04/20/18 | CME | 5 | EUR 787,500 | 2,881 | (431 | ) | ||||||||||||||||||||
Put - Euro-Bund (04/18) | 158.00 | 04/20/18 | CME | 14 | 2,212,000 | 4,343 | (1,895 | ) | ||||||||||||||||||||
Put - U.S. Treasury 5-Year Notes (06/18) | $113.25 | 05/25/18 | CME | 19 | $2,151,750 | 5,606 | (1,633 | ) | ||||||||||||||||||||
|
|
|
| |||||||||||||||||||||||||
| 38,838 | (19,115 | ) | ||||||||||||||||||||||||||
|
|
|
| |||||||||||||||||||||||||
Total Options on Futures | $192,880 | ($254,725 | ) | |||||||||||||||||||||||||
|
|
|
| |||||||||||||||||||||||||
Options on Securities
| Description | Exercise Price | Expiration Date | Counter- party | Notional Amount | Premium | Value | ||||||||||||||||||
Call - Fannie Mae 3.500% due 05/14/48 | $100.43 | 05/07/18 | JPM | $2,000,000 | $5,547 | ($6,060 | ) | |||||||||||||||||
|
|
|
| |||||||||||||||||||||
Total Written Options | $411,677 | ($307,783 | ) | |||||||||||||||||||||
|
|
|
| |||||||||||||||||||||
| (h) | Swap agreements outstanding as of March 31, 2018 were as follows: |
Credit Default Swaps on Corporate and Sovereign Issues - Sell Protection (1)
| Referenced Obligation | Payment Frequency | Fixed Deal Receive Rate | Expiration Date | Counter- party | Implied Credit Spread at 03/31/18 (2) | Notional Amount (3) | Value (5) | Upfront Premiums Paid (Received) | Unrealized Appreciation (Depreciation) | |||||||||||||||||||||||||||
Colombia Government | Q | 1.000% | 03/20/19 | GSC | 0.275% | $1,800,000 | $13,291 | ($16,452 | ) | $29,743 | ||||||||||||||||||||||||||
Colombia Government | Q | 1.000% | 03/20/19 | HSB | 0.275% | 3,500,000 | 25,844 | (28,642 | ) | 54,486 | ||||||||||||||||||||||||||
Petrobras International Co SA | Q | 1.000% | 12/20/19 | GSC | 0.754% | 300,000 | 1,351 | (32,995 | ) | 34,346 | ||||||||||||||||||||||||||
|
|
|
|
|
| |||||||||||||||||||||||||||||||
| 40,486 | (78,089 | ) | 118,575 | |||||||||||||||||||||||||||||||||
|
|
|
|
|
| |||||||||||||||||||||||||||||||
| Exchange | ||||||||||||||||||||||||||||||||||||
Citigroup Inc | Q | 1.000% | 12/20/20 | ICE | 0.335% | 900,000 | 16,030 | 18,995 | (2,965 | ) | ||||||||||||||||||||||||||
Tesco PLC | Q | 1.000% | 06/20/22 | ICE | 0.992% | EUR 800,000 | 411 | 3,990 | (3,579 | ) | ||||||||||||||||||||||||||
|
|
|
|
|
| |||||||||||||||||||||||||||||||
| 16,441 | 22,985 | (6,544 | ) | |||||||||||||||||||||||||||||||||
|
|
|
|
|
| |||||||||||||||||||||||||||||||
Total Credit Default Swaps on Corporate and Sovereign Issues - Sell Protection |
| $56,927 | ($55,104 | ) | $112,031 | |||||||||||||||||||||||||||||||
|
|
|
|
|
| |||||||||||||||||||||||||||||||
Credit Default Swaps on Credit Indices - Buy Protection (4)
| Referenced Obligation | Payment Frequency | Fixed Deal Pay Rate | Expiration Date | Exchange | Notional Amount (3) | Value (5) | Upfront Premiums Paid (Received) | Unrealized Appreciation (Depreciation) | ||||||||||||||||||||
CDX HY 29 5Y | Q | 5.000% | 12/20/22 | ICE | $6,670,000 | ($432,903 | ) | ($450,225 | ) | $17,322 | ||||||||||||||||||
|
|
|
|
|
| |||||||||||||||||||||||
| See Notes to Financial Statements | See explanation of symbols and terms, if any, on B-114 and B-115 |
B-25
Table of Contents
PACIFIC FUNDS
PF MANAGED BOND FUND
Schedule of Investments (Continued)
March 31, 2018
Credit Default Swaps on Credit Indices - Sell Protection (1)
| Referenced Obligation | Payment Frequency | Fixed Deal Receive Rate | Expiration Date | Exchange | Notional Amount (3) | Value (5) | Upfront Premiums Paid (Received) | Unrealized Appreciation (Depreciation) | ||||||||||||||||||||
CDX IG 23 2Y | Q | 1.000% | 12/20/19 | ICE | $990,000 | $12,173 | $12,936 | ($763 | ) | |||||||||||||||||||
CDX IG 25 5Y | Q | 1.000% | 12/20/20 | ICE | 2,290,000 | 40,111 | 41,980 | (1,869 | ) | |||||||||||||||||||
CDX IG 29 5Y | Q | 1.000% | 12/20/22 | ICE | 62,580,000 | 1,161,422 | 1,285,253 | (123,831 | ) | |||||||||||||||||||
CDX IG 30 5Y | Q | 1.000% | 06/20/23 | ICE | 7,900,000 | 130,389 | 130,390 | (1 | ) | |||||||||||||||||||
CDX HY 30 5Y | Q | 5.000% | 06/20/23 | ICE | 500,000 | 30,164 | 30,645 | (481 | ) | |||||||||||||||||||
|
|
|
|
|
| |||||||||||||||||||||||
| 1,374,259 | 1,501,204 | (126,945 | ) | |||||||||||||||||||||||||
|
|
|
|
|
| |||||||||||||||||||||||
Total Credit Default Swaps | $998,283 | $995,875 | $2,408 | |||||||||||||||||||||||||
|
|
|
|
|
| |||||||||||||||||||||||
| (1) | If the Fund is a seller of protection and a credit event occurs, as defined under the terms of that particular swap agreement, the Fund will either (i) pay to the buyer of protection an amount equal to the notional amount of the swap and take delivery of the referenced obligation or underlying investments comprising the referenced index or (ii) pay a net settlement amount in the form of cash or investments equal to the notional amount of the swap less the recovery value of the referenced obligation or underlying investments comprising the referenced index. |
| (2) | An implied credit spread is the spread in yield between a U.S. Treasury security and the referenced obligation or underlying investment that are identical in all respects except for the quality rating. Implied credit spreads, represented in absolute terms, utilized in determining the value of credit default swap agreements on corporate and sovereign issues as of year end serve as an indicator of the current status of the payment/performance risk and represent the likelihood of risk of default for the credit derivative. The implied credit spread of a particular referenced entity reflects the cost of buying/selling protection and may include upfront payments required to be made to enter into the agreement. Wider credit spreads, in comparison to narrower credit spreads, represent a deterioration of the referenced entity’s credit soundness and a greater likelihood of risk of default or other credit event occurring as defined under the terms of the agreement. A credit spread identified as “Defaulted” indicates a credit event has occurred for the referenced entity or obligation. |
| (3) | The maximum potential amount the Fund could be required to pay as a seller of credit protection or receive as a buyer of credit protection if a credit event occurs as defined under the terms of that particular swap agreement. |
| (4) | If the Fund is a buyer of protection and a credit event occurs, as defined under the terms of that particular swap agreement, the Fund will either (i) receive from the seller of protection an amount equal to the notional amount of the swap and deliver the referenced obligation or underlying investments comprising the referenced index or (ii) receive a net settlement amount in the form of cash or investments equal to the notional amount of the swap less the recovery value of the referenced obligation or underlying investments comprising the referenced index. |
| (5) | The quoted market prices and resulting values for credit default swap agreements on credit indices serve as an indicator of the current status of the payment/performance risk and represent the likelihood of an expected liability (or profit) for the credit derivative had the notional amount of the swap agreement been closed/sold as of year end. Increasing values (buy protection) or decreasing values (sell protection), when compared to the notional amount of the swap, represent a deterioration of the referenced entity’s credit soundness and a greater likelihood of risk of default or other credit event occurring as defined under the terms of the agreement. |
Interest Rate Swaps - Pay Floating Rate
| Floating Rate Index | Payment Frequency Floating Rate | Exchange | Fixed Rate | Expiration Date | Notional Amount | Value | Upfront Premiums Paid (Received) | Unrealized Appreciation (Depreciation) | ||||||||||||||||||||||||
3-Month USD-LIBOR | S / Q | CME | 1.597% | 03/29/19 | $7,860,000 | ($62,654 | ) | $— | ($62,654 | ) | ||||||||||||||||||||||
3-Month USD-LIBOR | S / Q | CME | 1.705% | 09/28/19 | 4,380,000 | (51,492 | ) | — | (51,492 | ) | ||||||||||||||||||||||
3-Month USD-LIBOR | S / Q | CME | 1.138% | 10/17/19 | 12,330,000 | (254,907 | ) | — | (254,907 | ) | ||||||||||||||||||||||
3-Month USD-LIBOR | S / Q | CME | 1.958% | 12/05/19 | 21,400,000 | (193,839 | ) | — | (193,839 | ) | ||||||||||||||||||||||
6-Month JPY-LIBOR | S / S | CME | 0.250% | 12/20/19 | JPY 690,000,000 | 23,503 | 30,105 | (6,602 | ) | |||||||||||||||||||||||
3-Month USD-LIBOR | S / Q | CME | 1.671% | 06/14/20 | $12,160,000 | (239,483 | ) | (3,505 | ) | (235,978 | ) | |||||||||||||||||||||
3-Month USD-LIBOR | S / Q | CME | 2.250% | 05/31/22 | 8,541,000 | (149,022 | ) | 15,860 | (164,882 | ) | ||||||||||||||||||||||
3-Month USD-LIBOR | S / Q | CME | 2.169% | 12/01/22 | 2,510,000 | (59,748 | ) | — | (59,748 | ) | ||||||||||||||||||||||
Brazil CETIP Interbank | Z / Z | CME | 9.650% | 01/02/25 | BRL 1,600,000 | 10,180 | (6,589 | ) | 16,769 | |||||||||||||||||||||||
6-Month EUR-LIBOR | A / S | LCH | 1.501% | 07/04/42 | EUR 1,900,000 | 4,144 | — | 4,144 | ||||||||||||||||||||||||
|
|
|
|
|
| |||||||||||||||||||||||||||
| ($973,318 | ) | $35,871 | ($1,009,189 | ) | ||||||||||||||||||||||||||||
|
|
|
|
|
| |||||||||||||||||||||||||||
Interest Rate Swaps - Receive Floating Rate
| Floating Rate Index | Payment Frequency Floating Rate | Exchange | Fixed Rate | Expiration Date | Notional Amount | Value | Upfront Premiums Paid (Received) | Unrealized Appreciation (Depreciation) | ||||||||||||||||||||||
3-Month USD-LIBOR | S / Q | CME | 1.250% | 06/21/20 | $6,300,000 | $184,016 | $104,066 | $79,950 | ||||||||||||||||||||||
6-Month GBP-LIBOR | S / S | LCH | 1.500% | 09/19/23 | GBP 3,700,000 | (20,178 | ) | (779 | ) | (19,399 | ) | |||||||||||||||||||
6-Month JPY-LIBOR | S / S | CME | 0.300% | 03/18/26 | JPY 1,140,000,000 | (81,080 | ) | (86,140 | ) | 5,060 | ||||||||||||||||||||
6-Month JPY-LIBOR | S / S | LCH | 0.300% | 03/18/26 | 970,000,000 | (61,710 | ) | (65,509 | ) | 3,799 | ||||||||||||||||||||
6-Month JPY-LIBOR | S / S | LCH | 0.300% | 09/20/27 | 440,000,000 | (9,847 | ) | (17,471 | ) | 7,624 | ||||||||||||||||||||
3-Month USD-LIBOR | S / Q | CME | 2.500% | 12/20/27 | $2,000,000 | 53,281 | (11,780 | ) | 65,061 | |||||||||||||||||||||
6-Month JPY-LIBOR | S / S | LCH | 0.285% | 01/25/28 | JPY 30,000,000 | 122 | 2,231 | (2,109 | ) | |||||||||||||||||||||
6-Month JPY-LIBOR | S / S | LCH | 0.301% | 02/13/28 | 10,000,000 | (97 | ) | 645 | (742 | ) | ||||||||||||||||||||
6-Month JPY-LIBOR | S / S | LCH | 0.354% | 02/16/28 | 20,000,000 | (1,166 | ) | — | (1,166 | ) | ||||||||||||||||||||
6-Month JPY-LIBOR | S / S | LCH | 0.300% | 03/20/28 | 100,000,000 | (415 | ) | 7,417 | (7,832 | ) | ||||||||||||||||||||
6-Month JPY-LIBOR | S / S | LCH | 0.380% | 06/18/28 | 10,000,000 | (633 | ) | 168 | (801 | ) | ||||||||||||||||||||
6-Month JPY-LIBOR | S / S | LCH | 0.399% | 06/18/28 | 50,000,000 | (4,058 | ) | (44 | ) | (4,014 | ) | |||||||||||||||||||
| See Notes to Financial Statements | See explanation of symbols and terms, if any, on B-114 and B-115 |
B-26
Table of Contents
PACIFIC FUNDS
PF MANAGED BOND FUND
Schedule of Investments (Continued)
March 31, 2018
| Floating Rate Index | Payment Frequency Floating Rate | Exchange | Fixed Rate | Expiration Date | Notional Amount | Value | Upfront Premiums Paid (Received) | Unrealized Appreciation (Depreciation) | ||||||||||||||||||||||||
6-Month GBP-LIBOR | S / S | LCH | 1.500% | 06/20/28 | GBP 900,000 | $1,894 | $28,954 | ($27,060 | ) | |||||||||||||||||||||||
3-Month USD-LIBOR | S / Q | LCH | 2.250% | 06/20/28 | $4,100,000 | 195,770 | 235,463 | (39,693 | ) | |||||||||||||||||||||||
6-Month GBP-LIBOR | S / S | LCH | 1.500% | 09/19/28 | GBP 1,000,000 | 5,119 | 23,890 | (18,771 | ) | |||||||||||||||||||||||
3-Month USD-LIBOR | S / Q | CME | 2.474% | 11/15/43 | $13,414,000 | 1,032,900 | 241,724 | 791,176 | ||||||||||||||||||||||||
3-Month USD-LIBOR | S / Q | CME | 2.950% | 11/15/43 | 6,393,000 | (82,664 | ) | 13,719 | (96,383 | ) | ||||||||||||||||||||||
3-Month JPY-LIBOR | S / S | CME | 0.641% | 05/09/46 | JPY 187,300,000 | 90,674 | — | 90,674 | ||||||||||||||||||||||||
3-Month CAD-CDOR | S / S | CME | 1.750% | 12/16/46 | CAD 300,000 | 42,126 | 38,848 | 3,278 | ||||||||||||||||||||||||
3-Month EUR-LIBOR | A / S | CME | 1.498% | 08/23/47 | EUR 2,276,000 | (12,255 | ) | 2,373 | (14,628 | ) | ||||||||||||||||||||||
6-Month GBP-LIBOR | S / S | LCH | 1.500% | 06/20/48 | GBP 1,700,000 | 6,382 | 58,200 | (51,818 | ) | |||||||||||||||||||||||
|
|
|
|
|
| |||||||||||||||||||||||||||
| $1,338,181 | $575,975 | $762,206 | ||||||||||||||||||||||||||||||
|
|
|
|
|
| |||||||||||||||||||||||||||
Interest Rate Swaps - Receive Floating Rate / Pay Floating Rate
| Receive | Pay | Payment Frequency | Exchange | Expiration Date | Notional Amount | Value | Upfront Premiums | Unrealized Appreciation (Depreciation) | ||||||||||||||||||||||
1-Day U.S. Fed Funds + 0.355% | 3-Month USD-LIBOR | Q | CME | 05/15/23 | $110,323,000 | $12,104 | ($32,564 | ) | $44,668 | |||||||||||||||||||||
|
|
|
|
|
| |||||||||||||||||||||||||
Total Interest Rate Swaps |
| $376,967 | $579,282 | ($202,315 | ) | |||||||||||||||||||||||||
|
|
|
|
|
| |||||||||||||||||||||||||
Total Swap Agreements |
| $1,375,250 | $1,575,157 | ($199,907 | ) | |||||||||||||||||||||||||
|
|
|
|
|
| |||||||||||||||||||||||||
| See Notes to Financial Statements | See explanation of symbols and terms, if any, on B-114 and B-115 |
B-27
Table of Contents
PACIFIC FUNDS
PF MANAGED BOND FUND
Schedule of Investments (Continued)
March 31, 2018
| (i) | Fair Value Measurements |
The following is a summary of the Fund’s investments as categorized under the three-tier hierarchy of inputs used in valuing the Fund’s assets and liabilities (See Note 3D in Notes to Financial Statements) as of March 31, 2018:
| Total Value at March 31, 2018 | Level 1 Quoted Price | Level 2 Significant Observable Inputs | Level 3 Significant Unobservable Inputs | |||||||||||||||
Assets | Corporate Bonds & Notes | $207,553,596 | $— | $207,553,596 | $— | |||||||||||||
Senior Loan Notes | 29,971,997 | — | 29,971,997 | — | ||||||||||||||
Mortgage-Backed Securities | 255,469,873 | — | 255,469,873 | — | ||||||||||||||
Asset-Backed Securities | 41,736,095 | — | 41,736,095 | — | ||||||||||||||
U.S. Government Agency Issues | 4,640,386 | — | 4,640,386 | — | ||||||||||||||
U.S. Treasury Obligations | 55,351,893 | — | 55,351,893 | — | ||||||||||||||
Foreign Government Bonds & Notes | 32,616,656 | — | 32,616,656 | — | ||||||||||||||
Municipal Bonds | 5,825,039 | — | 5,825,039 | — | ||||||||||||||
Short-Term Investments | 110,267,289 | 65,648,832 | 44,618,457 | — | ||||||||||||||
Derivatives: | ||||||||||||||||||
Credit Contracts | ||||||||||||||||||
Purchased Options | 59 | — | 59 | — | ||||||||||||||
Swaps | 1,431,186 | — | 1,431,186 | — | ||||||||||||||
|
|
|
|
|
|
|
| |||||||||||
Total Credit Contracts | 1,431,245 | — | 1,431,245 | — | ||||||||||||||
|
|
|
|
|
|
|
| |||||||||||
Foreign Currency Contracts | ||||||||||||||||||
Futures | 366,501 | 366,501 | — | — | ||||||||||||||
Forward Foreign Currency Contracts | 605,930 | — | 605,930 | — | ||||||||||||||
Purchased Options | 4,056 | — | 4,056 | — | ||||||||||||||
|
|
|
|
|
|
|
| |||||||||||
Total Foreign Currency Contracts | 976,487 | 366,501 | 609,986 | — | ||||||||||||||
|
|
|
|
|
|
|
| |||||||||||
Interest Rate Contracts | ||||||||||||||||||
Futures | 3,751,500 | 3,751,500 | — | — | ||||||||||||||
Purchased Options | 128,632 | — | 128,632 | — | ||||||||||||||
Swaps | 1,662,215 | — | 1,662,215 | — | ||||||||||||||
|
|
|
|
|
|
|
| |||||||||||
Total Interest Rate Contracts | 5,542,347 | 3,751,500 | 1,790,847 | — | ||||||||||||||
|
|
|
|
|
|
|
| |||||||||||
Total Assets - Derivatives | 7,950,079 | 4,118,001 | 3,832,078 | — | ||||||||||||||
|
|
|
|
|
|
|
| |||||||||||
Total Assets | 751,382,903 | 69,766,833 | 681,616,070 | — | ||||||||||||||
|
|
|
|
|
|
|
| |||||||||||
Liabilities | Sale-buyback Financing Transactions | (32,702,867 | ) | — | (32,702,867 | ) | — | |||||||||||
Derivatives: | ||||||||||||||||||
Credit Contracts | ||||||||||||||||||
Written Options | (1,423 | ) | — | (1,423 | ) | — | ||||||||||||
Swaps | (432,903 | ) | — | (432,903 | ) | — | ||||||||||||
|
|
|
|
|
|
|
| |||||||||||
Total Credit Contracts | (434,326 | ) | — | (434,326 | ) | — | ||||||||||||
|
|
|
|
|
|
|
| |||||||||||
Foreign Currency Contracts | ||||||||||||||||||
Futures | (61,082 | ) | (61,082 | ) | — | — | ||||||||||||
Forward Foreign Currency Contracts | (3,044,925 | ) | — | (3,044,925 | ) | — | ||||||||||||
Written Options | (17,351 | ) | — | (17,351 | ) | — | ||||||||||||
|
|
|
|
|
|
|
| |||||||||||
Total Foreign Currency Contracts | (3,123,358 | ) | (61,082 | ) | (3,062,276 | ) | — | |||||||||||
|
|
|
|
|
|
|
| |||||||||||
Interest Rate Contracts | ||||||||||||||||||
Futures | (2,051,963 | ) | (2,051,963 | ) | — | — | ||||||||||||
Written Options | (289,009 | ) | — | (289,009 | ) | — | ||||||||||||
Swaps | (1,285,248 | ) | — | (1,285,248 | ) | — | ||||||||||||
|
|
|
|
|
|
|
| |||||||||||
Total Interest Rate Contracts | (3,626,220 | ) | (2,051,963 | ) | (1,574,257 | ) | — | |||||||||||
|
|
|
|
|
|
|
| |||||||||||
Total Liabilities - Derivatives | (7,183,904 | ) | (2,113,045 | ) | (5,070,859 | ) | — | |||||||||||
|
|
|
|
|
|
|
| |||||||||||
Total Liabilities | (39,886,771 | ) | (2,113,045 | ) | (37,773,726 | ) | — | |||||||||||
|
|
|
|
|
|
|
| |||||||||||
Total | $711,496,132 | $67,653,788 | $643,842,344 | $— | ||||||||||||||
|
|
|
|
|
|
|
| |||||||||||
| See Notes to Financial Statements | See explanation of symbols and terms, if any, on B-114 and B-115 |
B-28
Table of Contents
PACIFIC FUNDS
PF SHORT DURATION BOND FUND
Schedule of Investments
March 31, 2018
Principal Amount | Value | |||||||
CORPORATE BONDS & NOTES - 56.1% |
| |||||||
Basic Materials - 2.0% |
| |||||||
Anglo American Capital PLC (United Kingdom) | $240,000 | $240,916 | ||||||
Celulosa Arauco y Constitucion SA | 120,000 | 126,145 | ||||||
INVISTA Finance LLC | 515,000 | 516,854 | ||||||
LyondellBasell Industries NV | 200,000 | 216,022 | ||||||
Solvay Finance America LLC (Belgium) | 325,000 | 326,823 | ||||||
The Sherwin-Williams Co | 850,000 | 836,217 | ||||||
|
| |||||||
| 2,262,977 | ||||||||
|
| |||||||
Communications - 5.6% |
| |||||||
Baidu Inc (China) | 410,000 | 408,765 | ||||||
BellSouth LLC | 1,175,000 | 1,176,338 | ||||||
Charter Communications Operating LLC | 370,000 | 371,191 | ||||||
4.464% due 07/23/22 | 50,000 | 51,141 | ||||||
CSC Holdings LLC | 200,000 | 235,498 | ||||||
Discovery Communications LLC | 145,000 | 143,556 | ||||||
JD.com Inc (China) | 370,000 | 363,102 | ||||||
Omnicom Group Inc | 510,000 | 531,498 | ||||||
Telecom Italia Capital SA (Italy) | 417,000 | 420,649 | ||||||
Telefonica Emisiones SAU (Spain) | 500,000 | 500,208 | ||||||
Tencent Holdings Ltd (China) | 425,000 | 424,352 | ||||||
The Interpublic Group of Cos Inc | 80,000 | 81,224 | ||||||
Time Warner Cable LLC | 350,000 | 353,315 | ||||||
8.250% due 04/01/19 | 405,000 | 425,103 | ||||||
8.750% due 02/14/19 | 240,000 | 251,355 | ||||||
Viacom Inc | 435,000 | 431,189 | ||||||
5.625% due 09/15/19 | 160,000 | 166,213 | ||||||
|
| |||||||
| 6,334,697 | ||||||||
|
| |||||||
Consumer, Cyclical - 6.9% |
| |||||||
Air Canada Pass-Through Trust (Canada) | 445,000 | 447,225 | ||||||
Aptiv PLC | 340,000 | 339,539 | ||||||
Brinker International Inc | 545,000 | 544,591 | ||||||
Daimler Finance North America LLC (Germany) | 475,000 | 474,498 | ||||||
1.750% due 10/30/19 ~ | 165,000 | 161,984 | ||||||
2.300% due 02/12/21 ~ | 455,000 | 443,882 | ||||||
2.375% due 08/01/18 ~ | 325,000 | 324,833 | ||||||
Delta Air Lines Inc | 65,000 | 63,808 | ||||||
2.875% due 03/13/20 | 500,000 | 496,919 | ||||||
DR Horton Inc | 125,000 | 123,157 | ||||||
Ford Motor Credit Co LLC | 250,000 | 247,429 | ||||||
2.551% due 10/05/18 | 385,000 | 384,756 | ||||||
3.470% due 04/05/21 | 380,000 | 379,684 | ||||||
Principal Amount | Value | |||||||
General Motors Co | $ | 175,000 | $ | 175,273 | ||||
General Motors Financial Co Inc | 220,000 | 220,269 | ||||||
GLP Capital LP | 840,000 | 845,779 | ||||||
Hyundai Capital America | 175,000 | 171,363 | ||||||
2.400% due 10/30/18 ~ | 125,000 | 124,657 | ||||||
2.500% due 03/18/19 ~ | 625,000 | 621,318 | ||||||
2.875% due 08/09/18 ~ | 175,000 | 175,011 | ||||||
Lennar Corp | 375,000 | 367,538 | ||||||
QVC Inc | 600,000 | 599,782 | ||||||
|
| |||||||
| 7,733,295 | ||||||||
|
| |||||||
Consumer, Non-Cyclical - 6.4% |
| |||||||
Abbott Laboratories | 531,000 | 526,583 | ||||||
AbbVie Inc | 125,000 | 121,918 | ||||||
Anthem Inc | 500,000 | 499,605 | ||||||
2.500% due 11/21/20 | 80,000 | 78,682 | ||||||
BAT Capital Corp (United Kingdom) | 110,000 | 107,896 | ||||||
Baxalta Inc | 50,000 | 49,928 | ||||||
3.028% (USD LIBOR + 0.780%) due 06/22/18 § | 40,000 | 40,041 | ||||||
Becton Dickinson and Co | 330,000 | 323,849 | ||||||
2.675% due 12/15/19 | 325,000 | 322,957 | ||||||
2.944% (USD LIBOR + 0.875%) due 12/29/20 § | 75,000 | 75,090 | ||||||
Bunge Ltd Finance Corp | 55,000 | 55,215 | ||||||
8.500% due 06/15/19 | 380,000 | 403,840 | ||||||
Catholic Health Initiatives | 130,000 | 130,170 | ||||||
Celgene Corp | 165,000 | 163,953 | ||||||
CVS Health Corp | 175,000 | 174,646 | ||||||
Equifax Inc | 75,000 | 72,761 | ||||||
ERAC USA Finance LLC | 55,000 | 54,463 | ||||||
2.800% due 11/01/18 ~ | 400,000 | 400,070 | ||||||
Express Scripts Holding Co | 105,000 | 105,136 | ||||||
HCA Inc | 690,000 | 694,347 | ||||||
Imperial Brands Finance PLC (United Kingdom) | 400,000 | 399,198 | ||||||
Medco Health Solutions Inc | 80,000 | 81,643 | ||||||
Reynolds American Inc (United Kingdom) | 250,000 | 249,885 | ||||||
8.125% due 06/23/19 | 300,000 | 318,497 | ||||||
S&P Global Inc | 35,000 | 34,983 | ||||||
Shire Acquisitions Investments Ireland DAC | 925,000 | 909,982 | ||||||
Teva Pharmaceutical Finance Netherlands III BV (Israel) | 550,000 | 531,965 | ||||||
The Kroger Co | 100,000 | 99,758 | ||||||
Tyson Foods Inc | 160,000 | 154,397 | ||||||
|
| |||||||
| 7,181,458 | ||||||||
|
| |||||||
| See Notes to Financial Statements | See explanation of symbols and terms, if any, on B-114 and B-115 |
B-29
Table of Contents
PACIFIC FUNDS
PF SHORT DURATION BOND FUND
Schedule of Investments (Continued)
March 31, 2018
Principal Amount | Value | |||||||
Energy - 4.8% |
| |||||||
Cenovus Energy Inc (Canada) | $ | 240,000 | $ | 248,323 | ||||
China Shenhua Overseas Capital Co Ltd (China) | 300,000 | 298,549 | ||||||
Columbia Pipeline Group Inc | 130,000 | 129,922 | ||||||
DCP Midstream Operating LP | 730,000 | 726,350 | ||||||
Encana Corp (Canada) | 200,000 | 207,393 | ||||||
Energy Transfer Equity LP | 305,000 | 329,209 | ||||||
Energy Transfer Partners LP | 345,000 | 348,627 | ||||||
Enterprise Products Operating LLC | 245,000 | 242,452 | ||||||
Marathon Oil Corp | 150,000 | 147,839 | ||||||
NuStar Logistics LP | 670,000 | 671,256 | ||||||
ONEOK Partners LP | 555,000 | 557,124 | ||||||
Phillips 66 | 150,000 | 150,043 | ||||||
2.606% (USD LIBOR + 0.600%) due 02/26/21 § | 165,000 | 165,225 | ||||||
Plains All American Pipeline LP | 50,000 | 49,369 | ||||||
5.000% due 02/01/21 | 120,000 | 124,023 | ||||||
5.750% due 01/15/20 | 120,000 | 124,821 | ||||||
Sabine Pass Liquefaction LLC | 355,000 | 373,415 | ||||||
Spectra Energy Partners LP | 540,000 | 540,591 | ||||||
|
| |||||||
| 5,434,531 | ||||||||
|
| |||||||
Financial - 17.3% |
| |||||||
ABN AMRO Bank NV (Netherlands) | 495,000 | 492,936 | ||||||
AerCap Ireland Capital DAC (Netherlands) | 150,000 | 150,721 | ||||||
Air Lease Corp | 370,000 | 363,576 | ||||||
2.500% due 03/01/21 | 70,000 | 68,678 | ||||||
American Express Credit Corp | 195,000 | 192,303 | ||||||
American International Group Inc | 250,000 | 247,736 | ||||||
ANZ New Zealand Int’l Ltd (New Zealand) | 200,000 | 196,109 | ||||||
Banco de Credito del Peru (Peru) | 200,000 | 197,690 | ||||||
Banco Santander Chile (Chile) | 445,000 | 436,656 | ||||||
Bank of America Corp | 210,000 | 208,993 | ||||||
2.503% due 10/21/22 | 95,000 | 91,300 | ||||||
2.905% (USD LIBOR + 1.160%) due 01/20/23 § | 295,000 | 298,864 | ||||||
2.958% (USD LIBOR + 0.650%) due 10/01/21 § | 230,000 | 230,645 | ||||||
5.650% due 05/01/18 | 175,000 | 175,443 | ||||||
Banque Federative du Credit Mutuel SA (France) | 425,000 | 424,417 | ||||||
Barclays Bank PLC (United Kingdom) | 235,000 | 232,141 | ||||||
Principal Amount | Value | |||||||
Barclays PLC (United Kingdom) | $ | 375,000 | $ | 384,400 | ||||
BB&T Corp | 300,000 | 293,765 | ||||||
BPCE SA (France) | 250,000 | 253,772 | ||||||
Brixmor Operating Partnership LP REIT | 35,000 | 35,177 | ||||||
Capital One Financial Corp | 70,000 | 68,647 | ||||||
Capital One NA | 665,000 | 653,901 | ||||||
CBOE Global Markets Inc | 165,000 | 163,105 | ||||||
China Overseas Finance Cayman Ltd (China) | 225,000 | 227,468 | ||||||
Citigroup Inc | 325,000 | 322,081 | ||||||
2.498% (USD LIBOR + 0.790%) due 01/10/20 § | 310,000 | 311,889 | ||||||
2.900% due 12/08/21 | 310,000 | 305,475 | ||||||
Citizens Bank NA | 605,000 | 603,011 | ||||||
2.450% due 12/04/19 | 300,000 | 296,803 | ||||||
CNO Financial Group Inc | 290,000 | 293,625 | ||||||
Credit Suisse AG (Switzerland) | 50,000 | 51,805 | ||||||
Crown Castle International Corp REIT | 255,000 | 245,936 | ||||||
3.400% due 02/15/21 | 110,000 | 110,471 | ||||||
Discover Bank | 250,000 | 249,957 | ||||||
7.000% due 04/15/20 | 410,000 | 438,288 | ||||||
First Niagara Financial Group Inc | 85,000 | 95,606 | ||||||
Grain Spectrum Funding LLC | 140,000 | 140,137 | ||||||
HBOS PLC (United Kingdom) | 175,000 | 175,922 | ||||||
ING Groep NV (Netherlands) | 205,000 | 208,336 | ||||||
International Lease Finance Corp | 340,000 | 351,742 | ||||||
Intesa Sanpaolo SPA (Italy) | 400,000 | 398,993 | ||||||
3.375% due 01/12/23 ~ | 200,000 | 195,395 | ||||||
3.875% due 01/15/19 | 225,000 | 226,510 | ||||||
JPMorgan Chase & Co | 315,000 | 315,914 | ||||||
4.250% due 10/15/20 | 110,000 | 113,217 | ||||||
4.400% due 07/22/20 | 50,000 | 51,539 | ||||||
4.950% due 03/25/20 | 78,000 | 80,975 | ||||||
Kimco Realty Corp REIT | 130,000 | 137,426 | ||||||
Morgan Stanley | 310,000 | 310,254 | ||||||
5.500% due 01/26/20 | 125,000 | 130,505 | ||||||
5.500% due 07/24/20 | 125,000 | 131,351 | ||||||
Provident Cos Inc | 406,000 | 411,338 | ||||||
Regions Bank | 375,000 | 374,364 | ||||||
2.688% (USD LIBOR + 0.380%) | 535,000 | 534,633 | ||||||
7.500% due 05/15/18 | 250,000 | 251,398 | ||||||
| See Notes to Financial Statements | See explanation of symbols and terms, if any, on B-114 and B-115 |
B-30
Table of Contents
PACIFIC FUNDS
PF SHORT DURATION BOND FUND
Schedule of Investments (Continued)
March 31, 2018
Principal Amount | Value | |||||||
Reinsurance Group of America Inc | $ | 35,000 | $ | 36,740 | ||||
6.450% due 11/15/19 | 280,000 | 294,642 | ||||||
Santander UK Group Holdings PLC (United Kingdom) | 55,000 | 54,542 | ||||||
Santander UK PLC (United Kingdom) | 385,000 | 376,138 | ||||||
Sberbank of Russia Via SB Capital SA (Russia) | EUR 200,000 | 251,587 | ||||||
Standard Chartered PLC (United Kingdom) | $200,000 | 197,166 | ||||||
Sumitomo Mitsui Banking Corp (Japan) | 400,000 | 399,505 | ||||||
Sumitomo Mitsui Trust Bank Ltd (Japan) | 390,000 | 383,372 | ||||||
SunTrust Banks Inc | 160,000 | 159,549 | ||||||
The Goldman Sachs Group Inc | 295,000 | 291,937 | ||||||
2.552% (USD LIBOR + 0.780%) due 10/31/22 § | 100,000 | 99,880 | ||||||
2.862% (USD LIBOR + 1.110%) due 04/26/22 § | 295,000 | 297,678 | ||||||
2.900% due 07/19/18 | 130,000 | 130,195 | ||||||
5.375% due 03/15/20 | 100,000 | 104,291 | ||||||
6.000% due 06/15/20 | 30,000 | 31,758 | ||||||
6.150% due 04/01/18 | 1,050,000 | 1,050,000 | ||||||
Trinity Acquisition PLC | 45,000 | 44,967 | ||||||
UBS Group Funding Switzerland AG (Switzerland) | 255,000 | 259,331 | ||||||
VEREIT Operating Partnership LP REIT | 720,000 | 720,246 | ||||||
Wells Fargo & Co | 23,000 | 22,610 | ||||||
XLIT Ltd (Bermuda) | 250,000 | 249,083 | ||||||
|
| |||||||
| 19,408,556 | ||||||||
|
| |||||||
Industrial - 5.2% |
| |||||||
Boral Finance PTY Ltd (Australia) | 35,000 | 34,211 | ||||||
CNH Industrial Capital LLC | 130,000 | 130,000 | ||||||
DAE Funding LLC (United Arab Emirates) | 210,000 | 205,275 | ||||||
Eagle Materials Inc | 50,000 | 50,750 | ||||||
Eastern Creation II Investment Holdings Ltd (China) | 200,000 | 197,149 | ||||||
GATX Corp | 470,000 | 469,402 | ||||||
2.500% due 07/30/19 | 215,000 | 213,453 | ||||||
Harris Corp | 555,000 | 554,874 | ||||||
Kansas City Southern | 400,000 | 394,828 | ||||||
Keysight Technologies Inc | 880,000 | 881,935 | ||||||
Martin Marietta Materials Inc | 150,000 | 150,266 | ||||||
Park Aerospace Holdings Ltd (Ireland) | 230,000 | 219,075 | ||||||
Penske Truck Leasing Co LP | 230,000 | 228,897 | ||||||
2.875% due 07/17/18 ~ | 810,000 | 810,377 | ||||||
3.200% due 07/15/20 ~ | 50,000 | 50,092 | ||||||
Principal Amount | Value | |||||||
Roper Technologies Inc | $ | 25,000 | $ | 24,925 | ||||
SBA Tower Trust | 285,000 | 284,211 | ||||||
3.448% due 03/15/48 ~ | 210,000 | 210,409 | ||||||
Stanley Black & Decker Inc | 75,000 | 74,481 | ||||||
Vulcan Materials Co | 390,000 | 390,277 | ||||||
2.725% (USD LIBOR + 0.600%) due 06/15/20 § | 215,000 | 214,748 | ||||||
|
| |||||||
| 5,789,635 | ||||||||
|
| |||||||
Technology - 3.5% |
| |||||||
Broadcom Corp | 615,000 | 606,618 | ||||||
3.000% due 01/15/22 | 190,000 | 186,551 | ||||||
Dell International LLC | 250,000 | 251,185 | ||||||
DXC Technology Co | 280,000 | 278,541 | ||||||
2.956% (USD LIBOR + 0.950%) due 03/01/21 § | 480,000 | 480,596 | ||||||
EMC Corp | 390,000 | 388,886 | ||||||
Fidelity National Information Services Inc | 250,000 | 241,744 | ||||||
Hewlett Packard Enterprise Co | 155,000 | 153,000 | ||||||
2.850% due 10/05/18 | 740,000 | 740,850 | ||||||
QUALCOMM Inc | 170,000 | 168,092 | ||||||
Xerox Corp | 155,000 | 154,688 | ||||||
5.625% due 12/15/19 | 300,000 | 312,051 | ||||||
|
| |||||||
| 3,962,802 | ||||||||
|
| |||||||
Utilities - 4.4% |
| |||||||
CMS Energy Corp | 60,000 | 63,844 | ||||||
Dominion Energy Inc | 120,000 | 119,319 | ||||||
1.875% due 12/15/18 ~ | 350,000 | 347,663 | ||||||
2.579% due 07/01/20 | 110,000 | 108,655 | ||||||
2.962% due 07/01/19 § | 45,000 | 44,928 | ||||||
Enel Finance International NV (Italy) | 320,000 | 312,503 | ||||||
Exelon Generation Co LLC | 575,000 | 573,586 | ||||||
FirstEnergy Corp | 240,000 | 232,946 | ||||||
NextEra Energy Capital Holdings Inc | 75,000 | 74,657 | ||||||
2.300% due 04/01/19 | 200,000 | 198,979 | ||||||
Origin Energy Finance Ltd (Australia) | 380,000 | 380,782 | ||||||
PPL Capital Funding Inc | 410,000 | 409,283 | ||||||
San Diego Gas & Electric Co | 111,429 | 108,727 | ||||||
Sempra Energy | 265,000 | 259,942 | ||||||
2.209% (USD LIBOR + 0.500%) due 01/15/21 § | 145,000 | 145,082 | ||||||
State Grid Overseas Investment Ltd (China) | 615,000 | 604,557 | ||||||
| See Notes to Financial Statements | See explanation of symbols and terms, if any, on B-114 and B-115 |
B-31
Table of Contents
PACIFIC FUNDS
PF SHORT DURATION BOND FUND
Schedule of Investments (Continued)
March 31, 2018
Principal Amount | Value | |||||||
TECO Finance Inc | $ | 300,000 | $ | 300,014 | ||||
The Southern Co | 625,000 | 616,743 | ||||||
|
| |||||||
| 4,902,210 | ||||||||
|
| |||||||
Total Corporate Bonds & Notes |
| 63,010,161 | ||||||
|
| |||||||
MORTGAGE-BACKED SECURITIES - 14.7% |
| |||||||
Collateralized Mortgage Obligations - Commercial - 5.0% |
| |||||||
BAMLL Commercial Mortgage Securities Trust | 205,000 | 204,948 | ||||||
3.490% due 04/14/33 ~ | 130,000 | 128,923 | ||||||
Banc of America Commercial Mortgage Trust | 80,220 | 78,760 | ||||||
BX Trust | 385,000 | 385,940 | ||||||
4.027% (USD LIBOR + 2.250%) due 10/15/32 § ~ | 125,000 | 125,480 | ||||||
Citigroup Commercial Mortgage Trust | 20,784 | 20,690 | ||||||
1.637% due 06/10/48 | 150,715 | 149,120 | ||||||
1.643% due 09/10/58 | 37,163 | 36,681 | ||||||
CLNS Trust | 395,000 | 395,764 | ||||||
2.740% (USD LIBOR + 1.000%) due 06/11/32 § ~ | 200,000 | 200,387 | ||||||
Commercial Mortgage Trust | 59,253 | 57,847 | ||||||
1.445% due 12/10/47 | 80,705 | 80,178 | ||||||
1.604% due 10/10/48 | 54,084 | 53,477 | ||||||
1.667% due 07/10/50 | 127,293 | 126,612 | ||||||
1.770% due 02/10/49 | 7,176 | 7,096 | ||||||
1.965% due 02/10/50 | 82,369 | 81,179 | ||||||
2.568% (USD LIBOR + 0.850%) due 02/13/32 § ~ | 180,000 | 180,245 | ||||||
3.009% due 08/10/46 | 270,803 | 270,986 | ||||||
3.221% due 10/10/48 | 200,000 | 201,749 | ||||||
CSAIL Commercial Mortgage Trust | 180,202 | 176,935 | ||||||
Great Wolf Trust | 175,000 | 175,349 | ||||||
3.247% (USD LIBOR + 1.320%) due 09/15/34 § ~ | 250,000 | 250,829 | ||||||
GS Mortgage Securities Trust | 49,888 | 48,810 | ||||||
1.593% due 07/10/48 | 48,898 | 48,403 | ||||||
1.950% due 08/10/50 | 264,131 | 258,523 | ||||||
Hospitality Mortgage Trust | 140,000 | 140,397 | ||||||
InTown Hotel Portfolio Trust | 100,000 | 100,216 | ||||||
3.027% (USD LIBOR + 1.250%) due 01/15/33 § ~ | 100,000 | 100,282 | ||||||
JP Morgan Chase Commercial Mortgage Securities Trust | 194,247 | 189,561 | ||||||
JPMBB Commercial Mortgage Securities Trust | 18,172 | 18,105 | ||||||
1.423% due 06/15/49 | 20,765 | 20,426 | ||||||
1.445% due 10/15/48 | 18,574 | 18,486 | ||||||
Principal Amount | Value | |||||||
1.451% due 09/15/47 | $ | 19,774 | $ | 19,652 | ||||
1.539% due 11/15/47 | 21,729 | 21,604 | ||||||
1.626% due 05/15/48 | 64,638 | 64,029 | ||||||
Morgan Stanley Bank of America Merrill Lynch Trust | 16,997 | 16,742 | ||||||
1.686% due 10/15/47 | 31,683 | 31,606 | ||||||
1.706% due 05/15/48 | 109,688 | 108,330 | ||||||
Morgan Stanley Capital I Trust | 99,294 | 98,179 | ||||||
2.627% (USD LIBOR + 0.850%) due 11/15/34 § ~ | 195,000 | 195,379 | ||||||
2.777% (USD LIBOR + 1.000%) due 11/15/34 § ~ | 155,000 | 155,395 | ||||||
Wells Fargo Commercial Mortgage Trust | 38,596 | 37,983 | ||||||
1.471% due 04/15/50 | 94,275 | 93,405 | ||||||
1.531% due 05/15/48 | 57,670 | 57,264 | ||||||
1.577% due 01/15/59 | 43,446 | 42,858 | ||||||
1.968% due 07/15/50 | 150,928 | 148,262 | ||||||
1.975% due 09/15/50 | 135,544 | 132,867 | ||||||
WFRBS Commercial Mortgage Trust | 19,307 | 19,139 | ||||||
1.663% due 10/15/57 | 47,715 | 47,434 | ||||||
|
| |||||||
| 5,622,512 | ||||||||
|
| |||||||
Collateralized Mortgage Obligations - Residential - 5.5% |
| |||||||
COLT Mortgage Loan Trust | 297,729 | 298,921 | ||||||
2.568% due 10/25/47 § ~ | 129,277 | 129,744 | ||||||
2.614% due 05/27/47 § ~ | 198,978 | 197,883 | ||||||
2.773% due 10/25/47 § ~ | 78,350 | 78,632 | ||||||
2.930% due 02/25/48 § ~ | 114,902 | 115,184 | ||||||
3.074% due 05/27/47 § ~ | 57,675 | 57,870 | ||||||
3.084% due 02/25/48 § ~ | 95,751 | 95,987 | ||||||
Deephaven Residential Mortgage Trust | 309,182 | 307,596 | ||||||
2.711% due 10/25/47 § ~ | 81,364 | 80,853 | ||||||
2.813% due 10/25/47 § ~ | 81,364 | 80,774 | ||||||
2.976% due 12/25/57 § ~ | 206,934 | 207,447 | ||||||
3.485% due 12/26/46 § ~ | 60,169 | 60,309 | ||||||
DSLA Mortgage Loan Trust | 335,013 | 329,527 | ||||||
Fannie Mae Connecticut Avenue Securities | 411,789 | 412,463 | ||||||
2.722% (USD LIBOR + 0.850%) due 11/25/29 § | 251,115 | 252,160 | ||||||
3.972% (USD LIBOR + 2.100%) due 08/25/28 § | 35,502 | 35,635 | ||||||
Fannie Mae REMICS | 214,717 | 214,563 | ||||||
2.372% (USD LIBOR + 0.500%) due 11/25/46 § | 166,798 | 166,583 | ||||||
2.372% (USD LIBOR + 0.500%) due 11/25/46 § | 253,528 | 255,816 | ||||||
3.000% due 11/25/47 | 416,809 | 413,970 | ||||||
5.000% due 08/25/19 | 6,718 | 6,772 | ||||||
Freddie Mac REMICS | 296,747 | 290,565 | ||||||
Freddie Mac Structured Agency Credit Risk Debt | 239,716 | 239,749 | ||||||
2.622% (USD LIBOR + 0.750%) due 03/25/30 § | 242,291 | 243,049 | ||||||
2.672% (USD LIBOR + 0.800%) due 12/25/29 § | 236,281 | 236,956 | ||||||
3.072% (USD LIBOR + 1.200%) due 08/25/29 § | 229,341 | 231,390 | ||||||
| See Notes to Financial Statements | See explanation of symbols and terms, if any, on B-114 and B-115 |
B-32
Table of Contents
PACIFIC FUNDS
PF SHORT DURATION BOND FUND
Schedule of Investments (Continued)
March 31, 2018
Principal Amount | Value | |||||||
3.622% (USD LIBOR + 1.750%) due 09/25/28 § | $ | 5,548 | $ | 5,554 | ||||
3.989% due 09/25/47 § ~ | 26,793 | 27,058 | ||||||
Freddie Mac Whole Loan Securities Trust | 72,408 | 72,080 | ||||||
Galton Funding Mortgage Trust | 219,959 | 219,389 | ||||||
GS Mortgage-Backed Securities Trust | 36,740 | 36,165 | ||||||
JP Morgan Alternative Loan Trust | 32,778 | 32,921 | ||||||
Metlife Securitization Trust | 154,189 | 153,474 | ||||||
Sequoia Mortgage Trust | 366,702 | 370,569 | ||||||
Structured Adjustable Rate Mortgage Loan Trust | 75,315 | 75,503 | ||||||
Verus Securitization Trust | 96,757 | 96,901 | ||||||
|
| |||||||
| 6,130,012 | ||||||||
|
| |||||||
Fannie Mae - 4.1% |
| |||||||
3.000% due 11/01/29 - 05/01/32 | 387,555 | 387,876 | ||||||
3.500% due 06/01/29 - 04/01/46 | 1,036,161 | 1,050,976 | ||||||
4.000% due 09/01/26 - 11/01/44 | 456,700 | 469,911 | ||||||
4.500% due 04/01/26 - 03/01/46 | 961,354 | 1,005,466 | ||||||
5.000% due 07/01/19 - 11/01/44 | 803,814 | 865,389 | ||||||
5.500% due 10/01/35 - 02/01/42 | 587,089 | 642,329 | ||||||
6.000% due 11/01/35 - 09/01/39 | 131,670 | 147,983 | ||||||
|
| |||||||
| 4,569,930 | ||||||||
|
| |||||||
Freddie Mac - 0.0% |
| |||||||
5.500% due 01/01/20 - 12/01/39 | 33,408 | 36,521 | ||||||
|
| |||||||
Government National Mortgage Association - 0.1% |
| |||||||
6.000% due 07/15/36 | 132,833 | 151,506 | ||||||
|
| |||||||
Total Mortgage-Backed Securities |
| 16,510,481 | ||||||
|
| |||||||
ASSET-BACKED SECURITIES - 19.7% |
| |||||||
Allegro Ltd (Cayman) | 310,000 | 310,017 | ||||||
Ally Auto Receivables Trust | 240,000 | 239,617 | ||||||
2.460% due 09/15/22 | 40,000 | 39,467 | ||||||
2.840% due 09/15/22 | 85,000 | 84,882 | ||||||
2.930% due 11/15/23 | 70,000 | 68,875 | ||||||
AmeriCredit Automobile Receivables Trust | 165,000 | 163,379 | ||||||
1.700% due 07/08/20 | 33,146 | 33,078 | ||||||
1.810% due 10/08/20 | 14,982 | 14,944 | ||||||
2.580% due 09/08/20 | 240,000 | 239,975 | ||||||
2.690% due 06/19/23 | 110,000 | 108,581 | ||||||
2.710% due 08/18/22 | 100,000 | 98,839 | ||||||
2.710% due 09/08/22 | 315,000 | 310,676 | ||||||
3.000% due 06/08/21 | 110,000 | 110,023 | ||||||
3.340% due 08/08/21 | 135,000 | 135,715 | ||||||
3.370% due 11/08/21 ~ | 225,000 | 225,941 | ||||||
3.580% due 08/09/21 ~ | 110,000 | 110,521 | ||||||
ARI Fleet Lease Trust | 26,959 | 26,905 | ||||||
1.910% due 04/15/26 ~ | 100,000 | 99,468 | ||||||
2.550% due 10/15/26 ~ | 145,000 | 144,463 | ||||||
Ascentium Equipment Receivables LLC | 13,486 | 13,483 | ||||||
Principal Amount | Value | |||||||
Ascentium Equipment Receivables Trust | $ | 14,689 | $ | 14,659 | ||||
1.870% due 07/10/19 ~ | 80,532 | 80,311 | ||||||
2.290% due 06/10/21 ~ | 95,000 | 94,035 | ||||||
2.310% due 12/10/21 ~ | 230,000 | 226,512 | ||||||
Avis Budget Rental Car Funding AESOP LLC | 675,000 | 673,790 | ||||||
2.500% due 02/20/21 ~ | 240,000 | 238,298 | ||||||
2.620% due 09/20/19 ~ | 135,000 | 134,900 | ||||||
2.970% due 02/20/20 ~ | 350,000 | 350,464 | ||||||
3.660% due 02/20/20 ~ | 310,000 | 311,433 | ||||||
Barings CLO Ltd (Cayman) | 385,000 | 385,113 | ||||||
Bayview Mortgage Fund Trust | 235,154 | 237,227 | ||||||
Bayview Opportunity Master Fund Trust | 143,337 | 144,354 | ||||||
BMW Vehicle Lease Trust | 75,000 | 74,564 | ||||||
2.070% due 10/20/20 | 115,000 | 113,970 | ||||||
2.180% due 06/22/20 | 185,000 | 183,810 | ||||||
California Republic Auto Receivables Trust | 60,000 | 59,681 | ||||||
Capital Auto Receivables Asset Trust | 52,468 | 52,180 | ||||||
1.630% due 01/20/21 | 40,000 | 39,621 | ||||||
1.730% due 09/20/19 | 35,661 | 35,617 | ||||||
1.730% due 04/20/20 | 41,277 | 41,168 | ||||||
2.430% due 05/20/22 ~ | 40,000 | 39,351 | ||||||
2.700% due 09/20/22 ~ | 65,000 | 64,126 | ||||||
Carlyle Global Market Strategies CLO Ltd (Cayman) | 250,000 | 249,791 | ||||||
3.089% (USD LIBOR + 1.250%) due 05/15/25 § ~ | 315,000 | 315,293 | ||||||
CarMax Auto Owner Trust | 205,000 | 202,178 | ||||||
3.270% due 03/15/22 | 155,000 | 155,188 | ||||||
Chrysler Capital Auto Receivables Trust | 13,769 | 13,764 | ||||||
1.640% due 07/15/21 ~ | 85,000 | 84,395 | ||||||
3.440% due 08/16/21 ~ | 380,000 | 381,509 | ||||||
Citigroup Mortgage Loan Trust Inc | 19,871 | 19,910 | ||||||
CNH Equipment Trust | 135,000 | 133,049 | ||||||
1.930% due 03/15/24 | 315,000 | 307,533 | ||||||
2.400% due 02/15/23 | 265,000 | 263,273 | ||||||
Elara HGV Timeshare Issuer LLC | 63,228 | 62,039 | ||||||
2.690% due 03/25/30 ~ | 100,912 | 99,311 | ||||||
Enterprise Fleet Financing LLC | 40,265 | 40,231 | ||||||
1.740% due 09/20/20 ~ | 165,103 | 164,932 | ||||||
1.830% due 09/20/21 ~ | 132,311 | 131,984 | ||||||
2.040% due 02/22/22 ~ | 295,000 | 291,838 | ||||||
Ford Credit Auto Owner Trust | 350,000 | 340,524 | ||||||
Ford Credit Floorplan Master Owner Trust | 240,000 | 236,621 | ||||||
2.290% due 06/15/20 | 370,000 | 369,808 | ||||||
GM Financial Automobile Leasing Trust | 113,248 | 112,837 | ||||||
2.120% due 09/20/21 | 65,000 | 64,141 | ||||||
2.260% due 08/20/20 | 45,000 | 44,732 | ||||||
2.580% due 03/20/20 | 455,000 | 453,570 | ||||||
3.110% due 12/20/21 | 105,000 | 104,679 | ||||||
3.370% due 10/20/22 | 245,000 | 244,305 | ||||||
| See Notes to Financial Statements | See explanation of symbols and terms, if any, on B-114 and B-115 |
B-33
Table of Contents
PACIFIC FUNDS
PF SHORT DURATION BOND FUND
Schedule of Investments (Continued)
March 31, 2018
Principal Amount | Value | |||||||
GM Financial Consumer Automobile Receivables Trust | $ | 25,000 | $ | 24,481 | ||||
GM Financial Consumer Automobile Trust | 100,000 | 98,206 | ||||||
GMF Floorplan Owner Revolving Trust | 145,000 | 144,857 | ||||||
2.220% due 05/15/20 ~ | 670,000 | 669,447 | ||||||
2.410% due 05/17/21 ~ | 100,000 | 99,528 | ||||||
GreatAmerica Leasing Receivables Funding LLC | 62,199 | 62,040 | ||||||
1.730% due 06/20/19 ~ | 66,524 | 66,352 | ||||||
2.060% due 06/22/20 ~ | 100,000 | 99,412 | ||||||
2.600% due 06/15/21 ~ | 95,000 | 94,569 | ||||||
GSAA Home Equity Trust | 32,028 | 31,896 | ||||||
Hilton Grand Vacations Trust | 92,518 | 90,867 | ||||||
2.660% due 12/26/28 ~ | 77,085 | 76,090 | ||||||
2.960% due 12/26/28 § ~ | 77,085 | 75,759 | ||||||
Hyundai Auto Lease Securitization Trust | 42,789 | 42,744 | ||||||
1.650% due 07/15/20 ~ | 100,000 | 99,205 | ||||||
Hyundai Auto Receivables Trust | 395,000 | 388,110 | ||||||
KKR Ltd (Cayman) | 405,000 | 405,158 | ||||||
2.871% (USD LIBOR + 0.800%) due 01/16/28 § ~ | 390,000 | 390,270 | ||||||
Kubota Credit Owner Trust | 53,594 | 53,553 | ||||||
Madison Park Funding XIV Ltd (Cayman) | 295,000 | 295,240 | ||||||
Magnetite XVI Ltd (Cayman) | 515,000 | 515,020 | ||||||
Mercedes-Benz Auto Lease Trust | 89,129 | 89,054 | ||||||
Mill City Mortgage Loan Trust | 67,010 | 66,268 | ||||||
2.750% due 07/25/59 § ~ | 157,775 | 156,700 | ||||||
MMAF Equipment Finance LLC | 4,708 | 4,706 | ||||||
2.040% due 02/16/22 ~ | 100,000 | 98,750 | ||||||
MVW Owner Trust | 26,307 | 25,842 | ||||||
2.420% due 12/20/34 ~ | 91,916 | 89,890 | ||||||
Navient Private Education Refi Loan Trust | 295,000 | 294,329 | ||||||
Neuberger Berman Ltd (Cayman) | 250,000 | 250,318 | ||||||
Nissan Auto Lease Trust | 160,000 | 158,788 | ||||||
Nissan Master Owner Trust Receivables | 75,000 | 74,028 | ||||||
OCP CLO Ltd (Cayman) | 360,000 | 359,916 | ||||||
OZLM VIII Ltd (Cayman) | 330,000 | 330,101 | ||||||
Santander Drive Auto Receivables Trust | 25,000 | 24,890 | ||||||
2.460% due 03/15/22 | 126,000 | 125,268 | ||||||
2.470% due 12/15/20 | 61,338 | 61,320 | ||||||
2.580% due 05/16/22 | 30,000 | 29,812 | ||||||
2.960% due 03/15/24 | 65,000 | 64,723 | ||||||
Principal Amount | Value | |||||||
3.490% due 05/17/21 | $ | 155,000 | $ | 156,311 | ||||
3.530% due 08/16/21 | 105,000 | 106,311 | ||||||
3.650% due 12/15/21 | 120,000 | 121,178 | ||||||
4.020% due 04/15/22 | 105,000 | 106,894 | ||||||
Santander Retail Auto Lease Trust | 85,000 | 84,097 | ||||||
Sierra Receivables Funding Co LLC | 257,570 | 255,149 | ||||||
Sierra Timeshare Receivables Funding LLC | 39,838 | 39,607 | ||||||
2.300% due 10/20/31 ~ | 61,593 | 61,171 | ||||||
2.330% due 07/20/33 ~ | 37,283 | 36,860 | ||||||
2.400% due 03/22/32 ~ | 52,842 | 52,439 | ||||||
2.430% due 10/20/33 ~ | 97,260 | 95,601 | ||||||
2.580% due 09/20/32 ~ | 312,994 | 312,362 | ||||||
3.080% due 03/21/33 ~ | 284,337 | 285,071 | ||||||
SLM Student Loan Trust | 144,679 | 142,429 | ||||||
3.245% (USD LIBOR + 1.500%) due 04/25/23 § | 46,689 | 47,691 | ||||||
3.395% (USD LIBOR + 1.650%) due 07/25/22 § | 75,636 | 77,429 | ||||||
3.445% (USD LIBOR + 1.700%) due 07/25/23 § | 74,068 | 76,057 | ||||||
SMART Trust (Australia) | 74,671 | 74,515 | ||||||
SMB Private Education Loan Trust | 119,761 | 120,863 | ||||||
3.050% due 05/15/26 ~ | 129,782 | 129,763 | ||||||
Springleaf Funding Trust | 100,000 | 99,592 | ||||||
Synchrony Credit Card Master Note Trust | 85,000 | 83,844 | ||||||
Towd Point Mortgage Trust | 69,714 | 68,567 | ||||||
2.750% due 02/25/55 § ~ | 50,493 | 50,228 | ||||||
2.750% due 04/25/55 § ~ | 88,122 | 87,678 | ||||||
2.750% due 05/25/55 § ~ | 79,960 | 79,528 | ||||||
2.750% due 08/25/55 § ~ | 64,392 | 63,702 | ||||||
2.750% due 10/25/56 § ~ | 77,075 | 76,423 | ||||||
2.750% due 04/25/57 § ~ | 172,570 | 171,530 | ||||||
3.000% due 01/25/58 § ~ | 112,987 | 112,667 | ||||||
USAA Auto Owner Trust | 165,000 | 164,679 | ||||||
Verizon Owner Trust | 160,000 | 157,832 | ||||||
2.360% due 05/20/21 ~ | 125,000 | 123,465 | ||||||
2.450% due 09/20/21 ~ | 100,000 | 98,993 | ||||||
2.530% due 04/20/22 ~ | 120,000 | 118,124 | ||||||
2.650% due 09/20/21 ~ | 100,000 | 99,068 | ||||||
Volkswagen Auto Loan Enhanced Trust | 536,594 | 534,923 | ||||||
Volvo Financial Equipment LLC | 43,800 | 43,645 | ||||||
Wells Fargo Home Equity Trust | 101,571 | 101,031 | ||||||
Wheels SPV LLC | 8,923 | 8,917 | ||||||
1.590% due 05/20/25 ~ | 109,319 | 108,746 | ||||||
World Omni Automobile Lease Securitization Trust | 55,000 | 54,604 | ||||||
|
| |||||||
Total Asset-Backed Securities |
| 22,078,559 | ||||||
|
| |||||||
| See Notes to Financial Statements | See explanation of symbols and terms, if any, on B-114 and B-115 |
B-34
Table of Contents
PACIFIC FUNDS
PF SHORT DURATION BOND FUND
Schedule of Investments (Continued)
March 31, 2018
Principal Amount | Value | |||||||
U.S. GOVERNMENT AGENCY ISSUES - 0.7% |
| |||||||
Fannie Mae | $ | 775,000 | $ | 759,610 | ||||
|
| |||||||
Total U.S. Government Agency Issues |
| 759,610 | ||||||
|
| |||||||
U.S. TREASURY OBLIGATIONS - 5.8% |
| |||||||
U.S. Treasury Notes - 5.8% |
| |||||||
2.250% due 02/29/20 | 6,520,000 | 6,516,852 | ||||||
|
| |||||||
Total U.S. Treasury Obligations |
| 6,516,852 | ||||||
|
| |||||||
MUNICIPAL BONDS - 0.1% |
| |||||||
State Board of Administration Finance Corp FL ‘A’ | 150,000 | 149,666 | ||||||
|
| |||||||
Total Municipal Bonds |
| 149,666 | ||||||
|
| |||||||
SHORT-TERM INVESTMENTS - 4.8% |
| |||||||
Commercial Paper - 1.7% |
| |||||||
Energy Transfer Partners LP | 680,000 | 679,783 | ||||||
Ford Motor Credit Co LLC | 405,000 | 394,475 | ||||||
Humana Inc | 405,000 | 400,794 | ||||||
Sherwin-Williams Co | 405,000 | 401,432 | ||||||
|
| |||||||
| 1,876,484 | ||||||||
|
| |||||||
Shares | Value | |||||||
Money Market Fund - 3.1% |
| |||||||
BlackRock Liquidity Funds T-Fund Portfolio | 3,485,280 | $ | 3,485,280 | |||||
|
| |||||||
Total Short-Term Investments |
| 5,361,764 | ||||||
|
| |||||||
TOTAL INVESTMENTS - 101.9% |
| 114,387,093 | ||||||
DERIVATIVES - 0.0% (See Notes (b) and (c) in Notes to Schedule of Investments) |
| 18,168 | ||||||
|
| |||||||
OTHER ASSETS & LIABILITIES, NET - (1.9%) |
| (2,136,503 | ) | |||||
|
| |||||||
NET ASSETS - 100.0% |
| $112,268,758 | ||||||
|
| |||||||
Notes to Schedule of Investments
| (a) | As of March 31, 2018, the Fund’s composition as a percentage of net assets was as follows: |
Corporate Bonds & Notes | 56.1% | |||
Asset-Backed Securities | 19.7% | |||
Mortgage-Backed Securities | 14.7% | |||
U.S. Treasury Obligations | 5.8% | |||
Short-Term Investments | 4.8% | |||
Others (each less than 3.0%) | 0.8% | |||
|
| |||
| 101.9% | ||||
Derivatives | 0.0% | |||
Other Assets & Liabilities, Net | (1.9% | ) | ||
|
| |||
| 100.0% | ||||
|
|
| (b) | Open futures contracts outstanding as of March 31, 2018 were as follows: |
| Long Futures Outstanding | Expiration Month | Number of Contracts | Notional Amount | Value | Unrealized Appreciation (Depreciation) | |||||||||||||||
U.S. Treasury 2-Year Notes | 06/18 | 127 | $26,980,626 | $27,001,391 | $20,765 | |||||||||||||||
U.S. Treasury 5-Year Notes | 06/18 | 30 | 3,413,748 | 3,433,828 | 20,080 | |||||||||||||||
|
| |||||||||||||||||||
| 40,845 | ||||||||||||||||||||
|
| |||||||||||||||||||
Short Futures Outstanding | ||||||||||||||||||||
U.S. Treasury 10-Year Notes | 06/18 | 15 | 1,794,275 | 1,817,109 | (22,834 | ) | ||||||||||||||
|
| |||||||||||||||||||
Total Futures Contracts | $18,011 | |||||||||||||||||||
|
| |||||||||||||||||||
| (c) | Forward foreign currency contracts outstanding as of March 31, 2018 were as follows: |
| Currency Purchased | Currency Sold | Settlement Month | Counterparty | Unrealized Appreciation | Unrealized (Depreciation) | |||||||||||||||||||
| USD | 254,829 | EUR | 206,245 | 05/18 | BNP | $157 | $— | |||||||||||||||||
|
|
|
| |||||||||||||||||||||
| See Notes to Financial Statements | See explanation of symbols and terms, if any, on B-114 and B-115 |
B-35
Table of Contents
PACIFIC FUNDS
PF SHORT DURATION BOND FUND
Schedule of Investments (Continued)
March 31, 2018
| (d) | Fair Value Measurements |
The following is a summary of the Fund’s investments as categorized under the three-tier hierarchy of inputs used in valuing the Fund’s assets and liabilities (See Note 3D in Notes to Financial Statements) as of March 31, 2018:
| Total Value at March 31, 2018 | Level 1 Quoted Price | Level 2 Significant Observable Inputs | Level 3 Significant Unobservable Inputs | |||||||||||||||
Assets | Corporate Bonds & Notes | $63,010,161 | $— | $63,010,161 | $— | |||||||||||||
Mortgage-Backed Securities | 16,510,481 | — | 16,510,481 | — | ||||||||||||||
Asset-Backed Securities | 22,078,559 | — | 22,078,559 | — | ||||||||||||||
U.S. Government Agency Issues | 759,610 | — | 759,610 | — | ||||||||||||||
U.S. Treasury Obligations | 6,516,852 | — | 6,516,852 | — | ||||||||||||||
Municipal Bonds | 149,666 | — | 149,666 | — | ||||||||||||||
Short-Term Investments | 5,361,764 | 3,485,280 | 1,876,484 | — | ||||||||||||||
Derivatives: | ||||||||||||||||||
Foreign Currency Contracts | ||||||||||||||||||
Forward Foreign Currency Contracts | 157 | — | 157 | — | ||||||||||||||
Interest Rate Contracts | ||||||||||||||||||
Futures | 40,845 | 40,845 | — | — | ||||||||||||||
|
|
|
|
|
|
|
| |||||||||||
Total Assets - Derivatives | 41,002 | 40,845 | 157 | |||||||||||||||
|
|
|
|
|
|
|
| |||||||||||
Total Assets | 114,428,095 | 3,526,125 | 110,901,970 | — | ||||||||||||||
|
|
|
|
|
|
|
| |||||||||||
Liabilities | Derivatives: | |||||||||||||||||
Interest Rate Contracts | ||||||||||||||||||
Futures | (22,834 | ) | (22,834 | ) | — | — | ||||||||||||
|
|
|
|
|
|
|
| |||||||||||
Total Liabilities | (22,834 | ) | (22,834 | ) | — | — | ||||||||||||
|
|
|
|
|
|
|
| |||||||||||
Total | $114,405,261 | $3,503,291 | $110,901,970 | $— | ||||||||||||||
|
|
|
|
|
|
|
| |||||||||||
| See Notes to Financial Statements | See explanation of symbols and terms, if any, on B-114 and B-115 |
B-36
Table of Contents
PACIFIC FUNDS
PF EMERGING MARKETS DEBT FUND
Schedule of Investments
March 31, 2018
Principal Amount | Value | |||||||
CORPORATE BONDS & NOTES - 20.7% | ||||||||
Argentina - 0.4% | ||||||||
Rio Energy SA | $150,000 | $148,500 | ||||||
YPF SA | ||||||||
6.950% due 07/21/27 ~ | 80,000 | 80,528 | ||||||
7.000% due 12/15/47 ~ | 30,000 | 26,970 | ||||||
8.500% due 07/28/25 ~ | 100,000 | 110,633 | ||||||
|
| |||||||
| 366,631 | ||||||||
|
| |||||||
Azerbaijan - 0.6% | ||||||||
Southern Gas Corridor CJSC | 220,000 | 243,160 | ||||||
State Oil Co of the Azerbaijan Republic | 270,000 | 293,794 | ||||||
|
| |||||||
| 536,954 | ||||||||
|
| |||||||
Brazil - 1.7% | ||||||||
Gol Finance Inc | 100,000 | 98,875 | ||||||
Petrobras Global Finance BV | ||||||||
6.850% due 06/05/15 | 215,000 | 204,250 | ||||||
6.875% due 01/20/40 | 175,000 | 172,769 | ||||||
8.750% due 05/23/26 | 215,000 | 252,902 | ||||||
QGOG Atlantic | 50,000 | 49,000 | ||||||
Rumo Luxembourg Sarl | 200,000 | 197,875 | ||||||
Vale Overseas Ltd | ||||||||
6.875% due 11/21/36 | 130,000 | 153,556 | ||||||
6.875% due 11/10/39 | 125,000 | 148,750 | ||||||
Vrio Finco 1 LLC | 200,000 | 203,000 | ||||||
|
| |||||||
| 1,480,977 | ||||||||
|
| |||||||
Chile - 1.5% | ||||||||
Corp Nacional del Cobre de Chile | ||||||||
4.500% due 08/01/47 ~ | 200,000 | 202,476 | ||||||
4.875% due 11/04/44 ~ | 200,000 | 211,703 | ||||||
5.625% due 10/18/43 ~ | 200,000 | 234,131 | ||||||
Empresa Nacional del Petroleo | ||||||||
3.750% due 08/05/26 ~ | 200,000 | 192,772 | ||||||
4.500% due 09/14/47 ~ | 200,000 | 186,900 | ||||||
VTR Finance BV | 200,000 | 208,802 | ||||||
|
| |||||||
| 1,236,784 | ||||||||
|
| |||||||
China - 1.2% | ||||||||
Amber Circle Funding Ltd | 200,000 | 198,004 | ||||||
China Evergrande Group | 200,000 | 196,991 | ||||||
China Railway Resources Huitung Ltd | 200,000 | 201,272 | ||||||
Sinochem Overseas Capital Co Ltd | 200,000 | 205,296 | ||||||
Sinopec Group Overseas Development Ltd | 200,000 | 213,617 | ||||||
|
| |||||||
| 1,015,180 | ||||||||
|
| |||||||
Colombia - 0.4% | ||||||||
Ecopetrol SA | 40,000 | 42,360 | ||||||
Empresas Publicas de Medellin ESP | COP 314,000,000 | 114,966 | ||||||
Millicom International Cellular SA | $200,000 | 191,750 | ||||||
|
| |||||||
| 349,076 | ||||||||
|
| |||||||
Principal Amount | Value | |||||||
Costa Rica - 0.3% | ||||||||
Banco Nacional de Costa Rica | $ | 200,000 | $ | 207,500 | ||||
|
| |||||||
Georgia - 0.3% | ||||||||
Georgian Railway JSC | 200,000 | 219,324 | ||||||
|
| |||||||
Hong Kong - 0.1% | ||||||||
Industrial & Commercial Bank of China Asia Ltd | 100,000 | 104,045 | ||||||
|
| |||||||
Indonesia - 1.3% | ||||||||
Majapahit Holding BV | ||||||||
7.750% due 01/20/20 ~ | 100,000 | 107,520 | ||||||
8.000% due 08/07/19 ~ | 100,000 | 106,320 | ||||||
P.T. Pertamina Persero | 400,000 | 429,384 | ||||||
P.T. Perusahaan Listrik Negara | 430,000 | 456,015 | ||||||
|
| |||||||
| 1,099,239 | ||||||||
|
| |||||||
Israel - 0.4% | ||||||||
Teva Pharmaceutical Finance Netherlands III BV | ||||||||
2.800% due 07/21/23 | 180,000 | 152,637 | ||||||
6.750% due 03/01/28 ~ | 200,000 | 197,684 | ||||||
|
| |||||||
| 350,321 | ||||||||
|
| |||||||
Jamaica - 0.2% | ||||||||
Digicel Group Ltd | 200,000 | 173,000 | ||||||
|
| |||||||
Kazakhstan - 1.4% | ||||||||
Development Bank of Kazakhstan JSC | 220,000 | 219,875 | ||||||
Kazakhstan Temir Zholy Finance BV | 300,000 | 336,312 | ||||||
Kazkommertsbank JSC | 90,427 | 90,259 | ||||||
KazMunayGas National Co JSC | ||||||||
5.750% due 04/30/43 ~ | 200,000 | 208,350 | ||||||
6.375% due 04/09/21 ~ | 200,000 | 215,606 | ||||||
7.000% due 05/05/20 ~ | 110,000 | 118,200 | ||||||
|
| |||||||
| 1,188,602 | ||||||||
|
| |||||||
Luxembourg - 0.2% | ||||||||
Altice Financing SA | 200,000 | 196,500 | ||||||
|
| |||||||
Malaysia - 0.4% | ||||||||
Petronas Capital Ltd | 100,000 | 103,171 | ||||||
Wakala Global Sukuk Bhd | 250,000 | 263,997 | ||||||
|
| |||||||
| 367,168 | ||||||||
|
| |||||||
Mexico - 1.8% | ||||||||
BBVA Bancomer SA | 200,000 | 193,000 | ||||||
Comision Federal de Electricidad | ||||||||
4.875% due 01/15/24 ~ | 200,000 | 206,250 | ||||||
5.750% due 02/14/42 ~ | 200,000 | 206,750 | ||||||
8.180% due 12/23/27 ~ | MXN 950,000 | 50,231 | ||||||
| See Notes to Financial Statements | See explanation of symbols and terms, if any, on B-114 and B-115 |
B-37
Table of Contents
PACIFIC FUNDS
PF EMERGING MARKETS DEBT FUND
Schedule of Investments (Continued)
March 31, 2018
Principal Amount | Value | |||||||
Petroleos Mexicanos | ||||||||
5.500% due 06/27/44 | $15,000 | $ | 13,395 | |||||
5.625% due 01/23/46 | 100,000 | 89,428 | ||||||
6.000% due 03/05/20 | 50,000 | 52,212 | ||||||
6.500% due 06/02/41 | 115,000 | 114,425 | ||||||
6.750% due 09/21/47 | 254,000 | 257,653 | ||||||
6.875% due 08/04/26 | 192,000 | 210,682 | ||||||
7.190% due 09/12/24 ~ | MXN 3,170,000 | 157,646 | ||||||
|
| |||||||
| 1,551,672 | ||||||||
|
| |||||||
Netherlands - 0.2% | ||||||||
VEON Holdings BV | $200,000 | 197,374 | ||||||
|
| |||||||
Pakistan - 0.9% | ||||||||
The Second Pakistan International Sukuk Co Ltd | 350,000 | 357,839 | ||||||
The Third Pakistan International Sukuk Co Ltd | ||||||||
5.500% due 10/13/21 ~ | 200,000 | 197,291 | ||||||
5.625% due 12/05/22 ~ | 200,000 | 193,413 | ||||||
|
| |||||||
| 748,543 | ||||||||
|
| |||||||
Peru - 0.8% | ||||||||
Banco de Credito del Peru | PEN 358,000 | 111,360 | ||||||
Nexa Resources SA | $200,000 | 205,250 | ||||||
Patrimonio EN Fideicomiso | 200,000 | 200,500 | ||||||
Petroleos del Peru SA | 200,000 | 200,050 | ||||||
|
| |||||||
| 717,160 | ||||||||
|
| |||||||
Philippines - 0.4% | ||||||||
Development Bank of the Philippines | 200,000 | 213,594 | ||||||
Power Sector Assets & Liabilities Management Corp | 130,000 | 158,566 | ||||||
|
| |||||||
| 372,160 | ||||||||
|
| |||||||
Russia - 1.7% | ||||||||
Credit Bank of Moscow | 200,000 | 205,009 | ||||||
Gazprom Neft OAO | 200,000 | 199,408 | ||||||
Gazprom OAO | ||||||||
8.625% due 04/28/34 ~ | 25,000 | 32,474 | ||||||
9.250% due 04/23/19 ~ | 60,000 | 63,628 | ||||||
Sberbank of Russia | ||||||||
5.125% due 10/29/22 ~ | 200,000 | 203,512 | ||||||
5.250% due 05/23/23 ~ | 200,000 | 203,706 | ||||||
SCF Capital Designated Activity Co | 232,000 | 236,251 | ||||||
Vnesheconombank | ||||||||
5.942% due 11/21/23 ~ | 220,000 | 235,929 | ||||||
6.902% due 07/09/20 ~ | 100,000 | 106,334 | ||||||
|
| |||||||
| 1,486,251 | ||||||||
|
| |||||||
Singapore - 0.2% | ||||||||
Puma International Financing SA | 200,000 | 199,332 | ||||||
|
| |||||||
South Africa - 0.7% | ||||||||
Eskom Holdings SOC Ltd | ||||||||
5.750% due 01/26/21 ~ | 356,000 | 353,527 | ||||||
7.125% due 02/11/25 ~ | 200,000 | 204,886 | ||||||
|
| |||||||
| 558,413 | ||||||||
|
| |||||||
Principal Amount | Value | |||||||
Ukraine - 0.3% | ||||||||
MHP SE | $ | 200,000 | $ | 211,150 | ||||
|
| |||||||
United Kingdom - 0.5% | ||||||||
Standard Chartered Bank | INR 30,000,000 | 458,475 | ||||||
|
| |||||||
Venezuela - 2.8% | ||||||||
Petroleos de Venezuela SA | ||||||||
5.375% due 04/12/27 Y ~ | $93,000 | 25,938 | ||||||
8.500% due 10/27/20 Y ~ | 2,513,250 | 2,158,882 | ||||||
9.000% due 11/17/21 Y ~ | 219,354 | 71,838 | ||||||
9.750% due 05/17/35 Y ~ | 286,278 | 90,750 | ||||||
12.750% due 02/17/22 Y ~ | 117,000 | 40,131 | ||||||
|
| |||||||
| 2,387,539 | ||||||||
|
| |||||||
Total Corporate Bonds & Notes | 17,779,370 | |||||||
|
| |||||||
SENIOR LOAN NOTES - 0.7% | ||||||||
United Arab Emirates - 0.7% | ||||||||
Dubai World Term B1 | 658,464 | 631,028 | ||||||
|
| |||||||
Total Senior Loan Notes | 631,028 | |||||||
|
| |||||||
FOREIGN GOVERNMENT BONDS & NOTES - 63.3% |
| |||||||
Angola - 0.3% | ||||||||
Angolan Government | 200,000 | 226,420 | ||||||
|
| |||||||
Argentina - 2.7% | ||||||||
Argentina Bonar | ||||||||
24.938% (ARS Deposit + 2.000%) | ARS 2,949,000 | 150,389 | ||||||
25.499% (ARS Deposit + 2.500%) | 486,000 | 24,568 | ||||||
26.251% (ARS Deposit + 3.250%) | 470,000 | 24,242 | ||||||
Argentina POM Politica Monetaria | 10,126,591 | 533,482 | ||||||
Argentine Bonos del Tesoro | 380,000 | 18,637 | ||||||
Argentine Republic Government | ||||||||
2.500% due 12/31/38 § ^ | $462,217 | 308,068 | ||||||
5.875% due 01/11/28 | 238,000 | 224,285 | ||||||
6.875% due 04/22/21 | 210,000 | 222,994 | ||||||
6.875% due 01/11/48 | 379,000 | 346,548 | ||||||
7.500% due 04/22/26 | 252,000 | 269,766 | ||||||
8.280% due 12/31/33 ^ | 210,300 | 229,395 | ||||||
|
| |||||||
| 2,352,374 | ||||||||
|
| |||||||
Bahrain - 0.2% | ||||||||
Bahrain Government | 200,000 | 183,000 | ||||||
|
| |||||||
Belarus - 1.1% | ||||||||
Republic of Belarus | ||||||||
6.200% due 02/28/30 ~ | 200,000 | 198,255 | ||||||
6.875% due 02/28/23 ~ | 460,000 | 488,451 | ||||||
7.625% due 06/29/27 ~ | 200,000 | 220,600 | ||||||
|
| |||||||
| 907,306 | ||||||||
|
| |||||||
| See Notes to Financial Statements | See explanation of symbols and terms, if any, on B-114 and B-115 |
B-38
Table of Contents
PACIFIC FUNDS
PF EMERGING MARKETS DEBT FUND
Schedule of Investments (Continued)
March 31, 2018
Principal Amount | Value | |||||||
Brazil - 6.4% | ||||||||
Banco Nacional de Desenvolvimento Economico e Social | $ | 170,000 | $ | 176,542 | ||||
Brazil Notas do Tesouro Nacional ‘B’ | ||||||||
6.000% due 08/15/22 ^ | BRL 1,588,000 | 1,587,692 | ||||||
Brazil Notas do Tesouro Nacional ‘F’ | ||||||||
10.000% due 01/01/23 | 3,330,000 | 1,055,463 | ||||||
10.000% due 01/01/25 | 2,347,000 | 738,751 | ||||||
10.000% due 01/01/27 | 2,345,000 | 734,720 | ||||||
Brazilian Government | ||||||||
2.625% due 01/05/23 | $200,000 | 190,200 | ||||||
4.250% due 01/07/25 | 175,000 | 174,431 | ||||||
4.625% due 01/13/28 | 200,000 | 196,250 | ||||||
5.000% due 01/27/45 | 141,000 | 127,042 | ||||||
5.625% due 01/07/41 | 100,000 | 98,375 | ||||||
5.625% due 02/21/47 | 200,000 | 194,400 | ||||||
7.125% due 01/20/37 | 110,000 | 128,645 | ||||||
8.250% due 01/20/34 | 70,000 | 88,393 | ||||||
|
| |||||||
| 5,490,904 | ||||||||
|
| |||||||
Chile - 0.1% | ||||||||
Bonos de la Tesoreria de la Republica en pesos | CLP 70,000,000 | 115,843 | ||||||
|
| |||||||
Colombia - 1.6% | ||||||||
Colombia Government | ||||||||
3.875% due 04/25/27 | $200,000 | 197,650 | ||||||
5.000% due 06/15/45 | 262,000 | 266,257 | ||||||
5.625% due 02/26/44 | 200,000 | 218,500 | ||||||
6.125% due 01/18/41 | 283,000 | 326,865 | ||||||
7.375% due 09/18/37 | 110,000 | 141,350 | ||||||
8.125% due 05/21/24 | 155,000 | 190,069 | ||||||
|
| |||||||
| 1,340,691 | ||||||||
|
| |||||||
Costa Rica - 0.2% | ||||||||
Costa Rica Government | ||||||||
4.375% due 04/30/25 ~ | 90,000 | 85,050 | ||||||
5.625% due 04/30/43 ~ | 90,000 | 81,500 | ||||||
|
| |||||||
| 166,550 | ||||||||
|
| |||||||
Croatia - 1.1% | ||||||||
Croatia Government | ||||||||
6.000% due 01/26/24 ~ | 310,000 | 342,748 | ||||||
6.375% due 03/24/21 ~ | 200,000 | 216,471 | ||||||
6.625% due 07/14/20 ~ | 260,000 | 279,243 | ||||||
6.750% due 11/05/19 ~ | 100,000 | 106,056 | ||||||
|
| |||||||
| 944,518 | ||||||||
|
| |||||||
Dominican Republic - 1.8% | ||||||||
Dominican Republic | ||||||||
5.500% due 01/27/25 ~ | 290,000 | 299,013 | ||||||
5.875% due 04/18/24 ~ | 220,000 | 231,554 | ||||||
6.600% due 01/28/24 ~ | 100,000 | 108,916 | ||||||
6.850% due 01/27/45 ~ | 270,000 | 291,937 | ||||||
6.875% due 01/29/26 ~ | 290,000 | 322,251 | ||||||
7.450% due 04/30/44 ~ | 130,000 | 147,550 | ||||||
7.500% due 05/06/21 ~ | 170,000 | 181,147 | ||||||
|
| |||||||
| 1,582,368 | ||||||||
|
| |||||||
Ecuador - 6.0% | ||||||||
Ecuador Government | ||||||||
7.875% due 01/23/28 ~ | 560,000 | 541,212 | ||||||
7.950% due 06/20/24 ~ | 368,000 | 366,620 | ||||||
8.750% due 06/02/23 ~ | 458,000 | 471,396 | ||||||
8.875% due 10/23/27 ~ | 490,000 | 500,510 | ||||||
9.625% due 06/02/27 ~ | 250,000 | 268,612 | ||||||
9.650% due 12/13/26 ~ | 452,000 | 478,555 | ||||||
Principal Amount | Value | |||||||
10.500% due 03/24/20 ~ | $ | 1,190,000 | $ | 1,277,762 | ||||
10.750% due 03/28/22 ~ | 1,094,000 | 1,200,938 | ||||||
|
| |||||||
| 5,105,605 | ||||||||
|
| |||||||
Egypt - 1.4% | ||||||||
Egypt Government | ||||||||
6.588% due 02/21/28 ~ | 200,000 | 203,463 | ||||||
6.875% due 04/30/40 ~ | 100,000 | 97,879 | ||||||
7.500% due 01/31/27 ~ | 450,000 | 488,108 | ||||||
7.903% due 02/21/48 ~ | 200,000 | 210,893 | ||||||
8.500% due 01/31/47 ~ | 200,000 | 223,728 | ||||||
|
| |||||||
| 1,224,071 | ||||||||
|
| |||||||
El Salvador - 0.8% | ||||||||
El Salvador Government | ||||||||
5.875% due 01/30/25 ~ | 102,000 | 100,500 | ||||||
6.375% due 01/18/27 ~ | 70,000 | 69,213 | ||||||
7.375% due 12/01/19 ~ | 100,000 | 104,366 | ||||||
7.625% due 02/01/41 ~ | 150,000 | 159,045 | ||||||
7.650% due 06/15/35 ~ | 55,000 | 58,264 | ||||||
8.250% due 04/10/32 ~ | 37,000 | 41,653 | ||||||
8.625% due 02/28/29 ~ | 115,000 | 132,250 | ||||||
|
| |||||||
| 665,291 | ||||||||
|
| |||||||
Ethiopia - 0.4% | ||||||||
Ethiopia International | 310,000 | 319,779 | ||||||
|
| |||||||
Gabon - 0.5% | ||||||||
Gabon Government | 400,000 | 398,130 | ||||||
|
| |||||||
Ghana - 0.3% | ||||||||
Ghana Government | 200,000 | 228,216 | ||||||
|
| |||||||
Hungary - 1.3% | ||||||||
Hungary Government | ||||||||
5.375% due 02/21/23 | 338,000 | 365,446 | ||||||
5.375% due 03/25/24 | 174,000 | 189,871 | ||||||
5.500% due 06/24/25 | HUF 30,270,000 | 147,725 | ||||||
5.750% due 11/22/23 | $306,000 | 338,604 | ||||||
7.625% due 03/29/41 | 40,000 | 57,853 | ||||||
|
| |||||||
| 1,099,499 | ||||||||
|
| |||||||
India - 1.0% | ||||||||
Export-Import Bank of India | 200,000 | 200,459 | ||||||
India Government | INR 44,000,000 | 681,301 | ||||||
|
| |||||||
| 881,760 | ||||||||
|
| |||||||
Indonesia - 4.4% | ||||||||
Indonesia Government | ||||||||
5.125% due 01/15/45 ~ | $200,000 | 208,444 | ||||||
5.250% due 01/08/47 ~ | 200,000 | 213,636 | ||||||
5.950% due 01/08/46 ~ | 200,000 | 232,282 | ||||||
6.625% due 02/17/37 ~ | 100,000 | 121,235 | ||||||
7.750% due 01/17/38 ~ | 100,000 | 135,523 | ||||||
8.500% due 10/12/35 ~ | 100,000 | 142,157 | ||||||
Indonesia Treasury | ||||||||
5.625% due 05/15/23 | IDR 1,901,000,000 | 136,249 | ||||||
6.125% due 05/15/28 | 5,180,000,000 | 362,892 | ||||||
6.625% due 05/15/33 | 2,036,000,000 | 144,742 | ||||||
7.000% due 05/15/22 | 303,000,000 | 22,869 | ||||||
7.500% due 08/15/32 | 4,580,000,000 | 341,400 | ||||||
7.500% due 05/15/38 | 1,460,000,000 | 107,478 | ||||||
| See Notes to Financial Statements | See explanation of symbols and terms, if any, on B-114 and B-115 |
B-39
Table of Contents
PACIFIC FUNDS
PF EMERGING MARKETS DEBT FUND
Schedule of Investments (Continued)
March 31, 2018
Principal Amount | Value | |||||||
8.250% due 07/15/21 | IDR 4,510,000,000 | $ | 349,695 | |||||
8.250% due 05/15/36 | 958,000,000 | 75,134 | ||||||
8.375% due 03/15/24 | 3,302,000,000 | 262,036 | ||||||
8.375% due 09/15/26 | 9,641,000,000 | 774,676 | ||||||
8.375% due 03/15/34 | 544,000,000 | 43,070 | ||||||
8.750% due 05/15/31 | 833,000,000 | 68,461 | ||||||
|
| |||||||
| 3,741,979 | ||||||||
|
| |||||||
Ivory Coast - 0.7% | ||||||||
Ivory Coast Government | $668,115 | 644,142 | ||||||
|
| |||||||
Jamaica - 0.3% | ||||||||
Jamaica Government | 200,000 | 238,700 | ||||||
|
| |||||||
Kazakhstan - 0.6% | ||||||||
KazAgro National Management Holding JSC | 200,000 | 199,453 | ||||||
Kazakhstan Government | 230,000 | 278,358 | ||||||
|
| |||||||
| 477,811 | ||||||||
|
| |||||||
Kenya - 0.2% | ||||||||
Kenya Government | 200,000 | 209,385 | ||||||
|
| |||||||
Lebanon - 1.7% | ||||||||
Lebanon Government | ||||||||
5.150% due 11/12/18 ~ | 30,000 | 30,046 | ||||||
5.450% due 11/28/19 ~ | 163,000 | 162,552 | ||||||
6.000% due 01/27/23 ~ | 60,000 | 58,487 | ||||||
6.100% due 10/04/22 ~ | 509,000 | 501,782 | ||||||
6.375% due 03/09/20 | 165,000 | 166,214 | ||||||
6.600% due 11/27/26 ~ | 99,000 | 94,607 | ||||||
6.750% due 11/29/27 ~ | 58,000 | 55,509 | ||||||
8.250% due 04/12/21 ~ | 345,000 | 363,371 | ||||||
|
| |||||||
| 1,432,568 | ||||||||
|
| |||||||
Malaysia - 1.3% | ||||||||
Malaysia Government | ||||||||
3.418% due 08/15/22 | MYR 287,000 | 73,382 | ||||||
3.480% due 03/15/23 | 27,000 | 6,892 | ||||||
3.654% due 10/31/19 | 113,000 | 29,375 | ||||||
3.659% due 10/15/20 | 2,266,000 | 589,803 | ||||||
3.759% due 03/15/19 | 113,000 | 29,389 | ||||||
3.844% due 04/15/33 | 261,000 | 63,204 | ||||||
3.882% due 03/10/22 | 130,000 | 34,015 | ||||||
3.900% due 11/30/26 | 21,000 | 5,416 | ||||||
3.955% due 09/15/25 | 9,000 | 2,328 | ||||||
4.181% due 07/15/24 | 217,000 | 56,971 | ||||||
4.232% due 06/30/31 | 562,000 | 143,869 | ||||||
4.254% due 05/31/35 | 8,000 | 2,004 | ||||||
4.392% due 04/15/26 | 22,000 | 5,830 | ||||||
4.498% due 04/15/30 | 194,000 | 50,930 | ||||||
|
| |||||||
| 1,093,408 | ||||||||
|
| |||||||
Mexico - 4.8% | ||||||||
Mexican Bonos | ||||||||
5.750% due 03/05/26 | MXN 17,230,000 | 861,500 | ||||||
6.500% due 06/10/21 | 20,530,000 | 1,107,107 | ||||||
6.500% due 06/09/22 | 8,750,000 | 469,280 | ||||||
8.000% due 12/07/23 | 3,470,000 | 197,941 | ||||||
10.000% due 12/05/24 | 15,490,000 | 978,290 | ||||||
Mexico Government | ||||||||
4.600% due 01/23/46 | $200,000 | 190,440 | ||||||
4.750% due 03/08/44 | 68,000 | 66,300 | ||||||
Principal Amount | Value | |||||||
5.550% due 01/21/45 | $ | 94,000 | $ | 101,619 | ||||
5.750% due 10/12/10 | 112,000 | 114,240 | ||||||
6.050% due 01/11/40 | 60,000 | 67,875 | ||||||
|
| |||||||
| 4,154,592 | ||||||||
|
| |||||||
Morocco - 0.6% | ||||||||
Morocco Government | ||||||||
4.250% due 12/11/22 ~ | 320,000 | 327,192 | ||||||
5.500% due 12/11/42 ~ | 200,000 | 213,368 | ||||||
|
| |||||||
| 540,560 | ||||||||
|
| |||||||
Nigeria - 0.5% | ||||||||
Nigeria Government | ||||||||
6.500% due 11/28/27 ~ | 200,000 | 203,086 | ||||||
7.625% due 11/28/47 ~ | 200,000 | 207,464 | ||||||
|
| |||||||
| 410,550 | ||||||||
|
| |||||||
Oman - 0.4% | ||||||||
Oman Government | ||||||||
6.500% due 03/08/47 ~ | 200,000 | 189,572 | ||||||
6.750% due 01/17/48 ~ | 200,000 | 192,457 | ||||||
|
| |||||||
| 382,029 | ||||||||
|
| |||||||
Pakistan - 0.7% | ||||||||
Pakistan Government | ||||||||
6.875% due 12/05/27 ~ | 200,000 | 189,752 | ||||||
7.250% due 04/15/19 ~ | 230,000 | 234,881 | ||||||
8.250% due 04/15/24 ~ | 200,000 | 209,340 | ||||||
|
| |||||||
| 633,973 | ||||||||
|
| |||||||
Panama - 0.8% | ||||||||
Panama Government | ||||||||
4.300% due 04/29/53 | 200,000 | 197,000 | ||||||
6.700% due 01/26/36 | 130,000 | 164,775 | ||||||
7.125% due 01/29/26 | 100,000 | 123,750 | ||||||
8.875% due 09/30/27 | 70,000 | 97,125 | ||||||
9.375% due 04/01/29 | 70,000 | 102,375 | ||||||
|
| |||||||
| 685,025 | ||||||||
|
| |||||||
Paraguay - 0.2% | ||||||||
Paraguay Government | 200,000 | 206,360 | ||||||
|
| |||||||
Peru - 1.3% | ||||||||
Fondo MIVIVIENDA SA | PEN 236,000 | 80,744 | ||||||
Peruvian Government | ||||||||
5.625% due 11/18/50 | $347,000 | 418,135 | ||||||
7.350% due 07/21/25 | 178,000 | 221,165 | ||||||
8.750% due 11/21/33 | 260,000 | 389,740 | ||||||
|
| |||||||
| 1,109,784 | ||||||||
|
| |||||||
Philippines - 0.9% | ||||||||
Philippine Government | ||||||||
6.375% due 10/23/34 | 130,000 | 167,008 | ||||||
7.750% due 01/14/31 | 170,000 | 233,342 | ||||||
9.500% due 02/02/30 | 200,000 | 305,071 | ||||||
10.625% due 03/16/25 | 46,000 | 66,490 | ||||||
|
| |||||||
| 771,911 | ||||||||
|
| |||||||
Poland - 0.4% | ||||||||
Republic of Poland Government | ||||||||
2.500% due 07/25/26 | PLN 568,000 | 159,997 | ||||||
3.000% due 03/17/23 | $47,000 | 46,616 | ||||||
3.250% due 07/25/25 | PLN 28,000 | 8,381 | ||||||
5.000% due 03/23/22 | $99,000 | 106,000 | ||||||
|
| |||||||
| 320,994 | ||||||||
|
| |||||||
| See Notes to Financial Statements | See explanation of symbols and terms, if any, on B-114 and B-115 |
B-40
Table of Contents
PACIFIC FUNDS
PF EMERGING MARKETS DEBT FUND
Schedule of Investments (Continued)
March 31, 2018
Principal Amount | Value | |||||||
Romania - 0.9% | ||||||||
Romanian Government | ||||||||
4.375% due 08/22/23 ~ | $ | 394,000 | $ | 405,391 | ||||
5.800% due 07/26/27 | RON 350,000 | 101,508 | ||||||
6.125% due 01/22/44 ~ | $38,000 | 45,775 | ||||||
6.750% due 02/07/22 ~ | 206,000 | 229,183 | ||||||
|
| |||||||
| 781,857 | ||||||||
|
| |||||||
Russia - 2.3% | ||||||||
Russia Federal | ||||||||
7.400% due 12/07/22 | RUB 2,717,000 | 49,429 | ||||||
7.500% due 08/18/21 | 38,942,000 | 702,309 | ||||||
7.700% due 03/23/33 | 1,359,000 | 24,802 | ||||||
7.750% due 09/16/26 | 21,175,000 | 391,435 | ||||||
8.500% due 09/17/31 | 19,423,000 | 381,191 | ||||||
Russia Foreign | ||||||||
4.375% due 03/21/29 ~ | $200,000 | 197,665 | ||||||
5.250% due 06/23/47 ~ | 200,000 | 200,311 | ||||||
|
| |||||||
| 1,947,142 | ||||||||
|
| |||||||
Senegal - 0.5% | ||||||||
Senegal Government | ||||||||
6.250% due 05/23/33 ~ | 200,000 | 197,606 | ||||||
6.750% due 03/13/48 ~ | 200,000 | 196,440 | ||||||
|
| |||||||
| 394,046 | ||||||||
|
| |||||||
Serbia - 0.2% | ||||||||
Serbia Government | 200,000 | 205,058 | ||||||
|
| |||||||
South Africa - 5.3% | ||||||||
Republic of South Africa Government | ||||||||
4.300% due 10/12/28 | 424,000 | 397,778 | ||||||
4.875% due 04/14/26 | 200,000 | 199,790 | ||||||
5.000% due 10/12/46 | 200,000 | 182,420 | ||||||
5.650% due 09/27/47 | 230,000 | 227,877 | ||||||
6.500% due 02/28/41 | ZAR 642,000 | 41,920 | ||||||
7.000% due 02/28/31 | 8,825,000 | 663,140 | ||||||
8.000% due 01/31/30 | 3,325,000 | 273,502 | ||||||
8.250% due 03/31/32 | 3,458,000 | 287,279 | ||||||
8.500% due 01/31/37 | 1,150,000 | 94,665 | ||||||
8.750% due 01/31/44 | 5,766,000 | 479,314 | ||||||
8.750% due 02/28/48 | 7,810,400 | 652,244 | ||||||
9.000% due 01/31/40 | 4,351,760 | 372,286 | ||||||
10.500% due 12/21/26 | 6,903,000 | 674,630 | ||||||
|
| |||||||
| 4,546,845 | ||||||||
|
| |||||||
Sri Lanka - 0.2% | ||||||||
Sri Lanka Government | $200,000 | 206,400 | ||||||
|
| |||||||
Suriname - 0.2% | ||||||||
Republic of Suriname | 200,000 | 206,000 | ||||||
|
| |||||||
Thailand - 0.3% | ||||||||
Thailand Government | ||||||||
1.250% due 03/12/28 ^ ~ | THB 1,045,912 | 32,520 | ||||||
2.000% due 12/17/22 | 2,961,000 | 95,768 | ||||||
3.400% due 06/17/36 | 3,679,000 | 121,632 | ||||||
|
| |||||||
| 249,920 | ||||||||
|
| |||||||
Turkey - 2.1% | ||||||||
Turkey Government | ||||||||
3.000% due 02/23/22 ^ | TRY 495,133 | 125,876 | ||||||
3.250% due 03/23/23 | $200,000 | 185,904 | ||||||
Principal Amount | Value | |||||||
4.875% due 04/16/43 | $ | 200,000 | $ | 161,976 | ||||
5.750% due 03/22/24 | 200,000 | 205,360 | ||||||
5.750% due 05/11/47 | 200,000 | 178,141 | ||||||
6.750% due 05/30/40 | 110,000 | 112,619 | ||||||
7.000% due 03/11/19 | 100,000 | 103,387 | ||||||
7.000% due 06/05/20 | 42,000 | 44,563 | ||||||
7.375% due 02/05/25 | 130,000 | 144,284 | ||||||
7.500% due 11/07/19 | 100,000 | 105,881 | ||||||
10.700% due 08/17/22 | TRY 920,000 | 214,067 | ||||||
11.000% due 02/24/27 | 993,000 | 232,312 | ||||||
|
| |||||||
| 1,814,370 | ||||||||
|
| |||||||
Ukraine - 1.1% | ||||||||
Ukraine Government | ||||||||
7.375% due 09/25/32 ~ | $400,000 | 386,760 | ||||||
7.750% due 09/01/22 ~ | 114,000 | 119,336 | ||||||
7.750% due 09/01/23 ~ | 114,000 | 118,248 | ||||||
7.750% due 09/01/24 ~ | 100,000 | 103,250 | ||||||
7.750% due 09/01/25 ~ | 100,000 | 102,697 | ||||||
7.750% due 09/01/26 ~ | 100,000 | 102,574 | ||||||
|
| |||||||
| 932,865 | ||||||||
|
| |||||||
Uruguay - 0.9% | ||||||||
Uruguay Government | ||||||||
4.125% due 11/20/45 | 98,548 | 92,339 | ||||||
4.500% due 08/14/24 | 194,235 | 203,762 | ||||||
5.100% due 06/18/50 | 90,000 | 92,475 | ||||||
7.625% due 03/21/36 | 112,000 | 152,958 | ||||||
7.875% due 01/15/33 | 153,000 | 209,434 | ||||||
|
| |||||||
| 750,968 | ||||||||
|
| |||||||
Venezuela - 1.4% | ||||||||
Venezuela Government | ||||||||
7.650% due 04/21/25 Y ~ | 80,000 | 24,216 | ||||||
7.750% due 10/13/19 Y ~ | 171,000 | 51,728 | ||||||
8.250% due 10/13/24 Y ~ | 432,000 | 129,902 | ||||||
9.000% due 05/07/23 Y ~ | 169,000 | 50,987 | ||||||
9.250% due 09/15/27 Y | 222,000 | 72,527 | ||||||
9.250% due 05/07/28 Y ~ | 275,000 | 82,693 | ||||||
11.750% due 10/21/26 Y ~ | 828,700 | 274,051 | ||||||
11.950% due 08/05/31 Y ~ | 1,355,900 | 452,464 | ||||||
12.750% due 08/23/22 Y ~ | 191,000 | 64,310 | ||||||
|
| |||||||
| 1,202,878 | ||||||||
|
| |||||||
Vietnam - 0.5% | ||||||||
Vietnam Government | ||||||||
4.800% due 11/19/24 ~ | 200,000 | 204,810 | ||||||
6.750% due 01/29/20 ~ | 180,000 | 190,439 | ||||||
|
| |||||||
| 395,249 | ||||||||
|
| |||||||
Zambia - 0.4% | ||||||||
Zambia Government | 307,000 | 324,196 | ||||||
|
| |||||||
Total Foreign Government Bonds & Notes | 54,243,890 | |||||||
|
| |||||||
SHORT-TERM INVESTMENTS - 11.9% | ||||||||
Foreign Government Issues - 1.1% | ||||||||
Bank of Thailand Bill (Thailand) | THB 4,489,000 | 142,721 | ||||||
Egypt Treasury Bills (Egypt) | ||||||||
6.781% due 04/17/18 | EGP 950,000 | 53,721 | ||||||
15.860% due 06/26/18 | 5,800,000 | 317,641 | ||||||
Letras del Banco Central de la Republica Argentina (Argentina) | ARS 9,421,355 | 438,034 | ||||||
|
| |||||||
| 952,117 | ||||||||
|
| |||||||
| See Notes to Financial Statements | See explanation of symbols and terms, if any, on B-114 and B-115 |
B-41
Table of Contents
PACIFIC FUNDS
PF EMERGING MARKETS DEBT FUND
Schedule of Investments (Continued)
March 31, 2018
Shares | Value | |||||||
Money Market Fund - 10.8% | ||||||||
BlackRock Liquidity Funds T-Fund Portfolio | 9,231,732 | $ | 9,231,732 | |||||
|
| |||||||
Total Short-Term Investments | 10,183,849 | |||||||
|
| |||||||
TOTAL INVESTMENTS - 96.6% | 82,838,137 | |||||||
DERIVATIVES – 0.5% | ||||||||
(See Notes (d) and (e) in Notes to Schedule of Investments) |
| 467,608 | ||||||
|
| |||||||
OTHER ASSETS & LIABILITIES, NET - 2.9% |
| 2,452,045 | ||||||
|
| |||||||
NET ASSETS - 100.0% | $85,757,790 | |||||||
|
| |||||||
Notes to Schedule of Investments
| (a) | Investments with a total aggregate value of $3,590,417 or 4.2% of the Fund’s net assets were in default as of March 31, 2018. |
| (b) | As of March 31, 2018, the Fund’s composition as a percentage of net assets was as follows: |
Foreign Government Bonds & Notes | 63.3% | |||
Corporate Bonds & Notes | 20.7% | |||
Short-Term Investments | 11.9% | |||
Others (each less than 3.0%) | 0.7% | |||
|
| |||
| 96.6% | ||||
Derivatives | 0.5% | |||
Other Assets & Liabilities, Net | 2.9% | |||
|
| |||
| 100.0% | ||||
|
|
| (c) | As of March 31, 2018, the Fund’s composition by country of risk as a percentage of net assets was as follows: |
United States (Includes Short-Term Investments) | 10.8% | |||
Brazil | 8.1% | |||
Mexico | 6.6% | |||
Ecuador | 6.0% | |||
South Africa | 6.0% | |||
Indonesia | 5.7% | |||
Venezuela | 4.2% | |||
Russia | 4.0% | |||
Argentina | 3.6% | |||
Others (each less than 3.0%) | 41.6% | |||
|
| |||
| 96.6% | ||||
Derivatives | 0.5% | |||
Other Assets & Liabilities, Net | 2.9% | |||
|
| |||
| 100.0% | ||||
|
|
| (d) | Forward foreign currency contracts outstanding as of March 31, 2018 were as follows: |
| Currency Purchased | Currency Sold | Settlement Month | Counterparty | Unrealized Appreciation | Unrealized (Depreciation) | |||||||||||||||||||
| ARS | 1,497,324 | USD | 74,475 | 04/18 | BNP | $— | ($1,193 | ) | ||||||||||||||||
| ARS | 512,500 | USD | 25,000 | 04/18 | HSB | 83 | — | |||||||||||||||||
| ARS | 1,474,976 | USD | 70,170 | 05/18 | BNP | 721 | — | |||||||||||||||||
| ARS | 7,333,291 | USD | 342,469 | 06/18 | BNP | 4,373 | — | |||||||||||||||||
| BRL | 5,469,627 | USD | 1,658,468 | 04/18 | GSC | — | (2,380 | ) | ||||||||||||||||
| BRL | 172,447 | USD | 53,090 | 04/18 | HSB | — | (877 | ) | ||||||||||||||||
| BRL | 1,034,560 | USD | 320,000 | 04/18 | MER | — | (6,757 | ) | ||||||||||||||||
| CLP | 131,394,638 | USD | 218,400 | 04/18 | BNP | — | (789 | ) | ||||||||||||||||
| CLP | 236,929,998 | USD | 390,696 | 04/18 | CSF | 1,699 | — | |||||||||||||||||
| CLP | 20,241,713 | USD | 34,340 | 04/18 | HSB | — | (816 | ) | ||||||||||||||||
| CNY | 916,270 | USD | 142,620 | 04/18 | ANZ | 2,868 | — | |||||||||||||||||
| CNY | 6,945,124 | USD | 1,095,100 | 04/18 | GSC | 7,665 | — | |||||||||||||||||
| CNY | 6,184,369 | USD | 947,651 | 04/18 | MER | 34,319 | — | |||||||||||||||||
| COP | 2,461,457,978 | USD | 864,100 | 04/18 | CIT | 16,482 | — | |||||||||||||||||
| COP | 1,923,550,985 | USD | 672,641 | 04/18 | CSF | 15,506 | — | |||||||||||||||||
| COP | 116,883,700 | USD | 40,940 | 04/18 | MER | 875 | — | |||||||||||||||||
| CZK | 7,183,770 | USD | 336,866 | 04/18 | BNP | 11,652 | — | |||||||||||||||||
| CZK | 28,364,499 | USD | 1,382,700 | 04/18 | DUB | — | (6,608 | ) | ||||||||||||||||
| CZK | 223,426 | USD | 10,780 | 04/18 | HSB | 59 | — | |||||||||||||||||
| CZK | 6,005,890 | USD | 295,682 | 05/18 | BNP | — | (3,774 | ) | ||||||||||||||||
| CZK | 1,245,359 | USD | 61,270 | 05/18 | DUB | — | (741 | ) | ||||||||||||||||
| CZK | 11,716,435 | USD | 573,747 | 08/18 | DUB | — | (1,487 | ) | ||||||||||||||||
| EGP | 499,980 | USD | 26,000 | 04/18 | BNP | 2,205 | — | |||||||||||||||||
| EGP | 862,117 | USD | 44,785 | 04/18 | GSC | 3,836 | — | |||||||||||||||||
| EGP | 1,859,110 | USD | 98,885 | 04/18 | MER | 5,979 | — | |||||||||||||||||
| EGP | 742,400 | USD | 39,374 | 06/18 | HSB | 1,970 | — | |||||||||||||||||
| EGP | 988,500 | USD | 50,000 | 07/18 | MER | 4,724 | — | |||||||||||||||||
| HUF | 186,698,083 | USD | 743,200 | 04/18 | DUB | — | (6,499 | ) | ||||||||||||||||
| HUF | 98,897,608 | USD | 391,166 | 04/18 | HSB | — | (921 | ) | ||||||||||||||||
| HUF | 17,914,388 | USD | 72,250 | 04/18 | MER | — | (1,561 | ) | ||||||||||||||||
| HUF | 50,627,766 | USD | 200,721 | 05/18 | BNP | — | (498 | ) | ||||||||||||||||
| IDR | 1,299,991,815 | USD | 97,239 | 04/18 | ANZ | — | (3,043 | ) | ||||||||||||||||
| IDR | 1,645,558,015 | USD | 121,397 | 04/18 | BNP | — | (2,162 | ) | ||||||||||||||||
| See Notes to Financial Statements | See explanation of symbols and terms, if any, on B-114 and B-115 |
B-42
Table of Contents
PACIFIC FUNDS
PF EMERGING MARKETS DEBT FUND
Schedule of Investments (Continued)
March 31, 2018
| Currency Purchased | Currency Sold | Settlement Month | Counterparty | Unrealized Appreciation | Unrealized (Depreciation) | |||||||||||||||||||
| IDR | 333,200,000 | USD | 25,000 | 04/18 | BRC | $ | — | ($857 | ) | |||||||||||||||
| IDR | 2,774,880,000 | USD | 205,000 | 04/18 | GSC | — | (3,934 | ) | ||||||||||||||||
| ILS | 67,902 | USD | 20,000 | 04/18 | BNP | — | (605 | ) | ||||||||||||||||
| ILS | 974,605 | USD | 285,852 | 04/18 | MER | — | (7,471 | ) | ||||||||||||||||
| INR | 959,094 | USD | 14,612 | 05/18 | BNP | — | (18 | ) | ||||||||||||||||
| INR | 76,167,608 | USD | 1,161,800 | 05/18 | BRC | — | (2,847 | ) | ||||||||||||||||
| KRW | 125,838,000 | USD | 117,859 | 04/18 | BNP | 326 | — | |||||||||||||||||
| KRW | 1,133,795,800 | USD | 1,063,000 | 04/18 | BRC | 1,837 | — | |||||||||||||||||
| KRW | 1,029,309,847 | USD | 970,315 | 04/18 | HSB | — | (3,609 | ) | ||||||||||||||||
| MXN | 42,637,308 | USD | 2,276,720 | 04/18 | BNP | 57,431 | — | |||||||||||||||||
| MXN | 16,454,281 | USD | 866,676 | 04/18 | CIT | 34,103 | — | |||||||||||||||||
| MXN | 470,158 | USD | 25,000 | 04/18 | DUB | 739 | — | |||||||||||||||||
| MXN | 3,235,724 | USD | 174,265 | 04/18 | HSB | 2,872 | — | |||||||||||||||||
| MYR | 1,783,723 | USD | 456,929 | 05/18 | DUB | 3,285 | — | |||||||||||||||||
| PEN | 1,237,738 | USD | 379,000 | 04/18 | CIT | 4,242 | — | |||||||||||||||||
| PEN | 413,641 | USD | 128,090 | 04/18 | DUB | — | (14 | ) | ||||||||||||||||
| PEN | 146,934 | USD | 45,568 | 04/18 | HSB | — | (73 | ) | ||||||||||||||||
| PEN | 70,254 | USD | 21,590 | 04/18 | MER | 163 | — | |||||||||||||||||
| PHP | 30,537,753 | USD | 585,500 | 04/18 | ANZ | — | (1,132 | ) | ||||||||||||||||
| PHP | 1,459,074 | USD | 28,050 | 04/18 | BNP | — | (129 | ) | ||||||||||||||||
| PHP | 9,356,617 | USD | 183,524 | 04/18 | CIT | — | (4,477 | ) | ||||||||||||||||
| PLN | 34,758 | USD | 10,180 | 04/18 | BNP | — | (21 | ) | ||||||||||||||||
| PLN | 6,816,911 | USD | 2,003,300 | 04/18 | DUB | — | (10,942 | ) | ||||||||||||||||
| PLN | 453,155 | USD | 127,334 | 04/18 | HSB | 5,109 | — | |||||||||||||||||
| PLN | 688,789 | USD | 197,780 | 04/18 | MER | 3,530 | — | |||||||||||||||||
| PLN | 198,700 | USD | 58,800 | 05/18 | BNP | — | (695 | ) | ||||||||||||||||
| PLN | 1,483,931 | USD | 447,459 | 05/18 | BRC | — | (13,522 | ) | ||||||||||||||||
| PLN | 1,019,580 | USD | 297,653 | 05/18 | MER | 497 | — | |||||||||||||||||
| PLN | 1,425,738 | USD | 425,426 | 05/18 | SCB | — | (8,507 | ) | ||||||||||||||||
| PLN | 1,053,200 | USD | 312,563 | 06/18 | DUB | — | (4,748 | ) | ||||||||||||||||
| PLN | 860,790 | USD | 254,704 | 06/18 | MER | — | (2,775 | ) | ||||||||||||||||
| PLN | 119,869 | USD | 35,336 | 06/18 | SCB | — | (254 | ) | ||||||||||||||||
| PLN | 219,121 | USD | 64,158 | 08/18 | BNP | 58 | — | |||||||||||||||||
| PLN | 228,064 | USD | 66,344 | 08/18 | HSB | 493 | — | |||||||||||||||||
| RON | 1,410,831 | USD | 374,900 | 04/18 | DUB | — | (2,259 | ) | ||||||||||||||||
| RON | 128,348 | USD | 34,020 | 05/18 | BNP | — | (106 | ) | ||||||||||||||||
| RON | 1,151,990 | USD | 305,713 | 05/18 | HSB | — | (1,320 | ) | ||||||||||||||||
| RUB | 53,550,275 | USD | 936,800 | 04/18 | GSC | — | (4,943 | ) | ||||||||||||||||
| RUB | 51,863,614 | USD | 910,579 | 04/18 | HSB | — | (8,072 | ) | ||||||||||||||||
| SGD | 1,026,138 | USD | 774,748 | 04/18 | HSB | 8,425 | — | |||||||||||||||||
| SGD | 78,581 | USD | 59,830 | 04/18 | MER | 145 | — | |||||||||||||||||
| SGD | 1,086,011 | USD | 828,700 | 04/18 | MSC | 170 | — | |||||||||||||||||
| THB | 14,537,067 | USD | 467,577 | 04/18 | BRC | — | (2,217 | ) | ||||||||||||||||
| THB | 13,688,781 | USD | 438,301 | 04/18 | CIT | — | (97 | ) | ||||||||||||||||
| THB | 1,306,877 | USD | 41,800 | 04/18 | GSC | 36 | — | |||||||||||||||||
| THB | 38,278,830 | USD | 1,230,000 | 04/18 | HSB | — | (4,620 | ) | ||||||||||||||||
| THB | 2,753,348 | USD | 88,200 | 05/18 | BNP | 40 | — | |||||||||||||||||
| THB | 1,000,800 | USD | 32,000 | 05/18 | DUB | 74 | — | |||||||||||||||||
| TRY | 523,412 | USD | 129,864 | 04/18 | BNP | 1,568 | — | |||||||||||||||||
| TRY | 1,299,789 | USD | 338,462 | 04/18 | BRC | — | (12,078 | ) | ||||||||||||||||
| TRY | 241,061 | USD | 60,000 | 04/18 | CIT | 532 | — | |||||||||||||||||
| TRY | 241,605 | USD | 60,000 | 04/18 | DUB | 668 | — | |||||||||||||||||
| TRY | 327,240 | USD | 85,000 | 04/18 | HSB | — | (2,828 | ) | ||||||||||||||||
| TRY | 2,151,343 | USD | 549,210 | 04/18 | MER | — | (8,995 | ) | ||||||||||||||||
| TWD | 19,560,818 | USD | 673,118 | 05/18 | ANZ | 747 | — | |||||||||||||||||
| TWD | 19,015,412 | USD | 653,900 | 05/18 | HSB | 1,176 | — | |||||||||||||||||
| USD | 775,000 | BRL | 2,524,578 | 04/18 | BNP | 10,611 | — | |||||||||||||||||
| USD | 1,271,083 | BRL | 4,152,056 | 04/18 | GSC | 13,928 | — | |||||||||||||||||
| USD | 1,653,779 | BRL | 5,469,627 | 05/18 | GSC | 1,618 | — | |||||||||||||||||
| USD | 116,438 | CLP | 70,328,713 | 04/18 | BNP | — | (38 | ) | ||||||||||||||||
| USD | 205,000 | CLP | 125,132,000 | 04/18 | CSF | — | (2,239 | ) | ||||||||||||||||
| USD | 47,799 | HUF | 12,021,474 | 04/18 | SCB | 363 | — | |||||||||||||||||
| USD | 46,451 | IDR | 630,435,716 | 04/18 | ANZ | 770 | — | |||||||||||||||||
| USD | 153,049 | IDR | 2,064,632,690 | 04/18 | CIT | 3,447 | — | |||||||||||||||||
| USD | 82,690 | IDR | 1,139,308,718 | 04/18 | GSC | 137 | — | |||||||||||||||||
| USD | 560,000 | MXN | 10,653,238 | 04/18 | DUB | — | (23,205 | ) | ||||||||||||||||
| USD | 1,912,191 | MXN | 35,779,726 | 04/18 | HSB | — | (46,547 | ) | ||||||||||||||||
| USD | 355,000 | MXN | 6,764,525 | 04/18 | MER | — | (15,319 | ) | ||||||||||||||||
| USD | 149,000 | PHP | 7,801,640 | 04/18 | ANZ | — | (291 | ) | ||||||||||||||||
| USD | 101,600 | PHP | 5,334,305 | 04/18 | BNP | — | (477 | ) | ||||||||||||||||
| USD | 71,000 | PHP | 3,720,400 | 04/18 | BRC | — | (193 | ) | ||||||||||||||||
| See Notes to Financial Statements | See explanation of symbols and terms, if any, on B-114 and B-115 |
B-43
Table of Contents
PACIFIC FUNDS
PF EMERGING MARKETS DEBT FUND
Schedule of Investments (Continued)
March 31, 2018
| Currency Purchased | Currency Sold | Settlement Month | Counterparty | Unrealized Appreciation | Unrealized (Depreciation) | |||||||||||||||||||
| USD | 97,400 | PHP | 5,093,046 | 04/18 | DUB | $ | — | ($60 | ) | |||||||||||||||
| USD | 109,836 | TRY | 442,585 | 04/18 | CIT | — | (1,299 | ) | ||||||||||||||||
| USD | 100,788 | TRY | 405,056 | 04/18 | HSB | �� | — | (924 | ) | |||||||||||||||
| USD | 1,001,332 | ZAR | 11,884,508 | 04/18 | CIT | — | (1,703 | ) | ||||||||||||||||
| USD | 2,691,318 | ZAR | 31,867,448 | 04/18 | GSC | 11,354 | — | |||||||||||||||||
| USD | 264,732 | ZAR | 3,183,928 | 04/18 | MER | — | (3,028 | ) | ||||||||||||||||
| USD | 137,807 | ZAR | 1,642,411 | 05/18 | BRC | 264 | — | |||||||||||||||||
| ZAR | 20,429,528 | USD | 1,723,400 | 04/18 | CIT | — | (5,334 | ) | ||||||||||||||||
| ZAR | 2,288,421 | USD | 190,346 | 04/18 | MER | 2,103 | — | |||||||||||||||||
| ZAR | 11,884,508 | USD | 993,599 | 05/18 | CIT | 1,794 | — | |||||||||||||||||
|
|
|
| |||||||||||||||||||||
Total Forward Foreign Currency Contracts | $289,671 | ($254,928 | ) | |||||||||||||||||||||
|
|
|
| |||||||||||||||||||||
| (e) | Swap agreements outstanding as of March 31, 2018 were as follows: |
Interest Rate Swaps - Pay Floating Rate
| Floating Rate Index | Payment Frequency Fixed Rate/ Floating Rate | Exchange | Fixed Rate | Expiration Date | Notional Amount | Value | Upfront Premiums Paid (Received) | Unrealized Appreciation (Depreciation) | ||||||||||||||||||||||
6-Month PLN-WIBOR | A / S | CME | 2.400% | 03/26/23 | PLN 1,060,000 | $408 | $— | $408 | ||||||||||||||||||||||
28-Day MXN-TIIE | L / L | CME | 7.349% | 06/14/23 | MXN 18,800,000 | — | — | — | ||||||||||||||||||||||
28-Day MXN-TIIE | L / L | CME | 7.475% | 06/14/23 | 19,000,000 | 4,572 | — | 4,572 | ||||||||||||||||||||||
3-Month ZAR-JIBAR | Q / Q | CME | 7.551% | 03/15/28 | ZAR 946,000 | (461 | ) | — | (461 | ) | ||||||||||||||||||||
3-Month ZAR-JIBAR | Q / Q | CME | 7.705% | 03/15/28 | 2,765,000 | 1,179 | — | 1,179 | ||||||||||||||||||||||
3-Month ZAR-JIBAR | Q / Q | CME | 7.670% | 06/20/28 | 3,100,000 | 31 | — | 31 | ||||||||||||||||||||||
|
|
|
|
|
| |||||||||||||||||||||||||
Total Interest Rate Swaps | $5,729 | $— | $5,729 | |||||||||||||||||||||||||||
|
|
|
|
|
| |||||||||||||||||||||||||
Total Return Swaps
| Receive Total Return | Payment Frequency | Counter- party | Expiration Date | Notional Amount | Value | Upfront Premiums Paid (Received) | Unrealized Appreciation (Depreciation) | |||||||||||||||||||
Indonesia Treasury 12.800% due 06/15/21 | S | SCB | 06/15/21 | IDR 621,000,000 | $55,547 | $62,469 | ($6,922 | ) | ||||||||||||||||||
Indonesia Treasury 8.375% due 03/15/24 | S | ANZ | 03/15/24 | 369,000,000 | 29,387 | 29,661 | (275 | ) | ||||||||||||||||||
Indonesia Treasury 8.375% due 03/15/24 | S | SCB | 03/15/24 | 112,000,000 | 8,919 | 9,003 | (83 | ) | ||||||||||||||||||
Indonesia Treasury 11.000% due 09/15/25 | S | SCB | 09/15/25 | 432,000,000 | 39,328 | 49,916 | (10,588 | ) | ||||||||||||||||||
Indonesia Treasury 7.000% due 05/15/27 | S | SCB | 05/15/27 | 100,000,000 | 7,598 | 7,244 | 354 | |||||||||||||||||||
Indonesia Treasury 9.000% due 03/15/29 | S | ANZ | 03/15/29 | 311,000,000 | 26,085 | 23,654 | 2,431 | |||||||||||||||||||
Indonesia Treasury 10.500% due 08/15/30 | S | SCB | 08/15/30 | 622,000,000 | 57,977 | 72,509 | (14,532 | ) | ||||||||||||||||||
Indonesia Treasury 6.625% due 05/15/33 | S | SCB | 05/15/33 | 270,000,000 | 19,686 | 20,666 | (980 | ) | ||||||||||||||||||
Indonesia Treasury 8.375% due 03/15/34 | S | ANZ | 03/15/34 | 1,261,000,000 | 100,190 | 100,409 | (219 | ) | ||||||||||||||||||
Indonesia Treasury 8.375% due 03/15/34 | S | SCB | 03/15/34 | 42,000,000 | 3,337 | 3,344 | (7 | ) | ||||||||||||||||||
Indonesia Treasury 8.250% due 05/15/36 | S | SCB | 05/15/36 | 980,000,000 | 79,082 | 75,773 | 3,309 | |||||||||||||||||||
|
|
|
|
|
| |||||||||||||||||||||
| $427,136 | $454,648 | ($27,512 | ) | |||||||||||||||||||||||
|
|
|
|
|
| |||||||||||||||||||||
Total Swap Agreements | $432,865 | $454,648 | ($21,783 | ) | ||||||||||||||||||||||
|
|
|
|
|
| |||||||||||||||||||||
| See Notes to Financial Statements | See explanation of symbols and terms, if any, on B-114 and B-115 |
B-44
Table of Contents
PACIFIC FUNDS
PF EMERGING MARKETS DEBT FUND
Schedule of Investments (Continued)
March 31, 2018
| (f) | Fair Value Measurements |
The following is a summary of the Fund’s investments as categorized under the three-tier hierarchy of inputs used in valuing the Fund’s assets and liabilities (See Note 3D in Notes to Financial Statements) as of March 31, 2018:
| Total Value at March 31, 2018 | Level 1 Quoted Price | Level 2 Significant Observable Inputs | Level 3 Significant Unobservable Inputs | |||||||||||||||
Assets | Corporate Bonds & Notes | $17,779,370 | $— | $17,779,370 | $— | |||||||||||||
Senior Loan Notes | 631,028 | — | 631,028 | — | ||||||||||||||
Foreign Government Bonds & Notes | 54,243,890 | — | 54,243,890 | — | ||||||||||||||
Short-Term Investments | 10,183,849 | 9,231,732 | 952,117 | — | ||||||||||||||
Derivatives: | ||||||||||||||||||
Foreign Currency Contracts | ||||||||||||||||||
Forward Foreign Currency Contracts | 289,671 | — | 289,671 | — | ||||||||||||||
Interest Rate Contracts | ||||||||||||||||||
Swaps | 433,326 | — | 433,326 | — | ||||||||||||||
|
|
|
|
|
|
|
| |||||||||||
Total Assets-Derivatives | 722,997 | — | 722,997 | — | ||||||||||||||
|
|
|
|
|
|
|
| |||||||||||
Total Assets | 83,561,134 | 9,231,732 | 74,329,402 | — | ||||||||||||||
|
|
|
|
|
|
|
| |||||||||||
Liabilities | Derivatives: | |||||||||||||||||
Foreign Currency Contracts | ||||||||||||||||||
Forward Foreign Currency Contracts | (254,928 | ) | — | (254,928 | ) | — | ||||||||||||
Interest Rate Contracts | ||||||||||||||||||
Swaps | (461 | ) | — | (461 | ) | — | ||||||||||||
|
|
|
|
|
|
|
| |||||||||||
Total Liabilities-Derivatives | (255,389 | ) | — | (255,389 | ) | — | ||||||||||||
|
|
|
|
|
|
|
| |||||||||||
Total Liabilities | (255,389 | ) | — | (255,389 | ) | — | ||||||||||||
|
|
|
|
|
|
|
| |||||||||||
Total | $83,305,745 | $9,231,732 | $74,074,013 | $— | ||||||||||||||
|
|
|
|
|
|
|
| |||||||||||
| See Notes to Financial Statements | See explanation of symbols and terms, if any, on B-114 and B-115 |
B-45
Table of Contents
PACIFIC FUNDS
PF COMSTOCK FUND
Schedule of Investments
March 31, 2018
Shares | Value | |||||||
COMMON STOCKS - 95.4% | ||||||||
Basic Materials - 1.9% | ||||||||
Alcoa Corp * | 6,034 | $271,304 | ||||||
CF Industries Holdings Inc | 25,384 | 957,738 | ||||||
International Paper Co | 18,598 | 993,691 | ||||||
|
| |||||||
| 2,222,733 | ||||||||
|
| |||||||
Communications - 6.7% | ||||||||
CBS Corp ‘B’ | 9,840 | 505,678 | ||||||
Charter Communications Inc ‘A’ * | 1,511 | 470,169 | ||||||
Cisco Systems Inc | 83,108 | 3,564,502 | ||||||
Comcast Corp ‘A’ | 18,745 | 640,517 | ||||||
eBay Inc * | 31,809 | 1,279,994 | ||||||
Twenty-First Century Fox Inc ‘B’ | 9,096 | 330,822 | ||||||
Vodafone Group PLC (United Kingdom) | 379,293 | 1,037,755 | ||||||
|
| |||||||
| 7,829,437 | ||||||||
|
| |||||||
Consumer, Cyclical - 5.1% | ||||||||
Advance Auto Parts Inc | 8,968 | 1,063,156 | ||||||
Carnival Corp | 28,729 | 1,884,048 | ||||||
General Motors Co | 58,461 | 2,124,473 | ||||||
Walmart Inc | 10,455 | 930,181 | ||||||
|
| |||||||
| 6,001,858 | ||||||||
|
| |||||||
Consumer, Non-Cyclical - 18.6% | ||||||||
Allergan PLC | 8,045 | 1,353,893 | ||||||
Anthem Inc | 7,875 | 1,730,138 | ||||||
Archer-Daniels-Midland Co | 19,741 | 856,167 | ||||||
Biogen Inc * | 3,648 | 998,895 | ||||||
Cardinal Health Inc | 18,152 | 1,137,767 | ||||||
CVS Health Corp | 12,379 | 770,098 | ||||||
Danone SA (France) | 18,280 | 1,482,186 | ||||||
Gilead Sciences Inc | 11,921 | 898,724 | ||||||
McKesson Corp | 6,920 | 974,820 | ||||||
Medtronic PLC | 9,964 | 799,312 | ||||||
Merck & Co Inc | 20,577 | 1,120,829 | ||||||
Mylan NV * | 32,750 | 1,348,318 | ||||||
Novartis AG (Switzerland) | 15,597 | 1,261,499 | ||||||
PayPal Holdings Inc * | 8,512 | 645,805 | ||||||
Pfizer Inc | 61,826 | 2,194,205 | ||||||
Reckitt Benckiser Group PLC (United Kingdom) | 11,321 | 955,578 | ||||||
Sanofi ADR (France) | 38,015 | 1,523,641 | ||||||
Shire PLC | 33,471 | 1,665,842 | ||||||
|
| |||||||
| 21,717,717 | ||||||||
|
| |||||||
Energy - 16.9% | ||||||||
Anadarko Petroleum Corp | 9,878 | 596,730 | ||||||
BP PLC ADR (United Kingdom) | 53,922 | 2,185,998 | ||||||
Canadian Natural Resources Ltd (Canada) | 38,317 | 1,204,516 | ||||||
Chevron Corp | 18,990 | 2,165,620 | ||||||
Devon Energy Corp | 53,367 | 1,696,537 | ||||||
Halliburton Co | 23,300 | 1,093,702 | ||||||
Hess Corp | 27,914 | 1,413,007 | ||||||
Marathon Oil Corp | 123,779 | 1,996,555 | ||||||
Noble Energy Inc | 24,013 | 727,594 | ||||||
Occidental Petroleum Corp | 14,743 | 957,705 | ||||||
QEP Resources Inc * | 55,361 | 541,984 | ||||||
Royal Dutch Shell PLC ‘A’ ADR (Netherlands) | 41,038 | 2,618,635 | ||||||
Suncor Energy Inc (Canada) | 74,705 | 2,580,311 | ||||||
|
| |||||||
| 19,778,894 | ||||||||
|
| |||||||
Financial - 32.6% | ||||||||
Aflac Inc | 15,170 | 663,839 | ||||||
Ally Financial Inc | 38,894 | 1,055,972 | ||||||
American International Group Inc | 31,978 | 1,740,243 | ||||||
Bank of America Corp | 192,757 | 5,780,782 | ||||||
Citigroup Inc | 92,516 | 6,244,830 | ||||||
Citizens Financial Group Inc | 35,227 | 1,478,830 | ||||||
Shares | Value | |||||||
Fifth Third Bancorp | 66,943 | $2,125,440 | ||||||
JPMorgan Chase & Co | 40,426 | 4,445,647 | ||||||
KeyCorp | 24,610 | 481,126 | ||||||
MetLife Inc | 39,712 | 1,822,384 | ||||||
Morgan Stanley | 46,583 | 2,513,619 | ||||||
State Street Corp | 15,613 | 1,557,084 | ||||||
The Allstate Corp | 12,738 | 1,207,562 | ||||||
The Bank of New York Mellon Corp | 31,777 | 1,637,469 | ||||||
The Goldman Sachs Group Inc | 5,278 | 1,329,317 | ||||||
The PNC Financial Services Group Inc | 14,221 | 2,150,784 | ||||||
Wells Fargo & Co | 34,727 | 1,820,042 | ||||||
|
| |||||||
| 38,054,970 | ||||||||
|
| |||||||
Industrial - 7.2% | ||||||||
Arconic Inc | 22,945 | 528,653 | ||||||
Caterpillar Inc | 6,321 | 931,589 | ||||||
Eaton Corp PLC | 23,708 | 1,894,506 | ||||||
Emerson Electric Co | 10,317 | 704,651 | ||||||
General Electric Co | 44,797 | 603,864 | ||||||
Ingersoll-Rand PLC | 7,571 | 647,396 | ||||||
Johnson Controls International PLC | 49,126 | 1,731,200 | ||||||
Textron Inc | 23,815 | 1,404,371 | ||||||
|
| |||||||
| 8,446,230 | ||||||||
|
| |||||||
Technology - 6.4% | ||||||||
Cognizant Technology Solutions Corp ‘A’ | 10,854 | 873,747 | ||||||
Intel Corp | 42,643 | 2,220,847 | ||||||
Microsoft Corp | 21,762 | 1,986,218 | ||||||
NetApp Inc | 13,285 | 819,552 | ||||||
QUALCOMM Inc | 28,245 | 1,565,055 | ||||||
|
| |||||||
| 7,465,419 | ||||||||
|
| |||||||
Total Common Stocks | 111,517,258 | |||||||
|
| |||||||
CLOSED-END MUTUAL FUNDS - 0.5% | ||||||||
Altaba Inc * | 7,861 | 582,028 | ||||||
|
| |||||||
Total Closed-End Mutual Funds | 582,028 | |||||||
|
| |||||||
SHORT-TERM INVESTMENT - 4.1% | ||||||||
Money Market Fund - 4.1% | ||||||||
BlackRock Liquidity Funds T-Fund Portfolio | 4,722,909 | 4,722,909 | ||||||
|
| |||||||
Total Short-Term Investment | 4,722,909 | |||||||
|
| |||||||
TOTAL INVESTMENTS - 100.0% | 116,822,195 | |||||||
DERIVATIVES - (0.0%) | ||||||||
(See Note (b) in Notes to Schedule of Investments) |
| (14,181 | ) | |||||
|
| |||||||
OTHER ASSETS & LIABILITIES, NET - 0.0% | 40,351 | |||||||
|
| |||||||
NET ASSETS - 100.0% | $116,848,365 | |||||||
|
| |||||||
| See Notes to Financial Statements | See explanation of symbols and terms, if any, on B-114 and B-115 |
B-46
Table of Contents
PACIFIC FUNDS
PF COMSTOCK FUND
Schedule of Investments (Continued)
March 31, 2018
Notes to Schedule of Investments
| (a) | As of March 31, 2018, the Fund’s composition by sector as a percentage of net assets was as follows: |
Financial | 32.6% | |||
Consumer, Non-Cyclical | 18.6% | |||
Energy | 16.9% | |||
Industrial | 7.2% | |||
Communications | 6.7% | |||
Technology | 6.4% | |||
Consumer, Cyclical | 5.1% | |||
Short-Term Investment | 4.1% | |||
Others (each less than 3.0%) | 2.4% | |||
|
| |||
| 100.0% | ||||
Derivatives | (0.0% | ) | ||
Other Assets & Liabilities, Net | 0.0% | |||
|
| |||
| 100.0% | ||||
|
|
| (b) | Forward foreign currency contracts outstanding as of March 31, 2018 were as follows: |
| Currency Purchased | Currency Sold | Settlement Month | Counterparty | Unrealized Appreciation | Unrealized (Depreciation) | |||||||||||||||||||||
| USD | 602,517 | CAD | 787,777 | 04/18 | BRC | $— | ($9,196 | ) | ||||||||||||||||||
| USD | 602,451 | CAD | 787,777 | 04/18 | JPM | — | (9,264 | ) | ||||||||||||||||||
| USD | 602,465 | CAD | 787,777 | 04/18 | RBC | — | (9,250 | ) | ||||||||||||||||||
| USD | 213,604 | CHF | 202,761 | 04/18 | BRC | 1,140 | — | |||||||||||||||||||
| USD | 213,592 | CHF | 202,761 | 04/18 | GSC | 1,129 | — | |||||||||||||||||||
| USD | 213,617 | CHF | 202,761 | 04/18 | JPM | 1,153 | — | |||||||||||||||||||
| USD | 705,747 | EUR | 572,347 | 04/18 | CIB | 436 | — | |||||||||||||||||||
| USD | 705,950 | EUR | 572,347 | 04/18 | GSC | 639 | — | |||||||||||||||||||
| USD | 706,122 | EUR | 572,347 | 04/18 | JPM | 811 | — | |||||||||||||||||||
| USD | 706,036 | EUR | 572,347 | 04/18 | RBC | 725 | — | |||||||||||||||||||
| USD | 941,115 | GBP | 668,065 | 04/18 | BRC | 2,972 | — | |||||||||||||||||||
| USD | 940,772 | GBP | 668,065 | 04/18 | GSC | 2,629 | — | |||||||||||||||||||
| USD | 940,038 | GBP | 668,065 | 04/18 | RBC | 1,895 | — | |||||||||||||||||||
|
|
|
| |||||||||||||||||||||||
Total Forward Foreign Currency Contracts |
| $13,529 | ($27,710 | ) | ||||||||||||||||||||||
|
|
|
| |||||||||||||||||||||||
| (c) | Fair Value Measurements |
The following is a summary of the Fund’s investments as categorized under the three-tier hierarchy of inputs used in valuing the Fund’s assets and liabilities (See Note 3D in Notes to Financial Statements) as of March 31, 2018:
| Total Value at March 31, 2018 | Level 1 Quoted Price | Level 2 Significant Observable Inputs | Level 3 Significant Unobservable Inputs | |||||||||||||||
Assets | Common Stocks | |||||||||||||||||
Basic Materials | $2,222,733 | $2,222,733 | $— | $— | ||||||||||||||
Communications | 7,829,437 | 6,791,682 | 1,037,755 | — | ||||||||||||||
Consumer, Cyclical | 6,001,858 | 6,001,858 | — | — | ||||||||||||||
Consumer, Non-Cyclical | 21,717,717 | 16,352,612 | 5,365,105 | — | ||||||||||||||
Energy | 19,778,894 | 19,778,894 | — | — | ||||||||||||||
Financial | 38,054,970 | 38,054,970 | — | — | ||||||||||||||
Industrial | 8,446,230 | 8,446,230 | — | — | ||||||||||||||
Technology | 7,465,419 | 7,465,419 | — | — | ||||||||||||||
|
|
|
|
|
|
|
| |||||||||||
Total Common Stocks | 111,517,258 | 105,114,398 | 6,402,860 | — | ||||||||||||||
|
|
|
|
|
|
|
| |||||||||||
Closed-End Mutual Fund | 582,028 | 582,028 | — | — | ||||||||||||||
Short-Term Investment | 4,722,909 | 4,722,909 | — | — | ||||||||||||||
Derivatives: | ||||||||||||||||||
Foreign Currency Contracts | ||||||||||||||||||
Forward Foreign Currency Contracts | 13,529 | — | 13,529 | — | ||||||||||||||
|
|
|
|
|
|
|
| |||||||||||
Total Assets | 116,835,724 | 110,419,335 | 6,416,389 | — | ||||||||||||||
|
|
|
|
|
|
|
| |||||||||||
Liabilities | Derivatives: | |||||||||||||||||
Foreign Currency Contracts | ||||||||||||||||||
Forward Foreign Currency Contracts | (27,710 | ) | — | (27,710 | ) | — | ||||||||||||
|
|
|
|
|
|
|
| |||||||||||
Total Liabilities | (27,710 | ) | — | (27,710 | ) | — | ||||||||||||
|
|
|
|
|
|
|
| |||||||||||
Total | $116,808,014 | $110,419,335 | $6,388,679 | $— | ||||||||||||||
|
|
|
|
|
|
|
| |||||||||||
| See Notes to Financial Statements | See explanation of symbols and terms, if any, on B-114 and B-115 |
B-47
Table of Contents
PACIFIC FUNDS
PF DEVELOPING GROWTH FUND
Schedule of Investments
March 31, 2018
Shares |
| |||||||
WARRANTS - 0.0% | ||||||||
Consumer, Non-Cyclical - 0.0% | ||||||||
Neuralstem Inc Exercise @ $3.64 | 1,194 | $— | ||||||
|
| |||||||
Total Warrants |
| — | ||||||
|
| |||||||
COMMON STOCKS - 97.6% | ||||||||
Basic Materials - 0.9% | ||||||||
PolyOne Corp | 2,008 | 85,380 | ||||||
|
| |||||||
Communications - 16.2% | ||||||||
Cargurus Inc * | 2,877 | 110,678 | ||||||
Chegg Inc * | 7,656 | 158,173 | ||||||
Etsy Inc * | 4,692 | 131,657 | ||||||
GrubHub Inc * | 1,828 | 185,487 | ||||||
Mimecast Ltd * | 2,615 | 92,649 | ||||||
Okta Inc * | 2,876 | 114,609 | ||||||
Proofpoint Inc * | 1,080 | 122,742 | ||||||
RingCentral Inc ‘A’ * | 2,235 | 141,923 | ||||||
Stamps.com Inc * | 476 | 95,700 | ||||||
The Trade Desk Inc ‘A’ * | 1,917 | 95,122 | ||||||
World Wrestling Entertainment Inc ‘A’ | 3,312 | 119,265 | ||||||
Zendesk Inc * | 1,629 | 77,980 | ||||||
Zscaler Inc * | 3,044 | 85,445 | ||||||
|
| |||||||
| 1,531,430 | ||||||||
|
| |||||||
Consumer, Cyclical - 12.5% | ||||||||
At Home Group Inc * | 4,482 | 143,603 | ||||||
Beacon Roofing Supply Inc * | 2,125 | 112,774 | ||||||
Canada Goose Holdings Inc (Canada) * | 2,955 | 98,756 | ||||||
Floor & Decor Holdings Inc ‘A’ * | 2,640 | 137,597 | ||||||
Live Nation Entertainment Inc * | 3,573 | 150,566 | ||||||
Marriott Vacations Worldwide Corp | 500 | 66,600 | ||||||
Planet Fitness Inc ‘A’ * | 6,857 | 258,989 | ||||||
Roku Inc * | 1,088 | 33,837 | ||||||
SodaStream International Ltd (Israel) * | 1,971 | 180,997 | ||||||
|
| |||||||
| 1,183,719 | ||||||||
|
| |||||||
Consumer, Non-Cyclical - 24.8% | ||||||||
Agios Pharmaceuticals Inc * | 1,500 | 122,670 | ||||||
Amicus Therapeutics Inc * | 5,799 | 87,217 | ||||||
Avexis Inc * | 934 | 115,424 | ||||||
Bluebird Bio Inc * | 368 | 62,836 | ||||||
Blueprint Medicines Corp * | 2,119 | 194,312 | ||||||
Exact Sciences Corp * | 1,066 | 42,992 | ||||||
FibroGen Inc * | 1,565 | 72,303 | ||||||
Foundation Medicine Inc * | 1,765 | 138,994 | ||||||
Grand Canyon Education Inc * | 1,743 | 182,876 | ||||||
HealthEquity Inc * | 933 | 56,484 | ||||||
Insmed Inc * | 2,324 | 52,336 | ||||||
Insulet Corp * | 2,843 | 246,431 | ||||||
Loxo Oncology Inc * | 1,195 | 137,867 | ||||||
Nevro Corp * | 1,264 | 109,551 | ||||||
Paylocity Holdings Corp * | 1,149 | 58,863 | ||||||
Penumbra Inc * | 1,600 | 185,040 | ||||||
Quanta Services Inc * | 1,921 | 65,986 | ||||||
Sage Therapeutics Inc * | 1,084 | 174,600 | ||||||
Sarepta Therapeutics Inc * | 1,492 | 110,542 | ||||||
Spark Therapeutics Inc * | 902 | 60,064 | ||||||
Tivity Health Inc * | 1,828 | 72,480 | ||||||
|
| |||||||
| 2,349,868 | ||||||||
|
| |||||||
Energy - 0.5% | ||||||||
SolarEdge Technologies Inc * | 968 | 50,917 | ||||||
|
| |||||||
Shares |
| |||||||
Financial - 9.8% | ||||||||
Air Lease Corp | 2,295 | $97,813 | ||||||
Cadence BanCorp | 3,422 | 93,181 | ||||||
CenterState Bank Corp | 4,007 | 106,306 | ||||||
Evercore Inc ‘A’ | 1,125 | 98,100 | ||||||
Hamilton Lane Inc ‘A’ | 1,365 | 50,819 | ||||||
Moelis & Co ‘A’ | 1,962 | 99,768 | ||||||
Texas Capital Bancshares Inc * | 991 | 89,091 | ||||||
Webster Financial Corp | 1,327 | 73,516 | ||||||
Western Alliance Bancorp * | 2,409 | 139,987 | ||||||
Wintrust Financial Corp | 932 | 80,198 | ||||||
|
| |||||||
| 928,779 | ||||||||
|
| |||||||
Industrial - 14.8% | ||||||||
Aerojet Rocketdyne Holdings Inc * | 669 | 18,712 | ||||||
Aerovironment Inc * | 1,833 | 83,420 | ||||||
Atlas Air Worldwide Holdings Inc * | 1,906 | 115,218 | ||||||
Builders FirstSource Inc * | 4,454 | 88,367 | ||||||
BWX Technologies Inc | 1,451 | 92,182 | ||||||
Cactus Inc ‘A’ * | 2,378 | 64,039 | ||||||
Chart Industries Inc * | 1,934 | 114,164 | ||||||
Curtiss-Wright Corp | 773 | 104,409 | ||||||
Eagle Materials Inc | 713 | 73,475 | ||||||
GasLog Ltd (Monaco) | 5,442 | 89,521 | ||||||
MasTec Inc * | 3,219 | 151,454 | ||||||
Proto Labs Inc * | 741 | 87,105 | ||||||
RBC Bearings Inc * | 530 | 65,826 | ||||||
Trex Co Inc * | 833 | 90,605 | ||||||
Universal Display Corp | 300 | 30,300 | ||||||
XPO Logistics Inc * | 1,254 | 127,670 | ||||||
|
| |||||||
| 1,396,467 | ||||||||
|
| |||||||
Technology - 18.1% | ||||||||
2U Inc * | 2,226 | 187,051 | ||||||
Appian Corp * | 1,531 | 38,550 | ||||||
Aspen Technology Inc * | 908 | 71,632 | ||||||
CEVA Inc * | 1,214 | 43,947 | ||||||
Coupa Software Inc * | 1,640 | 74,817 | ||||||
Entegris Inc | 1,298 | 45,170 | ||||||
EPAM Systems Inc * | 1,221 | 139,829 | ||||||
Everbridge Inc * | 3,080 | 112,728 | ||||||
Five9 Inc * | 3,835 | 114,245 | ||||||
HubSpot Inc * | 1,726 | 186,926 | ||||||
Instructure Inc * | 2,145 | 90,412 | ||||||
Lumentum Holdings Inc * | 749 | 47,786 | ||||||
Monolithic Power Systems Inc | 1,259 | 145,754 | ||||||
New Relic Inc * | 964 | 71,452 | ||||||
Nutanix Inc ‘A’ * | 1,394 | 68,459 | ||||||
Paycom Software Inc * | 1,492 | 160,226 | ||||||
Talend SA ADR * | 935 | 44,992 | ||||||
Twilio Inc ‘A’ * | 1,667 | 63,646 | ||||||
|
| |||||||
| 1,707,622 | ||||||||
|
| |||||||
Total Common Stocks |
| 9,234,182 | ||||||
|
| |||||||
SHORT-TERM INVESTMENT - 1.0% | ||||||||
Money Market Fund - 1.0% | ||||||||
BlackRock Liquidity Funds T-Fund Portfolio | 94,150 | 94,150 | ||||||
|
| |||||||
Total Short-Term Investment |
| 94,150 | ||||||
|
| |||||||
TOTAL INVESTMENTS - 98.6% |
| 9,328,332 | ||||||
OTHER ASSETS & LIABILITIES, NET - 1.4% |
| 135,126 | ||||||
|
| |||||||
NET ASSETS - 100.0% |
| $9,463,458 | ||||||
|
| |||||||
| See Notes to Financial Statements | See explanation of symbols and terms, if any, on B-114 and B-115 |
B-48
Table of Contents
PACIFIC FUNDS
PF DEVELOPING GROWTH FUND
Schedule of Investments (Continued)
March 31, 2018
Notes to Schedule of Investments
| (a) | As of March 31, 2018, the Fund’s composition by sector as a percentage of net assets was as follows: |
Consumer, Non-Cyclical | 24.8% | |||
Technology | 18.1% | |||
Communications | 16.2% | |||
Industrial | 14.8% | |||
Consumer, Cyclical | 12.5% | |||
Financial | 9.8% | |||
Others (each less than 3.0%) | 2.4% | |||
|
| |||
| 98.6% | ||||
Other Assets & Liabilities, Net | 1.4% | |||
|
| |||
| 100.0% | ||||
|
|
| (b) | Fair Value Measurements |
The following is a summary of the Fund’s investments as categorized under the three-tier hierarchy of inputs used in valuing the Fund’s assets and liabilities (See Note 3D in Notes to Financial Statements) as of March 31, 2018:
| Total Value at March 31, 2018 | Level 1 Quoted Price | Level 2 Significant Observable Inputs | Level 3 Significant Unobservable Inputs | |||||||||||||||
Assets | Common Stocks | $9,234,182 | $9,234,182 | $— | $— | |||||||||||||
Short-Term Investment | 94,150 | 94,150 | — | — | ||||||||||||||
|
|
|
|
|
|
|
| |||||||||||
Total | $9,328,332 | $9,328,332 | $— | $— | ||||||||||||||
|
|
|
|
|
|
|
| |||||||||||
| See Notes to Financial Statements | See explanation of symbols and terms, if any, on B-114 and B-115 |
B-49
Table of Contents
PACIFIC FUNDS
PF GROWTH FUND
Schedule of Investments
March 31, 2018
Shares | Value | |||||||
COMMON STOCKS - 98.9% | ||||||||
Basic Materials - 2.1% | ||||||||
Monsanto Co | 10,222 | $1,192,805 | ||||||
The Sherwin-Williams Co | 8,004 | 3,138,528 | ||||||
Univar Inc * | 5,124 | 142,191 | ||||||
|
| |||||||
| 4,473,524 | ||||||||
|
| |||||||
Communications - 21.9% | ||||||||
Alibaba Group Holding Ltd ADR (China) * | 7,936 | 1,456,573 | ||||||
Alphabet Inc ‘A’ * | 7,945 | 8,240,077 | ||||||
Alphabet Inc ‘C’ * | 4,626 | 4,773,061 | ||||||
Amazon.com Inc * | 8,089 | 11,707,533 | ||||||
Booking Holdings Inc * | 1,462 | 3,041,530 | ||||||
Comcast Corp ‘A’ | 66,057 | 2,257,168 | ||||||
Facebook Inc ‘A’ * | 53,551 | 8,556,914 | ||||||
Netflix Inc * | 18,006 | 5,318,072 | ||||||
|
| |||||||
| 45,350,928 | ||||||||
|
| |||||||
Consumer, Cyclical - 5.3% | ||||||||
Aramark | 31,446 | 1,244,004 | ||||||
Costco Wholesale Corp | 3,016 | 568,305 | ||||||
Dollar Tree Inc * | 11,347 | 1,076,830 | ||||||
Lululemon Athletica Inc * | 3,638 | 324,219 | ||||||
Marriott International Inc ‘A’ | 15,233 | 2,071,383 | ||||||
NIKE Inc ‘B’ | 35,802 | 2,378,685 | ||||||
Ross Stores Inc | 6,364 | 496,265 | ||||||
Six Flags Entertainment Corp | 12,306 | 766,172 | ||||||
Starbucks Corp | 34,014 | 1,969,070 | ||||||
|
| |||||||
| 10,894,933 | ||||||||
|
| |||||||
Consumer, Non-Cyclical - 21.5% | ||||||||
Abbott Laboratories | 27,541 | 1,650,257 | ||||||
Biogen Inc * | 4,168 | 1,141,282 | ||||||
BioMarin Pharmaceutical Inc * | 5,239 | 424,726 | ||||||
Bristol-Myers Squibb Co | 28,246 | 1,786,560 | ||||||
Celgene Corp * | 4,730 | 421,963 | ||||||
Colgate-Palmolive Co | 23,368 | 1,675,018 | ||||||
Constellation Brands Inc ‘A’ | 14,957 | 3,408,999 | ||||||
Danaher Corp | 38,829 | 3,801,747 | ||||||
Edwards Lifesciences Corp * | 10,010 | 1,396,595 | ||||||
Eli Lilly & Co | 9,536 | 737,800 | ||||||
FleetCor Technologies Inc * | 8,036 | 1,627,290 | ||||||
Global Payments Inc | 18,627 | 2,077,283 | ||||||
Medtronic PLC | 30,484 | 2,445,426 | ||||||
Monster Beverage Corp * | 24,687 | 1,412,343 | ||||||
PayPal Holdings Inc * | 19,454 | 1,475,975 | ||||||
Pernod Ricard SA (France) | 3,280 | 545,853 | ||||||
Philip Morris International Inc | 22,895 | 2,275,763 | ||||||
Regeneron Pharmaceuticals Inc * | 2,626 | 904,289 | ||||||
Stryker Corp | 8,202 | 1,319,866 | ||||||
The Cooper Cos Inc | 914 | 209,132 | ||||||
The Estee Lauder Cos Inc ‘A’ | 10,755 | 1,610,239 | ||||||
Thermo Fisher Scientific Inc | 23,458 | 4,843,139 | ||||||
Verisk Analytics Inc * | 18,825 | 1,957,800 | ||||||
Vertex Pharmaceuticals Inc * | 11,709 | 1,908,333 | ||||||
Worldpay Inc ‘A’ * | 10,319 | 848,635 | ||||||
Zoetis Inc | 30,589 | 2,554,487 | ||||||
|
| |||||||
| 44,460,800 | ||||||||
|
| |||||||
Energy - 0.8% | ||||||||
Concho Resources Inc * | 3,394 | 510,220 | ||||||
Pioneer Natural Resources Co | 6,349 | 1,090,631 | ||||||
|
| |||||||
| 1,600,851 | ||||||||
|
| |||||||
|
| |||||||
Shares | Value | |||||||
Financial - 14.2% | ||||||||
American Tower Corp REIT | 20,984 | $3,049,815 | ||||||
Aon PLC | 17,908 | 2,513,030 | ||||||
Intercontinental Exchange Inc | 28,833 | 2,090,969 | ||||||
Mastercard Inc ‘A’ | 38,956 | 6,823,533 | ||||||
Morgan Stanley | 37,720 | 2,035,371 | ||||||
The Blackstone Group LP | 18,096 | 578,167 | ||||||
The Charles Schwab Corp | 48,741 | 2,545,255 | ||||||
The Goldman Sachs Group Inc | 4,636 | 1,167,623 | ||||||
Visa Inc ‘A’ | 71,192 | 8,515,987 | ||||||
|
| |||||||
| 29,319,750 | ||||||||
|
| |||||||
Industrial - 8.5% | ||||||||
AMETEK Inc | 23,385 | 1,776,558 | ||||||
Amphenol Corp ‘A’ | 19,606 | 1,688,665 | ||||||
Canadian Pacific Railway Ltd (Canada) | 9,958 | 1,757,587 | ||||||
FLIR Systems Inc | 10,389 | 519,554 | ||||||
Fortive Corp | 19,204 | 1,488,694 | ||||||
Honeywell International Inc | 7,974 | 1,152,323 | ||||||
Roper Technologies Inc | 9,189 | 2,579,260 | ||||||
TE Connectivity Ltd | 10,267 | 1,025,673 | ||||||
Union Pacific Corp | 15,841 | 2,129,506 | ||||||
Vulcan Materials Co | 19,849 | 2,266,160 | ||||||
Xylem Inc | 15,750 | 1,211,490 | ||||||
|
| |||||||
| 17,595,470 | ||||||||
|
| |||||||
Technology - 24.6% | ||||||||
Activision Blizzard Inc | 54,408 | 3,670,364 | ||||||
Adobe Systems Inc * | 37,177 | 8,033,206 | ||||||
Analog Devices Inc | 14,136 | 1,288,214 | ||||||
Apple Inc | 17,777 | 2,982,625 | ||||||
Broadcom Ltd | 2,187 | 515,367 | ||||||
Cognizant Technology Solutions Corp ‘A’ | 23,021 | 1,853,191 | ||||||
Dropbox Inc ‘A’ * | 1,237 | 38,656 | ||||||
Electronic Arts Inc * | 29,707 | 3,601,677 | ||||||
Fidelity National Information Services Inc | 21,645 | 2,084,414 | ||||||
Fiserv Inc * | 55,154 | 3,933,032 | ||||||
Intuit Inc | 15,723 | 2,725,582 | ||||||
Microsoft Corp | 124,583 | 11,370,690 | ||||||
NVIDIA Corp | 16,169 | 3,744,579 | ||||||
PTC Inc * | 5,904 | 460,571 | ||||||
salesforce.com Inc * | 38,699 | 4,500,694 | ||||||
|
| |||||||
| 50,802,862 | ||||||||
|
| |||||||
Total Common Stocks | 204,499,118 | |||||||
|
| |||||||
SHORT-TERM INVESTMENT - 1.1% | ||||||||
Money Market Fund - 1.1% | ||||||||
BlackRock Liquidity Funds T-Fund Portfolio | 2,318,101 | 2,318,101 | ||||||
|
| |||||||
Total Short-Term Investment | 2,318,101 | |||||||
|
| |||||||
TOTAL INVESTMENTS - 100.0% | 206,817,219 | |||||||
OTHER ASSETS & LIABILITIES, NET - (0.0%) | (85,363 | ) | ||||||
|
| |||||||
NET ASSETS - 100.0% | $206,731,856 | |||||||
|
| |||||||
| See Notes to Financial Statements | See explanation of symbols and terms, if any, on B-114 and B-115 |
B-50
Table of Contents
PACIFIC FUNDS
PF GROWTH FUND
Schedule of Investments (Continued)
March 31, 2018
Notes to Schedule of Investments
| (a) | As of March 31, 2018, the Fund’s composition by sector as a percentage of net assets was as follows: |
Technology | 24.6% | |||
Communications | 21.9% | |||
Consumer, Non-Cyclical | 21.5% | |||
Financial | 14.2% | |||
Industrial | 8.5% | |||
Consumer, Cyclical | 5.3% | |||
Others (each less than 3.0%) | 4.0% | |||
|
| |||
| 100.0% | ||||
Other Assets & Liabilities, Net | (0.0% | ) | ||
|
| |||
| 100.0% | ||||
|
|
| (b) | Fair Value Measurements |
The following is a summary of the Fund’s investments as categorized under the three-tier hierarchy of inputs used in valuing the Fund’s assets and liabilities (See Note 3D in Notes to Financial Statements) as of March 31, 2018:
| Total Value at March 31, 2018 | Level 1 Quoted Price | Level 2 Significant Observable Inputs | Level 3 Significant Unobservable Inputs | |||||||||||||||
Assets | Common Stocks | $204,499,118 | $204,499,118 | $— | $— | |||||||||||||
Short-Term Investment | 2,318,101 | 2,318,101 | ||||||||||||||||
|
|
|
|
|
|
|
| |||||||||||
Total | $206,817,219 | $206,817,219 | $— | $— | ||||||||||||||
|
|
|
|
|
|
|
| |||||||||||
| See Notes to Financial Statements | See explanation of symbols and terms, if any, on B-114 and B-115 |
B-51
Table of Contents
PACIFIC FUNDS
PF LARGE-CAP GROWTH FUND
Schedule of Investments
March 31, 2018
Shares | Value | |||||||
COMMON STOCKS - 99.9% | ||||||||
Basic Materials - 2.1% | ||||||||
DowDuPont Inc | 6,260 | $398,825 | ||||||
The Sherwin-Williams Co | 1,616 | 633,666 | ||||||
|
| |||||||
| 1,032,491 | ||||||||
|
| |||||||
Communications - 29.4% | ||||||||
Alibaba Group Holding Ltd ADR (China) * | 2,049 | 376,073 | ||||||
Alphabet Inc ‘A’ * | 2,449 | 2,539,956 | ||||||
Amazon.com Inc * | 2,921 | 4,227,680 | ||||||
Booking Holdings Inc * | 874 | 1,818,261 | ||||||
Facebook Inc ‘A’ * | 9,027 | 1,442,424 | ||||||
MercadoLibre Inc (Argentina) | 2,021 | 720,264 | ||||||
Netflix Inc * | 5,505 | 1,625,902 | ||||||
Tencent Holdings Ltd (China) | 33,100 | 1,776,794 | ||||||
Zayo Group Holdings Inc * | 5,998 | 204,892 | ||||||
|
| |||||||
| 14,732,246 | ||||||||
|
| |||||||
Consumer, Cyclical - 7.4% | ||||||||
Domino’s Pizza Inc | 2,408 | 562,412 | ||||||
Mohawk Industries Inc * | 1,574 | 365,514 | ||||||
NIKE Inc ‘B’ | 10,921 | 725,591 | ||||||
Tesla Inc * | 1,127 | 299,929 | ||||||
The Home Depot Inc | 4,346 | 774,631 | ||||||
Ulta Beauty Inc * | 4,695 | 959,048 | ||||||
|
| |||||||
| 3,687,125 | ||||||||
|
| |||||||
Consumer, Non-Cyclical - 21.1% | ||||||||
Alexion Pharmaceuticals Inc * | 4,820 | 537,237 | ||||||
Becton Dickinson and Co | 3,390 | 734,613 | ||||||
Boston Scientific Corp * | 31,350 | 856,482 | ||||||
Constellation Brands Inc ‘A’ | 5,493 | 1,251,965 | ||||||
CoStar Group Inc * | 1,645 | 596,609 | ||||||
Dr Pepper Snapple Group Inc | 3,895 | 461,090 | ||||||
Equifax Inc | 5,738 | 675,994 | ||||||
Illumina Inc * | 3,120 | 737,630 | ||||||
PayPal Holdings Inc * | 10,670 | 809,533 | ||||||
S&P Global Inc | 3,869 | 739,211 | ||||||
UnitedHealth Group Inc | 10,192 | 2,181,088 | ||||||
Vertex Pharmaceuticals Inc * | 2,925 | 476,717 | ||||||
Zoetis Inc | 6,042 | 504,567 | ||||||
|
| |||||||
| 10,562,736 | ||||||||
|
| |||||||
Financial - 11.7% | ||||||||
Bank of America Corp | 42,745 | 1,281,923 | ||||||
Berkshire Hathaway Inc ‘B’ * | 4,303 | 858,362 | ||||||
First Republic Bank | 5,212 | 482,683 | ||||||
Mastercard Inc ‘A’ | 5,089 | 891,389 | ||||||
Visa Inc ‘A’ | 19,678 | 2,353,882 | ||||||
|
| |||||||
| 5,868,239 | ||||||||
|
| |||||||
Industrial - 8.1% | ||||||||
Caterpillar Inc | 2,182 | 321,583 | ||||||
Flex Ltd * | 17,627 | 287,849 | ||||||
Honeywell International Inc | 3,278 | 473,704 | ||||||
Rockwell Automation Inc | 1,450 | 252,590 | ||||||
Roper Technologies Inc | 1,840 | 516,470 | ||||||
TransDigm Group Inc | 1,635 | 501,847 | ||||||
Union Pacific Corp | 7,862 | 1,056,889 | ||||||
Vulcan Materials Co | 5,544 | 632,959 | ||||||
|
| |||||||
| 4,043,891 | ||||||||
|
| |||||||
Technology - 20.1% | ||||||||
Activision Blizzard Inc | 6,093 | 411,034 | ||||||
Adobe Systems Inc * | 5,204 | 1,124,480 | ||||||
Applied Materials Inc | 9,943 | 552,930 | ||||||
ASML Holding NV ‘NY’ (Netherlands) | 4,036 | 801,388 | ||||||
Autodesk Inc * | 6,642 | 834,102 | ||||||
Shares | Value | |||||||
Broadcom Ltd | 2,525 | $595,016 | ||||||
Electronic Arts Inc * | 7,376 | 894,266 | ||||||
Microsoft Corp | 34,195 | 3,120,978 | ||||||
NVIDIA Corp | 3,648 | 844,840 | ||||||
salesforce.com Inc * | 5,010 | 582,663 | ||||||
Workday Inc ‘A’ * | 2,292 | 291,336 | ||||||
|
| |||||||
| 10,053,033 | ||||||||
|
| |||||||
Total Common Stocks | 49,979,761 | |||||||
|
| |||||||
SHORT-TERM INVESTMENT - 0.4% | ||||||||
Money Market Fund - 0.4% | ||||||||
BlackRock Liquidity Funds T-Fund Portfolio | 169,410 | 169,410 | ||||||
|
| |||||||
Total Short-Term Investment | 169,410 | |||||||
|
| |||||||
TOTAL INVESTMENTS - 100.3% | 50,149,171 | |||||||
OTHER ASSETS & LIABILITIES, NET - (0.3%) | (126,787 | ) | ||||||
|
| |||||||
NET ASSETS - 100.0% | $50,022,384 | |||||||
|
| |||||||
Notes to Schedule of Investments
| (a) | As of March 31, 2018, the Fund’s composition by sector as a percentage of net assets was as follows: |
Communications | 29.4% | |||
Consumer, Non-Cyclical | 21.1% | |||
Technology | 20.1% | |||
Financial | 11.7% | |||
Industrial | 8.1% | |||
Consumer, Cyclical | 7.4% | |||
Others (each less than 3.0%) | 2.5% | |||
|
| |||
| 100.3% | ||||
Other Assets & Liabilities, Net | (0.3% | ) | ||
|
| |||
| 100.0% | ||||
|
|
| See Notes to Financial Statements | See explanation of symbols and terms, if any, on B-114 and B-115 |
B-52
Table of Contents
PACIFIC FUNDS
PF LARGE-CAP GROWTH FUND
Schedule of Investments (Continued)
March 31, 2018
| (b) | Fair Value Measurements |
The following is a summary of the Fund’s investments as categorized under the three-tier hierarchy of inputs used in valuing the Fund’s assets and liabilities (See Note 3D in Notes to Financial Statements) as of March 31, 2018:
| Total Value at March 31, 2018 | Level 1 Quoted Price | Level 2 Significant Observable Inputs | Level 3 Significant Unobservable Inputs | |||||||||||||||
Assets | Common Stocks | |||||||||||||||||
Basic Materials | $1,032,491 | $1,032,491 | $— | $— | ||||||||||||||
Communications | 14,732,246 | 12,955,452 | 1,776,794 | — | ||||||||||||||
Consumer, Cyclical | 3,687,125 | 3,687,125 | — | — | ||||||||||||||
Consumer, Non-Cyclical | 10,562,736 | 10,562,736 | — | — | ||||||||||||||
Financial | 5,868,239 | 5,868,239 | — | — | ||||||||||||||
Industrial | 4,043,891 | 4,043,891 | — | — | ||||||||||||||
Technology | 10,053,033 | 10,053,033 | — | — | ||||||||||||||
|
|
|
|
|
|
|
| |||||||||||
Total Common Stocks | 49,979,761 | 48,202,967 | 1,776,794 | — | ||||||||||||||
|
|
|
|
|
|
|
| |||||||||||
Short-Term Investment | 169,410 | 169,410 | — | — | ||||||||||||||
|
|
|
|
|
|
|
| |||||||||||
Total | $50,149,171 | $48,372,377 | $1,776,794 | $— | ||||||||||||||
|
|
|
|
|
|
|
| |||||||||||
| See Notes to Financial Statements | See explanation of symbols and terms, if any, on B-114 and B-115 |
B-53
Table of Contents
PACIFIC FUNDS
PF LARGE-CAP VALUE FUND
Schedule of Investments
March 31, 2018
Shares |
| |||||||
COMMON STOCKS - 98.0% |
| |||||||
Basic Materials - 3.8% |
| |||||||
Air Products & Chemicals Inc | 11,192 | $1,779,864 | ||||||
Freeport-McMoRan Inc * | 110,575 | 1,942,803 | ||||||
PPG Industries Inc | 18,479 | 2,062,256 | ||||||
|
| |||||||
| 5,784,923 | ||||||||
|
| |||||||
Communications - 12.1% |
| |||||||
Charter Communications Inc ‘A’ * | 11,403 | 3,548,842 | ||||||
DISH Network Corp ‘A’ * | 78,925 | 2,990,468 | ||||||
Motorola Solutions Inc | 41,349 | 4,354,050 | ||||||
Time Warner Inc | 51,068 | 4,830,011 | ||||||
Twenty-First Century Fox Inc ‘B’ | 84,281 | 3,065,300 | ||||||
|
| |||||||
| 18,788,671 | ||||||||
|
| |||||||
Consumer, Cyclical - 1.8% |
| |||||||
The Home Depot Inc | 15,730 | 2,803,715 | ||||||
|
| |||||||
Consumer, Non-Cyclical - 20.0% |
| |||||||
AmerisourceBergen Corp | 21,250 | 1,831,963 | ||||||
Amgen Inc | 16,544 | 2,820,421 | ||||||
Anheuser-Busch InBev SA/NV ADR (Belgium) | 14,748 | 1,621,395 | ||||||
Anthem Inc | 18,116 | 3,980,085 | ||||||
British American Tobacco PLC ADR (United Kingdom) | 30,945 | 1,785,217 | ||||||
CVS Health Corp | 49,065 | 3,052,334 | ||||||
Johnson & Johnson | 22,721 | 2,911,696 | ||||||
Kimberly-Clark Corp | 12,662 | 1,394,466 | ||||||
McCormick & Co Inc | 16,055 | 1,708,092 | ||||||
Merck & Co Inc | 58,692 | 3,196,953 | ||||||
Novartis AG ADR (Switzerland) | 16,234 | 1,312,519 | ||||||
Philip Morris International Inc | 31,015 | 3,082,891 | ||||||
UnitedHealth Group Inc | 10,817 | 2,314,838 | ||||||
|
| |||||||
| 31,012,870 | ||||||||
|
| |||||||
Energy - 11.3% |
| |||||||
Chevron Corp | 25,300 | 2,885,212 | ||||||
Exxon Mobil Corp | 34,000 | 2,536,740 | ||||||
Halliburton Co | 63,527 | 2,981,957 | ||||||
National Oilwell Varco Inc | 46,883 | 1,725,763 | ||||||
Royal Dutch Shell PLC ‘A’ ADR (Netherlands) | 33,105 | 2,112,430 | ||||||
Schlumberger Ltd | 30,312 | 1,963,611 | ||||||
Suncor Energy Inc (Canada) | 96,449 | 3,331,348 | ||||||
|
| |||||||
| 17,537,061 | ||||||||
|
| |||||||
Financial - 30.7% |
| |||||||
American Express Co | 39,808 | 3,713,290 | ||||||
American Tower Corp REIT | 18,464 | 2,683,558 | ||||||
Bank of America Corp | 110,228 | 3,305,738 | ||||||
Capital One Financial Corp | 20,565 | 1,970,538 | ||||||
Citigroup Inc | 52,668 | 3,555,090 | ||||||
JPMorgan Chase & Co | 70,095 | 7,708,347 | ||||||
Marsh & McLennan Cos Inc | 36,716 | 3,032,374 | ||||||
MetLife Inc | 31,071 | 1,425,848 | ||||||
State Street Corp | 26,913 | 2,684,033 | ||||||
Synchrony Financial | 49,839 | 1,671,102 | ||||||
The Bank of New York Mellon Corp | 39,370 | 2,028,736 | ||||||
The Progressive Corp | 42,885 | 2,612,983 | ||||||
The Travelers Cos Inc | 16,999 | 2,360,481 | ||||||
US Bancorp | 80,929 | 4,086,915 | ||||||
Wells Fargo & Co | 89,426 | 4,686,817 | ||||||
|
| |||||||
| 47,525,850 | ||||||||
|
| |||||||
Industrial - 11.6% |
| |||||||
Honeywell International Inc | 30,679 | 4,433,422 | ||||||
Illinois Tool Works Inc | 24,803 | 3,885,638 | ||||||
Martin Marietta Materials Inc | 13,209 | 2,738,226 | ||||||
Shares |
| |||||||
TE Connectivity Ltd | 37,913 | $3,787,509 | ||||||
United Technologies Corp | 25,019 | 3,147,891 | ||||||
|
| |||||||
| 17,992,686 | ||||||||
|
| |||||||
Technology - 5.2% |
| |||||||
Microsoft Corp | 43,611 | 3,980,376 | ||||||
Oracle Corp | 59,212 | 2,708,949 | ||||||
Xerox Corp | 45,304 | 1,303,849 | ||||||
|
| |||||||
| 7,993,174 | ||||||||
|
| |||||||
Utilities - 1.5% |
| |||||||
Sempra Energy | 20,972 | 2,332,506 | ||||||
|
| |||||||
Total Common Stocks |
| 151,771,456 | ||||||
|
| |||||||
SHORT-TERM INVESTMENT - 1.9% | ||||||||
Money Market Fund - 1.9% |
| |||||||
BlackRock Liquidity Funds T-Fund Portfolio | 2,992,029 | 2,992,029 | ||||||
|
| |||||||
Total Short-Term Investment |
| 2,992,029 | ||||||
|
| |||||||
TOTAL INVESTMENTS - 99.9% |
| 154,763,485 | ||||||
OTHER ASSETS & LIABILITIES, NET - 0.1% |
| 179,660 | ||||||
|
| |||||||
NET ASSETS - 100.0% |
| $154,943,145 | ||||||
|
| |||||||
| Notes to Schedule of Investments | ||||||||
(a) As of March 31, 2018, the Fund’s composition by sector as a percentage of net assets was as follows: |
| |||||||
Financial |
| 30.7% | ||||||
Consumer, Non-Cyclical |
| 20.0% | ||||||
Communications |
| 12.1% | ||||||
Industrial |
| 11.6% | ||||||
Energy |
| 11.3% | ||||||
Technology |
| 5.2% | ||||||
Basic Materials |
| 3.8% | ||||||
Others (each less than 3.0%) |
| 5.2% | ||||||
|
| |||||||
| 99.9% | ||||||||
Other Assets & Liabilities, Net |
| 0.1% | ||||||
|
| |||||||
| 100.0% | ||||||||
|
| |||||||
| See Notes to Financial Statements | See explanation of symbols and terms, if any, on B-114 and B-115 |
B-54
Table of Contents
PACIFIC FUNDS
PF LARGE-CAP VALUE FUND
Schedule of Investments (Continued)
March 31, 2018
| (b) | Fair Value Measurements |
The following is a summary of the Fund’s investments as categorized under the three-tier hierarchy of inputs used in valuing the Fund’s assets and liabilities (See Note 3D in Notes to Financial Statements) as of March 31, 2018:
| Total Value at March 31, 2018 | Level 1 Quoted Price | Level 2 Significant Observable Inputs | Level 3 Significant Unobservable Inputs | |||||||||||||||
Assets | Common Stocks | $151,771,456 | $151,771,456 | $— | $— | |||||||||||||
Short-Term Investment | 2,992,029 | 2,992,029 | — | — | ||||||||||||||
|
|
|
|
|
|
|
| |||||||||||
Total | $154,763,485 | $154,763,485 | $— | $— | ||||||||||||||
|
|
|
|
|
|
|
| |||||||||||
| See Notes to Financial Statements | See explanation of symbols and terms, if any, on B-114 and B-115 |
B-55
Table of Contents
PACIFIC FUNDS
PF MAIN STREET® CORE FUND
Schedule of Investments
March 31, 2018
Shares | Value | |||||||
COMMON STOCKS - 98.0% | ||||||||
Basic Materials - 2.2% | ||||||||
DowDuPont Inc | 21,238 | $1,353,073 | ||||||
PPG Industries Inc | 15,375 | 1,715,850 | ||||||
|
| |||||||
| 3,068,923 | ||||||||
|
| |||||||
Communications - 14.5% | ||||||||
Alphabet Inc ‘C’ * | 5,001 | 5,159,982 | ||||||
Cisco Systems Inc | 29,350 | 1,258,821 | ||||||
Comcast Corp ‘A’ | 107,068 | 3,658,513 | ||||||
eBay Inc * | 44,260 | 1,781,022 | ||||||
Facebook Inc ‘A’ * | 20,900 | 3,339,611 | ||||||
Motorola Solutions Inc | 26,970 | 2,839,941 | ||||||
Verizon Communications Inc | 39,108 | 1,870,145 | ||||||
|
| |||||||
| 19,908,035 | ||||||||
|
| |||||||
Consumer, Cyclical - 9.9% | ||||||||
Alaska Air Group Inc | 11,690 | 724,312 | ||||||
Aptiv PLC | 12,444 | 1,057,367 | ||||||
Best Buy Co Inc | 22,660 | 1,585,973 | ||||||
CarMax Inc * | 24,990 | 1,547,881 | ||||||
Delphi Technologies PLC | 4,144 | 197,462 | ||||||
Fastenal Co | 22,920 | 1,251,203 | ||||||
Lowe’s Cos Inc | 29,910 | 2,624,603 | ||||||
McDonald’s Corp | 12,070 | 1,887,507 | ||||||
O’Reilly Automotive Inc * | 9,210 | 2,278,370 | ||||||
Whirlpool Corp | 2,980 | 456,268 | ||||||
|
| |||||||
| 13,610,946 | ||||||||
|
| |||||||
Consumer, Non-Cyclical - 23.7% | ||||||||
Boston Scientific Corp * | 48,096 | 1,313,983 | ||||||
Celgene Corp * | 19,442 | 1,734,421 | ||||||
DaVita Inc * | 20,500 | 1,351,770 | ||||||
Equifax Inc | 5,910 | 696,257 | ||||||
Exact Sciences Corp * | 18,770 | 756,994 | ||||||
Express Scripts Holding Co * | 8,736 | 603,483 | ||||||
Gilead Sciences Inc | 22,660 | 1,708,337 | ||||||
Laboratory Corp of America Holdings * | 890 | 143,958 | ||||||
Merck & Co Inc | 60,990 | 3,322,125 | ||||||
Mondelez International Inc ‘A’ | 44,659 | 1,863,620 | ||||||
Nielsen Holdings PLC | 35,447 | 1,126,860 | ||||||
PayPal Holdings Inc * | 24,659 | 1,870,878 | ||||||
PepsiCo Inc | 33,679 | 3,676,063 | ||||||
Philip Morris International Inc | 25,058 | 2,490,765 | ||||||
S&P Global Inc | 12,708 | 2,427,990 | ||||||
Stryker Corp | 10,160 | 1,634,947 | ||||||
The Kraft Heinz Co | 30,467 | 1,897,789 | ||||||
UnitedHealth Group Inc | 18,221 | 3,899,294 | ||||||
|
| |||||||
| 32,519,534 | ||||||||
|
| |||||||
Energy - 5.5% | ||||||||
Exxon Mobil Corp | 28,140 | 2,099,525 | ||||||
Magellan Midstream Partners LP | 39,488 | 2,304,125 | ||||||
Suncor Energy Inc (Canada) | 89,029 | 3,075,062 | ||||||
|
| |||||||
| 7,478,712 | ||||||||
|
| |||||||
Financial - 18.7% | ||||||||
Berkshire Hathaway Inc ‘B’ * | 16,216 | 3,234,768 | ||||||
CME Group Inc ‘A’ | 13,285 | 2,148,716 | ||||||
Discover Financial Services | 22,048 | 1,585,913 | ||||||
Intercontinental Exchange Inc | 32,010 | 2,321,365 | ||||||
JPMorgan Chase & Co | 44,760 | 4,922,257 | ||||||
Marsh & McLennan Cos Inc | 26,664 | 2,202,180 | ||||||
Mid-America Apartment Communities Inc REIT | 10,410 | 949,808 | ||||||
SunTrust Banks Inc | 25,374 | 1,726,447 | ||||||
The Bank of New York Mellon Corp | 43,077 | 2,219,758 | ||||||
The Progressive Corp | 39,195 | 2,388,151 | ||||||
US Bancorp | 37,214 | 1,879,307 | ||||||
|
| |||||||
| 25,578,670 | ||||||||
|
| |||||||
Shares | Value | |||||||
Industrial - 8.1% | ||||||||
Agilent Technologies Inc | 28,559 | $1,910,597 | ||||||
Canadian Pacific Railway Ltd (Canada) | 5,829 | 1,028,819 | ||||||
General Electric Co | 102,457 | 1,381,120 | ||||||
Illinois Tool Works Inc | 10,350 | 1,621,431 | ||||||
Lockheed Martin Corp | 9,425 | 3,184,990 | ||||||
Republic Services Inc | 15,494 | 1,026,168 | ||||||
Vulcan Materials Co | 8,300 | 947,611 | ||||||
|
| |||||||
| 11,100,736 | ||||||||
|
| |||||||
Technology - 12.7% | ||||||||
Activision Blizzard Inc | 20,890 | 1,409,239 | ||||||
Amdocs Ltd | 28,877 | 1,926,673 | ||||||
Apple Inc | 47,932 | 8,042,031 | ||||||
Applied Materials Inc | 37,546 | 2,087,933 | ||||||
Cerner Corp * | 15,803 | 916,574 | ||||||
Maxim Integrated Products Inc | 15,180 | 914,140 | ||||||
ServiceNow Inc * | 4,210 | 696,545 | ||||||
Western Digital Corp | 14,990 | 1,383,127 | ||||||
|
| |||||||
| 17,376,262 | ||||||||
|
| |||||||
Utilities - 2.7% | ||||||||
National Grid PLC (United Kingdom) | 203,665 | 2,292,547 | ||||||
PG&E Corp | 32,923 | 1,446,307 | ||||||
|
| |||||||
| 3,738,854 | ||||||||
|
| |||||||
Total Common Stocks |
| 134,380,672 | ||||||
|
| |||||||
SHORT-TERM INVESTMENT - 2.0% | ||||||||
Money Market Fund - 2.0% | ||||||||
BlackRock Liquidity Funds T-Fund Portfolio | 2,776,677 | 2,776,677 | ||||||
|
| |||||||
Total Short-Term Investment |
| 2,776,677 | ||||||
|
| |||||||
TOTAL INVESTMENTS - 100.0% | 137,157,349 | |||||||
OTHER ASSETS & LIABILITIES, NET - (0.0%) | (56,769 | ) | ||||||
|
| |||||||
NET ASSETS - 100.0% | $137,100,580 | |||||||
|
| |||||||
Notes to Schedule of Investments
| (a) | As of March 31, 2018, the Fund’s composition by sector as a percentage of net assets was as follows: |
Consumer, Non-Cyclical | 23.7% | |||
Financial | 18.7% | |||
Communications | 14.5% | |||
Technology | 12.7% | |||
Consumer, Cyclical | 9.9% | |||
Industrial | 8.1% | |||
Energy | 5.5% | |||
Others (each less than 3.0%) | 6.9% | |||
|
| |||
| 100.0% | ||||
Other Assets & Liabilities, Net | (0.0% | ) | ||
|
| |||
| 100.0% | ||||
|
|
| See Notes to Financial Statements | See explanation of symbols and terms, if any, on B-114 and B-115 |
B-56
Table of Contents
PACIFIC FUNDS
PF MAIN STREET CORE FUND
Schedule of Investments (Continued)
March 31, 2018
| (b) | Fair Value Measurements |
The following is a summary of the Fund’s investments as categorized under the three-tier hierarchy of inputs used in valuing the Fund’s assets and liabilities (See Note 3D in Notes to Financial Statements) as of March 31, 2018:
| Total Value at March 31, 2018 | Level 1 Quoted Price | Level 2 Significant Observable Inputs | Level 3 Significant Unobservable Inputs | |||||||||||||||
Assets | Common Stocks | |||||||||||||||||
Basic Materials | $3,068,923 | $3,068,923 | $— | $— | ||||||||||||||
Communications | 19,908,035 | 19,908,035 | — | — | ||||||||||||||
Consumer, Cyclical | 13,610,946 | 13,610,946 | — | — | ||||||||||||||
Consumer, Non-Cyclical | 32,519,534 | 32,519,534 | — | — | ||||||||||||||
Energy | 7,478,712 | 7,478,712 | — | — | ||||||||||||||
Financial | 25,578,670 | 25,578,670 | — | — | ||||||||||||||
Industrial | 11,100,736 | 11,100,736 | — | — | ||||||||||||||
Technology | 17,376,262 | 17,376,262 | — | — | ||||||||||||||
Utilities | 3,738,854 | 1,446,307 | 2,292,547 | — | ||||||||||||||
|
|
|
|
|
|
|
| |||||||||||
Total Common Stocks | 134,380,672 | 132,088,125 | 2,292,547 | — | ||||||||||||||
|
|
|
|
|
|
|
| |||||||||||
Short-Term Investment | 2,776,677 | 2,776,677 | — | — | ||||||||||||||
|
|
|
|
|
|
|
| |||||||||||
Total | $137,157,349 | $134,864,802 | $2,292,547 | $— | ||||||||||||||
|
|
|
|
|
|
|
| |||||||||||
| See Notes to Financial Statements | See explanation of symbols and terms, if any, on B-114 and B-115 |
B-57
Table of Contents
PACIFIC FUNDS
PF MID-CAP EQUITY FUND
Schedule of Investments
March 31, 2018
Shares | Value | |||||||
COMMON STOCKS - 99.8% | ||||||||
Basic Materials - 5.7% | ||||||||
Albemarle Corp | 702 | $65,103 | ||||||
Celanese Corp ‘A’ | 1,934 | 193,806 | ||||||
CF Industries Holdings Inc | 6,081 | 229,436 | ||||||
Huntsman Corp | 5,156 | 150,813 | ||||||
Newmont Mining Corp | 8,211 | 320,804 | ||||||
Steel Dynamics Inc | 7,517 | 332,402 | ||||||
The Chemours Co | 4,843 | 235,903 | ||||||
Westlake Chemical Corp | 2,200 | 244,530 | ||||||
|
| |||||||
| 1,772,797 | ||||||||
|
| |||||||
Communications - 5.7% | ||||||||
Arista Networks Inc * | 2,539 | 648,207 | ||||||
eBay Inc * | 1,800 | 72,432 | ||||||
Expedia Group Inc | 1,291 | 142,539 | ||||||
IAC/InterActiveCorp* | 1,060 | 165,763 | ||||||
Match Group Inc * | 3,427 | 152,296 | ||||||
Palo Alto Networks Inc * | 1,017 | 184,606 | ||||||
Proofpoint Inc * | 1,393 | 158,314 | ||||||
Sprint Corp * | 55,051 | 268,649 | ||||||
|
| |||||||
| 1,792,806 | ||||||||
|
| |||||||
Consumer, Cyclical - 13.5% | ||||||||
Alaska Air Group Inc | 2,353 | 145,792 | ||||||
Allison Transmission Holdings Inc | 2,773 | 108,313 | ||||||
American Eagle Outfitters Inc | 10,281 | 204,900 | ||||||
Best Buy Co Inc | 3,161 | 221,238 | ||||||
Big Lots Inc | 1,792 | 78,006 | ||||||
Brunswick Corp | 2,885 | 171,340 | ||||||
Casey’s General Stores Inc | 1,752 | 192,317 | ||||||
Chipotle Mexican Grill Inc * | 200 | 64,622 | ||||||
Cracker Barrel Old Country Store Inc | 953 | 151,718 | ||||||
Darden Restaurants Inc | 911 | 77,663 | ||||||
DR Horton Inc | 1,744 | 76,457 | ||||||
Hilton Grand Vacations Inc * | 5,227 | 224,866 | ||||||
Lear Corp | 760 | 141,428 | ||||||
Live Nation Entertainment Inc * | 3,239 | 136,492 | ||||||
Mohawk Industries Inc * | 527 | 122,380 | ||||||
O’Reilly Automotive Inc * | 662 | 163,766 | ||||||
Polaris Industries Inc | 1,297 | 148,532 | ||||||
PVH Corp | 831 | 125,838 | ||||||
Ross Stores Inc | 2,785 | 217,174 | ||||||
Royal Caribbean Cruises Ltd | 2,788 | 328,259 | ||||||
Six Flags Entertainment Corp | 2,659 | 165,549 | ||||||
Skechers U.S.A. Inc ‘A’ * | 2,731 | 106,209 | ||||||
Spirit Airlines Inc * | 3,234 | 122,181 | ||||||
Tenneco Inc | 997 | 54,705 | ||||||
Texas Roadhouse Inc | 2,138 | 123,534 | ||||||
Thor Industries Inc | 1,522 | 175,289 | ||||||
Ulta Beauty Inc * | 315 | 64,345 | ||||||
Vail Resorts Inc | 586 | 129,916 | ||||||
WW Grainger Inc | 619 | 174,725 | ||||||
|
| |||||||
| 4,217,554 | ||||||||
|
| |||||||
Consumer, Non-Cyclical - 15.9% | ||||||||
ABIOMED Inc * | 3,476 | 1,011,481 | ||||||
Align Technology Inc * | 528 | 132,597 | ||||||
AMERCO | 288 | 99,389 | ||||||
BioMarin Pharmaceutical Inc * | 814 | 65,991 | ||||||
Conagra Brands Inc | 2,311 | 85,230 | ||||||
Edwards Lifesciences Corp * | 1,655 | 230,906 | ||||||
Exelixis Inc * | 4,948 | 109,598 | ||||||
H&R Block Inc | 7,981 | 202,797 | ||||||
Hormel Foods Corp | 4,443 | 152,484 | ||||||
Humana Inc | 521 | 140,060 | ||||||
Illumina Inc * | 1,026 | 242,567 | ||||||
Ionis Pharmaceuticals Inc * | 3,153 | 138,984 | ||||||
Shares | Value | |||||||
LendingTree Inc * | 706 | $231,674 | ||||||
ManpowerGroup Inc | 1,905 | 219,266 | ||||||
MarketAxess Holdings Inc | 639 | 138,944 | ||||||
Molina Healthcare Inc * | 1,868 | 151,644 | ||||||
Monster Beverage Corp * | 2,867 | 164,021 | ||||||
Nektar Therapeutics * | 3,364 | 357,459 | ||||||
NuVasive Inc * | 1,508 | 78,733 | ||||||
Robert Half International Inc | 2,559 | 148,141 | ||||||
S&P Global Inc | 1,186 | 226,597 | ||||||
Teleflex Inc | 792 | 201,944 | ||||||
The Clorox Co | 930 | 123,792 | ||||||
Tyson Foods Inc ‘A’ | 2,012 | 147,258 | ||||||
United Rentals Inc * | 1,113 | 192,248 | ||||||
|
| |||||||
| 4,993,805 | ||||||||
|
| |||||||
Energy - 6.6% | ||||||||
Andeavor | 3,833 | 385,446 | ||||||
Devon Energy Corp | 4,989 | 158,600 | ||||||
Marathon Petroleum Corp | 5,950 | 435,005 | ||||||
Newfield Exploration Co * | 10,117 | 247,057 | ||||||
Oceaneering International Inc | 5,539 | 102,693 | ||||||
Parsley Energy Inc ‘A’ * | 5,597 | 162,257 | ||||||
Patterson-UTI Energy Inc | 6,055 | 106,023 | ||||||
RPC Inc | 10,331 | 186,268 | ||||||
RSP Permian Inc * | 3,533 | 165,627 | ||||||
TechnipFMC PLC (United Kingdom) | 3,799 | 111,881 | ||||||
|
| |||||||
| 2,060,857 | ||||||||
|
| |||||||
Financial - 21.1% | ||||||||
Affiliated Managers Group Inc | 605 | 114,696 | ||||||
Ameriprise Financial Inc | 968 | 143,206 | ||||||
Arch Capital Group Ltd * | 1,533 | 131,209 | ||||||
Cboe Global Markets Inc | 1,215 | 138,632 | ||||||
Citizens Financial Group Inc | 5,497 | 230,764 | ||||||
Comerica Inc | 4,572 | 438,592 | ||||||
Cousins Properties Inc REIT | 40,091 | 347,990 | ||||||
Ellie Mae Inc * | 894 | 82,194 | ||||||
EPR Properties REIT | 4,260 | 236,004 | ||||||
Evercore Inc ‘A’ | 1,885 | 164,372 | ||||||
Everest Re Group Ltd | 2,253 | 578,615 | ||||||
First Horizon National Corp | 21,885 | 412,095 | ||||||
Host Hotels & Resorts Inc REIT | 17,654 | 329,071 | ||||||
KeyCorp | 14,377 | 281,070 | ||||||
Lamar Advertising Co ‘A’ REIT | 3,728 | 237,325 | ||||||
Lincoln National Corp | 1,891 | 138,156 | ||||||
Omega Healthcare Investors Inc REIT | 2,307 | 62,381 | ||||||
Outfront Media Inc REIT | 13,642 | 255,651 | ||||||
SunTrust Banks Inc | 6,567 | 446,819 | ||||||
T Rowe Price Group Inc | 1,180 | 127,405 | ||||||
The Hanover Insurance Group Inc | 1,663 | 196,051 | ||||||
Umpqua Holdings Corp | 16,666 | 356,819 | ||||||
Unum Group | 3,315 | 157,827 | ||||||
Voya Financial Inc | 13,174 | 665,287 | ||||||
White Mountains Insurance Group Ltd | 197 | 162,036 | ||||||
WR Berkley Corp | 2,313 | 168,155 | ||||||
|
| |||||||
| 6,602,422 | ||||||||
|
| |||||||
Industrial - 14.3% | ||||||||
Aerojet Rocketdyne Holdings Inc * | 6,719 | 187,930 | ||||||
AGCO Corp | 2,611 | 169,323 | ||||||
BWX Technologies Inc | 3,479 | 221,021 | ||||||
Coherent Inc * | 795 | 148,983 | ||||||
Dycom Industries Inc * | 1,913 | 205,896 | ||||||
Garmin Ltd | 2,492 | 146,854 | ||||||
Harris Corp | 2,662 | 429,327 | ||||||
Hexcel Corp | 4,137 | 267,209 | ||||||
Huntington Ingalls Industries Inc | 568 | 146,408 | ||||||
Keysight Technologies Inc * | 8,021 | 420,220 | ||||||
L3 Technologies Inc | 437 | 90,896 | ||||||
Martin Marietta Materials Inc | 870 | 180,351 | ||||||
| See Notes to Financial Statements | See explanation of symbols and terms, if any, on B-114 and B-115 |
B-58
Table of Contents
PACIFIC FUNDS
PF MID-CAP EQUITY FUND
Schedule of Investments (Continued)
March 31, 2018
Shares | Value | |||||||
Masco Corp | 1,724 | $69,719 | ||||||
Norfolk Southern Corp | 1,425 | 193,487 | ||||||
Old Dominion Freight Line Inc | 974 | 143,149 | ||||||
Owens Corning | 1,988 | 159,835 | ||||||
Parker-Hannifin Corp | 1,309 | 223,878 | ||||||
Rockwell Automation Inc | 752 | 130,998 | ||||||
Textron Inc | 5,142 | 303,224 | ||||||
The Timken Co | 3,546 | 161,698 | ||||||
Universal Display Corp | 887 | 89,587 | ||||||
Vulcan Materials Co | 1,297 | 148,078 | ||||||
Xylem Inc | 3,053 | 234,837 | ||||||
|
| |||||||
| 4,472,908 | ||||||||
|
| |||||||
Technology - 14.0% | ||||||||
Analog Devices Inc | 1,567 | 142,801 | ||||||
Aspen Technology Inc * | 1,469 | 115,889 | ||||||
DXC Technology Co | 12,142 | 1,220,635 | ||||||
Fiserv Inc * | 1,946 | 138,769 | ||||||
IPG Photonics Corp * | 626 | 146,096 | ||||||
Jack Henry & Associates Inc | 1,544 | 186,747 | ||||||
KLA-Tencor Corp | 1,664 | 181,393 | ||||||
Lam Research Corp | 806 | 163,747 | ||||||
Micron Technology Inc * | 3,494 | 182,177 | ||||||
ON Semiconductor Corp * | 7,259 | 177,555 | ||||||
Paychex Inc | 2,525 | 155,515 | ||||||
Red Hat Inc * | 1,193 | 178,365 | ||||||
Science Applications International Corp | 2,641 | 208,111 | ||||||
ServiceNow Inc * | 1,128 | 186,628 | ||||||
Skyworks Solutions Inc | 1,960 | 196,510 | ||||||
Take-Two Interactive Software Inc * | 1,376 | 134,545 | ||||||
Veeva Systems Inc ‘A’ * | 1,882 | 137,424 | ||||||
Western Digital Corp | 2,729 | 251,805 | ||||||
Workday Inc ‘A’ * | 1,095 | 139,185 | ||||||
Xilinx Inc | 1,839 | 132,849 | ||||||
|
| |||||||
| 4,376,746 | ||||||||
|
| |||||||
Shares | Value | |||||||
Utilities - 3.0% | ||||||||
American Water Works Co Inc | 413 | $33,920 | ||||||
Atmos Energy Corp | 7,707 | 649,238 | ||||||
CMS Energy Corp | 510 | 23,098 | ||||||
ONE Gas Inc | 2,520 | 166,370 | ||||||
PG&E Corp | 1,952 | 85,751 | ||||||
|
| |||||||
| 958,377 | ||||||||
|
| |||||||
Total Common Stocks | 31,248,272 | |||||||
|
| |||||||
TOTAL INVESTMENTS - 99.8% | 31,248,272 | |||||||
OTHER ASSETS & LIABILITIES, NET - 0.2% | 61,338 | |||||||
|
| |||||||
NET ASSETS - 100.0% | $31,309,610 | |||||||
|
| |||||||
Notes to Schedule of Investments
| (a) | As of March 31, 2018, the Fund’s composition by sector as a percentage of net assets was as follows: |
Financial | 21.1% | |||
Consumer, Non-Cyclical | 15.9% | |||
Industrial | 14.3% | |||
Technology | 14.0% | |||
Consumer, Cyclical | 13.5% | |||
Energy | 6.6% | |||
Communications | 5.7% | |||
Basic Materials | 5.7% | |||
Utilities | 3.0% | |||
|
| |||
| 99.8% | ||||
Other Assets & Liabilities, Net | 0.2% | |||
|
| |||
| 100.0% | ||||
|
|
| (b) | Fair Value Measurements |
The following is a summary of the Fund’s investments as categorized under the three-tier hierarchy of inputs used in valuing the Fund’s assets and liabilities (See Note 3D in Notes to Financial Statements) as of March 31, 2018:
| Total Value at March 31, 2018 | Level 1 Quoted Price | Level 2 Significant Observable Inputs | Level 3 Significant Unobservable Inputs | |||||||||||||||
Assets | Common Stocks | $31,248,272 | $31,248,272 | $— | $— | |||||||||||||
|
|
|
|
|
|
|
| |||||||||||
| See Notes to Financial Statements | See explanation of symbols and terms, if any, on B-114 and B-115 |
B-59
Table of Contents
PACIFIC FUNDS
PF MID-CAP VALUE FUND
Schedule of Investments
March 31, 2018
Shares | Value | |||||||
COMMON STOCKS - 98.0% | ||||||||
Basic Materials - 2.8% | ||||||||
FMC Corp | 3,483 | $266,693 | ||||||
Nutrien Ltd (Canada) | 7,272 | 343,675 | ||||||
Steel Dynamics Inc | 21,288 | 941,355 | ||||||
Valvoline Inc | 14,128 | 312,653 | ||||||
Versum Materials Inc | 3,363 | 126,550 | ||||||
|
| |||||||
| 1,990,926 | ||||||||
|
| |||||||
Communications - 2.2% | ||||||||
CBS Corp ‘B’ | 3,233 | 166,144 | ||||||
eBay Inc * | 12,184 | 490,284 | ||||||
Expedia Inc | 2,897 | 319,858 | ||||||
IAC/InterActiveCorp * | 2,671 | 417,691 | ||||||
Omnicom Group Inc | 1,927 | 140,035 | ||||||
|
| |||||||
| 1,534,012 | ||||||||
|
| |||||||
Consumer, Cyclical - 6.4% | ||||||||
American Airlines Group Inc | 5,320 | 276,427 | ||||||
BorgWarner Inc | 13,113 | 658,666 | ||||||
Delta Air Lines Inc | 6,778 | 371,502 | ||||||
Fiat Chrysler Automobiles (United Kingdom) | 10,220 | 209,714 | ||||||
Hasbro Inc | 5,231 | 440,973 | ||||||
Lear Corp | 1,431 | 266,295 | ||||||
PACCAR Inc | 3,722 | 246,285 | ||||||
PulteGroup Inc | 10,710 | 315,838 | ||||||
Southwest Airlines Co | 9,304 | 532,933 | ||||||
Tenneco Inc | 4,718 | 258,877 | ||||||
United Continental Holdings Inc * | 2,615 | 181,664 | ||||||
WABCO Holdings Inc * | 3,164 | 423,565 | ||||||
WESCO International Inc * | 5,676 | 352,196 | ||||||
|
| |||||||
| 4,534,935 | ||||||||
|
| |||||||
Consumer, Non-Cyclical - 10.0% | ||||||||
Boston Scientific Corp * | 13,173 | 359,886 | ||||||
Bruker Corp | 4,202 | 125,724 | ||||||
Cardinal Health Inc | 8,844 | 554,342 | ||||||
Coca-Cola European Partners PLC (United Kingdom) | 7,921 | 329,989 | ||||||
DaVita Inc * | 6,617 | 436,325 | ||||||
ICON PLC * | 3,797 | 448,578 | ||||||
Jazz Pharmaceuticals PLC * | 1,240 | 187,228 | ||||||
Laboratory Corp of America Holdings * | 5,613 | 907,903 | ||||||
ManpowerGroup Inc | 6,100 | 702,110 | ||||||
McKesson Corp | 5,388 | 759,008 | ||||||
Moody’s Corp | 2,252 | 363,248 | ||||||
Nielsen Holdings PLC | 4,074 | 129,512 | ||||||
Nomad Foods Ltd (United Kingdom) * | 16,152 | 254,232 | ||||||
Robert Half International Inc | 12,003 | 694,854 | ||||||
The Western Union Co | 15,500 | 298,065 | ||||||
Universal Health Services Inc ‘B’ | 2,690 | 318,523 | ||||||
Zimmer Biomet Holdings Inc | 1,834 | 199,979 | ||||||
|
| |||||||
| 7,069,506 | ||||||||
|
| |||||||
Energy - 7.7% | ||||||||
Anadarko Petroleum Corp | 14,249 | 860,782 | ||||||
Andeavor | 7,977 | 802,167 | ||||||
Cimarex Energy Co | 1,892 | 176,902 | ||||||
Diamondback Energy Inc * | 4,817 | 609,447 | ||||||
Energen Corp * | 8,074 | 507,532 | ||||||
Enerplus Corp (Canada) | 13,894 | 156,446 | ||||||
EQT Corp | 15,552 | 738,875 | ||||||
Jagged Peak Energy Inc * | 1,455 | 20,559 | ||||||
Marathon Petroleum Corp | 6,991 | 511,112 | ||||||
Parsley Energy Inc ‘A’ * | 11,334 | 328,573 | ||||||
Pioneer Natural Resources Co | 3,279 | 563,267 | ||||||
Superior Energy Services Inc * | 17,060 | 143,816 | ||||||
|
| |||||||
| 5,419,478 | ||||||||
|
| |||||||
Shares | Value | |||||||
Financial - 31.7% | ||||||||
Air Lease Corp | 8,347 | $355,749 | ||||||
Alleghany Corp | 1,762 | 1,082,643 | ||||||
Alliance Data Systems Corp | 1,493 | 317,800 | ||||||
American Homes 4 Rent ‘A’ REIT | 11,497 | 230,860 | ||||||
Aon PLC | 4,981 | 698,984 | ||||||
Boston Properties Inc REIT | 6,778 | 835,185 | ||||||
DCT Industrial Trust Inc REIT | 5,858 | 330,040 | ||||||
Discover Financial Services | 17,172 | 1,235,182 | ||||||
Douglas Emmett Inc REIT | 13,752 | 505,524 | ||||||
Duke Realty Corp REIT | 21,358 | 565,560 | ||||||
E*TRADE Financial Corp * | 9,576 | 530,606 | ||||||
East West Bancorp Inc | 15,869 | 992,447 | ||||||
Equity Residential REIT | 8,052 | 496,164 | ||||||
Essent Group Ltd * | 3,268 | 139,086 | ||||||
Everest Re Group Ltd | 2,357 | 605,325 | ||||||
Fifth Third Bancorp | 29,362 | 932,244 | ||||||
Huntington Bancshares Inc | 65,923 | 995,437 | ||||||
KeyCorp | 20,296 | 396,787 | ||||||
Kilroy Realty Corp REIT | 3,231 | 229,272 | ||||||
Loews Corp | 13,578 | 675,234 | ||||||
Marsh & McLennan Cos Inc | 4,648 | 383,878 | ||||||
Navient Corp | 27,776 | 364,421 | ||||||
Radian Group Inc | 5,814 | 110,699 | ||||||
Raymond James Financial Inc | 12,569 | 1,123,794 | ||||||
Regency Centers Corp REIT | 9,886 | 583,076 | ||||||
Regions Financial Corp | 32,399 | 601,973 | ||||||
Reinsurance Group of America Inc | 6,643 | 1,023,022 | ||||||
SL Green Realty Corp REIT | 7,514 | 727,581 | ||||||
SLM Corp * | 43,721 | 490,112 | ||||||
State Street Corp | 4,678 | 466,537 | ||||||
SunTrust Banks Inc | 13,339 | 907,586 | ||||||
Synchrony Financial | 16,366 | 548,752 | ||||||
TD Ameritrade Holding Corp | 12,251 | 725,627 | ||||||
The Allstate Corp | 7,622 | 722,566 | ||||||
Torchmark Corp | 2,544 | 214,128 | ||||||
Unum Group | 4,522 | 215,292 | ||||||
WR Berkley Corp | 8,138 | 591,633 | ||||||
XL Group Ltd (Bermuda) | 9,114 | 503,640 | ||||||
|
| |||||||
| 22,454,446 | ||||||||
|
| |||||||
Industrial - 19.7% | ||||||||
AMETEK Inc | 12,111 | 920,073 | ||||||
Arconic Inc | 14,471 | 333,412 | ||||||
Arrow Electronics Inc * | 6,981 | 537,677 | ||||||
Avnet Inc | 7,292 | 304,514 | ||||||
Belden Inc | 4,080 | 281,275 | ||||||
Berry Global Group Inc * | 8,996 | 493,071 | ||||||
Cemex SAB de CV ADR (Mexico) * | 30,354 | 200,943 | ||||||
Crown Holdings Inc * | 6,723 | 341,192 | ||||||
Cummins Inc | 2,142 | 347,197 | ||||||
Curtiss-Wright Corp | 3,953 | 533,932 | ||||||
Dover Corp | 5,231 | 513,789 | ||||||
Eaton Corp PLC | 6,821 | 545,066 | ||||||
EnerSys | 4,848 | 336,306 | ||||||
Flex Ltd * | 24,042 | 392,606 | ||||||
Fluor Corp | 5,774 | 330,388 | ||||||
Graphic Packaging Holding Co | 36,601 | 561,825 | ||||||
Harris Corp | 6,957 | 1,122,025 | ||||||
Hubbell Inc | 1,926 | 234,548 | ||||||
Huntington Ingalls Industries Inc | 1,382 | 356,224 | ||||||
Ingersoll-Rand PLC | 2,460 | 210,355 | ||||||
L3 Technologies Inc | 1,591 | 330,928 | ||||||
Masco Corp | 20,317 | 821,619 | ||||||
MasTec Inc * | 4,737 | 222,876 | ||||||
Parker-Hannifin Corp | 3,595 | 614,853 | ||||||
Spirit AeroSystems Holdings Inc ‘A’ | 6,201 | 519,024 | ||||||
Stanley Black & Decker Inc | 2,252 | 345,006 | ||||||
| See Notes to Financial Statements | See explanation of symbols and terms, if any, on B-114 and B-115 |
B-60
Table of Contents
PACIFIC FUNDS
PF MID-CAP VALUE FUND
Schedule of Investments (Continued)
March 31, 2018
Shares | Value | |||||||
TE Connectivity Ltd | 9,218 | $920,878 | ||||||
Textron Inc | 8,961 | 528,430 | ||||||
The Timken Co | 6,145 | 280,212 | ||||||
WestRock Co | 6,588 | 422,763 | ||||||
|
| |||||||
| 13,903,007 | ||||||||
|
| |||||||
Technology - 11.2% | ||||||||
Activision Blizzard Inc | 5,651 | 381,216 | ||||||
Amdocs Ltd | 15,296 | 1,020,549 | ||||||
Cognizant Technology Solutions Corp ‘A’ | 2,654 | 213,647 | ||||||
DXC Technology Co | 9,518 | 956,845 | ||||||
Fidelity National Information Services Inc | 11,291 | 1,087,323 | ||||||
HP Inc | 24,044 | 527,044 | ||||||
KLA-Tencor Corp | 3,615 | 394,071 | ||||||
Leidos Holdings Inc | 6,976 | 456,230 | ||||||
Marvell Technology Group Ltd (Bermuda) | 18,990 | 398,790 | ||||||
Microsemi Corp * | 3,603 | 233,186 | ||||||
NetApp Inc | 8,536 | 526,586 | ||||||
NetEase Inc ADR (China) | 577 | 161,785 | ||||||
ON Semiconductor Corp * | 11,222 | 274,490 | ||||||
Qorvo Inc * | 2,785 | 196,203 | ||||||
Skyworks Solutions Inc | 2,289 | 229,495 | ||||||
The Dun & Bradstreet Corp | 2,967 | 347,139 | ||||||
Western Digital Corp | 2,288 | 211,114 | ||||||
Xerox Corp | 11,630 | 334,711 | ||||||
|
| |||||||
| 7,950,424 | ||||||||
|
| |||||||
Utilities - 6.3% | ||||||||
Alliant Energy Corp | 17,126 | 699,768 | ||||||
DTE Energy Co | 5,183 | 541,105 | ||||||
Edison International | 6,432 | 409,461 | ||||||
Entergy Corp | 6,592 | 519,318 | ||||||
Great Plains Energy Inc | 9,970 | 316,946 | ||||||
PG&E Corp | 5,074 | 222,901 | ||||||
Pinnacle West Capital Corp | 11,559 | 922,408 | ||||||
Xcel Energy Inc | 18,671 | 849,157 | ||||||
|
| |||||||
| 4,481,064 | ||||||||
|
| |||||||
Total Common Stocks | 69,337,798 | |||||||
|
| |||||||
Shares | Value | |||||||
SHORT-TERM INVESTMENT - 2.1% | ||||||||
Money Market Fund - 2.1% | ||||||||
BlackRock Liquidity Funds T-Fund Portfolio | 1,521,234 | $1,521,234 | ||||||
|
| |||||||
Total Short-Term Investment | 1,521,234 | |||||||
|
| |||||||
TOTAL INVESTMENTS - 100.1% | 70,859,032 | |||||||
OTHER ASSETS & LIABILITIES, NET - (0.1%) | (81,765 | ) | ||||||
|
| |||||||
NET ASSETS - 100.0% |
| $70,777,267 | ||||||
|
| |||||||
Notes to Schedule of Investments
| (a) | As of March 31, 2018, the Fund’s composition by sector as a percentage of net assets was as follows: |
Financial | 31.7% | |||
Industrial | 19.7% | |||
Technology | 11.2% | |||
Consumer, Non-Cyclical | 10.0% | |||
Energy | 7.7% | |||
Consumer, Cyclical | 6.4% | |||
Utilities | 6.3% | |||
Others (each less than 3.0%) | 7.1% | |||
|
| |||
| 100.1% | ||||
Other Assets & Liabilities, Net | (0.1% | ) | ||
|
| |||
| 100.0% | ||||
|
|
| (b) | Fair Value Measurements |
The following is a summary of the Fund’s investments as categorized under the three-tier hierarchy of inputs used in valuing the Fund’s assets and liabilities (See Note 3D in Notes to Financial Statements) as of March 31, 2018:
| Total Value at March 31, 2018 | Level 1 Quoted Price | Level 2 Significant | Level 3 Significant | |||||||||||||||
Assets | Common Stocks | $69,337,798 | $69,337,798 | $— | $— | |||||||||||||
Short-Term Investment | 1,521,234 | 1,521,234 | — | — | ||||||||||||||
|
|
|
|
|
|
|
| |||||||||||
Total | $70,859,032 | $70,859,032 | $— | $— | ||||||||||||||
|
|
|
|
|
|
|
| |||||||||||
| See Notes to Financial Statements | See explanation of symbols and terms, if any, on B-114 and B-115 |
B-61
Table of Contents
PACIFIC FUNDS
PF SMALL-CAP VALUE FUND
Schedule of Investments
March 31, 2018
Shares | Value | |||||||
COMMON STOCKS - 97.5% | ||||||||
Basic Materials - 1.2% | ||||||||
Orion Engineered Carbons SA (Luxembourg) | 35,760 | $969,096 | ||||||
|
| |||||||
Communications - 4.4% | ||||||||
A10 Networks Inc * | 105,776 | 615,616 | ||||||
Extreme Networks Inc * | 40,320 | 446,342 | ||||||
Finisar Corp * | 36,940 | 584,021 | ||||||
Houghton Mifflin Harcourt Co * | 61,127 | 424,833 | ||||||
Infinera Corp * | 56,690 | 615,653 | ||||||
Scholastic Corp | 21,930 | 851,761 | ||||||
|
| |||||||
| 3,538,226 | ||||||||
|
| |||||||
Consumer, Cyclical - 14.7% | ||||||||
Anixter International Inc * | 15,830 | 1,199,123 | ||||||
Bloomin’ Brands Inc | 38,150 | 926,282 | ||||||
Caleres Inc | 19,130 | 642,768 | ||||||
Citi Trends Inc | 32,560 | 1,006,430 | ||||||
Cooper-Standard Holdings Inc * | 8,523 | 1,046,710 | ||||||
Crocs Inc * | 64,030 | 1,040,488 | ||||||
Dana Inc | 21,190 | 545,854 | ||||||
Deckers Outdoor Corp * | 10,640 | 957,919 | ||||||
Ethan Allen Interiors Inc | 22,380 | 513,621 | ||||||
Hawaiian Holdings Inc | 16,380 | 633,906 | ||||||
Knoll Inc | 44,420 | 896,840 | ||||||
Red Robin Gourmet Burgers Inc * | 12,340 | 715,720 | ||||||
Signet Jewelers Ltd | 15,150 | 583,578 | ||||||
SkyWest Inc | 21,395 | 1,163,888 | ||||||
Tower International Inc | 4,500 | 124,875 | ||||||
|
| |||||||
| 11,998,002 | ||||||||
|
| |||||||
Consumer, Non-Cyclical - 10.3% | ||||||||
ABM Industries Inc | 9,520 | 318,730 | ||||||
Booz Allen Hamilton Holding Corp | 23,910 | 925,795 | ||||||
Cott Corp (Canada) | 67,790 | 997,869 | ||||||
ICON PLC * | 9,411 | 1,111,816 | ||||||
LifePoint Health Inc * | 14,600 | 686,200 | ||||||
Molina Healthcare Inc * | 11,050 | 897,039 | ||||||
Nomad Foods Ltd (United Kingdom) * | 35,820 | 563,807 | ||||||
Sotheby’s * | 19,960 | 1,024,148 | ||||||
TrueBlue Inc * | 32,430 | 839,937 | ||||||
Viad Corp | 8,930 | 468,379 | ||||||
WellCare Health Plans Inc * | 2,910 | 563,463 | ||||||
|
| |||||||
| 8,397,183 | ||||||||
|
| |||||||
Energy - 7.2% | ||||||||
Helix Energy Solutions Group Inc * | 43,240 | 250,360 | ||||||
MRC Global Inc * | 39,260 | 645,434 | ||||||
Oasis Petroleum Inc * | 78,630 | 636,903 | ||||||
Oil States International Inc * | 25,280 | 662,336 | ||||||
Patterson-UTI Energy Inc | 35,430 | 620,379 | ||||||
QEP Resources Inc * | 78,840 | 771,844 | ||||||
RPC Inc | 44,310 | 798,909 | ||||||
SM Energy Co | 36,130 | 651,424 | ||||||
SRC Energy Inc * | 87,650 | 826,540 | ||||||
|
| |||||||
| 5,864,129 | ||||||||
|
| |||||||
Financial - 27.6% | ||||||||
1st Source Corp | 12,459 | 630,675 | ||||||
Armada Hoffler Properties Inc REIT | 38,540 | 527,613 | ||||||
Associated Banc-Corp | 46,760 | 1,161,986 | ||||||
Customers Bancorp Inc * | 28,576 | 832,990 | ||||||
Education Realty Trust Inc REIT | 21,990 | 720,173 | ||||||
Essent Group Ltd * | 18,730 | 797,149 | ||||||
First American Financial Corp | 8,690 | 509,929 | ||||||
First Commonwealth Financial Corp | 55,070 | 778,139 | ||||||
Fulton Financial Corp | 46,180 | 819,695 | ||||||
Shares | Value | |||||||
Gramercy Property Trust REIT | 36,995 | $803,901 | ||||||
Heritage Financial Corp | 27,162 | 831,157 | ||||||
Hope Bancorp Inc | 55,491 | 1,009,382 | ||||||
Independence Realty Trust Inc REIT | 79,140 | 726,505 | ||||||
Independent Bank Group Inc | 19,090 | 1,349,663 | ||||||
National Storage Affiliates Trust REIT | 37,690 | 945,265 | ||||||
Selective Insurance Group Inc | 14,780 | 897,146 | ||||||
STAG Industrial Inc REIT | 28,380 | 678,850 | ||||||
State Auto Financial Corp | 14,630 | 417,979 | ||||||
Sterling Bancorp | 58,340 | 1,315,567 | ||||||
Synovus Financial Corp | 16,540 | 826,008 | ||||||
Texas Capital Bancshares Inc * | 14,510 | 1,304,449 | ||||||
Umpqua Holdings Corp | 61,340 | 1,313,289 | ||||||
Validus Holdings Ltd | 7,990 | 538,926 | ||||||
Webster Financial Corp | 18,200 | 1,008,280 | ||||||
WSFS Financial Corp | 13,615 | 652,159 | ||||||
Zions Bancorp | 21,384 | 1,127,578 | ||||||
|
| |||||||
| 22,524,453 | ||||||||
|
| |||||||
Industrial - 17.5% | ||||||||
AECOM * | 20,869 | 743,552 | ||||||
Air Transport Services Group Inc * | 20,040 | 467,333 | ||||||
Atlas Air Worldwide Holdings Inc * | 12,890 | 779,200 | ||||||
Columbus McKinnon Corp | 21,880 | 784,179 | ||||||
Covenant Transportation Group Inc ‘A’ * | 35,973 | 1,073,075 | ||||||
EnerSys | 14,920 | 1,035,000 | ||||||
General Cable Corp | 28,280 | 837,088 | ||||||
Granite Construction Inc | 14,070 | 785,950 | ||||||
Graphic Packaging Holding Co | 68,920 | 1,057,922 | ||||||
MYR Group Inc * | 18,020 | 555,376 | ||||||
Oshkosh Corp | 10,510 | 812,108 | ||||||
Regal Beloit Corp | 13,260 | 972,621 | ||||||
Saia Inc * | 10,306 | 774,496 | ||||||
Sanmina Corp * | 25,550 | 668,132 | ||||||
SPX FLOW Inc * | 11,630 | 572,080 | ||||||
Terex Corp | 13,379 | 500,508 | ||||||
Trinseo SA | 14,249 | 1,055,138 | ||||||
Tutor Perini Corp * | 36,930 | 814,306 | ||||||
|
| |||||||
| 14,288,064 | ||||||||
|
| |||||||
Technology - 12.1% | ||||||||
CSG Systems International Inc | 22,440 | 1,016,308 | ||||||
Kulicke & Soffa Industries Inc (Singapore) * | 41,830 | 1,046,168 | ||||||
Luxoft Holding Inc * | 15,770 | 645,781 | ||||||
MagnaChip Semiconductor Corp (South Korea) * | 83,148 | 798,221 | ||||||
Mellanox Technologies Ltd (Israel) * | 9,540 | 694,989 | ||||||
Mitel Networks Corp * | 54,011 | 501,222 | ||||||
NCR Corp * | 32,750 | 1,032,280 | ||||||
Unisys Corp * | 74,944 | 805,648 | ||||||
VeriFone Systems Inc * | 53,960 | 829,905 | ||||||
Verint Systems Inc * | 28,560 | 1,216,656 | ||||||
Virtusa Corp * | 11,050 | 535,483 | ||||||
WNS Holdings Ltd ADR (India) * | 17,050 | 772,876 | ||||||
|
| |||||||
| 9,895,537 | ||||||||
|
| |||||||
Utilities - 2.5% | ||||||||
Black Hills Corp | 11,340 | 615,762 | ||||||
PNM Resources Inc | 20,430 | 781,447 | ||||||
Portland General Electric Co | 16,240 | 657,882 | ||||||
|
| |||||||
| 2,055,091 | ||||||||
|
| |||||||
Total Common Stocks | 79,529,781 | |||||||
|
| |||||||
| See Notes to Financial Statements | See explanation of symbols and terms, if any, on B-114 and B-115 |
B-62
Table of Contents
PACIFIC FUNDS
PF SMALL-CAP VALUE FUND
Schedule of Investments (Continued)
March 31, 2018
Shares | Value | |||||||
SHORT-TERM INVESTMENT - 2.6% |
| |||||||
Money Market Fund - 2.6% | ||||||||
BlackRock Liquidity Funds T-Fund Portfolio | 2,093,345 | $2,093,345 | ||||||
|
| |||||||
Total Short-Term Investment |
| 2,093,345 | ||||||
|
| |||||||
TOTAL INVESTMENTS - 100.1% |
| 81,623,126 | ||||||
OTHER ASSETS & LIABILITIES, NET - (0.1%) |
| (108,584 | ) | |||||
|
| |||||||
NET ASSETS - 100.0% |
| $81,514,542 | ||||||
|
| |||||||
Notes to Schedule of Investments
| (a) | As of March 31, 2018, the Fund’s composition by sector as a percentage of net assets was as follows: |
Financial | 27.6% | |||
Industrial | 17.5% | |||
Consumer, Cyclical | 14.7% | |||
Technology | 12.1% | |||
Consumer, Non-Cyclical | 10.3% | |||
Energy | 7.2% | |||
Communications | 4.4% | |||
Others (each less than 3.0%) | 6.3% | |||
|
| |||
| 100.1% | ||||
Other Assets & Liabilities, Net | (0.1% | ) | ||
|
| |||
| 100.0% | ||||
|
|
| (b) | Fair Value Measurements |
The following is a summary of the Fund’s investments as categorized under the three-tier hierarchy of inputs used in valuing the Fund’s assets and liabilities (See Note 3D in Notes to Financial Statements) as of March 31, 2018:
| Total Value at March 31, 2018 | Level 1 Quoted Price | Level 2 Significant Observable Inputs | Level 3 Significant Unobservable Inputs | |||||||||||||||
Assets | Common Stocks | $79,529,781 | $79,529,781 | $— | $— | |||||||||||||
Short-Term Investment | 2,093,345 | 2,093,345 | — | — | ||||||||||||||
|
|
|
|
|
|
|
| |||||||||||
Total | $81,623,126 | $81,623,126 | $— | $— | ||||||||||||||
|
|
|
|
|
|
|
| |||||||||||
| See Notes to Financial Statements | See explanation of symbols and terms, if any, on B-114 and B-115 |
B-63
Table of Contents
PACIFIC FUNDS
PF EMERGING MARKETS FUND
Schedule of Investments
March 31, 2018
Shares | Value | |||||||
PREFERRED STOCKS - 2.0% | ||||||||
Brazil - 1.9% | ||||||||
Itau Unibanco Holding SA ADR | 71,060 | $1,108,536 | ||||||
Lojas Americanas SA | 404,918 | 2,293,528 | ||||||
|
| |||||||
| 3,402,064 | ||||||||
|
| |||||||
India - 0.1% | ||||||||
Zee Entertainment Enterprises Ltd | 567,139 | 65,565 | ||||||
|
| |||||||
Total Preferred Stocks |
| 3,467,629 | ||||||
|
| |||||||
COMMON STOCKS - 95.1% | ||||||||
Argentina - 0.1% | ||||||||
MercadoLibre Inc | 280 | 99,789 | ||||||
|
| |||||||
Brazil - 4.0% | ||||||||
Atacadao Distribuicao Comercio e Industria Ltda * | 391,600 | 1,791,080 | ||||||
B3 SA - Brasil Bolsa Balcao | 434,716 | 3,524,920 | ||||||
Natura Cosmeticos SA | 9,800 | 95,167 | ||||||
Sul America SA | 48,640 | 323,388 | ||||||
Vale SA ADR | 108,460 | 1,379,611 | ||||||
|
| |||||||
| 7,114,166 | ||||||||
|
| |||||||
Chile - 0.2% | ||||||||
Banco de Chile | 1,774,197 | 298,109 | ||||||
SACI Falabella | 14,235 | 137,266 | ||||||
|
| |||||||
| 435,375 | ||||||||
|
| |||||||
China - 22.6% | ||||||||
3SBio Inc * ~ | 172,500 | 392,907 | ||||||
Alibaba Group Holding Ltd ADR * | 51,385 | 9,431,203 | ||||||
China International Capital Corp Ltd ‘H’ ~ | 338,400 | 685,804 | ||||||
China Lodging Group Ltd ADR | 22,055 | 2,904,864 | ||||||
Ctrip.com International Ltd ADR * | 67,690 | 3,155,708 | ||||||
Dong-E-E-Jiao Co. Ltd ‘A’ | 20,200 | 196,766 | ||||||
JD.com Inc ADR * | 10,473 | 424,052 | ||||||
Jiangsu Hengrui Medicine Co Ltd ‘A’ | 319,905 | 4,424,072 | ||||||
Kweichow Moutai Co Ltd ‘A’ | 18,544 | 2,014,885 | ||||||
New Oriental Education & Technology Group Inc ADR | 15,440 | 1,353,316 | ||||||
Sinopharm Group Co Ltd ‘H’ | 769,600 | 3,853,810 | ||||||
Sunny Optical Technology Group Co Ltd | 18,000 | 337,754 | ||||||
Tencent Holdings Ltd | 164,922 | 8,852,942 | ||||||
Want Want China Holdings Ltd | 789,000 | 634,762 | ||||||
Wuxi Biologics Cayman Inc * ~ | 35,500 | 345,489 | ||||||
Yum China Holdings Inc | 8,970 | 372,255 | ||||||
ZTO Express Cayman Inc ADR | 60,480 | 906,595 | ||||||
|
| |||||||
|
| |||||||
| 40,287,184 | ||||||||
|
| |||||||
Colombia - 1.1% | ||||||||
Grupo Aval Acciones y Valores SA ADR | 120,619 | 1,002,344 | ||||||
Grupo de Inversiones Suramericana SA | 71,746 | 957,278 | ||||||
|
| |||||||
| 1,959,622 | ||||||||
|
| |||||||
Egypt - 0.5% | ||||||||
Commercial International Bank Egypt SAE | 163,299 | 824,461 | ||||||
|
| |||||||
France - 4.8% | ||||||||
Kering SA | 9,777 | 4,689,222 | ||||||
LVMH Moet Hennessy Louis Vuitton SE | 12,866 | 3,964,961 | ||||||
|
| |||||||
| 8,654,183 | ||||||||
|
| |||||||
Hong Kong - 4.1% | ||||||||
AIA Group Ltd | 494,200 | 4,224,757 | ||||||
Hang Lung Group Ltd | 39,000 | 127,900 | ||||||
Shares | Value | |||||||
Hong Kong Exchanges & Clearing Ltd | 17,135 | $564,376 | ||||||
Hutchison China MediTech Ltd ADR * | 6,200 | 183,272 | ||||||
Jardine Strategic Holdings Ltd | 59,811 | 2,299,356 | ||||||
|
| |||||||
| 7,399,661 | ||||||||
|
| |||||||
India - 11.8% | ||||||||
Apollo Hospitals Enterprise Ltd | 52,601 | 864,225 | ||||||
Biocon Ltd | 115,121 | 1,055,061 | ||||||
Cholamandalam Investment and Finance Co Ltd | 30,819 | 689,831 | ||||||
Dalmia Bharat Ltd | 4,290 | 189,991 | ||||||
Dr Reddy’s Laboratories Ltd | 23,528 | 755,817 | ||||||
Housing Development Finance Corp Ltd | 221,634 | 6,243,012 | ||||||
Infosys Ltd | 68,087 | 1,191,400 | ||||||
Kotak Mahindra Bank Ltd | 254,031 | 4,102,363 | ||||||
Reliance Industries Ltd | 38,215 | 521,611 | ||||||
Tata Consultancy Services Ltd | 35,589 | 1,559,505 | ||||||
UltraTech Cement Ltd | 21,098 | 1,284,168 | ||||||
Zee Entertainment Enterprises Ltd | 290,647 | 2,579,910 | ||||||
|
| |||||||
| 21,036,894 | ||||||||
|
| |||||||
Indonesia - 1.8% | ||||||||
P.T. Astra International Tbk | 1,320,000 | 701,981 | ||||||
P.T. Bank Central Asia Tbk | 270,700 | 459,862 | ||||||
P.T. Bank Mandiri Persero Tbk | 1,973,500 | 1,106,644 | ||||||
P.T. Bank Rakyat Indonesia Persero Tbk | 1,237,300 | 324,717 | ||||||
P.T. Indocement Tunggal Prakarsa Tbk | 558,200 | 652,909 | ||||||
|
| |||||||
| 3,246,113 | ||||||||
|
| |||||||
Italy - 1.2% | ||||||||
PRADA SpA | 462,100 | 2,173,831 | ||||||
|
| |||||||
Malaysia - 1.0% | ||||||||
Genting Bhd | 642,300 | 1,449,658 | ||||||
Genting Malaysia Bhd | 207,000 | 262,229 | ||||||
|
| |||||||
| 1,711,887 | ||||||||
|
| |||||||
Mexico - 4.9% | ||||||||
Fomento Economico Mexicano SAB de CV | 261,393 | 2,384,169 | ||||||
Fomento Economico Mexicano SAB de CV ADR | 12,970 | 1,185,847 | ||||||
Grupo Aeroportuario del Sureste SAB de CV ‘B’ | 53,926 | 908,911 | ||||||
Grupo Financiero Inbursa SAB de CV ‘O’ | 923,011 | 1,527,690 | ||||||
Grupo Mexico SAB de CV ‘B’ | 660,987 | 2,201,472 | ||||||
Kimberly-Clark de Mexico SAB de CV ‘A’ | 254,233 | 476,023 | ||||||
|
| |||||||
| 8,684,112 | ||||||||
|
| |||||||
Nigeria - 0.1% | ||||||||
Zenith Bank PLC | 2,467,084 | 200,793 | ||||||
|
| |||||||
Peru - 1.2% | ||||||||
Credicorp Ltd | 9,750 | 2,213,640 | ||||||
|
| |||||||
Philippines - 3.5% | ||||||||
Ayala Corp | 32,260 | 588,655 | ||||||
Ayala Land Inc | 1,388,300 | 1,098,620 | ||||||
Jollibee Foods Corp | 191,030 | 1,101,032 | ||||||
SM Investments Corp | 117,867 | 2,085,897 | ||||||
SM Prime Holdings Inc | 2,085,670 | 1,356,024 | ||||||
|
| |||||||
| 6,230,228 | ||||||||
|
| |||||||
Portugal - 0.2% | ||||||||
Jeronimo Martins SGPS SA | 16,946 | 308,224 | ||||||
|
| |||||||
Russia - 7.6% | ||||||||
LUKOIL PJSC ADR | 8,320 | 574,442 | ||||||
Magnit PJSC | 23,995 | 1,945,251 | ||||||
Moscow Exchange MICEX-RTS PJSC | 253,749 | 520,866 | ||||||
| See Notes to Financial Statements | See explanation of symbols and terms, if any, on B-114 and B-115 |
B-64
Table of Contents
PACIFIC FUNDS
PF EMERGING MARKETS FUND
Schedule of Investments (Continued)
March 31, 2018
Shares | Value | |||||||
Novatek PJSC GDR ~ | 40,870 | $5,606,887 | ||||||
Polyus PJSC GDR ~ | 10,900 | 424,010 | ||||||
Sberbank of Russia PJSC | 531,096 | 2,365,475 | ||||||
Sberbank of Russia PJSC ADR | 68,768 | 1,284,407 | ||||||
Yandex NV ‘A’ * | 22,940 | 904,983 | ||||||
|
| |||||||
| 13,626,321 | ||||||||
|
| |||||||
South Africa - 3.6% | ||||||||
FirstRand Ltd | 608,671 | 3,439,452 | ||||||
Mediclinic International PLC | 128,980 | 1,088,220 | ||||||
Shoprite Holdings Ltd | 79,672 | 1,700,906 | ||||||
Steinhoff International Holdings NV | 515,514 | 143,697 | ||||||
|
| |||||||
| 6,372,275 | ||||||||
|
| |||||||
South Korea - 8.3% | ||||||||
Amorepacific Corp | 4,618 | 1,373,399 | ||||||
AMOREPACIFIC Group | 2,600 | 346,374 | ||||||
Celltrion Healthcare Co Ltd * | 211 | 21,082 | ||||||
Celltrion Inc * | 80 | 23,229 | ||||||
Kakao Corp | 2,653 | 328,545 | ||||||
LG Household & Health Care Ltd | 2,634 | 2,985,151 | ||||||
NAVER Corp | 5,324 | 3,955,913 | ||||||
Netmarble Games Corp ~ | 1,119 | 160,622 | ||||||
Samsung Biologics Co Ltd * ~ | 4,029 | 1,840,813 | ||||||
Samsung Electronics Co Ltd | 1,636 | 3,777,274 | ||||||
|
| |||||||
| 14,812,402 | ||||||||
|
| |||||||
Spain - 0.2% | ||||||||
Prosegur Cash SA ~ | 138,417 | 416,421 | ||||||
|
| |||||||
Switzerland - 3.0% | ||||||||
Glencore PLC | 1,059,756 | 5,266,160 | ||||||
|
| |||||||
Taiwan - 6.2% | ||||||||
Largan Precision Co Ltd | 4,000 | 456,837 | ||||||
Taiwan Semiconductor Manufacturing Co Ltd | 1,246,995 | 10,520,999 | ||||||
|
| |||||||
| 10,977,836 | ||||||||
|
| |||||||
Turkey - 1.0% | ||||||||
Anadolu Efes Biracilik Ve Malt Sanayii AS | 170,641 | 1,171,077 | ||||||
BIM Birlesik Magazalar AS | 38,219 | 693,045 | ||||||
|
| |||||||
| 1,864,122 | ||||||||
|
| |||||||
United Arab Emirates - 1.7% | ||||||||
DP World Ltd | 97,581 | 2,197,409 | ||||||
Emaar Properties PJSC | 562,288 | 887,892 | ||||||
|
| |||||||
| 3,085,301 | ||||||||
|
| |||||||
United Kingdom - 0.0% | ||||||||
Unilever PLC l | — | 23 | ||||||
|
| |||||||
United States - 0.4% | ||||||||
Snap Inc ‘A’ * | 42,160 | 669,079 | ||||||
|
| |||||||
Total Common Stocks |
| 169,670,103 | ||||||
|
| |||||||
Shares | Value | |||||||
SHORT-TERM INVESTMENT - 3.3% | ||||||||
Money Market Fund - 3.3% | ||||||||
BlackRock Liquidity Funds T-Fund Portfolio | 5,927,515 | $5,927,515 | ||||||
|
| |||||||
Total Short-Term Investment |
| 5,927,515 | ||||||
|
| |||||||
TOTAL INVESTMENTS - 100.4% |
| 179,065,247 | ||||||
OTHER ASSETS & LIABILITIES, NET - (0.4%) |
| (673,794 | ) | |||||
|
| |||||||
NET ASSETS - 100.0% |
| $178,391,453 | ||||||
|
| |||||||
Notes to Schedule of Investments
| (a) | As of March 31, 2018, the Fund’s composition by sector as a percentage of net assets was as follows: |
Financial | 23.6% | |||
Consumer, Non-Cyclical | 20.4% | |||
Communications | 17.1% | |||
Consumer, Cyclical | 13.5% | |||
Technology | 9.6% | |||
Basic Materials | 5.2% | |||
Energy | 3.8% | |||
Short-Term Investment | 3.3% | |||
Others (each less than 3.0%) | 3.9% | |||
|
| |||
| 100.4% | ||||
Other Assets & Liabilities, Net | (0.4% | ) | ||
|
| |||
| 100.0% | ||||
|
|
| (b) | As of March 31, 2018, the Fund’s composition by country of risk as a percentage of net assets was as follows: |
China | 22.6% | |||
India | 11.9% | |||
South Korea | 8.3% | |||
Russia | 7.6% | |||
Taiwan | 6.2% | |||
Brazil | 5.9% | |||
Mexico | 4.9% | |||
France | 4.8% | |||
Hong Kong | 4.1% | |||
United States (Includes Short-Term Investment) | 3.7% | |||
South Africa | 3.6% | |||
Philippines | 3.5% | |||
Switzerland | 3.0% | |||
Others (each less than 3.0%) | 10.3% | |||
|
| |||
| 100.4% | ||||
Other Assets & Liabilities, Net | (0.4% | ) | ||
|
| |||
| 100.0% | ||||
|
|
| See Notes to Financial Statements | See explanation of symbols and terms, if any, on B-114 and B-115 |
B-65
Table of Contents
PACIFIC FUNDS
PF EMERGING MARKETS FUND
Schedule of Investments (Continued)
March 31, 2018
| (c) | Fair Value Measurements |
The following is a summary of the Fund’s investments as categorized under the three-tier hierarchy of inputs used in valuing the Fund’s assets and liabilities (See Note 3D in Notes to Financial Statements) as of March 31, 2018:
| Total Value at March 31, 2018 | Level 1 Quoted Price | Level 2 Significant Observable Inputs | Level 3 Significant Unobservable Inputs | |||||||||||||||
Assets | Preferred Stocks | $3,467,629 | $3,467,629 | $— | $— | |||||||||||||
Common Stocks | ||||||||||||||||||
Argentina | 99,789 | 99,789 | — | — | ||||||||||||||
Brazil | 7,114,166 | 3,589,246 | 3,524,920 | — | ||||||||||||||
Chile | 435,375 | 435,375 | — | — | ||||||||||||||
China | 40,287,184 | 28,840,760 | 11,446,424 | — | ||||||||||||||
Colombia | 1,959,622 | 1,959,622 | — | — | ||||||||||||||
Egypt | 824,461 | 824,461 | — | — | ||||||||||||||
France | 8,654,183 | — | 8,654,183 | — | ||||||||||||||
Hong Kong | 7,399,661 | 183,272 | 7,216,389 | — | ||||||||||||||
India | 21,036,894 | — | 21,036,894 | — | ||||||||||||||
Indonesia | 3,246,113 | — | 3,246,113 | — | ||||||||||||||
Italy | 2,173,831 | — | 2,173,831 | — | ||||||||||||||
Malaysia | 1,711,887 | 1,711,887 | — | — | ||||||||||||||
Mexico | 8,684,112 | 8,684,112 | — | — | ||||||||||||||
Nigeria | 200,793 | 200,793 | — | — | ||||||||||||||
Peru | 2,213,640 | 2,213,640 | — | — | ||||||||||||||
Philippines | 6,230,228 | — | 6,230,228 | — | ||||||||||||||
Portugal | 308,224 | — | 308,224 | — | ||||||||||||||
Russia | 13,626,321 | 904,983 | 12,721,338 | — | ||||||||||||||
South Africa | 6,372,275 | 143,697 | 6,228,578 | — | ||||||||||||||
South Korea | 14,812,402 | 14,812,402 | — | — | ||||||||||||||
Spain | 416,421 | 416,421 | — | — | ||||||||||||||
Switzerland | 5,266,160 | — | 5,266,160 | — | ||||||||||||||
Taiwan | 10,977,836 | 10,977,836 | — | — | ||||||||||||||
Turkey | 1,864,122 | — | 1,864,122 | — | ||||||||||||||
United Arab Emirates | 3,085,301 | 887,892 | 2,197,409 | — | ||||||||||||||
United Kingdom | 23 | — | 23 | — | ||||||||||||||
United States | 669,079 | 669,079 | — | — | ||||||||||||||
|
|
|
|
|
|
|
| |||||||||||
Total Common Stocks | 169,670,103 | 77,555,267 | 92,114,836 | — | ||||||||||||||
|
|
|
|
|
|
|
| |||||||||||
Short-Term Investment | 5,927,515 | 5,927,515 | — | — | ||||||||||||||
|
|
|
|
|
|
|
| |||||||||||
Total | $179,065,247 | $86,950,411 | $92,114,836 | $— | ||||||||||||||
|
|
|
|
|
|
|
| |||||||||||
The table below shows transfers between levels. The Trust’s policy is to recognize transfers between levels as of the end of the reporting period.
Amount Transferred | Level Transfer | Change in Fair Valuation Measurement Inputs | ||||||||||||||||
| From | To | From | To | |||||||||||||||
| $2,197,409 | 1 | 2 | Unadjusted Exchange-Traded Price | Adjusted Exchange-Traded Price using an Applied Foreign Fair | ||||||||||||||
| 27,771,350 | 2 | 1 | Adjusted Exchange-Traded Price using an Applied Foreign Fair | Unadjusted Exchange-Traded Price | ||||||||||||||
| See Notes to Financial Statements | See explanation of symbols and terms, if any, on B-114 and B-115 |
B-66
Table of Contents
PACIFIC FUNDS
PF INTERNATIONAL LARGE-CAP FUND
Schedule of Investments
March 31, 2018
Shares | Value | |||||||
COMMON STOCKS - 98.4% | ||||||||
Australia - 0.6% | ||||||||
Amcor Ltd | 17,927 | $196,307 | ||||||
Orica Ltd | 39,204 | 539,629 | ||||||
|
| |||||||
| 735,936 | ||||||||
|
| |||||||
Belgium - 1.1% | ||||||||
KBC Group NV | 16,683 | 1,452,739 | ||||||
|
| |||||||
Brazil - 0.9% | ||||||||
Ambev SA ADR | 158,230 | 1,150,332 | ||||||
|
| |||||||
Canada - 3.3% | ||||||||
Canadian National Railway Co | 30,568 | 2,235,438 | ||||||
Suncor Energy Inc | 57,160 | 1,973,880 | ||||||
|
| |||||||
| 4,209,318 | ||||||||
|
| |||||||
China - 2.4% | ||||||||
Alibaba Group Holding Ltd ADR * | 3,357 | 616,144 | ||||||
Baidu Inc ADR * | 3,111 | 694,344 | ||||||
Yum China Holdings Inc | 41,070 | 1,704,405 | ||||||
|
| |||||||
| 3,014,893 | ||||||||
|
| |||||||
Denmark - 2.4% | ||||||||
Carlsberg AS ‘B’ | 7,164 | 855,343 | ||||||
Novo Nordisk AS ‘B’ | 42,968 | 2,113,418 | ||||||
|
| |||||||
| 2,968,761 | ||||||||
|
| |||||||
France - 15.4% | ||||||||
Air Liquide SA | 23,333 | 2,863,374 | ||||||
Danone SA | 20,352 | 1,650,188 | ||||||
Dassault Systemes SE | 7,257 | 986,905 | ||||||
Engie SA | 87,789 | 1,465,945 | ||||||
Essilor International Cie Generale d’Optique SA | 6,995 | 943,631 | ||||||
Hermes International | 668 | 395,958 | ||||||
L’Oreal SA | 5,681 | 1,283,104 | ||||||
Legrand SA | 15,935 | 1,250,273 | ||||||
LVMH Moet Hennessy Louis Vuitton SE | 8,557 | 2,637,041 | ||||||
Pernod Ricard SA | 17,009 | 2,830,613 | ||||||
Schneider Electric SE * | 34,013 | 2,995,235 | ||||||
|
| |||||||
| 19,302,267 | ||||||||
|
| |||||||
Germany - 9.9% | ||||||||
Bayer AG | 32,475 | 3,661,032 | ||||||
Beiersdorf AG | 19,368 | 2,194,931 | ||||||
Linde AG * | 5,495 | 1,161,146 | ||||||
Merck KGaA | 11,547 | 1,107,912 | ||||||
MTU Aero Engines AG | 4,220 | 711,230 | ||||||
ProSiebenSat.1 Media SE | 28,149 | 974,984 | ||||||
SAP SE | 25,012 | 2,625,809 | ||||||
|
| |||||||
| 12,437,044 | ||||||||
|
| |||||||
Hong Kong - 2.5% | ||||||||
AIA Group Ltd | 365,862 | 3,127,637 | ||||||
|
| |||||||
India - 3.1% | ||||||||
Housing Development Finance Corp Ltd | 51,512 | 1,450,996 | ||||||
Tata Consultancy Services Ltd | 55,709 | 2,441,161 | ||||||
|
| |||||||
| 3,892,157 | ||||||||
|
| |||||||
Israel - 1.2% | ||||||||
Check Point Software Technologies Ltd * | 15,069 | 1,496,954 | ||||||
|
| |||||||
Shares | Value | |||||||
Italy - 2.5% | ||||||||
Eni SPA | 77,266 | $1,361,062 | ||||||
Intesa Sanpaolo SPA | 419,114 | 1,525,998 | ||||||
Luxottica Group SPA | 3,511 | 218,120 | ||||||
|
| |||||||
| 3,105,180 | ||||||||
|
| |||||||
Japan - 13.8% | ||||||||
Daikin Industries Ltd | 13,200 | 1,455,777 | ||||||
Denso Corp | 29,800 | 1,629,961 | ||||||
FANUC Corp | 5,000 | 1,266,858 | ||||||
Hoya Corp | 54,700 | 2,727,160 | ||||||
Japan Tobacco Inc | 51,800 | 1,492,588 | ||||||
Kao Corp | 14,300 | 1,072,584 | ||||||
Kubota Corp | 75,400 | 1,319,438 | ||||||
Kyocera Corp | 25,600 | 1,444,504 | ||||||
Olympus Corp | 36,800 | 1,397,228 | ||||||
Shin-Etsu Chemical Co Ltd | 7,600 | 786,034 | ||||||
Terumo Corp | 51,100 | 2,684,545 | ||||||
|
| |||||||
| 17,276,677 | ||||||||
|
| |||||||
Netherlands - 5.1% | ||||||||
Akzo Nobel NV | 20,413 | 1,928,682 | ||||||
ING Groep NV | 158,198 | 2,669,627 | ||||||
Randstad Holding NV | 27,053 | 1,781,713 | ||||||
|
| |||||||
| 6,380,022 | ||||||||
|
| |||||||
Singapore - 1.8% | ||||||||
DBS Group Holdings Ltd | 105,600 | 2,230,520 | ||||||
|
| |||||||
Spain - 2.2% | ||||||||
Amadeus IT Group SA | 37,089 | 2,744,705 | ||||||
|
| |||||||
Sweden - 0.8% | ||||||||
Essity AB ‘B’ * | 36,887 | 1,022,256 | ||||||
|
| |||||||
Switzerland - 12.2% | ||||||||
Julius Baer Group Ltd | 22,048 | 1,356,867 | ||||||
Kuehne + Nagel International AG | 3,190 | 502,441 | ||||||
Nestle SA | 54,342 | 4,295,275 | ||||||
Novartis AG | 25,961 | 2,099,748 | ||||||
Roche Holding AG | 13,479 | 3,092,044 | ||||||
UBS Group AG | 153,900 | 2,711,553 | ||||||
Zurich Insurance Group AG | 3,641 | 1,201,029 | ||||||
|
| |||||||
| 15,258,957 | ||||||||
|
| |||||||
Taiwan - 1.5% | ||||||||
Taiwan Semiconductor Manufacturing Co Ltd ADR | 44,445 | 1,944,913 | ||||||
|
| |||||||
United Kingdom - 15.1% | ||||||||
Barclays PLC | 474,528 | 1,386,618 | ||||||
Compass Group PLC | 131,374 | 2,682,513 | ||||||
Diageo PLC | 57,723 | 1,952,171 | ||||||
Experian PLC | 84,300 | 1,823,124 | ||||||
Prudential PLC | 38,957 | 973,482 | ||||||
Reckitt Benckiser Group PLC | 26,041 | 2,198,058 | ||||||
RELX NV | 65,114 | 1,349,743 | ||||||
RELX PLC | 12,274 | 252,130 | ||||||
Rio Tinto PLC | 25,967 | 1,317,668 | ||||||
Rolls-Royce Holdings PLC * | 100,042 | 1,223,123 | ||||||
Smiths Group PLC | 39,286 | 835,664 | ||||||
Tesco PLC | 205,781 | 595,572 | ||||||
WPP PLC | 145,070 | 2,305,394 | ||||||
|
| |||||||
| 18,895,260 | ||||||||
|
| |||||||
| See Notes to Financial Statements | See explanation of symbols and terms, if any, on B-114 and B-115 |
B-67
Table of Contents
PACIFIC FUNDS
PF INTERNATIONAL LARGE-CAP FUND
Schedule of Investments (Continued)
March 31, 2018
Shares | Value | |||||||
United States - 0.6% | ||||||||
QIAGEN NV * | 24,675 | $797,703 | ||||||
|
| |||||||
Total Common Stocks | 123,444,231 | |||||||
|
| |||||||
SHORT-TERM INVESTMENT - 0.6% | ||||||||
Money Market Fund - 0.6% | ||||||||
BlackRock Liquidity Funds T-Fund Portfolio | 714,159 | 714,159 | ||||||
|
| |||||||
Total Short-Term Investment | 714,159 | |||||||
|
| |||||||
TOTAL INVESTMENTS - 99.0% | 124,158,390 | |||||||
OTHER ASSETS & LIABILITIES, NET - 1.0% |
| 1,226,102 | ||||||
|
| |||||||
NET ASSETS - 100.0% |
| $125,384,492 | ||||||
|
| |||||||
Notes to Schedule of Investments
| (a) | As of March 31, 2018, the Fund’s composition by sector as a percentage of net assets was as follows: |
Consumer, Non-Cyclical | 36.4% | |||
Financial | 16.0% | |||
Industrial | 14.9% | |||
Technology | 9.8% | |||
Consumer, Cyclical | 7.4% | |||
Basic Materials | 6.4% | |||
Communications | 3.7% | |||
Others (each less than 3.0%) | 4.4% | |||
|
| |||
| 99.0% | ||||
Other Assets & Liabilities, Net | 1.0% | |||
|
| |||
| 100.0% | ||||
|
|
| (b) | As of March 31, 2018, the Fund’s composition by country of risk as a percentage of net assets was as follows: |
France | 15.4% | |||
United Kingdom | 15.1% | |||
Japan | 13.8% | |||
Switzerland | 12.2% | |||
Germany | 9.9% | |||
Netherlands | 5.1% | |||
Canada | 3.3% | |||
India | 3.1% | |||
Others (each less than 3.0%) | 21.1% | |||
|
| |||
| 99.0% | ||||
Other Assets & Liabilities, Net | 1.0% | |||
|
| |||
| 100.0% | ||||
|
|
| (c) | Fair Value Measurements |
The following is a summary of the Fund’s investments as categorized under the three-tier hierarchy of inputs used in valuing the Fund’s assets and liabilities (See Note 3D in Notes to Financial Statements) as of March 31, 2018:
| Total Value at March 31, 2018 | Level 1 Quoted Price | Level 2 Significant Observable Inputs | Level 3 Significant Unobservable Inputs | |||||||||||||||
Assets | Common Stocks | |||||||||||||||||
Australia | $735,936 | $— | $735,936 | $— | ||||||||||||||
Belgium | 1,452,739 | — | 1,452,739 | — | ||||||||||||||
Brazil | 1,150,332 | 1,150,332 | — | — | ||||||||||||||
Canada | 4,209,318 | 4,209,318 | — | — | ||||||||||||||
China | 3,014,893 | 3,014,893 | — | — | ||||||||||||||
Denmark | 2,968,761 | — | 2,968,761 | — | ||||||||||||||
France | 19,302,267 | 2,830,613 | 16,471,654 | — | ||||||||||||||
Germany | 12,437,044 | — | 12,437,044 | — | ||||||||||||||
Hong Kong | 3,127,637 | — | 3,127,637 | — | ||||||||||||||
India | 3,892,157 | — | 3,892,157 | — | ||||||||||||||
Israel | 1,496,954 | 1,496,954 | — | — | ||||||||||||||
Italy | 3,105,180 | — | 3,105,180 | — | ||||||||||||||
Japan | 17,276,677 | 17,276,677 | — | — | ||||||||||||||
Netherlands | 6,380,022 | — | 6,380,022 | — | ||||||||||||||
Singapore | 2,230,520 | — | 2,230,520 | — | ||||||||||||||
Spain | 2,744,705 | — | 2,744,705 | — | ||||||||||||||
Sweden | 1,022,256 | — | 1,022,256 | — | ||||||||||||||
Switzerland | 15,258,957 | — | 15,258,957 | — | ||||||||||||||
Taiwan | 1,944,913 | 1,944,913 | — | — | ||||||||||||||
United Kingdom | 18,895,260 | — | 18,895,260 | — | ||||||||||||||
United States | 797,703 | — | 797,703 | — | ||||||||||||||
|
|
|
|
|
|
|
| |||||||||||
Total Common Stocks | 123,444,231 | 31,923,700 | 91,520,531 | — | ||||||||||||||
|
|
|
|
|
|
|
| |||||||||||
Short-Term Investment | 714,159 | 714,159 | — | — | ||||||||||||||
|
|
|
|
|
|
|
| |||||||||||
Total | $124,158,390 | $32,637,859 | $91,520,531 | $— | ||||||||||||||
|
|
|
|
|
|
|
| |||||||||||
The table below shows transfers between levels. The Trust’s policy is to recognize transfers between levels as of the end of the reporting period.
Amount Transferred | Level Transfer | Change in Fair Valuation Measurement Inputs | ||||||||||||||
| From | To | From | To | |||||||||||||
| $ | 18,710,062 | 2 | 1 | Adjusted Exchange-Traded Price using an Applied Foreign Fair Value Factor | Unadjusted Exchange-Traded Price | |||||||||||
| See Notes to Financial Statements | See explanation of symbols and terms, if any, on B-114 and B-115 |
B-68
Table of Contents
PACIFIC FUNDS
PF INTERNATIONAL SMALL-CAP FUND
Schedule of Investments
March 31, 2018
Shares | Value | |||||||
COMMON STOCKS - 97.9% |
| |||||||
Australia - 5.2% |
| |||||||
Asaleo Care Ltd | 89,001 | $88,093 | ||||||
Australian Pharmaceutical Industries Ltd | 52,648 | 61,022 | ||||||
Aveo Group » | 117,013 | 238,863 | ||||||
Beach Energy Ltd | 139,899 | 133,310 | ||||||
Charter Hall Long Wale REIT | 78,445 | 236,019 | ||||||
Charter Hall Retail REIT | 70,183 | 208,455 | ||||||
Costa Group Holdings Ltd | 39,996 | 211,323 | ||||||
CSR Ltd | 105,516 | 423,211 | ||||||
GrainCorp Ltd ‘A’ | 35,876 | 234,911 | ||||||
GWA Group Ltd | 181,836 | 473,572 | ||||||
Metcash Ltd | 174,340 | 421,882 | ||||||
Orora Ltd | 223,780 | 571,719 | ||||||
Sandfire Resources NL | 49,279 | 280,753 | ||||||
Seven Group Holdings Ltd | 16,893 | 229,562 | ||||||
Shopping Centres Australasia Property Group REIT | 104,039 | 186,920 | ||||||
Super Retail Group Ltd | 15,872 | 83,453 | ||||||
Whitehaven Coal Ltd | 77,662 | 269,397 | ||||||
WorleyParsons Ltd | 26,546 | 296,219 | ||||||
|
| |||||||
| 4,648,684 | ||||||||
|
| |||||||
Austria - 0.4% |
| |||||||
Vienna Insurance Group AG Wiener Versicherung Gruppe | 9,585 | 320,440 | ||||||
|
| |||||||
Belgium - 0.5% |
| |||||||
Barco NV | 2,535 | 312,516 | ||||||
Orange Belgium SA | 4,702 | 96,162 | ||||||
|
| |||||||
| 408,678 | ||||||||
|
| |||||||
Canada - 7.4% |
| |||||||
AGF Management Ltd ‘B’ | 45,600 | 232,185 | ||||||
Alamos Gold Inc ‘A’ | 37,000 | 192,417 | ||||||
Alaris Royalty Corp | 15,500 | 197,186 | ||||||
Avigilon Corp * | 7,500 | 157,061 | ||||||
BlackPearl Resources Inc * | 78,900 | 64,303 | ||||||
Bonavista Energy Corp | 28,800 | 26,378 | ||||||
BRP Inc | 10,200 | 391,738 | ||||||
Canfor Pulp Products Inc | 19,800 | 254,963 | ||||||
Cascades Inc | 14,700 | 152,095 | ||||||
Choice Properties REIT | 21,700 | 195,550 | ||||||
Cogeco Communications Inc | 4,000 | 219,009 | ||||||
Copper Mountain Mining Corp * | 191,000 | 176,419 | ||||||
Detour Gold Corp * | 16,000 | 161,944 | ||||||
Dundee Precious Metals Inc * | 89,300 | 213,485 | ||||||
Element Fleet Management Corp | 58,500 | 188,439 | ||||||
Empire Co Ltd ‘A’ | 12,900 | 258,931 | ||||||
Enerplus Corp | 42,100 | 473,496 | ||||||
Genworth MI Canada Inc | 11,642 | 370,491 | ||||||
Hudbay Minerals Inc | 31,200 | 220,859 | ||||||
Maple Leaf Foods Inc | 7,257 | 176,869 | ||||||
NuVista Energy Ltd * | 37,900 | 207,687 | ||||||
Parex Resources Inc * | 19,400 | 272,851 | ||||||
Premier Gold Mines Ltd * | 82,300 | 180,142 | ||||||
Raging River Exploration Inc * | 49,100 | 237,811 | ||||||
Rocky Mountain Dealership Inc | 23,900 | 227,434 | ||||||
Seven Generations Energy Ltd ‘A’ * | 19,600 | 243,412 | ||||||
SmartCentres REIT | 9,400 | 212,391 | ||||||
Taseko Mines Ltd * | 33,852 | 39,939 | ||||||
The Stars Group Inc * | 7,000 | 193,208 | ||||||
Transat AT Inc * | 29,500 | 169,899 | ||||||
Trican Well Service Ltd * | 55,600 | 129,468 | ||||||
Wajax Corp | 13,300 | 251,475 | ||||||
|
| |||||||
| 6,689,535 | ||||||||
|
| |||||||
China - 0.0% |
| |||||||
Gemdale Properties & Investment Corp Ltd | 348,143 | 41,698 | ||||||
|
| |||||||
Shares | Value | |||||||
Denmark - 2.6% |
| |||||||
Dfds AS | 7,999 | $ | 450,462 | |||||
FLSmidth & Co AS | 3,017 | 195,065 | ||||||
Rockwool International AS ‘B’ | 1,357 | 404,235 | ||||||
Royal Unibrew AS | 7,295 | 484,307 | ||||||
Spar Nord Bank AS | 19,282 | 229,984 | ||||||
Sydbank AS | 3,072 | 113,477 | ||||||
Topdanmark AS * | 9,953 | 469,958 | ||||||
|
| |||||||
| 2,347,488 | ||||||||
|
| |||||||
Finland - 0.6% |
| |||||||
Ramirent OYJ | 25,875 | 213,588 | ||||||
Valmet OYJ | 16,096 | 322,690 | ||||||
|
| |||||||
| 536,278 | ||||||||
|
| |||||||
France - 5.6% |
| |||||||
Alstom SA | 8,791 | 396,496 | ||||||
Alten SA | 3,202 | 308,688 | ||||||
Arkema SA | 2,139 | 279,244 | ||||||
Beneteau SA | 10,613 | 231,205 | ||||||
Coface SA * | 28,165 | 321,988 | ||||||
Derichebourg SA | 14,084 | 123,821 | ||||||
Eiffage SA | 5,037 | 573,671 | ||||||
Eramet* | 3,485 | 480,323 | ||||||
Eutelsat Communications SA | 9,574 | 189,761 | ||||||
Ipsen SA | 2,655 | 412,682 | ||||||
IPSOS | 6,285 | 246,978 | ||||||
Kaufman & Broad SA | 5,316 | 279,754 | ||||||
SCOR SE | 14,386 | 587,312 | ||||||
Trigano SA | 3,387 | 613,055 | ||||||
|
| |||||||
| 5,044,978 | ||||||||
|
| |||||||
Germany - 7.9% |
| |||||||
AIXTRON SE * | 10,464 | 202,479 | ||||||
Aurubis AG | 2,833 | 238,095 | ||||||
Brenntag AG | 8,787 | 523,109 | ||||||
Cewe Stiftung & Co KGaA | 1,558 | 153,228 | ||||||
Covestro AG ~ | 4,322 | 425,575 | ||||||
Deutz AG | 59,078 | 542,341 | ||||||
DIC Asset AG | 16,283 | 205,450 | ||||||
Grammer AG | 1,967 | 123,541 | ||||||
HOCHTIEF AG | 3,179 | 594,248 | ||||||
HUGO BOSS AG | 3,719 | 323,988 | ||||||
Jenoptik AG | 14,595 | 517,244 | ||||||
LEG Immobilien AG | 4,343 | 488,353 | ||||||
Leoni AG | 4,798 | 306,932 | ||||||
OSRAM Licht AG | 1,736 | 127,748 | ||||||
PNE Wind AG | 65,317 | 210,789 | ||||||
Rheinmetall AG | 4,251 | 603,407 | ||||||
Scout24 AG ~ | 5,277 | 246,050 | ||||||
Siltronic AG * | 1,961 | 336,336 | ||||||
Software AG | 2,626 | 137,660 | ||||||
TAG Immobilien AG | 15,015 | 311,533 | ||||||
Talanx AG | 6,969 | 303,017 | ||||||
United Internet AG | 2,330 | 146,815 | ||||||
|
| |||||||
| 7,067,938 | ||||||||
|
| |||||||
Hong Kong - 2.1% |
| |||||||
Dah Sing Financial Holdings Ltd | 24,800 | 157,709 | ||||||
HK Electric Investments & HK Electric Investments Ltd » ~ | 425,000 | 412,117 | ||||||
Kerry Properties Ltd | 74,500 | 336,888 | ||||||
Luk Fook Holdings International Ltd | 17,495 | 63,858 | ||||||
Melco International Development Ltd | 85,000 | 249,458 | ||||||
Shun Tak Holdings Ltd | 536,000 | 222,704 | ||||||
Valuetronics Holdings Ltd | 272,500 | 226,068 | ||||||
Vitasoy International Holdings Ltd | 92,000 | 237,426 | ||||||
|
| |||||||
| 1,906,228 | ||||||||
|
| |||||||
India - 0.4% |
| |||||||
Vedanta Resources PLC | 37,218 | 369,842 | ||||||
|
| |||||||
| See Notes to Financial Statements | See explanation of symbols and terms, if any, on B-114 and B-115 |
B-69
Table of Contents
PACIFIC FUNDS
PF INTERNATIONAL SMALL-CAP FUND
Schedule of Investments (Continued)
March 31, 2018
Shares | Value | |||||||
Israel - 0.5% |
| |||||||
Nova Measuring Instruments Ltd * | 9,565 | $ | 259,498 | |||||
Rami Levy Chain Stores Hashikma Marketing 2006 Ltd | 4,101 | 206,867 | ||||||
|
| |||||||
| 466,365 | ||||||||
|
| |||||||
Italy - 2.3% |
| |||||||
A2A SPA | 234,206 | 448,004 | ||||||
ASTM SpA | 9,410 | 237,280 | ||||||
El.En. SpA | 7,380 | 294,649 | ||||||
ERG SPA | 14,517 | 346,647 | ||||||
Infrastrutture Wireless Italiane SpA ~ | 30,674 | 242,921 | ||||||
Iren SPA | 101,761 | 319,501 | ||||||
Rizzoli Corriere Della Sera Mediagroup SPA * | 143,573 | 211,638 | ||||||
|
| |||||||
| 2,100,640 | ||||||||
|
| |||||||
Japan - 25.1% |
| |||||||
Akebono Brake Industry Co Ltd * | 63,200 | 169,872 | ||||||
Asahi Diamond Industrial Co Ltd | 28,600 | 301,038 | ||||||
Capcom Co Ltd | 20,400 | 440,765 | ||||||
Citizen Watch Co Ltd | 32,400 | 232,636 | ||||||
cocokara fine Inc | 3,700 | 252,798 | ||||||
Cosel Co Ltd | 21,200 | 295,272 | ||||||
CROOZ Inc * | 398 | 8,076 | ||||||
Daiho Corp | 41,000 | 229,651 | ||||||
Daiwabo Holdings Co Ltd | 14,300 | 626,940 | ||||||
DIC Corp | 7,200 | 241,229 | ||||||
DMG Mori Co Ltd | 11,634 | 217,362 | ||||||
Feed One Co Ltd | 110,200 | 223,704 | ||||||
First-corp Inc | 24,000 | 280,814 | ||||||
Foster Electric Co Ltd | 8,800 | 214,945 | ||||||
Glory Ltd | 7,100 | 253,226 | ||||||
Goldcrest Co Ltd | 19,900 | 425,286 | ||||||
Haseko Corp | 29,000 | 441,248 | ||||||
Japan Securities Finance Co Ltd | 43,500 | 266,956 | ||||||
Kato Sangyo Co Ltd | 7,000 | 245,054 | ||||||
Kinden Corp | 23,000 | 380,866 | ||||||
Kobe Bussan Co Ltd | 6,100 | 275,748 | ||||||
Kureha Corp | 5,200 | 338,668 | ||||||
Leopalace21 Corp | 45,900 | 382,626 | ||||||
Maruwa Co Ltd/Aichi | 7,200 | 569,748 | ||||||
Megmilk Snow Brand Co Ltd | 7,400 | 200,083 | ||||||
Meidensha Corp | 75,000 | 286,171 | ||||||
Meitec Corp | 6,600 | 365,340 | ||||||
Miraca Holdings Inc | 8,100 | 316,296 | ||||||
Mochida Pharmaceutical Co Ltd | 3,100 | 217,922 | ||||||
Morinaga & Co Ltd | 4,600 | 202,537 | ||||||
Morinaga Milk Industry Co Ltd | 7,100 | 288,924 | ||||||
Nagase & Co Ltd | 29,400 | 498,727 | ||||||
Nihon Unisys Ltd | 26,200 | 564,849 | ||||||
Nippon Chemi-Con Corp | 4,000 | 93,755 | ||||||
Nippon Piston Ring Co Ltd | 18,700 | 389,096 | ||||||
NIPPON REIT Investment Corp | 83 | 252,342 | ||||||
Nippon Yakin Kogyo Co Ltd | 109,600 | 299,738 | ||||||
Nisshin Steel Co Ltd | 20,400 | 243,677 | ||||||
Nitto Boseki Co Ltd | 9,600 | 203,539 | ||||||
North Pacific Bank Ltd | 62,400 | 208,186 | ||||||
Oiles Corp | 12,400 | 263,954 | ||||||
Penta-Ocean Construction Co Ltd | 57,700 | 422,427 | ||||||
Rengo Co Ltd | 27,700 | 239,240 | ||||||
Riken Vitamin Co Ltd | 7,500 | 290,400 | ||||||
Roland DG Corp | 7,500 | 172,619 | ||||||
Ryobi Ltd | 12,800 | 337,187 | ||||||
Sanken Electric Co Ltd | 30,000 | 219,351 | ||||||
Sankyu Inc | 8,700 | 430,891 | ||||||
Seikagaku Corp | 8,700 | 158,620 | ||||||
Seiren Co Ltd | 16,500 | 308,120 | ||||||
Seven Bank Ltd | 67,600 | 215,370 | ||||||
Shinmaywa Industries Ltd | 27,000 | 222,029 | ||||||
Shares | Value | |||||||
Shinoken Group Co Ltd | 10,900 | $ | 339,072 | |||||
Ship Healthcare Holdings Inc | 9,200 | 324,233 | ||||||
Sinanen Holdings Co Ltd | 8,000 | 195,179 | ||||||
Starts Corp Inc | 4,500 | 122,349 | ||||||
Sumitomo Seika Chemicals Co Ltd | 5,000 | 239,180 | ||||||
Tachi-S Co Ltd | 13,600 | 243,229 | ||||||
Takara Leben Co Ltd | 26,400 | 114,130 | ||||||
Tekken Corp | 7,700 | 221,075 | ||||||
The Hokkoku Bank Ltd | 7,900 | 307,002 | ||||||
The Hyakugo Bank Ltd | 50,400 | 238,252 | ||||||
The Oita Bank Ltd | 6,200 | 228,702 | ||||||
The Okinawa Electric Power Co Inc | 16,565 | 476,377 | ||||||
TOA ROAD Corp | 6,300 | 240,383 | ||||||
Toho Holdings Co Ltd | 13,600 | 320,301 | ||||||
Tokai Carbon Co Ltd | 33,600 | 521,344 | ||||||
Topy Industries Ltd | 7,900 | 230,158 | ||||||
Tosei Corp | 36,900 | 439,381 | ||||||
Toshiba TEC Corp | 39,000 | 230,177 | ||||||
Toyota Boshoku Corp | 10,800 | 221,674 | ||||||
Tsugami Corp | 34,000 | 427,536 | ||||||
Ulvac Inc | 8,600 | 482,515 | ||||||
Unipres Corp | 11,200 | 253,251 | ||||||
Unitika Ltd * | 31,100 | 194,658 | ||||||
Yodogawa Steel Works Ltd | 9,400 | 253,364 | ||||||
Yuasa Trading Co Ltd | 14,200 | 468,418 | ||||||
|
| |||||||
| 22,557,858 | ||||||||
|
| |||||||
Luxembourg - 0.4% |
| |||||||
Orion Engineered Carbons SA | 13,787 | 373,628 | ||||||
|
| |||||||
Malta - 0.3% |
| |||||||
Kindred Group PLC SDR | 21,009 | 288,235 | ||||||
|
| |||||||
Netherlands - 2.5% |
| |||||||
ASR Nederland NV | 13,119 | 560,945 | ||||||
BE Semiconductor Industries NV | 3,474 | 356,364 | ||||||
BinckBank NV | 44,232 | 252,882 | ||||||
Heijmans NV CVA * | 19,688 | 227,614 | ||||||
Koninklijke Volkerwessels NV | 7,511 | 206,125 | ||||||
OCI NV * | 4,815 | 111,413 | ||||||
Philips Lighting NV ~ | 5,981 | 224,868 | ||||||
SBM Offshore NV | 17,019 | 272,901 | ||||||
|
| |||||||
| 2,213,112 | ||||||||
|
| |||||||
New Zealand - 0.5% |
| |||||||
Air New Zealand Ltd | 100,337 | 235,110 | ||||||
Contact Energy Ltd | 64,062 | 244,294 | ||||||
|
| |||||||
| 479,404 | ||||||||
|
| |||||||
Norway - 0.4% |
| |||||||
Norwegian Finans Holding ASA * | 15,933 | 179,957 | ||||||
Salmar ASA | 3,688 | 151,856 | ||||||
|
| |||||||
| 331,813 | ||||||||
|
| |||||||
Russia - 0.4% |
| |||||||
Evraz PLC | 64,119 | 390,996 | ||||||
|
| |||||||
Singapore - 2.6% |
| |||||||
CDL Hospitality Trusts REIT » | 165,300 | 213,694 | ||||||
First Resources Ltd | 163,800 | 210,507 | ||||||
Frasers Commercial Trust REIT | 221,100 | 241,348 | ||||||
Keppel DC REIT | 239,200 | 263,367 | ||||||
Manulife US Real Estate Investment Trust REIT | 126,300 | 117,790 | ||||||
Mapletree Greater China Commercial Trust REIT | 313,009 | 275,085 | ||||||
Mapletree Industrial Trust REIT | 226,500 | 351,496 | ||||||
Venture Corp Ltd | 29,200 | 631,505 | ||||||
|
| |||||||
| 2,304,792 | ||||||||
|
| |||||||
| See Notes to Financial Statements | See explanation of symbols and terms, if any, on B-114 and B-115 |
B-70
Table of Contents
PACIFIC FUNDS
PF INTERNATIONAL SMALL-CAP FUND
Schedule of Investments (Continued)
March 31, 2018
Shares | Value | |||||||
South Korea - 4.5% |
| |||||||
Amotech Co Ltd * | 8,618 | $ | 316,939 | |||||
Chong Kun Dang Pharmaceutical Corp | 2,093 | 250,323 | ||||||
CJ O Shopping Co Ltd | 1,509 | 316,269 | ||||||
DB Insurance Co Ltd | 3,186 | 194,287 | ||||||
Dentium Co Ltd | 2,734 | 211,610 | ||||||
Eugene Technology Co Ltd | 14,577 | 253,685 | ||||||
Huchems Fine Chemical Corp | 11,446 | 264,163 | ||||||
Hyundai Marine & Fire Insurance Co Ltd | 9,819 | 358,344 | ||||||
Kumho Petrochemical Co Ltd | 2,736 | 247,444 | ||||||
LG Uplus Corp | 22,815 | 262,204 | ||||||
OCI Co Ltd | 2,056 | 302,835 | ||||||
Orion Holdings Corp | 7,930 | 203,848 | ||||||
SFA Engineering Corp | 7,406 | 240,405 | ||||||
Silicon Works Co Ltd | 6,688 | 234,039 | ||||||
SK Discovery Co Ltd | 5,894 | 229,478 | ||||||
SL Corp | 10,203 | 198,623 | ||||||
|
| |||||||
| 4,084,496 | ||||||||
|
| |||||||
Spain - 2.3% |
| |||||||
Atento SA | 19,121 | 149,144 | ||||||
Atlantica Yield PLC | 12,482 | 244,398 | ||||||
Bankinter SA | 37,651 | 387,630 | ||||||
Construcciones y Auxiliar de Ferrocarriles SA | 7,073 | 366,098 | ||||||
Enagas SA | 16,763 | 458,517 | ||||||
NH Hotel Group SA | 30,992 | 243,849 | ||||||
Saeta Yield SA | 10,384 | 155,769 | ||||||
Talgo SA ~ | 4,666 | 30,142 | ||||||
|
| |||||||
| 2,035,547 | ||||||||
|
| |||||||
Sweden - 3.5% |
| |||||||
Ahlsell AB ~ | 35,743 | 225,430 | ||||||
Attendo AB ~ | 17,768 | 167,364 | ||||||
Capio AB ~ | 37,482 | 190,148 | ||||||
Evolution Gaming Group AB ~ | 3,812 | 209,497 | ||||||
Hemfosa Fastigheter AB | 22,703 | 275,794 | ||||||
JM AB | 12,523 | 285,026 | ||||||
LeoVegas AB ~ | 24,483 | 209,261 | ||||||
Loomis AB ‘B’ | 4,156 | 150,036 | ||||||
NCC AB ‘B’ | 9,873 | 188,229 | ||||||
Nobia AB | 32,170 | 290,381 | ||||||
Peab AB | 33,020 | 298,116 | ||||||
SSAB AB ‘A’ * | 68,842 | 389,684 | ||||||
Wihlborgs Fastigheter AB | 11,643 | 270,200 | ||||||
|
| |||||||
| 3,149,166 | ||||||||
|
| |||||||
Switzerland - 8.3% |
| |||||||
Adecco Group AG | 7,400 | 527,102 | ||||||
Ascom Holding AG | 11,496 | 244,718 | ||||||
Banque Cantonale Vaudoise | 287 | 232,311 | ||||||
Bucher Industries AG | 635 | 265,341 | ||||||
Coca-Cola HBC AG | 16,032 | 593,290 | ||||||
Comet Holding AG | 1,335 | 184,931 | ||||||
EFG International AG | 46,341 | 371,689 | ||||||
Emmi AG | 343 | 281,489 | ||||||
GAM Holding AG | 19,120 | 321,949 | ||||||
Implenia AG | 3,276 | 259,920 | ||||||
Julius Baer Group Ltd | 9,791 | 602,553 | ||||||
Leonteq AG * | 3,572 | 204,347 | ||||||
Logitech International SA | 7,878 | 289,162 | ||||||
Oriflame Holding AG | 11,999 | 577,184 | ||||||
Rieter Holding AG | 1,208 | 236,718 | ||||||
Schweiter Technologies AG | 191 | 227,306 | ||||||
Siegfried Holding AG | 730 | 245,906 | ||||||
Sika AG | 17 | 133,351 | ||||||
Sonova Holding AG | 2,610 | 414,945 | ||||||
Straumann Holding AG | 938 | 591,825 | ||||||
Tecan Group AG | 1,323 | 280,187 | ||||||
VAT Group AG ~ | 2,035 | 342,674 | ||||||
|
| |||||||
| 7,428,898 | ||||||||
|
| |||||||
Shares | Value | |||||||
United Kingdom - 11.3% |
| |||||||
B&M European Value Retail SA | 63,250 | $ | 347,197 | |||||
Barratt Developments PLC | 20,839 | 155,069 | ||||||
Bellway PLC | 11,338 | 485,209 | ||||||
Brewin Dolphin Holdings PLC | 62,464 | 302,660 | ||||||
Centamin PLC | 129,808 | 281,446 | ||||||
Charter Court Financial Services Group PLC * ~ | 63,573 | 264,010 | ||||||
Chemring Group PLC | 91,982 | 258,101 | ||||||
Computacenter PLC | 18,617 | 300,711 | ||||||
ConvaTec Group PLC ~ | 83,797 | 233,788 | ||||||
Dialog Semiconductor PLC * | 2,703 | 64,373 | ||||||
esure Group PLC | 71,807 | 218,660 | ||||||
Fenner PLC | 61,844 | 528,411 | ||||||
Fevertree Drinks PLC | 13,572 | 501,385 | ||||||
Forterra PLC ~ | 64,312 | 267,079 | ||||||
Hansteen Holdings PLC REIT | 118,256 | 211,881 | ||||||
Hastings Group Holdings PLC ~ | 28,060 | 102,987 | ||||||
Inchcape PLC | 38,482 | 373,096 | ||||||
Indivior PLC * | 73,081 | 417,755 | ||||||
International Personal Finance PLC | 64,868 | 207,953 | ||||||
Jardine Lloyd Thompson Group PLC | 17,453 | 313,917 | ||||||
Man Group PLC | 60,608 | 146,149 | ||||||
Mitie Group PLC | 75,722 | 168,788 | ||||||
Morgan Sindall Group PLC | 14,410 | 236,541 | ||||||
On the Beach Group PLC ~ | 41,199 | 309,241 | ||||||
OneSavings Bank PLC | 53,260 | 279,351 | ||||||
Paragon Banking Group PLC | 44,502 | 294,561 | ||||||
Persimmon PLC | 6,821 | 242,092 | ||||||
Premier Oil PLC * | 98,110 | 95,768 | ||||||
QinetiQ Group PLC | 94,931 | 275,066 | ||||||
Safestore Holdings PLC REIT | 65,637 | 452,617 | ||||||
Spirent Communications PLC | 136,969 | 221,761 | ||||||
St Modwen Properties PLC | 41,919 | 228,270 | ||||||
Stock Spirits Group PLC | 65,485 | 228,310 | ||||||
Tate & Lyle PLC | 46,932 | 358,449 | ||||||
Taylor Wimpey PLC | 63,363 | 164,154 | ||||||
WH Smith PLC | 14,120 | 387,148 | ||||||
Workspace Group PLC REIT | 17,761 | 247,263 | ||||||
|
| |||||||
| 10,171,217 | ||||||||
|
| |||||||
United States - 0.3% |
| |||||||
Argonaut Gold Inc * | 119,900 | 228,939 | ||||||
|
| |||||||
Total Common Stocks |
| 87,986,893 | ||||||
|
| |||||||
SHORT-TERM INVESTMENT - 1.4% |
| |||||||
Money Market Fund - 1.4% |
| |||||||
BlackRock Liquidity Funds T-Fund Portfolio | 1,242,658 | 1,242,658 | ||||||
|
| |||||||
Total Short-Term Investment |
| 1,242,658 | ||||||
|
| |||||||
TOTAL INVESTMENTS - 99.3% |
| 89,229,551 | ||||||
OTHER ASSETS & LIABILITIES, NET - 0.7% |
| 586,729 | ||||||
|
| |||||||
NET ASSETS - 100.0% |
| $89,816,280 | ||||||
|
| |||||||
| See Notes to Financial Statements | See explanation of symbols and terms, if any, on B-114 and B-115 |
B-71
Table of Contents
PACIFIC FUNDS
PF INTERNATIONAL SMALL-CAP FUND
Schedule of Investments (Continued)
March 31, 2018
Notes to Schedule of Investments
| (a) | As of March 31, 2018, the Fund’s composition by sector as a percentage of net assets was as follows: |
Industrial | 20.7% | |||
Financial | 20.3% | |||
Consumer, Non-Cyclical | 15.8% | |||
Consumer, Cyclical | 15.3% | |||
Basic Materials | 9.9% | |||
Technology | 5.9% | |||
Utilities | 3.5% | |||
Energy | 3.4% | |||
Others (each less than 3.0%) | 4.5% | |||
|
| |||
| 99.3% | ||||
Other Assets & Liabilities, Net | 0.7% | |||
|
| |||
| 100.0% | ||||
|
|
| (b) | As of March 31, 2018, the Fund’s composition by country of risk as a percentage of net assets was as follows: |
Japan | 25.1% | |||
United Kingdom | 11.3% | |||
Switzerland | 8.3% | |||
Germany | 7.9% | |||
Canada | 7.4% | |||
France | 5.6% | |||
Australia | 5.2% | |||
South Korea | 4.5% | |||
Sweden | 3.5% | |||
Others (each less than 3.0%) | 20.5% | |||
|
| |||
| 99.3% | ||||
Other Assets & Liabilities, Net | 0.7% | |||
|
| |||
| 100.0% | ||||
|
|
| (c) | Fair Value Measurements |
The following is a summary of the Fund’s investments as categorized under the three-tier hierarchy of inputs used in valuing the Fund’s assets and liabilities (See Note 3D in Notes to Financial Statements) as of March 31, 2018:
| Total Value at March 31, 2018 | Level 1 Quoted Price | Level 2 Significant Observable Inputs | Level 3 Significant Unobservable Inputs | |||||||||||||||
Assets | Common Stocks | |||||||||||||||||
Australia | $4,648,684 | $— | $4,648,684 | $— | ||||||||||||||
Austria | 320,440 | — | 320,440 | — | ||||||||||||||
Belgium | 408,678 | — | 408,678 | — | ||||||||||||||
Canada | 6,689,535 | 6,689,535 | — | — | ||||||||||||||
China | 41,698 | 41,698 | — | — | ||||||||||||||
Denmark | 2,347,488 | — | 2,347,488 | — | ||||||||||||||
Finland | 536,278 | — | 536,278 | — | ||||||||||||||
France | 5,044,978 | 123,821 | 4,921,157 | — | ||||||||||||||
Germany | 7,067,938 | — | 7,067,938 | — | ||||||||||||||
Hong Kong | 1,906,228 | — | 1,906,228 | — | ||||||||||||||
India | 369,842 | — | 369,842 | — | ||||||||||||||
Israel | 466,365 | 259,498 | 206,867 | — | ||||||||||||||
Italy | 2,100,640 | 211,638 | 1,889,002 | — | ||||||||||||||
Japan | 22,557,858 | 22,557,858 | — | — | ||||||||||||||
Luxembourg | 373,628 | 373,628 | — | — | ||||||||||||||
Malta | 288,235 | — | 288,235 | — | ||||||||||||||
Netherlands | 2,213,112 | — | 2,213,112 | — | ||||||||||||||
New Zealand | 479,404 | — | 479,404 | — | ||||||||||||||
Norway | 331,813 | — | 331,813 | — | ||||||||||||||
Russia | 390,996 | — | 390,996 | — | ||||||||||||||
Singapore | 2,304,792 | — | 2,304,792 | — | ||||||||||||||
South Korea | 4,084,496 | 4,084,496 | — | — | ||||||||||||||
Spain | 2,035,547 | 882,201 | 1,153,346 | — | ||||||||||||||
Sweden | 3,149,166 | 167,364 | 2,981,802 | — | ||||||||||||||
Switzerland | 7,428,898 | — | 7,428,898 | — | ||||||||||||||
United Kingdom | 10,171,217 | 2,730,358 | 7,440,859 | — | ||||||||||||||
United States | 228,939 | 228,939 | — | — | ||||||||||||||
|
|
|
|
|
|
|
| |||||||||||
Total Common Stocks | 87,986,893 | 38,351,034 | 49,635,859 | — | ||||||||||||||
|
|
|
|
|
|
|
| |||||||||||
Short-Term Investment | 1,242,658 | 1,242,658 | — | — | ||||||||||||||
|
|
|
|
|
|
|
| |||||||||||
Total | $89,229,551 | $39,593,692 | $49,635,859 | $— | ||||||||||||||
|
|
|
|
|
|
|
| |||||||||||
The table below shows transfers between levels. The Trust’s policy is to recognize transfers between levels as of the end of the reporting period.
| Amount Transferred | Level Transfer | Change in Fair Valuation Measurement Inputs | ||||||||||||||
| From | To | From | To | |||||||||||||
| $3,688,230 | 1 | 2 | Unadjusted Exchange-Traded Price | Adjusted Exchange-Traded Price using an Applied Foreign Fair | ||||||||||||
| 15,099,406 | 2 | 1 | Adjusted Exchange-Traded Price using an Applied Foreign Fair Value Factor | Unadjusted Exchange-Traded Price | ||||||||||||
| See Notes to Financial Statements | See explanation of symbols and terms, if any, on B-114 and B-115 |
B-72
Table of Contents
PACIFIC FUNDS
PF INTERNATIONAL VALUE FUND
Schedule of Investments
March 31, 2018
Shares | Value | |||||||
PREFERRED STOCKS - 0.5% |
| |||||||
Brazil - 0.5% |
| |||||||
Telefonica Brasil SA | 47,700 | $732,379 | ||||||
|
| |||||||
Total Preferred Stocks |
| 732,379 | ||||||
|
| |||||||
COMMON STOCKS - 96.7% |
| |||||||
Belgium - 1.3% |
| |||||||
Ageas | 35,910 | 1,853,122 | ||||||
|
| |||||||
Brazil - 0.9% |
| |||||||
Petroleo Brasileiro SA ADR * | 91,270 | 1,290,558 | ||||||
|
| |||||||
Canada - 2.1% |
| |||||||
ARC Resources Ltd | 30,371 | 330,973 | ||||||
Barrick Gold Corp | 97,691 | 1,217,014 | ||||||
Cameco Corp | 33,599 | 305,415 | ||||||
Eldorado Gold Corp * | 200,897 | 168,753 | ||||||
Kinross Gold Corp * | 181,121 | 715,428 | ||||||
Tourmaline Oil Corp | 20,331 | 344,807 | ||||||
|
| |||||||
| 3,082,390 | ||||||||
|
| |||||||
China - 4.2% |
| |||||||
China Mobile Ltd | 186,000 | 1,704,763 | ||||||
China Telecom Corp Ltd ‘H’ | 3,986,000 | 1,767,919 | ||||||
China Unicom Hong Kong Ltd * | 1,020,000 | 1,304,887 | ||||||
Dongfeng Motor Group Co Ltd ‘H’ | 1,092,000 | 1,274,845 | ||||||
|
| |||||||
| 6,052,414 | ||||||||
|
| |||||||
Finland - 0.4% |
| |||||||
Nokia OYJ | 113,037 | 624,204 | ||||||
|
| |||||||
France - 11.1% |
| |||||||
Alstom SA | 27,332 | 1,232,741 | ||||||
BNP Paribas SA | 34,572 | 2,563,887 | ||||||
Cie de Saint-Gobain | 44,707 | 2,360,757 | ||||||
Engie SA | 89,416 | 1,493,114 | ||||||
Renault SA | 5,683 | 689,620 | ||||||
Rexel SA | 79,891 | 1,353,334 | ||||||
Societe Generale SA | 37,482 | 2,035,664 | ||||||
TOTAL SA | 72,858 | 4,176,202 | ||||||
|
| |||||||
| 15,905,319 | ||||||||
|
| |||||||
Germany - 4.3% |
| |||||||
CECONOMY AG | 86,544 | 995,016 | ||||||
E.ON SE | 124,529 | 1,383,779 | ||||||
METRO AG | 73,061 | 1,292,472 | ||||||
Rheinmetall AG | 3,408 | 483,748 | ||||||
RWE AG * | 46,226 | 1,142,625 | ||||||
Salzgitter AG | 16,141 | 825,710 | ||||||
|
| |||||||
| 6,123,350 | ||||||||
|
| |||||||
India - 1.1% |
| |||||||
Canara Bank | 128,558 | 526,947 | ||||||
NTPC Ltd | 386,888 | 1,011,513 | ||||||
|
| |||||||
| 1,538,460 | ||||||||
|
| |||||||
Ireland - 0.8% |
| |||||||
Bank of Ireland Group PLC * | 134,945 | 1,182,510 | ||||||
|
| |||||||
Shares | Value | |||||||
Italy - 7.2% |
| |||||||
Assicurazioni Generali SPA | 112,831 | $2,168,866 | ||||||
BPER Banca | 212,370 | 1,184,204 | ||||||
Eni SPA | 204,287 | 3,598,573 | ||||||
Saipem SPA * | 240,753 | 944,460 | ||||||
UniCredit SPA * | 115,417 | 2,412,341 | ||||||
|
| |||||||
| 10,308,444 | ||||||||
|
| |||||||
Japan - 25.6% |
| |||||||
Benesse Holdings Inc | 10,900 | 394,902 | ||||||
Canon Inc | 38,200 | 1,383,249 | ||||||
Chiyoda Corp | 58,600 | 552,929 | ||||||
Citizen Watch Co Ltd | 85,200 | 611,746 | ||||||
Dai-ichi Life Holdings Inc | 84,400 | 1,540,783 | ||||||
DeNA Co Ltd | 44,500 | 802,970 | ||||||
Eisai Co Ltd | 19,300 | 1,229,954 | ||||||
Fuji Media Holdings Inc | 30,935 | 527,673 | ||||||
Fujitsu Ltd | 280,800 | 1,728,000 | ||||||
Gree Inc | 105,300 | 598,717 | ||||||
Honda Motor Co Ltd | 98,800 | 3,398,412 | ||||||
Inpex Corp | 93,900 | 1,161,340 | ||||||
JGC Corp | 60,200 | 1,309,175 | ||||||
JSR Corp | 74,800 | 1,682,218 | ||||||
Mitsubishi Heavy Industries Ltd | 53,400 | 2,044,562 | ||||||
Mitsubishi Motors Corp | 95,000 | 679,432 | ||||||
Mitsubishi UFJ Financial Group Inc | 404,300 | 2,648,345 | ||||||
Mizuho Financial Group Inc | 1,321,800 | 2,377,638 | ||||||
Nikon Corp | 43,100 | 767,986 | ||||||
Nippon Television Holdings Inc | 43,940 | 778,412 | ||||||
Sankyo Co Ltd | 21,900 | 771,815 | ||||||
Sumitomo Mitsui Financial Group Inc | 66,400 | 2,781,929 | ||||||
Sumitomo Mitsui Trust Holdings Inc | 42,700 | 1,728,386 | ||||||
Suzuken Co Ltd | 17,500 | 722,828 | ||||||
T&D Holdings Inc | 137,100 | 2,175,587 | ||||||
Takeda Pharmaceutical Co Ltd | 49,900 | 2,430,635 | ||||||
|
| |||||||
| 36,829,623 | ||||||||
|
| |||||||
Netherlands - 3.9% |
| |||||||
ING Groep NV | 114,750 | 1,936,432 | ||||||
Koninklijke Philips NV | 4,079 | 156,193 | ||||||
PostNL NV | 266,912 | 1,000,180 | ||||||
Royal Dutch Shell PLC ‘B’ | 77,821 | 2,504,152 | ||||||
|
| |||||||
| 5,596,957 | ||||||||
|
| |||||||
Norway - 1.1% |
| |||||||
Statoil ASA | 37,685 | 891,928 | ||||||
Storebrand ASA | 81,348 | 668,969 | ||||||
|
| |||||||
| 1,560,897 | ||||||||
|
| |||||||
Russia - 3.6% |
| |||||||
Gazprom PJSC ADR | 406,699 | 2,005,026 | ||||||
LUKOIL PJSC ADR | 31,859 | 2,205,280 | ||||||
Sberbank of Russia PJSC ADR | 55,326 | 1,031,830 | ||||||
|
| |||||||
| 5,242,136 | ||||||||
|
| |||||||
South Africa - 1.5% |
| |||||||
Anglo American Platinum Ltd | 19,237 | 527,820 | ||||||
Gold Fields Ltd ADR | 329,851 | 1,326,001 | ||||||
Impala Platinum Holdings Ltd * | 118,843 | 236,675 | ||||||
|
| |||||||
| 2,090,496 | ||||||||
|
| |||||||
South Korea - 4.0% |
| |||||||
KB Financial Group Inc | 27,905 | 1,589,111 | ||||||
Kia Motors Corp | 45,162 | 1,313,465 | ||||||
KT Corp ADR * | 122,471 | 1,677,853 | ||||||
Shinhan Financial Group Co Ltd | 25,838 | 1,107,793 | ||||||
|
| |||||||
| 5,688,222 | ||||||||
|
| |||||||
| See Notes to Financial Statements | See explanation of symbols and terms, if any, on B-114 and B-115 |
B-73
Table of Contents
PACIFIC FUNDS
PF INTERNATIONAL VALUE FUND
Schedule of Investments (Continued)
March 31, 2018
Shares | Value | |||||||
Spain - 1.2% |
| |||||||
CaixaBank SA | 355,678 | $1,695,753 | ||||||
|
| |||||||
Sweden - 1.1% |
| |||||||
Telefonaktiebolaget LM Ericsson ‘B’ | 259,984 | 1,655,567 | ||||||
|
| |||||||
Switzerland - 6.1% |
| |||||||
Adecco Group AG | 15,900 | 1,132,558 | ||||||
Julius Baer Group Ltd | 20,953 | 1,289,479 | ||||||
LafargeHolcim Ltd | 36,219 | 1,984,608 | ||||||
UBS Group AG | 161,896 | 2,852,434 | ||||||
Zurich Insurance Group AG | 4,468 | 1,473,825 | ||||||
|
| |||||||
| 8,732,904 | ||||||||
|
| |||||||
Taiwan - 1.0% |
| |||||||
MediaTek Inc | 51,900 | 605,206 | ||||||
Shin Kong Financial Holding Co Ltd | 2,041,000 | 805,004 | ||||||
|
| |||||||
| 1,410,210 | ||||||||
|
| |||||||
United Kingdom - 14.2% |
| |||||||
Anglo American PLC | 77,755 | 1,811,273 | ||||||
AstraZeneca PLC | 40,814 | 2,805,598 | ||||||
BP PLC | 636,310 | 4,291,964 | ||||||
BT Group PLC | 490,443 | 1,565,398 | ||||||
Centrica PLC | 779,265 | 1,554,682 | ||||||
HSBC Holdings PLC | 402,343 | 3,778,279 | ||||||
J Sainsbury PLC | 534,602 | 1,793,310 | ||||||
Marks & Spencer Group PLC | 295,102 | 1,120,929 | ||||||
Standard Chartered PLC | 173,480 | 1,738,676 | ||||||
|
| |||||||
| 20,460,109 | ||||||||
|
| |||||||
Total Common Stocks |
| 138,923,645 | ||||||
|
| |||||||
EXCHANGE-TRADED FUND - 0.4% |
| |||||||
iShares Core MSCI EAFE | 8,500 | 559,980 | ||||||
|
| |||||||
Total Exchange-Traded Fund |
| 559,980 | ||||||
|
| |||||||
SHORT-TERM INVESTMENT - 1.1% |
| |||||||
Money Market Fund - 1.1% |
| |||||||
BlackRock Liquidity Funds T-Fund Portfolio | 1,565,169 | 1,565,169 | ||||||
|
| |||||||
Total Short-Term Investment |
| 1,565,169 | ||||||
|
| |||||||
TOTAL INVESTMENTS - 98.7% |
| 141,781,173 | ||||||
OTHER ASSETS & LIABILITIES, NET - 1.3% |
| 1,844,376 | ||||||
|
| |||||||
NET ASSETS - 100.0% |
| $143,625,549 | ||||||
|
| |||||||
Notes to Schedule of Investments
| (a) | As of March 31, 2018, the Fund’s composition by sector as a percentage of net assets was as follows: |
Financial | 32.8% | |||
Energy | 16.5% | |||
Consumer, Cyclical | 8.8% | |||
Communications | 8.6% | |||
Consumer, Non-Cyclical | 8.2% | |||
Industrial | 8.0% | |||
Basic Materials | 6.1% | |||
Utilities | 4.6% | |||
Technology | 3.6% | |||
Others (each less than 3.0%) | 1.5% | |||
|
| |||
| 98.7% | ||||
Other Assets & Liabilities, Net | 1.3% | |||
|
| |||
| 100.0% | ||||
|
|
| (b) | As of March 31, 2018, the Fund’s composition by country of risk as a percentage of net assets was as follows: |
Japan | 25.6% | |||
United Kingdom | 14.2% | |||
France | 11.1% | |||
Italy | 7.2% | |||
Switzerland | 6.1% | |||
Germany | 4.3% | |||
China | 4.2% | |||
South Korea | 4.0% | |||
Netherlands | 3.9% | |||
Russia | 3.6% | |||
Others (each less than 3.0%) | 14.5% | |||
|
| |||
| 98.7% | ||||
Other Assets & Liabilities, Net | 1.3% | |||
|
| |||
| 100.0% | ||||
|
|
| See Notes to Financial Statements | See explanation of symbols and terms, if any, on B-114 and B-115 |
B-74
Table of Contents
PACIFIC FUNDS
PF INTERNATIONAL VALUE FUND
Schedule of Investments (Continued)
March 31, 2018
| (c) | Fair Value Measurements |
The following is a summary of the Fund’s investments as categorized under the three-tier hierarchy of inputs used in valuing the Fund’s assets and liabilities (See Note 3D in Notes to Financial Statements) as of March 31, 2018:
| Total Value at March 31, 2018 | Level 1 Quoted Price | Level 2 Significant Observable Input | Level 3 Significant Unobservable Input | |||||||||||||||
Assets | Preferred Stocks | $732,379 | $732,379 | $— | $— | |||||||||||||
Common Stocks | ||||||||||||||||||
Belgium | 1,853,122 | — | 1,853,122 | — | ||||||||||||||
Brazil | 1,290,558 | 1,290,558 | — | — | ||||||||||||||
Canada | 3,082,390 | 3,082,390 | — | — | ||||||||||||||
China | 6,052,414 | — | 6,052,414 | — | ||||||||||||||
Finland | 624,204 | — | 624,204 | — | ||||||||||||||
France | 15,905,319 | — | 15,905,319 | — | ||||||||||||||
Germany | 6,123,350 | — | 6,123,350 | — | ||||||||||||||
India | 1,538,460 | — | 1,538,460 | — | ||||||||||||||
Ireland | 1,182,510 | — | 1,182,510 | — | ||||||||||||||
Italy | 10,308,444 | — | 10,308,444 | — | ||||||||||||||
Japan | 36,829,623 | 36,829,623 | — | — | ||||||||||||||
Netherlands | 5,596,957 | — | 5,596,957 | — | ||||||||||||||
Norway | 1,560,897 | — | 1,560,897 | — | ||||||||||||||
Russia | 5,242,136 | 5,242,136 | — | — | ||||||||||||||
South Africa | 2,090,496 | 1,326,001 | 764,495 | — | ||||||||||||||
South Korea | 5,688,222 | 5,688,222 | — | — | ||||||||||||||
Spain | 1,695,753 | — | 1,695,753 | — | ||||||||||||||
Sweden | 1,655,567 | — | 1,655,567 | — | ||||||||||||||
Switzerland | 8,732,904 | — | 8,732,904 | — | ||||||||||||||
Taiwan | 1,410,210 | 1,410,210 | — | — | ||||||||||||||
United Kingdom | 20,460,109 | 1,554,682 | 18,905,427 | — | ||||||||||||||
|
|
|
|
|
|
|
| |||||||||||
Total Common Stocks | 138,923,645 | 56,423,822 | 82,499,823 | — | ||||||||||||||
|
|
|
|
|
|
|
| |||||||||||
Exchange-Traded Fund | 559,980 | 559,980 | — | — | ||||||||||||||
Short-Term Investment | 1,565,169 | 1,565,169 | — | — | ||||||||||||||
|
|
|
|
|
|
|
| |||||||||||
Total | $141,781,173 | $59,281,350 | $82,499,823 | $— | ||||||||||||||
|
|
|
|
|
|
|
| |||||||||||
The table below shows transfers between levels. The Trust’s policy is to recognize transfers between levels as of the end of the reporting period.
| Amount Transferred | Level Transfer | Change in Fair Valuation Measurement Inputs | ||||||||||||||
| From | To | From | To | |||||||||||||
| $ | 10,557,072 | 2 | 1 | Adjusted Exchange-Traded Price using an Applied Foreign Fair Value Factor | Unadjusted Exchange-Traded Price | |||||||||||
| See Notes to Financial Statements | See explanation of symbols and terms, if any, on B-114 and B-115 |
B-75
Table of Contents
PACIFIC FUNDS
PF REAL ESTATE FUND
Schedule of Investments
March 31, 2018
Shares |
| |||||||
COMMON STOCKS - 98.7% |
| |||||||
Consumer, Cyclical - 0.7% |
| |||||||
Hilton Worldwide Holdings Inc | 3,585 | $282,354 | ||||||
|
| |||||||
Financial - 98.0% |
| |||||||
Alexandria Real Estate Equities Inc REIT | 2,716 | 339,201 | ||||||
American Homes 4 Rent ‘A’ REIT | 44,707 | 897,717 | ||||||
Apartment Investment & Management Co ‘A’ REIT | 4,140 | 168,705 | ||||||
AvalonBay Communities Inc REIT | 6,101 | 1,003,370 | ||||||
Blackstone Mortgage Trust Inc ‘A’ REIT | 7,030 | 220,883 | ||||||
Boston Properties Inc REIT | 24,876 | 3,065,221 | ||||||
Brandywine Realty Trust REIT | 11,098 | 176,236 | ||||||
Brixmor Property Group Inc REIT | 46,989 | 716,582 | ||||||
Camden Property Trust REIT | 10,605 | 892,729 | ||||||
Chesapeake Lodging Trust REIT | 9,719 | 270,285 | ||||||
Cousins Properties Inc REIT | 20,718 | 179,832 | ||||||
CubeSmart REIT | 22,158 | 624,856 | ||||||
DCT Industrial Trust Inc REIT | 14,736 | 830,226 | ||||||
DDR Corp REIT | 7,160 | 52,483 | ||||||
Digital Realty Trust Inc REIT | 4,550 | 479,479 | ||||||
Douglas Emmett Inc REIT | 3,519 | 129,358 | ||||||
Duke Realty Corp REIT | 11,474 | 303,832 | ||||||
Education Realty Trust Inc REIT | 9,710 | 318,003 | ||||||
Equity Residential REIT | 26,374 | 1,625,166 | ||||||
Essex Property Trust Inc REIT | 2,613 | 628,897 | ||||||
Federal Realty Investment Trust REIT | 763 | 88,592 | ||||||
Forest City Realty Trust Inc ‘A’ REIT | 9,620 | 194,901 | ||||||
Gaming & Leisure Properties Inc REIT | 13,040 | 436,449 | ||||||
GGP Inc REIT | 80,745 | 1,652,043 | ||||||
HCP Inc REIT | 44,354 | 1,030,343 | ||||||
Healthcare Realty Trust Inc REIT | 26,553 | 735,784 | ||||||
Healthcare Trust of America Inc ‘A’ REIT | 13,324 | 352,420 | ||||||
Host Hotels & Resorts Inc REIT | 37,521 | 699,391 | ||||||
Hudson Pacific Properties Inc REIT | 16,132 | 524,774 | ||||||
Invitation Homes Inc REIT | 7,114 | 162,413 | ||||||
JBG SMITH Properties REIT | 15,314 | 516,235 | ||||||
Kilroy Realty Corp REIT | 10,599 | 752,105 | ||||||
Kimco Realty Corp REIT | 13,701 | 197,294 | ||||||
LaSalle Hotel Properties REIT | 24,746 | 717,881 | ||||||
Liberty Property Trust REIT | 4,353 | 172,945 | ||||||
Life Storage Inc REIT | 6,222 | 519,661 | ||||||
Mack-Cali Realty Corp REIT | 36,759 | 614,243 | ||||||
Mid-America Apartment Communities Inc REIT | 3,840 | 350,362 | ||||||
National Retail Properties Inc REIT | 6,510 | 255,583 | ||||||
Paramount Group Inc REIT | 37,065 | 527,806 | ||||||
Pennsylvania Real Estate Investment Trust REIT | 8,175 | 78,889 | ||||||
Prologis Inc REIT | 19,179 | 1,208,085 | ||||||
Public Storage REIT | 5,440 | 1,090,122 | ||||||
QTS Realty Trust Inc ‘A’ REIT | 14,611 | 529,210 | ||||||
Regency Centers Corp REIT | 16,606 | 979,422 | ||||||
Shares |
| |||||||
Rexford Industrial Realty Inc REIT | 8,820 | $253,928 | ||||||
RLJ Lodging Trust REIT | 15,450 | 300,348 | ||||||
Simon Property Group Inc REIT | 31,552 | 4,870,051 | ||||||
SL Green Realty Corp REIT | 25,990 | 2,516,612 | ||||||
Starwood Property Trust Inc REIT | 8,470 | 177,446 | ||||||
Taubman Centers Inc REIT | 8,862 | 504,336 | ||||||
The Macerich Co REIT | 15,523 | 869,598 | ||||||
Tier REIT Inc REIT | 7,933 | 146,602 | ||||||
UDR Inc REIT | 9,000 | 320,580 | ||||||
Ventas Inc REIT | 11,091 | 549,337 | ||||||
Vornado Realty Trust REIT | 37,688 | 2,536,402 | ||||||
Welltower Inc REIT | 6,214 | 338,228 | ||||||
|
| |||||||
| 40,693,482 | ||||||||
|
| |||||||
Total Common Stocks |
| 40,975,836 | ||||||
|
| |||||||
SHORT-TERM INVESTMENT - 0.8% |
| |||||||
Money Market Fund - 0.8% |
| |||||||
BlackRock Liquidity Funds T-Fund Portfolio | 326,620 | 326,620 | ||||||
|
| |||||||
Total Short-Term Investment | 326,620 | |||||||
|
| |||||||
TOTAL INVESTMENTS - 99.5% | 41,302,456 | |||||||
OTHER ASSETS & LIABILITIES, NET - 0.5% |
| 216,762 | ||||||
|
| |||||||
NET ASSETS - 100.0% | $41,519,218 | |||||||
|
| |||||||
Notes to Schedule of Investments
| (a) | As of March 31, 2018, the Fund’s composition by property sector as a percentage of net assets was as follows: |
REITS-Office Property | 22.4% | |||||||
REITS-Regional Malls | 19.2% | |||||||
REITS-Apartments | 15.3% | |||||||
REITS-Diversified | 10.0% | |||||||
REITS-Health Care | 7.2% | |||||||
REITS-Warehouse/Industrial | 7.2% | |||||||
REITS-Hotels | 5.5% | |||||||
REITS-Storage | 5.4% | |||||||
REITS-Shopping Centers | 4.9% | |||||||
Others (each less than 3.0%) | 1.6% | |||||||
|
| |||||||
| 98.7% | ||||||||
Short-Term Investment | 0.8% | |||||||
Other Assets & Liabilities, Net | 0.5% | |||||||
|
| |||||||
| 100.0% | ||||||||
|
|
| (b) | Fair Value Measurements |
The following is a summary of the Fund’s investments as categorized under the three-tier hierarchy of inputs used in valuing the Fund’s assets and liabilities (See Note 3D in Notes to Financial Statements) as of March 31, 2018:
| Total Value at March 31, 2018 | Level 1 Quoted Price | Level 2 Significant Observable Inputs | Level 3 Significant Unobservable Inputs | |||||||||||||||
Assets | Common Stocks | $40,975,836 | $40,975,836 | $— | $— | |||||||||||||
Short-Term Investment | 326,620 | 326,620 | — | — | ||||||||||||||
|
|
|
|
|
|
|
| |||||||||||
Total | $41,302,456 | $41,302,456 | $— | $— | ||||||||||||||
|
|
|
|
|
|
|
| |||||||||||
| See Notes to Financial Statements | See explanation of symbols and terms, if any, on B-114 and B-115 |
B-76
Table of Contents
PACIFIC FUNDS
PF CURRENCY STRATEGIES FUND
Schedule of Investments
March 31, 2018
Principal Amount |
| |||||||
U.S. TREASURY OBLIGATIONS - 6.2% | ||||||||
U.S. Treasury Notes - 6.2% | ||||||||
1.000% due 09/15/18 | $3,900,000 | $3,884,787 | ||||||
|
| |||||||
Total U.S. Treasury Obligations |
| 3,884,787 | ||||||
|
| |||||||
FOREIGN GOVERNMENT BONDS & NOTES - 23.6% |
| |||||||
Canada - 6.3% |
| |||||||
Canadian Government | CAD 5,100,000 | 3,923,598 | ||||||
|
| |||||||
France - 4.9% |
| |||||||
French Republic Government OAT | EUR 2,500,000 | 3,082,757 | ||||||
|
| |||||||
Germany - 6.1% |
| |||||||
Bundesrepublik Deutschland Bundesanleihe | 3,020,000 | 3,842,276 | ||||||
|
| |||||||
United Kingdom - 6.3% |
| |||||||
United Kingdom Gilt | GBP 2,800,000 | 3,937,505 | ||||||
|
| |||||||
Total Foreign Government Bonds & Notes |
| 14,786,136 | ||||||
|
| |||||||
Shares | ||||||||
SHORT-TERM INVESTMENTS - 69.2% |
| |||||||
Money Market Fund - 27.8% |
| |||||||
BlackRock Liquidity Funds T-Fund Portfolio | 17,359,580 | 17,359,580 | ||||||
|
| |||||||
Principal Amount |
| |||||||
U.S. Treasury Bills - 41.4% |
| |||||||
0.991% due 04/05/18 | $8,000,000 | $7,998,919 | ||||||
1.576% due 05/10/18 | 4,000,000 | 3,993,149 | ||||||
1.646% due 06/07/18 | 4,000,000 | 3,987,850 | ||||||
1.711% due 07/05/18 | 4,000,000 | 3,982,189 | ||||||
1.845% due 08/09/18 ‡ | 6,000,000 | 5,960,768 | ||||||
|
| |||||||
| 25,922,875 | ||||||||
|
| |||||||
Total Short-Term Investments |
| 43,282,455 | ||||||
|
| |||||||
TOTAL INVESTMENTS - 99.0% |
| 61,953,378 | ||||||
DERIVATIVES - 1.4% (See Notes (c) through (e) in Notes to Schedule of Investments) |
| 906,597 | ||||||
|
| |||||||
OTHER ASSETS & LIABILITIES, NET - (0.4%) |
| (304,874 | ) | |||||
|
| |||||||
NET ASSETS - 100.0% |
| $62,555,101 | ||||||
|
| |||||||
Notes to Schedule of Investments
| (a) | As of March 31, 2018, the Fund’s composition as a percentage of net assets was as follows: |
Short-Term Investments | 69.2% | |||
Foreign Government Bonds & Notes | 23.6% | |||
| U.S. Treasury Obligations | 6.2% | |||
|
| |||
| 99.0% | ||||
| Derivatives | 1.4% | |||
Other Assets & Liabilities, Net | (0.4)% | |||
|
| |||
| 100.0% | ||||
|
|
| (b) | As of March 31, 2018, an investment with a value of $349,379 was fully or partially segregated with the broker(s)/custodian as collateral for forward foreign currency contracts and option contracts. |
| (c) | Forward foreign currency contracts outstanding as of March 31, 2018 were as follows: |
| Currency Purchased | Currency Sold | Settlement Month | Counterparty | Unrealized Appreciation | Unrealized (Depreciation) | |||||||||||||||||||
| AUD | 5,935,000 | USD | 4,549,296 | 04/18 | JPM | $9,125 | $— | |||||||||||||||||
| AUD | 1,905,000 | USD | 1,496,869 | 04/18 | SSB | — | (33,719 | ) | ||||||||||||||||
| AUD | 11,509,042 | USD | 8,919,450 | 06/18 | ANZ | — | (78,600 | ) | ||||||||||||||||
| AUD | 3,362,361 | USD | 2,614,888 | 06/18 | BRC | — | (32,038 | ) | ||||||||||||||||
| AUD | 6,591,178 | USD | 5,125,940 | 06/18 | CIT | — | (62,823 | ) | ||||||||||||||||
| CAD | 6,255,000 | USD | 4,825,681 | 04/18 | SSB | 31,373 | — | |||||||||||||||||
| CAD | 1,822,861 | USD | 1,419,638 | 06/18 | GSC | — | (2,886 | ) | ||||||||||||||||
| CAD | 3,947,254 | USD | 3,063,865 | 06/18 | JPM | 3,992 | — | |||||||||||||||||
| CAD | 2,152,372 | USD | 1,675,297 | 06/18 | RBC | — | (2,446 | ) | ||||||||||||||||
| CAD | 3,945,615 | USD | 3,063,865 | 06/18 | RBC | 2,718 | — | |||||||||||||||||
| CHF | 1,375,000 | USD | 1,458,963 | 04/18 | GSC | — | (18,165 | ) | ||||||||||||||||
| CHF | 16,096,510 | USD | 17,295,243 | 06/18 | JPM | — | (358,031 | ) | ||||||||||||||||
| CHF | 6,176,200 | USD | 6,593,080 | 06/18 | SCB | — | (94,304 | ) | ||||||||||||||||
| CLP | 707,700,000 | USD | 1,171,795 | 04/18 | BRC | 225 | — | |||||||||||||||||
| COP | 35,686,133,315 | USD | 12,531,343 | 04/18 | BRC | 237,362 | — | |||||||||||||||||
| EUR | 1,755,000 | USD | 2,161,184 | 04/18 | SSB | 1,525 | — | |||||||||||||||||
| EUR | 581,341 | USD | 719,968 | 06/18 | BRC | — | (952 | ) | ||||||||||||||||
| EUR | 3,817,384 | USD | 4,762,187 | 06/18 | GSC | — | (40,753 | ) | ||||||||||||||||
| EUR | 260,500 | USD | 321,882 | 06/18 | GSC | 311 | — | |||||||||||||||||
| EUR | 3,165,022 | USD | 3,919,864 | 06/18 | JPM | — | (5,288 | ) | ||||||||||||||||
| EUR | 6,664,005 | USD | 8,310,989 | 06/18 | SCB | — | (68,786 | ) | ||||||||||||||||
| GBP | 3,115,000 | USD | 4,347,738 | 04/18 | BRC | 26,561 | — | |||||||||||||||||
| See Notes to Financial Statements | See explanation of symbols and terms, if any, on B-114 and B-115 |
B-77
Table of Contents
PACIFIC FUNDS
PF CURRENCY STRATEGIES FUND
Schedule of Investments (Continued)
March 31, 2018
| Currency Purchased | Currency Sold | Settlement Month | Counterparty | Unrealized Appreciation | Unrealized (Depreciation) | |||||||||||||||||||
| GBP | 1,812,820 | USD | 2,529,200 | 06/18 | BRC | $21,609 | $— | |||||||||||||||||
| GBP | 4,258,018 | USD | 5,947,532 | 06/18 | GSC | 43,900 | — | |||||||||||||||||
| GBP | 7,487,626 | USD | 10,403,952 | 06/18 | JPM | 131,841 | — | |||||||||||||||||
| GBP | 1,657,136 | USD | 2,339,064 | 06/18 | RBC | — | (7,318 | ) | ||||||||||||||||
| GBP | 958,393 | USD | 1,345,623 | 06/18 | SCB | 2,926 | — | |||||||||||||||||
| GBP | 5,647,560 | USD | 7,832,940 | 06/18 | SSB | 113,709 | — | |||||||||||||||||
| INR | 396,040,000 | USD | 6,065,674 | 04/18 | GSC | — | (9,607 | ) | ||||||||||||||||
| JPY | 1,984,800,000 | USD | 18,572,584 | 04/18 | JPM | 105,653 | — | |||||||||||||||||
| JPY | 579,735,545 | USD | 5,521,265 | 06/18 | BRC | — | (47,490 | ) | ||||||||||||||||
| JPY | 419,354,784 | USD | 4,025,098 | 06/18 | GSC | — | (65,614 | ) | ||||||||||||||||
| JPY | 1,190,284,895 | USD | 11,339,157 | 06/18 | JPM | — | (100,669 | ) | ||||||||||||||||
| JPY | 207,552,025 | USD | 1,991,977 | 06/18 | SCB | — | (32,302 | ) | ||||||||||||||||
| JPY | 575,955,100 | USD | 5,432,996 | 06/18 | SCB | 5,085 | — | |||||||||||||||||
| KRW | 5,282,000,000 | USD | 4,964,286 | 04/18 | BRC | — | (5,217 | ) | ||||||||||||||||
| MXN | 475,670,000 | USD | 25,474,946 | 04/18 | BRC | 604,361 | — | |||||||||||||||||
| MYR | 18,266,000 | USD | 4,663,858 | 04/18 | GSC | 54,973 | — | |||||||||||||||||
| NOK | 46,040,000 | USD | 5,943,099 | 04/18 | GSC | — | (65,941 | ) | ||||||||||||||||
| NOK | 25,246,451 | USD | 3,227,188 | 06/18 | BRC | 607 | — | |||||||||||||||||
| NOK | 17,918,108 | USD | 2,321,157 | 06/18 | JPM | — | (30,301 | ) | ||||||||||||||||
| NOK | 15,624,400 | USD | 2,028,893 | 06/18 | SCB | — | (31,291 | ) | ||||||||||||||||
| NZD | 6,535,000 | USD | 4,776,432 | 04/18 | GSC | — | (53,829 | ) | ||||||||||||||||
| NZD | 4,544,965 | USD | 3,280,510 | 06/18 | ANZ | 3,347 | — | |||||||||||||||||
| NZD | 2,975,300 | USD | 2,183,846 | 06/18 | SCB | — | (34,114 | ) | ||||||||||||||||
| SEK | 51,300,000 | USD | 6,244,880 | 04/18 | JPM | — | (91,618 | ) | ||||||||||||||||
| SEK | 5,872,800 | USD | 720,707 | 06/18 | SCB | — | (13,685 | ) | ||||||||||||||||
| SGD | 2,015,000 | USD | 1,539,113 | 04/18 | SSB | — | (1,553 | ) | ||||||||||||||||
| USD | 6,170,511 | AUD | 7,840,000 | 04/18 | SSB | 148,940 | — | |||||||||||||||||
| USD | 9,786,477 | AUD | 12,650,745 | 06/18 | ANZ | 68,609 | — | |||||||||||||||||
| USD | 4,248,773 | AUD | 5,511,624 | 06/18 | GSC | 14,932 | — | |||||||||||||||||
| USD | 2,324,000 | AUD | 3,019,099 | 06/18 | JPM | 4,832 | — | |||||||||||||||||
| USD | 4,184,628 | AUD | 5,365,300 | 06/18 | SCB | 63,188 | — | |||||||||||||||||
| USD | 23,149,949 | CAD | 29,750,000 | 04/18 | SSB | 48,854 | — | |||||||||||||||||
| USD | 2,323,206 | CAD | 2,997,777 | 06/18 | BRC | — | (6,705 | ) | ||||||||||||||||
| USD | 1,904,278 | CAD | 2,488,948 | 06/18 | JPM | — | (30,165 | ) | ||||||||||||||||
| USD | 2,339,064 | CAD | 3,054,294 | 06/18 | RBC | — | (34,773 | ) | ||||||||||||||||
| USD | 4,864,473 | CAD | 6,324,860 | 06/18 | SCB | — | (51,291 | ) | ||||||||||||||||
| USD | 6,118,344 | CHF | 5,780,000 | 04/18 | GSC | 61,754 | — | |||||||||||||||||
| USD | 9,010,099 | CHF | 8,382,167 | 06/18 | BRC | 190,140 | — | |||||||||||||||||
| USD | 19,041,508 | CHF | 17,721,741 | 06/18 | JPM | 394,180 | — | |||||||||||||||||
| USD | 3,975,385 | CHF | 3,724,022 | 06/18 | SCB | 56,862 | — | |||||||||||||||||
| USD | 5,848,032 | CLP | 3,521,100,000 | 04/18 | CSF | 16,746 | — | |||||||||||||||||
| USD | 3,166,403 | COP | 9,052,747,011 | 04/18 | BRC | — | (72,722 | ) | ||||||||||||||||
| USD | 4,770,214 | COP | 13,304,604,005 | 04/18 | BRC | 9,750 | — | |||||||||||||||||
| USD | 9,152,950 | EUR | 7,405,000 | 04/18 | SSB | 27,674 | — | |||||||||||||||||
| USD | 12,925,478 | EUR | 10,443,861 | 06/18 | JPM | 8,258 | — | |||||||||||||||||
| USD | 12,491,207 | EUR | 10,083,654 | 06/18 | SSB | 19,498 | — | |||||||||||||||||
| USD | 17,610,328 | GBP | 12,665,000 | 04/18 | BRC | — | (174,741 | ) | ||||||||||||||||
| USD | 2,322,489 | GBP | 1,659,300 | 06/18 | BRC | — | (12,302 | ) | ||||||||||||||||
| USD | 1,749,724 | GBP | 1,258,183 | 06/18 | GSC | — | (20,658 | ) | ||||||||||||||||
| USD | 1,675,297 | GBP | 1,208,345 | 06/18 | RBC | — | (24,957 | ) | ||||||||||||||||
| USD | 6,877,997 | GBP | 4,913,328 | 06/18 | SCB | — | (35,518 | ) | ||||||||||||||||
| USD | 103,552 | GBP | 74,630 | 06/18 | SGN | — | (1,460 | ) | ||||||||||||||||
| USD | 6,059,162 | GBP | 4,368,664 | 06/18 | SSB | — | (87,959 | ) | ||||||||||||||||
| USD | 1,393,586 | INR | 90,820,000 | 04/18 | BRC | 4,807 | — | |||||||||||||||||
| USD | 4,743,853 | JPY | 500,800,000 | 04/18 | JPM | 31,005 | — | |||||||||||||||||
| USD | 3,063,865 | JPY | 325,209,355 | 06/18 | BRC | — | (6,712 | ) | ||||||||||||||||
| USD | 2,614,888 | JPY | 275,613,915 | 06/18 | BRC | 12,584 | — | |||||||||||||||||
| USD | 5,125,940 | JPY | 540,093,594 | 06/18 | CIT | 26,458 | — | |||||||||||||||||
| USD | 4,762,188 | JPY | 503,458,992 | 06/18 | GSC | 8,605 | — | |||||||||||||||||
| USD | 3,193,723 | JPY | 335,248,987 | 06/18 | JPM | 28,354 | — | |||||||||||||||||
| USD | 3,876,047 | JPY | 410,902,100 | 06/18 | SCB | — | (3,627 | ) | ||||||||||||||||
| USD | 4,468,957 | JPY | 472,786,155 | 06/18 | SCB | 4,982 | — | |||||||||||||||||
| USD | 376,864 | KRW | 403,000,000 | 04/18 | JPM | — | (1,497 | ) | ||||||||||||||||
| USD | 18,963,415 | KRW | 20,215,000,000 | 04/18 | SSB | — | (15,679 | ) | ||||||||||||||||
| USD | 6,285,031 | MXN | 118,190,000 | 04/18 | BRC | — | (194,910 | ) | ||||||||||||||||
| USD | 4,780,000 | MXN | 87,925,232 | 04/18 | MSC | — | (40,630 | ) | ||||||||||||||||
| USD | 1,290,591 | NOK | 9,920,000 | 04/18 | GSC | 24,270 | — | |||||||||||||||||
| USD | 8,611,277 | NOK | 67,366,447 | 06/18 | BRC | — | (1,621 | ) | ||||||||||||||||
| USD | 2,323,206 | NOK | 17,950,483 | 06/18 | BRC | 28,211 | — | |||||||||||||||||
| USD | 777,424 | NOK | 5,986,900 | 06/18 | SCB | 11,990 | — | |||||||||||||||||
| USD | 395,562 | NZD | 550,000 | 04/18 | GSC | — | (1,903 | ) | ||||||||||||||||
| See Notes to Financial Statements | See explanation of symbols and terms, if any, on B-114 and B-115 |
B-78
Table of Contents
PACIFIC FUNDS
PF CURRENCY STRATEGIES FUND
Schedule of Investments (Continued)
March 31, 2018
| Currency Purchased | Currency Sold | Settlement Month | Counterparty | Unrealized Appreciation | Unrealized (Depreciation) | |||||||||||||||||||||
| USD | 18,814,585 | NZD | 25,690,000 | 04/18 | GSC | $249,374 | $— | |||||||||||||||||||
| USD | 7,686,228 | NZD | 10,648,843 | 06/18 | ANZ | — | (7,841 | ) | ||||||||||||||||||
| USD | 2,317,662 | NZD | 3,229,813 | 06/18 | GSC | — | (15,963 | ) | ||||||||||||||||||
| USD | 740,451 | NZD | 1,008,800 | 06/18 | SCB | 11,567 | — | |||||||||||||||||||
| USD | 1,757,056 | NZD | 2,433,410 | 06/18 | SGN | — | (1,147 | ) | ||||||||||||||||||
| USD | 1,610,612 | SEK | 13,140,000 | 04/18 | JPM | 34,513 | — | |||||||||||||||||||
| USD | 719,968 | SEK | 5,886,578 | 06/18 | BRC | 11,288 | — | |||||||||||||||||||
| USD | 7,145,253 | SEK | 58,522,433 | 06/18 | JPM | 99,784 | — | |||||||||||||||||||
| USD | 6,189,570 | SGD | 8,130,000 | 04/18 | SSB | — | (14,082 | ) | ||||||||||||||||||
|
|
|
| |||||||||||||||||||||||
Total Forward Foreign Currency Contracts | $3,123,212 | ($2,248,203 | ) | |||||||||||||||||||||||
|
|
|
| |||||||||||||||||||||||
| (d) | Purchased options outstanding as of March 31, 2018 were as follows: |
Foreign Currency Options
| Description | Exercise Price | Expiration Date | Counterparty | Notional Amount | Cost | Value | ||||||||||||||||
Put - JPY versus USD | JPY 104.50 | 04/09/18 | JPM | $57,371,900 | $473,146 | $42,125 | ||||||||||||||||
Put - CHF versus GBP | CHF 1.23 | 07/31/18 | CIT | GBP 10,217,630 | 77,806 | 31,588 | ||||||||||||||||
|
|
|
| |||||||||||||||||||
Total Purchased Options | $550,952 | $73,713 | ||||||||||||||||||||
|
|
|
| |||||||||||||||||||
| (e) | Premiums received and value of written options outstanding as of March 31, 2018 were as follows: |
Foreign Currency Options
| Description | Exercise Price | Expiration Date | Counterparty | Notional Amount | Premium | Value | ||||||||||||||||
Put - JPY versus USD | JPY 104.50 | 04/09/18 | GSC | $57,371,900 | $235,799 | ($42,125 | ) | |||||||||||||||
|
|
|
| |||||||||||||||||||
| (f) | Fair Value Measurements |
The following is a summary of the Fund’s investments as categorized under the three-tier hierarchy of inputs used in valuing the Fund’s assets and liabilities (See Note 3D in Notes to Financial Statements) as of March 31, 2018:
| Total Value at March 31, 2018 | Level 1 Quoted Price | Level 2 Significant Observable Inputs | Level 3 Significant Unobservable Inputs | |||||||||||||||
Assets | U.S. Treasury Obligations | $3,884,787 | $— | $3,884,787 | $— | |||||||||||||
Foreign Government Bonds & Notes | 14,786,136 | — | 14,786,136 | — | ||||||||||||||
Short-Term Investments | 43,282,455 | 17,359,580 | 25,922,875 | — | ||||||||||||||
Derivatives: | ||||||||||||||||||
Foreign Currency Contracts | ||||||||||||||||||
Forward Foreign Currency Contracts | 3,123,212 | — | 3,123,212 | — | ||||||||||||||
Purchased Options | 73,713 | — | 73,713 | — | ||||||||||||||
|
|
|
|
|
|
|
| |||||||||||
Total Foreign Currency Contracts | 3,196,925 | — | 3,196,925 | — | ||||||||||||||
|
|
|
|
|
|
|
| |||||||||||
Total Asset — Derivatives | 3,196,925 | — | 3,196,925 | — | ||||||||||||||
|
|
|
|
|
|
|
| |||||||||||
Total Assets | 65,150,303 | 17,359,580 | 47,790,723 | — | ||||||||||||||
|
|
|
|
|
|
|
| |||||||||||
Liabilities | Derivatives: | |||||||||||||||||
Foreign Currency Contracts | ||||||||||||||||||
Forward Foreign Currency Contracts | (2,248,203 | ) | — | (2,248,203 | ) | — | ||||||||||||
Written Options | (42,125 | ) | — | (42,125 | ) | — | ||||||||||||
|
|
|
|
|
|
|
| |||||||||||
Total Foreign Currency Contracts | (2,290,328 | ) | — | (2,290,328 | ) | — | ||||||||||||
|
|
|
|
|
|
|
| |||||||||||
Total Liabilities | (2,290,328 | ) | — | (2,290,328 | ) | — | ||||||||||||
|
|
|
|
|
|
|
| |||||||||||
Total | $62,859,975 | $17,359,580 | $45,500,395 | $— | ||||||||||||||
|
|
|
|
|
|
|
| |||||||||||
| See Notes to Financial Statements | See explanation of symbols and terms, if any, on B-114 and B-115 |
B-79
Table of Contents
PACIFIC FUNDS
PF EQUITY LONG/SHORT FUND
Schedule of Investments
March 31, 2018
Shares | Value | |||||||
SHORT-TERM INVESTMENTS - 79.4% | ||||||||
Money Market Fund - 19.7% |
| |||||||
BlackRock Liquidity Funds T-Fund Portfolio | 11,284,794 | $11,284,794 | ||||||
|
| |||||||
Principal | ||||||||
U.S. Treasury Bills - 59.7% |
| |||||||
1.489% due 04/19/18 ‡ | $9,002,000 | 8,995,076 | ||||||
1.500% due 04/26/18 | 23,933,000 | 23,907,631 | ||||||
1.811% due 08/02/18 ‡ | 1,188,000 | 1,180,779 | ||||||
|
| |||||||
| 34,083,486 | ||||||||
|
| |||||||
Total Short-Term Investments | 45,368,280 | |||||||
|
| |||||||
TOTAL INVESTMENTS - 79.4% | 45,368,280 | |||||||
DERIVATIVES - 9.4% |
| |||||||
(See Notes (c) through (e) in Notes to Schedule of Investments) |
| 5,391,689 | ||||||
|
| |||||||
OTHER ASSETS & LIABILITIES, NET - 11.2% |
| 6,362,613 | ||||||
|
| |||||||
NET ASSETS - 100.0% |
| $57,122,582 | ||||||
|
| |||||||
Notes to Schedule of Investments
| (a) | As of March 31, 2018, the Fund’s composition as a percentage of net assets was as follows: |
Short-Term Investments | 79.4% | |||
Derivatives | 9.4% | |||
Other Assets & Liabilities, Net | 11.2% | |||
|
| |||
| 100.0% | ||||
|
|
| (b) | As of March 31, 2018, investments with a total aggregate value of $3,982,050 was fully or partially segregated with the broker(s)/custodian as collateral for open futures contracts, forward foreign currencies contracts, and swap agreements.: |
| (c) | Open futures contracts outstanding as of March 31, 2018 were as follows: |
| Long Futures Outstanding | Expiration Month | Number of Contracts | Notional Amount | Value | Unrealized Appreciation (Depreciation) | |||||||||||||||
AEX Index | 04/18 | 4 | $524,256 | $519,743 | ($4,513 | ) | ||||||||||||||
CAC 40 Index | 04/18 | 23 | 1,486,589 | 1,458,743 | (27,846 | ) | ||||||||||||||
DAX Index | 06/18 | 1 | 377,517 | 372,811 | (4,706 | ) | ||||||||||||||
FTSE 100 Index | 06/18 | 16 | 1,594,568 | 1,569,897 | (24,671 | ) | ||||||||||||||
IBEX 35 Index | 04/18 | 3 | 356,889 | 353,311 | (3,578 | ) | ||||||||||||||
OMX Index | 04/18 | 31 | 579,068 | 565,810 | (13,258 | ) | ||||||||||||||
S&P 500 E-Mini Index | 06/18 | 112 | 15,505,400 | 14,800,800 | (704,600 | ) | ||||||||||||||
S&P/TSE 60 Index | 06/18 | 1 | 142,654 | 140,645 | (2,009 | ) | ||||||||||||||
SPI 200 Index | 06/18 | 5 | 573,646 | 550,691 | (22,955 | ) | ||||||||||||||
TOPIX Index | 06/18 | 13 | 2,049,598 | 2,084,912 | 35,314 | |||||||||||||||
|
| |||||||||||||||||||
Total Futures Contracts | ($772,822 | ) | ||||||||||||||||||
|
| |||||||||||||||||||
| (d) | Forward foreign currency contracts outstanding as of March 31, 2018 were as follows: |
| Currency Purchased | Currency Sold | Settlement Month | Counterparty | Unrealized Appreciation | Unrealized (Depreciation) | |||||||||||||||||||
| AUD | 484,798 | USD | 378,734 | 06/18 | CIT | $— | ($6,302 | ) | ||||||||||||||||
| AUD | 727,202 | USD | 568,105 | 06/18 | JPM | — | (9,454 | ) | ||||||||||||||||
| CAD | 635,600 | USD | 497,438 | 06/18 | CIT | — | (3,325 | ) | ||||||||||||||||
| CAD | 953,400 | USD | 746,158 | 06/18 | JPM | — | (4,989 | ) | ||||||||||||||||
| CHF | 409,200 | USD | 439,036 | 06/18 | CIT | — | (7,971 | ) | ||||||||||||||||
| CHF | 613,800 | USD | 658,555 | 06/18 | JPM | — | (11,957 | ) | ||||||||||||||||
| DKK | 598,800 | USD | 99,991 | 06/18 | CIT | — | (537 | ) | ||||||||||||||||
| DKK | 898,200 | USD | 149,986 | 06/18 | JPM | — | (805 | ) | ||||||||||||||||
| EUR | 1,464,400 | USD | 1,817,881 | 06/18 | CIT | — | (4,879 | ) | ||||||||||||||||
| EUR | 2,196,600 | USD | 2,726,826 | 06/18 | JPM | — | (7,322 | ) | ||||||||||||||||
| GBP | 676,400 | USD | 943,254 | 06/18 | CIT | 9,044 | — | |||||||||||||||||
| GBP | 1,014,600 | USD | 1,414,883 | 06/18 | JPM | 13,564 | — | |||||||||||||||||
| HKD | 1,532,000 | USD | 196,402 | 06/18 | CIT | — | (668 | ) | ||||||||||||||||
| HKD | 2,298,000 | USD | 294,604 | 06/18 | JPM | — | (1,003 | ) | ||||||||||||||||
| ILS | 91,602 | USD | 26,501 | 06/18 | CIT | — | (255 | ) | ||||||||||||||||
| ILS | 137,398 | USD | 39,751 | 06/18 | JPM | — | (383 | ) | ||||||||||||||||
| JPY | 146,540,000 | USD | 1,383,632 | 06/18 | CIT | 1,144 | — | |||||||||||||||||
| JPY | 219,810,000 | USD | 2,075,451 | 06/18 | JPM | 1,713 | — | |||||||||||||||||
| See Notes to Financial Statements | See explanation of symbols and terms, if any, on B-114 and B-115 |
B-80
Table of Contents
PACIFIC FUNDS
PF EQUITY LONG/SHORT FUND
Schedule of Investments (Continued)
March 31, 2018
| Currency Purchased | Currency Sold | Settlement Month | Counterparty | Unrealized Appreciation | Unrealized (Depreciation) | |||||||||||||||||||||
| NOK | 284,004 | USD | 36,366 | 06/18 | CIT | $— | ($39 | ) | ||||||||||||||||||
| NOK | 425,996 | USD | 54,547 | 06/18 | JPM | — | (59 | ) | ||||||||||||||||||
| NZD | 12,800 | USD | 9,319 | 06/18 | CIT | — | (71 | ) | ||||||||||||||||||
| NZD | 19,200 | USD | 13,979 | 06/18 | JPM | — | (106 | ) | ||||||||||||||||||
| SEK | 1,199,998 | USD | 147,549 | 06/18 | CIT | — | (2,938 | ) | ||||||||||||||||||
| SEK | 1,800,002 | USD | 221,324 | 06/18 | JPM | — | (4,407 | ) | ||||||||||||||||||
| SGD | 95,600 | USD | 72,720 | 06/18 | CIT | 333 | — | |||||||||||||||||||
| SGD | 143,400 | USD | 109,080 | 06/18 | JPM | 500 | — | |||||||||||||||||||
| USD | 88,131 | AUD | 112,000 | 06/18 | CIT | 2,091 | — | |||||||||||||||||||
| USD | 132,197 | AUD | 168,000 | 06/18 | JPM | 3,136 | — | |||||||||||||||||||
| USD | 109,795 | CAD | 141,600 | 06/18 | CIT | — | (284 | ) | ||||||||||||||||||
| USD | 164,692 | CAD | 212,400 | 06/18 | JPM | — | (427 | ) | ||||||||||||||||||
| USD | 97,029 | CHF | 90,800 | 06/18 | CIT | 1,377 | — | |||||||||||||||||||
| USD | 145,544 | CHF | 136,200 | 06/18 | JPM | 2,066 | — | |||||||||||||||||||
| USD | 21,129 | DKK | 126,000 | 06/18 | CIT | 201 | — | |||||||||||||||||||
| USD | 31,693 | DKK | 189,000 | 06/18 | JPM | 302 | — | |||||||||||||||||||
| USD | 392,118 | EUR | 314,000 | 06/18 | CIT | 3,370 | — | |||||||||||||||||||
| USD | 588,177 | EUR | 471,000 | 06/18 | JPM | 5,054 | — | |||||||||||||||||||
| USD | 212,172 | GBP | 151,200 | 06/18 | CIT | — | (701 | ) | ||||||||||||||||||
| USD | 318,257 | GBP | 226,800 | 06/18 | JPM | — | (1,052 | ) | ||||||||||||||||||
| USD | 37,212 | HKD | 290,800 | 06/18 | CIT | 58 | — | |||||||||||||||||||
| USD | 55,818 | HKD | 436,200 | 06/18 | JPM | 87 | — | |||||||||||||||||||
| USD | 6,330 | ILS | 21,600 | 06/18 | CIT | 141 | — | |||||||||||||||||||
| USD | 9,495 | ILS | 32,400 | 06/18 | JPM | 211 | — | |||||||||||||||||||
| USD | 336,053 | JPY | 35,610,800 | 06/18 | CIT | — | (463 | ) | ||||||||||||||||||
| USD | 504,079 | JPY | 53,416,200 | 06/18 | JPM | — | (694 | ) | ||||||||||||||||||
| USD | 7,121 | NOK | 54,800 | 06/18 | CIT | 112 | — | |||||||||||||||||||
| USD | 10,682 | NOK | 82,200 | 06/18 | JPM | 168 | — | |||||||||||||||||||
| USD | 2,047 | NZD | 2,800 | 06/18 | CIT | 24 | — | |||||||||||||||||||
| USD | 3,071 | NZD | 4,200 | 06/18 | JPM | 36 | — | |||||||||||||||||||
| USD | 28,801 | SEK | 234,400 | 06/18 | CIT | 554 | — | |||||||||||||||||||
| USD | 43,202 | SEK | 351,600 | 06/18 | JPM | 831 | — | |||||||||||||||||||
| USD | 14,342 | SGD | 18,800 | 06/18 | CIT | — | (24 | ) | ||||||||||||||||||
| USD | 21,514 | SGD | 28,200 | 06/18 | JPM | — | (36 | ) | ||||||||||||||||||
|
|
|
| |||||||||||||||||||||||
Total Forward Foreign Currency Contracts |
| $46,117 | ($71,151 | ) | ||||||||||||||||||||||
|
|
|
| |||||||||||||||||||||||
| (e) | Swap agreements outstanding as of March 31, 2018 were as follows: |
Total Return Basket Swaps
| Counterparty | Payment Frequency | Currency | Expiration Dates (1) | Notional Amount Long (2) | Notional Amount Short (2) | Unrealized Appreciation (Depreciation) (3) | Net Dividends and Financing Fees, Including Cash (4) | Net Value of Reference Entities | Percentage of Total Net Value | |||||||||||||||||||||||
GSC | M | USD | 12/21/20 - 12/22/20 | $45,395,570 | ($42,002,025 | ) | $2,200,801 | ($115,578 | ) | $5,709,924 | 72.4 | % | ||||||||||||||||||||
JPM | M | AUD | 08/13/18 - 04/15/19 | 1,183,345 | (1,055,996 | ) | (40,385 | ) | (3,327 | ) | 90,291 | 1.1 | % | |||||||||||||||||||
JPM | M | GBP | 08/13/18 - 04/29/19 | 4,693,611 | (5,365,447 | ) | 669,605 | (21,544 | ) | 19,313 | 0.2 | % | ||||||||||||||||||||
JPM | M | HKD | 08/13/18 - 04/29/19 | 706,237 | (697,247 | ) | (23,382 | ) | (4,311 | ) | (10,081 | ) | (0.1 | %) | ||||||||||||||||||
JPM | M | SGD | 08/13/18 - 02/26/19 | 198,030 | (188,728 | ) | (7,334 | ) | (6,271 | ) | 8,239 | 0.1 | % | |||||||||||||||||||
MSC | M | CAD | 05/02/19 | 1,688,443 | (2,279,899 | ) | 756,696 | 105,263 | 59,977 | 0.8 | % | |||||||||||||||||||||
MSC | M | CHF | 05/02/19 | 1,251,158 | (1,278,655 | ) | 42,289 | (6,215 | ) | 21,007 | 0.3 | % | ||||||||||||||||||||
MSC | M | EUR | 05/02/19 | 10,465,011 | (9,868,234 | ) | 1,640,073 | 541,401 | 1,695,449 | 21.5 | % | |||||||||||||||||||||
MSC | M | JPY | 05/07/18 | 8,807,312 | (9,563,916 | ) | 918,892 | 114,178 | 48,110 | 0.6 | % | |||||||||||||||||||||
MSC | M | DKK | 05/01/19 | 799,729 | (772,203 | ) | (20,375 | ) | 20,007 | (12,856 | ) | (0.2 | %) | |||||||||||||||||||
MSC | M | NOK | 05/02/19 | 529,259 | (367,307 | ) | 89,069 | 21,495 | 229,526 | 2.9 | % | |||||||||||||||||||||
MSC | M | SEK | 05/02/19 | 1,196,161 | (1,207,041 | ) | 521 | (40,037 | ) | 29,678 | 0.4 | % | ||||||||||||||||||||
|
|
|
|
|
|
|
|
|
|
|
| |||||||||||||||||||||
| $76,913,866 | ($74,646,698 | ) | $6,226,470 | $605,061 | $7,888,577 | 100.0 | % | |||||||||||||||||||||||||
|
|
|
|
|
|
|
|
|
|
|
| |||||||||||||||||||||
| (1) | The expiration date(s) of the underlying investments in each basket swap are equal to or fall within the range disclosed. |
| (2) | Notional amount is representative of the cost basis of the long and short positions. |
| (3) | Unrealized Appreciation (Depreciation) includes Net Dividends and Financing Fees. |
| (4) | Net Dividends and Financing Fees, Including Cash, includes the gains (losses) realized within the swap when the swap resets. |
| Description | Counter- party | Expiration Dates (1) | ||||
The Fund receives or pays the net total return on all positions within the basket and pays financing based upon the then-current 1-Month USD-LIBOR (1.880% as of 03/31/18) and the 1-Day USD Federal Funds (1.680% as of 03/31/18) plus or minus a specified spread (rates range from (2.820%) to 0.250%) as negotiated by the parties, which is denominated in USD based on the local currencies of the positions within the swap. | GSC | 12/21/20- 12/22/20 | ||||
| See Notes to Financial Statements | See explanation of symbols and terms, if any, on B-114 and B-115 |
B-81
Table of Contents
PACIFIC FUNDS
PF EQUITY LONG/SHORT FUND
Schedule of Investments (Continued)
March 31, 2018
The following table represents the individual long and short positions and related values within the total return basket swap as of March 31, 2018:
| Referenced Entity | Shares | Value | ||||||
Long Positions: | ||||||||
United Kingdom | ||||||||
Avon Products Inc | 3,024 | $8,588 | ||||||
|
| |||||||
United States | ||||||||
AbbVie Inc | 2,361 | 223,468 | ||||||
Activision Blizzard Inc | 642 | 43,309 | ||||||
Adient PLC | 318 | 19,004 | ||||||
Adobe Systems Inc | 2,460 | 531,557 | ||||||
Aflac Inc | 10,648 | 465,956 | ||||||
AGCO Corp | 497 | 32,230 | ||||||
Agilent Technologies Inc | 702 | 46,964 | ||||||
Akamai Technologies Inc | 3,376 | 239,628 | ||||||
Alaska Air Group Inc | 874 | 54,153 | ||||||
Alcoa Corp | 5,771 | 259,464 | ||||||
Alexion Pharmaceuticals Inc | 784 | 87,385 | ||||||
Align Technology Inc | 581 | 145,907 | ||||||
Amazon.com Inc | 175 | 253,285 | ||||||
AMERCO | 53 | 18,290 | ||||||
American Eagle Outfitters Inc | 509 | 10,144 | ||||||
Ameriprise Financial Inc | 2,572 | 380,502 | ||||||
AmerisourceBergen Corp | 315 | 27,156 | ||||||
Amgen Inc | 2,576 | 439,156 | ||||||
Anadarko Petroleum Corp | 1,868 | 112,846 | ||||||
ANSYS Inc | 102 | 15,982 | ||||||
Antero Resources Corp | 1,632 | 32,395 | ||||||
Anthem Inc | 199 | 43,720 | ||||||
Apple Inc | 2,872 | 481,864 | ||||||
Applied Materials Inc | 8,516 | 473,575 | ||||||
Arista Networks Inc | 460 | 117,438 | ||||||
Armstrong World Industries Inc | 811 | 45,659 | ||||||
Arrow Electronics Inc | 4,373 | 336,808 | ||||||
Assurant Inc | 181 | 16,545 | ||||||
Assured Guaranty Ltd | 11,004 | 398,345 | ||||||
Athene Holding Ltd ‘A’ | 1,232 | 58,902 | ||||||
AutoZone Inc | 65 | 42,165 | ||||||
Avnet Inc | 5,591 | 233,480 | ||||||
Axis Capital Holdings Ltd | 132 | 7,599 | ||||||
Baxter International Inc | 5,956 | 387,378 | ||||||
Best Buy Co Inc | 4,803 | 336,162 | ||||||
BGC Partners Inc ‘A’ | 3,061 | 41,170 | ||||||
Biogen Inc | 1,973 | 540,247 | ||||||
Bio-Rad Laboratories Inc ‘A’ | 47 | 11,754 | ||||||
BlackRock Inc | 561 | 303,905 | ||||||
Booking Holdings Inc | 10 | 20,804 | ||||||
Booz Allen Hamilton Holding Corp | 879 | 34,035 | ||||||
Bristol-Myers Squibb Co | 314 | 19,861 | ||||||
Broadcom Ltd | 128 | 30,163 | ||||||
Bruker Corp | 10,011 | 299,529 | ||||||
Brunswick Corp | 5,864 | 348,263 | ||||||
Burlington Stores Inc | 1,441 | 191,869 | ||||||
BWX Technologies Inc | 1,272 | 80,810 | ||||||
Cabot Corp | 2,767 | 154,177 | ||||||
Cabot Oil & Gas Corp | 2,873 | 68,895 | ||||||
Cadence Design Systems Inc | 3,462 | 127,298 | ||||||
Carnival Corp | 2,300 | 150,834 | ||||||
Carter’s Inc | 162 | 16,864 | ||||||
CDW Corp | 3,274 | 230,195 | ||||||
Celanese Corp ‘A’ | 1,583 | 158,632 | ||||||
Celgene Corp | 6,197 | 552,834 | ||||||
Centene Corp | 592 | 63,267 | ||||||
Cerner Corp | 1,374 | 79,692 | ||||||
Charles River Laboratories International Inc | 3,870 | 413,084 | ||||||
Cigna Corp | 992 | 166,398 | ||||||
Cimarex Energy Co | 410 | 38,335 | ||||||
Cisco Systems Inc | 2,469 | 105,895 | ||||||
CME Group Inc | 553 | 89,442 | ||||||
| Referenced Entity | Shares | Value | ||||||
Cognizant Technology Solutions Corp ‘A’ | 1,769 | $ | 142,405 | |||||
Coherent Inc | 468 | 87,703 | ||||||
Colgate-Palmolive Co | 146 | 10,465 | ||||||
Comcast Corp ‘A’ | 5,698 | 194,701 | ||||||
CONSOL Energy Inc | 1,327 | 38,443 | ||||||
Consolidated Edison Inc | 1,701 | 132,576 | ||||||
Constellation Brands Inc ‘A’ | 2,485 | 566,381 | ||||||
Convergys Corp | 2,423 | 54,808 | ||||||
Costco Wholesale Corp | 103 | 19,408 | ||||||
Crane Co | 1,827 | 169,436 | ||||||
Cummins Inc | 1,400 | 226,926 | ||||||
Curtiss-Wright Corp | 1,595 | 215,437 | ||||||
Dana Inc | 6,073 | 156,440 | ||||||
Danaher Corp | 322 | 31,527 | ||||||
Darden Restaurants Inc | 841 | 71,695 | ||||||
Deckers Outdoor Corp | 655 | 58,970 | ||||||
Delphi Technologies PLC | 855 | 40,741 | ||||||
Delta Air Lines Inc | 683 | 37,435 | ||||||
DENTSPLY SIRONA Inc | 176 | 8,855 | ||||||
Devon Energy Corp | 5,720 | 181,839 | ||||||
Dolby Laboratories Inc ‘A’ | 1,455 | 92,480 | ||||||
Dollar General Corp | 157 | 14,687 | ||||||
DR Horton Inc | 7,495 | 328,581 | ||||||
DXC Technology Co | 3,324 | 334,162 | ||||||
Eaton Corp PLC | 765 | 61,131 | ||||||
eBay Inc | 4,545 | 182,891 | ||||||
Electronic Arts Inc | 2,322 | 281,519 | ||||||
EMCOR Group Inc | 349 | 27,198 | ||||||
Emerson Electric Co | 583 | 39,819 | ||||||
Energen Corp | 181 | 11,378 | ||||||
EQT Corp | 349 | 16,581 | ||||||
Esterline Technologies Corp | 2,861 | 209,282 | ||||||
Everest Re Group Ltd | 494 | 126,869 | ||||||
Exelixis Inc | 15,495 | 343,214 | ||||||
Exelon Corp | 23,691 | 924,186 | ||||||
Expedia Group Inc | 230 | 25,394 | ||||||
Expeditors International of Washington Inc | 267 | 16,901 | ||||||
F5 Networks Inc | 639 | 92,406 | ||||||
Facebook Inc ‘A’ | 2,768 | 442,299 | ||||||
Federated Investors Inc ‘B’ | 661 | 22,077 | ||||||
FedEx Corp | 351 | 84,279 | ||||||
First Solar Inc | 6,551 | 464,990 | ||||||
Flex Ltd | 10,455 | 170,730 | ||||||
FLIR Systems Inc | 3,437 | 171,884 | ||||||
FNF Group | 4,905 | 196,298 | ||||||
Foot Locker Inc | 6,267 | 285,399 | ||||||
Fortinet Inc | 145 | 7,769 | ||||||
Franklin Resources Inc | 7,914 | 274,458 | ||||||
Freeport-McMoRan Inc | 3,069 | 53,922 | ||||||
FTI Consulting Inc | 1,346 | 65,160 | ||||||
General Dynamics Corp | 1,522 | 336,210 | ||||||
General Motors Co | 2,896 | 105,241 | ||||||
Genpact Ltd | 3,446 | 110,238 | ||||||
Gilead Sciences Inc | 5,779 | 435,679 | ||||||
Globus Medical Inc ‘A’ | 910 | 45,336 | ||||||
Graham Holdings Co ‘B’ | 18 | 10,841 | ||||||
Halliburton Co | 3,007 | 141,149 | ||||||
Harris Corp | 433 | 69,834 | ||||||
HCP Inc REIT | 1,334 | 30,989 | ||||||
HD Supply Holdings Inc | 9,052 | 343,433 | ||||||
Herman Miller Inc | 6,375 | 203,681 | ||||||
Hewlett Packard Enterprise Co | 9,595 | 168,296 | ||||||
Hilton Grand Vacations Inc | 189 | 8,131 | ||||||
Hilton Worldwide Holdings Inc | 2,207 | 173,823 | ||||||
HollyFrontier Corp | 404 | 19,739 | ||||||
Honeywell International Inc | 2,285 | 330,205 | ||||||
HP Inc | 3,377 | 74,024 | ||||||
Hubbell Inc | 182 | 22,164 | ||||||
| See Notes to Financial Statements | See explanation of symbols and terms, if any, on B-114 and B-115 |
B-82
Table of Contents
PACIFIC FUNDS
PF EQUITY LONG/SHORT FUND
Schedule of Investments (Continued)
March 31, 2018
| Referenced Entity | Shares | Value | ||||||
Humana Inc | 1,725 | $ | 463,732 | |||||
Huntington Ingalls Industries Inc | 2,423 | 624,552 | ||||||
Huntsman Corp | 5,986 | 175,091 | ||||||
IAC/InterActiveCorp | 2,752 | 430,358 | ||||||
Ingersoll-Rand PLC | 963 | 82,346 | ||||||
Ingredion Inc | 563 | 72,582 | ||||||
Intel Corp | 5,574 | 290,294 | ||||||
International Business Machines Corp | 3,653 | 560,480 | ||||||
Intuitive Surgical Inc | 450 | 185,774 | ||||||
IPG Photonics Corp | 1,169 | 272,821 | ||||||
IQVIA Holdings Inc | 844 | 82,805 | ||||||
ITT Inc | 3,363 | 164,720 | ||||||
Jabil Inc | 381 | 10,946 | ||||||
JetBlue Airways Corp | 3,374 | 68,560 | ||||||
John Wiley & Sons Inc ‘A’ | 2,080 | 132,496 | ||||||
Johnson & Johnson | 1,070 | 137,121 | ||||||
JPMorgan Chase & Co | 4,830 | 531,155 | ||||||
Juniper Networks Inc | 10,556 | 256,827 | ||||||
Kimco Realty Corp REIT | 1,827 | 26,309 | ||||||
KLA-Tencor Corp | 1,122 | 122,309 | ||||||
Kohl’s Corp | 336 | 22,011 | ||||||
L3 Technologies Inc | 509 | 105,872 | ||||||
Laboratory Corp of America Holdings | 640 | 103,520 | ||||||
Lancaster Colony Corp | 64 | 7,881 | ||||||
Las Vegas Sands Corp | 1,713 | 123,165 | ||||||
Lear Corp | 3,832 | 713,097 | ||||||
Liberty Interactive Corp QVC Group ‘A’ | 6,051 | 152,304 | ||||||
Liberty Property Trust REIT | 367 | 14,581 | ||||||
Lincoln National Corp | 1,828 | 133,554 | ||||||
Louisiana-Pacific Corp | 558 | 16,054 | ||||||
Lowe’s Cos Inc | 631 | 55,370 | ||||||
Lululemon Athletica Inc | 3,200 | 285,184 | ||||||
LyondellBasell Industries NV ‘A’ | 7,632 | 806,550 | ||||||
Marathon Oil Corp | 2,385 | 38,470 | ||||||
Marathon Petroleum Corp | 2,244 | 164,059 | ||||||
MAXIMUS Inc | 178 | 11,880 | ||||||
McKesson Corp | 2,536 | 357,246 | ||||||
Merck & Co Inc | 7,172 | 390,659 | ||||||
Michael Kors Holdings Ltd | 7,357 | 456,723 | ||||||
Micron Technology Inc | 10,202 | 531,932 | ||||||
Microsoft Corp | 3,860 | 352,302 | ||||||
Molina Healthcare Inc | 473 | 38,398 | ||||||
Molson Coors Brewing Co ‘B’ | 2,060 | 155,180 | ||||||
MSA Safety Inc | 708 | 58,934 | ||||||
MSC Industrial Direct Co Inc ‘A’ | 419 | 38,426 | ||||||
Mylan NV | 2,149 | 88,474 | ||||||
Nasdaq Inc | 1,714 | 147,781 | ||||||
Netflix Inc | 52 | 15,358 | ||||||
Newell Brands Inc | 832 | 21,199 | ||||||
Newmont Mining Corp | 2,093 | 81,774 | ||||||
NextEra Energy Inc | 513 | 83,788 | ||||||
Northrop Grumman Corp | 238 | 83,091 | ||||||
Nu Skin Enterprises Inc ‘A’ | 3,661 | 269,852 | ||||||
NVIDIA Corp | 389 | 90,089 | ||||||
NVR Inc | 129 | 361,200 | ||||||
Oceaneering International Inc | 2,782 | 51,578 | ||||||
Old Dominion Freight Line Inc | 190 | 27,924 | ||||||
Olin Corp | 1,317 | 40,024 | ||||||
Omnicom Group Inc | 129 | 9,374 | ||||||
ON Semiconductor Corp | 548 | 13,404 | ||||||
Oracle Corp | 10,948 | 500,871 | ||||||
Oshkosh Corp | 3,541 | 273,613 | ||||||
Owens Corning | 5,248 | 421,939 | ||||||
Park Hotels & Resorts Inc REIT | 12,566 | 339,533 | ||||||
Patterson-UTI Energy Inc | 4,082 | 71,476 | ||||||
PayPal Holdings Inc | 458 | 34,748 | ||||||
PepsiCo Inc | 685 | 74,768 | ||||||
Pfizer Inc | 4,424 | 157,008 | ||||||
PG&E Corp | 998 | 43,842 | ||||||
Plantronics Inc | 1,771 | 106,915 | ||||||
Popular Inc | 1,140 | 47,447 | ||||||
| Referenced Entity | Shares | Value | ||||||
Prudential Financial Inc | 2,354 | $ | 243,757 | |||||
Public Service Enterprise Group Inc | 4,513 | 226,733 | ||||||
Public Storage REIT | 295 | 59,115 | ||||||
PulteGroup Inc | 1,334 | 39,340 | ||||||
QIAGEN NV | 11,677 | 377,284 | ||||||
Range Resources Corp | 1,945 | 28,280 | ||||||
Raytheon Co | 3,636 | 784,722 | ||||||
Regeneron Pharmaceuticals Inc | 798 | 274,799 | ||||||
Reinsurance Group of America Inc | 3,591 | 553,014 | ||||||
Robert Half International Inc | 903 | 52,275 | ||||||
Rockwell Automation Inc | 270 | 47,034 | ||||||
Ross Stores Inc | 2,212 | 172,492 | ||||||
Royal Caribbean Cruises Ltd | 1,104 | 129,985 | ||||||
Sanderson Farms Inc | 167 | 19,876 | ||||||
Science Applications International Corp | 100 | 7,880 | ||||||
Seagate Technology PLC | 3,159 | 184,865 | ||||||
ServiceMaster Global Holdings Inc | 216 | 10,984 | ||||||
Skechers U.S.A. Inc ‘A’ | 5,341 | 207,711 | ||||||
Skyworks Solutions Inc | 5,462 | 547,620 | ||||||
Snap-on Inc | 62 | 9,147 | ||||||
Southwest Airlines Co | 4,886 | 279,870 | ||||||
Southwestern Energy Co | 23,598 | 102,179 | ||||||
Spirit AeroSystems Holdings Inc ‘A’ | 6,830 | 571,671 | ||||||
Stanley Black & Decker Inc | 496 | 75,987 | ||||||
Steel Dynamics Inc | 1,781 | 78,756 | ||||||
Superior Energy Services Inc | 12,916 | 108,882 | ||||||
Synchrony Financial | 328 | 10,998 | ||||||
SYNNEX Corp | 2,093 | 247,811 | ||||||
T Rowe Price Group Inc | 649 | 70,073 | ||||||
Take-Two Interactive Software Inc | 571 | 55,832 | ||||||
Target Corp | 3,403 | 236,270 | ||||||
TE Connectivity Ltd | 1,013 | 101,199 | ||||||
TEGNA Inc | 8,848 | 100,779 | ||||||
Texas Instruments Inc | 3,871 | 402,158 | ||||||
The Allstate Corp | 5,531 | 524,339 | ||||||
The Bank of New York Mellon Corp | 380 | 19,581 | ||||||
The Boeing Co | 1,426 | 467,557 | ||||||
The Boston Beer Co Inc ‘A’ | 83 | 15,691 | ||||||
The Chemours Co | 1,378 | 67,122 | ||||||
The Estee Lauder Cos Inc ‘A’ | 2,077 | 310,968 | ||||||
The PNC Financial Services Group Inc | 1,757 | 265,729 | ||||||
The Procter & Gamble Co | 2,889 | 229,040 | ||||||
The Progressive Corp | 2,303 | 140,322 | ||||||
The Timken Co | 321 | 14,638 | ||||||
The TJX Cos Inc | 1,180 | 96,241 | ||||||
The Walt Disney Co | 1,929 | 193,749 | ||||||
Total System Services Inc | 2,610 | 225,139 | ||||||
TripAdvisor Inc | 992 | 40,563 | ||||||
Tupperware Brands Corp | 392 | 18,965 | ||||||
Twitter Inc | 1,757 | 50,971 | ||||||
Tyson Foods Inc ‘A’ | 4,923 | 360,314 | ||||||
United Continental Holdings Inc | 1,885 | 130,951 | ||||||
United Rentals Inc | 910 | 157,184 | ||||||
United Therapeutics Corp | 1,789 | 201,012 | ||||||
UnitedHealth Group Inc | 646 | 138,244 | ||||||
Unum Group | 3,202 | 152,447 | ||||||
Urban Outfitters Inc | 1,654 | 61,132 | ||||||
Valero Energy Corp | 1,847 | 171,346 | ||||||
Versum Materials Inc | 1,408 | 52,983 | ||||||
Vertex Pharmaceuticals Inc | 1,680 | 273,806 | ||||||
Viacom Inc ‘B’ | 5,552 | 172,445 | ||||||
Vistra Energy Corp | 16,983 | 353,756 | ||||||
Walgreens Boots Alliance Inc | 157 | 10,279 | ||||||
Walmart Inc | 5,989 | 532,841 | ||||||
Weingarten Realty Investors REIT | 1,633 | 45,855 | ||||||
WellCare Health Plans Inc | 914 | 176,978 | ||||||
WESCO International Inc | 2,898 | 179,821 | ||||||
Western Digital Corp | 6,871 | 633,987 | ||||||
Whirlpool Corp | 1,325 | 202,871 | ||||||
Woodward Inc | 699 | 50,090 | ||||||
World Fuel Services Corp | 2,950 | 72,423 | ||||||
| See Notes to Financial Statements | See explanation of symbols and terms, if any, on B-114 and B-115 |
B-83
Table of Contents
PACIFIC FUNDS
PF EQUITY LONG/SHORT FUND
Schedule of Investments (Continued)
March 31, 2018
| Referenced Entity | Shares | Value | ||||||
Worthington Industries Inc | 867 | $ | 37,212 | |||||
WW Grainger Inc | 358 | 101,053 | ||||||
Wynn Resorts Ltd | 602 | 109,781 | ||||||
Xerox Corp | 28 | 806 | ||||||
Zebra Technologies Corp ‘A’ | 123 | 17,120 | ||||||
Zynga Inc ‘A’ | 24,645 | 90,201 | ||||||
|
| |||||||
| 48,068,452 | ||||||||
|
| |||||||
Total Long Positions | 48,077,040 | |||||||
|
| |||||||
Short Positions: | ||||||||
Argentina | ||||||||
MercadoLibre Inc | 30 | (10,692 | ) | |||||
|
| |||||||
Australia | ||||||||
Atlassian Corp PLC ‘A’ | 9,672 | (521,514 | ) | |||||
|
| |||||||
Ghana | ||||||||
Kosmos Energy Ltd | 17,884 | (112,669 | ) | |||||
|
| |||||||
United States | ||||||||
Acadia Healthcare Co Inc | 5,326 | (208,673 | ) | |||||
ACI Worldwide Inc | 7,828 | (185,680 | ) | |||||
Advance Auto Parts Inc | 678 | (80,377 | ) | |||||
Advanced Micro Devices Inc | 42,930 | (431,446 | ) | |||||
AECOM | 2,128 | (75,821 | ) | |||||
AES Corp | 15,932 | (181,147 | ) | |||||
Agios Pharmaceuticals Inc | 4,488 | (367,029 | ) | |||||
Albemarle Corp | 6,333 | (587,322 | ) | |||||
Alkermes PLC | 9,174 | (531,725 | ) | |||||
Allegheny Technologies Inc | 9,514 | (225,291 | ) | |||||
Allergan PLC | 1,150 | (193,533 | ) | |||||
Alliance Data Systems Corp | 335 | (71,308 | ) | |||||
Allscripts Healthcare Solutions Inc | 5,978 | (73,828 | ) | |||||
Ally Financial Inc | 5,496 | (149,216 | ) | |||||
Alnylam Pharmaceuticals Inc | 442 | (52,642 | ) | |||||
American Airlines Group Inc | 5,698 | (296,068 | ) | |||||
American Homes 4 Rent ‘A’ REIT | 1,479 | (29,698 | ) | |||||
American International Group Inc | 140 | (7,619 | ) | |||||
Aon PLC | 88 | (12,349 | ) | |||||
Arconic Inc | 8,452 | (194,734 | ) | |||||
ARRIS International PLC | 1,358 | (36,082 | ) | |||||
athenahealth Inc | 233 | (33,326 | ) | |||||
Autodesk Inc | 93 | (11,679 | ) | |||||
AutoNation Inc | 1,973 | (92,297 | ) | |||||
Avis Budget Group Inc | 2,750 | (128,810 | ) | |||||
Axalta Coating Systems Ltd | 3,350 | (101,136 | ) | |||||
Ball Corp | 17,851 | (708,863 | ) | |||||
Bank of the Ozarks | 7,861 | (379,450 | ) | |||||
Belden Inc | 3,263 | (224,951 | ) | |||||
BioMarin Pharmaceutical Inc | 4,217 | (341,872 | ) | |||||
Bio-Techne Corp | 182 | (27,489 | ) | |||||
Black Hills Corp | 4,896 | (265,853 | ) | |||||
Blackbaud Inc | 73 | (7,432 | ) | |||||
Blue Buffalo Pet Products Inc | 2,399 | (95,504 | ) | |||||
Brandywine Realty Trust REIT | 4,078 | (64,759 | ) | |||||
Brookdale Senior Living Inc | 56,515 | (379,216 | ) | |||||
Cable One Inc | 23 | (15,804 | ) | |||||
Callon Petroleum Co | 21,152 | (280,052 | ) | |||||
CarMax Inc | 6,564 | (406,574 | ) | |||||
Carpenter Technology Corp | 1,687 | (74,430 | ) | |||||
Casey’s General Stores Inc | 2,426 | (266,302 | ) | |||||
Catalent Inc | 377 | (15,480 | ) | |||||
Centennial Resource Development Inc ‘A’ | 5,828 | (106,944 | ) | |||||
CenturyLink Inc | 19,857 | (326,250 | ) | |||||
CF Industries Holdings Inc | 1,347 | (50,822 | ) | |||||
Charter Communications Inc ‘A’ | 268 | (83,407 | ) | |||||
Chemical Financial Corp | 3,135 | (171,422 | ) | |||||
Cheniere Energy Inc | 11,290 | (603,450 | ) | |||||
| Referenced Entity | Shares | Value | ||||||
Chipotle Mexican Grill Inc | 40 | ( $ 12,924 | ) | |||||
Cinemark Holdings Inc | 229 | (8,626 | ) | |||||
CIT Group Inc | 2,258 | (116,287 | ) | |||||
Clean Harbors Inc | 4,284 | (209,102 | ) | |||||
Colony NorthStar Inc ‘A’ REIT | 16,234 | (91,235 | ) | |||||
CommScope Holding Co Inc | 605 | (24,182 | ) | |||||
CommVault Systems Inc | 386 | (22,079 | ) | |||||
Compass Minerals International Inc | 3,481 | (209,904 | ) | |||||
Conduent Inc | 17,241 | (321,372 | ) | |||||
Coty Inc ‘A’ | 23,916 | (437,663 | ) | |||||
Cousins Properties Inc REIT | 18,742 | (162,681 | ) | |||||
Covanta Holding Corp | 2,523 | (36,583 | ) | |||||
Cree Inc | 5,793 | (233,516 | ) | |||||
Cypress Semiconductor Corp | 14,277 | (242,138 | ) | |||||
DaVita Inc | 505 | (33,300 | ) | |||||
DDR Corp REIT | 12,304 | (90,188 | ) | |||||
DexCom Inc | 5,466 | (405,359 | ) | |||||
Diebold Nixdorf Inc | 3,582 | (55,163 | ) | |||||
Discovery Inc ‘A’ | 12,878 | (275,976 | ) | |||||
DISH Network Corp ‘A’ | 2,937 | (111,283 | ) | |||||
Dollar Tree Inc | 104 | (9,870 | ) | |||||
Domino’s Pizza Inc | 1,049 | (245,004 | ) | |||||
Dril-Quip Inc | 417 | (18,682 | ) | |||||
Dunkin’ Brands Group Inc | 5,620 | (335,458 | ) | |||||
Dycom Industries Inc | 447 | (48,111 | ) | |||||
Education Realty Trust Inc REIT | 245 | (8,024 | ) | |||||
Encompass Health Corp | 186 | (10,634 | ) | |||||
Energizer Holdings Inc | 215 | (12,810 | ) | |||||
Ensco PLC ‘A’ | 35,479 | (155,753 | ) | |||||
Envision Healthcare Corp | 18,514 | (711,493 | ) | |||||
Extraction Oil & Gas Inc | 4,255 | (48,762 | ) | |||||
FireEye Inc | 12,782 | (216,399 | ) | |||||
First Data Corp ‘A’ | 44,364 | (709,824 | ) | |||||
FirstEnergy Corp | 26,699 | (908,033 | ) | |||||
Flowserve Corp | 2,622 | (113,611 | ) | |||||
Fluor Corp | 173 | (9,899 | ) | |||||
FMC Corp | 405 | (31,011 | ) | |||||
FNB Corp | 10,327 | (138,898 | ) | |||||
Gartner Inc | 2,843 | (334,394 | ) | |||||
GATX Corp | 514 | (35,204 | ) | |||||
General Electric Co | 843 | (11,364 | ) | |||||
Genesee & Wyoming Inc ‘A’ | 3,623 | (256,472 | ) | |||||
Global Payments Inc | 2,736 | (305,119 | ) | |||||
GoDaddy Inc ‘A’ | 3,768 | (231,431 | ) | |||||
Granite Construction Inc | 4,433 | (247,627 | ) | |||||
Guidewire Software Inc | 5,312 | (429,369 | ) | |||||
Halyard Health Inc | 1,849 | (85,202 | ) | |||||
Harley-Davidson Inc | 224 | (9,605 | ) | |||||
Healthcare Services Group Inc | 509 | (22,131 | ) | |||||
HEICO Corp | 4,396 | (381,617 | ) | |||||
Henry Schein Inc | 957 | (64,320 | ) | |||||
Hess Corp | 12,881 | (652,036 | ) | |||||
IHS Markit Ltd | 6,262 | (302,079 | ) | |||||
Incyte Corp | 1,039 | (86,580 | ) | |||||
Integrated Device Technology Inc | 3,443 | (105,218 | ) | |||||
Ionis Pharmaceuticals Inc | 3,861 | (170,193 | ) | |||||
Jack in the Box Inc | 1,370 | (116,902 | ) | |||||
Kemper Corp | 1,338 | (76,266 | ) | |||||
Kennametal Inc | 1,198 | (48,112 | ) | |||||
Kinder Morgan Inc | 16,180 | (243,671 | ) | |||||
Kirby Corp | 258 | (19,853 | ) | |||||
KLX Inc | 3,790 | (269,317 | ) | |||||
Knowles Corp | 12,692 | (159,792 | ) | |||||
L Brands Inc | 7,532 | (287,798 | ) | |||||
LaSalle Hotel Properties REIT | 2,473 | (71,742 | ) | |||||
Leggett & Platt Inc | 2,092 | (92,801 | ) | |||||
Lennox International Inc | 49 | (10,014 | ) | |||||
Leucadia National Corp | 963 | (21,889 | ) | |||||
Liberty Broadband Corp ‘C’ | 658 | (56,384 | ) | |||||
Liberty Media Corp-Liberty SiriusXM ‘C’ | 183 | (7,476 | ) | |||||
LifePoint Health Inc | 1,891 | (88,877 | ) | |||||
| See Notes to Financial Statements | See explanation of symbols and terms, if any, on B-114 and B-115 |
B-84
Table of Contents
PACIFIC FUNDS
PF EQUITY LONG/SHORT FUND
Schedule of Investments (Continued)
March 31, 2018
| Referenced Entity | Shares | Value | ||||||
Lions Gate Entertainment Corp ‘A’ | 284 | ($7,336 | ) | |||||
LivaNova PLC | 1,982 | (175,407 | ) | |||||
Loews Corp | 977 | (48,586 | ) | |||||
Mack-Cali Realty Corp REIT | 1,099 | (18,364 | ) | |||||
Macquarie Infrastructure Corp | 16,460 | (607,868 | ) | |||||
Mallinckrodt PLC | 3,041 | (44,034 | ) | |||||
Markel Corp | 32 | (37,448 | ) | |||||
Martin Marietta Materials Inc | 98 | (20,315 | ) | |||||
Matador Resources Co | 2,891 | (86,470 | ) | |||||
Mattel Inc | 814 | (10,704 | ) | |||||
MB Financial Inc | 1,689 | (68,371 | ) | |||||
McCormick & Co Inc | 1,197 | (127,349 | ) | |||||
Medical Properties Trust Inc REIT | 1,650 | (21,450 | ) | |||||
Medidata Solutions Inc | 2,238 | (140,569 | ) | |||||
Mercury General Corp | 2,214 | (101,556 | ) | |||||
Meredith Corp | 2,021 | (108,730 | ) | |||||
Microchip Technology Inc | 882 | (80,580 | ) | |||||
Nabors Industries Ltd | 3,459 | (24,178 | ) | |||||
National Fuel Gas Co | 5,030 | (258,793 | ) | |||||
National Instruments Corp | 546 | (27,611 | ) | |||||
NCR Corp | 761 | (23,987 | ) | |||||
NetScout Systems Inc | 7,345 | (193,541 | ) | |||||
Neurocrine Biosciences Inc | 3,283 | (272,259 | ) | |||||
New Jersey Resources Corp | 851 | (34,125 | ) | |||||
Noble Energy Inc | 8,115 | (245,884 | ) | |||||
NOW Inc | 4,272 | (43,660 | ) | |||||
NRG Energy Inc | 9,627 | (293,912 | ) | |||||
NuVasive Inc | 5,878 | (306,890 | ) | |||||
OneMain Holdings Inc | 3,445 | (103,143 | ) | |||||
ONEOK Inc | 4,166 | (237,129 | ) | |||||
OPKO Health Inc | 11,411 | (36,173 | ) | |||||
Owens-Illinois Inc | 922 | (19,971 | ) | |||||
PacWest Bancorp | 1,569 | (77,713 | ) | |||||
Pandora Media Inc | 34,308 | (172,569 | ) | |||||
Papa John’s International Inc | 1,775 | (101,707 | ) | |||||
Parsley Energy Inc ‘A’ | 1,889 | (54,762 | ) | |||||
PBF Energy Inc ‘A’ | 1,327 | (44,985 | ) | |||||
Penske Automotive Group Inc | 1,909 | (84,626 | ) | |||||
People’s United Financial Inc | 3,333 | (62,194 | ) | |||||
Perrigo Co PLC | 3,914 | (326,193 | ) | |||||
Platform Specialty Products Corp | 19,312 | (185,975 | ) | |||||
Post Holdings Inc | 6,540 | (495,470 | ) | |||||
PPL Corp | 8,761 | (247,849 | ) | |||||
Premier Inc ‘A’ | 9,962 | (311,910 | ) | |||||
Prestige Brands Holdings Inc | 6,600 | (222,552 | ) | |||||
Quality Care Properties Inc REIT | 1,724 | (33,497 | ) | |||||
Realogy Holdings Corp | 5,002 | (136,455 | ) | |||||
Royal Gold Inc | 883 | (75,823 | ) | |||||
RSP Permian Inc | 755 | (35,394 | ) | |||||
Sabre Corp | 14,539 | (311,862 | ) | |||||
Sally Beauty Holdings Inc | 2,809 | (46,208 | ) | |||||
Scientific Games Corp | 2,382 | (99,091 | ) | |||||
Sealed Air Corp | 7,318 | (313,137 | ) | |||||
Seattle Genetics Inc | 4,568 | (239,089 | ) | |||||
Sempra Energy | 953 | (105,993 | ) | |||||
Sensata Technologies Holding PLC | 7,339 | (380,380 | ) | |||||
ServiceNow Inc | 823 | (136,165 | ) | |||||
Six Flags Entertainment Corp | 3,087 | (192,197 | ) | |||||
SLM Corp | 42,882 | (480,707 | ) | |||||
SM Energy Co | 9,917 | (178,803 | ) | |||||
Sotheby’s | 3,346 | (171,683 | ) | |||||
Southwest Gas Holdings Inc | 1,597 | (108,005 | ) | |||||
Spirit Airlines Inc | 3,602 | (136,084 | ) | |||||
| Referenced Entity | Shares | Value | ||||||
Spirit Realty Capital Inc REIT | 3,336 | ($25,887 | ) | |||||
Splunk Inc | 98 | (9,642 | ) | |||||
Sprint Corp | 10,381 | (50,659 | ) | |||||
Square Inc ‘A’ | 4,935 | (242,802 | ) | |||||
Stericycle Inc | 4,311 | (252,323 | ) | |||||
Sterling Bancorp | 12,365 | (278,831 | ) | |||||
Stifel Financial Corp | 4,442 | (263,100 | ) | |||||
Synaptics Inc | 915 | (41,843 | ) | |||||
Syneos Health Inc | 1,278 | (45,369 | ) | |||||
Tableau Software Inc ‘A’ | 1,940 | (156,791 | ) | |||||
Targa Resources Corp | 9,128 | (401,632 | ) | |||||
Taubman Centers Inc REIT | 2,945 | (167,600 | ) | |||||
Telephone & Data Systems Inc | 1,653 | (46,334 | ) | |||||
Tesla Inc | 320 | (85,162 | ) | |||||
Texas Capital Bancshares Inc | 1,993 | (179,171 | ) | |||||
The Charles Schwab Corp | 2,688 | (140,367 | ) | |||||
The Hain Celestial Group Inc | 2,559 | (82,067 | ) | |||||
The Kraft Heinz Co | 1,506 | (93,809 | ) | |||||
The Middleby Corp | 705 | (87,272 | ) | |||||
The Mosaic Co | 704 | (17,093 | ) | |||||
The New York Times Co ‘A’ | 1,030 | (24,823 | ) | |||||
The Ultimate Software Group Inc | 2,307 | (562,216 | ) | |||||
The Wendy’s Co | 10,983 | (192,752 | ) | |||||
The Williams Cos Inc | 8,328 | (207,034 | ) | |||||
TransDigm Group Inc | 2,391 | (733,894 | ) | |||||
Transocean Ltd | 5,320 | (52,668 | ) | |||||
TreeHouse Foods Inc | 7,706 | (294,909 | ) | |||||
TRI Pointe Group Inc | 13,971 | (229,544 | ) | |||||
Tyler Technologies Inc | 1,664 | (351,037 | ) | |||||
United Bankshares Inc | 8,539 | (301,000 | ) | |||||
United Natural Foods Inc | 251 | (10,778 | ) | |||||
United States Steel Corp | 1,686 | (59,330 | ) | |||||
Uniti Group Inc REIT | 33,091 | (537,729 | ) | |||||
Univar Inc | 1,804 | (50,061 | ) | |||||
Universal Display Corp | 557 | (56,257 | ) | |||||
Valley National Bancorp | 3,262 | (40,645 | ) | |||||
Valvoline Inc | 5,695 | (126,030 | ) | |||||
VEREIT Inc REIT | 102,351 | (712,363 | ) | |||||
VeriFone Systems Inc | 3,193 | (49,108 | ) | |||||
ViaSat Inc | 5,922 | (389,194 | ) | |||||
Vulcan Materials Co | 870 | (99,328 | ) | |||||
Wabtec Corp | 7,389 | (601,465 | ) | |||||
Washington Prime Group Inc REIT | 21,574 | (143,899 | ) | |||||
Waste Connections Inc | 1,155 | (82,860 | ) | |||||
Weatherford International PLC | 116,719 | (267,286 | ) | |||||
Webster Financial Corp | 3,525 | (195,285 | ) | |||||
Welbilt Inc | 7,041 | (136,947 | ) | |||||
WestRock Co | 178 | (11,422 | ) | |||||
WEX Inc | 731 | (114,489 | ) | |||||
White Mountains Insurance Group Ltd | 21 | (17,273 | ) | |||||
Whiting Petroleum Corp | 1,376 | (46,564 | ) | |||||
Workday Inc ‘A’ | 2,954 | (375,483 | ) | |||||
WPX Energy Inc | 2,114 | (31,245 | ) | |||||
XPO Logistics Inc | 1,773 | (180,509 | ) | |||||
Yum! Brands Inc | 1,391 | (118,416 | ) | |||||
Zayo Group Holdings Inc | 11,543 | (394,309 | ) | |||||
Zillow Group Inc ‘C’ | 8,792 | (473,010 | ) | |||||
|
| |||||||
| (41,722,241 | ) | |||||||
|
| |||||||
Total Short Positions | (42,367,116 | ) | ||||||
|
| |||||||
Total Long and Short Positions | $5,709,924 | |||||||
|
| |||||||
| Description | Counter- party | Expiration Dates (1) | ||||||
The Fund receives or pays the net total return on all positions within the basket and pays financing based upon the then-current 1-Month AUD-BBSW (1.790% as of 03/31/18) plus or minus a specified spread (rates range from (1.865%) to 0.350%) as negotiated by the parties, which is denominated in AUD based on the local currencies of the positions within the swap. | JPM | | 08/13/18- 04/15/19 |
| ||||
| See Notes to Financial Statements | See explanation of symbols and terms, if any, on B-114 and B-115 |
B-85
Table of Contents
PACIFIC FUNDS
PF EQUITY LONG/SHORT FUND
Schedule of Investments (Continued)
March 31, 2018
The following table represents the individual long and short positions and related values within the total return basket swap as of March 31, 2018:
| Referenced Entity | Shares | Value | ||||||
Long Positions: | ||||||||
Australia | ||||||||
AGL Energy Ltd | 1,516 | $25,410 | ||||||
Aurizon Holdings Ltd | 45,379 | 148,875 | ||||||
BlueScope Steel Ltd | 1,145 | 13,471 | ||||||
Caltex Australia Ltd | 365 | 8,866 | ||||||
CIMIC Group Ltd | 10,758 | 370,264 | ||||||
Fortescue Metals Group Ltd | 10,777 | 36,304 | ||||||
Iluka Resources Ltd | 926 | 7,601 | ||||||
Newcrest Mining Ltd | 9,742 | 146,934 | ||||||
Orica Ltd | 7,482 | 102,987 | ||||||
Origin Energy Ltd | 9,740 | 65,731 | ||||||
Qantas Airways Ltd | 3,134 | 14,139 | ||||||
South32 Ltd | 40,820 | 102,588 | ||||||
Woodside Petroleum Ltd | 5,109 | 115,858 | ||||||
|
| |||||||
| 1,159,028 | ||||||||
|
| |||||||
Total Long Positions | 1,159,028 | |||||||
|
| |||||||
| Referenced Entity | Shares | Value | ||||||
Short Positions: | ||||||||
Australia | ||||||||
APA Group | 32,657 | ($198,847 | ) | |||||
Computershare Ltd | 2,173 | (29,140 | ) | |||||
CSL Ltd | 780 | (93,973 | ) | |||||
Domino’s Pizza Enterprises Ltd | 611 | (19,688 | ) | |||||
Healthscope Ltd | 102,530 | (153,622 | ) | |||||
Platinum Asset Management Ltd | 7,008 | (31,743 | ) | |||||
REA Group Ltd | 2,025 | (124,329 | ) | |||||
SEEK Ltd | 18,035 | (260,126 | ) | |||||
TPG Telecom Ltd | 17,630 | (74,906 | ) | |||||
Vocus Group Ltd | 47,789 | (82,363 | ) | |||||
|
| |||||||
| (1,068,737 | ) | |||||||
|
| |||||||
Total Short Positions | (1,068,737 | ) | ||||||
|
| |||||||
Total Long and Short Positions | $90,291 | |||||||
|
| |||||||
| Description | Counter- party | Expiration Dates (1) | ||||
The Fund receives or pays the net total return on all positions within the basket and pays financing based upon the then-current 1-Month GBP-LIBOR (0.508% as of 03/31/18) plus or minus a specified spread (rates range from (4.008%) to 0.250%) as negotiated by the parties, which is denominated in GBP based on the local currencies of the positions within the swap. | JPM | 08/13/18- 04/29/19 | ||||
The following table represents the individual long and short positions and related values within the total return basket swap as of March 31, 2018:
| Referenced Entity | Shares | Value | ||||||
Long Positions: | ||||||||
Australia | ||||||||
BHP Billiton PLC | 15,743 | $311,132 | ||||||
|
| |||||||
Chile | ||||||||
Antofagasta PLC | 3,269 | 42,264 | ||||||
|
| |||||||
Germany | ||||||||
TUI AG | 353 | 7,570 | ||||||
|
| |||||||
Russia | ||||||||
Evraz PLC | 1,325 | 8,080 | ||||||
|
| |||||||
South Africa | ||||||||
Investec PLC | 18,436 | 142,479 | ||||||
|
| |||||||
Switzerland | ||||||||
Coca-Cola HBC AG | 6,925 | 256,271 | ||||||
IWG PLC | 2,516 | 8,063 | ||||||
|
| |||||||
| 264,334 | ||||||||
|
| |||||||
United Kingdom | ||||||||
Anglo American PLC | 3,631 | 84,582 | ||||||
Associated British Foods PLC | 4,713 | 164,773 | ||||||
Aviva PLC | 2,654 | 18,522 | ||||||
Barclays PLC | 34,288 | 100,193 | ||||||
Barratt Developments PLC | 28,944 | 215,381 | ||||||
BBA Aviation PLC | 17,699 | 79,692 | ||||||
Beazley PLC | 1,331 | 10,687 | ||||||
Bellway PLC | 3,587 | 153,505 | ||||||
Britvic PLC | 797 | 7,635 | ||||||
BT Group PLC | 88,458 | 282,341 | ||||||
Burberry Group PLC | 871 | 20,762 | ||||||
Close Brothers Group PLC | 4,427 | 89,282 | ||||||
Direct Line Insurance Group PLC | 1,421 | 7,609 | ||||||
Dixons Carphone PLC | 10,136 | 26,505 | ||||||
DS Smith PLC | 1,123 | 7,421 | ||||||
| Referenced Entity | Shares | Value | ||||||
Hays PLC | 4,089 | $10,817 | ||||||
Inchcape PLC | 13,636 | 132,206 | ||||||
Indivior PLC | 29,024 | 165,911 | ||||||
Intermediate Capital Group PLC | 5,498 | 75,939 | ||||||
International Consolidated Airlines Group SA | 1,751 | 15,113 | ||||||
JD Sports Fashion PLC | 10,080 | 47,543 | ||||||
Lloyds Banking Group PLC | 229,555 | 208,809 | ||||||
Man Group PLC | 23,488 | 56,638 | ||||||
Moneysupermarket.com Group PLC | 11,412 | 45,935 | ||||||
NEX Group PLC | 1,594 | 21,980 | ||||||
Old Mutual PLC | 12,479 | 41,990 | ||||||
Persimmon PLC | 9,736 | 345,552 | ||||||
Rio Tinto PLC | 4,312 | 218,808 | ||||||
Royal Bank of Scotland Group PLC | 15,124 | 55,018 | ||||||
Royal Mail PLC | 41,897 | 317,988 | ||||||
Smith & Nephew PLC | 1,957 | 36,610 | ||||||
SSE PLC | 3,946 | 70,788 | ||||||
Stagecoach Group PLC | 13,891 | 25,791 | ||||||
Standard Life PLC | 52,780 | 266,416 | ||||||
Tate & Lyle PLC | 13,217 | 100,946 | ||||||
Taylor Wimpey PLC | 66,080 | 171,193 | ||||||
Thomas Cook Group PLC | 25,337 | 42,070 | ||||||
WH Smith PLC | 327 | 8,966 | ||||||
William Hill PLC | 29,487 | 136,719 | ||||||
|
| |||||||
| 3,888,636 | ||||||||
|
| |||||||
Total Long Positions | 4,664,495 | |||||||
|
| |||||||
Short Positions: | ||||||||
Jordan | ||||||||
Hikma Pharmaceuticals PLC | 6,129 | (104,235 | ) | |||||
|
| |||||||
South Africa | ||||||||
Mediclinic International PLC | 14,794 | (124,819 | ) | |||||
|
| |||||||
United Kingdom | ||||||||
AA PLC | 46,520 | (52,541 | ) | |||||
Admiral Group PLC | 4,805 | (124,366 | ) | |||||
| See Notes to Financial Statements | See explanation of symbols and terms, if any, on B-114 and B-115 |
B-86
Table of Contents
PACIFIC FUNDS
PF EQUITY LONG/SHORT FUND
Schedule of Investments (Continued)
March 31, 2018
| Referenced Entity | Shares | Value | ||||||
Aggreko PLC | 10,911 | ($112,428 | ) | |||||
Ashtead Group PLC | 281 | (7,662 | ) | |||||
Auto Trader Group PLC | 18,997 | (93,378 | ) | |||||
B&M European Value Retail SA | 2,043 | (11,215 | ) | |||||
Babcock International Group PLC | 13,966 | (131,093 | ) | |||||
Balfour Beatty PLC | 32,600 | (122,524 | ) | |||||
British American Tobacco PLC | 233 | (13,469 | ) | |||||
BTG PLC | 16,727 | (158,804 | ) | |||||
Capita PLC | 56,896 | (114,988 | ) | |||||
Cobham PLC | 108,400 | (186,796 | ) | |||||
ConvaTec Group PLC | 70,424 | (196,478 | ) | |||||
Croda International PLC | 474 | (30,450 | ) | |||||
Essentra PLC | 9,580 | (56,975 | ) | |||||
Experian PLC | 4,027 | (87,090 | ) | |||||
Greene King PLC | 9,469 | (62,630 | ) | |||||
Halma PLC | 8,709 | (144,162 | ) | |||||
Hargreaves Lansdown PLC | 8,113 | (186,222 | ) | |||||
IMI PLC | 519 | (7,873 | ) | |||||
Inmarsat PLC | 39,163 | (199,128 | ) | |||||
InterContinental Hotels Group PLC | 307 | (18,393 | ) | |||||
J Sainsbury PLC | 32,195 | (107,997 | ) | |||||
John Wood Group PLC | 26,660 | (202,579 | ) | |||||
Johnson Matthey PLC | 312 | (13,310 | ) | |||||
| Referenced Entity | Shares | Value | ||||||
Just Eat PLC | 6,498 | ($63,631 | ) | |||||
Meggitt PLC | 3,165 | (19,201 | ) | |||||
Merlin Entertainments PLC | 35,415 | (172,207 | ) | |||||
Micro Focus International PLC | 6,386 | (89,171 | ) | |||||
Pennon Group PLC | 8,138 | (73,572 | ) | |||||
Petrofac Ltd | 6,759 | (48,213 | ) | |||||
Provident Financial PLC | 9,542 | (91,338 | ) | |||||
Rightmove PLC | 1,849 | (112,870 | ) | |||||
Rolls-Royce Holdings PLC | 1,907 | (23,315 | ) | |||||
Rotork PLC | 26,899 | (107,511 | ) | |||||
RPC Group PLC | 6,929 | (75,331 | ) | |||||
Tesco PLC | 264,286 | (764,897 | ) | |||||
The Sage Group PLC | 2,690 | (24,171 | ) | |||||
The Weir Group PLC | 2,545 | (71,340 | ) | |||||
United Utilities Group PLC | 6,807 | (68,361 | ) | |||||
Wm Morrison Supermarkets PLC | 28,198 | (84,604 | ) | |||||
WPP PLC | 5,276 | (83,844 | ) | |||||
|
| |||||||
| (4,416,128 | ) | |||||||
|
| |||||||
Total Short Positions | (4,645,182 | ) | ||||||
|
| |||||||
Total Long and Short Positions | $19,313 | |||||||
|
| |||||||
| Description | Counter- party | Expiration Dates (1) | ||||||
The Fund receives or pays the net total return on all positions within the basket and pays financing based upon the then-current 1-Month HKD-HIBOR (0.797% as of 03/31/18) plus or minus a specified spread (rates range from (2.250%) to 0.500%) as negotiated by the parties, which is denominated in HKD based on the local currencies of the positions within the swap. | JPM | | 08/13/18- 04/29/19 |
| ||||
The following table represents the individual long and short positions and related values within the total return basket swap as of March 31, 2018:
| Referenced Entity | Shares | Value | ||||||
Long Positions: | ||||||||
Hong Kong | ||||||||
Chow Tai Fook Jewellery Group Ltd | 38,200 | $43,594 | ||||||
Henderson Land Development Co Ltd | 7,000 | 45,900 | ||||||
Kerry Properties Ltd | 28,000 | 126,616 | ||||||
Melco International Development Ltd | 52,000 | 152,610 | ||||||
Sino Land Co Ltd | 28,000 | 45,384 | ||||||
VTech Holdings Ltd | 4,700 | 59,644 | ||||||
WH Group Ltd | 12,000 | 12,858 | ||||||
Wheelock & Co Ltd | 18,000 | 132,031 | ||||||
Yue Yuen Industrial Holdings Ltd | 33,000 | 132,213 | ||||||
|
| |||||||
| 750,850 | ||||||||
|
| |||||||
Total Long Positions | 750,850 | |||||||
|
| |||||||
Short Positions: | ||||||||
China | ||||||||
Guotai Junan International Holdings Ltd | 46,000 | (13,412 | ) | |||||
|
| |||||||
| Referenced Entity | Shares | Value | ||||||
Hong Kong | ||||||||
ASM Pacific Technology Ltd | 2,800 | ($39,447 | ) | |||||
Cathay Pacific Airways Ltd | 47,639 | (82,479 | ) | |||||
Haitong International Securities Group Ltd | 30,051 | (17,663 | ) | |||||
Hong Kong & China Gas Co Ltd | 82,270 | (169,539 | ) | |||||
Hysan Development Co Ltd | 2,000 | (10,614 | ) | |||||
MTR Corp Ltd | 24,103 | (130,112 | ) | |||||
Techtronic Industries Co Ltd | 2,000 | (11,738 | ) | |||||
Value Partners Group Ltd | 84,276 | (79,408 | ) | |||||
|
| |||||||
| (541,000 | ) | |||||||
|
| |||||||
Macao | ||||||||
MGM China Holdings Ltd | 64,997 | (169,050 | ) | |||||
|
| |||||||
United States | ||||||||
Samsonite International SA | 8,192 | (37,469 | ) | |||||
|
| |||||||
Total Short Positions | (760,931 | ) | ||||||
|
| |||||||
Total Long and Short Positions | ($10,081 | ) | ||||||
|
| |||||||
| Description | Counter- party | Expiration Dates (1) | ||||||
The Fund receives or pays the net total return on all positions within the basket and pays financing based upon the then-current 1-Month SGD-SIBOR (1.253% as of 03/31/18) plus or minus a specified spread (rates range from (2.000%) to 0.408%) as negotiated by the parties, which is denominated in SGD based on the local currencies of the positions within the swap. | JPM | | 08/13/18- 02/26/19 |
| ||||
| See Notes to Financial Statements | See explanation of symbols and terms, if any, on B-114 and B-115 |
B-87
Table of Contents
PACIFIC FUNDS
PF EQUITY LONG/SHORT FUND
Schedule of Investments (Continued)
March 31, 2018
The following table represents the individual long and short positions and related values within the total return basket swap as of March 31, 2018:
| Referenced Entity | Shares | Value | ||||||
Long Positions: | ||||||||
China | ||||||||
Yangzijiang Shipbuilding Holdings Ltd | 84,906 | $79,080 | ||||||
|
| |||||||
Singapore | ||||||||
Genting Singapore PLC | 131,000 | 108,655 | ||||||
|
| |||||||
Total Long Positions | 187,735 | |||||||
|
| |||||||
| Referenced Entity | Shares | Value | ||||||
Short Positions: | ||||||||
Singapore | ||||||||
CapitaLand Ltd | 10,700 | ($29,303 | ) | |||||
Golden Agri-Resources Ltd | 29,000 | (7,774 | ) | |||||
Keppel Corp Ltd | 2,886 | (17,256 | ) | |||||
Singapore Post Ltd | 119,400 | (125,163 | ) | |||||
|
| |||||||
| (179,496 | ) | |||||||
|
| |||||||
Total Short Positions | (179,496 | ) | ||||||
|
| |||||||
Total Long and Short Positions | $8,239 | |||||||
|
| |||||||
| Description | Counter- party | Expiration Date (1) | ||||||
The Fund receives or pays the net total return on all positions within the basket and pays financing based upon the then-current 1-Day CAD-USD Discount Rate (1.250% as of 03/31/18) plus or minus a specified spread (rates range from (0.250%) to 0.330%) as negotiated by the parties, which is denominated in CAD based on the local currencies of the positions within the swap. | MSC | 05/02/19 | ||||||
The following table represents the individual long and short positions and related values within the total return basket swap as of March 31, 2018:
| Referenced Entity | Shares | Value | ||||||
Long Positions: | ||||||||
Canada | ||||||||
Air Canada | 26,032 | $540,906 | ||||||
Atco Ltd ‘I’ | 241 | 7,741 | ||||||
Barrick Gold Corp | 2,397 | 29,861 | ||||||
BlackBerry Ltd | 595 | 6,840 | ||||||
BRP Inc | 348 | 13,365 | ||||||
CAE Inc | 427 | 7,948 | ||||||
Canadian Tire Corp Ltd ‘A’ | 741 | 97,431 | ||||||
Constellation Software Inc | 45 | 30,533 | ||||||
Dollarama Inc | 3,545 | 430,843 | ||||||
Empire Co Ltd ‘A’ | 5,526 | 110,919 | ||||||
Encana Corp | 730 | 8,029 | ||||||
Finning International Inc | 3,132 | 75,532 | ||||||
George Weston Ltd | 350 | 28,177 | ||||||
Industrial Alliance Insurance & Financial Services Inc | 1,935 | 79,602 | ||||||
Kinross Gold Corp | 6,391 | 25,249 | ||||||
Linamar Corp | 2,786 | 152,194 | ||||||
Lundin Mining Corp | 14,057 | 92,197 | ||||||
Methanex Corp | 177 | 10,723 | ||||||
National Bank of Canada | 633 | 29,794 | ||||||
Quebecor Inc ‘B’ | 540 | 10,323 | ||||||
Teck Resources Ltd ‘B’ | 5,689 | 146,514 | ||||||
West Fraser Timber Co Ltd | 3,545 | 235,563 | ||||||
WestJet Airlines Ltd | 575 | 10,577 | ||||||
|
| |||||||
| 2,180,861 | ||||||||
|
| |||||||
Total Long Positions | 2,180,861 | |||||||
|
| |||||||
| Referenced Entity | Shares | Value | ||||||
Short Positions: | ||||||||
Canada | ||||||||
AltaGas Ltd | 7,265 | ($134,434 | ) | |||||
Cameco Corp | 18,727 | (170,212 | ) | |||||
Canadian Utilities Ltd ‘A’ | 2,495 | (66,599 | ) | |||||
Cenovus Energy Inc | 913 | (7,774 | ) | |||||
Eldorado Gold Corp | 27,416 | (22,982 | ) | |||||
Element Fleet Management Corp | 4,338 | (13,973 | ) | |||||
Enbridge Inc | 15,778 | (496,235 | ) | |||||
First Quantum Minerals Ltd | 13,749 | (193,053 | ) | |||||
Franco-Nevada Corp | 344 | (23,470 | ) | |||||
Gildan Activewear Inc | 3,515 | (101,520 | ) | |||||
Goldcorp Inc | 3,152 | (43,524 | ) | |||||
Imperial Oil Ltd | 1,164 | (30,827 | ) | |||||
Inter Pipeline Ltd | 1,293 | (22,441 | ) | |||||
Keyera Corp | 3,048 | (79,279 | ) | |||||
Nutrien Ltd | 159 | (7,515 | ) | |||||
Pembina Pipeline Corp | 653 | (20,375 | ) | |||||
Peyto Exploration & Development Corp | 1,789 | (14,997 | ) | |||||
Restaurant Brands International Inc | 236 | (13,431 | ) | |||||
SNC-Lavalin Group Inc | 328 | (14,402 | ) | |||||
Stantec Inc | 732 | (18,062 | ) | |||||
TransCanada Corp | 6,683 | (276,377 | ) | |||||
Wheaton Precious Metals Corp | 10,894 | (221,964 | ) | |||||
WSP Global Inc | 2,090 | (96,263 | ) | |||||
Yamana Gold Inc | 11,282 | (31,175 | ) | |||||
|
| |||||||
| (2,120,884 | ) | |||||||
|
| |||||||
Total Short Positions | (2,120,884 | ) | ||||||
|
| |||||||
Total Long and Short Positions | $59,977 | |||||||
|
| |||||||
| Description | Counter- party | Expiration Date (1) | ||||||
The Fund receives or pays the net total return on all positions within the basket and pays financing based upon the then-current 1-Day CHF-TOIS ((0.740%) as of 03/31/18) plus or minus a specified spread (rates range from (2.130%) to 0.350%) as negotiated by the parties, which is denominated in CHF based on the local currencies of the positions within the swap. | MSC | 05/02/19 | ||||||
| See Notes to Financial Statements | See explanation of symbols and terms, if any, on B-114 and B-115 |
B-88
Table of Contents
PACIFIC FUNDS
PF EQUITY LONG/SHORT FUND
Schedule of Investments (Continued)
March 31, 2018
The following table represents the individual long and short positions and related values within the total return basket swap as of March 31, 2018:
| Referenced Entity | Shares | Value | ||||||
Long Positions: | ||||||||
Switzerland | ||||||||
Adecco Group AG | 3,238 | $230,643 | ||||||
Barry Callebaut AG | 15 | 29,336 | ||||||
dormakaba Holding AG | 10 | 7,831 | ||||||
Flughafen Zurich AG | 660 | 145,767 | ||||||
Georg Fischer AG | 190 | 254,386 | ||||||
Lonza Group AG | 405 | 95,515 | ||||||
Roche Holding AG | 41 | 9,405 | ||||||
Sika AG | 26 | 203,948 | ||||||
Swiss Life Holding AG | 207 | 73,768 | ||||||
Temenos Group AG | 3,867 | 463,689 | ||||||
|
| |||||||
| 1,514,288 | ||||||||
|
| |||||||
Total Long Positions | 1,514,288 | |||||||
|
| |||||||
| Referenced Entity | Shares | Value | ||||||
Short Positions: | ||||||||
Austria | ||||||||
ams AG | 1,267 | ($133,048 | ) | |||||
|
| |||||||
Switzerland | ||||||||
Aryzta AG | 1,659 | (36,949 | ) | |||||
Chocoladefabriken Lindt & Spruengli AG | 27 | (167,514 | ) | |||||
Credit Suisse Group AG | 30,197 | (507,159 | ) | |||||
Dufry AG | 653 | (85,771 | ) | |||||
GAM Holding AG | 546 | (9,194 | ) | |||||
Straumann Holding AG | 26 | (16,405 | ) | |||||
Vifor Pharma AG | 3,484 | (537,241 | ) | |||||
|
| |||||||
| (1,360,233 | ) | |||||||
|
| |||||||
Total Short Positions | (1,493,281 | ) | ||||||
|
| |||||||
Total Long and Short Positions | $21,007 | |||||||
|
| |||||||
| Description | Counter- party | Expiration Date (1) | ||||||
The Fund receives or pays the net total return on all positions within the basket and pays financing based upon the then-current 1-Day EUR-EONIA ((0.370%) as of 03/31/18) plus or minus a specified spread (rates range from (9.630%) to 0.350%) as negotiated by the parties, which is denominated in EUR based on the local currencies of the positions within the swap. | MSC | 05/02/19 | ||||||
The following table represents the individual long and short positions and related values within the total return basket swap as of March 31, 2018:
| Referenced Entity | Shares | Value | ||||||
Long Positions: | ||||||||
Belgium | ||||||||
Ageas | 3,411 | $176,024 | ||||||
Bekaert SA | 1,011 | 43,076 | ||||||
bpost SA | 4,900 | 110,696 | ||||||
KBC Group NV | 344 | 29,955 | ||||||
Solvay SA | 1,012 | 140,648 | ||||||
UCB SA | 2,656 | 216,300 | ||||||
|
| |||||||
| 716,699 | ||||||||
|
| |||||||
Finland | ||||||||
Cargotec OYJ ‘B’ | 1,668 | 88,862 | ||||||
Kesko OYJ ‘B’ | 3,000 | 171,817 | ||||||
Neste OYJ | 5,474 | 381,018 | ||||||
UPM-Kymmene OYJ | 209 | 7,748 | ||||||
|
| |||||||
| 649,445 | ||||||||
|
| |||||||
France | ||||||||
Air France-KLM | 20,156 | 224,918 | ||||||
Amundi SA | 609 | 48,907 | ||||||
Atos SE | 1,760 | 241,137 | ||||||
BioMerieux | 613 | 50,487 | ||||||
Cie Generale des Etablissements Michelin | 2,747 | 406,674 | ||||||
Cie Plastic Omnium SA | 243 | 11,648 | ||||||
CNP Assurances | 4,008 | 101,179 | ||||||
Elior Group | 1,041 | 22,645 | ||||||
Engie SA | 29,588 | 494,075 | ||||||
Eutelsat Communications SA | 2,358 | 46,737 | ||||||
Imerys SA | 79 | 7,678 | ||||||
Ipsen SA | 469 | 72,899 | ||||||
Lagardere SCA | 1,742 | 49,759 | ||||||
Peugeot SA | 14,707 | 354,136 | ||||||
Renault SA | 2,520 | 305,797 | ||||||
Teleperformance | 2,621 | 406,457 | ||||||
Thales SA | 1,287 | 156,787 | ||||||
TOTAL SA | 414 | 23,730 | ||||||
|
| |||||||
| 3,025,650 | ||||||||
|
| |||||||
| Referenced Entity | Shares | Value | ||||||
Germany | ||||||||
Aurubis AG | 2,716 | $ | 228,262 | |||||
Covestro AG | 5,622 | 553,583 | ||||||
Deutsche Lufthansa AG | 11,533 | 368,682 | ||||||
HeidelbergCement AG | 301 | 29,571 | ||||||
HOCHTIEF AG | 704 | 131,598 | ||||||
OSRAM Licht AG | 1,050 | 77,267 | ||||||
Rheinmetall AG | 2,056 | 291,838 | ||||||
Salzgitter AG | 3,389 | 173,368 | ||||||
Schaeffler AG | 3,434 | 53,035 | ||||||
Software AG | 4,525 | 237,209 | ||||||
Suedzucker AG | 6,470 | 109,774 | ||||||
Talanx AG | 2,070 | 90,005 | ||||||
Uniper SE | 1,312 | 39,983 | ||||||
|
| |||||||
| 2,384,175 | ||||||||
|
| |||||||
Italy | ||||||||
A2A SPA | 179,721 | 343,781 | ||||||
Autogrill SPA | 15,480 | 199,281 | ||||||
DiaSorin SPA | 746 | 67,198 | ||||||
Enel SPA | 25,612 | 156,725 | ||||||
Eni SPA | 17,019 | 299,794 | ||||||
Hera SPA | 25,487 | 93,388 | ||||||
Intesa Sanpaolo SPA | 21,308 | 77,583 | ||||||
Italgas SPA | 1,283 | 7,666 | ||||||
Mediobanca Banca di Credito Finanziario SPA | 771 | 9,064 | ||||||
Moncler SPA | 9,655 | 367,452 | ||||||
Prysmian SPA | 7,496 | 235,391 | ||||||
Recordati SPA | 666 | 24,572 | ||||||
|
| |||||||
| 1,881,895 | ||||||||
|
| |||||||
Luxembourg | ||||||||
APERAM SA | 854 | 40,894 | ||||||
ArcelorMittal | 1,782 | 56,600 | ||||||
|
| |||||||
| 97,494 | ||||||||
|
| |||||||
| See Notes to Financial Statements | See explanation of symbols and terms, if any, on B-114 and B-115 |
B-89
Table of Contents
PACIFIC FUNDS
PF EQUITY LONG/SHORT FUND
Schedule of Investments (Continued)
March 31, 2018
| Referenced Entity | Shares | Value | ||||||
Netherlands | ||||||||
Akzo Nobel NV | 875 | $ | 82,674 | |||||
ASM International NV | 3,973 | 290,520 | ||||||
ASR Nederland NV | 5,574 | 238,334 | ||||||
Koninklijke Ahold Delhaize NV | 1,611 | 38,174 | ||||||
Koninklijke DSM NV | 84 | 8,349 | ||||||
Koninklijke Philips NV | 4,854 | 185,870 | ||||||
NN Group NV | 9,141 | 406,135 | ||||||
Philips Lighting NV | 7,502 | 282,054 | ||||||
Randstad Holding NV | 491 | 32,337 | ||||||
Wolters Kluwer NV | 735 | 39,091 | ||||||
|
| |||||||
| 1,603,538 | ||||||||
|
| |||||||
Spain | ||||||||
Acerinox SA | 2,142 | 29,962 | ||||||
ACS Actividades de Construccion y Servicios SA | 210 | 8,193 | ||||||
Amadeus IT Group SA | 3,138 | 232,222 | ||||||
Ebro Foods SA | 2,524 | 64,214 | ||||||
Endesa SA | 11,397 | 251,078 | ||||||
Mapfre SA | 9,694 | 32,252 | ||||||
Prosegur Cia de Seguridad SA | 3,895 | 29,957 | ||||||
Red Electrica Corp SA | 926 | 19,115 | ||||||
Repsol SA | 29,697 | 527,884 | ||||||
|
| |||||||
| 1,194,877 | ||||||||
|
| |||||||
Switzerland | ||||||||
STMicroelectronics NV | 14,256 | 316,952 | ||||||
|
| |||||||
United Kingdom | ||||||||
Dialog Semiconductor PLC | 746 | 17,766 | ||||||
Fiat Chrysler Automobiles NV | 919 | 18,744 | ||||||
|
| |||||||
| 36,510 | ||||||||
|
| |||||||
Total Long Positions | 11,907,235 | |||||||
|
| |||||||
Short Positions: | ||||||||
Belgium | ||||||||
Anheuser-Busch InBev SA NV | 4,491 | (493,771 | ) | |||||
Galapagos NV | 1,145 | (114,282 | ) | |||||
Telenet Group Holding NV | 1,892 | (126,471 | ) | |||||
|
| |||||||
| (734,524 | ) | |||||||
|
| |||||||
Finland | ||||||||
Amer Sports OYJ | 5,407 | (166,861 | ) | |||||
Huhtamaki OYJ | 2,704 | (118,652 | ) | |||||
Metso OYJ | 342 | (10,790 | ) | |||||
Nokia OYJ | 2,219 | (12,254 | ) | |||||
Nokian Renkaat OYJ | 226 | (10,264 | ) | |||||
|
| |||||||
| (318,821 | ) | |||||||
|
| |||||||
France | ||||||||
Accor SA | 3,121 | (168,612 | ) | |||||
Airbus SE | 1,410 | (163,219 | ) | |||||
Bollore SA | 100,705 | (537,200 | ) | |||||
Carrefour SA | 1,729 | (35,859 | ) | |||||
Edenred | 15,575 | (541,739 | ) | |||||
Electricite de France SA | 27,076 | (392,022 | ) | |||||
Getlink SE | 13,128 | (187,379 | ) | |||||
Iliad SA | 512 | (105,997 | ) | |||||
Ingenico Group SA | 2,561 | (207,869 | ) | |||||
JCDecaux SA | 2,384 | (82,905 | ) | |||||
Orpea | 995 | (126,353 | ) | |||||
Remy Cointreau SA | 618 | (88,154 | ) | |||||
SCOR SE | 863 | (35,232 | ) | |||||
Suez | 3,211 | (46,527 | ) | |||||
Technicolor SA | 12,309 | (20,814 | ) | |||||
Ubisoft Entertainment SA | 146 | (12,356 | ) | |||||
Valeo SA | 444 | (29,371 | ) | |||||
Vivendi SA | 3,899 | (101,120 | ) | |||||
|
| |||||||
| (2,882,728 | ) | |||||||
|
| |||||||
| Referenced Entity | Shares | Value | ||||||
Germany | ||||||||
adidas AG | 82 | ($19,950 | ) | |||||
Axel Springer SE | 612 | (51,196 | ) | |||||
Bilfinger SE | 1,498 | (68,316 | ) | |||||
Deutsche Bank AG | 31,840 | (444,183 | ) | |||||
Deutsche Telekom AG | 11,176 | (182,847 | ) | |||||
Fielmann AG | 323 | (26,112 | ) | |||||
Fresenius Medical Care AG & Co KGaA | 170 | (17,363 | ) | |||||
GEA Group AG | 7,651 | (325,373 | ) | |||||
Henkel AG & Co KGaA | 378 | (49,689 | ) | |||||
KION Group AG | 167 | (15,591 | ) | |||||
LANXESS AG | 227 | (17,401 | ) | |||||
MTU Aero Engines AG | 46 | (7,753 | ) | |||||
ProSiebenSat.1 Media SE | 752 | (26,047 | ) | |||||
Sartorius AG Preferred | 811 | (113,488 | ) | |||||
Wirecard AG | 735 | (87,128 | ) | |||||
Zalando SE | 5,402 | (294,780 | ) | |||||
|
| |||||||
| (1,747,217 | ) | |||||||
|
| |||||||
Italy | ||||||||
BPER Banca | 43,514 | (242,640 | ) | |||||
Buzzi Unicem SpA | 4,630 | (108,449 | ) | |||||
Ferrari NV | 159 | (19,114 | ) | |||||
Leonardo SPA | 9,476 | (109,591 | ) | |||||
Saipem SpA | 55,226 | (216,648 | ) | |||||
Salvatore Ferragamo SPA | 296 | (8,155 | ) | |||||
Unione di Banche Italiane SpA | 23,637 | (108,004 | ) | |||||
|
| |||||||
| (812,601 | ) | |||||||
|
| |||||||
Luxembourg | ||||||||
Eurofins Scientific SE | 318 | (167,578 | ) | |||||
SES SA | 507 | (6,863 | ) | |||||
Tenaris SA | 49,495 | (855,575 | ) | |||||
|
| |||||||
| (1,030,016 | ) | |||||||
|
| |||||||
Netherlands | ||||||||
Altice NV ‘A’ | 50,151 | (414,471 | ) | |||||
Boskalis Westminster | 3,413 | (100,036 | ) | |||||
Koninklijke KPN NV | 4,941 | (14,858 | ) | |||||
Koninklijke Vopak NV | 4,515 | (221,687 | ) | |||||
OCI NV | 7,536 | (174,373 | ) | |||||
SBM Offshore NV | 16,573 | (265,750 | ) | |||||
|
| |||||||
| (1,191,175 | ) | |||||||
|
| |||||||
Portugal | ||||||||
Banco Comercial Portugues SA | 34,412 | (11,539 | ) | |||||
|
| |||||||
Spain | ||||||||
Atresmedia Corp de Medios de Comunicacion SA | 1,063 | (10,141 | ) | |||||
Bankia SA | 44,392 | (199,141 | ) | |||||
Cellnex Telecom SAU | 13,331 | (356,390 | ) | |||||
Ferrovial SA | 477 | (9,973 | ) | |||||
Grifols SA | 6,215 | (176,201 | ) | |||||
Industria de Diseno Textil SA | 11,670 | (366,889 | ) | |||||
Zardoya Otis SA | 5,376 | (54,169 | ) | |||||
|
| |||||||
| (1,172,904 | ) | |||||||
|
| |||||||
United Kingdom | ||||||||
Unilever NV | 1,204 | (67,960 | ) | |||||
|
| |||||||
United States | ||||||||
QIAGEN NV | 7,495 | (242,301 | ) | |||||
|
| |||||||
Total Short Positions | (10,211,786 | ) | ||||||
|
| |||||||
Total Long and Short Positions | $1,695,449 | |||||||
|
| |||||||
| See Notes to Financial Statements | See explanation of symbols and terms, if any, on B-114 and B-115 |
B-90
Table of Contents
PACIFIC FUNDS
PF EQUITY LONG/SHORT FUND
Schedule of Investments (Continued)
March 31, 2018
| Description | Counter- party | Expiration Date (1) | ||||||
The Fund receives or pays the net total return on all positions within the basket and pays financing based upon the then-current 1-Day JPY-MUTSC ((0.070%) as of 03/31/18) plus or minus a specified spread (rates range from (2.500%) to 0.450%) as negotiated by the parties, which is denominated in JPY based on the local currencies of the positions within the swap. | MSC | 05/07/18 | ||||||
The following table represents the individual long and short positions and related values within the total return basket swap as of March 31, 2018:
| Referenced Entity | Shares | Value | ||||||
Long Positions: | ||||||||
Japan | ||||||||
Alfresa Holdings Corp | 7,900 | $175,812 | ||||||
Amada Holdings Co Ltd | 5,300 | 64,354 | ||||||
ANA Holdings Inc | 1,100 | 42,571 | ||||||
Astellas Pharma Inc | 14,300 | 216,909 | ||||||
Bandai Namco Holdings Inc | 8,500 | 279,193 | ||||||
Citizen Watch Co Ltd | 5,100 | 36,619 | ||||||
Cosmos Pharmaceutical Corp | 300 | 60,871 | ||||||
Daiichi Sankyo Co Ltd | 2,900 | 96,099 | ||||||
Fuji Electric Co Ltd | 1,000 | 6,804 | ||||||
GungHo Online Entertainment Inc | 8,900 | 30,279 | ||||||
Hakuhodo DY Holdings Inc | 8,900 | 122,369 | ||||||
Haseko Corp | 28,800 | 438,205 | ||||||
Hitachi Chemical Co Ltd | 2,100 | 47,860 | ||||||
Hitachi High-Technologies Corp | 1,900 | 90,353 | ||||||
Hitachi Ltd | 43,000 | 311,493 | ||||||
Idemitsu Kosan Co Ltd | 7,300 | 277,510 | ||||||
Inpex Corp | 11,000 | 136,046 | ||||||
Itochu Techno-Solutions Corp | 15,600 | 326,500 | ||||||
Japan Airlines Co Ltd | 13,400 | 539,249 | ||||||
JFE Holdings Inc | 4,300 | 86,622 | ||||||
JXTG Holdings Inc | 80,100 | 484,567 | ||||||
Kajima Corp | 30,000 | 278,276 | ||||||
Kamigumi Co Ltd | 6,500 | 145,144 | ||||||
Kaneka Corp | 4,000 | 39,660 | ||||||
Kobayashi Pharmaceutical Co Ltd | 1,100 | 79,395 | ||||||
Koito Manufacturing Co Ltd | 100 | 6,936 | ||||||
Matsumotokiyoshi Holdings Co Ltd | 6,500 | 274,893 | ||||||
Medipal Holdings Corp | 6,700 | 137,268 | ||||||
MEIJI Holdings Co Ltd | 300 | 22,837 | ||||||
Mitsubishi Gas Chemical Co Inc | 6,900 | 165,294 | ||||||
Mitsubishi Tanabe Pharma Corp | 5,000 | 97,740 | ||||||
Mitsui Chemicals Inc | 300 | 9,459 | ||||||
Mixi Inc | 1,600 | 59,095 | ||||||
Nexon Co Ltd | 12,000 | 198,487 | ||||||
NHK Spring Co Ltd | 13,600 | 143,790 | ||||||
Nippon Electric Glass Co Ltd | 1,500 | 44,547 | ||||||
Nippon Express Co Ltd | 4,000 | 267,657 | ||||||
Nippon Shinyaku Co Ltd | 1,000 | 66,914 | ||||||
Nippon Shokubai Co Ltd | 800 | 54,283 | ||||||
Nippon Telegraph & Telephone Corp | 4,400 | 202,622 | ||||||
NOK Corp | 600 | 11,650 | ||||||
Obayashi Corp | 27,400 | 299,738 | ||||||
Obic Co Ltd | 100 | 8,317 | ||||||
Oji Holdings Corp | 4,000 | 25,713 | ||||||
Omron Corp | 900 | 52,949 | ||||||
Oracle Corp Japan | 2,700 | 219,492 | ||||||
Oriental Land Co Ltd | 700 | 71,477 | ||||||
Otsuka Corp | 4,000 | 201,495 | ||||||
Persol Holdings Co Ltd | 6,500 | 189,065 | ||||||
Pola Orbis Holdings Inc | 5,700 | 233,560 | ||||||
Sega Sammy Holdings Inc | 8,900 | 140,938 | ||||||
Sekisui Chemical Co Ltd | 800 | 13,954 | ||||||
Shimadzu Corp | 1,200 | 33,743 | ||||||
Shimamura Co Ltd | 100 | 12,509 | ||||||
Shimizu Corp | 900 | 8,044 | ||||||
SMC Corp | 300 | 121,432 | ||||||
Square Enix Holdings Co Ltd | 11,000 | 503,454 | ||||||
Start Today Co Ltd | 9,000 | 240,383 | ||||||
Sumitomo Heavy Industries Ltd | 1,900 | 72,050 | ||||||
| Referenced Entity | Shares | Value | ||||||
Sundrug Co Ltd | 300 | $13,857 | ||||||
Suzuken Co Ltd | 4,000 | 165,219 | ||||||
Taiheiyo Cement Corp | 700 | 25,426 | ||||||
Taisei Corp | 9,500 | 482,120 | ||||||
The Gunma Bank Ltd | 9,100 | 51,655 | ||||||
Tokyo Broadcasting System Holdings Inc | 3,800 | 80,603 | ||||||
Tokyo Electron Ltd | 500 | 94,051 | ||||||
Tosoh Corp | 10,600 | 208,005 | ||||||
Toyo Suisan Kaisha Ltd | 2,900 | 112,424 | ||||||
Toyoda Gosei Co Ltd | 1,400 | 32,551 | ||||||
Toyota Boshoku Corp | 7,500 | 153,940 | ||||||
Welcia Holdings Co Ltd | 400 | 17,950 | ||||||
|
| |||||||
| 10,062,346 | ||||||||
|
| |||||||
Total Long Positions | 10,062,346 | |||||||
|
| |||||||
Short Positions: | ||||||||
Japan | ||||||||
Advantest Corp | 5,500 | (115,215 | ) | |||||
Aeon Co Ltd | 15,400 | (274,915 | ) | |||||
AEON Financial Service Co Ltd | 7,100 | (163,146 | ) | |||||
Alps Electric Co Ltd | 8,400 | (205,885 | ) | |||||
Asics Corp | 18,000 | (333,086 | ) | |||||
Calbee Inc | 8,900 | (294,422 | ) | |||||
Casio Computer Co Ltd | 6,000 | (89,432 | ) | |||||
Dai-ichi Life Holdings Inc | 2,600 | (47,465 | ) | |||||
Daiwa Securities Group Inc | 5,000 | (31,892 | ) | |||||
DeNA Co Ltd | 2,300 | (41,502 | ) | |||||
Dentsu Inc | 300 | (13,167 | ) | |||||
Don Quijote Holdings Co Ltd | 1,800 | (103,360 | ) | |||||
Electric Power Development Co Ltd | 4,700 | (118,466 | ) | |||||
FamilyMart UNY Holdings Co Ltd | 5,600 | (471,557 | ) | |||||
Fast Retailing Co Ltd | 100 | (40,637 | ) | |||||
Hamamatsu Photonics KK | 5,104 | (192,830 | ) | |||||
Hokuriku Electric Power Co | 20,300 | (172,466 | ) | |||||
Isetan Mitsukoshi Holdings Ltd | 24,000 | (264,800 | ) | |||||
Japan Airport Terminal Co Ltd | 600 | (22,922 | ) | |||||
Japan Post Insurance Co Ltd | 400 | (9,379 | ) | |||||
JGC Corp | 700 | (15,223 | ) | |||||
Kakaku.com Inc | 8,300 | (145,243 | ) | |||||
Kansai Paint Co Ltd | 7,600 | (176,992 | ) | |||||
Keihan Holdings Co Ltd | 2,600 | (80,147 | ) | |||||
Keikyu Corp | 10,300 | (179,080 | ) | |||||
Keio Corp | 3,200 | (136,685 | ) | |||||
Kikkoman Corp | 3,300 | (132,738 | ) | |||||
Kintetsu Group Holdings Co Ltd | 4,900 | (190,879 | ) | |||||
Kobe Steel Ltd | 8,900 | (89,163 | ) | |||||
Konica Minolta Inc | 12,400 | (106,281 | ) | |||||
Kyushu Electric Power Co Inc | 9,900 | (117,976 | ) | |||||
LINE Corp | 600 | (23,739 | ) | |||||
Marui Group Co Ltd | 22,553 | (459,517 | ) | |||||
Mitsubishi Heavy Industries Ltd | 700 | (26,801 | ) | |||||
Mitsubishi Logistics Corp | 6,100 | (129,562 | ) | |||||
Mitsubishi UFJ Lease & Finance Co Ltd | 2,900 | (17,007 | ) | |||||
MonotaRO Co Ltd | 400 | (14,360 | ) | |||||
Murata Manufacturing Co Ltd | 100 | (13,693 | ) | |||||
Nagoya Railroad Co Ltd | 6,000 | (152,023 | ) | |||||
Nankai Electric Railway Co Ltd | 3,000 | (75,166 | ) | |||||
NGK Spark Plug Co Ltd | 16,200 | (390,213 | ) | |||||
Nidec Corp | 700 | (107,824 | ) | |||||
Nippon Paint Holdings Co Ltd | 7,000 | (256,896 | ) | |||||
Nippon Yusen KK | 1,200 | (24,224 | ) | |||||
| See Notes to Financial Statements | See explanation of symbols and terms, if any, on B-114 and B-115 |
B-91
Table of Contents
PACIFIC FUNDS
PF EQUITY LONG/SHORT FUND
Schedule of Investments (Continued)
March 31, 2018
| Referenced Entity | Shares | Value | ||||||
Nomura Holdings Inc | 12,000 | ($69,391 | ) | |||||
NTN Corp | 1,800 | (7,511 | ) | |||||
Odakyu Electric Railway Co Ltd | 10,800 | (218,527 | ) | |||||
Orient Corp | 5,500 | (8,632 | ) | |||||
Renesas Electronics Corp | 4,300 | (43,240 | ) | |||||
Ricoh Co Ltd | 47,900 | (473,125 | ) | |||||
Santen Pharmaceutical Co Ltd | 1,100 | (17,729 | ) | |||||
Seibu Holdings Inc | 900 | (15,665 | ) | |||||
Seven Bank Ltd | 36,200 | (115,331 | ) | |||||
Shikoku Electric Power Co Inc | 16,900 | (200,440 | ) | |||||
Shimano Inc | 3,300 | (475,748 | ) | |||||
Shinsei Bank Ltd | 600 | (9,225 | ) | |||||
SoftBank Group Corp | 1,700 | (127,015 | ) | |||||
Sompo Holdings Inc | 400 | (16,097 | ) | |||||
Sony Financial Holdings Inc | 15,900 | (289,295 | ) | |||||
SUMCO Corp | 1,100 | (28,843 | ) | |||||
Suruga Bank Ltd | 4,900 | (67,648 | ) | |||||
Sysmex Corp | 2,200 | (199,314 | ) | |||||
| Referenced Entity | Shares | Value | ||||||
T&D Holdings Inc | 17,600 | ($279,288 | ) | |||||
TDK Corp | 800 | (72,102 | ) | |||||
The Bank of Kyoto Ltd | 3,200 | (178,638 | ) | |||||
The Chugoku Electric Power Co Inc | 19,800 | (238,556 | ) | |||||
The Yokohama Rubber Co Ltd | 3,600 | (83,331 | ) | |||||
Tokio Marine Holdings Inc | 3,200 | (142,399 | ) | |||||
Toray Industries Inc | 3,400 | (32,161 | ) | |||||
Toyota Industries Corp | 900 | (54,471 | ) | |||||
Yakult Honsha Co Ltd | 1,200 | (88,755 | ) | |||||
Yamaha Corp | 2,200 | (96,659 | ) | |||||
Yamato Holdings Co Ltd | 5,700 | (142,949 | ) | |||||
Yaskawa Electric Corp | 3,400 | (154,175 | ) | |||||
|
| |||||||
| (10,014,236 | ) | |||||||
|
| |||||||
Total Short Positions | (10,014,236 | ) | ||||||
|
| |||||||
Total Long and Short Positions | $48,110 | |||||||
|
| |||||||
| Description | Counter- party | Expiration Date (1) | ||||||
The Fund receives or pays the net total return on all positions within the basket and pays financing based upon the then-current 1-Week DKK-CIBOR ((0.400%) as of 03/31/18) plus or minus a specified spread (rates range from (0.350%) to 0.350%) as negotiated by the parties, which is denominated in DKK based on the local currencies of the positions within the swap. | MSC | 05/01/19 | ||||||
The following table represents the individual long and short positions and related values within the total return basket swap as of March 31, 2018:
| Referenced Entity | Shares | Value | ||||||
Long Positions: | ||||||||
Denmark | ||||||||
Danske Bank AS | 899 | $33,685 | ||||||
Dfds AS | 228 | 12,840 | ||||||
DSV AS | 127 | 10,026 | ||||||
GN Store Nord AS | 8,153 | 289,169 | ||||||
H Lundbeck AS | 3,690 | 207,254 | ||||||
Jyske Bank AS | 297 | 17,658 | ||||||
Novo Nordisk AS ‘B’ | 1,043 | 51,301 | ||||||
Orsted AS | 552 | 35,914 | ||||||
TDC AS | 4,631 | 38,375 | ||||||
Vestas Wind Systems AS | 1,580 | 113,052 | ||||||
|
| |||||||
| 809,274 | ||||||||
|
| |||||||
Total Long Positions | 809,274 | |||||||
|
| |||||||
| Referenced Entity | Shares | Value | ||||||
Short Positions: | ||||||||
Denmark | ||||||||
AP Moller – Maersk AS ‘B’ | 52 | ($81,150 | ) | |||||
Chr Hansen Holding AS | 107 | (9,261 | ) | |||||
Genmab AS | 1,923 | (414,301 | ) | |||||
Novozymes AS ‘B’ | 1,899 | (98,862 | ) | |||||
Pandora AS | 2,020 | (218,556 | ) | |||||
|
| |||||||
| (822,130 | ) | |||||||
|
| |||||||
Total Short Positions | (822,130 | ) | ||||||
|
| |||||||
Total Long and Short Positions | ($12,856 | ) | ||||||
|
| |||||||
| Description | Counter- party | Expiration Date (1) | ||||||
The Fund receives or pays the net total return on all positions within the basket and pays financing based upon the then-current 1-Week NOK-NIBOR (0.960% as of 03/31/18) plus or minus a specified spread (rates range from (0.350%) to 0.350%) as negotiated by the parties, which is denominated in NOK based on the local currencies of the positions within the swap. | MSC | 05/02/19 | ||||||
The following table represents the individual long and short positions and related values within the total return basket swap as of March 31, 2018:
| Referenced Entity | Shares | Value | ||||||
Long Positions: | ||||||||
Norway | ||||||||
Leroy Seafood Group ASA | 22,041 | $136,859 | ||||||
Marine Harvest ASA | 6,065 | 122,595 | ||||||
Norsk Hydro ASA | 24,286 | 144,057 | ||||||
Salmar ASA | 4,223 | 173,885 | ||||||
|
| |||||||
| 577,396 | ||||||||
|
| |||||||
Total Long Positions | 577,396 | |||||||
|
| |||||||
| Referenced Entity | Shares | Value | ||||||
Short Positions: | ||||||||
Norway | ||||||||
Schibsted ASA ‘A’ | 10,613 | ($298,996 | ) | |||||
|
| |||||||
United Kingdom | ||||||||
Subsea 7 SA | 3,797 | (48,874 | ) | |||||
|
| |||||||
Total Short Positions | (347,870 | ) | ||||||
|
| |||||||
Total Long and Short Positions | $229,526 | |||||||
|
| |||||||
| See Notes to Financial Statements | See explanation of symbols and terms, if any, on B-114 and B-115 |
B-92
Table of Contents
PACIFIC FUNDS
PF EQUITY LONG/SHORT FUND
Schedule of Investments (Continued)
March 31, 2018
| Description | Counter- party | Expiration Date (1) | ||||||
The Fund receives or pays the net total return on all positions within the basket and pays financing based upon the then-current 1-Week SEK-STIBOR ((0.520%) as of 03/31/18) plus or minus a specified spread (rates range from (0.500%) to 0.350%) as negotiated by the parties, which is denominated in SEK based on the local currencies of the positions within the swap. | MSC | 05/02/19 | ||||||
The following table represents the individual long and short positions and related values within the total return basket swap as of March 31, 2018:
| Referenced Entity | Shares | Value | ||||||
Long Positions: | ||||||||
Malta | ||||||||
Kindred Group PLC SDR | 8,233 | $112,954 | ||||||
|
| |||||||
Sweden | ||||||||
Axfood AB | 620 | 10,613 | ||||||
BillerudKorsnas AB | 667 | 10,343 | ||||||
Boliden AB | 16,043 | 564,528 | ||||||
Electrolux AB ‘B’ | 2,037 | 64,327 | ||||||
Essity AB ‘B’ | 3,805 | 105,449 | ||||||
Holmen AB ‘B’ | 208 | 11,314 | ||||||
NCC AB ‘B’ | 9,381 | 178,849 | ||||||
Saab AB ‘B’ | 1,304 | 59,148 | ||||||
SSAB AB ‘A’ | 8,699 | 49,241 | ||||||
Svenska Cellulosa AB SCA ‘B’ | 6,506 | 69,527 | ||||||
Volvo AB ‘B’ | 1,780 | 32,582 | ||||||
|
| |||||||
| 1,155,921 | ||||||||
|
| |||||||
Total Long Positions | 1,268,875 | |||||||
|
| |||||||
| Referenced Entity | Shares | Value | ||||||
Short Positions: | ||||||||
Colombia | ||||||||
Millicom International Cellular SA SDR | 2,173 | ($148,709 | ) | |||||
|
| |||||||
Sweden | ||||||||
Getinge AB ‘B’ | 2,981 | (33,946 | ) | |||||
Hexagon AB ‘B’ | 133 | (7,939 | ) | |||||
Hexpol AB | 6,697 | (62,255 | ) | |||||
Svenska Handelsbanken AB ‘A’ | 6,158 | (77,079 | ) | |||||
Swedish Orphan Biovitrum AB | 541 | (9,687 | ) | |||||
Telefonaktiebolaget LM Ericsson ‘B’ | 141,267 | (899,582 | ) | |||||
|
| |||||||
| (1,090,488 | ) | |||||||
|
| |||||||
Total Short Positions | (1,239,197 | ) | ||||||
|
| |||||||
Total Long and Short Positions | $29,678 | |||||||
|
| |||||||
Total Basket Swaps | $7,888,577 | |||||||
|
| |||||||
Total Return Swaps – Receive Positive Return/Pay Negative Return
| Referenced Entity | Payment Frequency | Counter- Party | Expiration Date | Number of Contracts | Notional Amount | Value | Unrealized Appreciation (Depreciation) | |||||||||||||||||||||
Swiss Market Index | M | GSC | 06/15/18 | 7 | $638,391 | $629,488 | ($8,903 | ) | ||||||||||||||||||||
Swiss Market Index | M | MSC | 06/15/18 | 3 | 273,595 | 269,780 | (3,815 | ) | ||||||||||||||||||||
MSCI Canada Index | M | JPM | 06/20/18 | 117 | 562,581 | 555,460 | (7,121 | ) | ||||||||||||||||||||
MSCI Hong Kong Index | M | JPM | 06/20/18 | 33 | 371,008 | 360,878 | (10,130 | ) | ||||||||||||||||||||
MSCI Italy Index | M | JPM | 06/20/18 | 867 | 113,305 | 111,961 | (1,344 | ) | ||||||||||||||||||||
MSCI Japan Index | M | JPM | 06/20/18 | 6,246 | 113,573 | 113,542 | (31 | ) | ||||||||||||||||||||
MSCI Singapore Index | M | JPM | 06/20/18 | 47 | 215,940 | 110,359 | (5,581 | ) | ||||||||||||||||||||
|
| |||||||||||||||||||||||||||
| ($36,925 | ) | |||||||||||||||||||||||||||
|
| |||||||||||||||||||||||||||
Total Swap Agreements | $6,189,545 | |||||||||||||||||||||||||||
|
| |||||||||||||||||||||||||||
| See Notes to Financial Statements | See explanation of symbols and terms, if any, on B-114 and B-115 |
B-93
Table of Contents
PACIFIC FUNDS
PF EQUITY LONG/SHORT FUND
Schedule of Investments (Continued)
March 31, 2018
| (f) | Fair Value Measurements |
The following is a summary of the Fund’s investments as categorized under the three-tier hierarchy of inputs used in valuing the Fund’s assets and liabilities (See Note 3D in Notes to Financial Statements) as of March 31, 2018:
| Total Value at March 31, 2018 | Level 1 Quoted Price | Level 2 Significant Observable Inputs | Level 3 Significant Unobservable Inputs | |||||||||||||||
Assets | Short-Term Investments | $45,368,280 | $11,284,794 | $34,083,486 | $— | |||||||||||||
Derivatives: | ||||||||||||||||||
Equity Contracts | ||||||||||||||||||
Futures | 35,314 | 35,314 | — | — | ||||||||||||||
Swaps | 6,317,946 | — | 6,317,946 | — | ||||||||||||||
|
|
|
|
|
|
|
| |||||||||||
Total Equity Contracts | 6,353,260 | 35,314 | 6,317,946 | — | ||||||||||||||
|
|
|
|
|
|
|
| |||||||||||
Foreign Currency Contracts | ||||||||||||||||||
Forward Foreign Currency Contracts | 46,117 | — | 46,117 | — | ||||||||||||||
|
|
|
|
|
|
|
| |||||||||||
Total Asset — Derivatives | 6,399,377 | 35,314 | 6,364,063 | — | ||||||||||||||
|
|
|
|
|
|
|
| |||||||||||
Total Assets | 51,767,657 | 11,320,108 | 40,447,549 | — | ||||||||||||||
|
|
|
|
|
|
|
| |||||||||||
Liabilities | Derivatives: | |||||||||||||||||
Equity Contracts | ||||||||||||||||||
Futures | (808,136 | ) | (808,136 | ) | — | — | ||||||||||||
Swaps | (128,401 | ) | — | (128,401 | ) | — | ||||||||||||
|
|
|
|
|
|
|
| |||||||||||
Total Equity Contracts | (936,537 | ) | (808,136 | ) | (128,401 | ) | — | |||||||||||
|
|
|
|
|
|
|
| |||||||||||
Foreign Currency Contracts | ||||||||||||||||||
Forward Foreign Currency Contracts | (71,151 | ) | — | (71,151 | ) | — | ||||||||||||
|
|
|
|
|
|
|
| |||||||||||
Total Liabilities — Derivatives | (1,007,688 | ) | (808,136 | ) | (199,552 | ) | — | |||||||||||
|
|
|
|
|
|
|
| |||||||||||
Total Liabilities | (1,007,688 | ) | (808,136 | ) | (199,552 | ) | — | |||||||||||
|
|
|
|
|
|
|
| |||||||||||
Total | $50,759,969 | $10,511,972 | $40,247,997 | $— | ||||||||||||||
|
|
|
|
|
|
|
| |||||||||||
| See Notes to Financial Statements | See explanation of symbols and terms, if any, on B-114 and B-115 |
B-94
Table of Contents
PACIFIC FUNDS
PF GLOBAL ABSOLUTE RETURN FUND
Schedule of Investments
March 31, 2018
Shares | Value | |||||||
COMMON STOCKS - 7.7% | ||||||||
Cyprus - 0.4% | ||||||||
Bank of Cyprus Holdings PLC * | 100,337 | $245,191 | ||||||
|
| |||||||
Iceland - 2.8% | ||||||||
Eik fasteignafelag HF * | 1,184,000 | 119,023 | ||||||
Eimskipafelag Islands HF | 60,000 | 139,139 | ||||||
Hagar HF * | 498,250 | 214,437 | ||||||
Icelandair Group HF | 710,000 | 104,828 | ||||||
N1 HF | 94,600 | 113,999 | ||||||
Reginn HF * | 899,300 | 224,484 | ||||||
Reitir fasteignafelag HF | 330,629 | 298,210 | ||||||
Siminn HF | 5,974,100 | 269,213 | ||||||
Sjova-Almennar Tryggingar HF | 657,600 | 116,204 | ||||||
Tryggingamidstodin HF | 194,500 | 71,623 | ||||||
Vatryggingafelag Islands HF | 848,000 | 113,306 | ||||||
|
| |||||||
| 1,784,466 | ||||||||
|
| |||||||
Japan - 0.9% | ||||||||
Mitsubishi UFJ Financial Group Inc | 29,000 | 189,963 | ||||||
Mizuho Financial Group Inc | 61,400 | 110,446 | ||||||
Resona Holdings Inc | 8,600 | 45,423 | ||||||
Sumitomo Mitsui Financial Group Inc | 3,700 | 155,017 | ||||||
Sumitomo Mitsui Trust Holding Inc | 1,900 | 76,907 | ||||||
|
| |||||||
| 577,756 | ||||||||
|
| |||||||
Singapore - 0.3% | ||||||||
Yoma Strategic Holdings Ltd | 537,467 | 174,779 | ||||||
|
| |||||||
South Korea - 1.0% | ||||||||
Hana Financial Group Inc | 430 | 18,456 | ||||||
Hyundai Heavy Industries Co Ltd * | 23 | 2,848 | ||||||
Hyundai Mobis Co Ltd | 104 | 23,368 | ||||||
Hyundai Motor Co | 188 | 25,310 | ||||||
KB Financial Group Inc | 419 | 23,861 | ||||||
Korea Electric Power Corp | 640 | 19,724 | ||||||
Korea Zinc Co Ltd | 42 | 18,874 | ||||||
KT&G Corp | 130 | 12,196 | ||||||
LG Chem Ltd | 44 | 15,913 | ||||||
LG Corp | 253 | 20,437 | ||||||
LG Electronics Inc | 160 | 16,437 | ||||||
LG Household & Health Care Ltd | 16 | 18,133 | ||||||
Lotte Chemical Corp | 33 | 13,406 | ||||||
Lotte Corp * l | — | 40 | ||||||
Lotte Shopping Co Ltd l | — | 33 | ||||||
NAVER Corp | 46 | 34,180 | ||||||
POSCO | 58 | 17,712 | ||||||
S-Oil Corp | 120 | 13,510 | ||||||
Samsung Biologics Co Ltd * ~ | 39 | 17,819 | ||||||
Samsung C&T Corp | 160 | 21,015 | ||||||
Samsung Electronics Co Ltd | 37 | 85,427 | ||||||
Samsung Fire & Marine Insurance Co Ltd | 70 | 17,764 | ||||||
Samsung Life Insurance Co Ltd | 180 | 19,589 | ||||||
Samsung SDI Co Ltd | 126 | 22,755 | ||||||
Samsung SDS Co Ltd | 94 | 22,532 | ||||||
Shinhan Financial Group Co Ltd | 481 | 20,623 | ||||||
SK Holdings Co Ltd | 70 | 19,439 | ||||||
SK Hynix Inc | 563 | 42,942 | ||||||
SK Innovation Co Ltd | 73 | 14,451 | ||||||
SK Telecom Co Ltd | 100 | 21,906 | ||||||
Woori Bank | 910 | 12,507 | ||||||
|
| |||||||
| 633,207 | ||||||||
|
| |||||||
Turkey - 0.8% | ||||||||
Akbank Turk AS | 65,000 | 158,050 | ||||||
Turkiye Garanti Bankasi AS | 59,300 | 164,429 | ||||||
Turkiye Is Bankasi AS | 91,500 | 166,189 | ||||||
|
| |||||||
| 488,668 | ||||||||
|
| |||||||
Shares | Value | |||||||
Vietnam - 1.5% | ||||||||
Bank for Foreign Trade of Vietnam JSC | 19,050 | $58,880 | ||||||
Bank for Investment and Development of Vietnam JSC | 12,200 | 23,213 | ||||||
Bao Viet Holdings | 4,100 | 16,986 | ||||||
Binh Minh Plastics JSC | 6,600 | 19,908 | ||||||
Coteccons Construction JSC | 3,400 | 23,537 | ||||||
Danang Rubber JSC | 1,800 | 2,368 | ||||||
Domesco Medical Import Export JSC | 6,200 | 27,454 | ||||||
HA TIEN 1 Cement JSC | 5,600 | 3,621 | ||||||
Ho Chi Minh City Infrastructure Investment JSC * | 17,410 | 23,623 | ||||||
Hoa Phat Group JSC * | 18,800 | 49,783 | ||||||
Hoa Sen Group | 3,700 | 3,699 | ||||||
KIDO Group Corp | 9,700 | 16,160 | ||||||
Kinh Bac City Development Share Holding Corp * | 13,300 | 7,784 | ||||||
Masan Group Corp * | 16,900 | 84,094 | ||||||
PetroVietnam Drilling & Well Services JSC * | 6,800 | 5,694 | ||||||
Petrovietnam Fertilizer & Chemicals JSC | 10,000 | 9,645 | ||||||
PetroVietnam Gas JSC | 4,300 | 24,771 | ||||||
PetroVietnam Nhon Trach 2 Power JSC | 19,840 | 26,834 | ||||||
PetroVietnam Technical Services Corp | 16,300 | 15,078 | ||||||
Pha Lai Thermal Power JSC | 5,700 | 4,798 | ||||||
Refrigeration Electrical Engineering Corp | 10,500 | 17,355 | ||||||
Saigon - Hanoi Commercial Joint Stock Bank * | 24,510 | 13,862 | ||||||
Saigon Securities Inc | 17,300 | 29,580 | ||||||
Saigon Thuong Tin Commercial JSB * | 38,500 | 26,162 | ||||||
Tan Tao Investment & Industry JSC * | 27,800 | 3,656 | ||||||
Viet Capital Securities JSC * | 5,600 | 26,515 | ||||||
Viet Nam Construction and Import-Export JSC | 8,000 | 8,067 | ||||||
Vietnam Dairy Products JSC | 10,240 | 91,134 | ||||||
Vietnam Joint Stock Commercial Bank for Industry and Trade | 3,900 | 5,916 | ||||||
Vingroup JSC * | 47,320 | 243,140 | ||||||
|
| |||||||
| 913,317 | ||||||||
|
| |||||||
Total Common Stocks | 4,817,384 | |||||||
|
| |||||||
Principal Amount | ||||||||
CORPORATE BONDS & NOTES - 2.6% | ||||||||
Argentina - 0.9% | ||||||||
Banco Hipotecario SA | ARS 6,110,000 | 296,853 | ||||||
YPF SA | $372,000 | 278,410 | ||||||
|
| |||||||
| 575,263 | ||||||||
|
| |||||||
Ecuador - 0.9% | ||||||||
EP PetroEcuador | 184,211 | 186,513 | ||||||
Petroamazonas EP | 370,000 | 362,230 | ||||||
|
| |||||||
| 548,743 | ||||||||
|
| |||||||
Honduras - 0.4% | ||||||||
Inversiones Atlantida SA | 250,000 | 257,500 | ||||||
|
| |||||||
| See Notes to Financial Statements | See explanation of symbols and terms, if any, on B-114 and B-115 |
B-95
Table of Contents
PACIFIC FUNDS
PF GLOBAL ABSOLUTE RETURN FUND
Schedule of Investments (Continued)
March 31, 2018
Principal | Value | |||||||
United States - 0.4% | ||||||||
Central Storage Safety Project Trust | $ | 260,000 | $ | 269,833 | ||||
|
| |||||||
Total Corporate Bonds & Notes | 1,651,339 | |||||||
|
| |||||||
SENIOR LOAN NOTES - 1.5% |
| |||||||
Barbados - 1.3% | ||||||||
Barbados Government | 800,000 | 790,978 | ||||||
|
| |||||||
Kenya - 0.2% | ||||||||
Republic of Kenya | 114,000 | 114,000 | ||||||
|
| |||||||
Total Senior Loan Notes | 904,978 | |||||||
|
| |||||||
MORTGAGE-BACKED SECURITIES - 0.3% | ||||||||
United States - 0.3% | ||||||||
Fannie Mae (IO) | 1,538,483 | 200,558 | ||||||
|
| |||||||
Total Mortgage-Backed Securities | 200,558 | |||||||
|
| |||||||
FOREIGN GOVERNMENT BONDS & NOTES - 46.9% |
| |||||||
Albania - 1.8% | ||||||||
Albania Government | EUR 804,000 | 1,106,760 | ||||||
|
| |||||||
Argentina - 0.4% | ||||||||
Autonomous City of Buenos Aires (Argentina) | ARS 662,000 | 34,391 | ||||||
Provincia de Buenos Aires (Argentina) | 3,683,000 | 185,588 | ||||||
|
| |||||||
| 219,979 | ||||||||
|
| |||||||
Barbados - 0.7% | ||||||||
Barbados Government | ||||||||
6.625% due 12/05/35 ~ | $421,000 | 311,540 | ||||||
7.000% due 08/04/22 ~ | 145,000 | 123,518 | ||||||
|
| |||||||
| 435,058 | ||||||||
|
| |||||||
Dominican Republic - 4.7% | ||||||||
Dominican Republic | ||||||||
8.900% due 02/15/23 ~ | DOP 88,400,000 | 1,840,000 | ||||||
15.000% due 04/05/19 ~ | 18,500,000 | 404,842 | ||||||
15.950% due 06/04/21 ~ | 6,700,000 | 167,047 | ||||||
Principal Amount | Value | |||||||
16.000% due 07/10/20 ~ | DOP 20,700,000 | $ | 493,056 | |||||
16.950% due 02/04/22 ~ | 2,900,000 | 75,637 | ||||||
|
| |||||||
| 2,980,582 | ||||||||
|
| |||||||
El Salvador - 4.6% | ||||||||
El Salvador Government | ||||||||
5.875% due 01/30/25 ~ | $163,000 | 160,601 | ||||||
6.375% due 01/18/27 ~ | 194,000 | 191,818 | ||||||
7.650% due 06/15/35 ~ | 333,000 | 352,760 | ||||||
8.250% due 04/10/32 ~ | 679,000 | 764,398 | ||||||
8.625% due 02/28/29 ~ | 1,254,000 | 1,442,100 | ||||||
|
| |||||||
| 2,911,677 | ||||||||
|
| |||||||
Greece - 0.9% | ||||||||
Hellenic Republic Government | ||||||||
3.500% due 01/30/23 ~ | EUR 165,000 | 204,221 | ||||||
4.375% due 08/01/22 ~ | 285,000 | 366,689 | ||||||
|
| |||||||
| 570,910 | ||||||||
|
| |||||||
Iceland - 0.9% | ||||||||
Iceland Rikisbref | ISK 50,183,769 | 565,361 | ||||||
|
| |||||||
India - 3.2% | ||||||||
India Government | ||||||||
6.680% due 09/17/31 | INR 106,000,000 | 1,502,706 | ||||||
7.610% due 05/09/30 | 34,560,000 | 525,381 | ||||||
|
| |||||||
| 2,028,087 | ||||||||
|
| |||||||
Macedonia - 4.8% | ||||||||
Macedonia Government | ||||||||
2.750% due 01/18/25 ~ | EUR 140,000 | 172,503 | ||||||
3.975% due 07/24/21 ~ | 2,174,000 | 2,877,472 | ||||||
|
| |||||||
| 3,049,975 | ||||||||
|
| |||||||
New Zealand - 3.4% | ||||||||
New Zealand Government | NZD 2,652,993 | 2,166,042 | ||||||
|
| |||||||
Serbia - 13.5% | ||||||||
Serbia Treasury | ||||||||
5.750% due 09/20/35 | RSD 545,500,000 | 6,108,040 | ||||||
5.875% due 07/21/23 | 202,850,000 | 2,231,506 | ||||||
10.000% due 02/08/28 | 10,270,000 | 127,839 | ||||||
|
| |||||||
| 8,467,385 | ||||||||
|
| |||||||
Sri Lanka - 7.5% | ||||||||
Sri Lanka Government | ||||||||
8.000% due 11/15/18 | LKR 8,220,000 | 52,582 | ||||||
8.750% due 10/15/18 | 53,000,000 | 340,189 | ||||||
9.250% due 05/01/20 | 71,020,000 | 451,648 | ||||||
9.450% due 10/15/21 | 47,000,000 | 297,441 | ||||||
10.000% due 10/01/22 | 220,100,000 | 1,406,432 | ||||||
10.250% due 03/15/25 | 3,360,000 | 21,551 | ||||||
10.600% due 07/01/19 | 2,630,000 | 17,120 | ||||||
10.750% due 03/01/21 | 88,000,000 | 574,907 | ||||||
11.000% due 08/01/21 | 67,270,000 | 444,178 | ||||||
11.000% due 08/01/24 | 10,000,000 | 65,830 | ||||||
11.000% due 08/01/25 | 5,000,000 | 33,025 | ||||||
11.000% due 06/01/26 | 77,800,000 | 514,932 | ||||||
11.200% due 07/01/22 | 15,380,000 | 102,415 | ||||||
11.400% due 01/01/24 | 33,000,000 | 223,807 | ||||||
11.500% due 12/15/21 | 15,000,000 | 100,977 | ||||||
11.500% due 08/01/26 | 9,000,000 | 60,670 | ||||||
|
| |||||||
| 4,707,704 | ||||||||
|
| |||||||
| See Notes to Financial Statements | See explanation of symbols and terms, if any, on B-114 and B-115 |
B-96
Table of Contents
PACIFIC FUNDS
PF GLOBAL ABSOLUTE RETURN FUND
Schedule of Investments (Continued)
March 31, 2018
Principal Amount | Value | |||||||
Suriname - 0.5% | ||||||||
Republic of Suriname | $329,000 | $ | 338,870 | |||||
|
| |||||||
Total Foreign Government Bonds & Notes | 29,548,390 | |||||||
|
| |||||||
SHORT-TERM INVESTMENTS - 31.2% | ||||||||
Foreign Government Issues - 10.9% | ||||||||
Egypt Treasury Bills (Egypt) | ||||||||
(5.212)% due 04/03/18 | EGP 5,250,000 | 297,919 | ||||||
(1.226)% due 04/10/18 | 5,950,000 | 337,607 | ||||||
10.588% due 05/01/18 | 4,350,000 | 244,639 | ||||||
12.112% due 05/08/18 | 1,175,000 | 65,859 | ||||||
13.165% due 05/15/18 | 12,550,000 | 701,083 | ||||||
13.932% due 05/22/18 | 6,650,000 | 370,254 | ||||||
14.512% due 05/29/18 | 3,750,000 | 208,097 | ||||||
14.965% due 06/05/18 | 4,125,000 | 228,150 | ||||||
16.403% due 07/24/18 | 5,075,000 | 274,411 | ||||||
16.606% due 08/14/18 | 6,425,000 | 344,160 | ||||||
16.650% due 08/21/18 | 2,125,000 | 113,475 | ||||||
17.767% due 10/02/18 | 5,600,000 | 292,373 | ||||||
17.799% due 09/25/18 | 2,750,000 | 144,008 | ||||||
17.828% due 09/18/18 | 1,650,000 | 86,667 | ||||||
17.963% due 07/17/18 | 7,050,000 | 380,809 | ||||||
Letras del Banco Central de la Republica | ARS 5,591,000 | 262,275 | ||||||
Nigeria Treasury Bills (Nigeria) | ||||||||
15.066% due 01/17/19 | NGN 173,655,000 | 431,148 | ||||||
15.132% due 11/29/18 | 9,210,000 | 23,293 | ||||||
15.160% due 11/01/18 | 120,452,000 | 307,894 | ||||||
15.171% due 10/18/18 | 28,903,000 | 74,278 | ||||||
15.171% due 10/18/18 | 23,154,000 | 59,503 | ||||||
15.179% due 10/04/18 | 40,519,000 | 104,692 | ||||||
15.183% due 09/13/18 | 67,200,000 | 175,044 | ||||||
15.183% due 09/20/18 | 48,760,000 | 126,667 | ||||||
15.626% due 10/25/18 | 9,212,000 | 23,557 | ||||||
15.718% due 09/27/18 | 49,552,000 | 128,083 | ||||||
15.743% due 09/20/18 | 81,039,000 | 210,038 | ||||||
15.767% due 09/06/18 | 18,424,000 | 48,016 | ||||||
15.769% due 08/16/18 | 9,750,000 | 25,625 | ||||||
15.771% due 08/09/18 | 119,452,000 | 314,822 | ||||||
15.788% due 07/19/18 | 40,760,000 | 108,329 | ||||||
15.798% due 07/12/18 | 14,980,000 | 39,924 | ||||||
15.810% due 07/05/18 | 41,200,000 | 110,110 | ||||||
15.827% due 06/28/18 | 59,726,000 | 160,067 | ||||||
16.025% due 11/22/18 | 11,050,000 | 27,882 | ||||||
|
| |||||||
| 6,850,758 | ||||||||
|
| |||||||
Shares | ||||||||
Money Market Fund - 16.4% | ||||||||
BlackRock Liquidity Funds T-Fund Portfolio | 10,315,015 | 10,315,015 | ||||||
|
| |||||||
Principal Amount | Value | |||||||
U.S. Treasury Bills - 3.9% | ||||||||
1.557% due 05/03/18 ‡ | $1,250,000 | $1,248,255 | ||||||
1.603% due 05/17/18 ‡ | 1,250,000 | 1,247,443 | ||||||
|
| |||||||
| 2,495,698 | ||||||||
|
| |||||||
Total Short-Term Investments | 19,661,471 | |||||||
|
| |||||||
TOTAL INVESTMENTS - 90.2% | 56,784,120 | |||||||
DERIVATIVES - (1.9%) | ||||||||
(See Notes (f) through (j) in Notes to Schedule of Investments) |
| (1,175,777 | ) | |||||
|
| |||||||
OTHER ASSETS & LIABILITIES, NET - 11.7% |
| 7,355,533 | ||||||
|
| |||||||
NET ASSETS - 100.0% | $62,963,876 | |||||||
|
| |||||||
Notes to Schedule of Investments
| (a) | As of March 31, 2018, the Fund’s composition as a percentage of net assets was as follows: |
Foreign Government Bonds & Notes | 46.9% | |||
Short-Term Investments | 31.2% | |||
Common Stocks | 7.7% | |||
Others (each less than 3.0%) | 4.4% | |||
|
| |||
| 90.2% | ||||
Derivatives | (1.9% | ) | ||
Other Assets & Liabilities, Net | 11.7% | |||
|
| |||
| 100.0% | ||||
|
|
| (b) | As of March 31, 2018, the fund’s composition by country of risk as a percentage of net assets as follows: |
United States (Includes Short-Term Investments) | 21.0% | |||
Serbia | 13.5% | |||
Sri Lanka | 7.5% | |||
Egypt | 6.5% | |||
Macedonia | 4.8% | |||
Dominican Republic | 4.7% | |||
El Salvador | 4.6% | |||
Nigeria | 4.0% | |||
Iceland | 3.7% | |||
New Zealand | 3.4% | |||
India | 3.2% | |||
Others (each less than 3.0%) | 13.3% | |||
|
| |||
| 90.2% | ||||
Derivatives | (1.9% | ) | ||
Other Assets & Liabilities, Net | 11.7% | |||
|
| |||
| 100.0% | ||||
|
|
| (c) | An investment with a value of $790,978 or 1.3% of the Fund’s net assets was valued by the Trustee Valuation Committee or determined by a valuation committee established under the Valuation Policy and then subsequently submitted for approval or ratification to either the Trustee Valuation Committee or to the Board of Trustees. |
| (d) | As of March 31, 2018, investments with a total aggregate value of $1,286,663 were fully or partially segregated with the broker(s)/custodian as collateral for open futures contracts, forward volatility agreements, forward foreign currency contracts, option contracts and swap agreements. |
| (e) | The average amount of borrowings by the Fund on reverse repurchase agreements outstanding during the year ended March 31, 2018 was $663,125 at a weighted average interest rate of 1.896%. |
| See Notes to Financial Statements | See explanation of symbols and terms, if any, on B-114 and B-115 |
B-97
Table of Contents
PACIFIC FUNDS
PF GLOBAL ABSOLUTE RETURN FUND
Schedule of Investments (Continued)
March 31, 2018
| (f) | Open futures contracts outstanding as of March 31, 2018 were as follows: |
| Long Futures Outstanding | Expiration Month | Number of Contracts | Notional Amount | Value | Unrealized Appreciation (Depreciation) | |||||||||||||
Eurodollar | 12/18 | 204 | $49,738,436 | $49,727,550 | ($10,886 | ) | ||||||||||||
|
| |||||||||||||||||
Short Futures Outstanding | ||||||||||||||||||
Eurodollar | 12/19 | 204 | 49,586,888 | 49,579,650 | 7,238 | |||||||||||||
U.S. 5-Year Interest Rate Swap | 06/18 | 2 | 192,292 | 193,031 | (739 | ) | ||||||||||||
|
| |||||||||||||||||
| 6,499 | ||||||||||||||||||
|
| |||||||||||||||||
Total Futures Contracts | ($4,387 | ) | ||||||||||||||||
|
| |||||||||||||||||
| (g) | Forward volatility agreements outstanding as of March 31, 2018 were as follows: |
| Description | Exercise Volatility Rate | Notional Amount | Expiration Date | Counterparty | Unrealized Appreciation (Depreciation) | |||||||||||||||
Call & Put - CHF/USD 1-Year vs. 1-Year | 8.575% | $1,471,000 | 06/14/19 | DUB | ($3,842 | ) | ||||||||||||||
Call & Put - CHF/USD 1-Year vs. 1-Year | 8.350% | 764,000 | 06/19/19 | BNP | (578 | ) | ||||||||||||||
Call & Put - EUR/USD 1-Year vs. 1-Year | 8.550% | EUR 735,000 | 06/20/19 | BNP | (5,893 | ) | ||||||||||||||
|
| |||||||||||||||||||
Total Forward Volatility Agreements | ($10,313 | ) | ||||||||||||||||||
|
| |||||||||||||||||||
| (h) | Forward foreign currency contracts outstanding as of March 31, 2018 were as follows: |
Currency | Currency | Settlement Month | Counterparty | Unrealized Appreciation | Unrealized (Depreciation) | |||||||||||||||||||
| AED | 5,700,000 | USD | 1,547,231 | 02/20 | BNP | $803 | $— | |||||||||||||||||
| ARS | 2,220,000 | USD | 111,139 | 04/18 | BNP | — | (2,323 | ) | ||||||||||||||||
| ARS | 3,747,205 | USD | 181,947 | 04/18 | BNP | 1,820 | — | |||||||||||||||||
| ARS | 3,747,205 | USD | 188,919 | 04/18 | DUB | — | (4,779 | ) | ||||||||||||||||
| ARS | 2,081,000 | USD | 102,687 | 04/18 | JPM | — | (736 | ) | ||||||||||||||||
| ARS | 3,253,000 | USD | 155,720 | 05/18 | BNP | 1,300 | — | |||||||||||||||||
| ARS | 15,925,200 | USD | 749,282 | 06/18 | BNP | 11,036 | — | |||||||||||||||||
| ARS | 5,450,913 | USD | 254,273 | 06/18 | DUB | 5,968 | — | |||||||||||||||||
| AUD | 80,663 | USD | 62,492 | 04/18 | DUB | — | (538 | ) | ||||||||||||||||
| AUD | 1,635,500 | USD | 1,229,361 | 04/18 | DUB | 26,791 | — | |||||||||||||||||
| AUD | 4,769,570 | USD | 3,735,754 | 05/18 | GSC | — | (72,340 | ) | ||||||||||||||||
| AUD | 591,000 | USD | 462,098 | 05/18 | SCB | — | (8,139 | ) | ||||||||||||||||
| AUD | 370,000 | USD | 299,990 | 06/18 | GSC | — | (15,774 | ) | ||||||||||||||||
| CNH | 3,691,000 | USD | 580,803 | 06/18 | DUB | 5,312 | — | |||||||||||||||||
| CNH | 4,373,000 | USD | 687,943 | 06/18 | SCB | 6,470 | — | |||||||||||||||||
| COP | 1,535,970,000 | USD | 535,531 | 04/18 | DUB | 13,960 | — | |||||||||||||||||
| COP | 576,100,000 | USD | 197,721 | 05/18 | BNP | 8,222 | — | |||||||||||||||||
| COP | 2,737,999,497 | USD | 944,879 | 05/18 | CIT | 33,575 | — | |||||||||||||||||
| COP | 1,442,531,000 | USD | 494,305 | 05/18 | JPM | 21,367 | — | |||||||||||||||||
| COP | 8,526,355,000 | USD | 2,972,069 | 05/18 | SCB | 76,771 | — | |||||||||||||||||
| COP | 3,901,594,000 | USD | 1,361,398 | 06/18 | CIT | 31,679 | — | |||||||||||||||||
| COP | 737,726,000 | USD | 258,579 | 06/18 | DUB | 4,724 | — | |||||||||||||||||
| COP | 442,202,000 | USD | 154,268 | 06/18 | JPM | 3,511 | — | |||||||||||||||||
| COP | 1,369,009,000 | USD | 477,888 | 06/18 | SCB | 10,944 | — | |||||||||||||||||
| CZK | 26,452,000 | EUR | 1,036,509 | 04/18 | GSC | 5,376 | — | |||||||||||||||||
| CZK | 2,293,000 | EUR | 90,902 | 05/18 | CIT | — | (865 | ) | ||||||||||||||||
| CZK | 50,813,000 | EUR | 1,986,435 | 05/18 | JPM | 15,218 | — | |||||||||||||||||
| CZK | 15,440,000 | EUR | 606,441 | 06/18 | GSC | 632 | — | |||||||||||||||||
| CZK | 4,312,000 | EUR | 169,158 | 08/18 | GSC | 121 | — | |||||||||||||||||
| CZK | 76,220,000 | EUR | 2,987,848 | 09/18 | JPM | 564 | — | |||||||||||||||||
| DOP | 10,252,000 | USD | 207,069 | 07/18 | CIT | — | (2,916 | ) | ||||||||||||||||
| EGP | 785,000 | USD | 42,318 | 05/18 | CIT | 1,616 | — | |||||||||||||||||
| EUR | 169,597 | CZK | 4,312,000 | 04/18 | GSC | — | (162 | ) | ||||||||||||||||
| EUR | 1,684,947 | CZK | 42,983,000 | 06/18 | JPM | — | (5,196 | ) | ||||||||||||||||
| EUR | 447,938 | HUF | 139,685,000 | 04/18 | CIT | 1,052 | — | |||||||||||||||||
| EUR | 868,975 | HUF | 269,703,790 | 04/18 | GSC | 6,839 | — | |||||||||||||||||
| EUR | 440,568 | HUF | 136,813,210 | | 04/18 | | SCB | 3,186 | — | |||||||||||||||
| EUR | 287,204 | HUF | 89,850,000 | 05/18 | DUB | — | (418 | ) | ||||||||||||||||
| EUR | 237,510 | HUF | 73,560,000 | 05/18 | GSC | 2,590 | — | |||||||||||||||||
| EUR | 515,770 | HUF | 162,026,000 | 06/18 | CIT | — | (3,266 | ) | ||||||||||||||||
| EUR | 1,770,801 | NOK | 17,090,000 | 04/18 | CIT | — | (869 | ) | ||||||||||||||||
| EUR | 108,735 | NOK | 1,046,000 | 05/18 | CIT | 704 | — | |||||||||||||||||
| EUR | 930,615 | NOK | 8,954,000 | 05/18 | GSC | 5,798 | — | |||||||||||||||||
| EUR | 1,103,361 | PLN | 4,640,000 | 04/18 | GSC | 2,522 | — | |||||||||||||||||
| See Notes to Financial Statements | See explanation of symbols and terms, if any, on B-114 and B-115 |
B-98
Table of Contents
PACIFIC FUNDS
PF GLOBAL ABSOLUTE RETURN FUND
Schedule of Investments (Continued)
March 31, 2018
Currency | Currency | Settlement Month | Counterparty | Unrealized Appreciation | Unrealized (Depreciation) | |||||||||||||||||||
| EUR | 222,171 | RON | 1,077,638 | 01/19 | BNP | $— | ($4,321 | ) | ||||||||||||||||
| EUR | 379,021 | RON | 1,832,000 | 01/19 | CIT | — | (5,908 | ) | ||||||||||||||||
| EUR | 697,761 | RON | 3,375,000 | 01/19 | DUB | — | (11,305 | ) | ||||||||||||||||
| EUR | 232,172 | RON | 1,120,000 | 01/19 | JPM | — | (3,036 | ) | ||||||||||||||||
| EUR | 772,298 | RON | 3,730,530 | 02/19 | BNP | — | (9,713 | ) | ||||||||||||||||
| EUR | 987,907 | RON | 4,776,000 | 02/19 | CIT | — | (13,894 | ) | ||||||||||||||||
| EUR | 682,594 | RON | 3,297,000 | 02/19 | DUB | — | (7,990 | ) | ||||||||||||||||
| EUR | 269,542 | RON | 1,300,000 | 02/19 | JPM | — | (2,542 | ) | ||||||||||||||||
| EUR | 34,818 | RON | 168,000 | 02/19 | SCB | — | (369 | ) | ||||||||||||||||
| EUR | 795,793 | RSD | 95,694,000 | 09/18 | DUB | 614 | — | |||||||||||||||||
| EUR | 775,002 | SEK | 7,827,000 | 04/18 | DUB | 16,220 | — | |||||||||||||||||
| EUR | 1,000,525 | SEK | 10,067,200 | 05/18 | DUB | 25,467 | — | |||||||||||||||||
| EUR | 863,928 | SEK | 8,676,000 | 06/18 | GSC | 24,026 | — | |||||||||||||||||
| EUR | 738,928 | USD | 915,077 | 04/18 | JPM | — | (5,361 | ) | ||||||||||||||||
| EUR | 48,666 | USD | 58,941 | 04/18 | JPM | 974 | — | |||||||||||||||||
| EUR | 2,577,303 | USD | 3,212,731 | 05/18 | SCB | — | (31,231 | ) | ||||||||||||||||
| EUR | 472,000 | USD | 586,775 | 06/18 | DUB | — | (3,042 | ) | ||||||||||||||||
| EUR | 266,528 | USD | 331,164 | 06/18 | GSC | — | (1,162 | ) | ||||||||||||||||
| EUR | 39,600 | USD | 46,581 | 06/18 | SCB | 2,413 | — | |||||||||||||||||
| EUR | 2,421,528 | USD | 3,001,726 | 07/18 | GSC | 1,526 | — | |||||||||||||||||
| EUR | 639,441 | USD | 796,213 | 07/18 | SCB | — | (2,292 | ) | ||||||||||||||||
| HUF | 285,000,000 | EUR | 914,356 | 04/18 | GSC | — | (2,423 | ) | ||||||||||||||||
| HUF | 15,296,210 | EUR | 48,968 | 04/18 | SCB | — | (1 | ) | ||||||||||||||||
| ILS | 15,120,000 | USD | 4,375,253 | 05/18 | GSC | — | (54,019 | ) | ||||||||||||||||
| INR | 10,430,000 | USD | 159,505 | 05/18 | CIT | — | (614 | ) | ||||||||||||||||
| INR | 132,702,343 | USD | 2,024,290 | 05/18 | DUB | — | (2,704 | ) | ||||||||||||||||
| INR | 25,130,000 | USD | 380,441 | 06/18 | GSC | 892 | — | |||||||||||||||||
| INR | 39,100,000 | USD | 591,931 | 06/18 | UBS | 1,388 | — | |||||||||||||||||
| JPY | 28,171,970 | USD | 267,185 | 05/18 | SCB | — | (1,467 | ) | ||||||||||||||||
| JPY | 28,266,371 | USD | 265,462 | 05/18 | SCB | 1,146 | — | |||||||||||||||||
| KRW | 549,700,000 | USD | 514,652 | 04/18 | BNP | 1,371 | — | |||||||||||||||||
| KRW | 433,900,000 | USD | 407,418 | 04/18 | DUB | — | (141 | ) | ||||||||||||||||
| KRW | 270,300,000 | USD | 253,043 | 04/18 | DUB | 698 | — | |||||||||||||||||
| KRW | 3,063,008,544 | USD | 2,865,155 | 04/18 | GSC | 10,205 | — | |||||||||||||||||
| KRW | 1,066,100,000 | USD | 1,000,008 | 04/18 | SCB | 679 | — | |||||||||||||||||
| KRW | 687,000,000 | USD | 644,465 | 05/18 | GSC | 799 | — | |||||||||||||||||
| KRW | 84,500,000 | USD | 79,335 | 05/18 | SCB | 31 | — | |||||||||||||||||
| KZT | 68,933,000 | USD | 203,156 | 04/18 | DUB | 12,470 | — | |||||||||||||||||
| KZT | 243,301,000 | USD | 752,740 | 04/18 | GSC | 6,784 | — | |||||||||||||||||
| KZT | 44,242,000 | USD | 137,015 | 04/18 | JPM | 782 | — | |||||||||||||||||
| KZT | 314,073,000 | USD | 915,400 | 05/18 | DUB | 61,102 | — | |||||||||||||||||
| KZT | 503,985,000 | USD | 1,482,248 | 05/18 | GSC | 80,734 | — | |||||||||||||||||
| KZT | 794,356,000 | USD | 2,392,936 | 05/18 | SCB | 72,255 | — | |||||||||||||||||
| KZT | 206,437,000 | USD | 605,437 | 06/18 | DUB | 31,511 | — | |||||||||||||||||
| KZT | 123,388,000 | USD | 366,680 | 06/18 | GSC | 14,144 | — | |||||||||||||||||
| KZT | 44,423,000 | USD | 137,767 | 06/18 | SCB | — | (463 | ) | ||||||||||||||||
| KZT | 163,617,037 | USD | 485,673 | 06/18 | SCB | 19,868 | — | |||||||||||||||||
| KZT | 13,919,007 | USD | 40,112 | 07/18 | DUB | 2,644 | — | |||||||||||||||||
| KZT | 71,395,000 | USD | 213,758 | 07/18 | GSC | 5,322 | — | |||||||||||||||||
| KZT | 180,115,000 | USD | 536,057 | 07/18 | SCB | 17,030 | — | |||||||||||||||||
| MAD | 607,000 | USD | 59,803 | 06/18 | BNP | 5,904 | — | |||||||||||||||||
| MAD | 886,000 | USD | 86,676 | 06/18 | SCB | 9,167 | — | |||||||||||||||||
| MAD | 7,179,000 | USD | 710,792 | 07/18 | SCB | 62,782 | — | |||||||||||||||||
| MAD | 4,718,000 | USD | 477,048 | 12/18 | BNP | 26,888 | — | |||||||||||||||||
| MAD | 2,482,000 | USD | 250,884 | 12/18 | SCB | 14,238 | — | |||||||||||||||||
| MAD | 1,576,000 | USD | 164,711 | 01/19 | BNP | 3,223 | — | |||||||||||||||||
| NOK | 8,534,288 | EUR | 886,173 | 04/18 | CIT | — | (1,883 | ) | ||||||||||||||||
| NOK | 8,555,712 | EUR | 888,492 | 04/18 | JPM | — | (2,003 | ) | ||||||||||||||||
| NOK | 3,879,000 | EUR | 401,270 | 05/18 | CIT | — | (182 | ) | ||||||||||||||||
| NOK | 4,477,000 | EUR | 462,892 | 05/18 | DUB | 139 | — | |||||||||||||||||
| NOK | 8,954,000 | EUR | 925,803 | 05/18 | GSC | 149 | — | |||||||||||||||||
| NOK | 17,090,000 | EUR | 1,761,856 | 08/18 | CIT | 367 | — | |||||||||||||||||
| NZD | 7,643,716 | USD | 5,534,416 | 05/18 | GSC | — | (10,981 | ) | ||||||||||||||||
| NZD | 342,492 | USD | 246,800 | 05/18 | GSC | 689 | — | |||||||||||||||||
| OMR | 573,000 | USD | 1,469,985 | 04/19 | BNP | 1,728 | — | |||||||||||||||||
| OMR | 530,000 | USD | 1,350,835 | 08/19 | BNP | 1,913 | — | |||||||||||||||||
| PEN | 2,165,000 | USD | 667,571 | 04/18 | JPM | 3,364 | — | |||||||||||||||||
| PEN | 3,140,000 | USD | 960,157 | 05/18 | SCB | 11,604 | — | |||||||||||||||||
| PHP | 6,860,000 | USD | 134,978 | 04/18 | DUB | — | (3,661 | ) | ||||||||||||||||
| PHP | 13,800,000 | USD | 271,467 | 04/18 | GSC | — | (7,301 | ) | ||||||||||||||||
| PHP | 38,571,000 | USD | 747,152 | 05/18 | BNP | — | (9,140 | ) | ||||||||||||||||
| See Notes to Financial Statements | See explanation of symbols and terms, if any, on B-114 and B-115 |
B-99
Table of Contents
PACIFIC FUNDS
PF GLOBAL ABSOLUTE RETURN FUND
Schedule of Investments (Continued)
March 31, 2018
Currency | Currency | Settlement Month | Counterparty | Unrealized Appreciation | Unrealized (Depreciation) | |||||||||||||||||||
| PHP | 25,510,000 | USD | 494,332 | 05/18 | JPM | $— | ($6,227 | ) | ||||||||||||||||
| PHP | 25,289,000 | USD | 489,480 | 05/18 | UBS | — | (5,604 | ) | ||||||||||||||||
| PLN | 1,942,000 | EUR | 466,505 | 04/18 | CIT | — | (7,475 | ) | ||||||||||||||||
| PLN | 4,640,000 | EUR | 1,114,447 | 04/18 | GSC | — | (16,167 | ) | ||||||||||||||||
| PLN | 2,094,000 | EUR | 502,501 | 04/18 | SCB | — | (6,820 | ) | ||||||||||||||||
| PLN | 174,000 | EUR | 41,654 | 05/18 | BNP | — | (532 | ) | ||||||||||||||||
| PLN | 1,293,000 | EUR | 305,032 | 05/18 | DUB | 1,598 | — | |||||||||||||||||
| PLN | 840,000 | EUR | 199,301 | 05/18 | GSC | — | (364 | ) | ||||||||||||||||
| PLN | 2,209,000 | EUR | 525,155 | 06/18 | CIT | — | (3,290 | ) | ||||||||||||||||
QAR | 1,800,000 | USD | 491,287 | 12/18 | SCB | — | (583 | ) | ||||||||||||||||
| RON | 1,832,000 | EUR | 383,456 | 01/19 | CIT | 317 | — | |||||||||||||||||
| RON | 1,849,000 | EUR | 387,442 | 01/19 | DUB | — | (219 | ) | ||||||||||||||||
| RON | 1,120,000 | EUR | 234,490 | 01/19 | JPM | 115 | — | |||||||||||||||||
| RON | 1,300,000 | EUR | 271,407 | 02/19 | JPM | 186 | — | |||||||||||||||||
| RSD | 47,631,296 | EUR | 392,189 | 04/18 | CIT | 11,320 | — | |||||||||||||||||
| RSD | 32,798,000 | EUR | 276,776 | 04/18 | DUB | — | (151 | ) | ||||||||||||||||
| RSD | 42,330,000 | EUR | 341,288 | 04/18 | DUB | 19,895 | — | |||||||||||||||||
| RSD | 20,000,000 | EUR | 168,237 | 05/18 | DUB | — | (55 | ) | ||||||||||||||||
| RSD | 19,425,000 | EUR | 157,415 | 09/18 | CIT | 4,705 | — | |||||||||||||||||
| RSD | 152,217,000 | EUR | 1,228,774 | 09/18 | DUB | 44,525 | — | |||||||||||||||||
| RSD | 24,664,000 | EUR | 200,212 | 10/18 | DUB | 5,044 | — | |||||||||||||||||
| RUB | 77,820,000 | USD | 1,291,092 | 04/18 | GSC | 64,987 | — | |||||||||||||||||
| SEK | 7,827,000 | EUR | 788,130 | 04/18 | DUB | — | (32,392 | ) | ||||||||||||||||
| SEK | 10,067,200 | EUR | 1,015,938 | 05/18 | DUB | — | (44,500 | ) | ||||||||||||||||
| SEK | 8,676,000 | EUR | 886,000 | 06/18 | GSC | — | (51,318 | ) | ||||||||||||||||
| SGD | 5,255,840 | USD | 3,985,643 | 04/18 | DUB | 23,867 | — | |||||||||||||||||
| SGD | 1,630,000 | USD | 1,242,937 | 04/18 | GSC | 737 | — | |||||||||||||||||
| SGD | 2,800,000 | USD | 2,139,580 | 04/18 | HSB | — | (3,676 | ) | ||||||||||||||||
| SGD | 1,733,727 | USD | 1,315,243 | 05/18 | DUB | 8,184 | — | |||||||||||||||||
| SGD | 1,194,000 | USD | 905,815 | 05/18 | GSC | 6,084 | — | |||||||||||||||||
| THB | 10,590,000 | USD | 333,333 | 05/18 | CIT | 5,799 | — | |||||||||||||||||
| THB | 10,383,777 | USD | 332,813 | 05/18 | DUB | — | (285 | ) | ||||||||||||||||
| THB | 9,107,898 | USD | 289,719 | 05/18 | DUB | 1,985 | — | |||||||||||||||||
| THB | 22,339,000 | USD | 698,283 | 05/18 | SCB | 17,097 | — | |||||||||||||||||
| TRY | 3,850,075 | USD | 988,890 | 04/18 | GSC | — | (17,016 | ) | ||||||||||||||||
| TRY | 2,698,829 | USD | 695,485 | 04/18 | SCB | — | (16,599 | ) | ||||||||||||||||
| TRY | 2,113,171 | USD | 506,999 | 01/19 | DUB | — | (19,237 | ) | ||||||||||||||||
| TRY | 2,113,000 | USD | 506,836 | 01/19 | SCB | — | (19,114 | ) | ||||||||||||||||
| TRY | 2,113,171 | USD | 458,587 | 02/20 | DUB | — | (23,721 | ) | ||||||||||||||||
| TRY | 8,968,075 | USD | 1,950,284 | 02/20 | GSC | — | (103,541 | ) | ||||||||||||||||
| TRY | 2,752,925 | USD | 593,274 | 02/20 | JPM | — | (25,609 | ) | ||||||||||||||||
| TRY | 6,586,829 | USD | 1,431,383 | 02/20 | SCB | — | (76,529 | ) | ||||||||||||||||
| TWD | 11,000,000 | USD | 379,900 | 04/18 | GSC | — | (2,021 | ) | ||||||||||||||||
| TWD | 14,450,000 | USD | 497,332 | 04/18 | JPM | — | (936 | ) | ||||||||||||||||
| TWD | 11,000,000 | USD | 379,742 | 04/18 | SCB | — | (1,863 | ) | ||||||||||||||||
| USD | 47,438 | AED | 175,000 | 10/19 | SCB | — | (114 | ) | ||||||||||||||||
| USD | 23,790 | AED | 88,000 | 12/19 | BNP | — | (116 | ) | ||||||||||||||||
| USD | 5,419,809 | AED | 19,991,000 | 02/20 | BNP | — | (9,398 | ) | ||||||||||||||||
| USD | 1,674,523 | AUD | 2,150,000 | 05/18 | GSC | 23,150 | — | |||||||||||||||||
| USD | 392,514 | BHD | 151,000 | 09/19 | SCB | — | (2,824 | ) | ||||||||||||||||
| USD | 1,485,990 | BHD | 571,000 | 10/19 | SCB | — | (8,173 | ) | ||||||||||||||||
| USD | 356,307 | BHD | 137,000 | 02/20 | BNP | 144 | — | |||||||||||||||||
| USD | 358,395 | BHD | 138,000 | 03/20 | BNP | — | (252 | ) | ||||||||||||||||
| USD | 740,307 | CLP | 442,000,000 | 05/18 | JPM | 8,320 | — | |||||||||||||||||
| USD | 141,420 | CLP | 86,050,000 | 06/18 | BNP | — | (1,034 | ) | ||||||||||||||||
| USD | 2,404,181 | COP | 6,900,000,000 | 05/18 | GSC | — | (63,159 | ) | ||||||||||||||||
| USD | 1,507,510 | EUR | 1,267,252 | 04/18 | JPM | — | (52,639 | ) | ||||||||||||||||
| USD | 1,117,414 | EUR | 939,390 | 04/18 | SCB | — | (39,572 | ) | ||||||||||||||||
| USD | 1,936,719 | EUR | 1,622,586 | 05/18 | JPM | — | (65,674 | ) | ||||||||||||||||
| USD | 6,993,442 | EUR | 5,788,685 | 05/18 | SCB | — | (156,277 | ) | ||||||||||||||||
| USD | 4,368,409 | EUR | 3,496,028 | 05/18 | SCB | 55,002 | — | |||||||||||||||||
| USD | 71,110 | EUR | 61,937 | 06/18 | BNP | — | (5,489 | ) | ||||||||||||||||
| USD | 439,606 | EUR | 378,149 | 06/18 | DUB | — | (28,060 | ) | ||||||||||||||||
| USD | 1,104,781 | EUR | 890,450 | 06/18 | DUB | 1,624 | — | |||||||||||||||||
| USD | 781,441 | EUR | 632,399 | 06/18 | GSC | — | (1,566 | ) | ||||||||||||||||
| USD | 150,753 | EUR | 120,730 | 06/18 | GSC | 1,271 | — | |||||||||||||||||
| USD | 602,552 | EUR | 504,862 | 06/18 | SCB | — | (22,076 | ) | ||||||||||||||||
| USD | 7,290,630 | EUR | 5,814,862 | 07/18 | GSC | 78,158 | — | |||||||||||||||||
| USD | 1,454,785 | EUR | 1,160,666 | 07/18 | SCB | 13,716 | — | |||||||||||||||||
| USD | 536,318 | EUR | 430,000 | 08/18 | DUB | 971 | — | |||||||||||||||||
| USD | 5,803,530 | EUR | 4,655,255 | 08/18 | SCB | 16,629 | — | |||||||||||||||||
| See Notes to Financial Statements | See explanation of symbols and terms, if any, on B-114 and B-115 |
B-100
Table of Contents
PACIFIC FUNDS
PF GLOBAL ABSOLUTE RETURN FUND
Schedule of Investments (Continued)
March 31, 2018
Currency | Currency | Settlement Month | Counterparty | Unrealized Appreciation | Unrealized (Depreciation) | |||||||||||||||||||
| USD | 1,252,476 | ILS | 4,300,000 | 05/18 | GSC | $23,553 | $— | |||||||||||||||||
| USD | 632,911 | INR | 41,500,000 | 05/18 | DUB | 701 | — | |||||||||||||||||
| USD | 647,309 | INR | 42,668,000 | 06/18 | CIT | — | (152 | ) | ||||||||||||||||
| USD | 846,322 | JPY | 94,193,942 | 05/18 | SCB | — | (42,113 | ) | ||||||||||||||||
| USD | 416,799 | JPY | 44,998,000 | 08/18 | GSC | — | (9,954 | ) | ||||||||||||||||
| USD | 651,173 | KRW | 696,000,000 | 04/18 | BNP | — | (2,188 | ) | ||||||||||||||||
| USD | 1,420,496 | KRW | 1,516,948,001 | 04/18 | DUB | — | (3,519 | ) | ||||||||||||||||
| USD | 553,231 | KRW | 591,100,000 | 04/18 | GSC | — | (1,656 | ) | ||||||||||||||||
| USD | 192,301 | KRW | 204,320,000 | 04/18 | GSC | 498 | — | |||||||||||||||||
| USD | 119,296 | KRW | 128,330,000 | 04/18 | SCB | — | (1,228 | ) | ||||||||||||||||
| USD | 2,117,116 | KRW | 2,260,000,000 | 05/18 | BNP | — | (5,588 | ) | ||||||||||||||||
| USD | 900,595 | KRW | 968,500,000 | 05/18 | GSC | — | (9,992 | ) | ||||||||||||||||
| USD | 139,017 | KZT | | 44,423,000 | | 04/18 | SCB | — | (25 | ) | ||||||||||||||
| USD | 2,157,830 | KZT | 700,000,000 | 05/18 | SCB | — | (14,017 | ) | ||||||||||||||||
| USD | 500,325 | MAD | 4,612,000 | 07/18 | SCB | 3,388 | — | |||||||||||||||||
| USD | 480,447 | MAD | 4,472,000 | 12/18 | BNP | 2,787 | — | |||||||||||||||||
| USD | 422,012 | NZD | 617,612 | 04/18 | DUB | — | (24,323 | ) | ||||||||||||||||
| USD | 6,271,305 | NZD | 8,625,377 | 05/18 | GSC | 38,509 | — | |||||||||||||||||
| USD | 1,209,370 | NZD | 1,659,000 | 05/18 | SCB | 10,679 | — | |||||||||||||||||
| USD | 1,403,747 | NZD | 1,902,104 | 06/18 | GSC | 29,420 | — | |||||||||||||||||
| USD | 1,176,400 | NZD | 1,621,000 | 06/18 | JPM | 5,193 | — | |||||||||||||||||
| USD | 1,422,635 | NZD | 1,942,000 | 07/18 | GSC | 19,524 | — | |||||||||||||||||
| USD | 2,154,776 | OMR | 891,000 | 01/19 | BNP | — | (140,419 | ) | ||||||||||||||||
| USD | 1,450,633 | OMR | 573,000 | 04/19 | BNP | — | (21,080 | ) | ||||||||||||||||
| USD | 5,280,204 | OMR | 2,146,000 | 08/19 | BNP | — | (195,539 | ) | ||||||||||||||||
| USD | 687,007 | PEN | 2,241,000 | 04/18 | SCB | — | (7,480 | ) | ||||||||||||||||
| USD | 389,279 | PEN | 1,268,000 | 05/18 | BNP | — | (3,138 | ) | ||||||||||||||||
| USD | 550,077 | PEN | 1,796,000 | 05/18 | DUB | — | (5,746 | ) | ||||||||||||||||
| USD | 732,126 | PHP | 38,400,000 | 05/18 | MSC | — | (2,615 | ) | ||||||||||||||||
| USD | 196,206 | QAR | 724,000 | 12/18 | BNP | — | (1,144 | ) | ||||||||||||||||
| USD | 665,896 | QAR | 2,476,000 | 12/18 | SCB | — | (9,084 | ) | ||||||||||||||||
| USD | 623,130 | QAR | 2,294,000 | 01/19 | BNP | — | (2,029 | ) | ||||||||||||||||
| USD | 232,602 | QAR | 859,230 | 01/19 | SCB | — | (1,554 | ) | ||||||||||||||||
| USD | 384,683 | RUB | 22,000,000 | 04/18 | GSC | 1,397 | — | |||||||||||||||||
| USD | 466,721 | SGD | 616,853 | 04/18 | DUB | — | (3,829 | ) | ||||||||||||||||
| USD | 2,139,374 | SGD | 2,800,000 | 04/18 | DUB | 3,470 | — | |||||||||||||||||
| USD | 2,123,682 | SGD | 2,800,000 | 04/18 | HSB | — | (12,222 | ) | ||||||||||||||||
| USD | 337,207 | THB | 10,590,000 | 05/18 | CIT | — | (1,925 | ) | ||||||||||||||||
| USD | 620,600 | THB | 19,491,675 | 05/18 | DUB | — | (3,631 | ) | ||||||||||||||||
| USD | 696,175 | THB | 22,339,000 | 05/18 | SCB | — | (19,205 | ) | ||||||||||||||||
| USD | 1,004,481 | TRY | 3,850,075 | 04/18 | GSC | 32,607 | — | |||||||||||||||||
| USD | 700,995 | TRY | 2,698,829 | 04/18 | SCB | 22,108 | — | |||||||||||||||||
| USD | 506,756 | TRY | 2,113,171 | 01/19 | DUB | 18,994 | — | |||||||||||||||||
| USD | 507,323 | TRY | 2,113,000 | 01/19 | SCB | 19,601 | — | |||||||||||||||||
| USD | 1,099,109 | TRY | 5,118,000 | 02/20 | GSC | 43,756 | — | |||||||||||||||||
| USD | 339,901 | TRY | 1,582,000 | 02/20 | JPM | 13,686 | — | |||||||||||||||||
| USD | 187,543 | TWD | 5,450,000 | 04/18 | CIT | 321 | — | |||||||||||||||||
| USD | 791,221 | TWD | 23,000,000 | 04/18 | GSC | 1,110 | — | |||||||||||||||||
| USD | 240,989 | TWD | 7,000,000 | 04/18 | JPM | 520 | — | |||||||||||||||||
| USD | 34,437 | TWD | 1,000,000 | 04/18 | SCB | 85 | — | |||||||||||||||||
| USD | 208,659 | TWD | 6,000,000 | 07/18 | JPM | 1,121 | — | |||||||||||||||||
| USD | 386,779 | TWD | 11,000,000 | 10/18 | GSC | 3,534 | — | |||||||||||||||||
| USD | 386,548 | TWD | 11,000,000 | 10/18 | SCB | 3,303 | — | |||||||||||||||||
| USD | 299,752 | TWD | 8,450,000 | 04/19 | JPM | 878 | — | |||||||||||||||||
| USD | 1,028,823 | UYU | 29,452,000 | 04/18 | CIT | — | (4,300 | ) | ||||||||||||||||
| USD | 318,400 | ZAR | 4,015,000 | 04/18 | GSC | — | (20,087 | ) | ||||||||||||||||
| USD | 311,797 | ZAR | 4,353,000 | 05/18 | BNP | — | (53,531 | ) | ||||||||||||||||
| USD | 737,206 | ZAR | 9,922,000 | 06/18 | SCB | — | (92,158 | ) | ||||||||||||||||
| USD | 502,494 | ZAR | 7,052,000 | 06/18 | UBS | — | (86,951 | ) | ||||||||||||||||
| USD | 1,830,073 | ZAR | 22,638,000 | 07/18 | DUB | — | (55,400 | ) | ||||||||||||||||
| UYU | 23,444,000 | USD | 787,592 | 04/18 | CIT | 35,062 | — | |||||||||||||||||
| UYU | 8,720,000 | USD | 302,988 | 04/18 | HSB | 2,586 | — | |||||||||||||||||
| UYU | 8,950,000 | USD | 301,570 | 05/18 | CIT | 11,542 | — | |||||||||||||||||
| UYU | 8,117,684 | USD | 280,889 | 05/18 | JPM | 3,059 | — | |||||||||||||||||
| UYU | 11,442,000 | USD | 379,000 | 06/18 | CIT | 18,530 | — | |||||||||||||||||
| UYU | 6,140,000 | USD | 200,785 | 08/18 | CIT | 10,317 | — | |||||||||||||||||
| UYU | 4,690,000 | USD | 159,905 | 09/18 | CIT | — | (143 | ) | ||||||||||||||||
| UYU | 12,965,000 | USD | 429,049 | 09/18 | CIT | 13,717 | — | |||||||||||||||||
| UYU | 8,270,000 | USD | 267,551 | 10/18 | CIT | 13,373 | — | |||||||||||||||||
| UYU | 10,140,000 | USD | 326,360 | 11/18 | CIT | 16,096 | — | |||||||||||||||||
| ZAR | 2,749,000 | USD | 233,065 | 06/18 | SCB | — | (3,288 | ) | ||||||||||||||||
| ZAR | 4,630,000 | USD | 369,779 | 06/18 | SCB | 17,222 | — | |||||||||||||||||
| See Notes to Financial Statements | See explanation of symbols and terms, if any, on B-114 and B-115 |
B-101
Table of Contents
PACIFIC FUNDS
PF GLOBAL ABSOLUTE RETURN FUND
Schedule of Investments (Continued)
March 31, 2018
Currency | Currency | Settlement Month | Counterparty | Unrealized Appreciation | Unrealized (Depreciation) | |||||||||||||||||||||
| ZAR | 7,052,000 | USD | 598,066 | 06/18 | UBS | $— | ($8,620 | ) | ||||||||||||||||||
| ZAR | 5,425,000 | USD | 458,781 | 07/18 | DUB | — | (6,943 | ) | ||||||||||||||||||
| ZAR | 13,200,000 | USD | 1,091,135 | 07/18 | DUB | 8,267 | — | |||||||||||||||||||
|
|
|
| |||||||||||||||||||||||
Total Forward Foreign Currency Contracts |
| $1,731,665 | ($2,136,553 | ) | ||||||||||||||||||||||
|
|
|
| |||||||||||||||||||||||
| (i) | Purchased options outstanding as of March 31, 2018 were as follows: |
Foreign Currency Options
| Description | Expiration Price | Expiration Date | Counter- party | Notional Amount | Cost | Value | ||||||||||||||||||
Call - CNH versus USD | CNH 6.69 | 04/23/18 | SCB | $3,400,000 | $5,168 | $346 | ||||||||||||||||||
Call - CNH versus USD | 6.69 | 04/24/18 | CIT | 2,890,000 | 4,480 | 297 | ||||||||||||||||||
Call - CNH versus USD | 6.65 | 04/26/18 | CIT | 2,000,000 | 3,050 | 216 | ||||||||||||||||||
Call - CNH versus USD | 6.85 | 07/23/18 | CIT | 3,000,000 | 6,825 | 1,334 | ||||||||||||||||||
Call - CNH versus USD | 6.86 | 08/09/18 | BNP | 4,000,000 | 12,760 | 2,644 | ||||||||||||||||||
Call - CNH versus USD | 6.96 | 08/20/18 | SCB | 2,160,000 | 7,452 | 1,201 | ||||||||||||||||||
Call - CNH versus USD | 7.45 | 11/09/18 | CIT | 3,600,000 | 13,752 | 1,773 | ||||||||||||||||||
Call - CNH versus USD | 7.45 | 11/09/18 | JPM | 3,290,000 | 12,370 | 1,620 | ||||||||||||||||||
Call - CNH versus USD | 7.40 | 11/12/18 | DUB | 4,390,000 | 17,911 | 2,505 | ||||||||||||||||||
Call - CNH versus USD | 7.40 | 11/12/18 | GSC | 2,500,000 | 10,283 | 1,427 | ||||||||||||||||||
Call - EUR versus USD | $0.87 | 02/24/22 | GSC | 3,880,000 | 77,561 | 14,683 | ||||||||||||||||||
Call - EUR versus USD | 0.88 | 02/28/22 | BNP | 3,856,000 | 72,878 | 14,688 | ||||||||||||||||||
|
|
|
| |||||||||||||||||||||
| 244,490 | 42,734 | |||||||||||||||||||||||
|
|
|
| |||||||||||||||||||||
Put - EUR versus USD | 1.21 | 02/27/20 | CIT | EUR 3,560,000 | 73,942 | 65,067 | ||||||||||||||||||
Put - EUR versus USD | 1.21 | 02/27/20 | GSC | 1,775,000 | 36,476 | 33,248 | ||||||||||||||||||
Put - EUR versus USD | 1.22 | 02/27/20 | BNP | 1,775,000 | 39,576 | 37,061 | ||||||||||||||||||
|
|
|
| |||||||||||||||||||||
| 149,994 | 135,376 | |||||||||||||||||||||||
|
|
|
| |||||||||||||||||||||
Total Foreign Currency Options | $394,484 | $178,110 | ||||||||||||||||||||||
|
|
|
| |||||||||||||||||||||
Options on Indices
Description | Exercise Price | Expiration Date | Counter- party | Number of Contracts | Notional Amount | Cost | Value | |||||||||||||||||||||
Call - FTSE 100 | GBP 6,275.00 | 02/15/22 | GSC | 64 | GBP 401,600 | $89,450 | $80,793 | |||||||||||||||||||||
|
|
|
| |||||||||||||||||||||||||
Total Purchased Options | $483,934 | $258,903 | ||||||||||||||||||||||||||
|
|
|
| |||||||||||||||||||||||||
| (j) | Swap agreements outstanding as of March 31, 2018 were as follows: |
Credit Default Swaps on Sovereign Issues - Buy Protection (1)
| Referenced Obligation | Payment Frequency | Fixed Deal Pay Rate | Expiration Date | Counter- party | Implied Credit Spread at 03/31/18 (2) | Notional Amount (3) | Value | Upfront Premiums Paid (Received) | Unrealized Appreciation (Depreciation) | |||||||||||||||||||||||||
Croatia Government | Q | 1.000% | 06/20/18 | CIT | 0.145% | $800,000 | ($1,834 | ) | $76,719 | ($78,553 | ) | |||||||||||||||||||||||
Croatia Government | Q | 1.000% | 06/20/18 | MSC | 0.145% | 921,000 | (2,112 | ) | 92,071 | (94,183 | ) | |||||||||||||||||||||||
Lebanon Government | Q | 5.000% | 12/20/18 | GSC | 2.559% | 663,000 | (12,778 | ) | (39,103 | ) | 26,325 | |||||||||||||||||||||||
Qatar Government | Q | 1.000% | 03/20/19 | GSC | 0.220% | 490,000 | (3,883 | ) | (8,606 | ) | 4,723 | |||||||||||||||||||||||
Croatia Government | Q | 1.000% | 06/20/20 | CIT | 0.266% | 143,000 | (2,341 | ) | 10,929 | (13,270 | ) | |||||||||||||||||||||||
Qatar Government | Q | 1.000% | 12/20/20 | GSC | 0.432% | 1,120,000 | (17,231 | ) | 21,581 | (38,812 | ) | |||||||||||||||||||||||
Qatar Government | Q | 1.000% | 06/20/21 | CIT | 0.486% | 937,457 | (15,292 | ) | 5,720 | (21,012 | ) | |||||||||||||||||||||||
Qatar Government | Q | 1.000% | 06/20/21 | GSC | 0.486% | 1,241,000 | (20,244 | ) | 5,274 | (25,518 | ) | |||||||||||||||||||||||
Lebanon Government | Q | 5.000% | 06/20/21 | GSC | 3.819% | 200,000 | (7,218 | ) | (1,580 | ) | (5,638 | ) | ||||||||||||||||||||||
Qatar Government | Q | 1.000% | 12/20/22 | GSC | 0.794% | 350,000 | (3,303 | ) | (3,911 | ) | 608 | |||||||||||||||||||||||
Qatar Government | Q | 1.000% | 12/20/23 | GSC | 0.984% | 300,000 | (348 | ) | 284 | (632 | ) | |||||||||||||||||||||||
Qatar Government | Q | 1.000% | 09/20/24 | GSC | 1.104% | 290,000 | 1,666 | (622 | ) | 2,288 | ||||||||||||||||||||||||
South Africa Government | Q | 1.000% | 12/20/25 | BNP | 2.100% | 3,167,000 | 227,446 | 573,006 | (345,560 | ) | ||||||||||||||||||||||||
Colombia Government | Q | 1.000% | 06/20/28 | GSC | 1.785% | 419,000 | 27,135 | 28,890 | (1,755 | ) | ||||||||||||||||||||||||
|
|
|
|
|
| |||||||||||||||||||||||||||||
| 169,663 | 760,652 | (590,989 | ) | |||||||||||||||||||||||||||||||
|
|
|
|
|
| |||||||||||||||||||||||||||||
| Exchange | ||||||||||||||||||||||||||||||||||
South Africa Government | Q | 1.000% | 06/20/21 | ICE | 0.885% | 1,790,000 | (7,837 | ) | 126,600 | (134,437 | ) | |||||||||||||||||||||||
Qatar Government | Q | 1.000% | 12/20/22 | ICE | 0.794% | 2,040,000 | (18,431 | ) | 351 | (18,782 | ) | |||||||||||||||||||||||
Chile Government | Q | 1.000% | 06/20/23 | ICE | 0.505% | 1,123,000 | (27,192 | ) | (26,230 | ) | (962 | ) | ||||||||||||||||||||||
Colombia Government | Q | 1.000% | 06/20/23 | ICE | 1.059% | 1,820,000 | 4,500 | 6,256 | (1,756 | ) | ||||||||||||||||||||||||
Malaysia Government | Q | 1.000% | 06/20/23 | ICE | 0.731% | 7,987,000 | (106,877 | ) | (105,675 | ) | (1,202 | ) | ||||||||||||||||||||||
Mexican Government | Q | 1.000% | 06/20/23 | ICE | 1.079% | 2,496,000 | 9,851 | 11,226 | (1,375 | ) | ||||||||||||||||||||||||
| See Notes to Financial Statements | See explanation of symbols and terms, if any, on B-114 and B-115 |
B-102
Table of Contents
PACIFIC FUNDS
PF GLOBAL ABSOLUTE RETURN FUND
Schedule of Investments (Continued)
March 31, 2018
| Referenced Obligation | Payment Frequency | Fixed Deal Rate | Expiration Date | Exchange | Implied Credit Spread at 03/31/18 (2) | Notional Amount (3) | Value | Upfront Premiums Paid (Received) | Unrealized Appreciation (Depreciation) | |||||||||||||||||||||||||
Russia Government | Q | 1.000% | 06/20/23 | ICE | 1.232% | $5,686,000 | $57,392 | $56,243 | $1,149 | |||||||||||||||||||||||||
France Government | Q | 0.250% | 12/20/24 | ICE | 0.244% | 334,000 | 2,791 | 3,336 | (545 | ) | ||||||||||||||||||||||||
France Government | Q | 0.250% | 06/20/28 | ICE | 0.390% | 2,130,000 | 16,846 | 21,022 | (4,176 | ) | ||||||||||||||||||||||||
|
|
|
|
|
| |||||||||||||||||||||||||||||
| (68,957 | ) | 93,129 | (162,086 | ) | ||||||||||||||||||||||||||||||
|
|
|
|
|
| |||||||||||||||||||||||||||||
Total Credit Default Swaps on Sovereign Issues - Buy Protection |
| $100,706 | $853,781 | ($753,075 | ) | |||||||||||||||||||||||||||||
|
|
|
|
|
| |||||||||||||||||||||||||||||
| Credit Default Swaps on Sovereign Issues - Sell Protection (4) | ||||||||||||||||||||||||||||||||||
| Referenced Obligation | Payment Frequency | Fixed Deal Receive Rate | Expiration Date | Counter- party | Implied Credit Spread at 03/31/18 (2) | Notional Amount (3) | Value | Upfront Premiums Paid (Received) | Unrealized Appreciation (Depreciation) | |||||||||||||||||||||||||
Turkey Government | Q | 1.000% | 06/20/20 | BNP | 1.117% | $2,488,000 | ($5,460 | ) | ($125,661 | ) | $120,201 | |||||||||||||||||||||||
Turkey Government | Q | 1.000% | 12/20/26 | BNP | 2.698% | 1,313,084 | (155,720 | ) | (223,125 | ) | 67,405 | |||||||||||||||||||||||
Turkey Government | Q | 1.000% | 12/20/26 | GSC | 2.698% | 547,119 | (64,884 | ) | (93,525 | ) | 28,641 | |||||||||||||||||||||||
Turkey Government | Q | 1.000% | 12/20/27 | GSC | 2.813% | 327,000 | (44,602 | ) | (48,358 | ) | 3,756 | |||||||||||||||||||||||
|
|
|
|
|
| |||||||||||||||||||||||||||||
| ($270,666 | ) | ($490,669 | ) | $220,003 | ||||||||||||||||||||||||||||||
|
|
|
|
|
| |||||||||||||||||||||||||||||
| Credit Default Swaps on Credit Indices - Buy Protection (1) | ||||||||||||||||||||||||||||||||||
| Referenced Obligation | Payment Frequency | Fixed Deal Rate | Expiration Date | Exchange | Notional Amount (3) | Value (5) | Upfront Premiums Paid (Received) | Unrealized Appreciation (Depreciation) | ||||||||||||||||||||||||||
iTraxx FINSR 28 5Y | Q | 1.000% | 12/20/22 | ICE | EUR 2,460,000 | ($65,415 | ) | ($69,021 | ) | $3,606 | ||||||||||||||||||||||||
CDX EM 29 5Y | Q | 1.000% | 06/20/23 | ICE | $220,000 | 3,813 | (4,510 | ) | 8,323 | |||||||||||||||||||||||||
|
|
|
|
|
| |||||||||||||||||||||||||||||
| ($61,602 | ) | ($73,531 | ) | $11,929 | ||||||||||||||||||||||||||||||
|
|
|
|
|
| |||||||||||||||||||||||||||||
Total Credit Default Swaps |
| ($231,562 | ) | $289,581 | ($521,143 | ) | ||||||||||||||||||||||||||||
|
|
|
|
|
| |||||||||||||||||||||||||||||
| (1) | If the Fund is a buyer of protection and a credit event occurs, as defined under the terms of that particular swap agreement, the Fund will either (i) receive from the seller of protection an amount equal to the notional amount of the swap and deliver the referenced obligation or underlying investments comprising the referenced index or (ii) receive a net settlement amount in the form of cash or investments equal to the notional amount of the swap less the recovery value of the referenced obligation or underlying investments comprising the referenced index. |
| (2) | An implied credit spread is the spread in yield between a U.S. Treasury security and the referenced obligation or underlying investment that are identical in all respects except for the quality rating. Implied credit spreads, represented in absolute terms, utilized in determining the value of credit default swap agreements on sovereign issues as of year end serve as an indicator of the current status of the payment/performance risk and represent the likelihood of risk of default for the credit derivative. The implied credit spread of a particular referenced entity reflects the cost of buying/selling protection and may include upfront payments required to be made to enter into the agreement. Wider credit spreads, in comparison to narrower credit spreads, represent a deterioration of the referenced entity’s credit soundness and a greater likelihood of risk of default or other credit event occurring as defined under the terms of the agreement. A credit spread identified as “Defaulted” indicates a credit event has occurred for the referenced entity or obligation. |
| (3) | The maximum potential amount the Fund could be required to pay as a seller of credit protection or receive as a buyer of credit protection if a credit event occurs as defined under the terms of that particular swap agreement. |
| (4) | If the Fund is a seller of protection and a credit event occurs, as defined under the terms of that particular swap agreement, the Fund will either (i) pay to the buyer of protection an amount equal to the notional amount of the swap and take delivery of the referenced obligation or underlying investments comprising the referenced index or (ii) pay a net settlement amount in the form of cash or investments equal to the notional amount of the swap less the recovery value of the referenced obligation or underlying investments comprising the referenced index. |
| (5) | The quoted market prices and resulting values for credit default swap agreements on credit indices serve as an indicator of the current status of the payment/performance risk and represent the likelihood of an expected liability (or profit) for the credit derivative had the notional amount of the swap agreement been closed/sold as of year end. Increasing values, (buy protection) or decreasing values (sell protection), when compared to the notional amount of the swap, represent a deterioration of the referenced entity’s credit soundness and a greater likelihood of risk of default or other credit event occurring as defined under the terms of the agreement. |
Cross Currency Swaps - Pay Floating Rate
| Notional Amount on Floating Rate (Currency Delivered) | Notional Amount on Fixed Rate (Currency Received) | Payment Frequency | Floating Rate Index | Counter- party | Fixed Rate | Expiration Date | Value | Upfront Premiums Paid (Received) | Unrealized Appreciation (Depreciation) | |||||||||||||||||||||||||||||
| CLP 708,032,935 | CLF 26,554 | S | 6-Month Sinacofi CLP | GSC | 0.885% | 10/04/22 | ($8,512 | ) | $— | ($8,512 | ) | |||||||||||||||||||||||||||
| 708,079,936 | 26,554 | S | 6-Month Sinacofi CLP | GSC | 0.900% | 10/05/22 | (7,611 | ) | — | (7,611 | ) | |||||||||||||||||||||||||||
| 354,063,601 | 13,277 | S | 6-Month Sinacofi CLP | GSC | 0.900% | 10/06/22 | (3,413 | ) | — | (3,413 | ) | |||||||||||||||||||||||||||
| 708,312,814 | 26,554 | S | 6-Month Sinacofi CLP | GSC | 0.920% | 10/11/22 | (5,478 | ) | — | (5,478 | ) | |||||||||||||||||||||||||||
| 308,611,661 | 11,583 | S | 6-Month Sinacofi CLP | GSC | 0.910% | 10/26/22 | (2,411 | ) | — | (2,411 | ) | |||||||||||||||||||||||||||
| 123,407,460 | 4,633 | S | 6-Month Sinacofi CLP | GSC | 0.950% | 10/28/22 | (526 | ) | — | (526 | ) | |||||||||||||||||||||||||||
| 632,668,690 | 23,649 | S | 6-Month Sinacofi CLP | GSC | 0.960% | 12/04/22 | (1,137 | ) | — | (1,137 | ) | |||||||||||||||||||||||||||
| 129,133,095 | 4,826 | S | 6-Month Sinacofi CLP | GSC | 0.950% | 12/05/22 | (329 | ) | — | (329 | ) | |||||||||||||||||||||||||||
| 94,743,656 | 3,535 | S | 6-Month Sinacofi CLP | GSC | 0.990% | 01/04/23 | 207 | — | 207 | |||||||||||||||||||||||||||||
|
|
|
|
|
| |||||||||||||||||||||||||||||||||
| ($29,210 | ) | $— | ($29,210 | ) | ||||||||||||||||||||||||||||||||||
|
|
|
|
|
| |||||||||||||||||||||||||||||||||
| See Notes to Financial Statements | See explanation of symbols and terms, if any, on B-114 and B-115 |
B-103
Table of Contents
PACIFIC FUNDS
PF GLOBAL ABSOLUTE RETURN FUND
Schedule of Investments (Continued)
March 31, 2018
Cross Currency Swaps - Receive Floating Rate
| Notional Amount on Fixed Rate (Currency Delivered) | Notional Amount on Floating Rate (Currency Received) | Payment Frequency | Floating Rate Index | Counter- party | Fixed Rate | Expiration Date | Value | Upfront Premiums Paid (Received) | Unrealized Appreciation (Depreciation) | |||||||||||||||||||||||||||
KRW 947,300,000 | $835,509 | S | 6-Month USD-LIBOR | BNP | 1.095% | 03/02/20 | ($48,193 | ) | $— | ($48,193 | ) | |||||||||||||||||||||||||
722,900,000 | 624,536 | S | 6-Month USD-LIBOR | BNP | 1.190% | 03/08/20 | (51,221 | ) | — | (51,221 | ) | |||||||||||||||||||||||||
933,500,000 | 838,197 | S | 6-Month USD-LIBOR | BNP | 1.230% | 03/31/20 | (39,853 | ) | — | (39,853 | ) | |||||||||||||||||||||||||
549,700,000 | 484,368 | S | 6-Month USD-LIBOR | BNP | 1.180% | 04/20/20 | (28,440 | ) | — | (28,440 | ) | |||||||||||||||||||||||||
|
|
|
|
|
| |||||||||||||||||||||||||||||||
| ($167,707 | ) | $— | ($167,707 | ) | ||||||||||||||||||||||||||||||||
|
|
|
|
|
| |||||||||||||||||||||||||||||||
Total Cross Currency Swaps |
| ($196,917 | ) | $— | ($196,917 | ) | ||||||||||||||||||||||||||||||
|
|
|
|
|
| |||||||||||||||||||||||||||||||
Interest Rate Swaps - Pay Floating Rate
| Floating Rate Index | Payment Frequency Fixed Rate/ Floating Rate | Counter- party | Fixed Rate | Expiration Date | Notional Amount | Value | Upfront Premiums Paid (Received) | Unrealized Appreciation (Depreciation) | ||||||||||||||||||||||||
1-Day INR-MIBOR | S/S | GSC | 6.100% | 06/15/22 | INR 122,600,000 | ($31,851 | ) | $— | ($31,851 | ) | ||||||||||||||||||||||
1-Day INR-MIBOR | S/S | SCB | 6.130% | 06/19/22 | 53,900,000 | (13,080 | ) | — | (13,080 | ) | ||||||||||||||||||||||
1-Day INR-MIBOR | S/S | JPM | 6.160% | 06/21/22 | 18,173,000 | (4,089 | ) | — | (4,089 | ) | ||||||||||||||||||||||
1-Day INR-MIBOR | A/A | BNP | 6.100% | 06/23/22 | 32,783,000 | (8,558 | ) | — | (8,558 | ) | ||||||||||||||||||||||
1-Day INR-MIBOR | S/S | CIT | 6.120% | 06/29/22 | 79,900,000 | (20,012 | ) | — | (20,012 | ) | ||||||||||||||||||||||
1-Day INR-MIBOR | S/S | CIT | 6.135% | 06/29/22 | 39,400,000 | (9,514 | ) | — | (9,514 | ) | ||||||||||||||||||||||
1-Day INR-MIBOR | S/S | CIT | 6.180% | 06/30/22 | 67,500,000 | (14,493 | ) | — | (14,493 | ) | ||||||||||||||||||||||
1-Day INR-MIBOR | S/S | JPM | 6.215% | 07/06/22 | 17,800,000 | (3,472 | ) | — | (3,472 | ) | ||||||||||||||||||||||
1-Day INR-MIBOR | S/S | GSC | 6.230% | 07/07/22 | 28,420,000 | (5,294 | ) | — | (5,294 | ) | ||||||||||||||||||||||
1-Day INR-MIBOR | S/S | MSC | 6.220% | 07/11/22 | 102,680,000 | (19,843 | ) | — | (19,843 | ) | ||||||||||||||||||||||
1-Day INR-MIBOR | S/S | DUB | 6.685% | 12/22/22 | 38,000,000 | 3,023 | — | 3,023 | ||||||||||||||||||||||||
1-Day INR-MIBOR | S/S | SCB | 6.675% | 12/26/22 | 45,200,000 | 3,252 | — | 3,252 | ||||||||||||||||||||||||
1-Day INR-MIBOR | S/S | JPM | 6.685% | 12/27/22 | 53,000,000 | 4,145 | — | 4,145 | ||||||||||||||||||||||||
1-Day INR-MIBOR | S/S | DUB | 6.700% | 12/27/22 | 52,700,000 | 4,641 | — | 4,641 | ||||||||||||||||||||||||
1-Day INR-MIBOR | S/S | GSC | 6.755% | 01/04/23 | 35,100,000 | 4,272 | — | 4,272 | ||||||||||||||||||||||||
3-Month NZD Bank Bills | S/Q | JPM | 4.060% | 06/04/23 | NZD 810,000 | 47,021 | — | 47,021 | ||||||||||||||||||||||||
|
|
|
|
|
| |||||||||||||||||||||||||||
| (63,852 | ) | — | (63,852 | ) | ||||||||||||||||||||||||||||
|
|
|
|
|
| |||||||||||||||||||||||||||
| Exchange | ||||||||||||||||||||||||||||||||
28-Day MXN-TIIE | L/L | CME | 6.826% | 07/01/19 | MXN 127,610,000 | (79,507 | ) | — | (79,507 | ) | ||||||||||||||||||||||
28-Day MXN-TIIE | L/L | CME | 7.005% | 08/19/19 | 29,260,000 | (15,491 | ) | — | (15,491 | ) | ||||||||||||||||||||||
28-Day MXN-TIIE | L/L | CME | 7.035% | 08/19/19 | 29,260,000 | (14,846 | ) | — | (14,846 | ) | ||||||||||||||||||||||
28-Day MXN-TIIE | L/L | CME | 6.998% | 08/21/19 | 29,570,000 | (15,828 | ) | — | (15,828 | ) | ||||||||||||||||||||||
28-Day MXN-TIIE | L/L | CME | 7.005% | 08/22/19 | 24,770,000 | (13,148 | ) | — | (13,148 | ) | ||||||||||||||||||||||
28-Day MXN-TIIE | L/L | CME | 7.030% | 08/23/19 | 69,140,000 | (35,458 | ) | — | (35,458 | ) | ||||||||||||||||||||||
28-Day MXN-TIIE | L/L | CME | 7.250% | 10/21/19 | 8,640,000 | (3,103 | ) | — | (3,103 | ) | ||||||||||||||||||||||
28-Day MXN-TIIE | L/L | CME | 7.300% | 10/22/19 | 8,618,000 | (2,718 | ) | — | (2,718 | ) | ||||||||||||||||||||||
28-Day MXN-TIIE | L/L | CME | 7.310% | 10/22/19 | 34,472,000 | (10,225 | ) | — | (10,225 | ) | ||||||||||||||||||||||
28-Day MXN-TIIE | L/L | CME | 7.700% | 12/12/19 | 72,000,000 | 3,360 | — | 3,360 | ||||||||||||||||||||||||
28-Day MXN-TIIE | L/L | CME | 7.715% | 12/13/19 | 70,800,000 | 4,247 | — | 4,247 | ||||||||||||||||||||||||
28-Day MXN-TIIE | L/L | CME | 7.680% | 01/24/20 | 50,049,771 | 2,749 | — | 2,749 | ||||||||||||||||||||||||
28-Day MXN-TIIE | L/L | CME | 7.700% | 01/24/20 | 15,810,229 | 1,016 | — | 1,016 | ||||||||||||||||||||||||
3-Month CHF-LIBOR | A/Q | LCH | (0.458% | ) | 03/25/20 | CHF 3,006,000 | 1,310 | — | 1,310 | |||||||||||||||||||||||
3-Month CHF-LIBOR | A/Q | LCH | (0.455% | ) | 03/25/20 | 3,157,000 | 1,209 | — | 1,209 | |||||||||||||||||||||||
3-Month CHF-LIBOR | A/Q | LCH | (0.450% | ) | 03/25/20 | 3,006,000 | 1,071 | — | 1,071 | |||||||||||||||||||||||
3-Month SEK-STIBOR | A/Q | LCH | 0.075% | 03/25/20 | SEK 40,016,000 | 2,424 | — | 2,424 | ||||||||||||||||||||||||
3-Month SEK-STIBOR | A/Q | LCH | 0.078% | 03/25/20 | 40,615,000 | 2,583 | — | 2,583 | ||||||||||||||||||||||||
3-Month CHF-LIBOR | A/Q | LCH | (0.470% | ) | 03/26/20 | CHF 1,519,000 | 327 | — | 327 | |||||||||||||||||||||||
3-Month SEK-STIBOR | A/Q | LCH | 0.050% | 03/26/20 | SEK 13,288,000 | 387 | — | 387 | ||||||||||||||||||||||||
3-Month CHF-LIBOR | A/Q | LCH | (0.485% | ) | 03/27/20 | CHF 1,520,000 | 72 | — | 72 | |||||||||||||||||||||||
3-Month CHF-LIBOR | A/Q | LCH | (0.480% | ) | 03/27/20 | 1,519,000 | 153 | — | 153 | |||||||||||||||||||||||
3-Month SEK-STIBOR | A/Q | LCH | 0.043% | 03/27/20 | SEK 26,708,000 | 619 | — | 619 | ||||||||||||||||||||||||
3-Month CHF-LIBOR | A/Q | LCH | (0.470% | ) | 03/29/20 | CHF 3,064,000 | 554 | — | 554 | |||||||||||||||||||||||
3-Month SEK-STIBOR | A/Q | LCH | 0.045% | 03/29/20 | SEK 26,840,000 | 473 | — | 473 | ||||||||||||||||||||||||
3-Month CHF-LIBOR | A/Q | LCH | (0.495% | ) | 04/03/20 | CHF 4,578,000 | (594 | ) | — | (594 | ) | |||||||||||||||||||||
3-Month SEK-STIBOR | A/Q | LCH | 0.033% | 04/03/20 | SEK 26,774,000 | (129 | ) | — | (129 | ) | ||||||||||||||||||||||
3-Month SEK-STIBOR | A/Q | LCH | 0.028% | 04/06/20 | 13,584,000 | (194 | ) | — | (194 | ) | ||||||||||||||||||||||
3-Month USD-LIBOR | S/Q | LCH | 1.744% | 07/31/20 | $1,800,000 | (34,733 | ) | — | (34,733 | ) | ||||||||||||||||||||||
3-Month USD-LIBOR | A/Q | LCH | 1.750% | 07/31/20 | 535,000 | (10,384 | ) | — | (10,384 | ) | ||||||||||||||||||||||
3-Month USD-LIBOR | S/Q | LCH | 1.560% | 08/22/20 | 713,000 | (17,186 | ) | — | (17,186 | ) | ||||||||||||||||||||||
3-Month USD-LIBOR | S/Q | LCH | 1.545% | 09/23/20 | 80,000 | (2,077 | ) | — | (2,077 | ) | ||||||||||||||||||||||
3-Month USD-LIBOR | S/Q | LCH | 1.424% | 10/28/20 | 680,000 | (20,236 | ) | — | (20,236 | ) | ||||||||||||||||||||||
3-Month USD-LIBOR | S/Q | LCH | 1.426% | 10/28/20 | 680,000 | (20,193 | ) | — | (20,193 | ) | ||||||||||||||||||||||
| See Notes to Financial Statements | See explanation of symbols and terms, if any, on B-114 and B-115 |
B-104
Table of Contents
PACIFIC FUNDS
PF GLOBAL ABSOLUTE RETURN FUND
Schedule of Investments (Continued)
March 31, 2018
| Floating Rate Index | Payment Frequency Fixed Rate/ Floating Rate | Exchange | Fixed Rate | Expiration Date | Notional Amount | Value | Upfront Premiums Paid (Received) | Unrealized Appreciation (Depreciation) | ||||||||||||||||||||||||
3-Month USD-LIBOR | S/Q | LCH | 1.540% | 11/05/20 | $706,000 | ($19,111 | ) | $— | ($19,111 | ) | ||||||||||||||||||||||
3-Month USD-LIBOR | S/Q | LCH | 1.555% | 11/09/20 | 683,000 | (18,323 | ) | — | (18,323 | ) | ||||||||||||||||||||||
3-Month USD-LIBOR | S/Q | LCH | 1.114% | 02/23/21 | 441,000 | (18,809 | ) | — | (18,809 | ) | ||||||||||||||||||||||
6-Month PLN-WIBOR | A/S | LCH | 2.410% | 12/13/21 | PLN 1,172,000 | 2,794 | — | 2,794 | ||||||||||||||||||||||||
6-Month PLN-WIBOR | A/S | LCH | 2.460% | 01/12/22 | 2,113,000 | 5,938 | — | 5,938 | ||||||||||||||||||||||||
3-Month USD-LIBOR | S/Q | LCH | 1.841% | 09/15/22 | $320,000 | (11,259 | ) | (11,617 | ) | 358 | ||||||||||||||||||||||
Brazil CETIP Interbank | Z/Z | CME | 9.255% | 01/02/23 | BRL 2,743,294 | 13,579 | — | 13,579 | ||||||||||||||||||||||||
Brazil CETIP Interbank | Z/Z | CME | 9.290% | 01/02/23 | 2,627,455 | 13,826 | — | 13,826 | ||||||||||||||||||||||||
Brazil CETIP Interbank | Z/Z | CME | 9.310% | 01/02/23 | 1,287,783 | 7,019 | — | 7,019 | ||||||||||||||||||||||||
Brazil CETIP Interbank | Z/Z | CME | 9.325% | 01/02/23 | 1,237,035 | 6,894 | — | 6,894 | ||||||||||||||||||||||||
Brazil CETIP Interbank | Z/Z | CME | 9.360% | 01/02/23 | 1,406,950 | 8,224 | — | 8,224 | ||||||||||||||||||||||||
3-Month CAD-CDOR | S/S | LCH | 2.489% | 02/05/23 | CAD 3,280,000 | 14,838 | — | 14,838 | ||||||||||||||||||||||||
3-Month CAD-CDOR | S/S | LCH | 2.506% | 02/05/23 | 1,650,000 | 8,501 | — | 8,501 | ||||||||||||||||||||||||
3-Month CAD-CDOR | S/S | LCH | 2.458% | 02/06/23 | 1,998,500 | 6,869 | — | 6,869 | ||||||||||||||||||||||||
6-Month PLN-WIBOR | A/S | LCH | 2.688% | 02/07/23 | PLN 1,998,000 | 8,827 | — | 8,827 | ||||||||||||||||||||||||
6-Month PLN-WIBOR | A/S | LCH | 2.625% | 02/09/23 | 2,455,000 | 8,781 | — | 8,781 | ||||||||||||||||||||||||
6-Month EUR-LIBOR | A/S | LCH | 0.471% | 02/27/23 | EUR 3,100,000 | 22,652 | — | 22,652 | ||||||||||||||||||||||||
3-Month USD-LIBOR | S/Q | LCH | 1.686% | 06/03/26 | $480,000 | (37,640 | ) | — | (37,640 | ) | ||||||||||||||||||||||
3-Month NZD Bank Bills | S/Q | LCH | 2.485% | 07/25/26 | NZD 1,000,000 | (24,369 | ) | — | (24,369 | ) | ||||||||||||||||||||||
6-Month PLN-WIBOR | A/S | LCH | 2.226% | 07/28/26 | PLN 1,850,000 | (20,096 | ) | — | (20,096 | ) | ||||||||||||||||||||||
6-Month PLN-WIBOR | A/S | LCH | 2.280% | 09/21/26 | 483,000 | (4,879 | ) | — | (4,879 | ) | ||||||||||||||||||||||
6-Month PLN-WIBOR | A/S | LCH | 2.300% | 09/21/26 | 1,787,000 | (17,261 | ) | — | (17,261 | ) | ||||||||||||||||||||||
6-Month PLN-WIBOR | A/S | LCH | 2.490% | 10/13/26 | 510,000 | (2,861 | ) | — | (2,861 | ) | ||||||||||||||||||||||
6-Month PLN-WIBOR | A/S | LCH | 2.470% | 10/19/26 | 519,000 | (3,165 | ) | — | (3,165 | ) | ||||||||||||||||||||||
6-Month PLN-WIBOR | A/S | LCH | 2.430% | 10/20/26 | 570,000 | (3,988 | ) | — | (3,988 | ) | ||||||||||||||||||||||
6-Month PLN-WIBOR | A/S | LCH | 2.470% | 10/28/26 | 514,000 | (3,167 | ) | — | (3,167 | ) | ||||||||||||||||||||||
6-Month PLN-WIBOR | A/S | LCH | 2.560% | 11/02/26 | 514,000 | (2,153 | ) | — | (2,153 | ) | ||||||||||||||||||||||
6-Month PLN-WIBOR | A/S | LCH | 2.540% | 11/07/26 | 514,000 | (2,406 | ) | — | (2,406 | ) | ||||||||||||||||||||||
6-Month PLN-WIBOR | A/S | LCH | 2.500% | 11/08/26 | 514,000 | (2,867 | ) | — | (2,867 | ) | ||||||||||||||||||||||
6-Month PLN-WIBOR | A/S | LCH | 2.516% | 11/10/26 | 1,419,000 | (7,406 | ) | — | (7,406 | ) | ||||||||||||||||||||||
6-Month AUD Bank Bills | S/S | LCH | 2.660% | 06/15/27 | AUD 5,070,000 | (35,834 | ) | — | (35,834 | ) | ||||||||||||||||||||||
6-Month PLN-WIBOR | A/S | LCH | 3.120% | 02/07/28 | PLN 528,000 | 3,532 | — | 3,532 | ||||||||||||||||||||||||
6-Month PLN-WIBOR | A/S | LCH | 3.140% | 02/07/28 | 350,000 | 1,072 | — | 1,072 | ||||||||||||||||||||||||
6-Month PLN-WIBOR | A/S | LCH | 3.170% | 02/07/28 | 1,067,000 | 8,480 | — | 8,480 | ||||||||||||||||||||||||
6-Month PLN-WIBOR | A/S | LCH | 3.100% | 02/08/28 | 528,000 | 3,264 | — | 3,264 | ||||||||||||||||||||||||
6-Month PLN-WIBOR | A/S | LCH | 3.080% | 02/09/28 | 1,017,000 | 5,771 | — | 5,771 | ||||||||||||||||||||||||
U.S. CPI Urban Consumers NSA | Z/Z | LCH | 2.405% | 02/06/33 | $149,500 | 1,770 | — | 1,770 | ||||||||||||||||||||||||
Eurostat Eurozone HICP | Z/Z | LCH | 1.772% | 08/15/42 | EUR 379,000 | (8,668 | ) | — | (8,668 | ) | ||||||||||||||||||||||
Eurostat Eurozone HICP | Z/Z | LCH | 1.775% | 08/15/42 | 381,000 | (8,331 | ) | — | (8,331 | ) | ||||||||||||||||||||||
Eurostat Eurozone HICP | Z/Z | LCH | 1.793% | 08/15/42 | 371,000 | (5,931 | ) | — | (5,931 | ) | ||||||||||||||||||||||
Eurostat Eurozone HICP | Z/Z | LCH | 1.847% | 10/15/42 | 374,000 | 54 | — | 54 | ||||||||||||||||||||||||
Eurostat Eurozone HICP | Z/Z | LCH | 1.935% | 02/15/43 | 30,900 | 854 | — | 854 | ||||||||||||||||||||||||
Eurostat Eurozone HICP | Z/Z | LCH | 1.885% | 08/07/47 | 6,000 | (22 | ) | — | (22 | ) | ||||||||||||||||||||||
|
|
|
|
|
| |||||||||||||||||||||||||||
| (378,503 | ) | (11,617 | ) | (366,886 | ) | |||||||||||||||||||||||||||
|
|
|
|
|
| |||||||||||||||||||||||||||
Total Interest Rate Swaps - Pay Floating Rate |
| ($442,355 | ) | ($11,617 | ) | ($430,738 | ) | |||||||||||||||||||||||||
|
|
|
|
|
| |||||||||||||||||||||||||||
Interest Rate Swaps - Receive Floating Rate
| Floating Rate Index | Payment Frequency Fixed Rate/ Floating Rate | Counterparty | Fixed Rate | Expiration Date | Notional Amount | Value | Upfront Premiums Paid (Received) | Unrealized Appreciation (Depreciation) | ||||||||||||||||||||||||
3-Month SAR-SAIBOR | A/Q | GSC | 2.160% | 08/03/20 | SAR 3,990,000 | $6,218 | $— | $6,218 | ||||||||||||||||||||||||
3-Month SAR-SAIBOR | A/Q | GSC | 2.350% | 08/12/20 | 5,188,000 | 654 | — | 654 | ||||||||||||||||||||||||
3-Month SAR-SAIBOR | A/Q | GSC | 3.410% | 08/22/20 | 4,051,000 | (32,795 | ) | — | (32,795 | ) | ||||||||||||||||||||||
3-Month SAR-SAIBOR | A/Q | GSC | 2.645% | 02/23/21 | 2,118,000 | 5,236 | — | 5,236 | ||||||||||||||||||||||||
3-Month SAR-SAIBOR | A/Q | DUB | 2.760% | 03/07/21 | 4,235,000 | 7,136 | — | 7,136 | ||||||||||||||||||||||||
6-Month Sinacofi CLP | S/S | GSC | 3.560% | 10/04/22 | CLP 758,690,000 | (6,127 | ) | — | (6,127 | ) | ||||||||||||||||||||||
6-Month Sinacofi CLP | S/S | GSC | 3.570% | 10/05/22 | 1,105,520,000 | (9,651 | ) | — | (9,651 | ) | ||||||||||||||||||||||
6-Month Sinacofi CLP | S/S | GSC | 3.590% | 10/10/22 | 737,010,000 | (7,266 | ) | — | (7,266 | ) | ||||||||||||||||||||||
6-Month Sinacofi CLP | S/S | GSC | 3.500% | 10/26/22 | 337,840,000 | (468 | ) | — | (468 | ) | ||||||||||||||||||||||
6-Month Sinacofi CLP | S/S | GSC | 3.540% | 10/30/22 | 130,308,000 | (537 | ) | — | (537 | ) | ||||||||||||||||||||||
6-Month Sinacofi CLP | S/S | GSC | 3.570% | 12/04/22 | 656,370,000 | (2,133 | ) | — | (2,133 | ) | ||||||||||||||||||||||
6-Month Sinacofi CLP | S/S | GSC | 3.560% | 12/05/22 | 135,130,000 | (322 | ) | — | (322 | ) | ||||||||||||||||||||||
6-Month Sinacofi CLP | S/S | GSC | 3.600% | 01/04/23 | 99,907,000 | (273 | ) | — | (273 | ) | ||||||||||||||||||||||
3-Month SAR-SAIBOR | A/Q | GSC | 3.380% | 05/10/26 | SAR 1,945,000 | (8,376 | ) | — | (8,376 | ) | ||||||||||||||||||||||
3-Month SAR-SAIBOR | A/Q | GSC | 3.710% | 06/06/26 | 1,540,000 | (16,812 | ) | — | (16,812 | ) | ||||||||||||||||||||||
3-Month KRW-KWCDC | Q/Q | BNP | 1.920% | 02/07/27 | KRW 494,000,000 | 13,746 | — | 13,746 | ||||||||||||||||||||||||
| See Notes to Financial Statements | See explanation of symbols and terms, if any, on B-114 and B-115 |
B-105
Table of Contents
PACIFIC FUNDS
PF GLOBAL ABSOLUTE RETURN FUND
Schedule of Investments (Continued)
March 31, 2018
| Floating Rate Index | Payment Frequency Fixed Rate/ Floating Rate | Counterparty | Fixed Rate | Expiration Date | Notional Amount | Value | Upfront Premiums Paid (Received) | Unrealized Appreciation (Depreciation) | ||||||||||||||||||||||||
3-Month KRW-KWCDC | Q/Q | BNP | 1.845% | 02/07/37 | KRW 269,000,000 | $21,369 | $— | $21,369 | ||||||||||||||||||||||||
3-Month KRW-KWCDC | Q/Q | GSC | 2.030% | 07/12/37 | 136,100,000 | 7,307 | — | 7,307 | ||||||||||||||||||||||||
|
|
|
|
|
| |||||||||||||||||||||||||||
| (23,094 | ) | — | (23,094 | ) | ||||||||||||||||||||||||||||
|
|
|
|
|
| |||||||||||||||||||||||||||
| Exchange | ||||||||||||||||||||||||||||||||
Brazil CETIP Interbank | Z/Z | CME | 6.770% | 01/02/19 | BRL 28,655,008 | (33,666 | ) | — | (33,666 | ) | ||||||||||||||||||||||
Brazil CETIP Interbank | Z/Z | CME | 6.790% | 01/02/19 | 6,923,499 | (8,484 | ) | — | (8,484 | ) | ||||||||||||||||||||||
Brazil CETIP Interbank | Z/Z | CME | 6.798% | 01/02/19 | 6,824,586 | (8,497 | ) | — | (8,497 | ) | ||||||||||||||||||||||
Brazil CETIP Interbank | Z/Z | CME | 6.820% | 01/02/19 | 7,844,176 | (10,223 | ) | — | (10,223 | ) | ||||||||||||||||||||||
3-Month EUR-LIBOR | A/Q | LCH | (0.086% | ) | 03/25/20 | EUR 4,046,000 | (2,567 | ) | — | (2,567 | ) | |||||||||||||||||||||
3-Month EUR-LIBOR | A/Q | LCH | (0.088% | ) | 03/25/20 | 4,046,000 | (2,492 | ) | — | (2,492 | ) | |||||||||||||||||||||
3-Month EUR-LIBOR | A/Q | LCH | (0.106% | ) | 03/26/20 | 1,309,000 | (493 | ) | — | (493 | ) | |||||||||||||||||||||
3-Month EUR-LIBOR | A/Q | LCH | (0.103% | ) | 03/27/20 | 1,309,000 | (528 | ) | — | (528 | ) | |||||||||||||||||||||
3-Month EUR-LIBOR | A/Q | LCH | (0.110% | ) | 03/27/20 | 1,309,000 | (423 | ) | — | (423 | ) | |||||||||||||||||||||
3-Month EUR-LIBOR | A/Q | LCH | (0.113% | ) | 03/29/20 | 2,579,000 | (644 | ) | — | (644 | ) | |||||||||||||||||||||
3-Month EUR-LIBOR | A/Q | LCH | (0.120% | ) | 04/03/20 | 3,902,000 | (449 | ) | — | (449 | ) | |||||||||||||||||||||
6-Month HUF-BUBOR | A/S | LCH | 1.265% | 12/13/21 | HUF 80,325,000 | (6,643 | ) | — | (6,643 | ) | ||||||||||||||||||||||
6-Month HUF-BUBOR | A/S | LCH | 1.460% | 01/12/22 | 141,670,000 | (15,638 | ) | — | (15,638 | ) | ||||||||||||||||||||||
6-Month EUR-LIBOR | A/S | LCH | 0.250% | 09/20/22 | EUR 2,250,000 | 2,892 | 9,537 | (6,645 | ) | |||||||||||||||||||||||
6-Month HUF-BUBOR | A/S | LCH | 1.253% | 02/06/23 | HUF 132,996,000 | (7,278 | ) | — | (7,278 | ) | ||||||||||||||||||||||
6-Month HUF-BUBOR | A/S | LCH | 1.315% | 02/09/23 | 166,839,000 | (11,050 | ) | — | (11,050 | ) | ||||||||||||||||||||||
3-Month NZD Bank Bills | S/Q | LCH | 2.753% | 02/09/23 | NZD 1,440,000 | (7,253 | ) | — | (7,253 | ) | ||||||||||||||||||||||
3-Month NZD Bank Bills | S/Q | LCH | 2.755% | 02/09/23 | 1,040,000 | (5,324 | ) | — | (5,324 | ) | ||||||||||||||||||||||
3-Month NZD Bank Bills | S/Q | LCH | 2.740% | 02/13/23 | 2,600,000 | (11,937 | ) | — | (11,937 | ) | ||||||||||||||||||||||
3-Month NZD Bank Bills | S/Q | LCH | 2.728% | 02/16/23 | 1,000,000 | (4,154 | ) | — | (4,154 | ) | ||||||||||||||||||||||
3-Month NZD Bank Bills | S/Q | LCH | 2.734% | 02/20/23 | 1,100,000 | (4,763 | ) | — | (4,763 | ) | ||||||||||||||||||||||
3-Month NZD Bank Bills | S/Q | LCH | 2.740% | 02/22/23 | 1,180,000 | (5,323 | ) | — | (5,323 | ) | ||||||||||||||||||||||
6-Month EUR-LIBOR | A/S | LCH | 1.000% | 03/21/23 | EUR 570,000 | (20,562 | ) | (18,223 | ) | (2,339 | ) | |||||||||||||||||||||
6-Month HUF-BUBOR | A/S | LCH | 1.923% | 07/28/26 | HUF 131,000,000 | (8,652 | ) | — | (8,652 | ) | ||||||||||||||||||||||
6-Month HUF-BUBOR | A/S | LCH | 1.940% | 08/01/26 | 92,200,000 | (6,498 | ) | — | (6,498 | ) | ||||||||||||||||||||||
6-Month HUF-BUBOR | A/S | LCH | 1.888% | 09/21/26 | 89,324,000 | (4,154 | ) | — | (4,154 | ) | ||||||||||||||||||||||
6-Month HUF-BUBOR | A/S | LCH | 1.930% | 09/21/26 | 36,212,000 | (2,165 | ) | — | (2,165 | ) | ||||||||||||||||||||||
6-Month HUF-BUBOR | A/S | LCH | 1.935% | 09/21/26 | 35,307,000 | (2,166 | ) | — | (2,166 | ) | ||||||||||||||||||||||
6-Month HUF-BUBOR | A/S | LCH | 2.140% | 10/13/26 | 35,971,000 | (4,430 | ) | — | (4,430 | ) | ||||||||||||||||||||||
6-Month HUF-BUBOR | A/S | LCH | 2.075% | 10/28/26 | 35,850,000 | (3,597 | ) | — | (3,597 | ) | ||||||||||||||||||||||
6-Month HUF-BUBOR | A/S | LCH | 2.180% | 11/03/26 | 35,967,000 | (4,784 | ) | — | (4,784 | ) | ||||||||||||||||||||||
6-Month HUF-BUBOR | A/S | LCH | 2.150% | 11/07/26 | 35,266,000 | (4,323 | ) | — | (4,323 | ) | ||||||||||||||||||||||
6-Month HUF-BUBOR | A/S | LCH | 2.120% | 11/08/26 | 35,033,000 | (3,958 | ) | — | (3,958 | ) | ||||||||||||||||||||||
6-Month HUF-BUBOR | A/S | LCH | 2.145% | 11/10/26 | 96,456,000 | (11,644 | ) | — | (11,644 | ) | ||||||||||||||||||||||
3-Month NZD Bank Bills | S/Q | LCH | 3.400% | 04/28/27 | NZD 900,000 | (21,118 | ) | — | (21,118 | ) | ||||||||||||||||||||||
3-Month NZD Bank Bills | S/Q | LCH | 3.395% | 05/08/27 | 705,000 | (16,285 | ) | — | (16,285 | ) | ||||||||||||||||||||||
3-Month NZD Bank Bills | S/Q | LCH | 3.405% | 05/08/27 | 705,000 | (16,694 | ) | — | (16,694 | ) | ||||||||||||||||||||||
3-Month NZD Bank Bills | S/Q | LCH | 3.313% | 05/18/27 | 609,000 | (11,116 | ) | — | (11,116 | ) | ||||||||||||||||||||||
U.S. CPI Urban Consumers NSA | Z/Z | LCH | 1.965% | 06/23/27 | $2,000,000 | 61,935 | — | 61,935 | ||||||||||||||||||||||||
3-Month USD-LIBOR | S/Q | LCH | 2.111% | 09/05/27 | 215,000 | 11,813 | — | 11,813 | ||||||||||||||||||||||||
3-Month USD-LIBOR | S/Q | LCH | 2.023% | 09/11/27 | 259,000 | 16,207 | — | 16,207 | ||||||||||||||||||||||||
3-Month USD-LIBOR | S/Q | LCH | 2.175% | 09/19/27 | 1,592,000 | 79,610 | — | 79,610 | ||||||||||||||||||||||||
28-Day MXN-TIIE | L/L | CME | 7.670% | 12/02/27 | MXN 35,900,000 | (2,918 | ) | — | (2,918 | ) | ||||||||||||||||||||||
3-Month NZD Bank Bills | S/Q | LCH | 3.128% | 01/09/28 | NZD 1,000,000 | (5,212 | ) | — | (5,212 | ) | ||||||||||||||||||||||
3-Month NZD Bank Bills | S/Q | LCH | 3.130% | 01/09/28 | 1,000,000 | (5,366 | ) | — | (5,366 | ) | ||||||||||||||||||||||
3-Month NZD Bank Bills | S/Q | LCH | 3.150% | 01/11/28 | 1,000,000 | (6,590 | ) | — | (6,590 | ) | ||||||||||||||||||||||
3-Month NZD Bank Bills | S/Q | LCH | 3.203% | 01/12/28 | 2,000,000 | (19,628 | ) | — | (19,628 | ) | ||||||||||||||||||||||
3-Month USD-LIBOR | S/Q | LCH | 2.676% | 01/30/28 | $700,000 | 5,807 | — | 5,807 | ||||||||||||||||||||||||
3-Month USD-LIBOR | S/Q | LCH | 2.723% | 01/31/28 | 40,000 | 168 | — | 168 | ||||||||||||||||||||||||
3-Month USD-LIBOR | S/Q | LCH | 2.735% | 02/01/28 | 640,200 | 2,035 | — | 2,035 | ||||||||||||||||||||||||
3-Month USD-LIBOR | S/Q | LCH | 2.820% | 02/05/28 | 410,000 | (1,855 | ) | — | (1,855 | ) | ||||||||||||||||||||||
U.S. CPI Urban Consumers NSA | Z/Z | LCH | 2.353% | 02/06/28 | 36,100 | (236 | ) | — | (236 | ) | ||||||||||||||||||||||
6-Month HUF-BUBOR | A/S | LCH | 2.090% | 02/07/28 | HUF 23,271,000 | (831 | ) | — | (831 | ) | ||||||||||||||||||||||
6-Month HUF-BUBOR | A/S | LCH | 2.115% | 02/07/28 | 69,724,000 | (3,115 | ) | — | (3,115 | ) | ||||||||||||||||||||||
6-Month HUF-BUBOR | A/S | LCH | 2.180% | 02/07/28 | 34,475,000 | (2,350 | ) | — | (2,350 | ) | ||||||||||||||||||||||
6-Month HUF-BUBOR | A/S | LCH | 2.195% | 02/08/28 | 35,165,000 | (2,582 | ) | — | (2,582 | ) | ||||||||||||||||||||||
6-Month HUF-BUBOR | A/S | LCH | 2.230% | 02/09/28 | 67,395,000 | (5,790 | ) | — | (5,790 | ) | ||||||||||||||||||||||
3-Month USD-LIBOR | S/Q | LCH | 2.845% | 02/09/28 | $21,640 | (140 | ) | — | (140 | ) | ||||||||||||||||||||||
Eurostat Eurozone HICP | Z/Z | LCH | 1.569% | 08/15/32 | EUR 379,000 | 5,850 | — | 5,850 | ||||||||||||||||||||||||
Eurostat Eurozone HICP | Z/Z | LCH | 1.585% | 08/15/32 | 381,000 | 4,703 | — | 4,703 | ||||||||||||||||||||||||
Eurostat Eurozone HICP | Z/Z | LCH | 1.601% | 08/15/32 | 371,000 | 3,429 | — | 3,429 | ||||||||||||||||||||||||
Eurostat Eurozone HICP | Z/Z | LCH | 1.638% | 10/15/32 | 374,000 | 1,410 | — | 1,410 | ||||||||||||||||||||||||
Eurostat Eurozone HICP | Z/Z | LCH | 1.735% | 02/15/33 | 30,900 | (427 | ) | — | (427 | ) | ||||||||||||||||||||||
| See Notes to Financial Statements | See explanation of symbols and terms, if any, on B-114 and B-115 |
B-106
Table of Contents
PACIFIC FUNDS
PF GLOBAL ABSOLUTE RETURN FUND
Schedule of Investments (Continued)
March 31, 2018
| Floating Rate Index | Payment Frequency Fixed Rate/ Floating Rate | Exchange | Fixed Rate | Expiration Date | Notional Amount | Value | Upfront Premiums Paid (Received) | Unrealized Appreciation (Depreciation) | ||||||||||||||||||||||||
U.S. CPI Urban Consumers NSA | Z/Z | LCH | 2.419% | 02/06/43 | $149,500 | ($3,836 | ) | $— | ($3,836 | ) | ||||||||||||||||||||||
6-Month JPY-LIBOR | S/S | LCH | 0.783% | 12/19/46 | JPY 47,720,000 | 7,601 | — | 7,601 | ||||||||||||||||||||||||
6-Month JPY-LIBOR | S/S | LCH | 0.853% | 06/19/47 | 14,700,000 | (73 | ) | — | (73 | ) | ||||||||||||||||||||||
6-Month JPY-LIBOR | S/S | LCH | 0.856% | 06/19/47 | 14,700,000 | (187 | ) | — | (187 | ) | ||||||||||||||||||||||
U.S. CPI Urban Consumers NSA | Z/Z | LCH | 2.160% | 08/04/47 | $135,000 | 6,290 | — | 6,290 | ||||||||||||||||||||||||
U.S. CPI Urban Consumers NSA | Z/Z | LCH | 2.148% | 08/07/47 | 80,000 | 4,001 | — | 4,001 | ||||||||||||||||||||||||
U.S. CPI Urban Consumers NSA | Z/Z | LCH | 2.146% | 08/25/47 | 169,000 | 8,624 | — | 8,624 | ||||||||||||||||||||||||
U.S. CPI Urban Consumers NSA | Z/Z | LCH | 2.149% | 09/01/47 | 168,000 | 8,464 | — | 8,464 | ||||||||||||||||||||||||
6-Month JPY-LIBOR | S/S | LCH | 0.892% | 09/18/47 | JPY 51,000,000 | (5,064 | ) | — | (5,064 | ) | ||||||||||||||||||||||
6-Month JPY-LIBOR | S/S | LCH | 0.924% | 09/18/47 | 46,000,000 | (8,341 | ) | — | (8,341 | ) | ||||||||||||||||||||||
U.S. CPI Urban Consumers NSA | Z/Z | LCH | 2.220% | 10/05/47 | $147,000 | 4,729 | — | 4,729 | ||||||||||||||||||||||||
6-Month JPY-LIBOR | S/S | LCH | 0.946% | 12/18/47 | JPY 85,000,000 | (19,759 | ) | — | (19,759 | ) | ||||||||||||||||||||||
6-Month JPY-LIBOR | S/S | LCH | 0.949% | 12/18/47 | 22,000,000 | (5,316 | ) | — | (5,316 | ) | ||||||||||||||||||||||
6-Month JPY-LIBOR | S/S | LCH | 0.953% | 12/18/47 | 39,000,000 | (9,782 | ) | — | (9,782 | ) | ||||||||||||||||||||||
6-Month JPY-LIBOR | S/S | LCH | 0.958% | 12/18/47 | 43,850,000 | (11,574 | ) | — | (11,574 | ) | ||||||||||||||||||||||
6-Month EUR-LIBOR | A/S | LCH | 1.635% | 02/27/48 | EUR 640,000 | (29,817 | ) | — | (29,817 | ) | ||||||||||||||||||||||
|
|
|
|
|
| |||||||||||||||||||||||||||
| (205,196 | ) | (8,686 | ) | (196,510 | ) | |||||||||||||||||||||||||||
|
|
|
|
|
| |||||||||||||||||||||||||||
Total Interest Rate Swaps - Receive Floating Rate |
| ($228,290 | ) | ($8,686 | ) | ($219,604 | ) | |||||||||||||||||||||||||
|
|
|
|
|
| |||||||||||||||||||||||||||
Total Interest Rate Swaps | ($670,645 | ) | ($20,303 | ) | ($650,342 | ) | ||||||||||||||||||||||||||
|
|
|
|
|
| |||||||||||||||||||||||||||
Total Return Swaps - Pay Floating Rate
| Receive Total Return | Pay | Payment | Counter- party | Expiration Date | Notional Amount | Value | Upfront Premiums Paid (Received) | Unrealized Appreciation (Depreciation) | ||||||||||||||||||||||||
Ukraine Treasury Bills | 3-Month USD-LIBOR + 1.500% | Z/Z | CIT | 04/27/18 | UAH 29,190,000 | $60,332 | $— | | $60,332 | | ||||||||||||||||||||||
Egyptian Treasury Bills | 3-Month USD-LIBOR + 0.550% | Z/Q | GSC | 07/24/18 | EGP 3,325,000 | 7,775 | 468 | 7,307 | ||||||||||||||||||||||||
Ukraine Treasury Bills | 3-Month USD-LIBOR + 1.500% | Z/Z | CIT | 07/27/18 | UAH 7,245,000 | 10,155 | — | 10,155 | ||||||||||||||||||||||||
Ukraine Treasury Bills | 3-Month USD-LIBOR + 1.500% | Q/Z | CIT | 10/12/18 | 12,490,000 | 5,770 | — | 5,770 | ||||||||||||||||||||||||
|
|
|
|
|
| |||||||||||||||||||||||||||
| $84,032 | $468 | $83,564 | ||||||||||||||||||||||||||||||
|
|
|
|
|
| |||||||||||||||||||||||||||
Total Swap Agreements | ($1,015,092 | ) | $269,746 | ($1,284,838 | ) | |||||||||||||||||||||||||||
|
|
|
|
|
| |||||||||||||||||||||||||||
| See Notes to Financial Statements | See explanation of symbols and terms, if any, on B-114 and B-115 |
B-107
Table of Contents
PACIFIC FUNDS
PF GLOBAL ABSOLUTE RETURN FUND
Schedule of Investments (Continued)
March 31, 2018
| (k) | Fair Value Measurements |
The following is a summary of the Fund’s investments as categorized under the three-tier hierarchy of inputs used in valuing the Fund’s assets and liabilities (See Note 3D in Notes to Financial Statements) as of March 31, 2018:
Total Value at March 31, 2018 | Level 1 Quoted Price | Level 2 Significant Observable Inputs | Level 3 Significant Unobservable Inputs | |||||||||||||||
Assets | Common Stocks | |||||||||||||||||
Cyprus | $245,191 | $245,191 | $ — | $ — | ||||||||||||||
Iceland | 1,784,466 | 1,182,304 | 602,162 | — | ||||||||||||||
Japan | 577,756 | 577,756 | — | — | ||||||||||||||
Singapore | 174,779 | — | 174,779 | — | ||||||||||||||
South Korea | 633,207 | 633,207 | — | — | ||||||||||||||
Turkey | 488,668 | — | 488,668 | |||||||||||||||
Vietnam | 913,317 | 913,317 | — | — | ||||||||||||||
|
|
|
|
|
|
|
| |||||||||||
Total Common Stocks | 4,817,384 | 3,551,775 | 1,265,609 | — | ||||||||||||||
|
|
|
|
|
|
|
| |||||||||||
Corporate Bond & Notes | 1,651,339 | — | 1,651,339 | — | ||||||||||||||
Senior Loan Notes | 904,978 | — | 114,000 | 790,978 | ||||||||||||||
Mortgage-Backed Securities | 200,558 | — | 200,558 | — | ||||||||||||||
Foreign Government Bonds & Notes | 29,548,390 | — | 29,548,390 | — | ||||||||||||||
Short-Term Investments | 19,661,471 | 10,315,015 | 9,346,456 | — | ||||||||||||||
Derivatives: | ||||||||||||||||||
Credit Contracts | ||||||||||||||||||
Swaps | 351,440 | — | 351,440 | — | ||||||||||||||
Equity Contracts | ||||||||||||||||||
Purchased Options | 80,793 | — | 80,793 | — | ||||||||||||||
Foreign Currency Contracts | ||||||||||||||||||
Forward Foreign Currency Contracts | 1,731,665 | — | 1,731,665 | — | ||||||||||||||
Purchased Options | 178,110 | — | 178,110 | — | ||||||||||||||
Swaps | 207 | — | 207 | — | ||||||||||||||
|
|
|
|
|
|
|
| |||||||||||
Total Foreign Currency Contracts | 1,909,982 | — | 1,909,982 | — | ||||||||||||||
|
|
|
|
|
|
|
| |||||||||||
Interest Rate Contracts | ||||||||||||||||||
Futures | 7,238 | 7,238 | — | — | ||||||||||||||
Swaps | 623,713 | — | 623,713 | — | ||||||||||||||
|
|
|
|
|
|
|
| |||||||||||
Total Interest Rate Contracts | 630,951 | 7,238 | 623,713 | — | ||||||||||||||
|
|
|
|
|
|
|
| |||||||||||
Total Assets - Derivatives | 2,973,166 | 7,238 | 2,965,928 | — | ||||||||||||||
|
|
|
|
|
|
|
| |||||||||||
Total Assets | 59,757,286 | 13,874,028 | 45,092,280 | 790,978 | ||||||||||||||
|
|
|
|
|
|
|
| |||||||||||
Liabilities | Derivatives: | |||||||||||||||||
Credit Contracts | ||||||||||||||||||
Swaps | (583,002 | ) | — | (583,002 | ) | — | ||||||||||||
Foreign Currency Contracts | ||||||||||||||||||
Forward Volatility Agreements | (10,313 | ) | — | (10,313 | ) | — | ||||||||||||
Forward Foreign Currency Contracts | (2,136,553 | ) | — | (2,136,553 | ) | — | ||||||||||||
Swaps | (197,124 | ) | — | (197,124 | ) | — | ||||||||||||
|
|
|
|
|
|
|
| |||||||||||
Total Foreign Currency Contracts | (2,343,990 | ) | — | (2,343,990 | ) | — | ||||||||||||
|
|
|
|
|
|
|
| |||||||||||
Interest Rate Contracts | ||||||||||||||||||
Futures | (11,625 | ) | (11,625 | ) | — | — | ||||||||||||
Swaps | (1,210,326 | ) | — | (1,210,326 | ) | — | ||||||||||||
|
|
|
|
|
|
|
| |||||||||||
Total Interest Rate Contracts | (1,221,951 | ) | (11,625 | ) | (1,210,326 | ) | — | |||||||||||
|
|
|
|
|
|
|
| |||||||||||
Total Liabilities - Derivatives | (4,148,943 | ) | (11,625 | ) | (4,137,318 | ) | — | |||||||||||
|
|
|
|
|
|
|
| |||||||||||
Total Liabilities | (4,148,943 | ) | (11,625 | ) | (4,137,318 | ) | — | |||||||||||
|
|
|
|
|
|
|
| |||||||||||
Total | $55,608,343 | $13,862,403 | $40,954,962 | $790,978 | ||||||||||||||
|
|
|
|
|
|
|
| |||||||||||
| See Notes to Financial Statements | See explanation of symbols and terms, if any, on B-114 and B-115 |
B-108
Table of Contents
PACIFIC FUNDS
PF GLOBAL ABSOLUTE RETURN FUND
Schedule of Investments (Continued)
March 31, 2018
The following is a reconciliation of investments for significant unobservable inputs (Level 3) used in valuing the Fund’s assets and liabilities (See Note 3D in Notes to Financial Statements) for the year ended March 31, 2018:
| Senior Loan Notes | Short-Term Investment | Forward Foreign Currency Contracts | Total | |||||||||||||
Value, Beginning of Year | $687,242 | $215,290 | $660 | $903,192 | ||||||||||||
Purchases | 1,413,128 | — | — | 1,413,128 | ||||||||||||
Sales (Includes Paydowns) | (1,305,794 | ) | (220,000 | ) | (3,634 | ) | (1,529,428 | ) | ||||||||
Accrued Discounts (Premiums) | 9,182 | 4,710 | — | 13,892 | ||||||||||||
Net Realized Gains (Losses) | 18,378 | — | 3,634 | 22,012 | ||||||||||||
Change in Net Unrealized Appreciation (Depreciation) | (31,158 | ) | — | (660 | ) | (31,818 | ) | |||||||||
Transfers In | — | — | — | — | ||||||||||||
Transfers Out | — | — | — | — | ||||||||||||
|
|
|
|
|
|
|
| |||||||||
Value, End of Year | $790,978 | $— | $— | $790,978 | ||||||||||||
|
|
|
|
|
|
|
| |||||||||
Change in Net Unrealized Appreciation (Depreciation) on | ($3,812 | ) | $— | $— | ($3,812 | ) | ||||||||||
|
|
|
|
|
|
|
| |||||||||
Additional information about Level 3 fair value measurements as of March 31, 2018 was as follows:
| Value at 03/31/18 | Valuation Technique(s) | Unobservable Input(s) | Single Input or Range of Inputs | Weighted Average | ||||||||
Senior Loan Notes | $790,978 | Demand Yield Model | Comparable spread to U.S. Treasury Bonds | 1,349.0 bps | N/A | |||||||
A significant increase in the discount in the spread to U.S. Treasuries could result in a decrease to the fair value measurement. Conversely, significant movements in the opposite direction of this unobservable input could have the inverse effect on the fair value measurement.
Demand Yield: In fair valuing a senior loan note, the investment adviser utilizes one or more of the valuation techniques to assess the likelihood that the borrower will make a full repayment of the loan based on the performance of comparable credit quality senior loans of other companies. If the investment adviser believes that there is a reasonable likelihood of full repayment, the investment adviser will determine fair value using a matrix pricing approach that considers the yield on the senior loan note.
The table below shows transfers between levels. The Trust’s policy is to recognize transfers between levels as of the end of the reporting period.
| Amount Transferred | Level Transfer | Change in Fair Valuation Measurement Inputs | ||||||||||||||||
| From | To | From | To | |||||||||||||||
| $ | 863,314 | 2 | 1 | Adjusted Exchange-Traded Price using an Applied Foreign Fair Value Factor | Unadjusted Exchange-Traded Price | |||||||||||||
| See Notes to Financial Statements | See explanation of symbols and terms, if any, on B-114 and B-115 |
B-109
Table of Contents
PACIFIC FUNDS
PF MULTI-ASSET FUND
Schedule of Investments
March 31, 2018
Principal Amount |
| |||||||
CORPORATE BONDS & NOTES - 44.3% |
| |||||||
Basic Materials - 0.4% |
| |||||||
Anglo American Capital PLC (United Kingdom) | $1,600,000 | $1,625,656 | ||||||
Glencore Funding 80 LLC (Switzerland) | 1,600,000 | 1,545,304 | ||||||
|
| |||||||
| 3,170,960 | ||||||||
|
| |||||||
Communications - 2.8% |
| |||||||
Amazon.com Inc | 2,000,000 | 1,932,921 | ||||||
AT&T Inc | ||||||||
2.672% (USD LIBOR + 0.950%) due 07/15/21 § | 1,800,000 | 1,819,898 | ||||||
3.000% due 02/15/22 | 3,200,000 | 3,162,458 | ||||||
3.875% due 08/15/21 | 2,000,000 | 2,036,474 | ||||||
Cisco Systems Inc | 1,300,000 | 1,276,805 | ||||||
eBay Inc | 3,060,000 | 3,111,423 | ||||||
NBCUniversal Enterprise Inc | 2,400,000 | 2,382,674 | ||||||
Verizon Communications Inc | ||||||||
3.145% (USD LIBOR + 1.000%) due 03/16/22 § | 4,800,000 | 4,894,464 | ||||||
|
| |||||||
| 20,617,117 | ||||||||
|
| |||||||
Consumer, Cyclical - 5.7% |
| |||||||
Alimentation Couche-Tard Inc (Canada) | 4,200,000 | 4,152,109 | ||||||
Daimler Finance North America LLC (Germany) | ||||||||
2.354% (USD LIBOR + 0.450%) due 02/22/21 § ~ | 6,000,000 | 6,006,255 | ||||||
2.450% due 05/18/20 ~ | 3,200,000 | 3,155,186 | ||||||
Ford Motor Credit Co LLC | 3,200,000 | 3,174,114 | ||||||
2.867% (USD LIBOR + 1.080%) due 08/03/22 § | 3,200,000 | 3,228,049 | ||||||
General Motors Financial Co Inc | 3,200,000 | 3,162,421 | ||||||
3.612% (USD LIBOR + 1.310%) due 06/30/22 § | 2,400,000 | 2,436,186 | ||||||
Hyundai Capital America due 03/12/21 § ~ | 3,000,000 | 3,001,696 | ||||||
McDonald’s Corp | 1,600,000 | 1,576,059 | ||||||
Nissan Motor Acceptance Corp | ||||||||
2.985% (USD LIBOR + 0.690%) due 09/28/22 § ~ | 3,200,000 | 3,205,254 | ||||||
2.992% (USD LIBOR + 0.650%) due 07/13/22 § ~ | 2,500,000 | 2,503,368 | ||||||
The Home Depot Inc | 1,000,000 | 985,338 | ||||||
Toyota Motor Credit Corp | ||||||||
2.527% (USD LIBOR + 0.480%) due 09/08/22 § | 5,500,000 | 5,533,426 | ||||||
|
| |||||||
| 42,119,461 | ||||||||
|
| |||||||
Consumer, Non-Cyclical - 8.4% |
| |||||||
Amgen Inc | 1,500,000 | 1,464,979 | ||||||
Anheuser-Busch InBev Finance Inc (Belgium) | 4,000,000 | 3,970,683 | ||||||
3.300% due 02/01/23 | 5,300,000 | 5,307,044 | ||||||
Anheuser-Busch InBev Worldwide Inc (Belgium) | ||||||||
3.052% (USD LIBOR + 0.740%) due 01/12/24 § | 1,300,000 | 1,308,666 | ||||||
Principal Amount |
| |||||||
BAT International Finance PLC (United Kingdom) | $ | 3,200,000 | $ | 3,192,495 | ||||
Campbell Soup Co | ||||||||
2.645% (USD LIBOR + 0.500%) due 03/16/20 § | 3,000,000 | 3,000,855 | ||||||
CVS Health Corp | 1,500,000 | 1,444,926 | ||||||
2.777% (USD LIBOR + 0.720%) due 03/09/21 § | 1,500,000 | 1,511,906 | ||||||
3.350% due 03/09/21 | 1,750,000 | 1,760,441 | ||||||
Danone SA (France) | 2,500,000 | 2,397,234 | ||||||
Imperial Brands Finance PLC (United Kingdom) | 2,200,000 | 2,185,148 | ||||||
3.750% due 07/21/22 ~ | 1,000,000 | 1,004,572 | ||||||
Medtronic Inc | 4,200,000 | 4,208,123 | ||||||
Mondelez International Holdings Netherlands BV | 1,500,000 | 1,432,331 | ||||||
2.370% (USD LIBOR + 0.610%) due 10/28/19 § ~ | 1,010,000 | 1,011,598 | ||||||
Philip Morris International Inc | 5,000,000 | 4,836,271 | ||||||
2.000% due 02/21/20 | 4,000,000 | 3,941,232 | ||||||
Reynolds American Inc (United Kingdom) | 4,347,000 | 4,349,153 | ||||||
Smithfield Foods Inc | 4,100,000 | 4,017,133 | ||||||
Unilever Capital Corp (United Kingdom) | 4,000,000 | 3,991,114 | ||||||
UnitedHealth Group Inc | 2,300,000 | 2,317,192 | ||||||
Zimmer Biomet Holdings Inc | 1,500,000 | 1,484,256 | ||||||
2.928% (USD LIBOR + 0.750%) due 03/19/21 § | 1,600,000 | 1,602,676 | ||||||
|
| |||||||
| 61,740,028 | ||||||||
|
| |||||||
Energy - 2.1% |
| |||||||
BP Capital Markets PLC (United Kingdom) | 1,300,000 | 1,347,614 | ||||||
Energy Transfer Partners LP | 2,100,000 | 2,048,584 | ||||||
Enterprise Products Operating LLC | 2,000,000 | 1,988,107 | ||||||
5.250% due 01/31/20 | 2,100,000 | 2,180,099 | ||||||
Kinder Morgan Energy Partners LP | 2,000,000 | 2,002,287 | ||||||
MPLX LP | 1,500,000 | 1,483,311 | ||||||
Phillips 66 | ||||||||
2.606% (USD LIBOR + 0.600%) due 02/26/21 § | 1,500,000 | 1,502,047 | ||||||
Statoil ASA (Norway) | 1,000,000 | 968,980 | ||||||
Williams Partners LP | 1,500,000 | 1,554,857 | ||||||
|
| |||||||
| 15,075,886 | ||||||||
|
| |||||||
Financial - 20.6% |
| |||||||
AerCap Ireland Capital DAC (Netherlands) | 902,000 | 907,833 | ||||||
3.950% due 02/01/22 | 960,000 | 964,612 | ||||||
Air Lease Corp | 2,000,000 | 1,965,275 | ||||||
2.625% due 07/01/22 | 1,500,000 | 1,449,387 | ||||||
American Express Co | ||||||||
2.606% (USD LIBOR + 0.650%) due 02/27/23 § | 5,000,000 | 4,987,358 | ||||||
American Express Credit Corp | 1,500,000 | 1,492,263 | ||||||
| See Notes to Financial Statements | See explanation of symbols and terms, if any, on B-114 and B-115 |
B-110
Table of Contents
PACIFIC FUNDS
PF MULTI-ASSET FUND
Schedule of Investments (Continued)
March 31, 2018
Principal Amount |
| |||||||
Ares Capital Corp | $ | 1,000,000 | $ | 986,890 | ||||
3.875% due 01/15/20 | 1,500,000 | 1,516,081 | ||||||
Australia & New Zealand Banking Group Ltd (Australia) | 1,350,000 | 1,319,339 | ||||||
AvalonBay Communities Inc REIT | 1,500,000 | 1,519,960 | ||||||
Bank of America Corp | 6,400,000 | 6,299,176 | ||||||
2.503% due 10/21/22 | 7,200,000 | 6,919,541 | ||||||
2.905% (USD LIBOR + 1.160%) due 01/20/23 § | 14,892,000 | 15,087,081 | ||||||
4.125% due 01/22/24 | 1,000,000 | 1,029,713 | ||||||
Bank of Montreal (Canada) | 1,500,000 | 1,441,111 | ||||||
BB&T Corp | 3,700,000 | 3,669,716 | ||||||
Boston Properties LP REIT | 1,500,000 | 1,539,337 | ||||||
Citizens Bank NA | ||||||||
3.252% (USD LIBOR + 0.950%) due 03/29/23 § | 4,000,000 | 4,004,473 | ||||||
Commonwealth Bank of Australia (Australia) | 4,000,000 | 3,970,452 | ||||||
Cooperatieve Rabobank UA (Netherlands) | 3,200,000 | 3,159,346 | ||||||
4.500% due 01/11/21 | 1,600,000 | 1,661,442 | ||||||
Credit Suisse AG (Switzerland) | 2,200,000 | 2,186,201 | ||||||
Fifth Third Bank | 1,455,000 | 1,430,193 | ||||||
HSBC Bank USA NA | 3,200,000 | 3,313,986 | ||||||
HSBC Holdings PLC (United Kingdom) | 4,000,000 | 4,019,527 | ||||||
ING Bank NV (Netherlands) | 1,600,000 | 1,581,313 | ||||||
2.750% due 03/22/21 ~ | 2,200,000 | 2,173,922 | ||||||
Jackson National Life Global Funding | 1,850,000 | 1,794,154 | ||||||
MassMutual Global Funding II | 2,100,000 | 2,093,980 | ||||||
Mid-America Apartments LP REIT | 2,000,000 | 2,075,548 | ||||||
Mitsubishi UFJ Financial Group Inc (Japan) | ||||||||
2.535% (USD LIBOR + 0.790%) due 07/25/22 § | 4,000,000 | 4,023,409 | ||||||
2.757% (USD LIBOR + 0.740%) due 03/02/23 § | 5,300,000 | 5,295,625 | ||||||
National Australia Bank Ltd (Australia) | 2,000,000 | 1,967,273 | ||||||
New York Life Global Funding | 4,000,000 | 3,923,893 | ||||||
2.591% (USD LIBOR + 0.520%) due 06/10/22 § ~ | 2,000,000 | 2,013,718 | ||||||
PNC Bank NA | 1,000,000 | 993,487 | ||||||
2.450% due 11/05/20 | 3,700,000 | 3,643,663 | ||||||
Royal Bank of Canada (Canada) | ||||||||
2.503% (USD LIBOR + 0.730%) due 02/01/22 § | 1,300,000 | 1,311,545 | ||||||
Simon Property Group LP REIT | 1,100,000 | 1,076,966 | ||||||
Sumitomo Mitsui Financial Group Inc (Japan) | ||||||||
2.471% (USD LIBOR + 0.740%) due 01/17/23 § | 3,130,000 | 3,137,817 | ||||||
2.784% due 07/12/22 | 2,500,000 | 2,438,996 | ||||||
2.846% due 01/11/22 | 510,000 | 501,548 | ||||||
Svenska Handelsbanken AB (Sweden) | 2,000,000 | 1,963,276 | ||||||
2.450% due 03/30/21 | 2,300,000 | 2,259,541 | ||||||
Principal Amount |
| |||||||
The Allstate Corp | ||||||||
2.932% (USD LIBOR + 0.630%) due 03/29/23 § | $ | 2,000,000 | $ | 2,005,209 | ||||
The Bank of Nova Scotia (Canada) | 1,500,000 | 1,477,892 | ||||||
UBS AG (Switzerland) | 1,000,000 | 982,599 | ||||||
UBS Group Funding Switzerland AG (Switzerland) | 2,500,000 | 2,425,432 | ||||||
US Bancorp | 1,600,000 | 1,577,072 | ||||||
US Bank NA | 2,100,000 | 2,055,451 | ||||||
Ventas Realty LP REIT | 1,000,000 | 1,041,030 | ||||||
Wells Fargo & Co | ||||||||
2.851% (USD LIBOR + 1.110%) due 01/24/23 § | 9,800,000 | 9,939,501 | ||||||
3.500% due 03/08/22 | 4,000,000 | 4,011,760 | ||||||
Westpac Banking Corp (Australia) | ||||||||
3.005% (USD LIBOR + 0.710%) due 06/28/22 § | 4,000,000 | 4,033,141 | ||||||
|
| |||||||
| 150,659,054 | ||||||||
|
| |||||||
Industrial - 0.5% |
| |||||||
John Deere Capital Corp | ||||||||
2.538% (USD LIBOR + 0.290%) due 06/22/20 § | 2,000,000 | 2,001,975 | ||||||
The Boeing Co | 1,300,000 | 1,255,084 | ||||||
|
| |||||||
| 3,257,059 | ||||||||
|
| |||||||
Technology - 1.6% |
| |||||||
Analog Devices Inc | 1,200,000 | 1,198,466 | ||||||
Apple Inc | 3,200,000 | 3,117,148 | ||||||
2.400% due 01/13/23 | 4,200,000 | 4,079,866 | ||||||
Fidelity National Information Services Inc | 1,300,000 | 1,316,912 | ||||||
International Business Machines Corp | 1,000,000 | 984,393 | ||||||
Oracle Corp | 1,300,000 | 1,271,133 | ||||||
|
| |||||||
| 11,967,918 | ||||||||
|
| |||||||
Utilities - 2.2% |
| |||||||
Commonwealth Edison Co | 2,100,000 | 2,147,719 | ||||||
Dominion Energy Inc | 2,100,000 | 2,074,329 | ||||||
Duke Energy Corp | 1,705,000 | 1,623,901 | ||||||
Electricite de France SA (France) | 1,500,000 | 1,540,739 | ||||||
Enel Finance International NV (Italy) | 2,500,000 | 2,441,434 | ||||||
Mississippi Power Co | ||||||||
2.942% (USD LIBOR + 0.650%) due 03/27/20 § | 500,000 | 500,210 | ||||||
Sempra Energy | ||||||||
2.575% (USD LIBOR + 0.450%) due 03/15/21 § | 2,000,000 | 2,006,531 | ||||||
Southern California Edison Co | 3,000,000 | 3,000,775 | ||||||
Southern Power Co | ||||||||
2.752% (USD LIBOR + 0.550%) due 12/20/20 § ~ | 1,000,000 | 1,001,289 | ||||||
|
| |||||||
| 16,336,927 | ||||||||
|
| |||||||
Total Corporate Bonds & Notes |
| 324,944,410 | ||||||
|
| |||||||
| See Notes to Financial Statements | See explanation of symbols and terms, if any, on B-114 and B-115 |
B-111
Table of Contents
PACIFIC FUNDS
PF MULTI-ASSET FUND
Schedule of Investments (Continued)
March 31, 2018
Principal Amount |
| |||||||
ASSET-BACKED SECURITIES - 16.7% |
| |||||||
Ally Auto Receivables Trust | $ | 2,250,000 | $ | 2,240,412 | ||||
1.840% due 01/15/20 | 2,579,469 | 2,575,978 | ||||||
American Express Credit Account Master Trust | 20,000,000 | 19,809,168 | ||||||
AmeriCredit Automobile Receivables Trust | 4,500,000 | 4,476,982 | ||||||
Capital Auto Receivables Asset Trust | 5,000,000 | 5,004,000 | ||||||
2.540% due 10/20/20 ~ | 3,500,000 | 3,503,150 | ||||||
Chase Issuance Trust | 275,000 | 274,898 | ||||||
1.370% due 06/15/21 | 7,750,000 | 7,641,967 | ||||||
1.620% due 07/15/20 | 5,450,000 | 5,437,627 | ||||||
Citibank Credit Card Issuance Trust | 7,465,000 | 7,423,339 | ||||||
CNH Equipment Trust | 2,000,000 | 1,988,036 | ||||||
Ford Credit Auto Owner Trust | 5,936,876 | 5,919,412 | ||||||
Honda Auto Receivables Owner Trust | 2,000,000 | 1,991,810 | ||||||
1.900% due 03/15/19 | 2,535,004 | 2,536,767 | ||||||
2.360% due 06/15/20 | 4,000,000 | 3,998,284 | ||||||
Hyundai Auto Receivables Trust | 4,071,198 | 4,057,063 | ||||||
John Deere Owner Trust | 2,000,000 | 2,000,087 | ||||||
2.420% due 10/15/20 | 2,500,000 | 2,495,695 | ||||||
Navient Student Loan Trust | ||||||||
2.112% (USD LIBOR + 0.240%) due 09/27/66 § ~ | 4,612,644 | 4,613,783 | ||||||
2.218% (USD LIBOR + 0.240%) due 03/25/67 § ~ | 10,500,000 | 10,498,407 | ||||||
Nelnet Student Loan Trust | ||||||||
1.845% (USD LIBOR + 0.100%) due 01/25/30 § | 3,254,071 | 3,251,658 | ||||||
2.030% (USD LIBOR + 0.110%) due 08/23/27 § | 791,890 | 790,215 | ||||||
Nissan Auto Receivables Owner Trust | 1,710,219 | 1,710,274 | ||||||
2.390% due 12/15/20 | 3,500,000 | 3,494,905 | ||||||
SLM Student Loan Trust | ||||||||
1.835% (USD LIBOR + 0.090%) due 10/25/24 § | 1,154,514 | 1,153,213 | ||||||
1.845% (USD LIBOR + 0.100%) due 01/27/25 § | 664,437 | 664,401 | ||||||
1.855% (USD LIBOR + 0.110%) due 07/25/25 § | 543,889 | 543,845 | ||||||
2.291% (USD LIBOR + 0.550%) due 10/26/26 § | 2,346,237 | 2,350,259 | ||||||
SMB Private Education Loan Trust | ||||||||
2.047% (USD LIBOR + 0.270%) due 06/17/24 § ~ | 5,273,125 | 5,273,582 | ||||||
2.427% (USD LIBOR + 0.650%) due 11/15/23 § ~ | 1,182,269 | 1,182,283 | ||||||
Toyota Auto Receivables Owner Trust | 3,500,000 | 3,479,389 | ||||||
|
| |||||||
Total Asset-Backed Securities |
| 122,380,889 | ||||||
|
| |||||||
Principal Amount |
| |||||||
U.S. TREASURY OBLIGATIONS - 36.0% |
| |||||||
U.S. Treasury Notes - 36.0% |
| |||||||
1.125% due 01/31/19 | $ | 51,100,000 | $ | 50,696,963 | ||||
1.375% due 07/31/19 ‡ | 52,000,000 | 51,438,520 | ||||||
1.500% due 12/31/18 | 55,000,000 | 54,765,561 | ||||||
2.000% due 01/31/20 | 36,500,000 | 36,326,048 | ||||||
3.125% due 05/15/19 | 70,000,000 | 70,728,971 | ||||||
|
| |||||||
Total U.S. Treasury Obligations |
| 263,956,063 | ||||||
|
| |||||||
Shares | ||||||||
SHORT-TERM INVESTMENTS - 4.7% |
| |||||||
Money Market Fund - 0.5% |
| |||||||
BlackRock Liquidity Funds T-Fund Portfolio | 3,538,995 | 3,538,995 | ||||||
|
| |||||||
Principal | ||||||||
U.S. Treasury Bills - 4.2% |
| |||||||
1.861% due 08/16/18 | $31,300,000 | 31,082,595 | ||||||
|
| |||||||
Total Short-Term Investments |
| 34,621,590 | ||||||
|
| |||||||
TOTAL INVESTMENTS - 101.7% |
| 745,902,952 | ||||||
DERIVATIVES - (2.2%) (See Note (c) in Notes to Schedule of Investments) |
| (16,300,624 | ) | |||||
|
| |||||||
OTHER ASSETS & LIABILITIES, NET - 0.5% |
| 3,698,150 | ||||||
|
| |||||||
NET ASSETS - 100.0% |
| $733,300,478 | ||||||
|
| |||||||
Notes to Schedule of Investments
| (a) | As of March 31, 2018, the Fund’s composition as a percentage of net assets was as follows: |
Corporate Bonds & Notes | 44.3% | |||
U.S. Treasury Obligations | 36.0% | |||
Asset-Backed Securities | 16.7% | |||
Short-Term Investments | 4.7% | |||
|
| |||
| 101.7% | ||||
Derivatives | (2.2% | ) | ||
Other Assets & Liabilities, Net | 0.5% | |||
|
| |||
| 100.0% | ||||
|
|
| (b) | As of March 31, 2018, an investment with a value of $26,831,850 was fully or partially segregated with the broker(s)/custodian as collateral for open swap agreements. |
| See Notes to Financial Statements | See explanation of symbols and terms, if any, on B-114 and B-115 |
B-112
Table of Contents
PACIFIC FUNDS
PF MULTI-ASSET FUND
Schedule of Investments (Continued)
March 31, 2018
| (c) | Swap agreements outstanding as of March 31, 2018 was as follows: |
Total Return Swaps – Pay Floating Rate
| Receive Total Return | Pay | Payment Frequency | Counter- party | Expiration Date | Notional Amount | Value | Upfront Premiums Paid (Received) | Unrealized Appreciation (Depreciation) | ||||||||||||||||||||||
Russell 1000 Growth Index | 3-Month USD-LIBOR + 0.440% | Z | BRC | 03/14/19 | $22,703,198 | $12,947 | $— | $12,947 | ||||||||||||||||||||||
MSCI World Index | 3-Month USD-LIBOR - 0.065% | Z | JPM | 03/14/19 | 325,676,417 | (1,001,213 | ) | — | (1,001,213 | ) | ||||||||||||||||||||
Russell 1000 Index | 3-Month USD-LIBOR + 0.530% | Z | JPM | 03/14/19 | 5,147,975 | (301,557 | ) | — | (301,557 | ) | ||||||||||||||||||||
Russell Mid-Cap Value Index | 3-Month USD-LIBOR + 0.380% | Z | JPM | 03/14/19 | 32,443,245 | 274,337 | — | 274,337 | ||||||||||||||||||||||
Russell 2000 Index | 3-Month USD-LIBOR + 0.000% | Z | MSC | 03/14/19 | 6,572,860 | 167,332 | — | 167,332 | ||||||||||||||||||||||
Russell Mid-Cap Growth Index | 3-Month USD-LIBOR + 0.340% | Z | MSC | 03/14/19 | 19,843,447 | 409,277 | — | 409,277 | ||||||||||||||||||||||
MSCI World Index | 3-Month USD-LIBOR - 0.140% | Z | BRC | 05/16/19 | 2,003,682 | (60,606 | ) | — | (60,606 | ) | ||||||||||||||||||||
S&P 500 Index | 3-Month USD-LIBOR + 0.500% | Z | BRC | 05/16/19 | 25,385,812 | (1,123,546 | ) | — | (1,123,546 | ) | ||||||||||||||||||||
S&P Mid-Cap 400 Index | 3-Month USD-LIBOR + 0.340% | Z | JPM | 05/16/19 | 89,715,469 | (2,753,479 | ) | — | (2,753,479 | ) | ||||||||||||||||||||
MSCI EAFE Index | 3-Month USD-LIBOR - 0.110% | Z | MSC | 05/16/19 | 63,074,578 | (1,274,448 | ) | — | (1,274,448 | ) | ||||||||||||||||||||
MSCI Japan Index | 3-Month USD-LIBOR + 0.150% | Z | MSC | 05/16/19 | 3,752,840 | (41,917 | ) | — | (41,917 | ) | ||||||||||||||||||||
MSCI World Index | 3-Month USD-LIBOR - 0.120% | Z | MSC | 05/16/19 | 488,766,512 | (16,933,113 | ) | — | (16,933,113 | ) | ||||||||||||||||||||
|
|
|
|
|
| |||||||||||||||||||||||||
| ($22,625,986 | ) | $— | ($22,625,986 | ) | ||||||||||||||||||||||||||
|
|
|
|
|
| |||||||||||||||||||||||||
Total Return Swaps – Receive Floating Rate
| Receive | Pay Total Return | Payment Frequency | Counter- party | Expiration Date | Notional Amount | Value | Upfront Premiums Paid (Received) | Unrealized Appreciation (Depreciation) | ||||||||||||||||||||||
3-Month USD-LIBOR + 0.080% | MSCI EAFE Index | Z | BRC | 03/14/19 | $61,683,884 | ($116,247 | ) | $— | ($116,247 | ) | ||||||||||||||||||||
3-Month USD-LIBOR + 0.520% | S&P 500 Index | Z | GSC | 03/14/19 | 24,398,398 | 136,132 | — | 136,132 | ||||||||||||||||||||||
3-Month USD-LIBOR - 0.440% | MSCI Canada Index | Z | BRC | 05/16/19 | 21,323,971 | 286,496 | — | 286,496 | ||||||||||||||||||||||
3-Month USD-LIBOR - 0.270% | MSCI Europe Index | Z | BRC | 05/16/19 | 89,467,806 | 1,531,985 | — | 1,531,985 | ||||||||||||||||||||||
3-Month USD-LIBOR + 0.150% | MSCI Pacific Index | Z | BRC | 05/16/19 | 59,034,942 | 1,461,617 | — | 1,461,617 | ||||||||||||||||||||||
3-Month USD-LIBOR + 0.380% | Russell Mid-Cap Growth Index | Z | GSC | 05/16/19 | 8,118,948 | 305,033 | — | 305,033 | ||||||||||||||||||||||
3-Month USD-LIBOR + 0.340% | Russell Mid-Cap Value Index | Z | GSC | 05/16/19 | 15,714,227 | 408,779 | — | 408,779 | ||||||||||||||||||||||
3-Month USD-LIBOR + 0.430% | Russell 1000 Value Index | Z | JPM | 05/16/19 | 29,434,197 | 1,046,387 | — | 1,046,387 | ||||||||||||||||||||||
3-Month USD-LIBOR - 0.080% | Russell 2000 Index | Z | JPM | 05/16/19 | 1,527,132 | 58,328 | — | 58,328 | ||||||||||||||||||||||
3-Month USD-LIBOR + 0.440% | Russell 1000 Growth Index | Z | MSC | 05/16/19 | 23,922,997 | 1,206,852 | — | 1,206,852 | ||||||||||||||||||||||
|
|
|
|
|
| |||||||||||||||||||||||||
| $6,325,362 | $— | $6,325,362 | ||||||||||||||||||||||||||||
|
|
|
|
|
| |||||||||||||||||||||||||
Total Swap Agreements | ($16,300,624 | ) | $— | ($16,300,624 | ) | |||||||||||||||||||||||||
|
|
|
|
|
| |||||||||||||||||||||||||
| (d) | Fair Value Measurements |
The following is a summary of the Fund’s investments as categorized under the three-tier hierarchy of inputs used in valuing the Fund’s assets and liabilities (See Note 3D in Notes to Financial Statements) as of March 31, 2018:
| Total Value at March 31, 2018 | Level 1 Quoted Price | Level 2 Significant | Level 3 Significant | |||||||||||||||
Assets | Corporate Bonds & Notes | $324,944,410 | $— | $324,944,410 | $— | |||||||||||||
Asset-Backed Securities | 122,380,889 | — | 122,380,889 | — | ||||||||||||||
U.S. Treasury Obligations | 263,956,063 | — | 263,956,063 | — | ||||||||||||||
Short-Term Investments | 34,621,590 | 3,538,995 | 31,082,595 | — | ||||||||||||||
Derivatives: | ||||||||||||||||||
Equity Contracts | ||||||||||||||||||
Swaps | 7,305,502 | — | 7,305,502 | — | ||||||||||||||
|
|
|
|
|
|
|
| |||||||||||
Total Assets - Derivatives | 7,305,502 | — | 7,305,502 | — | ||||||||||||||
|
|
|
|
|
|
|
| |||||||||||
Total Assets | 753,208,454 | 3,538,995 | 749,669,459 | — | ||||||||||||||
|
|
|
|
|
|
|
| |||||||||||
Liabilities | Derivatives: | |||||||||||||||||
Equity Contracts | ||||||||||||||||||
Swaps | (23,606,126 | ) | — | (23,606,126 | ) | — | ||||||||||||
|
|
|
|
|
|
|
| |||||||||||
Total Liabilities | (23,606,126 | ) | — | (23,606,126 | ) | — | ||||||||||||
|
|
|
|
|
|
|
| |||||||||||
Total | $729,602,328 | $3,538,995 | $726,063,333 | $— | ||||||||||||||
|
|
|
|
|
|
|
| |||||||||||
| See Notes to Financial Statements | See explanation of symbols and terms, if any, on B-114 and B-115 |
B-113
Table of Contents
PACIFIC FUNDS
Schedule of Investments (Continued)
Explanation of Symbols and Terms
March 31, 2018
Explanation of Symbols: | ||
| * | Non-income producing investments. | |
| ^ | Investments with their principal amount adjusted for inflation. | |
| § | Variable rate investments. The rate shown is based on the latest available information as of March 31, 2018. For Senior Loan Notes, the rate shown may represent a weighted average interest rate. Interest rates for certain securities are subject to interest rate caps and floors, which would result in a period end rate being more, less or equal to the referenced rate plus spread. Certain variable rate securities are not based on a published reference rate and spread but are determined by the issuer or agent and are based on current market conditions. These securities do not indicate a reference rate and spread in their description. | |
| Y | Issuer filed bankruptcy and/or is in default as of March 31, 2018. | |
| ¥ | All or a portion of this senior loan position has not settled. Rates do not take effect until settlement date. Rates shown, if any, are for the settled portion. | |
| # | Securities purchased on a when-issued basis. | |
| ~ | Securities are not registered under the Securities Act of 1933 (1933 Act) and these securities are either (1) exempt from registration pursuant to Rule 144A of the 1933 Act and may only be sold to “qualified institutional buyers”, or (2) the securities comply with Regulation S rules governing offers and sales made outside the United States without registration under the 1933 Act and contain certain restrictions as to public resale. | |
| ‡ | Investments were fully or partially segregated with the broker(s)/custodian as collateral for reverse repurchase agreements, futures contracts, forward volatility agreements, forward foreign currency contracts, option contracts and/or swap agreements as of March 31, 2018. | |
| W | The values of these investments were determined by the Trustee Valuation Committee or determined by a valuation committee established under the Valuation Policy and then subsequently submitted for approval or ratification to either the Trustee Valuation Committee or to the Board of Trustees (the “Board”). Each determination was made in good faith in accordance with the procedures established by the Board and the provisions of the Investment Company Act of 1940 (See Note 3C in Notes to Financial Statements). | |
| l | Total shares owned by the Fund as of March 31, 2018 were less than one share. | |
| » | Stapled Security. A security contractually bound to one or more other securities to form a single saleable unit which cannot be sold separately. | |
| ± | Investments categorized as a significant unobservable input (Level 3) (See Note 3D in Notes to Financial Statements). | |
Counterparty & Exchange Abbreviations: | ||
| ANZ | Australia and New Zealand Banking Group | |
| BNP | BNP Paribas | |
| BRC | Barclays | |
| CIB | Canadian Imperial Bank of Commerce | |
| CIT | Citigroup | |
| CME | Chicago Mercantile Exchange | |
| CSF | Credit Suisse | |
| DUB | Deutsche Bank | |
| EUX | Eurex Exchange | |
| GSC | Goldman Sachs | |
| HSB | HSBC | |
| ICE | Intercontinental Exchange Inc | |
| JPM | JPMorgan Chase | |
| LCH | London Clearing House | |
| MER | Merrill Lynch | |
| MSC | Morgan Stanley | |
| RBC | Royal Bank of Canada | |
| RBS | Royal Bank of Scotland | |
| SCB | Standard Chartered Bank | |
| SGN | Societe Generale | |
| SSB | State Street Bank | |
| UBS | UBS | |
Currency Abbreviations: | ||
| AED | United Arab Emirates Dirham | |
| ARS | Argentine Peso | |
| AUD | Australian Dollar | |
| BHD | Bahraini Dinar | |
| BRL | Brazilian Real | |
| CAD | Canadian Dollar | |
| CHF | Swiss Franc | |
| CLF | Chilean Unidad de Fomento | |
| CLP | Chilean Peso | |
| CNH | Renminbi Offshore (Hong Kong) | |
| CNY | Chinese Renminbi | |
| COP | Colombian Peso | |
| CZK | Czech Koruna | |
| DKK | Danish Krone | |
| DOP | Dominican Peso | |
| EGP | Egyptian Pound | |
| EUR | Euro | |
| GBP | British Pound | |
| HKD | Hong Kong Dollar | |
| HUF | Hungarian Forint | |
| IDR | Indonesian Rupiah | |
| ILS | Israeli Shekel | |
| INR | Indian Rupee | |
| ISK | Icelandic Krona | |
| JPY | Japanese Yen | |
| KRW | Korean Won | |
| KZT | Kazakhstan Tenge | |
| LKR | Sri Lankan Rupee | |
| MAD | Moroccan Dirham | |
| MXN | Mexican Peso | |
| MYR | Malaysian Ringgit | |
| NGN | Nigerian Naira | |
| NOK | Norwegian Krone | |
| NZD | New Zealand Dollar | |
| OMR | Omani Rial | |
| PEN | Peruvian Nuevo Sol | |
| PHP | Philippine Peso | |
| PLN | Polish Zloty | |
| QAR | Qatari Riyal | |
| RON | Romanian Leu | |
| RSD | Serbian Dinar | |
| RUB | Russian Ruble | |
| SAR | Saudi Arabian Riyal | |
| SEK | Swedish Krona | |
| SGD | Singapore Dollar | |
| THB | Thai Baht | |
| TRY | Turkish Lira | |
| TWD | Taiwan Dollar | |
| UAH | Ukrainian Hryvnia | |
| USD | United States Dollar | |
| UYU | Uruguayan Peso | |
| ZAR | South African Rand | |
Payment Frequency Abbreviations: | ||
| A | Annual | |
| L | Lunar | |
| M | Monthly | |
| Q | Quarterly | |
| S | Semiannual | |
| Z | At Maturity | |
Reference Rate Abbreviations: | ||
| ARS Deposit | Argentina Deposit Rate | |
| ARS Reference | Argentina Reference Rate | |
| AUD Bank Bill | Australian Dollar Bank Bill Rate | |
| EUR LIBOR | Euro London Interbank Offered Rate | |
| GBP LIBOR | British Pound London Interbank Offered Rate | |
| US FED | United States Federal Reserve Bank Rate | |
| US PRIME | United States Prime Rate | |
| USD LIBOR | United States Dollar London Interbank Offered Rate | |
| UST | United States Treasury Rate | |
| See Notes to Financial Statements |
B-114
Table of Contents
PACIFIC FUNDS
Schedule of Investments (Continued)
Explanation of Symbols and Terms (Continued)
March 31, 2018
Other Abbreviations: | ||
| ADR | American Depositary Receipt | |
| GDR | Global Depositary Receipt | |
| IO | Interest Only | |
| ‘NY’ | New York Shares | |
| PIK | Payment In Kind | |
| REIT | Real Estate Investment Trust | |
| SDR | Swedish Depositary Receipt | |
Notes:
For debt investments, the interest rates disclosed in the Schedules of Investments reflect the stated coupon rate or for discounted investments or zero coupon bonds, the yield-to-maturity.
The countries listed in the Schedules of Investments are based on country of risk (See Note 4 in Notes to Financial Statements under Investments and Risks - Foreign and Emerging Markets Investments).
The sectors listed in the Schedules of Investments are obtained from a third party source (that is not affiliated with the Trust or the investment adviser) believed to be reliable. Sector names and weightings could be different if obtained from another source.
The descriptions of the companies and credit spreads, if any, shown in the Schedules of Investments were obtained from published reports or other sources believed to be reliable, and are not audited by the Independent Registered Public Accounting Firm.
| See Notes to Financial Statements |
B-115
Table of Contents
STATEMENTS OF ASSETS AND LIABILITIES
March 31, 2018
| PF Inflation Managed Fund | PF Managed Bond Fund | PF Short Duration Bond Fund | PF Emerging Markets Debt Fund | PF Comstock Fund | PF Developing Growth Fund | |||||||||||||||||||||||||
ASSETS | ||||||||||||||||||||||||||||||
Investments, at cost (excluding derivatives) | $91,000,387 | $746,332,926 | $115,099,928 | $82,295,375 | $70,679,312 | $6,586,312 | ||||||||||||||||||||||||
Investments, at value (excluding derivatives) | $90,955,618 | $743,432,824 | $114,387,093 | $82,838,137 | $116,822,195 | $9,328,332 | ||||||||||||||||||||||||
Outstanding purchased options, at value (at cost $12,145 and $294,308, respectively) | 8,909 | 132,747 | — | — | — | — | ||||||||||||||||||||||||
Cash | — | 610,778 | 795 | 224,655 | 32,015 | 417 | ||||||||||||||||||||||||
Cash (segregated for derivative instruments) | 287,000 | 4,365,255 | 67,300 | 110,000 | — | — | ||||||||||||||||||||||||
Foreign currency held, at value (1) | 73,013 | 3,009,470 | 3,790 | 786,088 | 36,745 | — | ||||||||||||||||||||||||
Receivables: | ||||||||||||||||||||||||||||||
Dividends and interest | 168,261 | 3,671,804 | 723,077 | 1,004,187 | 213,376 | 1,286 | ||||||||||||||||||||||||
Fund shares sold | 4,403 | 20,175 | 7,533 | 2,746 | 866 | — | ||||||||||||||||||||||||
Securities sold | 1,348,719 | 73,208,459 | — | 1,316,801 | 180,274 | 200,571 | ||||||||||||||||||||||||
Variation margin on futures contracts | — | 2,233,957 | 3,951 | — | — | — | ||||||||||||||||||||||||
Variation margin on swap contracts | — | 348,798 | — | 61,206 | — | — | ||||||||||||||||||||||||
Swap agreements | 13,394 | — | — | 140 | — | — | ||||||||||||||||||||||||
Due from adviser | 2,773 | 38,862 | 10,891 | 6,756 | 8,615 | 1,346 | ||||||||||||||||||||||||
Forward foreign currency contracts appreciation | 17,650 | 605,930 | 157 | 289,671 | 13,529 | — | ||||||||||||||||||||||||
Swap agreements, at value | 1,112 | 40,486 | — | 427,136 | — | — | ||||||||||||||||||||||||
Prepaid expenses and other assets | — | 11,279 | 1,259 | — | 1,007 | — | ||||||||||||||||||||||||
Total Assets | 92,880,852 | 831,730,824 | 115,205,846 | 87,067,523 | 117,308,622 | 9,531,952 | ||||||||||||||||||||||||
LIABILITIES | ||||||||||||||||||||||||||||||
Payables: | ||||||||||||||||||||||||||||||
Fund shares redeemed | 25,478 | 213,086 | 39,665 | 26,629 | 33,501 | 2,578 | ||||||||||||||||||||||||
Securities purchased | 3,032,573 | 195,604,674 | 2,779,970 | 938,404 | 247,908 | 52,119 | ||||||||||||||||||||||||
Sale-buyback financing transactions | 11,435,396 | 32,702,867 | — | — | — | — | ||||||||||||||||||||||||
Reverse repurchase agreement | 2,450,000 | — | — | — | — | — | ||||||||||||||||||||||||
Due to custodian | 16 | — | — | — | — | — | ||||||||||||||||||||||||
Due to brokers (2) | — | 240,000 | — | 10,000 | — | — | ||||||||||||||||||||||||
Swap agreements | — | 420,490 | — | — | — | — | ||||||||||||||||||||||||
Variation margin on futures contracts | 19,239 | — | — | — | — | — | ||||||||||||||||||||||||
Variation margin on swap contracts | 61,062 | — | — | — | — | — | ||||||||||||||||||||||||
Accrued advisory fees | 16,760 | 212,640 | 43,621 | 45,049 | 81,288 | 4,957 | ||||||||||||||||||||||||
Accrued administration fees | 6,285 | 79,740 | 16,358 | 8,608 | 16,590 | 1,239 | ||||||||||||||||||||||||
Accrued support service expenses | 447 | 24,576 | 5,465 | 1,478 | 6,290 | 309 | ||||||||||||||||||||||||
Accrued custodian fees and expenses | 1,647 | 17,607 | 2,059 | 7,066 | 3,020 | 334 | ||||||||||||||||||||||||
Accrued transfer agency out-of-pocket expenses | 490 | 22,729 | 5,037 | 1,438 | 5,871 | 298 | ||||||||||||||||||||||||
Accrued legal, audit and tax service fees | 2,445 | 77,076 | 16,817 | 5,579 | 19,480 | 1,098 | ||||||||||||||||||||||||
Accrued trustees’ fees and expenses and deferred compensation | 2,248 | 13,288 | 1,951 | 62 | 4,261 | 1,952 | ||||||||||||||||||||||||
Accrued other | 3,299 | 72,864 | 26,145 | 10,492 | 14,338 | 3,610 | ||||||||||||||||||||||||
Forward foreign currency contracts depreciation | 29,989 | 3,044,925 | — | 254,928 | 27,710 | — | ||||||||||||||||||||||||
Outstanding options written, at value (premiums received $56,546 and $411,677, respectively) | 10,070 | 307,783 | — | — | — | — | ||||||||||||||||||||||||
Swap agreements, at value | 11,112 | — | — | — | — | — | ||||||||||||||||||||||||
Total Liabilities | 17,108,556 | 233,054,345 | 2,937,088 | 1,309,733 | 460,257 | 68,494 | ||||||||||||||||||||||||
NET ASSETS | $75,772,296 | $598,676,479 | $112,268,758 | $85,757,790 | $116,848,365 | $9,463,458 | ||||||||||||||||||||||||
NET ASSETS CONSIST OF: | ||||||||||||||||||||||||||||||
Paid-in capital | $84,788,409 | $607,341,931 | $115,458,846 | $92,839,669 | $43,280,902 | $7,862,732 | ||||||||||||||||||||||||
Undistributed/accumulated net investment income (loss) | 186,399 | (1,643,668 | ) | 644,281 | (385,597 | ) | (517,809 | ) | (1,866 | ) | ||||||||||||||||||||
Undistributed/accumulated net realized gain (loss) | (9,183,265 | ) | (3,474,296 | ) | (3,139,672 | ) | (7,254,419 | ) | 27,957,417 | (1,139,428 | ) | |||||||||||||||||||
Net unrealized appreciation (depreciation) on investments and assets and liabilities in foreign currencies | (19,247 | ) | (3,547,488 | ) | (694,697 | ) | 558,137 | 46,127,855 | 2,742,020 | |||||||||||||||||||||
NET ASSETS | $75,772,296 | $598,676,479 | $112,268,758 | $85,757,790 | $116,848,365 | $9,463,458 | ||||||||||||||||||||||||
Class P Shares: | ||||||||||||||||||||||||||||||
Shares of beneficial interest outstanding | 8,533,123 | 56,563,475 | 11,469,397 | 9,152,207 | 7,535,629 | 637,876 | ||||||||||||||||||||||||
Net Asset Value Per Share | $8.88 | $10.58 | $9.79 | $9.37 | $15.51 | $14.84 | ||||||||||||||||||||||||
| (1) | The cost of foreign currency for the PF Inflation Managed, PF Managed Bond, PF Short Duration Bond, PF Emerging Markets Debt, and PF Comstock Funds was $73,549, $2,974,953, $3,820, $779,412, and $37,014, respectively. |
| (2) | The PF Managed Bond and PF Emerging Markets Debt Funds received cash collateral to mitigate risk of loss to certain counterparties, which will be repaid based on master netting arrangements between the Fund and the respective counterparties. The Funds invest such cash collateral in investment securities (See Note 5 in Notes to Financial Statements). |
See Notes to Financial Statements
C-1
Table of Contents
PACIFIC FUNDS
STATEMENTS OF ASSETS AND LIABILITIES (Continued)
March 31, 2018
| PF Growth Fund | PF Large-Cap Growth Fund | PF Large-Cap Value Fund | PF Main Street Core Fund | PF Mid-Cap Equity Fund | PF Mid-Cap Value Fund | |||||||||||||||||||||||||
ASSETS | ||||||||||||||||||||||||||||||
Investments, at cost (excluding derivatives) | $145,439,239 | $29,423,975 | $77,360,210 | $98,244,289 | $23,079,368 | $55,068,575 | ||||||||||||||||||||||||
Investments, at value (excluding derivatives) | $206,817,219 | $50,149,171 | $154,763,485 | $137,157,349 | $31,248,272 | $70,859,032 | ||||||||||||||||||||||||
Cash | 19,461 | 18,601 | 66,484 | 57,594 | — | 11,858 | ||||||||||||||||||||||||
Foreign currency held, at value (1) | — | 1,507 | — | — | — | — | ||||||||||||||||||||||||
Receivables: | ||||||||||||||||||||||||||||||
Dividends and interest | 84,409 | 7,322 | 425,490 | 187,451 | 26,143 | 153,413 | ||||||||||||||||||||||||
Fund shares sold | 433 | 86 | 1,097 | 346 | 144 | 923 | ||||||||||||||||||||||||
Securities sold | — | — | — | 34,635 | 308,926 | 744,066 | ||||||||||||||||||||||||
Due from adviser | 9,305 | 3,330 | 14,761 | 7,864 | 2,675 | — | ||||||||||||||||||||||||
Prepaid expenses and other assets | 1,139 | 516 | 4,613 | 3,598 | — | 521 | ||||||||||||||||||||||||
Total Assets | 206,931,966 | 50,180,533 | 155,275,930 | 137,448,837 | 31,586,160 | 71,769,813 | ||||||||||||||||||||||||
LIABILITIES | ||||||||||||||||||||||||||||||
Payables: | ||||||||||||||||||||||||||||||
Fund shares redeemed | 47,634 | 12,361 | 43,038 | 38,981 | 9,034 | 21,487 | ||||||||||||||||||||||||
Securities purchased | — | 74,495 | — | 144,016 | 189,581 | 847,617 | ||||||||||||||||||||||||
Due to custodian | — | — | — | — | 35,137 | — | ||||||||||||||||||||||||
Accrued advisory fees | 85,187 | 32,528 | 143,547 | 66,682 | 17,785 | 62,815 | ||||||||||||||||||||||||
Accrued administration fees | 23,233 | 6,921 | 33,126 | 22,227 | 4,104 | 13,460 | ||||||||||||||||||||||||
Accrued support service expenses | 4,743 | 3,162 | 14,539 | 10,415 | 2,268 | 6,634 | ||||||||||||||||||||||||
Accrued custodian fees and expenses | 1,392 | 1,436 | 3,071 | 2,391 | 735 | 1,550 | ||||||||||||||||||||||||
Accrued transfer agency out-of-pocket expenses | 4,635 | 2,896 | 13,522 | 9,479 | 2,050 | 6,086 | ||||||||||||||||||||||||
Accrued legal, audit and tax service fees | 17,565 | 9,142 | 45,016 | 29,765 | 6,128 | 19,214 | ||||||||||||||||||||||||
Accrued trustees’ fees and expenses and deferred compensation | 3,518 | 7,598 | 7,378 | 2,499 | 1,137 | 109 | ||||||||||||||||||||||||
Accrued other | 12,203 | 7,610 | 29,548 | 21,802 | 8,591 | 13,574 | ||||||||||||||||||||||||
Total Liabilities | 200,110 | 158,149 | 332,785 | 348,257 | 276,550 | 992,546 | ||||||||||||||||||||||||
NET ASSETS | $206,731,856 | $50,022,384 | $154,943,145 | $137,100,580 | $31,309,610 | $70,777,267 | ||||||||||||||||||||||||
NET ASSETS CONSIST OF: | ||||||||||||||||||||||||||||||
Paid-in capital | $139,495,631 | $6,826,000 | $23,479,076 | $49,707,566 | $17,647,083 | $26,235,103 | ||||||||||||||||||||||||
Undistributed/accumulated net investment income (loss) | 5,432 | (7,204 | ) | 625,163 | 561,960 | (1,016 | ) | — | ||||||||||||||||||||||
Undistributed/accumulated net realized gain (loss) | 5,852,813 | 22,478,392 | 53,435,631 | 47,917,564 | 5,494,639 | 28,751,707 | ||||||||||||||||||||||||
Net unrealized appreciation (depreciation) on investments and assets and liabilities in foreign currencies | 61,377,980 | 20,725,196 | 77,403,275 | 38,913,490 | 8,168,904 | 15,790,457 | ||||||||||||||||||||||||
NET ASSETS | $206,731,856 | $50,022,384 | $154,943,145 | $137,100,580 | $31,309,610 | $70,777,267 | ||||||||||||||||||||||||
Class P Shares: | ||||||||||||||||||||||||||||||
Shares of beneficial interest outstanding | 8,145,001 | 4,723,519 | 9,040,089 | 9,849,924 | 2,918,158 | 5,601,591 | ||||||||||||||||||||||||
Net Asset Value Per Share | $25.38 | $10.59 | $17.14 | $13.92 | $10.73 | $12.64 | ||||||||||||||||||||||||
| (1) | The cost of foreign currency for the PF Large-Cap Growth Fund was $1,483. |
See Notes to Financial Statements
C-2
Table of Contents
PACIFIC FUNDS
STATEMENTS OF ASSETS AND LIABILITIES (Continued)
March 31, 2018
| PF Small-Cap Value Fund | PF Emerging Markets Fund | PF International Large-Cap Fund | PF International Small-Cap Fund | PF International Value Fund | PF Real Estate Fund | |||||||||||||||||||||||||
ASSETS | ||||||||||||||||||||||||||||||
Investments, at cost (excluding derivatives) | $63,007,557 | $113,942,641 | $69,342,581 | $81,541,168 | $125,955,168 | $31,756,469 | ||||||||||||||||||||||||
Investments, at value (excluding derivatives) | $81,623,126 | $179,065,247 | $124,158,390 | $89,229,551 | $141,781,173 | $41,302,456 | ||||||||||||||||||||||||
Cash | 16,837 | 9,196 | 10,823 | — | — | 8,475 | ||||||||||||||||||||||||
Foreign currency held, at value (1) | — | 146,036 | 77,516 | 408,403 | 96,293 | — | ||||||||||||||||||||||||
Receivables: | ||||||||||||||||||||||||||||||
Dividends and interest | 67,811 | 291,135 | 1,300,507 | 503,354 | 1,291,538 | 160,827 | ||||||||||||||||||||||||
Fund shares sold | 289 | 1,749 | 1,097 | 796 | 462 | 420 | ||||||||||||||||||||||||
Securities sold | — | 587,976 | 686,030 | 651,016 | 1,236,575 | 248,036 | ||||||||||||||||||||||||
Due from adviser | 6,279 | 45,823 | 18,350 | 698 | 14,327 | 2,529 | ||||||||||||||||||||||||
Prepaid expenses and other assets | 198 | 2,710 | 1,629 | — | 1,966 | 314 | ||||||||||||||||||||||||
Total Assets | 81,714,540 | 180,149,872 | 126,254,342 | 90,793,818 | 144,422,334 | 41,723,057 | ||||||||||||||||||||||||
LIABILITIES | ||||||||||||||||||||||||||||||
Payables: | ||||||||||||||||||||||||||||||
Fund shares redeemed | 21,174 | 50,376 | 35,480 | 25,188 | 36,778 | 11,608 | ||||||||||||||||||||||||
Securities purchased | 72,753 | 1,382,333 | 619,697 | 866,376 | 558,871 | 146,768 | ||||||||||||||||||||||||
Due to custodian | — | — | — | 1,017 | 114 | — | ||||||||||||||||||||||||
Accrued advisory fees | 60,968 | 131,662 | 98,482 | 51,254 | 79,006 | 28,981 | ||||||||||||||||||||||||
Accrued administration fees | 12,194 | 24,687 | 17,379 | 9,045 | 18,232 | 4,830 | ||||||||||||||||||||||||
Accrued support service expenses | 3,884 | 7,390 | 6,221 | 1,512 | 5,981 | 1,237 | ||||||||||||||||||||||||
Accrued custodian fees and expenses | 1,036 | 91,351 | 30,141 | 9,125 | 22,051 | 507 | ||||||||||||||||||||||||
Accrued transfer agency out-of-pocket expenses | 3,691 | 6,902 | 5,717 | 1,492 | 5,549 | 1,173 | ||||||||||||||||||||||||
Accrued legal, audit and tax service fees | 12,929 | 24,207 | 19,004 | 5,890 | 18,793 | 4,129 | ||||||||||||||||||||||||
Accrued trustees’ fees and expenses and deferred compensation | 935 | 1,478 | 3,529 | 28 | 4,375 | 503 | ||||||||||||||||||||||||
Accrued foreign capital gains tax | — | 7,238 | 5,277 | — | 20,234 | — | ||||||||||||||||||||||||
Accrued other | 10,434 | 30,795 | 28,923 | 6,611 | 26,801 | 4,103 | ||||||||||||||||||||||||
Total Liabilities | 199,998 | 1,758,419 | 869,850 | 977,538 | 796,785 | 203,839 | ||||||||||||||||||||||||
NET ASSETS | $81,514,542 | $178,391,453 | $125,384,492 | $89,816,280 | $143,625,549 | $41,519,218 | ||||||||||||||||||||||||
NET ASSETS CONSIST OF: | ||||||||||||||||||||||||||||||
Paid-in capital | $55,494,976 | $110,477,779 | $53,849,520 | $80,723,467 | $128,194,711 | $31,282,882 | ||||||||||||||||||||||||
Undistributed/accumulated net investment income (loss) | (743 | ) | (1,522,112 | ) | (249,495 | ) | (93,534 | ) | 593,345 | 141,085 | ||||||||||||||||||||
Undistributed/accumulated net realized gain (loss) | 7,404,740 | 4,321,490 | 16,955,550 | 1,489,093 | (976,645 | ) | 549,264 | |||||||||||||||||||||||
Net unrealized appreciation (depreciation) on investments and assets and liabilities in foreign currencies | 18,615,569 | 65,114,296 | 54,828,917 | 7,697,254 | 15,814,138 | 9,545,987 | ||||||||||||||||||||||||
NET ASSETS | $81,514,542 | $178,391,453 | $125,384,492 | $89,816,280 | $143,625,549 | $41,519,218 | ||||||||||||||||||||||||
Class P Shares: | ||||||||||||||||||||||||||||||
Shares of beneficial interest outstanding | 7,265,519 | 10,311,228 | 6,014,301 | 7,993,290 | 14,126,782 | 3,500,559 | ||||||||||||||||||||||||
Net Asset Value Per Share | $11.22 | $17.30 | $20.85 | $11.24 | $10.17 | $11.86 | ||||||||||||||||||||||||
| (1) | The cost of foreign currency, including amounts due to custodian in foreign currency, for the PF Emerging Markets, PF International Large-Cap, PF International Small-Cap, and PF International Value Funds was $146,324, $77,516, $406,970, and $96,504, respectively. |
See Notes to Financial Statements
C-3
Table of Contents
PACIFIC FUNDS
STATEMENTS OF ASSETS AND LIABILITIES (Continued)
March 31, 2018
| PF Currency Strategies Fund | PF Equity Long/Short Fund | PF Global Absolute Return Fund | PF Multi-Asset Fund | |||||||||||||||||||
ASSETS | ||||||||||||||||||||||
Investments, at cost (excluding derivatives) | $61,713,992 | $45,374,928 | $55,140,790 | $746,448,534 | ||||||||||||||||||
Investments, at value (excluding derivatives) | $61,953,378 | $45,368,280 | $56,784,120 | $745,902,952 | ||||||||||||||||||
Outstanding purchased options, at value (at cost $550,952 and $483,934, respectively) | 73,713 | — | 258,903 | — | ||||||||||||||||||
Cash | 2,308 | — | 977 | 46,045 | ||||||||||||||||||
Cash (segregated for derivative instruments) | — | 6,215,000 | 7,000 | 3,010,000 | ||||||||||||||||||
Foreign currency held, at value (1) | 3,028 | 59,904 | 3,091,353 | — | ||||||||||||||||||
Receivables: | ||||||||||||||||||||||
Dividends and interest | 72,598 | — | 793,838 | 3,280,516 | ||||||||||||||||||
Fund shares sold | 2,131 | 1,549 | 2,161 | — | ||||||||||||||||||
Securities sold | 12,774 | — | 21,489 | — | ||||||||||||||||||
Variation margin on futures contracts | — | 1,495,361 | 741,080 | — | ||||||||||||||||||
Variation margin on swap contracts | — | — | 2,408,410 | — | ||||||||||||||||||
Swap agreements | — | — | 150,738 | — | ||||||||||||||||||
Due from adviser | — | — | 12,082 | 33,220 | ||||||||||||||||||
Forward foreign currency contracts appreciation | 3,123,212 | 46,117 | 1,731,665 | — | ||||||||||||||||||
Swap agreements, at value | — | 6,317,946 | 468,506 | 7,305,502 | ||||||||||||||||||
Prepaid expenses and other assets | 348 | — | 242 | 68,790 | ||||||||||||||||||
Total Assets | 65,243,490 | 59,504,157 | 66,472,564 | 759,647,025 | ||||||||||||||||||
LIABILITIES | ||||||||||||||||||||||
Payables: | ||||||||||||||||||||||
Fund shares redeemed | 16,895 | 17,032 | 17,032 | — | ||||||||||||||||||
Securities purchased | — | — | 303,026 | 1,300,000 | ||||||||||||||||||
Swap agreements | — | — | — | 1,160,794 | ||||||||||||||||||
Due to custodian | — | 52 | — | — | ||||||||||||||||||
Due to brokers (2) | 310,000 | 2,080,000 | 150,000 | — | ||||||||||||||||||
Accrued advisory fees | 39,022 | 54,770 | 49,784 | 169,462 | ||||||||||||||||||
Accrued administration fees | 9,005 | 8,216 | 9,335 | 72,627 | ||||||||||||||||||
Accrued support service expenses | 2,784 | 240 | 2,922 | 3,776 | ||||||||||||||||||
Accrued custodian fees and expenses | 3,290 | 3,247 | 32,342 | 1,315 | ||||||||||||||||||
Accrued transfer agency out-of-pocket expenses | 2,602 | 367 | 2,756 | 2,709 | ||||||||||||||||||
Accrued legal, audit and tax service fees | 8,964 | 7,570 | 9,627 | 24,189 | ||||||||||||||||||
Accrued trustees’ fees and expenses and deferred compensation | 1,226 | 16 | 50 | 42 | ||||||||||||||||||
Accrued other | 4,273 | 10,513 | 15,608 | 5,507 | ||||||||||||||||||
Forward foreign currency contracts depreciation | 2,248,203 | 71,151 | 2,136,553 | — | ||||||||||||||||||
Forward volatility agreements depreciation | — | — | 10,313 | — | ||||||||||||||||||
Outstanding options written, at value (premiums received $235,799) | 42,125 | — | — | — | ||||||||||||||||||
Swap agreements, at value | — | 128,401 | 769,340 | 23,606,126 | ||||||||||||||||||
Total Liabilities | 2,688,389 | 2,381,575 | 3,508,688 | 26,346,547 | ||||||||||||||||||
NET ASSETS | $62,555,101 | $57,122,582 | $62,963,876 | $733,300,478 | ||||||||||||||||||
NET ASSETS CONSIST OF: | ||||||||||||||||||||||
Paid-in capital | $63,532,120 | $55,212,697 | $66,863,430 | $750,370,599 | ||||||||||||||||||
Undistributed/accumulated net investment income (loss) | (1,805,479 | ) | (5,259,736 | ) | (485,828 | ) | 1,064,555 | |||||||||||||||
Undistributed/accumulated net realized gain (loss) | (3,212 | ) | 1,784,946 | (3,150,963 | ) | (1,288,470 | ) | |||||||||||||||
Net unrealized appreciation (depreciation) on investments and assets and liabilities in foreign currencies | 831,672 | 5,384,675 | (262,763 | ) | (16,846,206 | ) | ||||||||||||||||
NET ASSETS | $62,555,101 | $57,122,582 | $62,963,876 | $733,300,478 | ||||||||||||||||||
Class P Shares: | ||||||||||||||||||||||
Shares of beneficial interest outstanding | 6,862,489 | 5,880,145 | 6,646,056 | 77,848,542 | ||||||||||||||||||
Net Asset Value Per Share | $9.12 | $9.71 | $9.47 | $9.42 | ||||||||||||||||||
| (1) | The cost of foreign currency for the PF Currency Strategies, PF Equity Long/Short, and PF Global Absolute Return Funds was $3,026, $60,017, and $3,068,875, respectively. |
| (2) | The PF Currency Strategies, PF Equity Long/Short, and PF Global Absolute Return Funds received cash collateral to mitigate risk of loss to certain counterparties, which will be repaid based on master netting arrangements between the Funds and the respective counterparties. The Funds invest such cash collateral in investment securities (See Note 5 in Notes to Financial Statements). |
See Notes to Financial Statements
C-4
Table of Contents
STATEMENTS OF OPERATIONS
FOR THE YEAR ENDED MARCH 31, 2018
| PF Inflation Managed Fund | PF Managed Bond Fund | PF Short Duration Bond Fund | PF Emerging Markets Debt Fund | PF Comstock Fund | PF Developing Growth Fund | |||||||||||||||||||||||||
INVESTMENT INCOME | ||||||||||||||||||||||||||||||
Dividends, net of foreign taxes withheld | $1,707 | $511,784 | $15,969 | $18,230 | $3,882,767 | $26,657 | ||||||||||||||||||||||||
Interest, net of foreign taxes withheld | 635,697 | 22,038,174 | 3,294,394 | 2,744,607 | — | — | ||||||||||||||||||||||||
Other | — | 1,441 | — | — | — | — | ||||||||||||||||||||||||
Total Investment Income | 637,404 | 22,551,399 | 3,310,363 | 2,762,837 | 3,882,767 | 26,657 | ||||||||||||||||||||||||
EXPENSES | ||||||||||||||||||||||||||||||
Advisory fees | 63,382 | 2,820,705 | 626,851 | 348,678 | 1,339,935 | 54,167 | ||||||||||||||||||||||||
Administration fees | 23,768 | 1,057,764 | 235,069 | 66,626 | 267,987 | 13,542 | ||||||||||||||||||||||||
Support services expenses | 1,504 | 118,362 | 23,392 | 7,001 | 28,808 | 1,721 | ||||||||||||||||||||||||
Custodian fees and expenses | 6,082 | 61,708 | 8,920 | 33,775 | 9,872 | 1,249 | ||||||||||||||||||||||||
Shareholder report expenses | 773 | 62,626 | 13,701 | 3,330 | 15,583 | 752 | ||||||||||||||||||||||||
Transfer agency out-of-pocket expenses | 844 | 56,116 | 11,357 | 3,358 | 13,817 | 801 | ||||||||||||||||||||||||
Legal, audit and tax service fees | 2,694 | 99,464 | 21,138 | 6,912 | 24,905 | 1,454 | ||||||||||||||||||||||||
Trustees’ fees and expenses | 576 | 33,296 | 6,745 | 1,941 | 8,160 | 475 | ||||||||||||||||||||||||
Interest expense | 61,908 | 123,269 | — | — | — | — | ||||||||||||||||||||||||
Other | 7,149 | 109,370 | 46,089 | 21,407 | 14,217 | 7,376 | ||||||||||||||||||||||||
Total Expenses | 168,680 | 4,542,680 | 993,262 | 493,028 | 1,723,284 | 81,537 | ||||||||||||||||||||||||
Advisory Fee Waiver (1) | — | — | — | — | (26,799 | ) | — | |||||||||||||||||||||||
Adviser Expense Reimbursement (2) | (19,621 | ) | (540,942 | ) | (131,342 | ) | (77,724 | ) | (115,361 | ) | (13,829 | ) | ||||||||||||||||||
Net Expenses | 149,059 | 4,001,738 | 861,920 | 415,304 | 1,581,124 | 67,708 | ||||||||||||||||||||||||
NET INVESTMENT INCOME (LOSS) | 488,345 | 18,549,661 | 2,448,443 | 2,347,533 | 2,301,643 | (41,051 | ) | |||||||||||||||||||||||
NET REALIZED AND UNREALIZED GAIN (LOSS) | ||||||||||||||||||||||||||||||
Net Realized Gain (Loss) On: | ||||||||||||||||||||||||||||||
Investment security transactions (3) | (38,007 | ) | 8,924,620 | (351,786 | ) | 592,168 | 40,807,010 | 1,272,919 | ||||||||||||||||||||||
Closed short positions | 2,434 | 27,902 | — | — | — | — | ||||||||||||||||||||||||
Foreign currency transactions | 61,129 | 1,648,959 | 225 | 247,524 | (1,537 | ) | — | |||||||||||||||||||||||
Forward foreign currency contract transactions | (106,701 | ) | (3,118,157 | ) | (8,878 | ) | 692,467 | (2,057,400 | ) | — | ||||||||||||||||||||
Futures contract transactions | 1,047 | (2,558,454 | ) | (442,690 | ) | — | — | — | ||||||||||||||||||||||
Purchased option transactions | (4,973 | ) | (1,815,704 | ) | (770 | ) | — | — | — | |||||||||||||||||||||
Swap transactions | 66,734 | 2,826,318 | — | 247,011 | — | — | ||||||||||||||||||||||||
Written option transactions | 33,643 | 3,284,408 | 154 | — | — | — | ||||||||||||||||||||||||
Net Realized Gain (Loss) | 15,306 | 9,219,892 | (803,745 | ) | 1,779,170 | 38,748,073 | 1,272,919 | |||||||||||||||||||||||
Change In Net Unrealized Appreciation (Depreciation) On: | ||||||||||||||||||||||||||||||
Investment securities | 27,064 | (777,259 | ) | (658,237 | ) | (543,775 | ) | (18,076,202 | ) | 1,084,703 | ||||||||||||||||||||
Foreign currencies | (1,108 | ) | (16,613 | ) | (30 | ) | (2,173 | ) | 5,137 | — | ||||||||||||||||||||
Forward foreign currency contracts | (11,228 | ) | (1,913,606 | ) | 157 | 314,707 | 190,594 | — | ||||||||||||||||||||||
Futures contracts | (54,779 | ) | 2,611,575 | 2,319 | — | — | — | |||||||||||||||||||||||
Purchased options | (5,469 | ) | (917,861 | ) | — | — | — | — | ||||||||||||||||||||||
Swaps | 9,540 | (3,424,658 | ) | — | (188,963 | ) | — | — | ||||||||||||||||||||||
Written options | (337 | ) | (43,889 | ) | — | — | — | — | ||||||||||||||||||||||
Change in Net Unrealized Appreciation (Depreciation) | (36,317 | ) | (4,482,311 | ) | (655,791 | ) | (420,204 | ) | (17,880,471 | ) | 1,084,703 | |||||||||||||||||||
NET GAIN (LOSS) | (21,011 | ) | 4,737,581 | (1,459,536 | ) | 1,358,966 | 20,867,602 | 2,357,622 | ||||||||||||||||||||||
NET INCREASE (DECREASE) IN NET ASSETS RESULTING FROM OPERATIONS | $467,334 | $23,287,242 | $988,907 | $3,706,499 | $23,169,245 | $2,316,571 | ||||||||||||||||||||||||
| Foreign taxes withheld on dividends and interest | $— | $2,456 | $2,636 | $64,665 | $88,126 | $— | |||||||||||||||||||||||
| (1) | See Note 6 in Notes to Financial Statements. |
| (2) | See Note 7B in Notes to Financial Statements. |
| (3) | Net realized gain (loss) on investment security transactions for the PF Emerging Markets Debt Fund is net of foreign capital gains tax withheld of $5,513. |
See Notes to Financial Statements
C-5
Table of Contents
PACIFIC FUNDS
STATEMENTS OF OPERATIONS (Continued)
FOR THE YEAR ENDED MARCH 31, 2018
| PF Growth Fund | PF Large-Cap Growth Fund | PF Large-Cap Value Fund | PF Main Street Core Fund | PF Mid-Cap Equity Fund | PF Mid-Cap Value Fund | |||||||||||||||||||||||||
INVESTMENT INCOME | ||||||||||||||||||||||||||||||
Dividends, net of foreign taxes withheld | $1,233,523 | $578,632 | $8,576,158 | $5,369,119 | $759,786 | $2,513,418 | ||||||||||||||||||||||||
Interest, net of foreign taxes withheld | 4,479 | — | — | — | — | — | ||||||||||||||||||||||||
Total Investment Income | 1,238,002 | 578,632 | 8,576,158 | 5,369,119 | 759,786 | 2,513,418 | ||||||||||||||||||||||||
EXPENSES | ||||||||||||||||||||||||||||||
Advisory fees | 790,652 | 663,690 | 2,690,536 | 1,300,239 | 409,941 | 1,304,509 | ||||||||||||||||||||||||
Administration fees | 215,632 | 132,738 | 620,893 | 433,413 | 94,602 | 279,538 | ||||||||||||||||||||||||
Support services expenses | 21,075 | 15,930 | 66,479 | 48,400 | 11,164 | 28,977 | ||||||||||||||||||||||||
Custodian fees and expenses | 5,391 | 5,239 | 12,371 | 9,143 | 2,695 | 6,020 | ||||||||||||||||||||||||
Shareholder report expenses | 12,066 | 8,033 | 36,931 | 26,389 | 5,617 | 16,210 | ||||||||||||||||||||||||
Transfer agency out-of-pocket expenses | 10,421 | 7,439 | 31,923 | 22,931 | 5,225 | 13,947 | ||||||||||||||||||||||||
Legal, audit and tax service fees | 21,460 | 12,219 | 57,438 | 38,869 | 8,279 | 24,545 | ||||||||||||||||||||||||
Trustees’ fees and expenses | 6,395 | 4,333 | 18,947 | 13,444 | 3,021 | 7,747 | ||||||||||||||||||||||||
Other | 12,844 | 8,924 | 22,919 | 17,955 | 13,498 | 11,587 | ||||||||||||||||||||||||
Total Expenses | 1,095,936 | 858,545 | 3,558,437 | 1,910,783 | 554,042 | 1,693,080 | ||||||||||||||||||||||||
Advisory Fee Waiver (1) | — | (39,821 | ) | — | — | — | — | |||||||||||||||||||||||
Adviser Expense Reimbursement (2) | (89,652 | ) | (62,117 | ) | (247,008 | ) | (177,131 | ) | (49,499 | ) | — | |||||||||||||||||||
Net Expenses | 1,006,284 | 756,607 | 3,311,429 | 1,733,652 | 504,543 | 1,693,080 | ||||||||||||||||||||||||
NET INVESTMENT INCOME (LOSS) | 231,718 | (177,975 | ) | 5,264,729 | 3,635,467 | 255,243 | 820,338 | |||||||||||||||||||||||
NET REALIZED AND UNREALIZED GAIN (LOSS) | ||||||||||||||||||||||||||||||
Net Realized Gain (Loss) On: | ||||||||||||||||||||||||||||||
Investment security transactions | 10,115,807 | 28,755,963 | 105,972,866 | 56,056,459 | 15,006,079 | 32,285,461 | ||||||||||||||||||||||||
Foreign currency transactions | (1,078 | ) | (1,608 | ) | (3,601 | ) | (5,965 | ) | — | (198 | ) | |||||||||||||||||||
Net Realized Gain (Loss) | 10,114,729 | 28,754,355 | 105,969,265 | 56,050,494 | 15,006,079 | 32,285,263 | ||||||||||||||||||||||||
Change In Net Unrealized Appreciation (Depreciation) On: | ||||||||||||||||||||||||||||||
Investment securities | 18,433,706 | (5,338,864 | ) | (74,455,651 | ) | (33,454,956 | ) | (5,362,910 | ) | (11,667,329 | ) | |||||||||||||||||||
Foreign currencies | — | 48 | — | 3,181 | — | — | ||||||||||||||||||||||||
Change in Net Unrealized Appreciation (Depreciation) | 18,433,706 | (5,338,816 | ) | (74,455,651 | ) | (33,451,775 | ) | (5,362,910 | ) | (11,667,329 | ) | |||||||||||||||||||
NET GAIN (LOSS) | 28,548,435 | 23,415,539 | 31,513,614 | 22,598,719 | 9,643,169 | 20,617,934 | ||||||||||||||||||||||||
NET INCREASE (DECREASE) IN NET ASSETS | $28,780,153 | $23,237,564 | $36,778,343 | $26,234,186 | $9,898,412 | $21,438,272 | ||||||||||||||||||||||||
Foreign taxes withheld on dividends and interest | $4,979 | $2,479 | $210,300 | $42,068 | $284 | $522 | ||||||||||||||||||||||||
| (1) | See Note 6 in Notes to Financial Statements. |
| (2) | See Note 7B in Notes to Financial Statements. |
See Notes to Financial Statements
C-6
Table of Contents
PACIFIC FUNDS
STATEMENTS OF OPERATIONS (Continued)
FOR THE YEAR ENDED MARCH 31, 2018
| PF Small-Cap Value Fund | PF Emerging Markets Fund | PF International Large-Cap Fund | PF International Small-Cap Fund | PF International Value Fund | PF Real Estate Fund | |||||||||||||||||||||||||
INVESTMENT INCOME | ||||||||||||||||||||||||||||||
Dividends, net of foreign taxes withheld | $1,218,668 | $3,289,866 | $4,010,137 | $1,264,460 | $6,403,246 | $1,163,040 | ||||||||||||||||||||||||
Interest, net of foreign taxes withheld | — | — | 7,746 | — | — | — | ||||||||||||||||||||||||
Total Investment Income | 1,218,668 | 3,289,866 | 4,017,883 | 1,264,460 | 6,403,246 | 1,163,040 | ||||||||||||||||||||||||
EXPENSES | ||||||||||||||||||||||||||||||
Advisory fees | 853,455 | 1,666,069 | 1,495,364 | 394,202 | 1,109,068 | 330,442 | ||||||||||||||||||||||||
Administration fees | 170,691 | 312,388 | 263,888 | 69,565 | 255,939 | 55,074 | ||||||||||||||||||||||||
Support services expenses | 18,584 | 31,573 | 31,847 | 6,687 | 28,854 | 7,713 | ||||||||||||||||||||||||
Custodian fees and expenses | 3,883 | 357,937 | 119,217 | 43,239 | 93,484 | 1,875 | ||||||||||||||||||||||||
Shareholder report expenses | 9,661 | 17,689 | 15,570 | 3,513 | 15,162 | 3,276 | ||||||||||||||||||||||||
Transfer agency out-of-pocket expenses | 8,909 | 15,340 | 14,781 | 3,318 | 13,613 | 3,394 | ||||||||||||||||||||||||
Legal, audit and tax service fees | 16,482 | 29,935 | 25,065 | 7,118 | 24,254 | 5,653 | ||||||||||||||||||||||||
Trustees’ fees and expenses | 5,309 | 9,303 | 8,716 | 1,936 | 8,099 | 1,988 | ||||||||||||||||||||||||
Other | 12,949 | 54,710 | 41,607 | 8,762 | 29,953 | 6,204 | ||||||||||||||||||||||||
Total Expenses | 1,099,923 | 2,494,944 | 2,016,055 | 538,340 | 1,578,426 | 415,619 | ||||||||||||||||||||||||
Adviser Expense Reimbursement (1) | (75,777 | ) | (516,488 | ) | (256,803 | ) | (28,196 | ) | (213,419 | ) | (30,103 | ) | ||||||||||||||||||
Net Expenses | 1,024,146 | 1,978,456 | 1,759,252 | 510,144 | 1,365,007 | 385,516 | ||||||||||||||||||||||||
NET INVESTMENT INCOME (LOSS) | 194,522 | 1,311,410 | 2,258,631 | 754,316 | 5,038,239 | 777,524 | ||||||||||||||||||||||||
NET REALIZED AND UNREALIZED GAIN (LOSS) | ||||||||||||||||||||||||||||||
Net Realized Gain (Loss) On: | ||||||||||||||||||||||||||||||
Investment security transactions (2) | 13,993,170 | 29,957,684 | 32,297,023 | 4,361,546 | 27,444,642 | 4,246,790 | ||||||||||||||||||||||||
Foreign currency transactions | 1 | (139,188 | ) | (25,576 | ) | (64,725 | ) | 58,074 | — | |||||||||||||||||||||
Forward foreign currency contract transactions | — | — | — | — | 44,138 | — | ||||||||||||||||||||||||
Net Realized Gain (Loss) | 13,993,171 | 29,818,496 | 32,271,447 | 4,296,821 | 27,546,854 | 4,246,790 | ||||||||||||||||||||||||
Change In Net Unrealized Appreciation (Depreciation) On: | ||||||||||||||||||||||||||||||
Investment securities (3) | (5,896,589 | ) | 17,642,306 | (6,365,551 | ) | 1,645,152 | (9,581,437 | ) | (6,500,964 | ) | ||||||||||||||||||||
Foreign currencies | — | 954 | 74,327 | 9,767 | 39,639 | — | ||||||||||||||||||||||||
Forward foreign currency contracts | — | — | — | — | (154,168 | ) | — | |||||||||||||||||||||||
Change in Net Unrealized Appreciation (Depreciation) | (5,896,589 | ) | 17,643,260 | (6,291,224 | ) | 1,654,919 | (9,695,966 | ) | (6,500,964 | ) | ||||||||||||||||||||
NET GAIN (LOSS) | 8,096,582 | 47,461,756 | 25,980,223 | 5,951,740 | 17,850,888 | (2,254,174 | ) | |||||||||||||||||||||||
NET INCREASE (DECREASE) IN NET ASSETS RESULTING FROM OPERATIONS | $8,291,104 | $48,773,166 | $28,238,854 | $6,706,056 | $22,889,127 | ($1,476,650 | ) | |||||||||||||||||||||||
Foreign taxes withheld on dividends and interest | $6,983 | $372,725 | $454,760 | $121,638 | $507,393 | $— | ||||||||||||||||||||||||
| (1) | See Note 7B in Notes to Financial Statements. |
| (2) | Net realized gain (loss) on investment security transactions for the PF International Value Fund is net of foreign capital gains tax withheld of $2,202. |
| (3) | Change in net unrealized appreciation (depreciation) on investment securities for the PF Emerging Markets, PF International Large-Cap, and PF International Value Funds was net of increase (decrease) in deferred foreign capital gains tax of ($157,383), $5,277, and $20,234, respectively. |
See Notes to Financial Statements
C-7
Table of Contents
PACIFIC FUNDS
STATEMENTS OF OPERATIONS (Continued)
FOR THE YEAR OR PERIOD ENDED MARCH 31, 2018
| PF Currency Strategies Fund | PF Equity Long/Short Fund | PF Global Absolute Return Fund | PF Multi-Asset Fund (1) | |||||||||||||||||||
INVESTMENT INCOME | ||||||||||||||||||||||
Dividends, net of foreign taxes withheld | $226,887 | $170,435 | $149,163 | $25,177 | ||||||||||||||||||
Interest, net of foreign taxes withheld | 371,168 | 427,923 | 4,602,654 | 1,340,128 | ||||||||||||||||||
Total Investment Income | 598,055 | 598,358 | 4,751,817 | 1,365,305 | ||||||||||||||||||
EXPENSES | ||||||||||||||||||||||
Advisory fees | 530,566 | 835,015 | 680,493 | 217,820 | ||||||||||||||||||
Administration fees | 122,438 | 108,915 | 127,592 | 93,351 | ||||||||||||||||||
Support services expenses | 12,971 | 8,860 | 13,273 | 3,776 | ||||||||||||||||||
Custodian fees and expenses | 12,816 | 12,478 | 117,049 | 1,315 | ||||||||||||||||||
Shareholder report expenses | 6,897 | 4,698 | 7,085 | 4,836 | ||||||||||||||||||
Transfer agency out-of-pocket expenses | 6,228 | 3,392 | 6,397 | 2,709 | ||||||||||||||||||
Legal, audit and tax service fees | 11,404 | 9,636 | 12,102 | 24,189 | ||||||||||||||||||
Trustees’ fees and expenses | 4,681 | 3,025 | 3,618 | 2,405 | ||||||||||||||||||
Offering expenses | — | — | — | 15,194 | ||||||||||||||||||
Interest expense | — | — | 57,414 | — | ||||||||||||||||||
Recoupment of adviser reimbursement (2) | 4,400 | — | — | — | ||||||||||||||||||
Other | 5,544 | 22,113 | 35,292 | 672 | ||||||||||||||||||
Total Expenses | 717,945 | 1,008,132 | 1,060,315 | 366,267 | ||||||||||||||||||
Advisory Fee Waiver (3) | — | (108,915 | ) | — | — | |||||||||||||||||
Adviser Expense Reimbursement (2) | — | — | (109,755 | ) | (48,872 | ) | ||||||||||||||||
Net Expenses | 717,945 | 899,217 | 950,560 | 317,395 | ||||||||||||||||||
NET INVESTMENT INCOME (LOSS) | (119,890 | ) | (300,859 | ) | 3,801,257 | 1,047,910 | ||||||||||||||||
NET REALIZED AND UNREALIZED GAIN (LOSS) | ||||||||||||||||||||||
Net Realized Gain (Loss) On: | ||||||||||||||||||||||
Investment security transactions (4) | (3,212 | ) | 345 | 2,833,008 | (127,942 | ) | ||||||||||||||||
Closed short positions | — | — | (80,902 | ) | — | |||||||||||||||||
Foreign currency transactions | 1,292,985 | (17,506 | ) | 1,981,338 | — | |||||||||||||||||
Forward bonds and forward volatility agreements | — | — | (17,895 | ) | — | |||||||||||||||||
Forward foreign currency contract transactions | (127,087 | ) | 1,182,841 | (3,259,500 | ) | — | ||||||||||||||||
Futures contract transactions | — | 4,437,330 | (502,198 | ) | — | |||||||||||||||||
Purchased option transactions | (2,063,455 | ) | — | (931,857 | ) | — | ||||||||||||||||
Swap transactions | — | 10,830,662 | (2,887,895 | ) | (1,160,794 | ) | ||||||||||||||||
Written option transactions | — | — | 782,369 | — | ||||||||||||||||||
Net Realized Gain (Loss) | (900,769 | ) | 16,433,672 | (2,083,532 | ) | (1,288,736 | ) | |||||||||||||||
Change In Net Unrealized Appreciation (Depreciation) On: | ||||||||||||||||||||||
Investment securities | 650,986 | (1,236 | ) | 1,749,041 | (545,582 | ) | ||||||||||||||||
Short positions | — | — | 18 | — | ||||||||||||||||||
Foreign currencies | 3,291 | (943 | ) | (6,857 | ) | — | ||||||||||||||||
Forward bonds and forward volatility agreements | — | — | (10,313 | ) | — | |||||||||||||||||
Forward foreign currency contracts | (1,602,709 | ) | (140,700 | ) | 4,025 | — | ||||||||||||||||
Futures contracts | — | (783,908 | ) | 63,379 | — | |||||||||||||||||
Purchased options | 321,670 | — | (72,889 | ) | — | |||||||||||||||||
Swaps | — | (5,497,786 | ) | 26,037 | (16,300,624 | ) | ||||||||||||||||
Written options | 193,674 | — | (227,428 | ) | — | |||||||||||||||||
Change in Net Unrealized Appreciation (Depreciation) | (433,088 | ) | (6,424,573 | ) | 1,525,013 | (16,846,206 | ) | |||||||||||||||
NET GAIN (LOSS) | (1,333,857 | ) | 10,009,099 | (558,519 | ) | (18,134,942 | ) | |||||||||||||||
NET INCREASE (DECREASE) IN NET ASSETS | ($1,453,747 | ) | $9,708,240 | $3,242,738 | ($17,087,032 | ) | ||||||||||||||||
Foreign taxes withheld on dividends and interest | $— | $— | $105,839 | $11,417 | ||||||||||||||||||
| (1) | PF Multi-Asset Fund commenced operations on January 31, 2018. |
| (2) | See Note 7B in Notes to Financial Statements. |
| (3) | See Note 6 in Notes to Financial Statements. |
| (4) | Net realized gain (loss) on investment security transactions for the PF Global Absolute Return Fund is net of foreign capital gains tax withheld of $53,150. |
See Notes to Financial Statements
C-8
Table of Contents
STATEMENTS OF CHANGES IN NET ASSETS
Year Ended | Year Ended | Year Ended | Year Ended | Year Ended | Year Ended | |||||||||||||||||||||||||||||||||
PF Inflation Managed Fund | PF Managed Bond Fund | PF Short Duration Bond Fund | ||||||||||||||||||||||||||||||||||||
OPERATIONS | ||||||||||||||||||||||||||||||||||||||
Net investment income (loss) | $488,345 | $691,995 | $18,549,661 | $18,337,677 | $2,448,443 | $1,140,129 | ||||||||||||||||||||||||||||||||
Net realized gain (loss) | 15,306 | 730,390 | 9,219,892 | (8,172,424 | ) | (803,745 | ) | (2,525 | ) | |||||||||||||||||||||||||||||
Change in net unrealized appreciation (depreciation) | (36,317 | ) | (759,154 | ) | (4,482,311 | ) | 7,052,492 | (655,791 | ) | 50,648 | ||||||||||||||||||||||||||||
Net Increase (Decrease) in Net Assets | 467,334 | 663,231 | 23,287,242 | 17,217,745 | 988,907 | 1,188,252 | ||||||||||||||||||||||||||||||||
DIVIDENDS AND DISTRIBUTIONS TO SHAREHOLDERS | ||||||||||||||||||||||||||||||||||||||
Net investment income - Class P | (165,026 | ) | — | (26,381,232 | ) | (12,139,381 | ) | (2,387,342 | ) | (1,142,148 | ) | |||||||||||||||||||||||||||
Net realized gains - Class P | — | — | (871,668 | ) | (9,128,858 | ) | — | — | ||||||||||||||||||||||||||||||
Net Decrease from Dividends and | (165,026 | ) | — | (27,252,900 | ) | (21,268,239 | ) | (2,387,342 | ) | (1,142,148 | ) | |||||||||||||||||||||||||||
CAPITAL SHARE TRANSACTIONS | ||||||||||||||||||||||||||||||||||||||
Proceeds from sale of shares - Class P | 64,592,086 | 1,867,182 | 5,783,284 | 528,068,478 | 4,942,999 | 162,428,614 | ||||||||||||||||||||||||||||||||
Dividends and distribution reinvestments - Class P | 165,026 | — | 27,252,900 | 21,268,239 | 2,387,342 | 1,142,148 | ||||||||||||||||||||||||||||||||
Cost of shares repurchased - Class P | (2,417,220 | ) | (41,590,601 | ) | (172,610,204 | ) | (224,447,161 | ) | (61,302,167 | ) | (71,877,097 | ) | ||||||||||||||||||||||||||
Net Increase (Decrease) in Net Assets from | 62,339,892 | (39,723,419 | ) | (139,574,020 | ) | 324,889,556 | (53,971,826 | ) | 91,693,665 | |||||||||||||||||||||||||||||
NET INCREASE (DECREASE) IN NET ASSETS | 62,642,200 | (39,060,188 | ) | (143,539,678 | ) | 320,839,062 | (55,370,261 | ) | 91,739,769 | |||||||||||||||||||||||||||||
NET ASSETS | ||||||||||||||||||||||||||||||||||||||
Beginning of Year | 13,130,096 | 52,190,284 | 742,216,157 | 421,377,095 | 167,639,019 | 75,899,250 | ||||||||||||||||||||||||||||||||
End of Year | $75,772,296 | $13,130,096 | $598,676,479 | $742,216,157 | $112,268,758 | $167,639,019 | ||||||||||||||||||||||||||||||||
Undistributed/Accumulated Net Investment Income (Loss) | $186,399 | ($65,030 | ) | ($1,643,668 | ) | $5,511,453 | $644,281 | $444,150 | ||||||||||||||||||||||||||||||
PF Emerging Markets Debt Fund | PF Comstock Fund | PF Developing Growth Fund | ||||||||||||||||||||||||||||||||||||
OPERATIONS | ||||||||||||||||||||||||||||||||||||||
Net investment income (loss) | $2,347,533 | $4,852,113 | $2,301,643 | $2,958,466 | ($41,051 | ) | ($60,769 | ) | ||||||||||||||||||||||||||||||
Net realized gain (loss) | 1,779,170 | 1,559,494 | 38,748,073 | 17,311,113 | 1,272,919 | 5,646,450 | ||||||||||||||||||||||||||||||||
Change in net unrealized appreciation (depreciation) | (420,204 | ) | 4,241,650 | (17,880,471 | ) | 17,986,474 | 1,084,703 | (2,616,840 | ) | |||||||||||||||||||||||||||||
Net Increase (Decrease) in Net Assets | 3,706,499 | 10,653,257 | 23,169,245 | 38,256,053 | 2,316,571 | 2,968,841 | ||||||||||||||||||||||||||||||||
DIVIDENDS AND DISTRIBUTIONS TO SHAREHOLDERS | ||||||||||||||||||||||||||||||||||||||
Net investment income - Class P | (3,464,056 | ) | (5,017,945 | ) | (1,919,721 | ) | (4,565,894 | ) | — | — | ||||||||||||||||||||||||||||
Net realized gains - Class P | — | — | (13,036,920 | ) | (15,229,937 | ) | — | — | ||||||||||||||||||||||||||||||
Net Decrease from Dividends and | (3,464,056 | ) | (5,017,945 | ) | (14,956,641 | ) | (19,795,831 | ) | — | — | ||||||||||||||||||||||||||||
CAPITAL SHARE TRANSACTIONS | ||||||||||||||||||||||||||||||||||||||
Proceeds from sale of shares - Class P | 46,255,849 | 3,780,533 | 1,806,541 | 15,922,053 | 1,177,216 | 478,278 | ||||||||||||||||||||||||||||||||
Dividends and distribution reinvestments - Class P | 3,464,056 | 5,017,945 | 14,956,641 | 19,795,831 | — | — | ||||||||||||||||||||||||||||||||
Cost of shares repurchased - Class P | (6,818,320 | ) | (79,981,311 | ) | (91,847,485 | ) | (85,229,473 | ) | (2,835,820 | ) | (36,837,521 | ) | ||||||||||||||||||||||||||
Net Increase (Decrease) in Net Assets from | 42,901,585 | (71,182,833 | ) | (75,084,303 | ) | (49,511,589 | ) | (1,658,604 | ) | (36,359,243 | ) | |||||||||||||||||||||||||||
NET INCREASE (DECREASE) IN NET ASSETS | 43,144,028 | (65,547,521 | ) | (66,871,699 | ) | (31,051,367 | ) | 657,967 | (33,390,402 | ) | ||||||||||||||||||||||||||||
NET ASSETS | ||||||||||||||||||||||||||||||||||||||
Beginning of Year | 42,613,762 | 108,161,283 | 183,720,064 | 214,771,431 | 8,805,491 | 42,195,893 | ||||||||||||||||||||||||||||||||
End of Year | $85,757,790 | $42,613,762 | $116,848,365 | $183,720,064 | $9,463,458 | $8,805,491 | ||||||||||||||||||||||||||||||||
Undistributed/Accumulated Net Investment Income (Loss) | ($385,597 | ) | ($466,021 | ) | ($517,809 | ) | $1,044,255 | ($1,866 | ) | ($1,836 | ) | |||||||||||||||||||||||||||
See Notes to Financial Statements
C-9
Table of Contents
PACIFIC FUNDS
STATEMENTS OF CHANGES IN NET ASSETS (Continued)
Year Ended | Year Ended | Year Ended | Year Ended | Year Ended | Year Ended March 31, 2017 | |||||||||||||||||||||||||||||||||
PF Growth Fund | PF Large-Cap Growth Fund | PF Large-Cap Value Fund | ||||||||||||||||||||||||||||||||||||
OPERATIONS | ||||||||||||||||||||||||||||||||||||||
Net investment income (loss) | $231,718 | $137,341 | ($177,975 | ) | ($132,926 | ) | $5,264,729 | $5,547,223 | ||||||||||||||||||||||||||||||
Net realized gain (loss) | 10,114,729 | 4,023,284 | 28,754,355 | 18,997,343 | 105,969,265 | 7,966,087 | ||||||||||||||||||||||||||||||||
Change in net unrealized appreciation (depreciation) | 18,433,706 | 11,550,079 | (5,338,816 | ) | 410,043 | (74,455,651 | ) | 43,755,041 | ||||||||||||||||||||||||||||||
Net Increase (Decrease) in Net Assets | 28,780,153 | 15,710,704 | 23,237,564 | 19,274,460 | 36,778,343 | 57,268,351 | ||||||||||||||||||||||||||||||||
DIVIDENDS AND DISTRIBUTIONS TO SHAREHOLDERS | ||||||||||||||||||||||||||||||||||||||
Net investment income - Class P | (255,381 | ) | (123,468 | ) | — | — | (5,568,048 | ) | (5,153,645 | ) | ||||||||||||||||||||||||||||
Net realized gains - Class P | (5,034,209 | ) | (2,855,020 | ) | (17,288,657 | ) | (7,234,883 | ) | (5,764,837 | ) | (8,128,566 | ) | ||||||||||||||||||||||||||
Net Decrease from Dividends and | (5,289,590 | ) | (2,978,488 | ) | (17,288,657 | ) | (7,234,883 | ) | (11,332,885 | ) | (13,282,211 | ) | ||||||||||||||||||||||||||
CAPITAL SHARE TRANSACTIONS | ||||||||||||||||||||||||||||||||||||||
Proceeds from sale of shares - Class P | 78,781,362 | 36,603,565 | 347,299 | 15,561,817 | 2,825,708 | 163,777,327 | ||||||||||||||||||||||||||||||||
Dividends and distribution reinvestments - Class P | 5,289,590 | 2,978,488 | 17,288,657 | 7,234,883 | 11,332,885 | 13,282,211 | ||||||||||||||||||||||||||||||||
Cost of shares repurchased - Class P | (35,961,516 | ) | (39,879,937 | ) | (62,729,681 | ) | (96,607,788 | ) | (318,212,161 | ) | (87,465,047 | ) | ||||||||||||||||||||||||||
Net Increase (Decrease) in Net Assets from | 48,109,436 | (297,884 | ) | (45,093,725 | ) | (73,811,088 | ) | (304,053,568 | ) | 89,594,491 | ||||||||||||||||||||||||||||
NET INCREASE (DECREASE) IN NET ASSETS | 71,599,999 | 12,434,332 | (39,144,818 | ) | (61,771,511 | ) | (278,608,110 | ) | 133,580,631 | |||||||||||||||||||||||||||||
NET ASSETS | ||||||||||||||||||||||||||||||||||||||
Beginning of Year | 135,131,857 | 122,697,525 | 89,167,202 | 150,938,713 | 433,551,255 | 299,970,624 | ||||||||||||||||||||||||||||||||
End of Year | $206,731,856 | $135,131,857 | $50,022,384 | $89,167,202 | $154,943,145 | $433,551,255 | ||||||||||||||||||||||||||||||||
Undistributed/Accumulated Net Investment Income (Loss) | $5,432 | $38,775 | ($7,204 | ) | ($6,933 | ) | $625,163 | $1,494,081 | ||||||||||||||||||||||||||||||
PF Main Street Core Fund | PF Mid-Cap Equity Fund | PF Mid-Cap Value Fund | ||||||||||||||||||||||||||||||||||||
OPERATIONS | ||||||||||||||||||||||||||||||||||||||
Net investment income (loss) | $3,635,467 | $3,960,115 | $255,243 | $418,762 | $820,338 | $644,205 | ||||||||||||||||||||||||||||||||
Net realized gain (loss) | 56,050,494 | 12,614,101 | 15,006,079 | 26,424,105 | 32,285,263 | 4,076,194 | ||||||||||||||||||||||||||||||||
Change in net unrealized appreciation (depreciation) | (33,451,775 | ) | 28,240,255 | (5,362,910 | ) | (4,846,412 | ) | (11,667,329 | ) | 30,096,291 | ||||||||||||||||||||||||||||
Net Increase (Decrease) in Net Assets | 26,234,186 | 44,814,471 | 9,898,412 | 21,996,455 | 21,438,272 | 34,816,690 | ||||||||||||||||||||||||||||||||
DIVIDENDS AND DISTRIBUTIONS TO SHAREHOLDERS | ||||||||||||||||||||||||||||||||||||||
Net investment income - Class P | (3,871,073 | ) | (3,737,963 | ) | (279,701 | ) | (1,195,977 | ) | (438,030 | ) | (1,924,546 | ) | ||||||||||||||||||||||||||
Net realized gains - Class P | (18,706,665 | ) | (1,319,560 | ) | (10,976,374 | ) | (11,955,102 | ) | (1,403,960 | ) | — | |||||||||||||||||||||||||||
Net Decrease from Dividends and | (22,577,738 | ) | (5,057,523 | ) | (11,256,075 | ) | (13,151,079 | ) | (1,841,990 | ) | (1,924,546 | ) | ||||||||||||||||||||||||||
CAPITAL SHARE TRANSACTIONS | ||||||||||||||||||||||||||||||||||||||
Proceeds from sale of shares - Class P | 1,255,628 | 102,856,519 | 226,914 | 491,250 | 1,037,630 | 46,317,335 | ||||||||||||||||||||||||||||||||
Dividends and distribution reinvestments - Class P | 22,577,738 | 5,057,523 | 11,256,075 | 13,151,079 | 1,841,990 | 1,924,546 | ||||||||||||||||||||||||||||||||
Cost of shares repurchased - Class P | (191,711,474 | ) | (58,023,374 | ) | (44,826,567 | ) | (126,071,438 | ) | (149,015,276 | ) | (134,785,344 | ) | ||||||||||||||||||||||||||
Net Increase (Decrease) in Net Assets from | (167,878,108 | ) | 49,890,668 | (33,343,578 | ) | (112,429,109 | ) | (146,135,656 | ) | (86,543,463 | ) | |||||||||||||||||||||||||||
NET INCREASE (DECREASE) IN NET ASSETS | (164,221,660 | ) | 89,647,616 | (34,701,241 | ) | (103,583,733 | ) | (126,539,374 | ) | (53,651,319 | ) | |||||||||||||||||||||||||||
NET ASSETS | ||||||||||||||||||||||||||||||||||||||
Beginning of Year | 301,322,240 | 211,674,624 | 66,010,851 | 169,594,584 | 197,316,641 | 250,967,960 | ||||||||||||||||||||||||||||||||
End of Year | $137,100,580 | $301,322,240 | $31,309,610 | $66,010,851 | $70,777,267 | $197,316,641 | ||||||||||||||||||||||||||||||||
Undistributed/Accumulated Net Investment Income (Loss) | $561,960 | $776,828 | ($1,016 | ) | ($828 | ) | $— | ($382,378 | ) | |||||||||||||||||||||||||||||
See Notes to Financial Statements
C-10
Table of Contents
PACIFIC FUNDS
STATEMENTS OF CHANGES IN NET ASSETS (Continued)
Year Ended | Year Ended March 31, 2017 | Year Ended | Year Ended March 31, 2017 | Year Ended | Year Ended March 31, 2017 | |||||||||||||||||||||||||||||||||
PF Small-Cap Value Fund | PF Emerging Markets Fund | PF International Large-Cap Fund | ||||||||||||||||||||||||||||||||||||
OPERATIONS | ||||||||||||||||||||||||||||||||||||||
Net investment income (loss) | $194,522 | $160,984 | $1,311,410 | $1,104,879 | $2,258,631 | $3,821,169 | ||||||||||||||||||||||||||||||||
Net realized gain (loss) | 13,993,171 | 15,385,823 | 29,818,496 | (3,188,694 | ) | 32,271,447 | (3,602,639 | ) | ||||||||||||||||||||||||||||||
Change in net unrealized appreciation (depreciation) | (5,896,589 | ) | 14,017,983 | 17,643,260 | 27,236,698 | (6,291,224 | ) | 23,920,705 | ||||||||||||||||||||||||||||||
Net Increase (Decrease) in Net Assets | 8,291,104 | 29,564,790 | 48,773,166 | 25,152,883 | 28,238,854 | 24,139,235 | ||||||||||||||||||||||||||||||||
DIVIDENDS AND DISTRIBUTIONS TO SHAREHOLDERS | ||||||||||||||||||||||||||||||||||||||
Net investment income - Class P | (230,521 | ) | (735,591 | ) | (1,205,327 | ) | (855,663 | ) | (2,849,998 | ) | (4,537,465 | ) | ||||||||||||||||||||||||||
Net realized gains - Class P | (15,035,437 | ) | (4,442,493 | ) | — | — | — | — | ||||||||||||||||||||||||||||||
Net Decrease from Dividends and | (15,265,958 | ) | (5,178,084 | ) | (1,205,327 | ) | (855,663 | ) | (2,849,998 | ) | (4,537,465 | ) | ||||||||||||||||||||||||||
CAPITAL SHARE TRANSACTIONS | ||||||||||||||||||||||||||||||||||||||
Proceeds from sale of shares - Class P | 759,572 | 4,938,117 | 2,759,146 | 135,052,663 | 5,456,504 | 20,480,420 | ||||||||||||||||||||||||||||||||
Dividends and distribution reinvestments - Class P | 15,265,958 | 5,178,084 | 1,205,327 | 855,663 | 2,849,998 | 4,537,465 | ||||||||||||||||||||||||||||||||
Cost of shares repurchased - Class P | (46,126,238 | ) | (115,237,202 | ) | (73,761,115 | ) | (77,634,759 | ) | (84,980,635 | ) | (157,813,108 | ) | ||||||||||||||||||||||||||
Net Increase (Decrease) in Net Assets from | (30,100,708 | ) | (105,121,001 | ) | (69,796,642 | ) | 58,273,567 | (76,674,133 | ) | (132,795,223 | ) | |||||||||||||||||||||||||||
NET INCREASE (DECREASE) IN NET ASSETS | (37,075,562 | ) | (80,734,295 | ) | (22,228,803 | ) | 82,570,787 | (51,285,277 | ) | (113,193,453 | ) | |||||||||||||||||||||||||||
NET ASSETS | ||||||||||||||||||||||||||||||||||||||
Beginning of Year | 118,590,104 | 199,324,399 | 200,620,256 | 118,049,469 | 176,669,769 | 289,863,222 | ||||||||||||||||||||||||||||||||
End of Year | $81,514,542 | $118,590,104 | $178,391,453 | $200,620,256 | $125,384,492 | $176,669,769 | ||||||||||||||||||||||||||||||||
Undistributed/Accumulated Net Investment Income (Loss) | ($743 | ) | ($4,881 | ) | ($1,522,112 | ) | ($1,597,852 | ) | ($249,495 | ) | $74,419 | |||||||||||||||||||||||||||
PF International Small-Cap Fund | PF International Value Fund | PF Real Estate Fund | ||||||||||||||||||||||||||||||||||||
OPERATIONS | ||||||||||||||||||||||||||||||||||||||
Net investment income (loss) | $754,316 | $1,235,601 | $5,038,239 | $4,220,131 | $777,524 | $670,766 | ||||||||||||||||||||||||||||||||
Net realized gain (loss) | 4,296,821 | 7,241,415 | 27,546,854 | (3,738,120 | ) | 4,246,790 | 5,374,002 | |||||||||||||||||||||||||||||||
Change in net unrealized appreciation (depreciation) | 1,654,919 | (723,355 | ) | (9,695,966 | ) | 22,501,123 | (6,500,964 | ) | (6,722,381 | ) | ||||||||||||||||||||||||||||
Net Increase (Decrease) in Net Assets | 6,706,056 | 7,753,661 | 22,889,127 | 22,983,134 | (1,476,650 | ) | (677,613 | ) | ||||||||||||||||||||||||||||||
DIVIDENDS AND DISTRIBUTIONS TO SHAREHOLDERS | ||||||||||||||||||||||||||||||||||||||
Net investment income - Class P | (1,105,961 | ) | (1,650,584 | ) | (7,139,546 | ) | (5,468,588 | ) | (616,661 | ) | (1,644,503 | ) | ||||||||||||||||||||||||||
Net realized gains - Class P | (3,413,550 | ) | (2,548,172 | ) | — | — | (5,759,868 | ) | (2,630,689 | ) | ||||||||||||||||||||||||||||
Net Decrease from Dividends and | (4,519,511 | ) | (4,198,756 | ) | (7,139,546 | ) | (5,468,588 | ) | (6,376,529 | ) | (4,275,192 | ) | ||||||||||||||||||||||||||
CAPITAL SHARE TRANSACTIONS | ||||||||||||||||||||||||||||||||||||||
Proceeds from sale of shares - Class P | 49,538,815 | 5,877,107 | 5,213,861 | 79,341,742 | 9,367,327 | 11,536,965 | ||||||||||||||||||||||||||||||||
Dividends and distribution reinvestments - Class P | 4,519,511 | 4,198,756 | 7,139,546 | 5,468,588 | 6,376,529 | 4,275,192 | ||||||||||||||||||||||||||||||||
Cost of shares repurchased - Class P | (9,226,369 | ) | (89,391,227 | ) | (59,107,900 | ) | (68,454,441 | ) | (5,409,463 | ) | (42,537,880 | ) | ||||||||||||||||||||||||||
Net Increase (Decrease) in Net Assets from | 44,831,957 | (79,315,364 | ) | (46,754,493 | ) | 16,355,889 | 10,334,393 | (26,725,723 | ) | |||||||||||||||||||||||||||||
NET INCREASE (DECREASE) IN NET ASSETS | 47,018,502 | (75,760,459 | ) | (31,004,912 | ) | 33,870,435 | 2,481,214 | (31,678,528 | ) | |||||||||||||||||||||||||||||
NET ASSETS | ||||||||||||||||||||||||||||||||||||||
Beginning of Year | 42,797,778 | 118,558,237 | 174,630,461 | 140,760,026 | 39,038,004 | 70,716,532 | ||||||||||||||||||||||||||||||||
End of Year | $89,816,280 | $42,797,778 | $143,625,549 | $174,630,461 | $41,519,218 | $39,038,004 | ||||||||||||||||||||||||||||||||
Undistributed/Accumulated Net Investment Income (Loss) | ($93,534 | ) | $9,431 | $593,345 | $1,560,796 | $141,085 | ($301 | ) | ||||||||||||||||||||||||||||||
See Notes to Financial Statements
C-11
Table of Contents
PACIFIC FUNDS
STATEMENTS OF CHANGES IN NET ASSETS (Continued)
| Year/Period Ended March 31, 2018 | Year Ended March 31, 2017 | Year Ended March 31, 2018 | Year Ended March 31, 2017 | Year Ended March 31, 2018 | Year Ended March 31, 2017 | |||||||||||||||||||||||||||||||||
| PF Currency Strategies Fund | PF Equity Long/Short Fund | PF Global Absolute Return Fund | ||||||||||||||||||||||||||||||||||||
OPERATIONS | ||||||||||||||||||||||||||||||||||||||
Net investment income (loss) | ($119,890 | ) | ($633,380 | ) | ($300,859 | ) | ($954,939 | ) | $3,801,257 | $4,175,240 | ||||||||||||||||||||||||||||
Net realized gain (loss) | (900,769 | ) | 4,936,015 | 16,433,672 | 13,188,320 | (2,083,532 | ) | (4,586,089 | ) | |||||||||||||||||||||||||||||
Change in net unrealized appreciation (depreciation) | (433,088 | ) | 6,418,917 | (6,424,573 | ) | (3,607,855 | ) | 1,525,013 | 5,183,846 | |||||||||||||||||||||||||||||
Net Increase (Decrease) in Net Assets | (1,453,747 | ) | 10,721,552 | 9,708,240 | 8,625,526 | 3,242,738 | 4,772,997 | |||||||||||||||||||||||||||||||
DIVIDENDS AND DISTRIBUTIONS TO SHAREHOLDERS | ||||||||||||||||||||||||||||||||||||||
Net investment income - Class P | (2,053,772 | ) | (9,020,580 | ) | (4,575,880 | ) | (12,227,818 | ) | (221,727 | ) | (3,029,841 | ) | ||||||||||||||||||||||||||
Net realized gains - Class P | — | — | (5,371,424 | ) | — | — | — | |||||||||||||||||||||||||||||||
Net Decrease from Dividends and | (2,053,772 | ) | (9,020,580 | ) | (9,947,304 | ) | (12,227,818 | ) | (221,727 | ) | (3,029,841 | ) | ||||||||||||||||||||||||||
CAPITAL SHARE TRANSACTIONS | ||||||||||||||||||||||||||||||||||||||
Proceeds from sale of shares - Class P | 7,841,564 | 28,511,621 | 3,506,269 | 4,528,597 | 7,667,734 | 33,038,489 | ||||||||||||||||||||||||||||||||
Dividends and distribution reinvestments - Class P | 2,053,772 | 9,020,580 | 9,947,304 | 12,227,818 | 221,727 | 3,029,841 | ||||||||||||||||||||||||||||||||
Cost of shares repurchased - Class P | (31,655,007 | ) | (78,661,680 | ) | (27,173,385 | ) | (109,659,401 | ) | (34,991,071 | ) | (82,540,836 | ) | ||||||||||||||||||||||||||
Net Increase (Decrease) in Net Assets from | (21,759,671 | ) | (41,129,479 | ) | (13,719,812 | ) | (92,902,986 | ) | (27,101,610 | ) | (46,472,506 | ) | ||||||||||||||||||||||||||
NET INCREASE (DECREASE) IN NET ASSETS | (25,267,190 | ) | (39,428,507 | ) | (13,958,876 | ) | (96,505,278 | ) | (24,080,599 | ) | (44,729,350 | ) | ||||||||||||||||||||||||||
NET ASSETS | ||||||||||||||||||||||||||||||||||||||
Beginning of Year | 87,822,291 | 127,250,798 | 71,081,458 | 167,586,736 | 87,044,475 | 131,773,825 | ||||||||||||||||||||||||||||||||
End of Year | $62,555,101 | $87,822,291 | $57,122,582 | $71,081,458 | $62,963,876 | $87,044,475 | ||||||||||||||||||||||||||||||||
Undistributed/Accumulated Net Investment Income (Loss) | ($1,805,479 | ) | ($22,587 | ) | ($5,259,736 | ) | ($12,290,745 | ) | ($485,828 | ) | ($62,038 | ) | ||||||||||||||||||||||||||
| PF Multi-Asset Fund (1) | ||||||||||||||||||||||||||||||||||||||
OPERATIONS | ||||||||||||||||||||||||||||||||||||||
Net investment income (loss) | $1,047,910 | |||||||||||||||||||||||||||||||||||||
Net realized gain (loss) | (1,288,736 | ) | ||||||||||||||||||||||||||||||||||||
Change in net unrealized appreciation (depreciation) | (16,846,206 | ) | ||||||||||||||||||||||||||||||||||||
Net Increase (Decrease) in Net Assets | (17,087,032 | ) | ||||||||||||||||||||||||||||||||||||
DIVIDENDS AND DISTRIBUTIONS TO SHAREHOLDERS | ||||||||||||||||||||||||||||||||||||||
Net investment income - Class P | — | |||||||||||||||||||||||||||||||||||||
Net realized gains - Class P | — | |||||||||||||||||||||||||||||||||||||
Net Decrease from Dividends and | — | |||||||||||||||||||||||||||||||||||||
CAPITAL SHARE TRANSACTIONS | ||||||||||||||||||||||||||||||||||||||
Proceeds from sale of shares - Class P | 750,387,520 | |||||||||||||||||||||||||||||||||||||
Dividends and distribution reinvestments - Class P | — | |||||||||||||||||||||||||||||||||||||
Cost of shares repurchased - Class P | (10 | ) | ||||||||||||||||||||||||||||||||||||
Net Increase (Decrease) in Net Assets from | 750,387,510 | |||||||||||||||||||||||||||||||||||||
NET INCREASE (DECREASE) IN NET ASSETS | 733,300,478 | |||||||||||||||||||||||||||||||||||||
NET ASSETS | ||||||||||||||||||||||||||||||||||||||
Beginning of Period | — | |||||||||||||||||||||||||||||||||||||
End of Period | $733,300,478 | |||||||||||||||||||||||||||||||||||||
Undistributed/Accumulated Net Investment Income (Loss) | $1,064,555 | |||||||||||||||||||||||||||||||||||||
| (1) | PF Multi-Asset Fund commenced operations of January 31, 2018. |
See Notes to Financial Statements
C-12
Table of Contents
PACIFIC FUNDS
FOR THE YEAR ENDED MARCH 31, 2018
| PF Inflation Managed Fund | ||||||||||
CASH FLOWS FROM OPERATING ACTIVITIES (2): | ||||||||||
Net increase (decrease) in net assets from operations | $467,334 | |||||||||
Adjustments to reconcile net increase (decrease) in net assets from operations to net cash provided by (used in) operating activities: | ||||||||||
Purchases of long-term securities | (94,106,818 | ) | ||||||||
Proceeds from disposition of long-term securities | 24,383,141 | |||||||||
Proceeds from securities sold short | 1,533,715 | |||||||||
Purchases to cover securities sold short | (1,531,281 | ) | ||||||||
Proceeds (purchases) of short-term securities, net | (4,606,603 | ) | ||||||||
Proceeds (purchases) from foreign currency transactions | (109,641 | ) | ||||||||
(Increase) decrease in dividends and interest receivable | (128,518 | ) | ||||||||
(Increase) decrease in receivable for securities sold | (335,925 | ) | ||||||||
(Increase) decrease in receivable due from adviser | (2,773 | ) | ||||||||
(Increase) decrease in prepaid expenses and other assets | 140 | |||||||||
(Increase) decrease in variation margin on futures contracts | (94,860 | ) | ||||||||
(Increase) decrease in variation margin on swap contracts | 61,062 | |||||||||
Increase (decrease) in swap premiums | (2,427 | ) | ||||||||
Increase (decrease) in payable for securities purchased | 1,953,090 | |||||||||
Increase (decrease) in payable for due to custodian | 16 | |||||||||
Increase (decrease) in accrued advisory fees | 1,663 | |||||||||
Increase (decrease) in accrued administration fees | 4,656 | |||||||||
Increase (decrease) in accrued support services expenses | 62 | |||||||||
Increase (decrease) in accrued custodian fees and expenses | (235 | ) | ||||||||
Increase (decrease) in accrued transfer agency out-of-pocket expenses | 223 | |||||||||
Increase (decrease) in accrued legal, audit and tax service fees | 963 | |||||||||
Increase (decrease) in accrued trustees’ fees and expenses and deferred compensation | 119 | |||||||||
Increase (decrease) in accrued other payable | 978 | |||||||||
Change in net unrealized (appreciation) depreciation on investment securities | (27,064 | ) | ||||||||
Change in net unrealized (appreciation) depreciation on swaps (3) | 1,388 | |||||||||
Change in net unrealized (appreciation) depreciation on written options | 337 | |||||||||
Change in net unrealized (appreciation) depreciation on purchased options | 5,469 | |||||||||
Change in net unrealized (appreciation) depreciation on forward foreign currency contract transactions | 11,228 | |||||||||
Change in net unrealized (appreciation) depreciation on foreign currencies | 1,108 | |||||||||
Net realized (gain) loss on investment security transactions | 38,007 | |||||||||
Net realized (gain) loss on closed short positions | (2,434 | ) | ||||||||
Net realized (gain) loss on written option transactions | (33,643 | ) | ||||||||
Net realized (gain) loss on purchased option transactions | 4,973 | |||||||||
Net realized (gain) loss on forward foreign currency contract transactions | 106,701 | |||||||||
Net realized (gain) loss on foreign currency | (61,129 | ) | ||||||||
Net amortization on investments | 88,887 | |||||||||
Net cash provided by (used in) operating activities | (72,378,091 | ) | ||||||||
CASH FLOWS FROM FINANCING ACTIVITIES: | ||||||||||
Proceeds from shares sold | 64,596,260 | |||||||||
Payment of shares redeemed | (2,398,839 | ) | ||||||||
Increase (decrease) in payable for reverse repurchase agreement | 2,450,000 | |||||||||
Proceeds from sale-buyback financing activities | 213,406,604 | |||||||||
Payment on sale-buyback financing transactions | (205,573,044 | ) | ||||||||
Net cash provided by (used in) financing activities | 72,480,981 | |||||||||
NET INCREASE (DECREASE) IN CASH AND FOREIGN CURRENCY | 102,890 | |||||||||
CASH AND FOREIGN CURRENCY (4): | ||||||||||
Beginning of Year | 257,123 | |||||||||
End of Year | $360,013 | |||||||||
| (1) | Information on financial transactions which have been settled through the receipt or disbursement of cash is presented in the Statement of Cash Flows. The cash amounts shown in the Statement of Cash Flows are the amount included within the Statements of Assets and Liabilities and include cash and foreign currency, if any, but does not include any short-term investments. The PF Inflation Managed Fund has not met the exemption criteria under the Financial Accounting Standards Board Accounting Standards Codification Topic 230, Statement of Cash Flows, and therefore includes a Statement of Cash Flows. All other funds have met the exemption criteria. |
| (2) | Interest paid by the PF Inflation Managed Fund was $61,908. |
| (3) | Excludes centrally cleared swaps included in variation margin. |
| (4) | Includes cash (segregagted for derivative instruments) of $287,000. |
See Notes to Financial Statements
C-13
Table of Contents
PACIFIC FUNDS
Selected per share, ratios and supplemental data for each year or period ended March 31, were as follows:
| Fund | Selected Per Share Data | Ratios to Average Net Assets | Supplemental Data | |||||||||||||||||||||||||||||||||||||||||||||||||||||
| Investment Operations | Distributions | |||||||||||||||||||||||||||||||||||||||||||||||||||||||
| For the Year or Period Ended | Net Asset Value, Beginning of Year or Period | Net Investment Income (Loss) (1) | Net Realized and Unrealized Gain (Loss) | Total | Net Investment Income | Capital Gains | Total | Net Asset Value, End of Year or Period | Expenses Before Reductions (2) | Expenses After Reductions (2), (3) | Net Investment Income (Loss) (2) | Total Returns (4) | Net Assets, End of Year or Period (in thousands) | Portfolio Turnover Rates | ||||||||||||||||||||||||||||||||||||||||||
PF Inflation Managed Fund | ||||||||||||||||||||||||||||||||||||||||||||||||||||||||
| 4/1/2017 - 3/31/2018 | $8.92 | $0.27 | ($0.19 | ) | $0.08 | ($0.12 | ) | $— | ($0.12 | ) | $8.88 | 1.06 | % | 0.94 | %(5) | 3.08 | % | 0.87 | % | $75,772 | 108 | % | ||||||||||||||||||||||||||||||||||
| 4/1/2016 - 3/31/2017 | 8.73 | 0.29 | (0.10 | ) | 0.19 | — | — | — | 8.92 | 0.98 | % | 0.80 | % | 3.35 | % | 2.18 | % | 13,130 | 194 | % | ||||||||||||||||||||||||||||||||||||
| 4/1/2015 - 3/31/2016 | 8.80 | 0.20 | (0.27 | ) | (0.07 | ) | — | — | — | 8.73 | 0.79 | % | 0.64 | % | 2.36 | % | (0.80 | %) | 52,190 | 89 | % | |||||||||||||||||||||||||||||||||||
| 4/1/2014 - 3/31/2015 | 8.84 | 0.06 | 0.15 | 0.21 | (0.25 | ) | — | (0.25 | ) | 8.80 | 0.68 | % | 0.58 | % | 0.68 | % | 2.38 | % | 126,154 | 139 | % | |||||||||||||||||||||||||||||||||||
| 4/1/2013 - 3/31/2014 | 9.73 | 0.07 | (0.78 | ) | (0.71 | ) | (0.04 | ) | (0.14 | ) | (0.18 | ) | 8.84 | 0.64 | % | 0.56 | % | 0.83 | % | (7.40 | %) | 185,765 | 36 | % | ||||||||||||||||||||||||||||||||
PF Managed Bond Fund | ||||||||||||||||||||||||||||||||||||||||||||||||||||||||
| 4/1/2017 - 3/31/2018 | $10.67 | $0.29 | $0.05 | $0.34 | ($0.42 | ) | ($0.01 | ) | ($0.43 | ) | $10.58 | 0.64 | % | 0.57 | %(5) | 2.63 | % | 3.29 | % | $598,676 | 364 | % | ||||||||||||||||||||||||||||||||||
| 4/1/2016 - 3/31/2017 | 10.57 | 0.26 | 0.10 | 0.36 | (0.15 | ) | (0.11 | ) | (0.26 | ) | 10.67 | 0.64 | % | 0.56 | % | 2.39 | % | 3.42 | % | 742,216 | 372 | % | ||||||||||||||||||||||||||||||||||
| 4/1/2015 - 3/31/2016 | 11.06 | 0.28 | (0.16 | ) | 0.12 | (0.25 | ) | (0.36 | ) | (0.61 | ) | 10.57 | 0.64 | % | 0.55 | % | 2.58 | % | 1.31 | % | 421,377 | 370 | % | |||||||||||||||||||||||||||||||||
| 4/1/2014 - 3/31/2015 | 10.76 | 0.15 | 0.52 | 0.67 | (0.17 | ) | (0.20 | ) | (0.37 | ) | 11.06 | 0.63 | % | 0.55 | % | 1.37 | % | 6.32 | % | 643,882 | 578 | % | ||||||||||||||||||||||||||||||||||
| 4/1/2013 - 3/31/2014 | 11.11 | 0.13 | (0.27 | ) | (0.14 | ) | (0.15 | ) | (0.06 | ) | (0.21 | ) | 10.76 | 0.63 | % | 0.55 | % | 1.16 | % | (1.22 | %) | 579,753 | 530 | % | ||||||||||||||||||||||||||||||||
PF Short Duration Bond Fund | ||||||||||||||||||||||||||||||||||||||||||||||||||||||||
| 4/1/2017 - 3/31/2018 | $9.88 | $0.15 | ($0.09 | ) | $0.06 | ($0.15 | ) | $— | ($0.15 | ) | $9.79 | 0.63 | % | 0.55 | % | 1.56 | % | 0.65 | % | $112,269 | 67 | % | ||||||||||||||||||||||||||||||||||
| 4/1/2016 - 3/31/2017 | 9.84 | 0.12 | 0.01 | 0.13 | (0.09 | ) | — | (0.09 | ) | 9.88 | 0.68 | % | 0.55 | % | 1.16 | % | 1.36 | % | 167,639 | 233 | % | |||||||||||||||||||||||||||||||||||
| 4/1/2015 - 3/31/2016 | 10.01 | 0.12 | (0.09 | ) | 0.03 | (0.20 | ) | — | (0.20 | ) | 9.84 | 0.65 | % | 0.55 | % | 1.18 | % | 0.35 | % | 75,899 | 98 | % | ||||||||||||||||||||||||||||||||||
| 4/1/2014 - 3/31/2015 | 10.05 | 0.11 | (0.02 | ) | 0.09 | (0.13 | ) | — | (0.13 | ) | 10.01 | 0.64 | % | 0.55 | % | 1.11 | % | 0.88 | % | 213,334 | 60 | % | ||||||||||||||||||||||||||||||||||
| 4/1/2013 - 3/31/2014 | 10.12 | 0.10 | (0.04 | ) | 0.06 | (0.13 | ) | — | (0.13 | ) | 10.05 | 0.64 | % | 0.55 | % | 1.02 | % | 0.64 | % | 229,189 | 43 | % | ||||||||||||||||||||||||||||||||||
PF Emerging Markets Debt Fund | ||||||||||||||||||||||||||||||||||||||||||||||||||||||||
| 4/1/2017 - 3/31/2018 | $9.39 | $0.51 | $0.30 | $0.81 | ($0.83 | ) | $— | ($0.83 | ) | $9.37 | 1.11 | % | 0.94 | % | 5.28 | % | 8.76 | % | $85,758 | 68 | % | |||||||||||||||||||||||||||||||||||
| 4/1/2016 - 3/31/2017 | 9.14 | 0.72 | 0.58 | 1.30 | (1.05 | ) | — | (1.05 | ) | 9.39 | 1.10 | % | 0.94 | % | 7.58 | % | 14.88 | % | 42,614 | 75 | % | |||||||||||||||||||||||||||||||||||
| 4/1/2015 - 3/31/2016 | 8.89 | 0.61 | (0.35 | ) | 0.26 | (0.01 | ) | — | (0.01 | ) | 9.14 | 1.07 | % | 0.94 | % | 6.91 | % | 2.93 | % | 108,161 | 80 | % | ||||||||||||||||||||||||||||||||||
| 4/1/2014 - 3/31/2015 | 9.69 | 0.50 | (0.95 | ) | (0.45 | ) | (0.35 | ) | — | (0.35 | ) | 8.89 | 1.08 | % | 0.94 | % | 5.20 | % | (4.73 | %) | 162,011 | 105 | % | |||||||||||||||||||||||||||||||||
| 4/1/2013 - 3/31/2014 | 10.53 | 0.47 | (0.90 | ) | (0.43 | ) | (0.32 | ) | (0.09 | ) | (0.41 | ) | 9.69 | 1.06 | % | 0.94 | % | 4.71 | % | (3.92 | %) | 130,516 | 116 | % | ||||||||||||||||||||||||||||||||
PF Comstock Fund | ||||||||||||||||||||||||||||||||||||||||||||||||||||||||
| 4/1/2017 - 3/31/2018 | $15.00 | $0.20 | $1.63 | $1.83 | ($0.16 | ) | ($1.16 | ) | ($1.32 | ) | $15.51 | 0.96 | % | 0.89 | % | 1.29 | % | 12.13 | % | $116,848 | 13 | % | ||||||||||||||||||||||||||||||||||
| 4/1/2016 - 3/31/2017 | 13.66 | 0.23 | 2.75 | 2.98 | (0.36 | ) | (1.28 | ) | (1.64 | ) | 15.00 | 0.97 | % | 0.89 | % | 1.55 | % | 21.92 | % | 183,720 | 22 | % | ||||||||||||||||||||||||||||||||||
| 4/1/2015 - 3/31/2016 | 17.07 | 0.27 | (1.46 | ) | (1.19 | ) | (0.36 | ) | (1.86 | ) | (2.22 | ) | 13.66 | 0.96 | % | 0.89 | % | 1.73 | % | (7.54 | %) | 214,771 | 16 | % | ||||||||||||||||||||||||||||||||
| 4/1/2014 - 3/31/2015 | 17.61 | 0.22 | 1.07 | 1.29 | (0.37 | ) | (1.46 | ) | (1.83 | ) | 17.07 | 0.96 | % | 0.89 | % | 1.25 | % | 7.22 | % | 269,705 | 21 | % | ||||||||||||||||||||||||||||||||||
| 4/1/2013 - 3/31/2014 | 14.40 | 0.25 | 3.11 | 3.36 | (0.15 | ) | — | (0.15 | ) | 17.61 | 0.97 | % | 0.89 | % | 1.53 | % | 23.36 | % | 308,598 | 14 | % | |||||||||||||||||||||||||||||||||||
PF Developing Growth Fund | ||||||||||||||||||||||||||||||||||||||||||||||||||||||||
| 4/1/2017 - 3/31/2018 | $11.50 | ($0.06 | ) | $3.40 | $3.34 | $— | $— | $— | $14.84 | 0.90 | % | 0.75 | % | (0.45 | %) | 29.04 | % | $9,463 | 86 | % | ||||||||||||||||||||||||||||||||||||
| 4/1/2016 - 3/31/2017 | 9.80 | (0.04 | ) | 1.74 | 1.70 | — | — | — | 11.50 | 0.90 | % | 0.75 | % | (0.40 | %) | 17.35 | % | 8,805 | 123 | % | ||||||||||||||||||||||||||||||||||||
| 4/1/2015 - 3/31/2016 | 14.80 | (0.07 | ) | (3.18 | ) | (3.25 | ) | — | (1.75 | ) | (1.75 | ) | 9.80 | 0.82 | % | 0.75 | % | (0.51 | %) | (23.59 | %) | 42,196 | 229 | % | ||||||||||||||||||||||||||||||||
| 4/1/2014 - 3/31/2015 | 15.54 | (0.05 | ) | 1.20 | 1.15 | — | (1.89 | ) | (1.89 | ) | 14.80 | 0.82 | % | 0.75 | % | (0.35 | %) | 8.36 | % | 83,731 | 264 | % | ||||||||||||||||||||||||||||||||||
| 4/1/2013 - 3/31/2014 | 13.29 | (0.04 | ) | 2.67 | 2.63 | (0.02 | ) | (0.36 | ) | (0.38 | ) | 15.54 | 0.83 | % | 0.75 | % | (0.28 | %) | 19.90 | % | 59,921 | 84 | % | |||||||||||||||||||||||||||||||||
PF Growth Fund | ||||||||||||||||||||||||||||||||||||||||||||||||||||||||
| 4/1/2017 - 3/31/2018 | $20.94 | $0.04 | $5.33 | $5.37 | ($0.04 | ) | ($0.89 | ) | ($0.93 | ) | $25.38 | 0.76 | % | 0.70 | % | 0.16 | % | 25.93 | % | $206,732 | 34 | % | ||||||||||||||||||||||||||||||||||
| 4/1/2016 - 3/31/2017 | 18.82 | 0.02 | 2.61 | 2.63 | (0.02 | ) | (0.49 | ) | (0.51 | ) | 20.94 | 0.77 | % | 0.70 | % | 0.12 | % | 14.25 | % | 135,132 | 43 | % | ||||||||||||||||||||||||||||||||||
| 4/1/2015 - 3/31/2016 | 19.30 | 0.02 | 0.43 | 0.45 | (0.09 | ) | (0.84 | ) | (0.93 | ) | 18.82 | 0.76 | % | 0.70 | % | 0.11 | % | 2.17 | % | 122,698 | 35 | % | ||||||||||||||||||||||||||||||||||
| 4/1/2014 - 3/31/2015 | 17.33 | 0.05 | 2.19 | 2.24 | (0.13 | ) | (0.14 | ) | (0.27 | ) | 19.30 | 0.76 | % | 0.70 | % | 0.30 | % | 12.96 | % | 147,893 | 39 | % | ||||||||||||||||||||||||||||||||||
| 4/1/2013 - 3/31/2014 | 13.93 | 0.03 | 3.47 | 3.50 | (0.10 | ) | — | (0.10 | ) | 17.33 | 0.79 | % | 0.70 | % | 0.20 | % | 25.15 | % | 101,285 | 76 | % | |||||||||||||||||||||||||||||||||||
PF Large-Cap Growth Fund | ||||||||||||||||||||||||||||||||||||||||||||||||||||||||
| 4/1/2017 - 3/31/2018 | $10.11 | ($0.02 | ) | $2.73 | $2.71 | $— | ($2.23 | ) | ($2.23 | ) | $10.59 | 0.97 | % | 0.86 | % | (0.20 | %) | 28.46 | % | $50,022 | 48 | % | ||||||||||||||||||||||||||||||||||
| 4/1/2016 - 3/31/2017 | 9.24 | (0.01 | ) | 1.50 | 1.49 | — | (0.62 | ) | (0.62 | ) | 10.11 | 0.97 | % | 0.86 | % | (0.11 | %) | 16.74 | % | 89,167 | 80 | % | ||||||||||||||||||||||||||||||||||
| 4/1/2015 - 3/31/2016 | 10.71 | (0.02 | ) | (0.17 | ) | (0.19 | ) | — | (1.28 | ) | (1.28 | ) | 9.24 | 0.96 | % | 0.86 | % | (0.15 | %) | (2.67 | %) | 150,939 | 83 | % | ||||||||||||||||||||||||||||||||
| 4/1/2014 - 3/31/2015 | 10.28 | (0.02 | ) | 1.51 | 1.49 | — | (1.06 | ) | (1.06 | ) | 10.71 | 0.96 | % | 0.86 | % | (0.16 | %) | 14.84 | % | 199,138 | 100 | % | ||||||||||||||||||||||||||||||||||
| 4/1/2013 - 3/31/2014 | 10.40 | (0.01 | ) | 2.41 | 2.40 | (0.02 | ) | (2.50 | ) | (2.52 | ) | 10.28 | 0.97 | % | 0.84 | % | (0.06 | %) | 23.58 | % | 172,613 | 163 | % | |||||||||||||||||||||||||||||||||
PF Large-Cap Value Fund | ||||||||||||||||||||||||||||||||||||||||||||||||||||||||
| 4/1/2017 - 3/31/2018 | $16.60 | $0.22 | $0.79 | $1.01 | ($0.23 | ) | ($0.24 | ) | ($0.47 | ) | $17.14 | 0.86 | % | 0.80 | % | 1.27 | % | 6.01 | % | $154,943 | 7 | % | ||||||||||||||||||||||||||||||||||
| 4/1/2016 - 3/31/2017 | 14.78 | 0.22 | 2.11 | 2.33 | (0.20 | ) | (0.31 | ) | (0.51 | ) | 16.60 | 0.86 | % | 0.80 | % | 1.40 | % | 15.88 | % | 433,551 | 21 | % | ||||||||||||||||||||||||||||||||||
| 4/1/2015 - 3/31/2016 | 16.46 | 0.23 | (0.43 | ) | (0.20 | ) | (0.22 | ) | (1.26 | ) | (1.48 | ) | 14.78 | 0.86 | % | 0.80 | % | 1.45 | % | (1.29 | %) | 299,971 | 10 | % | ||||||||||||||||||||||||||||||||
| 4/1/2014 - 3/31/2015 | 16.71 | 0.23 | 1.36 | 1.59 | (0.38 | ) | (1.46 | ) | (1.84 | ) | 16.46 | 0.86 | % | 0.80 | % | 1.37 | % | 9.40 | % | 344,403 | 13 | % | ||||||||||||||||||||||||||||||||||
| 4/1/2013 - 3/31/2014 | 13.96 | 0.36 | 2.62 | 2.98 | (0.23 | ) | — | (0.23 | ) | 16.71 | 0.86 | % | 0.80 | % | 2.33 | % | 21.41 | % | 380,372 | 13 | % | |||||||||||||||||||||||||||||||||||
| See Notes to Financial Statements | See explanation of references, if any, on C-16 |
C-14
Table of Contents
PACIFIC FUNDS
FINANCIAL HIGHLIGHTS (Continued)
Selected per share, ratios and supplemental data for each year or period ended March 31, were as follows:
| Fund | Selected Per Share Data | Ratios to Average Net Assets | Supplemental Data | |||||||||||||||||||||||||||||||||||||||||||||||||||||
| Investment Operations | Distributions | |||||||||||||||||||||||||||||||||||||||||||||||||||||||
| For the Year or Period Ended | Net Asset Value, Beginning of Year or Period | Net Investment Income (Loss) (1) | Net Realized and Unrealized Gain (Loss) | Total | Net Investment Income | Capital Gains | Total | Net Asset Value, End of Year or Period | Expenses Before Reductions (2) | Expenses After Reductions (2), (3) | Net Investment Income (Loss) (2) | Total Returns (4) | Net Assets, End of Year or Period (in thousands) | Portfolio Turnover Rates | ||||||||||||||||||||||||||||||||||||||||||
PF Main Street Core Fund | ||||||||||||||||||||||||||||||||||||||||||||||||||||||||
| 4/1/2017 - 3/31/2018 | $14.03 | $0.18 | $0.85 | $1.03 | ($0.19 | ) | ($0.95 | ) | ($1.14 | ) | $13.92 | 0.66 | % | 0.60 | % | 1.26 | % | 7.12 | % | $137,101 | 30 | % | ||||||||||||||||||||||||||||||||||
| 4/1/2016 - 3/31/2017 | 12.16 | 0.18 | 1.91 | 2.09 | (0.16 | ) | (0.06 | ) | (0.22 | ) | 14.03 | 0.66 | % | 0.60 | % | 1.38 | % | 17.29 | % | 301,322 | 51 | % | ||||||||||||||||||||||||||||||||||
| 4/1/2015 - 3/31/2016 | 14.26 | 0.17 | 0.26 | 0.43 | (0.16 | ) | (2.37 | ) | (2.53 | ) | 12.16 | 0.66 | % | 0.60 | % | 1.27 | % | 2.87 | % | 211,675 | 50 | % | ||||||||||||||||||||||||||||||||||
| 4/1/2014 - 3/31/2015 | 14.85 | 0.16 | 1.51 | 1.67 | (0.14 | ) | (2.12 | ) | (2.26 | ) | 14.26 | 0.66 | % | 0.60 | % | 1.06 | % | 11.36 | % | 270,813 | 46 | % | ||||||||||||||||||||||||||||||||||
| 4/1/2013 - 3/31/2014 | 12.20 | 0.13 | 2.65 | 2.78 | (0.13 | ) | — | (0.13 | ) | 14.85 | 0.67 | % | 0.60 | % | 0.99 | % | 22.84 | % | 257,575 | 66 | % | |||||||||||||||||||||||||||||||||||
PF Mid-Cap Equity Fund | ||||||||||||||||||||||||||||||||||||||||||||||||||||||||
| 4/1/2017 - 3/31/2018 | $11.00 | $0.05 | $1.75 | $1.80 | ($0.04 | ) | ($2.03 | ) | ($2.07 | ) | $10.73 | 0.88 | % | 0.80 | % | 0.40 | % | 16.31 | % | $31,310 | 77 | % | ||||||||||||||||||||||||||||||||||
| 4/1/2016 - 3/31/2017 | 10.63 | 0.05 | 2.43 | 2.48 | (0.17 | ) | (1.94 | ) | (2.11 | ) | 11.00 | 0.89 | % | 0.80 | % | 0.45 | % | 24.02 | % | 66,011 | 101 | % | ||||||||||||||||||||||||||||||||||
| 4/1/2015 - 3/31/2016 | 12.15 | 0.15 | (0.59 | ) | (0.44 | ) | (0.12 | ) | (0.96 | ) | (1.08 | ) | 10.63 | 0.86 | % | 0.80 | % | 1.34 | % | (3.79 | %) | 169,595 | 184 | % | ||||||||||||||||||||||||||||||||
| 4/1/2014 - 3/31/2015 | 12.84 | 0.05 | 0.80 | 0.85 | (0.03 | ) | (1.51 | ) | (1.54 | ) | 12.15 | 0.86 | % | 0.80 | % | 0.40 | % | 7.44 | % | 218,141 | 172 | % | ||||||||||||||||||||||||||||||||||
| 4/1/2013 - 3/31/2014 | 11.00 | 0.04 | 2.84 | 2.88 | (0.06 | ) | (0.98 | ) | (1.04 | ) | 12.84 | 0.87 | % | 0.80 | % | 0.36 | % | 26.82 | % | 171,357 | 114 | % | ||||||||||||||||||||||||||||||||||
PF Mid-Cap Value Fund | ||||||||||||||||||||||||||||||||||||||||||||||||||||||||
| 4/1/2017 - 3/31/2018 | $11.56 | $0.05 | $1.15 | $1.20 | ($0.03 | ) | ($0.09 | ) | ($0.12 | ) | $12.64 | 0.91 | % | 0.91 | % | 0.44 | % | 10.36 | % | $70,777 | 47 | % | ||||||||||||||||||||||||||||||||||
| 4/1/2016 - 3/31/2017 | 9.72 | 0.04 | 1.93 | 1.97 | (0.13 | ) | — | (0.13 | ) | 11.56 | 0.92 | % | 0.92 | % | 0.36 | % | 20.36 | % | 197,317 | 56 | % | |||||||||||||||||||||||||||||||||||
| 7/29/2015 - 3/31/2016 | 10.00 | 0.09 | (0.32 | ) | (0.23 | ) | (0.05 | ) | — | (0.05 | ) | 9.72 | 0.93 | % | 0.93 | % | 1.34 | % | (2.30 | %) | 250,968 | 32 | % | |||||||||||||||||||||||||||||||||
PF Small-Cap Value Fund | ||||||||||||||||||||||||||||||||||||||||||||||||||||||||
| 4/1/2017 - 3/31/2018 | $12.09 | $0.02 | $0.79 | $0.81 | ($0.02 | ) | ($1.66 | ) | ($1.68 | ) | $11.22 | 0.97 | % | 0.90 | % | 0.17 | % | 6.54 | % | $81,515 | 30 | % | ||||||||||||||||||||||||||||||||||
| 4/1/2016 - 3/31/2017 | 10.14 | 0.01 | 2.44 | 2.45 | (0.07 | ) | (0.43 | ) | (0.50 | ) | 12.09 | 0.98 | % | 0.90 | % | 0.12 | % | 23.99 | % | 118,590 | 49 | % | ||||||||||||||||||||||||||||||||||
| 4/1/2015 - 3/31/2016 | 10.45 | 0.03 | (0.27 | ) | (0.24 | ) | (0.01 | ) | (0.06 | ) | (0.07 | ) | 10.14 | 0.96 | % | 0.90 | % | 0.33 | % | (2.29 | %) | 199,324 | 55 | % | ||||||||||||||||||||||||||||||||
| 4/1/2014 - 3/31/2015 | 13.55 | 0.07 | 1.17 | 1.24 | (0.14 | ) | (4.20 | ) | (4.34 | ) | 10.45 | 0.96 | % | 0.90 | % | 0.55 | % | 11.55 | % | 145,801 | 140 | % | ||||||||||||||||||||||||||||||||||
| 4/1/2013 - 3/31/2014 | 12.15 | 0.20 | 1.98 | 2.18 | (0.16 | ) | (0.62 | ) | (0.78 | ) | 13.55 | 0.97 | % | 0.90 | % | 1.52 | % | 18.13 | % | 147,702 | 41 | % | ||||||||||||||||||||||||||||||||||
PF Emerging Markets Fund | ||||||||||||||||||||||||||||||||||||||||||||||||||||||||
| 4/1/2017 - 3/31/2018 | $13.81 | $0.10 | $3.49 | $3.59 | ($0.10 | ) | $— | ($0.10 | ) | $17.30 | 1.20 | % | 0.95 | % | 0.63 | % | 25.93 | % | $178,391 | 34 | % | |||||||||||||||||||||||||||||||||||
| 4/1/2016 - 3/31/2017 | 12.09 | 0.08 | 1.71 | 1.79 | (0.07 | ) | — | (0.07 | ) | 13.81 | 1.20 | % | 0.95 | % | 0.64 | % | 14.83 | % | 200,620 | 69 | % | |||||||||||||||||||||||||||||||||||
| 4/1/2015 - 3/31/2016 | 13.58 | 0.10 | (1.47 | ) | (1.37 | ) | (0.12 | ) | — | (0.12 | ) | 12.09 | 1.23 | % | 0.95 | % | 0.84 | % | (10.09 | %) | 118,049 | 65 | % | |||||||||||||||||||||||||||||||||
| 4/1/2014 - 3/31/2015 | 14.75 | 0.12 | (0.71 | ) | (0.59 | ) | (0.19 | ) | (0.39 | ) | (0.58 | ) | 13.58 | 1.23 | % | 0.95 | % | 0.81 | % | (4.15 | %) | 138,242 | 40 | % | ||||||||||||||||||||||||||||||||
| 4/1/2013 - 3/31/2014 | 14.22 | 0.09 | 0.83 | 0.92 | (0.10 | ) | (0.29 | ) | (0.39 | ) | 14.75 | 1.27 | % | 0.95 | % | 0.59 | % | 6.43 | % | 153,333 | 31 | % | ||||||||||||||||||||||||||||||||||
PF International Large-Cap Fund | ||||||||||||||||||||||||||||||||||||||||||||||||||||||||
| 4/1/2017 - 3/31/2018 | $18.19 | $0.26 | $2.74 | $3.00 | ($0.34 | ) | $— | ($0.34 | ) | $20.85 | 1.14 | % | 1.00 | % | 1.28 | % | 16.54 | % | $125,384 | 10 | % | |||||||||||||||||||||||||||||||||||
| 4/1/2016 - 3/31/2017 | 16.69 | 0.25 | 1.58 | 1.83 | (0.33 | ) | — | (0.33 | ) | 18.19 | 1.13 | % | 1.00 | % | 1.46 | % | 11.17 | % | 176,670 | 16 | % | |||||||||||||||||||||||||||||||||||
| 4/1/2015 - 3/31/2016 | 18.50 | 0.20 | (1.85 | ) | (1.65 | ) | (0.16 | ) | — | (0.16 | ) | 16.69 | 1.10 | % | 1.00 | % | 1.17 | % | (8.93 | %) | 289,863 | 24 | % | |||||||||||||||||||||||||||||||||
| 4/1/2014 - 3/31/2015 | 18.46 | 0.29 | 0.01 | 0.30 | (0.26 | ) | — | (0.26 | ) | 18.50 | 1.10 | % | 1.00 | % | 1.56 | % | 1.70 | % | 220,898 | 41 | % | |||||||||||||||||||||||||||||||||||
| 4/1/2013 - 3/31/2014 | 16.48 | 0.22 | 1.97 | 2.19 | (0.21 | ) | — | (0.21 | ) | 18.46 | 1.10 | % | 1.00 | % | 1.23 | % | 13.28 | % | 240,522 | 14 | % | |||||||||||||||||||||||||||||||||||
PF International Small-Cap Fund | ||||||||||||||||||||||||||||||||||||||||||||||||||||||||
| 4/1/2017 - 3/31/2018 | $10.50 | $0.19 | $1.79 | $1.98 | ($0.29 | ) | ($0.95 | ) | ($1.24 | ) | $11.24 | 1.16 | % | 1.10 | % | 1.63 | % | 19.24 | % | $89,816 | 52 | % | ||||||||||||||||||||||||||||||||||
| 4/1/2016 - 3/31/2017 | 10.27 | 0.21 | 1.10 | 1.31 | (0.41 | ) | (0.67 | ) | (1.08 | ) | 10.50 | 1.18 | % | 1.09 | % | 2.07 | % | 13.85 | % | 42,798 | 53 | % | ||||||||||||||||||||||||||||||||||
| 4/1/2015 - 3/31/2016 | 10.69 | 0.15 | (0.12 | ) | 0.03 | (0.32 | ) | (0.13 | ) | (0.45 | ) | 10.27 | 1.11 | % | 1.08 | % | 1.37 | % | 0.22 | % | 118,558 | 51 | % | |||||||||||||||||||||||||||||||||
| 1/14/2015 - 3/31/2015 | 10.00 | 0.03 | 0.66 | 0.69 | — | — | — | 10.69 | 1.24 | % | 1.08 | % | 1.34 | % | 6.90 | % | 127,493 | 8 | % | |||||||||||||||||||||||||||||||||||||
PF International Value Fund | ||||||||||||||||||||||||||||||||||||||||||||||||||||||||
| 4/1/2017 - 3/31/2018 | $9.31 | $0.30 | $0.99 | $1.29 | ($0.43 | ) | $— | ($0.43 | ) | $10.17 | 0.92 | % | 0.80 | % | 2.95 | % | 14.01 | % | $143,626 | 111 | % | |||||||||||||||||||||||||||||||||||
| 4/1/2016 - 3/31/2017 | 8.35 | 0.21 | 1.03 | 1.24 | (0.28 | ) | — | (0.28 | ) | 9.31 | 0.90 | % | 0.80 | % | 2.43 | % | 15.15 | % | 174,630 | 67 | % | |||||||||||||||||||||||||||||||||||
| 4/1/2015 - 3/31/2016 | 9.51 | 0.16 | (1.19 | ) | (1.03 | ) | (0.13 | ) | — | (0.13 | ) | 8.35 | 0.92 | % | 0.80 | % | 1.80 | % | (10.87 | %) | 140,760 | 73 | % | |||||||||||||||||||||||||||||||||
| 4/1/2014 - 3/31/2015 | 10.33 | 0.22 | (0.65 | ) | (0.43 | ) | (0.39 | ) | — | (0.39 | ) | 9.51 | 0.91 | % | 0.80 | % | 2.19 | % | (4.07 | %) | 142,653 | 87 | % | |||||||||||||||||||||||||||||||||
| 4/1/2013 - 3/31/2014 | 9.10 | 0.39 | 1.08 | 1.47 | (0.24 | ) | — | (0.24 | ) | 10.33 | 0.91 | % | 0.80 | % | 3.89 | % | 16.15 | % | 176,541 | 54 | % | |||||||||||||||||||||||||||||||||||
PF Real Estate Fund | ||||||||||||||||||||||||||||||||||||||||||||||||||||||||
| 4/1/2017 - 3/31/2018 | $14.94 | $0.30 | ($0.75 | ) | ($0.45 | ) | ($0.22 | ) | ($2.41 | ) | ($2.63 | ) | $11.86 | 1.13 | % | 1.05 | % | 2.12 | % | (4.15 | %) | $41,519 | 47 | % | ||||||||||||||||||||||||||||||||
| 4/1/2016 - 3/31/2017 | 15.99 | 0.16 | (0.18 | ) | (0.02) | (0.39 | ) | (0.64 | ) | (1.03 | ) | 14.94 | 1.12 | % | 1.05 | % | 1.01 | % | (0.14 | %) | 39,038 | 27 | % | |||||||||||||||||||||||||||||||||
| 4/1/2015 - 3/31/2016 | 16.87 | 0.36 | 0.15 | 0.51 | (0.23 | ) | (1.16 | ) | (1.39 | ) | 15.99 | 1.12 | % | 1.05 | % | 2.33 | % | 3.61 | % | 70,717 | 26 | % | ||||||||||||||||||||||||||||||||||
| 4/1/2014 - 3/31/2015 | 14.19 | 0.22 | 3.11 | 3.33 | (0.31 | ) | (0.34 | ) | (0.65 | ) | 16.87 | 1.11 | % | 1.05 | % | 1.41 | % | 23.69 | % | 49,486 | 34 | % | ||||||||||||||||||||||||||||||||||
| 4/1/2013 - 3/31/2014 | 13.67 | 0.21 | 0.54 | 0.75 | (0.23 | ) | — | (0.23 | ) | 14.19 | 1.12 | % | 1.05 | % | 1.52 | % | 5.61 | % | 73,828 | 18 | % | |||||||||||||||||||||||||||||||||||
| See Notes to Financial Statements | See explanation of references, if any, on C-16 |
C-15
Table of Contents
PACIFIC FUNDS
FINANCIAL HIGHLIGHTS (Continued)
Selected per share, ratios and supplemental data for each year or period ended March 31, were as follows:
| Fund | Selected Per Share Data | Ratios to Average Net Assets | Supplemental Data | |||||||||||||||||||||||||||||||||||||||||||||||||||||
| Investment Operations | Distributions | |||||||||||||||||||||||||||||||||||||||||||||||||||||||
| For the Year or Period Ended | Net Asset Value, Beginning of Year or Period | Net Investment Income (Loss) (1) | Net Realized and Unrealized Gain (Loss) | Total | Net Investment Income | Capital Gains | Total | Net Asset Value, End of Year or Period | Expenses Before Reductions (2) | Expenses After Reductions (2), (3) | Net Investment Income (Loss) (2) | Total Returns (4) | Net Assets, End of Year or Period (in thousands) | Portfolio Turnover Rates | ||||||||||||||||||||||||||||||||||||||||||
PF Currency Strategies Fund | ||||||||||||||||||||||||||||||||||||||||||||||||||||||||
| 4/1/2017 - 3/31/2018 | $9.49 | ($0.01 | ) | ($0.13 | ) | ($0.14 | ) | ($0.23 | ) | $— | ($0.23 | ) | $9.12 | 0.88 | % | 0.88 | % | (0.15 | %) | (1.32 | %) | $62,555 | 0 | % | ||||||||||||||||||||||||||||||||
| 4/1/2016 - 3/31/2017 | 9.75 | (0.06 | ) | 0.90 | 0.84 | (1.10 | ) | — | (1.10 | ) | 9.49 | 0.90 | % | 0.90 | % | (0.62 | %) | 8.95 | % | 87,822 | 0 | % | ||||||||||||||||||||||||||||||||||
| 4/1/2015 - 3/31/2016 | 9.92 | (0.08 | ) | 0.11 | 0.03 | (0.20 | ) | — | (0.20 | ) | 9.75 | 0.86 | % | 0.86 | % | (0.78 | %) | 0.35 | % | 127,251 | 82 | % | ||||||||||||||||||||||||||||||||||
| 4/1/2014 - 3/31/2015 | 9.41 | (0.07 | ) | 0.79 | 0.72 | (0.21 | ) | — | (0.21 | ) | 9.92 | 0.86 | % | 0.86 | % | (0.76 | %) | 7.69 | % | 187,572 | 141 | % | ||||||||||||||||||||||||||||||||||
| 4/1/2013 - 3/31/2014 | 10.32 | (0.07 | ) | (0.52 | ) | (0.59 | ) | (0.32 | ) | — | (0.32 | ) | 9.41 | 0.89 | % | 0.85 | % | (0.68 | %) | (5.98 | %) | 131,023 | 49 | % | ||||||||||||||||||||||||||||||||
PF Equity Long/Short Fund | ||||||||||||||||||||||||||||||||||||||||||||||||||||||||
| 4/1/2017 - 3/31/2018 | $9.78 | ($0.04 | ) | $1.41 | $1.37 | ($0.64 | ) | ($0.80 | ) | ($1.44 | ) | $9.71 | 1.39 | % | 1.24 | % | (0.41 | %) | 14.45 | % | $57,123 | 0 | % | |||||||||||||||||||||||||||||||||
| 4/1/2016 - 3/31/2017 | 10.31 | (0.10 | ) | 1.38 | 1.28 | (1.81 | ) | — | (1.81 | ) | 9.78 | 1.43 | % | 1.28 | % | (0.95 | %) | 13.10 | % | 71,081 | 0 | % | ||||||||||||||||||||||||||||||||||
| 4/27/2015 - 3/31/2016 | 10.00 | (0.12 | ) | 2.09 | 1.97 | (1.66 | ) | — | (1.66 | ) | 10.31 | 1.42 | % | 1.27 | % | (1.21 | %) | 20.01 | % | 167,587 | 0 | % | ||||||||||||||||||||||||||||||||||
PF Global Absolute Return Fund | ||||||||||||||||||||||||||||||||||||||||||||||||||||||||
| 4/1/2017 - 3/31/2018 | $9.14 | $0.42 | ($0.07 | ) | $0.35 | ($0.02 | ) | $— | ($0.02 | ) | $9.47 | 1.25 | % | 1.12 | %(5) | 4.47 | % | 3.99 | % | $62,964 | 91 | % | ||||||||||||||||||||||||||||||||||
| 4/1/2016 - 3/31/2017 | 9.04 | 0.41 | 0.02 | 0.43 | (0.33 | ) | — | (0.33 | ) | 9.14 | 1.19 | % | 1.10 | % | 4.47 | % | 4.80 | % | 87,044 | 100 | % | |||||||||||||||||||||||||||||||||||
| 4/1/2015 - 3/31/2016 | 10.03 | 0.47 | (0.61 | ) | (0.14 | ) | (0.85 | ) | — | (0.85 | ) | 9.04 | 1.17 | % | 1.08 | % | 4.87 | % | (1.46 | %) | 131,774 | 127 | % | |||||||||||||||||||||||||||||||||
| 4/1/2014 - 3/31/2015 | 9.69 | 0.48 | 0.39 | 0.87 | (0.53 | ) | — | (0.53 | ) | 10.03 | 1.21 | % | 1.10 | % | 4.82 | % | 9.13 | % | 177,656 | 132 | % | |||||||||||||||||||||||||||||||||||
| 4/1/2013 - 3/31/2014 | 10.19 | 0.36 | (0.65 | ) | (0.29 | ) | (0.20 | ) | (0.01 | ) | (0.21 | ) | 9.69 | 1.36 | % | 1.18 | % | 3.64 | % | (2.80 | %) | 198,360 | 115 | % | ||||||||||||||||||||||||||||||||
PF Multi-Asset Fund (6) | ||||||||||||||||||||||||||||||||||||||||||||||||||||||||
| 1/31/2018 - 3/31/2018 | $10.00 | $0.03 | ($0.61 | ) | ($0.58 | ) | $— | $— | $— | $9.42 | 0.59 | % | 0.51 | % | 1.68 | % | (5.80 | %) | $733,300 | 37 | % | |||||||||||||||||||||||||||||||||||
| (1) | Net investment income (loss) per share has been calculated using the average shares method. |
| (2) | The ratios are annualized for periods of less than one full year. |
| (3) | The ratios of expenses after expense reductions to average net assets are after advisory fee waivers and adviser expense reimbursements, if any, as discussed in Note 6 and Note 7B, respectively, in Notes to the Financial Statements. |
| (4) | The total returns include reinvestment of all dividends and capital gains distribution, if any. Total returns are not annualized for periods less than one full year. |
| (5) | The annualized ratios of expenses, excluding interest expense, after expense reductions to average net assets for the year ended March 31, 2018 are as follows: |
Fund | Class P | |||
PF Inflation Managed Fund | 0.55% | |||
PF Managed Bond Fund | 0.55% | |||
PF Global Absolute Return Fund | 1.05% | |||
| (6) | PF Multi-Asset Fund commenced operations on January 31, 2018. |
| See Notes to Financial Statements |
C-16
Table of Contents
PACIFIC FUNDS
1. ORGANIZATION
Pacific Funds Series Trust (which may be referred to as “Pacific Funds” or the “Trust”) is registered under the Investment Company Act of 1940 (“1940 Act”), as amended, as an open-end, management investment company and is organized as a Delaware statutory trust. Pacific Life Fund Advisors LLC (“PLFA” or the “Investment Adviser”) serves as investment adviser to the Trust. As of March 31, 2018, the Trust was comprised of forty separate funds, twenty-two of which are presented in these financial statements (each individually a “Fund”, and collectively the “Funds”). All of the Funds listed in the table below (collectively known as the “PF Underlying Funds”) offer Class P shares only, which are sold at net asset value:
| PF Underlying Funds | ||||
| PF Inflation Managed Fund | PF Large-Cap Value Fund | PF International Value Fund | ||
| PF Managed Bond Fund | PF Main Street® Core Fund | PF Real Estate Fund | ||
| PF Short Duration Bond Fund | PF Mid-Cap Equity Fund | PF Currency Strategies Fund | ||
| PF Emerging Markets Debt Fund | PF Mid-Cap Value Fund | PF Equity Long/Short Fund | ||
| PF Comstock Fund | PF Small-Cap Value Fund | PF Global Absolute Return Fund | ||
| PF Developing Growth Fund | PF Emerging Markets Fund | PF Multi-Asset Fund | ||
| PF Growth Fund | PF International Large-Cap Fund | |||
| PF Large-Cap Growth Fund | PF International Small-Cap Fund | |||
Presently, only the following Fund of Funds, the Investment Adviser, and certain of its affiliates can invest in Class P shares of the PF Underlying Funds, Pacific FundsSM Floating Rate Income, Pacific FundsSM Core Income, Pacific FundsSM High Income, and Pacific FundsSM Small-Cap Growth.
| Fund of Funds | ||
| Pacific FundsSM Portfolio Optimization Conservative* | Pacific FundsSM Portfolio Optimization Growth* | |
| Pacific FundsSM Portfolio Optimization Moderate-Conservative* | Pacific FundsSM Portfolio Optimization Aggressive-Growth* | |
| Pacific FundsSM Portfolio Optimization Moderate* | Pacific FundsSM Diversified Alternatives | |
| * | These Funds are collectively known as the “Portfolio Optimization Funds”. |
There is a separate annual report containing the financial statements for the Portfolio Optimization Funds, Pacific Funds Diversified Alternatives, Pacific Funds Floating Rate Income, Pacific Funds Core Income, Pacific Funds High Income, and Pacific Funds Small-Cap Growth, which is available without charge. For information on how to obtain the annual report for these Funds, see the Where to Go for More Information section of this report on page F-21.
Main Street is a registered trademark of OppenheimerFunds, Inc.
2. SIGNIFICANT ACCOUNTING POLICIES
The following is a summary of the significant accounting policies followed by the Trust in the preparation of its financial statements in conformity with accounting principles generally accepted in the United States of America (“U.S. GAAP”), which may require management to make estimates and assumptions that affect the reported amounts of assets and liabilities and disclosures of contingent assets and liabilities at the date of the financial statements and the increases and decreases in net assets from operations during the reporting period. Actual results could differ from those estimates. Each Fund qualifies as an investment company under U.S. GAAP and follows the accounting and reporting guidance applicable to the Investment Companies Topic of U.S. GAAP.
Effective January 1, 2017, the Trust implemented Accounting Standards Update (“ASU”) No. 2016-19, Technical Corrections and Improvements issued by the Financial Accounting Standards Board (“FASB”). This ASU made technical changes to various sections of the accounting standards codification (“ASC”), including modifications to Topic 820, Fair Value Measurement and requires disclosure of reason(s) for the change in valuation approach and valuation technique. Changes in valuation approach and valuation technique, if any, are disclosed in Note 3D.
A. INVESTMENT TRANSACTIONS AND INCOME
Investment transactions are recorded on a trade date basis. Securities purchased or sold on a when-issued or delayed-delivery basis as well as certain loan transactions and mortgage securities (such as Government National Mortgage Association (“GNMA”) securities) may be settled a month or more after the trade date. Dividend income is recorded on the ex-dividend date, except certain dividends from foreign securities, which are recorded as soon as a Fund is informed of the ex-dividend date or upon receipt of the dividend. A Fund’s estimated components of distributions received from real estate investment trusts may be considered income, return of capital distributions or capital gain distributions. Return of capital distributions are recorded as a reduction of cost of the related investments. Interest income, adjusted for amortization of premium and accretion of discount, is recorded daily on an accrual basis. Investment income is recorded net of foreign taxes withheld, if any. A Fund may be subject to foreign taxes on income, gains on investments, or currency repatriation, a portion of which may be recoverable. A Fund will accrue such taxes and reclaims as applicable, based upon the current interpretation of tax rules and regulations that exist in the markets in which that Fund invests. Facility fees and other fees (such as origination fees) received from floating rate senior loan notes purchased (see Note 4) by a Fund are amortized over the expected term of each applicable senior loan. Commitment fees received by a Fund relating to unfunded senior loan commitments are amortized to income over the period of the commitment. Consent fees, which are compensation for agreeing to
D-1
Table of Contents
PACIFIC FUNDS
NOTES TO FINANCIAL STATEMENTS (Continued)
changes in the terms of debt instruments, are recorded as interest income when received. Realized gains and losses from investment transactions are recorded on the basis of identified cost. Gains and losses realized on principal paydowns from mortgage-backed and asset-backed securities are recorded as interest income. Litigation settlements on securities that were previously held are recorded as realized gains on investment securities.
B. DISTRIBUTIONS TO SHAREHOLDERS
Each Fund presented in these financial statements distributes all of its net investment income and realized capital gains, if any, to shareholders at least annually, although distributions could occur more often if advantageous to the applicable Fund and its shareholders. Dividends and distributions paid to shareholders are recorded on the ex-dividend date.
C. FOREIGN CURRENCY TRANSLATION
The Trust’s accounting records are maintained in U.S. dollars. The market value of investments and other assets and liabilities, which are denominated in non-U.S. currencies, are translated into U.S. dollars based on the applicable exchange rates at the end of each business day. Purchases and sales of investments and income and expenses, denominated in foreign currencies, are translated into U.S. dollars at the exchange rates in effect on the transaction date.
None of the Funds separately report the effect of changes in foreign exchange rates from changes in market prices of investments held. Such changes are included with the net realized gain or loss and change in net unrealized appreciation or depreciation on investments. Other foreign currency transactions resulting in realized and unrealized gain or loss, if any, are reported separately as net realized gain or loss on foreign currency transactions and change in net unrealized appreciation or depreciation on foreign currencies.
D. ALLOCATION OF INCOME, EXPENSES, GAINS AND LOSSES
Certain Trust expenses directly attributable to a particular Fund are charged to that Fund (such as fund-specific transactional fees, proxies, liquidations, litigation, and organizational/start-up costs). Generally, other Trust expenses are allocated proportionately among all the Funds in relation to the net assets of each Fund.
E. OFFERING COSTS
A new Fund bears all costs (or the applicable pro-rata share if there is more than one new Fund) associated with the offering expenses of the Fund, including legal, printing, and support services (see Notes 6 and 7A). All such costs are amortized as an expense of the new Fund on a straight-line basis over twelve months from commencement of operations.
F. NEW PRONOUNCEMENTS
On October 13, 2016, the U.S. Securities and Exchange Commission (“SEC”) adopted new rules (the “Reporting Rules”) and amended existing rules (the “Amended Rules”) intended to modernize reporting and enhance the disclosure of information for most registered investment companies. The Amended Rules include amendments relating to Regulation S-X, which modify the form and content of the financial statements of the Trust, went into effect as of August 1, 2017 and are reflected in this annual report. For the Trust, the effective date of the Reporting Rules will be June 1, 2018. At this time, management is evaluating the implications of the Reporting Rules and determining their impact on the Trust’s financial statements and accompanying notes.
On November 17, 2016, the FASB issued ASU 2016-18, Statement of Cash Flows (Topic 230): Restricted Cash. This update intends to reduce diversity in the presentation of restricted cash and restricted cash equivalents in the statement. Any restricted cash and restricted cash equivalents will be included as components of cash and cash equivalents as presented on the statement of cash flows. For the Trust, the effective date of this update is for periods beginning after December 15, 2017. At this time, management is evaluating the implications of this ASU and believes it will not have a material impact on the financial statements.
On March 30, 2017, the FASB issued ASU 2017-08, Premium Amortization on Purchased Callable Debt Securities, that will require the premium associated with the purchase of callable debt securities be amortized to the earliest call date and no longer amortized through the contractual life of the instrument. The changes are effective for fiscal years, and interim periods within those fiscal years, beginning after December 15, 2018. At this time, management is evaluating the implications of this ASU and its impact on the financial statements.
3. VALUATION AND FAIR VALUE MEASUREMENTS
A. VALUATION POLICY
The Trust’s Board of Trustees (the “Board”) has adopted a policy (“Valuation Policy”) for determining the value of the Trust’s investments each business day. Under the Valuation Policy, the Board has delegated certain functions to the Trustee Valuation Committee (“TVC”) and/or the Valuation Oversight Committee (“VOC”) or its delegate to determine the fair value of certain investments, which includes using third party pricing services. Each valuation committee that values the Funds’ investments does so in accordance with the Valuation Policy. Notes 3B and 3C below describe in greater detail the methodologies used to value each Fund’s investments.
B. DETERMINATION OF NET ASSET VALUE (“NAV”)
Each Fund presented in these financial statements is divided into shares. The price per share of a Fund’s shares is called its NAV. The NAV forms the basis for all transactions involving buying, selling, exchanging or reinvesting shares. Each Fund’s NAV is calculated by taking the total value of a Fund’s assets, subtracting a Fund’s liabilities, and dividing by the total number of shares outstanding.
Each Fund’s NAV is calculated once per day, every day the New York Stock Exchange (“NYSE”) is open, including days when foreign markets and/or bond markets are closed. For purposes of calculating the NAV, the value of investments held by each Fund is generally determined as of the scheduled closing time of the NYSE, which is usually 4:00 p.m. Eastern Time. Information that becomes known to the Trust or its agents after the scheduled close of the NYSE on a particular day will not normally be used to retroactively adjust the price of an
D-2
Table of Contents
PACIFIC FUNDS
NOTES TO FINANCIAL STATEMENTS (Continued)
investment for that same business day. Such information may include late dividend notifications, legal or regulatory matters, corporate actions, and corrected/adjusted last sales prices or official closing prices from an exchange.
Each Fund’s NAV will not be calculated on days when the NYSE is closed. There may be a delay in calculating the NAV if: (i) the NYSE is closed on a day other than a regular holiday or weekend, (ii) trading on the NYSE is restricted, (iii) an emergency exists (as determined by the SEC), making the sale of investments or determinations of NAV not practicable, or (iv) the SEC permits a delay for the protection of shareholders.
Certain Funds may hold investments that are primarily listed on foreign exchanges. Because those investments trade on weekends and other days when the Funds do not calculate their NAVs, the value of those investments may change on days when a shareholder will not be able to purchase or redeem shares of those Funds.
C. INVESTMENT VALUATION
The value of each security or other investment is the amount which a Fund might reasonably expect to receive for the investment upon its current sale in the ordinary course of business. For purposes of calculating the NAV, the value of investments held by each Fund is based primarily on pricing data obtained from various sources approved by the Board.
Domestic Equity Investments
For domestic equity investments (including exchange-traded funds), the Trust generally uses the official closing price or last reported sale price from an exchange as of the scheduled closing time of the NYSE and does not normally take into account trading, clearances or settlements that take place after the scheduled close of the NYSE. Investments for which no official closing price or last reported sales price are reported are generally valued at the mean between the most recent bid and ask prices obtained from approved pricing services, established market makers, or from broker-dealers.
Foreign Equity Investments
For foreign equity investments, the Trust generally uses the official closing price or last reported sale price from the principal foreign exchanges, which may be earlier than the scheduled close of the NYSE. The Trust then may adjust for market events occurring between the close of certain foreign exchanges and the scheduled close of the NYSE. The Trust has retained an independent statistical analysis service approved by the Board to assist in determining the value of certain foreign equity investments. This service utilizes proprietary computer models based on historical performance of markets and other considerations to determine adjustments for market events. Quotations of foreign investments in foreign currencies and those valued using forward currency rates are converted into U.S. dollar equivalents using a foreign exchange quotation from an approved source.
Exchange Traded Futures Contracts, Option Contracts, and Swap Agreements
Exchange traded futures contracts, option contracts, and swap agreements are generally valued using the settlement price determined by the relevant exchange. Exchange traded futures contracts, option contracts, and swap agreements for which no settlement price is reported, are generally valued at the mean between the most recent bid and ask prices obtained from approved pricing services, established market makers, or from broker-dealers.
Over-the-Counter (“OTC”) Investments
OTC investments (including forward commitments, swap agreements and option contracts) are generally valued by approved pricing services that use evaluated prices from various observable market and other factors. Certain OTC swap agreements are valued using industry pricing models, broker quotes or other methodologies pursuant to the Valuation Policy. Forward foreign currency contracts are generally valued using the mean between broker-dealer bid and ask quotations, and foreign currency exchange rates gathered from leading market makers.
Domestic and Foreign Debt Investments
Debt investments are generally valued using the mean between bid and ask prices provided by approved pricing and quotation services, which are based upon evaluated prices determined from various observable market and other factors. Certain debt investments are valued by using a benchmark, matrix, or other pricing methodology approved pursuant to the Valuation Policy.
Investments in Affiliated or Unaffiliated Investment Companies
Fund investments in affiliated or unaffiliated investment companies, including mutual funds, are valued at their respective published NAVs.
Investment Values Determined by a Valuation Committee
The Trust’s Valuation Policy includes methodologies approved for valuing investments in circumstances where market quotations are not readily available. In such circumstances, the Valuation Policy provides that the value of such investments may be determined in accordance with Board approved formulas and methodologies (“Alternate Valuation Methodologies”). Under the Valuation Policy these Alternate Valuation Methodologies may include, among others, amortized cost, the use of broker quotes, the use of purchase prices, last reported sale/trade prices, benchmark, proxy and matrix pricing. In the event market quotations or Alternate Valuation Methodologies are not readily available or are determined to be unreliable, the value of the investments will be determined in good faith by the TVC, or determined by the VOC or its delegate pursuant to the Valuation Policy and then subsequently submitted for approval or ratification to either the TVC or the Board. Valuations determined by the TVC or the VOC or its delegate may require subjective inputs about the value of such investments. While these valuations are intended to estimate the value a Fund might reasonably expect to receive upon the current sale of the investments in the ordinary course of business, such values may differ from the value that a Fund would actually realize if the investments were sold or values that would be obtained if a different valuation methodology had been used.
D-3
Table of Contents
PACIFIC FUNDS
NOTES TO FINANCIAL STATEMENTS (Continued)
Market quotations are considered not readily available if: (i) the market quotations received are deemed unreliable or inaccurate, (ii) approved pricing services do not provide a valuation for a particular investment, or (iii) material events occur after the close of the principal market for a particular investment but prior to the scheduled close of the NYSE.
D. FAIR VALUE MEASUREMENTS AND DISCLOSURES
The Trust characterizes its investments as Level 1, Level 2, or Level 3 based upon the various inputs or methodologies used to value the investments. Under the Valuation Policy, the VOC determines the level in which each investment is characterized. The VOC includes investment, legal, and compliance members of the Trust’s Investment Adviser, accounting members of the Trust’s Administrator (see Note 6), and the Trust’s Chief Compliance Officer (“CCO”). The three-tier hierarchy of inputs is summarized in the three broad levels listed below:
| • Level 1 - | Quoted prices (unadjusted) in active markets for identical investments |
| • Level 2 - | Significant observable market-based inputs, other than Level 1 quoted prices, or unobservable inputs that are corroborated by market data |
| • Level 3 - | Significant unobservable inputs that are not corroborated by observable market data |
The VOC reviews the Valuation Policy periodically (at least annually) to determine the appropriateness of the pricing methodologies used to value each Fund’s investments. The VOC also periodically evaluates how the Trust’s investments are characterized within the three-tier hierarchy and the appropriateness of third party pricing sources. The VOC also periodically (at least annually) conducts back-testing of the value of various Level 2 and Level 3 investments to evaluate the effectiveness of the pricing methodologies including the unobservable inputs used to value those investments. Such back-testing includes comparing Level 2 and Level 3 investment values to subsequently available exchange-traded prices, transaction prices, and/or observable vendor prices. All changes to the Valuation Policy are reported to the Board on a quarterly basis with material changes, as determined by the Trust’s CCO, requiring approval by the Board.
The inputs or methodologies used for characterizing each Fund’s investments within the three-tier hierarchy are not necessarily an indication of the relative risks associated with investing in those investments. Foreign equity investments that are valued with the assistance of a statistical research service approved by the Board (as described in Note 3C) and based on significant observable inputs are reflected as Level 2. Changes in valuation techniques may result in transfers into or out of an assigned level within the hierarchy. Transfers between different levels of the fair value hierarchy resulting from such changes are deemed to have occurred as of the end of the reporting period. A summary of each Fund’s investments as of March 31, 2018, as categorized under the three-tier hierarchy of inputs, can be found in the Notes to Schedule of Investments section of each Fund’s Schedule of Investments.
The following is a description of valuation inputs and techniques that the Trust currently utilizes to fair value each major category of assets and liabilities:
Equity Securities (Common and Preferred Stock) and Mutual Funds
Equity securities (foreign or domestic) that are actively traded on a securities exchange are fair valued based on quoted prices from the applicable exchange, and to the extent valuation adjustments are not applied to these securities, they are categorized as Level 1. Equity securities traded on inactive markets and certain foreign equity securities are fair valued using significant other observable inputs which include broker-dealer quotes, recently executed transactions adjusted for changes in the benchmark index, or evaluated price quotes received from pricing vendors that take into account the integrity of the market sector and issuer, the individual characteristics of the security, and information received from broker-dealers and other market sources pertaining to the issuer or security. To the extent that these inputs are observable and timely, the fair values of these securities would be categorized as Level 2; otherwise the fair values would be categorized as Level 3.
Investments in registered mutual funds, including affiliated registered mutual funds, are valued at their respective published NAV and are categorized as Level 1.
U.S. Treasury Obligations
U.S. Treasuries are fair valued based on pricing models that evaluate the mean between the most recently published bid and ask price from market data sources. The models also take into consideration yield curves and data received from active market makers and inter-dealer brokers. Yield curves change daily in response to market conditions and are generally obtained from the new issue market and broker-dealer sources. To the extent that these inputs are observable and timely, the fair values of U.S. Treasury obligations would be categorized as Level 2; otherwise the fair values would be categorized as Level 3.
Mortgage-Backed and Asset-Backed Securities
Mortgage-backed securities, including government sponsored enterprises, are fair valued using pricing models based on inputs that include issuer type, coupon, and cash flows, mortgage prepayment projection tables and adjustable rate mortgage evaluations that incorporate index data, periodic and life caps, the next coupon reset date, and the convertibility of the bond. To the extent that these inputs are observable and timely, the fair values of mortgage-backed securities would be categorized as Level 2; otherwise the fair value would be categorized as Level 3.
Asset-backed securities and collateralized mortgage obligations are fair valued using pricing models based on a security’s average life volatility. The models also take into account tranche characteristics such as coupon average life, collateral types, ratings, the issuer and tranche type, underlying collateral and performance of the collateral, and discount margin for certain floating rate issues. To the extent that these inputs are observable and timely, the fair values of asset-backed securities and collateralized mortgage obligations would be categorized as Level 2; otherwise the fair values would be categorized as Level 3.
Municipal Bonds
Municipal bonds are fair valued based on pricing models that take into account, among other factors, information received from market makers and broker-dealers, current trades, bid lists, offerings, market movements, the callability of the bond, state of issuance, benchmark yield
D-4
Table of Contents
PACIFIC FUNDS
NOTES TO FINANCIAL STATEMENTS (Continued)
curves, and bond insurance. To the extent that these inputs are observable and timely, the fair values of municipal bonds would be categorized as Level 2; otherwise the fair values would be categorized as Level 3.
Foreign Government Bonds and Notes
Foreign government bonds and notes are fair valued based on discounted cash flow models that incorporate option adjusted spreads along with benchmark curves and credit spreads. In addition, international bond markets are monitored daily for information pertaining to the issuer and/or the specific issue. To the extent that these inputs are observable and timely, the fair values of foreign government bonds and notes would be categorized as Level 2; otherwise the fair values would be categorized as Level 3.
Corporate Bonds and Notes and U.S. Government Agency Issues
Corporate bonds held by a Fund are generally comprised of two main categories: investment grade bonds and high yield bonds. Investment grade bonds are reported at fair value using various inputs and techniques, which include broker-dealer quotations, live trading levels, recently executed transactions in securities of the issuer or comparable issuers, issuer credit information, and option-adjusted spread models where applicable. Fair values for high yield bonds are based primarily on broker-dealer quotations from relevant market makers and recently executed transactions in securities of the issuer or comparable issuers. The broker-dealer quotations received are supported by credit analysis of the issuer that takes into consideration credit quality assessments, daily trading activity, and the activity of the underlying equities, listed bonds, and sector-specific trends. To the extent that these inputs are observable and timely, the fair values of corporate bonds would be categorized as Level 2; otherwise the fair values would be categorized as Level 3.
U.S. Government Agency Issues are reported at fair value using various inputs and techniques, which include broker-dealer quotations, live trading levels, recently executed transactions in securities of the issuer, issuer credit information, and option-adjusted spread models where applicable. To the extent that these inputs are observable and timely, the fair values of U.S. Government Agency Issues would be categorized as Level 2; otherwise the fair values would be categorized as Level 3.
Futures Contracts
Futures contracts and options on futures contracts that are actively traded on commodity exchanges are fair valued based on quoted prices from the applicable exchange, and to the extent valuation adjustments are not applied to futures contracts, they are categorized as Level 1. To the extent that valuation adjustments are observable and timely, the fair values of futures contracts would be categorized as Level 2; otherwise the fair values would be categorized as Level 3.
Option Contracts
Exchange listed option contracts that are traded on securities exchanges are categorized as Level 2 if they are fair valued based on quoted prices from the applicable exchange, or when valuation adjustments are applied to exchange listed option contracts, or such valuation adjustments are observable and timely, otherwise the fair values would be categorized as Level 3. OTC option contracts are fair valued based on either broker-dealer quotations or pricing models that incorporate various inputs such as interest rates, credit spreads, currency exchange rates and volatility measurements for in-the-money, at-the-money, and out-of-the-money contracts based on a given strike price. To the extent that these inputs are observable and timely, the fair values of OTC option contracts would be categorized as Level 2; otherwise the fair values would be categorized as Level 3.
Forward Foreign Currency Contracts
Forward foreign currency contracts are fair valued using the mean between broker-dealer bid and ask quotations, and forward foreign currency exchange rates gathered from leading market makers. To the extent that these inputs are observable and timely, the fair values of forward foreign currency contracts would be categorized as Level 2; otherwise the fair values would be categorized as Level 3.
Swap Agreements
Interest Rate Swaps – Interest rate swaps that are traded and cleared on a securities exchange or swap execution facility are fair valued based on quoted prices from the applicable exchange and are categorized as Level 2. Interest rate swaps traded over-the-counter are fair valued using pricing models that are based on real-time snap shots of relevant interest rate curves that are built using the most actively traded securities for a given maturity. The pricing models also incorporate cash and money market rates. In addition, market data pertaining to interest rate swaps are monitored regularly to ensure that interest rates are properly depicting the current market rate. To the extent that these inputs are observable and timely, the fair values of interest rate swaps would be categorized as Level 2; otherwise the fair values would be categorized as Level 3.
Credit Default Swaps – Credit default swaps that are traded and cleared on a securities exchange or swap execution facility are fair valued based on quoted prices from the applicable exchange and are categorized as Level 2. Credit default swaps traded over-the-counter are fair valued using pricing models that take into account, among other factors, information received from market makers and broker-dealers, default probabilities from index specific credit spread curves, recovery rates, and cash flows. To the extent that these inputs are observable and timely, the fair values of credit default swaps would be categorized as Level 2; otherwise the fair values would be categorized as Level 3.
Total Return Swaps – Total return swaps that are traded and cleared on a securities exchange or swap execution facility are fair valued based on quoted prices from the applicable exchange and are categorized as Level 2. Total Return swaps traded over-the-counter are fair valued using pricing models that take into account among other factors, index spread curves, nominal values, modified duration values and cash flows. To the extent that these inputs are observable and timely, the fair values of total return swaps would be categorized as Level 2; otherwise the fair values would be categorized as Level 3.
Total Return Basket Swaps – The value of total return basket swaps are derived from a combination of (i) the net value of the underlying positions, which are valued daily using the last sale or closing price on the principal exchange on which the securities are traded; (ii) financing
D-5
Table of Contents
PACIFIC FUNDS
NOTES TO FINANCIAL STATEMENTS (Continued)
costs; (iii) the value of dividends or accrued interest; (iv) cash balances within the swap; and (v) other factors, as applicable. To the extent that these inputs are observable and timely, the fair values of total return basket swaps would be categorized as Level 2; otherwise the fair values would be categorized as Level 3.
Volatility Swaps – Volatility swaps traded over-the-counter are fair valued using pricing models that are based on real-time snap shots of relevant discount interest rate curves, volatility inputs, and present value of future cash flows, which are observable from the market and built using the most actively traded securities for a given maturity. In addition, market data pertaining to volatility swaps are monitored regularly to ensure that volatility rates are properly depicting the current volatility rate. To the extent that these inputs are observable and timely, the fair values of volatility swaps would be categorized as Level 2; otherwise the fair values would be categorized as Level 3.
Senior Loan Notes
Floating rate senior loan notes (“Senior Loans”) are fair valued based on a quoted price received from a single broker-dealer or an average of quoted prices received from multiple broker-dealers or valued relative to other benchmark securities when broker-dealer quotes are unavailable. To the extent that these inputs are observable, the fair values of Senior Loans would be categorized as Level 2; otherwise the fair values would be categorized as Level 3.
Credit-Oriented Investments
For non-publicly traded instruments that represent debt to the Trust, the carrying amount approximates fair value due to the relatively short-term maturity of these financial instruments. The Trust may use market transactions for identical or similar instruments or a market yield approach, which utilizes expected future cash flows that are discounted using estimated current market rates. Discounted cash flow calculations may be adjusted to reflect current market conditions and/or the perceived credit risk of each Fund as applicable. Consideration may also include an evaluation of collateral. To the extent that these inputs are observable and timely, the fair values for credit-oriented investments are categorized as Level 2; otherwise the fair values would be categorized as Level 3.
4. INVESTMENTS AND RISKS
General Investment Risks
An investment in each Fund represents an indirect investment in the assets owned by that Fund. As with any mutual fund, the value of the assets owned by each Fund may move up or down, and as a result, an investment in a Fund at any point in time may be worth more or less than the original amount invested.
A Fund’s transactions in listed securities are settled/paid for upon delivery to or from their counterparties; therefore, the risk of counterparty default for listed securities is considered minimal, as delivery of securities sold is only made once a Fund has received payment. Payment is made on a purchase once the securities have been delivered by the counterparty. The trade will fail if either party fails to meet its obligations.
Market and Regulatory Risks
Events in the financial markets and economy may cause volatility and uncertainty and affect Fund performance. Market events may affect a single issuer, industry, sector, or the market as a whole. In addition, because of interdependencies between markets, events in one market may adversely impact other markets or issuers in which a Fund invests in unforeseen ways. Traditionally liquid investments may experience periods of diminished liquidity. During a general downturn in the financial markets, multiple asset classes may decline in value and a Fund may lose value, regardless of the individual results of the securities and other instruments in which the Fund invests. Governmental and regulatory actions, including tax law changes, may also impair Fund management and have unexpected or adverse consequences on particular markets, strategies, or investments. Future market or regulatory events may impact a Fund in unforeseen ways, such as causing the Fund to alter its existing strategies or potentially, to liquidate and close.
Equity Investments
Stock markets are volatile. Equity investments tend to go up or down in value, sometimes rapidly and unpredictably, in response to many factors, including a company’s historical and prospective earnings, the value of its assets, general economic conditions, interest rates, investor perceptions, and market liquidity. Due to the complexities of markets, events in one market or sector may adversely impact other markets or sectors.
Debt Investments
Debt investments are subject to many risks, including, but not limited to, interest rate risk, credit risk, market and regulatory risk, price volatility, and liquidity risk, which may affect their value. There is a risk that an issuer or guarantor of a debt investment might be unable or unwilling to meet its financial obligations and might not make interest or principal payments on an instrument when those payments are due (“default”). Defaults may potentially reduce a Fund’s income or ability to recover amounts due and may reduce the value of the debt investment, sometimes dramatically. High yield/high risk or “junk” securities may be more volatile than higher rated securities. High yield/high risk securities (including loans) are typically issued by companies that are highly leveraged, less creditworthy or financially distressed and are considered to be mostly speculative in nature (high risk), subject to greater liquidity risk, and subject to a greater risk of default than higher rated securities, especially during periods of economic uncertainty or during economic downturns. Debt investments, including bonds, fixed rate loans, and short-term instruments may be affected by changes in interest rates. Debt investments with longer durations tend to be more sensitive to changes in interest rates, making them more volatile than debt investments with shorter durations or floating or adjustable interest rates. The value of debt investments may fall when interest rates rise. Certain debt investments may be difficult to value, purchase, and sell, particularly during adverse market conditions, because there is a limited market for the investment or there are restrictions on resale.
Given the historically low interest rate environment in the U.S., risks associated with rising interest rates are heightened. The negative impact on debt investments from potential interest rate increases could be swift and significant, including falling market values, increased redemptions
D-6
Table of Contents
PACIFIC FUNDS
NOTES TO FINANCIAL STATEMENTS (Continued)
and reduced liquidity. Substantial redemptions from bond and other income funds may worsen that impact. Additionally, regulations applicable to and changing business practices of broker-dealers that make markets in debt investments may result in those broker-dealers restricting their market making activities for certain debt investments, which may reduce the liquidity and increase the volatility of such debt investments.
Certain asset-backed instruments, such as collateralized debt obligations, collateralized mortgage obligations, and other mortgage-related securities, structured investment vehicles, and other debt investments may have exposure to subprime loans or subprime mortgages, which are loans to persons with lower credit ratings. These instruments may present credit risk that is not transparent and that is greater than indicated by their ratings. The value of these instruments may be more acutely affected by downturns in the credit markets or the real estate market than certain other investments, and it may be difficult to value these instruments because of a thin secondary market.
Foreign and Emerging Markets Investments
Exposure to foreign markets can involve additional risks relating to market, economic, political, regulatory, geopolitical, or other conditions. These factors can make foreign investments more volatile and less liquid than U.S. investments. In addition, foreign markets can react differently to these conditions than the U.S. market. Markets and economies throughout the world are becoming increasingly interconnected, and conditions or events in one market, country or region may adversely impact investments or issuers in another market, country or region. Investments in or exposure to investments in emerging market countries may be riskier than investments in or exposure to investments in U.S. and certain developed markets. Risk may be more enhanced for investments in or exposure to investments in frontier market countries.
The Funds may face potential risks associated with the United Kingdom’s vote on June 23, 2016 to leave the European Union (the “EU”), commonly referred to as “Brexit.” There are considerable uncertainties about the repercussions resulting from Brexit, including the impact on trade agreements, regulations, and treaties. The exact time frame for the implementation of Brexit is unknown and may change. Brexit may also increase the likelihood that other EU members may decide to leave the EU. These potential consequences may result in increased market volatility and illiquidity in the United Kingdom, the EU and other financial markets, as well as slower economic growth and fluctuations in exchange rates. Any of these events may have a significant adverse effect on global markets and economies, which in turn could negatively impact the value of the Funds’ investments.
The countries listed in the Schedules of Investments for individual investment holdings (each a “Holding”) are each considered the country of risk to which a Holding, and therefore the Fund, is exposed. Each Holding’s country of risk is obtained from a third-party source that uses factors such as reporting currency, sales/revenue and location of management of the Holding’s issuer to determine country of risk. The country of risk may not be exclusive, however, as there may be other countries of risk to which a Holding is exposed that are not disclosed, although the country identified is expected to be the primary country of risk for that Holding. A Holding is generally subject to greater country risk based on where it conducts business or is economically tied to rather than where it is formed or incorporated. Foreign markets risks may include currency risk, market and regulatory risk, liquidity risk, emerging markets risk, frontier markets risk and geographic focus risk, among other risks.
Senior Loan Participations and Assignments
Certain Funds may invest in Senior Loans of domestic or foreign corporations, partnerships, and other entities (“Borrowers”), the interest rates of which float or adjust periodically based upon a specified adjustment schedule, benchmark indicator, or prevailing interest rates. Senior Loans generally pay interest at rates which are periodically redetermined by reference to a base lending rate plus a premium. These base lending rates generally include prime rates of one or more major U.S. banks, London Interbank Offered Rates (“LIBOR”) or certificates of deposit rates. Senior Loans often require prepayments from excess cash flow or permit the Borrower to repay at its election. The degree to which Borrowers repay cannot be predicted with accuracy. As a result, the actual maturity may be substantially less than the stated maturities. Senior Loans are exempt from registration under the Securities Act of 1933, may contain certain restrictions on resale, and cannot be sold publicly. A Fund’s investments in Senior Loans may be in the form of participations in loans or assignments of all or a portion of loans from third parties.
When a Fund purchases assignments, it acquires all the rights and obligations under the loan agreement of the assigning lender. Assignments may, however, be arranged through private negotiations between potential assignees and potential assignors, and the rights and obligations acquired by the purchaser of an assignment may differ from, and be more limited than those held by the assigning lender.
When a Fund purchases a participation of a Senior Loan interest, the Fund typically enters into a contractual agreement with the lender or other third party selling the participation. A participation interest in Senior Loans includes the right to receive payments of principal, interest, and any fees to which it is entitled from the lender and only upon receipt by the lender of payments from the Borrower, but not from the Borrower directly. When investing in a participation interest, if a Borrower is unable to meet its obligations under a loan agreement, a Fund generally has no right to enforce compliance with the terms of the loan agreement. As a result, the Fund assumes the credit risk of the Borrower, the selling participant, and any other persons that are interpositioned between the Fund and the Borrower. If the lead lender in a typical lending syndicate becomes insolvent, enters Federal Deposit Insurance Corporation (“FDIC”) receivership or, if not FDIC insured, enters into bankruptcy, the Fund may incur certain costs and delays in receiving payment or may suffer a loss of principal and/or interest. As of March 31, 2018, no participation interest in Senior Loans was held by any of the Funds presented in these financial statements.
Unfunded loan commitments on senior loan participations and assignments, if any, are marked to market daily and valued according to the Trust’s valuation policies and procedures. Any outstanding unfunded loan commitments are presented in the Notes to Schedules of Investments section of each applicable Fund’s Schedule of Investments. Any applicable net unrealized appreciation or depreciation at the end of the reporting period is recorded as an asset (unfunded loan commitment appreciation) or a liability (unfunded loan commitment depreciation) and any change in net unrealized appreciation or depreciation for the reporting period is recorded as a change in net unrealized appreciation or depreciation on unfunded loan commitment. As of March 31, 2018, none of the Funds presented in this report had any unfunded loan commitments.
D-7
Table of Contents
PACIFIC FUNDS
NOTES TO FINANCIAL STATEMENTS (Continued)
Inflation-Indexed Bonds
Certain Funds may invest in inflation-indexed bonds. Inflation-indexed bonds are debt securities whose principal value is periodically adjusted to the rate of inflation. The interest rate on these bonds is generally fixed at issuance at a rate lower than typical bonds. Over the life of an inflation-indexed bond, however, interest will be paid based on a principal value, which is adjusted for inflation. Any increase or decrease in the principal amount of an inflation-indexed bond will result in an adjustment to interest income.
Mortgage-Related and Other Asset-Backed Securities
Certain Funds may invest in mortgage-related and other asset-backed securities. These securities include mortgage pass-through securities, collateralized mortgage obligations (“CMOs”), collateralized loan obligations (“CLOs”), mortgage dollar rolls, CMO residuals, stripped mortgage-backed securities (“SMBS”), and other securities that directly or indirectly represent a participation in, or are secured by and payable from, mortgage loans secured by real property. Mortgage-related and other asset-backed securities are debt securities issued by a corporation, trust or custodian, or by a U.S. Government agency or instrumentality, that are collateralized by a pool of mortgages, mortgage pass-through securities, U.S. Government securities or other assets. The value of some mortgage-related and asset-backed securities may be particularly sensitive to changes in prevailing interest rates. Early repayment of principal on some mortgage-related securities may expose a Fund to a lower rate of return upon reinvestment of principal. The value of these securities may fluctuate in response to the market’s perception of the creditworthiness of the issuers. Additionally, although mortgage and mortgage-related securities are generally supported by some form of government or private guarantee and/or insurance, there is no assurance that private guarantors or issuers will meet their obligations.
SMBS represent a participation in, or are secured by and payable from, mortgage loans on real property, and may be structured in classes with rights to receive varying proportions of principal and interest. SMBS include interest-only securities (“IOs”), which receive all of the interest, and principal-only securities (“POs”), which receive the entire principal. The cash flows and yields on IOs are extremely sensitive to the rate of principal payments (including prepayments) on the underlying mortgage loans. If the underlying mortgages experience higher than anticipated prepayments, an investor in IOs of SMBS may fail to recoup fully its initial investment, even if the IOs are highly rated or are derived from securities guaranteed by the U.S. Government. Unlike other debt and other mortgage-backed securities, the market value of IOs tends to move in the same direction as interest rates. As prepayments on the underlying mortgages of POs increase, the yields on POs increase. Payments received from IOs are recorded as interest income. Because principal will not be received at the maturity of an IO, adjustments are made to the book value of the security on the coupon date until maturity. These adjustments are included in interest income. Payments received from POs are treated as reductions to the cost and par value of the securities. Any excess principal paydown gains or losses associated with the payments received are recorded as interest income.
U.S. Government Securities
Certain Funds may invest in securities issued by U.S. Government agencies or government-sponsored enterprises. U.S. Government securities are obligations of, and in certain cases, guaranteed by the U.S. Government, its agencies or instrumentalities. Some U.S. Government securities, such as Treasury Bills, Treasury Notes, Treasury Bonds, and securities guaranteed by GNMA (or “Ginnie Mae”), are supported by the full faith and credit of the U.S. Government; others, such as those of the Federal Home Loan Bank, are supported by the right of the issuer to borrow from the U.S. Department of the Treasury (the “U.S. Treasury”); others, such as those of the Federal National Mortgage Association (“FNMA” or “Fannie Mae”), are supported by the discretionary authority of the U.S. Government to purchase the agency’s obligations. Securities not backed by the full faith and credit of the U.S. Government may be subject to a greater risk of default. U.S. Government securities may include zero coupon securities, which do not distribute interest on a current basis and tend to be subject to greater risk than interest-paying securities of similar maturities.
Government-related guarantors (i.e., not backed by the full faith and credit of the U.S. Government) include FNMA and the Federal Home Loan Mortgage Corporation (“FHLMC” or “Freddie Mac”). FNMA and FHLMC are government-sponsored corporations, the common stocks of which are owned entirely by private stockholders. FNMA purchases conventional (i.e., not insured or guaranteed by any government agency) residential mortgages from a list of approved seller/servicers which include state and federally chartered savings and loan associations, mutual savings banks, commercial banks and credit unions, and mortgage bankers. Pass-through securities issued by FNMA are guaranteed as to timely payment of principal and interest by FNMA, but are not backed by the full faith and credit of the U.S. Government. FHLMC issues Participation Certificates (“PCs”), which are pass-through securities, each representing an undivided interest in a pool of residential mortgages. FHLMC guarantees the timely payment of interest and ultimate collection of principal, but PCs are not backed by the full faith and credit of the U.S. Government.
When-Issued Securities
Certain Funds may purchase and sell securities on a when-issued basis, including To Be Announced (“TBA”) securities. These transactions are made conditionally because a security, although authorized, has not yet been issued in the market. A commitment by a Fund is made regarding these transactions to purchase or sell securities for a predetermined price or yield, with payment and delivery taking place beyond the customary settlement period. A Fund may sell when-issued securities before they are delivered, which may result in a capital gain or loss. Risk may arise upon entering these contracts from the potential inability of a counterparty to meet the terms of their contracts, or if the issuer does not issue the securities due to political, economic, or other factors.
Delayed-Delivery Transactions
Certain Funds may purchase or sell securities on a delayed-delivery basis, including TBA securities. Payment and delivery may take place after the customary settlement period for that security. The price or yield of the underlying securities is fixed at the time the transaction is negotiated. When delayed-delivery purchases are outstanding, a Fund will set aside, and maintain until the settlement date in a segregated account, liquid assets in an amount sufficient to meet the purchase price. When purchasing a security on a delayed-delivery basis, a Fund
D-8
Table of Contents
PACIFIC FUNDS
NOTES TO FINANCIAL STATEMENTS (Continued)
assumes the rights and risks of ownership of the security, including the risk of price and yield fluctuations, and takes such fluctuations into account when determining its NAV. A Fund may dispose of or renegotiate a delayed-delivery transaction after it is entered into, and may sell delayed-delivery securities before they are delivered, which may result in a capital gain or loss. When a Fund has sold a security on a delayed-delivery basis, the Fund does not participate in future gains and losses with respect to the security.
Repurchase Agreements
Certain Funds may enter into repurchase agreements with institutions that the Investment Adviser or sub-adviser has determined are creditworthy. Under the terms of a typical repurchase agreement, a Fund takes possession of an underlying security (collateral) subject to an obligation of the seller to repurchase, and a Fund to resell the security at an agreed upon price and time. Repurchase agreements permit a Fund to maintain liquidity and potentially earn income over periods of time that may be as short as overnight. The collateral for all repurchase agreements are held in safekeeping for the benefit of the Funds at the Trust’s custodian, or broker-dealer, or a designated sub-custodian under a tri-party repurchase agreement. All repurchase agreements entered into by a Fund are collateralized with cash or securities of a type that the Fund is permitted to hold. The collateral is evaluated daily to ensure its market value equals or exceeds the current market value of the repurchase agreements, including accrued interest, except in the case of a repurchase agreement entered into for the purposes of selling a security short, where the value of the collateral delivered to a Fund must equal or exceed 95% of the value of the repurchase price during the term of the repurchase agreement. The terms of a repurchase agreement entered into for the purposes of selling a security short may provide that the cash purchase price paid by a Fund is more than the value of the collateral received that it is obligated to return to the counterparty under the repurchase agreement. Since in such a transaction, a Fund normally will have used the collateral received to settle the short sale, a Fund will segregate liquid assets equal to the marked to market value of the collateral received that it is obligated to return to the counterparty under the repurchase agreement.
In the event of default on the obligation to repurchase a security held by a Fund as collateral, the Fund has the right to liquidate the security and apply the proceeds to the counterparty’s obligations to the Fund under the repurchase agreement. Upon an event of default under the repurchase agreement, if the seller defaults and the value of the collateral declines or if the seller enters an insolvency proceeding, realization of the collateral by the Fund may be delayed, limited or wholly denied.
Borrowings and Other Financing Transactions
The following disclosures contain information on a Fund’s ability to lend or borrow cash or securities to the extent permitted under the 1940 Act, which may be viewed as borrowing or financing transactions by a Fund. The location and fair value amounts of these instruments are described below. For a detailed description of credit and counterparty risks that can be associated with borrowings and other financing transactions see Note 5.
Reverse Repurchase Agreements – Certain Funds may enter into reverse repurchase agreements. In a reverse repurchase agreement, a Fund sells a security that it holds to a financial institution with an agreement to repurchase the same security at an agreed-upon price and date. Securities sold under reverse repurchase agreements are recorded as a liability. Interest payments made are recorded as a component of interest expense. In periods of increased demand for the security, a Fund may receive a fee for use of the security by the counterparty, which may result in interest income to the Fund. A reverse repurchase agreement involves the risk that the market value of the security sold by a Fund may decline below the repurchase price of the security. A Fund will segregate assets determined to be liquid by the manager or otherwise cover its obligations under reverse repurchase agreements.
Sale-Buybacks Financing Transactions – Certain Funds may enter into transactions referred to as sale-buybacks. A sale-buyback transaction consists of a sale of a security by a Fund to a financial institution, the counterparty, with a simultaneous agreement to repurchase the same or substantially the same security at an agreed-upon price and date. Such transactions are recorded as secured borrowings. A Fund is not entitled to receive principal and interest payments, if any, made on the security sold to the counterparty during the term of the agreement. The agreed-upon proceeds for securities to be repurchased by a Fund are recorded as a liability. A Fund will recognize net income represented by the price differential between the price received for the transferred security and the agreed-upon repurchase price. This is commonly referred to as the price drop. A price drop consists of (i) the foregone interest and inflationary income adjustments, if any, a Fund would have otherwise received had the security not been sold and (ii) the negotiated financing terms between a Fund and counterparty. Foregone interest and inflationary income adjustments, if any, are recorded as components of interest income. Interest payments based upon negotiated financing terms made by the Fund to counterparties are recorded as a component of interest expense. In periods of increased demand for the security, a Fund may receive a fee for use of the security by the counterparty, which may result in interest income to a Fund. A Fund will segregate assets determined to be liquid or otherwise cover its obligations under sale-buyback transactions.
Short Sales – Certain Funds may enter into short sales. A short sale is a transaction in which a Fund sells securities it does not own. A Fund’s use of short sales involves the risk that the price of the security in the open market may be higher when purchased to close out the Fund’s short position, resulting in a loss to the Fund. Such a loss is theoretically unlimited because there is no limit on the potential increase in the price of a security or guarantee as to the price at which the manager would be able to purchase the security in the open market.
When a Fund sells securities short, it must borrow those securities to make delivery to the buyer. The Fund incurs an expense for such borrowing. The Fund may be required to pledge a portion of its assets to the broker as collateral for the borrowed securities. The Fund may not be able to purchase a security that it needs to deliver to close out a short position at an acceptable price. This may result in losses and/or require the Fund to sell long positions before the manager had intended. A Fund may not be able to successfully implement its short sale strategy, which may limit its ability to achieve its investment goal, due to limited availability of desired or eligible securities, the cost of borrowing securities, regulatory changes limiting or barring short sales, or for other reasons. Securities sold in short sale transactions and the interest and dividends payable on such securities, if any, are recorded as a liability.
D-9
Table of Contents
PACIFIC FUNDS
NOTES TO FINANCIAL STATEMENTS (Continued)
The use of proceeds received from selling short to purchase additional securities (long positions) results in leverage, which may increase a Fund’s exposure to long positions. Leverage could magnify gains and losses and, therefore, increase a Fund’s volatility.
Segregation and Collateral
If a Fund engages in certain transactions, such as derivative investments, repurchase agreements, or repurchase-to-maturity transactions accounted for as secured borrowings, it may require collateral in the form of cash or investments to be held in segregated accounts at the Trust’s custodian, with an exchange or clearing member firm, or segregated on the Fund’s books and records maintained by the custodian and/or the manager of the Fund. In each instance that segregation of collateral is required, it is done so in accordance with the 1940 Act and/or any interpretive guidance issued by the SEC. In the event of the counterparty default on the transaction, a Fund has the right to liquidate the collateral and apply the proceeds to the counterparty’s obligations to that Fund. Upon an event of default, if the seller defaults and the value of the collateral declines, or if the seller enters an insolvency proceeding, realization of the collateral by the Fund may be delayed, limited or wholly denied. There is also a possibility that a Fund could experience a delay in selling investments that are segregated as collateral.
5. DERIVATIVE INVESTMENTS AND RISKS, AND ENFORCEABLE MASTER NETTING ARRANGEMENTS
A. PRINCIPAL MARKET RISKS MANAGED BY INVESTING IN DERIVATIVES
Derivative instruments are investments whose values are tied to the value of an underlying security or asset, a group of assets, interest rates, exchange rates, currency or an index. Certain Funds are permitted to invest in derivative instruments, including, but not limited to, futures contracts, option contracts, forward foreign currency contracts, and swap agreements. Derivatives may have little or no initial cash investment value relative to their market value exposure and therefore can produce significant gains or losses in excess of their cost. This is sometimes referred to as leverage. Leverage can magnify a Fund’s gains and losses and therefore increase its volatility. A Fund’s investments in derivatives may increase, decrease or change the level or types of exposure to certain risk factors. The primary risks a Fund may attempt to manage through investing in derivative instruments include, but are not limited to, interest rate, foreign investments and currency, price volatility, and credit (including counterparty) risks.
Interest Rate Risk – A Fund may be exposed to interest rate risk through investments in debt securities. Interest rate risk is the risk that debt securities will decline in value as a result of changes in interest rates. For example, the value of bonds, fixed rate loans and short-term money market instruments may decline in value when interest rates rise. In a low interest rate environment, the risks associated with rising interest rates are heightened. Debt securities with longer durations tend to be more sensitive to changes in interest rates, making them more volatile than debt securities with shorter durations or money market instruments. Therefore, duration is a potentially useful tool to measure the sensitivity of a debt security’s yield (market price to interest rate movement). To manage these risks, certain Funds may invest in derivative instruments tied to interest rates.
Foreign Investments and Currency Risk – A Fund may be exposed to foreign investments and/or currency risk through direct investment in securities or through options, futures or currency transactions. The prices of foreign securities that are denominated in foreign currencies are affected by the value of the U.S. dollar. With respect to securities denominated in foreign currencies, in general, as the value of the U.S. dollar rises, the U.S. dollar price of a foreign security will fall. As the value of the U.S. dollar falls, the U.S. dollar value of the foreign security will rise. Currency rates in foreign countries may fluctuate significantly over short periods of time for a number of reasons. Foreign investments may be riskier than U.S. investments for many reasons, including changes in currency exchange rates, unstable political and economic conditions, a lack of adequate and timely company information, differences in the way securities markets operate, relatively lower market liquidity, less stringent financial reporting and accounting guidance and controls, less secure foreign banks or securities depositories than those in the U.S., foreign taxation issues, and foreign controls on investments. As a result, a Fund’s investments in foreign currency-denominated securities and other foreign investments may reduce the returns of the Fund. To manage these risks, certain Funds may invest in derivative instruments tied to foreign investments and/or currencies.
Price Volatility Risk – Derivatives tied to equity and debt securities are exposed to potential price volatility. Debt securities are affected by many factors, including prevailing interest rates, market conditions, and market liquidity. Volatility of below investment grade debt securities (including loans) may be relatively greater than for investment grade debt securities. Equity securities tend to go up or down in value, sometimes rapidly and unpredictably. The prices of equity securities change in response to many factors, including a company’s historical and prospective earnings, the value of its assets, general economic conditions, interest rates, investor perceptions, and market liquidity. Due to the complexities of markets, events in one market or sector may adversely impact other markets or sectors. To manage these risks, certain Funds may invest in various derivative instruments. Derivative instruments may be used to manage a Fund’s exposure to price volatility risk but may also be subject to greater price volatility than investments in traditional securities. The value of commodity-linked derivative instruments may be affected by changes in overall market movements, commodity index volatility, changes in interest rates, or factors affecting a particular industry or commodity, such as drought, floods, weather, livestock disease, embargoes, tariffs, and international economic, political, and regulatory developments.
Credit and Counterparty Risk – Credit risk is the risk that a debt security’s issuer (or borrower or counterparty) will be unable or unwilling to meet its financial obligations (e.g., may not be able to make principal and/or interest payments when they are due or otherwise default on other financial terms) and/or may go bankrupt. This is also sometimes described as counterparty risk. A Fund may lose money if the issuer or guarantor of debt security, or counterparty of a derivative contract, repurchase or reverse repurchase agreement, or a loan of Fund securities, is unable or unwilling to make timely principal and/or interest payments, or to otherwise honor its obligations. A Fund may attempt to minimize concentrations of credit risk by undertaking transactions with a large number of borrowers or counterparties on recognized and reputable exchanges. A Fund’s investments in debt investments may range in quality from those rated in the lowest category in which it is permitted to invest to those rated in the highest category by a rating agency, or if unrated, determined by the manager to be of comparable quality.
D-10
Table of Contents
PACIFIC FUNDS
NOTES TO FINANCIAL STATEMENTS (Continued)
Similar to credit risk, a Fund may be exposed to counterparty risk, or the risk that an institution or other entity with which a Fund has unsettled or open transactions will default. Financial assets of counterparties, which potentially expose a Fund to counterparty risk, consist mainly of cash due from counterparties and investments. Certain managers may attempt to minimize credit risks to the Funds by performing extensive reviews of each counterparty, entering into transactions with counterparties that the manager believes to be creditworthy at the time of the transaction and requiring the posting of collateral in applicable transactions. To manage these risks, certain Funds may invest in derivative instruments tied to a security issuers’ financial strength.
B. DERIVATIVE INVESTMENTS
In addition to managing the market risks described above, certain Funds, if permitted by their investment objectives, may also invest in derivatives for purposes of hedging, duration management, to gain exposure to specific investment opportunities, as a substitute for securities, to enhance returns, or to otherwise help achieve a Fund’s investment goal. Each derivative instrument and the reasons a Fund invested in derivatives during the reporting period are discussed in further detail below.
Futures Contracts – A futures contract is a commitment to buy or sell a specific amount of a financial instrument or commodity at a negotiated price on a specified future date. Futures contracts are subject to the possibility of illiquid markets, and the possibility of an imperfect correlation between the value of the instruments and the underlying securities. Initial margin is deposited with a futures broker upon entering into futures contracts and can be funded with either cash or securities, in accordance with the initial margin requirements of the broker or the exchange. During the period a futures contract is open, changes in the value of the contract are recognized as unrealized appreciation or depreciation by marking-to-market on a daily basis to reflect the market value of the contract at the end of each day’s trading. Variation margin receivables or payables represent the difference between the change in unrealized appreciation and depreciation on the open contracts and the cash deposits made on the margin accounts. When the contract is closed, a Fund records a realized gain or loss equal to the difference between the proceeds from (or cost of) the closing transaction and the Fund’s cost of the contract. Futures contracts are valued at the settlement price established each day by the board of trade or exchange on which they are traded.
During the reporting period, the following Funds entered into futures contracts for the reasons described: the PF Inflation Managed and PF Managed Bond Funds used futures contracts to manage interest rate risk exposure, as a substitute for cash bond exposure, and for purposes of liquidity. The PF Short Duration Bond Fund entered into interest rate futures to manage duration and yield curve exposure. The PF Equity Long/Short Fund used futures to gain exposure to equity markets. The PF Global Absolute Return Fund entered into futures contracts to manage duration and interest rate risk, to maintain full exposure to the equity markets, to manage exposure to various securities markets and movements in interest rates, to provide daily liquidity for the Fund’s inflows and outflows, and as a part of the Fund’s investment strategy.
Option Contracts – An option contract is a commitment that gives the purchaser of the contract the right, but not the obligation, to buy or sell an underlying reference asset at a specific price on or before a specified future date. On the other hand, the writer of an option contract is obligated, upon the exercise of the option, to buy or sell an underlying reference asset at a specific price on or before a specified future date. A swaption is an option contract granting the owner the right to enter into an underlying swap. Inflation-capped options are options on U.S. inflation rates at a stated strike price. The seller of an inflation-capped option receives an upfront premium and in return the buyer receives the right to receive a payment at the expiration of the option if the cumulative annualized inflation rate over the life of the option is above (for caps) or below (for floors) the stated strike price. The purpose of inflation-capped options is to protect the buyer from inflation erosion above a certain rate on a given notional exposure. A floor can be used to give downside protection to investments in inflation-linked products below a certain rate on a given notional exposure. Writing put options or purchasing call options tends to increase a Fund’s exposure to the underlying instrument. Writing call options or purchasing put options tends to decrease a Fund’s exposure to the underlying instrument. When a Fund writes or purchases a call, put, or inflation-capped option, an amount equal to the premium received or paid by the Fund is recorded as a liability or an investment, respectively, and subsequently adjusted to the current market value, based on the quoted daily settlement price of the option written or purchased. Certain options may be written or purchased with premiums to be determined on a future date. The premiums for these options are based upon implied volatility parameters at specified terms. Premiums received or paid from writing or purchasing options, which expire unexercised, are treated by a Fund on the expiration date as realized gains or losses. The difference between the premium and the amount paid or received on a closing purchase or sale transaction, including brokerage commissions, is also treated as a realized gain or loss. If an option is exercised, the premium paid or realized is added to the cost of the purchase or proceeds from the sale in determining whether the Fund has realized a gain or loss on investment transactions. A Fund, as a writer of an option, may have no control over whether the underlying instrument may be sold (call) or purchased (put) and as a result bears the market risk of an unfavorable change in the price of the underlying written option. In addition, an illiquid market may make it difficult for a Fund to close out an option contract.
The maximum risk of loss associated with writing put options is limited to the exercised fair value of the option contract. The maximum risk of loss associated with writing call options is potentially unlimited. Listed option contracts present minimal counterparty credit risk since they are exchange traded and the exchange’s clearinghouse, as counterparty to all exchange-traded options, guarantees the options against default. A Fund’s maximum risk of loss from counterparty credit risk related to OTC option contracts is limited to the premium paid.
During the reporting period, the following Funds entered into option contracts for the reasons described: the PF Inflation Managed and PF Managed Bond Funds purchased and wrote options and swaptions on futures, currencies, volatility and swaps as a means of capitalizing on anticipated changes in market volatility, and to generate income. The PF Inflation Managed and PF Managed Bond Funds held inflation floors, and the PF Inflation Managed Fund held inflation caps, to hedge duration. The PF Short Duration Bond Fund purchased and wrote options for hedging purposes. The PF Currency Strategies Fund purchased options to hedge risk on currency investments. The PF Global Absolute Return Fund purchased and wrote options to protect gains and to enhance returns.
Forward Foreign Currency Contracts – A forward foreign currency contract (“Forward Contract”) is a commitment to buy or sell a specific amount of a foreign currency at a negotiated price on a specified future date. Forward Contracts can help a Fund manage the risk of changes in
D-11
Table of Contents
PACIFIC FUNDS
NOTES TO FINANCIAL STATEMENTS (Continued)
currency exchange rates. The market value of a Forward Contract fluctuates with changes in foreign currency rates. These contracts are marked-to-market daily at the applicable forward currency translation rates. A Fund records realized gains or losses at the time the Forward Contract is closed. A Forward Contract is extinguished through a closing transaction or upon delivery of the currency or entering an offsetting contract. A Fund’s maximum risk of loss from counterparty credit risk related to Forward Contracts is the fair value of the contract. The risk may be mitigated to some extent if a master netting arrangement between a Fund and the counterparty is in place and to the extent a Fund obtains collateral to cover the Fund’s exposure to the counterparty.
During the reporting period, the following Funds entered into forward foreign currency contracts for the reasons described: the PF Inflation Managed and PF Managed Bond Funds purchased and sold Forward Contracts in connection with settling planned purchases or sales of investments, to hedge and manage the currency exposure associated with some or all of the Funds’ investments, to manage interest rate risk and yield curve exposures, and as part of the investment strategy of these Funds. The PF Short Duration Bond Fund entered into Forward Contracts in order to decrease currency exposure. The PF Emerging Markets Debt Fund entered into Forward Contracts to gain exposure to various markets, for purposes of hedging, and as part of the Fund’s investment strategy. The PF Comstock Fund entered into Forward Contracts for risk management purposes to mitigate currency risk and isolate securities selection as the primary driver of performance. The PF International Value Fund entered into Forward Contracts for risk management purposes to manage currency deviations relative to the benchmark. The PF Currency Strategies and PF Equity Long/Short Funds purchased and sold non-deliverable Forward Contracts to gain or increase exposure to various currencies (both long and short positions) for hedging purposes to protect the Funds’ returns against adverse currency movements and as a part of the investment strategy of these Funds. The PF Global Absolute Return Fund entered into Forward Contracts (including volatility forwards) to hedge against currency exposure associated with some or all of the Fund’s investments, to shift foreign currency exposure back to U.S. dollars, to shift investment exposure from one currency to another, to enhance returns, and as a substitute for securities.
Swap Agreements – Swap agreements are bilaterally negotiated agreements between the Funds and their counterparties to exchange swap investment cash flows, assets, foreign currencies or market-linked returns at specified intervals. Swap agreements are privately negotiated in the OTC market or are executed in a multilateral or other execution facility platform, such as a registered commodities exchange (“centrally cleared swaps”). In connection with these agreements, cash and securities may be identified as collateral in accordance with the terms of the respective swap agreements to provide assets of value and recourse in the event of default or bankruptcy/insolvency. Swaps are marked-to-market daily based upon values received from third party vendors or quotations from market makers. Market values greater than zero are recorded as an asset and market values less than zero are recorded as a liability. The change in value of swaps, including accruals of periodic amounts of interest to be paid or received on swaps, is recorded as unrealized appreciation or depreciation. Daily changes in valuation of centrally cleared swaps, if any, are recorded as variation margin receivable or payable. OTC swap payments received or made at the beginning of the measurement period are recorded as an asset or liability and represent payments made or received upon entering into the swap agreement to compensate for differences between the stated terms of the swap agreement and prevailing market conditions (credit spreads, currency exchange rates, interest rates, and other relevant factors). These upfront payments are recorded as realized gain or loss when the swap is closed. A liquidation payment received or made at the termination of the swap is recorded as realized gain or loss. Net periodic payments received by a Fund are recorded as realized gain.
Interest Rate Swaps – Interest rate swap agreements involve the exchange by a Fund with another party of their respective commitments to pay or receive interest with respect to the notional amount of principal. Certain forms of interest rate swap agreements may include: (i) interest rate caps, under which, in return for a premium, one party agrees to make payments to the other to the extent that interest rates exceed a specified rate, or “cap”, (ii) interest rate floors, under which, in return for a premium, one party agrees to make payments to the other to the extent that interest rates fall below a specified rate, or “floor”, (iii) interest rate collars, under which a party sells a cap and purchases a floor or vice versa in an attempt to protect itself against interest rate movements exceeding given minimum or maximum levels, (iv) callable interest rate swaps, under which the counterparty may terminate the swap transaction in whole at zero cost by a predetermined date and time prior to the maturity date, (v) spreadlocks, which allow the interest rate swap users to lock in the forward differential (or spread) between the interest rate swap rate and a specified benchmark, or (vi) basis swaps, under which two parties can exchange variable interest rates based on different money markets.
A Fund investing in interest rate swaps is subject to the risk that there is no liquid market for these agreements, that the counterparties may default on their obligations to perform or disagree as to the meaning of the contractual terms in the agreements, or that there may be unfavorable changes in interest rates. A Fund’s maximum risk of loss from counterparty credit risk related to interest rate swaps is the discounted net value of the cash flows to be received from/paid to the counterparty over the contract’s remaining life, to the extent that the amount is positive. The risk may be mitigated to some extent if a master netting arrangement between a Fund and the counterparty is in place and to the extent a Fund obtains collateral to cover the Fund’s exposure to the counterparty.
During the reporting period, the following Funds entered into interest rate swap agreements for the reasons described: the PF Inflation Managed and PF Managed Bond Funds entered into interest rate swaps to manage nominal or real interest rate risk in various global markets, and as a substitute for cash bond exposure. The PF Emerging Markets Debt Fund entered into interest rate swaps to gain exposure to various markets, for purposes of hedging, and as part of the Fund’s investment strategy. The PF Global Absolute Return Fund entered into interest rate swaps to gain or hedge interest rate risk, to gain or mitigate exposure to various markets, and to increase returns.
Cross-currency swaps are interest rate swaps in which interest cash flows are exchanged between two parties based on the notional amounts of two different currencies. The notional amounts are typically determined based on the spot exchange rates at the inception of the trade. Cross-currency swaps also involve the exchange of the notional amounts at the start of the contract at the current spot rate with an agreement to re-exchange such amounts at a later date at either the same exchange rate, a specified rate or the then current spot rate. The entire principal value of a cross-currency swap is subject to the risk that the counterparty to the swap will default on its contractual delivery obligations.
D-12
Table of Contents
PACIFIC FUNDS
NOTES TO FINANCIAL STATEMENTS (Continued)
During the reporting period, the PF Global Absolute Return Fund entered into cross-currency swaps to gain or mitigate exposure on currency risk, for purposes of hedging, and as part of the Fund’s investment strategy.
Credit Default Swaps – Credit default swap agreements involve one party making a stream of payments (referred to as the buyer of protection) to another party (the seller of protection) in exchange for the right to receive a specified return in the event of a default or other credit event for the referenced entity, obligation or index. A Fund investing in credit default swaps is subject to the risk that there is no liquid market for these agreements, that the counterparties may default on their obligations to perform or disagree as to the meaning of the contractual terms in the agreements, or that there may be unfavorable changes in interest rates.
As a seller of protection, a Fund generally receives an upfront payment and/or a fixed rate of income throughout the term of the swap provided there is no credit event. As the seller, a Fund would effectively add leverage to its Fund because, in addition to its total net assets, a Fund would be subject to investment exposure on the notional amount of the swap.
If a Fund is a seller of protection and a credit event occurs, as defined under the terms of that particular swap agreement, a Fund will either (i) pay to the buyer of protection an amount equal to the notional amount of the swap and take delivery of the referenced obligation, other deliverable obligations or underlying securities comprising the referenced index, or (ii) pay a net settlement amount in the form of cash or securities equal to the notional amount of the swap less the recovery value of the referenced obligation or underlying securities comprising the referenced index. If a Fund is a buyer of protection and a credit event occurs, as defined under the terms of that particular swap agreement, a Fund will either (i) receive from the seller of protection an amount equal to the notional amount of the swap and deliver the referenced obligation, other deliverable obligations or underlying securities comprising the referenced index, or (ii) receive a net settlement amount in the form of cash or securities equal to the notional amount of the swap less the recovery value of the referenced obligation or underlying securities comprising the referenced index. Recovery values are assumed by market makers considering either industry standard recovery rates or entity specific factors and considerations until a credit event occurs. If a credit event has occurred, the recovery value is determined by a facilitated auction whereby a minimum number of allowable broker bids, together with a specified valuation method, are used to calculate the settlement value.
Credit default swap agreements on corporate and sovereign issues involve one party making a stream of payments to another party in exchange for the right to receive a specified return in the event of a default or other credit event. If a credit event occurs and cash settlement is not elected, a variety of other deliverable obligations may be delivered in lieu of the specific referenced obligation. The ability to deliver other obligations may result in a cheapest-to-deliver option (the buyer of protection’s right to choose the deliverable obligation with the lowest value following a credit event).
Credit default swap agreements on asset-backed securities involve one party making a stream of payments to another party in exchange for the right to receive a specified return in the event of a default or other credit event. Unlike credit default swaps on corporate and sovereign issues, deliverable obligations in most instances would be limited to the specific referenced obligation as performance for asset-backed securities can vary across deals. Prepayments, principal paydowns, and other writedowns or loss events on the underlying mortgage loans will reduce the outstanding principal balance of the referenced obligation. These reductions may be temporary or permanent as defined under the terms of the swap agreement and the notional amount for the swap agreement will be adjusted by corresponding amounts.
Credit default swap agreements on credit indices involve one party making a stream of payments to another party in exchange for the right to receive a specified return in the event of a write-down, principal shortfall, interest shortfall or default of all or part of the referenced entities comprising the credit index. Credit default swap agreements on indices are benchmarks for protecting investors owning bonds against default. A credit index is a list of a basket of credit instruments or exposures designed to be representative of some part of the credit market as a whole. These indices are made up of reference credits that are judged by a poll of dealers to be the most liquid entities in the credit default swap market based on the sector of the index. Components of the indices may include, but are not limited to, investment grade securities, high yield securities, asset-backed securities, emerging markets, and/or various credit ratings within each sector. Credit indices are traded using credit default swaps with standardized terms including a fixed spread and standard maturity dates. An index credit default swap references all the names in the index, and if there is a default, the credit event is settled based on that name’s weight in the index. The composition of the indices changes periodically, usually every six months, and for most indices, each name has an equal weight in the index.
An implied credit spread is the spread in yield between a U.S. Treasury security and the referenced obligation or underlying investment that are identical in all respects except for the quality rating. Wider credit spreads, in absolute terms when compared to the notional amount of the swap, represent a deterioration of the referenced entity’s credit soundness and a greater likelihood or risk of default or other credit event occurring as defined under the terms of the agreement. Implied credit spreads, represented in absolute terms, utilized in determining the market value of credit default swap agreements on corporate and sovereign issues or U.S. Treasury obligation issues as of period end, are disclosed in the Notes to Schedules of Investments and serve as an indicator of the current status of the payment/performance risk and represent the likelihood or risk of default for the credit derivative. The implied credit spread of a particular referenced entity reflects the cost of buying/selling protection and may include upfront payments required to be made to enter into the agreement. For credit default swap agreements on asset-backed securities and credit indices, the quoted market prices and resulting values serve as the indicator of the current status of the payment/performance risk.
A Fund may use pair trades of credit default swaps. Pair trades attempt to match a long position with a short position of two securities in the same market sector for hedging purposes. Pair trades of credit default swaps attempt to gain exposure to credit risk while hedging or offsetting the effects of overall market movements. For example, a Fund may purchase protection through a credit default swap referenced to the debt of an issuer, and simultaneously selling protection through a credit default swap referenced to the debt of a different issuer with the intent to realize gains from the pricing differences of the two issuers who are expected to have similar market risks.
D-13
Table of Contents
PACIFIC FUNDS
NOTES TO FINANCIAL STATEMENTS (Continued)
A Fund may use spread curve trades by simultaneously purchasing and selling protection through credit default swaps referenced to the same issuer but with different maturities. Spread curves attempt to gain exposure to credit risk on a forward basis by realizing gains on the expected differences in spreads.
A Fund’s maximum risk of loss from counterparty credit risk related to credit default swaps, either as the buyer or seller of protection, is the fair value of the contract. The risk may be mitigated to some extent if a master netting arrangement between a Fund and the counterparty is in place and to the extent a Fund obtains collateral to cover the Fund’s exposure to the counterparty.
The aggregate fair value of credit default swaps in a net liability position is reflected as unrealized depreciation and is disclosed in the Notes to Schedules of Investments. The collateral posted, net of assets received as collateral, for swap agreements is also disclosed in the Notes to Schedules of Investments. The maximum potential amount of future payments (undiscounted) that a Fund as a seller of protection could be required to make under a credit default swap agreement is an amount equal to the notional amount of the agreement. Notional amounts of all credit default swap agreements outstanding as of March 31, 2018 for which a Fund is the seller of protection are disclosed in the Notes to Schedules of Investments. These potential amounts are partially offset by any recovery values of the respective referenced obligations, upfront payments received upon entering into the agreement, or net amounts received from the settlement of buy protection credit default swap agreements entered into by a Fund for the same referenced entity or entities.
During the reporting period, the following Funds entered into credit default swap agreements for the reasons described: the PF Inflation Managed Fund entered into credit default swaps on credit indices to obtain exposure to the credit risk of individual securities or to the broader investment grade, high yield, emerging market or mortgage asset classes. The PF Inflation Managed Fund also purchased credit protection through credit default swaps to reduce credit exposure to individual issuers, reduce broad credit risk, and to benefit from price differences between the credit default swap and cash bonds market. The PF Managed Bond Fund entered into credit default swaps to obtain exposure to the credit risk of individual securities or to the broader investment grade or emerging market sectors through the use of credit default swaps on credit indices. The PF Global Absolute Return Fund entered into credit default swaps to increase or decrease credit exposure to individual issuers of debt securities or to a specific debt security or a basket of debt securities, and to enhance returns.
Total Return Swaps – A Fund investing in total return swaps is subject to the risk that there is no liquid market for these agreements, that the counterparties may default on their obligations to perform or that there may be unfavorable changes in the value of the underlying index or reference instrument (generally caused by changes in interest rates or declines in credit quality). A total return swap agreement is one in which one party makes payments based on a set rate, either fixed or variable, while the other party makes payments based on the return of an underlying index or reference instrument, which includes both the income it generates and any capital gains. To the extent the total return of the index or reference instrument underlying the transaction exceeds or falls short of the offsetting interest rate obligation, a Fund will receive a payment from or make a payment to the counterparty. A Fund’s maximum risk of loss from counterparty credit risk related to total return swaps is the discounted net value of the cash flows to be received from or paid to the counterparty over the contract’s remaining life, to the extent that the amount is positive. The risk may be mitigated to some extent if a master netting arrangement between a Fund and the counterparty is in place and to the extent a Fund obtains collateral to cover a Fund’s exposure to the counterparty.
A Fund may enter into fully funded total return swaps which involves one party making an initial payment equal to the estimated value of the reference instrument. The parties to the swap then exchange respective commitments to pay or receive a net amount based on the change in the fair value of a reference instrument and a specified notional amount.
During the reporting period, the following Funds entered into total return swap agreements for the reasons described: the PF Emerging Markets Debt Fund and the PF Multi-Asset Fund entered into total return swaps to gain exposure to various markets, for purposes of hedging, and as part of each Fund’s investment strategy. The PF Equity Long/Short Fund used total return swaps to gain exposure to various markets. The PF Global Absolute Return Fund used total return swaps to enhance returns, and for credit and market exposure.
Total Return Basket Swaps – A total return basket swap is designed to function as a Fund of direct investments in long and short equity or fixed income positions. The Fund has the ability to trade in and out of long and short positions within the swap and will receive all of the economic benefits and risks equivalent to direct investments in these positions such as: capital appreciation or depreciation, corporate actions, and dividends and interest received and paid, all of which are reflected in the swap value. The swap value also includes interest charges and credits (“financing fees”) related to the notional values of the long and short positions and cash balances within the swap. These financing fees are based on defined market rates or a specified benchmark rate, plus or minus a specified spread. Positions within the swap are reset periodically, and financing fees are reset monthly. At maturity, any unrealized gain or loss on positions and accrued financing costs become available for cash settlement between the Fund and the swap counterparty. Cash settlement in and out of the swap may occur at a reset date or any other date, at the discretion of the Fund and the counterparty, over the life of the agreement, and is generally determined based on limits and thresholds established as part of the Master Agreement between the Fund and the counterparty. A change in the market value of a total return basket swap contract is recognized as a change in unrealized appreciation or depreciation on swaps in the Statements of Operations. Cash settlements between a Fund and the counterparty are recognized as realized gain or loss on swap transactions in the Statements of Operations. Total return basket swaps outstanding at period end, if any, are disclosed in Notes to Schedule of Investments.
During the reporting period, the PF Equity Long/Short Fund entered into total return basket swaps to gain exposure to equity indices and to gain security level stock exposure.
Volatility Swaps – Volatility swap agreements involve two parties agreeing to exchange cash flows based on the measured variance (or square of volatility) of a specified underlying reference asset. One party agrees to exchange a “fixed rate” or strike price payment for the “floating rate” or realized price variance on the underlying reference asset with respect to the notional amount. At inception, the strike price is generally chosen such that the fair value of the swap is zero.
D-14
Table of Contents
PACIFIC FUNDS
NOTES TO FINANCIAL STATEMENTS (Continued)
At the maturity date, a net cash flow is exchanged, where the payoff amount is equivalent to the difference between the realized price variance of the underlying reference asset and the strike price multiplied by the notional amount. As a receiver of the realized price variance, the Fund would receive the payoff amount when the realized price variance of the underlying reference asset is greater than the strike price and would owe the payoff amount when the variance is less than the strike. As a payer of the realized price variance, the Fund would owe the payoff amount when the realized price variance of the underlying reference asset is greater than the strike price and would receive the payoff amount when the variance is less than the strike. This type of agreement is essentially a forward contract on the future realized price variance of the underlying reference asset.
None of the Funds presented in these financial statements held volatility swaps as of March 31, 2018.
The following is a summary of the location of fair value amounts of derivative investments, if any, disclosed in the Trust’s Statements of Assets and Liabilities:
| Location on the Statements of Assets and Liabilities | ||||||
| Derivative Investments Risk Type | Asset Derivative Investments | Liability Derivative Investments | ||||
| Credit contracts | Outstanding purchased options, at value | Outstanding options written, at value | ||||
| Equity contracts | Receivable: Variation margin on futures contracts | Payable: Variation margin on futures contracts | ||||
| Interest rate contracts | Receivable: Variation margin on swap contracts | Payable: Variation margin on swap contracts | ||||
| Swap agreements, at value | Swap agreements, at value | |||||
| Foreign currency contracts | Outstanding purchased options, at value | Outstanding options written, at value | ||||
| Receivable: Variation margin on futures contracts | Payable: Variation margin on futures contracts | |||||
| Receivable: Variation margin on swap contracts | Payable: Variation margin on swap contracts | |||||
| Swap agreements, at value | Swap agreements, at value | |||||
| Forward foreign currency contracts appreciation | Forward foreign currency contracts depreciation | |||||
The following is a summary of fair values of derivative investments disclosed in the Trust’s Statements of Assets and Liabilities, categorized by primary risk exposure as of March 31, 2018:
| Asset Derivative Investments Value | ||||||||||||||||||||
| Fund | Total Value at March 31, 2018 | Credit Contracts | Equity Contracts | Foreign Currency Contracts | Interest Rate Contracts | |||||||||||||||
| PF Inflation Managed | $124,398 | $1,348 | * | $— | $17,650 | $105,400 | * | |||||||||||||
| PF Managed Bond | 7,950,079 | 1,431,245 | * | — | 976,487 | * | 5,542,347 | * | ||||||||||||
| PF Short Duration Bond | 41,002 | — | — | 157 | 40,845 | * | ||||||||||||||
| PF Emerging Markets Debt | 722,997 | — | — | 289,671 | 433,326 | * | ||||||||||||||
| PF Comstock | 13,529 | — | — | 13,529 | — | |||||||||||||||
| PF Currency Strategies | 3,196,925 | — | — | 3,196,925 | — | |||||||||||||||
| PF Equity Long/Short | 6,399,377 | — | 6,353,260 | * | 46,117 | — | ||||||||||||||
| PF Global Absolute Return | 2,973,166 | 351,440 | * | 80,793 | 1,909,982 | 630,951 | * | |||||||||||||
| PF Multi-Asset | 7,305,502 | — | 7,305,502 | — | — | |||||||||||||||
| Liability Derivative Investments Value | ||||||||||||||||||||
| Fund | Total Value at March 31, 2018 | Credit Contracts | Equity Contracts | Foreign Currency Contracts | Interest Rate Contracts | |||||||||||||||
| PF Inflation Managed | ($197,361 | ) | ($3,780 | )* | $— | ($29,989 | ) | ($163,592 | )* | |||||||||||
| PF Managed Bond | (7,183,904 | ) | (434,326 | )* | — | (3,123,358 | )* | (3,626,220 | )* | |||||||||||
| PF Short Duration Bond | (22,834 | ) | — | — | — | (22,834 | )* | |||||||||||||
| PF Emerging Markets Debt | (255,389 | ) | — | — | (254,928 | ) | (461 | )* | ||||||||||||
| PF Comstock | (27,710 | ) | — | — | (27,710 | ) | — | |||||||||||||
| PF Currency Strategies | (2,290,328 | ) | — | — | (2,290,328 | ) | — | |||||||||||||
| PF Equity Long/Short | (1,007,688 | ) | — | (936,537 | )* | (71,151 | ) | — | ||||||||||||
| PF Global Absolute Return | (4,148,943 | ) | (583,002 | )* | — | (2,343,990 | ) | (1,221,951 | )* | |||||||||||
| PF Multi-Asset | (23,606,126 | ) | — | (23,606,126 | ) | — | — | |||||||||||||
| * | Includes cumulative appreciation (depreciation) of futures contracts and centrally cleared options, and/or centrally cleared swaps as reported in the Notes to Schedules of Investments. |
The following is a summary of the location of realized gains and losses and changes in net unrealized appreciation and depreciation on derivative investments, if any, disclosed in the Trust’s Statements of Operations:
| Derivative Investments Risk Type | Location of Gain (Loss) on Derivative Investments Recognized in the Statements of Operations | |||
| Credit contracts | Net realized gain (loss) on futures contract transactions | |||
| Equity contracts | Net realized gain (loss) on purchased option transactions | |||
| Interest rate contracts | Net realized gain (loss) on swap transactions | |||
| Net realized gain (loss) on written option transactions | ||||
| Change in net unrealized appreciation (depreciation) on futures contracts | ||||
| Change in net unrealized appreciation (depreciation) on purchased options | ||||
| Change in net unrealized appreciation (depreciation) on swaps | ||||
| Change in net unrealized appreciation (depreciation) on written options |
D-15
Table of Contents
PACIFIC FUNDS
NOTES TO FINANCIAL STATEMENTS (Continued)
| Derivative Investments Risk Type | Location of Gain (Loss) on Derivative Investments Recognized in the Statements of Operations | |||
| Foreign currency contracts | Net realized gain (loss) on forward foreign currency contract transactions | |||
| Net realized gain (loss) on futures contract transactions | ||||
| Net realized gain (loss) on purchased option transactions | ||||
| Net realized gain (loss) on swap transactions | ||||
| Net realized gain (loss) on written option transactions | ||||
| Change in net unrealized appreciation (depreciation) on forward foreign currency contract transactions | ||||
| Change in net unrealized appreciation (depreciation) on futures contracts | ||||
| Change in net unrealized appreciation (depreciation) on purchased options | ||||
| Change in net unrealized appreciation (depreciation) on swaps | ||||
| Change in net unrealized appreciation (depreciation) on written options |
The following is a summary of each Fund’s net realized gain and/or loss and change in net unrealized appreciation and/or depreciation on derivative investments recognized in the Trust’s Statements of Operations categorized by primary risk exposure for the fiscal year ended March 31, 2018:
| Realized Gain (Loss) on Derivative Investments Recognized in the Statements of Operations | ||||||||||||||||||||
| Fund | Total | Credit Contracts | Equity Contracts | Foreign Currency Contracts | Interest Rate Contracts | |||||||||||||||
PF Inflation Managed | ($10,250 | ) | ($337 | ) | $— | ($103,618 | ) | $93,705 | ||||||||||||
PF Managed Bond | (1,381,589 | ) | (88,804 | ) | — | (1,208,477 | ) | (84,308 | ) | |||||||||||
PF Short Duration Bond | (452,184 | ) | (616 | ) | — | (8,878 | ) | (442,690 | ) | |||||||||||
PF Emerging Markets Debt | 939,478 | — | — | 692,467 | 247,011 | |||||||||||||||
PF Comstock | (2,057,400 | ) | — | — | (2,057,400 | ) | — | |||||||||||||
PF International Value | 44,138 | — | — | 44,138 | — | |||||||||||||||
PF Currency Strategies | (2,190,542 | ) | — | — | (2,190,542 | ) | — | |||||||||||||
PF Equity Long/Short | 16,450,833 | — | 15,267,992 | 1,182,841 | — | |||||||||||||||
PF Global Absolute Return | (6,816,976 | ) | (2,111,144 | ) | (1,105,417 | ) | (3,269,728 | ) | (330,687 | ) | ||||||||||
PF Multi-Asset | (1,160,794 | ) | — | (1,160,794 | ) | — | — | |||||||||||||
| Change in Net Unrealized Appreciation (Depreciation) on Derivative Investments Recognized in the Statements of Operations | ||||||||||||||||||||
| Fund | Total | �� | Credit Contracts | Equity Contracts | Foreign Currency Contracts | Interest Rate Contracts | ||||||||||||||
PF Inflation Managed | ($62,273 | ) | ($888 | ) | $— | ($11,228 | ) | ($50,157 | ) | |||||||||||
PF Managed Bond | (3,688,439 | ) | (233,991 | ) | — | (2,260,575 | ) | (1,193,873 | ) | |||||||||||
PF Short Duration Bond | 2,476 | — | — | 157 | 2,319 | |||||||||||||||
PF Emerging Markets Debt | 125,744 | — | — | 314,707 | (188,963 | ) | ||||||||||||||
PF Comstock | 190,594 | — | — | 190,594 | — | |||||||||||||||
PF International Value | (154,168 | ) | — | — | (154,168 | ) | — | |||||||||||||
PF Currency Strategies | (1,087,365 | ) | — | — | (1,087,365 | ) | — | |||||||||||||
PF Equity Long/Short | (6,422,394 | ) | — | (6,281,694 | ) | (140,700 | ) | — | ||||||||||||
PF Global Absolute Return | (217,189 | ) | 594,575 | 5,416 | (478,395 | ) | (338,785 | ) | ||||||||||||
PF Multi-Asset | (16,300,624 | ) | — | (16,300,624 | ) | — | — | |||||||||||||
For financial reporting purposes, the Trust does not offset fair value amounts recognized for derivative instruments and fair value amounts recognized for the right to reclaim cash collateral (receivables) or the obligation to return cash collateral (payables) arising from derivative instruments recognized at fair value executed with the same counterparty under a master netting arrangement.
The following is a summary of the average number of positions and values of derivative investments by derivative type for the fiscal year ended March 31, 2018:
| Average Positions and Values of Derivative Investments by Derivative Type | ||||||||||||||||||||||||||||||||||||||||||||
| Futures Contracts | Forward Contracts | Options Contracts | Swap Agreements | |||||||||||||||||||||||||||||||||||||||||
| Fund | Number of Positions | Value | Number of Positions | Value | Number of Positions | Value | Number of Positions | Value | ||||||||||||||||||||||||||||||||||||
PF Inflation Managed | 5 | ($7,325 | ) | 30 | ($16,032 | ) | 21 | $7,399 | 45 | $25,941 | ||||||||||||||||||||||||||||||||||
PF Managed Bond | 35 | 227,795 | 70 | (1,519,130 | ) | 73 | 130,921 | 37 | 1,639,462 | |||||||||||||||||||||||||||||||||||
PF Short Duration Bond | 3 | (21,158 | ) | — | (745 | ) | — | 11 | — | — | ||||||||||||||||||||||||||||||||||
PF Emerging Markets Debt | — | — | 107 | (67,488 | ) | — | — | 20 | 503,533 | |||||||||||||||||||||||||||||||||||
PF Comstock | — | — | 18 | (186,285 | ) | — | — | — | — | |||||||||||||||||||||||||||||||||||
PF International Value | — | — | 7 | 30,834 | — | — | — | — | ||||||||||||||||||||||||||||||||||||
PF Currency Strategies | — | — | 97 | (203,055 | ) | 6 | 354,582 | — | — | |||||||||||||||||||||||||||||||||||
PF Equity Long/Short | 12 | (59,800 | ) | 29 | 55,288 | — | — | 18 | 8,670,393 | |||||||||||||||||||||||||||||||||||
PF Global Absolute Return | 3 | 1,982 | 194 | (892,784 | ) | 18 | 272,139 | 206 | (826,004 | ) | ||||||||||||||||||||||||||||||||||
PF Multi-Asset | — | — | — | — | — | — | 22 | (16,300,624 | ) | |||||||||||||||||||||||||||||||||||
The table shown above and the amounts of net realized gains and losses and changes in net unrealized appreciation and depreciation on derivative investments as disclosed in the Statements of Operations serve as indicators of volume of derivative activity for each applicable Fund for the fiscal year ended March 31, 2018.
D-16
Table of Contents
PACIFIC FUNDS
NOTES TO FINANCIAL STATEMENTS (Continued)
C. ENFORCEABLE MASTER NETTING ARRANGEMENTS
Master Agreements and Netting Arrangements – Certain Funds are parties to various agreements, including but not limited to International Swaps and Derivatives Association Agreements and related Credit Support Annex, Master Repurchase Agreements, and Master Securities Forward Transactions Agreements (collectively “Master Agreements”), which govern the terms of certain transactions with select counterparties. These Master Agreements generally include provisions for general obligations, representations, agreements, collateral, and certain events of default or termination. These Master Agreements also include provisions for netting arrangements that help reduce credit and counterparty risk associated with relevant transactions (“netting arrangements”). The netting arrangements are generally tied to credit related events that, if triggered, would cause an event of default or termination giving a Fund or counterparty the right to terminate early and cause settlement, on a net basis, of all transactions under the applicable Master Agreement. In the event of an early termination as a result of an event of default under the Master Agreement, the total value exposure of all transactions will be offset against collateral exchanged to date, which would result in a net receivable or payable that would be due from or to the counterparty. However, bankruptcy or insolvency laws of a particular jurisdiction may impose restrictions on or prohibitions against the right of offset in the event of a bankruptcy or insolvency of the counterparty. Credit related events include, but are not limited to, bankruptcy, failure to make timely payments, restructuring, obligation acceleration, obligation default, a material decline in net assets, decline in credit rating or repudiation/moratorium. Any election made by a counterparty to early terminate the transactions under a Master Agreement could have a material adverse impact on a Fund’s financial statements. A Fund’s overall exposure to credit risk, subject to netting arrangements can change substantially within a short period, as it is affected by each transaction subject to the arrangement.
Master Agreements can also help limit counterparty risk by specifying collateral posting arrangements at pre-arranged exposure levels. Under the Master Agreements, collateral is routinely transferred if the total net exposure to certain transactions under the relevant Master Agreement with a counterparty in a given Fund exceeds a specified threshold, net of collateral already in place, which typically ranges from $0 to $250,000 depending on the counterparty and the type of Master Agreement. Collateral under the Master Agreements is usually in the form of cash or U.S. Treasury Bills but could include other types of securities. The value of all derivative transactions outstanding under a Master Agreement is calculated daily to determine the amount of collateral to be received or pledged by the counterparty. Posting of collateral for OTC derivative transactions are covered under tri-party collateral agreements between the Trust, the Trust’s custodian, and each counterparty. Collateral for centrally cleared derivatives transactions are posted with the applicable derivatives clearing organization.
The following is a summary of financial and derivative instruments that are subject to enforceable master agreements with netting arrangements (or similar arrangements) and collateral received and pledged in connection with the master agreements with netting arrangements (or similar arrangements) as of March 31, 2018:
| | Gross Amounts Presented in the Statements of Assets and | | Gross Amounts Not Offset in Statements of Assets and Liabilities | | Gross Amounts Presented in the Statements of Assets and Liabilities | | Gross Amounts Not Offset in Statements of Assets and Liabilities | ||||||||||||||||||||||||||||||||||||||
Description | | Financial Instruments | | Collateral Received | | Net Amount | | Financial Instruments | | Collateral Pledged | | Net Amount | |||||||||||||||||||||||||||||||||
| Assets | Liabilities | ||||||||||||||||||||||||||||||||||||||||||||
PF Inflation Managed | |||||||||||||||||||||||||||||||||||||||||||||
Swap agreements | $1,112 | ($445 | ) | $— | $667 | ($11,112 | ) | $445 | $— | ($10,667 | ) | ||||||||||||||||||||||||||||||||||
Option contracts | 8,909 | (1,608 | ) | — | 7,301 | (6,151 | ) | 1,608 | — | (4,543 | ) | ||||||||||||||||||||||||||||||||||
Forward foreign currency contracts | 17,650 | (8,607 | ) | — | 9,043 | (29,989 | ) | 8,607 | — | (21,382 | ) | ||||||||||||||||||||||||||||||||||
Reverse repurchase agreements | (2,450,000 | ) | — | 2,450,000 | — | ||||||||||||||||||||||||||||||||||||||||
Sale-buyback financing transactions | (11,435,396 | ) | 11,435,396 | — | — | ||||||||||||||||||||||||||||||||||||||||
PF Managed Bond | |||||||||||||||||||||||||||||||||||||||||||||
Swap agreements | 40,486 | — | — | 40,486 | — | — | — | — | |||||||||||||||||||||||||||||||||||||
Option contracts | 29,631 | (29,631 | ) | — | — | (53,058 | ) | 29,631 | 4,005 | (19,422 | ) | ||||||||||||||||||||||||||||||||||
Forward foreign currency contracts | 605,930 | (492,278 | ) | — | 113,652 | (3,044,925 | ) | 492,278 | 1,152,265 | (1,400,382 | ) | ||||||||||||||||||||||||||||||||||
Sale-buyback financing transactions | (32,702,867 | ) | 32,702,867 | — | — | ||||||||||||||||||||||||||||||||||||||||
PF Short Duration Bond | |||||||||||||||||||||||||||||||||||||||||||||
Forward foreign currency contracts | 157 | — | — | 157 | — | — | — | — | |||||||||||||||||||||||||||||||||||||
PF Emerging Markets Debt | |||||||||||||||||||||||||||||||||||||||||||||
Swap agreements | 427,136 | — | — | 427,136 | — | — | — | — | |||||||||||||||||||||||||||||||||||||
Forward foreign currency contracts | 289,671 | (114,619 | ) | (6,429 | ) | 168,623 | (254,928 | ) | 114,619 | — | (140,309 | ) | |||||||||||||||||||||||||||||||||
PF Comstock | |||||||||||||||||||||||||||||||||||||||||||||
Forward foreign currency contracts | 13,529 | (8,696 | ) | — | 4,833 | (27,710 | ) | 8,696 | — | (19,014 | ) | ||||||||||||||||||||||||||||||||||
PF Currency Strategies | |||||||||||||||||||||||||||||||||||||||||||||
Option contracts | 73,713 | — | (32,804 | ) | 40,909 | (42,125 | ) | — | — | (42,125 | ) | ||||||||||||||||||||||||||||||||||
Forward foreign currency contracts | 3,123,212 | (1,879,022 | ) | (778,512 | ) | 465,678 | (2,248,203 | ) | 1,879,022 | 250,348 | (118,833 | ) | |||||||||||||||||||||||||||||||||
PF Equity Long/Short | |||||||||||||||||||||||||||||||||||||||||||||
Swap agreements | 6,317,946 | (128,401 | ) | (2,080,000 | ) | 4,109,545 | (128,401 | ) | 128,401 | — | — | ||||||||||||||||||||||||||||||||||
Forward foreign currency contracts | 46,117 | (46,117 | ) | — | — | (71,151 | ) | 46,117 | 10,008 | (15,026 | ) | ||||||||||||||||||||||||||||||||||
PF Global Absolute Return | |||||||||||||||||||||||||||||||||||||||||||||
Swap agreements | 468,506 | (397,330 | ) | (14,066 | ) | 57,110 | (769,340 | ) | 397,330 | 98,441 | (273,569 | ) | |||||||||||||||||||||||||||||||||
Option contracts | 258,903 | — | (2,381 | ) | 256,522 | — | — | — | — | ||||||||||||||||||||||||||||||||||||
Forward foreign currency contracts | 1,731,665 | (1,432,659 | ) | (57,172 | ) | 241,834 | (2,136,553 | ) | 1,432,659 | 556,847 | (147,047 | ) | |||||||||||||||||||||||||||||||||
Forward volatility agreements | — | — | — | — | (10,313 | ) | — | 5,086 | (5,227 | ) | |||||||||||||||||||||||||||||||||||
PF Multi-Asset | |||||||||||||||||||||||||||||||||||||||||||||
Swap agreements | 7,305,502 | (4,462,912 | ) | (2,739,944 | ) | 102,646 | (23,606,126 | ) | 4,462,912 | 19,143,214 | — | ||||||||||||||||||||||||||||||||||
D-17
Table of Contents
PACIFIC FUNDS
NOTES TO FINANCIAL STATEMENTS (Continued)
During the reporting period, certain Funds may have had investments in repurchase agreements. The gross value and related collateral received for these investments, if any, are presented in each applicable Fund’s Schedule of Investments and the value of these investments is also presented in the Statements of Assets and Liabilities. The value of the related collateral, if any, held by each applicable Fund presented in these financial statements, exceeded the value of the repurchase agreements as of March 31, 2018.
6. INVESTMENT ADVISORY, ADMINISTRATION AND SHAREHOLDER SERVICES, SUPPORT SERVICES, AND DISTRIBUTION AGREEMENTS
Pursuant to an Investment Advisory Agreement, PLFA, a wholly-owned subsidiary of Pacific Life Insurance Company (“Pacific Life”) serves as Investment Adviser to each Fund of the Trust. PLFA receives investment advisory fees from each Fund which are based on annual percentages of the average daily net assets of each Fund. Pursuant to Sub-Advisory Agreements, the Trust and PLFA engage various investment management firms under PLFA’s supervision to sub-advise the PF Underlying Funds presented in these financial statements. PLFA, as Investment Adviser of the Trust, pays fees to these sub-advisers as compensation for their services. As of March 31, 2018, the investment advisory fees that PLFA receives from each Fund based upon an annual percentage of the average daily net assets of each Fund, and the sub-adviser of each Fund, are as follows:
| Fund | Advisory Fees | Sub-Adviser | ||
| PF Inflation Managed | 0.40% | Pacific Investment Management Company LLC | ||
| PF Managed Bond | 0.40% | Pacific Investment Management Company LLC and Western Asset Management Company (co-sub-advisors) | ||
| PF Short Duration Bond | 0.40% | T. Rowe Price Associates, Inc. | ||
| PF Emerging Markets Debt | 0.785% | Ashmore Investment Management Limited | ||
| PF Comstock (1) | 0.75% | Invesco Advisers, Inc. | ||
| PF Developing Growth | 0.60% | Lord, Abbett & Co. LLC | ||
| PF Growth | 0.55% | MFS Investment Management | ||
| PF Large-Cap Growth (1) | 0.75% | BlackRock Investment Management, LLC | ||
| PF Large-Cap Value | 0.65% | ClearBridge Investments, LLC | ||
| PF Main Street Core | 0.45% | OppenheimerFunds, Inc. | ||
| PF Mid-Cap Equity | 0.65% | Scout Investments, Inc. | ||
| PF Mid-Cap Value | 0.70% | Boston Partners | ||
| PF Small-Cap Value | 0.75% | AllianceBernstein L.P. | ||
| PF Emerging Markets | 0.80% | OppenheimerFunds, Inc. | ||
| PF International Large-Cap | 0.85% | MFS Investment Management | ||
| PF International Small-Cap | 0.85% | QS Investors, LLC | ||
| PF International Value (2) | 0.65% | Wellington Management Company LLP | ||
| PF Real Estate | 0.90% | Morgan Stanley Investment Management Inc. | ||
| PF Currency Strategies | 0.65% | Macro Currency Group and UBS Asset Management (Americas) Inc. (co-sub-advisers) | ||
| PF Equity Long/Short (1) | 1.15% | AQR Capital Management, LLC | ||
| PF Global Absolute Return | 0.80% | Eaton Vance Investment Managers | ||
| PF Multi-Asset | 0.35% | Pacific Life Fund Advisors LLC |
| (1) | PLFA agreed to waive its advisory fees through July 31, 2018 for the following Funds: 0.015% for the PF Comstock Fund; 0.045% for the PF Large-Cap Growth Fund; and 0.15% for the PF Equity Long/Short Fund. There is no guarantee that PLFA will continue such waivers after that date. |
| (2) | Prior to May 1, 2017, J.P. Morgan Investment Management Inc. served as sub-adviser of the PF International Value Fund. |
Pursuant to an Administration and Shareholder Services Agreement (the “Administration Agreement”), Pacific Life serves as administrator (the “Administrator”) to the Trust. The Trust paid the Administrator an administration fee at an annual rate of 0.15% for each of the PF Underlying Funds. The administration fee is for procuring or providing administrative, transfer agency, and shareholder services. In addition, Pacific Life and PLFA provide support services to the Trust that are outside the scope of the Administrator’s and Investment Adviser’s responsibilities under the Administration Agreement and Investment Advisory Agreement. Under the Support Services Agreement, the Trust compensates Pacific Life and PLFA for their expenses in providing support services to the Trust in connection with various matters, some of which include the time spent by legal, accounting, and compliance personnel of Pacific Life and PLFA (including individuals who may be officers or Trustees of the Trust) to attend meetings of the Board and to provide assistance with the coordination and supervision in connection with the services procured for the Trust. Support services do not include any services for which PLFA is responsible pursuant to the Investment Advisory Agreement. The Trust reimburses Pacific Life and PLFA for these support services on an approximate cost basis.
Pursuant to a Distribution Agreement, Pacific Select Distributors, LLC (the “Distributor”), a wholly-owned subsidiary of Pacific Life, serves as distributor of the Trust’s shares. Under the Distribution Agreement, the Distributor bears all expenses of providing services, including costs of sales presentations, mailings, advertisements, and other marketing efforts by the Distributor in connection with the distribution or sale of the Trust’s shares and makes distribution and/or service payments to selling groups in connection with the sale of certain of the Trust’s shares and subsequent servicing needs of shareholders provided by selling groups. The Class P shares of the PF Underlying Funds presented in these financial statements are not subject to a distribution and/or service fee.
7. TRANSACTIONS WITH AFFILIATES
A. ADVISORY FEES, ADMINISTRATION FEES AND EXPENSES FOR SUPPORT SERVICES
The Investment Adviser, the Distributor, and Pacific Life are related parties. The advisory fees earned by the Investment Adviser, including any advisory fee waiver, the administration fees earned by Pacific Life, and expenses for support services recovered by PLFA and Pacific Life
D-18
Table of Contents
PACIFIC FUNDS
NOTES TO FINANCIAL STATEMENTS (Continued)
(see Note 6) from each Fund presented in these financial statements for the fiscal year ended March 31, 2018 are presented in the Statements of Operations. The amounts of each of these fees that remained payable as of March 31, 2018 are presented in the Statements of Assets and Liabilities.
B. EXPENSE LIMITATION AGREEMENTS
To help limit the Trust’s expenses, PLFA has contractually agreed to reimburse each Fund (other than the PF Equity Long/Short Fund) presented in these financial statements for certain operating expenses that exceed an annual rate based on a percentage of a Fund’s average daily net assets. These operating expenses include, but are not limited to: administration fees and expenses; organizational expenses; custody expenses; expenses for audit, tax, and certain legal services; preparation, printing, filing, and distribution to existing shareholders of proxies, prospectuses and shareholder reports, and other regulatory documents, as applicable; independent trustees’ fees and expenses; and establishing, overseeing, and administering the Trust’s compliance program. These operating expenses do not include: investment advisory fees; distribution and/or service fees; dividends on securities sold short; acquired fund fees and expenses; interest (including commitment fees); taxes (including foreign taxes on dividends, interest or gains); brokerage commissions and other transactional expenses; and extraordinary expenses such as litigation expenses, liquidation expenses, reorganization expenses, and other expenses not incurred in the ordinary course of each Fund’s business. The expense cap for the PF Underlying Funds, except the PF Mid-Cap Value, PF International Small-Cap, PF Currency Strategies, and PF Global Absolute Return Funds is 0.15% through July 31, 2018 and 0.30% thereafter through July 31, 2022. The expense cap for the PF Mid-Cap Value, PF International Small-Cap, PF Currency Strategies, and PF Global Absolute Return Funds is 0.25% through July 31, 2018. There is no expense cap for the PF Equity Long/Short Fund.
There is no guarantee that PLFA will continue to cap expenses for a Fund upon the expiration of the expense cap. In addition, any expense reimbursements made by PLFA to a Fund are subject to recoupment by PLFA from such Fund in future periods, not to exceed three years from the date on which the reimbursement took place, provided that the recoupment would be limited to the lesser of: (i) the expense cap in effect at the time of the reimbursement or (ii) the expense cap in effect at the time of recoupment. Any amounts repaid to PLFA will have the effect of increasing such expenses of the applicable Funds, but not above the expense cap. The amounts of adviser reimbursement to each of the applicable Funds presented in these financial statements for the fiscal year ended March 31, 2018 are presented in the Statements of Operations. Any amounts that remained due from the Investment Adviser as of March 31, 2018 are presented in the Statements of Assets and Liabilities.
The cumulative expense reimbursement amounts, if any, as of March 31, 2018 that are subject to recoupment by PLFA from the Funds presented in these financial statements are as follows:
| Expiration Date | ||||||||||||
| Fund | 3/31/2019 | 3/31/2020 | 3/31/2021 | |||||||||
PF Inflation Managed | $95,880 | $33,114 | $19,621 | |||||||||
PF Managed Bond | 415,627 | 590,876 | 540,942 | |||||||||
PF Short Duration Bond | 108,855 | 123,091 | 131,342 | |||||||||
PF Emerging Markets Debt | 154,900 | 107,918 | 77,724 | |||||||||
PF Comstock | 145,785 | 134,866 | 115,361 | |||||||||
PF Developing Growth | 45,591 | 22,807 | 13,829 | |||||||||
PF Growth | 80,955 | 82,308 | 89,652 | |||||||||
PF Large-Cap Growth | 100,786 | 86,301 | 62,117 | |||||||||
PF Large-Cap Value | 188,396 | 243,001 | 247,008 | |||||||||
PF Main Street Core | 134,981 | 179,812 | 177,131 | |||||||||
PF Mid-Cap Equity | 116,181 | 79,956 | 49,499 | |||||||||
PF Small-Cap Value | 120,806 | 104,811 | 75,777 | |||||||||
PF Emerging Markets | 383,441 | 433,451 | 516,488 | |||||||||
PF International Large-Cap | 282,785 | 336,014 | 256,803 | |||||||||
PF International Small-Cap | 17,806 | 46,102 | 28,196 | |||||||||
PF International Value | 181,062 | 181,721 | 213,419 | |||||||||
PF Real Estate | 41,737 | 46,036 | 30,103 | |||||||||
PF Global Absolute Return | 117,298 | 91,278 | 109,755 | |||||||||
PF Multi-Asset | 48,872 | |||||||||||
|
| |||||||||||
| $2,732,872 | $2,923,463 | $2,803,639 | ||||||||||
|
|
|
|
|
| |||||||
During the fiscal year ended March 31, 2018, PLFA recouped from following Fund under the expense limitation agreement:
| Fund | Amount Recouped | |||
PF Currency Strategies | $4,400 | |||
There was no recoupment of expense reimbursement by PLFA from any other Funds presented in these financial statements for the fiscal year ended March 31, 2018.
C. INDEPENDENT TRUSTEES
The Trust pays each independent trustee of the Board retainer fees and specified amounts for various Board and committee services and for chairing those committees. The fees and expenses of the independent trustees of the Board are presented in the Statements of Operations. Each independent trustee of the Board is eligible to participate in the Trust’s Deferred Compensation Plan (the “Plan”). The Plan allows each independent trustee to voluntarily defer receipt of all or a percentage of fees, which otherwise would be payable for services performed. Amounts in the deferral account are obligations of each Fund at the time of such deferral and are payable in accordance with the Plan. Prior to December 31, 2017, deferred amounts were treated as though equivalent dollar amounts had been invested in shares of certain Funds. An
D-19
Table of Contents
PACIFIC FUNDS
NOTES TO FINANCIAL STATEMENTS (Continued)
independent trustee who deferred compensation had the option to select credit rate options that track the performance, at NAV without a sales load, of Class A shares of the Portfolio Optimization Funds, Pacific Funds Diversified Alternatives, Pacific Funds Short Duration Income, Pacific Funds Core Income, Pacific Funds Strategic Income, Pacific Funds Floating Rate Income, Pacific Funds Limited Duration High Income, Pacific Funds High Income, Pacific Funds Large-Cap, Pacific Funds Large-Cap Value, Pacific Funds Small/Mid-Cap, Pacific Funds Small-Cap, Pacific Funds Small-Cap Value, and Pacific Funds Small-Cap Growth, and/or Class P shares of the PF Underlying Funds. Effective January 1, 2018, a Trustee who defers compensation has the option to select credit rate options that track the performance, at NAV of Class A of certain series of the Trust without a sales load or at NAV of Class I shares of the Pacific Select Fund. The obligation of each Fund under the Plan (the “DCP Liability”) is recorded as a liability (accrued trustees’ fees and expenses and deferred compensation). Accordingly, the market value appreciation or depreciation on a Fund’s DCP Liability account will cause the expenses of that Fund to increase or decrease due to market fluctuation. The change in net unrealized appreciation or depreciation on a Fund’s DCP Liability account is recorded as an increase or decrease to expenses (trustees’ fees and expenses). For the fiscal year ended March 31, 2018, such expenses increased by $6,279 for all applicable Funds presented in these financial statements as a result of the market value appreciation on such accounts. As of March 31, 2018, the total amount in the DCP Liability accounts was $53,705 for all applicable Funds presented in these financial statements.
D. OFFICERS OF THE TRUST
None of the officers of the Trust received compensation from the Trust.
E. INDEMNIFICATIONS
Under the Trust’s organizational documents, its officers and trustees are indemnified against certain liabilities arising out of performance of their duties to the Trust. In addition, the Trust entered into an agreement with each of the trustees which provides that the Trust will indemnify and hold harmless each trustee against any expenses actually and reasonably incurred by any trustee in any proceeding arising out of or in connection with the trustee’s services to the Trust, to the fullest extent permitted by the Trust’s Declaration of Trust and By-Laws, the general trust law of the State of Delaware, the Securities Act of 1933, and the 1940 Act, each as now or hereinafter in force. In the normal course of business, the Trust enters into contracts with service providers and others that contain general indemnification clauses. The Trust’s maximum exposure under these arrangements and agreements is dependent on future claims that may be made against the Trust and/or the trustees and, therefore, cannot be estimated; however, based on experience, the risk of loss from such claims is considered remote.
F. INTERFUND TRANSACTIONS
In accordance with Rule 17a-7 under the 1940 Act and applicable Trust policies and procedures, purchase and sale transactions may be conducted between a Fund of the Trust and another Fund of the Trust or certain affiliates of the Trust if conducted at the independent “current market price” (the last sales price, intra-day price, or average of highest bid/lowest offer, as applicable) on a commission-free basis with no remuneration paid in connection with the transaction (other than cash payment against prompt delivery). At the quarterly Board meeting subsequent to the purchase and sale transactions taking place, the Board will be asked to determine that the transactions were conducted in compliance with applicable Trust policies and procedures.
For the fiscal year ended March 31, 2018, there were no purchase and sale transactions with an affiliated Fund conducted in compliance with Rule 17a-7 under the 1940 Act.
8. PURCHASES AND SALES OF INVESTMENTS
The cost of purchases and proceeds from sales of investments (excluding short-term investments) for the fiscal year or period ended March 31, 2018, are summarized in the following table:
| U.S. Government Securities | Other Securities | |||||||||||||||
| Fund | Purchases | Sales | Purchases | Sales | ||||||||||||
| PF Inflation Managed | $88,859,456 | $22,508,926 | $4,710,506 | $1,852,091 | ||||||||||||
| PF Managed Bond | 2,648,211,641 | 2,768,806,192 | 106,388,627 | 175,005,128 | ||||||||||||
| PF Short Duration Bond | 46,425,491 | 65,724,715 | 50,317,261 | 78,067,822 | ||||||||||||
| PF Emerging Markets Debt | — | — | 61,558,817 | 28,208,072 | ||||||||||||
| PF Comstock | — | — | 23,006,010 | 111,644,429 | ||||||||||||
| PF Developing Growth | — | — | 7,714,480 | 9,544,911 | ||||||||||||
| PF Growth | — | — | 91,504,702 | 48,668,237 | ||||||||||||
| PF Large-Cap Growth | — | — | 42,232,097 | 104,733,216 | ||||||||||||
| PF Large-Cap Value | — | — | 27,154,787 | 334,263,944 | ||||||||||||
| PF Main Street Core | — | — | 83,361,113 | 272,329,322 | ||||||||||||
| PF Mid-Cap Equity | — | — | 47,647,901 | 91,473,067 | ||||||||||||
| PF Mid-Cap Value | — | — | 85,660,736 | 229,785,536 | ||||||||||||
| PF Small-Cap Value | — | — | 33,569,027 | 78,580,479 | ||||||||||||
| PF Emerging Markets | — | — | 69,094,351 | 137,871,772 | ||||||||||||
| PF International Large-Cap | — | — | 16,384,749 | 93,532,650 | ||||||||||||
| PF International Small-Cap | — | — | 64,346,625 | 24,248,227 | ||||||||||||
| PF International Value | — | — | 185,222,233 | 234,318,321 | ||||||||||||
| PF Real Estate | — | — | 22,781,716 | 17,274,800 | ||||||||||||
| PF Global Absolute Return | 2,408,411 | 3,302,445 | 55,911,871 | 80,991,287 | ||||||||||||
| PF Multi-Asset | 275,937,366 | 93,446,708 | 430,841,828 | 6,960,227 | ||||||||||||
D-20
Table of Contents
PACIFIC FUNDS
NOTES TO FINANCIAL STATEMENTS (Continued)
9. SECURED BORROWINGS
The contractual maturity of secured borrowings and type of collateral pledged as of March 31, 2018, are summarized in the following table:
| Remaining Contractual Maturity of the Agreements | ||||||||||||||||||||||||
| Secured Borrowings | Collateral Type | Overnight and Continuous | Up to 30 days | 31-90 days | Greater Than 90 Days | Total | ||||||||||||||||||
PF Inflation Managed | ||||||||||||||||||||||||
Sale-buyback financing transactions | U.S. Treasury Obligations | $— | $11,435,396 | $— | $— | $11,435,396 | ||||||||||||||||||
Reverse repurchase agreements | U.S. Treasury Obligations | — | 2,450,000 | — | — | 2,450,000 | ||||||||||||||||||
Total borrowings | $— | $13,885,396 | $— | $— | $13,885,396 | |||||||||||||||||||
PF Managed Bond | ||||||||||||||||||||||||
Sale-buyback financing transactions | U.S. Treasury Obligations | $— | $32,702,867 | $— | $— | $32,702,867 | ||||||||||||||||||
Total borrowings | $— | $32,702,867 | $— | $— | $32,702,867 | |||||||||||||||||||
10. FEDERAL INCOME TAX INFORMATION
Each Fund intends to qualify each year as a regulated investment company (“RIC”) under Subchapter M of the Internal Revenue Code (the “Code”). A Fund that qualifies as a RIC does not have to pay income tax as long as it distributes sufficient taxable income and net capital gains. Each Fund declared and paid sufficient dividends on net investment income and capital gains distributions during the year or period ended March 31, 2018, to qualify as a RIC and is not required to pay Federal income tax under the Code. Accordingly, no provision for Federal income taxes is required in the financial statements. Required distributions are based on net investment income and net realized gains determined in accordance with income tax regulations, which may differ from U.S. GAAP for financial reporting purposes. These differences are primarily due to differing treatments for sale-buyback financing transactions, futures and options, swap income, paydown gain/loss, partnership income, foreign currency transactions, passive foreign investment companies, late year ordinary and post-October capital losses, capital loss carryforwards, and losses deferred due to wash sales. Permanent book and tax differences relating to shareholder distributions will result in reclassifications of capital accounts. In addition, the year in which amounts are distributed may differ from the year in which the net investment income is earned and the net gains are realized by each Fund.
The following table shows the accumulated capital losses and components of distributable earnings on a tax basis, and late year ordinary losses and post-October capital losses deferred, if any, as of March 31, 2018:
| Distributable Earnings | Late-Year Ordinary and Post-October Losses Deferral | |||||||||||||||||||||||||||||||
| Fund | Accumulated Capital Losses | Undistributed Ordinary Income | Undistributed Long-Term Capital Gains | Late-Year Ordinary Losses | Short-Term Capital Losses | Long-Term Capital Losses | Total | |||||||||||||||||||||||||
PF Inflation Managed | ($8,947,892 | ) | $242,609 | $— | $— | $— | $— | $— | ||||||||||||||||||||||||
PF Managed Bond | (1,263,843 | ) | 3,408 | — | 2,948,243 | — | — | 2,948,243 | ||||||||||||||||||||||||
PF Short Duration Bond | (3,120,664 | ) | 646,107 | — | — | — | — | — | ||||||||||||||||||||||||
PF Emerging Markets Debt | (6,909,138 | ) | 177,326 | — | — | — | — | — | ||||||||||||||||||||||||
PF Comstock | — | — | 30,085,393 | 528,128 | — | — | 528,128 | |||||||||||||||||||||||||
PF Developing Growth | (1,011,567 | ) | — | — | — | — | — | — | ||||||||||||||||||||||||
PF Growth | — | 404,823 | 5,934,530 | — | — | — | — | |||||||||||||||||||||||||
PF Large-Cap Growth | — | 1,274,580 | 21,362,233 | — | — | — | — | |||||||||||||||||||||||||
PF Large-Cap Value | — | 1,052,201 | 53,382,023 | — | — | — | — | |||||||||||||||||||||||||
PF Main Street Core | — | 1,851,718 | 47,890,108 | — | — | — | — | |||||||||||||||||||||||||
PF Mid-Cap Equity | — | 466,616 | 5,796,945 | — | — | — | — | |||||||||||||||||||||||||
PF Mid-Cap Value | — | 663,906 | 29,235,000 | — | — | — | — | |||||||||||||||||||||||||
PF Small-Cap Value | — | 175,310 | 7,808,545 | — | — | — | — | |||||||||||||||||||||||||
PF Emerging Markets | — | 674,478 | 6,209,047 | — | — | — | — | |||||||||||||||||||||||||
PF International Large-Cap | — | 65,299 | 18,661,917 | — | — | — | — | |||||||||||||||||||||||||
PF International Small-Cap | — | 90,120 | 1,498,859 | — | — | — | — | |||||||||||||||||||||||||
PF International Value | — | 1,161,039 | — | — | — | — | — | |||||||||||||||||||||||||
PF Real Estate | — | 141,518 | 1,589,368 | — | — | — | — | |||||||||||||||||||||||||
PF Currency Strategies | (3,212 | ) | — | — | 520,923 | — | — | 520,923 | ||||||||||||||||||||||||
PF Equity Long/Short | — | 1,496,713 | 458,624 | — | — | — | — | |||||||||||||||||||||||||
PF Global Absolute Return | (3,225,292 | ) | — | — | 1,112,607 | — | — | 1,112,607 | ||||||||||||||||||||||||
PF Multi-Asset | (52,422 | ) | 1,064,555 | — | — | — | — | — | ||||||||||||||||||||||||
D-21
Table of Contents
PACIFIC FUNDS
NOTES TO FINANCIAL STATEMENTS (Continued)
Accumulated capital losses represent net capital loss carryovers as of March 31, 2018 that may be available to offset future realized capital gains and thereby reduce future capital gains distributions. The following table shows the expiration dates and the amounts of capital loss carryover, if any, by each of the applicable Funds as of March 31, 2018 and capital loss carryover from prior years utilized during the year or period ended March 31, 2018:
Unlimited Period of Net | Accumulated Capital Loss Carryover | Capital Loss Carryover Utilized During the Year/Period Ended March 31, 2018 | Capital Loss Carryover Expired During the Year/Period Ended March 31, 2018 | |||||||||||||||||
Capital Loss Carryover | ||||||||||||||||||||
| Fund | Short-Term | Long-Term | ||||||||||||||||||
PF Inflation Managed | ($870,143 | ) | ($8,077,749 | ) | ($8,947,892 | ) | $66,842 | $— | ||||||||||||
PF Managed Bond | — | (1,263,843 | ) | (1,263,843 | ) | — | — | |||||||||||||
PF Short Duration Bond | (1,199,471 | ) | (1,921,193 | ) | (3,120,664 | ) | — | — | ||||||||||||
PF Emerging Markets Debt | (2,148,355 | ) | (4,760,783 | ) | (6,909,138 | ) | 593,866 | — | ||||||||||||
PF Developing Growth | (1,011,567 | ) | — | (1,011,567 | ) | 1,204,021 | — | |||||||||||||
PF Mid-Cap Value | — | — | — | 616,127 | — | |||||||||||||||
PF Emerging Markets | — | — | — | 22,986,989 | — | |||||||||||||||
PF International Large-Cap | — | — | — | 12,210,202 | — | |||||||||||||||
PF International Value | — | — | — | 24,566,134 | 28,195,469 | |||||||||||||||
PF Currency Strategies | (3,212 | ) | — | (3,212 | ) | — | — | |||||||||||||
PF Global Absolute Return | — | (3,225,292 | ) | (3,225,292 | ) | 2,278,679 | — | |||||||||||||
PF Multi-Asset | (52,422 | ) | — | (52,422 | ) | — | — | |||||||||||||
The aggregate cost of investments and the composition of unrealized appreciation and depreciation on investments and net unrealized appreciation and/or depreciation on derivatives for Federal income tax purposes as of March 31, 2018, were as follows:
| Fund | Total Cost of Investments on Tax Basis (1) | Gross Unrealized Appreciation on Investments | Gross Unrealized | Net Unrealized | Net Unrealized | Net Unrealized Appreciation (Depreciation) | ||||||||||||||||||
PF Inflation Managed | $91,288,738 | $346,771 | ($679,891 | ) | ($333,120 | ) | $33,601 | ($299,519 | ) | |||||||||||||||
PF Managed Bond | 746,076,780 | 19,125,394 | (21,769,350 | ) | (2,643,956 | ) | (976,129 | ) | (3,620,085 | ) | ||||||||||||||
PF Short Duration Bond | 115,100,925 | 148,294 | (862,126 | ) | (713,832 | ) | (30 | ) | (713,862 | ) | ||||||||||||||
PF Emerging Markets Debt | 82,739,145 | 1,754,271 | (1,655,279 | ) | 98,992 | (7,002 | ) | 91,990 | ||||||||||||||||
PF Comstock | 72,807,288 | 48,012,139 | (3,997,232 | ) | 44,014,907 | (847 | ) | 44,014,060 | ||||||||||||||||
PF Developing Growth | 6,714,173 | 2,805,065 | (190,906 | ) | 2,614,159 | — | 2,614,159 | |||||||||||||||||
PF Growth | 145,917,168 | 61,854,837 | (954,786 | ) | 60,900,051 | — | 60,900,051 | |||||||||||||||||
PF Large-Cap Growth | 29,582,396 | 21,060,478 | (493,703 | ) | 20,566,775 | — | 20,566,775 | |||||||||||||||||
PF Large-Cap Value | 77,727,095 | 78,162,170 | (1,125,780 | ) | 77,036,390 | — | 77,036,390 | |||||||||||||||||
PF Main Street Core | 99,504,566 | 42,878,600 | (5,225,817 | ) | 37,652,783 | 430 | 37,653,213 | |||||||||||||||||
PF Mid-Cap Equity | 23,848,290 | 8,811,890 | (1,411,908 | ) | 7,399,982 | — | 7,399,982 | |||||||||||||||||
PF Mid-Cap Value | 56,215,774 | 16,493,664 | (1,850,406 | ) | 14,643,258 | — | 14,643,258 | |||||||||||||||||
PF Small-Cap Value | 63,586,672 | 21,112,438 | (3,075,984 | ) | 18,036,454 | — | 18,036,454 | |||||||||||||||||
PF Emerging Markets | 118,025,667 | 70,687,440 | (9,647,860 | ) | 61,039,580 | (8,307 | ) | 61,031,273 | ||||||||||||||||
PF International Large-Cap | 71,360,573 | 57,894,883 | (5,097,066 | ) | 52,797,817 | 13,102 | 52,810,919 | |||||||||||||||||
PF International Small-Cap | 81,734,525 | 10,646,827 | (3,151,801 | ) | 7,495,026 | 8,808 | 7,503,834 | |||||||||||||||||
PF International Value | 127,495,605 | 22,941,952 | (8,656,384 | ) | 14,285,568 | (11,790 | ) | 14,273,778 | ||||||||||||||||
PF Real Estate | 32,796,573 | 10,504,938 | (1,999,055 | ) | 8,505,883 | — | 8,505,883 | |||||||||||||||||
PF Currency Strategies | 61,713,992 | 456,470 | (217,084 | ) | 239,386 | (243,385 | ) | (3,999 | ) | |||||||||||||||
PF Equity Long/Short | 45,374,928 | — | (6,648 | ) | (6,648 | ) | (39,461 | ) | (46,109 | ) | ||||||||||||||
PF Global Absolute Return | 55,163,249 | 3,117,680 | (1,496,809 | ) | 1,620,871 | (656,659 | ) | 964,212 | ||||||||||||||||
PF Multi-Asset | 746,523,788 | 184,981 | (805,817 | ) | (620,836 | ) | (17,461,418 | ) | (18,082,254 | ) | ||||||||||||||
| (1) | The difference between the total cost of investments on tax basis and investments, at cost, as presented in the Statements of Assets and Liabilities is primarily due to wash sale loss deferrals, investments in passive foreign investment companies, straddle loss deferrals, partnerships, and differing treatments for sale-buyback financing transactions and U.S. Treasury Inflation Protected Securities. |
| (2) | Other includes net appreciation or depreciation on derivatives, short sales and foreign currencies, if any. |
Each Fund recognizes the financial statement effects of a tax position taken or expected to be taken in a tax return when it is more likely than not, based on the technical merits, that the position will be sustained upon examination by the applicable tax authority. Tax positions not deemed to meet the more-likely-than-not threshold would be recorded as a tax liability for unrecognized tax benefits with a corresponding income tax expense. Management has analyzed all open tax years, as defined by the statute of limitations, for all major jurisdictions and has determined that no provision for income tax is required in the financial statements. Each Fund remains subject to examination by Federal and State tax authorities for the returns filed for tax years ended as of and after March 31, 2014.
D-22
Table of Contents
PACIFIC FUNDS
NOTES TO FINANCIAL STATEMENTS (Continued)
11. TAX CHARACTER OF DISTRIBUTIONS
The tax character of income and capital gain distributions to shareholders during the fiscal years ended March 31, 2018 and 2017, were as follows:
For the Year or Period Ended March 31, 2018 | For the Year Ended March 31, 2017 | |||||||||||||||||||||||||||
| Funds | Ordinary Income | Long-Term Capital Gains | Total Distributions | Ordinary Income | Long-Term Capital Gains | Total Distributions | ||||||||||||||||||||||
PF Inflation Managed | $165,026 | $— | $165,026 | $— | $— | $— | ||||||||||||||||||||||
PF Managed Bond | 27,252,900 | — | 27,252,900 | 18,708,744 | 2,559,495 | 21,268,239 | ||||||||||||||||||||||
PF Short Duration Bond | 2,387,342 | — | 2,387,342 | 1,142,148 | — | 1,142,148 | ||||||||||||||||||||||
PF Emerging Markets Debt | 3,464,056 | — | 3,464,056 | 5,017,945 | — | 5,017,945 | ||||||||||||||||||||||
PF Comstock | 2,145,665 | 12,810,976 | 14,956,641 | 5,621,099 | 14,174,732 | 19,795,831 | ||||||||||||||||||||||
PF Growth | 1,081,093 | 4,208,497 | 5,289,590 | 123,468 | 2,855,020 | 2,978,488 | ||||||||||||||||||||||
PF Large-Cap Growth | 1,032,897 | 16,255,760 | 17,288,657 | 115,659 | 7,119,224 | 7,234,883 | ||||||||||||||||||||||
PF Large-Cap Value | 6,916,773 | 4,416,112 | 11,332,885 | 5,153,645 | 8,128,566 | 13,282,211 | ||||||||||||||||||||||
PF Main Street Core | 7,865,603 | 14,712,135 | 22,577,738 | 3,737,963 | 1,319,560 | 5,057,523 | ||||||||||||||||||||||
PF Mid-Cap Equity | 2,759,880 | 8,496,195 | 11,256,075 | 1,195,977 | 11,955,102 | 13,151,079 | ||||||||||||||||||||||
PF Mid-Cap Value | 438,030 | 1,403,960 | 1,841,990 | 1,924,546 | — | 1,924,546 | ||||||||||||||||||||||
PF Small Cap Value | 230,521 | 15,035,437 | 15,265,958 | 734,079 | 4,444,005 | 5,178,084 | ||||||||||||||||||||||
PF Emerging Markets | 1,205,327 | — | 1,205,327 | 855,663 | — | 855,663 | ||||||||||||||||||||||
PF International Large-Cap | 2,849,998 | — | 2,849,998 | 4,537,465 | — | 4,537,465 | ||||||||||||||||||||||
PF International Small-Cap | 1,494,781 | 3,024,730 | 4,519,511 | 1,650,584 | 2,548,172 | 4,198,756 | ||||||||||||||||||||||
PF International Value | 7,139,546 | — | 7,139,546 | 5,468,588 | — | 5,468,588 | ||||||||||||||||||||||
PF Real Estate | 636,138 | 5,740,391 | 6,376,529 | 1,436,187 | 2,839,005 | 4,275,192 | ||||||||||||||||||||||
PF Currency Strategies | 2,053,772 | — | 2,053,772 | 9,020,435 | 145 | 9,020,580 | ||||||||||||||||||||||
PF Equity Long/Short | 6,050,516 | 3,896,788 | 9,947,304 | 12,227,818 | — | 12,227,818 | ||||||||||||||||||||||
PF Global Absolute Return | 221,727 | — | 221,727 | 3,029,841 | — | 3,029,841 | ||||||||||||||||||||||
12. RECLASSIFICATION OF ACCOUNTS
During the fiscal year ended March 31, 2018, reclassifications as shown in the following table have been made in each Fund’s capital account report these balances on a tax basis, excluding certain temporary differences, as of March 31, 2018. Additional adjustments may be required in subsequent reporting periods. These reclassifications, which have no impact on the NAV of the Funds, are primarily attributable to reclassifications of sale-buyback financing transactions, paydown gain/loss, partnership income, expiration of capital loss carryforwards, foreign currency transactions, non-deductible expenses, swap income, redesignation of dividends paid, treatment of net operating losses and capital gains under Federal tax rules versus U.S. GAAP. The calculation of net investment income per share in the financial highlights excludes these adjustments.
| Fund | Paid-In Capital | Undistributed/ Accumulated Net Investment Income (Loss) | Undistributed/ Accumulated Net Realized Gain (Loss) | |||||||||
PF Inflation Managed | $779 | ($71,890 | ) | $71,111 | ||||||||
PF Managed Bond | — | 676,450 | (676,450 | ) | ||||||||
PF Short Duration Bond | — | 139,030 | (139,030 | ) | ||||||||
PF Emerging Markets Debt | — | 1,196,947 | (1,196,947 | ) | ||||||||
PF Comstock | — | (1,943,986 | ) | 1,943,986 | ||||||||
PF Developing Growth | (41,021 | ) | 41,021 | — | ||||||||
PF Growth | — | (9,680 | ) | 9,680 | ||||||||
PF Large-Cap Growth | — | 177,704 | (177,704 | ) | ||||||||
PF Large-Cap Value | 48,427,424 | (565,599 | ) | (47,861,825 | ) | |||||||
PF Main Street Core | — | 20,738 | (20,738 | ) | ||||||||
PF Mid-Cap Equity | 4,084,091 | 24,270 | (4,108,361 | ) | ||||||||
PF Mid-Cap Value | — | 70 | (70 | ) | ||||||||
PF Small-Cap Value | — | 40,137 | (40,137 | ) | ||||||||
PF Emerging Markets | — | (30,343 | ) | 30,343 | ||||||||
PF International Large-Cap | — | 267,453 | (267,453 | ) | ||||||||
PF International Small-Cap | — | 248,680 | (248,680 | ) | ||||||||
PF International Value | (28,195,469 | ) | 1,133,856 | 27,061,613 | ||||||||
PF Real Estate | — | (19,477 | ) | 19,477 | ||||||||
PF Currency Strategies | (1,288,327 | ) | 390,770 | 897,557 | ||||||||
PF Equity Long/Short | — | 11,907,748 | (11,907,748 | ) | ||||||||
PF Global Absolute Return | 2 | (4,003,320 | ) | 4,003,318 | ||||||||
PF Multi-Asset | (16,911 | ) | 16,645 | 266 | ||||||||
D-23
Table of Contents
PACIFIC FUNDS
NOTES TO FINANCIAL STATEMENTS (Continued)
13. SHARES OF BENEFICIAL INTEREST
Each Fund is authorized to issue an unlimited number of shares of beneficial interest with no par value. Changes in shares of beneficial interest of each Fund for the year or period ended March 31, 2018 and 2017, were as follows:
| Year ended 3/31/2018 | Year ended 3/31/2017 | Year/ Period ended 3/31/2018 | Year ended 3/31/2017 | Year ended 3/31/2018 | Year ended 3/31/2017 | Year ended 3/31/2018 | Year ended 3/31/2017 | |||||||||||||||||||||||||||||||||||||
| PF Inflation Managed Fund | PF Managed Bond Fund | PF Short Duration Bond Fund | PF Emerging Markets Debt Fund | |||||||||||||||||||||||||||||||||||||||||
Class P | ||||||||||||||||||||||||||||||||||||||||||||
Shares sold | 7,313,111 | 212,291 | 531,321 | 48,765,280 | 501,598 | 16,371,096 | 4,948,673 | 397,378 | ||||||||||||||||||||||||||||||||||||
Dividends and distributions reinvested | 18,480 | — | 2,548,681 | 2,027,034 | 243,358 | 116,190 | 375,304 | 566,999 | ||||||||||||||||||||||||||||||||||||
Shares repurchased | (271,176 | ) | (4,719,640 | ) | (16,107,371 | ) | (21,078,348 | ) | (6,235,028 | ) | (7,244,313 | ) | (707,964 | ) | (8,262,837 | ) | ||||||||||||||||||||||||||||
Net increase (decrease) | 7,060,415 | (4,507,349 | ) | (13,027,369 | ) | 29,713,966 | (5,490,072 | ) | 9,242,973 | 4,616,013 | (7,298,460 | ) | ||||||||||||||||||||||||||||||||
Beginning shares outstanding | 1,472,708 | 5,980,057 | 69,590,844 | 39,876,878 | 16,959,469 | 7,716,496 | 4,536,194 | 11,834,654 | ||||||||||||||||||||||||||||||||||||
Ending shares outstanding | 8,533,123 | 1,472,708 | 56,563,475 | 69,590,844 | 11,469,397 | 16,959,469 | 9,152,207 | 4,536,194 | ||||||||||||||||||||||||||||||||||||
| PF Comstock Fund | PF Developing Growth Fund | PF Growth Fund | PF Large-Cap Growth Fund | |||||||||||||||||||||||||||||||||||||||||
Class P | ||||||||||||||||||||||||||||||||||||||||||||
Shares sold | 113,836 | 1,089,132 | 76,603 | 45,794 | 2,958,294 | 1,809,855 | 31,951 | 1,606,265 | ||||||||||||||||||||||||||||||||||||
Dividends and distributions reinvested | 948,701 | 1,306,982 | — | — | 221,110 | 154,733 | 1,756,977 | 781,305 | ||||||||||||||||||||||||||||||||||||
Shares repurchased | (5,778,341 | ) | (5,871,196 | ) | (204,222 | ) | (3,587,084 | ) | (1,488,410 | ) | (2,031,652 | ) | (5,886,402 | ) | (9,904,922 | ) | ||||||||||||||||||||||||||||
Net increase (decrease) | (4,715,804 | ) | (3,475,082 | ) | (127,619 | ) | (3,541,290 | ) | 1,690,994 | (67,064 | ) | (4,097,474 | ) | (7,517,352 | ) | |||||||||||||||||||||||||||||
Beginning shares outstanding | 12,251,433 | 15,726,515 | 765,495 | 4,306,785 | 6,454,007 | 6,521,071 | 8,820,993 | 16,338,345 | ||||||||||||||||||||||||||||||||||||
Ending shares outstanding | 7,535,629 | 12,251,433 | 637,876 | 765,495 | 8,145,001 | 6,454,007 | 4,723,519 | 8,820,993 | ||||||||||||||||||||||||||||||||||||
| PF Large-Cap Value Fund | PF Main Street Core Fund | PF Mid-Cap Equity Fund | PF Mid-Cap Value Fund | |||||||||||||||||||||||||||||||||||||||||
Class P | ||||||||||||||||||||||||||||||||||||||||||||
Shares sold | 162,487 | 10,543,796 | 85,871 | 8,070,710 | 19,834 | 44,366 | 84,900 | 4,079,687 | ||||||||||||||||||||||||||||||||||||
Dividends and distributions reinvested | 641,021 | 821,920 | 1,565,384 | 379,534 | 1,040,934 | 1,221,074 | 146,271 | 172,915 | ||||||||||||||||||||||||||||||||||||
Shares repurchased | (17,877,474 | ) | (5,549,767 | ) | (13,274,841 | ) | (4,381,264 | ) | (4,145,268 | ) | (11,212,725 | ) | (11,692,703 | ) | (13,002,500 | ) | ||||||||||||||||||||||||||||
Net increase (decrease) | (17,073,966 | ) | 5,815,949 | (11,623,586 | ) | 4,068,980 | (3,084,500 | ) | (9,947,285 | ) | (11,461,532 | ) | (8,749,898 | ) | ||||||||||||||||||||||||||||||
Beginning shares outstanding | 26,114,055 | 20,298,106 | 21,473,510 | 17,404,530 | 6,002,658 | 15,949,943 | 17,063,123 | 25,813,021 | ||||||||||||||||||||||||||||||||||||
Ending shares outstanding | 9,040,089 | 26,114,055 | 9,849,924 | 21,473,510 | 2,918,158 | 6,002,658 | 5,601,591 | 17,063,123 | ||||||||||||||||||||||||||||||||||||
| PF Small-Cap Value Fund | PF Emerging Markets Fund | PF International Large-Cap Fund | PF International Small-Cap Fund | |||||||||||||||||||||||||||||||||||||||||
Class P | ||||||||||||||||||||||||||||||||||||||||||||
Shares sold | 63,528 | 441,887 | 166,751 | 10,860,424 | 258,634 | 1,191,261 | 4,317,301 | 555,237 | ||||||||||||||||||||||||||||||||||||
Dividends and distributions reinvested | 1,337,718 | 414,942 | 72,654 | 69,509 | 135,456 | 271,867 | 403,934 | 428,783 | ||||||||||||||||||||||||||||||||||||
Shares repurchased | (3,945,051 | ) | (10,701,711 | ) | (4,456,527 | ) | (6,169,058 | ) | (4,094,473 | ) | (9,111,650 | ) | (805,699 | ) | (8,453,326 | ) | ||||||||||||||||||||||||||||
Net increase (decrease) | (2,543,805 | ) | (9,844,882 | ) | (4,217,122 | ) | 4,760,875 | (3,700,383 | ) | (7,648,522 | ) | 3,915,536 | (7,469,306 | ) | ||||||||||||||||||||||||||||||
Beginning shares outstanding | 9,809,324 | 19,654,206 | 14,528,350 | 9,767,475 | 9,714,684 | 17,363,206 | 4,077,754 | 11,547,060 | ||||||||||||||||||||||||||||||||||||
Ending shares outstanding | 7,265,519 | 9,809,324 | 10,311,228 | 14,528,350 | 6,014,301 | 9,714,684 | 7,993,290 | 4,077,754 | ||||||||||||||||||||||||||||||||||||
| PF International Value Fund | PF Real Estate Fund | PF Currency Strategies Fund | PF Equity Long/Short Fund | |||||||||||||||||||||||||||||||||||||||||
Class P | ||||||||||||||||||||||||||||||||||||||||||||
Shares sold | 509,308 | 9,099,961 | 778,164 | 719,019 | 868,157 | 2,855,605 | 344,554 | 446,920 | ||||||||||||||||||||||||||||||||||||
Dividends and distributions reinvested | 700,642 | 630,748 | 495,992 | 283,287 | 235,254 | 977,311 | 990,313 | 1,289,854 | ||||||||||||||||||||||||||||||||||||
Shares repurchased | (5,843,205 | ) | (7,837,956 | ) | (387,143 | ) | (2,810,469 | ) | (3,493,107 | ) | (7,628,910 | ) | (2,720,419 | ) | (10,718,954 | ) | ||||||||||||||||||||||||||||
Net increase (decrease) | (4,633,255 | ) | 1,892,753 | 887,013 | (1,808,163 | ) | (2,389,696 | ) | (3,795,994 | ) | (1,385,552 | ) | (8,982,180 | ) | ||||||||||||||||||||||||||||||
Beginning shares outstanding | 18,760,037 | 16,867,284 | 2,613,546 | 4,421,709 | 9,252,185 | 13,048,179 | 7,265,697 | 16,247,877 | ||||||||||||||||||||||||||||||||||||
Ending shares outstanding | 14,126,782 | 18,760,037 | 3,500,559 | 2,613,546 | 6,862,489 | 9,252,185 | 5,880,145 | 7,265,697 | ||||||||||||||||||||||||||||||||||||
| PF Global Absolute Return Fund | PF Multi-Asset Fund (1) | |||||||||||||||||||||||||||||||||||||||||||
Class P | ||||||||||||||||||||||||||||||||||||||||||||
Shares sold | 813,777 | 3,568,009 | 77,848,543 | |||||||||||||||||||||||||||||||||||||||||
Dividends and distributions reinvested | 23,488 | 331,130 | — | |||||||||||||||||||||||||||||||||||||||||
Shares repurchased | (3,711,334 | ) | (8,963,140 | ) | (1 | ) | ||||||||||||||||||||||||||||||||||||||
Net increase (decrease) | (2,874,069 | ) | (5,064,001 | ) | 77,848,542 | |||||||||||||||||||||||||||||||||||||||
Beginning shares outstanding | 9,520,125 | 14,584,126 | — | |||||||||||||||||||||||||||||||||||||||||
Ending shares outstanding | 6,646,056 | 9,520,125 | 77,848,542 | |||||||||||||||||||||||||||||||||||||||||
| (1) | PF Multi-Asset Fund commenced operations on January 31, 2018. |
D-24
Table of Contents
REPORT OF INDEPENDENT REGISTERED PUBLIC ACCOUNTING FIRM
To the shareholders and the Board of Trustees of Pacific Funds Series Trust
Opinion on the Financial Statements and Financial Highlights
We have audited the accompanying statements of assets and liabilities of PF Inflation Managed Fund, PF Managed Bond Fund, PF Short Duration Bond Fund, PF Emerging Markets Debt Fund, PF Comstock Fund, PF Developing Growth Fund, PF Growth Fund, PF Large-Cap Growth Fund, PF Large-Cap Value Fund, PF Main Street® Core Fund, PF Mid-Cap Equity Fund, PF Mid-Cap Value Fund, PF Small-Cap Value Fund, PF Emerging Markets Fund, PF International Large-Cap Fund, PF International Small-Cap Fund, PF International Value Fund, PF Real Estate Fund, PF Currency Strategies Fund, PF Equity Long/Short Fund, PF Global Absolute Return Fund and PF Multi-Asset Fund (the “Funds”) (twenty-two of the funds comprising Pacific Funds Series Trust), including the schedules of investments, as of March 31, 2018; the related statements of operations and cash flows (for PF Inflation Managed Fund), changes in net assets, and the financial highlights for the periods indicated in the table below; and the related notes. In our opinion, the financial statements and financial highlights present fairly, in all material respects, the financial position of each of the Funds as of March 31, 2018, and the results of their operations and their cash flows (for the PF Inflation Managed Fund), the changes in their net assets, and the financial highlights for the periods listed in the table below, in conformity with accounting principles generally accepted in the United States of America.
| Individual Fund Comprising the Pacific Funds Series Trust | Statements of Operations and Cash Flows (for PF Inflation Managed Fund) | Statements of Changes in Net Assets | Financial Highlights | |||
| PF Inflation Managed Fund, PF Managed Bond Fund, PF Short Duration Bond Fund, PF Emerging Markets Debt Fund, PF Comstock Fund, PF Developing Growth Fund, PF Growth Fund, PF Large-Cap Growth Fund, PF Large-Cap Value Fund, PF Main Street® Core Fund, PF Mid-Cap Equity Fund, PF Small-Cap Value Fund, PF Emerging Markets Fund, PF International Large-Cap Fund, PF International Value Fund, PF Real Estate Fund, PF Currency Strategies Fund and PF Global Absolute Return Fund | For the year ended March 31, 2018 | For the years ended March 31, 2018 and 2017 | For the years ended March 31, 2018, 2017, 2016, 2015, and 2014 | |||
PF Mid-Cap Value Fund | For the year ended March 31, 2018 | For the years ended March 31, 2018 and 2017 | For the years ended March 31, 2018, 2017, and the period from July 29, 2015 (commencement of operations) through March 31, 2016 | |||
PF International Small-Cap Fund | For the year ended March 31, 2018 | For the years ended March 31, 2018 and 2017 | For the years ended March 31, 2018, 2017, 2016, and the period from January 14, 2015 (commencement of operations) through March 31, 2015 | |||
PF Equity Long/Short Fund | For the year ended March 31, 2018 | For the years ended March 31, 2018 and 2017 | For the years ended March 31, 2018, 2017, and the period from April 27, 2015 (commencement of operations) through March 31, 2016 | |||
PF Multi-Asset Fund | For the period from January 31, 2018 (commencement of operations) through March 31, 2018 | |||||
Basis for Opinion
These financial statements and financial highlights are the responsibility of the Funds’ management. Our responsibility is to express an opinion on the Funds’ financial statements and financial highlights based on our audits. We are a public accounting firm registered with the Public Company Accounting Oversight Board (United States) (PCAOB) and are required to be independent with respect to the Funds in accordance with the U.S. federal securities laws and the applicable rules and regulations of the Securities and Exchange Commission and the PCAOB.
We conducted our audits in accordance with the standards of the PCAOB. Those standards require that we plan and perform the audit to obtain reasonable assurance about whether the financial statements and financial highlights are free of material misstatement, whether due to error or fraud. The Funds are not required to have, nor were we engaged to perform, an audit of their internal control over financial reporting. As part of our audits we are required to obtain an understanding of internal control over financial reporting but not for the purpose of expressing an opinion on the effectiveness of the Funds’ internal control over financial reporting. Accordingly, we express no such opinion.
Our audits included performing procedures to assess the risks of material misstatement of the financial statements and financial highlights, whether due to error or fraud, and performing procedures that respond to those risks. Such procedures included examining, on a test basis, evidence regarding the amounts and disclosures in the financial statements and financial highlights. Our audits also included evaluating the accounting principles used and significant estimates made by management, as well as evaluating the overall presentation of the financial statements and financial highlights. Our procedures included confirmation of securities owned as of March 31, 2018, by correspondence with the custodian and brokers; when replies were not received from brokers, we performed other auditing procedures. We believe that our audits provide a reasonable basis for our opinion.

Philadelphia, PA
May 24, 2018
We have served as the auditor of one or more affiliated investment companies of Pacific Funds Series Trust since 1988.
E-1
Table of Contents
PACIFIC FUNDS
(Unaudited)
For corporate shareholders, the percentage of investment income (dividend income and short-term gains, if any) for each of the Funds that qualify for the dividends-received deductions for the year ended March 31, 2018 is as follows:
| Fund | Percentage | |||
PF Comstock | 87.36% | |||
PF Growth | 71.12% | |||
PF Large-Cap Growth | 22.17% | |||
PF Large-Cap Value | 100.00% | |||
PF Main Street Core | 63.75% | |||
PF Mid-Cap Equity | 37.99% | |||
PF Mid-Cap Value | 100.00% | |||
PF Small-Cap Value | 100.00% | |||
PF Emerging Markets | 5.13% | |||
PF International Large-Cap | 1.06% | |||
PF International Small-Cap | 1.33% | |||
For the year ended March 31, 2018 certain dividends paid by the Funds may be subject to a maximum tax rate of 15% as provided by the Jobs and Growth Relief Reconciliation Act of 2003. Of the distributions made by the following Funds, the corresponding percentages represent the amount of each distribution which may qualify for the 15% dividend income tax rate.
| Fund | Percentage | |||
PF Comstock | 95.05% | |||
PF Growth | 80.34% | |||
PF Large-Cap Growth | 27.85% | |||
PF Large-Cap Value | 100.00% | |||
PF Main Street Core | 74.94% | |||
PF Mid-Cap Equity | 39.48% | |||
PF Mid-Cap Value | 100.00% | |||
PF Small-Cap Value | 100.00% | |||
PF Emerging Markets | 100.00% | |||
PF International Large-Cap | 100.00% | |||
PF International Small-Cap | 92.16% | |||
PF International Value | 100.00% | |||
Shareholders should not use the above tax information to prepare their tax returns. The information will be included in your Form 1099 DIV, which will be sent to you separately in January 2019. The Funds intend to pass through the maximum allowable percentages to shareholders.
The following Funds designated the listed amounts as long-term capital gain dividends during the year ended March 31, 2018. Distributable long-term gains are based on net realized long-term gains determined on a tax basis and may differ from such amounts for financial reporting purposes.
| Fund | Amount | |||
PF Comstock | $39,904,409 | |||
PF Growth | 8,989,976 | |||
PF Large-Cap Growth | 26,108,037 | |||
PF Large-Cap Value | 104,119,383 | |||
PF Main Street Core | 52,334,145 | |||
PF Mid-Cap Equity | 12,596,427 | |||
PF Mid-Cap Value | 30,638,960 | |||
PF Small-Cap Value | 15,035,437 | |||
PF Emerging Markets | 6,209,047 | |||
PF International Large-Cap | 18,661,917 | |||
PF International Small-Cap | 3,655,119 | |||
PF Real Estate | 5,740,391 | |||
PF Equity Long/Short | 3,896,788 | |||
F-1
Table of Contents
PACIFIC FUNDS
(Unaudited)
We believe it is important for you to understand the impact of fees and expenses regarding your investment. All mutual funds have operating expenses. As a shareholder of a mutual fund, you incur ongoing costs, which include advisory fees, administration fees and other fund expenses. The following example is intended to help you understand your ongoing costs (in dollars) of investing in each fund and to compare these costs with those of other mutual funds. The example is based on an investment of $1,000.00 made at the beginning of the period and held for the entire six-month period from October 1, 2017 to March 31, 2018.
ACTUAL EXPENSES
The first section of the table for each fund entitled “Actual Fund Return”, provides information about actual account values and actual expenses based on each fund’s actual performance and each fund’s actual expenses, after any applicable advisory fee waivers and adviser expense reimbursements (See Notes 6 and 7B in Notes to Financial Statements). The “Ending Account Value at 03/31/18” column shown is derived from the fund’s actual performance; the “Annualized Expense Ratio” column shows the fund’s actual annualized expense ratio; and the “Expenses Paid During the Period 10/01/17-03/31/18” column shows the dollar amount that would have been paid by you. All the information illustrated in the following table is based on the past six-month period from October 1, 2017 to March 31, 2018.
You may use the information in this section, together with the amount you invested, to estimate the expenses that you paid over the period. To do so, for each fund in your account, simply divide that fund’s value by $1,000.00 (for example, an $8,600.00 fund value divided by $1,000.00 = 8.6), then multiply the result by the number given for your fund(s) in the “Expenses Paid During the Period 10/01/17-03/31/18.”
HYPOTHETICAL EXAMPLE FOR COMPARISON PURPOSES
The second section of the table for each fund, entitled “Hypothetical”, provides information about hypothetical account values and hypothetical expenses based on a 5% per year hypothetical rate of return and actual fund’s expenses, after any applicable advisory fee waivers and adviser expense reimbursements (See Notes 6 and 7B in Notes to Financial Statements). It assumes that the fund had an annual 5% rate of return before expenses, but that the expense ratio is unchanged. The hypothetical account values and expenses may not be used to estimate the actual ending account values or expenses you paid for the period.
You may use the hypothetical example information to compare the ongoing costs of investing in the fund compared to other mutual funds. To do so, compare this 5% hypothetical example with the 5% hypothetical examples that appear in the shareholder reports of other mutual funds.
Please note that the expenses shown in the table are meant to highlight your ongoing costs only and do not reflect any transactional costs. Therefore, the second section of the table is useful in comparing ongoing costs only, and will not help you determine the relative total costs of owning different mutual funds. In addition, if these other costs were included, your costs would have been higher.
| Beginning Account Value at 10/01/17 | Ending Account Value at 03/31/18 | Annualized Expense Ratio | Expenses Paid During the Period 10/01/17 - 03/31/18 (1) | |||||||||||||
| PF Inflation Managed Fund | ||||||||||||||||
Actual Fund Return | ||||||||||||||||
Class P | $1,000.00 | $1,004.20 | 0.97% | $4.85 | ||||||||||||
Hypothetical | ||||||||||||||||
Class P | $1,000.00 | $1,020.09 | 0.97% | $4.89 | ||||||||||||
| PF Managed Bond Fund | ||||||||||||||||
Actual Fund Return | ||||||||||||||||
Class P | $1,000.00 | $992.00 | 0.58% | $2.88 | ||||||||||||
Hypothetical | ||||||||||||||||
Class P | $1,000.00 | $1,022.04 | 0.58% | $2.92 | ||||||||||||
| PF Short Duration Bond Fund | ||||||||||||||||
Actual Fund Return | ||||||||||||||||
Class P | $1,000.00 | $997.40 | 0.55% | $2.74 | ||||||||||||
Hypothetical | ||||||||||||||||
Class P | $1,000.00 | $1,022.19 | 0.55% | $2.77 | ||||||||||||
PF Emerging Markets Debt Fund |
| |||||||||||||||
Actual Fund Return | ||||||||||||||||
Class P | $1,000.00 | $1,020.20 | 0.94% | $4.73 | ||||||||||||
Hypothetical | ||||||||||||||||
Class P | $1,000.00 | $1,020.24 | 0.94% | $4.73 | ||||||||||||
| PF Comstock Fund | ||||||||||||||||
Actual Fund Return | ||||||||||||||||
Class P | $1,000.00 | $1,043.40 | 0.88% | $4.48 | ||||||||||||
Hypothetical | ||||||||||||||||
Class P | $1,000.00 | $1,020.54 | 0.88% | $4.43 | ||||||||||||
| PF Developing Growth Fund | ||||||||||||||||
Actual Fund Return | ||||||||||||||||
Class P | $1,000.00 | $1,155.80 | 0.75% | $4.03 | ||||||||||||
Hypothetical | ||||||||||||||||
Class P | $1,000.00 | $1,021.19 | 0.75% | $3.78 | ||||||||||||
| PF Growth Fund | ||||||||||||||||
Actual Fund Return | ||||||||||||||||
Class P | $1,000.00 | $1,122.10 | 0.70% | $3.70 | ||||||||||||
Hypothetical | ||||||||||||||||
Class P | $1,000.00 | $1,021.44 | 0.70% | $3.53 | ||||||||||||
| PF Large-Cap Growth Fund | ||||||||||||||||
Actual Fund Return | ||||||||||||||||
Class P | $1,000.00 | $1,137.30 | 0.86% | $4.58 | ||||||||||||
Hypothetical | ||||||||||||||||
Class P | $1,000.00 | $1,020.64 | 0.86% | $4.33 | ||||||||||||
| PF Large-Cap Value Fund | ||||||||||||||||
Actual Fund Return | ||||||||||||||||
Class P | $1,000.00 | $1,012.50 | 0.80% | $4.01 | ||||||||||||
Hypothetical | ||||||||||||||||
Class P | $1,000.00 | $1,020.94 | 0.80% | $4.03 | ||||||||||||
| PF Main Street Core Fund | ||||||||||||||||
Actual Fund Return | ||||||||||||||||
Class P | $1,000.00 | $989.40 | 0.60% | $2.98 | ||||||||||||
Hypothetical | ||||||||||||||||
Class P | $1,000.00 | $1,021.94 | 0.60% | $3.02 | ||||||||||||
See explanation of references on page F-3
F-2
Table of Contents
PACIFIC FUNDS
DISCLOSURE OF FUND EXPENSES (Continued)
(Unaudited)
| Beginning Account Value at 10/01/17 | Ending Account Value at 03/31/18 | Annualized Expense Ratio | Expenses Paid During the Period 10/01/17 - 03/31/18 (1) | |||||||||||||
| PF Mid-Cap Equity Fund | ||||||||||||||||
Actual Fund Return | ||||||||||||||||
Class P | $1,000.00 | $1,058.30 | 0.80% | $4.11 | ||||||||||||
Hypothetical | ||||||||||||||||
Class P | $1,000.00 | $1,020.94 | 0.80% | $4.03 | ||||||||||||
| PF Mid-Cap Value Fund | ||||||||||||||||
Actual Fund Return | ||||||||||||||||
Class P | $1,000.00 | $1,045.80 | 0.91% | $4.64 | ||||||||||||
Hypothetical | ||||||||||||||||
Class P | $1,000.00 | $1,020.39 | 0.91% | $4.58 | ||||||||||||
| PF Small-Cap Value Fund | ||||||||||||||||
Actual Fund Return | ||||||||||||||||
Class P | $1,000.00 | $1,014.20 | 0.90% | $4.52 | ||||||||||||
Hypothetical | ||||||||||||||||
Class P | $1,000.00 | $1,020.44 | 0.90% | $4.53 | ||||||||||||
| PF Emerging Markets Fund | ||||||||||||||||
Actual Fund Return | ||||||||||||||||
Class P | $1,000.00 | $1,084.20 | 0.95% | $4.94 | ||||||||||||
Hypothetical | ||||||||||||||||
Class P | $1,000.00 | $1,020.19 | 0.95% | $4.78 | ||||||||||||
| PF International Large-Cap Fund | ||||||||||||||||
Actual Fund Return | ||||||||||||||||
Class P | $1,000.00 | $1,025.60 | 1.00% | $5.05 | ||||||||||||
Hypothetical | ||||||||||||||||
Class P | $1,000.00 | $1,019.95 | 1.00% | $5.04 | ||||||||||||
| PF International Small-Cap Fund | ||||||||||||||||
Actual Fund Return | ||||||||||||||||
Class P | $1,000.00 | $1,033.90 | 1.10% | $5.58 | ||||||||||||
Hypothetical | ||||||||||||||||
Class P | $1,000.00 | $1,019.45 | 1.10% | $5.54 | ||||||||||||
| PF International Value Fund | ||||||||||||||||
Actual Fund Return | ||||||||||||||||
Class P | $1,000.00 | $1,031.50 | 0.80% | $4.05 | ||||||||||||
Hypothetical | ||||||||||||||||
Class P | $1,000.00 | $1,020.94 | 0.80% | $4.03 | ||||||||||||
| PF Real Estate Fund | ||||||||||||||||
Actual Fund Return | ||||||||||||||||
Class P | $1,000.00 | $957.20 | 1.05% | $5.12 | ||||||||||||
Hypothetical | ||||||||||||||||
Class P | $1,000.00 | $1,019.70 | 1.05% | $5.29 | ||||||||||||
| PF Currency Strategies Fund | ||||||||||||||||
Actual Fund Return | ||||||||||||||||
Class P | $1,000.00 | $1,016.80 | 0.87% | $4.37 | ||||||||||||
Hypothetical | ||||||||||||||||
Class P | $1,000.00 | $1,020.59 | 0.87% | $4.38 | ||||||||||||
| PF Equity Long/Short Fund | ||||||||||||||||
Actual Fund Return | ||||||||||||||||
Class P | $1,000.00 | $1,037.10 | 1.22% | $6.20 | ||||||||||||
Hypothetical | ||||||||||||||||
Class P | $1,000.00 | $1,018.85 | 1.22% | $6.14 | ||||||||||||
| Beginning Account Value at 10/01/17 | Ending Account Value at 03/31/18 | Annualized Expense Ratio | Expenses Paid During the Period 10/01/17 - 03/31/18 (1) | |||||||||||||
| PF Global Absolute Return Fund | ||||||||||||||||
Actual Fund Return | ||||||||||||||||
Class P | $1,000.00 | $1,020.90 | 1.12% | $5.64 | ||||||||||||
Hypothetical | ||||||||||||||||
Class P | $1,000.00 | $1,019.35 | 1.12% | $5.64 | ||||||||||||
| PF Multi-Asset Fund (2) | ||||||||||||||||
Actual Fund Return | ||||||||||||||||
Class P | $1,000.00 | $942.00 | 0.51% | $0.80 | ||||||||||||
Hypothetical | ||||||||||||||||
Class P | $1,000.00 | $1,022.39 | 0.51% | $2.57 | ||||||||||||
| (1) | Expenses paid during the period are equal to the fund’s annualized expense ratio (shown in table above), multiplied by the average account value over the period, multiplied by the number of days in the most recent fiscal half-year or applicable period, then divided by 365 days. |
| (2) | PF Multi-Asset Fund commenced operations on January 31, 2018. The actual fund return and expenses paid during the period for this fund was for the period January 31, 2018 to March 31, 2018, instead of the entire six-month period. The hypothetical return and expenses paid during the period are based on the entire six-month period for comparison purposes. |
F-3
Table of Contents
PACIFIC FUNDS
TRUSTEES AND OFFICERS INFORMATION
(Unaudited)
The business and affairs of the Pacific Funds Series Trust (which may be referred to as “Pacific Funds” or the “Trust”) are managed under the direction of the Board of Trustees under the Declaration of Trust. Information pertaining to the trustees and officers of the Trust is set forth below. Trustees who are not deemed to be “interested persons” of the Trust, as defined in the 1940 Act, are referred to as “Independent Trustees.” Certain trustees and officers are deemed to be “interested persons” of the Trust and thus are referred to as “Interested Persons”, because of their positions with Pacific Life Insurance Company (“Pacific Life”) and Pacific Life Fund Advisors LLC, a wholly-owned subsidiary of Pacific Life. The Trust’s Statement of Additional Information includes additional information about the trustees. For information on availability of the Trust’s Statement of Additional Information, refer to the WHERE TO GO FOR MORE INFORMATION section of this report.
The address of each trustee and officer is c/o Pacific Funds Series Trust, 700 Newport Center Drive, Newport Beach, CA 92660.
Name and Age | Position(s) with the Fund and Length of Time Served* | Current Directorship(s) Held and Principal Occupation(s) (and certain additional occupation information) During Past 5 years | Number of Funds In | |||
INDEPENDENT TRUSTEES | ||||||
Frederick L. Blackmon Year of birth 1952 | Trustee since 9/13/05 | Trustee (1/05 to present) of Pacific Select Fund; Former Director (2005 to 2016) of Trustmark Mutual Holding Company; Former Member of Board of Trustees (2010 to 2016) of Cranbrook Educational Community. | 97 | |||
| Formerly: Executive Vice President and Chief Financial Officer of Zurich Life; Executive Vice President and Chief Financial Officer of Alexander Hamilton Life Insurance Company (subsidiary of Household International); Member of Board of Governors of Cranbrook Schools; Member of Board of Regents of Eastern Michigan University. | ||||||
Gale K. Caruso Year of birth 1957 | Trustee since 1/01/06 | Trustee (1/06 to present) of Pacific Select Fund; Independent Trustee (2/15 to present) of Matthews Asia Funds. | 97 | |||
| Formerly: Member of the Board of Directors of LandAmerica Financial Group, Inc.; President and Chief Executive Officer of Zurich Life; Chairman, President and Chief Executive Officer of Scudder Canada Investor Services, Ltd.; Managing Director of Scudder Kemper Investments; Member of the Advisory Council to the Trust for Public Land in Maine; Member of the Board of Directors of Make-A-Wish of Maine. | ||||||
Lucie H. Moore Year of birth 1956 | Trustee since 6/12/01 | Trustee (10/98 to present ) of Pacific Select Funds; Member of the Board of Trustees (2014 to present) of Azusa Pacific University; Member of the Board of Trustees (2016 to present) of Pacifica Christian High School Orange County. | 97 | |||
| Formerly: Partner of Gibson, Dunn & Crutcher (Law); Member of the Board of Trustees of Sage Hill School; Member of the Board of Trustees of The Pegasus School; and Member of the Advisory Board of Court Appointed Special Advocates (CASA) of Orange County. | ||||||
Nooruddin (Rudy) S. Veerjee Year of birth 1958 | Trustee since 9/13/05 | Trustee (1/05 to present) of Pacific Select Fund.
Formerly: President of Transamerica Insurance and Investment Group; President of Transamerica Asset Management; Chairman and Chief Executive Officer of Transamerica Premier Funds (Mutual Fund); and Director of various Transamerica Life Companies. | 97 | |||
Paul A. Keller Year of birth 1954 | Trustee since 6/20/16 | Trustee (6/16 to present) of Pacific Select Fund; Consultant to the Trust and Pacific Select Fund (11/15 to 6/16); Independent Trustee (8/10 to present) of Fenimore Asset Management Trust (FAM Funds); Business Consultant (7/10 to present) (sole proprietor); Certified Public Accountant in New York (1982 to present); Adjunct Professor of Accounting (2011 to 2015), SUNY College at Old Westbury; Interim Chief Financial Officer (2014 to 2015) of The Leon Levy Foundation. | 97 | |||
| Formerly: Partner of PricewaterhouseCoopers LLP; Partner of McGladrey & Pullen LLP. | ||||||
F-4
Table of Contents
PACIFIC FUNDS
TRUSTEES AND OFFICERS INFORMATION (Continued)
(Unaudited)
Name and Age | Position(s) with the Trust and Length of Time Served* | Current Directorship(s) Held and Principal Occupation(s) (and certain additional occupation information) During Past 5 years | Number of Funds In Fund Complex Overseen** | |||||
INTERESTED PERSONS | ||||||||
James T. Morris Year of birth 1960 | Chairman of the Board and Trustee since 1/11/07 | Director (4/07 to present), Chairman (5/08 to present), Chief Executive Officer (4/07 to present) and President (1/16 to present) of Pacific Mutual Holding Company and Pacific LifeCorp; Director (4/07 to present), Chairman (5/08 to present), Chief Executive Officer (4/07 to present) and President (1/16 to present) of Pacific Life; Chief Executive Officer (5/07 to 10/15) and President (5/07 to 3/12) of Pacific Life Fund Advisors LLC; Director (4/16 to present) of Edison International (a public utility holding company); and Chairman of the Board and Trustee (1/07 to present) of Pacific Select Fund. | 97 | |||||
Adrian S. Griggs Year of birth 1966 | Chief Executive Officer since 1/1/2018 | Chief Operating Officer (1/17 to present), Executive Vice President (4/12 to present) and Chief Financial Officer (4/12 to 2/17) of Pacific Mutual Holding Company and Pacific LifeCorp; Chief Operating Officer (1/17 to present), Executive Vice President (4/12 to present), Chief Financial Officer (4/12 to 2/17) and Director (1/16 to present) of Pacific Life; Chief Financial Officer (4/12 to 10/15) and Executive Vice President (4/12 to 10/15) of Pacific Life Fund Advisors LLC; Chief Executive Officer (1/15 to present) of Pacific Select Distributors, LLC; and Chief Executive Officer (1/18 to present) of Pacific Select Fund. | 97 | |||||
Robin S. Yonis Year of birth 1954 | Vice President and General Counsel since 6/13/01 and Assistant Secretary since 9/17/15 | Vice President, Fund Advisor General Counsel and Assistant Secretary (5/07 to present) of Pacific Life Fund Advisors LLC; and Vice President and General Counsel (4/05 to present) and Assistant Secretary (9/15 to present) of Pacific Select Fund. | 97 | |||||
Sharon E. Pacheco Year of birth 1957 | Vice President and Chief Compliance Officer since 6/04/04 | Vice President and Chief Compliance Officer (11/03 to present) of Pacific Mutual Holding Company and Pacific LifeCorp; Vice President (2/00 to present) and Chief Compliance Officer (1/03 to present) of Pacific Life; Vice President and Chief Compliance Officer (5/07 to present) of Pacific Life Fund Advisors LLC; and Vice President and Chief Compliance Officer (6/04 to present) of Pacific Select Fund. | 97 | |||||
Howard T. Hirakawa Year of birth 1962 | Senior Vice President since 12/10/2014 (Vice President 6/06 to 12/09/14) | Senior Vice President (4/14 to present), Vice President (5/07 to 3/14) of Pacific Life Fund Advisors LLC; and Senior Vice President (12/14 to present) and Vice President (6/06 to 12/14) of Pacific Select Fund. | 97 | |||||
Trevor T. Smith Year of birth 1975 | Vice President since 3/23/16 and Treasurer since 4/01/18 (Assistant Treasurer 3/23/16 to 3/31/18) | Assistant Vice President (1/17 to present) and Director of Variable Product Accounting (4/09 to 12/16) of Pacific Life; Assistant Vice President (3/16 to present), Treasurer (4/18 to present) and Assistant Treasurer (3/16 to 3/18) of Pacific Select Fund. | 97 | |||||
Laurene E. MacElwee Year of birth 1966 | Vice President since 4/04/05 and Assistant Secretary since 6/13/01 | Vice President (4/11 to present), Assistant Secretary (5/07 to present) of Pacific Life Fund Advisors LLC; and Vice President (12/11 to present), Assistant Secretary (4/05 to present) of Pacific Select Fund. | 97 | |||||
Carleton J. Muench Year of birth 1973 | Vice President since 11/30/06 | Vice President (4/14 to present), Assistant Vice President (5/07 to 3/14) of Pacific Life Fund Advisors LLC; and Vice President (12/14 to present) and Assistant Vice President (11/06 to 12/14) of Pacific Select Fund. | 97 | |||||
Jane M. Guon Year of birth 1964 | Vice President and Secretary since 1/01/11 | Vice President and Secretary (1/11 to present) of Pacific Mutual Holding Company and Pacific LifeCorp; Vice President and Secretary (1/11 to present) and Director (1/11 to 3/17) of Pacific Life; Vice President and Secretary (1/11 to present) of Pacific Life Fund Advisors LLC, Vice President and Secretary (1/11 to present) of Pacific Select Distributors, LLC; and Vice President and Secretary (1/11 to present) of Pacific Select Fund. | 97 | |||||
F-5
Table of Contents
PACIFIC FUNDS
TRUSTEES AND OFFICERS INFORMATION (Continued)
(Unaudited)
Name and Age | Position(s) with the Trust and Length of Time Served* | Current Directorship(s) Held and Principal Occupation(s) (and certain additional occupation information) During Past 5 years | Number of Funds In Fund Complex | |||
INTERESTED PERSONS (Continued) | ||||||
Kevin W. Steiner Year of birth 1975 | Vice President since 1/01/13 | Assistant Vice President (4/12 to present) of Pacific Life Fund Advisors LLC; and Assistant Vice President (1/13 to present) of Pacific Select Fund. | 97 | |||
Audrey L. Cheng Year of birth 1975 | Vice President since 12/11/13 | Assistant Vice President (9/11 to present) of Pacific Life; Assistant Vice President (12/13 to present) of Pacific Select Fund. | 97 | |||
| Formerly: Vice President and Attorney of Pacific Investment Management Company LLC (“PIMCO”). | ||||||
| * | A trustee serves until he or she resigns, retires, or his or her successor is elected and qualified. |
| ** | As of March 31, 2018, the “Fund Complex” consisted of Pacific Select Fund (57 funds) and Pacific Funds (40 funds). |
F-6
Table of Contents
PACIFIC FUNDS
APPROVAL OF INVESTMENT ADVISORY
AND SUB-ADVISORY AGREEMENTS
(Unaudited)
I. Introduction and Background
The Board of Trustees (the “Trustees” or “Board”) of Pacific Funds Series Trust (“Pacific Funds” or the “Trust”) oversees the management of each of the separate funds of the Trust (each a “Fund” and collectively, the “Funds”) and, as required by Section 15(c) of the Investment Company Act of 1940, as amended (the “1940 Act”), initially approves and, after the initial period, determines annually whether to renew the investment advisory agreement (the “Advisory Agreement”) with Pacific Life Fund Advisors LLC (“PLFA”) and each sub-advisory agreement (the “Sub-Advisory Agreements,” together with the Advisory Agreement, the “Agreements”) with the various sub-advisers (the “Sub-Advisers”). PLFA serves as the investment adviser for all of the Funds and directly manages Pacific Funds Short Duration Income, Pacific Funds Core Income, Pacific Funds Strategic Income, Pacific Funds Floating Rate Income, Pacific Funds Limited Duration High Income and Pacific Funds High Income (the “PAM Managed Funds”) under the name Pacific Asset Management (“PAM”); Pacific Funds Portfolio Optimization Conservative, Pacific Funds Portfolio Optimization Moderate-Conservative, Pacific Funds Portfolio Optimization Moderate, Pacific Funds Portfolio Optimization Growth and Pacific Funds Portfolio Optimization Aggressive-Growth (the “Portfolio Optimization Funds”); and Pacific Funds Diversified Alternatives (together with the Portfolio Optimization Funds, the “Asset Allocation Funds” and together with the Portfolio Optimization Funds and PAM Managed Funds, the “Directly Managed Funds”). For all other Funds, PLFA has retained other firms to serve as Sub-Advisers under PLFA’s supervision. The Board, including all of the Trustees who are not “interested persons,” as that term is defined in the 1940 Act (“Independent Trustees”), last renewed the Agreements at an in-person meeting of the Trustees held on December 13, 2017.1
At this meeting and other meetings, the Board considered information (both written and oral) provided to assist it in its review of the Agreements and made assessments with respect to each Agreement. The Board requested, received and reviewed written materials from PLFA and each Sub-Adviser that were submitted in response to requests from the Independent Trustees and supporting materials relating to those questions and responses. In addition, the Board received in-person presentations about the Funds throughout the year, and the Independent Trustees were advised by independent legal counsel with respect to these and other relevant matters. The Board reviewed a variety of factors and considered a significant amount of information, including information received on an ongoing basis at Board and committee meetings, including reports on Fund performance, expenses, fee comparisons, investment advisory, compliance, and other services provided to the Funds by PLFA and the Sub-Advisers. The Board also reviewed financial and profitability information regarding PLFA and the Sub-Advisers and information regarding the organization and operations of each entity, such as their compliance monitoring, portfolio trading and brokerage practices and the personnel providing investment management and administrative services to each Fund. The Board considered the services provided to the Funds under the Agreements and the fees and expenses incurred by and charged to the Funds under the Agreements. The Board took into account that PLFA and its affiliates provide additional services to the Funds under other affiliated service agreements that are essential for the operation of the Funds and that although PLFA and its affiliates are separately compensated under those affiliated service agreements, these additional services are provided in connection with PLFA’s advisory relationship with the Funds. The Board reviewed data provided by PLFA that was gathered from various independent providers of investment company data to provide the Board with information concerning the Funds’ investment performance, management fees and expense information (both on an absolute basis and compared to peers). Additionally, the Independent Trustees retained an independent consultant (“Independent Consultant”), with substantial industry experience in providing fund boards of directors with analysis to assist them in their annual 15(c) review process, to assist the Trustees with certain of their analyses and to provide other relevant information. In connection with the analysis, the Independent Consultant utilized and provided the Independent Trustees with information obtained from independent service providers as well as from other sources.
The Trustees’ determinations were made on the basis of each Trustee’s business judgment after consideration of all the information presented. In reviewing the materials presented and in considering the information in the management presentations, the Trustees did not identify any single issue or particular information that, in isolation, would be a controlling factor in making a final decision regarding the proposed Agreements. Individual Trustees may have given different weights to certain factors and assigned various degrees of materiality to information received in connection with the approval process. The following summary describes the most important, but not all, of the factors considered by the Trustees in approving the Agreements, and in the case of the Independent Trustees, certain factors were considered in light of the legal advice furnished to them by independent legal counsel and information from the Independent Consultant that they had retained. This discussion is not intended to be all-inclusive.
II. Annual Consideration and Approval of Investment Advisory and Sub-Advisory Agreements
In evaluating the Advisory Agreement and each Sub-Advisory Agreement, the Board, including all the Independent Trustees, considered the following factors, among others:
A. Nature, Extent and Quality of Services
PLFA – The Trustees considered the depth and quality of PLFA’s investment management process, including its monitoring and oversight of the Sub-Advisers and PAM, and the benefits to shareholders of retaining PLFA and continuing the Advisory Agreement in light of the nature, extent, and quality of the services that have been provided by PLFA, including PAM. The Trustees considered the overall financial strength and stability of PLFA and its ability to provide a high level and quality of services to the Funds. They also considered PLFA’s responsiveness to questions or concerns raised by the Trustees throughout the year, including PLFA’s willingness to consider and implement investment and operational changes designed to improve investment results and the services provided to the Funds and their shareholders.
| 1 | At the December 13th meeting, the Board did not consider the continuance of the Sub-Advisory Agreements relating to the PF Mid-Cap Value Fund and PF International Value Fund, as those agreements were not up for renewal at that time. |
F-7
Table of Contents
PACIFIC FUNDS
APPROVAL OF INVESTMENT ADVISORY
AND SUB-ADVISORY AGREEMENTS (Continued)
(Unaudited)
The Trustees noted that PLFA’s officers and employees regularly consult with, and report to, the Board regarding the investment management services provided to the Funds. The Trustees considered the experience, capability and integrity of PLFA’s senior management and other personnel and the low turnover rates of its key personnel. The Trustees noted that the investment, legal, compliance, risk management and accounting professionals of PLFA and its affiliates have access to and utilize a variety of resources and systems relating to investment management, compliance, trading, performance and risk analysis, security valuation and fund accounting. The Trustees took into account the scope of services provided by PLFA under the Advisory Agreement. The Trustees considered that although PLFA is separately compensated at “approximate cost” for time spent on Fund matters by certain legal, compliance and accounting professionals of PLFA and its affiliates for services outside of the scope of the Advisory Agreement, these services are being provided as a result of PLFA’s advisory relationship with the Funds. The Trustees further considered PLFA’s continuing need and ability to attract and retain qualified personnel and to maintain and enhance its resources and systems to provide appropriate investment management, compliance, risk management and monitoring services for the Funds. The Trustees also considered the additional resources that PLFA has continued to invest in to enhance its management and oversight of the Funds, including additional tools to further enhance the asset allocation and Sub-Adviser research processes. In this regard, the Trustees also considered the role of PLFA’s internal conflicts review committee in considering and evaluating potential conflicts of interest with regard to Sub-Adviser selection and monitoring.
Directly Managed Funds – The Trustees considered the services provided by PLFA in rendering investment management services for those Funds for which the day-to-day investment management is provided by PLFA, including PAM. The Trustees considered that PLFA, including PAM, is responsible for identifying investments for each Directly Managed Fund and determining when and what securities, cash and/or other investments to purchase, retain, or sell for each Directly Managed Fund. The Trustees also considered that PLFA, including PAM, is responsible for the valuation of portfolio securities, including, but not limited to, the review of custodian pricing files, research and analysis related to fair valued securities and due diligence oversight of pricing vendors. The Trustees additionally noted that PLFA is responsible for evaluating and voting proxies for portfolio holdings of the Directly Managed Funds. With respect to the Asset Allocation Funds, the Trustees also considered, among other things, PLFA’s experience, resources and expertise in analyzing the composition of the various Funds that serve as investment options for the Asset Allocation Funds (collectively, the “Underlying Funds”) and in developing an asset allocation that is appropriate for each Asset Allocation Fund’s investment objectives and risk profile. The Trustees considered, in this regard, the tools and resources used by PLFA in constructing its asset allocation models. The Trustees considered that PLFA had recently engaged an independent consultant to review PLFA’s asset allocation process, and that the independent consultant commented favorably on PLFA’s asset allocation capabilities. With respect to the PAM Managed Funds, the Trustees also considered the investment oversight and monitoring of PAM discussed below under “Sub-Advised Funds.”
The Trustees also considered that PLFA provides certain additional services to the Funds outside of the scope of the Advisory Agreement at approximate cost and that such services are essential for the administration and operation of the Funds, including administration of the Funds’ compliance program. In this regard, the Trustees considered PLFA’s policies, procedures and systems to ensure compliance with applicable laws and regulations with respect to the Directly Managed Funds, its attention to matters that may involve conflicts of interest between itself and a Fund, and that all rebalancing of PLFA’s asset allocation models are presented to an internal conflicts review committee that considers and evaluates potential conflicts of interest in the allocation among the Underlying Funds. The Trustees reviewed information provided throughout the year on PLFA’s compliance policies and procedures, its compliance history, and received reports from the Trust’s Chief Compliance Officer (“CCO”) on compliance by PLFA with applicable laws and regulations. The Trustees also reviewed information on any responses by PLFA to regulatory and compliance developments throughout the year. The Trustees further noted the compliance monitoring conducted by PLFA and PAM on an ongoing basis and noted the development of additional procedures and systems necessary to maintain compliance with applicable laws and regulations as well as the resources that PLFA dedicates to these programs. The Trustees considered that the CCO has in place a systematic process for periodically reviewing PLFA’s written compliance policies and procedures, including the assessment of PLFA’s compliance program as required under Rule 38a-1 of the 1940 Act and PLFA’s code of ethics. The Trustees also considered that PLFA continues to cooperate with the CCO in reviewing its compliance operations.
Sub-Advised Funds – The Trustees considered PLFA’s responsibilities in rendering services to the Sub-Advised Funds and the fact that PLFA monitors and evaluates the performance of the Sub-Advisers in comparison to each Fund’s investment objective as well as to appropriate benchmark indices and peer funds. The Trustees also considered that PLFA monitors each Sub-Advised Fund’s adherence to its investment objectives and policies. The Trustees noted that PLFA provides the Board with periodic and special reports related to each Sub-Advised Fund’s performance and PLFA’s investment monitoring and evaluation. The Trustees also considered PLFA’s process in continuously analyzing and, from time to time as necessary and appropriate, recommending for consideration by the Board, the termination of a Sub-Advisory Agreement with a Sub-Adviser and the replacement of a Sub-Adviser.
For both Directly Managed Funds and Sub-Advised Funds, the Trustees considered the high quality of the products, information, analysis and services provided by PLFA to the Funds, including return analysis, attribution analysis, risk analysis, preparation of periodic performance and other reports, assessment of liquidity, analysis of derivatives, and coordination and oversight of other service providers to the Trust. The Trustees also noted that PLFA regularly informs the Trustees about matters relevant to the Trust and its shareholders, including relationships with financial intermediaries.
The Trustees considered the analyses conducted by PLFA of the Underlying Funds and a Sub-Adviser’s management of an Underlying Fund in the broader context of asset allocation strategies intended to target certain return and risk characteristics. The Trustees noted that PLFA has historically recommended new Underlying Funds that PLFA believed would contribute to the Asset Allocation Funds’ targeted return and risk objectives. The Trustees also took into account PLFA’s continuing analysis of the Underlying Funds and each Sub-Adviser’s investment performance for the impact on broader asset allocation strategies for the Asset Allocation Funds.
F-8
Table of Contents
PACIFIC FUNDS
APPROVAL OF INVESTMENT ADVISORY
AND SUB-ADVISORY AGREEMENTS (Continued)
(Unaudited)
The Trustees considered the depth and quality of PLFA’s monitoring and oversight of the Sub-Advisers and PAM. The Board noted that PLFA monitors numerous investment, performance, and risk metrics for the Funds. The Trustees considered PLFA’s continued investment in, and development of, its research and analytical capabilities, including investments in personnel and enhanced analytical tools for assessing Fund performance and the performance of the Sub-Advisers, including analytical tools relating to return analysis, risk analysis, and Fund performance attribution and reporting on such matters to the Trustees. The Trustees noted that PLFA uses these tools to analyze a Fund’s performance and risk profile and identify Funds that are underperforming as well as those that are performing well, and to analyze the Funds’ performance records against various measures. The Board considered that PLFA also conducts various analyses to assess the sources of and reasons for performance. The Trustees noted that PLFA has developed, and continues to enhance, processes to oversee and monitor the performance of Sub-Advisers, including the use of analytical methods to review Fund performance and execution of investment strategies. The Board noted that PLFA provides the Board with analyses of this data over rolling periods to assist the Board in identifying trends in Fund performance and other areas, and periodically provides the Trustees with information on economic and market trends to provide a context for assessing recent performance. The Trustees also noted that PLFA has developed effective methods for monitoring the Sub-Advisers’ investment style consistency, for analyzing the use of derivatives by Sub-Advisers and for tracking Fund liquidity. With respect to the PAM Managed Funds, the Board considered that PLFA provides oversight, diligence and reporting with regard to its PAM unit that is similar to the process it employs with regard to the Sub-Advisers. In making their assessments, the Trustees considered that PLFA has historically exercised diligence in monitoring the performance of the Sub-Advisers and PAM, and has recommended and taken measures to attempt to remedy relative underperformance by a Fund when PLFA and the Trustees believed it to be appropriate. The Trustees also considered the significant work performed by PLFA in conducting searches for new Sub-Advisers to replace existing Sub-Advisers where appropriate or to manage new Funds in the Trust.
The Board also noted that PLFA conducts regular due diligence on Sub-Advisers involving onsite visits, in-person meetings and telephonic meetings to gather information that PLFA uses to gain an in-depth understanding of a Sub-Adviser’s investment process and to seek to identify issues that may be relevant to a Sub-Adviser’s services to a Fund or a Fund’s performance, including, but not limited to, a Sub-Adviser’s investment process, investment capabilities, resources and personnel, the financial strength of a Sub-Adviser, significant staffing changes that could affect a Fund, material changes in a Sub-Adviser’s assets under management, compliance and regulatory concerns, best execution review and portfolio security valuation support.
The Trustees considered the time and attention paid by PLFA to matters involving the valuation of Fund securities for both the PAM Managed Funds and Sub-Advised Funds. The Trustees considered that PLFA has established a Valuation Oversight Committee that is responsible for, among other things, researching and evaluating information concerning securities that are not actively or publicly traded, valuing securities subject to a trading halt or for which a market quotation is not readily available, the valuation of equity securities traded in foreign markets, oversight of and due diligence on pricing vendors and the development of alternate valuation methodologies.
The Trustees considered PLFA’s oversight, review and analysis of trade execution reports and trends in trade execution for both the PAM Managed Funds and Sub-Advised Funds. The Trustees noted that PLFA works with a third-party transaction cost analysis consultant that provides statistical analysis on portfolio trading, and that PLFA presents information about the Funds’ portfolio trading costs to the Board annually and, where warranted, engages in a dialogue with personnel of a Sub-Adviser on trading costs and the quality of execution. The Board also noted that PLFA conducts regular review and analysis of each Sub-Adviser’s use of soft dollars and presents information about the Sub-Advisers’ use of soft dollars to the Board annually.
The Trustees also considered PLFA’s implementation of transition management programs when handling significant changes in the Funds, such as cash movements between the Funds arising from reallocations by funds of funds and the transition of Fund assets from one Sub-Adviser to another, including steps taken by PLFA to reduce transaction costs associated with a Fund transition. The Trustees considered that PLFA coordinates the onboarding process for new Sub-Advisers and oversees the establishment of necessary accounts and documentation for the Sub-Advisers to begin managing Fund assets.
In addition to the services described above, the Trustees also considered the compliance monitoring that PLFA and its affiliates conduct on the Sub-Advisers and the commitment of PLFA and its affiliates to those programs and PLFA’s efforts to keep the Trustees informed about the compliance programs of Sub-Advisers. In this regard, the Trustees reviewed information and reports from the Trust’s CCO on compliance by the Sub-Advisers with applicable laws and regulations. The Trustees considered that the CCO has in place a systematic process for periodically reviewing each Sub-Adviser’s written compliance policies and procedures, including the assessment of each Sub-Adviser’s compliance program as required under Rule 38a-1 of the 1940 Act and each Sub-Adviser’s code of ethics. The Trustees considered that PLFA is compensated at approximate cost for the administration of the Funds’ compliance program. The Trustees also considered that each Sub-Adviser continues to cooperate with the CCO in reviewing its compliance operations.
Sub-Advisers. The Trustees considered the benefits to shareholders of retaining each Sub-Adviser and continuing the Sub-Advisory Agreements, particularly in light of the nature, extent, and quality of the services that have been provided by the Sub-Advisers. The Trustees considered the services provided by each Sub-Adviser in rendering investment management services to a Sub-Advised Fund. The Trustees considered that each Sub-Adviser is responsible for identifying investments for a Sub-Advised Fund and determining when and what securities, cash and/or other investments to purchase, retain, or sell for a Sub-Advised Fund. The Trustees also considered that each Sub-Adviser is responsible for evaluating and voting proxies for portfolio holdings of a Sub-Advised Fund. The Trustees considered the quality of the portfolio management services which have benefited and should continue to benefit the Sub-Advised Funds and their shareholders, the organizational depth and resources of the Sub-Advisers, including the background and experience of each Sub-Adviser’s management personnel, and the expertise of each Sub-Adviser’s portfolio management team, as well as the investment methodology used by the Sub-Adviser. The Trustees also considered that the Sub-Advisers provide PLFA with information that assists PLFA in performing its oversight role.
F-9
Table of Contents
PACIFIC FUNDS
APPROVAL OF INVESTMENT ADVISORY
AND SUB-ADVISORY AGREEMENTS (Continued)
(Unaudited)
The Board concluded that it was satisfied with the nature, extent and quality of the investment management services provided by PLFA and the Sub-Advisers.
B. Investment Results
The Trustees considered the investment results of each Fund in light of its objective, strategies and market conditions. The Trustees compared each Fund’s total returns with the total returns of appropriate peer funds, which were selected by an Independent Consultant using data from Morningstar (each a “Selected Performance Peer Group”), and the Trustees reviewed a description of the Independent Consultant’s methodology for selecting the peer funds in each Selected Performance Peer Group. In addition, with respect to Funds other than the Portfolio Optimization Funds, the Trustees compared each Fund’s total returns with the total returns of the Fund’s broad-based market index, sector index, composite index or an alternative index selected by the Independent Consultant, as applicable (each, a “primary benchmark”). With respect to the Portfolio Optimization Funds, the Trustees compared each Fund’s total returns with the total returns of a custom benchmark that is comprised of certain broad-based market indices based on the broad asset class target allocations for the Fund.
The information provided to the Trustees included each Fund’s performance record for the one-, three-, five- and ten-year or since inception periods ended September 30, 2017, as available, compared to the applicable benchmark and Selected Performance Peer Group. The Trustees placed greater emphasis on a Fund’s performance against peers as opposed to an unmanaged index.
The Trustees considered the performance of each Fund on a case-by-case basis and noted that some Funds had outperformed their Selected Performance Peer Group over certain periods and/or exceeded the return of their respective benchmark while others underperformed their Selected Performance Peer Group over certain periods and/or trailed the return of their respective benchmark. In considering each Fund’s investment results, the Board placed greater emphasis on each Fund’s long-term performance track record rather than shorter-term performance. The Board also took into account that each Fund’s track record is measured as of a specific date, and that track records can vary as of different measurement dates. Therefore, in reviewing a Fund that is currently underperforming, the Trustees also considered the broader perspective of the Fund’s performance over varying time periods, the market conditions experienced during the periods under review, as well as the outlook for the Fund going forward in light of expected future market conditions. In the case of the Underlying Funds, the Board also considered the views of PLFA about the role of a particular Fund within a broader asset allocation strategy for the Asset Allocation Funds. Where there had been a change in Sub-Adviser for a Fund, the Board took into account that the current Sub-Adviser was only responsible for certain portions of the performance record. The Trustees discussed with PLFA the fact that certain periods of underperformance may be transitory while other periods of underperformance may be reflective of broader issues that may warrant consideration of corrective action. The Trustees discussed these Funds with representatives of PLFA, including an assessment of the approach used by the Sub-Advisers, and the approach used by PLFA and PAM with respect to the Directly Managed Funds, as well as the oversight and monitoring by PLFA as the investment adviser, to gain an understanding of underperformance and to assess whether any actions would be appropriate. In addition, the Board considered any specific actions that PLFA, PAM or a Sub-Adviser have taken, or agreed to take, to enhance the investment performance of a Fund, and the results of those actions. In reviewing the performance of each Fund, the Board took into account, among other things, each Fund’s performance track record. A summary of each Fund’s track record is provided below.
Pacific Funds Large-Cap
The Fund: (1) outperformed its Selected Performance Peer Group median for the one-year period; (2) underperformed its primary benchmark for the one-year period; and (3) is ranked in the third quintile of its Selected Performance Peer Group for the one-year period. In evaluating the performance of the Fund, the Board also considered that the Fund had not been in operation for a sufficient time period to establish a meaningful track record.
PF Comstock Fund
The Fund: (1) outperformed its Selected Performance Peer Group median for the one-, five- and ten-year periods and underperformed for the three-year period; (2) outperformed its primary benchmark for the one-year period, underperformed for the three- and five-year periods and slightly underperformed for the ten-year period; and (3) is ranked in the first quintile of its Selected Performance Peer Group for the one-year period, the fourth quintile for the three-year period, the second quintile for the five-year period and the third quintile for the ten-year period. In evaluating the performance of the Fund, the Board also considered PLFA’s views as to the reasons for the Fund’s relative performance against peers and its benchmark over various time periods and PLFA’s future outlook for the Fund.
PF Equity Long/Short Fund
The Fund: (1) outperformed its Selected Performance Peer Group median for the one-year period; (2) outperformed its primary benchmark for the one-year period; and (3) is ranked in the first quintile of its Selected Performance Peer Group for the one-year period. In evaluating the performance of the Fund, the Board also considered that the Fund had not been in operation for a sufficient time period to establish a meaningful track record.
PF Growth Fund
The Fund: (1) outperformed its Selected Performance Peer Group median for the one-, three- and five-year periods and underperformed for the ten-year period; (2) underperformed its primary benchmark for the one-, three-, five- and ten-year periods; and (3) is ranked in the second quintile of its Selected Performance Peer Group for the one- and five-year periods, the first quintile for the three-year period and the fourth quintile for the ten-year period. In evaluating the performance of the Fund, the Board also considered that the current Sub-Adviser has managed the Fund since 2013.
F-10
Table of Contents
PACIFIC FUNDS
APPROVAL OF INVESTMENT ADVISORY
AND SUB-ADVISORY AGREEMENTS (Continued)
(Unaudited)
PF Large-Cap Growth Fund
The Fund: (1) outperformed its Selected Performance Peer Group median for the one-, three- and five-year periods and underperformed for the ten-year period; (2) underperformed its primary benchmark for the one-, three-, five- and ten-year periods; and (3) is ranked in the second quintile of its Selected Performance Peer Group for the one- and three-year periods, the third quintile for the five-year period and the fourth quintile for the ten-year period. In evaluating the performance of the Fund, the Board also considered that the current Sub-Adviser has managed the Fund since 2013.
PF Large-Cap Value Fund
The Fund: (1) outperformed its Selected Performance Peer Group median for the one- and ten-year periods, underperformed for the three-year period and slightly underperformed for the five-year period; (2) outperformed its primary benchmark for the one- and ten-year periods and underperformed for the three- and five-year periods; and (3) is ranked in the third quintile of its Selected Performance Peer Group for the one-, three-, five- and ten-year periods.
PF Main Street Core Fund
The Fund: (1) outperformed its Selected Performance Peer Group median for the one-, three-, five- and ten-year periods; (2) outperformed its primary benchmark for the one- and three-year periods and underperformed for the five- and ten-year periods; and (3) is ranked in the second quintile of its Selected Performance Peer Group for the one- and ten-year periods and the first quintile for the three- and five-year periods.
Pacific Funds Large-Cap Value
The Fund: (1) underperformed its Selected Performance Peer Group median for the one-year period; (2) underperformed its primary benchmark for the one-year period; and (3) is ranked in the fourth quintile of its Selected Performance Peer Group for the one-year period. In evaluating the performance of the Fund, the Board also considered that the Fund had not been in operation for a sufficient time period to establish a meaningful track record.
Pacific Funds Small/Mid-Cap
The Fund: (1) outperformed its Selected Performance Peer Group median for the one-year period; (2) outperformed its primary benchmark for the one-year period; and (3) is ranked in the third quintile of its Selected Performance Peer Group for the one-year period. In evaluating the performance of the Fund, the Board also considered that the Fund had not been in operation for a sufficient time period to establish a meaningful track record.
Pacific Funds Small-Cap
The Fund: (1) outperformed its Selected Performance Peer Group median for the one-year period; (2) underperformed its primary benchmark for the one-year period; and (3) is ranked in the second quintile of its Selected Performance Peer Group for the one-year period. In evaluating the performance of the Fund, the Board also considered that the Fund had not been in operation for a sufficient time period to establish a meaningful track record.
Pacific Funds Small-Cap Growth
The Fund: (1) underperformed its Selected Performance Peer Group median for the one-year period; (2) underperformed its primary benchmark for the one-year period; and (3) is ranked in the fifth quintile of its Selected Performance Peer Group for the one-year period. In evaluating the performance of the Fund, the Board also considered that the Fund had not been in operation for a sufficient time period to establish a meaningful track record.
Pacific Funds Small-Cap Value
The Fund: (1) underperformed its Selected Performance Peer Group median for the one-year period; (2) underperformed its primary benchmark for the one-year period; and (3) is ranked in the third quintile of its Selected Performance Peer Group for the one-year period. In evaluating the performance of the Fund, the Board also considered that the Fund had not been in operation for a sufficient time period to establish a meaningful track record.
PF Developing Growth Fund
The Fund: (1) underperformed its Selected Performance Peer Group median for the one-, three-, five- and ten-year periods; (2) underperformed its primary benchmark for the one-, three-, five- and ten-year periods; and (3) is ranked in the fourth quintile of its Selected Performance Peer Group for the one-year period and the fifth quintile for the three-, five- and ten-year periods. In evaluating the performance of the Fund, the Board also considered that the current Sub-Adviser has managed the Fund since 2014. The Board also considered PLFA’s views as to the reasons for the Fund’s relative performance against peers and its benchmark over various time periods and PLFA’s future outlook for the Fund.
PF Mid-Cap Equity Fund
The Fund: (1) outperformed its Selected Performance Peer Group median for the one-, three-, five- and ten-year periods; (2) outperformed its primary benchmark for the one-, three- and five-year periods and underperformed for the ten-year period; and (3) is ranked in the first quintile of its Selected Performance Peer Group for the one-, three- and five-year periods and the third quintile for the ten-year period. In evaluating the performance of the Fund, the Board also considered that the current Sub-Adviser has managed the Fund since 2013. The Board also considered that it had recently approved a new Sub-Advisory Agreement for the Fund effective November 2017 in connection with a change in control of the Sub-Adviser and, therefore, the Sub-Advisory Agreement was not up for renewal at this time.
F-11
Table of Contents
PACIFIC FUNDS
APPROVAL OF INVESTMENT ADVISORY
AND SUB-ADVISORY AGREEMENTS (Continued)
(Unaudited)
PF Mid-Cap Growth Fund
The Fund: (1) outperformed its Selected Performance Peer Group median for the one-year period and underperformed for the three-, five- and ten-year periods; (2) outperformed its primary benchmark for the one-year period and underperformed for the three-, five- and ten-year periods; and (3) is ranked in the second quintile of its Selected Performance Peer Group for the one-year period and the fourth quintile for the three-, five- and ten-year periods. In evaluating the performance of the Fund, the Board also considered that the current Sub-Adviser has managed the Fund since 2013. The Board also considered PLFA’s views as to the reasons for the Fund’s relative performance against peers and its benchmark over various time periods and PLFA’s future outlook for the Fund.
PF Mid-Cap Value Fund
The Fund: (1) underperformed its Selected Performance Peer Group median for the one-year period; (2) outperformed its primary benchmark for the one-year period; and (3) is ranked in the third quintile of its Selected Performance Peer Group for the one-year period. In evaluating the performance of the Fund, the Board also considered that the Fund had not been in operation for a sufficient time period to establish a meaningful track record.
PF Small-Cap Value Fund
The Fund: (1) outperformed its Selected Performance Peer Group median for the one-, three-, five- and ten-year periods; (2) underperformed its primary benchmark for the one-year period and outperformed for the three-, five- and ten-year periods; and (3) is ranked in the third quintile of its Selected Performance Peer Group for the one-year period and the first quintile for the three-, five- and ten-year periods. In evaluating the performance of the Fund, the Board also considered that the current Sub-Adviser has managed the Fund since 2014.
PF Emerging Markets Debt Fund
The Fund: (1) outperformed its Selected Performance Peer Group median for the one- and three-year periods and performed in line for the five-year period; (2) outperformed its primary benchmark for the one-, three- and five-year periods; and (3) is ranked in the first quintile of its Selected Performance Peer Group for the one- and three-year periods and the third quintile for the five-year period.
PF Emerging Markets Fund
The Fund: (1) outperformed its Selected Performance Peer Group median for the one-, five- and ten-year periods and underperformed for the three-year period; (2) underperformed its primary benchmark for the one- and three-year periods and outperformed for the five- and ten-year periods; and (3) is ranked in the third quintile of its Selected Performance Peer Group for the one-year period, the fourth quintile for the three-year period, the second quintile for the five-year period and the first quintile for the ten-year period.
PF International Large-Cap Fund
The Fund: (1) outperformed its Selected Performance Peer Group median for the one- and ten-year periods and underperformed for the three- and five-year periods; (2) outperformed its primary benchmark for the one-, three- and ten-year periods and underperformed for the five-year period; and (3) is ranked in the second quintile of its Selected Performance Peer Group for the one-year period, the fourth quintile for the three-year period, the third quintile for the five-year period and the first quintile for the ten-year period. In evaluating the performance of the Fund, the Board also considered PLFA’s views as to the reasons for the Fund’s relative performance against peers and its benchmark over various time periods and PLFA’s future outlook for the Fund. The Board also considered that more recent performance relative to peers has improved.
PF International Small-Cap Fund
The Fund: (1) performed in line with its Selected Performance Peer Group median for the one-year period; (2) outperformed its primary benchmark for the one-year period; and (3) is ranked in the third quintile of its Selected Performance Peer Group for the one-year period. In evaluating the performance of the Fund, the Board also considered that the Fund had not been in operation for a sufficient time period to establish a meaningful track record.
PF International Value Fund
The Fund: (1) outperformed its Selected Performance Peer Group median for the one- and three-year periods and underperformed for the five- and ten-year periods; (2) outperformed its primary benchmark for the one-year period and underperformed for the three-, five- and ten-year periods; and (3) is ranked in the first quintile of its Selected Performance Peer Group for the one-year period, the third quintile for the three-year period, the fourth quintile for the five-year period and the fifth quintile for the ten-year period. In evaluating the performance of the Fund, the Board also considered that the prior Sub-Adviser had recently been replaced and the current Sub-Adviser has only managed the Fund since May 2017 and, therefore, the Sub-Advisory Agreement was not up for renewal at this time.
Pacific Funds Diversified Alternatives
The Fund: (1) outperformed its Selected Performance Peer Group median for the one- and three-year periods; (2) outperformed its primary benchmark for the one-year period and underperformed for the three-year period; and (3) is ranked in the first quintile of its Selected Performance Peer Group for the one- and three-year periods.
PF Currency Strategies Fund
The Fund: (1) underperformed its Selected Performance Peer Group median for the one-year period and outperformed for the three-year period; (2) underperformed its primary benchmark for the one- and three-year periods; and (3) is ranked in the fourth quintile of its Selected Performance Peer Group for the one-year period and the second quintile for the three-year period. In evaluating the performance of the Fund,
F-12
Table of Contents
PACIFIC FUNDS
APPROVAL OF INVESTMENT ADVISORY
AND SUB-ADVISORY AGREEMENTS (Continued)
(Unaudited)
the Board also considered that one of the Fund’s co-Sub-Advisers was the sole Sub-Adviser from the Fund’s inception until 2014, and that the other co-Sub-Adviser has managed the Fund since 2014. The Board also considered PLFA’s views as to the reasons for the Fund’s relative performance against peers and its benchmark over various time periods and PLFA’s future outlook for the Fund.
PF Global Absolute Return Fund
The Fund: (1) underperformed its Selected Performance Peer Group median for the one-year period and outperformed for the three-year period; (2) underperformed its primary benchmark for the one- and three-year periods; and (3) is ranked in the fourth quintile of its Selected Performance Peer Group for the one-year period and the second quintile for the three-year period. In evaluating the performance of the Fund, the Board also considered that the Selected Performance Peer Group was of limited usefulness due to the diversity of investment approaches of funds in the peer group. The Board also considered PLFA’s views as to the reasons for the Fund’s relative performance against peers and its benchmark over various time periods and PLFA’s future outlook for the Fund.
PF Real Estate Fund
The Fund: (1) underperformed its Selected Performance Peer Group median for the one-, three-, five- and ten-year periods; (2) underperformed its primary benchmark for the one-, three-, five- and ten-year periods; and (3) is ranked in the fifth quintile of its Selected Performance Peer Group for the one- and three-year periods and the fourth quintile for the five- and ten-year periods. In evaluating the performance of the Fund, the Board also considered PLFA’s views as to the reasons for the Fund’s relative performance against peers and its benchmark over various time periods and PLFA’s future outlook for the Fund. The Board also considered that the Fund has been on the “watch list” for a period of time, and that PLFA will be considering what further action, if any, is appropriate.
Pacific Funds Core Income
The Fund: (1) underperformed its Selected Performance Peer Group median for the one-, three- and five-year periods; (2) outperformed its primary benchmark for the one- and five-year periods and slightly outperformed for the three-year period; and (3) is ranked in the fourth quintile of its Selected Performance Peer Group for the one- and five-year periods and the fifth quintile for the three-year period. In evaluating the performance of the Fund, the Board also considered PLFA’s views as to the reasons for the Fund’s relative performance against peers and its benchmark over various time periods and PLFA’s future outlook for the Fund.
Pacific Funds Floating Rate Income
The Fund: (1) outperformed its Selected Performance Peer Group median for the one-, three- and five-year periods; (2) outperformed its primary benchmark for the one-year period and underperformed for the three- and five-year periods; and (3) is ranked in the second quintile of its Selected Performance Peer Group for the one-, three- and five-year periods.
Pacific Funds High Income
The Fund: (1) outperformed its Selected Performance Peer Group median for the one-year period, underperformed for the three-year period and slightly underperformed for the five-year period; (2) outperformed its primary benchmark for the one-year period and underperformed for the three- and five-year periods; and (3) is ranked in the first quintile of its Selected Performance Peer Group for the one-year period and the third quintile for the three- and five-year periods.
Pacific Funds Limited Duration High Income
The Fund: (1) underperformed its Selected Performance Peer Group median for the one- and three-year periods; (2) underperformed its primary benchmark for the one- and three-year periods; and (3) is ranked in the fifth quintile of its Selected Performance Peer Group for the one- and three-year periods. In evaluating the performance of the Fund, the Board also considered PLFA’s views as to the reasons for the Fund’s relative performance against peers and its benchmark over various time periods and PLFA’s future outlook for the Fund. The Board further considered that PLFA had advised it would consider what further action, if any, would be appropriate.
Pacific Funds Short Duration Income
The Fund: (1) outperformed its Selected Performance Peer Group median for the one-, three- and five-year periods; (2) outperformed its primary benchmark for the one-, three- and five-year periods; and (3) is ranked in the first quintile of its Selected Performance Peer Group for the one- and five-year periods and the second quintile for the three-year period.
Pacific Funds Strategic Income
The Fund: (1) outperformed its Selected Performance Peer Group median for the one-, three- and five-year periods; (2) outperformed its primary benchmark for the one-, three- and five-year periods; and (3) is ranked in the third quintile of its Selected Performance Peer Group for the one- and three-year periods and the first quintile for the five-year period.
PF Inflation Managed Fund
The Fund: (1) outperformed its Selected Performance Peer Group median for the one- and ten-year periods and underperformed for the three- and five-year periods; (2) outperformed its primary benchmark for the one-year period, underperformed for the three- and five-year periods and slightly underperformed for the ten-year period; and (3) is ranked in the third quintile of its Selected Performance Peer Group for the one- and five-year periods, the fourth quintile for the three-year period and the first quintile for the ten-year period. In evaluating the performance of the Fund, the Board also considered that the current Sub-Adviser co-managed the Fund with another firm from January 2015 to October 2016 and since October 2016 has been the sole Sub-Adviser.
F-13
Table of Contents
PACIFIC FUNDS
APPROVAL OF INVESTMENT ADVISORY
AND SUB-ADVISORY AGREEMENTS (Continued)
(Unaudited)
PF Managed Bond Fund
The Fund: (1) outperformed its Selected Performance Peer Group median for the one-, three-, five- and ten-year periods; (2) outperformed its primary benchmark for the one-, three-, five- and ten-year periods; and (3) is ranked in the first quintile of its Selected Performance Peer Group for the one-, three-, five- and ten-year periods. In evaluating the performance of the Fund, the Board also considered that one of the Fund’s co-Sub-Advisers was the sole Sub-Adviser from the Fund’s inception until 2014, and that the other co-Sub-Adviser has co-managed the Fund since 2014.
PF Short Duration Bond Fund
The Fund: (1) underperformed its Selected Performance Peer Group median for the one-, three-, five- and ten-year periods; (2) outperformed its primary benchmark for the one-year period, slightly underperformed for the three- and five-year periods and underperformed for the ten-year period; and (3) is ranked in the third quintile of its Selected Performance Peer Group for the one-year period and the fourth quintile for the three-, five- and ten-year periods. In evaluating the performance of the Fund, the Board also considered that the current Sub-Adviser has managed the Fund since 2011. The Board also considered that PLFA had advised that recent underperformance is attributable to the Sub-Adviser managing the Fund more conservatively versus peers, which results in lower credit exposure. The Board further considered that PLFA advised that performance has been in line with expectations given the Fund’s investment style.
Pacific Funds Portfolio Optimization Conservative
The Fund: (1) outperformed its Selected Performance Peer Group median for the one- and ten-year periods and performed in line for the three- and five-year periods; (2) outperformed its custom benchmark for the one-year period and underperformed for the three-, five- and ten-year periods; and (3) is ranked in the first quintile of its Selected Performance Peer Group for the one-year period, the third quintile for the three- and five-year periods and the second quintile for the ten-year period.
Pacific Funds Portfolio Optimization Moderate-Conservative
The Fund: (1) outperformed its Selected Performance Peer Group median for the one- and three-year periods, slightly underperformed for the five-year period and underperformed for the ten-year period; (2) outperformed its custom benchmark for the one-year period and underperformed for the three-, five- and ten-year periods; and (3) is ranked in the second quintile of its Selected Performance Peer Group for the one- and three-year periods and the fourth quintile for the five- and ten-year periods.
Pacific Funds Portfolio Optimization Moderate
The Fund: (1) outperformed its Selected Performance Peer Group median for the one-year period, slightly outperformed for the three-year period and underperformed for the five- and ten-year periods; (2) outperformed its custom benchmark for the one-year period and underperformed for the three-, five- and ten-year periods; and (3) is ranked in the second quintile of its Selected Performance Peer Group for the one-year period, the third quintile for the three-year period and the fourth quintile for the five- and ten-year periods.
Pacific Funds Portfolio Optimization Growth
The Fund: (1) outperformed its Selected Performance Peer Group median for the one- and three-year periods, slightly outperformed for the five-year period and underperformed for the ten-year period; (2) outperformed its custom benchmark for the one-year period and underperformed for the three-, five- and ten-year periods; and (3) is ranked in the first quintile of its Selected Performance Peer Group for the one-year period, the second quintile for the three-year period, the third quintile for the five-year period and the fifth quintile for the ten-year period.
Pacific Funds Portfolio Optimization Aggressive-Growth
The Fund: (1) outperformed its Selected Performance Peer Group for the one-year period and underperformed for the three-, five- and ten-year periods; (2) underperformed its custom benchmark for the one-, three-, five- and ten-year periods; and (3) is ranked in the first quintile of its Selected Performance Peer Group for the one-year period, the fourth quintile for the three-year period and the fifth quintile for the five- and ten-year periods. In evaluating the performance of the Fund, the Board also considered PLFA’s views as to the reasons for the Fund’s relative performance against peers and its benchmark over various time periods and PLFA’s future outlook for the Fund. The Board also considered that PLFA is encouraged by recent improved performance relative to peers.
The Trustees reviewed the monitoring of each Sub-Advisers’ investment results by PLFA, including PLFA’s historical practice of recommending to the Trustees the use of a new sub-adviser if performance lagged and the prospects for improvement within a reasonable timeframe were not promising, and reviewed the monitoring of the PAM unit’s investment results by PLFA. Generally, the Trustees noted that there continues to be a record of well-managed Funds that work well in the Asset Allocation Funds and that the Asset Allocation Funds provide a range of professionally managed asset allocation investment options. The Trustees considered the steps PLFA has taken to seek to improve performance of the Asset Allocation Funds, including ongoing assessment of asset allocation determinations, diversifying asset class investment options by adding additional Underlying Funds, and adding or changing Sub-Advisers to the Underlying Funds. The Trustees also noted that the Funds continue to deliver the investment style as disclosed to shareholders. The Trustees also noted the use by investors of the Asset Allocation Funds and the benefits the Asset Allocation Funds provide for shareholders generally.
The Board concluded that PLFA continues to have a long record of effectively managing a multi-manager fund group and asset allocation funds designed to give shareholders a reasonable array of choices through which to implement their investment programs. The Board further concluded that PLFA was implementing each Fund’s investment objective either directly or through the selection of Sub-Advisers and that PLFA’s record in managing each Fund indicates that its continued management, as well as the continuation of the respective Sub-Advisory Agreements, will benefit each Fund and its shareholders.
F-14
Table of Contents
PACIFIC FUNDS
APPROVAL OF INVESTMENT ADVISORY
AND SUB-ADVISORY AGREEMENTS (Continued)
(Unaudited)
C. Advisory Fees and Total Expense Ratios
The Trustees requested, received and reviewed information from PLFA relating to the advisory fees paid by the Funds and the sub-advisory fees paid by PLFA, including the portion of the advisory fees paid to each Sub-Adviser as compared to the portion retained by PLFA. The Trustees considered the nature and quality of the services provided by PLFA and also considered the nature and quality of services provided by each Sub-Adviser. The Independent Trustees also requested and reviewed information from the Independent Consultant along with the Independent Consultant’s analysis of advisory fees, sub-advisory fees and certain Fund expenses, excluding any applicable service or distribution fees, which were selected by the Independent Consultant for purposes of the peer group expense comparisons (“Operating Expenses”). The Trustees reviewed the advisory fees, sub-advisory fees and Operating Expenses of each Fund and compared such amounts with the fees and expense levels of applicable peer funds identified by the Independent Consultant (each a “Selected Expense Peer Group”). The Trustees reviewed a description of the Independent Consultant’s methodology for constructing the Selected Expense Peer Groups, noting that each Selected Expense Peer Group includes a group of similarly-sized funds with comparable strategies from a universe of funds that (i) included both sub-advised and directly managed funds; (ii) excluded funds that are managed with non-standard business models and expense structures; and (iii) excluded index funds. With respect to the Portfolio Optimization Funds, the Trustees also compared the net expense ratio with the average net expense ratio of funds in the Morningstar Category determined to be similar to the relevant Portfolio Optimization Fund (“Comparable Peer Fund Average”).
A summary of some of the comparative fee and expense information considered by the Trustees for each Fund is provided below.
Pacific Funds Large-Cap
The Trustees considered that (a) the advisory fee for the Fund is less than the median advisory fee rate of the funds in its Selected Expense Peer Group and ranked in the second quintile of its Selected Expense Peer Group; and (b) the Operating Expenses for the Fund are less than the median Operating Expenses of the funds in its Selected Expense Peer Group and ranked in the first quintile of its Selected Expense Peer Group. The Trustees considered that PLFA currently has contractually agreed to waive 0.10% of its advisory fee.
PF Comstock Fund
The Trustees considered that (a) the advisory fee for the Fund is slightly greater than the median advisory fee rate of the funds in its Selected Expense Peer Group and ranked in the third quintile of its Selected Expense Peer Group; and (b) the Operating Expenses for the Fund are less than the median Operating Expenses of the funds in its Selected Expense Peer Group and ranked in the second quintile of its Selected Expense Peer Group. The Trustees considered that PLFA currently has contractually agreed to waive 0.015% of its advisory fee.
PF Equity Long/Short Fund
The Trustees considered that (a) the advisory fee for the Fund is less than the median advisory fee rate of the funds in its Selected Expense Peer Group and ranked in the second quintile of its Selected Expense Peer Group; and (b) the Operating Expenses for the Fund are less than the median Operating Expenses of the funds in its Selected Expense Peer Group and ranked in the first quintile of its Selected Expense Peer Group. The Trustees considered that PLFA currently has contractually agreed to waive 0.15% of its advisory fee.
PF Growth Fund
The Trustees considered that (a) the advisory fee for the Fund is less than the median advisory fee rate of the funds in its Selected Expense Peer Group and ranked in the first quintile of its Selected Expense Peer Group; and (b) the Operating Expenses for the Fund are less than the median Operating Expenses of the funds in its Selected Expense Peer Group and ranked in the first quintile of its Selected Expense Peer Group.
PF Large-Cap Growth Fund
The Trustees considered that (a) the advisory fee for the Fund is slightly greater than the median advisory fee rate of the funds in its Selected Expense Peer Group and ranked in the fourth quintile of its Selected Expense Peer Group; and (b) the Operating Expenses for the Fund are less than the median Operating Expenses of the funds in its Selected Expense Peer Group and ranked in the second quintile of its Selected Expense Peer Group. The Trustees considered that PLFA currently has contractually agreed to waive 0.045% of its advisory fee.
PF Large-Cap Value Fund
The Trustees considered that (a) the advisory fee for the Fund is slightly less than the median advisory fee rate of the funds in its Selected Expense Peer Group and ranked in the second quintile of its Selected Expense Peer Group; and (b) the Operating Expenses for the Fund are less than the median Operating Expenses of the funds in its Selected Expense Peer Group and ranked in the second quintile of its Selected Expense Peer Group.
PF Main Street Core Fund
The Trustees considered that (a) the advisory fee for the Fund is less than the median advisory fee rate of the funds in its Selected Expense Peer Group and ranked in the first quintile of its Selected Expense Peer Group; and (b) the Operating Expenses for the Fund are less than the median Operating Expenses of the funds in its Selected Expense Peer Group and ranked in the first quintile of its Selected Expense Peer Group.
Pacific Funds Large-Cap Value
The Trustees considered that (a) the advisory fee for the Fund is slightly less than the median advisory fee rate of the funds in its Selected Expense Peer Group and ranked in the second quintile of its Selected Expense Peer Group; and (b) the Operating Expenses for the Fund are
F-15
Table of Contents
PACIFIC FUNDS
APPROVAL OF INVESTMENT ADVISORY
AND SUB-ADVISORY AGREEMENTS (Continued)
(Unaudited)
less than the median Operating Expenses of the funds in its Selected Expense Peer Group and ranked in the first quintile of its Selected Expense Peer Group.
Pacific Funds Small/Mid-Cap
The Trustees considered that (a) the advisory fee for the Fund is slightly greater than the median advisory fee rate of the funds in its Selected Expense Peer Group and ranked in the third quintile of its Selected Expense Peer Group; and (b) the Operating Expenses for the Fund are slightly less than the median Operating Expenses of the funds in its Selected Expense Peer Group and ranked in the second quintile of its Selected Expense Peer Group.
Pacific Funds Small-Cap
The Trustees considered that (a) the advisory fee for the Fund is slightly greater than the median advisory fee rate of the funds in its Selected Expense Peer Group and ranked in the third quintile of its Selected Expense Peer Group; and (b) the Operating Expenses for the Fund are slightly less than the median Operating Expenses of the funds in its Selected Expense Peer Group and ranked in the second quintile of its Selected Expense Peer Group.
Pacific Funds Small-Cap Growth
The Trustees considered that (a) the advisory fee for the Fund is slightly greater than the median advisory fee rate of the funds in its Selected Expense Peer Group and ranked in the third quintile of its Selected Expense Peer Group; and (b) the Operating Expenses for the Fund are slightly less than the median Operating Expenses of the funds in its Selected Expense Peer Group and ranked in the second quintile of its Selected Expense Peer Group.
Pacific Funds Small-Cap Value
The Trustees considered that (a) the advisory fee for the Fund is slightly greater than the median advisory fee rate of the funds in its Selected Expense Peer Group and ranked in the third quintile of its Selected Expense Peer Group; and (b) the Operating Expenses for the Fund are slightly less than the median Operating Expenses of the funds in its Selected Expense Peer Group and ranked in the second quintile of its Selected Expense Peer Group.
PF Developing Growth Fund
The Trustees considered that (a) the advisory fee for the Fund is less than the median advisory fee rate of the funds in its Selected Expense Peer Group and ranked in the first quintile of its Selected Expense Peer Group; and (b) the Operating Expenses for the Fund are less than the median Operating Expenses of the funds in its Selected Expense Peer Group and ranked in the first quintile of its Selected Expense Peer Group.
PF Mid-Cap Equity Fund
The Trustees considered that (a) the advisory fee for the Fund is less than the median advisory fee rate of the funds in its Selected Expense Peer Group and ranked in the second quintile of its Selected Expense Peer Group; and (b) the Operating Expenses for the Fund are less than the median Operating Expenses of the funds in its Selected Expense Peer Group and ranked in the first quintile of its Selected Expense Peer Group.
PF Mid-Cap Growth Fund
The Trustees considered that (a) the advisory fee for the Fund is slightly less than the median advisory fee rate of the funds in its Selected Expense Peer Group and ranked in the second quintile of its Selected Expense Peer Group; and (b) the Operating Expenses for the Fund are less than the median Operating Expenses of the funds in its Selected Expense Peer Group and ranked in the first quintile of its Selected Expense Peer Group. The Trustees considered that PLFA currently has contractually agreed to waive 0.025% of its advisory fee.
PF Mid-Cap Value Fund
The Trustees considered that (a) the advisory fee for the Fund is less than the median advisory fee rate of the funds in its Selected Expense Peer Group and ranked in the first quintile of its Selected Expense Peer Group; and (b) the Operating Expenses for the Fund are less than the median Operating Expenses of the funds in its Selected Expense Peer Group and ranked in the first quintile of its Selected Expense Peer Group.
PF Small-Cap Value Fund
The Trustees considered that (a) the advisory fee for the Fund is slightly less than the median advisory fee rate of the funds in its Selected Expense Peer Group and ranked in the second quintile of its Selected Expense Peer Group; and (b) the Operating Expenses for the Fund are less than the median Operating Expenses of the funds in its Selected Expense Peer Group and ranked in the second quintile of its Selected Expense Peer Group.
PF Emerging Markets Debt Fund
The Trustees considered that (a) the advisory fee for the Fund is greater than the median advisory fee rate of the funds in its Selected Expense Peer Group and ranked in the fifth quintile of its Selected Expense Peer Group; and (b) the Operating Expenses for the Fund are slightly less than the median Operating Expenses of the funds in its Selected Expense Peer Group and ranked in the second quintile of its Selected Expense Peer Group. The Trustees noted that, while the Fund’s advisory fee is in the fifth quintile of its Selected Expense Peer Group, the fee is only marginally higher (by 0.066%) than the median advisory fee rate of the funds in this group and that PLFA had advised that it believes it is reasonable to pay a premium for a sub-adviser with local resources and analysts in emerging market countries around the globe.
F-16
Table of Contents
PACIFIC FUNDS
APPROVAL OF INVESTMENT ADVISORY
AND SUB-ADVISORY AGREEMENTS (Continued)
(Unaudited)
PF Emerging Markets Fund
The Trustees considered that (a) the advisory fee for the Fund is less than the median advisory fee rate of the funds in its Selected Expense Peer Group and ranked in the first quintile of its Selected Expense Peer Group; and (b) the Operating Expenses for the Fund are less than the median Operating Expenses of the funds in its Selected Expense Peer Group and ranked in the second quintile of its Selected Expense Peer Group.
PF International Large-Cap Fund
The Trustees considered that (a) the advisory fee for the Fund is in line with the median advisory fee rate of the funds in its Selected Expense Peer Group and ranked in the third quintile of its Selected Expense Peer Group; and (b) the Operating Expenses for the Fund are less than the median Operating Expenses of the funds in its Selected Expense Peer Group and ranked in the first quintile of its Selected Expense Peer Group.
PF International Small-Cap Fund
The Trustees considered that (a) the advisory fee for the Fund is less than the median advisory fee rate of the funds in its Selected Expense Peer Group and ranked in the second quintile of its Selected Expense Peer Group; and (b) the Operating Expenses for the Fund are less than the median Operating Expenses of the funds in its Selected Expense Peer Group and ranked in the first quintile of its Selected Expense Peer Group.
PF International Value Fund
The Trustees considered that (a) the advisory fee for the Fund is less than the median advisory fee rate of the funds in its Selected Expense Peer Group and ranked in the first quintile of its Selected Expense Peer Group; and (b) the Operating Expenses for the Fund are less than the median Operating Expenses of the funds in its Selected Expense Peer Group and ranked in the first quintile of its Selected Expense Peer Group.
Pacific Funds Diversified Alternatives
The Trustees considered that (a) the advisory fee for the Fund is slightly less than the median advisory fee rate of the funds in its Selected Expense Peer Group and ranked in the second quintile of its Selected Expense Peer Group; and (b) the Operating Expenses for the Fund are less than the median Operating Expenses of the funds in its Selected Expense Peer Group and ranked in the second quintile of its Selected Expense Peer Group. The Trustees noted that pursuant to a fee waiver agreement, PLFA has agreed to a breakpoint schedule that will reduce its advisory fee once the Fund attains varying higher asset levels, but that the Fund has not yet reached the first breakpoint.
PF Currency Strategies Fund
The Trustees considered that (a) the advisory fee for the Fund is less than the median advisory fee rate of the funds in its Selected Expense Peer Group and ranked in the first quintile of its Selected Expense Peer Group; and (b) the Operating Expenses for the Fund are less than the median Operating Expenses of the funds in its Selected Expense Peer Group and ranked in the second quintile of its Selected Expense Peer Group.
PF Global Absolute Return Fund
The Trustees considered that (a) the advisory fee for the Fund is in line with the median advisory fee rate of the funds in its Selected Expense Peer Group and ranked in the third quintile of its Selected Expense Peer Group; and (b) the Operating Expenses for the Fund are greater than the median Operating Expenses of the funds in its Selected Expense Peer Group and ranked in the third quintile of its Selected Expense Peer Group.
PF Real Estate Fund
The Trustees considered that (a) the advisory fee for the Fund is greater than the median advisory fee rate of the funds in its Selected Expense Peer Group and ranked in the third quintile of its Selected Expense Peer Group; and (b) the Operating Expenses for the Fund are less than the median Operating Expenses of the funds in its Selected Expense Peer Group and ranked in the second quintile of its Selected Expense Peer Group.
Pacific Funds Core Income
The Trustees considered that (a) the advisory fee for the Fund is slightly greater than the median advisory fee rate of the funds in its Selected Expense Peer Group and ranked in the third quintile of its Selected Expense Peer Group; and (b) the Operating Expenses for the Fund are less than the median Operating Expenses of the funds in its Selected Expense Peer Group and ranked in the second quintile of its Selected Expense Peer Group. The Trustees noted that pursuant to a fee waiver agreement, PLFA has agreed to a breakpoint schedule that will reduce its advisory fee once the Fund attains varying higher asset levels, but that the Fund has not yet reached the first breakpoint.
Pacific Funds Floating Rate Income
The Trustees considered that (a) the advisory fee for the Fund is slightly greater than the median advisory fee rate of the funds in its Selected Expense Peer Group and ranked in the fifth quintile of its Selected Expense Peer Group; and (b) the Operating Expenses for the Fund are less than the median Operating Expenses of the funds in its Selected Expense Peer Group and ranked in the first quintile of its Selected Expense Peer Group. The Trustees noted that, while the Fund’s advisory fee is in the fifth quintile of its Selected Expense Peer Group, the fee is only marginally higher (by 0.008%) than the median advisory fee rate of the funds in this group. The Trustees further noted that pursuant to a fee waiver agreement, PLFA has agreed to a breakpoint schedule that reduces its advisory fee by 0.025% on net assets above $1 billion, and that the advisory fee will be further reduced pursuant to this fee waiver agreement once the Fund attains varying higher asset levels.
F-17
Table of Contents
PACIFIC FUNDS
APPROVAL OF INVESTMENT ADVISORY
AND SUB-ADVISORY AGREEMENTS (Continued)
(Unaudited)
Pacific Funds High Income
The Trustees considered that (a) the advisory fee for the Fund is slightly less than the median advisory fee rate of the funds in its Selected Expense Peer Group and ranked in the third quintile of its Selected Expense Peer Group; and (b) the Operating Expenses for the Fund are less than the median Operating Expenses of the funds in its Selected Expense Peer Group and ranked in the second quintile of its Selected Expense Peer Group. The Trustees noted that pursuant to a fee waiver agreement, PLFA has agreed to a breakpoint schedule that will reduce its advisory fee once the Fund attains varying higher asset levels, but that the Fund has not yet reached the first breakpoint.
Pacific Funds Limited Duration High Income
The Trustees considered that (a) the advisory fee for the Fund is in line with the median advisory fee rate of the funds in its Selected Expense Peer Group and ranked in the third quintile of its Selected Expense Peer Group; and (b) the Operating Expenses for the Fund are less than the median Operating Expenses of the funds in its Selected Expense Peer Group and ranked in the second quintile of its Selected Expense Peer Group. The Trustees noted that PLFA currently has contractually agreed to waive 0.02% of its advisory fee. The Trustees noted that pursuant to a fee waiver agreement, PLFA has agreed to a breakpoint schedule that will reduce its advisory fee once the Fund attains varying higher asset levels, but that the Fund has not yet reached the first breakpoint.
Pacific Funds Short Duration Income
The Trustees considered that (a) the advisory fee for the Fund is in line with the median advisory fee rate of the funds in its Selected Expense Peer Group and ranked in the third quintile of its Selected Expense Peer Group; and (b) the Operating Expenses for the Fund are slightly less than the median Operating Expenses of the funds in its Selected Expense Peer Group and ranked in the second quintile of its Selected Expense Peer Group. The Trustees noted that pursuant to a fee waiver agreement, PLFA has agreed to a breakpoint schedule that will reduce its advisory fee once the Fund attains varying higher asset levels, but that the Fund has not yet reached the first breakpoint.
Pacific Funds Strategic Income
The Trustees considered that (a) the advisory fee for the Fund is greater than the median advisory fee rate of the funds in its Selected Expense Peer Group and ranked in the fifth quintile of its Selected Expense Peer Group; and (b) the Operating Expenses for the Fund are slightly less than the median Operating Expenses of the funds in its Selected Expense Peer Group and ranked in the third quintile of its Selected Expense Peer Group. The Trustees noted that the Selected Expense Peer Group includes several intermediate-term bond funds, which are generally priced lower than multi-sector bond funds, such as the Fund. The Trustees further noted that pursuant to a fee waiver agreement, PLFA has agreed to a breakpoint schedule that will reduce its advisory fee once the Fund attains varying higher asset levels, but that the Fund has not yet reached the first breakpoint.
PF Inflation Managed Fund
The Trustees considered that (a) the advisory fee for the Fund is in line with the median advisory fee rate of the funds in its Selected Expense Peer Group and ranked in the second quintile of its Selected Expense Peer Group; and (b) the Operating Expenses for the Fund are slightly greater than the median Operating Expenses of the funds in its Selected Expense Peer Group and ranked in the fourth quintile of its Selected Expense Peer Group.
PF Managed Bond Fund
The Trustees considered that (a) the advisory fee for the Fund is slightly less than the median advisory fee rate of the funds in its Selected Expense Peer Group and ranked in the second quintile of its Selected Expense Peer Group; and (b) the Operating Expenses for the Fund are less than the median Operating Expenses of the funds in its Selected Expense Peer Group and ranked in the second quintile of its Selected Expense Peer Group.
PF Short Duration Bond Fund
The Trustees considered that (a) the advisory fee for the Fund is in line with the median advisory fee rate of the funds in its Selected Expense Peer Group and ranked in the third quintile of its Selected Expense Peer Group; and (b) the Operating Expenses for the Fund are greater than the median Operating Expenses of the funds in its Selected Expense Peer Group and ranked in the fourth quintile of its Selected Expense Peer Group.
Pacific Funds Portfolio Optimization Conservative
The Trustees considered that (a) the advisory fee for the Fund is greater than the median advisory fee rate of the funds in its Selected Expense Peer Group and ranked in the fourth quintile of its Selected Expense Peer Group; (b) the Operating Expenses for the Fund are greater than the median Operating Expenses of the funds in its Selected Expense Peer Group and ranked in the fourth quintile of its Selected Expense Peer Group; and (c) the net expense ratio was greater than the Comparable Peer Fund Average. The Trustees noted that pursuant to a fee waiver agreement, PLFA has agreed to a breakpoint schedule that will reduce its advisory fee once the Fund attains varying higher asset levels, but that the Fund has not yet reached the first breakpoint.
Pacific Funds Portfolio Optimization Moderate-Conservative
The Trustees considered that (a) the advisory fee for the Fund is greater than the median advisory fee rate of the funds in its Selected Expense Peer Group and ranked in the fourth quintile of its Selected Expense Peer Group; (b) the Operating Expenses for the Fund are greater than the median Operating Expenses of the funds in its Selected Expense Peer Group and ranked in the fourth quintile of its Selected Expense Peer Group; and (c) the net expense ratio was less than the Comparable Peer Fund Average. The Trustees noted that pursuant to a fee waiver agreement, PLFA has agreed to a breakpoint schedule that will reduce its advisory fee once the Fund attains varying higher asset levels, but that the Fund has not yet reached the first breakpoint.
F-18
Table of Contents
PACIFIC FUNDS
APPROVAL OF INVESTMENT ADVISORY
AND SUB-ADVISORY AGREEMENTS (Continued)
(Unaudited)
Pacific Funds Portfolio Optimization Moderate
The Trustees considered that (a) the advisory fee for the Fund is greater than the median advisory fee rate of the funds in its Selected Expense Peer Group and ranked in the fourth quintile of its Selected Expense Peer Group; (b) the Operating Expenses for the Fund are greater than the median Operating Expenses of the funds in its Selected Expense Peer Group and ranked in the fourth quintile of its Selected Expense Peer Group; and (c) the net expense ratio was less than the Comparable Peer Fund Average. The Trustees noted that pursuant to a fee waiver agreement, PLFA has agreed to a breakpoint schedule that will reduce its advisory fee once the Fund attains varying higher asset levels, but that the Fund has not yet reached the first breakpoint.
Pacific Funds Portfolio Optimization Growth
The Trustees considered that (a) the advisory fee for the Fund is greater than the median advisory fee rate of the funds in its Selected Expense Peer Group and ranked in the fourth quintile of its Selected Expense Peer Group; (b) the Operating Expenses for the Fund are greater than the median Operating Expenses of the funds in its Selected Expense Peer Group and ranked in the fourth quintile of its Selected Expense Peer Group; and (c) the net expense ratio was in line with the Comparable Peer Fund Average. The Trustees noted that pursuant to a fee waiver agreement, PLFA has agreed to a breakpoint schedule that will reduce its advisory fee once the Fund attains varying higher asset levels, but that the Fund has not yet reached the first breakpoint.
Pacific Funds Portfolio Optimization Aggressive-Growth
The Trustees considered that (a) the advisory fee for the Fund is greater than the median advisory fee rate of the funds in its Selected Expense Peer Group and ranked in the fourth quintile of its Selected Expense Peer Group; (b) the Operating Expenses for the Fund are greater than the median Operating Expenses of the funds in its Selected Expense Peer Group and ranked in the fourth quintile of its Selected Expense Peer Group; and (c) the net expense ratio was less than the Comparable Peer Fund Average. The Trustees noted that pursuant to a fee waiver agreement, PLFA has agreed to a breakpoint schedule that will reduce its advisory fee once the Fund attains varying higher asset levels, but that the Fund has not yet reached the first breakpoint.
During their review, the Trustees considered that all of the Funds, except for the Equity Long/Short Fund, were subject to contractual expense limitations on certain operating expenses agreed to by PLFA.
The Trustees also considered information from the Sub-Advisers regarding the comparative sub-advisory fees charged under other investment advisory contracts for similarly managed accounts, such as contracts of each Sub-Adviser with other similarly managed registered investment companies or other types of clients. The Trustees noted that in many cases there were differences in the level of services provided to the Funds by the Sub-Advisers and that the level of services provided by these Sub-Advisers on these other accounts differed due to the nature of the accounts or because there were other reasons to support the difference in fees, such as an affiliation between the Sub-Adviser and the account. These differences often explained variations in fee schedules. The Trustees were mindful that, with regard to the Sub-Advised Funds, the fee rates were the result of arms’-length negotiations between PLFA and the Sub-Advisers, and that any sub-advisory fees are paid by PLFA and are not paid directly by a Fund.
The Board concluded that the advisory fees, sub-advisory fees and total expenses of each Fund were fair and reasonable.
D. Costs, Level of Profits and Economies of Scale
The Trustees reviewed information provided by PLFA regarding PLFA’s costs of sponsoring and operating the Funds and information regarding the profitability of PLFA from each Fund. For purposes of analyzing PLFA’s costs and profitability with respect to the Funds, the Trustees assigned credibility to PLFA’s view that little weight should be given to the fees of Pacific Select Fund, another open-end investment company advised by PLFA that consists of multiple funds, on the basis that there are significant differences between Pacific Funds and Pacific Select Fund, including differences in fund size and platforms on which the funds are offered. For the Sub-Advised Funds, the Trustees also reviewed information provided by the Sub-Advisers regarding their costs in managing the Sub-Advised Funds and their profitability from the Funds.
PLFA and the Sub-Advisers’ Costs and Profitability. The Trustees noted that, based on the data available, PLFA appears to be providing and operating products that are competitively priced with other funds, especially other multi-manager and asset allocation funds. The Trustees noted PLFA’s willingness to build its investment capabilities and to sponsor new funds that PLFA believed would benefit the Asset Allocation Funds, despite the potential subsidies required by PLFA during a new fund’s start-up phase. The Trustees also noted that the analysis of the Trust’s profitability to PLFA supported a conclusion that PLFA’s costs and profitability are reasonable, whether considered inclusive or exclusive of distribution costs.
The Trustees also reviewed information provided regarding the structure and manner in which PLFA’s investment professionals were compensated and their respective views of the relationship of such compensation to the attraction and retention of quality personnel. The Trustees considered PLFA’s willingness to invest in technology, infrastructure and staff to reinforce and offer new services and to accommodate changing regulatory requirements. The Trustees also considered the organizational strengths of the Sub-Advisers and their ability to attract and retain investment personnel over time and to sustain the staffing of investment teams that provide services to the Sub-Advised Funds.
With respect to the Sub-Advisers, the Trustees noted that it was difficult in many cases to accurately determine or evaluate the Sub-Advisers’ costs and the profitability of the Sub-Advisory Agreements to the Sub-Advisers because of, among other things, the differences in the types and content of information provided by the Sub-Advisers, the fact that many Sub-Advisers manage substantial assets other than the Funds and, further, that any such assessment would involve assumptions regarding the Sub-Advisers’ expense allocation policies, capital structure, cost of capital, business mix and other factors.
F-19
Table of Contents
PACIFIC FUNDS
APPROVAL OF INVESTMENT ADVISORY
AND SUB-ADVISORY AGREEMENTS (Continued)
(Unaudited)
Accordingly, in the case of the Sub-Advisers, the Trustees considered the data described above in light of the arms’-length nature of the relationship (for the Sub-Advised Funds) between PLFA and such Sub-Advisers with respect to the negotiation of fund sub-advisory fees and the fact that such fees are paid by PLFA.
Economies of Scale. The Trustees noted and considered the extent to which economies of scale are realized by PLFA and the Sub-Advisers as each Fund grows, and whether advisory fee levels reflect economies of scale if the Funds grow in size. The Trustees noted PLFA’s commitment to competitive total expenses of certain Funds through expense limitation agreements and, for certain Asset Allocation and PAM Managed Funds, through advisory fee waivers. The Trustees also noted PLFA’s and its affiliates’ consistent reinvestment in the business in the form of adding to investment capabilities and resources, improvements in technology, product innovations and customer service. The Trustees considered information relating to economies of scale provided by PLFA, PLFA’s willingness to discuss and evaluate the topic of economies of scale with the Trustees, and PLFA’s agreement to enter into advisory fee waivers for certain PAM Managed Funds and Asset Allocation Funds that create effective breakpoints at asset levels at which PLFA believes it will have attained a level of profit that can be shared with these Funds.
With respect to the Sub-Advised Funds, the Trustees considered that the advisory fee for each Fund was originally set at an amount that was intended to be lower than peers to attract assets at the Fund’s inception. The Trustees noted that because fees for the Funds started relatively low from the first dollar under management in relation to peers, economies of scale will be realized at higher asset levels than would otherwise be the case. The Trustees also considered that some Sub-Advisers have agreed to breakpoints in their sub-advisory fee schedules. The Trustees noted that in setting its advisory fees relatively low at inception as compared to peers, and in subsidizing the expenses of the Funds from their inception and for many years, PLFA’s economics from the Sub-Advised Funds should be considered separate and apart from the economics of the Sub-Advisers. The Trustees noted PLFA’s view that the sub-advisory fee breakpoints were important for PLFA’s economics to overcome its expenses from the Funds. The Trustees also noted that shareholders will benefit from effective breakpoints for the Asset Allocation Funds.
The Trustees also considered PLFA’s willingness to reduce its own fees through certain advisory fee waivers and expense limitation agreements, whereby PLFA will reimburse the Funds for certain expenses that exceed stated expense caps. The Trustees considered that the advisory fee waivers effectively implement breakpoints in PLFA’s advisory fees at higher asset levels of these Funds, which are intended to share economies of scale that PLFA has attained.
The Trustees noted that PLFA and its affiliates had consistently reinvested in the business in the form of improvements in technology, product innovations, personnel and resources. The Trustees additionally noted that economies of scale were difficult to measure with precision, particularly on a Fund by Fund basis. This analysis is complicated by the additional services and content provided by PLFA and its affiliates through reinvestment in the business, as discussed above. The Trustees considered that the Funds are well managed, and provide shareholders with sophisticated asset allocation investment options at reasonable fee levels. The Board noted that PLFA had taken steps to ensure that shareholders benefit by negotiating favorable terms with service providers, and to provide certain support services, including, but not limited to, legal, compliance and accounting services, to the Funds on an approximate cost basis as opposed to an asset-based charge.
The Board determined that PLFA and its affiliates are sharing economies of scale given its agreement to reduce its own fees through fee waivers as assets grow for certain Funds, its commitment to competitive total expenses of the Funds, and the consistent reinvestment in the business in the form of improvements in technology and other resources and investments in personnel. The Board considered that PLFA has not yet attained levels of profitability that warrant sharing of economies of scale for some Funds, including the Sub-Advised Funds, but noted that shareholders will benefit in the future from the effective breakpoints for the Asset Allocation Funds. The Board further considered that it will continue to review whether there are additional economies of scale that will be realized as the Funds grow that can be shared with shareholders. The Board concluded that the Funds’ cost structures were reasonable and that overall profitability appeared reasonable at the current time. The Board further concluded that PLFA was sharing economies of scale with each Fund and its shareholders to their benefit.
E. Ancillary Benefits
The Trustees requested and received from PLFA and the Sub-Advisers information concerning other benefits received by PLFA, Pacific Life, the Sub-Advisers, and their affiliates as a result of their respective relationship with the Funds, including various service arrangements with PLFA affiliates and reimbursement at an approximate cost basis for support services in the case of PLFA, as well as commissions paid to broker-dealers affiliated with certain Sub-Advisers and the use of soft-dollars by certain of the Sub-Advisers. The Trustees also considered ancillary benefits received by Pacific Life and its affiliates from the Funds. The Trustees considered information concerning other significant economic relations between the Sub-Advisers and their affiliates and with PLFA and its affiliates and noted PLFA’s processes and procedures to identify and disclose such relationships to the Board. The Trustees also considered PLFA’s and each Sub-Adviser’s strong practices and procedures with regard to managing conflicts of interest and ensuring that such conflicts do not prevent PLFA or the Sub-Advisers from acting in the best interests of the Funds and their shareholders.
The Board concluded that such benefits were consistent with those generally derived by investment advisers to mutual funds or were otherwise not unusual.
F. Conclusion
Based on their review, including their consideration of each of the factors referred to above, and assisted by the advice of the Independent Consultant and independent counsel to the Independent Trustees, the Board, including the Independent Trustees, concluded that the Advisory Agreement and each applicable Sub-Advisory Agreement are fair and reasonable with respect to each Fund and its shareholders, and that the renewal of the Advisory Agreement and each applicable Sub-Advisory Agreement would be in the best interests of the Funds and their shareholders. The Board did not indicate that any single factor was determinative of its decision to approve the Advisory Agreement and each applicable Sub-Advisory Agreement, but indicated that the Board based its determination on the total mix of information available to it.
F-20
Table of Contents
PACIFIC FUNDS
WHERE TO GO FOR MORE INFORMATION
(Unaudited)
Availability of Quarterly Holdings
The Trust files Form N-Q (complete schedules of fund holdings) with the Securities and Exchange Commission (the “SEC”) for the first and third quarters of each fiscal year not later than 60 days after the close of the applicable quarter end. The Trust’s Form N-Q, (when required) is filed pursuant to applicable regulations and is available after filing (i) on the SEC’s website at http://www.sec.gov; (ii) for review and copying at the SEC’s Public Reference Room in Washington, D.C. (information on the operation of the Public Reference Room may be obtained by calling the SEC at 1-800-SEC-0330); and (iii) on the Trust’s website at https://www.pacificlife.com/pacificfunds.html. The SEC may charge you a fee for this information.
Availability of Proxy Voting Record
By August 31 of each year, the Trust files information regarding how the Trust’s managers voted proxies relating to fund securities during the most recent twelve-month period ended June 30. Such information is available after filing on the Trust’s’ website and on the SEC’s website noted below.
Information Relating to Investments Held by the Trust
For complete descriptions of the various securities and other instruments held by the Trust and their risks, please see the Trust’s prospectus and Statement of Additional Information (“SAI”). The prospectus and SAI are available as noted below.
Availability of Proxy Voting Policies
A description of the Proxy Voting Policies and Procedures that the Trust uses to determine how to vote proxies relating to fund securities is described in the Trust’s SAI.
How to obtain Information
The Trust’s prospectus, SAI (including Proxy Voting Policies) and annual and semi-annual reports are available:
| • | On the Trust’s website at https://www.pacificlife.com/pacificfunds.html |
| • | On the SEC’s website at http://www.sec.gov |
| • | Upon request by calling, without charge, 1-800-722-2333, 7 a.m. through 5 p.m. Pacific Time |
F-21
Table of Contents
Item 2. Code of Ethics.
As of the end of the period covered by this report, the Registrant has adopted a code of ethics that applies to the Registrant’s principal executive officer, principal financial officer, principal accounting officer or controller, or persons performing similar functions. There were no substantive amendments or waivers to the Code of Ethics during the period covered by this report.
A copy of this Code of Ethics is filed as Exhibit 99 to this Form N-CSR.
Item 3. Audit Committee Financial Expert.
The Registrant’s Board has determined that Paul A. Keller, a member of the Registrant’s Audit Committee, is an “audit committee financial expert” and “independent,” as such terms are defined in this Item. This designation does not increase the designee’s duties, obligations or liability as compared to his duties, obligations and liability as a member of the Audit Committee and of the Board; nor does it reduce the responsibility of the other Audit Committee members. There may be other individuals who, through education or experience, would qualify as “audit committee financial experts” if the Board had designated them as such. Most importantly, the Board believes each member of the Audit Committee contributes significantly to the effective oversight of the Registrant’s financial statements and condition. Mr. Keller is a retired partner of PricewaterhouseCoopers LLP.
Item 4. Principal Accountant Fees and Services.
Audit Fees
| (a) | The aggregate fees billed for the fiscal years ended March 31, 2018 and 2017 for professional services rendered by the principal accountant for the audit of the registrant’s annual financial statements or services that are normally provided by the accountant in connection with statutory and regulatory filings or engagements for those fiscal years are $915,000 and $860,335, respectively. |
Audit-Related Fees
| (b) | There were no aggregate fees billed for the fiscal years ended March 31, 2018 and 2017 for assurance and related services by the principal accountant that are reasonably related to the performance of the audit of the registrant’s financial statements and are not reported under paragraph (a) of this Item. |
Tax Fees
| (c) | The aggregate fees billed for the fiscal years ended March 31, 2018 and 2017 for professional services rendered by the principal accountant for tax compliance, tax advice, and tax planning are $180,010 and $175,975, respectively. The nature of the services comprising the fees was the review of income tax returns and excise tax. |
Table of Contents
All Other Fees
| (d) | There were no aggregate fees billed for the fiscal years ended March 31, 2018 and 2017 for products and services provided by the principal accountant, other than the services reported in paragraphs (a) through (c) of this Item. |
| (e)(1) | The Audit Committee is required to pre-approve audit and non-audit services performed for the Registrant by the independent auditor as outlined below in order to assure that the provision of such services does not impair the auditor’s independence: |
| A. | Pre-Approval Requirements for Services to Registrant. Before the Auditor is engaged by the Registrant to render audit related or permissible non-audit services, either: |
| (i) | The Audit Committee shall pre-approve such engagement; or |
| (ii) | Such engagement shall be entered into pursuant to pre-approval policies and procedures established by the Audit Committee. Any such policies and procedures must (1) be detailed as to the particular service and (2) not involve any delegation of the Audit Committee’s responsibilities to the Adviser. The Audit Committee hereby delegates authority to its Chairperson, and may delegate to one or more of its other members, the authority to grant pre-approvals. In the event of a pre-approval by the Chairperson or other authorized member of the Audit Committee, the person to whom authority is delegated under this Section shall report on such pre-approval to the full Audit Committee at its next regularly scheduled meeting. |
| (iii) | De Minimis Exceptions to Pre-Approval Requirements. Pre-approval for a service provided to the Registrant other than audit, review or attest services is not required if: (1) the aggregate amount of all such non-audit services provided to the Registrant constitutes not more than 5 percent of the total amount of revenues paid by the Registrant to the Auditor during the fiscal year in which the non audit services are provided; (2) such services were not recognized by the Registrant at the time of the engagement to be non-audit services; and (3) such services are promptly brought to the attention of the Audit Committee and are approved by the Audit Committee or by one or more members of the Audit Committee to whom authority to grant such approvals has been delegated by the Audit Committee. |
| B. | Pre-Approval of Non-Audit Services Provided to the Adviser and Others. The Audit Committee shall pre-approve any non-audit services proposed to be provided by the Auditor to (i) the Adviser and (ii) any entity in the investment company complex, if the nature of the services provided relate directly to the operations or financial reporting of the Registrant. Investment company complex means the Pacific Select Fund, the Pacific Funds Series Trust, the Adviser and any entity controlled by or under common control with the Adviser if such entity is an investment adviser or is engaged in the business of providing administrative, custodian, underwriting or transfer agent services to the Trusts or the Adviser. |
| (i) | De Minimis Exception: The De Minimis exceptions set forth above under Section (e)(1)A.(iii) apply to pre-approvals under this Section (e)(1)B. as well, except that the “total amount of revenues” calculation for this Section’s (e)(1)B. services is based on the |
Table of Contents
total amount of revenues paid to the Auditor by the Registrant and any other entity that has its services approved under this Section (i.e., the Adviser or any control person). |
| C. | Pre-Approval of Program and Subscription Services Provided to the Registrants and their Affiliates. The Audit Committee is deemed to have pre-approved Program and Subscription Services (“Programs”) provided to the Registrant and their affiliates, entities within the Registrant’s investment company complex or their affiliates, including employees of Pacific Life and Pacific Life Fund Advisors LLC (collectively, “Fund Persons”) so long as: (1) such Programs are free to Fund Persons or if there is a charge, Fund Persons pay: (a) the going rate for such Programs, or (b) the Fund Persons receive a discount of $500 or less; or (2) the Program is approved under or covered by and in compliance with the policies and/or procedures of Pacific Life’s Audit Committee with respect to the provision of educational services by the Auditor or other parties. Any Programs that do not meet the above criteria require approval by the Audit Committee, its Chairperson or other delegates as provided in Section (e)(1)A.(iii). Programs are educational programs and seminars provided by the Auditor or its affiliates and include live programs, webcasts, podcasts, websites, database subscriptions, checklists, research reports, local office seminars, Debrief webcast series, Technical library and similar or related items. Any Programs that do not meet the above criteria require approval by the Audit Committee, its Chairperson or other delegates as provided in this Section. |
(e)(2) No services included in (b)-(d) above were approved pursuant to paragraph (c)(7)(i)(C) of Rule 2-01 of Regulation S-X.
(f) Not applicable.
| (g) | The aggregate fees billed for the years ended March 31, 2018 and 2017 by the Registrant’s principal accountant for non-audit services rendered to the Registrant, its investment adviser, and any entity controlling, controlled by, or under common control with the investment adviser that provides ongoing services to the Registrant were $1,541,010 and $527,219, respectively. |
| (h) | The Registrant’s Audit Committee has considered whether the provision of non-audit services that were rendered to the Registrant’s investment adviser, and any entity controlling, controlled by, or under common control with the investment adviser that provides ongoing services to the Registrant which were not pre-approved (not requiring pre-approval) is compatible with maintaining the principal accountant’s independence. |
Item 5. Audit Committee of Listed Registrants.
Not applicable.
Item 6. Investments.
| (a) | Schedule of Investments in securities of unaffiliated issuers as of the close of the reporting period is included as part of the report to shareholders filed under Item 1 of this form. |
Table of Contents
| (b) | Not applicable. |
| Item 7. | Disclosure of Proxy Voting Policies and Procedures for Closed-End Management Investment Companies. |
Not applicable.
Item 8. Portfolio Managers of Closed-End Management Investment Companies.
Not applicable.
| Item 9. | Purchases of Equity Securities by Closed-End Management Investment Company and Affiliated Purchasers. |
Not applicable.
Item 10. Submission of Matters to a Vote of Security Holders.
There have been no material changes to the procedures by which shareholders may recommend nominees to the Registrant’s Board of Directors.
Item 11. Controls and Procedures.
| (a) | The Chief Executive Officer and Treasurer have concluded that Registrant’s disclosure controls and procedures (as defined in Rule 30a-3(c) under the Investment Company Act) and internal controls over financial reporting (as defined in Rule 30a-3(d) under the Investment Company Act) provide reasonable assurances that material information relating to Registrant is made known to them by the appropriate persons, based on their evaluation of these controls and procedures as of a date within 90 days of the filing of this report. |
| (b) | There were no changes in the Registrant’s internal control over financial reporting that occurred during the second fiscal quarter of the period covered by this report that have materially affected, or are reasonably likely to materially affect, the Registrant’s internal control over financial reporting. |
| Item 12. | Disclosure of Securities Lending Activities for Closed-End Management Investment Companies. |
Not applicable.
| Item 13. | Exhibits. |
Table of Contents
| (a)(1) | Code of Ethics, subject to the disclosure of Item 2 hereof is attached hereto as Exhibit 99.CODE ETH. |
| (a)(2) | Separate certifications pursuant to Rule 30a-2(a) under the Investment Company Act of 1940 (17 CFR 270.30a-2(a)) is attached hereto as Exhibit 99.CERT. |
Table of Contents
Signatures
Pursuant to the requirements of the Securities Exchange Act of 1934 and the Investment Company Act of 1940, the registrant has duly caused this report to be signed on its behalf by the undersigned, thereunto duly authorized.
| Pacific Funds Series Trust | ||||||
| By: | /s/ Adrian Griggs | |||||
| Adrian Griggs | ||||||
| Chief Executive Officer | ||||||
| Date: | June 6, 2018 | |||||
Pursuant to the requirements of the Securities Exchange Act of 1934 and the Investment Company Act of 1940, this report has been signed below by the following persons on behalf of the registrant and in the capacities and on the dates indicated.
| By: | /s/ Adrian Griggs | |||||
| Adrian Griggs | ||||||
| Chief Executive Officer | ||||||
| Date: | June 6, 2018 | |||||
| By: | /s/ Trevor Smith | |||||
| Trevor Smith | ||||||
| Treasurer (Principal Financial and Accounting Officer) | ||||||
| Date: | June 6, 2018 | |||||